UNITED STATES
SECURITIES AND EXCHANGE COMMISSION
Washington, D.C. 20549
FORM N-CSR
CERTIFIED SHAREHOLDER REPORT OF REGISTERED MANAGEMENT
INVESTMENT COMPANIES
| | |
| Investment Company Act file number: | | 811-07064 |
| |
| Exact name of registrant as specified in charter: | | The Target Portfolio Trust |
| |
| Address of principal executive offices: | | 655 Broad Street, 17th Floor |
| | Newark, New Jersey 07102 |
| |
| Name and address of agent for service: | | Deborah A. Docs |
| | 655 Broad Street, 17th Floor |
| | Newark, New Jersey 07102 |
| |
| Registrant’s telephone number, including area code: | | 800-225-1852 |
| |
| Date of fiscal year end: | | 7/31/2017 |
| |
| Date of reporting period: | | 7/31/2017 |
Item 1 – Reports to Stockholders

TARGET INTERNATIONAL EQUITY PORTFOLIO
ANNUAL REPORT
JULY 31, 2017

To enroll in e-delivery, go to pgiminvestments.com/edelivery
|
| Objective: Capital appreciation |
*** Your Proxy Vote is Critical ***
For shareholders of record on August 14th 2017, you may have received a very important package regarding a Special Shareholder Meeting scheduled for October 30, 2017. The package includes:
| • | | A description of the proxy proposals |
| • | | Several voting options that enable you to vote on these issues quickly and easily |
PLEASE
| • | | Read the information carefully! |
| • | | Vote your proxy immediately—doing so will enable us to hold the shareholder meeting on time and save the expense of additional solicitation costs if not enough shareholders vote. |
The proxy statement is also available online at WWW.PGIMINVESTMENTS.COM/FUNDCHANGES.
Prudential has retained a proxy solicitor D.F. King & Co., Inc. to assist in the solicitation of proxies, primarily by contacting shareholders by telephone.
If you have any proxy-related questions please call the DF King toll-free information line at 1-866-828-6951.
Thank you in advance for your vote!
This report is not authorized for distribution to prospective investors unless preceded or accompanied by a current prospectus.
The views expressed in this report and information about the Fund’s portfolio holdings are for the period covered by this report and are subject to change thereafter.
Mutual Funds are distributed by Prudential Investment Management Services LLC, a Prudential Financial company and member SIPC. © 2017 Prudential Financial, Inc. and its related entities. The Prudential logo, the Rock symbol, and Target Portfolio Trust are service marks of Prudential Financial, Inc. and its related entities, registered in many jurisdictions worldwide.
| | |
| 2 | | Visit our website at pgiminvestments.com |
Letter from the President

Dear Shareholder:
We hope you find the annual report for the Target International Equity Portfolio informative and useful. The report covers performance for the 12-month period ended July 31, 2017.
Effective April 3, 2017, Prudential Investments became known as PGIM® Investments. Why PGIM? This new name was chosen to further align with the global investment management businesses of Prudential Financial, which rebranded
from Prudential Investment Management in January 2016. This new name allows for one brand and reflects our ability and commitment to delivering investment solutions to clients around the globe. Please keep in mind that only the Fund adviser’s name was changed: the name of your Fund and its management and operation will not change.
Major global events during the reporting period included the US presidential election and domestic issues related to the new administration’s policy initiatives. The US economy experienced weak growth during the first quarter of 2017, although stronger growth took place in the second quarter. Britain began its formal legal process to leave the European Union, and recent parliamentary elections in Britain resulted in unseating the majority party. Overall, global economic growth picked up slightly.
Equities in the US reached new highs, and international equities gained significantly. European stocks posted impressive results. Asian markets were solid, and emerging markets outperformed most regions.
In mid-June, the Federal Reserve raised its Federal Funds rate by 0.25% for the second time in 2017. Fixed income markets were mixed, as rising interest rates affected bond markets. High yield and emerging markets bonds were among the top performers.
Given the uncertainty in today’s investment environment, we believe that active professional portfolio management offers a potential advantage. Active managers often have the knowledge and flexibility to find the best investment opportunities in the most challenging markets.
Even so, it’s best if investment decisions are based on your long-term goals rather than on short-term market and economic developments. We also encourage you to work with an experienced financial advisor who can help you set goals, determine your tolerance for risk, and build a diversified plan that’s right for you and make adjustments when necessary.
At PGIM Investments, we consider it a great privilege and responsibility to help investors participate in opportunities across global markets while meeting their toughest investment challenges. We’re part of PGIM, a top-10 global investment manager with more than $1 trillion in assets under management. This investment expertise allows us to deliver actively managed funds and strategies to meet the needs of investors around the globe.
Thank you for choosing our family of funds
Sincerely,

Stuart S. Parker, President
Target International Equity Portfolio
September 15, 2017
| | | | |
| Target International Equity Portfolio | | | 3 | |
Your Portfolio’s Performance (unaudited)
Performance data quoted represent past performance. Past performance does not guarantee future results. The investment return and principal value of an investment will fluctuate, so that an investor’s shares, when redeemed, may be worth more or less than their original cost. Current performance may be lower or higher than the past performance data quoted. An investor may obtain performance data as of the most recent month-end by visiting our website at www.pgiminvestments.com or by calling (800) 225-1852.
| | | | | | | | |
| | | Average Annual Total Returns as of 7/31/17 |
| | | One Year (%) | | Five Years (%) | | Ten Years (%) | | Since Inception (%) |
| Class Q | | 18.57 | | 8.46 | | N/A | | 4.30 (3/1/11) |
| Class R | | 17.82 | | 7.83 | | 0.71 | | — |
| Class Z* | | 18.42 | | 8.36 | | 1.21 | | — |
| MSCI EAFE ND Index | | 17.77 | | 9.06 | | 1.46 | | — |
| Lipper Customized Blend Funds Average** | | 18.23 | | 8.73 | | 1.46 | | — |
| Lipper International Multi-Cap Value Funds Average* | | 20.49 | | 8.39 | | 0.63 | | — |
*Prior to April 13, 2017, Class Z shares were known as Class T shares.
**The Fund is compared to the Lipper Customized Blend Funds Performance Universe, although Lipper classifies the Fund in the Lipper International Multi-Cap Value Funds Performance Universe. The Lipper Customized Blend Funds Performance Universe is utilized because the Fund’s manager believes that the funds included in this universe provide a more appropriate basis for fund performance comparisons.
| | |
| 4 | | Visit our website at pgiminvestments.com |
Growth of a $10,000 Investment
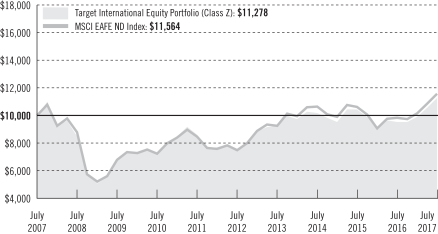
The graph compares a $10,000 investment in the Target International Equity Portfolio (Class Z) with a similar investment in the Morgan Stanley Capital International Europe, Australasia, Far East Net Dividend Index (MSCI EAFE ND Index) by portraying the initial account values at the beginning of the 10-year period (July 31, 2007) and the account values at the end of the current fiscal year (July 31, 2017), as measured on a quarterly basis. For purposes of the graph, and unless otherwise indicated, it has been assumed that (a) all recurring fees (including management fees) were deducted; and (b) all dividends and distributions were reinvested. The line graph provides information for Class Z shares only. As indicated in the tables provided earlier, performance for Class Q and Class R shares will vary due to the differing charges and expenses applicable to each share class (as indicated in the following paragraphs). Without waiver of fees and/or expense reimbursements, if any, the returns would have been lower.
Past performance does not predict future performance. Total returns and the ending account values in the graph include changes in share price and reinvestment of dividends and capital gains distributions in a hypothetical investment for the periods shown. The Fund’s total returns do not reflect the deduction of income taxes on an individual’s investment. Taxes may reduce your actual investment returns on income or gains paid by the Fund or any gains you may realize if you sell your shares.
Source: PGIM Investments LLC and Lipper Inc.
| | | | |
| Target International Equity Portfolio | | | 5 | |
Your Portfolio’s Performance (continued)
The Since Inception returns for the Index and the Lipper Averages are measured from the closest month-end to the Fund’s inception date. Inception returns are provided for any share class with less than 10 fiscal years of returns.
The returns in the tables do not reflect the deduction of taxes that a shareholder would pay on Fund distributions or following the redemption of Fund shares. The average annual total returns take into account applicable sales charges, which are described for each share class in the table below.
| | | | | | |
| | | Class Q | | Class R | | Class Z |
| Maximum initial sales charge | | None | | None | | None |
| Contingent deferred sales charge (CDSC) (as a percentage of the lower of original purchase price or net asset value at redemption) | | None | | None | | None |
| Annual distribution and service (12b-1) fees (shown as a percentage of average daily net assets) | | None | | .75% (.50% currently) | | None |
Benchmark Definitions
Morgan Stanley Capital International Europe, Australasia, and Far East Net Dividend Index
The Morgan Stanley Capital International Europe, Australasia, and Far East Net Dividend Index (MSCI EAFE ND Index) is an unmanaged, weighted index that reflects stock price movements of developed country markets in Europe, Australasia, and the Far East. It gives an indication of how foreign stocks have performed. The MSCI EAFE ND Index reflects the impact of the maximum withholding taxes on reinvested dividends. The average annual total returns for the Index measured from the month-end closest to the inception date through 7/31/17 is 4.61% for Class Q shares.
Lipper Customized Blend Funds Average
The Lipper Customized Blend Funds Average is a 50/50 blend of the Lipper International Multi-Cap Core Funds and Lipper International Large-Cap Core Funds Averages. The average annual total returns for the Average measured from the month-end closest to the inception date through 7/31/17 is 4.35% for Class Q shares.
Lipper International Multi-Cap Value Funds Average
Lipper International Multi-Cap Value Funds are funds that, by portfolio practice, invest in a variety of market-capitalization ranges without concentrating 75% of their equity assets in any one market-capitalization range over an extended period of time. International multi-cap value funds typically have below-average characteristics compared to the MSCI EAFE Index. The average annual total returns for the Average measured from the month-end closest to the inception date through 7/31/17 is 3.52% for Class Q shares.
Investors cannot invest directly in an index or average. The returns for the Index would be lower if they included the effects of sales charges, operating expenses of a mutual fund, or taxes. Returns for the Lipper Averages reflect the deduction of operating expenses, but not sales charges or taxes.
| | |
| 6 | | Visit our website at pgiminvestments.com |
Strategy and Performance Overview
How did the Fund perform?
The Target International Equity Portfolio’s Class Z shares returned 18.42% for the 12 months ended July 31, 2017. This compares with the 17.77% return of the MSCI EAFE ND Index (the Index), and the 20.49% return of the Lipper International Multi-Cap Value Funds Average.
What were market conditions?
| | • | | A stronger euro and yen, stabilizing energy prices, and a rebound in emerging markets were key influences on the global economic landscape in the period. |
| | • | | At the start of the reporting period, and for 2016, energy and materials drove returns; the financials sector was also a strong contributor in the fourth quarter of 2016. Both energy and materials returned over 25% for the year, as these sectors rebounded strongly off their bottom following Janet Yellen’s testimony before Congress where she said that economic risks had intensified, and that rate increases would be more gradual. At that point, the US dollar topped off near term, and the prices of oil and gold partially recovered from the drubbing they had taken over the previous few years. Later in the fourth quarter, and specifically after the election, financials dominated, as prospects of higher interest rates and better margins boosted the outlook for both banks and insurance companies. The three sectors delivered the strongest positive returns in the fourth quarter, and were the leading contributors to positive performance for the year. |
| | • | | Markets began 2017 aided by a stronger euro and yen versus the dollar—most likely due to investors’ expectations for tapering by central banks in Europe and Japan—given new signs of growth. In January, for the first time in almost four years, none of the eurozone’s 19 members experienced deflation. Further, eurozone factory activity rose to a six-year high, while the jobless rate fell to an eight-year low. Additionally, Japan’s long-stagnant economy delivered its fourth consecutive quarter of growth. The European Central Bank (ECB) and the Bank of Japan (BOJ) left their stimulus programs unchanged. |
| | • | | During the first quarter of 2017, international investors started to favor technology and consumer-related sectors in the wake of the US elections, thus benefiting growth fund managers. Emerging markets notably outperformed developed markets, as the likelihood of the trade sanctions initially advocated by President Trump during his campaign were perceived to be considerably less likely. Contrary to 2016, within emerging markets, exposures to China and India helped, while oil-producing countries faced headwinds, as the price of oil stabilized. |
| | • | | Europe’s slow-but-steady recovery continued toward the end of the reporting period, with a number of economic indicators showing strong improvement. Many investors, wary about the inconsistency of Europe’s performance over the past several years, appeared convinced that current economic growth has become sustainable. This sentiment was supported by ECB policy, which signaled confidence but remained accommodative and stimulative. Election results in France also brought a measure of elation to Europe, though the UK election raised uncertainty about government stability as well as ongoing Brexit negotiations. |
| | | | |
| Target International Equity Portfolio | | | 7 | |
Strategy and Performance Overview (continued)
| | • | | Overall, international stocks finished on top, as emerging markets stocks rallied against developed markets and large-cap US stocks. |
What worked?
| | • | | The Fund’s overall stock selection and allocation effects were positive during the period. Several sectors, such as industrials, real estate and energy, contributed to solid relative performance. Additionally, maintaining underweight exposure to weak-performing groups such as real estate, health care and consumer staples sectors was beneficial. |
| | • | | The Fund’s regional exposures contributed to results relative to the Index. Exposure to the Pacific Rim and to Western Europe were also beneficial during the period. |
| | • | | Within LSV Asset Management’s portion of the Fund, stock selection and allocation effects contributed to relative results during the period as positive results were earned in eight of the Index’s eleven sectors. Major contributors came from the industrials and financials sectors. From a country perspective, stock selection benefited most from names held in the Pacific Rim and Western Europe. |
What didn’t work?
| | • | | From a sector perspective, results were weakest in the consumer discretionary and telecommunications groups. A small cash position also detracted from relative results. |
| | • | | Lazard Asset Management’s portion of the Fund struggled during the period due to negative stock selection and allocation effects. Regarding allocation, this subadviser maintained an underweight position in two of the Index’s best performing groups: financials and materials. |
| | • | | Regarding Lazard’s stock selection, results were weak in a majority of sectors. The industrials, financials and health care groups saw the biggest declines. |
| | |
| 8 | | Visit our website at pgiminvestments.com |
Fees and Expenses (unaudited)
As a shareholder of the Fund, you incur two types of costs: (1) transaction costs, including sales charges (loads) on purchase payments and redemptions, as applicable, and (2) ongoing costs, including management fees, and other Fund expenses, as applicable. This example is intended to help you understand your ongoing costs (in dollars) of investing in the Fund and to compare these costs with the ongoing costs of investing in other mutual funds.
The example is based on an investment of $1,000 held through the six-month period ended July 31, 2017. The example is for illustrative purposes only; you should consult the Prospectus for information on initial and subsequent minimum investment requirements.
Actual Expenses
The first line for each share class in the table on the following pages provides information about actual account values and actual expenses. You may use the information on this line, together with the amount you invested, to estimate the expenses that you paid over the period. Simply divide your account value by $1,000 (for example, an $8,600 account value ÷ $1,000 = 8.6), then multiply the result by the number on the first line under the heading “Expenses Paid During the Six-Month Period” to estimate the expenses you paid on your account during this period.
Hypothetical Example for Comparison Purposes
The second line for each share class in the table on the following pages provides information about hypothetical account values and hypothetical expenses based on the Fund’s actual expense ratio and an assumed rate of return of 5% per year before expenses, which is not the Fund’s actual return. The hypothetical account values and expenses may not be used to estimate the actual ending account balance or expenses you paid for the period. You may use this information to compare the ongoing costs of investing in the Fund and other funds. To do so, compare this 5% hypothetical example with the 5% hypothetical examples that appear in the shareholder reports of the other funds.
The Fund’s transfer agent may charge additional fees to holders of certain accounts that are not included in the expenses shown in the table on the following pages. These fees apply to individual retirement accounts (IRAs) and Section 403(b) accounts. As of the close of the six-month period covered by the table, IRA fees included an annual maintenance fee of $15 per account (subject to a maximum annual maintenance fee of $25 for all accounts held by the same shareholder). Section 403(b) accounts are charged an annual $25 fiduciary maintenance fee. Some of the fees may vary in amount, or may be waived, based on your total account balance or the number of Prudential funds, including the Fund, that you own. You should consider the additional fees that were charged to your Fund account over the six-month period when you estimate the total ongoing expenses paid over the period and the impact of these fees on your ending account value, as these additional
| | | | |
| Target International Equity Portfolio | | | 9 | |
Fees and Expenses (continued)
expenses are not reflected in the information provided in the expense table. Additional fees have the effect of reducing investment returns.
Please note that the expenses shown in the table are meant to highlight your ongoing costs only and do not reflect any transactional costs such as sales charges (loads). Therefore, the second line for each share class in the table is useful in comparing ongoing costs only and will not help you determine the relative total costs of owning different funds. In addition, if these transactional costs were included, your costs would have been higher.
| | | | | | | | | | | | | | | | | | |
Target International
Equity Portfolio | | Beginning Account
Value
February 1, 2017 | | | Ending Account
Value
July 31, 2017 | | | Annualized
Expense Ratio
Based on the
Six-Month Period | | | Expenses Paid
During the
Six-Month Period* | |
| Class Q | | Actual | | $ | 1,000.00 | | | $ | 1,140.70 | | | | 0.83 | % | | $ | 4.41 | |
| | Hypothetical | | $ | 1,000.00 | | | $ | 1,020.68 | | | | 0.83 | % | | $ | 4.16 | |
| Class R | | Actual | | $ | 1,000.00 | | | $ | 1,137.50 | | | | 1.43 | % | | $ | 7.58 | |
| | Hypothetical | | $ | 1,000.00 | | | $ | 1,017.70 | | | | 1.43 | % | | $ | 7.15 | |
| Class Z | | Actual | | $ | 1,000.00 | | | $ | 1,139.70 | | | | 0.93 | % | | $ | 4.93 | |
| | | Hypothetical | | $ | 1,000.00 | | | $ | 1,020.18 | | | | 0.93 | % | | $ | 4.66 | |
*Fund expenses (net of fee waivers or subsidies, if any) for each share class are equal to the annualized expense ratio for each share class (provided in the table), multiplied by the average account value over the period, multiplied by the 181 days in the six-month period ended July 31, 2017, and divided by the 365 days in the Fund’s fiscal year ended July 31, 2017 (to reflect the six-month period). Expenses presented in the table include the expenses of any underlying portfolios in which the Fund may invest.
| | |
| 10 | | Visit our website at pgiminvestments.com |
Schedule of Investments
as of July 31, 2017
| | | | | | | | |
| Description | | Shares | | | Value | |
LONG-TERM INVESTMENTS 98.1% | | | | | | | | |
| | |
COMMON STOCKS | | | | | | | | |
| | |
Australia 5.2% | | | | | | | | |
Arrium Ltd.*^ | | | 783,800 | | | $ | 63 | |
Asaleo Care Ltd. | | | 385,000 | | | | 409,881 | |
Ausdrill Ltd. | | | 101,200 | | | | 157,512 | |
Australia & New Zealand Banking Group Ltd. | | | 38,100 | | | | 903,319 | |
Bank of Queensland Ltd. | | | 100,769 | | | | 971,352 | |
Bendigo & Adelaide Bank Ltd. | | | 77,000 | | | | 684,905 | |
BHP Billiton PLC | | | 184,761 | | | | 3,368,936 | |
Caltex Australia Ltd. | | | 104,851 | | | | 2,612,968 | |
CSR Ltd. | | | 247,500 | | | | 776,587 | |
Downer EDI Ltd. | | | 174,800 | | | | 889,746 | |
Fortescue Metals Group Ltd. | | | 195,100 | | | | 896,721 | |
Harvey Norman Holdings Ltd.(a) | | | 183,200 | | | | 640,567 | |
LendLease Group | | | 103,900 | | | | 1,401,427 | |
Metcash Ltd. | | | 470,100 | | | | 985,631 | |
Mineral Resources Ltd. | | | 69,900 | | | | 687,288 | |
Myer Holdings Ltd.(a) | | | 598,900 | | | | 363,739 | |
National Australia Bank Ltd. | | | 35,768 | | | | 857,459 | |
Qantas Airways Ltd. | | | 296,649 | | | | 1,260,780 | |
Seven Group Holdings Ltd. | | | 4,600 | | | | 44,024 | |
Seven West Media Ltd. | | | 535,500 | | | | 346,946 | |
Wesfarmers Ltd. | | | 36,700 | | | | 1,195,892 | |
| | | | | | | | |
| | | | 19,455,743 | |
| | |
Austria 0.9% | | | | | | | | |
OMV AG | | | 40,400 | | | | 2,288,538 | |
voestalpine AG | | | 24,500 | | | | 1,241,752 | |
| | | | | | | | |
| | | | 3,530,290 | |
| | |
Belgium 1.2% | | | | | | | | |
AGFA-Gevaert NV* | | | 121,300 | | | | 565,564 | |
Anheuser-Busch InBev SA/NV | | | 23,220 | | | | 2,801,079 | |
KBC Group NV | | | 14,244 | | | | 1,177,605 | |
| | | | | | | | |
| | | | 4,544,248 | |
| | |
Brazil 0.4% | | | | | | | | |
BB Seguridade Participacoes SA | | | 164,900 | | | | 1,449,455 | |
| | |
Canada 1.7% | | | | | | | | |
Canadian National Railway Co. | | | 24,040 | | | | 1,899,676 | |
National Bank of Canada | | | 42,400 | | | | 1,909,573 | |
See Notes to Financial Statements.
| | | | |
| Target International Equity Portfolio | | | 11 | |
Schedule of Investments (continued)
as of July 31, 2017
| | | | | | | | |
| Description | | Shares | | | Value | |
COMMON STOCKS (Continued) | | | | | | | | |
| | |
Canada (cont’d.) | | | | | | | | |
Suncor Energy, Inc. | | | 79,530 | | | $ | 2,594,333 | |
| | | | | | | | |
| | | | 6,403,582 | |
| | |
China 0.3% | | | | | | | | |
China Resources Cement Holdings Ltd. | | | 946,000 | | | | 562,742 | |
CITIC Telecom International Holdings Ltd. | | | 1,598,600 | | | | 486,685 | |
| | | | | | | | |
| | | | 1,049,427 | |
| | |
Denmark 1.8% | | | | | | | | |
A.P. Moller-Maersk A/S (Class B Stock) | | | 999 | | | | 2,180,658 | |
Carlsberg A/S (Class B Stock) | | | 16,450 | | | | 1,827,581 | |
Danske Bank A/S | | | 46,600 | | | | 1,887,192 | |
Dfds A/S | | | 14,300 | | | | 815,597 | |
| | | | | | | | |
| | | | 6,711,028 | |
| | |
Finland 1.3% | | | | | | | | |
Sampo Oyj (Class A Stock) | | | 41,020 | | | | 2,243,442 | |
Tieto Oyj | | | 16,100 | | | | 510,756 | |
UPM-Kymmene Oyj | | | 77,400 | | | | 2,107,062 | |
| | | | | | | | |
| | | | 4,861,260 | |
| | |
France 11.3% | | | | | | | | |
Air Liquide SA | | | 19,943 | | | | 2,445,277 | |
Airbus SE | | | 14,229 | | | | 1,188,924 | |
Arkema SA | | | 7,500 | | | | 853,763 | |
Atos SE | | | 12,700 | | | | 1,930,846 | |
AXA SA | | | 34,900 | | | | 1,030,715 | |
BNP Paribas SA | | | 19,400 | | | | 1,503,411 | |
Capgemini SE | | | 29,369 | | | | 3,197,378 | |
Carrefour SA | | | 62,400 | | | | 1,498,852 | |
Cie Generale des Etablissements Michelin | | | 33,052 | | | | 4,476,420 | |
CNP Assurances | | | 44,800 | | | | 1,081,543 | |
Credit Agricole SA | | | 75,300 | | | | 1,321,688 | |
Electricite de France SA | | | 61,400 | | | | 623,247 | |
Engie SA | | | 71,900 | | | | 1,158,032 | |
Orange SA | | | 118,100 | | | | 1,987,248 | |
Renault SA | | | 12,000 | | | | 1,081,099 | |
Sanofi | | | 44,700 | | | | 4,259,405 | |
SCOR SE | | | 26,000 | | | | 1,096,568 | |
Societe Generale SA | | | 25,100 | | | | 1,471,727 | |
Sopra Steria Group | | | 4,700 | | | | 812,792 | |
TOTAL SA | | | 48,500 | | | | 2,466,396 | |
See Notes to Financial Statements.
| | | | | | | | |
| Description | | Shares | | | Value | |
COMMON STOCKS (Continued) | | | | | | | | |
| | |
France (cont’d.) | | | | | | | | |
Valeo SA | | | 56,332 | | | $ | 3,900,334 | |
Vinci SA | | | 38,036 | | | | 3,405,974 | |
| | | | | | | | |
| | | | 42,791,639 | |
| | |
Germany 7.8% | | | | | | | | |
Allianz SE | | | 11,100 | | | | 2,366,046 | |
Aurubis AG(a) | | | 10,100 | | | | 899,129 | |
BASF SE | | | 15,800 | | | | 1,504,155 | |
Bayer AG | | | 13,600 | | | | 1,722,586 | |
Bayerische Motoren Werke AG | | | 18,800 | | | | 1,727,328 | |
Daimler AG | | | 30,700 | | | | 2,150,982 | |
Deutsche Bank AG | | | 45,100 | | | | 803,123 | |
Deutsche Lufthansa AG | | | 50,300 | | | | 1,080,190 | |
Deutsche Post AG | | | 80,603 | | | | 3,126,786 | |
Evonik Industries AG | | | 28,900 | | | | 984,261 | |
Hannover Rueck SE | | | 6,900 | | | | 870,906 | |
METRO AG | | | 45,200 | | | | 507,928 | |
Metro Wholesale & Food Specialist AG* | | | 45,200 | | | | 913,107 | |
Muenchener Rueckversicherungs-Gesellschaft AG | | | 8,700 | | | | 1,868,749 | |
Rheinmetall AG | | | 15,300 | | | | 1,526,781 | |
SAP SE | | | 35,382 | | | | 3,746,419 | |
Siemens AG | | | 11,100 | | | | 1,506,283 | |
STADA Arzneimittel AG(a) | | | 2,700 | | | | 210,220 | |
Uniper SE | | | 48,500 | | | | 999,532 | |
Volkswagen AG | | | 7,300 | | | | 1,147,890 | |
| | | | | | | | |
| | | | 29,662,401 | |
| | |
Hong Kong 2.2% | | | | | | | | |
Cheung Kong Property Holdings Ltd. | | | 58,900 | | | | 476,314 | |
Kingboard Chemical Holdings Ltd. | | | 240,500 | | | | 1,082,762 | |
Lee & Man Paper Manufacturing Ltd. | | | 1,351,600 | | | | 1,439,389 | |
Skyworth Digital Holdings Ltd. | | | 1,483,300 | | | | 794,714 | |
Tongda Group Holdings Ltd.(a) | | | 2,621,800 | | | | 760,534 | |
WH Group Ltd., 144A | | | 1,975,000 | | | | 1,851,844 | |
Wheelock & Co. Ltd. | | | 113,000 | | | | 851,511 | |
Yue Yuen Industrial Holdings Ltd. | | | 249,300 | | | | 1,029,276 | |
| | | | | | | | |
| | | | 8,286,344 | |
| | |
Ireland 0.9% | | | | | | | | |
Ryanair Holdings PLC, ADR* | | | 17,376 | | | | 1,969,222 | |
Smurfit Kappa Group PLC | | | 49,900 | | | | 1,484,072 | |
| | | | | | | | |
| | | | 3,453,294 | |
See Notes to Financial Statements.
| | | | |
| Target International Equity Portfolio | | | 13 | |
Schedule of Investments (continued)
as of July 31, 2017
| | | | | | | | |
| Description | | Shares | | | Value | |
COMMON STOCKS (Continued) | | | | | | | | |
| | |
Israel 0.4% | | | | | | | | |
Bank Hapoalim BM | | | 110,800 | | | $ | 767,490 | |
Teva Pharmaceutical Industries Ltd. | | | 20,600 | | | | 664,771 | |
| | | | | | | | |
| | | | 1,432,261 | |
| | |
Italy 1.8% | | | | | | | | |
Astaldi SpA | | | 57,600 | | | | 382,602 | |
Enel SpA | | | 495,000 | | | | 2,823,620 | |
Leonardo SpA | | | 23,800 | | | | 414,745 | |
Mediobanca SpA | | | 96,700 | | | | 1,008,927 | |
UniCredit SpA* | | | 116,925 | | | | 2,298,029 | |
| | | | | | | | |
| | | | 6,927,923 | |
| | |
Japan 21.1% | | | | | | | | |
ABC-Mart, Inc. | | | 13,800 | | | | 786,890 | |
Aoyama Trading Co. Ltd. | | | 13,700 | | | | 477,544 | |
Asahi Kasei Corp. | | | 107,000 | | | | 1,221,934 | |
Astellas Pharma, Inc. | | | 90,700 | | | | 1,155,113 | |
cocokara fine, Inc. | | | 16,600 | | | | 867,464 | |
Concordia Financial Group Ltd. | | | 148,000 | | | | 746,319 | |
Daiwa House Industry Co. Ltd. | | | 122,380 | | | | 4,268,786 | |
Don Quijote Holdings Co. Ltd. | | | 79,500 | | | | 2,887,347 | |
Dowa Holdings Co. Ltd. | | | 106,000 | | | | 855,776 | |
Enplas Corp. | | | 14,300 | | | | 588,498 | |
Fujikura Ltd. | | | 234,900 | | | | 1,977,685 | |
Fuyo General Lease Co. Ltd. | | | 18,600 | | | | 1,090,452 | |
Heiwa Corp. | | | 43,400 | | | | 954,775 | |
Hoshizaki Corp. | | | 11,700 | | | | 1,132,520 | |
Isuzu Motors Ltd. | | | 257,200 | | | | 3,526,778 | |
Japan Airlines Co. Ltd. | | | 29,800 | | | | 962,821 | |
Kaneka Corp. | | | 80,000 | | | | 641,053 | |
Kao Corp. | | | 24,560 | | | | 1,495,324 | |
KDDI Corp. | | | 161,900 | | | | 4,289,861 | |
Keihin Corp. | | | 43,200 | | | | 621,602 | |
Keiyo Bank Ltd. (The) | | | 128,000 | | | | 541,551 | |
KYORIN Holdings, Inc. | | | 32,700 | | | | 698,032 | |
Kyowa Exeo Corp. | | | 47,500 | | | | 810,986 | |
Lintec Corp. | | | 34,900 | | | | 847,253 | |
Makita Corp. | | | 56,000 | | | | 2,190,469 | |
Marubeni Corp. | | | 150,500 | | | | 997,285 | |
Matsumotokiyoshi Holdings Co. Ltd. | | | 17,100 | | | | 1,054,484 | |
Mazda Motor Corp. | | | 49,200 | | | | 739,614 | |
Medipal Holdings Corp. | | | 14,700 | | | | 269,002 | |
See Notes to Financial Statements.
| | | | | | | | |
| Description | | Shares | | | Value | |
COMMON STOCKS (Continued) | | | | | | | | |
| | |
Japan (cont’d.) | | | | | | | | |
Mitsubishi Gas Chemical Co., Inc. | | | 37,700 | | | $ | 869,799 | |
Mitsubishi UFJ Financial Group, Inc. | | | 271,300 | | | | 1,721,158 | |
Mixi, Inc. | | | 19,300 | | | | 1,060,721 | |
Mizuho Financial Group, Inc. | | | 681,100 | | | | 1,211,252 | |
NEC Corp. | | | 248,000 | | | | 674,174 | |
Nichi-iko Pharmaceutical Co. Ltd.(a) | | | 28,200 | | | | 432,009 | |
Nippon Telegraph & Telephone Corp. | | | 80,200 | | | | 3,924,844 | |
Nishi-Nippon Financial Holdings, Inc. | | | 66,740 | | | | 750,895 | |
Nissan Motor Co. Ltd. | | | 194,800 | | | | 1,934,221 | |
Nisshinbo Holdings, Inc. | | | 65,300 | | | | 661,268 | |
NTT DOCOMO, Inc. | | | 40,300 | | | | 935,846 | |
Resona Holdings, Inc. | | | 367,400 | | | | 1,892,720 | |
Sankyu, Inc. | | | 90,000 | | | | 677,866 | |
Sawai Pharmaceutical Co. Ltd. | | | 7,200 | | | | 405,804 | |
Seino Holdings Co. Ltd. | | | 66,300 | | | | 892,721 | |
Seven & i Holdings Co. Ltd. | | | 32,500 | | | | 1,309,902 | |
Shimachu Co. Ltd. | | | 27,300 | | | | 683,149 | |
Shinko Electric Industries Co. Ltd. | | | 62,000 | | | | 451,110 | |
Ship Healthcare Holdings, Inc. | | | 22,200 | | | | 681,324 | |
Shizuoka Gas Co. Ltd. | | | 17,100 | | | | 129,339 | |
SKY Perfect JSAT Holdings, Inc. | | | 166,600 | | | | 747,872 | |
Sony Corp. | | | 75,000 | | | | 3,081,323 | |
Sumitomo Heavy Industries Ltd. | | | 134,000 | | | | 976,917 | |
Sumitomo Mitsui Financial Group, Inc. | | | 106,300 | | | | 4,101,671 | |
Sumitomo Osaka Cement Co. Ltd. | | | 202,200 | | | | 946,461 | |
T-Gaia Corp. | | | 26,700 | | | | 534,343 | |
Toagosei Co. Ltd. | | | 61,700 | | | | 744,228 | |
Toho Holdings Co. Ltd. | | | 31,400 | | | | 620,737 | |
Tokai Rika Co. Ltd. | | | 53,600 | | | | 984,225 | |
Towa Pharmaceutical Co. Ltd. | | | 9,000 | | | | 434,719 | |
Toyo Tire & Rubber Co. Ltd. | | | 36,200 | | | | 743,061 | |
Toyoda Gosei Co. Ltd. | | | 34,100 | | | | 804,574 | |
Toyota Motor Corp. | | | 15,964 | | | | 899,729 | |
Tsubakimoto Chain Co. | | | 83,800 | | | | 710,996 | |
Ube Industries Ltd. | | | 482,000 | | | | 1,305,677 | |
United Arrows Ltd. | | | 28,800 | | | | 872,879 | |
Yamaha Corp. | | | 7,400 | | | | 261,688 | |
Yokohama Rubber Co. Ltd. (The) | | | 50,750 | | | | 1,021,988 | |
| | | | | | | | |
| | | | 79,790,428 | |
| | |
Liechtenstein 0.1% | | | | | | | | |
VP Bank AG | | | 1,895 | | | | 238,663 | |
See Notes to Financial Statements.
| | | | |
| Target International Equity Portfolio | | | 15 | |
Schedule of Investments (continued)
as of July 31, 2017
| | | | | | | | |
| Description | | Shares | | | Value | |
COMMON STOCKS (Continued) | | | | | | | | |
| | |
Luxembourg 0.3% | | | | | | | | |
RTL Group SA | | | 1,656 | | | $ | 128,830 | |
Tenaris SA | | | 63,676 | | | | 1,007,510 | |
| | | | | | | | |
| | | | 1,136,340 | |
| | |
Netherlands 3.7% | | | | | | | | |
Aegon NV | | | 106,800 | | | | 598,660 | |
ING Groep NV | | | 93,600 | | | | 1,748,801 | |
Koninklijke Ahold Delhaize NV | | | 36,600 | | | | 748,616 | |
Koninklijke KPN NV | | | 356,286 | | | | 1,292,013 | |
Koninklijke Philips NV | | | 22,000 | | | | 840,750 | |
NN Group NV | | | 25,600 | | | | 1,037,664 | |
Royal Dutch Shell PLC (Class A Stock)(XLON) | | | 130,250 | | | | 3,678,446 | |
Royal Dutch Shell PLC (Class B Stock) | | | 40,100 | | | | 1,142,358 | |
Wolters Kluwer NV | | | 63,489 | | | | 2,823,564 | |
| | | | | | | | |
| | | | 13,910,872 | |
| | |
New Zealand 0.5% | | | | | | | | |
Air New Zealand Ltd. | | | 501,100 | | | | 1,261,553 | |
Fletcher Building Ltd. | | | 126,700 | | | | 760,573 | |
| | | | | | | | |
| | | | 2,022,126 | |
| | |
Norway 2.2% | | | | | | | | |
DNB ASA | | | 97,000 | | | | 1,905,515 | |
Marine Harvest ASA* | | | 37,000 | | | | 689,809 | |
Salmar ASA | | | 1,500 | | | | 38,998 | |
Statoil ASA | | | 127,647 | | | | 2,399,008 | |
Telenor ASA | | | 115,209 | | | | 2,299,981 | |
Yara International ASA | | | 22,900 | | | | 910,188 | |
| | | | | | | | |
| | | | 8,243,499 | |
| | |
Portugal 0.3% | | | | | | | | |
EDP - Energias de Portugal SA | | | 316,500 | | | | 1,123,712 | |
| | |
Singapore 1.6% | | | | | | | | |
DBS Group Holdings Ltd. | | | 244,200 | | | | 3,895,876 | |
NetLink NBN Trust* | | | 1,749,900 | | | | 1,052,406 | |
United Overseas Bank Ltd. | | | 69,400 | | | | 1,228,075 | |
| | | | | | | | |
| | | | 6,176,357 | |
| | |
South Africa 0.2% | | | | | | | | |
Mondi PLC | | | 28,300 | | | | 745,406 | |
See Notes to Financial Statements.
| | | | | | | | |
| Description | | Shares | | | Value | |
COMMON STOCKS (Continued) | | | | | | | | |
| | |
Spain 2.1% | | | | | | | | |
Banco Bilbao Vizcaya Argentaria SA | | | 93,500 | | | $ | 845,956 | |
Banco Santander SA | | | 128,417 | | | | 874,282 | |
Distribuidora Internacional de Alimentacion SA | | | 162,500 | | | | 1,094,518 | |
Gas Natural SDG SA | | | 46,500 | | | | 1,088,284 | |
Iberdrola SA | | | 158,100 | | | | 1,246,288 | |
Red Electrica Corp. SA | | | 64,402 | | | | 1,379,705 | |
Repsol SA | | | 88,500 | | | | 1,482,184 | |
| | | | | | | | |
| | | | 8,011,217 | |
| | |
Sweden 2.8% | | | | | | | | |
Assa Abloy AB (Class B Stock) | | | 133,645 | | | | 2,863,071 | |
Boliden AB | | | 39,200 | | | | 1,230,646 | |
JM AB | | | 21,500 | | | | 754,631 | |
Nordea Bank AB | | | 293,503 | | | | 3,703,387 | |
SAS AB* | | | 285,948 | | | | 683,496 | |
Swedbank AB (Class A Stock) | | | 27,400 | | | | 714,520 | |
Telia Co. AB | | | 164,900 | | | | 775,172 | |
| | | | | | | | |
| | | | 10,724,923 | |
| | |
Switzerland 6.5% | | | | | | | | |
Aryzta AG* | | | 19,800 | | | | 636,272 | |
Autoneum Holding AG | | | 2,600 | | | | 624,777 | |
Baloise Holding AG | | | 10,200 | | | | 1,638,794 | |
Cembra Money Bank AG* | | | 4,200 | | | | 376,762 | |
Credit Suisse Group AG* | | | 75,100 | | | | 1,154,414 | |
Ferguson PLC | | | 47,069 | | | | 2,810,392 | |
Georg Fischer AG | | | 1,280 | | | | 1,455,798 | |
Helvetia Holding AG | | | 1,700 | | | | 950,173 | |
Julius Baer Group Ltd.* | | | 26,408 | | | | 1,494,878 | |
Novartis AG | | | 52,419 | | | | 4,464,934 | |
Roche Holding AG | | | 9,300 | | | | 2,354,474 | |
Swiss Life Holding AG* | | | 7,100 | | | | 2,591,164 | |
Swiss Re AG | | | 24,500 | | | | 2,362,101 | |
UBS Group AG* | | | 104,300 | | | | 1,813,826 | |
| | | | | | | | |
| | | | 24,728,759 | |
| | |
Taiwan 0.6% | | | | | | | | |
Taiwan Semiconductor Manufacturing Co. Ltd., ADR | | | 57,100 | | | | 2,053,316 | |
| | |
Turkey 0.3% | | | | | | | | |
Turkiye Garanti Bankasi AS | | | 368,220 | | | | 1,102,704 | |
See Notes to Financial Statements.
| | | | |
| Target International Equity Portfolio | | | 17 | |
Schedule of Investments (continued)
as of July 31, 2017
| | | | | | | | |
| Description | | Shares | | | Value | |
COMMON STOCKS (Continued) | | | | | | | | |
| | |
United Kingdom 16.0% | | | | | | | | |
3i Group PLC | | | 155,800 | | | $ | 1,923,372 | |
Amec Foster Wheeler PLC | | | 27,600 | | | | 161,899 | |
Aviva PLC | | | 159,700 | | | | 1,135,152 | |
BAE Systems PLC | | | 274,300 | | | | 2,176,249 | |
Barclays PLC | | | 229,000 | | | | 614,007 | |
Barratt Developments PLC | | | 125,500 | | | | 1,019,274 | |
Beazley PLC | | | 124,500 | | | | 841,383 | |
Bellway PLC | | | 37,800 | | | | 1,591,709 | |
Berkeley Group Holdings PLC | | | 21,600 | | | | 996,158 | |
Bovis Homes Group PLC | | | 69,200 | | | | 923,835 | |
BP PLC | | | 398,300 | | | | 2,339,516 | |
British American Tobacco PLC | | | 63,566 | | | | 3,954,171 | |
BT Group PLC | | | 487,000 | | | | 2,015,353 | |
Carillion PLC(a) | | | 188,500 | | | | 141,151 | |
Centrica PLC | | | 319,200 | | | | 836,199 | |
ConvaTec Group PLC, 144A* | | | 375,332 | | | | 1,538,295 | |
Debenhams PLC | | | 308,200 | | | | 174,862 | |
Diageo PLC | | | 70,439 | | | | 2,274,966 | |
easyJet PLC | | | 44,500 | | | | 725,812 | |
GKN PLC | | | 238,100 | | | | 1,010,106 | |
GlaxoSmithKline PLC | | | 173,900 | | | | 3,461,824 | |
Go-Ahead Group PLC | | | 24,800 | | | | 587,698 | |
Howden Joinery Group PLC | | | 188,629 | | | | 1,057,993 | |
Inchcape PLC | | | 61,900 | | | | 656,164 | |
Informa PLC | | | 164,531 | | | | 1,509,051 | |
Intermediate Capital Group PLC | | | 53,400 | | | | 638,505 | |
International Consolidated Airlines Group SA | | | 124,600 | | | | 950,259 | |
J Sainsbury PLC | | | 569,000 | | | | 1,838,418 | |
Kingfisher PLC | | | 296,800 | | | | 1,151,809 | |
Legal & General Group PLC | | | 284,500 | | | | 1,007,335 | |
Lloyds Banking Group PLC | | | 1,253,300 | | | | 1,083,526 | |
Man Group PLC | | | 366,600 | | | | 773,940 | |
Marks & Spencer Group PLC | | | 245,300 | | | | 1,042,554 | |
Marston’s PLC | | | 87,720 | | | | 134,301 | |
Meggitt PLC | | | 116,500 | | | | 773,241 | |
Old Mutual PLC | | | 318,612 | | | | 826,379 | |
Paragon Group of Cos. PLC (The) | | | 142,700 | | | | 814,860 | |
Provident Financial PLC | | | 10,448 | | | | 284,425 | |
Prudential PLC | | | 208,885 | | | | 5,096,900 | |
Redrow PLC | | | 149,800 | | | | 1,170,595 | |
RELX PLC | | | 133,766 | | | | 2,913,596 | |
Rio Tinto Ltd. | | | 20,100 | | | | 1,059,582 | |
See Notes to Financial Statements.
| | | | | | | | |
| Description | | Shares | | | Value | |
COMMON STOCKS (Continued) | | | | | | | | |
| | |
United Kingdom (cont’d.) | | | | | | | | |
Royal Mail PLC | | | 124,900 | | | $ | 664,140 | |
SSE PLC | | | 70,600 | | | | 1,284,807 | |
Unilever PLC | | | 53,072 | | | | 3,026,843 | |
Vesuvius PLC | | | 48,900 | | | | 350,483 | |
| | | | | | | | |
| | | | 60,552,697 | |
| | |
United States 2.6% | | | | | | | | |
Aon PLC | | | 23,170 | | | | 3,201,399 | |
Boart Longyear Ltd.* | | | 56,600 | | | | 2,399 | |
Medtronic PLC | | | 34,690 | | | | 2,912,919 | |
Shire PLC | | | 67,511 | | | | 3,774,029 | |
| | | | | | | | |
| | | | 9,890,746 | |
| | | | | | | | |
TOTAL LONG-TERM INVESTMENTS
(cost $304,506,767) | | | | 371,010,660 | |
| | | | | | | | |
| | |
SHORT-TERM INVESTMENTS 2.0% | | | | | | | | |
| | |
AFFILIATED MUTUAL FUNDS | | | | | | | | |
Prudential Investment Portfolios 2 - Prudential Core Ultra Short Bond Fund(w) | | | 3,884,787 | | | | 3,884,787 | |
Prudential Investment Portfolios 2 - Prudential Institutional Money Market Fund (cost $3,727,483; includes $3,724,229 of cash collateral for securities on loan)(b)(w) | | | 3,727,262 | | | | 3,727,634 | |
| | | | | | | | |
TOTAL SHORT-TERM INVESTMENTS
(cost $7,612,270) | | | | | | | 7,612,421 | |
| | | | | | | | |
TOTAL INVESTMENTS 100.1%
(cost $312,119,037) | | | | | | | 378,623,081 | |
Liabilities in excess of other assets (0.1)% | | | | | | | (391,628 | ) |
| | | | | | | | |
NET ASSETS 100.0% | | | | | | $ | 378,231,453 | |
| | | | | | | | |
The following abbreviations are used in the annual report:
144A—Security was purchased pursuant to Rule 144A under the Securities Act of 1933 and may not be resold subject to that rule except to qualified institutional buyers. Unless otherwise noted, 144A Securities are deemed to be liquid.
ADR—American Depositary Receipt
LIBOR—London Interbank Offered Rate
XLON—London Stock Exchange
| * | Non-income producing security. |
| ^ | Indicates a Level 3 security. The aggregate value of Level 3 securities is $63 and 0.0% of net assets. |
| (a) | All or a portion of security is on loan. The aggregate market value of such securities, including those sold and pending settlement, is $3,353,719; cash collateral of $3,724,229 (included in liabilities) was received with which the Fund purchased highly liquid short-term investments. |
| (b) | Represents security purchased with cash collateral received for securities on loan and includes dividend reinvestment. |
| (w) | PGIM Investments LLC, the manager of the Portfolio, also serves as manager of the Prudential Investment Portfolios 2 - Prudential Core Ultra Short Bond Fund and Prudential Institutional Money Market Fund. |
See Notes to Financial Statements.
| | | | |
| Target International Equity Portfolio | | | 19 | |
Schedule of Investments (continued)
as of July 31, 2017
Fair Value Measurements:
Various inputs are used in determining the value of the Portfolio’s investments. These inputs are summarized in the three broad levels listed below.
Level 1—unadjusted quoted prices generally in active markets for identical securities.
Level 2—quoted prices for similar securities, interest rates and yield curves, prepayment speeds, foreign currency exchange rates and other observable inputs.
Level 3—unobservable inputs for securities valued in accordance with Board approved fair valuation procedures.
The following is a summary of the inputs used as of July 31, 2017 in valuing such portfolio securities:
| | | | | | | | | | | | |
| | | Level 1 | | | Level 2 | | | Level 3 | |
Investments in Securities | | | | | | | | | | | | |
Common Stocks | | | | | | | | | | | | |
Australia | | $ | — | | | $ | 19,455,680 | | | $ | 63 | |
Austria | | | — | | | | 3,530,290 | | | | — | |
Belgium | | | — | | | | 4,544,248 | | | | — | |
Brazil | | | 1,449,455 | | | | — | | | | — | |
Canada | | | 6,403,582 | | | | — | | | | — | |
China | | | — | | | | 1,049,427 | | | | — | |
Denmark | | | — | | | | 6,711,028 | | | | — | |
Finland | | | — | | | | 4,861,260 | | | | — | |
France | | | — | | | | 42,791,639 | | | | — | |
Germany | | | 913,107 | | | | 28,749,294 | | | | — | |
Hong Kong | | | — | | | | 8,286,344 | | | | — | |
Ireland | | | 1,969,222 | | | | 1,484,072 | | | | — | |
Israel | | | — | | | | 1,432,261 | | | | — | |
Italy | | | — | | | | 6,927,923 | | | | — | |
Japan | | | — | | | | 79,790,428 | | | | — | |
Liechtenstein | | | — | | | | 238,663 | | | | — | |
Luxembourg | | | — | | | | 1,136,340 | | | | — | |
Netherlands | | | — | | | | 13,910,872 | | | | — | |
New Zealand | | | — | | | | 2,022,126 | | | | — | |
Norway | | | — | | | | 8,243,499 | | | | — | |
Portugal | | | — | | | | 1,123,712 | | | | — | |
Singapore | | | 1,052,406 | | | | 5,123,951 | | | | — | |
South Africa | | | — | | | | 745,406 | | | | — | |
Spain | | | — | | | | 8,011,217 | | | | — | |
Sweden | | | — | | | | 10,724,923 | | | | — | |
Switzerland | | | — | | | | 24,728,759 | | | | — | |
Taiwan | | | 2,053,316 | | | | — | | | | — | |
Turkey | | | — | | | | 1,102,704 | | | | — | |
United Kingdom | | | — | | | | 60,552,697 | | | | — | |
See Notes to Financial Statements.
| | | | | | | | | | | | |
| | | Level 1 | | | Level 2 | | | Level 3 | |
Investments in Securities (continued) | | | | | | | | | | | | |
Common Stocks (continued) | | | | | | | | | | | | |
United States | | $ | 6,114,318 | | | $ | 3,776,428 | | | $ | — | |
Affiliated Mutual Funds | | | 7,612,421 | | | | — | | | | — | |
| | | | | | | | | | | | |
Total | | $ | 27,567,827 | | | $ | 351,055,191 | | | $ | 63 | |
| | | | | | | | | | | | |
It is the Portfolio’s policy to recognize transfers in and transfers out at the fair value as of the beginning of period. At the reporting period end, securities transferred levels as follows:
| | | | | | | | | | | | |
Investments in Securities | | Amount Transferred | | | Level Transfer | | | Logic | |
Common Stocks | | $ | 5,609,055 | | | | L1 to L2 | | | | Official Close to Model Price | |
Industry Classification:
The industry classification of investments and liabilities in excess of other assets shown as a percentage of net assets as of July 31, 2017 were as follows (unaudited):
| | | | |
Banks | | | 12.0 | % |
Insurance | | | 8.8 | |
Oil, Gas & Consumable Fuels | | | 5.6 | |
Pharmaceuticals | | | 5.4 | |
Auto Components | | | 3.8 | |
Diversified Telecommunication Services | | | 3.7 | |
Automobiles | | | 3.5 | |
Chemicals | | | 3.3 | |
Food & Staples Retailing | | | 3.0 | |
Metals & Mining | | | 2.7 | |
Household Durables | | | 2.7 | |
Airlines | | | 2.4 | |
Capital Markets | | | 2.3 | |
Electric Utilities | | | 2.2 | |
Affiliated Mutual Funds (including 1.0% of collateral for securities on loan) | | | 2.0 | |
Real Estate Management & Development | | | 1.9 | |
Beverages | | | 1.8 | |
Machinery | | | 1.8 | |
IT Services | | | 1.7 | |
Professional Services | | | 1.5 | |
Wireless Telecommunication Services | | | 1.4 | |
Multiline Retail | | | 1.4 | |
Specialty Retail | | | 1.3 | |
Personal Products | | | 1.3 | |
Trading Companies & Distributors | | | 1.3 | |
Construction & Engineering | | | 1.3 | |
Aerospace & Defense | | | 1.2 | |
Industrial Conglomerates | | | 1.2 | |
Health Care Equipment & Supplies | | | 1.2 | |
Paper & Forest Products | | | 1.1 | |
Road & Rail | | | 1.1 | |
Tobacco | | | 1.0 | |
Air Freight & Logistics | | | 1.0 | |
Biotechnology | | | 1.0 | % |
Software | | | 1.0 | |
Food Products | | | 0.8 | |
Construction Materials | | | 0.8 | |
Marine | | | 0.8 | |
Building Products | | | 0.8 | |
Media | | | 0.7 | |
Semiconductors & Semiconductor Equipment | | | 0.7 | |
Electronic Equipment, Instruments & Components | | | 0.6 | |
Multi-Utilities | | | 0.5 | |
Electrical Equipment | | | 0.5 | |
Health Care Providers & Services | | | 0.4 | |
Containers & Packaging | | | 0.4 | |
Gas Utilities | | | 0.3 | |
Leisure Products | | | 0.3 | |
Energy Equipment & Services | | | 0.3 | |
Diversified Financial Services | | | 0.3 | |
Internet Software & Services | | | 0.3 | |
Textiles, Apparel & Luxury Goods | | | 0.3 | |
Independent Power & Renewable Electricity Producers | | | 0.3 | |
Commercial Services & Supplies | | | 0.2 | |
Thrifts & Mortgage Finance | | | 0.2 | |
Technology Hardware, Storage & Peripherals | | | 0.2 | |
Consumer Finance | | | 0.2 | |
Distributors | | | 0.2 | |
Health Care Technology | | | 0.1 | |
Hotels, Restaurants & Leisure | | | 0.0 | * |
| | | | |
| | | 100.1 | |
Liabilities in excess of other assets | | | (0.1 | ) |
| | | | |
| | | 100.0 | % |
| | | | |
See Notes to Financial Statements.
| | | | |
| Target International Equity Portfolio | | | 21 | |
Schedule of Investments (continued)
as of July 31, 2017
Financial Instruments/Transactions—Summary of Offsetting and Netting Arrangements:
The Portfolio entered into financial instruments/transactions during the reporting period that are either offset in accordance with current requirements or are subject to enforceable master netting arrangements or similar agreements that permit offsetting. The information about offsetting and related netting arrangements for financial instruments/transactions, where the legal right to set-off exists, is presented in the summary below.
Offsetting of financial instrument/transaction assets and liabilities:
| | | | | | | | | | | | |
Description | | Gross
Amounts of
Recognized
Assets(1) | | | Collateral
Received(2) | | | Net
Amount | |
Securities on Loan | | $ | 3,353,719 | | | $ | (3,353,719 | ) | | $ | — | |
| (1) | Amount represents market value. |
| (2) | Collateral amount disclosed by the Portfolio is limited to the market value of financial instruments/transactions. |
See Notes to Financial Statements.
This Page Intentionally Left Blank
Statement of Assets & Liabilities
as of July 31, 2017
| | | | |
Assets | | | | |
Investments at value, including securities on loan of $3,353,719: | | | | |
Unaffiliated investments (cost $304,506,767) | | $ | 371,010,660 | |
Affiliated investments (cost $7,612,270) | | | 7,612,421 | |
Cash | | | 405 | |
Foreign currency, at value (cost $2,842,739) | | | 2,879,635 | |
Tax reclaim receivable | | | 1,805,576 | |
Receivable for investments sold | | | 911,298 | |
Receivable for Trust shares sold | | | 310,827 | |
Dividends receivable | | | 170,396 | |
| | | | |
Total assets | | | 384,701,218 | |
| | | | |
| |
Liabilities | | | | |
Payable to broker for collateral for securities on loan | | | 3,724,229 | |
Payable for investments purchased | | | 1,386,585 | |
Payable for Trust shares reacquired | | | 387,153 | |
Loan payable | | | 349,000 | |
Management fee payable | | | 222,665 | |
Accrued expenses and other liabilities | | | 186,326 | |
Distribution fee payable | | | 140,548 | |
Affiliated transfer agent fee payable | | | 72,779 | |
Deferred trustees’ fees | | | 480 | |
| | | | |
Total liabilities | | | 6,469,765 | |
| | | | |
| |
Net Assets | | $ | 378,231,453 | |
| | | | |
| | | | | |
Net assets were comprised of: | | | | |
Shares of beneficial interest, at par | | $ | 26,900 | |
Paid-in capital in excess of par | | | 313,305,299 | |
| | | | |
| | | 313,332,199 | |
Undistributed net investment income | | | 4,145,800 | |
Accumulated net realized loss on investment and foreign currency transactions | | | (5,810,650 | ) |
Net unrealized appreciation on investments | | | 66,564,104 | |
| | | | |
Net assets, July 31, 2017 | | $ | 378,231,453 | |
| | | | |
See Notes to Financial Statements.
| | | | |
Class Q | | | | |
Net asset value, offering price and redemption price per share,
($84,957 ÷ 6,020 shares of beneficial interest issued and outstanding) | | $ | 14.11 | |
| | | | |
| |
Class R | | | | |
Net asset value, offering price and redemption price per share,
($334,497,231 ÷ 23,799,760 shares of beneficial interest issued and outstanding) | | $ | 14.05 | |
| | | | |
| |
Class Z | | | | |
Net asset value, offering price and redemption price per share,
($43,649,265 ÷ 3,094,022 shares of beneficial interest issued and outstanding) | | $ | 14.11 | |
| | | | |
See Notes to Financial Statements.
| | | | |
| Target International Equity Portfolio | | | 25 | |
Statement of Operations
Year Ended July 31, 2017
| | | | |
Net Investment Income (Loss) | | | | |
Income | | | | |
Unaffiliated dividend income (net of foreign withholding taxes of $1,237,103) | | $ | 12,028,884 | |
Affiliated dividend income | | | 58,947 | |
Income from securities lending, net (including affiliated income of $1,940) | | | 49,268 | |
| | | | |
Total income | | | 12,137,099 | |
| | | | |
| |
Expenses | | | | |
Management fee | | | 2,568,464 | |
Distribution fee—Class R | | | 2,430,971 | |
Transfer agent’s fees and expenses (including affiliated expense of $418,200) | | | 397,000 | |
Custodian and accounting fees | | | 266,000 | |
Shareholders’ reports | | | 56,000 | |
Registration fees | | | 54,000 | |
Audit fee | | | 35,000 | |
Legal fees and expenses | | | 22,000 | |
Trustees’ fees | | | 15,000 | |
Commitment fee on syndicated credit agreement | | | 7,000 | |
Loan interest expense | | | 5,986 | |
Miscellaneous | | | 66,638 | |
| | | | |
Total expenses | | | 5,924,059 | |
Less: Distribution fee waiver—Class R | | | (810,324 | ) |
| | | | |
Net expenses | | | 5,113,735 | |
| | | | |
Net investment income (loss) | | | 7,023,364 | |
| | | | |
| |
Realized And Unrealized Gain (Loss) On Investments And Foreign Currency Transactions | | | | |
Net realized gain (loss) on: | | | | |
Investment transactions (including affiliated of $116) | | | 2,261,724 | |
Foreign currency transactions | | | (113,655 | ) |
| | | | |
| | | 2,148,069 | |
| | | | |
Net change in unrealized appreciation (depreciation) on: | | | | |
Investments (including affiliated of $151) | | | 52,341,269 | |
Foreign currencies | | | 60,656 | |
| | | | |
| | | 52,401,925 | |
| | | | |
Net gain (loss) on investment and foreign currency transactions | | | 54,549,994 | |
| | | | |
Net Increase (Decrease) In Net Assets Resulting From Operations | | $ | 61,573,358 | |
| | | | |
See Notes to Financial Statements.
Statement of Changes in Net Assets
| | | | | | | | |
| | | Year Ended July 31, | |
| | | 2017 | | | 2016 | |
Increase (Decrease) in Net Assets | | | | | | | | |
Operations | | | | | | | | |
Net investment income (loss) | | $ | 7,023,364 | | | $ | 7,127,935 | |
Net realized gain (loss) on investment and foreign currency transactions | | | 2,148,069 | | | | (59,028,673 | ) |
Net change in unrealized appreciation (depreciation) on investments and foreign currencies | | | 52,401,925 | | | | (20,584,482 | ) |
| | | | | | | | |
Net increase (decrease) in net assets resulting from operations | | | 61,573,358 | | | | (72,485,220 | ) |
| | | | | | | | |
| | |
Dividends and Distributions | | | | | | | | |
Dividends from net investment income | | | | | | | | |
Class Q | | | (680 | ) | | | (4,810,734 | ) |
Class R | | | (5,313,374 | ) | | | (4,528,812 | ) |
Class Z | | | (907,951 | ) | | | (1,022,072 | ) |
| | | | | | | | |
| | | (6,222,005 | ) | | | (10,361,618 | ) |
| | | | | | | | |
Distributions from net realized gains | | | | | | | | |
Class Q | | | — | | | | (1,505,756 | ) |
Class R | | | — | | | | (2,027,967 | ) |
Class Z | | | — | | | | (341,086 | ) |
| | | | | | | | |
| | | — | | | | (3,874,809 | ) |
| | | | | | | | |
| | |
Trust share transactions | | | | | | | | |
Net proceeds from shares sold | | | 53,429,209 | | | | 152,960,938 | |
Net asset value of shares issued in reinvestment of dividends
and distributions | | | 6,215,315 | | | | 14,225,068 | |
Cost of shares reacquired | | | (97,155,387 | ) | | | (270,711,984 | ) |
| | | | | | | | |
Net increase (decrease) in net assets from Trust share transactions | | | (37,510,863 | ) | | | (103,525,978 | ) |
| | | | | | | | |
Total increase (decrease) | | | 17,840,490 | | | | (190,247,625 | ) |
| | |
Net Assets: | | | | | | | | |
Beginning of year | | | 360,390,963 | | | | 550,638,588 | |
| | | | | | | | |
End of year(a) | | $ | 378,231,453 | | | $ | 360,390,963 | |
| | | | | | | | |
(a) Includes undistributed net investment income of: | | $ | 4,145,800 | | | $ | 3,130,705 | |
| | | | | | | | |
See Notes to Financial Statements.
| | | | |
| Target International Equity Portfolio | | | 27 | |
Notes to Financial Statements
The Target Portfolio Trust (the “Trust”) is registered under the Investment Company Act of 1940, as amended (“1940 Act”), as an open-end management investment company. The Trust consists of four series: Prudential Corporate Bond Fund, Prudential Core Bond Fund, Target International Equity Portfolio and Prudential QMA Small-Cap Value Fund. These financial statements relate to Target International Equity Portfolio (the “Portfolio”). The financial statements of the other series are not presented herein. The Portfolio is diversified.
The investment objective of the Portfolio is capital appreciation.
Effective April 13, 2017, the Class T shares were renamed to Class Z.
1. Accounting Policies
The Portfolio follows investment company accounting and reporting guidance of the Financial Accounting Standards Board (“FASB”) Accounting Standard Codification Topic 946 Financial Services—Investment Companies. The following accounting policies conform to U.S. generally accepted accounting principles. The Portfolio consistently follows such policies in the preparation of its financial statements.
Securities Valuation: The Portfolio holds securities and other assets and liabilities that are fair valued at the close of each day (generally, 4:00 PM Eastern time) the New York Stock Exchange (“NYSE”) is open for trading. Fair value is the price that would be received to sell an asset or paid to transfer a liability in an orderly transaction between market participants on the measurement date. The Board of Trustees (the “Board”) has adopted valuation procedures for security valuation under which fair valuation responsibilities have been delegated to PGIM Investments LLC (“PGIM Investments” or “the Manager”) (formerly known as Prudential Investments LLC). Under the current valuation procedures, the Valuation Committee is responsible for supervising the valuation of portfolio securities and other assets and liabilities. The valuation procedures permit the Portfolio to utilize independent pricing vendor services, quotations from market makers, and alternative valuation methods when market quotations are either not readily available or not deemed representative of fair value. A record of the Valuation Committee’s actions is subject to the Board’s review, approval, and ratification at its next regularly scheduled quarterly meeting.
Various inputs determine how the Portfolio’s investments are valued, all of which are categorized according to the three broad levels (Level 1, 2, or 3) detailed in the Schedule of Investments.
Common and preferred stocks, exchange-traded funds, and derivative instruments, such as futures or options, that are traded on a national securities exchange are valued at the
last sale price as of the close of trading on the applicable exchange where the security principally trades. Securities traded via NASDAQ are valued at the NASDAQ official closing price. To the extent these securities are valued at the last sale price or NASDAQ official closing price, they are classified as Level 1 in the fair value hierarchy. In the event that no sale or official closing price on valuation date exists, these securities are generally valued at the mean between the last reported bid and ask prices, or at the last bid price in the absence of an ask price. These securities are classified as Level 2 in the fair value hierarchy.
Foreign equities traded on foreign securities exchanges are generally valued using pricing vendor services that provide model prices derived using adjustment factors based on information such as local closing price, relevant general and sector indices, currency fluctuations, depositary receipts, and futures, as applicable. Securities valued using such model prices are classified as Level 2 in the fair value hierarchy. The models generate an evaluated adjustment factor for each security, which is applied to the local closing price to adjust it for post closing market movements. Utilizing that evaluated adjustment factor, the vendor provides an evaluated price for each security. If the vendor does not provide an evaluated price, securities are valued in accordance with exchange-traded common and preferred stock valuation policies discussed above.
Investments in open-end, non-exchange-traded mutual funds are valued at their net asset values as of the close of the NYSE on the date of valuation. These securities are classified as Level 1 in the fair value hierarchy since they may be purchased or sold at their net asset values on the date of valuation.
Securities and other assets that cannot be priced according to the methods described above are valued based on pricing methodologies approved by the Board. In the event that unobservable inputs are used when determining such valuations, the securities will be classified as Level 3 in the fair value hierarchy.
When determining the fair value of securities, some of the factors influencing the valuation include: the nature of any restrictions on disposition of the securities; assessment of the general liquidity of the securities; the issuer’s financial condition and the markets in which it does business; the cost of the investment; the size of the holding and the capitalization of the issuer; the prices of any recent transactions or bids/offers for such securities or any comparable securities; any available analyst media or other reports or information deemed reliable by the investment adviser regarding the issuer or the markets or industry in which it operates. Using fair value to price securities may result in a value that is different from a security’s most recent closing price and from the price used by other unaffiliated mutual funds to calculate their net asset values.
Restricted and Illiquid Securities: Subject to guidelines adopted by the Board, the Portfolio may invest up to 15% of its net assets in illiquid securities, including those which are restricted as to disposition under securities law (“restricted securities”). Restricted securities are valued pursuant to the valuation procedures noted above. Illiquid securities are those that, because of
| | | | |
| Target International Equity Portfolio | | | 29 | |
Notes to Financial Statements (continued)
the absence of a readily available market or due to legal or contractual restrictions on resale, cannot be sold within seven days in the ordinary course of business at approximately the amount at which the Portfolio has valued the investment. Therefore, the Portfolio may find it difficult to sell illiquid securities at the time considered most advantageous by its Subadviser and may incur expenses that would not be incurred in the sale of securities that were freely marketable. Certain securities that would otherwise be considered illiquid because of legal restrictions on resale to the general public may be traded among qualified institutional buyers under Rule 144A of the Securities Act of 1933. These Rule 144A securities, as well as commercial paper that is sold in private placements under Section 4(2) of the Securities Act, may be deemed liquid by the Portfolio’s Subadviser under the guidelines adopted by the Trustees of the Portfolio. However, the liquidity of the Portfolio’s investments in Rule 144A securities could be impaired if trading does not develop or declines.
Foreign Currency Translation: The books and records of the Portfolio are maintained in U.S. dollars. Foreign currency amounts are translated into U.S. dollars on the following basis:
(i) market value of investment securities, other assets and liabilities—at the current rates of exchange;
(ii) purchases and sales of investment securities, income and expenses—at the rates of exchange prevailing on the respective dates of such transactions.
Although the net assets of the Portfolio are presented at the foreign exchange rates and market values at the close of the period, the Portfolio does not generally isolate that portion of the results of operations arising as a result of changes in the foreign exchange rates from the fluctuations arising from changes in the market prices of long-term portfolio securities held at the end of the period. Similarly, the Portfolio does not isolate the effect of changes in foreign exchange rates from the fluctuations arising from changes in the market prices of long-term portfolio securities sold during the period. Accordingly, holding period realized foreign currency gains (losses) are included in the reported net realized gains (losses) on investment transactions.
Additionally, net realized gains (losses) on foreign currency transactions represent net foreign exchange gains (losses) from the disposition of holdings of foreign currencies, forward currency contracts, currency gains (losses) realized between the trade and settlement dates on securities transactions, and the difference between the amounts of interest, dividends and foreign withholding taxes recorded on the Portfolio’s books and the U.S. dollar equivalent amounts actually received or paid. Net unrealized currency gains (losses) from valuing foreign currency denominated assets and liabilities (other than investments) at period end exchange rates are reflected as a component of net unrealized appreciation (depreciation) on foreign currencies.
Master Netting Arrangements: The Trust, on behalf of the Portfolio, is subject to various Master Agreements, or netting arrangements, with select counterparties. These are agreements which a subadviser may have negotiated and entered into on behalf of the Portfolio. A master netting arrangement between the Portfolio and the counterparty permits the Portfolio to offset amounts payable by the Portfolio to the same counterparty against amounts to be received; and by the receipt of collateral from the counterparty by the Portfolio to cover the Portfolio’s exposure to the counterparty. However, there is no assurance that such mitigating factors are easily enforceable. In addition to master netting arrangements, the right to set-off exists when all the conditions are met such that each of the parties owes the other determinable amounts, the reporting party has the right to set-off the amount owed with the amount owed by the other party, the reporting party intends to set-off and the right of set-off is enforceable by law. During the reporting period, there was no intention to settle on a net basis and all amounts are presented on a gross basis on the Statement of Assets and Liabilities.
Securities Lending: The Portfolio may lend its portfolio securities to banks and broker-dealers. The loans are secured by collateral at least equal to the market value of the securities loaned. Collateral pledged by each borrower is invested in an affiliated money market fund and is marked to market daily, based on the previous day’s market value, such that the value of the collateral exceeds the value of the loaned securities. Loans are subject to termination at the option of the borrower or the Portfolio. Upon termination of the loan, the borrower will return to the Portfolio securities identical to the loaned securities. Should the borrower of the securities fail financially, the Portfolio has the right to repurchase the securities in the open market using the collateral. The Portfolio recognizes income, net of any rebate and securities lending agent fees, for lending its securities in the form of fees or interest on the investment of any cash received as collateral. The borrower receives all interest and dividends from the securities loaned and such payments are passed back to the lender in amounts equivalent thereto. The Portfolio also continues to recognize any unrealized gain (loss) in the market price of the securities loaned and on the change in the value of the collateral invested that may occur during the term of the loan. In addition, realized gain (loss) is recognized on changes in the value of the collateral invested upon liquidation of the collateral. Net earnings from securities lending are disclosed on the Statement of Operations as “Income from securities lending, net”.
Concentration of Risk: Foreign security and currency transactions may involve certain considerations and risks not typically associated with those of domestic origin as a result of, among other factors, the possibility of political or economic instability or the level of governmental supervision and regulation of foreign securities markets.
Securities Transactions and Net Investment Income: Securities transactions are recorded on the trade date. Realized gains (losses) from investment and currency transactions are calculated on the specific identification method. Dividend income is recorded on the ex-date. Interest income, including amortization of premium and accretion of discount on debt securities, as required, is recorded on the accrual basis. Expenses are recorded on an
| | | | |
| Target International Equity Portfolio | | | 31 | |
Notes to Financial Statements (continued)
accrual basis, which may require the use of certain estimates by management that may differ from actual.
Net investment income or loss (other than distribution fees which are charged directly to the respective class and transfer agency fees specific to Class Q shares which are charged to that share class) and unrealized and realized gains (losses) are allocated daily to each class of shares based upon the relative proportion of adjusted net assets of each class at the beginning of the day.
Taxes: It is the Portfolio’s policy to continue to meet the requirements of the Internal Revenue Code applicable to regulated investment companies and to distribute all of its taxable net investment income and capital gains, if any, to its shareholders. Therefore, no federal income tax provision is required. Withholding taxes on foreign dividends, interest and capital gains, if any, are recorded, net of reclaimable amounts, at the time the related income is earned.
Dividends and Distributions: The Portfolio expects to pay dividends from net investment income and distributions from net realized capital gains, if any, annually. Dividends and distributions to shareholders, which are determined in accordance with federal income tax regulations and which may differ from generally accepted accounting principles, are recorded on the ex-date. Permanent book/tax differences relating to income and gain (loss) are reclassified amongst undistributed net investment income, accumulated net realized gain (loss) and paid-in capital in excess of par, as appropriate.
Estimates: The preparation of financial statements requires management to make estimates and assumptions that affect the reported amounts and disclosures in the financial statements. Actual results could differ from those estimates.
2. Agreements
The Trust, on behalf of the Portfolio, has a management agreement with PGIM Investments. Pursuant to this agreement, PGIM Investments has responsibility for all investment advisory services and supervises the subadvisers’ performance of such services. PGIM Investments has entered into a subadvisory agreements with each of LSV Asset Management (“LSV”) and Lazard Asset Management LLC, each a Subadviser and together, the Subadvisers. The subadvisory agreements provide that the Subadvisers furnish investment advisory services in connection with the management of the Portfolio. In connection therewith, the Subadvisers are obligated to keep certain books and records of the Portfolio. Pursuant to the advisory agreement, PGIM Investments pays the cost of compensation of officers of the Portfolio, occupancy and certain clerical and accounting costs of the Portfolio. The Portfolio bears all other costs and expenses.
The management fee paid to PGIM Investments is accrued daily and payable monthly at an annual rate of .70% of the Portfolio’s average daily net assets. The effective management fee rate was .70% for the year ended July 31, 2017.
The Trust, on behalf of the Portfolio, has a distribution agreement with Prudential Investment Management Services LLC (“PIMS”) which acts as the distributor of the Class Q, Class R and Class Z shares of the Portfolio. The Portfolio compensates PIMS for distributing and servicing the Portfolio’s Class R shares, pursuant to the plan of distribution (the “Class R Plan”), regardless of expenses actually incurred by PIMS. The distribution fee is accrued daily and payable monthly. No distribution or service fees are paid to PIMS as distributor of the Class Q and Class Z shares of the Portfolio.
Pursuant to the Class R Plan, the Portfolio compensates PIMS for distribution related activities at an annual rate of up to .75% of the average daily net assets of the Class R shares. PIMS has contractually agreed through November 30, 2018 to limit such fees to .50% of the average daily net assets of the Class R shares.
PGIM Investments and PIMS are indirect, wholly-owned subsidiaries of Prudential Financial, Inc. (“Prudential”).
3. Other Transactions with Affiliate
Prudential Mutual Fund Services LLC (“PMFS”), an affiliate of PGIM Investments and an indirect, wholly-owned subsidiary of Prudential, serves as the Portfolio’s transfer agent. Transfer agent’s fees and expenses in the Statement of Operations include certain out-of-pocket expenses paid to non-affiliates, where applicable.
The Portfolio may enter into certain securities purchase or sale transactions under Board approved Rule 17a-7 procedures. Rule 17a-7 is an exemptive rule under the 1940 Act, that permits purchase and sale transactions among affiliated investment companies, or between an investment company and a person that is affiliated solely by reason of having a common (or affiliated) investment adviser, common directors, and/or common officers. Such transactions are subject to ratification by the Board. For the period ended July 31, 2017 no such transactions were entered into by the Portfolio.
The Portfolio invests its overnight sweep cash in the Prudential Core Ultra Short Bond Fund (the “Core Fund”), and its securities lending cash collateral in the Prudential Institutional Money Market Fund (the “Money Market Fund”), each a series of the Prudential Investment Portfolios 2, registered under the 1940 Act and managed by PGIM Investments. For the reporting period ended July 31, 2017, PGIM, Inc. was compensated $1,758 by PGIM Investments for managing the Portfolio’s securities lending cash collateral as subadviser to the Money Market Fund. Earnings from the Core Fund and Money Market Fund are disclosed on the Statement of Operations as “Affiliated dividend income” and “Income from securities lending, net”, respectively.
| | | | |
| Target International Equity Portfolio | | | 33 | |
Notes to Financial Statements (continued)
4. Portfolio Securities
The aggregate cost of purchases and proceeds from sales of portfolio securities (excluding short-term investments and U.S. Treasury securities) for the year ended July 31, 2017, were $86,783,788 and $116,349,174, respectively.
5. Distributions and Tax Information
The Portfolio has a tax year end of October 31st.
Distributions to shareholders, which are determined in accordance with federal income tax regulations and which may differ from generally accepted accounting principles, are recorded on the ex-date. In order to present undistributed net investment income, accumulated net realized loss on investment and foreign currency transactions and paid-in capital in excess of par on the Statement of Assets and Liabilities that more closely represent their tax character, certain adjustments have been made to undistributed net investment income, accumulated net realized loss on investment and foreign currency transactions and paid-in capital in excess of par. For the tax year ended October 31, 2016, the adjustments were to increase undistributed net investment income by $213,736, decrease accumulated net realized loss on investment and foreign currency transactions by $48,866,383 and decrease paid-in capital in excess of par by $49,080,119 due to reclassification of distributions, differences in tax treatment of investments in passive foreign investment companies, certain transactions involving foreign currencies and other book to tax differences. Net investment income, net realized gain (loss) on investment and foreign currency transactions and net assets were not affected by this change.
The tax character of distributions paid during the tax year ended October 31, 2016 were $10,370,212 of ordinary income and $3,866,215 of long-term capital gains. The tax character of distributions paid during the tax year ended October 31, 2015 were $12,380,568 of ordinary income and $1,059,473 of long-term capital gains.
As of the latest tax year ended October 31, 2016, the accumulated undistributed earnings on a tax basis was $5,585,447 of ordinary income.
The United States federal income tax basis of the Portfolio’s investments and the net unrealized appreciation as of July 31, 2017 were as follows:
| | | | | | |
Tax Basis | | Appreciation | | Depreciation | | Net
Unrealized
Appreciation |
| $313,459,846 | | $79,051,183 | | $(13,887,948) | | $65,163,235 |
The differences between book basis and tax basis were primarily attributable to deferred losses on wash sales and other book to tax differences.
For federal income tax purposes, the Portfolio had a capital loss carryforward of approximately $8,065,000 as of October 31, 2016 which can be carried forward for an unlimited period. No future capital gains distributions are expected to be paid to shareholders until net gains have been realized in excess of such losses.
Management has analyzed the Portfolio’s tax positions taken on federal, state and local income tax returns for all open tax years and has concluded that no provision for income tax is required in the Portfolio’s financial statements for the current reporting period. The Portfolio’s federal, state and local income and federal excise tax returns for tax years for which the applicable statutes of limitations have not expired are subject to examination by the Internal Revenue Service and state departments of revenue.
6. Capital
The Trust has authorized an unlimited number of shares of beneficial interest at $.001 par value per share.
As of July 31, 2017, Prudential owned 882 Class Q shares of the Portfolio.
At reporting period end, two shareholders of record held 97% of the Portfolio’s outstanding shares on behalf of multiple beneficial owners, of which 88% were held by an affiliate of Prudential.
Transactions in shares of beneficial interest were as follows:
| | | | | | | | |
Class Q | | Shares | | | Amount | |
Year ended July 31, 2017: | | | | | | | | |
Shares sold | | | 5,089 | | | $ | 66,463 | |
Shares issued in reinvestment of dividends and distributions | | | 56 | | | | 680 | |
Shares reacquired | | | (1,147 | ) | | | (13,885 | ) |
| | | | | | | | |
Net increase (decrease) in shares outstanding | | | 3,998 | | | $ | 53,258 | |
| | | | | | | | |
Year ended July 31, 2016: | | | | | | | | |
Shares sold | | | 3,672,363 | | | $ | 45,263,069 | |
Shares issued in reinvestment of dividends and distributions | | | 513,953 | | | | 6,316,491 | |
Shares reacquired* | | | (18,642,678 | ) | | | (201,896,048 | ) |
| | | | | | | | |
Net increase (decrease) in shares outstanding | | | (14,456,362 | ) | | $ | (150,316,488 | ) |
| | | | | | | | |
| | | | |
| Target International Equity Portfolio | | | 35 | |
Notes to Financial Statements (continued)
| | | | | | | | |
Class R | | Shares | | | Amount | |
Year ended July 31, 2017: | | | | | | | | |
Shares sold | | | 4,100,652 | | | $ | 50,085,216 | |
Shares issued in reinvestment of dividends and distributions | | | 438,397 | | | | 5,313,374 | |
Shares reacquired | | | (6,714,791 | ) | | | (85,235,902 | ) |
| | | | | | | | |
Net increase (decrease) in shares outstanding | | | (2,175,742 | ) | | $ | (29,837,312 | ) |
| | | | | | | | |
Year ended July 31, 2016: | | | | | | | | |
Shares sold | | | 8,647,493 | | | $ | 104,404,864 | |
Shares issued in reinvestment of dividends and distributions | | | 533,505 | | | | 6,556,779 | |
Shares reacquired | | | (4,828,883 | ) | | | (58,857,389 | ) |
| | | | | | | | |
Net increase (decrease) in shares outstanding | | | 4,352,115 | | | $ | 52,104,254 | |
| | | | | | | | |
Class Z | | | | | | |
Year ended July 31, 2017: | | | | | | | | |
Shares sold | | | 258,566 | | | $ | 3,277,530 | |
Shares issued in reinvestment of dividends and distributions | | | 74,300 | | | | 901,261 | |
Shares reacquired | | | (946,213 | ) | | | (11,905,600 | ) |
| | | | | | | | |
Net increase (decrease) in shares outstanding | | | (613,347 | ) | | $ | (7,726,809 | ) |
| | | | | | | | |
Year ended July 31, 2016: | | | | | | | | |
Shares sold | | | 268,406 | | | $ | 3,293,005 | |
Shares issued in reinvestment of dividends and distributions | | | 109,992 | | | | 1,351,798 | |
Shares reacquired | | | (817,633 | ) | | | (9,958,547 | ) |
| | | | | | | | |
Net increase (decrease) in shares outstanding | | | (439,235 | ) | | $ | (5,313,744 | ) |
| | | | | | | | |
| * | Includes affiliated redemption of 88 shares with a value of $1,124 for Class Q Shares. |
7. Borrowings
The Trust, on behalf of the Portfolio, along with other affiliated registered investment companies (the “Funds”), is a party to a Syndicated Credit Agreement (“SCA”) with a group of banks. The purpose of the SCA is to provide an alternative source of temporary funding for capital share redemptions. The SCA provides for a commitment of $900 million for the period October 6, 2016 through October 5, 2017. The Funds pay an annualized commitment fee of .15% of the unused portion of the SCA. The Portfolio’s portion of the commitment fee for the unused amount, allocated based upon a method approved by the Board, is accrued daily and paid quarterly. The interest on borrowings under the SCA is paid monthly and at a per annum interest rate based upon a contractual spread plus the higher of (1) the effective federal funds rate, (2) the 1-month LIBOR rate or (3) zero percent.
Other affiliated registered investment companies that are parties to the SCA include portfolios that are subject to a predetermined mathematical formula used to manage certain benefit guarantees offered under variable annuity contracts. The formula may result
in large scale asset flows into and out of the portfolios. Consequently, the portfolios may be more likely to utilize the SCA for purposes of funding redemptions. It may be possible for those portfolios to fully exhaust the committed amount of the SCA, thereby requiring the Manager to allocate available funding per a Board-approved methodology designed to treat the Funds in the SCA equitably.
The Portfolio utilized the SCA during the year ended July 31, 2017. The average daily balance for the 136 days that the Portfolio had loans outstanding during the period was $737,853 borrowed at a weighted average interest rate of 2.15%. The maximum loan balance outstanding during the period was $6,056,000. At July 31, 2017, the Portfolio had an outstanding loan balance of $349,000.
8. Recent Accounting Pronouncements and Reporting Updates
On October 13, 2016, the Securities and Exchange Commission (the “SEC”) adopted new rules and forms and amended existing rules and forms which are intended to modernize and enhance the reporting and disclosure of information by registered investment companies and to improve the quality of information that funds provide to investors, including modifications to Regulation S-X which would require standardized, enhanced disclosure about derivatives in investment company financial statements. The compliance dates of the modifications to Regulation S-X are August 1, 2017 and other amendments and rules are generally June 1, 2018 and December 1, 2018. Management is currently evaluating the impacts to the financial statement disclosures.
9. Other
At the Trust’s Board meeting in March, 2017, the Board of Trustees approved a change in the methodology of allocating certain expenses, like Transfer Agent fees (including sub-transfer agent and networking fees) and Blue Sky fees. PGIM Investments implemented the changes effective August 1, 2017.
Expected on or about December 15, 2017 and pending shareholder approval, the Portfolio will merge into the Prudential Jennison International Opportunities Fund, a series of the Prudential World Fund, Inc.
At a meeting held on June 7, 2017, the Board of Trustees of the Portfolio approved a plan of reorganization whereby the Target International Equity Portfolio would be acquired by the Prudential Jennison International Opportunities Fund.
The reorganization is currently pending shareholder approval. A special meeting of shareholders of the Target International Equity Fund will be held on or about October 30, 2017 where shareholders of the Portfolio will be asked to approve or disapprove the plan of reorganization. It is expected that the reorganization, if approved, will be completed in the fourth quarter of 2017.
| | | | |
| Target International Equity Portfolio | | | 37 | |
Financial Highlights
| | | | | | | | | | | | | | | | | | | | | | | | | | | | | | | | |
| Class Q Shares | | | | | | | | | |
| | | Year Ended July 31, | | | | | | Nine Months
Ended
July 31, | | | | | | Year Ended
October 31, | |
| | | 2017(b) | | | 2016(b) | | | 2015 | | | | | | 2014(b)(f) | | | | | | 2013(b) | | | 2012(b) | |
| Per Share Operating Performance: | | | | | | | | | | | | | | | | | | | | | | | | | | | | | | | | |
| Net Asset Value, Beginning of Period | | | $12.18 | | | | $13.72 | | | | $13.81 | | | | | | | | $13.77 | | | | | | | | $11.42 | | | | $11.10 | |
| Income (loss) from investment operations: | | | | | | | | | | | | | | | | | | | | | | | | | | | | | | | | |
| Net investment income (loss) | | | .35 | | | | .12 | | | | .29 | | | | | | | | .26 | | | | | | | | .27 | | | | .27 | |
| Net realized and unrealized gain (loss) on investments | | | 1.86 | | | | (1.30 | ) | | | .03 | | | | | | | | .04 | | | | | | | | 2.37 | | | | .32 | |
| Total from investment operations | | | 2.21 | | | | (1.18 | ) | | | .32 | | | | | | | | .30 | | | | | | | | 2.64 | | | | .59 | |
| Less Dividends and Distributions: | | | | | | | | | | | | | | | | | | | | | | | | | | | | | | | | |
| Dividends from net investment income | | | (.28 | ) | | | (.27 | ) | | | (.35 | ) | | | | | | | (.26 | ) | | | | | | | (.29 | ) | | | (.27 | ) |
| Distributions from net realized gains | | | - | | | | (.09 | ) | | | (.06 | ) | | | | | | | - | | | | | | | | - | | | | - | |
| Total dividends and distributions | | | (.28 | ) | | | (.36 | ) | | | (.41 | ) | | | | | | | (.26 | ) | | | | | | | (.29 | ) | | | (.27 | ) |
| Net asset value, end of period | | | $14.11 | | | | $12.18 | | | | $13.72 | | | | | | | | $13.81 | | | | | | | | $13.77 | | | | $11.42 | |
| Total Return(a): | | | 18.57% | | | | (8.61)% | | | | 2.52% | | | | | | | | 2.26% | | | | | | | | 23.57% | | | | 5.60% | |
| | | | | | | | | | | | | | | | | | | | | | | | | | | | | | | | |
| Ratios/Supplemental Data: | | | | | | | | | | | | | | | | | | | | | | | | |
| Net assets, end of period (000) | | | $85 | | | | $25 | | | | $198,410 | | | | | | | | $167,988 | | | | | | | | $149,490 | | | | $120,574 | |
| Average net assets (000) | | | $40 | | | | $113,462 | | | | $181,358 | | | | | | | | $159,618 | | | | | | | | $135,226 | | | | $110,908 | |
| Ratios to average net assets(c): | | | | | | | | | | | | | | | | | | | | | | | | | | | | | | | | |
| Expenses after waivers and/or expense reimbursement | | | .83% | | | | .78% | | | | .82% | | | | | | | | .81% | (d) | | | | | | | .82% | | | | .84% | |
| Expenses before waivers and/or expense reimbursement | | | .83% | | | | .78% | | | | .82% | | | | | | | | .81% | (d) | | | | | | | .82% | | | | .84% | |
| Net investment income (loss) | | | 2.73% | | | | .96% | | | | 2.26% | | | | | | | | 2.55% | (d) | | | | | | | 2.15% | | | | 2.51% | |
| Portfolio turnover rate | | | 24% | | | | 22% | | | | 66% | | | | | | | | 23% | (e) | | | | | | | 26% | | | | 16% | |
| (a) | Total return is calculated assuming a purchase of a share on the first day and a sale on the last day of each period reported and includes reinvestment of dividends and distributions, if any. Total returns may reflect adjustments to conform to generally accepted accounting principles. Total returns for periods less than one full year are not annualized. |
| (b) | Calculated based upon average shares outstanding during the period. |
| (c) | Does not include expenses of the underlying fund in which the Portfolio invests. |
| (f) | For the nine month period ended July 31, 2014. The Trust changed its fiscal year end from October 31 to July 31, effective July 31, 2014. |
See Notes to Financial Statements.
| | | | | | | | | | | | | | | | | | | | | | | | | | | | | | | | |
| Class R Shares | | | | | | | | | | | | | | | | | | | | | | | | |
| | | Year Ended July 31, | | | | | | Nine Months
Ended
July 31, | | | | | | Year Ended
October 31, | |
| | | 2017(b) | | | 2016(b) | | | 2015 | | | | | | 2014(b)(f) | | | | | | 2013(b) | | | 2012(b) | |
| Per Share Operating Performance: | | | | | | | | | | | | | | | | | | | | | | | | | | | | | | | | |
| Net Asset Value, Beginning of Period | | | $12.14 | | | | $13.66 | | | | $13.75 | | | | | | | | $13.69 | | | | | | | | $11.36 | | | | $11.02 | |
| Income (loss) from investment operations: | | | | | | | | | | | | | | | | | | | | | | | | | | | | | | | | |
| Net investment income (loss) | | | .24 | | | | .21 | | | | .20 | | | | | | | | .20 | | | | | | | | .19 | | | | .21 | |
| Net realized and unrealized gain (loss) on investments | | | 1.88 | | | | (1.45 | ) | | | .04 | | | | | | | | .04 | | | | | | | | 2.36 | | | | .32 | |
| Total from investment operations | | | 2.12 | | | | (1.24 | ) | | | .24 | | | | | | | | .24 | | | | | | | | 2.55 | | | | .53 | |
| Less Dividends and Distributions: | | | | | | | | | | | | | | | | | | | | | | | | | | | | | | | | |
| Dividends from net investment income | | | (.21 | ) | | | (.19 | ) | | | (.27 | ) | | | | | | | (.18 | ) | | | | | | | (.22 | ) | | | (.19 | ) |
| Distributions from net realized gains | | | - | | | | (.09 | ) | | | (.06 | ) | | | | | | | - | | | | | | | | - | | | | - | |
| Total dividends and distributions | | | (.21 | ) | | | (.28 | ) | | | (.33 | ) | | | | | | | (.18 | ) | | | | | | | (.22 | ) | | | (.19 | ) |
| Net asset value, end of period | | | $14.05 | | | | $12.14 | | | | $13.66 | | | | | | | | $13.75 | | | | | | | | $13.69 | | | | $11.36 | |
| Total Return(a): | | | 17.74% | | | | (9.11)% | | | | 1.88% | | | | | | | | 1.82% | | | | | | | | 22.83% | | | | 5.01% | |
| | | | | | | | | | | | | | | | | | | | | | | | | | | | | | | | |
| Ratios/Supplemental Data: | | | | | | | | | | | | | | | | | | | | | | | | |
| Net assets, end of period (000) | | | $334,497 | | | | $315,218 | | | | $295,376 | | | | | | | | $251,908 | | | | | | | | $215,215 | | | | $148,857 | |
| Average net assets (000) | | | $324,129 | | | | $290,783 | | | | $273,404 | | | | | | | | $237,069 | | | | | | | | $179,681 | | | | $125,953 | |
| Ratios to average net assets(c): | | | | | | | | | | | | | | | | | | | | | | | | | | | | | | | | |
| Expenses after waivers and/or expense reimbursement | | | 1.45% | | | | 1.47% | | | | 1.45% | | | | | | | | 1.42% | (d) | | | | | | | 1.44% | | | | 1.45% | |
| Expenses before waivers and/or expense reimbursement | | | 1.70% | | | | 1.72% | | | | 1.70% | | | | | | | | 1.67% | (d) | | | | | | | 1.69% | | | | 1.70% | |
| Net investment income (loss) | | | 1.86% | | | | 1.71% | | | | 1.62% | | | | | | | | 1.97% | (d) | | | | | | | 1.53% | | | | 1.91% | |
| Portfolio turnover rate | | | 24% | | | | 22% | | | | 66% | | | | | | | | 23% | (e) | | | | | | | 26% | | | | 16% | |
| (a) | Total return is calculated assuming a purchase of a share on the first day and a sale on the last day of each period reported and includes reinvestment of dividends and distributions, if any. Total returns may reflect adjustments to conform to generally accepted accounting principles. Total returns for periods less than one full year are not annualized. |
| (b) | Calculated based upon average shares outstanding during the period. |
| (c) | Does not include expenses of the underlying fund in which the Portfolio invests. |
| (f) | For the nine month period ended July 31, 2014. The Trust changed its fiscal year end from October 31 to July 31, effective July 31, 2014. |
See Notes to Financial Statements.
| | | | |
| Target International Equity Portfolio | | | 39 | |
Financial Highlights (continued)
| | | | | | | | | | | | | | | | | | | | | | | | | | | | | | | | |
| Class Z Shares | |
| | | Year Ended July 31, | | | | | | Nine Months
Ended
July 31, | | | | | | Year Ended
October 31, | |
| | | 2017(b) | | | 2016(b) | | | 2015 | | | | | | 2014(b)(f) | | | | | | 2013(b) | | | 2012(b) | |
| Per Share Operating Performance: | | | | | | | | | | | | | | | | | | | | | | | | | | | | | | | | |
| Net Asset Value, Beginning of Period | | | $12.18 | | | | $13.71 | | | | $13.80 | | | | | | | | $13.75 | | | | | | | | $11.41 | | | | $11.08 | |
| Income (loss) from investment operations: | | | | | | | | | | | | | | | | | | | | | | | | | | | | | | | | |
| Net investment income (loss) | | | .30 | | | | .27 | | | | .29 | | | | | | | | .25 | | | | | | | | .25 | | | | .26 | |
| Net realized and unrealized gain (loss) on investments | | | 1.90 | | | | (1.46 | ) | | | .02 | | | | | | | | .05 | | | | | | | | 2.37 | | | | .32 | |
| Total from investment operations | | | 2.20 | | | | (1.19 | ) | | | .31 | | | | | | | | .30 | | | | | | | | 2.62 | | | | .58 | |
| Less Dividends and Distributions: | | | | | | | | | | | | | | | | | | | | | | | | | | | | | | | | |
| Dividends from net investment income | | | (.27 | ) | | | (.25 | ) | | | (.34 | ) | | | | | | | (.25 | ) | | | | | | | (.28 | ) | | | (.25 | ) |
| Distributions from net realized gains | | | - | | | | (.09 | ) | | | (.06 | ) | | | | | | | - | | | | | | | | - | | | | - | |
| Total dividends and distributions | | | (.27 | ) | | | (.34 | ) | | | (.40 | ) | | | | | | | (.25 | ) | | | | | | | (.28 | ) | | | (.25 | ) |
| Net asset value, end of period | | | $14.11 | | | | $12.18 | | | | $13.71 | | | | | | | | $13.80 | | | | | | | | $13.75 | | | | $11.41 | |
| Total Return(a): | | | 18.42% | | | | (8.67)% | | | | 2.41% | | | | | | | | 2.22% | | | | | | | | 23.39% | | | | 5.52% | |
| | | | | | | | | | | | | | | | | | | | | | | | | | | | | | | | |
| Ratios/Supplemental Data: | | | | | | | | | | | | | | | | | | | | | | | | |
| Net assets, end of period (000) | | | $43,649 | | | | $45,148 | | | | $56,853 | | | | | | | | $64,595 | | | | | | | | $68,194 | | | | $65,450 | |
| Average net assets (000) | | | $42,754 | | | | $48,724 | | | | $59,317 | | | | | | | | $67,125 | | | | | | | | $65,268 | | | | $67,572 | |
| Ratios to average net assets(c): | | | | | | | | | | | | | | | | | | | | | | | | | | | | | | | | |
| Expenses after waivers and/or expense reimbursement | | | .95% | | | | .97% | | | | .95% | | | | | | | | .92% | (d) | | | | | | | .94% | | | | .95% | |
| Expenses before waivers and/or expense reimbursement | | | .95% | | | | .97% | | | | .95% | | | | | | | | .92% | (d) | | | | | | | .94% | | | | .95% | |
| Net investment income (loss) | | | 2.34% | | | | 2.17% | | | | 2.06% | | | | | | | | 2.41% | (d) | | | | | | | 2.02% | | | | 2.39% | |
| Portfolio turnover rate | | | 24% | | | | 22% | | | | 66% | | | | | | | | 23% | (e) | | | | | | | 26% | | | | 16% | |
| (a) | Total return is calculated assuming a purchase of a share on the first day and a sale on the last day of each period reported and includes reinvestment of dividends and distributions, if any. Total returns may reflect adjustments to conform to generally accepted accounting principles. Total returns for periods less than one full year are not annualized. |
| (b) | Calculated based upon average shares outstanding during the period. |
| (c) | Does not include expenses of the underlying fund in which the Portfolio invests. |
| (f) | For the nine month period ended July 31, 2014. The Trust changed its fiscal year end from October 31 to July 31, effective July 31, 2014. |
See Notes to Financial Statements.
Report of Independent Registered Public Accounting Firm
The Board of Trustees and Shareholders
The Target Portfolio Trust:
We have audited the accompanying statement of assets and liabilities of Target International Equity Portfolio (the “Fund”), a series of Target Portfolio Trust, including the schedule of investments, as of July 31, 2017, and the related statement of operations for the year then ended, the statements of changes in net assets for each of the years in the two-year period then ended, and the financial highlights for each of the years or periods ended in the five-year period then ended. These financial statements and financial highlights are the responsibility of the Fund’s management. Our responsibility is to express an opinion on these financial statements and financial highlights based on our audits.
We conducted our audits in accordance with the standards of the Public Company Accounting Oversight Board (United States). Those standards require that we plan and perform the audit to obtain reasonable assurance about whether the financial statements and financial highlights are free of material misstatement. An audit includes examining, on a test basis, evidence supporting the amounts and disclosures in the financial statements. Our procedures included confirmation of securities owned as of July 31, 2017, by correspondence with the custodian, transfer agent and brokers or by other appropriate auditing procedures when replies from brokers were not received. An audit also includes assessing the accounting principles used and significant estimates made by management, as well as evaluating the overall financial statement presentation. We believe that our audits provide a reasonable basis for our opinion.
In our opinion, the financial statements and financial highlights referred to above present fairly, in all material respects, the financial position of the Fund as of July 31, 2017, and the results of its operations, changes in its net assets, and the financial highlights for the periods described in the first paragraph above, in conformity with U.S. generally accepted accounting principles.
As described in note 9 to the financial statements, the Portfolio is expected to be merged into an affiliated fund in December of 2017.

New York, New York
September 18, 2017
| | | | |
| Target International Equity Portfolio | | | 41 | |
INFORMATION ABOUT BOARD MEMBERS AND OFFICERS
(Unaudited)
Information about Board Members and Officers of the Fund is set forth below. Board Members who are not deemed to be “interested persons” of the Fund, as defined in the 1940 Act, are referred to as “Independent Board Members.” Board Members who are deemed to be “interested persons” of the Fund are referred to as “Interested Board Members.” The Board Members are responsible for the overall supervision of the operations of the Fund and perform the various duties imposed on the directors of investment companies by the 1940 Act. The Board in turn elects the Officers, who are responsible for administering the day-to-day operations of the Fund.
| | | | |
| Independent Board Members(1) |
Name, Address, Age Position(s) Portfolios Overseen | | Principal Occupation(s) During Past Five Years | | Other Directorships Held During Past Five Years |
Ellen S. Alberding (59) Board Member Portfolios Overseen: 87 | | President and Board Member, The Joyce Foundation (charitable foundation) (since 2002); Vice Chair, City Colleges of Chicago (community college system) (since 2011); Trustee, Skills for America’s Future (national initiative to connect employers to community colleges) (since 2011); Trustee, National Park Foundation (charitable foundation for national park system) (since 2009); Trustee, Economic Club of Chicago (since 2009). | | None. |
Kevin J. Bannon (65) Board Member Portfolios Overseen: 87 | | Retired; Managing Director (April 2008-May 2015) and Chief Investment Officer (October 2008-November 2013) of Highmount Capital LLC (registered investment adviser); formerly Executive Vice President and Chief Investment Officer (April 1993-August 2007) of Bank of New York Company; President (May 2003-May 2007) of BNY Hamilton Family of Mutual Funds. | | Director of Urstadt Biddle Properties (equity real estate investment trust) (since September 2008). |
Linda W. Bynoe (65) Board Member Portfolios Overseen: 87 | | President and Chief Executive Officer (since March 1995) and formerly Chief Operating Officer (December 1989-February 1995) of Telemat Ltd. (management consulting); formerly Vice President (January 1985-June 1989) at Morgan Stanley & Co. (broker-dealer). | | Director of Simon Property Group, Inc. (retail real estate) (May 2003-May 2012); Director of Anixter International, Inc. (communication products distributor) (since January 2006); Director of Northern Trust Corporation (financial services) (since April 2006); Trustee of Equity Residential (residential real estate) (since December 2009). |
Target International Equity Portfolio
| | | | |
| Independent Board Members(1) |
Name, Address, Age Position(s) Portfolios Overseen | | Principal Occupation(s) During Past Five Years | | Other Directorships Held During Past Five Years |
Barry H. Evans (56)± Board Member Portfolios Overseen: 87 | | Retired; Formerly President (2005–2016), Global Chief Operating Officer (2014–2016), Chief Investment Officer–Global Head of Fixed Income (1998-2014), and various portfolio manager roles (1986-2006), Manulife Asset Management U.S. | | Director, Manulife Trust Company (2011-present); Director, Manulife Asset Management Limited (2015-present); Formerly Chairman of the Board of Directors of Manulife Asset Management U.S. (2005-2016); Formerly Chairman of the Board, Declaration Investment Management and Research (2008-2016) |
Keith F. Hartstein (60) Board Member & Independent Chair Portfolios Overseen: 87 | | Retired; Member (since November 2014) of the Governing Council of the Independent Directors Council (organization of independent mutual fund directors); formerly President and Chief Executive Officer (2005-2012), Senior Vice President (2004-2005), Senior Vice President of Sales and Marketing (1997-2004), and various executive management positions (1990-1997), John Hancock Funds, LLC (asset management); Chairman, Investment Company Institute’s Sales Force Marketing Committee (2003-2008). | | None. |
Laurie Simon Hodrick
(55)± Board Member Portfolios Overseen: 87 | | A. Barton Hepburn Professor of Economics in the Faculty of Business, Columbia Business School (since 1996); Visiting Professor of Law and Rock Center for Corporate Governance Fellow, Stanford Law School (since 2015); Visiting Fellow, Hoover Institution, Stanford University (since 2015); Sole Member, ReidCourt LLC (since 2008) (a consulting firm); Formerly Managing Director, Global Head of Alternative Investment Strategies, Deutsche Bank (2006-2008); Formerly Director/Trustee, Merrill Lynch Investment Managers Funds (1999-2006) | | Independent Director, Corporate Capital Trust (since April 2017) (a business development company) |
Michael S. Hyland, CFA (71) Board Member Portfolios Overseen: 87 | | Retired (since February 2005); formerly Senior Managing Director (July 2001-February 2005) of Bear Stearns & Co, Inc.; Global Partner, INVESCO (1999-2001); Managing Director and President of Salomon Brothers Asset Management (1989-1999). | | None. |
Visit our website at pgiminvestments.com
| | | | |
| Independent Board Members(1) |
Name, Address, Age Position(s) Portfolios Overseen | | Principal Occupation(s) During Past Five Years | | Other Directorships Held During Past Five Years |
Richard A. Redeker (74) Board Member & Independent Vice Chair Portfolios Overseen: 87 | | Retired Mutual Fund Senior Executive (47 years); Management Consultant; Director, Mutual Fund Directors Forum (since 2014); Independent Directors Council (organization of independent mutual fund directors)-Executive Committee, Chair of Policy Steering Committee, Governing Council. | | None. |
Stephen G. Stoneburn (74) Board Member Portfolios Overseen: 87 | | Chairman (since July 2011), President and Chief Executive Officer (since June 1996) of Frontline Medical Communications (publishing company); formerly President (June 1995-June 1996) of Argus Integrated Media, Inc.; Senior Vice President and Managing Director (January 1993-1995) of Cowles Business Media; Senior Vice President of Fairchild Publications, Inc. (1975-1989). | | None. |
| ± | Mr. Evans and Ms. Hodrick joined the Board effective as of September 1, 2017. |
| | | | |
| Interested Board Members(1) |
Name, Address, Age Position(s) Portfolios Overseen | | Principal Occupation(s) During Past Five Years | | Other Directorships Held During Past Five Years |
Stuart S. Parker (54) Board Member & President Portfolios Overseen: 87 | | President of PGIM Investments LLC (formerly known as Prudential Investments LLC) (since January 2012); Executive Vice President of Prudential Investment Management Services LLC (since December 2012); Executive Vice President of Jennison Associates LLC and Head of Retail Distribution of PGIM Investments LLC (June 2005-December 2011). | | None. |
Target International Equity Portfolio
| | | | |
| Interested Board Members(1) |
Name, Address, Age Position(s) Portfolios Overseen | | Principal Occupation(s) During Past Five Years | | Other Directorships Held During Past Five Years |
Scott E. Benjamin (44) Board Member & Vice President Portfolios Overseen: 87 | | Executive Vice President (since June 2009) of PGIM Investments LLC; Executive Vice President (June 2009-June 2012) and Vice President (since June 2012) of Prudential Investment Management Services LLC; Executive Vice President (since September 2009) of AST Investment Services, Inc.; Senior Vice President of Product Development and Marketing, PGIM Investments (since February 2006); Vice President of Product Development and Product Management, Prudential Investments (2003-2006). | | None. |
Grace C. Torres* (58) Board Member Portfolios Overseen: 86 | | Retired; formerly Treasurer and Principal Financial and Accounting Officer of the Prudential Funds, Target Funds, Advanced Series Trust, Prudential Variable Contract Accounts and The Prudential Series Fund (1998-June 2014); Assistant Treasurer (March 1999-June 2014) and Senior Vice President (September 1999-June 2014) of PGIM Investments LLC; Assistant Treasurer (May 2003-June 2014) and Vice President (June 2005-June 2014) of AST Investment Services, Inc.; Senior Vice President and Assistant Treasurer (May 2003-June 2014) of Prudential Annuities Advisory Services, Inc. | | Director (since July 2015) of Sun Bancorp, Inc. N.A. and Sun National Bank |
| * | Note: Prior to her retirement in 2014, Ms. Torres was employed by PGIM Investments LLC. Due to her prior employment, she is considered to be an “interested person” under the 1940 Act. Ms. Torres is a Non-Management Interested Board Member. |
| (1) | The year that each individual joined the Board is as follows: |
Ellen S. Alberding, 2013; Kevin J. Bannon, 2008; Linda W. Bynoe, 2005; Barry H. Evans, 2017; Keith F. Hartstein, 2013; Laurie Simon Hodrick, 2017; Michael S. Hyland, 2008; Richard A. Redeker, 2003; Stephen G. Stoneburn, 1999; Grace C. Torres, 2014; Stuart S. Parker, Board Member and President since 2012; Scott E. Benjamin, Board Member since 2010 and Vice President since 2009.
Visit our website at pgiminvestments.com
| | | | |
| Fund Officers(a) |
Name, Address and Age Position with Fund | | Principal Occupation(s) During Past Five Years | | Length of Service as Fund Officer |
Raymond A. O’Hara (62) Chief Legal Officer | | Vice President and Corporate Counsel (since July 2010) of Prudential Insurance Company of America (Prudential); Vice President (March 2011-Present) of Pruco Life Insurance Company and Pruco Life Insurance Company of New Jersey; Vice President and Corporate Counsel (March 2011-Present) of Prudential Annuities Life Assurance Corporation; Chief Legal Officer of PGIM Investments LLC (since June 2012); Chief Legal Officer of Prudential Mutual Fund Services LLC (since June 2012) and Corporate Counsel of AST Investment Services, Inc. (since June 2012); formerly Assistant Vice President and Corporate Counsel (September 2008-July 2010) of The Hartford Financial Services Group, Inc.; formerly Associate (September 1980-December 1987) and Partner (January 1988–August 2008) of Blazzard & Hasenauer, P.C. (formerly, Blazzard, Grodd & Hasenauer, P.C.). | | Since 2012 |
Chad A. Earnst (42) Chief Compliance Officer | | Chief Compliance Officer (September 2014-Present) of PGIM Investments LLC; Chief Compliance Officer (September 2014-Present) of the Prudential Funds, Target Funds, Advanced Series Trust, The Prudential Series Fund, Prudential’s Gibraltar Fund, Inc., Prudential Global Short Duration High Yield Income Fund, Inc., Prudential Short Duration High Yield Fund, Inc. and Prudential Jennison MLP Income Fund, Inc.; formerly Assistant Director (March 2010-August 2014) of the Asset Management Unit, Division of Enforcement, US Securities & Exchange Commission; Assistant Regional Director (January 2010-August 2014), Branch Chief (June 2006–December 2009) and Senior Counsel (April 2003-May 2006) of the Miami Regional Office, Division of Enforcement, US Securities & Exchange Commission. | | Since 2014 |
| Deborah A. Docs (59) Secretary | | Vice President and Corporate Counsel (since January 2001) of Prudential; Vice President (since December 1996) and Assistant Secretary (since March 1999) of PGIM Investments LLC; formerly Vice President and Assistant Secretary (May 2003-June 2005) of AST Investment Services, Inc. | | Since 2004 |
| Jonathan D. Shain (59) Assistant Secretary | | Vice President and Corporate Counsel (since August 1998) of Prudential; Vice President and Assistant Secretary (since May 2001) of PGIM Investments LLC; Vice President and Assistant Secretary (since February 2001) of Prudential Mutual Fund Services LLC; formerly Vice President and Assistant Secretary (May 2003-June 2005) of AST Investment Services, Inc. | | Since 2005 |
| Claudia DiGiacomo (42) Assistant Secretary | | Vice President and Corporate Counsel (since January 2005) of Prudential; Vice President and Assistant Secretary of PGIM Investments LLC (since December 2005); Associate at Sidley Austin Brown & Wood LLP (1999-2004). | | Since 2005 |
Target International Equity Portfolio
| | | | |
| Fund Officers(a) |
Name, Address and Age Position with Fund | | Principal Occupation(s) During Past Five Years | | Length of Service as Fund Officer |
Andrew R. French (54) Assistant Secretary | | Vice President and Corporate Counsel (since February 2010) of Prudential; formerly Director and Corporate Counsel (2006-2010) of Prudential; Vice President and Assistant Secretary (since January 2007) of PGIM Investments LLC; Vice President and Assistant Secretary (since January 2007) of Prudential Mutual Fund Services LLC. | | Since 2006 |
Charles H. Smith (44) Anti-Money Laundering Compliance Officer | | Vice President, Corporate Compliance, Anti-Money Laundering Unit (since January 2015) of Prudential; committee member of the American Council of Life Insurers Anti-Money Laundering and Critical Infrastructure Committee (since January 2016); formerly Global Head of Economic Sanctions Compliance at AIG Property Casualty (February 2007–December 2014); Assistant Attorney General at the New York State Attorney General’s Office, Division of Public Advocacy. (August 1998—January 2007). | | Since 2016 |
M. Sadiq Peshimam (53) Treasurer and Principal Financial and Accounting Officer | | Vice President (since 2005) of PGIM Investments LLC; formerly Assistant Treasurer of funds in the Prudential Mutual Fund Complex (2006-2014). | | Since 2006 |
Peter Parrella (59) Assistant Treasurer | | Vice President (since 2007) and Director (2004-2007) within Prudential Mutual Fund Administration; formerly Tax Manager at SSB Citi Fund Management LLC (1997-2004). | | Since 2007 |
Lana Lomuti (50) Assistant Treasurer | | Vice President (since 2007) and Director (2005-2007), within Prudential Mutual Fund Administration; formerly Assistant Treasurer (December 2007-February 2014) of The Greater China Fund, Inc. | | Since 2014 |
Linda McMullin (56) Assistant Treasurer | | Vice President (since 2011) and Director (2008-2011) within Prudential Mutual Fund Administration. | | Since 2014 |
Kelly A. Coyne (49) Assistant Treasurer | | Director, Investment Operations of Prudential Mutual Fund Services LLC (since 2010). | | Since 2015 |
| (a) | Excludes Mr. Parker and Mr. Benjamin, interested Board Members who also serve as President and Vice President, respectively. |
Explanatory Notes to Tables:
| • | | Board Members are deemed to be “Interested,” as defined in the 1940 Act, by reason of their affiliation with PGIM Investments LLC and/or an affiliate of PGIM Investments LLC. |
| • | | Unless otherwise noted, the address of all Board Members and Officers is c/o PGIM Investments LLC, 655 Broad Street, Newark, New Jersey 07102-4410. |
| • | | There is no set term of office for Board Members or Officers. The Board Members have adopted a retirement policy, which calls for the retirement of Board Members on December 31 of the year in which they reach the age of 75. |
| • | | “Other Directorships Held” includes only directorships of companies required to register or file reports with the SEC under the 1934 Act (that is, “public companies”) or other investment companies registered under the 1940 Act. |
| • | | “Portfolios Overseen” includes all investment companies managed by PGIM Investments LLC. The investment companies for which PGIM Investments LLC serves as manager include the Prudential Mutual Funds, The Prudential Variable Contract Accounts, Target Mutual Funds, Prudential Short Duration High Yield Fund, Inc., Prudential Global Short Duration High Yield Fund, Inc., The Prudential Series Fund, Prudential’s Gibraltar Fund, Inc. and the Advanced Series Trust. |
Visit our website at pgiminvestments.com
Approval of Advisory Agreements
The Fund’s Board of Trustees
The Board of Trustees (the “Board”) of the Target International Equity Portfolio (the “Fund”)1 consists of twelve individuals, nine of whom are not “interested persons” of the Fund, as defined in the Investment Company Act of 1940, as amended (the “1940 Act”) (the “Independent Trustees”). The Board is responsible for the oversight of the Fund and its operations, and performs the various duties imposed on the directors of investment companies by the 1940 Act. The Independent Trustees have retained independent legal counsel to assist them in connection with their duties. The Chair of the Board is an Independent Trustee. The Board has established four standing committees: the Audit Committee, the Nominating and Governance Committee, and two Investment Committees. Each committee is chaired by, and composed of, Independent Trustees.
Annual Approval of the Fund’s Advisory Agreements
As required under the 1940 Act, the Board determines annually whether to renew the Fund’s management agreement with PGIM Investments LLC (“PGIM Investments”) and the Fund’s subadvisory agreements with each of LSV Asset Management (“LSV”) and Lazard Asset Management LLC (“Lazard”). In considering the renewal of the agreements, the Board, including all of the Independent Trustees,2 met on June 6-8, 2017 and approved the renewal of the management agreement through July 31, 2018, and approved the renewal of the subadvisory agreements pending shareholder approval of a proposed reorganization of the Fund, after concluding that the renewal of the agreements was in the best interests of the Fund and its shareholders.
In advance of the meetings, the Board requested and received materials relating to the agreements, and had the opportunity to ask questions and request further information in connection with its consideration. Among other things, the Board considered comparative fee information from PGIM Investments and each of LSV and Lazard. Also, the Board considered comparisons with other mutual funds in relevant Peer Universes and Peer Groups, as is further discussed below.
In approving the agreements, the Board, including the Independent Trustees advised by independent legal counsel, considered the factors it deemed relevant, including the nature, quality and extent of services provided by PGIM Investments and the subadvisers, the performance of the Fund, the profitability of PGIM Investments and its affiliates, expenses and fees, and the potential for economies of scale that may be shared with the Fund and its shareholders as the Fund’s assets grow. In their deliberations, the Trustees did not identify any single factor which alone was responsible for the Board’s decision to approve the agreements with respect to the Fund. In connection with its deliberations, the Board
| 1 | Target International Equity Portfolio is a series of The Target Portfolio Trust. |
| 2 | Barry H. Evans and Laurie Simon Hodrick joined the Board effective as of September 1, 2017. Neither Mr. Evans nor Ms. Hodrick participated in the consideration of the approval of the Fund’s advisory agreements. |
| | |
| Target International Equity Portfolio |
Approval of Advisory Agreements (continued)
considered information provided by PGIM Investments throughout the year at regular Board meetings, presentations from portfolio managers and other information, as well as information furnished at or in advance of the meetings on June 6-8, 2017.
The Trustees determined that the overall arrangements between the Fund and PGIM Investments, which serves as the Fund’s investment manager pursuant to a management agreement, and between PGIM Investments and each of LSV and Lazard, which serve as the Fund’s subadvisers pursuant to the terms of subadvisory agreements with PGIM Investments, are in the best interests of the Fund and its shareholders in light of the services performed, fees charged and such other matters as the Trustees considered relevant in the exercise of their business judgment.
The material factors and conclusions that formed the basis for the Trustees’ reaching their determinations to approve the continuance of the agreements are separately discussed below.
Nature, Quality and Extent of Services
The Board received and considered information regarding the nature, quality and extent of services provided to the Fund by PGIM Investments, LSV and Lazard. The Board considered the services provided by PGIM Investments, including but not limited to the oversight of the subadvisers for the Fund, as well as the provision of fund recordkeeping, compliance, and other services to the Fund. With respect to PGIM Investments’ oversight of the subadvisers, the Board noted that PGIM Investments’ Strategic Investment Research Group (“SIRG”), which is a business unit of PGIM Investments, is responsible for monitoring and reporting to PGIM Investments’ senior management on the performance and operations of the subadvisers. The Board also considered that PGIM Investments pays the salaries of all of the officers and interested Trustees of the Fund who are part of Fund management. The Board also considered the investment subadvisory services provided by LSV and Lazard, as well as adherence to the Fund’s investment restrictions and compliance with applicable Fund policies and procedures. The Board considered PGIM Investments’ evaluation of the subadvisers, as well as PGIM Investments’ recommendation, based on its review of the subadvisers, to renew the subadvisory agreements.
The Board considered the qualifications, backgrounds and responsibilities of PGIM Investments’ senior management responsible for the oversight of the Fund, LSV and Lazard, and also considered the qualifications, backgrounds and responsibilities of the LSV and Lazard portfolio managers who are responsible for the day-to-day management of the Fund’s portfolio. The Board was provided with information pertaining to PGIM Investments’, LSV’s and Lazard’s organizational structures, senior management, investment operations, and other relevant information pertaining to each of PGIM Investments, LSV and Lazard.
| | |
| Visit our website at pgiminvestments.com | | |
The Board also noted that it received favorable compliance reports from the Fund’s Chief Compliance Officer (“CCO”) as to each of PGIM Investments, LSV and Lazard.
The Board concluded that it was satisfied with the nature, extent and quality of the investment management services provided by PGIM Investments and the subadvisory services provided to the Fund by LSV and Lazard, and that there was a reasonable basis on which to conclude that the Fund benefits from the services provided by PGIM Investments, LSV and Lazard under the management and subadvisory agreements.
Costs of Services and Profits Realized by PGIM Investments
The Board was provided with information on the profitability of PGIM Investments in serving as the Fund’s investment manager. The Board discussed with PGIM Investments the methodology utilized in assembling the information regarding profitability and considered its reasonableness. The Board recognized that it is difficult to make comparisons of profitability from fund management contracts because comparative information is not generally publicly available and is affected by numerous factors, including the structure of the particular adviser, the types of funds it manages, its business mix, numerous assumptions regarding allocations and the adviser’s capital structure and cost of capital. Taking these factors into account, the Board concluded that the profitability of PGIM Investments in relation to the services rendered was not unreasonable.
The Board noted that the Fund’s subadvisers were not affiliated with PGIM Investments, and concluded that the level of profitability of a subadviser not affiliated with PGIM Investments may not be as significant as PGIM Investments profitability given the arm’s length nature of the process by which the subadvisory fee rates were negotiated by PGIM Investments and the unaffiliated subadvisers, as well as the fact that PGIM Investments compensates each subadviser out of its management fee.
Economies of Scale
The Board received and discussed information concerning economies of scale that PGIM Investments may realize as the Fund’s assets grow beyond current levels. The Board considered information provided by PGIM Investments regarding the management fees of the Fund compared to those of similarly managed funds and PGIM Investments’ investment in the Fund over time. The Board noted that economies of scale, if any, may be shared with the Fund in several ways, including low management fees from inception, additional technological and personnel investments to enhance shareholder services, and maintaining existing expense structures in the face of a rising cost environment.
The Board considered PGIM Investments’ assertion that it continually evaluates the management fee schedule of the Fund and the potential to share economies of scale through breakpoints or fee waivers as asset levels increase.
| | |
| Target International Equity Portfolio |
Approval of Advisory Agreements (continued)
The Board recognized the inherent limitations of any analysis of economies of scale, stemming largely from the Board’s understanding that most of PGIM Investments’ costs are not specific to individual funds, but rather are incurred across a variety of products and services.
Other Benefits to PGIM Investments, LSV and Lazard
The Board considered potential ancillary benefits that might be received by PGIM Investments, LSV and Lazard and their affiliates as a result of their relationship with the Fund. The Board concluded that potential benefits to be derived by PGIM Investments included transfer agency fees received by the Fund’s transfer agent (which is affiliated with PGIM Investments), benefits to its reputation as well as other intangible benefits resulting from PGIM Investments’ association with the Fund. The Board concluded that the potential benefits to be derived by LSV and Lazard included their ability to use soft dollar credits, brokerage commissions received by affiliates of LSV and Lazard, as well as the potential benefits consistent with those generally resulting from an increase in assets under management, specifically, potential access to additional research resources and benefits to their reputations. The Board concluded that the benefits derived by PGIM Investments, LSV and Lazard were consistent with the types of benefits generally derived by investment managers and subadvisers to mutual funds.
Performance of the Fund / Fees and Expenses
The Board considered certain additional specific factors and made related conclusions relating to the historical performance of the Fund for the one-, three-, five- and ten-year periods ended December 31, 2016.
The Board also considered the Fund’s actual management fee, as well as the Fund’s net total expense ratio, for the fiscal year ended July 31, 2016. The Board considered the management fee for the Fund as compared to the management fee charged by PGIM Investments to other funds and the fee charged by other advisers to comparable mutual funds in a Peer Group. The actual management fee represents the fee rate actually paid by Fund shareholders and includes any fee waivers or reimbursements. The net total expense ratio for the Fund represents the actual expense ratio incurred by Fund shareholders.
The Peer Universe, which was used to consider performance, is a custom blend of the Lipper International Multi-Cap Core Funds and International Large-Cap Core Funds Performance Universes3. The mutual funds included in the Peer Group, which was used to consider expenses and fees, were objectively determined by Broadridge, an independent
| 3 | Although the Fund is classified in the Lipper International Multi-Cap Value Funds Performance Universe, the custom blend was utilized for performance comparisons, because PGIM Investments believes that the funds included in this custom blend provide a more appropriate basis for fund performance comparisons. |
| | |
| Visit our website at pgiminvestments.com |
provider of mutual fund data. To the extent that PGIM Investments deemed appropriate, and for reasons addressed in detail with the Board, PGIM Investments may have provided
supplemental data compiled by Broadridge for the Board’s consideration. The comparisons placed the Fund in various quartiles, with the first quartile being the best 25% of the mutual funds (for performance, the best performing mutual funds and, for expenses, the lowest cost mutual funds).
The section below summarizes key factors considered by the Board and the Board’s conclusions regarding the Fund’s performance, fees and overall expenses. The table sets forth gross performance comparisons (which do not reflect the impact on performance of fund expenses, or any subsidies, expense caps or waivers that may be applicable) with the Peer Universe, actual management fees with the Peer Group (which reflect the impact of any subsidies or fee waivers), and net total expenses with the Peer Group, each of which were key factors considered by the Board.
| | | | | | | | |
| Performance | | 1 Year | | 3 Years | | 5 Years | | 10 Years |
| | | 3rd Quartile | | 2nd Quartile | | 3rd Quartile | | 2nd Quartile |
| Actual Management Fees: 2nd Quartile |
| Net Total Expenses: 2nd Quartile |
| | • | | The Board noted that the Fund outperformed its benchmark index over the three-, five- and ten-year periods. |
| | • | | The Board noted that based on a recommendation by PGIM Investments, it had approved seeking shareholder approval for a reorganization (merger) of the Fund with the Prudential Jennison International Opportunities Fund. |
| | • | | The Board concluded that, in light of the above, it would be in the best interests of the Fund and its shareholders to renew the management agreement, and to renew the subadvisory agreements, pending shareholder approval and completion of the proposed reorganization of the Fund, which was anticipated for the fourth quarter of 2017. |
| | • | | The Board concluded that the management fees (including subadvisory fees) and total expenses were reasonable in light of the services provided. |
* * *
After full consideration of these factors, the Board concluded that approval of the agreements was in the best interests of the Fund and its shareholders.
| | |
| Target International Equity Portfolio |
| | | | |
| ∎ MAIL | | ∎ TELEPHONE | | ∎ WEBSITE |
655 Broad Street Newark, NJ 07102 | | (800) 225-1852 | | www.pgiminvestments.com |
|
| PROXY VOTING |
| The Board of Trustees has delegated to the Fund’s investment subadvisers the responsibility for voting any proxies and maintaining proxy recordkeeping with respect to the Fund. A description of these proxy voting policies and procedures is available without charge, upon request, by calling (800) 225-1852. Information regarding how the Fund voted proxies relating to portfolio securities during the most recent 12-month period ended June 30 is available on the Fund’s website and on the Securities and Exchange Commission’s website at www.sec.gov. |
|
| TRUSTEES |
| Ellen S. Alberding • Kevin J. Bannon • Scott E. Benjamin • Linda W. Bynoe • Barry H. Evans • Keith F. Hartstein • Laurie Simon Hodrick • Michael S. Hyland • Stuart S. Parker • Richard A. Redeker • Stephen G. Stoneburn • Grace C. Torres |
|
| OFFICERS |
| Stuart S. Parker, President • Scott E. Benjamin, Vice President • M. Sadiq Peshimam, Treasurer and Principal Financial and Accounting Officer • Raymond A. O’Hara, Chief Legal Officer • Chad A. Earnst, Chief Compliance Officer • Deborah A. Docs, Secretary • Charles H. Smith, Anti-Money Laundering Compliance Officer • Jonathan D. Shain, Assistant Secretary • Claudia DiGiacomo, Assistant Secretary • Andrew R. French, Assistant Secretary • Peter Parrella, Assistant Treasurer • Lana Lomuti, Assistant Treasurer • Linda McMullin, Assistant Treasurer • Kelly A. Coyne, Assistant Treasurer |
| | | | |
| MANAGER | | PGIM Investments LLC | | 655 Broad Street Newark, NJ 07102 |
|
| INVESTMENT SUBADVISERS | | Lazard Asset Management LLC | | 30 Rockefeller Plaza 57th Floor New York, NY 10112 |
|
| | LSV Asset Management | | 155 North Wacker Drive Suite 4600 Chicago, IL 60606 |
|
| DISTRIBUTOR | | Prudential Investment Management Services LLC | | 655 Broad Street
Newark, NJ 07102 |
|
| CUSTODIAN | | The Bank of New York Mellon | | 225 Liberty Street New York, NY 10286 |
|
| TRANSFER AGENT | | Prudential Mutual Fund Services LLC | | PO Box 9658 Providence, RI 02940 |
|
INDEPENDENT REGISTERED
PUBLIC ACCOUNTING FIRM | | KPMG LLP | | 345 Park Avenue New York, NY 10154 |
|
| FUND COUNSEL | | Willkie Farr & Gallagher LLP | | 787 Seventh Avenue New York, NY 10019 |
|
|
| An investor should consider the investment objectives, risks, charges, and expenses of the Fund carefully before investing. The prospectus and summary prospectus contain this and other information about the Fund. An investor may obtain a prospectus and summary prospectus by visiting our website at www.pgiminvestments.com or by calling (800) 225-1852. The prospectus and summary prospectus should be read carefully before investing. |
|
| E-DELIVERY |
| To receive your mutual fund documents online, go to www.pgiminvestments.com/edelivery and enroll. Instead of receiving printed documents by mail, you will receive notification via email when new materials are available. You can cancel your enrollment or change your email address at any time by visiting the website address above. |
|
| SHAREHOLDER COMMUNICATIONS WITH TRUSTEES |
| Shareholders can communicate directly with the Board of Trustees by writing to the Chair of the Board, Target International Equity Portfolio, PGIM Investments, Attn: Board of Trustees, 655 Broad Street, Newark, NJ 07102. Shareholders can communicate directly with an individual Trustee by writing to the same address. Communications are not screened before being delivered to the addressee. |
|
| AVAILABILITY OF PORTFOLIO SCHEDULE |
| The Fund files its complete schedule of portfolio holdings with the Securities and Exchange Commission for the first and third quarters of each fiscal year on Form N-Q. The Fund’s Forms N-Q are available on the Commission’s website at www.sec.gov. The Fund’s Forms N-Q may also be reviewed and copied at the Commission’s Public Reference Room in Washington, D.C. Information on the operation and location of the Public Reference Room may be obtained by calling 1-800-SEC-0330. The Fund’s schedule of portfolio holdings is also available on the Fund’s website as of the end of each month no sooner than 15 days after the end of the month. |
|
| The Fund’s Statement of Additional Information contains additional information about the Fund’s Trustees and is available without charge, upon request, by calling (800) 225-1852. |
Mutual Funds:
| | | | |
ARE NOT INSURED BY THE FDIC OR ANY
FEDERAL GOVERNMENT AGENCY | | MAY LOSE VALUE | | ARE NOT A DEPOSIT OF OR GUARANTEED
BY ANY BANK OR ANY BANK AFFILIATE |
TARGET INTERNATIONAL EQUITY PORTFOLIO
| | | | | | |
| SHARE CLASS | | Q | | R | | Z |
| NASDAQ | | TIEQX | | TEQRX | | TAIEX |
| CUSIP | | 875921793 | | 875921827 | | 875921504 |
TMF158E

PRUDENTIAL CORPORATE BOND FUND
ANNUAL REPORT
JULY 31, 2017

To enroll in e-delivery, go to pgiminvestments.com/edelivery
|
| Objective: High current income consistent with the preservation of capital |
Highlights
| • | | Security selection in investment-grade corporate bonds was the largest contributor to performance, highlighted by the Fund’s positioning in the banking, upstream (production & exploration) energy, and metals & mining sectors. |
| • | | Security selection in emerging markets added to performance as well, but was offset by an underweight to the sector. |
| • | | The Fund’s positioning in the electric & water, retailers & restaurants, and telecommunications sectors detracted from performance. |
This report is not authorized for distribution to prospective investors unless preceded or accompanied by a current prospectus.
The views expressed in this report and information about the Fund’s portfolio holdings are for the period covered by this report and are subject to change thereafter.
Mutual funds are distributed by Prudential Investment Management Services LLC (PIMS), member SIPC. PGIM Fixed Income is a unit of PGIM, Inc. (PGIM), a registered investment adviser. PIMS and PGIM are Prudential Financial companies. © 2017 Prudential Financial, Inc. and its related entities. The Prudential logo and the Rock symbol are service marks of Prudential Financial, Inc. and its related entities, registered in many jurisdictions worldwide.
| | |
| 2 | | Visit our website at pgiminvestments.com |
Letter from the President

Dear Shareholder:
We hope you find the annual report for the Prudential Corporate Bond Fund informative and useful. The report covers performance for the 12-month period ended July 31, 2017.
Effective April 3, 2017, Prudential Investments became known as PGIM® Investments. Why PGIM? This new name was chosen to further align with the global investment management businesses of Prudential Financial, which rebranded from Prudential Investment Management in January 2016. This new name allows for one brand and reflects our ability and commitment to delivering investment solutions to clients around the globe. Please keep in mind that only the Fund adviser’s name was changed: the name of your Fund and its management and operation will not change.
Major global events during the reporting period included the US presidential election and domestic issues related to the new administration’s policy initiatives. The US economy experienced weak growth during the first quarter of 2017, although stronger growth took place in the second quarter. Britain began its formal legal process to leave the European Union, and recent parliamentary elections in Britain resulted in unseating the majority party. Overall, global economic growth picked up slightly.
Equities in the US reached new highs, and international equities gained significantly. European stocks posted impressive results. Asian markets were solid, and emerging markets outperformed most regions.
In mid-June, the Federal Reserve raised its Federal Funds rate by 0.25% for the second time in 2017. Fixed income markets were mixed, as rising interest rates affected bond markets. High yield and emerging markets bonds were among the top performers.
Given the uncertainty in today’s investment environment, we believe that active professional portfolio management offers a potential advantage. Active managers often have the knowledge and flexibility to find the best investment opportunities in the most challenging markets.
Even so, it’s best if investment decisions are based on your long-term goals rather than on short-term market and economic developments. We also encourage you to work with an experienced financial advisor who can help you set goals, determine your tolerance for risk, and build a diversified plan that’s right for you and make adjustments when necessary.
At PGIM Investments, we consider it a great privilege and responsibility to help investors participate in opportunities across global markets while meeting their toughest investment challenges. We’re part of PGIM, a top-10 global investment manager with more than $1 trillion in assets under management. This investment expertise allows us to deliver actively managed funds and strategies to meet the needs of investors around the globe.
Thank you for choosing our family of funds.
Sincerely,

Stuart S. Parker, President
Prudential Corporate Bond Fund
September 15, 2017
| | | | |
| Prudential Corporate Bond Fund | | | 3 | |
Your Fund’s Performance (unaudited)
Performance data quoted represent past performance. Past performance does not guarantee future results. The investment return and principal value of an investment will fluctuate, so that an investor’s shares, when redeemed, may be worth more or less than their original cost. Current performance may be lower or higher than the past performance data quoted. An investor may obtain performance data as of the most recent month-end by visiting our website at www.pgiminvestments.com or by calling (800) 225-1852.
| | | | | | | | | | | | | | |
| | | Average Annual Total Returns as of 7/31/17 (with sales charges) | |
| | | One Year (%) | | Five Years (%) | | | Ten Years (%) | | | Since Inception (%) | |
| Class A | | –2.81 | | | N/A | | | | N/A | | | | 2.33 (5/28/15) | |
| Class C | | 0.02 | | | N/A | | | | N/A | | | | 3.62 (5/28/15) | |
| Class Q | | 2.02 | | | N/A | | | | N/A | | | | 4.64 (5/28/15) | |
| Class R | | 1.51 | | | N/A | | | | N/A | | | | 4.13 (5/28/15) | |
| Class Z | | 2.02 | | | 3.02 | | | | 5.39 | | | | — | |
| Bloomberg Barclays US Credit Bond Index | | 1.26 | | | 3.27 | | | | 5.65 | | | | — | |
| Lipper Corporate Debt BBB-Rated Funds Average | | 1.66 | | | 3.26 | | | | 5.36 | | | | — | |
| | | | | | | | | | | | | | |
| | | Average Annual Total Returns as of 7/31/17 (without sales charges) | |
| | | One Year (%) | | Five Years (%) | | | Ten Years (%) | | | Since Inception (%) | |
| Class A | | 1.77 | | | N/A | | | | N/A | | | | 4.52 (5/28/15) | |
| Class C | | 1.01 | | | N/A | | | | N/A | | | | 3.62 (5/28/15) | |
| Class Q | | 2.02 | | | N/A | | | | N/A | | | | 4.64 (5/28/15) | |
| Class R | | 1.51 | | | N/A | | | | N/A | | | | 4.13 (5/28/15) | |
| Class Z | | 2.02 | | | 3.02 | | | | 5.39 | | | | — | |
| Bloomberg Barclays US Credit Bond Index | | 1.26 | | | 3.27 | | | | 5.65 | | | | — | |
| Lipper Corporate Debt BBB-Rated Funds Average | | 1.66 | | | 3.26 | | | | 5.36 | | | | — | |
| | |
| 4 | | Visit our website at pgiminvestments.com |
Growth of a $10,000 Investment
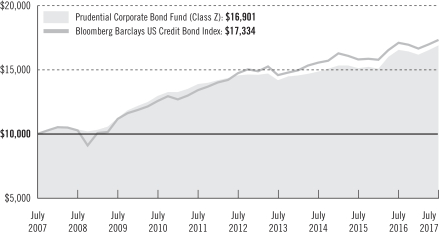
The graph compares a $10,000 investment in the Prudential Corporate Bond Fund (Class Z) with a similar investment in the Bloomberg Barclays US Credit Bond Index by portraying the initial account values at the beginning of the 10-year period (July 31, 2007) and the account values at the end of the current fiscal year (July 31, 2017), as measured on a quarterly basis. For purposes of the graph, and unless otherwise indicated, it has been assumed that (a) all recurring fees (including management fees) were deducted; and (b) all dividends and distributions were reinvested. The line graph provides information for Class Z shares only. As indicated in the tables provided earlier, performance for Class A, Class C, Class Q, and Class R shares will vary due to the differing charges and expenses applicable to each share class (as indicated in the following paragraphs). Without waiver of fees and/or expense reimbursements, if any, the returns would have been lower.
Past performance does not predict future performance. Total returns and the ending account values in the graph include changes in share price and reinvestment of dividends and capital gains distributions in a hypothetical investment for the periods shown. The Fund’s total returns do not reflect the deduction of income taxes on an individual’s investment. Taxes may reduce your actual investment returns on income or gains paid by the Fund or any gains you may realize if you sell your shares.
Source: PGIM Investments LLC and Lipper Inc.
The Since Inception returns for the Index and the Lipper Average are measured from the closest month-end to the Fund’s inception date. Inception returns are provided for any share class with less than 10 fiscal years of returns.
| | | | |
| Prudential Corporate Bond Fund | | | 5 | |
Your Fund’s Performance (continued)
The returns in the tables do not reflect the deduction of taxes that a shareholder would pay on Fund distributions or following the redemption of Fund shares. The average annual total returns take into account applicable sales charges, which are described in the table below.
| | | | | | | | | | |
| | | Class A | | Class C | | Class Q | | Class R | | Class Z |
| Maximum initial sales charge | | 4.50% of the public offering price | | None | | None | | None | | None |
| Contingent deferred sales charge (CDSC) (as a percentage of the lower of original purchase price or net asset value at redemption) | | 1% on sales of $1 million or more within 12 months of purchase | | 1% on sales made within 12 months of purchase | | None | | None | | None |
| Annual distribution and service (12b-1) fees (shown as a percentage of average daily net assets) | | .25% | | 1.00% | | None | | .75% (.50% currently) | | None |
Benchmark Definitions
Bloomberg Barclays US Credit Bond Index—The Bloomberg Barclays US Credit Bond Index measures the performance of investment-grade corporate debt and agency bonds that are dollar denominated and have a remaining maturity greater than one year. The average annual total return for the Index measured from the month-end closest to the inception date through 7/31/17 is 3.80% for Class A, C, Q, and R shares.
Lipper Corporate Debt BBB-Rated Funds Average—The Lipper Corporate Debt BBB-Rated Funds invest at least 65% of their assets in corporate and government debt issues rated in the top four grades. The average annual total return for the Average measured from the month-end closest to the inception date through 7/31/17 is 3.52% for Class A, C, Q, and R shares.
Investors cannot invest directly in an index or average. The returns for the Index would be lower if it included the effects of sales charges, operating expenses of a mutual fund, or taxes. Returns for the Lipper Average reflect the deduction of operating expenses, but not sales charges or taxes.
| | |
| 6 | | Visit our website at pgiminvestments.com |
| | | | | | |
| Distributions and Yields as of 7/31/17 | | | | |
| | Total Distributions Paid
for 12 Months ($) | | SEC 30-Day
SubsidizedYield* (%) | | SEC 30-Day
Unsubsidized
Yield** (%) |
| Class A | | 0.33 | | 2.45 | | 1.19 |
| Class C | | 0.25 | | 1.82 | | 0.51 |
| Class Q | | 0.36 | | 2.80 | | 1.58 |
| Class R | | 0.31 | | 2.30 | | 0.75 |
| Class Z | | 0.36 | | 2.81 | | 1.49 |
*SEC 30-Day Subsidized Yield (%)—A standardized yield calculation created by the Securities and Exchange Commission, it reflects the income earned during a 30-day period, after the deduction of the fund’s net expenses (net of any expense waivers or reimbursements).
**SEC 30-Day Unsubsidized Yield (%)—A standardized yield calculation created by the Securities and Exchange Commission, it reflects the income earned during a 30-day period, after the deduction of the Fund’s gross expenses.
| | | | |
| Credit Quality expressed as a percentage of total investments as of 7/31/17 (%) | |
| AAA | | | 4.1 | |
| AA | | | 5.8 | |
| A | | | 34.0 | |
| BBB | | | 52.4 | |
| BB | | | 2.0 | |
| Cash/Cash Equivalents | | | 1.9 | |
| Total Investments | | | 100.0 | |
Source: PGIM Fixed Income
Credit ratings reflect the highest rating assigned by a nationally recognized statistical rating organization (NRSRO) such as Moody’s Investor Service, Inc. (Moody’s), S&P Global Ratings (S&P), or Fitch, Inc. (Fitch). Credit ratings reflect the common nomenclature used by both S&P and Fitch. Where applicable, ratings are converted to the comparable S&P/Fitch rating tier nomenclature. These rating agencies are independent, and are widely used. The Not Rated category consists of securities that have not been rated by an NRSRO. Credit ratings are subject to change. Values may not sum to 100.0% due to rounding.
| | | | |
| Prudential Corporate Bond Fund | | | 7 | |
Strategy and Performance Overview
How did the Fund perform?
The Prudential Corporate Bond Fund’s Class Z shares returned 2.02% for the 12-month reporting period that ended July 31, 2017, outperforming the 1.26% gain of the Bloomberg Barclays US Credit Bond Index (the Index) and the 1.66% gain of the Lipper Corporate Debt BBB-Rated Funds Average.
What were market conditions?
| • | | During the reporting period, the market experienced several significant events, including the aftermath of the UK’s surprise vote to leave the European Union (commonly known as “Brexit”), the surprise victory of Donald Trump in the US Presidential election, the impact of ongoing bond-buying programs by the European Central Bank (ECB) and the Bank of England (BOE), two Federal Reserve (Fed) rate hikes, and the expected details about the Fed’s long-expected balance sheet runoff. As the period ended, speculation increased about who would head the Fed after Janet Yellen’s term expires in early 2018. Would it be a dove intent on boosting the Trump growth agenda? Or, would it be a more rules-based chairperson intent on reaching the Fed’s “dots”? (“Dots” refer to projections made by the members of the Fed’s Open Market Committee about where they think interest rates should be at a particular point in the future.) |
| • | | US economic growth, which had weakened earlier in the period, rebounded to a 2.6% pace during the second quarter of 2017 against a backdrop of continued above-trend growth in the rest of the G3. (The G3, or Group of Three, refers to the US, Japan and the European Union.) US inflation, however, was generally weaker than expected, continuing to undershoot G3 central bank targets. |
| • | | Overall, the underlying momentum in the US economy has remained solid since early 2016. Real final private sector demand in the US has been notably robust, growing at an annualized rate of between 2.6% and 3.3% in each of the last five calendar quarters and averaging 2.8% in first half of 2017. (Real final demand is the total demand for final goods and services, adjusted for inflation, in an economy.) Consumer spending has been particularly strong, but investment spending, too, has picked up as headwinds from the collapse in energy prices and the strengthening US dollar have faded. |
| • | | US companies continued to hire at a strong pace, with monthly job gains averaging 184,000 in the year to date through July 31, 2017, which is little changed from 2016’s average of 187,000 jobs and well above the estimated 75,000 to 100,000 jobs needed to keep the unemployment rate unchanged. Indeed, the unemployment rate gradually ticked lower during the reporting period, inching down to 4.3% in July. Importantly, job gains were widespread across industries. Even the retail sector, which shed jobs every month from February through May, saw stable employment in the last two months of the period. |
| | |
| 8 | | Visit our website at pgiminvestments.com |
| • | | Lean business inventories, solid core durable goods orders, and ongoing strong job gains suggest that real US GDP growth is on track to maintain its second-quarter momentum into the third quarter. |
| • | | US corporate bonds delivered a total return of 1.26%, with an excess return versus US Treasuries of 435 basis points. (A basis point is 1/100 of a percent.) Within the Index, financials outpaced industrials and utilities. Metals & mining, energy, and life insurance were amongst the strongest sectors, while tobacco, retailers & restaurants, and telecommunication services were amongst the largest underperforming sectors. |
| • | | As the period ended, credit fundamentals remained favorable, with most industries enjoying record profit margins and generating significant cashflow before share buybacks and dividends. Companies remained active in mergers and acquisitions, although the number of deals toward the end of the period dropped from record levels and leverage (debt) metrics appear to have stabilized. |
| • | | New issuance, already at record levels, pushed higher as companies sought to lock in low rates prior to anticipated Federal reserve interest rate hikes and to finance mergers and acquisitions, share buybacks and dividends. Most issues were oversubscribed, with minimal concessions, if any. Tenders for higher coupon debt also rose as companies moved to reduce interest expense ahead of potential US corporate tax reform that would eliminate or limit interest deductibility. |
What worked?
| • | | Security selection in investment-grade corporate bonds was the largest contributor to performance, highlighted by the Fund’s positioning in the banking, upstream energy (exploration and production) and metals and mining sectors. |
| • | | Security selection in emerging markets added to performance as well. |
| • | | In individual security selection, the Fund benefited from its overweights relative to the Index in Goldman Sachs (banking), Grupo Mexico (metals & mining) and Phillips 66 (downstream energy: refining and processing). |
| • | | An overweight to investment-grade corporates was also a large contributor to performance over the one-year period. An overweight in commercial mortgage-backed securities (CMBS) also added value. |
What didn’t work?
| • | | Underweights in emerging markets and municipals hurt performance over the one-year period. |
| • | | Within corporates, the Fund’s positioning in the electric & water, retailers & restaurants, and telecommunications sectors detracted from performance. |
| | | | |
| Prudential Corporate Bond Fund | | | 9 | |
Strategy and Performance Overview (continued)
| • | | In individual security selection, the Fund’s overweights in Berkshire Hathaway (property & casualty insurance), Duke Energy (electric & water), and Citigroup (banking) limited results. |
Did the Fund use derivatives and how did they affect performance?
| • | | The Fund’s investment strategy does not heavily rely on derivative strategies, although it does employ Treasury futures on a limited basis. Treasury futures are used to manage the Fund’s interest rate risk, which is more efficient than managing interest rate risk through the purchases and sales of cash corporate bonds. This derivative strategy did not have a material impact on the Fund’s performance. |
Current outlook
| • | | With second quarter earnings season well underway, PGIM Fixed Income maintains a favorable outlook on the investment-grade corporate bond market heading into August. Though central banks have shifted towards a more hawkish bias, investment-grade corporates generally remain supported by global monetary policies, especially the ECB bond purchase program. Credit fundamentals appear to have peaked but they remain strong, and corporate liquidity is robust. Though little progress on the new administration’s tax reform has been made, and the new administration has failed to repeal and replace the Affordable Care Act, spreads (yield differentials versus comparable-maturity Treasuries) have continued to grind tighter amid strong demand and record low volatility. Despite high expectations, companies have reported better-than-expected second quarter earnings driven by improved global growth and a weaker US dollar. |
| • | | Although it’s a generally favorable environment for corporates, near term risks in the market remain. While the Trump administration seems to favor business-friendly policies and reduced regulation, changes in tax policy, including loss of interest deductibility and protectionist trade policies, bear watching. Additionally, uncertainty regarding the impact of Brexit, unwinding of the Fed’s balance sheet and tapering of the ECB’s bond purchase program may induce volatility. |
| • | | PGIM Fixed Income continues to favor US financials over industrial issues, especially US money center banks, given their strong capital requirements and generally solid earnings. Within Industrials, the focus is on companies where an “event” has passed, as higher quality corporates continue to lever up and consolidation remains a concern. Furthermore, PGIM Fixed Income is focusing on US-centric issuers over multinationals or exporters that are vulnerable to potential protectionist trade policies. PGIM Fixed Income remains overweight BBB-rated, long-maturity credits due to a steep spread curve and possibly higher pension funding, which could lead to increased demand and potentially flatten the spread curve. (The corporate spread curve depicts the difference between the |
| | |
| 10 | | Visit our website at pgiminvestments.com |
| | spreads of long- and short-maturity corporate bonds versus US Treasuries of comparable maturity.) The main near-term risks in the market remain the policies of the new US administration, the impact of the tightening Fed, and political instability abroad. |
| | | | |
| Prudential Corporate Bond Fund | | | 11 | |
Fees and Expenses (unaudited)
As a shareholder of the Fund, you incur two types of costs: (1) transaction costs, including sales charges (loads) on purchase payments and redemptions, as applicable, and (2) ongoing costs, including management fees, and other Fund expenses, as applicable. This example is intended to help you understand your ongoing costs (in dollars) of investing in the Fund and to compare these costs with the ongoing costs of investing in other mutual funds.
The example is based on an investment of $1,000 held through the six-month period ended July 31, 2017. The example is for illustrative purposes only; you should consult the Prospectus for information on initial and subsequent minimum investment requirements.
Actual Expenses
The first line for each share class in the table on the following pages provides information about actual account values and actual expenses. You may use the information on this line, together with the amount you invested, to estimate the expenses that you paid over the period. Simply divide your account value by $1,000 (for example, an $8,600 account value ÷ $1,000 = 8.6), then multiply the result by the number on the first line under the heading “Expenses Paid During the Six-Month Period” to estimate the expenses you paid on your account during this period.
Hypothetical Example for Comparison Purposes
The second line for each share class in the table on the following pages provides information about hypothetical account values and hypothetical expenses based on the Fund’s actual expense ratio and an assumed rate of return of 5% per year before expenses, which is not the Fund’s actual return. The hypothetical account values and expenses may not be used to estimate the actual ending account balance or expenses you paid for the period. You may use this information to compare the ongoing costs of investing in the Fund and other funds. To do so, compare this 5% hypothetical example with the 5% hypothetical examples that appear in the shareholder reports of the other funds.
The Fund’s transfer agent may charge additional fees to holders of certain accounts that are not included in the expenses shown in the table on the following pages. These fees apply to individual retirement accounts (IRAs) and Section 403(b) accounts. As of the close of the six-month period covered by the table, IRA fees included an annual maintenance fee of $15 per account (subject to a maximum annual maintenance fee of $25 for all accounts held by the same shareholder). Section 403(b) accounts are charged an annual $25 fiduciary maintenance fee. Some of the fees may vary in amount, or may be waived, based on your total account balance or the number of Prudential funds, including the Fund, that you own. You should consider the additional fees that were charged to your Fund account over the six-month period when you estimate the total ongoing expenses paid over the
| | |
| 12 | | Visit our website at pgiminvestments.com |
period and the impact of these fees on your ending account value, as these additional expenses are not reflected in the information provided in the expense table. Additional fees have the effect of reducing investment returns.
Please note that the expenses shown in the table are meant to highlight your ongoing costs only and do not reflect any transactional costs such as sales charges (loads). Therefore, the second line for each share class in the table is useful in comparing ongoing costs only and will not help you determine the relative total costs of owning different funds. In addition, if these transactional costs were included, your costs would have been higher.
| | | | | | | | | | | | | | | | | | |
Prudential Corporate
Bond Fund | | Beginning Account
Value
February 1, 2017 | | | Ending Account
Value
July 31, 2017 | | | Annualized
Expense Ratio
Based on the
Six-Month Period | | | Expenses Paid
During the
Six-Month Period* | |
| Class A | | Actual | | $ | 1,000.00 | | | $ | 1,042.00 | | | | 0.80 | % | | $ | 4.05 | |
| | Hypothetical | | $ | 1,000.00 | | | $ | 1,020.83 | | | | 0.80 | % | | $ | 4.01 | |
| Class C | | Actual | | $ | 1,000.00 | | | $ | 1,038.20 | | | | 1.55 | % | | $ | 7.83 | |
| | Hypothetical | | $ | 1,000.00 | | | $ | 1,017.11 | | | | 1.55 | % | | $ | 7.75 | |
| Class Q | | Actual | | $ | 1,000.00 | | | $ | 1,043.30 | | | | 0.55 | % | | $ | 2.79 | |
| | Hypothetical | | $ | 1,000.00 | | | $ | 1,022.07 | | | | 0.55 | % | | $ | 2.76 | |
| Class R | | Actual | | $ | 1,000.00 | | | $ | 1,040.70 | | | | 1.05 | % | | $ | 5.31 | |
| | Hypothetical | | $ | 1,000.00 | | | $ | 1,019.59 | | | | 1.05 | % | | $ | 5.26 | |
| Class Z | | Actual | | $ | 1,000.00 | | | $ | 1,043.30 | | | | 0.55 | % | | $ | 2.79 | |
| | | Hypothetical | | $ | 1,000.00 | | | $ | 1,022.07 | | | | 0.55 | % | | $ | 2.76 | |
*Fund expenses (net of fee waivers or subsidies, if any) for each share class are equal to the annualized expense ratio for each share class (provided in the table), multiplied by the average account value over the period, multiplied by the 181 days in the six-month period ended July 31, 2017, and divided by 365 days. Expenses presented in the table include the expenses of any underlying portfolios in which the Fund may invest.
| | | | |
| Prudential Corporate Bond Fund | | | 13 | |
Schedule of Investments
as of July 31, 2017
| | | | | | | | | | | | | | | | |
| Description | | Interest
Rate | | | Maturity
Date | | | Principal
Amount (000)# | | | Value | |
LONG-TERM INVESTMENTS 97.1% | | | | | | | | | | | | | | | | |
| | | | |
COMMERCIAL MORTGAGE-BACKED SECURITIES 2.9% | | | | | | | | | | | | | | | | |
Citigroup Commercial Mortgage Trust,
Series 2016-GC37, Class A3 | | | 3.050 | % | | | 04/10/49 | | | | 250 | | | $ | 250,408 | |
Deutsche Bank Commercial Mortgage Trust,
Series 2017-C6, Class A3 | | | 3.269 | | | | 06/10/50 | | | | 100 | | | | 102,518 | |
JPMCC Commercial Mortgage Securities Trust,
Series 2017-JP6, Class A4 | | | 3.224 | | | | 07/15/50 | | | | 100 | | | | 101,394 | |
Morgan Stanley Bank of America Merrill Lynch Trust,
Series 2016-C29, Class A3 | | | 3.058 | | | | 05/15/49 | | | | 200 | | | | 200,517 | |
| | | | | | | | | | | | | | | | |
TOTAL COMMERCIAL MORTGAGE-BACKED SECURITIES
(cost $658,191) | | | | | | | | | | | | | | | 654,837 | |
| | | | | | | | | | | | | | | | |
| | | | |
CORPORATE BONDS 93.3% | | | | | | | | | | | | | | | | |
| | | | |
Aerospace & Defense 1.0% | | | | | | | | | | | | | | | | |
United Technologies Corp., Sr. Unsec’d. Notes | | | 1.900 | | | | 05/04/20 | | | | 230 | | | | 230,813 | |
| | | | |
Agriculture 1.8% | | | | | | | | | | | | | | | | |
BAT International Finance PLC (United Kingdom),
Gtd. Notes, 144A | | | 3.250 | | | | 06/07/22 | | | | 305 | | | | 312,846 | |
Philip Morris International, Inc., Sr. Unsec’d. Notes | | | 2.000 | | | | 02/21/20 | | | | 100 | | | | 100,483 | |
| | | | | | | | | | | | | | | | |
| | | | | | | | | | | | | | | 413,329 | |
| | | | |
Airlines 1.4% | | | | | | | | | | | | | | | | |
American Airlines 2016-2 Class AA Pass-Through Trust, Pass-Through Certificates | | | 3.200 | | | | 12/15/29 | | | | 88 | | | | 87,572 | |
Delta Air Lines, Inc., Sr. Unsec’d. Notes | | | 2.875 | | | | 03/13/20 | | | | 130 | | | | 132,378 | |
Southwest Airlines Co., Sr. Unsec’d. Notes | | | 2.650 | | | | 11/05/20 | | | | 100 | | | | 101,494 | |
| | | | | | | | | | | | | | | | |
| | | | | | | | | | | | | | | 321,444 | |
| | | | |
Auto Manufacturers 4.4% | | | | | | | | | | | | | | | | |
BMW US Capital LLC (Germany), Gtd. Notes, 144A | | | 2.150 | | | | 04/06/20 | | | | 75 | | | | 75,613 | |
Ford Motor Co., Sr. Unsec’d. Notes | | | 5.291 | | | | 12/08/46 | | | | 200 | | | | 206,212 | |
Ford Motor Credit Co. LLC, Sr. Unsec’d. Notes | | | 2.979 | | | | 08/03/22 | | | | 200 | | | | 200,120 | |
General Motors Financial Co., Inc.,
Gtd. Notes | | | 2.400 | | | | 04/10/18 | | | | 200 | | | | 200,881 | |
Gtd. Notes | | | 2.400 | | | | 05/09/19 | | | | 100 | | | | 100,388 | |
Gtd. Notes | | | 4.000 | | | | 01/15/25 | | | | 150 | | | | 151,638 | |
Gtd. Notes | | | 3.200 | | | | 07/06/21 | | | | 75 | | | | 76,145 | |
| | | | | | | | | | | | | | | | |
| | | | | | | | | | | | | | | 1,010,997 | |
| | | | |
Auto Parts & Equipment 0.5% | | | | | | | | | | | | | | | | |
ZF North America Capital, Inc. (Germany), Gtd. Notes, 144A | | | 4.500 | | | | 04/29/22 | | | | 100 | | | | 105,000 | |
See Notes to Financial Statements.
| | | | |
| Prudential Corporate Bond Fund | | | 15 | |
Schedule of Investments (continued)
as of July 31, 2017
| | | | | | | | | | | | | | | | |
| Description | | Interest
Rate | | | Maturity
Date | | | Principal
Amount (000)# | | | Value | |
CORPORATE BONDS (Continued) | |
| | | | |
Banks 19.1% | | | | | | | | | | | | | | | | |
Bank of America Corp.,
Sr. Unsec’d. Notes, MTN | | | 3.875 | % | | | 08/01/25 | | | | 250 | | | $ | 260,525 | |
Sr. Unsec’d. Notes, MTN | | | 4.443 | (c) | | | 01/20/48 | | | | 100 | | | | 106,316 | |
Series L, Sr. Unsec’d. Notes, MTN | | | 2.600 | | | | 01/15/19 | | | | 250 | | | | 252,559 | |
Series V, Jr. Sub. Notes | | | 5.125 | (c) | | | 12/29/49 | | | | 250 | | | | 254,970 | |
Barclays PLC (United Kingdom), Sr. Unsec’d. Notes | | | 3.650 | | | | 03/16/25 | | | | 200 | | | | 200,403 | |
Citigroup, Inc.,
Sr. Unsec’d. Notes | | | 2.550 | | | | 04/08/19 | | | | 550 | | | | 555,714 | |
Sr. Unsec’d. Notes | | | 3.200 | | | | 10/21/26 | | | | 150 | | | | 146,473 | |
Credit Suisse Group Funding Guernsey Ltd. (Switzerland), Gtd. Notes | | | 3.800 | | | | 06/09/23 | | | | 265 | | | | 276,159 | |
Deutsche Bank AG (Germany), Sr. Unsec’d. Notes, GMTN | | | 3.375 | | | | 05/12/21 | | | | 80 | | | | 81,365 | |
Goldman Sachs Group, Inc. (The),
Sub. Notes | | | 5.150 | | | | 05/22/45 | | | | 300 | | | | 338,977 | |
Series L, Jr. Sub. Notes | | | 5.700 | (c) | | | 12/29/49 | | | | 250 | | | | 261,120 | |
JPMorgan Chase & Co.,
Sr. Unsec’d. Notes | | | 2.250 | | | | 01/23/20 | | | | 150 | | | | 151,086 | |
Sr. Unsec’d. Notes | | | 3.200 | | | | 06/15/26 | | | | 390 | | | | 387,536 | |
Sr. Unsec’d. Notes | | | 3.882 | (c) | | | 07/24/38 | | | | 95 | | | | 94,876 | |
Sr. Unsec’d. Notes | | | 4.032 | (c) | | | 07/24/48 | | | | 25 | | | | 25,104 | |
Series 1, Jr. Sub. Notes | | | 7.900 | (c) | | | 12/29/49 | | | | 200 | | | | 207,500 | |
Morgan Stanley,
Sr. Unsec’d. Notes | | | 3.971 | (c) | | | 07/22/38 | | | | 85 | | | | 84,832 | |
Sr. Unsec’d. Notes, GMTN | | | 3.875 | | | | 01/27/26 | | | | 300 | | | | 310,180 | |
Series H, Jr. Sub. Notes | | | 5.450 | (c) | | | 07/29/49 | | | | 250 | | | | 258,750 | |
UBS Group Funding AG (Switzerland), Gtd. Notes, 144A | | | 4.125 | | | | 04/15/26 | | | | 90 | | | | 95,323 | |
| | | | | | | | | | | | | | | | |
| | | | | | | | | | | | | | | 4,349,768 | |
| | | | |
Biotechnology 2.5% | | | | | | | | | | | | | | | | |
Amgen, Inc., Sr. Unsec’d. Notes | | | 2.650 | | | | 05/11/22 | | | | 160 | | | | 161,822 | |
Baxalta, Inc., Gtd. Notes | | | 2.000 | | | | 06/22/18 | | | | 45 | | | | 45,092 | |
Biogen, Inc., Sr. Unsec’d. Notes | | | 4.050 | | | | 09/15/25 | | | | 215 | | | | 230,078 | |
Celgene Corp., Sr. Unsec’d. Notes | | | 4.625 | | | | 05/15/44 | | | | 100 | | | | 107,660 | |
Gilead Sciences, Inc., Sr. Unsec’d. Notes | | | 2.500 | | | | 09/01/23 | | | | 30 | | | | 29,846 | |
| | | | | | | | | | | | | | | | |
| | | | | | | | | | | | | | | 574,498 | |
| | | | |
Building Materials 0.3% | | | | | | | | | | | | | | | | |
Johnson Controls International PLC, Sr. Unsec’d. Notes | | | 4.950 | | | | 07/02/64 | | | | 75 | | | | 80,809 | |
| | | | |
Chemicals 3.4% | | | | | | | | | | | | | | | | |
Celanese US Holdings LLC, Gtd. Notes | | | 4.625 | | | | 11/15/22 | | | | 50 | | | | 54,364 | |
CF Industries, Inc., Gtd. Notes | | | 5.375 | | | | 03/15/44 | | | | 90 | | | | 81,000 | |
See Notes to Financial Statements.
| | | | | | | | | | | | | | | | |
| Description | | Interest
Rate | | | Maturity
Date | | | Principal
Amount (000)# | | | Value | |
CORPORATE BONDS (Continued) | |
| | | | |
Chemicals (cont’d) | | | | | | | | | | | | | | | | |
Dow Chemical Co. (The), Sr. Unsec’d. Notes | | | 4.375 | % | | | 11/15/42 | | | | 175 | | | $ | 179,320 | |
Eastman Chemical Co., Sr. Unsec’d. Notes | | | 3.600 | | | | 08/15/22 | | | | 49 | | | | 51,093 | |
LyondellBasell Industries NV, Sr. Unsec’d. Notes | | | 4.625 | | | | 02/26/55 | | | | 150 | | | | 151,931 | |
Mosaic Co. (The), Sr. Unsec’d. Notes | | | 5.625 | | | | 11/15/43 | | | | 20 | | | | 20,553 | |
Sherwin-Williams Co. (The), Sr. Unsec’d. Notes | | | 2.250 | | | | 05/15/20 | | | | 235 | | | | 236,401 | |
| | | | | | | | | | | | | | | | |
| | | | | | | | | | | | | | | 774,662 | |
| | | | |
Commercial Services 0.6% | | | | | | | | | | | | | | | | |
Equifax, Inc., Sr. Unsec’d. Notes | | | 2.300 | | | | 06/01/21 | | | | 25 | | | | 24,874 | |
Total System Services, Inc., Sr. Unsec’d. Notes | | | 3.800 | | | | 04/01/21 | | | | 100 | | | | 104,281 | |
| | | | | | | | | | | | | | | | |
| | | | | | | | | | | | | | | 129,155 | |
| | | | |
Computers 2.8% | | | | | | | | | | | | | | | | |
Apple, Inc., Sr. Unsec’d. Notes | | | 4.650 | | | | 02/23/46 | | | | 100 | | | | 112,370 | |
Dell International LLC/EMC Corp.,
Sr. Sec’d. Notes, 144A | | | 3.480 | | | | 06/01/19 | | | | 160 | | | | 163,793 | |
Sr. Sec’d. Notes, 144A | | | 4.420 | | | | 06/15/21 | | | | 55 | | | | 58,046 | |
Hewlett Packard Enterprise Co., Sr. Unsec’d. Notes | | | 2.850 | | | | 10/05/18 | | | | 105 | | | | 106,265 | |
Seagate HDD Cayman, Gtd. Notes | | | 3.750 | | | | 11/15/18 | | | | 200 | | | | 203,300 | |
| | | | | | | | | | | | | | | | |
| | | | | | | | | | | | | | | 643,774 | |
| | | | |
Diversified Financial Services 0.4% | | | | | | | | | | | | | | | | |
Discover Financial Services, Sr. Unsec’d. Notes | | | 3.750 | | | | 03/04/25 | | | | 100 | | | | 100,429 | |
| | | | |
Electric 10.3% | | | | | | | | | | | | | | | | |
Commonwealth Edison Co., First Mortgage | | | 4.700 | | | | 01/15/44 | | | | 100 | | | | 114,324 | |
Consolidated Edison, Inc., Sr. Unsec’d. Notes | | | 2.000 | | | | 05/15/21 | | | | 190 | | | | 188,445 | |
Dominion Energy, Inc., Jr. Sub. Notes | | | 2.579 | | | | 07/01/20 | | | | 135 | | | | 136,270 | |
DTE Electric Co., General Ref. Mortgage | | | 3.950 | | | | 06/15/42 | | | | 75 | | | | 76,194 | |
Duke Energy Progress LLC, First Mortgage | | | 4.150 | | | | 12/01/44 | | | | 200 | | | | 210,389 | |
Emera US Finance LP (Canada), Gtd. Notes | | | 3.550 | | | | 06/15/26 | | | | 40 | | | | 40,567 | |
Entergy Corp., Sr. Unsec’d. Notes | | | 2.950 | | | | 09/01/26 | | | | 100 | | | | 97,134 | |
Entergy Mississippi, Inc., First Mortgage | | | 2.850 | | | | 06/01/28 | | | | 40 | | | | 38,723 | |
Eversource Energy, Series K, Sr. Unsec’d. Notes | | | 2.750 | | | | 03/15/22 | | | | 95 | | | | 95,981 | |
FirstEnergy Corp., Series B, Sr. Unsec’d. Notes | | | 3.900 | | | | 07/15/27 | | | | 75 | | | | 75,595 | |
MidAmerican Energy Co., First Mortgage | | | 3.950 | | | | 08/01/47 | | | | 20 | | | | 20,696 | |
Pacific Gas & Electric Co., Sr. Unsec’d. Notes | | | 4.000 | | | | 12/01/46 | | | | 25 | | | | 25,833 | |
PacifiCorp, First Mortgage | | | 3.350 | | | | 07/01/25 | | | | 270 | | | | 277,119 | |
PPL Capital Funding, Inc., Gtd. Notes | | | 4.700 | | | | 06/01/43 | | | | 100 | | | | 106,881 | |
PSEG Power LLC, Gtd. Notes | | | 3.000 | | | | 06/15/21 | | | | 60 | | | | 61,127 | |
Public Service Electric & Gas Co., Sec’d. Notes, MTN | | | 3.650 | | | | 09/01/42 | | | | 75 | | | | 73,918 | |
See Notes to Financial Statements.
| | | | |
| Prudential Corporate Bond Fund | | | 17 | |
Schedule of Investments (continued)
as of July 31, 2017
| | | | | | | | | | | | | | | | |
| Description | | Interest
Rate | | | Maturity
Date | | | Principal
Amount (000)# | | | Value | |
CORPORATE BONDS (Continued) | |
|
Electric (cont’d.) | |
Puget Energy, Inc., Sr. Sec’d. Notes | | | 3.650 | % | | | 05/15/25 | | | | 400 | | | $ | 400,445 | |
RGS AEGCO Funding Corp., Series F, Sec’d. Notes | | | 9.820 | | | | 12/07/22 | | | | 48 | | | | 53,288 | |
San Diego Gas & Electric Co., First Mortgage | | | 4.300 | | | | 04/01/42 | | | | 75 | | | | 80,236 | |
Sierra Pacific Power Co., General Ref. Mortgage | | | 2.600 | | | | 05/01/26 | | | | 70 | | | | 68,004 | |
Westar Energy, Inc., First Mortgage | | | 5.100 | | | | 07/15/20 | | | | 100 | | | | 108,078 | |
| | | | | | | | | | | | | | | | |
| | | | | | | | | | | | | | | 2,349,247 | |
| | | | |
Foods 0.9% | | | | | | | | | | | | | | | | |
Kraft Heinz Foods Co.,
Gtd. Notes | | | 4.375 | | | | 06/01/46 | | | | 55 | | | | 53,441 | |
Gtd. Notes | | | 5.000 | | | | 07/15/35 | | | | 50 | | | | 54,119 | |
Kroger Co. (The),
Sr. Unsec’d. Notes | | | 2.650 | | | | 10/15/26 | | | | 35 | | | | 32,458 | |
Sr. Unsec’d. Notes | | | 2.800 | | | | 08/01/22 | | | | 10 | | | | 10,072 | |
Sysco Corp., Gtd. Notes | | | 3.250 | | | | 07/15/27 | | | | 45 | | | | 44,954 | |
| | | | | | | | | | | | | | | | |
| | | | | | | | | | | | | | | 195,044 | |
| | | | |
Forest Products & Paper 1.2% | | | | | | | | | | | | | | | | |
International Paper Co., Sr. Unsec’d. Notes | | | 5.000 | | | | 09/15/35 | | | | 250 | | | | 276,132 | |
| | | | |
Healthcare-Products 1.4% | | | | | | | | | | | | | | | | |
Abbott Laboratories, Sr. Unsec’d. Notes | | | 2.900 | | | | 11/30/21 | | | | 135 | | | | 137,386 | |
Baxter International, Inc., Sr. Unsec’d. Notes | | | 3.500 | | | | 08/15/46 | | | | 110 | | | | 99,140 | |
Becton, Dickinson & Co., Sr. Unsec’d. Notes | | | 2.404 | | | | 06/05/20 | | | | 75 | | | | 75,464 | |
| | | | | | | | | | | | | | | | |
| | | | | | | | | | | | | | | 311,990 | |
| | | | |
Healthcare-Services 3.2% | | | | | | | | | | | | | | | | |
Anthem, Inc., Sr. Unsec’d. Notes | | | 4.625 | | | | 05/15/42 | | | | 200 | | | | 215,425 | |
Laboratory Corp. of America Holdings, Sr. Unsec’d. Notes | | | 3.600 | | | | 02/01/25 | | | | 250 | | | | 255,382 | |
Quest Diagnostics, Inc., Sr. Unsec’d. Notes | | | 3.500 | | | | 03/30/25 | | | | 250 | | | | 254,937 | |
| | | | | | | | | | | | | | | | |
| | | | | | | | | | | | | | | 725,744 | |
| | | | |
Household Products/Wares 0.9% | | | | | | | | | | | | | | | | |
Reckitt Benckiser Treasury Services PLC (United Kingdom), Gtd. Notes, 144A | | | 2.375 | | | | 06/24/22 | | | | 200 | | | | 199,469 | |
| | | | |
Housewares 0.6% | | | | | | | | | | | | | | | | |
Newell Brands, Inc.,
Sr. Unsec’d. Notes | | | 4.000 | | | | 12/01/24 | | | | 100 | | | | 105,401 | |
Sr. Unsec’d. Notes | | | 4.200 | | | | 04/01/26 | | | | 20 | | | | 21,396 | |
| | | | | | | | | | | | | | | | |
| | | | | | | | | | | | | | | 126,797 | |
See Notes to Financial Statements.
| | | | | | | | | | | | | | | | |
| Description | | Interest
Rate | | | Maturity
Date | | | Principal
Amount (000)# | | | Value | |
CORPORATE BONDS (Continued) | |
| | | | |
Insurance 6.0% | | | | | | | | | | | | | | | | |
American International Group, Inc., Sr. Unsec’d. Notes | | | 4.375 | % | | | 01/15/55 | | | | 150 | | | $ | 147,111 | |
Berkshire Hathaway, Inc., Sr. Unsec’d. Notes | | | 3.125 | | | | 03/15/26 | | | | 125 | | | | 127,381 | |
Liberty Mutual Group, Inc., Gtd. Notes, 144A | | | 5.000 | | | | 06/01/21 | | | | 500 | | | | 544,672 | |
Markel Corp., Sr. Unsec’d. Notes | | | 5.350 | | | | 06/01/21 | | | | 500 | | | | 548,268 | |
| | | | | | | | | | | | | | | | |
| | | | | | | | | | | | | | | 1,367,432 | |
| | | | |
Media 4.9% | | | | | | | | | | | | | | | | |
Charter Communications Operating LLC/Charter Communications Operating Capital, Sr. Sec’d. Notes | | | 6.384 | | | | 10/23/35 | | | | 180 | | | | 210,587 | |
Comcast Corp.,
Gtd. Notes | | | 3.150 | | | | 03/01/26 | | | | 90 | | | | 91,100 | |
Gtd. Notes | | | 3.375 | | | | 08/15/25 | | | | 325 | | | | 335,905 | |
Scripps Networks Interactive, Inc.,
Sr. Unsec’d. Notes | | | 3.500 | | | | 06/15/22 | | | | 100 | | | | 102,303 | |
Sr. Unsec’d. Notes | | | 3.950 | | | | 06/15/25 | | | | 28 | | | | 28,517 | |
Time Warner, Inc., Gtd. Notes | | | 3.875 | | | | 01/15/26 | | | | 200 | | | | 203,742 | |
Viacom, Inc., Sr. Unsec’d. Notes | | | 5.250 | | | | 04/01/44 | | | | 150 | | | | 149,437 | |
| | | | | | | | | | | | | | | | |
| | | | | | | | | | | | | | | 1,121,591 | |
| | | | |
Mining 1.0% | | | | | | | | | | | | | | | | |
Barrick North America Finance LLC (Canada), Gtd. Notes | | | 5.700 | | | | 05/30/41 | | | | 50 | | | | 59,810 | |
BHP Billiton Finance USA Ltd. (Australia), Gtd. Notes | | | 5.000 | | | | 09/30/43 | | | | 50 | | | | 58,910 | |
Yamana Gold, Inc. (Canada), Gtd. Notes | | | 4.950 | | | | 07/15/24 | | | | 100 | | | | 101,338 | |
| | | | | | | | | | | | | | | | |
| | | | | | | | | | | | | | | 220,058 | |
| | | | |
Miscellaneous Manufacturing 0.2% | | | | | | | | | | | | | | | | |
Textron, Inc., Sr. Unsec’d. Notes | | | 4.000 | | | | 03/15/26 | | | | 45 | | | | 47,076 | |
| | | | |
Office/Business Equipment 0.8% | | | | | | | | | | | | | | | | |
Xerox Corp., Sr. Unsec’d. Notes, 144A | | | 4.070 | | | | 03/17/22 | | | | 175 | | | | 179,974 | |
| | | | |
Oil & Gas 4.8% | | | | | | | | | | | | | | | | |
Apache Corp., Sr. Unsec’d. Notes | | | 3.250 | | | | 04/15/22 | | | | 250 | | | | 255,086 | |
BP Capital Markets PLC (United Kingdom), Gtd. Notes | | | 3.588 | | | | 04/14/27 | | | | 100 | | | | 102,950 | |
Canadian Natural Resources Ltd. (Canada),
Sr. Unsec’d. Notes | | | 6.500 | | | | 02/15/37 | | | | 100 | | | | 119,806 | |
Cenovus Energy, Inc. (Canada), Sr. Unsec’d. Notes | | | 5.700 | | | | 10/15/19 | | | | 240 | | | | 253,176 | |
ConocoPhillips Co., Gtd. Notes | | | 4.200 | | | | 03/15/21 | | | | 50 | | | | 53,474 | |
Devon Energy Corp.,
Sr. Unsec’d. Notes | | | 5.000 | | | | 06/15/45 | | | | 5 | | | | 5,091 | |
Sr. Unsec’d. Notes | | | 5.600 | | | | 07/15/41 | | | | 15 | | | | 16,316 | |
See Notes to Financial Statements.
| | | | |
| Prudential Corporate Bond Fund | | | 19 | |
Schedule of Investments (continued)
as of July 31, 2017
| | | | | | | | | | | | | | | | |
| Description | | Interest
Rate | | | Maturity
Date | | | Principal
Amount (000)# | | | Value | |
CORPORATE BONDS (Continued) | |
| | | | |
Oil & Gas (cont’d) | | | | | | | | | | | | | | | | |
Husky Energy, Inc. (Canada), Sr. Unsec’d. Notes | | | 3.950 | % | | | 04/15/22 | | | | 90 | | | $ | 94,435 | |
Noble Energy, Inc., Sr. Unsec’d. Notes | | | 5.050 | | | | 11/15/44 | | | | 100 | | | | 103,503 | |
Shell International Finance BV (Netherlands), Gtd. Notes | | | 4.375 | | | | 05/11/45 | | | | 85 | | | | 90,140 | |
| | | | | | | | | | | | | | | | |
| | | | | | | | | | | | | | | 1,093,977 | |
| | | | |
Pharmaceuticals 4.9% | | | | | | | | | | | | | | | | |
Actavis Funding SCS, Gtd. Notes | | | 3.800 | | | | 03/15/25 | | | | 350 | | | | 363,835 | |
Mead Johnson Nutrition Co. (United Kingdom), Gtd. Notes | | | 3.000 | | | | 11/15/20 | | | | 100 | | | | 103,046 | |
Mylan NV, Gtd. Notes | | | 3.000 | | | | 12/15/18 | | | | 200 | | | | 202,816 | |
Pfizer, Inc., Sr. Unsec’d. Notes | | | 4.125 | | | | 12/15/46 | | | | 80 | | | | 85,148 | |
Shire Acquisitions Investments Ireland DAC,
Gtd. Notes | | | 2.400 | | | | 09/23/21 | | | | 180 | | | | 179,438 | |
Gtd. Notes | | | 3.200 | | | | 09/23/26 | | | | 100 | | | | 98,750 | |
Teva Pharmaceutical Finance Netherlands III BV (Israel),
Gtd. Notes | | | 3.150 | | | | 10/01/26 | | | | 30 | | | | 28,707 | |
Gtd. Notes | | | 4.100 | | | | 10/01/46 | | | | 60 | | | | 54,566 | |
| | | | | | | | | | | | | | | | |
| | | | | | | | | | | | | | | 1,116,306 | |
| | | | |
Pipelines 3.6% | | | | | | | | | | | | | | | | |
Enterprise Products Operating LLC,
Gtd. Notes | | | 4.850 | | | | 03/15/44 | | | | 100 | | | | 106,939 | |
Gtd. Notes | | | 4.900 | | | | 05/15/46 | | | | 150 | | | | 162,318 | |
Phillips 66 Partners LP, Sr. Unsec’d. Notes(a) | | | 3.605 | | | | 02/15/25 | | | | 350 | | | | 350,275 | |
Williams Partners LP, Sr. Unsec’d. Notes | | | 4.300 | | | | 03/04/24 | | | | 200 | | | | 210,735 | |
| | | | | | | | | | | | | | | | |
| | | | | | | | | | | | | | | 830,267 | |
| | | | |
Real Estate Investment Trusts (REITs) 2.9% | | | | | | | | | | | | | | | | |
Brixmor Operating Partnership LP, Sr. Unsec’d. Notes | | | 3.650 | | | | 06/15/24 | | | | 75 | | | | 74,140 | |
Digital Realty Trust LP, Gtd. Notes | | | 3.400 | | | | 10/01/20 | | | | 50 | | | | 51,545 | |
Kimco Realty Corp., Sr. Unsec’d. Notes | | | 3.400 | | | | 11/01/22 | | | | 75 | | | | 77,186 | |
Realty Income Corp., Sr. Unsec’d. Notes | | | 4.125 | | | | 10/15/26 | | | | 200 | | | | 207,943 | |
Welltower, Inc., Sr. Unsec’d. Notes | | | 4.500 | | | | 01/15/24 | | | | 230 | | | | 248,062 | |
| | | | | | | | | | | | | | | | |
| | | | | | | | | | | | | | | 658,876 | |
| | | | |
Retail 1.1% | | | | | | | | | | | | | | | | |
CVS Health Corp., Sr. Unsec’d. Notes | | | 5.125 | | | | 07/20/45 | | | | 100 | | | | 114,757 | |
Home Depot, Inc. (The),
Sr. Unsec’d. Notes | | | 3.500 | | | | 09/15/56 | | | | 25 | | | | 22,851 | |
Sr. Unsec’d. Notes | | | 4.250 | | | | 04/01/46 | | | | 100 | | | | 106,634 | |
| | | | | | | | | | | | | | | | |
| | | | | | | | | | | | | | | 244,242 | |
See Notes to Financial Statements.
| | | | | | | | | | | | | | | | |
| Description | | Interest
Rate | | | Maturity
Date | | | Principal
Amount (000)# | | | Value | |
CORPORATE BONDS (Continued) | |
| | | | |
Semiconductors 0.3% | | | | | | | | | | | | | | | | |
Broadcom Corp./Broadcom Cayman Finance Ltd.,
Gtd. Notes, 144A | | | 3.875 | % | | | 01/15/27 | | | | 75 | | | $ | 76,978 | |
| | | | |
Software 3.2% | | | | | | | | | | | | | | | | |
Fidelity National Information Services, Inc.,
Sr. Unsec’d. Notes | | | 2.250 | | | | 08/15/21 | | | | 125 | | | | 124,129 | |
Sr. Unsec’d. Notes | | | 2.850 | | | | 10/15/18 | | | | 75 | | | | 75,839 | |
Sr. Unsec’d. Notes | | | 3.625 | | | | 10/15/20 | | | | 84 | | | | 87,851 | |
Microsoft Corp.,
Sr. Unsec’d. Notes | | | 3.950 | | | | 08/08/56 | | | | 140 | | | | 141,341 | |
Sr. Unsec’d. Notes | | | 4.500 | | | | 02/06/57 | | | | 105 | | | | 116,554 | |
Oracle Corp.,
Sr. Unsec’d. Notes | | | 2.400 | | | | 09/15/23 | | | | 75 | | | | 74,596 | |
Sr. Unsec’d. Notes | | | 4.000 | | | | 07/15/46 | | | | 115 | | | | 116,793 | |
| | | | | | | | | | | | | | | | |
| | | | | | | | | | | | | | | 737,103 | |
| | | | |
Telecommunications 2.0% | | | | | | | | | | | | | | | | |
AT&T, Inc.,
Sr. Unsec’d. Notes | | | 5.150 | | | | 03/15/42 | | | | 230 | | | | 232,862 | |
Sr. Unsec’d. Notes | | | 5.300 | | | | 08/14/58 | | | | 30 | | | | 30,007 | |
Verizon Communications, Inc., Sr. Unsec’d. Notes | | | 5.012 | | | | 04/15/49 | | | | 190 | | | | 189,350 | |
| | | | | | | | | | | | | | | | |
| | | | | | | | | | | | | | | 452,219 | |
| | | | |
Textiles 0.5% | | | | | | | | | | | | | | | | |
Cintas Corp. No. 2, Gtd. Notes | | | 3.700 | | | | 04/01/27 | | | | 100 | | | | 104,579 | |
| | | | |
Transportation 0.4% | | | | | | | | | | | | | | | | |
FedEx Corp., Gtd. Notes | | | 4.500 | | | | 02/01/65 | | | | 100 | | | | 97,458 | |
| | | | | | | | | | | | | | | | |
TOTAL CORPORATE BONDS
(cost $20,735,478) | | | | | | | | | | | | | | | 21,267,237 | |
| | | | | | | | | | | | | | | | |
FOREIGN GOVERNMENT BOND 0.9% | | | | | | | | | | | | | | | | |
Mexico Government International Bond (Mexico),
Sr. Unsec’d. Notes
(cost $180,025) | | | 4.600 | | | | 01/23/46 | | | | 200 | | | | 198,000 | |
| | | | | | | | | | | | | | | | |
| | | | |
U.S. TREASURY OBLIGATION 0.0% | | | | | | | | | | | | | | | | |
U.S. Treasury Notes
(cost $5,050) | | | 2.375 | | | | 05/15/27 | | | | 5 | | | | 5,036 | |
| | | | | | | | | | | | | | | | |
TOTAL LONG-TERM INVESTMENTS
(cost $21,578,744) | | | | | | | | | | | | | | | 22,125,110 | |
| | | | | | | | | | | | | | | | |
See Notes to Financial Statements.
| | | | |
| Prudential Corporate Bond Fund | | | 21 | |
Schedule of Investments (continued)
as of July 31, 2017
| | | | | | | | | | | | | | | | |
| Description | | | | | | | | Shares | | | Value | |
SHORT-TERM INVESTMENTS 4.2% | | | | | | | | | | | | | | | | |
| | | | |
AFFILIATED MUTUAL FUNDS | | | | | | | | | | | | | | | | |
Prudential Investment Portfolios 2 - Prudential Core
Ultra Short Bond Fund(w) | | | | | | | | | | | 596,508 | | | $ | 596,508 | |
Prudential Investment Portfolios 2 - Prudential Institutional
Money Market Fund
(cost $362,372; includes $362,022 of cash collateral for
securities on loan)(b)(w) | | | | | | | | | | | 362,269 | | | | 362,305 | |
| | | | | | | | | | | | | | | | |
TOTAL SHORT-TERM INVESTMENTS
(cost $958,880) | | | | | | | | | | | | | | | 958,813 | |
| | | | | | | | | | | | | | | | |
TOTAL INVESTMENTS 101.3%
(cost $22,537,624) | | | | | | | | | | | | | | | 23,083,923 | |
Liabilities in excess of other assets(z) (1.3)% | | | | | | | | | | | | | | | (295,942 | ) |
| | | | | | | | | | | | | | | | |
NET ASSETS 100.0% | | | | | | | | | | | | | | $ | 22,787,981 | |
| | | | | | | | | | | | | | | | |
The following abbreviations are used in the annual report:
144A—Security was purchased pursuant to Rule 144A under the Securities Act of 1933 and may not be resold subject to that rule except to qualified institutional buyers. Unless otherwise noted, 144A securities are deemed to be liquid.
GMTN—Global Medium Term Note
LIBOR—London Interbank Offered Rate
MTN—Medium Term Note
OTC—Over-the-counter
| # | Principal amount is shown in U.S. dollars unless otherwise stated. |
| (a) | All or a portion of security is on loan. The aggregate market value of such securities, including those sold and pending settlement, is $354,060; cash collateral of $362,022 (included with liabilities) was received with which the Fund purchased highly liquid short-term investments. Securities on loan are subject to contractual netting arrangements. |
| (b) | Represents security purchased with cash collateral received for securities on loan and includes dividend reinvestment. |
| (c) | Variable rate instrument. The interest rate shown reflects the rate in effect at July 31, 2017. |
| (w) | PGIM Investments LLC, the manager of the Fund, also serves as manager of the Prudential Investment Portfolios 2 - Prudential Core Ultra Short Bond Fund and Prudential Institutional Money Market Fund. |
| (z) | Includes net unrealized appreciation (depreciation) on the following derivative contracts held at reporting period end: |
See Notes to Financial Statements.
Futures contracts outstanding at July 31, 2017:
| | | | | | | | | | | | | | | | | | | | |
Number of
Contracts | | | Type | | Expiration
Date | | | Value at
Trade Date | | | Value at
July 31,
2017 | | | Unrealized
Appreciation
(Depreciation) | |
| | | | Long Positions: | | | | | | | | | | | | | | | | |
| | 6 | | | 2 Year U.S. Treasury Notes | | | Sep. 2017 | | | $ | 1,297,453 | | | $ | 1,298,063 | | | $ | 610 | |
| | 16 | | | 5 Year U.S. Treasury Notes | | | Sep. 2017 | | | | 1,890,305 | | | | 1,890,375 | | | | 70 | |
| | 13 | | | 20 Year U.S. Treasury Bonds | | | Sep. 2017 | | | | 1,983,258 | | | | 1,988,594 | | | | 5,336 | |
| | | | | | | | | | | | | | | | | | | | |
| | | | | | | | | | | | | | | | | | | 6,016 | |
| | | | | | | | | | | | | | | | | | | | |
| | | | Short Positions: | | | | | | | | | | | | | | | | |
| | 15 | | | 10 Year U.S. Treasury Notes | | | Sep. 2017 | | | | 1,892,133 | | | | 1,888,360 | | | | 3,773 | |
| | 10 | | | 30 Year U.S. Ultra Treasury Bonds | | | Sep. 2017 | | | | 1,636,703 | | | | 1,645,000 | | | | (8,297 | ) |
| | | | | | | | | | | | | | | | | | | | |
| | | | | | | | | | | | | | | | | | | (4,524 | ) |
| | | | | | | | | | | | | | | | | | | | |
| | | | | | | | | | | | | | | | | | $ | 1,492 | |
| | | | | | | | | | | | | | | | | | | | |
Cash of $200,000 has been segregated with Citigroup Global Markets to cover requirements for open futures contracts at July 31, 2017.
Fair Value Measurements:
Various inputs are used in determining the value of the Fund’s investments. These inputs are summarized in the three broad levels listed below.
Level 1—unadjusted quoted prices generally in active markets for identical securities.
Level 2—quoted prices for similar securities, interest rates and yield curves, prepayment speeds, foreign currency exchange rates and other observable inputs.
Level 3—unobservable inputs for securities valued in accordance with Board approved fair valuation procedures.
See Notes to Financial Statements.
| | | | |
| Prudential Corporate Bond Fund | | | 23 | |
Schedule of Investments (continued)
as of July 31, 2017
The following is a summary of the inputs used as of July 31, 2017 in valuing such portfolio securities:
| | | | | | | | | | | | |
| | | Level 1 | | | Level 2 | | | Level 3 | |
Investments in Securities | | | | | | | | | | | | |
Commercial Mortgage-Backed Securities | | $ | — | | | $ | 654,837 | | | $ | — | |
Corporate Bonds | | | — | | | | 21,267,237 | | | | — | |
Foreign Government Bond | | | — | | | | 198,000 | | | | — | |
U.S. Treasury Obligation | | | — | | | | 5,036 | | | | — | |
Affiliated Mutual Funds | | | 958,813 | | | | — | | | | — | |
Other Financial Instruments* | | | | | | | | | | | | |
Futures Contracts | | | 1,492 | | | | — | | | | — | |
| | | | | | | | | | | | |
Total | | $ | 960,305 | | | $ | 22,125,110 | | | $ | — | |
| | | | | | | | | | | | |
| * | Other financial instruments are derivative instruments not reflected in the Schedule of Investments, such as futures, forwards and centrally cleared swap contracts, which are recorded at the unrealized appreciation (depreciation) on the instrument, and OTC swap contracts which are recorded at fair value. |
During the period, there were no transfers between Level 1, Level 2 and Level 3 to report.
Industry Classification:
The industry classification of investments and liabilities in excess of other assets shown as a percentage of net assets as of July 31, 2017 were as follows (unaudited):
| | | | |
Banks | | | 19.1 | % |
Electric | | | 10.3 | |
Insurance | | | 6.0 | |
Media | | | 4.9 | |
Pharmaceuticals | | | 4.9 | |
Oil & Gas | | | 4.8 | |
Auto Manufacturers | | | 4.4 | |
Affiliated Mutual Funds (including 1.6% of collateral for securities on loan) | | | 4.2 | |
Pipelines | | | 3.6 | |
Chemicals | | | 3.4 | |
Software | | | 3.2 | |
Healthcare-Services | | | 3.2 | |
Real Estate Investment Trusts (REITs) | | | 2.9 | |
Commercial Mortgage-Backed Securities | | | 2.9 | |
Computers | | | 2.8 | |
Biotechnology | | | 2.5 | |
Telecommunications | | | 2.0 | |
Agriculture | | | 1.8 | |
Airlines | | | 1.4 | |
Healthcare-Products | | | 1.4 | |
Forest Products & Paper | | | 1.2 | |
Retail | | | 1.1 | % |
Aerospace & Defense | | | 1.0 | |
Mining | | | 1.0 | |
Household Products/Wares | | | 0.9 | |
Foreign Government Bond | | | 0.9 | |
Foods | | | 0.9 | |
Office/Business Equipment | | | 0.8 | |
Commercial Services | | | 0.6 | |
Housewares | | | 0.6 | |
Auto Parts & Equipment | | | 0.5 | |
Textiles | | | 0.5 | |
Diversified Financial Services | | | 0.4 | |
Transportation | | | 0.4 | |
Building Materials | | | 0.3 | |
Semiconductors | | | 0.3 | |
Miscellaneous Manufacturing | | | 0.2 | |
U.S. Treasury Obligation | | | 0.0 | * |
| | | | |
| | | 101.3 | |
Liabilities in excess of other assets | | | (1.3 | ) |
| | | | |
| | | 100.0 | % |
| | | | |
See Notes to Financial Statements.
Effects of Derivative Instruments on the Financial Statements and Primary Underlying Risk Exposure:
The Fund invested in derivative instruments during the reporting period. The primary type of risk associated with these derivative instruments is interest rate contracts risk. The effect of such derivative instruments on the Fund’s financial position and financial performance as reflected in the Statement of Assets and Liabilities and Statement of Operations is presented in the summary below.
Fair values of derivative instruments as of July 31, 2017 as presented in the Statement of Assets and Liabilities:
| | | | | | | | | | | | |
| | | Asset Derivatives | | | Liability Derivatives | |
Derivatives not accounted
for as hedging instruments,
carried at fair value | | Balance
Sheet
Location | | Fair
Value | | | Balance
Sheet
Location | | Fair
Value | |
| Interest rate contracts | | Due from/to broker—
variation margin
futures | | $ | 9,789 | * | | Due from/to broker—
variation margin
futures | | $ | 8,297 | * |
| | | | | | | | | | | | |
| * | Includes cumulative appreciation (depreciation) as reported in the schedule of open futures and centrally cleared swap contracts. Only unsettled variation margin receivable (payable) is reported within the Statement of Assets and Liabilities. |
The effects of derivative instruments on the Statement of Operations for the year ended July, 31, 2017 are as follows:
| | | | |
Amount of Realized Gain (Loss) on Derivatives Recognized in Income | |
Derivatives not accounted for as hedging
instruments, carried at fair value | | Futures | |
Interest rate contracts | | $ | (24,107 | ) |
| | | | |
| | | | |
Change in Unrealized Appreciation (Depreciation) on Derivatives Recognized in Income | |
Derivatives not accounted for as hedging
instruments, carried at fair value | | Futures | |
Interest rate contracts | | $ | 33,133 | |
| | | | |
For the year ended July 31, 2017, the Fund’s average value at trade date for futures long positions was $5,105,920 and for short positions was $4,935,711.
See Notes to Financial Statements.
| | | | |
| Prudential Corporate Bond Fund | | | 25 | |
Schedule of Investments (continued)
as of July 31, 2017
Financial Instruments/Transactions—Summary of Offsetting and Netting Arrangements:
The Fund entered into financial instruments/transactions during the reporting period that are either offset in accordance with current requirements or are subject to enforceable master netting arrangements or similar agreements that permit offsetting. The information about offsetting and related netting arrangements for financial transactions, where the legal right to set-off exists, is presented in the summary below.
Offsetting of financial instrument/transaction assets and liabilities:
| | | | | | | | | | | | |
Description | | Gross
Amounts of
Recognized
Assets(1) | | | Collateral
Received(2) | | | Net
Amount | |
Securities on Loan | | $ | 354,060 | | | $ | (354,060 | ) | | $ | — | |
| | | | | | | | | | | | |
| (1) | Amount represents market value. |
| (2) | Collateral amount disclosed by the Fund is limited to the market value of financial instruments/transactions. |
See Notes to Financial Statements.
This Page Intentionally Left Blank
Statement of Assets & Liabilities
as of July 31, 2017
| | | | |
Assets | | | | |
Investments at value, including securities on loan of $354,060: | | | | |
Unaffiliated investments (cost $21,578,744) | | $ | 22,125,110 | |
Affiliated investments (cost $958,880) | | | 958,813 | |
Deposit with broker for futures | | | 200,000 | |
Receivable for investments sold | | | 316,874 | |
Interest receivable | | | 197,859 | |
Receivable for Fund shares sold | | | 53,536 | |
Due from manager | | | 16,668 | |
| | | | |
Total assets | | | 23,868,860 | |
| | | | |
| |
Liabilities | | | | |
Payable for investments purchased | | | 551,782 | |
Payable to broker for collateral for securities on loan | | | 362,022 | |
Accrued expenses and other liabilities | | | 89,276 | |
Payable for Fund shares reacquired | | | 72,428 | |
Dividends payable | | | 1,732 | |
Distribution fee payable | | | 1,307 | |
Due to broker—variation margin futures | | | 1,191 | |
Affiliated transfer agent fee payable | | | 642 | |
Deferred trustees’ fees | | | 499 | |
| | | | |
Total liabilities | | | 1,080,879 | |
| | | | |
| |
Net Assets | | $ | 22,787,981 | |
| | | | |
| | | | | |
Net assets were comprised of: | | | | |
Shares of beneficial interest, at par | | $ | 2,018 | |
Paid-in capital in excess of par | | | 22,861,845 | |
| | | | |
| | | 22,863,863 | |
Undistributed net investment income | | | 65,542 | |
Accumulated net realized loss on investment and foreign currency transactions | | | (689,215 | ) |
Net unrealized appreciation on investments and foreign currencies | | | 547,791 | |
| | | | |
Net assets, July 31, 2017 | | $ | 22,787,981 | |
| | | | |
See Notes to Financial Statements.
| | | | |
Class A | | | | |
Net asset value and redemption price per share,
($1,801,996 ÷ 159,215 shares of beneficial interest issued and outstanding) | | $ | 11.32 | |
Maximum sales charge (4.50% of offering price) | | | 0.53 | |
| | | | |
Maximum offering price to public | | $ | 11.85 | |
| | | | |
| |
Class C | | | | |
Net asset value, offering price and redemption price per share,
($1,095,436 ÷ 96,995 shares of beneficial interest issued and outstanding) | | $ | 11.29 | |
| | | | |
| |
Class Q | | | | |
Net asset value, offering price and redemption price per share,
($11,041 ÷ 978 shares of beneficial interest issued and outstanding) | | $ | 11.29 | |
| | | | |
| |
Class R | | | | |
Net asset value, offering price and redemption price per share,
($10,923 ÷ 967.5 shares of beneficial interest issued and outstanding) | | $ | 11.29 | |
| | | | |
| |
Class Z | | | | |
Net asset value, offering price and redemption price per share,
($19,868,585 ÷ 1,759,563 shares of beneficial interest issued and outstanding) | | $ | 11.29 | |
| | | | |
See Notes to Financial Statements.
| | | | |
| Prudential Corporate Bond Fund | | | 29 | |
Statement of Operations
Year Ended July 31, 2017
| | | | |
Net Investment Income (Loss) | | | | |
Income | | | | |
Interest income | | $ | 850,315 | |
Affiliated dividend income | | | 3,480 | |
Income from securities lending, net (including affiliated income of $139) | | | 233 | |
| | | | |
Total income | | | 854,028 | |
| | | | |
| |
Expenses | | | | |
Management fee | | | 105,854 | |
Distribution fee—Class A | | | 3,347 | |
Distribution fee—Class C | | | 10,144 | |
Distribution fee—Class R | | | 80 | |
Registration fees | | | 79,000 | |
Custodian and accounting fees | | | 66,000 | |
Audit fee | | | 36,000 | |
Shareholders’ reports | | | 33,000 | |
Transfer agent’s fees and expenses (including affiliated expense of $3,100) | | | 23,000 | |
Legal fees and expenses | | | 21,000 | |
Trustees’ fees | | | 9,000 | |
Loan interest expense | | | 81 | |
Miscellaneous | | | 13,146 | |
| | | | |
Total expenses | | | 399,652 | |
Less: Management fee waiver and/or expense reimbursement | | | (256,623 | ) |
Distribution fee waiver—Class R | | | (26 | ) |
| | | | |
Net expenses | | | 143,003 | |
| | | | |
Net investment income (loss) | | | 711,025 | |
| | | | |
| |
Realized And Unrealized Gain (Loss) On Investments And Foreign Currency Transactions | | | | |
Net realized gain (loss) on: | | | | |
Investment transactions (including affiliated of $(32)) | | | 147,933 | |
Futures transactions | | | (24,107 | ) |
Foreign currency transactions | | | 7 | |
| | | | |
| | | 123,833 | |
| | | | |
Net change in unrealized appreciation (depreciation) on: | | | | |
Investments (including affiliated of $(67)) | | | (497,320 | ) |
Futures | | | 33,133 | |
| | | | |
| | | (464,187 | ) |
| | | | |
Net gain (loss) on investment and foreign currency transactions | | | (340,354 | ) |
| | | | |
Net Increase (Decrease) In Net Assets Resulting From Operations | | $ | 370,671 | |
| | | | |
See Notes to Financial Statements.
Statement of Changes in Net Assets
| | | | | | | | |
| | | Year Ended July 31, | |
| | | 2017 | | | 2016 | |
Increase (Decrease) in Net Assets | | | | | | | | |
Operations | | | | | | | | |
Net investment income (loss) | | $ | 711,025 | | | $ | 948,488 | |
Net realized gain (loss) on investment and foreign currency transactions | | | 123,833 | | | | (628,485 | ) |
Net change in unrealized appreciation (depreciation) on investments and
foreign currencies | | | (464,187 | ) | | | 1,637,704 | |
| | | | | | | | |
Net increase (decrease) in net assets resulting from operations | | | 370,671 | | | | 1,957,707 | |
| | | | | | | | |
| | |
Dividends from net investment income | | | | | | | | |
Class A | | | (40,323 | ) | | | (7,623 | ) |
Class C | | | (22,930 | ) | | | (7,454 | ) |
Class Q | | | (348 | ) | | | (305 | ) |
Class R | | | (291 | ) | | | (255 | ) |
Class Z | | | (683,524 | ) | | | (1,013,549 | ) |
| | | | | | | | |
| | | (747,416 | ) | | | (1,029,186 | ) |
| | | | | | | | |
| | |
Fund share transactions | | | | | | | | |
Net proceeds from shares sold | | | 8,985,915 | | | | 12,055,486 | |
Net asset value of shares issued in reinvestment of dividends and distributions | | | 723,795 | | | | 1,008,034 | |
Cost of shares reacquired | | | (11,450,567 | ) | | | (33,365,328 | ) |
| | | | | | | | |
Net increase (decrease) in net assets from Fund share transactions | | | (1,740,857 | ) | | | (20,301,808 | ) |
| | | | | | | | |
Total increase (decrease) | | | (2,117,602 | ) | | | (19,373,287 | ) |
| | |
Net Assets: | | | | | | | | |
Beginning of year | | | 24,905,583 | | | | 44,278,870 | |
| | | | | | | | |
End of year(a) | | $ | 22,787,981 | | | $ | 24,905,583 | |
| | | | | | | | |
(a) Includes undistributed net investment income of: | | $ | 65,542 | | | $ | 36,396 | |
| | | | | | | | |
See Notes to Financial Statements.
| | | | |
| Prudential Corporate Bond Fund | | | 31 | |
Notes to Financial Statements
The Target Portfolio Trust (the “Trust”) is registered under the Investment Company Act of 1940, as amended (“1940 Act”), as an open-end management investment company. The Trust consists of four series: Prudential Corporate Bond Fund, Prudential Core Bond Fund, Target International Equity Portfolio and Prudential QMA Small-Cap Value Fund. These financial statements relate to Prudential Corporate Bond Fund (the “Fund”). The financial statements of the other series are not presented herein. The Fund is a diversified fund.
The investment objective of the Fund is high current income consistent with the preservation of principal.
1. Accounting Policies
The Fund follows investment company accounting and reporting guidance of the Financial Accounting Standards Board (“FASB”) Accounting Standard Codification Topic 946 Financial Services—Investment Companies. The following accounting policies conform to U.S. generally accepted accounting principles. The Fund consistently follows such policies in the preparation of its financial statements.
Securities Valuation: The Fund holds securities and other assets and liabilities that are fair valued at the close of each day (generally, 4:00 PM Eastern time) the New York Stock Exchange (“NYSE”) is open for trading. Fair value is the price that would be received to sell an asset or paid to transfer a liability in an orderly transaction between market participants on the measurement date. The Board of Trustees (the “Board”) has adopted valuation procedures for security valuation under which fair valuation responsibilities have been delegated to PGIM Investments LLC (“PGIM Investments” or “the Manager”) (formerly known as Prudential Investments LLC). Under the current valuation procedures, the Valuation Committee is responsible for supervising the valuation of portfolio securities and other assets and liabilities. The valuation procedures permit the Fund to utilize independent pricing vendor services, quotations from market makers, and alternative valuation methods when market quotations are either not readily available or not deemed representative of fair value. A record of the Valuation Committee’s actions is subject to the Board’s review, approval, and ratification at its next regularly scheduled quarterly meeting.
Various inputs determine how each Portfolio’s investments are valued, all of which are categorized according to the three broad levels (Level 1, 2, or 3) detailed in the Schedule of Investments.
Derivative instruments, such as futures or options, that are traded on a national securities exchange are valued at the last sale price as of the close of trading on the applicable exchange where the security principally trades. Securities traded via NASDAQ are valued at the NASDAQ official closing price. To the extent these securities are valued at the last sale
price or NASDAQ official closing price, they are classified as Level 1 in the fair value hierarchy. In the event that no sale or official closing price on valuation date exists, these securities are generally valued at the mean between the last reported bid and ask prices, or at the last bid price in the absence of an ask price. These securities are classified as Level 2 in the fair value hierarchy.
Investments in open-end, non-exchange-traded mutual funds are valued at their net asset values as of the close of the NYSE on the date of valuation. These securities are classified as Level 1 in the fair value hierarchy since they may be purchased or sold at their net asset values on the date of valuation.
Fixed income securities traded in the OTC market are generally classified as Level 2 in the fair value hierarchy. Such fixed income securities are typically valued using the market approach which generally involves obtaining data from an approved independent third-party vendor source. The Fund utilizes the market approach as the primary method to value securities when market prices of identical or comparable instruments are available. The third-party vendors’ valuation techniques used to derive the evaluated bid price are based on evaluating observable inputs, including but not limited to, yield curves, yield spreads, credit ratings, deal terms, tranche level attributes, default rates, cash flows, prepayment speeds, broker/dealer quotations and reported trades. Certain Level 3 securities are also valued using the market approach when obtaining a single broker quote or when utilizing recent transaction prices for identical or comparable securities. During the reporting period, there were no changes to report with respect to the valuation approach and/or valuation techniques discussed above.
Securities and other assets that cannot be priced according to the methods described above are valued based on pricing methodologies approved by the Board. In the event that unobservable inputs are used when determining such valuations, the securities will be classified as Level 3 in the fair value hierarchy.
When determining the fair value of securities, some of the factors influencing the valuation include: the nature of any restrictions on disposition of the securities; assessment of the general liquidity of the securities; the issuer’s financial condition and the markets in which it does business; the cost of the investment; the size of the holding and the capitalization of the issuer; the prices of any recent transactions or bids/offers for such securities or any comparable securities; any available analyst media or other reports or information deemed reliable by the investment adviser regarding the issuer or the markets or industry in which it operates. Using fair value to price securities may result in a value that is different from a security’s most recent closing price and from the price used by other unaffiliated mutual funds to calculate their net asset values.
Restricted and Illiquid Securities: Subject to guidelines adopted by the Board, the Fund may invest up to 15% of its net assets in illiquid securities, including those which are restricted as to disposition under securities law (“restricted securities”). Restricted securities are valued pursuant to the valuation procedures noted above. Illiquid securities
| | | | |
| Prudential Corporate Bond Fund | | | 33 | |
Notes to Financial Statements (continued)
are those that, because of the absence of a readily available market or due to legal or contractual restrictions on resale, cannot be sold within seven days in the ordinary course of business at approximately the amount at which the Fund has valued the investment. Therefore, the Fund may find it difficult to sell illiquid securities at the time considered most advantageous by its Subadviser and may incur expenses that would not be incurred in the sale of securities that were freely marketable. Certain securities that would otherwise be considered illiquid because of legal restrictions on resale to the general public may be traded among qualified institutional buyers under Rule 144A of the Securities Act of 1933. These Rule 144A securities, as well as commercial paper that is sold in private placements under Section 4(2) of the Securities Act, may be deemed liquid by the Fund’s Subadviser under the guidelines adopted by the Directors of the Fund. However, the liquidity of the Fund’s investments in Rule 144A securities could be impaired if trading does not develop or declines.
Foreign Currency Translation: The books and records of the Fund are maintained in U.S. dollars. Foreign currency amounts are translated into U.S. dollars on the following basis:
(i) market value of investment securities, other assets and liabilities—at the current rates of exchange;
(ii) purchases and sales of investment securities, income and expenses—at the rates of exchange prevailing on the respective dates of such transactions.
Although the net assets of the Fund are presented at the foreign exchange rates and market values at the close of the period, the Fund does not generally isolate that portion of the results of operations arising as a result of changes in the foreign exchange rates from the fluctuations arising from changes in the market prices of long-term portfolio securities held at the end of the period. Similarly, the Fund does not isolate the effect of changes in foreign exchange rates from the fluctuations arising from changes in the market prices of long-term portfolio securities sold during the period. Accordingly, holding period realized foreign currency gains (losses) are included in the reported net realized gains (losses) on investment transactions.
Additionally, net realized gains (losses) on foreign currency transactions represent net foreign exchange gains (losses) from the disposition of holdings of foreign currencies, forward currency contracts, currency gains (losses) realized between the trade and settlement dates on securities transactions, and the difference between the amounts of interest, dividends and foreign withholding taxes recorded on the Fund’s books and the U.S. dollar equivalent amounts actually received or paid. Net unrealized currency gains (losses) from valuing foreign currency denominated assets and liabilities (other than investments) at period end exchange rates are reflected as a component of net unrealized appreciation (depreciation) on foreign currencies.
Financial Futures Contracts: A financial futures contract is an agreement to purchase (long) or sell (short) an agreed amount of securities at a set price for delivery on a future date. Upon entering into a financial futures contract, the Fund is required to pledge to the broker an amount of cash and/or other assets equal to a certain percentage of the contract amount. This amount is known as the “initial margin.” Subsequent payments, known as “variation margin,” are made or received by the Fund each day, depending on the daily fluctuations in the value of the underlying security. Such variation margin is recorded for financial statement purposes on a daily basis as unrealized gain (loss). When the contract expires or is closed, the gain (loss) is realized and is presented in the Statement of Operations as net realized gain (loss) on futures transactions.
The Fund invested in financial futures contracts in order to hedge its existing portfolio securities, or securities the Fund intends to purchase, against fluctuations in value caused by changes in prevailing interest rates, value of equities or foreign currency exchange rates. Should interest rates move unexpectedly, the Fund may not achieve the anticipated benefits of the financial futures contracts and may realize a loss. The use of futures transactions involves the risk of imperfect correlation in movements in the price of futures contracts, interest rates and the underlying hedged assets. Since futures contracts are exchange-traded, there is minimal counterparty credit risk to the Fund since the exchanges’ clearinghouse acts as counterparty to all exchange-traded futures and guarantees the futures contracts against default.
Master Netting Arrangements: The Trust, on behalf of the Fund, is subject to various Master Agreements, or netting arrangements, with select counterparties. These are agreements which a subadviser may have negotiated and entered into on behalf of the Fund. A master netting arrangement between the Fund and the counterparty permits the Fund to offset amounts payable by the Fund to the same counterparty against amounts to be received; and by the receipt of collateral from the counterparty by the Fund to cover the Fund’s exposure to the counterparty. However, there is no assurance that such mitigating factors are easily enforceable. In addition to master netting arrangements, the right to set-off exists when all the conditions are met such that each of the parties owes the other determinable amounts, the reporting party has the right to set-off the amount owed with the amount owed by the other party, the reporting party intends to set-off and the right of set-off is enforceable by law. During the reporting period, there was no intention to settle on a net basis and all amounts are presented on a gross basis on the Statement of Assets and Liabilities.
Forward currency contracts, forward rate agreements, written options, short sales, swaps and financial futures contracts involve elements of both market and credit risk in excess of the amounts reflected on the Statement of Assets and Liabilities. Such risks may be mitigated by engaging in master netting arrangements.
Securities Lending: The Fund may lend its portfolio securities to banks and broker-dealers. The loans are secured by collateral at least equal to the market value of the securities loaned. Collateral pledged by each borrower is invested in an affiliated money market fund
| | | | |
| Prudential Corporate Bond Fund | | | 35 | |
Notes to Financial Statements (continued)
and is marked to market daily, based on the previous day’s market value, such that the value of the collateral exceeds the value of the loaned securities. Loans are subject to termination at the option of the borrower or the Fund. Upon termination of the loan, the borrower will return to the Fund securities identical to the loaned securities. Should the borrower of the securities fail financially, the Fund has the right to repurchase the securities in the open market using the collateral. The Fund recognizes income, net of any rebate and securities lending agent fees, for lending its securities in the form of fees or interest on the investment of any cash received as collateral. The borrower receives all interest and dividends from the securities loaned and such payments are passed back to the lender in amounts equivalent thereto. The Fund also continues to recognize any unrealized gain (loss) in the market price of the securities loaned and on the change in the value of the collateral invested that may occur during the term of the loan. In addition, realized gain (loss) is recognized on changes in the value of the collateral invested upon liquidation of the collateral. Net earnings from securities lending are disclosed on the Statement of Operations as “Income from securities lending, net”.
Concentration of Risk: The ability of debt securities issuers (other than those issued or guaranteed by the U.S. Government) held by the Fund to meet their obligations may be affected by the economic or political developments in a specific industry, region or country.
Securities Transactions and Net Investment Income: Securities transactions are recorded on the trade date. Realized gains (losses) from investment and currency transactions are calculated on the specific identification method. Dividend income is recorded on the ex-date. Interest income, including amortization of premium and accretion of discount on debt securities, as required, is recorded on the accrual basis. Expenses are recorded on an accrual basis, which may require the use of certain estimates by management that may differ from actual.
Net investment income or loss (other than distribution fees which are charged directly to the respective class and transfer agency fees specific to Class Q shares which are charged to that share class) and unrealized and realized gains (losses) are allocated daily to each class of shares based upon the relative proportion of adjusted net assets of each class at the beginning of the day.
Taxes: It is the Fund’s policy to continue to meet the requirements of the Internal Revenue Code applicable to regulated investment companies and to distribute all of its taxable net investment income and capital gains, if any, to its shareholders. Therefore, no federal income tax provision is required. Withholding taxes on foreign dividends, interest and capital gains, if any, are recorded, net of reclaimable amounts, at the time the related income is earned.
Dividends and Distributions: The Fund expects to pay dividends from net investment income monthly and distributions from net realized capital gains, if any, annually. Dividends and distributions to shareholders, which are determined in accordance with federal income tax regulations and which may differ from generally accepted accounting principles, are recorded on the ex-date. Permanent book/tax differences relating to income and gain (loss) are reclassified amongst undistributed net investment income, accumulated net realized gain (loss) and paid-in capital in excess of par, as appropriate.
Estimates: The preparation of financial statements requires management to make estimates and assumptions that affect the reported amounts and disclosures in the financial statements. Actual results could differ from those estimates.
2. Agreements
The Trust, on behalf of the Fund, has a management agreement with PGIM Investments. Pursuant to this agreement, PGIM Investments has responsibility for all investment advisory services and supervises the subadviser’s performance of such services. PGIM Investments has entered into a subadvisory agreement with PGIM, Inc., which provides subadvisory services to the Fund through its PGIM Fixed Income unit. The subadvisory agreement provides that PGIM, Inc. will furnish investment advisory services in connection with the management of the Fund. In connection therewith, PGIM, Inc. is obligated to keep certain books and records of the Fund. PGIM Investments pays for the services of PGIM, Inc., the cost of compensation of officers of the Fund, occupancy and certain clerical and bookkeeping costs of the Fund. The Fund bears all other cost and expenses.
The management fee paid to PGIM Investments is based on an annual rate of .45% of the Fund’s average daily net assets up to and including $5 billion; and .425% on average daily net assets exceeding $5 billion. The effective management fee rate before any waivers and/or expense reimbursements was .45% for the year ended July 31, 2017. The management fee waiver and/or expense reimbursement exceeded the management fee for the year ended July 31, 2017.
PGIM Investments has contractually agreed through November 30, 2018 to limit the net annual operating expenses (exclusive of distribution and service (12b-1) fees, taxes (such as income and foreign withholdings taxes, stamp duty and deferred tax expenses), interest, underlying funds, brokerage, extraordinary and certain other expenses such as dividend, broker charges and interest expense on short sales) of each class of shares of the Fund to .55% of the Fund’s average daily net assets. Expenses waived/reimbursed by the Manager in accordance with this agreement may be recouped by the Manager within the same fiscal year during which such waiver/reimbursement is made if such recoupment can be realized without exceeding the expense limit in effect at the time of the recoupment for that fiscal year.
The Fund has a distribution agreement with Prudential Investment Management Services LLC (“PIMS”) which acts as the distributor of the Class A, Class C, Class Q, Class R and
| | | | |
| Prudential Corporate Bond Fund | | | 37 | |
Notes to Financial Statements (continued)
Class Z shares of the Fund. The Fund compensates PIMS for distributing and servicing the Fund’s Class A, Class C and Class R shares, pursuant to the plans of distribution (the “Distribution Plans”), regardless of expenses actually incurred by PIMS. The distribution fees are accrued daily and payable monthly. No distribution or service fees are paid to PIMS as distributor of the Class Q or Class Z shares of the Fund.
Pursuant to the Distribution Plans, the Fund compensates PIMS for distribution related activities at an annual rate of up to .25%, 1% and .75% of the average daily net assets of the Class A, C and R shares, respectively. PIMS has contractually agreed through November 30, 2018 to limit such fees to .50% of the average daily net assets of the Class R shares.
PIMS has advised the Fund that it has received $23,784 in front-end sales charges resulting from sales of Class A shares during the year ended July 31, 2017. From these fees, PIMS paid such sales charges to affiliated broker-dealers, which in turn paid commissions to sales persons and incurred other distribution costs.
PIMS has advised the Fund that for the year ended July 31, 2017, it received $270 in contingent deferred sales charges imposed upon redemptions by certain Class C shareholders.
PGIM Investments, PGIM, Inc. and PIMS are indirect, wholly-owned subsidiaries of Prudential Financial, Inc. (“Prudential”).
3. Other Transactions with Affiliates
Prudential Mutual Fund Services LLC (“PMFS”), an affiliate of PGIM Investments and an indirect, wholly-owned subsidiary of Prudential, serves as the Fund’s transfer agent. Transfer agent’s fees and expenses in the Statement of Operations include certain out-of-pocket expenses paid to non-affiliates, where applicable.
The Fund may enter into certain securities purchase or sale transactions under Board approved Rule 17a-7 procedures. Rule 17a-7 is an exemptive rule under the 1940 Act, that permits purchase and sale transactions among affiliated investment companies, or between an investment company and a person that is affiliated solely by reason of having a common (or affiliated) investment adviser, common directors, and/or common officers. Such transactions are subject to ratification by the Board. For the year ended July 31, 2017 no such transactions were entered into by the Fund.
The Fund may invest its overnight sweep cash in the Prudential Core Ultra Short Bond Fund (the “Core Fund”), and its securities lending cash collateral in the Prudential Institutional Money Market Fund (the “Money Market Fund”), each a series of the Prudential Investment
Portfolios 2, registered under the 1940 Act and managed by PGIM Investments. For the reporting period ended July 31, 2017, PGIM, Inc. was compensated $146 by PGIM Investments for managing the Fund’s securities lending cash collateral as subadviser to the Money Market Fund. Earnings from the Core Fund and Money Market Fund are disclosed on the Statement of Operations as “Affiliated dividend income” and “Income from securities lending, net”, respectively.
4. Portfolio Securities
The aggregate cost of purchases and proceeds from sales of portfolio securities (excluding short-term investments and U.S. Treasury securities) for the year ended July 31, 2017, were $20,505,183 and $21,366,601, respectively.
5. Distributions and Tax Information
Distributions to shareholders, which are determined in accordance with federal income tax regulations and which may differ from generally accepted accounting principles, are recorded on the ex-date. In order to present undistributed net investment income, accumulated net realized loss on investment and foreign currency transactions and paid-in capital in excess of par on the Statement of Assets and Liabilities that more closely represent their tax character, certain adjustments have been made to undistributed net investment income, accumulated net realized loss on investment and foreign currency transactions and paid-in capital in excess of par. For the tax year ended July 31, 2017, the adjustments were to increase undistributed net investment income by $65,537, decrease accumulated net realized loss on investment and foreign currency transactions by $892,810 and decrease paid-in capital in excess of par by $958,347 due to differences in the tax treatment of premium amortization and the expiration of a capital loss carryforward. Net investment income, net realized gain (loss) on investment and foreign currency transactions and net assets were not affected by this change.
The tax character of distributions paid during the tax year ended July 31, 2017 was $747,416 of ordinary income. The tax character of distributions paid during the tax period ended July 31, 2016 was $693,091 of ordinary income.
As of July 31, 2017, the accumulated undistributed earnings on a tax basis was $67,773 of ordinary income.
The United States federal income tax basis of the Fund’s investments and the net unrealized appreciation as of July 31, 2017 were as follows:
| | | | | | |
Tax Basis | | Unrealized
Appreciation | | Unrealized
Depreciation | | Net
Unrealized
Appreciation |
| $22,615,431 | | $538,697 | | $(70,205) | | $468,492 |
The differences between book basis and tax basis were primarily attributable to deferred losses on wash sales and other book to tax differences.
| | | | |
| Prudential Corporate Bond Fund | | | 39 | |
Notes to Financial Statements (continued)
For federal income tax purposes, the Fund had a capital loss carryforward as of July 31, 2017 of approximately $610,000 which can be carried forward for an unlimited period. The fund had a capital loss carryforward of approximately $958,000 which has expired unused during the fiscal year ended July 31, 2017. The Fund utilized approximately $116,000 of its capital loss carryforward to offset net taxable gains realized in the fiscal year ended July 31, 2017. No capital gains distributions are expected to be paid to shareholders until net gains have been realized in excess of such losses.
Management has analyzed the Fund’s tax positions taken on federal, state and local income tax returns for all open tax years and has concluded that no provision for income tax is required in the Fund’s financial statements for the current reporting period. The Fund’s federal, state and local income and federal excise tax returns for tax years for which the applicable statutes of limitations have not expired are subject to examination by the Internal Revenue Service and state departments of revenue.
6. Capital
The Fund offers Class A, Class C, Class Q, Class R and Class Z shares. Class A shares are sold with a front-end sales charge of up to 4.50%. Investors who purchase $1 million or more of Class A shares and redeem those shares within 12 months of purchase are subject to a contingent deferred sales charge (“CDSC”) of 1%, but are not subject to an initial sales charge. The Class A CDSC is waived for purchases by certain retirement or benefit plans. Class C shares are sold with a CDSC of 1% on sales of shares made within 12 months of purchase. A special exchange privilege is also available for shareholders who qualify to purchase Class A shares at net asset value. Class R shares are available to certain retirement plans, clearing and settlement firms. Class Q, Class R and Class Z shares are not subject to any sales or redemption charge and are offered exclusively for sale to a limited group of investors.
Under certain circumstances, an exchange may be made from specified share classes of the Fund to one or more other share classes of the Fund as presented in the table of transactions in shares of beneficial interest.
The Trust has authorized an unlimited number of shares of beneficial interest at $.001 par value per share.
As of July 31, 2017, Prudential owned 973 Class A shares, 957 Class C shares, 978 Class Q shares and 967 Class R shares of the Fund.
At reporting period end, three shareholders of record held 78% of the Fund’s outstanding shares on behalf of multiple beneficial owners.
Transactions in shares of beneficial interest were as follows:
| | | | | | | | |
Class A | | Shares | | | Amount | |
Year ended July 31, 2017: | | | | | | | | |
Shares sold | | | 130,815 | | | $ | 1,463,656 | |
Shares issued in reinvestment of dividends and distributions | | | 3,414 | | | | 38,209 | |
Shares reacquired | | | (43,180 | ) | | | (479,305 | ) |
| | | | | | | | |
Net increase (decrease) in shares outstanding before conversion | | | 91,049 | | | | 1,022,560 | |
Shares reacquired upon conversion into other share class(es) | | | (3,587 | ) | | | (39,847 | ) |
| | | | | | | | |
Net increase (decrease) in shares outstanding | | | 87,462 | | | $ | 982,713 | |
| | | | | | | | |
Year ended July 31, 2016: | | | | | | | | |
Shares sold | | | 68,884 | | | $ | 765,352 | |
Shares issued in reinvestment of dividends and distributions | | | 680 | | | | 7,552 | |
Shares reacquired | | | (2,301 | ) | | | (25,238 | ) |
| | | | | | | | |
Net increase (decrease) in shares outstanding before conversion | | | 67,263 | | | | 747,666 | |
Shares reacquired upon conversion into other share class(es) | | | (2,069 | ) | | | (23,739 | ) |
| | | | | | | | |
Net increase (decrease) in shares outstanding | | | 65,194 | | | $ | 723,927 | |
| | | | | | | | |
Class C | | | | | | |
Year ended July 31, 2017: | | | | | | | | |
Shares sold | | | 61,586 | | | $ | 685,900 | |
Shares issued in reinvestment of dividends and distributions | | | 1,868 | | | | 20,845 | |
Shares reacquired | | | (32,511 | ) | | | (359,336 | ) |
| | | | | | | | |
Net increase (decrease) in shares outstanding | | | 30,943 | | | $ | 347,409 | |
| | | | | | | | |
Year ended July 31, 2016: | | | | | | | | |
Shares sold | | | 83,590 | | | $ | 896,991 | |
Shares issued in reinvestment of dividends and distributions | | | 491 | | | | 5,458 | |
Shares reacquired | | | (19,413 | ) | | | (209,695 | ) |
| | | | | | | | |
Net increase (decrease) in shares outstanding | | | 64,668 | | | $ | 692,754 | |
| | | | | | | | |
Class Q | | | | | | |
Year ended July 31, 2017: | | | | | | | | |
Shares sold | | | — | | | $ | — | |
Shares issued in reinvestment of dividends and distributions | | | 31 | | | | 348 | |
| | | | | | | | |
Net increase (decrease) in shares outstanding | | | 31 | | | $ | 348 | |
| | | | | | | | |
Year ended July 31, 2016: | | | | | | | | |
Shares sold | | | — | | | $ | — | |
Shares issued in reinvestment of dividends and distributions | | | 28 | | | | 305 | |
| | | | | | | | |
Net increase (decrease) in shares outstanding | | | 28 | | | $ | 305 | |
| | | | | | | | |
Class R | | | | | | |
Year ended July 31, 2017: | | | | | | | | |
Shares sold | | | — | | | $ | — | |
Shares issued in reinvestment of dividends and distributions | | | 26 | | | | 291 | |
| | | | | | | | |
Net increase (decrease) in shares outstanding | | | 26 | | | $ | 291 | |
| | | | | | | | |
Year ended July 31, 2016: | | | | | | | | |
Shares sold | | | — | | | $ | — | |
Shares issued in reinvestment of dividends and distributions | | | 23 | | | | 255 | |
| | | | | | | | |
Net increase (decrease) in shares outstanding | | | 23 | | | $ | 255 | |
| | | | | | | | |
| | | | |
| Prudential Corporate Bond Fund | | | 41 | |
Notes to Financial Statements (continued)
| | | | | | | | |
Class Z | | Shares | | | Amount | |
Year ended July 31, 2017: | | | | | | | | |
Shares sold | | | 611,442 | | | $ | 6,836,359 | |
Shares issued in reinvestment of dividends and distributions | | | 59,423 | | | | 664,102 | |
Shares reacquired | | | (954,080 | ) | | | (10,611,926 | ) |
| | | | | | | | |
Net increase (decrease) in shares outstanding before conversion | | | (283,215 | ) | | | (3,111,465 | ) |
Shares issued upon conversion from other share class(es) | | | 3,600 | | | | 39,847 | |
| | | | | | | | |
Net increase (decrease) in shares outstanding | | | (279,615 | ) | | $ | (3,071,618 | ) |
| | | | | | | | |
Year ended July 31, 2016: | | | | | | | | |
Shares sold | | | 954,492 | | | $ | 10,393,143 | |
Shares issued in reinvestment of dividends and distributions | | | 92,146 | | | | 994,464 | |
Shares reacquired | | | (3,116,010 | ) | | | (33,130,395 | ) |
| | | | | | | | |
Net increase (decrease) in shares outstanding before conversion | | | (2,069,372 | ) | | | (21,742,788 | ) |
Shares issued upon conversion from other share class(es) | | | 2,076 | | | | 23,739 | |
| | | | | | | | |
Net increase (decrease) in shares outstanding | | | (2,067,296 | ) | | $ | (21,719,049 | ) |
| | | | | | | | |
7. Borrowings
The Trust, on behalf of the Fund, along with other affiliated registered investment companies (the “Funds”), is a party to a Syndicated Credit Agreement (“SCA”) with a group of banks. The purpose of the SCA is to provide an alternative source of temporary funding for capital share redemptions. The SCA provides for a commitment of $900 million for the period October 6, 2016 through October 5, 2017. The Funds pay an annualized commitment fee of .15% of the unused portion of the SCA. The Fund’s portion of the commitment fee for the unused amount, allocated based upon a method approved by the Board, is accrued daily and paid quarterly. The interest on borrowings under the SCA is paid monthly and at a per annum interest rate based upon a contractual spread plus the higher of (1) the effective federal funds rate, (2) the 1-month LIBOR rate or (3) zero percent.
Other affiliated registered investment companies that are parties to the SCA include portfolios that are subject to a predetermined mathematical formula used to manage certain benefit guarantees offered under variable annuity contracts. The formula may result in large scale asset flows into and out of the portfolios. Consequently, the portfolios may be more likely to utilize the SCA for purposes of funding redemptions. It may be possible for those portfolios to fully exhaust the committed amount of the SCA, thereby requiring the Manager to allocate available funding per a Board-approved methodology designed to treat the Funds in the SCA equitably.
The Fund utilized the SCA during the year ended July 31, 2017. The average daily balance for the 2 days that the Fund had loans outstanding during the period was $818,000,
borrowed at a weighted average interest rate of 1.78%. The maximum loan balance outstanding during the period was $1,053,000. At July 31, 2017, the Fund did not have an outstanding loan balance.
8. Recent Accounting Pronouncements and Reporting Updates
On October 13, 2016, the Securities and Exchange Commission (the “SEC”) adopted new rules and forms and amended existing rules and forms which are intended to modernize and enhance the reporting and disclosure of information by registered investment companies and to improve the quality of information that funds provide to investors, including modifications to Regulation S-X which would require standardized, enhanced disclosure about derivatives in investment company financial statements. The compliance dates of the modifications to Regulation S-X are August 1, 2017 and other amendments and rules are generally June 1, 2018 and December 1, 2018. Management is currently evaluating the impacts to the financial statement disclosures.
9. Other
At the Trust’s Board meeting in March 2017, the Board of Trustees approved a change in the methodology of allocating certain expenses, like Transfer Agent fees (including sub-transfer agent and networking fees) and Blue Sky fees. PGIM Investments implemented the changes effective August 1, 2017.
| | | | |
| Prudential Corporate Bond Fund | | | 43 | |
Financial Highlights
| | | | | | | | | | | | | | | | |
| Class A Shares | | | | |
| | | Year Ended July 31, | | | | | | May 28,
2015(b)
through
July 31, | |
| | | 2017 | | | 2016 | | | | | | 2015 | |
| Per Share Operating Performance(c): | | | | | | | | | | | | | | | | |
| Net Asset Value, Beginning of Period | | | $11.46 | | | | $10.76 | | | | | | | | $10.94 | |
| Income (loss) from investment operations: | | | | | | | | | | | | | | | | |
| Net investment income (loss) | | | .32 | | | | .29 | | | | | | | | .04 | |
| Net realized and unrealized gain (loss) on investments | | | (.13 | ) | | | .71 | | | | | | | | (.17 | ) |
| Total from investment operations | | | .19 | | | | 1.00 | | | | | | | | (.13 | ) |
| Less dividends from net investment income | | | (.33 | ) | | | (.30 | ) | | | | | | | (.05 | ) |
| Net asset value, end of period | | | $11.32 | | | | $11.46 | | | | | | | | $10.76 | |
| Total Return(a): | | | 1.77% | | | | 9.49% | | | | | | | | (1.19)% | |
| | | | | | | | | | | | | | | | |
| Ratios/Supplemental Data: | | | | |
| Net assets, end of period (000) | | | $1,802 | | | | $822 | | | | | | | | $71 | |
| Average net assets (000) | | | $1,339 | | | | $269 | | | | | | | | $12 | |
| Ratios to average net assets(d): | | | | | | | | | | | | | | | | |
| Expenses after waivers and/or expense reimbursement | | | .80% | | | | .94% | | | | | | | | .98% | (e) |
| Expenses before waivers and/or expense reimbursement | | | 1.92% | | | | 1.77% | | | | | | | | 2.23% | (e) |
| Net investment income (loss) | | | 2.88% | | | | 2.64% | | | | | | | | 2.24% | (e) |
| Portfolio turnover rate | | | 90% | | | | 165% | | | | | | | | 1,221% | (f)(g) |
| (a) | Total return does not consider the effects of sales loads. Total return is calculated assuming a purchase of a share on the first day and a sale on the last day of each period reported and includes reinvestment of dividends and distributions, if any. Total returns may reflect adjustments to conform to generally accepted accounting principles. Total returns for periods less than one full year are not annualized. |
| (b) | Commencement of operations. |
| (c) | Calculated based upon average shares outstanding during the period. |
| (d) | Does not include expenses of the underlying fund in which the Fund invests. |
| (g) | The Fund accounts for mortgage dollar roll transactions as purchases and sales which, as a result, can increase its portfolio turnover rate. |
See Notes to Financial Statements.
| | | | | | | | | | | | | | | | |
| Class C Shares | | | | | | | | | | | | |
| | | Year Ended July 31, | | | | | | May 28,
2015(b)
through
July 31, | |
| | | 2017 | | | 2016 | | | | | | 2015 | |
| Per Share Operating Performance(c): | | | | | | | | | | | | | | | | |
| Net Asset Value, Beginning of Period | | | $11.43 | | | | $10.75 | | | | | | | | $10.94 | |
| Income (loss) from investment operations: | | | | | | | | | | | | | | | | |
| Net investment income (loss) | | | .24 | | | | .20 | | | | | | | | .03 | |
| Net realized and unrealized gain (loss) on investments | | | (.13 | ) | | | .70 | | | | | | | | (.18 | ) |
| Total from investment operations | | | .11 | | | | .90 | | | | | | | | (.15 | ) |
| Less dividends from net investment income | | | (.25 | ) | | | (.22 | ) | | | | | | | (.04 | ) |
| Net asset value, end of period | | | $11.29 | | | | $11.43 | | | | | | | | $10.75 | |
| Total Return(a): | | | 1.01% | | | | 8.51% | | | | | | | | (1.41)% | |
| | | | | | | | | | | | | | | | |
| Ratios/Supplemental Data: | | | | |
| Net assets, end of period (000) | | | $1,095 | | | | $755 | | | | | | | | $15 | |
| Average net assets (000) | | | $1,014 | | | | $369 | | | | | | | | $13 | |
| Ratios to average net assets(d): | | | | | | | | | | | | | | | | |
| Expenses after waivers and/or expense reimbursement | | | 1.55% | | | | 1.73% | | | | | | | | 1.87% | (e) |
| Expenses before waivers and/or expense reimbursement | | | 2.66% | | | | 2.56% | | | | | | | | 2.97% | (e) |
| Net investment income (loss) | | | 2.12% | | | | 1.84% | | | | | | | | 1.48% | (e) |
| Portfolio turnover rate | | | 90% | | | | 165% | | | | | | | | 1,221% | (f)(g) |
| (a) | Total return does not consider the effects of sales loads. Total return is calculated assuming a purchase of a share on the first day and a sale on the last day of each period reported and includes reinvestment of dividends and distributions, if any. Total returns may reflect adjustments to conform to generally accepted accounting principles. Total returns for periods less than one full year are not annualized. |
| (b) | Commencement of operations. |
| (c) | Calculated based upon average shares outstanding during the period. |
| (d) | Does not include expenses of the underlying fund in which the Fund invests. |
| (g) | The Fund accounts for mortgage dollar roll transactions as purchases and sales which, as a result, can increase its portfolio turnover rate. |
See Notes to Financial Statements.
| | | | |
| Prudential Corporate Bond Fund | | | 45 | |
Financial Highlights (continued)
| | | | | | | | | | | | | | | | |
| Class Q Shares | | | | | | | | | | | | |
| | | Year Ended
July 31, | | | | | | May 28,
2015(b)
through
July 31, | |
| | | 2017 | | | 2016 | | | | | | 2015 | |
| Per Share Operating Performance(c): | | | | | | | | | | | | | | | | |
| Net Asset Value, Beginning of Period | | | $11.43 | | | | $10.75 | | | | | | | | $10.94 | |
| Income (loss) from investment operations: | | | | | | | | | | | | | | | | |
| Net investment income (loss) | | | .35 | | | | .30 | | | | | | | | .04 | |
| Net realized and unrealized gain (loss) on investments | | | (.13 | ) | | | .71 | | | | | | | | (.18 | ) |
| Total from investment operations | | | .22 | | | | 1.01 | | | | | | | | (.14 | ) |
| Less dividends from net investment income | | | (.36 | ) | | | (.33 | ) | | | | | | | (.05 | ) |
| Net asset value, end of period | | | $11.29 | | | | $11.43 | | | | | | | | $10.75 | |
| Total Return(a): | | | 2.02% | | | | 9.57% | | | | | | | | (1.25)% | |
| | | | | | | | | | | | | | | | |
| Ratios/Supplemental Data: | | | | |
| Net assets, end of period (000) | | | $11 | | | | $11 | | | | | | | | $10 | |
| Average net assets (000) | | | $11 | | | | $10 | | | | | | | | $10 | |
| Ratios to average net assets(d): | | | | | | | | | | | | | | | | |
| Expenses after waivers and/or expense reimbursement | | | .55% | | | | .79% | | | | | | | | .87% | (e) |
| Expenses before waivers and/or expense reimbursement | | | 1.53% | | | | 1.28% | | | | | | | | 1.88% | (e) |
| Net investment income (loss) | | | 3.10% | | | | 2.80% | | | | | | | | 2.39% | (e) |
| Portfolio turnover rate | | | 90% | | | | 165% | | | | | | | | 1,221% | (f)(g) |
| (a) | Total return is calculated assuming a purchase of a share on the first day and a sale on the last day of each period reported and includes reinvestment of dividends and distributions, if any. Total returns may reflect adjustments to conform to generally accepted accounting principles. Total returns for periods less than one full year are not annualized. |
| (b) | Commencement of operations. |
| (c) | Calculated based upon average shares outstanding during the period. |
| (d) | Does not include expenses of the underlying fund in which the Fund invests. |
| (g) | The Fund accounts for mortgage dollar roll transactions as purchases and sales which, as a result, can increase its portfolio turnover rate. |
See Notes to Financial Statements.
| | | | | | | | | | | | | | | | |
| Class R Shares | | | | | | | | | | | | |
| | | Year Ended
July 31, | | | | | | May 28,
2015(b)
through
July 31, | |
| | | 2017 | | | 2016 | | | | | | 2015 | |
| Per Share Operating Performance(c): | | | | | | | | | | | | | | | | |
| Net Asset Value, Beginning of Period | | | $11.43 | | | | $10.75 | | | | | | | | $10.94 | |
| Income (loss) from investment operations: | | | | | | | | | | | | | | | | |
| Net investment income (loss) | | | .29 | | | | .25 | | | | | | | | .03 | |
| Net realized and unrealized gain (loss) on investments | | | (.12 | ) | | | .70 | | | | | | | | (.17 | ) |
| Total from investment operations | | | .17 | | | | .95 | | | | | | | | (.14 | ) |
| Less dividends from net investment income | | | (.31 | ) | | | (.27 | ) | | | | | | | (.05 | ) |
| Net asset value, end of period | | | $11.29 | | | | $11.43 | | | | | | | | $10.75 | |
| Total Return(a): | | | 1.51% | | | | 9.04% | | | | | | | | (1.32)% | |
| | | | | | | | | | | | | | | | |
| Ratios/Supplemental Data: | | | | |
| Net assets, end of period (000) | | | $11 | | | | $11 | | | | | | | | $10 | |
| Average net assets (000) | | | $11 | | | | $10 | | | | | | | | $10 | |
| Ratios to average net assets(d): | | | | | | | | | | | | | | | | |
| Expenses after waivers and/or expense reimbursement | | | 1.05% | | | | 1.29% | | | | | | | | 1.36% | (e) |
| Expenses before waivers and/or expense reimbursement | | | 2.42% | | | | 2.12% | | | | | | | | 2.77% | (e) |
| Net investment income (loss) | | | 2.59% | | | | 2.32% | | | | | | | | 1.91% | (e) |
| Portfolio turnover rate | | | 90% | | | | 165% | | | | | | | | 1,221% | (f)(g) |
| (a) | Total return is calculated assuming a purchase of a share on the first day and a sale on the last day of each period reported and includes reinvestment of dividends and distributions, if any. Total returns may reflect adjustments to conform to generally accepted accounting principles. Total returns for periods less than one full year are not annualized. |
| (b) | Commencement of operations. |
| (c) | Calculated based upon average shares outstanding during the period. |
| (d) | Does not include expenses of the underlying fund in which the Fund invests. |
| (g) | The Fund accounts for mortgage dollar roll transactions as purchases and sales which, as a result, can increase its portfolio turnover rate. |
See Notes to Financial Statements.
| | | | |
| Prudential Corporate Bond Fund | | | 47 | |
Financial Highlights (continued)
| | | | | | | | | | | | | | | | | | | | | | | | | | | | | | | | |
| Class Z Shares | | | | | | | | | |
| | | Year Ended July 31, | | | | | | Nine Months
Ended
July 31, | | | | | | Year Ended
October 31, | |
| | | 2017(g) | | | 2016(g) | | | 2015(g)(h) | | | | | | 2014(f) | | | | | | 2013 | | | 2012 | |
| Per Share Operating Performance: | | | | | | | | | | | | | |
| Net Asset Value, Beginning of Period | | | $11.43 | | | | $10.76 | | | | $10.69 | | | | | | | | $10.50 | | | | | | | | $10.83 | | | | $10.68 | |
| Income (loss) from investment operations: | | | | | | | | | | | | | | | | | | | | | | | | | | | | | | | | |
| Net investment income (loss) | | | .34 | | | | .30 | | | | .09 | | | | | | | | .05 | | | | | | | | .15 | | | | .29 | |
| Net realized and unrealized gain (loss) on investments | | | (.12 | ) | | | .70 | | | | .11 | | | | | | | | .21 | | | | | | | | (.26 | ) | | | .20 | |
| Total from investment operations | | | .22 | | | | 1.00 | | | | .20 | | | | | | | | .26 | | | | | | | | (.11 | ) | | | .49 | |
| Less dividends from net investment income | | | (.36 | ) | | | (.33 | ) | | | (.13 | ) | | | | | | | (.07 | ) | | | | | | | (.22 | ) | | | (.34 | ) |
| Net asset value, end of period | | | $11.29 | | | | $11.43 | | | | $10.76 | | | | | | | | $10.69 | | | | | | | | $10.50 | | | | $10.83 | |
| Total Return(a): | | | 2.02% | | | | 9.47% | | | | 1.83% | | | | | | | | 2.47% | | | | | | | | (.97)% | | | | 4.64% | |
| | | | | | | | | | | | | | | | | | | | | | | | | | | | | | | | |
| Ratios/Supplemental Data: | | | | | | | |
| Net assets, end of period (000) | | | $19,869 | | | | $23,307 | | | | $44,174 | | | | | | | | $43,879 | | | | | | | | $42,218 | | | | $43,605 | |
| Average net assets (000) | | | $21,149 | | | | $33,438 | | | | $44,354 | | | | | | | | $42,666 | | | | | | | | $43,290 | | | | $42,171 | |
| Ratios to average net assets(b): | | | | | | | | | | | | | | | | | | | | | | | | | | | | | | | | |
| Expenses after waivers and/or expense reimbursement | | | .55% | | | | .82% | | | | .91% | | | | | | | | .99% | (d) | | | | | | | .93% | | | | .93% | |
| Expenses before waivers and/or expense reimbursement | | | 1.64% | | | | 1.27% | | | | 1.10% | | | | | | | | .99% | (d) | | | | | | | .93% | | | | .93% | |
| Net investment income (loss) | | | 3.07% | | | | 2.79% | | | | .78% | | | | | | | | .65% | (d) | | | | | | | 1.39% | | | | 2.70% | |
| Portfolio turnover rate | | | 90% | | | | 165% | | | | 1,221% | (c) | | | | | | | 936% | (c)(e) | | | | | | | 990% | (c) | | | 847% | (c) |
| (a) | Total return is calculated assuming a purchase of a share on the first day and a sale on the last day of each period reported and includes reinvestment of dividends and distributions, if any. Total returns may reflect adjustments to conform to generally accepted accounting principles. Total returns for periods less than one full year are not annualized. |
| (b) | Does not include expenses of the underlying fund in which the Fund invests. |
| (c) | The Fund accounts for mortgage dollar roll transactions as purchases and sales which, as a result, can increase its portfolio turnover rate. |
| (f) | For the nine month period ended July 31, 2014. The Trust changed its fiscal year end from October 31 to July 31, effective July 31, 2014. |
| (g) | Calculated based upon average shares outstanding during the period. |
| (h) | Class T shares were renamed Class Z shares effective May 28, 2015. |
See Notes to Financial Statements.
Report of Independent Registered Public Accounting Firm
The Board of Trustees and Shareholders
The Target Portfolio Trust:
We have audited the accompanying statement of assets and liabilities of Prudential Corporate Bond Fund, a series of Target Portfolio Trust (the “Fund”), including the schedule of investments, as of July 31, 2017, and the related statement of operations for the year then ended, the statements of changes in net assets for each of the years in the two-year period then ended, and the financial highlights for each of the years in the three-year period then ended, for the nine-month period ended July 31, 2014 and for each of the years in the two-year period ended October 31, 2013. These financial statements and financial highlights are the responsibility of the Fund’s management. Our responsibility is to express an opinion on these financial statements and financial highlights based on our audits.
We conducted our audits in accordance with the standards of the Public Company Accounting Oversight Board (United States). Those standards require that we plan and perform the audit to obtain reasonable assurance about whether the financial statements and financial highlights are free of material misstatement. An audit includes examining, on a test basis, evidence supporting the amounts and disclosures in the financial statements. Our procedures included confirmation of securities owned as of July 31, 2017, by correspondence with the custodian, transfer agent and brokers or by other appropriate auditing procedures when replies from brokers were not received. An audit also includes assessing the accounting principles used and significant estimates made by management, as well as evaluating the overall financial statement presentation. We believe that our audits provide a reasonable basis for our opinion.
In our opinion, the financial statements and financial highlights referred to above present fairly, in all material respects, the financial position of the Fund as of July 31, 2017, and the results of its operations, changes in its net assets, and the financial highlights for the periods described in the first paragraph above, in conformity with U.S. generally accepted accounting principles.

New York, New York
September 18, 2017
| | | | |
| Prudential Corporate Bond Fund | | | 49 | |
Federal Income Tax Information (unaudited)
For the tax year ended July 31, 2017, the Fund reports 83.36% as interest-related dividends in accordance with Sections 871(k)(1) and 881(e)(1) of the Internal Revenue Code.
In January 2018, you will be advised on IRS Form 1099-DIV or substitute Form 1099-DIV, as to the Federal tax status of the distributions received by you in calendar year 2017.
INFORMATION ABOUT BOARD MEMBERS AND OFFICERS
(Unaudited)
Information about Board Members and Officers of the Fund is set forth below. Board Members who are not deemed to be “interested persons” of the Fund, as defined in the 1940 Act, are referred to as “Independent Board Members.” Board Members who are deemed to be “interested persons” of the Fund are referred to as “Interested Board Members.” The Board Members are responsible for the overall supervision of the operations of the Fund and perform the various duties imposed on the directors of investment companies by the 1940 Act. The Board in turn elects the Officers, who are responsible for administering the day-to-day operations of the Fund.
| | | | |
| Independent Board Members(1) |
Name, Address, Age Position(s) Portfolios Overseen | | Principal Occupation(s) During Past Five Years | | Other Directorships Held During Past Five Years |
Ellen S. Alberding (59) Board Member Portfolios Overseen: 87 | | President and Board Member, The Joyce Foundation (charitable foundation) (since 2002); Vice Chair, City Colleges of Chicago (community college system) (since 2011); Trustee, Skills for America’s Future (national initiative to connect employers to community colleges) (since 2011); Trustee, National Park Foundation (charitable foundation for national park system) (since 2009); Trustee, Economic Club of Chicago (since 2009). | | None. |
Kevin J. Bannon (65) Board Member Portfolios Overseen: 87 | | Retired; Managing Director (April 2008-May 2015) and Chief Investment Officer (October 2008-November 2013) of Highmount Capital LLC (registered investment adviser); formerly Executive Vice President and Chief Investment Officer (April 1993-August 2007) of Bank of New York Company; President (May 2003-May 2007) of BNY Hamilton Family of Mutual Funds. | | Director of Urstadt Biddle Properties (equity real estate investment trust) (since September 2008). |
Linda W. Bynoe (65) Board Member Portfolios Overseen: 87 | | President and Chief Executive Officer (since March 1995) and formerly Chief Operating Officer (December 1989-February 1995) of Telemat Ltd. (management consulting); formerly Vice President (January 1985-June 1989) at Morgan Stanley & Co. (broker-dealer). | | Director of Simon Property Group, Inc. (retail real estate) (May 2003-May 2012); Director of Anixter International, Inc. (communication products distributor) (since January 2006); Director of Northern Trust Corporation (financial services) (since April 2006); Trustee of Equity Residential (residential real estate) (since December 2009). |
Prudential Corporate Bond Fund
| | | | |
| Independent Board Members(1) |
Name, Address, Age Position(s) Portfolios Overseen | | Principal Occupation(s) During Past Five Years | | Other Directorships Held During Past Five Years |
Barry H. Evans (56)± Board Member Portfolios Overseen: 87 | | Retired; Formerly President (2005–2016), Global Chief Operating Officer (2014–2016), Chief Investment Officer – Global Head of Fixed Income (1998-2014), and various portfolio manager roles (1986-2006), Manulife Asset Management U.S. | | Director, Manulife Trust Company (2011- present); Director, Manulife Asset Management Limited (2015-present); Formerly Chairman of the Board of Directors of Manulife Asset Management U.S. (2005-2016); Formerly Chairman of the Board, Declaration Investment Management and Research (2008-2016) |
Keith F. Hartstein (60) Board Member & Independent Chair Portfolios Overseen: 87 | | Retired; Member (since November 2014) of the Governing Council of the Independent Directors Council (organization of independent mutual fund directors); formerly President and Chief Executive Officer (2005-2012), Senior Vice President (2004-2005), Senior Vice President of Sales and Marketing (1997-2004), and various executive management positions (1990-1997), John Hancock Funds, LLC (asset management); Chairman, Investment Company Institute’s Sales Force Marketing Committee (2003-2008). | | None. |
Laurie Simon Hodrick (55)± Board Member Portfolios Overseen: 87 | | A. Barton Hepburn Professor of Economics in the Faculty of Business, Columbia Business School (since 1996); Visiting Professor of Law and Rock Center for Corporate Governance Fellow, Stanford Law School (since 2015); Visiting Fellow, Hoover Institution, Stanford University (since 2015); Sole Member, ReidCourt LLC (since 2008) (a consulting firm); Formerly Managing Director, Global Head of Alternative Investment Strategies, Deutsche Bank (2006-2008); Formerly Director/Trustee, Merrill Lynch Investment Managers Funds (1999-2006) | | Independent Director, Corporate Capital Trust (since April 2017) (a business development company) |
Michael S. Hyland, CFA (71) Board Member Portfolios Overseen: 87 | | Retired (since February 2005); formerly Senior Managing Director (July 2001-February 2005) of Bear Stearns & Co, Inc.; Global Partner, INVESCO (1999-2001); Managing Director and President of Salomon Brothers Asset Management (1989-1999). | | None. |
Visit our website at pgiminvestments.com
| | | | |
| Independent Board Members(1) |
Name, Address, Age Position(s) Portfolios Overseen | | Principal Occupation(s) During Past Five Years | | Other Directorships Held During Past Five Years |
Richard A. Redeker (74) Board Member & Independent Vice Chair Portfolios Overseen: 87 | | Retired Mutual Fund Senior Executive (47 years); Management Consultant; Director, Mutual Fund Directors Forum (since 2014); Independent Directors Council (organization of independent mutual fund directors)-Executive Committee, Chair of Policy Steering Committee, Governing Council. | | None. |
Stephen G. Stoneburn (74) Board Member Portfolios Overseen: 87 | | Chairman (since July 2011), President and Chief Executive Officer (since June 1996) of Frontline Medical Communications (publishing company); formerly President (June 1995-June 1996) of Argus Integrated Media, Inc.; Senior Vice President and Managing Director (January 1993-1995) of Cowles Business Media; Senior Vice President of Fairchild Publications, Inc. (1975-1989). | | None. |
| ± | Mr. Evans and Ms. Hodrick joined the Board effective as of September 1, 2017. |
| | | | |
| Interested Board Members(1) |
Name, Address, Age Position(s) Portfolios Overseen | | Principal Occupation(s) During Past Five Years | | Other Directorships Held During Past Five Years |
Stuart S. Parker (54) Board Member & President Portfolios Overseen: 87 | | President of PGIM Investments LLC (formerly known as Prudential Investments LLC) (since January 2012); Executive Vice President of Prudential Investment Management Services LLC (since December 2012); Executive Vice President of Jennison Associates LLC and Head of Retail Distribution of PGIM Investments LLC (June 2005-December 2011). | | None. |
Prudential Corporate Bond Fund
| | | | |
| Interested Board Members(1) |
Name, Address, Age Position(s) Portfolios Overseen | | Principal Occupation(s) During Past Five Years | | Other Directorships Held During Past Five Years |
Scott E. Benjamin (44) Board Member & Vice President Portfolios Overseen: 87 | | Executive Vice President (since June 2009) of PGIM Investments LLC; Executive Vice President (June 2009-June 2012) and Vice President (since June 2012) of Prudential Investment Management Services LLC; Executive Vice President (since September 2009) of AST Investment Services, Inc.; Senior Vice President of Product Development and Marketing, PGIM Investments (since February 2006); Vice President of Product Development and Product Management, Prudential Investments (2003-2006). | | None. |
Grace C. Torres* (58) Board Member Portfolios Overseen: 86 | | Retired; formerly Treasurer and Principal Financial and Accounting Officer of the Prudential Funds, Target Funds, Advanced Series Trust, Prudential Variable Contract Accounts and The Prudential Series Fund (1998-June 2014); Assistant Treasurer (March 1999-June 2014) and Senior Vice President (September 1999-June 2014) of PGIM Investments LLC; Assistant Treasurer (May 2003-June 2014) and Vice President (June 2005-June 2014) of AST Investment Services, Inc.; Senior Vice President and Assistant Treasurer (May 2003-June 2014) of Prudential Annuities Advisory Services, Inc. | | Director (since July 2015) of Sun Bancorp, Inc. N.A. and Sun National Bank |
| * | Note: Prior to her retirement in 2014, Ms. Torres was employed by PGIM Investments LLC. Due to her prior employment, she is considered to be an “interested person” under the 1940 Act. Ms. Torres is a Non-Management Interested Board Member. |
| (1) | The year that each individual joined the Board is as follows: |
Ellen S. Alberding, 2013; Kevin J. Bannon, 2008; Linda W. Bynoe, 2005; Barry H. Evans, 2017; Keith F. Hartstein, 2013; Laurie Simon Hodrick, 2017; Michael S. Hyland, 2008; Richard A. Redeker, 2003; Stephen G. Stoneburn, 1999; Grace C. Torres, 2014; Stuart S. Parker, Board Member and President since 2012; Scott E. Benjamin, Board Member since 2010 and Vice President since 2009.
Visit our website at pgiminvestments.com
| | | | |
| Fund Officers(a) |
Name, Address and Age Position with Fund | | Principal Occupation(s) During Past Five Years | | Length of Service as Fund Officer |
Raymond A. O’Hara (62) Chief Legal Officer | | Vice President and Corporate Counsel (since July 2010) of Prudential Insurance Company of America (Prudential); Vice President (March 2011-Present) of Pruco Life Insurance Company and Pruco Life Insurance Company of New Jersey; Vice President and Corporate Counsel (March 2011-Present) of Prudential Annuities Life Assurance Corporation; Chief Legal Officer of PGIM Investments LLC (since June 2012); Chief Legal Officer of Prudential Mutual Fund Services LLC (since June 2012) and Corporate Counsel of AST Investment Services, Inc. (since June 2012); formerly Assistant Vice President and Corporate Counsel (September 2008-July 2010) of The Hartford Financial Services Group, Inc.; formerly Associate (September 1980-December 1987) and Partner (January 1988–August 2008) of Blazzard & Hasenauer, P.C. (formerly, Blazzard, Grodd & Hasenauer, P.C.). | | Since 2012 |
Chad A. Earnst (42) Chief Compliance Officer | | Chief Compliance Officer (September 2014-Present) of PGIM Investments LLC; Chief Compliance Officer (September 2014-Present) of the Prudential Funds, Target Funds, Advanced Series Trust, The Prudential Series Fund, Prudential’s Gibraltar Fund, Inc., Prudential Global Short Duration High Yield Income Fund, Inc., Prudential Short Duration High Yield Fund, Inc. and Prudential Jennison MLP Income Fund, Inc.; formerly Assistant Director (March 2010-August 2014) of the Asset Management Unit, Division of Enforcement, US Securities & Exchange Commission; Assistant Regional Director (January 2010-August 2014), Branch Chief (June 2006–December 2009) and Senior Counsel (April 2003-May 2006) of the Miami Regional Office, Division of Enforcement, US Securities & Exchange Commission. | | Since 2014 |
Deborah A. Docs (59) Secretary | | Vice President and Corporate Counsel (since January 2001) of Prudential; Vice President (since December 1996) and Assistant Secretary (since March 1999) of PGIM Investments LLC; formerly Vice President and Assistant Secretary (May 2003-June 2005) of AST Investment Services, Inc. | | Since 2004 |
Jonathan D. Shain (59) Assistant Secretary | | Vice President and Corporate Counsel (since August 1998) of Prudential; Vice President and Assistant Secretary (since May 2001) of PGIM Investments LLC; Vice President and Assistant Secretary (since February 2001) of Prudential Mutual Fund Services LLC; formerly Vice President and Assistant Secretary (May 2003-June 2005) of AST Investment Services, Inc. | | Since 2005 |
Claudia DiGiacomo (42) Assistant Secretary | | Vice President and Corporate Counsel (since January 2005) of Prudential; Vice President and Assistant Secretary of PGIM Investments LLC (since December 2005); Associate at Sidley Austin Brown & Wood LLP (1999-2004). | | Since 2005 |
Prudential Corporate Bond Fund
| | | | |
| Fund Officers(a) |
Name, Address and Age Position with Fund | | Principal Occupation(s) During Past Five Years | | Length of Service as Fund Officer |
Andrew R. French (54) Assistant Secretary | | Vice President and Corporate Counsel (since February 2010) of Prudential; formerly Director and Corporate Counsel (2006-2010) of Prudential; Vice President and Assistant Secretary (since January 2007) of PGIM Investments LLC; Vice President and Assistant Secretary (since January 2007) of Prudential Mutual Fund Services LLC. | | Since 2006 |
Charles H. Smith (44) Anti-Money Laundering Compliance Officer | | Vice President, Corporate Compliance, Anti-Money Laundering Unit (since January 2015) of Prudential; committee member of the American Council of Life Insurers Anti-Money Laundering and Critical Infrastructure Committee (since January 2016); formerly Global Head of Economic Sanctions Compliance at AIG Property Casualty (February 2007–December 2014); Assistant Attorney General at the New York State Attorney General’s Office, Division of Public Advocacy. (August 1998—January 2007). | | Since 2016 |
M. Sadiq Peshimam (53) Treasurer and Principal Financial and Accounting Officer | | Vice President (since 2005) of PGIM Investments LLC; formerly Assistant Treasurer of funds in the Prudential Mutual Fund Complex (2006-2014). | | Since 2006 |
Peter Parrella (59) Assistant Treasurer | | Vice President (since 2007) and Director (2004-2007) within Prudential Mutual Fund Administration; formerly Tax Manager at SSB Citi Fund Management LLC (1997-2004). | | Since 2007 |
Lana Lomuti (50) Assistant Treasurer | | Vice President (since 2007) and Director (2005-2007), within Prudential Mutual Fund Administration; formerly Assistant Treasurer (December 2007-February 2014) of The Greater China Fund, Inc. | | Since 2014 |
Linda McMullin (56) Assistant Treasurer | | Vice President (since 2011) and Director (2008-2011) within Prudential Mutual Fund Administration. | | Since 2014 |
Kelly A. Coyne (49) Assistant Treasurer | | Director, Investment Operations of Prudential Mutual Fund Services LLC (since 2010). | | Since 2015 |
| (a) | Excludes Mr. Parker and Mr. Benjamin, interested Board Members who also serve as President and Vice President, respectively. |
Explanatory Notes to Tables:
| • | | Board Members are deemed to be “Interested,” as defined in the 1940 Act, by reason of their affiliation with PGIM Investments LLC and/or an affiliate of PGIM Investments LLC. |
| • | | Unless otherwise noted, the address of all Board Members and Officers is c/o PGIM Investments LLC, 655 Broad Street, Newark, New Jersey 07102-4410. |
| • | | There is no set term of office for Board Members or Officers. The Board Members have adopted a retirement policy, which calls for the retirement of Board Members on December 31 of the year in which they reach the age of 75. |
| • | | “Other Directorships Held” includes only directorships of companies required to register or file reports with the SEC under the 1934 Act (that is, “public companies”) or other investment companies registered under the 1940 Act. |
| • | | “Portfolios Overseen” includes all investment companies managed by PGIM Investments LLC. The investment companies for which PGIM Investments LLC serves as manager include the Prudential Mutual Funds, The Prudential Variable Contract Accounts, Target Mutual Funds, Prudential Short Duration High Yield Fund, Inc., Prudential Global Short Duration High Yield Fund, Inc., The Prudential Series Fund, Prudential’s Gibraltar Fund, Inc. and the Advanced Series Trust. |
Visit our website at pgiminvestments.com
Approval of Advisory Agreement
The Fund’s Board of Trustees
The Board of Trustees (the “Board”) of the Prudential Corporate Bond Fund (the “Fund”)1 consists of twelve individuals, nine of whom are not “interested persons” of the Fund, as defined in the Investment Company Act of 1940, as amended (the “1940 Act”) (the “Independent Trustees”). The Board is responsible for the oversight of the Fund and its operations, and performs the various duties imposed on the directors of investment companies by the 1940 Act. The Independent Trustees have retained independent legal counsel to assist them in connection with their duties. The Chair of the Board is an Independent Trustee. The Board has established four standing committees: the Audit Committee, the Nominating and Governance Committee, and two Investment Committees. Each committee is chaired by, and composed of, Independent Trustees.
Annual Approval of the Fund’s Advisory Agreements
As required under the 1940 Act, the Board determines annually whether to renew the Fund’s management agreement with PGIM Investments LLC (“PGIM Investments”) and the Fund’s subadvisory agreement with PGIM, Inc. (“PGIM”) on behalf of its PGIM Fixed Income unit. In considering the renewal of the agreements, the Board, including all of the Independent Trustees,2 met on June 6-8, 2017 and approved the renewal of the agreements through July 31, 2018, after concluding that the renewal of the agreements was in the best interests of the Fund and its shareholders.
In advance of the meetings, the Board requested and received materials relating to the agreements, and had the opportunity to ask questions and request further information in connection with its consideration. Among other things, the Board considered comparative fee information from PGIM Investments and PGIM, Inc. Also, the Board considered comparisons with other mutual funds in relevant Peer Universes and Peer Groups, as is further discussed below.
In approving the agreements, the Board, including the Independent Trustees advised by independent legal counsel, considered the factors it deemed relevant, including the nature, quality and extent of services provided by PGIM Investments and the subadviser, the performance of the Fund, the profitability of PGIM Investments and its affiliates, expenses and fees, and the potential for economies of scale that may be shared with the Fund and its shareholders as the Fund’s assets grow. In their deliberations, the Trustees did not identify any single factor which alone was responsible for the Board’s decision to approve the agreements with respect to the Fund. In connection with its deliberations, the Board
| 1 | Prudential Corporate Bond Fund is a series of The Target Portfolio Trust. |
| 2 | Barry H. Evans and Laurie Simon Hodrick joined the Board effective as of September 1, 2017. Neither Mr. Evans nor Ms. Hodrick participated in the consideration of the approval of the Fund’s advisory agreements. |
| | |
| Prudential Corporate Bond Fund |
Approval of Advisory Agreement (continued)
considered information provided by PGIM Investments throughout the year at regular Board meetings, presentations from portfolio managers and other information, as well as information furnished at or in advance of the meetings on June 6-8, 2017.
The Trustees determined that the overall arrangements between the Fund and PGIM Investments, which serves as the Fund’s investment manager pursuant to a management agreement, and between PGIM Investments and PGIM, which, through its PGIM Fixed Income unit, serves as the Fund’s subadviser pursuant to the terms of a subadvisory agreement with PGIM Investments, are in the best interests of the Fund and its shareholders in light of the services performed, fees charged and such other matters as the Trustees considered relevant in the exercise of their business judgment.
The material factors and conclusions that formed the basis for the Trustees’ reaching their determinations to approve the continuance of the agreements are separately discussed below.
Nature, Quality, and Extent of Services
The Board received and considered information regarding the nature, quality and extent of services provided to the Fund by PGIM Investments and PGIM Fixed Income. The Board considered the services provided by PGIM Investments, including but not limited to the oversight of the subadviser for the Fund, as well as the provision of fund recordkeeping, compliance, and other services to the Fund. With respect to PGIM Investments’ oversight of the subadviser, the Board noted that PGIM Investments’ Strategic Investment Research Group (“SIRG”), which is a business unit of PGIM Investments, is responsible for monitoring and reporting to PGIM Investments’ senior management on the performance and operations of the subadviser. The Board also considered that PGIM Investments pays the salaries of all of the officers and interested Trustees of the Fund who are part of Fund management. The Board also considered the investment subadvisory services provided by PGIM Fixed Income, as well as adherence to the Fund’s investment restrictions and compliance with applicable Fund policies and procedures. The Board considered PGIM Investments’ evaluation of the subadviser, as well as PGIM Investments’ recommendation, based on its review of the subadviser, to renew the subadvisory agreement.
The Board considered the qualifications, backgrounds and responsibilities of PGIM Investments’ senior management responsible for the oversight of the Fund and PGIM Fixed Income, and also considered the qualifications, backgrounds and responsibilities of PGIM Fixed Income’s portfolio managers who are responsible for the day-to-day management of the Fund’s portfolio. The Board was provided with information pertaining to PGIM Investments’ and PGIM Fixed Income’s organizational structure, senior management, investment operations, and other relevant information pertaining to both PGIM Investments and PGIM Fixed Income. The Board also noted that it received favorable compliance
| | |
| Visit our website at pgiminvestments.com | | |
reports from the Fund’s Chief Compliance Officer (“CCO”) as to both PGIM Investments and PGIM Fixed Income. The Board noted that PGIM Fixed Income is affiliated with PGIM Investments.
The Board concluded that it was satisfied with the nature, extent and quality of the investment management services provided by PGIM Investments and the subadvisory services provided to the Fund by PGIM Fixed Income, and that there was a reasonable basis on which to conclude that the Fund benefits from the services provided by PGIM Investments and PGIM Fixed Income under the management and subadvisory agreements.
Costs of Services and Profits Realized by PGIM Investments
The Board was provided with information on the profitability of PGIM Investments and its affiliates in serving as the Fund’s investment manager. The Board discussed with PGIM Investments the methodology utilized in assembling the information regarding profitability and considered its reasonableness. The Board recognized that it is difficult to make comparisons of profitability from fund management contracts because comparative information is not generally publicly available and is affected by numerous factors, including the structure of the particular adviser, the types of funds it manages, its business mix, numerous assumptions regarding allocations and the adviser’s capital structure and cost of capital. The Board noted that the cost of services provided by PGIM Investments to the Fund during the year ended December 31, 2016 exceeded the management fees paid by the Fund, resulting in an operating loss to PGIM Investments. The Board further noted that the subadviser is affiliated with PGIM Investments and that its profitability is reflected in PGIM Investments profitability report. Taking these factors into account, the Board concluded that the profitability of PGIM Investments and its affiliates in relation to the services rendered was not unreasonable.
Economies of Scale
The Board received and discussed information concerning economies of scale that PGIM Investments may realize as the Fund’s assets grow beyond current levels. The Board noted that the management fee schedule for the Fund includes breakpoints, which have the effect of decreasing the fee rate as assets increase, but that at its current level of assets the Fund does not realize the effect of those rate reductions. The Board took note that the Fund’s fee structure currently results in benefits to Fund shareholders whether or not PGIM Investments realizes any economies of scale. The Board noted that economies of scale can be shared with the Fund in other ways, including low management fees from inception, additional technological and personnel investments to enhance shareholder services, and maintaining existing expense structures in the face of a rising cost environment. The Board also considered PGIM Investments’ assertion that it continually evaluates the management
| | |
| Prudential Corporate Bond Fund |
Approval of Advisory Agreement (continued)
fee schedule of the Fund and the potential to share economies of scale through breakpoints or fee waivers as asset levels increase.
The Board recognized the inherent limitations of any analysis of economies of scale, stemming largely from the Board’s understanding that most of PGIM Investments’ costs are not specific to individual funds, but rather are incurred across a variety of products and services.
Other Benefits to PGIM Investments and PGIM Fixed Income
The Board considered potential ancillary benefits that might be received by PGIM Investments and PGIM Fixed Income and their affiliates as a result of their relationship with the Fund. The Board concluded that potential benefits to be derived by PGIM Investments included transfer agency fees received by the Fund’s transfer agent (which is affiliated with PGIM Investments), as well as benefits to its reputation or other intangible benefits resulting from PGIM Investments’ association with the Fund. The Board concluded that the potential benefits to be derived by PGIM Fixed Income included those generally resulting from an increase in assets under management, specifically, potential access to additional research resources and benefits to its reputation. The Board concluded that the benefits derived by PGIM Investments and PGIM Fixed Income were consistent with the types of benefits generally derived by investment managers and subadvisers to mutual funds.
Performance of the Fund / Fees and Expenses
The Board considered certain additional specific factors and made related conclusions relating to the historical performance of the Fund for the one-, three-, five- and ten-year periods ended December 31, 2016.
The Board also considered the Fund’s actual management fee, as well as the Fund’s net total expense ratio, for the fiscal year ended July 31, 2016. The Board considered the management fee for the Fund as compared to the management fee charged by PGIM Investments to other funds and the fee charged by other advisers to comparable mutual funds in a Peer Group. The actual management fee represents the fee rate actually paid by Fund shareholders and includes any fee waivers or reimbursements. The net total expense ratio for the Fund represents the actual expense ratio incurred by Fund shareholders.
The mutual funds included in the Peer Universe (the Lipper BBB-Rated Corporate Debt Funds Performance Universe), which was used to consider performance, and the Peer Group, which was used to consider expenses and fees, were objectively determined by Broadridge, an independent provider of mutual fund data. The comparisons placed the Fund in various quartiles, with the first quartile being the best 25% of the mutual funds (for performance, the best performing mutual funds and, for expenses, the lowest cost mutual funds).
| | |
| Visit our website at pgiminvestments.com | | |
The section below summarizes key factors considered by the Board and the Board’s conclusions regarding the Fund’s performance, fees and overall expenses. The table sets forth gross performance comparisons (which do not reflect the impact on performance of fund expenses, or any subsidies, expense caps or waivers that may be applicable) with the Peer Universe, actual management fees with the Peer Group (which reflect the impact of any subsidies or fee waivers), and net total expenses with the Peer Group, each of which were key factors considered by the Board.
| | | | | | | | |
| Performance | | 1 Year | | 3 Years | | 5 Years | | 10 Years |
| | | 1st Quartile | | 1st Quartile | | 4th Quartile | | 2nd Quartile |
| Actual Management Fees: 1st Quartile |
| Net Total Expenses: 3rd Quartile |
| | • | | The Board noted that the Fund outperformed its benchmark index for the one-, three-, and ten-year periods. |
| | • | | The Board noted that during the second quarter of 2015, the Fund implemented new investment policies and investment strategies, and appointed a new subadviser to replace the Fund’s former subadvisers. As a result, the Fund’s past performance prior to that date did not reflect the current management of the Fund. |
| | • | | The Board and PGIM Investments agreed to continue the Fund’s existing expense cap, which caps the Fund’s annual operating expenses at 0.55% (excluding 12b-1 fees and certain other expenses), through November 30, 2017. |
| | • | | The Board noted information provided by PGIM Investments indicating that if the Fund’s current expense cap, which was implemented on May 1, 2016, had been in effect for the full fiscal year, the Fund’s net total expenses would have ranked in the first quartile in its Peer Group. |
| | • | | The Board concluded that, in light of the above, it would be in the best interests of the Fund and its shareholders to renew the agreements. |
| | • | | The Board concluded that the management fees (including subadvisory fees) and total expenses were reasonable in light of the services provided. |
* * *
After full consideration of these factors, the Board concluded that the approval of the agreements was in the best interests of the Fund and its shareholders.
| | |
| Prudential Corporate Bond Fund |
| | | | |
| ∎ MAIL | | ∎ TELEPHONE | | ∎ WEBSITE |
655 Broad Street Newark, NJ 07102 | | (800) 225-1852 | | www.pgiminvestments.com |
|
| PROXY VOTING |
| The Board of Trustees has delegated to the Fund’s investment subadvisers the responsibility for voting any proxies and maintaining proxy recordkeeping with respect to the Fund. A description of these proxy voting policies and procedures is available without charge, upon request, by calling (800) 225-1852. Information regarding how the Fund voted proxies relating to portfolio securities during the most recent 12-month period ended June 30 is available on the Fund’s website and on the Securities and Exchange Commission’s website at www.sec.gov. |
|
| TRUSTEES |
| Ellen S. Alberding • Kevin J. Bannon • Scott E. Benjamin • Linda W. Bynoe • Barry H. Evans • Keith F. Hartstein • Laurie Simon Hodrick • Michael S. Hyland • Stuart S. Parker • Richard A. Redeker • Stephen G. Stoneburn • Grace C. Torres |
|
| OFFICERS |
| Stuart S. Parker, President • Scott E. Benjamin, Vice President • M. Sadiq Peshimam, Treasurer and Principal Financial and Accounting Officer • Raymond A. O’Hara, Chief Legal Officer • Chad A. Earnst, Chief Compliance Officer • Deborah A. Docs, Secretary • Charles H. Smith, Anti-Money Laundering Compliance Officer • Jonathan D. Shain, Assistant Secretary • Claudia DiGiacomo, Assistant Secretary • Andrew R. French, Assistant Secretary • Peter Parrella, Assistant Treasurer • Lana Lomuti, Assistant Treasurer • Linda McMullin, Assistant Treasurer • Kelly A. Coyne, Assistant Treasurer |
| | | | |
| MANAGER | | PGIM Investments LLC | | 655 Broad Street
Newark, NJ 07102 |
|
| INVESTMENT SUBADVISER | | PGIM Fixed Income | | 655 Broad Street
Newark, NJ 07102 |
|
| DISTRIBUTOR | | Prudential Investment
Management Services LLC | | 655 Broad Street
Newark, NJ 07102 |
|
| CUSTODIAN | | The Bank of New York Mellon | | 225 Liberty Street
New York, NY 10286 |
|
| TRANSFER AGENT | | Prudential Mutual Fund
Services LLC | | PO Box 9658
Providence, RI 02940 |
|
| INDEPENDENT REGISTERED PUBLIC ACCOUNTING FIRM | | KPMG LLP | | 345 Park Avenue
New York, NY 10154 |
|
| FUND COUNSEL | | Willkie Farr & Gallagher LLP | | 787 Seventh Avenue
New York, NY 10019 |
|
| An investor should consider the investment objectives, risks, charges, and expenses of the Fund carefully before investing. The prospectus and summary prospectus contain this and other information about the Fund. An investor may obtain a prospectus and summary prospectus by visiting our website at www.pgiminvestments.com or by calling (800) 225-1852. The prospectus and summary prospectus should be read carefully before investing. |
|
| E-DELIVERY |
| To receive your mutual fund documents online, go to www.pgiminvestments.com/edelivery and enroll. Instead of receiving printed documents by mail, you will receive notification via email when new materials are available. You can cancel your enrollment or change your email address at any time by visiting the website address above. |
|
| SHAREHOLDER COMMUNICATIONS WITH TRUSTEES |
| Shareholders can communicate directly with the Board of Trustees by writing to the Chair of the Board, Prudential Corporate Bond Fund, PGIM Investments, Attn: Board of Trustees, 655 Broad Street, Newark, NJ 07102. Shareholders can communicate directly with an individual Trustee by writing to the same address. Communications are not screened before being delivered to the addressee. |
|
| AVAILABILITY OF PORTFOLIO SCHEDULE |
| The Fund files its complete schedule of portfolio holdings with the Securities and Exchange Commission for the first and third quarters of each fiscal year on Form N-Q. The Fund’s Forms N-Q are available on the Commission’s website at www.sec.gov. The Fund’s Forms N-Q may also be reviewed and copied at the Commission’s Public Reference Room in Washington, D.C. Information on the operation and location of the Public Reference Room may be obtained by calling 1-800-SEC-0330. The Fund’s schedule of portfolio holdings is also available on the Fund’s website as of the end of each month no sooner than 15 days after the end of the month. |
|
| The Fund’s Statement of Additional Information contains additional information about the Fund’s Trustees and is available without charge, upon request, by calling (800) 225-1852. |
Mutual Funds:
| | | | |
ARE NOT INSURED BY THE FDIC OR ANY
FEDERAL GOVERNMENT AGENCY | | MAY LOSE VALUE | | ARE NOT A DEPOSIT OF OR GUARANTEED
BY ANY BANK OR ANY BANK AFFILIATE |
PRUDENTIAL CORPORATE BOND FUND
| | | | | | | | | | |
| SHARE CLASS | | A | | C | | Q | | R | | Z |
| NASDAQ | | PCWAX | | PCWCX | | PCWQX | | PCWRX | | TGMBX |
| CUSIP | | 875921694 | | 875921686 | | 875921678 | | 875921660 | | 875921702 |
MF229E

PRUDENTIAL QMA SMALL-CAP VALUE FUND
ANNUAL REPORT
JULY 31, 2017

To enroll in e-delivery, go to pgiminvestments.com/edelivery
|
| Objective: Above-average capital appreciation |
Highlights
| • | | For the twelve months ended July 31, 2017, the Prudential QMA Small-Cap Value Fund’s Class Z shares outperformed the Russell 2000 Value Index (the Index) and the Lipper Small-Cap Value Funds Average. |
| • | | The Fund benefited from an overweight in the outperforming financials sector and underweights in the underperforming real estate, energy, and utilities sectors. Furthermore, the Fund had good security selection in the financials, real estate, and energy sectors. |
| • | | The Fund had unfavorable security selection in the consumer discretionary and health care sectors. |
This report is not authorized for distribution to prospective investors unless preceded or accompanied by a current prospectus.
The views expressed in this report and information about the Fund’s portfolio holdings are for the period covered by this report and are subject to change thereafter.
Mutual funds are distributed by Prudential Investment Management Services LLC, a Prudential Financial company and member SIPC. QMA is the primary business name of Quantitative Management Associates LLC, a wholly owned subsidiary of PGIM, Inc. (PGIM), a Prudential Financial company. © 2017 Prudential Financial, Inc. and its related entities. The Prudential logo and the Rock symbol are service marks of Prudential Financial, Inc. and its related entities, registered in many jurisdictions worldwide.
| | |
| 2 | | Visit our website at pgiminvestments.com |
Letter from the President

Dear Shareholder:
We hope you find the annual report for the Prudential QMA Small-Cap Value Fund informative and useful. The report covers performance for the 12-month period ended July 31, 2017.
Effective April 3, 2017, Prudential Investments became known as PGIM® Investments. Why PGIM? This new name was chosen to further align with the global investment management businesses of Prudential Financial, which rebranded from Prudential Investment Management in January 2016. This new name allows for one brand and reflects our ability and commitment to delivering investment solutions to clients around the globe. Please keep in mind that only the Fund adviser’s name was changed: the name of your Fund and its management and operation will not change.
Major global events during the reporting period included the US presidential election and domestic issues related to the new administration’s policy initiatives. The US economy experienced weak growth during the first quarter of 2017, although stronger growth took place in the second quarter. Britain began its formal legal process to leave the European Union, and recent parliamentary elections in Britain resulted in unseating the majority party. Overall, global economic growth picked up slightly.
Equities in the US reached new highs, and international equities gained significantly. European stocks posted impressive results. Asian markets were solid, and emerging markets outperformed most regions.
In mid-June, the Federal Reserve raised its Federal Funds rate by 0.25% for the second time in 2017. Fixed income markets were mixed, as rising interest rates affected bond markets. High yield and emerging markets bonds were among the top performers.
Given the uncertainty in today’s investment environment, we believe that active professional portfolio management offers a potential advantage. Active managers often have the knowledge and flexibility to find the best investment opportunities in the most challenging markets.
Even so, it’s best if investment decisions are based on your long-term goals rather than on short-term market and economic developments. We also encourage you to work with an experienced financial advisor who can help you set goals, determine your tolerance for risk, and build a diversified plan that’s right for you and make adjustments when necessary.
At PGIM Investments, we consider it a great privilege and responsibility to help investors participate in opportunities across global markets while meeting their toughest investment challenges. We’re part of PGIM, a top-10 global investment manager with more than $1 trillion in assets under management. This investment expertise allows us to deliver actively managed funds and strategies to meet the needs of investors around the globe.
Thank you for choosing our family of funds.
Sincerely,

Stuart S. Parker, President
Prudential QMA Small-Cap Value Fund
September 15, 2017
| | | | |
| Prudential QMA Small-Cap Value Fund | | | 3 | |
Your Fund’s Performance (unaudited)
Performance data quoted represent past performance. Past performance does not guarantee future results. The investment return and principal value of an investment will fluctuate, so that an investor’s shares, when redeemed, may be worth more or less than their original cost. Current performance may be lower or higher than the past performance data quoted. An investor may obtain performance data as of the most recent month-end by visiting our website at www.pgiminvestments.com or by calling (800) 225-1852.
| | | | | | | | | | | | | | | | | | |
| | | | | Average Annual Total Returns as of 7/31/17
(with sales charges) | |
| | | | | One Year (%) | | | Five Years (%) | | | Ten Years (%) | | | Since Inception (%) | |
| Class A | | | | | 12.73 | | | | N/A | | | | N/A | | | | 6.56 (2/14/14) | |
| Class C | | | | | 17.43 | | | | N/A | | | | N/A | | | | 7.60 (6/19/15) | |
| Class Q | | | | | 19.77 | | | | N/A | | | | N/A | | | | 10.00 (9/25/14) | |
| Class R | | | | | 19.00 | | | | 13.45 | | | | 7.91 | | | | — | |
| Class Z | | | | | 19.66 | | | | 14.02 | | | | 8.46 | | | | — | |
| Russell 2000 Value Index | | | | | 19.21 | | | | 13.76 | | | | 6.94 | | | | — | |
| Russell 2000 Index | | | | | 18.45 | | | | 14.19 | | | | 7.76 | | | | — | |
| Lipper Small-Cap Value Funds Average | | | | | 16.21 | | | | 12.55 | | | | 6.48 | | | | — | |
| | | | | | | | | | | | | | | | | | |
| | | | | Average Annual Total Returns as of 7/31/17
(without sales charges) | |
| | | | | One Year (%) | | | Five Years (%) | | | Ten Years (%) | | | Since Inception (%) | |
| Class A | | | | | 19.29 | | | | N/A | | | | N/A | | | | 8.31 (2/14/14) | |
| Class C | | | | | 18.43 | | | | N/A | | | | N/A | | | | 7.60 (6/19/15) | |
| Class Q | | | | | 19.77 | | | | N/A | | | | N/A | | | | 10.00 (9/25/14) | |
| Class R | | | | | 19.00 | | | | 13.45 | | | | 7.91 | | | | — | |
| Class Z | | | | | 19.66 | | | | 14.02 | | | | 8.46 | | | | — | |
| Russell 2000 Value Index | | | | | 19.21 | | | | 13.76 | | | | 6.94 | | | | — | |
| Russell 2000 Index | | | | | 18.45 | | | | 14.19 | | | | 7.76 | | | | — | |
| Lipper Small-Cap Value Funds Average | | | | | 16.21 | | | | 12.55 | | | | 6.48 | | | | — | |
| | |
| 4 | | Visit our website at pgiminvestments.com |
Growth of a $10,000 Investment
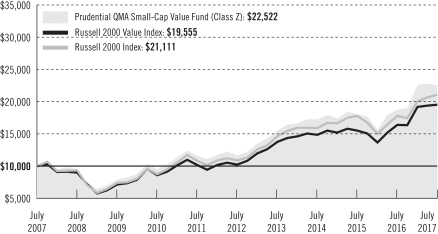
Source: PGIM Investments LLC and Lipper Inc.
The Since Inception returns for the Indexes and the Lipper Average are measured from the closest month-end to the Fund’s inception date. Inception returns are provided for any share class with less than 10 fiscal years of returns.
The graph compares a $10,000 investment in the Prudential QMA Small-Cap Value Fund (Class Z) with a similar investment in the Russell 2000 Value Index and the Russell 2000 Index by portraying the initial account values at the beginning of the 10-year period (July 31, 2007) and the account values at the end of the current fiscal period (July 31, 2017), as measured on a quarterly basis. For purposes of the graph, and unless otherwise indicated, it has been assumed that (a) all recurring fees (including management fees) were deducted; and (b) all dividends and distributions were reinvested. The line graph provides information for Class Z shares only. As indicated in the tables provided earlier, performance for Class A, Class C, Class Q, and Class R shares will vary due to the differing charges and expenses applicable to each share class (as indicated in the following paragraphs). Without waiver of fees and/or expense reimbursements, if any, the returns would have been lower.
Past performance does not predict future performance. Total returns and the ending account values in the graph include changes in share price and reinvestment of dividends and capital gains distributions in a hypothetical investment for the periods shown. The Fund’s total returns do not reflect the deduction of income taxes on an individual’s investment. Taxes may reduce your actual investment returns on income or gains paid by the Fund or any gains you may realize if you sell your shares.
| | | | |
| Prudential QMA Small-Cap Value Fund | | | 5 | |
Your Fund’s Performance (continued)
The returns in the tables do not reflect the deduction of taxes that a shareholder would pay on Fund distributions or following the redemption of Fund shares. The average annual total returns take into account applicable sales charges, which are described for each share class in the table below.
| | | | | | | | | | |
| | | Class A | | Class C | | Class Q | | Class R | | Class Z |
| Maximum initial sales charge | | 5.50% of the public offering price | | None | | None | | None | | None |
| Contingent deferred sales charge (CDSC) (as a percentage of the lower of original purchase price or net asset value at redemption) | | 1.00% on sales of $1 million or more made within 12 months of purchase | | 1.00% on sales made within 12 months of purchase | | None | | None | | None |
| Annual distribution and service (12b-1) fees (shown as a percentage of average daily net assets) | | .30% (.25% currently) | | 1.00% | | None | | .75% (.50% currently) | | None |
Benchmark Definitions
Russell 2000 Value Index
The Russell 2000 Value Index is an unmanaged index which contains those securities in the Russell 2000 Index with a below-average growth orientation. Companies in this index generally have lower price-to-earnings ratios, higher dividend yields, and lower forecasted growth rates.
The average annual total return for the Index measured from the month-end closest to the inception date through 7/31/17 is 8.65% for Class A, 10.19% for Class C, and 11.15% for Class Q shares.
Russell 2000 Index
The Russell 2000 Index is an unmanaged index of the 2,000 smallest US companies included in the Russell 3000® Index. It gives an indication of how stock prices of smaller companies have performed. The average annual total return for the Index measured from the month-end closest to the inception date through 7/31/17 is 8.33% for Class A, 7.86% for Class C, and 11.05% for Class Q shares.
Lipper Small-Cap Value Funds Average
Lipper Small-Cap Value Funds invest at least 75% of their equity assets in companies with market capitalizations (on a three-year weighted basis) below Lipper’s US Diversified Equity small-cap ceiling. Small-cap value funds typically have a below-average price-to-earnings ratio, price-to-book ratio, and a three-year sales-per-share growth rate, compared to the S&P SmallCap 600 Index. The average annual total return for the Average measured from the month-end closest to the inception date through 7/31/17 is 6.56% for Class A, 7.30% for Class C, and 8.00% for Class Q shares.
| | |
| 6 | | Visit our website at pgiminvestments.com |
Investors cannot invest directly in an index or average. The returns for the Indexes would be lower if they included the effects of sales charges, operating expenses of a mutual fund, or taxes. Returns for the Lipper Average reflect the deduction of operating expenses, but not sales charges or taxes.
| | | | |
Five Largest Holdings expressed as a
percentage of net assets as of 7/31/17 (%) | |
Washington Federal, Inc.,
Thrifts & Mortgage Finance | | | 1.1 | |
| MGIC Investment Corp., Thrifts & Mortgage Finance | | | 1.1 | |
| Umpqua Holdings Corp., Banks | | | 1.1 | |
| Cathay General Bancorp, Banks | | | 1.0 | |
| SkyWest, Inc., Airlines | | | 1.0 | |
Holdings reflect only long-term investments and are subject to change.
| | | | |
Five Largest Industries expressed as a
percentage of net assets as of 7/31/17 (%) | |
| Banks | | | 15.9 | |
| Equity Real Estate Investment Trusts (REITs) | | | 8.9 | |
| Thrifts & Mortgage Finance | | | 6.9 | |
| Specialty Retail | | | 5.9 | |
| Insurance | | | 4.6 | |
Industry weightings reflect only long-term investments and are subject to change.
| | | | |
| Prudential QMA Small-Cap Value Fund | | | 7 | |
Strategy and Performance Overview
How did the Fund perform?
The Prudential QMA Small-Cap Value Fund’s Class Z shares gained 19.66% for the twelve months ended July 31, 2017, outperforming the Index, which gained 19.21%, and the 16.21% gain of the Lipper Small-Cap Value Funds Average.
What were market conditions?
| • | | Stocks, especially small-cap stocks, turned in strong performance during the reporting period. As a result of some turbulence in November just after the US presidential election, stocks initially plummeted but quickly reversed course and maintained gains through the reporting period on strong earnings and positive investor sentiment. |
| • | | Headline macro-events included fiercely contested disputes in the US Congress over the Trump administration’s policy initiatives, especially on health care and tax reform. Investors shrugged off the political impasse, as stocks sailed smoothly to new highs. However, the extended low-volatility environment had some investors worried over concerns that a sense of complacency may have taken hold. |
| • | | Solid economic fundamentals in the US included moderate GDP expansion, robust employment, and accelerating corporate profit growth. Inflation remained benign. The Federal Reserve raised the federal funds target rate to 1.00%-1.25%. |
| • | | Overall, sector performance in the Index was mixed, but six sectors experienced double-digit returns. The top performer was information technology, which posted a 36.38% return. Financials rose by 29.55%. Industrials jumped to a 26.17% gain. Materials also experienced a double-digit return of 19.38%. Health care rose by 18.84%. Utilities rose by 12.01%. Consumer discretionary experienced a 9.26% gain. Real estate rose by 2.54%. On the negative side, consumer staples gave up 0.10%. Energy returned –0.69%. Telecommunications services was the laggard with a –11.63% loss. |
What worked?
| • | | The Fund benefited from an overweight in the outperforming financials sector and underweights in the underperforming real estate, energy, and utilities sectors. Furthermore, the Fund had good security selection in the financials, real estate, and energy sectors. |
| • | | Within the financials sector, the Fund added value from (1) solid selection among mortgage finance, consumer finance, and insurance stocks, (2) the timely sales of bank positions, and (3) an overweight in the strong performing investment banking & brokerage industry. |
| • | | At the security level in financials, the performance standouts were Walker & Dunlop, Inc. and American Equity Investment Life Holding Company. Walker & Dunlop, a commercial real estate lender, had strong operating results, driven by growth in transaction volume and margin improvement on a more profitable loan origination mix. |
| | |
| 8 | | Visit our website at pgiminvestments.com |
| | The stock price of American Equity recovered strongly as investors became less concerned that the company’s indexed annuity sales could be impacted by the US Department of Labor’s new fiduciary rules. |
| • | | In the real estate sector, underweights in the poor-performing retail and health care REITs industries helped relative performance. |
| • | | In the energy sector, the timely sales of oil & gas equipment & services holdings contributed significantly to performance. |
| • | | Among other top performing holdings, the Fund benefited from positions in Amkor Technology, Inc., CAI International, Inc., and Adtalem Global Education Inc. Amkor Technology is one of the world’s largest providers of outsourced semiconductor packaging and testing services. CAI International is one of the world’s leading intermodal freight container leasing and management companies. Adtalem Global Education is a global education provider. |
What didn’t work?
| • | | The Fund had unfavorable security selection in the consumer discretionary and health care sectors. |
| • | | In the consumer discretionary sector, poor security selection among retailers detracted significantly from performance, mainly from the untimely purchases of low-valued apparel retailers. Many apparel retailers are experiencing weak store traffic and changing shopping patterns, which are hurting their operating results. Some of these retailers are addressing this difficult environment with cost-cutting initiatives and expansion of their omnichannel capabilities. |
| • | | Ascena Retail Group, Inc. and Fossil Group, Inc. were the leading detractors at the security level within the consumer discretionary sector. Ascena Retail Group is a national specialty retailer offering apparel, shoes, and accessories for women. Fossil Group, a fashion accessories company, is challenged from weak demand for traditional watches while it grows its wearables business and executes on its cost structure reduction initiatives. |
| • | | In the health care sector, an overweight in the underperforming health care facilities industry and no exposure to the strong performing, expensively valued biotechnology stocks weighed on performance. The most significant underperforming holding here was Brookdale Senior Living Inc., a leading operator of senior living communities throughout the US. The increase in senior housing construction growth, which resulted in more supply, had negatively affected occupancy rates for some senior housing operators. |
| • | | Among other underperforming holdings, the Fund was not helped from positions in property owner Select Income REIT and oil & gas driller Atwood Oceanics, Inc. |
| | | | |
| Prudential QMA Small-Cap Value Fund | | | 9 | |
Strategy and Performance Overview (continued)
The percentage points shown in the tables identify each security’s positive or negative contribution to the Fund’s return, which is the sum of all contributions by individual holdings.
| | | | | | |
| Top Contributors (%) | | Top Detractors (%) |
| Amkor Technology, Inc. | | 0.50 | | Ascena Retail Group, Inc. | | –0.43 |
| Walker & Dunlop, Inc. | | 0.27 | | Brookdale Senior Living Inc. | | –0.26 |
| CAI International, Inc. | | 0.23 | | Select Income REIT | | –0.25 |
| American Equity Investment Life Holding Company | | 0.23 | | Atwood Oceanics, Inc. | | –0.24 |
| Adtalem Global Education Inc. | | 0.22 | | Fossil Group, Inc. | | –0.23 |
Current outlook
| • | | QMA continues to view the Fund as well positioned in small-cap stocks that are attractively valued. The spread in valuations between the most expensive and least expensive groups of stocks in the market continues to be wide relative to its history, suggesting an opportunity for a payoff to value stocks. The Fund also continues to trade at a discount to the Russell 2000 Value Index on a variety of valuation metrics. QMA believes this discount represents a real opportunity for strong future relative performance. |
| • | | Although the “average” stock does not appear cheap now, QMA’s quantitative model continues to find attractively valued small-cap companies within the US stock market. From a sector perspective, relative to the benchmark (the Russell 2000 Value Index), the Fund currently has large overweights in the consumer discretionary and financials sectors, and large underweights in the utilities and information technology sectors. |
| | |
| 10 | | Visit our website at pgiminvestments.com |
Fees and Expenses (unaudited)
As a shareholder of the Fund, you incur two types of costs: (1) transaction costs, including sales charges (loads) on purchase payments and redemptions, as applicable, and (2) ongoing costs, including management fees, and other Fund expenses, as applicable. This example is intended to help you understand your ongoing costs (in dollars) of investing in the Fund and to compare these costs with the ongoing costs of investing in other mutual funds.
The example is based on an investment of $1,000 held through the six-month period ended July 31, 2017. The example is for illustrative purposes only; you should consult the Prospectus for information on initial and subsequent minimum investment requirements.
Actual Expenses
The first line for each share class in the table on the following pages provides information about actual account values and actual expenses. You may use the information on this line, together with the amount you invested, to estimate the expenses that you paid over the period. Simply divide your account value by $1,000 (for example, an $8,600 account value ÷ $1,000 = 8.6), then multiply the result by the number on the first line under the heading “Expenses Paid During the Six-Month Period” to estimate the expenses you paid on your account during this period.
Hypothetical Example for Comparison Purposes
The second line for each share class in the table on the following pages provides information about hypothetical account values and hypothetical expenses based on the Fund’s actual expense ratio and an assumed rate of return of 5% per year before expenses, which is not the Fund’s actual return. The hypothetical account values and expenses may not be used to estimate the actual ending account balance or expenses you paid for the period. You may use this information to compare the ongoing costs of investing in the Fund and other funds. To do so, compare this 5% hypothetical example with the 5% hypothetical examples that appear in the shareholder reports of the other funds.
The Fund’s transfer agent may charge additional fees to holders of certain accounts that are not included in the expenses shown in the table on the following pages. These fees apply to individual retirement accounts (IRAs) and Section 403(b) accounts. As of the close of the six-month period covered by the table, IRA fees included an annual maintenance fee of $15 per account (subject to a maximum annual maintenance fee of $25 for all accounts held by the same shareholder). Section 403(b) accounts are charged an annual $25 fiduciary maintenance fee. Some of the fees may vary in amount, or may be waived, based on your total account balance or the number of Prudential funds, including the Fund, that you own. You should consider the additional fees that were charged to your Fund account over the six-month period when you estimate the total ongoing expenses paid over the
| | | | |
| Prudential QMA Small-Cap Value Fund | | | 11 | |
Fees and Expenses (continued)
period and the impact of these fees on your ending account value, as these additional expenses are not reflected in the information provided in the expense table. Additional fees have the effect of reducing investment returns.
Please note that the expenses shown in the table are meant to highlight your ongoing costs only and do not reflect any transactional costs such as sales charges (loads). Therefore, the second line for each share class in the table is useful in comparing ongoing costs only and will not help you determine the relative total costs of owning different funds. In addition, if these transactional costs were included, your costs would have been higher.
| | | | | | | | | | | | | | | | | | |
Prudential QMA Small-Cap
Value Fund | | Beginning Account
Value
February 1, 2017 | | | Ending Account
Value
July 31, 2017 | | | Annualized
Expense Ratio
Based on the
Six-Month��Period | | | Expenses Paid
During the
Six-Month Period* | |
| Class A | | Actual | | $ | 1,000.00 | | | $ | 993.50 | | | | 0.96 | % | | $ | 4.75 | |
| | Hypothetical | | $ | 1,000.00 | | | $ | 1,020.03 | | | | 0.96 | % | | $ | 4.81 | |
| Class C | | Actual | | $ | 1,000.00 | | | $ | 989.80 | | | | 1.71 | % | | $ | 8.44 | |
| | Hypothetical | | $ | 1,000.00 | | | $ | 1,016.31 | | | | 1.71 | % | | $ | 8.55 | |
| Class Q | | Actual | | $ | 1,000.00 | | | $ | 995.30 | | | | 0.62 | % | | $ | 3.07 | |
| | Hypothetical | | $ | 1,000.00 | | | $ | 1,021.72 | | | | 0.62 | % | | $ | 3.11 | |
| Class R | | Actual | | $ | 1,000.00 | | | $ | 992.50 | | | | 1.21 | % | | $ | 5.98 | |
| | Hypothetical | | $ | 1,000.00 | | | $ | 1,018.79 | | | | 1.21 | % | | $ | 6.06 | |
| Class Z | | Actual | | $ | 1,000.00 | | | $ | 994.90 | | | | 0.71 | % | | $ | 3.51 | |
| | | Hypothetical | | $ | 1,000.00 | | | $ | 1,021.27 | | | | 0.71 | % | | $ | 3.56 | |
*Fund expenses (net of fee waivers or subsidies, if any) for each share class are equal to the annualized expense ratio for each share class (provided in the table), multiplied by the average account value over the period, multiplied by the 181 days in the six-month period ended July 31, 2017, and divided by the 365 days in the Fund’s fiscal year ended July 31, 2017 (to reflect the six-month period). Expenses presented in the table include the expenses of any underlying portfolios in which the Fund may invest.
| | |
| 12 | | Visit our website at pgiminvestments.com |
Schedule of Investments
as of July 31, 2017
| | | | | | | | |
| Description | | Shares | | | Value | |
LONG-TERM INVESTMENTS 99.5% | |
|
COMMON STOCKS 98.9% | |
|
Aerospace & Defense 0.8% | |
Moog, Inc. (Class A Stock)* | | | 26,400 | | | $ | 1,962,048 | |
Triumph Group, Inc.(a) | | | 226,900 | | | | 5,808,640 | |
Vectrus, Inc.* | | | 158,800 | | | | 5,400,788 | |
| | | | | | | | |
| | | | | | | 13,171,476 | |
|
Air Freight & Logistics 0.7% | |
Atlas Air Worldwide Holdings, Inc.* | | | 191,728 | | | | 11,388,643 | |
|
Airlines 1.4% | |
Allegiant Travel Co. | | | 4,900 | | | | 633,325 | |
Hawaiian Holdings, Inc.* | | | 37,100 | | | | 1,535,940 | |
SkyWest, Inc. | | | 436,768 | | | | 15,942,032 | |
Spirit Airlines, Inc.* | | | 114,100 | | | | 4,432,785 | |
| | | | | | | | |
| | | | | | | 22,544,082 | |
|
Auto Components 3.1% | |
American Axle & Manufacturing Holdings, Inc.*(a) | | | 402,600 | | | | 5,934,324 | |
Cooper-Standard Holdings, Inc.* | | | 99,300 | | | | 10,154,418 | |
Dana, Inc. | | | 596,800 | | | | 14,156,096 | |
Stoneridge, Inc.* | | | 158,700 | | | | 2,421,762 | |
Superior Industries International, Inc. | | | 75,400 | | | | 1,474,070 | |
Tenneco, Inc.(a) | | | 128,800 | | | | 7,122,640 | |
Tower International, Inc. | | | 322,289 | | | | 7,960,538 | |
| | | | | | | | |
| | | | | | | 49,223,848 | |
|
Banks 15.9% | |
Arrow Financial Corp. | | | 37,119 | | | | 1,210,079 | |
Associated Banc-Corp. | | | 17,500 | | | | 419,125 | |
Banc of California, Inc.(a) | | | 237,200 | | | | 4,874,460 | |
Banco Latinoamericano de Comercio Exterior SA (Panama) | | | 239,611 | | | | 6,304,165 | |
Bank of Marin Bancorp | | | 46,662 | | | | 3,110,022 | |
Berkshire Hills Bancorp, Inc. | | | 368,604 | | | | 13,693,639 | |
Bridge Bancorp, Inc. | | | 38,500 | | | | 1,251,250 | |
Camden National Corp. | | | 94,326 | | | | 3,961,692 | |
Cathay General Bancorp | | | 442,000 | | | | 16,552,900 | |
Century Bancorp, Inc. (Class A Stock) | | | 6,900 | | | | 460,230 | |
Chemical Financial Corp.(a) | | | 70,400 | | | | 3,392,576 | |
Citizens & Northern Corp.(a) | | | 29,016 | | | | 669,689 | |
City Holding Co.(a) | | | 2,600 | | | | 170,638 | |
CNB Financial Corp. | | | 38,399 | | | | 1,012,198 | |
Community Trust Bancorp, Inc. | | | 106,966 | | | | 4,620,931 | |
See Notes to Financial Statements.
| | | | |
| Prudential QMA Small-Cap Value Fund | | | 13 | |
Schedule of Investments (continued)
as of July 31, 2017
| | | | | | | | |
| Description | | Shares | | | Value | |
COMMON STOCKS (Continued) | | | | | | | | |
| | |
Banks (cont’d.) | | | | | | | | |
Customers Bancorp, Inc.* | | | 347,630 | | | $ | 10,376,756 | |
Enterprise Financial Services Corp. | | | 225,380 | | | | 8,913,779 | |
FB Financial Corp.* | | | 6,000 | | | | 206,220 | |
Fidelity Southern Corp. | | | 307,893 | | | | 6,484,227 | |
Financial Institutions, Inc. | | | 159,528 | | | | 4,690,123 | |
First Business Financial Services, Inc. | | | 19,000 | | | | 403,940 | |
First Commonwealth Financial Corp. | | | 132,100 | | | | 1,721,263 | |
First Community Bancshares, Inc. | | | 60,634 | | | | 1,650,457 | |
First Financial Bancorp(a) | | | 152,751 | | | | 3,910,426 | |
First Financial Corp. | | | 106,859 | | | | 4,920,857 | |
First Interstate BancSystem, Inc. (Class A Stock) | | | 5,500 | | | | 201,025 | |
First Merchants Corp. | | | 32,607 | | | | 1,318,627 | |
FNB Corp. | | | 139,800 | | | | 1,915,260 | |
Franklin Financial Network, Inc.* | | | 12,600 | | | | 435,330 | |
Great Southern Bancorp, Inc. | | | 92,663 | | | | 4,813,843 | |
Great Western Bancorp, Inc. | | | 260,800 | | | | 10,173,808 | |
Hanmi Financial Corp. | | | 198,378 | | | | 5,683,530 | |
Heartland Financial USA, Inc. | | | 216,950 | | | | 10,218,345 | |
Hilltop Holdings, Inc. | | | 253,603 | | | | 6,347,683 | |
Hope Bancorp, Inc. | | | 804,016 | | | | 14,174,802 | |
Horizon Bancorp | | | 85,054 | | | | 2,242,874 | |
IBERIABANK Corp. | | | 157,100 | | | | 12,701,535 | |
International Bancshares Corp. | | | 394,982 | | | | 13,982,363 | |
Lakeland Bancorp, Inc. | | | 105,927 | | | | 2,049,687 | |
MainSource Financial Group, Inc. | | | 18,673 | | | | 652,435 | |
MidWestOne Financial Group, Inc. | | | 10,362 | | | | 356,660 | |
OFG Bancorp (Puerto Rico) | | | 44,700 | | | | 449,235 | |
Old National Bancorp | | | 634,343 | | | | 10,339,791 | |
Opus Bank(a) | | | 8,200 | | | | 195,160 | |
PacWest Bancorp | | | 10,300 | | | | 494,606 | |
Peapack Gladstone Financial Corp. | | | 52,779 | | | | 1,650,399 | |
Prosperity Bancshares, Inc.(a) | | | 67,958 | | | | 4,356,108 | |
S&T Bancorp, Inc. | | | 170,063 | | | | 6,441,986 | |
Sandy Spring Bancorp, Inc. | | | 6,100 | | | | 244,244 | |
Simmons First National Corp. (Class A Stock) | | | 27,700 | | | | 1,511,035 | |
TCF Financial Corp. | | | 112,900 | | | | 1,779,304 | |
TriCo Bancshares | | | 111,450 | | | | 4,112,505 | |
Trustmark Corp. | | | 9,500 | | | | 303,620 | |
Umpqua Holdings Corp. | | | 906,700 | | | | 16,810,218 | |
United Community Banks, Inc. | | | 64,400 | | | | 1,787,744 | |
Valley National Bancorp(a) | | | 89,000 | | | | 1,057,320 | |
WesBanco, Inc. | | | 174,648 | | | | 6,676,793 | |
See Notes to Financial Statements.
| | | | | | | | |
| Description | | Shares | | | Value | |
COMMON STOCKS (Continued) | | | | | | | | |
| | |
Banks (cont’d.) | | | | | | | | |
West Bancorporation, Inc. | | | 51,759 | | | $ | 1,190,457 | |
Western Alliance Bancorp* | | | 12,900 | | | | 649,902 | |
| | | | | | | | |
| | | | 252,299,876 | |
|
Biotechnology 0.4% | |
AMAG Pharmaceuticals, Inc.* | | | 114,000 | | | | 2,240,100 | |
PDL BioPharma, Inc.* | | | 550,300 | | | | 1,249,181 | |
United Therapeutics Corp.*(a) | | | 16,400 | | | | 2,105,760 | |
| | | | | | | | |
| | | | | | | 5,595,041 | |
|
Building Products 0.3% | |
Caesarstone Ltd. (Israel)* | | | 23,600 | | | | 828,360 | |
Continental Building Products, Inc.* | | | 153,300 | | | | 3,372,600 | |
Ply Gem Holdings, Inc.* | | | 26,800 | | | | 469,000 | |
| | | | | | | | |
| | | | | | | 4,669,960 | |
|
Capital Markets 2.2% | |
Arlington Asset Investment Corp. (Class A Stock) | | | 111,196 | | | | 1,434,429 | |
Artisan Partners Asset Management, Inc. (Class A Stock)(a) | | | 8,900 | | | | 295,925 | |
Greenhill & Co., Inc.(a) | | | 11,700 | | | | 216,450 | |
INTL FCStone, Inc.* | | | 127,200 | | | | 4,977,336 | |
Moelis & Co. (Class A Stock) | | | 67,500 | | | | 2,760,750 | |
OM Asset Management PLC | | | 256,100 | | | | 3,859,427 | |
Piper Jaffray Cos. | | | 133,683 | | | | 8,341,819 | |
Stifel Financial Corp.*(a) | | | 172,300 | | | | 8,761,455 | |
Waddell & Reed Financial, Inc. (Class A Stock)(a) | | | 213,400 | | | | 4,410,978 | |
| | | | | | | | |
| | | | | | | 35,058,569 | |
|
Chemicals 1.8% | |
A. Schulman, Inc. | | | 79,800 | | | | 2,098,740 | |
Cabot Corp. | | | 12,100 | | | | 657,393 | |
FutureFuel Corp. | | | 179,900 | | | | 2,619,344 | |
Innophos Holdings, Inc. | | | 64,300 | | | | 2,685,811 | |
Koppers Holdings, Inc.* | | | 93,600 | | | | 3,397,680 | |
Rayonier Advanced Materials, Inc. | | | 19,200 | | | | 286,272 | |
Stepan Co. | | | 115,219 | | | | 9,467,545 | |
Trinseo SA | | | 106,100 | | | | 7,458,830 | |
| | | | | | | | |
| | | | | | | 28,671,615 | |
|
Commercial Services & Supplies 3.0% | |
ACCO Brands Corp.* | | | 688,841 | | | | 8,024,997 | |
CECO Environmental Corp. | | | 81,600 | | | | 788,256 | |
See Notes to Financial Statements.
| | | | |
| Prudential QMA Small-Cap Value Fund | | | 15 | |
Schedule of Investments (continued)
as of July 31, 2017
| | | | | | | | |
| Description | | Shares | | | Value | |
COMMON STOCKS (Continued) | | | | | | | | |
| | |
Commercial Services & Supplies (cont’d.) | | | �� | | | | | |
Deluxe Corp.(a) | | | 11,600 | | | $ | 837,520 | |
Ennis, Inc. | | | 420,956 | | | | 8,103,403 | |
Essendant, Inc. | | | 217,600 | | | | 2,715,648 | |
Herman Miller, Inc. | | | 339,000 | | | | 11,415,825 | |
Knoll, Inc. | | | 39,100 | | | | 756,976 | |
McGrath RentCorp | | | 72,500 | | | | 2,575,925 | |
Pitney Bowes, Inc. | | | 164,100 | | | | 2,582,934 | |
Quad/Graphics, Inc. | | | 244,071 | | | | 5,481,835 | |
Steelcase, Inc. (Class A Stock) | | | 33,100 | | | | 451,815 | |
Viad Corp. | | | 42,100 | | | | 2,254,455 | |
VSE Corp. | | | 43,700 | | | | 2,265,845 | |
| | | | | | | | |
| | | | | | | 48,255,434 | |
|
Construction & Engineering 1.7% | |
AECOM*(a) | | | 181,500 | | | | 5,789,850 | |
Aegion Corp.* | | | 231,893 | | | | 5,551,519 | |
Argan, Inc. | | | 193,900 | | | | 12,496,855 | |
Chicago Bridge & Iron Co. NV(a) | | | 141,700 | | | | 2,655,458 | |
| | | | | | | | |
| | | | | | | 26,493,682 | |
|
Consumer Finance 1.9% | |
Encore Capital Group, Inc.*(a) | | | 218,291 | | | | 8,753,469 | |
Enova International, Inc.* | | | 378,205 | | | | 5,483,972 | |
Nelnet, Inc. (Class A Stock) | | | 204,553 | | | | 10,041,507 | |
Regional Management Corp.* | | | 72,100 | | | | 1,729,679 | |
World Acceptance Corp.*(a) | | | 53,700 | | | | 4,058,109 | |
| | | | | | | | |
| | | | | | | 30,066,736 | |
|
Containers & Packaging 0.6% | |
Bemis Co., Inc. | | | 61,500 | | | | 2,605,755 | |
Graphic Packaging Holding Co. | | | 64,600 | | | | 852,074 | |
Owens-Illinois, Inc.* | | | 244,700 | | | | 5,848,330 | |
Silgan Holdings, Inc. | | | 17,100 | | | | 518,130 | |
| | | | | | | | |
| | | | 9,824,289 | |
|
Diversified Consumer Services 0.2% | |
Adtalem Global Education, Inc.(a) | | | 86,000 | | | | 2,795,000 | |
American Public Education, Inc.* | | | 11,600 | | | | 247,080 | |
| | | | | | | | |
| | | | | | | 3,042,080 | |
|
Diversified Financial Services 0.1% | |
Marlin Business Services Corp. | | | 51,400 | | | | 1,336,400 | |
See Notes to Financial Statements.
| | | | | | | | |
| Description | | Shares | | | Value | |
COMMON STOCKS (Continued) | | | | | | | | |
|
Diversified Telecommunication Services 0.7% | |
Iridium Communications, Inc.*(a) | | | 1,152,998 | | | $ | 11,472,330 | |
|
Electrical Equipment 0.6% | |
Generac Holdings, Inc.* | | | 79,500 | | | | 2,859,615 | |
Regal Beloit Corp. | | | 78,700 | | | | 6,559,645 | |
| | | | | | | | |
| | | | 9,419,260 | |
|
Electronic Equipment, Instruments & Components 3.7% | |
Anixter International, Inc.* | | | 27,800 | | | | 2,189,250 | |
Bel Fuse, Inc. (Class B Stock) | | | 30,309 | | | | 765,302 | |
Benchmark Electronics, Inc.* | | | 123,446 | | | | 4,153,958 | |
Methode Electronics, Inc. | | | 50,800 | | | | 2,019,300 | |
Sanmina Corp.* | | | 443,974 | | | | 15,916,468 | |
ScanSource, Inc.* | | | 166,600 | | | | 6,597,360 | |
Tech Data Corp.* | | | 125,800 | | | | 12,881,920 | |
TTM Technologies, Inc.*(a) | | | 817,300 | | | | 14,204,674 | |
| | | | | | | | |
| | | | | | | 58,728,232 | |
|
Energy Equipment & Services 1.3% | |
Atwood Oceanics, Inc.* | | | 828,200 | | | | 6,509,652 | |
Diamond Offshore Drilling, Inc.*(a) | | | 484,600 | | | | 6,018,732 | |
Ensco PLC (Class A Stock) | | | 84,400 | | | | 446,476 | |
Exterran Corp.* | | | 16,100 | | | | 445,809 | |
McDermott International, Inc.*(a) | | | 761,500 | | | | 5,155,355 | |
Rowan Cos. PLC (Class A Stock)*(a) | | | 229,700 | | | | 2,680,599 | |
| | | | | | | | |
| | | | | | | 21,256,623 | |
|
Equity Real Estate Investment Trusts (REITs) 8.9% | |
Ashford Hospitality Prime, Inc. | | | 326,879 | | | | 3,386,467 | |
Ashford Hospitality Trust, Inc.(a) | | | 1,676,220 | | | | 10,543,424 | |
Brixmor Property Group, Inc. | | | 287,000 | | | | 5,622,330 | |
Care Capital Properties, Inc. | | | 74,800 | | | | 1,811,656 | |
CBL & Associates Properties, Inc.(a) | | | 179,900 | | | | 1,581,321 | |
Chatham Lodging Trust(a) | | | 351,900 | | | | 7,277,292 | |
CorEnergy Infrastructure Trust, Inc. | | | 180,815 | | | | 6,438,822 | |
DDR Corp. | | | 634,500 | | | | 6,465,555 | |
First Potomac Realty Trust | | | 140,085 | | | | 1,559,146 | |
Government Properties Income Trust(a) | | | 140,200 | | | | 2,485,746 | |
Hersha Hospitality Trust(a) | | | 451,100 | | | | 8,462,636 | |
Hospitality Properties Trust(a) | | | 212,800 | | | | 6,183,968 | |
InfraREIT, Inc. | | | 361,300 | | | | 8,125,637 | |
iStar, Inc.*(a) | | | 95,900 | | | | 1,146,005 | |
See Notes to Financial Statements.
| | | | |
| Prudential QMA Small-Cap Value Fund | | | 17 | |
Schedule of Investments (continued)
as of July 31, 2017
| | | | | | | | |
| Description | | Shares | | | Value | |
COMMON STOCKS (Continued) | | | | | | | | |
|
Equity Real Estate Investment Trusts (REITs) (cont’d.) | |
Lexington Realty Trust | | | 1,256,277 | | | $ | 12,788,900 | |
New Senior Investment Group, Inc. | | | 352,700 | | | | 3,664,553 | |
RAIT Financial Trust(a) | | | 336,319 | | | | 672,638 | |
Ramco-Gershenson Properties Trust | | | 125,600 | | | | 1,769,704 | |
RLJ Lodging Trust | | | 426,600 | | | | 9,026,856 | |
Select Income REIT | | | 597,628 | | | | 14,026,329 | |
Spirit Realty Capital, Inc. | | | 801,200 | | | | 6,353,516 | |
Washington Prime Group, Inc.(a) | | | 713,600 | | | | 6,436,672 | |
Xenia Hotels & Resorts, Inc. | | | 717,400 | | | | 14,577,568 | |
| | | | | | | | |
| | | | | | | 140,406,741 | |
|
Food & Staples Retailing 1.2% | |
Ingles Markets, Inc. (Class A Stock) | | | 186,605 | | | | 5,504,847 | |
SpartanNash Co. | | | 362,590 | | | | 10,058,247 | |
United Natural Foods, Inc.*(a) | | | 97,500 | | | | 3,756,675 | |
| | | | | | | | |
| | | | | | | 19,319,769 | |
|
Food Products 1.6% | |
Darling Ingredients, Inc.* | | | 321,500 | | | | 5,230,805 | |
Fresh Del Monte Produce, Inc. | | | 194,661 | | | | 10,019,202 | |
Omega Protein Corp. | | | 111,300 | | | | 1,780,800 | |
Sanderson Farms, Inc.(a) | | | 61,400 | | | | 8,028,050 | |
| | | | | | | | |
| | | | | | | 25,058,857 | |
|
Gas Utilities 0.2% | |
National Fuel Gas Co.(a) | | | 59,800 | | | | 3,540,758 | |
|
Health Care Providers & Services 1.9% | |
Brookdale Senior Living, Inc.* | | | 368,800 | | | | 5,236,960 | |
HealthSouth Corp. | | | 239,100 | | | | 10,176,096 | |
Kindred Healthcare, Inc. | | | 611,600 | | | | 5,473,820 | |
LifePoint Health, Inc.*(a) | | | 79,200 | | | | 4,704,480 | |
Select Medical Holdings Corp.* | | | 306,385 | | | | 4,963,437 | |
| | | | | | | | |
| | | | | | | 30,554,793 | |
|
Hotels, Restaurants & Leisure 1.0% | |
Bloomin’ Brands, Inc.(a) | | | 343,600 | | | | 5,988,948 | |
Brinker International, Inc. | | | 39,800 | | | | 1,411,706 | |
Fiesta Restaurant Group, Inc.*(a) | | | 34,600 | | | | 581,280 | |
Penn National Gaming, Inc.* | | | 252,600 | | | | 5,092,416 | |
Speedway Motorsports, Inc. | | | 91,990 | | | | 1,955,707 | |
| | | | | | | | |
| | | | | | | 15,030,057 | |
See Notes to Financial Statements.
| | | | | | | | |
| Description | | Shares | | | Value | |
COMMON STOCKS (Continued) | | | | | | | | |
|
Household Durables 3.2% | |
Helen of Troy Ltd.* | | | 111,700 | | | $ | 11,253,775 | |
KB Home(a) | | | 608,100 | | | | 13,937,652 | |
La-Z-Boy, Inc. | | | 64,000 | | | | 2,163,200 | |
MDC Holdings, Inc. | | | 295,800 | | | | 10,142,982 | |
Taylor Morrison Home Corp. (Class A Stock)* | | | 550,900 | | | | 12,461,358 | |
| | | | | | | | |
| | | | | | | 49,958,967 | |
|
Independent Power & Renewable Electricity Producers 0.8% | |
NRG Yield, Inc. (Class C Stock) | | | 718,000 | | | | 13,354,800 | |
|
Insurance 4.6% | |
Ambac Financial Group, Inc.* | | | 71,500 | | | | 1,460,745 | |
American Equity Investment Life Holding Co.(a) | | | 497,177 | | | | 13,314,400 | |
Argo Group International Holdings Ltd. | | | 178,481 | | | | 10,699,936 | |
CNO Financial Group, Inc. | | | 645,800 | | | | 14,775,904 | |
EMC Insurance Group, Inc. | | | 52,850 | | | | 1,463,945 | |
Employers Holdings, Inc. | | | 277,698 | | | | 12,038,208 | |
Enstar Group Ltd. (Bermuda)* | | | 8,900 | | | | 1,803,140 | |
FBL Financial Group, Inc. (Class A Stock) | | | 83,468 | | | | 5,667,477 | |
Heritage Insurance Holdings, Inc.(a) | | | 100,100 | | | | 1,262,261 | |
Independence Holding Co. | | | 4,200 | | | | 93,240 | |
National General Holdings Corp. | | | 93,500 | | | | 1,983,135 | |
National Western Life Group, Inc. (Class A Stock) | | | 13,400 | | | | 4,510,306 | |
Selective Insurance Group, Inc. | | | 53,567 | | | | 2,713,169 | |
United Insurance Holdings Corp.(a) | | | 39,280 | | | | 626,909 | |
| | | | | | | | |
| | | | | | | 72,412,775 | |
|
IT Services 1.0% | |
Convergys Corp. | | | 101,731 | | | | 2,438,492 | |
CSRA, Inc. | | | 178,800 | | | | 5,830,668 | |
EVERTEC, Inc. (Puerto Rico) | | | 97,700 | | | | 1,743,945 | |
Travelport Worldwide Ltd. | | | 410,100 | | | | 5,864,430 | |
| | | | | | | | |
| | | | | | | 15,877,535 | |
|
Leisure Products 0.0% | |
Malibu Boats, Inc. (Class A Stock)*(a) | | | 11,200 | | | | 320,432 | |
|
Machinery 2.2% | |
Columbus McKinnon Corp. | | | 62,500 | | | | 1,612,500 | |
Douglas Dynamics, Inc. | | | 24,001 | | | | 763,232 | |
Global Brass & Copper Holdings, Inc. | | | 206,876 | | | | 6,630,376 | |
Greenbrier Cos., Inc. (The)(a) | | | 257,700 | | | | 11,596,500 | |
See Notes to Financial Statements.
| | | | |
| Prudential QMA Small-Cap Value Fund | | | 19 | |
Schedule of Investments (continued)
as of July 31, 2017
| | | | | | | | |
| Description | | Shares | | | Value | |
COMMON STOCKS (Continued) | | | | | | | | |
|
Machinery (cont’d.) | |
Meritor, Inc.* | | | 102,500 | | | $ | 1,771,200 | |
TriMas Corp.* | | | 73,700 | | | | 1,794,595 | |
Wabash National Corp.(a) | | | 572,297 | | | | 10,919,426 | |
| | | | | | | | |
| | | | | | | 35,087,829 | |
|
Marine 0.2% | |
Costamare, Inc. (Monaco)(a) | | | 326,900 | | | | 2,101,967 | |
Matson, Inc. | | | 50,200 | | | | 1,415,640 | |
| | | | | | | | |
| | | | | | | 3,517,607 | |
|
Media 1.5% | |
Entercom Communications Corp. (Class A Stock)(a) | | | 102,682 | | | | 1,011,418 | |
Gannett Co., Inc.(a) | | | 691,500 | | | | 6,202,755 | |
Gray Television, Inc.* | | | 167,100 | | | | 2,489,790 | |
Meredith Corp.(a) | | | 170,300 | | | | 10,124,335 | |
Saga Communications, Inc. (Class A Stock) | | | 8,310 | | | | 322,843 | |
Time, Inc. | | | 306,600 | | | | 4,307,730 | |
| | | | | | | | |
| | | | | | | 24,458,871 | |
|
Metals & Mining 1.8% | |
Handy & Harman Ltd.* | | | 46,093 | | | | 1,525,678 | |
Kaiser Aluminum Corp. | | | 23,000 | | | | 2,237,670 | |
Reliance Steel & Aluminum Co. | | | 40,900 | | | | 2,959,524 | |
Schnitzer Steel Industries, Inc. (Class A Stock) | | | 189,700 | | | | 4,894,260 | |
SunCoke Energy, Inc.* | | | 51,800 | | | | 463,610 | |
Tahoe Resources, Inc. | | | 676,200 | | | | 3,698,814 | |
Worthington Industries, Inc. | | | 236,415 | | | | 11,979,148 | |
| | | | | | | | |
| | | | | | | 27,758,704 | |
|
Mortgage Real Estate Investment Trusts (REITs) 4.1% | |
AG Mortgage Investment Trust, Inc. | | | 329,181 | | | | 6,060,222 | |
Anworth Mortgage Asset Corp. | | | 75,700 | | | | 455,714 | |
Apollo Commercial Real Estate Finance, Inc.(a) | | | 276,483 | | | | 4,984,989 | |
ARMOUR Residential REIT, Inc. | | | 257,100 | | | | 6,494,346 | |
Capstead Mortgage Corp. | | | 610,092 | | | | 5,966,700 | |
Cherry Hill Mortgage Investment Corp. | | | 14,900 | | | | 285,931 | |
CYS Investments, Inc. | | | 832,609 | | | | 7,085,503 | |
Dynex Capital, Inc. | | | 680,806 | | | | 4,704,370 | |
Ellington Residential Mortgage REIT | | | 13,200 | | | | 195,756 | |
Invesco Mortgage Capital, Inc. | | | 512,726 | | | | 8,526,633 | |
Ladder Capital Corp. | | | 132,290 | | | | 1,740,936 | |
MTGE Investment Corp. | | | 371,737 | | | | 6,914,308 | |
See Notes to Financial Statements.
| | | | | | | | |
| Description | | Shares | | | Value | |
COMMON STOCKS (Continued) | | | | | | | | |
|
Mortgage Real Estate Investment Trusts (REITs) (cont’d.) | |
New York Mortgage Trust, Inc.(a) | | | 154,000 | | | $ | 973,280 | |
Redwood Trust, Inc. | | | 418,100 | | | | 7,220,587 | |
Western Asset Mortgage Capital Corp. | | | 396,600 | | | | 4,120,674 | |
| | | | | | | | |
| | | | | | | 65,729,949 | |
|
Multi-Utilities 0.0% | |
NorthWestern Corp.(a) | | | 12,000 | | | | 693,480 | |
|
Multiline Retail 0.3% | |
Big Lots, Inc.(a) | | | 97,900 | | | | 4,862,693 | |
|
Oil, Gas & Consumable Fuels 2.3% | |
Adams Resources & Energy, Inc. | | | 19,378 | | | | 736,170 | |
Carrizo Oil & Gas, Inc.*(a) | | | 370,500 | | | | 5,839,080 | |
DHT Holdings, Inc. | | | 959,800 | | | | 3,992,768 | |
Gulfport Energy Corp.* | | | 441,600 | | | | 5,572,992 | |
Halcon Resources Corp.* | | | 90,600 | | | | 594,336 | |
Laredo Petroleum, Inc.*(a) | | | 291,900 | | | | 3,783,024 | |
Newfield Exploration Co.*(a) | | | 221,600 | | | | 6,366,568 | |
REX American Resources Corp.* | | | 19,700 | | | | 1,969,606 | |
Scorpio Tankers, Inc. (Monaco)(a) | | | 369,800 | | | | 1,371,958 | |
Ship Finance International Ltd. (Norway)(a) | | | 452,669 | | | | 6,156,299 | |
Teekay Tankers Ltd. (Bermuda) (Class A Stock)(a) | | | 374,100 | | | | 673,380 | |
| | | | | | | | |
| | | | | | | 37,056,181 | |
|
Paper & Forest Products 1.4% | |
Clearwater Paper Corp.* | | | 47,500 | | | | 2,334,625 | |
Domtar Corp. | | | 103,400 | | | | 4,038,804 | |
Louisiana-Pacific Corp.* | | | 168,700 | | | | 4,236,057 | |
P.H. Glatfelter Co. | | | 156,300 | | | | 3,199,461 | |
Schweitzer-Mauduit International, Inc. | | | 204,343 | | | | 7,850,858 | |
| | | | | | | | |
| | | | | | | 21,659,805 | |
|
Pharmaceuticals 0.0% | |
Lannett Co., Inc.*(a) | | | 18,300 | | | | 372,405 | |
|
Professional Services 0.9% | |
Barrett Business Services, Inc. | | | 27,200 | | | | 1,496,816 | |
FTI Consulting, Inc.* | | | 64,300 | | | | 2,109,683 | |
Huron Consulting Group, Inc.* | | | 34,600 | | | | 1,228,300 | |
ICF International, Inc.* | | | 22,400 | | | | 1,013,600 | |
Navigant Consulting, Inc.* | | | 10,700 | | | | 181,151 | |
See Notes to Financial Statements.
| | | | |
| Prudential QMA Small-Cap Value Fund | | | 21 | |
Schedule of Investments (continued)
as of July 31, 2017
| | | | | | | | |
| Description | | Shares | | | Value | |
COMMON STOCKS (Continued) | | | | | | | | |
|
Professional Services (cont’d.) | |
TrueBlue, Inc.* | | | 324,500 | | | $ | 8,290,975 | |
| | | | | | | | |
| | | | | | | 14,320,525 | |
|
Real Estate Management & Development 0.5% | |
HFF, Inc. (Class A Stock)(a) | | | 43,600 | | | | 1,600,992 | |
Jones Lang LaSalle, Inc. | | | 47,500 | | | | 6,042,950 | |
| | | | | | | | |
| | | | | | | 7,643,942 | |
|
Road & Rail 0.3% | |
ArcBest Corp. | | | 13,700 | | | | 380,860 | |
Roadrunner Transportation Systems, Inc.* | | | 191,000 | | | | 1,333,180 | |
Ryder System, Inc. | | | 34,600 | | | | 2,517,496 | |
| | | | | | | | |
| | | | | | | 4,231,536 | |
|
Semiconductors & Semiconductor Equipment 1.0% | |
Amkor Technology, Inc.*(a) | | | 626,761 | | | | 6,499,512 | |
Cirrus Logic, Inc.* | | | 158,600 | | | | 9,744,384 | |
| | | | | | | | |
| | | | | | | 16,243,896 | |
|
Specialty Retail 5.9% | |
Aaron’s, Inc.(a) | | | 224,600 | | | | 10,394,488 | |
American Eagle Outfitters, Inc. | | | 304,200 | | | | 3,601,728 | |
Asbury Automotive Group, Inc.* | | | 54,400 | | | | 2,937,600 | |
Ascena Retail Group, Inc.*(a) | | | 1,074,800 | | | | 2,515,032 | |
Big 5 Sporting Goods Corp.(a) | | | 150,900 | | | | 1,622,175 | |
Caleres, Inc. | | | 201,300 | | | | 5,491,464 | |
Cato Corp. (The) (Class A Stock)(a) | | | 68,522 | | | | 1,165,559 | |
Chico’s FAS, Inc.(a) | | | 414,200 | | | | 3,789,930 | |
Children’s Place, Inc. (The)(a) | | | 46,700 | | | | 4,933,855 | |
DSW, Inc. (Class A Stock) | | | 392,600 | | | | 7,082,504 | |
Express, Inc.* | | | 717,600 | | | | 4,348,656 | |
Finish Line, Inc. (The) (Class A Stock)(a) | | | 380,300 | | | | 5,232,928 | |
Francesca’s Holdings Corp.* | | | 132,800 | | | | 1,292,144 | |
Genesco, Inc.* | | | 131,900 | | | | 4,233,990 | |
Group 1 Automotive, Inc.(a) | | | 99,100 | | | | 5,901,405 | |
Haverty Furniture Cos., Inc. | | | 41,500 | | | | 923,375 | |
Office Depot, Inc. | | | 1,833,200 | | | | 10,760,884 | |
Party City Holdco, Inc.*(a) | | | 54,900 | | | | 765,855 | |
Pier 1 Imports, Inc.(a) | | | 266,800 | | | | 1,229,948 | |
Select Comfort Corp.*(a) | | | 69,000 | | | | 2,332,890 | |
Shoe Carnival, Inc. | | | 132,658 | | | | 2,422,335 | |
Sonic Automotive, Inc. (Class A Stock)(a) | | | 261,100 | | | | 4,738,965 | |
See Notes to Financial Statements.
| | | | | | | | |
| Description | | Shares | | | Value | |
COMMON STOCKS (Continued) | | | | | | | | |
|
Specialty Retail (cont’d.) | |
Tailored Brands, Inc.(a) | | | 201,300 | | | $ | 2,524,302 | |
Tilly’s, Inc. (Class A Stock) | | | 98,000 | | | | 978,040 | |
Vitamin Shoppe, Inc.* | | | 82,900 | | | | 911,900 | |
Zumiez, Inc.* | | | 165,800 | | | | 2,105,660 | |
| | | | | | | | |
| | | | | | | 94,237,612 | |
| | |
Technology Hardware, Storage & Peripherals 0.1% | | | | | | | | |
NCR Corp.* | | | 18,500 | | | | 700,225 | |
| | |
Textiles, Apparel & Luxury Goods 1.8% | | | | | | | | |
Deckers Outdoor Corp.* | | | 36,200 | | | | 2,347,932 | |
Fossil Group, Inc.* | | | 284,600 | | | | 3,201,750 | |
Iconix Brand Group, Inc.*(a) | | | 504,100 | | | | 3,362,347 | |
Movado Group, Inc. | | | 153,900 | | | | 3,785,940 | |
Oxford Industries, Inc. | | | 29,700 | | | | 1,874,961 | |
Perry Ellis International, Inc.* | | | 110,600 | | | | 2,172,184 | |
Unifi, Inc.* | | | 60,900 | | | | 1,995,084 | |
Wolverine World Wide, Inc.(a) | | | 336,500 | | | | 9,489,300 | |
| | | | | | | | |
| | | | | | | 28,229,498 | |
| | |
Thrifts & Mortgage Finance 6.9% | | | | | | | | |
Dime Community Bancshares, Inc. | | | 423,283 | | | | 8,804,287 | |
Essent Group Ltd.* | | | 153,000 | | | | 5,878,260 | |
Federal Agricultural Mortgage Corp. (Class C Stock) | | | 109,162 | | | | 7,484,147 | |
First Defiance Financial Corp. | | | 102,672 | | | | 5,313,276 | |
Flagstar Bancorp, Inc.* | | | 77,600 | | | | 2,526,656 | |
HomeStreet, Inc.* | | | 43,700 | | | | 1,147,125 | |
MGIC Investment Corp.* | | | 1,472,500 | | | | 17,184,075 | |
Oritani Financial Corp. | | | 205,182 | | | | 3,406,021 | |
PennyMac Financial Services, Inc. (Class A Stock)* | | | 39,915 | | | | 694,521 | |
Provident Financial Services, Inc. | | | 305,420 | | | | 8,099,738 | |
Radian Group, Inc. | | | 879,166 | | | | 15,315,072 | |
TrustCo Bank Corp. | | | 116,141 | | | | 963,970 | |
United Financial Bancorp, Inc. | | | 204,700 | | | | 3,703,023 | |
Walker & Dunlop, Inc.* | | | 215,921 | | | | 10,850,030 | |
Washington Federal, Inc.(a) | | | 523,504 | | | | 17,511,209 | |
| | | | | | | | |
| | | | | | | 108,881,410 | |
| | |
Tobacco 0.5% | | | | | | | | |
Universal Corp. | | | 119,200 | | | | 7,622,840 | |
See Notes to Financial Statements.
| | | | |
| Prudential QMA Small-Cap Value Fund | | | 23 | |
Schedule of Investments (continued)
as of July 31, 2017
| | | | | | | | |
| Description | | Shares | | | Value | |
COMMON STOCKS (Continued) | | | | | | | | |
| | |
Trading Companies & Distributors 2.4% | | | | | | | | |
Air Lease Corp.(a) | | | 48,300 | | | $ | 1,911,714 | |
Aircastle Ltd. | | | 629,553 | | | | 14,819,678 | |
CAI International, Inc.* | | | 187,306 | | | | 4,913,036 | |
GATX Corp. | | | 163,747 | | | | 10,124,477 | |
H&E Equipment Services, Inc. | | | 94,900 | | | | 2,141,893 | |
Rush Enterprises, Inc. (Class A Stock)* | | | 56,100 | | | | 2,419,593 | |
WESCO International, Inc.* | | | 24,400 | | | | 1,250,500 | |
| | | | | | | | |
| | | | | | | 37,580,891 | |
| | | | | | | | |
TOTAL COMMON STOCKS
(cost $1,396,037,348) | | | | | | | 1,569,243,559 | |
| | | | | | | | |
| | |
UNAFFILIATED EXCHANGE TRADED FUND 0.6% | | | | | | | | |
iShares Russell 2000 Value ETF
(cost $8,882,276) | | | 78,739 | | | | 9,377,815 | |
| | | | | | | | |
TOTAL LONG-TERM INVESTMENTS
(cost $1,404,919,624) | | | | | | | 1,578,621,374 | |
| | | | | | | | |
| | |
SHORT-TERM INVESTMENTS 9.7% | | | | | | | | |
| | |
AFFILIATED MUTUAL FUNDS | | | | | | | | |
Prudential Investment Portfolios 2 - Prudential Core Ultra Short Bond Fund(w) | | | 7,537,319 | | | | 7,537,319 | |
Prudential Investment Portfolios 2 - Prudential Institutional Money Market Fund (cost $146,625,419; includes $146,468,482 of cash collateral for securities on loan)(b)(w) | | | 146,616,020 | | | | 146,630,682 | |
| | | | | | | | |
TOTAL SHORT-TERM INVESTMENTS
(cost $154,162,738) | | | | | | | 154,168,001 | |
| | | | | | | | |
TOTAL INVESTMENTS 109.2%
(cost $1,559,082,362) | | | | | | | 1,732,789,375 | |
Liabilities in excess of other assets (9.2)% | | | | | | | (146,025,779 | ) |
| | | | | | | | |
NET ASSETS 100.0% | | | | | | $ | 1,586,763,596 | |
| | | | | | | | |
The following abbreviations are used in the annual report:
ETF—Exchange Traded Fund
LIBOR—London Interbank Offered Rate
REITs—Real Estate Investment Trusts
| * | Non-income producing security. |
| (a) | All or a portion of security is on loan. The aggregate market value of such securities, including those sold and pending settlement, is $142,846,175; cash collateral of $146,468,482 (included in liabilities) was received with which the Fund purchased highly liquid short-term investments. |
| (b) | Represents security purchased with cash collateral received for securities on loan and includes dividend reinvestment. |
| (w) | PGIM Investments LLC, the manager of the Fund, also serves as manager of the Prudential Investment Portfolios 2 -Prudential Core Ultra Short Bond Fund and the Prudential Institutional Money Market Fund. |
See Notes to Financial Statements.
Fair Value Measurements:
Various inputs are used in determining the value of the Fund’s investments. These inputs are summarized in the three broad levels listed below.
Level 1—unadjusted quoted prices generally in active markets for identical securities.
Level 2—quoted prices for similar securities, interest rates and yield curves, prepayment speeds, foreign currency exchange rates and other observable inputs.
Level 3—unobservable inputs for securities valued in accordance with Board approved fair valuation procedures.
The following is a summary of the inputs used as of July 31, 2017 in valuing such portfolio securities:
| | | | | | | | | | | | |
| | | Level 1 | | | Level 2 | | | Level 3 | |
Investments in Securities | | | | | | | | | | | | |
Common Stocks | | | | | | | | | | | | |
Aerospace & Defense | | $ | 13,171,476 | | | $ | — | | | $ | — | |
Air Freight & Logistics | | | 11,388,643 | | | | — | | | | — | |
Airlines | | | 22,544,082 | | | | — | | | | — | |
Auto Components | | | 49,223,848 | | | | — | | | | — | |
Banks | | | 252,299,876 | | | | — | | | | — | |
Biotechnology | | | 5,595,041 | | | | — | | | | — | |
Building Products | | | 4,669,960 | | | | — | | | | — | |
Capital Markets | | | 35,058,569 | | | | — | | | | — | |
Chemicals | | | 28,671,615 | | | | — | | | | — | |
Commercial Services & Supplies | | | 48,255,434 | | | | — | | | | — | |
Construction & Engineering | | | 26,493,682 | | | | — | | | | — | |
Consumer Finance | | | 30,066,736 | | | | — | | | | — | |
Containers & Packaging | | | 9,824,289 | | | | — | | | | — | |
Diversified Consumer Services | | | 3,042,080 | | | | — | | | | — | |
Diversified Financial Services | | | 1,336,400 | | | | — | | | | — | |
Diversified Telecommunication Services | | | 11,472,330 | | | | — | | | | — | |
Electrical Equipment | | | 9,419,260 | | | | — | | | | — | |
Electronic Equipment, Instruments & Components | | | 58,728,232 | | | | — | | | | — | |
Energy Equipment & Services | | | 21,256,623 | | | | — | | | | — | |
Equity Real Estate Investment Trusts (REITs) | | | 140,406,741 | | | | — | | | | — | |
Food & Staples Retailing | | | 19,319,769 | | | | — | | | | — | |
Food Products | | | 25,058,857 | | | | — | | | | — | |
Gas Utilities | | | 3,540,758 | | | | — | | | | — | |
Health Care Providers & Services | | | 30,554,793 | | | | — | | | | — | |
Hotels, Restaurants & Leisure | | | 15,030,057 | | | | — | | | | — | |
Household Durables | | | 49,958,967 | | | | — | | | | — | |
Independent Power & Renewable Electricity Producers | | | 13,354,800 | | | | — | | | | — | |
See Notes to Financial Statements.
| | | | |
| Prudential QMA Small-Cap Value Fund | | | 25 | |
Schedule of Investments (continued)
as of July 31, 2017
| | | | | | | | | | | | |
| | | Level 1 | | | Level 2 | | | Level 3 | |
Investments in Securities (continued) | | | | | | | | | | | | |
Common Stocks (continued) | | | | | | | | | | | | |
Insurance | | | 72,412,775 | | | | — | | | | — | |
IT Services | | | 15,877,535 | | | | — | | | | — | |
Leisure Products | | | 320,432 | | | | — | | | | — | |
Machinery | | | 35,087,829 | | | | — | | | | — | |
Marine | | | 3,517,607 | | | | — | | | | — | |
Media | | | 24,458,871 | | | | — | | | | — | |
Metals & Mining | | | 27,758,704 | | | | — | | | | — | |
Mortgage Real Estate Investment Trusts (REITs) | | | 65,729,949 | | | | — | | | | — | |
Multi-Utilities | | | 693,480 | | | | — | | | | — | |
Multiline Retail | | | 4,862,693 | | | | — | | | | — | |
Oil, Gas & Consumable Fuels | | | 37,056,181 | | | | — | | | | — | |
Paper & Forest Products | | | 21,659,805 | | | | — | | | | — | |
Pharmaceuticals | | | 372,405 | | | | — | | | | — | |
Professional Services | | | 14,320,525 | | | | — | | | | — | |
Real Estate Management & Development | | | 7,643,942 | | | | — | | | | — | |
Road & Rail | | | 4,231,536 | | | | — | | | | — | |
Semiconductors & Semiconductor Equipment | | | 16,243,896 | | | | — | | | | — | |
Specialty Retail | | | 94,237,612 | | | | — | | | | — | |
Technology Hardware, Storage & Peripherals | | | 700,225 | | | | — | | | | — | |
Textiles, Apparel & Luxury Goods | | | 28,229,498 | | | | — | | | | — | |
Thrifts & Mortgage Finance | | | 108,881,410 | | | | — | | | | — | |
Tobacco | | | 7,622,840 | | | | — | | | | — | |
Trading Companies & Distributors | | | 37,580,891 | | | | — | | | | — | |
Unaffiliated Exchange Traded Fund | | | 9,377,815 | | | | — | | | | — | |
Affiliated Mutual Funds | | | 154,168,001 | | | | — | | | | — | |
| | | | | | | | | | | | |
Total | | $ | 1,732,789,375 | | | $ | — | | | $ | — | |
| | | | | | | | | | | | |
During the period, there were no transfers between Level 1, Level 2 and Level 3 to report.
Industry Classification:
The industry classification of investments and liabilities in excess of other assets shown as a percentage of net assets as of July 31, 2017 were as follows (unaudited):
| | | | |
Banks | | | 15.9 | % |
Affiliated Mutual Funds (including 9.2% of collateral for securities on loan) | | | 9.7 | |
Equity Real Estate Investment Trusts (REITs) | | | 8.9 | |
Thrifts & Mortgage Finance | | | 6.9 | |
Specialty Retail | | | 5.9 | |
Insurance | | | 4.6 | |
Mortgage Real Estate Investment Trusts (REITs) | | | 4.1 | |
Electronic Equipment, Instruments & Components | | | 3.7 | |
Household Durables | | | 3.2 | % |
Auto Components | | | 3.1 | |
Commercial Services & Supplies | | | 3.0 | |
Trading Companies & Distributors | | | 2.4 | |
Oil, Gas & Consumable Fuels | | | 2.3 | |
Machinery | | | 2.2 | |
Capital Markets | | | 2.2 | |
Health Care Providers & Services | | | 1.9 | |
Consumer Finance | | | 1.9 | |
See Notes to Financial Statements.
| | |
Industry Classification (cont’d.) | | |
| | | | |
Chemicals | | | 1.8 | % |
Textiles, Apparel & Luxury Goods | | | 1.8 | |
Metals & Mining | | | 1.8 | |
Construction & Engineering | | | 1.7 | |
Food Products | | | 1.6 | |
Media | | | 1.5 | |
Airlines | | | 1.4 | |
Paper & Forest Products | | | 1.4 | |
Energy Equipment & Services | | | 1.3 | |
Food & Staples Retailing | | | 1.2 | |
Semiconductors & Semiconductor Equipment | | | 1.0 | |
IT Services | | | 1.0 | |
Hotels, Restaurants & Leisure | | | 1.0 | |
Professional Services | | | 0.9 | |
Independent Power & Renewable Electricity Producers | | | 0.8 | |
Aerospace & Defense | | | 0.8 | |
Diversified Telecommunication Services | | | 0.7 | |
Air Freight & Logistics | | | 0.7 | |
Containers & Packaging | | | 0.6 | |
Electrical Equipment | | | 0.6 | % |
Unaffiliated Exchange Traded Fund | | | 0.6 | |
Real Estate Management & Development | | | 0.5 | |
Tobacco | | | 0.5 | |
Biotechnology | | | 0.4 | |
Multiline Retail | | | 0.3 | |
Building Products | | | 0.3 | |
Road & Rail | | | 0.3 | |
Gas Utilities | | | 0.2 | |
Marine | | | 0.2 | |
Diversified Consumer Services | | | 0.2 | |
Diversified Financial Services | | | 0.1 | |
Technology Hardware, Storage & Peripherals | | | 0.1 | |
Multi-Utilities | | | 0.0 | * |
Pharmaceuticals | | | 0.0 | * |
Leisure Products | | | 0.0 | * |
| | | | |
| | | 109.2 | |
Liabilities in excess of other assets | | | (9.2 | ) |
| | | | |
| | | 100.0 | % |
| | | | |
Financial Instruments/Transactions—Summary of Offsetting and Netting Arrangements:
The Fund entered into financial instruments/transactions during the reporting period that are either offset in accordance with current requirements or are subject to enforceable master netting arrangements or similar agreements that permit offsetting. The information about offsetting and related netting arrangements for financial instruments/transactions, where the legal right to set-off exists, is presented in the summary below.
Offsetting of financial instrument/transaction assets and liabilities:
| | | | | | | | | | | | |
Description | | Gross
Amounts of
Recognized
Assets(1) | | | Collateral
Received(2) | | | Net
Amount | |
Securities on Loan | | $ | 142,846,175 | | | $ | (142,846,175 | ) | | $ | — | |
| (1) | Amount represents market value. |
| (2) | Collateral amount disclosed by the Fund is limited to the market value of financial instruments/transactions. |
See Notes to Financial Statements.
| | | | |
| Prudential QMA Small-Cap Value Fund | | | 27 | |
Statement of Assets & Liabilities
as of July 31, 2017
| | | | |
Assets | | | | |
Investments at value, including securities on loan of $142,846,175: | | | | |
Unaffiliated investments (cost $1,404,919,624) | | $ | 1,578,621,374 | |
Affiliated investments (cost $154,162,738) | | | 154,168,001 | |
Cash | | | 34,417 | |
Receivable for investments sold | | | 1,453,072 | |
Dividends and interest receivable | | | 1,391,897 | |
Receivable for Fund shares sold | | | 1,307,215 | |
| | | | |
Total assets | | | 1,736,975,976 | |
| | | | |
| |
Liabilities | | | | |
Payable to broker for collateral for securities on loan | | | 146,468,482 | |
Payable for Fund shares reacquired | | | 2,201,555 | |
Management fee payable | | | 797,441 | |
Accrued expenses and other liabilities | | | 530,895 | |
Distribution fee payable | | | 131,352 | |
Affiliated transfer agent fee payable | | | 82,342 | |
Deferred trustees’ fees | | | 313 | |
| | | | |
Total liabilities | | | 150,212,380 | |
| | | | |
| |
Net Assets | | $ | 1,586,763,596 | |
| | | | |
| | | | | |
Net assets were comprised of: | | | | |
Shares of beneficial interest, at par | | $ | 74,513 | |
Paid-in capital in excess of par | | | 1,256,536,361 | |
| | | | |
| | | 1,256,610,874 | |
Undistributed net investment income | | | 9,003,992 | |
Accumulated net realized gain on investment transactions | | | 147,441,717 | |
Net unrealized appreciation on investments | | | 173,707,013 | |
| | | | |
Net assets, July 31, 2017 | | $ | 1,586,763,596 | |
| | | | |
See Notes to Financial Statements.
| | | | |
Class A | | | | |
Net asset value and redemption price per share,
($132,512,016 ÷ 6,214,067 shares of beneficial interest issued and outstanding) | | $ | 21.32 | |
Maximum sales charge (5.50% of offering price) | | | 1.24 | |
| | | | |
Maximum offering price to public | | $ | 22.56 | |
| | | | |
| |
Class C | | | | |
Net asset value, offering price and redemption price per share,
($40,476,101 ÷ 1,898,373 shares of beneficial interest issued and outstanding) | | $ | 21.32 | |
| | | | |
| |
Class Q | | | | |
Net asset value, offering price and redemption price per share,
($268,695,408 ÷ 12,592,236 shares of beneficial interest issued and outstanding) | | $ | 21.34 | |
| | | | |
| |
Class R | | | | |
Net asset value, offering price and redemption price per share,
($164,018,807 ÷ 7,786,756 shares of beneficial interest issued and outstanding) | | $ | 21.06 | |
| | | | |
| |
Class Z | | | | |
Net asset value, offering price and redemption price per share
($981,061,264 ÷ 46,021,591 shares of beneficial interest issued and outstanding) | | $ | 21.32 | |
| | | | |
See Notes to Financial Statements.
| | | | |
| Prudential QMA Small-Cap Value Fund | | | 29 | |
Statement of Operations
Year Ended July 31, 2017
| | | | |
Net Investment Income (Loss) | | | | |
Income | | | | |
Unaffiliated dividend income (net of foreign withholding taxes of $13,956) | | $ | 32,808,170 | |
Income from securities lending, net (including affiliated income of $200,972) | | | 1,240,276 | |
Affiliated dividend income | | | 65,912 | |
| | | | |
Total income | | | 34,114,358 | |
| | | | |
| |
Expenses | | | | |
Management fee | | | 9,212,218 | |
Distribution fee—Class A | | | 389,706 | |
Distribution fee—Class C | | | 417,446 | |
Distribution fee—Class R | | | 1,194,299 | |
Transfer agent’s fees and expenses (including affiliated expense of $449,700) | | | 1,075,000 | |
Custodian and accounting fees | | | 237,000 | |
Registration fees | | | 75,000 | |
Shareholders’ reports | | | 70,000 | |
Trustees’ fees | | | 31,000 | |
Audit fee | | | 31,000 | |
Legal fees and expenses | | | 28,000 | |
Commitment fee on syndicated credit agreement | | | 18,000 | |
Insurance expenses | | | 16,000 | |
Loan interest expense | | | 12,504 | |
Miscellaneous | | | 17,657 | |
| | | | |
Total expenses | | | 12,824,830 | |
Less: Management fee waiver and/or expense reimbursement | | | (127,161 | ) |
Less: Distribution fee waiver—Class A | | | (64,951 | ) |
Less: Distribution fee waiver—Class R | | | (398,100 | ) |
| | | | |
Net expenses | | | 12,234,618 | |
| | | | |
Net investment income (loss) | | | 21,879,740 | |
| | | | |
| |
Realized And Unrealized Gain (Loss) On Investments | | | | |
Net realized gain (loss) on investment transactions (including affiliated of ($2,521)) | | | 154,517,095 | |
Net change in unrealized appreciation (depreciation) on investments (including affiliated of $5,263) | | | 84,388,989 | |
| | | | |
Net gain (loss) on investment transactions | | | 238,906,084 | |
| | | | |
Net Increase (Decrease) In Net Assets Resulting From Operations | | $ | 260,785,824 | |
| | | | |
See Notes to Financial Statements.
Statement of Changes in Net Assets
| | | | | | | | |
| | | Year Ended July 31, | |
| | | 2017 | | | 2016 | |
Increase (Decrease) in Net Assets | | | | | | | | |
Operations | | | | | | | | |
Net investment income (loss) | | $ | 21,879,740 | | | $ | 23,726,513 | |
Net realized gain (loss) on investment transactions | | | 154,517,095 | | | | 8,321,644 | |
Net change in unrealized appreciation (depreciation) on investments | | | 84,388,989 | | | | 7,883,566 | |
| | | | | | | | |
Net increase (decrease) in net assets resulting from operations | | | 260,785,824 | | | | 39,931,723 | |
| | | | | | | | |
| | |
Dividends and Distributions | | | | | | | | |
Dividends from net investment income | | | | | | | | |
Class A | | | (1,874,765 | ) | | | (2,926,298 | ) |
Class C | | | (358,790 | ) | | | (483,294 | ) |
Class Q | | | (4,591,944 | ) | | | (5,241,621 | ) |
Class R | | | (2,094,395 | ) | | | (3,055,711 | ) |
Class Z | | | (15,379,742 | ) | | | (20,380,961 | ) |
| | | | | | | | |
| | | (24,299,636 | ) | | | (32,087,885 | ) |
| | | | | | | | |
Distributions from net realized gains | | | | | | | | |
Class A | | | (336,195 | ) | | | (36,197,413 | ) |
Class C | | | (117,214 | ) | | | (8,998,775 | ) |
Class Q | | | (692,119 | ) | | | (55,747,928 | ) |
Class R | | | (438,847 | ) | | | (42,286,390 | ) |
Class Z | | | (2,399,788 | ) | | | (224,305,821 | ) |
| | | | | | | | |
| | | (3,984,163 | ) | | | (367,536,327 | ) |
| | | | | | | | |
| | |
Fund share transactions (Net of share conversions) | | | | | | | | |
Net proceeds from shares sold | | | 447,840,846 | | | | 430,078,458 | |
Net asset value of shares issued in reinvestment of dividends and distributions | | | 28,084,999 | | | | 395,531,945 | |
Cost of shares reacquired | | | (482,265,511 | ) | | | (629,072,353 | ) |
| | | | | | | | |
Net increase (decrease) in net assets from Fund share transactions | | | (6,339,666 | ) | | | 196,538,050 | |
| | | | | | | | |
Total increase (decrease) | | | 226,162,359 | | | | (163,154,439 | ) |
| | |
Net Assets: | | | | | | | | |
Beginning of year | | | 1,360,601,237 | | | | 1,523,755,676 | |
| | | | | | | | |
End of year(a) | | $ | 1,586,763,596 | | | $ | 1,360,601,237 | |
| | | | | | | | |
(a) Includes undistributed net investment income of: | | $ | 9,003,992 | | | $ | 9,371,626 | |
| | | | | | | | |
See Notes to Financial Statements.
| | | | |
| Prudential QMA Small-Cap Value Fund | | | 31 | |
Notes to Financial Statements
The Target Portfolio Trust (the “Trust”) is registered under the Investment Company Act of 1940, as amended (“1940 Act”), as an open-end management investment company. The Trust consists of four series: Prudential Corporate Bond Fund, Prudential Core Bond Fund, Target International Equity Portfolio and Prudential QMA Small-Cap Value Fund. These financial statements relate to Prudential QMA Small-Cap Value Fund (the “Fund”). The financial statements of the other series are not presented herein.
The investment objective of the Fund is above average capital appreciation.
1. Accounting Policies
The Fund follows investment company accounting and reporting guidance of the Financial Accounting Standards Board (“FASB”) Accounting Standard Codification Topic 946 Financial Services—Investment Companies. The following accounting policies conform to U.S. generally accepted accounting principles. The Fund consistently follows such policies in the preparation of its financial statements.
Securities Valuation: The Fund holds securities and other assets and liabilities that are fair valued at the close of each day (generally, 4:00 PM Eastern time) the New York Stock Exchange (“NYSE”) is open for trading. Fair value is the price that would be received to sell an asset or paid to transfer a liability in an orderly transaction between market participants on the measurement date. The Board of Trustees (the “Board”) has adopted valuation procedures for security valuation under which fair valuation responsibilities have been delegated to PGIM Investments LLC (“PGIM Investments” or “the Manager”) (formerly known as Prudential Investments LLC). Under the current valuation procedures, the Valuation Committee is responsible for supervising the valuation of portfolio securities and other assets and liabilities. The valuation procedures permit the Fund to utilize independent pricing vendor services, quotations from market makers, and alternative valuation methods when market quotations are either not readily available or not deemed representative of fair value. A record of the Valuation Committee’s actions is subject to the Board’s review, approval, and ratification at its next regularly scheduled quarterly meeting.
Various inputs determine how the Fund’s investments are valued, all of which are categorized according to the three broad levels (Level 1, 2, or 3) detailed in the Schedule of Investments.
Common and preferred stocks, exchange-traded funds, and derivative instruments, such as futures or options, that are traded on a national securities exchange are valued at the last sale price as of the close of trading on the applicable exchange where the security principally trades. Securities traded via NASDAQ are valued at the NASDAQ official closing
price. To the extent these securities are valued at the last sale price or NASDAQ official closing price, they are classified as Level 1 in the fair value hierarchy. In the event that no sale or official closing price on valuation date exists, these securities are generally valued at the mean between the last reported bid and ask prices, or at the last bid price in the absence of an ask price. These securities are classified as Level 2 in the fair value hierarchy.
Foreign equities traded on foreign securities exchanges are generally valued using pricing vendor services that provide model prices derived using adjustment factors based on information such as local closing price, relevant general and sector indices, currency fluctuations, depositary receipts, and futures, as applicable. Securities valued using such model prices are classified as Level 2 in the fair value hierarchy. The models generate an evaluated adjustment factor for each security, which is applied to the local closing price to adjust it for post closing market movements. Utilizing that evaluated adjustment factor, the vendor provides an evaluated price for each security. If the vendor does not provide an evaluated price, securities are valued in accordance with exchange-traded common and preferred stock valuation policies discussed above.
Investments in open-end, non-exchange-traded mutual funds are valued at their net asset values as of the close of the NYSE on the date of valuation. These securities are classified as Level 1 in the fair value hierarchy since they may be purchased or sold at their net asset values on the date of valuation.
Securities and other assets that cannot be priced according to the methods described above are valued based on pricing methodologies approved by the Board. In the event that unobservable inputs are used when determining such valuations, the securities will be classified as Level 3 in the fair value hierarchy.
When determining the fair value of securities, some of the factors influencing the valuation include: the nature of any restrictions on disposition of the securities; assessment of the general liquidity of the securities; the issuer’s financial condition and the markets in which it does business; the cost of the investment; the size of the holding and the capitalization of the issuer; the prices of any recent transactions or bids/offers for such securities or any comparable securities; any available analyst media or other reports or information deemed reliable by the investment adviser regarding the issuer or the markets or industry in which it operates. Using fair value to price securities may result in a value that is different from a security’s most recent closing price and from the price used by other unaffiliated mutual funds to calculate their net asset values.
Restricted and Illiquid Securities: Subject to guidelines adopted by the Board, the Fund may invest up to 15% of its net assets in illiquid securities, including those which are restricted as to disposition under securities law (“restricted securities”). Restricted securities are valued pursuant to the valuation procedures noted above. Illiquid securities are those that, because of the absence of a readily available market or due to legal or contractual restrictions on resale, cannot be sold within seven days in the ordinary course
| | | | |
| Prudential QMA Small-Cap Value Fund | | | 33 | |
Notes to Financial Statements (continued)
of business at approximately the amount at which the Fund has valued the investment. Therefore, the Fund may find it difficult to sell illiquid securities at the time considered most advantageous by its Subadviser and may incur expenses that would not be incurred in the sale of securities that were freely marketable. Certain securities that would otherwise be considered illiquid because of legal restrictions on resale to the general public may be traded among qualified institutional buyers under Rule 144A of the Securities Act of 1933. These Rule 144A securities, as well as commercial paper that is sold in private placements under Section 4(2) of the Securities Act, may be deemed liquid by the Fund’s Subadviser under the guidelines adopted by the Trustees of the Fund. However, the liquidity of the Fund’s investments in Rule 144A securities could be impaired if trading does not develop or declines.
Foreign Currency Translation: The books and records of the Fund are maintained in U.S. dollars. Foreign currency amounts are translated into U.S. dollars on the following basis:
(i) market value of investment securities, other assets and liabilities—at the current rates of exchange;
(ii) purchases and sales of investment securities, income and expenses—at the rates of exchange prevailing on the respective dates of such transactions.
Although the net assets of the Fund are presented at the foreign exchange rates and market values at the close of the period, the Fund does not generally isolate that portion of the results of operations arising as a result of changes in the foreign exchange rates from the fluctuations arising from changes in the market prices of long-term portfolio securities held at the end of the period. Similarly, the Fund does not isolate the effect of changes in foreign exchange rates from the fluctuations arising from changes in the market prices of long-term portfolio securities sold during the period. Accordingly, holding period realized foreign currency gains (losses) are included in the reported net realized gains (losses) on investment transactions.
Additionally, net realized gains (losses) on foreign currency transactions represent net foreign exchange gains (losses) from the disposition of holdings of foreign currencies, forward currency contracts, currency gains (losses) realized between the trade and settlement dates on securities transactions, and the difference between the amounts of interest, dividends and foreign withholding taxes recorded on the Fund’s books and the U.S. dollar equivalent amounts actually received or paid. Net unrealized currency gains (losses) from valuing foreign currency denominated assets and liabilities (other than investments) at period end exchange rates are reflected as a component of net unrealized appreciation (depreciation) on foreign currencies.
Master Netting Arrangements: The Trust, on behalf of the Fund, is subject to various Master Agreements, or netting arrangements, with select counterparties. These are agreements which a subadviser may have negotiated and entered into on behalf of the Fund. A master netting arrangement between the Fund and the counterparty permits the Fund to offset amounts payable by the Fund to the same counterparty against amounts to be received; and by the receipt of collateral from the counterparty by the Fund to cover the Fund’s exposure to the counterparty. However, there is no assurance that such mitigating factors are easily enforceable. In addition to master netting arrangements, the right to set-off exists when all the conditions are met such that each of the parties owes the other determinable amounts, the reporting party has the right to set-off the amount owed with the amount owed by the other party, the reporting party intends to set-off and the right of set-off is enforceable by law. During the reporting period, there was no intention to settle on a net basis and all amounts are presented on a gross basis on the Statement of Assets and Liabilities.
Securities Lending: The Fund may lend its portfolio securities to one or more banks and broker-dealers. The loans are secured by collateral at least equal to the market value of the securities loaned. Collateral pledged by each borrower is invested in an affiliated money market fund and is marked to market daily, based on the previous day’s market value, such that the value of the collateral exceeds the value of the loaned securities. Loans are subject to termination at the option of the borrower or the Fund. Upon termination of the loan, the borrower will return to the Fund securities identical to the loaned securities. Should the borrower of the securities fail financially, the Fund has the right to repurchase the securities in the open market using the collateral. The Fund recognizes income, net of any rebate and securities lending agent fees, for lending its securities in the form of fees or interest on the investment of any cash received as collateral. The borrower receives all interest and dividends from the securities loaned and such payments are passed back to the lender in amounts equivalent thereto. The Fund also continues to recognize any unrealized gain (loss) in the market price of the securities loaned and on the change in the value of the collateral invested that may occur during the term of the loan. In addition, realized gain (loss) is recognized on changes in the value of the collateral invested upon liquidation of the collateral. Net earnings from securities lending are disclosed on the Statement of Operations as “Income from securities lending, net”.
Concentration of Risk—Counterparty Risk: For the one year period beginning July 25, 2017 through July 24, 2018, the Fund entered into an exclusive securities lending arrangement with a single counterparty (ie the borrower) as the sole counterparty to the Fund’s portfolio for its securities lending activity. If the borrower defaults, the loaned securities may fail to be returned to the Fund. However, this risk is mitigated since the market value of the securities on loan are fully collateralized. Furthermore, the Fund’s securities lending agent indemnified the Fund against default by the borrower.
Equity Real Estate Investment Trusts (REITs): The Fund invests in Equity REITs, which report information on the source of their distributions annually. Based on current and historical information, a portion of distributions received from Equity REITs during the
| | | | |
| Prudential QMA Small-Cap Value Fund | | | 35 | |
Notes to Financial Statements (continued)
period is estimated to be dividend income, capital gain or return of capital and recorded accordingly. When material these estimates are adjusted periodically when the actual source of distributions is disclosed by the Equity REITs.
Concentration of Risk for REITs: Real estate securities are subject to the same risks as direct investments in real estate and mortgages, and their value will depend on the value of the underlying properties or the underlying loans or interests. The underlying loans may be subject to the risks of default or of prepayments that occur earlier or later than expected, and such loans may also include so-called “subprime” mortgages. The value of these securities will rise and fall in response to many factors, including economic conditions, the demand for rental property and interest rates. In particular, the value of these securities may decline when interest rates rise and will also be affected by the real estate market and by the management of the underlying properties.
In addition, investing in REITs involves certain unique risks in addition to those risks associated with investing in the real estate industry in general. Equity REITs may be affected by changes in the value of the underlying property owned by the REITs, while mortgage REITs may be affected by the quality of any credit extended. REITs are dependent upon management skills, may not be diversified geographically or by property/mortgage asset type, and are subject to heavy cash flow dependency, default by borrowers and self-liquidation. REITs may be more volatile and/or more illiquid than other types of equity securities. REITs (especially mortgage REITs) are subject to interest rate risks. REITs may incur significant amounts of leverage. The Fund will indirectly bear a portion of the expenses, including management fees, paid by each REIT in which it invests, in addition to the expenses of the Fund.
Securities Transactions and Net Investment Income: Securities transactions are recorded on the trade date. Realized gains (losses) from investment and currency transactions are calculated on the specific identification method. Dividend income is recorded on the ex-date. Interest income, including amortization of premium and accretion of discount on debt securities, as required, is recorded on the accrual basis. Expenses are recorded on an accrual basis, which may require the use of certain estimates by management that may differ from actual.
Net investment income or loss (other than distribution fees which are charged directly to the respective class and transfer agency fees specific to Class Q shares which are charged to that share class) and unrealized and realized gains (losses) are allocated daily to each class of shares based upon the relative proportion of adjusted net assets of each class at the beginning of the day.
Taxes: It is the Fund’s policy to continue to meet the requirements of the Internal Revenue Code applicable to regulated investment companies and to distribute all of its taxable net investment income and capital gains, if any, to its shareholders. Therefore, no federal income tax provision is required. Withholding taxes on foreign dividends, interest and capital gains, if any, are recorded, net of reclaimable amounts, at the time the related income is earned.
Dividends and Distributions: The Fund expects to pay dividends from net investment income and distributions from net realized capital gains, if any, annually. Dividends and distributions to shareholders, which are determined in accordance with federal income tax regulations and which may differ from generally accepted accounting principles, are recorded on the ex-date. Permanent book/tax differences relating to income and gain (loss) are reclassified amongst undistributed net investment income, accumulated net realized gain (loss) and paid-in capital in excess of par, as appropriate.
Estimates: The preparation of financial statements requires management to make estimates and assumptions that affect the reported amounts and disclosures in the financial statements. Actual results could differ from those estimates.
2. Agreements
The Trust, on behalf of the Fund, has a management agreement with PGIM Investments. Pursuant to this agreement, PGIM Investments has responsibility for all investment advisory services and supervises the subadviser’s performance of such services. PGIM Investments has entered into a subadvisory agreement with Quantitative Management Associates, LLC (“QMA”). The subadvisory agreement provides that QMA will furnish investment advisory services in connection with the management of the Fund. In connection therewith, QMA is obligated to keep certain books and records of the Fund. PGIM Investments pays for the services of QMA, the cost of compensation of officers of the Fund, occupancy and certain clerical and bookkeeping costs of the Fund. The Fund bears all other costs and expenses.
The management fee paid to PGIM Investments is accrued daily and payable monthly, at an annual rate of .60% of the Fund’s average daily net assets up to $2 billion and .575% of the Fund’s average daily net assets in excess of $2 billion. The effective management fee rate before any waivers and/or expense reimbursement was .60% for the year ended July 31, 2017. The effective management fee rate, net of waivers and/or expense reimbursement, was .59%.
PGIM entered into a contractual agreement that would waive fees in an amount up to .01% of the Fund’s average daily net assets through November 30, 2018, to the extent that Fund’s net annual operating expenses and acquired fund fees and expenses (exclusive of taxes, interest, distribution (12b-1) fees and certain extraordinary expenses) exceed .68% of the Fund’s average daily net assets on an annualized basis.
| | | | |
| Prudential QMA Small-Cap Value Fund | | | 37 | |
Notes to Financial Statements (continued)
The Fund has a distribution agreement with Prudential Investment Management Services LLC (“PIMS”) which acts as the distributor of the Class A, Class C, Class Q, Class R and Class Z shares of the Fund. The Fund compensates PIMS for distributing and servicing the Fund’s Class A, Class C and Class R shares, pursuant to the plans of distribution (the “Class A, C and R Plans”), regardless of expenses actually incurred by PIMS. The distribution fees are accrued daily and payable monthly. No distribution or service fees are paid to PIMS as distributor of the Class Q and Class Z shares of the Fund.
Pursuant to the Class A, C and R Plans, the Fund compensates PIMS for distribution related activities at an annual rate of up to .30%, 1%, and .75% of the average daily net assets of the Class A, C and R shares, respectively. PIMS has contractually agreed through November 30, 2018 to reduce such fees to .25% and .50% of the average daily net assets of the Class A and Class R shares, respectively.
PIMS has advised the Fund that it received $173,154 in front-end sales charges resulting from sales of Class A shares during the year ended July 31, 2017. From these fees, PIMS paid such sales charges to broker-dealers, which in turn paid commissions to salespersons and incurred other distribution costs. PIMS has advised the Fund that for the year ended July 31, 2017, it received $208 and $971 in contingent deferred sales charges imposed upon redemptions by certain Class A and Class C shareholders, respectively.
PGIM, Inc., PGIM Investments, PIMS and QMA are indirect, wholly-owned subsidiaries of Prudential Financial, Inc. (“Prudential”).
3. Other Transactions with Affiliates
Prudential Mutual Fund Services LLC (“PMFS”), an affiliate of PGIM Investments and an indirect, wholly-owned subsidiary of Prudential, serves as the Fund’s transfer agent. Transfer agent’s fees and expenses in the Statement of Operations include certain out-of-pocket expenses paid to non-affiliates, where applicable.
The Fund may enter into certain securities purchase or sale transactions under Board approved Rule 17a-7 procedures. Rule 17a-7 is an exemptive rule under the 1940 Act, that permits purchase and sale transactions among affiliated investment companies, or between an investment company and a person that is affiliated solely by reason of having a common (or affiliated) investment adviser, common directors, and/or common officers. Such transactions are subject to ratification by the Board. For the period ended July 31, 2017 no such transactions were entered into by the Fund.
The Fund may invest its overnight sweep cash in the Prudential Core Ultra Short Bond Fund (the “Core Fund”), and its securities lending cash collateral in the Prudential
Institutional Money Market Fund (the “Money Market Fund”), each a series of the Prudential Investment Portfolios 2, registered under the 1940 Act and managed by PGIM Investments. For the reporting period ended July 31, 2017, PGIM, Inc. was compensated $172,113 by PGIM Investments for managing the Fund’s securities lending cash collateral as subadviser to the Money Market Fund. Earnings from the Core Fund and Money Market Fund are disclosed on the Statement of Operations as “Affiliated dividend income” and “Income from securities lending, net”, respectively.
4. Portfolio Securities
The aggregate cost of purchases and proceeds from sales of portfolio securities (excluding short-term investments and U.S. Treasury securities) for the year ended July 31, 2017, were $1,448,250,159 and $1,472,822,493 respectively.
5. Distributions and Tax Information
The Fund has a tax year end of October 31st.
Distributions to shareholders, which are determined in accordance with federal income tax regulations and which may differ from generally accepted accounting principles, are recorded on the ex-date. In order to present undistributed net investment income, accumulated net realized gain on investment transactions and paid-in capital in excess of par on the Statement of Assets and Liabilities that more closely represent their tax character, certain adjustments have been made to undistributed net investment income and accumulated net realized gain on investment transactions. For the tax year ended October 31, 2016, the adjustments were to increase undistributed net investment income and decrease accumulated net realized gain on investment transactions by $2,052,262 due to reclassification of distributions and other book to tax differences. Net investment income, net realized gain (loss) on investment transactions and net assets were not affected by this change.
The tax character of distributions paid during the tax year ended October 31, 2016 were $51,248,554 of ordinary income and $348,375,656 of long-term capital gains. The tax character of distributions paid during the tax year ended October 31, 2015 were $30,506,983 of ordinary income and $181,680,298 of long-term capital gains.
As of the latest tax year ended October 31, 2016, the accumulated undistributed earnings on a tax basis was $21,926,948 of ordinary income.
The United States federal income tax basis of the Fund’s investments and the net unrealized appreciation as of July 31, 2017 were as follows:
| | | | | | |
Tax Basis | | Appreciation | | Depreciation | | Net
Unrealized
Appreciation |
| $1,567,140,628 | | $254,424,430 | | $(88,775,683) | | $165,648,747 |
| | | | |
| Prudential QMA Small-Cap Value Fund | | | 39 | |
Notes to Financial Statements (continued)
The differences between book basis and tax basis were primarily attributable to deferred losses on wash sales and other book to tax differences.
Management has analyzed the Fund’s tax positions taken on federal, state and local income tax returns for all open tax years and has concluded that no provision for income tax is required in the Fund’s financial statements for the current reporting period. The Fund’s federal, state and local income and federal excise tax returns for tax years for which the applicable statutes of limitations have not expired are subject to examination by the Internal Revenue Service and state departments of revenue.
6. Capital
The Fund offers Class A, Class C, Class Q, Class R and Class Z shares. Class A shares are sold with a maximum front-end sales charge of 5.50%. Investors who purchase $1 million or more of Class A shares and redeem those shares within 12 months of purchase are subject to a contingent deferred sales charge (“CDSC”) of 1%, but are not subject to an initial sales charge. The Class A CDSC is waived for purchases by certain retirement or benefit plans. Class C shares are sold with a CDSC of 1% on sales of shares made within 12 months of purchase. A special exchange privilege is also available for shareholders who qualify to purchase Class A shares at net asset value. Class R shares are available to certain retirement plans, clearing and settlement firms. Class Q, Class R and Class Z shares are not subject to any sales or redemption charge and are offered exclusively for sale to a limited group of investors.
Under certain limited circumstances, an exchange may be made from specified share classes of the Fund to one or more other share classes of the Fund as presented in the table of transactions in shares of beneficial interest.
The Trust has authorized an unlimited number of shares of beneficial interest at $.001 par value per share.
At reporting period end, four shareholders of record held 47% of the Fund’s outstanding shares on behalf of multiple beneficial owners, of which 9% were held by an affiliate of Prudential.
Transactions in shares of beneficial interest were as follows:
| | | | | | | | |
Class A | | Shares | | | Amount | |
Year ended July 31, 2017: | | | | | | | | |
Shares sold | | | 1,045,987 | | | $ | 21,956,239 | |
Shares issued in reinvestment of dividends and distributions | | | 97,123 | | | | 2,122,116 | |
Shares reacquired | | | (1,355,866 | ) | | | (27,710,814 | ) |
| | | | | | | | |
Net increase (decrease) in shares outstanding before conversion | | | (212,756 | ) | | | (3,632,459 | ) |
Shares issued upon conversion from other share class(es) | | | 102,329 | | | | 2,130,933 | |
Shares reacquired upon conversion into other share class(es) | | | (119,721 | ) | | | (2,567,682 | ) |
| | | | | | | | |
Net increase (decrease) in shares outstanding | | | (230,148 | ) | | $ | (4,069,208 | ) |
| | | | | | | | |
Year ended July 31, 2016: | | | | | | | | |
Shares sold | | | 741,128 | | | $ | 14,557,674 | |
Shares issued in reinvestment of dividends and distributions | | | 2,282,974 | | | | 37,577,751 | |
Shares reacquired† | | | (2,061,116 | ) | | | (37,860,684 | ) |
| | | | | | | | |
Net increase (decrease) in shares outstanding before conversion | | | 962,986 | | | | 14,274,741 | |
Shares issued upon conversion from other share class(es) | | | 221 | | | | 3,893 | |
Shares reacquired upon conversion into other share class(es) | | | (27,001 | ) | | | (568,847 | ) |
| | | | | | | | |
Net increase (decrease) in shares outstanding | | | 936,206 | | | $ | 13,709,787 | |
| | | | | | | | |
Class C | | | | | | |
Year ended July 31, 2017: | | | | | | | | |
Shares sold | | | 923,353 | | | $ | 18,051,418 | |
Shares issued in reinvestment of dividends and distributions | | | 20,007 | | | | 439,154 | |
Shares reacquired | | | (563,729 | ) | | | (11,832,910 | ) |
| | | | | | | | |
Net increase (decrease) in shares outstanding before conversion | | | 379,631 | | | | 6,657,662 | |
Shares reacquired upon conversion into other share class(es) | | | (145,662 | ) | | | (3,049,402 | ) |
| | | | | | | | |
Net increase (decrease) in shares outstanding | | | 233,969 | | | $ | 3,608,260 | |
| | | | | | | | |
Year ended July 31, 2016: | | | | | | | | |
Shares sold | | | 127,743 | | | $ | 2,219,705 | |
Shares issued in reinvestment of dividends and distributions | | | 506,460 | | | | 8,386,969 | |
Shares reacquired† | | | (366,450 | ) | | | (6,682,184 | ) |
| | | | | | | | |
Net increase (decrease) in shares outstanding before conversion | | | 267,753 | | | | 3,924,490 | |
Shares reacquired upon conversion into other share class(es) | | | (4,483 | ) | | | (81,931 | ) |
| | | | | | | | |
Net increase (decrease) in shares outstanding | | | 263,270 | | | $ | 3,842,559 | |
| | | | | | | | |
| | | | |
| Prudential QMA Small-Cap Value Fund | | | 41 | |
Notes to Financial Statements (continued)
| | | | | | | | |
Class Q | | Shares | | | Amount | |
Year ended July 31, 2017: | | | | | | | | |
Shares sold | | | 3,800,437 | | | $ | 78,935,339 | |
Shares issued in reinvestment of dividends and distributions | | | 241,197 | | | | 5,262,925 | |
Shares reacquired | | | (4,219,698 | ) | | | (88,384,325 | ) |
| | | | | | | | |
Net increase (decrease) in shares outstanding before conversion | | | (178,064 | ) | | | (4,186,061 | ) |
Shares issued upon conversion from other share class(es) | | | 2,269 | | | | 48,884 | |
| | | | | | | | |
Net increase (decrease) in shares outstanding | | | (175,795 | ) | | $ | (4,137,177 | ) |
| | | | | | | | |
Year ended July 31, 2016: | | | | | | | | |
Shares sold | | | 6,022,597 | | | $ | 124,733,146 | |
Shares issued in reinvestment of dividends and distributions | | | 3,710,452 | | | | 60,962,725 | |
Shares reacquired† | | | (2,298,834 | ) | | | (41,757,071 | ) |
| | | | | | | | |
Net increase (decrease) in shares outstanding before conversion | | | 7,434,215 | | | | 143,938,800 | |
Shares issued upon conversion from other share class(es) | | | 527,433 | | | | 12,392,432 | |
| | | | | | | | |
Net increase (decrease) in shares outstanding | | | 7,961,648 | | | $ | 156,331,232 | |
| | | | | | | | |
Class R | | | | | | |
Year ended July 31, 2017: | | | | | | | | |
Shares sold | | | 2,303,406 | | | $ | 47,413,620 | |
Shares issued in reinvestment of dividends and distributions | | | 117,171 | | | | 2,533,242 | |
Shares reacquired | | | (3,113,826 | ) | | | (64,071,727 | ) |
| | | | | | | | |
Net increase (decrease) in shares outstanding | | | (693,249 | ) | | $ | (14,124,865 | ) |
| | | | | | | | |
Year ended July 31, 2016: | | | | | | | | |
Shares sold | | | 2,053,824 | | | $ | 39,349,205 | |
Shares issued in reinvestment of dividends and distributions | | | 2,781,724 | | | | 45,342,101 | |
Shares reacquired† | | | (2,377,876 | ) | | | (43,278,167 | ) |
| | | | | | | | |
Net increase (decrease) in shares outstanding | | | 2,457,672 | | | $ | 41,413,139 | |
| | | | | | | | |
| | | | | | | | |
Class Z | | Shares | | | Amount | |
Year ended July 31, 2017: | | | | | | | | |
Shares sold | | | 13,360,300 | | | $ | 281,484,230 | |
Shares issued in reinvestment of dividends and distributions | | | 812,818 | | | | 17,727,562 | |
Shares reacquired | | | (14,028,222 | ) | | | (290,265,735 | ) |
| | | | | | | | |
Net increase (decrease) in shares outstanding before conversion | | | 144,896 | | | | 8,946,057 | |
Shares issued upon conversion from other share class(es) | | | 162,008 | | | | 3,454,904 | |
Shares reacquired upon conversion into other share class(es) | | | (828 | ) | | | (17,637 | ) |
| | | | | | | | |
Net increase (decrease) in shares outstanding | | | 306,076 | | | $ | 12,383,324 | |
| | | | | | | | |
Year ended July 31, 2016: | | | | | | | | |
Shares sold | | | 13,871,631 | | | $ | 249,218,728 | |
Shares issued in reinvestment of dividends and distributions | | | 14,815,006 | | | | 243,262,399 | |
Shares reacquired | | | (25,215,261 | ) | | | (499,494,247 | ) |
| | | | | | | | |
Net increase (decrease) in shares outstanding before conversion | | | 3,471,376 | | | | (7,013,120 | ) |
Shares issued upon conversion from other share class(es) | | | 31,376 | | | | 648,773 | |
Shares reacquired upon conversion into other share class(es) | | | (527,962 | ) | | | (12,394,320 | ) |
| | | | | | | | |
Net increase (decrease) in shares outstanding | | | 2,974,790 | | | $ | (18,758,667 | ) |
| | | | | | | | |
| † | Includes affiliated redemption of 422 shares with a value of $10,354 for Class A shares, 379 shares with a value of $9,291 for Class C shares, 839 shares with a value of $20,642 for Class Q shares, and 206 shares with a value of $5,013 for Class R shares. |
7. Borrowings
The Trust, on behalf of the Fund, along with other affiliated registered investment companies (the “Funds”), is a party to a Syndicated Credit Agreement (“SCA”) with a group of banks. The purpose of the SCA is to provide an alternative source of temporary funding for capital share redemptions. The SCA provides for a commitment of $900 million for the period October 6, 2016 through October 5, 2017. The Funds pay an annualized commitment fee of .15% of the unused portion of the SCA. The Fund’s portion of the commitment fee for the unused amount, allocated based upon a method approved by the Board, is accrued daily and paid quarterly. The interest on borrowings under the SCA is paid monthly and at a per annum interest rate based upon a contractual spread plus the higher of (1) the effective federal funds rate, (2) the 1-month LIBOR rate or (3) zero percent.
Other affiliated registered investment companies that are parties to the SCA include
portfolios that are subject to a predetermined mathematical formula used to manage
certain benefit guarantees offered under variable annuity contracts. The formula may
result in large scale asset flows into and out of the portfolios. Consequently, the
portfolios may be more likely to utilize the SCA for purposes of funding redemptions.
It may be possible for those portfolios to fully exhaust the committed amount of the
SCA, thereby requiring the Manager to allocate available funding per a Board-approved
methodology designed to treat the Funds in the SCA equitably.
The Fund utilized the SCA during the year ended July 31, 2017. The average daily balance for the 32 days that the Fund had loans outstanding during the period was $6,485,625,
| | | | |
| Prudential QMA Small-Cap Value Fund | | | 43 | |
Notes to Financial Statements (continued)
borrowed at a weighted average interest rate of 2.17%. The maximum loan balance outstanding during the period was $31,671,000. At July 31, 2017, the Fund did not have an outstanding loan balance.
8. Recent Accounting Pronouncements and Reporting Updates
On October 13, 2016, the Securities and Exchange Commission (the “SEC”) adopted new rules and forms and amended existing rules and forms which are intended to modernize and enhance the reporting and disclosure of information by registered investment companies and to improve the quality of information that funds provide to investors, including modifications to Regulation S-X which would require standardized, enhanced disclosure about derivatives in investment company financial statements. The compliance dates of the modifications to Regulation S-X are August 1, 2017 and other amendments and rules are generally June 1, 2018 and December 1, 2018. Management is currently evaluating the impacts to the financial statement disclosures.
9. Other
At the Trust’s Board meeting in March 2017, the Board of Trustees approved a change in the methodology of allocating certain expenses, like Transfer Agent fees (including sub-transfer agent and networking fees) and Blue Sky fees. PGIM Investments implemented the changes effective August 1, 2017.
Financial Highlights
| | | | | | | | | | | | | | | | | | | | |
| Class A Shares | |
| | | Year Ended July 31, | | | | | | February 14,
2014(d)
through
July 31,
| |
| | | 2017 | | | 2016 | | | 2015 | | | | | | 2014(g) | |
| Per Share Operating Performance(b): | | | | | | | | | | | | | | | | | | | | |
| Net Asset Value, Beginning of Period | | | $18.16 | | | | $25.21 | | | | $26.70 | | | | | | | | $26.26 | |
| Income (loss) from investment operations: | | | | | | | | | | | | | | | | | | | | |
| Net investment income (loss) | | | .26 | | | | .32 | | | | .46 | | | | | | | | .09 | |
| Net realized and unrealized gain (loss) on investments | | | 3.25 | | | | (.07 | ) | | | .78 | | | | | | | | .35 | |
| Total from investment operations | | | 3.51 | | | | .25 | | | | 1.24 | | | | | | | | .44 | |
| Less Dividends and Distributions: | | | | | | | | | | | | | | | | | | | | |
| Dividends from net investment income | | | (.30 | ) | | | (.55 | ) | | | (.19 | ) | | | | | | | - | |
| Distributions from net realized gains | | | (.05 | ) | | | (6.75 | ) | | | (2.54 | ) | | | | | | | - | |
| Total dividends and distributions | | | (.35 | ) | | | (7.30) | | | | (2.73 | ) | | | | | | | - | |
| Net asset value, end of period | | | $21.32 | | | | $18.16 | | | | $25.21 | | | | | | | | $26.70 | |
| Total Return(a): | | | 19.29% | | | | 3.98% | | | | 4.53% | | | | | | | | 1.68% | |
| |
| Ratios/Supplemental Data: | |
| Net assets, end of period (000) | | | $132,512 | | | | $116,997 | | | | $138,855 | | | | | | | | $13 | |
| Average net assets (000) | | | $129,902 | | | | $121,788 | | | | $16,282 | | | | | | | | $12 | |
| Ratios to average net assets(c): | | | | | | | | | | | | | | | | | | | | |
| Expenses after waivers and/or expense reimbursement | | | .96% | | | | .98% | | | | 1.14% | | | | | | | | .93% | (e) |
| Expenses before waivers and/or expense reimbursement | | | 1.02% | | | | 1.04% | | | | 1.20% | | | | | | | | .98% | (e) |
| Net investment income (loss) | | | 1.27% | | | | 1.67% | | | | 1.76% | | | | | | | | .74% | (e) |
| Portfolio turnover rate | | | 95% | | | | 72% | | | | 111% | | | | | | | | 42% | (f) |
| (a) | Total return does not consider the effects of sales loads. Total return is calculated assuming a purchase of a share on the first day and a sale on the last day of each period reported and includes reinvestment of dividends and distributions, if any. Total returns may reflect adjustments to conform to generally accepted accounting principles. Total returns for periods less than one full year are not annualized. |
| (b) | Calculated based upon average shares outstanding during the period. |
| (c) | Does not include expenses of the underlying funds in which the Fund invests. |
| (d) | Commencement of operations. |
| (g) | For the period ended July 31, 2014. The Trust changed its fiscal year end from October 31 to July 31, effective July 31, 2014. |
See Notes to Financial Statements.
| | | | |
| Prudential QMA Small-Cap Value Fund | | | 45 | |
Financial Highlights (continued)
| | | | | | | | | | | | | | | | |
| Class C Shares | |
| | | Year Ended July 31, | | | | | | June 19,
2015(d)
through
July 31, | |
| | | 2017 | | | 2016 | | | | | | 2015 | |
| Per Share Operating Performance(b): | | | | | | | | | | | | | | | | |
| Net Asset Value, Beginning of Period | | | $18.18 | | | | $25.19 | | | | | | | | $26.36 | |
| Income (loss) from investment operations: | | | | | | | | | | | | | | | | |
| Net investment income (loss) | | | .10 | | | | .17 | | | | | | | | .02 | |
| Net realized and unrealized gain (loss) on investments | | | 3.26 | | | | (.06 | ) | | | | | | | (1.19 | ) |
| Total from investment operations | | | 3.36 | | | | .11 | | | | | | | | (1.17 | ) |
| Less Dividends and Distributions: | | | | | | | | | | | | | | | | |
| Dividends from net investment income | | | (.17 | ) | | | (.37 | ) | | | | | | | - | |
| Distributions from net realized gains | | | (.05 | ) | | | (6.75 | ) | | | | | | | - | |
| Total dividends and distributions | | | (.22 | ) | | | (7.12 | ) | | | | | | | - | |
| Net asset value, end of period | | | $21.32 | | | | $18.18 | | | | | | | | $25.19 | |
| Total Return(a): | | | 18.43% | | | | 3.19% | | | | | | | | (4.44)% | |
| | | | | | | | | | | | | | | | |
| Ratios/Supplemental Data: | | | | | | | | | | | | |
| Net assets, end of period (000) | | | $40,476 | | | | $30,257 | | | | | | | | $35,293 | |
| Average net assets (000) | | | $41,745 | | | | $30,498 | | | | | | | | $33,702 | |
| Ratios to average net assets(c): | | | | | | | | | | | | | | | | |
| Expenses after waivers and/or expense reimbursement | | | 1.71% | | | | 1.73% | | | | | | | | 1.90% | (e) |
| Expenses before waivers and/or expense reimbursement | | | 1.72% | | | | 1.74% | | | | | | | | 1.91% | (e) |
| Net investment income (loss) | | | .49% | | | | .92% | | | | | | | | .75% | (e) |
| Portfolio turnover rate | | | 95% | | | | 72% | | | | | | | | 111% | (f) |
| (a) | Total return does not consider the effects of sales loads. Total return is calculated assuming a purchase of a share on the first day and a sale on the last day of each period reported and includes reinvestment of dividends and distributions, if any. Total returns may reflect adjustments to conform to generally accepted accounting principles. Total returns for periods less than one full year are not annualized. |
| (b) | Calculated based upon average shares outstanding during the period. |
| (c) | Does not include expenses of the underlying funds in which the Fund invests. |
| (d) | Commencement of operations. |
See Notes to Financial Statements.
| | | | | | | | | | | | | | | | |
| Class Q Shares | |
| | | Year Ended July 31, | | | | | | September 25,
2014(d)
through
July 31, | |
| | | 2017 | | | 2016 | | | | | | 2015 | |
| Per Share Operating Performance(b): | | | | | | | | | | | | | | | | |
| Net Asset Value, Beginning of Period | | | $18.15 | | | | $25.23 | | | | | | | | $26.68 | |
| Income (loss) from investment operations: | | | | | | | | | | | | | | | | |
| Net investment income (loss) | | | .32 | | | | .36 | | | | | | | | .36 | |
| Net realized and unrealized gain (loss) on investments | | | 3.28 | | | | (.05 | ) | | | | | | | 1.01 | |
| Total from investment operations | | | 3.60 | | | | .31 | | | | | | | | 1.37 | |
| Less Dividends and Distributions: | | | | | | | | | | | | | | | | |
| Dividends from net investment income | | | (.36 | ) | | | (.64 | ) | | | | | | | (.28 | ) |
| Distributions from net realized gains | | | (.05 | ) | | | (6.75 | ) | | | | | | | (2.54 | ) |
| Total dividends and distributions | | | (.41 | ) | | | (7.39 | ) | | | | | | | (2.82 | ) |
| Net asset value, end of period | | | $21.34 | | | | $18.15 | | | | | | | | $25.23 | |
| Total Return(a): | | | 19.77% | | | | 4.29% | | | | | | | | 5.04% | |
| |
| Ratios/Supplemental Data: | |
| Net assets, end of period (000) | | | $268,695 | | | | $231,801 | | | | | | | | $121,283 | |
| Average net assets (000) | | | $263,763 | | | | $187,644 | | | | | | | | $36,516 | |
| Ratios to average net assets(c): | | | | | | | | | | | | | | | | |
| Expenses after waivers and/or expense reimbursement | | | .64% | | | | .66% | | | | | | | | .70% | (e) |
| Expenses before waivers and/or expense reimbursement | | | .64% | | | | .66% | | | | | | | | .70% | (e) |
| Net investment income (loss) | | | 1.58% | | | | 1.96% | | | | | | | | 1.67% | (e) |
| Portfolio turnover rate | | | 95% | | | | 72% | | | | | | | | 111% | (f) |
| (a) | Total return is calculated assuming a purchase of a share on the first day and a sale on the last day of each period reported and includes reinvestment of dividends and distributions, if any. Total returns may reflect adjustments to conform to generally accepted accounting principles. Total returns for periods less than one full year are not annualized. |
| (b) | Calculated based upon average shares outstanding during the period. |
| (c) | Does not include expenses of the underlying funds in which the Fund invests. |
| (d) | Commencement of operations. |
See Notes to Financial Statements.
| | | | |
| Prudential QMA Small-Cap Value Fund | | | 47 | |
Financial Highlights (continued)
| | | | | | | | | | | | | | | | | | | | | | | | | | | | | | | | |
| Class R Shares | |
| | | Year Ended July 31, | | | | | | Nine Months
Ended
July 31, | | | | | | Year Ended
October 31, | |
| | | 2017 | | | 2016 | | | 2015 | | | | | | 2014(f) | | | | | | 2013 | | | 2012 | |
| Per Share Operating Performance(b): | | | | | | | | | | | | | | | | | | | | | | | | | | | | | | | | |
| Net Asset Value, Beginning of Period | | | $17.95 | | | | $25.00 | | | | $26.51 | | | | | | | | $27.48 | | | | | | | | $21.21 | | | | $20.17 | |
| Income (loss) from investment operations: | | | | | | | | | | | | | | | | | | | | | | | | | | | | | | | | |
| Net investment income (loss) | | | .21 | | | | .26 | | | | .26 | | | | | | | | .11 | | | | | | | | .20 | | | | .19 | |
| Net realized and unrealized gain (loss) on investments | | | 3.21 | | | | (.07 | ) | | | .91 | | | | | | | | .98 | | | | | | | | 6.87 | | | | 1.65 | |
| Total from investment operations | | | 3.42 | | | | .19 | | | | 1.17 | | | | | | | | 1.09 | | | | | | | | 7.07 | | | | 1.84 | |
| Less Dividends and Distributions: | | | | | | | | | | | | | | | | | | | | | | | | | | | | | | | | |
| Dividends from net investment income | | | (.26 | ) | | | (.49 | ) | | | (.14 | ) | | | | | | | (.15 | ) | | | | | | | (.19 | ) | | | (.14 | ) |
| Distributions from net realized gains | | | (.05 | ) | | | (6.75 | ) | | | (2.54 | ) | | | | | | | (1.91 | ) | | | | | | | (.61 | ) | | | (.66 | ) |
| Total dividends and distributions | | | (.31 | ) | | | (7.24 | ) | | | (2.68 | ) | | | | | | | (2.06 | ) | | | | | | | (.80 | ) | | | (.80 | ) |
| Net asset value, end of period | | | $21.06 | | | | $17.95 | | | | $25.00 | | | | | | | | $26.51 | | | | | | | | $27.48 | | | | $21.21 | |
| Total Return(a): | | | 19.00% | | | | 3.70% | | | | 4.29% | | | | | | | | 4.17% | | | | | | | | 34.55% | | | | 9.51% | |
| |
| Ratios/Supplemental Data: | |
| Net assets, end of period (000) | | | $164,019 | | | | $152,186 | | | | $150,536 | | | | | | | | $143,655 | | | | | | | | $119,047 | | | | $84,483 | |
| Average net assets (000) | | | $159,240 | | | | $145,703 | | | | $152,743 | | | | | | | | $134,383 | | | | | | | | $99,668 | | | | $76,205 | |
| Ratios to average net assets(c): | | | | | | | | | | | | | | | | | | | | | | | | | | | | | | | | |
| Expenses after waivers and/or expense reimbursement | | | 1.21% | | | | 1.23% | | | | 1.22% | | | | | | | | 1.18% | (d) | | | | | | | 1.17% | | | | 1.18% | |
| Expenses before waivers and/or expense reimbursement | | | 1.47% | | | | 1.49% | | | | 1.48% | | | | | | | | 1.43% | (d) | | | | | | | 1.42% | | | | 1.43% | |
| Net investment income (loss) | | | 1.03% | | | | 1.42% | | | | .99% | | | | | | | | .54% | (d) | | | | | | | .83% | | | | .92% | |
| Portfolio turnover rate | | | 95% | | | | 72% | | | | 111% | | | | | | | | 42% | (e) | | | | | | | 40% | | | | 37% | |
| (a) | Total return is calculated assuming a purchase of a share on the first day and a sale on the last day of each period reported and includes reinvestment of dividends and distributions, if any. Total returns may reflect adjustments to conform to generally accepted accounting principles. Total returns for periods less than one full year are not annualized. |
| (b) | Calculated based upon average shares outstanding during the period. |
| (c) | Does not include expenses of the underlying funds in which the Fund invests. |
| (f) | For the nine month period ended July 31, 2014. The Trust changed its fiscal year end from October 31 to July 31, effective July 31, 2014. |
See Notes to Financial Statements.
| | | | | | | | | | | | | | | | | | | | | | | | | | | | | | | | |
| Class Z Shares | |
| | | Year Ended July 31, | | | | | | Nine Months
Ended
July 31, | | | | | | Year Ended
October 31, | |
| | | 2017 | | | 2016 | | | 2015(g) | | | | | | 2014(f) | | | | | | 2013 | | | 2012 | |
| Per Share Operating Performance(b): | | | | | | | | | | | | | |
| Net Asset Value, Beginning Of Period | | | $18.14 | | | | $25.22 | | | | $26.73 | | | | | | | | $27.71 | | | | | | | | $21.39 | | | | $20.33 | |
| Income (loss) from investment operations: | | | | | | | | | | | | | | | | | | | | | | | | | | | | | | | | |
| Net investment income (loss) | | | .31 | | | | .37 | | | | .39 | | | | | | | | .21 | | | | | | | | .32 | | | | .29 | |
| Net realized and unrealized gain (loss) on investments | | | 3.27 | | | | (.08 | ) | | | .92 | | | | | | | | 1.00 | | | | | | | | 6.91 | | | | 1.67 | |
| Total from investment operations | | | 3.58 | | | | .29 | | | | 1.31 | | | | | | | | 1.21 | | | | | | | | 7.23 | | | | 1.96 | |
| Less Dividends and Distributions: | | | | | | | | | | | | | |
| Dividends from net investment income | | | (.35 | ) | | | (.62 | ) | | | (.28 | ) | | | | | | | (.28 | ) | | | | | | | (.30 | ) | | | (.24 | ) |
| Distributions from net realized gains | | | (.05 | ) | | | (6.75 | ) | | | (2.54 | ) | | | | | | | (1.91 | ) | | | | | | | (.61 | ) | | | (.66 | ) |
| Total dividends and distributions | | | (.40 | ) | | | (7.37 | ) | | | (2.82 | ) | | | | | | | (2.19 | ) | | | | | | | (.91 | ) | | | (.90 | ) |
| Net asset value, end of period | | | $21.32 | | | | $18.14 | | | | $25.22 | | | | | | | | $26.73 | | | | | | | | $27.71 | | | | $21.39 | |
| Total Return(a): | | | 19.66% | | | | 4.20% | | | | 4.79% | | | | | | | | 4.60% | | | | | | | | 35.16% | | | | 10.11% | |
| | | | | | | | | | | | | | | | | | | | | | | | | | | | | | | | |
| Ratios/Supplemental Data: | |
| Net assets, end of period (000) | | | $981,061 | | | | $829,360 | | | | $1,077,790 | | | | | | | | $1,781,471 | | | | | | | | $1,622,779 | | | | $1,079,475 | |
| Average net assets (000) | | | $940,720 | | | | $811,529 | | | | $1,828,713 | | | | | | | | $1,782,968 | | | | | | | | $1,342,995 | | | | $1,000,086 | |
| Ratios to average net assets(c): | | | | | | | | | | | | | | | | | | | | | | | | | | | | | | | | |
| Expenses after waivers and/or expense reimbursement | | | .71% | | | | .73% | | | | .72% | | | | | | | | .68% | (d) | | | | | | | .67% | | | | .68% | |
| Expenses before waivers and/or expense reimbursement | | | .72% | | | | .74% | | | | .72% | | | | | | | | .68% | (d) | | | | | | | .67% | | | | .68% | |
| Net investment income (loss) | | | 1.51% | | | | 1.93% | | | | 1.48% | | | | | | | | 1.05% | (d) | | | | | | | 1.32% | | | | 1.42% | |
| Portfolio turnover rate | | | 95% | | | | 72% | | | | 111% | | | | | | | | 42% | (e) | | | | | | | 40% | | | | 37% | |
| (a) | Total return is calculated assuming a purchase of a share on the first day and a sale on the last day of each period reported and includes reinvestment of dividends and distributions, if any. Total returns may reflect adjustments to conform to generally accepted accounting principles. Total returns for periods less than one full year are not annualized. |
| (b) | Calculated based upon average shares outstanding during the period. |
| (c) | Does not include expenses of the underlying funds in which the Fund invests. |
| (f) | For the nine month period ended July 31, 2014. The Trust changed its fiscal year end from October 31 to July 31, effective July 31, 2014. |
| (g) | Class T shares were renamed Class Z shares effective June 19, 2015. |
See Notes to Financial Statements.
| | | | |
| Prudential QMA Small-Cap Value Fund | | | 49 | |
Report of Independent Registered Public
Accounting Firm
The Board of Trustees and Shareholders
The Target Portfolio Trust:
We have audited the accompanying statement of assets and liabilities of Prudential QMA Small-Cap Value Fund (the “Fund”), a series of Target Portfolio Trust, including the portfolio of investments, as of July 31, 2017, and the related statement of operations for the year then ended, the statements of changes in net assets for each of the years in the two-year period then ended, and the financial highlights for each of the years or periods ended in the five -year period then ended. These financial statements and financial highlights are the responsibility of the Fund’s management. Our responsibility is to express an opinion on these financial statements and financial highlights based on our audits.
We conducted our audits in accordance with the standards of the Public Company Accounting Oversight Board (United States). Those standards require that we plan and perform the audit to obtain reasonable assurance about whether the financial statements and financial highlights are free of material misstatement. An audit includes examining, on a test basis, evidence supporting the amounts and disclosures in the financial statements. Our procedures included confirmation of securities owned as of July 31, 2017, by correspondence with the custodian, transfer agent and brokers or by other appropriate auditing procedures when replies from brokers were not received. An audit also includes assessing the accounting principles used and significant estimates made by management, as well as evaluating the overall financial statement presentation. We believe that our audits provide a reasonable basis for our opinion.
In our opinion, the financial statements and financial highlights referred to above present fairly, in all material respects, the financial position of the Fund as of July 31, 2017, and the results of its operations, changes in its net assets, and the financial highlights for the periods described in the first paragraph above, in conformity with U.S. generally accepted accounting principles.

New York, New York
September 18, 2017
INFORMATION ABOUT BOARD MEMBERS AND OFFICERS
(Unaudited)
Information about Board Members and Officers of the Fund is set forth below. Board Members who are not deemed to be “interested persons” of the Fund, as defined in the 1940 Act, are referred to as “Independent Board Members.” Board Members who are deemed to be “interested persons” of the Fund are referred to as “Interested Board Members.” The Board Members are responsible for the overall supervision of the operations of the Fund and perform the various duties imposed on the directors of investment companies by the 1940 Act. The Board in turn elects the Officers, who are responsible for administering the day-to-day operations of the Fund.
| | | | |
| Independent Board Members(1) |
Name, Address, Age Position(s) Portfolios Overseen | | Principal Occupation(s) During Past Five Years | | Other Directorships Held During Past Five Years |
Ellen S. Alberding (59) Board Member Portfolios Overseen: 87 | | President and Board Member, The Joyce Foundation (charitable foundation) (since 2002); Vice Chair, City Colleges of Chicago (community college system) (since 2011); Trustee, Skills for America’s Future (national initiative to connect employers to community colleges) (since 2011); Trustee, National Park Foundation (charitable foundation for national park system) (since 2009); Trustee, Economic Club of Chicago (since 2009). | | None. |
Kevin J. Bannon (65) Board Member Portfolios Overseen: 87 | | Retired; Managing Director (April 2008-May 2015) and Chief Investment Officer (October 2008-November 2013) of Highmount Capital LLC (registered investment adviser); formerly Executive Vice President and Chief Investment Officer (April 1993-August 2007) of Bank of New York Company; President (May 2003-May 2007) of BNY Hamilton Family of Mutual Funds. | | Director of Urstadt Biddle Properties (equity real estate investment trust) (since September 2008). |
Linda W. Bynoe (65) Board Member Portfolios Overseen: 87 | | President and Chief Executive Officer (since March 1995) and formerly Chief Operating Officer (December 1989-February 1995) of Telemat Ltd. (management consulting); formerly Vice President (January 1985-June 1989) at Morgan Stanley & Co. (broker-dealer). | | Director of Simon Property Group, Inc. (retail real estate) (May 2003-May 2012); Director of Anixter International, Inc. (communication products distributor) (since January 2006); Director of Northern Trust Corporation (financial services) (since April 2006); Trustee of Equity Residential (residential real estate) (since December 2009). |
Prudential QMA Small-Cap Value Fund
| | | | |
| Independent Board Members(1) |
Name, Address, Age Position(s) Portfolios Overseen | | Principal Occupation(s) During Past Five Years | | Other Directorships Held During Past Five Years |
Barry H. Evans (56)± Board Member Portfolios Overseen: 87 | | Retired; Formerly President (2005–2016), Global Chief Operating Officer (2014–2016), Chief Investment Officer–Global Head of Fixed Income (1998-2014), and various portfolio manager roles (1986-2006), Manulife Asset Management U.S. | | Director, Manulife Trust Company (2011-present); Director, Manulife Asset Management Limited (2015-present); Formerly Chairman of the Board of Directors of Manulife Asset Management U.S. (2005-2016); Formerly Chairman of the Board, Declaration Investment Management and Research (2008-2016) |
Keith F. Hartstein (60) Board Member & Independent Chair Portfolios Overseen: 87 | | Retired; Member (since November 2014) of the Governing Council of the Independent Directors Council (organization of independent mutual fund directors); formerly President and Chief Executive Officer (2005-2012), Senior Vice President (2004-2005), Senior Vice President of Sales and Marketing (1997-2004), and various executive management positions (1990-1997), John Hancock Funds, LLC (asset management); Chairman, Investment Company Institute’s Sales Force Marketing Committee (2003-2008). | | None. |
Laurie Simon Hodrick (55)± Board Member Portfolios Overseen: 87 | | A. Barton Hepburn Professor of Economics in the Faculty of Business, Columbia Business School (since 1996); Visiting Professor of Law and Rock Center for Corporate Governance Fellow, Stanford Law School (since 2015); Visiting Fellow, Hoover Institution, Stanford University (since 2015); Sole Member, ReidCourt LLC (since 2008) (a consulting firm); Formerly Managing Director, Global Head of Alternative Investment Strategies, Deutsche Bank (2006-2008); Formerly Director/Trustee, Merrill Lynch Investment Managers Funds (1999-2006) | | Independent Director, Corporate Capital Trust (since April 2017) (a business development company) |
Michael S. Hyland, CFA (71) Board Member Portfolios Overseen: 87 | | Retired (since February 2005); formerly Senior Managing Director (July 2001-February 2005) of Bear Stearns & Co, Inc.; Global Partner, INVESCO (1999-2001); Managing Director and President of Salomon Brothers Asset Management (1989-1999). | | None. |
Visit our website at pgiminvestments.com
| | | | |
| Independent Board Members(1) |
Name, Address, Age Position(s) Portfolios Overseen | | Principal Occupation(s) During Past Five Years | | Other Directorships Held During Past Five Years |
Richard A. Redeker (74) Board Member & Independent Vice Chair Portfolios Overseen: 87 | | Retired Mutual Fund Senior Executive (47 years); Management Consultant; Director, Mutual Fund Directors Forum (since 2014); Independent Directors Council (organization of independent mutual fund directors)-Executive Committee, Chair of Policy Steering Committee, Governing Council. | | None. |
Stephen G. Stoneburn (74) Board Member Portfolios Overseen: 87 | | Chairman (since July 2011), President and Chief Executive Officer (since June 1996) of Frontline Medical Communications (publishing company); formerly President (June 1995-June 1996) of Argus Integrated Media, Inc.; Senior Vice President and Managing Director (January 1993-1995) of Cowles Business Media; Senior Vice President of Fairchild Publications, Inc. (1975-1989). | | None. |
| ± | Mr. Evans and Ms. Hodrick joined the Board effective as of September 1, 2017. |
| | | | |
| Interested Board Members(1) |
Name, Address, Age Position(s) Portfolios Overseen | | Principal Occupation(s) During Past Five Years | | Other Directorships Held During Past Five Years |
Stuart S. Parker (54) Board Member & President Portfolios Overseen: 87 | | President of PGIM Investments LLC (formerly known as Prudential Investments LLC) (since January 2012); Executive Vice President of Prudential Investment Management Services LLC (since December 2012); Executive Vice President of Jennison Associates LLC and Head of Retail Distribution of PGIM Investments LLC (June 2005-December 2011). | | None. |
Prudential QMA Small-Cap Value Fund
| | | | |
| Interested Board Members(1) |
Name, Address, Age Position(s) Portfolios Overseen | | Principal Occupation(s) During Past Five Years | | Other Directorships Held During Past Five Years |
Scott E. Benjamin (44) Board Member & Vice President Portfolios Overseen: 87 | | Executive Vice President (since June 2009) of PGIM Investments LLC; Executive Vice President (June 2009-June 2012) and Vice President (since June 2012) of Prudential Investment Management Services LLC; Executive Vice President (since September 2009) of AST Investment Services, Inc.; Senior Vice President of Product Development and Marketing, PGIM Investments (since February 2006); Vice President of Product Development and Product Management, Prudential Investments (2003-2006). | | None. |
Grace C. Torres* (58) Board Member Portfolios Overseen: 86 | | Retired; formerly Treasurer and Principal Financial and Accounting Officer of the Prudential Funds, Target Funds, Advanced Series Trust, Prudential Variable Contract Accounts and The Prudential Series Fund (1998-June 2014); Assistant Treasurer (March 1999-June 2014) and Senior Vice President (September 1999-June 2014) of PGIM Investments LLC; Assistant Treasurer (May 2003-June 2014) and Vice President (June 2005-June 2014) of AST Investment Services, Inc.; Senior Vice President and Assistant Treasurer (May 2003-June 2014) of Prudential Annuities Advisory Services, Inc. | | Director (since July 2015) of Sun Bancorp, Inc. N.A. and Sun National Bank |
| * | Note: Prior to her retirement in 2014, Ms. Torres was employed by PGIM Investments LLC. Due to her prior employment, she is considered to be an “interested person” under the 1940 Act. Ms. Torres is a Non-Management Interested Board Member. |
| (1) | The year that each individual joined the Board is as follows: Ellen S. Alberding, 2013; Kevin J. Bannon, 2008; Linda W. Bynoe, 2005; Barry H. Evans, 2017; Keith F. Hartstein, 2013; Laurie Simon Hodrick, 2017; Michael S. Hyland, 2008; Richard A. Redeker, 2003; Stephen G. Stoneburn, 1999; Grace C. Torres, 2014; Stuart S. Parker, Board Member and President since 2012; Scott E. Benjamin, Board Member since 2010 and Vice President since 2009. |
Visit our website at pgiminvestments.com
| | | | |
| Fund Officers(a) |
Name, Address and Age Position with Fund | | Principal Occupation(s) During Past Five Years | | Length of Service as Fund Officer |
Raymond A. O’Hara (62) Chief Legal Officer | | Vice President and Corporate Counsel (since July 2010) of Prudential Insurance Company of America (Prudential); Vice President (March 2011-Present) of Pruco Life Insurance Company and Pruco Life Insurance Company of New Jersey; Vice President and Corporate Counsel (March 2011-Present) of Prudential Annuities Life Assurance Corporation; Chief Legal Officer of PGIM Investments LLC (since June 2012); Chief Legal Officer of Prudential Mutual Fund Services LLC (since June 2012) and Corporate Counsel of AST Investment Services, Inc. (since June 2012); formerly Assistant Vice President and Corporate Counsel (September 2008-July 2010) of The Hartford Financial Services Group, Inc.; formerly Associate (September 1980-December 1987) and Partner (January 1988–August 2008) of Blazzard & Hasenauer, P.C. (formerly, Blazzard, Grodd & Hasenauer, P.C.). | | Since 2012 |
Chad A. Earnst (42) Chief Compliance Officer | | Chief Compliance Officer (September 2014-Present) of PGIM Investments LLC; Chief Compliance Officer (September 2014-Present) of the Prudential Funds, Target Funds, Advanced Series Trust, The Prudential Series Fund, Prudential’s Gibraltar Fund, Inc., Prudential Global Short Duration High Yield Income Fund, Inc., Prudential Short Duration High Yield Fund, Inc. and Prudential Jennison MLP Income Fund, Inc.; formerly Assistant Director (March 2010-August 2014) of the Asset Management Unit, Division of Enforcement, US Securities & Exchange Commission; Assistant Regional Director (January 2010-August 2014), Branch Chief (June 2006–December 2009) and Senior Counsel (April 2003-May 2006) of the Miami Regional Office, Division of Enforcement, US Securities & Exchange Commission. | | Since 2014 |
Deborah A. Docs (59) Secretary | | Vice President and Corporate Counsel (since January 2001) of Prudential; Vice President (since December 1996) and Assistant Secretary (since March 1999) of PGIM Investments LLC; formerly Vice President and Assistant Secretary (May 2003-June 2005) of AST Investment Services, Inc. | | Since 2004 |
Jonathan D. Shain (59) Assistant Secretary | | Vice President and Corporate Counsel (since August 1998) of Prudential; Vice President and Assistant Secretary (since May 2001) of PGIM Investments LLC; Vice President and Assistant Secretary (since February 2001) of Prudential Mutual Fund Services LLC; formerly Vice President and Assistant Secretary (May 2003-June 2005) of AST Investment Services, Inc. | | Since 2005 |
Claudia DiGiacomo (42) Assistant Secretary | | Vice President and Corporate Counsel (since January 2005) of Prudential; Vice President and Assistant Secretary of PGIM Investments LLC (since December 2005); Associate at Sidley Austin Brown & Wood LLP (1999-2004). | | Since 2005 |
Prudential QMA Small-Cap Value Fund
| | | | |
| Fund Officers(a) |
Name, Address and Age Position with Fund | | Principal Occupation(s) During Past Five Years | | Length of Service as Fund Officer |
Andrew R. French (54) Assistant Secretary | | Vice President and Corporate Counsel (since February 2010) of Prudential; formerly Director and Corporate Counsel (2006-2010) of Prudential; Vice President and Assistant Secretary (since January 2007) of PGIM Investments LLC; Vice President and Assistant Secretary (since January 2007) of Prudential Mutual Fund Services LLC. | | Since 2006 |
Charles H. Smith (44) Anti-Money Laundering Compliance Officer | | Vice President, Corporate Compliance, Anti-Money Laundering Unit (since January 2015) of Prudential; committee member of the American Council of Life Insurers Anti-Money Laundering and Critical Infrastructure Committee (since January 2016); formerly Global Head of Economic Sanctions Compliance at AIG Property Casualty (February 2007–December 2014); Assistant Attorney General at the New York State Attorney General’s Office, Division of Public Advocacy. (August 1998—January 2007). | | Since 2016 |
M. Sadiq Peshimam (53) Treasurer and Principal Financial and Accounting Officer | | Vice President (since 2005) of PGIM Investments LLC; formerly Assistant Treasurer of funds in the Prudential Mutual Fund Complex (2006-2014). | | Since 2006 |
Peter Parrella (59) Assistant Treasurer | | Vice President (since 2007) and Director (2004-2007) within Prudential Mutual Fund Administration; formerly Tax Manager at SSB Citi Fund Management LLC (1997-2004). | | Since 2007 |
Lana Lomuti (50) Assistant Treasurer | | Vice President (since 2007) and Director (2005-2007), within Prudential Mutual Fund Administration; formerly Assistant Treasurer (December 2007-February 2014) of The Greater China Fund, Inc. | | Since 2014 |
Linda McMullin (56) Assistant Treasurer | | Vice President (since 2011) and Director (2008-2011) within Prudential Mutual Fund Administration. | | Since 2014 |
Kelly A. Coyne (49) Assistant Treasurer | | Director, Investment Operations of Prudential Mutual Fund Services LLC (since 2010). | | Since 2015 |
| (a) | Excludes Mr. Parker and Mr. Benjamin, interested Board Members who also serve as President and Vice President, respectively. |
Explanatory Notes to Tables:
| • | | Board Members are deemed to be “Interested,” as defined in the 1940 Act, by reason of their affiliation with PGIM Investments LLC and/or an affiliate of PGIM Investments LLC. |
| • | | Unless otherwise noted, the address of all Board Members and Officers is c/o PGIM Investments LLC, 655 Broad Street, Newark, New Jersey 07102-4410. |
| • | | There is no set term of office for Board Members or Officers. The Board Members have adopted a retirement policy, which calls for the retirement of Board Members on December 31 of the year in which they reach the age of 75. |
| • | | “Other Directorships Held” includes only directorships of companies required to register or file reports with the SEC under the 1934 Act (that is, “public companies”) or other investment companies registered under the 1940 Act. |
| • | | “Portfolios Overseen” includes all investment companies managed by PGIM Investments LLC. The investment companies for which PGIM Investments LLC serves as manager include the Prudential Mutual Funds, The Prudential Variable Contract Accounts, Target Mutual Funds, Prudential Short Duration High Yield Fund, Inc., Prudential Global Short Duration High Yield Fund, Inc., The Prudential Series Fund, Prudential’s Gibraltar Fund, Inc. and the Advanced Series Trust. |
Visit our website at pgiminvestments.com
Approval of Advisory Agreement
The Fund’s Board of Trustees
The Board of Trustees (the “Board”) of Prudential QMA Small-Cap Value Fund (the “Fund”)1 consists of twelve individuals, nine of whom are not “interested persons” of the Fund, as defined in the Investment Company Act of 1940, as amended (the “1940 Act”) (the “Independent Trustees”). The Board is responsible for the oversight of the Fund and its operations, and performs the various duties imposed on the directors of investment companies by the 1940 Act. The Independent Trustees have retained independent legal counsel to assist them in connection with their duties. The Chair of the Board is an Independent Trustee. The Board has established four standing committees: the Audit Committee, the Nominating and Governance Committee, and two Investment Committees. Each committee is chaired by, and composed of, Independent Trustees.
Annual Approval of the Fund’s Advisory Agreements
As required under the 1940 Act, the Board determines annually whether to renew the Fund’s management agreement with PGIM Investments LLC (“PGIM Investments”) and the Fund’s subadvisory agreement with Quantitative Management Associates LLC (“QMA”). In considering the renewal of the agreements, the Board, including all of the Independent Trustees,2 met on June 6-8, 2017 and approved the renewal of the agreements through July 31, 2018, after concluding that the renewal of the agreements was in the best interests of the Fund and its shareholders.
In advance of the meetings, the Board requested and received materials relating to the agreements, and had the opportunity to ask questions and request further information in connection with its consideration. Among other things, the Board considered comparative fee information from PGIM Investments and QMA. Also, the Board considered comparisons with other mutual funds in relevant Peer Universes and Peer Groups, as is further discussed below.
In approving the agreements, the Board, including the Independent Trustees advised by independent legal counsel, considered the factors it deemed relevant, including the nature, quality and extent of services provided by PGIM Investments and the subadviser, the performance of the Fund, the profitability of PGIM Investments and its affiliates, expenses and fees, and the potential for economies of scale that may be shared with the Fund and its shareholders as the Fund’s assets grow. In their deliberations, the Trustees did not identify any single factor which alone was responsible for the Board’s decision to approve the agreements with respect to the Fund. In connection with its deliberations, the Board considered information provided by PGIM Investments throughout the year at regular Board
| 1 | Prudential QMA Small-Cap Value Fund is a series of The Target Portfolio Trust. |
| 2 | Barry H. Evans and Laurie Simon Hodrick joined the Board effective as of September 1, 2017. Neither Mr. Evans nor Ms. Hodrick participated in the consideration of the approval of the Fund’s advisory agreements. |
| | |
| Prudential QMA Small-Cap Value Fund |
Approval of Advisory Agreement (continued)
meetings, presentations from portfolio managers and other information, as well as information furnished at or in advance of the meetings on June 6-8, 2017.
The Trustees determined that the overall arrangements between the Fund and PGIM Investments, which serves as the Fund’s investment manager pursuant to a management agreement, and between PGIM Investments and QMA, which serves as the Fund’s subadviser pursuant to the terms of a subadvisory agreement with PGIM Investments, are in the best interests of the Fund and its shareholders in light of the services performed, fees charged and such other matters as the Trustees considered relevant in the exercise of their business judgment.
The material factors and conclusions that formed the basis for the Trustees’ reaching their determinations to approve the continuance of the agreements are separately discussed below.
Nature, Quality and Extent of Services
The Board received and considered information regarding the nature, quality and extent of services provided to the Fund by PGIM Investments and QMA. The Board considered the services provided by PGIM Investments, including but not limited to the oversight of the subadviser for the Fund, as well as the provision of fund recordkeeping, compliance, and other services to the Fund. With respect to PGIM Investments’ oversight of the subadviser, the Board noted that PGIM Investments’ Strategic Investment Research Group (“SIRG”), which is a business unit of PGIM Investments, is responsible for monitoring and reporting to PGIM Investments’ senior management on the performance and operations of the subadviser. The Board also considered that PGIM Investments pays the salaries of all of the officers and interested Trustees of the Fund who are part of Fund management. The Board also considered the investment subadvisory services provided by QMA, as well as adherence to the Fund’s investment restrictions and compliance with applicable Fund policies and procedures. The Board considered PGIM Investments’ evaluation of the subadviser, as well as PGIM Investments’ recommendation, based on its review of the subadviser, to renew the subadvisory agreement.
The Board considered the qualifications, backgrounds and responsibilities of PGIM Investments’ senior management responsible for the oversight of the Fund and QMA, and also considered the qualifications, backgrounds and responsibilities of the QMA portfolio managers who are responsible for the day-to-day management of the Fund’s portfolio. The Board was provided with information pertaining to PGIM Investments’ and QMA’s organizational structure, senior management, investment operations, and other relevant information pertaining to PGIM Investments and QMA. The Board also noted that it received favorable compliance reports from the Fund’s Chief Compliance Officer (“CCO”)
| | |
| Visit our website at pgiminvestments.com | | |
as to each of PGIM Investments and QMA. The Board noted that QMA is affiliated with PGIM Investments.
The Board concluded that it was satisfied with the nature, extent and quality of the investment management services provided by PGIM Investments and the subadvisory services provided to the Fund by QMA, and that there was a reasonable basis on which to conclude that the Fund benefits from the services provided by PGIM Investments and QMA under the management and subadvisory agreements.
Costs of Services and Profits Realized by PGIM Investments
The Board was provided with information on the profitability of PGIM Investments and its affiliates in serving as the Fund’s investment manager. The Board discussed with PGIM Investments the methodology utilized in assembling the information regarding profitability and considered its reasonableness. The Board recognized that it is difficult to make comparisons of profitability from fund management contracts because comparative information is not generally publicly available and is affected by numerous factors, including the structure of the particular adviser, the types of funds it manages, its business mix, numerous assumptions regarding allocations and the adviser’s capital structure and cost of capital. The Board further noted that the subadviser is affiliated with PGIM Investments and that its profitability is reflected in PGIM Investments’ profitability report. Taking these factors into account, the Board concluded that the profitability of PGIM Investments and its affiliates in relation to the services rendered was not unreasonable.
Economies of Scale
The Board received and discussed information concerning economies of scale that PGIM Investments may realize as the Fund’s assets grow beyond current levels. The Board noted that the management fee schedule for the Fund includes breakpoints, which have the effect of decreasing the fee rate as assets increase, but that at its current level of assets the Fund does not realize the effect of those rate reductions. The Board took note that the Fund’s fee structure currently results in benefits to Fund shareholders whether or not PGIM Investments realizes any economies of scale. The Board noted that economies of scale can be shared with the Fund in other ways, including low management fees from inception, additional technological and personnel investments to enhance shareholder services, and maintaining existing expense structures in the face of a rising cost environment. The Board also considered PGIM Investments’ assertion that it continually evaluates the management fee schedule of the Fund and the potential to share economies of scale through breakpoints or fee waivers as asset levels increase.
| | |
| Prudential QMA Small-Cap Value Fund |
Approval of Advisory Agreement (continued)
The Board recognized the inherent limitations of any analysis of economies of scale, stemming largely from the Board’s understanding that most of PGIM Investments’ costs are not specific to individual funds, but rather are incurred across a variety of products and services.
Other Benefits to PGIM Investments and QMA
The Board considered potential ancillary benefits that might be received by PGIM Investments and QMA and their affiliates as a result of their relationship with the Fund. The Board concluded that potential benefits to be derived by PGIM Investments included transfer agency fees received by the Fund’s transfer agent (which is affiliated with PGIM Investments), and benefits to its reputation as well as other intangible benefits resulting from PGIM Investments’ association with the Fund. The Board concluded that the potential benefits to be derived by QMA included its ability to use soft dollar credits, as well as the potential benefits consistent with those generally resulting from an increase in assets under management, specifically, potential access to additional research resources and benefits to its reputation. The Board concluded that the benefits derived by PGIM Investments and QMA were consistent with the types of benefits generally derived by investment managers and subadvisers to mutual funds.
Performance of the Fund / Fees and Expenses
The Board considered certain additional specific factors and made related conclusions relating to the historical performance of the Fund for the one-, three-, five- and ten-year periods ended December 31, 2016.
The Board also considered the Fund’s actual management fee, as well as the Fund’s net total expense ratio, for the fiscal year ended July 31, 2016. The Board considered the management fee for the Fund as compared to the management fee charged by PGIM Investments to other funds and the fee charged by other advisers to comparable mutual funds in a Peer Group. The actual management fee represents the fee rate actually paid by Fund shareholders and includes any fee waivers or reimbursements. The net total expense ratio for the Fund represents the actual expense ratio incurred by Fund shareholders.
The mutual funds included in the Peer Universe (the Lipper Small-Cap Value Funds Performance Universe), which was used to evaluate performance, and the Peer Group, which was used to evaluate fees and expenses, were objectively determined by Broadridge, an independent provider of mutual fund data. The comparisons placed the Fund in various quartiles, with the first quartile being the best 25% of the mutual funds (for performance, the best performing mutual funds and, for expenses, the lowest cost mutual funds).
| | |
| Visit our website at pgiminvestments.com | | |
The section below summarizes key factors considered by the Board and the Board’s conclusions regarding the Fund’s performance, fees and overall expenses. The table sets forth gross performance comparisons (which do not reflect the impact on performance of fund expenses, or any subsidies, expense caps or waivers that may be applicable) with the Peer Universe, actual management fees with the Peer Group (which reflect the impact of any subsidies or fee waivers), and net total expenses with the Peer Group, each of which were key factors considered by the Board.
| | | | | | | | |
| Performance | | 1 Year | | 3 Years | | 5 Years | | 10 Years |
| | | 1st Quartile | | 1st Quartile | | 2nd Quartile | | 1st Quartile |
| Actual Management Fees: 1st Quartile |
| Net Total Expenses: 1st Quartile |
| | • | | The Board noted that the Fund outperformed its benchmark index over all periods. |
| | • | | The Board and PGIM Investments agreed to continue the Fund’s existing waiver of up to 0.01% to the extent that the Fund’s annual operating expenses (exclusive of 12b-1 fees and certain other fees and expenses) exceed 0.68% through November 30, 2017. |
| | • | | The Board concluded that, in light of the above, it would be in the best interests of the Fund and its shareholders to renew the agreements. |
| | • | | The Board concluded that the management fees (including subadvisory fees) and total expenses were reasonable in light of the services provided. |
* * *
After full consideration of these factors, the Board concluded that approval of the agreement was in the best interests of the Fund and its shareholders.
| | |
| Prudential QMA Small-Cap Value Fund |
| | | | |
| ∎ MAIL | | ∎ TELEPHONE | | ∎ WEBSITE |
655 Broad Street Newark, NJ 07102 | | (800) 225-1852 | | www.pgiminvestments.com |
|
| PROXY VOTING |
| The Board of Trustees has delegated to the Fund’s investment subadviser the responsibility for voting any proxies and maintaining proxy recordkeeping with respect to the Fund. A description of these proxy voting policies and procedures is available without charge, upon request, by calling (800) 225-1852. Information regarding how the Fund voted proxies relating to portfolio securities during the most recent 12-month period ended June 30 is available on the Fund’s website and on the Securities and Exchange Commission’s website at www.sec.gov. |
|
| TRUSTEES |
| Ellen S. Alberding • Kevin J. Bannon • Scott E. Benjamin • Linda W. Bynoe • Barry H. Evans • Keith F. Hartstein • Laurie Simon Hodrick • Michael S. Hyland • Stuart S. Parker • Richard A. Redeker • Stephen G. Stoneburn • Grace C. Torres |
|
| OFFICERS |
| Stuart S. Parker, President • Scott E. Benjamin, Vice President • M. Sadiq Peshimam, Treasurer and Principal Financial and Accounting Officer • Raymond A. O’Hara, Chief Legal Officer • Chad A. Earnst, Chief Compliance Officer • Deborah A. Docs, Secretary • Charles H. Smith, Anti-Money Laundering Compliance Officer • Jonathan D. Shain, Assistant Secretary • Claudia DiGiacomo, Assistant Secretary • Andrew R. French, Assistant Secretary • Peter Parrella, Assistant Treasurer • Lana Lomuti, Assistant Treasurer • Linda McMullin, Assistant Treasurer • Kelly A. Coyne, Assistant Treasurer |
| | | | |
| MANAGER | | PGIM Investments LLC | | 655 Broad Street Newark, NJ 07102 |
|
| INVESTMENT SUBADVISER | | Quantitative Management Associates LLC | | Gateway Center Two 100 Mulberry Street Newark, NJ 07102 |
|
| DISTRIBUTOR | | Prudential Investment Management Services LLC | | 655 Broad Street Newark, NJ 07102 |
|
| CUSTODIAN | | The Bank of New York Mellon | | 225 Liberty Street New York, NY 10286 |
|
| TRANSFER AGENT | | Prudential Mutual Fund Services LLC | | PO Box 9658 Providence, RI 02940 |
|
INDEPENDENT REGISTERED
PUBLIC ACCOUNTING FIRM | | KPMG LLP | | 345 Park Avenue New York, NY 10154 |
|
| FUND COUNSEL | | Willkie Farr & Gallagher LLP | | 787 Seventh Avenue New York, NY 10019 |
|
|
| An investor should consider the investment objectives, risks, charges, and expenses of the Fund carefully before investing. The prospectus and summary prospectus contain this and other information about the Fund. An investor may obtain a prospectus and summary prospectus by visiting our website at www.pgiminvestments.com or by calling (800) 225-1852. The prospectus and summary prospectus should be read carefully before investing. |
|
| E-DELIVERY |
| To receive your mutual fund documents online, go to www.pgiminvestments.com/edelivery and enroll. Instead of receiving printed documents by mail, you will receive notification via email when new materials are available. You can cancel your enrollment or change your email address at any time by visiting the website address above. |
|
| SHAREHOLDER COMMUNICATIONS WITH TRUSTEES |
| Shareholders can communicate directly with the Board of Trustees by writing to the Chair of the Board, Prudential QMA Small-Cap Value Fund, PGIM Investments, Attn: Board of Trustees, 655 Broad Street, Newark, NJ 07102. Shareholders can communicate directly with an individual Trustee by writing to the same address. Communications are not screened before being delivered to the addressee. |
|
| AVAILABILITY OF PORTFOLIO SCHEDULE |
| The Fund files its complete schedule of portfolio holdings with the Securities and Exchange Commission for the first and third quarters of each fiscal year on Form N-Q. The Fund’s Forms N-Q are available on the Commission’s website at www.sec.gov. The Fund’s Forms N-Q may also be reviewed and copied at the Commission’s Public Reference Room in Washington, D.C. Information on the operation and location of the Public Reference Room may be obtained by calling 1-800-SEC-0330. The Fund’s schedule of portfolio holdings is also available on the Fund’s website as of the end of each month no sooner than 15 days after the end of the month. |
|
| The Fund’s Statement of Additional Information contains additional information about the Fund’s Trustees and is available without charge, upon request, by calling (800) 225-1852. |
Mutual Funds:
| | | | |
ARE NOT INSURED BY THE FDIC OR ANY
FEDERAL GOVERNMENT AGENCY | | MAY LOSE VALUE | | ARE NOT A DEPOSIT OF OR GUARANTEED
BY ANY BANK OR ANY BANK AFFILIATE |

PRUDENTIAL QMA SMALL-CAP VALUE FUND
| | | | | | | | | | |
| SHARE CLASS | | A | | C | | Q | | R | | Z |
| NASDAQ | | TSVAX | | TRACX | | TSVQX | | TSVRX | | TASVX |
| CUSIP | | 875921785 | | 875921710 | | 875921777 | | 875921843 | | 875921306 |
MF232E

PRUDENTIAL CORE BOND FUND
ANNUAL REPORT
JULY 31, 2017

To enroll in e-delivery, go to pgiminvestments.com/edelivery
Highlights
| • | | Sector allocation was a strong contributor to the Fund’s relative performance, highlighted by overweight positions in investment-grade corporate bonds, commercial mortgage-backed securities, and asset-backed securities. |
| • | | Security selection among non-agency mortgage-backed securities, collateralized loan obligations, investment-grade corporate bonds, asset-backed securities, US Treasuries, and emerging markets debt added to returns. |
| • | | An underweight position at the sector level in emerging markets debt was a modest detractor during the reporting period. |
This report is not authorized for distribution to prospective investors unless preceded or accompanied by a current prospectus.
The views expressed in this report and information about the Fund’s portfolio holdings are for the period covered by this report and are subject to change thereafter.
Mutual funds are distributed by Prudential Investment Management Services LLC (PIMS), member SIPC. PGIM Fixed Income is a unit of PGIM, Inc. (PGIM), a registered investment adviser. PIMS and PGIM are Prudential Financial companies. © 2017 Prudential Financial, Inc. and its related entities. The Prudential logo and the Rock symbol are service marks of Prudential Financial, Inc. and its related entities, registered in many jurisdictions worldwide.
| | |
| 2 | | Visit our website at pgiminvestments.com |
Letter from the President

Dear Shareholder:
We hope you find the annual report for the Prudential Core Bond Fund informative and useful. The report covers performance for the 12-month period ended July 31, 2017.
Effective April 3, 2017, Prudential Investments became known as PGIM® Investments. Why PGIM? This new name was chosen to further align with the global investment management businesses of Prudential Financial, which rebranded from Prudential Investment Management in January 2016. This new name allows for one brand and reflects our ability and commitment to delivering investment solutions to clients around the globe. Please keep in mind that only the Fund adviser’s name was changed: the name of your Fund and its management and operation will not change.
Major global events during the reporting period included the US presidential election and domestic issues related to the new administration’s policy initiatives. The US economy experienced weak growth during the first quarter of 2017, although stronger growth took place in the second quarter. Britain began its formal legal process to leave the European Union, and recent parliamentary elections in Britain resulted in unseating the majority party. Overall, global economic growth picked up slightly.
Equities in the US reached new highs, and international equities gained significantly. European stocks posted impressive results. Asian markets were solid, and emerging markets outperformed most regions.
In mid-June, the Federal Reserve raised its Federal Funds rate by 0.25% for the second time in 2017. Fixed income markets were mixed, as rising interest rates affected bond markets. High yield and emerging markets bonds were among the top performers.
Given the uncertainty in today’s investment environment, we believe that active professional portfolio management offers a potential advantage. Active managers often have the knowledge and flexibility to find the best investment opportunities in the most challenging markets.
Even so, it’s best if investment decisions are based on your long-term goals rather than on short-term market and economic developments. We also encourage you to work with an experienced financial advisor who can help you set goals, determine your tolerance for risk, and build a diversified plan that’s right for you and make adjustments when necessary.
At PGIM Investments, we consider it a great privilege and responsibility to help investors participate in opportunities across global markets while meeting their toughest investment challenges. We’re part of PGIM, a top-10 global investment manager with more than $1 trillion in assets under management. This investment expertise allows us to deliver actively managed funds and strategies to meet the needs of investors around the globe.
Thank you for choosing our family of funds.
Sincerely,

Stuart S. Parker, President
Prudential Core Bond Fund
September 15, 2017
| | | | |
| Prudential Core Bond Fund | | | 3 | |
Your Fund’s Performance (unaudited)
Performance data quoted represent past performance. Past performance does not guarantee future results. The investment return and principal value of an investment will fluctuate, so that an investor’s shares, when redeemed, may be worth more or less than their original cost. Current performance may be lower or higher than the past performance data quoted. An investor may obtain performance data as of the most recent month-end by visiting our website at www.pgiminvestments.com or by calling (800) 225-1852.
| | | | | | | | | | | | | | |
| | | Average Annual Total Returns as of 7/31/17 (with sales charges) | |
| | | One Year (%) | | Five Years (%) | | | Ten Years (%) | | | Since Inception (%) | |
| Class A | | –4.72 | | | N/A | | | | N/A | | | | 0.39 (2/17/15) | |
| Class C | | –1.95 | | | N/A | | | | N/A | | | | 1.53 (2/17/15) | |
| Class Q | | 0.07 | | | N/A | | | | N/A | | | | 2.58 (2/17/15) | |
| Class R | | –0.48 | | | N/A | | | | N/A | | | | 2.06 (2/17/15) | |
| Class Z | | 0.02 | | | 1.38 | | | | 4.97 | | | | — | |
| Bloomberg Barclays US Aggregate Bond Index | | –0.51 | | | 2.02 | | | | 4.44 | | | | — | |
| Lipper Core Bond Funds Average | | 0.12 | | | 2.07 | | | | 4.13 | | | | — | |
| | | | | | | | | | | | | | |
| | | Average Annual Total Returns as of 7/31/17 (without sales charges) | |
| | | One Year (%) | | Five Years (%) | | | Ten Years (%) | | | Since Inception (%) | |
| Class A | | –0.23 | | | N/A | | | | N/A | | | | 2.29 (2/17/15) | |
| Class C | | –0.98 | | | N/A | | | | N/A | | | | 1.53 (2/17/15) | |
| Class Q | | 0.07 | | | N/A | | | | N/A | | | | 2.58 (2/17/15) | |
| Class R | | –0.48 | | | N/A | | | | N/A | | | | 2.06 (2/17/15) | |
| Class Z | | 0.02 | | | 1.38 | | | | 4.97 | | | | — | |
| Bloomberg Barclays US Aggregate Bond Index | | –0.51 | | | 2.02 | | | | 4.44 | | | | — | |
| Lipper Core Bond Funds Average | | 0.12 | | | 2.07 | | | | 4.13 | | | | — | |
| | |
| 4 | | Visit our website at pgiminvestments.com |
Growth of a $10,000 Investment
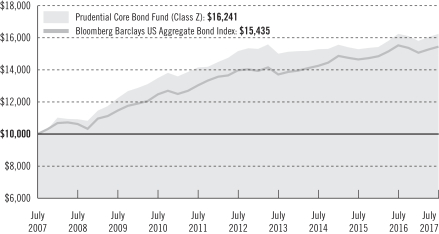
The graph compares a $10,000 investment in the Prudential Core Bond Fund (Class Z) with a similar investment in the Bloomberg Barclays US Aggregate Bond Index by portraying the initial account values at the beginning of the 10-year period (July 31, 2007) and the account values at the end of the current fiscal period (July 31, 2017), as measured on a quarterly basis. For purposes of the graph, and unless otherwise indicated, it has been assumed that (a) all recurring fees (including management fees) were deducted; and (b) all dividends and distributions were reinvested. The line graph provides information for Class Z shares only. As indicated in the tables provided earlier, performance for Class A, Class C, Class Q, and Class R shares will vary due to the differing charges and expenses applicable to each share class (as indicated in the following paragraphs). Without waiver of fees and/or expense reimbursements, if any, the returns would have been lower.
Past performance does not predict future performance. Total returns and the ending account values in the graph include changes in share price and reinvestment of dividends and capital gains distributions in a hypothetical investment for the periods shown. The Fund’s total returns do not reflect the deduction of income taxes on an individual’s investment. Taxes may reduce your actual investment returns on income or gains paid by the Fund or any gains you may realize if you sell your shares.
Source: PGIM Investments LLC and Lipper Inc.
The Since Inception returns for the Index and the Lipper Average are measured from the closest month-end to the Fund’s inception date. Inception returns are provided for any share class with less than 10 fiscal years of returns.
| | | | |
| Prudential Core Bond Fund | | | 5 | |
Your Fund’s Performance (continued)
The returns in the tables do not reflect the deduction of taxes that a shareholder would pay on Fund distributions or following the redemption of Fund shares. The average annual total returns take into account applicable sales charges, which are described in the table below.
| | | | | | | | | | |
| | | Class A | | Class C | | Class Q | | Class R | | Class Z |
| Maximum initial sales charge | | 4.50% of the public offering price | | None | | None | | None | | None |
| Contingent deferred sales charge (CDSC) (as a percentage of the lower of original purchase price or net asset value at redemption) | | 1% on sales of $1 million or more made within 12 months of purchase | | 1% on sales made within 12 months of purchase | | None | | None | | None |
| Annual distribution and service (12b-1) fees | | .25% | | 1% | | None | | .75%
(.50%
currently) | | None |
Benchmark Definitions
Bloomberg Barclays US Aggregate Bond Index—The Bloomberg Barclays US Aggregate Bond Index is unmanaged and represents securities that are SEC-registered, taxable, and dollar denominated. It covers the US investment-grade fixed rate bond market, with index components for government and corporate securities, mortgage pass-through securities, and asset-backed securities. The average annual total return for the Index measured from the month-end closest to the inception date through 7/31/17 is 1.97% for Class A, C, Q, and R shares.
Lipper Core Bond Funds Average—Lipper Core Bond funds invest at least 85% in domestic investment-grade debt issues (rated in the top four grades) with any remaining investment in non-benchmark sectors such as high yield, global and emerging market debt. These funds maintain dollar-weighted average maturities of five to 10 years. The average annual total return for the Average measured from the month-end closest to the inception date through 7/31/17 is 1.87% for Class A, C, Q, and R shares.
Investors cannot invest directly in an index or average. The returns for the Index would be lower if they included the effects of sales charges, operating expenses of a mutual fund, or taxes. Returns for the Lipper Average reflect the deduction of operating expenses, but not sales charges or taxes.
| | |
| 6 | | Visit our website at pgiminvestments.com |
| | | | | | |
| Distributions and Yields as of 7/31/17 |
| | Total Distributions
Paid for
12 Months ($) | | SEC 30-Day
Subsidized
Yield* (%) | | SEC 30-Day
Unsubsidized
Yield** (%) |
| Class A | | 0.21 | | 1.86 | | 1.46 |
| Class C | | 0.14 | | 1.21 | | 0.79 |
| Class Q | | 0.24 | | 2.25 | | 2.00 |
| Class R | | 0.19 | | 1.68 | | 1.02 |
| Class Z | | 0.24 | | 2.20 | | 1.78 |
*SEC 30-Day Subsidized Yield (%)—A standardized yield calculation created by the Securities and Exchange Commission, it reflects the income earned during a 30-day period, after the deduction of the fund’s net expenses (net of any expense waivers or reimbursements).
**SEC 30-Day Unsubsidized Yield (%)—A standardized yield calculation created by the Securities and Exchange Commission, it reflects the income earned during a 30-day period, after the deduction of the Fund’s gross expenses.
| | | | |
| Credit Quality expressed as a percentage of total investments as of 7/31/17 (%) | |
| AAA | | | 59.1 | |
| AA | | | 6.5 | |
| A | | | 15.2 | |
| BBB | | | 14.4 | |
| BB | | | 0.3 | |
| Not Rated | | | 3.0 | |
| Cash/Equivalents | | | 1.5 | |
| Total Investments | | | 100.0 | |
Source: PGIM Fixed Income
Credit ratings reflect the highest rating assigned by a nationally recognized statistical rating organization (NRSRO) such as Moody’s, S&P and Fitch. Moody’s Investor Service, Inc. (Moody’s), S&P Global Ratings (S&P), or Fitch, Inc. (Fitch). Credit ratings reflect the common nomenclature used by both S&P and Fitch. Where applicable, ratings are converted to the comparable S&P/Fitch rating tier nomenclature. These rating agencies are independent, and are widely used. The Not Rated category consists of securities that have not been rated by an NRSRO. Credit ratings are subject to change. Values may not sum to 100.0% due to rounding.
| | | | |
| Prudential Core Bond Fund | | | 7 | |
Strategy and Performance Overview
How did the Fund perform?
The Prudential Core Bond Fund’s Class Z shares returned 0.02% for the 12-month reporting period that ended July 31, 2017, outperforming the -0.51% decline of the Bloomberg Barclays US Aggregate Bond Index (the Index) and underperforming the 0.12% gain of the Lipper Core Bond Funds Average.
What were market conditions?
| • | | During the reporting period, the market experienced several significant events, including the aftermath of the UK’s surprise vote to leave the European Union (commonly known as “Brexit”), the surprise victory of Donald Trump in the US Presidential election, the impact of ongoing bond-buying programs by the European Central Bank and the Bank of England, two Federal Reserve (Fed) rate hikes, and the wait for details about the Fed’s long-expected balance sheet runoff. As the period ended, speculation increased about who would head the Fed after Janet Yellen’s term expires in early 2018. Would it be a dove intent on boosting the Trump growth agenda? Or, would it be a more rules-based chairperson intent on reaching the Fed’s “dots?” (“Dots” refer to projections made by the members of the Fed’s Open Market Committee about where they think interest rates should be at a particular point in the future.) |
| • | | US economic growth, which had weakened earlier in the period, rebounded to a 2.6% pace during the second quarter of 2017 against a backdrop of continued above-trend growth in the rest of the G3. (The G3, or Group of Three, refers to the US, Japan and the European Union.) US inflation, however, was generally weaker than expected, continuing to undershoot G3 central bank targets. |
| • | | Overall, the underlying momentum in the US economy has remained solid since early 2016. Real final private sector demand has been notably robust, growing at an annualized rate of between 2.6% and 3.3% in each of the last five calendar quarters and averaging 2.8% in first half of 2017. (Real final demand is the total demand for final goods and services, adjusted for inflation, in an economy.) Consumer spending has been particularly strong, but investment spending, too, has picked up as headwinds from the collapse in energy prices and the strengthening US dollar have faded. |
| • | | US companies continued to hire at a strong pace, with monthly job gains averaging 184,000 in the year to date through July 31, 2017, which is little changed from 2016’s average of 187,000 jobs and well above the estimated 75,000 to 100,000 jobs needed to keep the unemployment rate unchanged. Indeed, the unemployment rate gradually ticked lower during the reporting period, inching down to 4.3% in July. Importantly, job gains were widespread across industries. Even the retail sector, which shed jobs every month from February through May, saw stable employment in the last two months of the period. |
| | |
| 8 | | Visit our website at pgiminvestments.com |
| • | | Lean business inventories, solid core durable goods orders, and ongoing strong job gains suggest real US GDP growth is on track to maintain its second-quarter momentum into the third quarter. |
| • | | The US fixed income markets, as represented by the Index, struggled during the reporting period, posting a negative return of –0.51%. Lower-quality bonds outperformed, with BBB-rated bonds returning 2.9% for the period. |
| • | | US corporate bonds delivered a total return of 1.55%, with an excess return versus US Treasuries of 474 basis points. (A basis point is 1/100 of a percent.) Within the Index, financials outpaced industrials and utilities. Metals & mining, energy, and life insurance were amongst the strongest sectors, while tobacco, retailers & restaurants, and telecommunication services were amongst the weakest underperforming sectors. |
| • | | Agency mortgage-backed securities outperformed Treasuries during the period, delivering a 0.19% total return and an excess return of 14 basis points over similar-maturity US Treasury securities. The period began with strong demand for mortgage-backed securities, including outsized buying by banks and non-US investors, and continued Fed reinvesting which helped tighten spreads (yield differentials versus comparable-maturity Treasuries) back to 2015 year-end levels. Mortgage-backed securities prepayments rose early in the period in response to low mortgage rates late in second quarter of 2016. Toward the end of the period, mortgage-backed securities spreads tightened, net supply increased, and outright buyers seemed willing to wait for better entry points to add mortgage-backed securities exposure. The 30-year mortgage rate ended the period at approximately 4%. |
| • | | Structured products performed very well with notable spread tightening in asset-backed securities (ABS), non-agency mortgage-backed securities, and commercial mortgage-backed securities (CMBS). |
What worked?
| • | | Sector allocation was a strong contributor to the Fund’s relative performance, highlighted by overweight positions in investment-grade corporate bonds, CMBS, and ABS. |
| • | | Security selection among non-agency mortgage-backed securities, collateralized loan obligations (CLOs), investment-grade corporate bonds, ABS, US Treasuries, and emerging markets debt added to returns. |
| • | | Within corporate bonds, positioning in the upstream energy, foreign non-corporate, and banking sectors was positive. |
| • | | In individual security selection, the Fund benefited from overweights to issuers in the upstream energy sector, including Anadarko Petroleum, Devon Energy, and Apache Corporation. Overweights in Citigroup (banking), Hungary (foreign non-corporate), and General Motors (automotive) were also positive. |
| | | | |
| Prudential Core Bond Fund | | | 9 | |
Strategy and Performance Overview (continued)
| • | | The Fund’s tactical duration positioning added to performance during the period. Duration measures the sensitivity of the price (the value of principal) of a bond to a change in interest rates. The longer the duration, the greater the potential risk or reward when interest rates move. The Fund’s active duration positioning ranged from -0.4 years short to +0.2 years long versus the Index, ending the period toward the middle of the range at a neutral position relative to the Index. |
What didn’t work?
| • | | An underweight position at the sector level in emerging markets debt was a modest detractor during the reporting period. |
| • | | Security selection in mortgage-backed securities also limited relative results. |
| • | | The Fund’s positioning in the electric & water, chemicals, and railroads sectors detracted from performance. |
| • | | In individual security selection, the Fund’s overweight positions in HCA Healthcare (health care & pharmaceutical) and Public Service Enterprise Group (electric & water) detracted from returns. Avoiding HSBC (banking) and Valepar (metals & mining) was also negative for performance. |
| • | | The Fund’s yield curve flattening positioning hurt performance during the period. |
Did the Fund use derivatives and how did they affect performance?
| • | | Derivatives were used in the Fund during the reporting period to manage interest rate and credit risk in the US and global markets. |
| • | | The Fund’s exposure to derivatives had a negligible impact on performance during the period. |
Current outlook
| • | | PGIM Fixed Income maintains a positive view of fundamentals in the credit sectors of the fixed income market and the Fund is overweight in spread sectors, including investment-grade corporate bonds, and in structured products, such as CLOs, CMBS and ABS. |
| • | | Within investment-grade corporate bonds, the Fund continues to have a longer duration emphasis, with an overweight in financials. PGIM Fixed Income favors US financials over industrial issues, especially US money center banks given their strong capital requirements and generally solid earnings. Among industrials, the Fund’s focus is on names where an “event” has passed, as companies that issue higher-quality corporate bonds continue to add debt and consolidation remains a concern. Furthermore, PGIM Fixed Income is focusing on US-centric issuers rather than multinationals or exporters |
| | |
| 10 | | Visit our website at pgiminvestments.com |
| | that are vulnerable to potential protectionist trade policies. The Fund remains overweight in BBB-rated, long-maturity credits due to a steep corporate spread curve and possibly higher pension funding, which could lead to increased demand and the potential flattening of the corporate spread curve. (The corporate spread curve depicts the difference between the spreads of long- and short-maturity corporate bonds versus US Treasuries of comparable maturity.) The main near-term risks in the corporate bond market are the policies of the US Administration, the impact of the tightening Fed, and political instability both inside and outside the US. |
| | • | | Although structured products are noteworthy for favorable supply technicals and a benign fundamental backdrop, PGIM Fixed Income believes securities with lower credit enhancement remain vulnerable to spread volatility. PGIM Fixed Income remains very positive on assets at the top of the capital structure. |
| | • | | Within ABS, PGIM Fixed Income continues to like select issuers in the consumer loan, subprime auto, and refinance private student loan sectors. Also favored are high-quality roll-down plays in five- to seven-year revolver prime auto and bank credit card loans. (In a roll-down play, an investor seeks to enhance returns by investing on the steepest part of the yield curve where yields can change the most over a period of time.) |
| | • | | In CMBS, PGIM Fixed Income continues to find value in high-quality securities of new issue conduit deals. (Conduit deals are collateralized by a pool of approximately 50 to 100 fixed-rate commercial mortgage loans that are fairly well diversified by loan size, geographic location, and property type.) |
| | • | | The Fund maintains an underweight in government-related sectors, including Treasuries, agency securities, and agency mortgage-backed securities, as PGIM Fixed Income finds more compelling value in the sectors previously mentioned. |
| | | | |
| Prudential Core Bond Fund | | | 11 | |
Fees and Expenses (unaudited)
As a shareholder of the Fund, you incur two types of costs: (1) transaction costs, including sales charges (loads) on purchase payments and redemptions, as applicable, and (2) ongoing costs, including management fees, and other Fund expenses, as applicable. This example is intended to help you understand your ongoing costs (in dollars) of investing in the Fund and to compare these costs with the ongoing costs of investing in other mutual funds.
The example is based on an investment of $1,000 held through the six-month period ended July 31, 2017. The example is for illustrative purposes only; you should consult the Prospectus for information on initial and subsequent minimum investment requirements.
Actual Expenses
The first line for each share class in the table on the following pages provides information about actual account values and actual expenses. You may use the information on this line, together with the amount you invested, to estimate the expenses that you paid over the period. Simply divide your account value by $1,000 (for example, an $8,600 account value ÷ $1,000 = 8.6), then multiply the result by the number on the first line under the heading “Expenses Paid During the Six-Month Period” to estimate the expenses you paid on your account during this period.
Hypothetical Example for Comparison Purposes
The second line for each share class in the table on the following pages provides information about hypothetical account values and hypothetical expenses based on the Fund’s actual expense ratio and an assumed rate of return of 5% per year before expenses, which is not the Fund’s actual return. The hypothetical account values and expenses may not be used to estimate the actual ending account balance or expenses you paid for the period. You may use this information to compare the ongoing costs of investing in the Fund and other funds. To do so, compare this 5% hypothetical example with the 5% hypothetical examples that appear in the shareholder reports of the other funds.
The Fund’s transfer agent may charge additional fees to holders of certain accounts that are not included in the expenses shown in the table on the following pages. These fees apply to individual retirement accounts (IRAs) and Section 403(b) accounts. As of the close of the six-month period covered by the table, IRA fees included an annual maintenance fee of $15 per account (subject to a maximum annual maintenance fee of $25 for all accounts held by the same shareholder). Section 403(b) accounts are charged an annual $25 fiduciary maintenance fee. Some of the fees may vary in amount, or may be waived, based on your total account balance or the number of Prudential funds, including the Fund, that you own. You should consider the additional fees that were charged to your Fund account over the six-month period when you estimate the total ongoing expenses paid over the
| | |
| 12 | | Visit our website at pgiminvestments.com |
period and the impact of these fees on your ending account value, as these additional expenses are not reflected in the information provided in the expense table. Additional fees have the effect of reducing investment returns.
Please note that the expenses shown in the table are meant to highlight your ongoing costs only and do not reflect any transactional costs such as sales charges (loads). Therefore, the second line for each share class in the table is useful in comparing ongoing costs only and will not help you determine the relative total costs of owning different funds. In addition, if these transactional costs were included, your costs would have been higher.
| | | | | | | | | | | | | | | | | | |
Prudential
Core Bond Fund | | Beginning Account
Value
February 1, 2017 | | | Ending Account
Value
July 31, 2017 | | | Annualized
Expense Ratio
Based on the
Six-Month Period | | | Expenses Paid
During the
Six-Month Period* | |
| Class A | | Actual | | $ | 1,000.00 | | | $ | 1,027.70 | | | | 0.70 | % | | $ | 3.52 | |
| | Hypothetical | | $ | 1,000.00 | | | $ | 1,021.32 | | | | 0.70 | % | | $ | 3.51 | |
| Class C | | Actual | | $ | 1,000.00 | | | $ | 1,022.90 | | | | 1.45 | % | | $ | 7.27 | |
| | Hypothetical | | $ | 1,000.00 | | | $ | 1,017.60 | | | | 1.45 | % | | $ | 7.25 | |
| Class Q | | Actual | | $ | 1,000.00 | | | $ | 1,028.20 | | | | 0.40 | % | | $ | 2.01 | |
| | Hypothetical | | $ | 1,000.00 | | | $ | 1,022.81 | | | | 0.40 | % | | $ | 2.01 | |
| Class R | | Actual | | $ | 1,000.00 | | | $ | 1,026.50 | | | | 0.95 | % | | $ | 4.77 | |
| | Hypothetical | | $ | 1,000.00 | | | $ | 1,020.08 | | | | 0.95 | % | | $ | 4.76 | |
| Class Z | | Actual | | $ | 1,000.00 | | | $ | 1,028.00 | | | | 0.45 | % | | $ | 2.26 | |
| | | Hypothetical | | $ | 1,000.00 | | | $ | 1,022.56 | | | | 0.45 | % | | $ | 2.26 | |
*Fund expenses (net of fee waivers or subsidies, if any) for each share class are equal to the annualized expense ratio for each share class (provided in the table), multiplied by the average account value over the period, multiplied by the 181 days in the six-month period ended July 31, 2017, and divided by 365 days. Expenses presented in the table include the expenses of any underlying portfolios in which the Fund may invest.
| | | | |
| Prudential Core Bond Fund | | | 13 | |
Schedule of Investments
as of July 31, 2017
| | | | | | | | | | | | | | | | |
| Description | | Interest
Rate | | | Maturity
Date | | | Principal
Amount (000)# | | | Value | |
LONG-TERM INVESTMENTS 97.6% | | | | | | | | | | | | | | | | |
| | | | |
ASSET-BACKED SECURITIES 13.5% | | | | | | | | | | | | | | | | |
| | | | |
Automobiles 2.2% | | | | | | | | | | | | | | | | |
Americredit Automobile Receivables Trust, Series 2016-4, Class C | | | 2.410 | % | | | 07/08/22 | | | | 100 | | | $ | 99,849 | |
Avis Budget Rental Car Funding AESOP LLC, | | | | | | | | | | | | | | | | |
Series 2013-1A, Class A, 144A | | | 1.920 | | | | 09/20/19 | | | | 600 | | | | 599,790 | |
Series 2015-2A, Class A, 144A | | | 2.630 | | | | 12/20/21 | | | | 300 | | | | 301,565 | |
Series 2016-1A, Class A, 144A | | | 2.990 | | | | 06/20/22 | | | | 900 | | | | 907,682 | |
Enterprise Fleet Financing LLC, | | | | | | | | | | | | | | | | |
Series 2016-2, Class A2, 144A | | | 1.740 | | | | 02/22/22 | | | | 179 | | | | 179,242 | |
Series 2017-1, Class A2, 144A | | | 2.130 | | | | 07/20/22 | | | | 800 | | | | 803,193 | |
Series 2017-2, Class A2, 144A | | | 1.970 | | | | 01/20/23 | | | | 600 | | | | 599,908 | |
Ford Credit Auto Owner Trust, Series 2017-1, Class A, 144A | | | 2.620 | | | | 08/15/28 | | | | 1,500 | | | | 1,520,493 | |
Hertz Vehicle Financing LLC, | | | | | | | | | | | | | | | | |
Series 2016-1A, Class A, 144A | | | 2.320 | | | | 03/25/20 | | | | 200 | | | | 199,767 | |
Series 2016-4A, Class A, 144A | | | 2.650 | | | | 07/25/22 | | | | 500 | | | | 492,645 | |
Onemain Direct Auto Receivables Trust, | | | | | | | | | | | | | | | | |
Series 2016-1A, Class A, 144A | | | 2.040 | | | | 01/15/21 | | | | 32 | | | | 31,978 | |
Series 2017-1A, Class A, 144A | | | 2.160 | | | | 10/15/20 | | | | 1,600 | | | | 1,598,923 | |
| | | | | | | | | | | | | | | | |
| | | | | | | | | | | | | | | 7,335,035 | |
| | | | |
Collateralized Loan Obligations 7.8% | | | | | | | | | | | | | | | | |
A Voce CLO Ltd. (Cayman Islands), Series 2014-1A,
Class A1R, 144A | | | 2.464 | (c) | | | 07/15/26 | | | | 500 | | | | 500,111 | |
ALM VIII Ltd. (Cayman Islands), Series 2013-8A,
Class A1R, 144A | | | 2.794 | (c) | | | 10/15/28 | | | | 250 | | | | 252,034 | |
ALM XII Ltd. (Cayman Islands), Series 2015-12A,
Class A1R, 144A | | | 2.354 | (c) | | | 04/16/27 | | | | 400 | | | | 400,216 | |
Anchorage Capital CLO 6 Ltd. (Cayman Islands),
Series 2015-6A, Class AR, 144A | | | 2.574 | (c) | | | 07/15/30 | | | | 750 | | | | 750,000 | |
Atlas Sr. Loan Fund Ltd. (Cayman Islands), Series 2017-8A, Class A, 144A | | | 2.607 | (c) | | | 01/16/30 | | | | 250 | | | | 249,998 | |
Atlas Sr. Loan Fund V Ltd. (Cayman Islands),
Series 2014-1A, Class AR2, 144A | | | 2.564 | (c) | | | 07/16/29 | | | | 750 | | | | 750,540 | |
Avery Point V CLO Ltd. (Cayman Islands), Series 2014-5A, Class A, 144A | | | 2.764 | (c) | | | 07/17/26 | | | | 250 | | | | 250,387 | |
Avery Point VI CLO Ltd. (Cayman Islands), Series 2015-6A, Class A, 144A | | | 2.621 | (c) | | | 08/05/27 | | | | 250 | | | | 251,154 | |
Ballyrock CLO Ltd. (Cayman Islands), Series 2016-1A, Class A, 144A | | | 2.894 | (c) | | | 10/15/28 | | | | 250 | | | | 254,237 | |
Battalion CLO Ltd. (Cayman Islands), Series 2015-8A, Class A1R, 144A | | | 2.644 | (c) | | | 07/18/30 | | | | 250 | | | | 250,200 | |
See Notes to Financial Statements.
| | | | |
| Prudential Core Bond Fund | | | 15 | |
Schedule of Investments (continued)
as of July 31, 2017
| | | | | | | | | | | | | | | | |
| Description | | Interest
Rate | | | Maturity
Date | | | Principal
Amount (000)# | | | Value | |
ASSET-BACKED SECURITIES (Continued) | | | | | | | | | | | | | | | | |
| | | | |
Collateralized Loan Obligations (cont’d.) | | | | | | | | | | | | | | | | |
Battalion CLO X Ltd. (Cayman Islands),
Series 2016-10A, Class A1, 144A | | | 2.863 | %(c) | | | 01/24/29 | | | | 250 | | | $ | 250,412 | |
Benefit Street Partners CLO V Ltd. (Cayman Islands),
Series 2014-VA, Class AR, 144A | | | 2.507 | (c) | | | 10/20/26 | | | | 500 | | | | 501,668 | |
Benefit Street Partners CLO VII Ltd. (Cayman Islands),
Series 2015-VIIA, Class A1A, 144A | | | 2.834 | (c) | | | 07/18/27 | | | | 500 | | | | 502,498 | |
BlueMountain CLO Ltd. (Cayman Islands),
Series 2015-1A, Class A1R, 144A | | | 2.634 | (c) | | | 04/13/27 | | | | 500 | | | | 500,267 | |
Brookside Mill CLO Ltd. (Cayman Islands),
Series 2013-1A, Class A1, 144A | | | 2.454 | (c) | | | 04/17/25 | | | | 241 | | | | 241,258 | |
Canyon Capital CLO Ltd. (Cayman Islands),
Series 2015-1A, Class AS, 144A | | | 2.408 | (c) | | | 04/15/29 | | | | 750 | | | | 750,166 | |
Carlyle Global Market Strategies CLO Ltd.,
Series 2012-4A, Class AR, 144A | | | 2.757 | (c) | | | 01/20/29 | | | | 250 | | | | 252,723 | |
Carlyle Global Market Strategies CLO Ltd. (Cayman Islands), | | | | | | | | | | | | | | | | |
Series 2014-2A, Class AR, 144A | | | 2.432 | (c) | | | 05/15/25 | | | | 500 | | | | 499,875 | |
Series 2014-3A, Class A1AR, 144A | | | 2.467 | (c) | | | 07/27/26 | | | | 500 | | | | 500,631 | |
Carlyle US CLO Ltd. (Cayman Islands), Series 2017-1A, Class A1B, 144A | | | 2.391 | (c) | | | 04/20/31 | | | | 750 | | | | 749,805 | |
Catamaran CLO Ltd. (Cayman Islands), Series 2015-1A, Class A, 144A | | | 2.863 | (c) | | | 04/22/27 | | | | 250 | | | | 250,385 | |
Eaton Vance CLO Ltd. (Cayman Islands), Series 2014-1A, Class AR, 144A | | | 2.504 | (c) | | | 07/15/26 | | | | 250 | | | | 250,463 | |
Elevation CLO Ltd. (Cayman Islands),
Series 2014-3A, Class AR, 144A | | | 2.484 | (c) | | | 10/15/26 | | | | 500 | | | | 499,585 | |
Series 2015-4A, Class A, 144A | | | 2.854 | (c) | | | 04/18/27 | | | | 250 | | | | 250,554 | |
Series 2017-6A, Class A1, 144A | | | 2.553 | (c) | | | 07/15/29 | | | | 250 | | | | 250,000 | |
Flagship CLO Ltd. (Cayman Islands), Series 2014-8A, Class AR, 144A | | | 2.554 | (c) | | | 01/16/26 | | | | 250 | | | | 250,127 | |
Galaxy XVIII CLO Ltd. (Cayman Islands),
Series 2014-18A, Class AR, 144A | | | 2.474 | (c) | | | 10/15/26 | | | | 500 | | | | 500,247 | |
Highbridge Loan Management Ltd. (Cayman Islands), Series 6A-2015, Class A, 144A | | | 2.621 | (c) | | | 05/05/27 | | | | 250 | | | | 250,399 | |
ICG U.S. CLO Ltd. (Cayman Islands), Series 2014-1A, Class A1, 144A | | | 2.457 | (c) | | | 04/20/26 | | | | 200 | | | | 199,738 | |
Jackson Mill CLO Ltd. (Cayman Islands), Series 2015-1A, Class A, 144A, MTN | | | 2.844 | (c) | | | 04/15/27 | | | | 250 | | | | 250,373 | |
Jamestown CLO LX Ltd. (Cayman Islands),
Series 2016-9A, Class A1B, 144A | | | 2.807 | (c) | | | 10/20/28 | | | | 250 | | | | 252,058 | |
KVK CLO Ltd. (Cayman Islands), | | | | | | | | | | | | | | | | |
Series 2014-1A, Class A1R, 144A | | | 2.482 | (c) | | | 05/15/26 | | | | 500 | | | | 500,114 | |
Series 2014-3A, Class AR, 144A | | | 2.504 | (c) | | | 10/15/26 | | | | 750 | | | | 750,375 | |
See Notes to Financial Statements.
| | | | | | | | | | | | | | | | |
| Description | | Interest
Rate | | | Maturity
Date | | | Principal
Amount (000)# | | | Value | |
ASSET-BACKED SECURITIES (Continued) | | | | | | | | | | | | | | | | |
| | | | |
Collateralized Loan Obligations (cont’d.) | | | | | | | | | | | | | | | | |
Limerock CLO III LLC (Cayman Islands),
Series 2014-3A, Class A1R, 144A | | | 2.507 | %(c) | | | 10/20/26 | | | | 500 | | | $ | 500,255 | |
Madison Park Funding XI Ltd. (Cayman Islands),
Series 2013-11A, Class A1A, 144A | | | 2.593 | (c) | | | 10/23/25 | | | | 750 | | | | 750,245 | |
Magnetite XI Ltd. (Cayman Islands), Series 2014-11A, Class A1R, 144A | | | 2.424 | (c) | | | 01/18/27 | | | | 500 | | | | 500,875 | |
Mountain View CLO Ltd. (Cayman Islands),
Series 2014-1A, Class AR, 144A | | | 2.544 | (c) | | | 10/15/26 | | | | 250 | | | | 250,122 | |
Mountain View CLO Ltd. (Cayman Islands),
Series 2015-9A, Class A1A, 144A, MTN | | | 2.764 | (c) | | | 07/15/27 | | | | 250 | | | | 250,395 | |
Ocean Trails CLO VI (Cayman Islands),
Series 2016-6A, Class A2A, 144A | | | 2.994 | (c) | | | 07/15/28 | | | | 250 | | | | 251,771 | |
OCP CLO Ltd. (Cayman Islands), Series 2017-13A, Class A1A, 144A | | | 2.561 | (c) | | | 07/15/30 | | | | 250 | | | | 249,656 | |
OZLM Funding II Ltd. (Cayman Islands),
Series 2012-2A, Class A1R, 144A | | | 2.610 | (c) | | | 10/30/27 | | | | 500 | | | | 501,599 | |
OZLM XV Ltd. (Cayman Islands), Series 2016-15A, Class A1, 144A | | | 2.617 | (c) | | | 01/20/29 | | | | 750 | | | | 758,642 | |
Palmer Square CLO Ltd. (Cayman Islands),
Series 2014-1A, Class A1R, 144A | | | 2.674 | (c) | | | 01/17/27 | | | | 500 | | | | 499,818 | |
Series 2015-1A, Class A1R, 144A | | | 2.472 | (c) | | | 05/21/29 | | | | 500 | | | | 499,987 | |
Series 2015-2A, Class A1AR, 144A | | | 2.577 | (c) | | | 07/20/30 | | | | 500 | | | | 499,747 | |
Regatta IV Funding Ltd. (Cayman Islands),
Series 2014-1A, Class A1R, 144A | | | 2.334 | (c) | | | 07/25/26 | | | | 500 | | | | 500,257 | |
Regatta VIII Funding Ltd. (Cayman Islands),
Series 2016-1A, Class A1, 144A | | | 2.794 | (c) | | | 12/20/28 | | | | 250 | | | | 250,351 | |
Silvermore CLO Ltd. (Cayman Islands),
Series 2014-1A, Class A1R, 144A | | | 2.632 | (c) | | | 05/15/26 | | | | 496 | | | | 495,604 | |
Sound Point CLO XII Ltd. (Cayman Islands),
Series 2016-2A, Class A, 144A | | | 2.967 | (c) | | | 10/20/28 | | | | 250 | | | | 252,781 | |
Sound Point CLO XVI Ltd. (Cayman Islands),
Series 2017-2A, Class A, 144A | | | 2.567 | (c) | | | 07/25/30 | | | | 500 | | | | 501,464 | |
TICP CLO VI Ltd. (Cayman Islands), Series 2016-6A, Class A, 144A | | | 2.854 | (c) | | | 01/15/29 | | | | 500 | | | | 504,969 | |
TICP CLO VII Ltd. (Cayman Islands), Series 2017-7A, Class AS, 144A | | | — | (p) | | | 07/15/29 | | | | 250 | | | | 250,115 | |
Trinitas CLO V Ltd. (Cayman Islands), Series 2016-5A, Class A, 144A | | | 3.014 | (c) | | | 10/25/28 | | | | 500 | | | | 502,196 | |
Trinitas CLO VI Ltd. (Cayman Islands),
Series 2017-6a, Class A, 144A | | | 2.655 | (c) | | | 07/25/29 | | | | 500 | | | | 500,278 | |
UCG U.S. CLO Ltd. (Cayman Islands), Series 2017-2A, Class A1, 144A^ | | | 2.591 | (s) | | | 10/23/29 | | | | 500 | | | | 500,000 | |
See Notes to Financial Statements.
| | | | |
| Prudential Core Bond Fund | | | 17 | |
Schedule of Investments (continued)
as of July 31, 2017
| | | | | | | | | | | | | | | | |
| Description | | Interest
Rate | | | Maturity
Date | | | Principal
Amount (000)# | | | Value | |
ASSET-BACKED SECURITIES (Continued) | | | | | | | | | | | | | | | | |
| | | | |
Collateralized Loan Obligations (cont’d.) | | | | | | | | | | | | | | | | |
Voya CLO Ltd. (Cayman Islands), Series 2014-3A,
Class A1, 144A | | | 2.734 | %(c) | | | 07/25/26 | | | | 750 | | | $ | 751,185 | |
Washington Mill CLO Ltd. (Cayman Islands),
Series 2014-1A, Class A1R, 144A | | | 2.527 | (c) | | | 04/20/26 | | | | 1,000 | | | | 999,763 | |
Wellfleet CLO Ltd. (Cayman Islands), | | | | | | | | | | | | | | | | |
Series 2016-2A, Class A1, 144A | | | 2.957 | (c) | | | 10/20/28 | | | | 500 | | | | 503,027 | |
Series 2017-1A, Class A1, 144A | | | 2.431 | (c) | | | 04/20/29 | | | | 250 | | | | 250,031 | |
Zais CLO 6 Ltd. (Cayman Islands), Series 2017-1a, Class A1, 144A | | | 2.572 | (c) | | | 07/15/29 | | | | 250 | | | | 250,076 | |
| | | | | | | | | | | | | | | | |
| | | | | | | | | | | | | | | 25,637,807 | |
| | | | |
Consumer Loans 0.9% | | | | | | | | | | | | | | | | |
Onemain Financial Issuance Trust, Series 2015-2A, Class A, 144A | | | 2.570 | | | | 07/18/25 | | | | 802 | | | | 802,703 | |
SpringCastle America Funding LLC, Series 2016-AA, Class A, 144A | | | 3.050 | | | | 04/25/29 | | | | 232 | | | | 233,816 | |
Springleaf Funding Trust,
Series 2015-AA, Class A, 144A | | | 3.160 | | | | 11/15/24 | | | | 345 | | | | 347,914 | |
Series 2016-AA, Class A, 144A | | | 2.900 | | | | 11/15/29 | | | | 800 | | | | 808,217 | |
Series 2017-AA, Class A, 144A | | | 2.680 | | | | 07/15/30 | | | | 700 | | | | 704,009 | |
| | | | | | | | | | | | | | | | |
| | | | | | | | | | | | | | | 2,896,659 | |
| | | | |
Credit Cards 1.8% | | | | | | | | | | | | | | | | |
American Express Credit Account Master Trust, | | | | | | | | | | | | | | | | |
Series 2017-2, Class A | | | 1.609 | (c) | | | 09/16/24 | | | | 1,100 | | | | 1,107,832 | |
Series 2017-5, Class A^ | | | 1.632 | (c) | | | 02/18/25 | | | | 500 | | | | 500,000 | |
Chase Issuance Trust, Series 2017-A2, Class A | | | 1.626 | (c) | | | 03/15/24 | | | | 500 | | | | 501,676 | |
Citibank Credit Card Issuance Trust, | | | | | | | | | | | | | | | | |
Series 2016-A3, Class A3 | | | 1.713 | (c) | | | 12/07/23 | | | | 800 | | | | 807,499 | |
Series 2017-A5, Class A5 | | | 1.847 | (c) | | | 04/22/26 | | | | 800 | | | | 806,175 | |
Discover Card Execution Note Trust,
Series 2017-A1, Class A1 | | | 1.716 | (c) | | | 07/15/24 | | | | 900 | | | | 906,820 | |
Series 2017-A4, Class A4 | | | 2.530 | | | | 10/15/26 | | | | 800 | | | | 799,463 | |
Series 2017-A5, Class A5 | | | 1.829 | (c) | | | 12/15/26 | | | | 400 | | | | 402,122 | |
| | | | | | | | | | | | | | | | |
| | | | | | | | | | | | | | | 5,831,587 | |
| | | | |
Equipment 0.2% | | | | | | | | | | | | | | | | |
MMAF Equipment Finance LLC, Series 2017-AA,
Class A4, 144A | | | 2.410 | | | | 08/16/24 | | | | 800 | | | | 803,681 | |
See Notes to Financial Statements.
| | | | | | | | | | | | | | | | |
| Description | | Interest
Rate | | | Maturity
Date | | | Principal
Amount (000)# | | | Value | |
ASSET-BACKED SECURITIES (Continued) | | | | | | | | | | | | | | | | |
| | | | |
Other 0.0% | | | | | | | | | | | | | | | | |
Sierra Timeshare Receivables Funding LLC,
Series 2013-3A, Class A, 144A | | | 2.200 | % | | | 10/20/30 | | | | 111 | | | $ | 110,595 | |
|
Residential Mortgage-Backed Securities 0.6% | |
Credit Suisse Mortgage Trust, | | | | | | | | | | | | | | | | |
Series 2016-RPL1, Class A1, 144A | | | 4.201 | (c) | | | 12/26/46 | | | | 787 | | | | 790,726 | |
Series 2017-6R, Class 1A1^ | | | 2.722 | | | | 03/06/47 | | | | 675 | | | | 675,000 | |
RAAC Trust, Series 2007-SP3, Class A1 | | | 2.432 | (c) | | | 09/25/47 | | | | 308 | | | | 305,894 | |
VOLT LVII LLC, Series 2017-NPL4, Class A1, 144A | | | 3.375 | | | | 04/25/47 | | | | 139 | | | | 139,490 | |
VOLT LX LLC, Series 2017-NPL7, Class A1, 144A | | | 3.250 | | | | 04/25/59 | | | | 164 | | | | 165,012 | |
| | | | | | | | | | | | | | | | |
| | | | | | | | | | | | | | | 2,076,122 | |
| | | | | | | | | | | | | | | | |
TOTAL ASSET-BACKED SECURITIES
(cost $44,519,827) | | | | | | | | | | | | | | | 44,691,486 | |
| | | | | | | | | | | | | | | | |
|
COMMERCIAL MORTGAGE-BACKED SECURITIES 11.2% | |
Assurant Commercial Mortgage Trust, Series 2016-1A, Class AS, 144A | | | 3.172 | | | | 05/15/49 | | | | 300 | | | | 299,283 | |
BBCMS Mortgage Trust, Series 2016-ETC, Class A, 144A | | | 2.937 | | | | 08/14/36 | | | | 500 | | | | 490,285 | |
CD Mortgage Trust, Series 2016-CD1, Class A3 | | | 2.459 | | | | 08/10/49 | | | | 500 | | | | 481,307 | |
CFCRE Commercial Mortgage Trust, Series 2016-C7, Class A2 | | | 3.585 | | | | 12/10/54 | | | | 2,000 | | | | 2,062,137 | |
Citigroup Commercial Mortgage Trust, | | | | | | | | | | | | | | | | |
Series 2015-GC27, Class A4 | | | 2.878 | | | | 02/10/48 | | | | 1,100 | | | | 1,093,741 | |
Series 2016-C3, Class A3 | | | 2.896 | | | | 11/15/49 | | | | 900 | | | | 888,005 | |
Commercial Mortgage Trust, Series 2016-COR1, Class A3 | | | 2.826 | | | | 10/10/49 | | | | 800 | | | | 785,579 | |
CSAIL Commercial Mortgage Trust, Series 2017-C8, Class A3 | | | 3.127 | | | | 06/15/50 | | | | 1,200 | | | | 1,202,012 | |
Fannie Mae-ACES, | | | | | | | | | | | | | | | | |
Series 2015-M7, Class AB2 | | | 2.502 | | | | 12/25/24 | | | | 491 | | | | 479,211 | |
Series 2016-M7, Class AB2 | | | 2.385 | | | | 09/25/26 | | | | 200 | | | | 194,686 | |
Series 2016-M11, Class A2 | | | 2.369 | (c) | | | 07/25/26 | | | | 1,200 | | | | 1,157,009 | |
Series 2016-M13, Class A2 | | | 2.477 | (c) | | | 09/25/26 | | | | 1,900 | | | | 1,849,915 | |
Series 2017-M1, Class A2 | | | 2.417 | (c) | | | 10/25/26 | | | | 500 | | | | 483,926 | |
Series 2017-M4, Class A2 | | | 2.597 | (c) | | | 12/25/26 | | | | 2,500 | | | | 2,449,118 | |
Series 2017-M8, Class A2 | | | 3.061 | (c) | | | 05/25/27 | | | | 1,900 | | | | 1,927,837 | |
FHLMC Multifamily Structured Pass-Through Certificates, | | | | | | | | | | | | | | | | |
Series K036, Class A2 | | | 3.527 | (c) | | | 10/25/23 | | | | 1,100 | | | | 1,168,689 | |
Series K053, Class A2 | | | 2.995 | | | | 12/25/25 | | | | 350 | | | | 358,375 | |
See Notes to Financial Statements.
| | | | |
| Prudential Core Bond Fund | | | 19 | |
Schedule of Investments (continued)
as of July 31, 2017
| | | | | | | | | | | | | | | | |
| Description | | Interest
Rate | | | Maturity
Date | | | Principal
Amount (000)# | | | Value | |
COMMERCIAL MORTGAGE-BACKED SECURITIES (Continued) | |
FHLMC Multifamily Structured Pass-Through Certificates, | | | | | | | | | | | | | | | | |
Series K057, Class AM | | | 2.624 | % | | | 08/25/26 | | | | 1,650 | | | $ | 1,616,737 | |
GS Mortgage Securities Corp. II, Series 2015-GC30, Class A3 | | | 3.119 | | | | 05/10/50 | | | | 1,000 | | | | 1,012,080 | |
GS Mortgage Securities Trust, Series 2015-GC34, Class A3 | | | 3.244 | | | | 10/10/48 | | | | 2,000 | | | | 2,034,584 | |
JPMBB Commercial Mortgage Securities Trust, Series 2015-C27, Class A3A1 | | | 2.920 | | | | 02/15/48 | | | | 1,100 | | | | 1,100,723 | |
JPMCC Commercial Mortgage Securities Trust, Series 2017-JP7, Class ASB | | | 3.241 | | | | 09/15/50 | | | | 575 | | | | 592,636 | |
JPMDB Commercial Mortgage Securities Trust, Series 2017-C5, Class A4 | | | 3.414 | | | | 03/15/50 | | | | 1,400 | | | | 1,443,540 | |
JPMorgan Chase Commercial Mortgage Securities Trust, Series 2016-JP3, Class A4 | | | 2.627 | | | | 08/15/49 | | | | 700 | | | | 679,413 | |
Ladder Capital Mortgage Trust, Series 2017-LC26, Class A3, 144A | | | 3.289 | | | | 07/12/50 | | | | 1,600 | | | | 1,604,982 | |
Morgan Stanley Bank of America Merrill Lynch Trust, Series 2015-C20, Class A2 | | | 2.790 | | | | 02/15/48 | | | | 850 | | | | 861,026 | |
Morgan Stanley Capital I Trust, | | | | | | | | | | | | | | | | |
Series 2016-BNK2, Class A3 | | | 2.791 | | | | 11/15/49 | | | | 900 | | | | 881,344 | |
Series 2016-UB11, Class A3 | | | 2.531 | | | | 08/15/49 | | | | 1,200 | | | | 1,151,819 | |
UBS Commercial Mortgage Trust, Series 2017-C2, Class ASB^ | | | 3.264 | | | | 08/15/50 | | | | 800 | | | | 823,976 | |
UBS-Barclays Commercial Mortgage Trust, | | | | | | | | | | | | | | | | |
Series 2013-C6, Class A3FL, 144A | | | 1.784 | (c) | | | 04/10/46 | | | | 750 | | | | 753,886 | |
Series 2013-C6, Class A4 | | | 3.244 | | | | 04/10/46 | | | | 101 | | | | 103,871 | |
Wells Fargo Commercial Mortgage Trust, | | | | | | | | | | | | | | | | |
Series 2016-BNK1, Class A2 | | | 2.399 | | | | 08/15/49 | | | | 1,200 | | | | 1,143,007 | |
Series 2016-NXS6, Class A3 | | | 2.642 | | | | 11/15/49 | | | | 1,500 | | | | 1,454,089 | |
Series 2017-C38, Class A4 | | | 3.190 | | | | 07/15/50 | | | | 1,000 | | | | 1,007,937 | |
Series 2017-RB1, Class A4 | | | 3.374 | | | | 03/15/50 | | | | 1,400 | | | | 1,432,678 | |
| | | | | | | | | | | | | | | | |
TOTAL COMMERCIAL MORTGAGE-BACKED SECURITIES
(cost $37,272,514) | | | | | | | | | | | | | | | 37,069,443 | |
| | | | | | | | | | | | | | | | |
| | | | |
CORPORATE BONDS 30.5% | | | | | | | | | | | | | | | | |
| | | | |
Aerospace & Defense 0.1% | | | | | | | | | | | | | | | | |
Embraer Netherlands Finance BV (Brazil), Gtd. Notes | | | 5.050 | | | | 06/15/25 | | | | 150 | | | | 156,887 | |
Harris Corp., Sr. Unsec’d. Notes | | | 3.832 | | | | 04/27/25 | | | | 30 | | | | 31,204 | |
| | | | | | | | | | | | | | | | |
| | | | | | | | | | | | | | | 188,091 | |
See Notes to Financial Statements.
| | | | | | | | | | | | | | | | |
| Description | | Interest
Rate | | | Maturity
Date | | | Principal
Amount (000)# | | | Value | |
CORPORATE BONDS (Continued) | |
| | | | |
Agriculture 0.0% | | | | | | | | | | | | | | | | |
Altria Group, Inc., Gtd. Notes | | | 2.850 | % | | | 08/09/22 | | | | 100 | | | $ | 102,031 | |
| | | | |
Airlines 0.4% | | | | | | | | | | | | | | | | |
American Airlines 2013-2 Class A Pass-Through Trust, Pass-Thru Certificates | | | 4.950 | | | | 07/15/24 | | | | 212 | | | | 227,126 | |
American Airlines 2015-1 Class A Pass-Through Trust, Pass-Thru Certificates | | | 3.375 | | | | 11/01/28 | | | | 95 | | | | 95,624 | |
Delta Air Lines 2009-1 Class A Pass-Through Trust, Series A, Pass-Thru Certificates | | | 7.750 | | | | 06/17/21 | | | | 171 | | | | 188,124 | |
Delta Air Lines, Inc., Sr. Unsec’d. Notes | | | 2.875 | | | | 03/13/20 | | | | 285 | | | | 290,213 | |
United Airlines 2016-2 Class AA Pass-Through Trust, Pass-Thru Certificates | | | 2.875 | | | | 04/07/30 | | | | 400 | | | | 393,940 | |
| | | | | | | | | | | | | | | | |
| | | | | | | | | | | | | | | 1,195,027 | |
| | | | |
Auto Manufacturers 1.5% | | | | | | | | | | | | | | | | |
BMW US Capital LLC (Germany), Gtd. Notes, 144A | | | 2.250 | | | | 09/15/23 | | | | 645 | | | | 630,470 | |
Daimler Finance North America LLC (Germany), Gtd. Notes, 144A | | | 2.250 | | | | 03/02/20 | | | | 295 | | | | 296,253 | |
Ford Motor Co., | | | | | | | | | | | | | | | | |
Sr. Unsec’d. Notes | | | 4.346 | | | | 12/08/26 | | | | 250 | | | | 258,534 | |
Sr. Unsec’d. Notes | | | 4.750 | | | | 01/15/43 | | | | 100 | | | | 96,876 | |
Sr. Unsec’d. Notes | | | 5.291 | | | | 12/08/46 | | | | 300 | | | | 309,318 | |
Ford Motor Credit Co. LLC, Sr. Unsec’d. Notes | | | 2.375 | | | | 01/16/18 | | | | 1,350 | | | | 1,353,738 | |
General Motors Financial Co., Inc., | | | | | | | | | | | | | | | | |
Gtd. Notes | | | 3.150 | | | | 01/15/20 | | | | 550 | | | | 562,281 | |
Gtd. Notes | | | 3.450 | | | | 04/10/22 | | | | 180 | | | | 183,503 | |
Gtd. Notes | | | 4.350 | | | | 01/17/27 | | | | 560 | | | | 570,689 | |
Gtd. Notes | | | 5.250 | | | | 03/01/26 | | | | 375 | | | | 406,520 | |
Harley-Davidson Financial Services, Inc., Gtd. Notes, 144A, MTN | | | 2.150 | | | | 02/26/20 | | | | 175 | | | | 174,774 | |
| | | | | | | | | | | | | | | | |
| | | | | | | | | | | | | | | 4,842,956 | |
| | | | |
Banks 7.9% | | | | | | | | | | | | | | | | |
Bank of America Corp., | | | | | | | | | | | | | | | | |
Series L, Sub. Notes, MTN | | | 4.183 | | | | 11/25/27 | | | | 250 | | | | 258,175 | |
Sr. Unsec’d. Notes | | | 5.750 | | | | 12/01/17 | | | | 100 | | | | 101,377 | |
Sr. Unsec’d. Notes, GMTN | | | 3.593 | (c) | | | 07/21/28 | | | | 590 | | | | 591,513 | |
Sr. Unsec’d. Notes, MTN | | | 3.248 | | | | 10/21/27 | | | | 1,010 | | | | 983,548 | |
Sr. Unsec’d. Notes, MTN | | | 4.125 | | | | 01/22/24 | | | | 200 | | | | 212,931 | |
Sr. Unsec’d. Notes, MTN | | | 4.443 | (c) | | | 01/20/48 | | | | 430 | | | | 457,159 | |
Sub. Notes, MTN | | | 4.000 | | | | 01/22/25 | | | | 800 | | | | 824,241 | |
See Notes to Financial Statements.
| | | | |
| Prudential Core Bond Fund | | | 21 | |
Schedule of Investments (continued)
as of July 31, 2017
| | | | | | | | | | | | | | | | |
| Description | | Interest
Rate | | | Maturity
Date | | | Principal
Amount (000)# | | | Value | |
CORPORATE BONDS (Continued) | |
|
Banks (cont’d.) | |
Bank of New York Mellon Corp. (The), Sr. Unsec’d. Notes, MTN | | | 2.200 | % | | | 08/16/23 | | | | 450 | | | $ | 439,866 | |
Barclays PLC (United Kingdom), | | | | | | | | | | | | | | | | |
Sr. Unsec’d. Notes | | | 3.200 | | | | 08/10/21 | | | | 345 | | | | 351,368 | |
Sr. Unsec’d. Notes | | | 3.684 | | | | 01/10/23 | | | | 230 | | | | 236,206 | |
Sr. Unsec’d. Notes | | | 4.375 | | | | 01/12/26 | | | | 200 | | | | 209,398 | |
Sr. Unsec’d. Notes | | | 4.950 | | | | 01/10/47 | | | | 200 | | | | 219,046 | |
BNP Paribas SA (France), Sr. Unsec’d. Notes, 144A, MTN | | | 2.950 | | | | 05/23/22 | | | | 435 | | | | 440,886 | |
BPCE SA (France), Gtd. Notes, 144A, MTN | | | 3.000 | | | | 05/22/22 | | | | 250 | | | | 252,713 | |
Capital One NA, Sr. Unsec’d. Notes | | | 2.250 | | | | 09/13/21 | | | | 250 | | | | 247,246 | |
Citigroup, Inc., | | | | | | | | | | | | | | | | |
Sr. Unsec’d. Notes | | | 3.200 | | | | 10/21/26 | | | | 290 | | | | 283,182 | |
Sr. Unsec’d. Notes | | | 3.400 | | | | 05/01/26 | | | | 350 | | | | 349,122 | |
Sr. Unsec’d. Notes | | | 3.668 | (c) | | | 07/24/28 | | | | 180 | | | | 180,829 | |
Sr. Unsec’d. Notes | | | 3.887 | (c) | | | 01/10/28 | | | | 670 | | | | 686,252 | |
Sr. Unsec’d. Notes | | | 4.281 | (c) | | | 04/24/48 | | | | 220 | | | | 226,600 | |
Sub. Notes | | | 4.300 | | | | 11/20/26 | | | | 85 | | | | 88,328 | |
Sub. Notes | | | 4.450 | | | | 09/29/27 | | | | 840 | | | | 883,987 | |
Sub. Notes | | | 4.750 | | | | 05/18/46 | | | | 10 | | | | 10,614 | |
Credit Suisse AG (Switzerland), Sr. Unsec’d. Notes, MTN | | | 1.750 | | | | 01/29/18 | | | | 310 | | | | 310,257 | |
Deutsche Bank AG (Germany), Sr. Unsec’d. Notes | | | 1.875 | | | | 02/13/18 | | | | 320 | | | | 320,057 | |
Dexia Credit Local SA (France), | | | | | | | | | | | | | | | | |
Gov’t. Liquid Gtd. Notes | | | 1.875 | | | | 01/29/20 | | | | 250 | | | | 248,903 | |
Gov’t. Liquid Gtd. Notes, 144A | | | 1.875 | | | | 09/15/21 | | | | 250 | | | | 244,973 | |
Gov’t. Liquid Gtd. Notes, 144A | | | 2.250 | | | | 02/18/20 | | | | 500 | | | | 502,190 | |
Discover Bank, Sr. Unsec’d. Notes | | | 4.200 | | | | 08/08/23 | | | | 250 | | | | 265,996 | |
Goldman Sachs Group, Inc. (The), | | | | | | | | | | | | | | | | |
Sr. Unsec’d. Notes | | | 3.500 | | | | 01/23/25 | | | | 75 | | | | 76,172 | |
Sr. Unsec’d. Notes | | | 3.850 | | | | 01/26/27 | | | | 475 | | | | 484,666 | |
Sr. Unsec’d. Notes, GMTN | | | 7.500 | | | | 02/15/19 | | | | 1,250 | | | | 1,354,797 | |
Sr. Unsec’d. Notes, MTN | | | 4.000 | | | | 03/03/24 | | | | 1,365 | | | | 1,434,466 | |
Sub. Notes | | | 4.250 | | | | 10/21/25 | | | | 250 | | | | 260,165 | |
Sub. Notes | | | 5.150 | | | | 05/22/45 | | | | 335 | | | | 378,525 | |
JPMorgan Chase & Co., | | | | | | | | | | | | | | | | |
Sr. Unsec’d. Notes | | | 2.950 | | | | 10/01/26 | | | | 410 | | | | 400,505 | |
Sr. Unsec’d. Notes | | | 3.125 | | | | 01/23/25 | | | | 315 | | | | 315,180 | |
Sr. Unsec’d. Notes | | | 3.200 | | | | 01/25/23 | | | | 100 | | | | 102,712 | |
Sr. Unsec’d. Notes | | | 3.200 | | | | 06/15/26 | | | | 230 | | | | 228,547 | |
Sr. Unsec’d. Notes | | | 3.540 | (c) | | | 05/01/28 | | | | 225 | | | | 226,466 | |
Sr. Unsec’d. Notes | | | 3.625 | | | | 05/13/24 | | | | 875 | | | | 908,384 | |
See Notes to Financial Statements.
| | | | | | | | | | | | | | | | |
| Description | | Interest
Rate | | | Maturity
Date | | | Principal
Amount (000)# | | | Value | |
CORPORATE BONDS (Continued) | |
|
Banks (cont’d.) | |
JPMorgan Chase & Co., (cont’d.) | | | | | | | | | | | | | | | | |
Sr. Unsec’d. Notes | | | 3.882 | %(c) | | | 07/24/38 | | | | 420 | | | $ | 419,450 | |
Sr. Unsec’d. Notes, MTN | | | 6.300 | | | | 04/23/19 | | | | 100 | | | | 107,524 | |
Sub. Notes | | | 3.875 | | | | 09/10/24 | | | | 375 | | | | 388,975 | |
Sub. Notes | | | 4.250 | | | | 10/01/27 | | | | 375 | | | | 396,073 | |
JPMorgan Chase Bank NA, Sub. Notes | | | 6.000 | | | | 10/01/17 | | | | 700 | | | | 705,185 | |
KeyBank NA, Sr. Unsec’d. Notes | | | 2.250 | | | | 03/16/20 | | | | 305 | | | | 307,110 | |
Morgan Stanley, | | | | | | | | | | | | | | | | |
Series F, Sr. Unsec’d. Notes, MTN | | | 3.875 | | | | 04/29/24 | | | | 365 | | | | 380,947 | |
Sr. Unsec’d. Notes | | | 3.971 | (c) | | | 07/22/38 | | | | 375 | | | | 374,258 | |
Sr. Unsec’d. Notes | | | 4.375 | | | | 01/22/47 | | | | 210 | | | | 220,008 | |
Sr. Unsec’d. Notes, GMTN | | | 3.700 | | | | 10/23/24 | | | | 500 | | | | 517,454 | |
Sr. Unsec’d. Notes, GMTN | | | 3.875 | | | | 01/27/26 | | | | 470 | | | | 485,948 | |
Sr. Unsec’d. Notes, MTN | | | 2.625 | | | | 11/17/21 | | | | 420 | | | | 421,505 | |
Sub. Notes, GMTN | | | 4.350 | | | | 09/08/26 | | | | 800 | | | | 839,461 | |
MUFG Americas Holdings Corp., Sr. Unsec’d. Notes | | | 2.250 | | | | 02/10/20 | | | | 335 | | | | 336,425 | |
National City Corp., Sub. Notes | | | 6.875 | | | | 05/15/19 | | | | 780 | | | | 846,994 | |
Nordea Bank AB (Sweden), Sr. Unsec’d. Notes, 144A, MTN (original cost $199,444; purchased 09/09/15)(f) | | | 1.875 | | | | 09/17/18 | | | | 200 | | | | 200,340 | |
North American Development Bank (Supranational Bank), Sr. Unsec’d. Notes | | | 4.375 | | | | 02/11/20 | | | | 100 | | | | 105,689 | |
Royal Bank of Scotland Group PLC (United Kingdom), Sr. Unsec’d. Notes | | | 3.875 | | | | 09/12/23 | | | | 220 | | | | 225,591 | |
Santander UK Group Holdings PLC (United Kingdom), Sr. Unsec’d. Notes | | | 3.571 | | | | 01/10/23 | | | | 430 | | | | 440,494 | |
Sumitomo Mitsui Banking Corp. (Japan), Gtd. Notes | | | 2.450 | | | | 01/16/20 | | | | 250 | | | | 252,124 | |
Sumitomo Mitsui Financial Group, Inc. (Japan), Sr. Unsec’d. Notes | | | 2.442 | | | | 10/19/21 | | | | 235 | | | | 234,506 | |
SunTrust Banks, Inc., Sr. Unsec’d. Notes | | | 2.700 | | | | 01/27/22 | | | | 350 | | | | 352,482 | |
Svenska Handelsbanken AB (Sweden), Gtd. Notes, MTN | | | 1.875 | | | | 09/07/21 | | | | 465 | | | | 458,471 | |
UBS Group Funding Switzerland AG (Switzerland), Gtd. Notes, 144A | | | 3.000 | | | | 04/15/21 | | | | 345 | | | | 351,575 | |
| | | | | | | | | | | | | | | | |
| | | | | | | | | | | | | | | 25,966,137 | |
|
Beverages 0.1% | |
Anheuser-Busch InBev Finance, Inc. (Belgium), | | | | | | | | | | | | | | | | |
Gtd. Notes | | | 4.700 | | | | 02/01/36 | | | | 180 | | | | 199,000 | |
Gtd. Notes | | | 4.900 | | | | 02/01/46 | | | | 50 | | | | 56,154 | |
| | | | | | | | | | | | | | | | |
| | | | | | | | | | | | | | | 255,154 | |
See Notes to Financial Statements.
| | | | |
| Prudential Core Bond Fund | | | 23 | |
Schedule of Investments (continued)
as of July 31, 2017
| | | | | | | | | | | | | | | | |
| Description | | Interest
Rate | | | Maturity
Date | | | Principal
Amount (000)# | | | Value | |
CORPORATE BONDS (Continued) | |
|
Biotechnology 0.5% | |
Amgen, Inc., Sr. Unsec’d. Notes | | | 4.663 | % | | | 06/15/51 | | | | 420 | | | $ | 456,100 | |
Celgene Corp., | | | | | | | | | | | | | | | | |
Sr. Unsec’d. Notes | | | 2.125 | | | | 08/15/18 | | | | 460 | | | | 462,092 | |
Sr. Unsec’d. Notes | | | 3.250 | | | | 08/15/22 | | | | 125 | | | | 129,205 | |
Gilead Sciences, Inc., | | | | | | | | | | | | | | | | |
Sr. Unsec’d. Notes | | | 2.500 | | | | 09/01/23 | | | | 220 | | | | 218,869 | |
Sr. Unsec’d. Notes | | | 3.700 | | | | 04/01/24 | | | | 500 | | | | 528,470 | |
| | | | | | | | | | | | | | | | |
| | | | | | | | | | | | | | | 1,794,736 | |
|
Chemicals 1.1% | |
Agrium, Inc. (Canada), Sr. Unsec’d. Notes | | | 4.125 | | | | 03/15/35 | | | | 40 | | | | 39,861 | |
Air Liquide Finance SA (France), Gtd. Notes, 144A | | | 2.250 | | | | 09/27/23 | | | | 735 | | | | 715,412 | |
CF Industries, Inc., Gtd. Notes | | | 6.875 | | | | 05/01/18 | | | | 350 | | | | 362,477 | |
Dow Chemical Co. (The), | | | | | | | | | | | | | | | | |
Sr. Unsec’d. Notes | | | 4.125 | | | | 11/15/21 | | | | 520 | | | | 558,485 | |
Sr. Unsec’d. Notes | | | 4.250 | | | | 11/15/20 | | | | 350 | | | | 371,960 | |
Eastman Chemical Co., | | | | | | | | | | | | | | | | |
Sr. Unsec’d. Notes | | | 2.700 | | | | 01/15/20 | | | | 550 | | | | 556,912 | |
Sr. Unsec’d. Notes | | | 4.650 | | | | 10/15/44 | | | | 290 | | | | 307,350 | |
LYB International Finance BV, Gtd. Notes | | | 4.000 | | | | 07/15/23 | | | | 250 | | | | 266,888 | |
LyondellBasell Industries NV, Sr. Unsec’d. Notes | | | 5.750 | | | | 04/15/24 | | | | 310 | | | | 357,505 | |
| | | | | | | | | | | | | | | | |
| | | | | | | | | | | | | | | 3,536,850 | |
|
Commercial Services 0.5% | |
Equifax, Inc., Sr. Unsec’d. Notes | | | 3.300 | | | | 12/15/22 | | | | 350 | | | | 360,148 | |
ERAC USA Finance LLC, | | | | | | | | | | | | | | | | |
Gtd. Notes, 144A | | | 2.700 | | | | 11/01/23 | | | | 580 | | | | 571,116 | |
Gtd. Notes, 144A | | | 4.500 | | | | 02/15/45 | | | | 75 | | | | 74,622 | |
President & Fellows of Harvard College, Unsec’d. Notes | | | 3.300 | | | | 07/15/56 | | | | 160 | | | | 152,308 | |
Total System Services, Inc., Sr. Unsec’d. Notes | | | 4.800 | | | | 04/01/26 | | | | 250 | | | | 274,282 | |
University of Southern California, Unsec’d. Notes | | | 3.028 | | | | 10/01/39 | | | | 310 | | | | 289,724 | |
| | | | | | | | | | | | | | | | |
| | | | | | | | | | | | | | | 1,722,200 | |
|
Computers 0.4% | |
Apple, Inc., | | | | | | | | | | | | | | | | |
Sr. Unsec’d. Notes | | | 3.450 | | | | 02/09/45 | | | | 85 | | | | 79,861 | |
Sr. Unsec’d. Notes | | | 3.850 | | | | 08/04/46 | | | | 525 | | | | 523,450 | |
Dell International LLC/EMC Corp., | | | | | | | | | | | | | | | | |
Sr. Sec’d. Notes, 144A | | | 3.480 | | | | 06/01/19 | | | | 75 | | | | 76,778 | |
Sr. Sec’d. Notes, 144A | | | 4.420 | | | | 06/15/21 | | | | 585 | | | | 617,397 | |
See Notes to Financial Statements.
| | | | | | | | | | | | | | | | |
| Description | | Interest
Rate | | | Maturity
Date | | | Principal
Amount (000)# | | | Value | |
CORPORATE BONDS (Continued) | |
|
Computers (cont’d.) | |
Hewlett Packard Enterprise Co., | | | | | | | | | | | | | | | | |
Sr. Unsec’d. Notes | | | 2.450 | % | | | 10/05/17 | | | | 95 | | | $ | 95,164 | |
Sr. Unsec’d. Notes | | | 2.850 | | | | 10/05/18 | | | | 55 | | | | 55,663 | |
| | | | | | | | | | | | | | | | |
| | | | | | | | | | | | | | | 1,448,313 | |
|
Containers & Packaging 0.4% | |
Bemis Co., Inc., Sr. Unsec’d. Notes | | | 6.800 | | | | 08/01/19 | | | | 700 | | | | 765,416 | |
WestRock RKT Co., Gtd. Notes | | | 4.000 | | | | 03/01/23 | | | | 540 | | | | 569,952 | |
| | | | | | | | | | | | | | | | |
| | | | | | | | | | | | | | | 1,335,368 | |
|
Diversified Financial Services 0.2% | |
Jefferies Group LLC, Sr. Unsec’d. Notes | | | 6.450 | | | | 06/08/27 | | | | 150 | | | | 173,144 | |
Synchrony Financial, Sr. Unsec’d. Notes | | | 2.700 | | | | 02/03/20 | | | | 470 | | | | 474,031 | |
| | | | | | | | | | | | | | | | |
| | | | | | | | | | | | | | | 647,175 | |
|
Diversified Machinery 0.1% | |
Rockwell Automation, Inc., | | | | | | | | | | | | | | | | |
Sr. Unsec’d. Notes | | | 2.050 | | | | 03/01/20 | | | | 270 | | | | 270,599 | |
Sr. Unsec’d. Notes | | | 2.875 | | | | 03/01/25 | | | | 115 | | | | 114,540 | |
Xylem, Inc., Sr. Unsec’d. Notes | | | 3.250 | | | | 11/01/26 | | | | 70 | | | | 70,309 | |
| | | | | | | | | | | | | | | | |
| | | | | | | | | | | | | | | 455,448 | |
|
Electric 2.7% | |
Alabama Power Co., Sr. Unsec’d. Notes | | | 2.800 | | | | 04/01/25 | | | | 75 | | | | 73,820 | |
CenterPoint Energy Houston Electric LLC, Gen. Ref. Mtge. | | | 2.400 | | | | 09/01/26 | | | | 190 | | | | 181,587 | |
Commonwealth Edison Co., 1st Mortgage | | | 3.700 | | | | 03/01/45 | | | | 40 | | | | 39,176 | |
Consolidated Edison Co. of New York, Inc., Sr. Unsec’d. Notes | | | 4.300 | | | | 12/01/56 | | | | 40 | | | | 42,332 | |
Consumers Energy Co., 1st Mortgage | | | 3.250 | | | | 08/15/46 | | | | 155 | | | | 142,274 | |
Delmarva Power & Light Co., 1st Mortgage | | | 4.150 | | | | 05/15/45 | | | | 60 | | | | 63,106 | |
Dominion Energy, Inc., Sr. Unsec’d. Notes | | | 2.850 | | | | 08/15/26 | | | | 55 | | | | 53,103 | |
DTE Energy Co., Sr. Unsec’d. Notes | | | 2.850 | | | | 10/01/26 | | | | 350 | | | | 335,396 | |
Duke Energy Corp., Sr. Unsec’d. Notes | | | 2.650 | | | | 09/01/26 | | | | 145 | | | | 140,296 | |
Duke Energy Florida LLC, | | | | | | | | | | | | | | | | |
1st Mortgage | | | 3.200 | | | | 01/15/27 | | | | 600 | | | | 611,101 | |
1st Mortgage | | | 3.400 | | | | 10/01/46 | | | | 185 | | | | 173,522 | |
Duke Energy Progress LLC, 1st Mortgage | | | 3.700 | | | | 10/15/46 | | | | 75 | | | | 74,324 | |
Emera US Finance LP (Canada), | | | | | | | | | | | | | | | | |
Gtd. Notes | | | 2.150 | | | | 06/15/19 | | | | 350 | | | | 350,766 | |
Gtd. Notes | | | 3.550 | | | | 06/15/26 | | | | 75 | | | | 76,063 | |
See Notes to Financial Statements.
| | | | |
| Prudential Core Bond Fund | | | 25 | |
Schedule of Investments (continued)
as of July 31, 2017
| | | | | | | | | | | | | | | | |
| Description | | Interest
Rate | | | Maturity
Date | | | Principal
Amount (000)# | | | Value | |
CORPORATE BONDS (Continued) | |
|
Electric (cont’d.) | |
Entergy Corp., | | | | | | | | | | | | | | | | |
Sr. Unsec’d. Notes | | | 4.000 | % | | | 07/15/22 | | | | 260 | | | $ | 276,046 | |
Sr. Unsec’d. Notes | | | 5.125 | | | | 09/15/20 | | | | 250 | | | | 270,063 | |
Fortis, Inc. (Canada), Sr. Unsec’d. Notes | | | 3.055 | | | | 10/04/26 | | | | 350 | | | | 339,877 | |
MidAmerican Energy Co., 1st Mortgage | | | 3.950 | | | | 08/01/47 | | | | 225 | | | | 232,835 | |
Monongahela Power Co., 1st Mortgage, 144A | | | 4.100 | | | | 04/15/24 | | | | 851 | | | | 907,173 | |
Oncor Electric Delivery Co. LLC, Sr. Sec’d. Notes | | | 2.950 | | | | 04/01/25 | | | | 60 | | | | 60,011 | |
Pacific Gas & Electric Co., Sr. Unsec’d. Notes | | | 4.000 | | | | 12/01/46 | | | | 405 | | | | 418,488 | |
PECO Energy Co., 1st Ref. Mortgage | | | 4.800 | | | | 10/15/43 | | | | 120 | | | | 136,943 | |
Public Service Electric & Gas Co., | | | | | | | | | | | | | | | | |
1st Mortgage, MTN | | | 2.250 | | | | 09/15/26 | | | | 370 | | | | 349,518 | |
Sr. Sec’d. Notes, MTN | | | 5.300 | | | | 05/01/18 | | | | 1,300 | | | | 1,335,775 | |
Southern Power Co., Series D, Sr. Unsec’d. Notes | | | 1.950 | | | | 12/15/19 | | | | 430 | | | | 428,283 | |
Southwestern Electric Power Co., Sr. Unsec’d. Notes | | | 2.750 | | | | 10/01/26 | | | | 675 | | | | 654,541 | |
Union Electric Co., Sr. Sec’d. Notes | | | 3.650 | | | | 04/15/45 | | | | 50 | | | | 49,289 | |
Virginia Electric & Power Co., | | | | | | | | | | | | | | | | |
Series A, Sr. Unsec’d. Notes | | | 3.500 | | | | 03/15/27 | | | | 535 | | | | 552,738 | |
Series C, Sr. Unsec’d. Notes | | | 4.000 | | | | 11/15/46 | | | | 175 | | | | 180,058 | |
Xcel Energy, Inc., Sr. Unsec’d. Notes | | | 3.350 | | | | 12/01/26 | | | | 510 | | | | 518,788 | |
| | | | | | | | | | | | | | | | |
| | | | | | | | | | | | | | | 9,067,292 | |
|
Engineering & Construction 0.1% | |
Mexico City Airport Trust (Mexico), Sr. Sec’d. Notes, 144A | | | 4.250 | | | | 10/31/26 | | | | 200 | | | | 205,750 | |
|
Foods 0.5% | |
Ahold Finance USA LLC (Netherlands), Gtd. Notes | | | 6.875 | | | | 05/01/29 | | | | 280 | | | | 352,640 | |
JM Smucker Co. (The), Gtd. Notes | | | 3.000 | | | | 03/15/22 | | | | 115 | | | | 117,405 | |
Kraft Heinz Foods Co., | | | | | | | | | | | | | | | | |
Gtd. Notes | | | 3.000 | | | | 06/01/26 | | | | 110 | | | | 105,941 | |
Gtd. Notes | | | 4.375 | | | | 06/01/46 | | | | 35 | | | | 34,008 | |
Gtd. Notes | | | 5.000 | | | | 07/15/35 | | | | 75 | | | | 81,179 | |
Kroger Co. (The), | | | | | | | | | | | | | | | | |
Sr. Unsec’d. Notes | | | 3.300 | | | | 01/15/21 | | | | 285 | | | | 293,362 | |
Sr. Unsec’d. Notes | | | 3.875 | | | | 10/15/46 | | | | 65 | | | | 57,425 | |
Mondelez International Holdings Netherlands BV, Gtd. Notes, 144A | | | 2.000 | | | | 10/28/21 | | | | 500 | | | | 489,960 | |
| | | | | | | | | | | | | | | | |
| | | | | | | | | | | | | | | 1,531,920 | |
|
Forest Products & Paper 0.3% | |
Georgia-Pacific LLC, Sr. Unsec’d. Notes, 144A | | | 3.600 | | | | 03/01/25 | | | | 220 | | | | 228,294 | |
International Paper Co., | | | | | | | | | | | | | | | | |
Sr. Unsec’d. Notes | | | 4.350 | | | | 08/15/48 | | | | 250 | | | | 249,750 | |
Sr. Unsec’d. Notes | | | 4.400 | | | | 08/15/47 | | | | 180 | | | | 180,964 | |
Sr. Unsec’d. Notes | | | 4.800 | | | | 06/15/44 | | | | 170 | | | | 181,528 | |
| | | | | | | | | | | | | | | | |
| | | | | | | | | | | | | | | 840,536 | |
See Notes to Financial Statements.
| | | | | | | | | | | | | | | | |
| Description | | Interest
Rate | | | Maturity
Date | | | Principal
Amount (000)# | | | Value | |
CORPORATE BONDS (Continued) | |
|
Gas 0.2% | |
Sempra Energy, Sr. Unsec’d. Notes | | | 2.400 | % | | | 03/15/20 | | | | 135 | | | $ | 136,453 | |
Southern Co. Gas Capital Corp., Gtd. Notes | | | 2.450 | | | | 10/01/23 | | | | 555 | | | | 539,453 | |
| | | | | | | | | | | | | | | | |
| | | | | | | | | | | | | | | 675,906 | |
|
Hand/Machine Tools 0.2% | |
Stanley Black & Decker, Inc., Sub. Notes | | | 1.622 | | | | 11/17/18 | | | | 750 | | | | 749,480 | |
|
Healthcare - Products 0.6% | |
Abbott Laboratories, | | | | | | | | | | | | | | | | |
Sr. Unsec’d. Notes | | | 2.000 | | | | 09/15/18 | | | | 395 | | | | 396,257 | |
Sr. Unsec’d. Notes | | | 2.900 | | | | 11/30/21 | | | | 495 | | | | 503,750 | |
Baxter International, Inc., Sr. Unsec’d. Notes | | | 2.600 | | | | 08/15/26 | | | | 170 | | | | 162,593 | |
Becton, Dickinson and Co., Sr. Unsec’d. Notes | | | 4.685 | | | | 12/15/44 | | | | 160 | | | | 168,871 | |
Medtronic, Inc., | | | | | | | | | | | | | | | | |
Gtd. Notes | | | 3.500 | | | | 03/15/25 | | | | 140 | | | | 146,765 | |
Gtd. Notes | | | 4.375 | | | | 03/15/35 | | | | 328 | | | | 363,294 | |
Thermo Fisher Scientific, Inc., Sr. Unsec’d. Notes | | | 2.950 | | | | 09/19/26 | | | | 105 | | | | 102,996 | |
| | | | | | | | | | | | | | | | |
| | | | | | | | | | | | | | | 1,844,526 | |
|
Healthcare - Services 1.2% | |
Aetna, Inc., | | | | | | | | | | | | | | | | |
Sr. Unsec’d. Notes | | | 3.500 | | | | 11/15/24 | | | | 100 | | | | 103,856 | |
Sr. Unsec’d. Notes | | | 6.750 | | | | 12/15/37 | | | | 170 | | | | 237,219 | |
Anthem, Inc., Sr. Unsec’d. Notes | | | 7.000 | | | | 02/15/19 | | | | 310 | | | | 333,117 | |
Baptist Health South Florida, Inc., Sec’d. Notes | | | 4.342 | | | | 11/15/41 | | | | 350 | | | | 365,985 | |
Cigna Corp., Sr. Unsec’d. Notes | | | 3.250 | | | | 04/15/25 | | | | 270 | | | | 272,805 | |
HCA, Inc., Sr. Sec’d. Notes | | | 3.750 | | | | 03/15/19 | | | | 700 | | | | 715,750 | |
Humana, Inc., Sr. Unsec’d. Notes | | | 3.950 | | | | 03/15/27 | | | | 85 | | | | 89,207 | |
Laboratory Corp. of America Holdings, Sr. Unsec’d. Notes | | | 4.625 | | | | 11/15/20 | | | | 260 | | | | 277,791 | |
Memorial Sloan-Kettering Cancer Center, Sr. Unsec’d. Notes | | | 4.200 | | | | 07/01/55 | | | | 75 | | | | 76,565 | |
New York and Presbyterian Hospital (The), Unsec’d. Notes | | | 4.024 | | | | 08/01/45 | | | | 40 | | | | 40,419 | |
Providence St. Joseph Health Obligated Group, Unsec’d. Notes | | | 2.746 | | | | 10/01/26 | | | | 40 | | | | 38,353 | |
Quest Diagnostics, Inc., Sr. Unsec’d. Notes | | | 3.500 | | | | 03/30/25 | | | | 190 | | | | 193,752 | |
Roche Holdings, Inc. (Switzerland), Gtd. Notes, 144A | | | 3.350 | | | | 09/30/24 | | | | 410 | | | | 427,715 | |
RWJ Barnabas Health, Inc., Sr. Unsec’d. Notes | | | 3.949 | | | | 07/01/46 | | | | 175 | | | | 169,926 | |
UnitedHealth Group, Inc., | | | | | | | | | | | | | | | | |
Sr. Unsec’d. Notes | | | 3.375 | | | | 04/15/27 | | | | 295 | | | | 303,902 | |
Sr. Unsec’d. Notes | | | 4.200 | | | | 01/15/47 | | | | 415 | | | | 443,078 | |
| | | | | | | | | | | | | | | | |
| | | | | | | | | | | | | | | 4,089,440 | |
See Notes to Financial Statements.
| | | | |
| Prudential Core Bond Fund | | | 27 | |
Schedule of Investments (continued)
as of July 31, 2017
| | | | | | | | | | | | | | | | |
| Description | | Interest
Rate | | | Maturity
Date | | | Principal
Amount (000)# | | | Value | |
CORPORATE BONDS (Continued) | |
|
Household Products/Wares 0.3% | |
Reckitt Benckiser Treasury Services PLC (United Kingdom), Gtd. Notes, 144A | | | 3.000 | % | | | 06/26/27 | | | | 905 | | | $ | 898,427 | |
|
Housewares 0.2% | |
Newell Brands, Inc., | | | | | | | | | | | | | | | | |
Sr. Unsec’d. Notes | | | 2.875 | | | | 12/01/19 | | | | 240 | | | | 244,948 | |
Sr. Unsec’d. Notes | | | 4.200 | | | | 04/01/26 | | | | 35 | | | | 37,443 | |
Sr. Unsec’d. Notes | | | 5.500 | | | | 04/01/46 | | | | 300 | | | | 360,678 | |
| | | | | | | | | | | | | | | | |
| | | | | | | | | | | | | | | 643,069 | |
|
Insurance 1.2% | |
American International Group, Inc., | | | | | | | | | | | | | | | | |
Sr. Unsec’d. Notes | | | 3.900 | | | | 04/01/26 | | | | 410 | | | | 425,580 | |
Sr. Unsec’d. Notes | | | 4.500 | | | | 07/16/44 | | | | 260 | | | | 268,983 | |
Sr. Unsec’d. Notes | | | 4.800 | | | | 07/10/45 | | | | 150 | | | | 162,264 | |
Arch Capital Finance LLC, Gtd. Notes | | | 5.031 | | | | 12/15/46 | | | | 95 | | | | 105,789 | |
Arch Capital Group US, Inc., Gtd. Notes | | | 5.144 | | | | 11/01/43 | | | | 100 | | | | 113,158 | |
Chubb INA Holdings, Inc., | | | | | | | | | | | | | | | | |
Gtd. Notes | | | 3.150 | | | | 03/15/25 | | | | 95 | | | | 96,658 | |
Gtd. Notes | | | 4.350 | | | | 11/03/45 | | | | 300 | | | | 329,927 | |
Liberty Mutual Group, Inc., | | | | | | | | | | | | | | | | |
Gtd. Notes, 144A | | | 4.850 | | | | 08/01/44 | | | | 300 | | | | 325,797 | |
Gtd. Notes, 144A | | | 6.500 | | | | 05/01/42 | | | | 150 | | | | 194,953 | |
Lincoln National Corp., Sr. Unsec’d. Notes | | | 6.300 | | | | 10/09/37 | | | | 115 | | | | 143,264 | |
Markel Corp., Sr. Unsec’d. Notes | | | 3.625 | | | | 03/30/23 | | | | 400 | | | | 414,267 | |
MetLife, Inc., Series D, Sr. Unsec’d. Notes | | | 4.368 | | | | 09/15/23 | | | | 80 | | | | 88,020 | |
New York Life Global Funding, Sec’d. Notes, 144A | | | 1.950 | | | | 02/11/20 | | | | 225 | | | | 225,253 | |
Northwestern Mutual Life Insurance Co. (The), Sub. Notes, 144A | | | 6.063 | | | | 03/30/40 | | | | 120 | | | | 156,171 | |
Nuveen Finance LLC, Sr. Unsec’d. Notes, 144A | | | 2.950 | | | | 11/01/19 | | | | 150 | | | | 152,630 | |
Principal Financial Group, Inc., | | | | | | | | | | | | | | | | |
Gtd. Notes | | | 3.100 | | | | 11/15/26 | | | | 105 | | | | 104,671 | |
Gtd. Notes | | | 4.300 | | | | 11/15/46 | | | | 140 | | | | 145,417 | |
Gtd. Notes | | | 4.350 | | | | 05/15/43 | | | | 140 | | | | 147,361 | |
Progressive Corp. (The), Sr. Unsec’d. Notes | | | 3.700 | | | | 01/26/45 | | | | 140 | | | | 136,165 | |
Teachers Insurance & Annuity Association of America, Sub. Notes, 144A | | | 4.900 | | | | 09/15/44 | | | | 120 | | | | 133,669 | |
| | | | | | | | | | | | | | | | |
| | | | | | | | | | | | | | | 3,869,997 | |
|
Lodging 0.1% | |
Marriott International, Inc., | | | | | | | | | | | | | | | | |
Sr. Unsec’d. Notes | | | 3.000 | | | | 03/01/19 | | | | 250 | | | | 253,919 | |
Sr. Unsec’d. Notes | | | 3.125 | | | | 06/15/26 | | | | 250 | | | | 247,765 | |
| | | | | | | | | | | | | | | | |
| | | | | | | | | | | | | | | 501,684 | |
See Notes to Financial Statements.
| | | | | | | | | | | | | | | | |
| Description | | Interest
Rate | | | Maturity
Date | | | Principal
Amount (000)# | | | Value | |
CORPORATE BONDS (Continued) | |
|
Media 1.3% | |
21st Century Fox America, Inc., Gtd. Notes | | | 4.750 | % | | | 11/15/46 | | | | 130 | | | $ | 138,732 | |
Charter Communications Operating LLC/Charter Communications Operating Capital, | | | | | | | | | | | | | | | | |
Sr. Sec’d. Notes | | | 6.384 | | | | 10/23/35 | | | | 80 | | | | 93,594 | |
Sr. Sec’d. Notes | | | 6.484 | | | | 10/23/45 | | | | 95 | | | | 111,986 | |
Sr. Sec’d. Notes | | | 6.834 | | | | 10/23/55 | | | | 275 | | | | 327,559 | |
Comcast Corp., Gtd. Notes | | | 2.350 | | | | 01/15/27 | | | | 1,350 | | | | 1,271,580 | |
Cox Communications, Inc., | | | | | | | | | | | | | | | | |
Sr. Unsec’d. Notes, 144A | | | 3.150 | | | | 08/15/24 | | | | 800 | | | | 800,942 | |
Sr. Unsec’d. Notes, 144A | | | 3.350 | | | | 09/15/26 | | | | 195 | | | | 192,236 | |
Grupo Televisa SAB (Mexico), Sr. Unsec’d. Notes | | | 5.000 | | | | 05/13/45 | | | | 200 | | | | 198,718 | |
Time Warner Cable LLC, Sr. Sec’d. Notes | | | 5.500 | | | | 09/01/41 | | | | 150 | | | | 161,360 | |
Time Warner, Inc., | | | | | | | | | | | | | | | | |
Gtd. Notes | | | 3.400 | | | | 06/15/22 | | | | 850 | | | | 879,201 | |
Gtd. Notes | | | 3.800 | | | | 02/15/27 | | | | 100 | | | | 101,101 | |
| | | | | | | | | | | | | | | | |
| | | | | | | | | | | | | | | 4,277,009 | |
|
Mining 0.2% | |
Barrick Gold Corp. (Canada), Sr. Unsec’d. Notes | | | 5.250 | | | | 04/01/42 | | | | 50 | | | | 57,324 | |
Barrick North America Finance LLC (Canada), Gtd. Notes | | | 5.750 | | | | 05/01/43 | | | | 190 | | | | 231,776 | |
Southern Copper Corp. (Peru), | | | | | | | | | | | | | | | | |
Sr. Unsec’d. Notes | | | 5.875 | | | | 04/23/45 | | | | 90 | | | | 99,078 | |
Sr. Unsec’d. Notes | | | 6.750 | | | | 04/16/40 | | | | 100 | | | | 118,103 | |
| | | | | | | | | | | | | | | | |
| | | | | | | | | | | | | | | 506,281 | |
|
Miscellaneous Manufacturing 0.2% | |
Ingersoll-Rand Luxembourg Finance SA, Gtd. Notes | | | 3.550 | | | | 11/01/24 | | | | 170 | | | | 175,113 | |
Pentair Finance SA (United Kingdom), Gtd. Notes | | | 2.650 | | | | 12/01/19 | | | | 420 | | | | 423,448 | |
| | | | | | | | | | | | | | | | |
| | | | | | | | | | | | | | | 598,561 | |
|
Multi-National 0.2% | |
Corp. Andina de Fomento (Supranational Bank), Sr. Unsec’d. Notes | | | 2.125 | | | | 09/27/21 | | | | 745 | | | | 740,701 | |
|
Office & Business Equipment 0.0% | |
Xerox Corp., Sr. Unsec’d. Notes | | | 2.750 | | | | 09/01/20 | | | | 137 | | | | 137,476 | |
See Notes to Financial Statements.
| | | | |
| Prudential Core Bond Fund | | | 29 | |
Schedule of Investments (continued)
as of July 31, 2017
| | | | | | | | | | | | | | | | |
| Description | | Interest
Rate | | | Maturity
Date | | | Principal
Amount (000)# | | | Value | |
CORPORATE BONDS (Continued) | |
|
Oil & Gas 2.1% | |
Anadarko Finance Co., Gtd. Notes | | | 7.500 | % | | | 05/01/31 | | | | 100 | | | $ | 125,421 | |
Apache Corp., | | | | | | | | | | | | | | | | |
Sr. Unsec’d. Notes | | | 3.250 | | | | 04/15/22 | | | | 500 | | | | 510,173 | |
Sr. Unsec’d. Notes | | | 4.750 | | | | 04/15/43 | | | | 100 | | | | 101,716 | |
Sr. Unsec’d. Notes | | | 5.100 | | | | 09/01/40 | | | | 175 | | | | 183,829 | |
Canadian Natural Resources Ltd. (Canada), Sr. Unsec’d. Notes | | | 6.250 | | | | 03/15/38 | | | | 175 | | | | 207,931 | |
Cenovus Energy, Inc. (Canada), Sr. Unsec’d. Notes | | | 6.750 | | | | 11/15/39 | | | | 350 | | | | 377,957 | |
Chevron Corp., Sr. Unsec’d. Notes | | | 1.961 | | | | 03/03/20 | | | | 125 | | | | 125,547 | |
Devon Financing Co. LLC, Gtd. Notes | | | 7.875 | | | | 09/30/31 | | | | 250 | | | | 327,003 | |
Helmerich & Payne International Drilling Co., Gtd. Notes | | | 4.650 | | | | 03/15/25 | | | | 190 | | | | 201,793 | |
Husky Energy, Inc. (Canada), | | | | | | | | | | | | | | | | |
Sr. Unsec’d. Notes | | | 4.000 | | | | 04/15/24 | | | | 150 | | | | 153,038 | |
Sr. Unsec’d. Notes | | | 6.150 | | | | 06/15/19 | | | | 300 | | | | 321,273 | |
Sr. Unsec’d. Notes | | | 6.800 | | | | 09/15/37 | | | | 200 | | | | 246,471 | |
KazMunayGas National Co. JSC (Kazakhstan), Sr. Unsec’d. Notes, 144A | | | 3.875 | | | | 04/19/22 | | | | 200 | | | | 199,000 | |
Kerr-McGee Corp., Gtd. Notes | | | 7.875 | | | | 09/15/31 | | | | 250 | | | | 326,642 | |
Noble Energy, Inc., | | | | | | | | | | | | | | | | |
Sr. Unsec’d. Notes | | | 3.900 | | | | 11/15/24 | | | | 425 | | | | 436,967 | |
Sr. Unsec’d. Notes | | | 5.050 | | | | 11/15/44 | | | | 150 | | | | 155,254 | |
Petroleos Mexicanos (Mexico), | | | | | | | | | | | | | | | | |
Gtd. Notes, 144A | | | 5.375 | | | | 03/13/22 | | | | 80 | | | | 85,240 | |
Gtd. Notes | | | 5.500 | | | | 01/21/21 | | | | 480 | | | | 514,560 | |
Gtd. Notes | | | 6.500 | | | | 06/02/41 | | | | 90 | | | | 92,475 | |
Gtd. Notes, 144A, MTN | | | 6.750 | | | | 09/21/47 | | | | 470 | | | | 494,440 | |
Gtd. Notes, MTN | | | 6.875 | | | | 08/04/26 | | | | 390 | | | | 441,051 | |
Raizen Fuels Finance SA (Brazil), Gtd. Notes, 144A | | | 5.300 | | | | 01/20/27 | | | | 220 | | | | 226,050 | |
Sinopec Group Overseas Development Ltd. (China), Gtd. Notes, 144A | | | 2.500 | | | | 04/28/20 | | | | 200 | | | | 201,100 | |
Statoil ASA (Norway), Gtd. Notes | | | 2.250 | | | | 11/08/19 | | | | 800 | | | | 807,959 | |
Valero Energy Corp., Sr. Unsec’d. Notes | | | 3.400 | | | | 09/15/26 | | | | 220 | | | | 218,132 | |
| | | | | | | | | | | | | | | | |
| | | | | | | | | | | | | | | 7,081,022 | |
|
Oil & Gas Services 0.2% | |
Schlumberger Holdings Corp., Sr. Unsec’d. Notes, 144A | | | 4.000 | | | | 12/21/25 | | | | 500 | | | | 529,315 | |
|
Pharmaceuticals 1.3% | |
AbbVie, Inc., | | | | | | | | | | | | | | | | |
Sr. Unsec’d. Notes | | | 3.600 | | | | 05/14/25 | | | | 105 | | | | 108,213 | |
Sr. Unsec’d. Notes | | | 4.500 | | | | 05/14/35 | | | | 550 | | | | 586,204 | |
See Notes to Financial Statements.
| | | | | | | | | | | | | | | | |
| Description | | Interest
Rate | | | Maturity
Date | | | Principal
Amount (000)# | | | Value | |
CORPORATE BONDS (Continued) | |
|
Pharmaceuticals (cont’d.) | |
Allergan Funding SCS, | | | | | | | | | | | | | | | | |
Gtd. Notes | | | 4.550 | % | | | 03/15/35 | | | | 225 | | | $ | 241,157 | |
Gtd. Notes | | | 4.750 | | | | 03/15/45 | | | | 129 | | | | 140,557 | |
AmerisourceBergen Corp., Sr. Unsec’d. Notes | | | 3.250 | | | | 03/01/25 | | | | 55 | | | | 56,124 | |
Bayer US Finance LLC (Germany), Gtd. Notes, 144A | | | 3.000 | | | | 10/08/21 | | | | 150 | | | | 153,721 | |
Express Scripts Holding Co., | | | | | | | | | | | | | | | | |
Gtd. Notes | | | 3.400 | | | | 03/01/27 | | | | 325 | | | | 319,493 | |
Gtd. Notes | | | 4.500 | | | | 02/25/26 | | | | 700 | | | | 748,203 | |
Mead Johnson Nutrition Co. (United Kingdom), Gtd. Notes | | | 4.600 | | | | 06/01/44 | | | | 70 | | | | 77,492 | |
Mylan NV, Gtd. Notes(a) | | | 3.950 | | | | 06/15/26 | | | | 400 | | | | 407,984 | |
Shire Acquisitions Investments Ireland DAC, | | | | | | | | | | | | | | | | |
Gtd. Notes | | | 2.875 | | | | 09/23/23 | | | | 225 | | | | 224,579 | |
Gtd. Notes | | | 3.200 | | | | 09/23/26 | | | | 1,220 | | | | 1,204,748 | |
Teva Pharmaceutical Finance Netherlands III BV (Israel), | | | | | | | | | | | | | | | | |
Gtd. Notes | | | 3.150 | | | | 10/01/26 | | | | 45 | | | | 43,060 | |
Gtd. Notes | | | 4.100 | | | | 10/01/46 | | | | 15 | | | | 13,641 | |
| | | | | | | | | | | | | | | | |
| | | | | | | | | | | | | | | 4,325,176 | |
|
Pipelines 1.4% | |
Colorado Interstate Gas Co. LLC/Colorado Interstate Issuing Corp., Gtd. Notes, 144A | | | 4.150 | | | | 08/15/26 | | | | 555 | | | | 553,219 | |
DCP Midstream Operating LP, | | | | | | | | | | | | | | | | |
Gtd. Notes, 144A | | | 4.750 | | | | 09/30/21 | | | | 50 | | | | 51,375 | |
Gtd. Notes, 144A | | | 5.350 | | | | 03/15/20 | | | | 150 | | | | 157,500 | |
Enterprise Products Operating LLC, Series N, Gtd. Notes | | | 6.500 | | | | 01/31/19 | | | | 420 | | | | 447,642 | |
Florida Gas Transmission Co. LLC, Sr. Unsec’d. Notes, 144A | | | 5.450 | | | | 07/15/20 | | | | 600 | | | | 650,160 | |
Magellan Midstream Partners LP, Sr. Unsec’d. Notes | | | 4.200 | | | | 03/15/45 | | | | 275 | | | | 259,832 | |
MPLX LP, | | | | | | | | | | | | | | | | |
Sr. Unsec’d. Notes | | | 4.000 | | | | 02/15/25 | | | | 130 | | | | 131,951 | |
Sr. Unsec’d. Notes | | | 4.875 | | | | 06/01/25 | | | | 200 | | | | 214,001 | |
Sr. Unsec’d. Notes | | | 5.200 | | | | 03/01/47 | | | | 5 | | | | 5,166 | |
ONEOK Partners LP, Gtd. Notes | | | 6.125 | | | | 02/01/41 | | | | 300 | | | | 342,376 | |
Oneok, Inc., Gtd. Notes | | | 4.950 | | | | 07/13/47 | | | | 85 | | | | 85,245 | |
Phillips 66 Partners LP, | | | | | | | | | | | | | | | | |
Sr. Unsec’d. Notes | | | 2.646 | | | | 02/15/20 | | | | 225 | | | | 226,129 | |
Sr. Unsec’d. Notes | | | 3.550 | | | | 10/01/26 | | | | 310 | | | | 305,388 | |
Plains All American Pipeline LP/PAA Finance Corp., Sr. Unsec’d. Notes | | | 4.700 | | | | 06/15/44 | | | | 270 | | | | 246,742 | |
Spectra Energy Partners LP, Sr. Unsec’d. Notes | | | 3.375 | | | | 10/15/26 | | | | 140 | | | | 139,033 | |
See Notes to Financial Statements.
| | | | |
| Prudential Core Bond Fund | | | 31 | |
Schedule of Investments (continued)
as of July 31, 2017
| | | | | | | | | | | | | | | | |
| Description | | Interest
Rate | | | Maturity
Date | | | Principal
Amount (000)# | | | Value | |
CORPORATE BONDS (Continued) | |
|
Pipelines (cont’d.) | |
Williams Partners LP, | | | | | | | | | | | | | | | | |
Sr. Unsec’d. Notes | | | 4.000 | % | | | 09/15/25 | | | | 350 | | | $ | 359,449 | |
Sr. Unsec’d. Notes | | | 4.300 | | | | 03/04/24 | | | | 325 | | | | 342,444 | |
| | | | | | | | | | | | | | | | |
| | | | | | | | | | | | | | | 4,517,652 | |
|
Real Estate Investment Trusts (REITs) 0.6% | |
Camden Property Trust, Sr. Unsec’d. Notes | | | 4.625 | | | | 06/15/21 | | | | 200 | | | | 213,938 | |
HCP, Inc., Sr. Unsec’d. Notes | | | 4.000 | | | | 06/01/25 | | | | 300 | | | | 311,046 | |
Realty Income Corp., Sr. Unsec’d. Notes | | | 6.750 | | | | 08/15/19 | | | | 240 | | | | 262,173 | |
Select Income REIT, Sr. Unsec’d. Notes | | | 2.850 | | | | 02/01/18 | | | | 135 | | | | 135,522 | |
Welltower, Inc., Sr. Unsec’d. Notes | | | 6.125 | | | | 04/15/20 | | | | 430 | | | | 474,300 | |
Weyerhaeuser Co., Sr. Unsec’d. Notes | | | 4.625 | | | | 09/15/23 | | | | 425 | | | | 462,344 | |
| | | | | | | | | | | | | | | | |
| | | | | | | | | | | | | | | 1,859,323 | |
|
Retail 0.1% | |
CVS Health Corp., | | | | | | | | | | | | | | | | |
Sr. Unsec’d. Notes | | | 5.125 | | | | 07/20/45 | | | | 185 | | | | 212,300 | |
Sr. Unsec’d. Notes | | | 5.300 | | | | 12/05/43 | | | | 150 | | | | 175,133 | |
Home Depot, Inc. (The), Sr. Unsec’d. Notes | | | 3.500 | | | | 09/15/56 | | | | 65 | | | | 59,414 | |
McDonald’s Corp., Sr. Unsec’d. Notes, MTN | | | 4.700 | | | | 12/09/35 | | | | 30 | | | | 33,269 | |
| | | | | | | | | | | | | | | | |
| | | | | | | | | | | | | | | 480,116 | |
|
Semiconductors 0.1% | |
Broadcom Corp./Broadcom Cayman Finance Ltd., Gtd. Notes, 144A | | | 3.875 | | | | 01/15/27 | | | | 480 | | | | 492,660 | |
|
Software 0.7% | |
Electronic Arts, Inc., Sr. Unsec’d. Notes | | | 3.700 | | | | 03/01/21 | | | | 200 | | | | 209,128 | |
Fidelity National Information Services, Inc., Sr. Unsec’d. Notes | | | 3.000 | | | | 08/15/26 | | | | 555 | | | | 543,797 | |
Fiserv, Inc., Sr. Unsec’d. Notes | | | 3.850 | | | | 06/01/25 | | | | 500 | | | | 525,220 | |
Microsoft Corp., | | | | | | | | | | | | | | | | |
Sr. Unsec’d. Notes | | | 2.375 | | | | 02/12/22 | | | | 290 | | | | 293,213 | |
Sr. Unsec’d. Notes | | | 3.125 | | | | 11/03/25 | | | | 125 | | | | 128,474 | |
Sr. Unsec’d. Notes | | | 3.950 | | | | 08/08/56 | | | | 405 | | | | 408,880 | |
Oracle Corp., Sr. Unsec’d. Notes | | | 4.000 | | | | 07/15/46 | | | | 350 | | | | 355,455 | |
| | | | | | | | | | | | | | | | |
| | | | | | | | | | | | | | | 2,464,167 | |
|
Telecommunications 0.4% | |
AT&T, Inc., | | | | | | | | | | | | | | | | |
Sr. Unsec’d. Notes | | | 4.900 | | | | 08/14/37 | | | | 150 | | | | 149,222 | |
Sr. Unsec’d. Notes | | | 5.300 | | | | 08/14/58 | | | | 170 | | | | 170,042 | |
See Notes to Financial Statements.
| | | | | | | | | | | | | | | | |
| Description | | Interest
Rate | | | Maturity
Date | | | Principal
Amount (000)# | | | Value | |
CORPORATE BONDS (Continued) | |
|
Telecommunications (cont’d.) | |
AT&T, Inc., (cont’d.) | | | | | | | | | | | | | | | | |
Sr. Unsec’d. Notes | | | 3.400 | % | | | 05/15/25 | | | | 530 | | | $ | 522,106 | |
Sr. Unsec’d. Notes | | | 4.500 | | | | 05/15/35 | | | | 60 | | | | 58,432 | |
Sr. Unsec’d. Notes | | | 5.250 | | | | 03/01/37 | | | | 445 | | | | 465,771 | |
Verizon Communications, Inc., Sr. Unsec’d. Notes | | | 4.500 | | | | 09/15/20 | | | | 100 | | | | 106,921 | |
| | | | | | | | | | | | | | | | |
| | | | | | | | | | | | | | | 1,472,494 | |
|
Textiles 0.4% | |
Cintas Corp. No. 2, | | | | | | | | | | | | | | | | |
Gtd. Notes | | | 2.900 | | | | 04/01/22 | | | | 385 | | | | 392,216 | |
Gtd. Notes | | | 3.700 | | | | 04/01/27 | | | | 815 | | | | 852,316 | |
| | | | | | | | | | | | | | | | |
| | | | | | | | | | | | | | | 1,244,532 | |
|
Transportation 0.4% | |
Burlington Northern Santa Fe LLC, Sr. Unsec’d. Notes | | | 4.450 | | | | 03/15/43 | | | | 280 | | | | 305,295 | |
Canadian National Railway Co. (Canada), Sr. Unsec’d. Notes | | | 5.550 | | | | 03/01/19 | | | | 250 | | | | 264,914 | |
Canadian Pacific Railway Co. (Canada), Sr. Unsec’d. Notes | | | 7.250 | | | | 05/15/19 | | | | 250 | | | | 272,155 | |
CSX Corp., Sr. Unsec’d. Notes | | | 2.600 | | | | 11/01/26 | | | | 420 | | | | 406,948 | |
Ryder System, Inc., Sr. Unsec’d. Notes, MTN | | | 2.650 | | | | 03/02/20 | | | | 110 | | | | 111,478 | |
| | | | | | | | | | | | | | | | |
| | | | | | | | | | | | | | | 1,360,790 | |
|
Trucking & Leasing 0.1% | |
Penske Truck Leasing Co. LP/PTL Finance Corp., Sr. Unsec’d. Notes, 144A | | | 3.050 | | | | 01/09/20 | | | | 300 | | | | 306,821 | |
|
Water 0.0% | |
American Water Capital Corp., Sr. Unsec’d. Notes | | | 4.000 | | | | 12/01/46 | | | | 145 | | | | 148,694 | |
| | | | | | | | | | | | | | | | |
TOTAL CORPORATE BONDS
(cost $99,608,990) | | | | | | | | | | | | | | | 100,950,303 | |
| | | | | | | | | | | | | | | | |
|
FOREIGN GOVERNMENT BONDS 1.9% | |
Belgium Government International Bond (Belgium), Sr. Unsec’d. Notes, 144A, EMTN | | | 1.125 | | | | 08/03/19 | | | | 200 | | | | 197,995 | |
Colombia Government International Bond (Colombia), Sr. Unsec’d. Notes | | | 4.375 | | | | 07/12/21 | | | | 200 | | | | 213,300 | |
Finnvera OYJ (Finland), Gov’t. Gtd. Notes, EMTN | | | 1.875 | | | | 09/16/19 | | | | 200 | | | | 200,132 | |
Hungary Government International Bond (Hungary), Sr. Unsec’d. Notes(a) | | | 7.625 | | | | 03/29/41 | | | | 106 | | | | 160,797 | |
See Notes to Financial Statements.
| | | | |
| Prudential Core Bond Fund | | | 33 | |
Schedule of Investments (continued)
as of July 31, 2017
| | | | | | | | | | | | | | | | |
| Description | | Interest
Rate | | | Maturity
Date | | | Principal
Amount (000)# | | | Value | |
FOREIGN GOVERNMENT BONDS (Continued) | |
Indonesia Government International Bond (Indonesia), | | | | | | | | | | | | | | | | |
Sr. Unsec’d. Notes | | | 4.875 | % | | | 05/05/21 | | | | 250 | | | $ | 268,694 | |
Sr. Unsec’d. Notes, MTN | | | 3.750 | | | | 04/25/22 | | | | 200 | | | | 206,758 | |
Iraq Government AID Bond, Gov’t. Gtd. Notes | | | 2.149 | | | | 01/18/22 | | | | 200 | | | | 201,507 | |
Japan Bank for International Cooperation (Japan), | | | | | | | | | | | | | | | | |
Gov’t. Gtd. Notes | | | 2.125 | | | | 06/01/20 | | | | 200 | | | | 200,668 | |
Gov’t. Gtd. Notes | | | 2.125 | | | | 07/21/20 | | | | 400 | | | | 401,400 | |
Gov’t. Gtd. Notes | | | 2.250 | | | | 02/24/20 | | | | 200 | | | | 201,325 | |
Japan Finance Organization for Municipalities (Japan), | | | | | | | | | | | | | | | | |
Sr. Unsec’d. Notes, 144A, MTN | | | 2.125 | | | | 10/25/23 | | | | 200 | | | | 194,391 | |
Sr. Unsec’d. Notes, 144A, MTN | | | 2.625 | | | | 04/20/22 | | | | 400 | | | | 402,204 | |
Lithuania Government International Bond (Lithuania), Sr. Unsec’d. Notes, 144A | | | 6.125 | | | | 03/09/21 | | | | 260 | | | | 292,890 | |
Mexico Government International Bond (Mexico), Sr. Unsec’d. Notes, MTN | | | 4.750 | | | | 03/08/44 | | | | 220 | | | | 222,640 | |
Panama Government International Bond (Panama), Sr. Unsec’d. Notes | | | 3.750 | | | | 03/16/25 | | | | 200 | | | | 208,000 | |
Poland Government International Bond (Poland), Sr. Unsec’d. Notes | | | 3.000 | | | | 03/17/23 | | | | 100 | | | | 101,700 | |
Province of Alberta (Canada), Unsec’d. Notes | | | 2.200 | | | | 07/26/22 | | | | 285 | | | | 284,636 | |
Province of Manitoba (Canada), Sr. Unsec’d. Notes | | | 2.125 | | | | 06/22/26 | | | | 100 | | | | 95,052 | |
Province of Ontario (Canada), | | | | | | | | | | | | | | | | |
Sr. Unsec’d. Notes | | | 2.250 | | | | 05/18/22 | | | | 165 | | | | 165,432 | |
Sr. Unsec’d. Notes | | | 2.400 | | | | 02/08/22 | | | | 125 | | | | 126,318 | |
Sr. Unsec’d. Notes | | | 4.400 | | | | 04/14/20 | | | | 120 | | | | 128,008 | |
Province of Quebec (Canada), | | | | | | | | | | | | | | | | |
Sr. Unsec’d. Notes | | | 2.750 | | | | 04/12/27 | | | | 620 | | | | 619,311 | |
Unsec’d. Notes, MTN | | | 7.140 | | | | 02/27/26 | | | | 100 | | | | 128,365 | |
Saudi Government International Bond (Saudi Arabia), Sr. Unsec’d. Notes, 144A, MTN | | | 2.375 | | | | 10/26/21 | | | | 205 | | | | 201,851 | |
Tokyo Metropolitan Government (Japan), Sr. Unsec’d. Notes, 144A | | | 2.500 | | | | 06/08/22 | | | | 400 | | | | 401,691 | |
Turkey Government International Bond (Turkey), Sr. Unsec’d. Notes | | | 7.000 | | | | 06/05/20 | | | | 250 | | | | 274,587 | |
Uruguay Government International Bond (Uruguay), Sr. Unsec’d. Notes | | | 5.100 | | | | 06/18/50 | | | | 150 | | | | 154,875 | |
| | | | | | | | | | | | | | | | |
TOTAL FOREIGN GOVERNMENT BONDS
(cost $6,168,694) | | | | | | | | | | | | | | | 6,254,527 | |
| | | | | | | | | | | | | | | | |
See Notes to Financial Statements.
| | | | | | | | | | | | | | | | |
| Description | | Interest
Rate | | | Maturity
Date | | | Principal
Amount (000)# | | | Value | |
MUNICIPAL BONDS 0.6% | | | | | | | | | | | | | | | | |
|
Alabama 0.0% | |
Alabama Economic Settlement Authority, Revenue Bonds, BABs | | | 4.263 | % | | | 09/15/32 | | | | 40 | | | $ | 42,407 | |
|
California 0.2% | |
California Educational Facilities Authority, Revenue Bonds, BABs | | | 5.000 | | | | 06/01/46 | | | | 130 | | | | 175,942 | |
City of Los Angeles Department of Airports, Revenue Bonds, BABs | | | 6.582 | | | | 05/15/39 | | | | 300 | | | | 390,879 | |
University of California, | | | | | | | | | | | | | | | | |
Revenue Bonds | | | 3.931 | | | | 05/15/45 | | | | 30 | | | | 30,924 | |
Revenue Bonds | | | 4.131 | | | | 05/15/45 | | | | 30 | | | | 31,033 | |
| | | | | | | | | | | | | | | | |
| | | | | | | | | | | | | | | 628,778 | |
|
New Jersey 0.1% | |
New Jersey Turnpike Authority, Revenue Bonds, BABs | | | 7.102 | | | | 01/01/41 | | | | 250 | | | | 365,520 | |
|
Pennsylvania 0.1% | |
Pennsylvania Turnpike Commission, | | | | | | | | | | | | | | | | |
Revenue Bonds, BABs | | | 5.511 | | | | 12/01/45 | | | | 150 | | | | 192,975 | |
Revenue Bonds, BABs | | | 6.105 | | | | 12/01/39 | | | | 70 | | | | 92,877 | |
| | | | | | | | | | | | | | | | |
| | | | | | | | | | | | | | | 285,852 | |
|
Texas 0.1% | |
University of Texas System (The), Revenue Bonds | | | 5.000 | | | | 08/15/47 | | | | 305 | | | | 404,875 | |
|
Washington 0.1% | |
Central Puget Sound Regional Transit Authority, Revenue Bonds, BABs | | | 5.000 | | | | 11/01/46 | | | | 165 | | | | 218,859 | |
| | | | | | | | | | | | | | | | |
TOTAL MUNICIPAL BONDS
(cost $1,908,474) | | | | | | | | | | | | | | | 1,946,291 | |
| | | | | | | | | | | | | | | | |
|
RESIDENTIAL MORTGAGE-BACKED SECURITIES 4.2% | |
Alternative Loan Trust, Series 2003-J3, Class 2A1 | | | 6.250 | | | | 12/25/33 | | | | 8 | | | | 8,549 | |
American Home Mortgage Investment Trust, Series 2004-4, Class 5A | | | 3.448 | (c) | | | 02/25/45 | | | | 26 | | | | 25,827 | |
Banc of America Funding Trust, Series 2015-R4, Class 4A1, 144A | | | 3.500 | (c) | | | 01/27/30 | | | | 271 | | | | 270,467 | |
Bayview Opportunity Master Fund IIIb Trust, Series 2017-CRT2, Class M, 144A | | | 3.233 | (c) | | | 11/25/27 | | | | 180 | | | | 179,455 | |
Bayview Opportunity Master Fund IVb Trust, Series 2017-CRT1, Class M, 144A | | | 3.372 | (c) | | | 10/25/28 | | | | 289 | | | | 289,424 | |
BCAP LLC Trust, Series 2011-RR4, Class 7A1, 144A | | | 5.250 | | | | 04/26/37 | | | | 345 | | | | 305,986 | |
See Notes to Financial Statements.
| | | | |
| Prudential Core Bond Fund | | | 35 | |
Schedule of Investments (continued)
as of July 31, 2017
| | | | | | | | | | | | | | | | |
| Description | | Interest
Rate | | | Maturity
Date | | | Principal
Amount (000)# | | | Value | |
RESIDENTIAL MORTGAGE-BACKED SECURITIES (Continued) | |
Bear Stearns ARM Trust, Series 2005-5, Class A2 | | | 2.820 | %(c) | | | 08/25/35 | | | | 122 | | | $ | 121,033 | |
CIM Trust, | | | | | | | | | | | | | | | | |
Series 2017-2, Class A1, 144A | | | 3.227 | (c) | | | 12/25/57 | | | | 480 | | | | 479,808 | |
Series 2017-3, Class A | | | 3.227 | (c) | | | 01/25/57 | | | | 1,072 | | | | 1,087,397 | |
Credit Suisse First Boston Mortgage Securities Corp., Series 2003-8, Class 5A1 | | | 6.500 | | | | 04/25/33 | | | | 8 | | | | 7,734 | |
Credit Suisse Mortgage Trust, Series 2017-3R | | | 3.051 | (c) | | | 02/27/47 | | | | 488 | | | | 486,094 | |
Fannie Mae Connecticut Avenue Securities, | | | | | | | | | | | | | | | | |
Series 2016-C02, Class 1M1 | | | 3.382 | (c) | | | 09/25/28 | | | | 72 | | | | 72,672 | |
Series 2016-C04, Class 1M1 | | | 2.682 | (c) | | | 01/25/29 | | | | 122 | | | | 124,061 | |
FHLMC Structured Pass-Through Securities, | | | | | | | | | | | | | | | | |
Series T-59, Class 1A2 | | | 7.000 | | | | 10/25/43 | | | | 136 | | | | 162,938 | |
Series T-75, Class A1 | | | 1.272 | (c) | | | 12/25/36 | | | | 145 | | | | 144,445 | |
Freddie Mac Structured Agency Credit Risk Debt Notes, | | | | | | | | | | | | | | | | |
Series 2015-DNA1, Class M1 | | | 2.132 | (c) | | | 10/25/27 | | | | 250 | | | | 250,820 | |
Series 2016-DNA4, Class M2 | | | 2.532 | (c) | | | 03/25/29 | | | | 260 | | | | 264,250 | |
Series 2016-HQA4, Class M2 | | | 2.532 | (c) | | | 04/25/29 | | | | 260 | | | | 262,838 | |
Series 2017-DNA1, Class M1 | | | 2.432 | (c) | | | 07/25/29 | | | | 632 | | | | 640,846 | |
Government National Mortgage Assoc., | | | | | | | | | | | | | | | | |
Series 2000-9, Class FG | | | 1.826 | (c) | | | 02/16/30 | | | | 23 | | | | 23,001 | |
Series 2000-9, Class FH | | | 1.726 | (c) | | | 02/16/30 | | | | 19 | | | | 19,499 | |
GSR Mortgage Loan Trust, Series 2005-AR6, Class 2A1 | | | 3.124 | (c) | | | 09/25/35 | | | | 86 | | | | 87,189 | |
LSTAR Securities Investment Ltd. (Cayman Islands), Series 2016-3, Class A, 144A | | | 3.227 | (c) | | | 09/01/21 | | | | 190 | | | | 189,799 | |
LSTAR Securities Investment Ltd., Series 2017-3, Class A1, 144A | | | 3.227 | (c) | | | 04/01/22 | | | | 620 | | | | 621,412 | |
LSTAR Securities Investment Ltd. (Cayman Islands), Series 2017-4, Class A, 144A | | | 3.227 | (c) | | | 05/01/22 | | | | 2,269 | | | | 2,253,567 | |
LSTAR Securities Investment Ltd., Series 2017-5, Class A, 144A | | | 3.227 | (c) | | | 05/01/22 | | | | 2,119 | | | | 2,105,412 | |
Merrill Lynch Mortgage Investors Trust, Series 2005-2, Class 3A | | | 2.227 | (c) | | | 10/25/35 | | | | 76 | | | | 72,606 | |
Merrill Lynch Mortgage Investors Trust MLMI, Series 2005-A10, Class A | | | 1.442 | (c) | | | 02/25/36 | | | | 141 | | | | 135,226 | |
Mortgage Repurchase Agreement Financing Trust, | | | | | | | | | | | | | | | | |
Series 2016-4, Class A1, 144A^ | | | 2.424 | (c) | | | 05/10/19 | | | | 1,350 | | | | 1,350,000 | |
Series 2016-5, Class A, 144A | | | 2.394 | (c) | | | 06/10/19 | | | | 200 | | | | 199,685 | |
Series 2017-1, Class A2, 144A | | | 2.074 | (c) | | | 07/10/19 | | | | 560 | | | | 560,184 | |
Sequoia Mortgage Trust, Series 10, Class 2A1 | | | 1.988 | (c) | | | 10/20/27 | | | | 70 | | | | 66,326 | |
Structured Asset Mortgage Investments II Trust, Series 2005-AR5, Class A1 | | | 1.478 | (c) | | | 07/19/35 | | | | 67 | | | | 63,543 | |
See Notes to Financial Statements.
| | | | | | | | | | | | | | | | |
| Description | | Interest
Rate | | | Maturity
Date | | | Principal
Amount (000)# | | | Value | |
RESIDENTIAL MORTGAGE-BACKED SECURITIES (Continued) | |
Washington Mutual Mortgage Pass-Through Certificates Trust, | | | | | | | | | | | | | | | | |
Series 2002-AR6, Class A | | | 2.176 | %(c) | | | 06/25/42 | | | | 119 | | | $ | 114,235 | |
Series 2002-AR9, Class 1A | | | 2.176 | (c) | | | 08/25/42 | | | | 7 | | | | 6,575 | |
Series 2005-AR13, Class A1A1 | | | 1.522 | (c) | | | 10/25/45 | | | | 781 | | | | 775,185 | |
| | | | | | | | | | | | | | | | |
TOTAL RESIDENTIAL MORTGAGE-BACKED SECURITIES
(cost $13,758,558) | | | | | | | | | | | | | | | 13,828,088 | |
| | | | | | | | | | | | | | | | |
|
U.S. GOVERNMENT AGENCY OBLIGATIONS 23.0% | |
Federal Home Loan Mortgage Corp. | | | 2.500 | | | | 01/01/29 | | | | 843 | | | | 854,915 | |
Federal Home Loan Mortgage Corp. | | | 3.000 | | | | 07/01/43 | | | | 793 | | | | 798,136 | |
Federal Home Loan Mortgage Corp. | | | 3.000 | | | | 12/01/46 | | | | 1,498 | | | | 1,502,397 | |
Federal Home Loan Mortgage Corp. | | | 3.500 | | | | 06/01/42 | | | | 741 | | | | 766,894 | |
Federal Home Loan Mortgage Corp. | | | 3.500 | | | | 09/01/42 | | | | 985 | | | | 1,019,909 | |
Federal Home Loan Mortgage Corp. | | | 3.500 | | | | 05/01/45 | | | | 805 | | | | 829,647 | |
Federal Home Loan Mortgage Corp. | | | 3.500 | | | | TBA | | | | 500 | | | | 515,117 | |
Federal Home Loan Mortgage Corp. | | | 4.000 | | | | 12/01/40 | | | | 321 | | | | 339,404 | |
Federal Home Loan Mortgage Corp. | | | 4.000 | | | | 01/01/41 | | | | 588 | | | | 621,280 | |
Federal Home Loan Mortgage Corp. | | | 4.000 | | | | 04/01/42 | | | | 914 | | | | 966,893 | |
Federal Home Loan Mortgage Corp. | | | 4.000 | | | | 10/01/45 | | | | 434 | | | | 457,379 | |
Federal Home Loan Mortgage Corp. | | | 4.000 | | | | 08/01/46 | | | | 500 | | | | 526,591 | |
Federal Home Loan Mortgage Corp. | | | 4.000 | | | | TBA | | | | 750 | | | | 789,961 | |
Federal Home Loan Mortgage Corp. | | | 4.500 | | | | 06/01/42 | | | | 270 | | | | 291,106 | |
Federal Home Loan Mortgage Corp. | | | 4.500 | | | | 09/01/44 | | | | 368 | | | | 394,669 | |
Federal Home Loan Mortgage Corp. | | | 5.000 | | | | 08/01/40 | | | | 552 | | | | 607,418 | |
Federal Home Loan Mortgage Corp., MTN | | | 1.500 | | | | 01/17/20 | | | | 360 | | | | 360,094 | |
Federal National Mortgage Assoc. | | | 2.500 | | | | 05/01/30 | | | | 733 | | | | 741,213 | |
Federal National Mortgage Assoc. | | | 2.500 | | | | 09/01/46 | | | | 489 | | | | 473,173 | |
Federal National Mortgage Assoc. | | | 2.500 | | | | 10/01/46 | | | | 482 | | | | 465,784 | |
Federal National Mortgage Assoc. | | | 2.625 | (c) | | | 08/01/24 | | | | 11 | | | | 11,332 | |
Federal National Mortgage Assoc. | | | 3.000 | | | | 06/01/30 | | | | 517 | | | | 532,300 | |
Federal National Mortgage Assoc. | | | 3.000 | | | | 11/01/36 | | | | 470 | | | | 479,782 | |
Federal National Mortgage Assoc. | | | 3.000 | | | | 10/01/42 | | | | 462 | | | | 464,905 | |
Federal National Mortgage Assoc. | | | 3.000 | | | | 10/01/42 | | | | 750 | | | | 755,246 | |
Federal National Mortgage Assoc. | | | 3.000 | | | | 02/01/43 | | | | 466 | | | | 469,257 | |
Federal National Mortgage Assoc. | | | 3.000 | | | | 04/01/43 | | | | 772 | | | | 776,986 | |
Federal National Mortgage Assoc. | | | 3.000 | | | | 06/01/43 | | | | 1,183 | | | | 1,190,937 | |
Federal National Mortgage Assoc. | | | 3.000 | | | | TBA | | | | 250 | | | | 250,391 | |
Federal National Mortgage Assoc. | | | 3.000 | | | | TBA | | | | 4,500 | | | | 4,628,848 | |
Federal National Mortgage Assoc. | | | 3.500 | | | | 12/01/29 | | | | 356 | | | | 371,375 | |
Federal National Mortgage Assoc. | | | 3.500 | | | | 08/01/31 | | | | 918 | | | | 958,781 | |
Federal National Mortgage Assoc. | | | 3.500 | | | | 10/01/41 | | | | 324 | | | | 335,295 | |
Federal National Mortgage Assoc. | | | 3.500 | | | | 04/01/42 | | | | 654 | | | | 675,916 | |
See Notes to Financial Statements.
| | | | |
| Prudential Core Bond Fund | | | 37 | |
Schedule of Investments (continued)
as of July 31, 2017
| | | | | | | | | | | | | | | | |
| Description | | Interest
Rate | | | Maturity
Date | | | Principal
Amount (000)# | | | Value | |
Federal National Mortgage Assoc. | | | 3.500 | % | | | 05/01/42 | | | | 666 | | | $ | 688,600 | |
Federal National Mortgage Assoc. | | | 3.500 | | | | 06/01/42 | | | | 1,447 | | | | 1,496,574 | |
Federal National Mortgage Assoc. | | | 3.500 | | | | 10/01/42 | | | | 1,061 | | | | 1,096,304 | |
Federal National Mortgage Assoc. | | | 3.500 | | | | 10/01/42 | | | | 791 | | | | 818,375 | |
Federal National Mortgage Assoc. | | | 3.500 | | | | 06/01/45 | | | | 1,477 | | | | 1,521,987 | |
Federal National Mortgage Assoc. | | | 3.500 | | | | 09/01/45 | | | | 985 | | | | 1,014,311 | |
Federal National Mortgage Assoc. | | | 3.500 | | | | 10/01/45 | | | | 1,299 | | | | 1,338,661 | |
Federal National Mortgage Assoc. | | | 3.500 | | | | 01/01/46 | | | | 451 | | | | 465,004 | |
Federal National Mortgage Assoc. | | | 3.500 | | | | TBA | | | | 2,500 | | | | 2,573,828 | |
Federal National Mortgage Assoc. | | | 4.000 | | | | 02/01/41 | | | | 871 | | | | 920,674 | |
Federal National Mortgage Assoc. | | | 4.000 | | | | 12/01/41 | | | | 753 | | | | 795,140 | |
Federal National Mortgage Assoc. | | | 4.000 | | | | 09/01/44 | | | | 534 | | | | 562,446 | |
Federal National Mortgage Assoc. | | | 4.000 | | | | 10/01/44 | | | | 1,356 | | | | 1,428,485 | |
Federal National Mortgage Assoc. | | | 4.000 | | | | 12/01/45 | | | | 447 | | | | 470,285 | |
Federal National Mortgage Assoc.(t) | | | 4.000 | | | | TBA | | | | 750 | | | | 789,580 | |
Federal National Mortgage Assoc. | | | 4.000 | | | | TBA | | | | 2,500 | | | | 2,628,027 | |
Federal National Mortgage Assoc. | | | 4.500 | | | | 08/01/40 | | | | 248 | | | | 268,557 | |
Federal National Mortgage Assoc. | | | 4.500 | | | | 04/01/41 | | | | 132 | | | | 143,026 | |
Federal National Mortgage Assoc. | | | 4.500 | | | | 08/01/41 | | | | 383 | | | | 414,580 | |
Federal National Mortgage Assoc. | | | 4.500 | | | | 08/01/41 | | | | 1,002 | | | | 1,082,024 | |
Federal National Mortgage Assoc. | | | 4.500 | | | | 08/01/44 | | | | 747 | | | | 803,663 | |
Federal National Mortgage Assoc. | | | 4.500 | | | | 01/01/45 | | | | 499 | | | | 536,888 | |
Federal National Mortgage Assoc. | | | 4.500 | | | | TBA | | | | 1,500 | | | | 1,610,273 | |
Federal National Mortgage Assoc. | | | 5.000 | | | | 09/01/30 | | | | 63 | | | | 68,948 | |
Federal National Mortgage Assoc. | | | 5.000 | | | | 03/01/42 | | | | 899 | | | | 985,046 | |
Federal National Mortgage Assoc. | | | 5.000 | | | | TBA | | | | 500 | | | | 546,602 | |
Federal National Mortgage Assoc. | | | 5.451 | (c) | | | 12/01/30 | | | | 1 | | | | 1,340 | |
Federal National Mortgage Assoc. | | | 5.500 | | | | 07/01/30 | | | | 500 | | | | 552,671 | |
Federal National Mortgage Assoc. | | | 5.500 | | | | 04/01/31 | | | | 500 | | | | 552,670 | |
Federal National Mortgage Assoc. | | | 5.500 | | | | 01/01/40 | | | | 369 | | | | 411,648 | |
Federal National Mortgage Assoc. | | | 6.000 | | | | 10/01/36 | | | | 204 | | | | 232,145 | |
Federal National Mortgage Assoc. | | | 6.000 | | | | 07/01/41 | | | | 217 | | | | 245,173 | |
Federal National Mortgage Assoc.(hh) | | | 6.625 | | | | 11/15/30 | | | | 55 | | | | 78,577 | |
Federal National Mortgage Assoc.(hh) | | | 7.125 | | | | 01/15/30 | | | | 80 | | | | 116,888 | |
Government National Mortgage Assoc. | | | 3.000 | | | | 03/20/43 | | | | 951 | | | | 968,484 | |
Government National Mortgage Assoc. | | | 3.000 | | | | 08/20/43 | | | | 183 | | | | 186,479 | |
Government National Mortgage Assoc. | | | 3.000 | | | | 09/20/43 | | | | 345 | | | | 351,606 | |
Government National Mortgage Assoc. | | | 3.000 | | | | 01/20/44 | | | | 322 | | | | 328,175 | |
Government National Mortgage Assoc. | | | 3.000 | | | | 08/15/45 | | | | 514 | | | | 521,439 | |
Government National Mortgage Assoc. | | | 3.000 | | | | 07/20/46 | | | | 990 | | | | 1,005,105 | |
Government National Mortgage Assoc. | | | 3.000 | | | | 10/20/46 | | | | 488 | | | | 495,152 | |
Government National Mortgage Assoc. | | | 3.000 | | | | 03/20/47 | | | | 2,717 | | | | 2,758,858 | |
Government National Mortgage Assoc. | | | 3.500 | | | | 01/15/42 | | | | 233 | | | | 242,260 | |
Government National Mortgage Assoc. | | | 3.500 | | | | 12/20/42 | | | | 670 | | | | 699,225 | |
See Notes to Financial Statements.
| | | | | | | | | | | | | | | | |
| Description | | Interest
Rate | | | Maturity
Date | | | Principal
Amount (000)# | | | Value | |
Government National Mortgage Assoc. | | | 3.500 | % | | | 01/20/43 | | | | 980 | | | $ | 1,022,406 | |
Government National Mortgage Assoc. | | | 3.500 | | | | 02/20/43 | | | | 441 | | | | 459,922 | |
Government National Mortgage Assoc. | | | 3.500 | | | | 03/20/45 | | | | 349 | | | | 362,763 | |
Government National Mortgage Assoc. | | | 3.500 | | | | 04/20/45 | | | | 1,464 | | | | 1,523,135 | |
Government National Mortgage Assoc. | | | 3.500 | | | | TBA | | | | 3,000 | | | | 3,117,187 | |
Government National Mortgage Assoc. | | | 4.000 | | | | 12/20/40 | | | | 597 | | | | 633,493 | |
Government National Mortgage Assoc. | | | 4.000 | | | | 06/20/41 | | | | 236 | | | | 249,920 | |
Government National Mortgage Assoc. | | | 4.000 | | | | 11/15/41 | | | | 335 | | | | 353,370 | |
Government National Mortgage Assoc. | | | 4.000 | | | | 12/20/42 | | | | 471 | | | | 498,072 | |
Government National Mortgage Assoc. | | | 4.000 | | | | 04/20/43 | | | | 361 | | | | 381,981 | |
Government National Mortgage Assoc. | | | 4.000 | | | | 10/20/43 | | | | 396 | | | | 419,812 | |
Government National Mortgage Assoc. | | | 4.000 | | | | 09/20/44 | | | | 480 | | | | 507,699 | |
Government National Mortgage Assoc. | | | 4.000 | | | | 10/20/45 | | | | 477 | | | | 502,132 | |
Government National Mortgage Assoc.(t) | | | 4.000 | | | | TBA | | | | 1,000 | | | | 1,052,812 | |
Government National Mortgage Assoc. | | | 4.000 | | | | TBA | | | | 1,000 | | | | 1,051,445 | |
Government National Mortgage Assoc. | | | 4.500 | | | | 10/20/43 | | | | 201 | | | | 213,568 | |
Government National Mortgage Assoc. | | | 4.500 | | | | 01/20/44 | | | | 238 | | | | 252,969 | |
Government National Mortgage Assoc. | | | 4.500 | | | | 04/20/44 | | | | 838 | | | | 891,287 | |
Government National Mortgage Assoc. | | | 4.500 | | | | 03/20/45 | | | | 227 | | | | 240,886 | |
Government National Mortgage Assoc. | | | 4.500 | | | | 07/20/46 | | | | 555 | | | | 590,566 | |
Government National Mortgage Assoc. | | | 4.500 | | | | 08/20/46 | | | | 478 | | | | 507,803 | |
Government National Mortgage Assoc. | | | 4.500 | | | | 11/20/46 | | | | 471 | | | | 501,262 | |
Government National Mortgage Assoc. | | | 5.000 | | | | 10/20/37 | | | | 17 | | | | 19,078 | |
Government National Mortgage Assoc. | | | 5.000 | | | | 04/20/45 | | | | 125 | | | | 135,016 | |
Government National Mortgage Assoc. | | | 6.000 | | | | 12/15/39 | | | | 279 | | | | 314,510 | |
| | | | | | | | | | | | | | | | |
TOTAL U.S. GOVERNMENT AGENCY OBLIGATIONS
(cost $76,020,380) | | | | | | | | | | | | | | | 75,842,208 | |
| | | | | | | | | | | | | | | | |
|
U.S. TREASURY OBLIGATIONS 12.7% | |
U.S. Treasury Bonds(hh) | | | 2.875 | | | | 05/15/43 | | | | 400 | | | | 399,875 | |
U.S. Treasury Bonds | | | 3.000 | | | | 11/15/44 | | | | 180 | | | | 183,846 | |
U.S. Treasury Bonds | | | 3.000 | | | | 05/15/45 | | | | 3,430 | | | | 3,498,868 | |
U.S. Treasury Bonds | | | 3.000 | | | | 02/15/47 | | | | 975 | | | | 993,739 | |
U.S. Treasury Bonds | | | 4.250 | | | | 11/15/40 | | | | 3,835 | | | | 4,782,513 | |
U.S. Treasury Bonds | | | 4.750 | | | | 02/15/41 | | | | 140 | | | | 187,048 | |
U.S. Treasury Inflation Indexed Bonds, TIPS | | | 0.125 | | | | 04/15/22 | | | | 3,965 | | | | 3,988,635 | |
U.S. Treasury Inflation Indexed Bonds, TIPS | | | 0.375 | | | | 01/15/27 | | | | 3,160 | | | | 3,159,310 | |
U.S. Treasury Notes(hh) | | | 0.750 | | | | 02/28/18 | | | | 225 | | | | 224,437 | |
U.S. Treasury Notes | | | 1.375 | | | | 04/30/21 | | | | 160 | | | | 158,306 | |
U.S. Treasury Notes | | | 1.500 | | | | 07/15/20 | | | | 320 | | | | 319,963 | |
U.S. Treasury Notes | | | 1.500 | | | | 03/31/23 | | | | 3,650 | | | | 3,562,885 | |
U.S. Treasury Notes | | | 1.625 | | | | 04/30/23 | | | | 4,050 | | | | 3,976,594 | |
U.S. Treasury Notes | | | 1.875 | | | | 04/30/22 | | | | 175 | | | | 175,431 | |
U.S. Treasury Notes | | | 1.875 | | | | 07/31/22 | | | | 1,070 | | | | 1,072,131 | |
U.S. Treasury Notes | | | 2.125 | | | | 06/30/21 | | | | 25 | | | | 25,413 | |
See Notes to Financial Statements.
| | | | |
| Prudential Core Bond Fund | | | 39 | |
Schedule of Investments (continued)
as of July 31, 2017
| | | | | | | | | | | | | | | | |
| Description | | Interest
Rate | | | Maturity
Date | | | Principal
Amount (000)# | | | Value | |
U.S. Treasury Notes | | | 2.125 | % | | | 09/30/21 | | | | 1,455 | | | $ | 1,477,848 | |
U.S. Treasury Notes(k) | | | 2.125 | | | | 12/31/22 | | | | 1,945 | | | | 1,965,969 | |
U.S. Treasury Notes | | | 2.125 | | | | 05/15/25 | | | | 9,295 | | | | 9,258,331 | |
U.S. Treasury Notes | | | 2.375 | | | | 05/15/27 | | | | 180 | | | | 181,287 | |
U.S. Treasury Notes | | | 8.125 | | | | 08/15/21 | | | | 35 | | | | 43,739 | |
U.S. Treasury Strips Coupon | | | 2.570 | (s) | | | 02/15/31 | | | | 3,000 | | | | 2,105,574 | |
U.S. Treasury Strips Coupon | | | 2.760 | (s) | | | 08/15/29 | | | | 100 | | | | 73,550 | |
U.S. Treasury Strips Coupon | | | 2.857 | (s) | | | 05/15/31 | | | | 100 | | | | 69,472 | |
U.S. Treasury Strips Coupon | | | 3.019 | (s) | | | 11/15/35 | | | | 200 | | | | 119,820 | |
U.S. Treasury Strips Coupon | | | 3.177 | (s) | | | 08/15/40 | | | | 200 | | | | 100,841 | |
| | | | | | | | | | | | | | | | |
TOTAL U.S. TREASURY OBLIGATIONS
(cost $42,344,771) | | | | | | | | | | | | | | | 42,105,425 | |
| | | | | | | | | | | | | | | | |
TOTAL LONG-TERM INVESTMENTS
(cost $321,602,208) | | | | | | | | | | | | | | | 322,687,771 | |
| | | | | | | | | | | | | | | | |
| | | | |
| | | | | | | | | Shares | | | | |
| | | | |
SHORT-TERM INVESTMENTS 9.4% | | | | | | | | | | | | | | | | |
| | | | |
AFFILIATED MUTUAL FUNDS 9.4% | | | | | | | | | | | | | | | | |
Prudential Investment Portfolios 2 - Prudential Core Ultra Short Bond Fund(w) | | | | | | | | | | | 30,387,632 | | | | 30,387,632 | |
Prudential Investment Portfolios 2 - Prudential Institutional Money Market Fund
(cost $567,416; includes $566,641 of cash collateral for securities on loan)(b)(w) | | | | | | | | | | | 567,359 | | | | 567,416 | |
| | | | | | | | | | | | | | | | |
TOTAL AFFILIATED MUTUAL FUNDS
(cost $30,955,048) | | | | | | | | | | | | | | | 30,955,048 | |
| | | | | | | | | | | | | | | | |
| | | | |
| | | | | | | | | Notional
Amount (000)# | | | | |
OPTIONS PURCHASED* 0.0% | | | | | | | | | | | | | | | | |
| | | | |
Call Options | | | | | | | | | | | | | | | | |
10 Year U.S. Treasury Notes Futures | | | | | | | | | | | | | | | | |
expiring 08/25/17, Strike Price $125.50 | | | | | | | | | | | 92 | | | | 66,125 | |
expiring 08/25/17, Strike Price $128.50 | | | | | | | | | | | 92 | | | | 1,437 | |
| | | | | | | | | | | | | | | | |
TOTAL OPTIONS PURCHASED
(cost $66,447) | | | | | | | | | | | | | | | 67,562 | |
| | | | | | | | | | | | | | | | |
TOTAL SHORT-TERM INVESTMENTS
(cost $31,021,495) | | | | | | | | | | | | | | | 31,022,610 | |
| | | | | | | | | | | | | | | | |
TOTAL INVESTMENTS BEFORE OPTION WRITTEN 107.0%
(cost $352,623,703) | | | | | | | | | | | | 353,710,381 | |
| | | | | | | | | | | | | | | | |
See Notes to Financial Statements.
| | | | | | | | | | | | | | | | |
| Description | | | | | | | | Notional
Amount (000)# | | | Value | |
OPTIONS WRITTEN* (0.0)% | | | | | | | | | | | | | | | | |
| | | | |
Call Option | | | | | | | | | | | | | | | | |
10 Year U.S. Treasury Notes Futures
expiring 08/25/17, Strike Price $127.00
(premiums received $33,647) | | | | | | | | | | | 184 | | | $ | (23,000 | ) |
| | | | | | | | | | | | | | | | |
TOTAL INVESTMENTS, NET OF OPTIONS WRITTEN 107.0%
(cost $352,590,056) | | | | | | | | | | | | | | | 353,687,381 | |
Liabilities in excess of other assets(z) (7.0)% | | | | | | | | | | | | | | | (23,058,782 | ) |
| | | | | | | | | | | | | | | | |
NET ASSETS 100.0% | | | | | | | | | | | | | | $ | 330,628,599 | |
| | | | | | | | | | | | | | | | |
The following abbreviations are used in the annual report:
144A—Security was purchased pursuant to Rule 144A under the Securities Act of 1933 and may not be resold subject to that rule except to qualified institutional buyers. Unless otherwise noted, 144A securities are deemed to be liquid.
ACES—Alternative Credit Enhancements Securities
BABs—Build America Bonds
bps—Basis Points
CLO—Collateralized Loan Obligation
CMBX—Commercial Mortgage Backed Securities Index
EMTN—Euro Medium Term Note
FHLMC—Federal Home Loan Mortgage Corp.
GMTN—Global Medium Term Note
LIBOR—London Interbank Offered Rate
MTN—Medium Term Note
OTC—Over-the-counter
REITS—Real Estate Investment Trusts
STRIPS—Separate Trading of Registered Interest and Principal of Securities
TBA—To Be Announced
TIPS—Treasury Inflation-Protected Securities
USOIS—United States Overnight Index Swap
| * | Non-income producing security. |
| # | Principal or notional amount is shown in U.S. dollars unless otherwise stated. |
| ^ | Indicates a Level 3 security. The aggregate value of Level 3 securities is $3,848,976 and 1.2% of net assets. |
| (a) | All or a portion of security is on loan. The aggregate market value of such securities, including those sold and pending settlement, is $554,032; cash collateral of $566,641 (included in liabilities) was received with which the Fund purchased highly liquid short-term investments. |
| (b) | Represents security purchased with cash collateral received for securities on loan and includes dividend reinvestment. |
| (c) | Variable rate instrument. The interest rate shown reflects the rate in effect at July 31, 2017. |
| (f) | Indicates a restricted security; the aggregate original cost of the restricted securities is $199,444. The aggregate value of $200,340 is approximately 0.1% of net assets. |
| (hh) | Represents security, or a portion thereof, segregated as collateral for centrally cleared swap agreements. |
| (k) | Represents security, or a portion thereof, segregated as collateral for futures contracts. |
| (p) | Interest rate not available as of July 31, 2017. |
See Notes to Financial Statements.
| | | | |
| Prudential Core Bond Fund | | | 41 | |
Schedule of Investments (continued)
as of July 31, 2017
| (s) | Represents zero coupon bond or principal only securities. Rate represents yield to maturity at purchase date. |
| (t) | All or partial principal amount represents “TBA” mortgage dollar rolls. The aggregate mortgage dollar roll principal amount of $1,750,000 is approximately 0.5% of net assets. |
| (w) | PGIM Investments LLC, the manager of the Fund, also serves as manager of the Prudential Investment Portfolios 2 -Prudential Core Ultra Short Bond Fund and Prudential Institutional Money Market Fund. |
| (z) | Includes net unrealized appreciation (depreciation) on the following derivative contracts held at reporting period end: |
Futures contracts outstanding at July 31, 2017:
| | | | | | | | | | | | | | | | | | | | |
Number of
Contracts | | | Type | | Expiration
Date | | | Value at
Trade Date | | | Value at
July 31,
2017 | | | Unrealized
Appreciation
(Depreciation) | |
| | | | Long Positions: | | | | | | | | | | | | | | | | |
| | 182 | | | 2 Year U.S. Treasury Notes | | | Sep. 2017 | | | $ | 39,314,952 | | | $ | 39,374,563 | | | $ | 59,611 | |
| | 458 | | | 5 Year U.S. Treasury Notes | | | Sep. 2017 | | | | 54,087,891 | | | | 54,111,984 | | | | 24,093 | |
| | 24 | | | 10 Year U.S. Ultra Treasury Notes | | | Sep. 2017 | | | | 3,231,484 | | | | 3,241,125 | | | | 9,641 | |
| | 77 | | | 30 Year U.S. Ultra Treasury Bonds | | | Sep. 2017 | | | | 12,640,320 | | | | 12,666,500 | | | | 26,180 | |
| | | | | | | | | | | | | | | | | | | | |
| | | | | | | | | | | | | | | | | | | 119,525 | |
| | | | | | | | | | | | | | | | | | | | |
| | | | Short Positions: | | | | | | | | | | | | | | | | |
| | 197 | | | 10 Year U.S. Treasury Notes | | | Sep. 2017 | | | | 24,757,417 | | | | 24,800,453 | | | | (43,036 | ) |
| | 61 | | | 20 Year U.S. Treasury Bonds | | | Sep. 2017 | | | | 9,369,508 | | | | 9,331,094 | | | | 38,414 | |
| | | | | | | | | | | | | | | | | | | | |
| | | | | | | | | | | | | | | | | | | (4,622 | ) |
| | | | | | | | | | | | | | | | | | | | |
| | | | | | | | | | | | | | | | | | $ | 114,903 | |
| | | | | | | | | | | | | | | | | | | | |
Cash of $4,047 and a security with a market value of $555,930 have been segregated with Citigroup Global Markets to cover requirements for open futures contracts at July 31, 2017.
Credit default swap agreements outstanding at July 31, 2017:
| | | | | | | | | | | | | | | | | | | | | | | | | | |
Reference
Entity/
Obligation | | Termination
Date | | | Fixed
Rate | | | Notional
Amount
(000)#(3) | | | Fair
Value(4) | | | Upfront
Premiums
Paid
(Received) | | | Unrealized
Appreciation
(Depreciation) | | | Counterparty |
OTC credit default swap on credit indices—Sell Protection(2): |
CMBX.NA.6.AA | | | 05/11/63 | | | | 1.500% | | | | 2,000 | | | $ | 7,122 | | | $ | (26,031 | ) | | $ | 33,153 | | | Morgan Stanley |
| | | | | | | | | | | | | | | | | | | | | | | | | | |
The Fund entered into credit default swaps (“CDS”) to provide a measure of protection against defaults or to take an active long or short position with respect to the likelihood of a particular issuer’s default or the reference entity’s credit soundness. CDS contracts generally trade based on a spread which represents the cost a protection buyer has to pay the protection seller. The protection buyer is said to be short the credit as the value of the contract rises the more the credit deteriorates. The value of the CDS contract increases for the protection buyer if the spread increases.
See Notes to Financial Statements.
| (1) | If the Fund is a buyer of protection, it pays the fixed rate. When a credit event occurs, as defined under the terms of that particular swap agreement, the Fund will either (i) receive from the seller of protection an amount equal to the notional amount of the swap and make delivery of the referenced obligation or underlying securities comprising the referenced index or (ii) receive a net settlement amount in the form of cash or securities equal to the notional amount of the swap less the recovery value of the referenced obligation or underlying securities comprising the referenced index. |
| (2) | If the Fund is a seller of protection, it receives the fixed rate. When a credit event occurs, as defined under the terms of that particular swap agreement, the Fund will either (i) pay to the buyer of protection an amount equal to the notional amount and take delivery of the referenced obligation or underlying securities comprising the referenced index or (ii) pay a net settlement amount in the form of cash or securities equal to the notional amount of the swap less the recovery value of the referenced obligation or underlying securities comprising the referenced index. |
| (3) | Notional amount represents the maximum potential amount the Fund could be required to pay as a seller of credit protection or receive as a buyer of credit protection if a credit event occurs as defined under the terms of that particular swap agreement. |
| (4) | The fair value of credit default swap agreements on credit indices and asset-backed securities serves as an indicator of the current status of the payment/performance risk and represents the likelihood of an expected liability (or profit) for the credit derivative should the notional amount of the swap agreement be closed/sold as of the reporting date. Increasing fair value in absolute terms, when compared to the notional amount of the swap, represents a deterioration of the referenced entity’s credit soundness and a greater likelihood of risk of default or other credit event occurring as defined under the terms of the agreement. |
| (5) | Implied credit spreads, represented in absolute terms, utilized in determining the fair value of credit default swap agreements on corporate issues or sovereign issues of an emerging country as of the reporting date serve as an indicator of the current status of the payment/performance risk and represent the likelihood of risk of default for the credit derivative. The implied credit spread of a particular referenced entity reflects the cost of buying/selling protection and may include up-front payments required to be made to enter into the agreement. Wider credit spreads represent a deterioration of the referenced entity’s credit soundness and a greater likelihood of risk of default or other credit event occurring as defined under the terms of the agreement. |
Interest rate swap agreements outstanding at July 31, 2017:
| | | | | | | | | | | | | | | | | | | | | | | | | | |
Notional
Amount
(000)# | | | Termination
Date | | | Fixed
Rate | | | Floating Rate | | | Value at
Trade Date | | | Value at
July 31,
2017 | | | Unrealized
Appreciation
(Depreciation) | |
| | Centrally cleared swap agreements: | |
| | 15,735 | | | | 09/09/17 | | | | 0.539% | | | | 1 Day USOIS(1) | | | $ | — | | | $ | 37,009 | | | $ | 37,009 | |
| | 16,205 | | | | 10/18/17 | | | | 0.607% | | | | 1 Day USOIS(1) | | | | — | | | | 39,844 | | | | 39,844 | |
| | 10,090 | | | | 11/09/17 | | | | 0.626% | | | | 1 Day USOIS(1) | | | | — | | | | 27,563 | | | | 27,563 | |
| | 15,900 | | | | 06/30/19 | | | | 1.487% | | | | 1 Day USOIS(1) | | | | (6,038 | ) | | | (27,021 | ) | | | (20,983 | ) |
| | 3,010 | | | | 06/30/19 | | | | 1.502% | | | | 1 Day USOIS(1) | | | | (1,835 | ) | | | (5,940 | ) | | | (4,105 | ) |
| | 130 | | | | 05/31/21 | | | | 1.849% | | | | 3 Month LIBOR(1) | | | | 582 | | | | (425 | ) | | | (1,007 | ) |
| | 1,120 | | | | 08/31/21 | | | | 2.015% | | | | 3 Month LIBOR(1) | | | | (3,197 | ) | | | (9,006 | ) | | | (5,809 | ) |
| | 5,475 | | | | 07/17/22 | | | | —(3) | | | | — | (3) | | | 334 | | | | 277 | | | | (57 | ) |
| | 395 | | | | 05/31/23 | | | | 1.399% | | | | 3 Month LIBOR(1) | | | | (7,190 | ) | | | 12,447 | | | | 19,637 | |
| | 3,545 | | | | 08/15/23 | | | | 1.406% | | | | 3 Month LIBOR(1) | | | | — | | | | 104,540 | | | | 104,540 | |
| | 1,690 | | | | 08/15/23 | | | | 1.459% | | | | 3 Month LIBOR(1) | | | | 81,189 | | | | 47,581 | | | | (33,608 | ) |
| | 1,600 | | | | 11/15/23 | | | | 2.209% | | | | 3 Month LIBOR(1) | | | | — | | | | (22,493 | ) | | | (22,493 | ) |
| | 1,215 | | | | 02/15/24 | | | | 2.115% | | | | 3 Month LIBOR(1) | | | | 3,113 | | | | (7,243 | ) | | | (10,356 | ) |
See Notes to Financial Statements.
| | | | |
| Prudential Core Bond Fund | | | 43 | |
Schedule of Investments (continued)
as of July 31, 2017
| | | | | | | | | | | | | | | | | | | | | | | | |
Notional
Amount
(000)# | | | Termination
Date | | | Fixed
Rate | | | Floating Rate | | Value at
Trade
Date | | | Value at
July 31,
2017 | | | Unrealized
Appreciation
(Depreciation) | |
| | 2,571 | | | | 02/15/24 | | | | 2.151% | | | 3 Month LIBOR(1) | | $ | (2,558 | ) | | $ | (21,113 | ) | | $ | (18,555 | ) |
| | 3,080 | | | | 02/15/24 | | | | 2.167% | | | 3 Month LIBOR(1) | | | (17,091 | ) | | | (27,007 | ) | | | (9,916 | ) |
| | 1,580 | | | | 02/15/24 | | | | 2.183% | | | 3 Month LIBOR(1) | | | (3,010 | ) | | | (16,200 | ) | | | (13,190 | ) |
| | 1,765 | | | | 01/08/26 | | | | 2.210% | | | 3 Month LIBOR(1) | | | — | | | | (8,117 | ) | | | (8,117 | ) |
| | 1,447 | | | | 02/15/27 | | | | 1.824% | | | 1 Day USOIS(1) | | | 19,731 | | | | 12,562 | | | | (7,169 | ) |
| | 390 | | | | 02/15/27 | | | | 1.899% | | | 1 Day USOIS(1) | | | 495 | | | | 845 | | | | 350 | |
| | 395 | | | | 02/15/27 | | | | 1.965% | | | 1 Day USOIS(1) | | | — | | | | (1,403 | ) | | | (1,403 | ) |
| | 920 | | | | 02/15/27 | | | | 2.068% | | | 1 Day USOIS(1) | | | (543 | ) | | | (11,491 | ) | | | (10,948 | ) |
| | 1,875 | | | | 02/15/36 | | | | 2.338% | | | 3 Month LIBOR(2) | | | (11,942 | ) | | | (46,111 | ) | | | (34,169 | ) |
| | | | | | | | | | | | | | | | | | | | | | | | |
| | | | | | | | | | | | | | $ | 52,040 | | | $ | 79,098 | | | $ | 27,058 | |
| | | | | | | | | | | | | | | | | | | | | | | | |
Cash of $151,000 and securities with a combined market value of $564,999 have been segregated with Citigroup Global Markets to cover requirements for open centrally cleared interest rate swap contracts at July 31, 2017.
| (1) | The Fund pays the fixed rate and receives the floating rate. |
| (2) | The Fund pays the floating rate and receives the fixed rate. |
| (3) | The Fund pays the floating rate of 3 Month LIBOR and receives the floating rate of 1 Day USOIS plus 28 bps. |
Fair Value Measurements:
Various inputs are used in determining the value of the Fund’s investments. These inputs are summarized in the three broad levels listed below.
Level 1—unadjusted quoted prices generally in active markets for identical securities.
Level 2—quoted prices for similar securities, interest rates and yield curves, prepayment speeds, foreign currency exchange rates and other observable inputs.
Level 3—unobservable inputs for securities valued in accordance with Board approved fair valuation procedures.
The following is a summary of the inputs used as of July 31, 2017 in valuing such portfolio securities:
| | | | | | | | | | | | |
| | | Level 1 | | | Level 2 | | | Level 3 | |
Investments in Securities | | | | | | | | | | | | |
Asset-Backed Securities | | | | | | | | | | | | |
Automobiles | | $ | — | | | $ | 7,335,035 | | | $ | — | |
Collateralized Loan Obligations | | | — | | | | 25,137,807 | | | | 500,000 | |
Consumer Loans | | | — | | | | 2,896,659 | | | | — | |
Credit Cards | | | — | | | | 5,331,587 | | | | 500,000 | |
Equipment | | | — | | | | 803,681 | | | | — | |
Other | | | — | | | | 110,595 | | | | — | |
Residential Mortgage-Backed Securities | | | — | | | | 1,401,122 | | | | 675,000 | |
See Notes to Financial Statements.
| | | | | | | | | | | | |
| | | Level 1 | | | Level 2 | | | Level 3 | |
Investments in Securities (continued) | | | | | | | | | | | | |
Commercial Mortgage-Backed Securities | | $ | — | | | $ | 36,245,467 | | | $ | 823,976 | |
Corporate Bonds | | | — | | | | 100,950,303 | | | | — | |
Foreign Government Bonds | | | — | | | | 6,254,527 | | | | — | |
Municipal Bonds | | | — | | | | 1,946,291 | | | | — | |
Residential Mortgage-Backed Securities | | | — | | | | 12,478,088 | | | | 1,350,000 | |
U.S. Government Agency Obligations | | | — | | | | 75,842,208 | | | | — | |
U.S. Treasury Obligations | | | — | | | | 42,105,425 | | | | — | |
Affiliated Mutual Funds | | | 30,955,048 | | | | — | | | | — | |
Options Purchased | | | 67,562 | | | | — | | | | — | |
Options Written | | | (23,000 | ) | | | — | | | | — | |
Other Financial Instruments* | | | | | | | | | | | | |
Futures Contracts | | | 114,903 | | | | — | | | | — | |
OTC Credit Default Swap Agreement | | | — | | | | 7,122 | | | | — | |
Centrally Cleared Interest Rate Swap Agreements | | | — | | | | 27,058 | | | | — | |
| | | | | | | | | | | | |
Total | | $ | 31,114,513 | | | $ | 318,872,975 | | | $ | 3,848,976 | |
| | | | | | | | | | | | |
During the period, there were no transfers between Level 1, Level 2 and Level 3 to report.
The following is a reconciliation of assets in which unobservable inputs (Level 3) were used in determining fair value:
| | | | | | | | | | | | | | | | | | | | |
| | | Asset-
Backed
Securities
Collateralized
Loan
Obligations | | | Asset-
Backed
Securities
Credit
Cards | | | Asset-
Backed
Securities
Residential
Mortgage-
Backed
Securities | | | Commercial
Mortgage-
Backed
Securities | | | Residential
Mortgage-
Backed
Securities | |
Balance as of 07/31/2016 | | $ | — | | | $ | — | | | $ | 1,912,194 | | | $ | — | | | $ | — | |
Realized gain (loss) | | | — | | | | — | | | | 7,002 | | | | — | | | | — | |
Change in unrealized appreciation (depreciation) | | | — | | | | — | | | | 19,027 | | | | — | | | | — | |
Purchases/Exchanges/Issuances | | | 500,000 | | | | 500,000 | | | | 675,000 | | | | 823,976 | | | | 1,350,000 | |
Sales/Paydowns | | | — | | | | — | | | | (1,940,717 | ) | | | — | | | | — | |
Accrued discount/premium | | | — | | | | — | | | | 2,494 | | | | — | | | | — | |
Transfers into Level 3 | | | — | | | | — | | | | — | | | | — | | | | — | |
Transfers out of Level 3 | | | — | | | | — | | | | — | | | | — | | | | — | |
| | | | | | | | | | | | | | | | | | | | |
Balance as of 07/31/2017 | | $ | 500,000 | | | $ | 500,000 | | | $ | 675,000 | | | $ | 823,976 | | | $ | 1,350,000 | |
| | | | | | | | | | | | | | | | | | | | |
| * | Other financial instruments are derivative instruments not reflected in the Schedule of Investments, such as futures, forwards and centrally cleared swap contracts, which are recorded at the unrealized appreciation (depreciation) on the instrument, and OTC swap contracts which are recorded at fair value. |
See Notes to Financial Statements.
| | | | |
| Prudential Core Bond Fund | | | 45 | |
Schedule of Investments (continued)
as of July 31, 2017
Level 3 securities as presented in the table above are being fair valued using pricing methodologies approved by Board, which contain unobservable inputs as follows:
| | | | | | | | | | | | |
Level 3 Securities | | Fair Value as of
July 31, 2017 | | | Valuation
Methodology | | | Unobservable Input | |
Asset-Backed Securities Collateralized Loan Obligations | | $ | 500,000 | | | | Pricing at Cost | | | | Unadjusted Purchase Price | |
Asset-Backed Securities Credit Cards | | | 500,000 | | | | Market Approach | | | | Single Broker Indicative Quote | |
Asset-Backed Securities Residential Mortgage-Backed Securities | | | 675,000 | | | | Market Approach | | | | Single Broker Indicative Quote | |
Commercial Mortgage-Backed Securities | | | 823,976 | | | | Pricing at Cost | | | | Unadjusted Purchase Price | |
Residential Mortgage-Backed Securities | | | 1,350,000 | | | | Market Approach | | | | Single Broker Indicative Quote | |
| | | | | | | | | | | | |
| | $ | 3,848,976 | | | | | | | | | |
| | | | | | | | | | | | |
Industry Classification:
The industry classification of investments and liabilities in excess of other assets shown as a percentage of net assets as of July 31, 2017 were as follows (unaudited):
| | | | |
U.S. Government Agency Obligations | | | 23.0 | % |
U.S. Treasury Obligations | | | 12.7 | |
Commercial Mortgage-Backed Securities | | | 11.2 | |
Affiliated Mutual Funds (including 0.2% of collateral for securities on loan) | | | 9.4 | |
Banks | | | 7.9 | |
Collateralized Loan Obligations | | | 7.8 | |
Residential Mortgage-Backed Securities | | | 4.8 | |
Electric | | | 2.7 | |
Automobiles | | | 2.2 | |
Oil & Gas | | | 2.1 | |
Foreign Government Bonds | | | 1.9 | |
Credit Cards | | | 1.8 | |
Auto Manufacturers | | | 1.5 | |
Pipelines | | | 1.4 | |
Pharmaceuticals | | | 1.3 | |
Media | | | 1.3 | |
Healthcare-Services | | | 1.2 | |
Insurance | | | 1.2 | |
Chemicals | | | 1.1 | |
Consumer Loans | | | 0.9 | |
Software | | | 0.7 | |
Municipal Bonds | | | 0.6 | |
Real Estate Investment Trusts (REITs) | | | 0.6 | |
Healthcare-Products | | | 0.6 | |
Biotechnology | | | 0.5 | |
Commercial Services | | | 0.5 | |
Foods | | | 0.5 | |
Telecommunications | | | 0.4 | |
Computers | | | 0.4 | |
Transportation | | | 0.4 | |
Containers & Packaging | | | 0.4 | |
Textiles | | | 0.4 | % |
Airlines | | | 0.4 | |
Household Products/Wares | | | 0.3 | |
Forest Products & Paper | | | 0.3 | |
Equipment | | | 0.2 | |
Hand/Machine Tools | | | 0.2 | |
Multi-National | | | 0.2 | |
Gas | | | 0.2 | |
Diversified Financial Services | | | 0.2 | |
Housewares | | | 0.2 | |
Miscellaneous Manufacturing | | | 0.2 | |
Oil & Gas Services | | | 0.2 | |
Mining | | | 0.2 | |
Lodging | | | 0.1 | |
Semiconductors | | | 0.1 | |
Retail | | | 0.1 | |
Diversified Machinery | | | 0.1 | |
Trucking & Leasing | | | 0.1 | |
Beverages | | | 0.1 | |
Engineering & Construction | | | 0.1 | |
Aerospace & Defense | | | 0.1 | |
Water | | | 0.0 | * |
Office & Business Equipment | | | 0.0 | * |
Other | | | 0.0 | * |
Agriculture | | | 0.0 | * |
Options Purchased | | | 0.0 | * |
| | | | |
| | | 107.0 | |
Options Written | | | (0.0 | )* |
Liabilities in excess of other assets | | | (7.0 | ) |
| | | | |
| | | 100.0 | % |
| | | | |
See Notes to Financial Statements.
Effects of Derivative Instruments on the Financial Statements and Primary Underlying Risk Exposure:
The Fund invested in derivative instruments during the reporting period. The primary types of risk associated with these derivative instruments are credit contracts risk and interest rate contracts risk. The effect of such derivative instruments on the Fund’s financial position and financial performance as reflected in the Statement of Assets and Liabilities and Statement of Operations is presented in the summary below.
Fair values of derivative instruments as of July 31, 2017 as presented in the Statement of Assets and Liabilities:
| | | | | | | | | | | | |
Derivatives not accounted
for as hedging instruments,
carried at fair value | | Asset Derivatives | | | Liability Derivatives | |
| | Balance Sheet
Location | | Fair
Value | | | Balance Sheet
Location | | Fair
Value | |
| Credit contracts | | — | | $ | — | | | Premiums received for OTC swap agreements | | $ | 26,031 | |
| | | | |
| Credit contracts | | Unrealized appreciation on OTC swap agreements | | | 33,153 | | | — | | | — | |
| | | | |
| Interest rate contracts | | Due from/to broker— variation margin futures | | | 157,939 | * | | Due from/to broker— variation margin futures | | | 43,036 | * |
| | | | |
| Interest rate contracts | | Due from/to broker— variation margin swaps | | | 228,943 | * | | Due from/to broker— variation margin swaps | | | 201,885 | * |
| | | | |
| Interest rate contracts | | Unaffiliated investments | | | 67,562 | | | Options written outstanding, at value | | | 23,000 | |
| | | | | | | | | | | | |
Total | | | | $ | 487,597 | | | | | $ | 293,952 | |
| | | | | | | | | | | | |
| * | Includes cumulative appreciation (depreciation) as reported in the schedule of open futures and centrally cleared swap contracts. Only unsettled variation margin receivable (payable) is reported within the Statement of Assets and Liabilities. |
See Notes to Financial Statements.
| | | | |
| Prudential Core Bond Fund | | | 47 | |
Schedule of Investments (continued)
as of July 31, 2017
The effects of derivative instruments on the Statement of Operations for the year ended July 31, 2017 are as follows:
| | | | | | | | | | | | | | | | | | | | | | | | |
Amount of Realized Gain (Loss) on Derivatives Recognized in Income | |
Derivatives not accounted
for as hedging instruments,
carried at fair value | | Options
Purchased(1) | | | Options
Written | | | Futures | | | Forward
Rate
Agreements | | | Swaps | | | Total | |
Credit contracts | | $ | — | | | $ | — | | | $ | — | | | $ | — | | | $ | 27,915 | | | $ | 27,915 | |
Interest rate contracts | | | (174,371 | ) | | | 50,182 | | | | (438,981 | ) | | | 9,854 | | | | (75,037 | ) | | | (628,353 | ) |
| | | | | | | | | | | | | | | | | | | | | | | | |
Total | | $ | (174,371 | ) | | $ | 50,182 | | | $ | (438,981 | ) | | $ | 9,854 | | | $ | (47,122 | ) | | $ | (600,438 | ) |
| | | | | | | | | | | | | | | | | | | | | | | | |
| (1) | Included in net realized gain (loss) on investment transactions in the Statement of Operations. |
| | | | | | | | | | | | | | | | | | | | |
Change in Unrealized Appreciation (Depreciation) on Derivatives Recognized in Income | |
Derivatives not accounted
for as hedging instruments,
carried at fair value | | Options
Purchased(2) | | | Options
Written | | | Futures | | | Swaps | | | Total | |
Credit contracts | | $ | — | | | $ | — | | | $ | — | | | $ | 33,153 | | | $ | 33,153 | |
Interest rate contracts | | | 1,115 | | | | 10,647 | | | | (263,039 | ) | | | 477,484 | | | | 226,207 | |
| | | | | | | | | | | | | | | | | | | | |
Total | | $ | 1,115 | | | $ | 10,647 | | | $ | (263,039 | ) | | $ | 510,637 | | | $ | 259,360 | |
| | | | | | | | | | | | | | | | | | | | |
| (2) | Included in net change in unrealized appreciation (depreciation) on investments in the Statement of Operations. |
For the year ended July 31, 2017, the Fund’s average volume of derivative activities is as follows:
| | | | | | | | | | | | | | | | | | |
Options
Purchased(1) | | | Options
Written(3) | | | Futures
Contracts—Long
Positions(2) | | | Futures
Contracts—Short
Positions(2) | | | Credit Default
Swap
Agreements—Sell
Protection(3) | |
| $ | 30,807 | | | $ | 59,800 | | | $ | 60,071,657 | | | $ | 11,486,970 | | | $ | 1,600,000 | |
| | | | | | | | | | | | | | |
Forward Rate
Agreements(3) | | | Inflation Rate
Swap
Agreements(3) | | | Interest Rate
Swap
Agreements(3) | | | Total Return
Swap
Agreements(3) | |
| | 4,840,000 | | | $ | 230,000 | | | $ | 55,954,800 | | | $ | 240,000 | |
| (3) | Notional Amount in USD. |
See Notes to Financial Statements.
Financial Instruments/Transactions—Summary of Offsetting and Netting Arrangements:
The Fund invested in OTC derivatives and entered into financial instruments/transactions during the reporting period that are either offset in accordance with current requirements or are subject to enforceable master netting arrangements or similar agreements that permit offsetting. The information about offsetting and related netting arrangements for OTC derivatives and financial instruments/transactions, where the legal right to set-off exists, is presented in the summary below.
Offsetting of financial instrument/transaction assets and liabilities:
| | | | | | | | | | | | |
Description | | Gross
Amounts of
Recognized
Assets(3) | | | Collateral
Received(4) | | | Net
Amount | |
Securities on Loan | | $ | 554,032 | | | $ | (554,032 | ) | | $ | — | |
| | | | | | | | | | | | |
Offsetting of OTC derivative assets and liabilities:
| | | | | | | | | | | | | | | | |
Counterparty | | Gross
amounts of
recognized
assets(1) | | | Gross
amounts
available
for offset | | | Collateral
Received(4) | | | Net
Amount | |
Morgan Stanley | | $ | 33,153 | | | $ | (26,031 | ) | | $ | — | | | $ | 7,122 | |
| | | | | | | | | | | | | | | | |
| | | | |
Counterparty | | Gross
amounts of
recognized
liabilities(2) | | | Gross
amounts
available
for offset | | | Collateral
Pledged(4) | | | Net
Amount | |
Morgan Stanley | | $ | (26,031 | ) | | $ | 26,031 | | | $ | — | | | $ | — | |
| | | | | | | | | | | | | | | | |
| (1) | Includes unrealized appreciation on swaps and forwards, premiums paid on swap agreements and market value of purchased options. |
| (2) | Includes unrealized depreciation on swaps and forwards, premiums received on swap agreements and market value of written options. |
| (3) | Amount represents market value. |
| (4) | Collateral amount disclosed by the Fund is limited to the market value of financial instruments/transactions and the Fund's OTC derivative exposure by counterparty. |
See Notes to Financial Statements.
| | | | |
| Prudential Core Bond Fund | | | 49 | |
Statement of Assets & Liabilities
as of July 31, 2017
| | | | |
Assets | | | | |
Investments at value, including securities on loan of $554,032: | | | | |
Unaffiliated investments (cost $321,668,655) | | $ | 322,755,333 | |
Affiliated investments (cost $30,955,048) | | | 30,955,048 | |
Deposit with broker for futures | | | 4,047 | |
Deposit with broker for centrally cleared swaps | | | 151,000 | |
Receivable for investments sold | | | 16,742,924 | |
Receivable for Fund shares sold | | | 2,189,315 | |
Interest receivable | | | 1,580,328 | |
Unrealized appreciation on OTC swap agreements | | | 33,153 | |
Due from broker—variation margin swaps | | | 11,314 | |
Due from broker—variation margin futures | | | 7,453 | |
| | | | |
Total assets | | | 374,429,915 | |
| | | | |
| |
Liabilities | | | | |
Payable for investments purchased | | | 42,321,031 | |
Payable for Fund shares reacquired | | | 669,746 | |
Payable to broker for collateral for securities on loan | | | 566,641 | |
Accrued expenses and other liabilities | | | 164,148 | |
Premium received for OTC swap agreements | | | 26,031 | |
Options written outstanding, at value (premiums received $33,647) | | | 23,000 | |
Distribution fee payable | | | 12,092 | |
Management fee payable | | | 9,598 | |
Payable to custodian | | | 6,241 | |
Dividends payable | | | 1,784 | |
Affiliated transfer agent fee payable | | | 524 | |
Deferred trustees’ fees | | | 480 | |
| | | | |
Total liabilities | | | 43,801,316 | |
| | | | |
| |
Net Assets | | $ | 330,628,599 | |
| | | | |
| | | | | |
Net assets were comprised of: | | | | |
Shares of beneficial interest, at par | | $ | 33,090 | |
Paid-in capital in excess of par | | | 333,466,432 | |
| | | | |
| | | 333,499,522 | |
Undistributed net investment income | | | 6,755 | |
Accumulated net realized loss on investment transactions | | | (3,926,379 | ) |
Net unrealized appreciation on investments and foreign currencies | | | 1,048,701 | |
| | | | |
Net assets, July 31, 2017 | | $ | 330,628,599 | |
| | | | |
See Notes to Financial Statements.
| | | | |
Class A | | | | |
Net asset value and redemption price per share, | | | | |
($43,489,310 ÷ 4,353,663 shares of beneficial interest issued and outstanding) | | $ | 9.99 | |
Maximum sales charge (4.50% of offering price) | | | 0.47 | |
| | | | |
Maximum offering price to public | | $ | 10.46 | |
| | | | |
| |
Class C | | | | |
Net asset value, offering price and redemption price per share, | | | | |
($3,486,185 ÷ 348,806 shares of beneficial interest issued and outstanding) | | $ | 9.99 | |
| | | | |
| |
Class Q | | | | |
Net asset value, offering price and redemption price per share, | | | | |
($201,345,187 ÷ 20,149,272 shares of beneficial interest issued and outstanding) | | $ | 9.99 | |
| | | | |
| |
Class R | | | | |
Net asset value, offering price and redemption price per share | | | | |
($10,510 ÷ 1,052 shares of beneficial interest issued and outstanding) | | $ | 9.99 | |
| | | | |
| |
Class Z | | | | |
Net asset value, offering price and redemption price per share, | | | | |
($82,297,407 ÷ 8,237,648 shares of beneficial interest issued and outstanding) | | $ | 9.99 | |
| | | | |
See Notes to Financial Statements.
| | | | |
| Prudential Core Bond Fund | | | 51 | |
Statement of Operations
Year Ended July 31, 2017
| | | | |
Net Investment Income (Loss) | | | | |
Income | | | | |
Interest income | | $ | 5,541,286 | |
Affiliated dividend income | | | 315,297 | |
Income from securities lending, net (including affiliated income of $334) | | | 555 | |
| | | | |
Total income | | | 5,857,138 | |
| | | | |
| |
Expenses | | | | |
Management fee | | | 833,660 | |
Distribution fee—Class A | | | 95,328 | |
Distribution fee—Class C | | | 30,095 | |
Distribution fee—Class R | | | 78 | |
Custodian and accounting fees | | | 149,000 | |
Transfer agent’s fees and expenses (including affiliated expense of $2,700) | | | 134,000 | |
Registration fees | | | 129,000 | |
Audit fee | | | 62,000 | |
Shareholders’ reports | | | 44,000 | |
Legal fees and expenses | | | 21,000 | |
Trustees’ fees | | | 13,000 | |
Miscellaneous | | | 16,751 | |
| | | | |
Total expenses | | | 1,527,912 | |
Less: Management fee waiver and/or expense reimbursement | | | (372,418 | ) |
Distribution fee waiver—Class R | | | (26 | ) |
| | | | |
Net expenses | | | 1,155,468 | |
| | | | |
Net investment income (loss) | | | 4,701,670 | |
| | | | |
| |
Realized And Unrealized Gain (Loss) On Investments And Foreign Currency Transactions | | | | |
Net realized gain (loss) on: | | | | |
Investment transactions (including affiliated of $72) | | | (617,812 | ) |
Futures transactions | | | (438,981 | ) |
Options written transactions | | | 50,182 | |
Forward rate agreements transactions | | | 9,854 | |
Swap agreements transactions | | | (47,122 | ) |
Foreign currency transactions | | | 1,421 | |
| | | | |
| | | (1,042,458 | ) |
| | | | |
Net change in unrealized appreciation (depreciation) on: | | | | |
Investments | | | (735,966 | ) |
Futures | | | (263,039 | ) |
Options written | | | 10,647 | |
Swap agreements | | | 510,637 | |
Foreign currencies | | | 2 | |
| | | | |
| | | (477,719 | ) |
| | | | |
Net gain (loss) on investment and foreign currency transactions | | | (1,520,177 | ) |
| | | | |
Net Increase (Decrease) In Net Assets Resulting From Operations | | $ | 3,181,493 | |
| | | | |
See Notes to Financial Statements.
Statement of Changes in Net Assets
| | | | | | | | |
| | | Year Ended July 31, | |
| | | 2017 | | | 2016 | |
Increase (Decrease) in Net Assets | | | | | | | | |
Operations | | | | | | | | |
Net investment income (loss) | | $ | 4,701,670 | | | $ | 2,084,577 | |
Net realized gain (loss) on investment and foreign currency transactions | | | (1,042,458 | ) | | | 1,030,840 | |
Net change in unrealized appreciation (depreciation) on investments and
foreign currencies | | | (477,719 | ) | | | 2,846,143 | |
| | | | | | | | |
Net increase (decrease) in net assets resulting from operations | | | 3,181,493 | | | | 5,961,560 | |
| | | | | | | | |
| | |
Dividends and Distributions | | | | | | | | |
Dividends from net investment income | | | | | | | | |
Class A | | | (829,812 | ) | | | (61,731 | ) |
Class C | | | (42,130 | ) | | | (12,300 | ) |
Class Q | | | (2,138,412 | ) | | | (236 | ) |
Class R | | | (196 | ) | | | (192 | ) |
Class Z | | | (2,651,141 | ) | | | (2,176,455 | ) |
| | | | | | | | |
| | | (5,661,691 | ) | | | (2,250,914 | ) |
| | | | | | | | |
Tax return of capital contributions | | | | | | | | |
Class A | | | — | | | | (8,869 | ) |
Class C | | | — | | | | (1,767 | ) |
Class Q | | | — | | | | (34 | ) |
Class R | | | — | | | | (28 | ) |
Class Z | | | — | | | | (312,700 | ) |
| | | | | | | | |
| | | — | | | | (323,398 | ) |
| | | | | | | | |
| | |
Fund share transactions | | | | | | | | |
Net proceeds from shares sold | | | 301,461,573 | | | | 36,654,523 | |
Net asset value of shares issued in reinvestment of dividends
and distributions | | | 5,627,254 | | | | 2,524,586 | |
Cost of shares reacquired | | | (90,643,525 | ) | | | (29,913,657 | ) |
| | | | | | | | |
Net increase (decrease) in net assets from Trust share transactions | | | 216,445,302 | | | | 9,265,452 | |
| | | | | | | | |
Total increase (decrease) | | | 213,965,104 | | | | 12,652,700 | |
| | |
Net Assets: | | | | | | | | |
Beginning of year | | | 116,663,495 | | | | 104,010,795 | |
| | | | | | | | |
End of year(a) | | $ | 330,628,599 | | | $ | 116,663,495 | |
| | | | | | | | |
(a) Includes undistributed net investment income of: | | $ | 6,755 | | | | — | |
| | | | | | | | |
See Notes to Financial Statements.
| | | | |
| Prudential Core Bond Fund | | | 53 | |
Notes to Financial Statements
The Target Portfolio Trust (the “Trust”) is registered under the Investment Company Act of 1940, as amended (“1940 Act”), as an open-end management investment company. The Trust consists of four series: Prudential Corporate Bond Fund, Prudential Core Bond Fund, Target International Equity Portfolio and Prudential QMA Small-Cap Value Fund. These financial statements relate to Prudential Core Bond Fund (the “Fund”). The financial statements of the other series are not presented herein. The Fund is a diversified fund.
The investment objective of the Fund is total return.
1. Accounting Policies
The Fund follows investment company accounting and reporting guidance of the Financial Accounting Standards Board (“FASB”) Accounting Standard Codification Topic 946 Financial Services—Investment Companies. The following accounting policies conform to U.S. generally accepted accounting principles. The Fund consistently follows such policies in the preparation of its financial statements.
Securities Valuation: The Fund holds securities and other assets and liabilities that are fair valued at the close of each day (generally, 4:00 PM Eastern time) the New York Stock Exchange (“NYSE”) is open for trading. Fair value is the price that would be received to sell an asset or paid to transfer a liability in an orderly transaction between market participants on the measurement date. The Board of Trustees (the “Board”) has adopted valuation procedures for security valuation under which fair valuation responsibilities have been delegated to PGIM Investments LLC (“PGIM Investments” or “the Manager”) (formerly known as Prudential Investments LLC). Under the current valuation procedures, the Valuation Committee is responsible for supervising the valuation of portfolio securities and other assets and liabilities. The valuation procedures permit the Fund to utilize independent pricing vendor services, quotations from market makers, and alternative valuation methods when market quotations are either not readily available or not deemed representative of fair value. A record of the Valuation Committee’s actions is subject to the Board’s review, approval, and ratification at its next regularly scheduled quarterly meeting.
Various inputs determine how the Fund’s investments are valued, all of which are categorized according to the three broad levels (Level 1, 2, or 3) detailed in the Schedule of Investments.
Derivative instruments, such as futures or options, that are traded on a national securities exchange are valued at the last sale price as of the close of trading on the applicable exchange where the security principally trades. Securities traded via NASDAQ are valued at the NASDAQ official closing price. To the extent these securities are valued at the last sale
price or NASDAQ official closing price, they are classified as Level 1 in the fair value hierarchy. In the event that no sale or official closing price on valuation date exists, these securities are generally valued at the mean between the last reported bid and ask prices, or at the last bid price in the absence of an ask price. These securities are classified as Level 2 in the fair value hierarchy.
Investments in open-end, non-exchange-traded mutual funds are valued at their net asset values as of the close of the NYSE on the date of valuation. These securities are classified as Level 1 in the fair value hierarchy since they may be purchased or sold at their net asset values on the date of valuation.
Fixed income securities traded in the OTC market are generally classified as Level 2 in the fair value hierarchy. Such fixed income securities are typically valued using the market approach which generally involves obtaining data from an approved independent third-party vendor source. The Fund utilizes the market approach as the primary method to value securities when market prices of identical or comparable instruments are available. The third-party vendors’ valuation techniques used to derive the evaluated bid price are based on evaluating observable inputs, including but not limited to, yield curves, yield spreads, credit ratings, deal terms, tranche level attributes, default rates, cash flows, prepayment speeds, broker/dealer quotations and reported trades. Certain Level 3 securities are also valued using the market approach when obtaining a single broker quote or when utilizing recent transaction prices for identical or comparable securities. During the reporting period, there were no changes to report with respect to the valuation approach and/or valuation techniques discussed above.
OTC derivative instruments are generally classified as Level 2 in the fair value hierarchy. Such derivative instruments are typically valued using the market approach and/or income approach which generally involves obtaining data from an approved independent third-party vendor source. The Fund utilizes the market approach when quoted prices in broker-dealer markets are available but also includes consideration of alternative valuation approaches, including the income approach. In the absence of reliable market quotations, the income approach is typically utilized for purposes of valuing OTC derivatives such as interest rate swaps based on a discounted cash flow analysis whereby the value of the instrument is equal to the present value of its future cash inflows or outflows. Such analysis includes projecting future cash flows and determining the discount rate (including the present value factors that affect the discount rate) used to discount the future cash flows. In addition, the third-party vendors’ valuation techniques used to derive the evaluated OTC derivative price is based on evaluating observable inputs, including but not limited to, underlying asset prices, indices, spreads, interest rates and exchange rates. Certain OTC derivatives may be classified as Level 3 when valued using the market approach by obtaining a single broker quote or when utilizing unobservable inputs in the income approach. During the reporting period, there were no changes to report with respect to the valuation approach and/or valuation techniques discussed above.
| | | | |
| Prudential Core Bond Fund | | | 55 | |
Notes to Financial Statements (continued)
Centrally cleared swaps listed or traded on a multilateral or trade facility platform, such as a registered exchange, are generally valued at the daily settlement price determined by the respective exchange. These securities are classified as Level 2 in the fair value hierarchy, as the daily settlement price is not public.
Securities and other assets that cannot be priced according to the methods described above are valued based on pricing methodologies approved by the Board. In the event that unobservable inputs are used when determining such valuations, the securities will be classified as Level 3 in the fair value hierarchy.
When determining the fair value of securities, some of the factors influencing the valuation include: the nature of any restrictions on disposition of the securities; assessment of the general liquidity of the securities; the issuer’s financial condition and the markets in which it does business; the cost of the investment; the size of the holding and the capitalization of the issuer; the prices of any recent transactions or bids/offers for such securities or any comparable securities; any available analyst media or other reports or information deemed reliable by the investment adviser regarding the issuer or the markets or industry in which it operates. Using fair value to price securities may result in a value that is different from a security’s most recent closing price and from the price used by other unaffiliated mutual funds to calculate their net asset values.
Restricted and Illiquid Securities: Subject to guidelines adopted by the Board, the Fund may invest up to 15% of its net assets in illiquid securities, including those which are restricted as to disposition under securities law (“restricted securities”). Restricted securities are valued pursuant to the valuation procedures noted above. Illiquid securities are those that, because of the absence of a readily available market or due to legal or contractual restrictions on resale, cannot be sold within seven days in the ordinary course of business at approximately the amount at which the Fund has valued the investment. Therefore, the Fund may find it difficult to sell illiquid securities at the time considered most advantageous by its Subadviser and may incur expenses that would not be incurred in the sale of securities that were freely marketable. Certain securities that would otherwise be considered illiquid because of legal restrictions on resale to the general public may be traded among qualified institutional buyers under Rule 144A of the Securities Act of 1933. These Rule 144A securities, as well as commercial paper that is sold in private placements under Section 4(2) of the Securities Act, may be deemed liquid by the Fund’s Subadviser under the guidelines adopted by the Trustees of the Fund. However, the liquidity of the Fund’s investments in Rule 144A securities could be impaired if trading does not develop or declines.
CAS and STACR: The Fund purchased government controlled Fannie Mae and Freddie Mac securities that transfer most of the cost of defaults to private investors including the
Funds. These are insurance-like products that are called CAS by Fannie Mae and STACR securities by Freddie Mac. Payments on the securities are based primarily on the performance of a reference pool of underlying mortgages. With such securities, the Fund could lose some or all of its principal if the underlying mortgages experience credit defaults.
Foreign Currency Translation: The books and records of the Fund are maintained in U.S. dollars. Foreign currency amounts are translated into U.S. dollars on the following basis:
(i) market value of investment securities, other assets and liabilities—at the current rates of exchange;
(ii) purchases and sales of investment securities, income and expenses—at the rates of exchange prevailing on the respective dates of such transactions.
Although the net assets of the Fund are presented at the foreign exchange rates and market values at the close of the period, the Fund does not generally isolate that portion of the results of operations arising as a result of changes in the foreign exchange rates from the fluctuations arising from changes in the market prices of long-term portfolio securities held at the end of the period. Similarly, the Fund does not isolate the effect of changes in foreign exchange rates from the fluctuations arising from changes in the market prices of long-term portfolio securities sold during the period. Accordingly, holding period realized foreign currency gains (losses) are included in the reported net realized gains (losses) on investment transactions. Notwithstanding the above, the Fund does isolate the effect of fluctuations in foreign currency exchange rates when determining the gain (loss) upon the sale or maturity of foreign currency denominated debt obligations; such amounts are included in net realized gains (losses) on foreign currency transactions.
Additionally, net realized gains (losses) on foreign currency transactions represent net foreign exchange gains (losses) from the disposition of holdings of foreign currencies, forward currency contracts, currency gains (losses) realized between the trade and settlement dates on securities transactions, and the difference between the amounts of interest, dividends and foreign withholding taxes recorded on the Fund’s books and the U.S. dollar equivalent amounts actually received or paid. Net unrealized currency gains (losses) from valuing foreign currency denominated assets and liabilities (other than investments) at period end exchange rates are reflected as a component of net unrealized appreciation (depreciation) on foreign currencies.
Options: The Fund purchased and wrote options in order to hedge against adverse market movements or fluctuations in value caused by changes in prevailing interest rates or foreign currency exchange rates, with respect to securities which the Fund currently owns or intends to purchase. The Fund may also use options to gain additional market exposure. The Fund’s principal reason for writing options is to realize, through receipt of premiums, a greater current return than would be realized on the underlying security alone. When the Fund purchases an option, it pays a premium and an amount equal to that premium is recorded as an asset. When the Fund writes an option, it receives a premium and an amount equal to that premium is recorded as a liability. The asset or liability is adjusted daily to reflect the current market value
| | | | |
| Prudential Core Bond Fund | | | 57 | |
Notes to Financial Statements (continued)
of the option. If an option expires unexercised, the Fund realizes a gain (loss) to the extent of the premium received or paid. If an option is exercised, the premium received or paid is recorded as an adjustment to the proceeds from the sale or the cost of the purchase in determining whether the Fund has realized a gain (loss). The difference between the premium and the amount received or paid at the closing of a purchase or sale transaction is also treated as a realized gain (loss). Gain (loss) on purchased options is included in net realized gain (loss) on investment transactions. Gain (loss) on written options is presented separately as net realized gain (loss) on options written transactions.
The Fund, as writer of an option, may have no control over whether the underlying securities may be sold (called) or purchased (put). As a result, the Fund bears the market risk of an unfavorable change in the price of the security underlying the written option. OTC options also involve the risk of the potential inability of the counterparties to meet the terms of their contracts. With exchange-traded options contracts, there is minimal counterparty credit risk to the Fund since the exchanges’ clearinghouse acts as counterparty to all exchange-traded options and guarantees the options contracts against default.
When the Fund writes an option on a swap, an amount equal to any premium received by the Fund is recorded as a liability and is subsequently adjusted to the current market value of the written option on the swap. If a call option on a swap is exercised, the Fund becomes obligated to pay a fixed interest rate (noted as the strike price) and receive a variable interest rate on a notional amount. If a put option on a swap is exercised, the Fund becomes obligated to pay a variable interest rate and receive a fixed interest rate (noted as the strike price) on a notional amount. Premiums received from writing options on swaps that expire or are exercised are treated as realized gains upon the expiration or exercise of such options on swaps. The risk associated with writing put and call options on swaps is that the Fund will be obligated to be party to a swap agreement if an option on a swap is exercised.
Financial Futures Contracts: A financial futures contract is an agreement to purchase (long) or sell (short) an agreed amount of securities at a set price for delivery on a future date. Upon entering into a financial futures contract, the Fund is required to pledge to the broker an amount of cash and/or other assets equal to a certain percentage of the contract amount. This amount is known as the “initial margin.” Subsequent payments, known as “variation margin,” are made or received by the Fund each day, depending on the daily fluctuations in the value of the underlying security. Such variation margin is recorded for financial statement purposes on a daily basis as unrealized gain (loss). When the contract expires or is closed, the gain (loss) is realized and is presented in the Statement of Operations as net realized gain (loss) on futures transactions.
The Fund invested in financial futures contracts in order to hedge its existing portfolio securities, or securities the Fund intends to purchase, against fluctuations in value caused
by changes in prevailing interest rates, value of equities or foreign currency exchange rates. Should interest rates move unexpectedly, the Fund may not achieve the anticipated benefits of the financial futures contracts and may realize a loss. The use of futures transactions involves the risk of imperfect correlation in movements in the price of futures contracts, interest rates and the underlying hedged assets. Since futures contracts are exchange-traded, there is minimal counterparty credit risk to the Fund since the exchanges’ clearinghouse acts as counterparty to all exchange-traded futures and guarantees the futures contracts against default.
Forward Rate Agreements: Forward rate agreements represent an agreement between counterparties to exchange cash flows based on the difference between two interest rates, applied to a notional principal amount on a fixed future date. The Fund entered into forward rate agreements to gain yield exposure based on anticipated market conditions at the specified termination date of the agreement.
Swap Agreements: The Fund may enter into credit default, interest rate and other type of swap agreements. A swap agreement is an agreement to exchange the return generated by one instrument for the return generated by another instrument. Swap agreements are negotiated in the OTC market and may be executed either directly with counterparty (“OTC-traded”) or through a central clearing facility, such as a registered commodities exchange. Swap agreements are valued daily at current market value and any change in value is included in the net unrealized appreciation (depreciation) on swap agreements. Centrally cleared swaps pay or receive an amount known as “variation margin”, based on daily changes in the valuation of the swap contract. Any upfront premiums paid and received are shown as swap premiums paid and swap premiums received in the Statement of Assets and Liabilities. Risk of loss may exceed amounts recognized on the Statement of Assets and Liabilities. Swap agreements outstanding at period end, if any, are listed on the Schedule of Investments.
Interest Rate Swaps: Interest rate swaps represent an agreement between counterparties to exchange cash flows based on the difference between two interest rates, applied to a notional principal amount for a specified period. The Fund is subject to interest rate risk exposure in the normal course of pursuing its investment objectives. The Fund used interest rate swaps to maintain its ability to generate steady cash flow by receiving a stream of fixed-rate payments and to increase exposure to prevailing market rates by receiving floating rate payments. The Fund’s maximum risk of loss from counterparty credit risk is the discounted net present value of the cash flows to be received from the counterparty over the contract’s remaining life.
Inflation Swaps: The Fund entered into inflation swap agreements to protect against fluctuations in inflation rates. Inflation swaps are characterized by one party paying a fixed rate in exchange for a floating rate that is derived from an inflation index, such as the Consumer Price Index or UK Retail Price Index. Inflation swaps subject the Fund to interest rate risk.
Credit Default Swaps (“CDS”): CDS involve one party (the protection buyer) making a stream of payments to another party (the protection seller) in exchange for the right to receive a specified payment in the event of a default or as a result of a default (collectively a
| | | | |
| Prudential Core Bond Fund | | | 59 | |
Notes to Financial Statements (continued)
“credit event”) for the referenced entity (typically corporate issues or sovereign issues of an emerging country) on its obligation; or in the event of a write-down, principal shortfall, interest shortfall or default of all or part of the referenced entities comprising a credit index.
The Fund is subject to credit risk in the normal course of pursuing its investment objectives, and as such, has entered into CDS contracts to provide a measure of protection against defaults or to take an active long or short position with respect to the likelihood of a particular issuer’s default or the reference entity’s credit soundness. CDS contracts generally trade based on a spread which represents the cost a protection buyer has to pay the protection seller. The protection buyer is said to be short the credit as the value of the contract rises the more the credit deteriorates. The value of the CDS contract increases for the protection buyer if the spread increases. The Fund’s maximum risk of loss from counterparty credit risk for purchased CDS is the inability of the counterparty to honor the contract up to the notional value due to a credit event.
As a seller of protection on credit default swap agreements, the Fund generally receives an agreed upon payment from the buyer of protection throughout the term of the swap, provided no credit event occurs. As the seller, the Fund effectively increases its investment risk because, in addition to its total net assets, the Fund may be subject to investment exposure on the notional amount of the swap.
The maximum amount of the payment that the Fund, as a seller of protection, could be required to make under a credit default swap agreement would be equal to the notional amount of the underlying security or index contract as a result of a credit event. This potential amount will be partially offset by any recovery values of the respective referenced obligations, or net amounts received from the settlement of buy protection credit default swap agreements which the Fund entered into for the same referenced entity or index. As a buyer of protection, the Fund generally receives an amount up to the notional value of the swap if a credit event occurs.
Implied credit spreads, represented in absolute terms, utilized in determining the market value of credit default swap agreements on corporate or sovereign issues of an emerging country as of period end are disclosed in the footnotes to the Schedule of Investments, if applicable. These spreads serve as indicators of the current status of the payment/performance risk and represent the likelihood of default risk for the credit derivative. The implied credit spread of a particular referenced entity reflects the cost of buying/selling protection and may include upfront payments required to enter into the agreement. For credit default swap agreements on asset-backed securities and credit indices, the quoted market prices and resulting values serve as indicators of the current status of the payment/performance risk. Wider credit spreads and increased market value in absolute terms,
when compared to the notional amount of the swap, represent a deterioration of the referenced entity’s credit soundness and a greater likelihood of risk of default or other credit event occurring as defined under the terms of the agreement.
Total Return Swaps: In a total return swap, one party would receive payments based on the market value of the security or the commodity involved, or total return of a specific referenced asset, such as an equity, index or bond, and in return pay a fixed amount. The Fund is subject to risk exposures associated with the referenced asset in the normal course of pursuing its investment objectives. The Fund entered into total return swaps to manage its exposure to a security or an index. The Fund’s maximum risk of loss from counterparty credit risk is the change in the value of the security, in the Fund’s favor, from the point of entering into the contract.
Master Netting Arrangements: The Fund is subject to various Master Agreements, or netting arrangements, with select counterparties. These are agreements which a subadviser may have negotiated and entered into on behalf of the Fund. A master netting arrangement between the Fund and the counterparty permits the Fund to offset amounts payable by the Fund to the same counterparty against amounts to be received; and by the receipt of collateral from the counterparty by the Fund to cover the Fund’s exposure to the counterparty. However, there is no assurance that such mitigating factors are easily enforceable. In addition to master netting arrangements, the right to set-off exists when all the conditions are met such that each of the parties owes the other determinable amounts, the reporting party has the right to set-off the amount owed with the amount owed by the other party, the reporting party intends to set-off and the right of set-off is enforceable by law. During the reporting period, there was no intention to settle on a net basis and all amounts are presented on a gross basis on the Statement of Assets and Liabilities.
The Fund is a party to ISDA (International Swaps and Derivatives Association, Inc.) Master Agreements with certain counterparties that govern OTC derivative and foreign exchange contracts entered into from time to time. The Master Agreements may contain provisions regarding, among other things, the parties’ general obligations, representations, agreements, collateral requirements, events of default and early termination. With respect to certain counterparties, in accordance with the terms of the Master Agreements, collateral posted to the Fund is held in a segregated account by the Fund’s custodian and with respect to those amounts which can be sold or re-pledged, is presented in the Schedule of Investments. Collateral pledged by the Fund is segregated by the Fund’s custodian and identified in the Schedule of Investments. Collateral can be in the form of cash or debt securities issued by the U.S. Government or related agencies or other securities as agreed to by the Fund and the applicable counterparty. Collateral requirements are determined based on the Fund’s net position with each counterparty. Termination events applicable to the Fund may occur upon a decline in the Fund’s net assets below a specified threshold over a certain period of time. Termination events applicable to counterparties may occur upon a decline in the counterparty’s long-term and short term credit ratings below a specified level. In each case, upon occurrence, the other party may elect to terminate early and cause settlement of all derivative and foreign exchange contracts outstanding,
| | | | |
| Prudential Core Bond Fund | | | 61 | |
Notes to Financial Statements (continued)
including the payment of any losses and costs resulting from such early termination, as reasonably determined by the terminating party. Any decision by one or more of the Fund’s counterparties to elect early termination could impact the Fund’s future derivative activity.
In addition to each instrument’s primary underlying risk exposure (e.g. interest rate, credit, equity or foreign exchange, etc.), swap agreements involve, to varying degrees, elements of credit, market and documentation risk. Such risks involve the possibility that no liquid market for these agreements will exist, the counterparty to the agreement may default on its obligation to perform or disagree on the contractual terms of the agreement, and changes in net interest rates will be unfavorable. In connection with these agreements, securities in the portfolio may be identified or received as collateral from the counterparty in accordance with the terms of the respective swap agreements to provide or receive assets of value and to serve as recourse in the event of default or bankruptcy/insolvency of either party. Such OTC derivative agreements include conditions which, when materialized, give the counterparty the right to cause an early termination of the transactions under those agreements. Any election by the counterparty for early termination of the contract(s) may impact the amounts reported on financial statements.
As of July 31, 2017, the Fund has not met conditions under such agreements which give the counterparty the right to call for an early termination.
Forward currency contracts, forward rate agreements, written options, swaps and financial futures contracts involve elements of both market and credit risk in excess of the amounts reflected on the Statement of Assets and Liabilities. Such risks may be mitigated by engaging in master netting arrangements.
Securities Lending: The Fund may lend its portfolio securities to banks and broker-dealers. The loans are secured by collateral at least equal to the market value of the securities loaned. Collateral pledged by each borrower is invested in an affiliated money market fund and is marked to market daily, based on the previous day’s market value, such that the value of the collateral exceeds the value of the loaned securities. Loans are subject to termination at the option of the borrower or the Fund. Upon termination of the loan, the borrower will return to the Fund securities identical to the loaned securities. Should the borrower of the securities fail financially, the Fund has the right to repurchase the securities in the open market using the collateral. The Fund recognizes income, net of any rebate and securities lending agent fees, for lending its securities in the form of fees or interest on the investment of any cash received as collateral. The borrower receives all interest and dividends from the securities loaned and such payments are passed back to the lender in amounts equivalent thereto. The Fund also continues to recognize any unrealized gain (loss) in the market price of the securities loaned and on the change in the value of the collateral invested that may occur during the term of the
loan. In addition, realized gain (loss) is recognized on changes in the value of the collateral invested upon liquidation of the collateral. Net earnings from securities lending are disclosed on the Statement of Operations as “Income from securities lending, net”.
Mortgage Dollar Rolls: The Fund entered into mortgage dollar rolls in which the Fund sells mortgage securities for delivery in the current month, realizing a gain (loss), and simultaneously enters into contracts to repurchase somewhat similar (same type, coupon and maturity) securities on a specified future date. During the roll period, the Fund forgoes principal and interest paid on the securities. The Fund is compensated by the interest earned on the cash proceeds of the initial sale and by the lower repurchase price at the future date. The difference between the sale proceeds and the lower repurchase price is recorded as a realized gain on investment transactions. The Fund maintains a segregated account, the dollar value of which is at least equal to its obligations, with respect to dollar rolls. The Fund is subject to the risk that the market value of the securities the Fund is obligated to repurchase under the agreement may decline below the repurchase price.
Concentration of Risk: The ability of debt securities issuers (other than those issued or guaranteed by the U.S. Government) held by the Fund to meet their obligations may be affected by the economic or political developments in a specific industry, region or country. Foreign security and currency transactions may involve certain considerations and risks not typically associated with those of domestic origin as a result of, among other factors, the possibility of political or economic instability or the level of governmental supervision and regulation of foreign securities markets.
Securities Transactions and Net Investment Income: Securities transactions are recorded on the trade date. Realized gains (losses) from investment and currency transactions are calculated on the specific identification method. Dividend income is recorded on the ex-date. Interest income, including amortization of premium and accretion of discount on debt securities, as required, is recorded on the accrual basis. Expenses are recorded on an accrual basis, which may require the use of certain estimates by management that may differ from actual.
Net investment income or loss (other than distribution fees which are charged directly to the respective class and transfer agency fees specific to Class Q shares which are charged to that share class) and unrealized and realized gains (losses) are allocated daily to each class of shares based upon the relative proportion of adjusted net assets of each class at the beginning of the day.
Taxes: It is the Fund’s policy to continue to meet the requirements of the Internal Revenue Code applicable to regulated investment companies and to distribute all of its taxable net investment income and capital gains, if any, to its shareholders. Therefore, no federal income tax provision is required. Withholding taxes on foreign dividends, interest and capital gains, if any, are recorded, net of reclaimable amounts, at the time the related income is earned.
Dividends and Distributions: The Fund expects to pay dividends from net investment income monthly and distributions from net realized capital gains, if any, annually. Dividends and distributions to shareholders, which are determined in accordance with
| | | | |
| Prudential Core Bond Fund | | | 63 | |
Notes to Financial Statements (continued)
federal income tax regulations and which may differ from generally accepted accounting principles, are recorded on the ex-date. Permanent book/tax differences relating to income and gain (loss) are reclassified amongst undistributed net investment income, accumulated net realized gain (loss) and paid-in capital in excess of par, as appropriate.
Estimates: The preparation of financial statements requires management to make estimates and assumptions that affect the reported amounts and disclosures in the financial statements. Actual results could differ from those estimates.
2. Agreements
The Trust, on behalf of the Fund, has a management agreement with PGIM Investments. Pursuant to this agreement, PGIM Investments has responsibility for all investment advisory services and supervises the subadviser’s performance of such services. PGIM Investments has entered into a subadvisory agreement with PGIM, Inc., which provides subadvisory services to the Fund through its PGIM Fixed Income unit. The subadvisory agreement provides that PGIM, Inc. will furnish investment advisory services in connection with the management of the Fund. In connection therewith, PGIM, Inc. is obligated to keep certain books and records of the Fund. PGIM Investments pays for the services of PGIM, Inc., the cost of compensation of officers of the Fund, occupancy and certain clerical and bookkeeping costs of the Fund. The Fund bears all other cost and expenses.
The management fee paid to PGIM Investments is accrued daily and payable monthly at an annual rate of .35% of the Fund’s average daily net assets up to $10 billion and .34% of such assets in excess of $10 billion. The effective management fee rate before any waivers and/or expense reimbursements was .35% for the year ended July 31, 2017. The effective management fee rate, net of waivers and/or expense reimbursement, was .19%.
PGIM Investments has contractually agreed through November 30, 2018 to limit the net annual operating expenses (exclusive of distribution and service (12b-1) fees, taxes (such as income and foreign withholdings taxes, stamp duty and deferred tax expenses), interest, underlying funds, brokerage, extraordinary and certain other expenses such as dividend, broker charges and interest expense on short sales) of each class of shares of the Fund to .45% of the Fund’s average daily net assets. In addition, PI has contractually agreed through November 30, 2018 to limit net annual operating expenses (exclusive of distribution and service (12b-1) fees, transfer agency expenses (including sub-transfer agency and networking fees), taxes (such as income and foreign withholdings taxes, stamp duty and deferred tax expenses), interest, underlying funds, brokerage, extraordinary and certain other expenses such as dividend, broker charges and interest expense on short sales) of each class of shares of the Fund to ..40% of the Fund’s average daily net assets.
Expenses waived/reimbursed by the Manager in accordance with this agreement may be recouped by the Manager within the same fiscal year during which such waiver/reimbursement is made if such recoupment can be realized without exceeding the expense limit in effect at the time of the recoupment for that fiscal year.
The Trust, on behalf of the Fund has a distribution agreement with Prudential Investment Management Services LLC (“PIMS”) which acts as the distributor of the Class A, Class C, Class Q, Class R and Class Z shares of the Fund. The Fund compensates PIMS for distributing and servicing the Fund’s Class A, Class C and Class R shares, pursuant to the plans of distribution (the “Distribution Plans”), regardless of expenses actually incurred by PIMS. The distribution fees are accrued daily and payable monthly. No distribution or service fees are paid to PIMS as distributor of the Class Q or Class Z shares of the Fund.
Pursuant to the Fund’s Distribution Plans, the Fund compensates PIMS for distribution related activities at an annual rate of up to .25%, 1% and .75% of the average daily net assets of the Class A, C and R shares, respectively. PIMS has contractually agreed through November 30, 2018 to limit such fees to .50% of the average daily net assets of the Class R shares.
PIMS has advised the Fund that it has received $349,905 in front-end sales charges resulting from sales of Class A shares, during the year ended July 31, 2017. From these fees, PIMS paid such sales charges to affiliated broker-dealers, which in turn paid commissions to sales persons and incurred other distribution costs.
PIMS has advised the Fund that for the year ended July 31, 2017, it received $1,342 and $5,263 in contingent deferred sales charges imposed upon redemptions by certain Class A and Class C shareholders.
PGIM Investments, PGIM, Inc. and PIMS are indirect, wholly-owned subsidiaries of Prudential Financial, Inc. (“Prudential”).
3. Other Transactions with Affiliates
Prudential Mutual Fund Services LLC (“PMFS”), an affiliate of PGIM Investments and an indirect, wholly-owned subsidiary of Prudential, serves as the Fund’s transfer agent. Transfer agent’s fees and expenses in the Statement of Operations include certain out-of-pocket expenses paid to non-affiliates, where applicable.
The Fund may enter into certain securities purchase or sale transactions under Board approved Rule 17a-7 procedures. Rule 17a-7 is an exemptive rule under the 1940 Act, that permits purchase and sale transactions among affiliated investment companies, or between an investment company and a person that is affiliated solely by reason of having a common (or affiliated) investment adviser, common directors, and/or common officers. Such transactions are subject to ratification by the Board. For the period ended July 31, 2017 no such transactions were entered into by the Fund.
| | | | |
| Prudential Core Bond Fund | | | 65 | |
Notes to Financial Statements (continued)
The Fund may invest its overnight sweep cash in the Prudential Core Ultra Short Bond Fund (the “Core Fund”), and its securities lending cash collateral in the Prudential Institutional Money Market Fund (the “Money Market Fund”), each a series of the Prudential Investment Portfolios 2, registered under the 1940 Act and managed by PGIM Investments. For the reporting period ended July 31, 2017, PGIM, Inc. was compensated $287 by PGIM Investments for managing the Fund’s securities lending cash collateral as subadviser to the Money Market Fund. Earnings from the Core Fund and Money Market Fund are disclosed on the Statement of Operations as “Affiliated dividend income” and “Income from securities lending, net”, respectively.
4. Portfolio Securities
The aggregate cost of purchases and proceeds from sales of portfolio securities (excluding short-term investments and U.S. Treasury securities) for the year ended July 31, 2017, were $776,547,583 and $583,469,646, respectively.
Transactions in options written during the year ended July 31, 2017, were as follows:
| | | | | | | | |
| | | Notional
Amount | | | Premium
Received | |
Options outstanding at July 31, 2016 | | | — | | | $ | — | |
Written options | | | 773,000 | | | | 89,037 | |
Expired options | | | (489,000 | ) | | | (41,490 | ) |
Exercised options | | | — | | | | — | |
Closed options | | | (100,000 | ) | | | (13,900 | ) |
| | | | | | | | |
Options outstanding at July 31, 2017 | | | 184,000 | | | $ | 33,647 | |
| | | | | | | | |
5. Distributions and Tax Information
Distributions to shareholders, which are determined in accordance with federal income tax regulations and which may differ from generally accepted accounting principles, are recorded on the ex-date. In order to present undistributed net investment income, accumulated net realized loss on investment transactions and paid-in capital in excess of par on the Statement of Assets and Liabilities that more closely represent their tax character, certain adjustments have been made to undistributed net investment income and accumulated net realized loss on investment transactions. For the tax year ended July 31, 2017, the adjustments were to increase undistributed net investment income and increase accumulated net realized loss on investment transactions by $973,422 due to reclassification of paydown gains (losses), certain transactions involving foreign currencies, swaps and differences in the tax treatment of premium amortization. Net investment income, net realized gain (loss) on investment and foreign currency transactions and net assets were not affected by this change.
The tax character of distributions paid during the tax year ended July 31, 2017 was $5,661,691 of ordinary income. The tax character of distributions paid during the tax period ended July 31, 2016 were $1,690,029 of ordinary income and $201,122 of tax return of capital.
As of July 31, 2017, the accumulated undistributed earnings on a tax basis was $9,019 of ordinary income.
The United States federal income tax basis of the Fund’s investments and the total net unrealized depreciation as of July 31, 2017 were as follows:
| | | | | | | | | | |
Tax Basis | | Appreciation | | Depreciation | | Net
Unrealized
Depreciation | | Other Basis
Adjustments | | Total Net
Unrealized
Depreciation |
| $353,775,969 | | $1,705,807 | | $(1,771,395) | | $(65,588) | | $(138,511) | | $(204,099) |
The differences between book basis and tax basis were primarily attributable to deferred losses on wash sales and other cost basis differences between financial and tax accounting. The other cost basis adjustments are primarily attributable to swaps, futures and mark-to-market of receivables and payables.
For federal income tax purposes, the Fund had a capital loss carryforward for the tax year ended July 31, 2017 of approximately $1,569,000 which can be carried forward for an unlimited period. No capital gain distributions are expected to be paid to shareholders until net gains have been realized in excess of such losses.
The Fund elected to treat post-October capital losses of approximately $1,104,000 as having been incurred in the following fiscal year (July 31, 2018).
Management has analyzed the Fund’s tax positions taken on federal, state and local income tax returns for all open tax years and has concluded that no provision for income tax is required in the Fund’s financial statements for the current reporting period. The Fund’s federal, state and local income and federal excise tax returns for tax years for which the applicable statutes of limitations have not expired are subject to examination by the Internal Revenue Service and state departments of revenue.
6. Capital
The Fund offers Class A, Class C Class Q, Class R and Class Z shares. Class A shares are sold with a maximum front-end sales charge of 4.50%. Investors who purchase $1 million or more of Class A shares and redeem those shares within 12 months of purchase are subject to a contingent deferred sales charge (“CDSC”) of 1%, but are not subject to an initial sales charge. The Class A CDSC is waived for purchases by certain retirement or benefit plans. Class C shares are sold with a CDSC of 1% on sales of shares made within 12 months of purchase. A special exchange privilege is also available for shareholders who qualify to purchase Class A shares at net asset value. Class R shares are available to certain retirement plans, clearing and
| | | | |
| Prudential Core Bond Fund | | | 67 | |
Notes to Financial Statements (continued)
settlement firms. Class Q, Class R and Class Z shares are not subject to any sales or redemption charge and are offered exclusively for sale to a limited group of investors.
Under certain circumstances, an exchange may be made from specified share classes of the Fund to one or more other share classes of the Fund as presented in the table of transactions in shares of beneficial interest.
The Trust has authorized an unlimited number of shares of beneficial interest at $.001 par value per share.
As of July 31, 2017, Prudential owned 1,039 Class C shares, 1,066 Class Q shares and 1,052 Class R shares of the Fund.
At reporting period end, three shareholders of record held 94% of the Fund’s outstanding shares on behalf of multiple beneficial owners.
Transactions in shares of beneficial interest were as follows:
| | | | | | | | |
Class A | | Shares | | | Amount | |
Year ended July 31, 2017: | | | | | | | | |
Shares sold | | | 4,879,112 | | | $ | 48,572,739 | |
Shares issued in reinvestment of dividends and distributions | | | 83,292 | | | | 827,658 | |
Shares reacquired | | | (2,273,240 | ) | | | (22,525,876 | ) |
| | | | | | | | |
Net increase (decrease) in shares outstanding before conversion | | | 2,689,164 | | | | 26,874,521 | |
Shares reacquired upon conversion into other share class(es) | | | (40,883 | ) | | | (406,271 | ) |
| | | | | | | | |
Net increase (decrease) in shares outstanding | | | 2,648,281 | | | $ | 26,468,250 | |
| | | | | | | | |
Year ended July 31, 2016: | | | | | | | | |
Shares sold | | | 1,810,605 | | | $ | 18,240,194 | |
Shares issued in reinvestment of dividends and distributions | | | 6,927 | | | | 69,594 | |
Shares reacquired† | | | (132,661 | ) | | | (1,303,455 | ) |
| | | | | | | | |
Net increase (decrease) in shares outstanding | | | 1,684,871 | | | $ | 17,006,333 | |
| | | | | | | | |
Class C | | | | | | |
Year ended July 31, 2017: | | | | | | | | |
Shares sold | | | 239,782 | | | $ | 2,406,997 | |
Shares issued in reinvestment of dividends and distributions | | | 4,126 | | | | 41,089 | |
Shares reacquired | | | (112,646 | ) | | | (1,121,164 | ) |
| | | | | | | | |
Net increase (decrease) in shares outstanding | | | 131,262 | | | $ | 1,326,922 | |
| | | | | | | | |
Year ended July 31, 2016: | | | | | | | | |
Shares sold | | | 222,926.4 | | | $ | 2,217,684 | |
Shares issued in reinvestment of dividends and distributions | | | 1,310 | | | | 13,143 | |
Shares reacquired | | | (13,076 | ) | | | (129,464 | ) |
| | | | | | | | |
Net increase (decrease) in shares outstanding | | | 211,160.4 | | | $ | 2,101,363 | |
| | | | | | | | |
| | | | | | | | |
Class Q | | Shares | | | Amount | |
Year ended July 31, 2017: | | | | | | | | |
Shares sold | | | 9,581,826 | | | $ | 94,976,282 | |
Shares issued in reinvestment of dividends and distributions | | | 215,127 | | | | 2,138,147 | |
Shares reacquired | | | (1,245,527 | ) | | | (12,344,974 | ) |
| | | | | | | | |
Net increase (decrease) in shares outstanding before conversion | | | 8,551,426 | | | | 84,769,455 | |
Shares issued upon conversion from other share class(es) | | | 11,596,806 | | | | 114,810,035 | |
| | | | | | | | |
Net increase (decrease) in shares outstanding | | | 20,148,232 | | | $ | 199,579,490 | |
| | | | | | | | |
Year ended July 31, 2016: | | | | | | | | |
Shares issued in reinvestment of dividends and distributions | | | 27.2 | | | | 270 | |
| | | | | | | | |
Net increase (decrease) in shares outstanding | | | 27.2 | | | $ | 270 | |
| | | | | | | | |
Class R | | | | | | |
Year ended July 31, 2017: | | | | | | | | |
Shares issued in reinvestment of dividends and distributions | | | 19.4 | | | $ | 196 | |
| | | | | | | | |
Net increase (decrease) in shares outstanding | | | 19.4 | | | $ | 196 | |
| | | | | | | | |
Year ended July 31, 2016: | | | | | | | | |
Shares issued in reinvestment of dividends and distributions | | | 22.6 | | | | 220 | |
| | | | | | | | |
Net increase (decrease) in shares outstanding | | | 22.6 | | | $ | 220 | |
| | | | | | | | |
Class Z | | | | | | |
Year ended July 31, 2017: | | | | | | | | |
Shares sold | | | 15,569,571 | | | $ | 155,505,555 | |
Shares issued in reinvestment of dividends and distributions | | | 263,271 | | | | 2,620,164 | |
Shares reacquired | | | (5,518,779 | ) | | | (54,651,511 | ) |
| | | | | | | | |
Net increase (decrease) in shares outstanding before conversion | | | 10,314,063 | | | | 103,474,208 | |
Shares reacquired upon conversion into other share class(es) | | | (11,555,936 | ) | | | (114,403,764 | ) |
| | | | | | | | |
Net increase (decrease) in shares outstanding | | | (1,241,873 | ) | | $ | (10,929,556 | ) |
| | | | | | | | |
Year ended July 31, 2016: | | | | | | | | |
Shares sold | | | 1,614,599 | | | $ | 16,196,645 | |
Shares issued in reinvestment of dividends and distributions | | | 245,827 | | | | 2,441,359 | |
Shares reacquired | | | (2,878,907 | ) | | | (28,480,738 | ) |
| | | | | | | | |
Net increase (decrease) in shares outstanding | | | (1,018,481 | ) | | $ | (9,842,734 | ) |
| | | | | | | | |
| † | Includes affiliated redemption of 1,018 shares with a value of $9,952 for Class A shares. |
7. Borrowings
The Trust, on behalf of the Fund, along with other affiliated registered investment companies (the “Funds”), is a party to a Syndicated Credit Agreement (“SCA”) with a group of banks. The purpose of the SCA is to provide an alternative source of temporary funding for capital share redemptions. The SCA provides for a commitment of $900 million for the period October 6, 2016 through October 5, 2017. The Funds pay an annualized commitment fee of .15% of the unused portion of the SCA. The Fund’s portion of the commitment fee for the unused amount, allocated based upon a method approved by the Board, is accrued daily and paid quarterly. The interest on borrowings under the SCA is paid monthly and at a per annum interest rate based upon a contractual spread plus the higher of (1) the effective federal funds rate, (2) the 1-month LIBOR rate or (3) zero percent.
| | | | |
| Prudential Core Bond Fund | | | 69 | |
Notes to Financial Statements (continued)
Other affiliated registered investment companies that are parties to the SCA include portfolios that are subject to a predetermined mathematical formula used to manage certain benefit guarantees offered under variable annuity contracts. The formula may result in large scale asset flows into and out of the portfolios. Consequently, the portfolios may be more likely to utilize the SCA for purposes of funding redemptions. It may be possible for those portfolios to fully exhaust the committed amount of the SCA, thereby requiring the Manager to allocate available funding per a Board-approved methodology designed to treat the Funds in the SCA equitably.
The Fund did not utilize the SCA during the year ended July 31, 2017.
8. Recent Accounting Pronouncements and Reporting Updates
On October 13, 2016, the Securities and Exchange Commission (the “SEC”) adopted new rules and forms and amended existing rules and forms which are intended to modernize and enhance the reporting and disclosure of information by registered investment companies and to improve the quality of information that funds provide to investors, including modifications to Regulation S-X which would require standardized, enhanced disclosure about derivatives in investment company financial statements. The compliance dates of the modifications to Regulation S-X are August 1, 2017 and other amendments and rules are generally June 1, 2018 and December 1, 2018. Management is currently evaluating the impacts to the financial statement disclosures.
9. Other
At the Trust’s Board meeting in March, 2017, the Board of Trustees approved a change in the methodology of allocating certain expenses, like Transfer Agent fees (including sub-transfer agent and networking fees) and Blue Sky fees. PGIM Investments implemented the changes effective August 1, 2017.
Financial Highlights
| | | | | | | | | | | | | | | | |
| Class A Shares | |
| | | Year Ended July 31, | | | | | | February 17,
2015(g)
through
July 31,
| |
| | | 2017 | | | 2016 | | | | | | 2015 | |
| Per Share Operating Performance(b): | | | | | | | | | | | | | | | | |
| Net Asset Value, Beginning of Period | | | $10.22 | | | | $9.88 | | | | | | | | $9.99 | |
| Income (loss) from investment operations: | | | | | | | | | | | | | | | | |
| Net investment income (loss) | | | .18 | | | | .18 | | | | | | | | .09 | |
| Net realized and unrealized gain (loss) on investments | | | (.20 | ) | | | .39 | | | | | | | | (.09 | ) |
| Total from investment operations | | | (.02 | ) | | | .57 | | | | | | | | - | |
| Less Dividends and Distributions: | | | | | | | | | | | | | | | | |
| Dividends from net investment income | | | (.21 | ) | | | (.20 | ) | | | | | | | (.11 | ) |
| Tax return of capital distributions | | | - | | | | (.03 | ) | | | | | | | - | |
| Total dividends and distributions | | | (.21 | ) | | | (.23 | ) | | | | | | | (.11 | ) |
| Net asset value, end of period | | | $9.99 | | | | $10.22 | | | | | | | | $9.88 | |
| Total Return(a): | | | (.13)% | | | | 5.91% | | | | | | | | (.05)% | |
| | | | | | | | | | | | | | | | |
| Ratios/Supplemental Data: | | | | | | | | | | | | |
| Net assets, end of period (000) | | | $43,489 | | | | $17,437 | | | | | | | | $203 | |
| Average net assets (000) | | | $38,131 | | | | $3,049 | | | | | | | | $78 | |
| Ratios to average net assets(c)(d): | | | | | | | | | | | | | | | | |
| Expenses after waivers and/or expense reimbursement | | | .70% | | | | .70% | | | | | | | | .70% | (e) |
| Expenses before waivers and/or expense reimbursement | | | .89% | | | | .90% | | | | | | | | 1.16% | (e) |
| Net investment income (loss) | | | 1.77% | | | | 1.74% | | | | | | | | 1.97% | (e) |
| Portfolio turnover rate(h) | | | 314% | | | | 224% | | | | | | | | 535% | (f) |
| (a) | Total return does not consider the effects of sales loads. Total return is calculated assuming a purchase of a share on the first day and a sale on the last day of each period reported and includes reinvestment of dividends and distributions, if any. Total returns may reflect adjustments to conform to generally accepted accounting principles. Total returns for periods less than one full year are not annualized. |
| (b) | Calculated based on average shares outstanding during the period. |
| (c) | Does not include expenses of the underlying portfolios in which the Fund invests. |
| (d) | The distributor of the Fund had contractually agreed to limit its distribution and service (12b-1) fees to .25% of the average daily net assets through March 8, 2015. Effective March 9, 2015, the contractual distribution and service (12b-1) fees were reduced from .30% to .25% of the average daily net assets. |
| (g) | Commencement of operations. |
| (h) | The Fund accounts for mortgage dollar roll transactions as purchases and sales which, as a result, can increase its portfolio turnover rate. |
See Notes to Financial Statements.
| | | | |
| Prudential Core Bond Fund | | | 71 | |
Financial Highlights (continued)
| | | | | | | | | | | | | | | | |
| Class C Shares | |
| | | Year Ended July 31, | | | | | | February 17,
2015(f)
through
July 31,
| |
| | | 2017 | | | 2016 | | | | | | 2015 | |
| Per Share Operating Performance(b): | | | | | | | | | | | | | | | | |
| Net Asset Value, Beginning of Period | | | $10.23 | | | | $9.89 | | | | | | | | $9.99 | |
| Income (loss) from investment operations: | | | | | | | | | | | | | | | | |
| Net investment income (loss) | | | .10 | | | | .11 | | | | | | | | .05 | |
| Net realized and unrealized gain (loss) on investments | | | (.20 | ) | | | .39 | | | | | | | | (.08 | ) |
| Total from investment operations | | | (.10 | ) | | | .50 | | | | | | | | (.03 | ) |
| Less Dividends and Distributions: | | | | | | | | | | | | | | | | |
| Dividends from net investment income | | | (.14 | ) | | | (.14 | ) | | | | | | | (.07 | ) |
| Tax return of capital distributions | | | - | | | | (.02 | ) | | | | | | | - | |
| Total dividends and distributions | | | (.14 | ) | | | (.16 | ) | | | | | | | (.07 | ) |
| Net asset value, end of period | | | $9.99 | | | | $10.23 | | | | | | | | $9.89 | |
| Total Return(a): | | | (.98)% | | | | 5.13% | | | | | | | | (.30)% | |
| | | | | | | | | | | | | | | | |
| Ratios/Supplemental Data: | |
| Net assets, end of period (000) | | | $3,486 | | | | $2,226 | | | | | | | | $63 | |
| Average net assets (000) | | | $3,009 | | | | $880 | | | | | | | | $16 | |
| Ratios to average net assets(c): | | | | | | | | | | | | | | | | |
| Expenses after waivers and/or expense reimbursement | | | 1.45% | | | | 1.45% | | | | | | | | 1.45% | (d) |
| Expenses before waivers and/or expense reimbursement | | | 1.64% | | | | 1.69% | | | | | | | | 1.82% | (d) |
| Net investment income (loss) | | | .98% | | | | 1.08% | | | | | | | | 1.03% | (d) |
| Portfolio turnover rate(g) | | | 314% | | | | 224% | | | | | | | | 535% | (e) |
| (a) | Total return does not consider the effects of sales loads. Total return is calculated assuming a purchase of a share on the first day and a sale on the last day of each period reported and includes reinvestment of dividends and distributions, if any. Total returns may reflect adjustments to conform to generally accepted accounting principles. Total returns for periods less than one full year are not annualized. |
| (b) | Calculated based on average shares outstanding during the period. |
| (c) | Does not include expenses of the underlying portfolios in which the Fund invests. |
| (f) | Commencement of operations. |
| (g) | The Fund accounts for mortgage dollar roll transactions as purchases and sales which, as a result, can increase its portfolio turnover rate. |
See Notes to Financial Statements.
| | | | | | | | | | | | | | | | |
| Class Q Shares | |
| | | Year Ended July 31, | | | | | | February 17,
2015(f)
through
July 31,
| |
| | | 2017 | | | 2016 | | | | | | 2015 | |
| Per Share Operating Performance(b): | | | | | | | | | | | | | | | | |
| Net Asset Value, Beginning of Period | | | $10.23 | | | | $9.88 | | | | | | | | $9.99 | |
| Income (loss) from investment operations: | | | | | | | | | | | | | | | | |
| Net investment income (loss) | | | .22 | | | | .21 | | | | | �� | | | .09 | |
| Net realized and unrealized gain (loss) on investments | | | (.22 | ) | | | .40 | | | | | | | | (.08 | ) |
| Total from investment operations | | | - | | | | .61 | | | | | | | | .01 | |
| Less Dividends and Distributions: | | | | | | | | | | | | | | | | |
| Dividends from net investment income | | | (.24 | ) | | | (.23 | ) | | | | | | | (.12 | ) |
| Tax return of capital distributions | | | - | | | | (.03 | ) | | | | | | | - | |
| Total dividends and distributions | | | (.24 | ) | | | (.26 | ) | | | | | | | (.12 | ) |
| Net asset value, end of period | | | $9.99 | | | | $10.23 | | | | | | | | $9.88 | |
| Total Return(a): | | | .07% | | | | 6.32% | | | | | | | | .06% | |
| | | | | | | | | | | | | | | | |
| Ratios/Supplemental Data: | | | | | | | | | | | | |
| Net assets, end of period (000) | | | $201,345 | | | | $11 | | | | | | | | $10 | |
| Average net assets (000) | | | $83,714 | | | | $10 | | | | | | | | $10 | |
| Ratios to average net assets(c): | | | | | | | | | | | | | | | | |
| Expenses after waivers and/or expense reimbursement | | | .40% | | | | .45% | | | | | | | | .45% | (d) |
| Expenses before waivers and/or expense reimbursement | | | .53% | | | | .67% | | | | | | | | .75% | (d) |
| Net investment income (loss) | | | 2.22% | | | | 2.15% | | | | | | | | 2.05% | (d) |
| Portfolio turnover rate(g) | | | 314% | | | | 224% | | | | | | | | 535% | (e) |
| (a) | Total return is calculated assuming a purchase of a share on the first day and a sale on the last day of each period reported and includes reinvestment of dividends and distributions, if any. Total returns may reflect adjustments to conform to generally accepted accounting principles. Total returns for periods less than one full year are not annualized. |
| (b) | Calculated based on average shares outstanding during the period. |
| (c) | Does not include expenses of the underlying portfolios in which the Fund invests. |
| (f) | Commencement of operations. |
| (g) | The Fund accounts for mortgage dollar roll transactions as purchases and sales which, as a result, can increase its portfolio turnover rate. |
See Notes to Financial Statements.
| | | | |
| Prudential Core Bond Fund | | | 73 | |
Financial Highlights (continued)
| | | | | | | | | | | | | | | | |
| Class R Shares | | | | | | | | | | | | |
| | | Year Ended July 31, | | | | | | February 17,
2015(f)
through
July 31,
| |
| | | 2017 | | | 2016 | | | | | | 2015 | |
| Per Share Operating Performance(b): | | | | | | | | | | | | | | | | |
| Net Asset Value, Beginning of Period | | | $10.23 | | | | $9.88 | | | | | | | | $9.99 | |
| Income (loss) from investment operations: | | | | | | | | | | | | | | | | |
| Net investment income (loss) | | | .15 | | | | .16 | | | | | | | | .07 | |
| Net realized and unrealized gain (loss) on investments | | | (.20 | ) | | | .41 | | | | | | | | (.09 | ) |
| Total from investment operations | | | (.05 | ) | | | .57 | | | | | | | | (.02 | ) |
| Less Dividends and Distributions: | | | | | | | | | | | | | | | | |
| Dividends from net investment income | | | (.19 | ) | | | (.19 | ) | | | | | | | (.09 | ) |
| Tax return of capital distributions | | | - | | | | (.03 | ) | | | | | | | - | |
| Total dividends and distributions | | | (.19 | ) | | | (.22 | ) | | | | | | | (.09 | ) |
| Net asset value, end of period | | | $9.99 | | | | $10.23 | | | | | | | | $9.88 | |
| Total Return(a): | | | (.48)% | | | | 5.81% | | | | | | | | (.16)% | |
| | | | | | | | | | | | | | | | |
| Ratios/Supplemental Data: | | | | | | | | | | | | |
| Net assets, end of period (000) | | | $11 | | | | $11 | | | | | | | | $10 | |
| Average net assets (000) | | | $10 | | | | $10 | | | | | | | | $10 | |
| Ratios to average net assets(c): | | | | | | | | | | | | | | | | |
| Expenses after waivers and/or expense reimbursement | | | .95% | | | | .95% | | | | | | | | .95% | (d) |
| Expenses before waivers and/or expense reimbursement | | | 1.40% | | | | 1.52% | | | | | | | | 1.64% | (d) |
| Net investment income (loss) | | | 1.46% | | | | 1.66% | | | | | | | | 1.56% | (d) |
| Portfolio turnover rate(g) | | | 314% | | | | 224% | | | | | | | | 535% | (e) |
| (a) | Total return is calculated assuming a purchase of a share on the first day and a sale on the last day of each period reported and includes reinvestment of dividends and distributions, if any. Total returns may reflect adjustments to conform to generally accepted accounting principles. Total returns for periods less than one full year are not annualized. |
| (b) | Calculated based on average shares outstanding during the period. |
| (c) | Does not include expenses of the underlying portfolios in which the Fund invests. |
| (f) | Commencement of operations. |
| (g) | The Fund accounts for mortgage dollar roll transactions as purchases and sales which, as a result, can increase its portfolio turnover rate. |
See Notes to Financial Statements.
| | | | | | | | | | | | | | | | | | | | | | | | | | | | | | | | |
| Class Z Shares | | | | | | | | | | | | | | | | | | | | | | | | |
| | | Year Ended July 31, | | | | | | Nine Months
Ended
July 31, | | | | | | Year Ended October 31, | |
| | | 2017(d) | | | 2016(d) | | | 2015(d)(f) | | | | | | 2014(c) | | | | | | 2013 | | | 2012 | |
| Per Share Operating Performance: | | | | | | | | | | | | | | | | | | | | | | | | | | | | | |
| Net Asset Value, Beginning of Period | | | $10.23 | | | | $9.88 | | | | $10.13 | | | | | | | | $10.30 | | | | | | | | $10.85 | | | | $10.50 | |
| Income (loss) from investment operations: | | | | | | | | | | | | | | | | | | | | | | | | | | | | | |
| Net investment income (loss) | | | .19 | | | | .21 | | | | .19 | | | | | | | | .17 | | | | | | | | .25 | | | | .27 | |
| Net realized and unrealized gain (loss) on investments | | | (.19 | ) | | | .40 | | | | (.19 | ) | | | | | | | (.07 | ) | | | | | | | (.40 | ) | | | .56 | |
| Total from investment operations | | | - | | | | .61 | | | | - | | | | | | | | .10 | | | | | | | | (.15 | ) | | | .83 | |
| Less Dividends and Distributions: | | | | | | | | | | | | | | | | | | | | | | | | | | | | | | | | |
| Dividends from net investment income | | | (.24 | ) | | | (.23 | ) | | | (.25 | ) | | | | | | | (.21 | ) | | | | | | | (.22 | ) | | | (.42 | ) |
| Tax return of capital distributions | | | - | | | | (.03 | ) | | | - | | | | | | | | - | | | | | | | | - | | | | - | |
| Distributions from net realized gains | | | - | | | | - | | | | - | | | | | | | | (.06 | ) | | | | | | | (.18 | ) | | | (.06 | ) |
| Total dividends and distributions | | | (.24 | ) | | | (.26 | ) | | | (.25 | ) | | | | | | | (.27 | ) | | | | | | | (.40 | ) | | | (.48 | ) |
| Net asset value, end of period | | | $9.99 | | | | $10.23 | | | | $9.88 | | | | | | | | $10.13 | | | | | | | | $10.30 | | | | $10.85 | |
| Total Return(a): | | | .02% | | | | 6.32% | | | | (.02)% | | | | | | | | 1.01% | | | | | | | | (1.41)% | | | | 8.13% | |
| |
| Ratios/Supplemental Data: | | | | | | | | | | | | | | | | | | | | | | | | |
| Net assets, end of period (000) | | | $82,297 | | | | $96,978 | | | | $103,725 | | | | | | | | $124,058 | | | | | | | | $131,981 | | | | $169,193 | |
| Average net assets (000) | | | $113,324 | | | | $93,861 | | | | $114,825 | | | | | | | | $127,349 | | | | | | | | $149,452 | | | | $177,149 | |
| Ratios to average net assets(b): | | | | | | | | | | | | | | | | | | | | | | | | | | | | | |
| Expenses after waivers and/or expense reimbursement | | | .45% | | | | .45% | | | | .61% | | | | | | | | .77% | (g) | | | | | | | .71% | | | | .66% | |
| Expenses before waivers and/or expense reimbursement | | | .61% | | | | .75% | | | | .78% | | | | | | | | .77% | (g) | | | | | | | .71% | | | | .66% | |
| Net investment income (loss) | | | 1.89% | | | | 2.15% | | | | 1.88% | | | | | | | | 2.22% | (g) | | | | | | | 2.33% | | | | 2.50% | |
| Portfolio turnover rate(e) | | | 314% | | | | 224% | | | | 535% | | | | | | | | 234% | (h) | | | | | | | 193% | | | | 175% | |
| (a) | Total return is calculated assuming a purchase of a share on the first day and a sale on the last day of each period reported and includes reinvestment of dividends and distributions, if any. Total returns may reflect adjustments to conform to generally accepted accounting principles. Total returns for periods less than one full year are not annualized. |
| (b) | Does not include expenses of the underlying portfolios in which the Fund invests. |
| (c) | For the nine month period ended July 31, 2014. The Trust changed its fiscal year end from October 31 to July 31, effective July 31, 2014. |
| (d) | Calculated based on average shares outstanding during the period. |
| (e) | The Fund accounts for mortgage dollar roll transactions as purchases and sales which, as a result, can increase its portfolio turnover rate. |
| (f) | Class T shares were renamed Class Z shares effective February 17, 2015. |
See Notes to Financial Statements.
| | | | |
| Prudential Core Bond Fund | | | 75 | |
Report of Independent Registered Public Accounting Firm
The Board of Trustees and Shareholders
The Target Portfolio Trust:
We have audited the accompanying statement of assets and liabilities of Prudential Core Bond Fund, a series of Target Portfolio Trust (the “Fund”), including the schedule of investments, as of July 31, 2017, and the related statement of operations for the year then ended, the statements of changes in net assets for each of the years in the two-year period then ended, and the financial highlights for each of the years in the three-year period then ended, for the nine-month period ended July 31, 2014 and for each of the years in the two-year period ended October 31, 2013. These financial statements and financial highlights are the responsibility of the Fund’s management. Our responsibility is to express an opinion on these financial statements and financial highlights based on our audits.
We conducted our audits in accordance with the standards of the Public Company Accounting Oversight Board (United States). Those standards require that we plan and perform the audit to obtain reasonable assurance about whether the financial statements and financial highlights are free of material misstatement. An audit includes examining, on a test basis, evidence supporting the amounts and disclosures in the financial statements. Our procedures included confirmation of securities owned as of July 31, 2017, by correspondence with the custodian, transfer agent and brokers or by other appropriate auditing procedures when replies from brokers were not received. An audit also includes assessing the accounting principles used and significant estimates made by management, as well as evaluating the overall financial statement presentation. We believe that our audits provide a reasonable basis for our opinion.
In our opinion, the financial statements and financial highlights referred to above present fairly, in all material respects, the financial position of the Fund as of July 31, 2017, and the results of its operations, changes in its net assets, and the financial highlights for the periods described in the first paragraph above, in conformity with U.S. generally accepted accounting principles.

New York, New York
September 18, 2017
| | |
| 76 | | Visit our website at pgiminvestments.com |
Federal Income Tax Information (unaudited)
For the tax year ended July 31, 2017, the Fund reports 86.25% as interest-related dividends in accordance with Sections 871(k)(1) and 881(e)(1) of the Internal Revenue Code.
In January 2018, you will be advised on IRS Form 1099-DIV or substitute 1099-DIV, as to the Federal tax status of the distributions received by you in calendar year 2017.
We are required by Massachusetts, Missouri and Oregon to Inform you that dividends which have been derived from interest on federal obligations are not taxable to shareholders providing the Mutual Fund meets certain requirements mandated by the respective state’s taxing authorities. We are pleased to report that 5.38% of the dividends paid by the Fund qualify for such deduction.
For more detailed information regarding your state and local taxes, you should contact your tax adviser or the state/local taxing authorities.
| | | | |
| Prudential Core Bond Fund | | | 77 | |
INFORMATION ABOUT BOARD MEMBERS AND OFFICERS
(Unaudited)
Information about Board Members and Officers of the Fund is set forth below. Board Members who are not deemed to be “interested persons” of the Fund, as defined in the 1940 Act, are referred to as “Independent Board Members.” Board Members who are deemed to be “interested persons” of the Fund are referred to as “Interested Board Members.” The Board Members are responsible for the overall supervision of the operations of the Fund and perform the various duties imposed on the directors of investment companies by the 1940 Act. The Board in turn elects the Officers, who are responsible for administering the day-to-day operations of the Fund.
| | | | |
| Independent Board Members(1) |
Name, Address, Age Position(s) Portfolios Overseen | | Principal Occupation(s) During Past Five Years | | Other Directorships Held During Past Five Years |
Ellen S. Alberding (59) Board Member Portfolios Overseen: 87 | | President and Board Member, The Joyce Foundation (charitable foundation) (since 2002); Vice Chair, City Colleges of Chicago (community college system) (since 2011); Trustee, Skills for America’s Future (national initiative to connect employers to community colleges) (since 2011); Trustee, National Park Foundation (charitable foundation for national park system) (since 2009); Trustee, Economic Club of Chicago (since 2009). | | None. |
Kevin J. Bannon (65) Board Member Portfolios Overseen: 87 | | Retired; Managing Director (April 2008-May 2015) and Chief Investment Officer (October 2008-November 2013) of Highmount Capital LLC (registered investment adviser); formerly Executive Vice President and Chief Investment Officer (April 1993-August 2007) of Bank of New York Company; President (May 2003-May 2007) of BNY Hamilton Family of Mutual Funds. | | Director of Urstadt Biddle Properties (equity real estate investment trust) (since September 2008). |
Linda W. Bynoe (65) Board Member Portfolios Overseen: 87 | | President and Chief Executive Officer (since March 1995) and formerly Chief Operating Officer (December 1989-February 1995) of Telemat Ltd. (management consulting); formerly Vice President (January 1985-June 1989) at Morgan Stanley & Co. (broker-dealer). | | Director of Simon Property Group, Inc. (retail real estate) (May 2003-May 2012); Director of Anixter International, Inc. (communication products distributor) (since January 2006); Director of Northern Trust Corporation (financial services) (since April 2006); Trustee of Equity Residential (residential real estate) (since December 2009). |
Prudential Core Bond Fund
| | | | |
| Independent Board Members(1) |
Name, Address, Age Position(s) Portfolios Overseen | | Principal Occupation(s) During Past Five Years | | Other Directorships Held During Past Five Years |
Barry H. Evans (56)± Board Member Portfolios Overseen: 87 | | Retired; Formerly President (2005–2016), Global Chief Operating Officer (2014–2016), Chief Investment Officer–Global Head of Fixed Income (1998-2014), and various portfolio manager roles (1986-2006), Manulife Asset Management U.S. | | Director, Manulife Trust Company (2011- present); Director, Manulife Asset Management Limited (2015-present); Formerly Chairman of the Board of Directors of Manulife Asset Management U.S. (2005-2016); Formerly Chairman of the Board, Declaration Investment Management and Research (2008-2016) |
Keith F. Hartstein (60) Board Member & Independent Chair Portfolios Overseen: 87 | | Retired; Member (since November 2014) of the Governing Council of the Independent Directors Council (organization of independent mutual fund directors); formerly President and Chief Executive Officer (2005-2012), Senior Vice President (2004-2005), Senior Vice President of Sales and Marketing (1997-2004), and various executive management positions (1990-1997), John Hancock Funds, LLC (asset management); Chairman, Investment Company Institute’s Sales Force Marketing Committee (2003-2008). | | None. |
Laurie Simon Hodrick
(55)± Board Member Portfolios Overseen: 87 | | A. Barton Hepburn Professor of Economics in the Faculty of Business, Columbia Business School (since 1996); Visiting Professor of Law and Rock Center for Corporate Governance Fellow, Stanford Law School (since 2015); Visiting Fellow, Hoover Institution, Stanford University (since 2015); Sole Member, ReidCourt LLC (since 2008) (a consulting firm); Formerly Managing Director, Global Head of Alternative Investment Strategies, Deutsche Bank (2006-2008); Formerly Director/Trustee, Merrill Lynch Investment Managers Funds (1999-2006) | | Independent Director, Corporate Capital Trust (since April 2017) (a business development company) |
Michael S. Hyland, CFA (71) Board Member Portfolios Overseen: 87 | | Retired (since February 2005); formerly Senior Managing Director (July 2001-February 2005) of Bear Stearns & Co, Inc.; Global Partner, INVESCO (1999-2001); Managing Director and President of Salomon Brothers Asset Management (1989-1999). | | None. |
Visit our website at pgiminvestments.com
| | | | |
| Independent Board Members(1) |
Name, Address, Age Position(s) Portfolios Overseen | | Principal Occupation(s) During Past Five Years | | Other Directorships Held During Past Five Years |
Richard A. Redeker (74) Board Member & Independent Vice Chair Portfolios Overseen: 87 | | Retired Mutual Fund Senior Executive (47 years); Management Consultant; Director, Mutual Fund Directors Forum (since 2014); Independent Directors Council (organization of independent mutual fund directors)-Executive Committee, Chair of Policy Steering Committee, Governing Council. | | None. |
Stephen G. Stoneburn (74) Board Member Portfolios Overseen: 87 | | Chairman (since July 2011), President and Chief Executive Officer (since June 1996) of Frontline Medical Communications (publishing company); formerly President (June 1995-June 1996) of Argus Integrated Media, Inc.; Senior Vice President and Managing Director (January 1993-1995) of Cowles Business Media; Senior Vice President of Fairchild Publications, Inc. (1975-1989). | | None. |
| ± | Mr. Evans and Ms. Hodrick joined the Board effective as of September 1, 2017. |
| | | | |
| Interested Board Members(1) |
Name, Address, Age Position(s) Portfolios Overseen | | Principal Occupation(s) During Past Five Years | | Other Directorships Held During Past Five Years |
Stuart S. Parker (54) Board Member & President Portfolios Overseen: 87 | | President of PGIM Investments LLC (formerly known as Prudential Investments LLC) (since January 2012); Executive Vice President of Prudential Investment Management Services LLC (since December 2012); Executive Vice President of Jennison Associates LLC and Head of Retail Distribution of PGIM Investments LLC (June 2005-December 2011). | | None. |
Prudential Core Bond Fund
| | | | |
| Interested Board Members(1) |
Name, Address, Age Position(s) Portfolios Overseen | | Principal Occupation(s) During Past Five Years | | Other Directorships Held During Past Five Years |
Scott E. Benjamin (44) Board Member & Vice President Portfolios Overseen: 87 | | Executive Vice President (since June 2009) of PGIM Investments LLC; Executive Vice President (June 2009-June 2012) and Vice President (since June 2012) of Prudential Investment Management Services LLC; Executive Vice President (since September 2009) of AST Investment Services, Inc.; Senior Vice President of Product Development and Marketing, PGIM Investments (since February 2006); Vice President of Product Development and Product Management, Prudential Investments (2003-2006). | | None. |
Grace C. Torres* (58) Board Member Portfolios Overseen: 86 | | Retired; formerly Treasurer and Principal Financial and Accounting Officer of the Prudential Funds, Target Funds, Advanced Series Trust, Prudential Variable Contract Accounts and The Prudential Series Fund (1998-June 2014); Assistant Treasurer (March 1999-June 2014) and Senior Vice President (September 1999-June 2014) of PGIM Investments LLC; Assistant Treasurer (May 2003-June 2014) and Vice President (June 2005-June 2014) of AST Investment Services, Inc.; Senior Vice President and Assistant Treasurer (May 2003-June 2014) of Prudential Annuities Advisory Services, Inc. | | Director (since July 2015) of Sun Bancorp, Inc. N.A. and Sun National Bank |
| * | Note: Prior to her retirement in 2014, Ms. Torres was employed by PGIM Investments LLC. Due to her prior employment, she is considered to be an “interested person” under the 1940 Act. Ms. Torres is a Non-Management Interested Board Member. |
| (1) | The year that each individual joined the Board is as follows: |
Ellen S. Alberding, 2013; Kevin J. Bannon, 2008; Linda W. Bynoe, 2005; Barry H. Evans, 2017; Keith F. Hartstein, 2013; Laurie Simon Hodrick, 2017; Michael S. Hyland, 2008; Richard A. Redeker, 2003; Stephen G. Stoneburn, 1999; Grace C. Torres, 2014; Stuart S. Parker, Board Member and President since 2012; Scott E. Benjamin, Board Member since 2010 and Vice President since 2009.
Visit our website at pgiminvestments.com
| | | | |
| Fund Officers(a) |
Name, Address and Age Position with Fund | | Principal Occupation(s) During Past Five Years | | Length of Service as Fund Officer |
Raymond A. O’Hara (62) Chief Legal Officer | | Vice President and Corporate Counsel (since July 2010) of Prudential Insurance Company of America (Prudential); Vice President (March 2011-Present) of Pruco Life Insurance Company and Pruco Life Insurance Company of New Jersey; Vice President and Corporate Counsel (March 2011-Present) of Prudential Annuities Life Assurance Corporation; Chief Legal Officer of PGIM Investments LLC (since June 2012); Chief Legal Officer of Prudential Mutual Fund Services LLC (since June 2012) and Corporate Counsel of AST Investment Services, Inc. (since June 2012); formerly Assistant Vice President and Corporate Counsel (September 2008-July 2010) of The Hartford Financial Services Group, Inc.; formerly Associate (September 1980-December 1987) and Partner (January 1988–August 2008) of Blazzard & Hasenauer, P.C. (formerly, Blazzard, Grodd & Hasenauer, P.C.). | | Since 2012 |
Chad A. Earnst (42) Chief Compliance Officer | | Chief Compliance Officer (September 2014-Present) of PGIM Investments LLC; Chief Compliance Officer (September 2014-Present) of the Prudential Funds, Target Funds, Advanced Series Trust, The Prudential Series Fund, Prudential’s Gibraltar Fund, Inc., Prudential Global Short Duration High Yield Income Fund, Inc., Prudential Short Duration High Yield Fund, Inc. and Prudential Jennison MLP Income Fund, Inc.; formerly Assistant Director (March 2010-August 2014) of the Asset Management Unit, Division of Enforcement, US Securities & Exchange Commission; Assistant Regional Director (January 2010-August 2014), Branch Chief (June 2006–December 2009) and Senior Counsel (April 2003-May 2006) of the Miami Regional Office, Division of Enforcement, US Securities & Exchange Commission. | | Since 2014 |
Deborah A. Docs (59) Secretary | | Vice President and Corporate Counsel (since January 2001) of Prudential; Vice President (since December 1996) and Assistant Secretary (since March 1999) of PGIM Investments LLC; formerly Vice President and Assistant Secretary (May 2003-June 2005) of AST Investment Services, Inc. | | Since 2004 |
Jonathan D. Shain (59) Assistant Secretary | | Vice President and Corporate Counsel (since August 1998) of Prudential; Vice President and Assistant Secretary (since May 2001) of PGIM Investments LLC; Vice President and Assistant Secretary (since February 2001) of Prudential Mutual Fund Services LLC; formerly Vice President and Assistant Secretary (May 2003-June 2005) of AST Investment Services, Inc. | | Since 2005 |
Claudia DiGiacomo (42) Assistant Secretary | | Vice President and Corporate Counsel (since January 2005) of Prudential; Vice President and Assistant Secretary of PGIM Investments LLC (since December 2005); Associate at Sidley Austin Brown & Wood LLP (1999-2004). | | Since 2005 |
Prudential Core Bond Fund
| | | | |
| Fund Officers(a) |
Name, Address and Age Position with Fund | | Principal Occupation(s) During Past Five Years | | Length of Service as Fund Officer |
Andrew R. French (54) Assistant Secretary | | Vice President and Corporate Counsel (since February 2010) of Prudential; formerly Director and Corporate Counsel (2006-2010) of Prudential; Vice President and Assistant Secretary (since January 2007) of PGIM Investments LLC; Vice President and Assistant Secretary (since January 2007) of Prudential Mutual Fund Services LLC. | | Since 2006 |
Charles H. Smith (44) Anti-Money Laundering Compliance Officer | | Vice President, Corporate Compliance, Anti-Money Laundering Unit (since January 2015) of Prudential; committee member of the American Council of Life Insurers Anti-Money Laundering and Critical Infrastructure Committee (since January 2016); formerly Global Head of Economic Sanctions Compliance at AIG Property Casualty (February 2007–December 2014); Assistant Attorney General at the New York State Attorney General’s Office, Division of Public Advocacy. (August 1998—January 2007). | | Since 2016 |
M. Sadiq Peshimam (53) Treasurer and Principal Financial and Accounting Officer | | Vice President (since 2005) of PGIM Investments LLC; formerly Assistant Treasurer of funds in the Prudential Mutual Fund Complex (2006-2014). | | Since 2006 |
Peter Parrella (59) Assistant Treasurer | | Vice President (since 2007) and Director (2004-2007) within Prudential Mutual Fund Administration; formerly Tax Manager at SSB Citi Fund Management LLC (1997-2004). | | Since 2007 |
Lana Lomuti (50) Assistant Treasurer | | Vice President (since 2007) and Director (2005-2007), within Prudential Mutual Fund Administration; formerly Assistant Treasurer (December 2007-February 2014) of The Greater China Fund, Inc. | | Since 2014 |
Linda McMullin (56) Assistant Treasurer | | Vice President (since 2011) and Director (2008-2011) within Prudential Mutual Fund Administration. | | Since 2014 |
Kelly A. Coyne (49) Assistant Treasurer | | Director, Investment Operations of Prudential Mutual Fund Services LLC (since 2010). | | Since 2015 |
| (a) | Excludes Mr. Parker and Mr. Benjamin, interested Board Members who also serve as President and Vice President, respectively. |
Explanatory Notes to Tables:
| • | | Board Members are deemed to be “Interested,” as defined in the 1940 Act, by reason of their affiliation with PGIM Investments LLC and/or an affiliate of PGIM Investments LLC. |
| • | | Unless otherwise noted, the address of all Board Members and Officers is c/o PGIM Investments LLC, 655 Broad Street, Newark, New Jersey 07102-4410. |
| • | | There is no set term of office for Board Members or Officers. The Board Members have adopted a retirement policy, which calls for the retirement of Board Members on December 31 of the year in which they reach the age of 75. |
| • | | “Other Directorships Held” includes only directorships of companies required to register or file reports with the SEC under the 1934 Act (that is, “public companies”) or other investment companies registered under the 1940 Act. |
| • | | “Portfolios Overseen” includes all investment companies managed by PGIM Investments LLC. The investment companies for which PGIM Investments LLC serves as manager include the Prudential Mutual Funds, The Prudential Variable Contract Accounts, Target Mutual Funds, Prudential Short Duration High Yield Fund, Inc., Prudential Global Short Duration High Yield Fund, Inc., The Prudential Series Fund, Prudential’s Gibraltar Fund, Inc. and the Advanced Series Trust. |
Visit our website at pgiminvestments.com
Approval of Advisory Agreement
The Fund’s Board of Trustees
The Board of Trustees (the “Board”) of the Prudential Core Bond Fund (the “Fund”)1 consists of twelve individuals, nine of whom are not “interested persons” of the Fund, as defined in the Investment Company Act of 1940, as amended (the “1940 Act”) (the “Independent Trustees”). The Board is responsible for the oversight of the Fund and its operations, and performs the various duties imposed on the directors of investment companies by the 1940 Act. The Independent Trustees have retained independent legal counsel to assist them in connection with their duties. The Chair of the Board is an Independent Trustee. The Board has established four standing committees: the Audit Committee, the Nominating and Governance Committee, and two Investment Committees. Each committee is chaired by, and composed of, Independent Trustees.
Annual Approval of the Fund’s Advisory Agreements
As required under the 1940 Act, the Board determines annually whether to renew the Fund’s management agreement with PGIM Investments LLC (“PGIM Investments”), the Fund’s subadvisory agreement with PGIM, Inc. (“PGIM”) on behalf of its PGIM Fixed Income unit, and the Fund’s sub-subadvisory agreement with PGIM Limited (“PGIML”). In considering the renewal of the agreements, the Board, including all the Independent Trustees2, met on June 6-8, 2017 and approved the renewal of the agreements through July 31, 2018, after concluding that the renewal of the agreements was in the best interests of the Fund and its shareholders.
In advance of the meetings, the Board requested and received materials relating to the agreements, and had the opportunity to ask questions and request further information in connection with its consideration. Among other things, the Board considered comparative fee information from PGIM Investments and PGIM. Also, the Board considered comparisons with other mutual funds in relevant Peer Universes and Peer Groups, as is further discussed below.
In approving the agreements, the Board, including the Independent Trustees advised by independent legal counsel, considered the factors it deemed relevant, including the nature, quality and extent of services provided by PGIM Investments and the subadviser, the performance of the Fund, the profitability of PGIM Investments and its affiliates, expenses and fees, and the potential for economies of scale that may be shared with the Fund and its shareholders as the Fund’s assets grow. In their deliberations, the Trustees did not identify any single factor which alone was responsible for the Board’s decision to approve the agreements with respect to the Fund. In connection with its deliberations, the Board considered information provided by PGIM Investments throughout the year at regular Board
| 1 | Prudential Core Bond Fund is a series of The Target Portfolio Trust. |
| 2 | Barry H. Evans and Laurie Simon Hodrick joined the Board effective as of September 1, 2017. Neither Mr. Evans nor Ms. Hodrick participated in the consideration of the approval of the Fund’s advisory agreements. |
| | |
| Prudential Core Bond Fund |
Approval of Advisory Agreement (continued)
meetings, presentations from portfolio managers and other information, as well as information furnished at or in advance of the meetings on June 6-8, 2017.
The Trustees determined that the overall arrangements between the Fund and PGIM Investments, which serves as the Fund’s investment manager pursuant to a management agreement, between PGIM Investments and PGIM, which, through its PGIM Fixed Income unit, serves as the Fund’s subadviser pursuant to the terms of a subadvisory agreement with PGIM Investments, and between PGIM and PGIML, which serves as the Fund’s sub-subadviser pursuant to the terms of a sub-subadvisory agreement with PGIM, are in the best interests of the Fund and its shareholders in light of the services performed, fees charged and such other matters as the Trustees considered relevant in the exercise of their business judgment.
The material factors and conclusions that formed the basis for the Trustees’ reaching their determinations to approve the continuance of the agreements are separately discussed below.
Nature, Quality, and Extent of Services
The Board received and considered information regarding the nature, quality and extent of services provided to the Fund by PGIM Investments, PGIM Fixed Income, and PGIML. The Board considered the services provided by PGIM Investments, including but not limited to the oversight of the subadviser and sub-subadviser for the Fund, as well as the provision of fund recordkeeping, compliance, and other services to the Fund. With respect to PGIM Investments’ oversight of the subadviser and sub-subadviser, the Board noted that PGIM Investments’ Strategic Investment Research Group (“SIRG”), which is a business unit of PGIM Investments, is responsible for monitoring and reporting to PGIM Investments’ senior management on the performance and operations of the subadviser and sub-subadviser. The Board also considered that PGIM Investments pays the salaries of all of the officers and interested Trustees of the Fund who are part of Fund management. The Board also considered the investment subadvisory services provided by PGIM Fixed Income and PGIML, including investment research and security selection, as well as adherence to the Fund’s investment restrictions and compliance with applicable Fund policies and procedures. The Board considered PGIM Investments’ evaluation of the subadviser and sub-subadviser, as well as PGIM Investments’ recommendation, based on its review of the subadviser and sub-subadviser, to renew the subadvisory and sub-subadvisory agreements.
The Board considered the qualifications, backgrounds and responsibilities of PGIM Investments’ senior management responsible for the oversight of the Fund, PGIM Fixed Income, and PGIML, and also considered the qualifications, backgrounds and responsibilities of PGIM Fixed Income’s portfolio managers who are responsible for the day-to-day management of the Fund’s portfolio. The Board was provided with information
| | |
| Visit our website at pgiminvestments.com | | |
pertaining to PGIM Investments’, PGIM Fixed Income’s, and PGIML’s organizational structure, senior management, investment operations, and other relevant information pertaining to PGIM Investments, PGIM Fixed Income, and PGIML. The Board also noted that it received favorable compliance reports from the Fund’s Chief Compliance Officer (“CCO”) as to PGIM Investments, PGIM Fixed Income, and PGIML. The Board noted that PGIM Fixed Income and PGIML are affiliated with PGIM Investments.
The Board concluded that it was satisfied with the nature, extent and quality of the investment management services provided by PGIM Investments, the subadvisory services provided to the Fund by PGIM Fixed Income, and the sub-subadvisory services provided by PGIML, and that there was a reasonable basis on which to conclude that the Fund benefits from the services provided by PGIM Investments, PGIM Fixed Income, and PGIML under the management and subadvisory agreements.
Costs of Services and Profits Realized by PGIM Investments
The Board was provided with information on the profitability of PGIM Investments and its affiliates in serving as the Fund’s investment manager. The Board discussed with PGIM Investments the methodology utilized in assembling the information regarding profitability and considered its reasonableness. The Board recognized that it is difficult to make comparisons of profitability from fund management contracts because comparative information is not generally publicly available and is affected by numerous factors, including the structure of the particular adviser, the types of funds it manages, its business mix, numerous assumptions regarding allocations and the adviser’s capital structure and cost of capital. The Board noted that the cost of services provided by PGIM Investments to the Fund during the year ended December 31, 2016 exceeded the management fees paid by the Fund, resulting in an operating loss to PGIM Investments. The Board further noted that the subadviser and sub-subadviser are affiliated with PGIM Investments and that their profitability is reflected in PGIM Investments’ profitability report. Taking these factors into account, the Board concluded that the profitability of PGIM Investments and its affiliates in relation to the services rendered was not unreasonable.
Economies of Scale
The Board received and discussed information concerning economies of scale that PGIM Investments may realize as the Fund’s assets grow beyond current levels. The Board noted that the management fee schedule for the Fund includes breakpoints, which have the effect of decreasing the fee rate as assets increase, but that at its current level of assets the Fund does not realize the effect of those rate reductions. The Board took note that the Fund’s fee structure currently results in benefits to Fund shareholders whether or not PGIM Investments realizes any economies of scale. The Board noted that economies of scale can
| | |
| Prudential Core Bond Fund |
Approval of Advisory Agreement (continued)
be shared with the Fund in other ways, including low management fees from inception, additional technological and personnel investments to enhance shareholder services, and maintaining existing expense structures in the face of a rising cost environment. The Board also considered PGIM Investments’ assertion that it continually evaluates the management fee schedule of the Fund and the potential to share economies of scale through breakpoints or fee waivers as asset levels increase.
The Board recognized the inherent limitations of any analysis of economies of scale, stemming largely from the Board’s understanding that most of PGIM Investments’ costs are not specific to individual funds, but rather are incurred across a variety of products and services.
Other Benefits to PGIM Investments, PGIM Fixed Income, and PGIML
The Board considered potential ancillary benefits that might be received by PGIM Investments, PGIM Fixed Income, and PGIML and their affiliates as a result of their relationship with the Fund. The Board concluded that potential benefits to be derived by PGIM Investments included transfer agency fees received by the Fund’s transfer agent (which is affiliated with PGIM Investments), as well as benefits to its reputation or other intangible benefits resulting from PGIM Investments’ association with the Fund. The Board concluded that the potential benefits to be derived by PGIM Fixed Income and PGIML included the ability to use soft dollar credits, as well as the potential benefits consistent with those generally resulting from an increase in assets under management, specifically, potential access to additional research resources and benefits to their reputations. The Board concluded that the benefits derived by PGIM Investments, PGIM Fixed Income, and PGIML were consistent with the types of benefits generally derived by investment managers and subadvisers to mutual funds.
Performance of the Fund / Fees and Expenses
The Board considered certain additional specific factors and made related conclusions relating to the historical performance of the Fund for the one-, three-, five- and ten-year periods ended December 31, 2016.
The Board also considered the Fund’s actual management fee, as well as the Fund’s net total expense ratio, for the fiscal year ended July 31, 2016. The Board considered the management fee for the Fund as compared to the management fee charged by PGIM Investments to other funds and the fee charged by other advisers to comparable mutual funds in a Peer Group. The actual management fee represents the fee rate actually paid by Fund shareholders and includes any fee waivers or reimbursements. The net total expense ratio for the Fund represents the actual expense ratio incurred by Fund shareholders.
| | |
| Visit our website at pgiminvestments.com | | |
The mutual funds included in the Peer Universe (the Lipper Core Bond Funds Performance Universe), which was used to consider performance, and the Peer Group, which was used to consider fees and expenses, were objectively determined by Broadridge, an independent provider of mutual fund data. The comparisons placed the Fund in various quartiles, with the first quartile being the best 25% of the mutual funds (for performance, the best performing mutual funds and, for expenses, the lowest cost mutual funds).
The section below summarizes key factors considered by the Board and the Board’s conclusions regarding the Fund’s performance, fees and overall expenses. The table sets forth gross performance comparisons (which do not reflect the impact on performance of fund expenses, or any subsidies, expense caps or waivers that may be applicable) with the Peer Universe, actual management fees with the Peer Group (which reflect the impact of any subsidies or fee waivers), and net total expenses with the Peer Group, each of which were key factors considered by the Board.
| | | | | | | | |
| Performance | | 1 Year | | 3 Years | | 5 Years | | 10 Years |
| | | 2nd Quartile | | 4th Quartile | | 4th Quartile | | 1st Quartile |
| Actual Management Fees: 1st Quartile |
| Net Total Expenses: 2nd Quartile |
| | • | | The Board noted that the Fund outperformed its benchmark index over the one-, five-, and ten-year periods. |
| | • | | The Board noted that during the first quarter of 2015, the Fund implemented new investment policies and investment strategies, changed its investment objective, and appointed a new subadviser to replace the Fund’s former subadvisers. As a result, the Fund’s past performance prior to that date did not reflect the current management of the Fund. |
| | • | | The Board and PGIM Investments agreed to continue the Fund’s existing expense cap, which caps the Fund’s annual operating expenses at 0.45% (exclusive of 12b-1 and certain other fees) and at 0.40% (exclusive of 12b-1 fees, transfer agent and certain other fees) through November 30, 2017. |
| | • | | The Board concluded that, in light of the above, it would be in the best interests of the Fund and its shareholders to renew the agreements. |
| | • | | The Board concluded that the management fees (including subadvisory fees) and total expenses were reasonable in light of the services provided. |
* * *
After full consideration of these factors, the Board concluded that the approval of the agreements was in the best interests of the Fund and its shareholders.
| | |
| Prudential Core Bond Fund |
| | | | |
| ∎ MAIL | | ∎ TELEPHONE | | ∎ WEBSITE |
655 Broad Street Newark, NJ 07102 | | (800) 225-1852 | | www.pgiminvestments.com |
|
| PROXY VOTING |
| The Board of Trustees has delegated to the Fund’s investment subadviser the responsibility for voting any proxies and maintaining proxy recordkeeping with respect to the Fund. A description of these proxy voting policies and procedures is available without charge, upon request, by calling (800) 225-1852. Information regarding how the Fund voted proxies relating to portfolio securities during the most recent 12-month period ended June 30 is available on the Fund’s website and on the Securities and Exchange Commission’s website at www.sec.gov. |
|
| TRUSTEES |
| Ellen S. Alberding • Kevin J. Bannon • Scott E. Benjamin • Linda W. Bynoe • Barry H. Evans • Keith F. Hartstein • Laurie Simon Hodrick • Michael S. Hyland • Stuart S. Parker • Richard A. Redeker • Stephen G. Stoneburn • Grace C. Torres |
|
| OFFICERS |
| Stuart S. Parker, President • Scott E. Benjamin, Vice President • M. Sadiq Peshimam, Treasurer and Principal Financial and Accounting Officer • Raymond A. O’Hara, Chief Legal Officer • Chad A. Earnst, Chief Compliance Officer • Deborah A. Docs, Secretary • Charles H. Smith, Anti-Money Laundering Compliance Officer • Jonathan D. Shain, Assistant Secretary • Claudia DiGiacomo, Assistant Secretary • Andrew R. French, Assistant Secretary • Peter Parrella, Assistant Treasurer • Lana Lomuti, Assistant Treasurer • Linda McMullin, Assistant Treasurer • Kelly A. Coyne, Assistant Treasurer |
| | | | |
| MANAGER | | PGIM Investments LLC | | 655 Broad Street Newark, NJ 07102 |
|
| INVESTMENT SUBADVISER | | PGIM Fixed Income | | 655 Broad Street Newark, NJ 07102 |
|
| DISTRIBUTOR | | Prudential Investment Management Services LLC | | 655 Broad Street
Newark, NJ 07102 |
|
| CUSTODIAN | | The Bank of New York Mellon | | 225 Liberty Street New York, NY 10286 |
|
| TRANSFER AGENT | | Prudential Mutual Fund Services LLC | | PO Box 9658 Providence, RI 02940 |
|
| INDEPENDENT REGISTERED PUBLIC ACCOUNTING FIRM | | KPMG LLP | | 345 Park Avenue New York, NY 10154 |
|
| FUND COUNSEL | | Willkie Farr & Gallagher LLP | | 787 Seventh Avenue New York, NY 10019 |
|
|
| An investor should consider the investment objectives, risks, charges, and expenses of the Fund carefully before investing. The prospectus and summary prospectus contain this and other information about the Fund. An investor may obtain a prospectus and summary prospectus by visiting our website at www.pgiminvestments.com or by calling (800) 225-1852. The prospectus and summary prospectus should be read carefully before investing. |
|
| E-DELIVERY |
| To receive your mutual fund documents online, go to www.pgiminvestments.com/edelivery and enroll. Instead of receiving printed documents by mail, you will receive notification via email when new materials are available. You can cancel your enrollment or change your email address at any time by visiting the website address above. |
|
| SHAREHOLDER COMMUNICATIONS WITH TRUSTEES |
| Shareholders can communicate directly with the Board of Trustees by writing to the Chair of the Board, Prudential Core Bond Fund, PGIM Investments, Attn: Board of Trustees, 655 Broad Street, Newark, NJ 07102. Shareholders can communicate directly with an individual Trustee by writing to the same address. Communications are not screened before being delivered to the addressee. |
|
| AVAILABILITY OF PORTFOLIO SCHEDULE |
| The Fund files its complete schedule of portfolio holdings with the Securities and Exchange Commission for the first and third quarters of each fiscal year on Form N-Q. The Fund’s Forms N-Q are available on the Commission’s website at www.sec.gov. The Fund’s Forms N-Q may also be reviewed and copied at the Commission’s Public Reference Room in Washington, D.C. Information on the operation and location of the Public Reference Room may be obtained by calling 1-800-SEC-0330. The Fund’s schedule of portfolio holdings is also available on the Fund’s website as of the end of each month no sooner than 15 days after the end of the month. |
|
| The Fund’s Statement of Additional Information contains additional information about the Fund’s Trustees and is available without charge, upon request, by calling (800) 225-1852. |
Mutual Funds:
| | | | |
ARE NOT INSURED BY THE FDIC OR ANY
FEDERAL GOVERNMENT AGENCY | | MAY LOSE VALUE | | ARE NOT A DEPOSIT OF OR GUARANTEED
BY ANY BANK OR ANY BANK AFFILIATE |
PRUDENTIAL CORE BOND FUND
| | | | | | | | | | |
| SHARE CLASS | | A | | C | | Q | | R | | Z |
| NASDAQ | | TPCAX | | TPCCX | | TPCQX | | TPCRX | | TAIBX |
| CUSIP | | 875921769 | | 875921751 | | 875921744 | | 875921736 | | 875921801 |
MF226E
Item 2 – Code of Ethics – – See Exhibit (a)
As of the end of the period covered by this report, the registrant has adopted a code of ethics (the “Section 406 Standards for Investment Companies – Ethical Standards for Principal Executive and Financial Officers”) that applies to the registrant’s Principal Executive Officer and Principal Financial Officer; the registrant’s Principal Financial Officer also serves as the Principal Accounting Officer.
The registrant hereby undertakes to provide any person, without charge, upon request, a copy of the code of ethics. To request a copy of the code of ethics, contact the registrant 800-225-1852, and ask for a copy of the Section 406 Standards for Investment Companies - Ethical Standards for Principal Executive and Financial Officers.
| Item 3 | – Audit Committee Financial Expert – |
The registrant’s Board has determined that Mr. Kevin J. Bannon, member of the Board’s Audit Committee is an “audit committee financial expert,” and that he is “independent,” for purposes of this Item.
Item 4 – Principal Accountant Fees and Services –
(a) Audit Fees
For the fiscal years ended July 31, 2017 and July 31, 2016, KPMG LLP (“KPMG”), the Registrant’s principal accountant, billed the Registrant $163,898 and $160,625 respectively, for professional services rendered for the audit of the Registrant’s annual financial statements or services that are normally provided in connection with statutory and regulatory filings. In addition to the above, $18,000 of audit fees billed by KPMG were paid by PGIM Investments, LLC and/or its affiliates for the fiscal year ended July 31, 2017.
(b) Audit-Related Fees
For the fiscal years ended July 31, 2017 and July 31, 2016: none.
(c) Tax Fees
For the fiscal years ended July 31, 2017 and July 31, 2016: none.
(d) All Other Fees
For the fiscal years ended July 31, 2017 and July 31, 2016: none.
(e) (1) Audit Committee Pre-Approval Policies and Procedures
THE PRUDENTIAL MUTUAL FUNDS
AUDIT COMMITTEE POLICY
on
Pre-Approval of Services Provided by the Independent Accountants
The Audit Committee of each Prudential Mutual Fund is charged with the responsibility to monitor the independence of the Fund’s independent accountants. As part of this responsibility, the Audit Committee must pre-approve the independent accounting firm’s engagement to render audit and/or permissible non-audit services, as required by law. In evaluating a proposed engagement of the independent accountants, the Audit Committee will assess the effect that the engagement might reasonably be expected to have on the accountant’s independence. The Committee’s evaluation will be based on:
| | ● | | a review of the nature of the professional services expected to be provided, |
| | ● | | a review of the safeguards put into place by the accounting firm to safeguard independence, and |
| | ● | | periodic meetings with the accounting firm. |
Policy for Audit and Non-Audit Services Provided to the Funds
On an annual basis, the scope of audits for each Fund, audit fees and expenses, and audit-related and non-audit services (and fees proposed in respect thereof) proposed to be performed by the Fund’s independent accountants will be presented by the Treasurer and the independent accountants to the Audit Committee for review and, as appropriate, approval prior to the initiation of such services. Such presentation shall be accompanied by confirmation by both the Treasurer and the independent accountants that the proposed non-audit services will not adversely affect the independence of the independent accountants. Such proposed non-audit services shall be described in sufficient detail to enable the Audit Committee to assess the appropriateness of such services and fees, and the compatibility of the provision of such services with the auditor’s independence. The Committee shall receive periodic reports on the progress of the audit and other services which are approved by the Committee or by the Committee Chair pursuant to authority delegated in this Policy.
The categories of services enumerated under “Audit Services”, “Audit-related Services”, and “Tax Services” are intended to provide guidance to the Treasurer and the independent accountants as to those categories of services which the Committee believes are generally consistent with the independence of the independent accountants and which the Committee (or the Committee Chair) would expect upon the presentation of specific proposals to pre-approve. The enumerated categories are not intended as an exclusive list of audit, audit-related or tax services, which the Committee (or the Committee Chair) would consider for pre-approval.
Audit Services
The following categories of audit services are considered to be consistent with the role of the Fund’s independent accountants:
| | Ø | Annual Fund financial statement audits |
| | Ø | Seed audits (related to new product filings, as required) |
| | Ø | SEC and regulatory filings and consents |
Audit-related Services
The following categories of audit-related services are considered to be consistent with the role of the Fund’s independent accountants:
| | Ø | Accounting consultations |
| | Ø | Fund merger support services |
| | Ø | Agreed Upon Procedure Reports |
| | Ø | Other Internal Control Reports |
Individual audit-related services that fall within one of these categories (except for fund merger support services) and are not presented to the Audit Committee as part of the annual pre-approval process are subject to an authorized pre-approval by the Audit Committee so long as the estimated fee for those services does not exceed $30,000. Any services provided under such pre-approval will be reported to the Audit Committee at its next regular meeting. Should the amount of such services exceed $30,000 any additional fees will be subject to pre-approval by the Committee Chair (or any other Committee member on whom this responsibility has been delegated). Fees related to fund merger support services are subject to a separate authorized pre-approval by the Audit Committee with fees determined on a per occurrence and merger complexity basis.
Tax Services
The following categories of tax services are considered to be consistent with the role of the Fund’s independent accountants:
| | Ø | Tax compliance services related to the filing or amendment of the following: |
| | ◾ | Federal, state and local income tax compliance; and, |
| | ◾ | Sales and use tax compliance |
| | Ø | Timely RIC qualification reviews |
| | Ø | Tax distribution analysis and planning |
| | Ø | Tax authority examination services |
| | Ø | Tax appeals support services |
| | Ø | Accounting methods studies |
| | Ø | Fund merger support services |
| | Ø | Tax consulting services and related projects |
Individual tax services that fall within one of these categories and are not presented to the Audit Committee as part of the annual pre-approval process are subject to an authorized pre-approval by the Audit Committee so long as the estimated fee for those services does not exceed $30,000. Any services provided under such pre-approval will be reported to the Audit Committee at its next regular meeting. Should the amount of such services exceed $30,000 any additional fees will
be subject to pre-approval by the Committee Chair (or any other Committee member on whom this responsibility has been delegated).
Other Non-Audit Services
Certain non-audit services that the independent accountants are legally permitted to render will be subject to pre-approval by the Committee or by one or more Committee members to whom the Committee has delegated this authority and who will report to the full Committee any pre-approval decisions made pursuant to this Policy. Non-audit services presented for pre-approval pursuant to this paragraph will be accompanied by a confirmation from both the Treasurer and the independent accountants that the proposed services will not adversely affect the independence of the independent accountants.
Proscribed Services
The Fund’s independent accountants will not render services in the following categories of non-audit services:
| | Ø | Bookkeeping or other services related to the accounting records or financial statements of the Fund |
| | Ø | Financial information systems design and implementation |
| | Ø | Appraisal or valuation services, fairness opinions, or contribution-in-kind reports |
| | Ø | Internal audit outsourcing services |
| | Ø | Management functions or human resources |
| | Ø | Broker or dealer, investment adviser, or investment banking services |
| | Ø | Legal services and expert services unrelated to the audit |
| | Ø | Any other service that the Public Company Accounting Oversight Board determines, by regulation, is impermissible. |
Pre-approval of Non-Audit Services Provided to Other Entities Within the Prudential Fund Complex
Certain non-audit services provided to PGIM Investments LLC or any of its affiliates that also provide ongoing services to the Prudential Mutual Funds will be subject to pre-approval by the Audit Committee. The only non-audit services provided to these entities that will require pre-approval are those related directly to the operations and financial reporting of the Funds. Individual projects that are not presented to the Audit Committee as part of the annual pre-approval process will be subject to pre-approval by the Committee Chair (or any other Committee member on whom this responsibility has been delegated) so long as the estimated fee for those services does not exceed $30,000. Services presented for pre-approval pursuant to this paragraph will be accompanied by a confirmation from both the Treasurer and the independent accountants that the proposed services will not adversely affect the independence of the independent accountants.
Although the Audit Committee will not pre-approve all services provided to PGIM Investments LLC and its affiliates, the Committee will receive an annual report from the Fund’s
independent accounting firm showing the aggregate fees for all services provided to PGIM Investments LLC and its affiliates.
(e) (2) Percentage of services referred to in 4(b) – 4(d) that were approved by the audit committee –
For the fiscal years ended July 31, 2017 and July 31, 2016: none.
(f) Percentage of hours expended attributable to work performed by other than full time employees of principal accountant if greater than 50%.
The percentage of hours expended on the principal accountant’s engagement to audit the registrant’s financial statements for the most recent fiscal year that were attributed to work performed by persons other than the principal accountant’s full-time, permanent employees was 0%.
(g) Non-Audit Fees
The aggregate non-audit fees billed by KPMG for services rendered to the registrant’s investment adviser and any entity controlling, controlled by, or under common control with the investment adviser that provides ongoing services to the registrant for the fiscal years ended July 31, 2017 and July 31, 2016 was $0 and $0, respectively.
(h) Principal Accountant’s Independence
Not applicable as KPMG has not provided non-audit services to the registrant’s investment adviser and any entity controlling, controlled by, or under common control with the investment adviser that provides ongoing services to the registrant that were not pre-approved pursuant to Rule 2-01(c)(7)(ii) of Regulation S-X.
| | | | |
| Item 5 | | – | | Audit Committee of Listed Registrants – Not applicable. |
| | |
| Item 6 | | – | | Schedule of Investments – The schedule is included as part of the report to shareholders filed under Item 1 of this Form. |
| | |
| Item 7 | | – | | Disclosure of Proxy Voting Policies and Procedures for Closed-End Management Investment Companies – Not applicable. |
| | |
| Item 8 | | – | | Portfolio Managers of Closed-End Management Investment Companies – Not applicable. |
| | |
| Item 9 | | – | | Purchases of Equity Securities by Closed-End Management Investment Company and Affiliated Purchasers – Not applicable. |
| | |
| Item 10 | | – | | Submission of Matters to a Vote of Security Holders – Not applicable. |
| | |
| Item 11 | | – | | Controls and Procedures |
| | (a) | It is the conclusion of the registrant’s principal executive officer and principal financial officer that the effectiveness of the registrant’s current disclosure controls and procedures (such disclosure controls and procedures having been evaluated within 90 days of the date of this filing) provide reasonable assurance that the information required to be disclosed by the registrant has been recorded, processed, summarized and reported within the time period specified in the Commission’s rules and forms and that the information |
| | required to be disclosed by the registrant has been accumulated and communicated to the registrant’s principal executive officer and principal financial officer in order to allow timely decisions regarding required disclosure. |
| | (b) | There has been no significant change in the registrant’s internal control over financial reporting that occurred during the registrant’s most recent fiscal quarter of the period covered by this report that has materially affected, or is likely to materially affect, the registrant’s internal control over financial reporting. |
Item 12 – Exhibits
| | (a) | (1) Code of Ethics – Attached hereto as Exhibit EX-99.CODE-ETH |
| | (2) | Certifications pursuant to Section 302 of the Sarbanes-Oxley Act – Attached hereto as Exhibit EX-99.CERT. |
| | (3) | Any written solicitation to purchase securities under Rule 23c-1. – Not applicable. |
| | (b) | Certifications pursuant to Section 906 of the Sarbanes-Oxley Act – Attached hereto as Exhibit EX-99.906CERT. |
SIGNATURES
Pursuant to the requirements of the Securities Exchange Act of 1934 and the Investment Company Act of 1940, the registrant has duly caused this report to be signed on its behalf by the undersigned, thereunto duly authorized.
| | |
Registrant: | | The Target Portfolio Trust |
| |
By: | | /s/ Deborah A. Docs |
| | Deborah A. Docs |
| | Secretary |
| |
Date: | | September 21, 2017 |
Pursuant to the requirements of the Securities Exchange Act of 1934 and the Investment Company Act of 1940, this report has been signed below by the following persons on behalf of the registrant and in the capacities and on the dates indicated.
| | |
By: | | /s/ Stuart S. Parker |
| | Stuart S. Parker |
| | President and Principal Executive Officer |
| |
Date: | | September 21, 2017 |
| |
By: | | /s/ M. Sadiq Peshimam |
| | M. Sadiq Peshimam |
| | Treasurer and Principal Financial and Accounting Officer |
| |
Date: | | September 21, 2017 |