UNITED STATES
SECURITIES AND EXCHANGE COMMISSION
Washington, D.C. 20549
FORM N-CSR
CERTIFIED SHAREHOLDER REPORT OF REGISTERED MANAGEMENT INVESTMENT COMPANIES
| | |
| Investment Company Act file number: | | 811-07064 |
| |
| Exact name of registrant as specified in charter: | | The Target Portfolio Trust |
| |
| Address of principal executive offices: | | 655 Broad Street, 17th Floor Newark, New Jersey 07102 |
| |
| Name and address of agent for service: | | Andrew R. French 655 Broad Street, 17th Floor Newark, New Jersey 07102 |
| |
| Registrant’s telephone number, including area code: | | 800-225-1852 |
| |
| Date of fiscal year end: | | 7/31/2020 |
| |
| Date of reporting period: | | 7/31/2020 |
Item 1 – Reports to Stockholders

PGIM CORPORATE BOND FUND
ANNUAL REPORT
JULY 31, 2020
COMING SOON: PAPERLESS SHAREHOLDER REPORTS
Beginning on January 1, 2021, as permitted by regulations adopted by the Securities and Exchange Commission, paper copies of the Fund’s annual and semiannual shareholder reports will no longer be sent by mail, unless you specifically request paper copies of the reports. Instead, the reports will be made available on the Fund’s website (pgim.com/investments), and you will be notified by mail each time a report is posted and provided with a website link to access the report.
If you already elected to receive shareholder reports electronically, you will not be affected by this change and you need not take any action. You may elect to receive shareholder reports and other communications from the Fund electronically anytime by contacting your financial intermediary (such as a broker-dealer or bank) or, if you are a direct investor, by calling 1-800-225-1852 or by sending an email request to PGIM Investments at shareholderreports@pgim.com.
You may elect to receive all future reports in paper free of charge. If you invest through a financial intermediary, you can contact your financial intermediary or follow instructions included with this notice to elect to continue to receive paper copies of your shareholder reports. If you invest directly with the Fund, you can call 1-800-225-1852 or send an email request to shareholderreports@pgim.com to let the Fund know you wish to continue receiving paper copies of your shareholder reports. Your election to receive reports in paper will apply to all funds held in your account if you invest through your financial intermediary or all funds held with the fund complex if you invest directly with the Fund.

To enroll in e-delivery, go to pgim.com/investments/resource/edelivery
Table of Contents
This report is not authorized for distribution to prospective investors unless preceded or accompanied by a current prospectus.
The views expressed in this report and information about the Fund’s portfolio holdings are for the period covered by this report and are subject to change thereafter.
Mutual funds are distributed by Prudential Investment Management Services LLC (PIMS), member SIPC. PGIM Fixed Income is a unit of PGIM, Inc. (PGIM), a registered investment adviser. PIMS and PGIM are Prudential Financial companies. © 2020 Prudential Financial, Inc. and its related entities. PGIM and the PGIM logo are service marks of Prudential Financial, Inc. and its related entities, registered in many jurisdictions worldwide.
| | |
| 2 | | Visit our website at pgim.com/investments |
Letter from the President

Dear Shareholder:
We hope you find the annual report for the PGIM Corporate Bond Fund informative and useful. The report covers performance for the 12-month period that ended July 31, 2020.
During the first half of the period, the global economy remained healthy—particularly in the US—fueled by rising corporate profits and strong job growth. The outlook changed dramatically in March as the coronavirus outbreak quickly and substantially shut down economic activity worldwide, leading to significant job losses and a steep decline in global growth and earnings. Responding to this disruption, the Federal Reserve (the Fed) cut the federal funds rate target to near zero and flooded capital markets with liquidity; and Congress passed stimulus bills worth approximately $3 trillion that offered an economic lifeline to consumers and businesses.
While stocks climbed throughout the first half of the period, they fell significantly in March amid a spike in volatility, ending the 11-year-long equity bull market. With stores and factories closing and consumers staying at home to limit the spread of the virus, investors sold stocks on fears that corporate earnings would take a serious hit. As states reopened their economies in the spring and early summer, a strong equity market rally helped large-cap US and emerging market stocks post gains during the period, while US small caps and stocks in developed foreign markets declined.
The bond market overall—including US and global bonds as well as emerging market debt—rose during the period as investors sought safety in fixed income. A significant rally in interest rates pushed the 10-year US Treasury yield down to a record low. In March, the Fed took several aggressive actions to keep the bond markets running smoothly, restarting many of the relief programs that proved to be successful in helping end the global financial crisis in 2008-09.
Regarding your investments with PGIM, we believe it is important to maintain a diversified portfolio of funds consistent with your tolerance for risk, time horizon, and financial goals. Your financial advisor can help you create a diversified investment plan that may include funds covering all the basic asset classes and that reflects your personal investor profile and risk tolerance. However, diversification and asset allocation strategies do not assure a profit or protect against loss in declining markets.
At PGIM Investments, we consider it a great privilege and responsibility to help investors participate in opportunities across global markets while meeting their toughest investment challenges. PGIM is a top-10 global investment manager with more than $1 trillion in assets under management. This scale and investment expertise allow us to deliver actively managed funds and strategies to meet the needs of investors around the globe.
Thank you for choosing our family of funds.
Sincerely,

Stuart S. Parker, President
PGIM Corporate Bond Fund
September 15, 2020
| | | | |
| PGIM Corporate Bond Fund | | | 3 | |
Your Fund’s Performance (unaudited)
Performance data quoted represent past performance. Past performance does not guarantee future results. The investment return and principal value of an investment will fluctuate, so that an investor’s shares, when redeemed, may be worth more or less than their original cost. Current performance may be lower or higher than the past performance data quoted. An investor may obtain performance data as of the most recent month-end by visiting our website at pgim.com/investments or by calling (800) 225-1852.
| | | | | | | | |
| |
| | | Average Annual Total Returns as of 7/31/20 |
| | | One Year (%) | | Five Years (%) | | Ten Years (%) | | Since Inception (%) |
| Class A | | | | | | | | |
| (with sales charges) | | 7.00 | | 5.20 | | N/A | | 4.77 (5/28/15) |
| (without sales charges) | | 10.59 | | 5.90 | | N/A | | 5.44 (5/28/15) |
| Class C | | | | | | | | |
| (with sales charges) | | 8.79 | | 5.08 | | N/A | | 4.62 (5/28/15) |
| (without sales charges) | | 9.79 | | 5.08 | | N/A | | 4.62 (5/28/15) |
| Class R | | | | | | | | |
| (without sales charges) | | 10.34 | | 5.60 | | N/A | | 5.13 (5/28/15) |
| Class Z | | | | | | | | |
| (without sales charges) | | 10.89 | | 6.11 | | 4.60 | | — |
| Class R6 | | | | | | | | |
| (without sales charges) | | 10.89 | | 6.13 | | N/A | | 5.65 (5/28/15) |
| Bloomberg Barclays US Credit Index |
| | | 11.86 | | 6.05 | | 5.36 | | 5.62 |
Since Inception returns are provided for any share class with less than 10 fiscal years of returns. Since Inception returns for the Index are measured from the closest month-end to the class’ inception date.
| | |
| 4 | | Visit our website at pgim.com/investments |
Growth of a $10,000 Investment
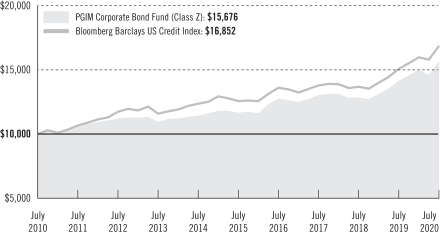
The graph compares a $10,000 investment in the Fund’s Class Z shares with a similar investment in the Bloomberg Barclays US Credit Index by portraying the initial account values at the beginning of the 10-year period (July 31, 2010) and the account values at the end of the current fiscal year (July 31, 2020), as measured on a quarterly basis. For purposes of the graph, and unless otherwise indicated, it has been assumed that (a) all recurring fees (including management fees) were deducted; and (b) all dividends and distributions were reinvested. The line graph provides information for Class Z shares only. As indicated in the tables provided earlier and in the following paragraphs, performance for other share classes will vary due to the differing charges and expenses applicable to each share class (as indicated in the following paragraphs). Without waiver of fees and/or expense reimbursements, if any, the returns would have been lower.
| | | | |
| PGIM Corporate Bond Fund | | | 5 | |
Your Fund’s Performance (continued)
The returns in the tables do not reflect the deduction of taxes that a shareholder would pay on Fund distributions or following the redemption of Fund shares. The average annual total returns take into account applicable sales charges, which are described in the table below.
| | | | | | | | | | |
| | | | | | |
| | | Class A | | Class C | | Class R | | Class Z | | Class R6 |
| Maximum initial sales charge | | 3.25% of the public offering price | | None | | None | | None | | None |
| Contingent deferred sales charge (CDSC) (as a percentage of the lower of the original purchase price or the net asset value at redemption) | | For purchases prior to July 15, 2019: 1.00% on sales of $1 million or more made within 12 months of purchase For purchases on or after July 15, 2019: 1.00% on sales of $500,000 or more made within 12 months of purchase | | 1.00% on sales made within 12 months of purchase | | None | | None | | None |
| Annual distribution or distribution and service (12b-1) fees (shown as a percentage of average daily net assets) | | 0.25% | | 1.00% | | 0.75% (0.50% currently) | | None | | None |
| | |
| 6 | | Visit our website at pgim.com/investments |
Benchmark Definitions
Bloomberg Barclays US Credit Index—The Bloomberg Barclays US Credit Index measures the performance of investment grade corporate debt and agency bonds that are dollar denominated and have a remaining maturity greater than one year.
Investors cannot invest directly in an index. The returns for the Index would be lower if they included the effects of sales charges, operating expenses of a mutual fund, or taxes.
| | | | | | |
| | |
| Distributions and Yields as of 7/31/20 | | | | |
| | Total Distributions
Paid for
12 Months ($) | | SEC 30-Day
SubsidizedYield* (%) | | SEC 30-Day
Unsubsidized
Yield** (%) |
| Class A | | 0.34 | | 1.43 | | 0.33 |
| Class C | | 0.25 | | 0.75 | | -1.00 |
| Class R | | 0.31 | | 1.20 | | -132.96 |
| Class Z | | 0.36 | | 1.73 | | 1.19 |
| Class R6 | | 0.36 | | 1.73 | | 1.23 |
*SEC 30-Day Subsidized Yield (%)—A standardized yield calculation created by the Securities and Exchange Commission, it reflects the income earned during a 30-day period, after the deduction of the Fund’s net expenses (net of any expense waivers or reimbursements). The investor experience is represented by the SEC 30-Day Subsidized Yield.
**SEC 30-Day Unsubsidized Yield (%)—A standardized yield calculation created by the Securities and Exchange Commission, it reflects the income earned during a 30-day period, after the deduction of the Fund’s gross expenses. The investor experience is represented by the SEC 30-Day Subsidized Yield.
| | | | |
|
| Credit Quality expressed as a percentage of total investments as of 7/31/20 | |
| AAA | | | 6.6 | |
| AA | | | 10.1 | |
| A | | | 33.7 | |
| BBB | | | 38.8 | |
| BB | | | 4.1 | |
| Cash/Cash Equivalents | | | 6.7 | |
| Total Investments | | | 100.0 | |
Credit ratings reflect the highest rating assigned by a nationally recognized statistical rating organization (NRSRO) such as Moody’s Investors Service, Inc. (Moody’s), S&P Global Ratings (S&P), or Fitch, Inc. (Fitch). Credit ratings reflect the common nomenclature used by both S&P and Fitch. Where applicable, ratings are converted to the comparable S&P/Fitch rating tier nomenclature. These rating agencies are independent, and are widely used. Credit ratings are subject to change.
| | | | |
| PGIM Corporate Bond Fund | | | 7 | |
Strategy and Performance Overview
How did the Fund perform?
The PGIM Corporate Bond Fund’s Class Z shares returned 10.89% in the 12-month reporting period that ended July 31, 2020, underperforming the 11.86% return of the Bloomberg Barclays US Credit Index (the Index).
What were the market conditions?
| | • | | Investment-grade corporate bonds posted strong results in the third quarter of 2019 amid continued (albeit low) growth, stable inflation, strong technicals, and central banks that appeared set to provide stimulus. Market sentiment was somewhat mixed, as escalating US-China trade tensions were offset by solid credit metrics and slowing merger-and-acquisition (M&A) activity. |
| | • | | In the fourth quarter of 2019, investment-grade corporate bonds again generated positive returns, as underlying trends remained supportive. Credit metrics remained a bright spot amid strong profit margins and ample free cashflow. Positive (albeit moderating) economic growth, accommodative central banks, and investors’ ongoing search for yield contributed to tightening credit spreads. (Credit spreads are yield differentials between corporate bonds and US Treasury securities of comparable maturity.) |
| | • | | During the first quarter of 2020, investment-grade corporate bonds succumbed to the unprecedented economic and business pressures resulting from the emergence of COVID-19 and a dramatic slide in oil prices. US corporate spreads rose to a high of approximately 375 basis points (bps) in mid-March before narrowing into quarter-end following aggressive actions from the Federal Reserve (the Fed). (One basis point equals 0.01%.) |
| | • | | Investment-grade corporate bonds rebounded sharply in the second quarter of 2020, as the Fed’s aggressive stimulus actions—including a near-zero federal funds rate as well as primary and secondary credit facilities—significantly improved market liquidity. The Fed’s maneuvering to allow for the purchases of individual corporate bonds, in addition to its ongoing purchases of exchange-traded funds, sent a strong signal to the markets of its intent to not only provide a backstop but also to drive funding markets back to normal. At quarter end, however, a more cautious tone emerged as a spike in US virus counts raised the prospect of delayed reopenings and a more prolonged recovery, which weighed on the market. |
| | • | | In July 2020, investment-grade corporate bonds continued to recover against the backdrop of better-than-feared corporate earnings, favorable vaccine headlines, additional steps toward reopening the US economy, improving market technicals, and ongoing support from the Fed. US corporate spreads ended the reporting period at 132 bps. |
| | |
| 8 | | Visit our website at pgim.com/investments |
What worked?
| | • | | Security selection in investment-grade corporate bonds was the largest contributor to the Fund’s relative performance during the reporting period, highlighted by positioning in the healthcare & pharmaceutical, automotive, and upstream energy sectors. |
| | • | | Underweight positioning in emerging markets debt also added to performance. |
| | • | | In individual security selection, the Fund benefited from underweights in Occidental Petroleum Corp. (upstream energy) and General Motors Co. (automotive) and its overweight in AbbVie Inc. (healthcare & pharmaceuticals). |
What didn’t work?
| | • | | An overweight to commercial mortgage-backed securities and municipal bonds, as well as an underweight to investment-grade corporates on a spread duration contribution basis, hurt the Fund’s relative performance. (Duration measures the sensitivity of the price—the value of principal—of a bond to a change in interest rates. Spread duration is the change in a bond’s price for a 100-bps change in that bond’s spread versus a US Treasury security of similar maturity.) |
| | • | | Security selection in municipal bonds and emerging markets debt was also a detractor. |
| | • | | The Fund’s positioning in the midstream energy, foreign non-corporate, and telecom sectors detracted from performance. |
| | • | | In individual security selection, the Fund’s overweights in Cenovus Energy Inc. (upstream energy), Oneok, Inc. (midstream energy), and Sunoco LP (midstream energy) limited results. |
Did the Fund use derivatives?
The Fund’s investment strategy does not heavily rely on derivative strategies, although it does employ Treasury futures on a limited basis. Treasury futures are used to manage the Fund’s duration and interest rate risk. Using futures is more efficient than managing interest rate risk through the purchase and sale of cash corporate bonds. This derivative strategy added to the Fund’s performance for the reporting period.
Current outlook
| | • | | Looking forward, the technical backdrop appears strong with issuance expected to decline materially during the second half of 2020. Investor demand remains robust amid historically low yields globally while investment-grade corporate spreads remain relatively attractive. While the pandemic’s longer-term impact on the US and global economy remains uncertain and a possible second wave of infections represents a risk, macroeconomic data has shown sequential improvement and the level of fiscal and monetary policy globally is unprecedented. |
| | | | |
| PGIM Corporate Bond Fund | | | 9 | |
Strategy and Performance Overview (continued)
| | • | | While credit fundamentals have deteriorated with weaker corporate earnings, second-quarter results have been better than many market participants had feared. Furthermore, many companies have struck a cautiously optimistic tone, indicating expectations for sequential earnings improvement. PGIM Fixed Income remains cautious on certain sectors that are most exposed to the negative implications associated with the pandemic, but is looking to take advantage of spread compression in select higher-yielding BBB-rated bonds, distressed survivors, cyclical industries, and “off-the-run” bonds (i.e., older issues). PGIM Fixed Income continues to favor better-quality financials and electric utilities over industrials. Within industrials, BBB-rated issuers that are focused on preserving or improving credit metrics, liquidity, and ratings are favored over their much tighter-trading higher-quality peers, which may be more likely to pursue aggressive financial policies at the expense of their balance sheets. |
| | • | | Potential risks to the investment-grade corporate bond market include a sustained global recession due to the coronavirus outbreak; geopolitical risks, especially in the Middle East; a return to more hostile trade tensions between the US and China; an increase in M&A activity; an equity market correction; and the potential for a non-business friendly President/Congress in 2020. |
| | |
| 10 | | Visit our website at pgim.com/investments |
Fees and Expenses (unaudited)
As a shareholder of the Fund, you incur two types of costs: (1) transaction costs, including sales charges (loads) on purchase payments and redemptions, as applicable, and (2) ongoing costs, including management fees, distribution and/or service (12b-1) fees, and other Fund expenses, as applicable. This example is intended to help you understand your ongoing costs (in dollars) of investing in the Fund and to compare these costs with the ongoing costs of investing in other mutual funds.
The example is based on an investment of $1,000 held through the six-month period ended July 31, 2020. The example is for illustrative purposes only; you should consult the Fund’s Prospectus for information on initial and subsequent minimum investment requirements.
Actual Expenses
The first line for each share class in the table on the following page provides information about actual account values and actual expenses. You may use the information on this line, together with the amount you invested, to estimate the expenses that you paid over the period. Simply divide your account value by $1,000 (for example, an $8,600 account value ÷ $1,000 = 8.6), then multiply the result by the number on the first line under the heading “Expenses Paid During the Six-Month Period” to estimate the expenses you paid on your account during this period.
Hypothetical Example for Comparison Purposes
The second line for each share class in the table on the following page provides information about hypothetical account values and hypothetical expenses based on the Fund’s actual expense ratio and an assumed rate of return of 5% per year before expenses, which is not the Fund’s actual return. The hypothetical account values and expenses may not be used to estimate the actual ending account balance or expenses you paid for the period. You may use this information to compare the ongoing costs of investing in the Fund and other funds. To do so, compare this 5% hypothetical example with the 5% hypothetical examples that appear in the shareholder reports of the other funds.
The Fund’s transfer agent may charge additional fees to holders of certain accounts that are not included in the expenses shown in the table on the following page. These fees apply to individual retirement accounts (IRAs) and Section 403(b) accounts. As of the close of the six-month period covered by the table, IRA fees included an annual maintenance fee of $15 per account (subject to a maximum annual maintenance fee of $25 for all accounts held by the same shareholder). Section 403(b) accounts are charged an annual $25 fiduciary maintenance fee. Some of the fees may vary in amount, or may be waived, based on your total account balance or the number of PGIM funds, including the Fund, that you own. You should consider the additional fees that were charged to your Fund account over the six-month period when you estimate the total ongoing expenses paid over the period
| | | | |
| PGIM Corporate Bond Fund | | | 11 | |
Fees and Expenses (continued)
and the impact of these fees on your ending account value, as these additional expenses are not reflected in the information provided in the expense table. Additional fees have the effect of reducing investment returns.
Please note that the expenses shown in the table are meant to highlight your ongoing costs only and do not reflect any transactional costs such as sales charges (loads). Therefore, the second line for each share class in the table is useful in comparing ongoing costs only and will not help you determine the relative total costs of owning different funds. In addition, if these transactional costs were included, your costs would have been higher.
| | | | | | | | | | | | | | | | | | |
| | | | |
PGIM Corporate
Bond Fund | | Beginning Account
Value
February 1, 2020 | | | Ending Account
Value
July 31, 2020 | | | Annualized
Expense Ratio
Based on the
Six-Month Period | | | Expenses Paid
During the
Six-Month Period* | |
Class A | | Actual | | $ | 1,000.00 | | | $ | 1,043.60 | | | | 0.80 | % | | $ | 4.06 | |
| | Hypothetical | | $ | 1,000.00 | | | $ | 1,020.89 | | | | 0.80 | % | | $ | 4.02 | |
Class C | | Actual | | $ | 1,000.00 | | | $ | 1,039.80 | | | | 1.55 | % | | $ | 7.86 | |
| | Hypothetical | | $ | 1,000.00 | | | $ | 1,017.16 | | | | 1.55 | % | | $ | 7.77 | |
Class R | | Actual | | $ | 1,000.00 | | | $ | 1,042.30 | | | | 1.05 | % | | $ | 5.33 | |
| | Hypothetical | | $ | 1,000.00 | | | $ | 1,019.64 | | | | 1.05 | % | | $ | 5.27 | |
Class Z | | Actual | | $ | 1,000.00 | | | $ | 1,044.90 | | | | 0.55 | % | | $ | 2.80 | |
| | Hypothetical | | $ | 1,000.00 | | | $ | 1,022.13 | | | | 0.55 | % | | $ | 2.77 | |
Class R6 | | Actual | | $ | 1,000.00 | | | $ | 1,044.90 | | | | 0.55 | % | | $ | 2.80 | |
| | | Hypothetical | | $ | 1,000.00 | | | $ | 1,022.13 | | | | 0.55 | % | | $ | 2.77 | |
*Fund expenses (net of fee waivers or subsidies, if any) for each share class are equal to the annualized expense ratio for each share class (provided in the table), multiplied by the average account value over the period, multiplied by the 182 days in the six-month period ended July 31, 2020, and divided by the 366 days in the Fund’s fiscal year ended July 31, 2020 (to reflect the six-month period). Expenses presented in the table include the expenses of any underlying portfolios in which the Fund may invest.
| | |
| 12 | | Visit our website at pgim.com/investments |
PGIM Corporate Bond Fund
Schedule of Investments
as of July 31, 2020
| | | | | | | | | | | | |
| | | | |
| Description | | Interest Rate | | Maturity Date | | Principal Amount (000)# | | | Value | |
|
LONG-TERM INVESTMENTS 92.3% | |
|
COMMERCIAL MORTGAGE-BACKED SECURITIES 5.3% | |
BANK, | | | | | | | | | | | | |
Series 2019-BN16, Class A3 | | 3.741% | | 02/15/52 | | | 200 | | | $ | 232,077 | |
Benchmark Mortgage Trust, | | | | | | | | | | | | |
Series 2019-B09, Class A4 | | 3.751 | | 03/15/52 | | | 200 | | | | 232,043 | |
CCUBS Commercial Mortgage Trust, | | | | | | | | | | | | |
Series 2017-C01, Class A3 | | 3.283(cc) | | 11/15/50 | | | 250 | | | | 278,982 | |
CFCRE Commercial Mortgage Trust, | | | | | | | | | | | | |
Series 2016-C07, Class A2 | | 3.585 | | 12/10/54 | | | 300 | | | | 327,604 | |
Citigroup Commercial Mortgage Trust, | | | | | | | | | | | | |
Series 2016-GC37, Class A3 | | 3.050 | | 04/10/49 | | | 250 | | | | 266,284 | |
DBJPM Mortgage Trust, | | | | | | | | | | | | |
Series 2017-C06, Class A3 | | 3.269 | | 06/10/50 | | | 100 | | | | 106,958 | |
JPMCC Commercial Mortgage Securities Trust, | | | | | | | | | | | | |
Series 2017-JP06, Class A4 | | 3.224 | | 07/15/50 | | | 100 | | | | 111,094 | |
Morgan Stanley Bank of America Merrill Lynch Trust, | | | | | | | | | | | | |
Series 2016-C29, Class A3 | | 3.058 | | 05/15/49 | | | 200 | | | | 216,161 | |
Series 2016-C31, Class A4 | | 2.840 | | 11/15/49 | | | 300 | | | | 317,322 | |
Wells Fargo Commercial Mortgage Trust, | | | | | | | | | | | | |
Series 2017-C40, Class A3 | | 3.317 | | 10/15/50 | | | 200 | | | | 220,232 | |
| | | | | | | | | | | | |
| |
TOTAL COMMERCIAL MORTGAGE-BACKED SECURITIES
(cost $2,099,919) | | | | 2,308,757 | |
| | | | | | | | | | | | |
| | |
CORPORATE BONDS 86.0% | | | | | | | | |
|
Aerospace & Defense 1.0% | |
Boeing Co. (The), | | | | | | | | | | | | |
Sr. Unsec’d. Notes | | 2.700 | | 02/01/27 | | | 65 | | | | 63,008 | |
Sr. Unsec’d. Notes | | 3.200 | | 03/01/29 | | | 30 | | | | 29,348 | |
Sr. Unsec’d. Notes | | 5.805 | | 05/01/50 | | | 80 | | | | 93,843 | |
Sr. Unsec’d. Notes | | 5.930 | | 05/01/60 | | | 100 | | | | 120,387 | |
Lockheed Martin Corp., | | | | | | | | | | | | |
Sr. Unsec’d. Notes | | 2.800 | | 06/15/50 | | | 50 | | | | 56,436 | |
Raytheon Technologies Corp., | | | | | | | | | | | | |
Sr. Unsec’d. Notes | | 3.950 | | 08/16/25 | | | 60 | | | | 69,324 | |
| | | | | | | | | | | | |
| | | | |
| | | | | | | | | | | 432,346 | |
| | | | |
Agriculture 1.2% | | | | | | | | | | | | |
Altria Group, Inc., | | | | | | | | | | | | |
Gtd. Notes | | 3.800 | | 02/14/24 | | | 100 | | | | 109,918 | |
| | | | | | | | | | | | |
See Notes to Financial Statements.
| | | | |
| PGIM Corporate Bond Fund | | | 13 | |
PGIM Corporate Bond Fund
Schedule of Investments (continued)
as of July 31, 2020
| | | | | | | | | | | | |
| | | | |
| Description | | Interest Rate | | Maturity Date | | Principal Amount (000)# | | | Value | |
|
CORPORATE BONDS (Continued) | |
|
Agriculture (cont’d.) | |
Archer-Daniels-Midland Co., | | | | | | | | | | | | |
Sr. Unsec’d. Notes | | 3.250% | | 03/27/30 | | | 25 | | | $ | 29,165 | |
BAT Capital Corp. (United Kingdom), | | | | | | | | | | | | |
Gtd. Notes | | 4.390 | | 08/15/37 | | | 50 | | | | 57,130 | |
BAT International Finance PLC (United Kingdom), | | | | | | | | | | | | |
Gtd. Notes, 144A | | 3.250 | | 06/07/22 | | | 305 | | | | 318,695 | |
| | | | | | | | | | | | |
| | | | |
| | | | | | | | | | | 514,908 | |
|
Apparel 0.1% | |
Ralph Lauren Corp., | | | | | | | | | | | | |
Sr. Unsec’d. Notes | | 1.700 | | 06/15/22 | | | 30 | | | | 30,610 | |
|
Auto Manufacturers 3.0% | |
Daimler Finance North America LLC (Germany), | | | | | | | | | | | | |
Gtd. Notes, 144A | | 2.550 | | 08/15/22 | | | 200 | | | | 206,605 | |
Ford Motor Credit Co. LLC, | | | | | | | | | | | | |
Sr. Unsec’d. Notes | | 2.979 | | 08/03/22 | | | 200 | | | | 201,132 | |
Sr. Unsec’d. Notes | | 3.350 | | 11/01/22 | | | 265 | | | | 267,019 | |
General Motors Co., | | | | | | | | | | | | |
Sr. Unsec’d. Notes | | 6.125 | | 10/01/25 | | | 200 | | | | 233,193 | |
General Motors Financial Co., Inc., | | | | | | | | | | | | |
Gtd. Notes | | 3.200 | | 07/06/21 | | | 75 | | | | 76,217 | |
Gtd. Notes | | 3.550 | | 04/09/21 | | | 30 | | | | 30,448 | |
Gtd. Notes | | 4.000 | | 01/15/25 | | | 150 | | | | 160,308 | |
Sr. Unsec’d. Notes | | 4.200 | | 11/06/21 | | | 100 | | | | 103,333 | |
| | | | | | | | | | | | |
| | | | |
| | | | | | | | | | | 1,278,255 | |
|
Auto Parts & Equipment 0.2% | |
ZF North America Capital, Inc. (Germany), | | | | | | | | | | | | |
Gtd. Notes, 144A | | 4.500 | | 04/29/22 | | | 100 | | | | 104,767 | |
|
Banks 21.6% | |
Banco Santander SA (Spain), | | | | | | | | | | | | |
Sr. Unsec’d. Notes | | 2.746 | | 05/28/25 | | | 200 | | | | 211,262 | |
Bank of America Corp., | | | | | | | | | | | | |
Sr. Unsec’d. Notes | | 2.592(ff) | | 04/29/31 | | | 300 | | | | 321,802 | |
Sr. Unsec’d. Notes | | 3.419(ff) | | 12/20/28 | | | 263 | | | | 297,238 | |
Sr. Unsec’d. Notes, MTN | | 2.676(ff) | | 06/19/41 | | | 250 | | | | 266,248 | |
See Notes to Financial Statements.
PGIM Corporate Bond Fund
Schedule of Investments (continued)
as of July 31, 2020
| | | | | | | | | | | | |
| | | | |
| Description | | Interest Rate | | Maturity Date | | Principal Amount (000)# | | | Value | |
|
CORPORATE BONDS (Continued) | |
|
Banks (cont’d.) | |
Bank of America Corp., (cont’d.) | | | | | | | | | | | | |
Sr. Unsec’d. Notes, MTN | | 3.550%(ff) | | 03/05/24 | | | 195 | | | $ | 208,867 | |
Sr. Unsec’d. Notes, MTN | | 3.824(ff) | | 01/20/28 | | | 360 | | | | 411,887 | |
Sr. Unsec’d. Notes, MTN | | 4.330(ff) | | 03/15/50 | | | 55 | | | | 74,708 | |
Barclays Bank PLC (United Kingdom), | | | | | | | | | | | | |
Sr. Unsec’d. Notes | | 1.700 | | 05/12/22 | | | 200 | | | | 204,051 | |
Barclays PLC (United Kingdom), | | | | | | | | | | | | |
Sr. Unsec’d. Notes | | 4.610(ff) | | 02/15/23 | | | 320 | | | | 337,166 | |
BNP Paribas SA (France), | | | | | | | | | | | | |
Sr. Unsec’d. Notes, 144A, MTN | | 3.052(ff) | | 01/13/31 | | | 200 | | | | 218,080 | |
BPCE SA (France), | | | | | | | | | | | | |
Sr. Unsec’d. Notes, 144A | | 2.375 | | 01/14/25 | | | 250 | | | | 261,888 | |
Citibank NA, | | | | | | | | | | | | |
Sr. Unsec’d. Notes | | 3.650 | | 01/23/24 | | | 280 | | | | 309,021 | |
Citigroup, Inc., | | | | | | | | | | | | |
Jr. Sub. Notes, Series V | | 4.700(ff) | | –(rr) | | | 25 | | | | 24,007 | |
Sr. Unsec’d. Notes | | 3.200 | | 10/21/26 | | | 150 | | | | 166,934 | |
Sr. Unsec’d. Notes | | 4.412(ff) | | 03/31/31 | | | 300 | | | | 364,893 | |
Sub. Notes | | 4.600 | | 03/09/26 | | | 300 | | | | 348,126 | |
Credit Suisse Group Funding Guernsey Ltd. (Switzerland), | | | | | | | | | | | | |
Gtd. Notes | | 3.800 | | 06/09/23 | | | 265 | | | | 285,979 | |
Danske Bank A/S (Denmark), | | | | | | | | | | | | |
Sr. Unsec’d. Notes, 144A | | 5.000(ff) | | 01/12/23 | | | 200 | | | | 209,873 | |
Deutsche Bank AG (Germany), | | | | | | | | | | | | |
Sr. Unsec’d. Notes | | 3.150 | | 01/22/21 | | | 150 | | | | 151,351 | |
Sr. Unsec’d. Notes | | 3.950 | | 02/27/23 | | | 100 | | | | 105,247 | |
Sr. Unsec’d. Notes, GMTN | | 3.375 | | 05/12/21 | | | 80 | | | | 81,293 | |
Goldman Sachs Group, Inc. (The), | | | | | | | | | | | | |
Sr. Unsec’d. Notes | | 3.500 | | 04/01/25 | | | 150 | | | | 166,233 | |
Sr. Unsec’d. Notes | | 4.223(ff) | | 05/01/29 | | | 100 | | | | 118,005 | |
Sub. Notes | | 5.150 | | 05/22/45 | | | 150 | | | | 208,096 | |
JPMorgan Chase & Co., | | | | | | | | | | | | |
Jr. Sub. Notes, Series I, 3 Month LIBOR + 3.470% | | 3.738(c) | | –(rr) | | | 98 | | | | 93,780 | |
Sr. Unsec’d. Notes | | 2.522(ff) | | 04/22/31 | | | 150 | | | | 161,768 | |
Sr. Unsec’d. Notes | | 3.125 | | 01/23/25 | | | 520 | | | | 569,766 | |
Sr. Unsec’d. Notes | | 3.882(ff) | | 07/24/38 | | | 95 | | | | 117,441 | |
Sr. Unsec’d. Notes | | 3.964(ff) | | 11/15/48 | | | 145 | | | | 187,889 | |
Sr. Unsec’d. Notes | | 4.452(ff) | | 12/05/29 | | | 350 | | | | 423,992 | |
Sub. Notes | | 2.956(ff) | | 05/13/31 | | | 10 | | | | 10,875 | |
See Notes to Financial Statements.
| | | | |
| PGIM Corporate Bond Fund | | | 15 | |
PGIM Corporate Bond Fund
Schedule of Investments (continued)
as of July 31, 2020
| | | | | | | | | | | | |
| | | | |
| Description | | Interest Rate | | Maturity Date | | Principal Amount (000)# | | | Value | |
|
CORPORATE BONDS (Continued) | |
|
Banks (cont’d.) | |
Morgan Stanley, | | | | | | | | | | | | |
Sr. Unsec’d. Notes, GMTN | | 4.431%(ff) | | 01/23/30 | | | 285 | | | $ | 345,871 | |
Sr. Unsec’d. Notes, MTN | | 3.622(ff) | | 04/01/31 | | | 250 | | | | 292,955 | |
Sr. Unsec’d. Notes, MTN | | 3.971(ff) | | 07/22/38 | | | 235 | | | | 292,985 | |
Santander UK Group Holdings PLC (United Kingdom), | | | | | | | | | | | | |
Sr. Unsec’d. Notes | | 3.373(ff) | | 01/05/24 | | | 200 | | | | 210,648 | |
Societe Generale SA (France), | | | | | | | | | | | | |
Sr. Unsec’d. Notes, 144A, MTN | | 2.625 | | 01/22/25 | | | 200 | | | | 206,773 | |
UBS Group AG (Switzerland), | | | | | | | | | | | | |
Sr. Unsec’d. Notes, 144A | | 4.125 | | 09/24/25 | | | 200 | | | | 229,818 | |
Wells Fargo & Co., | | | | | | | | | | | | |
Sr. Unsec’d. Notes, MTN | | 2.393(ff) | | 06/02/28 | | | 340 | | | | 357,124 | |
Sr. Unsec’d. Notes, MTN | | 2.572(ff) | | 02/11/31 | | | 25 | | | | 26,537 | |
Sr. Unsec’d. Notes, MTN | | 4.478(ff) | | 04/04/31 | | | 350 | | | | 430,080 | |
| | | | | | | | | | | | |
| | | | |
| | | | | | | | | | | 9,310,557 | |
|
Beverages 1.3% | |
Anheuser-Busch Cos. LLC/Anheuser-Busch InBev Worldwide, Inc. (Belgium), | | | | | | | | | | | | |
Gtd. Notes | | 4.900 | | 02/01/46 | | | 140 | | | | 179,500 | |
Anheuser-Busch InBev Worldwide, Inc. (Belgium), | | | | | | | | | | | | |
Gtd. Notes | | 5.550 | | 01/23/49 | | | 110 | | | | 153,991 | |
Constellation Brands, Inc., | | | | | | | | | | | | |
Gtd. Notes | | 5.250 | | 11/15/48 | | | 50 | | | | 71,306 | |
Keurig Dr. Pepper, Inc., | | | | | | | | | | | | |
Gtd. Notes | | 4.417 | | 05/25/25 | | | 150 | | | | 175,389 | |
| | | | | | | | | | | | |
| | | | |
| | | | | | | | | | | 580,186 | |
|
Building Materials 0.3% | |
Johnson Controls International PLC, | | | | | | | | | | | | |
Sr. Unsec’d. Notes | | 4.950 | | 07/02/64 | | | 54 | | | | 69,362 | |
Vulcan Materials Co., | | | | | | | | | | | | |
Sr. Unsec’d. Notes | | 3.500 | | 06/01/30 | | | 40 | | | | 45,147 | |
| | | | | | | | | | | | |
| | | | |
| | | | | | | | | | | 114,509 | |
See Notes to Financial Statements.
PGIM Corporate Bond Fund
Schedule of Investments (continued)
as of July 31, 2020
| | | | | | | | | | | | |
| | | | |
| Description | | Interest Rate | | Maturity Date | | Principal Amount (000)# | | | Value | |
| | |
CORPORATE BONDS (Continued) | | | | | | | | |
|
Chemicals 0.9% | |
Celanese US Holdings LLC, | | | | | | | | | | | | |
Gtd. Notes | | 4.625% | | 11/15/22 | | | 50 | | | $ | 53,669 | |
CF Industries, Inc., | | | | | | | | | | | | |
Gtd. Notes | | 5.375 | | 03/15/44 | | | 20 | | | | 24,402 | |
Dow Chemical Co. (The), | | | | | | | | | | | | |
Sr. Unsec’d. Notes | | 5.550 | | 11/30/48 | | | 50 | | | | 68,890 | |
Eastman Chemical Co., | | | | | | | | | | | | |
Sr. Unsec’d. Notes | | 3.600 | | 08/15/22 | | | 49 | | | | 51,268 | |
LyondellBasell Industries NV, | | | | | | | | | | | | |
Sr. Unsec’d. Notes | | 4.625 | | 02/26/55 | | | 60 | | | | 72,605 | |
Sherwin-Williams Co. (The), | | | | | | | | | | | | |
Sr. Unsec’d. Notes | | 2.950 | | 08/15/29 | | | 90 | | | | 100,347 | |
| | | | | | | | | | | | |
| | | | |
| | | | | | | | | | | 371,181 | |
|
Commercial Services 3.9% | |
California Institute of Technology, | | | | | | | | | | | | |
Sr. Unsec’d. Notes | | 4.700 | | 11/01/2111 | | | 50 | | | | 74,982 | |
Duke University, | | | | | | | | | | | | |
Unsec’d. Notes | | 2.832 | | 10/01/55 | | | 90 | | | | 102,636 | |
Equifax, Inc., | | | | | | | | | | | | |
Sr. Unsec’d. Notes | | 2.300 | | 06/01/21 | | | 10 | | | | 10,140 | |
Georgetown University (The), | | | | | | | | | | | | |
Unsec’d. Notes, Series A | | 5.215 | | 10/01/2118 | | | 145 | | | | 206,957 | |
Global Payments, Inc., | | | | | | | | | | | | |
Sr. Unsec’d. Notes | | 3.800 | | 04/01/21 | | | 100 | | | | 101,902 | |
IHS Markit Ltd., | | | | | | | | | | | | |
Gtd. Notes, 144A | | 4.750 | | 02/15/25 | | | 300 | | | | 341,694 | |
Massachusetts Institute of Technology, | | | | | | | | | | | | |
Unsec’d. Notes | | 3.885 | | 07/01/2116 | | | 100 | | | | 135,654 | |
Northwestern University, | | | | | | | | | | | | |
Unsec’d. Notes | | 2.640 | | 12/01/50 | | | 50 | | | | 54,392 | |
Trustees of the University of Pennsylvania (The), | | | | | | | | | | | | |
Sr. Unsec’d. Notes | | 3.610 | | 02/15/2119 | | | 320 | | | | 391,602 | |
Verisk Analytics, Inc., | | | | | | | | | | | | |
Sr. Unsec’d. Notes | | 3.625 | | 05/15/50 | | | 125 | | | | 153,678 | |
Yale University, | | | | | | | | | | | | |
Unsec’d. Notes | | 2.402 | | 04/15/50 | | | 85 | | | | 92,767 | |
| | | | | | | | | | | | |
| | | | |
| | | | | | | | | | | 1,666,404 | |
See Notes to Financial Statements.
| | | | |
| PGIM Corporate Bond Fund | | | 17 | |
PGIM Corporate Bond Fund
Schedule of Investments (continued)
as of July 31, 2020
| | | | | | | | | | | | |
| | | | |
| Description | | Interest Rate | | Maturity Date | | Principal Amount (000)# | | | Value | |
| | |
CORPORATE BONDS (Continued) | | | | | | | | |
|
Computers 0.9% | |
Apple, Inc., | | | | | | | | | | | | |
Sr. Unsec’d. Notes | | 4.650% | | 02/23/46 | | | 100 | | | $ | 144,867 | |
Genpact Luxembourg Sarl (Luxembourg), | | | | | | | | | | | | |
Gtd. Notes | | 3.375 | | 12/01/24 | | | 200 | | | | 208,345 | |
Leidos, Inc., | | | | | | | | | | | | |
Gtd. Notes, 144A | | 4.375 | | 05/15/30 | | | 30 | | | | 35,077 | |
| | | | | | | | | | | | |
| | | | |
| | | | | | | | | | | 388,289 | |
|
Distribution/Wholesale 0.2% | |
W.W. Grainger, Inc., | | | | | | | | | | | | |
Sr. Unsec’d. Notes | | 1.850 | | 02/15/25 | | | 100 | | | | 105,194 | |
|
Diversified Financial Services 0.8% | |
Cantor Fitzgerald LP, | | | | | | | | | | | | |
Sr. Unsec’d. Notes, 144A | | 4.875 | | 05/01/24 | | | 40 | | | | 43,335 | |
GE Capital International Funding Co. Unlimited Co., | | | | | | | | | | | | |
Gtd. Notes | | 4.418 | | 11/15/35 | | | 80 | | | | 82,432 | |
Nomura Holdings, Inc. (Japan), | | | | | | | | | | | | |
Sr. Unsec’d. Notes | | 1.851 | | 07/16/25 | | | 200 | | | | 203,061 | |
| | | | | | | | | | | | |
| | | | |
| | | | | | | | | | | 328,828 | |
|
Electric 10.4% | |
Arizona Public Service Co., | | | | | | | | | | | | |
Sr. Unsec’d. Notes | | 3.350 | | 05/15/50 | | | 75 | | | | 87,514 | |
CenterPoint Energy Houston Electric LLC, | | | | | | | | | | | | |
General Ref. Mortgage | | 2.900 | | 07/01/50 | | | 25 | | | | 28,552 | |
Commonwealth Edison Co., | | | | | | | | | | | | |
First Mortgage | | 4.700 | | 01/15/44 | | | 100 | | | | 139,669 | |
Dominion Energy South Carolina, Inc., | | | | | | | | | | | | |
First Mortgage | | 4.600 | | 06/15/43 | | | 150 | | | | 202,791 | |
Dominion Energy, Inc., | | | | | | | | | | | | |
Jr. Sub. Notes | | 2.715 | | 08/15/21 | | | 310 | | | | 316,625 | |
DTE Electric Co., | | | | | | | | | | | | |
General Ref. Mortgage | | 3.950 | | 06/15/42 | | | 75 | | | | 90,080 | |
Entergy Corp., | | | | | | | | | | | | |
Sr. Unsec’d. Notes | | 2.950 | | 09/01/26 | | | 100 | | | | 112,133 | |
Eversource Energy, | | | | | | | | | | | | |
Sr. Unsec’d. Notes, Series K | | 2.750 | | 03/15/22 | | | 95 | | | | 98,458 | |
See Notes to Financial Statements.
PGIM Corporate Bond Fund
Schedule of Investments (continued)
as of July 31, 2020
| | | | | | | | | | | | |
| | | | |
| Description | | Interest Rate | | Maturity Date | | Principal Amount (000)# | | | Value | |
| | |
CORPORATE BONDS (Continued) | | | | | | | | |
|
Electric (cont’d.) | |
Exelon Generation Co. LLC, | | | | | | | | | | | | |
Sr. Unsec’d. Notes | | 3.250% | | 06/01/25 | | | 80 | | | $ | 88,362 | |
FirstEnergy Corp., | | | | | | | | | | | | |
Sr. Unsec’d. Notes, Series B | | 3.900 | | 07/15/27 | | | 75 | | | | 82,356 | |
FirstEnergy Transmission LLC, | | | | | | | | | | | | |
Sr. Unsec’d. Notes, 144A | | 5.450 | | 07/15/44 | | | 100 | | | | 129,507 | |
Florida Power & Light Co., | | | | | | | | | | | | |
First Mortgage | | 3.700 | | 12/01/47 | | | 100 | | | | 131,436 | |
Interstate Power & Light Co., | | | | | | | | | | | | |
Sr. Unsec’d. Notes | | 2.300 | | 06/01/30 | | | 150 | | | | 158,632 | |
MidAmerican Energy Co., | | | | | | | | | | | | |
First Mortgage | | 3.950 | | 08/01/47 | | | 20 | | | | 26,604 | |
Mississippi Power Co., | | | | | | | | | | | | |
Sr. Unsec’d. Notes | | 4.250 | | 03/15/42 | | | 140 | | | | 170,609 | |
Nevada Power Co., | | | | | | | | | | | | |
General Ref. Mortgage, Series CC | | 3.700 | | 05/01/29 | | | 300 | | | | 355,742 | |
NextEra Energy Capital Holdings, Inc., | | | | | | | | | | | | |
Gtd. Notes | | 2.250 | | 06/01/30 | | | 75 | | | | 80,781 | |
Gtd. Notes | | 2.403 | | 09/01/21 | | | 150 | | | | 153,326 | |
Gtd. Notes | | 2.800 | | 01/15/23 | | | 120 | | | | 126,344 | |
PacifiCorp, | | | | | | | | | | | | |
First Mortgage | | 3.350 | | 07/01/25 | | | 270 | | | | 299,480 | |
PPL Capital Funding, Inc., | | | | | | | | | | | | |
Gtd. Notes | | 4.700 | | 06/01/43 | | | 100 | | | | 125,030 | |
PPL Electric Utilities Corp., | | | | | | | | | | | | |
First Mortgage | | 4.750 | | 07/15/43 | | | 150 | | | | 208,742 | |
PSEG Power LLC, | | | | | | | | | | | | |
Gtd. Notes | | 3.000 | | 06/15/21 | | | 60 | | | | 61,252 | |
Public Service Co. of New Hampshire, | | | | | | | | | | | | |
First Mortgage | | 3.600 | | 07/01/49 | | | 45 | | | | 56,367 | |
Public Service Electric & Gas Co., | | | | | | | | | | | | |
Sec’d. Notes, MTN | | 3.650 | | 09/01/42 | | | 75 | | | | 92,886 | |
Puget Energy, Inc., | | | | | | | | | | | | |
Sr. Sec’d. Notes | | 3.650 | | 05/15/25 | | | 400 | | | | 426,988 | |
RGS AEGCO Funding Corp., | | | | | | | | | | | | |
Sec’d. Notes, Series F | | 9.820 | | 12/07/22 | | | 36 | | | | 37,052 | |
Rochester Gas & Electric Corp., | | | | | | | | | | | | |
First Mortgage, 144A | | 3.100 | | 06/01/27 | | | 135 | | | | 151,598 | |
San Diego Gas & Electric Co., | | | | | | | | | | | | |
First Mortgage | | 4.300 | | 04/01/42 | | | 75 | | | | 94,006 | |
See Notes to Financial Statements.
| | | | |
| PGIM Corporate Bond Fund | | | 19 | |
PGIM Corporate Bond Fund
Schedule of Investments (continued)
as of July 31, 2020
| | | | | | | | | | | | |
| | | | |
| Description | | Interest Rate | | Maturity Date | | Principal Amount (000)# | | | Value | |
| | |
CORPORATE BONDS (Continued) | | | | | | | | |
|
Electric (cont’d.) | |
Sierra Pacific Power Co., | | | | | | | | | | | | |
General Ref. Mortgage | | 2.600% | | 05/01/26 | | | 70 | | | $ | 76,313 | |
Southern California Edison Co., | | | | | | | | | | | | |
First Ref. Mortgage | | 5.500 | | 03/15/40 | | | 200 | | | | 266,557 | |
| | | | | | | | | | | | |
| | | | |
| | | | | | | | | | | 4,475,792 | |
|
Foods 1.7% | |
Kraft Heinz Foods Co., | | | | | | | | | | | | |
Gtd. Notes | | 3.000 | | 06/01/26 | | | 45 | | | | 47,567 | |
Gtd. Notes | | 5.000 | | 07/15/35 | | | 50 | | | | 58,560 | |
Kroger Co. (The), | | | | | | | | | | | | |
Sr. Unsec’d. Notes | | 2.650 | | 10/15/26 | | | 35 | | | | 38,679 | |
Sr. Unsec’d. Notes | | 5.150 | | 08/01/43 | | | 60 | | | | 80,873 | |
Mars, Inc., | | | | | | | | | | | | |
Gtd. Notes, 144A | | 3.200 | | 04/01/30 | | | 80 | | | | 92,897 | |
Gtd. Notes, 144A | | 3.600 | | 04/01/34 | | | 25 | | | | 30,793 | |
Sr. Unsec’d. Notes, 144A | | 2.375 | | 07/16/40 | | | 40 | | | | 41,358 | |
Tyson Foods, Inc., | | | | | | | | | | | | |
Sr. Unsec’d. Notes | | 4.000 | | 03/01/26 | | | 180 | | | | 207,764 | |
Sr. Unsec’d. Notes | | 5.100 | | 09/28/48 | | | 100 | | | | 139,688 | |
| | | | | | | | | | | | |
| | | | |
| | | | | | | | | | | 738,179 | |
|
Gas 0.2% | |
Atmos Energy Corp., | | | | | | | | | | | | |
Sr. Unsec’d. Notes | | 2.625 | | 09/15/29 | | | 65 | | | | 71,849 | |
|
Healthcare-Services 3.8% | |
Anthem, Inc., | | | | | | | | | | | | |
Sr. Unsec’d. Notes | | 4.625 | | 05/15/42 | | | 100 | | | | 132,392 | |
HCA, Inc., | | | | | | | | | | | | |
Sr. Sec’d. Notes | | 5.000 | | 03/15/24 | | | 100 | | | | 112,658 | |
Sr. Sec’d. Notes | | 5.250 | | 06/15/49 | | | 100 | | | | 132,669 | |
Sr. Sec’d. Notes | | 5.500 | | 06/15/47 | | | 25 | | | | 33,482 | |
Laboratory Corp. of America Holdings, | | | | | | | | | | | | |
Sr. Unsec’d. Notes | | 3.600 | | 02/01/25 | | | 250 | | | | 278,492 | |
Mayo Clinic, | | | | | | | | | | | | |
Unsec’d. Notes | | 3.774 | | 11/15/43 | | | 85 | | | | 101,894 | |
Unsec’d. Notes | | 4.000 | | 11/15/47 | | | 80 | | | | 101,442 | |
See Notes to Financial Statements.
PGIM Corporate Bond Fund
Schedule of Investments (continued)
as of July 31, 2020
| | | | | | | | | | | | |
| | | | |
| Description | | Interest Rate | | Maturity Date | | Principal Amount (000)# | | | Value | |
| | |
CORPORATE BONDS (Continued) | | | | | | | | |
|
Healthcare-Services (cont’d.) | |
OhioHealth Corp., | | | | | | | | | | | | |
Unsec’d. Notes | | 3.042% | | 11/15/50 | | | 35 | | | $ | 39,469 | |
Quest Diagnostics, Inc., | | | | | | | | | | | | |
Sr. Unsec’d. Notes | | 3.500 | | 03/30/25 | | | 250 | | | | 278,592 | |
Texas Health Resources, | | | | | | | | | | | | |
Sec’d. Notes | | 4.330 | | 11/15/55 | | | 130 | | | | 176,199 | |
UnitedHealth Group, Inc., | | | | | | | | | | | | |
Sr. Unsec’d. Notes | | 2.900 | | 05/15/50 | | | 130 | | | | 147,709 | |
Sr. Unsec’d. Notes | | 3.700 | | 08/15/49 | | | 80 | | | | 102,672 | |
| | | | | | | | | | | | |
| | | | |
| | | | | | | | | | | 1,637,670 | |
|
Housewares 0.2% | |
Newell Brands, Inc., | | | | | | | | | | | | |
Sr. Unsec’d. Notes | | 4.000 | | 12/01/24 | | | 100 | | | | 102,054 | |
|
Insurance 2.6% | |
American International Group, Inc., | | | | | | | | | | | | |
Sr. Unsec’d. Notes | | 4.375 | | 01/15/55 | | | 150 | | | | 185,514 | |
Arch Capital Finance LLC, | | | | | | | | | | | | |
Gtd. Notes | | 5.031 | | 12/15/46 | | | 100 | | | | 134,725 | |
CNA Financial Corp., | | | | | | | | | | | | |
Sr. Unsec’d. Notes | | 3.450 | | 08/15/27 | | | 100 | | | | 111,140 | |
Sr. Unsec’d. Notes | | 3.900 | | 05/01/29 | | | 40 | | | | 45,632 | |
Liberty Mutual Group, Inc., | | | | | | | | | | | | |
Gtd. Notes, 144A | | 4.569 | | 02/01/29 | | | 500 | | | | 607,724 | |
W.R. Berkley Corp., | | | | | | | | | | | | |
Sr. Unsec’d. Notes | | 4.000 | | 05/12/50 | | | 50 | | | | 59,974 | |
| | | | | | | | | | | | |
| | | | |
| | | | | | | | | | | 1,144,709 | |
|
Iron/Steel 0.0% | |
Steel Dynamics, Inc., | | | | | | | | | | | | |
Sr. Unsec’d. Notes | | 2.800 | | 12/15/24 | | | 20 | | | | 21,215 | |
|
Media 3.9% | |
Charter Communications Operating LLC/Charter Communications Operating Capital, | | | | | | | | | | | | |
Sr. Sec’d. Notes | | 3.700 | | 04/01/51 | | | 170 | | | | 179,539 | |
Sr. Sec’d. Notes | | 6.384 | | 10/23/35 | | | 180 | | | | 246,626 | |
See Notes to Financial Statements.
| | | | |
| PGIM Corporate Bond Fund | | | 21 | |
PGIM Corporate Bond Fund
Schedule of Investments (continued)
as of July 31, 2020
| | | | | | | | | | | | |
| | | | |
| Description | | Interest Rate | | Maturity Date | | Principal Amount (000)# | | | Value | |
| | |
CORPORATE BONDS (Continued) | | | | | | | | |
|
Media (cont’d.) | |
Comcast Corp., | | | | | | | | | | | | |
Gtd. Notes | | 3.375% | | 08/15/25 | | | 345 | | | $ | 388,258 | |
Gtd. Notes | | 4.150 | | 10/15/28 | | | 15 | | | | 18,328 | |
Gtd. Notes | | 4.700 | | 10/15/48 | | | 185 | | | | 264,929 | |
Discovery Communications LLC, | | | | | | | | | | | | |
Gtd. Notes | | 3.950 | | 06/15/25 | | | 28 | | | | 31,603 | |
Gtd. Notes | | 4.650 | | 05/15/50 | | | 45 | | | | 54,057 | |
Gtd. Notes | | 4.950 | | 05/15/42 | | | 100 | | | | 120,512 | |
ViacomCBS, Inc., | | | | | | | | | | | | |
Sr. Unsec’d. Notes | | 5.250 | | 04/01/44 | | | 150 | | | | 177,703 | |
Walt Disney Co. (The), | | | | | | | | | | | | |
Gtd. Notes | | 7.625 | | 11/30/28 | | | 150 | | | | 214,093 | |
| | | | | | | | | | | | |
| | | | |
| | | | | | | | | | | 1,695,648 | |
|
Mining 1.0% | |
Barrick North America Finance LLC (Canada), | | | | | | | | | | | | |
Gtd. Notes | | 7.500 | | 09/15/38 | | | 75 | | | | 115,621 | |
Newmont Corp., | | | | | | | | | | | | |
Gtd. Notes | | 2.800 | | 10/01/29 | | | 200 | | | | 220,587 | |
Teck Resources Ltd. (Canada), | | | | | | | | | | | | |
Sr. Unsec’d. Notes | | 5.400 | | 02/01/43 | | | 100 | | | | 102,892 | |
| | | | | | | | | | | | |
| | | | |
| | | | | | | | | | | 439,100 | |
|
Miscellaneous Manufacturing 0.5% | |
Hillenbrand, Inc., | | | | | | | | | | | | |
Gtd. Notes | | 4.500 | | 09/15/26 | | | 100 | | | | 107,479 | |
Pentair Finance Sarl, | | | | | | | | | | | | |
Gtd. Notes | | 4.500 | | 07/01/29 | | | 65 | | | | 73,121 | |
Textron, Inc., | | | | | | | | | | | | |
Sr. Unsec’d. Notes | | 4.000 | | 03/15/26 | | | 45 | | | | 48,722 | |
| | | | | | | | | | | | |
| | | | |
| | | | | | | | | | | 229,322 | |
|
Office/Business Equipment 0.0% | |
Xerox Corp., | | | | | | | | | | | | |
Sr. Unsec’d. Notes | | 4.125 | | 03/15/23 | | | 20 | | | | 20,602 | |
See Notes to Financial Statements.
PGIM Corporate Bond Fund
Schedule of Investments (continued)
as of July 31, 2020
| | | | | | | | | | | | | | |
| | | | |
| Description | | Interest Rate | | Maturity Date | | | Principal Amount (000)# | | | Value | |
| | |
CORPORATE BONDS (Continued) | | | | | | | | | |
|
Oil & Gas 4.3% | |
Apache Corp., | | | | | | | | | | | | | | |
Sr. Unsec’d. Notes | | 3.250% | | | 04/15/22 | | | | 102 | | | $ | 102,573 | |
Canadian Natural Resources Ltd. (Canada), | | | | | | | | | | | | | | |
Sr. Unsec’d. Notes | | 6.250 | | | 03/15/38 | | | | 100 | | | | 126,200 | |
Cenovus Energy, Inc. (Canada), | | | | | | | | | | | | | | |
Sr. Unsec’d. Notes | | 4.250 | | | 04/15/27 | | | | 200 | | | | 189,849 | |
Sr. Unsec’d. Notes | | 5.250 | | | 06/15/37 | | | | 75 | | | | 68,718 | |
Sr. Unsec’d. Notes | | 5.400 | | | 06/15/47 | | | | 15 | | | | 13,500 | |
Concho Resources, Inc., | | | | | | | | | | | | | | |
Gtd. Notes | | 4.875 | | | 10/01/47 | | | | 50 | | | | 60,105 | |
Devon Energy Corp., | | | | | | | | | | | | | | |
Sr. Unsec’d. Notes | | 5.000 | | | 06/15/45 | | | | 55 | | | | 54,326 | |
Diamondback Energy, Inc., | | | | | | | | | | | | | | |
Gtd. Notes | | 2.875 | | | 12/01/24 | | | | 75 | | | | 76,222 | |
Energen Corp., | | | | | | | | | | | | | | |
Sr. Unsec’d. Notes | | 4.625 | | | 09/01/21 | | | | 170 | | | | 172,145 | |
EOG Resources, Inc., | | | | | | | | | | | | | | |
Sr. Unsec’d. Notes | | 4.950 | | | 04/15/50 | | | | 120 | | | | 164,192 | |
Equinor ASA (Norway), | | | | | | | | | | | | | | |
Gtd. Notes | | 2.375 | | | 05/22/30 | | | | 80 | | | | 85,922 | |
Husky Energy, Inc. (Canada), | | | | | | | | | | | | | | |
Sr. Unsec’d. Notes | | 3.950 | | | 04/15/22 | | | | 90 | | | | 92,548 | |
Noble Energy, Inc., | | | | | | | | | | | | | | |
Sr. Unsec’d. Notes | | 5.050 | | | 11/15/44 | | | | 100 | | | | 133,449 | |
Occidental Petroleum Corp., | | | | | | | | | | | | | | |
Sr. Unsec’d. Notes | | 2.700 | | | 08/15/22 | | | | 60 | | | | 58,033 | |
Sr. Unsec’d. Notes | | 5.147(s) | | | 10/10/36 | | | | 200 | | | | 87,395 | |
Petrobras Global Finance BV (Brazil), | | | | | | | | | | | | | | |
Gtd. Notes | | 5.999 | | | 01/27/28 | | | | 65 | | | | 71,529 | |
Petroleos Mexicanos (Mexico), | | | | | | | | | | | | | | |
Gtd. Notes | | 6.350 | | | 02/12/48 | | | | 60 | | | | 47,293 | |
Gtd. Notes, 144A | | 5.950 | | | 01/28/31 | | | | 100 | | | | 86,019 | |
Gtd. Notes, MTN | | 6.750 | | | 09/21/47 | | | | 80 | | | | 65,139 | |
Shell International Finance BV (Netherlands), | | | | | | | | | | | | | | |
Gtd. Notes | | 4.375 | | | 05/11/45 | | | | 85 | | | | 111,757 | |
| | | | | | | | | | | | | | |
| | | | |
| | | | | | | | | | | | | 1,866,914 | |
See Notes to Financial Statements.
| | | | |
| PGIM Corporate Bond Fund | | | 23 | |
PGIM Corporate Bond Fund
Schedule of Investments (continued)
as of July 31, 2020
| | | | | | | | | | | | | | |
| | | | |
| Description | | Interest Rate | | Maturity Date | | | Principal Amount (000)# | | | Value | |
| | |
CORPORATE BONDS (Continued) | | | | | | | | | |
|
Pharmaceuticals 5.7% | |
AbbVie, Inc., | | | | | | | | | | | | | | |
Sr. Unsec’d. Notes | | 3.600% | | | 05/14/25 | | | | 165 | | | $ | 184,593 | |
Sr. Unsec’d. Notes | | 4.875 | | | 11/14/48 | | | | 110 | | | | 150,036 | |
Sr. Unsec’d. Notes, 144A | | 4.050 | | | 11/21/39 | | | | 95 | | | | 116,771 | |
Sr. Unsec’d. Notes, 144A | | 4.250 | | | 11/21/49 | | | | 150 | | | | 191,824 | |
Bristol-Myers Squibb Co., | | | | | | | | | | | | | | |
Sr. Unsec’d. Notes | | 4.250 | | | 10/26/49 | | | | 30 | | | | 42,763 | |
Sr. Unsec’d. Notes | | 4.625 | | | 05/15/44 | | | | 200 | | | | 283,819 | |
Cigna Corp., | | | | | | | | | | | | | | |
Gtd. Notes | | 3.050 | | | 11/30/22 | | | | 300 | | | | 316,536 | |
Gtd. Notes | | 4.900 | | | 12/15/48 | | | | 150 | | | | 211,071 | |
CVS Health Corp., | | | | | | | | | | | | | | |
Sr. Unsec’d. Notes | | 4.300 | | | 03/25/28 | | | | 125 | | | | 148,111 | |
Sr. Unsec’d. Notes | | 4.780 | | | 03/25/38 | | | | 100 | | | | 128,476 | |
Sr. Unsec’d. Notes | | 5.125 | | | 07/20/45 | | | | 100 | | | | 135,893 | |
McKesson Corp., | | | | | | | | | | | | | | |
Sr. Unsec’d. Notes | | 4.750 | | | 05/30/29 | | | | 120 | | | | 147,911 | |
Mylan NV, | | | | | | | | | | | | | | |
Gtd. Notes | | 3.950 | | | 06/15/26 | | | | 140 | | | | 159,864 | |
Gtd. Notes | | 5.250 | | | 06/15/46 | | | | 10 | | | | 13,139 | |
Mylan, Inc., | | | | | | | | | | | | | | |
Gtd. Notes | | 5.200 | | | 04/15/48 | | | | 40 | | | | 52,614 | |
Shire Acquisitions Investments Ireland DAC, | | | | | | | | | | | | | | |
Gtd. Notes | | 3.200 | | | 09/23/26 | | | | 100 | | | | 112,369 | |
Teva Pharmaceutical Finance Netherlands III BV (Israel), | | | | | | | | | | | | | | |
Gtd. Notes | | 2.200 | | | 07/21/21 | | | | 26 | | | | 25,832 | |
Upjohn, Inc., | | | | | | | | | | | | | | |
Gtd. Notes, 144A | | 3.850 | | | 06/22/40 | | | | 25 | | | | 28,576 | |
Gtd. Notes, 144A | | 4.000 | | | 06/22/50 | | | | 25 | | | | 28,692 | |
| | | | | | | | | | | | | | |
| | | | |
| | | | | | | | | | | | | 2,478,890 | |
|
Pipelines 6.2% | |
Colonial Enterprises, Inc., | | | | | | | | | | | | | | |
Gtd. Notes, 144A | | 3.250 | | | 05/15/30 | | | | 90 | | | | 99,483 | |
DCP Midstream Operating LP, | | | | | | | | | | | | | | |
Gtd. Notes, 144A | | 4.750 | | | 09/30/21 | | | | 250 | | | | 254,120 | |
Energy Transfer Operating LP, | | | | | | | | | | | | | | |
Gtd. Notes | | 5.000 | | | 05/15/50 | | | | 45 | | | | 44,625 | |
Gtd. Notes | | 5.800 | | | 06/15/38 | | | | 15 | | | | 15,409 | |
See Notes to Financial Statements.
PGIM Corporate Bond Fund
Schedule of Investments (continued)
as of July 31, 2020
| | | | | | | | | | | | | | |
| | | | |
| Description | | Interest Rate | | Maturity Date | | | Principal Amount (000)# | | | Value | |
| | |
CORPORATE BONDS (Continued) | | | | | | | | | |
|
Pipelines (cont’d.) | |
Energy Transfer Operating LP, (cont’d.) | | | | | | | | | | | | | | |
Gtd. Notes | | 6.250% | | | 04/15/49 | | | | 15 | | | $ | 16,158 | |
Enterprise Products Operating LLC, | | | | | | | | | | | | | | |
Gtd. Notes | | 2.800 | | | 01/31/30 | | | | 150 | | | | 160,915 | |
Gtd. Notes | | 4.850 | | | 03/15/44 | | | | 100 | | | | 120,951 | |
Magellan Midstream Partners LP, | | | | | | | | | | | | | | |
Sr. Unsec’d. Notes | | 3.250 | | | 06/01/30 | | | | 60 | | | | 65,295 | |
Sr. Unsec’d. Notes | | 4.200 | | | 10/03/47 | | | | 80 | | | | 89,713 | |
Midwest Connector Capital Co. LLC, | | | | | | | | | | | | | | |
Gtd. Notes, 144A | | 3.625 | | | 04/01/22 | | | | 90 | | | | 90,042 | |
Gtd. Notes, 144A | | 3.900 | | | 04/01/24 | | | | 75 | | | | 75,409 | |
MPLX LP, | | | | | | | | | | | | | | |
Sr. Unsec’d. Notes | | 3.500 | | | 12/01/22 | | | | 35 | | | | 36,495 | |
Sr. Unsec’d. Notes | | 4.000 | | | 03/15/28 | | | | 45 | | | | 48,986 | |
Sr. Unsec’d. Notes | | 4.500 | | | 07/15/23 | | | | 110 | | | | 118,851 | |
Sr. Unsec’d. Notes | | 5.200 | | | 12/01/47 | | | | 75 | | | | 82,617 | |
ONEOK, Inc., | | | | | | | | | | | | | | |
Gtd. Notes | | 3.100 | | | 03/15/30 | | | | 45 | | | | 42,462 | |
Gtd. Notes | | 4.350 | | | 03/15/29 | | | | 2 | | | | 2,059 | |
Gtd. Notes | | 4.500 | | | 03/15/50 | | | | 30 | | | | 27,315 | |
Gtd. Notes | | 4.950 | | | 07/13/47 | | | | 150 | | | | 146,128 | |
Plains All American Pipeline LP/PAA Finance Corp., | | | | | | | | | | | | | | |
Sr. Unsec’d. Notes | | 3.650 | | | 06/01/22 | | | | 300 | | | | 307,222 | |
Sunoco Logistics Partners Operations LP, | | | | | | | | | | | | | | |
Gtd. Notes | | 5.400 | | | 10/01/47 | | | | 150 | | | | 149,781 | |
Transcontinental Gas Pipe Line Co. LLC, | | | | | | | | | | | | | | |
Sr. Unsec’d. Notes, 144A | | 3.950 | | | 05/15/50 | | | | 80 | | | | 90,903 | |
Western Midstream Operating LP, | | | | | | | | | | | | | | |
Sr. Unsec’d. Notes | | 4.000 | | | 07/01/22 | | | | 300 | | | | 309,819 | |
Sr. Unsec’d. Notes | | 6.250 | | | 02/01/50 | | | | 10 | | | | 9,850 | |
Williams Cos., Inc. (The), | | | | | | | | | | | | | | |
Sr. Unsec’d. Notes | | 4.300 | | | 03/04/24 | | | | 200 | | | | 219,037 | |
Sr. Unsec’d. Notes | | 5.100 | | | 09/15/45 | | | | 30 | | | | 35,450 | |
| | | | | | | | | | | | | | |
| | | | |
| | | | | | | | | | | | | 2,659,095 | |
|
Real Estate 0.5% | |
Ontario Teachers’ Cadillac Fairview Properties Trust (Canada), | | | | | | | | | | | | | | |
Sr. Unsec’d. Notes, 144A | | 4.125 | | | 02/01/29 | | | | 200 | | | | 225,555 | |
See Notes to Financial Statements.
| | | | |
| PGIM Corporate Bond Fund | | | 25 | |
PGIM Corporate Bond Fund
Schedule of Investments (continued)
as of July 31, 2020
| | | | | | | | | | | | | | |
| | | | |
| Description | | Interest Rate | | Maturity Date | | | Principal Amount (000)# | | | Value | |
| | |
CORPORATE BONDS (Continued) | | | | | | | | | |
|
Real Estate Investment Trusts (REITs) 2.9% | |
Brixmor Operating Partnership LP, | | | | | | | | | | | | | | |
Sr. Unsec’d. Notes | | 3.650% | | | 06/15/24 | | | | 75 | | | $ | 78,301 | |
Sr. Unsec’d. Notes | | 4.125 | | | 06/15/26 | | | | 200 | | | | 213,855 | |
Healthpeak Properties, Inc., | | | | | | | | | | | | | | |
Sr. Unsec’d. Notes | | 3.000 | | | 01/15/30 | | | | 145 | | | | 156,772 | |
Kimco Realty Corp., | | | | | | | | | | | | | | |
Sr. Unsec’d. Notes | | 3.400 | | | 11/01/22 | | | | 75 | | | | 79,477 | |
Sabra Health Care LP, | | | | | | | | | | | | | | |
Gtd. Notes | | 4.800 | | | 06/01/24 | | | | 30 | | | | 30,412 | |
SITE Centers Corp., | | | | | | | | | | | | | | |
Sr. Unsec’d. Notes | | 3.625 | | | 02/01/25 | | | | 306 | | | | 312,498 | |
Ventas Realty LP, | | | | | | | | | | | | | | |
Gtd. Notes | | 3.500 | | | 02/01/25 | | | | 295 | | | | 316,468 | |
Welltower, Inc., | | | | | | | | | | | | | | |
Sr. Unsec’d. Notes | | 2.750 | | | 01/15/31 | | | | 50 | | | | 51,071 | |
| | | | | | | | | | | | | | |
| | | | |
| | | | | | | | | | | | | 1,238,854 | |
|
Retail 1.3% | |
AutoNation, Inc., | | | | | | | | | | | | | | |
Sr. Unsec’d. Notes | | 4.750 | | | 06/01/30 | | | | 165 | | | | 191,032 | |
Dollar Tree, Inc., | | | | | | | | | | | | | | |
Sr. Unsec’d. Notes | | 4.000 | | | 05/15/25 | | | | 200 | | | | 227,385 | |
Walgreens Boots Alliance, Inc., | | | | | | | | | | | | | | |
Sr. Unsec’d. Notes | | 4.100 | | | 04/15/50 | | | | 150 | | | | 156,673 | |
| | | | | | | | | | | | | | |
| | | | |
| | | | | | | | | | | | | 575,090 | |
|
Semiconductors 0.8% | |
Broadcom Corp./Broadcom Cayman Finance Ltd., | | | | | | | | | | | | | | |
Gtd. Notes | | 3.875 | | | 01/15/27 | | | | 40 | | | | 44,388 | |
NXP BV/NXP Funding LLC (Netherlands), | | | | | | | | | | | | | | |
Gtd. Notes, 144A | | 4.625 | | | 06/15/22 | | | | 200 | | | | 213,359 | |
NXP BV/NXP Funding LLC/NXP USA, Inc. (Netherlands), | | | | | | | | | | | | | | |
Gtd. Notes, 144A | | 3.150 | | | 05/01/27 | | | | 75 | | �� | | 81,492 | |
| | | | | | | | | | | | | | |
| | | | |
| | | | | | | | | | | | | 339,239 | |
See Notes to Financial Statements.
PGIM Corporate Bond Fund
Schedule of Investments (continued)
as of July 31, 2020
| | | | | | | | | | | | |
| | | | |
| Description | | Interest Rate | | Maturity Date | | Principal Amount (000)# | | | Value | |
| | |
CORPORATE BONDS (Continued) | | | | | | | | |
|
Shipbuilding 0.3% | |
Huntington Ingalls Industries, Inc., | | | | | | | | | | | | |
Gtd. Notes | | 3.483% | | 12/01/27 | | | 100 | | | $ | 110,865 | |
|
Software 1.0% | |
Microsoft Corp., | | | | | | | | | | | | |
Sr. Unsec’d. Notes | | 2.675 | | 06/01/60 | | | 137 | | | | 151,802 | |
Sr. Unsec’d. Notes | | 3.950 | | 08/08/56 | | | 116 | | | | 162,457 | |
Oracle Corp., | | | | | | | | | | | | |
Sr. Unsec’d. Notes | | 3.900 | | 05/15/35 | | | 45 | | | | 56,487 | |
Sr. Unsec’d. Notes | | 4.000 | | 07/15/46 | | | 65 | | | | 81,395 | |
| | | | | | | | | | | | |
| | | | |
| | | | | | | | | | | 452,141 | |
|
Telecommunications 2.3% | |
AT&T, Inc., | | | | | | | | | | | | |
Sr. Unsec’d. Notes | | 3.100 | | 02/01/43 | | | 60 | | | | 61,752 | |
Sr. Unsec’d. Notes | | 3.500 | | 06/01/41 | | | 270 | | | | 294,442 | |
Sr. Unsec’d. Notes | | 4.500 | | 03/09/48 | | | 145 | | | | 177,178 | |
Sr. Unsec’d. Notes | | 5.150 | | 03/15/42 | | | 115 | | | | 147,114 | |
T-Mobile USA, Inc., | | | | | | | | | | | | |
Sr. Sec’d. Notes, 144A | | 4.500 | | 04/15/50 | | | 15 | | | | 18,719 | |
Verizon Communications, Inc., | | | | | | | | | | | | |
Sr. Unsec’d. Notes | | 5.012 | | 04/15/49 | | | 190 | | | | 281,248 | |
| | | | | | | | | | | | |
| | | | |
| | | | | | | | | | | 980,453 | |
|
Transportation 0.2% | |
FedEx Corp., | | | | | | | | | | | | |
Gtd. Notes | | 4.500 | | 02/01/65 | | | 100 | | | | 107,761 | |
|
Trucking & Leasing 0.2% | |
Penske Truck Leasing Co. LP/PTL Finance Corp., | | | | | | | | | | | | |
Sr. Unsec’d. Notes, 144A | | 3.650 | | 07/29/21 | | | 65 | | | | 66,735 | |
|
Water 0.6% | |
American Water Capital Corp., | | | | | | | | | | | | |
Sr. Unsec’d. Notes | | 3.750 | | 09/01/47 | | | 200 | | | | 252,217 | |
| | | | | | | | | | | | |
| | | | |
TOTAL CORPORATE BONDS
(cost $33,290,642) | | | | | | | | | | | 37,155,983 | |
| | | | | | | | | | | | |
See Notes to Financial Statements.
| | | | |
| PGIM Corporate Bond Fund | | | 27 | |
PGIM Corporate Bond Fund
Schedule of Investments (continued)
as of July 31, 2020
| | | | | | | | | | | | | | |
| | | | |
| Description | | Interest Rate | | Maturity Date | | | Principal Amount (000)# | | | Value | |
| | |
MUNICIPAL BONDS 1.0% | | | | | | | | | |
|
Illinois 0.8% | |
State of Illinois, | | | | | | | | | | | | | | |
General Obligation Unlimited, Taxable(a) | | 5.100% | | | 06/01/33 | | | | 340 | | | $ | 356,966 | |
|
Texas 0.2% | |
Texas Private Activity Bond Surface Transportation Corp., | | | | | | | | | | | | | | |
Taxable, Revenue Bonds, Series B | | 3.922 | | | 12/31/49 | | | | 50 | | | | 55,153 | |
| | | | | | | | | | | | | | |
| | | | |
TOTAL MUNICIPAL BONDS | | | | | | | | | | | | | | |
(cost $411,616) | | | | | | | | | | | | | 412,119 | |
| | | | | | | | | | | | | | |
| | | | |
TOTAL LONG-TERM INVESTMENTS | | | | | | | | | | | | | | |
(cost $35,802,177) | | | | | | | | | | | | | 39,876,859 | |
| | | | | | | | | | | | | | |
| | | | |
| | | | | | | | Shares | | | | |
| | |
SHORT-TERM INVESTMENTS 7.8% | | | | | | | | | |
| | |
AFFILIATED MUTUAL FUNDS | | | | | | | | | |
PGIM Core Ultra Short Bond Fund(w) | | | | | | | | | 3,010,529 | | | | 3,010,529 | |
PGIM Institutional Money Market Fund | | | | | | | | | | | | | | |
(cost $355,874; includes $355,746 of cash collateral for securities on loan)(b)(w) | | | | | | | 355,976 | | | | 355,941 | |
| | | | | | | | | | | | | | |
| | |
TOTAL SHORT-TERM INVESTMENTS | | | | | | | | | |
(cost $3,366,403) | | | | | | | | | | | | | 3,366,470 | |
| | | | | | | | | | | | | | |
| | |
TOTAL INVESTMENTS 100.1% | | | | | | | | | |
(cost $39,168,580) | | | | | | | | | | | | | 43,243,329 | |
Liabilities in excess of other assets(z) (0.1)% | | | | | | | | | | | | | (40,371 | ) |
| | | | | | | | | | | | | | |
| | |
NET ASSETS 100.0% | | | | | | | $ | 43,202,958 | |
| | | | | | | | | | | | | | |
Below is a list of the abbreviation(s) used in the annual report:
144A—Security was purchased pursuant to Rule 144A under the Securities Act of 1933 and, pursuant to the requirements of Rule 144A, may not be resold except to qualified institutional buyers.
GMTN—Global Medium Term Note
LIBOR—London Interbank Offered Rate
LP—Limited Partnership
MTN—Medium Term Note
REITs—Real Estate Investment Trust
See Notes to Financial Statements.
PGIM Corporate Bond Fund
Schedule of Investments (continued)
as of July 31, 2020
| # | Principal amount is shown in U.S. dollars unless otherwise stated. |
| (a) | All or a portion of security is on loan. The aggregate market value of such securities, including those sold and pending settlement, is $348,803; cash collateral of $355,746 (included in liabilities) was received with which the Fund purchased highly liquid short-term investments. In the event of significant appreciation in value of securities on loan on the last business day of the reporting period, the Fund may reflect a collateral value that is less than the market value of the loaned securities and such shortfall is remedied the following business day. |
| (b) | Represents security, or portion thereof, purchased with cash collateral received for securities on loan and includes dividend reinvestment. |
| (c) | Variable rate instrument. The interest rate shown reflects the rate in effect at July 31, 2020. |
| (cc) | Variable rate instrument. The rate shown is based on the latest available information as of July 31, 2020. Certain variable rate securities are not based on a published reference rate and spread but are determined by the issuer or agent and are based on current market conditions. These securities do not indicate a reference rate and spread in their description. |
| (ff) | Variable rate security. Security may be issued at a fixed coupon rate, which converts to a variable rate at a specified date. Rate shown is the rate in effect as of period end. |
| (rr) | Perpetual security with no stated maturity date. |
| (s) | Represents zero coupon bond or principal only security. Rate represents yield to maturity at purchase date. |
| (w) | PGIM Investments LLC, the manager of the Fund, also serves as manager of the PGIM Core Ultra Short Bond Fund and PGIM Institutional Money Market Fund. |
| (z) | Includes net unrealized appreciation/(depreciation) and/or market value of the below holdings which are excluded from the Schedule of Investments: |
Futures contracts outstanding at July 31, 2020:
| | | | | | | | | | | | | | |
Number of Contracts | | Type | | Expiration
Date | | | Current
Notional
Amount | | | Value /
Unrealized
Appreciation
(Depreciation) | |
| Long Positions: | | | | | | | | | | | | |
| 4 | | 2 Year U.S. Treasury Notes | | | Sep. 2020 | | | $ | 883,938 | | | | $ 675 | |
| 9 | | 5 Year U.S. Treasury Notes | | | Sep. 2020 | | | | 1,135,125 | | | | 6,648 | |
| 10 | | 20 Year U.S. Treasury Bonds | | | Sep. 2020 | | | | 1,822,812 | | | | 46,375 | |
| | | | | | | | | | | | | 53,698 | |
| Short Positions: | | | | | | | | | | | | |
| 1 | | 10 Year U.S. Treasury Notes | | | Sep. 2020 | | | | 140,078 | | | | (2,970) | |
| 5 | | 30 Year U.S. Ultra Treasury Bonds | | | Sep. 2020 | | | | 1,138,438 | | | | (47,513) | |
| | | | | | | | | | | | | (50,483) | |
| | | | | | | | | | | | | $ 3,215 | |
Summary of Collateral for Centrally Cleared/Exchange-traded Derivatives:
Cash and securities segregated as collateral, including pending settlement for closed positions, to cover requirements for centrally cleared/exchange-traded derivatives are listed by broker as follows:
| | | | |
Broker | | Cash and/or Foreign Currency | | Securities Market Value |
Citigroup Global Markets, Inc. | | $200,000 | | $— |
See Notes to Financial Statements.
| | | | |
| PGIM Corporate Bond Fund | | | 29 | |
PGIM Corporate Bond Fund
Schedule of Investments (continued)
as of July 31, 2020
Fair Value Measurements:
Various inputs are used in determining the value of the Fund’s investments. These inputs are summarized in the three broad levels listed below.
Level 1—unadjusted quoted prices generally in active markets for identical securities.
Level 2—quoted prices for similar securities, interest rates and yield curves, prepayment speeds, foreign currency exchange rates and other observable inputs.
Level 3—unobservable inputs for securities valued in accordance with Board approved fair valuation procedures.
The following is a summary of the inputs used as of July 31, 2020 in valuing such portfolio securities:
| | | | | | | | | | |
| | | Level 1 | | | Level 2 | | | Level 3 |
Investments in Securities | | | | | | | | | | |
Assets | | | | | | | | | | |
Commercial Mortgage-Backed Securities | | | $ — | | | | $ 2,308,757 | | | $— |
Corporate Bonds | | | — | | | | 37,155,983 | | | — |
Municipal Bonds | | | — | | | | 412,119 | | | — |
Affiliated Mutual Funds | | | 3,366,470 | | | | — | | | — |
Total | | | $3,366,470 | | | | $39,876,859 | | | $— |
| | | |
Other Financial Instruments* | | | | | | | | | | |
Assets | | | | | | | | | | |
Futures Contracts | | | $ 53,698 | | | | $ — | | | $— |
| | | |
Liabilities | | | | | | | | | | |
Futures Contracts | | | $ (50,483 | ) | | | $ — | | | $— |
| * | Other financial instruments are derivative instruments not reflected in the Schedule of Investments, such as futures, forwards and centrally cleared swap contracts, which are recorded at the unrealized appreciation (depreciation) on the instrument, and OTC swap contracts which are recorded at fair value. |
Industry Classification:
The industry classification of investments and liabilities in excess of other assets shown as a percentage of net assets as of July 31, 2020 were as follows (unaudited):
| | | | | | | | | | | | | | |
Banks | | | 21.6 | % | | | | | | Oil & Gas | | | 4.3 | % |
Electric | | | 10.4 | | | | | | | Media | | | 3.9 | |
Affiliated Mutual Funds (0.8% represents | | | | | | | | | | Commercial Services | | | 3.9 | |
investments purchased with collateral from | | | | | | | | | | Healthcare-Services | | | 3.8 | |
securities on loan) | | | 7.8 | | | | | | | Auto Manufacturers | | | 3.0 | |
Pipelines | | | 6.2 | | | | | | | Real Estate Investment Trusts (REITs) | | | 2.9 | |
Pharmaceuticals | | | 5.7 | | | | | | | Insurance | | | 2.6 | |
Commercial Mortgage-Backed Securities | | | 5.3 | | | | | | | Telecommunications | | | 2.3 | |
See Notes to Financial Statements.
PGIM Corporate Bond Fund
Schedule of Investments (continued)
as of July 31, 2020
Industry Classification (continued):
| | | | | | | | | | | | | | |
Foods | | | 1.7 | % | | | | | | Transportation | | | 0.2 | % |
Beverages | | | 1.3 | | | | | | | Distribution/Wholesale | | | 0.2 | |
Retail | | | 1.3 | | | | | | | Auto Parts & Equipment | | | 0.2 | |
Agriculture | | | 1.2 | | | | | | | Housewares | | | 0.2 | |
Software | | | 1.0 | | | | | | | Gas | | | 0.2 | |
Mining | | | 1.0 | | | | | | | Trucking & Leasing | | | 0.2 | |
Aerospace & Defense | | | 1.0 | | | | | | | Apparel | | | 0.1 | |
Municipal Bonds | | | 1.0 | | | | | | | Iron/Steel | | | 0.0 | * |
Computers | | | 0.9 | | | | | | | Office/Business Equipment | | | 0.0 | * |
Chemicals | | | 0.9 | | | | | | | | | | 100.1 | |
Semiconductors | | | 0.8 | | | | | | | Liabilities in excess of other assets | | | (0.1 | ) |
Diversified Financial Services | | | 0.8 | | | | | | | | | | 100.0 | % |
Water | | | 0.6 | | | | | | | | | | | |
Miscellaneous Manufacturing | | | 0.5 | | | | | | | | | | | |
Real Estate | | | 0.5 | | | | | | | * Less than +/- 0.05% | | | | |
Building Materials | | | 0.3 | | | | | | | | | | | |
Shipbuilding | | | 0.3 | | | | | | | | | | | |
Effects of Derivative Instruments on the Financial Statements and Primary Underlying Risk Exposure:
The Fund invested in derivative instruments during the reporting period. The primary type of risk associated with these derivative instruments is interest rate contracts risk. See the Notes to Financial Statements for additional detail regarding these derivative instruments and their risks. The effect of such derivative instruments on the Fund’s financial position and financial performance as reflected in the Statement of Assets and Liabilities and Statement of Operations is presented in the summary below.
Fair values of derivative instruments as of July 31, 2020 as presented in the Statement of Assets and Liabilities:
| | | | | | | | |
| | | Asset Derivatives | | Liability Derivatives |
Derivatives not accounted for as
hedging instruments, carried at fair value | | Statement of
Assets and
Liabilities Location | | Fair Value | | Statement of
Assets and
Liabilities Location | | Fair Value |
| Interest rate contracts | | Due from/to
broker-variation margin
futures | | $53,698* | | Due from/to
broker-variation margin
futures | | $50,483* |
| * | Includes cumulative appreciation (depreciation) as reported in the schedule of open futures and centrally cleared swap contracts. Only unsettled variation margin receivable (payable) is reported within the Statement of Assets and Liabilities. |
See Notes to Financial Statements.
| | | | |
| PGIM Corporate Bond Fund | | | 31 | |
PGIM Corporate Bond Fund
Schedule of Investments (continued)
as of July 31, 2020
The effects of derivative instruments on the Statement of Operations for the year ended July 31, 2020 are as follows:
| | | | | |
Amount of Realized Gain (Loss) on Derivatives Recognized in Income |
Derivatives not accounted for as hedging
instruments, carried at fair value | | Futures |
Interest rate contracts | | | $ | (80,323 | ) |
|
Change in Unrealized Appreciation (Depreciation) on Derivatives Recognized in Income |
Derivatives not accounted for
as hedging instruments, carried at fair value | | Futures |
Interest rate contracts | | | $ | (23,698 | ) |
For the year ended July 31, 2020, the Fund’s average volume of derivative activities is as follows:
| | |
Futures
Contracts—
Long
Positions(1) | | Futures
Contracts—
Short
Positions(1) |
| $2,412,939 | | $3,125,994 |
| (1) | Notional Amount in USD. |
The Fund invested in OTC derivatives and entered into other financial transactions during the reporting period that are either offset in accordance with current requirements or are subject to enforceable master netting arrangements or similar agreements that permit offsetting. The information about offsetting and related netting arrangements for OTC derivatives and other financial transactions, where the legal right to set-off exists, is presented in the summary below.
| | | | | | | | | | | | | | | |
Description | | Gross Market
Value of
Recognized
Assets/(Liabilities) | | Collateral
Pledged/(Received)(1) | | Net
Amount |
| Securities on Loan | | | $ | 348,803 | | | | $ | (348,803 | ) | | | $ | — | |
| | | | | | | | | | | | | | | |
| (1) | Collateral amount disclosed by the Fund is limited to the market value of financial instruments/transactions. |
See Notes to Financial Statements.
Statement of Assets and Liabilities
as of July 31, 2020
| | | | |
Assets | | | | |
Investments at value, including securities on loan of $348,803: | | | | |
Unaffiliated investments (cost $35,802,177) | | | $39,876,859 | |
Affiliated investments (cost $3,366,403) | | | 3,366,470 | |
Dividends and interest receivable | | | 329,322 | |
Deposit with broker for centrally cleared/exchange-traded derivatives | | | 200,000 | |
Receivable for Fund shares sold | | | 78,389 | |
Due from Manager | | | 9,615 | |
Due from broker—variation margin futures | | | 703 | |
Prepaid expenses and other assets | | | 58 | |
Total Assets | | | 43,861,416 | |
| |
Liabilities | | | | |
Payable to broker for collateral for securities on loan | | | 355,746 | |
Payable for investments purchased | | | 134,859 | |
Payable for Fund shares reacquired | | | 71,377 | |
Accrued expenses and other liabilities | | | 49,275 | |
Audit fee payable | | | 36,429 | |
Dividends payable | | | 6,667 | |
Distribution fee payable | | | 2,503 | |
Trustees’ fees payable | | | 903 | |
Affiliated transfer agent fee payable | | | 699 | |
Total Liabilities | | | 658,458 | |
| |
Net Assets | | | $43,202,958 | |
| | | | |
| | | | | |
Net assets were comprised of: | | | | |
Shares of beneficial interest, at par | | | $ 3,509 | |
Paid-in capital in excess of par | | | 39,783,571 | |
Total distributable earnings (loss) | | | 3,415,878 | |
Net assets, July 31, 2020 | | | $43,202,958 | |
See Notes to Financial Statements.
| | | | |
| PGIM Corporate Bond Fund | | | 33 | |
Statement of Assets and Liabilities
as of July 31, 2020
| | | | |
| |
Class A | | | | |
Net asset value and redemption price per share, | | | | |
($5,021,343 ÷ 406,901 shares of beneficial interest issued and outstanding) | | | $12.34 | |
Maximum sales charge (3.25% of offering price) | | | 0.41 | |
Maximum offering price to public | | | $12.75 | |
| |
Class C | | | | |
Net asset value, offering price and redemption price per share, | | | | |
($1,783,036 ÷ 144,824 shares of beneficial interest issued and outstanding) | | | $12.31 | |
| |
Class R | | | | |
Net asset value, offering price and redemption price per share, | | | | |
($12,961 ÷ 1,053 shares of beneficial interest issued and outstanding) | | | $12.31 | |
| |
Class Z | | | | |
Net asset value, offering price and redemption price per share, | | | | |
($26,655,227 ÷ 2,165,347 shares of beneficial interest issued and outstanding) | | | $12.31 | |
| |
Class R6 | | | | |
Net asset value, offering price and redemption price per share, | | | | |
($9,730,391 ÷ 790,463 shares of beneficial interest issued and outstanding) | | | $12.31 | |
See Notes to Financial Statements.
Statement of Operations
Year Ended July 31, 2020
| | | | | |
Net Investment Income (Loss) | | | | | |
Income | | | | | |
Interest income | | | | $1,198,868 | |
Affiliated dividend income | | | | 11,907 | |
Income from securities lending, net (including affiliated income of $1,786) | | | | 2,652 | |
Total income | | | | 1,213,427 | |
| |
Expenses | | | | | |
Management fee | | | | 157,489 | |
Distribution fee(a) | | | | 24,566 | |
Registration fees(a) | | | | 77,200 | |
Custodian and accounting fees | | | | 70,060 | |
Audit fee | | | | 36,428 | |
Transfer agent’s fees and expenses (including affiliated expense of $4,609)(a) | | | | 30,963 | |
Shareholders’ reports | | | | 30,933 | |
Legal fees and expenses | | | | 22,035 | |
Trustees’ fees | | | | 10,989 | |
SEC registration fees | | | | 1,679 | |
Miscellaneous | | | | 18,037 | |
Total expenses | | | | 480,379 | |
Less: Fee waiver and/or expense reimbursement(a) | | | | (263,149 | ) |
Distribution fee waiver(a) | | | | (47 | ) |
Net expenses | | | | 217,183 | |
Net investment income (loss) | | | | 996,244 | |
| |
Realized And Unrealized Gain (Loss) On Investment Transactions | | | | | |
Net realized gain (loss) on: | | | | | |
Investment transactions (including affiliated of $(324)) | | | | 298,709 | |
Futures transactions | | | | (80,323 | ) |
| | | | 218,386 | |
Net change in unrealized appreciation (depreciation) on: | | | | | |
Investments (including affiliated of $67) | | | | 2,616,218 | |
Futures | | | | (23,698 | ) |
| | | | 2,592,520 | |
Net gain (loss) on investment transactions | | | | 2,810,906 | |
Net Increase (Decrease) In Net Assets Resulting From Operations | | | | $3,807,150 | |
| (a) | Class specific expenses and waivers were as follows: |
| | | | | | | | | | | | | | | | | | | | |
| | | Class A | | | Class C | | | Class R | | | Class Z | | | Class R6 | |
Distribution fee | | | 8,151 | | | | 16,272 | | | | 143 | | | | — | | | | — | |
Registration fees | | | 16,272 | | | | 15,027 | | | | 15,027 | | | | 15,847 | | | | 15,027 | |
Transfer agent’s fees and expenses | | | 5,087 | | | | 1,714 | | | | 75 | | | | 23,967 | | | | 120 | |
Fee waiver and/or expense reimbursement | | | (35,522 | ) | | | (24,027 | ) | | | (15,190 | ) | | | (132,355 | ) | | | (56,055 | ) |
Distribution fee waiver | | | — | | | | — | | | | (47 | ) | | | — | | | | — | |
See Notes to Financial Statements.
| | | | |
| PGIM Corporate Bond Fund | | | 35 | |
Statements of Changes in Net Assets
| | | | | | | | |
| |
| | | Year Ended
July 31, | |
| | |
| | | 2020 | | | 2019 | |
| | |
Increase (Decrease) in Net Assets | | | | | | | | |
Operations | | | | | | | | |
Net investment income (loss) | | $ | 996,244 | | | $ | 838,163 | |
Net realized gain (loss) on investment transactions | | | 218,386 | | | | (84,339 | ) |
Net change in unrealized appreciation (depreciation) on investments | | | 2,592,520 | | | | 1,943,555 | |
| | | | | | | | |
Net increase (decrease) in net assets resulting from operations | | | 3,807,150 | | | | 2,697,379 | |
| | | | | | | | |
| | |
Dividends and Distributions | | | | | | | | |
Distributions from distributable earnings | | | | | | | | |
Class A | | | (93,118 | ) | | | (88,579 | ) |
Class C | | | (34,439 | ) | | | (26,596 | ) |
Class R | | | (502 | ) | | | (571 | ) |
Class Z | | | (653,856 | ) | | | (598,906 | ) |
Class R6 | | | (284,140 | ) | | | (158,195 | ) |
| | | | | | | | |
| | | (1,066,055 | ) | | | (872,847 | ) |
| | | | | | | | |
| | |
Fund share transactions (Net of share conversions) | | | | | | | | |
Net proceeds from shares sold | | | 20,079,708 | | | | 12,767,604 | |
Net asset value of shares issued in reinvestment of dividends and distributions | | | 1,052,750 | | | | 861,560 | |
Cost of shares reacquired | | | (11,263,580 | ) | | | (6,653,904 | ) |
| | | | | | | | |
Net increase (decrease) in net assets from Fund share transactions | | | 9,868,878 | | | | 6,975,260 | |
| | | | | | | | |
Total increase (decrease) | | | 12,609,973 | | | | 8,799,792 | |
| | |
Net Assets: | | | | | | | | |
Beginning of year | | | 30,592,985 | | | | 21,793,193 | |
| | | | | | | | |
End of year | | $ | 43,202,958 | | | $ | 30,592,985 | |
| | | | | | | | |
See Notes to Financial Statements.
Notes to Financial Statements
1. Organization
The Target Portfolio Trust (the “Trust”) is registered under the Investment Company Act of 1940, as amended (“1940 Act”), as a diversified open-end management investment company. The Trust currently consists of three series: PGIM Corporate Bond Fund, PGIM Core Bond Fund and PGIM QMA Small-Cap Value Fund (collectively the “Funds”).
These financial statements relate only to the PGIM Corporate Bond Fund (the “Fund”).
The investment objective of the Fund is high current income consistent with the preservation of principal.
2. Accounting Policies
The Fund follows the investment company accounting and reporting guidance of the Financial Accounting Standards Board (“FASB”) Accounting Standard Codification (“ASC”) Topic 946 Financial Services — Investment Companies. The following accounting policies conform to U.S. generally accepted accounting principles. The Fund consistently follows such policies in the preparation of its financial statements.
Securities Valuation: The Fund holds securities and other assets and liabilities that are fair valued at the close of each day (generally, 4:00 PM Eastern time) the New York Stock Exchange (“NYSE”) is open for trading. Fair value is the price that would be received to sell an asset or paid to transfer a liability in an orderly transaction between market participants on the measurement date. The Trust’s Board of Trustees (the “Board”) has adopted valuation procedures for security valuation under which fair valuation responsibilities have been delegated to PGIM Investments LLC (“PGIM Investments” or the “Manager”). Pursuant to the Board’s delegation, the Manager has established a Valuation Committee responsible for supervising the fair valuation of portfolio securities and other assets and liabilities. The valuation procedures permit the Fund to utilize independent pricing vendor services, quotations from market makers, and alternative valuation methods when market quotations are either not readily available or not deemed representative of fair value. A record of the Valuation Committee’s actions is subject to the Board’s review, approval, and ratification at its next regularly scheduled quarterly meeting.
For the fiscal reporting year-end, securities and other assets and liabilities were fair valued at the close of the last U.S. business day. Trading in certain foreign securities may occur when the NYSE is closed (including weekends and holidays). Because such foreign securities trade in markets that are open on weekends and U.S. holidays, the values of some of the Fund’s foreign investments may change on days when investors cannot purchase or redeem Fund shares.
| | | | |
| PGIM Corporate Bond Fund | | | 37 | |
Notes to Financial Statements (continued)
Various inputs determine how the Fund’s investments are valued, all of which are categorized according to the three broad levels (Level 1, 2, or 3) detailed in the Schedule of Investments and referred to herein as the “fair value hierarchy” in accordance with FASB ASC Topic 820 - Fair Value Measurements and Disclosures.
Derivative instruments, such as futures or options, that are traded on a national securities exchange are valued at the last sale price as of the close of trading on the applicable exchange where the security principally trades. Securities traded via NASDAQ are valued at the NASDAQ official closing price. To the extent these securities are valued at the last sale price or NASDAQ official closing price, they are classified as Level 1 in the fair value hierarchy. In the event that no sale or official closing price on valuation date exists, these securities are generally valued at the mean between the last reported bid and ask prices, or at the last bid price in the absence of an ask price. These securities are classified as Level 2 in the fair value hierarchy.
Investments in open-end (other than exchange-traded mutual funds) funds are valued at their net asset values as of the close of the NYSE on the date of valuation. These securities are classified as Level 1 in the fair value hierarchy since they may be purchased or sold at their net asset values on the date of valuation.
Fixed income securities traded in the OTC market are generally classified as Level 2 in the fair value hierarchy. Such fixed income securities are typically valued using the market approach which generally involves obtaining data from an approved independent third-party vendor source. The Fund utilizes the market approach as the primary method to value securities when market prices of identical or comparable instruments are available. The third-party vendors’ valuation techniques used to derive the evaluated bid price are based on evaluating observable inputs, including but not limited to, yield curves, yield spreads, credit ratings, deal terms, tranche level attributes, default rates, cash flows, prepayment speeds, broker/dealer quotations and reported trades. Certain Level 3 securities are also valued using the market approach when obtaining a single broker quote or when utilizing transaction prices for identical securities that have been used in excess of five business days. During the reporting period, there were no changes to report with respect to the valuation approach and/or valuation techniques discussed above.
Securities and other assets that cannot be priced according to the methods described above are valued based on pricing methodologies approved by the Board. In the event that unobservable inputs are used when determining such valuations, the securities will be classified as Level 3 in the fair value hierarchy.
When determining the fair value of securities, some of the factors influencing the valuation include: the nature of any restrictions on disposition of the securities; assessment of the
general liquidity of the securities; the issuer’s financial condition and the markets in which it does business; the cost of the investment; the size of the holding and the capitalization of the issuer; the prices of any recent transactions or bids/offers for such securities or any comparable securities; any available analyst media or other reports or information deemed reliable by the Manager regarding the issuer or the markets or industry in which it operates. Using fair value to price securities may result in a value that is different from a security’s most recent closing price and from the price used by other unaffiliated mutual funds to calculate their net asset values.
Illiquid Securities: Pursuant to Rule 22e-4 under the 1940 Act, the Trust has adopted a Board approved Liquidity Risk Management Program (“LRMP”) that requires, among other things, that the Fund limit its illiquid investments that are assets to no more than 15% of net assets. Illiquid securities are those that, because of the absence of a readily available market or due to legal or contractual restrictions on resale, may not reasonably be expected to be sold or disposed of in current market conditions in seven calendar days or less without the sale or disposition significantly changing the market value of the investment. The Fund may find it difficult to sell illiquid securities at the time considered most advantageous by its subadviser(s) and may incur transaction costs that would not be incurred in the sale of securities that were freely marketable.
Restricted Securities: Securities acquired in unregistered, private sales from the issuing company or from an affiliate of the issuer are considered restricted as to disposition under federal securities law (“restricted securities”). Such restricted securities are valued pursuant to the valuation procedures noted above. Restricted securities that would otherwise be considered illiquid investments pursuant to the Trust’s LRMP because of legal restrictions on resale to the general public may be traded among qualified institutional buyers under Rule 144A of the Securities Act of 1933. Therefore, these Rule 144A securities, as well as commercial paper that is sold in private placements under Section 4(2) of the Securities Act of 1933, may be classified higher than “illiquid” under the LRMP (i.e. “moderately liquid” or “less liquid” investments). However, the liquidity of the Fund’s investments in restricted securities could be impaired if trading does not develop or declines.
Foreign Currency Translation: The books and records of the Fund are maintained in U.S. dollars. Foreign currency amounts are translated into U.S. dollars on the following basis:
(i) market value of investment securities, other assets and liabilities — at the current rates of exchange;
(ii) purchases and sales of investment securities, income and expenses — at the rates of exchange prevailing on the respective dates of such transactions.
Although the net assets of the Fund are presented at the foreign exchange rates and market values at the close of the period, the Fund does not generally isolate that portion of the results of operations arising as a result of changes in the foreign exchange rates from the fluctuations arising from changes in the market prices of long-term portfolio securities held
| | | | |
| PGIM Corporate Bond Fund | | | 39 | |
Notes to Financial Statements (continued)
at the end of the period. Similarly, the Fund does not isolate the effect of changes in foreign exchange rates from the fluctuations arising from changes in the market prices of long-term portfolio securities sold during the period. Accordingly, holding period realized foreign currency gains (losses) are included in the reported net realized gains (losses) on investment transactions.
Net realized gains (losses) on foreign currency transactions represent net foreign exchange gains (losses) from the disposition of holdings of foreign currencies, currency gains (losses) realized between the trade and settlement dates on investment transactions, and the difference between the amounts of interest, dividends and foreign withholding taxes recorded on the Fund’s books and the U.S. dollar equivalent amounts actually received or paid. Net unrealized currency gains (losses) arise from valuing foreign currency denominated assets and liabilities (other than investments) at period end exchange rates.
Financial Futures Contracts: A financial futures contract is an agreement to purchase (long) or sell (short) an agreed amount of securities at a set price for delivery on a future date. Upon entering into a financial futures contract, the Fund is required to pledge to the broker an amount of cash and/or other assets equal to a certain percentage of the contract amount. This amount is known as the “initial margin.” Subsequent payments, known as “variation margin,” are made or received by the Fund each day, depending on the daily fluctuations in the value of the underlying security. Such variation margin is recorded for financial statement purposes on a daily basis as unrealized gain (loss). When the contract expires or is closed, the gain (loss) is realized and is presented in the Statement of Operations as net realized gain (loss) on futures transactions.
The Fund invested in financial futures contracts in order to hedge its existing portfolio securities, or securities the Fund intends to purchase, against fluctuations in value caused by changes in prevailing interest rates. Should interest rates move unexpectedly, the Fund may not achieve the anticipated benefits of the financial futures contracts and may realize a loss. The use of futures transactions involves the risk of imperfect correlation in movements in the price of futures contracts, interest rates and the underlying hedged assets. Since futures contracts are exchange-traded, there is minimal counterparty credit risk to the Fund since the exchanges’ clearinghouse acts as counterparty to all exchange-traded futures and guarantees the futures contracts against default.
Master Netting Arrangements: The Trust, on behalf of the Fund, is subject to various Master Agreements, or netting arrangements, with select counterparties. These are agreements which a subadviser may have negotiated and entered into on behalf of all or a portion of the Fund. A master netting arrangement between the Fund and the counterparty permits the Fund to offset amounts payable by the Fund to the same counterparty against amounts to be received; and by the receipt of collateral from the counterparty by the Fund to cover the
Fund’s exposure to the counterparty. However, there is no assurance that such mitigating factors are easily enforceable. In addition to master netting arrangements, the right to set-off exists when all the conditions are met such that each of the parties owes the other determinable amounts, the reporting party has the right to set-off the amount owed with the amount owed by the other party, the reporting party intends to set-off and the right of set-off is enforceable by law. During the reporting period, there was no intention to settle on a net basis and all amounts are presented on a gross basis on the Statement of Assets and Liabilities.
Forward currency contracts, forward rate agreements, written options, short sales, swaps and financial futures contracts involve elements of both market and credit risk in excess of the amounts reflected on the Statement of Assets and Liabilities. Such risks may be mitigated by engaging in master netting arrangements.
Securities Lending: The Fund lends its portfolio securities to banks and broker-dealers. The loans are secured by collateral at least equal to the market value of the securities loaned. Collateral pledged by each borrower is invested in an affiliated money market fund and is marked to market daily, based on the previous day’s market value, such that the value of the collateral exceeds the value of the loaned securities. In the event of significant appreciation in value of securities on loan on the last business day of the reporting period, the financial statements may reflect a collateral value that is less than the market value of the loaned securities. Such shortfall is remedied as described above. Loans are subject to termination at the option of the borrower or the Fund. Upon termination of the loan, the borrower will return to the Fund securities identical to the loaned securities. Should the borrower of the securities fail financially, the Fund has the right to repurchase the securities in the open market using the collateral.
The Fund recognizes income, net of any rebate and securities lending agent fees, for lending its securities in the form of fees or interest on the investment of any cash received as collateral. The borrower receives all interest and dividends from the securities loaned and such payments are passed back to the lender in amounts equivalent thereto. The Fund also continues to recognize any unrealized gain (loss) in the market price of the securities loaned and on the change in the value of the collateral invested that may occur during the term of the loan. In addition, realized gain (loss) is recognized on changes in the value of the collateral invested upon liquidation of the collateral. Net earnings from securities lending are disclosed in the Statement of Operations.
Securities Transactions and Net Investment Income: Securities transactions are recorded on the trade date. Realized gains (losses) from investment and currency transactions are calculated on the specific identification method. Dividend income is recorded on the ex-date, or for certain foreign securities, when the Fund becomes aware of such dividends. Interest income, including amortization of premium and accretion of discount on debt securities, as required, is recorded on the accrual basis. Expenses are recorded on an accrual basis, which may require the use of certain estimates by management that may differ from actual. Net investment income or loss (other than class specific expenses and
| | | | |
| PGIM Corporate Bond Fund | | | 41 | |
Notes to Financial Statements (continued)
waivers, which are allocated as noted below) and unrealized and realized gains (losses) are allocated daily to each class of shares based upon the relative proportion of adjusted net assets of each class at the beginning of the day. Class specific expenses and waivers, where applicable, are charged to the respective share classes. Class specific expenses include distribution fees and distribution fee waivers, shareholder servicing fees, transfer agent’s fees and expenses, registration fees and fee waivers and/or expense reimbursements, as applicable.
Taxes: It is the Fund’s policy to continue to meet the requirements of the Internal Revenue Code applicable to regulated investment companies and to distribute all of its taxable net investment income and capital gains, if any, to its shareholders. Therefore, no federal income tax provision is required. Withholding taxes on foreign dividends, interest and capital gains, if any, are recorded, net of reclaimable amounts, at the time the related income is earned.
Dividends and Distributions: The Fund expects to declare dividends of its net investment income daily and pay such dividends monthly. Distributions from net realized capital and currency gains, if any, are declared and paid at least annually. Dividends and distributions to shareholders, which are determined in accordance with federal income tax regulations and which may differ from generally accepted accounting principles, are recorded on the ex-date. Permanent book/tax differences relating to income and gain (loss) are reclassified between total distributable earnings (loss) and paid-in capital in excess of par, as appropriate.
Estimates: The preparation of financial statements requires management to make estimates and assumptions that affect the reported amounts and disclosures in the financial statements. Actual results could differ from those estimates.
3. Agreements
The Trust, on behalf of the Fund, has a management agreement with the Manager. Pursuant to this agreement, the Manager has responsibility for all investment advisory services and supervises the subadviser’s performance of such services. In addition, under the management agreement, the Manager provides all of the administrative functions necessary for the organization, operation and management of the Fund. The Manager administers the corporate affairs of the Fund and, in connection therewith, furnishes the Fund with office facilities, together with those ordinary clerical and bookkeeping services which are not being furnished by the Fund’s custodian and the Fund’s transfer agent. The Manager is also responsible for the staffing and management of dedicated groups of legal, marketing, compliance and related personnel necessary for the operation of the Fund. The legal, marketing, compliance and related personnel are also responsible for the management and
oversight of the various service providers to the Fund, including, but not limited to, the custodian, transfer agent, and accounting agent.
The Manager has entered into subadvisory agreements with PGIM Limited and PGIM, Inc., which provides subadvisory services to the Fund through its PGIM Fixed Income unit (each a “subadviser” and collectively the “subadvisers”). The subadvisory agreements provide that the subadvisers will furnish investment advisory services in connection with the management of the Fund. In connection therewith, the subadvisers are obligated to keep certain books and records of the Fund. The Manager pays for the services of the subadvisers, the cost of compensation of officers of the Fund, occupancy and certain clerical and bookkeeping costs of the Fund. The Fund bears all other costs and expenses.
The management fee paid to the Manager is accrued daily and payable monthly at an annual rate of 0.45% average daily net assets up to and including $5 billion and 0.425% on average daily net assets assets exceeding $5 billion. The effective management fee rate before any waivers and/or expense reimbursements was 0.45% for the year ended July 31, 2020.
The Manager has contractually agreed, through November 30, 2021, to limit total annual operating expenses after fee waivers and/or expense reimbursements to 0.80% of average daily net assets for Class A shares, 1.55% of average daily net assets for Class C shares, 1.05% of average daily net assets for Class R shares, 0.55% of average daily net assets for Class Z shares and 0.55% of average daily net assets for Class R6 shares. This contractual waiver excludes interest, brokerage, taxes (such as income and foreign withholding taxes, stamp duty and deferred tax expenses), acquired fund fees and expenses, extraordinary expenses, and certain other Fund expenses such as dividend and interest expense and broker charges on short sales.
Where applicable, the Manager agrees to waive management fees or shared operating expenses on any share class to the same extent that it waives such expenses on any other share class. In addition, total annual operating expenses for Class R6 shares will not exceed total annual operating expenses for Class Z shares. Fees and/or expenses waived and/or reimbursed by the Manager may be recouped by the Manager within the same fiscal year during which such waiver and/or reimbursement is made if such recoupment can be realized without exceeding the expense limit in effect at the time of the recoupment for that fiscal year.
The Trust, on behalf of the Fund, has a distribution agreement with Prudential Investment Management Services LLC (“PIMS”), which acts as the distributor of the Class A, Class C, Class R, Class Z and Class R6 shares of the Fund. The Fund compensates PIMS for distributing and servicing the Fund’s Class A, Class C and Class R shares, pursuant to the plans of distribution (the “Distribution Plans”), regardless of expenses actually incurred by PIMS. The distribution fees are accrued daily and payable monthly. No distribution or service fees are paid to PIMS as distributor of the Class Z or Class R6 shares of the Fund.
| | | | |
| PGIM Corporate Bond Fund | | | 43 | |
Notes to Financial Statements (continued)
Pursuant to the Distribution Plans, the Fund compensates PIMS for distribution related activities at an annual rate of up to 0.25%, 1% and 0.75% of the average daily net assets of the Class A, Class C and Class R shares, respectively. PIMS has contractually agreed through November 30, 2021 to limit such fees to 0.50% of the average daily net assets of the Class R shares.
For the year ended July 31, 2020, PIMS received $9,852 in front-end sales charges resulting from sales of Class A shares. Additionally, for the year ended July 31, 2020, PIMS received and $650 in contingent deferred sales charges imposed upon redemptions by certain Class C shareholders. From these fees, PIMS paid such sales charges to broker-dealers, who in turn paid commissions to salespersons and incurred other distribution costs.
PGIM Investments, PGIM, Inc., PGIM Limited and PIMS are indirect, wholly-owned subsidiaries of Prudential Financial, Inc. (“Prudential”).
4. Other Transactions with Affiliates
Prudential Mutual Fund Services LLC (“PMFS”), an affiliate of PGIM Investments and an indirect, wholly-owned subsidiary of Prudential, serves as the Fund’s transfer agent. Transfer agent’s fees and expenses in the Statement of Operations include certain out-of-pocket expenses paid to non-affiliates, where applicable.
The Fund may invest its overnight sweep cash in the PGIM Core Ultra Short Bond Fund (the “Core Fund”), and its securities lending cash collateral in the PGIM Institutional Money Market Fund (the “Money Market Fund”), each a series of Prudential Investment Portfolios 2, registered under the 1940 Act and managed by PGIM Investments. Through the Fund’s investments in the mentioned underlying funds, PGIM Investments and/or its affiliates are paid fees or reimbursed for providing their services. In addition to the realized and unrealized gains on investments in the Core Fund and Money Market Fund, earnings from such investments are disclosed on the Statement of Operations as “Affiliated dividend income” and “Income from securities lending, net”, respectively.
The Fund may enter into certain securities purchase or sale transactions under Board approved Rule 17a-7 procedures. Rule 17a-7 is an exemptive rule under the 1940 Act, that subject to certain conditions, permits purchase and sale transactions among affiliated investment companies, or between an investment company and a person that is affiliated solely by reason of having a common (or affiliated) investment adviser, common directors, and/or common officers. Pursuant to the Rule 17a-7 procedures and consistent with guidance issued by the Securities and Exchange Commission (“SEC”), the Trust’s Chief
Compliance Officer (“CCO”) prepares a quarterly summary of all such transactions for submission to the Board, together with the CCO’s written representation that all such 17a-7 transactions were effected in accordance with the Fund’s Rule 17a-7 procedures.
For the year ended July 31, 2020, the Fund’s purchase and sales transactions under Rule 17a-7 and realized gain as a result of 17a-7 sales transactions were as follows:
| | | | | | |
Fund | | Purchases | | Sales | | Realized
Loss |
| Corporate Bond | | $— | | $636,463 | | $(95,506) |
5. Portfolio Securities
The aggregate cost of purchases and proceeds from sales of portfolio securities (excluding short-term investments and U.S. Government securities) for the year ended July 31, 2020, were $15,367,198 and $8,193,034, respectively.
A summary of the cost of purchases and proceeds from sales of shares of affiliated investments for the year ended July 31, 2020, is presented as follows:
| | | | | | | | | | | | | | | | | | | | | | | | | | | | | | |
Value,
Beginning of Year | | | Cost of Purchases | | | Proceeds from Sales | | | Change in
Unrealized
Gain
(Loss) | | | Realized
Gain
(Loss) | | | Value, End of Year | | | Shares,
End
of Year | | | Income | |
| | |
| | PGIM Core Ultra Short Bond Fund* | | | | | | | | | |
| | $672,792 | | | | $20,036,785 | | | | $17,699,048 | | | | $— | | | | $— | | | | $3,010,529 | | | | 3,010,529 | | | | $11,907 | |
| | |
| | PGIM Institutional Money Market Fund* | | | | | | | | | |
| | — | | | | 2,060,151 | | | | 1,703,953 | | | | 67 | | | | (324) | | | | 355,941 | | | | 355,976 | | | | 1,786 | ** |
| | $672,792 | | | | $22,096,936 | | | | $19,403,001 | | | | $67 | | | | $(324) | | | | $3,366,470 | | | | | | | | $13,693 | |
| * | The Fund did not have any capital gain distributions during the reporting period. |
| ** | The amount, or a portion thereof, represents the affiliated securities lending income shown on the Statement of Operations. |
6. Distributions and Tax Information
Distributions to shareholders, which are determined in accordance with federal income tax regulations and which may differ from generally accepted accounting principles, are recorded on the ex-date.
For the year ended July 31, 2020, the tax character of dividends paid by the Fund was $1,066,055 of ordinary income. For the year ended July 31, 2019, the tax character of dividends paid by the Fund was $872,847 of ordinary income.
As of July 31, 2020, the accumulated undistributed earnings on a tax basis was $77,303 of ordinary income.
| | | | |
| PGIM Corporate Bond Fund | | | 45 | |
Notes to Financial Statements (continued)
The United States federal income tax basis of the Fund’s investments and the net unrealized appreciation as of July 31, 2020 were as follows:
| | | | | | |
| Tax Basis | | Gross Unrealized Appreciation | | Gross Unrealized Depreciation | | Net Unrealized Appreciation |
| $39,270,766 | | $4,070,244 | | $(94,466) | | $3,975,778 |
The differences between book basis and tax basis were primarily attributable to book/tax differences in the treatment of premium amortization and other book to tax differences.
For federal income tax purposes, the Fund had a capital loss carryforward as of July 31, 2020 of approximately $631,000 which can be carried forward for an unlimited period. The Fund utilized approximately $136,000 of its capital loss carryforward to offset net taxable gains realized in the fiscal year ended July 31, 2020. No capital gains distributions are expected to be paid to shareholders until net gains have been realized in excess of such losses.
The Manager has analyzed the Fund’s tax positions taken on federal, state and local income tax returns for all open tax years and has concluded that no provision for income tax is required in the Fund’s financial statements for the current reporting period. Since tax authorities can examine previously filed tax returns, the Fund’s U.S. federal and state tax returns for each of the four fiscal years up to the most recent fiscal year ended July 31, 2020 are subject to such review.
7. Capital and Ownership
The Fund offers Class A, Class C, Class R, Class Z and Class R6 shares. Class A shares are sold with a maximum front-end sales charge of 3.25%. Investors who purchase $1 million or more prior to July 15, 2019 ($500,000 or more on or after July 15, 2019) of Class A shares and sell those shares within 12 months of purchase are subject to a contingent deferred sales charge (“CDSC”) of 1.00% on sales although these purchases are not subject to a front-end sales charge. The Class A CDSC is waived for certain retirement and/or benefit plans. A special exchange privilege is also available for shareholders who qualified to purchase Class A shares at net asset value. Class C shares are sold with a CDSC of 1% on sales made within 12 months of purchase. Class C shares will automatically convert to Class A shares on a monthly basis approximately 10 years after purchase. Class R shares are available to certain retirement plans, clearing and settlement firms. Class R, Class Z and Class R6 shares are not subject to any sales or redemption charges and are available exclusively for sale to a limited group of investors.
Under certain circumstances, an exchange may be made from specified share classes of the Fund to one or more other share classes of the Fund as presented in the table of transactions in shares of beneficial interest, below.
The Trust has authorized an unlimited number of shares of beneficial interest of the Fund at $0.001 par value per share.
As of July 31, 2020, Prudential, through its affiliated entities, including affiliated funds (if applicable), owned shares of the Fund as follows:
| | | | | | | | |
| | | Number of Shares | | | Percentage of
Outstanding Shares | |
Class R | | | 1,053 | | | | 100.0% | |
Class R6 | | | 790,463 | | | | 100.0% | |
At the reporting period end, the number of shareholders holding greater than 5% of the Fund are as follows:
| | | | | | |
| Affiliated | | Unaffiliated |
Number of
Shareholders | | Percentage of
Outstanding Shares | | Number of
Shareholders | | Percentage of
Outstanding Shares |
1 | | 22.9% | | 3 | | 65.7% |
Transactions in shares of beneficial interest were as follows:
| | | | | | | | |
Class A | | Shares | | | Amount | |
Year ended July 31, 2020: | | | | | | | | |
Shares sold | | | 257,411 | | | $ | 3,049,764 | |
Shares issued in reinvestment of dividends and distributions | | | 7,519 | | | | 88,720 | |
Shares reacquired | | | (128,858 | ) | | | (1,485,647 | ) |
| | | | | | | | |
Net increase (decrease) in shares outstanding before conversion | | | 136,072 | | | | 1,652,837 | |
Shares issued upon conversion from other share class(es) | | | 10,025 | | | | 117,723 | |
Shares reacquired upon conversion into other share class(es) | | | (5,170 | ) | | | (61,651 | ) |
| | | | | | | | |
Net increase (decrease) in shares outstanding | | | 140,927 | | | $ | 1,708,909 | |
| | | | | | | | |
Year ended July 31, 2019: | | | | | | | | |
Shares sold | | | 85,799 | | | $ | 945,293 | |
Shares issued in reinvestment of dividends and distributions | | | 7,813 | | | | 85,465 | |
Shares reacquired | | | (72,058 | ) | | | (792,830 | ) |
| | | | | | | | |
Net increase (decrease) in shares outstanding before conversion | | | 21,554 | | | | 237,928 | |
Shares issued upon conversion from other share class(es) | | | 9,542 | | | | 102,398 | |
Shares reacquired upon conversion into other share class(es) | | | (2,421 | ) | | | (26,572 | ) |
| | | | | | | | |
Net increase (decrease) in shares outstanding | | | 28,675 | | | $ | 313,754 | |
| | | | | | | | |
| | | | |
| PGIM Corporate Bond Fund | | | 47 | |
Notes to Financial Statements (continued)
| | | | | | | | | | |
Class C | | Shares | | Amount |
Year ended July 31, 2020: | | | | | | | | | | |
Shares sold | | | | 63,461 | | | | $ | 744,061 | |
Shares issued in reinvestment of dividends and distributions | | | | 2,866 | | | | | 33,677 | |
Shares reacquired | | | | (35,199 | ) | | | | (416,669 | ) |
| | | | | | | | | | |
Net increase (decrease) in shares outstanding before conversion | | | | 31,128 | | | | | 361,069 | |
Shares reacquired upon conversion into other share class(es) | | | | (7,291 | ) | | | | (87,734 | ) |
| | | | | | | | | | |
Net increase (decrease) in shares outstanding | | | | 23,837 | | | | $ | 273,335 | |
| | | | | | | | | | |
Year ended July 31, 2019: | | | | | | | | | | |
Shares sold | | | | 48,595 | | | | $ | 533,369 | |
Shares issued in reinvestment of dividends and distributions | | | | 2,348 | | | | | 25,675 | |
Shares reacquired | | | | (16,771 | ) | | | | (178,977 | ) |
| | | | | | | | | | |
Net increase (decrease) in shares outstanding before conversion | | | | 34,172 | | | | | 380,067 | |
Shares reacquired upon conversion into other share class(es) | | | | (1,435 | ) | | | | (15,570 | ) |
| | | | | | | | | | |
Net increase (decrease) in shares outstanding | | | | 32,737 | | | | $ | 364,497 | |
| | | | | | | | | | |
Class R | | | | |
Year ended July 31, 2020: | | | | | | | | | | |
Shares sold | | | | 28 | | | | $ | 322 | |
Shares issued in reinvestment of dividends and distributions | | | | 42 | | | | | 494 | |
Shares reacquired | | | | (780 | ) | | | | (8,875 | ) |
| | | | | | | | | | |
Net increase (decrease) in shares outstanding | | | | (710 | ) | | | $ | (8,059 | ) |
| | | | | | | | | | |
Year ended July 31, 2019: | | | | | | | | | | |
Shares sold | | | | 55 | | | | $ | 593 | |
Shares issued in reinvestment of dividends and distributions | | | | 52 | | | | | 570 | |
Shares reacquired | | | | (28 | ) | | | | (321 | ) |
| | | | | | | | | | |
Net increase (decrease) in shares outstanding | | | | 79 | | | | $ | 842 | |
| | | | | | | | | | |
Class Z | | | | |
Year ended July 31, 2020: | | | | | | | | | | |
Shares sold | | | | 1,395,014 | | | | $ | 16,285,561 | |
Shares issued in reinvestment of dividends and distributions | | | | 54,927 | | | | | 646,133 | |
Shares reacquired | | | | (802,197 | ) | | | | (9,352,389 | ) |
| | | | | | | | | | |
Net increase (decrease) in shares outstanding before conversion | | | | 647,744 | | | | | 7,579,305 | |
Shares issued upon conversion from other share class(es) | | | | 11,096 | | | | | 132,716 | |
Shares reacquired upon conversion into other share class(es) | | | | (8,667 | ) | | | | (101,054 | ) |
| | | | | | | | | | |
Net increase (decrease) in shares outstanding | | | | 650,173 | | | | $ | 7,610,967 | |
| | | | | | | | | | |
Year ended July 31, 2019: | | | | | | | | | | |
Shares sold | | | | 301,526 | | | | $ | 3,288,349 | |
Shares issued in reinvestment of dividends and distributions | | | | 54,309 | | | | | 591,655 | |
Shares reacquired | | | | (526,693 | ) | | | | (5,681,776 | ) |
| | | | | | | | | | |
Net increase (decrease) in shares outstanding before conversion | | | | (170,858 | ) | | | | (1,801,772 | ) |
Shares issued upon conversion from other share class(es) | | | | 2,428 | | | | | 26,572 | |
Shares reacquired upon conversion into other share class(es) | | | | (8,127 | ) | | | | (86,828 | ) |
| | | | | | | | | | |
Net increase (decrease) in shares outstanding | | | | (176,557 | ) | | | $ | (1,862,028 | ) |
| | | | | | | | | | |
| | | | | | | | |
Class R6 | | Shares | | | Amount | |
Year ended July 31, 2020: | | | | | | | | |
Shares issued in reinvestment of dividends and distributions | | | 24,062 | | | $ | 283,726 | |
| | | | | | | | |
Net increase (decrease) in shares outstanding | | | 24,062 | | | $ | 283,726 | |
| | | | | | | | |
Year ended July 31, 2019: | | | | | | | | |
Shares sold | | | 751,174 | | | $ | 8,000,000 | |
Shares issued in reinvestment of dividends and distributions | | | 14,216 | | | | 158,195 | |
| | | | | | | | |
Net increase (decrease) in shares outstanding | | | 765,390 | | | $ | 8,158,195 | |
| | | | | | | | |
8. Borrowings
The Trust, on behalf of the Fund, along with other affiliated registered investment companies (the “RICs”), is a party to a Syndicated Credit Agreement (“SCA”) with a group of banks. The purpose of the SCA is to provide an alternative source of temporary funding for capital share redemptions. The table below provides details of the current SCA in effect at the reporting period-end as well as the prior SCA.
| | | | |
| | | Current SCA | | Prior SCA |
Term of Commitment | | 10/3/2019 – 10/1/2020 | | 10/4/2018 – 10/2/2019 |
Total Commitment | | $1,222,500,000* | | $900,000,000 |
Annualized Commitment Fee on the Unused Portion of the SCA | | 0.15% | | 0.15% |
Annualized Interest Rate on Borrowings | | 1.20% plus the higher of (1) the effective federal funds rate, (2) the one-month LIBOR rate or (3) zero percent | | 1.25% plus the higher of (1) the effective federal funds rate, (2) the one-month LIBOR rate or (3) zero percent |
| * Effective March 31, 2020, the SCA’s total commitment was increased from $900,000,000 to $1,162,500,000 and subsequently, effective April 7, 2020 was increased to $1,222,500,000. |
Certain affiliated registered investment companies that are parties to the SCA include portfolios that are subject to a predetermined mathematical formula used to manage certain benefit guarantees offered under variable annuity contracts. The formula may result in large scale asset flows into and out of these portfolios. Consequently, these portfolios may be more likely to utilize the SCA for purposes of funding redemptions. It may be possible for those portfolios to fully exhaust the committed amount of the SCA, thereby requiring the Manager to allocate available funding per a Board-approved methodology designed to treat the RICs in the SCA equitably.
The Fund utilized the SCA during the year ended July 31, 2020. The average daily balance for the 6 days that the Fund had loans outstanding during the period was $659,167, borrowed at a weighted average interest rate of 1.62%. The maximum loan balance outstanding during the period was $987,000. At July 31, 2020, the Fund did not have an outstanding loan balance.
| | | | |
| PGIM Corporate Bond Fund | | | 49 | |
Notes to Financial Statements (continued)
9. Risks of Investing in the Fund
The Fund’s risks include, but are not limited to, some or all of the risks discussed below. For further information on the Fund’s risks, please refer to the Fund’s Prospectus and Statement of Additional Information.
Bond Obligations Risk: The Fund’s holdings, share price, yield and total return may fluctuate in response to bond market movements. The value of bonds may decline for issuer-related reasons, including management performance, financial leverage and reduced demand for the issuer’s goods and services. Certain types of fixed-income obligations also may be subject to “call and redemption risk,” which is the risk that the issuer may call a bond held by the Fund for redemption before it matures and the Fund may not be able to reinvest at the same level and therefore would earn less income.
Derivatives Risk: Derivatives involve special risks and costs and may result in losses to the Fund. The successful use of derivatives requires sophisticated management, and, to the extent that derivatives are used, the Fund will depend on the subadviser’s ability to analyze and manage derivative transactions. The prices of derivatives may move in unexpected ways, especially in abnormal market conditions. Some derivatives are “leveraged” and therefore may magnify or otherwise increase investment losses to the Fund. Other risks arise from the potential inability to terminate or sell derivatives positions. A liquid secondary market may not always exist for the Fund’s derivatives positions. In fact, many OTC derivative instruments will not have liquidity beyond the counterparty to the instrument. OTC derivative instruments also involve the risk that the other party will not meet its obligations to the Fund.
Interest Rate Risk: The value of an investment may go down when interest rates rise. A rise in rates tends to have a greater impact on the prices of longer term or duration securities. When interest rates fall, the issuers of debt obligations may prepay principal more quickly than expected, and the Fund may be required to reinvest the proceeds at a lower interest rate. This is referred to as “prepayment risk.” When interest rates rise, debt obligations may be repaid more slowly than expected, and the value of the Fund’s holdings may fall sharply. This is referred to as “extension risk”. The Fund may face a heightened level of interest rate risk as a result of the U.S. Federal Reserve Board’s policies. The Fund’s investments may lose value if short-term or long-term interest rates rise sharply or in a manner not anticipated by the subadviser.
Large Shareholder and Large Scale Redemption Risk: Certain individuals, accounts, funds (including funds affiliated with the Manager) or institutions, including the Manager and its affiliates, may from time to time own or control a substantial amount of the Fund’s shares. There is no requirement that these entities maintain their investment in the Fund. There is a risk that such large shareholders or that the Fund’s shareholders generally may redeem all
or a substantial portion of their investments in the Fund in a short period of time, which could have a significant negative impact on the Fund’s NAV, liquidity, and brokerage costs. Large redemptions could also result in tax consequences to shareholders and impact the Fund’s ability to implement its investment strategy. The Fund’s ability to pursue its investment objective after one or more large scale redemptions may be impaired and, as a result, the Fund may invest a larger portion of its assets in cash or cash equivalents.
LIBOR Risk: Many financial instruments use or may use a floating rate based on the London Interbank Offered Rate, or “LIBOR,” which is the offered rate for short-term Eurodollar deposits between major international banks. On July 27, 2017, the Financial Conduct Authority announced a desire to phase out the use of LIBOR by the end of 2021. There remains uncertainty regarding the future utilization of LIBOR and the nature of any replacement rate. As such, the potential impact of a transition away from LIBOR on the Fund or the financial instruments in which the Fund invests cannot yet be determined. The elimination of LIBOR or changes to other reference rates or any other changes or reforms to the determination or supervision of reference rates could have an adverse impact on the market for, or value of, any securities or payments linked to those reference rates, which may adversely affect the Fund’s performance and/or net asset value. Furthermore, the risks associated with the expected discontinuation of LIBOR and transition may be exacerbated if the work necessary to effect an orderly transition to an alternative reference rate is not completed in a timely manner. Because the usefulness of LIBOR as a benchmark could deteriorate during the transition period, these effects could occur prior to the end of 2021.
Liquidity Risk: The Fund may invest in instruments that trade in lower volumes and are less liquid than other investments. Liquidity risk exists when particular investments made by the Fund are difficult to purchase or sell. Liquidity risk includes the risk that the Fund may make investments that may become less liquid in response to market developments or adverse investor perceptions. Investments that are illiquid or that trade in lower volumes may be more difficult to value. If the Fund is forced to sell these investments to pay redemption proceeds or for other reasons, the Fund may lose money. In addition, when there is no willing buyer and investments may not reasonably be expected to be sold or disposed of in current market conditions in seven calendar days or less without the sale or disposition significantly changing the market value of the investment, the Fund may incur higher transaction costs when executing trade orders of a given size. The reduction in dealer market-making capacity in the fixed-income markets that has occurred in recent years also has the potential to reduce liquidity. An inability to sell a portfolio position can adversely affect the Fund’s value or prevent the Fund from being able to take advantage of other investment opportunities.
Market and Credit Risk: Securities markets may be volatile and the market prices of the Fund’s securities may decline. Securities fluctuate in price based on changes in an issuer’s financial condition and overall market and economic conditions. If the market prices of the securities owned by the Fund fall, the value of an investment in the Fund will decline. Additionally, the Fund may also be exposed to credit risk in the event that an issuer or
| | | | |
| PGIM Corporate Bond Fund | | | 51 | |
Notes to Financial Statements (continued)
guarantor fails to perform or that an institution or entity with which the Fund has unsettled or open transactions defaults.
Market Disruption and Geopolitical Risks: International wars or conflicts and geopolitical developments in foreign countries, along with instability in regions such as Asia, Eastern Europe, and the Middle East, possible terrorist attacks in the United States or around the world, public health epidemics such as the outbreak of infectious diseases like the recent outbreak of coronavirus globally or the 2014–2016 outbreak in West Africa of the Ebola virus, and other similar events could adversely affect the U.S. and foreign financial markets, including increases in market volatility, reduced liquidity in the securities markets and government intervention, and may cause further long-term economic uncertainties in the United States and worldwide generally.
Financial Highlights
| | | | | | | | | | | | | | | | | | | | |
| Class A Shares | | | | | | | | | | | | | | | |
| | | Year Ended July 31, | |
| | | 2020 | | | 2019 | | | 2018 | | | 2017 | | | 2016 | |
| Per Share Operating Performance(a): | | | | | | | | | | | | | | | | | |
| Net Asset Value, Beginning of Year | | | $11.48 | | | | $10.81 | | | | $11.32 | | | | $11.46 | | | | $10.76 | |
| Income (loss) from investment operations: | | | | | | | | | | | | | | | | | |
| Net investment income (loss) | | | 0.31 | | | | 0.34 | | | | 0.32 | | | | 0.32 | | | | 0.29 | |
| Net realized and unrealized gain (loss) on investment transactions | | | 0.89 | | | | 0.69 | | | | (0.49 | ) | | | (0.13 | ) | | | 0.71 | |
| Total from investment operations | | | 1.20 | | | | 1.03 | | | | (0.17 | ) | | | 0.19 | | | | 1.00 | |
| Less Dividends and Distributions: | | | | | | | | | | | | | | | | | | | | |
| Dividends from net investment income | | | (0.34 | ) | | | (0.36 | ) | | | (0.34 | ) | | | (0.33 | ) | | | (0.30 | ) |
| Net asset value, end of year | | | $12.34 | | | | $11.48 | | | | $10.81 | | | | $11.32 | | | | $11.46 | |
| Total Return(b): | | | 10.59 | % | | | 9.73 | % | | | (1.51 | )% | | | 1.77 | % | | | 9.49 | % |
| | |
| Ratios/Supplemental Data: | | | | | | | | | | | | | | | | | | | | |
| Net assets, end of year (000) | | | $5,021 | | | | $3,053 | | | | $2,565 | | | | $1,802 | | | | $822 | |
| Average net assets (000) | | | $3,260 | | | | $2,698 | | | | $2,200 | | | | $1,339 | | | | $269 | |
| Ratios to average net assets(c)(d): | | | | | | | | | | | | | | | | | | | | |
| Expenses after waivers and/or expense reimbursement | | | 0.80 | % | | | 0.80 | % | | | 0.80 | % | | | 0.80 | % | | | 0.94 | % |
| Expenses before waivers and/or expense reimbursement | | | 1.89 | % | | | 2.22 | % | | | 2.25 | % | | | 1.92 | % | | | 1.77 | % |
| Net investment income (loss) | | | 2.66 | % | | | 3.14 | % | | | 2.89 | % | | | 2.88 | % | | | 2.64 | % |
| Portfolio turnover rate(e) | | | 50 | % | | | 71 | % | | | 70 | % | | | 90 | % | | | 165 | % |
| (a) | Calculated based on average shares outstanding during the year. |
| (b) | Total return does not consider the effects of sales loads. Total return is calculated assuming a purchase of a share on the first day and a sale on the last day of each year reported and includes reinvestment of dividends and distributions, if any. Total returns may reflect adjustments to conform to generally accepted accounting principles. |
| (c) | Effective August 1, 2017, class specific expenses include transfer agent fees and expenses and registration fees, which are charged to their respective share class. |
| (d) | Does not include expenses of the underlying funds in which the Fund invests. |
| (e) | The Fund’s portfolio turnover rate is calculated in accordance with regulatory requirements, without regard to transactions involving short-term investments and certain derivatives. If such transactions were included, the Fund’s portfolio turnover rate may be higher. |
See Notes to Financial Statements.
| | | | |
| PGIM Corporate Bond Fund | | | 53 | |
Financial Highlights (continued)
| | | | | | | | | | | | | | | | | | | | |
| Class C Shares | | | | | | | | | | | | | | | |
| | | Year Ended July 31, | |
| | | 2020 | | | 2019 | | | 2018 | | | 2017 | | | 2016 | |
| Per Share Operating Performance(a): | | | | | | | | | | | | | | | | | |
| Net Asset Value, Beginning of Year | | | $11.45 | | | | $10.79 | | | | $11.29 | | | | $11.43 | | | | $10.75 | |
| Income (loss) from investment operations: | | | | | | | | | | | | | | | | | |
| Net investment income (loss) | | | 0.23 | | | | 0.26 | | | | 0.24 | | | | 0.24 | | | | 0.20 | |
| Net realized and unrealized gain (loss) on investment transactions | | | 0.88 | | | | 0.68 | | | | (0.48 | ) | | | (0.13 | ) | | | 0.70 | |
| Total from investment operations | | | 1.11 | | | | 0.94 | | | | (0.24 | ) | | | 0.11 | | | | 0.90 | |
| Less Dividends and Distributions: | | | | | | | | | | | | | | | | | | | | |
| Dividends from net investment income | | | (0.25 | ) | | | (0.28 | ) | | | (0.26 | ) | | | (0.25 | ) | | | (0.22 | ) |
| Net asset value, end of year | | | $12.31 | | | | $11.45 | | | | $10.79 | | | | $11.29 | | | | $11.43 | |
| Total Return(b): | | | 9.79 | % | | | 8.83 | % | | | (2.16 | )% | | | 1.01 | % | | | 8.51 | % |
| | |
| Ratios/Supplemental Data: | | | | | | | | | | | | | | | | | | | | |
| Net assets, end of year (000) | | | $1,783 | | | | $1,386 | | | | $952 | | | | $1,095 | | | | $755 | |
| Average net assets (000) | | | $1,627 | | | | $1,053 | | | | $1,050 | | | | $1,014 | | | | $369 | |
| Ratios to average net assets(c)(d): | | | | | | | | | | | | | | | | | | | | |
| Expenses after waivers and/or expense reimbursement | | | 1.55 | % | | | 1.55 | % | | | 1.55 | % | | | 1.55 | % | | | 1.73 | % |
| Expenses before waivers and/or expense reimbursement | | | 3.03 | % | | | 3.49 | % | | | 3.54 | % | | | 2.66 | % | | | 2.56 | % |
| Net investment income (loss) | | | 1.92 | % | | | 2.38 | % | | | 2.12 | % | | | 2.12 | % | | | 1.84 | % |
| Portfolio turnover rate(e) | | | 50 | % | | | 71 | % | | | 70 | % | | | 90 | % | | | 165 | % |
| (a) | Calculated based on average shares outstanding during the year. |
| (b) | Total return does not consider the effects of sales loads. Total return is calculated assuming a purchase of a share on the first day and a sale on the last day of each year reported and includes reinvestment of dividends and distributions, if any. Total returns may reflect adjustments to conform to generally accepted accounting principles. |
| (c) | Effective August 1, 2017, class specific expenses include transfer agent fees and expenses and registration fees, which are charged to their respective share class. |
| (d) | Does not include expenses of the underlying funds in which the Fund invests. |
| (e) | The Fund’s portfolio turnover rate is calculated in accordance with regulatory requirements, without regard to transactions involving short-term investments and certain derivatives. If such transactions were included, the Fund’s portfolio turnover rate may be higher. |
See Notes to Financial Statements.
| | | | | | | | | | | | | | | | | | | | |
| Class R Shares | | | | | | | | | | | | | | | |
| | | Year Ended July 31, | |
| | | 2020 | | | 2019 | | | 2018 | | | 2017 | | | 2016 | |
| Per Share Operating Performance(a): | | | | | | | | | | | | | | | | | |
| Net Asset Value, Beginning of Year | | | $11.45 | | | | $10.79 | | | | $11.29 | | | | $11.43 | | | | $10.75 | |
| Income (loss) from investment operations: | | | | | | | | | | | | | | | | | |
| Net investment income (loss) | | | 0.29 | | | | 0.31 | | | | 0.29 | | | | 0.29 | | | | 0.25 | |
| Net realized and unrealized gain (loss) on investment transactions | | | 0.87 | | | | 0.68 | | | | (0.47 | ) | | | (0.12 | ) | | | 0.70 | |
| Total from investment operations | | | 1.16 | | | | 0.99 | | | | (0.18 | ) | | | 0.17 | | | | 0.95 | |
| Less Dividends and Distributions: | | | | | | | | | | | | | | | | | | | | |
| Dividends from net investment income | | | (0.30 | ) | | | (0.33 | ) | | | (0.32 | ) | | | (0.31 | ) | | | (0.27 | ) |
| Net asset value, end of year | | | $12.31 | | | | $11.45 | | | | $10.79 | | | | $11.29 | | | | $11.43 | |
| Total Return(b): | | | 10.34 | % | | | 9.37 | % | | | (1.67 | )% | | | 1.51 | % | | | 9.04 | % |
| | |
| Ratios/Supplemental Data: | | | | | | | | | | | | | | | | | | | | |
| Net assets, end of year (000) | | | $13 | | | | $20 | | | | $18 | | | | $11 | | | | $11 | |
| Average net assets (000) | | | $19 | | | | $19 | | | | $12 | | | | $11 | | | | $10 | |
| Ratios to average net assets(c)(d): | | | | | | | | | | | | | | | | | | | | |
| Expenses after waivers and/or expense reimbursement | | | 1.05 | % | | | 1.05 | % | | | 1.05 | % | | | 1.05 | % | | | 1.29 | % |
| Expenses before waivers and/or expense reimbursement | | | 81.14 | % | | | 65.60 | % | | | 109.57 | % | | | 2.42 | % | | | 2.12 | % |
| Net investment income (loss) | | | 2.45 | % | | | 2.88 | % | | | 2.66 | % | | | 2.59 | % | | | 2.32 | % |
| Portfolio turnover rate(e) | | | 50 | % | | | 71 | % | | | 70 | % | | | 90 | % | | | 165 | % |
| (a) | Calculated based on average shares outstanding during the year. |
| (b) | Total return is calculated assuming a purchase of a share on the first day and a sale on the last day of each year reported and includes reinvestment of dividends and distributions, if any. Total returns may reflect adjustments to conform to generally accepted accounting principles. |
| (c) | Effective August 1, 2017, class specific expenses include transfer agent fees and expenses and registration fees, which are charged to their respective share class. |
| (d) | Does not include expenses of the underlying funds in which the Fund invests. |
| (e) | The Fund’s portfolio turnover rate is calculated in accordance with regulatory requirements, without regard to transactions involving short-term investments and certain derivatives. If such transactions were included, the Fund’s portfolio turnover rate may be higher. |
See Notes to Financial Statements.
| | | | |
| PGIM Corporate Bond Fund | | | 55 | |
Financial Highlights (continued)
| | | | | | | | | | | | | | | | | | | | |
| Class Z Shares | | | | | | | | | | | | | | | |
| | | Year Ended July 31, | |
| | | 2020 | | | 2019 | | | 2018 | | | 2017 | | | 2016 | |
| Per Share Operating Performance(a): | | | | | | | | | | | | | | | | | |
| Net Asset Value, Beginning of Year | | | $11.45 | | | | $10.79 | | | | $11.29 | | | | $11.43 | | | | $10.76 | |
| Income (loss) from investment operations: | | | | | | | | | | | | | | | | | |
| Net investment income (loss) | | | 0.34 | | | | 0.37 | | | | 0.35 | | | | 0.34 | | | | 0.30 | |
| Net realized and unrealized gain (loss) on investment transactions | | | 0.88 | | | | 0.67 | | | | (0.48 | ) | | | (0.12 | ) | | | 0.70 | |
| Total from investment operations | | | 1.22 | | | | 1.04 | | | | (0.13 | ) | | | 0.22 | | | | 1.00 | |
| Less Dividends and Distributions: | | | | | | | | | | | | | | | | | | | | |
| Dividends from net investment income | | | (0.36 | ) | | | (0.38 | ) | | | (0.37 | ) | | | (0.36 | ) | | | (0.33 | ) |
| Net asset value, end of year | | | $12.31 | | | | $11.45 | | | | $10.79 | | | | $11.29 | | | | $11.43 | |
| Total Return(b): | | | 10.89 | % | | | 9.92 | % | | | (1.18 | )% | | | 2.02 | % | | | 9.47 | % |
| | |
| Ratios/Supplemental Data: | | | | | | | | | | | | | | | | | | | | |
| Net assets, end of year (000) | | | $26,655 | | | | $17,356 | | | | $18,247 | | | | $19,869 | | | | $23,307 | |
| Average net assets (000) | | | $21,000 | | | | $16,929 | | | | $20,078 | | | | $21,149 | | | | $33,438 | |
| Ratios to average net assets(c)(d): | | | | | | | | | | | | | | | | | | | | |
| Expenses after waivers and/or expense reimbursement | | | 0.55 | % | | | 0.55 | % | | | 0.55 | % | | | 0.55 | % | | | 0.82 | % |
| Expenses before waivers and/or expense reimbursement | | | 1.18 | % | | | 1.41 | % | | | 1.32 | % | | | 1.64 | % | | | 1.27 | % |
| Net investment income (loss) | | | 2.91 | % | | | 3.39 | % | | | 3.12 | % | | | 3.07 | % | | | 2.79 | % |
| Portfolio turnover rate(e) | | | 50 | % | | | 71 | % | | | 70 | % | | | 90 | % | | | 165 | % |
| (a) | Calculated based on average shares outstanding during the year. |
| (b) | Total return is calculated assuming a purchase of a share on the first day and a sale on the last day of each year reported and includes reinvestment of dividends and distributions, if any. Total returns may reflect adjustments to conform to generally accepted accounting principles. |
| (c) | Effective August 1, 2017, class specific expenses include transfer agent fees and expenses and registration fees, which are charged to their respective share class. |
| (d) | Does not include expenses of the underlying funds in which the Fund invests. |
| (e) | The Fund’s portfolio turnover rate is calculated in accordance with regulatory requirements, without regard to transactions involving short-term investments and certain derivatives. If such transactions were included, the Fund’s portfolio turnover rate may be higher. |
See Notes to Financial Statements.
| | | | | | | | | | | | | | | | | | | | |
| Class R6 Shares | | | | | | | | | | | | | | | |
| | | Year Ended July 31, | |
| | | 2020 | | | 2019 | | | 2018 | | | 2017 | | | 2016 | |
| Per Share Operating Performance(a): | | | | | | | | | | | | | | | | | |
| Net Asset Value, Beginning of Year | | | $11.45 | | | | $10.79 | | | | $11.29 | | | | $11.43 | | | | $10.75 | |
| Income (loss) from investment operations: | | | | | | | | | | | | | | | | | |
| Net investment income (loss) | | | 0.34 | | | | 0.37 | | | | 0.35 | | | | 0.35 | | | | 0.30 | |
| Net realized and unrealized gain (loss) on investment transactions | | | 0.88 | | | | 0.67 | | | | (0.48 | ) | | | (0.13 | ) | | | 0.71 | |
| Total from investment operations | | | 1.22 | | | | 1.04 | | | | (0.13 | ) | | | 0.22 | | | | 1.01 | |
| Less Dividends and Distributions: | | | | | | | | | | | | | | | | | | | | |
| Dividends from net investment income | | | (0.36 | ) | | | (0.38 | ) | | | (0.37 | ) | | | (0.36 | ) | | | (0.33 | ) |
| Net asset value, end of year | | | $12.31 | | | | $11.45 | | | | $10.79 | | | | $11.29 | | | | $11.43 | |
| Total Return(b): | | | 10.89 | % | | | 9.92 | % | | | (1.18 | )% | | | 2.02 | % | | | 9.57 | % |
| | |
| Ratios/Supplemental Data: | | | | | | | | | | | | | | | | | | | | |
| Net assets, end of year (000) | | | $9,730 | | | | $8,778 | | | | $11 | | | | $11 | | | | $11 | |
| Average net assets (000) | | | $9,091 | | | | $4,552 | | | | $11 | | | | $11 | | | | $10 | |
| Ratios to average net assets(c)(d): | | | | | | | | | | | | | | | | | | | | |
| Expenses after waivers and/or expense reimbursement | | | 0.55 | % | | | 0.55 | % | | | 0.55 | % | | | 0.55 | % | | | 0.79 | % |
| Expenses before waivers and/or expense reimbursement | | | 1.17 | % | | | 1.42 | % | | | 121.08 | % | | | 1.53 | % | | | 1.28 | % |
| Net investment income (loss) | | | 2.93 | % | | | 3.39 | % | | | 3.12 | % | | | 3.10 | % | | | 2.80 | % |
| Portfolio turnover rate(e) | | | 50 | % | | | 71 | % | | | 70 | % | | | 90 | % | | | 165 | % |
| (a) | Calculated based on average shares outstanding during the year. |
| (b) | Total return is calculated assuming a purchase of a share on the first day and a sale on the last day of each year reported and includes reinvestment of dividends and distributions, if any. Total returns may reflect adjustments to conform to generally accepted accounting principles. |
| (c) | Effective August 1, 2017, class specific expenses include transfer agent fees and expenses and registration fees, which are charged to their respective share class. |
| (d) | Does not include expenses of the underlying funds in which the Fund invests. |
| (e) | The Fund’s portfolio turnover rate is calculated in accordance with regulatory requirements, without regard to transactions involving short-term investments and certain derivatives. If such transactions were included, the Fund’s portfolio turnover rate may be higher. |
See Notes to Financial Statements.
| | | | |
| PGIM Corporate Bond Fund | | | 57 | |
Report of Independent Registered Public Accounting Firm
To the Shareholders of PGIM Corporate Bond Fund and Board of Trustees
The Target Portfolio Trust:
Opinion on the Financial Statements
We have audited the accompanying statement of assets and liabilities of PGIM Corporate Bond Fund, a series of The Target Portfolio Trust (the Fund), including the schedule of investments, as of July 31, 2020, the related statement of operations for the year then ended, the statements of changes in net assets for each of the years in the two-year period then ended, and the related notes (collectively, the financial statements) and the financial highlights for each of the years or period indicated therein. In our opinion, the financial statements and financial highlights present fairly, in all material respects, the financial position of the Fund as of July 31, 2020, the results of its operations for the year then ended, the changes in its net assets for each of the years in the two-year period then ended, and the financial highlights for each of the years in the five-year period then ended, in conformity with U.S. generally accepted accounting principles.
Basis for Opinion
These financial statements and financial highlights are the responsibility of the Fund’s management. Our responsibility is to express an opinion on these financial statements and financial highlights based on our audits. We are a public accounting firm registered with the Public Company Accounting Oversight Board (United States) (PCAOB) and are required to be independent with respect to the Fund in accordance with the U.S. federal securities laws and the applicable rules and regulations of the Securities and Exchange Commission and the PCAOB.
We conducted our audits in accordance with the standards of the PCAOB. Those standards require that we plan and perform the audit to obtain reasonable assurance about whether the financial statements and financial highlights are free of material misstatement, whether due to error or fraud. Our audits included performing procedures to assess the risks of material misstatement of the financial statements and financial highlights, whether due to error or fraud, and performing procedures that respond to those risks. Such procedures included examining, on a test basis, evidence regarding the amounts and disclosures in the financial statements and financial highlights. Such procedures also included confirmation of securities owned as of July 31, 2020, by correspondence with the custodian, transfer agent, and brokers, or by other appropriate auditing procedures when replies were not received. Our audits also included evaluating the accounting principles used and significant estimates made by management, as well as evaluating the overall presentation of the financial statements and financial highlights. We believe that our audits provide a reasonable basis for our opinion.

We have served as the auditor of one or more PGIM and/or Prudential Retail investment companies since 2003.
New York, New York
September 16, 2020
Fund Liquidity Risk Management Program (unaudited)
Consistent with Rule 22e-4 under the 1940 Act (the “Liquidity Rule”), the Fund has adopted and implemented a liquidity risk management program (the “LRMP”). The Fund’s LRMP seeks to assess and manage the Trust’s liquidity risk, which is defined as the risk that the Fund is unable to meet investor redemption requests without significantly diluting the remaining investors’ interests in the Fund. The Fund’s Board of Trustees (the “Board”) has approved PGIM Investments LLC (“PGIM Investments”), the Fund’s investment manager, to serve as the administrator of the Fund’s LRMP. As part of its responsibilities as administrator, PGIM Investments has retained a third party to perform certain functions, including providing market data and liquidity classification model information.
The Fund’s LRMP includes a number of processes designed to support the assessment and management of its liquidity risk. In particular, the Fund’s LRMP includes no less than annual assessments of factors that influence the Fund’s liquidity risk; no less than monthly classifications of the Fund’s investments into one of four liquidity classifications provided for in the Liquidity Rule; a 15% of net assets limit on the acquisition of “illiquid investments” (as defined under the Liquidity Rule); establishment of a minimum percentage of the Fund’s assets to be invested in investments classified as “highly liquid” (as defined under the Liquidity Rule) if the Fund does not invest primarily in highly liquid investments; and regular reporting to the Fund’s Board.
At a meeting of the Board on March 3-5, 2020, PGIM Investments provided a written report (“LRMP Report”) to the Board addressing the operation, adequacy, and effectiveness of the Fund’s LRMP, including any material changes to the LRMP for the period from the inception of the Fund’s LRMP on December 1, 2018 through December 31, 2019 (“Reporting Period”). The LRMP Report concluded that the Fund’s LRMP was reasonably designed to assess and manage the Fund’s liquidity risk and was adequately and effectively implemented during the Reporting Period. There were no material changes to the LRMP during the Reporting Period. The LRMP Report further concluded that the Fund’s investment strategies continue to be appropriate given the Fund’s status as an open-end fund.
There can be no assurance that the LRMP will achieve its objectives in the future. Additional information regarding risks of investing in the Fund, including liquidity risks presented by the Fund’s investment portfolio, is found in the Fund’s Prospectus and Statement of Additional Information.
| | | | |
| PGIM Corporate Bond Fund | | | 59 | |
Federal Income Tax Information (unaudited)
For the tax year ended July 31, 2020, the Fund reports 83.18% as interest-related dividends in accordance with Sections 871(k)(1) and 881(e)(1) of the Internal Revenue Code.
In January 2021, you will be advised on IRS Form 1099-DIV or substitute Form 1099-DIV, as to the Federal tax status of the distributions received by you in calendar year 2020.
INFORMATION ABOUT BOARD MEMBERS AND OFFICERS (unaudited)
Information about Board Members and Officers of the Fund is set forth below. Board Members who are not deemed to be “interested persons” of the Fund, as defined in the 1940 Act, are referred to as “Independent Board Members.” Board Members who are deemed to be “interested persons” of the Fund are referred to as “Interested Board Members.” The Board Members are responsible for the overall supervision of the operations of the Fund and perform the various duties imposed on the directors of investment companies by the 1940 Act. The Board in turn elects the Officers, who are responsible for administering the day-to-day operations of the Fund.
| | | | | | |
| Independent Board Members | | | | |
| | | | |
Name Year of Birth Position(s) Portfolios Overseen | | Principal Occupation(s) During Past Five Years | | Other Directorships Held During Past Five Years | | Length of Board Service |
| | | | |
Ellen S. Alberding 1958 Board Member Portfolios Overseen: 95 | | President and Board Member, The Joyce Foundation (charitable foundation) (since 2002); Vice Chair, City Colleges of Chicago (community college system) (2011-2015); Trustee, National Park Foundation (charitable foundation for national park system) (2009-2018); Trustee, Economic Club of Chicago (2009-2016); Trustee, Loyola University (since 2018). | | None. | | Since September 2013 |
| | | | |
Kevin J. Bannon 1952 Board Member Portfolios Overseen: 95 | | Retired; Managing Director (April 2008-May 2015) and Chief Investment Officer (October 2008-November 2013) of Highmount Capital LLC (registered investment adviser); formerly Executive Vice President and Chief Investment Officer (April 1993-August 2007) of Bank of New York Company; President (May 2003-May 2007) of BNY Hamilton Family of Mutual Funds. | | Director of Urstadt Biddle Properties (equity real estate investment trust) (since September 2008). | | Since July 2008 |
PGIM Corporate Bond Fund
| | | | | | |
| Independent Board Members | | | | |
| | | | |
Name Year of Birth Position(s) Portfolios Overseen | | Principal Occupation(s) During Past Five Years | | Other Directorships Held During Past Five Years | | Length of Board Service |
| | | | |
Linda W. Bynoe 1952 Board Member Portfolios Overseen: 95 | | President and Chief Executive Officer (since March 1995) and formerly Chief Operating Officer (December 1989-February 1995) of Telemat Limited LLC (formerly, Telemat Ltd). (management consulting); formerly Vice President (January 1985-June 1989) at Morgan Stanley & Co. (broker-dealer). | | Director of Anixter International, Inc. (communication products distributor) (since January 2006–June 2020); Director of Northern Trust Corporation (financial services) (since April 2006); Trustee of Equity Residential (residential real estate) (since December 2009). | | Since March 2005 |
| | | | |
Barry H. Evans 1960 Board Member Portfolios Overseen: 94 | | Retired; formerly President (2005 – 2016), Global Chief Operating Officer (2014–2016), Chief Investment Officer – Global Head of Fixed Income (1998-2014), and various portfolio manager roles (1986-2006), Manulife Asset Management U.S. | | Formerly Director, Manulife Trust Company (2011-2018); formerly Director, Manulife Asset Management Limited (2015-2017); formerly Chairman of the Board of Directors of Manulife Asset Management U.S. (2005-2016); formerly Chairman of the Board, Declaration Investment Management and Research (2008-2016). | | Since September 2017 |
| | | | |
Keith F. Hartstein 1956 Board Member & Independent Chair Portfolios Overseen: 95 | | Executive Committee of the IDC Board of Governors (since October 2019); Retired; Member (since November 2014) of the Governing Council of the Independent Directors Council (IDC) (organization of independent mutual fund directors); formerly President and Chief Executive Officer (2005-2012), Senior Vice President (2004-2005), Senior Vice President of Sales and Marketing (1997-2004), and various executive management positions (1990-1997), John Hancock Funds, LLC (asset management); Chairman, Investment Company Institute’s Sales Force Marketing Committee (2003-2008). | | None. | | Since September 2013 |
Visit our website at pgim.com/investments
| | | | | | |
| Independent Board Members | | | | |
| | | | |
Name Year of Birth Position(s) Portfolios Overseen | | Principal Occupation(s) During Past Five Years | | Other Directorships Held During Past Five Years | | Length of Board Service |
| | | | |
Laurie Simon Hodrick 1962 Board Member Portfolios Overseen: 94 | | A. Barton Hepburn Professor Emerita of Economics in the Faculty of Business, Columbia Business School (since 2018); Visiting Professor of Law, Stanford Law School (since 2015); Visiting Fellow at the Hoover Institution, Stanford University (since 2015); Sole Member, ReidCourt LLC (since 2008) (a consulting firm); formerly A. Barton Hepburn Professor of Economics in the Faculty of Business, Columbia Business School (1996-2017); formerly Managing Director, Global Head of Alternative Investment Strategies, Deutsche Bank (2006-2008). | | Independent Director, Synnex Corporation (since April 2019) (information technology); Independent Director, Kabbage, Inc. (since July 2018) (financial services); Independent Director, Corporate Capital Trust (2017-2018) (a business development company). | | Since September 2017 |
| | | | |
Michael S. Hyland, CFA 1945 Board Member Portfolios Overseen: 95 | | Retired (since February 2005); formerly Senior Managing Director (July 2001-February 2005) of Bear Stearns & Co, Inc.; Global Partner, INVESCO (1999-2001); Managing Director and President of Salomon Brothers Asset Management (1989-1999). | | None. | | Since July 2008 |
| | | | |
Brian K. Reid 1961 Board Member Portfolios Overseen: 94 | | Retired; formerly Chief Economist for the Investment Company Institute (ICI) (2005-2017); formerly Senior Economist and Director of Industry and Financial Analysis at the ICI (1998-2004); formerly Senior Economist, Industry and Financial Analysis at the ICI (1996-1998); formerly Staff Economist at the Federal Reserve Board (1989-1996); Director, ICI Mutual Insurance Company (2012-2017). | | None. | | Since March 2018 |
PGIM Corporate Bond Fund
| | | | | | |
| Independent Board Members | | | | |
| | | | |
Name Year of Birth Position(s) Portfolios Overseen | | Principal Occupation(s) During Past Five Years | | Other Directorships Held During Past Five Years | | Length of Board Service |
| | | | |
Grace C. Torres 1959 Board Member Portfolios Overseen: 94 | | Retired; formerly Treasurer and Principal Financial and Accounting Officer of the PGIM Funds, Target Funds, Advanced Series Trust, Prudential Variable Contract Accounts and The Prudential Series Fund (1998-June 2014); Assistant Treasurer (March 1999-June 2014) and Senior Vice President (September 1999-June 2014) of PGIM Investments LLC; Assistant Treasurer (May 2003-June 2014) and Vice President (June 2005-June 2014) of AST Investment Services, Inc.; Senior Vice President and Assistant Treasurer (May 2003-June 2014) of Prudential Annuities Advisory Services, Inc. | | Formerly Director (July 2015-January 2018) of Sun Bancorp, Inc. N.A. and Sun National Bank; Director (since January 2018) of OceanFirst Financial Corp. and OceanFirst Bank. | | Since November 2014 |
| | | | | | |
| Interested Board Members | | | | |
| | | | |
Name Year of Birth Position(s) Portfolios Overseen | | Principal Occupation(s) During Past Five Years | | Other Directorships Held During Past Five Years | | Length of Board Service |
| | | | |
Stuart S. Parker 1962 Board Member & President Portfolios Overseen: 96 | | President of PGIM Investments LLC (formerly known as Prudential Investments LLC) (since January 2012); Executive Vice President of Prudential Investment Management Services LLC (since December 2012); formerly Executive Vice President of Jennison Associates LLC and Head of Retail Distribution of PGIM Investments LLC (June 2005-December 2011). | | None. | | Since January 2012 |
Visit our website at pgim.com/investments
| | | | | | |
| Interested Board Members | | | | |
| | | | |
Name Year of Birth Position(s) Portfolios Overseen | | Principal Occupation(s) During Past Five Years | | Other Directorships Held During Past Five Years | | Length of Board Service |
| | | | |
Scott E. Benjamin 1973 Board Member & Vice President Portfolios Overseen: 96 | | Executive Vice President (since June 2009) of PGIM Investments LLC; Vice President (since June 2012) of Prudential Investment Management Services LLC; Executive Vice President (since September 2009) of AST Investment Services, Inc.; Senior Vice President of Product Development and Marketing, PGIM Investments (since February 2006); formerly Vice President of Product Development and Product Management, PGIM Investments LLC (2003-2006). | | None. | | Since March 2010 |
| | | | |
| Fund Officers(a) | | | | |
| | | |
Name Year of Birth Fund Position | | Principal Occupation(s) During Past Five Years | | Length of Service as Fund Officer |
| | | |
Claudia DiGiacomo 1974 Chief Legal Officer | | Vice President and Corporate Counsel (since January 2005) of Prudential; Chief Legal Officer of PGIM Investments LLC (since August 2020); Chief Legal Officer of Prudential Mutual Fund Services LLC (since August 2020); Chief Legal Officer of PIFM Holdco, LLC (since August 2020); and Corporate Counsel of AST Investment Services, Inc. (since August 2020); formerly Associate at Sidley Austin Brown & Wood LLP (1999-2004). | | Since December 2005 |
| | | |
Dino Capasso 1974 Chief Compliance Officer | | Chief Compliance Officer (July 2019-Present) of PGIM Investments LLC; Chief Compliance Officer (July 2019-Present) of the PGIM Funds, Target Funds, Advanced Series Trust, The Prudential Series Fund, Prudential’s Gibraltar Fund, Inc., PGIM Global High Yield Fund, Inc., and PGIM High Yield Bond Fund, Inc.; Vice President and Deputy Chief Compliance Officer (June 2017-2019) of PGIM Investments LLC; formerly, Senior Vice President and Senior Counsel (January 2016-June 2017), and Vice President and Counsel (February 2012-December 2015) of Pacific Investment Management Company LLC. | | Since March 2018 |
PGIM Corporate Bond Fund
| | | | |
| Fund Officers(a) | | | | |
| | | |
Name Year of Birth Fund Position | | Principal Occupation(s) During Past Five Years | | Length of Service as Fund Officer |
| | | |
Andrew R. French 1962 Secretary | | Vice President (since December 2018 - present) of PGIM Investments LLC; Formerly, Vice President and Corporate Counsel (2010-2018) of Prudential; formerly Director and Corporate Counsel (2006-2010) of Prudential; Vice President and Assistant Secretary (since January 2007) of PGIM Investments LLC; Vice President and Assistant Secretary (since January 2007) of Prudential Mutual Fund Services LLC. | | Since October 2006 |
| | | |
Jonathan D. Shain 1958 Assistant Secretary | | Vice President and Corporate Counsel (since August 1998) of Prudential; Vice President and Assistant Secretary (since May 2001) of PGIM Investments LLC; Vice President and Assistant Secretary (since February 2001) of Prudential Mutual Fund Services LLC; formerly Vice President and Assistant Secretary (May 2003-June 2005) of AST Investment Services, Inc. | | Since May 2005 |
| | | |
Diana N. Huffman 1982 Assistant Secretary | | Vice President and Corporate Counsel (since September 2015) of Prudential; Vice President and Assistant Secretary (since August 2020) of PGIM Investments LLC; formerly Associate at Willkie Farr & Gallagher LLP (2009-2015). | | Since March 2019 |
| | | |
Melissa Gonzalez 1980 Assistant Secretary | | Vice President and Corporate Counsel (since September 2018) of Prudential; Vice President and Assistant Secretary (since August 2020) of PGIM Investments LLC; formerly Director and Corporate Counsel (March 2014-September 2018) of Prudential. | | Since March 2020 |
| | | |
Patrick E. McGuinness 1986 Assistant Secretary | | Vice President and Assistant Secretary (since August 2020) of PGIM Investments LLC; Director and Corporate Counsel (since February 2017) of Prudential; and Corporate Counsel (2012 – 2017) of IIL, Inc. | | Since June 2020 |
| | | |
Kelly A. Coyne 1968 Assistant Secretary | | Director, Investment Operations of Prudential Mutual Fund Services LLC (since 2010). | | Since March 2015 |
| | | |
Christian J. Kelly 1975 Treasurer and Principal Financial and Accounting Officer | | Vice President, Head of Fund Administration of PGIM Investments LLC (since November 2018); formerly, Director of Fund Administration of Lord Abbett & Co. LLC (2009-2018), Treasurer and Principal Accounting Officer of the Lord Abbett Family of Funds (2017-2018); Director of Accounting, Avenue Capital Group (2008-2009); Senior Manager, Investment Management Practice of Deloitte & Touche LLP (1998-2007). | | Since January 2019 |
| | | |
Lana Lomuti 1967 Assistant Treasurer | | Vice President (since 2007) and Director (2005-2007), within PGIM Investments Fund Administration; formerly Assistant Treasurer (December 2007-February 2014) of The Greater China Fund, Inc. | | Since April 2014 |
| | | |
Russ Shupak 1973 Assistant Treasurer | | Vice President (since 2017) and Director (2013-2017), within PGIM Investments Fund Administration. | | Since October 2019 |
Visit our website at pgim.com/investments
| | | | |
| Fund Officers(a) | | | | |
| | | |
Name Year of Birth Fund Position | | Principal Occupation(s) During Past Five Years | | Length of Service as Fund Officer |
| | | |
Deborah Conway 1969 Assistant Treasurer | | Vice President (since 2017) and Director (2007-2017), within PGIM Investments Fund Administration. | | Since October 2019 |
| | | |
Elyse M. McLaughlin 1974 Assistant Treasurer | | Vice President (since 2017) and Director (2011-2017), within PGIM Investments Fund Administration. | | Since October 2019 |
| | | |
Charles H. Smith 1973 Anti-Money Laundering Compliance Officer | | Vice President, Corporate Compliance, Anti-Money Laundering Unit (since January 2015) of Prudential; committee member of the American Council of Life Insurers Anti-Money Laundering and Critical Infrastructure Committee (since January 2016); formerly Global Head of Economic Sanctions Compliance at AIG Property Casualty (February 2007-December 2014); Assistant Attorney General at the New York State Attorney General’s Office, Division of Public Advocacy. (August 1998-January 2007). | | Since January 2017 |
(a) Excludes Mr. Parker and Mr. Benjamin, interested Board Members who also serve as President and Vice President, respectively.
Explanatory Notes to Tables:
| ∎ | | Board Members are deemed to be “Interested,” as defined in the 1940 Act, by reason of their affiliation with PGIM Investments LLC and/or an affiliate of PGIM Investments LLC. |
| ∎ | | Unless otherwise noted, the address of all Board Members and Officers is c/o PGIM Investments LLC, 655 Broad Street, Newark, New Jersey 07102-4410. |
| ∎ | | There is no set term of office for Board Members or Officers. The Board Members have adopted a retirement policy, which calls for the retirement of Board Members on December 31 of the year in which they reach the age of 75. |
| ∎ | | “Other Directorships Held” includes all directorships of companies required to register or file reports with the SEC under the 1934 Act (that is, “public companies”) or other investment companies registered under the 1940 Act. |
| ∎ | | “Portfolios Overseen” includes all investment companies managed by PGIM Investments LLC. The investment companies for which PGIM Investments LLC serves as manager include the PGIM Funds, The Prudential Variable Contract Accounts, PGIM ETF Trust, PGIM High Yield Bond Fund, Inc., PGIM Global High Yield Fund, Inc., The Prudential Series Fund, Prudential’s Gibraltar Fund, Inc. and the Advanced Series Trust. |
| ∎ | | As used in the Fund Officers table “Prudential” means The Prudential Insurance Company of America. |
PGIM Corporate Bond Fund
Approval of Advisory Agreements
The Fund’s Board of Trustees
The Board of Trustees (the “Board”) of PGIM Corporate Bond Fund (the “Fund”)1 consists of eleven individuals, nine of whom are not “interested persons” of the Fund, as defined in the Investment Company Act of 1940, as amended (the “1940 Act”) (the “Independent Trustees”). The Board is responsible for the oversight of the Fund and its operations, and performs the various duties imposed on the directors of investment companies by the 1940 Act. The Independent Trustees have retained independent legal counsel to assist them in connection with their duties. The Chair of the Board is an Independent Trustee. The Board has established four standing committees: the Audit Committee, the Nominating and Governance Committee, and two Investment Committees. Each committee is chaired by, and composed of, Independent Trustees.
Annual Approval of the Fund’s Advisory Agreements
As required under the 1940 Act, the Board determines annually whether to renew the Fund’s management agreement with PGIM Investments LLC (“PGIM Investments”) and the Fund’s subadvisory agreement with PGIM, Inc. on behalf of its PGIM Fixed Income unit, and PGIM Limited (collectively referred to herein as “PGIM” or the “subadviser”). In considering the renewal of the agreements, the Board, including all of the Independent Trustees, met on May 27, 2020 and on June 9-11, 2020 and approved the renewal of the agreements through July 31, 2021, after concluding that the renewal of the agreements was in the best interests of the Fund and its shareholders.
In advance of the meetings, the Board requested and received materials relating to the agreements, and had the opportunity to ask questions and request further information in connection with its consideration. Among other things, the Board considered comparative fee information from PGIM Investments and PGIM. Also, the Board considered comparisons with other mutual funds in relevant Peer Universes and Peer Groups, as is further discussed below.
In approving the agreements, the Board, including the Independent Trustees advised by independent legal counsel, considered the factors it deemed relevant, including the nature, quality and extent of services provided by PGIM Investments and the subadviser, the performance of the Fund, the profitability of PGIM Investments and its affiliates, expenses and fees, and the potential for economies of scale that may be shared with the Fund and its shareholders as the Fund’s assets grow. In their deliberations, the Trustees did not identify any single factor which alone was responsible for the Board’s decision to approve the agreements with respect to the Fund. In connection with its deliberations, the Board considered information provided by PGIM Investments throughout the year at regular Board meetings, presentations
| 1 | PGIM Corporate Bond Fund is a series of The Target Portfolio Trust. |
Approval of Advisory Agreements (continued)
from portfolio managers and other information, as well as information furnished at or in advance of the meetings on May 27, 2020 and on June 9-11, 2020.
The Trustees determined that the overall arrangements between the Fund and PGIM Investments, which serves as the Fund’s investment manager pursuant to a management agreement, and between PGIM Investments and PGIM, which serves as the Fund’s subadviser pursuant to the terms of a subadvisory agreement with PGIM Investments, are in the best interests of the Fund and its shareholders in light of the services performed, fees charged and such other matters as the Trustees considered relevant in the exercise of their business judgment.
The material factors and conclusions that formed the basis for the Trustees’ reaching their determinations to approve the continuance of the agreements are separately discussed below.
Nature, Quality, and Extent of Services
The Board received and considered information regarding the nature, quality and extent of services provided to the Fund by PGIM Investments and PGIM. The Board noted that PGIM is affiliated with PGIM Investments. The Board considered the services provided by PGIM Investments, including but not limited to the oversight of the subadviser for the Fund, as well as the provision of fund recordkeeping, compliance and other services to the Fund, and PGIM Investments’ role as administrator for the Fund’s liquidity risk management program. With respect to PGIM Investments’ oversight of the subadviser, the Board noted that PGIM Investments’ Strategic Investment Research Group (“SIRG”), which is a business unit of PGIM Investments, is responsible for monitoring and reporting to PGIM Investments’ senior management on the performance and operations of the subadviser. The Board also considered that PGIM Investments pays the salaries of all of the officers and interested Trustees of the Fund who are part of Fund management. The Board also considered the investment subadvisory services provided by PGIM, including investment research and security selection, as well as adherence to the Fund’s investment restrictions and compliance with applicable Fund policies and procedures. The Board considered PGIM Investments’ evaluation of the subadviser, as well as PGIM Investments’ recommendation, based on its review of the subadviser, to renew the subadvisory agreement.
The Board considered the qualifications, backgrounds and responsibilities of PGIM Investments’ senior management responsible for the oversight of the Fund and PGIM, and also considered the qualifications, backgrounds and responsibilities of PGIM’s portfolio managers who are responsible for the day-to-day management of the Fund’s portfolio. The Board was provided with information pertaining to PGIM Investments’ and PGIM’s organizational structure, senior management, investment operations, and other relevant
| | |
| Visit our website at pgiminvestments.com | | |
information pertaining to both PGIM Investments and PGIM. The Board also noted that it received favorable compliance reports from the Fund’s Chief Compliance Officer (“CCO”) as to both PGIM Investments and PGIM.
The Board concluded that it was satisfied with the nature, extent and quality of the investment management services provided by PGIM Investments and the subadvisory services provided to the Fund by PGIM, and that there was a reasonable basis on which to conclude that the Fund benefits from the services provided by PGIM Investments and PGIM under the management and subadvisory agreements.
Costs of Services and Profits Realized by PGIM Investments
The Board was provided with information on the profitability of PGIM Investments and its affiliates in serving as the Fund’s investment manager. The Board discussed with PGIM Investments the methodology utilized in assembling the information regarding profitability and considered its reasonableness. The Board recognized that it is difficult to make comparisons of profitability from fund management contracts because comparative information is not generally publicly available and is affected by numerous factors, including the structure of the particular adviser, the types of funds it manages, its business mix, numerous assumptions regarding allocations and the adviser’s capital structure and cost of capital. The Board noted that the cost of services provided by PGIM Investments to the Fund during the year ended December 31, 2019 exceeded the management fees paid by the Fund, resulting in an operating loss to PGIM Investments. Taking these factors into account, the Board concluded that the profitability of PGIM Investments and its affiliates in relation to the services rendered was not unreasonable.
Economies of Scale
The Board received and discussed information concerning economies of scale that PGIM Investments may realize as the Fund’s assets grow beyond current levels. The Board noted that the management fee schedule for the Fund includes breakpoints, which have the effect of decreasing the fee rate as assets increase. During the course of time, the Board has considered information regarding the launch date of the Fund, the management fees of the Fund compared to those of similarly managed funds and PGIM Investments’ investment in the Fund over time. The Board noted that economies of scale can be shared with the Fund in other ways, including low management fees from inception, additional technological and personnel investments to enhance shareholder services, and maintaining existing expense structures in the face of a rising cost environment. The Board also considered PGIM Investments’ assertion that it continually evaluates the management fee schedule of the Fund and the potential to share economies of scale through breakpoints or fee waivers as asset levels increase.
Approval of Advisory Agreements (continued)
The Board recognized the inherent limitations of any analysis of economies of scale, stemming largely from the Board’s understanding that most of PGIM Investments’ costs are not specific to individual funds, but rather are incurred across a variety of products and services.
Other Benefits to PGIM Investments and PGIM
The Board considered potential ancillary benefits that might be received by PGIM Investments, PGIM and their affiliates as a result of their relationship with the Fund. The Board concluded that potential benefits to be derived by PGIM Investments included transfer agency fees received by the Fund’s transfer agent (which is affiliated with PGIM Investments), as well as benefits to its reputation or other intangible benefits resulting from PGIM Investments’ association with the Fund. The Board concluded that the potential benefits to be derived by PGIM included those generally resulting from an increase in assets under management, specifically, potential access to additional research resources and benefits to its reputation. The Board concluded that the benefits derived by PGIM Investments and PGIM were consistent with the types of benefits generally derived by investment managers and subadvisers to mutual funds.
Performance of the Fund / Fees and Expenses
The Board considered certain additional factors and made related conclusions relating to the historical performance of the Fund for the one-, three-, five- and ten-year periods ended December 31, 2019.
The Board also considered the Fund’s actual management fee, as well as the Fund’s net total expense ratio, for the fiscal year ended July 31, 2019. The Board considered the management fee for the Fund as compared to the management fee charged by PGIM Investments to other funds and the fee charged by other advisers to comparable mutual funds in a Peer Group. The actual management fee represents the fee rate actually paid by Fund shareholders and includes any fee waivers or reimbursements. The net total expense ratio for the Fund represents the actual expense ratio incurred by Fund shareholders.
The mutual funds included in the Peer Universe, which was used to consider performance, and the Peer Group, which was used to consider expenses and fees, were objectively determined by Broadridge, an independent provider of mutual fund data. In certain circumstances, PGIM Investments also provided supplemental Peer Universe or Peer Group information, for reasons addressed with the Board. The comparisons placed the Fund in various quartiles over various periods, with the first quartile being the best 25% of the mutual funds (for performance, the best performing mutual funds and, for expenses, the lowest cost mutual funds).
| | |
| Visit our website at pgiminvestments.com | | |
The section below summarizes key factors considered by the Board and the Board’s conclusions regarding the Fund’s performance, fees and overall expenses. The table sets forth net performance comparisons (which reflect the impact on performance of fund expenses, or any subsidies, expense caps or waivers that may be applicable) with the Peer Universe, actual management fees with the Peer Group (which reflect the impact of any subsidies or fee waivers), and net total expenses with the Peer Group, each of which were key factors considered by the Board.
| | | | | | | | |
| Net Performance | | 1 Year | | 3 Years | | 5 Years | | 10 Years |
| | | 2nd Quartile | | 2nd Quartile | | 2nd Quartile | | 3rd Quartile |
| Actual Management Fees: 1st Quartile |
| Net Total Expenses: 2nd Quartile |
| | • | | The Board noted that the Fund outperformed its benchmark index over the one-year period and the five- year period, and underperformed its benchmark index over the three-year period and the ten-year period. |
| | • | | The Board and PGIM Investments agreed to retain the Fund’s existing contractual expense cap, which (exclusive of certain fees and expenses) caps total annual operating expenses at 0.80% for Class A shares, 1.55% for Class C shares, 0.55% for Class R6 shares, 1.05% for Class R shares, and 0.55% for Class Z shares through November 30, 2020. |
| | • | | In addition, PGIM Investments will waive management fees or shared operating expenses on any share class to the same extent that it waives such expenses on any other share class, and has agreed that total annual fund operating expenses for Class R6 shares will not exceed total annual fund operating expenses for Class Z shares. |
| | • | | The Board concluded that, in light of the above, it would be in the best interests of the Fund and its shareholders to renew the agreements. |
| | • | | The Board concluded that the management fees (including subadvisory fees) and total expenses were reasonable in light of the services provided. |
* * *
After full consideration of these factors, the Board concluded that the approval of the agreements was in the best interests of the Fund and its shareholders.
| | | | |
| | |
| ∎ MAIL | | ∎ TELEPHONE | | ∎ WEBSITE |
655 Broad Street Newark, NJ 07102 | | (800) 225-1852 | | pgim.com/investments |
|
| PROXY VOTING |
| The Board of Trustees has delegated to the Fund’s subadvisers the responsibility for voting any proxies and maintaining proxy recordkeeping with respect to the Fund. A description of these proxy voting policies and procedures is available without charge, upon request, by calling (800) 225-1852 or by visiting the Securities and Exchange Commission’s website at sec.gov. Information regarding how the Fund voted proxies relating to portfolio securities during the most recent 12-month period ended June 30 is available on the Fund’s website and on the Commission’s website at sec.gov. |
|
| TRUSTEES |
| Ellen S. Alberding • Kevin J. Bannon • Scott E. Benjamin • Linda W. Bynoe • Barry H. Evans • Keith F. Hartstein • Laurie Simon Hodrick • Michael S. Hyland • Stuart S. Parker • Brian K. Reid • Grace C. Torres |
|
| OFFICERS |
Stuart S. Parker, President • Scott E. Benjamin, Vice President • Christian J. Kelly, Treasurer and Principal Financial and Accounting Officer • Claudia DiGiacomo, Chief Legal Officer • Dino Capasso, Chief Compliance Officer • Charles H. Smith, Anti-Money Laundering Compliance Officer • Andrew R. French, Secretary • Jonathan D. Shain, Assistant Secretary • Melissa Gonzalez, Assistant Secretary • Diana N. Huffman, Assistant Secretary • Kelly A. Coyne, Assistant Secretary • Patrick McGuinness, Assistant Secretary • Lana Lomuti, Assistant Treasurer • Russ Shupak, Assistant Treasurer • Elyse McLaughlin, Assistant Treasurer • Deborah Conway, Assistant Treasurer |
| | | | |
| MANAGER | | PGIM Investments LLC | | 655 Broad Street Newark, NJ 07102 |
|
| SUBADVISER | | PGIM Fixed Income | | 655 Broad Street Newark, NJ 07102 |
| | PGIM Limited | | Grand Buildings, 1-3 Strand Trafalgar Square London, WC2N 5HR United Kingdom |
|
| DISTRIBUTOR | | Prudential Investment Management Services LLC | | 655 Broad Street Newark, NJ 07102 |
|
| CUSTODIAN | | The Bank of New York Mellon | | 240 Greenwich Street New York, NY 10286 |
|
| TRANSFER AGENT | | Prudential Mutual Fund Services LLC | | PO Box 9658 Providence, RI 02940 |
|
| INDEPENDENT REGISTERED PUBLIC ACCOUNTING FIRM | | KPMG LLP | | 345 Park Avenue New York, NY 10154 |
|
| FUND COUNSEL | | Willkie Farr & Gallagher LLP | | 787 Seventh Avenue New York, NY 10019 |
|
|
| An investor should consider the investment objectives, risks, charges, and expenses of the Fund carefully before investing. The prospectus and summary prospectus contain this and other information about the Fund. An investor may obtain a prospectus and summary prospectus by visiting our website at pgim.com/investments or by calling (800) 225-1852. The prospectus and summary prospectus should be read carefully before investing. |
|
| E-DELIVERY |
| To receive your mutual fund documents online, go to pgim.com/investments/resource/edelivery and enroll. Instead of receiving printed documents by mail, you will receive notification via email when new materials are available. You can cancel your enrollment or change your email address at any time by visiting the website address above. |
|
| SHAREHOLDER COMMUNICATIONS WITH TRUSTEES |
| Shareholders can communicate directly with the Board of Trustees by writing to the Chair of the Board, PGIM Corporate Bond Fund, PGIM Investments, Attn: Board of Trustees, 655 Broad Street, Newark, NJ 07102. Shareholders can communicate directly with an individual Trustee by writing to that Trustee at the same address. Communications are not screened before being delivered to the addressee. |
|
| AVAILABILITY OF PORTFOLIO SCHEDULE |
The Fund files its complete schedule of portfolio holdings with the Securities and Exchange Commission for the first and third quarters of each fiscal year as an exhibit to its reports on Form N-PORT. The Fund’s Form N-PORT filings are available on the Commission’s website at sec.gov. |
|
The Fund’s Statement of Additional Information contains additional information about the Fund’s Trustees and is available without charge, upon request, by calling (800) 225-1852. |
Mutual Funds:
| | | | |
ARE NOT INSURED BY THE FDIC OR ANY
FEDERAL GOVERNMENT AGENCY | | MAY LOSE VALUE | | ARE NOT A DEPOSIT OF OR GUARANTEED
BY ANY BANK OR ANY BANK AFFILIATE |
PGIM CORPORATE BOND FUND
| | | | | | | | | | |
| SHARE CLASS | | A | | C | | R | | Z | | R6 |
| NASDAQ | | PCWAX | | PCWCX | | PCWRX | | TGMBX | | PCWQX |
| CUSIP | | 875921694 | | 875921686 | | 875921660 | | 875921702 | | 875921678 |
MF229E

PGIM QMA SMALL-CAP VALUE FUND
ANNUAL REPORT
JULY 31, 2020
COMING SOON: PAPERLESS SHAREHOLDER REPORTS
Beginning on January 1, 2021, as permitted by regulations adopted by the Securities and Exchange Commission, paper copies of the Fund’s annual and semiannual shareholder reports will no longer be sent by mail, unless you specifically request paper copies of the reports. Instead, the reports will be made available on the Fund’s website (pgim.com/investments), and you will be notified by mail each time a report is posted and provided with a website link to access the report.
If you already elected to receive shareholder reports electronically, you will not be affected by this change and you need not take any action. You may elect to receive shareholder reports and other communications from the Fund electronically anytime by contacting your financial intermediary (such as a broker-dealer or bank) or, if you are a direct investor, by calling 1-800-225-1852 or by sending an email request to PGIM Investments at shareholderreports@pgim.com.
You may elect to receive all future reports in paper free of charge. If you invest through a financial intermediary, you can contact your financial intermediary or follow instructions included with this notice to elect to continue to receive paper copies of your shareholder reports. If you invest directly with the Fund, you can call 1-800-225-1852 or send an email request to shareholderreports@pgim.com to let the Fund know you wish to continue receiving paper copies of your shareholder reports. Your election to receive reports in paper will apply to all funds held in your account if you invest through your financial intermediary or all funds held with the fund complex if you invest directly with the Fund.

To enroll in e-delivery, go to pgim.com/investments/resource/edelivery
Table of Contents
This report is not authorized for distribution to prospective investors unless preceded or accompanied by a current prospectus.
The views expressed in this report and information about the Fund’s portfolio holdings are for the period covered by this report and are subject to change thereafter.
Mutual funds are distributed by Prudential Investment Management Services LLC, a Prudential Financial company and member SIPC. QMA is the primary business name of QMA LLC, a wholly owned subsidiary of PGIM, Inc. (PGIM), a Prudential Financial company. © 2020 Prudential Financial, Inc. and its related entities. PGIM and the PGIM logo are service marks of Prudential Financial, Inc. and its related entities, registered in many jurisdictions worldwide.
| | |
| 2 | | Visit our website at pgim.com/investments |
Letter from the President

Dear Shareholder:
We hope you find the annual report for the PGIM QMA Small-Cap Value Fund informative and useful. The report covers performance for the 12-month period that ended July 31, 2020.
During the first half of the period, the global economy remained healthy—particularly in the US—fueled by rising corporate profits and strong job growth. The outlook changed dramatically in March as the coronavirus outbreak quickly and substantially shut down economic activity worldwide, leading to significant job losses and a steep decline in global growth and earnings. Responding to this disruption, the Federal Reserve (the Fed) cut the federal funds rate target to near zero and flooded capital markets with liquidity; and Congress passed stimulus bills worth approximately $3 trillion that offered an economic lifeline to consumers and businesses.
While stocks climbed throughout the first half of the period, they fell significantly in March amid a spike in volatility, ending the 11-year-long equity bull market. With stores and factories closing and consumers staying at home to limit the spread of the virus, investors sold stocks on fears that corporate earnings would take a serious hit. As states reopened their economies in the spring and early summer, a strong equity market rally helped large-cap US and emerging market stocks post gains during the period, while US small caps and stocks in developed foreign markets declined.
The bond market overall—including US and global bonds as well as emerging market debt—rose during the period as investors sought safety in fixed income. A significant rally in interest rates pushed the 10-year US Treasury yield down to a record low. In March, the Fed took several aggressive actions to keep the bond markets running smoothly, restarting many of the relief programs that proved to be successful in helping end the global financial crisis in 2008-09.
Regarding your investments with PGIM, we believe it is important to maintain a diversified portfolio of funds consistent with your tolerance for risk, time horizon, and financial goals. Your financial advisor can help you create a diversified investment plan that may include funds covering all the basic asset classes and that reflects your personal investor profile and risk tolerance. However, diversification and asset allocation strategies do not assure a profit or protect against loss in declining markets.
At PGIM Investments, we consider it a great privilege and responsibility to help investors participate in opportunities across global markets while meeting their toughest investment challenges. PGIM is a top-10 global investment manager with more than $1 trillion in assets under management. This scale and investment expertise allow us to deliver actively managed funds and strategies to meet the needs of investors around the globe.
Thank you for choosing our family of funds.
Sincerely,

Stuart S. Parker, President
PGIM QMA Small-Cap Value Fund
September 15, 2020
| | | | |
| PGIM QMA Small-Cap Value Fund | | | 3 | |
Your Fund’s Performance (unaudited)
Performance data quoted represent past performance. Past performance does not guarantee future results. The investment return and principal value of an investment will fluctuate, so that an investor’s shares, when redeemed, may be worth more or less than their original cost. Current performance may be lower or higher than the past performance data quoted. An investor may obtain performance data as of the most recent month-end by visiting our website at pgim.com/investments or by calling (800) 225-1852.
| | | | | | | | | | | | | | |
| |
| | | Average Annual Total Returns as of 7/31/20 | |
| | | One Year (%) | | Five Years (%) | | | Ten Years (%) | | | Since Inception (%) | |
| Class A | | | | | | | | | | | | | | |
| (with sales charges) | | –31.02 | | | –3.80 | | | | N/A | | | | –2.03 (2/14/14) | |
| (without sales charges) | | –27.01 | | | –2.70 | | | | N/A | | | | –1.17 (2/14/14) | |
| Class C | | | | | | | | | | | | | | |
| (with sales charges) | | –28.49 | | | –3.52 | | | | N/A | | | | –4.29 (6/19/15) | |
| (without sales charges) | | –27.80 | | | –3.52 | | | | N/A | | | | –4.29 (6/19/15) | |
| Class R | | | | | | | | | | | | | | |
| (without sales charges) | | –27.08 | | | –2.89 | | | | 4.78 | | | | — | |
| Class Z | | | | | | | | | | | | | | |
| (without sales charges) | | –26.66 | | | –2.37 | | | | 5.33 | | | | — | |
| Class R2 | | | | | | | | | | | | | | |
| (without sales charges) | | –26.96 | | | N/A | | | | N/A | | | | –15.51 (12/28/17) | |
| Class R4 | | | | | | | | | | | | | | |
| (without sales charges) | | –26.80 | | | N/A | | | | N/A | | | | –15.30 (12/28/17) | |
| Class R6 | | | | | | | | | | | | | | |
| (without sales charges) | | –26.60 | | | –2.30 | | | | N/A | | | | –1.14 (9/25/14) | |
| Russell 2000 Value Index | | | | | | | | | | | | | | |
| | –15.91 | | | 2.24 | | | | 7.30 | | | | — | |
| Russell 2000 Index | | | | | | | | | | | | | | |
| | –4.59 | | | 5.10 | | | | 10.07 | | | | — | |
| | | | | | | | | | | | | | |
|
| Average Annual Total Returns as of 7/31/20 Since Inception (%) | |
| | | Class A (2/14/14) | | Class C
(6/19/15) | | | Class R2, R4 (12/28/17) | | | Class R6 (9/25/14) | |
| Russell 2000 Value Index | |
| | 2.67 | | | 1.64 | | | | –6.84 | | | | 3.14 | |
| Russell 2000 Index | |
| | | 5.69 | | | 4.78 | | | | –0.04 | | | | 6.67 | |
| | |
| 4 | | Visit our website at pgim.com/investments |
Growth of a $10,000 Investment
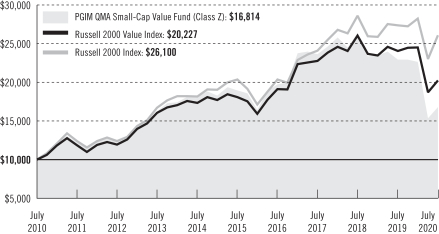
The graph compares a $10,000 investment in the Fund’s Class Z shares with a similar investment in the Russell 2000 Value Index and the Russell 2000 Index by portraying the initial account values at the beginning of the 10-year period (July 31, 2010) and the account values at the end of the current fiscal year (July 31, 2020), as measured on a quarterly basis. For purposes of the graph, and unless otherwise indicated, it has been assumed that (a) all recurring fees (including management fees) were deducted; and (b) all dividends and distributions were reinvested. The line graph provides information for Class Z shares only. As indicated in the tables provided earlier and in the following paragraphs, performance for other share classes will vary due to the differing charges and expenses applicable to each share class (as indicated in the following paragraphs). Without waiver of fees and/or expense reimbursements, if any, the returns would have been lower.
Since Inception returns are provided for any share class with less than 10 fiscal years of returns. Since Inception returns for the Index are measured from the closest month-end to the class’ inception date.
| | | | |
| PGIM QMA Small-Cap Value Fund | | | 5 | |
Your Fund’s Performance (continued)
The returns in the tables do not reflect the deduction of taxes that a shareholder would pay on Fund distributions or following the redemption of Fund shares. The average annual total returns take into account applicable sales charges, which are described for each share class in the table below.
| | | | | | | | | | | | | | |
| | | | | | | | |
| | | Class A | | Class C | | Class R | | Class Z | | Class R2 | | Class R4 | | Class R6 |
| Maximum initial sales charge | | 5.50% of the public offering price | | None | | None | | None | | None | | None | | None |
| Contingent deferred sales charge (CDSC) (as a percentage of the lower of the original purchase price or the net asset value at redemption) | | 1.00% on sales of $1 million or more made within 12 months of purchase | | 1.00% on sales made within 12 months of purchase | | None | | None | | None | | None | | None |
| Annual distribution or distribution and service (12b-1) fees (shown as a percentage of average daily net assets) | | 0.30% (0.25% currently) | | 1.00% | | 0.75% (0.50% currently) | | None | | 0.25% | | None | | None |
| Shareholder service fees | | None | | None | | None | | None | | 0.10%* | | 0.10%* | | None |
*Shareholder service fee reflects maximum allowable fees under a shareholder services plan.
Benchmark Definitions
Russell 2000 Value Index—The Russell 2000® Value Index is an unmanaged index which contains those securities in the Russell 2000 Index with a below-average growth orientation. Companies in this Index generally have low price-to-book and price-to-earnings ratios, higher dividend yields, and lower forecasted growth rates.
Russell 2000 Index—The Russell 2000® Index is an unmanaged index of the 2,000 smallest US companies included in the Russell 3000® Index. It gives an indication of how stock prices of smaller companies have performed.
Investors cannot invest directly in an index. The returns for the Indexes would be lower if they included the effects of sales charges, operating expenses of a mutual fund, or taxes that may be paid by an investor.
| | |
| 6 | | Visit our website at pgim.com/investments |
Presentation of Fund Holdings as of 7/31/20
| | | | |
| | |
| Ten Largest Holdings | | Line of Business | | % of Net Assets |
Stifel Financial Corp. | | Capital Markets | | 1.1% |
Sabra Health Care REIT, Inc. | | Equity Real Estate Investment Trusts (REITs) | | 1.0% |
Radian Group, Inc. | | Thrifts & Mortgage Finance | | 1.0% |
Meritage Homes Corp. | | Household Durables | | 1.0% |
Taylor Morrison Home Corp. | | Household Durables | | 1.0% |
Altra Industrial Motion Corp. | | Machinery | | 1.0% |
American Equity Investment Life Holding Co. | | Insurance | | 0.9% |
KB Home | | Household Durables | | 0.9% |
TRI Pointe Group, Inc. | | Household Durables | | 0.9% |
Valley National Bancorp | | Banks | | 0.9% |
Holdings reflect only long-term investments and are subject to change.
| | | | |
| PGIM QMA Small-Cap Value Fund | | | 7 | |
Strategy and Performance Overview
How did the Fund perform?
The PGIM QMA Small-Cap Value Fund’s Class Z shares returned -26.66% in the 12-month reporting period that ended July 31, 2020, underperforming the -15.91% return of the Russell 2000 Value Index (the Index).
What were the market conditions?
| | • | | During the first half of the reporting period, US equities reached all-time highs despite ongoing trade disputes and signs of slowing global economic growth. After peaking on February 21, 2020, however, the markets suffered their worst weekly drop in a decade during the last week of February based on concerns surrounding the global spread of COVID-19. Amid increasing fears the COVID-19 pandemic could tip the world economy into recession, investors sold risky assets in March and pushed the stock market to its worst quarterly performance since the global financial crisis in 2008. Stocks rallied during the second quarter of 2020, fueled by massive monetary and fiscal stimulus measures, reports about potential COVID-19 vaccines and treatments, improving employment and retail sales data, and states reopening their economies. At the end of the quarter, however, investors’ optimism cooled as several states announced plans to scale back their reopening after a spike in COVID-19 cases. In spite of weak macroeconomic data and fears of a resurgence of COVID-19, US equities resumed their rally in July, aided by ongoing stimulus measures and strong corporate earnings results. |
| | • | | US small-cap equities underperformed their large-cap and mid-cap counterparts during the reporting period. Small-cap stocks (as measured by the Russell 2000 Index) fell 4.59%, while mid-cap stocks (as measured by the Russell Midcap Index) rose 2.04%, and large-cap stocks (as measured by the Russell 1000 Index) gained 12.03%. |
| | • | | Value stocks significantly underperformed growth stocks within each of the market-cap indices. In the small-cap space, the Russell 2000 Value Index lagged the Russell 2000 Growth Index by nearly 22% (-15.91% vs. 6%). |
What worked?
| | • | | The Fund outperformed the Index in only two sectors: consumer staples and consumer discretionary. |
| | • | | Relative gains in consumer staples came from an overweight among food & staples retailers, whose stocks rallied due to the high demand for their products brought on by the pandemic. |
| | • | | Relative gains in consumer discretionary were mainly driven by overweight positions among homebuilders, whose shares were helped by historically low interest rates. |
| | |
| 8 | | Visit our website at pgim.com/investments |
What didn’t work?
| | • | | QMA uses a systematic process to select stocks that trade at a discount to their fundamental values but show positive business prospects. This deep-value focus favors stocks that exhibit the highest earnings yields, cash flow yields, and book yields within QMA’s investable universe. |
| | • | | During the reporting period, this deep-value strategy drove the Fund’s underperformance, as cheaper stocks lagged their more expensive counterparts. |
| | • | | The period was one of the most challenging ever for deep-value stocks, as growth significantly outperformed value and all of the fundamental measures QMA uses to evaluate stocks (e.g., book/price, cash flow/price, earnings/price, and business prospects) were out of favor. |
| | • | | At the sector level, the Fund’s most significant relative detractors came from the financials, real estate, and information technology sectors. |
| | • | | Within financials, underperformance was driven by overweight positions among inexpensive banks and mortgage real estate investment trusts (REITs), which were hit particularly hard by the negative impact of COVID-19 on economic growth. |
| | • | | Within real estate, overweight positioning among inexpensive hotel & resort REITS detracted from relative performance. These companies were hurt by travel bans and stay-at-home orders that kept customers away. |
| | • | | Within information technology, relative underperformance was driven by the Fund’s underweight positions in expensive semiconductors and communications equipment stocks, which performed well overall during the period. |
Did the Fund hold derivatives?
The Fund did not hold any derivatives.
Current outlook
| | • | | The trend of cheaper stocks underperforming their more expensive counterparts within the Index that occurred throughout 2018-2019 accelerated in the first quarter of 2020, which was a major headwind for the Fund. In the second quarter of 2020, however, cheaper stocks within the Index rebounded, and the Fund responded positively to the improved environment for deep value. |
| | • | | QMA believes there is a significant opportunity for further recovery in deep-value stocks. With a historically wide dispersion in valuations between cheap and expensive stocks, QMA’s model emphasizes companies with high book yields (book/price). QMA’s research shows that earnings yield (earnings/price) is the most effective measure of identifying value in typical economic environments. Book/price ratios are more useful |
| | | | |
| PGIM QMA Small-Cap Value Fund | | | 9 | |
Strategy and Performance Overview (continued)
| | when many companies have negative earnings, which QMA expects to occur in the coming quarters. Using book value in greater proportion better positions the Fund, in QMA’s view, toward companies that it expects to outperform should value recover and the dispersion in valuations reverts to its narrower norm. QMA was encouraged by the strong performance of book value and its beneficial contribution to the Fund’s return during the second-quarter rally. |
| | • | | Exogenous events such as the COVID-19 pandemic create significant departures from fundamental valuations. These periods of heightened risk are historically followed by an eventual return to more fundamental drivers of returns. While the time frame for this remains uncertain, QMA fully expects the same outcome. QMA regards the combination of fundamental insights from its models, along with prudent risk controls, as the most effective approach to navigating the market environment in the months ahead. |
| | |
| 10 | | Visit our website at pgim.com/investments |
Fees and Expenses (unaudited)
As a shareholder of the Fund, you incur two types of costs: (1) transaction costs, including sales charges (loads) on purchase payments and redemptions, as applicable, and (2) ongoing costs, including management fees, distribution and/or service (12b-1) fees, and other Fund expenses, as applicable. This example is intended to help you understand your ongoing costs (in dollars) of investing in the Fund and to compare these costs with the ongoing costs of investing in other mutual funds.
The example is based on an investment of $1,000 held through the six-month period ended July 31, 2020. The example is for illustrative purposes only; you should consult the Fund’s Prospectus for information on initial and subsequent minimum investment requirements.
Actual Expenses
The first line for each share class in the table on the following page provides information about actual account values and actual expenses. You may use the information on this line, together with the amount you invested, to estimate the expenses that you paid over the period. Simply divide your account value by $1,000 (for example, an $8,600 account value ÷ $1,000 = 8.6), then multiply the result by the number on the first line under the heading “Expenses Paid During the Six-Month Period” to estimate the expenses you paid on your account during this period.
Hypothetical Example for Comparison Purposes
The second line for each share class in the table on the following page provides information about hypothetical account values and hypothetical expenses based on the Fund’s actual expense ratio and an assumed rate of return of 5% per year before expenses, which is not the Fund’s actual return. The hypothetical account values and expenses may not be used to estimate the actual ending account balance or expenses you paid for the period. You may use this information to compare the ongoing costs of investing in the Fund and other funds. To do so, compare this 5% hypothetical example with the 5% hypothetical examples that appear in the shareholder reports of the other funds.
The Fund’s transfer agent may charge additional fees to holders of certain accounts that are not included in the expenses shown in the table on the following page. These fees apply to individual retirement accounts (IRAs) and Section 403(b) accounts. As of the close of the six-month period covered by the table, IRA fees included an annual maintenance fee of $15 per account (subject to a maximum annual maintenance fee of $25 for all accounts held by the same shareholder). Section 403(b) accounts are charged an annual $25 fiduciary maintenance fee. Some of the fees may vary in amount, or may be waived, based on your total account balance or the number of PGIM funds, including the Fund, that you own. You should consider the additional fees that were charged to your Fund account over the six-month period when you estimate the total ongoing expenses paid over the period
| | | | |
| PGIM QMA Small-Cap Value Fund | | | 11 | |
Fees and Expenses (continued)
and the impact of these fees on your ending account value, as these additional expenses are not reflected in the information provided in the expense table. Additional fees have the effect of reducing investment returns.
Please note that the expenses shown in the table are meant to highlight your ongoing costs only and do not reflect any transactional costs such as sales charges (loads). Therefore, the second line for each share class in the table is useful in comparing ongoing costs only and will not help you determine the relative total costs of owning different funds. In addition, if these transactional costs were included, your costs would have been higher.
| | | | | | | | | | | | | | | | | | |
| | | | |
PGIM QMA Small-Cap
Value Fund | | Beginning Account
Value
February 1, 2020 | | | Ending Account
Value
July 31, 2020 | | | Annualized
Expense Ratio
Based on the
Six-Month Period | | | Expenses Paid
During the
Six-Month Period* | |
| Class A | | Actual | | $ | 1,000.00 | | | $ | 740.10 | | | | 1.22 | % | | $ | 5.28 | |
| | Hypothetical | | $ | 1,000.00 | | | $ | 1,018.80 | | | | 1.22 | % | | $ | 6.12 | |
| Class C | | Actual | | $ | 1,000.00 | | | $ | 736.30 | | | | 2.26 | % | | $ | 9.76 | |
| | Hypothetical | | $ | 1,000.00 | | | $ | 1,013.63 | | | | 2.26 | % | | $ | 11.31 | |
| Class R | | Actual | | $ | 1,000.00 | | | $ | 740.30 | | | | 1.31 | % | | $ | 5.67 | |
| | Hypothetical | | $ | 1,000.00 | | | $ | 1,018.35 | | | | 1.31 | % | | $ | 6.57 | |
| Class Z | | Actual | | $ | 1,000.00 | | | $ | 742.70 | | | | 0.70 | % | | $ | 3.03 | |
| | Hypothetical | | $ | 1,000.00 | | | $ | 1,021.38 | | | | 0.70 | % | | $ | 3.52 | |
| Class R2 | | Actual | | $ | 1,000.00 | | | $ | 740.90 | | | | 1.14 | % | | $ | 4.93 | |
| | Hypothetical | | $ | 1,000.00 | | | $ | 1,019.19 | | | | 1.14 | % | | $ | 5.72 | |
| Class R4 | | Actual | | $ | 1,000.00 | | | $ | 741.70 | | | | 0.89 | % | | $ | 3.85 | |
| | Hypothetical | | $ | 1,000.00 | | | $ | 1,020.44 | | | | 0.89 | % | | $ | 4.47 | |
| Class R6 | | Actual | | $ | 1,000.00 | | | $ | 742.80 | | | | 0.69 | % | | $ | 2.99 | |
| | | Hypothetical | | $ | 1,000.00 | | | $ | 1,021.43 | | | | 0.69 | % | | $ | 3.47 | |
*Fund expenses (net of fee waivers or subsidies, if any) for each share class are equal to the annualized expense ratio for each share class (provided in the table), multiplied by the average account value over the period, multiplied by the 182 days in the six-month period ended July 31, 2020, and divided by the 366 days in the Fund’s fiscal year ended July 31, 2020 (to reflect the six-month period). Expenses presented in the table include the expenses of any underlying portfolios in which the Fund may invest.
| | |
| 12 | | Visit our website at pgim.com/investments |
Schedule of Investments
as of July 31, 2020
| | | | | | | | |
| | |
| Description | | Shares | | | Value | |
| | |
LONG-TERM INVESTMENTS 99.6% | | | | | | | | |
| | |
COMMON STOCKS 99.4% | | | | | | | | |
| | |
Air Freight & Logistics 0.9% | | | | | | | | |
Atlas Air Worldwide Holdings, Inc.* | | | 88,028 | | | $ | 4,584,498 | |
| | |
Airlines 2.2% | | | | | | | | |
Hawaiian Holdings, Inc.(a) | | | 226,200 | | | | 2,689,518 | |
JetBlue Airways Corp.*(a) | | | 167,900 | | | | 1,736,086 | |
Mesa Air Group, Inc.* | | | 149,900 | | | | 464,690 | |
SkyWest, Inc. | | | 130,868 | | | | 3,443,137 | |
Spirit Airlines, Inc.*(a) | | | 211,700 | | | | 3,346,977 | |
| | | | | | | | |
| | |
| | | | | | | 11,680,408 | |
| | |
Auto Components 4.2% | | | | | | | | |
Adient PLC* | | | 263,300 | | | | 4,381,312 | |
American Axle & Manufacturing Holdings, Inc.*(a) | | | 519,100 | | | | 3,664,846 | |
Cooper Tire & Rubber Co.(a) | | | 148,100 | | | | 4,599,986 | |
Cooper-Standard Holdings, Inc.* | | | 75,000 | | | | 803,250 | |
Dana, Inc. | | | 386,900 | | | | 4,422,267 | |
Modine Manufacturing Co.* | | | 332,000 | | | | 1,806,080 | |
Tenneco, Inc. (Class A Stock)*(a) | | | 390,700 | | | | 2,895,087 | |
| | | | | | | | |
| | |
| | | | | | | 22,572,828 | |
| | |
Banks 19.7% | | | | | | | | |
Ameris Bancorp | | | 120,600 | | | | 2,782,845 | |
Atlantic Union Bankshares Corp. | | | 87,000 | | | | 1,963,590 | |
BancorpSouth Bank | | | 52,200 | | | | 1,092,546 | |
Banner Corp. | | | 39,300 | | | | 1,392,399 | |
Berkshire Hills Bancorp, Inc. | | | 156,804 | | | | 1,561,768 | |
Boston Private Financial Holdings, Inc. | | | 207,300 | | | | 1,219,961 | |
Byline Bancorp, Inc.(a) | | | 32,200 | | | | 417,312 | |
Cadence BanCorp | | | 330,800 | | | | 2,583,548 | |
Camden National Corp. | | | 17,125 | | | | 542,691 | |
Cathay General Bancorp(a) | | | 108,200 | | | | 2,616,276 | |
CNB Financial Corp. | | | 34,399 | | | | 561,736 | |
Columbia Banking System, Inc.(a) | | | 11,700 | | | | 338,481 | |
Community Trust Bancorp, Inc. | | | 81,566 | | | | 2,496,735 | |
ConnectOne Bancorp, Inc. | | | 118,600 | | | | 1,635,494 | |
Customers Bancorp, Inc.*(a) | | | 190,030 | | | | 2,251,856 | |
Dime Community Bancshares, Inc. | | | 18,583 | | | | 218,257 | |
Eagle Bancorp, Inc. | | | 12,800 | | | | 385,024 | |
Enterprise Financial Services Corp. | | | 2,800 | | | | 81,368 | |
Financial Institutions, Inc. | | | 144,527 | | | | 2,134,664 | |
First BanCorp. (Puerto Rico) | | | 78,500 | | | | 427,040 | |
See Notes to Financial Statements.
| | | | |
| PGIM QMA Small-Cap Value Fund | | | 13 | |
Schedule of Investments (continued)
as of July 31, 2020
| | | | | | | | |
| | |
| Description | | Shares | | | Value | |
| | |
COMMON STOCKS (Continued) | | | | | | | | |
| | |
Banks (cont’d.) | | | | | | | | |
First Bancorp/Southern Pines NC | | | 12,800 | | | $ | 264,448 | |
First Busey Corp. | | | 41,100 | | | | 702,810 | |
First Business Financial Services, Inc. | | | 18,800 | | | | 279,556 | |
First Commonwealth Financial Corp. | | | 20,900 | | | | 164,483 | |
First Financial Bancorp | | | 239,351 | | | | 3,330,569 | |
First Financial Corp. | | | 80,359 | | | | 2,686,401 | |
First Merchants Corp. | | | 62,400 | | | | 1,524,432 | |
First Midwest Bancorp, Inc. | | | 258,400 | | | | 3,135,684 | |
Fulton Financial Corp. | | | 309,300 | | | | 3,000,210 | |
Great Southern Bancorp, Inc. | | | 28,063 | | | | 1,012,232 | |
Great Western Bancorp, Inc. | | | 167,500 | | | | 2,177,500 | |
Hancock Whitney Corp. | | | 155,300 | | | | 2,960,018 | |
Hanmi Financial Corp. | | | 68,178 | | | | 629,283 | |
Heartland Financial USA, Inc. | | | 96,904 | | | | 3,027,281 | |
Hilltop Holdings, Inc. | | | 132,903 | | | | 2,587,621 | |
Home BancShares, Inc.(a) | | | 103,700 | | | | 1,693,421 | |
Hope Bancorp, Inc. | | | 384,116 | | | | 3,238,098 | |
Horizon Bancorp, Inc. | | | 33,331 | | | | 336,976 | |
Independent Bank Group, Inc.(a) | | | 73,100 | | | | 3,211,283 | |
International Bancshares Corp. | | | 82,482 | | | | 2,509,102 | |
Investors Bancorp, Inc. | | | 49,400 | | | | 401,128 | |
Lakeland Bancorp, Inc. | | | 150,327 | | | | 1,530,329 | |
Midland States Bancorp, Inc. | | | 30,100 | | | | 424,109 | |
MidWestOne Financial Group, Inc. | | | 22,962 | | | | 415,153 | |
OceanFirst Financial Corp. | | | 193,200 | | | | 2,959,824 | |
Old National Bancorp(a) | | | 197,943 | | | | 2,769,223 | |
Pacific Premier Bancorp, Inc. | | | 124,000 | | | | 2,605,240 | |
Peapack-Gladstone Financial Corp. | | | 82,679 | | | | 1,346,014 | |
QCR Holdings, Inc. | | | 23,600 | | | | 705,168 | |
Renasant Corp.(a) | | | 138,100 | | | | 3,208,063 | |
S&T Bancorp, Inc.(a) | | | 25,563 | | | | 549,605 | |
Sandy Spring Bancorp, Inc. | | | 125,200 | | | | 2,894,624 | |
Simmons First National Corp. (Class A Stock)(a) | | | 212,200 | | | | 3,520,398 | |
South State Corp. | | | 84,485 | | | | 4,026,555 | |
Towne Bank | | | 8,500 | | | | 149,940 | |
Trustmark Corp. | | | 6,600 | | | | 148,632 | |
United Bankshares, Inc.(a) | | | 107,800 | | | | 2,837,296 | |
United Community Banks, Inc. | | | 9,200 | | | | 164,956 | |
Univest Financial Corp. | | | 30,100 | | | | 460,229 | |
Valley National Bancorp(a) | | | 658,100 | | | | 4,916,007 | |
Veritex Holdings, Inc. | | | 76,600 | | | | 1,280,752 | |
WesBanco, Inc. | | | 129,048 | | | | 2,559,022 | |
| | | | | | | | |
| | |
| | | | | | | 105,047,266 | |
See Notes to Financial Statements.
| | | | | | | | |
| | |
| Description | | Shares | | | Value | |
| | |
COMMON STOCKS (Continued) | | | | | | | | |
| | |
Capital Markets 1.4% | | | | | | | | |
Oppenheimer Holdings, Inc. (Class A Stock) | | | 84,900 | | | $ | 1,799,031 | |
Stifel Financial Corp. | | | 117,200 | | | | 5,681,856 | |
| | | | | | | | |
| | |
| | | | | | | 7,480,887 | |
| | |
Chemicals 1.0% | | | | | | | | |
AdvanSix, Inc.* | | | 36,300 | | | | 451,935 | |
Kraton Corp.* | | | 178,100 | | | | 2,342,015 | |
Minerals Technologies, Inc. | | | 37,600 | | | | 1,762,688 | |
Olin Corp. | | | 72,500 | | | | 814,900 | |
| | | | | | | | |
| | |
| | | | | | | 5,371,538 | |
| | |
Commercial Services & Supplies 1.5% | | | | | | | | |
ACCO Brands Corp.(a) | | | 607,741 | | | | 3,962,471 | |
ADT, Inc.(a) | | | 150,700 | | | | 1,297,527 | |
Matthews International Corp. (Class A Stock) | | | 65,100 | | | | 1,406,160 | |
Quad/Graphics, Inc.(a) | | | 213,771 | | | | 664,828 | |
Viad Corp. | | | 11,000 | | | | 159,060 | |
VSE Corp.(a) | | | 24,800 | | | | 697,624 | |
| | | | | | | | |
| | |
| | | | | | | 8,187,670 | |
| | |
Communications Equipment 0.3% | | | | | | | | |
Applied Optoelectronics, Inc.*(a) | | | 15,500 | | | | 220,255 | |
Comtech Telecommunications Corp. | | | 43,600 | | | | 715,912 | |
NetScout Systems, Inc.*(a) | | | 15,900 | | | | 404,814 | |
| | | | | | | | |
| | |
| | | | | | | 1,340,981 | |
| | |
Construction & Engineering 0.2% | | | | | | | | |
Tutor Perini Corp.*(a) | | | 107,900 | | | | 1,269,983 | |
| | |
Consumer Finance 2.1% | | | | | | | | |
Encore Capital Group, Inc.*(a) | | | 98,491 | | | | 3,597,876 | |
EZCORP, Inc. (Class A Stock)* | | | 198,600 | | | | 1,135,992 | |
Navient Corp. | | | 103,900 | | | | 827,044 | |
Nelnet, Inc. (Class A Stock)(a) | | | 73,753 | | | | 4,277,674 | |
Regional Management Corp.* | | | 78,500 | | | | 1,192,415 | |
| | | | | | | | |
| | |
| | | | | | | 11,031,001 | |
| | |
Diversified Consumer Services 0.7% | | | | | | | | |
Laureate Education, Inc. (Class A Stock)* | | | 308,600 | | | | 3,913,048 | |
See Notes to Financial Statements.
| | | | |
| PGIM QMA Small-Cap Value Fund | | | 15 | |
Schedule of Investments (continued)
as of July 31, 2020
| | | | | | | | |
| | |
| Description | | Shares | | | Value | |
| | |
COMMON STOCKS (Continued) | | | | | | | | |
| | |
Diversified Financial Services 0.1% | | | | | | | | |
Banco Latinoamericano de Comercio Exterior SA (Panama) (Class E Stock) | | | 22,500 | | | $ | 262,575 | |
Cannae Holdings, Inc.* | | | 2,200 | | | | 82,896 | |
| | | | | | | | |
| | |
| | | | | | | 345,471 | |
| | |
Diversified Telecommunication Services 0.1% | | | | | | | | |
Liberty Latin America Ltd. (Chile) (Class A Stock)* | | | 7,900 | | | | 81,212 | |
Liberty Latin America Ltd. (Chile) (Class C Stock)*(a) | | | 28,400 | | | | 290,532 | |
| | | | | | | | |
| | |
| | | | | | | 371,744 | |
| | |
Electric Utilities 0.1% | | | | | | | | |
ALLETE, Inc. | | | 2,300 | | | | 136,390 | |
Portland General Electric Co. | | | 3,900 | | | | 172,107 | |
| | | | | | | | |
| | |
| | | | | | | 308,497 | |
| | |
Electronic Equipment, Instruments & Components 2.2% | | | | | | | | |
Arrow Electronics, Inc.* | | | 22,400 | | | | 1,604,288 | |
Avnet, Inc. | | | 66,500 | | | | 1,776,880 | |
Benchmark Electronics, Inc. | | | 23,100 | | | | 470,316 | |
Kimball Electronics, Inc.* | | | 7,900 | | | | 104,912 | |
MTS Systems Corp. | | | 28,600 | | | | 530,530 | |
Sanmina Corp.* | | | 83,600 | | | | 2,481,248 | |
ScanSource, Inc.* | | | 46,800 | | | | 1,074,060 | |
TTM Technologies, Inc.*(a) | | | 304,200 | | | | 3,744,702 | |
| | | | | | | | |
| | |
| | | | | | | 11,786,936 | |
| | |
Energy Equipment & Services 0.9% | | | | | | | | |
Archrock, Inc.(a) | | | 184,900 | | | | 1,231,434 | |
Liberty Oilfield Services, Inc. (Class A Stock)(a) | | | 81,900 | | | | 462,735 | |
National Energy Services Reunited Corp.* | | | 17,300 | | | | 115,737 | |
ProPetro Holding Corp.* | | | 325,200 | | | | 1,746,324 | |
Select Energy Services, Inc. (Class A Stock)* | | | 261,500 | | | | 1,161,060 | |
| | | | | | | | |
| | |
| | | | | | | 4,717,290 | |
| | |
Entertainment 0.1% | | | | | | | | |
Marcus Corp. (The) | | | 19,000 | | | | 262,390 | |
| | |
Equity Real Estate Investment Trusts (REITs) 9.3% | | | | | | | | |
Apple Hospitality REIT, Inc. | | | 77,600 | | | | 684,432 | |
Chatham Lodging Trust | | | 275,900 | | | | 1,437,439 | |
See Notes to Financial Statements.
| | | | | | | | |
| | |
| Description | | Shares | | | Value | |
| | |
COMMON STOCKS (Continued) | | | | | | | | |
| | |
Equity Real Estate Investment Trusts (REITs) (cont’d.) | | | | | | | | |
CoreCivic, Inc. | | | 133,200 | | | $ | 1,186,812 | |
CorEnergy Infrastructure Trust, Inc. | | | 6,700 | | | | 58,692 | |
CorePoint Lodging, Inc. | | | 177,800 | | | | 993,902 | |
DiamondRock Hospitality Co. | | | 432,200 | | | | 1,996,764 | |
Diversified Healthcare Trust | | | 723,500 | | | | 2,818,032 | |
EPR Properties | | | 31,600 | | | | 904,708 | |
Franklin Street Properties Corp. | | | 599,500 | | | | 3,147,375 | |
Global Net Lease, Inc. | | | 131,100 | | | | 2,182,815 | |
Hersha Hospitality Trust(a) | | | 408,200 | | | | 1,943,032 | |
iStar, Inc. | | | 26,800 | | | | 311,148 | |
Jernigan Capital, Inc.(a) | | | 201,000 | | | | 2,816,010 | |
Kite Realty Group Trust | | | 194,300 | | | | 1,917,741 | |
Macerich Co. (The)(a) | | | 176,594 | | | | 1,347,412 | |
Office Properties Income Trust | | | 157,618 | | | | 3,964,093 | |
Park Hotels & Resorts, Inc. | | | 157,900 | | | | 1,305,833 | |
Pebblebrook Hotel Trust(a) | | | 295,400 | | | | 3,131,240 | |
Preferred Apartment Communities, Inc. (Class A Stock)(a) | | | 54,500 | | | | 394,035 | |
Retail Properties of America, Inc. (Class A Stock) | | | 73,200 | | | | 465,552 | |
RLJ Lodging Trust(a) | | | 453,200 | | | | 3,630,132 | |
RPT Realty | | | 38,800 | | | | 241,336 | |
Sabra Health Care REIT, Inc. | | | 375,100 | | | | 5,528,974 | |
Service Properties Trust | | | 107,300 | | | | 718,910 | |
SITE Centers Corp.(a) | | | 79,900 | | | | 585,667 | |
SL Green Realty Corp. | | | 31,200 | | | | 1,450,800 | |
Summit Hotel Properties, Inc. | | | 557,400 | | | | 2,887,332 | |
Sunstone Hotel Investors, Inc. | | | 40,200 | | | | 300,696 | |
Xenia Hotels & Resorts, Inc. | | | 173,400 | | | | 1,380,264 | |
| | | | | | | | |
| | |
| | | | | | | 49,731,178 | |
| | |
Food & Staples Retailing 2.7% | | | | | | | | |
Andersons, Inc. (The) | | | 97,000 | | | | 1,379,340 | |
Ingles Markets, Inc. (Class A Stock)(a) | | | 93,505 | | | | 3,763,576 | |
SpartanNash Co. | | | 178,590 | | | | 3,754,855 | |
United Natural Foods, Inc.*(a) | | | 215,600 | | | | 4,279,660 | |
Weis Markets, Inc.(a) | | | 22,300 | | | | 1,110,986 | |
| | | | | | | | |
| | |
| | | | | | | 14,288,417 | |
| | |
Food Products 0.2% | | | | | | | | |
Darling Ingredients, Inc.*(a) | | | 45,200 | | | | 1,262,436 | |
Seneca Foods Corp. (Class A Stock)* | | | 1,700 | | | | 66,606 | |
| | | | | | | | |
| | |
| | | | | | | 1,329,042 | |
See Notes to Financial Statements.
| | | | |
| PGIM QMA Small-Cap Value Fund | | | 17 | |
Schedule of Investments (continued)
as of July 31, 2020
| | | | | | | | |
| | |
| Description | | Shares | | | Value | |
| | |
COMMON STOCKS (Continued) | | | | | | | | |
| | |
Gas Utilities 0.0% | | | | | | | | |
Spire, Inc. | | | 3,200 | | | $ | 197,312 | |
| | |
Health Care Providers & Services 1.0% | | | | | | | | |
Acadia Healthcare Co., Inc.*(a) | | | 7,500 | | | | 223,575 | |
Brookdale Senior Living, Inc.* | | | 41,400 | | | | 114,678 | |
MEDNAX, Inc.*(a) | | | 36,300 | | | | 725,274 | |
Owens & Minor, Inc. | | | 253,310 | | | | 4,073,225 | |
Triple-S Management Corp. (Puerto Rico) (Class B Stock)*(a) | | | 13,400 | | | | 260,764 | |
| | | | | | | | |
| | |
| | | | | | | 5,397,516 | |
| | |
Hotels, Restaurants & Leisure 0.8% | | | | | | | | |
Biglari Holdings, Inc. (Class B Stock)*(a) | | | 6,600 | | | | 428,538 | |
Del Taco Restaurants, Inc.* | | | 94,900 | | | | 725,985 | |
Marriott Vacations Worldwide Corp. | | | 24,600 | | | | 2,082,636 | |
RCI Hospitality Holdings, Inc.(a) | | | 39,300 | | | | 474,744 | |
Red Robin Gourmet Burgers, Inc.*(a) | | | 36,000 | | | | 314,640 | |
| | | | | | | | |
| | |
| | | | | | | 4,026,543 | |
| | |
Household Durables 4.3% | | | | | | | | |
Beazer Homes USA, Inc.*(a) | | | 41,900 | | | | 468,861 | |
Ethan Allen Interiors, Inc. | | | 47,300 | | | | 560,032 | |
KB Home | | | 149,600 | | | | 5,032,544 | |
M/I Homes, Inc.* | | | 38,500 | | | | 1,602,755 | |
Meritage Homes Corp.* | | | 53,400 | | | | 5,296,212 | |
Taylor Morrison Home Corp.*(a) | | | 221,300 | | | | 5,189,485 | |
TRI Pointe Group, Inc.* | | | 296,300 | | | | 4,954,136 | |
| | | | | | | | |
| | |
| | | | | | | 23,104,025 | |
| | |
Insurance 3.9% | | | | | | | | |
American Equity Investment Life Holding Co.(a) | | | 198,777 | | | | 5,058,875 | |
CNO Financial Group, Inc. | | | 324,100 | | | | 4,893,910 | |
Employers Holdings, Inc. | | | 88,998 | | | | 2,894,215 | |
Enstar Group Ltd. (Bermuda)* | | | 5,300 | | | | 890,135 | |
FBL Financial Group, Inc. (Class A Stock) | | | 42,068 | | | | 1,463,125 | |
Genworth Financial, Inc. (Class A Stock)* | | | 387,600 | | | | 790,704 | |
National General Holdings Corp. | | | 40,300 | | | | 1,369,797 | |
National Western Life Group, Inc. (Class A Stock)(a) | | | 17,600 | | | | 3,428,304 | |
| | | | | | | | |
| | |
| | | | | | | 20,789,065 | |
| | |
Interactive Media & Services 0.6% | | | | | | | | |
Cars.com, Inc.*(a) | | | 414,000 | | | | 3,361,680 | |
See Notes to Financial Statements.
| | | | | | | | |
| | |
| Description | | Shares | | | Value | |
| | |
COMMON STOCKS (Continued) | | | | | | | | |
| | |
IT Services 0.4% | | | | | | | | |
Conduent, Inc.* | | | 40,700 | | | $ | 77,737 | |
DXC Technology Co. | | | 110,500 | | | | 1,979,055 | |
| | | | | | | | |
| | |
| | | | | | | 2,056,792 | |
| | |
Machinery 2.1% | | | | | | | | |
Altra Industrial Motion Corp.(a) | | | 148,200 | | | | 5,072,886 | |
EnPro Industries, Inc.(a) | | | 9,100 | | | | 434,343 | |
Gates Industrial Corp. PLC* | | | 96,900 | | | | 1,021,326 | |
Greenbrier Cos., Inc. (The)(a) | | | 28,900 | | | | 743,597 | |
Lydall, Inc.* | | | 124,500 | | | | 2,016,900 | |
Manitowoc Co., Inc. (The)* | | | 38,500 | | | | 410,410 | |
NN, Inc.(a) | | | 173,700 | | | | 913,662 | |
Park-Ohio Holdings Corp.(a) | | | 8,000 | | | | 115,360 | |
Wabash National Corp. | | | 23,500 | | | | 267,665 | |
| | | | | | | | |
| | |
| | | | | | | 10,996,149 | |
| | |
Marine 0.5% | | | | | | | | |
Costamare, Inc. (Monaco)(a) | | | 634,500 | | | | 2,886,975 | |
| | |
Media 1.1% | | | | | | | | |
Emerald Holding, Inc. | | | 262,700 | | | | 714,544 | |
Entercom Communications Corp. (Class A Stock)(a) | | | 604,000 | | | | 845,600 | |
Gray Television, Inc.*(a) | | | 206,000 | | | | 2,954,040 | |
iHeartMedia, Inc. (Class A Stock)*(a) | | | 32,300 | | | | 270,028 | |
Saga Communications, Inc. (Class A Stock) | | | 3,410 | | | | 79,726 | |
TEGNA, Inc. | | | 84,400 | | | | 994,232 | |
| | | | | | | | |
| | |
| | | | | | | 5,858,170 | |
| | |
Metals & Mining 2.6% | | | | | | | | |
Allegheny Technologies, Inc.*(a) | | | 263,600 | | | | 2,290,684 | |
Carpenter Technology Corp. | | | 89,800 | | | | 2,007,928 | |
Commercial Metals Co.(a) | | | 81,400 | | | | 1,683,352 | |
Schnitzer Steel Industries, Inc. (Class A Stock)(a) | | | 217,800 | | | | 4,007,520 | |
SunCoke Energy, Inc. | | | 357,400 | | | | 1,140,106 | |
United States Steel Corp.(a) | | | 123,300 | | | | 821,178 | |
Warrior Met Coal, Inc. | | | 136,000 | | | | 2,165,120 | |
| | | | | | | | |
| | |
| | | | | | | 14,115,888 | |
| | |
Mortgage Real Estate Investment Trusts (REITs) 4.3% | | | | | | | | |
Anworth Mortgage Asset Corp. | | | 171,500 | | | | 310,415 | |
Apollo Commercial Real Estate Finance, Inc.(a) | | | 298,883 | | | | 2,779,612 | |
See Notes to Financial Statements.
| | | | |
| PGIM QMA Small-Cap Value Fund | | | 19 | |
Schedule of Investments (continued)
as of July 31, 2020
| | | | | | | | |
| | |
| Description | | Shares | | | Value | |
| | |
COMMON STOCKS (Continued) | | | | | | | | |
| | |
Mortgage Real Estate Investment Trusts (REITs) (cont’d.) | | | | | | | | |
Ares Commercial Real Estate Corp. | | | 36,800 | | | $ | 335,984 | |
Arlington Asset Investment Corp. (Class A Stock) | | | 238,296 | | | | 648,165 | |
ARMOUR Residential REIT, Inc. | | | 189,700 | | | | 1,771,798 | |
Blackstone Mortgage Trust, Inc. (Class A Stock) | | | 159,800 | | | | 3,846,386 | |
Capstead Mortgage Corp. | | | 22,300 | | | | 137,145 | |
Cherry Hill Mortgage Investment Corp. | | | 135,014 | | | | 1,246,179 | |
Chimera Investment Corp.(a) | | | 174,900 | | | | 1,572,351 | |
Colony Credit Real Estate, Inc.(a) | | | 21,700 | | | | 136,710 | |
Dynex Capital, Inc. | | | 117,535 | | | | 1,815,916 | |
Ellington Financial, Inc. | | | 43,200 | | | | 508,032 | |
Granite Point Mortgage Trust, Inc.(a) | | | 151,500 | | | | 1,028,685 | |
Invesco Mortgage Capital, Inc.(a) | | | 389,288 | | | | 1,195,114 | |
KKR Real Estate Finance Trust, Inc. | | | 56,300 | | | | 937,395 | |
Ladder Capital Corp. | | | 122,168 | | | | 949,246 | |
New York Mortgage Trust, Inc. | | | 254,300 | | | | 666,266 | |
Ready Capital Corp. | | | 64,213 | | | | 514,988 | |
TPG RE Finance Trust, Inc. | | | 169,000 | | | | 1,466,920 | |
Two Harbors Investment Corp.(a) | | | 112,000 | | | | 608,160 | |
Western Asset Mortgage Capital Corp.(a) | | | 287,300 | | | | 606,203 | |
| | | | | | | | |
| | |
| | | | | | | 23,081,670 | |
| | |
Multiline Retail 1.2% | | | | | | | | |
Big Lots, Inc.(a) | | | 75,900 | | | | 2,985,906 | |
Dillard’s, Inc. (Class A Stock)(a) | | | 77,200 | | | | 1,818,060 | |
Macy’s, Inc. | | | 230,900 | | | | 1,399,254 | |
| | | | | | | | |
| | |
| | | | | | | 6,203,220 | |
| | |
Multi-Utilities 0.1% | | | | | | | | |
Black Hills Corp. | | | 4,700 | | | | 271,942 | |
| | |
Oil, Gas & Consumable Fuels 5.5% | | | | | | | | |
Arch Resources, Inc. | | | 31,100 | | | | 964,722 | |
Berry Corp.(a) | | | 281,900 | | | | 1,326,339 | |
Bonanza Creek Energy, Inc.* | | | 110,000 | | | | 2,000,900 | |
Cimarex Energy Co. | | | 5,300 | | | | 129,638 | |
CNX Resources Corp.*(a) | | | 315,600 | | | | 3,045,540 | |
CONSOL Energy, Inc.*(a) | | | 138,200 | | | | 812,616 | |
Continental Resources, Inc.(a) | | | 20,100 | | | | 347,529 | |
Delek US Holdings, Inc.(a) | | | 11,900 | | | | 208,012 | |
DHT Holdings, Inc. | | | 57,000 | | | | 323,760 | |
Diamond S Shipping, Inc.* | | | 28,800 | | | | 252,864 | |
Diamondback Energy, Inc. | | | 21,700 | | | | 864,962 | |
Dorian LPG Ltd.*(a) | | | 42,600 | | | | 363,804 | |
See Notes to Financial Statements.
| | | | | | | | |
| | |
| Description | | Shares | | | Value | |
| | |
COMMON STOCKS (Continued) | | | | | | | | |
| | |
Oil, Gas & Consumable Fuels (cont’d.) | | | | | | | | |
EQT Corp. | | | 72,500 | | | $ | 1,052,700 | |
Frontline Ltd. (Norway)(a) | | | 36,200 | | | | 289,600 | |
Gulfport Energy Corp.*(a) | | | 123,900 | | | | 125,139 | |
HollyFrontier Corp. | | | 45,100 | | | | 1,240,250 | |
International Seaways, Inc. | | | 20,200 | | | | 348,854 | |
Matador Resources Co.*(a) | | | 272,200 | | | | 2,362,696 | |
Montage Resources Corp.*(a) | | | 66,200 | | | | 283,998 | |
Ovintiv, Inc.(a) | | | 240,300 | | | | 2,328,507 | |
Parsley Energy, Inc. (Class A Stock) | | | 166,500 | | | | 1,828,170 | |
PBF Energy, Inc. (Class A Stock)(a) | | | 122,900 | | | | 1,066,772 | |
PDC Energy, Inc.*(a) | | | 18,600 | | | | 265,236 | |
Peabody Energy Corp. | | | 373,200 | | | | 1,164,384 | |
Penn Virginia Corp.*(a) | | | 109,400 | | | | 1,084,154 | |
Renewable Energy Group, Inc.*(a) | | | 50,500 | | | | 1,392,790 | |
Southwestern Energy Co.*(a) | | | 767,700 | | | | 1,865,511 | |
Talos Energy, Inc.*(a) | | | 84,700 | | | | 576,807 | |
World Fuel Services Corp. | | | 63,800 | | | | 1,501,214 | |
| | | | | | | | |
| | |
| | | | | | | 29,417,468 | |
| | |
Paper & Forest Products 1.4% | | | | | | | | |
Clearwater Paper Corp.* | | | 50,200 | | | | 1,853,384 | |
Domtar Corp. | | | 97,100 | | | | 2,038,129 | |
Verso Corp. (Class A Stock) | | | 271,428 | | | | 3,314,136 | |
| | | | | | | | |
| | |
| | | | | | | 7,205,649 | |
| | |
Personal Products 0.7% | | | | | | | | |
Edgewell Personal Care Co.* | | | 116,300 | | | | 3,476,207 | |
| | |
Pharmaceuticals 0.1% | | | | | | | | |
Lannett Co., Inc.*(a) | | | 126,200 | | | | 750,890 | |
| | |
Professional Services 0.8% | | | | | | | | |
Kelly Services, Inc. (Class A Stock) | | | 181,100 | | | | 2,682,091 | |
TrueBlue, Inc.* | | | 105,900 | | | | 1,634,037 | |
| | | | | | | | |
| | |
| | | | | | | 4,316,128 | |
| | |
Real Estate Management & Development 0.9% | | | | | | | | |
RE/MAX Holdings, Inc. (Class A Stock) | | | 2,100 | | | | 67,977 | |
Realogy Holdings Corp.(a) | | | 513,200 | | | | 4,649,592 | |
| | | | | | | | |
| | |
| | | | | | | 4,717,569 | |
See Notes to Financial Statements.
| | | | |
| PGIM QMA Small-Cap Value Fund | | | 21 | |
Schedule of Investments (continued)
as of July 31, 2020
| | | | | | | | |
| | |
| Description | | Shares | | | Value | |
| | |
COMMON STOCKS (Continued) | | | | | | | | |
| | |
Road & Rail 1.2% | | | | | | | | |
ArcBest Corp. | | | 135,700 | | | $ | 4,123,923 | |
Covenant Logistics Group, Inc. (Class A Stock)* | | | 149,600 | | | | 2,520,760 | |
| | | | | | | | |
| | |
| | | | | | | 6,644,683 | |
| | |
Semiconductors & Semiconductor Equipment 0.1% | | | | | | | | |
Amkor Technology, Inc.* | | | 36,100 | | | | 490,780 | |
Photronics, Inc.* | | | 14,600 | | | | 173,448 | |
| | | | | | | | |
| | |
| | | | | | | 664,228 | |
| | |
Specialty Retail 5.8% | | | | | | | | |
Abercrombie & Fitch Co. (Class A Stock)(a) | | | 333,700 | | | | 3,213,531 | |
Bed Bath & Beyond, Inc.(a) | | | 431,700 | | | | 4,670,994 | |
Caleres, Inc.(a) | | | 88,900 | | | | 560,959 | |
Cato Corp. (The) (Class A Stock) | | | 164,100 | | | | 1,179,879 | |
Citi Trends, Inc. | | | 28,100 | | | | 483,882 | |
Conn’s, Inc.*(a) | | | 104,000 | | | | 1,035,840 | |
Container Store Group, Inc. (The)*(a) | | | 52,300 | | | | 180,435 | |
Designer Brands, Inc. (Class A Stock)(a) | | | 155,700 | | | | 920,187 | |
Genesco, Inc.* | | | 140,200 | | | | 2,180,110 | |
Group 1 Automotive, Inc. | | | 37,000 | | | | 3,108,740 | |
Guess?, Inc.(a) | | | 23,900 | | | | 247,126 | |
Hibbett Sports, Inc.*(a) | | | 157,200 | | | | 3,645,468 | |
MarineMax, Inc.* | | | 120,300 | | | | 3,337,122 | |
ODP Corp. (The)(a) | | | 89,780 | | | | 1,981,445 | |
Signet Jewelers Ltd.(a) | | | 328,000 | | | | 3,522,720 | |
Sonic Automotive, Inc. (Class A Stock)(a) | | | 16,100 | | | | 613,732 | |
| | | | | | | | |
| | |
| | | | | | | 30,882,170 | |
| | |
Technology Hardware, Storage & Peripherals 0.3% | | | | | | | | |
Xerox Holdings Corp. | | | 108,200 | | | | 1,801,530 | |
| | |
Textiles, Apparel & Luxury Goods 0.4% | | | | | | | | |
Fossil Group, Inc.*(a) | | | 39,900 | | | | 132,069 | |
G-III Apparel Group Ltd.*(a) | | | 200,900 | | | | 1,986,901 | |
Movado Group, Inc.(a) | | | 13,700 | | | | 132,068 | |
| | | | | | | | |
| | |
| | | | | | | 2,251,038 | |
| | |
Thrifts & Mortgage Finance 4.8% | | | | | | | | |
Essent Group Ltd. | | | 87,600 | | | | 3,138,708 | |
Federal Agricultural Mortgage Corp. (Class C Stock) | | | 1,762 | | | | 104,856 | |
Flagstar Bancorp, Inc. | | | 117,600 | | | | 3,690,288 | |
See Notes to Financial Statements.
| | | | | | | | |
| | |
| Description | | Shares | | | Value | |
| | |
COMMON STOCKS (Continued) | | | | | | | | |
| | |
Thrifts & Mortgage Finance (cont’d.) | | | | | | | | |
Meta Financial Group, Inc. | | | 31,200 | | | $ | 582,192 | |
Mr. Cooper Group, Inc.* | | | 214,300 | | | | 3,499,519 | |
Northwest Bancshares, Inc. | | | 37,400 | | | | 368,390 | |
PennyMac Financial Services, Inc. | | | 24,415 | | | | 1,178,268 | |
Premier Financial Corp. | | | 70,082 | | | | 1,239,050 | |
Provident Financial Services, Inc. | | | 178,620 | | | | 2,438,163 | |
Radian Group, Inc. | | | 368,966 | | | | 5,504,973 | |
Washington Federal, Inc.(a) | | | 33,900 | | | | 791,226 | |
WSFS Financial Corp. | | | 111,600 | | | | 3,183,948 | |
| | | | | | | | |
| | | | | | | 25,719,581 | |
| | |
Tobacco 0.4% | | | | | | | | |
Universal Corp. | | | 46,300 | | | | 1,952,008 | |
| | |
Trading Companies & Distributors 4.0% | | | | | | | | |
Air Lease Corp.(a) | | | 63,100 | | | | 1,654,482 | |
Beacon Roofing Supply, Inc.* | | | 114,600 | | | | 3,570,936 | |
CAI International, Inc.* | | | 217,806 | | | | 3,748,441 | |
GATX Corp.(a) | | | 20,900 | | | | 1,274,691 | |
GMS, Inc.* | | | 7,200 | | | | 168,696 | |
MRC Global, Inc.* | | | 30,600 | | | | 182,070 | |
Rush Enterprises, Inc. (Class A Stock) | | | 19,800 | | | | 942,084 | |
Textainer Group Holdings Ltd. (China)* | | | 292,200 | | | | 2,466,168 | |
Triton International Ltd. (Bermuda) | | | 142,300 | | | | 4,478,181 | |
WESCO International, Inc.* | | | 76,300 | | | | 2,965,781 | |
| | | | | | | | |
| | | | | | | 21,451,530 | |
| | |
Wireless Telecommunication Services 0.2% | | | | | | | | |
Telephone & Data Systems, Inc. | | | 62,200 | | | | 1,207,924 | |
| | | | | | | | |
| | |
TOTAL COMMON STOCKS
(cost $668,639,699) | | | | | | | 530,426,623 | |
| | | | | | | | |
| | |
EXCHANGE-TRADED FUND 0.2% | | | | | | | | |
iShares Russell 2000 Value ETF(a)
(cost $1,054,294) | | | 11,000 | | | | 1,094,500 | |
| | | | | | | | |
| | |
TOTAL LONG-TERM INVESTMENTS
(cost $669,693,993) | | | | | | | 531,521,123 | |
| | | | | | | | |
See Notes to Financial Statements.
| | | | |
| PGIM QMA Small-Cap Value Fund | | | 23 | |
Schedule of Investments (continued)
as of July 31, 2020
| | | | | | | | |
| | |
| Description | | Shares | | | Value | |
| | |
SHORT-TERM INVESTMENTS 22.3% | | | | | | | | |
| | |
AFFILIATED MUTUAL FUNDS | | | | | | | | |
PGIM Core Ultra Short Bond Fund(w) | | | 2,427,601 | | | $ | 2,427,601 | |
PGIM Institutional Money Market Fund
(cost $116,297,280; includes $116,253,319 of cash collateral for securities on loan)(b)(w) | | | 116,411,178 | | | | 116,399,537 | |
| | | | | | | | |
| | |
TOTAL SHORT-TERM INVESTMENTS
(cost $118,724,881) | | | | | | | 118,827,138 | |
| | | | | | | | |
| | |
TOTAL INVESTMENTS 121.9% | | | | | | | | |
(cost $788,418,874) | | | | | | | 650,348,261 | |
Liabilities in excess of other assets (21.9)% | | | | | | | (116,695,831 | ) |
| | | | | | | | |
| | |
NET ASSETS 100.0% | | | | | | $ | 533,652,430 | |
| | | | | | | | |
Below is a list of the abbreviation(s) used in the annual report:
ETF—Exchange-Traded Fund
LIBOR—London Interbank Offered Rate
REITs—Real Estate Investment Trust
| * | Non-income producing security. |
| (a) | All or a portion of security is on loan. The aggregate market value of such securities, including those sold and pending settlement, is $111,790,355; cash collateral of $116,253,319 (included in liabilities) was received with which the Fund purchased highly liquid short-term investments. In the event of significant appreciation in value of securities on loan on the last business day of the reporting period, the Fund may reflect a collateral value that is less than the market value of the loaned securities and such shortfall is remedied the following business day. |
| (b) | Represents security, or portion thereof, purchased with cash collateral received for securities on loan and includes dividend reinvestment. |
| (w) | PGIM Investments LLC, the manager of the Fund, also serves as manager of the PGIM Core Ultra Short Bond Fund and PGIM Institutional Money Market Fund. |
Fair Value Measurements:
Various inputs are used in determining the value of the Fund’s investments. These inputs are summarized in the three broad levels listed below.
Level 1—unadjusted quoted prices generally in active markets for identical securities.
Level 2—quoted prices for similar securities, interest rates and yield curves, prepayment speeds, foreign currency exchange rates and other observable inputs.
Level 3—unobservable inputs for securities valued in accordance with Board approved fair valuation procedures.
See Notes to Financial Statements.
The following is a summary of the inputs used as of July 31, 2020 in valuing such portfolio securities:
| | | | | | | | | | | | | | | |
| | | Level 1 | | Level 2 | | Level 3 |
Investments in Securities | | | | | | | | | | | | | | | |
Assets | | | | | | | | | | | | | | | |
Common Stocks | | | | | | | | | | | | | | | |
Air Freight & Logistics | | | $ | 4,584,498 | | | | $ | — | | | | $ | — | |
Airlines | | | | 11,680,408 | | | | | — | | | | | — | |
Auto Components | | | | 22,572,828 | | | | | — | | | | | — | |
Banks | | | | 105,047,266 | | | | | — | | | | | — | |
Capital Markets | | | | 7,480,887 | | | | | — | | | | | — | |
Chemicals | | | | 5,371,538 | | | | | — | | | | | — | |
Commercial Services & Supplies | | | | 8,187,670 | | | | | — | | | | | — | |
Communications Equipment | | | | 1,340,981 | | | | | — | | | | | — | |
Construction & Engineering | | | | 1,269,983 | | | | | — | | | | | — | |
Consumer Finance | | | | 11,031,001 | | | | | — | | | | | — | |
Diversified Consumer Services | | | | 3,913,048 | | | | | — | | | | | — | |
Diversified Financial Services | | | | 345,471 | | | | | — | | | | | — | |
Diversified Telecommunication Services | | | | 371,744 | | | | | — | | | | | — | |
Electric Utilities | | | | 308,497 | | | | | — | | | | | — | |
Electronic Equipment, Instruments & Components | | | | 11,786,936 | | | | | — | | | | | — | |
Energy Equipment & Services | | | | 4,717,290 | | | | | — | | | | | — | |
Entertainment | | | | 262,390 | | | | | — | | | | | — | |
Equity Real Estate Investment Trusts (REITs) | | | | 49,731,178 | | | | | — | | | | | — | |
Food & Staples Retailing | | | | 14,288,417 | | | | | — | | | | | — | |
Food Products | | | | 1,329,042 | | | | | — | | | | | — | |
Gas Utilities | | | | 197,312 | | | | | — | | | | | — | |
Health Care Providers & Services | | | | 5,397,516 | | | | | — | | | | | — | |
Hotels, Restaurants & Leisure | | | | 4,026,543 | | | | | — | | | | | — | |
Household Durables | | | | 23,104,025 | | | | | — | | | | | — | |
Insurance | | | | 20,789,065 | | | | | — | | | | | — | |
Interactive Media & Services | | | | 3,361,680 | | | | | — | | | | | — | |
IT Services | | | | 2,056,792 | | | | | — | | | | | — | |
Machinery | | | | 10,996,149 | | | | | — | | | | | — | |
Marine | | | | 2,886,975 | | | | | — | | | | | — | |
Media | | | | 5,858,170 | | | | | — | | | | | — | |
Metals & Mining | | | | 14,115,888 | | | | | — | | | | | — | |
Mortgage Real Estate Investment Trusts (REITs) | | | | 23,081,670 | | | | | — | | | | | — | |
Multiline Retail | | | | 6,203,220 | | | | | — | | | | | — | |
Multi-Utilities | | | | 271,942 | | | | | — | | | | | — | |
Oil, Gas & Consumable Fuels | | | | 29,417,468 | | | | | — | | | | | — | |
Paper & Forest Products | | | | 7,205,649 | | | | | — | | | | | — | |
Personal Products | | | | 3,476,207 | | | | | — | | | | | — | |
Pharmaceuticals | | | | 750,890 | | | | | — | | | | | — | |
Professional Services | | | | 4,316,128 | | | | | — | | | | | — | |
Real Estate Management & Development | | | | 4,717,569 | | | | | — | | | | | — | |
Road & Rail | | | | 6,644,683 | | | | | — | | | | | — | |
Semiconductors & Semiconductor Equipment | | | | 664,228 | | | | | — | | | | | — | |
Specialty Retail | | | | 30,882,170 | | | | | — | | | | | — | |
Technology Hardware, Storage & Peripherals | | | | 1,801,530 | | | | | — | | | | | — | |
Textiles, Apparel & Luxury Goods | | | | 2,251,038 | | | | | — | | | | | — | |
See Notes to Financial Statements.
| | | | |
| PGIM QMA Small-Cap Value Fund | | | 25 | |
Schedule of Investments (continued)
as of July 31, 2020
| | | | | | | | | | | | | | | |
| | | Level 1 | | Level 2 | | Level 3 |
Investments in Securities (continued) | | | | | | | | | | | | | | | |
Assets (continued) | | | | | | | | | | | | | | | |
Common Stocks (continued) | | | | | | | | | | | | | | | |
Thrifts & Mortgage Finance | | | $ | 25,719,581 | | | | $ | — | | | | $ | — | |
Tobacco | | | | 1,952,008 | | | | | — | | | | | — | |
Trading Companies & Distributors | | | | 21,451,530 | | | | | — | | | | | — | |
Wireless Telecommunication Services | | | | 1,207,924 | | | | | — | | | | | — | |
Exchange-Traded Fund | | | | 1,094,500 | | | | | — | | | | | — | |
Affiliated Mutual Funds | | | | 118,827,138 | | | | | — | | | | | — | |
| | | | | | | | | | | | | | | |
Total | | | $ | 650,348,261 | | | | $ | — | | | | $ | — | |
| | | | | | | | | | | | | | | |
Industry Classification:
The industry classification of investments and liabilities in excess of other assets shown as a percentage of net assets as of July 31, 2020 were as follows (unaudited):
| | | | | | | | | | | | | | |
| | | | | |
|
|
| | | | | | |
Affiliated Mutual Funds (21.8% represents investments purchased with collateral from securities on loan) | | | 22.3 | % | | Air Freight & Logistics | | | 0.9 | % |
Banks | | | 19.7 | | | Professional Services | | | 0.8 | |
Equity Real Estate Investment Trusts (REITs) | | | 9.3 | | | Hotels, Restaurants & Leisure | | | 0.8 | |
Specialty Retail | | | 5.8 | | | Diversified Consumer Services | | | 0.7 | |
Oil, Gas & Consumable Fuels | | | 5.5 | | | Personal Products | | | 0.7 | |
Thrifts & Mortgage Finance | | | 4.8 | | | Interactive Media & Services | | | 0.6 | |
Household Durables | | | 4.3 | | | Marine | | | 0.5 | |
Mortgage Real Estate Investment Trusts (REITs) | | | 4.3 | | | Textiles, Apparel & Luxury Goods | | | 0.4 | |
Auto Components | | | 4.2 | | | IT Services | | | 0.4 | |
Trading Companies & Distributors | | | 4.0 | | | Tobacco | | | 0.4 | |
Insurance | | | 3.9 | | | Technology Hardware, Storage & Peripherals | | | 0.3 | |
Food & Staples Retailing | | | 2.7 | | | Communications Equipment | | | 0.3 | |
Metals & Mining | | | 2.6 | | | Food Products | | | 0.2 | |
Electronic Equipment, Instruments & Components | | | 2.2 | | | Construction & Engineering | | | 0.2 | |
Airlines | | | 2.2 | | | Wireless Telecommunication Services | | | 0.2 | |
Consumer Finance | | | 2.1 | | | Exchange-Traded Fund | | | 0.2 | |
Machinery | | | 2.1 | | | Pharmaceuticals | | | 0.1 | |
Commercial Services & Supplies | | | 1.5 | | | Semiconductors & Semiconductor Equipment | | | 0.1 | |
Capital Markets | | | 1.4 | | | Diversified Telecommunication Services | | | 0.1 | |
Paper & Forest Products | | | 1.4 | | | Diversified Financial Services | | | 0.1 | |
Road & Rail | | | 1.2 | | | Electric Utilities | | | 0.1 | |
Multiline Retail | | | 1.2 | | | Multi-Utilities | | | 0.1 | |
Media | | | 1.1 | | | Entertainment | | | 0.1 | |
Health Care Providers & Services | | | 1.0 | | | | | | | |
Chemicals | | | 1.0 | |
Real Estate Management & Development | | | 0.9 | |
Energy Equipment & Services | | | 0.9 | |
See Notes to Financial Statements.
| | | | |
Industry Classification (continued): | | | |
| |
Gas Utilities | | | 0.0 | *% |
| | | | |
| | | 121.9 | |
Liabilities in excess of other assets | | | (21.9 | ) |
| | | | |
| |
| | | 100.0 | % |
| | | | |
Financial Instruments/Transactions—Summary of Offsetting and Netting Arrangements:
The Fund entered into financial instruments/transactions during the reporting period that are either offset in accordance with current requirements or are subject to enforceable master netting arrangements or similar agreements that permit offsetting. The information about offsetting and related netting arrangements for financial instruments/transactions where the legal right to set-off exists is presented in the summary below.
Offsetting of financial instrument/transaction assets and liabilities:
| | | | | | | | | | | | | | | |
Description | | Gross Market
Value of
Recognized
Assets/(Liabilities) | | Collateral
Pledged/(Received)(1) | | Net
Amount |
Securities on Loan | | | $ | 111,790,355 | | | | $ | (111,790,355 | ) | | | $ | — | |
| | | | | | | | | | | | | | | |
| (1) | Collateral amount disclosed by the Fund is limited to the market value of financial instruments/transactions. |
See Notes to Financial Statements.
| | | | |
| PGIM QMA Small-Cap Value Fund | | | 27 | |
Statement of Assets and Liabilities
as of July 31, 2020
| | | | |
Assets | | | | |
Investments at value, including securities on loan of $111,790,355: | | | | |
Unaffiliated investments (cost $669,693,993) | | $ | 531,521,123 | |
Affiliated investments (cost $118,724,881) | | | 118,827,138 | |
Dividends receivable | | | 678,135 | |
Receivable for Fund shares sold | | | 629,073 | |
| | | | |
Total Assets | | | 651,655,469 | |
| | | | |
| |
Liabilities | | | | |
Payable to broker for collateral for securities on loan | | | 116,253,319 | |
Payable for Fund shares reacquired | | | 978,521 | |
Accrued expenses and other liabilities | | | 388,308 | |
Management fee payable | | | 266,334 | |
Distribution fee payable | | | 66,265 | |
Affiliated transfer agent fee payable | | | 48,865 | |
Trustees’ fees payable | | | 1,427 | |
| | | | |
Total Liabilities | | | 118,003,039 | |
| | | | |
| |
Net Assets | | $ | 533,652,430 | |
| | | | |
| |
| | | | | |
Net assets were comprised of: | | | | |
Shares of beneficial interest, at par | | $ | 46,955 | |
Paid-in capital in excess of par | | | 808,876,103 | |
Total distributable earnings (loss) | | | (275,270,628 | ) |
| | | | |
Net assets, July 31, 2020 | | $ | 533,652,430 | |
| | | | |
See Notes to Financial Statements.
| | | | |
Class A | | | | |
Net asset value, redemption price per share,
($71,927,808 ÷ 6,312,594 shares of beneficial interest issued and outstanding) | | $ | 11.39 | |
Maximum sales charge (5.50% of offering price) | | | 0.66 | |
| | | | |
Maximum offering price to public | | $ | 12.05 | |
| | | | |
| |
Class C | | | | |
Net asset value, offering price and redemption price per share,
($5,782,122 ÷ 507,566 shares of beneficial interest issued and outstanding) | | $ | 11.39 | |
| | | | |
| |
Class R | | | | |
Net asset value, offering price and redemption price per share, ($110,952,581 ÷ 9,881,922 shares of beneficial interest issued and outstanding) | | $ | 11.23 | |
| | | | |
| |
Class Z | | | | |
Net asset value, offering price and redemption price per share,
($150,272,371 ÷ 13,183,938 shares of beneficial interest issued and outstanding) | | $ | 11.40 | |
| | | | |
| |
Class R2 | | | | |
Net asset value, offering price and redemption price per share,
($291,957 ÷ 25,656 shares of beneficial interest issued and outstanding) | | $ | 11.38 | |
| | | | |
| |
Class R4 | | | | |
Net asset value, offering price and redemption price per share,
($926,782 ÷ 81,276 shares of beneficial interest issued and outstanding) | | $ | 11.40 | |
| | | | |
| |
Class R6 | | | | |
Net asset value, offering price and redemption price per share,
($193,498,809 ÷ 16,962,086 shares of beneficial interest issued and outstanding) | | $ | 11.41 | |
| | | | |
See Notes to Financial Statements.
| | | | |
| PGIM QMA Small-Cap Value Fund | | | 29 | |
Statement of Operations
Year Ended July 31, 2020
| | | | |
Net Investment Income (Loss) | | | | |
Income | | | | |
Unaffiliated dividend income (net of $1,238 foreign withholding tax) | | $ | 18,998,512 | |
Income from securities lending, net (including affiliated income of $590,670) | | | 985,884 | |
Affiliated dividend income | | | 21,459 | |
| | | | |
Total income | | | 20,005,855 | |
| | | | |
| |
Expenses | | | | |
Management fee | | | 4,711,925 | |
Distribution fee(a) | | | 1,235,401 | |
Shareholder servicing fees(a) | | | 1,216 | |
Transfer agent’s fees and expenses (including affiliated expense of $322,438)(a) | | | 649,512 | |
Custodian and accounting fees | | | 139,259 | |
Registration fees(a) | | | 119,914 | |
Shareholders’ reports | | | 106,693 | |
Audit fee | | | 31,975 | |
Legal fees and expenses | | | 24,190 | |
Trustees’ fees | | | 23,057 | |
Miscellaneous | | | 121,324 | |
| | | | |
Total expenses | | | 7,164,466 | |
Less: Fee waiver and/or expense reimbursement(a) | | | (83,666 | ) |
Distribution fee waiver(a) | | | (337,100 | ) |
| | | | |
Net expenses | | | 6,743,700 | |
| | | | |
Net investment income (loss) | | | 13,262,155 | |
| | | | |
| |
Realized And Unrealized Gain (Loss) On Investments | | | | |
Net realized gain (loss) on investment transactions (including affiliated of $(176,063)) | | | (128,850,845 | ) |
Net change in unrealized appreciation (depreciation) on investments (including affiliated of $82,147) | | | (94,827,211 | ) |
| | | | |
Net gain (loss) on investment transactions | | | (223,678,056 | ) |
| | | | |
Net Increase (Decrease) In Net Assets Resulting From Operations | | $ | (210,415,901 | ) |
| | | | |
| (a) | Class specific expenses and waivers were as follows: |
| | | | | | | | | | | | | | | | | | | | | | | | | | | | |
| | | Class A | | | Class C | | | Class R | | | Class Z | | | Class R2 | | | Class R4 | | | Class R6 | |
Distribution fee | | | 277,582 | | | | 84,557 | | | | 872,508 | | | | — | | | | 754 | | | | — | | | | — | |
Shareholder servicing fees | | | — | | | | — | | | | — | | | | — | | | | 302 | | | | 914 | | | | — | |
Transfer agent’s fees and expenses | | | 216,176 | | | | 32,959 | | | | 162,687 | | | | 230,863 | | | | 605 | | | | 1,600 | | | | 4,622 | |
Registration fees | | | 16,271 | | | | 15,101 | | | | 18,329 | | | | 23,370 | | | | 15,301 | | | | 15,301 | | | | 16,241 | |
Fee waiver and/or expense reimbursement | | | (9,253 | ) | | | (846 | ) | | | (11,633 | ) | | | (30,756 | ) | | | (15,491 | ) | | | (15,687 | ) | | | — | |
Distribution fee waiver | | | (46,263 | ) | | | — | | | | (290,837 | ) | | | — | | | | — | | | | — | | | | — | |
See Notes to Financial Statements.
Statements of Changes in Net Assets
| | | | | | | | |
| |
| | | Year Ended
July 31, | |
| | |
| | | 2020 | | | 2019 | |
Increase (Decrease) in Net Assets | | | | | | | | |
Operations | | | | | | | | |
Net investment income (loss) | | $ | 13,262,155 | | | $ | 22,042,429 | |
Net realized gain (loss) on investment transactions | | | (128,850,845 | ) | | | 55,523,977 | |
Net change in unrealized appreciation (depreciation) on investments | | | (94,827,211 | ) | | | (282,664,548 | ) |
| | | | | | | | |
Net increase (decrease) in net assets resulting from operations | | | (210,415,901 | ) | | | (205,098,142 | ) |
| | | | | | | | |
| | |
Dividends and Distributions | | | | | | | | |
Distributions from distributable earnings | | | | | | | | |
Class A | | | (5,992,876 | ) | | | (9,575,305 | ) |
Class C | | | (469,895 | ) | | | (2,211,007 | ) |
Class R | | | (6,576,700 | ) | | | (11,255,549 | ) |
Class Z | | | (20,502,176 | ) | | | (60,412,692 | ) |
Class R2 | | | (18,357 | ) | | | (19,556 | ) |
Class R4 | | | (74,887 | ) | | | (766 | ) |
Class R6 | | | (18,877,072 | ) | | | (32,451,884 | ) |
| | | | | | | | |
| | | (52,511,963 | ) | | | (115,926,759 | ) |
| | | | | | | | |
Fund share transactions (Net of share conversions) | | | | | | | | |
Net proceeds from shares sold | | | 217,585,808 | | | | 222,921,605 | |
Net asset value of shares issued in reinvestment of dividends and distributions | | | 49,169,832 | | | | 111,161,668 | |
Cost of shares reacquired | | | (710,576,365 | ) | | | (347,999,658 | ) |
| | | | | | | | |
Net increase (decrease) in net assets from Fund share transactions | | | (443,820,725 | ) | | | (13,916,385 | ) |
| | | | | | | | |
Total increase (decrease) | | | (706,748,589 | ) | | | (334,941,286 | ) |
| | |
Net Assets: | | | | | | | | |
Beginning of year | | | 1,240,401,019 | | | | 1,575,342,305 | |
| | | | | | | | |
End of year | | $ | 533,652,430 | | | $ | 1,240,401,019 | |
| | | | | | | | |
See Notes to Financial Statements.
| | | | |
| PGIM QMA Small-Cap Value Fund | | | 31 | |
Notes to Financial Statements
1. Organization
The Target Portfolio Trust (the “Trust”) is registered under the Investment Company Act of 1940, as amended (“1940 Act”), as a diversified open-end management investment company. The Trust currently consists of three series: PGIM Corporate Bond Fund, PGIM Core Bond Fund and PGIM QMA Small-Cap Value Fund (collectively the “Funds”).
These financial statements relate only to the PGIM QMA Small-Cap Value Fund (the “Fund”).
The investment objective of the Fund is above average capital appreciation.
2. Accounting Policies
The Fund follows the investment company accounting and reporting guidance of the Financial Accounting Standards Board (“FASB”) Accounting Standard Codification (“ASC”) Topic 946 Financial Services — Investment Companies. The following accounting policies conform to U.S. generally accepted accounting principles. The Fund consistently follows such policies in the preparation of its financial statements.
Securities Valuation: The Fund holds securities and other assets and liabilities that are fair valued at the close of each day (generally, 4:00 PM Eastern time) the New York Stock Exchange (“NYSE”) is open for trading. Fair value is the price that would be received to sell an asset or paid to transfer a liability in an orderly transaction between market participants on the measurement date. The Trust’s Board of Trustees (the “Board”) has adopted valuation procedures for security valuation under which fair valuation responsibilities have been delegated to PGIM Investments LLC (“PGIM Investments” or the “Manager”). Pursuant to the Board’s delegation, the Manager has established a Valuation Committee responsible for supervising the fair valuation of portfolio securities and other assets and liabilities. The valuation procedures permit the Fund to utilize independent pricing vendor services, quotations from market makers, and alternative valuation methods when market quotations are either not readily available or not deemed representative of fair value. A record of the Valuation Committee’s actions is subject to the Board’s review, approval, and ratification at its next regularly scheduled quarterly meeting.
For the fiscal reporting year-end, securities and other assets and liabilities were fair valued at the close of the last U.S. business day. Trading in certain foreign securities may occur when the NYSE is closed (including weekends and holidays). Because such foreign securities trade in markets that are open on weekends and U.S. holidays, the values of some of the Fund’s foreign investments may change on days when investors cannot purchase or redeem Fund shares.
Various inputs determine how the Fund’s investments are valued, all of which are categorized according to the three broad levels (Level 1, 2, or 3) detailed in the Schedule of Investments and referred to herein as the “fair value hierarchy” in accordance with FASB ASC Topic 820 - Fair Value Measurements and Disclosures.
Common and preferred stocks, exchange-traded funds, and derivative instruments, such as futures or options, that are traded on a national securities exchange are valued at the last sale price as of the close of trading on the applicable exchange where the security principally trades. Securities traded via NASDAQ are valued at the NASDAQ official closing price. To the extent these securities are valued at the last sale price or NASDAQ official closing price, they are classified as Level 1 in the fair value hierarchy. In the event that no sale or official closing price on valuation date exists, these securities are generally valued at the mean between the last reported bid and ask prices, or at the last bid price in the absence of an ask price. These securities are classified as Level 2 in the fair value hierarchy.
Investments in open-end (other than exchange-traded mutual funds) funds are valued at their net asset values as of the close of the NYSE on the date of valuation. These securities are classified as Level 1 in the fair value hierarchy since they may be purchased or sold at their net asset values on the date of valuation.
Securities and other assets that cannot be priced according to the methods described above are valued based on pricing methodologies approved by the Board. In the event that unobservable inputs are used when determining such valuations, the securities will be classified as Level 3 in the fair value hierarchy.
When determining the fair value of securities, some of the factors influencing the valuation include: the nature of any restrictions on disposition of the securities; assessment of the general liquidity of the securities; the issuer’s financial condition and the markets in which it does business; the cost of the investment; the size of the holding and the capitalization of the issuer; the prices of any recent transactions or bids/offers for such securities or any comparable securities; any available analyst media or other reports or information deemed reliable by the Manager regarding the issuer or the markets or industry in which it operates. Using fair value to price securities may result in a value that is different from a security’s most recent closing price and from the price used by other unaffiliated mutual funds to calculate their net asset values.
Illiquid Securities: Pursuant to Rule 22e-4 under the 1940 Act, the Fund has adopted a Board approved Liquidity Risk Management Program (“LRMP”) that requires, among other things, that the Fund limit its illiquid investments that are assets to no more than 15% of net assets. Illiquid securities are those that, because of the absence of a readily available market or due to legal or contractual restrictions on resale, may not reasonably be expected to be sold or disposed of in current market conditions in seven calendar days or less without the sale or disposition significantly changing the market value of the investment. The Fund may find it difficult to sell illiquid securities at the time considered most advantageous by its
| | | | |
| PGIM QMA Small-Cap Value Fund | | | 33 | |
Notes to Financial Statements (continued)
subadviser(s) and may incur transaction costs that would not be incurred in the sale of securities that were freely marketable.
Restricted Securities: Securities acquired in unregistered, private sales from the issuing company or from an affiliate of the issuer are considered restricted as to disposition under federal securities law (“restricted securities”). Such restricted securities are valued pursuant to the valuation procedures noted above. Restricted securities that would otherwise be considered illiquid investments pursuant to the Fund’s LRMP because of legal restrictions on resale to the general public may be traded among qualified institutional buyers under Rule 144A of the Securities Act of 1933. Therefore, these Rule 144A securities, as well as commercial paper that is sold in private placements under Section 4(2) of the Securities Act of 1933, may be classified higher than “illiquid” under the LRMP (i.e. “moderately liquid” or “less liquid” investments). However, the liquidity of the Fund’s investments in restricted securities could be impaired if trading does not develop or declines.
Master Netting Arrangements: The Trust, on behalf of the Fund, is subject to various Master Agreements, or netting arrangements, with select counterparties. These are agreements which a subadviser may have negotiated and entered into on behalf of all or a portion of the Fund. A master netting arrangement between the Fund and the counterparty permits the Fund to offset amounts payable by the Fund to the same counterparty against amounts to be received; and by the receipt of collateral from the counterparty by the Fund to cover the Fund’s exposure to the counterparty. However, there is no assurance that such mitigating factors are easily enforceable. In addition to master netting arrangements, the right to set-off exists when all the conditions are met such that each of the parties owes the other determinable amounts, the reporting party has the right to set-off the amount owed with the amount owed by the other party, the reporting party intends to set-off and the right of set-off is enforceable by law. During the reporting period, there was no intention to settle on a net basis and all amounts are presented on a gross basis on the Statement of Assets and Liabilities.
Securities Lending: The Fund lends its portfolio securities to banks and broker-dealers. The loans are secured by collateral at least equal to the market value of the securities loaned. Collateral pledged by each borrower is invested in an affiliated money market fund and is marked to market daily, based on the previous day’s market value, such that the value of the collateral exceeds the value of the loaned securities. In the event of significant appreciation in value of securities on loan on the last business day of the reporting period, the financial statements may reflect a collateral value that is less than the market value of the loaned securities. Such shortfall is remedied as described above. Loans are subject to termination at the option of the borrower or the Fund. Upon termination of the loan, the borrower will return to the Fund securities identical to the loaned securities. Should the borrower of the
securities fail financially, the Fund has the right to repurchase the securities in the open market using the collateral.
The Fund recognizes income, net of any rebate and securities lending agent fees, for lending its securities in the form of fees or interest on the investment of any cash received as collateral. The borrower receives all interest and dividends from the securities loaned and such payments are passed back to the lender in amounts equivalent thereto. The Fund also continues to recognize any unrealized gain (loss) in the market price of the securities loaned and on the change in the value of the collateral invested that may occur during the term of the loan. In addition, realized gain (loss) is recognized on changes in the value of the collateral invested upon liquidation of the collateral. Net earnings from securities lending are disclosed in the Statement of Operations.
Equity and Mortgage Real Estate Investment Trusts (collectively equity REITs): The Fund invested in equity REITs, which report information on the source of their distributions annually. Based on current and historical information, a portion of distributions received from equity REITs during the period is estimated to be dividend income, capital gain or return of capital and recorded accordingly. When material, these estimates are adjusted periodically when the actual source of distributions is disclosed by the equity REITs.
Securities Transactions and Net Investment Income: Securities transactions are recorded on the trade date. Realized gains (losses) from investment and currency transactions are calculated on the specific identification method. Dividend income is recorded on the ex-date, or for certain foreign securities, when the Fund becomes aware of such dividends. Expenses are recorded on an accrual basis, which may require the use of certain estimates by management that may differ from actual. Net investment income or loss (other than class specific expenses and waivers, which are allocated as noted below) and unrealized and realized gains (losses) are allocated daily to each class of shares based upon the relative proportion of adjusted net assets of each class at the beginning of the day. Class specific expenses and waivers, where applicable, are charged to the respective share classes. Class specific expenses include distribution fees and distribution fee waivers, shareholder servicing fees, transfer agent’s fees and expenses, registration fees and fee waivers and/or expense reimbursements, as applicable.
Taxes: It is the Fund’s policy to continue to meet the requirements of the Internal Revenue Code applicable to regulated investment companies and to distribute all of its taxable net investment income and capital gains, if any, to its shareholders. Therefore, no federal income tax provision is required. Withholding taxes on foreign dividends, interest and capital gains, if any, are recorded, net of reclaimable amounts, at the time the related income is earned.
Tax reform legislation commonly referred to as the Tax Cuts and Jobs Act permits a direct REIT shareholder to claim a 20% “qualified business income” deduction for ordinary REIT dividends. The tax legislation did not expressly permit regulated investment companies (“RICs”) paying dividends attributable to such income to pass through this special treatment
| | | | |
| PGIM QMA Small-Cap Value Fund | | | 35 | |
Notes to Financial Statements (continued)
to its shareholders. On January 18, 2019, the Internal Revenue Service issued final regulations that permit RICs to pass through “qualified REIT dividends” to their shareholders.
Dividends and Distributions: The Fund expects to pay dividends from net investment income and distributions from net realized capital gains, if any, annually. Dividends and distributions to shareholders, which are determined in accordance with federal income tax regulations and which may differ from generally accepted accounting principles, are recorded on the ex-date. Permanent book/tax differences relating to income and gain (loss) are reclassified between total distributable earnings (loss) and paid-in capital in excess of par, as appropriate.
Estimates: The preparation of financial statements requires management to make estimates and assumptions that affect the reported amounts and disclosures in the financial statements. Actual results could differ from those estimates.
3. Agreements
The Trust, on behalf of the Fund, has a management agreement with the Manager. Pursuant to this agreement, the Manager has responsibility for all investment advisory services and supervises the subadviser’s performance of such services. In addition, under the management agreement, the Manager provides all of the administrative functions necessary for the organization, operation and management of the Fund. The Manager administers the corporate affairs of the Fund and, in connection therewith, furnishes the Fund with office facilities, together with those ordinary clerical and bookkeeping services which are not being furnished by the Fund’s custodian and the Fund’s transfer agent. The Manager is also responsible for the staffing and management of dedicated groups of legal, marketing, compliance and related personnel necessary for the operation of the Fund. The legal, marketing, compliance and related personnel are also responsible for the management and oversight of the various service providers to the Fund, including, but not limited to, the custodian, transfer agent, and accounting agent.
The Manager has entered into a subadvisory agreement with QMA LLC (“QMA”). The subadvisory agreement provides that QMA will furnish investment advisory services in connection with the management of the Fund. In connection therewith, QMA is obligated to keep certain books and records of the Fund. The Manager pays for the services of QMA, the cost of compensation of officers of the Fund, occupancy and certain clerical and bookkeeping costs of the Fund. The Fund bears all other costs and expenses.
The management fee paid to the Manager is accrued daily and payable monthly at an annual rate of 0.60% average daily net assets up to $2 billion and 0.575% of the Fund’s
average daily net assets in excess of $2 billion. The effective management fee rate before any waivers and/or expense reimbursements was 0.60% for the year ended July 31, 2020.
The Manager has contractually agreed, through November 30, 2021, to waive and/or reimburse up to 0.01% of fees and expenses from the Fund to the extent that the Fund’s net operating expenses (exclusive of taxes, interest, distribution (12b-1 fees) and certain extraordinary expenses) exceed 0.68% of the Fund’s average daily assets on an annualized basis. Separately, the Manager has contractually agreed, through November 30, 2021, to limit transfer agency, shareholder servicing, sub-transfer agency, and blue sky fees, as applicable, to the extent that such fees cause the total annual operating expenses to exceed 1.14% of average daily net assets for Class R2 shares or 0.89% of average daily net assets for Class R4 shares. This contractual expense limitation excludes interest, brokerage, taxes (such as income and foreign withholding taxes, stamp duty and deferred tax expenses), acquired fund fees and expenses, extraordinary expenses, and certain other Fund expenses such as dividend and interest expense and broker charges on short sales.
Where applicable, the Manager agrees to waive management fees or shared operating expenses on any share class to the same extent that it waives similar expenses on any other share class. In addition, total annual operating expenses for Class R6 shares will not exceed total annual operating expenses for Class Z shares. Fees and/or expenses waived and/or reimbursed by the Manager may be recouped by the Manager within the same fiscal year during which such waiver and/or reimbursement is made if such recoupment can be realized without exceeding the expense limit in effect at the time of the recoupment for that fiscal year.
The Trust, on behalf of the Fund, has a distribution agreement with Prudential Investment Management Services LLC (“PIMS”), which acts as the distributor of the Class A, Class C, Class R, Class Z, Class R2, Class R4 and Class R6 shares of the Fund. The Fund compensates PIMS for distributing and servicing the Fund’s Class A, Class C, Class R and Class R2 shares, pursuant to the plans of distribution (the “Distribution Plans”), regardless of expenses actually incurred by PIMS. The distribution fees are accrued daily and payable monthly. No distribution or service fees are paid to PIMS as distributor of the Class Z, Class R4 and Class R6 shares of the Fund.
Pursuant to the Distribution Plans, the Fund compensates PIMS for distribution related activities at an annual rate of up to 0.30%, 1%, 0.75% and 0.25% of the average daily net assets of the Class A, Class C, Class R and Class R2 shares, respectively. PIMS has contractually agreed through November 30, 2021 to reduce such fees to 0.25% and 0.50% of the average daily net assets of the Class A and Class R shares, respectively.
The Fund has adopted a Shareholder Services Plan with respect to Class R2 and Class R4 shares. Under the terms of the Shareholder Services Plan, Class R2 and Class R4 shares are authorized to pay to Prudential Mutual Fund Services LLC (“PMFS”), its affiliates or third-party service providers, as compensation for services rendered to the shareholders of such Class R2 and Class R4 shares, a shareholder service fee at an annual rate of up to
| | | | |
| PGIM QMA Small-Cap Value Fund | | | 37 | |
Notes to Financial Statements (continued)
0.10% of the average daily net assets attributable to Class R2 and Class R4 shares. The shareholder service fee is accrued daily and paid monthly, as applicable.
For the year ended July 31, 2020, PIMS received $65,234 in front-end sales charges resulting from sales of Class A shares. Additionally, for the year ended July 31, 2020, PIMS received $243 in contingent deferred sales charges imposed upon redemptions by certain Class C shareholders. From these fees, PIMS paid such sales charges to broker-dealers, who in turn paid commissions to salespersons and incurred other distribution costs.
PGIM Investments, PIMS, PMFS and QMA are indirect, wholly-owned subsidiaries of Prudential Financial, Inc. (“Prudential”).
4. Other Transactions with Affiliates
PMFS serves as the Fund’s transfer agent. Transfer agent’s fees and expenses in the Statement of Operations include certain out-of-pocket expenses paid to non-affiliates, where applicable.
The Fund may invest its overnight sweep cash in the PGIM Core Ultra Short Bond Fund (the “Core Fund”), and its securities lending cash collateral in the PGIM Institutional Money Market Fund (the “Money Market Fund”), each a series of Prudential Investment Portfolios 2, registered under the 1940 Act and managed by PGIM Investments. Through the Fund’s investments in the mentioned underlying funds, PGIM Investments and/or its affiliates are paid fees or reimbursed for providing their services. In addition to the realized and unrealized gains on investments in the Core Fund and Money Market Fund, earnings from such investments are disclosed on the Statement of Operations as “Affiliated dividend income” and “Income from securities lending, net”, respectively.
The Fund may enter into certain securities purchase or sale transactions under Board approved Rule 17a-7 procedures. Rule 17a-7 is an exemptive rule under the 1940 Act, that subject to certain conditions, permits purchase and sale transactions among affiliated investment companies, or between an investment company and a person that is affiliated solely by reason of having a common (or affiliated) investment adviser, common directors, and/or common officers. Pursuant to the Rule 17a-7 procedures and consistent with guidance issued by the Securities and Exchange Commission (“SEC”), the Trust’s Chief Compliance Officer (“CCO”) prepares a quarterly summary of all such transactions for submission to the Board, together with the CCO’s written representation that all such 17a-7 transactions were effected in accordance with the Fund’s Rule 17a-7 procedures. For the year ended July 31, 2020, no 17a-7 transactions were entered into by the Fund.
5. Portfolio Securities
The aggregate cost of purchases and proceeds from sales of portfolio securities (excluding short-term investments and U.S. Government securities) for the year ended July 31, 2020, were $416,800,194 and $894,929,448, respectively.
A summary of the cost of purchases and proceeds from sales of shares of affiliated investments for the year ended July 31, 2020, is presented as follows:
| | | | | | | | | | | | | | | | | | | | | | | | | | | | | | |
Value, Beginning of Year | | | Cost of Purchases | | | Proceeds from Sales | | | Change in Unrealized
Gain (Loss) | | | Realized Gain (Loss) | | | Value, End of Year | | | Shares, End of Year | | | Income | |
| | | | |
| | PGIM Core Ultra Short Bond Fund* | | | | | | | | | | | | | | | | | |
| $ | 4,553,616 | | | $ | 154,056,333 | | | $ | 156,182,348 | | | $ | — | | | $ | — | | | $ | 2,427,601 | | | | 2,427,601 | | | $ | 21,459 | |
| | | |
| | PGIM Institutional Money Market Fund* | | | | | | | | | | | | | |
| | 156,319,638 | | | | 755,590,075 | | | | 795,416,260 | | | | 82,147 | | | | (176,063 | ) | | | 116,399,537 | | | | 116,411,178 | | | | 590,670 | ** |
| | | | | | | | | | | | | | | | | | | | | | | | | | | | | | |
| $ | 160,873,254 | | | $ | 909,646,408 | | | $ | 951,598,608 | | | $ | 82,147 | | | $ | (176,063 | ) | | $ | 118,827,138 | | | | | | | $ | 612,129 | |
| | | | | | | | | | | | | | | | | | | | | | | | | | | | | | |
| * | The Fund did not have any capital gain distributions during the reporting period. |
| ** | The amount, or a portion thereof, represents the affiliated securities lending income shown on the Statement of Operations. |
6. Distributions and Tax Information
The Fund has a tax year end of October 31st.
Distributions to shareholders, which are determined in accordance with federal income tax regulations and which may differ from generally accepted accounting principles, are recorded on the ex-date.
The tax character of distributions paid during the tax year ended October 31, 2019 were $63,821,630 of ordinary income and $52,105,129 of long-term capital gains. The tax character of distributions paid during the tax year ended October 31, 2018 were $76,889,522 of ordinary income and $115,901,286 of long-term capital gains.
As of the latest tax year ended October 31, 2019, the accumulated undistributed earnings on a tax basis were $23,993,221 of ordinary income and $22,986,122 of long-term capital gains.
The United States federal income tax basis of the Fund’s investments and the net unrealized depreciation as of July 31, 2020 were as follows:
| | | | | | |
| Tax Basis | | Gross Unrealized Appreciation | | Gross Unrealized Depreciation | | Net Unrealized Depreciation |
|
| $803,869,169 | | $53,902,013 | | $(207,422,921) | | $(153,520,908) |
| | | | |
| PGIM QMA Small-Cap Value Fund | | | 39 | |
Notes to Financial Statements (continued)
The difference between book basis and tax basis was primarily attributable to deferred losses on wash sales.
The Manager has analyzed the Fund’s tax positions taken on federal, state and local income tax returns for all open tax years and has concluded that no provision for income tax is required in the Fund’s financial statements for the current reporting period. Since tax authorities can examine previously filed tax returns, the Fund’s U.S. federal and state tax returns for each of the four tax years up to the most recent tax year ended October 31, 2019 are subject to such review.
7. Capital and Ownership
The Fund offers Class A, Class C, Class R, Class Z, Class R2, Class R4 and Class R6 shares. Class A shares are sold with a maximum front-end sales charge of 5.50%. Investors who purchase $1 million or more of Class A shares and sell these shares within 12 months of purchase are subject to a contingent deferred sales charge (“CDSC”) of 1%, although they are not subject to an initial sales charge. The Class A CDSC is waived for certain retirement and/or benefit plans. A special exchange privilege is also available for shareholders who qualified to purchase Class A shares at net asset value. Class C shares are sold with a CDSC of 1% on sales made within 12 months of purchase. Class C shares will automatically convert to Class A shares on a monthly basis approximately 10 years after purchase. Class R shares are available to certain retirement plans, clearing and settlement firms. Class R, Class Z, Class R2, Class R4 and Class R6 shares are not subject to any sales or redemption charges and are available exclusively for sale to a limited group of investors.
The Trust has authorized an unlimited number of shares of beneficial interest of the Fund at $0.001 par value per share.
Under certain circumstances, an exchange may be made from specified share classes of the Fund to one or more other share classes of the Fund as presented in the table of transactions in shares of beneficial interest, below.
As of July 31, 2020, Prudential, through its affiliated entities, including affiliated funds (if applicable), owned shares of the Fund as follows:
| | | | | | | | | | |
| | | Number of Shares | | Percentage of
Outstanding Shares |
Class A | | | | 874 | | | | | 0.1 | % |
Class R | | | | 9,218,871 | | | | | 93.3 | % |
Class Z | | | | 486,582 | | | | | 3.7 | % |
Class R2 | | | | 568 | | | | | 2.2 | % |
Class R4 | | | | 570 | | | | | 0.7 | % |
At the reporting period end, the number of shareholders holding greater than 5% of the Fund are as follows:
| | | | | | |
| Affiliated | | Unaffiliated |
| Number of | | Percentage of | | Number of | | Percentage of |
| Shareholders | | Outstanding Shares | | Shareholders | | Outstanding Shares |
1 | | 20.3% | | 4 | | 42.2% |
Transactions in shares of beneficial interest were as follows:
| | | | | | | | |
Class A | | Shares | | | Amount | |
Year ended July 31, 2020: | | | | | | | | |
Shares sold | | | 519,299 | | | $ | 6,794,850 | |
Shares issued in reinvestment of dividends and distributions | | | 356,043 | | | | 5,860,476 | |
Shares reacquired | | | (1,585,551 | ) | | | (22,188,415 | ) |
| | | | | | | | |
Net increase (decrease) in shares outstanding before conversion | | | (710,209 | ) | | | (9,533,089 | ) |
Shares issued upon conversion from other share class(es) | | | 47,342 | | | | 571,089 | |
Shares reacquired upon conversion into other share class(es) | | | (75,514 | ) | | | (1,096,851 | ) |
| | | | | | | | |
Net increase (decrease) in shares outstanding | | | (738,381 | ) | | $ | (10,058,851 | ) |
| | | | | | | | |
Year ended July 31, 2019: | | | | | | | | |
Shares sold | | | 505,377 | | | $ | 8,904,793 | |
Shares issued in reinvestment of dividends and distributions | | | 611,259 | | | | 9,327,812 | |
Shares reacquired | | | (1,328,083 | ) | | | (22,999,915 | ) |
| | | | | | | | |
Net increase (decrease) in shares outstanding before conversion | | | (211,447 | ) | | | (4,767,310 | ) |
Shares issued upon conversion from other share class(es) | | | 875,416 | | | | 15,014,299 | |
Shares reacquired upon conversion into other share class(es) | | | (128,779 | ) | | | (2,354,525 | ) |
| | | | | | | | |
Net increase (decrease) in shares outstanding | | | 535,190 | | | $ | 7,892,464 | |
| | | | | | | | |
Class C | | | | | | |
Year ended July 31, 2020: | | | | | | | | |
Shares sold | | | 94,815 | | | $ | 1,184,835 | |
Shares issued in reinvestment of dividends and distributions | | | 28,079 | | | | 465,265 | |
Shares reacquired | | | (268,417 | ) | | | (3,737,937 | ) |
| | | | | | | | |
Net increase (decrease) in shares outstanding before conversion | | | (145,523 | ) | | | (2,087,837 | ) |
Shares reacquired upon conversion into other share class(es) | | | (30,675 | ) | | | (390,781 | ) |
| | | | | | | | |
Net increase (decrease) in shares outstanding | | | (176,198 | ) | | $ | (2,478,618 | ) |
| | | | | | | | |
Year ended July 31, 2019: | | | | | | | | |
Shares sold | | | 97,129 | | | $ | 1,704,040 | |
Shares issued in reinvestment of dividends and distributions | | | 142,042 | | | | 2,181,765 | |
Shares reacquired | | | (429,017 | ) | | | (7,562,711 | ) |
| | | | | | | | |
Net increase (decrease) in shares outstanding before conversion | | | (189,846 | ) | | | (3,676,906 | ) |
Shares reacquired upon conversion into other share class(es) | | | (875,270 | ) | | | (15,109,932 | ) |
| | | | | | | | |
Net increase (decrease) in shares outstanding | | | (1,065,116 | ) | | $ | (18,786,838 | ) |
| | | | | | | | |
| | | | |
| PGIM QMA Small-Cap Value Fund | | | 41 | |
Notes to Financial Statements (continued)
| | | | | | | | |
Class R | | Shares | | | Amount | |
Year ended July 31, 2020: | | | | | | | | |
Shares sold | | | 3,788,298 | | | $ | 33,178,840 | |
Shares issued in reinvestment of dividends and distributions | | | 405,219 | | | | 6,576,700 | |
Shares reacquired | | | (2,883,667 | ) | | | (38,455,582 | ) |
| | | | | | | | |
Net increase (decrease) in shares outstanding | | | 1,309,850 | | | $ | 1,299,958 | |
| | | | | | | | |
Year ended July 31, 2019: | | | | | | | | |
Shares sold | | | 1,865,355 | | | $ | 30,019,153 | |
Shares issued in reinvestment of dividends and distributions | | | 747,381 | | | | 11,255,549 | |
Shares reacquired | | | (1,904,957 | ) | | | (33,034,488 | ) |
| | | | | | | | |
Net increase (decrease) in shares outstanding | | | 707,779 | | | $ | 8,240,214 | |
| | | | | | | | |
Class Z | | | | | | |
Year ended July 31, 2020: | | | | | | | | |
Shares sold | | | 6,055,480 | | | $ | 74,306,981 | |
Shares issued in reinvestment of dividends and distributions | | | 1,243,687 | | | | 20,421,344 | |
Shares reacquired | | | (28,441,606 | ) | | | (411,146,356 | ) |
| | | | | | | | |
Net increase (decrease) in shares outstanding before conversion | | | (21,142,439 | ) | | | (316,418,031 | ) |
Shares issued upon conversion from other share class(es) | | | 81,589 | | | | 1,183,377 | |
Shares reacquired upon conversion into other share class(es) | | | (3,555,202 | ) | | | (60,940,151 | ) |
| | | | | | | | |
Net increase (decrease) in shares outstanding | | | (24,616,052 | ) | | $ | (376,174,805 | ) |
| | | | | | | | |
Year ended July 31, 2019: | | | | | | | | |
Shares sold | | | 6,552,669 | | | $ | 113,039,784 | |
Shares issued in reinvestment of dividends and distributions | | | 3,680,081 | | | | 56,010,840 | |
Shares reacquired | | | (11,924,024 | ) | | | (205,679,642 | ) |
| | | | | | | | |
Net increase (decrease) in shares outstanding before conversion | | | (1,691,274 | ) | | | (36,629,018 | ) |
Shares issued upon conversion from other share class(es) | | | 162,948 | | | | 2,989,364 | |
Shares reacquired upon conversion into other share class(es) | | | (36,132 | ) | | | (626,971 | ) |
| | | | | | | | |
Net increase (decrease) in shares outstanding | | | (1,564,458 | ) | | $ | (34,266,625 | ) |
| | | | | | | | |
Class R2 | | | | | | |
Year ended July 31, 2020: | | | | | | | | |
Shares sold | | | 8,198 | | | $ | 94,892 | |
Shares issued in reinvestment of dividends and distributions | | | 1,117 | | | | 18,357 | |
Shares reacquired | | | (6,486 | ) | | | (89,962 | ) |
| | | | | | | | |
Net increase (decrease) in shares outstanding | | | 2,829 | | | $ | 23,287 | |
| | | | | | | | |
Year ended July 31, 2019: | | | | | | | | |
Shares sold | | | 23,957 | | | $ | 412,473 | |
Shares issued in reinvestment of dividends and distributions | | | 1,283 | | | | 19,556 | |
Shares reacquired | | | (3,296 | ) | | | (57,691 | ) |
| | | | | | | | |
Net increase (decrease) in shares outstanding | | | 21,944 | | | $ | 374,338 | |
| | | | | | | | |
| | | | | | | | |
Class R4 | | Shares | | | Amount | |
Year ended July 31, 2020: | | | | | | | | |
Shares sold | | | 91,497 | | | $ | 1,442,769 | |
Shares issued in reinvestment of dividends and distributions | | | 4,555 | | | | 74,887 | |
Shares reacquired | | | (15,316 | ) | | | (164,493 | ) |
| | | | | | | | |
Net increase (decrease) in shares outstanding | | | 80,736 | | | $ | 1,353,163 | |
| | | | | | | | |
Year ended July 31, 2019: | | | | | | | | |
Shares issued in reinvestment of dividends and distributions | | | 51 | | | $ | 767 | |
| | | | | | | | |
Net increase (decrease) in shares outstanding | | | 51 | | | $ | 767 | |
| | | | | | | | |
Class R6 | | | | | | |
Year ended July 31, 2020: | | | | | | | | |
Shares sold | | | 8,423,977 | | | $ | 100,582,641 | |
Shares issued in reinvestment of dividends and distributions | | | 958,783 | | | | 15,752,803 | |
Shares reacquired | | | (17,282,074 | ) | | | (234,793,620 | ) |
| | | | | | | | |
Net increase (decrease) in shares outstanding before conversion | | | (7,899,314 | ) | | | (118,458,176 | ) |
Shares issued upon conversion from other share class(es) | | | 3,528,413 | | | | 60,673,317 | |
| | | | | | | | |
Net increase (decrease) in shares outstanding | | | (4,370,901 | ) | | $ | (57,784,859 | ) |
| | | | | | | | |
Year ended July 31, 2019: | | | | | | | | |
Shares sold | | | 3,950,123 | | | $ | 68,841,362 | |
Shares issued in reinvestment of dividends and distributions | | | 2,125,107 | | | | 32,365,379 | |
Shares reacquired | | | (4,528,102 | ) | | | (78,665,211 | ) |
| | | | | | | | |
Net increase (decrease) in shares outstanding before conversion | | | 1,547,128 | | | | 22,541,530 | |
Shares issued upon conversion from other share class(es) | | | 4,864 | | | | 87,765 | |
| | | | | | | | |
Net increase (decrease) in shares outstanding | | | 1,551,992 | | | $ | 22,629,295 | |
| | | | | | | | |
8. Borrowings
The Trust, on behalf of the Fund, along with other affiliated registered investment companies (the “RICs”), is a party to a Syndicated Credit Agreement (“SCA”) with a group of banks. The purpose of the SCA is to provide an alternative source of temporary funding for capital share redemptions. The table below provides details of the current SCA in effect at the reporting period-end as well as the prior SCA.
| | | | |
| | | Current SCA | | Prior SCA |
| Term of Commitment | | 10/3/2019 – 10/1/2020 | | 10/4/2018 – 10/2/2019 |
| Total Commitment | | $1,222,500,000* | | $900,000,000 |
| Annualized Commitment Fee on the Unused Portion of the SCA | | 0.15% | | 0.15% |
| Annualized Interest Rate on Borrowings | | 1.20% plus the higher of (1)
the effective federal funds
rate, (2) the one-month
LIBOR rate or (3) zero
percent | | 1.25% plus the higher of (1)
the effective federal funds
rate, (2) the one-month
LIBOR rate or (3) zero
percent |
| * Effective March 31, 2020, the SCA’s total commitment was increased from $900,000,000 to $1,162,500,000 and subsequently, effective April 7, 2020 was increased to $1,222,500,000. |
Certain affiliated registered investment companies that are parties to the SCA include portfolios that are subject to a predetermined mathematical formula used to manage certain benefit guarantees offered under variable annuity contracts. The formula may result in large scale asset flows into and out of these portfolios. Consequently, these portfolios may be more
| | | | |
| PGIM QMA Small-Cap Value Fund | | | 43 | |
Notes to Financial Statements (continued)
likely to utilize the SCA for purposes of funding redemptions. It may be possible for those portfolios to fully exhaust the committed amount of the SCA, thereby requiring the Manager to allocate available funding per a Board-approved methodology designed to treat the RICs in the SCA equitably.
The Fund utilized the SCA during the year ended July 31, 2020. The average daily balance for the 130 days that the Fund had loans outstanding during the period was approximately $4,449,192, borrowed at a weighted average interest rate of 2.87%. The maximum loan outstanding amount during the period was $94,116,000. At July 31, 2020, the Fund did not have an outstanding loan amount.
9. Risks of Investing in the Fund
The Fund’s risks include, but are not limited to, some or all of the risks discussed below. For further information on the Fund’s risks, please refer to the Fund’s Prospectus and Statement of Additional Information.
Equity and Equity-Related Securities Risks: The value of a particular security could go down and you could lose money. In addition to an individual security losing value, the value of the equity markets or a sector in which the Fund invests could go down. The Fund’s holdings can vary significantly from broad market indexes and the performance of the Fund can deviate from the performance of these indexes. Different parts of a market can react differently to adverse issuer, market, regulatory, political and economic developments.
Large Shareholder and Large Scale Redemption Risk: Certain individuals, accounts, funds (including funds affiliated with the Manager) or institutions, including the Manager and its affiliates, may from time to time own or control a substantial amount of the Fund’s shares. There is no requirement that these entities maintain their investment in the Fund. There is a risk that such large shareholders or that the Fund’s shareholders generally may redeem all or a substantial portion of their investments in the Fund in a short period of time, which could have a significant negative impact on the Fund’s NAV, liquidity, and brokerage costs. Large redemptions could also result in tax consequences to shareholders and impact the Fund’s ability to implement its investment strategy. The Fund’s ability to pursue its investment objective after one or more large scale redemptions may be impaired and, as a result, the Fund may invest a larger portion of its assets in cash or cash equivalents.
Market and Credit Risk: Securities markets may be volatile and the market prices of the Fund’s securities may decline. Securities fluctuate in price based on changes in an issuer’s financial condition and overall market and economic conditions. If the market prices of the securities owned by the Fund fall, the value of an investment in the Fund will decline. Additionally, the Fund may also be exposed to credit risk in the event that an issuer or
guarantor fails to perform or that an institution or entity with which the Fund has unsettled or open transactions defaults.
Market Disruption and Geopolitical Risks: International wars or conflicts and geopolitical developments in foreign countries, along with instability in regions such as Asia, Eastern Europe, and the Middle East, possible terrorist attacks in the United States or around the world, public health epidemics such as the outbreak of infectious diseases like the recent outbreak of coronavirus globally or the 2014–2016 outbreak in West Africa of the Ebola virus, and other similar events could adversely affect the U.S. and foreign financial markets, including increases in market volatility, reduced liquidity in the securities markets and government intervention, and may cause further long-term economic uncertainties in the United States and worldwide generally.
Risks of Investing in equity REITs: Real estate securities are subject to similar risks as direct investments in real estate and mortgages, and their value will depend on the value of the underlying properties or the underlying loans or interests. The underlying loans may be subject to the risks of default or of payments that occur earlier or later than expected, and such loans may also include so-called “subprime” mortgages. The value of these securities will rise and fall in response to many factors, including economic conditions, the demand for rental property and interest rates. In particular, the value of these securities may decline when interest rates rise and will also be affected by the real estate market and by the management of the underlying properties.
In addition, investing in equity REITs involves certain unique risks in addition to those risks associated with investing in the real estate industry in general. Equity REITs may be affected by changes in the value of the underlying property owned by the equity REITs, while mortgage REITs may be affected by the quality of any credit extended. Equity REITs are dependent upon management skills, may not be diversified geographically or by property/mortgage asset type, and are subject to heavy cash flow dependency, default by borrowers and self-liquidation. Since equity REITs are relatively smaller in size when compared to the broader market, and smaller companies tend to be more volatile than larger companies, they may be more volatile and/or more illiquid than other types of equity securities. Equity REITs are subject to interest rate risks. Equity REITs may incur significant amounts of leverage. The Fund will indirectly bear a portion of the expenses, including management fees, paid by each equity REIT in which it invests, in addition to the expenses of the Fund.
| | | | |
| PGIM QMA Small-Cap Value Fund | | | 45 | |
Financial Highlights
| | | | | | | | | | | | | | | | | | | | |
| Class A Shares | | | | | | | | | | | | | | | |
| | | Year Ended July 31, | |
| | | 2020 | | | 2019 | | | 2018 | | | 2017 | | | 2016 | |
| Per Share Operating Performance(a): | | | | | | | | | | | | | | | | | | | | |
| Net Asset Value, Beginning of Year | | | $16.46 | | | | $20.95 | | | | $21.32 | | | | $18.16 | | | | $25.21 | |
| Income (loss) from investment operations: | | | | | | | | | | | | | | | | | | | | |
| Net investment income (loss) | | | 0.18 | | | | 0.23 | | | | 0.26 | | | | 0.26 | | | | 0.32 | |
| Net realized and unrealized gain (loss) on investment and foreign currency transactions | | | (4.35 | ) | | | (3.17 | ) | | | 2.04 | | | | 3.25 | | | | (0.07 | ) |
| Total from investment operations | | | (4.17 | ) | | | (2.94 | ) | | | 2.30 | | | | 3.51 | | | | 0.25 | |
| Less Dividends and Distributions: | | | | | | | | | | | | | | | | | | | | |
| Dividends from net investment income | | | (0.48 | ) | | | (0.28 | ) | | | (0.31 | ) | | | (0.30 | ) | | | (0.55 | ) |
| Distributions from net realized gains | | | (0.42 | ) | | | (1.27 | ) | | | (2.36 | ) | | | (0.05 | ) | | | (6.75 | ) |
| Total dividends and distributions | | | (0.90 | ) | | | (1.55 | ) | | | (2.67 | ) | | | (0.35 | ) | | | (7.30 | ) |
| Net asset value, end of year | | | $11.39 | | | | $16.46 | | | | $20.95 | | | | $21.32 | | | | $18.16 | |
| Total Return(b): | | | (27.01 | )% | | | (13.47 | )% | | | 11.31 | % | | | 19.29 | % | | | 3.98 | % |
| | |
| Ratios/Supplemental Data: | | | | | | | | | | |
| Net assets, end of year (000) | | | $71,928 | | | | $116,090 | | | | $136,533 | | | | $132,512 | | | | $116,997 | |
| Average net assets (000) | | | $92,527 | | | | $118,685 | | | | $133,270 | | | | $129,902 | | | | $121,788 | |
| Ratios to average net assets(c)(d): | | | | | | | | | | | | | | | | | | | | |
| Expenses after waivers and/or expense reimbursement | | | 1.15 | % | | | 1.07 | % | | | 1.02 | % | | | 0.96 | % | | | 0.98 | % |
| Expenses before waivers and/or expense reimbursement | | | 1.21 | % | | | 1.13 | % | | | 1.08 | % | | | 1.02 | % | | | 1.04 | % |
| Net investment income (loss) | | | 1.31 | % | | | 1.31 | % | | | 1.27 | % | | | 1.27 | % | | | 1.67 | % |
| Portfolio turnover rate(e) | | | 53 | % | | | 80 | % | | | 70 | % | | | 95 | % | | | 72 | % |
| (a) | Calculated based on average shares outstanding during the year. |
| (b) | Total return does not consider the effects of sales loads. Total return is calculated assuming a purchase of a share on the first day and a sale on the last day of each year reported and includes reinvestment of dividends and distributions, if any. Total returns may reflect adjustments to conform to generally accepted accounting principles. |
| (c) | Does not include expenses of the underlying funds in which the Fund invests. |
| (d) | Effective August 1, 2017, class specific expenses include transfer agent fees and expenses and registration fees, which are charged to their respective share class. |
| (e) | The Fund’s portfolio turnover rate is calculated in accordance with regulatory requirements, without regard to transactions involving short-term investments and certain derivatives. If such transactions were included, the Fund’s portfolio turnover rate may be higher. |
See Notes to Financial Statements.
| | | | | | | | | | | | | | | | | | | | |
| Class C Shares | | | | | | | | | | | | | | | |
| | | Year Ended July 31, | |
| | | 2020 | | | 2019 | | | 2018 | | | 2017 | | | 2016 | |
| Per Share Operating Performance(a): | | | | | | | | | | | | | | | | | | | | |
| Net Asset Value, Beginning of Year | | | $16.48 | | | | $20.95 | | | | $21.32 | | | | $18.18 | | | | $25.19 | |
| Income (loss) from investment operations: | | | | | | | | | | | | | | | | | | | | |
| Net investment income (loss) | | | 0.05 | | | | 0.12 | | | | 0.10 | | | | 0.10 | | | | 0.17 | |
| Net realized and unrealized gain (loss) on investment and foreign currency transactions | | | (4.40 | ) | | | (3.20 | ) | | | 2.03 | | | | 3.26 | | | | (0.06 | ) |
| Total from investment operations | | | (4.35 | ) | | | (3.08 | ) | | | 2.13 | | | | 3.36 | | | | 0.11 | |
| Less Dividends and Distributions: | | | | | | | | | | | | | | | | | | | | |
| Dividends from net investment income | | | (0.32 | ) | | | (0.12 | ) | | | (0.14 | ) | | | (0.17 | ) | | | (0.37 | ) |
| Distributions from net realized gains | | | (0.42 | ) | | | (1.27 | ) | | | (2.36 | ) | | | (0.05 | ) | | | (6.75 | ) |
| Total dividends and distributions | | | (0.74 | ) | | | (1.39 | ) | | | (2.50 | ) | | | (0.22 | ) | | | (7.12 | ) |
| Net asset value, end of year | | | $11.39 | | | | $16.48 | | | | $20.95 | | | | $21.32 | | | | $18.18 | |
| Total Return(b): | | | (27.80 | )% | | | (14.22 | )% | | | 10.44 | % | | | 18.43 | % | | | 3.19 | % |
| | |
| Ratios/Supplemental Data: | | | | | | | | | | |
| Net assets, end of year (000) | | | $5,782 | | | | $11,269 | | | | $36,638 | | | | $40,476 | | | | $30,257 | |
| Average net assets (000) | | | $8,456 | | | | $24,635 | | | | $38,734 | | | | $41,745 | | | | $30,498 | |
| Ratios to average net assets(c)(d): | | | | | | | | | | | | | | | | | | | | |
| Expenses after waivers and/or expense reimbursement | | | 2.22 | % | | | 1.92 | % | | | 1.81 | % | | | 1.71 | % | | | 1.73 | % |
| Expenses before waivers and/or expense reimbursement | | | 2.23 | % | | | 1.93 | % | | | 1.82 | % | | | 1.72 | % | | | 1.74 | % |
| Net investment income (loss) | | | 0.35 | % | | | 0.66 | % | | | 0.49 | % | | | 0.49 | % | | | 0.92 | % |
| Portfolio turnover rate(e) | | | 53 | % | | | 80 | % | | | 70 | % | | | 95 | % | | | 72 | % |
| (a) | Calculated based on average shares outstanding during the year. |
| (b) | Total return does not consider the effects of sales loads. Total return is calculated assuming a purchase of a share on the first day and a sale on the last day of each year reported and includes reinvestment of dividends and distributions, if any. Total returns may reflect adjustments to conform to generally accepted accounting principles. |
| (c) | Does not include expenses of the underlying funds in which the Fund invests. |
| (d) | Effective August 1, 2017, class specific expenses include transfer agent fees and expenses and registration fees, which are charged to their respective share class. |
| (e) | The Fund’s portfolio turnover rate is calculated in accordance with regulatory requirements, without regard to transactions involving short-term investments and certain derivatives. If such transactions were included, the Fund’s portfolio turnover rate may be higher. |
See Notes to Financial Statements.
| | | | |
| PGIM QMA Small-Cap Value Fund | | | 47 | |
Financial Highlights (continued)
| | | | | | | | | | | | | | | | | | | | |
| Class R Shares | | | | | | | | | | | | | | | |
| | | Year Ended July 31, | |
| | | 2020 | | | 2019 | | | 2018 | | | 2017 | | | 2016 | |
| Per Share Operating Performance(a): | | | | | | | | | | | | | | | | | | | | |
| Net Asset Value, Beginning of Year | | | $16.23 | | | | $20.66 | | | | $21.06 | | | | $17.95 | | | | $25.00 | |
| Income (loss) from investment operations: | | | | | | | | | | | | | | | | | | | | |
| Net investment income (loss) | | | 0.11 | | | | 0.20 | | | | 0.21 | | | | 0.21 | | | | 0.26 | |
| Net realized and unrealized gain (loss) on investment and foreign currency transactions | | | (4.24 | ) | | | (3.13 | ) | | | 2.01 | | | | 3.21 | | | | (0.07 | ) |
| Total from investment operations | | | (4.13 | ) | | | (2.93 | ) | | | 2.22 | | | | 3.42 | | | | 0.19 | |
| Less Dividends and Distributions: | | | | | | | | | | | | | | | | | | | | |
| Dividends from net investment income | | | (0.45 | ) | | | (0.23 | ) | | | (0.26 | ) | | | (0.26 | ) | | | (0.49 | ) |
| Distributions from net realized gains | | | (0.42 | ) | | | (1.27 | ) | | | (2.36 | ) | | | (0.05 | ) | | | (6.75 | ) |
| Total dividends and distributions | | | (0.87 | ) | | | (1.50 | ) | | | (2.62 | ) | | | (0.31 | ) | | | (7.24 | ) |
| Net asset value, end of year | | | $11.23 | | | | $16.23 | | | | $20.66 | | | | $21.06 | | | | $17.95 | |
| Total Return(b): | | | (27.08 | )% | | | (13.63 | )% | | | 11.05 | % | | | 19.00 | % | | | 3.70 | % |
| | |
| Ratios/Supplemental Data: | | | | | | | | | | |
| Net assets, end of year (000) | | | $110,953 | | | | $139,136 | | | | $162,502 | | | | $164,019 | | | | $152,186 | |
| Average net assets (000) | | | $116,334 | | | | $143,139 | | | | $165,270 | | | | $159,240 | | | | $145,703 | |
| Ratios to average net assets(c)(d): | | | | | | | | | | | | | | | | | | | | |
| Expenses after waivers and/or expense reimbursement | | | 1.31 | % | | | 1.27 | % | | | 1.26 | % | | | 1.21 | % | | | 1.23 | % |
| Expenses before waivers and/or expense reimbursement | | | 1.57 | % | | | 1.53 | % | | | 1.52 | % | | | 1.47 | % | | | 1.49 | % |
| Net investment income (loss) | | | 0.82 | % | | | 1.16 | % | | | 1.04 | % | | | 1.03 | % | | | 1.42 | % |
| Portfolio turnover rate(e) | | | 53 | % | | | 80 | % | | | 70 | % | | | 95 | % | | | 72 | % |
| (a) | Calculated based on average shares outstanding during the year. |
| (b) | Total return is calculated assuming a purchase of a share on the first day and a sale on the last day of each year reported and includes reinvestment of dividends and distributions, if any. Total returns may reflect adjustments to conform to generally accepted accounting principles. |
| (c) | Does not include expenses of the underlying funds in which the Fund invests. |
| (d) | Effective August 1, 2017, class specific expenses include transfer agent fees and expenses and registration fees, which are charged to their respective share class. |
| (e) | The Fund’s portfolio turnover rate is calculated in accordance with regulatory requirements, without regard to transactions involving short-term investments and certain derivatives. If such transactions were included, the Fund’s portfolio turnover rate may be higher. |
See Notes to Financial Statements.
| | | | | | | | | | | | | | | | | | | | |
| Class Z Shares | | | | | | | | | | | | | | | |
| | | Year Ended July 31, | |
| | | 2020 | | | 2019 | | | 2018 | | | 2017 | | | 2016 | |
| Per Share Operating Performance(a): | | | | | | | | | | | | | | | | | | | | |
| Net Asset Value, Beginning of Year | | | $16.46 | | | | $20.95 | | | | $21.32 | | | | $18.14 | | | | $25.22 | |
| Income (loss) from investment operations: | | | | | | | | | | | | | | | | | | | | |
| Net investment income (loss) | | | 0.29 | | | | 0.30 | | | | 0.34 | | | | 0.31 | | | | 0.37 | |
| Net realized and unrealized gain (loss) on investment and foreign currency transactions | | | (4.38 | ) | | | (3.18 | ) | | | 2.02 | | | | 3.27 | | | | (0.08 | ) |
| Total from investment operations | | | (4.09 | ) | | | (2.88 | ) | | | 2.36 | | | | 3.58 | | | | 0.29 | |
| Less Dividends and Distributions: | | | | | | | | | | | | | | | | | | | | |
| Dividends from net investment income | | | (0.55 | ) | | | (0.34 | ) | | | (0.37 | ) | | | (0.35 | ) | | | (0.62 | ) |
| Distributions from net realized gains | | | (0.42 | ) | | | (1.27 | ) | | | (2.36 | ) | | | (0.05 | ) | | | (6.75 | ) |
| Total dividends and distributions | | | (0.97 | ) | | | (1.61 | ) | | | (2.73 | ) | | | (0.40 | ) | | | (7.37 | ) |
| Net asset value, end of year | | | $11.40 | | | | $16.46 | | | | $20.95 | | | | $21.32 | | | | $18.14 | |
| Total Return(b): | | | (26.66 | )% | | | (13.11 | )% | | | 11.65 | % | | | 19.66 | % | | | 4.20 | % |
| | |
| Ratios/Supplemental Data: | | | | | | | | | | |
| Net assets, end of year (000) | | | $150,272 | | | | $622,093 | | | | $824,748 | | | | $981,061 | | | | $829,360 | |
| Average net assets (000) | | | $307,558 | | | | $698,954 | | | | $862,416 | | | | $940,720 | | | | $811,529 | |
| Ratios to average net assets(c)(d): | | | | | | | | | | | | | | | | | | | | |
| Expenses after waivers and/or expense reimbursement | | | 0.73 | % | | | 0.69 | % | | | 0.69 | % | | | 0.71 | % | | | 0.73 | % |
| Expenses before waivers and/or expense reimbursement | | | 0.74 | % | | | 0.70 | % | | | 0.70 | % | | | 0.72 | % | | | 0.74 | % |
| Net investment income (loss) | | | 2.05 | % | | | 1.72 | % | | | 1.62 | % | | | 1.51 | % | | | 1.93 | % |
| Portfolio turnover rate(e) | | | 53 | % | | | 80 | % | | | 70 | % | | | 95 | % | | | 72 | % |
| (a) | Calculated based on average shares outstanding during the year. |
| (b) | Total return is calculated assuming a purchase of a share on the first day and a sale on the last day of each year reported and includes reinvestment of dividends and distributions, if any. Total returns may reflect adjustments to conform to generally accepted accounting principles. |
| (c) | Does not include expenses of the underlying funds in which the Fund invests. |
| (d) | Effective August 1, 2017, class specific expenses include transfer agent fees and expenses and registration fees, which are charged to their respective share class. |
| (e) | The Fund’s portfolio turnover rate is calculated in accordance with regulatory requirements, without regard to transactions involving short-term investments and certain derivatives. If such transactions were included, the Fund’s portfolio turnover rate may be higher. |
See Notes to Financial Statements.
| | | | |
| PGIM QMA Small-Cap Value Fund | | | 49 | |
Financial Highlights (continued)
| | | | | | | | | | | | | | | | | | | | | | | | | |
| Class R2 Shares | | | | | | | | | | |
| | | | | | | | | December 28, 2017(a) through July 31, 2018 | | |
| | | Year Ended July 31, | | | | |
| | | 2020 | | 2019 | | | | |
| Per Share Operating Performance(b): | | | | | | | | | | | | | | | | | | | | | | | | | |
| Net Asset Value, Beginning of Period | | | | $16.43 | | | | | $20.91 | | | | | | | | | | $20.44 | | | | | | |
| Income (loss) from investment operations: | | | | | | | | | | | | | | | | | | | | | | | | | |
| Net investment income (loss) | | | | 0.17 | | | | | 0.23 | | | | | | | | | | 0.09 | | | | | | |
| Net realized and unrealized gain (loss) on investment and foreign currency transactions | | | | (4.32 | ) | | | | (3.18 | ) | | | | | | | | | 0.38 | | | | | | |
| Total from investment operations | | | | (4.15 | ) | | | | (2.95 | ) | | | | | | | | | 0.47 | | | | | | |
| Less Dividends and Distributions: | | | | | | | | | | | | | | | | | | | | | | | | | |
| Dividends from net investment income | | | | (0.48 | ) | | | | (0.26 | ) | | | | | | | | | - | | | | | | |
| Distributions from net realized gains | | | | (0.42 | ) | | | | (1.27 | ) | | | | | | | | | - | | | | | | |
| Total dividends and distributions | | | | (0.90 | ) | | | | (1.53 | ) | | | | | | | | | - | | | | | | |
| Net asset value, end of period | | | | $11.38 | | | | | $16.43 | | | | | | | | | | $20.91 | | | | | | |
| Total Return(c): | | | | (26.96 | )% | | | | (13.54 | )% | | | | | | | | | 2.30 | % | | | | | |
| | | | | | | | | | | | |
| Ratios/Supplemental Data: | | | | | | |
| Net assets, end of period (000) | | | | $292 | | | | | $375 | | | | | | | | | | $18 | | | | | | |
| Average net assets (000) | | | | $302 | | | | | $184 | | | | | | | | | | $14 | | | | | | |
| Ratios to average net assets(d): | | | | | | | | | | | | | | | | | | | | | | | | | |
| Expenses after waivers and/or expense reimbursement | | | | 1.15 | % | | | | 1.14 | % | | | | | | | | | 1.14 | %(e) | | | | | |
| Expenses before waivers and/or expense reimbursement | | | | 6.28 | % | | | | 8.15 | % | | | | | | | | | 187.96 | %(e) | | | | | |
| Net investment income (loss) | | | | 1.26 | % | | | | 1.35 | % | | | | | | | | | 0.72 | %(e) | | | | | |
| Portfolio turnover rate(f) | | | | 53 | % | | | | 80 | % | | | | | | | | | 70 | % | | | | | |
| (a) | Commencement of operations. |
| (b) | Calculated based on average shares outstanding during the period. |
| (c) | Total return is calculated assuming a purchase of a share on the first day and a sale on the last day of each period reported and includes reinvestment of dividends and distributions, if any. Total returns may reflect adjustments to conform to generally accepted accounting principles. Total returns for periods less than one full year are not annualized. |
| (d) | Does not include expenses of the underlying funds in which the Fund invests. |
| (f) | The Fund’s portfolio turnover rate is calculated in accordance with regulatory requirements, without regard to transactions involving short-term investments and certain derivatives. If such transactions were included, the Fund’s portfolio turnover rate may be higher. |
See Notes to Financial Statements.
| | | | | | | | | | | | | | | | | | | | | | | | | |
| Class R4 Shares | | | | | | | | | | |
| | | | | | | | | December 28, 2017(a) through July 31, 2018 | | |
| | | Year Ended July 31, | | | | |
| | | 2020 | | 2019 | | | | |
| Per Share Operating Performance(b): | | | | | | | | | | | | | | | | | | | | | | | | | |
| Net Asset Value, Beginning of Period | | | | $16.46 | | | | | $20.94 | | | | | | | | | | $20.44 | | | | | | |
| Income (loss) from investment operations: | | | | | | | | | | | | | | | | | | | | | | | | | |
| Net investment income (loss) | | | | 0.16 | | | | | 0.27 | | | | | | | | | | 0.11 | | | | | | |
| Net realized and unrealized gain (loss) on investment and foreign currency transactions | | | | (4.28 | ) | | | | (3.18 | ) | | | | | | | | | 0.39 | | | | | | |
| Total from investment operations | | | | (4.12 | ) | | | | (2.91 | ) | | | | | | | | | 0.50 | | | | | | |
| Less Dividends and Distributions: | | | | | | | | | | | | | | | | | | | | | | | | | |
| Dividends from net investment income | | | | (0.52 | ) | | | | (0.30 | ) | | | | | | | | | - | | | | | | |
| Distributions from net realized gains | | | | (0.42 | ) | | | | (1.27 | ) | | | | | | | | | - | | | | | | |
| Total dividends and distributions | | | | (0.94 | ) | | | | (1.57 | ) | | | | | | | | | - | | | | | | |
| Net asset value, end of period | | | | $11.40 | | | | | $16.46 | | | | | | | | | | $20.94 | | | | | | |
| Total Return(c): | | | | (26.80 | )% | | | | (13.31 | )% | | | | | | | | | 2.45 | % | | | | | |
| | | | | | | | | | | | |
| Ratios/Supplemental Data: | | | | | | |
| Net assets, end of period (000) | | | | $927 | | | | | $9 | | | | | | | | | | $10 | | | | | | |
| Average net assets (000) | | | | $918 | | | | | $9 | | | | | | | | | | $10 | | | | | | |
| Ratios to average net assets(d): | | | | | | | | | | | | | | | | | | | | | | | | | |
| Expenses after waivers and/or expense reimbursement | | | | 0.89 | % | | | | 0.89 | % | | | | | | | | | 0.89 | %(e) | | | | | |
| Expenses before waivers and/or expense reimbursement | | | | 2.60 | % | | | | 140.80 | % | | | | | | | | | 270.32 | %(e) | | | | | |
| Net investment income (loss) | | | | 1.16 | % | | | | 1.51 | % | | | | | | | | | 0.95 | %(e) | | | | | |
| Portfolio turnover rate(f) | | | | 53 | % | | | | 80 | % | | | | | | | | | 70 | % | | | | | |
| (a) | Commencement of operations. |
| (b) | Calculated based on average shares outstanding during the period. |
| (c) | Total return is calculated assuming a purchase of a share on the first day and a sale on the last day of each period reported and includes reinvestment of dividends and distributions, if any. Total returns may reflect adjustments to conform to generally accepted accounting principles. Total returns for periods less than one full year are not annualized. |
| (d) | Does not include expenses of the underlying funds in which the Fund invests. |
| (f) | The Fund’s portfolio turnover rate is calculated in accordance with regulatory requirements, without regard to transactions involving short-term investments and certain derivatives. If such transactions were included, the Fund’s portfolio turnover rate may be higher. |
See Notes to Financial Statements.
| | | | |
| PGIM QMA Small-Cap Value Fund | | | 51 | |
Financial Highlights (continued)
| | | | | | | | | | | | | | | | | | | | |
| Class R6 Shares | | | | | | | | | | | | | | | |
| | | Year Ended July 31, | |
| | | 2020 | | | 2019 | | | 2018 | | | 2017 | | | 2016 | |
| Per Share Operating Performance(a): | | | | | | | | | | | | | | | | | | | | |
| Net Asset Value, Beginning of Year | | | $16.47 | | | | $20.97 | | | | $21.34 | | | | $18.15 | | | | $25.23 | |
| Income (loss) from investment operations: | | | | | | | | | | | | | | | | | | | | |
| Net investment income (loss) | | | 0.25 | | | | 0.31 | | | | 0.34 | | | | 0.32 | | | | 0.36 | |
| Net realized and unrealized gain (loss) on investment and foreign currency transactions | | | (4.33 | ) | | | (3.19 | ) | | | 2.04 | | | | 3.28 | | | | (0.05 | ) |
| Total from investment operations | | | (4.08 | ) | | | (2.88 | ) | | | 2.38 | | | | 3.60 | | | | 0.31 | |
| Less Dividends and Distributions: | | | | | | | | | | | | | | | | | | | | |
| Dividends from net investment income | | | (0.56 | ) | | | (0.35 | ) | | | (0.39 | ) | | | (0.36 | ) | | | (0.64 | ) |
| Distributions from net realized gains | | | (0.42 | ) | | | (1.27 | ) | | | (2.36 | ) | | | (0.05 | ) | | | (6.75 | ) |
| Total dividends and distributions | | | (0.98 | ) | | | (1.62 | ) | | | (2.75 | ) | | | (0.41 | ) | | | (7.39 | ) |
| Net asset value, end of year | | | $11.41 | | | | $16.47 | | | | $20.97 | | | | $21.34 | | | | $18.15 | |
| Total Return(b): | | | (26.60 | )% | | | (13.09 | )% | | | 11.72 | % | | | 19.77 | % | | | 4.29 | % |
| | |
| Ratios/Supplemental Data: | | | | | | | | | | |
| Net assets, end of year (000) | | | $193,499 | | | | $351,429 | | | | $414,892 | | | | $268,695 | | | | $231,801 | |
| Average net assets (000) | | | $259,226 | | | | $372,557 | | | | $361,244 | | | | $263,763 | | | | $187,644 | |
| Ratios to average net assets(c)(d): | | | | | | | | | | | | | | | | | | | | |
| Expenses after waivers and/or expense reimbursement | | | 0.67 | % | | | 0.63 | % | | | 0.63 | % | | | 0.64 | % | | | 0.66 | % |
| Expenses before waivers and/or expense reimbursement | | | 0.67 | % | | | 0.63 | % | | | 0.63 | % | | | 0.64 | % | | | 0.66 | % |
| Net investment income (loss) | | | 1.83 | % | | | 1.78 | % | | | 1.64 | % | | | 1.58 | % | | | 1.96 | % |
| Portfolio turnover rate(e) | | | 53 | % | | | 80 | % | | | 70 | % | | | 95 | % | | | 72 | % |
| (a) | Calculated based on average shares outstanding during the year. |
| (b) | Total return is calculated assuming a purchase of a share on the first day and a sale on the last day of each year reported and includes reinvestment of dividends and distributions, if any. Total returns may reflect adjustments to conform to generally accepted accounting principles. |
| (c) | Does not include expenses of the underlying funds in which the Fund invests. |
| (d) | Effective August 1, 2017, class specific expenses include transfer agent fees and expenses and registration fees, which are charged to their respective share class. |
| (e) | The Fund’s portfolio turnover rate is calculated in accordance with regulatory requirements, without regard to transactions involving short-term investments and certain derivatives. If such transactions were included, the Fund’s portfolio turnover rate may be higher. |
See Notes to Financial Statements.
Report of Independent Registered Public
Accounting Firm
To the Shareholders of PGIM QMA Small-Cap Value Fund and Board of Trustees
The Target Portfolio Trust:
Opinion on the Financial Statements
We have audited the accompanying statement of assets and liabilities of PGIM QMA Small-Cap Value Fund, a series of The Target Portfolio Trust (the Fund), including the schedule of investments, as of July 31, 2020, the related statement of operations for the year then ended, the statements of changes in net assets for each of the years in the two-year period then ended, and the related notes (collectively, the financial statements) and the financial highlights for each of the years or periods indicated therein. In our opinion, the financial statements and financial highlights present fairly, in all material respects, the financial position of the Fund as of July 31, 2020, the results of its operations for the year then ended, the changes in its net assets for each of the years in the two-year period then ended, and the financial highlights for each of the years or periods indicated therein, in conformity with U.S. generally accepted accounting principles.
Basis for Opinion
These financial statements and financial highlights are the responsibility of the Fund’s management. Our responsibility is to express an opinion on these financial statements and financial highlights based on our audits. We are a public accounting firm registered with the Public Company Accounting Oversight Board (United States) (PCAOB) and are required to be independent with respect to the Fund in accordance with the U.S. federal securities laws and the applicable rules and regulations of the Securities and Exchange Commission and the PCAOB.
We conducted our audits in accordance with the standards of the PCAOB. Those standards require that we plan and perform the audit to obtain reasonable assurance about whether the financial statements and financial highlights are free of material misstatement, whether due to error or fraud. Our audits included performing procedures to assess the risks of material misstatement of the financial statements and financial highlights, whether due to error or fraud, and performing procedures that respond to those risks. Such procedures included examining, on a test basis, evidence regarding the amounts and disclosures in the financial statements and financial highlights. Such procedures also included confirmation of securities owned as of July 31, 2020, by correspondence with the custodian, transfer agent, and brokers, or by other appropriate auditing procedures when replies were not received. Our audits also included evaluating the accounting principles used and significant estimates made by management, as well as evaluating the overall presentation of the financial statements and financial highlights. We believe that our audits provide a reasonable basis for our opinion.

We have served as the auditor of one or more PGIM and/or Prudential Retail investment companies since 2003.
New York, New York
September 16, 2020
| | | | |
| PGIM QMA Small-Cap Value Fund | | | 53 | |
Fund Liquidity Risk Management Program (unaudited)
Consistent with Rule 22e-4 under the 1940 Act (the “Liquidity Rule”), the Fund has adopted and implemented a liquidity risk management program (the “LRMP”). The Fund’s LRMP seeks to assess and manage the Fund’s liquidity risk, which is defined as the risk that the Fund is unable to meet investor redemption requests without significantly diluting the remaining investors’ interests in the Fund. The Trust’s Board of Trustees (the “Board”) has approved PGIM Investments LLC (“PGIM Investments”), the Fund’s investment manager, to serve as the administrator of the Fund’s LRMP. As part of its responsibilities as administrator, PGIM Investments has retained a third party to perform certain functions, including providing market data and liquidity classification model information.
The Fund’s LRMP includes a number of processes designed to support the assessment and management of its liquidity risk. In particular, the Fund’s LRMP includes no less than annual assessments of factors that influence the Fund’s liquidity risk; no less than monthly classifications of the Fund’s investments into one of four liquidity classifications provided for in the Liquidity Rule; a 15% of net assets limit on the acquisition of “illiquid investments” (as defined under the Liquidity Rule); establishment of a minimum percentage of the Fund’s assets to be invested in investments classified as “highly liquid” (as defined under the Liquidity Rule) if the Fund does not invest primarily in highly liquid investments; and regular reporting to the Fund’s Board.
At a meeting of the Board on March 3-5, 2020, PGIM Investments provided a written report (“LRMP Report”) to the Board addressing the operation, adequacy, and effectiveness of the Fund’s LRMP, including any material changes to the LRMP for the period from the inception of the Fund’s LRMP on December 1, 2018 through December 31, 2019 (“Reporting Period”). The LRMP Report concluded that the Fund’s LRMP was reasonably designed to assess and manage the Fund’s liquidity risk and was adequately and effectively implemented during the Reporting Period. There were no material changes to the LRMP during the Reporting Period. The LRMP Report further concluded that the Fund’s investment strategies continue to be appropriate given the Fund’s status as an open-end fund.
There can be no assurance that the LRMP will achieve its objectives in the future. Additional information regarding risks of investing in the Fund, including liquidity risks presented by the Fund’s investment portfolio, is found in the Fund’s Prospectus and Statement of Additional Information.
INFORMATION ABOUT BOARD MEMBERS AND OFFICERS (unaudited)
Information about Board Members and Officers of the Fund is set forth below. Board Members who are not deemed to be “interested persons” of the Fund, as defined in the 1940 Act, are referred to as “Independent Board Members.” Board Members who are deemed to be “interested persons” of the Fund are referred to as “Interested Board Members.” The Board Members are responsible for the overall supervision of the operations of the Fund and perform the various duties imposed on the directors of investment companies by the 1940 Act. The Board in turn elects the Officers, who are responsible for administering the day-to-day operations of the Fund.
| | | | | | |
| Independent Board Members | | | | |
| | | | |
Name Year of Birth Position(s) Portfolios Overseen | | Principal Occupation(s) During Past Five Years | | Other Directorships Held During Past Five Years | | Length of Board Service |
| | | | |
Ellen S. Alberding 1958 Board Member Portfolios Overseen: 95 | | President and Board Member, The Joyce Foundation (charitable foundation) (since 2002); Vice Chair, City Colleges of Chicago (community college system) (2011-2015); Trustee, National Park Foundation (charitable foundation for national park system) (2009-2018); Trustee, Economic Club of Chicago (2009-2016); Trustee, Loyola University (since 2018). | | None. | | Since September 2013 |
| | | | |
Kevin J. Bannon 1952 Board Member Portfolios Overseen: 95 | | Retired; Managing Director (April 2008-May 2015) and Chief Investment Officer (October 2008-November 2013) of Highmount Capital LLC (registered investment adviser); formerly Executive Vice President and Chief Investment Officer (April 1993-August 2007) of Bank of New York Company; President (May 2003-May 2007) of BNY Hamilton Family of Mutual Funds. | | Director of Urstadt Biddle Properties (equity real estate investment trust) (since September 2008). | | Since July 2008 |
PGIM QMA Small-Cap Value Fund
| | | | | | |
Independent Board Members | | | | |
| | | | |
Name Year of Birth Position(s) Portfolios Overseen | | Principal Occupation(s) During Past Five Years | | Other Directorships Held During Past Five Years | | Length of Board Service |
| | | | |
Linda W. Bynoe 1952 Board Member Portfolios Overseen: 95 | | President and Chief Executive Officer (since March 1995) and formerly Chief Operating Officer (December 1989-February 1995) of Telemat Limited LLC (formerly, Telemat Ltd). (management consulting); formerly Vice President (January 1985-June 1989) at Morgan Stanley & Co. (broker-dealer). | | Director of Anixter International, Inc. (communication products distributor) (since January 2006–June 2020); Director of Northern Trust Corporation (financial services) (since April 2006); Trustee of Equity Residential (residential real estate) (since December 2009). | | Since March 2005 |
| | | | |
Barry H. Evans 1960 Board Member Portfolios Overseen: 94 | | Retired; formerly President (2005 – 2016), Global Chief Operating Officer (2014–2016), Chief Investment Officer – Global Head of Fixed Income (1998-2014), and various portfolio manager roles (1986-2006), Manulife Asset Management U.S. | | Formerly Director, Manulife Trust Company (2011-2018); formerly Director, Manulife Asset Management Limited (2015-2017); formerly Chairman of the Board of Directors of Manulife Asset Management U.S. (2005-2016); formerly Chairman of the Board, Declaration Investment Management and Research (2008-2016). | | Since September 2017 |
| | | | |
Keith F. Hartstein 1956 Board Member & Independent Chair Portfolios Overseen: 95 | | Executive Committee of the IDC Board of Governors (since October 2019); Retired; Member (since November 2014) of the Governing Council of the Independent Directors Council (IDC) (organization of independent mutual fund directors); formerly President and Chief Executive Officer (2005-2012), Senior Vice President (2004-2005), Senior Vice President of Sales and Marketing (1997-2004), and various executive management positions (1990-1997), John Hancock Funds, LLC (asset management); Chairman, Investment Company Institute’s Sales Force Marketing Committee (2003-2008). | | None. | | Since September 2013 |
Visit our website at pgim.com/investments
| | | | | | |
| Independent Board Members | | | | |
| | | | |
Name Year of Birth Position(s) Portfolios Overseen | | Principal Occupation(s) During Past Five Years | | Other Directorships Held During Past Five Years | | Length of Board Service |
| | | | |
Laurie Simon Hodrick 1962 Board Member Portfolios Overseen: 94 | | A. Barton Hepburn Professor Emerita of Economics in the Faculty of Business, Columbia Business School (since 2018); Visiting Professor of Law, Stanford Law School (since 2015); Visiting Fellow at the Hoover Institution, Stanford University (since 2015); Sole Member, ReidCourt LLC (since 2008) (a consulting firm); formerly A. Barton Hepburn Professor of Economics in the Faculty of Business, Columbia Business School (1996-2017); formerly Managing Director, Global Head of Alternative Investment Strategies, Deutsche Bank (2006-2008). | | Independent Director, Synnex Corporation (since April 2019) (information technology); Independent Director, Kabbage, Inc. (since July 2018) (financial services); Independent Director, Corporate Capital Trust (2017-2018) (a business development company). | | Since September 2017 |
| | | | |
Michael S. Hyland, CFA 1945 Board Member Portfolios Overseen: 95 | | Retired (since February 2005); formerly Senior Managing Director (July 2001-February 2005) of Bear Stearns & Co, Inc.; Global Partner, INVESCO (1999-2001); Managing Director and President of Salomon Brothers Asset Management (1989-1999). | | None. | | Since July 2008 |
| | | | |
Brian K. Reid 1961 Board Member Portfolios Overseen: 94 | | Retired; formerly Chief Economist for the Investment Company Institute (ICI) (2005-2017); formerly Senior Economist and Director of Industry and Financial Analysis at the ICI (1998-2004); formerly Senior Economist, Industry and Financial Analysis at the ICI (1996-1998); formerly Staff Economist at the Federal Reserve Board (1989-1996); Director, ICI Mutual Insurance Company (2012-2017). | | None. | | Since March 2018 |
PGIM QMA Small-Cap Value Fund
| | | | | | |
| Independent Board Members | | | | |
| | | | |
Name Year of Birth Position(s) Portfolios Overseen | | Principal Occupation(s) During Past Five Years | | Other Directorships Held During Past Five Years | | Length of Board Service |
| | | | |
Grace C. Torres 1959 Board Member Portfolios Overseen: 94 | | Retired; formerly Treasurer and Principal Financial and Accounting Officer of the PGIM Funds, Target Funds, Advanced Series Trust, Prudential Variable Contract Accounts and The Prudential Series Fund (1998-June 2014); Assistant Treasurer (March 1999-June 2014) and Senior Vice President (September 1999-June 2014) of PGIM Investments LLC; Assistant Treasurer (May 2003-June 2014) and Vice President (June 2005-June 2014) of AST Investment Services, Inc.; Senior Vice President and Assistant Treasurer (May 2003-June 2014) of Prudential Annuities Advisory Services, Inc. | | Formerly Director (July 2015-January 2018) of Sun Bancorp, Inc. N.A. and Sun National Bank; Director (since January 2018) of OceanFirst Financial Corp. and OceanFirst Bank. | | Since November 2014 |
| | | | | | |
| Interested Board Members | | | | |
| | | | |
Name Year of Birth Position(s) Portfolios Overseen | | Principal Occupation(s) During Past Five Years | | Other Directorships Held During Past Five Years | | Length of Board Service |
| | | | |
Stuart S. Parker 1962 Board Member & President Portfolios Overseen: 96 | | President of PGIM Investments LLC (formerly known as Prudential Investments LLC) (since January 2012); Executive Vice President of Prudential Investment Management Services LLC (since December 2012); formerly Executive Vice President of Jennison Associates LLC and Head of Retail Distribution of PGIM Investments LLC (June 2005-December 2011). | | None. | | Since January 2012 |
Visit our website at pgim.com/investments
| | | | | | |
| Interested Board Members | | | | |
| | | | |
Name Year of Birth Position(s) Portfolios Overseen | | Principal Occupation(s) During Past Five Years | | Other Directorships Held During Past Five Years | | Length of Board Service |
| | | | |
Scott E. Benjamin 1973 Board Member & Vice President Portfolios Overseen: 96 | | Executive Vice President (since June 2009) of PGIM Investments LLC; Vice President (since June 2012) of Prudential Investment Management Services LLC; Executive Vice President (since September 2009) of AST Investment Services, Inc.; Senior Vice President of Product Development and Marketing, PGIM Investments (since February 2006); formerly Vice President of Product Development and Product Management, PGIM Investments LLC (2003-2006). | | None. | | Since March 2010 |
| | | | |
| Fund Officers(a) | | | | |
| | | |
Name Year of Birth Fund Position | | Principal Occupation(s) During Past Five Years | | Length of
Service as Fund
Officer |
| | | |
Claudia DiGiacomo 1974 Chief Legal Officer | | Vice President and Corporate Counsel (since January 2005) of Prudential; Chief Legal Officer of PGIM Investments LLC (since August 2020); Chief Legal Officer of Prudential Mutual Fund Services LLC (since August 2020); Chief Legal Officer of PIFM Holdco, LLC (since August 2020); and Corporate Counsel of AST Investment Services, Inc. (since August 2020); formerly Associate at Sidley Austin Brown & Wood LLP (1999-2004). | | Since December 2005 |
| | | |
Dino Capasso 1974 Chief Compliance Officer | | Chief Compliance Officer (July 2019-Present) of PGIM Investments LLC; Chief Compliance Officer (July 2019-Present) of the PGIM Funds, Target Funds, Advanced Series Trust, The Prudential Series Fund, Prudential’s Gibraltar Fund, Inc., PGIM Global High Yield Fund, Inc., and PGIM High Yield Bond Fund, Inc.; Vice President and Deputy Chief Compliance Officer (June 2017-2019) of PGIM Investments LLC; formerly, Senior Vice President and Senior Counsel (January 2016-June 2017), and Vice President and Counsel (February 2012-December 2015) of Pacific Investment Management Company LLC. | | Since March 2018 |
PGIM QMA Small-Cap Value Fund
| | | | |
| Fund Officers(a) | | | | |
| | | |
Name Year of Birth Fund Position | | Principal Occupation(s) During Past Five Years | | Length of Service as Fund Officer |
| | | |
Andrew R. French 1962 Secretary | | Vice President (since December 2018 - present) of PGIM Investments LLC; Formerly, Vice President and Corporate Counsel (2010-2018) of Prudential; formerly Director and Corporate Counsel (2006-2010) of Prudential; Vice President and Assistant Secretary (since January 2007) of PGIM Investments LLC; Vice President and Assistant Secretary (since January 2007) of Prudential Mutual Fund Services LLC. | | Since October 2006 |
| | | |
Jonathan D. Shain 1958 Assistant Secretary | | Vice President and Corporate Counsel (since August 1998) of Prudential; Vice President and Assistant Secretary (since May 2001) of PGIM Investments LLC; Vice President and Assistant Secretary (since February 2001) of Prudential Mutual Fund Services LLC; formerly Vice President and Assistant Secretary (May 2003-June 2005) of AST Investment Services, Inc. | | Since May 2005 |
| | | |
Diana N. Huffman 1982 Assistant Secretary | | Vice President and Corporate Counsel (since September 2015) of Prudential; Vice President and Assistant Secretary (since August 2020) of PGIM Investments LLC; formerly Associate at Willkie Farr & Gallagher LLP (2009-2015). | | Since March 2019 |
| | | |
Melissa Gonzalez 1980 Assistant Secretary | | Vice President and Corporate Counsel (since September 2018) of Prudential; Vice President and Assistant Secretary (since August 2020) of PGIM Investments LLC; formerly Director and Corporate Counsel (March 2014-September 2018) of Prudential. | | Since March 2020 |
| | | |
Patrick E. McGuinness 1986 Assistant Secretary | | Vice President and Assistant Secretary (since August 2020) of PGIM Investments LLC; Director and Corporate Counsel (since February 2017) of Prudential; and Corporate Counsel (2012 – 2017) of IIL, Inc. | | Since June 2020 |
| | | |
Kelly A. Coyne 1968 Assistant Secretary | | Director, Investment Operations of Prudential Mutual Fund Services LLC (since 2010). | | Since March 2015 |
| | | |
Christian J. Kelly 1975 Treasurer and Principal Financial and Accounting Officer | | Vice President, Head of Fund Administration of PGIM Investments LLC (since November 2018); formerly, Director of Fund Administration of Lord Abbett & Co. LLC (2009-2018), Treasurer and Principal Accounting Officer of the Lord Abbett Family of Funds (2017-2018); Director of Accounting, Avenue Capital Group (2008-2009); Senior Manager, Investment Management Practice of Deloitte & Touche LLP (1998-2007). | | Since January 2019 |
| | | |
Lana Lomuti 1967 Assistant Treasurer | | Vice President (since 2007) and Director (2005-2007), within PGIM Investments Fund Administration; formerly Assistant Treasurer (December 2007-February 2014) of The Greater China Fund, Inc. | | Since April 2014 |
| | | |
Russ Shupak 1973 Assistant Treasurer | | Vice President (since 2017) and Director (2013-2017), within PGIM Investments Fund Administration. | | Since October 2019 |
Visit our website at pgim.com/investments
| | | | |
| Fund Officers(a) | | | | |
| | | |
Name Year of Birth Fund Position | | Principal Occupation(s) During Past Five Years | | Length of Service as Fund Officer |
| | | |
Deborah Conway 1969 Assistant Treasurer | | Vice President (since 2017) and Director (2007-2017), within PGIM Investments Fund Administration. | | Since October 2019 |
| | | |
Elyse M. McLaughlin 1974 Assistant Treasurer | | Vice President (since 2017) and Director (2011-2017), within PGIM Investments Fund Administration. | | Since October 2019 |
| | | |
Charles H. Smith 1973 Anti-Money Laundering Compliance Officer | | Vice President, Corporate Compliance, Anti-Money Laundering Unit (since January 2015) of Prudential; committee member of the American Council of Life Insurers Anti-Money Laundering and Critical Infrastructure Committee (since January 2016); formerly Global Head of Economic Sanctions Compliance at AIG Property Casualty (February 2007-December 2014); Assistant Attorney General at the New York State Attorney General’s Office, Division of Public Advocacy. (August 1998-January 2007). | | Since January 2017 |
(a) Excludes Mr. Parker and Mr. Benjamin, interested Board Members who also serve as President and Vice President, respectively.
Explanatory Notes to Tables:
| ∎ | | Board Members are deemed to be “Interested,” as defined in the 1940 Act, by reason of their affiliation with PGIM Investments LLC and/or an affiliate of PGIM Investments LLC. |
| ∎ | | Unless otherwise noted, the address of all Board Members and Officers is c/o PGIM Investments LLC, 655 Broad Street, Newark, New Jersey 07102-4410. |
| ∎ | | There is no set term of office for Board Members or Officers. The Board Members have adopted a retirement policy, which calls for the retirement of Board Members on December 31 of the year in which they reach the age of 75. |
| ∎ | | “Other Directorships Held” includes all directorships of companies required to register or file reports with the SEC under the 1934 Act (that is, “public companies”) or other investment companies registered under the 1940 Act. |
| ∎ | | “Portfolios Overseen” includes all investment companies managed by PGIM Investments LLC. The investment companies for which PGIM Investments LLC serves as manager include the PGIM Funds, The Prudential Variable Contract Accounts, PGIM ETF Trust, PGIM High Yield Bond Fund, Inc., PGIM Global High Yield Fund, Inc., The Prudential Series Fund, Prudential’s Gibraltar Fund, Inc. and the Advanced Series Trust. |
| ∎ | | As used in the Fund Officers table “Prudential” means The Prudential Insurance Company of America. |
PGIM QMA Small-Cap Value Fund
Approval of Advisory Agreements
The Fund’s Board of Trustees
The Board of Trustees (the “Board”) of PGIM QMA Small-Cap Value Fund (the “Fund”)1 consists of eleven individuals, nine of whom are not “interested persons” of the Fund, as defined in the Investment Company Act of 1940, as amended (the “1940 Act”) (the “Independent Trustees”). The Board is responsible for the oversight of the Fund and its operations, and performs the various duties imposed on the directors of investment companies by the 1940 Act. The Independent Trustees have retained independent legal counsel to assist them in connection with their duties. The Chair of the Board is an Independent Trustee. The Board has established four standing committees: the Audit Committee, the Nominating and Governance Committee, and two Investment Committees. Each committee is chaired by, and composed of, Independent Trustees.
Annual Approval of the Fund’s Advisory Agreements
As required under the 1940 Act, the Board determines annually whether to renew the Fund’s management agreement with PGIM Investments LLC (“PGIM Investments”) and the Fund’s subadvisory agreement with QMA LLC (“QMA”). In considering the renewal of the agreements, the Board, including all of the Independent Trustees, met on May 27, 2020 and on June 9-11, 2020 and approved the renewal of the agreements through July 31, 2021, after concluding that the renewal of the agreements was in the best interests of the Fund and its shareholders.
In advance of the meetings, the Board requested and received materials relating to the agreements, and had the opportunity to ask questions and request further information in connection with its consideration. Among other things, the Board considered comparative fee information from PGIM Investments and QMA. Also, the Board considered comparisons with other mutual funds in relevant Peer Universes and Peer Groups, as is further discussed below.
In approving the agreements, the Board, including the Independent Trustees advised by independent legal counsel, considered the factors it deemed relevant, including the nature, quality and extent of services provided by PGIM Investments and the subadviser, the performance of the Fund, the profitability of PGIM Investments and its affiliates, expenses and fees, and the potential for economies of scale that may be shared with the Fund and its shareholders as the Fund’s assets grow. In their deliberations, the Trustees did not identify any single factor which alone was responsible for the Board’s decision to approve the agreements with respect to the Fund. In connection with its deliberations, the Board considered information provided by PGIM Investments throughout the year at regular Board meetings, presentations from portfolio managers and other information, as
| 1 | PGIM QMA Small-Cap Value Fund is a series of The Target Portfolio Trust. |
| | |
| PGIM QMA Small-Cap Value Fund |
Approval of Advisory Agreements (continued)
well as information furnished at or in advance of the meetings on May 27, 2020 and on June 9-11, 2020.
The Trustees determined that the overall arrangements between the Fund and PGIM Investments, which serves as the Fund’s investment manager pursuant to a management agreement, and between PGIM Investments and QMA, which serves as the Fund’s subadviser pursuant to the terms of a subadvisory agreement with PGIM Investments, are in the best interests of the Fund and its shareholders in light of the services performed, fees charged and such other matters as the Trustees considered relevant in the exercise of their business judgment. The material factors and conclusions that formed the basis for the Trustees’ reaching their determinations to approve the continuance of the agreements are separately discussed below.
Nature, Quality and Extent of Services
The Board received and considered information regarding the nature, quality and extent of services provided to the Fund by PGIM Investments and QMA. The Board noted that QMA is affiliated with PGIM Investments. The Board considered the services provided by PGIM Investments, including but not limited to the oversight of the subadviser for the Fund, as well as the provision of fund recordkeeping, compliance and other services to the Fund, and PGIM Investments’ role as administrator for the Fund’s liquidity risk management program . With respect to PGIM Investments’ oversight of the subadviser, the Board noted that PGIM Investments ’ Strategic Investment Research Group (“SIRG”), which is a business unit of PGIM Investments, is responsible for monitoring and reporting to PGIM Investments’ senior management on the performance and operations of the subadviser. The Board also considered that PGIM Investments pays the salaries of all of the officers and interested Trustees of the Fund who are part of Fund management. The Board also considered the investment subadvisory services provided by QMA, including investment research and security selection as well as adherence to the Fund’s investment restrictions and compliance with applicable Fund policies and procedures. The Board considered PGIM Investments’ evaluation of the subadviser, as well as PGIM Investments’ recommendation, based on its review of the subadviser, to renew the subadvisory agreement.
The Board considered the qualifications, backgrounds and responsibilities of PGIM Investments’ senior management responsible for the oversight of the Fund and QMA, and also considered the qualifications, backgrounds and responsibilities of the QMA portfolio managers who are responsible for the day-to-day management of the Fund’s portfolio. The Board was provided with information pertaining to PGIM Investments’ and QMA’s organizational structure, senior management, investment operations, and other relevant information pertaining to PGIM Investments and QMA. The Board also noted that it received favorable compliance reports from the Fund’s Chief Compliance Officer (“CCO”) as to PGIM Investments and QMA.
| | |
| Visit our website at pgim.com/investments | | |
The Board concluded that it was satisfied with the nature, extent and quality of the investment management services provided by PGIM Investments and the subadvisory services provided to the Fund by QMA, and that there was a reasonable basis on which to conclude that the Fund benefits from the services provided by PGIM Investments and QMA under the management and subadvisory agreements.
Costs of Services and Profits Realized by PGIM Investments
The Board was provided with information on the profitability of PGIM Investments and its affiliates in serving as the Fund’s investment manager. The Board discussed with PGIM Investments the methodology utilized in assembling the information regarding profitability and considered its reasonableness. The Board recognized that it is difficult to make comparisons of profitability from fund management contracts because comparative information is not generally publicly available and is affected by numerous factors, including the structure of the particular adviser, the types of funds it manages, its business mix, numerous assumptions regarding allocations and the adviser’s capital structure and cost of capital. Taking these factors into account, the Board concluded that the profitability of PGIM Investments and its affiliates in relation to the services rendered was not unreasonable.
Economies of Scale
The Board received and discussed information concerning economies of scale that PGIM Investments may realize as the Fund’s assets grow beyond current levels. The Board noted that the management fee schedule for the Fund includes breakpoints, which have the effect of decreasing the fee rate as assets increase. During the course of time, the Board has considered information regarding the launch date of the Fund, the management fees of the Fund compared to those of similarly managed funds and PGIM Investments’ investment in the Fund over time. The Board noted that economies of scale can be shared with the Fund in other ways, including low management fees from inception, additional technological and personnel investments to enhance shareholder services, and maintaining existing expense structures in the face of a rising cost environment. The Board also considered PGIM Investments’ assertion that it continually evaluates the management fee schedule of the Fund and the potential to share economies of scale through breakpoints or fee waivers as asset levels increase.
The Board recognized the inherent limitations of any analysis of economies of scale, stemming largely from the Board’s understanding that most of PGIM Investments’ costs are not specific to individual funds, but rather are incurred across a variety of products and services.
| | |
| PGIM QMA Small-Cap Value Fund |
Approval of Advisory Agreements (continued)
Other Benefits to PGIM Investments and QMA
The Board considered potential ancillary benefits that might be received by PGIM Investments, QMA and their affiliates as a result of their relationship with the Fund. The Board concluded that potential benefits to be derived by PGIM Investments included transfer agency fees received by the Fund’s transfer agent (which is affiliated with PGIM Investments), and benefits to its reputation as well as other intangible benefits resulting from PGIM Investments’ association with the Fund. The Board concluded that the potential benefits to be derived by QMA included its ability to use soft dollar credits, as well as the potential benefits consistent with those generally resulting from an increase in assets under management, specifically, potential access to additional research resources and benefits to its reputation. The Board concluded that the benefits derived by PGIM Investments and QMA we re consistent with the types of benefits generally derived by investment managers and subadvisers to mutual funds.
Performance of the Fund / Fees and Expenses
The Board considered certain additional factors and made related conclusions relating to the historical performance of the Fund for the one-, three-, five- and ten-year periods ended December 31, 2019.
The Board also considered the Fund’s actual management fee, as well as the Fund’s net total expense ratio, for the fiscal year ended July 31, 2019. The Board considered the management fee for the Fund as compared to the management fee charged by PGIM Investments to other funds and the fee charged by other advisers to comparable mutual funds in a Peer Group. The actual management fee represents the fee rate actually paid by Fund shareholders and includes any fee waivers or reimbursements. The net total expense ratio for the Fund represents the actual expense ratio incurred by Fund shareholders.
The mutual funds included in the Peer Universe, which was used to evaluate performance, and the Peer Group, which was used to evaluate fees and expenses, were objectively determined by Broadridge, an independent provider of mutual fund data. In certain circumstances, PGIM Investments also provided supplemental Peer Universe or Peer Group information for reasons addressed with the Board. The comparisons placed the Fund in various quartiles over various periods, with the first quartile being the best 25% of the mutual funds (for performance, the best performing mutual funds and, for expenses, the lowest cost mutual funds).
The section below summarizes key factors considered by the Board and the Board’s conclusions regarding the Fund’s performance, fees and overall expenses. The table sets forth net performance comparisons (which reflect the impact on performance of fund expenses, or any subsidies, expense caps or waivers that may be applicable) with the Peer
| | |
| Visit our website at pgim.com/investments | | |
Universe, actual management fees with the Peer Group (which reflect the impact of any subsidies or fee waivers), and net total expenses with the Peer Group, each of which were key factors considered by the Board.
| | | | | | | | |
| Net Performance | | 1 Year | | 3 Years | | 5 Years | | 10 Years |
| | | 4th Quartile | | 4th Quartile | | 3rd Quartile | | 3rd Quartile |
| Actual Management Fees: 1st Quartile |
| Net Total Expenses: 1st Quartile |
| | • | | The Board noted that the Fund underperformed its benchmark index over all periods. |
| | • | | The Board considered PGIM Investments’ assertions that the Fund’s underperformance was attributable to its deep value investment style and its overweight to deep value stocks relative to the benchmark index and Peer Universe, at a time when the market environment heavily favored growth stocks. |
| | • | | The Board also considered that longer-term performance was competitive prior to 2018, as the Fund’s three-year rolling annualized return outperformed its benchmark more than 80% of the time since inception. The Board noted that the Fund’s underperformance during the periods identified above was largely the result of underperformance during one year, 2019. In that regard, the Board noted that when it considered the performance of the Fund one year before, the Fund ranked in the second quartile of its Peer Group over the three- and five-year periods and outperformed its benchmark index over the ten-year period ended December 31, 2018. |
| | • | | The Board further considered PGIM Investments’ assertion that while the current market environment has been extremely challenging to the Fund’s investment style, it is encouraged by QMA’s track record before the current market environment and during periods where the Fund’s value style factor exposure has delivered outsized gains. The Board noted that PGIM Investments views the recent performance challenges as temporary and agreed to continue to monitor the performance of the Fund. |
| | • | | The Board and PGIM Investments agreed to retain the Fund’s existing contractual waiver of up to 0.01% to the extent that the Fund’s annual operating expenses and acquired fund fees and expenses (exclusive of certain fees and expenses) exceed 0.68% through November 30, 2020. |
| | • | | The Board and PGIM Investments also agreed to continue the Fund’s existing expense cap, which (exclusive of certain fees and expenses) caps transfer agency, shareholder servicing, sub-transfer agency and blue sky fees to the extent that such fees cause the total annual fund operating expenses to exceed 1.14% for Class R2 shares and 0.89% for Class R4 shares through November 30, 2020. |
| | • | | In addition, PGIM Investments will waive management fees or shared operating expenses on any share class to the same extent that it waives such expenses on any other share class, and has agreed that total annual fund operating expenses for Class R6 shares will not exceed total annual fund operating expenses for Class Z shares. |
| | |
| PGIM QMA Small-Cap Value Fund |
Approval of Advisory Agreements (continued)
| | • | | The Board concluded that, in light of the above, it would be in the best interests of the Fund and its shareholders to renew the agreements. |
| | • | | The Board concluded that the management fees (including subadvisory fees) and total expenses were reasonable in light of the services provided. |
* * *
After full consideration of these factors, the Board concluded that approval of the agreements was in the best interests of the Fund and its shareholders.
| | |
| Visit our website at pgim.com/investments | | |
| | | | |
| | |
| ∎ MAIL | | ∎ TELEPHONE | | ∎ WEBSITE |
655 Broad Street Newark, NJ 07102 | | (800) 225-1852 | | pgim.com/investments |
|
| PROXY VOTING |
| The Board of Trustees of the Fund has delegated to the Fund’s subadviser the responsibility for voting any proxies and maintaining proxy recordkeeping with respect to the Fund. A description of these proxy voting policies and procedures is available without charge, upon request, by calling (800) 225-1852 or by visiting the Securities and Exchange Commission’s website at sec.gov. Information regarding how the Fund voted proxies relating to portfolio securities during the most recent 12-month period ended June 30 is available on the Fund’s website and on the Commission’s website at sec.gov. |
|
| TRUSTEES |
| Ellen S. Alberding • Kevin J. Bannon • Scott E. Benjamin • Linda W. Bynoe • Barry H. Evans • Keith F. Hartstein • Laurie Simon Hodrick • Michael S. Hyland • Stuart S. Parker • Brian K. Reid • Grace C. Torres |
|
| OFFICERS |
Stuart S. Parker, President • Scott E. Benjamin, Vice President • Christian J. Kelly, Treasurer and Principal Financial and Accounting Officer • Claudia DiGiacomo, Chief Legal Officer • Dino Capasso, Chief Compliance Officer • Charles H. Smith, Anti-Money Laundering Compliance Officer • Andrew R. French, Secretary • Jonathan D. Shain, Assistant Secretary • Melissa Gonzalez, Assistant Secretary • Diana N. Huffman, Assistant Secretary • Kelly A. Coyne, Assistant Secretary • Patrick McGuinness, Assistant Secretary • Lana Lomuti, Assistant Treasurer • Russ Shupak, Assistant Treasurer • Elyse McLaughlin, Assistant Treasurer • Deborah Conway, Assistant Treasurer |
| | | | |
| MANAGER | | PGIM Investments LLC | | 655 Broad Street Newark, NJ 07102 |
|
| SUBADVISER | | QMA LLC | | Gateway Center Two 100 Mulberry Street Newark, NJ 07102 |
|
| DISTRIBUTOR | | Prudential Investment Management Services LLC | | 655 Broad Street Newark, NJ 07102 |
|
| CUSTODIAN | | The Bank of New York Mellon | | 240 Greenwich Street New York, NY 10286 |
|
| TRANSFER AGENT | | Prudential Mutual Fund Services LLC | | PO Box 9658 Providence, RI 02940 |
|
INDEPENDENT REGISTERED
PUBLIC ACCOUNTING FIRM | | KPMG LLP | | 345 Park Avenue New York, NY 10154 |
|
| FUND COUNSEL | | Willkie Farr & Gallagher LLP | | 787 Seventh Avenue New York, NY 10019 |
|
|
| An investor should consider the investment objectives, risks, charges, and expenses of the Fund carefully before investing. The prospectus and summary prospectus contain this and other information about the Fund. An investor may obtain a prospectus and summary prospectus by visiting our website at pgim.com/investments or by calling (800) 225-1852. The prospectus and summary prospectus should be read carefully before investing. |
|
| E-DELIVERY |
| To receive your mutual fund documents online, go to pgim.com/investments/resource/edelivery and enroll. Instead of receiving printed documents by mail, you will receive notification via email when new materials are available. You can cancel your enrollment or change your email address at any time by visiting the website address above. |
|
| SHAREHOLDER COMMUNICATIONS WITH TRUSTEES |
| Shareholders can communicate directly with the Board of Trustees by writing to the Chair of the Board, PGIM QMA Small-Cap Value Fund, PGIM Investments, Attn: Board of Trustees, 655 Broad Street, Newark, NJ 07102. Shareholders can communicate directly with an individual Trustee by writing to that Trustee at the same address. Communications are not screened before being delivered to the addressee. |
|
| AVAILABILITY OF PORTFOLIO SCHEDULE |
The Fund files its complete schedule of portfolio holdings with the Securities and Exchange Commission for the first and third quarters of each fiscal year as an exhibit to its reports on Form N-PORT. The Fund’s Form N-PORT filings are available on the Commission’s website at sec.gov. |
|
| The Fund’s Statement of Additional Information contains additional information about the Fund’s Trustees and is available without charge, upon request, by calling (800) 225-1852. |
Mutual Funds:
| | | | |
ARE NOT INSURED BY THE FDIC OR ANY
FEDERAL GOVERNMENT AGENCY | | MAY LOSE VALUE | | ARE NOT A DEPOSIT OF OR GUARANTEED
BY ANY BANK OR ANY BANK AFFILIATE |
PGIM QMA SMALL-CAP VALUE FUND
| | | | | | | | | | | | | | |
| SHARE CLASS | | A | | C | | R | | Z | | R2 | | R4 | | R6 |
| NASDAQ | | TSVAX | | TRACX | | TSVRX | | TASVX | | PSVDX | | PSVKX | | TSVQX |
| CUSIP | | 875921785 | | 875921710 | | 875921843 | | 875921306 | | 875921611 | | 875921595 | | 875921777 |
MF232E

PGIM CORE BOND FUND
ANNUAL REPORT
JULY 31, 2020
COMING SOON: PAPERLESS SHAREHOLDER REPORTS
Beginning on January 1, 2021, as permitted by regulations adopted by the Securities and Exchange Commission, paper copies of the Fund’s annual and semiannual shareholder reports will no longer be sent by mail, unless you specifically request paper copies of the reports. Instead, the reports will be made available on the Fund’s website (pgim.com/investments), and you will be notified by mail each time a report is posted and provided with a website link to access the report.
If you already elected to receive shareholder reports electronically, you will not be affected by this change and you need not take any action. You may elect to receive shareholder reports and other communications from the Fund electronically anytime by contacting your financial intermediary (such as a broker-dealer or bank) or, if you are a direct investor, by calling 1-800-225-1852 or by sending an email request to PGIM Investments at shareholderreports@pgim.com.
You may elect to receive all future reports in paper free of charge. If you invest through a financial intermediary, you can contact your financial intermediary or follow instructions included with this notice to elect to continue to receive paper copies of your shareholder reports. If you invest directly with the Fund, you can call 1-800-225-1852 or send an email request to shareholderreports@pgim.com to let the Fund know you wish to continue receiving paper copies of your shareholder reports. Your election to receive reports in paper will apply to all funds held in your account if you invest through your financial intermediary or all funds held with the fund complex if you invest directly with the Fund.

To enroll in e-delivery, go to pgim.com/investments/resource/edelivery
Table of Contents
This report is not authorized for distribution to prospective investors unless preceded or accompanied by a current prospectus.
The views expressed in this report and information about the Fund’s portfolio holdings are for the period covered by this report and are subject to change thereafter.
Mutual funds are distributed by Prudential Investment Management Services LLC (PIMS), member SIPC. PGIM Fixed Income is a unit of PGIM, Inc. (PGIM), a registered investment adviser. PIMS and PGIM are Prudential Financial companies. © 2020 Prudential Financial, Inc. and its related entities. PGIM and the PGIM logo are service marks of Prudential Financial, Inc. and its related entities, registered in many jurisdictions worldwide.
| | |
| 2 | | Visit our website at pgim.com/investments |
Letter from the President

Dear Shareholder:
We hope you find the annual report for the PGIM Core Bond Fund informative and useful. The report covers performance for the 12-month period that ended July 31, 2020.
During the first half of the period, the global economy remained healthy—particularly in the US—fueled by rising corporate profits and strong job growth. The outlook changed dramatically in March as the coronavirus outbreak quickly and substantially shut down economic activity worldwide, leading to significant job losses and a steep decline in global growth and earnings. Responding to this disruption, the Federal Reserve (the Fed) cut the federal funds rate target to near zero and flooded capital markets with liquidity; and Congress passed stimulus bills worth approximately $3 trillion that offered an economic lifeline to consumers and businesses.
While stocks climbed throughout the first half of the period, they fell significantly in March amid a spike in volatility, ending the 11-year-long equity bull market. With stores and factories closing and consumers staying at home to limit the spread of the virus, investors sold stocks on fears that corporate earnings would take a serious hit. As states reopened their economies in the spring and early summer, a strong equity market rally helped large-cap US and emerging market stocks post gains during the period, while US small caps and stocks in developed foreign markets declined.
The bond market overall—including US and global bonds as well as emerging market debt—rose during the period as investors sought safety in fixed income. A significant rally in interest rates pushed the 10-year US Treasury yield down to a record low. In March, the Fed took several aggressive actions to keep the bond markets running smoothly, restarting many of the relief programs that proved to be successful in helping end the global financial crisis in 2008-09.
Regarding your investments with PGIM, we believe it is important to maintain a diversified portfolio of funds consistent with your tolerance for risk, time horizon, and financial goals. Your financial advisor can help you create a diversified investment plan that may include funds covering all the basic asset classes and that reflects your personal investor profile and risk tolerance. However, diversification and asset allocation strategies do not assure a profit or protect against loss in declining markets.
At PGIM Investments, we consider it a great privilege and responsibility to help investors participate in opportunities across global markets while meeting their toughest investment challenges. PGIM is a top-10 global investment manager with more than $1 trillion in assets under management. This scale and investment expertise allow us to deliver actively managed funds and strategies to meet the needs of investors around the globe.
Thank you for choosing our family of funds.
Sincerely,

Stuart S. Parker, President
PGIM Core Bond Fund
September 15, 2020
Your Fund’s Performance (unaudited)
Performance data quoted represent past performance. Past performance does not guarantee future results. The investment return and principal value of an investment will fluctuate, so that an investor’s shares, when redeemed, may be worth more or less than their original cost. Current performance may be lower or higher than the past performance data quoted. An investor may obtain performance data as of the most recent month-end by visiting our website at pgim.com/investments or by calling (800) 225-1852.
| | | | | | | | |
| |
| | | Average Annual Total Returns as of 7/31/20 |
| | | One Year (%) | | Five Years (%) | | Ten Years (%) | | Since Inception (%) |
| Class A | | | | | | | | |
| (with sales charges) | | 5.94 | | 3.63 | | N/A | | 3.32 (2/17/15) |
| (without sales charges) | | 9.50 | | 4.32 | | N/A | | 3.94 (2/17/15) |
| Class C | | | | | | | | |
| (with sales charges) | | 7.68 | | 3.54 | | N/A | | 3.18 (2/17/15) |
| (without sales charges) | | 8.68 | | 3.54 | | N/A | | 3.18 (2/17/15) |
| Class R | | | | | | | | |
| (without sales charges) | | 9.23 | | 4.07 | | N/A | | 3.69 (2/17/15) |
| Class Z | | | | | | | | |
| (without sales charges) | | 9.98 | | 4.63 | | 3.57 | | — |
| Class R6 | | | | | | | | |
| (without sales charges) | | 10.00 | | 4.66 | | N/A | | 4.28 (2/17/15) |
| Bloomberg Barclays US Aggregate Bond Index |
| | | 10.12 | | 4.47 | | 3.87 | | 4.01 |
Since Inception returns are provided for any share class with less than 10 fiscal years of returns. Since Inception returns for the Index are measured from the closest month-end to the class’ inception date.
| | |
| 4 | | Visit our website at pgim.com/investments |
Growth of a $10,000 Investment
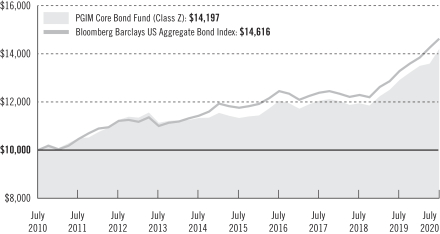
The graph compares a $10,000 investment in the Fund’s Class Z shares with a similar investment in the Bloomberg Barclays US Aggregate Bond Index by portraying the initial account values at the beginning of the 10-year period (July 31, 2010) and the account values at the end of the current fiscal year (July 31, 2020), as measured on a quarterly basis. For purposes of the graph, and unless otherwise indicated, it has been assumed that (a) all recurring fees (including management fees) were deducted; and (b) all dividends and distributions were reinvested. The line graph provides information for Class Z shares only. As indicated in the tables provided earlier, performance for Class A, Class C, Class R, and Class R6 shares will vary due to the differing charges and expenses applicable to each share class (as indicated in the following paragraphs). Without waiver of fees and/or expense reimbursements, if any, the returns would have been lower.
Your Fund’s Performance (continued)
The returns in the tables do not reflect the deduction of taxes that a shareholder would pay on Fund distributions or following the redemption of Fund shares. The average annual total returns take into account applicable sales charges, which are described in the table below.
| | | | | | | | | | |
| | | | | | |
| | | Class A | | Class C | | Class R | | Class Z | | Class R6 |
| Maximum initial sales charge | | 3.25% of the public offering price | | None | | None | | None | | None |
| Contingent deferred sales charge (CDSC) (as a percentage of the lower of the original purchase price or the net asset value at redemption) | | For purchases prior to July 15, 2019: 1.00% on sales of $1 million or more made within 12 months of purchase. For purchases on or after July 15, 2019: 1.00% on sales of $500,000 or more made within 12 months of purchase | | 1.00% on sales made within 12 months of purchase | | None | | None | | None |
| Annual distribution or distribution and service (12b-1) fees (shown as a percentage of average daily net assets) | | 0.25% | | 1.00% | | 0.75%
(0.50%
currently) | | None | | None |
Benchmark Definitions
Bloomberg Barclays US Aggregate Bond Index—The Bloomberg Barclays US Aggregate Bond Index is unmanaged and represents securities that are SEC registered, taxable, and dollar denominated. It covers the US investment grade fixed rate bond market, with index components for government and corporate securities, mortgage pass-through securities, and asset-backed securities.
| | |
| 6 | | Visit our website at pgim.com/investments |
Investors cannot invest directly in an index. The returns for the Index would be lower if they included the effects of sales charges, operating expenses of a mutual fund, or taxes.
| | | | | | |
|
| Distributions and Yields as of 7/31/20 |
| | Total Distributions
Paid for
12 Months ($) | | SEC 30-Day
Subsidized
Yield* (%) | | SEC 30-Day
Unsubsidized
Yield** (%) |
| Class A | | 0.26 | | 1.21 | | 1.15 |
| Class C | | 0.18 | | 0.57 | | 0.00 |
| Class R | | 0.23 | | 1.02 | | –113.55 |
| Class Z | | 0.29 | | 1.67 | | 1.41 |
| Class R6 | | 0.29 | | 1.68 | | 1.61 |
*SEC 30-Day Subsidized Yield (%)—A standardized yield calculation created by the Securities and Exchange Commission, it reflects the income earned during a 30-day period, after the deduction of the Fund’s net expenses (net of any expense waivers or reimbursements). The investor experience is represented by the SEC 30-Day Subsidized Yield.
**SEC 30-Day Unsubsidized Yield (%)—A standardized yield calculation created by the Securities and Exchange Commission, it reflects the income earned during a 30-day period, after the deduction of the Fund’s gross expenses. The investor experience is represented by the SEC 30-Day Subsidized Yield.
| | | | |
|
| Credit Quality expressed as a percentage of total investments as of 7/31/20 (%) | |
| AAA | | | 61.3 | |
| AA | | | 6.5 | |
| A | | | 14.3 | |
| BBB | | | 14.1 | |
| BB | | | 0.6 | |
| Not Rated | | | 1.5 | |
| Cash Equivalents | | | 1.7 | |
| Total Investments | | | 100.0 | |
Credit ratings reflect the highest rating assigned by a nationally recognized statistical rating organization (NRSRO) such as Moody’s Investors Service, Inc. (Moody’s), S&P Global Ratings (S&P), or Fitch, Inc. (Fitch). Credit ratings reflect the common nomenclature used by both S&P and Fitch. Where applicable, ratings are converted to the comparable S&P/Fitch rating tier nomenclature. These rating agencies are independent, and are widely used. The Not Rated category consists of securities that have not been rated by an NRSRO. Credit ratings are subject to change.
Strategy and Performance Overview
How did the Fund perform?
The PGIM Core Bond Fund’s Class Z shares returned 9.98% in the 12-month reporting period that ended July 31, 2020, underperforming the 10.12% return of the Bloomberg Barclays US Aggregate Bond Index (the Index).
What were the market conditions?
| • | | Following several stable months, the last part of the reporting period was dominated by the global outbreak of COVID-19, its economic impact, and the resulting decline in risk sentiment around the globe. After generating sizable returns throughout the latter part of 2019, credit spreads widened sharply during the first quarter of 2020 as the coronavirus and an oil price shock led to acute declines across most spread sectors. (Credit spreads are yield differentials between corporate bonds and US Treasuries of comparable maturity.) In response to unprecedented monetary and fiscal stimulus programs aimed at stabilizing the economy and financial markets, spreads subsequently tightened sharply but remained wider than their pre-COVID-19 levels. |
| • | | Through the first part of the reporting period, spread sectors benefited from accommodative central banks, low and range-bound interest rates, and an extended (albeit slow) economic expansion. The signing of a phase-one US-China trade deal further boosted sentiment toward the end of 2019 and through most of January 2020. However, this optimism proved short-lived, as markets came under heavy pressure in February and March when growing concerns around the coronavirus and a decline in oil prices sparked a sharp sell-off across most asset classes. |
| • | | US investment-grade bond spreads rose to a high of approximately 375 basis points (bps) in mid-March before narrowing into quarter-end following aggressive actions by the Federal Reserve (the Fed). (One basis point equals 0.01%). Collateralized loan obligation (CLO) spreads widened across the board, with AAA-rated tranches widening 117 bps during the first quarter to 250 bps. Commercial mortgage-backed securities (CMBS) spreads also widened across the capital stack, with those of high-quality tranches of conduit CMBS widening by 98 bps during the quarter. |
| • | | Following a difficult March, spread markets rebounded sharply, as the Fed’s aggressive stimulus actions—including a near-zero federal funds rate, purchases of mortgage-backed securities (MBS) and CMBS, primary and secondary corporate credit facilities, and a term asset-backed loan facility (TALF)—significantly improved market liquidity. Risk-on sentiment saw spreads decline sharply over the last four months of the reporting period. |
| • | | US Treasury yields fell sharply across the curve during the period, with the yield on the 2-year Treasury note declining from 1.89% to 0.11%. The yield on the 10-year Treasury note declined from 2.02% at the beginning of the period to 0.55% at the end of July. |
| • | | One of the more notable developments within the US Treasuries complex during the second quarter of 2020 was a sharp steepening of the yield curve on some initial signs of |
| | |
| 8 | | Visit our website at pgim.com/investments |
| | a solid economic rebound. The 2- to 10-year segment of the curve began the quarter at 43 bps and subsequently bear-steepened to 69 bps following a stronger-than-expected May payrolls report. (Bear-steepening is a change in the yield curve wherein longer-term yields rise faster than short-term yields.) This set the stage for subsequent curve flattening amid renewed expectations for a gradual economic recovery and years of broad monetary accommodation. |
What worked?
| | • | | Security selection was a strong contributor to the Fund’s relative performance, highlighted by positioning in corporate bonds, CMBS, and Treasuries. |
| | • | | Although overall sector allocation hurt performance, an overweight to corporate bonds and underweight positioning to MBS added to returns. |
| | • | | Within credit, positioning in the healthcare & pharmaceuticals, banking, and electric utilities industries contributed to results. |
| | • | | In individual security selection, the Fund benefited from an underweight to Occidental Petroleum Corp. and overweights to Broadcom Inc. and AbbVie Inc. |
| | • | | The Fund’s duration positioning added modestly to performance during the period. (Duration measures the sensitivity of the price—the value of principal—of a bond to a change in interest rates.) |
What didn’t work?
| | • | | Overall sector allocation was negative, with overweights to CMBS and CLOs limiting the Fund’s relative results. |
| | • | | Security selection in ABS and emerging markets debt hurt performance for the reporting period. |
| | • | | The Fund’s positioning in the midstream energy, aerospace & defense, and telecom sectors detracted from performance. |
| | • | | The Fund’s yield curve positioning detracted slightly from performance during the period. |
| | • | | In individual security selection, the Fund’s overweight positioning in ONEOK Inc., Avis Rental Cars, and Continental Resources Inc. detracted from performance. |
Did the Fund use derivatives?
The Fund uses derivatives when they facilitate implementation of the overall investment approach. During the reporting period, the Fund used interest rate futures, options, and
Strategy and Performance Overview (continued)
swaps to help manage duration positioning and yield curve exposure. In aggregate, these positions added to performance.
Current outlook
| | • | | The Fund’s active duration positioning ranged from -0.30 years short to +0.20 years long, as PGIM Fixed Income tactically traded duration during the reporting period. The Fund’s duration positioning at the end of the period was +0.03 years long. |
| | • | | Although spread sectors rebounded significantly in the second quarter of 2020, spreads remained wider than their pre-COVID-19 levels. PGIM Fixed Income continues to find value within investment-grade corporate bonds and asset-backed securities (ABS), which represent attractive value in relation to Treasuries and agency mortgage-backed securities. |
| | • | | When the period ended, the Fund was overweight in structured products (CMBS, ABS, and CLOs), investment-grade corporate bonds, and municipal bonds. The Fund was underweight US Treasury securities and agency mortgage-backed securities. |
| | • | | Within structured products, PGIM Fixed Income maintains the Fund’s bias toward the top of the capital structure based on the belief that these securities may revisit their post-crisis tights. PGIM Fixed Income generally holds a negative view on lower-quality structured products that are subordinate in the capital structure. |
| | • | | Within investment-grade corporate bonds, PGIM Fixed Income favors shorter-term maturities that should benefit from the Fed’s bond buying program. PGIM Fixed Income is looking to take advantage of spread compression in select higher-yielding BBB-rated bonds, distressed survivors, cyclical sectors such as autos and chemicals, and “off-the-run” bonds (i.e., older issues). In addition, PGIM Fixed Income still favors electric utilities and money center banks. |
| | |
| 10 | | Visit our website at pgim.com/investments |
Fees and Expenses (unaudited)
As a shareholder of the Fund, you incur two types of costs: (1) transaction costs, including sales charges (loads) on purchase payments and redemptions, as applicable, and (2) ongoing costs, including management fees, distribution and/or service (12b-1) fees, and other Fund expenses, as applicable. This example is intended to help you understand your ongoing costs (in dollars) of investing in the Fund and to compare these costs with the ongoing costs of investing in other mutual funds.
The example is based on an investment of $1,000 held through the six-month period ended July 31, 2020. The example is for illustrative purposes only; you should consult the Fund’s Prospectus for information on initial and subsequent minimum investment requirements.
Actual Expenses
The first line for each share class in the table on the following page provides information about actual account values and actual expenses. You may use the information on this line, together with the amount you invested, to estimate the expenses that you paid over the period. Simply divide your account value by $1,000 (for example, an $8,600 account value ÷ $1,000 = 8.6), then multiply the result by the number on the first line under the heading “Expenses Paid During the Six-Month Period” to estimate the expenses you paid on your account during this period.
Hypothetical Example for Comparison Purposes
The second line for each share class in the table on the following page provides information about hypothetical account values and hypothetical expenses based on the Fund’s actual expense ratio and an assumed rate of return of 5% per year before expenses, which is not the Fund’s actual return. The hypothetical account values and expenses may not be used to estimate the actual ending account balance or expenses you paid for the period. You may use this information to compare the ongoing costs of investing in the Fund and other funds. To do so, compare this 5% hypothetical example with the 5% hypothetical examples that appear in the shareholder reports of the other funds.
The Fund’s transfer agent may charge additional fees to holders of certain accounts that are not included in the expenses shown in the table on the following page. These fees apply to individual retirement accounts (IRAs) and Section 403(b) accounts. As of the close of the six-month period covered by the table, IRA fees included an annual maintenance fee of $15 per account (subject to a maximum annual maintenance fee of $25 for all accounts held by the same shareholder). Section 403(b) accounts are charged an annual $25 fiduciary maintenance fee. Some of the fees may vary in amount, or may be waived, based on your total account balance or the number of PGIM funds, including the Fund, that you own. You should consider the additional fees that were charged to your Fund account over the six-month period when you estimate the total ongoing expenses paid over the period
Fees and Expenses (continued)
and the impact of these fees on your ending account value, as these additional expenses are not reflected in the information provided in the expense table. Additional fees have the effect of reducing investment returns.
Please note that the expenses shown in the table are meant to highlight your ongoing costs only and do not reflect any transactional costs such as sales charges (loads). Therefore, the second line for each share class in the table is useful in comparing ongoing costs only and will not help you determine the relative total costs of owning different funds. In addition, if these transactional costs were included, your costs would have been higher.
| | | | | | | | | | | | | | | | | | |
| | | | |
PGIM
Core Bond Fund | | Beginning Account
Value
February 1, 2020 | | | Ending Account
Value
July 31, 2020 | | | Annualized
Expense Ratio
Based on the
Six-Month Period | | | Expenses Paid
During the
Six-Month Period* | |
| Class A | | Actual | | $ | 1,000.00 | | | $ | 1,049.60 | | | | 0.71 | % | | $ | 3.62 | |
| | Hypothetical | | $ | 1,000.00 | | | $ | 1,021.33 | | | | 0.71 | % | | $ | 3.57 | |
| Class C | | Actual | | $ | 1,000.00 | | | $ | 1,046.70 | | | | 1.45 | % | | $ | 7.38 | |
| | Hypothetical | | $ | 1,000.00 | | | $ | 1,017.65 | | | | 1.45 | % | | $ | 7.27 | |
| Class R | | Actual | | $ | 1,000.00 | | | $ | 1,049.30 | | | | 0.95 | % | | $ | 4.84 | |
| | Hypothetical | | $ | 1,000.00 | | | $ | 1,020.14 | | | | 0.95 | % | | $ | 4.77 | |
| Class Z | | Actual | | $ | 1,000.00 | | | $ | 1,052.50 | | | | 0.33 | % | | $ | 1.68 | |
| | Hypothetical | | $ | 1,000.00 | | | $ | 1,023.22 | | | | 0.33 | % | | $ | 1.66 | |
| Class R6 | | Actual | | $ | 1,000.00 | | | $ | 1,052.60 | | | | 0.32 | % | | $ | 1.63 | |
| | | Hypothetical | | $ | 1,000.00 | | | $ | 1,023.27 | | | | 0.32 | % | | $ | 1.61 | |
*Fund expenses (net of fee waivers or subsidies, if any) for each share class are equal to the annualized expense ratio for each share class (provided in the table), multiplied by the average account value over the period, multiplied by the 182 days in the six-month period ended July 31, 2020, and divided by the 366 days in the Fund’s fiscal year ended July 31, 2020 (to reflect the six-month period). Expenses presented in the table include the expenses of any underlying portfolios in which the Fund may invest.
| | |
| 12 | | Visit our website at pgim.com/investments |
Schedule of Investments
as of July 31, 2020
| | | | | | | | | | | | | | | | |
| | | | |
| Description | | Interest
Rate | | | Maturity
Date | | | Principal
Amount
(000)# | | | Value | |
| | | | |
LONG-TERM INVESTMENTS 96.2% | | | | | | | | | | | | | | | | |
| | | | |
ASSET-BACKED SECURITIES 15.2% | | | | | | | | | | | | | | | | |
| | | | |
Automobiles 4.0% | | | | | | | | | | | | | | | | |
AmeriCredit Automobile Receivables Trust, | | | | | | | | | | | | | | | | |
Series 2018-01, Class C | | | 3.500 | % | | | 01/18/24 | | | | 500 | | | $ | 521,331 | |
Series 2019-01, Class B | | | 3.130 | | | | 02/18/25 | | | | 300 | | | | 311,597 | |
Series 2019-01, Class C | | | 3.360 | | | | 02/18/25 | | | | 400 | | | | 421,760 | |
Series 2019-02, Class C | | | 2.740 | | | | 04/18/25 | | | | 700 | | | | 721,632 | |
Series 2019-03, Class C | | | 2.320 | | | | 07/18/25 | | | | 1,700 | | | | 1,741,050 | |
Series 2020-01, Class B | | | 1.480 | | | | 01/21/25 | | | | 1,400 | | | | 1,408,254 | |
Series 2020-02, Class C | | | 1.480 | | | | 02/18/26 | | | | 400 | | | | 401,109 | |
Avis Budget Rental Car Funding AESOP LLC, | | | | | | | | | | | | | | | | |
Series 2016-01A, Class A, 144A | | | 2.990 | | | | 06/20/22 | | | | 900 | | | | 900,797 | |
Series 2018-01A, Class A, 144A | | | 3.700 | | | | 09/20/24 | | | | 1,100 | | | | 1,116,413 | |
Series 2018-02A, Class A, 144A | | | 4.000 | | | | 03/20/25 | | | | 500 | | | | 510,099 | |
Series 2019-02A, Class A, 144A | | | 3.350 | | | | 09/22/25 | | | | 1,100 | | | | 1,126,722 | |
Series 2019-03A, Class A, 144A | | | 2.360 | | | | 03/20/26 | | | | 1,700 | | | | 1,702,589 | |
Series 2020-01A, Class A, 144A | | | 2.330 | | | | 08/20/26 | | | | 1,200 | | | | 1,165,871 | |
Drive Auto Receivables Trust, | | | | | | | | | | | | | | | | |
Series 2019-03, Class B | | | 2.650 | | | | 02/15/24 | | | | 500 | | | | 508,989 | |
Series 2020-02, Class B | | | 1.420 | | | | 03/17/25 | | | | 600 | | | | 607,741 | |
Ford Credit Auto Owner Trust, | | | | | | | | | | | | | | | | |
Series 2017-02, Class A, 144A | | | 2.360 | | | | 03/15/29 | | | | 1,600 | | | | 1,656,177 | |
Series 2018-01, Class A, 144A | | | 3.190 | | | | 07/15/31 | | | | 2,000 | | | | 2,141,045 | |
Series 2018-02, Class A, 144A | | | 3.470 | | | | 01/15/30 | | | | 1,100 | | | | 1,173,077 | |
Series 2019-01, Class A, 144A | | | 3.520 | | | | 07/15/30 | | | | 4,000 | | | | 4,321,712 | |
Series 2020-01, Class A, 144A | | | 2.040 | | | | 08/15/31 | | | | 3,300 | | | | 3,415,505 | |
Ford Credit Floorplan Master Owner Trust, | | | | | | | | | | | | | | | | |
Series 2017-03, Class A | | | 2.480 | | | | 09/15/24 | | | | 500 | | | | 517,534 | |
Series 2018-02, Class A | | | 3.170 | | | | 03/15/25 | | | | 4,000 | | | | 4,215,836 | |
Series 2019-02, Class A | | | 3.060 | | | | 04/15/26 | | | | 500 | | | | 533,488 | |
Series 2019-03, Class A1 | | | 2.230 | | | | 09/15/24 | | | | 1,300 | | | | 1,335,997 | |
GM Financial Consumer Automobile Receivables Trust, | | | | | | | | | | | | | | | | |
Series 2018-04, Class C | | | 3.620 | | | | 06/17/24 | | | | 200 | | | | 211,349 | |
GMF Floorplan Owner Revolving Trust, | | | | | | | | | | | | | | | | |
Series 2019-02, Class A, 144A | | | 2.900 | | | | 04/15/26 | | | | 2,000 | | | | 2,145,490 | |
OneMain Direct Auto Receivables Trust, | | | | | | | | | | | | | | | | |
Series 2017-02A, Class B, 144A | | | 2.550 | | | | 11/14/23 | | | | 148 | | | | 148,217 | |
Series 2018-01A, Class A, 144A | | | 3.430 | | | | 12/16/24 | | | | 1,800 | | | | 1,821,464 | |
Series 2019-01A, Class A, 144A | | | 3.630 | | | | 09/14/27 | | | | 1,900 | | | | 2,047,176 | |
Santander Drive Auto Receivables Trust, | | | | | | | | | | | | | | | | |
Series 2019-02, Class C | | | 2.900 | | | | 10/15/24 | | | | 1,300 | | | | 1,328,279 | |
Series 2019-03, Class B | | | 2.280 | | | | 09/15/23 | | | | 1,900 | | | | 1,924,964 | |
Series 2019-03, Class C | | | 2.490 | | | | 10/15/25 | | | | 800 | | | | 814,931 | |
See Notes to Financial Statements.
Schedule of Investments (continued)
as of July 31, 2020
| | | | | | | | | | | | | | | | |
| | | | |
| Description | | Interest
Rate | | | Maturity
Date | | | Principal
Amount
(000)# | | | Value | |
| | | | |
ASSET-BACKED SECURITIES (Continued) | | | | | | | | | | | | | | | | |
| | | | |
Automobiles (cont’d.) | | | | | | | | | | | | | | | | |
Santander Drive Auto Receivables Trust, (cont’d.) | | | | | | | | | | | | | | | | |
Series 2020-02, Class C | | | 1.460 | % | | | 09/15/25 | | | | 600 | | | $ | 603,311 | |
Toyota Auto Loan Extended Note Trust, | | | | | | | | | | | | | | | | |
Series 2019-01A, Class A, 144A | | | 2.560 | | | | 11/25/31 | | | | 800 | | | | 854,567 | |
Series 2020-01A, Class A, 144A | | | 1.350 | | | | 05/25/33 | | | | 1,600 | | | | 1,642,217 | |
World Omni Select Auto Trust, | | | | | | | | | | | | | | | | |
Series 2019-A, Class B | | | 2.170 | | | | 12/15/25 | | | | 1,675 | | | | 1,719,912 | |
Series 2019-A, Class C | | | 2.380 | | | | 12/15/25 | | | | 300 | | | | 307,980 | |
| | | | | | | | | | | | | | | | |
| | | | |
| | | | | | | | | | | | | | | 48,046,182 | |
| | | | |
Collateralized Loan Obligations 7.0% | | | | | | | | | | | | | | | | |
AIG CLO Ltd. (Cayman Islands), | | | | | | | | | | | | | | | | |
Series 2019-02A, Class A, 144A, 3 Month LIBOR + 1.360% (Cap N/A, Floor 1.360%) | | | 1.605 | (c) | | | 10/25/32 | | | | 2,000 | | | | 1,964,900 | |
Allegro CLO Ltd. (Cayman Islands), | | | | | | | | | | | | | | | | |
Series 2019-02A, Class A1A, 144A, 3 Month LIBOR + 1.390% (Cap N/A, Floor 1.390%) | | | 1.662 | (c) | | | 01/19/33 | | | | 5,000 | | | | 4,951,635 | |
Anchorage Capital CLO Ltd. (Cayman Islands), | | | | | | | | | | | | | | | | |
Series 2015-06A, Class AR, 144A, 3 Month LIBOR + 1.270% (Cap N/A, Floor 0.000%) | | | 1.545 | (c) | | | 07/15/30 | | | | 750 | | | | 741,170 | |
Series 2019-11A, Class A, 144A, 3 Month LIBOR + 1.390% (Cap N/A, Floor 1.390%) | | | 1.648 | (c) | | | 07/22/32 | | | | 1,500 | | | | 1,467,023 | |
ArrowMark Colorado Holdings (Cayman Islands), | | | | | | | | | | | | | | | | |
Series 2017-06A, Class A1, 144A, 3 Month LIBOR + 1.280% (Cap N/A, Floor 0.000%) | | | 1.555 | (c) | | | 07/15/29 | | | | 250 | | | | 246,384 | |
Atlas Senior Loan Fund Ltd. (Cayman Islands), | | | | | | | | | | | | | | | | |
Series 2014-01A, Class AR2, 144A, 3 Month LIBOR + 1.260% (Cap N/A, Floor 0.000%) | | | 1.531 | (c) | | | 07/16/29 | | | | 742 | | | | 731,735 | |
Series 2017-08A, Class A, 144A, 3 Month LIBOR + 1.300% (Cap N/A, Floor 0.000%) | | | 1.571 | (c) | | | 01/16/30 | | | | 250 | | | | 244,398 | |
Ballyrock CLO Ltd. (Cayman Islands), | | | | | | | | | | | | | | | | |
Series 2016-01A, Class AR, 144A, 3 Month LIBOR + 1.350% (Cap N/A, Floor 1.350%) | | | 1.625 | (c) | | | 10/15/28 | | | | 1,500 | | | | 1,492,966 | |
Series 2019-02A, Class A1A, 144A, 3 Month LIBOR + 1.250% (Cap N/A, Floor 1.250%) | | | 1.627 | (c) | | | 11/20/30 | | | | 1,000 | | | | 981,336 | |
Battalion CLO Ltd. (Cayman Islands), | | | | | | | | | | | | | | | | |
Series 2014-07A, Class A1RR, 144A, 3 Month LIBOR + 1.040% (Cap N/A, Floor 1.040%) | | | 1.313 | (c) | | | 07/17/28 | | | | 1,250 | | | | 1,232,512 | |
Benefit Street Partners CLO Ltd. (Cayman Islands), | | | | | | | | | | | | | | | | |
Series 2017-12A, Class A1, 144A, 3 Month LIBOR + 1.250% (Cap N/A, Floor 0.000%) | | | 1.525 | (c) | | | 10/15/30 | | | | 500 | | | | 491,506 | |
See Notes to Financial Statements.
| | | | | | | | | | | | | | | | |
| | | | |
| Description | | Interest
Rate | | | Maturity
Date | | | Principal
Amount
(000)# | | | Value | |
| | | | |
ASSET-BACKED SECURITIES (Continued) | | | | | | | | | | | | | | | | |
| | | | |
Collateralized Loan Obligations (cont’d.) | | | | | | | | | | | | | | | | |
Benefit Street Partners CLO Ltd. (Cayman Islands), (cont’d.) | | | | | | | | | | | | | | | | |
Series 2019-18A, Class A, 144A, 3 Month LIBOR + 1.340% (Cap N/A, Floor 1.340%) | | | 1.615 | %(c) | | | 10/15/32 | | | | 1,250 | | | $ | 1,227,885 | |
Canyon Capital CLO Ltd. (Cayman Islands), | | | | | | | | | | | | | | | | |
Series 2015-01A, Class AS, 144A, 3 Month LIBOR + 1.250% (Cap N/A, Floor 0.000%) | | | 1.525 | (c) | | | 04/15/29 | | | | 750 | | | | 739,092 | |
Carlyle Global Market Strategies CLO Ltd. (Cayman Islands), | | | | | | | | | | | | | | | | |
Series 2015-05A, Class A1R, 144A, 3 Month LIBOR + 1.320% (Cap N/A, Floor 1.320%) | | | 1.592 | (c) | | | 01/20/32 | | | | 1,500 | | | | 1,467,288 | |
Carlyle US CLO Ltd. (Cayman Islands), | | | | | | | | | | | | | | | | |
Series 2017-01A, Class A1B, 144A, 3 Month LIBOR + 1.230% (Cap N/A, Floor 0.000%) | | | 1.502 | (c) | | | 04/20/31 | | | | 746 | | | | 725,536 | |
Series 2018-01A, Class A1, 144A, 3 Month LIBOR + 1.020% (Cap N/A, Floor 0.000%) | | | 1.292 | (c) | | | 04/20/31 | | | | 1,000 | | | | 976,451 | |
CBAM Ltd. (Cayman Islands), | | | | | | | | | | | | | | | | |
Series 2019-11A, Class A1, 144A, 3 Month LIBOR + 1.360% (Cap N/A, Floor 1.360%) | | | 1.632 | (c) | | | 10/20/32 | | | | 4,000 | | | | 3,958,532 | |
CIFC Funding Ltd. (Cayman Islands), | | | | | | | | | | | | | | | | |
Series 2014-05A, Class A1R2, 144A, 3 Month LIBOR + 1.200% (Cap N/A, Floor 1.200%) | | | 1.473 | (c) | | | 10/17/31 | | | | 1,000 | | | | 978,803 | |
Elevation CLO Ltd. (Cayman Islands), | | | | | | | | | | | | | | | | |
Series 2017-07A, Class A, 144A, 3 Month LIBOR + 1.220% (Cap N/A, Floor 0.000%) | | | 1.495 | (c) | | | 07/15/30 | | | | 750 | | | | 735,918 | |
Greywolf CLO Ltd. (Cayman Islands), | | | | | | | | | | | | | | | | |
Series 2018-01A, Class A1, 144A, 3 Month LIBOR + 1.030% (Cap N/A, Floor 0.000%) | | | 1.275 | (c) | | | 04/26/31 | | | | 1,000 | | | | 971,643 | |
Highbridge Loan Management Ltd. (Cayman Islands), | | | | | | | | | | | | | | | | |
Series 2015-06A, Class A1R, 144A, 3 Month LIBOR + 1.000% (Cap N/A, Floor 0.000%) | | | 1.541 | (c) | | | 02/05/31 | | | | 248 | | | | 242,683 | |
HPS Loan Management Ltd. (Cayman Islands), | | | | | | | | | | | | | | | | |
Series 15A-19, Class A1, 144A, 3 Month LIBOR + 1.320% (Cap N/A, Floor 1.320%) | | | 1.578 | (c) | | | 07/22/32 | | | | 1,250 | | | | 1,226,923 | |
ICG US CLO Ltd. (Cayman Islands), | | | | | | | | | | | | | | | | |
Series 2017-02A, Class A1, 144A, 3 Month LIBOR + 1.280% (Cap N/A, Floor 0.000%) | | | 1.536 | (c) | | | 10/23/29 | | | | 500 | | | | 491,507 | |
KKR CLO Ltd. (Cayman Islands), | | | | | | | | | | | | | | | | |
Series 11, Class AR, 144A, 3 Month LIBOR + 1.180% (Cap N/A, Floor 0.000%) | | | 1.455 | (c) | | | 01/15/31 | | | | 500 | | | | 489,394 | |
Limerock CLO LLC (Cayman Islands), | | | | | | | | | | | | | | | | |
Series 2014-03A, Class A1R, 144A, 3 Month LIBOR + 1.200% (Cap N/A, Floor 0.000%) | | | 1.472 | (c) | | | 10/20/26 | | | | 141 | | | | 140,494 | |
See Notes to Financial Statements.
Schedule of Investments (continued)
as of July 31, 2020
| | | | | | | | | | | | | | | | |
| | | | |
| Description | | Interest
Rate | | | Maturity
Date | | | Principal
Amount
(000)# | | | Value | |
| | | | |
ASSET-BACKED SECURITIES (Continued) | | | | | | | | | | | | | | | | |
| | | | |
Collateralized Loan Obligations (cont’d.) | | | | | | | | | | | | | | | | |
MidOcean Credit CLO (Cayman Islands), | | | | | | | | | | | | | | | | |
Series 2014-03A, Class A1R, 144A, 3 Month LIBOR + 1.120% (Cap N/A, Floor 1.120%) | | | 1.391 | %(c) | | | 04/21/31 | | | | 995 | | | $ | 966,531 | |
Series 2016-05A, Class AR, 144A, 3 Month LIBOR + 1.120% (Cap N/A, Floor 0.000%) | | | 1.392 | (c) | | | 07/19/28 | | | | 3,000 | | | | 2,961,166 | |
Series 2018-08A, Class A1, 144A, 3 Month LIBOR + 1.150% (Cap N/A, Floor 0.000%) | | | 1.527 | (c) | | | 02/20/31 | | | | 1,500 | | | | 1,466,911 | |
Series 2018-09A, Class A1, 144A, 3 Month LIBOR + 1.150% (Cap N/A, Floor 1.150 %) | | | 1.422 | (c) | | | 07/20/31 | | | | 1,250 | | | | 1,225,125 | |
Mountain View CLO LLC (Cayman Islands), | | | | | | | | | | | | | | | | |
Series 2017-02A, Class A, 144A, 3 Month LIBOR + 1.210% (Cap N/A, Floor 0.000%) | | | 1.481 | (c) | | | 01/16/31 | | | | 1,250 | | | | 1,221,515 | |
Mountain View CLO Ltd. (Cayman Islands), | | | | | | | | | | | | | | | | |
Series 2013-01A, Class AR, 144A, 3 Month LIBOR + 1.250% (Cap N/A, Floor 0.000%) | | | 1.516 | (c) | | | 10/12/30 | | | | 474 | | | | 463,086 | |
Series 2015-09A, Class A1R, 144A, 3 Month LIBOR + 1.120% (Cap N/A, Floor 0.000%) | | | 1.395 | (c) | | | 07/15/31 | | | | 2,000 | | | | 1,944,351 | |
Northwoods Capital Ltd. (Cayman Islands), | | | | | | | | | | | | | | | | |
Series 2019-20A, Class A1, 144A, 3 Month LIBOR + 1.320% (Cap N/A, Floor 1.320%) | | | 1.565 | (c) | | | 01/25/30 | | | | 2,500 | | | | 2,445,911 | |
OCP CLO Ltd. (Cayman Islands), | | | | | | | | | | | | | | | | |
Series 2017-13A, Class A1A, 144A, 3 Month LIBOR + 1.260% (Cap N/A, Floor 0.000%) | | | 1.535 | (c) | | | 07/15/30 | | | | 250 | | | | 247,580 | |
Series 2019-17A, Class A1, 144A, 3 Month LIBOR + 1.330% (Cap N/A, Floor 1.330%) | | | 1.602 | (c) | | | 07/20/32 | | | | 2,500 | | | | 2,469,771 | |
Octagon Investment Partners 45 Ltd. (Cayman Islands), | | | | | | | | | | | | | | | | |
Series 2019-01A, Class A, 144A, 3 Month LIBOR + 1.330% (Cap N/A, Floor 1.330%) | | | 1.605 | (c) | | | 10/15/32 | | | | 2,000 | | | | 1,977,396 | |
OZLM Funding Ltd. (Cayman Islands), | | | | | | | | | | | | | | | | |
Series 2013-04A, Class A1R, 144A, 3 Month LIBOR + 1.250% (Cap N/A, Floor 0.000%) | | | 1.508 | (c) | | | 10/22/30 | | | | 987 | | | | 964,428 | |
OZLM Ltd. (Cayman Islands), | | | | | | | | | | | | | | | | |
Series 2015-11A, Class A1R, 144A, 3 Month LIBOR + 1.250% (Cap N/A, Floor 0.000%) | | | 1.518 | (c) | | | 10/30/30 | | | | 495 | | | | 486,592 | |
Series 2019-24A, Class A1A, 144A, 3 Month LIBOR + 1.390% (Cap N/A, Floor 0.000%) | | | 1.662 | (c) | | | 07/20/32 | | | | 1,250 | | | | 1,223,752 | |
Palmer Square CLO Ltd. (Cayman Islands), | | | | | | | | | | | | | | | | |
Series 2014-01A, Class A1R2, 144A, 3 Month LIBOR + 1.130% (Cap N/A, Floor 1.130%) | | | 1.403 | (c) | | | 01/17/31 | | | | 1,000 | | | | 981,554 | |
Pikes Peak CLO (Cayman Islands), | | | | | | | | | | | | | | | | |
Series 2019-04A, Class A, 144A, 3 Month LIBOR + 1.370% (Cap N/A, Floor 1.370%) | | | 1.645 | (c) | | | 07/15/32 | | | | 4,000 | | | | 3,939,249 | |
See Notes to Financial Statements.
| | | | | | | | | | | | | | | | |
| | | | |
| Description | | Interest
Rate | | | Maturity
Date | | | Principal
Amount
(000)# | | | Value | |
| | | | |
ASSET-BACKED SECURITIES (Continued) | | | | | | | | | | | | | | | | |
| | | | |
Collateralized Loan Obligations (cont’d.) | | | | | | | | | | | | | | | | |
Romark CLO Ltd. (Cayman Islands), | | | | | | | | | | | | | | | | |
Series 2018-02A, Class A1, 144A, 3 Month LIBOR + 1.175% (Cap N/A, Floor 1.175%) | | | 1.420 | %(c) | | | 07/25/31 | | | | 250 | | | $ | 244,209 | |
Romark WM-R Ltd. (Cayman Islands), | | | | | | | | | | | | | | | | |
Series 2018-01A, Class A1, 144A, 3 Month LIBOR + 1.030% (Cap N/A, Floor 0.000%) | | | 1.302 | (c) | | | 04/20/31 | | | | 991 | | | | 965,120 | |
Sound Point CLO Ltd. (Cayman Islands), | | | | | | | | | | | | | | | | |
Series 2013-01A, Class A1R, 144A, 3 Month LIBOR + 1.070% (Cap N/A, Floor 1.070%) | | | 1.315 | (c) | | | 01/26/31 | | | | 1,000 | | | | 968,020 | |
Series 2016-02A, Class AR, 144A, 3 Month LIBOR + 1.290% (Cap N/A, Floor 1.290%) | | | 1.562 | (c) | | | 10/20/28 | | | | 250 | | | | 248,073 | |
Series 2016-03A, Class AR, 144A, 3 Month LIBOR + 1.150% (Cap N/A, Floor 0.000%) | | | 1.406 | (c) | | | 01/23/29 | | | | 3,000 | | | | 2,956,442 | |
Series 2017-01A, Class AR, 144A, 3 Month LIBOR + 1.150% (Cap N/A, Floor 1.150%) | | | 1.406 | (c) | | | 01/23/29 | | | | 2,750 | | | | 2,701,971 | |
Series 2017-02A, Class A, 144A, 3 Month LIBOR + 1.280% (Cap N/A, Floor 0.000%) | | | 1.525 | (c) | | | 07/25/30 | | | | 500 | | | | 494,105 | |
Series 2019-01A, Class A, 144A, 3 Month LIBOR + 1.370% (Cap N/A, Floor 1.370%) | | | 1.642 | (c) | | | 01/20/32 | | | | 3,250 | | | | 3,198,529 | |
Telos CLO Ltd. (Cayman Islands), | | | | | | | | | | | | | | | | |
Series 2013-04A, Class AR, 144A, 3 Month LIBOR + 1.240% (Cap N/A, Floor 0.000%) | | | 1.513 | (c) | | | 01/17/30 | | | | 992 | | | | 974,045 | |
TICP CLO Ltd. (Cayman Islands), | | | | | | | | | | | | | | | | |
Series 2017-09A, Class A, 144A, 3 Month LIBOR + 1.140% (Cap N/A, Floor 0.000%) | | | 1.412 | (c) | | | 01/20/31 | | | | 1,000 | | | | 982,528 | |
Trimaran Cavu Ltd. (Cayman Islands), | | | | | | | | | | | | | | | | |
Series 2019-01A, Class A1, 144A, 3 Month LIBOR + 1.460% (Cap N/A, Floor 1.460%) | | | 1.732 | (c) | | | 07/20/32 | | | | 1,250 | | | | 1,241,247 | |
Trinitas CLO Ltd. (Cayman Islands), | | | | | | | | | | | | | | | | |
Series 2017-06A, Class AR, 144A, 3 Month LIBOR + 1.170% (Cap N/A, Floor 1.170%) | | | 1.415 | (c) | | | 07/25/29 | | | | 5,000 | | | | 4,903,063 | |
Vibrant CLO Ltd. (Cayman Islands), | | | | | | | | | | | | | | | | |
Series 2016-05A, Class AR, 144A, 3 Month LIBOR + 1.250% (Cap N/A, Floor 1.250%) | | | 1.522 | (c) | | | 01/20/29 | | | | 3,000 | | | | 2,952,866 | |
Voya CLO Ltd. (Cayman Islands), | | | | | | | | | | | | | | | | |
Series 2013-01A, Class A1AR, 144A, 3 Month LIBOR + 1.210% (Cap N/A, Floor 0.000%) | | | 1.485 | (c) | | | 10/15/30 | | | | 747 | | | | 730,901 | |
Series 2015-01A, Class A1R, 144A, 3 Month LIBOR + 0.900% (Cap N/A, Floor 0.900%) | | | 1.172 | (c) | | | 01/18/29 | | | | 1,000 | | | | 983,714 | |
Series 2016-01A, Class A1R, 144A, 3 Month LIBOR + 1.070% (Cap N/A, Floor 1.070%) | | | 1.342 | (c) | | | 01/20/31 | | | | 1,000 | | | | 979,996 | |
See Notes to Financial Statements.
Schedule of Investments (continued)
as of July 31, 2020
| | | | | | | | | | | | | | | | |
| | | | |
| Description | | Interest
Rate | | | Maturity
Date | | | Principal
Amount
(000)# | | | Value | |
| | | | |
ASSET-BACKED SECURITIES (Continued) | | | | | | | | | | | | | | | | |
| | | | |
Collateralized Loan Obligations (cont’d.) | | | | | | | | | | | | | | | | |
Wellfleet CLO Ltd. (Cayman Islands), | | | | | | | | | | | | | | | | |
Series 2018-01A, Class A, 144A, 3 Month LIBOR + 1.100% (Cap N/A, Floor 1.100%) | | | 1.373 | %(c) | | | 07/17/31 | | | | 2,500 | | | $ | 2,445,019 | |
York CLO Ltd. (Cayman Islands), | | | | | | | | | | | | | | | | |
Series 2015-01A, Class AR, 144A, 3 Month LIBOR + 1.150% (Cap N/A, Floor 0.000%) | | | 1.408 | (c) | | | 01/22/31 | | | | 500 | | | | 492,387 | |
Zais CLO Ltd. (Cayman Islands), | | | | | | | | | | | | | | | | |
Series 2017-01A, Class A1, 144A, 3 Month LIBOR + 1.370% (Cap N/A, Floor 0.000%) | | | 1.645 | (c) | | | 07/15/29 | | | | 245 | | | | 241,324 | |
Series 2017-02A, Class A, 144A, 3 Month LIBOR + 1.290% (Cap N/A, Floor 0.000%) | | | 1.565 | (c) | | | 04/15/30 | | | | 246 | | | | 238,962 | |
Series 2018-01A, Class A, 144A, 3 Month LIBOR + 0.950% (Cap N/A, Floor 0.000%) | | | 1.225 | (c) | | | 04/15/29 | | | | 734 | | | | 707,512 | |
| | | | | | | | | | | | | | | | |
| | | | |
| | | | | | | | | | | | | | | 83,552,665 | |
| | | | |
Consumer Loans 0.4% | | | | | | | | | | | | | | | | |
OneMain Financial Issuance Trust, | | | | | | | | | | | | | | | | |
Series 2017-01A, Class A2, 144A, 1 Month LIBOR + 0.800% (Cap N/A, Floor 0.000%) | | | 0.975 | (c) | | | 09/14/32 | | | | 370 | | | | 368,525 | |
Series 2018-01A, Class A, 144A | | | 3.300 | | | | 03/14/29 | | | | 260 | | | | 263,573 | |
Oportun Funding X LLC, | | | | | | | | | | | | | | | | |
Series 2018-C, Class A, 144A | | | 4.100 | | | | 10/08/24 | | | | 500 | | | | 503,491 | |
Oportun Funding XII LLC, | | | | | | | | | | | | | | | | |
Series 2018-D, Class A, 144A | | | 4.150 | | | | 12/09/24 | | | | 400 | | | | 401,029 | |
SoFi Consumer Loan Program Trust, | | | | | | | | | | | | | | | | |
Series 2020-01, Class A, 144A | | | 2.020 | | | | 01/25/29 | | | | 1,933 | | | | 1,950,452 | |
Springleaf Funding Trust, | | | | | | | | | | | | | | | | |
Series 2017-AA, Class A, 144A | | | 2.680 | | | | 07/15/30 | | | | 677 | | | | 676,867 | |
| | | | | | | | | | | | | | | | |
| | | | |
| | | | | | | | | | | | | | | 4,163,937 | |
| | | | |
Credit Cards 0.2% | | | | | | | | | | | | | | | | |
Citibank Credit Card Issuance Trust, | | | | | | | | | | | | | | | | |
Series 2018-A07, Class A7 | | | 3.960 | | | | 10/13/30 | | | | 2,100 | | | | 2,550,353 | |
| | | | |
Equipment 0.3% | | | | | | | | | | | | | | | | |
MMAF Equipment Finance LLC, | | | | | | | | | | | | | | | | |
Series 2017-AA, Class A4, 144A | | | 2.410 | | | | 08/16/24 | | | | 600 | | | | 610,611 | |
Series 2017-B, Class A5, 144A | | | 2.720 | | | | 06/15/40 | | | | 800 | | | | 841,671 | |
Series 2018-A, Class A5, 144A | | | 3.610 | | | | 03/10/42 | | | | 200 | | | | 215,255 | |
See Notes to Financial Statements.
| | | | | | | | | | | | | | | | |
| | | | |
| Description | | Interest
Rate | | | Maturity
Date | | | Principal
Amount
(000)# | | | Value | |
| | | | |
ASSET-BACKED SECURITIES (Continued) | | | | | | | | | | | | | | | | |
| | | | |
Equipment (cont’d.) | | | | | | | | | | | | | | | | |
MMAF Equipment Finance LLC, (cont’d.) | | | | | | | | | | | | | | | | |
Series 2019-A, Class A5, 144A | | | 3.080 | % | | | 11/12/41 | | | | 800 | | | $ | 865,056 | |
Series 2019-B, Class A5, 144A | | | 2.290 | | | | 11/12/41 | | | | 1,200 | | | | 1,258,502 | |
| | | | | | | | | | | | | | | | |
| | | | |
| | | | | | | | | | | | | | | 3,791,095 | |
| | | | |
Home Equity Loans 0.1% | | | | | | | | | | | | | | | | |
Option One Mortgage Loan Trust, | | | | | | | | | | | | | | | | |
Series 2005-03, Class M2, 1 Month LIBOR + 0.735% (Cap N/A, Floor 0.490%) | | | 0.907 | (c) | | | 08/25/35 | | | | 1,010 | | | | 996,611 | |
| | | | |
Manufactured Housing 0.1% | | | | | | | | | | | | | | | | |
Towd Point Mortgage Trust, | | | | | | | | | | | | | | | | |
Series 2019-MH01, Class A1, 144A | | | 3.000 | (cc) | | | 11/25/58 | | | | 1,070 | | | | 1,090,266 | |
| | | | |
Other 0.2% | | | | | | | | | | | | | | | | |
Sierra Timeshare Receivables Funding LLC, | | | | | | | | | | | | | | | | |
Series 2019-02A, Class A, 144A | | | 2.590 | | | | 05/20/36 | | | | 719 | | | | 730,510 | |
Series 2019-03A, Class A, 144A | | | 2.340 | | | | 08/20/36 | | | | 955 | | | | 970,602 | |
| | | | | | | | | | | | | | | | |
| | | | |
| | | | | | | | | | | | | | | 1,701,112 | |
| | | | |
Residential Mortgage-Backed Securities 0.5% | | | | | | | | | | | | | | | | |
Credit Suisse Mortgage Trust, | | | | | | | | | | | | | | | | |
Series 2018-RPL08, Class A1, 144A | | | 4.125 | (cc) | | | 07/25/58 | | | | 305 | | | | 305,759 | |
Legacy Mortgage Asset Trust, | | | | | | | | | | | | | | | | |
Series 2019-GS01, Class A1, 144A | | | 4.000 | | | | 01/25/59 | | | | 149 | | | | 151,934 | |
Series 2019-GS02, Class A1, 144A | | | 3.750 | | | | 01/25/59 | | | | 328 | | | | 331,635 | |
Series 2019-GS04, Class A1, 144A | | | 3.438 | | | | 05/25/59 | | | | 527 | | | | 526,302 | |
Series 2019-SL01, Class A, 144A | | | 4.000 | (cc) | | | 12/28/54 | | | | 177 | | | | 178,049 | |
Mill City Mortgage Loan Trust, | | | | | | | | | | | | | | | | |
Series 2017-03, Class A1, 144A | | | 2.750 | (cc) | | | 01/25/61 | | | | 386 | | | | 395,896 | |
Series 2018-01, Class A1, 144A | | | 3.250 | (cc) | | | 05/25/62 | | | | 527 | | | | 547,387 | |
RAAC Series Trust, | | | | | | | | | | | | | | | | |
Series 2007-SP03, Class A1, 1 Month LIBOR + 1.200% (Cap 14.000%, Floor 1.200%) | | | 1.372 | (c) | | | 09/25/47 | | | | 121 | | | | 121,130 | |
Towd Point Mortgage Trust, | | | | | | | | | | | | | | | | |
Series 2017-04, Class A1, 144A | | | 2.750 | (cc) | | | 06/25/57 | | | | 891 | | | | 922,589 | |
Series 2017-05, Class A1, 144A, 1 Month LIBOR + 0.600% (Cap N/A, Floor 0.000%) | | | 0.772 | (c) | | | 02/25/57 | | | | 566 | | | | 560,495 | |
Series 2017-06, Class A1, 144A | | | 2.750 | (cc) | | | 10/25/57 | | | | 663 | | | | 689,804 | |
Series 2018-01, Class A1, 144A | | | 3.000 | (cc) | | | 01/25/58 | | | | 755 | | | | 782,119 | |
See Notes to Financial Statements.
Schedule of Investments (continued)
as of July 31, 2020
| | | | | | | | | | | | | | | | |
| | | | |
| Description | | Interest
Rate | | | Maturity
Date | | | Principal
Amount
(000)# | | | Value | |
| | | | |
ASSET-BACKED SECURITIES (Continued) | | | | | | | | | | | | | | | | |
| | | | |
Residential Mortgage-Backed Securities (cont’d.) | | | | | | | | | | | | | | | | |
Towd Point Mortgage Trust, (cont’d.) | | | | | | | | | | | | | | | | |
Series 2018-02, Class A1, 144A | | | 3.250 | %(cc) | | | 03/25/58 | | | | 339 | | | $ | 358,752 | |
Series 2019-HY03, Class A1A, 144A, 1 Month LIBOR + 1.000% (Cap N/A, Floor 1.000%) | | | 1.172 | (c) | | | 10/25/59 | | | | 410 | | | | 408,362 | |
| | | | | | | | | | | | | | | | |
| | | | | | | | | | | | | | | 6,280,213 | |
| | | | |
Student Loans 2.4% | | | | | | | | | | | | | | | | |
Commonbond Student Loan Trust, | | | | | | | | | | | | | | | | |
Series 2017-BGS, Class A1, 144A | | | 2.680 | | | | 09/25/42 | | | | 450 | | | | 458,583 | |
Series 2018-AGS, Class A1, 144A | | | 3.210 | | | | 02/25/44 | | | | 366 | | | | 376,702 | |
Series 2020-AGS, Class A, 144A | | | 1.980 | | | | 08/25/50 | | | | 1,900 | | | | 1,922,710 | |
ELFI Graduate Loan Program LLC, | | | | | | | | | | | | | | | | |
Series 2020-A, Class A, 144A | | | 1.730 | | | | 08/25/45 | | | | 2,900 | | | | 2,914,295 | |
Laurel Road Prime Student Loan Trust, | | | | | | | | | | | | | | | | |
Series 2017-C, Class A2B, 144A | | | 2.810 | | | | 11/25/42 | | | | 343 | | | | 351,008 | |
Series 2018-B, Class A2FX, 144A | | | 3.540 | | | | 05/26/43 | | | | 609 | | | | 618,250 | |
Series 2019-A, Class A2FX, 144A | | | 2.730 | | | | 10/25/48 | | | | 481 | | | | 496,159 | |
Navient Private Education Refi Loan Trust, | | | | | | | | | | | | | | | | |
Series 2018-A, Class A2, 144A | | | 3.190 | | | | 02/18/42 | | | | 1,210 | | | | 1,235,903 | |
Series 2018-CA, Class A2, 144A | | | 3.520 | | | | 06/16/42 | | | | 600 | | | | 618,384 | |
Series 2019-CA, Class A2, 144A | | | 3.130 | | | | 02/15/68 | | | | 800 | | | | 830,214 | |
Series 2019-EA, Class A2A, 144A | | | 2.640 | | | | 05/15/68 | | | | 800 | | | | 830,959 | |
Series 2019-FA, Class A2, 144A | | | 2.600 | | | | 08/15/68 | | | | 1,600 | | | | 1,656,530 | |
Series 2019-GA, Class A, 144A | | | 2.400 | | | | 10/15/68 | | | | 2,648 | | | | 2,709,320 | |
Series 2020-BA, Class A2, 144A | | | 2.120 | | | | 01/15/69 | | | | 1,100 | | | | 1,119,063 | |
Series 2020-DA, Class A, 144A | | | 1.690 | | | | 05/15/69 | | | | 2,600 | | | | 2,618,246 | |
Series 2020-FA, Class A, 144A | | | 1.220 | | | | 07/15/69 | | | | 1,600 | | | | 1,603,248 | |
SoFi Professional Loan Program LLC, | | | | | | | | | | | | | | | | |
Series 2017-F, Class A2FX, 144A | | | 2.840 | | | | 01/25/41 | | | | 1,373 | | | | 1,404,126 | |
Series 2019-A, Class A2FX, 144A | | | 3.690 | | | | 06/15/48 | | | | 1,300 | | | | 1,368,986 | |
Series 2019-C, Class A2FX, 144A | | | 2.370 | | | | 11/16/48 | | | | 1,100 | | | | 1,134,741 | |
SoFi Professional Loan Program Trust, | | | | | | | | | | | | | | | | |
Series 2018-B, Class A2FX, 144A | | | 3.340 | | | | 08/25/47 | | | | 1,000 | | | | 1,035,512 | |
Series 2020-A, Class A2FX, 144A | | | 2.540 | | | | 05/15/46 | | | | 1,500 | | | | 1,566,847 | |
Series 2020-C, Class AFX, 144A | | | 1.950 | | | | 02/15/46 | | | | 1,456 | | | | 1,487,972 | |
| | | | | | | | | | | | | | | | |
| | | | |
| | | | | | | | | | | | | | | 28,357,758 | |
| | | | | | | | | | | | | | | | |
TOTAL ASSET-BACKED SECURITIES | |
(cost $178,739,392) | | | | | | | | | | | | | | | 180,530,192 | |
| | | | | | | | | | | | | | | | |
See Notes to Financial Statements.
| | | | | | | | | | | | | | | | |
| | | | |
| Description | | Interest
Rate | | | Maturity
Date | | | Principal
Amount
(000)# | | | Value | |
| | | | |
COMMERCIAL MORTGAGE-BACKED SECURITIES 20.0% | | | | | | | | | | | | | | | | |
Arbor Multifamily Mortgage Securities Trust, | | | | | | | | | | | | | | | | |
Series 2020-MF01, Class A4, 144A | | | 2.495% | | | | 05/15/53 | | | | 5,500 | | | $ | 5,913,260 | |
Assurant Commercial Mortgage Trust, | | | | | | | | | | | | | | | | |
Series 2016-01A, Class AS, 144A | | | 3.172 | | | | 05/15/49 | | | | 300 | | | | 313,881 | |
BANK, | | | | | | | | | | | | | | | | |
Series 2019-BN20, Class A2 | | | 2.758 | | | | 09/15/62 | | | | 6,800 | | | | 7,476,732 | |
Series 2019-BN23, Class A2 | | | 2.669 | | | | 12/15/52 | | | | 2,200 | | | | 2,410,617 | |
Series 2020-BN25, Class A4 | | | 2.399 | | | | 01/15/63 | | | | 3,800 | | | | 4,092,482 | |
Series 2020-BN26, Class A3 | | | 2.155 | | | | 03/15/63 | | | | 5,000 | | | | 5,280,660 | |
Series 2020-BN27, Class A4 | | | 1.901 | | | | 04/15/63 | | | | 4,700 | | | | 4,853,696 | |
Barclays Commercial Mortgage Securities Trust, | | | | | | | | | | | | | | | | |
Series 2016-ETC, Class A, 144A | | | 2.937 | | | | 08/14/36 | | | | 500 | | | | 483,079 | |
Series 2018-TALL, Class A, 144A, 1 Month LIBOR + | | | | | | | | | | | | | | | | |
0.722% (Cap N/A, Floor 0.722%) | | | 0.897(c) | | | | 03/15/37 | | | | 6,000 | | | | 5,818,109 | |
Series 2020-C07, Class A4 | | | 1.819 | | | | 04/15/53 | | | | 5,700 | | | | 5,870,042 | |
Benchmark Mortgage Trust, | | | | | | | | | | | | | | | | |
Series 2018-B01, Class A4 | | | 3.402 | | | | 01/15/51 | | | | 1,070 | | | | 1,209,622 | |
Series 2018-B03, Class A4 | | | 3.761 | | | | 04/10/51 | | | | 1,500 | | | | 1,738,172 | |
Series 2019-B10, Class A3 | | | 3.455 | | | | 03/15/62 | | | | 2,500 | | | | 2,850,694 | |
Series 2020-B17, Class A4 | | | 2.042 | | | | 03/15/53 | | | | 1,800 | | | | 1,881,531 | |
Series 2020-IG03, Class A2, 144A | | | 2.475 | | | | 09/15/48 | | | | 5,500 | | | | 5,836,585 | |
BX Commercial Mortgage Trust, | | | | | | | | | | | | | | | | |
Series 2020-BXLP, Class A, 144A, 1 Month LIBOR + | | | | | | | | | | | | | | | | |
0.800% (Cap N/A, Floor 0.800%) | | | 0.975(c) | | | | 12/15/36 | | | | 2,797 | | | | 2,780,884 | |
Cantor Commercial Real Estate Lending, | | | | | | | | | | | | | | | | |
Series 2019-CF03, Class A3 | | | 2.752 | | | | 01/15/53 | | | | 2,900 | | | | 3,175,990 | |
CD Mortgage Trust, | | | | | | | | | | | | | | | | |
Series 2016-CD01, Class A3 | | | 2.459 | | | | 08/10/49 | | | | 500 | | | | 526,210 | |
Series 2019-CD08, Class A3 | | | 2.657 | | | | 08/15/57 | | | | 2,700 | | | | 2,931,151 | |
CF Mortgage Trust, | | | | | | | | | | | | | | | | |
Series 2020-P01, Class A1, 144A | | | 2.840(cc) | | | | 04/15/25 | | | | 2,896 | | | | 3,048,107 | |
CFCRE Commercial Mortgage Trust, | | | | | | | | | | | | | | | | |
Series 2016-C07, Class A2 | | | 3.585 | | | | 12/10/54 | | | | 2,000 | | | | 2,184,026 | |
Citigroup Commercial Mortgage Trust, | | | | | | | | | | | | | | | | |
Series 2015-GC27, Class A4 | | | 2.878 | | | | 02/10/48 | | | | 1,100 | | | | 1,152,322 | |
Series 2016-C03, Class A3 | | | 2.896 | | | | 11/15/49 | | | | 900 | | | | 956,022 | |
Series 2017-P08, Class A3 | | | 3.203 | | | | 09/15/50 | | | | 1,700 | | | | 1,853,309 | |
Series 2019-C07, Class A3 | | | 2.860 | | | | 12/15/72 | | | | 4,400 | | | | 4,879,007 | |
Series 2019-GC41, Class A4 | | | 2.620 | | | | 08/10/56 | | | | 3,000 | | | | 3,262,863 | |
Commercial Mortgage Trust, | | | | | | | | | | | | | | | | |
Series 2015-DC01, Class A5 | | | 3.350 | | | | 02/10/48 | | | | 1,510 | | | | 1,632,664 | |
Series 2015-PC01, Class A4 | | | 3.620 | | | | 07/10/50 | | | | 3,200 | | | | 3,436,914 | |
Series 2016-COR01, Class A3 | | | 2.826 | | | | 10/10/49 | | | | 800 | | | | 857,903 | |
See Notes to Financial Statements.
Schedule of Investments (continued)
as of July 31, 2020
| | | | | | | | | | | | | | | | |
| | | | |
| Description | | Interest
Rate | | | Maturity
Date | | | Principal
Amount
(000)# | | | Value | |
| | |
COMMERCIAL MORTGAGE-BACKED SECURITIES (Continued) | | | | | | | | | |
CSAIL Commercial Mortgage Trust, | | | | | | | | | | | | | | | | |
Series 2017-C08, Class A3 | | | 3.127% | | | | 06/15/50 | | | | 1,200 | | | $ | 1,305,565 | |
DBJPM Mortgage Trust, | | | | | | | | | | | | | | | | |
Series 2016-C03, Class A4 | | | 2.632 | | | | 08/10/49 | | | | 650 | | | | 694,738 | |
Fannie Mae-Aces, | | | | | | | | | | | | | | | | |
Series 2016-M11, Class A2 | | | 2.369(cc) | | | | 07/25/26 | | | | 1,200 | | | | 1,295,993 | |
Series 2016-M13, Class A2 | | | 2.483(cc) | | | | 09/25/26 | | | | 1,900 | | | | 2,063,182 | |
Series 2017-M01, Class A2 | | | 2.416(cc) | | | | 10/25/26 | | | | 500 | | | | 541,191 | |
Series 2017-M04, Class A2 | | | 2.584(cc) | | | | 12/25/26 | | | | 2,500 | | | | 2,739,224 | |
Series 2017-M08, Class A2 | | | 3.061(cc) | | | | 05/25/27 | | | | 1,900 | | | | 2,132,032 | |
Series 2018-M04, Class A2 | | | 3.045(cc) | | | | 03/25/28 | | | | 1,325 | | | | 1,506,304 | |
Series 2018-M10, Class A1 | | | 3.370(cc) | | | | 07/25/28 | | | | 441 | | | | 486,917 | |
Series 2018-M10, Class A2 | | | 3.370(cc) | | | | 07/25/28 | | | | 2,650 | | | | 3,064,894 | |
Series 2019-M21, Class 3A1 | | | 2.100 | | | | 06/25/34 | | | | 7,074 | | | | 7,381,734 | |
Series 2019-M22, Class A1 | | | 2.104 | | | | 08/25/29 | | | | 3,683 | | | | 3,886,357 | |
Series 2019-M25, Class A1 | | | 2.142 | | | | 11/25/29 | | | | 4,353 | | | | 4,647,586 | |
FHLMC Multifamily Structured Pass-Through Certificates, | | | | | | | | | | | | | | | | |
Series K057, Class AM | | | 2.624 | | | | 08/25/26 | | | | 1,650 | | | | 1,807,411 | |
Series K058, Class A2 | | | 2.653 | | | | 08/25/26 | | | | 1,100 | | | | 1,213,835 | |
Series K068, Class AM | | | 3.315 | | | | 08/25/27 | | | | 1,500 | | | | 1,729,023 | |
Series K069, Class AM | | | 3.248(cc) | | | | 09/25/27 | | | | 300 | | | | 343,087 | |
Series K070, Class A2 | | | 3.303(cc) | | | | 11/25/27 | | | | 2,125 | | | | 2,461,898 | |
Series K070, Class AM | | | 3.364 | | | | 12/25/27 | | | | 425 | | | | 493,224 | |
Series K074, Class A2 | | | 3.600 | | | | 01/25/28 | | | | 3,600 | | | | 4,245,966 | |
Series K075, Class AM | | | 3.650(cc) | | | | 02/25/28 | | | | 1,075 | | | | 1,267,212 | |
Series K076, Class A2 | | | 3.900 | | | | 04/25/28 | | | | 2,800 | | | | 3,375,163 | |
Series K076, Class AM | | | 3.900 | | | | 04/25/28 | | | | 800 | | | | 960,137 | |
Series K077, Class A2 | | | 3.850(cc) | | | | 05/25/28 | | | | 1,670 | | | | 2,010,178 | |
Series K077, Class AM | | | 3.850(cc) | | | | 05/25/28 | | | | 340 | | | | 409,075 | |
Series K078, Class AM | | | 3.920 | | | | 06/25/28 | | | | 1,025 | | | | 1,233,515 | |
Series K079, Class A2 | | | 3.926 | | | | 06/25/28 | | | | 1,000 | | | | 1,207,519 | |
Series K079, Class AM | | | 3.930 | | | | 06/25/28 | | | | 1,350 | | | | 1,622,264 | |
Series K080, Class A2 | | | 3.926(cc) | | | | 07/25/28 | | | | 3,100 | | | | 3,751,423 | |
Series K080, Class AM | | | 3.986(cc) | | | | 07/25/28 | | | | 7,860 | | | | 9,484,858 | |
Series K081, Class AM | | | 3.900(cc) | | | | 08/25/28 | | | | 1,100 | | | | 1,322,069 | |
Series K086, Class A2 | | | 3.859(cc) | | | | 11/25/28 | | | | 1,200 | | | | 1,454,580 | |
Series K086, Class AM | | | 3.919(cc) | | | | 12/25/28 | | | | 350 | | | | 424,427 | |
Series K087, Class AM | | | 3.832(cc) | | | | 12/25/28 | | | | 450 | | | | 541,759 | |
Series K089, Class AM | | | 3.633(cc) | | | | 01/25/29 | | | | 11,315 | | | | 13,500,258 | |
Series K091, Class AM | | | 3.566 | | | | 03/25/29 | | | | 2,000 | | | | 2,389,362 | |
Series K157, Class A2 | | | 3.990(cc) | | | | 05/25/33 | | | | 800 | | | | 997,425 | |
Series K730, Class AM | | | 3.590(cc) | | | | 01/25/25 | | | | 4,100 | | | | 4,550,248 | |
Series KC03, Class A2 | | | 3.499 | | | | 01/25/26 | | | | 1,350 | | | | 1,479,578 | |
Series KW08, Class A2 | | | 3.600 | | | | 01/25/29 | | | | 4,500 | | | | 5,336,995 | |
See Notes to Financial Statements.
| | | | | | | | | | | | | | | | |
| | | | |
| Description | | Interest
Rate | | | Maturity
Date | | | Principal Amount (000)# | | | Value | |
| | |
COMMERCIAL MORTGAGE-BACKED SECURITIES (Continued) | | | | | | | | | |
FHLMC Multifamily Structured Pass-Through Certificates, (cont’d.) | | | | | | | | | | | | | | | | |
Series W5FX, Class AFX | | | 3.214%(cc) | | | | 04/25/28 | | | | 2,375 | | | $ | 2,711,791 | |
GS Mortgage Securities Trust, | | | | | | | | | | | | | | | | |
Series 2015-GC30, Class A3 | | | 3.119 | | | | 05/10/50 | | | | 986 | | | | 1,049,751 | |
Series 2015-GC34, Class A3 | | | 3.244 | | | | 10/10/48 | | | | 4,400 | | | | 4,768,758 | |
JPMBB Commercial Mortgage Securities Trust, | | | | | | | | | | | | | | | | |
Series 2015-C27, Class A3A1 | | | 2.920 | | | | 02/15/48 | | | | 1,065 | | | | 1,137,281 | |
JPMDB Commercial Mortgage Securities Trust, | | | | | | | | | | | | | | | | |
Series 2017-C05, Class A4 | | | 3.414 | | | | 03/15/50 | | | | 1,400 | | | | 1,546,186 | |
JPMorgan Chase Commercial Mortgage Securities Trust, | | | | | | | | | | | | | | | | |
Series 2016-JP02, Class A3 | | | 2.559 | | | | 08/15/49 | | | | 1,000 | | | | 1,061,349 | |
Series 2016-JP03, Class A4 | | | 2.627 | | | | 08/15/49 | | | | 700 | | | | 748,511 | |
Series 2017-JP05, Class A4 | | | 3.457 | | | | 03/15/50 | | | | 560 | | | | 628,258 | |
Series 2017-JP07, Class ASB | | | 3.241 | | | | 09/15/50 | | | | 575 | | | | 623,617 | |
LCCM, | | | | | | | | | | | | | | | | |
Series 2017-LC26, Class A3, 144A | | | 3.289 | | | | 07/12/50 | | | | 1,600 | | | | 1,739,422 | |
Morgan Stanley Bank of America Merrill Lynch Trust, | | | | | | | | | | | | | | | | |
Series 2015-C20, Class A2 | | | 2.790 | | | | 02/15/48 | | | | 516 | | | | 515,492 | |
Morgan Stanley Capital I Trust, | | | | | | | | | | | | | | | | |
Series 2016-BNK02, Class A3 | | | 2.791 | | | | 11/15/49 | | | | 900 | | | | 961,169 | |
Series 2016-UB11, Class A3 | | | 2.531 | | | | 08/15/49 | | | | 1,200 | | | | 1,272,071 | |
UBS Commercial Mortgage Trust, | | | | | | | | | | | | | | | | |
Series 2017-C02, Class ASB | | | 3.264 | | | | 08/15/50 | | | | 800 | | | | 867,256 | |
Series 2017-C03, Class ASB | | | 3.215 | | | | 08/15/50 | | | | 900 | | | | 972,588 | |
Series 2017-C05, Class A4 | | | 3.212 | | | | 11/15/50 | | | | 1,800 | | | | 1,973,660 | |
Series 2018-C09, Class A3 | | | 3.854 | | | | 03/15/51 | | | | 750 | | | | 849,871 | |
Series 2018-C14, Class A3 | | | 4.180 | | | | 12/15/51 | | | | 1,400 | | | | 1,627,476 | |
Series 2019-C18, Class A3 | | | 2.782 | | | | 12/15/52 | | | | 4,400 | | | | 4,806,336 | |
UBS-Barclays Commercial Mortgage Trust, | | | | | | | | | | | | | | | | |
Series 2013-C06, Class A4 | | | 3.244 | | | | 04/10/46 | | | | 101 | | | | 105,099 | |
Wells Fargo Commercial Mortgage Trust, | | | | | | | | | | | | | | | | |
Series 2016-BNK01, Class A2 | | | 2.399 | | | | 08/15/49 | | | | 1,200 | | | | 1,250,992 | |
Series 2016-C35, Class A3 | | | 2.674 | | | | 07/15/48 | | | | 1,900 | | | | 2,030,678 | |
Series 2016-NXS06, Class A3 | | | 2.642 | | | | 11/15/49 | | | | 1,500 | | | | 1,589,871 | |
Series 2017-C38, Class A4 | | | 3.190 | | | | 07/15/50 | | | | 1,000 | | | | 1,105,384 | |
Series 2017-RB01, Class A4 | | | 3.374 | | | | 03/15/50 | | | | 1,400 | | | | 1,562,402 | |
Series 2018-C46, Class A3 | | | 3.888 | | | | 08/15/51 | | | | 2,000 | | | | 2,318,389 | |
Series 2019-C49, Class A3 | | | 3.749 | | | | 03/15/52 | | | | 3,000 | | | | 3,341,342 | |
Series 2019-C50, Class A4 | | | 3.466 | | | | 05/15/52 | | | | 2,500 | | | | 2,789,416 | |
Series 2019-C52, Class A3 | | | 2.631 | | | | 08/15/52 | | | | 2,000 | | | | 2,139,429 | |
| | | | |
TOTAL COMMERCIAL MORTGAGE-BACKED SECURITIES
(cost $220,246,454) | | | | | | | | | | | | | | | 238,158,585 | |
See Notes to Financial Statements.
PGIM Core Bond Fund 23
Schedule of Investments (continued)
as of July 31, 2020
| | | | | | | | | | | | | | | | |
| | | | |
| Description | | Interest
Rate | | | Maturity
Date | | | Principal Amount (000)# | | | Value | |
| | | | |
CORPORATE BONDS 30.2% | | | | | | | | | | | | | | | | |
| | | | |
Aerospace & Defense 0.2% | | | | | | | | | | | | | | | | |
BAE Systems PLC (United Kingdom), | | | | | | | | | | | | | | | | |
Sr. Unsec’d. Notes, 144A | | | 3.400% | | | | 04/15/30 | | | | 335 | | | $ | 378,379 | |
Boeing Co. (The), | | | | | | | | | | | | | | | | |
Sr. Unsec’d. Notes | | | 3.750 | | | | 02/01/50 | | | | 830 | | | | 752,247 | |
Embraer Netherlands Finance BV (Brazil), | | | | | | | | | | | | | | | | |
Gtd. Notes | | | 5.050 | | | | 06/15/25 | | | | 281 | | | | 261,593 | |
Embraer Overseas Ltd. (Brazil), | | | | | | | | | | | | | | | | |
Gtd. Notes, 144A | | | 5.696 | | | | 09/16/23(a) | | | | 375 | | | | 376,179 | |
L3Harris Technologies, Inc., | | | | | | | | | | | | | | | | |
Sr. Unsec’d. Notes | | | 3.832 | | | | 04/27/25 | | | | 30 | | | | 33,813 | |
Raytheon Technologies Corp., | | | | | | | | | | | | | | | | |
Sr. Unsec’d. Notes | | | 4.125 | | | | 11/16/28 | | | | 450 | | | | 540,284 | |
| | | | |
| | | | | | | | | | | | | | | 2,342,495 | |
| | | | |
Agriculture 0.3% | | | | | | | | | | | | | | | | |
Altria Group, Inc., | | | | | | | | | | | | | | | | |
Gtd. Notes | | | 2.850 | | | | 08/09/22 | | | | 100 | | | | 104,460 | |
Gtd. Notes | | | 3.400 | | | | 05/06/30(a) | | | | 630 | | | | 705,889 | |
BAT Capital Corp. (United Kingdom), | | | | | | | | | | | | | | | | |
Gtd. Notes | | | 2.789 | | | | 09/06/24 | | | | 1,890 | | | | 2,016,048 | |
Gtd. Notes | | | 3.222 | | | | 08/15/24(a) | | | | 890 | | | | 960,922 | |
| | | | | | | | | | | | | | | | |
| | | | |
| | | | | | | | | | | | | | | 3,787,319 | |
| | | | |
Airlines 0.3% | | | | | | | | | | | | | | | | |
American Airlines 2013-2 Class A Pass-Through Trust,
Pass-Through Certificates | | | 4.950 | | | | 07/15/24 | | | | 130 | | | | 105,174 | |
American Airlines 2015-1 Class A Pass-Through Trust,
Pass-Through Certificates | | | 3.375 | | | | 11/01/28 | | | | 79 | | | | 66,070 | |
Delta Air Lines 2020-1 Class AA Pass Through Trust,
Pass-Through Certificates | | | 2.000 | | | | 12/10/29 | | | | 690 | | | | 658,072 | |
Delta Air Lines, Inc., | | | | | | | | | | | | | | | | |
Sr. Unsec’d. Notes | | | 3.400 | | | | 04/19/21(a) | | | | 665 | | | | 662,853 | |
Southwest Airlines Co., | | | | | | | | | | | | | | | | |
Sr. Unsec’d. Notes | | | 5.250 | | | | 05/04/25(a) | | | | 874 | | | | 935,857 | |
United Airlines 2016-2 Class AA Pass-Through Trust,
Pass-Through Certificates | | | 2.875 | | | | 04/07/30 | | | | 347 | | | | 325,867 | |
United Airlines 2019-2 Class AA Pass-Through Trust,
Pass-Through Certificates | | | 2.700 | | | | 11/01/33 | | | | 450 | | | | 409,062 | |
| | | | |
| | | | | | | | | | | | | | | 3,162,955 | |
See Notes to Financial Statements.
| | | | | | | | | | | | | | | | |
| | | | |
| Description | | Interest
Rate | | | Maturity
Date | | | Principal Amount (000)# | | | Value | |
| | | | |
CORPORATE BONDS (Continued) | | | | | | | | | | | | | | | | |
| | | | |
Auto Manufacturers 0.8% | | | | | | | | | | | | | | | | |
BMW US Capital LLC (Germany), | | | | | | | | | | | | | | | | |
Gtd. Notes, 144A, 3 Month LIBOR + 0.410% | | | 0.676%(c) | | | | 04/12/21 | | | | 60 | | | $ | 59,868 | |
Gtd. Notes, 144A | | | 2.250 | | | | 09/15/23 | | | | 645 | | | | 674,538 | |
Gtd. Notes, 144A | | | 3.100 | | | | 04/12/21 | | | | 80 | | | | 81,466 | |
Daimler Finance North America LLC (Germany), | | | | | | | | | | | | | | | | |
Gtd. Notes, 144A | | | 3.350 | | | | 05/04/21 | | | | 495 | | | | 504,334 | |
Ford Motor Co., | | | | | | | | | | | | | | | | |
Sr. Unsec’d. Notes | | | 5.291 | | | | 12/08/46 | | | | 285 | | | | 271,202 | |
Ford Motor Credit Co. LLC, | | | | | | | | | | | | | | | | |
Sr. Unsec’d. Notes | | | 3.087 | | | | 01/09/23 | (a) | | | 1,125 | | | | 1,121,071 | |
Sr. Unsec’d. Notes | | | 3.336 | | | | 03/18/21 | | | | 515 | | | | 516,767 | |
Sr. Unsec’d. Notes | | | 3.350 | | | | 11/01/22 | | | | 1,390 | | | | 1,400,588 | |
General Motors Financial Co., Inc., | | | | | | | | | | | | | | | | |
Gtd. Notes, 3 Month LIBOR + 0.850% | | | 1.118(c) | | | | 04/09/21 | | | | 130 | | | | 129,745 | |
Gtd. Notes | | | 3.450 | | | | 04/10/22 | | | | 180 | | | | 184,994 | |
Gtd. Notes | | | 3.550 | | | | 04/09/21 | | | | 95 | | | | 96,420 | |
Gtd. Notes | | | 3.850 | | | | 01/05/28 | | | | 490 | | | | 517,393 | |
Gtd. Notes | | | 4.350 | | | | 01/17/27 | | | | 180 | | | | 196,918 | |
Gtd. Notes | | | 5.250 | | | | 03/01/26 | | | | 375 | | | | 424,473 | |
Sr. Unsec’d. Notes | | | 3.600 | | | | 06/21/30 | (a) | | | 2,655 | | | | 2,753,514 | |
| | | | |
| | | | | | | | | | | | | | | 8,933,291 | |
| | | | |
Banks 7.6% | | | | | | | | | | | | | | | | |
Banco Santander SA (Spain), | | | | | | | | | | | | | | | | |
Sr. Unsec’d. Notes | | | 3.848 | | | | 04/12/23 | | | | 200 | | | | 214,769 | |
Bank of America Corp., | | | | | | | | | | | | | | | | |
Sr. Unsec’d. Notes, GMTN | | | 3.593(ff) | | | | 07/21/28 | | | | 1,595 | | | | 1,814,818 | |
Sr. Unsec’d. Notes, MTN | | | 2.496(ff) | | | | 02/13/31 | (a) | | | 2,705 | | | | 2,874,790 | |
Sr. Unsec’d. Notes, MTN | | | 3.824(ff) | | | | 01/20/28 | | | | 1,720 | | | | 1,967,902 | |
Sr. Unsec’d. Notes, MTN | | | 3.974(ff) | | | | 02/07/30 | | | | 400 | | | | 469,831 | |
Sr. Unsec’d. Notes, MTN | | | 4.125 | | | | 01/22/24 | | | | 200 | | | | 223,058 | |
Sr. Unsec’d. Notes, MTN | | | 4.271(ff) | | | | 07/23/29 | | | | 320 | | | | 380,877 | |
Sr. Unsec’d. Notes, MTN | | | 4.330(ff) | | | | 03/15/50 | | | | 1,555 | | | | 2,112,207 | |
Sub. Notes, MTN | | | 4.000 | | | | 01/22/25 | | | | 800 | | | | 893,434 | |
Sub. Notes, MTN | | | 4.450 | | | | 03/03/26 | | | | 1,500 | | | | 1,731,733 | |
Bank of New York Mellon Corp. (The), | | | | | | | | | | | | | | | | |
Sr. Unsec’d. Notes, MTN | | | 2.950 | | | | 01/29/23 | | | | 450 | | | | 477,345 | |
Barclays PLC (United Kingdom), | | | | | | | | | | | | | | | | |
Sr. Unsec’d. Notes | | | 3.684 | | | | 01/10/23 | | | | 480 | | | | 498,468 | |
Sr. Unsec’d. Notes | | | 3.932(ff) | | | | 05/07/25 | | | | 1,300 | | | | 1,419,798 | |
Sr. Unsec’d. Notes | | | 4.375 | | | | 01/12/26 | | | | 200 | | | | 228,122 | |
See Notes to Financial Statements.
Schedule of Investments (continued)
as of July 31, 2020
| | | | | | | | | | | | | | | | |
| | | | |
| Description | | Interest
Rate | | | Maturity
Date | | | Principal Amount (000)# | | | Value | |
| | | | |
CORPORATE BONDS (Continued) | | | | | | | | | | | | | | | | |
| | | | |
Banks (cont’d.) | | | | | | | | | | | | | | | | |
Barclays PLC (United Kingdom), (cont’d.) | | | | | | | | | | | | | | | | |
Sr. Unsec’d. Notes, MTN | | | 4.972%(ff) | | | | 05/16/29 | | | | 400 | | | $ | 478,536 | |
BNP Paribas SA (France), | | | | | | | | | | | | | | | | |
Sr. Unsec’d. Notes, 144A | | | 2.219(ff) | | | | 06/09/26 | | | | 655 | | | | 680,459 | |
Sr. Unsec’d. Notes, 144A, MTN | | | 2.950 | | | | 05/23/22 | | | | 435 | | | | 451,645 | |
Sr. Unsec’d. Notes, 144A, MTN | | | 3.052(ff) | | | | 01/13/31 | | | | 1,080 | | | | 1,177,635 | |
Sub. Notes, 144A, MTN | | | 4.375 | | | | 09/28/25 | | | | 710 | | | | 793,785 | |
BPCE SA (France), | | | | | | | | | | | | | | | | |
Sr. Unsec’d. Notes, 144A | | | 2.375 | | | | 01/14/25 | | | | 2,650 | | | | 2,776,008 | |
Sr. Unsec’d. Notes, 144A, MTN | | | 3.250 | | | | 01/11/28 | | | | 625 | | | | 694,328 | |
Citigroup, Inc., | | | | | | | | | | | | | | | | |
Sr. Unsec’d. Notes | | | 2.666(ff) | | | | 01/29/31 | | | | 1,400 | | | | 1,496,932 | |
Sr. Unsec’d. Notes | | | 3.200 | | | | 10/21/26 | | | | 290 | | | | 322,740 | |
Sr. Unsec’d. Notes | | | 3.400 | | | | 05/01/26 | | | | 350 | | | | 391,869 | |
Sr. Unsec’d. Notes | | | 3.520(ff) | | | | 10/27/28 | | | | 180 | | | | 202,831 | |
Sr. Unsec’d. Notes | | | 3.668(ff) | | | | 07/24/28 | | | | 490 | | | | 556,648 | |
Sr. Unsec’d. Notes | | | 3.887(ff) | | | | 01/10/28 | | | | 670 | | | | 765,070 | |
Sub. Notes | | | 4.400 | | | | 06/10/25 | (a) | | | 4,000 | | | | 4,549,945 | |
Sub. Notes | | | 4.450 | | | | 09/29/27 | | | | 840 | | | | 976,263 | |
Sub. Notes | | | 4.600 | | | | 03/09/26 | | | | 945 | | | | 1,096,596 | |
Sub. Notes | | | 4.750 | | | | 05/18/46 | | | | 460 | | | | 614,701 | |
Credit Suisse Group AG (Switzerland), | | | | | | | | | | | | | | | | |
Sr. Unsec’d. Notes, 144A | | | 2.193(ff) | | | | 06/05/26 | | | | 555 | | | | 572,016 | |
Sr. Unsec’d. Notes, 144A | | | 2.593(ff) | | | | 09/11/25 | | | | 1,730 | | | | 1,810,362 | |
Sr. Unsec’d. Notes, 144A | | | 3.869(ff) | | | | 01/12/29 | | | | 870 | | | | 978,669 | |
Sr. Unsec’d. Notes, 144A | | | 4.282 | | | | 01/09/28 | | | | 350 | | | | 398,604 | |
Discover Bank, | | | | | | | | | | | | | | | | |
Sr. Unsec’d. Notes | | | 4.200 | | | | 08/08/23 | | | | 250 | | | | 275,229 | |
Goldman Sachs Group, Inc. (The), | | | | | | | | | | | | | | | | |
Sr. Unsec’d. Notes | | | 3.272(ff) | | | | 09/29/25 | | | | 1,160 | | | | 1,260,575 | |
Sr. Unsec’d. Notes | | | 3.500 | | | | 01/23/25 | | | | 75 | | | | 82,522 | |
Sr. Unsec’d. Notes | | | 3.500 | | | | 04/01/25 | (a) | | | 1,230 | | | | 1,363,111 | |
Sr. Unsec’d. Notes | | | 3.691(ff) | | | | 06/05/28 | | | | 1,750 | | | | 1,993,138 | |
Sr. Unsec’d. Notes | | | 3.850 | | | | 01/26/27 | | | | 475 | | | | 540,421 | |
Sr. Unsec’d. Notes | | | 4.223(ff) | | | | 05/01/29 | | | | 155 | | | | 182,907 | |
Sub. Notes | | | 4.250 | | | | 10/21/25 | | | | 250 | | | | 284,721 | |
Sub. Notes | | | 5.150 | | | | 05/22/45 | | | | 335 | | | | 464,748 | |
ING Groep NV (Netherlands), | | | | | | | | | | | | | | | | |
Sr. Unsec’d. Notes | | | 3.550 | | | | 04/09/24 | | | | 200 | | | | 218,976 | |
Intesa Sanpaolo SpA (Italy), | | | | | | | | | | | | | | | | |
Sr. Unsec’d. Notes, Series XR, 144A | | | 4.000 | | | | 09/23/29 | (a) | | | 1,790 | | | | 1,945,064 | |
See Notes to Financial Statements.
| | | | | | | | | | | | | | | | |
| | | | |
| Description | | Interest
Rate | | | Maturity
Date | | | Principal Amount (000)# | | | Value | |
| | | | |
CORPORATE BONDS (Continued) | | | | | | | | | | | | | | | | |
| | | | |
Banks (cont’d.) | | | | | | | | | | | | | | | | |
JPMorgan Chase & Co., | | | | | | | | | | | | | | | | |
Jr. Sub. Notes, Series II | | | 4.000%(ff) | | | | –(rr) | | | | 3,920 | | | $ | 3,633,258 | |
Sr. Unsec’d. Notes | | | 2.550 | | | | 03/01/21 | | | | 100 | | | | 101,127 | |
Sr. Unsec’d. Notes | | | 2.950 | | | | 10/01/26 | | | | 410 | | | | 454,871 | |
Sr. Unsec’d. Notes | | | 3.200 | | | | 01/25/23 | | | | 100 | | | | 106,692 | |
Sr. Unsec’d. Notes | | | 3.200 | | | | 06/15/26 | | | | 230 | | | | 258,310 | |
Sr. Unsec’d. Notes | | | 3.300 | | | | 04/01/26 | | | | 4,000 | | | | 4,503,373 | |
Sr. Unsec’d. Notes | | | 3.509(ff) | | | | 01/23/29 | | | | 210 | | | | 238,958 | |
Sr. Unsec’d. Notes | | | 3.625 | | | | 05/13/24(a) | | | | 875 | | | | 969,960 | |
Sr. Unsec’d. Notes | | | 3.964(ff) | | | | 11/15/48 | | | | 355 | | | | 460,004 | |
Sr. Unsec’d. Notes | | | 4.005(ff) | | | | 04/23/29 | | | | 3,585 | | | | 4,216,252 | |
Sub. Notes | | | 2.956(ff) | | | | 05/13/31 | | | | 1,855 | | | | 2,017,291 | |
Sub. Notes | | | 3.875 | | | | 09/10/24 | | | | 375 | | | | 419,157 | |
Sub. Notes | | | 4.250 | | | | 10/01/27 | | | | 375 | | | | 440,941 | |
Mitsubishi UFJ Financial Group, Inc. (Japan), | | | | | | | | | | | | | | | | |
Sr. Unsec’d. Notes | | | 2.623 | | | | 07/18/22 | | | | 2,400 | | | | 2,495,775 | |
Morgan Stanley, | | | | | | | | | | | | | | | | |
Sr. Unsec’d. Notes, GMTN | | | 3.750 | | | | 02/25/23 | | | | 315 | | | | 340,316 | |
Sr. Unsec’d. Notes, GMTN | | | 3.772(ff) | | | | 01/24/29 | | | | 760 | | | | 881,362 | |
Sr. Unsec’d. Notes, GMTN | | | 3.875 | | | | 01/27/26(a) | | | | 470 | | | | 539,781 | |
Sr. Unsec’d. Notes, GMTN | | | 4.000 | | | | 07/23/25 | | | | 455 | | | | 522,267 | |
Sr. Unsec’d. Notes, GMTN | | | 4.431(ff) | | | | 01/23/30 | | | | 1,200 | | | | 1,456,299 | |
Sr. Unsec’d. Notes, MTN | | | 2.720(ff) | | | | 07/22/25 | | | | 1,500 | | | | 1,603,023 | |
Sr. Unsec’d. Notes, MTN | | | 3.591(ff) | | | | 07/22/28 | | | | 310 | | | | 354,314 | |
Sr. Unsec’d. Notes, Series F, MTN | | | 3.875 | | | | 04/29/24 | | | | 365 | | | | 406,709 | |
Sub. Notes, GMTN | | | 4.350 | | | | 09/08/26 | | | | 3,800 | | | | 4,443,334 | |
Natwest Group PLC (United Kingdom), | | | | | | | | | | | | | | | | |
Sr. Unsec’d. Notes | | | 3.875 | | | | 09/12/23 | | | | 220 | | | | 238,923 | |
Sr. Unsec’d. Notes | | | 4.445(ff) | | | | 05/08/30(a) | | | | 720 | | | | 855,570 | |
Santander UK Group Holdings PLC (United Kingdom), | | | | | | | | | | | | | | | | |
Sr. Unsec’d. Notes | | | 3.571 | | | | 01/10/23 | | | | 430 | | | | 446,178 | |
State Bank of India (India), | | | | | | | | | | | | | | | | |
Sr. Unsec’d. Notes, 144A | | | 4.375 | | | | 01/24/24 | | | | 630 | | | | 674,495 | |
Sumitomo Mitsui Financial Group, Inc. (Japan), | | | | | | | | | | | | | | | | |
Sr. Unsec’d. Notes | | | 2.348 | | | | 01/15/25 | | | | 2,520 | | | | 2,680,966 | |
Sr. Unsec’d. Notes | | | 2.442 | | | | 10/19/21 | | | | 235 | | | | 240,632 | |
Svenska Handelsbanken AB (Sweden), | | | | | | | | | | | | | | | | |
Gtd. Notes, MTN | | | 1.875 | | | | 09/07/21 | | | | 465 | | | | 472,702 | |
Truist Bank, | | | | | | | | | | | | | | | | |
Sub. Notes | | | 2.250 | | | | 03/11/30 | | | | 2,840 | | | | 2,991,721 | |
Truist Financial Corp., | | | | | | | | | | | | | | | | |
Sr. Unsec’d. Notes | | | 2.700 | | | | 01/27/22 | | | | 350 | | | | 361,292 | |
See Notes to Financial Statements.
Schedule of Investments (continued)
as of July 31, 2020
| | | | | | | | | | | | | | | | |
| | | | |
| Description | | Interest
Rate | | | Maturity
Date | | | Principal Amount (000)# | | | Value | |
| | | | |
CORPORATE BONDS (Continued) | | | | | | | | | | | | | | | | |
| | | | |
Banks (cont’d.) | | | | | | | | | | | | | | | | |
UBS Group AG (Switzerland), | | | | | | | | | | | | | | | | |
Sr. Unsec’d. Notes, 144A | | | 2.859 | %(ff) | | | 08/15/23 | | | | 570 | | | $ | 592,945 | |
Sr. Unsec’d. Notes, 144A | | | 3.000 | | | | 04/15/21 | | | | 345 | | | | 351,268 | |
Sr. Unsec’d. Notes, 144A | | | 3.126 | (ff) | | | 08/13/30 | (a) | | | 1,180 | | | | 1,308,262 | |
Wells Fargo & Co., | | | | | | | | | | | | | | | | |
Sr. Unsec’d. Notes, MTN | | | 2.572 | (ff) | | | 02/11/31 | | | | 2,740 | | | | 2,908,431 | |
| | | | |
| | | | | | | | | | | | | | | 90,690,965 | |
| | | | |
Beverages 0.5% | | | | | | | | | | | | | | | | |
Anheuser-Busch Cos. LLC/Anheuser-Busch InBev | | | | | | | | | | | | | | | | |
Worldwide, Inc. (Belgium), | | | | | | | | | | | | | | | | |
Gtd. Notes | | | 4.700 | | | | 02/01/36 | | | | 180 | | | | 221,142 | |
Gtd. Notes | | | 4.900 | | | | 02/01/46 | | | | 650 | | | | 833,394 | |
Anheuser-Busch InBev Worldwide, Inc. (Belgium), | | | | | | | | | | | | | | | | |
Gtd. Notes | | | 5.450 | | | | 01/23/39 | | | | 975 | | | | 1,277,280 | |
Gtd. Notes | | | 5.550 | | | | 01/23/49 | | | | 900 | | | | 1,259,928 | |
Constellation Brands, Inc., | | | | | | | | | | | | | | | | |
Gtd. Notes | | | 4.650 | | | | 11/15/28 | | | | 450 | | | | 546,576 | |
Diageo Capital PLC (United Kingdom), | | | | | | | | | | | | | | | | |
Gtd. Notes | | | 2.125 | | | | 04/29/32 | (a) | | | 1,665 | | | | 1,789,799 | |
Keurig Dr. Pepper, Inc., | | | | | | | | | | | | | | | | |
Gtd. Notes | | | 3.551 | | | | 05/25/21 | | | | 370 | | | | 379,287 | |
| | | | |
| | | | | | | | | | | | | | | 6,307,406 | |
| | | | |
Biotechnology 0.2% | | | | | | | | | | | | | | | | |
Amgen, Inc., | | | | | | | | | | | | | | | | |
Sr. Unsec’d. Notes | | | 2.200 | | | | 02/21/27 | | | | 2,000 | | | | 2,138,798 | |
Gilead Sciences, Inc., | | | | | | | | | | | | | | | | |
Sr. Unsec’d. Notes | | | 2.500 | | | | 09/01/23 | | | | 220 | | | | 233,419 | |
| | | | |
| | | | | | | | | | | | | | | 2,372,217 | |
| | | | |
Building Materials 0.3% | | | | | | | | | | | | | | | | |
Martin Marietta Materials, Inc., | | | | | | | | | | | | | | | | |
Sr. Unsec’d. Notes | | | 4.250 | | | | 12/15/47 | | | | 395 | | | | 461,982 | |
Sr. Unsec’d. Notes, Series CB | | | 2.500 | | | | 03/15/30 | | | | 885 | | | | 928,812 | |
See Notes to Financial Statements.
| | | | | | | | | | | | | | | | |
| | | | |
| Description | | Interest
Rate | | | Maturity
Date | | | Principal Amount (000)# | | | Value | |
| | |
CORPORATE BONDS (Continued) | | | | | | | | | |
| | |
Building Materials (cont’d.) | | | | | | | | | |
Owens Corning, | | | | | | | | | | | | | | | | |
Sr. Unsec’d. Notes | | | 4.400% | | | | 01/30/48 | | | | 825 | | | $ | 915,268 | |
Vulcan Materials Co., | | | | | | | | | | | | | | | | |
Sr. Unsec’d. Notes | | | 4.700 | | | | 03/01/48 | | | | 750 | | | | 926,929 | |
| | | | |
| | | | | | | | | | | | | | | 3,232,991 | |
| | | | |
Chemicals 0.4% | | | | | | | | | | | | | | | | |
Braskem Netherlands Finance BV (Brazil), | | | | | | | | | | | | | | | | |
Gtd. Notes, 144A | | | 5.875 | | | | 01/31/50(a) | | | | 270 | | | | 244,102 | |
CNAC HK Finbridge Co. Ltd. (China), | | | | | | | | | | | | | | | | |
Gtd. Notes | | | 3.500 | | | | 07/19/22 | | | | 1,375 | | | | 1,421,392 | |
LYB International Finance BV, | | | | | | | | | | | | | | | | |
Gtd. Notes | | | 4.000 | | | | 07/15/23 | | | | 250 | | | | 272,925 | |
LYB International Finance III LLC, | | | | | | | | | | | | | | | | |
Gtd. Notes | | | 4.200 | | | | 05/01/50(a) | | | | 1,070 | | | | 1,230,308 | |
LyondellBasell Industries NV, | | | | | | | | | | | | | | | | |
Sr. Unsec’d. Notes | | | 5.750 | | | | 04/15/24 | | | | 310 | | | | 360,443 | |
Nutrien Ltd. (Canada), | | | | | | | | | | | | | | | | |
Sr. Unsec’d. Notes | | | 4.125 | | | | 03/15/35 | | | | 40 | | | | 46,360 | |
Sr. Unsec’d. Notes | | | 5.250 | | | | 01/15/45 | | | | 340 | | | | 445,635 | |
Sasol Financing USA LLC (South Africa), | | | | | | | | | | | | | | | | |
Gtd. Notes | | | 5.875 | | | | 03/27/24 | | | | 200 | | | | 187,558 | |
Gtd. Notes | | | 6.500 | | | | 09/27/28 | | | | 400 | | | | 361,901 | |
| | | | |
| | | | | | | | | | | | | | | 4,570,624 | |
| | | | |
Commercial Services 1.0% | | | | | | | | | | | | | | | | |
Cintas Corp. No. 2, | | | | | | | | | | | | | | | | |
Gtd. Notes | | | 2.900 | | | | 04/01/22 | | | | 385 | | | | 399,325 | |
ERAC USA Finance LLC, | | | | | | | | | | | | | | | | |
Gtd. Notes, 144A | | | 2.700 | | | | 11/01/23 | | | | 580 | | | | 603,916 | |
Gtd. Notes, 144A | | | 3.300 | | | | 10/15/22 | | | | 750 | | | | 783,303 | |
Gtd. Notes, 144A | | | 4.500 | | | | 02/15/45 | | | | 75 | | | | 81,362 | |
Experian Finance PLC (United Kingdom), | | | | | | | | | | | | | | | | |
Gtd. Notes, 144A | | | 2.750 | | | | 03/08/30 | | | | 1,735 | | | | 1,902,837 | |
Global Payments, Inc., | | | | | | | | | | | | | | | | |
Sr. Unsec’d. Notes | | | 2.650 | | | | 02/15/25 | | | | 575 | | | | 616,398 | |
Massachusetts Institute of Technology, | | | | | | | | | | | | | | | | |
Unsec’d. Notes | | | 3.885 | | | | 07/01/2116 | | | | 700 | | | | 949,581 | |
Northwestern University, | | | | | �� | | | | | | | | | | | |
Unsec’d. Notes | | | 2.640 | | | | 12/01/50 | | | | 860 | | | | 935,550 | |
See Notes to Financial Statements.
Schedule of Investments (continued)
as of July 31, 2020
| | | | | | | | | | | | | | | | |
| | | | |
| Description | | Interest
Rate | | | Maturity
Date | | | Principal Amount (000)# | | | Value | |
| | | | |
CORPORATE BONDS (Continued) | | | | | | | | | | | | | | | | |
| | | | |
Commercial Services (cont’d.) | | | | | | | | | | | | | | | | |
PayPal Holdings, Inc., | | | | | | | | | | | | | | | | |
Sr. Unsec’d. Notes | | | 2.850% | | | | 10/01/29 | | | | 1,790 | | | | $2,024,169 | |
President & Fellows of Harvard College, | | | | | | | | | | | | | | | | |
Unsec’d. Notes | | | 3.300 | | | | 07/15/56 | | | | 160 | | | | 206,402 | |
Trustees of Boston College, | | | | | | | | | | | | | | | | |
Unsec’d. Notes | | | 3.129 | | | | 07/01/52 | | | | 637 | | | | 750,861 | |
University of Notre Dame du Lac, | | | | | | | | | | | | | | | | |
Unsec’d. Notes | | | 3.394 | | | | 02/15/48 | | | | 365 | | | | 461,451 | |
University of Southern California, | | | | | | | | | | | | | | | | |
Unsec’d. Notes | | | 3.028 | | | | 10/01/39 | | | | 310 | | | | 348,268 | |
Verisk Analytics, Inc., | | | | | | | | | | | | | | | | |
Sr. Unsec’d. Notes | | | 4.125 | | | | 03/15/29(a) | | | | 1,185 | | | | 1,429,330 | |
| | | | |
| | | | | | | | | | | | | | | 11,492,753 | |
| | | | |
Computers 0.9% | | | | | | | | | | | | | | | | |
Apple, Inc., | | | | | | | | | | | | | | | | |
Sr. Unsec’d. Notes | | | 2.650 | | | | 05/11/50(a) | | | | 2,095 | | | | 2,320,801 | |
Sr. Unsec’d. Notes | | | 3.850 | | | | 08/04/46 | | | | 525 | | | | 682,914 | |
Hewlett Packard Enterprise Co., | | | | | | | | | | | | | | | | |
Sr. Unsec’d. Notes, 3 Month LIBOR + 0.680% | | | 0.998(c) | | | | 03/12/21 | | | | 3,330 | | | | 3,328,315 | |
HP, Inc., | | | | | | | | | | | | | | | | |
Sr. Unsec’d. Notes | | | 2.200 | | | | 06/17/25 | | | | 2,530 | | | | 2,656,615 | |
NetApp, Inc., | | | | | | | | | | | | | | | | |
Sr. Unsec’d. Notes | | | 1.875 | | | | 06/22/25 | | | | 1,470 | | | | 1,525,096 | |
| | | | |
| | | | | | | | | | | | | | | 10,513,741 | |
| | | | |
Diversified Financial Services 0.1% | | | | | | | | | | | | | | | | |
Capital One Financial Corp., | | | | | | | | | | | | | | | | |
Sr. Unsec’d. Notes | | | 3.450 | | | | 04/30/21 | | | | 370 | | | | 377,340 | |
Jefferies Group LLC, | | | | | | | | | | | | | | | | |
Sr. Unsec’d. Notes | | | 6.450 | | | | 06/08/27 | | | | 150 | | | | 178,183 | |
Private Export Funding Corp., | | | | | | | | | | | | | | | | |
Sr. Unsec’d. Notes, 144A | | | 2.650 | | | | 02/16/21 | | | | 630 | | | | 638,181 | |
| | | | |
| | | | | | | | | | | | | | | 1,193,704 | |
| | | | |
Electric 3.6% | | | | | | | | | | | | | | | | |
AEP Transmission Co. LLC, | | | | | | | | | | | | | | | | |
Sr. Unsec’d. Notes | | | 4.250 | | | | 09/15/48 | | | | 830 | | | | 1,111,119 | |
Alabama Power Co., | | | | | | | | | | | | | | | | |
Sr. Unsec’d. Notes | | | 2.800 | | | | 04/01/25 | | | | 75 | | | | 81,001 | |
See Notes to Financial Statements.
| | | | | | | | | | | | | | | | |
| | | | |
| Description | | Interest
Rate | | | Maturity
Date | | | Principal Amount (000)# | | | Value | |
| | | | |
CORPORATE BONDS (Continued) | | | | | | | | | | | | | | | | |
| | | | |
Electric (cont’d.) | | | | | | | | | | | | | | | | |
Ameren Illinois Co., | | | | | | | | | | | | | | | | |
First Mortgage | | | 3.700% | | | | 12/01/47 | | | | 625 | | | $ | 792,587 | |
Arizona Public Service Co., | | | | | | | | | | | | | | | | |
Sr. Unsec’d. Notes | | | 3.350 | | | | 05/15/50 | | | | 1,810 | | | | 2,111,999 | |
Baltimore Gas & Electric Co., | | | | | | | | | | | | | | | | |
Sr. Unsec’d. Notes | | | 2.900 | | | | 06/15/50 | | | | 100 | | | | 111,472 | |
CenterPoint Energy Houston Electric LLC, | | | | | | | | | | | | | | | | |
General Ref. Mortgage, Series Z | | | 2.400 | | | | 09/01/26 | | | | 190 | | | | 204,003 | |
CenterPoint Energy, Inc., | | | | | | | | | | | | | | | | |
Sr. Unsec’d. Notes | | | 3.700 | | | | 09/01/49 | | | | 495 | | | | 579,968 | |
Cleco Corporate Holdings LLC, | | | | | | | | | | | | | | | | |
Sr. Unsec’d. Notes | | | 3.375 | | | | 09/15/29 | | | | 305 | | | | 312,580 | |
Commonwealth Edison Co., | | | | | | | | | | | | | | | | |
First Mortgage | | | 3.700 | | | | 03/01/45 | | | | 40 | | | | 49,666 | |
First Mortgage | | | 4.000 | | | | 03/01/48 | | | | 115 | | | | 152,431 | |
First Mortgage, Series 123 | | | 3.750 | | | | 08/15/47 | | | | 775 | | | | 989,899 | |
Consolidated Edison Co. of New York, Inc., | | | | | | | | | | | | | | | | |
Sr. Unsec’d. Notes, Series C | | | 4.300 | | | | 12/01/56 | | | | 40 | | | | 54,066 | |
Sr. Unsec’d. Notes, Series E | | | 4.650 | | | | 12/01/48 | | | | 720 | | | | 1,008,310 | |
Consumers Energy Co., | | | | | | | | | | | | | | | | |
First Mortgage | | | 3.250 | | | | 08/15/46 | | | | 155 | | | | 186,531 | |
Delmarva Power & Light Co., | | | | | | | | | | | | | | | | |
First Mortgage | | | 4.150 | | | | 05/15/45 | | | | 60 | | | | 77,032 | |
Dominion Energy, Inc., | | | | | | | | | | | | | | | | |
Sr. Unsec’d. Notes, Series D | | | 2.850 | | | | 08/15/26 | | | | 55 | | | | 60,571 | |
DTE Electric Co., | | | | | | | | | | | | | | | | |
General Ref. Mortgage, Series A | | | 4.050 | | | | 05/15/48 | | | | 370 | | | | 494,777 | |
DTE Energy Co., | | | | | | | | | | | | | | | | |
Sr. Unsec’d. Notes | | | 2.850 | | | | 10/01/26 | | | | 350 | | | | 380,530 | |
Duke Energy Corp., | | | | | | | | | | | | | | | | |
Sr. Unsec’d. Notes | | | 2.650 | | | | 09/01/26 | | | | 145 | | | | 159,859 | |
Sr. Unsec’d. Notes | | | 3.950 | | | | 08/15/47 | | | | 185 | | | | 236,530 | |
Duke Energy Florida LLC, | | | | | | | | | | | | | | | | |
First Mortgage | | | 3.200 | | | | 01/15/27 | | | | 600 | | | | 687,642 | |
First Mortgage | | | 3.400 | | | | 10/01/46 | | | | 185 | | | | 225,546 | |
First Mortgage | | | 4.200 | | | | 07/15/48 | | | | 205 | | | | 280,896 | |
Duke Energy Progress LLC, | | | | | | | | | | | | | | | | |
First Mortgage | | | 3.700 | | | | 10/15/46 | | | | 75 | | | | 95,025 | |
Emera US Finance LP (Canada), | | | | | | | | | | | | | | | | |
Gtd. Notes | | | 3.550 | | | | 06/15/26 | | | | 75 | | | | 84,764 | |
Enel Finance International NV (Italy), | | | | | | | | | | | | | | | | |
Gtd. Notes, 144A | | | 2.650 | | | | 09/10/24 | | | | 655 | | | | 688,423 | |
See Notes to Financial Statements.
Schedule of Investments (continued)
as of July 31, 2020
| | | | | | | | | | | | | | | | |
| | | | |
| Description | | Interest
Rate | | | Maturity
Date | | | Principal Amount (000)# | | | Value | |
| | | | |
CORPORATE BONDS (Continued) | | | | | | | | | | | | | | | | |
| | | | |
Electric (cont’d.) | | | | | | | | | | | | | | | | |
Enel Finance International NV (Italy), (cont’d.) | | | | | | | | | | | | | | | | |
Gtd. Notes, 144A | | | 3.500% | | | | 04/06/28 | | | | 475 | | | $ | 526,871 | |
Gtd. Notes, 144A | | | 3.625 | | | | 05/25/27 | | | | 230 | | | | 257,022 | |
Gtd. Notes, 144A | | | 4.625 | | | | 09/14/25 | | | | 240 | | | | 277,323 | |
Engie Energia Chile SA (Chile), | | | | | | | | | | | | | | | | |
Sr. Unsec’d. Notes, 144A | | | 3.400 | | | | 01/28/30 | | | | 200 | | | | 213,418 | |
Entergy Corp., | | | | | | | | | | | | | | | | |
Sr. Unsec’d. Notes | | | 4.000 | | | | 07/15/22 | | | | 260 | | | | 276,110 | |
Entergy Louisiana LLC, | | | | | | | | | | | | | | | | |
Sec’d. Notes | | | 4.000 | | | | 03/15/33 | | | | 170 | | | | 216,156 | |
Entergy Texas, Inc., | | | | | | | | | | | | | | | | |
First Mortgage | | | 4.500 | | | | 03/30/39 | | | | 1,000 | | | | 1,248,687 | |
Evergy, Inc., | | | | | | | | | | | | | | | | |
Sr. Unsec’d. Notes | | | 2.450 | | | | 09/15/24 | | | | 2,135 | | | | 2,281,280 | |
Eversource Energy, | | | | | | | | | | | | | | | | |
Sr. Unsec’d. Notes, Series M | | | 3.300 | | | | 01/15/28 | | | | 335 | | | | 376,105 | |
Florida Power & Light Co., | | | | | | | | | | | | | | | | |
First Mortgage | | | 3.150 | | | | 10/01/49 | | | | 1,420 | | | | 1,744,618 | |
Fortis, Inc. (Canada), | | | | | | | | | | | | | | | | |
Sr. Unsec’d. Notes | | | 3.055 | | | | 10/04/26 | | | | 217 | | | | 237,649 | |
Georgia Power Co., | | | | | | | | | | | | | | | | |
Sr. Unsec’d. Notes, Series B | | | 2.650 | | | | 09/15/29 | | | | 1,005 | | | | 1,094,092 | |
IPALCO Enterprises, Inc., | | | | | | | | | | | | | | | | |
Sr. Sec’d. Notes, 144A | | | 4.250 | | | | 05/01/30 | | | | 240 | | | | 267,346 | |
Israel Electric Corp. Ltd. (Israel), | | | | | | | | | | | | | | | | |
Sr. Sec’d. Notes, 144A, GMTN | | | 4.250 | | | | 08/14/28 | | | | 235 | | | | 267,716 | |
MidAmerican Energy Co., | | | | | | | | | | | | | | | | |
First Mortgage | | | 3.950 | | | | 08/01/47 | | | | 225 | | | | 299,298 | |
Monongahela Power Co., | | | | | | | | | | | | | | | | |
First Mortgage, 144A | | | 4.100 | | | | 04/15/24 | | | | 851 | | | | 943,111 | |
Narragansett Electric Co. (The), | | | | | | | | | | | | | | | | |
Sr. Unsec’d. Notes, 144A | | | 3.395 | | | | 04/09/30 | | | | 915 | | | | 1,067,400 | |
NextEra Energy Capital Holdings, Inc., | | | | | | | | | | | | | | | | |
Gtd. Notes | | | 2.403 | | | | 09/01/21 | | | | 2,100 | | | | 2,146,571 | |
Ohio Power Co., | | | | | | | | | | | | | | | | |
Sr. Unsec’d. Notes | | | 4.150 | | | | 04/01/48 | | | | 250 | | | | 332,767 | |
Oncor Electric Delivery Co. LLC, | | | | | | | | | | | | | | | | |
Sr. Sec’d. Notes | | | 2.950 | | | | 04/01/25 | | | | 60 | | | | 65,563 | |
PacifiCorp, | | | | | | | | | | | | | | | | |
First Mortgage | | | 2.700 | | | | 09/15/30 | | | | 890 | | | | 1,007,212 | |
First Mortgage | | | 3.300 | | | | 03/15/51 | | | | 375 | | | | 455,856 | |
See Notes to Financial Statements.
| | | | | | | | | | | | | | | | |
| | | | |
| Description | | Interest
Rate | | | Maturity
Date | | | Principal Amount (000)# | | | Value | |
| | | | |
CORPORATE BONDS (Continued) | | | | | | | | | | | | | | | | |
| | | | |
Electric (cont’d.) | | | | | | | | | | | | | | | | |
PECO Energy Co., | | | | | | | | | | | | | | | | |
First Mortgage | | | 3.000% | | | | 09/15/49 | | | | 180 | | | $ | 209,871 | |
First Ref. Mortgage | | | 4.800 | | | | 10/15/43 | | | | 120 | | | | 167,385 | |
Pennsylvania Electric Co., | | | | | | | | | | | | | | | | |
Sr. Unsec’d. Notes, 144A | | | 3.600 | | | | 06/01/29 | | | | 1,435 | | | | 1,607,797 | |
PPL Capital Funding, Inc., | | | | | | | | | | | | | | | | |
Gtd. Notes | | | 4.000 | | | | 09/15/47 | | | | 330 | | | | 385,097 | |
Gtd. Notes | | | 5.000 | | | | 03/15/44 | | | | 170 | | | | 221,663 | |
PPL Electric Utilities Corp., | | | | | | | | | | | | | | | | |
First Mortgage | | | 3.000 | | | | 10/01/49 | | | | 235 | | | | 270,433 | |
Public Service Co. of Colorado, | | | | | | | | | | | | | | | | |
First Mortgage | | | 3.200 | | | | 03/01/50 | | | | 720 | | | | 869,048 | |
First Mortgage | | | 4.100 | | | | 06/15/48 | | | | 235 | | | | 319,515 | |
Public Service Electric & Gas Co., | | | | | | | | | | | | | | | | |
First Mortgage, MTN | | | 2.250 | | | | 09/15/26 | | | | 370 | | | | 399,853 | |
First Mortgage, MTN | | | 3.200 | | | | 05/15/29 | | | | 1,265 | | | | 1,461,768 | |
First Mortgage, MTN | | | 3.600 | | | | 12/01/47 | | | | 95 | | | | 120,322 | |
First Mortgage, MTN | | | 3.700 | | | | 05/01/28 | | | | 590 | | | | 696,786 | |
Public Service Electric and Gas Co., | | | | | | | | | | | | | | | | |
First Mortgage, MTN | | | 2.700 | | | | 05/01/50 | | | | 390 | | | | 437,367 | |
Puget Sound Energy, Inc., | | | | | | | | | | | | | | | | |
Sr. Sec’d. Notes | | | 3.250 | | | | 09/15/49 | | | | 535 | | | | 637,769 | |
San Diego Gas & Electric Co., | | | | | | | | | | | | | | | | |
First Mortgage | | | 4.150 | | | | 05/15/48 | | | | 420 | | | | 553,054 | |
Southern California Edison Co., | | | | | | | | | | | | | | | | |
First Mortgage | | | 3.650 | | | | 02/01/50 | | | | 290 | | | | 331,479 | |
Southwestern Electric Power Co., | | | | | | | | | | | | | | | | |
Sr. Unsec’d. Notes, Series K | | | 2.750 | | | | 10/01/26 | | | | 675 | | | | 727,339 | |
Southwestern Public Service Co., | | | | | | | | | | | | | | | | |
First Mortgage | | | 3.700 | | | | 08/15/47 | | | | 355 | | | | 434,728 | |
SP PowerAssets Ltd. (Singapore), | | | | | | | | | | | | | | | | |
Sr. Unsec’d. Notes, 144A, MTN | | | 3.000 | | | | 09/26/27 | | | | 465 | | | | 515,275 | |
Tucson Electric Power Co., | | | | | | | | | | | | | | | | |
Sr. Unsec’d. Notes | | | 4.000 | | | | 06/15/50 | | | | 1,315 | | | | 1,666,321 | |
Union Electric Co., | | | | | | | | | | | | | | | | |
Sr. Sec’d. Notes | | | 3.650 | | | | 04/15/45 | | | | 50 | | | | 62,108 | |
Virginia Electric & Power Co., | | | | | | | | | | | | | | | | |
Sr. Unsec’d. Notes | | | 4.600 | | | | 12/01/48 | | | | 460 | | | | 664,126 | |
Sr. Unsec’d. Notes, Series A | | | 3.500 | | | | 03/15/27 | | | | 535 | | | | 616,022 | |
Sr. Unsec’d. Notes, Series C | | | 4.000 | | | | 11/15/46 | | | | 175 | | | | 231,995 | |
Vistra Operations Co. LLC, | | | | | | | | | | | | | | | | |
Sr. Sec’d. Notes, 144A | | | 3.550 | | | | 07/15/24 | | | | 1,515 | | | | 1,587,395 | |
See Notes to Financial Statements.
Schedule of Investments (continued)
as of July 31, 2020
| | | | | | | | | | | | | | | | | | | | |
| | | | | |
| Description | | Interest
Rate | | | Maturity
Date | | | | | | Principal Amount (000)# | | | Value | |
| | | |
CORPORATE BONDS (Continued) | | | | | | | | | | | | | |
| | | | | |
Electric (cont’d.) | | | | | | | | | | | | | | | | | | | | |
Wisconsin Power & Light Co., | | | | | | | | | | | | | | | | | | | | |
Sr. Unsec’d. Notes | | | 3.050% | | | | 10/15/27 | | | | | | | | 535 | | | $ | 598,451 | |
Xcel Energy, Inc., | | | | | | | | | | | | | | | | | | | | |
Sr. Unsec’d. Notes | | | 3.350 | | | | 12/01/26 | | | | | | | | 510 | | | | 582,890 | |
| | | | | | | | | | | | | | | | | | | | |
| | | | | |
| | | | | | | | | | | | | | | | | | | 43,195,255 | |
| | | | | |
Electronics 0.1% | | | | | | | | | | | | | | | | | | | | |
FLIR Systems, Inc., | | | | | | | | | | | | | | | | | | | | |
Sr. Unsec’d. Notes | | | 3.125 | | | | 06/15/21 | | | | | | | | 275 | | | | 280,545 | |
Trimble, Inc., | | | | | | | | | | | | | | | | | | | | |
Sr. Unsec’d. Notes | | | 4.150 | | | | 06/15/23 | | | | | | | | 770 | | | | 828,648 | |
| | | | | | | | | | | | | | | | | | | | |
| | | | | |
| | | | | | | | | | | | | | | | | | | 1,109,193 | |
| | | | | |
Engineering & Construction 0.1% | | | | | | | | | | | | | | | | | | | | |
Mexico City Airport Trust (Mexico), | | | | | | | | | | | | | | | | | | | | |
Sr. Sec’d. Notes, 144A | | | 3.875 | | | | 04/30/28 | | | | | | | | 200 | | | | 175,910 | |
Sr. Sec’d. Notes, 144A | | | 4.250 | | | | 10/31/26 | | | | | | | | 200 | | | | 181,107 | |
Sr. Sec’d. Notes, 144A | | | 5.500 | | | | 07/31/47 | | | | | | | | 600 | | | | 504,346 | |
| | | | | | | | | | | | | | | | | | | | |
| | | | | |
| | | | | | | | | | | | | | | | | | | 861,363 | |
| | | | | |
Foods 0.6% | | | | | | | | | | | | | | | | | | | | |
Ahold Finance USA LLC (Netherlands), | | | | | | | | | | | | | | | | | | | | |
Gtd. Notes | | | 6.875 | | | | 05/01/29 | | | | | | | | 280 | | | | 398,621 | |
Campbell Soup Co., | | | | | | | | | | | | | | | | | | | | |
Sr. Unsec’d. Notes | | | 2.375 | | | | 04/24/30 | | | | | | | | 2,175 | | | | 2,314,370 | |
J.M. Smucker Co. (The), | | | | | | | | | | | | | | | | | | | | |
Sr. Unsec’d. Notes | | | 3.000 | | | | 03/15/22 | | | | | | | | 115 | | | | 119,353 | |
Kraft Heinz Foods Co., | | | | | | | | | | | | | | | | | | | | |
Gtd. Notes | | | 3.000 | | | | 06/01/26 | | | | | | | | 110 | | | | 116,274 | |
Gtd. Notes, 144A | | | 4.875 | | | | 10/01/49 | | | | | | | | 900 | | | | 990,107 | |
Kroger Co. (The), | | | | | | | | | | | | | | | | | | | | |
Sr. Unsec’d. Notes | | | 3.300 | | | | 01/15/21 | | | | | | | | 285 | | | | 288,051 | |
Sr. Unsec’d. Notes | | | 3.875 | | | | 10/15/46 | | | | | | | | 65 | | | | 77,691 | |
Mars, Inc., | | | | | | | | | | | | | | | | | | | | |
Gtd. Notes, 144A | | | 3.950 | | | | 04/01/49 | | | | | | | | 580 | | | | 766,253 | |
Mondelez International Holdings Netherlands BV, | | | | | | | | | | | | | | | | | | | | |
Gtd. Notes, 144A | | | 2.000 | | | | 10/28/21 | | | | | | | | 500 | | | | 508,764 | |
See Notes to Financial Statements.
| | | | | | | | | | | | | | | | | | | | |
| | | | | |
| Description | | Interest
Rate | | | Maturity
Date | | | | | | Principal Amount (000)# | | | Value | |
| | | | | |
CORPORATE BONDS (Continued) | | | | | | | | | | | | | | | | | | | | |
| | | | | |
Foods (cont’d.) | | | | | | | | | | | | | | | | | | | | |
Tyson Foods, Inc., | | | | | | | | | | | | | | | | | | | | |
Sr. Unsec’d. Notes | | | 2.250% | | | | 08/23/21 | | | | | | | | 985 | | | $ | 1,000,968 | |
Sr. Unsec’d. Notes | | | 5.100 | | | | 09/28/48 | (a) | | | | | | | 710 | | | | 991,783 | |
| | | | | | | | | | | | | | | | | | | | |
| | | | | |
| | | | | | | | | | | | | | | | | | | 7,572,235 | |
| | | | | |
Forest Products & Paper 0.0% | | | | | | | | | | | | | | | | | | | | |
Georgia-Pacific LLC, | | | | | | | | | | | | | | | | | | | | |
Sr. Unsec’d. Notes, 144A | | | 3.600 | | | | 03/01/25 | (a) | | | | | | | 220 | | | | 245,587 | |
| | | | | |
Gas 0.3% | | | | | | | | | | | | | | | | | | | | |
Atmos Energy Corp., | | | | | | | | | | | | | | | | | | | | |
Sr. Unsec’d. Notes | | | 3.375 | | | | 09/15/49 | | | | | | | | 1,200 | | | | 1,453,365 | |
CenterPoint Energy Resources Corp., | | | | | | | | | | | | | | | | | | | | |
Sr. Unsec’d. Notes | | | 4.100 | | | | 09/01/47 | | | | | | | | 305 | | | | 370,983 | |
NiSource, Inc., | | | | | | | | | | | | | | | | | | | | |
Sr. Unsec’d. Notes | | | 3.600 | | | | 05/01/30 | | | | | | | | 395 | | | | 465,224 | |
Piedmont Natural Gas Co., Inc., | | | | | | | | | | | | | | | | | | | | |
Sr. Unsec’d. Notes | | | 3.500 | | | | 06/01/29 | | | | | | | | 440 | | | | 513,713 | |
Southern Co. Gas Capital Corp., | | | | | | | | | | | | | | | | | | | | |
Gtd. Notes | | | 2.450 | | | | 10/01/23 | | | | | | | | 555 | | | | 583,733 | |
| | | | | | | | | | | | | | | | | | | | |
| | | | | |
| | | | | | | | | | | | | | | | | | | 3,387,018 | |
| | | | | |
Healthcare-Products 0.0% | | | | | | | | | | | | | | | | | | | | |
Medtronic, Inc., | | | | | | | | | | | | | | | | | | | | |
Gtd. Notes | | | 4.375 | | | | 03/15/35 | | | | | | | | 235 | | | | 319,042 | |
Thermo Fisher Scientific, Inc., | | | | | | | | | | | | | | | | | | | | |
Sr. Unsec’d. Notes | | | 2.950 | | | | 09/19/26 | | | | | | | | 105 | | | | 117,534 | |
| | | | | | | | | | | | | | | | | | | | |
| | | | | |
| | | | | | | | | | | | | | | | | | | 436,576 | |
| | | | | |
Healthcare-Services 1.0% | | | | | | | | | | | | | | | | | | | | |
Aetna, Inc., | | | | | | | | | | | | | | | | | | | | |
Sr. Unsec’d. Notes | | | 3.500 | | | | 11/15/24 | | | | | | | | 100 | | | | 110,390 | |
Sr. Unsec’d. Notes | | | 4.500 | | | | 05/15/42 | | | | | | | | 1,000 | | | | 1,235,175 | |
Sr. Unsec’d. Notes | | | 6.750 | | | | 12/15/37 | | | | | | | | 170 | | | | 247,707 | |
AHS Hospital Corp., | | | | | | | | | | | | | | | | | | | | |
Unsec’d. Notes | | | 5.024 | | | | 07/01/45 | | | | | | | | 200 | | | | 273,227 | |
Allina Health System, | | | | | | | | | | | | | | | | | | | | |
Unsec’d. Notes, Series 2019 | | | 3.887 | | | | 04/15/49 | | | | | | | | 250 | | | | 307,613 | |
Ascension Health, | | | | | | | | | | | | | | | | | | | | |
Sr. Unsec’d. Notes, Series B | | | 3.106 | | | | 11/15/39 | | | | | | | | 265 | | | | 298,044 | |
See Notes to Financial Statements.
Schedule of Investments (continued)
as of July 31, 2020
| | | | | | | | | | | | | | | | | | | | |
| | | | | |
| Description | | Interest
Rate | | | Maturity
Date | | | | | | Principal Amount (000)# | | | Value | |
| | | | | |
CORPORATE BONDS (Continued) | | | | | | | | | | | | | | | | | | | | |
| | | | | |
Healthcare-Services (cont’d.) | | | | | | | | | | | | | | | | | | | | |
Ascension Health, (cont’d.) | | | | | | | | | | | | | | | | | | | | |
Unsec’d. Notes | | | 4.847% | | | | 11/15/53 | | | | | | | | 500 | | | $ | 771,456 | |
Humana, Inc., | | | | | | | | | | | | | | | | | | | | |
Sr. Unsec’d. Notes | | | 2.500 | | | | 12/15/20 | | | | | | | | 620 | | | | 624,656 | |
Laboratory Corp. of America Holdings, | | | | | | | | | | | | | | | | | | | | |
Sr. Unsec’d. Notes | | | 2.950 | | | | 12/01/29 | | | | | | | | 1,595 | | | | 1,762,968 | |
Memorial Sloan-Kettering Cancer Center, | | | | | | | | | | | | | | | | | | | | |
Sr. Unsec’d. Notes | | | 4.200 | | | | 07/01/55 | | | | | | | | 75 | | | | 104,694 | |
Mount Sinai Hospitals Group, Inc., | | | | | | | | | | | | | | | | | | | | |
Sec’d. Notes, Series 2019 | | | 3.737 | | | | 07/01/49 | | | | | | | | 1,795 | | | | 2,034,690 | |
New York & Presbyterian Hospital (The), | | | | | | | | | | | | | | | | | | | | |
Unsec’d. Notes | | | 4.024 | | | | 08/01/45 | | | | | | | | 40 | | | | 52,076 | |
OhioHealth Corp., | | | | | | | | | | | | | | | | | | | | |
Unsec’d. Notes | | | 3.042 | | | | 11/15/50 | | | | | | | | 795 | | | | 896,511 | |
Providence St. Joseph Health Obligated Group, | | | | | | | | | | | | | | | | | | | | |
Unsec’d. Notes, Series 19A | | | 2.532 | | | | 10/01/29 | | | | | | | | 420 | | | | 453,807 | |
Unsec’d. Notes, Series H | | | 2.746 | | | | 10/01/26 | | | | | | | | 40 | | | | 43,707 | |
Quest Diagnostics, Inc., | | | | | | | | | | | | | | | | | | | | |
Sr. Unsec’d. Notes | | | 2.950 | | | | 06/30/30 | | | | | | | | 1,910 | | | | 2,114,707 | |
Sr. Unsec’d. Notes | | | 3.500 | | | | 03/30/25 | | | | | | | | 190 | | | | 211,729 | |
RWJ Barnabas Health, Inc., | | | | | | | | | | | | | | | | | | | | |
Sr. Unsec’d. Notes | | | 3.949 | | | | 07/01/46 | | | | | | | | 175 | | | | 202,528 | |
Stanford Health Care, | | | | | | | | | | | | | | | | | | | | |
Unsec’d. Notes, Series 2018 | | | 3.795 | | | | 11/15/48 | | | | | | | | 450 | | | | 564,943 | |
UnitedHealth Group, Inc., | | | | | | | | | | | | | | | | | | | | |
Sr. Unsec’d. Notes | | | 3.750 | | | | 07/15/25 | | | | | | | | 90 | | | | 103,427 | |
| | | | | | | | | | | | | | | | | | | | |
| | | | | |
| | | | | | | | | | | | | | | | | | | 12,414,055 | |
| | | | | |
Housewares 0.0% | | | | | | | | | | | | | | | | | | | | |
Newell Brands, Inc., | | | | | | | | | | | | | | | | | | | | |
Sr. Unsec’d. Notes | | | 4.700 | | | | 04/01/26 | | | | | | | | 35 | | | | 37,929 | |
| | | | | |
Insurance 0.8% | | | | | | | | | | | | | | | | | | | | |
American International Group, Inc., | | | | | | | | | | | | | | | | | | | | |
Sr. Unsec’d. Notes | | | 3.750 | | | | 07/10/25 | | | | | | | | 410 | | | | 462,162 | |
Sr. Unsec’d. Notes | | | 4.500 | | | | 07/16/44 | (a) | | | | | | | 410 | | | | 506,018 | |
Arch Capital Finance LLC, | | | | | | | | | | | | | | | | | | | | |
Gtd. Notes | | | 5.031 | | | | 12/15/46 | | | | | | | | 95 | | | | 127,989 | |
Arch Capital Group US, Inc., | | | | | | | | | | | | | | | | | | | | |
Gtd. Notes | | | 5.144 | | | | 11/01/43 | | | | | | | | 100 | | | | 133,318 | |
See Notes to Financial Statements.
| | | | | | | | | | | | | | | | | | | | |
| | | | | |
| Description | | Interest
Rate | | | Maturity
Date | | | | | | Principal Amount (000)# | | | Value | |
| | | | | |
CORPORATE BONDS (Continued) | | | | | | | | | | | | | | | | | | | | |
| | | | | |
Insurance (cont’d.) | | | | | | | | | | | | | | | | | | | | |
CNA Financial Corp., | | | | | | | | | | | | | | | | | | | | |
Sr. Unsec’d. Notes | | | 3.950% | | | | 05/15/24 | | | | | | | | 1,170 | | | $ | 1,289,640 | |
Liberty Mutual Group, Inc., | | | | | | | | | | | | | | | | | | | | |
Gtd. Notes, 144A | | | 3.950 | | | | 05/15/60 | | | | | | | | 185 | | | | 213,687 | |
Gtd. Notes, 144A | | | 3.951 | | | | 10/15/50 | | | | | | | | 450 | | | | 522,315 | |
Lincoln National Corp., | | | | | | | | | | | | | | | | | | | | |
Sr. Unsec’d. Notes | | | 6.300 | | | | 10/09/37 | | | | | | | | 115 | | | | 155,338 | |
Markel Corp., | | | | | | | | | | | | | | | | | | | | |
Sr. Unsec’d. Notes | | | 3.350 | | | | 09/17/29 | | | | | | | | 1,625 | | | | 1,783,006 | |
Sr. Unsec’d. Notes | | | 3.625 | | | | 03/30/23 | | | | | | | | 400 | | | | 426,429 | |
Sr. Unsec’d. Notes | | | 4.150 | | | | 09/17/50 | | | | | | | | 1,310 | | | | 1,595,696 | |
Sr. Unsec’d. Notes | | | 5.000 | | | | 04/05/46 | | | | | | | | 350 | | | | 461,180 | |
Principal Financial Group, Inc., | | | | | | | | | | | | | | | | | | | | |
Gtd. Notes | | | 3.100 | | | | 11/15/26 | | | | | | | | 105 | | | | 116,381 | |
Gtd. Notes | | | 4.300 | | | | 11/15/46 | | | | | | | | 140 | | | | 177,447 | |
Gtd. Notes | | | 4.350 | | | | 05/15/43 | | | | | | | | 85 | | | | 106,354 | |
Teachers Insurance & Annuity Association of America, | | | | | | | | | | | | | | | | | | | | |
Sub. Notes, 144A | | | 3.300 | | | | 05/15/50 | �� | | | | | | | 930 | | | | 1,030,958 | |
Sub. Notes, 144A | | | 4.900 | | | | 09/15/44 | | | | | | | | 120 | | | | 162,602 | |
W.R. Berkley Corp., | | | | | | | | | | | | | | | | | | | | |
Sr. Unsec’d. Notes | | | 4.000 | | | | 05/12/50 | (a) | | | | | | | 545 | | | | 653,712 | |
| | | | | | | | | | | | | | | | | | | | |
| | | | | |
| | | | | | | | | | | | | | | | | | | 9,924,232 | |
| | | | | |
Iron/Steel 0.2% | | | | | | | | | | | | | | | | | | | | |
Steel Dynamics, Inc., | | | | | | | | | | | | | | | | | | | | |
Sr. Unsec’d. Notes | | | 3.450 | | | | 04/15/30 | | | | | | | | 1,950 | | | | 2,180,828 | |
| | | | | |
Lodging 0.1% | | | | | | | | | | | | | | | | | | | | |
Las Vegas Sands Corp., | | | | | | | | | | | | | | | | | | | | |
Sr. Unsec’d. Notes | | | 3.500 | | | | 08/18/26 | | | | | | | | 1,230 | | | | 1,233,443 | |
Marriott International, Inc., | | | | | | | | | | | | | | | | | | | | |
Sr. Unsec’d. Notes, Series R | | | 3.125 | | | | 06/15/26 | | | | | | | | 250 | | | | 247,292 | |
| | | | | | | | | | | | | | | | | | | | |
| | | | | |
| | | | | | | | | | | | | | | | | | | 1,480,735 | |
| | | | | |
Machinery-Construction & Mining 0.1% | | | | | | | | | | | | | | | | | | | | |
Caterpillar, Inc., | | | | | | | | | | | | | | | | | | | | |
Sr. Unsec’d. Notes | | | 2.600 | | | | 04/09/30 | | | | | | | | 735 | | | | 821,747 | |
See Notes to Financial Statements.
Schedule of Investments (continued)
as of July 31, 2020
| | | | | | | | | | | | | | | | | | | | |
| | | | | |
| Description | | Interest
Rate | | | Maturity
Date | | | | | | Principal Amount (000)# | | | Value | |
| | | | | |
CORPORATE BONDS (Continued) | | | | | | | | | | | | | | | | | | | | |
| | | | | |
Machinery-Diversified 0.2% | | | | | | | | | | | | | | | | | | | | |
CNH Industrial Capital LLC, | | | | | | | | | | | | | | | | | | | | |
Gtd. Notes | | | 1.950% | | | | 07/02/23 | | | | | | | | 1,375 | | | $ | 1,386,824 | |
Deere & Co., | | | | | | | | | | | | | | | | | | | | |
Sr. Unsec’d. Notes | | | 2.875 | | | | 09/07/49 | | | | | | | | 620 | | | | 708,684 | |
Rockwell Automation, Inc., | | | | | | | | | | | | | | | | | | | | |
Sr. Unsec’d. Notes | | | 2.875 | | | | 03/01/25 | | | | | | | | 115 | | | | 124,453 | |
Xylem, Inc., | | | | | | | | | | | | | | | | | | | | |
Sr. Unsec’d. Notes | | | 3.250 | | | | 11/01/26 | | | | | | | | 70 | | | | 78,660 | |
| | | | | | | | | | | | | | | | | | | | |
| | | | | |
| | | | | | | | | | | | | | | | | | | 2,298,621 | |
| | | | | |
Media 1.4% | | | | | | | | | | | | | | | | | | | | |
Charter Communications Operating LLC/Charter | | | | | | | | | | | | | | | | | | | | |
Communications Operating Capital, | | | | | | | | | | | | | | | | | | | | |
Sr. Sec’d. Notes | | | 2.800 | | | | 04/01/31 | (a) | | | | | | | 3,225 | | | | 3,387,426 | |
Sr. Sec’d. Notes | | | 4.800 | | | | 03/01/50 | | | | | | | | 335 | | | | 404,714 | |
Sr. Sec’d. Notes | | | 5.375 | | | | 05/01/47 | | | | | | | | 530 | | | | 669,813 | |
Sr. Sec’d. Notes | | | 6.384 | | | | 10/23/35 | | | | | | | | 2,480 | | | | 3,397,951 | |
Sr. Sec’d. Notes | | | 6.484 | | | | 10/23/45 | | | | | | | | 400 | | | | 564,358 | |
Comcast Corp., | | | | | | | | | | | | | | | | | | | | |
Gtd. Notes | | | 4.150 | | | | 10/15/28 | | | | | | | | 805 | | | | 983,605 | |
Gtd. Notes | | | 4.250 | | | | 10/15/30 | | | | | | | | 275 | | | | 346,011 | |
Cox Communications, Inc., | | | | | | | | | | | | | | | | | | | | |
Sr. Unsec’d. Notes, 144A | | | 3.150 | | | | 08/15/24 | | | | | | | | 800 | | | | 869,830 | |
Sr. Unsec’d. Notes, 144A | | | 3.500 | | | | 08/15/27 | | | | | | | | 2,000 | | | | 2,261,249 | |
Sr. Unsec’d. Notes, 144A | | | 4.600 | | | | 08/15/47 | | | | | | | | 500 | | | | 668,804 | |
Discovery Communications LLC, | | | | | | | | | | | | | | | | | | | | |
Gtd. Notes | | | 5.200 | | | | 09/20/47 | | | | | | | | 177 | | | | 224,196 | |
Time Warner Cable LLC, | | | | | | | | | | | | | | | | | | | | |
Sr. Sec’d. Notes | | | 5.500 | | | | 09/01/41 | | | | | | | | 150 | | | | 188,066 | |
ViacomCBS, Inc., | | | | | | | | | | | | | | | | | | | | |
Sr. Unsec’d. Notes | | | 4.375 | | | | 03/15/43 | (a) | | | | | | | 1,500 | | | | 1,662,077 | |
Walt Disney Co. (The), | | | | | | | | | | | | | | | | | | | | |
Gtd. Notes | | | 6.400 | | | | 12/15/35 | | | | | | | | 512 | | | | 785,639 | |
| | | | | | | | | | | | | | | | | | | | |
| | | | | |
| | | | | | | | | | | | | | | | | | | 16,413,739 | |
| | | | | |
Mining 0.2% | | | | | | | | | | | | | | | | | | | | |
Barrick North America Finance LLC (Canada), | | | | | | | | | | | | | | | | | | | | |
Gtd. Notes | | | 5.750 | | | | 05/01/43 | | | | | | | | 190 | | | | 284,072 | |
Newmont Corp., | | | | | | | | | | | | | | | | | | | | |
Gtd. Notes | | | 2.250 | | | | 10/01/30 | | | | | | | | 845 | | | | 891,152 | |
Gtd. Notes | | | 2.800 | | | | 10/01/29 | (a) | | | | | | | 1,270 | | | | 1,400,729 | |
See Notes to Financial Statements.
| | | | | | | | | | | | | | | | | | | | |
| | | | | |
Description | | Interest
Rate | | | Maturity
Date | | | | | | Principal Amount (000)# | | | Value | |
| | | | |
CORPORATE BONDS (Continued) | | | | | | | | | | | | | | | | | |
| | | | | |
Mining (cont’d.) | | | | | | | | | | | | | | | | | | | | |
Southern Copper Corp. (Peru), | | | | | | | | | | | | | | | | | | | | |
Sr. Unsec’d. Notes | | | 6.750% | | | | 04/16/40 | | | | | | | | 100 | | | $ | 146,866 | |
| | | | | | | | | | | | | | | | | | | | |
| | | | | |
| | | | | | | | | | | | | | | | | | | 2,722,819 | |
| | | | | |
Multi-National 0.1% | | | | | | | | | | | | | | | | | | | | |
Corp. Andina de Fomento (Supranational Bank), | | | | | | | | | | | | | | | | | | | | |
Sr. Unsec’d. Notes | | | 2.125 | | | | 09/27/21 | | | | | | | | 300 | | | | 302,283 | |
Sr. Unsec’d. Notes | | | 2.750 | | | | 01/06/23 | | | | | | | | 185 | | | | 191,912 | |
Sr. Unsec’d. Notes | | | 3.250 | | | | 02/11/22 | | | | | | | | 95 | | | | 97,584 | |
| | | | | | | | | | | | | | | | | | | | |
| | | | | |
| | | | | | | | | | | | | | | | | | | 591,779 | |
| | | | | |
Office/Business Equipment 0.0% | | | | | | | | | | | | | | | | | | | | |
Xerox Corp., | | | | | | | | | | | | | | | | | | | | |
Sr. Unsec’d. Notes | | | 2.750 | | | | 09/01/20 | | | | | | | | 137 | | | | 137,026 | |
| | | | | |
Oil & Gas 2.0% | | | | | | | | | | | | | | | | | | | | |
Apache Corp., | | | | | | | | | | | | | | | | | | | | |
Sr. Unsec’d. Notes | | | 3.250 | | | | 04/15/22 | | | | | | | | 202 | | | | 203,135 | |
BP Capital Markets America, Inc., | | | | | | | | | | | | | | | | | | | | |
Gtd. Notes | | | 3.790 | | | | 02/06/24 | | | | | | | | 855 | | | | 939,586 | |
BP Capital Markets PLC (United Kingdom), | | | | | | | | | | | | | | | | | | | | |
Gtd. Notes | | | 4.375(ff) | | | | –(rr) | | | | | | | | 2,420 | | | | 2,526,505 | |
Canadian Natural Resources Ltd. (Canada), | | | | | | | | | | | | | | | | | | | | |
Sr. Unsec’d. Notes | | | 2.950 | | | | 01/15/23 | (a) | | | | | | | 1,310 | | | | 1,362,087 | |
Sr. Unsec’d. Notes | | | 6.250 | | | | 03/15/38 | | | | | | | | 175 | | | | 220,851 | |
Cenovus Energy, Inc. (Canada), | | | | | | | | | | | | | | | | | | | | |
Sr. Unsec’d. Notes | | | 5.400 | | | | 06/15/47 | | | | | | | | 384 | | | | 345,598 | |
Sr. Unsec’d. Notes | | | 6.750 | | | | 11/15/39 | | | | | | | | 350 | | | | 364,427 | |
CNOOC Finance 2013 Ltd. (China), | | | | | | | | | | | | | | | | | | | | |
Gtd. Notes | | | 2.875 | | | | 09/30/29 | | | | | | | | 1,085 | | | | 1,174,581 | |
Concho Resources, Inc., | | | | | | | | | | | | | | | | | | | | |
Gtd. Notes | | | 3.750 | | | | 10/01/27 | (a) | | | | | | | 2,000 | | | | 2,188,799 | |
Gtd. Notes | | | 4.300 | | | | 08/15/28 | | | | | | | | 1,110 | | | | 1,257,890 | |
Gtd. Notes | | | 4.875 | | | | 10/01/47 | | | | | | | | 55 | | | | 66,115 | |
Continental Resources, Inc., | | | | | | | | | | | | | | | | | | | | |
Gtd. Notes | | | 3.800 | | | | 06/01/24 | (a) | | | | | | | 2,300 | | | | 2,226,460 | |
Gtd. Notes | | | 4.500 | | | | 04/15/23 | (a) | | | | | | | 725 | | | | 725,072 | |
Equinor ASA (Norway), | | | | | | | | | | | | | | | | | | | | |
Gtd. Notes | | | 2.375 | | | | 05/22/30 | | | | | | | | 1,110 | | | | 1,192,169 | |
See Notes to Financial Statements.
Schedule of Investments (continued)
as of July 31, 2020
| | | | | | | | | | | | | | | | | | | | |
| | | | | |
| Description | | Interest
Rate | | | Maturity
Date | | | | | | Principal Amount (000)# | | | Value | |
| | | | | |
CORPORATE BONDS (Continued) | | | | | | | | | | | | | | | | | | | | |
| | | | | |
Oil & Gas (cont’d.) | | | | | | | | | | | | | | | | | | | | |
Helmerich & Payne, Inc., | | | | | | | | | | | | | | | | | | | | |
Sr. Unsec’d. Notes | | | 4.650% | | | | 03/15/25 | | | | | | | | 1,190 | | | $ | 1,295,027 | |
Husky Energy, Inc. (Canada), | | | | | | | | | | | | | | | | | | | | |
Sr. Unsec’d. Notes | | | 4.000 | | | | 04/15/24 | | | | | | | | 150 | | | | 157,383 | |
Sr. Unsec’d. Notes | | | 6.800 | | | | 09/15/37 | | | | | | | | 200 | | | | 253,076 | |
KazMunayGas National Co. JSC (Kazakhstan), | | | | | | | | | | | | | | | | | | | | |
Sr. Unsec’d. Notes, 144A | | | 4.750 | | | | 04/24/25 | | | | | | | | 200 | | | | 220,773 | |
Marathon Petroleum Corp., | | | | | | | | | | | | | | | | | | | | |
Sr. Unsec’d. Notes | | | 3.800 | | | | 04/01/28 | | | | | | | | 380 | | | | 417,624 | |
Noble Energy, Inc., | | | | | | | | | | | | | | | | | | | | |
Sr. Unsec’d. Notes | | | 3.900 | | | | 11/15/24 | | | | | | | | 425 | | | | 472,846 | |
Sr. Unsec’d. Notes | | | 5.050 | | | | 11/15/44 | | | | | | | | 435 | | | | 580,504 | |
Occidental Petroleum Corp., | | | | | | | | | | | | | | | | | | | | |
Sr. Unsec’d. Notes | | | 2.600 | | | | 08/13/21 | (a) | | | | | | | 223 | | | | 221,260 | |
Sr. Unsec’d. Notes | | | 7.500 | | | | 05/01/31 | | | | | | | | 100 | | | | 106,500 | |
Sr. Unsec’d. Notes | | | 7.875 | | | | 09/15/31 | | | | | | | | 250 | | | | 267,352 | |
Ovintiv, Inc., | | | | | | | | | | | | | | | | | | | | |
Gtd. Notes | | | 6.500 | | | | 08/15/34 | | | | | | | | 200 | | | | 186,029 | |
Petroleos Mexicanos (Mexico), | | | | | | | | | | | | | | | | | | | | |
Gtd. Notes | | | 5.500 | | | | 01/21/21 | | | | | | | | 70 | | | | 70,715 | |
Gtd. Notes | | | 6.350 | | | | 02/12/48 | | | | | | | | 154 | | | | 121,385 | |
Gtd. Notes | | | 6.500 | | | | 03/13/27 | | | | | | | | 1,020 | | | | 973,180 | |
Gtd. Notes, 144A | | | 6.490 | | | | 01/23/27 | | | | | | | | 1,048 | | | | 1,000,840 | |
Gtd. Notes, 144A | | | 7.690 | | | | 01/23/50 | | | | | | | | 398 | | | | 349,053 | |
Gtd. Notes, MTN | | | 6.750 | | | | 09/21/47 | | | | | | | | 1,305 | | | | 1,062,584 | |
Gtd. Notes, MTN | | | 6.875 | | | | 08/04/26 | | | | | | | | 870 | | | | 865,279 | |
Sinopec Group Overseas Development 2018 Ltd. | | | | | | | | | | | | | | | | | | | | |
(China), | | | | | | | | | | | | | | | | | | | | |
Gtd. Notes, 144A | | | 3.680 | | | | 08/08/49 | | | | | | | | 585 | | | | 704,099 | |
Valero Energy Corp., | | | | | | | | | | | | | | | | | | | | |
Sr. Unsec’d. Notes | | | 3.400 | | | | 09/15/26 | | | | | | | | 220 | | | | 242,566 | |
| | | | | | | | | | | | | | | | | | | | |
| | | | | |
| | | | | | | | | | | | | | | | | | | 24,361,350 | |
| | | | | |
Oil & Gas Services 0.0% | | | | | | | | | | | | | | | | | | | | |
Schlumberger Holdings Corp., | | | | | | | | | | | | | | | | | | | | |
Sr. Unsec’d. Notes, 144A | | | 3.900 | | | | 05/17/28 | (a) | | | | | | | 487 | | | | 537,013 | |
Sr. Unsec’d. Notes, 144A | | | 4.000 | | | | 12/21/25 | | | | | | | | 33 | | | | 36,642 | |
| | | | | | | | | | | | | | | | | | | | |
| | | | | |
| | | | | | | | | | | | | | | | | | | 573,655 | |
See Notes to Financial Statements.
| | | | | | | | | | | | | | | | | | | | |
| | | | | |
| Description | | Interest
Rate | | | Maturity
Date | | | | | | Principal Amount (000)# | | | Value | |
| | | | | |
CORPORATE BONDS (Continued) | | | | | | | | | | | | | | | | | | | | |
| | | | | |
Packaging & Containers 0.1% | | | | | | | | | | | | | | | | | | | | |
WRKCo, Inc., | | | | | | | | | | | | | | | | | | | | |
Gtd. Notes | | | 4.650% | | | | 03/15/26 | | | | | | | | 560 | | | $ | 659,001 | |
| | | | | |
Pharmaceuticals 1.9% | | | | | | | | | | | | | | | | | | | | |
AbbVie, Inc., | | | | | | | | | | | | | | | | | | | | |
Sr. Unsec’d. Notes | | | 3.600 | | | | 05/14/25 | | | | | | | | 105 | | | | 117,468 | |
Sr. Unsec’d. Notes | | | 4.500 | | | | 05/14/35 | | | | | | | | 550 | | | | 687,360 | |
Sr. Unsec’d. Notes | | | 4.700 | | | | 05/14/45 | | | | | | | | 1,330 | | | | 1,746,110 | |
Sr. Unsec’d. Notes, 144A | | | 4.250 | | | | 11/21/49 | | | | | | | | 2,295 | | | | 2,934,909 | |
Sr. Unsec’d. Notes, 144A | | | 4.550 | | | | 03/15/35 | | | | | | | | 360 | | | | 458,653 | |
Sr. Unsec’d. Notes, 144A | | | 4.750 | | | | 03/15/45 | | | | | | | | 1,008 | | | | 1,321,912 | |
AmerisourceBergen Corp., | | | | | | | | | | | | | | | | | | | | |
Sr. Unsec’d. Notes | | | 3.250 | | | | 03/01/25 | | | | | | | | 55 | | | | 60,717 | |
Bayer US Finance II LLC (Germany), | | | | | | | | | | | | | | | | | | | | |
Gtd. Notes, 144A, 3 Month LIBOR + 0.630% | | | 0.927 | (c) | | | 06/25/21 | | | | | | | | 335 | | | | 335,658 | |
Gtd. Notes, 144A | | | 3.500 | | | | 06/25/21 | | | | | | | | 200 | | | | 204,607 | |
Bayer US Finance LLC (Germany), | | | | | | | | | | | | | | | | | | | | |
Gtd. Notes, 144A | | | 3.000 | | | | 10/08/21 | | | | | | | | 150 | | | | 153,792 | |
Bristol-Myers Squibb Co., | | | | | | | | | | | | | | | | | | | | |
Sr. Unsec’d. Notes | | | 3.250 | | | | 08/15/22 | | | | | | | | 125 | | | | 132,223 | |
Sr. Unsec’d. Notes | | | 4.125 | | | | 06/15/39 | | | | | | | | 115 | | | | 153,707 | |
Sr. Unsec’d. Notes | | | 4.250 | | | | 10/26/49 | | | | | | | | 395 | | | | 563,043 | |
Sr. Unsec’d. Notes | | | 4.350 | | | | 11/15/47 | | | | | | | | 475 | | | | 671,793 | |
Sr. Unsec’d. Notes | | | 5.000 | | | | 08/15/45 | | | | | | | | 230 | | | | 346,225 | |
Cigna Corp., | | | | | | | | | | | | | | | | | | | | |
Gtd. Notes | | | 3.250 | | | | 04/15/25 | | | | | | | | 270 | | | | 297,584 | |
Gtd. Notes | | | 3.400 | | | | 03/01/27 | | | | | | | | 325 | | | | 366,580 | |
Gtd. Notes | | | 4.375 | | | | 10/15/28 | | | | | | | | 1,950 | | | | 2,354,524 | |
Gtd. Notes | | | 4.500 | | | | 02/25/26 | | | | | | | | 700 | | | | 825,691 | |
Sr. Unsec’d. Notes | | | 2.400 | | | | 03/15/30 | (a) | | | | | | | 780 | | | | 831,574 | |
CVS Health Corp., | | | | | | | | | | | | | | | | | | | | |
Sr. Unsec’d. Notes | | | 4.300 | | | | 03/25/28 | (a) | | | | | | | 2,025 | | | | 2,399,395 | |
Sr. Unsec’d. Notes | | | 4.780 | | | | 03/25/38 | | | | | | | | 85 | | | | 109,205 | |
Sr. Unsec’d. Notes | | | 5.125 | | | | 07/20/45 | (a) | | | | | | | 465 | | | | 631,901 | |
Sr. Unsec’d. Notes | | | 5.300 | | | | 12/05/43 | | | | | | | | 155 | | | | 212,841 | |
Mylan, Inc., | | | | | | | | | | | | | | | | | | | | |
Gtd. Notes | | | 5.200 | | | | 04/15/48 | (a) | | | | | | | 1,250 | | | | 1,644,176 | |
Shire Acquisitions Investments Ireland DAC, | | | | | | | | | | | | | | | | | | | | |
Gtd. Notes | | | 2.875 | | | | 09/23/23 | | | | | | | | 225 | | | | 239,578 | |
Gtd. Notes | | | 3.200 | | | | 09/23/26 | | | | | | | | 1,220 | | | | 1,370,908 | |
See Notes to Financial Statements.
Schedule of Investments (continued)
as of July 31, 2020
| | | | | | | | | | | | | | | | | | | | |
| | | | | |
| Description | | Interest
Rate | | | Maturity
Date | | | | | | Principal Amount (000)# | | | Value | |
| | | | | |
CORPORATE BONDS (Continued) | | | | | | | | | | | | | | | | | | | | |
| | | | | |
Pharmaceuticals (cont’d.) | | | | | | | | | | | | | | | | | | | | |
Upjohn, Inc., | | | | | | | | | | | | | | | | | | | | |
Gtd. Notes, 144A | | | 3.850% | | | | 06/22/40 | (a) | | | | | | | 1,065 | | | $ | 1,217,360 | |
| | | | | | | | | | | | | | | | | | | | |
| | | | | |
| | | | | | | | | | | | | | | | | | | 22,389,494 | |
| | | | | |
Pipelines 1.5% | | | | | | | | | | | | | | | | | | | | |
Colonial Enterprises, Inc., | | | | | | | | | | | | | | | | | | | | |
Gtd. Notes, 144A | | | 3.250 | | | | 05/15/30 | (a) | | | | | | | 1,730 | | | | 1,912,288 | |
Colorado Interstate Gas Co. LLC/Colorado Interstate | | | | | | | | | | | | | | | | | | | | |
Issuing Corp., | | | | | | | | | | | | | | | | | | | | |
Gtd. Notes, 144A | | | 4.150 | | | | 08/15/26 | | | | | | | | 555 | | | | 623,367 | |
DCP Midstream Operating LP, | | | | | | | | | | | | | | | | | | | | |
Gtd. Notes, 144A | | | 4.750 | | | | 09/30/21 | | | | | | | | 50 | | | | 50,824 | |
Energy Transfer Operating LP, | | | | | | | | | | | | | | | | | | | | |
Gtd. Notes | | | 4.950 | | | | 06/15/28 | | | | | | | | 430 | | | | 459,809 | |
Gtd. Notes | | | 5.000 | | | | 05/15/50 | | | | | | | | 565 | | | | 560,294 | |
Gtd. Notes | | | 6.250 | | | | 04/15/49 | | | | | | | | 910 | | | | 980,267 | |
Enterprise Products Operating LLC, | | | | | | | | | | | | | | | | | | | | |
Gtd. Notes | | | 3.700 | | | | 01/31/51 | (a) | | | | | | | 445 | | | | 482,352 | |
Gtd. Notes | | | 3.950 | | | | 01/31/60 | | | | | | | | 485 | | | | 530,276 | |
Magellan Midstream Partners LP, | | | | | | | | | | | | | | | | | | | | |
Sr. Unsec’d. Notes | | | 3.250 | | | | 06/01/30 | | | | | | | | 1,300 | | | | 1,414,723 | |
Sr. Unsec’d. Notes | | | 4.200 | | | | 03/15/45 | | | | | | | | 275 | | | | 285,884 | |
MPLX LP, | | | | | | | | | | | | | | | | | | | | |
Sr. Unsec’d. Notes | | | 4.000 | | | | 02/15/25 | | | | | | | | 130 | | | | 141,257 | |
Sr. Unsec’d. Notes | | | 4.500 | | | | 04/15/38 | | | | | | | | 270 | | | | 287,579 | |
Sr. Unsec’d. Notes | | | 4.875 | | | | 06/01/25 | | | | | | | | 200 | | | | 225,979 | |
Sr. Unsec’d. Notes | | | 5.200 | | | | 03/01/47 | | | | | | | | 5 | | | | 5,660 | |
Sr. Unsec’d. Notes | | | 5.500 | | | | 02/15/49 | | | | | | | | 210 | | | | 250,731 | |
ONEOK Partners LP, | | | | | | | | | | | | | | | | | | | | |
Gtd. Notes | | | 6.125 | | | | 02/01/41 | | | | | | | | 300 | | | | 332,789 | |
ONEOK, Inc., | | | | | | | | | | | | | | | | | | | | |
Gtd. Notes | | | 3.100 | | | | 03/15/30 | | | | | | | | 2,415 | | | | 2,278,815 | |
Gtd. Notes | | | 4.450 | | | | 09/01/49 | | | | | | | | 1,000 | | | | 903,152 | |
Gtd. Notes | | | 4.500 | | | | 03/15/50 | | | | | | | | 195 | | | | 177,546 | |
Gtd. Notes | | | 4.950 | | | | 07/13/47 | | | | | | | | 85 | | | | 82,806 | |
Phillips 66 Partners LP, | | | | | | | | | | | | | | | | | | | | |
Sr. Unsec’d. Notes | | | 3.550 | | | | 10/01/26 | | | | | | | | 310 | | | | 335,710 | |
Plains All American Pipeline LP/PAA Finance Corp., | | | | | | | | | | | | | | | | | | | | |
Sr. Unsec’d. Notes | | | 3.550 | | | | 12/15/29 | | | | | | | | 350 | | | | 344,820 | |
Sr. Unsec’d. Notes | | | 4.650 | | | | 10/15/25 | | | | | | | | 1,000 | | | | 1,080,998 | |
Sr. Unsec’d. Notes | | | 4.700 | | | | 06/15/44 | | | | | | | | 170 | | | | 158,804 | |
See Notes to Financial Statements.
| | | | | | | | | | | | | | | | | | | | |
| | | | | |
| Description | | Interest
Rate | | | Maturity
Date | | | | | | Principal Amount (000)# | | | Value | |
| | | | | |
CORPORATE BONDS (Continued) | | | | | | | | | | | | | | | | | | | | |
| | | | | |
Pipelines (cont’d.) | | | | | | | | | | | | | | | | | | | | |
Plains All American Pipeline LP/PAA Finance Corp., (cont’d.) | | | | | | | | | | | | | | | | | | | | |
Sr. Unsec’d. Notes | | | 5.150% | | | | 06/01/42 | | | | | | | | 105 | | | $ | 104,237 | |
Spectra Energy Partners LP, | | | | | | | | | | | | | | | | | | | | |
Gtd. Notes | | | 3.375 | | | | 10/15/26 | | | | | | | | 140 | | | | 154,197 | |
Texas Eastern Transmission LP, | | | | | | | | | | | | | | | | | | | | |
Sr. Unsec’d. Notes, 144A | | | 3.500 | | | | 01/15/28 | | | | | | | | 300 | | | | 328,021 | |
Transcontinental Gas Pipe Line Co. LLC, | | | | | | | | | | | | | | | | | | | | |
Sr. Unsec’d. Notes | | | 4.600 | | | | 03/15/48 | | | | | | | | 500 | | | | 622,583 | |
Sr. Unsec’d. Notes, 144A | | | 3.950 | | | | 05/15/50 | | | | | | | | 625 | | | | 710,183 | |
Western Midstream Operating LP, | | | | | | | | | | | | | | | | | | | | |
Sr. Unsec’d. Notes | | | 4.000 | | | | 07/01/22 | | | | | | | | 665 | | | | 686,766 | |
Sr. Unsec’d. Notes | | | 5.300 | | | | 03/01/48 | | | | | | | | 320 | | | | 287,448 | |
Williams Cos., Inc. (The), | | | | | | | | | | | | | | | | | | | | |
Sr. Unsec’d. Notes | | | 4.000 | | | | 09/15/25 | | | | | | | | 350 | | | | 391,418 | |
Sr. Unsec’d. Notes | | | 4.300 | | | | 03/04/24 | | | | | | | | 325 | | | | 355,935 | |
Sr. Unsec’d. Notes | | | 4.850 | | | | 03/01/48 | | | | | | | | 55 | | | | 65,397 | |
Sr. Unsec’d. Notes | | | 5.400 | | | | 03/04/44 | | | | | | | | 400 | | | | 474,768 | |
| | | | | | | | | | | | | | | | | | | | |
| | | | | |
| | | | | | | | | | | | | | | | | | | 18,087,683 | |
| | | | | |
Real Estate Investment Trusts (REITs) 0.6% | | | | | | | | | | | | | | | | | | | | |
Healthpeak Properties, Inc., | | | | | | | | | | | | | | | | | | | | |
Sr. Unsec’d. Notes | | | 3.250 | | | | 07/15/26 | (a) | | | | | | | 1,000 | | | | 1,113,646 | |
Realty Income Corp., | | | | | | | | | | | | | | | | | | | | |
Sr. Unsec’d. Notes | | | 3.250 | | | | 01/15/31 | | | | | | | | 985 | | | | 1,104,871 | |
Simon Property Group LP, | | | | | | | | | | | | | | | | | | | | |
Sr. Unsec’d. Notes | | | 2.000 | | | | 09/13/24 | | | | | | | | 2,300 | | | | 2,377,182 | |
Welltower, Inc., | | | | | | | | | | | | | | | | | | | | |
Sr. Unsec’d. Notes | | | 2.700 | | | | 02/15/27 | | | | | | | | 775 | | | | 822,718 | |
Sr. Unsec’d. Notes | | | 3.625 | | | | 03/15/24 | | | | | | | | 1,500 | | | | 1,626,765 | |
Weyerhaeuser Co., | | | | | | | | | | | | | | | | | | | | |
Sr. Unsec’d. Notes | | | 4.625 | | | | 09/15/23 | | | | | | | | 425 | | | | 472,877 | |
| | | | | | | | | | | | | | | | | | | | |
| | | | | |
| | | | | | | | | | | | | | | | | | | 7,518,059 | |
| | | | | |
Retail 0.3% | | | | | | | | | | | | | | | | | | | | |
Alimentation Couche-Tard, Inc. (Canada), | | | | | | | | | | | | | | | | | | | | |
Gtd. Notes, 144A | | | 3.550 | | | | 07/26/27 | | | | | | | | 940 | | | | 1,037,004 | |
See Notes to Financial Statements.
Schedule of Investments (continued)
as of July 31, 2020
| | | | | | | | | | | | | | | | | | | | |
| | | | | |
| Description | | Interest
Rate | | | Maturity
Date | | | | | | Principal Amount (000)# | | | Value | |
| | | | | |
CORPORATE BONDS (Continued) | | | | | | | | | | | | | | | | | | | | |
| | | | | |
Retail (cont’d.) | | | | | | | | | | | | | | | | | | | | |
Dollar General Corp., | | | | | | | | | | | | | | | | | | | | |
Sr. Unsec’d. Notes | | | 4.125% | | | | 04/03/50 | | | | | | | | 1,515 | | | $ | 1,923,093 | |
Dollar Tree, Inc., | | | | | | | | | | | | | | | | | | | | |
Sr. Unsec’d. Notes | | | 4.200 | | | | 05/15/28 | | | | | | | | 850 | | | | 1,011,701 | |
| | | | | | | | | | | | | | | | | | | | |
| | | | | |
| | | | | | | | | | | | | | | | | | | 3,971,798 | |
| | | | | |
Semiconductors 0.5% | | | | | | | | | | | | | | | | | | | | |
Broadcom, Inc., | | | | | | | | | | | | | | | | | | | | |
Gtd. Notes, 144A | | | 3.150 | | | | 11/15/25 | | | | | | | | 2,395 | | | | 2,583,306 | |
Gtd. Notes, 144A | | | 3.459 | | | | 09/15/26 | | | | | | | | 884 | | | | 968,164 | |
Gtd. Notes, 144A | | | 5.000 | | | | 04/15/30 | | | | | | | | 2,040 | | | | 2,422,976 | |
| | | | | | | | | | | | | | | | | | | | |
| | | | | |
| | | | | | | | | | | | | | | | | | | 5,974,446 | |
| | | | | |
Software 0.2% | | | | | | | | | | | | | | | | | | | | |
Electronic Arts, Inc., | | | | | | | | | | | | | | | | | | | | |
Sr. Unsec’d. Notes | | | 3.700 | | | | 03/01/21 | | | | | | | | 200 | | | | 203,345 | |
Microsoft Corp., | | | | | | | | | | | | | | | | | | | | |
Sr. Unsec’d. Notes | | | 2.525 | | | | 06/01/50 | | | | | | | | 191 | | | | 211,317 | |
Sr. Unsec’d. Notes | | | 2.675 | | | | 06/01/60 | | | | | | | | 1,000 | | | | 1,108,040 | |
Sr. Unsec’d. Notes | | | 3.950 | | | | 08/08/56 | | | | | | | | 335 | | | | 469,164 | |
| | | | | | | | | | | | | | | | | | | | |
| | | | | |
| | | | | | | | | | | | | | | | | | | 1,991,866 | |
| | | | | |
Telecommunications 1.2% | | | | | | | | | | | | | | | | | | | | |
AT&T, Inc., | | | | | | | | | | | | | | | | | | | | |
Sr. Unsec’d. Notes | | | 3.400 | | | | 06/15/22 | | | | | | | | 850 | | | | 896,649 | |
Sr. Unsec’d. Notes | | | 3.400 | | | | 05/15/25 | | | | | | | | 275 | | | | 305,288 | |
Sr. Unsec’d. Notes | | | 3.600 | | | | 07/15/25 | | | | | | | | 50 | | | | 55,953 | |
Sr. Unsec’d. Notes | | | 3.800 | | | | 02/15/27 | | | | | | | | 200 | | | | 228,622 | |
Sr. Unsec’d. Notes | | | 4.300 | | | | 02/15/30 | | | | | | | | 170 | | | | 203,227 | |
Sr. Unsec’d. Notes | | | 4.500 | | | | 05/15/35 | | | | | | | | 60 | | | | 71,974 | |
Sr. Unsec’d. Notes | | | 4.500 | | | | 03/09/48 | (a) | | | | | | | 1,125 | | | | 1,374,658 | |
Sr. Unsec’d. Notes | | | 4.550 | | | | 03/09/49 | | | | | | | | 575 | | | | 704,683 | |
Sr. Unsec’d. Notes | | | 4.850 | | | | 03/01/39 | | | | | | | | 2,100 | | | | 2,620,361 | |
Sr. Unsec’d. Notes | | | 4.900 | | | | 08/15/37 | (a) | | | | | | | 550 | | | | 688,620 | |
Sr. Unsec’d. Notes | | | 5.250 | | | | 03/01/37 | | | | | | | | 445 | | | | 572,804 | |
Sr. Unsec’d. Notes | | | 5.450 | | | | 03/01/47 | | | | | | | | 685 | | | | 923,731 | |
Level 3 Financing, Inc., | | | | | | | | | | | | | | | | | | | | |
Sr. Sec’d. Notes, 144A | | | 3.400 | | | | 03/01/27 | | | | | | | | 2,000 | | | | 2,155,385 | |
T-Mobile USA, Inc., | | | | | | | | | | | | | | | | | | | | |
Sr. Sec’d. Notes, 144A | | | 4.375 | | | | 04/15/40 | | | | | | | | 380 | | | | 465,724 | |
See Notes to Financial Statements.
| | | | | | | | | | | | | | | | | | | | |
| | | | | |
| Description | | Interest
Rate | | | Maturity
Date | | | | | | Principal Amount (000)# | | | Value | |
| | | | | |
CORPORATE BONDS (Continued) | | | | | | | | | | | | | | | | | | | | |
| | | | | |
Telecommunications (cont’d.) | | | | | | | | | | | | | | | | | | | | |
T-Mobile USA, Inc., (cont’d.) | | | | | | | | | | | | | | | | | | | | |
Sr. Sec’d. Notes, 144A | | | 4.500% | | | | 04/15/50 | (a) | | | | | | | 505 | | | $ | 630,223 | |
Verizon Communications, Inc., | | | | | | | | | | | | | | | | | | | | |
Sr. Unsec’d. Notes | | | 4.500 | | | | 08/10/33 | | | | | | | | 290 | | | | 379,528 | |
Sr. Unsec’d. Notes | | | 4.862 | | | | 08/21/46 | | | | | | | | 1,025 | | | | 1,465,577 | |
| | | | | | | | | | | | | | | | | | | | |
| | | | | |
| | | | | | | | | | | | | | | | | | | 13,743,007 | |
| | | | | |
Transportation 0.2% | | | | | | | | | | | | | | | | | | | | |
CSX Corp., | | | | | | | | | | | | | | | | | | | | |
Sr. Unsec’d. Notes | | | 2.600 | | | | 11/01/26 | | | | | | | | 420 | | | | 464,093 | |
Kansas City Southern, | | | | | | | | | | | | | | | | | | | | |
Gtd. Notes | | | 3.500 | | | | 05/01/50 | (a) | | | | | | | 1,585 | | | | 1,855,794 | |
| | | | | | | | | | | | | | | | | | | | |
| | | | | |
| | | | | | | | | | | | | | | | | | | 2,319,887 | |
| | | | | |
Water 0.3% | | | | | | | | | | | | | | | | | | | | |
American Water Capital Corp., | | | | | | | | | | | | | | | | | | | | |
Sr. Unsec’d. Notes | | | 2.800 | | | | 05/01/30 | | | | | | | | 1,580 | | | | 1,778,456 | |
Sr. Unsec’d. Notes | | | 3.750 | | | | 09/01/47 | | | | | | | | 25 | | | | 31,527 | |
Sr. Unsec’d. Notes | | | 4.000 | | | | 12/01/46 | | | | | | | | 145 | | | | 189,018 | |
Essential Utilities, Inc., | | | | | | | | | | | | | | | | | | | | |
Sr. Unsec’d. Notes | | | 2.704 | | | | 04/15/30 | | | | | | | | 1,380 | | | | 1,508,636 | |
| | | | | | | | | | | | | | | | | | | | |
| | | | | |
| | | | | | | | | | | | | | | | | | | 3,507,637 | |
| | | | | | | | | | | | | | | | | | | | |
TOTAL CORPORATE BONDS | | | | | | | | | | | | | | | | | | | | |
(cost $326,569,172) | | | | | | | | | | | | | | | | | | | 359,529,081 | |
| | | | | | | | | | | | | | | | | | | | |
| | | | | |
MUNICIPAL BONDS 0.8% | | | | | | | | | | | | | | | | | | | | |
| | | | | |
Alabama 0.0% | | | | | | | | | | | | | | | | | | | | |
Alabama Economic Settlement Authority, | | | | | | | | | | | | | | | | | | | | |
Taxable, Revenue Bonds, Series B | | | 4.263 | | | | 09/15/32 | | | | | | | | 40 | | | | 47,939 | |
| | | | | |
California 0.2% | | | | | | | | | | | | | | | | | | | | |
Bay Area Toll Authority, | | | | | | | | | | | | | | | | | | | | |
Taxable, Revenue Bonds | | | 2.574 | | | | 04/01/31 | | | | | | | | 1,405 | | | | 1,524,073 | |
City of Los Angeles Department of Airports, | | | | | | | | | | | | | | | | | | | | |
Taxable, Revenue Bonds, BABs | | | 6.582 | | | | 05/15/39 | | | | | | | | 300 | | | | 410,715 | |
See Notes to Financial Statements.
Schedule of Investments (continued)
as of July 31, 2020
| | | | | | | | | | | | | | | | |
| | | | |
| Description | | Interest
Rate | | | Maturity
Date | | | Principal
Amount
(000)# | | | Value | |
| | | | |
MUNICIPAL BONDS (Continued) | | | | | | | | | | | | | | | | |
| | | | |
California (cont’d.) | | | | | | | | | | | | | | | | |
University of California, | | | | | | | | | | | | | | | | |
Taxable, Revenue Bonds, Series AP | | | 3.931 | % | | | 05/15/45 | | | | 30 | | | $ | 37,556 | |
Taxable, Revenue Bonds, Series J | | | 4.131 | | | | 05/15/45 | | | | 30 | | | | 37,105 | |
| | | | | | | | | | | | | | | | |
| | | | |
| | | | | | | | | | | | | | | 2,009,449 | |
| | | | |
Illinois 0.1% | | | | | | | | | | | | | | | | |
State of Illinois, | | | | | | | | | | | | | | | | |
General Obligation Unlimited, Series A | | | 5.000 | | | | 10/01/22 | | | | 110 | | | | 116,209 | |
General Obligation Unlimited, Series D | | | 5.000 | | | | 11/01/22 | | | | 895 | | | | 947,393 | |
General Obligation Unlimited, Taxable | | | 5.100 | | | | 06/01/33 | | | | 450 | | | | 472,455 | |
| | | | | | | | | | | | | | | | |
| | | | |
| | | | | | | | | | | | | | | 1,536,057 | |
| | | | |
New Jersey 0.0% | | | | | | | | | | | | | | | | |
New Jersey Turnpike Authority, | | | | | | | | | | | | | | | | |
Taxable, Revenue Bonds, BABs, Series A | | | 7.102 | | | | 01/01/41 | | | | 250 | | | | 429,240 | |
| | | | |
North Carolina 0.1% | | | | | | | | | | | | | | | | |
North Carolina State Education Assistance Authority, | | | | | | | | | | | | | | | | |
Taxable, Revenue Bonds, Series 2011-002, Class A3, 3 Month LIBOR + 0.800% | | | 1.045 | (c) | | | 07/25/36 | | | | 700 | | | | 676,074 | |
| | | | |
Pennsylvania 0.1% | | | | | | | | | | | | | | | | |
Pennsylvania State University (The), | | | | | | | | | | | | | | | | |
Taxable, Revenue Bonds, Series D | | | 2.840 | | | | 09/01/50 | | | | 745 | | | | 822,808 | |
Pennsylvania Turnpike Commission, | | | | | | | | | | | | | | | | |
Revenue Bonds, BABs | | | 6.105 | | | | 12/01/39 | | | | 70 | | | | 106,573 | |
Revenue Bonds, BABs, Series B | | | 5.511 | | | | 12/01/45 | | | | 150 | | | | 229,227 | |
| | | | | | | | | | | | | | | | |
| | | | |
| | | | | | | | | | | | | | | 1,158,608 | |
| | | | |
Texas 0.3% | | | | | | | | | | | | | | | | |
City of San Antonio TX Electric & Gas Systems Revenue, | | | | | | | | | | | | | | | | |
Revenue Bonds, BABs | | �� | 5.985 | | | | 02/01/39 | | | | 775 | | | | 1,159,857 | |
Grand Parkway Transportation Corp., | | | | | | | | | | | | | | | | |
Taxable, Revenue Bonds, Series E | | | 5.184 | | | | 10/01/42 | | | | 775 | | | | 1,136,189 | |
Permanent University Fund - University of Texas System, | | | | | | | | | | | | | | | | |
Taxable, Revenue Bonds, Series A | | | 3.376 | | | | 07/01/47 | | | | 555 | | | | 697,224 | |
Texas Private Activity Bond Surface Transportation Corp., | | | | | | | | | | | | | | | | |
Taxable, Revenue Bonds, Series B | | | 3.922 | | | | 12/31/49 | | | | 340 | | | | 375,041 | |
| | | | | | | | | | | | | | | | |
| | | | |
| | | | | | | | | | | | | | | 3,368,311 | |
See Notes to Financial Statements.
| | | | | | | | | | | | | | | | |
| | | | |
| Description | | Interest
Rate | | | Maturity
Date | | | Principal Amount
(000)# | | | Value | |
MUNICIPAL BONDS (Continued) | | | | | | | | | | | | | | | | |
| | | | |
Virginia 0.0% | | | | | | | | | | | | | | | | |
University of Virginia, | | | | | | | | | | | | | | | | |
Taxable, Revenue Bonds, Series C | | | 4.179 | % | | | 09/01/2117 | | | | 130 | | | $ | 187,053 | |
| | | | | | | | | | | | | | | | |
| | | | |
TOTAL MUNICIPAL BONDS | | | | | | | | | | | | | | | | |
(cost $8,521,421) | | | | | | | | | | | | | | | 9,412,731 | |
| | | | | | | | | | | | | | | | |
| | | | |
RESIDENTIAL MORTGAGE-BACKED SECURITIES 2.5% | | | | | | | | | | | | | | | | |
Alternative Loan Trust, | | | | | | | | | | | | | | | | |
Series 2003-J03, Class 2A1 | | | 6.250 | | | | 12/25/33 | | | | 3 | | | | 3,423 | |
Banc of America Funding Trust, | | | | | | | | | | | | | | | | |
Series 2015-R04, Class 4A1, 144A | | | 3.500 | (cc) | | | 01/27/30 | | | | 18 | | | | 17,447 | |
BCAP LLC Trust, | | | | | | | | | | | | | | | | |
Series 2011-RR04, Class 7A1, 144A | | | 5.250 | | | | 04/26/37 | | | | 186 | | | | 153,351 | |
Bellemeade Re Ltd. (Bermuda), | | | | | | | | | | | | | | | | |
Series 2018-01A, Class M1B, 144A, 1 Month LIBOR + 1.600% (Cap N/A, Floor 0.000%) | | | 1.772 | (c) | | | 04/25/28 | | | | 149 | | | | 147,873 | |
Series 2019-03A, Class M1A, 144A, 1 Month LIBOR + 1.100% (Cap N/A, Floor 1.100%) | | | 1.272 | (c) | | | 07/25/29 | | | | 168 | | | | 167,623 | |
Series 2019-03A, Class M1B, 144A, 1 Month LIBOR + 1.600% (Cap N/A, Floor 1.600%) | | | 1.772 | (c) | | | 07/25/29 | | | | 450 | | | | 436,388 | |
Series 2020-01A, Class M1A, 144A, 1 Month LIBOR + 2.650% (Cap N/A, Floor 0.000%) | | | 2.822 | (c) | | | 06/25/30 | | | | 710 | | | | 712,140 | |
Series 2020-01A, Class M1B, 144A, 1 Month LIBOR + 3.400% (Cap N/A, Floor 0.000%) | | | 3.572 | (c) | | | 06/25/30 | | | | 180 | | | | 181,441 | |
CIM Trust, | | | | | | | | | | | | | | | | |
Series 2017-03, Class A1, 144A, 1 Month LIBOR + 2.000% (Cap N/A, Floor 0.000%) | | | 2.171 | (c) | | | 01/25/57 | | | | 543 | | | | 543,231 | |
Series 2017-05, Class A3, 144A | | | 4.000 | (cc) | | | 05/25/57 | | | | 1,600 | | | | 1,590,045 | |
Series 2017-06, Class A1, 144A | | | 3.015 | (cc) | | | 06/25/57 | | | | 798 | | | | 803,198 | |
Series 2017-08, Class A1, 144A | | | 3.000 | (cc) | | | 12/25/65 | | | | 603 | | | | 601,020 | |
Credit Suisse First Boston Mortgage Securities Corp., | | | | | | | | | | | | | | | | |
Series 2003-08, Class 5A1 | | | 6.500 | | | | 04/25/33 | | | | 3 | | | | 3,476 | |
Credit Suisse Mortgage Trust, | | | | | | | | | | | | | | | | |
Series 2019-11R, Class 1A1, 144A, 1 Month LIBOR + 1.350% (Cap N/A, Floor 1.350%) | | | 1.529 | (c) | | | 09/25/45 | | | | 1,223 | | | | 1,212,793 | |
Series 2020-WL01, Class A, 144A, 1 Month LIBOR + | | | | | | | | | | | | | | | | |
1.400% (Cap N/A, Floor 0.000%)^ | | | 1.572 | (c) | | | 12/25/59 | | | | 2,461 | | | | 2,436,209 | |
Eagle Re Ltd. (Bermuda), | | | | | | | | | | | | | | | | |
Series 2019-01, Class M1B, 144A, 1 Month LIBOR + | | | | | | | | | | | | | | | | |
1.800% (Cap N/A, Floor 0.000%) | | | 1.972 | (c) | | | 04/25/29 | | | | 90 | | | | 89,515 | |
Fannie Mae REMICS, | | | | | | | | | | | | | | | | |
Series 2011-141, Class MZ | | | 4.500 | | | | 01/25/42 | | | | 706 | | | | 791,989 | |
Series 2014-11, Class VB | | | 4.500 | | | | 04/25/42 | | | | 500 | | | | 588,287 | |
See Notes to Financial Statements.
Schedule of Investments (continued)
as of July 31, 2020
| | | | | | | | | | | | | | | | | | | | |
| | | | | |
| Description | | Interest
Rate | | | Maturity
Date | | | | | | Principal
Amount
(000)# | | | Value | |
| | | |
RESIDENTIAL MORTGAGE-BACKED SECURITIES (Continued) | | | | | | | | | | | | | |
FHLMC Structured Pass-Through Certificates, | | | | | | | | | | | | | | | | | | | | |
Series T-59, Class 1A2 | | | 7.000 | % | | | 10/25/43 | | | | | | | | 95 | | | $ | 120,064 | |
Freddie Mac REMICS, | | | | | | | | | | | | | | | | | | | | |
Series 4249, Class GW | | | 3.500 | | | | 10/15/41 | | | | | | | | 1,720 | | | | 1,914,099 | |
Series 4661, Class BV | | | 3.500 | | | | 12/15/36 | | | | | | | | 1,000 | | | | 1,062,761 | |
Series 4717, Class PA | | | 3.000 | | | | 04/15/45 | | | | | | | | 918 | | | | 960,102 | |
Freddie Mac Structured Agency Credit Risk Debt Notes, | | | | | | | | | | | | | | | | | | | | |
Series 2016-HQA04, Class M2, 1 Month LIBOR + 1.300% (Cap N/A, Floor 0.000%) | | | 1.472 | (c) | | | 04/25/29 | | | | | | | | 1 | | | | 1,208 | |
Series 2017-DNA03, Class M1, 1 Month LIBOR + 0.750% (Cap N/A, Floor 0.000%) | | | 0.922 | (c) | | | 03/25/30 | | | | | | | | 228 | | | | 227,500 | |
Freddie Mac Structured Agency Credit Risk Trust, | | | | | | | | | | | | | | | | | | | | |
Series 2018-DNA03, Class M1, 144A, 1 Month LIBOR + 0.750% (Cap N/A, Floor 0.000%) | | | 0.922 | (c) | | | 09/25/48 | | | | | | | | 1 | | | | 1,156 | |
GCAT LLC, | | | | | | | | | | | | | | | | | | | | |
Series 2019-04, Class A1, 144A | | | 3.228 | | | | 11/26/49 | | | | | | | | 2,685 | | | | 2,643,427 | |
Government National Mortgage Assoc., | | | | | | | | | | | | | | | | | | | | |
Series 2013-99, Class AX | | | 3.000 | | | | 07/20/43 | | | | | | | | 1,323 | | | | 1,413,735 | |
Series 2016-46, Class JE | | | 2.500 | | | | 11/20/45 | | | | | | | | 456 | | | | 476,959 | |
Series 2017-101, Class AB | | | 2.500 | | | | 07/20/47 | | | | | | | | 1,000 | | | | 1,048,586 | |
Series 2018-07, Class GA | | | 3.000 | | | | 02/20/47 | | | | | | | | 813 | | | | 839,136 | |
GSR Mortgage Loan Trust, | | | | | | | | | | | | | | | | | | | | |
Series 2005-AR06, Class 2A1 | | | 3.987 | (cc) | | | 09/25/35 | | | | | | | | 29 | | | | 28,916 | |
Home Re Ltd. (Bermuda), | | | | | | | | | | | | | | | | | | | | |
Series 2019-01, Class M1, 144A, 1 Month LIBOR + 1.650% (Cap N/A, Floor 0.000%) | | | 1.822 | (c) | | | 05/25/29 | | | | | | | | 61 | | | | 59,872 | |
Legacy Mortgage Asset Trust, | | | | | | | | | | | | | | | | | | | | |
Series 2019-GS06, Class A1, 144A | | | 3.000 | | | | 06/25/59 | | | | | | | | 278 | | | | 277,623 | |
Series 2019-PR01, Class A1, 144A | | | 3.858 | | | | 09/25/59 | | | | | | | | 1,589 | | | | 1,581,338 | |
Series 2020-GS01, Class A1, 144A | | | 2.882 | | | | 10/25/59 | | | | | | | | 1,063 | | | | 1,056,543 | |
LSTAR Securities Investment Trust, | | | | | | | | | | | | | | | | | | | | |
Series 2019-02, Class A1, 144A, 1 Month LIBOR + | | | | | | | | | | | | | �� | | | | | | | |
1.500% (Cap N/A, Floor 0.000%) | | | 1.671 | (c) | | | 04/01/24 | | | | | | | | 195 | | | | 193,374 | |
Mortgage Repurchase Agreement Financing Trust, | | | | | | | | | | | | | | | | | | | | |
Series 2020-03, Class A1, 144A, 1 Month LIBOR + 1.250% (Cap N/A, Floor 1.250%) | | | 1.426 | (c) | | | 01/23/23 | | | | | | | | 445 | | | | 445,000 | |
Series 2020-04, Class A1, 144A^ | | | — | (p) | | | 04/23/23 | | | | | | | | 425 | | | | 425,000 | |
Series 2020-04, Class A2, 144A^ | | | — | (p) | | | 04/23/23 | | | | | | | | 825 | | | | 825,000 | |
New Residential Mortgage Loan Trust, | | | | | | | | | | | | | | | | | | | | |
Series 2018-01A, Class A1A, 144A | | | 4.000 | (cc) | | | 12/25/57 | | | | | | | | 422 | | | | 451,075 | |
Series 2018-04A, Class A1S, 144A, 1 Month LIBOR + 0.750% (Cap N/A, Floor 0.750%) | | | 0.922 | (c) | | | 01/25/48 | | | | | | | | 162 | | | | 159,835 | |
See Notes to Financial Statements.
| | | | | | | | | | | | | | | | |
| | | | |
| Description | | Interest
Rate | | | Maturity
Date | | | Principal
Amount
(000)# | | | Value | |
| | |
RESIDENTIAL MORTGAGE-BACKED SECURITIES (Continued) | | | | | | | | | |
Oaktown Re III Ltd. (Bermuda), | | | | | | | | | | | | | | | | |
Series 2019-01A, Class M1A, 144A, 1 Month LIBOR + 1.400% (Cap N/A, Floor 1.400%) | | | 1.572 | %(c) | | | 07/25/29 | | | | 19 | | | $ | 18,632 | |
Oaktown Re IV Ltd. (Bermuda), | | | | | | | | | | | | | | | | |
Series 2020-01A, Class M1A, 144A, 1 Month LIBOR + 3.200% (Cap N/A, Floor 3.200%) | | | 3.378 | (c) | | | 07/25/30 | | | | 400 | | | | 399,840 | |
OBX Trust, | | | | | | | | | | | | | | | | |
Series 2018-01, Class A2, 144A, 1 Month LIBOR + 0.650% (Cap N/A, Floor 0.000%) | | | 0.822 | (c) | | | 06/25/57 | | | | 347 | | | | 342,632 | |
Radnor Re Ltd. (Bermuda), | | | | | | | | | | | | | | | | |
Series 2018-01, Class M1, 144A, 1 Month LIBOR + 1.400% (Cap N/A, Floor 0.000%) | | | 1.572 | (c) | | | 03/25/28 | | | | 17 | | | | 17,241 | |
Series 2020-01, Class M1A, 144A, 1 Month LIBOR + 0.950% (Cap N/A, Floor 0.950%) | | | 1.122 | (c) | | | 02/25/30 | | | | 200 | | | | 197,869 | |
Seasoned Credit Risk Transfer Trust, | | | | | | | | | | | | | | | | |
Series 2019-02, Class MA | | | 3.500 | | | | 08/25/58 | | | | 1,233 | | | | 1,351,019 | |
Sequoia Mortgage Trust 10, | | | | | | | | | | | | | | | | |
Series 10, Class 2A1, 1 Month LIBOR + 0.760% (Cap 11.750%, Floor 0.380%) | | | 0.947 | (c) | | | 10/20/27 | | | | 26 | | | | 24,509 | |
Structured Asset Mortgage Investments II Trust, | | | | | | | | | | | | | | | | |
Series 2005-AR05, Class A1, 1 Month LIBOR + 0.250% (Cap 11.000%, Floor 0.250%) | | | 0.437 | (c) | | | 07/19/35 | | | | 31 | | | | 28,666 | |
WaMu Mortgage Pass-Through Certificates Series Trust, | | | | | | | | | | | | | | | | |
Series 2002-AR06, Class A, Federal Reserve US 12 | | | | | | | | | | | | | | | | |
Month Cumulative Avg 1 Year CMT + 1.400% (Cap N/A, Floor 1.400%) | | | 2.722 | (c) | | | 06/25/42 | | | | 58 | | | | 53,667 | |
Series 2002-AR09, Class 1A, Federal Reserve US 12 | | | | | | | | | | | | | | | | |
Month Cumulative Avg 1 Year CMT + 1.400% (Cap | | | | | | | | | | | | | | | | |
N/A, Floor 1.400%) | | | 2.722 | (c) | | | 08/25/42 | | | | 3 | | | | 3,227 | |
Series 2005-AR13, Class A1A1, 1 Month LIBOR + 0.290% (Cap 10.500%, Floor 0.290%) | | | 0.462 | (c) | | | 10/25/45 | | | | 400 | | | | 389,308 | |
| | | | | | | | | | | | | | | | |
TOTAL RESIDENTIAL MORTGAGE-BACKED SECURITIES | | | | | | | | | | | | | | | | |
(cost $29,166,656) | | | | | | | | | | | | | | | 29,518,368 | |
| | | | | | | | | | | | | | | | |
| | | | |
SOVEREIGN BONDS 0.8% | | | | | | | | | | | | | | | | |
Abu Dhabi Government International Bond (United Arab Emirates), | | | | | | | | | | | | | | | | |
Sr. Unsec’d. Notes, 144A | | | 3.125 | | | | 10/11/27 | | | | 840 | | | | 941,468 | |
Colombia Government International Bond (Colombia), | | | | | | | | | | | | | | | | |
Sr. Unsec’d. Notes | | | 4.375 | | | | 07/12/21 | | | | 200 | | | | 206,005 | |
Sr. Unsec’d. Notes | | | 5.000 | | | | 06/15/45 | | | | 370 | | | | 457,474 | |
Sr. Unsec’d. Notes | | | 7.375 | | | | 09/18/37 | | | | 175 | | | | 255,354 | |
Export-Import Bank of India (India), | | | | | | | | | | | | | | | | |
Sr. Unsec’d. Notes, 144A | | | 3.875 | | | | 02/01/28 | | | | 290 | | | | 305,368 | |
See Notes to Financial Statements.
Schedule of Investments (continued)
as of July 31, 2020
| | | | | | | | | | | | | | | | |
| | | | |
| Description | | Interest
Rate | | | Maturity
Date | | | Principal
Amount
(000)# | | | Value | |
SOVEREIGN BONDS (Continued) | | | | | | | | | | | | | | | | |
Indonesia Government International Bond (Indonesia), | | | | | | | | | | | | | | | | |
Sr. Unsec’d. Notes | | | 4.450 | % | | | 02/11/24 | | | | 200 | | | $ | 221,036 | |
Sr. Unsec’d. Notes, EMTN | | | 3.750 | | | | 04/25/22 | | | | 200 | | | | 208,503 | |
Sr. Unsec’d. Notes, EMTN | | | 4.750 | | | | 01/08/26 | | | | 200 | | | | 231,267 | |
Japan Finance Organization for Municipalities (Japan), | | | | | | | | | | | | | | | | |
Sr. Unsec’d. Notes, 144A, MTN | | | 1.750 | | | | 09/05/24 | | | | 200 | | | | 209,017 | |
Sr. Unsec’d. Notes, 144A, MTN | | | 2.125 | | | | 10/25/23 | | | | 200 | | | | 209,962 | |
Sr. Unsec’d. Notes, 144A, MTN | | | 2.625 | | | | 04/20/22 | | | | 400 | | | | 414,490 | |
Sr. Unsec’d. Notes, 144A, MTN | | | 3.000 | | | | 03/12/24 | | | | 400 | | | | 433,885 | |
Lithuania Government International Bond (Lithuania), | | | | | | | | | | | | | | | | |
Sr. Unsec’d. Notes, 144A | | | 6.125 | | | | 03/09/21 | | | | 260 | | | | 268,823 | |
Panama Government International Bond (Panama), | | | | | | | | | | | | | | | | |
Sr. Unsec’d. Notes | | | 4.500 | | | | 04/16/50 | | | | 200 | | | | 266,021 | |
Province of Alberta (Canada), | | | | | | | | | | | | | | | | |
Sr. Unsec’d. Notes | | | 3.300 | | | | 03/15/28 | | | | 335 | | | | 392,165 | |
Province of Manitoba (Canada), | | | | | | | | | | | | | | | | |
Sr. Unsec’d. Notes | | | 2.125 | | | | 06/22/26 | | | | 100 | | | | 108,013 | |
Sr. Unsec’d. Notes, Series GX | | | 2.600 | | | | 04/16/24 | | | | 140 | | | | 150,758 | |
Province of Quebec (Canada), | | | | | | | | | | | | | | | | |
Unsec’d. Notes, MTN | | | 7.140 | | | | 02/27/26 | | | | 100 | | | | 133,446 | |
Qatar Government International Bond (Qatar), | | | | | | | | | | | | | | | | |
Sr. Unsec’d. Notes, 144A | | | 3.875 | | | | 04/23/23 | | | | 335 | | | | 361,825 | |
Sr. Unsec’d. Notes, 144A | | | 5.103 | | | | 04/23/48 | | | | 370 | | | | 544,511 | |
Republic of Poland Government International Bond | | | | | | | | | | | | | | | | |
(Poland), | | | | | | | | | | | | | | | | |
Sr. Unsec’d. Notes | | | 3.000 | | | | 03/17/23 | | | | 100 | | | | 106,373 | |
Saudi Government International Bond (Saudi Arabia), | | | | | | | | | | | | | | | | |
Sr. Unsec’d. Notes, 144A, MTN | | | 2.375 | | | | 10/26/21 | | | | 435 | | | | 443,194 | |
Sr. Unsec’d. Notes, 144A, MTN | | | 2.875 | | | | 03/04/23 | | | | 460 | | | | 482,101 | |
Sr. Unsec’d. Notes, 144A, MTN | | | 4.000 | | | | 04/17/25 | | | | 320 | | | | 358,099 | |
Tokyo Metropolitan Government (Japan), | | | | | | | | | | | | | | | | |
Sr. Unsec’d. Notes, 144A | | | 2.500 | | | | 06/08/22 | | | | 400 | | | | 414,208 | |
Sr. Unsec’d. Notes, 144A | | | 3.250 | | | | 06/01/23 | | | | 200 | | | | 214,845 | |
Uruguay Government International Bond (Uruguay), | | | | | | | | | | | | | | | | |
Sr. Unsec’d. Notes | | | 4.975 | | | | 04/20/55 | | | | 540 | | | | 750,552 | |
Sr. Unsec’d. Notes | | | 5.100 | | | | 06/18/50 | | | | 60 | | | | 83,924 | |
| | | | | | | | | | | | | | | | |
TOTAL SOVEREIGN BONDS | | | | | | | | | | | | | | | | |
(cost $8,245,953) | | | | | | | | | | | | | | | 9,172,687 | |
| | | | | | | | | | | | | | | | |
| | | | |
U.S. GOVERNMENT AGENCY OBLIGATIONS 18.8% | | | | | | | | | | | | | | | | |
Federal Home Loan Mortgage Corp. | | | 2.000 | | | | 01/01/32 | | | | 691 | | | | 721,840 | |
Federal Home Loan Mortgage Corp. | | | 2.500 | | | | 01/01/29 | | | | 450 | | | | 473,442 | |
Federal Home Loan Mortgage Corp. | | | 2.500 | | | | 07/01/31 | | | | 628 | | | | 668,300 | |
Federal Home Loan Mortgage Corp. | | | 2.500 | | | | 01/01/32 | | | | 320 | | | | 340,555 | |
See Notes to Financial Statements.
| | | | | | | | | | | | | | | | |
| | | | |
| Description | | Interest
Rate | | Maturity
Date | | | Principal
Amount
(000)# | | | Value | |
| | | | |
U.S. GOVERNMENT AGENCY OBLIGATIONS (Continued) | | | | | | | | | | | | | | | | |
Federal Home Loan Mortgage Corp. | | | 2.500 | % | | | 10/01/32 | | | | 824 | | | $ | 876,725 | |
Federal Home Loan Mortgage Corp. | | | 2.500 | | | | 12/01/32 | | | | 1,577 | | | | 1,658,966 | |
Federal Home Loan Mortgage Corp. | | | 2.500 | | | | 09/01/46 | | | | 424 | | | | 451,870 | |
Federal Home Loan Mortgage Corp. | | | 2.500 | | | | 11/01/49 | | | | 1,220 | | | | 1,299,606 | |
Federal Home Loan Mortgage Corp. | | | 3.000 | | | | 02/01/32 | | | | 1,360 | | | | 1,447,831 | |
Federal Home Loan Mortgage Corp. | | | 3.000 | | | | 01/01/37 | | | | 351 | | | | 373,410 | |
Federal Home Loan Mortgage Corp. | | | 3.000 | | | | 12/01/37 | | | | 166 | | | | 175,701 | |
Federal Home Loan Mortgage Corp. | | | 3.000 | | | | 07/01/43 | | | | 536 | | | | 576,942 | |
Federal Home Loan Mortgage Corp. | | | 3.000 | | | | 06/01/46 | | | | 1,182 | | | | 1,257,285 | |
Federal Home Loan Mortgage Corp. | | | 3.000 | | | | 12/01/46 | | | | 1,006 | | | | 1,067,228 | |
Federal Home Loan Mortgage Corp. | | | 3.000 | | | | 01/01/47 | | | | 1,100 | | | | 1,166,707 | |
Federal Home Loan Mortgage Corp. | | | 3.000 | | | | 06/01/50 | | | | 1,218 | | | | 1,289,820 | |
Federal Home Loan Mortgage Corp. | | | 3.500 | | | | 11/01/28 | | | | 466 | | | | 497,369 | |
Federal Home Loan Mortgage Corp. | | | 3.500 | | | | 11/01/37 | | | | 345 | | | | 366,957 | |
Federal Home Loan Mortgage Corp. | | | 3.500 | | | | 06/01/42 | | | | 457 | | | | 494,723 | |
Federal Home Loan Mortgage Corp. | | | 3.500 | | | | 06/01/42 | | | | 494 | | | | 534,876 | |
Federal Home Loan Mortgage Corp. | | | 3.500 | | | | 07/01/42 | | | | 499 | | | | 540,140 | |
Federal Home Loan Mortgage Corp. | | | 3.500 | | | | 09/01/42 | | | | 576 | | | | 624,349 | |
Federal Home Loan Mortgage Corp. | | | 3.500 | | | | 10/01/42 | | | | 654 | | | | 709,094 | |
Federal Home Loan Mortgage Corp. | | | 3.500 | | | | 06/01/43 | | | | 326 | | | | 353,923 | |
Federal Home Loan Mortgage Corp. | | | 3.500 | | | | 05/01/45 | | | | 450 | | | | 481,985 | |
Federal Home Loan Mortgage Corp. | | | 3.500 | | | | 01/01/47 | | | | 331 | | | | 352,229 | |
Federal Home Loan Mortgage Corp. | | | 3.500 | | | | 02/01/47 | | | | 808 | | | | 860,186 | |
Federal Home Loan Mortgage Corp. | | | 3.500 | | | | 11/01/47 | | | | 642 | | | | 679,710 | |
Federal Home Loan Mortgage Corp. | | | 3.500 | | | | 08/01/48 | | | | 329 | | | | 346,863 | |
Federal Home Loan Mortgage Corp. | | | 3.500 | | | | 10/01/48 | | | | 1,277 | | | | 1,344,358 | |
Federal Home Loan Mortgage Corp. | | | 4.000 | | | | 12/01/40 | | | | 151 | | | | 165,008 | |
Federal Home Loan Mortgage Corp. | | | 4.000 | | | | 01/01/41 | | | | 324 | | | | 354,588 | |
Federal Home Loan Mortgage Corp. | | | 4.000 | | | | 04/01/42 | | | | 452 | | | | 490,455 | |
Federal Home Loan Mortgage Corp. | | | 4.000 | | | | 10/01/45 | | | | 244 | | | | 264,140 | |
Federal Home Loan Mortgage Corp. | | | 4.000 | | | | 02/01/46 | | | | 3,854 | | | | 4,234,024 | |
Federal Home Loan Mortgage Corp. | | | 4.000 | | | | 05/01/46 | | | | 277 | | | | 299,011 | |
Federal Home Loan Mortgage Corp. | | | 4.000 | | | | 08/01/46 | | | | 331 | | | | 359,799 | |
Federal Home Loan Mortgage Corp. | | | 4.000 | | | | 11/01/47 | | | | 324 | | | | 345,949 | |
Federal Home Loan Mortgage Corp. | | | 4.000 | | | | 04/01/48 | | | | 561 | | | | 597,596 | |
Federal Home Loan Mortgage Corp. | | | 4.000 | | | | 05/01/48 | | | | 580 | | | | 616,582 | |
Federal Home Loan Mortgage Corp. | | | 4.000 | | | | 07/01/48 | | | | 826 | | | | 879,765 | |
Federal Home Loan Mortgage Corp. | | | 4.500 | | | | 06/01/42 | | | | 152 | | | | 168,549 | |
Federal Home Loan Mortgage Corp. | | | 4.500 | | | | 09/01/44 | | | | 195 | | | | 215,665 | |
Federal Home Loan Mortgage Corp. | | | 4.500 | | | | 07/01/45 | | | | 481 | | | | 534,697 | |
Federal Home Loan Mortgage Corp. | | | 4.500 | | | | 04/01/47 | | | | 2,710 | | | | 2,931,450 | |
Federal Home Loan Mortgage Corp. | | | 4.500 | | | | 07/01/47 | | | | 273 | | | | 293,933 | |
Federal Home Loan Mortgage Corp. | | | 4.500 | | | | 07/01/47 | | | | 577 | | | | 623,684 | |
Federal Home Loan Mortgage Corp. | | | 4.500 | | | | 11/01/47 | | | | 1,148 | | | | 1,239,984 | |
Federal Home Loan Mortgage Corp. | | | 4.500 | | | | 02/01/48 | | | | 346 | | | | 373,423 | |
See Notes to Financial Statements.
Schedule of Investments (continued)
as of July 31, 2020
| | | | | | | | | | | | | | | | |
| | | | |
| Description | | Interest
Rate | | Maturity
Date | | | Principal
Amount
(000)# | | | Value | |
| | | | |
U.S. GOVERNMENT AGENCY OBLIGATIONS (Continued) | | | | | | | | | | | | | | | | |
Federal Home Loan Mortgage Corp. | | | 4.500 | % | | | 07/01/48 | | | | 878 | | | $ | 944,210 | |
Federal Home Loan Mortgage Corp. | | | 5.000 | | | | 08/01/40 | | | | 272 | | | | 311,136 | |
Federal Home Loan Mortgage Corp. | | | 5.000 | | | | 12/01/47 | | | | 474 | | | | 519,890 | |
Federal Home Loan Mortgage Corp. | | | 5.000 | | | | 02/01/48 | | | | 625 | | | | 684,648 | |
Federal National Mortgage Assoc. | | | 1.625 | | | | 01/07/25 | | | | 1,545 | | | | 1,629,542 | |
Federal National Mortgage Assoc. | | | 2.000 | | | | TBA | | | | 500 | | | | 519,375 | |
Federal National Mortgage Assoc. | | | 2.000 | | | | TBA | | | | 12,500 | | | | 12,926,275 | |
Federal National Mortgage Assoc. | | | 2.000 | | | | 10/01/34 | | | | 1,042 | | | | 1,084,327 | |
Federal National Mortgage Assoc. | | | 2.375 | | | | 01/19/23 | | | | 280 | | | | 295,072 | |
Federal National Mortgage Assoc. | | | 2.500 | | | | TBA | | | | 3,500 | | | | 3,671,173 | |
Federal National Mortgage Assoc. | | | 2.500 | | | | 02/05/24 | (k) | | | 645 | | | | 695,127 | |
Federal National Mortgage Assoc. | | | 2.500 | | | | 05/01/30 | | | | 429 | | | | 456,014 | |
Federal National Mortgage Assoc. | | | 2.500 | | | | 04/01/31 | | | | 1,260 | | | | 1,342,010 | |
Federal National Mortgage Assoc. | | | 2.500 | | | | 11/01/31 | | | | 313 | | | | 333,389 | |
Federal National Mortgage Assoc. | | | 2.500 | | | | 02/01/43 | | | | 126 | | | | 134,586 | |
Federal National Mortgage Assoc. | | | 2.500 | | | | 09/01/46 | | | | 374 | | | | 396,082 | |
Federal National Mortgage Assoc. | | | 2.500 | | | | 10/01/46 | | | | 271 | | | | 289,037 | |
Federal National Mortgage Assoc. | | | 2.500 | | | | 10/01/46 | | | | 366 | | | | 390,855 | |
Federal National Mortgage Assoc. | | | 2.500 | | | | 09/01/49 | | | | 610 | | | | 640,450 | |
Federal National Mortgage Assoc. | | | 2.500 | | | | 10/01/49 | | | | 452 | | | | 474,873 | |
Federal National Mortgage Assoc. | | | 2.500 | | | | 11/01/49 | | | | 2,254 | | | | 2,366,380 | |
Federal National Mortgage Assoc., Cost of Funds for the | | | | | | | | | | | | | | | | |
11th District of San Francisco + 2.000% (Cap | | | | | | | | | | | | | | | | |
9.375%, Floor 2.000%) | | | 2.875 | (c) | | | 08/01/24 | | | | 6 | | | | 5,834 | |
Federal National Mortgage Assoc. | | | 3.000 | | | | TBA | | | | 11,000 | | | | 11,611,472 | |
Federal National Mortgage Assoc. | | | 3.000 | | | | 06/01/30 | | | | 253 | | | | 268,637 | |
Federal National Mortgage Assoc. | | | 3.000 | | | | 05/01/31 | | | | 118 | | | | 124,167 | |
Federal National Mortgage Assoc. | | | 3.000 | | | | 12/01/31 | | | | 333 | | | | 350,609 | |
Federal National Mortgage Assoc. | | | 3.000 | | | | 05/01/32 | | | | 331 | | | | 347,376 | |
Federal National Mortgage Assoc. | | | 3.000 | | | | 09/01/32 | | | | 154 | | | | 161,939 | |
Federal National Mortgage Assoc. | | | 3.000 | | | | 11/01/36 | | | | 294 | | | | 311,565 | |
Federal National Mortgage Assoc. | | | 3.000 | | | | 10/01/42 | | | | 312 | | | | 335,702 | |
Federal National Mortgage Assoc. | | | 3.000 | | | | 10/01/42 | | | | 510 | | | | 548,412 | |
Federal National Mortgage Assoc. | | | 3.000 | | | | 02/01/43 | | | | 314 | | | | 341,592 | |
Federal National Mortgage Assoc. | | | 3.000 | | | | 04/01/43 | | | | 541 | | | | 582,372 | |
Federal National Mortgage Assoc. | | | 3.000 | | | | 06/01/43 | | | | 678 | | | | 729,528 | |
Federal National Mortgage Assoc. | | | 3.000 | | | | 12/01/45 | | | | 860 | | | | 935,162 | |
Federal National Mortgage Assoc. | | | 3.000 | | | | 05/01/46 | | | | 1,582 | | | | 1,681,776 | |
Federal National Mortgage Assoc. | | | 3.000 | | | | 10/01/46 | | | | 4,754 | | | | 5,055,913 | |
Federal National Mortgage Assoc. | | | 3.000 | | | | 11/01/46 | | | | 1,688 | | | | 1,790,294 | |
Federal National Mortgage Assoc. | | | 3.000 | | | | 03/01/47 | | | | 1,057 | | | | 1,122,536 | |
Federal National Mortgage Assoc. | | | 3.000 | | | | 04/01/47 | | | | 2,497 | | | | 2,651,951 | |
Federal National Mortgage Assoc. | | | 3.000 | | | | 06/01/50 | | | | 1,756 | | | | 1,859,778 | |
Federal National Mortgage Assoc. | | | 3.500 | | | | 12/01/29 | | | | 170 | | | | 179,395 | |
Federal National Mortgage Assoc. | | | 3.500 | | | | 12/01/30 | | | | 155 | | | | 163,962 | |
See Notes to Financial Statements.
| | | | | | | | | | | | | | | | |
| | | | |
| Description | | Interest
Rate | | Maturity
Date | | | Principal
�� Amount
(000)# | | | Value | |
| | | | |
U.S. GOVERNMENT AGENCY OBLIGATIONS (Continued) | | | | | | | | | | | | | | | | |
Federal National Mortgage Assoc. | | | 3.500 | % | | | 07/01/31 | | | | 827 | | | $ | 881,428 | |
Federal National Mortgage Assoc. | | | 3.500 | | | | 08/01/31 | | | | 544 | | | | 574,530 | |
Federal National Mortgage Assoc. | | | 3.500 | | | | 02/01/33 | | | | 313 | | | | 329,654 | |
Federal National Mortgage Assoc. | | | 3.500 | | | | 05/01/33 | | | | 158 | | | | 166,629 | |
Federal National Mortgage Assoc. | | | 3.500 | | | | 10/01/41 | | | | 190 | | | | 205,413 | |
Federal National Mortgage Assoc. | | | 3.500 | | | | 04/01/42 | | | | 404 | | | | 437,657 | |
Federal National Mortgage Assoc. | | | 3.500 | | | | 05/01/42 | | | | 416 | | | | 451,404 | |
Federal National Mortgage Assoc. | | | 3.500 | | | | 05/01/42 | | | | 2,088 | | | | 2,275,582 | |
Federal National Mortgage Assoc. | | | 3.500 | | | | 06/01/42 | | | | 1,009 | | | | 1,099,527 | |
Federal National Mortgage Assoc. | | | 3.500 | | | | 10/01/42 | | | | 521 | | | | 567,316 | |
Federal National Mortgage Assoc. | | | 3.500 | | | | 10/01/42 | | | | 663 | | | | 718,500 | |
Federal National Mortgage Assoc. | | | 3.500 | | | | 10/01/42 | | | | 1,079 | | | | 1,170,246 | |
Federal National Mortgage Assoc. | | | 3.500 | | | | 06/01/43 | | | | 323 | | | | 350,524 | |
Federal National Mortgage Assoc. | | | 3.500 | | | | 06/01/45 | | | | 434 | | | | 464,246 | |
Federal National Mortgage Assoc. | | | 3.500 | | | | 06/01/45 | | | | 835 | | | | 889,217 | |
Federal National Mortgage Assoc. | | | 3.500 | | | | 09/01/45 | | | | 558 | | | | 597,116 | |
Federal National Mortgage Assoc. | | | 3.500 | | | | 10/01/45 | | | | 749 | | | | 801,633 | |
Federal National Mortgage Assoc. | | | 3.500 | | | | 01/01/46 | | | | 246 | | | | 261,905 | |
Federal National Mortgage Assoc. | | | 3.500 | | | | 01/01/46 | | | | 588 | | | | 628,611 | |
Federal National Mortgage Assoc. | | | 3.500 | | | | 04/01/46 | | | | 7,650 | | | | 8,149,212 | |
Federal National Mortgage Assoc. | | | 3.500 | | | | 11/01/46 | | | | 305 | | | | 324,883 | |
Federal National Mortgage Assoc. | | | 3.500 | | | | 06/01/47 | | | | 1,319 | | | | 1,395,784 | |
Federal National Mortgage Assoc. | | | 3.500 | | | | 07/01/47 | | | | 783 | | | | 828,917 | |
Federal National Mortgage Assoc. | | | 3.500 | | | | 08/01/47 | | | | 438 | | | | 465,072 | |
Federal National Mortgage Assoc. | | | 3.500 | | | | 09/01/47 | | | | 994 | | | | 1,050,417 | |
Federal National Mortgage Assoc. | | | 3.500 | | | | 10/01/47 | | | | 3,188 | | | | 3,379,857 | |
Federal National Mortgage Assoc. | | | 3.500 | | | | 11/01/47 | | | | 3,153 | | | | 3,335,275 | |
Federal National Mortgage Assoc. | | | 3.500 | | | | 01/01/48 | | | | 541 | | | | 572,225 | |
Federal National Mortgage Assoc. | | | 3.500 | | | | 01/01/48 | | | | 682 | | | | 729,808 | |
Federal National Mortgage Assoc. | | | 3.500 | | | | 04/01/48 | | | | 1,662 | | | | 1,756,836 | |
Federal National Mortgage Assoc. | | | 3.500 | | | | 08/01/48 | | | | 1,510 | | | | 1,590,800 | |
Federal National Mortgage Assoc. | | | 3.500 | | | | 10/01/48 | | | | 1,034 | | | | 1,091,810 | |
Federal National Mortgage Assoc. | | | 3.500 | | | | 11/01/48 | | | | 624 | | | | 659,675 | |
Federal National Mortgage Assoc. | | | 4.000 | | | | 09/01/40 | | | | 313 | | | | 344,308 | |
Federal National Mortgage Assoc. | | | 4.000 | | | | 11/01/40 | | | | 1,518 | | | | 1,661,529 | |
Federal National Mortgage Assoc. | | | 4.000 | | | | 02/01/41 | | | | 547 | | | | 601,745 | |
Federal National Mortgage Assoc. | | | 4.000 | | | | 02/01/41 | | | | 788 | | | | 866,619 | |
Federal National Mortgage Assoc. | | | 4.000 | | | | 12/01/41 | | | | 454 | | | | 498,842 | |
Federal National Mortgage Assoc. | | | 4.000 | | | | 10/01/43 | | | | 456 | | | | 501,659 | |
Federal National Mortgage Assoc. | | | 4.000 | | | | 09/01/44 | | | | 281 | | | | 305,645 | |
Federal National Mortgage Assoc. | | | 4.000 | | | | 10/01/44 | | | | 653 | | | | 709,598 | |
Federal National Mortgage Assoc. | | | 4.000 | | | | 12/01/45 | | | | 236 | | | | 255,570 | |
Federal National Mortgage Assoc. | | | 4.000 | | | | 04/01/46 | | | | 269 | | | | 288,302 | |
Federal National Mortgage Assoc. | | | 4.000 | | | | 08/01/46 | | | | 420 | | | | 450,662 | |
Federal National Mortgage Assoc. | | | 4.000 | | | | 09/01/46 | | | | 2,580 | | | | 2,790,471 | |
See Notes to Financial Statements.
PGIM Core Bond Fund 53
Schedule of Investments (continued)
as of July 31, 2020
| | | | | | | | | | | | | | | | |
| | | | |
| Description | | Interest
Rate | | Maturity
Date | | | Principal
Amount
(000)# | | | Value | |
| | | | |
U.S. GOVERNMENT AGENCY OBLIGATIONS (Continued) | | | | | | | | | | | | | | | | |
Federal National Mortgage Assoc. | | | 4.000 | % | | | 02/01/47 | | | | 1,677 | | | $ | 1,785,696 | |
Federal National Mortgage Assoc. | | | 4.000 | | | | 03/01/47 | | | | 1,218 | | | | 1,331,083 | |
Federal National Mortgage Assoc. | | | 4.000 | | | | 06/01/47 | | | | 1,002 | | | | 1,070,698 | |
Federal National Mortgage Assoc. | | | 4.000 | | | | 10/01/47 | | | | 300 | | | | 319,897 | |
Federal National Mortgage Assoc. | | | 4.000 | | | | 11/01/47 | | | | 610 | | | | 652,590 | |
Federal National Mortgage Assoc. | | | 4.000 | | | | 12/01/47 | | | | 621 | | | | 662,635 | |
Federal National Mortgage Assoc. | | | 4.000 | | | | 02/01/48 | | | | 602 | | | | 640,226 | |
Federal National Mortgage Assoc. | | | 4.000 | | | | 10/01/48 | | | | 615 | | | | 681,101 | |
Federal National Mortgage Assoc. | | | 4.500 | | | | 08/01/40 | | | | 140 | | | | 155,310 | |
Federal National Mortgage Assoc. | | | 4.500 | | | | 04/01/41 | | | | 160 | | | | 178,400 | |
Federal National Mortgage Assoc. | | | 4.500 | | | | 06/01/41 | | | | 371 | | | | 411,304 | |
Federal National Mortgage Assoc. | | | 4.500 | | | | 08/01/41 | | | | 218 | | | | 241,690 | |
Federal National Mortgage Assoc. | | | 4.500 | | | | 08/01/41 | | | | 536 | | | | 596,330 | |
Federal National Mortgage Assoc. | | | 4.500 | | | | 08/01/44 | | | | 445 | | | | 495,008 | |
Federal National Mortgage Assoc. | | | 4.500 | | | | 01/01/45 | | | | 256 | | | | 284,957 | |
Federal National Mortgage Assoc. | | | 4.500 | | | | 11/01/47 | | | | 392 | | | | 423,704 | |
Federal National Mortgage Assoc. | | | 4.500 | | | | 06/01/48 | | | | 707 | | | | 761,945 | |
Federal National Mortgage Assoc. | | | 4.500 | | | | 12/01/48 | | | | 644 | | | | 691,516 | |
Federal National Mortgage Assoc. | | | 4.500 | | | | 02/01/49 | | | | 217 | | | | 232,469 | |
Federal National Mortgage Assoc. | | | 5.000 | | | | 09/01/30 | | | | 33 | | | | 37,191 | |
Federal National Mortgage Assoc. | | | 5.000 | | | | 03/01/42 | | | | 474 | | | | 543,266 | |
Federal National Mortgage Assoc. | | | 5.000 | | | | 10/01/47 | | | | 634 | | | | 694,737 | |
Federal National Mortgage Assoc. | | | 5.000 | | | | 01/01/48 | | | | 107 | | | | 117,480 | |
Federal National Mortgage Assoc. | | | 5.500 | | | | 01/01/40 | | | | 166 | | | | 186,645 | |
Federal National Mortgage Assoc., Cost of Funds for the | | | | | | | | | | | | | | | | |
11th District of San Francisco + 1.250% (Cap | | | | | | | | | | | | | | | | |
12.727%, Floor 5.700%) | | | 5.699 | (c) | | | 12/01/30 | | | | 1 | | | | 608 | |
Federal National Mortgage Assoc. | | | 6.000 | | | | 10/01/36 | | | | 110 | | | | 129,387 | |
Federal National Mortgage Assoc. | | | 6.000 | | | | 07/01/41 | | | | 112 | | | | 131,953 | |
Federal National Mortgage Assoc. | | | 6.625 | | | | 11/15/30 | (k) | | | 485 | | | | 754,082 | |
Federal National Mortgage Assoc. | | | 7.125 | | | | 01/15/30 | (k) | | | 80 | | | | 125,194 | |
Government National Mortgage Assoc. | | | 2.500 | | | | TBA | | | | 2,000 | | | | 2,107,656 | |
Government National Mortgage Assoc. | | | 2.500 | | | | TBA | (tt) | | | 3,000 | | | | 3,168,516 | |
Government National Mortgage Assoc. | | | 2.500 | | | | 12/20/46 | | | | 666 | | | | 709,346 | |
Government National Mortgage Assoc. | | | 3.000 | | | | TBA | | | | 1,000 | | | | 1,055,330 | |
Government National Mortgage Assoc. | | | 3.000 | | | | 07/20/42 | | | | 824 | | | | 879,330 | |
Government National Mortgage Assoc. | | | 3.000 | | | | 03/20/43 | | | | 561 | | | | 599,146 | |
Government National Mortgage Assoc. | | | 3.000 | | | | 08/20/43 | | | | 107 | | | | 114,327 | |
Government National Mortgage Assoc. | | | 3.000 | | | | 09/20/43 | | | | 208 | | | | 221,883 | |
Government National Mortgage Assoc. | | | 3.000 | | | | 01/20/44 | | | | 180 | | | | 191,344 | |
Government National Mortgage Assoc. | | | 3.000 | | | | 05/20/45 | | | | 266 | | | | 283,734 | |
Government National Mortgage Assoc. | | | 3.000 | | | | 08/15/45 | | | | 288 | | | | 303,853 | |
Government National Mortgage Assoc. | | | 3.000 | | | | 05/20/46 | | | | 1,730 | | | | 1,835,748 | |
Government National Mortgage Assoc. | | | 3.000 | | | | 07/20/46 | | | | 2,777 | | | | 2,949,156 | |
Government National Mortgage Assoc. | | | 3.000 | | | | 08/20/46 | | | | 152 | | | | 161,591 | |
See Notes to Financial Statements.
| | | | | | | | | | | | | | | | |
| | | | |
| Description | | Interest
Rate | | Maturity
Date | | | Principal
Amount
(000)# | | | Value | |
| | | | |
U.S. GOVERNMENT AGENCY OBLIGATIONS (Continued) | | | | | | | | | | | | | | | | |
Government National Mortgage Assoc. | | | 3.000 | % | | | 10/20/46 | | | | 852 | | | $ | 905,238 | |
Government National Mortgage Assoc. | | | 3.000 | | | | 03/20/47 | | | | 1,623 | | | | 1,719,090 | |
Government National Mortgage Assoc. | | | 3.000 | | | | 01/20/48 | | | | 245 | | | | 259,251 | |
Government National Mortgage Assoc. | | | 3.000 | | | | 08/20/48 | | | | 3,194 | | | | 3,385,329 | |
Government National Mortgage Assoc. | | | 3.500 | | | | TBA | | | | 500 | | | | 525,996 | |
Government National Mortgage Assoc. | | | 3.500 | | | | 01/15/42 | | | | 133 | | | | 145,046 | |
Government National Mortgage Assoc. | | | 3.500 | | | | 12/20/42 | | | | 388 | | | | 420,740 | |
Government National Mortgage Assoc. | | | 3.500 | | | | 01/20/43 | | | | 573 | | | | 621,400 | |
Government National Mortgage Assoc. | | | 3.500 | | | | 02/20/43 | | | | 258 | | | | 279,107 | |
Government National Mortgage Assoc. | | | 3.500 | | | | 08/20/43 | | | | 996 | | | | 1,076,125 | |
Government National Mortgage Assoc. | | | 3.500 | | | | 10/20/43 | | | | 1,303 | | | | 1,405,008 | |
Government National Mortgage Assoc. | | | 3.500 | | | | 03/20/45 | | | | 168 | | | | 179,265 | |
Government National Mortgage Assoc. | | | 3.500 | | | | 04/20/45 | | | | 978 | | | | 1,043,945 | |
Government National Mortgage Assoc. | | | 3.500 | | | | 04/20/46 | | | | 1,891 | | | | 2,020,906 | |
Government National Mortgage Assoc. | | | 3.500 | | | | 07/20/46 | | | | 1,230 | | | | 1,311,747 | |
Government National Mortgage Assoc. | | | 3.500 | | | | 10/20/46 | | | | 2,275 | | | | 2,429,355 | |
Government National Mortgage Assoc. | | | 3.500 | | | | 12/20/46 | | | | 2,126 | | | | 2,257,368 | |
Government National Mortgage Assoc. | | | 3.500 | | | | 01/20/47 | | | | 681 | | | | 722,204 | |
Government National Mortgage Assoc. | | | 3.500 | | | | 05/20/47 | | | | 1,452 | | | | 1,547,249 | |
Government National Mortgage Assoc. | | | 3.500 | | | | 11/20/47 | | | | 1,083 | | | | 1,148,930 | |
Government National Mortgage Assoc. | | | 3.500 | | | | 01/20/48 | | | | 771 | | | | 818,814 | |
Government National Mortgage Assoc. | | | 3.500 | | | | 10/20/48 | | | | 481 | | | | 508,376 | |
Government National Mortgage Assoc. | | | 3.500 | | | | 11/20/48 | | | | 880 | | | | 926,844 | |
Government National Mortgage Assoc. | | | 3.500 | | | | 12/20/48 | | | | 325 | | | | 341,509 | |
Government National Mortgage Assoc. | | | 3.500 | | | | 02/20/49 | | | | 794 | | | | 841,417 | |
Government National Mortgage Assoc. | | | 3.500 | | | | 05/20/49 | | | | 1,487 | | | | 1,562,814 | |
Government National Mortgage Assoc. | | | 4.000 | | | | 12/20/40 | | | | 326 | | | | 359,477 | |
Government National Mortgage Assoc. | | | 4.000 | | | | 06/20/41 | | | | 127 | | | | 139,962 | |
Government National Mortgage Assoc. | | | 4.000 | | | | 11/15/41 | | | | 173 | | | | 186,628 | |
Government National Mortgage Assoc. | | | 4.000 | | | | 12/20/42 | | | | 283 | | | | 312,441 | |
Government National Mortgage Assoc. | | | 4.000 | | | | 04/20/43 | | | | 213 | | | | 234,883 | |
Government National Mortgage Assoc. | | | 4.000 | | | | 10/20/43 | | | | 202 | | | | 221,290 | |
Government National Mortgage Assoc. | | | 4.000 | | | | 12/20/43 | | | | 433 | | | | 474,236 | |
Government National Mortgage Assoc. | | | 4.000 | | | | 09/20/44 | | | | 249 | | | | 271,353 | |
Government National Mortgage Assoc. | | | 4.000 | | | | 08/20/45 | | | | 487 | | | | 527,238 | |
Government National Mortgage Assoc. | | | 4.000 | | | | 10/20/45 | | | | 227 | | | | 246,196 | |
Government National Mortgage Assoc. | | | 4.000 | | | | 03/20/46 | | | | 431 | | | | 466,163 | |
Government National Mortgage Assoc. | | | 4.000 | | | | 11/20/46 | | | | 333 | | | | 359,313 | |
Government National Mortgage Assoc. | | | 4.000 | | | | 03/20/47 | | | | 361 | | | | 388,788 | |
Government National Mortgage Assoc. | | | 4.000 | | | | 05/20/47 | | | | 581 | | | | 625,736 | |
Government National Mortgage Assoc. | | | 4.000 | | | | 07/20/47 | | | | 2,384 | | | | 2,569,239 | |
Government National Mortgage Assoc. | | | 4.000 | | | | 11/20/47 | | | | 1,579 | | | | 1,699,214 | |
Government National Mortgage Assoc. | | | 4.000 | | | | 12/20/47 | | | | 368 | | | | 394,933 | |
Government National Mortgage Assoc. | | | 4.000 | | | | 07/20/48 | | | | 819 | | | | 872,402 | |
Government National Mortgage Assoc. | | | 4.000 | | | | 08/20/48 | | | | 280 | | | | 299,575 | |
See Notes to Financial Statements.
Schedule of Investments (continued)
as of July 31, 2020
| | | | | | | | | | | | | | | | |
| | | | |
| Description | | Interest
Rate | | Maturity
Date | | | Principal
Amount
(000)# | | | Value | |
| | | | |
U.S. GOVERNMENT AGENCY OBLIGATIONS (Continued) | | | | | | | | | | | | | | | | |
Government National Mortgage Assoc. | | | 4.000 | % | | | 09/20/48 | | | | 702 | | | $ | 750,244 | |
Government National Mortgage Assoc. | | | 4.000 | | | | 11/20/48 | | | | 294 | | | | 313,705 | |
Government National Mortgage Assoc. | | | 4.000 | | | | 01/20/49 | | | | 376 | | | | 399,541 | |
Government National Mortgage Assoc. | | | 4.000 | | | | 02/20/49 | | | | 804 | | | | 854,966 | |
Government National Mortgage Assoc. | | | 4.000 | | | | 03/20/49 | | | | 499 | | | | 529,883 | |
Government National Mortgage Assoc. | | | 4.500 | | | | 12/20/41 | | | | 625 | | | | 704,139 | |
Government National Mortgage Assoc. | | | 4.500 | | | | 10/20/43 | | | | 102 | | | | 112,766 | |
Government National Mortgage Assoc. | | | 4.500 | | | | 01/20/44 | | | | 127 | | | | 139,721 | |
Government National Mortgage Assoc. | | | 4.500 | | | | 04/20/44 | | | | 442 | | | | 487,450 | |
Government National Mortgage Assoc. | | | 4.500 | | | | 03/20/45 | | | | 112 | | | | 123,225 | |
Government National Mortgage Assoc. | | | 4.500 | | | | 07/20/46 | | | | 261 | | | | 287,909 | |
Government National Mortgage Assoc. | | | 4.500 | | | | 08/20/46 | | | | 218 | | | | 240,791 | |
Government National Mortgage Assoc. | | | 4.500 | | | | 11/20/46 | | | | 201 | | | | 221,070 | |
Government National Mortgage Assoc. | | | 4.500 | | | | 01/20/47 | | | | 1,302 | | | | 1,425,862 | |
Government National Mortgage Assoc. | | | 4.500 | | | | 01/20/48 | | | | 225 | | | | 243,219 | |
Government National Mortgage Assoc. | | | 4.500 | | | | 02/20/48 | | | | 1,546 | | | | 1,669,910 | |
Government National Mortgage Assoc. | | | 4.500 | | | | 03/20/48 | | | | 161 | | | | 173,825 | |
Government National Mortgage Assoc. | | | 4.500 | | | | 07/20/48 | | | | 302 | | | | 326,733 | |
Government National Mortgage Assoc. | | | 4.500 | | | | 08/20/48 | | | | 110 | | | | 118,464 | |
Government National Mortgage Assoc. | | | 4.500 | | | | 12/20/48 | | | | 576 | | | | 618,633 | |
Government National Mortgage Assoc. | | | 5.000 | | | | 10/20/37 | | | | 8 | | | | 9,048 | |
Government National Mortgage Assoc. | | | 5.000 | | | | 09/20/40 | | | | 119 | | | | 135,484 | |
Government National Mortgage Assoc. | | | 5.000 | | | | 04/20/45 | | | | 61 | | | | 70,065 | |
Government National Mortgage Assoc. | | | 5.000 | | | | 08/20/45 | | | | 262 | | | | 294,711 | |
Government National Mortgage Assoc. | | | 6.000 | | | | 12/15/39 | | | | 158 | | | | 188,076 | |
| | | | | | | | | | | | | | | | |
| | | | |
TOTAL U.S. GOVERNMENT AGENCY OBLIGATIONS
(cost $216,746,719) | | | | | | | | | | | | | | | 224,172,016 | |
| | | | | | | | | | | | | | | | |
| | | | |
U.S. TREASURY OBLIGATIONS 7.9% | | | | | | | | | | | | | | | | |
U.S. Treasury Bonds | | | 2.875 | | | | 05/15/43 | | | | 540 | | | | 733,219 | |
U.S. Treasury Bonds | | | 3.000 | | | | 11/15/44 | | | | 7,600 | | | | 10,594,875 | |
U.S. Treasury Bonds | | | 3.125 | | | | 02/15/43 | | | | 3,585 | | | | 5,046,448 | |
U.S. Treasury Bonds | | | 3.125 | | | | 08/15/44 | (k) | | | 21,080 | | | | 29,910,546 | |
U.S. Treasury Bonds | | | 3.375 | | | | 05/15/44 | | | | 10,660 | | | | 15,671,865 | |
U.S. Treasury Bonds | | | 3.625 | | | | 08/15/43 | | | | 2,650 | | | | 4,015,164 | |
U.S. Treasury Bonds | | | 3.625 | | | | 02/15/44 | | | | 3,250 | | | | 4,940,508 | |
U.S. Treasury Bonds | | | 3.750 | | | | 11/15/43 | | | | 1,845 | | | | 2,848,219 | |
U.S. Treasury Notes | | | 1.625 | | | | 09/30/26 | | | | 540 | | | | 582,567 | |
U.S. Treasury Strips Coupon | | | 1.750 | (s) | | | 08/15/42 | | | | 415 | | | | 318,448 | |
U.S. Treasury Strips Coupon | | | 2.014 | (s) | | | 11/15/41 | | | | 1,195 | | | | 931,446 | |
U.S. Treasury Strips Coupon | | | 2.222 | (s) | | | 02/15/41 | | | | 1,590 | | | | 1,254,796 | |
U.S. Treasury Strips Coupon | | | 2.226 | (s) | | | 05/15/39 | | | | 990 | | | | 807,469 | |
U.S. Treasury Strips Coupon | | | 2.324 | (s) | | | 05/15/42 | | | | 6,220 | | | | 4,791,344 | |
U.S. Treasury Strips Coupon | | | 2.340 | (s) | | | 02/15/43 | | | | 3,590 | | | | 2,725,455 | |
See Notes to Financial Statements.
| | | | | | | | | | | | | | | | |
| | | | |
| Description | | Interest
Rate | | Maturity
Date | | | Principal
Amount
(000)# | | | Value | |
| | | | |
U.S. TREASURY OBLIGATIONS (Continued) | | | | | | | | | | | | | | | | |
U.S. Treasury Strips Coupon | | | 2.346 | %(s) | | | 11/15/40 | | | | 760 | | | $ | 603,814 | |
U.S. Treasury Strips Coupon | | | 2.380 | (s) | | | 05/15/41 | | | | 1,590 | | | | 1,251,690 | |
U.S. Treasury Strips Coupon | | | 2.394 | (s) | | | 11/15/43 | | | | 2,087 | | | | 1,556,364 | |
U.S. Treasury Strips Coupon | | | 2.434 | (s) | | | 11/15/45 | | | | 575 | | | | 412,944 | |
U.S. Treasury Strips Coupon | | | 2.436 | (s) | | | 02/15/46 | | | | 415 | | | | 296,466 | |
U.S. Treasury Strips Coupon | | | 2.524 | (s) | | | 11/15/39 | (k) | | | 2,980 | | | | 2,408,794 | |
U.S. Treasury Strips Coupon | | | 2.570 | (s) | | | 02/15/31 | (k) | | | 2,110 | | | | 1,952,327 | |
| | | | | | | | | | | | | | | | |
| | | | |
TOTAL U.S. TREASURY OBLIGATIONS
(cost $88,661,729) | | | | | | | | | | | | | | | 93,654,768 | |
| | | | | | | | | | | | | | | | |
| | | | |
TOTAL LONG-TERM INVESTMENTS
(cost $1,076,897,496) | | | | | | | | | | | | | | | 1,144,148,428 | |
| | | | | | | | | | | | | | | | |
| | | | |
| | | | | | | | Shares | | | | |
| | | | |
SHORT-TERM INVESTMENTS 8.0% | | | | | | | | | | | | | | | | |
| | | | |
AFFILIATED MUTUAL FUNDS 8.0% | | | | | | | | | | | | | | | | |
PGIM Core Ultra Short Bond Fund(w) | | | | 55,054,897 | | | | 55,054,897 | |
PGIM Institutional Money Market Fund | | | | | | | | | | | | | | | | |
(cost $39,984,172; includes $39,974,953 of cash collateral for securities on loan)(b)(w) | | | | | | | | | | | 40,001,531 | | | | 39,997,531 | |
| | | | | | | | | | | | | | | | |
| | | | |
TOTAL AFFILIATED MUTUAL FUNDS
(cost $95,039,069) | | | | | | | | | | | | | | | 95,052,428 | |
| | | | | | | | | | | | | | | | |
| | | | |
OPTIONS PURCHASED*~ 0.0%
(cost $6,721) | | | | | | | | | | | | | | | 341,587 | |
| | | | | | | | | | | | | | | | |
| | | | |
TOTAL SHORT-TERM INVESTMENTS
(cost $95,045,790) | | | | | | | | | | | | | | | 95,394,015 | |
| | | | | | | | | | | | | | | | |
| | | | |
TOTAL INVESTMENTS 104.2%
(cost $1,171,943,286) | | | | | | | | | | | | | | | 1,239,542,443 | |
Liabilities in excess of other assets(z) (4.2)% | | | | | | | | (50,413,202 | ) |
| | | | | | | | | | | | | | | | |
| | | | |
NET ASSETS 100.0% | | | | | | | | | | | | | | $ | 1,189,129,241 | |
| | | | | | | | | | | | | | | | |
Below is a list of the abbreviation(s) used in the annual report:
144A—Security was purchased pursuant to Rule 144A under the Securities Act of 1933 and, pursuant to the requirements of Rule 144A, may not be resold except to qualified institutional buyers.
A—Annual payment frequency for swaps
Aces—Alternative Credit Enhancements Securities
BABs—Build America Bonds
CLO—Collateralized Loan Obligation
See Notes to Financial Statements.
Schedule of Investments (continued)
as of July 31, 2020
CMBX—Commercial Mortgage-Backed Index
CMS—Constant Maturity Swap
CMT—Constant Maturity Treasury
EMTN—Euro Medium Term Note
FHLMC—Federal Home Loan Mortgage Corporation
GMTN—Global Medium Term Note
LIBOR—London Interbank Offered Rate
LP—Limited Partnership
M—Monthly payment frequency for swaps
MTN—Medium Term Note
OTC—Over-the-counter
Q—Quarterly payment frequency for swaps
REITs—Real Estate Investment Trust
REMICS—Real Estate Mortgage Investment Conduit Security
S—Semiannual payment frequency for swaps
Strips—Separate Trading of Registered Interest and Principal of Securities
TBA—To Be Announced
USOIS—United States Overnight Index Swap
| * | Non-income producing security. |
| # | Principal or notional amount is shown in U.S. dollars unless otherwise stated. |
| ~ | See tables subsequent to the Schedule of Investments for options detail. |
| ^ | Indicates a Level 3 instrument. The aggregate value of Level 3 instruments is $3,662,146 and 0.3% of net assets. |
| (a) | All or a portion of security is on loan. The aggregate market value of such securities, including those sold and pending settlement, is $39,230,868; cash collateral of $39,974,953 (included in liabilities) was received with which the Fund purchased highly liquid short-term investments. In the event of significant appreciation in value of securities on loan on the last business day of the reporting period, the Fund may reflect a collateral value that is less than the market value of the loaned securities and such shortfall is remedied the following business day. |
| (b) | Represents security, or portion thereof, purchased with cash collateral received for securities on loan and includes dividend reinvestment. |
| (c) | Variable rate instrument. The interest rate shown reflects the rate in effect at July 31, 2020. |
| (cc) | Variable rate instrument. The rate shown is based on the latest available information as of July 31, 2020. Certain variable rate securities are not based on a published reference rate and spread but are determined by the issuer or agent and are based on current market conditions. These securities do not indicate a reference rate and spread in their description. |
| (ff) | Variable rate security. Security may be issued at a fixed coupon rate, which converts to a variable rate at a specified date. Rate shown is the rate in effect as of period end. |
| (k) | Represents security, or a portion thereof, segregated as collateral for centrally cleared/exchange-traded derivatives. |
| (p) | Interest rate not available as of July 31, 2020. |
| (rr) | Perpetual security with no stated maturity date. |
| (s) | Represents zero coupon bond or principal only security. Rate represents yield to maturity at purchase date. |
| (tt) | All or partial principal amount represents “TBA” mortgage dollar rolls. The aggregate mortgage dollar roll principal amount of 3,000,000 is 0.3% of net assets. |
| (w) | PGIM Investments LLC, the manager of the Fund, also serves as manager of the PGIM Core Ultra Short Bond Fund and PGIM Institutional Money Market Fund. |
| (z) | Includes net unrealized appreciation/(depreciation) and/or market value of the below holdings which are excluded from the Schedule of Investments: |
See Notes to Financial Statements.
Forward Commitment Contracts
| | | | | | | | | | | | | | | | | | | | | | | | | |
U.S. Government Agency Obligations | | Interest
Rate | | Maturity
Date | | Settlement
Date | | Principal
Amount
(000)# | | Value |
Federal National Mortgage Assoc.
(proceeds receivable $1,578,750) | | | | 3.500 | % | | | | TBA | | | | | 08/13/20 | | | | | (1,500 | ) | | | $ | (1,581,680 | ) |
| | | | | | | | | | | | | | | | | | | | | | | | | |
Options Purchased:
OTC Traded
| | | | | | | | | | | | | | | | | | | | | | | | | | | | |
Description | | Call/
Put | | | Counterparty | | | Expiration
Date | | | Strike | | | Contracts | | | Notional
Amount
(000)# | | | Value | |
2- Year 10 CMS Curve CAP | | | Call | | | | Barclays Bank PLC | | | | 07/12/21 | | | | 0.11% | | | | — | | | | 1,177 | | | $ | 23,463 | |
2- Year 10 CMS Curve CAP | | | Call | | | | Barclays Bank PLC | | | | 07/13/21 | | | | 0.11% | | | | — | | | | 1,144 | | | | 22,682 | |
2- Year 10 CMS Curve CAP | | | Call | | | | Bank of America, N.A. | | | | 08/16/21 | | | | 0.15% | | | | — | | | | 2,860 | | | | 54,293 | |
2- Year 10 CMS Curve CAP | | | Call | | | | Bank of America, N.A. | | | | 08/20/21 | | | | 0.15% | | | | — | | | | 5,678 | | | | 107,521 | |
2- Year 10 CMS Curve CAP | | | Call | | | | Bank of America, N.A. | | | | 09/13/21 | | | | 0.14% | | | | — | | | | 5,760 | | | | 113,457 | |
2- Year 10 CMS Curve CAP | | | Call | | | | Barclays Bank PLC | | | | 11/09/21 | | | | 0.21% | | | | — | | | | 1,144 | | | | 20,171 | |
| | | | | | | | | | | | | | | | | | | | | | | | | | | | |
Total Options Purchased (cost $6,721) | | | | | | | | | | | | | | | | | | | | | | | | | | $ | 341,587 | |
| | | | | | | | | | | | | | | | | | | | | | | | | | | | |
Futures contracts outstanding at July 31, 2020:
| | | | | | | | | | | | | | |
Number
of Contracts | | Type | | Expiration
Date | | | Current
Notional
Amount | | | Value /
Unrealized
Appreciation
(Depreciation) | |
| | | |
Long Positions: | | | | | | | | | | | | |
| 621 | | 2 Year U.S.Treasury Notes | | | Sep. 2020 | | | $ | 137,231,297 | | | $ | 111,545 | |
| 550 | | 5 Year U.S.Treasury Notes | | | Sep. 2020 | | | | 69,368,750 | | | | 342,726 | |
| 91 | | 30 Year U.S. Ultra Treasury Bonds | | | Sep. 2020 | | | | 20,719,563 | | | | 393,402 | |
| | | | | | | | | | | | | | |
| | | | | | | | | | | | | 847,673 | |
| | | | | | | | | | | | | | |
| | | |
Short Positions: | | | | | | | | | | | | |
| 554 | | 10 Year U.S. Treasury Notes | | | Sep. 2020 | | | | 77,603,284 | | | | (614,208 | ) |
| 178 | | 10 Year U.S. Ultra Treasury Notes | | | Sep. 2020 | | | | 28,346,500 | | | | (453,512 | ) |
| 106 | | 20 Year U.S. Treasury Bonds | | | Sep. 2020 | | | | 19,321,813 | | | | (500,616 | ) |
| | | | | | | | | | | | | | |
| | | | | | | | | | | | | (1,568,336 | ) |
| | | | | | | | | | | | | | |
| | | | | | | | | | | | $ | (720,663 | ) |
| | | | | | | | | | | | | | |
See Notes to Financial Statements.
Schedule of Investments (continued)
as of July 31, 2020
Credit default swap agreement outstanding at July 31, 2020:
| | | | | | | | | | | | | | | | | | | | | | | | | | | | |
Reference Entity/ Obligation | | Termination
Date | | Fixed
Rate | | | Notional
Amount
(000)#(3) | | | Implied
Credit
Spread at
July 31,
2020(4) | | | Fair
Value | | | Upfront
Premiums
Paid
(Received) | | | Unrealized
Appreciation
(Depreciation) | | | Counterparty |
OTC Credit Default Swap Agreement on asset-backed securities - Sell Protection(2)^: |
Towd Point Mortgage
Trust | | 07/25/56 | | | 0.450 | %(M) | | | 4,873 | | | | * | | | $ | (24,063) | | | $ | — | | | $ | (24,063) | | | Citigroup
Global
Markets, Inc. |
| | | | | | | | | | | | | | | | | | | | | | | | | | | | |
| | | | | | | | | | | | | | | | | | | | | | | | | | | | |
Reference Entity/ Obligation | | Termination
Date | | Fixed
Rate | | | Notional
Amount
(000)#(3) | | | Implied
Credit
Spread at
July 31,
2020(4) | | | Fair
Value | | | Upfront
Premiums
Paid
(Received) | | | Unrealized
Appreciation
(Depreciation) | | | Counterparty |
OTC Credit Default Swap Agreement on corporate and/or sovereign issues - Sell Protection(2): |
Boeing Co. | | 12/20/21 | | | 1.000 | %(Q) | | | 3,100 | | | | 2.725 | % | | $ | (69,154) | | | $ | 23,374 | | | $ | (92,528) | | | Bank of America,
N.A. |
| | | | | | | | | | | | | | | | | | | | | | | | | | | | |
| | | | | | | | | | | | | | | | | | | | | | | | | | | | |
Reference Entity/ Obligation | | Termination
Date | | Fixed
Rate | | | Notional
Amount
(000)#(3) | | | Implied
Credit
Spread at
July 31,
2020(4) | | | Fair
Value | | | Upfront
Premiums
Paid
(Received) | | | Unrealized
Appreciation
(Depreciation) | | | Counterparty |
OTC Credit Default Swap Agreement on credit indices - Sell Protection(2): |
CMBX.NA.6.AA | | 05/11/63 | | | 1.500 | %(M) | | | 2,000 | | | | * | | | $ | (11,735 | ) | | $ | (23,836 | ) | | $ | 12,101 | | | Morgan
Stanley &
Co.
International
PLC |
| | | | | | | | | | | | | | | | | | | | | | | | | | | | |
The Fund entered into credit default swaps (“CDS”) to provide a measure of protection against defaults or to take an active long or short position with respect to the likelihood of a particular issuer’s default or the reference entity’s credit soundness. CDS contracts generally trade based on a spread which represents the cost a protection buyer has to pay the protection seller. The protection buyer is said to be short the credit as the value of the contract rises the more the credit deteriorates. The value of the CDS contract increases for the protection buyer if the spread increases.
| (1) | If the Fund is a buyer of protection, it pays the fixed rate. When a credit event occurs, as defined under the terms of that particular swap agreement, the Fund will either (i) receive from the seller of protection an amount equal to the notional amount of the swap and make delivery of the referenced obligation or underlying securities comprising the referenced index or (ii) receive a net settlement amount in the form of cash or securities equal to the notional amount of the swap less the recovery value of the referenced obligation or underlying securities comprising the referenced index. |
| (2) | If the Fund is a seller of protection, it receives the fixed rate. When a credit event occurs, as defined under the terms of that particular swap agreement, the Fund will either (i) pay to the buyer of protection an amount equal to the notional |
See Notes to Financial Statements.
| | amount of the swap and take delivery of the referenced obligation or underlying securities comprising the referenced index or (ii) pay a net settlement amount in the form of cash or securities equal to the notional amount of the swap less the recovery value of the referenced obligation or underlying securities comprising the referenced index. |
| (3) | Notional amount represents the maximum potential amount the Fund could be required to pay as a seller of credit protection or receive as a buyer of credit protection if a credit event occurs as defined under the terms of that particular swap agreement. |
| (4) | Implied credit spreads, represented in absolute terms, utilized in determining the fair value of credit default swap agreements where the Fund is the seller of protection as of the reporting date serve as an indicator of the current status of the payment/ performance risk and represent the likelihood of risk of default for the credit derivative. The implied credit spread of a particular referenced entity reflects the cost of buying/selling protection and may include up-front payments required to be made to enter into the agreement. Wider credit spreads represent a deterioration of the referenced entity’s credit soundness and a greater likelihood of risk of default or other credit event occurring as defined under the terms of the agreement. |
| * | When an implied credit spread is not available, reference the fair value of credit default swap agreements on credit indices and asset-backed securities. Where the Fund is the seller of protection, it serves as an indicator of the current status of the payment/performance risk and represents the likelihood of an expected liability (or profit) for the credit derivative should the notional amount of the swap agreement be closed/sold as of the reporting date. Increasing fair value in absolute terms, when compared to the notional amount of the swap, represents a deterioration of the referenced entity’s credit soundness and a greater likelihood of risk of default or other credit event occurring as defined under the terms of the agreement. |
Interest rate swap agreements outstanding at July 31, 2020:
| | | | | | | | | | | | | | | | | | | | | | |
Notional Amount (000)# | | Termination
Date | | Fixed
Rate | | | Floating
Rate | | | Value at
Trade Date | | | Value at
July 31,
2020 | | | Unrealized
Appreciation
(Depreciation) | |
Centrally Cleared Interest Rate Swap Agreements: | | | | | | | | | |
376 | | 11/15/45 | | | 0.508%(A) | | | | 1 Day USOIS(1)(A) | | | $ | (2,239 | ) | | $ | 3,886 | | | $ | 6,125 | |
568 | | 11/15/45 | | | 1.253%(A) | | | | 1 Day USOIS(1)(A) | | | | (8,408 | ) | | | (96,998 | ) | | | (88,590 | ) |
2,200 | | 08/09/49 | | | 1.508%(A) | | | | 1 Day USOIS(1)(A) | | | | (180,857 | ) | | | (581,367 | ) | | | (400,510 | ) |
1,807 | | 03/30/50 | | | 0.855%(S) | | | | 3 Month LIBOR(1)(Q) | | | | — | | | | (42,321 | ) | | | (42,321 | ) |
| | | | | | | | | | | | | | | | | | | | | | |
| | | | | | | | | | | | $ | (191,504 | ) | | $ | (716,800 | ) | | $ | (525,296 | ) |
| | | | | | | | | | | | | | | | | | | | | | |
| (1) | The Fund pays the fixed rate and receives the floating rate. |
Balances Reported in the Statement of Assets and Liabilities for OTC Swap Agreements:
| | | | | | | | | | |
| | Premiums Paid | | | Premiums Received | | Unrealized
Appreciation | | Unrealized
Depreciation |
OTC Swap Agreement | | $ | 23,374 | | | $(23,836) | | $12,101 | | $(116,591) |
See Notes to Financial Statements.
Schedule of Investments (continued)
as of July 31, 2020
Summary of Collateral for Centrally Cleared/Exchange-traded Derivatives:
Cash and securities segregated as collateral, including pending settlement for closed positions, to cover requirements for centrally cleared/exchange-traded derivatives are listed by broker as follows:
| | | | | | | | | | |
Broker | | Cash and/or Foreign Currency | | Securities Market Value |
Citigroup Global Markets, Inc. | | | $ | 621,000 | | | | $ | 1,935,165 | |
| | | | | | | | | | |
Fair Value Measurements:
Various inputs are used in determining the value of the Fund’s investments. These inputs are summarized in the three broad levels listed below.
Level 1—unadjusted quoted prices generally in active markets for identical securities.
Level 2—quoted prices for similar securities, interest rates and yield curves, prepayment speeds, foreign currency exchange rates and other observable inputs.
Level 3—unobservable inputs for securities valued in accordance with Board approved fair valuation procedures.
The following is a summary of the inputs used as of July 31, 2020 in valuing such portfolio securities:
| | | | | | | | | | | | | | | |
| | | Level 1 | | Level 2 | | Level 3 |
Investments in Securities | | | | | | | | | | | | | | | |
Assets | | | | | | | | | | | | | | | |
Asset-Backed Securities | | | | | | | | | | | | | | | |
Automobiles | | | $ | — | | | | $ | 48,046,182 | | | | $ | — | |
Collateralized Loan Obligations | | | | — | | | | | 83,552,665 | | | | | — | |
Consumer Loans | | | | — | | | | | 4,163,937 | | | | | — | |
Credit Cards | | | | — | | | | | 2,550,353 | | | | | — | |
Equipment | | | | — | | | | | 3,791,095 | | | | | — | |
Home Equity Loans | | | | — | | | | | 996,611 | | | | | — | |
Manufactured Housing | | | | — | | | | | 1,090,266 | | | | | — | |
Other | | | | — | | | | | 1,701,112 | | | | | — | |
Residential Mortgage-Backed Securities | | | | — | | | | | 6,280,213 | | | | | — | |
Student Loans | | | | — | | | | | 28,357,758 | | | | | — | |
Commercial Mortgage-Backed Securities | | | | — | | | | | 238,158,585 | | | | | — | |
Corporate Bonds | | | | — | | | | | 359,529,081 | | | | | — | |
Municipal Bonds | | | | — | | | | | 9,412,731 | | | | | — | |
Residential Mortgage-Backed Securities | | | | — | | | | | 25,832,159 | | | | | 3,686,209 | |
Sovereign Bonds | | | | — | | | | | 9,172,687 | | | | | — | |
U.S. Government Agency Obligations | | | | — | | | | | 224,172,016 | | | | | — | |
U.S. Treasury Obligations | | | | — | | | | | 93,654,768 | | | | | — | |
Affiliated Mutual Funds | | | | 95,052,428 | | | | | — | | | | | — | |
Options Purchased | | | | — | | | | | 341,587 | | | | | — | |
| | | | | | | | | | | | | | | |
Total | | | $ | 95,052,428 | | | | $ | 1,140,803,806 | | | | $ | 3,686,209 | |
| | | | | | | | | | | | | | | |
See Notes to Financial Statements.
| | | | | | | | | | | | |
| | | Level 1 | | | Level 2 | | | Level 3 | |
Other Financial Instruments* | | | | | | | | | | | | |
Assets | | | | | | | | | | | | |
Futures Contracts | | $ | 847,673 | | | $ | — | | | $ | — | |
Centrally Cleared Interest Rate Swap Agreement | | | — | | | | 6,125 | | | | — | |
| | | | | | | | | | | | |
Total | | $ | 847,673 | | | $ | 6,125 | | | $ | — | |
| | | | | | | | | | | | |
| | | |
Liabilities | | | | | | | | | | | | |
Forward Commitment Contract | | $ | — | | | $ | (1,581,680 | ) | | $ | — | |
Futures Contracts | | | (1,568,336 | ) | | | — | | | | — | |
OTC Credit Default Swap Agreements | | | — | | | | (80,889 | ) | | | (24,063 | ) |
Centrally Cleared Interest Rate Swap Agreements | | | — | | | | (531,421 | ) | | | — | |
| | | | | | | | | | | | |
Total | | $ | (1,568,336 | ) | | $ | (2,193,990 | ) | | $ | (24,063 | ) |
| | | | | | | | | | | | |
| * | Other financial instruments are derivative instruments, with the exception of forward commitment contracts, and are not reflected in the Schedule of Investments. Futures, forwards and centrally cleared swap contracts are recorded at net unrealized appreciation (depreciation) and OTC swap contracts are recorded at fair value. Forward commitment contracts are recorded at market value. |
Industry Classification:
The industry classification of investments and liabilities in excess of other assets shown as a percentage of net assets as of July 31, 2020 were as follows (unaudited):
| | | | | | | | | | |
Commercial Mortgage-Backed Securities | | | 20.0 | % | | Sovereign Bonds | | | 0.8 | % |
U.S. Government Agency Obligations | | | 18.8 | | | Auto Manufacturers | | | 0.8 | |
Affiliated Mutual Funds (3.4% represents | | | | | | Foods | | | 0.6 | |
investments purchased with collateral from | | | | | | Real Estate Investment Trusts (REITs) | | | 0.6 | |
securities on loan) | | | 8.0 | | | Beverages | | | 0.5 | |
U.S. Treasury Obligations | | | 7.9 | | | Semiconductors | | | 0.5 | |
Banks | | | 7.6 | | | Chemicals | | | 0.4 | |
Collateralized Loan Obligations | | | 7.0 | | | Consumer Loans | | | 0.4 | |
Automobiles | | | 4.0 | | | Retail | | | 0.3 | |
Electric | | | 3.6 | | | Equipment | | | 0.3 | |
Residential Mortgage-Backed Securities | | | 3.0 | | | Agriculture | | | 0.3 | |
Student Loans | | | 2.4 | | | Water | | | 0.3 | |
Oil & Gas | | | 2.0 | | | Gas | | | 0.3 | |
Pharmaceuticals | | | 1.9 | | | Building Materials | | | 0.3 | |
Pipelines | | | 1.5 | | | Airlines | | | 0.3 | |
Media | | | 1.4 | | | Mining | | | 0.2 | |
Telecommunications | | | 1.2 | | | Credit Cards | | | 0.2 | |
Healthcare-Services | | | 1.0 | | | Biotechnology | | | 0.2 | |
Commercial Services | | | 1.0 | | | Aerospace & Defense | | | 0.2 | |
Computers | | | 0.9 | | | Transportation | | | 0.2 | |
Insurance | | | 0.8 | | | Machinery-Diversified | | | 0.2 | |
Municipal Bonds | | | 0.8 | | | Iron/Steel | | | 0.2 | |
See Notes to Financial Statements.
Schedule of Investments (continued)
as of July 31, 2020
| | | | | | | | | | |
Industry Classification (continued): | | | | | | | | |
| | | |
Software | | | 0.2 | % | | Options Purchased | | | 0.0 | *% |
Other | | | 0.2 | | | Forest Products & Paper | | | 0.0 | * |
Lodging | | | 0.1 | | | Office/Business Equipment | | | 0.0 | * |
Diversified Financial Services | | | 0.1 | | | Housewares | | | 0.0 | * |
Electronics | | | 0.1 | | | | | | 104.2 | |
Manufactured Housing | | | 0.1 | | | Liabilities in excess of other assets | | | (4.2 | ) |
Home Equity Loans | | | 0.1 | | | | | | | |
Engineering & Construction | | | 0.1 | | | | | | 100.0 | % |
| | | | | | | | | | |
Machinery-Construction & Mining | | | 0.1 | | | | | | | |
Packaging & Containers | | | 0.1 | | | * Less than + /- 0.05% | | | | |
Multi-National | | | 0.1 | | | | | | | |
Oil & Gas Services | | | 0.0 | * | | | | | | |
Healthcare-Products | | | 0.0 | * | | | | | | |
Effects of Derivative Instruments on the Financial Statements and Primary Underlying Risk Exposure:
The Fund invested in derivative instruments during the reporting period. The primary types of risk associated with these derivative instruments are credit contracts risk and interest rate contracts risk. See the Notes to Financial Statements for additional detail regarding these derivative instruments and their risks. The effect of such derivative instruments on the Fund’s financial position and financial performance as reflected in the Statement of Assets and Liabilities and Statement of Operations is presented in the summary below.
Fair values of derivative instruments as of July 31, 2020 as presented in the Statement of Assets and Liabilities:
| | | | | | | | | | | | | | | | |
| | | Asset Derivatives | | | Liability Derivatives | |
Derivatives not accounted for as hedging instruments, carried at fair value | | Statement of
Assets and
Liabilities Location | | | Fair
Value | | | Statement of
Assets and
Liabilities Location | | | Fair
Value | |
Credit contracts | |
| Premiums paid for OTC
swap agreements |
| | $ | 23,374 | | |
| Premiums received for
OTC swap agreements |
| | $ | 23,836 | |
Credit contracts | |
| Unrealized appreciation
on OTC swap
agreements |
| | | 12,101 | | |
| Unrealized depreciation
on OTC swap
agreements |
| | | 116,591 | |
Interest rate contracts | |
| Due from/to broker-
variation margin futures |
| | | 847,673 | * | |
| Due from/to
broker-variation margin
futures |
| | | 1,568,336 | * |
Interest rate contracts | |
| Due from/to
broker-variation margin
swaps |
| | | 6,125 | * | |
| Due from/to broker-
variation margin swaps |
| | | 531,421 | * |
Interest rate contracts | | | Unaffiliated investments | | | | 341,587 | | | | — | | | | — | |
| | | | | | | | | | | | | | | | |
| | | | | | $ | 1,230,860 | | | | | | | $ | 2,240,184 | |
| | | | | | | | | | | | | | | | |
| * | Includes cumulative appreciation (depreciation) as reported in the schedule of open futures and centrally cleared swap contracts. Only unsettled variation margin receivable (payable) is reported within the Statement of Assets and Liabilities. |
See Notes to Financial Statements.
The effects of derivative instruments on the Statement of Operations for the year ended July 31, 2020 are as follows:
| | | | | | | | | | | | | | | | | | | | | | | | | |
Amount of Realized Gain (Loss) on Derivatives Recognized in Income |
Derivatives not accounted for as hedging instruments, carried at fair value | | Options
Purchased(1) | | Options
Written | | Futures | | Forward
Rate
Agreements | | Swaps |
Credit contracts | | | $ | — | | | | $ | — | | | | $ | — | | | | $ | — | | | | $ | 53,041 | |
Interest rate contracts | | | | (520,099 | ) | | | | 234,321 | | | | | 21,456,968 | | | | | (153,633 | ) | | | | (8,947,924 | ) |
| | | | | | | | | | | | | | | | | | | | | | | | | |
Total | | | $ | (520,099 | ) | | | $ | 234,321 | | | | $ | 21,456,968 | | | | $ | (153,633 | ) | | | $ | (8,894,883 | ) |
| | | | | | | | | | | | | | | | | | | | | | | | | |
| (1) | Included in net realized gain (loss) on investment transactions in the Statement of Operations. |
| | | | | | | | | | | | | | | | | | | | | | | | | |
Change in Unrealized Appreciation (Depreciation) on Derivatives Recognized in Income |
Derivatives not accounted for as hedging instruments, carried at fair value | | Options
Purchased(2) | | Options
Written | | Futures | | Forward
Rate
Agreements | | Swaps |
Credit contracts | | | $ | — | | | | $ | — | | | | $ | — | | | | $ | — | | | | $ | (171,509 | ) |
Interest rate contracts | | | | 204,695 | | | | | (38,994 | ) | | | | (2,760,408 | ) | | | | 16,647 | | | | | 2,382,983 | |
| | | | | | | | | | | | | | | | | | | | | | | | | |
| | | | | |
Total | | | $ | 204,695 | | | | $ | (38,994 | ) | | | $ | (2,760,408 | ) | | | $ | 16,647 | | | | $ | 2,211,474 | |
| | | | | | | | | | | | | | | | | | | | | | | | | |
| (2) | Included in net change in unrealized appreciation (depreciation) on investments in the Statement of Operations. |
For the year ended July 31, 2020, the Fund’s average volume of derivative activities is as follows:
| | | | | | |
Options
Purchased(1) | | Options
Written(2) | | Futures
Contracts—
Long
Positions(2) | | Futures
Contracts—
Short
Positions(2) |
| $69,046 | | $263,800 | | $199,586,364 | | $91,833,244 |
| | |
Forward Rate Agreements(2) | | Interest Rate Swap Agreements(2) |
| $12,320,000 | | $82,414,560 |
|
Credit Default
Swap Agreements—
Sell Protection(2) |
| $6,481,291 |
| (2) | Notional Amount in USD. |
Financial Instruments/Transactions—Summary of Offsetting and Netting Arrangements:
The Fund invested in OTC derivatives and entered into financial instruments/transactions during the reporting period that are either offset in accordance with current requirements or are subject to enforceable master netting arrangements or similar
See Notes to Financial Statements.
Schedule of Investments (continued)
as of July 31, 2020
agreements that permit offsetting. The information about offsetting and related netting arrangements for OTC derivatives and financial instruments/transactions where the legal right to set-off exists is presented in the summary below.
Offsetting of financial instrument/transaction assets and liabilities:
| | | | | | | | | | | | |
Description | | Gross Market
Value of
Recognized
Assets/(Liabilities) | | | Collateral
Pledged/(Received)(2) | | | Net
Amount | |
Securities on Loan | | $ | 39,230,868 | | | $ | (39,230,868 | ) | | $ | — | |
| | | | | | | | | | | | |
Offsetting of OTC derivative assets and liabilities:
| | | | | | | | | | | | | | | | | | | | |
Counterparty | | Gross Amounts of
Recognized
Assets(1) | | | Gross Amounts of
Recognized
Liabilities(1) | | | Net Amounts of
Recognized
Assets/(Liabilities) | | | Collateral
Pledged/(Received)(2) | | | Net
Amount | |
Bank of America, N.A. | | $ | 298,645 | | | $ | (92,528 | ) | | $ | 206,117 | | | $ | (206,117 | ) | | $ | — | |
Barclays Bank PLC | | | 66,316 | | | | — | | | | 66,316 | | | | — | | | | 66,316 | |
Citigroup Global Markets, Inc. | | | — | | | | (24,063 | ) | | | (24,063) | | | | — | | | | (24,063) | |
Morgan Stanley & Co. International PLC | | | 12,101 | | | | (23,836 | ) | | | (11,735 | ) | | | — | | | | (11,735 | ) |
| | | | | | | | | | | | | | | | | | | | |
| | $ | 377,062 | | | $ | (140,427 | ) | | $ | 236,635 | | | $ | (206,117 | ) | | $ | 30,518 | |
| | | | | | | | | | | | | | | | | | | | |
| (1) | Includes unrealized appreciation/(depreciation) on swaps and forwards, premiums paid/(received) on swap agreements and market value of purchased and written options, as represented on the Statement of Assets and Liabilities. |
| (2) | Collateral amount disclosed by the Fund is limited to the market value of financial instruments/transactions and the Fund’s OTC derivative exposure by counterparty. |
See Notes to Financial Statements.
Statement of Assets and Liabilities
as of July 31, 2020
| | | | | |
Assets | | | | | |
Investments at value, including securities on loan of $39,230,868: | | | | | |
Unaffiliated investments (cost $1,076,904,217) | | | $ | 1,144,490,015 | |
Affiliated investments (cost $95,039,069) | | | | 95,052,428 | |
Receivable for investments sold | | | | 77,019,554 | |
Receivable for Fund shares sold | | | | 22,604,350 | |
Dividends and interest receivable | | | | 5,268,726 | |
Deposit with broker for centrally cleared/exchange-traded derivatives | | | | 621,000 | |
| |
Due from broker—variation margin futures | | | | 37,364 | |
Premiums paid for OTC swap agreements | | | | 23,374 | |
Unrealized appreciation on OTC swap agreements | | | | 12,101 | |
| | | | | |
Total Assets | | | | 1,345,128,912 | |
| | | | | |
| |
Liabilities | | | | | |
Payable for investments purchased | | | | 110,792,086 | |
Payable to broker for collateral for securities on loan | | | | 39,974,953 | |
Payable for Fund shares reacquired | | | | 2,731,742 | |
Forward commitment contracts, at value (proceeds receivable $1,578,750) | | | | 1,581,680 | |
Accrued expenses and other liabilities | | | | 366,558 | |
Management fee payable | | | | 191,053 | |
Dividends payable | | | | 167,783 | |
Unrealized depreciation on OTC swap agreements | | | | 116,591 | |
Distribution fee payable | | | | 40,550 | |
Premiums received for OTC swap agreements | | | | 23,836 | |
Due to broker—variation margin swaps | | | | 7,547 | |
Affiliated transfer agent fee payable | | | | 3,358 | |
Trustees’ fees payable | | | | 1,934 | |
| | | | | |
Total Liabilities | | | | 155,999,671 | |
| | | | | |
| |
Net Assets | | | $ | 1,189,129,241 | |
| | | | | |
| |
| | | | | | |
Net assets were comprised of: | | | | | |
Shares of beneficial interest, at par | | | $ | 110,256 | |
Paid-in capital in excess of par | | | | 1,118,543,107 | |
Total distributable earnings (loss) | | | | 70,475,878 | |
| | | | | |
Net assets, July 31, 2020 | | | $ | 1,189,129,241 | |
| | | | | |
See Notes to Financial Statements.
Statement of Assets and Liabilities
as of July 31, 2020
| | | | |
Class A | | | | |
Net asset value and redemption price per share, | | | | |
($181,510,258 ÷ 16,833,024 shares of beneficial interest issued and outstanding) | | $ | 10.78 | |
Maximum sales charge (3.25% of offering price) | | | 0.36 | |
| | | | |
Maximum offering price to public | | $ | 11.14 | |
| | | | |
| |
Class C | | | | |
Net asset value, offering price and redemption price per share, | | | | |
($8,595,645 ÷ 796,595 shares of beneficial interest issued and outstanding) | | $ | 10.79 | |
| | | | |
| |
Class R | | | | |
Net asset value, offering price and redemption price per share, | | | | |
($17,932 ÷ 1,663 shares of beneficial interest issued and outstanding) | | $ | 10.78 | |
| | | | |
| |
Class Z | | | | |
Net asset value, offering price and redemption price per share, | | | | |
($282,255,852 ÷ 26,171,555 shares of beneficial interest issued and outstanding) | | $ | 10.78 | |
| | | | |
| |
Class R6 | | | | |
Net asset value, offering price and redemption price per share, | | | | |
($716,749,554 ÷ 66,452,999 shares of beneficial interest issued and outstanding) | | $ | 10.79 | |
| | | | |
See Notes to Financial Statements.
68
Statement of Operations
Year Ended July 31, 2020
| | | | |
Net Investment Income (Loss) | | | | |
Income | | | | |
Interest income | | $ | 25,139,589 | |
Affiliated dividend income | | | 462,093 | |
Affiliated income from securities lending, net | | | 39,923 | |
| | | | |
Total income | | | 25,641,605 | |
| | | | |
| |
Expenses | | | | |
Management fee | | | 3,099,877 | |
Distribution fee(a) | | | 360,778 | |
Transfer agent’s fees and expenses (including affiliated expense of $18,477)(a) | | | 345,968 | |
Custodian and accounting fees | | | 166,261 | |
Registration fees(a) | | | 144,166 | |
Shareholders’ reports | | | 90,998 | |
Audit fee | | | 63,262 | |
SEC registration fees | | | 52,588 | |
Legal fees and expenses | | | 27,881 | |
Trustees’ fees | | | 25,243 | |
Miscellaneous | | | 23,949 | |
| | | | |
Total expenses | | | 4,400,971 | |
Less: Fee waiver and/or expense reimbursement(a) | | | (724,965 | ) |
Distribution fee waiver(a) | | | (42 | ) |
| | | | |
Net expenses | | | 3,675,964 | |
| | | | |
Net investment income (loss) | | | 21,965,641 | |
| | | | |
| |
Realized And Unrealized Gain (Loss) On Investment And Foreign Currency Transactions | | | | |
Net realized gain (loss) on: | | | | |
Investment transactions (including affiliated of $(10,977)) | | | 2,752,899 | |
Futures transactions | | | 21,456,968 | |
Forward rate agreement transactions | | | (153,633 | ) |
Options written transactions | | | 234,321 | |
Swap agreement transactions | | | (8,894,883 | ) |
Foreign currency transactions | | | (8 | ) |
| | | | |
| | | 15,395,664 | |
| | | | |
Net change in unrealized appreciation (depreciation) on: | | | | |
Investments (including affiliated of $12,947) | | | 52,763,624 | |
Futures | | | (2,760,408 | ) |
Forward rate agreements | | | 16,647 | |
Options written | | | (38,994 | ) |
Swap agreements | | | 2,211,474 | |
Foreign currencies | | | (2 | ) |
| | | | |
| | | 52,192,341 | |
| | | | |
Net gain (loss) on investment and foreign currency transactions | | | 67,588,005 | |
| | | | |
Net Increase (Decrease) In Net Assets Resulting From Operations | | $ | 89,553,646 | |
| | | | |
See Notes to Financial Statements.
Statement of Operations
Year Ended July 31, 2020
| (a) | Class specific expenses and waivers were as follows: |
| | | | | | | | | | | | | | | | | | | | |
| | | Class A | | | Class C | | | Class R | | | Class Z | | | Class R6 | |
Distribution fee | | | 298,215 | | | | 62,436 | | | | 127 | | | | — | | | | — | |
Transfer agent’s fees and expenses | | | 108,432 | | | | 7,621 | | | | 75 | | | | 226,548 | | | | 3,292 | |
Registration fees | | | 34,771 | | | | 17,752 | | | | 17,047 | | | | 24,597 | | | | 49,999 | |
Fee waiver and/or expense reimbursement | | | (54,805 | ) | | | (20,781 | ) | | | (17,106) | | | | (307,566 | ) | | | (324,707) | |
Distribution fee waiver | | | — | | | | — | | | | (42 | ) | | | — | | | | — | |
See Notes to Financial Statements.
Statements of Changes in Net Assets
| | | | | | | | | | |
| | | Year Ended July 31, |
| | | 2020 | | 2019 |
Increase (Decrease) in Net Assets | | | | | | | | | | |
Operations | | | | | | | | | | |
Net investment income (loss) | | | $ | 21,965,641 | | | | $ | 14,196,960 | |
Net realized gain (loss) on investment and foreign currency transactions | | | | 15,395,664 | | | | | 4,453,559 | |
Net change in unrealized appreciation (depreciation) on investments and foreign currencies | | | | 52,192,341 | | | | | 21,176,914 | |
| | | | | | | | | | |
Net increase (decrease) in net assets resulting from operations | | | | 89,553,646 | | | | | 39,827,433 | |
| | | | | | | | | | |
| | |
Dividends and Distributions | | | | | | | | | | |
Distributions from distributable earnings | | | | | | | | | | |
Class A | | | | (2,925,571 | ) | | | | (1,755,631 | ) |
Class C | | | | (105,633 | ) | | | | (79,023 | ) |
Class R | | | | (374 | ) | | | | (415 | ) |
Class Z | | | | (6,205,888 | ) | | | | (3,701,526 | ) |
Class R6 | | | | (16,854,435 | ) | | | | (10,042,604 | ) |
| | | | | | | | | | |
| | | | (26,091,901 | ) | | | | (15,579,199 | ) |
| | | | | | | | | | |
Fund share transactions (Net of share conversions) | | | | | | | | | | |
Net proceeds from shares sold | | | | 729,705,122 | | | | | 232,754,660 | |
Net asset value of shares issued in reinvestment of dividends and distributions | | | | 25,779,534 | | | | | 15,560,437 | |
Cost of shares reacquired | | | | (240,586,128 | ) | | | | (111,205,574 | ) |
| | | | | | | | | | |
Net increase (decrease) in net assets from Fund share transactions | | | | 514,898,528 | | | | | 137,109,523 | |
| | | | | | | | | | |
Total increase (decrease) | | | | 578,360,273 | | | | | 161,357,757 | |
| | |
Net Assets: | | | | | | | | | | |
Beginning of year | | | | 610,768,968 | | | | | 449,411,211 | |
| | | | | | | | | | |
End of year | | | $ | 1,189,129,241 | | | | $ | 610,768,968 | |
| | | | | | | | | | |
See Notes to Financial Statements.
Notes to Financial Statements
1. Organization
The Target Portfolio Trust (the “Trust”) is registered under the Investment Company Act of 1940, as amended (“1940 Act”), as a diversified open-end management investment company. The Trust currently consists of three series: PGIM Corporate Bond Fund, PGIM Core Bond Fund and PGIM QMA Small-Cap Value Fund (collectively the “Funds”).
These financial statements relate only to the PGIM Core Bond Fund (the “Fund”).
The investment objective of the Fund is total return.
2. Accounting Policies
The Fund follows the investment company accounting and reporting guidance of the Financial Accounting Standards Board (“FASB”) Accounting Standard Codification (“ASC”) Topic 946 Financial Services — Investment Companies. The following accounting policies conform to U.S. generally accepted accounting principles. The Fund consistently follows such policies in the preparation of its financial statements.
Securities Valuation: The Fund holds securities and other assets and liabilities that are fair valued at the close of each day (generally, 4:00 PM Eastern time) the New York Stock Exchange (“NYSE”) is open for trading. Fair value is the price that would be received to sell an asset or paid to transfer a liability in an orderly transaction between market participants on the measurement date. The Trust’s Board of Trustees (the “Board”) has adopted valuation procedures for security valuation under which fair valuation responsibilities have been delegated to PGIM Investments LLC (“PGIM Investments” or the “Manager”). Pursuant to the Board’s delegation, the Manager has established a Valuation Committee responsible for supervising the fair valuation of portfolio securities and other assets and liabilities. The valuation procedures permit the Fund to utilize independent pricing vendor services, quotations from market makers, and alternative valuation methods when market quotations are either not readily available or not deemed representative of fair value. A record of the Valuation Committee’s actions is subject to the Board’s review, approval, and ratification at its next regularly scheduled quarterly meeting.
For the fiscal reporting year-end, securities and other assets and liabilities were fair valued at the close of the last U.S. business day. Trading in certain foreign securities may occur when the NYSE is closed (including weekends and holidays). Because such foreign securities trade in markets that are open on weekends and U.S. holidays, the values of some of the Fund’s foreign investments may change on days when investors cannot purchase or redeem Fund shares.
Various inputs determine how the Fund’s investments are valued, all of which are categorized according to the three broad levels (Level 1, 2, or 3) detailed in the Schedule of Investments and referred to herein as the “fair value hierarchy” in accordance with FASB ASC Topic 820 - Fair Value Measurements and Disclosures.
Derivative instruments, such as futures or options, that are traded on a national securities exchange are valued at the last sale price as of the close of trading on the applicable exchange where the security principally trades. Securities traded via NASDAQ are valued at the NASDAQ official closing price. To the extent these securities are valued at the last sale price or NASDAQ official closing price, they are classified as Level 1 in the fair value hierarchy. In the event that no sale or official closing price on valuation date exists, these securities are generally valued at the mean between the last reported bid and ask prices, or at the last bid price in the absence of an ask price. These securities are classified as Level 2 in the fair value hierarchy.
Investments in open-end (other than exchange-traded mutual funds) funds are valued at their net asset values as of the close of the NYSE on the date of valuation. These securities are classified as Level 1 in the fair value hierarchy since they may be purchased or sold at their net asset values on the date of valuation.
Fixed income securities traded in the OTC market are generally classified as Level 2 in the fair value hierarchy. Such fixed income securities are typically valued using the market approach which generally involves obtaining data from an approved independent third-party vendor source. The Fund utilizes the market approach as the primary method to value securities when market prices of identical or comparable instruments are available. The third-party vendors’ valuation techniques used to derive the evaluated bid price are based on evaluating observable inputs, including but not limited to, yield curves, yield spreads, credit ratings, deal terms, tranche level attributes, default rates, cash flows, prepayment speeds, broker/dealer quotations and reported trades. Certain Level 3 securities are also valued using the market approach when obtaining a single broker quote or when utilizing transaction prices for identical securities that have been used in excess of five business days. During the reporting period, there were no changes to report with respect to the valuation approach and/or valuation techniques discussed above.
OTC and centrally cleared derivative instruments are generally classified as Level 2 in the fair value hierarchy. Such derivative instruments are typically valued using the market approach and/or income approach which generally involves obtaining data from an approved independent third-party vendor source. The Fund utilizes the market approach when quoted prices in broker-dealer markets are available but also includes consideration of alternative valuation approaches, including the income approach. In the absence of reliable market quotations, the income approach is typically utilized for purposes of valuing derivatives such as interest rate swaps based on a discounted cash flow analysis whereby the value of the instrument is equal to the present value of its future cash inflows or outflows. Such analysis includes projecting future cash flows and determining the discount rate (including the present value factors that affect the discount rate) used to discount the future
Notes to Financial Statements (continued)
cash flows. In addition, the third-party vendors’ valuation techniques used to derive the evaluated derivative price is based on evaluating observable inputs, including but not limited to, underlying asset prices, indices, spreads, interest rates and exchange rates. Certain derivatives may be classified as Level 3 when valued using the market approach by obtaining a single broker quote or when utilizing unobservable inputs in the income approach. During the reporting period, there were no changes to report with respect to the valuation approach and/or valuation techniques discussed above.
Securities and other assets that cannot be priced according to the methods described above are valued based on pricing methodologies approved by the Board. In the event that unobservable inputs are used when determining such valuations, the securities will be classified as Level 3 in the fair value hierarchy.
When determining the fair value of securities, some of the factors influencing the valuation include: the nature of any restrictions on disposition of the securities; assessment of the general liquidity of the securities; the issuer’s financial condition and the markets in which it does business; the cost of the investment; the size of the holding and the capitalization of the issuer; the prices of any recent transactions or bids/offers for such securities or any comparable securities; any available analyst media or other reports or information deemed reliable by the Manager regarding the issuer or the markets or industry in which it operates. Using fair value to price securities may result in a value that is different from a security’s most recent closing price and from the price used by other unaffiliated mutual funds to calculate their net asset values.
Illiquid Securities: Pursuant to Rule 22e-4 under the 1940 Act, the Trust has adopted a Board approved Liquidity Risk Management Program (“LRMP”) that requires, among other things, that the Fund limit its illiquid investments that are assets to no more than 15% of net assets. Illiquid securities are those that, because of the absence of a readily available market or due to legal or contractual restrictions on resale, may not reasonably be expected to be sold or disposed of in current market conditions in seven calendar days or less without the sale or disposition significantly changing the market value of the investment. The Fund may find it difficult to sell illiquid securities at the time considered most advantageous by its subadviser(s) and may incur transaction costs that would not be incurred in the sale of securities that were freely marketable.
Restricted Securities: Securities acquired in unregistered, private sales from the issuing company or from an affiliate of the issuer are considered restricted as to disposition under federal securities law (“restricted securities”). Such restricted securities are valued pursuant to the valuation procedures noted above. Restricted securities that would otherwise be considered illiquid investments pursuant to the Trust’s LRMP because of legal restrictions on resale to the general public may be traded among qualified institutional buyers under
Rule 144A of the Securities Act of 1933. Therefore, these Rule 144A securities, as well as commercial paper that is sold in private placements under Section 4(2) of the Securities Act of 1933, may be classified higher than “illiquid” under the LRMP (i.e. “moderately liquid” or “less liquid” investments). However, the liquidity of the Fund’s investments in restricted securities could be impaired if trading does not develop or declines.
Foreign Currency Translation: The books and records of the Fund are maintained in U.S. dollars. Foreign currency amounts are translated into U.S. dollars on the following basis:
(i) market value of investment securities, other assets and liabilities — at the current rates of exchange;
(ii) purchases and sales of investment securities, income and expenses — at the rates of exchange prevailing on the respective dates of such transactions.
Although the net assets of the Fund are presented at the foreign exchange rates and market values at the close of the period, the Fund does not generally isolate that portion of the results of operations arising as a result of changes in the foreign exchange rates from the fluctuations arising from changes in the market prices of long-term portfolio securities held at the end of the period. Similarly, the Fund does not isolate the effect of changes in foreign exchange rates from the fluctuations arising from changes in the market prices of long-term portfolio securities sold during the period. Accordingly, holding period realized foreign currency gains (losses) are included in the reported net realized gains (losses) on investment transactions. Notwithstanding the above, the Fund does isolate the effect of fluctuations in foreign currency exchange rates when determining the gain (loss) upon the sale or maturity of foreign currency denominated debt obligations; such amounts are included in net realized gains (losses) on foreign currency transactions.
Additionally, net realized gains (losses) on foreign currency transactions represent net foreign exchange gains (losses) from the disposition of holdings of foreign currencies, currency gains (losses) realized between the trade and settlement dates on investment transactions, and the difference between the amounts of interest, dividends and foreign withholding taxes recorded on the Fund’s books and the U.S. dollar equivalent amounts actually received or paid. Net unrealized currency gains (losses) arise from valuing foreign currency denominated assets and liabilities (other than investments) at period end exchange rates.
Options: The Fund purchased or wrote options in order to hedge against adverse market movements or fluctuations in value caused by changes in prevailing interest rates, value of equities or foreign currency exchange rates with respect to securities or financial instruments which the Fund currently owns or intends to purchase. The Fund may also use options to gain additional market exposure. The Fund’s principal reason for writing options is to realize, through receipt of premiums, a greater current return than would be realized on the underlying security alone. When the Fund purchases an option, it pays a premium and an amount equal to that premium is recorded as an asset. When the Fund writes an option,
Notes to Financial Statements (continued)
it receives a premium and an amount equal to that premium is recorded as a liability. The asset or liability is adjusted daily to reflect the current market value of the option. If an option expires unexercised, the Fund realizes a gain (loss) to the extent of the premium received or paid. If an option is exercised, the premium received or paid is recorded as an adjustment to the proceeds from the sale or the cost of the purchase in determining whether the Fund has realized a gain (loss). The difference between the premium and the amount received or paid at the closing of a purchase or sale transaction is also treated as a realized gain (loss). Gain (loss) on purchased options is included in net realized gain (loss) on investment transactions. Gain (loss) on written options is presented separately as net realized gain (loss) on options written transactions.
The Fund, as writer of an option, may have no control over whether the underlying securities or financial instruments may be sold (called) or purchased (put). As a result, the Fund bears the market risk of an unfavorable change in the price of the security or financial instrument underlying the written option. The Fund, as purchaser of an OTC option, bears the risk of the potential inability of the counterparties to meet the terms of their contracts. With exchange-traded options contracts, there is minimal counterparty credit risk to the Fund since the exchanges’ clearinghouse acts as counterparty to all exchange-traded options and guarantees the options contracts against default.
When the Fund writes an option on a swap, an amount equal to any premium received by the Fund is recorded as a liability and is subsequently adjusted to the current market value of the written option on the swap. If a call option on a swap is exercised, the Fund becomes obligated to pay a fixed interest rate (noted as the strike price) and receive a variable interest rate on a notional amount. If a put option on a swap is exercised, the Fund becomes obligated to pay a variable interest rate and receive a fixed interest rate (noted as the strike price) on a notional amount. Premiums received from writing options on swaps that expire or are exercised are treated as realized gains upon the expiration or exercise of such options on swaps. The risk associated with writing put and call options on swaps is that the Fund will be obligated to be party to a swap agreement if an option on a swap is exercised.
Financial Futures Contracts: A financial futures contract is an agreement to purchase (long) or sell (short) an agreed amount of securities at a set price for delivery on a future date. Upon entering into a financial futures contract, the Fund is required to pledge to the broker an amount of cash and/or other assets equal to a certain percentage of the contract amount. This amount is known as the “initial margin.” Subsequent payments, known as “variation margin,” are made or received by the Fund each day, depending on the daily fluctuations in the value of the underlying security. Such variation margin is recorded for financial statement purposes on a daily basis as unrealized gain (loss). When the contract expires or is closed, the gain (loss) is realized and is presented in the Statement of Operations as net realized gain (loss) on futures transactions.
The Fund invested in financial futures contracts in order to hedge its existing portfolio securities, or securities the Fund intends to purchase, against fluctuations in value caused by changes in prevailing interest rates. Should interest rates move unexpectedly, the Fund may not achieve the anticipated benefits of the financial futures contracts and may realize a loss. The use of futures transactions involves the risk of imperfect correlation in movements in the price of futures contracts, interest rates and the underlying hedged assets. Since futures contracts are exchange-traded, there is minimal counterparty credit risk to the Fund since the exchanges’ clearinghouse acts as counterparty to all exchange-traded futures and guarantees the futures contracts against default.
Forward Rate Agreements: Forward rate agreements represent an agreement between counterparties to exchange cash flows based on the difference between two interest rates, applied to a notional principal amount on a fixed future date. The Fund entered into forward rate agreements to gain yield exposure based on anticipated market conditions at the specified termination date of the agreement.
Swap Agreements: The Fund entered into certain types of swap agreements detailed in the disclosures below. A swap agreement is an agreement to exchange the return generated by one instrument for the return generated by another instrument. Swap agreements are negotiated in the OTC market and may be executed either directly with a counterparty (“OTC-traded”) or through a central clearing facility, such as a registered exchange. Swap agreements are valued daily at current market value and any change in value is included in the net unrealized appreciation (depreciation) on swap agreements. Centrally cleared swaps pay or receive an amount known as “variation margin”, based on daily changes in the valuation of the swap contract. For OTC-traded, upfront premiums paid and received are shown as swap premiums paid and swap premiums received in the Statement of Assets and Liabilities. Risk of loss may exceed amounts recognized on the Statement of Assets and Liabilities. Swap agreements outstanding at period end, if any, are listed on the Schedule of Investments.
Interest Rate Swaps: Interest rate swaps represent an agreement between counterparties to exchange cash flows based on the difference between two interest rates, applied to a notional principal amount for a specified period. The Fund is subject to interest rate risk exposure in the normal course of pursuing its investment objective. The Fund used interest rate swaps to maintain its ability to generate steady cash flow by receiving a stream of fixed rate payments or to increase exposure to prevailing market rates by receiving floating rate payments. The Fund’s maximum risk of loss from counterparty credit risk is the discounted net present value of the cash flows to be received from the counterparty over the contract’s remaining life.
Credit Default Swaps (“CDS”): CDS involve one party (the protection buyer) making a stream of payments to another party (the protection seller) in exchange for the right to receive a specified payment in the event of a default or as a result of a default (collectively a “credit event”) for the referenced entity (typically corporate issues or sovereign issues of an
Notes to Financial Statements (continued)
emerging country) on its obligation; or in the event of a write-down, principal shortfall, interest shortfall or default of all or part of the referenced entities comprising a credit index.
The Fund is subject to credit risk in the normal course of pursuing its investment objectives, and as such, has entered into CDS contracts to provide a measure of protection against defaults or to take an active long or short position with respect to the likelihood of a particular issuer’s default or the reference entity’s credit soundness. CDS contracts generally trade based on a spread which represents the cost a protection buyer has to pay the protection seller. The protection buyer is said to be short the credit as the value of the contract rises the more the credit deteriorates. The value of the CDS contract increases for the protection buyer if the spread increases. The Fund’s maximum risk of loss from counterparty credit risk for purchased CDS is the inability of the counterparty to honor the contract up to the notional value due to a credit event.
As a seller of protection on credit default swap agreements, the Fund generally receives an agreed upon payment from the buyer of protection throughout the term of the swap, provided no credit event occurs. As the seller, the Fund effectively increases its investment risk because, in addition to its total net assets, the Fund may be subject to investment exposure on the notional amount of the swap.
The maximum amount of the payment that the Fund, as a seller of protection, could be required to make under a credit default swap agreement would be equal to the notional amount of the underlying security or index contract as a result of a credit event. This potential amount will be partially offset by any recovery values of the respective referenced obligations, or net amounts received from the settlement of buy protection credit default swap agreements which the Fund entered into for the same referenced entity or index. As a buyer of protection, the Fund generally receives an amount up to the notional value of the swap if a credit event occurs.
Implied credit spreads, represented in absolute terms, utilized in determining the market value of credit default swap agreements where the Fund is the seller of protection as of period end are disclosed in the footnotes to the Schedule of Investments, if applicable. These spreads serve as indicators of the current status of the payment/performance risk and represent the likelihood of default risk for the credit derivative. The implied credit spread of a particular referenced entity reflects the cost of buying/selling protection and may include upfront payments required to enter into the agreement. Wider credit spreads and increased market value in absolute terms, when compared to the notional amount of the swap, represent a deterioration of the referenced entity’s credit soundness and a greater likelihood of risk of default or other credit event occurring as defined under the terms of the agreement.
Master Netting Arrangements: The Trust, on behalf of the Fund, is subject to various Master Agreements, or netting arrangements, with select counterparties. These are agreements which a subadviser may have negotiated and entered into on behalf of all or a portion of the Fund. A master netting arrangement between the Fund and the counterparty permits the Fund to offset amounts payable by the Fund to the same counterparty against amounts to be received; and by the receipt of collateral from the counterparty by the Fund to cover the Fund’s exposure to the counterparty. However, there is no assurance that such mitigating factors are easily enforceable. In addition to master netting arrangements, the right to set-off exists when all the conditions are met such that each of the parties owes the other determinable amounts, the reporting party has the right to set-off the amount owed with the amount owed by the other party, the reporting party intends to set-off and the right of set-off is enforceable by law. During the reporting period, there was no intention to settle on a net basis and all amounts are presented on a gross basis on the Statement of Assets and Liabilities.
The Trust, on behalf of the Fund, is a party to International Swaps and Derivatives Association, Inc. (“ISDA”) Master Agreements with certain counterparties that govern OTC derivative and foreign exchange contracts entered into from time to time. The Master Agreements may contain provisions regarding, among other things, the parties’ general obligations, representations, agreements, collateral requirements, events of default and early termination. With respect to certain counterparties, in accordance with the terms of the Master Agreements, collateral posted to the Fund is held in a segregated account by the Fund’s custodian and with respect to those amounts which can be sold or re-pledged, is presented in the Schedule of Investments. Collateral pledged by the Fund is segregated by the Fund’s custodian and identified in the Schedule of Investments. Collateral can be in the form of cash or debt securities issued by the U.S. Government or related agencies or other securities as agreed to by the Fund and the applicable counterparty. Collateral requirements are determined based on the Fund’s net position with each counterparty. Termination events applicable to the Fund may occur upon a decline in the Fund’s net assets below a specified threshold over a certain period of time. Termination events applicable to counterparties may occur upon a decline in the counterparty’s long-term and short-term credit ratings below a specified level. In each case, upon occurrence, the other party may elect to terminate early and cause settlement of all derivative and foreign exchange contracts outstanding, including the payment of any losses and costs resulting from such early termination, as reasonably determined by the terminating party. Any decision by one or more of the Fund’s counterparties to elect early termination could impact the Fund’s future derivative activity.
In addition to each instrument’s primary underlying risk exposure (e.g. interest rate, credit, equity or foreign exchange, etc.), swap agreements involve, to varying degrees, elements of credit, market and documentation risk. Such risks involve the possibility that no liquid market for these agreements will exist, the counterparty to the agreement may default on its obligation to perform or disagree on the contractual terms of the agreement, and changes in net interest rates will be unfavorable. In connection with these agreements, securities in the portfolio may be identified or received as collateral from the counterparty in accordance with the terms of the respective swap agreements to provide or receive assets of value and to
Notes to Financial Statements (continued)
serve as recourse in the event of default or bankruptcy/insolvency of either party. Such OTC derivative agreements include conditions which, when materialized, give the counterparty the right to cause an early termination of the transactions under those agreements. Any election by the counterparty for early termination of the contract(s) may impact the amounts reported on financial statements.
As of July 31, 2020, the Fund has not met conditions under such agreements which give the counterparty the right to call for an early termination.
Forward currency contracts, forward rate agreements, written options, short sales, swaps and financial futures contracts involve elements of both market and credit risk in excess of the amounts reflected on the Statement of Assets and Liabilities. Such risks may be mitigated by engaging in master netting arrangements.
Delayed-Delivery Transactions: The Fund purchased or sold securities on a when-issued or delayed-delivery and forward commitment basis. These transactions involve a commitment by the Fund to purchase or sell securities for a predetermined price or yield, with payment and delivery taking place beyond the customary settlement period. When delayed-delivery purchases are outstanding, the Fund will set aside and maintain an amount of liquid assets sufficient to meet the purchase price in a segregated account until the settlement date. When purchasing a security on a delayed-delivery basis, the Fund assumes the rights and risks of ownership of the security, including the risk of price and yield fluctuations, and takes such fluctuations into account when determining its net asset value. The Fund may dispose of or renegotiate a delayed-delivery transaction subsequent to establishment, and may sell when-issued securities before they are delivered, which may result in a realized gain (loss). When selling a security on a delayed-delivery basis, the Fund forfeits its eligibility to realize future gains (losses) with respect to the security.
Securities Lending: The Fund lends its portfolio securities to banks and broker-dealers. The loans are secured by collateral at least equal to the market value of the securities loaned. Collateral pledged by each borrower is invested in an affiliated money market fund and is marked to market daily, based on the previous day’s market value, such that the value of the collateral exceeds the value of the loaned securities. In the event of significant appreciation in value of securities on loan on the last business day of the reporting period, the financial statements may reflect a collateral value that is less than the market value of the loaned securities. Such shortfall is remedied as described above. Loans are subject to termination at the option of the borrower or the Fund. Upon termination of the loan, the borrower will return to the Fund securities identical to the loaned securities. Should the borrower of the securities fail financially, the Fund has the right to repurchase the securities in the open market using the collateral.
The Fund recognizes income, net of any rebate and securities lending agent fees, for lending its securities in the form of fees or interest on the investment of any cash received as collateral. The borrower receives all interest and dividends from the securities loaned and such payments are passed back to the lender in amounts equivalent thereto. The Fund also continues to recognize any unrealized gain (loss) in the market price of the securities loaned and on the change in the value of the collateral invested that may occur during the term of the loan. In addition, realized gain (loss) is recognized on changes in the value of the collateral invested upon liquidation of the collateral. Net earnings from securities lending are disclosed in the Statement of Operations.
Securities Transactions and Net Investment Income: Securities transactions are recorded on the trade date. Realized gains (losses) from investment and currency transactions are calculated on the specific identification method. Dividend income is recorded on the ex-date, or for certain foreign securities, when the Fund becomes aware of such dividends. Interest income, including amortization of premium and accretion of discount on debt securities, as required, is recorded on the accrual basis. Expenses are recorded on an accrual basis, which may require the use of certain estimates by management that may differ from actual. Net investment income or loss (other than class specific expenses and waivers, which are allocated as noted below) and unrealized and realized gains (losses) are allocated daily to each class of shares based upon the relative proportion of adjusted net assets of each class at the beginning of the day. Class specific expenses and waivers, where applicable, are charged to the respective share classes. Class specific expenses include distribution fees and distribution fee waivers, shareholder servicing fees, transfer agent’s fees and expenses, registration fees and fee waivers and/or expense reimbursements, as applicable.
Taxes: It is the Fund’s policy to continue to meet the requirements of the Internal Revenue Code applicable to regulated investment companies and to distribute all of its taxable net investment income and capital gains, if any, to its shareholders. Therefore, no federal income tax provision is required. Withholding taxes on foreign dividends, interest and capital gains, if any, are recorded, net of reclaimable amounts, at the time the related income is earned.
Dividends and Distributions: The Fund expects to declare dividends of its net investment income daily and pay such dividends monthly. Distributions from net realized capital and currency gains, if any, are declared and paid at least annually. Dividends and distributions to shareholders, which are determined in accordance with federal income tax regulations and which may differ from generally accepted accounting principles, are recorded on the ex-date. Permanent book/tax differences relating to income and gain (loss) are reclassified between total distributable earnings (loss) and paid-in capital in excess of par, as appropriate.
Estimates: The preparation of financial statements requires management to make estimates and assumptions that affect the reported amounts and disclosures in the financial statements. Actual results could differ from those estimates.
Notes to Financial Statements (continued)
3. Agreements
The Trust, on behalf of the Fund, has a management agreement with the Manager. Pursuant to this agreement, the Manager has responsibility for all investment advisory services and supervises each subadviser’s performance of such services. In addition, under the management agreement, the Manager provides all of the administrative functions necessary for the organization, operation and management of the Fund. The Manager administers the corporate affairs of the Fund and, in connection therewith, furnishes the Fund with office facilities, together with those ordinary clerical and bookkeeping services which are not being furnished by the Fund’s custodian and the Fund’s transfer agent. The Manager is also responsible for the staffing and management of dedicated groups of legal, marketing, compliance and related personnel necessary for the operation of the Fund. The legal, marketing, compliance and related personnel are also responsible for the management and oversight of the various service providers to the Fund, including, but not limited to, the custodian, transfer agent, and accounting agent.
The Manager has entered into subadvisory agreements with PGIM Limited and PGIM, Inc., which provides subadvisory services to the Fund through its PGIM Fixed Income unit (each a “subadviser” and collectively the “subadvisers”). The subadvisory agreements provide that subadvisers will furnish investment advisory services in connection with the management of the Fund. In connection therewith, the subadvisers are obligated to keep certain books and records of the Fund. The Manager pays for the services of the subadvisers, the cost of compensation of officers of the Fund, occupancy and certain clerical and bookkeeping costs of the Fund. The Fund bears all other costs and expenses.
Effective December 13, 2019, the management fee paid to the Manager is accrued daily and payable monthly at an annual rate of 0.32% of the Fund’s average daily net assets up to $10 billion; and 0.31% of the Fund’s average daily net assets in excess of $10 billion. Prior to December 13, 2019, the management fee paid to the Manager was accrued daily and payable monthly at an annual rate of 0.35% of the Fund’s average daily net assets up to $10 billion; and 0.34% of the Fund’s average daily net assets in excess of $10 billion. The effective management fee rate before any waivers and/or expense reimbursements was 0.33% for the year ended July 31, 2020.
Effective December 1, 2019, the Manager has contractually agreed, through November 30, 2021, to limit total annual fund operating expenses, after fee waivers and/or expense reimbursements to 0.70% of average daily net assets for Class A shares, 1.45% of average daily net assets for Class C shares, 0.95% of average daily net assets for Class R shares, 0.33% of average daily net assets for Class Z shares, and 0.32% of average daily net assets for Class R6 shares. Prior to December 1, 2019, the Manager had contractually agreed to limit total annual operating expenses after fee waivers and/or expense reimbursements to 0.70% of average daily net assets for Class A shares, 1.45% of average daily net assets for
Class C shares, 0.95% of average daily net assets for Class R shares, 0.41% of average daily net assets for Class Z shares, and 0.36% of average daily net assets for Class R6 shares. This contractual waiver excludes interest, brokerage, taxes (such as income and foreign withholding taxes, stamp duty and deferred tax expenses), acquired fund fees and expenses, extraordinary expenses, and certain other Fund expenses such as dividend and interest expense and broker charges on short sales.
Where applicable, the Manager agrees to waive management fees or shared operating expenses on any share class to the same extent that it waives similar expenses on any other share class. In addition, total annual operating expenses for Class R6 shares will not exceed total annual operating expenses for Class Z shares. Fees and/or expenses waived and/or reimbursed by the Manager may be recouped by the Manager within the same fiscal year during which such waiver and/or reimbursement is made if such recoupment can be realized without exceeding the expense limit in effect at the time of the recoupment for that fiscal year
The Trust, on behalf of the Fund, has a distribution agreement with Prudential Investment Management Services LLC (“PIMS”), which acts as the distributor of the Class A, Class C, Class R, Class Z and Class R6 shares of the Fund. The Fund compensates PIMS for distributing and servicing the Fund’s Class A, Class C and Class R shares, pursuant to the plans of distribution (the “Distribution Plans”), regardless of expenses actually incurred by PIMS. The distribution fees are accrued daily and payable monthly. No distribution or service fees are paid to PIMS as distributor of the Class Z or Class R6 shares of the Fund.
Pursuant to the Distribution Plans, the Fund compensates PIMS for distribution related activities at an annual rate of up to 0.25%, 1% and 0.75% of the average daily net assets of the Class A, Class C and Class R shares, respectively. PIMS has contractually agreed through November 30, 2021 to limit such fees to 0.50% of the average daily net assets of the Class R shares.
For the year ended July 31, 2020, PIMS received $685,944 in front-end sales charges resulting from sales of Class A shares. Additionally, for the year ended July 31, 2020, PIMS received $9,805 and $1,176 in contingent deferred sales charges imposed upon redemptions by certain Class A and Class C shareholders, respectively. From these fees, PIMS paid such sales charges to broker-dealers, who in turn paid commissions to salespersons and incurred other distribution costs.
PGIM Investments, PGIM, Inc., PGIM Limited and PIMS are indirect, wholly-owned subsidiaries of Prudential Financial, Inc. (“Prudential”).
4. Other Transactions with Affiliates
Prudential Mutual Fund Services LLC (“PMFS”), an affiliate of PGIM Investments and an indirect, wholly-owned subsidiary of Prudential, serves as the Fund’s transfer agent. Transfer
Notes to Financial Statements (continued)
agent’s fees and expenses in the Statement of Operations include certain out-of-pocket expenses paid to non-affiliates, where applicable.
The Fund may invest its overnight sweep cash in the PGIM Core Ultra Short Bond Fund (the “Core Fund”), and its securities lending cash collateral in the PGIM Institutional Money Market Fund (the “Money Market Fund”), each a series of Prudential Investment Portfolios 2, registered under the 1940 Act and managed by PGIM Investments. Through the Fund’s investments in the mentioned underlying funds, PGIM Investments and/or its affiliates are paid fees or reimbursed for providing their services. In addition to the realized and unrealized gains on investments in the Core Fund and Money Market Fund, earnings from such investments are disclosed on the Statement of Operations as “Affiliated dividend income” and “Income from securities lending, net”, respectively.
The Fund may enter into certain securities purchase or sale transactions under Board approved Rule 17a-7 procedures. Rule 17a-7 is an exemptive rule under the 1940 Act, that subject to certain conditions, permits purchase and sale transactions among affiliated investment companies, or between an investment company and a person that is affiliated solely by reason of having a common (or affiliated) investment adviser, common directors, and/or common officers. Pursuant to the Rule 17a-7 procedures and consistent with guidance issued by the Securities and Exchange Commission (“SEC”), the Trust’s Chief Compliance Officer (“CCO”) prepares a quarterly summary of all such transactions for submission to the Board, together with the CCO’s written representation that all such 17a-7 transactions were effected in accordance with the Fund’s Rule 17a-7 procedures. For the year ended July 31, 2020, no 17a-7 transactions were entered into by the Fund.
5. Portfolio Securities
The aggregate cost of purchases and proceeds from sales of portfolio securities (excluding short-term investments and U.S. Government securities) for the year ended July 31, 2020, were $1,026,356,828 and $518,989,296, respectively.
A summary of the cost of purchases and proceeds from sales of shares of affiliated investments for the year ended July 31, 2020, is presented as follows:
| | | | | | | | | | | | | | | | | | | | | | | | | | | | | | | | | | | |
Value,
Beginning
of Year | | Cost of
Purchases | | Proceeds
from Sales | | Change in
Unrealized
Gain
(Loss) | | Realized
Gain
(Loss) | | Value,
End of Year | | Shares,
End
of Year | | Income |
|
PGIM Core Ultra Short Bond Fund* | |
$38,407,250 | | | $ | 532,520,664 | | | | $ | 515,873,017 | | | | $ | — | | | | $ | — | | | | $ | 55,054,897 | | | | | 55,054,897 | | | | $ | 462,093 | |
| | | | | | | | | | | | | | | | | | | | | | | | | | | | | | | | | | | |
Value, Beginning of Year | | Cost of Purchases | | Proceeds from Sales | | Change in Unrealized Gain (Loss) | | Realized Gain (Loss) | | Value, End of Year | | Shares, End of Year | | Income |
|
PGIM Institutional Money Market Fund* | |
$1,631,425 | | | $ | 169,949,124 | | | | $ | 131,584,988 | | | | $ | 12,947 | | | | $ | (10,977 | ) | | | $ | 39,997,531 | | | | | 40,001,531 | | | | $ | 39,923 | ** |
| | | | | | | | | | | | | | | | | | | | | | | | | | | | | | | | | | | |
$40,038,675 | | | $ | 702,469,788 | | | | $ | 647,458,005 | | | | $ | 12,947 | | | | $ | (10,977 | ) | | | $ | 95,052,428 | | | | | | | | | $ | 502,016 | |
| | | | | | | | | | | | | | | | | | | | | | | | | | | | | | | | | | | |
| * | The Fund did not have any capital gain distributions during the reporting period. |
| ** | The amount, or a portion thereof, represents the affiliated securities lending income shown on the Statement of Operations. |
6. Distributions and Tax Information
Distributions to shareholders, which are determined in accordance with federal income tax regulations and which may differ from generally accepted accounting principles, are recorded on the ex-date.
For the year ended July 31, 2020, the tax character of dividends paid by the Fund were $25,902,500 of ordinary income and $189,401 of long-term capital gains. For the year ended July 31, 2019, the tax character of dividends paid by the Fund was $15,579,199 of ordinary income.
As of July 31, 2020, the accumulated undistributed earnings on a tax basis were $2,755,052 of ordinary income and $4,498,057 of long-term capital gains.
The United States federal income tax basis of the Fund’s investments and the net unrealized appreciation as of July 31, 2020 were as follows:
| | | | | | |
| Tax Basis | | Gross Unrealized Appreciation | | Gross Unrealized Depreciation | | Net Unrealized Appreciation |
|
| $1,173,014,719 | | $72,777,707 | | $(9,182,574) | | $63,595,133 |
The difference between book basis and tax basis was primarily attributable to deferred losses on wash sales, differences in the treatment of premium amortization for book and tax purposes, and mark-to-market of futures contracts.
The Fund utilized approximately $3,444,000 of its capital loss carryforward to offset net taxable gains realized in the fiscal year ended July 31, 2020.
The Fund elected to treat late year losses of approximately $205,000 as having been incurred in the following fiscal year (July 31, 2021).
The Manager has analyzed the Fund’s tax positions taken on federal, state and local income tax returns for all open tax years and has concluded that no provision for income tax is
Notes to Financial Statements (continued)
required in the Fund’s financial statements for the current reporting period. Since tax authorities can examine previously filed tax returns, the Fund’s U.S. federal and state tax returns for each of the four fiscal years up to the most recent fiscal year ended July 31, 2020 are subject to such review.
7. Capital and Ownership
The Fund offers Class A, Class C, Class R, Class Z and Class R6 shares. Class A shares are sold with a maximum front-end sales charge of 3.25%. Investors who purchase $1 million or more prior to July 15, 2019 ($500,000 or more on or after July 15, 2019) of Class A shares and sell those shares within 12 months of purchase are subject to a contingent deferred sales charge (“CDSC”) of 1.00% on sales although these purchases are not subject to a front-end sales charge. The Class A CDSC is waived for certain retirement and/or benefit plans. A special exchange privilege is also available for shareholders who qualified to purchase Class A shares at net asset value. Class C shares are sold with a CDSC of 1% on sales made within 12 months of purchase. Class C shares will automatically convert to Class A shares on a monthly basis approximately 10 years after purchase. Class R shares are available to certain retirement plans, clearing and settlement firms. Class R, Class Z and Class R6 shares are not subject to any sales or redemption charges and are available exclusively for sale to a limited group of investors.
Under certain circumstances, an exchange may be made from specified share classes of the Fund to one or more other share classes of the Fund as presented in the table of transactions in shares of beneficial interest, below.
The Trust has authorized an unlimited number of shares of beneficial interest of the Fund at $0.001 par value per share.
As of July 31, 2020, Prudential, through its affiliated entities, including affiliated funds (if applicable), owned shares of the Fund as follows:
| | | | |
| | | Number of Shares | | Percentage of Outstanding Shares |
Class R | | 1,130 | | 67.9% |
At the reporting period end, the number of shareholders holding greater than 5% of the Fund are as follows:
| | | | | | |
| Affiliated | | Unaffiliated |
Number of Shareholders | | Percentage of
Outstanding Shares | | Number of Shareholders | | Percentage of
Outstanding Shares |
| — | | —% | | 3 | | 81.9% |
Transactions in shares of beneficial interest were as follows:
| | | | | | | | | | |
Class A | | Shares | | Amount |
Year ended July 31, 2020: | | | | | | | | | | |
Shares sold | | | | 11,997,070 | | | | $ | 124,717,956 | |
Shares issued in reinvestment of dividends and distributions | | | | 278,920 | | | | | 2,898,472 | |
Shares reacquired | | | | (2,963,749 | ) | | | | (30,547,949 | ) |
| | | | | | | | | | |
Net increase (decrease) in shares outstanding before conversion | | | | 9,312,241 | | | | | 97,068,479 | |
Shares issued upon conversion from other share class(es) | | | | 81,423 | | | | | 836,957 | |
Shares reacquired upon conversion into other share class(es) | | | | (83,334 | ) | | | | (863,063 | ) |
| | | | | | | | | | |
Net increase (decrease) in shares outstanding | | | | 9,310,330 | | | | $ | 97,042,373 | |
| | | | | | | | | | |
| | |
Year ended July 31, 2019: | | | | | | | | | | |
Shares sold | | | | 3,011,197 | | | | $ | 29,465,083 | |
Shares issued in reinvestment of dividends and distributions | | | | 179,181 | | | | | 1,751,520 | |
Shares reacquired | | | | (1,287,438 | ) | | | | (12,464,558 | ) |
| | | | | | | | | | |
Net increase (decrease) in shares outstanding before conversion | | | | 1,902,940 | | | | | 18,752,045 | |
Shares issued upon conversion from other share class(es) | | | | 50,913 | | | | | 493,537 | |
Shares reacquired upon conversion into other share class(es) | | | | (33,254 | ) | | | | (322,233 | ) |
| | | | | | | | | | |
Net increase (decrease) in shares outstanding | | | | 1,920,599 | | | | $ | 18,923,349 | |
| | | | | | | | | | |
Class C | | | | |
Year ended July 31, 2020: | | | | | | | | | | |
Shares sold | | | | 582,398 | | | | $ | 6,004,983 | |
Shares issued in reinvestment of dividends and distributions | | | | 10,089 | | | | | 104,950 | |
Shares reacquired | | | | (151,341 | ) | | | | (1,568,722 | ) |
| | | | | | | | | | |
Net increase (decrease) in shares outstanding before conversion | | | | 441,146 | | | | | 4,541,211 | |
Shares reacquired upon conversion into other share class(es) | | | | (44,776 | ) | | | | (464,613 | ) |
| | | | | | | | | | |
Net increase (decrease) in shares outstanding | | | | 396,370 | | | | $ | 4,076,598 | |
| | | | | | | | | | |
| | |
Year ended July 31, 2019: | | | | | | | | | | |
Shares sold | | | | 216,388 | | | | $ | 2,107,199 | |
Shares issued in reinvestment of dividends and distributions | | | | 8,033 | | | | | 78,425 | |
Shares reacquired | | | | (166,834 | ) | | | | (1,615,314 | ) |
| | | | | | | | | | |
Net increase (decrease) in shares outstanding before conversion | | | | 57,587 | | | | | 570,310 | |
Shares reacquired upon conversion into other share class(es) | | | | (23,579 | ) | | | | (229,869 | ) |
| | | | | | | | | | |
Net increase (decrease) in shares outstanding | | | | 34,008 | | | | $ | 340,441 | |
Class R | | | | |
Year ended July 31, 2020: | | | | | | | | | | |
Shares sold | | | | 32 | | | | $ | 334 | |
Shares issued in reinvestment of dividends and distributions | | | | 36 | | | | | 373 | |
Shares reacquired | | | | (1 | ) | | | | (13 | ) |
| | | | | | | | | | |
Net increase (decrease) in shares outstanding | | | | 67 | | | | $ | 694 | |
| | | | | | | | | | |
| | |
Year ended July 31, 2019: | | | | | | | | | | |
Shares sold | | | | 30 | | | | $ | 300 | |
Shares issued in reinvestment of dividends and distributions | | | | 42 | | | | | 414 | |
Shares reacquired | | | | (25 | ) | | | | (255 | ) |
| | | | | | | | | | |
Net increase (decrease) in shares outstanding | | | | 47 | | | | $ | 459 | |
| | | | | | | | | | |
Notes to Financial Statements (continued)
| | | | | | | | | | |
Class Z | | Shares | | Amount |
Year ended July 31, 2020: | | | | | | | | | | |
Shares sold | | | | 16,016,445 | | | | $ | 165,403,199 | |
Shares issued in reinvestment of dividends and distributions | | | | 579,634 | | | | | 6,021,326 | |
Shares reacquired | | | | (6,603,959 | ) | | | | (67,986,748 | ) |
| | | | | | | | | | |
Net increase (decrease) in shares outstanding before conversion | | | | 9,992,120 | | | | | 103,437,777 | |
Shares issued upon conversion from other share class(es) | | | | 113,709 | | | | | 1,185,032 | |
Shares reacquired upon conversion into other share class(es) | | | | (62,585 | ) | | | | (644,821 | ) |
| | | | | | | | | | |
Net increase (decrease) in shares outstanding | | | | 10,043,244 | | | | $ | 103,977,988 | |
| | | | | | | | | | |
| | |
Year ended July 31, 2019: | | | | | | | | | | |
Shares sold | | | | 7,865,642 | | | | $ | 77,391,227 | |
Shares issued in reinvestment of dividends and distributions | | | | 377,379 | | | | | 3,688,179 | |
Shares reacquired | | | | (2,621,561 | ) | | | | (25,498,883 | ) |
| | | | | | | | | | |
Net increase (decrease) in shares outstanding before conversion | | | | 5,621,460 | | | | | 55,580,523 | |
Shares issued upon conversion from other share class(es) | | | | 29,986 | | | | | 290,554 | |
Shares reacquired upon conversion into other share class(es) | | | | (44,517 | ) | | | | (430,326 | ) |
| | | | | | | | | | |
Net increase (decrease) in shares outstanding | | | | 5,606,929 | | | | $ | 55,440,751 | |
| | | | | | | | | | |
Class R6 | | | | |
Year ended July 31, 2020: | | | | | | | | | | |
Shares sold | | | | 41,967,800 | | | | $ | 433,578,650 | |
Shares issued in reinvestment of dividends and distributions | | | | 1,612,758 | | | | | 16,754,413 | |
Shares reacquired | | | | (13,571,928 | ) | | | | (140,482,696 | ) |
| | | | | | | | | | |
Net increase (decrease) in shares outstanding before conversion | | | | 30,008,630 | | | | | 309,850,367 | |
Shares issued upon conversion from other share class(es) | | | | 64,105 | | | | | 666,909 | |
Shares reacquired upon conversion into other share class(es) | | | | (68,514 | ) | | | | (716,401 | ) |
| | | | | | | | | | |
Net increase (decrease) in shares outstanding | | | | 30,004,221 | | | | $ | 309,800,875 | |
| | | | | | | | | | |
| | |
Year ended July 31, 2019: | | | | | | | | | | |
Shares sold | | | | 12,640,134 | | | | $ | 123,790,851 | |
Shares issued in reinvestment of dividends and distributions | | | | 1,027,886 | | | | | 10,041,899 | |
Shares reacquired | | | | (7,387,538 | ) | | | | (71,626,564 | ) |
| | | | | | | | | | |
Net increase (decrease) in shares outstanding before conversion | | | | 6,280,482 | | | | | 62,206,186 | |
Shares issued upon conversion from other share class(es) | | | | 22,379 | | | | | 216,744 | |
Shares reacquired upon conversion into other share class(es) | | | | (1,904 | ) | | | | (18,407 | ) |
| | | | | | | | | | |
Net increase (decrease) in shares outstanding | | | | 6,300,957 | | | | $ | 62,404,523 | |
| | | | | | | | | | |
8. Borrowings
The Trust, on behalf of the Fund, along with other affiliated registered investment companies (the “RICs”), is a party to a Syndicated Credit Agreement (“SCA”) with a group of banks. The purpose of the SCA is to provide an alternative source of temporary funding for capital share redemptions. The table below provides details of the current SCA in effect at the reporting period-end as well as the prior SCA.
| | | | |
| | | Current SCA | | Prior SCA |
Term of Commitment | | 10/3/2019 – 10/1/2020 | | 10/4/2018 – 10/2/2019 |
Total Commitment | | $ 1,222,500,000* | | $ 900,000,000 |
| | | | |
| | | Current SCA | | Prior SCA |
Annualized Commitment Fee on the Unused Portion of the SCA | | 0.15% | | 0.15% |
| Annualized Interest Rate on Borrowings | | 1.20% plus the higher of (1) the effective federal funds rate, (2) the one-month LIBOR rate or (3) zero percent | | 1.25% plus the higher of (1) the effective federal funds rate, (2) the one-month LIBOR rate or (3) zero percent |
| * Effective March 31, 2020, the SCA’s total commitment was increased from $900,000,000 to $1,162,500,000 and subsequently, effective April 7, 2020 was increased to $1,222,500,000. |
Certain affiliated registered investment companies that are parties to the SCA include portfolios that are subject to a predetermined mathematical formula used to manage certain benefit guarantees offered under variable annuity contracts. The formula may result in large scale asset flows into and out of these portfolios. Consequently, these portfolios may be more likely to utilize the SCA for purposes of funding redemptions. It may be possible for those portfolios to fully exhaust the committed amount of the SCA, thereby requiring the Manager to allocate available funding per a Board-approved methodology designed to treat the RICs in the SCA equitably.
The Fund did not utilize the SCA during the year ended July 31, 2020.
9. Risks of Investing in the Fund
The Fund’s risks include, but are not limited to, some or all of the risks discussed below. For further information on the Fund’s risks, please refer to the Fund’s Prospectus and Statement of Additional Information.
Bond Obligations Risk: The Fund’s holdings, share price, yield and total return may fluctuate in response to bond market movements. The value of bonds may decline for issuer-related reasons, including management performance, financial leverage and reduced demand for the issuer’s goods and services. Certain types of fixed-income obligations also may be subject to “call and redemption risk,” which is the risk that the issuer may call a bond held by the Fund for redemption before it matures and the Fund may not be able to reinvest at the same level and therefore would earn less income.
Derivatives Risk: Derivatives involve special risks and costs and may result in losses to the Fund. The successful use of derivatives requires sophisticated management, and, to the extent that derivatives are used, the Fund will depend on each subadviser’s ability to analyze and manage derivative transactions. The prices of derivatives may move in unexpected ways, especially in abnormal market conditions. Some derivatives are “leveraged” and therefore may magnify or otherwise increase investment losses to the Fund. Other risks arise from the potential inability to terminate or sell derivatives positions. A liquid secondary market may not always exist for the Fund’s derivatives positions. In fact, many OTC derivative instruments will not have liquidity beyond the counterparty to the instrument. OTC derivative instruments also involve the risk that the other party will not meet its obligations to the Fund.
Notes to Financial Statements (continued)
Foreign Securities Risk: The Fund’s investments in securities of foreign issuers or issuers with significant exposure to foreign markets involve additional risk. Foreign countries in which the Fund may invest may have markets that are less liquid, less regulated and more volatile than US markets. The value of the Fund’s investments may decline because of factors affecting the particular issuer as well as foreign markets and issuers generally, such as unfavorable government actions, and political or financial instability.
Interest Rate Risk: The value of an investment may go down when interest rates rise. A rise in rates tends to have a greater impact on the prices of longer term or duration securities. When interest rates fall, the issuers of debt obligations may prepay principal more quickly than expected, and the Fund may be required to reinvest the proceeds at a lower interest rate. This is referred to as “prepayment risk.” When interest rates rise, debt obligations may be repaid more slowly than expected, and the value of the Fund’s holdings may fall sharply. This is referred to as “extension risk”. The Fund may face a heightened level of interest rate risk as a result of the U.S. Federal Reserve Board’s policies. The Fund’s investments may lose value if short-term or long-term interest rates rise sharply or in a manner not anticipated by the subadvisers.
Large Shareholder and Large Scale Redemption Risk: Certain individuals, accounts, funds (including funds affiliated with the Manager) or institutions, including the Manager and its affiliates, may from time to time own or control a substantial amount of the Fund’s shares. There is no requirement that these entities maintain their investment in the Fund. There is a risk that such large shareholders or that the Fund’s shareholders generally may redeem all or a substantial portion of their investments in the Fund in a short period of time, which could have a significant negative impact on the Fund’s NAV, liquidity, and brokerage costs. Large redemptions could also result in tax consequences to shareholders and impact the Fund’s ability to implement its investment strategy. The Fund’s ability to pursue its investment objective after one or more large scale redemptions may be impaired and, as a result, the Fund may invest a larger portion of its assets in cash or cash equivalents.
LIBOR Risk: Many financial instruments use or may use a floating rate based on the London Interbank Offered Rate, or “LIBOR,” which is the offered rate for short-term Eurodollar deposits between major international banks. On July 27, 2017, the Financial Conduct Authority announced a desire to phase out the use of LIBOR by the end of 2021. There remains uncertainty regarding the future utilization of LIBOR and the nature of any replacement rate. As such, the potential impact of a transition away from LIBOR on the Fund or the financial instruments in which the Fund invest cannot yet be determined. The elimination of LIBOR or changes to other reference rates or any other changes or reforms to the determination or supervision of reference rates could have an adverse impact on the market for, or value of, any securities or payments linked to those reference rates, which may adversely affect the Fund’s performance and/or net asset value. Furthermore, the risks
associated with the expected discontinuation of LIBOR and transition may be exacerbated if the work necessary to effect an orderly transition to an alternative reference rate is not completed in a timely manner. Because the usefulness of LIBOR as a benchmark could deteriorate during the transition period, these effects could occur prior to the end of 2021.
Liquidity Risk: The Fund may invest in instruments that trade in lower volumes and are less liquid than other investments. Liquidity risk exists when particular investments made by the Fund are difficult to purchase or sell. Liquidity risk includes the risk that the Fund may make investments that may become less liquid in response to market developments or adverse investor perceptions. Investments that are illiquid or that trade in lower volumes may be more difficult to value. If the Fund is forced to sell these investments to pay redemption proceeds or for other reasons, the Fund may lose money. In addition, when there is no willing buyer and investments may not reasonably be expected to be sold or disposed of in current market conditions in seven calendar days or less without the sale or disposition significantly changing the market value of the investment, the Fund may incur higher transaction costs when executing trade orders of a given size. The reduction in dealer market-making capacity in the fixed-income markets that has occurred in recent years also has the potential to reduce liquidity. An inability to sell a portfolio position can adversely affect the Fund’s value or prevent the Fund from being able to take advantage of other investment opportunities.
Market and Credit Risk: Securities markets may be volatile and the market prices of the Fund’s securities may decline. Securities fluctuate in price based on changes in an issuer’s financial condition and overall market and economic conditions. If the market prices of the securities owned by the Fund fall, the value of an investment in the Fund will decline. Additionally, the Fund may also be exposed to credit risk in the event that an issuer or guarantor fails to perform or that an institution or entity with which the Fund has unsettled or open transactions defaults.
Market Disruption and Geopolitical Risks: International wars or conflicts and geopolitical developments in foreign countries, along with instability in regions such as Asia, Eastern Europe, and the Middle East, possible terrorist attacks in the United States or around the world, public health epidemics such as the outbreak of infectious diseases like the recent outbreak of coronavirus globally or the 2014–2016 outbreak in West Africa of the Ebola virus, and other similar events could adversely affect the U.S. and foreign financial markets, including increases in market volatility, reduced liquidity in the securities markets and government intervention, and may cause further long-term economic uncertainties in the United States and worldwide generally.
U.S. Government and Agency Securities Risk: U.S. Government and agency securities are subject to market risk, interest rate risk and credit risk. Not all U.S. Government securities are insured or guaranteed by the full faith and credit of the U.S. Government; some are only insured or guaranteed by the issuing agency, which must rely on its own resources to repay the debt. In addition, the value of U.S. Government securities may be affected by changes in the credit rating of the U.S. Government.
Financial Highlights
| | | | | | | | | | | | | | | | | | | | |
| Class A Shares | |
| | | Year Ended July 31, | |
| | | 2020 | | | 2019 | | | 2018 | | | 2017 | | | 2016 | |
| Per Share Operating Performance(a): | | | | | | | | | | | | | | | | | | | | |
| Net Asset Value, Beginning of Year | | | $10.09 | | | | $9.63 | | | | $9.99 | | | | $10.22 | | | | $9.88 | |
| Income (loss) from investment operations: | | | | | | | | | | | | | | | | | | | | |
| Net investment income (loss) | | | 0.21 | | | | 0.26 | | | | 0.22 | | | | 0.18 | | | | 0.18 | |
| Net realized and unrealized gain (loss) on investment and foreign currency transactions | | | 0.74 | | | | 0.49 | | | | (0.33 | ) | | | (0.20 | ) | | | 0.39 | |
| Total from investment operations | | | 0.95 | | | | 0.75 | | | | (0.11 | ) | | | (0.02 | ) | | | 0.57 | |
| Less Dividends and Distributions: | | | | | | | | | | | | | | | | | | | | |
| Dividends from net investment income | | | (0.26 | ) | | | (0.29 | ) | | | (0.25 | ) | | | (0.21 | ) | | | (0.20 | ) |
| Tax return of capital distributions | | | - | | | | - | | | | - | | | | - | | | | (0.03 | ) |
| Distributions from net realized gains | | | - | (b) | | | - | | | | - | | | | - | | | | - | |
| Total dividends and distributions | | | (0.26 | ) | | | (0.29 | ) | | | (0.25 | ) | | | (0.21 | ) | | | (0.23 | ) |
| Net asset value, end of year | | | $10.78 | | | | $10.09 | | | | $9.63 | | | | $9.99 | | | | $10.22 | |
| Total Return(c): | | | 9.50 | % | | | 7.90 | % | | | (1.14 | )% | | | (0.13 | )% | | | 5.91 | % |
| | | | | | | | | | | | | | | | | | | | |
| Ratios/Supplemental Data: | | | | |
| Net assets, end of year (000) | | | $181,510 | | | | $75,923 | | | | $53,967 | | | | $43,489 | | | | $17,437 | |
| Average net assets (000) | | | $119,286 | | | | $59,735 | | | | $48,790 | | | | $38,131 | | | | $3,049 | |
| Ratios to average net assets(d)(e)(f): | | | | | | | | | | | | | | | | | | | | |
| Expenses after waivers and/or expense reimbursement | | | 0.70 | % | | | 0.70 | % | | | 0.70 | % | | | 0.70 | % | | | 0.70 | % |
| Expenses before waivers and/or expense reimbursement | | | 0.75 | % | | | 0.82 | % | | | 0.84 | % | | | 0.89 | % | | | 0.90 | % |
| Net investment income (loss) | | | 2.01 | % | | | 2.66 | % | | | 2.23 | % | | | 1.77 | % | | | 1.74 | % |
| Portfolio turnover rate(g)(h) | | | 90 | % | | | 69 | % | | | 172 | % | | | 314 | % | | | 224 | % |
| (a) | Calculated based on average shares outstanding during the year. |
| (b) | Less than $(0.005) per share. |
| (c) | Total return does not consider the effects of sales loads. Total return is calculated assuming a purchase of a share on the first day and a sale on the last day of each year reported and includes reinvestment of dividends and distributions, if any. Total returns may reflect adjustments to conform to generally accepted accounting principles. |
| (d) | Effective August 1, 2017, class specific expenses include transfer agent fees and expenses and registration fees, which are charged to their respective share class. |
| (e) | Does not include expenses of the investment companies in which the Fund invests. |
| (f) | Effective March 9, 2015, the contractual distribution and service (12b-1) fees were reduced from 0.30% to 0.25% of the average daily net assets and the 0.05% contractual 12b-1 fee waiver was terminated. |
| (g) | The Fund accounts for mortgage dollar roll transactions as purchases and sales which, as a result, can increase its portfolio turnover rate. |
| (h) | The Fund’s portfolio turnover rate is calculated in accordance with regulatory requirements, without regard to transactions involving short-term investments and certain derivatives. If such transactions were included, the Fund’s portfolio turnover rate may be higher. |
See Notes to Financial Statements.
| | | | | | | | | | | | | | | | | | | | |
| Class C Shares | |
| | | Year Ended July 31, | |
| | | 2020 | | | 2019 | | | 2018 | | | 2017 | | | 2016 | |
| Per Share Operating Performance(a): | | | | | | | | | | | | | | | | | | | | |
| Net Asset Value, Beginning of Year | | | $10.10 | | | | $9.64 | | | | $9.99 | | | | $10.23 | | | | $9.89 | |
| Income (loss) from investment operations: | | | | | | | | | | | | | | | | | | | | |
| Net investment income (loss) | | | 0.13 | | | | 0.19 | | | | 0.14 | | | | 0.10 | | | | 0.11 | |
| Net realized and unrealized gain (loss) on investment and foreign currency transactions | | | 0.74 | | | | 0.48 | | | | (0.32 | ) | | | (0.20 | ) | | | 0.39 | |
| Total from investment operations | | | 0.87 | | | | 0.67 | | | | (0.18 | ) | | | (0.10 | ) | | | 0.50 | |
| Less Dividends and Distributions: | | | | | | | | | | | | | | | | | | | | |
| Dividends from net investment income | | | (0.18 | ) | | | (0.21 | ) | | | (0.17 | ) | | | (0.14 | ) | | | (0.14 | ) |
| Tax return of capital distributions | | | - | | | | - | | | | - | | | | - | | | | (0.02 | ) |
| Distributions from net realized gains | | | - | (b) | | | - | | | | - | | | | - | | | | - | |
| Total dividends and distributions | | | (0.18 | ) | | | (0.21 | ) | | | (0.17 | ) | | | (0.14 | ) | | | (0.16 | ) |
| Net asset value, end of year | | | $10.79 | | | | $10.10 | | | | $9.64 | | | | $9.99 | | | | $10.23 | |
| Total Return(c): | | | 8.68 | % | | | 7.09 | % | | | (1.78 | )% | | | (0.98 | )% | | | 5.13 | % |
| | | | | | | | | | | | | | | | | | | | |
| Ratios/Supplemental Data: | | | | |
| Net assets, end of year (000) | | | $8,596 | | | | $4,042 | | | | $3,530 | | | | $3,486 | | | | $2,226 | |
| Average net assets (000) | | | $6,244 | | | | $3,593 | | | | $3,635 | | | | $3,009 | | | | $880 | |
| Ratios to average net assets(d)(e): | | | | | | | | | | | | | | | | | | | | |
| Expenses after waivers and/or expense reimbursement | | | 1.45 | % | | | 1.45 | % | | | 1.45 | % | | | 1.45 | % | | | 1.45 | % |
| Expenses before waivers and/or expense reimbursement | | | 1.78 | % | | | 1.95 | % | | | 1.99 | % | | | 1.64 | % | | | 1.69 | % |
| Net investment income (loss) | | | 1.25 | % | | | 1.91 | % | | | 1.47 | % | | | 0.98 | % | | | 1.08 | % |
| Portfolio turnover rate(f)(g) | | | 90 | % | | | 69 | % | | | 172 | % | | | 314 | % | | | 224 | % |
| (a) | Calculated based on average shares outstanding during the year. |
| (b) | Less than $(0.005) per share. |
| (c) | Total return does not consider the effects of sales loads. Total return is calculated assuming a purchase of a share on the first day and a sale on the last day of each year reported and includes reinvestment of dividends and distributions, if any. Total returns may reflect adjustments to conform to generally accepted accounting principles. |
| (d) | Effective August 1, 2017, class specific expenses include transfer agent fees and expenses and registration fees, which are charged to their respective share class. |
| (e) | Does not include expenses of the investment companies in which the Fund invests. |
| (f) | The Fund accounts for mortgage dollar roll transactions as purchases and sales which, as a result, can increase its portfolio turnover rate. |
| (g) | The Fund’s portfolio turnover rate is calculated in accordance with regulatory requirements, without regard to transactions involving short-term investments and certain derivatives. If such transactions were included, the Fund’s portfolio turnover rate may be higher. |
See Notes to Financial Statements.
Financial Highlights (continued)
| | | | | | | | | | | | | | | | | | | | |
| Class R Shares | |
| | | Year Ended July 31, | |
| | | 2020 | | | 2019 | | | 2018 | | | 2017 | | | 2016 | |
| Per Share Operating Performance(a): | | | | | | | | | | | | | | | | | | | | |
| Net Asset Value, Beginning of Year | | $ | 10.09 | | | $ | 9.63 | | | $ | 9.99 | | | $ | 10.23 | | | $ | 9.88 | |
| Income (loss) from investment operations: | | | | | | | | | | | | | | | | | | | | |
| Net investment income (loss) | | | 0.19 | | | | 0.23 | | | | 0.20 | | | | 0.15 | | | | 0.16 | |
| Net realized and unrealized gain (loss) on investment and foreign currency transactions | | | 0.73 | | | | 0.49 | | | | (0.34 | ) | | | (0.20 | ) | | | 0.41 | |
| Total from investment operations | | | 0.92 | | | | 0.72 | | | | (0.14 | ) | | | (0.05 | ) | | | 0.57 | |
| Less Dividends and Distributions: | | | | | | | | | | | | | | | | | | | | |
| Dividends from net investment income | | | (0.23 | ) | | | (0.26 | ) | | | (0.22 | ) | | | (0.19 | ) | | | (0.19 | ) |
| Tax return of capital distributions | | | - | | | | - | | | | - | | | | - | | | | (0.03 | ) |
| Distributions from net realized gains | | | - | (b) | | | - | | | | - | | | | - | | | | - | |
| Total dividends and distributions | | | (0.23 | ) | | | (0.26 | ) | | | (0.22 | ) | | | (0.19 | ) | | | (0.22 | ) |
| Net asset value, end of year | | $ | 10.78 | | | $ | 10.09 | | | $ | 9.63 | | | $ | 9.99 | | | $ | 10.23 | |
| Total Return(c): | | | 9.23 | % | | | 7.63 | % | | | (1.39 | )% | | | (0.48 | )% | | | 5.81 | % |
| | | | | | | | | | | | | | | | | | | | |
| Ratios/Supplemental Data: | | | | |
| Net assets, end of year (000) | | $ | 18 | | | $ | 16 | | | $ | 15 | | | $ | 11 | | | $ | 11 | |
| Average net assets (000) | | $ | 17 | | | $ | 15 | | | $ | 13 | | | $ | 10 | | | $ | 10 | |
| Ratios to average net assets(d)(e): | | | | | | | | | | | | | | | | | | | | |
| | | | | | | | | | | | | | | | | | | | | |
| Expenses after waivers and/or expense reimbursement | | | 0.95 | % | | | 0.95 | % | | | 0.95 | % | | | 0.95 | % | | | 0.95 | % |
| Expenses before waivers and/or expense reimbursement | | | 102.99 | % | | | 89.73 | % | | | 113.11 | % | | | 1.40 | % | | | 1.52 | % |
| Net investment income (loss) | | | 1.80 | % | | | 2.41 | % | | | 1.99 | % | | | 1.46 | % | | | 1.66 | % |
| Portfolio turnover rate(f)(g) | | | 90 | % | | | 69 | % | | | 172 | % | | | 314 | % | | | 224 | % |
| (a) | Calculated based on average shares outstanding during the year. |
| (b) | Less than $(0.005) per share. |
| (c) | Total return is calculated assuming a purchase of a share on the first day and a sale on the last day of each year reported and includes reinvestment of dividends and distributions, if any. Total returns may reflect adjustments to conform to generally accepted accounting principles. |
| (d) | Effective August 1, 2017, class specific expenses include transfer agent fees and expenses and registration fees, which are charged to their respective share class. |
| (e) | Does not include expenses of the investment companies in which the Fund invests. |
| (f) | The Fund accounts for mortgage dollar roll transactions as purchases and sales which, as a result, can increase its portfolio turnover rate. |
| (g) | The Fund’s portfolio turnover rate is calculated in accordance with regulatory requirements, without regard to transactions involving short-term investments and certain derivatives. If such transactions were included, the Fund’s portfolio turnover rate may be higher. |
See Notes to Financial Statements.
94
| | | | | | | | | | | | | | | | | | | | |
| Class Z Shares | |
| | | Year Ended July 31, | |
| | | 2020 | | | 2019 | | | 2018 | | | 2017 | | | 2016 | |
| Per Share Operating Performance(a): | | | | | | | | | | | | | | | | | | | | |
| Net Asset Value, Beginning of Year | | $ | 10.09 | | | $ | 9.63 | | | $ | 9.99 | | | $ | 10.23 | | | $ | 9.88 | |
| Income (loss) from investment operations: | | | | | | | | | | | | | | | | | | | | |
| Net investment income (loss) | | | 0.25 | | | | 0.28 | | | | 0.24 | | | | 0.19 | | | | 0.21 | |
| Net realized and unrealized gain (loss) on investment and foreign currency transactions | | | 0.73 | | | | 0.49 | | | | (0.33 | ) | | | (0.19 | ) | | | 0.40 | |
| Total from investment operations | | | 0.98 | | | | 0.77 | | | | (0.09 | ) | | | - | | | | 0.61 | |
| Less Dividends and Distributions: | | | | | | | | | | | | | | | | | | | | |
| Dividends from net investment income | | | (0.29 | ) | | | (0.31 | ) | | | (0.27 | ) | | | (0.24 | ) | | | (0.23 | ) |
| Tax return of capital distributions | | | - | | | | - | | | | - | | | | - | | | | (0.03 | ) |
| Distributions from net realized gains | | | - | (b) | | | - | | | | - | | | | - | | | | - | |
| Total dividends and distributions | | | (0.29 | ) | | | (0.31 | ) | | | (0.27 | ) | | | (0.24 | ) | | | (0.26 | ) |
| Net asset value, end of year | | $ | 10.78 | | | $ | 10.09 | | | $ | 9.63 | | | $ | 9.99 | | | $ | 10.23 | |
| Total Return(c): | | | 9.98 | % | | | 8.17 | % | | | (0.90 | )% | | | 0.02 | % | | | 6.32 | % |
| | | | | | | | | | | | | | | | | | | | |
| Ratios/Supplemental Data: | | | | |
| Net assets, end of year (000) | | $ | 282,256 | | | $ | 162,803 | | | $ | 101,369 | | | $ | 82,297 | | | $ | 96,978 | |
| Average net assets (000) | | $ | 220,426 | | | $ | 115,704 | | | $ | 84,455 | | | $ | 113,324 | | | $ | 93,861 | |
| Ratios to average net assets(d)(e): | | | | | | | | | | | | | | | | | | | | |
| Expenses after waivers and/or expense reimbursement | | | 0.35 | % | | | 0.44 | % | | | 0.45 | % | | | 0.45 | % | | | 0.45 | % |
| Expenses before waivers and/or expense reimbursement | | | 0.49 | % | | | 0.53 | % | | | 0.52 | % | | | 0.61 | % | | | 0.75 | % |
| Net investment income (loss) | | | 2.38 | % | | | 2.92 | % | | | 2.48 | % | | | 1.89 | % | | | 2.15 | % |
| Portfolio turnover rate(f)(g) | | | 90 | % | | | 69 | % | | | 172 | % | | | 314 | % | | | 224 | % |
| (a) | Calculated based on average shares outstanding during the year. |
| (b) | Less than $(0.005) per share. |
| (c) | Total return is calculated assuming a purchase of a share on the first day and a sale on the last day of each year reported and includes reinvestment of dividends and distributions, if any. Total returns may reflect adjustments to conform to generally accepted accounting principles. |
| (d) | Effective August 1, 2017, class specific expenses include transfer agent fees and expenses and registration fees, which are charged to their respective share class. |
| (e) | Does not include expenses of the investment companies in which the Fund invests. |
| (f) | The Fund accounts for mortgage dollar roll transactions as purchases and sales which, as a result, can increase its portfolio turnover rate. |
| (g) | The Fund’s portfolio turnover rate is calculated in accordance with regulatory requirements, without regard to transactions involving short-term investments and certain derivatives. If such transactions were included, the Fund’s portfolio turnover rate may be higher. |
See Notes to Financial Statements.
Financial Highlights (continued)
| | | | | | | | | | | | | | | | | | | | |
| Class R6 Shares | |
| | | Year Ended July 31, | |
| | | 2020 | | | 2019 | | | 2018 | | | 2017 | | | 2016 | |
| Per Share Operating Performance(a): | | | | | | | | | | | | | | | | | | | | |
| Net Asset Value, Beginning of Year | | $ | 10.10 | | | $ | 9.64 | | | $ | 9.99 | | | $ | 10.23 | | | $ | 9.88 | |
| Income (loss) from investment operations: | | | | | | | | | | | | | | | | | | | | |
| Net investment income (loss) | | | 0.25 | | | | 0.29 | | | | 0.25 | | | | 0.22 | | | | 0.21 | |
| Net realized and unrealized gain (loss) on investment and foreign currency transactions | | | 0.73 | | | | 0.49 | | | | (0.32 | ) | | | (0.22 | ) | | | 0.40 | |
| Total from investment operations | | | 0.98 | | | | 0.78 | | | | (0.07 | ) | | | - | | | | 0.61 | |
| Less Dividends and Distributions: | | | | | | | | | | | | | | | | | | | | |
| Dividends from net investment income | | | (0.29 | ) | | | (0.32 | ) | | | (0.28 | ) | | | (0.24 | ) | | | (0.23 | ) |
| Tax return of capital distributions | | | - | | | | - | | | | - | | | | - | | | | (0.03 | ) |
| Distributions from net realized gains | | | - | (b) | | | - | | | | - | | | | - | | | | - | |
| Total dividends and distributions | | | (0.29 | ) | | | (0.32 | ) | | | (0.28 | ) | | | (0.24 | ) | | | (0.26 | ) |
| Net asset value, end of year | | $ | 10.79 | | | $ | 10.10 | | | $ | 9.64 | | | $ | 9.99 | | | $ | 10.23 | |
| Total Return(c): | | | 10.00 | % | | | 8.12 | % | | | (0.74 | )% | | | 0.07 | % | | | 6.32 | % |
| | | | | | | | | | | | | | | | | | | | |
| Ratios/Supplemental Data: | | | | |
| Net assets, end of year (000) | | $ | 716,750 | | | $ | 367,985 | | | $ | 290,530 | | | $ | 201,345 | | | $ | 11 | |
| Average net assets (000) | | $ | 595,755 | | | $ | 309,110 | | | $ | 254,525 | | | $ | 83,714 | | | $ | 10 | |
| Ratios to average net assets(d)(e): | | | | | | | | | | | | | | | | | | | | |
| Expenses after waivers and/or expense reimbursement | | | 0.33 | % | | | 0.39 | % | | | 0.40 | % | | | 0.40 | % | | | 0.45 | % |
| Expenses before waivers and/or expense reimbursement | | | 0.38 | % | | | 0.44 | % | | | 0.45 | % | | | 0.53 | % | | | 0.67 | % |
| Net investment income (loss) | | | 2.39 | % | | | 2.97 | % | | | 2.54 | % | | | 2.22 | % | | | 2.15 | % |
| Portfolio turnover rate(f)(g) | | | 90 | % | | | 69 | % | | | 172 | % | | | 314 | % | | | 224 | % |
| (a) | Calculated based on average shares outstanding during the year. |
| (b) | Less than $(0.005) per share. |
| (c) | Total return is calculated assuming a purchase of a share on the first day and a sale on the last day of each year reported and includes reinvestment of dividends and distributions, if any. Total returns may reflect adjustments to conform to generally accepted accounting principles. |
| (d) | Effective August 1, 2017, class specific expenses include transfer agent fees and expenses and registration fees, which are charged to their respective share class. |
| (e) | Does not include expenses of the investment companies in which the Fund invests. |
| (f) | The Fund accounts for mortgage dollar roll transactions as purchases and sales which, as a result, can increase its portfolio turnover rate. |
| (g) | The Fund’s portfolio turnover rate is calculated in accordance with regulatory requirements, without regard to transactions involving short-term investments and certain derivatives. If such transactions were included, the Fund’s portfolio turnover rate may be higher. |
See Notes to Financial Statements.
Report of Independent Registered Public Accounting Firm
To the Shareholders of PGIM Core Bond Fund and Board of Trustees
The Target Portfolio Trust:
Opinion on the Financial Statements
We have audited the accompanying statement of assets and liabilities of PGIM Core Bond Fund, a series of The Target Portfolio Trust (the Fund), including the schedule of investments, as of July 31, 2020, the related statement of operations for the year then ended, the statements of changes in net assets for each of the years in the two-year period then ended, and the related notes (collectively, the financial statements) and the financial highlights for each of the years indicated therein. In our opinion, the financial statements and financial highlights present fairly, in all material respects, the financial position of the Fund as of July 31, 2020, the results of its operations for the year then ended, the changes in its net assets for each of the years in the two-year period then ended, and the financial highlights for each of the years in the five-year period then ended, in conformity with U.S. generally accepted accounting principles.
Basis for Opinion
These financial statements and financial highlights are the responsibility of the Fund’s management. Our responsibility is to express an opinion on these financial statements and financial highlights based on our audits. We are a public accounting firm registered with the Public Company Accounting Oversight Board (United States) (PCAOB) and are required to be independent with respect to the Fund in accordance with the U.S. federal securities laws and the applicable rules and regulations of the Securities and Exchange Commission and the PCAOB.
We conducted our audits in accordance with the standards of the PCAOB. Those standards require that we plan and perform the audit to obtain reasonable assurance about whether the financial statements and financial highlights are free of material misstatement, whether due to error or fraud. Our audits included performing procedures to assess the risks of material misstatement of the financial statements and financial highlights, whether due to error or fraud, and performing procedures that respond to those risks. Such procedures included examining, on a test basis, evidence regarding the amounts and disclosures in the financial statements and financial highlights. Such procedures also included confirmation of securities owned as of July 31, 2020, by correspondence with the custodian, transfer agent, and brokers, or by other appropriate auditing procedures when replies were not received. Our audits also included evaluating the accounting principles used and significant estimates made by management, as well as evaluating the overall presentation of the financial statements and financial highlights. We believe that our audits provide a reasonable basis for our opinion.

We have served as the auditor of one or more PGIM and/or Prudential Retail investment companies since 2003.
New York, New York
September 18, 2020
Fund Liquidity Risk Management Program (unaudited)
Consistent with Rule 22e-4 under the 1940 Act (the “Liquidity Rule”), the Fund has adopted and implemented a liquidity risk management program (the “LRMP”). The Fund’s LRMP seeks to assess and manage the Trust’s liquidity risk, which is defined as the risk that the Fund is unable to meet investor redemption requests without significantly diluting the remaining investors’ interests in the Fund. The Fund’s Board of Trustees (the “Board”) has approved PGIM Investments LLC (“PGIM Investments”), the Fund’s investment manager, to serve as the administrator of the Fund’s LRMP. As part of its responsibilities as administrator, PGIM Investments has retained a third party to perform certain functions, including providing market data and liquidity classification model information.
The Fund’s LRMP includes a number of processes designed to support the assessment and management of its liquidity risk. In particular, the Fund’s LRMP includes no less than annual assessments of factors that influence the Fund’s liquidity risk; no less than monthly classifications of the Fund’s investments into one of four liquidity classifications provided for in the Liquidity Rule; a 15% of net assets limit on the acquisition of “illiquid investments” (as defined under the Liquidity Rule); establishment of a minimum percentage of the Fund’s assets to be invested in investments classified as “highly liquid” (as defined under the Liquidity Rule) if the Fund does not invest primarily in highly liquid investments; and regular reporting to the Fund’s Board.
At a meeting of the Board on March 3-5, 2020, PGIM Investments provided a written report (“LRMP Report”) to the Board addressing the operation, adequacy, and effectiveness of the Fund’s LRMP, including any material changes to the LRMP for the period from the inception of the Fund’s LRMP on December 1, 2018 through December 31, 2019 (“Reporting Period”). The LRMP Report concluded that the Fund’s LRMP was reasonably designed to assess and manage the Fund’s liquidity risk and was adequately and effectively implemented during the Reporting Period. There were no material changes to the LRMP during the Reporting Period. The LRMP Report further concluded that the Fund’s investment strategies continue to be appropriate given the Fund’s status as an open-end fund.
There can be no assurance that the LRMP will achieve its objectives in the future. Additional information regarding risks of investing in the Fund, including liquidity risks presented by the Fund’s investment portfolio, is found in the Fund’s Prospectus and Statement of Additional Information.
Income Tax Information (unaudited)
For the tax year ended July 31, 2020, the Fund reports 85.67% as interest-related dividends in accordance with Sections 871(k)(1) and 881(e)(1) of the Internal Revenue Code.
In January 2021, you will be advised on IRS Form 1099-DIV or substitute 1099-DIV, as to the Federal tax status of the distributions received by you in calendar year 2020.
We are required by Massachusetts, Missouri and Oregon to inform you that dividends which have been derived from interest on federal obligations are not taxable to shareholders provided the Fund meets certain requirements mandated by the respective state’s taxing authorities. We are pleased to report that 3.98% of the dividends paid by the Fund qualify for such deduction.
For more detailed information regarding your state and local taxes, you should contact your tax adviser or the state/local taxing authorities.
INFORMATION ABOUT BOARD MEMBERS AND OFFICERS (unaudited)
Information about Board Members and Officers of the Fund is set forth below. Board Members who are not deemed to be “interested persons” of the Fund, as defined in the 1940 Act, are referred to as “Independent Board Members.” Board Members who are deemed to be “interested persons” of the Fund are referred to as “Interested Board Members.” The Board Members are responsible for the overall supervision of the operations of the Fund and perform the various duties imposed on the directors of investment companies by the 1940 Act. The Board in turn elects the Officers, who are responsible for administering the day-to-day operations of the Fund.
| | | | | | |
| Independent Board Members | | | | |
| | | | |
Name Year of Birth Position(s) Portfolios Overseen | | Principal Occupation(s) During Past Five Years | | Other Directorships Held During Past Five Years | | Length of Board Service |
| | | | |
Ellen S. Alberding 1958 Board Member Portfolios Overseen: 95 | | President and Board Member, The Joyce Foundation (charitable foundation) (since 2002); Vice Chair, City Colleges of Chicago (community college system) (2011-2015); Trustee, National Park Foundation (charitable foundation for national park system) (2009-2018); Trustee, Economic Club of Chicago (2009-2016); Trustee, Loyola University (since 2018). | | None. | | Since September 2013 |
| | | | |
Kevin J. Bannon 1952 Board Member Portfolios Overseen: 95 | | Retired; Managing Director (April 2008-May 2015) and Chief Investment Officer (October 2008-November 2013) of Highmount Capital LLC (registered investment adviser); formerly Executive Vice President and Chief Investment Officer (April 1993-August 2007) of Bank of New York Company; President (May 2003-May 2007) of BNY Hamilton Family of Mutual Funds. | | Director of Urstadt Biddle Properties (equity real estate investment trust) (since September 2008). | | Since July 2008 |
PGIM Core Bond Fund
| | | | | | |
| Independent Board Members | | | | |
| | | | |
Name Year of Birth Position(s) Portfolios Overseen | | Principal Occupation(s) During Past Five Years | | Other Directorships Held During Past Five Years | | Length of Board Service |
| | | | |
Linda W. Bynoe 1952 Board Member Portfolios Overseen: 95 | | President and Chief Executive Officer (since March 1995) and formerly Chief Operating Officer (December 1989-February 1995) of Telemat Limited LLC (formerly, Telemat Ltd). (management consulting); formerly Vice President (January 1985-June 1989) at Morgan Stanley & Co. (broker-dealer). | | Director of Anixter International, Inc. (communication products distributor) (since January 2006–June 2020); Director of Northern Trust Corporation (financial services) (since April 2006); Trustee of Equity Residential (residential real estate) (since December 2009). | | Since March 2005 |
| | | | |
Barry H. Evans 1960 Board Member Portfolios Overseen: 94 | | Retired; formerly President (2005 – 2016), Global Chief Operating Officer (2014–2016), Chief Investment Officer – Global Head of Fixed Income (1998-2014), and various portfolio manager roles (1986-2006), Manulife Asset Management U.S. | | Formerly Director, Manulife Trust Company (2011-2018); formerly Director, Manulife Asset Management Limited (2015-2017); formerly Chairman of the Board of Directors of Manulife Asset Management U.S. (2005-2016); formerly Chairman of the Board, Declaration Investment Management and Research (2008-2016). | | Since September 2017 |
| | | | |
Keith F. Hartstein 1956 Board Member & Independent Chair Portfolios Overseen: 95 | | Executive Committee of the IDC Board of Governors (since October 2019); Retired; Member (since November 2014) of the Governing Council of the Independent Directors Council (IDC) (organization of independent mutual fund directors); formerly President and Chief Executive Officer (2005-2012), Senior Vice President (2004-2005), Senior Vice President of Sales and Marketing (1997-2004), and various executive management positions (1990-1997), John Hancock Funds, LLC (asset management); Chairman, Investment Company Institute’s Sales Force Marketing Committee (2003-2008). | | None. | | Since September 2013 |
Visit our website at pgim.com/investments
| | | | | | |
| Independent Board Members | | | | |
| | | | |
Name Year of Birth Position(s) Portfolios Overseen | | Principal Occupation(s) During Past Five Years | | Other Directorships Held During Past Five Years | | Length of Board Service |
| | | | |
Laurie Simon Hodrick 1962 Board Member Portfolios Overseen: 94 | | A. Barton Hepburn Professor Emerita of Economics in the Faculty of Business, Columbia Business School (since 2018); Visiting Professor of Law, Stanford Law School (since 2015); Visiting Fellow at the Hoover Institution, Stanford University (since 2015); Sole Member, ReidCourt LLC (since 2008) (a consulting firm); formerly A. Barton Hepburn Professor of Economics in the Faculty of Business, Columbia Business School (1996-2017); formerly Managing Director, Global Head of Alternative Investment Strategies, Deutsche Bank (2006-2008). | | Independent Director, Synnex Corporation (since April 2019) (information technology); Independent Director, Kabbage, Inc. (since July 2018) (financial services); Independent Director, Corporate Capital Trust (2017-2018) (a business development company). | | Since September 2017 |
| | | | |
Michael S. Hyland, CFA 1945 Board Member Portfolios Overseen: 95 | | Retired (since February 2005); formerly Senior Managing Director (July 2001-February 2005) of Bear Stearns & Co, Inc.; Global Partner, INVESCO (1999-2001); Managing Director and President of Salomon Brothers Asset Management (1989-1999). | | None. | | Since July 2008 |
| | | | |
Brian K. Reid 1961 Board Member Portfolios Overseen: 94 | | Retired; formerly Chief Economist for the Investment Company Institute (ICI) (2005-2017); formerly Senior Economist and Director of Industry and Financial Analysis at the ICI (1998-2004); formerly Senior Economist, Industry and Financial Analysis at the ICI (1996-1998); formerly Staff Economist at the Federal Reserve Board (1989-1996); Director, ICI Mutual Insurance Company (2012-2017). | | None. | | Since March 2018 |
PGIM Core Bond Fund
| | | | | | |
| Independent Board Members | | | | |
| | | | |
Name Year of Birth Position(s) Portfolios Overseen | | Principal Occupation(s) During Past Five Years | | Other Directorships Held During Past Five Years | | Length of Board Service |
| | | | |
Grace C. Torres 1959 Board Member Portfolios Overseen: 94 | | Retired; formerly Treasurer and Principal Financial and Accounting Officer of the PGIM Funds, Target Funds, Advanced Series Trust, Prudential Variable Contract Accounts and The Prudential Series Fund (1998-June 2014); Assistant Treasurer (March 1999-June 2014) and Senior Vice President (September 1999-June 2014) of PGIM Investments LLC; Assistant Treasurer (May 2003-June 2014) and Vice President (June 2005-June 2014) of AST Investment Services, Inc.; Senior Vice President and Assistant Treasurer (May 2003-June 2014) of Prudential Annuities Advisory Services, Inc. | | Formerly Director (July 2015-January 2018) of Sun Bancorp, Inc. N.A. and Sun National Bank; Director (since January 2018) of OceanFirst Financial Corp. and OceanFirst Bank. | | Since November 2014 |
| | | | | | |
| Interested Board Members | | | | |
| | | | |
Name Year of Birth Position(s) Portfolios Overseen | | Principal Occupation(s) During Past Five Years | | Other Directorships Held During Past Five Years | | Length of Board Service |
| | | | |
Stuart S. Parker 1962 Board Member & President Portfolios Overseen: 96 | | President of PGIM Investments LLC (formerly known as Prudential Investments LLC) (since January 2012); Executive Vice President of Prudential Investment Management Services LLC (since December 2012); formerly Executive Vice President of Jennison Associates LLC and Head of Retail Distribution of PGIM Investments LLC (June 2005-December 2011). | | None. | | Since January 2012 |
Visit our website at pgim.com/investments
| | | | | | |
| Interested Board Members | | | | |
| | | | |
Name Year of Birth Position(s) Portfolios Overseen | | Principal Occupation(s) During Past Five Years | | Other Directorships Held During Past Five Years | | Length of Board Service |
| | | | |
Scott E. Benjamin 1973 Board Member & Vice President Portfolios Overseen: 96 | | Executive Vice President (since June 2009) of PGIM Investments LLC; Vice President (since June 2012) of Prudential Investment Management Services LLC; Executive Vice President (since September 2009) of AST Investment Services, Inc.; Senior Vice President of Product Development and Marketing, PGIM Investments (since February 2006); formerly Vice President of Product Development and Product Management, PGIM Investments LLC (2003-2006). | | None. | | Since March 2010 |
| | | | |
| Fund Officers(a) | | | | |
| | | |
Name Year of Birth Fund Position | | Principal Occupation(s) During Past Five Years | | Length of Service as Fund Officer |
| | | |
Claudia DiGiacomo 1974 Chief Legal Officer | | Vice President and Corporate Counsel (since January 2005) of Prudential; Chief Legal Officer of PGIM Investments LLC (since August 2020); Chief Legal Officer of Prudential Mutual Fund Services LLC (since August 2020); Chief Legal Officer of PIFM Holdco, LLC (since August 2020); and Corporate Counsel of AST Investment Services, Inc. (since August 2020); formerly Associate at Sidley Austin Brown & Wood LLP (1999-2004). | | Since December 2005 |
| | | |
Dino Capasso 1974 Chief Compliance Officer | | Chief Compliance Officer (July 2019-Present) of PGIM Investments LLC; Chief Compliance Officer (July 2019-Present) of the PGIM Funds, Target Funds, Advanced Series Trust, The Prudential Series Fund, Prudential’s Gibraltar Fund, Inc., PGIM Global High Yield Fund, Inc., and PGIM High Yield Bond Fund, Inc.; Vice President and Deputy Chief Compliance Officer (June 2017-2019) of PGIM Investments LLC; formerly, Senior Vice President and Senior Counsel (January 2016-June 2017), and Vice President and Counsel (February 2012-December 2015) of Pacific Investment Management Company LLC. | | Since March 2018 |
PGIM Core Bond Fund
| | | | |
| Fund Officers(a) | | | | |
| | | |
Name Year of Birth Fund Position | | Principal Occupation(s) During Past Five Years | | Length of Service as Fund Officer |
| | | |
Andrew R. French 1962 Secretary | | Vice President (since December 2018 - present) of PGIM Investments LLC; Formerly, Vice President and Corporate Counsel (2010-2018) of Prudential; formerly Director and Corporate Counsel (2006-2010) of Prudential; Vice President and Assistant Secretary (since January 2007) of PGIM Investments LLC; Vice President and Assistant Secretary (since January 2007) of Prudential Mutual Fund Services LLC. | | Since October 2006 |
| | | |
Jonathan D. Shain 1958 Assistant Secretary | | Vice President and Corporate Counsel (since August 1998) of Prudential; Vice President and Assistant Secretary (since May 2001) of PGIM Investments LLC; Vice President and Assistant Secretary (since February 2001) of Prudential Mutual Fund Services LLC; formerly Vice President and Assistant Secretary (May 2003-June 2005) of AST Investment Services, Inc. | | Since May 2005 |
| | | |
Diana N. Huffman 1982 Assistant Secretary | | Vice President and Corporate Counsel (since September 2015) of Prudential; Vice President and Assistant Secretary (since August 2020) of PGIM Investments LLC; formerly Associate at Willkie Farr & Gallagher LLP (2009-2015). | | Since March 2019 |
| | | |
Melissa Gonzalez 1980 Assistant Secretary | | Vice President and Corporate Counsel (since September 2018) of Prudential; Vice President and Assistant Secretary (since August 2020) of PGIM Investments LLC; formerly Director and Corporate Counsel (March 2014-September 2018) of Prudential. | | Since March 2020 |
| | | |
Patrick E. McGuinness 1986 Assistant Secretary | | Vice President and Assistant Secretary (since August 2020) of PGIM Investments LLC; Director and Corporate Counsel (since February 2017) of Prudential; and Corporate Counsel (2012 – 2017) of IIL, Inc. | | Since June 2020 |
| | | |
Kelly A. Coyne 1968 Assistant Secretary | | Director, Investment Operations of Prudential Mutual Fund Services LLC (since 2010). | | Since March 2015 |
| | | |
Christian J. Kelly 1975 Treasurer and Principal Financial and Accounting Officer | | Vice President, Head of Fund Administration of PGIM Investments LLC (since November 2018); formerly, Director of Fund Administration of Lord Abbett & Co. LLC (2009-2018), Treasurer and Principal Accounting Officer of the Lord Abbett Family of Funds (2017-2018); Director of Accounting, Avenue Capital Group (2008-2009); Senior Manager, Investment Management Practice of Deloitte & Touche LLP (1998-2007). | | Since January 2019 |
| | | |
Lana Lomuti 1967 Assistant Treasurer | | Vice President (since 2007) and Director (2005-2007), within PGIM Investments Fund Administration; formerly Assistant Treasurer (December 2007-February 2014) of The Greater China Fund, Inc. | | Since April 2014 |
| | | |
Russ Shupak 1973 Assistant Treasurer | | Vice President (since 2017) and Director (2013-2017), within PGIM Investments Fund Administration. | | Since October 2019 |
Visit our website at pgim.com/investments
| | | | |
| Fund Officers(a) | | | | |
| | | |
Name Year of Birth Fund Position | | Principal Occupation(s) During Past Five Years | | Length of Service as Fund Officer |
| | | |
Deborah Conway 1969 Assistant Treasurer | | Vice President (since 2017) and Director (2007-2017), within PGIM Investments Fund Administration. | | Since October 2019 |
| | | |
Elyse M. McLaughlin 1974 Assistant Treasurer | | Vice President (since 2017) and Director (2011-2017), within PGIM Investments Fund Administration. | | Since October 2019 |
| | | |
Charles H. Smith 1973 Anti-Money Laundering Compliance Officer | | Vice President, Corporate Compliance, Anti-Money Laundering Unit (since January 2015) of Prudential; committee member of the American Council of Life Insurers Anti-Money Laundering and Critical Infrastructure Committee (since January 2016); formerly Global Head of Economic Sanctions Compliance at AIG Property Casualty (February 2007-December 2014); Assistant Attorney General at the New York State Attorney General’s Office, Division of Public Advocacy. (August 1998-January 2007). | | Since January 2017 |
(a) Excludes Mr. Parker and Mr. Benjamin, interested Board Members who also serve as President and Vice President, respectively.
Explanatory Notes to Tables:
| ∎ | | Board Members are deemed to be “Interested,” as defined in the 1940 Act, by reason of their affiliation with PGIM Investments LLC and/or an affiliate of PGIM Investments LLC. |
| ∎ | | Unless otherwise noted, the address of all Board Members and Officers is c/o PGIM Investments LLC, 655 Broad Street, Newark, New Jersey 07102-4410. |
| ∎ | | There is no set term of office for Board Members or Officers. The Board Members have adopted a retirement policy, which calls for the retirement of Board Members on December 31 of the year in which they reach the age of 75. |
| ∎ | | “Other Directorships Held” includes all directorships of companies required to register or file reports with the SEC under the 1934 Act (that is, “public companies”) or other investment companies registered under the 1940 Act. |
| ∎ | | “Portfolios Overseen” includes all investment companies managed by PGIM Investments LLC. The investment companies for which PGIM Investments LLC serves as manager include the PGIM Funds, The Prudential Variable Contract Accounts, PGIM ETF Trust, PGIM High Yield Bond Fund, Inc., PGIM Global High Yield Fund, Inc., The Prudential Series Fund, Prudential’s Gibraltar Fund, Inc. and the Advanced Series Trust. |
| ∎ | | As used in the Fund Officers table “Prudential” means The Prudential Insurance Company of America. |
PGIM Core Bond Fund
Approval of Advisory Agreements
The Fund’s Board of Trustees
The Board of Trustees (the “Board”) of PGIM Core Bond Fund (the “Fund”)1 consists of eleven individuals, nine of whom are not “interested persons” of the Fund, as defined in the Investment Company Act of 1940, as amended (the “1940 Act”) (the “Independent Trustees”). The Board is responsible for the oversight of the Fund and its operations, and performs the various duties imposed on the directors of investment companies by the 1940 Act. The Independent Trustees have retained independent legal counsel to assist them in connection with their duties. The Chair of the Board is an Independent Trustee. The Board has established four standing committees: the Audit Committee, the Nominating and Governance Committee, and two Investment Committees. Each committee is chaired by, and composed of, Independent Trustees.
Annual Approval of the Fund’s Advisory Agreements
As required under the 1940 Act, the Board determines annually whether to renew the Fund’s management agreement with PGIM Investments LLC (“PGIM Investments”), the Fund’s subadvisory agreement with PGIM, Inc. (“PGIM”) on behalf of its PGIM Fixed Income unit, and PGIM Limited (“PGIML”). In considering the renewal of the agreements, the Board, including all the Independent Trustees, met on May 27, 2020 and on June 9-11, 2020 and approved the renewal of the agreements through July 31, 2021, after concluding that the renewal of the agreements was in the best interests of the Fund and its shareholders.
In advance of the meetings, the Board requested and received materials relating to the agreements, and had the opportunity to ask questions and request further information in connection with its consideration. Among other things, the Board considered comparative fee information from PGIM Investments, PGIM, and, where appropriate, affiliates of PGIM. Also, the Board considered comparisons with other mutual funds in relevant Peer Universes and Peer Groups, as is further discussed below.
In approving the agreements, the Board, including the Independent Trustees advised by independent legal counsel, considered the factors it deemed relevant, including the nature, quality and extent of services provided by PGIM Investments, the subadviser and, as relevant, its affiliates the performance of the Fund, the profitability of PGIM Investments and its affiliates, expenses and fees, and the potential for economies of scale that may be shared with the Fund and its shareholders as the Fund’s assets grow. In their deliberations, the Trustees did not identify any single factor which alone was responsible for the Board’s decision to approve the agreements with respect to the Fund. In connection with its deliberations, the Board considered information provided by PGIM Investments throughout
| 1 | PGIM Core Bond Fund is a series of The Target Portfolio Trust. |
Approval of Advisory Agreements (continued)
the year at regular Board meetings, presentations from portfolio managers and other information, as well as information furnished at or in advance of the meetings on May 27, 2020 and on June 9-11, 2020.
The Trustees determined that the overall arrangements between the Fund and PGIM Investments, which serves as the Fund’s investment manager pursuant to a management agreement, and between PGIM Investments and each of PGIML and PGIM (through its PGIM Fixed Income unit) which serve as the Fund’s subadvisers pursuant to the terms of a subadvisory agreement with PGIM Investment, are in the best interests of the Fund and its shareholders in light of the services performed, fees charged and such other matters as the Trustees considered relevant in the exercise of their business judgment.
The material factors and conclusions that formed the basis for the Trustees’ reaching their determinations to approve the continuance of the agreements are separately discussed below.
Nature, Quality, and Extent of Services
The Board received and considered information regarding the nature, quality and extent of services provided to the Fund by PGIM Investments, PGIM Fixed Income, and PGIML. The Board noted that PGIM Fixed Income and PGIML are affiliated with PGIM Investments. The Board considered the services provided by PGIM Investments, including but not limited to the oversight of the subadvisers for the Fund, as well as the provision of fund recordkeeping, compliance and other services to the Fund, and PGIM Investments’ role as administrator for the Fund’s liquidity risk management program. With respect to PGIM Investments’ oversight of the subadvisers, the Board noted that PGIM Investments’ Strategic Investment Research Group (“SIRG”), which is a business unit of PGIM Investments, is responsible for monitoring and reporting to PGIM Investments’ senior management on the performance and operations of the subadvisers. The Board also considered that PGIM Investments pays the salaries of all of the officers and interested Trustees of the Fund who are part of Fund management. The Board also considered the investment subadvisory services provided by PGIM Fixed Income and PGIML, including investment research and security selection, as well as adherence to the Fund’s investment restrictions and compliance with applicable Fund policies and procedures. The Board considered PGIM Investments’ evaluation of the subadvisers, as well as PGIM Investments’ recommendation, based on its review of the subadvisers, to renew the subadvisory agreement.
The Board considered the qualifications, backgrounds and responsibilities of PGIM Investments’ senior management responsible for the oversight of the Fund, PGIM Fixed Income, and PGIML, and also considered the qualifications, backgrounds and responsibilities of PGIM Fixed Income’s portfolio managers who are responsible for the
| | |
| Visit our website at pgim.com/investments | | |
day-to-day management of the Fund’s portfolio. The Board was provided with information pertaining to PGIM Investments’, PGIM Fixed Income’s, and PGIML’s organizational structure, senior management, investment operations, and other relevant information pertaining to PGIM Investments, PGIM Fixed Income, and PGIML. The Board also noted that it received favorable compliance reports from the Fund’s Chief Compliance Officer (“CCO”) as to PGIM Investments, PGIM Fixed Income, and PGIML.
The Board concluded that it was satisfied with the nature, extent and quality of the investment management services provided by PGIM Investments, the subadvisory services provided to the Fund by PGIM Fixed Income and PGIML, and that there was a reasonable basis on which to conclude that the Fund benefits from the services provided by PGIM Investments, PGIM Fixed Income, and PGIML under the management and subadvisory agreements.
Costs of Services and Profits Realized by PGIM Investments
The Board was provided with information on the profitability of PGIM Investments and its affiliates in serving as the Fund’s investment manager. The Board discussed with PGIM Investments the methodology utilized in assembling the information regarding profitability and considered its reasonableness. The Board recognized that it is difficult to make comparisons of profitability from fund management contracts because comparative information is not generally publicly available and is affected by numerous factors, including the structure of the particular adviser, the types of funds it manages, its business mix, numerous assumptions regarding allocations and the adviser’s capital structure and cost of capital. The Board noted that the cost of services provided by PGIM Investments to the Fund during the year ended December 31, 2019 exceeded the management fees paid by the Fund, resulting in an operating loss to PGIM Investments. Taking these factors into account, the Board concluded that the profitability of PGIM Investments and its affiliates in relation to the services rendered was not unreasonable.
Economies of Scale
The Board received and discussed information concerning economies of scale that PGIM Investments may realize as the Fund’s assets grow beyond current levels. The Board noted that the management fee schedule for the Fund includes breakpoints, which have the effect of decreasing the fee rate as assets increase. During the course of time, the Board has considered information regarding the launch date of the Fund, the management fees of the Fund compared to those of similarly managed funds and PGIM Investments’ investment in the Fund over time. The Board noted that economies of scale can be shared with the Fund in other ways, including low management fees from inception, additional technological and personnel investments to enhance shareholder services, and maintaining existing expense structures in the face of a rising cost environment. The Board also
Approval of Advisory Agreements (continued)
considered PGIM Investments’ assertion that it continually evaluates the management fee schedule of the Fund and the potential to share economies of scale through breakpoints or fee waivers as asset levels increase.
The Board recognized the inherent limitations of any analysis of economies of scale, stemming largely from the Board’s understanding that most of PGIM Investments’ costs are not specific to individual funds, but rather are incurred across a variety of products and services.
Other Benefits to PGIM Investments, PGIM Fixed Income, and PGIML
The Board considered potential ancillary benefits that might be received by PGIM Investments, PGIM Fixed Income, PGIML and their affiliates as a result of their relationship with the Fund. The Board concluded that potential benefits to be derived by PGIM Investments included transfer agency fees received by the Fund’s transfer agent (which is affiliated with PGIM Investments), as well as benefits to its reputation or other intangible benefits resulting from PGIM Investments’ association with the Fund. The Board concluded that the potential benefits to be derived by PGIM Fixed Income and PGIML included the ability to use soft dollar credits, as well as the potential benefits consistent with those generally resulting from an increase in assets under management, specifically, potential access to additional research resources and benefits to their reputations. The Board concluded that the benefits derived by PGIM Investments, PGIM Fixed Income, and PGIML were consistent with the types of benefits generally derived by investment managers and subadvisers to mutual funds.
Performance of the Fund / Fees and Expenses
The Board considered certain additional factors and made related conclusions relating to the historical performance of the Fund for the one-, three-, five- and ten-year periods ended December 31, 2019.
The Board also considered the Fund’s actual management fee, as well as the Fund’s net total expense ratio, for the fiscal year ended July 31, 2019. The Board considered the management fee for the Fund as compared to the management fee charged by PGIM Investments to other funds and the fee charged by other advisers to comparable mutual funds in a Peer Group. The actual management fee represents the fee rate actually paid by Fund shareholders and includes any fee waivers or reimbursements. The net total expense ratio for the Fund represents the actual expense ratio incurred by Fund shareholders.
The mutual funds included in the Peer Universe, which was used to consider performance, and the Peer Group, which was used to consider fees and expenses, were objectively
| | |
| Visit our website at pgim.com/investments | | |
determined by Broadridge, an independent provider of mutual fund data. In certain circumstances, PGIM Investments also provided supplemental Peer Universe or Peer Group information, for reasons addressed with the Board. The comparisons placed the Fund in various quartiles over various periods, with the first quartile being the best 25% of the mutual funds (for performance, the best performing mutual funds and, for expenses, the lowest cost mutual funds).
The section below summarizes key factors considered by the Board and the Board’s conclusions regarding the Fund’s performance, fees and overall expenses. The table sets forth net performance comparisons (which reflect the impact on performance of fund expenses, or any subsidies, expense caps or waivers that may be applicable) with the Peer Universe, actual management fees with the Peer Group (which reflect the impact of any subsidies or fee waivers), and net total expenses with the Peer Group, each of which were key factors considered by the Board.
| | | | | | | | |
| Net Performance | | 1 Year | | 3 Years | | 5 Years | | 10 Years |
| | | 2nd Quartile | | 2nd Quartile | | 2nd Quartile | | 3rd Quartile |
| Actual Management Fees: 1st Quartile |
| Net Total Expenses: 1st Quartile |
| | • | | The Board noted that the Fund outperformed its benchmark index over the one-, three- and five-year periods, though it underperformed over the ten-year period. |
| | • | | The Board and PGIM Investments agreed to enhance the Fund’s existing contractual expense cap, such that, effective December 1, 2019, the expense cap (exclusive of certain fees and expenses) is 0.70% for Class A shares, 1.45% for Class C shares and 0.95% for Class R shares, 0.33% for Class Z shares, and 0.32% for Class R6 shares through November 30, 2020. |
| | • | | In addition, PGIM Investments will waive management fees or shared operating expenses on any share class to the same extent that it waives such expenses on any other share class, and has agreed that total annual fund operating expenses for Class R6 shares will not exceed total annual fund operating expenses for Class Z shares. |
| | • | | The Board concluded that, in light of the above, it would be in the best interests of the Fund and its shareholders to renew the agreements. |
| | • | | The Board concluded that the management fees (including subadvisory fees) and total expenses were reasonable in light of the services provided. |
* * *
After full consideration of these factors, the Board concluded that the approval of the agreements was in the best interests of the Fund and its shareholders.
| | | | |
| | |
| ∎ MAIL | | ∎ TELEPHONE | | ∎ WEBSITE |
655 Broad Street Newark, NJ 07102 | | (800) 225-1852 | | pgim.com/investments |
|
| PROXY VOTING |
| The Board of Trustees has delegated to the Fund’s subadvisers the responsibility for voting any proxies and maintaining proxy recordkeeping with respect to the Fund. A description of these proxy voting policies and procedures is available without charge, upon request, by calling (800) 225-1852 or by visiting the Securities and Exchange Commission’s website at sec.gov. Information regarding how the Fund voted proxies relating to portfolio securities during the most recent 12-month period ended June 30 is available on the Fund’s website and on the Commission’s website at sec.gov. |
|
| TRUSTEES |
| Ellen S. Alberding • Kevin J. Bannon • Scott E. Benjamin • Linda W. Bynoe • Barry H. Evans • Keith F. Hartstein • Laurie Simon Hodrick • Michael S. Hyland • Stuart S. Parker • Brian K. Reid • Grace C. Torres |
|
| OFFICERS |
| Stuart S. Parker, President • Scott E. Benjamin, Vice President • Christian J. Kelly, Treasurer and Principal Financial and Accounting Officer • Claudia DiGiacomo, Chief Legal Officer • Dino Capasso, Chief Compliance Officer • Charles H. Smith, Anti-Money Laundering Compliance Officer • Andrew R. French, Secretary • Jonathan D. Shain, Assistant Secretary • Melissa Gonzalez, Assistant Secretary • Diana N. Huffman, Assistant Secretary • Kelly A. Coyne, Assistant Secretary • Patrick McGuinness, Assistant Secretary • Lana Lomuti, Assistant Treasurer • Russ Shupak, Assistant Treasurer • Elyse McLaughlin, Assistant Treasurer • Deborah Conway, Assistant Treasurer |
| | | | |
| MANAGER | | PGIM Investments LLC | | 655 Broad Street Newark, NJ 07102 |
|
| SUBADVISER | | PGIM Fixed Income | | 655 Broad Street Newark, NJ 07102 |
| | PGIM Limited | | Grand Buildings, 1-3 Strand Trafalgar Square London, WC2N 5HR United Kingdom |
|
| DISTRIBUTOR | | Prudential Investment Management Services LLC | | 655 Broad Street
Newark, NJ 07102 |
|
| CUSTODIAN | | The Bank of New York Mellon | | 240 Greenwich Street New York, NY 10286 |
|
| TRANSFER AGENT | | Prudential Mutual Fund Services LLC | | PO Box 9658 Providence, RI 02940 |
|
| INDEPENDENT REGISTERED PUBLIC ACCOUNTING FIRM | | KPMG LLP | | 345 Park Avenue New York, NY 10154 |
|
| FUND COUNSEL | | Willkie Farr & Gallagher LLP | | 787 Seventh Avenue New York, NY 10019 |
|
|
| An investor should consider the investment objectives, risks, charges, and expenses of the Fund carefully before investing. The prospectus and summary prospectus contain this and other information about the Fund. An investor may obtain a prospectus and summary prospectus by visiting our website at pgim.com/investments or by calling (800) 225-1852. The prospectus and summary prospectus should be read carefully before investing. |
|
| E-DELIVERY |
| To receive your mutual fund documents online, go to pgim.com/investments/resource/edelivery and enroll. Instead of receiving printed documents by mail, you will receive notification via email when new materials are available. You can cancel your enrollment or change your email address at any time by visiting the website address above. |
|
| SHAREHOLDER COMMUNICATIONS WITH TRUSTEES |
| Shareholders can communicate directly with the Board of Trustees by writing to the Chair of the Board, PGIM Core Bond Fund, PGIM Investments, Attn: Board of Trustees, 655 Broad Street, Newark, NJ 07102. Shareholders can communicate directly with an individual Trustee by writing to that Trustee at the same address. Communications are not screened before being delivered to the addressee. |
|
| AVAILABILITY OF PORTFOLIO SCHEDULE |
| The Fund files its complete schedule of portfolio holdings with the Securities and Exchange Commission for the first and third quarters of each fiscal year as an exhibit to its reports on Form N-PORT. The Fund’s Form N-PORT filings are available on the Commission’s website at sec.gov. |
|
| The Fund’s Statement of Additional Information contains additional information about the Fund’s Trustees and is available without charge, upon request, by calling (800) 225-1852. |
Mutual Funds:
| | | | |
ARE NOT INSURED BY THE FDIC OR ANY
FEDERAL GOVERNMENT AGENCY | | MAY LOSE VALUE | | ARE NOT A DEPOSIT OF OR GUARANTEED
BY ANY BANK OR ANY BANK AFFILIATE |
PGIM CORE BOND FUND
| | | | | | | | | | |
| SHARE CLASS | | A | | C | | R | | Z | | R6 |
| NASDAQ | | TPCAX | | TPCCX | | TPCRX | | TAIBX | | TPCQX |
| CUSIP | | 875921769 | | 875921751 | | 875921736 | | 875921801 | | 875921744 |
MF226 E
Item 2 – Code of Ethics — See Exhibit (a)
As of the end of the period covered by this report, the registrant has adopted a code of ethics (the “Section 406 Standards for Investment Companies – Ethical Standards for Principal Executive and Financial Officers”) that applies to the registrant’s Principal Executive Officer and Principal Financial Officer; the registrant’s Principal Financial Officer also serves as the Principal Accounting Officer.
The registrant hereby undertakes to provide any person, without charge, upon request, a copy of the code of ethics. To request a copy of the code of ethics, contact the registrant 800-225-1852, and ask for a copy of the Section 406 Standards for Investment Companies - Ethical Standards for Principal Executive and Financial Officers.
Item 3 – Audit Committee Financial Expert –
The registrant’s Board has determined that Ms. Grace C. Torres, member of the Board’s Audit Committee is an “audit committee financial expert,” and that she is “independent,” for purposes of this item.
Item 4 – Principal Accountant Fees and Services –
(a) Audit Fees
For the fiscal years ended July 31, 2020 and July 31, 2019, KPMG LLP (“KPMG”), the Registrant’s principal accountant, billed the Registrant $131,665 and $131,665 respectively, for professional services rendered for the audit of the Registrant’s annual financial statements or services that are normally provided in connection with statutory and regulatory filings.
(b) Audit-Related Fees
For the fiscal year ended July 31, 2020, fees of $4,254 were billed to the Registrant for services rendered by KPMG in connection with an accounting system conversion and were paid by The Bank of New York Mellon. For the fiscal year ended July 31, 2019, there are no fees to report.
(c) Tax Fees
For the fiscal years ended July 31, 2020 and July 31, 2019: none.
(d) All Other Fees
For the fiscal years ended July 31, 2020 and July 31, 2019: none.
(e) (1) Audit Committee Pre-Approval Policies and Procedures
THE PGIM MUTUAL FUNDS
AUDIT COMMITTEE POLICY
on
Pre-Approval of Services Provided by the Independent
Accountants
The Audit Committee of each PGIM Mutual Fund is charged with the responsibility to monitor the independence of the Fund’s independent accountants. As part of this responsibility, the Audit Committee must pre-approve the independent accounting firm’s engagement to render audit and/or permissible non-audit services, as required by law. In evaluating a proposed engagement of the independent accountants, the Audit Committee will assess the effect that the engagement might reasonably be expected to have on the accountant’s independence. The Committee’s evaluation will be based on:
| | • | | a review of the nature of the professional services expected to be provided, |
| | • | | a review of the safeguards put into place by the accounting firm to safeguard independence, and |
| | • | | periodic meetings with the accounting firm. |
Policy for Audit and Non-Audit Services Provided to the Funds
On an annual basis, the scope of audits for each Fund, audit fees and expenses, and audit-related and non-audit services (and fees proposed in respect thereof) proposed to be performed by the Fund’s independent accountants will be presented by the Treasurer and the independent accountants to the Audit Committee for review and, as appropriate, approval prior to the initiation of such services.
Such presentation shall be accompanied by confirmation by both the Treasurer and the independent accountants that the proposed
non-audit services will not adversely affect the independence of the independent accountants. Such proposed non-audit services shall be described in sufficient detail to enable the Audit Committee to assess the appropriateness of such services and fees, and the compatibility of the provision of such services with the auditor’s independence. The Committee shall receive periodic reports on the progress of the audit and other services which are approved by the Committee or by the Committee Chair pursuant to authority delegated in this Policy.
The categories of services enumerated under “Audit Services”, “Audit-related Services”, and “Tax Services” are intended to provide guidance to the Treasurer and the independent accountants as to those categories of services which the Committee believes are generally consistent with the independence of the independent accountants and which the Committee (or the Committee Chair) would expect upon the presentation of specific proposals to pre-approve. The enumerated categories are not intended as an exclusive list of audit, audit-related or tax services, which the Committee (or the Committee Chair) would consider for pre-approval.
Audit Services
The following categories of audit services are considered to be consistent with the role of the Fund’s independent accountants:
| | • | | Annual Fund financial statement audits |
| | • | | Seed audits (related to new product filings, as required) |
| | • | | SEC and regulatory filings and consents |
Audit-related Services
The following categories of audit-related services are considered to be consistent with the role of the Fund’s independent accountants:
| | • | | Accounting consultations |
| | • | | Fund merger support services |
| | • | | Agreed Upon Procedure Reports |
| | • | | Other Internal Control Reports |
Individual audit-related services that fall within one of these categories (except for fund merger support services) and are not presented to the Audit Committee as part of the annual pre-approval process are subject to an authorized pre-approval by the Audit Committee so long as the estimated fee for those services does not exceed $30,000. Any services provided under such pre-approval will be reported to the Audit Committee at its next regular meeting. Should the amount of such services exceed $30,000 any additional fees will be subject to pre-approval by the Committee Chair (or any other Committee member on whom this responsibility has been delegated). Fees related to fund merger support services are subject to a separate authorized
pre-approval by the Audit Committee with fees determined on a per occurrence and merger complexity basis.
Tax Services
The following categories of tax services are considered to be consistent with the role of the Fund’s independent accountants:
| | • | | Tax compliance services related to the filing or amendment of the following: |
| | • | | Federal, state and local income tax compliance; and, |
| | • | | Sales and use tax compliance |
| | • | | Timely RIC qualification reviews |
| | • | | Tax distribution analysis and planning |
| | • | | Tax authority examination services |
| | • | | Tax appeals support services |
| | • | | Accounting methods studies |
| | • | | Fund merger support services |
| | • | | Tax consulting services and related projects |
Individual tax services that fall within one of these categories and are not presented to the Audit Committee as part of the annual pre-approval process are subject to an authorized pre-approval by the Audit Committee so long as the estimated fee for those services does not exceed $30,000. Any services provided under such pre-approval will be reported to the Audit Committee at its next regular meeting. Should the amount of such services exceed $30,000 any additional fees will be subject to pre-approval by the Committee Chair (or any other Committee member on whom this responsibility has been delegated).
Other Non-Audit Services
Certain non-audit services that the independent accountants are legally permitted to render will be subject to pre-approval by the Committee or by one or more Committee members to whom the Committee has delegated this authority and who will report to the full Committee any pre-approval decisions made pursuant to this Policy. Non-audit services presented for pre-approval pursuant to this paragraph will be accompanied by a confirmation from both the Treasurer and the independent accountants that the proposed services will not adversely affect the independence of the independent accountants.
Proscribed Services
The Fund’s independent accountants will not render services in the following categories of non-audit services:
| | • | | Bookkeeping or other services related to the accounting records or financial statements of the Fund |
| | • | | Financial information systems design and implementation |
| | • | | Appraisal or valuation services, fairness opinions, or contribution-in-kind reports |
| | • | | Internal audit outsourcing services |
| | • | | Management functions or human resources |
| | • | | Broker or dealer, investment adviser, or investment banking services |
| | • | | Legal services and expert services unrelated to the audit |
| | • | | Any other service that the Public Company Accounting Oversight Board determines, by regulation, is impermissible. |
Pre-approval of Non-Audit Services Provided to Other Entities Within the PGIM Fund Complex
Certain non-audit services provided to PGIM Investments LLC or any of its affiliates that also provide ongoing services to the PGIM Mutual Funds will be subject to pre-approval by the Audit Committee. The only non-audit services provided to these entities that will require pre-approval are those related directly to the operations and financial reporting of the Funds.
Individual projects that are not presented to the Audit Committee as part of the annual pre-approval process will be subject to pre-approval by the Committee Chair (or any other Committee member on whom this responsibility has been delegated) so long as the estimated fee for those services does not exceed $30,000. Services presented for pre-approval pursuant to this paragraph will be accompanied by a confirmation from both the Treasurer and the independent accountants that the proposed services will not adversely affect the independence of the independent accountants.
Although the Audit Committee will not pre-approve all services provided to PGIM Investments LLC and its affiliates, the Committee will receive an annual report from the Fund’s independent accounting firm showing the aggregate fees for all services provided to PGIM Investments and its affiliates.
(e) (2) Percentage of services referred to in 4(b) – 4(d) that were approved by the audit committee –
For the fiscal year ended July 31, 2020, 100% of the services referred to in Item 4(b) was approved by the audit committee. For the fiscal year ended July 31, 2019: none.
(f) Percentage of hours expended attributable to work performed by other than full time employees of principal accountant if greater than 50%.
The percentage of hours expended on the principal accountant’s engagement to audit the registrant’s financial statements for the most recent fiscal year that were attributed to work performed by persons other than the principal accountant’s full-time, permanent employees was 0%.
(g) Non-Audit Fees
The aggregate non-audit fees billed by KPMG for services rendered to the registrant’s investment adviser and any entity controlling, controlled by, or under common control with the investment adviser that provides ongoing services to the registrant for the fiscal years ended July 31, 2020 and July 31, 2019 was $0 and $0, respectively.
(h) Principal Accountant’s Independence
Not applicable as KPMG has not provided non-audit services to the registrant’s investment adviser and any entity controlling, controlled by, or under common control with the investment adviser that provides ongoing services to the registrant that were not pre-approved pursuant to Rule 2-01(c)(7)(ii) of Regulation S-X.
Item 5 – Audit Committee of Listed Registrants – Not applicable.
Item 6 – Schedule of Investments – The schedule is included as part of the report to shareholders filed under Item 1 of this Form.
Item 7 – Disclosure of Proxy Voting Policies and Procedures for Closed-End Management Investment Companies – Not applicable.
Item 8 – Portfolio Managers of Closed-End Management Investment Companies – Not applicable.
Item 9 – Purchases of Equity Securities by Closed-End Management Investment Company and Affiliated Purchasers – Not applicable.
Item 10 – Submission of Matters to a Vote of Security Holders – There have been no material changes to these procedures.
Item 11 – Controls and Procedures
| | (a) | It is the conclusion of the registrant’s principal executive officer and principal financial officer that the effectiveness of the registrant’s current disclosure controls and procedures (such disclosure controls and procedures having been evaluated within 90 days of the date of this filing) provide reasonable assurance that |
SIGNATURES
Pursuant to the requirements of the Securities Exchange Act of 1934 and the Investment Company Act of 1940, the registrant has duly caused this report to be signed on its behalf by the undersigned, thereunto duly authorized.
| | |
| Registrant: | | The Target Portfolio Trust |
| |
| By: | | /s/ Andrew R. French |
| | Andrew R. French |
| | Secretary |
| |
| Date: | | September 18, 2020 |
Pursuant to the requirements of the Securities Exchange Act of 1934 and the Investment Company Act of 1940, this report has been signed below by the following persons on behalf of the registrant and in the capacities and on the dates indicated.
| | |
| By: | | /s/ Stuart S. Parker |
| | Stuart S. Parker |
| | President and Principal Executive Officer |
| |
| Date: | | September 18, 2020 |
| |
| By: | | /s/ Christian J. Kelly |
| | Christian J. Kelly |
| | Treasurer and Principal Financial and Accounting Officer |
| |
| Date: | | September 18, 2020 |