UNITED STATES
SECURITIES AND EXCHANGE COMMISSION
Washington, D.C. 20549
FORM N-CSR
CERTIFIED SHAREHOLDER REPORT OF REGISTERED MANAGEMENT
INVESTMENT COMPANIES
| | |
| Investment Company Act file number: | | 811-07064 |
| |
| Exact name of registrant as specified in charter: | | The Target Portfolio Trust |
| |
| Address of principal executive offices: | | 655 Broad Street, 17th Floor Newark, New Jersey 07102 |
| |
| Name and address of agent for service: | | Deborah A. Docs 655 Broad Street, 17th Floor Newark, New Jersey 07102 |
| |
| Registrant’s telephone number, including area code: | | 800-225-1852 |
| |
| Date of fiscal year end: | | 7/31/2018 |
| |
| Date of reporting period: | | 7/31/2018 |
Item 1 – Reports to Stockholders

PGIM CORPORATE BOND FUND
(formerly known as Prudential Corporate Bond Fund)
ANNUAL REPORT
JULY 31, 2018

To enroll in e-delivery, go to pgiminvestments.com/edelivery
|
| Objective: High current income consistent with the preservation of principal |
Highlights
PGIM CORPORATE BOND FUND
| • | | Security selection in investment-grade corporate bonds was the largest contributor to performance, highlighted by the Fund’s position in the banking, upstream energy, and media & entertainment sectors. |
| • | | An overweight in commercial mortgage-backed securities (CMBS) also added to performance. |
| • | | An underweight to, and security selection in, emerging markets as well as an overweight to, and security selection in, municipals hurt performance over the period. |
This report is not authorized for distribution to prospective investors unless preceded or accompanied by a current prospectus.
The views expressed in this report and information about the Fund’s portfolio holdings are for the period covered by this report and are subject to change thereafter.
Mutual funds are distributed by Prudential Investment Management Services LLC (PIMS), member SIPC. PGIM Fixed Income is a unit of PGIM, Inc. (PGIM), a registered investment adviser. PIMS and PGIM are Prudential Financial companies. © 2018 Prudential Financial, Inc. and its related entities. PGIM and the PGIM logo are service marks of Prudential Financial, Inc. and its related entities, registered in many jurisdictions worldwide.
| | |
| 2 | | Visit our website at pgiminvestments.com |
Table of Contents
| | | | |
| PGIM Corporate Bond Fund | | | 3 | |
This Page Intentionally Left Blank
Letter from the President

Dear Shareholder:
We hope you find the annual report for the PGIM Corporate Bond Fund informative and useful. The report covers performance for the 12-month period that ended July 31, 2018.
We have important information to share with you. Effective June 11, 2018, Prudential Mutual Funds were renamed PGIM Funds. This renaming is part of our ongoing effort to further build our reputation and establish our global brand, which began when our firm adopted PGIM Investments as its name in April 2017. Please note that only the Fund’s name has changed. Your Fund’s management and operation, along with its symbols, remained the same.*
Over the reporting period, the global economy continued to grow, and central banks gradually tightened monetary policy. In the US, the economy expanded and employment increased. In June, the Federal Reserve hiked interest rates for the seventh time since 2015, based on confidence in the economy.
Equity returns were strong, due to optimistic earnings expectations and investor sentiment. Global equities, including emerging markets, generally posted positive returns. However, they trailed the performance of US equities, which rose on higher corporate profits, new regulatory policies, and tax reform benefits. Volatility spiked briefly in the middle of the period on inflation concerns, rising interest rates, and a potential global trade war, but it decreased as the period ended.
The overall bond market declined modestly during the period, as measured by the Bloomberg Barclays US Aggregate Bond Index. The best performance came from higher-yielding, economically sensitive sectors. Although they finished the period with negative returns, US investment-grade corporate bonds outperformed US government nominal bonds. A major trend during the period was the flattening of the US Treasury yield curve, which increased the yield on fixed income investments with shorter maturities and made them more attractive to investors.
Regarding your investments with PGIM, we believe it is important to maintain a diversified portfolio of funds consistent with your tolerance for risk, time horizon, and financial goals. Your financial advisor can help you create a diversified investment plan that may include funds covering all the basic asset classes and that reflects your personal investor profile and risk tolerance. However, diversification and asset allocation strategies do not assure a profit or protect against loss in declining markets.
At PGIM Investments, we consider it a great privilege and responsibility to help investors participate in opportunities across global markets while meeting their toughest investment challenges. PGIM is a top-10 global investment manager with more than $1 trillion in assets under management. This investment expertise allows us to deliver actively managed funds and strategies to meet the needs of investors around the globe.
Thank you for choosing our family of funds.
Sincerely,

Stuart S. Parker, President
PGIM Corporate Bond Fund
September 14, 2018
*The Prudential Day One Funds did not change their names.
| | | | |
| PGIM Corporate Bond Fund | | | 5 | |
Your Fund’s Performance (unaudited)
Performance data quoted represent past performance. Past performance does not guarantee future results. The investment return and principal value of an investment will fluctuate, so that an investor’s shares, when redeemed, may be worth more or less than their original cost. Current performance may be lower or higher than the past performance data quoted. An investor may obtain performance data as of the most recent month-end by visiting our website at www.pgiminvestments.com or by calling (800) 225-1852.
| | | | | | | | |
| | | Average Annual Total Returns as of 7/31/18 (with sales charges) |
| | | One Year (%) | | Five Years (%) | | Ten Years (%) | | Since Inception (%) |
| Class A | | –5.94 | | N/A | | N/A | | 1.11 (5/28/15) |
| Class C | | –3.12 | | N/A | | N/A | | 1.77 (5/28/15) |
| Class R | | –1.67 | | N/A | | N/A | | 2.27 (5/28/15) |
| Class Z | | –1.18 | | 3.29 | | 4.88 | | — |
| Class R6* | | –1.18 | | N/A | | N/A | | 2.77 (5/28/15) |
| Bloomberg Barclays US Credit Bond Index |
| | –0.66 | | 3.37 | | 5.29 | | — |
| Lipper Corporate Debt BBB-Rated Funds Average |
| | | –0.83 | | 3.23 | | 5.15 | | — |
| | | | | | | | |
| | | Average Annual Total Returns as of 7/31/18 (without sales charges) |
| | | One Year (%) | | Five Years (%) | | Ten Years (%) | | Since Inception (%) |
| Class A | | –1.51 | | N/A | | N/A | | 2.58 (5/28/15) |
| Class C | | –2.16 | | N/A | | N/A | | 1.77 (5/28/15) |
| Class R | | –1.67 | | N/A | | N/A | | 2.27 (5/28/15) |
| Class Z | | –1.18 | | 3.29 | | 4.88 | | — |
| Class R6* | | –1.18 | | N/A | | N/A | | 2.77 (5/28/15) |
| Bloomberg Barclays US Credit Bond Index |
| | –0.66 | | 3.37 | | 5.29 | | — |
| Lipper Corporate Debt BBB-Rated Funds Average |
| | | –0.83 | | 3.23 | | 5.15 | | — |
* Formerly known as Class Q
| | |
| 6 | | Visit our website at pgiminvestments.com |
Growth of a $10,000 Investment
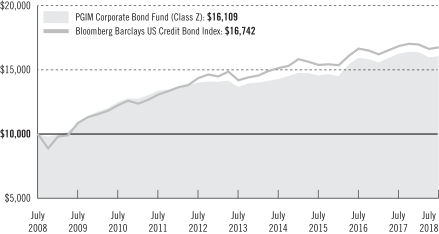
The graph compares a $10,000 investment in the Fund’s Class Z shares with a similar investment in the Bloomberg Barclays US Credit Bond Index by portraying the initial account values at the beginning of the 10-year period (July 31, 2008) and the account values at the end of the current fiscal year (July 31, 2018), as measured on a quarterly basis. For purposes of the graph, and unless otherwise indicated, it has been assumed that (a) all recurring fees (including management fees) were deducted; and (b) all dividends and distributions were reinvested. The line graph provides information for Class Z shares only. As indicated in the tables provided earlier, performance for Class A, Class C, Class R, and Class R6* shares will vary due to the differing charges and expenses applicable to each share class (as indicated in the following paragraphs). Without waiver of fees and/or expense reimbursements, if any, the returns would have been lower.
Past performance does not predict future performance. Total returns and the ending account values in the graph include changes in share price and reinvestment of dividends and capital gains distributions in a hypothetical investment for the periods shown. The Fund’s total returns do not reflect the deduction of income taxes on an individual’s investment. Taxes may reduce your actual investment returns on income or gains paid by the Fund or any gains you may realize if you sell your shares.
*Formerly known as Class Q
Source: PGIM Investments LLC and Lipper Inc.
Since Inception returns are provided for any share class with less than 10 fiscal years of returns. Since Inception returns for the Index and the Lipper Average are measured from the closest month-end to the class’ inception date.
| | | | |
| PGIM Corporate Bond Fund | | | 7 | |
Your Fund’s Performance (continued)
The returns in the tables do not reflect the deduction of taxes that a shareholder would pay on Fund distributions or following the redemption of Fund shares. The average annual total returns take into account applicable sales charges, which are described in the table below.
| | | | | | | | | | |
| | | Class A | | Class C | | Class R | | Class Z | | Class R6* |
| Maximum initial sales charge | | 4.50% of the public offering price | | None | | None | | None | | None |
| Contingent deferred sales charge (CDSC) (as a percentage of the lower of original purchase price or net asset value at redemption) | | 1.00% on sales of $1 million or more within 12 months of purchase | | 1.00% on sales made within 12 months of purchase | | None | | None | | None |
| Annual distribution and service (12b-1) fees (shown as a percentage of average daily net assets) | | 0.25% | | 1.00% | | 0.75% (0.50% currently) | | None | | None |
Benchmark Definitions
Bloomberg Barclays US Credit Bond Index—The Bloomberg Barclays US Credit Bond Index measures the performance of investment-grade corporate debt and agency bonds that are dollar denominated and have a remaining maturity greater than one year. The average annual total returns for the Index measured from the month-end closest to the inception date of the Fund’s Class A, Class C, Class R, and Class R6* shares through 7/31/18 is 2.37%.
Lipper Corporate Debt BBB-Rated Funds Average—The Lipper Corporate Debt BBB-Rated Funds invest at least 65% of their assets in corporate and government debt issues rated in the top four grades. The average annual total returns for the Average measured from the month-end closest to the inception date of the Fund’s Class A, Class C, Class R, and Class R6* shares through 7/31/18 is 2.16%.
Investors cannot invest directly in an index or average. The returns for the Index would be lower if they included the effects of sales charges, operating expenses of a mutual fund, or taxes. Returns for the Lipper Average reflect the deduction of operating expenses, but not sales charges or taxes.
*Formerly known as Class Q
| | |
| 8 | | Visit our website at pgiminvestments.com |
| | | | | | |
| Distributions and Yields as of 7/31/18 | | | | |
| | Total Distributions Paid
for 12 Months ($) | | SEC 30-Day
SubsidizedYield** (%) | | SEC 30-Day
Unsubsidized
Yield*** (%) |
| Class A | | 0.34 | | 3.21 | | 3.95 |
| Class C | | 0.26 | | 2.61 | | 0.68 |
| Class R | | 0.32 | | 3.10 | | –58.79 |
| Class Z | | 0.37 | | 3.61 | | 3.06 |
| Class R6* | | 0.37 | | 3.59 | | –85.69 |
*Formerly known as class Q
**SEC 30-Day Subsidized Yield (%)—A standardized yield calculation created by the Securities and Exchange Commission, it reflects the income earned during a 30-day period, after the deduction of the Fund’s net expenses (net of any expense waivers or reimbursements).
***SEC 30-Day Unsubsidized Yield (%)—A standardized yield calculation created by the Securities and Exchange Commission, it reflects the income earned during a 30-day period, after the deduction of the Fund’s gross expenses.
| | | | |
| Credit Quality expressed as a percentage of total investments as of 7/31/18 (%) | |
| AAA | | | 7.4 | |
| AA | | | 9.2 | |
| A | | | 27.2 | |
| BBB | | | 53.4 | |
| BB | | | 1.9 | |
| Cash/Cash Equivalents | | | 0.9 | |
| Total Investments | | | 100.0 | |
Source: PGIM Fixed Income
Credit ratings reflect the highest rating assigned by a nationally recognized statistical rating organization (NRSRO) such as Moody’s Investor Service, Inc. (Moody’s), S&P Global Ratings (S&P), or Fitch, Inc. (Fitch). Credit ratings reflect the common nomenclature used by both S&P and Fitch. Where applicable, ratings are converted to the comparable S&P/Fitch rating tier nomenclature. These rating agencies are independent, and are widely used. Credit ratings are subject to change. Values may not sum to 100.0% due to rounding.
| | | | |
| PGIM Corporate Bond Fund | | | 9 | |
Strategy and Performance Overview
How did the Fund perform?
The PGIM Corporate Bond Fund’s Class Z shares declined 1.18% for the 12-month reporting period that ended July 31, 2018, underperforming the 0.66% decline of the Bloomberg Barclays US Credit Bond Index (the Index) and the 0.83% decline of the Lipper Corporate Debt BBB-Rated Funds Average.
What were market conditions?
| • | | 2017 was not expected to be a good year for bonds. There was so much for the bond market to fear. European and Japanese interest rates had risen as the European Central Bank (ECB) and Bank of Japan (BoJ) began their respective stylized tapering. The U.S. had its Republican sweep, bringing with it expectations for pro-cyclical fiscal stimuli and upside risks for Federal Reserve (Fed) rate hikes. All said, this confluence of events was expected to finally torpedo the decades-old bond bull market. |
| • | | While European political fears turned out to be a bit overblown, all of the other fears were more or less grounded. The ECB and BoJ continued to reduce their purchases, fiscal stimulus in the U.S. was on the way, and the world’s economy generally continued to improve. But thanks to positive yield curves lending a little yield and roll-down advantage relative to cash, coupled with a little more spread tightening (i.e., narrower spreads between yields on U.S. Treasuries versus other types of bonds with comparable maturities), 2017 confounded many of the initial expectations and turned out to be yet another solid year for fixed income. Broad benchmarks generally outperformed cash and, as many expected, the higher-yielding sectors turned in particularly impressive performances. |
| • | | The markets struggled at the end of the period as the fears on the trade and political fronts that emerged early in 2018 were realized in the second quarter to varying degrees, while the long shadow of quantitative tightening continued to stretch across the markets. The trade conflicts started getting uneasy at the G20 but then became real as U.S. barbs were met with tit-for-tat measures, which PGIM Fixed Income believes are at risk of intensifying during the third quarter of this year and beyond. (The G20, or Group of Twenty, is an international forum for governments representing 19 of the world’s largest economies and the European Union.) The results from the elections in Italy in the first quarter of 2018 transformed into a market nightmare in the second quarter as renegade parties entered a coalition with a platform that appeared to jeopardize Italy’s finances and its relationship with Europe. Meanwhile, emerging market developments, including elections in Turkey and Mexico, raised concerns about the potential rise in policy heterodoxy. Over the first half of 2018, these concerns fueled a continued widening of spreads from the tight spreads in the first quarter, which may have gotten a bit ahead of fundamentals. |
| | |
| 10 | | Visit our website at pgiminvestments.com |
| • | | Corporate fixed income markets, as represented by the Bloomberg Barclays US Credit Bond Index, posted a return of -0.66%, resulting in an excess return to U.S. Treasuries of 79 basis points (bps). (One basis point equals 0.01%.) Within the Index, industrials outpaced financials and utilities over the reporting period, albeit all posted negative total returns. Metals & mining, energy, and telecom were among the strongest sectors over the period, while cable & satellite, finance companies, and capital goods were among the largest underperformers. |
| • | | As the period came to a close, spreads remained tight due to light bond supply, strong gross domestic product (GDP) growth, and higher U.S. Treasury yields. At the end of July, total supply tapered off to $62 billion, down 45% year over year. Year-to-date (YTD) issuance has been approximately $725 billion, about $61 billion less than July 2017 YTD issuance. |
| • | | Demand for new deals was robust. Average demand for new deals was 3.1 times the size of the transaction. With 81% of the companies in the S&P 500 Index having reported earnings, 74% topped revenue estimates and 80% topped earnings estimates. The revenue growth estimate for the second quarter of 2018 is 9.8%, and earnings are expected to increase 21.3% from the first quarter of 2017. |
What worked?
| • | | Security selection in investment-grade corporate bonds was the largest contributor to performance, highlighted by the Fund’s positioning in the banking, upstream energy, and media & entertainment sectors. |
| • | | In individual security selection, the Fund benefited from overweights in Puget Holdings (electric utilities) and Bank of America (banking). An underweight to General Electric (capital goods) also added value. |
| • | | An overweight in commercial mortgage-backed securities (CMBS) added to performance for the 12-month period. |
What didn’t work?
| • | | An underweight to, and security selection in, emerging markets as well as an overweight to, and security selection in, municipals hurt performance over the period. |
| • | | The Fund’s positioning in the property & casualty insurance, revenue education municipal, and retailers & restaurants sectors detracted from performance. |
| • | | In individual security selection, the Fund’s overweights in Goldman Sachs (banking), Ford Motor Company (automotive), and Johnson Controls International (capital goods) limited results. |
| | | | |
| PGIM Corporate Bond Fund | | | 11 | |
Strategy and Performance Overview (continued)
Did the Fund use derivatives and how did they affect performance?
| • | | The Fund’s investment strategy does not rely heavily on derivative strategies, although it does employ Treasury futures on a limited basis. Treasury futures are used to manage the Fund’s interest rate risk, which is more efficient than managing interest rate risk through the purchase and sale of cash corporate bonds. This derivative strategy detracted modestly from performance for the period. |
Current outlook
| • | | Despite sustained volatility in global markets, the global economic climate still supports U.S. corporate bonds. Credit fundamentals in the second quarter of 2018 showed an improvement in leverage metrics, with a slowdown in debt growth and an increase in free cash flow and profit margins year over year. We remain optimistic that spreads will tighten modestly given strong investor demand and improving fundamentals. |
| • | | Although it’s a generally favorable environment for corporates, market risks remain. The Federal Reserve (the Fed) is expected to hike the federal funds rate two more times this year. Trump administration initiatives—infrastructure spending, tax cuts, and reduced regulation—may lend support to the business sector, while the recent imposition of tariffs adds uncertainty. The market will continue to monitor the administration’s policies, the impact of tightening Fed policy, global negative interest rate policies (NIRP), global central bank policies and their effectiveness, crude/commodity prices, U.S. economic data, the pace of the weakening yuan, adjustments in China policies, and new issue supply. |
| • | | As we enter the later stage of the credit cycle, PGIM Fixed Income continues to favor better-quality financials and electric utilities over industrials subject to event risk. Within industrials, PGIM Fixed Income is focusing on names where an “event” has passed, as higher-quality corporates continue to lever up, and mergers and acquisitions (M&A) activity remains a concern. PGIM Fixed Income remains overweight in BBB-rated issuers due to a steep spread curve. |
| | |
| 12 | | Visit our website at pgiminvestments.com |
Fees and Expenses (unaudited)
As a shareholder of the Fund, you incur two types of costs: (1) transaction costs, including sales charges (loads) on purchase payments and redemptions, as applicable, and (2) ongoing costs, including management fees, and other Fund expenses, as applicable. This example is intended to help you understand your ongoing costs (in dollars) of investing in the Fund and to compare these costs with the ongoing costs of investing in other mutual funds.
The example is based on an investment of $1,000 held through the six-month period ended July 31, 2018. The example is for illustrative purposes only; you should consult the Prospectus for information on initial and subsequent minimum investment requirements.
Actual Expenses
The first line for each share class in the table on the following page provides information about actual account values and actual expenses. You may use the information on this line, together with the amount you invested, to estimate the expenses that you paid over the period. Simply divide your account value by $1,000 (for example, an $8,600 account value ÷ $1,000 = 8.6), then multiply the result by the number on the first line under the heading “Expenses Paid During the Six-Month Period” to estimate the expenses you paid on your account during this period.
Hypothetical Example for Comparison Purposes
The second line for each share class in the table on the following page provides information about hypothetical account values and hypothetical expenses based on the Fund’s actual expense ratio and an assumed rate of return of 5% per year before expenses, which is not the Fund’s actual return. The hypothetical account values and expenses may not be used to estimate the actual ending account balance or expenses you paid for the period. You may use this information to compare the ongoing costs of investing in the Fund and other funds. To do so, compare this 5% hypothetical example with the 5% hypothetical examples that appear in the shareholder reports of the other funds.
The Fund’s transfer agent may charge additional fees to holders of certain accounts that are not included in the expenses shown in the table on the following page. These fees apply to individual retirement accounts (IRAs) and Section 403(b) accounts. As of the close of the six-month period covered by the table, IRA fees included an annual maintenance fee of $15 per account (subject to a maximum annual maintenance fee of $25 for all accounts held by the same shareholder). Section 403(b) accounts are charged an annual $25 fiduciary maintenance fee. Some of the fees may vary in amount, or may be waived, based on your total account balance or the number of Prudential funds, including the Fund, that you own. You should consider the additional fees that were charged to your Fund account over the six-month period when you estimate the total ongoing expenses paid over the
| | | | |
| PGIM Corporate Bond Fund | | | 13 | |
Fees and Expenses (continued)
period and the impact of these fees on your ending account value, as these additional expenses are not reflected in the information provided in the expense table. Additional fees have the effect of reducing investment returns.
Please note that the expenses shown in the table are meant to highlight your ongoing costs only and do not reflect any transactional costs such as sales charges (loads). Therefore, the second line for each share class in the table is useful in comparing ongoing costs only and will not help you determine the relative total costs of owning different funds. In addition, if these transactional costs were included, your costs would have been higher.
| | | | | | | | | | | | | | | | | | |
PGIM Corporate
Bond Fund | | Beginning Account
Value
February 1, 2018 | | | Ending Account
Value
July 31, 2018 | | | Annualized
Expense Ratio
Based on the
Six-Month Period | | | Expenses Paid
During the
Six-Month Period* | |
| Class A | | Actual | | $ | 1,000.00 | | | $ | 979.20 | | | | 0.80 | % | | $ | 3.93 | |
| | Hypothetical | | $ | 1,000.00 | | | $ | 1,020.83 | | | | 0.80 | % | | $ | 4.01 | |
| Class C | | Actual | | $ | 1,000.00 | | | $ | 975.50 | | | | 1.55 | % | | $ | 7.59 | |
| | Hypothetical | | $ | 1,000.00 | | | $ | 1,017.11 | | | | 1.55 | % | | $ | 7.75 | |
| Class R | | Actual | | $ | 1,000.00 | | | $ | 977.90 | | | | 1.05 | % | | $ | 5.15 | |
| | Hypothetical | | $ | 1,000.00 | | | $ | 1,019.59 | | | | 1.05 | % | | $ | 5.26 | |
| Class Z | | Actual | | $ | 1,000.00 | | | $ | 980.30 | | | | 0.55 | % | | $ | 2.70 | |
| | Hypothetical | | $ | 1,000.00 | | | $ | 1,022.07 | | | | 0.55 | % | | $ | 2.76 | |
| Class R6** | | Actual | | $ | 1,000.00 | | | $ | 980.30 | | | | 0.55 | % | | $ | 2.70 | |
| | | Hypothetical | | $ | 1,000.00 | | | $ | 1,022.07 | | | | 0.55 | % | | $ | 2.76 | |
*Fund expenses (net of fee waivers or subsidies, if any) for each share class are equal to the annualized expense ratio for each share class (provided in the table), multiplied by the average account value over the period, multiplied by the 181 days in the six-month period ended July 31, 2018, and divided by the 365 days in the Fund’s fiscal year ended July 31, 2018 (to reflect the six-month period). Expenses presented in the table include the expenses of any underlying portfolios in which the Fund may invest.
**Formerly known as Class Q shares.
| | |
| 14 | | Visit our website at pgiminvestments.com |
Schedule of Investments
as of July 31, 2018
| | | | | | | | | | | | | | | | |
| Description | | Interest
Rate | | | Maturity
Date | | | Principal
Amount (000)# | | | Value | |
LONG-TERM INVESTMENTS 98.0% | | | | | | | | | | | | | | | | |
| | | | |
COMMERCIAL MORTGAGE-BACKED SECURITIES 4.9% | | | | | | | | | | | | | | | | |
CCUBS Commercial Mortgage Trust,
Series 2017-C1, Class A3 | | | 3.283 | % | | | 11/15/50 | | | | 250 | | | $ | 239,088 | |
Citigroup Commercial Mortgage Trust,
Series 2016-GC37, Class A3 | | | 3.050 | | | | 04/10/49 | | | | 250 | | | | 239,253 | |
DBJPM Mortgage Trust,
Series 2017-C6, Class A3 | | | 3.269 | | | | 06/10/50 | | | | 100 | | | | 98,182 | |
JPMorgan Chase Commercial Mortgage Securities Trust,
Series 2017-JP6, Class A4 | | | 3.224 | | | | 07/15/50 | | | | 100 | | | | 95,950 | |
Morgan Stanley Bank of America Merrill Lynch Trust,
Series 2016-C29, Class A3 | | | 3.058 | | | | 05/15/49 | | | | 200 | | | | 191,718 | |
Wells Fargo Commercial Mortgage Trust,
Series 2017-C40, Class A3 | | | 3.317 | | | | 10/15/50 | | | | 200 | | | | 192,303 | |
| | | | | | | | | | | | | | | | |
TOTAL COMMERCIAL MORTGAGE-BACKED SECURITIES
(cost $1,112,192) | | | | | | | | | | | | | | | 1,056,494 | |
| | | | | | | | | | | | | | | | |
| | | | |
CORPORATE BONDS 91.7% | | | | | | | | | | | | | | | | |
| | | | |
Aerospace & Defense 1.5% | | | | | | | | | | | | | | | | |
Arconic, Inc.,
Sr. Unsec’d. Notes | | | 6.150 | | | | 08/15/20 | | | | 120 | | | | 124,200 | |
General Dynamics Corp.,
Gtd. Notes | | | 2.875 | | | | 05/11/20 | | | | 195 | | | | 194,727 | |
| | | | | | | | | | | | | | | | |
| | | | | | | | | | | | | | | 318,927 | |
| | | | |
Agriculture 1.4% | | | | | | | | | | | | | | | | |
BAT International Finance PLC (United Kingdom),
Gtd. Notes, 144A | | | 3.250 | | | | 06/07/22 | | | | 305 | | | | 298,852 | |
| | | | |
Airlines 0.6% | | | | | | | | | | | | | | | | |
Delta Air Lines, Inc.,
Sr. Unsec’d. Notes | | | 2.875 | | | | 03/13/20 | | | | 130 | | | | 128,931 | |
| | | | |
Auto Manufacturers 2.7% | | | | | | | | | | | | | | | | |
Ford Motor Co.,
Sr. Unsec’d. Notes | | | 5.291 | | | | 12/08/46 | | | | 160 | | | | 147,805 | |
Ford Motor Credit Co. LLC,
Sr. Unsec’d. Notes | | | 2.979 | | | | 08/03/22 | | | | 200 | | | | 191,814 | |
General Motors Financial Co., Inc.,
Gtd. Notes | | | 3.200 | | | | 07/06/21 | | | | 75 | | | | 73,939 | |
See Notes to Financial Statements.
| | | | |
| PGIM Corporate Bond Fund | | | 15 | |
Schedule of Investments (continued)
as of July 31, 2018
| | | | | | | | | | | | | | | | |
| Description | | Interest
Rate | | | Maturity
Date | | | Principal
Amount (000)# | | | Value | |
CORPORATE BONDS (Continued) | |
| | | | |
Auto Manufacturers (cont’d.) | | | | | | | | | | | | | | | | |
General Motors Financial Co., Inc., (cont’d.) | |
Gtd. Notes | | | 3.550 | % | | | 04/09/21 | | | | 30 | | | $ | 29,947 | |
Gtd. Notes | | | 4.000 | | | | 01/15/25 | | | | 150 | | | | 146,342 | |
| | | | | | | | | | | | | | | | |
| | | | | | | | | | | | | | | 589,847 | |
| | | | |
Auto Parts & Equipment 0.5% | | | | | | | | | | | | | | | | |
ZF North America Capital, Inc. (Germany),
Gtd. Notes, 144A | | | 4.500 | | | | 04/29/22 | | | | 100 | | | | 101,735 | |
| | | | |
Banks 19.2% | | | | | | | | | | | | | | | | |
Bank of America Corp., | | | | | | | | | | | | | | | | |
Jr. Sub. Notes | | | 5.125 | | | | 12/29/49 | | | | 250 | | | | 253,915 | |
Series L, Sr. Unsec’d. Notes, MTN | | | 2.600 | | | | 01/15/19 | | | | 37 | | | | 37,003 | |
Sr. Unsec’d. Notes | | | 3.419 | | | | 12/20/28 | | | | 263 | | | | 247,333 | |
Sr. Unsec’d. Notes, MTN | | | 3.550 | | | | 03/05/24 | | | | 195 | | | | 193,086 | |
Sr. Unsec’d. Notes, MTN | | | 4.443 | | | | 01/20/48 | | | | 130 | | | | 130,274 | |
Barclays PLC (United Kingdom),
Sr. Unsec’d. Notes | | | 3.650 | | | | 03/16/25 | | | | 200 | | | | 189,026 | |
Capital One Financial Corp.,
Sr. Unsec’d. Notes | | | 3.300 | | | | 10/30/24 | | | | 100 | | | | 95,182 | |
Citigroup, Inc., | | | | | | | | | | | | | | | | |
Sr. Unsec’d. Notes | | | 3.200 | | | | 10/21/26 | | | | 150 | | | | 140,386 | |
Sub. Notes | | | 4.600 | | | | 03/09/26 | | | | 300 | | | | 301,815 | |
Credit Suisse Group Funding Guernsey Ltd. (Switzerland),
Gtd. Notes | | | 3.800 | | | | 06/09/23 | | | | 265 | | | | 262,817 | |
Deutsche Bank AG (Germany), | | | | | | | | | | | | | | | | |
Sr. Unsec’d. Notes | | | 3.950 | | | | 02/27/23 | | | | 100 | | | | 96,758 | |
Sr. Unsec’d. Notes, GMTN | | | 3.375 | | | | 05/12/21 | | | | 80 | | | | 78,043 | |
Goldman Sachs Group, Inc. (The), | | | | | | | | | | | | | | | | |
Sr. Unsec’d. Notes, MTN | | | 4.800 | | | | 07/08/44 | | | | 150 | | | | 154,668 | |
Sub. Notes | | | 5.150 | | | | 05/22/45 | | | | 150 | | | | 155,480 | |
JPMorgan Chase & Co., | | | | | | | | | | | | | | | | |
Jr. Sub. Notes, Series I, 3 Month LIBOR + 3.470% | | | 5.809 | (c) | | | 12/29/49 | | | | 200 | | | | 200,880 | |
Sr. Unsec’d. Notes | | | 3.200 | | | | 06/15/26 | | | | 390 | | | | 370,609 | |
Sr. Unsec’d. Notes | | | 3.882 | | | | 07/24/38 | | | | 95 | | | | 89,025 | |
Sr. Unsec’d. Notes | | | 3.964 | | | | 11/15/48 | | | | 145 | | | | 133,720 | |
Morgan Stanley, | | | | | | | | | | | | | | | | |
Jr. Sub. Notes, Series H, MTN | | | 5.450 | | | | 07/29/49 | | | | 250 | | | | 253,750 | |
Sr. Unsec’d. Notes, GMTN | | | 3.875 | | | | 01/27/26 | | | | 300 | | | | 296,302 | |
See Notes to Financial Statements.
| | | | | | | | | | | | | | | | |
| Description | | Interest
Rate | | | Maturity
Date | | | Principal
Amount (000)# | | | Value | |
CORPORATE BONDS (Continued) | |
| | | | |
Banks (cont’d.) | | | | | | | | | | | | | | | | |
Morgan Stanley, (cont’d.) | | | | | | | | | | | | | | | | |
Sr. Unsec’d. Notes, MTN | | | 3.971 | % | | | 07/22/38 | | | | 235 | | | $ | 221,337 | |
Santander UK Group Holdings PLC (United Kingdom),
Sr. Unsec’d. Notes | | | 3.373 | | | | 01/05/24 | | | | 200 | | | | 193,179 | |
UBS Group Funding Switzerland AG (Switzerland),
Gtd. Notes, 144A | | | 4.125 | | | | 04/15/26 | | | | 90 | | | | 89,783 | |
| | | | | | | | | | | | | | | | |
| | | | | | | | | | | | | | | 4,184,371 | |
| | | | |
Beverages 2.4% | | | | | | | | | | | | | | | | |
Anheuser-Busch InBev Worldwide, Inc. (Belgium),
Gtd. Notes | | | 3.500 | | | | 01/12/24 | | | | 200 | | | | 199,298 | |
Keurig Dr. Pepper, Inc., | | | | | | | | | | | | | | | | |
Gtd. Notes, 144A | | | 3.551 | | | | 05/25/21 | | | | 140 | | | | 140,460 | |
Gtd. Notes, 144A | | | 4.057 | | | | 05/25/23 | | | | 180 | | | | 180,946 | |
| | | | | | | | | | | | | | | | |
| | | | | | | | | | | | | | | 520,704 | |
| | | | |
Biotechnology 1.1% | | | | | | | | | | | | | | | | |
Amgen, Inc.,
Sr. Unsec’d. Notes | | | 2.650 | | | | 05/11/22 | | | | 160 | | | | 155,504 | |
Celgene Corp.,
Sr. Unsec’d. Notes | | | 4.625 | | | | 05/15/44 | | | | 100 | | | | 95,653 | |
| | | | | | | | | | | | | | | | |
| | | | | | | | | | | | | | | 251,157 | |
| | | | |
Building Materials 0.3% | | | | | | | | | | | | | | | | |
Johnson Controls International PLC,
Sr. Unsec’d. Notes | | | 4.950 | | | | 07/02/64 | | | | 75 | | | | 70,689 | |
| | | | |
Chemicals 1.2% | | | | | | | | | | | | | | | | |
Celanese US Holdings LLC,
Gtd. Notes | | | 4.625 | | | | 11/15/22 | | | | 50 | | | | 51,231 | |
Eastman Chemical Co.,
Sr. Unsec’d. Notes | | | 3.600 | | | | 08/15/22 | | | | 49 | | | | 48,950 | |
LyondellBasell Industries NV,
Sr. Unsec’d. Notes | | | 4.625 | | | | 02/26/55 | | | | 150 | | | | 140,278 | |
Mosaic Co. (The),
Sr. Unsec’d. Notes | | | 5.625 | | | | 11/15/43 | | | | 20 | | | | 20,112 | |
| | | | | | | | | | | | | | | | |
| | | | | | | | | | | | | | | 260,571 | |
See Notes to Financial Statements.
| | | | |
| PGIM Corporate Bond Fund | | | 17 | |
Schedule of Investments (continued)
as of July 31, 2018
| | | | | | | | | | | | | | | | |
| Description | | Interest
Rate | | | Maturity Date | | | Principal
Amount (000)# | | | Value | |
CORPORATE BONDS (Continued) | |
|
Commercial Services 1.1% | |
California Institute of Technology,
Sr. Unsec’d. Notes | | | 4.700 | % | | | 11/01/2111 | | | | 50 | | | $ | 52,110 | |
Equifax, Inc.,
Sr. Unsec’d. Notes | | | 2.300 | | | | 06/01/21 | | | | 10 | | | | 9,628 | |
Total System Services, Inc.,
Sr. Unsec’d. Notes | | | 3.800 | | | | 04/01/21 | | | | 100 | | | | 100,460 | |
University of Notre Dame du Lac,
Unsec’d. Notes | | | 3.394 | | | | 02/15/48 | | | | 75 | | | | 69,343 | |
| | | | | | | | | | | | | | | | |
| | | | | | | | | | | | | | | 231,541 | |
| | | | |
Computers 1.2% | | | | | | | | | | | | | | | | |
Apple, Inc.,
Sr. Unsec’d. Notes | | | 4.650 | | | | 02/23/46 | | | | 100 | | | | 109,110 | |
Dell International LLC/EMC Corp.,
Sr. Sec’d. Notes, 144A | | | 3.480 | | | | 06/01/19 | | | | 160 | | | | 160,523 | |
| | | | | | | | | | | | | | | | |
| | | | | | | | | | | | | | | 269,633 | |
| | | | |
Diversified Financial Services 0.4% | | | | | | | | | | | | | | | | |
Discover Financial Services,
Sr. Unsec’d. Notes | | | 3.750 | | | | 03/04/25 | | | | 100 | | | | 95,744 | |
| | | | |
Electric 10.7% | | | | | | | | | | | | | | | | |
Commonwealth Edison Co.,
First Mortgage | | | 4.700 | | | | 01/15/44 | | | | 100 | | | | 108,219 | |
Dominion Energy, Inc.,
Jr. Sub. Notes | | | 2.579 | | | | 07/01/20 | | | | 135 | | | | 133,043 | |
DTE Electric Co.,
General Ref. Mortgage | | | 3.950 | | | | 06/15/42 | | | | 75 | | | | 72,145 | |
Duke Energy Progress LLC,
First Mortgage | | | 4.150 | | | | 12/01/44 | | | | 200 | | | | 200,871 | |
Entergy Corp.,
Sr. Unsec’d. Notes | | | 2.950 | | | | 09/01/26 | | | | 100 | | | | 91,687 | |
Entergy Mississippi, Inc.,
First Mortgage | | | 2.850 | | | | 06/01/28 | | | | 40 | | | | 36,560 | |
Eversource Energy,
Series K, Sr. Unsec’d. Notes | | | 2.750 | | | | 03/15/22 | | | | 95 | | | | 92,516 | |
FirstEnergy Corp.,
Series B, Sr. Unsec’d. Notes | | | 3.900 | | | | 07/15/27 | | | | 75 | | | | 73,086 | |
Florida Power & Light Co.,
First Mortgage | | | 3.700 | | | | 12/01/47 | | | | 100 | | | | 94,612 | |
See Notes to Financial Statements.
| | | | | | | | | | | | | | | | |
| Description | | Interest
Rate | | | Maturity
Date | | | Principal
Amount (000)# | | | Value | |
CORPORATE BONDS (Continued) | |
| | | | |
Electric (cont’d.) | | | | | | | | | | | | | | | | |
MidAmerican Energy Co.,
First Mortgage | | | 3.950 | % | | | 08/01/47 | | | | 20 | | | $ | 19,234 | |
NextEra Energy Capital Holdings, Inc.,
Gtd. Notes | | | 2.800 | | | | 01/15/23 | | | | 120 | | | | 115,610 | |
Pacific Gas & Electric Co., | | | | | | | | | | | | | | | | |
Sr. Unsec’d. Notes | | | 4.000 | | | | 12/01/46 | | | | 25 | | | | 22,262 | |
Sr. Unsec’d. Notes | | | 4.450 | | | | 04/15/42 | | | | 100 | | | | 92,720 | |
PacifiCorp,
First Mortgage | | | 3.350 | | | | 07/01/25 | | | | 270 | | | | 265,178 | |
PPL Capital Funding, Inc.,
Gtd. Notes | | | 4.700 | | | | 06/01/43 | | | | 100 | | | | 100,951 | |
PSEG Power LLC,
Gtd. Notes | | | 3.000 | | | | 06/15/21 | | | | 60 | | | | 59,402 | |
Public Service Electric & Gas Co.,
Sec’d. Notes, MTN | | | 3.650 | | | | 09/01/42 | | | | 75 | | | | 70,299 | |
Puget Energy, Inc.,
Sr. Sec’d. Notes | | | 3.650 | | | | 05/15/25 | | | | 400 | | | | 387,213 | |
RGS AEGCO Funding Corp.,
Series F, Sec’d. Notes | | | 9.820 | | | | 12/07/22 | | | | 48 | | | | 55,051 | |
San Diego Gas & Electric Co.,
First Mortgage | | | 4.300 | | | | 04/01/42 | | | | 75 | | | | 74,512 | |
Sierra Pacific Power Co.,
General Ref. Mortgage | | | 2.600 | | | | 05/01/26 | | | | 70 | | | | 64,437 | |
Westar Energy, Inc.,
First Mortgage | | | 5.100 | | | | 07/15/20 | | | | 100 | | | | 103,219 | |
| | | | | | | | | | | | | | | | |
| | | | | | | | | | | | | | | 2,332,827 | |
| | | | |
Foods 1.3% | | | | | | | | | | | | | | | | |
General Mills, Inc.,
Sr. Unsec’d. Notes | | | 3.200 | | | | 04/16/21 | | | | 25 | | | | 24,886 | |
Kraft Heinz Foods Co., | | | | | | | | | | | | | | | | |
Gtd. Notes | | | 4.375 | | | | 06/01/46 | | | | 55 | | | | 48,898 | |
Gtd. Notes | | | 5.000 | | | | 07/15/35 | | | | 50 | | | | 49,639 | |
Kroger Co. (The), | | | | | | | | | | | | | | | | |
Sr. Unsec’d. Notes | | | 2.650 | | | | 10/15/26 | | | | 35 | | | | 31,185 | |
Sr. Unsec’d. Notes | | | 2.800 | | | | 08/01/22 | | | | 10 | | | | 9,683 | |
Sr. Unsec’d. Notes | | | 5.150 | | | | 08/01/43 | | | | 60 | | | | 59,988 | |
Mondelez International, Inc.,
Sr. Unsec’d. Notes | | | 3.000 | | | | 05/07/20 | | | | 50 | | | | 49,846 | |
| | | | | | | | | | | | | | | | |
| | | | | | | | | | | | | | | 274,125 | |
See Notes to Financial Statements.
| | | | |
| PGIM Corporate Bond Fund | | | 19 | |
Schedule of Investments (continued)
as of July 31, 2018
| | | | | | | | | | | | | | | | |
| Description | | Interest
Rate | | | Maturity
Date | | | Principal
Amount (000)# | | | Value | |
CORPORATE BONDS (Continued) | | | | | | | | | | | | | | | | |
| | | | |
Gas 0.5% | | | | | | | | | | | | | | | | |
NiSource, Inc.,
Sr. Unsec’d. Notes | | | 2.650 | % | | | 11/17/22 | | | | 110 | | | $ | 105,492 | |
| | | | |
Healthcare-Products 1.4% | | | | | | | | | | | | | | | | |
Abbott Laboratories,
Sr. Unsec’d. Notes | | | 2.900 | | | | 11/30/21 | | | | 135 | | | | 133,162 | |
Baxter International, Inc.,
Sr. Unsec’d. Notes | | | 3.500 | | | | 08/15/46 | | | | 110 | | | | 94,868 | |
Becton, Dickinson & Co.,
Sr. Unsec’d. Notes | | | 2.404 | | | | 06/05/20 | | | | 75 | | | | 73,747 | |
| | | | | | | | | | | | | | | | |
| | | | | | | | | | | | | | | 301,777 | |
| | | | |
Healthcare-Services 4.5% | | | | | | | | | | | | | | | | |
Anthem, Inc.,
Sr. Unsec’d. Notes | | | 4.625 | | | | 05/15/42 | | | | 100 | | | | 98,349 | |
Duke University Health System, Inc.,
Sr. Unsec’d. Notes | | | 3.920 | | | | 06/01/47 | | | | 100 | | | | 97,279 | |
Laboratory Corp. of America Holdings,
Sr. Unsec’d. Notes | | | 3.600 | | | | 02/01/25 | | | | 250 | | | | 244,276 | |
Mayo Clinic, | | | | | | | | | | | | | | | | |
Unsec’d. Notes | | | 3.774 | | | | 11/15/43 | | | | 85 | | | | 81,438 | |
Unsec’d. Notes | | | 4.000 | | | | 11/15/47 | | | | 80 | | | | 78,387 | |
Quest Diagnostics, Inc.,
Sr. Unsec’d. Notes | | | 3.500 | | | | 03/30/25 | | | | 250 | | | | 241,106 | |
Texas Health Resources,
Sec’d. Notes | | | 4.330 | | | | 11/15/55 | | | | 130 | | | | 131,316 | |
| | | | | | | | | | | | | | | | |
| | | | | | | | | | | | | | | 972,151 | |
| | | | |
Housewares 0.5% | | | | | | | | | | | | | | | | |
Newell Brands, Inc., | | | | | | | | | | | | | | | | |
Sr. Unsec’d. Notes | | | 4.000 | | | | 12/01/24 | | | | 100 | | | | 96,721 | |
Sr. Unsec’d. Notes | | | 4.200 | | | | 04/01/26 | | | | 20 | | | | 19,291 | |
| | | | | | | | | | | | | | | | |
| | | | | | | | | | | | | | | 116,012 | |
| | | | |
Insurance 6.3% | | | | | | | | | | | | | | | | |
American International Group, Inc.,
Sr. Unsec’d. Notes | | | 4.375 | | | | 01/15/55 | | | | 150 | | | | 135,291 | |
Arch Capital Finance LLC,
Gtd. Notes | | | 5.031 | | | | 12/15/46 | | | | 100 | | | | 104,725 | |
See Notes to Financial Statements.
| | | | | | | | | | | | | | | | |
| Description | | Interest
Rate | | | Maturity
Date | | | Principal
Amount (000)# | | | Value | |
CORPORATE BONDS (Continued) | | | | | | | | | | | | | | | | |
| | | | |
Insurance (cont’d.) | | | | | | | | | | | | | | | | |
CNA Financial Corp.,
Sr. Unsec’d. Notes | | | 3.450 | % | | | 08/15/27 | | | | 100 | | | $ | 92,165 | |
Liberty Mutual Group, Inc.,
Gtd. Notes, 144A | | | 5.000 | | | | 06/01/21 | | | | 500 | | | | 516,725 | |
Markel Corp.,
Sr. Unsec’d. Notes | | | 5.350 | | | | 06/01/21 | | | | 500 | | | | 521,320 | |
| | | | | | | | | | | | | | | | |
| | | | | | | | | | | | | | | 1,370,226 | |
| | | | |
Machinery-Construction & Mining 0.3% | | | | | | | | | | | | | | | | |
Caterpillar Financial Services Corp.,
Sr. Unsec’d. Notes, MTN | | | 3.450 | | | | 05/15/23 | | | | 65 | | | | 65,209 | |
| | | | |
Media 4.9% | | | | | | | | | | | | | | | | |
Charter Communications Operating LLC/Charter Communications Operating Capital,
Sr. Sec’d. Notes | | | 6.384 | | | | 10/23/35 | | | | 180 | | | | 194,901 | |
Comcast Corp.,
Gtd. Notes | | | 3.375 | | | | 08/15/25 | | | | 325 | | | | 314,690 | |
Discovery Communications LLC, | | | | | | | | | | | | | | | | |
Gtd. Notes | | | 4.950 | | | | 05/15/42 | | | | 100 | | | | 94,465 | |
Gtd. Notes, 144A | | | 3.500 | | | | 06/15/22 | | | | 100 | | | | 98,677 | |
Gtd. Notes, 144A | | | 3.950 | | | | 06/15/25 | | | | 28 | | | | 27,473 | |
Time Warner, Inc.,
Gtd. Notes | | | 3.875 | | | | 01/15/26 | | | | 200 | | | | 193,566 | |
Viacom, Inc.,
Sr. Unsec’d. Notes | | | 5.250 | | | | 04/01/44 | | | | 150 | | | | 147,621 | |
| | | | | | | | | | | | | | | | |
| | | | | | | | | | | | | | | 1,071,393 | |
| | | | |
Mining 0.7% | | | | | | | | | | | | | | | | |
Barrick North America Finance LLC (Canada), | | | | | | | | | | | | | | | | |
Gtd. Notes | | | 5.700 | | | | 05/30/41 | | | | 50 | | | | 54,579 | |
Gtd. Notes | | | 7.500 | | | | 09/15/38 | | | | 75 | | | | 93,963 | |
| | | | | | | | | | | | | | | | |
| | | | | | | | | | | | | | | 148,542 | |
| | | | |
Miscellaneous Manufacturing 0.2% | | | | | | | | | | | | | | | | |
Textron, Inc.,
Sr. Unsec’d. Notes | | | 4.000 | | | | 03/15/26 | | | | 45 | | | | 44,372 | |
See Notes to Financial Statements.
| | | | |
| PGIM Corporate Bond Fund | | | 21 | |
Schedule of Investments (continued)
as of July 31, 2018
| | | | | | | | | | | | | | | | |
| Description | | Interest
Rate | | | Maturity
Date | | | Principal
Amount (000)# | | | Value | |
CORPORATE BONDS (Continued) | | | | | | | | | | | | | | | | |
| | | | |
Office/Business Equipment 1.2% | | | | | | | | | | | | | | | | |
Pitney Bowes, Inc.,
Sr. Unsec’d. Notes | | | 3.625 | % | | | 09/15/20 | | | | 100 | | | $ | 99,125 | |
Xerox Corp.,
Sr. Unsec’d. Notes | | | 3.625 | | | | 03/15/23 | | | | 175 | | | | 167,024 | |
| | | | | | | | | | | | | | | | |
| | | | | | | | | | | | | | | 266,149 | |
| | | | |
Oil & Gas 6.0% | | | | | | | | | | | | | | | | |
Apache Corp.,
Sr. Unsec’d. Notes | | | 3.250 | | | | 04/15/22 | | | | 250 | | | | 246,669 | |
Canadian Natural Resources Ltd. (Canada),
Sr. Unsec’d. Notes | | | 6.500 | | | | 02/15/37 | | | | 100 | | | | 119,831 | |
Cenovus Energy, Inc. (Canada), | | | | | | | | | | | | | | | | |
Sr. Unsec’d. Notes | | | 5.400 | | | | 06/15/47 | | | | 120 | | | | 120,932 | |
Sr. Unsec’d. Notes | | | 5.700 | | | | 10/15/19 | | | | 240 | | | | 245,664 | |
Concho Resources, Inc.,
Gtd. Notes | | | 4.875 | | | | 10/01/47 | | | | 50 | | | | 50,861 | |
Devon Energy Corp., | | | | | | | | | | | | | | | | |
Sr. Unsec’d. Notes | | | 4.000 | | | | 07/15/21 | | | | 100 | | | | 100,982 | |
Sr. Unsec’d. Notes | | | 5.000 | | | | 06/15/45 | | | | 55 | | | | 56,849 | |
Sr. Unsec’d. Notes | | | 5.600 | | | | 07/15/41 | | | | 15 | | | | 16,347 | |
Husky Energy, Inc. (Canada),
Sr. Unsec’d. Notes | | | 3.950 | | | | 04/15/22 | | | | 90 | | | | 90,579 | |
Noble Energy, Inc.,
Sr. Unsec’d. Notes | | | 5.050 | | | | 11/15/44 | | | | 100 | | | | 101,355 | |
Petrobras Global Finance BV (Brazil),
Gtd. Notes, 144A | | | 5.999 | | | | 01/27/28 | | | | 65 | | | | 61,503 | |
Shell International Finance BV (Netherlands),
Gtd. Notes | | | 4.375 | | | | 05/11/45 | | | | 85 | | | | 89,005 | |
| | | | | | | | | | | | | | | | |
| | | | | | | | | | | | | | | 1,300,577 | |
| | | | |
Pharmaceuticals 6.3% | | | | | | | | | | | | | | | | |
Allergan Funding SCS,
Gtd. Notes | | | 3.800 | | | | 03/15/25 | | | | 350 | | | | 343,403 | |
CVS Health Corp., | | | | | | | | | | | | | | | | |
Sr. Unsec’d. Notes | | | 4.780 | | | | 03/25/38 | | | | 100 | | | | 100,778 | |
Sr. Unsec’d. Notes | | | 5.050 | | | | 03/25/48 | | | | 90 | | | | 93,267 | |
Sr. Unsec’d. Notes | | | 5.125 | | | | 07/20/45 | | | | 100 | | | | 104,049 | |
Express Scripts Holding Co.,
Gtd. Notes | | | 3.050 | | | | 11/30/22 | | | | 300 | | | | 290,627 | |
See Notes to Financial Statements.
| | | | | | | | | | | | | | | | |
| Description | | Interest
Rate | | | Maturity
Date | | | Principal
Amount (000)# | | | Value | |
CORPORATE BONDS (Continued) | | | | | | | | | | | | | | | | |
| | | | |
Pharmaceuticals (cont’d.) | | | | | | | | | | | | | | | | |
Johnson & Johnson,
Sr. Unsec’d. Notes | | | 3.400 | % | | | 01/15/38 | | | | 95 | | | $ | 90,154 | |
Shire Acquisitions Investments Ireland DAC, | | | | | | | | | | | | | | | | |
Gtd. Notes | | | 2.400 | | | | 09/23/21 | | | | 180 | | | | 173,491 | |
Gtd. Notes | | | 3.200 | | | | 09/23/26 | | | | 100 | | | | 92,410 | |
Teva Pharmaceutical Finance Netherlands III BV (Israel),
Gtd. Notes | | | 2.200 | | | | 07/21/21 | | | | 100 | | | | 93,243 | |
| | | | | | | | | | | | | | | | |
| | | | | | | | | | | | | | | 1,381,422 | |
| | | | |
Pipelines 4.7% | | | | | | | | | | | | | | | | |
Andeavor Logistics LP/Tesoro Logistics Finance Corp.,
Gtd. Notes | | | 3.500 | | | | 12/01/22 | | | | 35 | | | | 34,395 | |
DCP Midstream Operating LP,
Gtd. Notes, 144A | | | 4.750 | | | | 09/30/21 | | | | 250 | | | | 253,185 | |
Energy Transfer Partners LP,
Gtd. Notes | | | 6.000 | | | | 06/15/48 | | | | 10 | | | | 10,447 | |
Enterprise Products Operating LLC, | | | | | | | | | | | | | | | | |
Gtd. Notes | | | 4.850 | | | | 03/15/44 | | | | 100 | | | | 102,731 | |
Gtd. Notes | | | 4.900 | | | | 05/15/46 | | | | 150 | | | | 154,515 | |
Magellan Midstream Partners LP,
Sr. Unsec’d. Notes | | | 4.200 | | | | 10/03/47 | | | | 80 | | | | 75,072 | |
MPLX LP, | | | | | | | | | | | | | | | | |
Sr. Unsec’d. Notes | | | 3.375 | | | | 03/15/23 | | | | 45 | | | | 44,070 | |
Sr. Unsec’d. Notes | | | 4.500 | | | | 07/15/23 | | | | 110 | | | | 112,478 | |
Williams Partners LP, | | | | | | | | | | | | | | | | |
Sr. Unsec’d. Notes | | | 4.300 | | | | 03/04/24 | | | | 200 | | | | 201,717 | |
Sr. Unsec’d. Notes | | | 5.100 | | | | 09/15/45 | | | | 30 | | | | 30,534 | |
| | | | | | | | | | | | | | | | |
| | | | | | | | | | | | | | | 1,019,144 | |
| | | | |
Real Estate Investment Trusts (REITs) 1.8% | | | | | | | | | | | | | | | | |
Brixmor Operating Partnership LP,
Sr. Unsec’d. Notes | | | 3.650 | | | | 06/15/24 | | | | 75 | | | | 72,175 | |
Digital Realty Trust LP,
Gtd. Notes | | | 3.400 | | | | 10/01/20 | | | | 50 | | | | 49,945 | |
Kimco Realty Corp.,
Sr. Unsec’d. Notes | | | 3.400 | | | | 11/01/22 | | | | 75 | | | | 73,732 | |
Realty Income Corp.,
Sr. Unsec’d. Notes | | | 3.875 | | | | 04/15/25 | | | | 200 | | | | 197,377 | |
| | | | | | | | | | | | | | | | |
| | | | | | | | | | | | | | | 393,229 | |
See Notes to Financial Statements.
| | | | |
| PGIM Corporate Bond Fund | | | 23 | |
Schedule of Investments (continued)
as of July 31, 2018
| | | | | | | | | | | | | | | | |
| Description | | Interest
Rate | | | Maturity
Date | | | Principal
Amount (000)# | | | Value | |
CORPORATE BONDS (Continued) | | | | | | | | | | | | | | | | |
| | | | |
Retail 0.9% | | | | | | | | | | | | | | | | |
Dollar Tree, Inc.,
Sr. Unsec’d. Notes | | | 4.000 | % | | | 05/15/25 | | | | 200 | | | $ | 197,956 | |
| | | | |
Semiconductors 1.2% | | | | | | | | | | | | | | | | |
Broadcom Corp./Broadcom Cayman Finance Ltd.,
Gtd. Notes | | | 3.875 | | | | 01/15/27 | | | | 75 | | | | 70,337 | |
NXP BV/NXP Funding LLC (Netherlands),
Gtd. Notes, 144A | | | 4.625 | | | | 06/15/22 | | | | 200 | | | | 202,500 | |
| | | | | | | | | | | | | | | | |
| | | | | | | | | | | | | | | 272,837 | |
| | | | |
Shipbuilding 0.4% | | | | | | | | | | | | | | | | |
Huntington Ingalls Industries, Inc.,
Gtd. Notes | | | 3.483 | | | | 12/01/27 | | | | 100 | | | | 95,347 | |
| | | | |
Software 2.4% | | | | | | | | | | | | | | | | |
Electronic Arts, Inc.,
Sr. Unsec’d. Notes | | | 3.700 | | | | 03/01/21 | | | | 50 | | | | 50,494 | |
Microsoft Corp., | | | | | | | | | | | | | | | | |
Sr. Unsec’d. Notes | | | 3.950 | | | | 08/08/56 | | | | 140 | | | | 139,751 | |
Sr. Unsec’d. Notes | | | 4.000 | | | | 02/12/55 | | | | 25 | | | | 25,198 | |
Sr. Unsec’d. Notes | | | 4.500 | | | | 02/06/57 | | | | 80 | | | | 87,952 | |
Oracle Corp., | | | | | | | | | | | | | | | | |
Sr. Unsec’d. Notes | | | 2.400 | | | | 09/15/23 | | | | 75 | | | | 71,616 | |
Sr. Unsec’d. Notes | | | 3.900 | | | | 05/15/35 | | | | 45 | | | | 44,432 | |
Sr. Unsec’d. Notes | | | 4.000 | | | | 07/15/46 | | | | 115 | | | | 111,482 | |
| | | | | | | | | | | | | | | | |
| | | | | | | | | | | | | | | 530,925 | |
| | | | |
Telecommunications 1.5% | | | | | | | | | | | | | | | | |
AT&T, Inc.,
Sr. Unsec’d. Notes | | | 5.150 | | | | 03/15/42 | | | | 115 | | | | 110,841 | |
Verizon Communications, Inc., | | | | | | | | | | | | | | | | |
Sr. Unsec’d. Notes | | | 4.500 | | | | 08/10/33 | | | | 15 | | | | 14,879 | |
Sr. Unsec’d. Notes | | | 5.012 | | | | 04/15/49 | | | | 190 | | | | 193,155 | |
| | | | | | | | | | | | | | | | |
| | | | | | | | | | | | | | | 318,875 | |
See Notes to Financial Statements.
| | | | | | | | | | | | | | | | |
| Description | | Interest
Rate | | | Maturity
Date | | | Principal
Amount (000)# | | | Value | |
CORPORATE BONDS (Continued) | | | | | | | | | | | | | | | | |
| | | | |
Transportation 0.4% | | | | | | | | | | | | | | | | |
FedEx Corp.,
Gtd. Notes | | | 4.500 | % | | | 02/01/65 | | | | 100 | | | $ | 91,200 | |
| | | | | | | | | | | | | | | | |
TOTAL CORPORATE BONDS
(cost $20,391,524) | | | | | | | | | | | | | | | 19,992,489 | |
| | | | | | | | | | | | | | | | |
| | | | |
MUNICIPAL BOND 0.6% | | | | | | | | | | | | | | | | |
| | | | |
Texas | | | | | | | | | | | | | | | | |
Permanent University Fund - University of Texas System, Revenue Bonds
(cost $150,000) | | | 3.376 | | | | 07/01/47 | | | | 150 | | | | 135,960 | |
| | | | |
SOVEREIGN BOND 0.8% | | | | | | | | | | | | | | | | |
Mexico Government International Bond (Mexico),
Sr. Unsec’d. Notes
(cost $180,338) | | | 4.600 | | | | 01/23/46 | | | | 200 | | | | 183,500 | |
| | | | | | | | | | | | | | | | |
TOTAL LONG-TERM INVESTMENTS
(cost $21,834,054) | | | | | | | | | | | | | | | 21,368,443 | |
| | | | | | | | | | | | | | | | |
| | | | |
| | | | | | | | | Shares | | | | |
SHORT-TERM INVESTMENT 0.6% | | | | | | | | | | | | | | | | |
| | | | |
AFFILIATED MUTUAL FUND | | | | | | | | | | | | | | | | |
PGIM Core Ultra Short Bond Fund
(cost $126,677)(w) | | | | | | | | | | | 126,677 | | | | 126,677 | |
| | | | | | | | | | | | | | | | |
TOTAL INVESTMENTS 98.6%
(cost $21,960,731) | | | | | | | | | | | | | | | 21,495,120 | |
Other assets in excess of liabilities(z) 1.4% | | | | | | | | | | | | | | | 298,073 | |
| | | | | | | | | | | | | | | | |
NET ASSETS 100.0% | | | | | | | | | | | | | | $ | 21,793,193 | |
| | | | | | | | | | | | | | | | |
The following abbreviations are used in the annual report:
144A—Security was purchased pursuant to Rule 144A under the Securities Act of 1933 and may not be resold subject to that rule except to qualified institutional buyers. Unless otherwise noted, 144A securities are deemed to be liquid.
GMTN—Global Medium Term Note
LIBOR—London Interbank Offered Rate
MTN—Medium Term Note
REITs—Real Estate Investment Trusts
| # | Principal amount is shown in U.S. dollars unless otherwise stated. |
See Notes to Financial Statements.
| | | | |
| PGIM Corporate Bond Fund | | | 25 | |
Schedule of Investments (continued)
as of July 31, 2018
| (c) | Variable rate instrument. The interest rate shown reflects the rate in effect at July 31, 2018. |
| (w) | PGIM Investments LLC, the manager of the Fund, also serves as manager of the PGIM Core Ultra Short Bond Fund. |
| (z) | Includes net unrealized appreciation (depreciation) on the following derivative contracts held at reporting period end: |
Futures contracts outstanding at July 31, 2018:
| | | | | | | | | | | | | | | | |
Number of
Contracts | | | Type | | Expiration
Date | | | Current
Notional
Amount | | | Value /
Unrealized
Appreciation
(Depreciation) | |
| | | | Long Positions: | | | | | | | | | | | | |
| | 2 | | | 2 Year U.S. Treasury Notes | | | Sep. 2018 | | | $ | 422,750 | | | $ | (62 | ) |
| | 19 | | | 5 Year U.S. Treasury Notes | | | Sep. 2018 | | | | 2,149,375 | | | | (3,125 | ) |
| | 11 | | | 20 Year U.S. Treasury Bonds | | | Sep. 2018 | | | | 1,572,656 | | | | 27,156 | |
| | | | | | | | | | | | | | | | |
| | | | | | | | | | | | | | | 23,969 | |
| | | | | | | | | | | | | | | | |
| | | | Short Positions: | | | | | | | | | | | | |
| | 11 | | | 10 Year U.S. Treasury Notes | | | Sep. 2018 | | | | 1,313,641 | | | | 1,875 | |
| | 12 | | | 30 Year U.S. Ultra Treasury Bonds | | | Sep. 2018 | | | | 1,882,875 | | | | (18,344 | ) |
| | | | | | | | | | | | | | | | |
| | | | | | | | | | | | | | | (16,469 | ) |
| | | | | | | | | | | | | | | | |
| | | | | | | | | | | | | | $ | 7,500 | |
| | | | | | | | | | | | | | | | |
Cash of $200,000 has been segregated with Citigroup Global Markets to cover requirements for open futures contracts at July 31, 2018.
Fair Value Measurements:
Various inputs are used in determining the value of the Fund’s investments. These inputs are summarized in the three broad levels listed below.
Level 1—unadjusted quoted prices generally in active markets for identical securities.
Level 2—quoted prices for similar securities, interest rates and yield curves, prepayment speeds, foreign currency exchange rates and other observable inputs.
Level 3—unobservable inputs for securities valued in accordance with Board approved fair valuation procedures.
The following is a summary of the inputs used as of July 31, 2018 in valuing such portfolio securities:
| | | | | | | | | | | | |
| | | Level 1 | | | Level 2 | | | Level 3 | |
Investments in Securities | | | | | | | | | | | | |
Commercial Mortgage-Backed Securities | | $ | — | | | $ | 1,056,494 | | | $ | — | |
Corporate Bonds | | | — | | | | 19,992,489 | | | | — | |
Municipal Bond | | | — | | | | 135,960 | | | | — | |
Sovereign Bond | | | — | | | | 183,500 | | | | — | |
Affiliated Mutual Fund | | | 126,677 | | | | — | | | | — | |
Other Financial Instruments* | | | | | | | | | | | | |
Futures Contracts | | | 7,500 | | | | — | | | | — | |
| | | | | | | | | | | | |
Total | | $ | 134,177 | | | $ | 21,368,443 | | | $ | — | |
| | | | | | | | | | | | |
See Notes to Financial Statements.
| * | Other financial instruments are derivative instruments not reflected in the Schedule of Investments, such as futures, forwards and centrally cleared swap contracts, which are recorded at the unrealized appreciation (depreciation) on the instrument, and OTC swap contracts which are recorded at fair value. |
During the period, there were no transfers between Level 1, Level 2 and Level 3 to report.
Industry Classification:
The industry classification of investments and other assets in excess of liabilities shown as a percentage of net assets as of July 31, 2018 were as follows (unaudited):
| | | | |
Banks | | | 19.2 | % |
Electric | | | 10.7 | |
Pharmaceuticals | | | 6.3 | |
Insurance | | | 6.3 | |
Oil & Gas | | | 6.0 | |
Media | | | 4.9 | |
Commercial Mortgage-Backed Securities | | | 4.9 | |
Pipelines | | | 4.7 | |
Healthcare-Services | | | 4.5 | |
Auto Manufacturers | | | 2.7 | |
Software | | | 2.4 | |
Beverages | | | 2.4 | |
Real Estate Investment Trusts (REITs) | | | 1.8 | |
Aerospace & Defense | | | 1.5 | |
Telecommunications | | | 1.5 | |
Healthcare-Products | | | 1.4 | |
Agriculture | | | 1.4 | |
Foods | | | 1.3 | |
Semiconductors | | | 1.2 | |
Computers | | | 1.2 | |
Office/Business Equipment | | | 1.2 | |
Chemicals | | | 1.2 | |
Biotechnology | | | 1.1 | % |
Commercial Services | | | 1.1 | |
Retail | | | 0.9 | |
Sovereign Bond | | | 0.8 | |
Mining | | | 0.7 | |
Municipal Bond | | | 0.6 | |
Airlines | | | 0.6 | |
Affiliated Mutual Fund | | | 0.6 | |
Housewares | | | 0.5 | |
Gas | | | 0.5 | |
Auto Parts & Equipment | | | 0.5 | |
Diversified Financial Services | | | 0.4 | |
Shipbuilding | | | 0.4 | |
Transportation | | | 0.4 | |
Building Materials | | | 0.3 | |
Machinery-Construction & Mining | | | 0.3 | |
Miscellaneous Manufacturing | | | 0.2 | |
| | | | |
| | | 98.6 | |
Other assets in excess of liabilities | | | 1.4 | |
| | | | |
| | | 100.0 | % |
| | | | |
Effects of Derivative Instruments on the Financial Statements and Primary Underlying Risk Exposure:
The Fund invested in derivative instruments during the reporting period. The primary type of risk associated with these derivative instruments is interest rate contracts risk. The effect of such derivative instruments on the Fund’s financial position and financial performance as reflected in the Statement of Assets and Liabilities and Statement of Operations is presented in the summary below.
See Notes to Financial Statements.
| | | | |
| PGIM Corporate Bond Fund | | | 27 | |
Schedule of Investments (continued)
as of July 31, 2018
Fair values of derivative instruments as of July 31, 2018 as presented in the Statement of Assets and Liabilities:
| | | | | | | | | | | | |
| | | Asset Derivatives | | | Liability Derivatives | |
Derivatives not accounted
for as hedging instruments,
carried at fair value | | Balance Sheet
Location | | Fair
Value | | | Balance Sheet
Location | | Fair
Value | |
| Interest rate contracts | | Due from/to broker—variation margin futures | | $ | 29,031 | * | | Due from/to
broker—variation
margin futures | | $ | 21,531 | * |
| | | | | | | | | | | | |
| * | Includes cumulative appreciation (depreciation) as reported in the schedule of open futures and centrally cleared swap contracts. Only unsettled variation margin receivable (payable) is reported within the Statement of Assets and Liabilities. |
The effects of derivative instruments on the Statement of Operations for the year ended July 31, 2018 are as follows:
| | | | |
Amount of Realized Gain (Loss) on Derivatives Recognized in Income | |
Derivatives not accounted for as hedging
instruments, carried at fair value | | Futures | |
Interest rate contracts | | $ | 2,397 | |
| | | | |
|
Change in Unrealized Appreciation (Depreciation) on Derivatives Recognized in Income | |
Derivatives not accounted for as hedging
instruments, carried at fair value | | Futures | |
Interest rate contracts | | $ | 6,008 | |
| | | | |
For the year ended July 31, 2018, the Fund’s average volume of derivative activities is as follows:
| | | | | | | | | | | | | | |
| | | Futures
Contracts—
Long
Positions(1) | | | | | Futures
Contracts—
Short
Positions(1) | | | | |
| | $ | 4,921,116 | | | | | $ | 3,940,535 | | | | | |
| (1) | Notional Amount in USD. |
See Notes to Financial Statements.
Statement of Assets & Liabilities
as of July 31, 2018
| | | | |
Assets | | | | |
Investments at value: | | | | |
Unaffiliated investments (cost $21,834,054) | | $ | 21,368,443 | |
Affiliated investments (cost $126,677) | | | 126,677 | |
Deposit with broker for futures | | | 200,000 | |
Interest receivable | | | 192,936 | |
Due from Manager | | | 2,586 | |
Receivable for Fund shares sold | | | 2,577 | |
| | | | |
Total Assets | | | 21,893,219 | |
| | | | |
| |
Liabilities | | | | |
Audit fee payable | | | 36,068 | |
Payable for Fund shares reacquired | | | 19,331 | |
Custodian and accounting fees payable | | | 16,033 | |
Shareholders’ reports payable | | | 8,793 | |
Accrued expenses and other liabilities | | | 6,559 | |
Legal fees and expenses payable | | | 5,735 | |
Due to broker—variation margin futures | | | 4,101 | |
Distribution fee payable | | | 1,360 | |
Dividends payable | | | 1,288 | |
Affiliated transfer agent fee payable | | | 758 | |
| | | | |
Total Liabilities | | | 100,026 | |
| | | | |
| |
Net Assets | | $ | 21,793,193 | |
| | | | |
| | | | | |
Net assets were comprised of: | | | | |
Shares of beneficial interest, at par | | $ | 2,020 | |
Paid-in capital in excess of par | | | 22,940,922 | |
| | | | |
| | | 22,942,942 | |
Undistributed net investment income | | | 65,565 | |
Accumulated net realized loss on investment transactions | | | (757,203 | ) |
Net unrealized depreciation on investments | | | (458,111 | ) |
| | | | |
Net assets, July 31, 2018 | | $ | 21,793,193 | |
| | | | |
See Notes to Financial Statements.
| | | | |
| PGIM Corporate Bond Fund | | | 29 | |
Statement of Assets & Liabilities
as of July 31, 2018
| | | | |
Class A | | | | |
Net asset value and redemption price per share,
($2,565,303 ÷ 237,299 shares of beneficial interest issued and outstanding) | | $ | 10.81 | |
Maximum sales charge (4.50% of offering price) | | | 0.51 | |
| | | | |
Maximum offering price to public | | $ | 11.32 | |
| | | | |
| |
Class C | | | | |
Net asset value, offering price and redemption price per share,
($951,873 ÷ 88,250 shares of beneficial interest issued and outstanding) | | $ | 10.79 | |
| | | | |
| |
Class R | | | | |
Net asset value, offering price and redemption price per share,
($18,170 ÷ 1,684 shares of beneficial interest issued and outstanding) | | $ | 10.79 | |
| | | | |
| |
Class Z | | | | |
Net asset value, offering price and redemption price per share,
($18,246,942 ÷ 1,691,731 shares of beneficial interest issued and outstanding) | | $ | 10.79 | |
| | | | |
| |
Class R6 | | | | |
Net asset value, offering price and redemption price per share,
($10,905 ÷ 1,011 shares of beneficial interest issued and outstanding) | | $ | 10.79 | |
| | | | |
See Notes to Financial Statements.
Statement of Operations
Year Ended July 31, 2018
| | | | |
Net Investment Income (Loss) | | | | |
Income | | | | |
Interest income | | $ | 853,307 | |
Affiliated dividend income | | | 4,549 | |
Income from securities lending, net (including affiliated income of $443) | | | 626 | |
| | | | |
Total income | | | 858,482 | |
| | | | |
| |
Expenses | | | | |
Management fee | | | 105,078 | |
Distribution fee(a) | | | 16,088 | |
Custodian and accounting fees | | | 64,429 | |
Registration fees(a) | | | 63,351 | |
Audit fee | | | 36,067 | |
Transfer agent’s fees and expenses (including affiliated expense of $4,186)(a) | | | 25,807 | |
Legal fees and expenses | | | 22,166 | |
Shareholders’ reports | | | 19,361 | |
Trustees’ fees | | | 12,542 | |
Miscellaneous | | | 13,665 | |
| | | | |
Total expenses | | | 378,554 | |
Less: Fee waiver and/or expense reimbursement(a) | | | (233,910 | ) |
Distribution fee waiver(a) | | | (30 | ) |
| | | | |
Net expenses | | | 144,614 | |
| | | | |
Net investment income (loss) | | | 713,868 | |
| | | | |
| |
Realized And Unrealized Gain (Loss) On Investment Transactions | | | | |
Net realized gain (loss) on: | | | | |
Investment transactions (including affiliated of $(199)) | | | (20,598 | ) |
Futures transactions | | | 2,397 | |
| | | | |
| | | (18,201 | ) |
| | | | |
Net change in unrealized appreciation (depreciation) on: | | | | |
Investments (including affiliated of $67) | | | (1,011,910 | ) |
Futures | | | 6,008 | |
| | | | |
| | | (1,005,902 | ) |
| | | | |
Net gain (loss) on investment transactions | | | (1,024,103 | ) |
| | | | |
Net Increase (Decrease) In Net Assets Resulting From Operations | | $ | (310,235 | ) |
| | | | |
| (a) | Class specific expenses and waivers were as follows: |
| | | | | | | | | | | | | | | | | | | | |
| | | Class A | | | Class C | | | Class R | | | Class Z | | | Class R6 | |
Distribution fee | | | 5,500 | | | | 10,496 | | | | 92 | | | | — | | | | — | |
Registration fees | | | 13,521 | | | | 13,171 | | | | 13,158 | | | | 10,342 | | | | 13,159 | |
Transfer agent’s fees and expenses | | | 4,617 | | | | 1,145 | | | | 42 | | | | 19,986 | | | | 17 | |
Fee waiver and/or expense reimbursement | | | (31,810 | ) | | | (20,891 | ) | | | (13,278 | ) | | | (154,687 | ) | | | (13,244 | ) |
Distribution fee waiver | | | — | | | | — | | | | (30 | ) | | | — | | | | — | |
See Notes to Financial Statements.
| | | | |
| PGIM Corporate Bond Fund | | | 31 | |
Statements of Changes in Net Assets
| | | | | | | | |
| | | Year Ended July 31, | |
| | | 2018 | | | 2017 | |
Increase (Decrease) in Net Assets | | | | | | | | |
Operations | | | | | | | | |
Net investment income (loss) | | $ | 713,868 | | | $ | 711,025 | |
Net realized gain (loss) on investment transactions | | | (18,201 | ) | | | 123,833 | |
Net change in unrealized appreciation (depreciation) on investments | | | (1,005,902 | ) | | | (464,187 | ) |
| | | | | | | | |
Net increase (decrease) in net assets resulting from operations | | | (310,235 | ) | | | 370,671 | |
| | | | | | | | |
Dividends from net investment income | | | | | | | | |
Class A | | | (68,377 | ) | | | (40,323 | ) |
Class C | | | (24,540 | ) | | | (22,930 | ) |
Class R | | | (352 | ) | | | (291 | ) |
Class Z | | | (669,996 | ) | | | (683,524 | ) |
Class R6 | | | (367 | ) | | | (348 | ) |
| | | | | | | | |
| | | (763,632 | ) | | | (747,416 | ) |
| | | | | | | | |
| | |
Fund share transactions | | | | | | | | |
Net proceeds from shares sold | | | 8,530,196 | | | | 8,985,915 | |
Net asset value of shares issued in reinvestment of dividends and distributions | | | 742,350 | | | | 723,795 | |
Cost of shares reacquired | | | (9,193,467 | ) | | | (11,450,567 | ) |
| | | | | | | | |
Net increase (decrease) in net assets from Fund share transactions | | | 79,079 | | | | (1,740,857 | ) |
| | | | | | | | |
Total increase (decrease) | | | (994,788 | ) | | | (2,117,602 | ) |
| | |
Net Assets: | | | | | | | | |
Beginning of year | | | 22,787,981 | | | | 24,905,583 | |
| | | | | | | | |
End of year(a) | | $ | 21,793,193 | | | $ | 22,787,981 | |
| | | | | | | | |
(a) Includes undistributed/(distributions in excess of) net investment income of: | | $ | 65,565 | | | $ | 65,542 | |
| | | | | | | | |
See Notes to Financial Statements.
Notes to Financial Statements
The Target Portfolio Trust (the “Trust”) is registered under the Investment Company Act of 1940, as amended (“1940 Act”), as a diversified open-end management investment company. The Trust currently consists of three series: PGIM Corporate Bond Fund, PGIM Core Bond Fund and PGIM QMA Small-Cap Value Fund (collectively, the “Funds”). These financial statements relate to the PGIM Corporate Bond Fund (the “Fund”). Effective June 11, 2018, the Funds’ names were changed by replacing “Prudential” with “PGIM”, and Class Q shares were renamed Class R6 shares.
The investment objective of the Fund is high current income consistent with the preservation of principal.
1. Accounting Policies
The Fund follows investment company accounting and reporting guidance of the Financial Accounting Standards Board (“FASB”) Accounting Standard Codification Topic 946 Financial Services—Investment Companies. The following accounting policies conform to U.S. generally accepted accounting principles. The Fund consistently follows such policies in the preparation of its financial statements.
Securities Valuation: The Fund holds securities and other assets and liabilities that are fair valued at the close of each day (generally, 4:00 PM Eastern time) the New York Stock Exchange (“NYSE”) is open for trading. Fair value is the price that would be received to sell an asset or paid to transfer a liability in an orderly transaction between market participants on the measurement date. The Trust’s Board of Trustees (the “Board”) has adopted valuation procedures for security valuation under which fair valuation responsibilities have been delegated to PGIM Investments LLC (“PGIM Investments” or “the Manager”). Pursuant to the Board’s delegation, a Valuation Committee has been established as two persons, being one or more officers of the Trust, including: the Trust’s Treasurer (or the Treasurer’s direct reports); and the Trust’s Chief or Deputy Chief Compliance Officer (or Vice-President-level direct reports of the Chief or Deputy Chief Compliance Officer). Under the current valuation procedures, the Valuation Committee of the Board is responsible for supervising the valuation of portfolio securities and other assets and liabilities. The valuation procedures permit the Fund to utilize independent pricing vendor services, quotations from market makers, and alternative valuation methods when market quotations are either not readily available or not deemed representative of fair value. A record of the Valuation Committee’s actions is subject to the Board’s review, approval, and ratification at its next regularly scheduled quarterly meeting.
For the fiscal reporting period-end, securities and other assets and liabilities were fair valued at the close of the last U.S. business day. Trading in certain foreign securities may occur when the NYSE is closed (including weekends and holidays). Because such foreign
| | | | |
| PGIM Corporate Bond Fund | | | 33 | |
Notes to Financial Statements (continued)
securities trade in markets that are open on weekends and U.S. holidays, the values of some of the Fund’s foreign investments may change on days when investors cannot purchase or redeem Fund shares.
Various inputs determine how the Fund’s investments are valued, all of which are categorized according to the three broad levels (Level 1, 2, or 3) detailed in the Schedule of Investments.
Derivative instruments, such as futures or options, that are traded on a national securities exchange are valued at the last sale price as of the close of trading on the applicable exchange where the security principally trades. Securities traded via NASDAQ are valued at the NASDAQ official closing price. To the extent these securities are valued at the last sale price or NASDAQ official closing price, they are classified as Level 1 in the fair value hierarchy. In the event that no sale or official closing price on valuation date exists, these securities are generally valued at the mean between the last reported bid and ask prices, or at the last bid price in the absence of an ask price. These securities are classified as Level 2 in the fair value hierarchy.
Investments in open-end, non-exchange-traded mutual funds are valued at their net asset values as of the close of the NYSE on the date of valuation. These securities are classified as Level 1 in the fair value hierarchy since they may be purchased or sold at their net asset values on the date of valuation.
Fixed income securities traded in the OTC market are generally classified as Level 2 in the fair value hierarchy. Such fixed income securities are typically valued using the market approach which generally involves obtaining data from an approved independent third-party vendor source. The Fund utilizes the market approach as the primary method to value securities when market prices of identical or comparable instruments are available. The third-party vendors’ valuation techniques used to derive the evaluated bid price are based on evaluating observable inputs, including but not limited to, yield curves, yield spreads, credit ratings, deal terms, tranche level attributes, default rates, cash flows, prepayment speeds, broker/dealer quotations and reported trades. Certain Level 3 securities are also valued using the market approach when obtaining a single broker quote or when utilizing transaction prices for identical securities that have been used in excess of five business days.
During the reporting period, there were no changes to report with respect to the valuation approach and/or valuation techniques discussed above.
Securities and other assets that cannot be priced according to the methods described above are valued based on pricing methodologies approved by the Board. In the event that
unobservable inputs are used when determining such valuations, the securities will be classified as Level 3 in the fair value hierarchy.
When determining the fair value of securities, some of the factors influencing the valuation include: the nature of any restrictions on disposition of the securities; assessment of the general liquidity of the securities; the issuer’s financial condition and the markets in which it does business; the cost of the investment; the size of the holding and the capitalization of the issuer; the prices of any recent transactions or bids/offers for such securities or any comparable securities; any available analyst media or other reports or information deemed reliable by the Manager regarding the issuer or the markets or industry in which it operates. Using fair value to price securities may result in a value that is different from a security’s most recent closing price and from the price used by other unaffiliated mutual funds to calculate their net asset values.
Restricted and Illiquid Securities: Subject to guidelines adopted by the Board, the Fund may invest up to 15% of its net assets in illiquid securities, including those which are restricted as to disposition under securities law (“restricted securities”). Restricted securities are valued pursuant to the valuation procedures noted above. Illiquid securities are those that, because of the absence of a readily available market or due to legal or contractual restrictions on resale, cannot be sold within seven days in the ordinary course of business at approximately the amount at which the Fund has valued the investment. Therefore, the Fund may find it difficult to sell illiquid securities at the time considered most advantageous by its Subadviser and may incur transaction costs that would not be incurred in the sale of securities that were freely marketable. Certain securities that would otherwise be considered illiquid because of legal restrictions on resale to the general public may be traded among qualified institutional buyers under Rule 144A of the Securities Act of 1933. These Rule 144A securities, as well as commercial paper that is sold in private placements under Section 4(2) of the Securities Act, may be deemed liquid by the Fund’s Subadviser under the guidelines adopted by the Trustees of the Trust. However, the liquidity of the Fund’s investments in Rule 144A securities could be impaired if trading does not develop or declines.
Foreign Currency Translation: The books and records of the Fund are maintained in U.S. dollars. Foreign currency amounts are translated into U.S. dollars on the following basis:
(i) market value of investment securities, other assets and liabilities—at the current rates of exchange;
(ii) purchases and sales of investment securities, income and expenses—at the rates of exchange prevailing on the respective dates of such transactions.
Although the net assets of the Fund are presented at the foreign exchange rates and market values at the close of the period, the Fund does not generally isolate that portion of the results of operations arising as a result of changes in the foreign exchange rates from the fluctuations arising from changes in the market prices of long-term portfolio securities held at the end of the period. Similarly, the Fund does not isolate the effect of changes in foreign
| | | | |
| PGIM Corporate Bond Fund | | | 35 | |
Notes to Financial Statements (continued)
exchange rates from the fluctuations arising from changes in the market prices of long-term portfolio securities sold during the period. Accordingly, holding period realized foreign currency gains (losses) are included in the reported net realized gains (losses) on investment transactions.
Net realized gains (losses) on foreign currency transactions represent net foreign exchange gains (losses) from the disposition of holdings of foreign currencies, currency gains (losses) realized between the trade and settlement dates on securities transactions, and the difference between the amounts of interest, dividends and foreign withholding taxes recorded on the Fund’s books and the U.S. dollar equivalent amounts actually received or paid. Net unrealized currency gains (losses) from valuing foreign currency denominated assets and liabilities (other than investments) at period end exchange rates are reflected as a component of net unrealized appreciation (depreciation) on foreign currencies.
Financial Futures Contracts: A financial futures contract is an agreement to purchase (long) or sell (short) an agreed amount of securities at a set price for delivery on a future date. Upon entering into a financial futures contract, the Fund is required to pledge to the broker an amount of cash and/or other assets equal to a certain percentage of the contract amount. This amount is known as the “initial margin.” Subsequent payments, known as “variation margin,” are made or received by the Fund each day, depending on the daily fluctuations in the value of the underlying security. Such variation margin is recorded for financial statement purposes on a daily basis as unrealized gain (loss). When the contract expires or is closed, the gain (loss) is realized and is presented in the Statement of Operations as net realized gain (loss) on futures transactions.
The Fund invested in financial futures contracts in order to hedge its existing portfolio securities, or securities the Fund intends to purchase, against fluctuations in value caused by changes in prevailing interest rates. Should interest rates move unexpectedly, the Fund may not achieve the anticipated benefits of the financial futures contracts and may realize a loss. The use of futures transactions involves the risk of imperfect correlation in movements in the price of futures contracts, interest rates and the underlying hedged assets. Since futures contracts are exchange-traded, there is minimal counterparty credit risk to the Fund since the exchanges’ clearinghouse acts as counterparty to all exchange-traded futures and guarantees the futures contracts against default.
Master Netting Arrangements: The Trust, on behalf of the Fund, is subject to various Master Agreements, or netting arrangements, with select counterparties. These are agreements which a subadviser may have negotiated and entered into on behalf of the Fund. A master netting arrangement between the Fund and the counterparty permits the Fund to offset amounts payable by the Fund to the same counterparty against amounts to be received; and by the receipt of collateral from the counterparty by the Fund to cover the Fund’s exposure to the counterparty. However, there is no assurance that such mitigating factors are easily
enforceable. In addition to master netting arrangements, the right to set-off exists when all the conditions are met such that each of the parties owes the other determinable amounts, the reporting party has the right to set-off the amount owed with the amount owed by the other party, the reporting party intends to set-off and the right of set-off is enforceable by law. During the reporting period, there was no intention to settle on a net basis and all amounts are presented on a gross basis on the Statement of Assets and Liabilities.
Forward currency contracts, forward rate agreements, written options, short sales, swaps and financial futures contracts involve elements of both market and credit risk in excess of the amounts reflected on the Statement of Assets and Liabilities. Such risks may be mitigated by engaging in master netting arrangements.
Securities Lending: The Fund may lend its portfolio securities to banks and broker-dealers. The loans are secured by collateral at least equal to the market value of the securities loaned. Collateral pledged by each borrower is invested in an affiliated money market fund and is marked to market daily, based on the previous day’s market value, such that the value of the collateral exceeds the value of the loaned securities. In the event of significant appreciation in value of securities on loan on the last business day of the reporting period, the financial statements may reflect a collateral value that is less than the market value of the loaned securities. Such shortfall is remedied as described above. Loans are subject to termination at the option of the borrower or the Fund. Upon termination of the loan, the borrower will return to the Fund securities identical to the loaned securities. Should the borrower of the securities fail financially, the Fund has the right to repurchase the securities in the open market using the collateral.
The Fund recognizes income, net of any rebate and securities lending agent fees, for lending its securities in the form of fees or interest on the investment of any cash received as collateral. The borrower receives all interest and dividends from the securities loaned and such payments are passed back to the lender in amounts equivalent thereto. The Fund also continues to recognize any unrealized gain (loss) in the market price of the securities loaned and on the change in the value of the collateral invested that may occur during the term of the loan. In addition, realized gain (loss) is recognized on changes in the value of the collateral invested upon liquidation of the collateral. Net earnings from securities lending are disclosed on the Statement of Operations as “Income from securities lending, net”.
Securities Transactions and Net Investment Income: Securities transactions are recorded on the trade date. Realized gains (losses) from investment and currency transactions are calculated on the specific identification method. Dividend income is recorded on the ex-date. Interest income, including amortization of premium and accretion of discount on debt securities, as required, is recorded on the accrual basis. Expenses are recorded on an accrual basis, which may require the use of certain estimates by management that may differ from actual. Net investment income or loss (other than class specific expenses and waivers, which are allocated as noted below) and unrealized and realized gains (losses) are allocated daily to each class of shares based upon the relative proportion of adjusted net assets of each class at the beginning of the day.
| | | | |
| PGIM Corporate Bond Fund | | | 37 | |
Notes to Financial Statements (continued)
Class specific expenses and waivers, where applicable, are charged to the respective share classes. Class specific expenses include distribution fees and distribution fee waivers, shareholder servicing fee, transfer agent’s fees and expenses, registration fees and fee waivers and/or expense reimbursements, as applicable.
Taxes: It is the Fund’s policy to continue to meet the requirements of the Internal Revenue Code applicable to regulated investment companies and to distribute all of its taxable net investment income and capital gains, if any, to its shareholders. Therefore, no federal income tax provision is required. Withholding taxes on foreign dividends, interest and capital gains, if any, are recorded, net of reclaimable amounts, at the time the related income is earned.
Dividends and Distributions: The Fund expects to declare dividends of its net investment income daily and pay such dividends monthly. Distributions from net realized capital and currency gains, if any, are declared and paid at least annually. Dividends and distributions to shareholders, which are determined in accordance with federal income tax regulations and which may differ from generally accepted accounting principles, are recorded on the ex-date. Permanent book/tax differences relating to income and gain (loss) are reclassified amongst undistributed net investment income, accumulated net realized gain (loss) and paid-in capital in excess of par, as appropriate.
Estimates: The preparation of financial statements requires management to make estimates and assumptions that affect the reported amounts and disclosures in the financial statements. Actual results could differ from those estimates.
2. Agreements
The Trust, on behalf of the Fund, has a management agreement with PGIM Investments. Pursuant to this agreement, PGIM Investments has responsibility for all investment advisory services and supervises the Subadviser’s performance of such services. In addition, under the management agreement, PGIM Investments provides all of the administrative functions necessary for the organization, operation and management of the Fund. PGIM Investments administers the corporate affairs of the Fund and, in connection therewith, furnishes the Fund with office facilities, together with those ordinary clerical and bookkeeping services which are not being furnished by, the Fund’s custodian (the Custodian), and the Fund’s transfer agent. PGIM Investments is also responsible for the staffing and management of dedicated groups of legal, marketing, compliance and related personnel necessary for the operation of the Fund. The legal, marketing, compliance and related personnel are also responsible for the management and oversight of the various service providers to the Fund, including, but not limited to, the custodian, transfer agent, and accounting agent.
PGIM Investments has entered into a subadvisory agreement with PGIM, Inc., which provides subadvisory services to the Fund through its PGIM Fixed Income unit. The subadvisory agreement provides that PGIM, Inc. will furnish investment advisory services in connection with the management of the Fund. In connection therewith, PGIM, Inc. is obligated to keep certain books and records of the Fund. PGIM Investments pays for the services of PGIM, Inc., the cost of compensation of officers of the Fund, occupancy and certain clerical and bookkeeping costs of the Fund. The Fund bears all other costs and expenses.
The management fee paid to PGIM Investments is based on an annual rate of 0.45% of the Fund’s average daily net assets up to and including $5 billion; and 0.425% on average daily net assets exceeding $5 billion. The management fee rate before any waivers and/or expense reimbursements, was 0.45% for the year ended July 31, 2018.
PGIM Investments has contractually agreed through November 30, 2019, to limit total annual fund operating expenses after fee waivers and/or expense reimbursements to 0.80% of average daily net assets for Class A shares, 1.55% of average daily net assets for Class C shares, 1.05% of average daily net assets for Class R shares, 0.55% of average daily net assets for Class Z shares and 0.55% of average daily net assets for Class R6 shares. This contractual waiver excludes interest, brokerage, taxes (such as income and foreign withholding taxes, stamp duty and deferred tax expenses), acquired fund fees and expenses, extraordinary expenses, and certain other Fund expenses such as dividend and interest expense and broker charges on short sales. Where applicable, PGIM Investments agrees to waive management fees or shared operating expenses on any share class to the same extent that it waives similar expenses on any other share class. In addition, total annual fund operating expenses for Class R6 shares will not exceed total annual fund operating expenses for Class Z shares. Fees and/or expenses waived and/or reimbursed by PGIM Investments may be recouped by PGIM Investments within the same fiscal year during which such waiver and/or reimbursement is made if such recoupment can be realized without exceeding the expense limit in effect at the time of the recoupment for that fiscal year.
The Fund has a distribution agreement with Prudential Investment Management Services LLC (“PIMS”) which acts as the distributor of the Class A, Class C, Class R, Class Z and Class R6 shares of the Fund. The Fund compensates PIMS for distributing and servicing the Fund’s Class A, Class C and Class R shares, pursuant to the plans of distribution (the “Distribution Plans”), regardless of expenses actually incurred by PIMS. The distribution fees are accrued daily and payable monthly. No distribution or service fees are paid to PIMS as distributor of the Class Z or Class R6 shares of the Fund.
Pursuant to the Distribution Plans, the Fund compensates PIMS for distribution related activities at an annual rate of up to 0.25%, 1% and 0.75% of the average daily net assets of the Class A, Class C and Class R shares, respectively. PIMS has contractually agreed through November 30, 2019 to limit such fees to 0.50% of the average daily net assets of the Class R shares.
| | | | |
| PGIM Corporate Bond Fund | | | 39 | |
Notes to Financial Statements (continued)
PIMS has advised the Fund that it has received $12,507 in front-end sales charges resulting from sales of Class A shares during the year ended July 31, 2018. From these fees, PIMS paid such sales charges to broker-dealers, which in turn paid commissions to sales persons and incurred other distribution costs.
PIMS has advised the Fund that for the year ended July 31, 2018, it received $183 in contingent deferred sales charges imposed upon redemptions by certain Class C shareholders.
PGIM Investments, PGIM, Inc. and PIMS are indirect, wholly-owned subsidiaries of Prudential Financial, Inc. (“Prudential”).
3. Other Transactions with Affiliates
Prudential Mutual Fund Services LLC (“PMFS”), an affiliate of PGIM Investments and an indirect, wholly-owned subsidiary of Prudential, serves as the Fund’s transfer agent. Transfer agent’s fees and expenses in the Statement of Operations include certain out-of-pocket expenses paid to non-affiliates, where applicable.
The Fund may enter into certain securities purchase or sale transactions under Board approved Rule 17a-7 procedures. Rule 17a-7 is an exemptive rule under the 1940 Act, that permits purchase and sale transactions among affiliated investment companies, or between an investment company and a person that is affiliated solely by reason of having a common (or affiliated) investment adviser, common directors, and/or common officers. Such transactions are subject to ratification by the Board. For the reporting period ended July 31, 2018 no such transactions were entered into by the Fund.
The Fund may invest its overnight sweep cash in the PGIM Core Ultra Short Bond Fund (the “Core Fund”), and its securities lending cash collateral in the PGIM Institutional Money Market Fund (the “Money Market Fund”), each a series of Prudential Investment Portfolios 2, registered under the 1940 Act and managed by PGIM Investments. For the reporting period ended July 31, 2018, PGIM, Inc. was compensated $234 by PGIM Investments for managing the Fund’s securities lending cash collateral as subadviser to the Money Market Fund. Earnings from the Core Fund and Money Market Fund are disclosed on the Statement of Operations as “Affiliated dividend income” and “Income from securities lending, net”, respectively.
4. Portfolio Securities
The aggregate cost of purchases and proceeds from sales of portfolio securities (excluding short-term investments and U.S. Government securities) for the year ended July 31, 2018, were $9,401,411 and $9,666,580, respectively.
A summary of the cost of purchases and proceeds from sales of shares of affiliated mutual funds for the year ended July 31, 2018, is presented as follows:
| | | | | | | | | | | | | | | | | | | | | | | | | | | | | | | | |
Affiliated
Mutual
Funds* | | Value,
Beginning
of Year | | | Cost of
Purchases | | | Proceeds
from Sales | | | Change in
Unrealized
Gain
(Loss) | | | Realized
Gain
(Loss) | | | Value,
End of Year | | | Shares,
End
of Year | | | Dividend
Income | |
PGIM Core Ultra Short Bond Fund | | $ | 596,508 | | | $ | 9,230,176 | | | $ | 9,700,007 | | | $ | — | | | $ | — | | | $ | 126,677 | | | | 126,677 | | | $ | 4,549 | |
PGIM Institutional Money Market Fund | | | 362,305 | | | | 706,997 | | | | 1,069,170 | | | | 67 | | | | (199 | ) | | | — | | | | — | | | | 443 | ** |
| | | | | | | | | | | | | | | | | | | | | | | | | | | | | | | | |
| | $ | 958,813 | | | $ | 9,937,173 | | | $ | 10,769,177 | | | $ | 67 | | | $ | (199 | ) | | $ | 126,677 | | | | | | | $ | 4,992 | |
| | | | | | | | | | | | | | | | | | | | | | | | | | | | | | | | |
| * | The Funds did not have any capital gain distributions during the reporting period. |
| ** | This amount is included in “Income from securities lending, net” on the Statement of Operations. |
5. Distributions and Tax Information
Distributions to shareholders, which are determined in accordance with federal income tax regulations and which may differ from generally accepted accounting principles, are recorded on the ex-date. In order to present undistributed net investment income, accumulated net realized loss on investment transactions and paid-in capital in excess of par on the Statement of Assets and Liabilities that more closely represent their tax character, certain adjustments have been made to undistributed net investment income and accumulated net realized loss on investment transactions. For the year ended July 31, 2018, the adjustments were to increase undistributed net investment income and increase accumulated net realized loss on investment transactions by $49,787 due to differences in the treatment for book and tax purposes of premium amortization. Net investment income, net realized gain (loss) on investment transactions and net assets were not affected by this change.
The tax character of distributions paid during the year ended July 31, 2018 was $763,632 of ordinary income. The tax character of distributions paid during the tax year ended July 31, 2017 was $747,416 of ordinary income.
As of July 31, 2018, the accumulated undistributed earnings on a tax basis was $66,853 of ordinary income.
| | | | |
| PGIM Corporate Bond Fund | | | 41 | |
Notes to Financial Statements (continued)
The United States federal income tax basis of the Fund’s investments and the net unrealized depreciation as of July 31, 2018 were as follows:
| | | | | | |
Tax Basis | | Gross
Unrealized
Appreciation | | Gross
Unrealized
Depreciation | | Net
Unrealized
Depreciation |
| $22,070,196 | | $37,093 | | $(604,669) | | $(567,576) |
The differences between book basis and tax basis were primarily attributable to book/tax differences in the treatment of premium amortization and other book to tax differences.
For federal income tax purposes, the Fund had a capital loss carryforward as of July 31, 2018 of approximately $648,000 which can be carried forward for an unlimited period. No capital gains distributions are expected to be paid to shareholders until net gains have been realized in excess of such losses.
Management has analyzed the Fund’s tax positions taken on federal, state and local income tax returns for all open tax years and has concluded that no provision for income tax is required in the Fund’s financial statements for the current reporting period. The Fund’s federal, state and local income and federal excise tax returns for tax years for which the applicable statutes of limitations have not expired are subject to examination by the Internal Revenue Service and state departments of revenue.
6. Capital and Ownership
The Fund offers Class A, Class C, Class R, Class Z and Class R6 shares. Class A shares are sold with a maximum front-end sales charge of 4.50%. Investors who purchase $1 million or more of Class A shares and sell these shares within 12 months of purchase are subject to a contingent deferred sales charge (“CDSC”) of 1%, although they are not subject to an initial sales charge. The Class A CDSC is waived for certain retirement and/or benefit plans. A special exchange privilege is also available for shareholders who qualified to purchase Class A shares at net asset value. Class C shares are sold with a CDSC of 1% on sales made within 12 months of purchase. Class R shares are available to certain retirement plans, clearing and settlement firms. Class R, Class Z and Class R6 shares are not subject to any sales or redemption charge and are offered exclusively for sale to a limited group of investors.
Under certain circumstances, an exchange may be made from specified share classes of the Fund to one or more other share classes of the Fund as presented in the table of transactions in shares of beneficial interest.
The Trust has authorized an unlimited number of shares of beneficial interest at $0.001 par value per share.
As of July 31, 2018, Prudential, through its affiliate entities, including affiliated funds (if applicable), owned 995 Class R shares and 1,011 Class R6 shares of the Fund. At reporting period end, 3 shareholders of record held 76% of the Fund’s outstanding shares on behalf of multiple beneficial owners.
Transactions in shares of beneficial interest were as follows:
| | | | | | | | |
Class A | | Shares | | | Amount | |
Year ended July 31, 2018: | | | | | | | | |
Shares sold | | | 106,900 | | | $ | 1,194,419 | |
Shares issued in reinvestment of dividends and distributions | | | 5,922 | | | | 65,519 | |
Shares reacquired | | | (57,018 | ) | | | (633,882 | ) |
| | | | | | | | |
Net increase (decrease) in shares outstanding before conversion | | | 55,804 | | | | 626,056 | |
Shares issued upon conversion from other share class(es) | | | 23,719 | | | | 256,161 | |
Shares reacquired upon conversion into other share class(es) | | | (1,439 | ) | | | (16,219 | ) |
| | | | | | | | |
Net increase (decrease) in shares outstanding | | | 78,084 | | | $ | 865,998 | |
| | | | | | | | |
Year ended July 31, 2017: | | | | | | | | |
Shares sold | | | 130,815 | | | $ | 1,463,656 | |
Shares issued in reinvestment of dividends and distributions | | | 3,414 | | | | 38,209 | |
Shares reacquired | | | (43,180 | ) | | | (479,305 | ) |
| | | | | | | | |
Net increase (decrease) in shares outstanding before conversion | | | 91,049 | | | | 1,022,560 | |
Shares reacquired upon conversion into other share class(es) | | | (3,587 | ) | | | (39,847 | ) |
| | | | | | | | |
Net increase (decrease) in shares outstanding | | | 87,462 | | | $ | 982,713 | |
| | | | | | | | |
Class C | | | | | | |
Year ended July 31, 2018: | | | | | | | | |
Shares sold | | | 17,768 | | | $ | 200,026 | |
Shares issued in reinvestment of dividends and distributions | | | 2,065 | | | | 22,835 | |
Shares reacquired | | | (28,578 | ) | | | (319,348 | ) |
| | | | | | | | |
Net increase (decrease) in shares outstanding | | | (8,745 | ) | | $ | (96,487 | ) |
| | | | | | | | |
Year ended July 31, 2017: | | | | | | | | |
Shares sold | | | 61,586 | | | $ | 685,900 | |
Shares issued in reinvestment of dividends and distributions | | | 1,868 | | | | 20,845 | |
Shares reacquired | | | (32,511 | ) | | | (359,336 | ) |
| | | | | | | | |
Net increase (decrease) in shares outstanding | | | 30,943 | | | $ | 347,409 | |
| | | | | | | | |
Class R | | | | | | |
Year ended July 31, 2018: | | | | | | | | |
Shares sold | | | 685 | | | $ | 7,350 | |
Shares issued in reinvestment of dividends and distributions | | | 32 | | | | 352 | |
Shares reacquired | | | (1 | ) | | | (3 | ) |
| | | | | | | | |
Net increase (decrease) in shares outstanding | | | 716 | | | $ | 7,699 | |
| | | | | | | | |
Year ended July 31, 2017: | | | | | | | | |
Shares issued in reinvestment of dividends and distributions | | | 26 | | | $ | 291 | |
| | | | | | | | |
Net increase (decrease) in shares outstanding | | | 26 | | | $ | 291 | |
| | | | | | | | |
| | | | |
| PGIM Corporate Bond Fund | | | 43 | |
Notes to Financial Statements (continued)
| | | | | | | | |
Class Z | | Shares | | | Amount | |
Year ended July 31, 2018: | | | | | | | | |
Shares sold | | | 639,723 | | | $ | 7,128,401 | |
Shares issued in reinvestment of dividends and distributions | | | 59,032 | | | | 653,277 | |
Shares reacquired | | | (744,267 | ) | | | (8,240,234 | ) |
| | | | | | | | |
Net increase (decrease) in shares outstanding before conversion | | | (45,512 | ) | | | (458,556 | ) |
Shares issued upon conversion from other share class(es) | | | 1,443 | | | | 16,219 | |
Shares reacquired upon conversion into other share class(es) | | | (23,763 | ) | | | (256,161 | ) |
| | | | | | | | |
Net increase (decrease) in shares outstanding | | | (67,832 | ) | | $ | (698,498 | ) |
| | | | | | | | |
Year ended July 31, 2017: | | | | | | | | |
Shares sold | | | 611,442 | | | $ | 6,836,359 | |
Shares issued in reinvestment of dividends and distributions | | | 59,423 | | | | 664,102 | |
Shares reacquired | | | (954,080 | ) | | | (10,611,926 | ) |
| | | | | | | | |
Net increase (decrease) in shares outstanding before conversion | | | (283,215 | ) | | | (3,111,465 | ) |
Shares issued upon conversion from other share class(es) | | | 3,600 | | | | 39,847 | |
| | | | | | | | |
Net increase (decrease) in shares outstanding | | | (279,615 | ) | | $ | (3,071,618 | ) |
| | | | | | | | |
Class R6 | | | | | | |
Year ended July 31, 2018: | | | | | | | | |
Shares issued in reinvestment of dividends and distributions | | | 33 | | | $ | 367 | |
| | | | | | | | |
Net increase (decrease) in shares outstanding | | | 33 | | | $ | 367 | |
| | | | | | | | |
Year ended July 31, 2017: | | | | | | | | |
Shares issued in reinvestment of dividends and distributions | | | 31 | | | $ | 348 | |
| | | | | | | | |
Net increase (decrease) in shares outstanding | | | 31 | | | $ | 348 | |
| | | | | | | | |
7. Borrowings
The Trust, on behalf of the Fund, along with other affiliated registered investment companies (the “Funds”), is a party to a Syndicated Credit Agreement (“SCA”) with a group of banks. The purpose of the SCA is to provide an alternative source of temporary funding for capital share redemptions. The SCA provides for a commitment of $900 million for the period October 5, 2017 through October 4, 2018. The Funds pay an annualized commitment fee of 0.15% of the unused portion of the SCA. The Fund’s portion of the commitment fee for the unused amount, allocated based upon a method approved by the Board, is accrued daily and paid quarterly. Prior to October 5, 2017, the Funds had another SCA that provided a commitment of $900 million and the Funds paid an annualized commitment fee of 0.15% of the unused portion of the SCA. The interest on borrowings under the SCAs is paid monthly and at a per annum interest rate based upon a contractual spread plus the higher of (1) the effective federal funds rate, (2) the 1-month LIBOR rate or (3) zero percent.
Other affiliated registered investment companies that are parties to the SCA include portfolios that are subject to a predetermined mathematical formula used to manage certain benefit guarantees offered under variable annuity contracts. The formula may result in large scale asset flows into and out of these portfolios. Consequently, these portfolios may be more
likely to utilize the SCA for purposes of funding redemptions. It may be possible for those portfolios to fully exhaust the committed amount of the SCA, thereby requiring the Manager to allocate available funding per a Board-approved methodology designed to treat the Funds in the SCA equitably.
The Fund utilized the SCA during the reporting period ended July 31, 2018. The average daily balance for the 1 day that the Fund had loans outstanding during the period was $1,636,000, borrowed at a weighted average interest rate of 2.83%. The maximum loan balance outstanding during the period was $1,636,000. At July 31, 2018, the Fund did not have an outstanding loan balance.
8. Other Risks
The Fund’s risks include, but are not limited to, the risks discussed below:
Bond Obligations Risk: The Fund’s holdings, share price, yield and total return may fluctuate in response to bond market movements. The value of bonds may decline for issuer-related reasons, including management performance, financial leverage and reduced demand for the issuer’s goods and services. Certain types of fixed-income obligations also may be subject to “call and redemption risk,” which is the risk that the issuer may call a bond held by the Fund for redemption before it matures and the Fund may not be able to reinvest at the same level and therefore would earn less income.
Interest Rate Risk: The market price of the Fund’s investments will change in response to changes in interest rate and other factors. During periods of rising interest rates, the market price of fixed income instruments generally declines. As interest rates increase, slower than expected principal payments may extend the average life of securities, potentially locking in below-market interest rates and reducing the Fund’s value. In typical market interest rate environments, the prices of long-term debt obligations generally fluctuate more than prices of short-term debt obligations as interest rates change. Fluctuations in the market price of the Fund’s instruments will not affect interest income derived from the instruments already owned by the Fund, but will be reflected in the Fund’s NAV.
Liquidity Risk: The Fund may invest in instruments that trade in lower volumes and are less liquid than other investments. Liquidity risk includes the risk that the Fund may make investments that may become less liquid in response to market developments or adverse investor perceptions. Investments that are illiquid or that trade in lower volumes may be more difficult to value. When there is no willing buyer and investments cannot be readily sold at the desired time or price, the Fund may have to accept a lower price or may not be able to sell the instrument at all. An inability to sell a portfolio position can adversely affect the Fund’s value or prevent the Fund from being able to take advantage of other investment opportunities.
Market and Credit Risk: Securities markets may be volatile and the market prices of the Fund’s securities may decline. Securities fluctuate in price based on changes in an issuer’s
| | | | |
| PGIM Corporate Bond Fund | | | 45 | |
Notes to Financial Statements (continued)
financial condition and overall market and economic conditions. If the market prices of the securities owned by the Fund fall, the value of an investment in the Fund will decline. Additionally, the Fund may also be exposed to credit risk in the event that an issuer or guarantor fails to perform or that an institution or entity with which the Fund has unsettled or open transactions defaults.
Financial Highlights
| | | | | | | | | | | | | | | | | | | | |
| Class A Shares | | | | |
| | | Year Ended July 31, | | | | | | May 28,
2015(a)
through
July 31, | |
| | | 2018 | | | 2017 | | | 2016 | | | | | | 2015 | |
| Per Share Operating Performance(b): | | | | | | | | | | | | | | | | | | | | |
| Net Asset Value, Beginning of Period | | | $11.32 | | | | $11.46 | | | | $10.76 | | | | | | | | $10.94 | |
| Income (loss) from investment operations: | | | | | | | | | | | | | | | | | | | | |
| Net investment income (loss) | | | 0.32 | | | | 0.32 | | | | 0.29 | | | | | | | | 0.04 | |
| Net realized and unrealized gain (loss) on investment transactions | | | (0.49 | ) | | | (0.13 | ) | | | 0.71 | | | | | | | | (0.17 | ) |
| Total from investment operations: | | | (0.17 | ) | | | 0.19 | | | | 1.00 | | | | | | | | (0.13 | ) |
| Less Dividends and Distributions: | | | | | | | | | | | | | | | | | | | | |
| Dividends from net investment income | | | (0.34 | ) | | | (0.33 | ) | | | (0.30 | ) | | | | | | | (0.05 | ) |
| Net asset value, end of period | | | $10.81 | | | | $11.32 | | | | $11.46 | | | | | | | | $10.76 | |
| Total Return(c): | | | (1.51)% | | | | 1.77% | | | | 9.49% | | | | | | | | (1.19)% | |
| |
| Ratios/Supplemental Data: | | | | |
| Net assets, end of period (000) | | | $2,565 | | | | $1,802 | | | | $822 | | | | | | | | $71 | |
| Average net assets (000) | | | $2,200 | | | | $1,339 | | | | $269 | | | | | | | | $12 | |
| Ratios to average net assets(d): | | | | | | | | | | | | | | | | | | | | |
| Expenses after waivers and/or expense reimbursement | | | 0.80% | | | | 0.80% | | | | 0.94% | | | | | | | | 0.98% | (e) |
| Expenses before waivers and/or expense reimbursement | | | 2.25% | (f) | | | 1.92% | | | | 1.77% | | | | | | | | 2.23% | (e) |
| Net investment income (loss) | | | 2.89% | | | | 2.88% | | | | 2.64% | | | | | | | | 2.24% | (e) |
| Portfolio turnover rate(g) | | | 70% | | | | 90% | | | | 165% | | | | | | | | 1,221% | (h)(i) |
| (a) | Commencement of operations. |
| (b) | Calculated based on average shares outstanding during the period. |
| (c) | Total return does not consider the effects of sales loads. Total return is calculated assuming a purchase of a share on the first day and a sale on the last day of each period reported and includes reinvestment of dividends and distributions, if any. Total returns may reflect adjustments to conform to generally accepted accounting principles. Total returns for periods less than one full year are not annualized. |
| (d) | Does not include expenses of the underlying funds in which the Fund invests. |
| (f) | Effective August 1, 2017, class specific expenses include Transfer Agent Fees and expenses and Registration Fees, which are charged to their respective share class. |
| (g) | The Fund’s portfolio turnover rate is calculated in accordance with regulatory requirements, without regard to transactions involving short term investments and certain derivatives. If such transactions were included, the Fund’s portfolio turnover rate may be higher. |
| (h) | The Fund accounts for mortgage dollar roll transactions as purchases and sales which, as a result, can increase its portfolio turnover rate. |
See Notes to Financial Statements.
| | | | |
| PGIM Corporate Bond Fund | | | 47 | |
Financial Highlights (continued)
| | | | | | | | | | | | | | | | | | | | |
| Class C Shares | | | | |
| | | Year Ended July 31, | | | | | | May 28,
2015(a)
through
July 31, | |
| | | 2018 | | | 2017 | | | 2016 | | | | | | 2015 | |
| Per Share Operating Performance(b): | | | | | | | | | | | | | | | | | | | | |
| Net Asset Value, Beginning of Period | | | $11.29 | | | | $11.43 | | | | $10.75 | | | | | | | | $10.94 | |
| Income (loss) from investment operations: | | | | | | | | | | | | | | | | | | | | |
| Net investment income (loss) | | | 0.24 | | | | 0.24 | | | | 0.20 | | | | | | | | 0.03 | |
| Net realized and unrealized gain (loss) on investment transactions | | | (0.48 | ) | | | (0.13 | ) | | | 0.70 | | | | | | | | (0.18 | ) |
| Total from investment operations: | | | (0.24 | ) | | | 0.11 | | | | 0.90 | | | | | | | | (0.15 | ) |
| Less Dividends and Distributions: | | | | | | | | | | | | | | | | | | | | |
| Dividends from net investment income | | | (0.26 | ) | | | (0.25 | ) | | | (0.22 | ) | | | | | | | (0.04 | ) |
| Net asset value, end of period | | | $10.79 | | | | $11.29 | | | | $11.43 | | | | | | | | $10.75 | |
| Total Return(c): | | | (2.16)% | | | | 1.01% | | | | 8.51% | | | | | | | | (1.41)% | |
| |
| Ratios/Supplemental Data: | | | | |
| Net assets, end of period (000) | | | $952 | | | | $1,095 | | | | $755 | | | | | | | | $15 | |
| Average net assets (000) | | | $1,050 | | | | $1,014 | | | | $369 | | | | | | | | $13 | |
| Ratios to average net assets(d): | | | | | | | | | | | | | | | | | | | | |
| Expenses after waivers and/or expense reimbursement | | | 1.55% | | | | 1.55% | | | | 1.73% | | | | | | | | 1.87% | (e) |
| Expenses before waivers and/or expense reimbursement | | | 3.54% | (f) | | | 2.66% | | | | 2.56% | | | | | | | | 2.97% | (e) |
| Net investment income (loss) | | | 2.12% | | | | 2.12% | | | | 1.84% | | | | | | | | 1.48% | (e) |
| Portfolio turnover rate(g) | | | 70% | | | | 90% | | | | 165% | | | | | | | | 1,221% | (h)(i) |
| (a) | Commencement of operations. |
| (b) | Calculated based on average shares outstanding during the period. |
| (c) | Total return does not consider the effects of sales loads. Total return is calculated assuming a purchase of a share on the first day and a sale on the last day of each period reported and includes reinvestment of dividends and distributions, if any. Total returns may reflect adjustments to conform to generally accepted accounting principles. Total returns for periods less than one full year are not annualized. |
| (d) | Does not include expenses of the underlying funds in which the Fund invests. |
| (f) | Effective August 1, 2017, class specific expenses include Transfer Agent Fees and expenses and Registration Fees, which are charged to their respective share class. |
| (g) | The Fund’s portfolio turnover rate is calculated in accordance with regulatory requirements, without regard to transactions involving short term investments and certain derivatives. If such transactions were included, the Fund’s portfolio turnover rate may be higher. |
| (h) | The Fund accounts for mortgage dollar roll transactions as purchases and sales which, as a result, can increase its portfolio turnover rate. |
See Notes to Financial Statements.
| | | | | | | | | | | | | | | | | | | | |
| Class R Shares | | | | |
| | | Year Ended July 31, | | | | | | May 28,
2015(a)
through
July 31, | |
| | | 2018 | | | 2017 | | | 2016 | | | | | | 2015 | |
| Per Share Operating Performance(b): | | | | | | | | | | | | | | | | | | | | |
| Net Asset Value, Beginning of Period | | | $11.29 | | | | $11.43 | | | | $10.75 | | | | | | | | $10.94 | |
| Income (loss) from investment operations: | | | | | | | | | | | | | | | | | | | | |
| Net investment income (loss) | | | 0.29 | | | | 0.29 | | | | 0.25 | | | | | | | | 0.03 | |
| Net realized and unrealized gain (loss) on investment transactions | | | (0.47 | ) | | | (0.12 | ) | | | 0.70 | | | | | | | | (0.17 | ) |
| Total from investment operations: | | | (0.18 | ) | | | 0.17 | | | | 0.95 | | | | | | | | (0.14 | ) |
| Less Dividends and Distributions: | | | | | | | | | | | | | | | | | | | | |
| Dividends from net investment income | | | (0.32 | ) | | | (0.31 | ) | | | (0.27 | ) | | | | | | | (0.05 | ) |
| Net asset value, end of period | | | $10.79 | | | | $11.29 | | | | $11.43 | | | | | | | | $10.75 | |
| Total Return(c): | | | (1.67)% | | | | 1.51% | | | | 9.04% | | | | | | | | (1.32)% | |
| |
| Ratios/Supplemental Data: | | | | |
| Net assets, end of period (000) | | | $18 | | | | $11 | | | | $11 | | | | | | | | $10 | |
| Average net assets (000) | | | $12 | | | | $11 | | | | $10 | | | | | | | | $10 | |
| Ratios to average net assets(d): | | | | | | | | | | | | | | | | | | | | |
| Expenses after waivers and/or expense reimbursement | | | 1.05% | | | | 1.05% | | | | 1.29% | | | | | | | | 1.36% | (e) |
| Expenses before waivers and/or expense reimbursement | | | 109.57% | (f) | | | 2.42% | | | | 2.12% | | | | | | | | 2.77% | (e) |
| Net investment income (loss) | | | 2.66% | | | | 2.59% | | | | 2.32% | | | | | | | | 1.91% | (e) |
| Portfolio turnover rate(g) | | | 70% | | | | 90% | | | | 165% | | | | | | | | 1,221% | (h)(i) |
| (a) | Commencement of operations. |
| (b) | Calculated based on average shares outstanding during the period. |
| (c) | Total return is calculated assuming a purchase of a share on the first day and a sale on the last day of each period reported and includes reinvestment of dividends and distributions, if any. Total returns may reflect adjustments to conform to generally accepted accounting principles. Total returns for periods less than one full year are not annualized. |
| (d) | Does not include expenses of the underlying funds in which the Fund invests. |
| (f) | Effective August 1, 2017, class specific expenses include Transfer Agent Fees and expenses and Registration Fees, which are charged to their respective share class. |
| (g) | The Fund’s portfolio turnover rate is calculated in accordance with regulatory requirements, without regard to transactions involving short term investments and certain derivatives. If such transactions were included, the Fund’s portfolio turnover rate may be higher. |
| (h) | The Fund accounts for mortgage dollar roll transactions as purchases and sales which, as a result, can increase its portfolio turnover rate. |
See Notes to Financial Statements.
| | | | |
| PGIM Corporate Bond Fund | | | 49 | |
Financial Highlights (continued)
| | | | | | | | | | | | | | | | | | | | | | | | | | | | | | | | |
| Class Z Shares | | | | | | | | | | | | | |
| | | Year Ended July 31, | | | | | | Nine Months
Ended
July 31, | | | | | | Year Ended
October 31, | |
| | | 2018(a) | | | 2017(a) | | | 2016(a) | | | 2015(a)(b) | | | 2014(c) | | | 2013 | |
| Per Share Operating Performance: | | | | | | | | | | | | | | | | | | | | | | | | | | | | | | | | |
| Net Asset Value, Beginning of Period | | | $11.29 | | | | $11.43 | | | | $10.76 | | | | $10.69 | | | | | | | | $10.50 | | | | | | | | $10.83 | |
| Income (loss) from investment operations: | | | | | | | | | | | | | | | | | | | | | | | | | | | | | | | | |
| Net investment income (loss) | | | 0.35 | | | | 0.34 | | | | 0.30 | | | | 0.09 | | | | | | | | 0.05 | | | | | | | | 0.15 | |
| Net realized and unrealized gain (loss) on investment transactions | | | (0.48 | ) | | | (0.12 | ) | | | 0.70 | | | | 0.11 | | | | | | | | 0.21 | | | | | | | | (0.26 | ) |
| Total from investment operations: | | | (0.13 | ) | | | 0.22 | | | | 1.00 | | | | 0.20 | | | | | | | | 0.26 | | | | | | | | (0.11 | ) |
| Less Dividends and Distributions: | | | | | | | | | | | | | | | | | | | | | | | | | | | | | | | | |
| Dividends from net investment income | | | (0.37 | ) | | | (0.36 | ) | | | (0.33 | ) | | | (0.13 | ) | | | | | | | (0.07 | ) | | | | | | | (0.22 | ) |
| Net asset value, end of period | | | $10.79 | | | | $11.29 | | | | $11.43 | | | | $10.76 | | | | | | | | $10.69 | | | | | | | | $10.50 | |
| Total Return(d): | | | (1.18)% | | | | 2.02% | | | | 9.47% | | | | 1.83% | | | | | | | | 2.47% | | | | | | | | (0.97)% | |
| |
| Ratios/Supplemental Data: | |
| Net assets, end of period (000) | | | $18,247 | | | | $19,869 | | | | $23,307 | | | | $44,174 | | | | | | | | $43,879 | | | | | | | | $42,218 | |
| Average net assets (000) | | | $20,078 | | | | $21,149 | | | | $33,438 | | | | $44,354 | | | | | | | | $42,666 | | | | | | | | $43,290 | |
| Ratios to average net assets(e): | | | | | | | | | | | | | | | | | | | | | | | | | | | | | | | | |
| Expenses after waivers and/or expense reimbursement | | | 0.55% | | | | 0.55% | | | | 0.82% | | | | 0.91% | | | | | | | | 0.99% | (f) | | | | | | | 0.93% | |
| Expenses before waivers and/or expense reimbursement | | | 1.32% | (g) | | | 1.64% | | | | 1.27% | | | | 1.10% | | | | | | | | 0.99% | (f) | | | | | | | 0.93% | |
| Net investment income (loss) | | | 3.12% | | | | 3.07% | | | | 2.79% | | | | 0.78% | | | | | | | | 0.65% | (f) | | | | | | | 1.39% | |
| Portfolio turnover rate(h) | | | 70% | | | | 90% | | | | 165% | | | | 1,221% | (i) | | | | | | | 936% | (i)(j) | | | | | | | 990% | (i) |
| (a) | Calculated based on average shares outstanding during the period. |
| (b) | Class T shares were renamed Class Z shares effective May 28, 2015 |
| (c) | For the nine month period ended July 31, 2014. The Trust changed its fiscal year end from October 31 to July 31, effective July 31, 2014. |
| (d) | Total return is calculated assuming a purchase of a share on the first day and a sale on the last day of each period reported and includes reinvestment of dividends and distributions, if any. Total returns may reflect adjustments to conform to generally accepted accounting principles. Total returns for periods less than one full year are not annualized. |
| (e) | Does not include expenses of the underlying funds in which the Fund invests. |
| (g) | Effective August 1, 2017, class specific expenses include Transfer Agent Fees and expenses and Registration Fees, which are charged to their respective share class. |
| (h) | The Fund’s portfolio turnover rate is calculated in accordance with regulatory requirements, without regard to transactions involving short term investments and certain derivatives. If such transactions were included, the Fund’s portfolio turnover rate may be higher. |
| (i) | The Fund accounts for mortgage dollar roll transactions as purchases and sales which, as a result, can increase its portfolio turnover rate. |
See Notes to Financial Statements.
| | | | | | | | | | | | | | | | | | | | |
| Class R6 Shares | | | | |
| | | Year Ended July 31, | | | | | | May 28,
2015(a)
through
July 31, | |
| | | 2018 | | | 2017 | | | 2016 | | | | | | 2015 | |
| Per Share Operating Performance(b): | | | | | | | | | | | | | | | | | | | | |
| Net Asset Value, Beginning of Period | | | $11.29 | | | | $11.43 | | | | $10.75 | | | | | | | | $10.94 | |
| Income (loss) from investment operations: | | | | | | | | | | | | | | | | | | | | |
| Net investment income (loss) | | | 0.35 | | | | 0.35 | | | | 0.30 | | | | | | | | 0.04 | |
| Net realized and unrealized gain (loss) on investment transactions | | | (0.48 | ) | | | (0.13 | ) | | | 0.71 | | | | | | | | (0.18 | ) |
| Total from investment operations: | | | (0.13 | ) | | | 0.22 | | | | 1.01 | | | | | | | | (0.14 | ) |
| Less Dividends and Distributions: | | | | | | | | | | | | | | | | | | | | |
| Dividends from net investment income | | | (0.37 | ) | | | (0.36 | ) | | | (0.33 | ) | | | | | | | (0.05 | ) |
| Net asset value, end of period | | | $10.79 | | | | $11.29 | | | | $11.43 | | | | | | | | $10.75 | |
| Total Return(c): | | | (1.18)% | | | | 2.02% | | | | 9.57% | | | | | | | | (1.25)% | |
| |
| Ratios/Supplemental Data: | |
| Net assets, end of period (000) | | | $11 | | | | $11 | | | | $11 | | | | | | | | $10 | |
| Average net assets (000) | | | $11 | | | | $11 | | | | $10 | | | | | | | | $10 | |
| Ratios to average net assets(d): | | | | | | | | | | | | | | | | | | | | |
| Expenses after waivers and/or expense reimbursement | | | 0.55% | | | | 0.55% | | | | 0.79% | | | | | | | | 0.87% | (e) |
| Expenses before waivers and/or expense reimbursement | | | 121.08% | (f) | | | 1.53% | | | | 1.28% | | | | | | | | 1.88% | (e) |
| Net investment income (loss) | | | 3.12% | | | | 3.10% | | | | 2.80% | | | | | | | | 2.39% | (e) |
| Portfolio turnover rate(g) | | | 70% | | | | 90% | | | | 165% | | | | | | | | 1,221% | (h)(i) |
| (a) | Commencement of operations. |
| (b) | Calculated based on average shares outstanding during the period. |
| (c) | Total return is calculated assuming a purchase of a share on the first day and a sale on the last day of each period reported and includes reinvestment of dividends and distributions, if any. Total returns may reflect adjustments to conform to generally accepted accounting principles. Total returns for periods less than one full year are not annualized. |
| (d) | Does not include expenses of the underlying funds in which the Fund invests. |
| (f) | Effective August 1, 2017, class specific expenses include Transfer Agent Fees and expenses and Registration Fees, which are charged to their respective share class. |
| (g) | The Fund’s portfolio turnover rate is calculated in accordance with regulatory requirements, without regard to transactions involving short term investments and certain derivatives. If such transactions were included, the Fund’s portfolio turnover rate may be higher. |
| (h) | The Fund accounts for mortgage dollar roll transactions as purchases and sales which, as a result, can increase its portfolio turnover rate. |
See Notes to Financial Statements.
| | | | |
| PGIM Corporate Bond Fund | | | 51 | |
Report of Independent Registered Public Accounting Firm
The Board of Trustees and Shareholders
The Target Portfolio Trust:
Opinion on the Financial Statements
We have audited the accompanying statement of assets and liabilities of the fund listed in the Appendix (the Fund), including the schedule of investments, as of July 31, 2018, the related statement of operations for the year then ended, the statements of changes in net assets for each of the years in the two-year period ended July 31, 2018, and the related notes (collectively, the financial statements) and the financial highlights for the years or periods indicated therein. In our opinion, the financial statements and financial highlights present fairly, in all material respects, the financial position of the Fund as of July 31, 2018, the results of its operations for the year then ended, the changes in its net assets for each of the years in the two-year period ended July 31, 2018, and the financial highlights for the years or periods indicated therein, in conformity with U.S. generally accepted accounting principles.
Basis for Opinion
These financial statements and financial highlights are the responsibility of the Fund’s management. Our responsibility is to express an opinion on these financial statements and financial highlights based on our audits. We are a public accounting firm registered with the Public Company Accounting Oversight Board (United States) (“PCAOB”) and are required to be independent with respect to the Fund in accordance with the U.S. federal securities laws and the applicable rules and regulations of the Securities and Exchange Commission and the PCAOB.
We conducted our audits in accordance with the standards of the PCAOB. Those standards require that we plan and perform the audit to obtain reasonable assurance about whether the financial statements and financial highlights are free of material misstatement, whether due to error or fraud. Our audits included performing procedures to assess the risks of material misstatement of the financial statements and financial highlights, whether due to error or fraud, and performing procedures that respond to those risks. Such procedures included examining, on a test basis, evidence regarding the amounts and disclosures in the financial statements and financial highlights. Such procedures also included confirmation of securities owned as of July 31, 2018, by correspondence with the custodians, transfer agents and brokers or by other appropriate auditing procedures when replies from brokers were not received. Our audits also included evaluating the accounting principles used and significant estimates made by management, as well as evaluating the overall presentation of the financial statements and financial highlights. We believe that our audits provide a reasonable basis for our opinion.

We have served as the auditor of one or more PGIM and/or Prudential Retail investment companies since 2003.
New York, New York
September 18, 2018
Appendix A
PGIM Corporate Bond Fund (formerly Prudential Corporate Bond Fund)
Federal Income Tax Information (unaudited)
For the tax year ended July 31, 2018, the Fund reports 84.65% as interest-related dividends in accordance with Sections 871(k)(1) and 881(e)(1) of the Internal Revenue Code.
In January 2019, you will be advised on IRS Form 1099-DIV or substitute Form 1099-DIV, as to the Federal tax status of the distributions received by you in calendar year 2018.
INFORMATION ABOUT BOARD MEMBERS AND OFFICERS
(Unaudited)
Information about Board Members and Officers of the Fund is set forth below. Board Members who are not deemed to be “interested persons” of the Fund, as defined in the 1940 Act, are referred to as “Independent Board Members.” Board Members who are deemed to be “interested persons” of the Fund are referred to as “Interested Board Members.” The Board Members are responsible for the overall supervision of the operations of the Fund and perform the various duties imposed on the directors of investment companies by the 1940 Act. The Board in turn elects the Officers, who are responsible for administering the day-to-day operations of the Fund.
| | | | | | |
| | | |
Independent Board Members | | | | |
| | | | |
Name, Address, Age Position(s) Portfolios Overseen | | Principal Occupation(s) During Past Five Years | | Other Directorships Held During Past Five Years | | Length of Board Service |
| | | | |
Ellen S. Alberding (60) Board Member Portfolios Overseen: 91 | | President and Board Member, The Joyce Foundation (charitable foundation) (since 2002); Vice Chair, City Colleges of Chicago (community college system) (2011-2015); Trustee, National Park Foundation (charitable foundation for national park system) (2009-2018); Trustee, Economic Club of Chicago (since 2009); Trustee, Loyola University (since 2018). | | None. | | Since September 2013 |
| | | | |
Kevin J. Bannon (66) Board Member Portfolios Overseen: 91 | | Retired; Managing Director (April 2008-May 2015) and Chief Investment Officer (October 2008-November 2013) of Highmount Capital LLC (registered investment adviser); formerly Executive Vice President and Chief Investment Officer (April 1993-August 2007) of Bank of New York Company; President (May 2003-May 2007) of BNY Hamilton Family of Mutual Funds. | | Director of Urstadt Biddle Properties (equity real estate investment trust) (since September 2008). | | Since July 2008 |
| | | | |
Linda W. Bynoe (66) Board Member Portfolios Overseen: 91 | | President and Chief Executive Officer (since March 1995) and formerly Chief Operating Officer (December 1989-February 1995) of Telemat Ltd. (management consulting); formerly Vice President (January 1985-June 1989) at Morgan Stanley & Co. (broker-dealer). | | Director of Anixter International, Inc. (communication products distributor) (since January 2006); Director of Northern Trust Corporation (financial services) (since April 2006); Trustee of Equity Residential (residential real estate) (since December 2009). | | Since March 2005 |
PGIM Corporate Bond Fund
| | | | | | |
| | | |
Independent Board Members | | | | |
| | | | |
Name, Address, Age Position(s) Portfolios Overseen | | Principal Occupation(s) During Past Five Years | | Other Directorships Held During Past Five Years | | Length of Board Service |
| | | | |
Barry H. Evans (57) Board Member Portfolios Overseen: 90 | | Retired; formerly President (2005 – 2016), Global Chief Operating Officer (2014– 2016), Chief Investment Officer – Global Head of Fixed Income (1998-2014), and various portfolio manager roles (1986-2006), Manulife Asset Management U.S. | | Director, Manulife Trust Company (since 2011); formerly Director, Manulife Asset Management Limited (2015-2017); formerly Chairman of the Board of Directors of Manulife Asset Management U.S. (2005-2016); formerly Chairman of the Board, Declaration Investment Management and Research (2008-2016). | | Since September 2017 |
| | | | |
Keith F. Hartstein (61) Board Member & Independent Chair Portfolios Overseen: 91 | | Retired; Member (since November 2014) of the Governing Council of the Independent Directors Council (organization of independent mutual fund directors); formerly President and Chief Executive Officer (2005-2012), Senior Vice President (2004-2005), Senior Vice President of Sales and Marketing (1997-2004), and various executive management positions (1990-1997), John Hancock Funds, LLC (asset management); Chairman, Investment Company Institute’s Sales Force Marketing Committee (2003-2008). | | None. | | Since September 2013 |
Visit our website at pgiminvestments.com
| | | | | | |
| | | |
Independent Board Members | | | | |
| | | | |
Name, Address, Age Position(s) Portfolios Overseen | | Principal Occupation(s) During Past Five Years | | Other Directorships Held During Past Five Years | | Length of Board Service |
| | | | |
Laurie Simon Hodrick (56) Board Member Portfolios Overseen: 90 | | A. Barton Hepburn Professor Emerita of Economics in the Faculty of Business, Columbia Business School (since 2018); Visiting Professor of Law, Stanford Law School (since 2015); Visiting Fellow at the Hoover Institution, Stanford University (since 2015); Sole Member, ReidCourt LLC (since 2008) (a consulting firm); formerly A. Barton Hepburn Professor of Economics in the Faculty of Business, Columbia Business School (1996-2017); formerly Managing Director, Global Head of Alternative Investment Strategies, Deutsche Bank (2006-2008); Independent Director Kabbage, Inc. (since July 2018) (financial services). | | Independent Director, Corporate Capital Trust (since April 2017) (a business development company); Independent Director, Kabbage, Inc. (since July 2018) (financial services). | | Since September 2017 |
| | | | |
Michael S. Hyland, CFA (72) Board Member Portfolios Overseen: 91 | | Retired (since February 2005); formerly Senior Managing Director (July 2001-February 2005) of Bear Stearns & Co, Inc.; Global Partner, INVESCO (1999-2001); Managing Director and President of Salomon Brothers Asset Management (1989-1999). | | None. | | Since July 2008 |
| | | | |
Richard A. Redeker (75) Board Member Portfolios Overseen: 91 | | Retired Mutual Fund Senior Executive (50 years); Management Consultant; Director, Mutual Fund Directors Forum (since 2014); Independent Directors Council (organization of independent mutual fund directors)-Executive Committee, Chair of Policy Steering Committee, Governing Council. | | None. | | Since October 1993 |
PGIM Corporate Bond Fund
| | | | | | |
| | | |
Independent Board Members | | | | |
| | | | |
Name, Address, Age Position(s) Portfolios Overseen | | Principal Occupation(s) During Past Five Years | | Other Directorships Held During Past Five Years | | Length of Board Service |
| | | | |
Brian K. Reid (56)# Board Member Portfolios Overseen: 90 | | Retired; formerly Chief Economist for the Investment Company Institute (ICI) (2005-2017); formerly Senior Economist and Director of Industry and Financial Analysis at the ICI (1998-2004); formerly Senior Economist, Industry and Financial Analysis at the ICI (1996-1998); formerly Staff Economist at the Federal Reserve Board (1989-1996); Director, ICI Mutual Insurance Company (2012-2017). | | None. | | Since March 2018 |
# Mr. Reid joined the Board effective as of March 1, 2018.
| | | | | | |
| | | |
Interested Board Members | | | | |
| | | | |
Name, Address, Age Position(s) Portfolios Overseen | | Principal Occupation(s) During Past Five Years | | Other Directorships Held During Past Five Years | | Length of Board Service |
| | | | |
Stuart S. Parker (55) Board Member & President Portfolios Overseen: 91 | | President of PGIM Investments LLC (formerly known as Prudential Investments LLC) (since January 2012); Executive Vice President of Prudential Investment Management Services LLC (since December 2012); formerly Executive Vice President of Jennison Associates LLC and Head of Retail Distribution of PGIM Investments LLC (June 2005-December 2011). | | None. | | Since January 2012 |
Visit our website at pgiminvestments.com
| | | | | | |
| | | |
Interested Board Members | | | | |
| | | | |
Name, Address, Age Position(s) Portfolios Overseen | | Principal Occupation(s) During Past Five Years | | Other Directorships Held During Past Five Years | | Length of Board Service |
| | | | |
Scott E. Benjamin (45) Board Member & Vice President Portfolios Overseen:91 | | Executive Vice President (since June 2009) of PGIM Investments LLC; Executive Vice President (June 2009-June 2012) and Vice President (since June 2012) of Prudential Investment Management Services LLC; Executive Vice President (since September 2009) of AST Investment Services, Inc.; Senior Vice President of Product Development and Marketing, PGIM Investments (since February 2006); formerly Vice President of Product Development and Product Management, PGIM Investments LLC (2003-2006). | | None. | | Since March 2010 |
| | | | |
Grace C. Torres* (59) Board Member Portfolios Overseen: 90 | | Retired; formerly Treasurer and Principal Financial and Accounting Officer of the PGIM Funds, Target Funds, Advanced Series Trust, Prudential Variable Contract Accounts and The Prudential Series Fund (1998-June 2014); Assistant Treasurer (March 1999-June 2014) and Senior Vice President (September 1999-June 2014) of PGIM Investments LLC; Assistant Treasurer (May 2003-June 2014) and Vice President (June 2005-June 2014) of AST Investment Services, Inc.; Senior Vice President and Assistant Treasurer (May 2003-June 2014) of Prudential Annuities Advisory Services, Inc. | | Director (July 2015-January 2018) of Sun Bancorp, Inc. N.A. and Sun National Bank; Director (since January 2018) of OceanFirst Financial Corp. and OceanFirst Bank. | | Since November 2014 |
* Note: Prior to her retirement in 2014, Ms. Torres was employed by PGIM Investments LLC. Due to her prior employment, she is considered to be an “interested person” under the 1940 Act. Ms. Torres is a Non-Management Interested Board Member.
PGIM Corporate Bond Fund
| | | | |
| |
Fund Officers(a) |
| | | |
Name, Address and Age Position with Fund | | Principal Occupation(s) During Past Five Years | | Length of Service as Fund Officer |
| | | |
Raymond A. O’Hara (63) Chief Legal Officer | | Vice President and Corporate Counsel (since July 2010) of Prudential Insurance Company of America (Prudential); Vice President (March 2011-Present) of Pruco Life Insurance Company and Pruco Life Insurance Company of New Jersey; Vice President and Corporate Counsel (March 2011-Present) of Prudential Annuities Life Assurance Corporation; Chief Legal Officer of PGIM Investments LLC (since June 2012); Chief Legal Officer of Prudential Mutual Fund Services LLC (since June 2012) and Corporate Counsel of AST Investment Services, Inc. (since June 2012); formerly Assistant Vice President and Corporate Counsel (September 2008-July 2010) of The Hartford Financial Services Group, Inc.; formerly Associate (September 1980-December 1987) and Partner (January 1988–August 2008) of Blazzard & Hasenauer, P.C. (formerly, Blazzard, Grodd & Hasenauer, P.C.). | | Since June 2012 |
| | | |
Chad A. Earnst (43) Chief Compliance Officer | | Chief Compliance Officer (September 2014-Present) of PGIM Investments LLC; Chief Compliance Officer (September 2014-Present) of the PGIM Funds, Target Funds, Advanced Series Trust, The Prudential Series Fund, Prudential’s Gibraltar Fund, Inc., PGIM Global Short Duration High Yield Income Fund, Inc., PGIM Short Duration High Yield Fund, Inc. and PGIM Jennison MLP Income Fund, Inc.; formerly Assistant Director (March 2010-August 2014) of the Asset Management Unit, Division of Enforcement, US Securities & Exchange Commission; Assistant Regional Director (January 2010-August 2014), Branch Chief (June 2006–December 2009) and Senior Counsel (April 2003-May 2006) of the Miami Regional Office, Division of Enforcement, US Securities & Exchange Commission. | | Since September 2014 |
| | | |
Dino Capasso (44) Deputy Chief Compliance Officer | | Vice President and Deputy Chief Compliance Officer (June 2017-Present) of PGIM Investments LLC; formerly, Senior Vice President and Senior Counsel (January 2016-June 2017), and Vice President and Counsel (February 2012-December 2015) of Pacific Investment Management Company LLC. | | Since March 2018 |
| | | |
Deborah A. Docs (60) Secretary | | Vice President and Corporate Counsel (since January 2001) of Prudential; Vice President (since December 1996) and Assistant Secretary (since March 1999) of PGIM Investments LLC; formerly Vice President and Assistant Secretary (May 2003-June 2005) of AST Investment Services, Inc. | | Since May 2004 |
| | | |
Jonathan D. Shain (60) Assistant Secretary | | Vice President and Corporate Counsel (since August 1998) of Prudential; Vice President and Assistant Secretary (since May 2001) of PGIM Investments LLC; Vice President and Assistant Secretary (since February 2001) of Prudential Mutual Fund Services LLC; formerly Vice President and Assistant Secretary (May 2003-June 2005) of AST Investment Services, Inc. | | Since May 2005 |
Visit our website at pgiminvestments.com
| | | | |
| |
Fund Officers(a) |
| | | |
Name, Address and Age Position with Fund | | Principal Occupation(s) During Past Five Years | | Length of Service as Fund Officer |
| | | |
Claudia DiGiacomo (43) Assistant Secretary | | Vice President and Corporate Counsel (since January 2005) of Prudential; Vice President and Assistant Secretary of PGIM Investments LLC (since December 2005); formerly Associate at Sidley Austin Brown & Wood LLP (1999-2004). | | Since December 2005 |
| | | |
Andrew R. French (55) Assistant Secretary | | Vice President and Corporate Counsel (since February 2010) of Prudential; formerly Director and Corporate Counsel (2006-2010) of Prudential; Vice President and Assistant Secretary (since January 2007) of PGIM Investments LLC; Vice President and Assistant Secretary (since January 2007) of Prudential Mutual Fund Services LLC. | | Since October 2006 |
| | | |
Charles H. Smith (45) Anti-Money Laundering Compliance Officer | | Vice President, Corporate Compliance, Anti-Money Laundering Unit (since January 2015) of Prudential; committee member of the American Council of Life Insurers Anti-Money Laundering and Critical Infrastructure Committee (since January 2016); formerly Global Head of Economic Sanctions Compliance at AIG Property Casualty (February 2007 – December 2014); Assistant Attorney General at the New York State Attorney General’s Office, Division of Public Advocacy. (August 1998 —January 2007). | | Since January 2017 |
| | | |
Brian D. Nee (52) Treasurer and Principal Financial and Accounting Officer | | Vice President and Head of Finance of PGIM Investments LLC (since August 2015) and PGIM Global Partners (since February 2017); formerly, Vice President, Treasurer’s Department of Prudential (September 2007-August 2015). | | Since July 2018 |
| | | |
Peter Parrella (60) Assistant Treasurer | | Vice President (since 2007) and Director (2004-2007) within Prudential Mutual Fund Administration; formerly Tax Manager at SSB Citi Fund Management LLC (1997-2004). | | Since June 2007 |
| | | |
Lana Lomuti (51) Assistant Treasurer | | Vice President (since 2007) and Director (2005-2007), within Prudential Mutual Fund Administration; formerly Assistant Treasurer (December 2007-February 2014) of The Greater China Fund, Inc. | | Since April 2014 |
| | | |
Linda McMullin (57) Assistant Treasurer | | Vice President (since 2011) and Director (2008-2011) within Prudential Mutual Fund Administration. | | Since April 2014 |
| | | |
Kelly A. Coyne (50) Assistant Treasurer | | Director, Investment Operations of Prudential Mutual Fund Services LLC (since 2010). | | Since March 2015 |
(a) Excludes Mr. Parker and Mr. Benjamin, interested Board Members who also serve as President and Vice President, respectively.
Explanatory Notes to Tables:
| ∎ | | Board Members are deemed to be “Interested,” as defined in the 1940 Act, by reason of their affiliation with PGIM Investments LLC and/or an affiliate of PGIM Investments LLC. |
| ∎ | | Unless otherwise noted, the address of all Board Members and Officers is c/o PGIM Investments LLC, 655 Broad Street, Newark, New Jersey 07102-4410. |
| ∎ | | There is no set term of office for Board Members or Officers. The Board Members have adopted a retirement policy, which calls for the retirement of Board Members on December 31 of the year in which they reach the age of 75. |
| ∎ | | “Other Directorships Held” includes only directorships of companies required to register or file reports with the SEC under the 1934 Act (that is, “public companies”) or other investment companies registered under the 1940 Act. |
PGIM Corporate Bond Fund
| ∎ | | “Portfolios Overseen” includes all investment companies managed by PGIM Investments LLC. The investment companies for which PGIM Investments LLC serves as manager include the PGIM Funds, The Prudential Variable Contract Accounts, PGIM ETF Trust, PGIM Short Duration High Yield Fund, Inc., PGIM Global Short Duration High Yield Fund, Inc., The Prudential Series Fund, Prudential’s Gibraltar Fund, Inc. and the Advanced Series Trust. |
Visit our website at pgiminvestments.com
Approval of Advisory Agreement
The Fund’s Board of Trustees
The Board of Trustees (the “Board”) of PGIM Corporate Bond Fund (the “Fund”)1 consists of twelve individuals, nine of whom are not “interested persons” of the Fund, as defined in the Investment Company Act of 1940, as amended (the “1940 Act”) (the “Independent Trustees”). The Board is responsible for the oversight of the Fund and its operations, and performs the various duties imposed on the directors of investment companies by the 1940 Act. The Independent Trustees have retained independent legal counsel to assist them in connection with their duties. The Chair of the Board is an Independent Trustee. The Board has established four standing committees: the Audit Committee, the Nominating and Governance Committee, and two Investment Committees. Each committee is chaired by, and composed of, Independent Trustees.
Annual Approval of the Fund’s Advisory Agreements
As required under the 1940 Act, the Board determines annually whether to renew the Fund’s management agreement with PGIM Investments LLC (“PGIM Investments”) and the Fund’s subadvisory agreement with PGIM, Inc. (“PGIM”) on behalf of its PGIM Fixed Income unit. In considering the renewal of the agreements, the Board, including all of the Independent Trustees, met on June 7, 2018 and on June 19-21, 2018 and approved the renewal of the agreements through July 31, 2019, after concluding that the renewal of the agreements was in the best interests of the Fund and its shareholders.
In advance of the meetings, the Board requested and received materials relating to the agreements, and had the opportunity to ask questions and request further information in connection with its consideration. Among other things, the Board considered comparative fee information from PGIM Investments and PGIM. Also, the Board considered comparisons with other mutual funds in relevant Peer Universes and Peer Groups, as is further discussed below.
In approving the agreements, the Board, including the Independent Trustees advised by independent legal counsel, considered the factors it deemed relevant, including the nature, quality and extent of services provided by PGIM Investments and the subadviser, the performance of the Fund, the profitability of PGIM Investments and its affiliates, expenses and fees, and the potential for economies of scale that may be shared with the Fund and its shareholders as the Fund’s assets grow. In their deliberations, the Trustees did not identify any single factor which alone was responsible for the Board’s decision to approve the agreements with respect to the Fund. In connection with its deliberations, the Board considered information provided by PGIM Investments throughout the year at regular Board meetings, presentations from portfolio managers and other information, as well as information furnished at or in advance of the meetings on June 7, 2018 and on June 19-21, 2018.
| 1 | PGIM Corporate Bond Fund is a series of The Target Portfolio Trust. |
Approval of Advisory Agreement (continued)
The Trustees determined that the overall arrangements between the Fund and PGIM Investments, which serves as the Fund’s investment manager pursuant to a management agreement, and between PGIM Investments and PGIM, which, through its PGIM Fixed Income unit, serves as the Fund’s subadviser pursuant to the terms of a subadvisory agreement with PGIM Investments, are in the best interests of the Fund and its shareholders in light of the services performed, fees charged and such other matters as the Trustees considered relevant in the exercise of their business judgment.
The material factors and conclusions that formed the basis for the Trustees’ reaching their determinations to approve the continuance of the agreements are separately discussed below.
Nature, Quality, and Extent of Services
The Board received and considered information regarding the nature, quality and extent of services provided to the Fund by PGIM Investments and PGIM Fixed Income. The Board considered the services provided by PGIM Investments, including but not limited to the oversight of the subadviser for the Fund, as well as the provision of fund recordkeeping, compliance, and other services to the Fund. With respect to PGIM Investments’ oversight of the subadviser, the Board noted that PGIM Investments’ Strategic Investment Research Group (“SIRG”), which is a business unit of PGIM Investments, is responsible for monitoring and reporting to PGIM Investments’ senior management on the performance and operations of the subadviser. The Board also considered that PGIM Investments pays the salaries of all of the officers and interested Trustees of the Fund who are part of Fund management. The Board also considered the investment subadvisory services provided by PGIM Fixed Income, including investment research and security selection, as well as adherence to the Fund’s investment restrictions and compliance with applicable Fund policies and procedures. The Board considered PGIM Investments’ evaluation of the subadviser, as well as PGIM Investments’ recommendation, based on its review of the subadviser, to renew the subadvisory agreement.
The Board considered the qualifications, backgrounds and responsibilities of PGIM Investments’ senior management responsible for the oversight of the Fund and PGIM Fixed Income, and also considered the qualifications, backgrounds and responsibilities of PGIM Fixed Income’s portfolio managers who are responsible for the day-to-day management of the Fund’s portfolio. The Board was provided with information pertaining to PGIM Investments’ and PGIM Fixed Income’s organizational structure, senior management, investment operations, and other relevant information pertaining to both PGIM Investments and PGIM Fixed Income. The Board also noted that it received favorable compliance reports from the Fund’s Chief Compliance Officer (“CCO”) as to both PGIM Investments and PGIM Fixed Income. The Board noted that PGIM Fixed Income is affiliated with PGIM Investments.
| | |
| Visit our website at pgiminvestments.com | | |
The Board concluded that it was satisfied with the nature, extent and quality of the investment management services provided by PGIM Investments and the subadvisory services provided to the Fund by PGIM Fixed Income, and that there was a reasonable basis on which to conclude that the Fund benefits from the services provided by PGIM Investments and PGIM Fixed Income under the management and subadvisory agreements.
Costs of Services and Profits Realized by PGIM Investments
The Board was provided with information on the profitability of PGIM Investments and its affiliates in serving as the Fund’s investment manager. The Board discussed with PGIM Investments the methodology utilized in assembling the information regarding profitability and considered its reasonableness. The Board recognized that it is difficult to make comparisons of profitability from fund management contracts because comparative information is not generally publicly available and is affected by numerous factors, including the structure of the particular adviser, the types of funds it manages, its business mix, numerous assumptions regarding allocations and the adviser’s capital structure and cost of capital. The Board noted that the cost of services provided by PGIM Investments to the Fund during the year ended December 31, 2017 exceeded the management fees paid by the Fund, resulting in an operating loss to PGIM Investments. Taking these factors into account, the Board concluded that the profitability of PGIM Investments and its affiliates in relation to the services rendered was not unreasonable.
Economies of Scale
The Board received and discussed information concerning economies of scale that PGIM Investments may realize as the Fund’s assets grow beyond current levels. The Board noted that the management fee schedule for the Fund includes breakpoints, which have the effect of decreasing the fee rate as assets increase. During the course of time, the Board has considered information regarding the launch date of the Fund, the management fees of the Fund compared to those of similarly managed funds and PGIM Investments’ investment in the Fund over time. The Board noted that economies of scale can be shared with the Fund in other ways, including low management fees from inception, additional technological and personnel investments to enhance shareholder services, and maintaining existing expense structures in the face of a rising cost environment. The Board also considered PGIM Investments’ assertion that it continually evaluates the management fee schedule of the Fund and the potential to share economies of scale through breakpoints or fee waivers as asset levels increase.
The Board recognized the inherent limitations of any analysis of economies of scale, stemming largely from the Board’s understanding that most of PGIM Investments’ costs are not specific to individual funds, but rather are incurred across a variety of products and services.
Approval of Advisory Agreement (continued)
Other Benefits to PGIM Investments and PGIM Fixed Income
The Board considered potential ancillary benefits that might be received by PGIM Investments, PGIM Fixed Income and their affiliates as a result of their relationship with the Fund. The Board concluded that potential benefits to be derived by PGIM Investments included transfer agency fees received by the Fund’s transfer agent (which is affiliated with PGIM Investments), as well as benefits to its reputation or other intangible benefits resulting from PGIM Investments’ association with the Fund. The Board concluded that the potential benefits to be derived by PGIM Fixed Income included those generally resulting from an increase in assets under management, specifically, potential access to additional research resources and benefits to its reputation. The Board concluded that the benefits derived by PGIM Investments and PGIM Fixed Income were consistent with the types of benefits generally derived by investment managers and subadvisers to mutual funds.
Performance of the Fund / Fees and Expenses
The Board considered certain additional specific factors and made related conclusions relating to the historical performance of the Fund for the one-, three-, five- and ten-year periods ended December 31, 2017.
The Board also considered the Fund’s actual management fee, as well as the Fund’s net total expense ratio, for the fiscal year ended July 31, 2017. The Board considered the management fee for the Fund as compared to the management fee charged by PGIM Investments to other funds and the fee charged by other advisers to comparable mutual funds in a Peer Group. The actual management fee represents the fee rate actually paid by Fund shareholders and includes any fee waivers or reimbursements. The net total expense ratio for the Fund represents the actual expense ratio incurred by Fund shareholders.
The mutual funds included in the Peer Universe, which was used to consider performance, and the Peer Group, which was used to consider expenses and fees, were objectively determined by Broadridge, an independent provider of mutual fund data. In certain circumstances, PGIM Investments also may have provided supplemental Peer Universe or Peer Group information, for reasons addressed with the Board. The comparisons placed the Fund in various quartiles, with the first quartile being the best 25% of the mutual funds (for performance, the best performing mutual funds and, for expenses, the lowest cost mutual funds).
The section below summarizes key factors considered by the Board and the Board’s conclusions regarding the Fund’s performance, fees and overall expenses. The table sets forth gross performance comparisons (which do not reflect the impact on performance of fund expenses, or any subsidies, expense caps or waivers that may be applicable) with the Peer Universe, actual management fees with the Peer Group (which reflect the impact of
| | |
| Visit our website at pgiminvestments.com | | |
any subsidies or fee waivers), and net total expenses with the Peer Group, each of which were key factors considered by the Board.
| | | | | | | | |
| Gross Performance | | 1 Year | | 3 Years | | 5 Years | | 10 Years |
| | 2nd Quartile | | 2nd Quartile | | 2nd Quartile | | 2nd Quartile |
| Actual Management Fees: 1st Quartile |
| Net Total Expenses: 2nd Quartile |
| | • | | The Board noted that the Fund outperformed its benchmark index over all periods. |
| | • | | The Board and PGIM Investments agreed to retain the Fund’s existing contractual expense cap, which (exclusive of certain fees and expenses) caps the Fund’s annual operating expenses at 0.80% for Class A shares, 1.55% for Class C shares, 0.55% for Class R6 shares, 1.05% for Class R shares, and 0.55% for Class Z shares through November 30, 2018. |
| | • | | The Board concluded that, in light of the above, it would be in the best interests of the Fund and its shareholders to renew the agreements. |
| | • | | The Board concluded that the management fees (including subadvisory fees) and total expenses were reasonable in light of the services provided. |
* * *
After full consideration of these factors, the Board concluded that the approval of the agreements was in the best interests of the Fund and its shareholders.
| | | | |
| ∎ MAIL | | ∎ TELEPHONE | | ∎ WEBSITE |
655 Broad Street Newark, NJ 07102 | | (800) 225-1852 | | www.pgiminvestments.com |
|
| PROXY VOTING |
| The Board of Trustees has delegated to the Fund’s investment subadvisers the responsibility for voting any proxies and maintaining proxy recordkeeping with respect to the Fund. A description of these proxy voting policies and procedures is available without charge, upon request, by calling (800) 225-1852. Information regarding how the Fund voted proxies relating to portfolio securities during the most recent 12-month period ended June 30 is available on the Fund’s website and on the Securities and Exchange Commission’s website at www.sec.gov. |
|
| TRUSTEES |
| Ellen S. Alberding • Kevin J. Bannon • Scott E. Benjamin • Linda W. Bynoe • Barry H. Evans • Keith F. Hartstein • Laurie Simon Hodrick • Michael S. Hyland • Stuart S. Parker • Richard A. Redeker • Brian K. Reid • Grace C. Torres |
|
| OFFICERS |
Stuart S. Parker, President • Scott E. Benjamin, Vice President • Brian D. Nee, Treasurer and Principal Financial and Accounting Officer • Raymond A. O’Hara, Chief Legal Officer • Chad A. Earnst, Chief Compliance Officer • Deborah A. Docs, Secretary • Dino Capasso, Vice President and Deputy Chief Compliance Officer • Charles H. Smith, Anti-Money Laundering Compliance Officer • Jonathan D. Shain, Assistant Secretary • Claudia DiGiacomo, Assistant Secretary • Andrew R. French, Assistant Secretary • Peter Parrella, Assistant Treasurer • Lana Lomuti, Assistant Treasurer • Linda McMullin, Assistant Treasurer • Kelly A. Coyne, Assistant Treasurer |
| | | | |
| MANAGER | | PGIM Investments LLC | | 655 Broad Street Newark, NJ 07102 |
|
| INVESTMENT SUBADVISER | | PGIM Fixed Income | | 655 Broad Street Newark, NJ 07102 |
|
| DISTRIBUTOR | | Prudential Investment Management Services LLC | | 655 Broad Street Newark, NJ 07102 |
|
| CUSTODIAN | | The Bank of New York Mellon | | 225 Liberty Street New York, NY 10286 |
|
| TRANSFER AGENT | | Prudential Mutual Fund Services LLC | | PO Box 9658 Providence, RI 02940 |
|
| INDEPENDENT REGISTERED PUBLIC ACCOUNTING FIRM | | KPMG LLP | | 345 Park Avenue New York, NY 10154 |
|
| FUND COUNSEL | | Willkie Farr & Gallagher LLP | | 787 Seventh Avenue New York, NY 10019 |
|
|
| An investor should consider the investment objectives, risks, charges, and expenses of the Fund carefully before investing. The prospectus and summary prospectus contain this and other information about the Fund. An investor may obtain a prospectus and summary prospectus by visiting our website at www.pgiminvestments.com or by calling (800) 225-1852. The prospectus and summary prospectus should be read carefully before investing. |
|
| E-DELIVERY |
| To receive your mutual fund documents online, go to www.pgiminvestments.com/edelivery and enroll. Instead of receiving printed documents by mail, you will receive notification via email when new materials are available. You can cancel your enrollment or change your email address at any time by visiting the website address above. |
|
| SHAREHOLDER COMMUNICATIONS WITH TRUSTEES |
| Shareholders can communicate directly with the Board of Trustees by writing to the Chair of the Board, PGIM Corporate Bond Fund, PGIM Investments, Attn: Board of Trustees, 655 Broad Street, Newark, NJ 07102. Shareholders can communicate directly with an individual Trustee by writing to the same address. Communications are not screened before being delivered to the addressee. |
|
| AVAILABILITY OF PORTFOLIO SCHEDULE |
| The Fund files its complete schedule of portfolio holdings with the Securities and Exchange Commission for the first and third quarters of each fiscal year on Form N-Q. The Fund’s Forms N-Q are available on the Commission’s website at www.sec.gov. The Fund’s Forms N-Q may also be reviewed and copied at the Commission’s Public Reference Room in Washington, D.C. Information on the operation and location of the Public Reference Room may be obtained by calling 1-800-SEC-0330. The Fund’s schedule of portfolio holdings is also available on the Fund’s website as of the end of each month no sooner than 15 days after the end of the month. |
|
| The Fund’s Statement of Additional Information contains additional information about the Fund’s Trustees and is available without charge, upon request, by calling (800) 225-1852. |
Mutual Funds:
| | | | |
ARE NOT INSURED BY THE FDIC OR ANY
FEDERAL GOVERNMENT AGENCY | | MAY LOSE VALUE | | ARE NOT A DEPOSIT OF OR GUARANTEED
BY ANY BANK OR ANY BANK AFFILIATE |
PGIM CORPORATE BOND FUND
| | | | | | | | | | |
| SHARE CLASS | | A | | C | | R | | Z | | R6* |
| NASDAQ | | PCWAX | | PCWCX | | PCWRX | | TGMBX | | PCWQX |
| CUSIP | | 875921694 | | 875921686 | | 875921660 | | 875921702 | | 875921678 |
| *Formerly | known as Class Q |
MF229E

PGIM QMA SMALL-CAP VALUE FUND
(formerly known as Prudential QMA Small-Cap Value Fund)
ANNUAL REPORT
JULY 31, 2018

To enroll in e-delivery, go to pgiminvestments.com/edelivery
|
| Objective: Above-average capital appreciation |
Highlights
| • | | The Fund benefited most from good security selection in the consumer discretionary and real estate sectors. Furthermore, the Fund added value from an underweight exposure to the underperforming utilities and real estate sectors. |
| • | | The Fund’s relative performance was hurt by its underweight exposure to the strongly performing healthcare sector. In addition, the Fund had unfavorable security selection in the industrials, energy, and information technology sectors. |
This report is not authorized for distribution to prospective investors unless preceded or accompanied by a current prospectus.
The views expressed in this report and information about the Fund’s portfolio holdings are for the period covered by this report and are subject to change thereafter.
Mutual funds are distributed by Prudential Investment Management Services LLC, a Prudential Financial company and member SIPC. QMA is the primary business name of Quantitative Management Associates LLC, a wholly owned subsidiary of PGIM, Inc. (PGIM), a Prudential Financial company. © 2018 Prudential Financial, Inc. and its related entities. PGIM and the PGIM logo are service marks of Prudential Financial, Inc. and its related entities, registered in many jurisdictions worldwide.
| | |
| 2 | | Visit our website at pgiminvestments.com |
Table of Contents
| | | | |
| PGIM QMA Small-Cap Value Fund | | | 3 | |
This Page Intentionally Left Blank
Letter from the President

Dear Shareholder:
We hope you find the annual report for the PGIM QMA Small-Cap Value Fund informative and useful. The report covers performance for the 12-month period that ended July 31, 2018.
We have important information to share with you. Effective June 11, 2018, Prudential Mutual Funds were renamed PGIM Funds. This renaming is part of our ongoing effort to further build our reputation and establish our global
brand, which began when our firm adopted PGIM Investments as its name in April 2017. Please note that only the Fund’s name has changed. Your Fund’s management and operation, along with its symbols, remained the same.*
Over the reporting period, the global economy continued to grow, and central banks gradually tightened monetary policy. In the US, the economy expanded and employment increased. In June, the Federal Reserve hiked interest rates for the seventh time since 2015, based on confidence in the economy.
Equity returns were strong, due to optimistic earnings expectations and investor sentiment. Global equities, including emerging markets, generally posted positive returns. However, they trailed the performance of US equities, which rose on higher corporate profits, new regulatory policies, and tax reform benefits. Volatility spiked briefly in the middle of the period on inflation concerns, rising interest rates, and a potential global trade war, but it decreased as the period ended.
The overall bond market declined modestly during the period, as measured by the Bloomberg Barclays US Aggregate Bond Index. The best performance came from higher-yielding, economically sensitive sectors. Although they finished the period with negative returns, US investment-grade corporate bonds outperformed US government nominal bonds. A major trend during the period was the flattening of the US Treasury yield curve, which increased the yield on fixed income investments with shorter maturities and made them more attractive to investors.
Regarding your investments with PGIM, we believe it is important to maintain a diversified portfolio of funds consistent with your tolerance for risk, time horizon, and financial goals. Your financial advisor can help you create a diversified investment plan that may include funds covering all the basic asset classes and that reflects your personal investor profile and risk tolerance. However, diversification and asset allocation strategies do not assure a profit or protect against loss in declining markets.
At PGIM Investments, we consider it a great privilege and responsibility to help investors participate in opportunities across global markets while meeting their toughest investment challenges. PGIM is a top-10 global investment manager with more than $1 trillion in assets under management. This investment expertise allows us to deliver actively managed funds and strategies to meet the needs of investors around the globe.
Thank you for choosing our family of funds.
Sincerely,

Stuart S. Parker, President
PGIM QMA Small-Cap Value Fund
September 14, 2018
*The Prudential Day One Funds did not change their names.
| | | | |
| PGIM QMA Small-Cap Value Fund | | | 5 | |
Your Fund’s Performance (unaudited)
Performance data quoted represent past performance. Past performance does not guarantee future results. The investment return and principal value of an investment will fluctuate, so that an investor’s shares, when redeemed, may be worth more or less than their original cost. Current performance may be lower or higher than the past performance data quoted. An investor may obtain performance data as of the most recent month-end by visiting our website at www.pgiminvestments.com or by calling (800) 225-1852.
| | | | | | | | |
| | | Average Annual Total Returns as of 7/31/18
(with sales charges) |
| | | One Year (%) | | Five Years (%) | | Ten Years (%) | | Since Inception (%) |
| Class A | | 5.19 | | N/A | | N/A | | 7.61 (2/14/14) |
| Class C | | 9.46 | | N/A | | N/A | | 8.50 (6/19/15) |
| Class R | | 11.05 | | 9.58 | | 9.60 | | — |
| Class Z | | 11.65 | | 10.16 | | 10.16 | | — |
| Class R2 | | N/A | | N/A | | N/A | | 2.30** (12/28/17) |
| Class R4 | | N/A | | N/A | | N/A | | 2.45** (12/28/17) |
| Class R6* | | 11.72 | | N/A | | N/A | | 10.45 (9/25/14) |
| Russell 2000 Value Index |
| | 14.37 | | 10.19 | | 9.52 | | — |
| Russell 2000 Index |
| | 18.73 | | 11.33 | | 10.39 | | — |
| Lipper Small-Cap Value Funds Average |
| | | 13.86 | | 8.69 | | 9.43 | | — |
*Formerly known as Class Q
**Not annualized
| | |
| 6 | | Visit our website at pgiminvestments.com |
| | | | | | | | |
| | | Average Annual Total Returns as of 7/31/18
(without sales charges) |
| | | One Year (%) | | Five Years (%) | | Ten Years (%) | | Since Inception (%) |
| Class A | | 11.31 | | N/A | | N/A | | 8.98 (2/14/14) |
| Class C | | 10.44 | | N/A | | N/A | | 8.50 (6/19/15) |
| Class R | | 11.05 | | 9.58 | | 9.60 | | — |
| Class Z | | 11.65 | | 10.16 | | 10.16 | | — |
| Class R2 | | N/A | | N/A | | N/A | | 2.30** (12/28/17) |
| Class R4 | | N/A | | N/A | | N/A | | 2.45** (12/28/17) |
| Class R6* | | 11.72 | | N/A | | N/A | | 10.45 (9/25/14) |
| Russell 2000 Value Index |
| | 14.37 | | 10.19 | | 9.52 | | — |
| Russell 2000 Index |
| | 18.73 | | 11.33 | | 10.39 | | — |
| Lipper Small-Cap Value Funds Average |
| | | 13.86 | | 8.69 | | 9.43 | | — |
*Formerly known as Class Q
**Not annualized
Growth of a $10,000 Investment
The graph compares a $10,000 investment in the Fund’s Class Z shares with a similar investment in the Russell 2000 Value Index and the Russell 2000 Index by portraying the initial account values at the beginning of the 10-year period (July 31, 2008) and the
| | | | |
| PGIM QMA Small-Cap Value Fund | | | 7 | |
Your Fund’s Performance (continued)
account values at the end of the current fiscal period (July 31, 2018), as measured on a quarterly basis. For purposes of the graph, and unless otherwise indicated, it has been assumed that (a) all recurring fees (including management fees) were deducted; and (b) all dividends and distributions were reinvested. The line graph provides information for Class Z shares only. As indicated in the tables provided earlier, performance for Class A, Class C, Class R, Class R2, Class R4 and Class R6* shares will vary due to the differing charges and expenses applicable to each share class (as indicated in the following paragraphs). Without waiver of fees and/or expense reimbursements, if any, the returns would have been lower.
Past performance does not predict future performance. Total returns and the ending account values in the graph include changes in share price and reinvestment of dividends and capital gains distributions in a hypothetical investment for the periods shown. The Fund’s total returns do not reflect the deduction of income taxes on an individual’s investment. Taxes may reduce your actual investment returns on income or gains paid by the Fund or any gains you may realize if you sell your shares.
*Formerly known as Class Q
Source: PGIM Investments LLC and Lipper Inc.
Inception returns are provided for any share class with less than 10 fiscal years of returns. Since Inception returns for the Index and the Lipper Average are measured from the closest month-end to the class’ inception date.
| | |
| 8 | | Visit our website at pgiminvestments.com |
The returns in the tables do not reflect the deduction of taxes that a shareholder would pay on Fund distributions or following the redemption of Fund shares. The average annual total returns take into account applicable sales charges, which are described for each share class in the table below.
| | | | | | | | | | | | | | |
| | | Class A | | Class C | | Class R | | Class Z | | Class R2 | | Class R4 | | Class R6* |
| Maximum initial sales charge | | 5.50% of the public offering price | | None | | None | | None | | None | | None | | None |
| Contingent deferred sales charge (CDSC) (as a percentage of the lower of original purchase price or net asset value at redemption) | | 1.00% on sales of $1 million or more made within 12 months of purchase | | 1.00% on sales made within 12 months of purchase | | None | | None | | None | | None | | None |
Annual distribution or distribution and service (12b-1) fees (shown as a percentage of average daily net assets) | | 0.30% (0.25% currently) | | 1.00% | | 0.75% (0.50% currently) | | None | | 0.25% | | None | | None |
| Shareholder Service Fees | | None | | None | | None | | None | | 0.10% | | 0.10% | | None |
*Formerly known as Class Q
Benchmark Definitions
Russell 2000 Value Index—The Russell 2000 Value Index is an unmanaged index which contains those securities in the Russell 2000 Index with a below-average growth orientation. Companies in this index generally have lower price-to-earnings ratios, higher dividend yields, and lower forecasted growth rates.
The cumulative total returns for the Index measured from the month-end closest to the inception date of the Fund’s Class R2 shares and Class R4 shares through 7/31/18 is 7.31%. The average annual total returns for the Index measured from the month-end closest to the inception date through 7/31/18 are 9.90% for Class A, 11.53% for Class C, and 11.98% for Class R6*.
| | | | |
| PGIM QMA Small-Cap Value Fund | | | 9 | |
Your Fund’s Performance (continued)
Russell 2000 Index—The Russell 2000 Index is an unmanaged index of the 2,000 smallest US companies included in the Russell 3000® Index. It gives an indication of how stock prices of smaller companies have performed. The cumulative total returns for the Index measured from the month-end closest to the inception date of the Fund’s Class R2 shares and Class R4 shares through 7/31/18 is 9.54%. The average annual total returns for the Index measured from the month-end closest to the inception date through 7/31/18 are 10.56% for Class A, 11.27% for Class C, and 13.00% for Class R6*.
Lipper Small-Cap Value Funds Average—Lipper Small-Cap Value Funds invest at least 75% of their equity assets in companies with market capitalizations (on a three-year weighted basis) below Lipper’s US Diversified Equity small-cap ceiling. Small-cap value funds typically have a below-average price-to-earnings ratio, price-to-book ratio, and a three-year sales-per-share growth rate, compared to the S&P SmallCap 600 Index. The cumulative total returns for the Average measured from the month-end closest to the inception date of the Fund’s Class R2 shares and Class R4 shares through 7/31/18 is 5.36%. The average annual total returns for the Average measured from the month-end closest to the inception date through 7/31/18 are 8.05% for Class A, 9.25% for Class C, and 9.43% for Class R6*.
Investors cannot invest directly in an index or average. The returns for the Indexes would be lower if they included the effects of sales charges, operating expenses of a mutual fund, or taxes. Returns for the Lipper Average reflect the deduction of operating expenses, but not sales charges or taxes.
*Formerly known as Class Q
Presentation of Fund Holdings
| | | | |
Five Largest Holdings expressed as a
percentage of net assets as of 7/31/18 (%) | |
| Radian Group, Inc., Thrifts & Mortgage Finance | | | 1.1 | |
| SkyWest, Inc., Airlines | | | 1.1 | |
| MGIC Investment Corp., Thrifts & Mortgage Finance | | | 1.1 | |
| GATX Corp., Trading Companies & Distributors | | | 1.1 | |
| Cathay General Bancorp, Banks | | | 1.1 | |
Holdings reflect only long-term investments and are subject to change.
| | | | |
Five Largest Industries expressed as a
percentage of net assets as of 7/31/18 (%) | |
| Banks | | | 16.6 | |
| Equity Real Estate Investment Trusts (REITs) | | | 11.2 | |
| Thrifts & Mortgage Finance | | | 7.5 | |
| Specialty Retail | | | 6.1 | |
| Mortgage Real Estate Investment Trusts (REITs) | | | 5.5 | |
Industry weightings reflect only long-term investments and are subject to change.
| | |
| 10 | | Visit our website at pgiminvestments.com |
Strategy and Performance Overview
How did the Fund perform?
The PGIM QMA Small-Cap Value Fund’s Class Z shares gained 11.65% for the 12 months ended July 31, 2018, trailing the performance of the Russell 2000® Value Index, which returned 14.37%, and the Lipper Small-Cap Value Funds Average, which returned 13.86%.
What were market conditions?
| • | | US equities delivered strong gains during the reporting period, with the S&P 1500 Index returning 16.3%. |
| • | | During this period, growth stocks significantly outperformed value stocks across all capitalizations. Growth stocks benefited from strong results in the information technology sector. |
| • | | Conversely, the telecommunication services and utilities sectors both underperformed the broad stock market. |
| • | | Small-cap stocks outperformed their mid- and large-cap counterparts for the reporting period. Small-cap stocks (as measured by the Russell 2000® Index) returned 18.7%, while mid-cap stocks (as measured by the Russell Midcap® Index) returned 13.5% and large-cap stocks (as measured by the S&P 500 Index) returned 16.2%. |
What worked?
| • | | The Fund benefited most from good security selection in the consumer discretionary and real estate sectors. Furthermore, the Fund added value from an underweight exposure to the underperforming utilities and real estate sectors. |
| • | | In the consumer discretionary sector, the timely purchases of specialty retailers and media companies contributed significantly to performance. At the security level, the performance standouts were Tailored Brands, Inc. and Stoneridge, Inc. Tailored Brands, a regional specialty apparel retailer, reported an increase in earnings and sales, with substantial growth in its custom business. Stoneridge, an independent designer and manufacturer of automotive electrical and electronic components, benefited from strong financial performance and increased growth opportunities. |
| • | | In the real estate sector, the Fund added value from favorable selection among hotel and resorts real estate investment trusts (REITs) and from its underweight positions in office and healthcare REITs. |
| • | | In the utilities sector, the Fund’s underweight exposure to the expensive and underperforming multi-utilities, gas utilities, and electric utilities industries contributed significantly to relative performance. |
| • | | The Fund’s other top performing holdings included Enova International Inc., a technology and analytics company that specializes in financial services; SkyWest, Inc., a regional airline carrier in North America; and Iridium Communications Inc., a global mobile voice and data communication services provider. |
| | | | |
| PGIM QMA Small-Cap Value Fund | | | 11 | |
Strategy and Performance Overview (continued)
What didn’t work?
| • | | The Fund’s relative performance was hurt by its underweight exposure to the strong-performing healthcare sector. In addition, the Fund had unfavorable security selection in the industrials, energy, and information technology sectors. |
| • | | In the healthcare sector, underweight positions in the expensive but strongly performing biotechnology and healthcare equipment & supplies industries detracted significantly from performance. |
| • | | In the industrials sector, unfavorable security selection among construction & engineering and machinery companies detracted significantly from performance. Within the construction & engineering industry, Argan, Inc. was the leading detractor at the security level. Argan, an engineering firm serving the power generation and renewable energy markets, experienced increased project backlogs and significant short-term headwinds from the engineering, procurement and construction industry. |
| • | | In the energy sector, unfavorable security selection among the oil & gas exploration & production and oil & gas refining & marketing subindustries weighed on performance. |
| • | | In the information technology sector, unfavorable security selection among semiconductor firms and electronic manufacturing services companies weighed on performance. The most significant underperforming holdings were Cirrus Logic, Inc. and Tech Data Corporation. Cirrus Logic, an audio solutions producer, experienced a decline in revenue as a result of saturation in the smartphone market. Tech Data, a wholesale distributor for technology products and services, reported lower-than-expected profit growth due to margin pressure from a competitive pricing environment. |
| • | | Other significant, underperforming holdings included specialty retailer Office Depot, Inc. and home builder Beazer Homes USA, Inc. |
The percentage points shown in the tables identify each security’s positive or negative contribution to the Fund’s return relative to the benchmark’s return.
| | | | | | |
| Top Relative Contributors (%) | | Top Relative Detractors (%) |
| Enova International Inc. | | 0.36 | | Argan, Inc. | | –0.38 |
| SkyWest, Inc. | | 0.35 | | Cirrus Logic, Inc. | | –0.32 |
| Iridium Communications Inc. | | 0.34 | | Office Depot, Inc. | | –0.28 |
| Tailored Brands, Inc. | | 0.27 | | Tech Data Corporation | | –0.21 |
| Stoneridge, Inc. | | 0.19 | | Beazer Homes USA, Inc. | | –0.20 |
| | |
| 12 | | Visit our website at pgiminvestments.com |
Current outlook
| • | | While QMA views valuations for the overall market to be somewhat stretched, the difference in valuations between the cheapest and most expensive groups of stocks in the market continues to be wider than the historical norm, suggesting an opportunity for a payoff to value stocks. |
| • | | QMA believes the Fund is well positioned in small-cap stocks that are attractively valued. At the end of the reporting period, the Fund was trading at a discount to the benchmark Russell 2000 Value Index on a variety of valuation metrics. |
| • | | The Fund’s sectors that are most overweighted relative to the benchmark are the financials and consumer discretionary sectors, where QMA’s quantitative model finds many cheap stocks. The information technology and utilities sectors, where most stocks rank as expensive, are among the Fund’s most underweighted sectors. |
| | | | |
| PGIM QMA Small-Cap Value Fund | | | 13 | |
Fees and Expenses (unaudited)
As a shareholder of the Fund, you incur two types of costs: (1) transaction costs, including sales charges (loads) on purchase payments and redemptions, as applicable, and (2) ongoing costs, including management fees, and other Fund expenses, as applicable. This example is intended to help you understand your ongoing costs (in dollars) of investing in the Fund and to compare these costs with the ongoing costs of investing in other mutual funds.
��
The example is based on an investment of $1,000 held through the six-month period ended July 31, 2018. The example is for illustrative purposes only; you should consult the Prospectus for information on initial and subsequent minimum investment requirements.
Actual Expenses
The first line for each share class in the table on the following page provides information about actual account values and actual expenses. You may use the information on this line, together with the amount you invested, to estimate the expenses that you paid over the period. Simply divide your account value by $1,000 (for example, an $8,600 account value ÷ $1,000 = 8.6), then multiply the result by the number on the first line under the heading “Expenses Paid During the Six-Month Period” to estimate the expenses you paid on your account during this period.
Hypothetical Example for Comparison Purposes
The second line for each share class in the table on the following page provides information about hypothetical account values and hypothetical expenses based on the Fund’s actual expense ratio and an assumed rate of return of 5% per year before expenses, which is not the Fund’s actual return. The hypothetical account values and expenses may not be used to estimate the actual ending account balance or expenses you paid for the period. You may use this information to compare the ongoing costs of investing in the Fund and other funds. To do so, compare this 5% hypothetical example with the 5% hypothetical examples that appear in the shareholder reports of the other funds.
The Fund’s transfer agent may charge additional fees to holders of certain accounts that are not included in the expenses shown in the table on the following page. These fees apply to individual retirement accounts (IRAs) and Section 403(b) accounts. As of the close of the six-month period covered by the table, IRA fees included an annual maintenance fee of $15 per account (subject to a maximum annual maintenance fee of $25 for all accounts held by the same shareholder). Section 403(b) accounts are charged an annual $25 fiduciary maintenance fee. Some of the fees may vary in amount, or may be waived, based on your total account balance or the number of Prudential funds, including the Fund, that you own. You should consider the additional fees that were charged to your Fund account over the six-month period when you estimate the total ongoing expenses paid over the
| | |
| 14 | | Visit our website at pgiminvestments.com |
period and the impact of these fees on your ending account value, as these additional expenses are not reflected in the information provided in the expense table. Additional fees have the effect of reducing investment returns.
Please note that the expenses shown in the table are meant to highlight your ongoing costs only and do not reflect any transactional costs such as sales charges (loads). Therefore, the second line for each share class in the table is useful in comparing ongoing costs only and will not help you determine the relative total costs of owning different funds. In addition, if these transactional costs were included, your costs would have been higher.
| | | | | | | | | | | | | | | | | | |
PGIM QMA Small-Cap
Value Fund | | Beginning Account
Value
February 1, 2018 | | | Ending Account
Value
July 31, 2018 | | | Annualized
Expense Ratio
Based on the
Six-Month Period | | | Expenses Paid
During the
Six-Month Period* | |
| Class A | | Actual | | $ | 1,000.00 | | | $ | 1,021.00 | | | | 1.01 | % | | $ | 5.06 | |
| | Hypothetical | | $ | 1,000.00 | | | $ | 1,019.79 | | | | 1.01 | % | | $ | 5.06 | |
| Class C | | Actual | | $ | 1,000.00 | | | $ | 1,017.00 | | | | 1.76 | % | | $ | 8.80 | |
| | Hypothetical | | $ | 1,000.00 | | | $ | 1,016.07 | | | | 1.76 | % | | $ | 8.80 | |
| Class R | | Actual | | $ | 1,000.00 | | | $ | 1,019.20 | | | | 1.26 | % | | $ | 6.31 | |
| | Hypothetical | | $ | 1,000.00 | | | $ | 1,018.55 | | | | 1.26 | % | | $ | 6.31 | |
| Class Z | | Actual | | $ | 1,000.00 | | | $ | 1,022.40 | | | | 0.68 | % | | $ | 3.41 | |
| | Hypothetical | | $ | 1,000.00 | | | $ | 1,021.42 | | | | 0.68 | % | | $ | 3.41 | |
| Class R2 | | Actual | | $ | 1,000.00 | | | $ | 1,020.00 | | | | 1.14 | % | | $ | 5.71 | |
| | Hypothetical | | $ | 1,000.00 | | | $ | 1,019.14 | | | | 1.14 | % | | $ | 5.71 | |
| Class R4 | | Actual | | $ | 1,000.00 | | | $ | 1,021.50 | | | | 0.89 | % | | $ | 4.46 | |
| | Hypothetical | | $ | 1,000.00 | | | $ | 1,020.38 | | | | 0.89 | % | | $ | 4.46 | |
| Class R6** | | Actual | | $ | 1,000.00 | | | $ | 1,022.90 | | | | 0.63 | % | | $ | 3.16 | |
| | | Hypothetical | | $ | 1,000.00 | | | $ | 1,021.67 | | | | 0.63 | % | | $ | 3.16 | |
*Fund expenses (net of fee waivers or subsidies, if any) for each share class are equal to the annualized expense ratio for each share class (provided in the table), multiplied by the average account value over the period, multiplied by the 181 days in the six-month period ended July 31, 2018, and divided by the 365 days in the Fund’s fiscal year ended July 31, 2018 (to reflect the six-month period). Expenses presented in the table include the expenses of any underlying portfolios in which the Fund may invest.
**Formerly known as Class Q shares.
| | | | |
| PGIM QMA Small-Cap Value Fund | | | 15 | |
Schedule of Investments
as of July 31, 2018
| | | | | | | | |
| Description | | Shares | | | Value | |
LONG-TERM INVESTMENTS 99.7% | | | | | | | | |
| | |
COMMON STOCKS 99.6% | | | | | | | | |
| | |
Aerospace & Defense 0.2% | | | | | | | | |
Engility Holdings, Inc.* | | | 18,300 | | | $ | 633,180 | |
Vectrus, Inc.* | | | 78,500 | | | | 2,465,685 | |
| | | | | | | | |
| | | | | | | 3,098,865 | |
| | |
Air Freight & Logistics 0.9% | | | | | | | | |
Atlas Air Worldwide Holdings, Inc.* | | | 214,228 | | | | 14,363,987 | |
| | |
Airlines 1.4% | | | | | | | | |
Hawaiian Holdings, Inc. | | | 107,600 | | | | 4,314,760 | |
SkyWest, Inc. | | | 296,468 | | | | 17,758,433 | |
| | | | | | | | |
| | | | | | | 22,073,193 | |
| | |
Auto Components 4.0% | | | | | | | | |
American Axle & Manufacturing Holdings, Inc.* | | | 688,100 | | | | 11,505,032 | |
Cooper-Standard Holdings, Inc.* | | | 98,300 | | | | 13,250,840 | |
Dana, Inc. | | | 396,600 | | | | 8,467,410 | |
Modine Manufacturing Co.* | | | 211,300 | | | | 3,687,185 | |
Stoneridge, Inc.* | | | 170,400 | | | | 5,793,600 | |
Superior Industries International, Inc. | | | 141,300 | | | | 2,592,855 | |
Tenneco, Inc. | | | 165,700 | | | | 7,638,770 | |
Tower International, Inc. | | | 328,989 | | | | 10,626,345 | |
| | | | | | | | |
| | | | | | | 63,562,037 | |
| | |
Automobiles 0.2% | | | | | | | | |
Winnebago Industries, Inc. | | | 90,800 | | | | 3,622,920 | |
| | |
Banks 16.6% | | | | | | | | |
Arrow Financial Corp. | | | 49,534 | | | | 1,916,966 | |
Associated Banc-Corp. | | | 232,000 | | | | 6,264,000 | |
Bank of Marin Bancorp | | | 4,262 | | | | 378,679 | |
Bank of NT Butterfield & Son Ltd. (The) (Bermuda) | | | 16,200 | | | | 801,252 | |
BankUnited, Inc. | | | 146,500 | | | | 5,692,990 | |
Berkshire Hills Bancorp, Inc. | | | 274,004 | | | | 11,124,562 | |
Boston Private Financial Holdings, Inc. | | | 120,100 | | | | 1,729,440 | |
Bridge Bancorp, Inc. | | | 10,100 | | | | 361,580 | |
Camden National Corp. | | | 101,926 | | | | 4,698,789 | |
Cathay General Bancorp | | | 403,100 | | | | 16,764,929 | |
Chemical Financial Corp. | | | 4,500 | | | | 255,600 | |
Citizens & Northern Corp. | | | 18,416 | | | | 498,705 | |
CNB Financial Corp. | | | 58,699 | | | | 1,820,256 | |
See Notes to Financial Statements.
| | | | |
| PGIM QMA Small-Cap Value Fund | | | 17 | |
Schedule of Investments (continued)
as of July 31, 2018
| | | | | | | | |
| Description | | Shares | | | Value | |
COMMON STOCKS (Continued) | | | | | | | | |
| | |
Banks (cont’d.) | | | | | | | | |
Community Trust Bancorp, Inc. | | | 135,066 | | | $ | 6,594,597 | |
Customers Bancorp, Inc.* | | | 346,730 | | | | 8,831,213 | |
Enterprise Financial Services Corp. | | | 153,180 | | | | 8,616,375 | |
Fidelity Southern Corp. | | | 156,793 | | | | 3,752,056 | |
Financial Institutions, Inc. | | | 191,928 | | | | 6,084,118 | |
First Bancorp/Southern Pines NC | | | 6,500 | | | | 269,230 | |
First Business Financial Services, Inc. | | | 17,800 | | | | 422,928 | |
First Community Bancshares, Inc. | | | 47,934 | | | | 1,559,293 | |
First Financial Bancorp | | | 131,151 | | | | 3,980,433 | |
First Financial Corp. | | | 95,459 | | | | 4,906,593 | |
First Hawaiian, Inc. | | | 172,200 | | | | 4,866,372 | |
FNB Corp. | | | 361,800 | | | | 4,641,894 | |
Franklin Financial Network, Inc.* | | | 11,300 | | | | 442,395 | |
Fulton Financial Corp. | | | 364,700 | | | | 6,327,545 | |
Great Southern Bancorp, Inc. | | | 84,063 | | | | 4,963,920 | |
Great Western Bancorp, Inc. | | | 285,900 | | | | 11,964,915 | |
Hancock Whitney Corp. | | | 122,700 | | | | 6,165,675 | |
Hanmi Financial Corp. | | | 198,578 | | | | 4,974,379 | |
Heartland Financial USA, Inc. | | | 204,850 | | | | 12,034,938 | |
Hilltop Holdings, Inc. | | | 476,303 | | | | 9,907,102 | |
Home BancShares, Inc. | | | 77,800 | | | | 1,804,182 | |
Hope Bancorp, Inc. | | | 693,716 | | | | 11,640,554 | |
Horizon Bancorp, Inc. | | | 20,531 | | | | 431,356 | |
IBERIABANK Corp. | | | 102,681 | | | | 8,532,791 | |
International Bancshares Corp. | | | 366,982 | | | | 16,312,350 | |
Lakeland Bancorp, Inc. | | | 90,327 | | | | 1,752,344 | |
MidWestOne Financial Group, Inc. | | | 21,162 | | | | 680,570 | |
OFG Bancorp (Puerto Rico) | | | 101,200 | | | | 1,684,980 | |
Old National Bancorp | | | 678,943 | | | | 13,205,441 | |
PacWest Bancorp | | | 81,300 | | | | 4,082,886 | |
Peapack Gladstone Financial Corp. | | | 62,779 | | | | 2,064,174 | |
Popular, Inc. (Puerto Rico) | | | 85,400 | | | | 4,238,402 | |
QCR Holdings, Inc. | | | 20,900 | | | | 908,105 | |
S&T Bancorp, Inc. | | | 176,663 | | | | 7,907,436 | |
Sandy Spring Bancorp, Inc. | | | 46,500 | | | | 1,818,615 | |
Simmons First National Corp. (Class A Stock) | | | 14,000 | | | | 417,200 | |
Sterling Bancorp | | | 253,200 | | | | 5,621,040 | |
Synovus Financial Corp. | | | 22,900 | | | | 1,131,718 | |
TriCo Bancshares | | | 34,050 | | | | 1,321,821 | |
Trustmark Corp. | | | 37,300 | | | | 1,312,587 | |
Univest Corp. of Pennsylvania | | | 40,400 | | | | 1,102,920 | |
WesBanco, Inc. | | | 165,948 | | | | 8,109,879 | |
West Bancorporation, Inc. | | | 68,359 | | | | 1,695,303 | |
| | | | | | | | |
| | | | | | | 261,390,373 | |
See Notes to Financial Statements.
| | | | | | | | |
| Description | | Shares | | | Value | |
COMMON STOCKS (Continued) | | | | | | | | |
| | |
Biotechnology 0.2% | | | | | | | | |
PDL BioPharma, Inc.* | | | 125,400 | | | $ | 314,754 | |
United Therapeutics Corp.* | | | 28,100 | | | | 3,453,771 | |
| | | | | | | | |
| | | | | | | 3,768,525 | |
| | |
Building Products 0.1% | | | | | | | | |
Apogee Enterprises, Inc. | | | 30,900 | | | | 1,568,484 | |
| | |
Capital Markets 2.0% | | | | | | | | |
Arlington Asset Investment Corp. (Class A Stock) | | | 268,796 | | | | 2,827,734 | |
BrightSphere Investment Group PLC | | | 309,500 | | | | 4,410,375 | |
Evercore, Inc. (Class A Stock) | | | 25,500 | | | | 2,881,500 | |
INTL. FCStone, Inc.* | | | 28,000 | | | | 1,500,520 | |
Piper Jaffray Cos. | | | 4,443 | | | | 343,666 | |
Stifel Financial Corp. | | | 233,100 | | | | 12,850,803 | |
Waddell & Reed Financial, Inc. (Class A Stock) | | | 350,600 | | | | 7,260,926 | |
| | | | | | | | |
| | | | | | | 32,075,524 | |
| | |
Chemicals 1.5% | | | | | | | | |
AdvanSix, Inc.* | | | 35,900 | | | | 1,452,873 | |
Cabot Corp. | | | 8,000 | | | | 528,800 | |
Innophos Holdings, Inc. | | | 55,700 | | | | 2,516,526 | |
Koppers Holdings, Inc.* | | | 152,100 | | | | 5,711,355 | |
Kraton Corp.* | | | 31,900 | | | | 1,534,071 | |
Kronos Worldwide, Inc. | | | 31,300 | | | | 711,762 | |
Stepan Co. | | | 75,819 | | | | 6,640,228 | |
Trinseo SA | | | 62,400 | | | | 4,661,280 | |
| | | | | | | | |
| | | | | | | 23,756,895 | |
| | |
Commercial Services & Supplies 2.4% | | | | | | | | |
ACCO Brands Corp. | | | 696,641 | | | | 8,917,005 | |
Deluxe Corp. | | | 47,100 | | | | 2,775,603 | |
Ennis, Inc. | | | 360,856 | | | | 7,848,618 | |
Essendant, Inc. | | | 74,300 | | | | 1,235,609 | |
Herman Miller, Inc. | | | 193,000 | | | | 7,305,050 | |
Knoll, Inc. | | | 18,500 | | | | 417,175 | |
Matthews International Corp. (Class A Stock) | | | 31,700 | | | | 1,665,835 | |
Quad Graphics, Inc. | | | 310,971 | | | | 6,393,564 | |
Steelcase, Inc. (Class A Stock) | | | 45,500 | | | | 625,625 | |
VSE Corp. | | | 26,300 | | | | 1,133,530 | |
| | | | | | | | |
| | | | | | | 38,317,614 | |
See Notes to Financial Statements.
| | | | |
| PGIM QMA Small-Cap Value Fund | | | 19 | |
Schedule of Investments (continued)
as of July 31, 2018
| | | | | | | | |
| Description | | Shares | | | Value | |
COMMON STOCKS (Continued) | | | | | | | | |
| | |
Communications Equipment 0.3% | | | | | | | | |
InterDigital, Inc. | | | 51,500 | | | $ | 4,246,175 | |
| | |
Construction & Engineering 0.5% | | | | | | | | |
AECOM* | | | 109,500 | | | | 3,674,820 | |
KBR, Inc. | | | 205,100 | | | | 4,097,898 | |
| | | | | | | | |
| | | | | | | 7,772,718 | |
| | |
Consumer Finance 2.1% | | | | | | | | |
Encore Capital Group, Inc.* | | | 183,491 | | | | 6,624,025 | |
Enova International, Inc.* | | | 244,905 | | | | 7,592,055 | |
Nelnet, Inc. (Class A Stock) | | | 213,753 | | | | 12,564,401 | |
OneMain Holdings, Inc.* | | | 8,500 | | | | 282,625 | |
Regional Management Corp.* | | | 82,200 | | | | 2,726,574 | |
World Acceptance Corp.* | | | 37,700 | | | | 3,766,607 | |
| | | | | | | | |
| | | | | | | 33,556,287 | |
| | |
Containers & Packaging 0.2% | | | | | | | | |
Greif, Inc. (Class A Stock) | | | 47,300 | | | | 2,575,485 | |
Owens-Illinois, Inc.* | | | 24,900 | | | | 465,132 | |
| | | | | | | | |
| | | | | | | 3,040,617 | |
| | |
Diversified Financial Services 0.5% | | | | | | | | |
Banco Latinoamericano de Comercio Exterior SA (Panama) (Class E Stock) | | | 265,311 | | | | 6,306,443 | |
Cannae Holdings, Inc.* | | | 48,200 | | | | 879,650 | |
| | | | | | | | |
| | | | | | | 7,186,093 | |
| | |
Diversified Telecommunication Services 0.9% | | | | | | | | |
Iridium Communications, Inc.* | | | 857,698 | | | | 14,838,175 | |
| | |
Electrical Equipment 0.8% | | | | | | | | |
Atkore International Group, Inc.* | | | 290,200 | | | | 6,866,132 | |
Generac Holdings, Inc.* | | | 32,100 | | | | 1,725,375 | |
Regal Beloit Corp. | | | 44,000 | | | | 3,781,800 | |
| | | | | | | | |
| | | | | | | 12,373,307 | |
| | |
Electronic Equipment, Instruments & Components 3.1% | | | | | | | | |
Electro Scientific Industries, Inc.* | | | 26,600 | | | | 479,598 | |
Jabil, Inc. | | | 169,600 | | | | 4,777,632 | |
KEMET Corp.* | | | 334,650 | | | | 8,697,554 | |
See Notes to Financial Statements.
| | | | | | | | |
| Description | | Shares | | | Value | |
COMMON STOCKS (Continued) | | | | | | | | |
| | |
Electronic Equipment, Instruments & Components (cont’d.) | | | | | | | | |
Sanmina Corp.* | | | 53,674 | | | $ | 1,561,913 | |
SYNNEX Corp. | | | 23,800 | | | | 2,295,986 | |
Tech Data Corp.* | | | 159,800 | | | | 13,328,918 | |
TTM Technologies, Inc.* | | | 625,700 | | | | 10,862,152 | |
Vishay Intertechnology, Inc. | | | 246,000 | | | | 6,150,000 | |
| | | | | | | | |
| | | | | | | 48,153,753 | |
| | |
Energy Equipment & Services 0.9% | | | | | | | | |
FTS International, Inc.* | | | 11,300 | | | | 135,600 | |
McDermott International, Inc.* | | | 359,954 | | | | 6,482,772 | |
Ocean Rig Udw, Inc. (Cayman Islands) (Class A Stock)* | | | 33,900 | | | | 950,556 | |
US Silica Holdings, Inc. | | | 245,300 | | | | 6,613,288 | |
| | | | | | | | |
| | | | | | | 14,182,216 | |
| | |
Equity Real Estate Investment Trusts (REITs) 11.2% | | | | | | | | |
Ashford Hospitality Trust, Inc. | | | 1,676,220 | | | | 13,242,138 | |
Braemar Hotels & Resorts, Inc. | | | 461,379 | | | | 5,273,562 | |
Brixmor Property Group, Inc. | | | 315,900 | | | | 5,588,271 | |
CBL & Associates Properties, Inc.(a) | | | 624,700 | | | | 3,404,615 | |
Chatham Lodging Trust | | | 455,600 | | | | 9,813,624 | |
CoreCivic, Inc. | | | 217,500 | | | | 5,576,700 | |
CorEnergy Infrastructure Trust, Inc.(a) | | | 209,415 | | | | 7,964,052 | |
DDR Corp. | | | 260,000 | | | | 3,562,000 | |
Franklin Street Properties Corp. | | | 351,800 | | | | 3,099,358 | |
Global Net Lease, Inc. | | | 171,700 | | | | 3,633,172 | |
Government Properties Income Trust | | | 237,100 | | | | 3,573,097 | |
Hersha Hospitality Trust | | | 513,700 | | | | 11,090,783 | |
Hospitality Properties Trust | | | 212,800 | | | | 6,015,856 | |
InfraREIT, Inc. | | | 322,700 | | | | 6,760,565 | |
iStar, Inc.* | | | 143,300 | | | | 1,557,671 | |
Kite Realty Group Trust | | | 295,000 | | | | 4,976,650 | |
Lexington Realty Trust | | | 769,477 | | | | 6,763,703 | |
Mack-Cali Realty Corp. | | | 359,500 | | | | 6,999,465 | |
MedEquities Realty Trust, Inc., REIT | | | 90,300 | | | | 1,011,360 | |
New Senior Investment Group, Inc. | | | 836,400 | | | | 5,921,712 | |
Pennsylvania Real Estate Investment Trust | | | 80,600 | | | | 855,972 | |
Ramco-Gershenson Properties Trust | | | 301,000 | | | | 3,958,150 | |
RLJ Lodging Trust | | | 525,800 | | | | 11,877,822 | |
Sabra Health Care REIT, Inc. | | | 391,300 | | | | 8,455,993 | |
Select Income REIT | | | 643,028 | | | | 13,407,134 | |
Spirit Realty Capital, Inc. | | | 697,000 | | | | 5,833,890 | |
See Notes to Financial Statements.
| | | | |
| PGIM QMA Small-Cap Value Fund | | | 21 | |
Schedule of Investments (continued)
as of July 31, 2018
| | | | | | | | |
| Description | | Shares | | | Value | |
COMMON STOCKS (Continued) | | | | | | | | |
| | |
Equity Real Estate Investment Trusts (REITs) (cont’d.) | | | | | | | | |
Washington Prime Group, Inc. | | | 757,200 | | | $ | 6,080,316 | |
Xenia Hotels & Resorts, Inc. | | | 405,100 | | | | 9,880,389 | |
| | | | | | | | |
| | | | | | | 176,178,020 | |
| | |
Food & Staples Retailing 1.1% | | | | | | | | |
Ingles Markets, Inc. (Class A Stock) | | | 209,705 | | | | 6,238,724 | |
SpartanNash Co. | | | 447,590 | | | | 10,724,256 | |
| | | | | | | | |
| | | | | | | 16,962,980 | |
| | |
Food Products 0.4% | | | | | | | | |
Dean Foods Co. | | | 107,900 | | | | 1,059,578 | |
Sanderson Farms, Inc.(a) | | | 57,800 | | | | 5,827,974 | |
| | | | | | | | |
| | | | | | | 6,887,552 | |
| | |
Gas Utilities 0.5% | | | | | | | | |
National Fuel Gas Co. | | | 43,300 | | | | 2,325,210 | |
New Jersey Resources Corp. | | | 85,100 | | | | 3,935,875 | |
Spire, Inc. | | | 26,800 | | | | 1,918,880 | |
| | | | | | | | |
| | | | | | | 8,179,965 | |
| | |
Health Care Providers & Services 1.3% | | | | | | | | |
Acadia Healthcare Co., Inc.* | | | 78,300 | | | | 3,091,284 | |
LifePoint Health, Inc.* | | | 122,500 | | | | 7,938,000 | |
Magellan Health, Inc.* | | | 45,500 | | | | 3,310,125 | |
National HealthCare Corp. | | | 2,500 | | | | 180,200 | |
Tenet Healthcare Corp.* | | | 113,500 | | | | 4,271,005 | |
Triple-S Management Corp. (Puerto Rico) (Class B Stock)* | | | 37,700 | | | | 1,338,727 | |
| | | | | | | | |
| | | | | | | 20,129,341 | |
| | |
Hotels, Restaurants & Leisure 0.4% | | | | | | | | |
Bloomin’ Brands, Inc. | | | 16,200 | | | | 313,308 | |
Brinker International, Inc. | | | 52,600 | | | | 2,481,142 | |
El Pollo Loco Holdings, Inc.* | | | 180,100 | | | | 2,089,160 | |
Penn National Gaming, Inc.* | | | 18,100 | | | | 580,105 | |
Speedway Motorsports, Inc. | | | 66,689 | | | | 1,177,061 | |
| | | | | | | | |
| | | | | | | 6,640,776 | |
| | |
Household Durables 3.6% | | | | | | | | |
Beazer Homes USA, Inc.* | | | 611,100 | | | | 7,828,191 | |
See Notes to Financial Statements.
| | | | | | | | |
| Description | | Shares | | | Value | |
COMMON STOCKS (Continued) | | | | | | | | |
| | |
Household Durables (cont’d.) | | | | | | | | |
Helen of Troy Ltd.* | | | 134,000 | | | $ | 15,349,700 | |
KB Home | | | 361,400 | | | | 8,583,250 | |
La-Z-Boy, Inc. | | | 189,100 | | | | 5,767,550 | |
Taylor Morrison Home Corp. (Class A Stock)* | | | 502,200 | | | | 9,807,966 | |
TRI Pointe Group, Inc.* | | | 377,900 | | | | 5,354,843 | |
William Lyon Homes (Class A Stock)* | | | 154,000 | | | | 3,361,820 | |
| | | | | | | | |
| | | | | | | 56,053,320 | |
| | |
Independent Power & Renewable Electricity Producers 1.0% | | | | | | | | |
NRG Yield, Inc. (Class A Stock) | | | 76,200 | | | | 1,408,176 | |
NRG Yield, Inc. (Class C Stock) | | | 782,500 | | | | 14,554,500 | |
| | | | | | | | |
| | | | | | | 15,962,676 | |
| | |
Insurance 3.3% | | | | | | | | |
American Equity Investment Life Holding Co. | | | 455,877 | | | | 16,288,485 | |
American National Insurance Co. | | | 4,900 | | | | 632,051 | |
CNO Financial Group, Inc. | | | 327,500 | | | | 6,664,625 | |
EMC Insurance Group, Inc. | | | 54,250 | | | | 1,452,272 | |
Employers Holdings, Inc. | | | 293,998 | | | | 13,656,207 | |
FBL Financial Group, Inc. (Class A Stock) | | | 76,868 | | | | 6,280,116 | |
First American Financial Corp. | | | 7,900 | | | | 442,400 | |
Heritage Insurance Holdings, Inc. | | | 22,600 | | | | 388,042 | |
National Western Life Group, Inc. (Class A Stock) | | | 17,900 | | | | 5,799,600 | |
| | | | | | | | |
| | | | | | | 51,603,798 | |
| | |
IT Services 0.6% | | | | | | | | |
Convergys Corp. | | | 150,431 | | | | 3,700,603 | |
Sykes Enterprises, Inc.* | | | 90,100 | | | | 2,672,366 | |
Travelport Worldwide Ltd. | | | 162,600 | | | | 3,073,140 | |
| | | | | | | | |
| | | | | | | 9,446,109 | |
| | |
Leisure Products 0.1% | | | | | | | | |
Vista Outdoor, Inc.* | | | 48,400 | | | | 786,016 | |
| | |
Machinery 2.3% | | | | | | | | |
Allison Transmission Holdings, Inc. | | | 97,700 | | | | 4,591,900 | |
American Railcar Industries, Inc. | | | 12,100 | | | | 551,397 | |
Briggs & Stratton Corp. | | | 89,300 | | | | 1,579,717 | |
Global Brass & Copper Holdings, Inc. | | | 230,276 | | | | 7,587,594 | |
Greenbrier Cos., Inc. (The) | | | 196,200 | | | | 11,114,730 | |
Kennametal, Inc. | | | 29,500 | | | | 1,149,320 | |
See Notes to Financial Statements.
| | | | |
| PGIM QMA Small-Cap Value Fund | | | 23 | |
Schedule of Investments (continued)
as of July 31, 2018
| | | | | | | | |
| Description | | Shares | | | Value | |
COMMON STOCKS (Continued) | | | | | | | | |
| | |
Machinery (cont’d.) | | | | | | | | |
Milacron Holdings Corp.* | | | 181,300 | | | $ | 3,780,105 | |
Wabash National Corp. | | | 280,497 | | | | 5,553,841 | |
| | | | | | | | |
| | | | | | | 35,908,604 | |
| | |
Marine 0.6% | | | | | | | | |
Costamare, Inc. (Monaco) | | | 479,600 | | | | 3,328,424 | |
Matson, Inc. | | | 146,200 | | | | 5,263,200 | |
| | | | | | | | |
| | | | | | | 8,591,624 | |
| | |
Media 1.1% | | | | | | | | |
Gannett Co., Inc. | | | 802,300 | | | | 8,480,311 | |
Gray Television, Inc.* | | | 386,600 | | | | 5,972,970 | |
Saga Communications, Inc. (Class A Stock) | | | 3,110 | | | | 117,714 | |
TEGNA, Inc. | | | 276,300 | | | | 3,047,589 | |
| | | | | | | | |
| | | | | | | 17,618,584 | |
| | |
Metals & Mining 1.5% | | | | | | | | |
Commercial Metals Co. | | | 45,000 | | | | 1,005,300 | |
Schnitzer Steel Industries, Inc. (Class A Stock) | | | 333,700 | | | | 10,995,415 | |
SunCoke Energy, Inc.* | | | 25,200 | | | | 287,532 | |
Warrior Met Coal, Inc. | | | 28,300 | | | | 732,121 | |
Worthington Industries, Inc. | | | 241,615 | | | | 11,312,414 | |
| | | | | | | | |
| | | | | | | 24,332,782 | |
| | |
Mortgage Real Estate Investment Trusts (REITs) 5.5% | | | | | | | | |
AG Mortgage Investment Trust, Inc. | | | 364,281 | | | | 7,114,408 | |
Anworth Mortgage Asset Corp. | | | 247,300 | | | | 1,246,392 | |
Apollo Commercial Real Estate Finance, Inc. | | | 415,983 | | | | 7,941,115 | |
ARMOUR Residential REIT, Inc. | | | 298,000 | | | | 7,083,460 | |
Capstead Mortgage Corp. | | | 632,992 | | | | 5,298,143 | |
Cherry Hill Mortgage Investment Corp. | | | 196,900 | | | | 3,626,898 | |
CYS Investments, Inc. | | | 832,609 | | | | 6,086,372 | |
Dynex Capital, Inc. | | | 695,406 | | | | 4,624,450 | |
Invesco Mortgage Capital, Inc. | | | 620,026 | | | | 10,286,231 | |
Ladder Capital Corp. | | | 580,190 | | | | 9,277,238 | |
MFA Financial, Inc. | | | 80,600 | | | | 648,830 | |
MTGE Investment Corp. | | | 328,637 | | | | 6,589,172 | |
New York Mortgage Trust, Inc. | | | 155,700 | | | | 966,897 | |
PennyMac Mortgage Investment Trust | | | 62,600 | | | | 1,207,554 | |
Redwood Trust, Inc. | | | 454,100 | | | | 7,633,421 | |
TPG RE Finance Trust, Inc. | | | 7,900 | | | | 162,898 | |
See Notes to Financial Statements.
| | | | | | | | |
| Description | | Shares | | | Value | |
COMMON STOCKS (Continued) | | | | | | | | |
| | |
Mortgage Real Estate Investment Trusts (REITs) (cont’d.) | | | | | | | | |
Two Harbors Investment Corp. | | | 35,700 | | | $ | 553,350 | |
Western Asset Mortgage Capital Corp. | | | 552,600 | | | | 6,117,282 | |
| | | | | | | | |
| | | | | | | 86,464,111 | |
| | |
Multiline Retail 0.4% | | | | | | | | |
Dillard’s, Inc., (Class A Stock)(a) | | | 75,900 | | | | 6,092,493 | |
| | |
Multi-Utilities 0.8% | | | | | | | | |
NorthWestern Corp. | | | 206,900 | | | | 12,275,377 | |
| | |
Oil, Gas & Consumable Fuels 3.1% | | | | | | | | |
Adams Resources & Energy, Inc. | | | 12,278 | | | | 491,120 | |
Arch Coal, Inc. (Class A Stock) | | | 49,300 | | | | 4,170,287 | |
CONSOL Energy, Inc.* | | | 8,400 | | | | 349,692 | |
DHT Holdings, Inc. | | | 393,500 | | | | 1,672,375 | |
Gulfport Energy Corp.* | | | 397,800 | | | | 4,578,678 | |
Laredo Petroleum, Inc.* | | | 550,200 | | | | 5,127,864 | |
Midstates Petroleum Co., Inc.* | | | 51,800 | | | | 679,098 | |
Newfield Exploration Co.(a)* | | | 181,300 | | | | 5,206,936 | |
Par Pacific Holdings, Inc.* | | | 70,300 | | | | 1,230,953 | |
Peabody Energy Corp. | | | 182,700 | | | | 7,762,923 | |
Range Resources Corp. | | | 377,600 | | | | 5,826,368 | |
REX American Resources Corp.* | | | 30,300 | | | | 2,333,100 | |
Ship Finance International Ltd. (Norway) | | | 549,269 | | | | 7,991,864 | |
Southwestern Energy Co.* | | | 306,600 | | | | 1,575,924 | |
| | | | | | | | |
| | | | | | | 48,997,182 | |
| | |
Paper & Forest Products 2.3% | | | | | | | | |
Boise Cascade Co. | | | 55,700 | | | | 2,409,025 | |
Clearwater Paper Corp.* | | | 101,100 | | | | 2,284,860 | |
Domtar Corp. | | | 63,800 | | | | 3,076,436 | |
Louisiana-Pacific Corp. | | | 488,350 | | | | 13,146,382 | |
P.H. Glatfelter Co. | | | 215,500 | | | | 3,527,735 | |
Schweitzer-Mauduit International, Inc. | | | 270,243 | | | | 11,212,382 | |
| | | | | | | | |
| | | | | | | 35,656,820 | |
| | |
Personal Products 0.1% | | | | | | | | |
Edgewell Personal Care Co.* | | | 40,400 | | | | 2,175,944 | |
| | |
Pharmaceuticals 0.8% | | | | | | | | |
Lannett Co., Inc.* | | | 19,400 | | | | 247,350 | |
See Notes to Financial Statements.
| | | | |
| PGIM QMA Small-Cap Value Fund | | | 25 | |
Schedule of Investments (continued)
as of July 31, 2018
| | | | | | | | |
| Description | | Shares | | | Value | |
COMMON STOCKS (Continued) | | | | | | | | |
| | |
Pharmaceuticals (cont’d.) | | | | | | | | |
Mallinckrodt PLC* | | | 183,600 | | | $ | 4,305,420 | |
Prestige Brands Holdings, Inc.(a)* | | | 244,600 | | | | 8,739,558 | |
| | | | | | | | |
| | | | | | | 13,292,328 | |
| | |
Professional Services 0.7% | | | | | | | | |
Barrett Business Services, Inc. | | | 13,700 | | | | 1,258,756 | |
TrueBlue, Inc.* | | | 381,000 | | | | 10,306,050 | |
| | | | | | | | |
| | | | | | | 11,564,806 | |
| | |
Road & Rail 0.2% | | | | | | | | |
Ryder System, Inc. | | | 36,700 | | | | 2,873,610 | |
| | |
Semiconductors & Semiconductor Equipment 0.6% | | | | | | | | |
Amkor Technology, Inc.* | | | 995,261 | | | | 8,638,866 | |
Axcelis Technologies, Inc.* | | | 26,600 | | | | 585,200 | |
Ultra Clean Holdings, Inc.* | | | 41,300 | | | | 554,246 | |
| | | | | | | | |
| | | | | | | 9,778,312 | |
| | |
Specialty Retail 6.1% | | | | | | | | |
Abercrombie & Fitch Co. (Class A Stock) | | | 58,900 | | | | 1,395,341 | |
Asbury Automotive Group, Inc.* | | | 54,000 | | | | 3,796,200 | |
Buckle, Inc. (The)(a) | | | 108,800 | | | | 2,616,640 | |
Caleres, Inc. | | | 208,000 | | | | 6,965,920 | |
Chico’s FAS, Inc. | | | 660,400 | | | | 5,745,480 | |
Dick’s Sporting Goods, Inc. | | | 71,900 | | | | 2,454,666 | |
DSW, Inc. (Class A Stock) | | | 277,000 | | | | 7,600,880 | |
Express, Inc.* | | | 197,500 | | | | 1,901,925 | |
Foot Locker, Inc. | | | 74,100 | | | | 3,616,821 | |
Genesco, Inc.* | | | 191,200 | | | | 7,781,840 | |
Group 1 Automotive, Inc. | | | 115,400 | | | | 8,076,846 | |
Haverty Furniture Cos., Inc. | | | 131,700 | | | | 2,607,660 | |
Hibbett Sports, Inc.* | | | 201,200 | | | | 4,617,540 | |
J. Jill, Inc.* | | | 110,100 | | | | 901,719 | |
Murphy USA, Inc.* | | | 58,500 | | | | 4,635,540 | |
Office Depot, Inc. | | | 2,034,600 | | | | 5,106,846 | |
Party City Holdco, Inc.* | | | 194,700 | | | | 3,066,525 | |
Shoe Carnival, Inc. | | | 179,158 | | | | 5,620,186 | |
Signet Jewelers Ltd. | | | 184,400 | | | | 10,647,256 | |
Sonic Automotive, Inc. (Class A Stock) | | | 283,900 | | | | 5,777,365 | |
Tailored Brands, Inc. | | | 25,400 | | | | 512,064 | |
| | | | | | | | |
| | | | | | | 95,445,260 | |
See Notes to Financial Statements.
| | | | | | | | |
| Description | | Shares | | | Value | |
COMMON STOCKS (Continued) | | | | | | | | |
| | |
Textiles, Apparel & Luxury Goods 0.3% | | | | | | | | |
Perry Ellis International, Inc.* | | | 152,700 | | | $ | 4,281,708 | |
| | |
Thrifts & Mortgage Finance 7.5% | | | | | | | | |
Capitol Federal Financial, Inc. | | | 43,600 | | | | 569,852 | |
Dime Community Bancshares, Inc. | | | 419,783 | | | | 7,220,268 | |
Essent Group Ltd.* | | | 189,300 | | | | 7,269,120 | |
Federal Agricultural Mortgage Corp. (Class C Stock) | | | 120,062 | | | | 11,320,646 | |
First Defiance Financial Corp. | | | 205,344 | | | | 6,603,863 | |
Flagstar Bancorp, Inc.* | | | 99,900 | | | | 3,401,595 | |
Meta Financial Group, Inc. | | | 5,400 | | | | 483,030 | |
MGIC Investment Corp.* | | | 1,414,900 | | | | 17,657,952 | |
OceanFirst Financial Corp. | | | 53,300 | | | | 1,554,761 | |
Oritani Financial Corp. | | | 266,082 | | | | 4,257,312 | |
PennyMac Financial Services, Inc. (Class A Stock)* | | | 28,915 | | | | 553,722 | |
Provident Financial Services, Inc. | | | 368,820 | | | | 9,419,663 | |
Radian Group, Inc. | | | 934,566 | | | | 17,896,939 | |
TrustCo Bank Corp. NY | | | 90,741 | | | | 825,743 | |
United Financial Bancorp, Inc. | | | 355,700 | | | | 6,228,307 | |
Walker & Dunlop, Inc. | | | 168,421 | | | | 9,980,628 | |
Washington Federal, Inc. | | | 380,504 | | | | 12,765,909 | |
| | | | | | | | |
| | | | | | | 118,009,310 | |
| | |
Trading Companies & Distributors 3.4% | | | | | | | | |
Aircastle Ltd. | | | 608,853 | | | | 12,621,522 | |
BMC Stock Holdings, Inc.* | | | 29,800 | | | | 655,600 | |
CAI International, Inc.* | | | 204,106 | | | | 4,686,274 | |
GATX Corp. | | | 212,247 | | | | 17,476,418 | |
H&E Equipment Services, Inc. | | | 5,200 | | | | 191,308 | |
Rush Enterprises, Inc. (Class A Stock)* | | | 97,800 | | | | 4,409,802 | |
Textainer Group Holdings Ltd.* | | | 66,700 | | | | 1,060,530 | |
Triton International Ltd. (Bermuda) | | | 348,400 | | | | 12,263,680 | |
| | | | | | | | |
| | | | | | | 53,365,134 | |
| | | | | | | | |
TOTAL COMMON STOCKS
(cost $1,329,188,424) | | | | | | | 1,568,502,300 | |
| | | | | | | | |
See Notes to Financial Statements.
| | | | |
| PGIM QMA Small-Cap Value Fund | | | 27 | |
Schedule of Investments (continued)
as of July 31, 2018
| | | | | | | | |
| Description | | Shares | | | Value | |
EXCHANGE TRADED FUND 0.1% | | | | | | | | |
iShares Russell 2000 Value ETF(a)
(cost $2,283,416) | | | 17,872 | | | $ | 2,388,950 | |
| | | | | | | | |
TOTAL LONG-TERM INVESTMENTS
(cost $1,331,471,840) | | | | | | | 1,570,891,250 | |
| | | | | | | | |
|
SHORT-TERM INVESTMENTS 1.8% | |
|
AFFILIATED MUTUAL FUNDS | |
PGIM Core Ultra Short Bond Fund(w) | | | 7,546,207 | | | | 7,546,207 | |
PGIM Institutional Money Market Fund
(cost $19,985,152; includes $19,701,896 of cash collateral for securities on loan)(b)(w) | | | 19,984,889 | | | | 19,986,888 | |
| | | | | | | | |
TOTAL SHORT-TERM INVESTMENTS
(cost $27,531,359) | | | | | | | 27,533,095 | |
| | | | | | | | |
TOTAL INVESTMENTS 101.5%
(cost $1,359,003,199) | | | | | | | 1,598,424,345 | |
Liabilities in excess of other assets (1.5)% | | | | | | | (23,082,040 | ) |
| | | | | | | | |
NET ASSETS 100.0% | | | | | | $ | 1,575,342,305 | |
| | | | | | | | |
See the Glossary for abbreviations used in the annual report:
ETF—Exchange Traded Fund
REITs—Real Estate Investment Trusts
| * | Non-income producing security. |
| (a) | All or a portion of security is on loan. The aggregate market value of such securities, including those sold and pending settlement, is $19,208,293; cash collateral of $19,701,896 (including in liabilities) was received with which the Fund purchased highly liquid short-term investments. |
| (b) | Represents security purchased with cash collateral received for securities on loan and includes dividend reinvestment. |
| (w) | PGIM Investments LLC, the manager of the Fund, also serves as manager of the PGIM Core Ultra Short Bond Fund and PGIM Institutional Money Market Fund. |
Fair Value Measurements:
Various inputs are used in determining the value of the Fund’s investments. These inputs are summarized in the three broad levels listed below.
Level 1—unadjusted quoted prices generally in active markets for identical securities.
Level 2—quoted prices for similar securities, interest rates and yield curves, prepayment speeds, foreign currency exchange rates and other observable inputs.
Level 3—unobservable inputs for securities valued in accordance with Board approved fair valuation procedures.
See Notes to Financial Statements.
The following is a summary of the inputs used as of July 31, 2018 in valuing such portfolio securities:
| | | | | | | | | | | | |
| | | Level 1 | | | Level 2 | | | Level 3 | |
Investments in Securities | | | | | | | | | | | | |
Common Stocks | | | | | | | | | | | | |
Aerospace & Defense | | $ | 3,098,865 | | | $ | — | | | $ | — | |
Air Freight & Logistics | | | 14,363,987 | | | | — | | | | — | |
Airlines | | | 22,073,193 | | | | — | | | | — | |
Auto Components | | | 63,562,037 | | | | — | | | | — | |
Automobiles | | | 3,622,920 | | | | — | | | | — | |
Banks | | | 261,390,373 | | | | — | | | | — | |
Biotechnology | | | 3,768,525 | | | | — | | | | — | |
Building Products | | | 1,568,484 | | | | — | | | | — | |
Capital Markets | | | 32,075,524 | | | | — | | | | — | |
Chemicals | | | 23,756,895 | | | | — | | | | — | |
Commercial Services & Supplies | | | 38,317,614 | | | | — | | | | — | |
Communications Equipment | | | 4,246,175 | | | | — | | | | — | |
Construction & Engineering | | | 7,772,718 | | | | — | | | | — | |
Consumer Finance | | | 33,556,287 | | | | — | | | | — | |
Containers & Packaging | | | 3,040,617 | | | | — | | | | — | |
Diversified Financial Services | | | 7,186,093 | | | | — | | | | — | |
Diversified Telecommunication Services | | | 14,838,175 | | | | — | | | | — | |
Electrical Equipment | | | 12,373,307 | | | | — | | | | — | |
Electronic Equipment, Instruments & Components | | | 48,153,753 | | | | — | | | | — | |
Energy Equipment & Services | | | 14,182,216 | | | | — | | | | — | |
Equity Real Estate Investment Trusts (REITs) | | | 176,178,020 | | | | — | | | | — | |
Food & Staples Retailing | | | 16,962,980 | | | | — | | | | — | |
Food Products | | | 6,887,552 | | | | — | | | | — | |
Gas Utilities | | | 8,179,965 | | | | — | | | | — | |
Health Care Providers & Services | | | 20,129,341 | | | | — | | | | — | |
Hotels, Restaurants & Leisure | | | 6,640,776 | | | | — | | | | — | |
Household Durables | | | 56,053,320 | | | | — | | | | — | |
Independent Power & Renewable Electricity Producers | | | 15,962,676 | | | | — | | | | — | |
Insurance | | | 51,603,798 | | | | — | | | | — | |
IT Services | | | 9,446,109 | | | | — | | | | — | |
Leisure Products | | | 786,016 | | | | — | | | | — | |
Machinery | | | 35,908,604 | | | | — | | | | — | |
Marine | | | 8,591,624 | | | | — | | | | — | |
Media | | | 17,618,584 | | | | — | | | | — | |
Metals & Mining | | | 24,332,782 | | | | — | | | | — | |
Mortgage Real Estate Investment Trusts (REITs) | | | 86,464,111 | | | | — | | | | — | |
Multiline Retail | | | 6,092,493 | | | | — | | | | — | |
Multi-Utilities | | | 12,275,377 | | | | — | | | | — | |
Oil, Gas & Consumable Fuels | | | 48,997,182 | | | | — | | | | — | |
Paper & Forest Products | | | 35,656,820 | | | | — | | | | — | |
Personal Products | | | 2,175,944 | | | | — | | | | — | |
Pharmaceuticals | | | 13,292,328 | | | | — | | | | — | |
Professional Services | | | 11,564,806 | | | | — | | | | — | |
Road & Rail | | | 2,873,610 | | | | — | | | | — | |
Semiconductors & Semiconductor Equipment | | | 9,778,312 | | | | — | | | | — | |
Specialty Retail | | | 95,445,260 | | | | — | | | | — | |
See Notes to Financial Statements.
| | | | |
| PGIM QMA Small-Cap Value Fund | | | 29 | |
Schedule of Investments (continued)
as of July 31, 2018
| | | | | | | | | | | | |
| | | Level 1 | | | Level 2 | | | Level 3 | |
Investments in Securities (continued) | | | | | | | | | | | | |
Common Stocks (continued) | | | | | | | | | | | | |
Textiles, Apparel & Luxury Goods | | $ | 4,281,708 | | | $ | — | | | $ | — | |
Thrifts & Mortgage Finance | | | 118,009,310 | | | | — | | | | — | |
Trading Companies & Distributors | | | 53,365,134 | | | | — | | | | — | |
Exchange Traded Fund | | | 2,388,950 | | | | — | | | | — | |
Affiliated Mutual Funds | | | 27,533,095 | | | | — | | | | — | |
| | | | | | | | | | | | |
Total | | $ | 1,598,424,345 | | | $ | — | | | $ | — | |
| | | | | | | | | | | | |
During the period, there were no transfers between Level 1, Level 2 and Level 3 to report.
Industry Classification:
The industry classification of investments and liabilities in excess of other assets shown as a percentage of net assets as of July 31, 2018 were as follows (unaudited):
| | | | |
Banks | | | 16.6 | % |
Equity Real Estate Investment Trusts (REITs) | | | 11.2 | |
Thrifts & Mortgage Finance | | | 7.5 | |
Specialty Retail | | | 6.1 | |
Mortgage Real Estate Investment Trusts (REITs) | | | 5.5 | |
Auto Components | | | 4.0 | |
Household Durables | | | 3.6 | |
Trading Companies & Distributors | | | 3.4 | |
Insurance | | | 3.3 | |
Oil, Gas & Consumable Fuels | | | 3.1 | |
Electronic Equipment, Instruments & Components | | | 3.1 | |
Commercial Services & Supplies | | | 2.4 | |
Machinery | | | 2.3 | |
Paper & Forest Products | | | 2.3 | |
Consumer Finance | | | 2.1 | |
Capital Markets | | | 2.0 | |
Affiliated Mutual Funds (1.3% represents investments purchased with collateral from securities on loan) | | | 1.8 | |
Metals & Mining | | | 1.5 | |
Chemicals | | | 1.5 | |
Airlines | | | 1.4 | |
Health Care Providers & Services | | | 1.3 | |
Media | | | 1.1 | |
Food & Staples Retailing | | | 1.1 | |
Independent Power & Renewable Electricity Producers | | | 1.0 | |
Diversified Telecommunication Services | | | 0.9 | |
Air Freight & Logistics | | | 0.9 | |
Energy Equipment & Services | | | 0.9 | |
| | | | |
Pharmaceuticals | | | 0.8 | % |
Electrical Equipment | | | 0.8 | |
Multi-Utilities | | | 0.8 | |
Professional Services | | | 0.7 | |
Semiconductors & Semiconductor Equipment | | | 0.6 | |
IT Services | | | 0.6 | |
Marine | | | 0.6 | |
Gas Utilities | | | 0.5 | |
Construction & Engineering | | | 0.5 | |
Diversified Financial Services | | | 0.5 | |
Food Products | | | 0.4 | |
Hotels, Restaurants & Leisure | | | 0.4 | |
Multiline Retail | | | 0.4 | |
Textiles, Apparel & Luxury Goods | | | 0.3 | |
Communications Equipment | | | 0.3 | |
Biotechnology | | | 0.2 | |
Automobiles | | | 0.2 | |
Aerospace & Defense | | | 0.2 | |
Containers & Packaging | | | 0.2 | |
Road & Rail | | | 0.2 | |
Personal Products | | | 0.1 | |
Building Products | | | 0.1 | |
Leisure Products | | | 0.1 | |
Exchange Traded Fund | | | 0.1 | |
| | | | |
| | | 101.5 | |
Liabilities in excess of other assets | | | (1.5 | ) |
| | | | |
| | | 100.0 | % |
| | | | |
See Notes to Financial Statements.
Financial Instruments/Transactions—Summary of Offsetting and Netting Arrangements:
The Fund entered into financial instruments/transactions during the reporting period that are either offset in accordance with current requirements or are subject to enforceable master netting arrangements or similar agreements that permit offsetting. The information about offsetting and related netting arrangements for financial instruments/transactions, where the legal right to set-off exists, is presented in the summary below.
Offsetting of financial instrument/transaction assets and liabilities:
| | | | | | | | | | | | |
Description | | Gross Market
Value of
Recognized
Assets/(Liabilities) | | | Collateral
Pledged/
(Received)(1) | | | Net Amount | |
Securities on Loan | | $ | 19,208,293 | | | $ | (19,208,293 | ) | | $ | — | |
| | | | | | | | | | | | |
| (1) | Collateral amount disclosed by the Fund is limited to the market value of financial instruments/transactions. |
See Notes to Financial Statements.
| | | | |
| PGIM QMA Small-Cap Value Fund | | | 31 | |
Statement of Assets & Liabilities
as of July 31, 2018
| | | | |
Assets | | | | |
Investments at value, including securities on loan of $19,208,293: | | | | |
Unaffiliated investments (cost $1,331,471,840) | | $ | 1,570,891,250 | |
Affiliated investments (cost $27,531,359) | | | 27,533,095 | |
Receivable for Fund shares sold | | | 3,703,241 | |
Dividends and interest receivable | | | 1,355,558 | |
Receivable for investments sold | | | 6,613 | |
Prepaid expenses | | | 122 | |
| | | | |
Total Assets | | | 1,603,489,879 | |
| | | | |
| |
Liabilities | | | | |
Payable to broker for collateral for securities on loan | | | 19,701,896 | |
Payable for Fund shares reacquired | | | 6,892,990 | |
Management fee payable | | | 793,616 | |
Accrued expenses and other liabilities | | | 505,949 | |
Distribution fee payable | | | 130,230 | |
Affiliated transfer agent fee payable | | | 67,763 | |
Shareholders’ reports payable | | | 55,130 | |
| | | | |
Total Liabilities | | | 28,147,574 | |
| | | | |
| |
Net Assets | | $ | 1,575,342,305 | |
| | | | |
| | | | | |
Net assets were comprised of: | | | | |
Shares of beneficial interest, at par | | $ | 75,276 | |
Paid-in capital in excess of par | | | 1,266,584,892 | |
| | | | |
| | | 1,266,660,168 | |
Undistributed net investment income | | | 7,552,567 | |
Accumulated net realized gain on investment transactions | | | 61,708,423 | |
Net unrealized appreciation on investments | | | 239,421,147 | |
| | | | |
Net assets, July 31, 2018 | | $ | 1,575,342,305 | |
| | | | |
See Notes to Financial Statements.
| | | | |
| |
Class A | | | | |
Net asset value, redemption price per share,
($136,532,689 ÷ 6,515,785 shares of beneficial interest issued and outstanding) | | $ | 20.95 | |
Maximum sales charge (5.50% of offering price) | | | 1.22 | |
| | | | |
Maximum offering price to public | | $ | 22.17 | |
| | | | |
| |
Class C | | | | |
Net asset value, offering price and redemption price per share,
($36,637,894 ÷ 1,748,880 shares of beneficial interest issued and outstanding) | | $ | 20.95 | |
| | | | |
| |
Class R | | | | |
Net asset value, offering price and redemption price per share,
($162,502,488 ÷ 7,864,293 shares of beneficial interest issued and outstanding) | | $ | 20.66 | |
| | | | |
| |
Class Z | | | | |
Net asset value, offering price and redemption price per share,
($824,748,248 ÷ 39,364,448 shares of beneficial interest issued and outstanding) | | $ | 20.95 | |
| | | | |
| |
Class R2 | | | | |
Net asset value, offering price and redemption price per share,
($18,460 ÷ 883 shares of beneficial interest issued and outstanding) | | $ | 20.91 | |
| | | | |
| |
Class R4 | | | | |
Net asset value, offering price and redemption price per share,
($10,246 ÷ 489 shares of beneficial interest issued and outstanding) | | $ | 20.94 | |
| | | | |
| |
Class R6 | | | | |
Net asset value, offering price and redemption price per share,
($414,892,280 ÷ 19,780,995 shares of beneficial interest issued and outstanding) | | $ | 20.97 | |
| | | | |
See Notes to Financial Statements.
| | | | |
| PGIM QMA Small-Cap Value Fund | | | 33 | |
Statement of Operations
Year Ended July 31, 2018
| | | | |
Net Investment Income (Loss) | | | | |
Income | | | | |
Unaffiliated dividend income (net of $8,163 foreign withholding tax) | | $ | 33,820,103 | |
Income from securities lending, net (including affiliated income of $562,325) | | | 1,961,603 | |
Affiliated dividend income | | | 66,285 | |
| | | | |
Total income | | | 35,847,991 | |
| | | | |
| |
Expenses | | | | |
Management fee | | | 9,365,685 | |
Distribution fee(a) | | | 2,026,694 | |
Shareholder servicing fee(a) | | | 15 | |
Transfer agent’s fees and expenses (including affiliated expense of $402,975)(a) | | | 1,087,997 | |
Custodian and accounting fees | | | 119,244 | |
Shareholders’ reports | | | 104,433 | |
Registration fees(a) | | | 101,893 | |
Trustees’ fees | | | 38,117 | |
Legal fees and expenses | | | 37,627 | |
Audit fee | | | 36,658 | |
Miscellaneous | | | 80,933 | |
| | | | |
Total expenses | | | 12,999,296 | |
Less: Fee waiver and/or expense reimbursement(a) | | | (151,475 | ) |
Distribution fee waiver(a) | | | (479,809 | ) |
| | | | |
Net expenses | | | 12,368,012 | |
| | | | |
Net investment income (loss) | | | 23,479,979 | |
| | | | |
| |
Realized And Unrealized Gain (Loss) On Investments | | | | |
Net realized gain (loss) on investment transactions (including affiliated of $9,134) | | | 82,126,110 | |
Net change in unrealized appreciation (depreciation) on investments (including affiliated of $1,736) | | | 65,714,134 | |
| | | | |
Net gain (loss) on investment transactions | | | 147,840,244 | |
| | | | |
Net Increase (Decrease) In Net Assets Resulting From Operations | | $ | 171,320,223 | |
| | | | |
| (a) | Class specific expenses and waivers were as follows: |
| | | | | | | | | | | | | | | | | | | | | | | | | | | | |
| | | Class A | | | Class C | | | Class R | | | Class Z | | | Class R2 | | | Class R4 | | | Class R6 | |
Distribution fee | | | 399,810 | | | | 387,340 | | | | 1,239,523 | | | | — | | | | 21 | | | | — | | | | — | |
Shareholder servicing fee | | | — | | | | — | | | | — | | | | — | | | | 9 | | | | 6 | | | | — | |
Transfer agent’s fees and expenses | | | 197,810 | | | | 61,925 | | | | 221,434 | | | | 605,231 | | | | 39 | | | | 24 | | | | 1,534 | |
Registration fees | | | 11,364 | | | | 13,305 | | | | 16,164 | | | | 12,516 | | | | 15,734 | | | | 15,734 | | | | 17,076 | |
Fee waiver and/or expense reimbursement | | | (13,327 | ) | | | (3,873 | ) | | | (16,527 | ) | | | (86,241 | ) | | | (15,759 | ) | | | (15,748 | ) | | | — | |
Distribution fee waiver | | | (66,635 | ) | | | — | | | | (413,174 | ) | | | — | | | | — | | | | — | | | | — | |
See Notes to Financial Statements.
Statements of Changes in Net Assets
| | | | | | | | |
| | | Year Ended July 31, | |
| | | 2018 | | | 2017 | |
Increase (Decrease) in Net Assets | | | | | | | | |
Operations | | | | | | | | |
Net investment income (loss) | | $ | 23,479,979 | | | $ | 21,879,740 | |
Net realized gain (loss) on investment transactions | | | 82,126,110 | | | | 154,517,095 | |
Net change in unrealized appreciation (depreciation) on investments | | | 65,714,134 | | | | 84,388,989 | |
| | | | | | | | |
Net increase (decrease) in net assets resulting from operations | | | 171,320,223 | | | | 260,785,824 | |
| | | | | | | | |
| | |
Dividends and Distributions | | | | | | | | |
Dividends from net investment income | | | | | | | | |
Class A | | | (1,850,518 | ) | | | (1,874,765 | ) |
Class C | | | (249,331 | ) | | | (358,790 | ) |
Class R | | | (1,957,064 | ) | | | (2,094,395 | ) |
Class Z | | | (14,533,576 | ) | | | (15,379,742 | ) |
Class R6 | | | (6,343,161 | ) | | | (4,591,944 | ) |
| | | | | | | | |
| | | (24,933,650 | ) | | | (24,299,636 | ) |
| | | | | | | | |
Distributions from net realized gains | | | | | | | | |
Class A | | | (14,227,511 | ) | | | (336,195 | ) |
Class C | | | (4,176,634 | ) | | | (117,214 | ) |
Class R | | | (17,892,947 | ) | | | (438,847 | ) |
Class Z | | | (92,687,961 | ) | | | (2,399,788 | ) |
Class R6 | | | (38,872,105 | ) | | | (692,119 | ) |
| | | | | | | | |
| | | (167,857,158 | ) | | | (3,984,163 | ) |
| | | | | | | | |
| | |
Fund share transactions (Net of share conversions) | | | | | | | | |
Net proceeds from shares sold | | | 289,069,270 | | | | 447,840,846 | |
Net asset value of shares issued in reinvestment of dividends and distributions | | | 191,749,863 | | | | 28,084,999 | |
Cost of shares reacquired | | | (470,769,839 | ) | | | (482,265,511 | ) |
| | | | | | | | |
Net increase (decrease) in net assets from Fund share transactions | | | 10,049,294 | | | | (6,339,666 | ) |
| | | | | | | | |
Total increase (decrease) | | | (11,421,291 | ) | | | 226,162,359 | |
| | |
Net Assets: | | | | | | | | |
Beginning of year | | | 1,586,763,596 | | | | 1,360,601,237 | |
| | | | | | | | |
End of year(a) | | $ | 1,575,342,305 | | | $ | 1,586,763,596 | |
| | | | | | | | |
(a) Includes undistributed/(distributions in excess of) net investment income of: | | $ | 7,552,567 | | | $ | 9,003,992 | |
| | | | | | | | |
See Notes to Financial Statements.
| | | | |
| PGIM QMA Small-Cap Value Fund | | | 35 | |
Notes to Financial Statements
The Target Portfolio Trust (the “Trust”) is registered under the Investment Company Act of 1940, as amended (“1940 Act”), as a diversified open-end management investment company. The Trust currently consists of three series: PGIM Corporate Bond Fund, PGIM Core Bond Fund and PGIM QMA Small-Cap Value Fund. These financial statements relate only to the PGIM QMA Small-Cap Value Fund (the “Fund”). Effective June 11, 2018, the Funds’ name was changed by replacing “Prudential” with “PGIM” and Class Q shares were renamed Class R6 shares.
The investment objective of the Fund is above average capital appreciation.
1. Accounting Policies
The Fund follows investment company accounting and reporting guidance of the Financial Accounting Standards Board (“FASB”) Accounting Standard Codification Topic 946 Financial Services—Investment Companies. The following accounting policies conform to U.S. generally accepted accounting principles. The Fund consistently follows such policies in the preparation of its financial statements.
Securities Valuation: The Fund holds securities and other assets and liabilities that are fair valued at the close of each day (generally, 4:00 PM Eastern time) the New York Stock Exchange (“NYSE”) is open for trading. Fair value is the price that would be received to sell an asset or paid to transfer a liability in an orderly transaction between market participants on the measurement date. The Trust’s Board of Trustees (the “Board”) has adopted valuation procedures for security valuation under which fair valuation responsibilities have been delegated to PGIM Investments LLC (“PGIM Investments” or “the Manager”). Pursuant to the Board’s delegation, a Valuation Committee has been established as two persons, being one or more officers of the Trust, including: the Trust’s Treasurer (or the Treasurer’s direct reports); and the Trust’s Chief or Deputy Chief Compliance Officer (or Vice-President-level direct reports of the Chief or Deputy Chief Compliance Officer). Under the current valuation procedures, the Valuation Committee of the Board is responsible for supervising the valuation of portfolio securities and other assets and liabilities. The valuation procedures permit the Fund to utilize independent pricing vendor services, quotations from market makers, and alternative valuation methods when market quotations are either not readily available or not deemed representative of fair value. A record of the Valuation Committee’s actions is subject to the Board’s review, approval, and ratification at its next regularly scheduled quarterly meeting.
For the fiscal reporting period-end, securities and other assets and liabilities were fair valued at the close of the last U.S. business day. Trading in certain foreign securities may occur when the NYSE is closed (including weekends and holidays). Because such foreign securities trade in markets that are open on weekends and U.S. holidays, the values of some
of the Fund’s foreign investments may change on days when investors cannot purchase or redeem Fund shares.
Various inputs determine how the Fund’s investments are valued, all of which are categorized according to the three broad levels (Level 1, 2, or 3) detailed in the Schedule of Investments.
Common and preferred stocks, exchange-traded funds, and derivative instruments, such as futures or options, that are traded on a national securities exchange are valued at the last sale price as of the close of trading on the applicable exchange where the security principally trades. Securities traded via NASDAQ are valued at the NASDAQ official closing price. To the extent these securities are valued at the last sale price or NASDAQ official closing price, they are classified as Level 1 in the fair value hierarchy. In the event that no sale or official closing price on valuation date exists, these securities are generally valued at the mean between the last reported bid and ask prices, or at the last bid price in the absence of an ask price. These securities are classified as Level 2 in the fair value hierarchy.
Investments in open-end, non-exchange-traded mutual funds are valued at their net asset values as of the close of the NYSE on the date of valuation. These securities are classified as Level 1 in the fair value hierarchy since they may be purchased or sold at their net asset values on the date of valuation.
Securities and other assets that cannot be priced according to the methods described above are valued based on pricing methodologies approved by the Board. In the event that unobservable inputs are used when determining such valuations, the securities will be classified as Level 3 in the fair value hierarchy.
When determining the fair value of securities, some of the factors influencing the valuation include: the nature of any restrictions on disposition of the securities; assessment of the general liquidity of the securities; the issuer’s financial condition and the markets in which it does business; the cost of the investment; the size of the holding and the capitalization of the issuer; the prices of any recent transactions or bids/offers for such securities or any comparable securities; any available analyst media or other reports or information deemed reliable by the Manager regarding the issuer or the markets or industry in which it operates. Using fair value to price securities may result in a value that is different from a security’s most recent closing price and from the price used by other unaffiliated mutual funds to calculate their net asset values.
Restricted and Illiquid Securities: Subject to guidelines adopted by the Board, the Fund may invest up to 15% of its net assets in illiquid securities, including those which are restricted as to disposition under securities law (“restricted securities”). Restricted securities are valued pursuant to the valuation procedures noted above. Illiquid securities are those that, because of the absence of a readily available market or due to legal or contractual restrictions on resale, cannot be sold within seven days in the ordinary course of business at approximately the amount at which the Fund has valued the investment. Therefore, the
| | | | |
| PGIM QMA Small-Cap Value Fund | | | 37 | |
Notes to Financial Statements (continued)
Fund may find it difficult to sell illiquid securities at the time considered most advantageous by its Subadviser and may incur transaction costs that would not be incurred in the sale of securities that were freely marketable. Certain securities that would otherwise be considered illiquid because of legal restrictions on resale to the general public may be traded among qualified institutional buyers under Rule 144A of the Securities Act of 1933. These Rule 144A securities, as well as commercial paper that is sold in private placements under Section 4(2) of the Securities Act, may be deemed liquid by the Fund’s Subadviser under the guidelines adopted by the Trustees of the Trust. However, the liquidity of the Fund’s investments in Rule 144A securities could be impaired if trading does not develop or declines.
Master Netting Arrangements: The Trust, on behalf of the Fund, is subject to various Master Agreements, or netting arrangements, with select counterparties. These are agreements which a subadviser may have negotiated and entered into on behalf of the Fund. A master netting arrangement between the Fund and the counterparty permits the Fund to offset amounts payable by the Fund to the same counterparty against amounts to be received; and by the receipt of collateral from the counterparty by the Fund to cover the Fund’s exposure to the counterparty. However, there is no assurance that such mitigating factors are easily enforceable. In addition to master netting arrangements, the right to set-off exists when all the conditions are met such that each of the parties owes the other determinable amounts, the reporting party has the right to set-off the amount owed with the amount owed by the other party, the reporting party intends to set-off and the right of set-off is enforceable by law. During the reporting period, there was no intention to settle on a net basis and all amounts are presented on a gross basis on the Statement of Assets and Liabilities.
Securities Lending: The Fund may lend its portfolio securities to banks and broker-dealers. The loans are secured by collateral at least equal to the market value of the securities loaned. Collateral pledged by each borrower is invested in an affiliated money market fund and is marked to market daily, based on the previous day’s market value, such that the value of the collateral exceeds the value of the loaned securities. In the event of significant appreciation in value of securities on loan on the last business day of the reporting period, the financial statements may reflect a collateral value that is less than the market value of the loaned securities. Such shortfall is remedied as described above. Loans are subject to termination at the option of the borrower or the Fund. Upon termination of the loan, the borrower will return to the Fund securities identical to the loaned securities. Should the borrower of the securities fail financially, the Fund has the right to repurchase the securities in the open market using the collateral. The Fund recognizes income, net of any rebate and securities lending agent fees, for lending its securities in the form of fees or interest on the investment of any cash received as collateral. The borrower receives all interest and dividends from the securities loaned and such payments are passed back to the lender in amounts equivalent thereto. The Fund also continues to recognize any unrealized gain (loss)
in the market price of the securities loaned and on the change in the value of the collateral invested that may occur during the term of the loan. In addition, realized gain (loss) is recognized on changes in the value of the collateral invested upon liquidation of the collateral. Net earnings from securities lending are disclosed on the Statement of Operations as “Income from securities lending, net”.
Equity and Mortgage Real Estate Investment Trusts (REITs): The Fund invests in equity REITs, which report information on the source of their distributions annually. Based on current and historical information, a portion of distributions received from equity REITs during the period is estimated to be dividend income, capital gain or return of capital and recorded accordingly. When material, these estimates are adjusted periodically when the actual source of distributions is disclosed by the equity REITs.
Securities Transactions and Net Investment Income: Securities transactions are recorded on the trade date. Realized gains (losses) from investment and currency transactions are calculated on the specific identification method. Dividend income is recorded on the ex-date. Expenses are recorded on an accrual basis, which may require the use of certain estimates by management that may differ from actual. Net investment income or loss (other than class specific expenses and waivers, which are allocated as noted below) and unrealized and realized gains (losses) are allocated daily to each class of shares based upon the relative proportion of adjusted net assets of each class at the beginning of the day.
Class specific expenses and waivers, where applicable, are charged to the respective share classes. Class specific expenses include distribution fees and distribution fee waivers, shareholder servicing fee, transfer agent’s fees and expenses, registration fees and fee waivers and/or expense reimbursements, as applicable.
Taxes: It is the Fund’s policy to continue to meet the requirements of the Internal Revenue Code applicable to regulated investment companies and to distribute all of its taxable net investment income and capital gains, if any, to its shareholders. Therefore, no federal income tax provision is required. Withholding taxes on foreign dividends, interest and capital gains, if any, are recorded, net of reclaimable amounts, at the time the related income is earned.
Dividends and Distributions: The Fund expects to pay dividends from net investment income and distributions from net realized capital gains, if any, annually. Dividends and distributions to shareholders, which are determined in accordance with federal income tax regulations and which may differ from generally accepted accounting principles, are recorded on the ex-date. Permanent book/tax differences relating to income and gain (loss) are reclassified amongst undistributed net investment income, accumulated net realized gain (loss) and paid-in capital in excess of par, as appropriate.
Estimates: The preparation of financial statements requires management to make estimates and assumptions that affect the reported amounts and disclosures in the financial statements. Actual results could differ from those estimates.
| | | | |
| PGIM QMA Small-Cap Value Fund | | | 39 | |
Notes to Financial Statements (continued)
2. Agreements
The Trust, on behalf of the Fund, has a management agreement with PGIM Investments. Pursuant to this agreement, PGIM Investments has responsibility for all investment advisory services and supervises the Subadviser’s performance of such services. In addition, under the management agreement, PGIM Investments provides all of the administrative functions necessary for the organization, operation and management of the Fund. PGIM Investments administers the corporate affairs of the Fund and, in connection therewith, furnishes the Fund with office facilities, together with those ordinary clerical and bookkeeping services which are not being furnished by, the Fund’s custodian (the Custodian), and the Fund’s transfer agent. PGIM Investments is also responsible for the staffing and management of dedicated groups of legal, marketing, compliance and related personnel necessary for the operation of the Fund. The legal, marketing, compliance and related personnel are also responsible for the management and oversight of the various service providers to the Fund, including, but not limited to, the custodian, transfer agent, and accounting agent.
PGIM Investments has entered into a subadvisory agreement with Quantitative Management Associates, LLC (“QMA”). The subadvisory agreement provides that QMA will furnish investment advisory services in connection with the management of the Fund. In connection therewith, QMA is obligated to keep certain books and records of the Fund. PGIM Investments pays for the services of QMA, the cost of compensation of officers of the Fund, occupancy and certain clerical and bookkeeping costs of the Fund. The Fund bears all other costs and expenses.
The management fee paid to PGIM Investments is accrued daily and payable monthly, at an annual rate of 0.60% of the Fund’s average daily net assets up to $2 billion and 0.575% of the Fund’s average daily net assets in excess of $2 billion. The effective management fee rate before any waivers and/or expense reimbursements, was 0.60% for the year ended July 31, 2018.
PGIM Investments LLC has contractually agreed to waive fees payable to PGIM Investments by the Fund in an amount up to 0.01% of the Fund’s average daily net assets through November 30, 2019, to the extent that the Fund’s net annual operating expenses and acquired fund fees and expenses (exclusive of taxes, interest, distribution and service (12b-1) fees and certain extraordinary expenses) exceed 0.68% of the Fund’s average daily net assets on an annualized basis. Separately, PGIM Investments has contractually agreed, through November 30, 2019, to limit transfer agency, shareholder servicing, sub-transfer agency, and blue sky fees, as applicable, to the extent that such fees cause the Total Annual Fund Operating Expenses to exceed 1.14% of average daily net assets for Class R2 shares or 0.89% of average daily net assets for Class R4 shares. This contractual expense limitation excludes interest, brokerage, taxes (such as income and foreign withholding taxes, stamp duty and deferred tax expenses), acquired fund fees and expenses, extraordinary expenses,
and certain other Fund expenses such as dividend and interest expense and broker charges on short sales. Where applicable, PGIM Investments agrees to waive management fees or shared operating expenses on any share class to the same extent that it waives similar expenses on any other share class. In addition, Total Annual Fund Operating Expenses for Class R6 shares will not exceed Total Annual Fund Operating Expenses for Class Z shares. Fees and/or expenses waived and/or reimbursed by PGIM Investments may be recouped by PGIM Investments within the same fiscal year during which such waiver and/or reimbursement is made if such recoupment can be realized without exceeding the expense limit in effect at the time of the recoupment for that fiscal year.
The Trust, on behalf of the Fund, has a distribution agreement with Prudential Investment Management Services LLC (“PIMS”) which acts as the distributor of the Class A, Class C, Class R, Class Z, Class R2, Class R4 and Class R6 shares of the Fund. The Fund compensates PIMS for distributing and servicing the Fund’s Class A, Class C, Class R and Class R2 shares, pursuant to the plans of distribution (the “Distribution Plans”), regardless of expenses actually incurred by PIMS. The distribution fees are accrued daily and payable monthly. No distribution or service fees are paid to PIMS as distributor of the Class Z, Class R4 and Class R6 shares of the Fund.
Pursuant to the Distribution Plans, the Fund compensates PIMS for distribution-related activities at an annual rate of up to 0.30%, 1%, 0.75 and 0.25% of the average daily net assets of the Class A, Class C, Class R and Class R2 shares, respectively. PIMS has contractually agreed through November 30, 2019 to reduce such fees to 0.25% and 0.50% of the average daily net assets of the Class A and Class R shares, respectively.
The Fund has adopted a Shareholder Services Plan with respect to Class R2 and Class R4 shares. Under the terms of the Shareholder Services Plan, Class R2 and Class R4 shares are authorized to pay to Prudential Mutual Fund Services LLC (“PMFS”), its affiliates or third-party service providers, as compensation for services rendered to the shareholders of such Class R2 and R4 shares, a shareholder service fee at an annual rate of 0.10% of the average daily net assets attributable to Class R2 and Class R4 shares. The shareholder service fee is accrued daily and paid monthly.
PIMS has advised the Fund that it has received $79,196 in front-end sales charges resulting from sales of Class A shares during the year ended July 31, 2018. From these fees, PIMS paid such sales charges to broker-dealers, which in turn paid commissions to sales persons and incurred other distribution costs. PIMS has advised the Fund that for the year ended July 31, 2018, it received $244 and $1,086 in contingent deferred sales charges imposed upon redemptions by certain Class A and Class C shareholders, respectively.
PGIM, Inc., PGIM Investments, PIMS and QMA are indirect, wholly-owned subsidiaries of Prudential Financial, Inc. (“Prudential”).
| | | | |
| PGIM QMA Small-Cap Value Fund | | | 41 | |
Notes to Financial Statements (continued)
3. Other Transactions with Affiliates
Prudential Mutual Fund Services LLC (“PMFS”), an affiliate of PGIM Investments and an indirect, wholly-owned subsidiary of Prudential, serves as the Fund’s transfer agent. Transfer agent’s fees and expenses in the Statement of Operations include certain out-of-pocket expenses paid to non-affiliates, where applicable.
The Fund may enter into certain securities purchase or sale transactions under Board approved Rule 17a-7 procedures. Rule 17a-7 is an exemptive rule under the 1940 Act, that permits purchase and sale transactions among affiliated investment companies, or between an investment company and a person that is affiliated solely by reason of having a common (or affiliated) investment adviser, common directors, and/or common officers. Such transactions are subject to ratification by the Board. For the reporting period ended July 31, 2018 no such transactions were entered into by the Fund.
The Fund may invest its overnight sweep cash in the PGIM Core Ultra Short Bond Fund (the “Core Fund”), and its securities lending cash collateral in the PGIM Institutional Money Market Fund (the “Money Market Fund”), each a series of Prudential Investment Portfolios 2, registered under the 1940 Act and managed by PGIM Investments. For the reporting period ended July 31, 2018, PGIM, Inc. was compensated $283,563 by PGIM Investments for managing the Fund’s securities lending cash collateral as subadviser to the Money Market Fund. Earnings from the Core Fund and Money Market Fund are disclosed on the Statement of Operations as “Affiliated dividend income” and “Income from securities lending, net”, respectively.
4. Portfolio Securities
The aggregate cost of purchases and proceeds from sales of portfolio securities (excluding short-term investments and U.S. Government securities) for the year ended July 31, 2018, were $1,082,766,773 and $1,235,158,246, respectively.
A summary of the cost of purchases and proceeds from sales of shares of affiliated mutual funds for the year ended July 31, 2018, is presented as follows:
| | | | | | | | | | | | | | | | | | | | | | | | | | | | | | | | |
Affiliated
Mutual Funds* | | Value,
Beginning
of Year | | | Cost of
Purchases | | | Proceeds
from Sales | | | Change in
Unrealized
Gain
(Loss) | | | Realized
Gain
(Loss) | | | Value,
End of
Year | | | Shares,
End of
Year | | | Dividend
Income | |
PGIM Core Ultra Short Bond Fund | | $ | 7,537,319 | | | $ | 145,474,711 | | | $ | 145,465,823 | | | $ | — | | | $ | — | | | $ | 7,546,207 | | | | 7,546,207 | | | $ | 66,285 | |
PGIM Institutional Money Market Fund | | | 146,630,682 | | | | 1,513,085,130 | | | | 1,639,734,531 | | | | (3,527 | ) | | | 9,134 | | | | 19,986,888 | | | | 19,984,889 | | | | 562,325 | ** |
| | | | | | | | | | | | | | | | | | | | | | | | | | | | | | | | |
| | $ | 154,168,001 | | | $ | 1,658,559,841 | | | $ | 1,785,200,354 | | | $ | (3,527 | ) | | $ | 9,134 | | | $ | 27,533,095 | | | | | | | $ | 628,610 | |
| | | | | | | | | | | | | | | | | | | | | | | | | | | | | | | | |
| * | The Fund did not have any capital gain distributions during the reporting period. |
| ** | This amount is included in “Income from securities lending, net” on the Statement of Operations. |
5. Tax Information
The Fund has a tax year end of October 31st.
Distributions to shareholders, which are determined in accordance with federal income tax regulations and which may differ from generally accepted accounting principles, are recorded on the ex-date. In order to present undistributed net investment income, accumulated net realized gain on investment transactions and paid-in capital in excess of par on the Statement of Assets and Liabilities that more closely represent their tax character, certain adjustments have been made to undistributed net investment income and accumulated net realized gain on investment transactions. For the tax year ended October 31, 2017, the adjustments were to increase undistributed net investment income and decrease accumulated net realized gain on investment transactions by $2,246 due to investments in passive foreign investment companies. Net investment income, net realized gain (loss) on investment transactions and net assets were not affected by this change.
The tax character of distributions paid during the tax year ended October 31, 2017 was $28,283,799 of ordinary income. The tax character of distributions paid during the tax year ended October 31, 2016 were $51,248,554 of ordinary income and $348,375,656 of long-term capital gains.
| | | | |
| PGIM QMA Small-Cap Value Fund | | | 43 | |
Notes to Financial Statements (continued)
As of the latest tax year ended October 31, 2017, the accumulated undistributed earnings on a tax basis were $69,809,159 of ordinary income and $115,479,678 of long-term capital gains.
The United States federal income tax basis of the Fund’s investments and the net unrealized appreciation as of July 31, 2018 were as follows:
| | | | | | |
Tax Basis | | Gross
Unrealized
Appreciation | | Gross
Unrealized
Depreciation | | Net
Unrealized
Appreciation |
| $1,370,322,595 | | $280,658,280 | | $(52,556,530) | | $228,101,750 |
The differences between book basis and tax basis were primarily attributable to deferred losses on wash sales, investment in passive foreign investment companies and other book to tax differences.
Management has analyzed the Fund’s tax positions taken on federal, state and local income tax returns for all open tax years and has concluded that no provision for income tax is required in the Fund’s financial statements for the current reporting period. The Fund’s federal, state and local income and federal excise tax returns for tax years for which the applicable statutes of limitations have not expired are subject to examination by the Internal Revenue Service and state departments of revenue.
6. Capital and Ownership
The Fund offers Class A, Class C, Class R, Class Z, Class R2, Class R4 and Class R6 shares. Class A shares are sold with a maximum front-end sales charge of 5.50%. Investors who purchase $1 million or more of Class A shares and sell these shares within 12 months of purchase are subject to a contingent deferred sales charge (“CDSC”) of 1%, although they are not subject to an initial sales charge. The Class A CDSC is waived for certain retirement and/or benefit plans. A special exchange privilege is also available for shareholders who qualified to purchase Class A shares at net asset value. Class C shares are sold with a CDSC of 1% on sales made within 12 months of purchase. Class R shares are available to certain retirement plans, clearing and settlement firms. Class R, Class Z, Class R2, Class R4, and Class R6 shares are not subject to any sales or redemption charge and are offered exclusively for sale to a limited group of investors.
The Trust has authorized an unlimited number of shares of beneficial interest at $0.001 par value per share.
Under certain circumstances, an exchange may be made from specified share classes of the Fund to one or more other share classes of the Fund as presented in the table of transactions in shares of beneficial interest.
As of July 31, 2018, Prudential, through its affiliate entities, including affiliated funds (if applicable), owned 489 Class R2, 489 Class R4 and 374,522 Class R6 shares of the Fund. At reporting period end, four shareholders of record held 42% of the Fund’s outstanding shares on behalf of multiple beneficial owners, of which 8% were held by an affiliate of Prudential.
Transactions in shares of beneficial interest were as follows:
| | | | | | | | |
Class A | | Shares | | | Amount | |
Year ended July 31, 2018: | | | | | | | | |
Shares sold | | | 609,750 | | | $ | 12,628,799 | |
Shares issued in reinvestment of dividends and distributions | | | 774,075 | | | | 15,574,392 | |
Shares reacquired | | | (1,109,257 | ) | | | (22,985,716 | ) |
| | | | | | | | |
Net increase (decrease) in shares outstanding before conversion | | | 274,568 | | | | 5,217,475 | |
Shares issued upon conversion from other share class(es) | | | 123,984 | | | | 2,622,003 | |
Shares reacquired upon conversion into other share class(es) | | | (96,834 | ) | | | (1,987,831 | ) |
| | | | | | | | |
Net increase (decrease) in shares outstanding | | | 301,718 | | | $ | 5,851,647 | |
| | | | | | | | |
Year ended July 31, 2017: | | | | | | | | |
Shares sold | | | 1,045,987 | | | $ | 21,956,239 | |
Shares issued in reinvestment of dividends and distributions | | | 97,123 | | | | 2,122,116 | |
Shares reacquired | | | (1,355,866 | ) | | | (27,710,814 | ) |
| | | | | | | | |
Net increase (decrease) in shares outstanding before conversion | | | (212,756 | ) | | | (3,632,459 | ) |
Shares issued upon conversion from other share class(es) | | | 102,329 | | | | 2,130,933 | |
Shares reacquired upon conversion into other share class(es) | | | (119,721 | ) | | | (2,567,682 | ) |
| | | | | | | | |
Net increase (decrease) in shares outstanding | | | (230,148 | ) | | $ | (4,069,208 | ) |
| | | | | | | | |
Class C | | | | | | |
Year ended July 31, 2018: | | | | | | | | |
Shares sold | | | 175,315 | | | $ | 3,644,251 | |
Shares issued in reinvestment of dividends and distributions | | | 215,029 | | | | 4,345,731 | |
Shares reacquired | | | (475,865 | ) | | | (9,923,324 | ) |
| | | | | | | | |
Net increase (decrease) in shares outstanding before conversion | | | (85,521 | ) | | | (1,933,342 | ) |
Shares reacquired upon conversion into other share class(es) | | | (63,972 | ) | | | (1,322,968 | ) |
| | | | | | | | |
Net increase (decrease) in shares outstanding | | | (149,493 | ) | | $ | (3,256,310 | ) |
| | | | | | | | |
Year ended July 31, 2017: | | | | | | | | |
Shares sold | | | 923,353 | | | $ | 18,051,418 | |
Shares issued in reinvestment of dividends and distributions | | | 20,007 | | | | 439,154 | |
Shares reacquired | | | (563,729 | ) | | | (11,832,910 | ) |
| | | | | | | | |
Net increase (decrease) in shares outstanding before conversion | | | 379,631 | | | | 6,657,662 | |
Shares reacquired upon conversion into other share class(es) | | | (145,662 | ) | | | (3,049,402 | ) |
| | | | | | | | |
Net increase (decrease) in shares outstanding | | | 233,969 | | | $ | 3,608,260 | |
| | | | | | | | |
| | | | |
| PGIM QMA Small-Cap Value Fund | | | 45 | |
Notes to Financial Statements (continued)
| | | | | | | | |
Class R | | Shares | | | Amount | |
Year ended July 31, 2018: | | | | | | | | |
Shares sold | | | 1,006,458 | | | $ | 20,163,276 | |
Shares issued in reinvestment of dividends and distributions | | | 998,994 | | | | 19,850,011 | |
Shares reacquired | | | (1,927,915 | ) | | | (39,388,781 | ) |
| | | | | | | | |
Net increase (decrease) in shares outstanding | | | 77,537 | | | $ | 624,506 | |
| | | | | | | | |
Year ended July 31, 2017: | | | | | | | | |
Shares sold | | | 2,303,406 | | | $ | 47,413,620 | |
Shares issued in reinvestment of dividends and distributions | | | 117,171 | | | | 2,533,242 | |
Shares reacquired | | | (3,113,826 | ) | | | (64,071,727 | ) |
| | | | | | | | |
Net increase (decrease) in shares outstanding | | | (693,249 | ) | | $ | (14,124,865 | ) |
| | | | | | | | |
Class Z | | | | | | |
Year ended July 31, 2018: | | | | | | | | |
Shares sold | | | 6,916,540 | | | $ | 144,318,377 | |
Shares issued in reinvestment of dividends and distributions | | | 5,320,753 | | | | 106,787,513 | |
Shares reacquired | | | (15,779,927 | ) | | | (326,819,846 | ) |
| | | | | | | | |
Net increase (decrease) in shares outstanding before conversion | | | (3,542,634 | ) | | | (75,713,956 | ) |
Shares issued upon conversion from other share class(es) | | | 144,337 | | | | 2,963,061 | |
Shares reacquired upon conversion into other share class(es) | | | (3,258,846 | ) | | | (71,723,534 | ) |
| | | | | | | | |
Net increase (decrease) in shares outstanding | | | (6,657,143 | ) | | $ | (144,474,429 | ) |
| | | | | | | | |
Year ended July 31, 2017: | | | | | | | | |
Shares sold | | | 13,360,300 | | | $ | 281,484,230 | |
Shares issued in reinvestment of dividends and distributions | | | 812,818 | | | | 17,727,562 | |
Shares reacquired | | | (14,028,222 | ) | | | (290,265,735 | ) |
| | | | | | | | |
Net increase (decrease) in shares outstanding before conversion | | | 144,896 | | | | 8,946,057 | |
Shares issued upon conversion from other share class(es) | | | 162,008 | | | | 3,454,904 | |
Shares reacquired upon conversion into other share class(es) | | | (828 | ) | | | (17,637 | ) |
| | | | | | | | |
Net increase (decrease) in shares outstanding | | | 306,076 | | | $ | 12,383,324 | |
| | | | | | | | |
Class R2* | | | | | | |
Period ended July 31, 2018: | | | | | | | | |
Shares sold | | | 883 | | | $ | 17,555 | |
Shares reacquired | | | — | | | | (4 | ) |
| | | | | | | | |
Net increase (decrease) in shares outstanding | | | 883 | | | $ | 17,551 | |
| | | | | | | | |
Class R4* | | | | | | |
Period ended July 31, 2018: | | | | | | | | |
Shares sold | | | 489 | | | $ | 10,000 | |
| | | | | | | | |
Net increase (decrease) in shares outstanding | | | 489 | | | $ | 10,000 | |
| | | | | | | | |
| | | | | | | | |
Class R6 | | Shares | | | Amount | |
Year ended July 31, 2018: | | | | | | | | |
Shares sold | | | 5,231,548 | | | $ | 108,287,012 | |
Shares issued in reinvestment of dividends and distributions | | | 2,249,488 | | | | 45,192,216 | |
Shares reacquired | | | (3,440,933 | ) | | | (71,652,168 | ) |
| | | | | | | | |
Net increase (decrease) in shares outstanding before conversion | | | 4,040,103 | | | | 81,827,060 | |
Shares issued upon conversion from other share class(es) | | | 3,148,656 | | | | 69,449,269 | |
| | | | | | | | |
Net increase (decrease) in shares outstanding | | | 7,188,759 | | | $ | 151,276,329 | |
| | | | | | | | |
Year ended July 31, 2017: | | | | | | | | |
Shares sold | | | 3,800,437 | | | $ | 78,935,339 | |
Shares issued in reinvestment of dividends and distributions | | | 241,197 | | | | 5,262,925 | |
Shares reacquired | | | (4,219,698 | ) | | | (88,384,325 | ) |
| | | | | | | | |
Net increase (decrease) in shares outstanding before conversion | | | (178,064 | ) | | | (4,186,061 | ) |
Shares issued upon conversion from other share class(es) | | | 2,269 | | | | 48,884 | |
| | | | | | | | |
Net increase (decrease) in shares outstanding | | | (175,795 | ) | | $ | (4,137,177 | ) |
| | | | | | | | |
| * | Commencement of offering was December 28, 2017. |
7. Borrowings
The Trust, on behalf of the Fund, along with other affiliated registered investment companies (the “Funds”), is a party to a Syndicated Credit Agreement (“SCA”) with a group of banks. The purpose of the SCA is to provide an alternative source of temporary funding for capital share redemptions. The SCA provides for a commitment of $900 million for the period October 5, 2017 through October 4, 2018. The Funds pay an annualized commitment fee of 0.15% of the unused portion of the SCA. The Fund’s portion of the commitment fee for the unused amount, allocated based upon a method approved by the Board, is accrued daily and paid quarterly. Prior to October 5, 2017, the Funds had another SCA that provided a commitment of $900 million and the Funds paid an annualized commitment fee of 0.15% of the unused portion of the SCA. The interest on borrowings under the SCAs is paid monthly and at a per annum interest rate based upon a contractual spread plus the higher of (1) the effective federal funds rate, (2) the 1-month LIBOR rate or (3) zero percent.
Other affiliated registered investment companies that are parties to the SCA include portfolios that are subject to a predetermined mathematical formula used to manage certain benefit guarantees offered under variable annuity contracts. The formula may result in large scale asset flows into and out of these portfolios. Consequently, these portfolios may be more likely to utilize the SCA for purposes of funding redemptions. It may be possible for those portfolios to fully exhaust the committed amount of the SCA, thereby requiring the Manager to allocate available funding per a Board-approved methodology designed to treat the Funds in the SCA equitably.
The Fund utilized the SCA during the reporting period ended July 31, 2018. The average daily balance for the 36 days that the Fund had loans outstanding during the period was $5,575,389, borrowed at a weighted average interest rate of 2.52%. The maximum loan balance outstanding during the period was $35,234,000. At July 31, 2018, the Fund did not have an outstanding loan balance.
| | | | |
| PGIM QMA Small-Cap Value Fund | | | 47 | |
Notes to Financial Statements (continued)
8. Other Risks
The Fund’s risks include, but are not limited to, the risks discussed below:
Counterparty Risk: For the one year period beginning July 25, 2017 through July 24, 2018, the Fund entered into an exclusive securities lending arrangement with a single counterparty (ie the borrower) as the sole counterparty to the Fund’s portfolio for its securities lending activity. If the borrower defaults, the loaned securities may fail to be returned to the Fund. However, this risk is mitigated since the market value of the securities on loan are fully collateralized. Furthermore, the Fund’s securities lending agent indemnified the Fund against default by the borrower.
Risks of Investing in Real Estate Investment Trusts (REITs): Real estate securities are subject to similar risks as direct investments in real estate and mortgages, and their value will depend on the value of the underlying properties or the underlying loans or interests. The underlying loans may be subject to the risks of default or of payments that occur earlier or later than expected, and such loans may also include so-called “subprime” mortgages. The value of these securities will rise and fall in response to many factors, Including economic conditions, the demand for rental property and interest rates. In particular, the value of these securities may decline when interest rates rise and will also be affected by the real estate market and by the management of the underlying properties.
In addition, investing in REITs involves certain unique risks in addition to those risks associated with investing in the real estate industry in general. Equity REITs may be affected by changes in the value of the underlying property owned by the REITs, while mortgage REITs may be affected by the quality of any credit extended. REITs are dependent upon management skills, may not be diversified geographically or by property/mortgage asset type, and are subject to heavy cash flow dependency, default by borrowers and self-liquidation. Since REITs are relatively smaller in size when compared to the broader market, and smaller companies tend to be more volatile than larger companies, they may be more volatile and/or more illiquid than other types of equity securities. REITs (especially mortgage REITs) are subject to interest rate risks. REITs may incur significant amounts of leverage. The Portfolio will indirectly bear a portion of the expenses, including management fees, paid by each REIT in which it invests, in addition to the expenses of the Portfolio.
Liquidity Risk: The Fund may invest in instruments that trade in lower volumes and are less liquid than other investments. Liquidity risk includes the risk that the Fund may make investments that may become less liquid in response to market developments or adverse investor perceptions. Investments that are illiquid or that trade in lower volumes may be more difficult to value. When there is no willing buyer and investments cannot be readily sold at the desired time or price, the Fund may have to accept a lower price or may not be
able to sell the instrument at all. An inability to sell a portfolio position can adversely affect the Fund’s value or prevent the Fund from being able to take advantage of other investment opportunities.
Market and Credit Risk: Securities markets may be volatile and the market prices of the Fund’s securities may decline. Securities fluctuate in price based on changes in an issuer’s financial condition and overall market and economic conditions. If the market prices of the securities owned by the Fund fall, the value of an investment in the Fund will decline. Additionally, the Fund may also be exposed to credit risk in the event that an issuer or guarantor fails to perform or that an institution or entity with which the Fund has unsettled or open transactions defaults.
| | | | |
| PGIM QMA Small-Cap Value Fund | | | 49 | |
Financial Highlights
| | | | | | | | | | | | | | | | | | | | | | | | |
| Class A Shares | | | | | | | | | | | | | | | | | | |
| | | Year Ended July 31, | | | | | | February 14,
2014(a) through July 31, | |
| | | 2018 | | | 2017 | | | 2016 | | | 2015 | | | | | | 2014(b) | |
| Per Share Operating Performance(c): | | | | | | | | | | | | | | | | | | | | | | | | |
| Net Asset Value, Beginning of Period | | | $21.32 | | | | $18.16 | | | | $25.21 | | | | $26.70 | | | | | | | | $26.26 | |
| Income (loss) from investment operations: | | | | | | | | | | | | | | | | | | | | | | | | |
| Net investment income (loss) | | | 0.26 | | | | 0.26 | | | | 0.32 | | | | 0.46 | | | | | | | | 0.09 | |
| Net realized and unrealized gain (loss) on investment and foreign currency transactions | | | 2.04 | | | | 3.25 | | | | (0.07 | ) | | | 0.78 | | | | | | | | 0.35 | |
| Total from investment operations: | | | 2.30 | | | | 3.51 | | | | 0.25 | | | | 1.24 | | | | | | | | 0.44 | |
| Less Dividends and Distributions: | | | | | | | | | | | | | | | | | | | | | | | | |
| Dividends from net investment income | | | (0.31 | ) | | | (0.30 | ) | | | (0.55 | ) | | | (0.19 | ) | | | | | | | - | |
| Distributions from net realized gains | | | (2.36 | ) | | | (0.05 | ) | | | (6.75 | ) | | | (2.54 | ) | | | | | | | - | |
| Total dividends and distributions | | | (2.67 | ) | | | (0.35 | ) | | | (7.30 | ) | | | (2.73 | ) | | | | | | | - | |
| Net asset value, end of period | | | $20.95 | | | | $21.32 | | | | $18.16 | | | | $25.21 | | | | | | | | $26.70 | |
| Total Return(d): | | | 11.31% | | | | 19.29% | | | | 3.98% | | | | 4.53% | | | | | | | | 1.68% | |
| |
| Ratios/Supplemental Data: | |
| Net assets, end of period (000) | | | $136,533 | | | | $132,512 | | | | $116,997 | | | | $138,855 | | | | | | | | $13 | |
| Average net assets (000) | | | $133,270 | | | | $129,902 | | | | $121,788 | | | | $16,282 | | | | | | | | $12 | |
| Ratios to average net assets(e): | | | | | | | | | | | | | | | | | | | | | | | | |
| Expenses after waivers and/or expense reimbursement | | | 1.02% | | | | 0.96% | | | | 0.98% | | | | 1.14% | | | | | | | | 0.93% | (f) |
| Expenses before waivers and/or expense reimbursement | | | 1.08% | (g) | | | 1.02% | | | | 1.04% | | | | 1.20% | | | | | | | | 0.98% | (f) |
| Net investment income (loss) | | | 1.27% | | | | 1.27% | | | | 1.67% | | | | 1.76% | | | | | | | | 0.74% | (f) |
| Portfolio turnover rate(h) | | | 70% | | | | 95% | | | | 72% | | | | 111% | | | | | | | | 42% | (i) |
| (a) | Commencement of operations. |
| (b) | For the period ended July 31, 2014. The Trust changed its fiscal year end from October 31 to July 31, effective July 31, 2014. |
| (c) | Calculated based on average shares outstanding during the period. |
| (d) | Total return does not consider the effects of sales loads. Total return is calculated assuming a purchase of a share on the first day and a sale on the last day of each period reported and includes reinvestment of dividends and distributions, if any. Total returns may reflect adjustments to conform to generally accepted accounting principles. Total returns for periods less than one full year are not annualized. |
| (e) | Does not include expenses of the underlying funds in which the Fund invests. |
| (g) | Effective August 1, 2017, class specific expenses include Transfer Agent Fees and expenses and Registration Fees, which are charged to their respective share class. |
| (h) | The Fund’s portfolio turnover rate is calculated in accordance with regulatory requirements, without regard to transactions involving short term investments and certain derivatives. If such transactions were included, the Fund’s portfolio turnover rate may be higher. |
See Notes to Financial Statements.
| | | | | | | | | | | | | | | | | | | | |
| Class C Shares | | | | | | | | | | | | | | | |
| | | Year Ended July 31, | | | | | | June 19,
2015(a) through
July 31, | |
| | | 2018 | | | 2017 | | | 2016 | | | 2015 | |
| Per Share Operating Performance(b): | | | | | | | | | | | | | | | | | |
| Net Asset Value, Beginning of Period | | | $21.32 | | | | $18.18 | | | | $25.19 | | | | | | | | $26.36 | |
| Income (loss) from investment operations: | | | | | | | | | |
| Net investment income (loss) | | | 0.10 | | | | 0.10 | | | | 0.17 | | | | | | | | 0.02 | |
| Net realized and unrealized gain (loss) on investment and foreign currency transactions | | | 2.03 | | | | 3.26 | | | | (0.06 | ) | | | | | | | (1.19 | ) |
| Total from investment operations: | | | 2.13 | | | | 3.36 | | | | 0.11 | | | | | | | | (1.17 | ) |
| Less Dividends and Distributions: | | | | | | | | | | | | | | | | | |
| Dividends from net investment income | | | (0.14 | ) | | | (0.17 | ) | | | (0.37 | ) | | | | | | | - | |
| Distributions from net realized gains | | | (2.36 | ) | | | (0.05 | ) | | | (6.75 | ) | | | | | | | - | |
| Total dividends and distributions | | | (2.50 | ) | | | (0.22 | ) | | | (7.12 | ) | | | | | | | - | |
| Net asset value, end of period | | | $20.95 | | | | $21.32 | | | | $18.18 | | | | | | | | $25.19 | |
| Total Return(c): | | | 10.44% | | | | 18.43% | | | | 3.19% | | | | | | | | (4.44)% | |
| |
| Ratios/Supplemental Data: | |
| Net assets, end of period (000) | | | $36,638 | | | | $40,476 | | | | $30,257 | | | | | | | | $35,293 | |
| Average net assets (000) | | | $38,734 | | | | $41,745 | | | | $30,498 | | | | | | | | $33,702 | |
| Ratios to average net assets(d): | | | | | | | | | | | | | | | | | |
| Expenses after waivers and/or expense reimbursement | | | 1.81% | | | | 1.71% | | | | 1.73% | | | | | | | | 1.90% | (e) |
| Expenses before waivers and/or expense reimbursement | | | 1.82% | (f) | | | 1.72% | | | | 1.74% | | | | | | | | 1.91% | (e) |
| Net investment income (loss) | | | 0.49% | | | | 0.49% | | | | 0.92% | | | | | | | | 0.75% | (e) |
| Portfolio turnover rate(g) | | | 70% | | | | 95% | | | | 72% | | | | | | | | 111% | (h) |
| (a) | Commencement of operations. |
| (b) | Calculated based on average shares outstanding during the period. |
| (c) | Total return does not consider the effects of sales loads. Total return is calculated assuming a purchase of a share on the first day and a sale on the last day of each period reported and includes reinvestment of dividends and distributions, if any. Total returns may reflect adjustments to conform to generally accepted accounting principles. Total returns for periods less than one full year are not annualized. |
| (d) | Does not include expenses of the underlying funds in which the Fund invests. |
| (f) | Effective August 1, 2017, class specific expenses include Transfer Agent Fees and expenses and Registration Fees, which are charged to their respective share class. |
| (g) | The Fund’s portfolio turnover rate is calculated in accordance with regulatory requirements, without regard to transactions involving short term investments and certain derivatives. If such transactions were included, the Fund’s portfolio turnover rate may be higher. |
See Notes to Financial Statements.
| | | | |
| PGIM QMA Small-Cap Value Fund | | | 51 | |
Financial Highlights (continued)
| | | | | | | | | | | | | | | | | | | | | | | | | | | | | | | | |
| Class R Shares | | | | | | | | | | | | | | | | | | | | | | | | |
| | | Year Ended July 31, | | | | | | Nine Months
Ended
July 31, | | | | | | Year Ended
October 31, | |
| | | 2018 | | | 2017 | | | 2016 | | | 2015 | | | 2014(a) | | | 2013 | |
| Per Share Operating Performance(b): | |
| Net Asset Value, Beginning of Period | | | $21.06 | | | | $17.95 | | | | $25.00 | | | | $26.51 | | | | | | | | $27.48 | | | | | | | | $21.21 | |
| Income (loss) from investment operations: | | | | | | | | | | | | | | | | | | | | | | | | | | | | | |
| Net investment income (loss) | | | 0.21 | | | | 0.21 | | | | 0.26 | | | | 0.26 | | | | | | | | 0.11 | | | | | | | | 0.20 | |
| Net realized and unrealized gain (loss) on investment and foreign currency transactions | | | 2.01 | | | | 3.21 | | | | (0.07 | ) | | | 0.91 | | | | | | | | 0.98 | | | | | | | | 6.87 | |
| Total from investment operations: | | | 2.22 | | | | 3.42 | | | | 0.19 | | | | 1.17 | | | | | | | | 1.09 | | | | | | | | 7.07 | |
| Less Dividends and Distributions: | | | | | | | | | | | | | | | | | | | | | | | | | | | | | | | | |
| Dividends from net investment income | | | (0.26 | ) | | | (0.26 | ) | | | (0.49 | ) | | | (0.14 | ) | | | | | | | (0.15 | ) | | | | | | | (0.19 | ) |
| Distributions from net realized gains | | | (2.36 | ) | | | (0.05 | ) | | | (6.75 | ) | | | (2.54 | ) | | | | | | | (1.91 | ) | | | | | | | (0.61 | ) |
| Total dividends and distributions | | | (2.62 | ) | | | (0.31 | ) | | | (7.24 | ) | | | (2.68 | ) | | | | | | | (2.06 | ) | | | | | | | (0.80 | ) |
| Net asset value, end of period | | | $20.66 | | | | $21.06 | | | | $17.95 | | | | $25.00 | | | | | | | | $26.51 | | | | | | | | $27.48 | |
| Total Return(c): | | | 11.05% | | | | 19.00% | | | | 3.70% | | | | 4.29% | | | | | | | | 4.17% | | | | | | | | 34.55% | |
| |
| Ratios/Supplemental Data: | |
| Net assets, end of period (000) | | | $162,502 | | | | $164,019 | | | | $152,186 | | | | $150,536 | | | | | | | | $143,655 | | | | | | | | $119,047 | |
| Average net assets (000) | | | $165,270 | | | | $159,240 | | | | $145,703 | | | | $152,743 | | | | | | | | $134,383 | | | | | | | | $99,668 | |
| Ratios to average net assets(d): | | | | | | | | | | | | | | | | | | | | | | | | | | | | | | | | |
| Expenses after waivers and/or expense reimbursement | | | 1.26% | | | | 1.21% | | | | 1.23% | | | | 1.22% | | | | | | | | 1.18% | (e) | | | | | | | 1.17% | |
| Expenses before waivers and/or expense reimbursement | | | 1.52% | (f) | | | 1.47% | | | | 1.49% | | | | 1.48% | | | | | | | | 1.43% | (e) | | | | | | | 1.42% | |
| Net investment income (loss) | | | 1.04% | | | | 1.03% | | | | 1.42% | | | | 0.99% | | | | | | | | 0.54% | (e) | | | | | | | 0.83% | |
| Portfolio turnover rate(g) | | | 70% | | | | 95% | | | | 72% | | | | 111% | | | | | | | | 42% | (h) | | | | | | | 40% | |
| (a) | For the nine month period ended July 31, 2014. The Trust changed its fiscal year end from October 31 to July 31, effective July 31, 2014. |
| (b) | Calculated based on average shares outstanding during the period. |
| (c) | Total return is calculated assuming a purchase of a share on the first day and a sale on the last day of each period reported and includes reinvestment of dividends and distributions, if any. Total returns may reflect adjustments to conform to generally accepted accounting principles. Total returns for periods less than one full year are not annualized. |
| (d) | Does not include expenses of the underlying funds in which the Fund invests. |
| (f) | Effective August 1, 2017, class specific expenses include Transfer Agent Fees and expenses and Registration Fees, which are charged to their respective share class. |
| (g) | The Fund’s portfolio turnover rate is calculated in accordance with regulatory requirements, without regard to transactions involving short term investments and certain derivatives. If such transactions were included, the Fund’s portfolio turnover rate may be higher. |
See Notes to Financial Statements.
| | | | | | | | | | | | | | | | | | | | | | | | | | | | | | | | |
| Class Z Shares | | | | | | | | | | | | | | | | | | | | | | | | |
| | | Year Ended July 31, | | | | | | Nine Months Ended July 31, | | | | | | Year Ended
October 31, | |
| | | 2018 | | | 2017 | | | 2016 | | | 2015 | | | 2014(a) | | | | | | 2013 | |
| Per Share Operating Performance(b): | | | | | | | | | | | | | | | | | | | | | | | | | | | | | |
| Net Asset Value, Beginning of Period | | | $21.32 | | | | $18.14 | | | | $25.22 | | |
| $26.73
|
| | | | | | | $27.71 | | | | | | | | $21.39 | |
| Income (loss) from investment operations: | | | | | | | | | | | | | | | | | | | | | | | | | | | | | |
| Net investment income (loss) | | | 0.34 | | | | 0.31 | | | | 0.37 | | | | 0.39 | | | | | | | | 0.21 | | | | | | | | 0.32 | |
| Net realized and unrealized gain (loss) on investment and foreign currency transactions | | | 2.02 | | | | 3.27 | | | | (0.08 | ) | | | 0.92 | | | | | | | | 1.00 | | | | | | | | 6.91 | |
| Total from investment operations: | | | 2.36 | | | | 3.58 | | | | 0.29 | | |
| 1.31
|
| | | | | | | 1.21 | | | | | | | | 7.23 | |
| Less Dividends and Distributions: | | | | | | | | | | | | | | | | | | | | | | | | | | | | | | | | |
| Dividends from net investment income | | | (0.37 | ) | | | (0.35 | ) | | | (0.62 | ) | | | (0.28 | ) | | | | | | | (0.28 | ) | | | | | | | (0.30 | ) |
| Distributions from net realized gains | | | (2.36 | ) | | | (0.05 | ) | | | (6.75 | ) | | | (2.54 | ) | | | | | | | (1.91 | ) | | | | | | | (0.61 | ) |
| Total dividends and distributions | | | (2.73 | ) | | | (0.40 | ) | | | (7.37 | ) | |
| (2.82
| )
| | | | | | | (2.19 | ) | | | | | | | (0.91 | ) |
| Net asset value, end of period | | | $20.95 | | | | $21.32 | | | | $18.14 | | |
| $25.22
|
| | | | | | | $26.73 | | | | | | | | $27.71 | |
| Total Return(c): | | | 11.65% | | | | 19.66% | | | | 4.20% | | | | 4.79% | | | | | | |
| 4.60%
|
| | | | | | | 35.16% | |
| |
| Ratios/Supplemental Data: | |
| Net assets, end of period (000) | | | $824,748 | | | | $981,061 | | | | $829,360 | | | | $1,077,790 | | | | | | | | $1,781,471 | | | | | | | | $1,622,779 | |
| Average net assets (000) | | | $862,416 | | | | $940,720 | | | | $811,529 | | | | $1,828,713 | | | | | | | | $1,782,968 | | | | | | | | $1,342,995 | |
| Ratios to average net assets(d): | | | | | | | | | | | | | | | | | | | | | | | | | | | | | | | | |
| Expenses after waivers and/or expense reimbursement | | | 0.69% | | | | 0.71% | | | | 0.73% | | | | 0.72% | | | | | | | | 0.68% | (e) | | | | | | | 0.67% | |
| Expenses before waivers and/or expense reimbursement | | | 0.70% | (f) | | | 0.72% | | | | 0.74% | | | | 0.72% | | | | | | | | 0.68% | (e) | | | | | | | 0.67% | |
| Net investment income (loss) | | | 1.62% | | | | 1.51% | | | | 1.93% | | | | 1.48% | | | | | | | | 1.05% | (e) | | | | | | | 1.32% | |
| Portfolio turnover rate(g) | | | 70% | | | | 95% | | | | 72% | | | | 111% | | | | | | | | 42% | (h) | | | | | | | 40% | |
| (a) | For the nine month period ended July 31, 2014. The Trust changed its fiscal year end from October 31 to July 31, effective July 31, 2014. |
| (b) | Calculated based on average shares outstanding during the period. |
| (c) | Total return is calculated assuming a purchase of a share on the first day and a sale on the last day of each period reported and includes reinvestment of dividends and distributions, if any. Total returns may reflect adjustments to conform to generally accepted accounting principles. Total returns for periods less than one full year are not annualized. |
| (d) | Does not include expenses of the underlying funds in which the Fund invests. |
| (f) | Effective August 1, 2017, class specific expenses include Transfer Agent Fees and expenses and Registration Fees, which are charged to their respective share class. |
| (g) | The Fund’s portfolio turnover rate is calculated in accordance with regulatory requirements, without regard to transactions involving short term investments and certain derivatives. If such transactions were included, the Fund’s portfolio turnover rate may be higher. |
See Notes to Financial Statements.
| | | | |
| PGIM QMA Small-Cap Value Fund | | | 53 | |
Financial Highlights (continued)
| | | | |
| Class R2 Shares | | | |
| | | December 28,
2017(a) through
July 31, 2018 | |
| Per Share Operating Performance(b): | | | | |
| Net Asset Value, Beginning of Period | | | $20.44 | |
| Income (loss) from investment operations: | | | | |
| Net investment income (loss) | | | 0.09 | |
| Net realized and unrealized gain (loss) on investment and foreign currency transactions | | | 0.38 | |
| Total from investment operations: | | | 0.47 | |
| Net asset value, end of period | | | $20.91 | |
| Total Return(c): | | | 2.30% | |
| Ratios/Supplemental Data: | | | | |
| Net assets, end of period (000) | | | $18 | |
| Average net assets (000) | | | $14 | |
| Ratios to average net assets(d): | | | | |
| Expenses after waivers and/or expense reimbursement | | | 1.14% | (e) |
| Expenses before waivers and/or expense reimbursement | | | 187.96% | (e)(f) |
| Net investment income (loss) | | | 0.72% | (e) |
| Portfolio turnover rate(g) | | | 70% | (h) |
| (a) | Commencement of operations. |
| (b) | Calculated based on average shares outstanding during the period. |
| (c) | Total return is calculated assuming a purchase of a share on the first day and a sale on the last day of each period reported and includes reinvestment of dividends and distributions, if any. Total returns may reflect adjustments to conform to generally accepted accounting principles. Total returns for periods less than one full year are not annualized. |
| (d) | Does not include expenses of the underlying funds in which the Fund invests. |
| (f) | Effective August 1, 2017, class specific expenses include Transfer Agent Fees and expenses and Registration Fees, which are charged to their respective share class. |
| (g) | The Fund’s portfolio turnover rate is calculated in accordance with regulatory requirements, without regard to transactions involving short term investments and certain derivatives. If such transactions were included, the Fund’s portfolio turnover rate may be higher. |
See Notes to Financial Statements.
| | | | |
| Class R4 Shares | | | |
| | | December 28,
2017(a)
through
July 31, 2018 | |
| Per Share Operating Performance(b): | | | | |
| Net Asset Value, Beginning of Period | | | $20.44 | |
| Income (loss) from investment operations: | | | | |
| Net investment income (loss) | | | 0.11 | |
| Net realized and unrealized gain (loss) on investment and foreign currency transactions | | | 0.39 | |
| Total from investment operations: | | | 0.50 | |
| Net asset value, end of period | | | $20.94 | |
| Total Return(c): | | | 2.45% | |
| Ratios/Supplemental Data: | | | | |
| Net assets, end of period (000) | | | $10 | |
| Average net assets (000) | | | $10 | |
| Ratios to average net assets(d): | | | | |
| Expenses after waivers and/or expense reimbursement | | | 0.89% | (e) |
| Expenses before waivers and/or expense reimbursement | | | 270.32% | (e)(f) |
| Net investment income (loss) | | | 0.95% | (e) |
| Portfolio turnover rate(g) | | | 70% | (h) |
| (a) | Commencement of operations. |
| (b) | Calculated based on average shares outstanding during the period. |
| (c) | Total return is calculated assuming a purchase of a share on the first day and a sale on the last day of each period reported and includes reinvestment of dividends and distributions, if any. Total returns may reflect adjustments to conform to generally accepted accounting principles. Total returns for periods less than one full year are not annualized. |
| (d) | Does not include expenses of the underlying funds in which the Fund invests. |
| (f) | Effective August 1, 2017, class specific expenses include Transfer Agent Fees and expenses and Registration Fees, which are charged to their respective share class. |
| (g) | The Fund’s portfolio turnover rate is calculated in accordance with regulatory requirements, without regard to transactions involving short term investments and certain derivatives. If such transactions were included, the Fund’s portfolio turnover rate may be higher. |
See Notes to Financial Statements.
| | | | |
| PGIM QMA Small-Cap Value Fund | | | 55 | |
Financial Highlights (continued)
| | | | | | | | | | | | | | | | | | | | | | | | |
| Class R6 Shares | | | | | | | | | | | | | | | | | | |
| | | | | | Year Ended July 31, | | | | | | September 25,
2014(a)
through July 31, | |
| | | | | | 2018 | | | 2017 | | | 2016 | | | | | | 2015 | |
| Per Share Operating Performance(b): | | | | | | | | | | | | | | | | | | | | | |
| Net Asset Value, Beginning of Period | | | | | | | $21.34 | | | | $18.15 | | | | $25.23 | | | | | | | | $26.68 | |
| Income (loss) from investment operations: | | | | | | | | | | | | | | | | | | | | | |
| Net investment income (loss) | | | | | | | 0.34 | | | | 0.32 | | | | 0.36 | | | | | | | | 0.36 | |
| Net realized and unrealized gain (loss) on investment and foreign currency transactions | | | | | | | 2.04 | | | | 3.28 | | | | (0.05 | ) | | | | | | | 1.01 | |
| Total from investment operations: | | | | | | | 2.38 | | | | 3.60 | | | | 0.31 | | | | | | | | 1.37 | |
| Less Dividends and Distributions: | | | | | | | | | | | | | | | | | | | | | | | | |
| Dividends from net investment income | | | | | | | (0.39 | ) | | | (0.36 | ) | | | (0.64 | ) | | | | | | | (0.28 | ) |
| Distributions from net realized gains | | | | | | | (2.36 | ) | | | (0.05 | ) | | | (6.75 | ) | | | | | | | (2.54 | ) |
| Total dividends and distributions | | | | | | | (2.75 | ) | | | (0.41 | ) | | | (7.39 | ) | | | | | | | (2.82 | ) |
| Net asset value, end of period | | | | | | | $20.97 | | | | $21.34 | | | | $18.15 | | | | | | | | $25.23 | |
| Total Return(c): | | | | | | | 11.72% | | | | 19.77% | | | | 4.29% | | | | | | | | 5.04% | |
| Ratios/Supplemental Data: | |
| Net assets, end of period (000) | | | | | | | $414,892 | | | | $268,695 | | | | $231,801 | | | | | | | | $121,283 | |
| Average net assets (000) | | | | | | | $361,244 | | | | $263,763 | | | | $187,644 | | | | | | | | $36,516 | |
| Ratios to average net assets(d): | | | | | | | | | | | | | | | | | | | | | | | | |
| Expenses after waivers and/or expense reimbursement | | | | | | | 0.63% | | | | 0.64% | | | | 0.66% | | | | | | | | 0.70% | (e) |
| Expenses before waivers and/or expense reimbursement | | | | | | | 0.63% | (f) | | | 0.64% | | | | 0.66% | | | | | | | | 0.70% | (e) |
| Net investment income (loss) | | | | | | | 1.64% | | | | 1.58% | | | | 1.96% | | | | | | | | 1.67% | (e) |
| Portfolio turnover rate(g) | | | | | | | 70% | | | | 95% | | | | 72% | | | | | | | | 111% | (h) |
| (a) | Commencement of operations. |
| (b) | Calculated based on average shares outstanding during the period. |
| (c) | Total return is calculated assuming a purchase of a share on the first day and a sale on the last day of each period reported and includes reinvestment of dividends and distributions, if any. Total returns may reflect adjustments to conform to generally accepted accounting principles. Total returns for periods less than one full year are not annualized. |
| (d) | Does not include expenses of the underlying funds in which the Fund invests. |
| (f) | Effective August 1, 2017, class specific expenses include Transfer Agent Fees and expenses and Registration Fees, which are charged to their respective share class. |
| (g) | The Fund’s portfolio turnover rate is calculated in accordance with regulatory requirements, without regard to transactions involving short term investments and certain derivatives. If such transactions were included, the Fund’s portfolio turnover rate may be higher. |
See Notes to Financial Statements.
Report of Independent Registered Public
Accounting Firm
The Board of Trustees and Shareholders
The Target Portfolio Trust:
Opinion on the Financial Statements
We have audited the accompanying statement of assets and liabilities of the fund listed in the Appendix (the Fund), including the schedule of investments, as of July 31, 2018, the related statement of operations for the year then ended, the statements of changes in net assets for each of the years in the two-year period ended July 31, 2018, and the related notes (collectively, the financial statements) and the financial highlights for the year or period indicated therein. In our opinion, the financial statements and financial highlights present fairly, in all material respects, the financial position of the Fund as of July 31, 2018, the results of its operations for the year then ended, the changes in its net assets for each of the years in the two-year period ended July 31, 2018, and the financial highlights for the year or period indicated therein, in conformity with U.S. generally accepted accounting principles.
Basis for Opinion
These financial statements and financial highlights are the responsibility of the Fund’s management. Our responsibility is to express an opinion on these financial statements and financial highlights based on our audits. We are a public accounting firm registered with the Public Company Accounting Oversight Board (United States) (“PCAOB”) and are required to be independent with respect to the Fund in accordance with the U.S. federal securities laws and the applicable rules and regulations of the Securities and Exchange Commission and the PCAOB.
We conducted our audits in accordance with the standards of the PCAOB. Those standards require that we plan and perform the audit to obtain reasonable assurance about whether the financial statements and financial highlights are free of material misstatement, whether due to error or fraud. Our audits included performing procedures to assess the risks of material misstatement of the financial statements and financial highlights, whether due to error or fraud, and performing procedures that respond to those risks. Such procedures included examining, on a test basis, evidence regarding the amounts and disclosures in the financial statements and financial highlights. Such procedures also included confirmation of securities owned as of July 31, 2018, by correspondence with the custodians, transfer agents and brokers or by other appropriate auditing procedures when replies from brokers were not received. Our audits also included evaluating the accounting principles used and significant estimates made by management, as well as evaluating the overall presentation of the financial statements and financial highlights. We believe that our audits provide a reasonable basis for our opinion.

We have served as the auditor of one or more PGIM and/or Prudential Retail investment companies since 2003.
New York, New York
September 17, 2018
| | | | |
| PGIM QMA Small-Cap Value Fund | | | 57 | |
Appendix A
PGIM QMA Small-Cap Value Fund (formerly Prudential QMA Small-Cap Value Fund)
INFORMATION ABOUT BOARD MEMBERS AND OFFICERS
(Unaudited)
Information about Board Members and Officers of the Fund is set forth below. Board Members who are not deemed to be “interested persons” of the Fund, as defined in the 1940 Act, are referred to as “Independent Board Members.” Board Members who are deemed to be “interested persons” of the Fund are referred to as “Interested Board Members.” The Board Members are responsible for the overall supervision of the operations of the Fund and perform the various duties imposed on the directors of investment companies by the 1940 Act. The Board in turn elects the Officers, who are responsible for administering the day-to-day operations of the Fund.
| | | | | | |
| | | |
Independent Board Members | | | | |
| | | | |
Name, Address, Age Position(s) Portfolios Overseen | | Principal Occupation(s) During Past Five Years | | Other Directorships Held During Past Five Years | | Length of Board Service |
| | | | |
Ellen S. Alberding (60) Board Member Portfolios Overseen: 91 | | President and Board Member, The Joyce Foundation (charitable foundation) (since 2002); Vice Chair, City Colleges of Chicago (community college system) (2011-2015); Trustee, National Park Foundation (charitable foundation for national park system) (2009-2018); Trustee, Economic Club of Chicago (since 2009); Trustee, Loyola University (since 2018). | | None. | | Since September 2013 |
| | | | |
Kevin J. Bannon (66) Board Member Portfolios Overseen: 91 | | Retired; Managing Director (April 2008-May 2015) and Chief Investment Officer (October 2008-November 2013) of Highmount Capital LLC (registered investment adviser); formerly Executive Vice President and Chief Investment Officer (April 1993-August 2007) of Bank of New York Company; President (May 2003-May 2007) of BNY Hamilton Family of Mutual Funds. | | Director of Urstadt Biddle Properties (equity real estate investment trust) (since September 2008). | | Since July 2008 |
| | | | |
Linda W. Bynoe (66) Board Member Portfolios Overseen: 91 | | President and Chief Executive Officer (since March 1995) and formerly Chief Operating Officer (December 1989-February 1995) of Telemat Ltd. (management consulting); formerly Vice President (January 1985-June 1989) at Morgan Stanley & Co. (broker-dealer). | | Director of Anixter International, Inc. (communication products distributor) (since January 2006); Director of Northern Trust Corporation (financial services) (since April 2006); Trustee of Equity Residential (residential real estate) (since December 2009). | | Since March 2005 |
PGIM QMA Small-Cap Value Fund
| | | | | | |
| | | |
Independent Board Members | | | | |
| | | | |
Name, Address, Age Position(s) Portfolios Overseen | | Principal Occupation(s) During Past Five Years | | Other Directorships Held During Past Five Years | | Length of Board Service |
| | | | |
Barry H. Evans (57) Board Member Portfolios Overseen: 90 | | Retired; formerly President (2005 – 2016), Global Chief Operating Officer (2014– 2016), Chief Investment Officer – Global Head of Fixed Income (1998-2014), and various portfolio manager roles (1986-2006), Manulife Asset Management U.S. | | Director, Manulife Trust Company (since 2011); formerly Director, Manulife Asset Management Limited (2015-2017); formerly Chairman of the Board of Directors of Manulife Asset Management U.S. (2005-2016); formerly Chairman of the Board, Declaration Investment Management and Research (2008-2016). | | Since September 2017 |
| | | | |
Keith F. Hartstein (61) Board Member & Independent Chair Portfolios Overseen: 91 | | Retired; Member (since November 2014) of the Governing Council of the Independent Directors Council (organization of independent mutual fund directors); formerly President and Chief Executive Officer (2005-2012), Senior Vice President (2004-2005), Senior Vice President of Sales and Marketing (1997-2004), and various executive management positions (1990-1997), John Hancock Funds, LLC (asset management); Chairman, Investment Company Institute’s Sales Force Marketing Committee (2003-2008). | | None. | | Since September 2013 |
Visit our website at pgiminvestments.com
| | | | | | |
| | | |
Independent Board Members | | | | |
| | | | |
Name, Address, Age Position(s) Portfolios Overseen | | Principal Occupation(s) During Past Five Years | | Other Directorships Held During Past Five Years | | Length of Board Service |
| | | | |
Laurie Simon Hodrick (56) Board Member Portfolios Overseen: 90 | | A. Barton Hepburn Professor Emerita of Economics in the Faculty of Business, Columbia Business School (since 2018); Visiting Professor of Law, Stanford Law School (since 2015); Visiting Fellow at the Hoover Institution, Stanford University (since 2015); Sole Member, ReidCourt LLC (since 2008) (a consulting firm); formerly A. Barton Hepburn Professor of Economics in the Faculty of Business, Columbia Business School (1996-2017); formerly Managing Director, Global Head of Alternative Investment Strategies, Deutsche Bank (2006-2008); Independent Director Kabbage, Inc. (since July 2018) (financial services). | | Independent Director, Corporate Capital Trust (since April 2017) (a business development company); Independent Director, Kabbage, Inc. (since July 2018) (financial services). | | Since September 2017 |
| | | | |
Michael S. Hyland, CFA (72) Board Member Portfolios Overseen: 91 | | Retired (since February 2005); formerly Senior Managing Director (July 2001-February 2005) of Bear Stearns & Co, Inc.; Global Partner, INVESCO (1999-2001); Managing Director and President of Salomon Brothers Asset Management (1989-1999). | | None. | | Since July 2008 |
| | | | |
Richard A. Redeker (75) Board Member Portfolios Overseen: 91 | | Retired Mutual Fund Senior Executive (50 years); Management Consultant; Director, Mutual Fund Directors Forum (since 2014); Independent Directors Council (organization of independent mutual fund directors)-Executive Committee, Chair of Policy Steering Committee, Governing Council. | | None. | | Since October 1993 |
PGIM QMA Small-Cap Value Fund
| | | | | | |
| | | |
Independent Board Members | | | | |
| | | | |
Name, Address, Age Position(s) Portfolios Overseen | | Principal Occupation(s) During Past Five Years | | Other Directorships Held During Past Five Years | | Length of Board Service |
| | | | |
Brian K. Reid (56)# Board Member Portfolios Overseen: 90 | | Retired; formerly Chief Economist for the Investment Company Institute (ICI) (2005-2017); formerly Senior Economist and Director of Industry and Financial Analysis at the ICI (1998-2004); formerly Senior Economist, Industry and Financial Analysis at the ICI (1996-1998); formerly Staff Economist at the Federal Reserve Board (1989-1996); Director, ICI Mutual Insurance Company (2012-2017). | | None. | | Since March 2018 |
# Mr. Reid joined the Board effective as of March 1, 2018.
| | | | | | |
| | | |
Interested Board Members | | | | |
| | | | |
Name, Address, Age Position(s) Portfolios Overseen | | Principal Occupation(s) During Past Five Years | | Other Directorships Held During Past Five Years | | Length of Board Service |
| | | | |
Stuart S. Parker (55) Board Member & President Portfolios Overseen: 91 | | President of PGIM Investments LLC (formerly known as Prudential Investments LLC) (since January 2012); Executive Vice President of Prudential Investment Management Services LLC (since December 2012); formerly Executive Vice President of Jennison Associates LLC and Head of Retail Distribution of PGIM Investments LLC (June 2005-December 2011). | | None. | | Since January 2012 |
Visit our website at pgiminvestments.com
| | | | | | |
| | | |
Interested Board Members | | | | |
| | | | |
Name, Address, Age Position(s) Portfolios Overseen | | Principal Occupation(s) During Past Five Years | | Other Directorships Held During Past Five Years | | Length of Board Service |
| | | | |
Scott E. Benjamin (45) Board Member & Vice President Portfolios Overseen:91 | | Executive Vice President (since June 2009) of PGIM Investments LLC; Executive Vice President (June 2009-June 2012) and Vice President (since June 2012) of Prudential Investment Management Services LLC; Executive Vice President (since September 2009) of AST Investment Services, Inc.; Senior Vice President of Product Development and Marketing, PGIM Investments (since February 2006); formerly Vice President of Product Development and Product Management, PGIM Investments LLC (2003-2006). | | None. | | Since March 2010 |
| | | | |
Grace C. Torres* (59) Board Member Portfolios Overseen: 90 | | Retired; formerly Treasurer and Principal Financial and Accounting Officer of the PGIM Funds, Target Funds, Advanced Series Trust, Prudential Variable Contract Accounts and The Prudential Series Fund (1998-June 2014); Assistant Treasurer (March 1999-June 2014) and Senior Vice President (September 1999-June 2014) of PGIM Investments LLC; Assistant Treasurer (May 2003-June 2014) and Vice President (June 2005-June 2014) of AST Investment Services, Inc.; Senior Vice President and Assistant Treasurer (May 2003-June 2014) of Prudential Annuities Advisory Services, Inc. | | Director (July 2015-January 2018) of Sun Bancorp, Inc. N.A. and Sun National Bank; Director (since January 2018) of OceanFirst Financial Corp. and OceanFirst Bank. | | Since November 2014 |
* Note: Prior to her retirement in 2014, Ms. Torres was employed by PGIM Investments LLC. Due to her prior employment, she is considered to be an “interested person” under the 1940 Act. Ms. Torres is a Non-Management Interested Board Member.
PGIM QMA Small-Cap Value Fund
| | | | |
| |
Fund Officers(a) |
| | | |
| Name, Address and Age Position with Fund | | Principal Occupation(s) During Past Five Years | | Length of Service as Fund Officer |
| | | |
Raymond A. O’Hara (63) Chief Legal Officer | | Vice President and Corporate Counsel (since July 2010) of Prudential Insurance Company of America (Prudential); Vice President (March 2011-Present) of Pruco Life Insurance Company and Pruco Life Insurance Company of New Jersey; Vice President and Corporate Counsel (March 2011-Present) of Prudential Annuities Life Assurance Corporation; Chief Legal Officer of PGIM Investments LLC (since June 2012); Chief Legal Officer of Prudential Mutual Fund Services LLC (since June 2012) and Corporate Counsel of AST Investment Services, Inc. (since June 2012); formerly Assistant Vice President and Corporate Counsel (September 2008-July 2010) of The Hartford Financial Services Group, Inc.; formerly Associate (September 1980-December 1987) and Partner (January 1988–August 2008) of Blazzard & Hasenauer, P.C. (formerly, Blazzard, Grodd & Hasenauer, P.C.). | | Since June 2012 |
| | | |
Chad A. Earnst (43) Chief Compliance Officer | | Chief Compliance Officer (September 2014-Present) of PGIM Investments LLC; Chief Compliance Officer (September 2014-Present) of the PGIM Funds, Target Funds, Advanced Series Trust, The Prudential Series Fund, Prudential’s Gibraltar Fund, Inc., PGIM Global Short Duration High Yield Income Fund, Inc., PGIM Short Duration High Yield Fund, Inc. and PGIM Jennison MLP Income Fund, Inc.; formerly Assistant Director (March 2010-August 2014) of the Asset Management Unit, Division of Enforcement, US Securities & Exchange Commission; Assistant Regional Director (January 2010-August 2014), Branch Chief (June 2006–December 2009) and Senior Counsel (April 2003-May 2006) of the Miami Regional Office, Division of Enforcement, US Securities & Exchange Commission. | | Since September 2014 |
| | | |
Dino Capasso (44) Deputy Chief Compliance Officer | | Vice President and Deputy Chief Compliance Officer (June 2017-Present) of PGIM Investments LLC; formerly, Senior Vice President and Senior Counsel (January 2016-June 2017), and Vice President and Counsel (February 2012-December 2015) of Pacific Investment Management Company LLC. | | Since March 2018 |
| | | |
Deborah A. Docs (60) Secretary | | Vice President and Corporate Counsel (since January 2001) of Prudential; Vice President (since December 1996) and Assistant Secretary (since March 1999) of PGIM Investments LLC; formerly Vice President and Assistant Secretary (May 2003-June 2005) of AST Investment Services, Inc. | | Since May 2004 |
| | | |
Jonathan D. Shain (60) Assistant Secretary | | Vice President and Corporate Counsel (since August 1998) of Prudential; Vice President and Assistant Secretary (since May 2001) of PGIM Investments LLC; Vice President and Assistant Secretary (since February 2001) of Prudential Mutual Fund Services LLC; formerly Vice President and Assistant Secretary (May 2003-June 2005) of AST Investment Services, Inc. | | Since May 2005 |
Visit our website at pgiminvestments.com
| | | | |
| |
Fund Officers(a) |
| | | |
Name, Address and Age Position with Fund | | Principal Occupation(s) During Past Five Years | | Length of Service as Fund Officer |
| | | |
Claudia DiGiacomo (43) Assistant Secretary | | Vice President and Corporate Counsel (since January 2005) of Prudential; Vice President and Assistant Secretary of PGIM Investments LLC (since December 2005); formerly Associate at Sidley Austin Brown & Wood LLP (1999-2004). | | Since December 2005 |
| | | |
Andrew R. French (55) Assistant Secretary | | Vice President and Corporate Counsel (since February 2010) of Prudential; formerly Director and Corporate Counsel (2006-2010) of Prudential; Vice President and Assistant Secretary (since January 2007) of PGIM Investments LLC; Vice President and Assistant Secretary (since January 2007) of Prudential Mutual Fund Services LLC. | | Since October 2006 |
| | | |
Charles H. Smith (45) Anti-Money Laundering Compliance Officer | | Vice President, Corporate Compliance, Anti-Money Laundering Unit (since January 2015) of Prudential; committee member of the American Council of Life Insurers Anti-Money Laundering and Critical Infrastructure Committee (since January 2016); formerly Global Head of Economic Sanctions Compliance at AIG Property Casualty (February 2007 – December 2014); Assistant Attorney General at the New York State Attorney General’s Office, Division of Public Advocacy. (August 1998 —January 2007). | | Since January 2017 |
| | | |
Brian D. Nee (52) Treasurer and Principal Financial and Accounting Officer | | Vice President and Head of Finance of PGIM Investments LLC (since August 2015) and PGIM Global Partners (since February 2017); formerly, Vice President, Treasurer’s Department of Prudential (September 2007-August 2015). | | Since July 2018 |
| | | |
Peter Parrella (60) Assistant Treasurer | | Vice President (since 2007) and Director (2004-2007) within Prudential Mutual Fund Administration; formerly Tax Manager at SSB Citi Fund Management LLC (1997-2004). | | Since June 2007 |
| | | |
Lana Lomuti (51) Assistant Treasurer | | Vice President (since 2007) and Director (2005-2007), within Prudential Mutual Fund Administration; formerly Assistant Treasurer (December 2007-February 2014) of The Greater China Fund, Inc. | | Since April 2014 |
| | | |
Linda McMullin (57) Assistant Treasurer | | Vice President (since 2011) and Director (2008-2011) within Prudential Mutual Fund Administration. | | Since April 2014 |
| | | |
Kelly A. Coyne (50) Assistant Treasurer | | Director, Investment Operations of Prudential Mutual Fund Services LLC (since 2010). | | Since March 2015 |
(a) Excludes Mr. Parker and Mr. Benjamin, interested Board Members who also serve as President and Vice President, respectively.
Explanatory Notes to Tables:
| ∎ | | Board Members are deemed to be “Interested,” as defined in the 1940 Act, by reason of their affiliation with PGIM Investments LLC and/or an affiliate of PGIM Investments LLC. |
| ∎ | | Unless otherwise noted, the address of all Board Members and Officers is c/o PGIM Investments LLC, 655 Broad Street, Newark, New Jersey 07102-4410. |
| ∎ | | There is no set term of office for Board Members or Officers. The Board Members have adopted a retirement policy, which calls for the retirement of Board Members on December 31 of the year in which they reach the age of 75. |
| ∎ | | “Other Directorships Held” includes only directorships of companies required to register or file reports with the SEC under the 1934 Act (that is, “public companies”) or other investment companies registered under the 1940 Act. |
PGIM QMA Small-Cap Value Fund
| ∎ | | “Portfolios Overseen” includes all investment companies managed by PGIM Investments LLC. The investment companies for which PGIM Investments LLC serves as manager include the PGIM Funds, The Prudential Variable Contract Accounts, PGIM ETF Trust, PGIM Short Duration High Yield Fund, Inc., PGIM Global Short Duration High Yield Fund, Inc., The Prudential Series Fund, Prudential’s Gibraltar Fund, Inc. and the Advanced Series Trust. |
Visit our website at pgiminvestments.com
Approval of Advisory Agreement
The Fund’s Board of Trustees
The Board of Trustees (the “Board”) of PGIM QMA Small-Cap Value Fund (the “Fund”)1 consists of twelve individuals, nine of whom are not “interested persons” of the Fund, as defined in the Investment Company Act of 1940, as amended (the “1940 Act”) (the “Independent Trustees”). The Board is responsible for the oversight of the Fund and its operations, and performs the various duties imposed on the directors of investment companies by the 1940 Act. The Independent Trustees have retained independent legal counsel to assist them in connection with their duties. The Chair of the Board is an Independent Trustee. The Board has established four standing committees: the Audit Committee, the Nominating and Governance Committee, and two Investment Committees. Each committee is chaired by, and composed of, Independent Trustees.
Annual Approval of the Fund’s Advisory Agreements
As required under the 1940 Act, the Board determines annually whether to renew the Fund’s management agreement with PGIM Investments LLC (“PGIM Investments”) and the Fund’s subadvisory agreement with Quantitative Management Associates LLC (“QMA”). In considering the renewal of the agreements, the Board, including all of the Independent Trustees, met on June 7, 2018 and on June 19-21, 2018 and approved the renewal of the agreements through July 31, 2019, after concluding that the renewal of the agreements was in the best interests of the Fund and its shareholders.
In advance of the meetings, the Board requested and received materials relating to the agreements and had the opportunity to ask questions and request further information in connection with its consideration. Among other things, the Board considered comparative fee information from PGIM Investments and QMA. Also, the Board considered comparisons with other mutual funds in relevant Peer Universes and Peer Groups, as is further discussed below.
In approving the agreements, the Board, including the Independent Trustees advised by independent legal counsel, considered the factors it deemed relevant, including the nature, quality and extent of services provided by PGIM Investments and the subadviser, the performance of the Fund, the profitability of PGIM Investments and its affiliates, expenses and fees, and the potential for economies of scale that may be shared with the Fund and its shareholders as the Fund’s assets grow. In their deliberations, the Trustees did not identify any single factor which alone was responsible for the Board’s decision to approve the agreements with respect to the Fund. In connection with its deliberations, the Board considered information provided by PGIM Investments throughout the year at regular
Board meetings, presentations from portfolio managers and other information, as well
| 1 | PGIM QMA Small-Cap Value Fund is a series of The Target Portfolio Trust. |
| | |
| PGIM QMA Small-Cap Value Fund |
Approval of Advisory Agreement (continued)
as information furnished at or in advance of the meetings on June 7, 2018 and on June 19-21, 2018.
The Trustees determined that the overall arrangements between the Fund and PGIM Investments, which serves as the Fund’s investment manager pursuant to a management agreement, and between PGIM Investments and QMA, which serves as the Fund’s subadviser pursuant to the terms of a subadvisory agreement with PGIM Investments, are in the best interests of the Fund and its shareholders in light of the services performed, fees charged and such other matters as the Trustees considered relevant in the exercise of their business judgment.
The material factors and conclusions that formed the basis for the Trustees’ reaching their determinations to approve the continuance of the agreements are separately discussed below.
Nature, Quality and Extent of Services
The Board received and considered information regarding the nature, quality and extent of services provided to the Fund by PGIM Investments and QMA. The Board considered the services provided by PGIM Investments, including but not limited to the oversight of the subadviser for the Fund, as well as the provision of fund recordkeeping, compliance, and other services to the Fund. With respect to PGIM Investments’ oversight of the subadviser, the Board noted that PGIM Investments’ Strategic Investment Research Group (“SIRG”), which is a business unit of PGIM Investments, is responsible for monitoring and reporting to PGIM Investments’ senior management on the performance and operations of the subadviser. The Board also considered that PGIM Investments pays the salaries of all of the officers and interested Trustees of the Fund who are part of Fund management. The Board also considered the investment subadvisory services provided by QMA, including investment research and security selection as well as adherence to the Fund’s investment restrictions and compliance with applicable Fund policies and procedures. The Board considered PGIM Investments’ evaluation of the subadviser, as well as PGIM Investments’ recommendation, based on its review of the subadviser, to renew the subadvisory agreement.
The Board considered the qualifications, backgrounds and responsibilities of PGIM Investments’ senior management responsible for the oversight of the Fund and QMA, and also considered the qualifications, backgrounds and responsibilities of the QMA portfolio managers who are responsible for the day-to-day management of the Fund’s portfolio. The Board was provided with information pertaining to PGIM Investments’ and QMA’s organizational structure, senior management, investment operations, and other relevant information pertaining to PGIM Investments and QMA. The Board also noted that it received favorable compliance reports from the Fund’s Chief Compliance Officer (“CCO”) as to PGIM Investments and QMA. The Board noted that QMA is affiliated with PGIM Investments.
| | |
| Visit our website at pgiminvestments.com | | |
The Board concluded that it was satisfied with the nature, extent and quality of the investment management services provided by PGIM Investments and the subadvisory services provided to the Fund by QMA, and that there was a reasonable basis on which to conclude that the Fund benefits from the services provided by PGIM Investments and QMA under the management and subadvisory agreements.
Costs of Services and Profits Realized by PGIM Investments
The Board was provided with information on the profitability of PGIM Investments and its affiliates in serving as the Fund’s investment manager. The Board discussed with PGIM Investments the methodology utilized in assembling the information regarding profitability and considered its reasonableness. The Board recognized that it is difficult to make comparisons of profitability from fund management contracts because comparative information is not generally publicly available and is affected by numerous factors, including the structure of the particular adviser, the types of funds it manages, its business mix, numerous assumptions regarding allocations and the adviser’s capital structure and cost of capital. Taking these factors into account, the Board concluded that the profitability of PGIM Investments and its affiliates in relation to the services rendered was not unreasonable.
Economies of Scale
The Board received and discussed information concerning economies of scale that PGIM Investments may realize as the Fund’s assets grow beyond current levels. The Board noted that the management fee schedule for the Fund includes breakpoints, which have the effect of decreasing the fee rate as assets increase. During the course of time, the Board has considered information regarding the launch date of the Fund, the management fees of the Fund compared to those of similarly managed funds and PGIM Investments’ investment in the Fund over time. The Board noted that economies of scale can be shared with the Fund in other ways, including low management fees from inception, additional technological and personnel investments to enhance shareholder services, and maintaining existing expense structures in the face of a rising cost environment. The Board also considered PGIM Investments’ assertion that it continually evaluates the management fee schedule of the Fund and the potential to share economies of scale through breakpoints or fee waivers as asset levels increase.
The Board recognized the inherent limitations of any analysis of economies of scale, stemming largely from the Board’s understanding that most of PGIM Investments’ costs are not specific to individual funds, but rather are incurred across a variety of products and services.
| | |
| PGIM QMA Small-Cap Value Fund |
Approval of Advisory Agreement (continued)
Other Benefits to PGIM Investments and QMA
The Board considered potential ancillary benefits that might be received by PGIM Investments, QMA and their affiliates as a result of their relationship with the Fund. The Board concluded that potential benefits to be derived by PGIM Investments included transfer agency fees received by the Fund’s transfer agent (which is affiliated with PGIM Investments), and benefits to its reputation as well as other intangible benefits resulting from PGIM Investments’ association with the Fund. The Board concluded that the potential benefits to be derived by QMA included its ability to use soft dollar credits, as well as the potential benefits consistent with those generally resulting from an increase in assets under management, specifically, potential access to additional research resources and benefits to its reputation. The Board concluded that the benefits derived by PGIM Investments and QMA were consistent with the types of benefits generally derived by investment managers and subadvisers to mutual funds.
Performance of the Fund / Fees and Expenses
The Board considered certain additional specific factors and made related conclusions relating to the historical performance of the Fund for the one-, three-, five- and ten-year periods ended December 31, 2017.
The Board also considered the Fund’s actual management fee, as well as the Fund’s net total expense ratio, for the fiscal year ended July 31, 2017. The Board considered the management fee for the Fund as compared to the management fee charged by PGIM Investments to other funds and the fee charged by other advisers to comparable mutual funds in a Peer Group. The actual management fee represents the fee rate actually paid by Fund shareholders and includes any fee waivers or reimbursements. The net total expense ratio for the Fund represents the actual expense ratio incurred by Fund shareholders.
The mutual funds included in the Peer Universe, which was used to evaluate performance, and the Peer Group, which was used to evaluate fees and expenses, were objectively determined by Broadridge, an independent provider of mutual fund data. In certain circumstances, PGIM Investments also may have provided supplemental Peer Universe or Peer Group information for reasons addressed with the Board. The comparisons placed the Fund in various quartiles, with the first quartile being the best 25% of the mutual funds (for performance, the best performing mutual funds and, for expenses, the lowest cost mutual funds).
The section below summarizes key factors considered by the Board and the Board’s conclusions regarding the Fund’s performance, fees and overall expenses. The table sets forth gross performance comparisons (which do not reflect the impact on performance of fund expenses, or any subsidies, expense caps or waivers that may be applicable) with the
| | |
| Visit our website at pgiminvestments.com | | |
Peer Universe, actual management fees with the Peer Group (which reflect the impact of any subsidies or fee waivers), and net total expenses with the Peer Group, each of which were key factors considered by the Board.
| | | | | | | | |
Gross
Performance | | 1 Year | | 3 Years | | 5 Years | | 10 Years |
| | 4th Quartile | | 2nd Quartile | | 2nd Quartile | | 2nd Quartile |
| Actual Management Fees: 2nd Quartile |
| Net Total Expenses: 1st Quartile |
| | • | | The Board noted that the Fund outperformed its benchmark index over the three-, five- and ten-year periods, though it underperformed over the one-year period. |
| | • | | The Board also considered that, when it evaluated performance the prior year, as of December 31, 2016, the Fund ranked in the first quartile of its peers over the one-, three- and ten-year periods and ranked in the second quartile over the five-year period and outperformed its benchmark index over the one-, three, five- and ten-year periods. |
| | • | | The Board and PGIM Investments agreed to retain the Fund’s existing contractual waiver of up to 0.01% to the extent that the Fund’s annual operating expenses and acquired fund fees and expenses (exclusive of certain fees and expenses) exceed 0.68% through November 30, 2019. |
| | • | | The Board and PGIM Investments also agreed to continue the Fund’s existing expense cap which (exclusive of certain fees and expenses) caps transfer agency, shareholder servicing, sub-transfer agency and blue sky fees to the extent that such fees cause the total annual fund operating expenses to exceed 1.14% for Class R2 shares and 0.89% for Class R4 shares through November 30, 2019. |
| | • | | The Board concluded that, in light of the above, it would be in the best interests of the Fund and its shareholders to renew the agreements. |
| | • | | The Board concluded that the management fees (including subadvisory fees) and total expenses were reasonable in light of the services provided. |
* * *
After full consideration of these factors, the Board concluded that approval of the agreements was in the best interests of the Fund and its shareholders.
| | |
| PGIM QMA Small-Cap Value Fund |
| | | | |
| ∎ MAIL | | ∎ TELEPHONE | | ∎ WEBSITE |
655 Broad Street Newark, NJ 07102 | | (800) 225-1852 | | www.pgiminvestments.com |
|
| PROXY VOTING |
| The Board of Trustees has delegated to the Fund’s investment subadviser the responsibility for voting any proxies and maintaining proxy recordkeeping with respect to the Fund. A description of these proxy voting policies and procedures is available without charge, upon request, by calling (800) 225-1852. Information regarding how the Fund voted proxies relating to portfolio securities during the most recent 12-month period ended June 30 is available on the Fund’s website and on the Securities and Exchange Commission’s website at www.sec.gov. |
|
| TRUSTEES |
| Ellen S. Alberding • Kevin J. Bannon • Scott E. Benjamin • Linda W. Bynoe • Barry H. Evans • Keith F. Hartstein • Laurie Simon Hodrick • Michael S. Hyland • Stuart S. Parker • Richard A. Redeker • Brian K. Reid • Grace C. Torres |
|
| OFFICERS |
| Stuart S. Parker, President • Scott E. Benjamin, Vice President • Brian D. Nee, Treasurer and Principal Financial and Accounting Officer • Raymond A. O’Hara, Chief Legal Officer • Chad A. Earnst, Chief Compliance Officer • Deborah A. Docs, Secretary • Dino Capasso, Vice President and Deputy Chief Compliance Officer • Charles H. Smith, Anti-Money Laundering Compliance Officer • Jonathan D. Shain, Assistant Secretary • Claudia DiGiacomo, Assistant Secretary • Andrew R. French, Assistant Secretary • Peter Parrella, Assistant Treasurer • Lana Lomuti, Assistant Treasurer • Linda McMullin, Assistant Treasurer • Kelly A. Coyne, Assistant Treasurer |
| | | | |
| MANAGER | | PGIM Investments LLC | | 655 Broad Street Newark, NJ 07102 |
|
| INVESTMENT SUBADVISER | | Quantitative Management Associates LLC | | Gateway Center Two 100 Mulberry Street Newark, NJ 07102 |
|
| DISTRIBUTOR | | Prudential Investment Management Services LLC | | 655 Broad Street Newark, NJ 07102 |
|
| CUSTODIAN | | The Bank of New York Mellon | | 225 Liberty Street New York, NY 10286 |
|
| TRANSFER AGENT | | Prudential Mutual Fund Services LLC | | PO Box 9658 Providence, RI 02940 |
|
INDEPENDENT REGISTERED
PUBLIC ACCOUNTING FIRM | | KPMG LLP | | 345 Park Avenue New York, NY 10154 |
|
| FUND COUNSEL | | Willkie Farr & Gallagher LLP | | 787 Seventh Avenue New York, NY 10019 |
|
|
| An investor should consider the investment objectives, risks, charges, and expenses of the Fund carefully before investing. The prospectus and summary prospectus contain this and other information about the Fund. An investor may obtain a prospectus and summary prospectus by visiting our website at www.pgiminvestments.com or by calling (800) 225-1852. The prospectus and summary prospectus should be read carefully before investing. |
|
| E-DELIVERY |
| To receive your mutual fund documents online, go to www.pgiminvestments.com/edelivery and enroll. Instead of receiving printed documents by mail, you will receive notification via email when new materials are available. You can cancel your enrollment or change your email address at any time by visiting the website address above. |
|
| SHAREHOLDER COMMUNICATIONS WITH TRUSTEES |
| Shareholders can communicate directly with the Board of Trustees by writing to the Chair of the Board, PGIM QMA Small-Cap Value Fund, PGIM Investments, Attn: Board of Trustees, 655 Broad Street, Newark, NJ 07102. Shareholders can communicate directly with an individual Trustee by writing to the same address. Communications are not screened before being delivered to the addressee. |
|
| AVAILABILITY OF PORTFOLIO SCHEDULE |
| The Fund files its complete schedule of portfolio holdings with the Securities and Exchange Commission for the first and third quarters of each fiscal year on Form N-Q. The Fund’s Forms N-Q are available on the Commission’s website at www.sec.gov. The Fund’s Forms N-Q may also be reviewed and copied at the Commission’s Public Reference Room in Washington, D.C. Information on the operation and location of the Public Reference Room may be obtained by calling 1-800-SEC-0330. The Fund’s schedule of portfolio holdings is also available on the Fund’s website as of the end of each month no sooner than 15 days after the end of the month. |
|
| The Fund’s Statement of Additional Information contains additional information about the Fund’s Trustees and is available without charge, upon request, by calling (800) 225-1852. |
Mutual Funds:
| | | | |
ARE NOT INSURED BY THE FDIC OR ANY
FEDERAL GOVERNMENT AGENCY | | MAY LOSE VALUE | | ARE NOT A DEPOSIT OF OR GUARANTEED
BY ANY BANK OR ANY BANK AFFILIATE |
PGIM QMA SMALL-CAP VALUE FUND
| | | | | | | | | | | | | | |
| SHARE CLASS | | A | | C | | R | | Z | | R2 | | R4 | | R6* |
| NASDAQ | | TSVAX | | TRACX | | TSVRX | | TASVX | | PSVDX | | PSVKX | | TSVQX |
| CUSIP | | 875921785 | | 875921710 | | 875921843 | | 875921306 | | 875921611 | | 875921595 | | 875921777 |
* Formerly known as Class Q
MF232E

PGIM CORE BOND FUND
(formerly known as Prudential Core Bond Fund)
ANNUAL REPORT
JULY 31, 2018

To enroll in e-delivery, go to pgiminvestments.com/edelivery
Highlights
| • | | Sector allocation was a strong contributor to performance, highlighted by overweights to commercial mortgage-backed securities (CMBS) and asset-backed securities (ABS). |
| • | | An underweight in mortgage-backed securities (MBS) was a modest detractor over the one-year period. |
| • | | Security selection in collateralized loan obligations (CLOs), non-agency mortgages, interest rate swaps, ABS, and emerging markets added to performance. |
| • | | Security selection in investment-grade corporates, CMBS, and MBS limited results. |
This report is not authorized for distribution to prospective investors unless preceded or accompanied by a current prospectus.
The views expressed in this report and information about the Fund’s portfolio holdings are for the period covered by this report and are subject to change thereafter.
Mutual funds are distributed by Prudential Investment Management Services LLC (PIMS), member SIPC. PGIM Fixed Income is a unit of PGIM, Inc. (PGIM), a registered investment adviser. PIMS and PGIM are Prudential Financial companies. © 2018 Prudential Financial, Inc. and its related entities. PGIM and the PGIM logo are service marks of Prudential Financial, Inc. and its related entities, registered in many jurisdictions worldwide.
| | |
| 2 | | Visit our website at pgiminvestments.com |
Table of Contents
This Page Intentionally Left Blank
Letter from the President

Dear Shareholder:
We hope you find the annual report for the PGIM Core Bond Fund informative and useful. The report covers performance for the 12-month period that ended July 31, 2018.
We have important information to share with you. Effective June 11, 2018, Prudential Mutual Funds were renamed PGIM Funds. This renaming is part of our ongoing effort to further build our reputation and establish our global brand, which began when our firm adopted PGIM Investments as its name in April 2017. Please note that only the Fund’s name has changed. Your Fund’s management and operation, along with its symbols, remained the same.*
Over the reporting period, the global economy continued to grow, and central banks gradually tightened monetary policy. In the US, the economy expanded and employment increased. In June, the Federal Reserve hiked interest rates for the seventh time since 2015, based on confidence in the economy.
Equity returns were strong, due to optimistic earnings expectations and investor sentiment. Global equities, including emerging markets, generally posted positive returns. However, they trailed the performance of US equities, which rose on higher corporate profits, new regulatory policies, and tax reform benefits. Volatility spiked briefly in the middle of the period on inflation concerns, rising interest rates, and a potential global trade war, but it decreased as the period ended.
The overall bond market declined modestly during the period, as measured by the Bloomberg Barclays US Aggregate Bond Index. The best performance came from higher-yielding, economically sensitive sectors. Although they finished the period with negative returns, US investment-grade corporate bonds outperformed US government nominal bonds. A major trend during the period was the flattening of the US Treasury yield curve, which increased the yield on fixed income investments with shorter maturities and made them more attractive to investors.
Regarding your investments with PGIM, we believe it is important to maintain a diversified portfolio of funds consistent with your tolerance for risk, time horizon, and financial goals. Your financial advisor can help you create a diversified investment plan that may include funds covering all the basic asset classes and that reflects your personal investor profile and risk tolerance. However, diversification and asset allocation strategies do not assure a profit or protect against loss in declining markets.
At PGIM Investments, we consider it a great privilege and responsibility to help investors
participate in opportunities across global markets while meeting their toughest investment
challenges. PGIM is a top-10 global investment manager with more than $1 trillion in assets under management. This investment expertise allows us to deliver actively managed funds and strategies to meet the needs of investors around the globe.
Thank you for choosing our family of funds.
Sincerely,

Stuart S. Parker, President
PGIM Core Bond Fund
September 14, 2018
*The Prudential Day One Funds did not change their names.
Your Fund’s Performance (unaudited)
Performance data quoted represent past performance. Past performance does not guarantee future results. The investment return and principal value of an investment will fluctuate, so that an investor’s shares, when redeemed, may be worth more or less than their original cost. Current performance may be lower or higher than the past performance data quoted. An investor may obtain performance data as of the most recent month-end by visiting our website at www.pgiminvestments.com or by calling (800) 225-1852.
| | | | | | | | |
| | | Average Annual Total Returns as of 7/31/18 (with sales charges) |
| | | One Year (%) | | Five Years (%) | | Ten Years (%) | | Since Inception (%) |
| Class A | | –5.59 | | N/A | | N/A | | –0.05 (2/17/15) |
| Class C | | –2.74 | | N/A | | N/A | | 0.56 (2/17/15) |
| Class R | | –1.39 | | N/A | | N/A | | 1.05 (2/17/15) |
| Class Z | | –0.90 | | 1.41 | | 3.96 | | — |
| Class R6* | | –0.74 | | N/A | | N/A | | 1.61 (2/17/15) |
| Bloomberg Barclays US Aggregate Bond Index |
| | –0.80 | | 2.25 | | 3.73 | | — |
| Lipper Core Bond Funds Average | | | | | | |
| | | –0.86 | | 2.12 | | 3.75 | | — |
| | | | | | | | |
| | | Average Annual Total Returns as of 7/31/18 (without sales charges) |
| | | One Year (%) | | Five Years (%) | | Ten Years (%) | | Since Inception (%) |
| Class A | | –1.14 | | N/A | | N/A | | 1.29 (2/17/15) |
| Class C | | –1.78 | | N/A | | N/A | | 0.56 (2/17/15) |
| Class R | | –1.39 | | N/A | | N/A | | 1.05 (2/17/15) |
| Class Z | | –0.90 | | 1.41 | | 3.96 | | — |
| Class R6* | | –0.74 | | N/A | | N/A | | 1.61 (2/17/15) |
| Bloomberg Barclays US Aggregate Bond Index |
| | –0.80 | | 2.25 | | 3.73 | | — |
| Lipper Core Bond Funds Average | | | | | | | | |
| | | –0.86 | | 2.12 | | 3.75 | | — |
*Formerly known as Class Q shares
| | |
| 6 | | Visit our website at pgiminvestments.com |
Growth of a $10,000 Investment
The graph compares a $10,000 investment in the Fund’s Class Z shares with a similar investment in the Bloomberg Barclays US Aggregate Bond Index by portraying the initial account values at the beginning of the 10-year period (July 31, 2008) and the account values at the end of the current fiscal period (July 31, 2018), as measured on a quarterly basis. For purposes of the graph, and unless otherwise indicated, it has been assumed that (a) all recurring fees (including management fees) were deducted; and (b) all dividends and distributions were reinvested. The line graph provides information for Class Z shares only. As indicated in the tables provided earlier, performance for Class A, Class C, Class R, and Class R6* shares will vary due to the differing charges and expenses applicable to each share class (as indicated in the following paragraphs). Without waiver of fees and/or expense reimbursements, if any, the returns would have been lower.
Past performance does not predict future performance. Total returns and the ending account values in the graph include changes in share price and reinvestment of dividends and capital gains distributions in a hypothetical investment for the periods shown. The Fund’s total returns do not reflect the deduction of income taxes on an individual’s investment. Taxes may reduce your actual investment returns on income or gains paid by the Fund or any gains you may realize if you sell your shares.
*Formerly known as Class Q
Source: PGIM Investments LLC and Lipper Inc.
Since Inception returns are provided for any share class with less than 10 fiscal years of returns. Since Inception returns for the Index and the Lipper Average are measured from the closest month-end to the class’ inception date.
Your Fund’s Performance (continued)
The returns in the tables do not reflect the deduction of taxes that a shareholder would pay on Fund distributions or following the redemption of Fund shares. The average annual total returns take into account applicable sales charges, which are described in the table below.
| | | | | | | | | | |
| | | Class A | | Class C | | Class R | | Class Z | | Class R6* |
| Maximum initial sales charge | | 4.50% of the public offering price | | None | | None | | None | | None |
| Contingent deferred sales charge (CDSC) (as a percentage of the lower of original purchase price or net asset value at redemption) | | 1.00% on sales of $1 million or more made within 12 months of purchase | | 1.00% on sales made within 12 months of purchase | | None | | None | | None |
| Annual distribution or distribution and service (12b-1) fees (shown as a percentage of average daily net assets) | | 0.25% | | 1.00% | | 0.75%
(0.50%
currently) | | None | | None |
Benchmark Definitions
Bloomberg Barclays US Aggregate Bond Index—The Bloomberg Barclays US Aggregate Bond Index is unmanaged and represents securities that are SEC registered, taxable, and dollar denominated. It covers the US investment-grade fixed rate bond market, with index components for government and corporate securities, mortgage pass-through securities, and asset-backed securities. The average annual total returns for the Index measured from the month-end closest to the inception date of the Fund’s Class A, Class C, Class R, and Class R6* shares through 7/31/18 is 1.15%.
Lipper Core Bond Funds Average—Lipper Core Bond funds invest at least 85% in domestic investment-grade debt issues (rated in the top four grades) with any remaining investment in non-benchmark sectors such as high yield, global, and emerging market debt. These funds maintain dollar-weighted average maturities of five to 10 years. The average annual total returns for the Average measured from the month-end closest to the inception date of the Fund’s Class A, Class C, Class R, and Class R6* shares through 7/31/18 is 1.06%.
Investors cannot invest directly in an index or average. The returns for the Index would be lower if they included the effects of sales charges, operating expenses of a mutual fund, or taxes. Returns for the Lipper Average reflect the deduction of operating expenses, but not sales charges or taxes.
*Formerly known as Class Q
| | |
| 8 | | Visit our website at pgiminvestments.com |
| | | | | | |
| Distributions and Yields as of 7/31/18 |
| | Total Distributions
Paid for
12 Months ($) | | SEC 30-Day
Subsidized
Yield** (%) | | SEC 30-Day
Unsubsidized
Yield*** (%) |
| Class A | | 0.25 | | 2.53 | | 2.38 |
| Class C | | 0.17 | | 1.89 | | 1.09 |
| Class R | | 0.22 | | 2.38 | | –93.94 |
| Class Z | | 0.27 | | 2.89 | | 2.87 |
| Class R6* | | 0.28 | | 2.94 | | 2.89 |
*Formerly known as Class Q
**SEC 30-Day Subsidized Yield (%)—A standardized yield calculation created by the Securities and Exchange Commission, it reflects the income earned during a 30-day period, after the deduction of the fund’s net expenses (net of any expense waivers or reimbursements).
***SEC 30-Day Unsubsidized Yield (%)—A standardized yield calculation created by the Securities and Exchange Commission, it reflects the income earned during a 30-day period, after the deduction of the Fund’s gross expenses.
| | | | |
| Credit Quality expressed as a percentage of total investments as of 7/31/18 (%) | |
| AAA | | | 61.9 | |
| AA | | | 7.2 | |
| A | | | 14.9 | |
| BBB | | | 13.4 | |
| BB | | | 0.1 | |
| Not Rated | | | 2.2 | |
| Cash Equivalents | | | 0.4 | |
| Total Investments | | | 100.0 | |
Source: PGIM Fixed Income
Credit ratings reflect the highest rating assigned by a nationally recognized statistical rating organization (NRSRO) such as Moody’s Investor Service, Inc. (Moody’s), S&P Global Ratings (S&P), or Fitch, Inc. (Fitch). Credit ratings reflect the common nomenclature used by both S&P and Fitch. Where applicable, ratings are converted to the comparable S&P/Fitch rating tier nomenclature. These rating agencies are independent, and are widely used. The Not Rated category consists of securities that have not been rated by an NRSRO. Credit ratings are subject to change. Values may not sum to 100.0% due to rounding.
Strategy and Performance Overview
How did the Fund perform?
The PGIM Core Bond Fund’s Class Z shares declined 0.90% for the 12-month reporting period that ended July 31, 2018, underperforming the 0.80% decline of the Bloomberg Barclays US Aggregate Bond Index (the Index) and the 0.86% decline of the Lipper Core Bond Funds Average.
What were market conditions?
| • | | 2017 was not expected to be a good year for bonds. There was so much for the bond market to fear. European and Japanese interest rates had risen as the European Central Bank (ECB) and Bank of Japan (BoJ) began their respective stylized tapering. The U.S. had its Republican sweep, bringing with it expectations for pro-cyclical fiscal stimuli and upside risks for Federal Reserve (Fed) rate hikes. All said, this confluence of events was expected to finally torpedo the decades-old bond bull market. |
| • | | While European political fears turned out to be a bit overblown, all of the other fears were more or less grounded. The ECB and BoJ continued to reduce their purchases, fiscal stimulus in the U.S. was on the way, and the world’s economy generally continued to improve. But thanks to positive yield curves lending a little yield and roll-down advantage relative to cash, coupled with a little more spread tightening (i.e., narrower spreads between yields on U.S. Treasuries versus other types of bonds with comparable maturities), 2017 confounded many of the initial expectations and turned out to be yet another solid year for fixed income. Broad benchmarks generally outperformed cash and, as many expected, the higher-yielding sectors turned in particularly impressive performances. |
| • | | The markets struggled at the end of the period as the fears on the trade and political fronts that emerged early in 2018 were realized in the second quarter to varying degrees, while the long shadow of quantitative tightening continued to stretch across the markets. The trade conflicts started getting uneasy at the G20 but then became real as U.S. barbs were met with tit-for-tat measures, which PGIM Fixed Income believes are at risk of intensifying during the third quarter of this year and beyond. (The G20, or Group of Twenty, is an international forum for governments representing 19 of the world’s largest economies and the European Union.) The results from the elections in Italy in the first quarter of 2018 transformed into a market nightmare in the second quarter as renegade parties entered a coalition with a platform that appeared to jeopardize Italy’s finances and its relationship with Europe. Meanwhile, emerging market developments, including elections in Turkey and Mexico, raised concerns about the potential rise in policy heterodoxy. Over the first half of 2018, these concerns fueled a continued widening of spreads from the tight spreads in the first quarter, which may have gotten a bit ahead of fundamentals. |
| • | | The fixed income markets, as represented by the Bloomberg Barclays US Aggregate Bond Index, posted a modestly negative return of –0.80%. |
| | |
| 10 | | Visit our website at pgiminvestments.com |
| • | | U.S. corporate bonds, as represented by the Bloomberg Barclays Corporate Index, returned –0.73% with an excess return to U.S. Treasuries of +76 basis points (bps) during the reporting period. (One basis point equals 0.01%.) Industrials outperformed financials and utilities, albeit all sectors posted negative returns over the reporting period. Metals & mining, energy, and telecom were among the strongest sectors over the period, while cable & satellite, finance companies, and capital goods were amongst the largest underperformers. |
| • | | The Bloomberg Barclays Agency MBS Index posted its best month in July since September 2017 as strong broad-based demand returned with a sell-off in rates to 3%, muted volatility, and contained supply coming off peak seasonals. The 30-year mortgage rate has remained sticky recently. It dipped to about 4.63% in June and ended July at 4.75%. |
| • | | Structured products also posted tepid returns for the reporting period. At the end of the period, issuance of CMBS remained on the light side, and we expect supply to remain light in August. ABS saw a surge in supply at the end of the period as investors looked to put capital to work entering the new quarter. Year to date, new issuance is approximately $148 billion, 13% ahead of the pace in 2017. In secondary markets, dealers remained more risk averse and maintained light balance sheets as a heavy primary market supply hindered demand for secondary paper. |
What worked?
| • | | Sector allocation was a strong contributor to performance, highlighted by overweights to CMBS and ABS. |
| • | | Security selection in CLOs, non-agency mortgages, interest rate swaps, ABS, and emerging markets added to performance. |
| • | | Within corporates, positioning in the upstream energy, banking, and foreign non-corporate sectors was positive. |
| • | | In individual security selection, the Fund benefited from overweights to issuers in the upstream energy sector, including Cenovus Energy, Devon Energy, and Husky Energy. Overweights to DDR Corp. (REITs) and Qatar were also positive. |
| • | | The Fund’s tactical duration position and yield curve flattener positioning both added modestly to performance for the one-year period. Duration measures the sensitivity of the price (the value of principal) of a bond to a change in interest rates. The Fund’s active duration positioning ranged from –0.3 years short to +0.4 years long versus its benchmark, ending the period at the shorter end of the range at –0.2 years. |
What didn’t work?
| • | | An underweight in MBS was a modest detractor over the one-year period. |
| • | | Security selection in investment-grade corporates, CMBS, and MBS limited results. |
Strategy and Performance Overview (continued)
| • | | The Fund’s positioning in the electric utilities, consumer non-cyclical, and revenue education municipal sectors detracted from performance. |
| • | | In individual security selection, the Fund’s overweight positions in Newell Brands (consumer non-cyclical) and Exelon (electric utilities) detracted from returns. Underweights to Verizon (telecom) and Vale (metals & mining) were also negative. |
Did the Fund use derivatives and how did they affect performance?
The Fund uses derivatives when they facilitate implementation of the overall investment approach. During the reporting period, the Fund used interest rate futures, options, and swaps to help manage duration positioning and yield curve exposure. Futures and options modestly detracted from performance while swaps added value.
Current outlook
| • | | At the outset of the second quarter, PGIM Fixed Income anticipated a trading range on the U.S. Treasury 10-year yield between 2.65% and 2.95% with U.S. Treasuries poised to outperform derivatives (both futures and interest rate swaps). While the 10-year trading range was slightly higher at 2.75% to 3.10%, cash Treasuries outperformed swaps as spreads at the intermediate and long portions of the yield curve widened during the quarter. Looking ahead, given the potential for further changes to the interest rate on excess reserves (IOER) toward the lower end of the Fed’s rate corridor, U.S. Treasury funding rates should trade lower in tandem, thus richening U.S Treasuries relative to fixed-rate derivatives. |
| • | | Overall, PGIM Fixed Income anticipates that it will likely add duration when the 10-year yield approaches the top of the recent trading range of 2.75%-3.00%, while potentially shedding duration when the yield moves toward the bottom of the range. More specifically, PGIM Fixed Income is maintaining long positioning in the seven-year portion of the U.S. yield curve and short positioning at the front of the curve. PGIM Fixed Income believes the market continues to underprice future Fed tightening given that PGIM Fixed Income’s base case calls for a total of four fed funds rate hikes in 2018 (i.e., two more hikes in the second half of this year) and two additional hikes in 2019. |
| • | | PGIM Fixed Income maintains a positive view of fundamentals in the credit sectors of the fixed income market with overweight positions in spread sectors including structured product sectors (CLO, CMBS, and ABS). |
| • | | In investment-grade corporate bonds, as we enter the later stage of the credit cycle, PGIM Fixed Income continues to favor better-quality financials and electric utilities over industrials that are subject to event risk. Within industrials, PGIM Fixed Income is focusing on names where an “event” has passed, as higher-quality corporates continue to lever up and mergers and acquisitions (M&A) activity remains a concern. We remain overweight in BBB-rated issuers due to a steep spread curve. |
| | |
| 12 | | Visit our website at pgiminvestments.com |
| • | | Regarding mortgage products, PGIM Fixed Income is neutral versus rates while it remains underweight versus other spread products. PGIM Fixed Income prefers up-in-coupon positioning in both 30- and 15-year sectors to maximize carry relative to the Index. PGIM Fixed Income remains a holder of seasoned pools given better prepayment behavior and better convexity. |
| • | | PGIM Fixed Income has a long-term positive view of structured products at the top of the capital structure, especially CLOs and CMBS, although spreads could widen modestly in the short term before stabilizing. PGIM Fixed Income remains content to earn carry at current spreads, and remains negative on conduit CMBS mezzanine tranches as credit quality has been unimpressive. Amid tight spreads and high leverage demand, the Fund is looking more at financing trades, rather than exposure to underlying assets. |
| • | | U.S. government-related sectors, including Treasuries, agency bonds, and agency mortgage-backed securities, remain a significant underweight as we find more compelling value in the aforementioned sectors. |
Fees and Expenses (unaudited)
As a shareholder of the Fund, you incur two types of costs: (1) transaction costs, including sales charges (loads) on purchase payments and redemptions, as applicable, and (2) ongoing costs, including management fees, and other Fund expenses, as applicable. This example is intended to help you understand your ongoing costs (in dollars) of investing in the Fund and to compare these costs with the ongoing costs of investing in other mutual funds.
The example is based on an investment of $1,000 held through the six-month period ended July 31, 2018. The example is for illustrative purposes only; you should consult the Prospectus for information on initial and subsequent minimum investment requirements.
Actual Expenses
The first line for each share class in the table on the following page provides information about actual account values and actual expenses. You may use the information on this line, together with the amount you invested, to estimate the expenses that you paid over the period. Simply divide your account value by $1,000 (for example, an $8,600 account value ÷ $1,000 = 8.6), then multiply the result by the number on the first line under the heading “Expenses Paid During the Six-Month Period” to estimate the expenses you paid on your account during this period.
Hypothetical Example for Comparison Purposes
The second line for each share class in the table on the following page provides information about hypothetical account values and hypothetical expenses based on the Fund’s actual expense ratio and an assumed rate of return of 5% per year before expenses, which is not the Fund’s actual return. The hypothetical account values and expenses may not be used to estimate the actual ending account balance or expenses you paid for the period. You may use this information to compare the ongoing costs of investing in the Fund and other funds. To do so, compare this 5% hypothetical example with the 5% hypothetical examples that appear in the shareholder reports of the other funds.
The Fund’s transfer agent may charge additional fees to holders of certain accounts that are not included in the expenses shown in the table on the following page. These fees apply to individual retirement accounts (IRAs) and Section 403(b) accounts. As of the close of the six-month period covered by the table, IRA fees included an annual maintenance fee of $15 per account (subject to a maximum annual maintenance fee of $25 for all accounts held by the same shareholder). Section 403(b) accounts are charged an annual $25 fiduciary maintenance fee. Some of the fees may vary in amount, or may be waived, based on your total account balance or the number of Prudential funds, including the Fund, that you own. You should consider the additional fees that were charged to your Fund account over the six-month period when you estimate the total ongoing expenses paid over the
| | |
| 14 | | Visit our website at pgiminvestments.com |
period and the impact of these fees on your ending account value, as these additional expenses are not reflected in the information provided in the expense table. Additional fees have the effect of reducing investment returns.
Please note that the expenses shown in the table are meant to highlight your ongoing costs only and do not reflect any transactional costs such as sales charges (loads). Therefore, the second line for each share class in the table is useful in comparing ongoing costs only and will not help you determine the relative total costs of owning different funds. In addition, if these transactional costs were included, your costs would have been higher.
| | | | | | | | | | | | | | | | | | |
PGIM
Core Bond Fund | | Beginning Account
Value
February 1, 2018 | | | Ending Account
Value
July 31, 2018 | | | Annualized
Expense Ratio
Based on the
Six-Month Period | | | Expenses Paid
During the
Six-Month Period* | |
| Class A | | Actual | | $ | 1,000.00 | | | $ | 991.70 | | | | 0.70 | % | | $ | 3.46 | |
| | Hypothetical | | $ | 1,000.00 | | | $ | 1,021.32 | | | | 0.70 | % | | $ | 3.51 | |
| Class C | | Actual | | $ | 1,000.00 | | | $ | 988.10 | | | | 1.45 | % | | $ | 7.15 | |
| | Hypothetical | | $ | 1,000.00 | | | $ | 1,017.60 | | | | 1.45 | % | | $ | 7.25 | |
| Class R | | Actual | | $ | 1,000.00 | | | $ | 990.50 | | | | 0.95 | % | | $ | 4.69 | |
| | Hypothetical | | $ | 1,000.00 | | | $ | 1,020.08 | | | | 0.95 | % | | $ | 4.76 | |
| Class Z | | Actual | | $ | 1,000.00 | | | $ | 992.00 | | | | 0.45 | % | | $ | 2.22 | |
| | Hypothetical | | $ | 1,000.00 | | | $ | 1,022.56 | | | | 0.45 | % | | $ | 2.26 | |
| Class R6** | | Actual | | $ | 1,000.00 | | | $ | 993.20 | | | | 0.40 | % | | $ | 1.98 | |
| | | Hypothetical | | $ | 1,000.00 | | | $ | 1,022.81 | | | | 0.40 | % | | $ | 2.01 | |
*Fund expenses (net of fee waivers or subsidies, if any) for each share class are equal to the annualized expense ratio for each share class (provided in the table), multiplied by the average account value over the period, multiplied by the 181 days in the six-month period ended July 31, 2018, and divided by the 365 days in the Fund’s fiscal year ended July 31, 2018 (to reflect the six-month period). Expenses presented in the table include the expenses of any underlying portfolios in which the Fund may invest.
**Formerly known as Class Q shares.
Schedule of Investments
as of July 31, 2018
| | | | | | | | | | | | | | | | |
| Description | | Interest
Rate | | | Maturity
Date | | | Principal
Amount (000)# | | | Value | |
LONG-TERM INVESTMENTS 98.7% | | | | | | | | | | | | | | | | |
| | | | |
ASSET-BACKED SECURITIES 21.6% | | | | | | | | | | | | | | | | |
| | | | |
Automobiles 4.6% | | | | | | | | | | | | | | | | |
AmeriCredit Automobile Receivables Trust, | | | | | | | | | | | | | | | | |
Series 2016-4, Class C | | | 2.410 | % | | | 07/08/22 | | | | 100 | | | $ | 98,339 | |
Series 2017-3, Class C | | | 2.690 | | | | 06/19/23 | | | | 240 | | | | 235,713 | |
Series 2017-4, Class C | | | 2.600 | | | | 09/18/23 | | | | 600 | | | | 587,494 | |
Series 2018-1, Class C | | | 3.500 | | | | 01/18/24 | | | | 500 | | | | 500,625 | |
Avis Budget Rental Car Funding AESOP LLC, | | | | | | | | | | | | | | | | |
Series 2013-1A, Class A, 144A | | | 1.920 | | | | 09/20/19 | | | | 367 | | | | 366,271 | |
Series 2015-2A, Class A, 144A | | | 2.630 | | | | 12/20/21 | | | | 300 | | | | 295,340 | |
Series 2016-1A, Class A, 144A | | | 2.990 | | | | 06/20/22 | | | | 900 | | | | 888,677 | |
Series 2018-1A, Class A, 144A | | | 3.700 | | | | 09/20/24 | | | | 1,100 | | | | 1,100,036 | |
Drive Auto Receivables Trust,
Series 2018-1, Class B | | | 2.880 | | | | 02/15/22 | | | | 500 | | | | 498,571 | |
Enterprise Fleet Financing LLC, | | | | | | | | | | | | | | | | |
Series 2016-2, Class A2, 144A | | | 1.740 | | | | 02/22/22 | | | | 90 | | | | 89,838 | |
Series 2017-1, Class A2, 144A | | | 2.130 | | | | 07/20/22 | | | | 569 | | | | 565,472 | |
Ford Credit Auto Owner Trust, | | | | | | | | | | | | | | | | |
Series 2017-1, Class A, 144A | | | 2.620 | | | | 08/15/28 | | | | 1,500 | | | | 1,462,201 | |
Series 2017-2, Class A, 144A | | | 2.360 | | | | 03/15/29 | | | | 1,600 | | | | 1,533,327 | |
Ford Credit Auto Owner Trust/Ford Credit,
Series 2018-2, Class A, 144A^ | | | 3.470 | | | | 01/15/30 | | | | 1,100 | | | | 1,099,960 | |
Ford Credit Floorplan Master Owner Trust A, | | | | | | | | | | | | | | | | |
Series 2017-3, Class A | | | 2.480 | | | | 09/15/24 | | | | 1,200 | | | | 1,165,367 | |
Series 2018-2, Class A | | | 3.170 | | | | 03/15/25 | | | | 4,000 | | | | 3,972,589 | |
Hertz Vehicle Financing II LP,
Series 2016-1A, Class A, 144A | | | 2.320 | | | | 03/25/20 | | | | 200 | | | | 199,174 | |
OneMain Direct Auto Receivables Trust, | | | | | | | | | | | | | | | | |
Series 2017-01A, Class A, 144A | | | 2.160 | | | | 10/15/20 | | | | 926 | | | | 922,898 | |
Series 2017-2A, Class B, 144A | | | 2.550 | | | | 11/14/23 | | | | 1,600 | | | | 1,577,960 | |
Series 2017-2A, Class C, 144A | | | 2.820 | | | | 07/15/24 | | | | 400 | | | | 393,476 | |
Series 2018-1A, Class A, 144A | | | 3.430 | | | | 12/16/24 | | | | 1,800 | | | | 1,799,589 | |
Santander Drive Auto Receivables Trust, | | | | | | | | | | | | | | | | |
Series 2017-3, Class C | | | 2.760 | | | | 12/15/22 | | | | 400 | | | | 394,325 | |
Series 2018-1, Class C | | | 2.960 | | | | 03/15/24 | | | | 300 | | | | 296,597 | |
Series 2018-2, Class C | | | 3.350 | | | | 07/17/23 | | | | 430 | | | | 428,331 | |
| | | | | | | | | | | | | | | | |
| | | | | | | | | | | | | | | 20,472,170 | |
See Notes to Financial Statements.
Schedule of Investments (continued)
as of July 31, 2018
| | | | | | | | | | | | | | | | |
| Description | | Interest
Rate | | | Maturity
Date | | | Principal
Amount (000)# | | | Value | |
ASSET-BACKED SECURITIES (Continued) | | | | | | | | | | | | | | | | |
| | | | |
Collateralized Loan Obligations 10.1% | | | | | | | | | | | | | | | | |
ALM Ltd. (Cayman Islands),
Series 2013-8A, Class A1R, 144A, 3 Month LIBOR + 1.490% | | | 3.829 | %(c) | | | 10/15/28 | | | | 250 | | | $ | 250,271 | |
Anchorage Capital CLO Ltd. (Cayman Islands),
Series 2015-6A, Class AR, 144A, 3 Month LIBOR + 1.270% | | | 3.609 | (c) | | | 07/15/30 | | | | 750 | | | | 750,984 | |
Apidos CLO XXIII (Cayman Islands),
Series 2015-23A, Class A1R, 144A, 3 Month LIBOR + 0.820% | | | 3.159 | (c) | | | 01/15/27 | | | | 1,250 | | | | 1,245,870 | |
ArrowMark Colorado Holdings (Cayman Islands),
Series 2017-6A, Class A1, 144A, 3 Month LIBOR + 1.280% | | | 3.619 | (c) | | | 07/15/29 | | | | 250 | | | | 250,364 | |
Atlas Senior Loan Fund Ltd. (Cayman Islands), | | | | | | | | | | | | | | | | |
Series 2014-1A, Class AR2, 144A, 3 Month LIBOR + 1.260% | | | 3.599 | (c) | | | 07/16/29 | | | | 750 | | | | 750,968 | |
Series 2017-8A, Class A, 144A, 3 Month LIBOR + 1.300% | | | 3.639 | (c) | | | 01/16/30 | | | | 250 | | | | 249,848 | |
Avery Point CLO Ltd. (Cayman Islands),
Series 2015-6A, Class A, 144A, 3 Month LIBOR + 1.450% | | | 3.813 | (c) | | | 08/05/27 | | | | 250 | | | | 250,000 | |
Ballyrock CLO Ltd. (Cayman Islands),
Series 2016-1A, Class A, 144A, 3 Month LIBOR + 1.590% | | | 3.929 | (c) | | | 10/15/28 | | | | 250 | | | | 250,000 | |
Battalion CLO Ltd. (Cayman Islands), | | | | | | | | | | | | | | | | |
Series 2014-7A, Class A1RR, 144A, 3 Month LIBOR + 1.040% | | | 3.376 | (c) | | | 07/17/28 | | | | 1,250 | | | | 1,246,957 | |
Series 2015-8A, Class A1R, 144A, 3 Month LIBOR + 1.340% | | | 3.673 | (c) | | | 07/18/30 | | | | 250 | | | | 250,496 | |
Series 2016-10A, Class A1, 144A, 3 Month LIBOR + 1.550% | | | 3.892 | (c) | | | 01/24/29 | | | | 250 | | | | 250,814 | |
Benefit Street Partners CLO Ltd. (Cayman Islands),
Series 2017-12A, Class A1, 144A, 3 Month LIBOR + 1.250% | | | 3.589 | (c) | | | 10/15/30 | | | | 500 | | | | 500,698 | |
BlueMountain CLO Ltd. (Cayman Islands),
Series 2015-1A, Class A1R, 144A, 3 Month LIBOR + 1.330% | | | 3.667 | (c) | | | 04/13/27 | | | | 500 | | | | 500,000 | |
Canyon Capital CLO Ltd. (Cayman Islands),
Series 2015-1A, Class AS, 144A, 3 Month LIBOR + 1.250% | | | 3.589 | (c) | | | 04/15/29 | | | | 750 | | | | 750,826 | |
Carlyle Global Market Strategies CLO Ltd.,
Series 2012-4A, Class AR, 144A, 3 Month LIBOR + 1.450% | | | 3.798 | (c) | | | 01/20/29 | | | | 250 | | | | 250,580 | |
Carlyle US CLO Ltd. (Cayman Islands), | | | | | | | | | | | | | | | | |
Series 2017-1A, Class A1B, 144A, 3 Month LIBOR + 1.230% | | | 3.578 | (c) | | | 04/20/31 | | | | 750 | | | | 751,296 | |
See Notes to Financial Statements.
| | | | | | | | | | | | | | | | |
| Description | | Interest
Rate | | | Maturity
Date | | | Principal
Amount (000)# | | | Value | |
ASSET-BACKED SECURITIES (Continued) | | | | | | | | | | | | | | | | |
| | | | |
Collateralized Loan Obligations (cont’d.) | | | | | | | | | | | | | | | | |
Carlyle US CLO Ltd. (Cayman Islands), (cont’d.) | | | | | | | | | | | | | | | | |
Series 2018-1A, Class A1, 144A, 3 Month LIBOR + 1.020% | | | 3.075 | %(c) | | | 04/20/31 | | | | 1,000 | | | $ | 996,430 | |
Elevation CLO Ltd. (Cayman Islands), | | | | | | | | | | | | | | | | |
Series 2014-3A, Class AR, 144A, 3 Month LIBOR + 1.180% | | | 3.519 | (c) | | | 10/15/26 | | | | 500 | | | | 499,993 | |
Series 2015-4A, Class A, 144A, 3 Month LIBOR + 1.550% | | | 3.883 | (c) | | | 04/18/27 | | | | 250 | | | | 250,821 | |
Series 2017-7A, Class A, 144A, 3 Month LIBOR + 1.220% | | | 3.559 | (c) | | | 07/15/30 | | | | 750 | | | | 750,667 | |
Flagship CLO Ltd. (Cayman Islands),
Series 2014-8A, Class ARR, 144A, 3 Month LIBOR + 0.850% | | | 3.189 | (c) | | | 01/16/26 | | | | 250 | | | | 249,696 | |
Galaxy CLO Ltd. (Cayman Islands),
Series 2014-18A, Class AR, 144A, 3 Month LIBOR + 1.170% | | | 3.509 | (c) | | | 10/15/26 | | | | 500 | | | | 499,994 | |
Greywolf CLO Ltd. (Cayman Islands),
Series 2018-1A, Class A1, 144A, 3 Month LIBOR + 1.030% | | | 3.539 | (c) | | | 04/26/31 | | | | 1,000 | | | | 1,000,182 | |
Highbridge Loan Management Ltd. (Cayman Islands),
Series 2015-6A, Class A1R, 144A, 3 Month LIBOR + 1.000% | | | 3.363 | (c) | | | 02/05/31 | | | | 250 | | | | 247,932 | |
ICG US CLO Ltd. (Cayman Islands),
Series 2017-2A, Class A1, 144A, 3 Month LIBOR + 1.280% | | | 3.627 | (c) | | | 10/23/29 | | | | 500 | | | | 500,197 | |
Jamestown CLO Ltd. (Cayman Islands),
Series 2016-9A, Class A1B, 144A, 3 Month LIBOR + 1.500% | | | 3.848 | (c) | | | 10/20/28 | | | | 250 | | | | 250,300 | |
KKR CLO Ltd. (Cayman Islands),
Series 11, Class AR, 144A, 3 Month LIBOR + 1.180% | | | 3.519 | (c) | | | 01/15/31 | | | | 500 | | | | 500,243 | |
KVK CLO Ltd. (Cayman Islands), | | | | | | | | | | | | | | | | |
Series 2014-1A, Class A1R, 144A, 3 Month LIBOR + 1.300% | | | 3.643 | (c) | | | 05/15/26 | | | | 500 | | | | 499,997 | |
Series 2014-3A, Class AR, 144A, 3 Month LIBOR + 1.200% | | | 3.539 | (c) | | | 10/15/26 | | | | 750 | | | | 749,990 | |
Limerock CLO LLC (Cayman Islands),
Series 2014-3A, Class A1R, 144A, 3 Month LIBOR + 1.200% | | | 3.548 | (c) | | | 10/20/26 | | | | 500 | | | | 500,273 | |
MidOcean Credit CLO (Cayman Islands), | | | | | | | | | | | | | | | | |
Series 2014-3A, Class A1R, 144A, 3 Month LIBOR + 1.120% | | | 2.681 | (c) | | | 04/21/31 | | | | 1,000 | | | | 996,659 | |
Series 2018-08A, Class A1, 144A, 3 Month LIBOR + 1.150% | | | 3.036 | (c) | | | 02/20/31 | | | | 1,500 | | | | 1,499,814 | |
See Notes to Financial Statements.
Schedule of Investments (continued)
as of July 31, 2018
| | | | | | | | | | | | | | | | |
| Description | | Interest
Rate | | | Maturity
Date | | | Principal
Amount (000)# | | | Value | |
ASSET-BACKED SECURITIES (Continued) | | | | | | | | | | | | | | | | |
| | | | |
Collateralized Loan Obligations (cont’d.) | | | | | | | | | | | | | | | | |
MidOcean Credit CLO (Cayman Islands), (cont’d.) | | | | | | | | | | | | | | | | |
Series 2018-9A, Class A1, 144A, 3 Month LIBOR + 1.150% | | | 3.397 | %(c) | | | 07/20/31 | | | | 1,250 | | | $ | 1,248,625 | |
Mountain View CLO LLC (Cayman Islands),
Series 2017-2A, Class A, 144A, 3 Month LIBOR + 1.210% | | | 3.549 | (c) | | | 01/16/31 | | | | 1,250 | | | | 1,245,010 | |
Mountain View CLO Ltd. (Cayman Islands), | | | | | | | | | | | | | | | | |
Series 2013-1A, Class AR, 144A, 3 Month LIBOR + 1.250% | | | 3.587 | (c) | | | 10/12/30 | | | | 500 | | | | 500,944 | |
Series 2015-09A, Class A1R, 144A, 3 Month LIBOR + 1.120% | | | 3.459 | (c) | | | 07/15/31 | | | | 2,000 | | | | 1,993,156 | |
Neuberger Berman CLO Ltd. (Cayman Islands),
Series 2017-16SA, Class A, 144A, 3 Month LIBOR + 0.850% | | | 3.189 | (c) | | | 01/15/28 | | | | 1,000 | | | | 997,459 | |
Ocean Trails CLO Ltd. (Cayman Islands),
Series 2016-6A, Class A2A, 144A, 3 Month LIBOR + 1.690% | | | 4.029 | (c) | | | 07/15/28 | | | | 250 | | | | 251,396 | |
OCP CLO Ltd. (Cayman Islands),
Series 2017-13A, Class A1A, 144A, 3 Month LIBOR + 1.260% | | | 3.599 | (c) | | | 07/15/30 | | | | 250 | | | | 250,290 | |
OZLM Funding Ltd. (Cayman Islands), | | | | | | | | | | | | | | | | |
Series 2012-02A, Class A1R, 144A, 3 Month LIBOR + 1.440% | | | 3.779 | (c) | | | 10/30/27 | | | | 500 | | | | 500,022 | |
Series 2013-04A, Class A1R, 144A, 3 Month LIBOR + 1.250% | | | 3.597 | (c) | | | 10/22/30 | | | | 1,000 | | | | 1,001,718 | |
OZLM Ltd. (Cayman Islands), | | | | | | | | | | | | | | | | |
Series 2015-11A, Class A1R, 144A, 3 Month LIBOR + 1.250% | | | 3.589 | (c) | | | 10/30/30 | | | | 500 | | | | 500,892 | |
Series 2016-15A, Class A1, 144A, 3 Month LIBOR + 1.490% | | | 3.838 | (c) | | | 01/20/29 | | | | 750 | | | | 752,334 | |
Palmer Square CLO Ltd. (Cayman Islands), | | | | | | | | | | | | | | | | |
Series 2014-1A, Class A1R2, 144A, 3 Month LIBOR + 1.130% | | | 3.466 | (c) | | | 01/17/31 | | | | 1,000 | | | | 998,573 | |
Series 2015-1A, Class A1R, 144A, 3 Month LIBOR + 1.300% | | | 3.631 | (c) | | | 05/21/29 | | | | 500 | | | | 500,942 | |
Series 2015-2A, Class A1AR, 144A, 3 Month LIBOR + 1.270% | | | 3.618 | (c) | | | 07/20/30 | | | | 500 | | | | 500,714 | |
Regatta Funding Ltd. (Cayman Islands), | | | | | | | | | | | | | | | | |
Series 2014-1A, Class A1R, 144A, 3 Month LIBOR + 1.020% | | | 3.355 | (c) | | | 07/25/26 | | | | 500 | | | | 499,934 | |
Series 2016-1A, Class A1, 144A, 3 Month LIBOR + 1.520% | | | 3.845 | (c) | | | 12/20/28 | | | | 250 | | | | 250,520 | |
See Notes to Financial Statements.
| | | | | | | | | | | | | | | | |
| Description | | Interest
Rate | | | Maturity
Date | | | Principal
Amount (000)# | | | Value | |
ASSET-BACKED SECURITIES (Continued) | | | | | | | | | | | | | | | | |
| | | | |
Collateralized Loan Obligations (cont’d.) | | | | | | | | | | | | | | | | |
Romark CLO Ltd. (Cayman Islands), | | | | | | | | | | | | | | | | |
Series 2018-1A, Class A1, 144A, 3 Month LIBOR + 1.030% | | | 3.378 | %(c) | | | 04/20/31 | | | | 1,000 | | | $ | 999,897 | |
Series 2018-2A, Class A1, 144A, 3 Month LIBOR + 1.175% | | | 2.355 | (c) | | | 07/25/31 | | | | 250 | | | | 250,000 | |
Silvermore CLO Ltd. (Cayman Islands),
Series 2014-1A, Class A1R, 144A, 3 Month LIBOR + 1.170% | | | 3.513 | (c) | | | 05/15/26 | | | | 496 | | | | 495,598 | |
Sound Point CLO Ltd. (Cayman Islands), | | | | | | | | | | | | | | | | |
Series 2013-01A, Class A1R, 144A, 3 Month LIBOR + 1.070% | | | 3.405 | (c) | | | 01/26/31 | | | | 1,000 | | | | 997,859 | |
Series 2016-2A, Class A, 144A, 3 Month LIBOR + 1.660% | | | 4.008 | (c) | | | 10/20/28 | | | | 250 | | | | 250,398 | |
Series 2017-2A, Class A, 144A, 3 Month LIBOR + 1.280% | | | 3.615 | (c) | | | 07/25/30 | | | | 500 | | | | 500,445 | |
Telos CLO Ltd. (Cayman Islands),
Series 2013-04A, Class AR, 144A, 3 Month LIBOR + 1.240% | | | 3.576 | (c) | | | 01/17/30 | | | | 1,000 | | | | 998,432 | |
TICP CLO Ltd. (Cayman Islands), | | | | | | | | | | | | | | | | |
Series 2016-06A, Class A, 144A, 3 Month LIBOR + 1.550% | | | 3.889 | (c) | | | 01/15/29 | | | | 500 | | | | 501,522 | |
Series 2017-7A, Class AS, 144A, 3 Month LIBOR + 1.230% | | | 3.569 | (c) | | | 07/15/29 | | | | 250 | | | | 250,179 | |
Series 2017-9A, Class A, 144A, 3 Month LIBOR + 1.140% | | | 3.488 | (c) | | | 01/20/31 | | | | 1,000 | | | | 1,000,030 | |
Trinitas CLO Ltd. (Cayman Islands), | | | | | | | | | | | | | | | | |
Series 2016-5A, Class A, 144A, 3 Month LIBOR + 1.700% | | | 4.035 | (c) | | | 10/25/28 | | | | 500 | | | | 500,875 | |
Series 2017-6A, Class A, 144A, 3 Month LIBOR + 1.320% | | | 3.655 | (c) | | | 07/25/29 | | | | 500 | | | | 500,980 | |
Voya CLO Ltd. (Cayman Islands), | | | | | | | | | | | | | | | | |
Series 2013-1A, Class A1AR, 144A, 3 Month LIBOR + 1.210% | | | 3.549 | (c) | | | 10/15/30 | | | | 750 | | | | 750,909 | |
Series 2015-1A, Class A1R, 144A, 3 Month LIBOR + 0.900% | | | 3.233 | (c) | | | 01/18/29 | | | | 1,000 | | | | 996,399 | |
Series 2016-01A, Class A1R, 144A, 3 Month LIBOR + 1.070% | | | 3.418 | (c) | | | 01/20/31 | | | | 1,000 | | | | 997,847 | |
Wellfleet CLO Ltd. (Cayman Islands), | | | | | | | | | | | | | | | | |
Series 2016-02A, Class A1, 144A, 3 Month LIBOR + 1.650% | | | 3.998 | (c) | | | 10/20/28 | | | | 500 | | | | 500,785 | |
Series 2017-1A, Class A1, 144A, 3 Month LIBOR + 1.320% | | | 3.668 | (c) | | | 04/20/29 | | | | 250 | | | | 250,422 | |
Series 2018-01A, Class A, 144A, 3 Month LIBOR + 1.100% | | | 3.470 | (c) | | | 07/17/31 | | | | 2,500 | | | | 2,488,029 | |
York CLO Ltd. (Cayman Islands),
Series 2015-1A, Class AR, 144A, 3 Month LIBOR + 1.150% | | | 3.497 | (c) | | | 01/22/31 | | | | 500 | | | | 500,095 | |
See Notes to Financial Statements.
Schedule of Investments (continued)
as of July 31, 2018
| | | | | | | | | | | | | | | | |
| Description | | Interest
Rate | | | Maturity
Date | | | Principal
Amount (000)# | | | Value | |
ASSET-BACKED SECURITIES (Continued) | | | | | | | | | | | | | | | | |
| | | | |
Collateralized Loan Obligations (cont’d.) | | | | | | | | | | | | | | | | |
Zais CLO Ltd. (Cayman Islands), | | | | | | | | | | | | | | | | |
Series 2017-1A, Class A1, 144A, 3 Month LIBOR + 1.370% | | | 3.709 | %(c) | | | 07/15/29 | | | | 250 | | | $ | 250,589 | |
Series 2017-2A, Class A, 144A, 3 Month LIBOR + 1.290% | | | 3.629 | (c) | | | 04/15/30 | | | | 250 | | | | 251,350 | |
Series 2018-1A, Class A, 144A, 3 Month LIBOR + 0.950% | | | 3.289 | (c) | | | 04/15/29 | | | | 750 | | | | 747,020 | |
| | | | | | | | | | | | | | | | |
| | | | | | | | | | | | | | | 45,465,349 | |
| | | | |
Consumer Loans 0.7% | | | | | | | | | | | | | | | | |
OneMain Financial Issuance Trust, | | | | | | | | | | | | | | | | |
Series 2015-2A, Class A, 144A | | | 2.570 | | | | 07/18/25 | | | | 84 | | | | 83,675 | |
Series 2017-1A, Class A2, 144A, 1 Month LIBOR + 0.800% | | | 2.872 | (c) | | | 09/14/32 | | | | 900 | | | | 901,656 | |
Series 2018-01A, Class A, 144A | | | 3.300 | | | | 03/14/29 | | | | 360 | | | | 357,772 | |
SpringCastle America Funding LLC,
Series 2016-AA, Class A, 144A | | | 3.050 | | | | 04/25/29 | | | | 163 | | | | 162,584 | |
Springleaf Funding Trust, | | | | | | | | | | | | | | | | |
Series 2015-AA, Class A, 144A | | | 3.160 | | | | 11/15/24 | | | | 191 | | | | 191,105 | |
Series 2016-AA, Class A, 144A | | | 2.900 | | | | 11/15/29 | | | | 800 | | | | 797,061 | |
Series 2017-AA, Class A, 144A | | | 2.680 | | | | 07/15/30 | | | | 700 | | | | 687,420 | |
| | | | | | | | | | | | | | | | |
| | | | | | | | | | | | | | | 3,181,273 | |
| | | | |
Credit Cards 1.0% | | | | | | | | | | | | | | | | |
American Express Credit Account Master Trust,
Series 2017-5, Class A, 1 Month LIBOR + 0.380% | | | 2.452 | (c) | | | 02/18/25 | | | | 500 | | | | 502,868 | |
Chase Issuance Trust,
Series 2017-A2, Class A, 1 Month LIBOR + 0.400% | | | 2.472 | (c) | | | 03/15/24 | | | | 500 | | | | 502,626 | |
Citibank Credit Card Issuance Trust, | | | | | | | | | | | | | | | | |
Series 2016-A3, Class A3, 1 Month LIBOR + 0.490% | | | 2.587 | (c) | | | 12/07/23 | | | | 800 | | | | 805,970 | |
Series 2017-A5, Class A5, 1 Month LIBOR + 0.620% | | | 2.701 | (c) | | | 04/22/26 | | | | 800 | | | | 810,132 | |
Discover Card Execution Note Trust, | | | | | | | | | | | | | | | | |
Series 2017-A1, Class A1, 1 Month LIBOR + 0.490% | | | 2.562 | (c) | | | 07/15/24 | | | | 900 | | | | 907,129 | |
Series 2017-A4, Class A4 | | | 2.530 | | | | 10/15/26 | | | | 800 | | | | 769,180 | |
Series 2017-A5, Class A5, 1 Month LIBOR + 0.600% | | | 2.672 | (c) | | | 12/15/26 | | | | 400 | | | | 402,876 | |
| | | | | | | | | | | | | | | | |
| | | | | | | | | | | | | | | 4,700,781 | |
| | | | |
Equipment 0.6% | | | | | | | | | | | | | | | | |
MMAF Equipment Finance LLC, | | | | | | | | | | | | | | | | |
Series 2017-AA, Class A4, 144A | | | 2.410 | | | | 08/16/24 | | | | 800 | | | | 780,659 | |
Series 2017-B, Class A4, 144A | | | 2.410 | | | | 11/15/24 | | | | 500 | | | | 486,157 | |
See Notes to Financial Statements.
| | | | | | | | | | | | | | | | |
| Description | | Interest
Rate | | | Maturity
Date | | | Principal
Amount (000)# | | | Value | |
ASSET-BACKED SECURITIES (Continued) | | | | | | | | | | | | | | | | |
| | | | |
Equipment (cont’d.) | | | | | | | | | | | | | | | | |
MMAF Equipment Finance LLC, (cont’d.) | | | | | | | | | | | | | | | | |
Series 2017-B, Class A5, 144A | | | 2.720 | % | | | 06/15/40 | | | | 800 | | | $ | 766,302 | |
Series 2018-A, Class A4, 144A | | | 3.390 | | | | 01/10/25 | | | | 500 | | | | 500,048 | |
Series 2018-A, Class A5, 144A | | | 3.610 | | | | 03/10/42 | | | | 200 | | | | 200,271 | |
| | | | | | | | | | | | | | | | |
| | | | | | | | | | | | | | | 2,733,437 | |
| | | | |
Home Equity Loans 0.5% | | | | | | | | | | | | | | | | |
New Residential Mortgage Loan Trust,
Series 2018-1A, Class A1A, 144A | | | 4.000 | (cc) | | | 12/25/57 | | | | 619 | | | | 622,790 | |
Option One Mortgage Loan Trust,
Series 2005-3, Class M2, 1 Month LIBOR + 0.735% | | | 2.799 | (c) | | | 08/25/35 | | | | 1,500 | | | | 1,499,450 | |
| | | | | | | | | | | | | | | | |
| | | | | | | | | | | | | | | 2,122,240 | |
| | | | |
Other 0.0% | | | | | | | | | | | | | | | | |
Sierra Timeshare Receivables Funding LLC,
Series 2013-3A, Class A, 144A | | | 2.200 | | | | 10/20/30 | | | | 72 | | | | 72,069 | |
| | | | |
Residential Mortgage-Backed Securities 2.2% | | | | | | | | | | | | | | | | |
Credit Suisse Mortgage Trust, | | | | | | | | | | | | | | | | |
Series 2016-RPL1, Class A1, 144A, 1 Month LIBOR + 3.150% | | | 5.242 | (c) | | | 12/26/46 | | | | 631 | | | | 644,387 | |
Series 2018-3R, Class 1A1, 144A, 1 Month LIBOR + 1.200% | | | 3.071 | (c) | | | 12/25/46 | | | | 557 | | | | 556,731 | |
Mill City Mortgage Loan Trust, | | | | | | | | | | | | | | | | |
Series 2017-3, Class A1, 144A | | | 2.750 | (cc) | | | 01/25/61 | | | | 643 | | | | 628,839 | |
Series 2018-01, Class A1, 144A | | | 3.250 | (cc) | | | 05/25/62 | | | | 1,685 | | | | 1,667,787 | |
RAAC Series Trust,
Series 2007-SP3, Class A1, 1 Month LIBOR + 1.200% | | | 3.264 | (c) | | | 09/25/47 | | | | 236 | | | | 234,793 | |
Towd Point Mortgage Trust, | | | | | | | | | | | | | | | | |
Series 2017-04, Class A1, 144A | | | 2.750 | (cc) | | | 06/25/57 | | | | 1,501 | | | | 1,461,017 | |
Series 2017-06, Class A1, 144A | | | 2.750 | (cc) | | | 10/25/57 | | | | 1,096 | | | | 1,066,487 | |
Series 2017-5, Class A1, 144A, 1 Month LIBOR + 0.600% | | | 2.664 | (c) | | | 02/25/57 | | | | 1,184 | | | | 1,184,356 | |
Series 2018-02, Class A1, 144A | | | 3.250 | (cc) | | | 03/25/58 | | | | 1,119 | | | | 1,105,534 | |
Series 2018-1, Class A1, 144A | | | 3.000 | (cc) | | | 01/25/58 | | | | 1,128 | | | | 1,108,767 | |
VOLT LLC, | | | | | | | | | | | | | | | | |
Series 2017-NPL04, Class A1, 144A | | | 3.375 | | | | 04/25/47 | | | | 65 | | | | 64,443 | |
Series 2017-NPL07, Class A1, 144A | | | 3.250 | | | | 06/25/47 | | | | 83 | | | | 82,726 | |
| | | | | | | | | | | | | | | | |
| | | | | | | | | | | | | | | 9,805,867 | |
See Notes to Financial Statements.
Schedule of Investments (continued)
as of July 31, 2018
| | | | | | | | | | | | | | | | |
| Description | | Interest
Rate | | | Maturity
Date | | | Principal
Amount (000)# | | | Value | |
ASSET-BACKED SECURITIES (Continued) | | | | | | | | | | | | | | | | |
| | | | |
Student Loans 1.9% | | | | | | | | | | | | | | | | |
Commonbond Student Loan Trust, | | | | | | | | | | | | | | | | |
Series 2017-BGS, Class A1, 144A | | | 2.680 | % | | | 09/25/42 | | | | 929 | | | $ | 906,592 | |
Series 2018-AGS, Class A1, 144A | | | 3.210 | | | | 02/25/44 | | | | 664 | | | | 659,897 | |
Laurel Road Prime Student Loan Trust, | | | | | | | | | | | | | | | | |
Series 2017-C, Class A2B, 144A | | | 2.810 | | | | 11/25/42 | | | | 600 | | | | 583,905 | |
Series 2018-B, Class A2FX, 144A | | | 3.540 | | | | 05/26/43 | | | | 900 | | | | 900,318 | |
Navient Private Education Refi Loan Trust, | | | | | | | | | | | | | | | | |
Series 2018-A, Class A2, 144A | | | 3.190 | | | | 02/18/42 | | | | 1,300 | | | | 1,281,019 | |
Series 2018-CA, Class A2, 144A^ | | | 3.520 | | | | 06/16/42 | | | | 600 | | | | 599,941 | |
SoFi Professional Loan Program LLC,
Series 2017-F, Class A2FX, 144A | | | 2.840 | | | | 01/25/41 | | | | 1,600 | | | | 1,559,103 | |
SoFi Professional Loan Program Trust, | | | | | | | | | | | | | | | | |
Series 2018-B, Class A1FX, 144A | | | 2.640 | | | | 08/25/47 | | | | 817 | | | | 812,358 | |
Series 2018-B, Class A2FX, 144A | | | 3.340 | | | | 08/25/47 | | | | 1,400 | | | | 1,393,084 | |
| | | | | | | | | | | | | | | | |
| | | | | | | | | | | | | | | 8,696,217 | |
| | | | | | | | | | | | | | | | |
TOTAL ASSET-BACKED SECURITIES
(cost $97,831,808) | | | | 97,249,403 | |
| | | | | | | | | | | | | | | | |
| | | | |
COMMERCIAL MORTGAGE-BACKED SECURITIES 17.0% | | | | | | | | | | | | | | | | |
Assurant Commercial Mortgage Trust,
Series 2016-1A, Class AS, 144A | | | 3.172 | | | | 05/15/49 | | | | 300 | | | | 285,318 | |
BBCMS Mortgage Trust,
Series 2016-ETC, Class A, 144A | | | 2.937 | | | | 08/14/36 | | | | 500 | | | | 465,611 | |
Benchmark Mortgage Trust,
Series 2018-B3, Class A4 | | | 3.761 | | | | 04/10/51 | | | | 1,500 | | | | 1,496,685 | |
BENCHMARK Mortgage Trust,
Series 2018-B1, Class A4 | | | 3.402 | | | | 01/15/51 | | | | 2,000 | | | | 1,944,607 | |
CD Mortgage Trust,
Series 2016-CD1, Class A3 | | | 2.459 | | | | 08/10/49 | | | | 500 | | | | 460,824 | |
CFCRE Commercial Mortgage Trust,
Series 2016-C7, Class A2 | | | 3.585 | | | | 12/10/54 | | | | 2,000 | | | | 1,970,633 | |
Citigroup Commercial Mortgage Trust, | | | | | | | | | | | | | | | | |
Series 2015-GC27, Class A4 | | | 2.878 | | | | 02/10/48 | | | | 1,100 | | | | 1,055,867 | |
Series 2016-C03, Class A3 | | | 2.896 | | | | 11/15/49 | | | | 900 | | | | 847,263 | |
Series 2017-P08, Class A3 | | | 3.203 | | | | 09/15/50 | | | | 1,700 | | | | 1,624,139 | |
Commercial Mortgage Trust, | | | | | | | | | | | | | | | | |
Series 2015-PC1, Class A4 | | | 3.620 | | | | 07/10/50 | | | | 3,200 | | | | 3,181,596 | |
Series 2016-COR1, Class A3 | | | 2.826 | | | | 10/10/49 | | | | 800 | | | | 752,800 | |
CSAIL Commercial Mortgage Trust,
Series 2017-C8, Class A3 | | | 3.127 | | | | 06/15/50 | | | | 1,200 | | | | 1,139,463 | |
See Notes to Financial Statements.
| | | | | | | | | | | | | | | | |
| Description | | Interest
Rate | | | Maturity
Date | | | Principal
Amount (000)# | | | Value | |
COMMERCIAL MORTGAGE-BACKED SECURITIES (Continued) | | | | | | | | | | | | | | | | |
DBJPM Mortgage Trust,
Series 2016-C3, Class A4 | | | 2.632 | % | | | 09/10/49 | | | | 650 | | | $ | 603,470 | |
Fannie Mae-Aces, | | | | | | | | | | | | | | | | |
Series 2015-M07, Class AB2 | | | 2.502 | | | | 12/25/24 | | | | 486 | | | | 468,369 | |
Series 2016-M07, Class AB2 | | | 2.385 | | | | 09/25/26 | | | | 200 | | | | 184,291 | |
Series 2016-M11, Class A2 | | | 2.369 | (cc) | | | 07/25/26 | | | | 1,200 | | | | 1,106,617 | |
Series 2016-M13, Class A2 | | | 2.477 | (cc) | | | 09/25/26 | | | | 1,900 | | | | 1,765,957 | |
Series 2017-M01, Class A2 | | | 2.417 | (cc) | | | 10/25/26 | | | | 500 | | | | 461,728 | |
Series 2017-M04, Class A2 | | | 2.597 | (cc) | | | 12/25/26 | | | | 2,500 | | | | 2,334,976 | |
Series 2017-M08, Class A2 | | | 3.061 | (cc) | | | 05/25/27 | | | | 1,900 | | | | 1,830,727 | |
Series 2018-M04, Class A2 | | | 3.043 | (cc) | | | 03/25/28 | | | | 1,325 | | | | 1,271,878 | |
Series 2018-M10, Class A1 | | | 3.498 | (cc) | | | 07/25/28 | | | | 725 | | | | 727,757 | |
Series 2018-M10, Class A2 | | | 3.498 | (cc) | | | 07/25/28 | | | | 2,650 | | | | 2,613,692 | |
FHLMC Multifamily Structured Pass-Through Certificates, | | | | | | | | | | | | | | | | |
Series K036, Class A2 | | | 3.527 | (cc) | | | 10/25/23 | | | | 1,100 | | | | 1,116,509 | |
Series K057, Class AM | | | 2.624 | | | | 08/25/26 | | | | 1,650 | | | | 1,539,824 | |
Series K068, Class AM | | | 3.315 | | | | 08/25/27 | | | | 1,500 | | | | 1,465,399 | |
Series K069, Class A2 | | | 3.187 | (cc) | | | 09/25/27 | | | | 1,300 | | | | 1,268,761 | |
Series K069, Class AM | | | 3.248 | (cc) | | | 09/25/27 | | | | 300 | | | | 292,137 | |
Series K070, Class A2 | | | 3.303 | (cc) | | | 11/25/27 | | | | 2,125 | | | | 2,092,735 | |
Series K070, Class AM | | | 3.364 | (cc) | | | 12/25/27 | | | | 425 | | | | 417,494 | |
Series K072, Class A2 | | | 3.444 | | | | 12/25/27 | | | | 600 | | | | 596,929 | |
Series K074, Class A2 | | | 3.600 | | | | 01/25/28 | | | | 3,600 | | | | 3,620,062 | |
Series K075, Class AM | | | 3.650 | (cc) | | | 02/25/28 | | | | 1,075 | | | | 1,078,380 | |
Series K076, Class A2 | | | 3.900 | | | | 04/25/28 | | | | 2,800 | | | | 2,881,205 | |
Series K076, Class AM | | | 3.900 | | | | 04/25/28 | | | | 800 | | | | 817,415 | |
Series K077, Class A2 | | | 3.850 | (cc) | | | 05/25/28 | | | | 1,670 | | | | 1,710,506 | |
Series K077, Class AM | | | 3.850 | (cc) | | | 05/25/28 | | | | 340 | | | | 345,201 | |
Series K078, Class AM | | | 3.920 | (cc) | | | 06/25/28 | | | | 1,025 | | | | 1,047,481 | |
Series W5FX, Class AFX | | | 3.214 | (cc) | | | 04/25/28 | | | | 770 | | | | 749,302 | |
GS Mortgage Securities Corp. II,
Series 2015-GC30, Class A3 | | | 3.119 | | | | 05/10/50 | | | | 1,000 | | | | 969,581 | |
GS Mortgage Securities Trust,
Series 2015-GC34, Class A3 | | | 3.244 | | | | 10/10/48 | | | | 4,400 | | | | 4,284,301 | |
JPMBB Commercial Mortgage Securities Trust,
Series 2015-C27, Class A3A1 | | | 2.920 | | | | 02/15/48 | | | | 1,100 | | | | 1,058,864 | |
JPMDB Commercial Mortgage Securities Trust,
Series 2017-C05, Class A4 | | | 3.414 | | | | 03/15/50 | | | | 1,400 | | | | 1,368,473 | |
JPMorgan Chase Commercial Mortgage Securities Trust, | | | | | | | | | | | | | | | | |
Series 2016-JP2, Class A3 | | | 2.559 | | | | 08/15/49 | | | | 1,000 | | | | 924,089 | |
Series 2016-JP3, Class A4 | | | 2.627 | | | | 08/15/49 | | | | 700 | | | | 647,107 | |
Series 2017-JP5, Class A4 | | | 3.457 | | | | 03/15/50 | | | | 900 | | | | 879,401 | |
See Notes to Financial Statements.
Schedule of Investments (continued)
as of July 31, 2018
| | | | | | | | | | | | | | | | |
| Description | | Interest
Rate | | | Maturity
Date | | | Principal
Amount (000)# | | | Value | |
COMMERCIAL MORTGAGE-BACKED SECURITIES (Continued) | | | | | | | | | | | | | | | | |
JPMorgan Chase Commercial Mortgage Securities Trust, (cont’d.) | | | | | | | | | | | | | | | | |
Series 2017-JP7, Class ASB | | | 3.241 | % | | | 09/15/50 | | | | 575 | | | $ | 560,570 | |
LCCM,
Series 2017-LC26, Class A3, 144A | | | 3.289 | | | | 07/12/50 | | | | 1,600 | | | | 1,526,298 | |
Morgan Stanley Bank of America Merrill Lynch Trust,
Series 2015-C20, Class A2 | | | 2.790 | | | | 02/15/48 | | | | 850 | | | | 847,287 | |
Morgan Stanley Capital I Trust, | | | | | | | | | | | | | | | | |
Series 2016-BNK2, Class A3 | | | 2.791 | | | | 11/15/49 | | | | 900 | | | | 839,931 | |
Series 2016-UB11, Class A3 | | | 2.531 | | | | 08/15/49 | | | | 1,200 | | | | 1,102,188 | |
UBS Commercial Mortgage Trust, | | | | | | | | | | | | | | | | |
Series 2017-C2, Class ASB | | | 3.264 | | | | 08/15/50 | | | | 800 | | | | 784,978 | |
Series 2017-C3, Class ASB | | | 3.215 | | | | 08/15/50 | | | | 900 | | | | 884,292 | |
Series 2017-C5, Class A4 | | | 3.212 | | | | 11/15/50 | | | | 1,800 | | | | 1,715,964 | |
Series 2018-C9, Class A3 | | | 3.854 | | | | 03/15/51 | | | | 750 | | | | 748,688 | |
UBS-Barclays Commercial Mortgage Trust, | | | | | | | | | | | | | | | | |
Series 2013-C6, Class A3FL, 144A, 1 Month LIBOR + 0.790% | | | 2.857 | (c) | | | 04/10/46 | | | | 749 | | | | 760,382 | |
Series 2013-C6, Class A4 | | | 3.244 | | | | 04/10/46 | | | | 101 | | | | 100,249 | |
Wells Fargo Commercial Mortgage Trust, | | | | | | | | | | | | | | | | |
Series 2016-BNK1, Class A2 | | | 2.399 | | | | 08/15/49 | | | | 1,200 | | | | 1,092,150 | |
Series 2016-C35, Class A3 | | | 2.674 | | | | 07/15/48 | | | | 1,900 | | | | 1,764,320 | |
Series 2016-NXS6, Class A3 | | | 2.642 | | | | 11/15/49 | | | | 1,500 | | | | 1,393,363 | |
Series 2017-C38, Class A4 | | | 3.190 | | | | 07/15/50 | | | | 1,000 | | | | 956,097 | |
Series 2017-RB01, Class A4 | | | 3.374 | | | | 03/15/50 | | | | 1,400 | | | | 1,356,747 | |
| | | | | | | | | | | | | | | | |
TOTAL COMMERCIAL MORTGAGE-BACKED SECURITIES
(cost $78,826,253) | | | | 76,198,928 | |
| | | | | | | | | | | | | | | | |
| | | | |
CORPORATE BONDS 30.6% | | | | | | | | | | | | | | | | |
| | | | |
Aerospace & Defense 0.3% | | | | | | | | | | | | | | | | |
Embraer Overseas Ltd. (Brazil),
Gtd. Notes, 144A | | | 5.696 | | | | 09/16/23 | | | | 85 | | | | 88,434 | |
General Dynamics Corp., | | | | | | | | | | | | | | | | |
Gtd. Notes | | | 2.875 | | | | 05/11/20 | | | | 645 | | | | 644,097 | |
Gtd. Notes | | | 3.000 | | | | 05/11/21 | | | | 770 | | | | 766,666 | |
Harris Corp.,
Sr. Unsec’d. Notes | | | 3.832 | | | | 04/27/25 | | | | 30 | | | | 29,434 | |
| | | | | | | | | | | | | | | | |
| | | | | | | | | | | | | | | 1,528,631 | |
| | | | |
Agriculture 0.4% | | | | | | | | | | | | | | | | |
Altria Group, Inc.,
Gtd. Notes | | | 2.850 | | | | 08/09/22 | | | | 100 | | | | 97,691 | |
See Notes to Financial Statements.
| | | | | | | | | | | | | | | | |
| Description | | Interest
Rate | | | Maturity
Date | | | Principal
Amount (000)# | | | Value | |
CORPORATE BONDS (Continued) | | | | | | | | | | | | | | | | |
| | | | |
Agriculture (cont’d.) | | | | | | | | | | | | | | | | |
BAT Capital Corp. (United Kingdom), | | | | | | | | | | | | | | | | |
Gtd. Notes, 144A | | | 2.297 | % | | | 08/14/20 | | | | 690 | | | $ | 676,784 | |
Gtd. Notes, 144A | | | 3.222 | | | | 08/15/24 | | | | 890 | | | | 850,042 | |
| | | | | | | | | | | | | | | | |
| | | | | | | | | | | | | | | 1,624,517 | |
| | | | |
Airlines 0.4% | | | | | | | | | | | | | | | | |
American Airlines 2013-2 Class A Pass-Through Trust,
Pass-Through Certificates | | | 4.950 | | | | 07/15/24 | | | | 193 | | | | 198,678 | |
American Airlines 2015-1 Class A Pass-Through Trust,
Pass-Through Certificates | | | 3.375 | | | | 11/01/28 | | | | 90 | | | | 86,438 | |
Delta Air Lines 2009-1 Class A Pass-Through Trust,
Pass-Through Certificates | | | 7.750 | | | | 06/17/21 | | | | 133 | | | | 139,625 | |
Delta Air Lines, Inc., | | | | | | | | | | | | | | | | |
Sr. Unsec’d. Notes | | | 2.875 | | | | 03/13/20 | | | | 285 | | | | 282,657 | |
Sr. Unsec’d. Notes | | | 3.400 | | | | 04/19/21 | | | | 665 | | | | 661,020 | |
United Airlines 2016-2 Class AA Pass-Through Trust,
Pass-Through Certificates | | | 2.875 | | | | 04/07/30 | | | | 389 | | | | 362,363 | |
| | | | | | | | | | | | | | | | |
| | | | | | | | | | | | | | | 1,730,781 | |
| | | | |
Auto Manufacturers 1.2% | | | | | | | | | | | | | | | | |
BMW US Capital LLC (Germany), | | | | | | | | | | | | | | | | |
Gtd. Notes, 144A | | | 2.250 | | | | 09/15/23 | | | | 645 | | | | 600,023 | |
Gtd. Notes, 144A, 3 Month LIBOR + 0.410% | | | 2.747 | (c) | | | 04/12/21 | | | | 60 | | | | 60,164 | |
Gtd. Notes, 144A | | | 3.100 | | | | 04/12/21 | | | | 80 | | | | 79,493 | |
Daimler Finance North America LLC (Germany), | | | | | | | | | | | | | | | | |
Gtd. Notes, 144A | | | 2.250 | | | | 03/02/20 | | | | 295 | | | | 290,218 | |
Gtd. Notes, 144A | | | 3.100 | | | | 05/04/20 | | | | 295 | | | | 293,270 | |
Gtd. Notes, 144A | | | 3.350 | | | | 05/04/21 | | | | 495 | | | | 492,443 | |
Ford Motor Co., | | | | | | | | | | | | | | | | |
Sr. Unsec’d. Notes | | | 4.750 | | | | 01/15/43 | | | | 100 | | | | 86,525 | |
Sr. Unsec’d. Notes | | | 5.291 | | | | 12/08/46 | | | | 285 | | | | 263,277 | |
Ford Motor Credit Co. LLC, | | | | | | | | | | | | | | | | |
Sr. Unsec’d. Notes | | | 3.336 | | | | 03/18/21 | | | | 515 | | | | 509,469 | |
Sr. Unsec’d. Notes | | | 3.815 | | | | 11/02/27 | | | | 250 | | | | 229,757 | |
General Motors Financial Co., Inc., | | | | | | | | | | | | | | | | |
Gtd. Notes | | | 3.150 | | | | 01/15/20 | | | | 550 | | | | 551,048 | |
Gtd. Notes3 Month LIBOR + 0.850% | | | 3.189 | (c) | | | 04/09/21 | | | | 130 | | | | 130,803 | |
Gtd. Notes | | | 3.450 | | | | 04/10/22 | | | | 180 | | | | 176,690 | |
Gtd. Notes | | | 3.550 | | | | 04/09/21 | | | | 95 | | | | 94,833 | |
Gtd. Notes | | | 3.850 | | | | 01/05/28 | | | | 705 | | | | 656,355 | |
Gtd. Notes | | | 4.350 | | | | 01/17/27 | | | | 560 | | | | 544,050 | |
See Notes to Financial Statements.
Schedule of Investments (continued)
as of July 31, 2018
| | | | | | | | | | | | | | | | |
| Description | | Interest
Rate | | | Maturity
Date | | | Principal
Amount (000)# | | | Value | |
CORPORATE BONDS (Continued) | | | | | | | | | | | | | | | | |
| | | | |
Auto Manufacturers (cont’d.) | | | | | | | | | | | | | | | | |
General Motors Financial Co., Inc., (cont’d.) | | | | | | | | | | | | | | | | |
Gtd. Notes | | | 5.250 | % | | | 03/01/26 | | | | 375 | | | $ | 388,541 | |
Harley-Davidson Financial Services, Inc.,
Gtd. Notes, 144A, MTN | | | 2.150 | | | | 02/26/20 | | | | 175 | | | | 171,849 | |
| | | | | | | | | | | | | | | | |
| | | | | | | | | | | | | | | 5,618,808 | |
| | | | |
Banks 9.7% | | | | | | | | | | | | | | | | |
Banco Santander SA (Spain),
Sr. Unsec’d. Notes | | | 3.848 | | | | 04/12/23 | | | | 200 | | | | 197,862 | |
Bank of America Corp., | | | | | | | | | | | | | | | | |
Sr. Unsec’d. Notes, GMTN | | | 3.593 | | | | 07/21/28 | | | | 1,595 | | | | 1,516,932 | |
Sr. Unsec’d. Notes, MTN | | | 3.499 | | | | 05/17/22 | | | | 1,480 | | | | 1,478,671 | |
Sr. Unsec’d. Notes, MTN | | | 3.824 | | | | 01/20/28 | | | | 870 | | | | 846,244 | |
Sr. Unsec’d. Notes, MTN | | | 4.125 | | | | 01/22/24 | | | | 200 | | | | 203,645 | |
Sr. Unsec’d. Notes, MTN | | | 4.443 | | | | 01/20/48 | | | | 160 | | | | 160,338 | |
Sub. Notes, MTN | | | 4.000 | | | | 01/22/25 | | | | 800 | | | | 789,906 | |
Bank of Montreal (Canada), | | | | | | | | | | | | | | | | |
Sr. Unsec’d. Notes, MTN, 3 Month LIBOR + 0.460% | | | 2.797 | (c) | | | 04/13/21 | | | | 200 | | | | 200,822 | |
Sr. Unsec’d. Notes, Series D, MTN | | | 3.100 | | | | 04/13/21 | | | | 235 | | | | 234,331 | |
Bank of New York Mellon Corp. (The),
Sr. Unsec’d. Notes, MTN | | | 2.950 | | | | 01/29/23 | | | | 450 | | | | 439,872 | |
Barclays PLC (United Kingdom), | | | | | | | | | | | | | | | | |
Sr. Unsec’d. Notes | | | 3.684 | | | | 01/10/23 | | | | 480 | | | | 467,553 | |
Sr. Unsec’d. Notes | | | 4.375 | | | | 01/12/26 | | | | 200 | | | | 195,706 | |
Sr. Unsec’d. Notes, MTN | | | 4.972 | | | | 05/16/29 | | | | 400 | | | | 401,405 | |
BNP Paribas SA (France), | | | | | | | | | | | | | | | | |
Sr. Unsec’d. Notes, 144A | | | 3.375 | | | | 01/09/25 | | | | 710 | | | | 674,023 | |
Sr. Unsec’d. Notes, 144A, MTN | | | 2.950 | | | | 05/23/22 | | | | 435 | | | | 423,103 | |
BPCE SA (France),
Sr. Unsec’d. Notes, 144A, MTN | | | 3.250 | | | | 01/11/28 | | | | 625 | | | | 578,484 | |
Capital One Financial Corp., | | | | | | | | | | | | | | | | |
Sr. Unsec’d. Notes | | | 2.500 | | | | 05/12/20 | | | | 700 | | | | 690,761 | |
Sr. Unsec’d. Notes | | | 3.450 | | | | 04/30/21 | (a) | | | 1,200 | | | | 1,195,086 | |
Capital One NA,
Sr. Unsec’d. Notes | | | 2.250 | | | | 09/13/21 | | | | 250 | | | | 239,831 | |
Citibank NA,
Sr. Unsec’d. Notes | | | 3.050 | | | | 05/01/20 | | | | 1,750 | | | | 1,746,731 | |
Citigroup, Inc., | | | | | | | | | | | | | | | | |
Sr. Unsec’d. Notes | | | 3.200 | | | | 10/21/26 | | | | 290 | | | | 271,413 | |
Sr. Unsec’d. Notes | | | 3.400 | | | | 05/01/26 | | | | 350 | | | | 334,006 | |
Sr. Unsec’d. Notes | | | 3.520 | | | | 10/27/28 | | | | 180 | | | | 169,443 | |
See Notes to Financial Statements.
| | | | | | | | | | | | | | | | |
| Description | | Interest
Rate | | | Maturity
Date | | | Principal
Amount (000)# | | | Value | |
CORPORATE BONDS (Continued) | | | | | | | | | | | | | | | | |
| | | | |
Banks (cont’d.) | | | | | | | | | | | | | | | | |
Citigroup, Inc., (cont’d.) | | | | | | | | | | | | | | | | |
Sr. Unsec’d. Notes | | | 3.668 | % | | | 07/24/28 | | | | 490 | | | $ | 467,594 | |
Sr. Unsec’d. Notes | | | 3.887 | | | | 01/10/28 | | | | 670 | | | | 650,863 | |
Sub. Notes | | | 4.300 | | | | 11/20/26 | | | | 885 | | | | 866,993 | |
Sub. Notes | | | 4.450 | | | | 09/29/27 | | | | 840 | | | | 830,462 | |
Sub. Notes | | | 4.750 | | | | 05/18/46 | | | | 460 | | | | 452,366 | |
Credit Suisse Group AG (Switzerland),
Sr. Unsec’d. Notes, 144A | | | 3.869 | | | | 01/12/29 | | | | 1,220 | | | | 1,167,415 | |
Development Bank of Japan, Inc. (Japan),
Gov’t. Gtd. Notes, 144A, MTN | | | 2.125 | | | | 09/01/22 | | | | 200 | | | | 191,289 | |
Dexia Credit Local SA (France), | | | | | | | | | | | | | | | | |
Gov’t. Liquid Gtd. Notes | | | 1.875 | | | | 01/29/20 | | | | 250 | | | | 246,192 | |
Gov’t. Liquid Gtd. Notes, 144A | | | 1.875 | | | | 09/15/21 | | | | 250 | | | | 240,348 | |
Gov’t. Liquid Gtd. Notes, 144A | | | 2.250 | | | | 02/18/20 | | | | 500 | | | | 494,480 | |
Discover Bank,
Sr. Unsec’d. Notes | | | 4.200 | | | | 08/08/23 | | | | 250 | | | | 252,339 | |
Goldman Sachs Group, Inc. (The), | | | | | | | | | | | | | | | | |
Sr. Unsec’d. Notes | | | 3.272 | | | | 09/29/25 | | | | 1,160 | | | | 1,108,198 | |
Sr. Unsec’d. Notes | | | 3.500 | | | | 01/23/25 | | | | 75 | | | | 72,612 | |
Sr. Unsec’d. Notes | | | 3.850 | | | | 01/26/27 | | | | 475 | | | | 461,479 | |
Sr. Unsec’d. Notes | | | 4.223 | | | | 05/01/29 | | | | 870 | | | | 858,598 | |
Sr. Unsec’d. Notes, GMTN | | | 7.500 | | | | 02/15/19 | | | | 1,250 | | | | 1,282,258 | |
Sr. Unsec’d. Notes, MTN | | | 4.000 | | | | 03/03/24 | | | | 1,365 | | | | 1,373,447 | |
Sr. Unsec’d. Notes, Series D, MTN | | | 6.000 | | | | 06/15/20 | | | | 215 | | | | 225,362 | |
Sub. Notes | | | 4.250 | | | | 10/21/25 | | | | 250 | | | | 248,321 | |
Sub. Notes | | | 5.150 | | | | 05/22/45 | | | | 335 | | | | 347,238 | |
HSBC Holdings PLC (United Kingdom),
Sr. Unsec’d. Notes, 3 Month LIBOR + 0.600% | | | 2.926 | (c) | | | 05/18/21 | | | | 655 | | | | 657,093 | |
JPMorgan Chase & Co., | | | | | | | | | | | | | | | | |
Sr. Unsec’d. Notes | | | 2.950 | | | | 10/01/26 | | | | 410 | | | | 381,944 | |
Sr. Unsec’d. Notes | | | 3.125 | | | | 01/23/25 | | | | 315 | | | | 301,750 | |
Sr. Unsec’d. Notes | | | 3.200 | | | | 01/25/23 | | | | 100 | | | | 98,396 | |
Sr. Unsec’d. Notes | | | 3.200 | | | | 06/15/26 | | | | 230 | | | | 218,564 | |
Sr. Unsec’d. Notes | | | 3.509 | | | | 01/23/29 | | | | 210 | | | | 199,493 | |
Sr. Unsec’d. Notes | | | 3.625 | | | | 05/13/24 | | | | 875 | | | | 869,083 | |
Sr. Unsec’d. Notes | | | 3.964 | | | | 11/15/48 | | | | 355 | | | | 327,384 | |
Sr. Unsec’d. Notes | | | 4.005 | | | | 04/23/29 | | | | 835 | | | | 821,088 | |
Sr. Unsec’d. Notes | | | 6.300 | | | | 04/23/19 | | | | 100 | | | | 102,610 | |
Sub. Notes | | | 3.875 | | | | 09/10/24 | | | | 375 | | | | 371,327 | |
Sub. Notes | | | 4.250 | | | | 10/01/27 | | | | 375 | | | | 372,673 | |
JPMorgan Chase Bank NA,
Sr. Unsec’d. Notes | | | 3.086 | | | | 04/26/21 | | | | 2,000 | | | | 1,995,181 | |
See Notes to Financial Statements.
Schedule of Investments (continued)
as of July 31, 2018
| | | | | | | | | | | | | | | | |
| Description | | Interest
Rate | | | Maturity
Date | | | Principal
Amount (000)# | | | Value | |
CORPORATE BONDS (Continued) | | | | | | | | | | | | | | | | |
| | | | |
Banks (cont’d.) | | | | | | | | | | | | | | | | |
KeyBank NA,
Sr. Unsec’d. Notes | | | 2.250 | % | | | 03/16/20 | | | | 305 | | | $ | 300,670 | |
Lloyds Bank PLC (United Kingdom),
Gtd. Notes | | | 3.300 | | | | 05/07/21 | | | | 1,000 | | | | 997,445 | |
Morgan Stanley, | | | | | | | | | | | | | | | | |
Sr. Unsec’d. Notes | | | 4.375 | | | | 01/22/47 | | | | 140 | | | | 138,432 | |
Sr. Unsec’d. Notes, GMTN | | | 3.125 | | | | 01/23/23 | | | | 320 | | | | 312,865 | |
Sr. Unsec’d. Notes, GMTN | | | 3.772 | | | | 01/24/29 | | | | 145 | | | | 139,933 | |
Sr. Unsec’d. Notes, GMTN | | | 3.875 | | | | 01/27/26 | | | | 470 | | | | 464,206 | |
Sr. Unsec’d. Notes, GMTN | | | 4.000 | | | | 07/23/25 | | | | 455 | | | | 455,405 | |
Sr. Unsec’d. Notes, MTN | | | 3.971 | | | | 07/22/38 | | | | 375 | | | | 353,197 | |
Sr. Unsec’d. Notes, Series F, MTN | | | 3.875 | | | | 04/29/24 | | | | 365 | | | | 364,903 | |
Sub. Notes, GMTN | | | 4.350 | | | | 09/08/26 | | | | 800 | | | | 795,118 | |
MUFG Americas Holdings Corp.,
Sr. Unsec’d. Notes | | | 2.250 | | | | 02/10/20 | | | | 335 | | | | 330,516 | |
National City Corp.,
Sub. Notes | | | 6.875 | | | | 05/15/19 | | | | 780 | | | | 804,600 | |
Nordea Bank AB (Sweden),
Sr. Unsec’d. Notes, 144A, MTN | | | 1.875 | | | | 09/17/18 | | | | 200 | | | | 199,849 | |
Royal Bank of Canada (Canada), | | | | | | | | | | | | | | | | |
Sr. Unsec’d. Notes, GMTN, 3 Month LIBOR + 0.390% | | | 2.729 | (c) | | | 04/30/21 | | | | 690 | | | | 690,923 | |
Sr. Unsec’d. Notes, GMTN | | | 3.200 | | | | 04/30/21 | | | | 1,875 | | | | 1,874,170 | |
Royal Bank of Scotland Group PLC (United Kingdom),
Sr. Unsec’d. Notes | | | 3.875 | | | | 09/12/23 | | | | 220 | | | | 215,530 | |
Santander UK Group Holdings PLC (United Kingdom),
Sr. Unsec’d. Notes | | | 3.571 | | | | 01/10/23 | | | | 430 | | | | 421,226 | |
Sumitomo Mitsui Banking Corp. (Japan), | | | | | | | | | | | | | | | | |
Bank Gtd. Notes3 Month LIBOR + 0.350% | | | 2.686 | (c) | | | 01/17/20 | | | | 535 | | | | 535,909 | |
Gtd. Notes | | | 2.450 | | | | 01/16/20 | | | | 250 | | | | 247,206 | |
Sumitomo Mitsui Financial Group, Inc. (Japan),
Sr. Unsec’d. Notes | | | 2.442 | | | | 10/19/21 | | | | 235 | | | | 227,011 | |
SunTrust Banks, Inc.,
Sr. Unsec’d. Notes | | | 2.700 | | | | 01/27/22 | | | | 350 | | | | 339,981 | |
Svenska Handelsbanken AB (Sweden),
Gtd. Notes, MTN | | | 1.875 | | | | 09/07/21 | | | | 465 | | | | 443,725 | |
UBS Group Funding Switzerland AG (Switzerland), | | | | | | | | | | | | | | | | |
Gtd. Notes, 144A | | | 2.859 | | | | 08/15/23 | | | | 570 | | | | 547,724 | |
Gtd. Notes, 144A | | | 3.000 | | | | 04/15/21 | | | | 345 | | | | 340,746 | |
| | | | | | | | | | | | | | | | |
| | | | | | | | | | | | | | | 43,551,898 | |
See Notes to Financial Statements.
| | | | | | | | | | | | | | | | |
| Description | | Interest
Rate | | | Maturity
Date | | | Principal
Amount (000)# | | | Value | |
CORPORATE BONDS (Continued) | | | | | | | | | | | | | | | | |
| | | | |
Beverages 0.1% | | | | | | | | | | | | | | | | |
Anheuser-Busch InBev Finance, Inc. (Belgium),
Gtd. Notes | | | 4.700 | % | | | 02/01/36 | | | | 180 | | | $ | 185,906 | |
Keurig Dr. Pepper, Inc.,
Gtd. Notes, 144A | | | 3.551 | | | | 05/25/21 | | | | 370 | | | | 371,216 | |
| | | | | | | | | | | | | | | | |
| | | | | | | | | | | | | | | 557,122 | |
| | | | |
Biotechnology 0.2% | | | | | | | | | | | | | | | | |
Celgene Corp., | | | | | | | | | | | | | | | | |
Sr. Unsec’d. Notes | | | 3.250 | | | | 08/15/22 | | | | 125 | | | | 122,995 | |
Sr. Unsec’d. Notes | | | 4.350 | | | | 11/15/47 | | | | 475 | | | | 436,098 | |
Gilead Sciences, Inc.,
Sr. Unsec’d. Notes | | | 2.500 | | | | 09/01/23 | | | | 220 | | | | 209,151 | |
| | | | | | | | | | | | | | | | |
| | | | | | | | | | | | | | | 768,244 | |
| | | | |
Building Materials 0.2% | | | | | | | | | | | | | | | | |
Martin Marietta Materials, Inc.,
Sr. Unsec’d. Notes | | | 4.250 | | | | 12/15/47 | | | | 395 | | | | 348,951 | |
Vulcan Materials Co.,
Sr. Unsec’d. Notes, 144A | | | 4.700 | | | | 03/01/48 | | | | 750 | | | | 710,673 | |
| | | | | | | | | | | | | | | | |
| | | | | | | | | | | | | | | 1,059,624 | |
| | | | |
Chemicals 0.9% | | | | | | | | | | | | | | | | |
CNAC HK Finbridge Co. Ltd. (China),
Gtd. Notes | | | 3.500 | | | | 07/19/22 | | | | 1,375 | | | | 1,328,804 | |
Dow Chemical Co. (The), | | | | | | | | | | | | | | | | |
Sr. Unsec’d. Notes | | | 4.125 | | | | 11/15/21 | | | | 520 | | | | 529,708 | |
Sr. Unsec’d. Notes | | | 4.250 | | | | 11/15/20 | | | | 350 | | | | 356,925 | |
Eastman Chemical Co., | | | | | | | | | | | | | | | | |
Sr. Unsec’d. Notes | | | 2.700 | | | | 01/15/20 | | | | 550 | | | | 546,620 | |
Sr. Unsec’d. Notes | | | 4.650 | | | | 10/15/44 | | | | 260 | | | | 255,737 | |
LYB International Finance BV,
Gtd. Notes | | | 4.000 | | | | 07/15/23 | | | | 250 | | | | 250,959 | |
LyondellBasell Industries NV,
Sr. Unsec’d. Notes | | | 5.750 | | | | 04/15/24 | | | | 310 | | | | 335,534 | |
Nutrien Ltd. (Canada), | | | | | | | | | | | | | | | | |
Sr. Unsec’d. Notes | | | 4.125 | | | | 03/15/35 | | | | 40 | | | | 37,111 | |
Sr. Unsec’d. Notes | | | 5.250 | | | | 01/15/45 | | | | 340 | | | | 353,587 | |
| | | | | | | | | | | | | | | | |
| | | | | | | | | | | | | | | 3,994,985 | |
See Notes to Financial Statements.
Schedule of Investments (continued)
as of July 31, 2018
| | | | | | | | | | | | | | | | |
| Description | | Interest
Rate | | | Maturity
Date | | | Principal
Amount (000)# | | | Value | |
CORPORATE BONDS (Continued) | | | | | | | | | | | | | | | | |
| | | | |
Commercial Services 0.5% | | | | | | | | | | | | | | | | |
ERAC USA Finance LLC, | | | | | | | | | | | | | | | | |
Gtd. Notes, 144A | | | 2.700 | % | | | 11/01/23 | | | | 580 | | | $ | 547,104 | |
Gtd. Notes, 144A | | | 3.300 | | | | 10/15/22 | | | | 750 | | | | 738,433 | |
Gtd. Notes, 144A | | | 4.500 | | | | 02/15/45 | | | | 75 | | | | 70,977 | |
President & Fellows of Harvard College,
Unsec’d. Notes | | | 3.300 | | | | 07/15/56 | | | | 160 | | | | 140,091 | |
University of Notre Dame du Lac,
Unsec’d. Notes | | | 3.394 | | | | 02/15/48 | | | | 365 | | | | 337,471 | |
University of Southern California,
Unsec’d. Notes | | | 3.028 | | | | 10/01/39 | | | | 310 | | | | 278,794 | |
| | | | | | | | | | | | | | | | |
| | | | | | | | | | | | | | | 2,112,870 | |
| | | | |
Computers 0.2% | | | | | | | | | | | | | | | | |
Apple, Inc., | | | | | | | | | | | | | | | | |
Sr. Unsec’d. Notes | | | 3.450 | | | | 02/09/45 | | | | 85 | | | | 76,951 | |
Sr. Unsec’d. Notes | | | 3.850 | | | | 08/04/46 | | | | 525 | | | | 506,942 | |
Dell International LLC/EMC Corp.,
Sr. Sec’d. Notes, 144A | | | 3.480 | | | | 06/01/19 | | | | 75 | | | | 75,245 | |
Hewlett Packard Enterprise Co., | | | | | | | | | | | | | | | | |
Sr. Unsec’d. Notes | | | 2.850 | | | | 10/05/18 | | | | 23 | | | | 23,009 | |
Sr. Unsec’d. Notes, 144A | | | 2.100 | | | | 10/04/19 | | | | 245 | | | | 242,074 | |
| | | | | | | | | | | | | | | | |
| | | | | | | | | | | | | | | 924,221 | |
| | | | |
Diversified Financial Services 1.0% | | | | | | | | | | | | | | | | |
American Express Co.,
Sr. Unsec’d. Notes | | | 3.375 | | | | 05/17/21 | | | | 1,400 | | | | 1,401,926 | |
CPPIB Capital, Inc. (Canada),
Gtd. Notes, 144A, MTN | | | 2.750 | | | | 11/02/27 | | | | 250 | | | | 238,215 | |
Jefferies Group LLC,
Sr. Unsec’d. Notes | | | 6.450 | | | | 06/08/27 | | | | 150 | | | | 161,330 | |
Ontario Teachers’ Finance Trust (Canada),
Local Gov’t. Gtd. Notes, 144A | | | 2.750 | | | | 04/16/21 | | | | 250 | | | | 247,789 | |
Private Export Funding Corp.,
Sr. Unsec’d. Notes, 144A | | | 2.650 | | | | 02/16/21 | | | | 730 | | | | 723,910 | |
Synchrony Financial,
Sr. Unsec’d. Notes | | | 2.700 | | | | 02/03/20 | | | | 495 | | | | 488,530 | |
Visa, Inc.,
Sr. Unsec’d. Notes | | | 2.150 | | | | 09/15/22 | | | | 1,130 | | | | 1,085,858 | |
| | | | | | | | | | | | | | | | |
| | | | | | | | | | | | | | | 4,347,558 | |
See Notes to Financial Statements.
| | | | | | | | | | | | | | | | |
| Description | | Interest
Rate | | | Maturity
Date | | | Principal
Amount (000)# | | | Value | |
CORPORATE BONDS (Continued) | | | | | | | | | | | | | | | | |
| | | | |
Electric 3.2% | | | | | | | | | | | | | | | | |
Alabama Power Co.,
Sr. Unsec’d. Notes | | | 2.800 | % | | | 04/01/25 | | | | 75 | | | $ | 70,158 | |
Ameren Illinois Co.,
First Mortgage | | | 3.700 | | | | 12/01/47 | | | | 625 | | | | 587,523 | |
CenterPoint Energy Houston Electric LLC,
General Ref. Mortgage, Series Z | | | 2.400 | | | | 09/01/26 | | | | 190 | | | | 172,762 | |
Commonwealth Edison Co., | | | | | | | | | | | | | | | | |
First Mortgage | | | 3.700 | | | | 03/01/45 | | | | 40 | | | | 37,215 | |
First Mortgage | | | 3.750 | | | | 08/15/47 | | | | 775 | | | | 722,947 | |
First Mortgage | | | 4.000 | | | | 03/01/48 | | | | 115 | | | | 113,957 | |
Consolidated Edison Co. of New York, Inc.,
Sr. Unsec’d. Notes, Series C | | | 4.300 | | | | 12/01/56 | | | | 40 | | | | 39,149 | |
Consumers Energy Co.,
First Mortgage | | | 3.250 | | | | 08/15/46 | | | | 155 | | | | 134,237 | |
Delmarva Power & Light Co.,
First Mortgage | | | 4.150 | | | | 05/15/45 | | | | 60 | | | | 58,984 | |
Dominion Energy, Inc.,
Sr. Unsec’d. Notes | | | 2.850 | | | | 08/15/26 | | | | 55 | | | | 50,290 | |
DTE Electric Co.,
General Ref. Mortgage | | | 4.050 | | | | 05/15/48 | | | | 370 | | | | 367,823 | |
DTE Energy Co.,
Sr. Unsec’d. Notes | | | 2.850 | | | | 10/01/26 | | | | 350 | | | | 319,086 | |
Duke Energy Corp., | | | | | | | | | | | | | | | | |
Sr. Unsec’d. Notes | | | 2.650 | | | | 09/01/26 | | | | 145 | | | | 131,638 | |
Sr. Unsec’d. Notes | | | 3.950 | | | | 08/15/47 | | | | 185 | | | | 171,025 | |
Duke Energy Florida LLC, | | | | | | | | | | | | | | | | |
First Mortgage | | | 3.200 | | | | 01/15/27 | | | | 600 | | | | 576,891 | |
First Mortgage | | | 3.400 | | | | 10/01/46 | | | | 185 | | | | 162,522 | |
Duke Energy Progress LLC,
First Mortgage | | | 3.700 | | | | 10/15/46 | | | | 75 | | | | 68,903 | |
Emera US Finance LP (Canada), | | | | | | | | | | | | | | | | |
Gtd. Notes | | | 2.150 | | | | 06/15/19 | | | | 350 | | | | 347,411 | |
Gtd. Notes | | | 3.550 | | | | 06/15/26 | | | | 75 | | | | 71,092 | |
Entergy Corp., | | | | | | | | | | | | | | | | |
Sr. Unsec’d. Notes | | | 4.000 | | | | 07/15/22 | | | | 260 | | | | 264,238 | |
Sr. Unsec’d. Notes | | | 5.125 | | | | 09/15/20 | | | | 250 | | | | 257,469 | |
Entergy Louisiana LLC,
Collateral Trust | | | 4.000 | | | | 03/15/33 | | | | 170 | | | | 170,061 | |
Eversource Energy,
Sr. Unsec’d. Notes, Series M | | | 3.300 | | | | 01/15/28 | | | | 335 | | | | 315,836 | |
Exelon Generation Co. LLC,
Sr. Unsec’d. Notes | | | 5.200 | | | | 10/01/19 | | | | 375 | | | | 383,690 | |
See Notes to Financial Statements.
Schedule of Investments (continued)
as of July 31, 2018
| | | | | | | | | | | | | | | | |
| Description | | Interest
Rate | | | Maturity
Date | | | Principal
Amount (000)# | | | Value | |
CORPORATE BONDS (Continued) | | | | | | | | | | | | | | | | |
| | | | |
Electric (cont’d.) | | | | | | | | | | | | | | | | |
Fortis, Inc. (Canada),
Sr. Unsec’d. Notes | | | 3.055 | % | | | 10/04/26 | | | | 350 | | | $ | 320,609 | |
Israel Electric Corp. Ltd. (Israel), | | | | | | | | | | | | | | | | |
Sr. Sec’d. Notes, 144A | | | 9.375 | | | | 01/28/20 | | | | 420 | | | | 454,461 | |
Sr. Sec’d. Notes, 144A, GMTN | | | 4.250 | | | | 08/14/28 | | | | 235 | | | | 229,464 | |
MidAmerican Energy Co.,
First Mortgage | | | 3.950 | | | | 08/01/47 | | | | 225 | | | | 216,377 | |
Monongahela Power Co.,
First Mortgage, 144A | | | 4.100 | | | | 04/15/24 | | | | 851 | | | | 868,596 | |
Ohio Power Co.,
Sr. Unsec’d. Notes | | | 4.150 | | | | 04/01/48 | | | | 250 | | | | 252,787 | |
Oncor Electric Delivery Co. LLC,
Sr. Sec’d. Notes | | | 2.950 | | | | 04/01/25 | | | | 60 | | | | 57,403 | |
Pacific Gas & Electric Co.,
Sr. Unsec’d. Notes | | | 4.000 | | | | 12/01/46 | | | | 405 | | | | 360,640 | |
PECO Energy Co.,
First Ref. Mortgage | | | 4.800 | | | | 10/15/43 | | | | 120 | | | | 128,422 | |
PPL Capital Funding, Inc., | | | | | | | | | | | | | | | | |
Gtd. Notes | | | 4.000 | | | | 09/15/47 | | | | 330 | | | | 301,693 | |
Gtd. Notes | | | 5.000 | | | | 03/15/44 | | | | 170 | | | | 177,358 | |
Public Service Co. of Colorado,
First Mortgage | | | 4.100 | | | | 06/15/48 | | | | 235 | | | | 236,573 | |
Public Service Electric & Gas Co., | | | | | | | | | | | | | | | | |
First Mortgage, MTN | | | 2.250 | | | | 09/15/26 | | | | 370 | | | | 333,923 | |
First Mortgage, MTN | | | 3.600 | | | | 12/01/47 | | | | 95 | | | | 87,944 | |
First Mortgage, MTN | | | 3.700 | | | | 05/01/28 | | | | 590 | | | | 592,622 | |
San Diego Gas & Electric Co.,
First Mortgage | | | 4.150 | | | | 05/15/48 | | | | 420 | | | | 412,643 | |
Sempra Energy,
Sr. Unsec’d. Notes | | | 2.400 | | | | 03/15/20 | | | | 135 | | | | 132,843 | |
Southern Power Co.,
Sr. Unsec’d. Notes, Series D | | | 1.950 | | | | 12/15/19 | | | | 430 | | | | 423,390 | |
Southwestern Electric Power Co.,
Sr. Unsec’d. Notes, Series K | | | 2.750 | | | | 10/01/26 | | | | 675 | | | | 617,851 | |
Southwestern Public Service Co.,
First Mortgage | | | 3.700 | | | | 08/15/47 | | | | 355 | | | | 330,489 | |
SP PowerAssets Ltd. (Singapore),
Sr. Unsec’d. Notes, 144A, MTN | | | 3.000 | | | | 09/26/27 | | | | 465 | | | | 434,663 | |
Union Electric Co.,
Sr. Sec’d. Notes | | | 3.650 | | | | 04/15/45 | | | | 50 | | | | 46,260 | |
Virginia Electric & Power Co., | | | | | | | | | | | | | | | | |
Sr. Unsec’d. Notes, Series A | | | 3.500 | | | | 03/15/27 | | | | 535 | | | | 524,102 | |
See Notes to Financial Statements.
| | | | | | | | | | | | | | | | |
| Description | | Interest
Rate | | | Maturity
Date | | | Principal
Amount (000)# | | | Value | |
CORPORATE BONDS (Continued) | | | | | | | | | | | | | | | | |
| | | | |
Electric (cont’d.) | | | | | | | | | | | | | | | | |
Virginia Electric & Power Co., (cont’d.) | | | | | | | | | | | | | | | | |
Sr. Unsec’d. Notes, Series C | | | 4.000 | % | | | 11/15/46 | | | | 175 | | | $ | 166,684 | |
Wisconsin Power & Light Co.,
Sr. Unsec’d. Notes | | | 3.050 | | | | 10/15/27 | | | | 535 | | | | 501,073 | |
Xcel Energy, Inc.,
Sr. Unsec’d. Notes | | | 3.350 | | | | 12/01/26 | | | | 510 | | | | 486,154 | |
| | | | | | | | | | | | | | | | |
| | | | | | | | | | | | | | | 14,289,931 | |
| | | | |
Electronics 0.1% | | | | | | | | | | | | | | | | |
FLIR Systems, Inc.,
Sr. Unsec’d. Notes | | | 3.125 | | | | 06/15/21 | | | | 275 | | | | 271,890 | |
| | | | |
Engineering & Construction 0.0% | | | | | | | | | | | | | | | | |
Mexico City Airport Trust (Mexico),
Sr. Sec’d. Notes, 144A | | | 4.250 | | | | 10/31/26 | | | | 200 | | | | 190,350 | |
| | | | |
Foods 0.8% | | | | | | | | | | | | | | | | |
Ahold Finance USA LLC (Netherlands),
Gtd. Notes | | | 6.875 | | | | 05/01/29 | | | | 280 | | | | 326,634 | |
JM Smucker Co. (The),
Sr. Unsec’d. Notes | | | 3.000 | | | | 03/15/22 | | | | 115 | | | | 112,402 | |
Kraft Heinz Foods Co., | | | | | | | | | | | | | | | | |
Gtd. Notes | | | 3.000 | | | | 06/01/26 | | | | 110 | | | | 100,813 | |
Gtd. Notes | | | 3.375 | | | | 06/15/21 | | | | 605 | | | | 605,177 | |
Gtd. Notes | | | 4.375 | | | | 06/01/46 | | | | 35 | | | | 31,117 | |
Gtd. Notes | | | 5.000 | | | | 07/15/35 | | | | 75 | | | | 74,459 | |
Kroger Co. (The), | | | | | | | | | | | | | | | | |
Sr. Unsec’d. Notes | | | 3.300 | | | | 01/15/21 | | | | 285 | | | | 285,410 | |
Sr. Unsec’d. Notes | | | 3.875 | | | | 10/15/46 | | | | 65 | | | | 55,317 | |
Mondelez International Holdings Netherlands BV,
Gtd. Notes, 144A | | | 2.000 | | | | 10/28/21 | | | | 500 | | | | 476,736 | |
Mondelez International, Inc.,
Sr. Unsec’d. Notes | | | 3.000 | | | | 05/07/20 | | | | 390 | | | | 388,800 | |
Tyson Foods, Inc.,
Sr. Unsec’d. Notes | | | 2.250 | | | | 08/23/21 | | | | 985 | | | | 949,194 | |
| | | | | | | | | | | | | | | | |
| | | | | | | | | | | | | | | 3,406,059 | |
See Notes to Financial Statements.
Schedule of Investments (continued)
as of July 31, 2018
| | | | | | | | | | | | | | | | |
| Description | | Interest
Rate | | | Maturity
Date | | | Principal
Amount (000)# | | | Value | |
CORPORATE BONDS (Continued) | | | | | | | | | | | | | | | | |
| | | | |
Forest Products & Paper 0.1% | | | | | | | | | | | | | | | | |
Georgia-Pacific LLC,
Sr. Unsec’d. Notes, 144A | | | 3.600 | % | | | 03/01/25 | | | | 220 | | | $ | 217,924 | |
International Paper Co.,
Sr. Unsec’d. Notes | | | 4.400 | | | | 08/15/47 | | | | 180 | | | | 168,183 | |
| | | | | | | | | | | | | | | | |
| | | | | | | | | | | | | | | 386,107 | |
| | | | |
Gas 0.2% | | | | | | | | | | | | | | | | |
CenterPoint Energy Resources Corp.,
Sr. Unsec’d. Notes | | | 4.100 | | | | 09/01/47 | | | | 305 | | | | 283,054 | |
Southern Co. Gas Capital Corp.,
Gtd. Notes | | | 2.450 | | | | 10/01/23 | | | | 555 | | | | 520,052 | |
| | | | | | | | | | | | | | | | |
| | | | | | | | | | | | | | | 803,106 | |
| | | | |
Hand/Machine Tools 0.2% | | | | | | | | | | | | | | | | |
Stanley Black & Decker, Inc.,
Sub. Notes | | | 1.622 | | | | 11/17/18 | | | | 750 | | | | 747,674 | |
| | | | |
Healthcare-Products 0.3% | | | | | | | | | | | | | | | | |
Abbott Laboratories, | | | | | | | | | | | | | | | | |
Sr. Unsec’d. Notes | | | 2.000 | | | | 09/15/18 | | | | 395 | | | | 394,878 | |
Sr. Unsec’d. Notes | | | 2.900 | | | | 11/30/21 | | | | 495 | | | | 488,260 | |
Medtronic, Inc.,
Gtd. Notes | | | 4.375 | | | | 03/15/35 | | | | 328 | | | | 345,018 | |
Thermo Fisher Scientific, Inc.,
Sr. Unsec’d. Notes | | | 2.950 | | | | 09/19/26 | | | | 105 | | | | 97,302 | |
| | | | | | | | | | | | | | | | |
| | | | | | | | | | | | | | | 1,325,458 | |
| | | | |
Healthcare-Services 1.0% | | | | | | | | | | | | | | | | |
Aetna, Inc., | | | | | | | | | | | | | | | | |
Sr. Unsec’d. Notes | | | 3.500 | | | | 11/15/24 | | | | 100 | | | | 97,685 | |
Sr. Unsec’d. Notes | | | 6.750 | | | | 12/15/37 | | | | 170 | | | | 213,129 | |
AHS Hospital Corp.,
Unsec’d. Notes | | | 5.024 | | | | 07/01/45 | | | | 200 | | | | 224,039 | |
Ascension Health,
Unsec’d. Notes | | | 4.847 | | | | 11/15/53 | | | | 500 | | | | 557,353 | |
Cigna Corp.,
Sr. Unsec’d. Notes | | | 3.250 | | | | 04/15/25 | | | | 270 | | | | 256,233 | |
HCA, Inc.,
Sr. Sec’d. Notes | | | 3.750 | | | | 03/15/19 | | | | 700 | | | | 701,085 | |
See Notes to Financial Statements.
| | | | | | | | | | | | | | | | |
| Description | | Interest
Rate | | | Maturity
Date | | | Principal
Amount (000)# | | | Value | |
CORPORATE BONDS (Continued) | | | | | | | | | | | | | | | | |
| | | | |
Healthcare-Services (cont’d.) | | | | | | | | | | | | | | | | |
Humana, Inc.,
Sr. Unsec’d. Notes | | | 2.500 | % | | | 12/15/20 | | | | 620 | | | $ | 607,332 | |
Laboratory Corp. of America Holdings,
Sr. Unsec’d. Notes | | | 4.625 | | | | 11/15/20 | | | | 260 | | | | 266,765 | |
Memorial Sloan-Kettering Cancer Center,
Sr. Unsec’d. Notes | | | 4.200 | | | | 07/01/55 | | | | 75 | | | | 76,088 | |
New York & Presbyterian Hospital (The),
Unsec’d. Notes | | | 4.024 | | | | 08/01/45 | | | | 40 | | | | 39,347 | |
Providence St Joseph Health Obligated Group,
Unsec’d. Notes | | | 2.746 | | | | 10/01/26 | | | | 40 | | | | 37,076 | |
Quest Diagnostics, Inc.,
Sr. Unsec’d. Notes | | | 3.500 | | | | 03/30/25 | | | | 190 | | | | 183,241 | |
Roche Holdings, Inc. (Switzerland),
Gtd. Notes, 144A | | | 3.350 | | | | 09/30/24 | | | | 410 | | | | 407,116 | |
RWJ Barnabas Health, Inc.,
Sr. Unsec’d. Notes | | | 3.949 | | | | 07/01/46 | | | | 175 | | | | 164,643 | |
Stanford Health Care,
Unsec’d. Notes | | | 3.795 | | | | 11/15/48 | | | | 450 | | | | 426,786 | |
UnitedHealth Group, Inc.,
Sr. Unsec’d. Notes | | | 3.750 | | | | 07/15/25 | | | | 90 | | | | 90,390 | |
| | | | | | | | | | | | | | | | |
| | | | | | | | | | | | | | | 4,348,308 | |
| | | | |
Housewares 0.1% | | | | | | | | | | | | | | | | |
Newell Brands, Inc., | | | | | | | | | | | | | | | | |
Sr. Unsec’d. Notes | | | 2.875 | | | | 12/01/19 | | | | 240 | | | | 238,630 | |
Sr. Unsec’d. Notes | | | 4.200 | | | | 04/01/26 | | | | 35 | | | | 33,759 | |
Sr. Unsec’d. Notes | | | 5.500 | | | | 04/01/46 | | | | 425 | | | | 408,640 | |
| | | | | | | | | | | | | | | | |
| | | | | | | | | | | | | | | 681,029 | |
| | | | |
Insurance 0.7% | | | | | | | | | | | | | | | | |
American International Group, Inc., | | | | | | | | | | | | | | | | |
Sr. Unsec’d. Notes | | | 3.900 | | | | 04/01/26 | | | | 410 | | | | 403,362 | |
Sr. Unsec’d. Notes | | | 4.500 | | | | 07/16/44 | | | | 410 | | | | 391,699 | |
Arch Capital Finance LLC,
Gtd. Notes | | | 5.031 | | | | 12/15/46 | | | | 95 | | | | 99,488 | |
Arch Capital Group US, Inc.,
Gtd. Notes | | | 5.144 | | | | 11/01/43 | | | | 100 | | | | 105,996 | |
Chubb INA Holdings, Inc.,
Gtd. Notes | | | 3.150 | | | | 03/15/25 | | | | 95 | | | | 92,102 | |
See Notes to Financial Statements.
Schedule of Investments (continued)
as of July 31, 2018
| | | | | | | | | | | | | | | | |
| Description | | Interest
Rate | | | Maturity
Date | | | Principal
Amount (000)# | | | Value | |
CORPORATE BONDS (Continued) | | | | | | | | | | | | | | | | |
| | | | |
Insurance (cont’d.) | | | | | | | | | | | | | | | | |
Liberty Mutual Group, Inc., | | | | | | | | | | | | | | | | |
Gtd. Notes, 144A | | | 4.850 | % | | | 08/01/44 | | | | 300 | | | $ | 298,946 | |
Gtd. Notes, 144A | | | 6.500 | | | | 05/01/42 | | | | 150 | | | | 184,021 | |
Lincoln National Corp.,
Sr. Unsec’d. Notes | | | 6.300 | | | | 10/09/37 | | | | 115 | | | | 136,219 | |
Markel Corp.,
Sr. Unsec’d. Notes | | | 3.625 | | | | 03/30/23 | | | | 400 | | | | 393,910 | |
New York Life Global Funding,
Sec’d. Notes, 144A | | | 1.950 | | | | 02/11/20 | | | | 225 | | | | 221,095 | |
Northwestern Mutual Life Insurance Co. (The),
Sub. Notes, 144A | | | 6.063 | | | | 03/30/40 | | | | 120 | | | | 148,898 | |
Nuveen Finance LLC,
Sr. Unsec’d. Notes, 144A | | | 2.950 | | | | 11/01/19 | | | | 150 | | | | 149,917 | |
Principal Financial Group, Inc., | | | | | | | | | | | | | | | | |
Gtd. Notes | | | 3.100 | | | | 11/15/26 | | | | 105 | | | | 97,709 | |
Gtd. Notes | | | 4.300 | | | | 11/15/46 | | | | 140 | | | | 133,725 | |
Gtd. Notes | | | 4.350 | | | | 05/15/43 | | | | 85 | | | | 82,045 | |
Teachers Insurance & Annuity Association of America,
Sub. Notes, 144A | | | 4.900 | | | | 09/15/44 | | | | 120 | | | | 126,868 | |
| | | | | | | | | | | | | | | | |
| | | | | | | | | | | | | | | 3,066,000 | |
| | | | |
Lodging 0.1% | | | | | | | | | | | | | | | | |
Marriott International, Inc., | | | | | | | | | | | | | | | | |
Sr. Unsec’d. Notes | | | 3.000 | | | | 03/01/19 | | | | 250 | | | | 249,931 | |
Sr. Unsec’d. Notes | | | 3.125 | | | | 06/15/26 | | | | 250 | | | | 232,112 | |
| | | | | | | | | | | | | | | | |
| | | | | | | | | | | | | | | 482,043 | |
| | | | |
Machinery-Diversified 0.1% | | | | | | | | | | | | | | | | |
Rockwell Automation, Inc., | | | | | | | | | | | | | | | | |
Sr. Unsec’d. Notes | | | 2.050 | | | | 03/01/20 | | | | 270 | | | | 265,365 | |
Sr. Unsec’d. Notes | | | 2.875 | | | | 03/01/25 | | | | 115 | | | | 109,014 | |
Xylem, Inc.,
Sr. Unsec’d. Notes | | | 3.250 | | | | 11/01/26 | | | | 70 | | | | 65,720 | |
| | | | | | | | | | | | | | | | |
| | | | | | | | | | | | | | | 440,099 | |
| | | | |
Media 0.6% | | | | | | | | | | | | | | | | |
Charter Communications Operating LLC/Charter Communications Operating Capital, | | | | | | | | | | | | | | | | |
Sr. Sec’d. Notes | | | 5.375 | | | | 05/01/47 | | | | 80 | | | | 76,855 | |
Sr. Sec’d. Notes | | | 6.384 | | | | 10/23/35 | | | | 80 | | | | 86,622 | |
See Notes to Financial Statements.
| | | | | | | | | | | | | | | | |
| Description | | Interest
Rate | | | Maturity
Date | | | Principal
Amount (000)# | | | Value | |
CORPORATE BONDS (Continued) | | | | | | | | | | | | | | | | |
| | | | |
Media (cont’d.) | | | | | | | | | | | | | | | | |
Charter Communications Operating LLC/Charter Communications Operating Capital, (cont’d.) | | | | | | | | | | | | | | | | |
Sr. Sec’d. Notes | | | 6.484 | % | | | 10/23/45 | | | | 95 | | | $ | 103,650 | |
Sr. Sec’d. Notes | | | 6.834 | | | | 10/23/55 | | | | 250 | | | | 273,439 | |
Cox Communications, Inc., | | | | | | | | | | | | | | | | |
Sr. Unsec’d. Notes, 144A | | | 3.150 | | | | 08/15/24 | | | | 800 | | | | 758,571 | |
Sr. Unsec’d. Notes, 144A | | | 3.350 | | | | 09/15/26 | | | | 195 | | | | 181,307 | |
Discovery Communications LLC,
Gtd. Notes | | | 5.000 | | | | 09/20/37 | | | | 225 | | | | 220,566 | |
Time Warner Cable LLC,
Sr. Sec’d. Notes | | | 5.500 | | | | 09/01/41 | | | | 150 | | | | 145,543 | |
Warner Media LLC, | | | | | | | | | | | | | | | | |
Gtd. Notes | | | 3.400 | | | | 06/15/22 | | | | 850 | | | | 841,316 | |
Gtd. Notes | | | 3.800 | | | | 02/15/27 | | | | 100 | | | | 95,619 | |
| | | | | | | | | | | | | | | | |
| | | | | | | | | | | | | | | 2,783,488 | |
| | | | |
Mining 0.1% | | | | | | | | | | | | | | | | |
Barrick Gold Corp. (Canada),
Sr. Unsec’d. Notes | | | 5.250 | | | | 04/01/42 | | | | 50 | | | | 51,826 | |
Barrick North America Finance LLC (Canada),
Gtd. Notes | | | 5.750 | | | | 05/01/43 | | | | 190 | | | | 210,336 | |
Southern Copper Corp. (Peru),
| | | | | | | | | | | | | | | | |
Sr. Unsec’d. Notes | | | 5.250 | | | | 11/08/42 | | | | 50 | | | | 51,142 | |
Sr. Unsec’d. Notes | | | 5.875 | | | | 04/23/45 | | | | 90 | | | | 99,152 | |
Sr. Unsec’d. Notes | | | 6.750 | | | | 04/16/40 | | | | 100 | | | | 119,247 | |
| | | | | | | | | | | | | | | | |
| | | | | | | | | | | | | | | 531,703 | |
| | | |
Miscellaneous Manufacturing 0.1% | | | | | | | | | | | | | |
Ingersoll-Rand Luxembourg Finance SA,
Gtd. Notes | | | 3.550 | | | | 11/01/24 | | | | 170 | | | | 166,546 | |
Pentair Finance Sarl (United Kingdom),
Gtd. Notes | | | 2.650 | | | | 12/01/19 | | | | 420 | | | | 416,131 | |
| | | | | | | | | | | | | | | | |
| | | | | | | | | | | | | | | 582,677 | |
| | | |
Multi-National 0.2% | | | | | | | | | | | | | |
Corp. Andina de Fomento (Supranational Bank),
Sr. Unsec’d. Notes | | | 2.125 | | | | 09/27/21 | | | | 745 | | | | 714,820 | |
See Notes to Financial Statements.
Schedule of Investments (continued)
as of July 31, 2018
| | | | | | | | | | | | | | | | |
| Description | | Interest
Rate | | | Maturity
Date | | | Principal
Amount (000)# | | | Value | |
CORPORATE BONDS (Continued) | | | | | | | | | | | | | | | | |
| | | | |
Multi-National (cont’d.) | | | | | | | | | | | | | | | | |
Corp. Andina de Fomento (Supranational Bank), (cont’d.) | | | | | | | | | |
Sr. Unsec’d. Notes | | | 2.750 | % | | | 01/06/23 | | | | 185 | | | $ | 178,349 | |
North American Development Bank (Supranational Bank),
Sr. Unsec’d. Notes | | | 4.375 | | | | 02/11/20 | | | | 100 | | | | 101,814 | |
| | | | | | | | | | | | | | | | |
| | | | | | | | | | | | | | | 994,983 | |
| | | |
Office/Business Equipment 0.0% | | | | | | | | | | | | | |
Xerox Corp.,
Sr. Unsec’d. Notes | | | 2.750 | | | | 09/01/20 | | | | 137 | | | | 134,032 | |
| | | |
Oil & Gas 2.4% | | | | | | | | | | | | | |
Anadarko Finance Co.,
Gtd. Notes, Series B | | | 7.500 | | | | 05/01/31 | | | | 100 | | | | 124,657 | |
Anadarko Petroleum Corp.,
Sr. Unsec’d. Notes | | | 4.850 | | | | 03/15/21 | | | | 325 | | | | 334,738 | |
Andeavor,
Sr. Unsec’d. Notes | | | 3.800 | | | | 04/01/28 | | | | 380 | | | | 363,217 | |
Apache Corp.,
Sr. Unsec’d. Notes | | | 3.250 | | | | 04/15/22 | | | | 500 | | | | 493,338 | |
Canadian Natural Resources Ltd. (Canada), | | | | | | | | | | | | | | | | |
Sr. Unsec’d. Notes | | | 2.950 | | | | 01/15/23 | | | | 1,310 | | | | 1,265,828 | |
Sr. Unsec’d. Notes | | | 6.250 | | | | 03/15/38 | | | | 175 | | | | 206,662 | |
Cenovus Energy, Inc. (Canada), | | | | | | | | | | | | | | | | |
Sr. Unsec’d. Notes | | | 5.400 | | | | 06/15/47 | | | | 384 | | | | 386,983 | |
Sr. Unsec’d. Notes | | | 6.750 | | | | 11/15/39 | | | | 350 | | | | 403,672 | |
Chevron Corp.,
Sr. Unsec’d. Notes | | | 1.961 | | | | 03/03/20 | | | | 125 | | | | 123,437 | |
Concho Resources, Inc.,
Gtd. Notes | | | 4.875 | | | | 10/01/47 | | | | 55 | | | | 55,947 | |
Devon Energy Corp.,
Sr. Unsec’d. Notes | | | 4.750 | | | | 05/15/42 | | | | 100 | | | | 98,920 | |
Encana Corp. (Canada),
Sr. Unsec’d. Notes | | | 6.500 | | | | 08/15/34 | | | | 200 | | | | 235,274 | |
Helmerich & Payne International Drilling Co.,
Gtd. Notes | | | 4.650 | | | | 03/15/25 | | | | 190 | | | | 194,676 | |
Husky Energy, Inc. (Canada), | | | | | | | | | | | | | | | | |
Sr. Unsec’d. Notes | | | 4.000 | | | | 04/15/24 | | | | 150 | | | | 149,617 | |
Sr. Unsec’d. Notes | | | 6.150 | | | | 06/15/19 | | | | 300 | | | | 307,590 | |
Sr. Unsec’d. Notes | | | 6.800 | | | | 09/15/37 | | | | 200 | | | | 246,806 | |
KazMunayGas National Co. JSC (Kazakhstan),
Sr. Unsec’d. Notes, 144A | | | 3.875 | | | | 04/19/22 | | | | 200 | | | | 198,500 | |
See Notes to Financial Statements.
| | | | | | | | | | | | | | | | |
| Description | | Interest
Rate | | | Maturity
Date | | | Principal
Amount (000)# | | | Value | |
CORPORATE BONDS (Continued) | | | | | | | | | | | | | | | | |
| | | | |
Oil & Gas (cont’d.) | | | | | | | | | | | | | | | | |
Kerr-McGee Corp.,
Gtd. Notes | | | 7.875 | % | | | 09/15/31 | | | | 250 | | | $ | 314,966 | |
Noble Energy, Inc., | | | | | | | | | | | | | | | | |
Sr. Unsec’d. Notes | | | 3.900 | | | | 11/15/24 | | | | 425 | | | | 419,987 | |
Sr. Unsec’d. Notes | | | 5.050 | | | | 11/15/44 | | | | 435 | | | | 440,894 | |
Petroleos Mexicanos (Mexico), | | | | | | | | | | | | | | | | |
Gtd. Notes | | | 5.375 | | | | 03/13/22 | | | | 1,000 | | | | 1,027,000 | |
Gtd. Notes | | | 5.500 | | | | 01/21/21 | | | | 480 | | | | 494,448 | |
Gtd. Notes | | | 6.500 | | | | 06/02/41 | | | | 90 | | | | 83,286 | |
Gtd. Notes, MTN | | | 6.750 | | | | 09/21/47 | | | | 1,230 | | | | 1,139,361 | |
Gtd. Notes, MTN | | | 6.875 | | | | 08/04/26 | | | | 390 | | | | 407,550 | |
Sinopec Group Overseas Development 2015 Ltd. (China),
Gtd. Notes, 144A | | | 2.500 | | | | 04/28/20 | | | | 200 | | | | 196,857 | |
Statoil ASA (Norway),
Gtd. Notes | | | 2.250 | | | | 11/08/19 | | | | 800 | | | | 793,351 | |
Valero Energy Corp.,
Sr. Unsec’d. Notes | | | 3.400 | | | | 09/15/26 | | | | 220 | | | | 210,211 | |
| | | | | | | | | | | | | | | | |
| | | | | | | | | | | | | | | 10,717,773 | |
| | | | |
Oil & Gas Services 0.3% | | | | | | | | | | | | | | | | |
Baker Hughes a GE Co. LLC/Baker Hughes Co-Obligor, Inc.,
Sr. Unsec’d. Notes | | | 3.337 | | | | 12/15/27 | | | | 148 | | | | 139,640 | |
Schlumberger Holdings Corp.,
| | | | | | | | | | | | | | | | |
Sr. Unsec’d. Notes, 144A | | | 3.000 | | | | 12/21/20 | | | | 506 | | | | 503,320 | |
Sr. Unsec’d. Notes, 144A | | | 4.000 | | | | 12/21/25 | | | | 500 | | | | 500,454 | |
Schlumberger Investment SA,
Gtd. Notes, 144A | | | 3.300 | | | | 09/14/21 | | | | 200 | | | | 199,509 | |
| | | | | | | | | | | | | | | | |
| | | | | | | | | | | | | | | 1,342,923 | |
| | | | |
Packaging & Containers 0.3% | | | | | | | | | | | | | | | | |
Bemis Co., Inc.,
Sr. Unsec’d. Notes | | | 6.800 | | | | 08/01/19 | | | | 700 | | | | 723,691 | |
WestRock RKT Co.,
Gtd. Notes | | | 4.000 | | | | 03/01/23 | | | | 540 | | | | 545,448 | |
| | | | | | | | | | | | | | | | |
| | | | | | | | | | | | | | | 1,269,139 | |
| | | | |
Pharmaceuticals 1.2% | | | | | | | | | | | | | | | | |
AbbVie, Inc., | | | | | | | | | | | | | | | | |
Sr. Unsec’d. Notes | | | 3.600 | | | | 05/14/25 | | | | 105 | | | | 102,418 | |
Sr. Unsec’d. Notes | | | 4.500 | | | | 05/14/35 | | | | 550 | | | | 541,385 | |
See Notes to Financial Statements.
Schedule of Investments (continued)
as of July 31, 2018
| | | | | | | | | | | | | | | | |
| Description | | Interest
Rate | | | Maturity
Date | | | Principal
Amount (000)# | | | Value | |
CORPORATE BONDS (Continued) | | | | | | | | | | | | | | | | |
| | | | |
Pharmaceuticals (cont’d.) | | | | | | | | | | | | | | | | |
Allergan Funding SCS, | | | | | | | | | | | | | | | | |
Gtd. Notes | | | 4.550 | % | | | 03/15/35 | | | | 360 | | | $ | 351,103 | |
Gtd. Notes | | | 4.850 | | | | 06/15/44 | | | | 25 | | | | 24,658 | |
AmerisourceBergen Corp.,
Sr. Unsec’d. Notes | | | 3.250 | | | | 03/01/25 | | | | 55 | | | | 51,998 | |
Bayer US Finance II LLC (Germany), | | | | | | | | | | | | | | | | |
Gtd. Notes, 144A, 3 Month LIBOR + 0.630% | | | 2.965 | (c) | | | 06/25/21 | | | | 335 | | | | 337,360 | |
Gtd. Notes, 144A | | | 3.500 | | | | 06/25/21 | | | | 200 | | | | 200,440 | |
Bayer US Finance LLC (Germany),
Gtd. Notes, 144A | | | 3.000 | | | | 10/08/21 | | | | 150 | | | | 148,003 | |
CVS Health Corp., | | | | | | | | | | | | | | | | |
Sr. Unsec’d. Notes | | | 4.780 | | | | 03/25/38 | | | | 90 | | | | 90,700 | |
Sr. Unsec’d. Notes | | | 5.050 | | | | 03/25/48 | | | | 315 | | | | 326,434 | |
Sr. Unsec’d. Notes | | | 5.125 | | | | 07/20/45 | | | | 465 | | | | 483,828 | |
Sr. Unsec’d. Notes | | | 5.300 | | | | 12/05/43 | | | | 150 | | | | 159,222 | |
Express Scripts Holding Co., | | | | | | | | | | | | | | | | |
Gtd. Notes | | | 3.400 | | | | 03/01/27 | | | | 325 | | | | 302,237 | |
Gtd. Notes | | | 4.500 | | | | 02/25/26 | | | | 700 | | | | 704,351 | |
Mylan NV,
Gtd. Notes | | | 3.950 | | | | 06/15/26 | | | | 400 | | | | 385,072 | |
Shire Acquisitions Investments Ireland DAC, | | | | | | | | | | | | | | | | |
Gtd. Notes | | | 2.875 | | | | 09/23/23 | | | | 225 | | | | 212,529 | |
Gtd. Notes | | | 3.200 | | | | 09/23/26 | | | | 1,220 | | | | 1,127,401 | |
| | | | | | | | | | | | | | | | |
| | | | | | | | | | | | | | | 5,549,139 | |
| | | | |
Pipelines 1.5% | | | | | | | | | | | | | | | | |
Colorado Interstate Gas Co. LLC/Colorado Interstate Issuing Corp.,
Gtd. Notes, 144A | | | 4.150 | | | | 08/15/26 | | | | 555 | | | | 543,537 | |
DCP Midstream Operating LP,
| | | | | | | | | | | | | | | | |
Gtd. Notes, 144A | | | 4.750 | | | | 09/30/21 | | | | 50 | | | | 50,637 | |
Gtd. Notes, 144A | | | 5.350 | | | | 03/15/20 | | | | 150 | | | | 153,938 | |
Energy Transfer Partners LP,
Gtd. Notes | | | 4.950 | | | | 06/15/28 | | | | 430 | | | | 439,445 | |
Enterprise Products Operating LLC,
Gtd. Notes | | | 6.500 | | | | 01/31/19 | | | | 420 | | | | 427,475 | |
Florida Gas Transmission Co. LLC,
Sr. Unsec’d. Notes, 144A | | | 5.450 | | | | 07/15/20 | | | | 600 | | | | 620,630 | |
Magellan Midstream Partners LP,
Sr. Unsec’d. Notes | | | 4.200 | | | | 03/15/45 | | | | 275 | | | | 244,179 | |
See Notes to Financial Statements.
| | | | | | | | | | | | | | | | |
| Description | | Interest
Rate | | | Maturity
Date | | | Principal
Amount (000)# | | | Value | |
CORPORATE BONDS (Continued) | | | | | | | | | | | | | | | | |
| | | | |
Pipelines (cont’d.) | | | | | | | | | | | | | | | | |
MPLX LP, | | | | | | | | | | | | | | | | |
Sr. Unsec’d. Notes | | | 4.000 | % | | | 02/15/25 | | | | 130 | | | $ | 128,281 | |
Sr. Unsec’d. Notes | | | 4.500 | | | | 04/15/38 | | | | 270 | | | | 256,491 | |
Sr. Unsec’d. Notes | | | 4.875 | | | | 06/01/25 | | | | 200 | | | | 207,750 | |
Sr. Unsec’d. Notes | | | 5.200 | | | | 03/01/47 | | | | 5 | | | | 5,078 | |
ONEOK Partners LP,
Gtd. Notes | | | 6.125 | | | | 02/01/41 | | | | 300 | | | | 337,216 | |
ONEOK, Inc.,
Gtd. Notes | | | 4.950 | | | | 07/13/47 | | | | 85 | | | | 86,202 | |
Phillips 66 Partners LP, | | | | | | | | | | | | | | | | |
Sr. Unsec’d. Notes | | | 2.646 | | | | 02/15/20 | | | | 225 | | | | 222,243 | |
Sr. Unsec’d. Notes | | | 3.550 | | | | 10/01/26 | | | | 310 | | | | 292,534 | |
Plains All American Pipeline LP/PAA Finance Corp.,
Sr. Unsec’d. Notes | | | 4.700 | | | | 06/15/44 | | | | 270 | | | | 245,715 | |
Spectra Energy Partners LP,
Sr. Unsec’d. Notes | | | 3.375 | | | | 10/15/26 | | | | 140 | | | | 131,278 | |
Texas Eastern Transmission LP,
Sr. Unsec’d. Notes, 144A | | | 3.500 | | | | 01/15/28 | | | | 300 | | | | 282,285 | |
Transcontinental Gas Pipe Line Co. LLC,
Sr. Unsec’d. Notes, 144A | | | 4.600 | | | | 03/15/48 | | | | 500 | | | | 490,928 | |
Western Gas Partners LP,
Sr. Unsec’d. Notes | | | 5.300 | | | | 03/01/48 | | | | 280 | | | | 268,133 | |
Williams Partners LP, | | | | | | | | | | | | | | | | |
Sr. Unsec’d. Notes | | | 4.000 | | | | 09/15/25 | | | | 350 | | | | 346,611 | |
Sr. Unsec’d. Notes | | | 4.300 | | | | 03/04/24 | | | | 325 | | | | 327,790 | |
Sr. Unsec’d. Notes | | | 4.850 | | | | 03/01/48 | | | | 55 | | | | 54,031 | |
Sr. Unsec’d. Notes | | | 5.400 | | | | 03/04/44 | | | | 400 | | | | 411,272 | |
| | | | | | | | | | | | | | | | |
| | | | | | | | | | | | | | | 6,573,679 | |
| | | | |
Real Estate Investment Trusts (REITs) 0.2% | | | | | | | | | | | | | | | | |
Camden Property Trust,
Sr. Unsec’d. Notes | | | 4.625 | | | | 06/15/21 | | | | 200 | | | | 205,404 | |
Welltower, Inc.,
Sr. Unsec’d. Notes | | | 6.125 | | | | 04/15/20 | | | | 430 | | | | 449,252 | |
Weyerhaeuser Co.,
Sr. Unsec’d. Notes | | | 4.625 | | | | 09/15/23 | | | | 425 | | | | 440,202 | |
| | | | | | | | | | | | | | | | |
| | | | | | | | | | | | | | | 1,094,858 | |
See Notes to Financial Statements.
Schedule of Investments (continued)
as of July 31, 2018
| | | | | | | | | | | | | | | | |
| Description | | Interest
Rate | | | Maturity
Date | | | Principal
Amount (000)# | | | Value | |
CORPORATE BONDS (Continued) | | | | | | | | | | | | | | | | |
| | | | |
Retail 0.3% | | | | | | | | | | | | | | | | |
Alimentation Couche-Tard, Inc. (Canada),
Gtd. Notes, 144A | | | 3.550 | % | | | 07/26/27 | | | | 940 | | | $ | 894,942 | |
Dollar Tree, Inc.,
Sr. Unsec’d. Notes, 3 Month LIBOR + 0.700% | | | 3.036 | (c) | | | 04/17/20 | | | | 335 | | | | 335,684 | |
| | | | | | | | | | | | | | | | |
| | | | | | | | | | | | | | | 1,230,626 | |
| | | | |
Semiconductors 0.1% | | | | | | | | | | | | | | | | |
Broadcom Corp./Broadcom Cayman Finance Ltd.,
Gtd. Notes | | | 3.875 | | | | 01/15/27 | | | | 480 | | | | 450,157 | |
| | | | |
Software 0.6% | | | | | | | | | | | | | | | | |
Electronic Arts, Inc.,
Sr. Unsec’d. Notes | | | 3.700 | | | | 03/01/21 | | | | 200 | | | | 201,976 | |
Fiserv, Inc.,
Sr. Unsec’d. Notes | | | 3.850 | | | | 06/01/25 | | | | 500 | | | | 498,993 | |
Microsoft Corp.,
| | | | | | | | | | | | | | | | |
Sr. Unsec’d. Notes | | | 3.950 | | | | 08/08/56 | | | | 405 | | | | 404,279 | |
Sr. Unsec’d. Notes | | | 4.500 | | | | 02/06/57 | | | | 1,000 | | | | 1,099,402 | |
Oracle Corp., | | | | | | | | | | | | | | | | |
Sr. Unsec’d. Notes | | | 3.800 | | | | 11/15/37 | | | | 415 | | | | 402,035 | |
Sr. Unsec’d. Notes | | | 4.000 | | | | 07/15/46 | | | | 350 | | | | 339,292 | |
| | | | | | | | | | | | | | | | |
| | | | | | | | | | | | | | | 2,945,977 | |
| | | | |
Telecommunications 0.3% | | | | | | | | | | | | | | | | |
AT&T, Inc., | | | | | | | | | | | | | | | | |
Sr. Unsec’d. Notes | | | 3.400 | | | | 05/15/25 | | | | 530 | | | | 503,399 | |
Sr. Unsec’d. Notes | | | 4.500 | | | | 05/15/35 | | | | 60 | | | | 56,128 | |
Sr. Unsec’d. Notes | | | 5.250 | | | | 03/01/37 | | | | 445 | | | | 445,498 | |
Verizon Communications, Inc., | | | | | | | | | | | | | | | | |
Sr. Unsec’d. Notes | | | 4.500 | | | | 08/10/33 | | | | 290 | | | | 287,657 | |
Sr. Unsec’d. Notes | | | 4.600 | | | | 04/01/21 | | | | 100 | | | | 102,832 | |
| | | | | | | | | | | | | | | | |
| | | | | | | | | | | | | | | 1,395,514 | |
| | | | |
Textiles 0.1% | | | | | | | | | | | | | | | | |
Cintas Corp. No 2,
Gtd. Notes | | | 2.900 | | | | 04/01/22 | | | | 385 | | | | 376,849 | |
See Notes to Financial Statements.
| | | | | | | | | | | | | | | | |
| Description | | Interest
Rate | | | Maturity
Date | | | Principal
Amount (000)# | | | Value | |
CORPORATE BONDS (Continued) | | | | | | | | | | | | | | | | |
| | | | |
Transportation 0.2% | | | | | | | | | | | | | | | | |
Canadian National Railway Co. (Canada),
Sr. Unsec’d. Notes | | | 5.550 | % | | | 03/01/19 | | | | 250 | | | $ | 253,985 | |
Canadian Pacific Railway Co. (Canada),
Sr. Unsec’d. Notes | | | 7.250 | | | | 05/15/19 | | | | 250 | | | | 258,293 | |
CSX Corp.,
Sr. Unsec’d. Notes | | | 2.600 | | | | 11/01/26 | | | | 420 | | | | 384,913 | |
Ryder System, Inc.,
Sr. Unsec’d. Notes, MTN | | | 2.650 | | | | 03/02/20 | | | | 110 | | | | 109,035 | |
| | | | | | | | | | | | | | | | |
| | | | | | | | | | | | | | | 1,006,226 | |
| | | | |
Trucking & Leasing 0.1% | | | | | | | | | | | | | | | | |
Penske Truck Leasing Co. Lp/PTL Finance Corp.,
Sr. Unsec’d. Notes, 144A | | | 3.050 | | | | 01/09/20 | | | | 300 | | | | 298,088 | |
| | | | |
Water 0.0% | | | | | | | | | | | | | | | | |
American Water Capital Corp., | | | | | | | | | | | | | | | | |
Sr. Unsec’d. Notes | | | 3.750 | | | | 09/01/47 | | | | 25 | | | | 23,292 | |
Sr. Unsec’d. Notes | | | 4.000 | | | | 12/01/46 | | | | 145 | | | | 139,177 | |
| | | | | | | | | | | | | | | | |
| | | | | | | | | | | | | | | 162,469 | |
| | | | | | | | | | | | | | | | |
TOTAL CORPORATE BONDS
(cost $141,318,572) | | | | | | | | | | | | | | | 137,697,613 | |
| | | | | | | | | | | | | | | | |
| | | | |
MUNICIPAL BONDS 0.9% | | | | | | | | | | | | | | | | |
| | | | |
Alabama 0.0% | | | | | | | | | | | | | | | | |
Alabama Economic Settlement Authority,
Revenue Bonds, BABs | | | 4.263 | | | | 09/15/32 | | | | 40 | | | | 40,751 | |
| | | | |
California 0.1% | | | | | | | | | | | | | | | | |
California Educational Facilities Authority,
Revenue BondsBABs | | | 5.000 | | | | 06/01/46 | | | | 130 | | | | 169,467 | |
Los Angeles Department of Airports,
BABs, Revenue Bonds | | | 6.582 | | | | 05/15/39 | | | | 300 | | | | 378,432 | |
University of California, | | | | | | | | | | | | | | | | |
Taxable, Revenue Bonds, Series AP | | | 3.931 | | | | 05/15/45 | | | | 30 | | | | 29,715 | |
Taxable, Revenue Bonds, Series J | | | 4.131 | | | | 05/15/45 | | | | 30 | | | | 30,124 | |
| | | | | | | | | | | | | | | | |
| | | | | | | | | | | | | | | 607,738 | |
See Notes to Financial Statements.
Schedule of Investments (continued)
as of July 31, 2018
| | | | | | | | | | | | | | | | |
| Description | | Interest
Rate | | | Maturity Date | | | Principal
Amount (000)# | | | Value | |
MUNICIPAL BONDS (Continued) | | | | | | | | | | | | | | | | |
| | | | |
Illinois 0.2% | | | | | | | | | | | | | | | | |
State of Illinois,
GO Unlimited, Series D | | | 5.000 | % | | | 11/01/22 | | | | 895 | | | $ | 950,418 | |
| | | | |
New Jersey 0.1% | | | | | | | | | | | | | | | | |
New Jersey Turnpike Authority,
BABs, Revenue Bonds, Series A | | | 7.102 | | | | 01/01/41 | | | | 250 | | | | 350,118 | |
| | | | |
North Carolina 0.2% | | | | | | | | | | | | | | | | |
North Carolina State Education Assistance Authority,
Revenue Bonds, 3 Month LIBOR + 0.800% | | | 3.135 | (c) | | | 07/25/36 | | | | 700 | | | | 700,434 | |
| | | | |
Pennsylvania 0.1% | | | | | | | | | | | | | | | | |
Pennsylvania Turnpike Commission,
| | | | | | | | | | | | | | | | |
BABs, Revenue Bonds, | | | 6.105 | | | | 12/01/39 | | | | 70 | | | | 88,635 | |
BABs, Revenue Bonds, Series B | | | 5.511 | | | | 12/01/45 | | | | 150 | | | | 181,945 | |
| | | | | | | | | | | | | | | | |
| | | | | | | | | | | | | | | 270,580 | |
| | | | |
Texas 0.2% | | | | | | | | | | | | | | | | |
Permanent University Fund - University of Texas System,
Revenue Bonds | | | 3.376 | | | | 07/01/47 | | | | 555 | | | | 503,052 | |
University of Texas System (The),
Revenue Bonds | | | 5.000 | | | | 08/15/47 | | | | 305 | | | | 386,676 | |
| | | | | | | | | | | | | | | | |
| | | | | | | | | | | | | | | 889,728 | |
| | | | |
Virginia 0.0% | | | | | | | | | | | | | | | | |
University of Virginia,
Taxable, Revenue Bonds, Series C | | | 4.179 | | | | 09/01/2117 | | | | 130 | | | | 128,463 | |
| | | | | | | | | | | | | | | | |
TOTAL MUNICIPAL BONDS
(cost $4,037,787) | | | | | | | | | | | | | | | 3,938,230 | |
| | | | | | | | | | | | | | | | |
| | |
RESIDENTIAL MORTGAGE-BACKED SECURITIES 3.2% | | | | | | | | | |
Alternative Loan Trust,
Series 2003-J3, Class 2A1 | | | 6.250 | | | | 12/25/33 | | | | 6 | | | | 6,511 | |
American Home Mortgage Investment Trust,
Series 2004-4, Class 5A, 6 Month LIBOR + 2.000% | | | 4.501 | (c) | | | 02/25/45 | | | | 11 | | | | 10,787 | |
Banc of America Funding Corp.,
Series 2015-R4, Class 4A1, 144A | | | 3.500 | (cc) | | | 01/27/30 | | | | 181 | | | | 179,104 | |
BCAP LLC Trust,
Series 2011-RR4, Class 7A1, 144A | | | 5.250 | | | | 04/26/37 | | | | 288 | | | | 240,104 | |
See Notes to Financial Statements.
| | | | | | | | | | | | | | | | |
| Description | | Interest
Rate | | | Maturity
Date | | | Principal
Amount (000)# | | | Value | |
RESIDENTIAL MORTGAGE-BACKED SECURITIES (Continued) | |
Bellemeade Re Ltd., | | | | | | | | | | | | | | | | |
Series 2017-1, Class M1, 144A, 1 Month LIBOR + 1.700% | | | 3.764 | %(c) | | | 10/25/27 | | | | 200 | | | $ | 200,922 | |
Series 2018-1A, Class M1B, 144A, 1 Month LIBOR + 1.600% | | | 3.664 | (c) | | | 04/25/28 | | | | 400 | | | | 401,269 | |
CIM Trust, | | | | | | | | | | | | | | | | |
Series 2017-2, Class A1, 144A, 1 Month LIBOR + 2.000% | | | 4.092 | (c) | | | 12/25/57 | | | | 403 | | | | 407,868 | |
Series 2017-3, Class A1, 144A, 1 Month LIBOR + 2.000% | | | 4.092 | (c) | | | 01/25/57 | | | | 861 | | | | 877,614 | |
Series 2017-6, Class A1, 144A | | | 3.015 | (cc) | | | 06/25/57 | | | | 438 | | | | 428,356 | |
Series 2017-8, Class A1, 144A | | | 3.000 | (cc) | | | 12/25/65 | | | | 957 | | | | 941,899 | |
Credit Suisse First Boston Mortgage Securities Corp.,
Series 2003-8, Class 5A1 | | | 6.500 | | | | 04/25/33 | | | | 5 | | | | 4,621 | |
Fannie Mae Connecticut Avenue Securities, | | | | | | | | | | | | | | | | |
Series 2016-C02, Class 1M1, 1 Month LIBOR + 2.150% | | | 4.214 | (c) | | | 09/25/28 | | | | 23 | | | | 22,735 | |
Series 2016-C04, Class 1M1, 1 Month LIBOR + 1.450% | | | 3.514 | (c) | | | 01/25/29 | | | | 62 | | | | 61,994 | |
Freddie Mac REMICS,
Series 4777, Class CB | | | 3.500 | | | | 10/15/45 | | | | 1,722 | | | | 1,724,307 | |
Freddie Mac Structured Agency Credit Risk Debt Notes, | | | | | | | | | | | | | | | | |
Series 2016-DNA4, Class M2, 1 Month LIBOR + 1.300% | | | 3.364 | (c) | | | 03/25/29 | | | | 240 | | | | 242,422 | |
Series 2016-HQA4, Class M2, 1 Month LIBOR + 1.300% | | | 3.364 | (c) | | | 04/25/29 | | | | 260 | | | | 263,382 | |
Series 2017-DNA1, Class M1, 1 Month LIBOR + 1.200% | | | 3.264 | (c) | | | 07/25/29 | | | | 574 | | | | 578,990 | |
Series 2017-DNA3, Class M1, 1 Month LIBOR + 0.750% | | | 2.814 | (c) | | | 03/25/30 | | | | 1,418 | | | | 1,421,671 | |
Freddie Mac Structured Pass-Through Certificates, | | | | | | | | | | | | | | | | |
Series T-59, Class 1A2 | | | 7.000 | | | | 10/25/43 | | | | 120 | | | | 134,123 | |
Series T-75, Class A1, 1 Month LIBOR + 0.040% | | | 1.891 | (c) | | | 12/25/36 | | | | 74 | | | | 74,150 | |
GSR Mortgage Loan Trust,
Series 2005-AR6, Class 2A1 | | | 3.714 | (cc) | | | 09/25/35 | | | | 61 | | | | 62,228 | |
Holmes Master Issuer PLC,
Series 2018-1A, Class A2, 144A, 3 Month LIBOR + 0.360% | | | 2.699 | (c) | | | 10/15/54 | | | | 700 | | | | 699,325 | |
Lanark Master Issuer PLC,
Series 2018-1A, Class 1A, 144A, 3 Month LIBOR + 0.420% | | | 2.749 | (c) | | | 12/22/69 | | | | 564 | | | | 562,490 | |
LSTAR Securities Investment Ltd., | | | | | | | | | | | | | | | | |
Series 2017-5, Class A, 144A, 1 Month LIBOR + 2.000% | | | 4.092 | (c) | | | 05/01/22 | | | | 576 | | | | 576,319 | |
Series 2017-8, Class A, 144A, 1 Month LIBOR + 1.650% | | | 3.742 | (c) | | | 11/01/22 | | | | 331 | | | | 332,457 | |
LSTAR Securities Investment Trust, | | | | | | | | | | | | | | | | |
Series 2017-6, Class A, 144A, 1 Month LIBOR + 1.750% | | | 3.842 | (c) | | | 09/01/22 | | | | 102 | | | | 102,609 | |
Series 2018-2, Class A1, 144A, 1 Month LIBOR + 1.500% | | | 3.592 | (c) | | | 04/01/23 | | | | 1,355 | | | | 1,355,958 | |
Merrill Lynch Mortgage Investors Trust Series,
Series 2005-2, Class 3A, 1 Month LIBOR + 1.000% | | | 3.092 | (c) | | | 10/25/35 | | | | 50 | | | | 47,984 | |
Merrill Lynch Mortgage Investors Trust, MLMI Series,
Series 2005-A10, Class A, 1 Month LIBOR + 0.210% | | | 2.274 | (c) | | | 02/25/36 | | | | 116 | | | | 111,174 | |
OBX Trust,
Series 2018-1, Class A2, 144A, 1 Month LIBOR + 0.650% | | | 2.714 | (c) | | | 06/25/57 | | | | 889 | | | | 889,690 | |
See Notes to Financial Statements.
Schedule of Investments (continued)
as of July 31, 2018
| | | | | | | | | | | | | | | | |
| Description | | Interest
Rate | | | Maturity
Date | | | Principal
Amount (000)# | | | Value | |
RESIDENTIAL MORTGAGE-BACKED SECURITIES (Continued) | |
Radnor RE Ltd.,
Series 2018-1, Class M1, 144A, 1 Month LIBOR + 1.400% | | | 3.464 | %(c) | | | 03/25/28 | | | | 440 | | | $ | 440,383 | |
Sequoia Mortgage Trust 10,
Series 10, Class 2A1, 1 Month LIBOR + 0.760% | | | 2.846 | (c) | | | 10/20/27 | | | | 57 | | | | 54,459 | |
Structured Asset Mortgage Investments II Trust,
Series 2005-AR5, Class A1, 1 Month LIBOR + 0.250% | | | 2.332 | (c) | | | 07/19/35 | | | | 46 | | | | 44,587 | |
WaMu Mortgage Pass-Through Certificates Series Trust, | | | | | | | | | | | | | | | | |
Series 2002-AR6, Class A, Federal Reserve US 12 Month Cumulative Avg 1 Year CMT + 1.400% | | | 3.054 | (c) | | | 06/25/42 | | | | 78 | | | | 74,783 | |
Series 2002-AR9, Class 1A, Federal Reserve US 12 Month Cumulative Avg 1 Year CMT + 1.400% | | | 3.054 | (c) | | | 08/25/42 | | | | 5 | | | | 5,401 | |
Series 2005-AR13, Class A1A1, 1 Month LIBOR + 0.290% | | | 2.354 | (c) | | | 10/25/45 | | | | 620 | | | | 619,943 | |
| | | | | | | | | | | | | | | | |
TOTAL RESIDENTIAL MORTGAGE-BACKED SECURITIES
(cost $14,187,939) | | | | | | | | | | | | | | | 14,202,619 | |
| | | | | | | | | | | | | | | | |
| | | | |
SOVEREIGN BONDS 2.2% | | | | | | | | | | | | | | | | |
Abu Dhabi Government International Bond (United Arab Emirates),
Sr. Unsec’d. Notes, 144A | | | 3.125 | | | | 10/11/27 | | | | 840 | | | | 791,062 | |
Colombia Government International Bond (Colombia), | | | | | | | | | | | | | | | | |
Sr. Unsec’d. Notes | | | 4.375 | | | | 07/12/21 | | | | 200 | | | | 204,800 | |
Sr. Unsec’d. Notes | | | 7.375 | | | | 09/18/37 | | | | 175 | | | | 220,500 | |
Export-Import Bank of India (India), | | | | | | | | | | | | | | | | |
Sr. Unsec’d. Notes, 144A | | | 3.875 | | | | 02/01/28 | | | | 290 | | | | 273,496 | |
Sr. Unsec’d. Notes, EMTN | | | 2.750 | | | | 04/01/20 | | | | 400 | | | | 392,480 | |
Finnvera OYJ (Finland),
Gov’t. Gtd. Notes, EMTN | | | 1.875 | | | | 09/16/19 | | | | 200 | | | | 197,903 | |
Indonesia Government International Bond (Indonesia), | | | | | | | | | | | | | | | | |
Sr. Unsec’d. Notes, MTN | | | 3.750 | | | | 04/25/22 | | | | 200 | | | | 199,417 | |
Sr. Unsec’d. Notes, MTN | | | 4.750 | | | | 01/08/26 | | | | 200 | | | | 205,707 | |
Japan Bank for International Cooperation (Japan), | | | | | | | | | | | | | | | | |
Gov’t. Gtd. Notes | | | 2.125 | | | | 06/01/20 | | | | 200 | | | | 197,002 | |
Gov’t. Gtd. Notes | | | 2.125 | | | | 07/21/20 | | | | 400 | | | | 393,117 | |
Gov’t. Gtd. Notes | | | 2.125 | | | | 11/16/20 | | | | 800 | | | | 782,350 | |
Gov’t. Gtd. Notes | | | 2.250 | | | | 02/24/20 | | | | 200 | | | | 197,963 | |
Japan Finance Organization for Municipalities (Japan), | | | | | | | | | | | | | | | | |
Sr. Unsec’d. Notes, 144A, MTN | | | 2.125 | | | | 10/25/23 | | | | 200 | | | | 187,388 | |
Sr. Unsec’d. Notes, 144A, MTN | | | 2.625 | | | | 04/20/22 | | | | 400 | | | | 389,424 | |
Sr. Unsec’d. Notes, EMTN | | | 2.125 | | | | 04/13/21 | | | | 200 | | | | 193,973 | |
Lithuania Government International Bond (Lithuania),
Sr. Unsec’d. Notes, 144A | | | 6.125 | | | | 03/09/21 | | | | 260 | | | | 278,460 | |
Panama Government International Bond (Panama),
Sr. Unsec’d. Notes | | | 3.750 | | | | 03/16/25 | | | | 200 | | | | 199,400 | |
See Notes to Financial Statements.
| | | | | | | | | | | | | | | | |
| Description | | Interest
Rate | | | Maturity
Date | | | Principal
Amount (000)# | | | Value | |
SOVEREIGN BONDS (Continued) | |
Panama Government International Bond (Panama), (cont’d.) | | | | | | | | | | | | | | | | |
Sr. Unsec’d. Notes | | | 4.500 | % | | | 04/16/50 | | | | 200 | | | $ | 197,000 | |
Province of Alberta (Canada),
Sr. Unsec’d. Notes | | | 3.300 | | | | 03/15/28 | | | | 335 | | | | 331,183 | |
Province of Manitoba (Canada),
Sr. Unsec’d. Notes | | | 2.125 | | | | 06/22/26 | | | | 100 | | | | 91,081 | |
Province of Ontario (Canada),
Sr. Unsec’d. Notes | | | 2.250 | | | | 05/18/22 | | | | 165 | | | | 159,273 | |
Province of Quebec (Canada), | | | | | | | | | | | | | | | | |
Sr. Unsec’d. Notes | | | 2.750 | | | | 04/12/27 | | | | 415 | | | | 396,651 | |
Unsec’d. Notes, MTN | | | 7.140 | | | | 02/27/26 | | | | 100 | | | | 120,742 | |
Qatar Government International Bond (Qatar), | | | | | | | | | | | | | | | | |
Sr. Unsec’d. Notes, 144A | | | 3.875 | | | | 04/23/23 | | | | 335 | | | | 336,239 | |
Sr. Unsec’d. Notes, 144A | | | 5.103 | | | | 04/23/48 | | | | 370 | | | | 377,874 | |
Republic of Poland Government International Bond (Poland),
Sr. Unsec’d. Notes | | | 3.000 | | | | 03/17/23 | | | | 100 | | | | 98,235 | |
Saudi Government International Bond (Saudi Arabia), | | | | | | | | | | | | | | | | |
Sr. Unsec’d. Notes, 144A, MTN | | | 2.375 | | | | 10/26/21 | | | | 435 | | | | 418,357 | |
Sr. Unsec’d. Notes, 144A, MTN | | | 2.875 | | | | 03/04/23 | | | | 460 | | | | 441,876 | |
Sr. Unsec’d. Notes, 144A, MTN | | | 4.000 | | | | 04/17/25 | | | | 320 | | | | 319,768 | |
Tokyo Metropolitan Government (Japan), | | | | | | | | | | | | | | | | |
Sr. Unsec’d. Notes, 144A | | | 2.500 | | | | 06/08/22 | | | | 400 | | | | 387,094 | |
Sr. Unsec’d. Notes, 144A | | | 3.250 | | | | 06/01/23 | | | | 200 | | | | 199,056 | |
Turkey Government International Bond (Turkey),
Sr. Unsec’d. Notes | | | 7.000 | | | | 06/05/20 | | | | 250 | | | | 254,000 | |
Uruguay Government International Bond (Uruguay), | | | | | | | | | | | | | | | | |
Sr. Unsec’d. Notes | | | 4.975 | | | | 04/20/55 | | | | 215 | | | | 213,065 | |
Sr. Unsec’d. Notes | | | 5.100 | | | | 06/18/50 | | | | 150 | | | | 151,657 | |
| | | | | | | | | | | | | | | | |
TOTAL SOVEREIGN BONDS
(cost $10,018,347) | | | | | | | | | | | | | | | 9,797,593 | |
| | | | | | | | | | | | | | | | |
| | | | |
U.S. GOVERNMENT AGENCY OBLIGATIONS 20.7% | | | | | | | | | | | | | | | | |
Federal Farm Credit Banks | | | 3.220 | | | | 03/26/31 | | | | 540 | | | | 523,396 | |
Federal Home Loan Mortgage Corp. | | | 1.375 | | | | 08/15/19 | | | | 320 | | | | 316,387 | |
Federal Home Loan Mortgage Corp. | | | 2.000 | | | | 01/01/32 | | | | 950 | | | | 896,021 | |
Federal Home Loan Mortgage Corp. | | | 2.375 | | | | 01/13/22 | | | | 280 | | | | 275,479 | |
Federal Home Loan Mortgage Corp. | | | 2.500 | | | | 01/01/29 | | | | 727 | | | | 707,904 | |
Federal Home Loan Mortgage Corp. | | | 2.500 | | | | 07/01/31 | | | | 908 | | | | 878,809 | |
Federal Home Loan Mortgage Corp. | | | 2.500 | | | | 01/01/32 | | | | 442 | | | | 428,341 | |
Federal Home Loan Mortgage Corp. | | | 3.000 | | | | 01/01/37 | | | | 485 | | | | 476,001 | |
Federal Home Loan Mortgage Corp. | | | 3.000 | | | | 12/01/37 | | | | 242 | | | | 236,158 | |
Federal Home Loan Mortgage Corp. | | | 3.000 | | | | 07/01/43 | | | | 710 | | | | 689,241 | |
Federal Home Loan Mortgage Corp. | | | 3.000 | | | | 12/01/46 | | | | 1,375 | | | | 1,326,396 | |
Federal Home Loan Mortgage Corp. | | | 3.000 | | | | 01/01/47 | | | | 1,477 | | | | 1,423,909 | |
See Notes to Financial Statements.
Schedule of Investments (continued)
as of July 31, 2018
| | | | | | | | | | | | | | | | |
| Description | | Interest
Rate | | | Maturity
Date | | | Principal
Amount (000)# | | | Value | |
U.S. GOVERNMENT AGENCY OBLIGATIONS (Continued) | |
Federal Home Loan Mortgage Corp. | | | 3.500 | % | | | 06/01/42 | | | | 649 | | | $ | 648,025 | |
Federal Home Loan Mortgage Corp. | | | 3.500 | | | | 09/01/42 | | | | 830 | | | | 828,542 | |
Federal Home Loan Mortgage Corp. | | | 3.500 | | | | 10/01/42 | | | | 912 | | | | 910,345 | |
Federal Home Loan Mortgage Corp. | | | 3.500 | | | | 06/01/43 | | | | 449 | | | | 448,661 | |
Federal Home Loan Mortgage Corp. | | | 3.500 | | | | 05/01/45 | | | | 688 | | | | 684,726 | |
Federal Home Loan Mortgage Corp. | | | 3.500 | | | | 01/01/47 | | | | 495 | | | | 491,460 | |
Federal Home Loan Mortgage Corp. | | | 3.500 | | | | 01/01/48 | | | | 488 | | | | 483,743 | |
Federal Home Loan Mortgage Corp. | | | 4.000 | | | | TBA | | | | 1,000 | | | | 1,013,849 | |
Federal Home Loan Mortgage Corp. | | | 4.000 | | | | 12/01/40 | | | | 237 | | | | 242,594 | |
Federal Home Loan Mortgage Corp. | | | 4.000 | | | | 01/01/41 | | | | 505 | | | | 517,265 | |
Federal Home Loan Mortgage Corp. | | | 4.000 | | | | 04/01/42 | | | | 637 | | | | 652,466 | |
Federal Home Loan Mortgage Corp. | | | 4.000 | | | | 10/01/45 | | | | 377 | | | | 384,455 | |
Federal Home Loan Mortgage Corp. | | | 4.000 | | | | 05/01/46 | | | | 444 | | | | 452,155 | |
Federal Home Loan Mortgage Corp. | | | 4.000 | | | | 08/01/46 | | | | 441 | | | | 449,417 | |
Federal Home Loan Mortgage Corp. | | | 4.500 | | | | TBA | | | | 3,000 | | | | 3,105,847 | |
Federal Home Loan Mortgage Corp. | | | 4.500 | | | | 06/01/42 | | | | 223 | | | | 233,957 | |
Federal Home Loan Mortgage Corp. | | | 4.500 | | | | 09/01/44 | | | | 298 | | | | 309,231 | |
Federal Home Loan Mortgage Corp. | | | 4.500 | | | | 07/01/47 | | | | 1,005 | | | | 1,042,068 | |
Federal Home Loan Mortgage Corp. | | | 5.000 | | | | 08/01/40 | | | | 458 | | | | 487,894 | |
Federal National Mortgage Assoc. | | | 2.375 | | | | 01/19/23 | | | | 1,490 | | | | 1,455,988 | |
Federal National Mortgage Assoc. | | | 2.500 | | | | 05/01/30 | | | | 629 | | | | 611,523 | |
Federal National Mortgage Assoc. | | | 2.500 | | | | 11/01/31 | | | | 445 | | | | 431,295 | |
Federal National Mortgage Assoc. | | | 2.500 | | | | 11/01/31 | | | | 456 | | | | 441,892 | |
Federal National Mortgage Assoc. | | | 2.500 | | | | 02/01/43 | | | | 163 | | | | 152,868 | |
Federal National Mortgage Assoc. | | | 2.500 | | | | 09/01/46 | | | | 463 | | | | 432,171 | |
Federal National Mortgage Assoc. | | | 2.500 | | | | 10/01/46 | | | | 449 | | | | 419,292 | |
Federal National Mortgage Assoc., Cost of Funds for the 11th District of San Francisco + 2.000% | | | 2.750 | (c) | | | 08/01/24 | | | | 9 | | | | 9,362 | |
Federal National Mortgage Assoc. | | | 3.000 | | | | 06/01/30 | | | | 410 | | | | 407,530 | |
Federal National Mortgage Assoc. | | | 3.000 | | | | 05/01/31 | | | | 187 | | | | 185,846 | |
Federal National Mortgage Assoc. | | | 3.000 | | | | 12/01/31 | | | | 482 | | | | 477,452 | |
Federal National Mortgage Assoc. | | | 3.000 | | | | 05/01/32 | | | | 469 | | | | 465,423 | |
Federal National Mortgage Assoc. | | | 3.000 | | | | 09/01/32 | | | | 238 | | | | 236,304 | |
Federal National Mortgage Assoc. | | | 3.000 | | | | 11/01/36 | | | | 419 | | | | 411,226 | |
Federal National Mortgage Assoc. | | | 3.000 | | | | 10/01/42 | | | | 401 | | | | 389,942 | |
Federal National Mortgage Assoc. | | | 3.000 | | | | 10/01/42 | | | | 669 | | | | 651,077 | |
Federal National Mortgage Assoc. | | | 3.000 | | | | 02/01/43 | | | | 406 | | | | 395,181 | |
Federal National Mortgage Assoc. | | | 3.000 | | | | 04/01/43 | | | | 683 | | | | 664,162 | |
Federal National Mortgage Assoc. | | | 3.000 | | | | 06/01/43 | | | | 896 | | | | 870,825 | |
Federal National Mortgage Assoc. | | | 3.000 | | | | 12/01/46 | | | | 482 | | | | 465,290 | |
Federal National Mortgage Assoc. | | | 3.000 | | | | 01/01/47 | | | | 3,514 | | | | 3,391,814 | |
Federal National Mortgage Assoc. | | | 3.500 | | | | TBA | | | | 1,500 | | | | 1,511,543 | |
Federal National Mortgage Assoc. | | | 3.500 | | | | 12/01/29 | | | | 270 | | | | 272,554 | |
Federal National Mortgage Assoc. | | | 3.500 | | | | 08/01/31 | | | | 753 | | | | 761,589 | |
See Notes to Financial Statements.
| | | | | | | | | | | | | | | | |
| Description | | Interest
Rate | | | Maturity
Date | | | Principal
Amount (000)# | | | Value | |
U.S. GOVERNMENT AGENCY OBLIGATIONS (Continued) | |
Federal National Mortgage Assoc. | | | 3.500 | % | | | 12/01/32 | | | | 433 | | | $ | 437,234 | |
Federal National Mortgage Assoc. | | | 3.500 | | | | 10/01/41 | | | | 285 | | | | 284,357 | |
Federal National Mortgage Assoc. | | | 3.500 | | | | 04/01/42 | | | | 576 | | | | 575,543 | |
Federal National Mortgage Assoc. | | | 3.500 | | | | 05/01/42 | | | | 582 | | | | 580,946 | |
Federal National Mortgage Assoc. | | | 3.500 | | | | 06/01/42 | | | | 1,288 | | | | 1,286,683 | |
Federal National Mortgage Assoc. | | | 3.500 | | | | 10/01/42 | | | | 667 | | | | 666,076 | |
Federal National Mortgage Assoc. | | | 3.500 | | | | 10/01/42 | | | | 923 | | | | 921,437 | |
Federal National Mortgage Assoc. | | | 3.500 | | | | 06/01/43 | | | | 435 | | | | 433,143 | |
Federal National Mortgage Assoc. | | | 3.500 | | | | 06/01/45 | | | | 673 | | | | 668,352 | |
Federal National Mortgage Assoc. | | | 3.500 | | | | 06/01/45 | | | | 1,302 | | | | 1,294,021 | |
Federal National Mortgage Assoc. | | | 3.500 | | | | 09/01/45 | | | | 858 | | | | 852,517 | |
Federal National Mortgage Assoc. | | | 3.500 | | | | 10/01/45 | | | | 1,138 | | | | 1,130,876 | |
Federal National Mortgage Assoc. | | | 3.500 | | | | 01/01/46 | | | | 391 | | | | 388,323 | |
Federal National Mortgage Assoc. | | | 3.500 | | | | 01/01/46 | | | | 892 | | | | 886,790 | |
Federal National Mortgage Assoc. | | | 3.500 | | | | 11/01/47 | | | | 6,061 | | | | 6,010,290 | |
Federal National Mortgage Assoc. | | | 4.000 | | | | TBA | | | | 1,500 | | | | 1,523,672 | |
Federal National Mortgage Assoc. | | | 4.000 | | | | 09/01/40 | | | | 444 | | | | 453,992 | |
Federal National Mortgage Assoc. | | | 4.000 | | | | 02/01/41 | | | | 748 | | | | 765,138 | |
Federal National Mortgage Assoc. | | | 4.000 | | | | 12/01/41 | | | | 653 | | | | 668,528 | |
Federal National Mortgage Assoc. | | | 4.000 | | | | 09/01/44 | | | | 447 | | | | 454,632 | |
Federal National Mortgage Assoc. | | | 4.000 | | | | 10/01/44 | | | | 1,119 | | | | 1,139,135 | |
Federal National Mortgage Assoc. | | | 4.000 | | | | 12/01/45 | | | | 374 | | | | 379,681 | |
Federal National Mortgage Assoc. | | | 4.000 | | | | 08/01/46 | | | | 810 | | | | 824,262 | |
Federal National Mortgage Assoc. | | | 4.500 | | | | 08/01/40 | | | | 206 | | | | 215,555 | |
Federal National Mortgage Assoc. | | | 4.500 | | | | 04/01/41 | | | | 229 | | | | 240,000 | |
Federal National Mortgage Assoc. | | | 4.500 | | | | 08/01/41 | | | | 312 | | | | 327,132 | |
Federal National Mortgage Assoc. | | | 4.500 | | | | 08/01/41 | | | | 742 | | | | 773,666 | |
Federal National Mortgage Assoc. | | | 4.500 | | | | 08/01/44 | | | | 622 | | | | 648,542 | |
Federal National Mortgage Assoc. | | | 4.500 | | | | 01/01/45 | | | | 400 | | | | 417,142 | |
Federal National Mortgage Assoc. | | | 5.000 | | | | 09/01/30 | | | | 51 | | | | 53,975 | |
Federal National Mortgage Assoc. | | | 5.000 | | | | 03/01/42 | | | | 724 | | | | 774,160 | |
Federal National Mortgage Assoc. | | | 5.000 | | | | 10/01/47 | | | | 1,179 | | | | 1,245,976 | |
Federal National Mortgage Assoc. | | | 5.000 | | | | 01/01/48 | | | | 176 | | | | 186,479 | |
Federal National Mortgage Assoc. | | | 5.500 | | | | TBA | | | | 750 | | | | 800,918 | |
Federal National Mortgage Assoc. | | | 5.500 | | | | 01/01/40 | | | | 271 | | | | 292,085 | |
Federal National Mortgage Assoc., Cost of Funds for the 11th District of San Francisco + 1.250% | | | 5.617 | (c) | | | 12/01/30 | | | | 1 | | | | 937 | |
Federal National Mortgage Assoc. | | | 6.000 | | | | 10/01/36 | | | | 159 | | | | 174,246 | |
Federal National Mortgage Assoc. | | | 6.000 | | | | 07/01/41 | | | | 166 | | | | 180,841 | |
Federal National Mortgage Assoc. | | | 6.625 | | | | 11/15/30 | (k) | | | 485 | | | | 646,204 | |
Federal National Mortgage Assoc. | | | 7.125 | | | | 01/15/30 | (k) | | | 80 | | | | 108,917 | |
Government National Mortgage Assoc. | | | 2.500 | | | | 12/20/46 | | | | 308 | | | | 290,850 | |
Government National Mortgage Assoc. | | | 3.000 | | | | 03/20/43 | | | | 802 | | | | 789,804 | |
Government National Mortgage Assoc. | | | 3.000 | | | | 08/20/43 | | | | 155 | | | | 152,291 | |
See Notes to Financial Statements.
Schedule of Investments (continued)
as of July 31, 2018
| | | | | | | | | | | | | | | | |
| Description | | Interest
Rate | | | Maturity
Date | | | Principal
Amount (000)# | | | Value | |
U.S. GOVERNMENT AGENCY OBLIGATIONS (Continued) | |
Government National Mortgage Assoc. | | | 3.000 | % | | | 09/20/43 | | | | 292 | | | $ | 287,899 | |
Government National Mortgage Assoc. | | | 3.000 | | | | 01/20/44 | | | | 272 | | | | 267,713 | |
Government National Mortgage Assoc. | | | 3.000 | | | | 05/20/45 | | | | 421 | | | | 412,589 | |
Government National Mortgage Assoc. | | | 3.000 | | | | 08/15/45 | | | | 458 | | | | 447,207 | |
Government National Mortgage Assoc. | | | 3.000 | | | | 07/20/46 | | | | 1,806 | | | | 1,767,059 | |
Government National Mortgage Assoc. | | | 3.000 | | | | 08/20/46 | | | | 234 | | | | 229,040 | |
Government National Mortgage Assoc. | | | 3.000 | | | | 10/20/46 | | | | 429 | | | | 419,756 | |
Government National Mortgage Assoc. | | | 3.000 | | | | 03/20/47 | | | | 1,889 | | | | 1,846,807 | |
Government National Mortgage Assoc. | | | 3.500 | | | | 01/15/42 | | | | 195 | | | | 195,733 | |
Government National Mortgage Assoc. | | | 3.500 | | | | 12/20/42 | | | | 559 | | | | 563,371 | |
Government National Mortgage Assoc. | | | 3.500 | | | | 01/20/43 | | | | 822 | | | | 828,720 | |
Government National Mortgage Assoc. | | | 3.500 | | | | 02/20/43 | | | | 370 | | | | 372,686 | |
Government National Mortgage Assoc. | | | 3.500 | | | | 08/20/43 | | | | 448 | | | | 451,577 | |
Government National Mortgage Assoc. | | | 3.500 | | | | 03/20/45 | | | | 275 | | | | 275,884 | |
Government National Mortgage Assoc. | | | 3.500 | | | | 04/20/45 | | | | 1,630 | | | | 1,634,822 | |
Government National Mortgage Assoc. | | | 3.500 | | | | 07/20/46 | | | | 1,992 | | | | 1,995,256 | |
Government National Mortgage Assoc. | | | 3.500 | | | | 12/20/46 | | | | 2,345 | | | | 2,347,603 | |
Government National Mortgage Assoc. | | | 4.000 | | | | 12/20/40 | | | | 487 | | | | 502,633 | |
Government National Mortgage Assoc. | | | 4.000 | | | | 06/20/41 | | | | 192 | | | | 197,664 | |
Government National Mortgage Assoc. | | | 4.000 | | | | 11/15/41 | | | | 263 | | | | 270,712 | |
Government National Mortgage Assoc. | | | 4.000 | | | | 12/20/42 | | | | 393 | | | | 404,939 | |
Government National Mortgage Assoc. | | | 4.000 | | | | 04/20/43 | | | | 299 | | | | 308,300 | |
Government National Mortgage Assoc. | | | 4.000 | | | | 10/20/43 | | | | 317 | | | | 326,764 | |
Government National Mortgage Assoc. | | | 4.000 | | | | 09/20/44 | | | | 381 | | | | 392,600 | |
Government National Mortgage Assoc. | | | 4.000 | | | | 08/20/45 | | | | 393 | | | | 404,554 | |
Government National Mortgage Assoc. | | | 4.000 | | | | 10/20/45 | | | | 372 | | | | 383,737 | |
Government National Mortgage Assoc. | | | 4.000 | | | | 03/20/46 | | | | 718 | | | | 737,502 | |
Government National Mortgage Assoc. | | | 4.000 | | | | 11/20/46 | | | | 574 | | | | 591,144 | |
Government National Mortgage Assoc. | | | 4.000 | | | | 03/20/47 | | | | 642 | | | | 657,692 | |
Government National Mortgage Assoc. | | | 4.500 | | | | TBA | | | | 2,250 | | | | 2,333,180 | |
Government National Mortgage Assoc. | | | 4.500 | | | | 10/20/43 | | | | 157 | | | | 165,464 | |
Government National Mortgage Assoc. | | | 4.500 | | | | 01/20/44 | | | | 191 | | | | 200,942 | |
Government National Mortgage Assoc. | | | 4.500 | | | | 04/20/44 | | | | 667 | | | | 702,198 | |
Government National Mortgage Assoc. | | | 4.500 | | | | 03/20/45 | | | | 172 | | | | 181,409 | |
Government National Mortgage Assoc. | | | 4.500 | | | | 07/20/46 | | | | 413 | | | | 434,285 | |
Government National Mortgage Assoc. | | | 4.500 | | | | 08/20/46 | | | | 350 | | | | 367,941 | |
Government National Mortgage Assoc. | | | 4.500 | | | | 11/20/46 | | | | 345 | | | | 364,763 | |
Government National Mortgage Assoc. | | | 5.000 | | | | 10/20/37 | | | | 13 | | | | 13,599 | |
Government National Mortgage Assoc. | | | 5.000 | | | | 04/20/45 | | | | 96 | | | | 102,014 | |
Government National Mortgage Assoc. | | | 5.000 | | | | 08/20/45 | | | | 378 | | | | 402,376 | |
Government National Mortgage Assoc. | | | 6.000 | | | | 12/15/39 | | | | 228 | | | | 247,788 | |
| | | | | | | | | | | | | | | | |
TOTAL U.S. GOVERNMENT AGENCY OBLIGATIONS
(cost $95,219,810) | | | | | | | | | | | | | | | 93,060,161 | |
| | | | | | | | | | | | | | | | |
See Notes to Financial Statements.
| | | | | | | | | | | | | | | | |
| Description | | Interest
Rate | | | Maturity
Date | | | Principal
Amount (000)# | | | Value | |
U.S. TREASURY OBLIGATIONS 2.5% | |
U.S. Treasury Bonds | | | 3.000 | % | | | 02/15/48 | | | | 1,365 | | | $ | 1,342,872 | |
U.S. Treasury Bonds | | | 3.625 | | | | 08/15/43 | | | | 10 | | | | 10,945 | |
U.S. Treasury Notes | | | 1.625 | | | | 04/30/23 | | | | 625 | | | | 591,309 | |
U.S. Treasury Notes | | | 1.750 | | | | 05/15/23 | | | | 115 | | | | 109,394 | |
U.S. Treasury Notes | | | 2.000 | | | | 11/30/20 | | | | 680 | | | | 668,950 | |
U.S. Treasury Notes | | | 2.000 | | | | 06/30/24 | | | | 380 | | | | 361,549 | |
U.S. Treasury Notes | | | 2.125 | | | | 09/30/21 | (k) | | | 1,835 | | | | 1,798,730 | |
U.S. Treasury Notes | | | 2.125 | | | | 05/15/25 | | | | 110 | | | | 104,586 | |
U.S. Treasury Notes | | | 2.375 | | | | 08/15/24 | | | | 5 | | | | 4,854 | |
U.S. Treasury Notes | | | 2.625 | | | | 07/31/20 | | | | 110 | | | | 109,901 | |
U.S. Treasury Notes | | | 2.625 | | | | 06/30/23 | | | | 575 | | | | 569,115 | |
U.S. Treasury Notes | | | 2.750 | | | | 07/31/23 | | | | 2,655 | | | | 2,642,762 | |
U.S. Treasury Notes | | | 2.875 | | | | 07/31/25 | | | | 355 | | | | 353,808 | |
U.S. Treasury Notes | | | 2.875 | | | | 05/15/28 | | | | 280 | | | | 277,856 | |
U.S. Treasury Strips Coupon | | | 2.570 | (s) | | | 02/15/31 | (k) | | | 2,460 | | | | 1,669,400 | |
U.S. Treasury Strips Coupon | | | 2.739 | (s) | | | 11/15/29 | | | | 575 | | | | 405,792 | |
U.S. Treasury Strips Coupon | | | 2.783 | (s) | | | 08/15/29 | | | | 100 | | | | 71,233 | |
U.S. Treasury Strips Coupon | | | 2.878 | (s) | | | 05/15/31 | | | | 100 | | | | 67,269 | |
U.S. Treasury Strips Coupon | | | 3.042 | (s) | | | 11/15/35 | | | | 200 | | | | 116,571 | |
U.S. Treasury Strips Coupon | | | 3.202 | (s) | | | 08/15/40 | | | | 200 | | | | 100,494 | |
| | | | | | | | | | | | | | | | |
TOTAL U.S. TREASURY OBLIGATIONS
(cost $11,526,710) | | | | | | | | | | | | | | | 11,377,390 | |
| | | | | | | | | | | | | | | | |
TOTAL LONG-TERM INVESTMENTS
(cost $452,967,226) | | | | | | | | | | | | | | | 443,521,937 | |
| | | | | | | | | | | | | | | | |
| | | | |
| | | | | | | | | Shares | | | | |
|
SHORT-TERM INVESTMENTS 3.8% | |
|
AFFILIATED MUTUAL FUNDS 3.6% | |
PGIM Core Ultra Short Bond Fund(w) | | | | 16,023,307 | | | | 16,023,307 | |
PGIM Institutional Money Market Fund
(cost $203,091; includes $200,899 of cash collateral for securities on loan)(b)(w) | | | | 203,071 | | | | 203,091 | |
| | | | | | | | | | | | | | | | |
TOTAL AFFILIATED MUTUAL FUNDS
(cost $16,226,398) | | | | | | | | 16,226,398 | |
| | | | | | | | | | | | | | | | |
See Notes to Financial Statements.
Schedule of Investments (continued)
as of July 31, 2018
| | | | | | | | | | | | | | | | |
| Description | | Interest
Rate | | | Maturity
Date | | | Principal
Amount (000)# | | | Value | |
COMMERCIAL PAPER 0.2% | | | | | | | | | | | | | | | | |
Ford Motor Credit Co. LLC 144A
(cost $1,017,812) | | | 3.201 | % | | | 04/09/19 | | | | 1,040 | | | $ | 1,020,111 | |
| | | | | | | | | | | | | | | | |
OPTIONS PURCHASED*~ 0.0% | | | | | | | | | | | | | | | | |
(cost $11,603) | | | | | | | | | | | | | | | 273 | |
| | | | | | | | | | | | | | | | |
TOTAL SHORT-TERM INVESTMENTS
(cost $17,255,813) | | | | | | | | | | | | | | | 17,246,782 | |
| | | | | | | | | | | | | | | | |
TOTAL INVESTMENTS 102.5%
(cost $470,223,039) | | | | | | | | | | | | | | | 460,768,719 | |
Liabilities in excess of other assets(z) (2.5)% | | | | | | | | | | | | | | | (11,357,508 | ) |
| | | | | | | | | | | | | | | | |
NET ASSETS 100.0% | | | | | | | | | | | | | | $ | 449,411,211 | |
| | | | | | | | | | | | | | | | |
The following abbreviations are used in the annual report:
144A—Security was purchased pursuant to Rule 144A under the Securities Act of 1933 and may not be resold subject
to that rule except to qualified institutional buyers. Unless otherwise noted, 144A securities are deemed to be liquid.
A—Annual payment frequency for swaps
Aces—Alternative Credit Enhancements Securities
BABs—Build America Bonds
CLO—Collateralized Loan Obligation
CMM—Constant Maturity Mortgage
CMS—Constant Maturity Swap
CMT—Constant Maturity Treasury
EMTN—Euro Medium Term Note
FHLMC—Federal Home Loan Mortgage Corporation
GMTN—Global Medium Term Note
GO—General Obligation
LIBOR—London Interbank Offered Rate
M—Monthly payment frequency for swaps
MTN—Medium Term Note
OTC—Over-the-counter
Q—Quarterly payment frequency for swaps
REITs—Real Estate Investment Trusts
REMICS—Real Estate Mortgage Investment Conduit Security
S—Semiannual payment frequency for swaps
Strips—Separate Trading of Registered Interest and Principal of Securities
T—Swap payment upon termination
TBA—To Be Announced
USOIS—United States Overnight Index Swap
| * | Non-income producing security. |
| # | Principal or notional amount is shown in U.S. dollars unless otherwise stated. |
See Notes to Financial Statements.
| ~ | See tables subsequent to the Schedule of Investments for options detail. |
| ^ | Indicates a Level 3 security. The aggregate value of Level 3 securities is $1,697,780 and 0.4% of net assets. |
| (a) | All or a portion of security is on loan. The aggregate market value of such securities, including those sold and pending settlement, is $196,908; cash collateral of $200,899 (including in liabilities) was received with which the Fund purchased highly liquid short-term investments. |
| (b) | Represents security purchased with cash collateral received for securities on loan and includes dividend reinvestment. |
| (c) | Variable rate instrument. The interest rate shown reflects the rate in effect at July 31, 2018. |
| (cc) | Variable rate instrument. The rate shown is based on the latest available information as of July 31, 2018. Certain variable rate securities are not based on a published reference rate and spread but are determined by the issuer or agent and are based on current market conditions. These securities do not indicate a reference rate and spread in their description. |
| (k) | Represents security, or a portion thereof, segregated as collateral for centrally cleared/exchange-traded derivatives. |
| (s) | Represents zero coupon bond or principal only security. Rate represents yield to maturity at purchase date. |
| (w) | PGIM Investments LLC, the manager of the Fund, also serves as manager of the PGIM Core Ultra Short Bond Fund and PGIM Institutional Money Market Fund. |
| (z) | Includes net unrealized appreciation (depreciation) on the following derivative contracts and market value for forward commitment contracts held at reporting period end, with the exception of options which are included in the total investments at market value: |
Forward Commitment Contract
| | | | | | | | | | | | | | | | | | | | |
U.S. Government Agency Obligations | | Interest
Rate | | | Maturity
Date | | | Settlement
Date | | | Principal
Amount (000)# | | | Value | |
Federal National Mortgage Assoc.
(proceeds receivable $(1,521,641)) | | | 4.000 | % | | | TBA | | | | 09/13/18 | | | | (1,500 | ) | | $ | (1,521,562 | ) |
| | | | | | | | | | | | | | | | | | | | |
Options Purchased:
OTC Traded
| | | | | | | | | | | | | | | | | | | | | | | | | | |
Description | | Call/
Put | | Counterparty | | | Expiration
Date | | | Strike | | | Contracts | | | Notional
Amount
(000)# | | | Value | |
2- Year 10 CMS Curve CAP | | Call | | | Barclays Capital Group | | | | 07/12/21 | | | | 0.11 | % | | | — | | | | 5,885 | | | $ | 139 | |
2- Year 10 CMS Curve CAP | | Call | | | Barclays Capital Group | | | | 07/13/21 | | | | 0.11 | % | | | — | | | | 5,720 | | | | 134 | |
| | | | | | | | | | | | | | | | | | | | | | | | | | |
Total Options Purchased
(cost $ 11,603) | | | | | | | | | | | | | | | | | | | | | | | | $ | 273 | |
| | | | | | | | | | | | | | | | | | | | | | | | | | |
Futures contracts outstanding at July 31, 2018:
| | | | | | | | | | | | | | | | |
Number of
Contracts | | | Type | | Expiration
Date | | | Current
Notional
Amount | | | Value /
Unrealized
Appreciation
(Depreciation) | |
| | | | Long Positions: | | | | | |
| | 208 | | | 2 Year U.S. Treasury Notes | | | Sep. 2018 | | | $ | 43,966,000 | | | $ | (37,841 | ) |
| | 801 | | | 5 Year U.S. Treasury Notes | | | Sep. 2018 | | | | 90,613,125 | | | | 81,535 | |
| | 171 | | | 30 Year U.S. Ultra Treasury Bonds | | | Sep. 2018 | | | | 26,830,969 | | | | 297,913 | |
| | | | | | | | | | | | | | | | |
| | | | | | | | | | | | | | | 341,607 | |
| | | | | | | | | | | | | | | | |
See Notes to Financial Statements.
Schedule of Investments (continued)
as of July 31, 2018
Futures contracts outstanding at July 31, 2018 (continued):
| | | | | | | | | | | | | | | | |
Number of
Contracts | | | Type | | Expiration
Date | | | Current
Notional
Amount | | | Value /
Unrealized
Appreciation
(Depreciation) | |
| | | | Short Positions: | | | | | |
| | 88 | | | 90 Day Euro Dollar | | | Dec. 2018 | | | $ | 21,410,400 | | | $ | 161,700 | |
| | 116 | | | 10 Year U.S. Treasury Notes | | | Sep. 2018 | | | | 13,852,937 | | | | 66,859 | |
| | 19 | | | 10 Year U.S. Ultra Treasury Notes | | | Sep. 2018 | | | | 2,415,078 | | | | (28,812 | ) |
| | | | | | | | | | | | | | | | |
| | | | | | | | | | | | | | | 199,747 | |
| | | | | | | | | | | | | | | | |
| | | | | | | | | | | | | | $ | 541,354 | |
| | | | | | | | | | | | | | | | |
A security with a market value of $1,143,934 has been segregated with Citigroup Global Markets to cover requirements for open futures contracts at July 31, 2018.
Credit default swap agreements outstanding at July 31, 2018:
| | | | | | | | | | | | | | | | | | | | | | | | | | | | | | |
Reference Entity/ Obligation | | Termination
Date | | | Fixed
Rate | | | Notional
Amount
(000)#(3) | | | Implied
Credit
Spread at
July 31,
2018(4) | | | Fair
Value | | | Upfront
Premiums
Paid
(Received) | | | Unrealized
Appreciation
(Depreciation) | | | Counterparty |
OTC Credit Default Swap Agreement on credit indices—Sell Protection(2): | | | |
CMBX.NA.6.AA | | | 05/11/63 | | | | 1.500%(M) | | | | 2,000 | | | | 1.215 | % | | $ | 22,240 | | | $ | (26,031 | ) | | $ | 48,271 | | | Morgan Stanley |
| | | | | | | | | | | | | | | | | | | | | | | | | | | | | | |
The Fund entered into credit default swaps (“CDS”) to provide a measure of protection against defaults or to take an active long or short position with respect to the likelihood of a particular issuer’s default or the reference entity’s credit soundness. CDS contracts generally trade based on a spread which represents the cost a protection buyer has to pay the protection seller. The protection buyer is said to be short the credit as the value of the contract rises the more the credit deteriorates. The value of the CDS contract increases for the protection buyer if the spread increases.
| (1) | If the Fund is a buyer of protection, it pays the fixed rate. When a credit event occurs, as defined under the terms of that particular swap agreement, the Fund will either (i) receive from the seller of protection an amount equal to the notional amount of the swap and make delivery of the referenced obligation or underlying securities comprising the referenced index or (ii) receive a net settlement amount in the form of cash or securities equal to the notional amount of the swap less the recovery value of the referenced obligation or underlying securities comprising the referenced index. |
| (2) | If the Fund is a seller of protection, it receives the fixed rate. When a credit event occurs, as defined under the terms of that particular swap agreement, the Fund will either (i) pay to the buyer of protection an amount equal to the notional amount of the swap and take delivery of the referenced obligation or underlying securities comprising the referenced index or (ii) pay a net settlement amount in the form of cash or securities equal to the notional amount of the swap less the recovery value of the referenced obligation or underlying securities comprising the referenced index. |
See Notes to Financial Statements.
| (3) | Notional amount represents the maximum potential amount the Fund could be required to pay as a seller of credit protection or receive as a buyer of credit protection if a credit event occurs as defined under the terms of that particular swap agreement. |
| (4) | Implied credit spreads, represented in absolute terms, utilized in determining the fair value of credit default swap agreements where the Fund is the seller of protection as of the reporting date serve as an indicator of the current status of the payment/ performance risk and represent the likelihood of risk of default for the credit derivative. The implied credit spread of a particular referenced entity reflects the cost of buying/selling protection and may include up-front payments required to be made to enter into the agreement. Wider credit spreads represent a deterioration of the referenced entity’s credit soundness and a greater likelihood of risk of default or other credit event occurring as defined under the terms of the agreement. |
Forward rate agreement outstanding at July 31, 2018:
| | | | | | | | | | | | | | | | | | | | | | | | | | |
Notional Amount
(000)# | | | Termination
Date | | | Fixed
Rate | | | Floating
Rate | | Fair
Value | | | Upfront
Premiums
Paid
(Received) | | | Unrealized
Appreciation
(Depreciation) | | | Counterparty |
| | OTC Forward Rate Agreement^: |
| | 19,700 | | | | 08/30/18 | | | | —(3) | | | —(3) | | $ | (2,121 | ) | | $ | — | | | $ | (2,121 | ) | | JPMorgan Chase |
| | | | | | | | | | | | | | | | | | | | | | | | | | |
| (1) | The Fund pays the fixed rate and receives the floating rate. |
| (2) | The Fund pays the floating rate and receives the fixed rate. |
| (3) | The Fund pays or receives payment based on CMM102 minus 10 Year CMT minus 1.125% upon termination. |
Inflation swap agreements outstanding at July 31, 2018:
| | | | | | | | | | | | | | | | | | | | | | | | |
Notional Amount (000)# | | | Termination
Date | | | Fixed
Rate | | | Floating Rate | | Value at
Trade
Date | | | Value at
July 31,
2018 | | | Unrealized
Appreciaton
(Depreciation) | |
| | Centrally Cleared Inflation Swap Agreement: | |
| | 450 | | | | 10/25/27 | | | | 2.160%(T) | | | U.S. CPI Urban Consumers NSA Index(2)(T) | | $ | 10 | | | $ | (11,676 | ) | | $ | (11,686 | ) |
| | | | | | | | | | | | | | | | | | | | | | | | |
| | | | | | | | | | | | |
(1) The Fund pays the fixed rate and receives the floating rate. |
(2) The Fund pays the floating rate and receives the fixed rate. |
| | | | | | | | | | | | |
|
| Interest rate swap agreements outstanding at July 31, 2018: |
| | | | | | | | | | | | | | | | | | | | | | | | |
| | | | | | |
Notional Amount (000)# | | | Termination
Date | | | Fixed
Rate | | | Floating Rate | | Value at
Trade
Date | | | Value at
July 31,
2018 | | | Unrealized
Appreciaton
(Depreciation) | |
| | Centrally Cleared Interest Rate Swap Agreements: | |
| | 368,055 | | | | 01/30/19 | | | | 2.261%(T) | | | 1 Day USOIS(1)(T) | | $ | — | | | $ | 24,916 | | | $ | 24,916 | |
| | 315,660 | | | | 03/20/19 | | | | 2.158%(T) | | | 1 Day USOIS(1)(T) | | | — | | | | 86,216 | | | | 86,216 | |
| | 15,900 | | | | 06/30/19 | | | | 1.486%(A) | | | 1 Day USOIS(1)(A) | | | (6,038 | ) | | | 121,803 | | | | 127,841 | |
| | 3,010 | | | | 06/30/19 | | | | 1.502%(A) | | | 1 Day USOIS(1)(A) | | | (1,835 | ) | | | 22,585 | | | | 24,420 | |
| | 8,085 | | | | 09/30/19 | | | | 1.707%(A) | | | 1 Day USOIS(1)(A) | | | 2,248 | | | | 60,655 | | | | 58,407 | |
| | 13,855 | | | | 12/31/19 | | | | 1.840%(A) | | | 1 Day USOIS(1)(A) | | | 10,045 | | | | 115,365 | | | | 105,320 | |
| | 7,205 | | | | 12/31/19 | | | | 1.950%(A) | | | 1 Day USOIS(1)(A) | | | 2,025 | | | | 46,321 | | | | 44,296 | |
| | 3,600 | | | | 12/31/19 | | | | 2.040%(A) | | | 1 Day USOIS(1)(A) | | | 39 | | | | 17,525 | | | | 17,486 | |
See Notes to Financial Statements.
Schedule of Investments (continued)
as of July 31, 2018
Interest rate swap agreements outstanding at July 31, 2018 (continued):
| | | | | | | | | | | | | | | | | | | | | | | | |
Notional
Amount
(000)# | | | Termination
Date | | | Fixed
Rate | | | Floating Rate | | Value at
Trade
Date | | | Value at
July 31,
2018 | | | Unrealized
Appreciaton
(Depreciation) | |
| | Centrally Cleared Interest Rate Swap Agreements (cont’d.): | |
| | 2,770 | | | | 12/31/19 | | | | 2.107%(A) | | | 1 Day USOIS(1)(A) | | $ | (5 | ) | | $ | 10,334 | | | $ | 10,339 | |
| | 7,395 | | | | 03/23/21 | | | | 2.370%(A) | | | 1 Day USOIS(1)(A) | | | — | | | | 25,746 | | | | 25,746 | |
| | 1,195 | | | | 09/27/21 | | | | 2.330%(A) | | | 1 Day USOIS(1)(A) | | | (276 | ) | | | 7,404 | | | | 7,680 | |
| | 685 | | | | 05/31/22 | | | | 2.353%(A) | | | 1 Day USOIS(1)(A) | | | — | | | | 5,990 | | | | 5,990 | |
| | 690 | | | | 11/30/22 | | | | 2.969%(S) | | | 3 Month LIBOR(1)(Q) | | | — | | | | 682 | | | | 682 | |
| | 1,215 | | | | 02/15/24 | | | | 2.115%(S) | | | 3 Month LIBOR(1)(Q) | | | 3,113 | | | | 48,324 | | | | 45,211 | |
| | 2,571 | | | | 02/15/24 | | | | 2.151%(S) | | | 3 Month LIBOR(1)(Q) | | | (2,558 | ) | | | 97,101 | | | | 99,659 | |
| | 3,080 | | | | 02/15/24 | | | | 2.167%(S) | | | 3 Month LIBOR(1)(Q) | | | (17,091 | ) | | | 113,569 | | | | 130,660 | |
| | 1,580 | | | | 02/15/24 | | | | 2.183%(S) | | | 3 Month LIBOR(1)(Q) | | | (3,010 | ) | | | 56,592 | | | | 59,602 | |
| | 1,120 | | | | 08/15/24 | | | | 2.168%(S) | | | 3 Month LIBOR(1)(Q) | | | — | | | | 45,206 | | | | 45,206 | |
| | 9,600 | | | | 08/15/24 | | | | 2.170%(S) | | | 3 Month LIBOR(1)(Q) | | | 29,514 | | | | 386,511 | | | | 356,997 | |
| | 3,450 | | | | 08/15/24 | | | | 2.176%(S) | | | 3 Month LIBOR(1)(Q) | | | 11,173 | | | | 137,745 | | | | 126,572 | |
| | 5,535 | | | | 11/15/24 | | | | 2.333%(S) | | | 3 Month LIBOR(1)(Q) | | | 18,482 | | | | 209,248 | | | | 190,766 | |
| | 3,095 | | | | 02/12/25 | | | | 2.408%(A) | | | 1 Day USOIS(1)(A) | | | — | | | | 33,460 | | | | 33,460 | |
| | 3,923 | | | | 05/31/25 | | | | 2.998%(S) | | | 3 Month LIBOR(1)(Q) | | | (2,549 | ) | | | 1,890 | | | | 4,439 | |
| | 1,765 | | | | 01/08/26 | | | | 2.210%(S) | | | 3 Month LIBOR(1)(Q) | | | — | | | | 93,650 | | | | 93,650 | |
| | 1,447 | | | | 02/15/27 | | | | 1.824%(A) | | | 1 Day USOIS(1)(A) | | | 19,731 | | | | 91,318 | | | | 71,587 | |
| | 390 | | | | 02/15/27 | | | | 1.899%(A) | | | 1 Day USOIS(1)(A) | | | 495 | | | | 21,926 | | | | 21,431 | |
| | 395 | | | | 02/15/27 | | | | 1.965%(A) | | | 1 Day USOIS(1)(A) | | | — | | | | 20,093 | | | | 20,093 | |
| | 920 | | | | 02/15/27 | | | | 2.068%(A) | | | 1 Day USOIS(1)(A) | | | (543 | ) | | | 39,830 | | | | 40,373 | |
| | 260 | | | | 05/15/27 | | | | 2.295%(S) | | | 3 Month LIBOR(1)(Q) | | | — | | | | 14,647 | | | | 14,647 | |
| | 1,725 | | | | 02/15/36 | | | | 2.338%(S) | | | 3 Month LIBOR(2)(Q) | | | (11,942 | ) | | | (165,899 | ) | | | (153,957 | ) |
| | 145 | | | | 11/15/43 | | | | 2.659%(S) | | | 3 Month LIBOR(1)(Q) | | | — | | | | 10,452 | | | | 10,452 | |
| | | | | | | | | | | | | | | | | | | | | | | | |
| | | | | | | | | | | | | | $ | 51,018 | | | $ | 1,801,205 | | | $ | 1,750,187 | |
| | | | | | | | | | | | | | | | | | | | | | | | |
Cash of $151,000 and securities with a combined market value of $1,437,641 have been segregated with Citigroup Global Markets to cover requirements for open centrally cleared swap contracts at July 31, 2018.
| (1) | The Fund pays the fixed rate and receives the floating rate. |
| (2) | The Fund pays the floating rate and receives the fixed rate. |
Balances Reported in the Statement of Assets and Liabilities for OTC Forward Rate and Swap Agreements:
| | | | | | | | | | | | | | | | |
| | | Premiums Paid | | | Premiums Received | | | Unrealized
Appreciation | | | Unrealized
Depreciation | |
OTC Forward Rate Agreement | | $ | — | | | $ | — | | | $ | — | | | $ | (2,121 | ) |
OTC Swap Agreement | | $ | — | | | $ | (26,031 | ) | | $ | 48,271 | | | $ | — | |
See Notes to Financial Statements.
Fair Value Measurements:
Various inputs are used in determining the value of the Fund’s investments. These inputs are summarized in the three broad levels listed below.
Level 1—unadjusted quoted prices generally in active markets for identical securities.
Level 2—quoted prices for similar securities, interest rates and yield curves, prepayment speeds, foreign currency exchange rates and other observable inputs.
Level 3—unobservable inputs for securities valued in accordance with Board approved fair valuation procedures.
The following is a summary of the inputs used as of July 31, 2018 in valuing such portfolio securities:
| | | | | | | | | | | | |
| | | Level 1 | | | Level 2 | | | Level 3 | |
Investments in Securities | | | | | | | | | | | | |
Affiliated Mutual Funds | | $ | 16,226,398 | | | $ | — | | | $ | — | |
Asset-Backed Securities | | | | | | | | | | | | |
Automobiles | | | — | | | | 19,372,210 | | | | 1,099,960 | |
Collateralized Loan Obligations | | | — | | | | 45,465,349 | | | | — | |
Consumer Loans | | | — | | | | 3,181,273 | | | | — | |
Credit Cards | | | — | | | | 4,700,781 | | | | — | |
Equipment | | | — | | | | 2,733,437 | | | | — | |
Home Equity Loans | | | — | | | | 2,122,240 | | | | — | |
Other | | | — | | | | 72,069 | | | | — | |
Residential Mortgage-Backed Securities | | | — | | | | 9,805,867 | | | | — | |
Student Loans | | | — | | | | 8,096,276 | | | | 599,941 | |
Commercial Mortgage-Backed Securities | | | — | | | | 76,198,928 | | | | — | |
Commercial Paper | | | — | | | | 1,020,111 | | | | — | |
Corporate Bonds | | | — | | | | 137,697,613 | | | | — | |
Municipal Bonds | | | — | | | | 3,938,230 | | | | — | |
Residential Mortgage-Backed Securities | | | — | | | | 14,202,619 | | | | — | |
Sovereign Bonds | | | — | | | | 9,797,593 | | | | — | |
U.S. Government Agency Obligations | | | — | | | | 93,060,161 | | | | — | |
U.S. Treasury Obligations | | | — | | | | 11,377,390 | | | | — | |
Options Purchased | | | — | | | | 273 | | | | — | |
Other Financial Instruments* | | | | | | | | | | | | |
Forward Commitment Contract | | | — | | | | (1,521,562 | ) | | | — | |
Futures Contracts | | | 541,354 | | | | — | | | | — | |
OTC Credit Default Swap Agreement | | | — | | | | 22,240 | | | | — | |
OTC Forward Rate Agreement | | | — | | | | — | | | | (2,121 | ) |
Centrally Cleared Inflation Swap Agreement | | | — | | | | (11,686 | ) | | | — | |
Centrally Cleared Interest Rate Swap Agreements | | | — | | | | 1,750,187 | | | | — | |
| | | | | | | | | | | | |
Total | | $ | 16,767,752 | | | $ | 443,081,599 | | | $ | 1,697,780 | |
| | | | | | | | | | | | |
| * | Other financial instruments are derivatives, with the exception of forward commitment contracts and are not reflected in the Schedule of Investments. Futures, forwards and centrally cleared swap contracts are recorded at net unrealized appreciation (depreciation) and OTC swap contracts are recorded at fair value. Forward commitment contracts are recorded at market value. |
See Notes to Financial Statements.
Schedule of Investments (continued)
as of July 31, 2018
The following is a reconciliation of assets in which unobservable inputs (Level 3) were used in determining fair value:
| | | | | | | | | | | | | | | | |
| | | Asset-Backed
Securities—
Automobiles | | | Asset-Backed
Securities—
Collateralized Loan
Obligations | | | Asset-Backed
Securities—
Credit Cards | | | Asset-Backed
Securities—
Residential
Mortgage-Backed
Securities | |
Balance as of 07/31/17 | | $ | — | | | $ | 500,000 | | | $ | 500,000 | | | $ | 675,000 | |
Realized gain (loss) | | | — | | | | — | | | | — | | | | — | |
Change in unrealized appreciation (depreciation) | | | — | | | | — | | | | — | | | | — | |
Purchases/Exchanges/Issuances | | | 1,099,960 | | | | — | | | | — | | | | — | |
Sales/Paydowns | | | — | | | | — | | | | — | | | | (675,000 | ) |
Accrued discount/premium | | | — | | | | — | | | | — | | | | — | |
Transfer into Level 3 | | | — | | | | — | | | | — | | | | — | |
Transfer out of Level 3 | | | — | | | | (500,000 | ) | | | (500,000 | ) | | | — | |
| | | | | | | | | | | | | | | | |
Balance as of 07/31/18 | | $ | 1,099,960 | | | $ | — | | | $ | — | | | $ | — | |
| | | | | | | | | | | | | | | | |
Change in unrealized appreciation (depreciation) relating to securities still held at reporting period end | | $ | — | | | $ | — | | | $ | — | | | $ | — | |
| | | | | | | | | | | | | | | | |
| | | | |
| | | Asset-Backed
Securities
Student
Loans | | | Commercial
Mortgage
Backed
Securities | | | Residential
Mortgage
Backed
Securities | | | OTC
Forward
Rate
Agreement | |
Balance as of 07/31/17 | | $ | — | | | $ | 823,976 | | | $ | 1,350,000 | | | $ | — | |
Realized gain (loss) | | | — | | | | — | | | | — | | | | — | |
Change in unrealized appreciation (depreciation) | | | — | | | | — | | | | — | | | | (2,121 | ) |
Purchases/Exchanges/Issuances | | | 599,941 | | | | — | | | | — | | | | — | |
Sales/Paydowns | | | — | | | | — | | | | (1,350,000 | ) | | | — | |
Accrued discount/premium | | | — | | | | — | | | | — | | | | — | |
Transfer into Level 3 | | | — | | | | — | | | | — | | | | — | |
Transfer out of Level 3 | | | — | | | | (823,976 | ) | | | — | | | | — | |
| | | | | | | | | | | | | | | | |
Balance as of 07/31/18 | | $ | 599,941 | | | $ | — | | | $ | — | | | $ | (2,121 | ) |
| | | | | | | | | | | | | | | | |
Change in unrealized appreciation (depreciation) relating to securities still held at reporting period end | | $ | — | | | $ | — | | | $ | — | | | $ | (2,121 | ) |
| | | | | | | | | | | | | | | | |
See Notes to Financial Statements.
Level 3 securities as presented in the table above are being fair valued using pricing methodologies approved by Board, which contain unobservable inputs as follows:
| | | | | | | | | | | | |
Level 3 Securities | | Fair Value as of
Jule 31, 2018 | | | Valuation
Methodology | | | Unobservable Inputs | |
Asset-Backed Securities—Automobiles | | $ | 1,099,960 | | | | Market Approach | | | | Single Broker Indicative Quote | |
Asset-Backed Securities—Student Loans | | | 599,941 | | | | Market Approach | | | | Single Broker Indicative Quote | |
OTC Forward Rate Agreement | | | (2,121 | ) | | | Model Pricing | | |
| Forward Rate Volitility &
Convexity Adjustment |
|
| | | | | | | | | | | | |
| | $ | 1,697,780 | | | | | | | | | |
| | | | | | | | | | | | |
It is the Fund’s policy to recognize transfers in and transfers out at the fair value as of the beginning of period. Securities transferred levels as follows:
| | | | | | | | | | |
Investments in Securities | | Amount Transferred | | | Level Transfer | | | Logic |
Asset-Backed Securities—Collateralized Loan Obligations | | $ | 500,000 | | | | L3 to L2 | | | Cost to Evaluated Bid |
Asset-Backed Securities—Credit Cards | | $ | 500,000 | | | | L3 to L2 | | | Single Broker Indicative Quote
to Evaluated Bid |
Commercial Mortgage-Backed Securities | | $ | 823,976 | | | | L3 to L2 | | | Cost to Evaluated Bid |
Industry Classification:
The industry classification of investments and liabilities in excess of other assets shown as a percentage of net assets as of July 31, 2018 were as follows (unaudited):
| | | | |
U.S. Government Agency Obligations | | | 20.7 | % |
Commercial Mortgage-Backed Securities | | | 17.0 | |
Collateralized Loan Obligations | | | 10.1 | |
Banks | | | 9.7 | |
Residential Mortgage-Backed Securities | | | 5.4 | |
Automobiles | | | 4.6 | |
Affiliated Mutual Funds (0.0% represents investments purchased with collateral from securities on loan) | | | 3.6 | |
Electric | | | 3.2 | |
U.S. Treasury Obligations | | | 2.5 | |
Oil & Gas | | | 2.4 | |
Sovereign Bonds | | | 2.2 | |
Student Loans | | | 1.9 | % |
Pipelines | | | 1.5 | |
Auto Manufacturers | | | 1.2 | |
Pharmaceuticals | | | 1.2 | |
Credit Cards | | | 1.0 | |
Healthcare-Services | | | 1.0 | |
Diversified Financial Services | | | 1.0 | |
Chemicals | | | 0.9 | |
Municipal Bonds | | | 0.9 | |
Foods | | | 0.8 | |
Consumer Loans | | | 0.7 | |
Insurance | | | 0.7 | |
Software | | | 0.6 | |
See Notes to Financial Statements.
Schedule of Investments (continued)
as of July 31, 2018
| | | | |
Industry Classification (cont’d.): | | | |
Media | | | 0.6 | % |
Equipment | | | 0.6 | |
Home Equity Loans | | | 0.5 | |
Commercial Services | | | 0.5 | |
Airlines | | | 0.4 | |
Agriculture | | | 0.4 | |
Aerospace & Defense | | | 0.3 | |
Telecommunications | | | 0.3 | |
Oil & Gas Services | | | 0.3 | |
Healthcare-Products | | | 0.3 | |
Packaging & Containers | | | 0.3 | |
Retail | | | 0.3 | |
Real Estate Investment Trusts (REITs) | | | 0.2 | |
Building Materials | | | 0.2 | |
Commercial Paper | | | 0.2 | |
Transportation | | | 0.2 | |
Multi-National | | | 0.2 | |
Computers | | | 0.2 | |
Gas | | | 0.2 | |
Biotechnology | | | 0.2 | |
Hand/Machine Tools | | | 0.2 | |
Housewares | | | 0.1 | |
Miscellaneous Manufacturing | | | 0.1 | |
| | | | |
Beverages | | | 0.1 | % |
Mining | | | 0.1 | |
Lodging | | | 0.1 | |
Semiconductors | | | 0.1 | |
Machinery-Diversified | | | 0.1 | |
Forest Products & Paper | | | 0.1 | |
Textiles | | | 0.1 | |
Trucking & Leasing | | | 0.1 | |
Electronics | | | 0.1 | |
Engineering & Construction | | | 0.0 | * |
Water | | | 0.0 | * |
Office/Business Equipment | | | 0.0 | * |
Other | | | 0.0 | * |
Options Purchased | | | 0.0 | * |
| | | | |
| | | 102.5 | |
Liabilities in excess of other assets | | | (2.5 | ) |
| | | | |
| | | 100.0 | % |
| | | | |
Effects of Derivative Instruments on the Financial Statements and Primary Underlying Risk Exposure:
The Fund invested in derivative instruments during the reporting period. The primary types of risk associated with these derivative instruments are credit contracts risk and interest rate contracts risk. The effect of such derivative instruments on the Fund’s financial position and financial performance as reflected in the Statement of Assets and Liabilities and Statement of Operations is presented in the summary below.
Fair values of derivative instruments as of July 31, 2018 as presented in the Statement of Assets and Liabilities:
| | | | | | | | | | | | |
Derivatives not accounted for as hedging instruments, carried at fair value | | Asset Derivatives | | | Liability Derivatives | |
| | Balance Sheet
Location | | Fair
Value | | | Balance Sheet
Location | | Fair
Value | |
| Credit contracts | | — | | $ | — | | | Premiums received for OTC swap agreements | | $ | 26,031 | |
| Credit contracts | | Unrealized appreciation on OTC swap agreements | | | 48,271 | | | — | | | — | |
| Interest rate contracts | | Due from/to broker—variation margin futures | | | 608,007 | * | | Due from/to broker—variation margin futures | | | 66,653 | * |
See Notes to Financial Statements.
| | | | | | | | | | | | | | | | |
Derivatives not accounted for as hedging instruments, carried at fair value | | Asset Derivatives | | | Liability Derivatives | |
| | Balance Sheet
Location | | | Fair
Value | | | Balance Sheet
Location | | | Fair
Value | |
| Interest rate contracts | |
| Due from/to broker—
variation margin swaps |
| | | 1,904,144 | * | |
| Due from/to
broker—variation
margin swaps |
| | | 165,643 | * |
| Interest rate contracts | | | Unaffiliated investments | | | | 273 | | | | — | | | | — | |
| Interest rate contracts | | | — | | | | — | | |
| Unrealized
depreciation on
OTC forward rate
agreements |
| | | 2,121 | |
| | | | | | | | | | | | | | | | |
| | | | | | $ | 2,560,695 | | | | | | | $ | 260,448 | |
| | | | | | | | | | | | | | | | |
| * | Includes cumulative appreciation (depreciation) as reported in the schedule of open futures and centrally cleared swap contracts. Only unsettled variation margin receivable (payable) is reported within the Statement of Assets and Liabilities. |
The effects of derivative instruments on the Statement of Operations for the year ended July 31, 2018 are as follows:
| | | | | | | | | | | | | | | | | | | | |
Amount of Realized Gain (Loss) on Derivatives Recognized in Income | |
Derivatives not accounted for as hedging instruments, carried at fair value | | Options
Purchased(1) | | | Options
Written | | | Futures | | | Forward
Rate
Agreements | | | Swaps | |
Credit contracts | | $ | — | | | $ | — | | | $ | — | | | $ | — | | | $ | 30,414 | |
Interest rate contracts | | | (292,265 | ) | | | 166,469 | | | | (3,206,908 | ) | | | 7,092 | | | | 520,874 | |
| | | | | | | | | | | | | | | | | | | | |
Total | | $ | (292,265 | ) | | $ | 166,469 | | | $ | (3,206,908 | ) | | $ | 7,092 | | | $ | 551,288 | |
| | | | | | | | | | | | | | | | | | | | |
| (1) | Included in net realized gain (loss) on investment transactions in the Statement of Operations. |
| | | | | | | | | | | | | | | | | | | | |
Change in Unrealized Appreciation (Depreciation) on Derivatives Recognized in Income | |
Derivatives not accounted for as hedging instruments, carried at fair value | | Options
Purchased(2) | | | Options
Written | | | Futures | | | Forward
Rate
Agreements | | | Swaps | |
Credit contracts | | $ | — | | | $ | — | | | $ | — | | | $ | — | | | $ | 15,118 | |
Interest rate contracts | | | (12,445 | ) | | | (10,647 | ) | | | 426,451 | | | | (2,121 | ) | | | 1,711,443 | |
| | | | | | | | | | | | | | | | | | | | |
Total | | $ | (12,445 | ) | | $ | (10,647 | ) | | $ | 426,451 | | | $ | (2,121 | ) | | $ | 1,726,561 | |
| | | | | | | | | | | | | | | | | | | | |
| (2) | Included in net change in unrealized appreciation (depreciation) on investments in the Statement of Operations. |
For the year ended July 31, 2018, the Fund’s average volume of derivative activities is as follows:
| | | | | | | | | | | | | | |
Options
Purchased(1) | | | Options
Written(2) | | | Futures
Contracts—
Long
Positions(2) | | | Futures
Contracts—
Short
Positions(2) | |
| $ | 35,078 | | | $ | 121,800 | | | $ | 152,942,505 | | | $ | 39,283,257 | |
See Notes to Financial Statements.
Schedule of Investments (continued)
as of July 31, 2018
| | | | | | | | | | |
Forward Rate
Agreements(2) | | | Inflation Swap
Agreements(2) | | | Interest Rate
Swap
Agreements(2) | |
| $ | 3,580,000 | | | $ | 405,000 | | | $ | 293,408,600 | |
| | | | | | | | |
| | |
| | | Credit Default
Swap Agreements—
Sell Protection(2) | | | | |
| | $ | 2,000,000 | | | | | |
| (2) | Notional Amount in USD. |
Financial Instruments/Transactions—Summary of Offsetting and Netting Arrangements:
The Fund invested in OTC derivatives and entered into financial instruments/transactions during the reporting period that are either offset in accordance with current requirements or are subject to enforceable master netting arrangements or similar agreements that permit offsetting. The information about offsetting and related netting arrangements for OTC derivatives and financial instruments/transactions, where the legal right to set-off exists, is presented in the summary below.
Offsetting of financial instrument/transaction assets and liabilities:
| | | | | | | | | | | | |
Description | | Gross Market
Value of
Recognized
Assets/(Liabilities) | | | Collateral
Pledged/(Received)(2) | | | Net Amount | |
| Securities on Loan | | $ | 196,908 | | | $ | (196,908 | ) | | $ | — | |
| | | | | | | | | | | | |
Offsetting of OTC derivative assets and liabilities:
| | | | | | | | | | | | | | | | | | | | |
Counterparty | | Gross
Amounts of
Recognized
Assets(1) | | | Gross
Amounts of
Recognized
Liabilities(1) | | | Net Amounts of
Recognized
Assets/(Liabilities) | | | Collateral
Pledged/(Received)(2) | | | Net Amount | |
| Barclays Capital Group | | $ | 273 | | | $ | — | | | $ | 273 | | | $ | — | | | $ | 273 | |
| JPMorgan Chase | | | — | | | | (2,121 | ) | | | (2,121 | ) | | | — | | | | (2,121 | ) |
| Morgan Stanley | | | 48,271 | | | | (26,031 | ) | | | 22,240 | | | | — | | | | 22,240 | |
| | | | | | | | | | | | | | | | | | | | |
| | $ | 48,544 | | | $ | (28,152 | ) | | $ | 20,392 | | | $ | — | | | $ | 20,392 | |
| | | | | | | | | | | | | | | | | | | | |
| (1) | Includes unrealized appreciation/(depreciation) on swaps and forwards, premiums paid/(received) on swap agreements and market value of purchased and written options, as represented on the Statement of Assets and Liabilities. |
| (2) | Collateral amount disclosed by the Fund is limited to the market value of financial instruments/transactions and the Fund’s OTC derivative exposure by counterparty. |
See Notes to Financial Statements.
Statement of Assets & Liabilities
as of July 31, 2018
| | | | |
Assets | | | | |
Investments at value, including securities on loan of $196,908: | | | | |
Unaffiliated investments (cost $453,996,641) | | $ | 444,542,321 | |
Affiliated investments (cost $16,226,398) | | | 16,226,398 | |
Deposit with broker for centrally cleared swaps | | | 151,000 | |
Receivable for investments sold | | | 15,650,373 | |
Interest receivable | | | 2,193,986 | |
Receivable for Fund shares sold | | | 1,735,137 | |
Due from broker—variation margin futures | | | 103,670 | |
Unrealized appreciation on OTC swap agreements | | | 48,271 | |
Prepaid expenses | | | 24 | |
| | | | |
Total Assets | | | 480,651,180 | |
| | | | |
| |
Liabilities | | | | |
Payable for investments purchased | | | 28,400,829 | |
Forward commitment contracts, at value (proceeds received $1,521,641) | | | 1,521,562 | |
Payable for Fund shares reacquired | | | 800,300 | |
Payable to broker for collateral for securities on loan | | | 200,899 | |
Accrued expenses and other liabilities | | | 156,193 | |
Management fee payable | | | 108,888 | |
Premiums received for OTC swap agreements | | | 26,031 | |
Distribution fee payable | | | 14,328 | |
Due to broker—variation margin swaps | | | 8,226 | |
Unrealized depreciation on OTC forward rate agreements | | | 2,121 | |
Affiliated transfer agent fee payable | | | 569 | |
Deposit due to broker—futures | | | 23 | |
| | | | |
Total Liabilities | | | 31,239,969 | |
| | | | |
| |
Net Assets | | $ | 449,411,211 | |
| | | | |
| | | | | |
Net assets were comprised of: | | | | |
Shares of beneficial interest, at par | | $ | 46,639 | |
Paid-in capital in excess of par | | | 466,598,673 | |
| | | | |
| | | 466,645,312 | |
Undistributed net investment income | | | 49,317 | |
Accumulated net realized loss on investment and foreign currency transactions | | | (9,924,300 | ) |
Net unrealized depreciation on investments and foreign currencies | | | (7,359,118 | ) |
| | | | |
Net assets, July 31, 2018 | | $ | 449,411,211 | |
| | | | |
See Notes to Financial Statements.
Statement of Assets & Liabilities
as of July 31, 2018
| | | | |
Class A | | | | |
Net asset value and redemption price per share, | | | | |
($53,967,218 ÷ 5,602,095 shares of beneficial interest issued and outstanding) | | $ | 9.63 | |
Maximum sales charge (4.50% of offering price) | | | 0.45 | |
| | | | |
Maximum offering price to public | | $ | 10.08 | |
| | | | |
| |
Class C | | | | |
Net asset value, offering price and redemption price per share, | | | | |
($3,529,924 ÷ 366,217 shares of beneficial interest issued and outstanding) | | $ | 9.64 | |
| | | | |
| |
Class R | | | | |
Net asset value, offering price and redemption price per share, | | | | |
($14,913 ÷ 1,549 shares of beneficial interest issued and outstanding) | | $ | 9.63 | |
| | | | |
| |
Class Z | | | | |
Net asset value, offering price and redemption price per share, | | | | |
($101,369,331 ÷ 10,521,382 shares of beneficial interest issued and outstanding) | | $ | 9.63 | |
| | | | |
| |
Class R6 | | | | |
Net asset value, offering price and redemption price per share, | | | | |
($290,529,825 ÷ 30,147,821 shares of beneficial interest issued and outstanding) | | $ | 9.64 | |
| | | | |
See Notes to Financial Statements.
Statement of Operations
Year Ended July 31, 2018
| | | | |
Net Investment Income (Loss) | | | | |
Income | | | | |
Interest income | | $ | 11,136,815 | |
Affiliated dividend income | | | 354,548 | |
Income from securities lending, net (including affiliated income of $1,352) | | | 2,132 | |
| | | | |
Total income | | | 11,493,495 | |
| | | | |
| |
Expenses | | | | |
Management fee | | | 1,369,965 | |
Distribution fee(a) | | | 158,423 | |
Custodian and accounting fees | | | 133,087 | |
Transfer agent’s fees and expenses (including affiliated expense of $3,170)(a) | | | 111,983 | |
Registration fees(a) | | | 97,971 | |
Shareholders’ reports | | | 85,074 | |
Audit fee | | | 62,636 | |
Legal fees and expenses | | | 23,856 | |
Trustees’ fees | | | 18,836 | |
Miscellaneous | | | 15,689 | |
| | | | |
Total expenses | | | 2,077,520 | |
Less: Fee waiver and/or expense reimbursement(a) | | | (284,973 | ) |
Distribution fee waiver(a) | | | (34 | ) |
| | | | |
Net expenses | | | 1,792,513 | |
| | | | |
Net investment income (loss) | | | 9,700,982 | |
| | | | |
| |
Realized And Unrealized Gain (Loss) On Investment And Foreign Currency Transactions | | | | |
Net realized gain (loss) on: | | | | |
Investment transactions (including affiliated of $100) | | | (2,306,591 | ) |
Futures transactions | | | (3,206,908 | ) |
Forward rate agreement transactions | | | 7,092 | |
Options written transactions | | | 166,469 | |
Swap agreement transactions | | | 551,288 | |
Foreign currency transactions | | | (1,787 | ) |
| | | | |
| | | (4,790,437 | ) |
| | | | |
Net change in unrealized appreciation (depreciation) on: | | | | |
Investments | | | (10,548,059 | ) |
Futures | | | 426,451 | |
Forward rate agreements | | | (2,121 | ) |
Options written | | | (10,647 | ) |
Swap agreements | | | 1,726,561 | |
Foreign currencies | | | (4 | ) |
| | | | |
| | | (8,407,819 | ) |
| | | | |
Net gain (loss) on investment and foreign currency transactions | | | (13,198,256 | ) |
| | | | |
Net Increase (Decrease) In Net Assets Resulting From Operations | | $ | (3,497,274 | ) |
| | | | |
| (a) | Class specific expenses and waivers were as follows: |
See Notes to Financial Statements.
Statement of Operations
Year Ended July 31, 2018
| | | | | | | | | | | | | | | | | | | | |
| | | Class A | | | Class C | | | Class R | | | Class Z | | | Class R6 | |
Distribution fee | | | 121,974 | | | | 36,348 | | | | 101 | | | | — | | | | — | |
Transfer agent’s fees and expenses | | | 54,894 | | | | 4,807 | | | | 48 | | | | 51,864 | | | | 370 | |
Registration fees | | | 18,370 | | | | 15,219 | | | | 15,050 | | | | 16,153 | | | | 33,179 | |
Fee waiver and/or expense reimbursement | | | (66,834 | ) | | | (19,557 | ) | | | (15,096 | ) | | | (57,748 | ) | | | (125,738 | ) |
Distribution fee waiver | | | — | | | | — | | | | (34 | ) | | | — | | | | — | |
See Notes to Financial Statements.
Statements of Changes in Net Assets
| | | | | | | | |
| | | Year Ended July 31, | |
| | | 2018 | | | 2017 | |
Increase (Decrease) in Net Assets | | | | | | | | |
Operations | | | | | | | | |
Net investment income (loss) | | $ | 9,700,982 | | | $ | 4,701,670 | |
Net realized gain (loss) on investment and foreign currency transactions | | | (4,790,437 | ) | | | (1,042,458 | ) |
Net change in unrealized appreciation (depreciation) on investments and foreign currencies | | | (8,407,819 | ) | | | (477,719 | ) |
| | | | | | | | |
Net increase (decrease) in net assets resulting from operations | | | (3,497,274 | ) | | | 3,181,493 | |
| | | | | | | | |
Dividends from net investment income | | | | | | | | |
Class A | | | (1,235,463 | ) | | | (829,812 | ) |
Class C | | | (64,510 | ) | | | (42,130 | ) |
Class R | | | (309 | ) | | | (196 | ) |
Class Z | | | (2,350,329 | ) | | | (2,651,141 | ) |
Class R6 | | | (7,215,293 | ) | | | (2,138,412 | ) |
| | | | | | | | |
| | | (10,865,904 | ) | | | (5,661,691 | ) |
| | | | | | | | |
| | |
Fund share transactions (Net of share conversions) | | | | | | | | |
Net proceeds from shares sold | | | 196,937,730 | | | | 301,461,573 | |
Net asset value of shares issued in reinvestment of dividends | | | 10,842,567 | | | | 5,627,254 | |
Cost of shares reacquired | | | (74,634,507 | ) | | | (90,643,525 | ) |
| | | | | | | | |
Net increase (decrease) in net assets from Fund share transactions | | | 133,145,790 | | | | 216,445,302 | |
| | | | | | | | |
Total increase (decrease) | | | 118,782,612 | | | | 213,965,104 | |
| | |
Net Assets: | | | | | | | | |
Beginning of year | | | 330,628,599 | | | | 116,663,495 | |
| | | | | | | | |
End of year(a) | | $ | 449,411,211 | | | $ | 330,628,599 | |
| | | | | | | | |
(a) Includes undistributed/(distributions in excess of) net investment income of: | | $ | 49,317 | | | $ | 6,755 | |
| | | | | | | | |
See Notes to Financial Statements.
Notes to Financial Statements
The Target Portfolio Trust (the “Trust”) is registered under the Investment Company Act of 1940, as amended (“1940 Act”), as a diversified open-end management investment company. The Trust currently consists of three series: PGIM Corporate Bond Fund, PGIM Core Bond Fund and PGIM QMA Small-Cap Value Fund (collectively the “Funds”). These financial statements relate to the PGIM Core Bond Fund (the “Fund”). Effective June 11, 2018, the Funds’ names were changed by replacing “Prudential” with “PGIM”, and Class Q shares were renamed Class R6 shares.
The investment objective of the Fund is total return.
1. Accounting Policies
The Fund follows investment company accounting and reporting guidance of the Financial Accounting Standards Board (“FASB”) Accounting Standard Codification Topic 946 Financial Services — Investment Companies. The following accounting policies conform to U.S. generally accepted accounting principles. The Fund consistently follows such policies in the preparation of its financial statements.
Securities Valuation: The Fund holds securities and other assets and liabilities that are fair valued at the close of each day (generally, 4:00 PM Eastern time) the New York Stock Exchange (“NYSE”) is open for trading. Fair value is the price that would be received to sell an asset or paid to transfer a liability in an orderly transaction between market participants on the measurement date. The Trust’s Board of Trustees (the “Board”) has adopted valuation procedures for security valuation under which fair valuation responsibilities have been delegated to PGIM Investments LLC (“PGIM Investments” or “the Manager”). Pursuant to the Board’s delegation, a Valuation Committee has been established as two persons, being one or more officers of the Trust, including: the Trust’s Treasurer (or the Treasurer’s direct reports); and the Trust’s Chief or Deputy Chief Compliance Officer (or Vice-President-level direct reports of the Chief or Deputy Chief Compliance Officer). Under the current valuation procedures, the Valuation Committee of the Board is responsible for supervising the valuation of portfolio securities and other assets and liabilities. The valuation procedures permit the Fund to utilize independent pricing vendor services, quotations from market makers, and alternative valuation methods when market quotations are either not readily available or not deemed representative of fair value. A record of the Valuation Committee’s actions is subject to the Board’s review, approval, and ratification at its next regularly scheduled quarterly meeting.
For the fiscal reporting period-end, securities and other assets and liabilities were fair valued at the close of the last U.S. business day. Trading in certain foreign securities may occur when the NYSE is closed (including weekends and holidays). Because such foreign securities trade in markets that are open on weekends and U.S. holidays, the values of some
of the Fund’s foreign investments may change on days when investors cannot purchase or redeem Fund shares.
Various inputs determine how the Fund’s investments are valued, all of which are categorized according to the three broad levels (Level 1, 2, or 3) detailed in the Schedule of Investments.
Derivative instruments, such as futures or options, that are traded on a national securities exchange are valued at the last sale price as of the close of trading on the applicable exchange where the security principally trades. Securities traded via NASDAQ are valued at the NASDAQ official closing price. To the extent these securities are valued at the last sale price or NASDAQ official closing price, they are classified as Level 1 in the fair value hierarchy. In the event that no sale or official closing price on valuation date exists, these securities are generally valued at the mean between the last reported bid and ask prices, or at the last bid price in the absence of an ask price. These securities are classified as Level 2 in the fair value hierarchy.
Investments in open-end, non-exchange-traded mutual funds are valued at their net asset values as of the close of the NYSE on the date of valuation. These securities are classified as Level 1 in the fair value hierarchy since they may be purchased or sold at their net asset values on the date of valuation.
Fixed income securities traded in the OTC market are generally classified as Level 2 in the fair value hierarchy. Such fixed income securities are typically valued using the market approach which generally involves obtaining data from an approved independent third-party vendor source. The Fund utilizes the market approach as the primary method to value securities when market prices of identical or comparable instruments are available. The third-party vendors’ valuation techniques used to derive the evaluated bid price are based on evaluating observable inputs, including but not limited to, yield curves, yield spreads, credit ratings, deal terms, tranche level attributes, default rates, cash flows, prepayment speeds, broker/dealer quotations and reported trades. Certain Level 3 securities are also valued using the market approach when obtaining a single broker quote or when utilizing transaction prices for identical securities that have been used in excess of five business days.
During the reporting period, there were no changes to report with respect to the valuation approach and/or valuation techniques discussed above.
OTC derivative instruments are generally classified as Level 2 in the fair value hierarchy. Such derivative instruments are typically valued using the market approach and/or income approach which generally involves obtaining data from an approved independent third-party vendor source. The Fund utilizes the market approach when quoted prices in broker-dealer markets are available but also includes consideration of alternative valuation approaches, including the income approach. In the absence of reliable market quotations, the income approach is typically utilized for purposes of valuing OTC derivatives such as interest rate
Notes to Financial Statements (continued)
swaps based on a discounted cash flow analysis whereby the value of the instrument is equal to the present value of its future cash inflows or outflows. Such analysis includes projecting future cash flows and determining the discount rate (including the present value factors that affect the discount rate) used to discount the future cash flows. In addition, the third-party vendors’ valuation techniques used to derive the evaluated OTC derivative price is based on evaluating observable inputs, including but not limited to, underlying asset prices, indices, spreads, interest rates and exchange rates. Certain OTC derivatives may be classified as Level 3 when valued using the market approach by obtaining a single broker quote or when utilizing unobservable inputs in the income approach. During the reporting period, there were no changes to report with respect to the valuation approach and/or valuation techniques discussed above.
Centrally cleared swaps listed or traded on a multilateral or trade facility platform, such as a registered exchange, are generally valued at the daily settlement price determined by the respective exchange. These securities are classified as Level 2 in the fair value hierarchy, as the daily settlement price is not public.
Securities and other assets that cannot be priced according to the methods described above are valued based on pricing methodologies approved by the Board. In the event that unobservable inputs are used when determining such valuations, the securities will be classified as Level 3 in the fair value hierarchy.
When determining the fair value of securities, some of the factors influencing the valuation include: the nature of any restrictions on disposition of the securities; assessment of the general liquidity of the securities; the issuer’s financial condition and the markets in which it does business; the cost of the investment; the size of the holding and the capitalization of the issuer; the prices of any recent transactions or bids/offers for such securities or any comparable securities; any available analyst media or other reports or information deemed reliable by the Manager regarding the issuer or the markets or industry in which it operates. Using fair value to price securities may result in a value that is different from a security’s most recent closing price and from the price used by other unaffiliated mutual funds to calculate their net asset values.
Restricted and Illiquid Securities: Subject to guidelines adopted by the Board, the Fund may invest up to 15% of its net assets in illiquid securities, including those which are restricted as to disposition under securities law (“restricted securities”). Restricted securities are valued pursuant to the valuation procedures noted above. Illiquid securities are those that, because of the absence of a readily available market or due to legal or contractual restrictions on resale, cannot be sold within seven days in the ordinary course of business at approximately the amount at which the Fund has valued the investment. Therefore, the Fund may find it difficult to sell illiquid securities at the time considered most advantageous by its Subadviser and may incur transaction costs that would not be incurred in the sale of
securities that were freely marketable. Certain securities that would otherwise be considered illiquid because of legal restrictions on resale to the general public may be traded among qualified institutional buyers under Rule 144A of the Securities Act of 1933. These Rule 144A securities, as well as commercial paper that is sold in private placements under Section 4(2) of the Securities Act, may be deemed liquid by the Fund’s Subadviser under the guidelines adopted by the Trustees of the Trust. However, the liquidity of the Fund’s investments in Rule 144A securities could be impaired if trading does not develop or declines.
Connecticut Avenue Securities (CAS) and Structured Agency Credit Risk (STACR): The Fund purchased government controlled Fannie Mae and Freddie Mac securities that transfer most of the cost of defaults to private investors including the Fund. These are insurance-like products that are called CAS by Fannie Mae and STACR securities by Freddie Mac. Payments on the securities are based primarily on the performance of a reference pool of underlying mortgages. With such securities, the Fund could lose some or all of its principal if the underlying mortgages experience credit defaults.
Foreign Currency Translation: The books and records of the Fund are maintained in U.S. dollars. Foreign currency amounts are translated into U.S. dollars on the following basis:
(i) market value of investment securities, other assets and liabilities—at the current rates of exchange;
(ii) purchases and sales of investment securities, income and expenses—at the rates of exchange prevailing on the respective dates of such transactions.
Although the net assets of the Fund are presented at the foreign exchange rates and market values at the close of the period, the Fund does not generally isolate that portion of the results of operations arising as a result of changes in the foreign exchange rates from the fluctuations arising from changes in the market prices of long-term portfolio securities held at the end of the period. Similarly, the Fund does not isolate the effect of changes in foreign exchange rates from the fluctuations arising from changes in the market prices of long-term portfolio securities sold during the period. Accordingly, holding period realized foreign currency gains (losses) are included in the reported net realized gains (losses) on investment transactions. Notwithstanding the above, the Fund does isolate the effect of fluctuations in foreign currency exchange rates when determining the gain (loss) upon the sale or maturity of foreign currency denominated debt obligations; such amounts are included in net realized gains (losses) on foreign currency transactions.
Additionally, net realized gains (losses) on foreign currency transactions represent net foreign exchange gains (losses) from the disposition of holdings of foreign currencies, currency gains (losses) realized between the trade and settlement dates on securities transactions, and the difference between the amounts of interest, dividends and foreign withholding taxes recorded on the Fund’s books and the U.S. dollar equivalent amounts actually received or paid. Net unrealized currency gains (losses) from valuing foreign currency denominated assets and liabilities (other than investments) at period end
Notes to Financial Statements (continued)
exchange rates are reflected as a component of net unrealized appreciation (depreciation) on foreign currencies.
Options: The Fund purchased or wrote options in order to hedge against adverse market movements or fluctuations in value caused by changes in prevailing interest rates, value of equities or foreign currency exchange rates with respect to securities or financial instruments which the Fund currently owns or intends to purchase. The Fund may also use options to gain additional market exposure. The Fund’s principal reason for writing options is to realize, through receipt of premiums, a greater current return than would be realized on the underlying security alone. When the Fund purchases an option, it pays a premium and an amount equal to that premium is recorded as an asset. When the Fund writes an option, it receives a premium and an amount equal to that premium is recorded as a liability. The asset or liability is adjusted daily to reflect the current market value of the option. If an option expires unexercised, the Fund realizes a gain (loss) to the extent of the premium received or paid. If an option is exercised, the premium received or paid is recorded as an adjustment to the proceeds from the sale or the cost of the purchase in determining whether the Fund has realized a gain (loss). The difference between the premium and the amount received or paid at the closing of a purchase or sale transaction is also treated as a realized gain (loss). Gain (loss) on purchased options is included in net realized gain (loss) on investment transactions. Gain (loss) on written options is presented separately as net realized gain (loss) on options written transactions.
The Fund, as writer of an option, may have no control over whether the underlying securities or financial instruments may be sold (called) or purchased (put). As a result, the Fund bears the market risk of an unfavorable change in the price of the security or financial instrument underlying the written option. The Fund, as purchaser or an OTC option, bears the risk of the potential inability of the counterparties to meet the terms of their contracts. With exchange-traded options contracts, there is minimal counterparty credit risk to the Fund since the exchanges’ clearinghouse acts as counterparty to all exchange-traded options and guarantees the options contracts against default.
When the Fund writes an option on a swap, an amount equal to any premium received by the Fund is recorded as a liability and is subsequently adjusted to the current market value of the written option on the swap. If a call option on a swap is exercised, the Fund becomes obligated to pay a fixed interest rate (noted as the strike price) and receive a variable interest rate on a notional amount. If a put option on a swap is exercised, the Fund becomes obligated to pay a variable interest rate and receive a fixed interest rate (noted as the strike price) on a notional amount. Premiums received from writing options on swaps that expire or are exercised are treated as realized gains upon the expiration or exercise of such options on swaps. The risk associated with writing put and call options on swaps is that the Fund will be obligated to be party to a swap agreement if an option on a swap is exercised.
Futures Contracts: A financial futures contract is an agreement to purchase (long) or sell (short) an agreed amount of securities at a set price for delivery on a future date. Upon entering into a financial futures contract, the Fund is required to pledge to the broker an amount of cash and/or other assets equal to a certain percentage of the contract amount. This amount is known as the “initial margin.” Subsequent payments, known as “variation margin,” are made or received by the Fund each day, depending on the daily fluctuations in the value of the underlying security. Such variation margin is recorded for financial statement purposes on a daily basis as unrealized gain (loss). When the contract expires or is closed, the gain (loss) is realized and is presented in the Statement of Operations as net realized gain (loss) on futures transactions.
The Fund invested in financial futures contracts in order to hedge its existing portfolio securities, or securities the Fund intends to purchase, against fluctuations in value caused by changes in prevailing interest rates. Should interest rates move unexpectedly, the Fund may not achieve the anticipated benefits of the financial futures contracts and may realize a loss. The use of futures transactions involves the risk of imperfect correlation in movements in the price of futures contracts, interest rates and the underlying hedged assets. Since futures contracts are exchange-traded, there is minimal counterparty credit risk to the Fund since the exchanges’ clearinghouse acts as counterparty to all exchange-traded futures and guarantees the futures contracts against default.
Forward Rate Agreements: Forward rate agreements represent an agreement between counterparties to exchange cash flows based on the difference between two interest rates, applied to a notional principal amount on a fixed future date. The Fund entered into forward rate agreements to gain yield exposure based on anticipated market conditions at the specified termination date of the agreement.
Swap Agreements: The Fund may enter into credit default, interest rate and other types of swap agreements. A swap agreement is an agreement to exchange the return generated by one instrument for the return generated by another instrument. Swap agreements are negotiated in the OTC market and may be executed either directly with counterparty (“OTC-traded”) or through a central clearing facility, such as a registered exchange. Swap agreements are valued daily at current market value and any change in value is included in the net unrealized appreciation (depreciation) on swap agreements. Centrally cleared swaps pay or receive an amount known as “variation margin”, based on daily changes in the valuation of the swap contract. Any upfront premiums paid and received are shown as swap premiums paid and swap premiums received in the Statement of Assets and Liabilities. Risk of loss may exceed amounts recognized on the Statement of Assets and Liabilities. Swap agreements outstanding at period end, if any, are listed on the Schedule of Investments.
Interest Rate Swaps: Interest rate swaps represent an agreement between counterparties to exchange cash flows based on the difference between two interest rates, applied to a notional principal amount for a specified period. The Fund is subject to interest rate risk exposure in the normal course of pursuing its investment objective. The Fund used interest rate swaps to maintain its ability to generate steady cash flow by receiving a stream of
Notes to Financial Statements (continued)
fixed-rate payments and to increase exposure to prevailing market rates by receiving floating rate payments. The Fund’s maximum risk of loss from counterparty credit risk is the discounted net present value of the cash flows to be received from the counterparty over the contract’s remaining life.
Inflation Swaps: The Fund entered into inflation swap agreements to protect against fluctuations in inflation rates. Inflation swaps are characterized by one party paying a fixed rate in exchange for a floating rate that is derived from an inflation index, such as the Consumer Price Index or UK Retail Price Index. Inflation swaps subject the Fund to interest rate risk.
Credit Default Swaps (“CDS”): CDS involve one party (the protection buyer) making a stream of payments to another party (the protection seller) in exchange for the right to receive a specified payment in the event of a default or as a result of a default (collectively a “credit event”) for the referenced entity (typically corporate issues or sovereign issues of an emerging country) on its obligation; or in the event of a write-down, principal shortfall, interest shortfall or default of all or part of the referenced entities comprising a credit index.
The Fund is subject to credit risk in the normal course of pursuing its investment objectives, and as such, has entered into CDS contracts to provide a measure of protection against defaults or to take an active long or short position with respect to the likelihood of a particular issuer’s default or the reference entity’s credit soundness. CDS contracts generally trade based on a spread which represents the cost a protection buyer has to pay the protection seller. The protection buyer is said to be short the credit as the value of the contract rises the more the credit deteriorates. The value of the CDS contract increases for the protection buyer if the spread increases. The Fund’s maximum risk of loss from counterparty credit risk for purchased CDS is the inability of the counterparty to honor the contract up to the notional value due to a credit event.
As a seller of protection on credit default swap agreements, the Fund generally receives an agreed upon payment from the buyer of protection throughout the term of the swap, provided no credit event occurs. As the seller, the Fund effectively increases its investment risk because, in addition to its total net assets, the Fund may be subject to investment exposure on the notional amount of the swap.
The maximum amount of the payment that the Fund, as a seller of protection, could be required to make under a credit default swap agreement would be equal to the notional amount of the underlying security or index contract as a result of a credit event. This potential amount will be partially offset by any recovery values of the respective referenced obligations, or net amounts received from the settlement of buy protection credit default swap agreements which the Fund entered into for the same referenced entity or index. As a buyer of protection, the Fund generally receives an amount up to the notional value of the swap if a credit event occurs.
Implied credit spreads, represented in absolute terms, utilized in determining the market value of credit default swap agreements where the Fund is the seller of protection as of period end are disclosed in the footnotes to the Schedule of Investments, if applicable. These spreads serve as indicators of the current status of the payment/performance risk and represent the likelihood of default risk for the credit derivative. The implied credit spread of a particular referenced entity reflects the cost of buying/selling protection and may include upfront payments required to enter into the agreement. Wider credit spreads and increased market value in absolute terms, when compared to the notional amount of the swap, represent a deterioration of the referenced entity’s credit soundness and a greater likelihood of risk of default or other credit event occurring as defined under the terms of the agreement.
Master Netting Arrangements: The Fund is subject to various Master Agreements, or netting arrangements, with select counterparties. These are agreements which a subadviser may have negotiated and entered into on behalf of the Fund. A master netting arrangement between the Fund and the counterparty permits the Fund to offset amounts payable by the Fund to the same counterparty against amounts to be received; and by the receipt of collateral from the counterparty by the Fund to cover the Fund’s exposure to the counterparty. However, there is no assurance that such mitigating factors are easily enforceable. In addition to master netting arrangements, the right to set-off exists when all the conditions are met such that each of the parties owes the other determinable amounts, the reporting party has the right to set-off the amount owed with the amount owed by the other party, the reporting party intends to set-off and the right of set-off is enforceable by law. During the reporting period, there was no intention to settle on a net basis and all amounts are presented on a gross basis on the Statement of Assets and Liabilities.
The Trust, on behalf of the Fund, is a party to ISDA (International Swaps and Derivatives Association, Inc.) Master Agreements with certain counterparties that govern OTC derivative and foreign exchange contracts entered into from time to time. The Master Agreements may contain provisions regarding, among other things, the parties’ general obligations, representations, agreements, collateral requirements, events of default and early termination. With respect to certain counterparties, in accordance with the terms of the Master Agreements, collateral posted to the Fund is held in a segregated account by the Fund’s custodian and with respect to those amounts which can be sold or re-pledged, is presented in the Schedule of Investments. Collateral pledged by the Fund is segregated by the Fund’s custodian and identified in the Schedule of Investments. Collateral can be in the form of cash or debt securities issued by the U.S. Government or related agencies or other securities as agreed to by the Fund and the applicable counterparty. Collateral requirements are determined based on the Fund’s net position with each counterparty. Termination events applicable to the Fund may occur upon a decline in the Fund’s net assets below a specified threshold over a certain period of time. Termination events applicable to counterparties may occur upon a decline in the counterparty’s long-term and short-term credit ratings below a specified level. In each case, upon occurrence, the other party may elect to terminate early and cause settlement of all derivative and foreign exchange contracts outstanding, including the payment of any losses and costs resulting from such early termination, as reasonably
Notes to Financial Statements (continued)
determined by the terminating party. Any decision by one or more of the Fund’s counterparties to elect early termination could impact the Fund’s future derivative activity.
In addition to each instrument’s primary underlying risk exposure (e.g. interest rate, credit, equity or foreign exchange, etc.), swap agreements involve, to varying degrees, elements of credit, market and documentation risk. Such risks involve the possibility that no liquid market for these agreements will exist, the counterparty to the agreement may default on its obligation to perform or disagree on the contractual terms of the agreement, and changes in net interest rates will be unfavorable. In connection with these agreements, securities in the portfolio may be identified or received as collateral from the counterparty in accordance with the terms of the respective swap agreements to provide or receive assets of value and to serve as recourse in the event of default or bankruptcy/insolvency of either party. Such OTC derivative agreements include conditions which, when materialized, give the counterparty the right to cause an early termination of the transactions under those agreements. Any election by the counterparty for early termination of the contract(s) may impact the amounts reported on financial statements.
As of July 31, 2018, the Fund has not met conditions under such agreements which give the counterparty the right to call for an early termination.
Forward currency contracts, forward rate agreements, written options, short sales, swaps and financial futures contracts involve elements of both market and credit risk in excess of the amounts reflected on the Statement of Assets and Liabilities. Such risks may be mitigated by engaging in master netting arrangements.
Delayed-Delivery Transactions: The Fund may purchase or sell securities on a when-issued or delayed-delivery and forward commitment basis. These transactions involve a commitment by the Fund to purchase or sell securities for a predetermined price or yield, with payment and delivery taking place beyond the customary settlement period. When delayed-delivery purchases are outstanding, the Fund will set aside and maintain an amount of liquid assets sufficient to meet the purchase price in a segregated account until the settlement date. When purchasing a security on a delayed-delivery basis, the Fund assumes the rights and risks of ownership of the security, including the risk of price and yield fluctuations, and takes such fluctuations into account when determining its net asset value. The Fund may dispose of or renegotiate a delayed-delivery transaction subsequent to establishment, and may sell when-issued securities before they are delivered, which may result in a realized gain (loss). When selling a security on a delayed-delivery basis, the Fund forfeits its eligibility to realize future gains (losses) with respect to the security.
Securities Lending: The Fund may lend its portfolio securities to banks and broker-dealers. The loans are secured by collateral at least equal to the market value of the securities loaned. Collateral pledged by each borrower is invested in an affiliated money market fund and is marked to market daily, based on the previous day’s market value, such that the value
of the collateral exceeds the value of the loaned securities. In the event of significant appreciation in value of securities on loan on the last business day of the reporting period, the financial statements may reflect a collateral value that is less than the market value of the loaned securities. Such shortfall is remedied as described above. Loans are subject to termination at the option of the borrower or the Fund. Upon termination of the loan, the borrower will return to the Fund securities identical to the loaned securities. Should the borrower of the securities fail financially, the Fund has the right to repurchase the securities in the open market using the collateral. The Fund recognizes income, net of any rebate and securities lending agent fees, for lending its securities in the form of fees or interest on the investment of any cash received as collateral. The borrower receives all interest and dividends from the securities loaned and such payments are passed back to the lender in amounts equivalent thereto. The Fund also continues to recognize any unrealized gain (loss) in the market price of the securities loaned and on the change in the value of the collateral invested that may occur during the term of the loan. In addition, realized gain (loss) is recognized on changes in the value of the collateral invested upon liquidation of the collateral. Net earnings from securities lending are disclosed on the Statement of Operations as “Income from securities lending, net”.
Securities Transactions and Net Investment Income: Securities transactions are recorded on the trade date. Realized gains (losses) from investment and currency transactions are calculated on the specific identification method. Dividend income is recorded on the ex-date. Interest income, including amortization of premium and accretion of discount on debt securities, as required, is recorded on the accrual basis. Expenses are recorded on an accrual basis, which may require the use of certain estimates by management that may differ from actual. Net investment income or loss (other than class specific expenses and waivers, which are allocated as noted below) and unrealized and realized gains (losses) are allocated daily to each class of shares based upon the relative proportion of adjusted net assets of each class at the beginning of the day.
Class specific expenses and waivers, where applicable, are charged to the respective share classes. Class specific expenses include distribution fees and distribution fee waivers, shareholder servicing fee, transfer agent’s fees and expenses, registration fees and fee waivers and/or expense reimbursements, as applicable.
Taxes: It is the Fund’s policy to continue to meet the requirements of the Internal Revenue Code applicable to regulated investment companies and to distribute all of its taxable net investment income and capital gains, if any, to its shareholders. Therefore, no federal income tax provision is required. Withholding taxes on foreign dividends, interest and capital gains, if any, are recorded, net of reclaimable amounts, at the time the related income is earned.
Dividends and Distributions: The Fund expects to declare dividends of its net investment income daily and pay such dividends monthly. Distributions from net realized capital and currency gains, if any, are declared and paid at least annually. Dividends and distributions to shareholders, which are determined in accordance with federal income tax regulations and
Notes to Financial Statements (continued)
which may differ from generally accepted accounting principles, are recorded on the ex-date. Permanent book/tax differences relating to income and gain (loss) are reclassified amongst undistributed net investment income, accumulated net realized gain (loss) and paid-in capital in excess of par, as appropriate.
Estimates: The preparation of financial statements requires management to make estimates and assumptions that affect the reported amounts and disclosures in the financial statements. Actual results could differ from those estimates.
2. Agreements
The Trust, on behalf of the Fund, has a management agreement with PGIM Investments. Pursuant to this agreement, PGIM Investments has responsibility for all investment advisory services and supervises the Subadviser’s performance of such services. In addition, under the management agreement, PGIM Investments provides all of the administrative functions necessary for the organization, operation and management of the Fund. PGIM Investments administers the corporate affairs of the Fund and, in connection therewith, furnishes the Fund with office facilities, together with those ordinary clerical and bookkeeping services which are not being furnished by, the Fund’s custodian (the Custodian), and the Fund’s transfer agent. PGIM Investments is also responsible for the staffing and management of dedicated groups of legal, marketing, compliance and related personnel necessary for the operation of the Fund. The legal, marketing, compliance and related personnel are also responsible for the management and oversight of the various service providers to the Fund, including, but not limited to, the custodian, transfer agent, and accounting agent.
PGIM Investments has entered into a subadvisory agreement with PGIM, Inc., which provides subadvisory services to the Fund through its PGIM Fixed Income unit. The subadvisory agreement provides that PGIM, Inc. will furnish investment advisory services in connection with the management of the Fund. In connection therewith, PGIM, Inc. is obligated to keep certain books and records of the Fund. PGIM Investments pays for the services of PGIM, Inc., the cost of compensation of officers of the Fund, occupancy and certain clerical and bookkeeping costs of the Fund. The Fund bears all other costs and expenses.
The management fee paid to PGIM Investments is accrued daily and payable monthly at an annual rate of 0.35% of the Fund’s average daily net assets up to $10 billion and 0.34% of such assets in excess of $10 billion. The effective management fee rate before any waivers and/or expense reimbursements, was 0.35% for the year ended July 31, 2018.
PGIM Investments has contractually agreed through November 30, 2019, to limit Total Annual Fund Operating Expenses after fee waivers and/or expense reimbursements to 0.70% of average daily net assets for Class A shares, 1.45% of average daily net assets for
Class C shares, 0.95% of average daily net assets for Class R shares, 0.45% of average daily net assets for Class Z shares and 0.40% of average daily net assets for Class R6 shares. This contractual waiver excludes interest, brokerage, taxes (such as income and foreign withholding taxes, stamp duty and deferred tax expenses), acquired fund fees and expenses, extraordinary expenses, and certain other Fund expenses such as dividend and interest expense and broker charges on short sales. Where applicable, PGIM Investments agrees to waive management fees or shared operating expenses on any share class to the same extent that it waives similar expenses on any other share class. In addition, Total Annual Fund Operating Expenses for Class R6 shares will not exceed Total Annual Fund Operating Expenses for Class Z shares. Fees and/or expenses waived and/or reimbursed by PGIM Investments may be recouped by PGIM Investments within the same fiscal year during which such waiver and/or reimbursement is made if such recoupment can be realized without exceeding the expense limit in effect at the time of the recoupment for that fiscal year.
The Fund has a distribution agreement with Prudential Investment Management Services LLC (“PIMS”) which acts as the distributor of the Class A, Class C, Class R, Class Z and Class R6 shares of the Fund. The Fund compensates PIMS for distributing and servicing the Fund’s Class A, Class C and Class R shares, pursuant to the plans of distribution (the “Distribution Plans”), regardless of expenses actually incurred by PIMS. The distribution fees are accrued daily and payable monthly. No distribution or service fees are paid to PIMS as distributor of the Class Z or Class R6 shares of the Fund.
Pursuant to the Fund’s Distribution Plans, the Fund compensates PIMS for distribution related activities at an annual rate of up to 0.25%, 1% and 0.75% of the average daily net assets of the Class A, C and R shares, respectively. PIMS has contractually agreed through November 30, 2019 to limit such fees to 0.50% of the average daily net assets of the Class R shares.
PIMS has advised the Fund that it has received $226,099 in front-end sales charges resulting from sales of Class A shares during the year ended July 31, 2018. From these fees, PIMS paid such sales charges to broker-dealers, which in turn paid commissions to sales persons and incurred other distribution costs.
PIMS has advised the Fund that for the year ended July 31, 2018, it received $1,145 and $1,900 in contingent deferred sales charges imposed upon redemptions by certain Class A and Class C shareholders, respectively.
PGIM Investments, PGIM, Inc. and PIMS are indirect, wholly-owned subsidiaries of Prudential Financial, Inc. (“Prudential”).
3. Other Transactions with Affiliates
Prudential Mutual Fund Services LLC (“PMFS”), an affiliate of PGIM Investments and an indirect, wholly-owned subsidiary of Prudential, serves as the Fund’s transfer agent. Transfer
Notes to Financial Statements (continued)
agent’s fees and expenses in the Statement of Operations include certain out-of-pocket expenses paid to non-affiliates, where applicable.
The Fund may enter into certain securities purchase or sale transactions under Board approved Rule 17a-7 procedures. Rule 17a-7 is an exemptive rule under the 1940 Act, that permits purchase and sale transactions among affiliated investment companies, or between an investment company and a person that is affiliated solely by reason of having a common (or affiliated) investment adviser, common directors, and/or common officers. Such transactions are subject to ratification by the Board. For the reporting period ended July 31, 2018 no such transactions were entered into by the Fund.
The Fund may invest its overnight sweep cash in the PGIM Core Ultra Short Bond Fund (the “Core Fund”), and its securities lending cash collateral in the PGIM Institutional Money Market Fund (the “Money Market Fund”), each a series of Prudential Investment Portfolios 2, registered under the 1940 Act and managed by PGIM Investments. For the reporting period ended July 31, 2018, PGIM, Inc. was compensated $777 by PGIM Investments for managing the Fund’s securities lending cash collateral as subadviser to the Money Market Fund. Earnings from the Core Fund and Money Market Fund are disclosed on the Statement of Operations as “Affiliated dividend income” and “Income from securities lending, net”, respectively.
4. Portfolio Securities
The aggregate cost of purchases and proceeds from sales of portfolio securities (excluding short-term investments and U.S. Government securities) for the year ended July 31, 2018, were $633,018,104 and $471,783,875, respectively.
A summary of the cost of purchases and proceeds from sales of shares of affiliated mutual funds for the year ended July 31, 2018, is presented as follows:
| | | | | | | | | | | | | | | | | | | | | | | | | | | | | | | | |
Affiliated Mutual Funds* | | Value,
Beginning
of Year | | | Cost of
Purchases | | | Proceeds
from Sales | | | Change in
Unrealized
Gain
(Loss) | | | Realized
Gain
(Loss) | | | Value,
End of Year | | | Shares,
End
of Year | | | Dividend
Income | |
PGIM Core Ultra Short Bond Fund | | $ | 30,387,632 | | | $ | 1,387,545,639 | | | $ | 1,401,909,964 | | | $ | — | | | $ | — | | | $ | 16,023,307 | | | | 16,023,307 | | | $ | 354,548 | |
PGIM Institutional Money Market Fund | | | 567,416 | | | | 9,220,776 | | | | 9,585,201 | | | | — | | | | 100 | | | | 203,091 | | | | 203,071 | | | | 1,352 | ** |
| | | | | | | | | | | | | | | | | | | | | | | | | | | | | | | | |
| | $ | 30,955,048 | | | $ | 1,396,766,415 | | | $ | 1,411,495,165 | | | $ | — | | | $ | 100 | | | $ | 16,226,398 | | | | | | | $ | 355,900 | |
| | | | | | | | | | | | | | | | | | | | | | | | | | | | | | | | |
| * | The Funds did not have any capital gain distributions during the reporting period. |
| ** | This amount is included in “Income from securities lending, net” on the Statement of Operations. |
5. Distributions and Tax Information
Distributions to shareholders, which are determined in accordance with federal income tax regulations and which may differ from generally accepted accounting principles, are recorded on the ex-date. In order to present undistributed net investment income, accumulated net realized loss on investment and foreign currency transactions and paid-in capital in excess of par on the Statement of Assets and Liabilities that more closely represent their tax character, certain adjustments have been made to undistributed net investment income and accumulated net realized loss on investment and foreign currency transactions. For the tax year ended July 31, 2018, the adjustments were to increase undistributed net investment income and increase accumulated net realized loss on investment and foreign currency transactions by $1,207,484 due to reclassification of paydown gains (losses), certain transactions involving foreign currencies, swaps and differences in the tax treatment of premium amortization. Net investment income, net realized gain (loss) on investment and foreign currency transactions and net assets were not affected by this change.
For the years ended July 31, 2018 and July 31, 2017, the tax character of dividends paid by the Fund was $10,865,904 and $5,661,691 of ordinary income, respectively.
As of July 31, 2018, the accumulated undistributed earnings on a tax basis was $49,317 of ordinary income.
The United States federal income tax basis of the Fund’s investments and the net unrealized depreciation as of July 31, 2018 were as follows:
| | | | | | |
Tax Basis | | Gross Unrealized Appreciation | | Gross Unrealized Depreciation | | Net Unrealized Depreciation |
| $470,943,649 | | $2,512,779 | | $(11,909,297) | | $(9,396,518) |
The differences between book basis and tax basis were primarily attributable to deferred losses on wash sales, amortization of premiums, futures and other cost basis differences between financial and tax accounting.
For federal income tax purposes, the Fund had a capital loss carryforward for the tax year ended July 31, 2018 of approximately $7,887,000 which can be carried forward for an unlimited period. No capital gain distributions are expected to be paid to shareholders until net gains have been realized in excess of such losses.
Management has analyzed the Fund’s tax positions taken on federal, state and local income tax returns for all open tax years and has concluded that no provision for income tax is required in the Fund’s financial statements for the current reporting period. The Fund’s
Notes to Financial Statements (continued)
federal, state and local income and federal excise tax returns for tax years for which the applicable statutes of limitations have not expired are subject to examination by the Internal Revenue Service and state departments of revenue.
6. Capital and Ownership
The Fund offers Class A, Class C, Class R, Class Z and Class R6 shares. Class A shares are sold with a maximum front-end sales charge of 4.50%. Investors who purchase $1 million or more of Class A shares and sell these shares within 12 months of purchase are subject to a contingent deferred sales charge (“CDSC”) of 1%, although they are not subject to an initial sales charge. The Class A CDSC is waived for certain retirement and/or benefit plans. A special exchange privilege is also available for shareholders who qualified to purchase Class A shares at net asset value. Class C shares are sold with a CDSC of 1% on sales made within 12 months of purchase. Class R shares are available to certain retirement plans, clearing and settlement firms. Class R, Class Z and Class R6 shares are not subject to any sales or redemption charge and are offered exclusively for sale to a limited group of investors.
Under certain circumstances, an exchange may be made from specified share classes of the Fund to one or more other share classes of the Fund as presented in the table of transactions in shares of beneficial interest.
The Trust has authorized an unlimited number of shares of beneficial interest at $0.001 par value per share.
As of July 31, 2018, Prudential, through its affiliate entities, including affiliated funds (if applicable), owned 1,076 shares of Class R shares of the Fund. At reporting period end, 3 shareholders of record held 91% of the Fund’s outstanding shares on behalf of multiple beneficial owners.
Transactions in shares of beneficial interest were as follows:
| | | | | | | | |
Class A | | Shares | | | Amount | |
Year ended July 31, 2018: | | | | | | | | |
Shares sold | | | 1,614,256 | | | $ | 15,894,522 | |
Shares issued in reinvestment of dividends and distributions | | | 125,759 | | | | 1,232,672 | |
Shares reacquired | | | (540,853 | ) | | | (5,301,621 | ) |
| | | | | | | | |
Net increase (decrease) in shares outstanding before conversion | | | 1,199,162 | | | | 11,825,573 | |
Shares issued upon conversion from other share class(es) | | | 107,457 | | | | 1,039,956 | |
Shares reacquired upon conversion into other share class(es) | | | (58,187 | ) | | | (574,020 | ) |
| | | | | | | | |
Net increase (decrease) in shares outstanding | | | 1,248,432 | | | $ | 12,291,509 | |
| | | | | | | | |
Year ended July 31, 2017: | | | | | | | | |
Shares sold | | | 4,879,112 | | | $ | 48,572,739 | |
Shares issued in reinvestment of dividends and distributions | | | 83,292 | | | | 827,658 | |
Shares reacquired | | | (2,273,240 | ) | | | (22,525,876 | ) |
| | | | | | | | |
Net increase (decrease) in shares outstanding before conversion | | | 2,689,164 | | | | 26,874,521 | |
Shares reacquired upon conversion into other share class(es) | | | (40,883 | ) | | | (406,271 | ) |
| | | | | | | | |
Net increase (decrease) in shares outstanding | | | 2,648,281 | | | $ | 26,468,250 | |
| | | | | | | | |
Class C | | | | | | |
Year ended July 31, 2018: | | | | | | | | |
Shares sold | | | 176,273 | | | $ | 1,744,652 | |
Shares issued in reinvestment of dividends and distributions | | | 6,475 | | | | 63,553 | |
Shares reacquired | | | (164,125 | ) | | | (1,614,836 | ) |
| | | | | | | | |
Net increase (decrease) in shares outstanding before conversion | | | 18,623 | | | | 193,369 | |
Shares reacquired upon conversion into other share class(es) | | | (1,212 | ) | | | (11,676 | ) |
| | | | | | | | |
Net increase (decrease) in shares outstanding | | | 17,411 | | | $ | 181,693 | |
| | | | | | | | |
Year ended July 31, 2017: | | | | | | | | |
Shares sold | | | 239,782 | | | $ | 2,406,997 | |
Shares issued in reinvestment of dividends and distributions | | | 4,126 | | | | 41,089 | |
Shares reacquired | | | (112,646 | ) | | | (1,121,164 | ) |
| | | | | | | | |
Net increase (decrease) in shares outstanding | | | 131,262 | | | $ | 1,326,922 | |
| | | | | | | | |
Class R | | | | | | |
Year ended July 31, 2018: | | | | | | | | |
Shares sold | | | 466 | | | $ | 4,614 | |
Shares issued in reinvestment of dividends and distributions | | | 32 | | | | 308 | |
Shares reacquired | | | (1 | ) | | | (8 | ) |
| | | | | | | | |
Net increase (decrease) in shares outstanding | | | 497 | | | $ | 4,914 | |
| | | | | | | | |
Year ended July 31, 2017: | | | | | | | | |
Shares issued in reinvestment of dividends and distributions | | | 19 | | | $ | 196 | |
| | | | | | | | |
Net increase (decrease) in shares outstanding | | | 19 | | | $ | 196 | |
| | | | | | | | |
Notes to Financial Statements (continued)
| | | | | | | | |
Class Z | | Shares | | | Amount | |
Year ended July 31, 2018: | | | | | | | | |
Shares sold | | | 4,125,680 | | | $ | 40,037,037 | |
Shares issued in reinvestment of dividends and distributions | | | 237,753 | | | | 2,331,874 | |
Shares reacquired | | | (1,985,498 | ) | | | (19,544,929 | ) |
| | | | | | | | |
Net increase (decrease) in shares outstanding before conversion | | | 2,377,935 | | | | 22,823,982 | |
Shares issued upon conversion from other share class(es) | | | 13,106 | | | | 127,325 | |
Shares reacquired upon conversion into other share class(es) | | | (107,307 | ) | | | (1,038,461 | ) |
| | | | | | | | |
Net increase (decrease) in shares outstanding | | | 2,283,734 | | | $ | 21,912,846 | |
| | | | | | | | |
Year ended July 31, 2017: | | | | | | | | |
Shares sold | | | 15,569,571 | | | $ | 155,505,555 | |
Shares issued in reinvestment of dividends and distributions | | | 263,271 | | | | 2,620,164 | |
Shares reacquired | | | (5,518,779 | ) | | | (54,651,511 | ) |
| | | | | | | | |
Net increase (decrease) in shares outstanding before conversion | | | 10,314,063 | | | | 103,474,208 | |
Shares reacquired upon conversion into other share class(es) | | | (11,555,936 | ) | | | (114,403,764 | ) |
| | | | | | | | |
Net increase (decrease) in shares outstanding | | | (1,241,873 | ) | | $ | (10,929,556 | ) |
| | | | | | | | |
Class R6 | | | | | | |
Year ended July 31, 2018: | | | | | | | | |
Shares sold | | | 14,138,841 | | | $ | 139,256,905 | |
Shares issued in reinvestment of dividends and distributions | | | 735,873 | | | | 7,214,160 | |
Shares reacquired | | | (4,922,296 | ) | | | (48,173,113 | ) |
| | | | | | | | |
Net increase (decrease) in shares outstanding before conversion | | | 9,952,418 | | | | 98,297,952 | |
Shares issued upon conversion from other share class(es) | | | 47,448 | | | | 469,690 | |
Shares reacquired upon conversion into other share class(es) | | | (1,317 | ) | | | (12,814 | ) |
| | | | | | | | |
Net increase (decrease) in shares outstanding | | | 9,998,549 | | | $ | 98,754,828 | |
| | | | | | | | |
Year ended July 31, 2017: | | | | | | | | |
Shares sold | | | 9,581,826 | | | $ | 94,976,282 | |
Shares issued in reinvestment of dividends and distributions | | | 215,127 | | | | 2,138,147 | |
Shares reacquired | | | (1,245,527 | ) | | | (12,344,974 | ) |
| | | | | | | | |
Net increase (decrease) in shares outstanding before conversion | | | 8,551,426 | | | | 84,769,455 | |
Shares issued upon conversion from other share class(es) | | | 11,596,806 | | | | 114,810,035 | |
| | | | | | | | |
Net increase (decrease) in shares outstanding | | | 20,148,232 | | | $ | 199,579,490 | |
| | | | | | | | |
7. Borrowings
The Trust, on behalf of the Fund, along with other affiliated registered investment companies (the “Funds”), is a party to a Syndicated Credit Agreement (“SCA”) with a group of banks. The purpose of the SCA is to provide an alternative source of temporary funding for capital share redemptions. The SCA provides for a commitment of $900 million for the period October 5, 2017 through October 4, 2018. The Funds pay an annualized commitment fee of 0.15% of the unused portion of the SCA. The Fund’s portion of the commitment fee for the unused amount, allocated based upon a method approved by the Board, is accrued daily and paid quarterly. Prior to October 5, 2017, the Funds had another SCA that provided a commitment of $900 million and the Funds paid an annualized commitment fee of 0.15%
of the unused portion of the SCA. The interest on borrowings under the SCAs is paid monthly and at a per annum interest rate based upon a contractual spread plus the higher of (1) the effective federal funds rate, (2) the 1-month LIBOR rate or (3) zero percent.
Other affiliated registered investment companies that are parties to the SCA include portfolios that are subject to a predetermined mathematical formula used to manage certain benefit guarantees offered under variable annuity contracts. The formula may result in large scale asset flows into and out of these portfolios. Consequently, these portfolios may be more likely to utilize the SCA for purposes of funding redemptions. It may be possible for those portfolios to fully exhaust the committed amount of the SCA, thereby requiring the Manager to allocate available funding per a Board-approved methodology designed to treat the Funds in the SCA equitably.
The Fund did not utilize the SCA during the year ended July 31, 2018.
8. Other Risks
The Fund’s risks include, but are not limited to, the risks discussed below:
Bond Obligations Risk: The Fund’s holdings, share price, yield and total return may fluctuate in response to bond market movements. The value of bonds may decline for issuer-related reasons, including management performance, financial leverage and reduced demand for the issuer’s goods and services. Certain types of fixed-income obligations also may be subject to “call and redemption risk,” which is the risk that the issuer may call a bond held by the Fund for redemption before it matures and the Fund may not be able to reinvest at the same level and therefore would earn less income.
Derivatives Risk: Derivatives involve special risks and costs and may result in losses to the Fund. The prices of derivatives may move in unexpected ways, especially in abnormal market conditions. Some derivatives are “leveraged” and therefore may magnify or otherwise increase investment losses to the Fund. The Fund’s use of derivatives may also increase the amount of taxes payable by shareholders. Other risks arise from the potential inability to terminate or close out of derivatives positions. A liquid secondary market may not always exist for the Fund’s derivatives positions. Generally, many OTC derivative instruments will not have liquidity beyond the counterparty to the instrument. OTC derivative instruments also involve the risk that the other party will not meet its obligations to the Fund.
Foreign Securities Risk: The Fund’s investments in securities of foreign issuers or issuers with significant exposure to foreign markets involve additional risk. Foreign countries in which the Fund may invest may have markets that are less liquid, less regulated and more volatile than US markets. The value of the Fund’s investments may decline because of factors affecting the particular issuer as well as foreign markets and issuers generally, such as unfavorable government actions, and political or financial instability.
Notes to Financial Statements (continued)
Interest Rate Risk: The market price of the Fund’s investments will change in response to changes in interest rate and other factors. During periods of rising interest rates, the market price of fixed income instruments generally declines. As interest rates increase, slower than expected principal payments may extend the average life of securities, potentially locking in below-market interest rates and reducing the Fund’s value. In typical market interest rate environments, the prices of long-term debt obligations generally fluctuate more than prices of short-term debt obligations as interest rates change. Fluctuations in the market price of the Fund’s instruments will not affect interest income derived from the instruments already owned by the Fund, but will be reflected in the Fund’s NAV.
Liquidity Risk: The Fund may invest in instruments that trade in lower volumes and are less liquid than other investments. Liquidity risk includes the risk that the Fund may make investments that may become less liquid in response to market developments or adverse investor perceptions. Investments that are illiquid or that trade in lower volumes may be more difficult to value. When there is no willing buyer and investments cannot be readily sold at the desired time or price, the Fund may have to accept a lower price or may not be able to sell the instrument at all. An inability to sell a portfolio position can adversely affect the Fund’s value or prevent the Fund from being able to take advantage of other investment opportunities.
Market and Credit Risk: Securities markets may be volatile and the market prices of the Fund’s securities may decline. Securities fluctuate in price based on changes in an issuer’s financial condition and overall market and economic conditions. If the market prices of the securities owned by the Fund fall, the value of an investment in the Fund will decline. Additionally, the Fund may also be exposed to credit risk in the event that an issuer or guarantor fails to perform or that an institution or entity with which the Fund has unsettled or open transactions defaults.
U.S. Government and Agency Securities Risk: U.S. Government and agency securities are subject to market risk, interest rate risk and credit risk. Not all U.S. Government securities are insured or guaranteed by the full faith and credit of the U.S. Government; some are only insured or guaranteed by the issuing agency, which must rely on its own resources to repay the debt. In addition, the value of U.S. Government securities may be affected by changes in the credit rating of the U.S. Government.
Financial Highlights
��
| | | | | | | | | | | | | | | | | | | | |
| Class A Shares | |
| | | Year Ended July 31, | | | | | | February 17,
2015(a) through
July 31, | |
| | | 2018 | | | 2017 | | | 2016 | | | | | | 2015 | |
| Per Share Operating Performance(b): | | | | | | | | | | | | | | | | | | | | |
| Net Asset Value, Beginning of Period | | | $9.99 | | | | $10.22 | | | | $9.88 | | | | | | | | $9.99 | |
| Income (loss) from investment operations: | | | | | | | | | | | | | | | | | | | | |
| Net investment income (loss) | | | 0.22 | | | | 0.18 | | | | 0.18 | | | | | | | | 0.09 | |
| Net realized and unrealized gain (loss) on investment and foreign currency transactions | | | (0.33 | ) | | | (0.20 | ) | | | 0.39 | | | | | | | | (0.09 | ) |
| Total from investment operations: | | | (0.11 | ) | | | (0.02 | ) | | | 0.57 | | | | | | | | - | |
| Less Dividends and Distributions: | | | | | | | | | | | | | | | | | | | | |
| Dividends from net investment income | | | (0.25 | ) | | | (0.21 | ) | | | (0.20 | ) | | | | | | | (0.11 | ) |
| Tax return of capital distributions | | | - | | | | - | | | | (0.03 | ) | | | | | | | - | |
| Total dividends and distributions | | | (0.25 | ) | | | (0.21 | ) | | | (0.23 | ) | | | | | | | (0.11 | ) |
| Net asset value, end of period | | | $9.63 | | | | $9.99 | | | | $10.22 | | | | | | | | $9.88 | |
| Total Return(c): | | | (1.14)% | | | | (0.13)% | | | | 5.91% | | | | | | | | (0.05)% | |
| |
| Ratios/Supplemental Data: | |
| Net assets, end of period (000) | | | $53,967 | | | | $43,489 | | | | $17,437 | | | | | | | | $203 | |
| Average net assets (000) | | | $48,790 | | | | $38,131 | | | | $3,049 | | | | | | | | $78 | |
| Ratios to average net assets(d)(e): | | | | | | | | | | | | | | | | | | | | |
| Expenses after waivers and/or expense reimbursement | | | 0.70% | | | | 0.70% | | | | 0.70% | | | | | | | | 0.70% | (f) |
| Expenses before waivers and/or expense reimbursement | | | 0.84% | (g) | | | 0.89% | | | | 0.90% | | | | | | | | 1.16% | (f) |
| Net investment income (loss) | | | 2.23% | | | | 1.77% | | | | 1.74% | | | | | | | | 1.97% | (f) |
| Portfolio turnover rate(h)(i) | | | 172% | | | | 314% | | | | 224% | | | | | | | | 535% | (j) |
| (a) | Commencement of operations. |
| (b) | Calculated based on average shares outstanding during the period. |
| (c) | Total return does not consider the effects of sales loads. Total return is calculated assuming a purchase of a share on the first day and a sale on the last day of each period reported and includes reinvestment of dividends and distributions, if any. Total returns may reflect adjustments to conform to generally accepted accounting principles. Total returns for periods less than one full year are not annualized. |
| (d) | Does not include expenses of the underlying funds in which the Fund invests. |
| (e) | The distributor of the Fund had contractually agreed to limit its distribution and service (12b-1) fees to 0.25% of the average daily net assets through March 8, 2015. Effective March 9, 2015, the contractual distribution and service (12b-1) fees were reduced from 0.30% to 0.25% of the average daily net assets and the 0.05% contractual 12b-1 fee waiver was terminated. |
| (g) | Effective August 1, 2017, class specific expenses include Transfer Agent Fees and expenses and Registration Fees, which are charged to their respective share class. |
| (h) | The Fund accounts for mortgage dollar roll transactions, when applicable, as purchases and sales which, as a result, can increase its portfolio turnover rate. |
| (i) | The Fund’s portfolio turnover rate is calculated in accordance with regulatory requirements, without regard to transactions involving short term investments and certain derivatives. If such transactions were included, the Fund’s portfolio turnover rate may be higher. |
See Notes to Financial Statements.
Financial Highlights (continued)
| | | | | | | | | | | | | | | | | | | | |
| Class C Shares | |
| | | Year Ended July 31, | | | | | | February 17,
2015(a)
through
July 31, | |
| | | 2018 | | | 2017 | | | 2016 | | | | | | 2015 | |
| Per Share Operating Performance(b): | | | | | | | | | | | | | | | | | | | | |
| Net Asset Value, Beginning of Period | | | $9.99 | | | | $10.23 | | | | $9.89 | | | | | | | | $9.99 | |
| Income (loss) from investment operations: | | | | | | | | | | | | | | | | | | | | |
| Net investment income (loss) | | | 0.14 | | | | 0.10 | | | | 0.11 | | | | | | | | 0.05 | |
| Net realized and unrealized gain (loss) on investment and foreign currency transactions | | | (0.32 | ) | | | (0.20 | ) | | | 0.39 | | | | | | | | (0.08 | ) |
| Total from investment operations: | | | (0.18 | ) | | | (0.10 | ) | | | 0.50 | | | | | | | | (0.03 | ) |
| Less Dividends and Distributions: | | | | | | | | | | | | | | | | | | | | |
| Dividends from net investment income | | | (0.17 | ) | | | (0.14 | ) | | | (0.14 | ) | | | | | | | (0.07 | ) |
| Tax return of capital distributions | | | - | | | | - | | | | (0.02 | ) | | | | | | | - | |
| Total dividends and distributions | | | (0.17 | ) | | | (0.14 | ) | | | (0.16 | ) | | | | | | | (0.07 | ) |
| Net asset value, end of period | | | $9.64 | | | | $9.99 | | | | $10.23 | | | | | | | | $9.89 | |
| Total Return(c): | | | (1.78)% | | | | (0.98)% | | | | 5.13% | | | | | | | | (0.30)% | |
| |
| Ratios/Supplemental Data: | |
| Net assets, end of period (000) | | | $3,530 | | | | $3,486 | | | | $2,226 | | | | | | | | $63 | |
| Average net assets (000) | | | $3,635 | | | | $3,009 | | | | $880 | | | | | | | | $16 | |
| Ratios to average net assets(d): | | | | | | | | | | | | | | | | | | | | |
| Expenses after waivers and/or expense reimbursement | | | 1.45% | | | | 1.45% | | | | 1.45% | | | | | | | | 1.45% | (e) |
| Expenses before waivers and/or expense reimbursement | | | 1.99% | (f) | | | 1.64% | | | | 1.69% | | | | | | | | 1.82% | (e) |
| Net investment income (loss) | | | 1.47% | | | | 0.98% | | | | 1.08% | | | | | | | | 1.03% | (e) |
| Portfolio turnover rate(g)(h) | | | 172% | | | | 314% | | | | 224% | | | | | | | | 535% | (i) |
| (a) | Commencement of operations. |
| (b) | Calculated based on average shares outstanding during the period. |
| (c) | Total return does not consider the effects of sales loads. Total return is calculated assuming a purchase of a share on the first day and a sale on the last day of each period reported and includes reinvestment of dividends and distributions, if any. Total returns may reflect adjustments to conform to generally accepted accounting principles. Total returns for periods less than one full year are not annualized. |
| (d) | Does not include expenses of the underlying funds in which the Fund invests. |
| (f) | Effective August 1, 2017, class specific expenses include Transfer Agent Fees and expenses and Registration Fees, which are charged to their respective share class. |
| (g) | The Fund accounts for mortgage dollar roll transactions, when applicable, as purchases and sales which, as a result, can increase its portfolio turnover rate. |
| (h) | The Fund’s portfolio turnover rate is calculated in accordance with regulatory requirements, without regard to transactions involving short term investments and certain derivatives. If such transactions were included, the Fund’s portfolio turnover rate may be higher. |
See Notes to Financial Statements.
| | | | | | | | | | | | | | | | | | | | |
| Class R Shares | |
| | | Year Ended July 31, | | | | | | February 17,
2015(a)
through
July 31, | |
| | | 2018 | | | 2017 | | | 2016 | | | | | | 2015 | |
| Per Share Operating Performance(b): | | | | | | | | | | | | | | | | | | | | |
| Net Asset Value, Beginning of Period | | | $9.99 | | | | $10.23 | | | | $9.88 | | | | | | | | $9.99 | |
| Income (loss) from investment operations: | | | | | | | | | | | | | | | | | | | | |
| Net investment income (loss) | | | 0.20 | | | | 0.15 | | | | 0.16 | | | | | | | | 0.07 | |
| Net realized and unrealized gain (loss) on investment and foreign currency transactions | | | (0.34 | ) | | | (0.20 | ) | | | 0.41 | | | | | | | | (0.09 | ) |
| Total from investment operations: | | | (0.14 | ) | | | (0.05 | ) | | | 0.57 | | | | | | | | (0.02 | ) |
| Less Dividends and Distributions: | | | | | | | | | | | | | | | | | | | | |
| Dividends from net investment income | | | (0.22 | ) | | | (0.19 | ) | | | (0.19 | ) | | | | | | | (0.09 | ) |
| Tax return of capital distributions | | | - | | | | - | | | | (0.03 | ) | | | | | | | - | |
| Total dividends and distributions | | | (0.22 | ) | | | (0.19 | ) | | | (0.22 | ) | | | | | | | (0.09 | ) |
| Net asset value, end of period | | | $9.63 | | | | $9.99 | | | | $10.23 | | | | | | | | $9.88 | |
| Total Return(c): | | | (1.39)% | | | | (0.48)% | | | | 5.81% | | | | | | | | (0.16)% | |
| |
| Ratios/Supplemental Data: | |
| Net assets, end of period (000) | | | $15 | | | | $11 | | | | $11 | | | | | | | | $10 | |
| Average net assets (000) | | | $13 | | | | $10 | | | | $10 | | | | | | | | $10 | |
| Ratios to average net assets(d): | | | | | | | | | | | | | | | | | | | | |
| Expenses after waivers and/or expense reimbursement | | | 0.95% | | | | 0.95% | | | | 0.95% | | | | | | | | 0.95% | (e) |
| Expenses before waivers and/or expense reimbursement | | | 113.11% | (f) | | | 1.40% | | | | 1.52% | | | | | | | | 1.64% | (e) |
| Net investment income (loss) | | | 1.99% | | | | 1.46% | | | | 1.66% | | | | | | | | 1.56% | (e) |
| Portfolio turnover rate(g)(h) | | | 172% | | | | 314% | | | | 224% | | | | | | | | 535% | (i) |
| (a) | Commencement of operations. |
| (b) | Calculated based on average shares outstanding during the period. |
| (c) | Total return is calculated assuming a purchase of a share on the first day and a sale on the last day of each period reported and includes reinvestment of dividends and distributions, if any. Total returns may reflect adjustments to conform to generally accepted accounting principles. Total returns for periods less than one full year are not annualized. |
| (d) | Does not include expenses of the underlying funds in which the Fund invests. |
| (f) | Effective August 1, 2017, class specific expenses include Transfer Agent Fees and expenses and Registration Fees, which are charged to their respective share class. |
| (g) | The Fund accounts for mortgage dollar roll transactions, when applicable, as purchases and sales which, as a result, can increase its portfolio turnover rate. |
| (h) | The Fund’s portfolio turnover rate is calculated in accordance with regulatory requirements, without regard to transactions involving short term investments and certain derivatives. If such transactions were included, the Fund’s portfolio turnover rate may be higher. |
See Notes to Financial Statements.
Financial Highlights (continued)
| | | | | | | | | | | | | | | | | | | | | | | | | | | | | | | | |
| Class Z Shares | | | | | | | | | | | | | | | | | | | | | | | | |
| | | Year Ended July 31, | | | | | | Nine Months Ended July 31, | | | | | | Year Ended October 31, | |
| | | 2018(a) | | | 2017(a) | | | 2016(a) | | | 2015(a)(b) | | | | | | 2014(c) | | | | | | 2013 | |
| Per Share Operating Performance: | | | | | | | | | | | | | | | | | | | | | | | | | | | | | | | | |
| Net Asset Value, Beginning of Period | | | $9.99 | | | | $10.23 | | | | $9.88 | | | | $10.13 | | | | | | | | $10.30 | | | | | | | | $10.85 | |
| Income (loss) from investment operations: | | | | | | | | | | | | | | | | | | | | | | | | | | | | | | | | |
| Net investment income (loss) | | | 0.24 | | | | 0.19 | | | | 0.21 | | | | 0.19 | | | | | | | | 0.17 | | | | | | | | 0.25 | |
| Net realized and unrealized gain (loss) on investment and foreign currency transactions | | | (0.33 | ) | | | (0.19 | ) | | | 0.40 | | | | (0.19 | ) | | | | | | | (0.07 | ) | | | | | | | (0.40 | ) |
| Total from investment operations: | | | (0.09 | ) | | | - | | | | 0.61 | | | | - | | | | | | | | 0.10 | | | | | | | | (0.15 | ) |
| Less Dividends and Distributions: | | | | | | | | | | | | | | | | | | | | | | | | | | | | | | | | |
| Dividends from net investment income | | | (0.27 | ) | | | (0.24 | ) | | | (0.23 | ) | | | (0.25 | ) | | | | | | | (0.21 | ) | | | | | | | (0.22 | ) |
| Tax return of capital distributions | | | - | | | | - | | | | (0.03 | ) | | | - | | | | | | | | - | | | | | | | | - | |
| Distributions from net realized gains | | | - | | | | - | | | | - | | | | - | | | | | | | | (0.06 | ) | | | | | | | (0.18 | ) |
| Total dividends and distributions | | | (0.27 | ) | | | (0.24 | ) | | | (0.26 | ) | | | (0.25 | ) | | | | | | | (0.27 | ) | | | | | | | (0.40 | ) |
| Net asset value, end of period | | | $9.63 | | | | $9.99 | | | | $10.23 | | | | $9.88 | | | | | | | | $10.13 | | | | | | | | $10.30 | |
| Total Return(d): | | | (0.90)% | | | | 0.02% | | | | 6.32% | | | | (0.02)% | | | | | | | | 1.01% | | | | | | | | (1.41)% | |
| |
| Ratios/Supplemental Data: | |
| Net assets, end of period (000) | | | $101,369 | | | | $82,297 | | | | $96,978 | | | | $103,725 | | | | | | | | $124,058 | | | | | | | | $131,981 | |
| Average net assets (000) | | | $84,455 | | | | $113,324 | | | | $93,861 | | | | $114,825 | | | | | | | | $127,349 | | | | | | | | $149,452 | |
| Ratios to average net assets(e): | | | | | | | | | | | | | | | | | | | | | | | | | | | | | | | | |
| Expenses after waivers and/or expense reimbursement | | | 0.45% | | | | 0.45% | | | | 0.45% | | | | 0.61% | | | | | | | | 0.77% | (f) | | | | | | | 0.71% | |
| Expenses before waivers and/or expense reimbursement | | | 0.52% | (g) | | | 0.61% | | | | 0.75% | | | | 0.78% | | | | | | | | 0.77% | (f) | | | | | | | 0.71% | |
| Net investment income (loss) | | | 2.48% | | | | 1.89% | | | | 2.15% | | | | 1.88% | | | | | | | | 2.22% | (f) | | | | | | | 2.33% | |
| Portfolio turnover rate(h)(i) | | | 172% | | | | 314% | | | | 224% | | | | 535% | | | | | | | | 234% | (j) | | | | | | | 193% | |
| (a) | Calculated based on average shares outstanding during the period. |
| (b) | Class T shares were renamed Class Z shares effective February 17, 2015. |
| (c) | For the nine month period ended July 31, 2014. The Trust changed its fiscal year end from October 31 to July 31, effective July 31, 2014. |
| (d) | Total return is calculated assuming a purchase of a share on the first day and a sale on the last day of each period reported and includes reinvestment of dividends and distributions, if any. Total returns may reflect adjustments to conform to generally accepted accounting principles. Total returns for periods less than one full year are not annualized. |
| (e) | Does not include expenses of the underlying funds in which the Fund invests. |
| (g) | Effective August 1, 2017, class specific expenses include Transfer Agent Fees and expenses and Registration Fees, which are charged to their respective share class. |
| (h) | The Fund accounts for mortgage dollar roll transactions, when applicable, as purchases and sales which, as a result, can increase its portfolio turnover rate. |
| (i) | The Fund’s portfolio turnover rate is calculated in accordance with regulatory requirements, without regard to transactions involving short term investments and certain derivatives. If such transactions were included, the Fund’s portfolio turnover rate may be higher. |
See Notes to Financial Statements.
| | | | | | | | | | | | | | | | | | | | | | | | | | | | |
| Class R6 Shares | | | | | | | | | | | | | | | | | | | | | |
| | | Year Ended July 31, | | | | | | February 17,
2015(a) through
July 31, | |
| | | 2018 | | | | | | 2017 | | | | | | 2016 | | | | | | 2015 | |
| Per Share Operating Performance(b): | | | | | | | | | | | | | | | | | | | | | | | | | | | | |
| Net Asset Value, Beginning of Period | | | $9.99 | | | | | | | | $10.23 | | | | | | | | $9.88 | | | | | | | | $9.99 | |
| Income (loss) from investment operations: | | | | | | | | | | | | | | | | | | | | | | | | | | | | |
| Net investment income (loss) | | | 0.25 | | | | | | | | 0.22 | | | | | | | | 0.21 | | | | | | | | 0.09 | |
| Net realized and unrealized gain (loss) on investment and foreign currency transactions | | | (0.32 | ) | | | | | | | (0.22 | ) | | | | | | | 0.40 | | | | | | | | (0.08 | ) |
| Total from investment operations: | | | (0.07 | ) | | | | | | | - | | | | | | | | 0.61 | | | | | | | | 0.01 | |
| Less Dividends and Distributions: | | | | | | | | | | | | | | | | | | | | | | | | | | | | |
| Dividends from net investment income | | | (0.28 | ) | | | | | | | (0.24 | ) | | | | | | | (0.23 | ) | | | | | | | (0.12 | ) |
| Tax return of capital distributions | | | - | | | | | | | | - | | | | | | | | (0.03 | ) | | | | | | | - | |
| Total dividends and distributions | | | (0.28 | ) | | | | | | | (0.24 | ) | | | | | | | (0.26 | ) | | | | | | | (0.12 | ) |
| Net asset value, end of period | | | $9.64 | | | | | | | | $9.99 | | | | | | | | $10.23 | | | | | | | | $9.88 | |
| Total Return(c): | | | (0.74)% | | | | | | | | 0.07% | | | | | | | | 6.32% | | | | | | | | 0.06% | |
| |
| Ratios/Supplemental Data: | |
| Net assets, end of period (000) | | | $290,530 | | | | | | | | $201,345 | | | | | | | | $11 | | | | | | | | $10 | |
| Average net assets (000) | | | $254,525 | | | | | | | | $83,714 | | | | | | | | $10 | | | | | | | | $10 | |
| Ratios to average net assets(d): | | | | | | | | | | | | | | | | | | | | | | | | | | | | |
| Expenses after waivers and/or expense reimbursement | | | 0.40% | | | | | | | | 0.40% | | | | | | | | 0.45% | | | | | | | | 0.45% | (e) |
| Expenses before waivers and/or expense reimbursement | | | 0.45% | (f) | | | | | | | 0.53% | | | | | | | | 0.67% | | | | | | | | 0.75% | (e) |
| Net investment income (loss) | | | 2.54% | | | | | | | | 2.22% | | | | | | | | 2.15% | | | | | | | | 2.05% | (e) |
| Portfolio turnover rate(g)(h) | | | 172% | | | | | | | | 314% | | | | | | | | 224% | | | | | | | | 535% | (i) |
| (a) | Commencement of operations. |
| (b) | Calculated based on average shares outstanding during the period. |
| (c) | Total return is calculated assuming a purchase of a share on the first day and a sale on the last day of each period reported and includes reinvestment of dividends and distributions, if any. Total returns may reflect adjustments to conform to generally accepted accounting principles. Total returns for periods less than one full year are not annualized. |
| (d) | Does not include expenses of the underlying funds in which the Fund invests. |
| (f) | Effective August 1, 2017, class specific expenses include Transfer Agent Fees and expenses and Registration Fees, which are charged to their respective share class. |
| (g) | The Fund accounts for mortgage dollar roll transactions, when applicable, as purchases and sales which, as a result, can increase its portfolio turnover rate. |
| (h) | The Fund’s portfolio turnover rate is calculated in accordance with regulatory requirements, without regard to transactions involving short term investments and certain derivatives. If such transactions were included, the Fund’s portfolio turnover rate may be higher. |
See Notes to Financial Statements.
Report of Independent Registered Public Accounting Firm
The Board of Trustees and Shareholders
The Target Portfolio Trust:
Opinion on the Financial Statements
We have audited the accompanying statement of assets and liabilities of the fund listed in the Appendix (the Fund), including the schedule of investments, as of July 31, 2018, the related statement of operations for the year then ended, the statements of changes in net assets for each of the years in the two-year period ended July 31, 2018, and the related notes (collectively, the financial statements) and the financial highlights for the years or periods indicated therein. In our opinion, the financial statements and financial highlights present fairly, in all material respects, the financial position of the Fund as of July 31, 2018, the results of its operations for the year then ended, the changes in its net assets for each of the years in the two-year period ended July 31, 2018, and the financial highlights for the years or periods indicated therein, in conformity with U.S. generally accepted accounting principles.
Basis for Opinion
These financial statements and financial highlights are the responsibility of the Fund’s management. Our responsibility is to express an opinion on these financial statements and financial highlights based on our audits. We are a public accounting firm registered with the Public Company Accounting Oversight Board (United States) (“PCAOB”) and are required to be independent with respect to the Fund in accordance with the U.S. federal securities laws and the applicable rules and regulations of the Securities and Exchange Commission and the PCAOB.
We conducted our audits in accordance with the standards of the PCAOB. Those standards require that we plan and perform the audit to obtain reasonable assurance about whether the financial statements and financial highlights are free of material misstatement, whether due to error or fraud. Our audits included performing procedures to assess the risks of material misstatement of the financial statements and financial highlights, whether due to error or fraud, and performing procedures that respond to those risks. Such procedures included examining, on a test basis, evidence regarding the amounts and disclosures in the financial statements and financial highlights. Such procedures also included confirmation of securities owned as of July 31, 2018, by correspondence with the custodians, transfer agents and brokers or by other appropriate auditing procedures when replies from brokers were not received. Our audits also included evaluating the accounting principles used and significant estimates made by management, as well as evaluating the overall presentation of the financial statements and financial highlights. We believe that our audits provide a reasonable basis for our opinion.

We have served as the auditor of one or more PGIM and/or Prudential Retail investment companies since 2003.
New York, New York
September 18, 2018
Appendix A
PGIM Core Bond Fund (formerly Prudential Core Bond Fund)
Income Tax Information (unaudited)
For the tax year ended July 31, 2018, the Fund reports 87.47% as interest-related dividends in accordance with Sections 871(k)(1) and 881(e)(1) of the Internal Revenue Code.
In January 2019, you will be advised on IRS Form 1099-DIV or substitute 1099-DIV, as to the Federal tax status of the distributions received by you in calendar year 2018.
We are required by Massachusetts, Missouri and Oregon to Inform you that dividends which have been derived from interest on federal obligations are not taxable to shareholders providing the Mutual Fund meets certain requirements mandated by the respective state’s taxing authorities. We are pleased to report that 7.51% of the dividends paid by the Fund qualify for such deduction.
For more detailed information regarding your state and local taxes, you should contact your tax adviser or the state/local taxing authorities.
INFORMATION ABOUT BOARD MEMBERS AND OFFICERS
(Unaudited)
Information about Board Members and Officers of the Fund is set forth below. Board Members who are not deemed to be “interested persons” of the Fund, as defined in the 1940 Act, are referred to as “Independent Board Members.” Board Members who are deemed to be “interested persons” of the Fund are referred to as “Interested Board Members.” The Board Members are responsible for the overall supervision of the operations of the Fund and perform the various duties imposed on the directors of investment companies by the 1940 Act. The Board in turn elects the Officers, who are responsible for administering the day-to-day operations of the Fund.
| | | | | | |
| | | |
Independent Board Members | | | | |
| | | | |
Name, Address, Age Position(s) Portfolios Overseen | | Principal Occupation(s) During Past Five Years | | Other Directorships Held During Past Five Years | | Length of Board Service |
| | | | |
Ellen S. Alberding (60) Board Member Portfolios Overseen: 91 | | President and Board Member, The Joyce Foundation (charitable foundation) (since 2002); Vice Chair, City Colleges of Chicago (community college system) (2011-2015); Trustee, National Park Foundation (charitable foundation for national park system) (2009-2018); Trustee, Economic Club of Chicago (since 2009); Trustee, Loyola University (since 2018). | | None. | | Since September 2013 |
| | | | |
Kevin J. Bannon (66) Board Member Portfolios Overseen: 91 | | Retired; Managing Director (April 2008-May 2015) and Chief Investment Officer (October 2008-November 2013) of Highmount Capital LLC (registered investment adviser); formerly Executive Vice President and Chief Investment Officer (April 1993-August 2007) of Bank of New York Company; President (May 2003-May 2007) of BNY Hamilton Family of Mutual Funds. | | Director of Urstadt Biddle Properties (equity real estate investment trust) (since September 2008). | | Since July 2008 |
| | | | |
Linda W. Bynoe (66) Board Member Portfolios Overseen: 91 | | President and Chief Executive Officer (since March 1995) and formerly Chief Operating Officer (December 1989-February 1995) of Telemat Ltd. (management consulting); formerly Vice President (January 1985-June 1989) at Morgan Stanley & Co. (broker-dealer). | | Director of Anixter International, Inc. (communication products distributor) (since January 2006); Director of Northern Trust Corporation (financial services) (since April 2006); Trustee of Equity Residential (residential real estate) (since December 2009). | | Since March 2005 |
PGIM Core Bond Fund
| | | | | | |
| | | |
Independent Board Members | | | | |
| | | | |
Name, Address, Age Position(s) Portfolios Overseen | | Principal Occupation(s) During Past Five Years | | Other Directorships Held During Past Five Years | | Length of Board Service |
| | | | |
Barry H. Evans (57) Board Member Portfolios Overseen: 90 | | Retired; formerly President (2005 – 2016), Global Chief Operating Officer (2014– 2016), Chief Investment Officer – Global Head of Fixed Income (1998-2014), and various portfolio manager roles (1986-2006), Manulife Asset Management U.S. | | Director, Manulife Trust Company (since 2011); formerly Director, Manulife Asset Management Limited (2015-2017); formerly Chairman of the Board of Directors of Manulife Asset Management U.S. (2005-2016); formerly Chairman of the Board, Declaration Investment Management and Research (2008-2016). | | Since September 2017 |
| | | | |
Keith F. Hartstein (61) Board Member & Independent Chair Portfolios Overseen: 91 | | Retired; Member (since November 2014) of the Governing Council of the Independent Directors Council (organization of independent mutual fund directors); formerly President and Chief Executive Officer (2005-2012), Senior Vice President (2004-2005), Senior Vice President of Sales and Marketing (1997-2004), and various executive management positions (1990-1997), John Hancock Funds, LLC (asset management); Chairman, Investment Company Institute’s Sales Force Marketing Committee (2003-2008). | | None. | | Since September 2013 |
Visit our website at pgiminvestments.com
| | | | | | |
| | | |
Independent Board Members | | | | |
| | | | |
Name, Address, Age Position(s) Portfolios Overseen | | Principal Occupation(s) During Past Five Years | | Other Directorships Held During Past Five Years | | Length of Board Service |
| | | | |
Laurie Simon Hodrick (56) Board Member Portfolios Overseen: 90 | | A. Barton Hepburn Professor Emerita of Economics in the Faculty of Business, Columbia Business School (since 2018); Visiting Professor of Law, Stanford Law School (since 2015); Visiting Fellow at the Hoover Institution, Stanford University (since 2015); Sole Member, ReidCourt LLC (since 2008) (a consulting firm); formerly A. Barton Hepburn Professor of Economics in the Faculty of Business, Columbia Business School (1996-2017); formerly Managing Director, Global Head of Alternative Investment Strategies, Deutsche Bank (2006-2008); Independent Director Kabbage, Inc. (since July 2018) (financial services). | | Independent Director, Corporate Capital Trust (since April 2017) (a business development company); Independent Director, Kabbage, Inc. (since July 2018) (financial services). | | Since September 2017 |
| | | | |
Michael S. Hyland, CFA (72) Board Member Portfolios Overseen: 91 | | Retired (since February 2005); formerly Senior Managing Director (July 2001-February 2005) of Bear Stearns & Co, Inc.; Global Partner, INVESCO (1999-2001); Managing Director and President of Salomon Brothers Asset Management (1989-1999). | | None. | | Since July 2008 |
| | | | |
Richard A. Redeker (75) Board Member Portfolios Overseen: 91 | | Retired Mutual Fund Senior Executive (50 years); Management Consultant; Director, Mutual Fund Directors Forum (since 2014); Independent Directors Council (organization of independent mutual fund directors)-Executive Committee, Chair of Policy Steering Committee, Governing Council. | | None. | | Since October 1993 |
PGIM Core Bond Fund
| | | | | | |
| | | |
Independent Board Members | | | | |
| | | | |
Name, Address, Age Position(s) Portfolios Overseen | | Principal Occupation(s) During Past Five Years | | Other Directorships Held During Past Five Years | | Length of Board Service |
| | | | |
Brian K. Reid (56)# Board Member Portfolios Overseen: 90 | | Retired; formerly Chief Economist for the Investment Company Institute (ICI) (2005-2017); formerly Senior Economist and Director of Industry and Financial Analysis at the ICI (1998-2004); formerly Senior Economist, Industry and Financial Analysis at the ICI (1996-1998); formerly Staff Economist at the Federal Reserve Board (1989-1996); Director, ICI Mutual Insurance Company (2012-2017). | | None. | | Since March 2018 |
# Mr. Reid joined the Board effective as of March 1, 2018.
| | | | | | |
| | | |
Interested Board Members | | | | |
| | | | |
Name, Address, Age Position(s) Portfolios Overseen | | Principal Occupation(s) During Past Five Years | | Other Directorships Held During Past Five Years | | Length of Board Service |
| | | | |
Stuart S. Parker (55) Board Member & President Portfolios Overseen: 91 | | President of PGIM Investments LLC (formerly known as Prudential Investments LLC) (since January 2012); Executive Vice President of Prudential Investment Management Services LLC (since December 2012); formerly Executive Vice President of Jennison Associates LLC and Head of Retail Distribution of PGIM Investments LLC (June 2005-December 2011). | | None. | | Since January 2012 |
Visit our website at pgiminvestments.com
| | | | | | |
| | | |
Interested Board Members | | | | |
| | | | |
Name, Address, Age Position(s) Portfolios Overseen | | Principal Occupation(s) During Past Five Years | | Other Directorships Held During Past Five Years | | Length of Board Service |
| | | | |
Scott E. Benjamin (45) Board Member & Vice President Portfolios Overseen:91 | | Executive Vice President (since June 2009) of PGIM Investments LLC; Executive Vice President (June 2009-June 2012) and Vice President (since June 2012) of Prudential Investment Management Services LLC; Executive Vice President (since September 2009) of AST Investment Services, Inc.; Senior Vice President of Product Development and Marketing, PGIM Investments (since February 2006); formerly Vice President of Product Development and Product Management, PGIM Investments LLC (2003-2006). | | None. | | Since March 2010 |
| | | | |
Grace C. Torres* (59) Board Member Portfolios Overseen: 90 | | Retired; formerly Treasurer and Principal Financial and Accounting Officer of the PGIM Funds, Target Funds, Advanced Series Trust, Prudential Variable Contract Accounts and The Prudential Series Fund (1998-June 2014); Assistant Treasurer (March 1999-June 2014) and Senior Vice President (September 1999-June 2014) of PGIM Investments LLC; Assistant Treasurer (May 2003-June 2014) and Vice President (June 2005-June 2014) of AST Investment Services, Inc.; Senior Vice President and Assistant Treasurer (May 2003-June 2014) of Prudential Annuities Advisory Services, Inc. | | Director (July 2015-January 2018) of Sun Bancorp, Inc. N.A. and Sun National Bank; Director (since January 2018) of OceanFirst Financial Corp. and OceanFirst Bank. | | Since November 2014 |
* Note: Prior to her retirement in 2014, Ms. Torres was employed by PGIM Investments LLC. Due to her prior employment, she is considered to be an “interested person” under the 1940 Act. Ms. Torres is a Non-Management Interested Board Member.
PGIM Core Bond Fund
| | | | |
| |
Fund Officers(a) |
| | | |
| Name, Address and Age Position with Fund | | Principal Occupation(s) During Past Five Years | | Length of Service as Fund Officer |
| | | |
Raymond A. O’Hara (63) Chief Legal Officer | | Vice President and Corporate Counsel (since July 2010) of Prudential Insurance Company of America (Prudential); Vice President (March 2011-Present) of Pruco Life Insurance Company and Pruco Life Insurance Company of New Jersey; Vice President and Corporate Counsel (March 2011-Present) of Prudential Annuities Life Assurance Corporation; Chief Legal Officer of PGIM Investments LLC (since June 2012); Chief Legal Officer of Prudential Mutual Fund Services LLC (since June 2012) and Corporate Counsel of AST Investment Services, Inc. (since June 2012); formerly Assistant Vice President and Corporate Counsel (September 2008-July 2010) of The Hartford Financial Services Group, Inc.; formerly Associate (September 1980-December 1987) and Partner (January 1988–August 2008) of Blazzard & Hasenauer, P.C. (formerly, Blazzard, Grodd & Hasenauer, P.C.). | | Since June 2012 |
| | | |
Chad A. Earnst (43) Chief Compliance Officer | | Chief Compliance Officer (September 2014-Present) of PGIM Investments LLC; Chief Compliance Officer (September 2014-Present) of the PGIM Funds, Target Funds, Advanced Series Trust, The Prudential Series Fund, Prudential’s Gibraltar Fund, Inc., PGIM Global Short Duration High Yield Income Fund, Inc., PGIM Short Duration High Yield Fund, Inc. and PGIM Jennison MLP Income Fund, Inc.; formerly Assistant Director (March 2010-August 2014) of the Asset Management Unit, Division of Enforcement, US Securities & Exchange Commission; Assistant Regional Director (January 2010-August 2014), Branch Chief (June 2006–December 2009) and Senior Counsel (April 2003-May 2006) of the Miami Regional Office, Division of Enforcement, US Securities & Exchange Commission. | | Since September 2014 |
| | | |
Dino Capasso (44) Deputy Chief Compliance Officer | | Vice President and Deputy Chief Compliance Officer (June 2017-Present) of PGIM Investments LLC; formerly, Senior Vice President and Senior Counsel (January 2016-June 2017), and Vice President and Counsel (February 2012-December 2015) of Pacific Investment Management Company LLC. | | Since March 2018 |
| | | |
Deborah A. Docs (60) Secretary | | Vice President and Corporate Counsel (since January 2001) of Prudential; Vice President (since December 1996) and Assistant Secretary (since March 1999) of PGIM Investments LLC; formerly Vice President and Assistant Secretary (May 2003-June 2005) of AST Investment Services, Inc. | | Since May 2004 |
| | | |
Jonathan D. Shain (60) Assistant Secretary | | Vice President and Corporate Counsel (since August 1998) of Prudential; Vice President and Assistant Secretary (since May 2001) of PGIM Investments LLC; Vice President and Assistant Secretary (since February 2001) of Prudential Mutual Fund Services LLC; formerly Vice President and Assistant Secretary (May 2003-June 2005) of AST Investment Services, Inc. | | Since May 2005 |
Visit our website at pgiminvestments.com
| | | | |
| |
Fund Officers(a) |
| | | |
Name, Address and Age Position with Fund | | Principal Occupation(s) During Past Five Years | | Length of Service as Fund Officer |
| | | |
Claudia DiGiacomo (43) Assistant Secretary | | Vice President and Corporate Counsel (since January 2005) of Prudential; Vice President and Assistant Secretary of PGIM Investments LLC (since December 2005); formerly Associate at Sidley Austin Brown & Wood LLP (1999-2004). | | Since December 2005 |
| | | |
Andrew R. French (55) Assistant Secretary | | Vice President and Corporate Counsel (since February 2010) of Prudential; formerly Director and Corporate Counsel (2006-2010) of Prudential; Vice President and Assistant Secretary (since January 2007) of PGIM Investments LLC; Vice President and Assistant Secretary (since January 2007) of Prudential Mutual Fund Services LLC. | | Since October 2006 |
| | | |
Charles H. Smith (45) Anti-Money Laundering Compliance Officer | | Vice President, Corporate Compliance, Anti-Money Laundering Unit (since January 2015) of Prudential; committee member of the American Council of Life Insurers Anti-Money Laundering and Critical Infrastructure Committee (since January 2016); formerly Global Head of Economic Sanctions Compliance at AIG Property Casualty (February 2007 – December 2014); Assistant Attorney General at the New York State Attorney General’s Office, Division of Public Advocacy. (August 1998 —January 2007). | | Since January 2017 |
| | | |
Brian D. Nee (52) Treasurer and Principal Financial and Accounting Officer | | Vice President and Head of Finance of PGIM Investments LLC (since August 2015) and PGIM Global Partners (since February 2017); formerly, Vice President, Treasurer’s Department of Prudential (September 2007-August 2015). | | Since July 2018 |
| | | |
Peter Parrella (60) Assistant Treasurer | | Vice President (since 2007) and Director (2004-2007) within Prudential Mutual Fund Administration; formerly Tax Manager at SSB Citi Fund Management LLC (1997-2004). | | Since June 2007 |
| | | |
Lana Lomuti (51) Assistant Treasurer | | Vice President (since 2007) and Director (2005-2007), within Prudential Mutual Fund Administration; formerly Assistant Treasurer (December 2007-February 2014) of The Greater China Fund, Inc. | | Since April 2014 |
| | | |
Linda McMullin (57) Assistant Treasurer | | Vice President (since 2011) and Director (2008-2011) within Prudential Mutual Fund Administration. | | Since April 2014 |
| | | |
Kelly A. Coyne (50) Assistant Treasurer | | Director, Investment Operations of Prudential Mutual Fund Services LLC (since 2010). | | Since March 2015 |
(a) Excludes Mr. Parker and Mr. Benjamin, interested Board Members who also serve as President and Vice President, respectively.
Explanatory Notes to Tables:
| ∎ | | Board Members are deemed to be “Interested,” as defined in the 1940 Act, by reason of their affiliation with PGIM Investments LLC and/or an affiliate of PGIM Investments LLC. |
| ∎ | | Unless otherwise noted, the address of all Board Members and Officers is c/o PGIM Investments LLC, 655 Broad Street, Newark, New Jersey 07102-4410. |
| ∎ | | There is no set term of office for Board Members or Officers. The Board Members have adopted a retirement policy, which calls for the retirement of Board Members on December 31 of the year in which they reach the age of 75. |
| ∎ | | “Other Directorships Held” includes only directorships of companies required to register or file reports with the SEC under the 1934 Act (that is, “public companies”) or other investment companies registered under the 1940 Act. |
PGIM Core Bond Fund
| ∎ | | “Portfolios Overseen” includes all investment companies managed by PGIM Investments LLC. The investment companies for which PGIM Investments LLC serves as manager include the PGIM Funds, The Prudential Variable Contract Accounts, PGIM ETF Trust, PGIM Short Duration High Yield Fund, Inc., PGIM Global Short Duration High Yield Fund, Inc., The Prudential Series Fund, Prudential’s Gibraltar Fund, Inc. and the Advanced Series Trust. |
Visit our website at pgiminvestments.com
Approval of Advisory Agreement
The Fund’s Board of Trustees
The Board of Trustees (the “Board”) of PGIM Core Bond Fund (the “Fund”)1 consists of twelve individuals, nine of whom are not “interested persons” of the Fund, as defined in the Investment Company Act of 1940, as amended (the “1940 Act”) (the “Independent Trustees”). The Board is responsible for the oversight of the Fund and its operations, and performs the various duties imposed on the directors of investment companies by the 1940 Act. The Independent Trustees have retained independent legal counsel to assist them in connection with their duties. The Chair of the Board is an Independent Trustee. The Board has established four standing committees: the Audit Committee, the Nominating and Governance Committee, and two Investment Committees. Each committee is chaired by, and composed of, Independent Trustees.
Annual Approval of the Fund’s Advisory Agreements
As required under the 1940 Act, the Board determines annually whether to renew the Fund’s management agreement with PGIM Investments LLC (“PGIM Investments”), the Fund’s subadvisory agreement with PGIM, Inc. (“PGIM”) on behalf of its PGIM Fixed Income unit, and the Fund’s sub-subadvisory agreement with PGIM Limited (“PGIML”). In considering the renewal of the agreements, the Board, including all the Independent Trustees, met on June 7, 2018 and on June 19-21, 2018 and approved the renewal of the agreements through July 31, 2019, after concluding that the renewal of the agreements was in the best interests of the Fund and its shareholders.
In advance of the meetings, the Board requested and received materials relating to the agreements, and had the opportunity to ask questions and request further information in connection with its consideration. Among other things, the Board considered comparative fee information from PGIM Investments, PGIM, and, where appropriate, affiliates of PGIM. Also, the Board considered comparisons with other mutual funds in relevant Peer Universes and Peer Groups, as is further discussed below.
In approving the agreements, the Board, including the Independent Trustees advised by independent legal counsel, considered the factors it deemed relevant, including the nature, quality and extent of services provided by PGIM Investments, the subadviser and, as relevant, its affiliates the performance of the Fund, the profitability of PGIM Investments and its affiliates, expenses and fees, and the potential for economies of scale that may be shared with the Fund and its shareholders as the Fund’s assets grow. In their deliberations, the Trustees did not identify any single factor which alone was responsible for the Board’s decision to approve the agreements with respect to the Fund. In connection with its deliberations, the Board considered information provided by PGIM Investments throughout
| 1 | PGIM Core Bond Fund is a series of The Target Portfolio Trust. |
Approval of Advisory Agreement (continued)
the year at regular Board meetings, presentations from portfolio managers and other information, as well as information furnished at or in advance of the meetings on June 7, 2018 and on June 19-21, 2018.
The Trustees determined that the overall arrangements between the Fund and PGIM Investments, which serves as the Fund’s investment manager pursuant to a management agreement, between PGIM Investments and PGIM, which, through its PGIM Fixed Income unit, serves as the Fund’s subadviser pursuant to the terms of a subadvisory agreement with PGIM Investments, and between PGIM and PGIML, which serves as the Fund’s sub-subadviser pursuant to the terms of a sub-subadvisory agreement with PGIM, are in the best interests of the Fund and its shareholders in light of the services performed, fees charged and such other matters as the Trustees considered relevant in the exercise of their business judgment.
The material factors and conclusions that formed the basis for the Trustees’ reaching their determinations to approve the continuance of the agreements are separately discussed below.
Nature, Quality, and Extent of Services
The Board received and considered information regarding the nature, quality and extent of services provided to the Fund by PGIM Investments, PGIM Fixed Income, and PGIML. The Board considered the services provided by PGIM Investments, including but not limited to the oversight of the subadviser and sub-subadviser for the Fund, as well as the provision of fund recordkeeping, compliance, and other services to the Fund. With respect to PGIM Investments’ oversight of the subadviser and sub-subadviser, the Board noted that PGIM Investments’ Strategic Investment Research Group (“SIRG”), which is a business unit of PGIM Investments, is responsible for monitoring and reporting to PGIM Investments’ senior management on the performance and operations of the subadviser and sub-subadviser. The Board also considered that PGIM Investments pays the salaries of all of the officers and interested Trustees of the Fund who are part of Fund management. The Board also considered the investment subadvisory services provided by PGIM Fixed Income and PGIML, including investment research and security selection, as well as adherence to the Fund’s investment restrictions and compliance with applicable Fund policies and procedures. The Board considered PGIM Investments’ evaluation of the subadviser and sub-subadviser, as well as PGIM Investments’ recommendation, based on its review of the subadviser and sub-subadviser, to renew the subadvisory and sub-subadvisory agreements.
The Board considered the qualifications, backgrounds and responsibilities of PGIM Investments’ senior management responsible for the oversight of the Fund, PGIM Fixed Income, and PGIML, and also considered the qualifications, backgrounds and
| | |
| Visit our website at pgiminvestments.com | | |
responsibilities of PGIM Fixed Income’s portfolio managers who are responsible for the day-to-day management of the Fund’s portfolio. The Board was provided with information pertaining to PGIM Investments’, PGIM Fixed Income’s, and PGIML’s organizational structure, senior management, investment operations, and other relevant information pertaining to PGIM Investments, PGIM Fixed Income, and PGIML. The Board also noted that it received favorable compliance reports from the Fund’s Chief Compliance Officer (“CCO”) as to PGIM Investments, PGIM Fixed Income, and PGIML. The Board noted that PGIM Fixed Income and PGIML are affiliated with PGIM Investments.
The Board concluded that it was satisfied with the nature, extent and quality of the investment management services provided by PGIM Investments, the subadvisory services provided to the Fund by PGIM Fixed Income, and the sub-subadvisory services provided by PGIML, and that there was a reasonable basis on which to conclude that the Fund benefits from the services provided by PGIM Investments, PGIM Fixed Income, and PGIML under the management, subadvisory and sub-subadvisory agreements.
Costs of Services and Profits Realized by PGIM Investments
The Board was provided with information on the profitability of PGIM Investments and its affiliates in serving as the Fund’s investment manager. The Board discussed with PGIM Investments the methodology utilized in assembling the information regarding profitability and considered its reasonableness. The Board recognized that it is difficult to make comparisons of profitability from fund management contracts because comparative information is not generally publicly available and is affected by numerous factors, including the structure of the particular adviser, the types of funds it manages, its business mix, numerous assumptions regarding allocations and the adviser’s capital structure and cost of capital. The Board noted that the cost of services provided by PGIM Investments to the Fund during the year ended December 31, 2017 exceeded the management fees paid by the Fund, resulting in an operating loss to PGIM Investments. Taking these factors into account, the Board concluded that the profitability of PGIM Investments and its affiliates in relation to the services rendered was not unreasonable.
Economies of Scale
The Board received and discussed information concerning economies of scale that PGIM Investments may realize as the Fund’s assets grow beyond current levels. The Board noted that the management fee schedule for the Fund includes breakpoints, which have the effect of decreasing the fee rate as assets increase. During the course of time, the Board has considered information regarding the launch date of the Fund, the management fees of the Fund compared to those of similarly managed funds and PGIM Investments’ investment in the Fund over time. The Board noted that economies of scale can be shared
Approval of Advisory Agreement (continued)
with the Fund in other ways, including low management fees from inception, additional technological and personnel investments to enhance shareholder services, and maintaining existing expense structures in the face of a rising cost environment. The Board also considered PGIM Investments’ assertion that it continually evaluates the management fee schedule of the Fund and the potential to share economies of scale through breakpoints or fee waivers as asset levels increase.
The Board recognized the inherent limitations of any analysis of economies of scale, stemming largely from the Board’s understanding that most of PGIM Investments’ costs are not specific to individual funds, but rather are incurred across a variety of products and services.
Other Benefits to PGIM Investments, PGIM Fixed Income, and PGIML
The Board considered potential ancillary benefits that might be received by PGIM Investments, PGIM Fixed Income, PGIML and their affiliates as a result of their relationship with the Fund. The Board concluded that potential benefits to be derived by PGIM Investments included transfer agency fees received by the Fund’s transfer agent (which is affiliated with PGIM Investments), as well as benefits to its reputation or other intangible benefits resulting from PGIM Investments’ association with the Fund. The Board concluded that the potential benefits to be derived by PGIM Fixed Income and PGIML included the ability to use soft dollar credits, as well as the potential benefits consistent with those generally resulting from an increase in assets under management, specifically, potential access to additional research resources and benefits to their reputations. The Board concluded that the benefits derived by PGIM Investments, PGIM Fixed Income, and PGIML were consistent with the types of benefits generally derived by investment managers and subadvisers to mutual funds.
Performance of the Fund / Fees and Expenses
The Board considered certain additional specific factors and made related conclusions relating to the historical performance of the Fund for the one-, three-, five- and ten-year periods ended December 31, 2017.
The Board also considered the Fund’s actual management fee, as well as the Fund’s net total expense ratio, for the fiscal year ended July 31, 2017. The Board considered the management fee for the Fund as compared to the management fee charged by PGIM Investments to other funds and the fee charged by other advisers to comparable mutual funds in a Peer Group. The actual management fee represents the fee rate actually paid by Fund shareholders and includes any fee waivers or reimbursements. The net total expense ratio for the Fund represents the actual expense ratio incurred by Fund shareholders.
| | |
| Visit our website at pgiminvestments.com | | |
The mutual funds included in the Peer Universe, which was used to consider performance, and the Peer Group, which was used to consider fees and expenses, were objectively determined by Broadridge, an independent provider of mutual fund data. In certain circumstances, PGIM Investments also may have provided supplemental Peer Universe or Peer Group information, for reasons addressed with the Board. The comparisons placed the Fund in various quartiles, with the first quartile being the best 25% of the mutual funds (for performance, the best performing mutual funds and, for expenses, the lowest cost mutual funds).
The section below summarizes key factors considered by the Board and the Board’s conclusions regarding the Fund’s performance, fees and overall expenses. The table sets forth gross performance comparisons (which do not reflect the impact on performance of fund expenses, or any subsidies, expense caps or waivers that may be applicable) with the Peer Universe, actual management fees with the Peer Group (which reflect the impact of any subsidies or fee waivers), and net total expenses with the Peer Group, each of which were key factors considered by the Board.
| | | | | | | | |
| Gross Performance | | 1 Year | | 3 Years | | 5 Years | | 10 Years |
| | | 2nd Quartile | | 3rd Quartile | | 4th Quartile | | 2nd Quartile |
| Actual Management Fees: 1st Quartile |
| Net Total Expenses: 1st Quartile |
| | • | | The Board noted that the Fund outperformed its benchmark index over the one-, three-, and ten-year periods, though it underperformed over the five-year period. |
| | • | | The Board and PGIM Investments agreed to retain the Fund’s existing contractual expense cap, which (exclusive of certain fees and expenses) caps the Fund’s annual operating expenses at 0.70% for Class A shares, 1.45% for Class C shares, 0.40% for Class R6 shares, 0.95% for Class R shares, and 0.45% for Class Z shares through November 30, 2018. |
| | • | | The Board concluded that, in light of the above, it would be in the best interests of the Fund and its shareholders to renew the agreements. |
| | • | | The Board concluded that the management fees (including subadvisory fees) and total expenses were reasonable in light of the services provided. |
* * *
After full consideration of these factors, the Board concluded that the approval of the agreements was in the best interests of the Fund and its shareholders.
| | | | |
| ∎ MAIL | | ∎ TELEPHONE | | ∎ WEBSITE |
655 Broad Street Newark, NJ 07102 | | (800) 225-1852 | | www.pgiminvestments.com |
|
| PROXY VOTING |
| The Board of Trustees has delegated to the Fund’s investment subadviser the responsibility for voting any proxies and maintaining proxy recordkeeping with respect to the Fund. A description of these proxy voting policies and procedures is available without charge, upon request, by calling (800) 225-1852. Information regarding how the Fund voted proxies relating to portfolio securities during the most recent 12-month period ended June 30 is available on the Fund’s website and on the Securities and Exchange Commission’s website at www.sec.gov. |
|
| TRUSTEES |
| Ellen S. Alberding • Kevin J. Bannon • Scott E. Benjamin • Linda W. Bynoe • Barry H. Evans • Keith F. Hartstein • Laurie Simon Hodrick • Michael S. Hyland • Stuart S. Parker • Richard A. Redeker • Brian K. Reid • Grace C. Torres |
|
| OFFICERS |
| Stuart S. Parker, President • Scott E. Benjamin, Vice President • Brian D. Nee, Treasurer and Principal Financial and Accounting Officer • Raymond A. O’Hara, Chief Legal Officer • Chad A. Earnst, Chief Compliance Officer • Deborah A. Docs, Secretary • Dino Capasso, Vice President and Deputy Chief Compliance Officer • Charles H. Smith, Anti-Money Laundering Compliance Officer • Jonathan D. Shain, Assistant Secretary • Claudia DiGiacomo, Assistant Secretary • Andrew R. French, Assistant Secretary • Peter Parrella, Assistant Treasurer • Lana Lomuti, Assistant Treasurer • Linda McMullin, Assistant Treasurer • Kelly A. Coyne, Assistant Treasurer |
| | | | |
| MANAGER | | PGIM Investments LLC | | 655 Broad Street Newark, NJ 07102 |
|
| INVESTMENT SUBADVISER | | PGIM Fixed Income | | 655 Broad Street Newark, NJ 07102 |
|
| DISTRIBUTOR | | Prudential Investment Management Services LLC | | 655 Broad Street
Newark, NJ 07102 |
|
| CUSTODIAN | | The Bank of New York Mellon | | 225 Liberty Street New York, NY 10286 |
|
| TRANSFER AGENT | | Prudential Mutual Fund Services LLC | | PO Box 9658 Providence, RI 02940 |
|
| INDEPENDENT REGISTERED PUBLIC ACCOUNTING FIRM | | KPMG LLP | | 345 Park Avenue New York, NY 10154 |
|
| FUND COUNSEL | | Willkie Farr & Gallagher LLP | | 787 Seventh Avenue New York, NY 10019 |
|
|
| An investor should consider the investment objectives, risks, charges, and expenses of the Fund carefully before investing. The prospectus and summary prospectus contain this and other information about the Fund. An investor may obtain a prospectus and summary prospectus by visiting our website at www.pgiminvestments.com or by calling (800) 225-1852. The prospectus and summary prospectus should be read carefully before investing. |
|
| E-DELIVERY |
| To receive your mutual fund documents online, go to www.pgiminvestments.com/edelivery and enroll. Instead of receiving printed documents by mail, you will receive notification via email when new materials are available. You can cancel your enrollment or change your email address at any time by visiting the website address above. |
|
| SHAREHOLDER COMMUNICATIONS WITH TRUSTEES |
| Shareholders can communicate directly with the Board of Trustees by writing to the Chair of the Board, PGIM Core Bond Fund, PGIM Investments, Attn: Board of Trustees, 655 Broad Street, Newark, NJ 07102. Shareholders can communicate directly with an individual Trustee by writing to the same address. Communications are not screened before being delivered to the addressee. |
|
| AVAILABILITY OF PORTFOLIO SCHEDULE |
| The Fund files its complete schedule of portfolio holdings with the Securities and Exchange Commission for the first and third quarters of each fiscal year on Form N-Q. The Fund’s Forms N-Q are available on the Commission’s website at www.sec.gov. The Fund’s Forms N-Q may also be reviewed and copied at the Commission’s Public Reference Room in Washington, D.C. Information on the operation and location of the Public Reference Room may be obtained by calling 1-800-SEC-0330. The Fund’s schedule of portfolio holdings is also available on the Fund’s website as of the end of each month no sooner than 15 days after the end of the month. |
|
| The Fund’s Statement of Additional Information contains additional information about the Fund’s Trustees and is available without charge, upon request, by calling (800) 225-1852. |
Mutual Funds:
| | | | |
ARE NOT INSURED BY THE FDIC OR ANY
FEDERAL GOVERNMENT AGENCY | | MAY LOSE VALUE | | ARE NOT A DEPOSIT OF OR GUARANTEED
BY ANY BANK OR ANY BANK AFFILIATE |
PGIM CORE BOND FUND
| | | | | | | | | | |
| SHARE CLASS | | A | | C | | R | | Z | | R6* |
| NASDAQ | | TPCAX | | TPCCX | | TPCRX | | TAIBX | | TPCQX |
| CUSIP | | 875921769 | | 875921751 | | 875921736 | | 875921801 | | 875921744 |
*Formerly known as Class Q
MF226E
Item 2 – Code of Ethics – – See Exhibit (a)
As of the end of the period covered by this report, the registrant has adopted a code of ethics (the “Section 406 Standards for Investment Companies – Ethical Standards for Principal Executive and Financial Officers”) that applies to the registrant’s Principal Executive Officer and Principal Financial Officer; the registrant’s Principal Financial Officer also serves as the Principal Accounting Officer.
The registrant hereby undertakes to provide any person, without charge, upon request, a copy of the code of ethics. To request a copy of the code of ethics, contact the registrant 800-225-1852, and ask for a copy of the Section 406 Standards for Investment Companies - Ethical Standards for Principal Executive and Financial Officers.
Item 3 – Audit Committee Financial Expert –
The registrant’s Board has determined that Mr. Kevin J. Bannon, member of the Board’s Audit Committee is an “audit committee financial expert,” and that he is “independent,” for purposes of this Item.
Item 4 – Principal Accountant Fees and Services –
(a) Audit Fees
For the fiscal years ended July 31, 2018 and July 31, 2017, KPMG LLP (“KPMG”), the Registrant’s principal accountant, billed the Registrant $135,361 and $163,898 respectively, for professional services rendered for the audit of the Registrant’s annual financial statements or services that are normally provided in connection with statutory and regulatory filings. In addition to the above, $18,000 of audit fees billed by KPMG were paid by PGIM Investments, LLC and/or its affiliates for the fiscal year ended July 31, 2017.
(b) Audit-Related Fees
For the fiscal years ended July 31, 2018 and July 31, 2017: none.
(c) Tax Fees
For the fiscal years ended July 31, 2018 and July 31, 2017: none.
(d) All Other Fees
For the fiscal years ended July 31, 2018 and July 31, 2017: none.
(e) (1) Audit Committee Pre-Approval Policies and Procedures
THE PRUDENTIAL MUTUAL FUNDS
AUDIT COMMITTEE POLICY
on
Pre-Approval of Services Provided by the Independent Accountants
The Audit Committee of each Prudential Mutual Fund is charged with the responsibility to monitor the independence of the Fund’s independent accountants. As part of this responsibility, the Audit Committee must pre-approve the independent accounting firm’s engagement to render audit and/or permissible non-audit services, as required by law. In evaluating a proposed engagement of the independent accountants, the Audit Committee will assess the effect that the engagement might reasonably be expected to have on the accountant’s independence. The Committee’s evaluation will be based on:
| | • | | a review of the nature of the professional services expected to be provided, |
| | • | | a review of the safeguards put into place by the accounting firm to safeguard independence, and |
| | • | | periodic meetings with the accounting firm. |
Policy for Audit and Non-Audit Services Provided to the Funds
On an annual basis, the scope of audits for each Fund, audit fees and expenses, and audit-related and non-audit services (and fees proposed in respect thereof) proposed to be performed by the Fund’s independent accountants will be presented by the Treasurer and the independent accountants to the Audit Committee for review and, as appropriate, approval prior to the initiation of such services. Such presentation shall be accompanied by confirmation by both the Treasurer and the independent accountants that the proposed non-audit services will not adversely affect the independence of the independent accountants. Such proposed non-audit services shall be described in sufficient detail to enable the Audit Committee to assess the appropriateness of such services and fees, and the compatibility of the provision of such services with the auditor’s independence. The Committee shall receive periodic reports on the progress of the audit and other services which are approved by the Committee or by the Committee Chair pursuant to authority delegated in this Policy.
The categories of services enumerated under “Audit Services”, “Audit-related Services”, and “Tax Services” are intended to provide guidance to the Treasurer and the independent accountants as to those categories of services which the Committee believes are generally consistent with the independence of the independent accountants and which the Committee (or the Committee Chair) would expect upon the presentation of specific proposals to pre-approve. The enumerated categories are not intended as an exclusive list of audit, audit-related or tax services, which the Committee (or the Committee Chair) would consider for pre-approval.
Audit Services
The following categories of audit services are considered to be consistent with the role of the Fund’s independent accountants:
| | Ø | Annual Fund financial statement audits |
| | Ø | Seed audits (related to new product filings, as required) |
| | Ø | SEC and regulatory filings and consents |
Audit-related Services
The following categories of audit-related services are considered to be consistent with the role of the Fund’s independent accountants:
| | Ø | Accounting consultations |
| | Ø | Fund merger support services |
| | Ø | Agreed Upon Procedure Reports |
| | Ø | Other Internal Control Reports |
Individual audit-related services that fall within one of these categories (except for fund merger support services) and are not presented to the Audit Committee as part of the annual pre-approval process are subject to an authorized pre-approval by the Audit Committee so long as the estimated fee for those services does not exceed $30,000. Any services provided under such pre-approval will be reported to the Audit Committee at its next regular meeting. Should the amount of such services exceed $30,000 any additional fees will be subject to pre-approval by the Committee Chair (or any other Committee member on whom this responsibility has been delegated). Fees related to fund merger support services are subject to a separate authorized pre-approval by the Audit Committee with fees determined on a per occurrence and merger complexity basis.
Tax Services
The following categories of tax services are considered to be consistent with the role of the Fund’s independent accountants:
| | Ø | Tax compliance services related to the filing or amendment of the following: |
| | ◾ | Federal, state and local income tax compliance; and, |
| | ◾ | Sales and use tax compliance |
| | Ø | Timely RIC qualification reviews |
| | Ø | Tax distribution analysis and planning |
| | Ø | Tax authority examination services |
| | Ø | Tax appeals support services |
| | Ø | Accounting methods studies |
| | Ø | Fund merger support services |
| | Ø | Tax consulting services and related projects |
Individual tax services that fall within one of these categories and are not presented to the Audit Committee as part of the annual pre-approval process are subject to an authorized pre-approval by the Audit Committee so long as the estimated fee for those services does not exceed $30,000. Any services provided under such pre-approval will be reported to the Audit Committee at its next regular meeting. Should the amount of such services exceed $30,000 any additional fees will
be subject to pre-approval by the Committee Chair (or any other Committee member on whom this responsibility has been delegated).
Other Non-Audit Services
Certain non-audit services that the independent accountants are legally permitted to render will be subject to pre-approval by the Committee or by one or more Committee members to whom the Committee has delegated this authority and who will report to the full Committee any pre-approval decisions made pursuant to this Policy. Non-audit services presented for pre-approval pursuant to this paragraph will be accompanied by a confirmation from both the Treasurer and the independent accountants that the proposed services will not adversely affect the independence of the independent accountants.
Proscribed Services
The Fund’s independent accountants will not render services in the following categories of non-audit services:
| | |
| Ø | | Bookkeeping or other services related to the accounting records or financial statements of the Fund |
| Ø | | Financial information systems design and implementation |
| Ø | | Appraisal or valuation services, fairness opinions, or contribution-in-kind reports |
| Ø | | Actuarial services |
| Ø | | Internal audit outsourcing services |
| Ø | | Management functions or human resources |
| Ø | | Broker or dealer, investment adviser, or investment banking services |
| Ø | | Legal services and expert services unrelated to the audit |
| Ø | | Any other service that the Public Company Accounting Oversight Board determines, by regulation, is impermissible. |
Pre-approval of Non-Audit Services Provided to Other Entities Within the Prudential Fund Complex
Certain non-audit services provided to PGIM Investments LLC or any of its affiliates that also provide ongoing services to the Prudential Mutual Funds will be subject to pre-approval by the Audit Committee. The only non-audit services provided to these entities that will require pre-approval are those related directly to the operations and financial reporting of the Funds. Individual projects that are not presented to the Audit Committee as part of the annual pre-approval process will be subject to pre-approval by the Committee Chair (or any other Committee member on whom this responsibility has been delegated) so long as the estimated fee for those services does not exceed $30,000. Services presented for pre-approval pursuant to this paragraph will be accompanied by a confirmation from both the Treasurer and the independent accountants that the proposed services will not adversely affect the independence of the independent accountants.
Although the Audit Committee will not pre-approve all services provided to PGIM Investments LLC and its affiliates, the Committee will receive an annual report from the Fund’s independent
accounting firm showing the aggregate fees for all services provided to PGIM Investments LLC and its affiliates.
(e) (2) Percentage of services referred to in 4(b) – 4(d) that were approved by the audit committee –
For the fiscal years ended July 31, 2018 and July 31, 2017: none.
(f) Percentage of hours expended attributable to work performed by other than full time employees of principal accountant if greater than 50%.
The percentage of hours expended on the principal accountant’s engagement to audit the registrant’s financial statements for the most recent fiscal year that were attributed to work performed by persons other than the principal accountant’s full-time, permanent employees was 0%.
(g) Non-Audit Fees
The aggregate non-audit fees billed by KPMG for services rendered to the registrant’s investment adviser and any entity controlling, controlled by, or under common control with the investment adviser that provides ongoing services to the registrant for the fiscal years ended July 31, 2018 and July 31, 2017 was $0 and $0, respectively.
(h) Principal Accountant’s Independence
Not applicable as KPMG has not provided non-audit services to the registrant’s investment adviser and any entity controlling, controlled by, or under common control with the investment adviser that provides ongoing services to the registrant that were not pre-approved pursuant to Rule 2-01(c)(7)(ii) of Regulation S-X.
Item 5 – Audit Committee of Listed Registrants – Not applicable.
Item 6 – Schedule of Investments – The schedule is included as part of the report to shareholders filed under Item 1 of this Form.
Item 7 – Disclosure of Proxy Voting Policies and Procedures for Closed-End Management Investment Companies – Not applicable.
Item 8 – Portfolio Managers of Closed-End Management Investment Companies – Not applicable.
Item 9 – Purchases of Equity Securities by Closed-End Management Investment Company and Affiliated Purchasers – Not applicable.
Item 10 – Submission of Matters to a Vote of Security Holders – Not applicable.
Item 11 – Controls and Procedures
| | (a) | It is the conclusion of the registrant’s principal executive officer and principal financial officer that the effectiveness of the registrant’s current disclosure controls and procedures (such disclosure controls and procedures having been evaluated within 90 days of the date of this filing) provide reasonable assurance that the information required to be disclosed by the registrant has been recorded, processed, summarized and reported within the time period specified in the Commission’s rules and forms and that the information |
| | required to be disclosed by the registrant has been accumulated and communicated to the registrant’s principal executive officer and principal financial officer in order to allow timely decisions regarding required disclosure. |
| | (b) | There has been no significant change in the registrant’s internal control over financial reporting that occurred during the registrant’s most recent fiscal quarter of the period covered by this report that has materially affected, or is likely to materially affect, the registrant’s internal control over financial reporting. |
Item 12 – Exhibits
(a) (1) Code of Ethics – Attached hereto as Exhibit EX-99.CODE-ETH
| | (2) | Certifications pursuant to Section 302 of the Sarbanes-Oxley Act – Attached hereto as Exhibit EX-99.CERT. |
| | (3) | Any written solicitation to purchase securities under Rule 23c-1. – Not applicable. |
| | (b) | Certifications pursuant to Section 906 of the Sarbanes-Oxley Act – Attached hereto as Exhibit EX-99.906CERT. |
SIGNATURES
Pursuant to the requirements of the Securities Exchange Act of 1934 and the Investment Company Act of 1940, the registrant has duly caused this report to be signed on its behalf by the undersigned, thereunto duly authorized.
| | |
| Registrant: | | The Target Portfolio Trust |
| |
| By: | | /s/ Deborah A. Docs |
| | Deborah A. Docs |
| | Secretary |
| |
| Date: | | September 18, 2018 |
Pursuant to the requirements of the Securities Exchange Act of 1934 and the Investment Company Act of 1940, this report has been signed below by the following persons on behalf of the registrant and in the capacities and on the dates indicated.
| | |
| By: | | /s/ Stuart S. Parker |
| | Stuart S. Parker |
| | President and Principal Executive Officer |
| |
| Date: | | September 18, 2018 |
| | |
| By: | | /s/ Brian D. Nee |
| | Brian D. Nee |
| | Treasurer and Principal Financial and Accounting Officer |
| |
| Date: | | September 18, 2018 |