UNITED STATES
SECURITIES AND EXCHANGE COMMISSION
Washington, D.C. 20549
FORM N-CSR
CERTIFIED SHAREHOLDER REPORT OF REGISTERED
MANAGEMENT INVESTMENT COMPANIES
Investment Company Act file number: 811-07064
The Target Portfolio Trust
Exact name of registrant as specified in charter:
Gateway Center 3,
100 Mulberry Street,
Newark, New Jersey 07102
Address of principal executive offices:
Deborah A. Docs
Gateway Center 3,
100 Mulberry Street,
Newark, New Jersey 07102
Name and address of agent for service:
Registrant’s telephone number, including area code: 800-225-1852
Date of fiscal year end: 10/31/2009
Date of reporting period: 10/31/2009
Item 1 – Reports to Stockholders

| | |
| OCTOBER 31, 2009 | | ANNUAL REPORT |
The TARGET Portfolio Trust®
This report is not authorized for distribution to prospective investors unless preceded or accompanied by a current prospectus.
The views expressed in this report and information about the Trust portfolios’ securities are for the period covered by this report and are subject to change thereafter.
TARGET Funds, TARGET Portfolio Trust, Prudential, Prudential Financial, and the Rock Prudential logo are registered service marks of The Prudential Insurance Company of America, Newark, NJ, and its affiliates.

December 15, 2009
Dear TARGET Shareholder:
We hope you find the annual report for The TARGET Portfolio Trust informative and useful. Today many investors are asking where they can find new growth opportunities. Whether you are looking for capital growth, current income, or a combination of both, the TARGET portfolios feature a wide range of strategies to suit a variety of investment needs.
TARGET is founded upon the belief that investment management talent is dispersed across a variety of firms and can be systematically indentified through research. The managers for each portfolio are carefully chosen from among the leading institutional money managers and are monitored by your team of experienced investment management analysts. Of course, the future performance of the TARGET portfolios cannot be guaranteed.
Your selections among the TARGET portfolios can evolve as your needs change. Your financial professional can help you stay informed of important developments and assist you in determining whether you need to modify your investments.
Thank you for your continued confidence.
Sincerely,

Judy A. Rice, President
The TARGET Portfolio Trust
| | |
| THE TARGET PORTFOLIO TRUST | | 1 |
Equity Portfolios’ Performance
Performance data quoted represent past performance. Past performance does not guarantee future results. The investment return and principal value of an investment will fluctuate, so that an investor’s shares, when redeemed, may be worth more or less than their original cost. Current performance may be lower or higher than the past performance data quoted. An investor may obtain performance data as of the most recent month-end by visiting our website at www.prudential.com or by calling (800) 225-1852.
Large Capitalization Growth Portfolio:
Gross operating expenses: Class R, 1.61%; Class T, 0.86%. Net operating expenses apply to: Class R, 1.36%; Class T, 0.86%, after contractual reduction through 2/28/2011.
Large Capitalization Value Portfolio:
Gross operating expenses: Class R, 1.58%; Class T, 0.83%. Net operating expenses apply to: Class R, 1.33%; Class T, 0.83%, after contractual reduction through 2/28/2011.
Small Capitalization Growth Portfolio:
Gross operating expenses: Class R, 1.77%; Class T, 1.02%. Net operating expenses apply to: Class R, 1.52%; Class T, 1.02%, after contractual reduction through 2/28/2011.
Small Capitalization Value Portfolio:
Gross operating expenses: Class R, 1.55%; Class T, 0.80%. Net operating expenses apply to: Class R, 1.30%; Class T, 0.80%, after contractual reduction through 2/28/2011.
International Equity Portfolio:
Gross operating expenses: Class R, 1.76%; Class T, 1.01%. Net operating expenses apply to: Class R, 1.51%; Class T, 1.01%, after contractual reduction through 2/28/2011.
| | | | | | | | | | | |
| Equity Portfolios |
| | | Cumulative Total Returns1
as of 10/31/09 |
| | | One Year | | | Five Years | | | Ten Years | | | Since Inception2 |
Large Capitalization Growth Portfolio (Class R) | | 8.13 | % | | N/A | | | N/A | | | –16.39% (8/22/06) |
Large Capitalization Growth Portfolio (Class T) | | 8.64 | | | –2.38 | % | | –28.46 | % | | — |
S&P 500 Index3 | | 9.80 | | | 1.67 | | | –9.10 | | | *** |
Russell 1000 Growth Index3 | | 17.51 | | | 6.53 | | | –29.20 | | | **** |
Lipper Large-Cap Growth Funds Avg.4 | | 14.74 | | | 3.91 | | | –16.62 | | | ***** |
| | |
| 2 | | THE TARGET PORTFOLIO TRUST |
| | | | | | | | | | | |
| | | Average Annual Total Returns1
as of 9/30/09 |
| | | One Year | | | Five Years | | | Ten Years | | | Since Inception2 |
Large Capitalization Growth Portfolio (Class R) | | –6.81 | % | | N/A | | | N/A | | | –4.96% (8/22/06) |
Large Capitalization Growth Portfolio (Class T) | | –6.27 | | | 0.56 | % | | –2.19 | % | | — |
S&P 500 Index3 | | –6.91 | | | 1.01 | | | –0.15 | | | *** |
Russell 1000 Growth Index3 | | –1.85 | | | 1.86 | | | –2.56 | | | **** |
Lipper Large-Cap Growth Funds Avg.4 | | –2.72 | | | 1.42 | | | –1.34 | | | ***** |
| | | | | | | | | | | |
| | | Cumulative Total Returns1
as of 10/31/09 |
| | | One Year | | | Five Years | | | Ten Years | | | Since Inception2 |
Large Capitalization Value Portfolio (Class R) | | 3.59 | % | | N/A | | | N/A | | | –28.48% (8/22/06) |
Large Capitalization Value Portfolio (Class T) | | 4.15 | | | –8.01 | % | | 26.29 | % | | — |
S&P 500 Index3 | | 9.80 | | | 1.67 | | | –9.10 | | | *** |
Russell 1000 Value Index3 | | 4.78 | | | –0.27 | | | 18.39 | | | **** |
Lipper Large-Cap Value Funds Avg.4 | | 8.59 | | | 0.01 | | | 16.80 | | | ***** |
| | | | | | | | | | | |
| | | Average Annual Total Returns1
as of 9/30/09 |
| | | One Year | | | Five Years | | | Ten Years | | | Since Inception2 |
Large Capitalization Value Portfolio (Class R) | | –14.79 | % | | N/A | | | N/A | | | –9.82% (8/22/06) |
Large Capitalization Value Portfolio (Class T) | | –14.26 | | | –1.18 | % | | 2.61 | % | | — |
S&P 500 Index3 | | –6.91 | | | 1.01 | | | –0.15 | | | *** |
Russell 1000 Value Index3 | | –10.62 | | | 0.90 | | | 2.59 | | | **** |
Lipper Large-Cap Value Funds Avg.4 | | –7.92 | | | 0.65 | | | 2.04 | | | ***** |
| | |
| THE TARGET PORTFOLIO TRUST | | 3 |
Equity Portfolios’ Performance (continued)
| | | | | | | | | | | |
| | | Cumulative Total Returns1
as of 10/31/09 |
| | | One Year | | | Five Years | | | Ten Years | | | Since Inception2 |
Small Capitalization Growth Portfolio (Class R) | | 7.53 | % | | N/A | | | N/A | | | –30.16% (8/22/06) |
Small Capitalization Growth Portfolio (Class T) | | 8.06 | | | –18.82 | % | | –26.17 | % | | — |
Russell 2000 Index3 | | 6.46 | | | 2.99 | | | 49.53 | | | *** |
Russell 2000 Growth Index3 | | 11.34 | | | 4.84 | | | 1.20 | | | **** |
Lipper Small-Cap Growth Funds Avg.4 | | 13.12 | | | 1.09 | | | 21.32 | | | ***** |
| | | | | | | | | | | |
| | | Average Annual Total Returns1
as of 9/30/09 |
| | | One Year | | | Five Years | | | Ten Years | | | Since Inception2 |
Small Capitalization Growth Portfolio (Class R) | | –10.44 | % | | N/A | | | N/A | | | –9.30% (8/22/06) |
Small Capitalization Growth Portfolio (Class T) | | –10.05 | | | –2.29 | % | | –2.29 | % | | — |
Russell 2000 Index3 | | –9.55 | | | 2.41 | | | 4.88 | | | *** |
Russell 2000 Growth Index3 | | –6.32 | | | 2.91 | | | 1.10 | | | **** |
Lipper Small-Cap Growth Funds Avg.4 | | –5.01 | | | 1.88 | | | 2.30 | | | ***** |
| | | | | | | | | | | |
| | | Cumulative Total Returns1
as of 10/31/09 |
| | | One Year | | | Five Years | | | Ten Years | | | Since Inception2 |
Small Capitalization Value Portfolio (Class R) | | 11.29 | % | | N/A | | | N/A | | | –9.05% (8/22/06) |
Small Capitalization Value Portfolio (Class T) | | 11.82 | | | 20.73 | % | | 177.45 | % | | — |
Russell 2000 Index3 | | 6.46 | | | 2.99 | | | 49.53 | | | *** |
Russell 2000 Value Index3 | | 1.96 | | | 0.40 | | | 106.64 | | | **** |
Lipper Small-Cap Core Funds Avg.4 | | 11.82 | | | 5.20 | | | 90.79 | | | ***** |
| | |
| 4 | | THE TARGET PORTFOLIO TRUST |
| | | | | | | | | | | |
| | | Average Annual Total Returns1
as of 9/30/09 |
| | | One Year | | | Five Years | | | Ten Years | | | Since Inception2 |
Small Capitalization Value Portfolio (Class R) | | –6.64 | % | | N/A | | | N/A | | | –1.71% (8/22/06) |
Small Capitalization Value Portfolio (Class T) | | –6.20 | | | 5.19 | % | | 10.87 | % | | — |
Russell 2000 Index3 | | –9.55 | | | 2.41 | | | 4.88 | | | *** |
Russell 2000 Value Index3 | | –12.61 | | | 1.78 | | | 8.05 | | | **** |
Lipper Small-Cap Core Funds Avg.4 | | –6.42 | | | 2.22 | | | 6.79 | | | ***** |
| | | | | | | | | | | |
| | | Cumulative Total Returns1
as of 10/31/09 |
| | | One Year | | | Five Years | | | Ten Years | | | Since Inception2 |
International Equity Portfolio (Class R) | | 26.27 | % | | N/A | | | N/A | | | –8.92% (8/22/06) |
International Equity Portfolio (Class T) | | 26.84 | | | 33.70 | % | | 20.93 | % | | — |
MSCI EAFE ND Index3 | | 27.71 | | | 28.23 | | | 22.47 | | | *** |
Lipper International Large-Cap Core Funds Avg.4 | | 23.97 | | | 24.98 | | | 18.48 | | | ***** |
| | | | | | | | | | | |
| | | Average Annual Total Returns1
as of 9/30/09 |
| | | One Year | | | Five Years | | | Ten Years | | | Since Inception2 |
International Equity Portfolio (Class R) | | 2.20 | % | | N/A | | | N/A | | | –2.44% (8/22/06) |
International Equity Portfolio (Class T) | | 2.77 | | | 6.94 | % | | 2.35 | % | | — |
MSCI EAFE ND Index3 | | 3.23 | | | 6.07 | | | 2.55 | | | *** |
Lipper International Large-Cap Core Funds Avg.4 | | 0.76 | | | 5.65 | | | 2.22 | | | ***** |
Source: Prudential Investments LLC and Lipper Inc. Performance figures may reflect fee waivers and/or expense reimbursements. In the absence of such fee waivers and/or expense reimbursements, total returns would be lower.
1Total returns assume the reinvestment of all dividends and distributions, and take into account all charges and expenses applicable to an investment in each portfolio. Class R shares are subject to an annual distribution and service (12b-1) fee of up to 0.75%. Returns in the table do not reflect the deduction of taxes that a shareholder would pay on portfolio distributions or following the redemption of portfolio shares.
2Inception returns are provided for any share class with less than 10 calendar years of returns.
3Investors cannot invest directly in an index. The returns for the benchmark indexes would be lower if they reflected deductions for portfolio operating expenses, sales charges, or taxes. The Standard & Poor’s 500 Composite Stock Price Index (S&P 500 Index) is an unmanaged index of 500 stocks of large U.S. companies. It gives a broad look at how stock prices have performed. The Russell 1000 Growth Index contains those securities in the Russell 1000 Index with an above-average growth orientation. Companies in this index tend to exhibit higher price-to-book and price-to-earnings ratios, lower dividend yields, and higher forecasted growth rates. The Russell 1000 Value Index contains those securities in the Russell 1000 Index with a below-average growth orientation. Companies in this index generally have low price-to-book and price-to-earnings ratios, higher dividend yields, and lower forecasted growth values. The Russell 2000 Index is an unmanaged index of the stocks of the 2,000 smallest U.S. companies included in the Russell 3000 Index. It gives an indication of how the stock prices of smaller companies have performed. The Russell 2000 Growth Index contains those securities in the Russell 2000 Index with an above-average growth orientation. Companies in this index generally have higher price-to-book and price-to-earnings ratios. The Russell 2000 Value Index contains those securities in the
| | |
| THE TARGET PORTFOLIO TRUST | | 5 |
Equity Portfolios’ Performance (continued)
Russell 2000 Index with a below-average growth orientation. Companies in this index generally have low price-to-earnings ratios, higher dividend yields, and lower forecasted growth values. The Morgan Stanley Capital International Europe, Australasia, and Far East Index (MSCI EAFE ND Index) is an unmanaged, weighted index that reflects stock price movements in Europe, Australasia, and the Far East. It gives an indication of how foreign stocks have performed.
4The Lipper averages represent returns based on an average of all funds in the respective Lipper categories for the periods noted. The returns for the Lipper averages would be lower if they reflected deductions for portfolio operating expenses, sales charges, or taxes. Large-Cap Growth funds invest at least 75% of their equity assets in companies with market capitalizations (on a three-year weighted basis) above Lipper’s USDE large-cap floor. Large-cap growth funds have an above-average price-to-earnings ratio, price-to-book ratio, and three-year sales-per-share growth value compared with the S&P 500 Index. Large-Cap Value funds invest at least 75% of their equity assets in companies with market capitalizations (on a three-year weighted basis) above Lipper’s USDE large-cap floor. Large-cap value funds typically have a below-average price-to-earnings ratio and three-year sales-per-share growth value compared with the S&P 500 Index. Small-Cap Growth funds invest at least 75% of their equity assets in companies with market capitalizations (on a three-year weighted basis) less than 250% of the dollar-weighted median of the smallest 500 of the middle 1,000 securities of the S&P SuperComposite 1500 Index. Small-cap growth funds typically have an above-average price-to-earnings ratio, price-to-book ratio, and three-year sales-per-share growth value compared with the S&P SmallCap 600 Index. Small-Cap Core funds invest at least 75% of their equity assets in companies with market capitalizations (on a three-year weighted basis) below Lipper’s USDE small-cap ceiling. Small-cap core funds typically have an average price-to-earnings ratio, price-to-book ratio, and three-year sales-per-share growth value, compared to the S&P SmallCap 600 Index. International Large Cap Core funds invest at least 75% of their equity assets in companies strictly outside of the U.S. with market capitalizations (on a three-year weighted basis) above Lipper’s international large-cap floor. International large-cap core funds typically have an average price-to-cash flow ratio, price-to-book ratio, and three-year sales-per-share growth value compared to their large-cap-specific subset of the S&P/Citigroup World ex-U.S. BMI.
***Large Capitalization Growth Portfolio—S&P 500 Index Closest Month-End to Inception cumulative total return as of 10/31/09 is –14.85% for Class R. S&P 500 Index Closest Month-End to Inception average annual total return as of 9/30/09 is –4.50% for Class R. Large Capitalization Value Portfolio—S&P 500 Index Closest Month-End to Inception cumulative total return as of 10/31/09 is –14.85% for Class R. S&P 500 Index Closest Month-End to Inception average annual total return as of 9/30/09 is –4.50% for Class R. Small Capitalization Growth Portfolio—Russell 2000 Index Closest Month-End to Inception cumulative total return as of 10/31/09 is –18.33% for Class R. Russell 2000 Index Closest Month-End to Inception average annual total return as of 9/30/09 is
–4.20% for Class R. Small Capitalization Value Portfolio—Russell 2000 Index Closest Month-End to Inception cumulative total return as of 10/31/09 is
–18.33% for Class R. Russell 2000 Index Closest Month-End to Inception average annual total return as of 9/30/09 is –4.20% for Class R. International Equity Portfolio—MSCI EAFE ND Index Closest Month-End to Inception cumulative total return as of 10/31/09 is –11.40% for Class R. MSCI EAFE ND Index Closest Month-End to Inception average annual total return as of 9/30/09 is –3.46% for Class R.
****Large Capitalization Growth Portfolio—Russell 1000 Growth Index Closest Month-End to Inception cumulative total return as of 10/31/09 is –6.06% for Class R. Russell 1000 Growth Index Closest Month-End to Inception average annual total return as of 9/30/09 is –1.57% for Class R. Large Capitalization Value Portfolio—Russell 1000 Value Index Closest Month-End to Inception cumulative total return as of 10/31/09 is –22.69% for Class R. Russell 1000 Value Index Closest Month-End to Inception average annual total return as of 9/30/09 is –7.07% for Class R. Small Capitalization Growth Portfolio—Russell 2000 Growth Index Closest Month-End to Inception cumulative total return as of 10/31/09 is –13.44% for Class R. Russell 2000 Growth Index Closest Month-End to Inception average annual total return as of 9/30/09 is –2.32% for Class R. Small Capitalization Value Portfolio—Russell 2000 Value Index Closest Month-End to Inception cumulative total
| | |
| 6 | | THE TARGET PORTFOLIO TRUST |
return as of 10/31/09 is –23.31% for Class R. Russell 2000 Value Index Closest Month-End to Inception average annual total return as of 9/30/09 is –6.18% for Class R.
*****Large Capitalization Growth Portfolio—Lipper Average Closest Month-End to Inception cumulative total return as of 10/31/09 is –8.56% for Class R. Lipper Average Closest Month-End to Inception average annual total return as of 9/30/09 is –2.20% for Class R. Large Capitalization Value Portfolio—Lipper Average Closest Month-End to Inception cumulative total return as of 10/31/09 is –19.40% for Class R. Lipper Average Closest Month-End to Inception average annual total return as of 9/30/09 is –6.14% for Class R. Small Capitalization Growth Portfolio—Lipper Average Closest Month-End to Inception cumulative total return as of 10/31/09 is –15.66% for Class R. Lipper Average Closest Month-End to Inception average annual total return as of 9/30/09 is –3.55% for Class R. Small Capitalization Value Portfolio—Lipper Average Closest Month-End to Inception cumulative total return as of 10/31/09 is –16.63% for Class R. Lipper Average Closest Month-End to Inception average annual total return as of 9/30/09 is –4.24% for Class R. International Equity Portfolio—Lipper Average Closest Month-End to Inception cumulative total return as of 10/31/09 is –13.17% for Class R. Lipper Average Closest Month-End to Inception average annual total return as of 9/30/09 is –3.79% for Class R.
| | |
| THE TARGET PORTFOLIO TRUST | | 7 |
Fixed Income Portfolios’ Performance
Performance data quoted represent past performance. Past performance does not guarantee future results. The investment return and principal value of an investment will fluctuate, so that an investor’s shares, when redeemed, may be worth more or less than their original cost. Current performance may be lower or higher than the past performance data quoted. An investor may obtain performance data as of the most recent month-end by visiting our website at www.prudential.com or by calling (800) 225-1852.
International Bond Portfolio:
Gross operating expenses: Class T, 1.93%. Net operating expenses apply to: Class T, 1.93%.
Total Return Bond Portfolio:
Gross operating expenses: Class R, 1.57%; Class T, 0.82%. Net operating expenses apply to: Class R, 1.32%; Class T, 0.82%, after contractual reduction through 2/28/2011.
Intermediate-Term Bond Portfolio:
Gross operating expenses: Class T, 0.74%. Net operating expenses apply to: Class T, 0.74%.
Mortgage Backed Securities Portfolio:
Gross operating expenses: Class T, 1.07%. Net operating expenses apply to: Class T, 1.07%.
| | | | | | | | | |
| Fixed Income Portfolios | |
| | | Cumulative Total Returns1
as of 10/31/09 | |
| | | One Year | | | Five Years | | | Ten Years | |
International Bond Portfolio (Class T) | | 12.29 | % | | 19.28 | % | | 40.43 | % |
Citigroup Non-U.S. WGBI–Hedged3 | | 6.69 | | | 27.94 | | | 69.47 | |
Lipper International Income Funds Avg.4 | | 22.12 | | | 29.65 | | | 87.36 | |
| |
| | | Average Annual Total Returns1
as of 9/30/09 | |
| | | One Year | | | Five Years | | | Ten Years | |
International Bond Portfolio (Class T) | | 10.39 | % | | 3.71 | % | | 3.33 | % |
Citigroup Non-U.S. WGBI–Hedged3 | | 7.87 | | | 5.21 | | | 5.45 | |
Lipper International Income Funds Avg.4 | | 15.80 | | | 5.78 | | | 6.32 | |
| | |
| 8 | | THE TARGET PORTFOLIO TRUST |
| | | | | | | | | | | |
| | | Cumulative Total Returns1
as of 10/31/09 |
| | | One Year | | | Five Years | | | Ten Years | | | Since Inception2 |
Total Return Bond Portfolio (Class R) | | 24.44 | % | | N/A | | | N/A | | | 30.14% (8/22/06) |
Total Return Bond Portfolio (Class T) | | 25.15 | | | 39.94 | % | | 103.53 | % | | — |
Barclays Capital U.S. Aggregate Bond Index3 | | 13.79 | | | 27.95 | | | 84.38 | | | *** |
Lipper Corporate Debt BBB-Rated Funds Avg.4 | | 26.85 | | | 21.91 | | | 81.54 | | | **** |
| |
| | | Average Annual Total Returns1
as of 9/30/09 |
| | | One Year | | | Five Years | | | Ten Years | | | Since Inception2 |
Total Return Bond Portfolio (Class R) | | 20.91 | % | | N/A | | | N/A | | | 8.63% (8/22/06) |
Total Return Bond Portfolio (Class T) | | 21.51 | | | 6.97 | % | | 7.29 | % | | — |
Barclays Capital U.S. Aggregate Bond Index3 | | 10.56 | | | 5.13 | | | 6.30 | | | *** |
Lipper Corporate Debt BBB-Rated Funds Avg.4 | | 17.43 | | | 4.01 | | | 5.92 | | | **** |
| | | | | | | | | | | | | | | | | | |
| | | Cumulative Total Returns1
as of 10/31/09 | | | Average Annual Total Returns1
as of 9/30/09 | |
| | | One Year | | | Five Years | | | Ten Years | | | One Year | | | Five Years | | | Ten Years | |
Intermediate-Term Bond Portfolio (Class T) | | 17.01 | % | | 37.19 | % | | 91.81 | % | | 16.14 | % | | 6.48 | % | | 6.65 | % |
Barclays Capital Int. Govt./Credit Bond Index3 | | 12.03 | | | 25.43 | | | 77.72 | | | 10.01 | | | 4.68 | | | 5.90 | |
Lipper Int. Inv.-Grade Debt Funds Avg.4 | | 17.30 | | | 21.54 | | | 70.90 | | | 11.65 | | | 3.87 | | | 5.37 | |
| | | | | | | | | | | | | | | | | | |
Mortgage Backed Securities Portfolio (Class T) | | 16.20 | % | | 28.03 | % | | 73.74 | % | | 12.05 | % | | 4.83 | % | | 5.53 | % |
Barclays Capital Mortgage-Backed Securities Index3 | | 12.05 | | | 33.21 | | | 86.86 | | | 9.85 | | | 5.92 | | | 6.44 | |
Citigroup Mortgage-Backed Securities Index3 | | 12.27 | | | 33.42 | | | 87.65 | | | 9.69 | | | 5.98 | | | 6.48 | |
Lipper U.S. Mortgage Funds Avg.4 | | 11.01 | | | 20.49 | | | 63.75 | | | 7.52 | | | 3.64 | | | 4.91 | |
Source: Prudential Investments LLC and Lipper Inc. Performance figures may reflect fee waivers and/or expense reimbursements. In the absence of such fee waivers and/or expense reimbursements, total returns would be lower.
1Total returns assume the reinvestment of all dividends and distributions, and take into account all charges and expenses applicable to an investment in each portfolio. Class R shares are subject to an annual distribution and service (12b-1) fee of up to 0.75%. Returns in the table do not reflect the deduction of taxes that a shareholder would pay on portfolio distributions or following the redemption of portfolio shares.
2Inception returns are provided for any share class with less than 10 calendar years of returns.
3Investors cannot invest directly in an index. The returns for the benchmark indexes would be lower if they reflected deductions for portfolio operating expenses, sales charges, or taxes. The Citigroup Non-U.S. World Government Bond Index Hedged (WGBI–Hedged) is an unmanaged index of approximately 600 high-quality bonds with foreign currency exposure translated to the U.S. dollar. It gives a broad indication of how foreign bonds have performed. The Barclays Capital U.S. Aggregate Bond Index is an unmanaged index of investment- grade securities issued by the U.S. government and its agencies and by corporations with between one and 10 years remaining to maturity. It gives a broad indication of how bond prices of short- and intermediate-term bonds have performed. The Barclays Capital Intermediate Government/Credit Bond Index is an unmanaged index of publicly traded U.S. government bonds and investment-grade corporate bonds with maturities of up to 10 years. It gives a broad indication of how intermediate-term bonds have performed. The Barclays Capital
| | |
| THE TARGET PORTFOLIO TRUST | | 9 |
Fixed Income Portfolios’ Performance (continued)
Mortgage-Backed Securities Index is a market capitalization-weighted index of 15- and 30-year fixed-rate securities backed by GNMA, FNMA, and FHLMC mortgage pools, and balloon mortgages with fixed-rate coupons. The Citigroup Mortgage-Backed Securities Index is an unmanaged index of 15- and 30-year mortgage-related securities issued by U.S. government agencies. Each of them gives a broad indication of how mortgage-backed securities have performed.
4The Lipper Averages represent returns based on an average of all funds in the respective Lipper categories for the periods noted. The returns for the Lipper averages would be lower if they reflected deductions for portfolio operating expenses, sales charges, or taxes. International Income funds invest primarily in U.S. dollar and non-U.S. dollar debt securities of issuers located in at least three countries, excluding the United States, except in periods of market weakness. Corporate Debt BBB-Rated funds invest primarily in corporate and government debt issues rated in the top four grades. Intermediate Investment-Grade Debt funds invest primarily in investment-grade debt issues (rated in the top four grades) with dollar-weighted average maturities of five to 10 years. U.S. Mortgage funds invest primarily in mortgages/securities issued or guaranteed as to principal and interest by the U.S. government and certain federal agencies.
***Total Return Bond Portfolio—Barclays Capital U.S. Aggregate Bond Index Closest Month-End to Inception cumulative total return as of 10/31/09 is 22.14% for Class R. Barclays Capital U.S. Aggregate Bond Index Closest Month-End to Inception average annual total return as of 9/30/09 is 6.53% for Class R.
****Total Return Bond Portfolio—Lipper Average Closest Month-End to Inception cumulative total return as of 10/31/09 is 15.87% for Class R. Lipper Average Closest Month-End to Inception average annual total return as of 9/30/09 is 4.54% for Class R.
| | |
| 10 | | THE TARGET PORTFOLIO TRUST |
Money Market Portfolio Performance
Yields will fluctuate from time to time, and past performance does not guarantee future results. Current performance may be lower or higher than the past performance data quoted. The investment return and principal value will fluctuate, and shares, when sold, may be worth more or less than the original cost. For the most recent month-end performance update, call (800) 225-1852.
U.S. Government Money Market Portfolio:
Gross operating expenses: Class T, 0.63%. Net operating expenses apply to: Class T, 0.40%, after a voluntary waiver of management fees.
| | | | | | | | | |
| Money Market Portfolio as of 10/31/09 | | | | | | |
| | | Cumulative
Total Returns1
12 Months | | | Net Asset Value
(NAV) | | 7-Day Current
Yield | |
U.S. Government Money Market Portfolio (Class T) | | 0.38 | % | | $ | 1.00 | | 0.03 | % |
Lipper U.S. Government Money Market Funds Avg.2 | | 0.20 | | | | N/A | | N/A | |
iMoneyNet, Inc. All Taxable Money Market Funds Avg.3 | | N/A | | | | N/A | | 0.04 | |
Source: Prudential Investments LLC and Lipper Inc. Performance figures may reflect fee waivers and/or expense reimbursements. In the absence of such fee waivers and/or expense reimbursements, total returns would be lower.
1Total returns assume the reinvestment of all dividends and distributions, and take into account all charges and expenses applicable to an investment in each portfolio. The returns in the table do not reflect the deduction of taxes that a shareholder would pay on portfolio distributions or following the redemption of portfolio shares.
2The Lipper average represents returns based on an average of all funds in the respective Lipper categories for the periods noted. The return for the Lipper average would be lower if it reflected deductions for portfolio operating expenses, sales charges, or taxes. U.S. Government Money Market funds invest principally in financial instruments issued or guaranteed by the U.S. government, its agencies, or instrumentalities with dollar-weighted average maturities of less than 90 days. These funds intend to keep a constant net asset value.
3iMoneyNet, Inc. regularly reports a 7-day current yield on Tuesdays for taxable money market funds. This is the data of all funds in the iMoneyNet, Inc. All Taxable Money Market Funds Average category as of 10/27/09, the closest date to the end of our reporting period.
An investment in the U.S. Government Money Market Portfolio (the Portfolio) is not insured or guaranteed by the Federal Deposit Insurance Corporation or any other government agency. Although the Portfolio seeks to preserve the value of your investment at $1 per share, it is possible to lose money by investing in the Portfolio.
| | |
| THE TARGET PORTFOLIO TRUST | | 11 |
Strategy and Performance Overview
Large Capitalization Growth Portfolio
The Large Cap Growth Portfolio’s Class T shares returned 8.64% for the 12-month reporting period ended October 31, 2009, which trailed the 17.51% return of its benchmark, the Russell 1000® Growth Index (the Index). The Portfolio also underperformed the 14.74% return of the Lipper Large-Cap Growth Funds Average.
On December 15, 2008 Goldman Sachs Asset Management (GSAM) was replaced by MFS Investment Management (MFS) as a co-manager of the Portfolio. MFS was selected due to its complementary investment style with co-manager Marsico Capital Management, LLC (Marsico).
The Portfolio uses a multi-manager approach, seeking to maximize returns by diversifying Portfolio performance across firms and by combining complementary approaches. A traditional large-cap growth manager, Marsico constructs a relatively concentrated portfolio using an active top-down, bottom-up approach to investing. MFS follows a more diversified strategy that takes a traditional approach to identifying under-priced growth opportunities.
The Portfolio’s performance relative to the Index weakened due to some key factors. The Portfolio had a large overall overexposure to the financial sector, which produced moderately low gains for the year, even though it staged a powerful rally during second half of the reporting period. The Portfolio was also underexposed to technology and consumer staples, two sectors in the Index that broadly outperformed during the fiscal year. However, holdings in the computer hardware industry helped performance.
Style and size factors also negatively affected performance. The Portfolio had an overexposure to stocks experiencing recent momentum in price strength. As a style-specific factor, momentum performed negatively for the year. The Portfolio’s size-factor was also mostly negative for the year, as the Portfolio was overexposed to stocks with larger market capitalizations than most stocks in the Index. On the positive side, the Portfolio’s risk-management strategies rewarded performance.
As for individual stock selection, holdings in consumer services, financial securities & asset management, transportation, and materials rewarded performance. Individual companies among the top contributors to relative performance included Wells Fargo and MasterCard (financial securities & asset management), Wynn Resorts and McDonalds (consumer services), and Monsanto (materials).
The Portfolio of Investments following this report shows the size of the Portfolio’s positions at period-end.
| | |
| 12 | | THE TARGET PORTFOLIO TRUST |
Relative to the Index, both Marsico and MFS underperformed. The Marsico portion detracted from its significant overexposure to stocks in the financial sector and to stocks experiencing rapidly rising prices. However, the Marsico portion contributed slightly more to the Portfolio’s positive performance than MFS, as Marsico was more sensitive to overall market movements, especially from July to September 2009 when the market rallied. The MFS portion underperformed the Index, primarily because of its overexposure to stocks experiencing price momentum. MFS also had an underexposure to a strong consumer staples sector and an overexposure to a weak financials sector. Conversely, the MFS portion benefitted performance because it was less sensitive to market movements in early 2009, when the market faced fierce headwinds that caused investors to flock toward less risky assets.
The Portfolio of Investments following this report shows the size of the Portfolio’s positions at period-end.
| | |
| THE TARGET PORTFOLIO TRUST | | 13 |
Strategy and Performance Overview (continued)
Large Capitalization Value Portfolio
The Large Cap Value Portfolio’s Class T shares returned 4.15% in the 12-month reporting period ended October 31, 2009, which trailed the 4.78% return of its benchmark, the Russell 1000® Value Index. The Portfolio also underperformed the 8.59% return of the Lipper Large-Cap Value Funds Average.
Effective December 15, 2008, Eaton Vance Management replaced J.P. Morgan Investment Management, Inc. as a co-manager alongside Hotchkis and Wiley Capital Management, LLC (Hotchkis and Wiley) and NFJ Investment Group L.P. (NFJ). Eaton Vance Management was chosen as the replacement due to its Large Cap, Relative Value Strategy, and to complement the portions co-managed by Hotchkis and Wiley and NFJ.
Both the NFJ and Eaton Vance Management portions had portfolio compositions that were less sensitive to movements in the greater market. This positioning may have helped to limit losses during the first half of the reporting period when the markets fell dramatically. However, when the markets staged a powerful rally during the second half of the reporting period, this lower sensitivity to market movements negatively affected performance.
Stock selection across several sectors primarily drove the Portfolio’s positive performance during the reporting period. Specifically, an underweight position in Citigroup in financials augmented performance. In industrials, the Portfolio benefited from an underweight position in General Electric. Positions in consumer cyclicals, which includes specialty retailing, leisure goods, autos and other big-ticket items, further helped performance. Stock selection in the Eaton Vance Management portion of this multi-managed portfolio was primarily responsible for the positive return. The Hotchkis and Wiley portion helped to a lesser extent.
Allocations to specific sectors had a slightly positive impact on performance. In the recovering financials sector, the Portfolio had an underweight stance in the banking industry and was also underweight in the energy reserves industries. An overweight position in computer software in a robust information technology sector also contributed to positive performance. The Hotchkis and Wiley and NFJ portions of the Portfolio were chiefly responsible for generating helpful returns in sector selection.
The Portfolio of Investments following this report shows the size of the Portfolio’s positions at period-end.
| | |
| 14 | | THE TARGET PORTFOLIO TRUST |
Small Capitalization Growth Portfolio
The Small Cap Growth Portfolio’s Class T shares gained 8.06% for the 12-month reporting period ended October 31, 2009, which trailed the 11.34% increase of the Russell 2000® Growth Index (the Index). The Portfolio also underperformed the 13.12% return of the Lipper Small-Cap Growth Funds Average.
Eagle Asset Management (Eagle) and Ashfield Capital Partners (Ashfield) were selected as managers of the Portfolio because of their complementary investment styles. The primary goal of this co-management strategy is to help limit risk in particular economic sectors or market scenarios with a portfolio that provides prospective opportunities in most equity markets.
Eagle describes its traditional growth investment process as “Rapid Growth at a Reasonable Price.” The manager seeks companies with accelerating and sustainable earnings growth, a positive catalyst, a high or expanding return on equity, and a credible and competent management team. Ashfield’s investment philosophy is based upon the belief that the price of a stock will be directly related to the underlying growth potential of the business. To some extent, each manager tends to have contrasting views toward certain sectors, but they share similar perspectives on portfolio risk and style factors.
The Portfolio underperformed the Index primarily because, when the equity market rallied sharply during the first half of 2009, the Portfolio had a smaller exposure than the Index to certain types of stocks that performed particularly well. These included, for example, shares with higher levels of volatility. The Portfolio also underperformed because it had a greater exposure than the Index to companies with larger capitalization levels. Furthermore, due to its lower beta, the Portfolio exhibited less sensitivity to movements in the broader stock market as the rally continued during 2009. However, the Portfolio’s risk positioning overall had a positive effect on its relative performance.
Sector and industry allocations did not have significant effect on relative performance for the period. Nonetheless, an overweight position in consumer services, specifically in leisure goods and hotels, hurt performance. Also, exposure to the healthcare sector dragged down relative performance, since the Portfolio was overweight in the pharmaceuticals industry. Conversely, the Portfolio benefited from exposure to the computer software, internet, and energy industries.
Stock-specific factors slightly affected relative performance. Strong stock selection in the leisure goods and computer software industries was offset by holdings in “defensive” sectors, or stocks usually resistant to changes in the economy, such as biotech and medical services in the healthcare sector. Holdings in banks and financial services also detracted from relative performance.
The Portfolio of Investments following this report shows the size of the Portfolio’s positions at period-end.
| | |
| THE TARGET PORTFOLIO TRUST | | 15 |
Strategy and Performance Overview (continued)
Small Capitalization Value Portfolio
The Small Cap Value Portfolio’s Class T shares gained 11.82% for the 12-month reporting period ended October 31, 2009, which widely outperformed the 1.96% return of the its benchmark the Russell 2000® Value Index (the Index). The Portfolio performed evenly with the 11.82% return of the Lipper Small-Cap Core Funds Average.
Small companies and firms may respond to economic trends differently. For example, some may occupy specific niches in which they are immune to economic cycles. Also, some inexpensive stocks may be not be followed closely by analysts. Accordingly, small-cap managers can benefit from informational inefficiencies in the market. Research is critical and the Portfolio’s managers are chosen based on their experience and capabilities. The asset managers themselves may reach position-size limits they can hold in small firms. Consequently, that is why the Portfolio uses several managers. As managers reach their capacity limits, new asset managers may be added to the Portfolio. EARNEST Partners, LLC; Lee Munder Capital Group; J.P. Morgan Investment Management, Inc.; NFJ Investment Group L.P.; and Vaughan Nelson Investment Management, L.P. co-managed the Portfolio.
Positions in specific sectors contributed positively to performance. An underweight stance in the recovering financials sector coupled with an overweight position in a strong materials sector benefited the Portfolio’s performance relative to the Index. However, the Portfolio’s overweight positions in energy, technology, and industrials were a drag on performance.
An underexposure to various stocks in the Index turned out to be a positive factor. The Portfolio achieved better results by avoiding stocks of specific companies, rather than experiencing the losses it would have incurred by holding them.
Several style-specific attributes added to results. An overexposure to stocks with low price-to-earnings ratios (P/E) added to relative performance as did an overexposure to companies with the potential for solid earnings growth. The Portfolio was rewarded by not purchasing shares in companies with high levels of debt.
Conversely, an overweight position in stocks with capitalization rates higher than most stocks in the Index detracted from results. An underweight allocation to stocks with wide swings in share prices also hurt performance. Compared with the Index, the Portfolio also held a higher number of stocks experiencing rapid price momentum, which detracted from performance.
The Portfolio of Investments following this report shows the size of the Portfolio’s positions at period-end.
| | |
| 16 | | THE TARGET PORTFOLIO TRUST |
International Equity Portfolio
The International Equity Portfolio’s Class T shares posted a 26.84% return for the 12-month reporting period ended October 31, 2009, underperforming the 27.71% return of the MSCI EAFE ND Index (the Index), and outperforming the 23.97% return of the Lipper International Large-Cap Core Funds Average. LSV Asset Management (LSV) and Thornburg Investment Management, Inc. (Thornburg) are co-managers of the Portfolio.
LSV is a deep value manager, whose active quantitative investment strategy is based on the portfolio management team’s research into value investing and behavioral finance. LSV believes that superior investment performance can be achieved by exploiting behavioral biases exhibited by other investors including: the tendency to extrapolate the past too far into the future; wrongly equating a good company with a good investment regardless of price; and ignoring statistical evidence and developing a “mindset” about a company. While LSV does not conduct traditional security analysis, the objective of LSV’s purely quantitative modeling approach is to pick undervalued stocks with near-term appreciation potential.
Thornburg employs a strategy that seeks to minimize risk by exposing the Portfolio to traditional, relative, and/or deep value stocks. The investment process utilizes quantitative screens to identify attractively valued stocks, using a range of valuation multiples. Thornburg also looks for information that indicates fundamental improvement, such as earnings surprises or earnings revisions, relative to peers. Management performs fundamental research on those companies that look attractive through its screening process, while reserving the right to circumvent the screen. Thornburg’s fundamental analysis results in an estimate of a company’s intrinsic value.
For the first half of the reporting period the LSV portion significantly underperformed the index because of its focus on value stocks and an overweight in financials, which was the worst performing sector. Beginning in late March 2009, LSV noticeably outperformed the Index as investors regained their appetite for riskier assets. The deep value strategy was rewarded and small-cap stocks outshone large-cap stocks. Overall, LSV outperformed the Index during the reporting period.
The Thornburg portion significantly outperformed the index in the first half of the period, mostly because of its focus on relative value, its underweight position in financials, and its emphasis on higher quality stocks. However, an allocation to emerging markets detracted from performance, since emerging markets fell dramatically
The Portfolio of Investments following this report shows the size of the Portfolio’s positions at period-end.
| | |
| THE TARGET PORTFOLIO TRUST | | 17 |
Strategy and Performance Overview (continued)
in first part of the fiscal year. In the second half of the reporting period, beginning in late March, Thornburg underperformed the Index as investors’ increased appetite for risk sparked a rally that rewarded deep value and small-cap stocks, which outperformed large-cap stocks. Additionally, when emerging markets staged a powerful rally later in the reporting period, Thornburg’s focus on larger more established companies was unable to keep pace with this trend. Overall, Thornburg marginally underperformed during the entire period.
The Portfolio of Investments following this report shows the size of the Portfolio’s positions at period-end.
| | |
| 18 | | THE TARGET PORTFOLIO TRUST |
International Bond Portfolio
The International Bond Portfolio’s Class T shares gained 12.29% for the 12-month reporting period ended October 31, 2009, outperforming the 6.69% gain of the Citigroup Non-U.S. World Government Bond Index-Hedged (the Index). However, the Portfolio’s Class T shares lagged the 22.12% gain of the Lipper International Income Funds Average. Pacific Investment Management Company LLC (PIMCO) managed the Portfolio.
Conditions in the credit markets improved during the reporting period that began November 1, 2008. A flight to quality that favored highly rated bonds, such as government securities of economically developed nations, began to fade early in the reporting period and was later replaced by investors’ preference for riskier bonds that provided more attractive yields. This shift occurred as the world financial system began to recover from a crisis whose roots were in the troubled U.S. housing market, and the global economy began to emerge from its worst recession since World War II.
Early in the reporting period, the Portfolio’s duration exposure (interest-rate sensitivity) to debt securities markets of developed nations other than the United States was such that the Portfolio benefited when the flight to quality drove interest rates lower, particularly on short-term debt securities. This caused their prices to gain as bond prices move inversely to yields. By contrast, duration exposure in the U.S. Treasury market did not work well and subtracted from the Portfolio’s return.
Later in the reporting period, yields on longer-term government securities rose, causing yield curves to become steeper. The Portfolio was positioned in the U.S., U.K., and euro zone debt securities markets to benefit from this development.
PIMCO’s allocation strategy favoring bond markets that outperformed the U.S. Treasury market added to the Portfolio’s return. The Portfolio held investment-grade corporate bonds with an emphasis on the financial sector that performed well as the financial system stabilized. It held asset-backed securities that performed well as the Federal Reserve (the Fed) launched a program that provides loans on favorable terms to investors who purchase securities backed by certain types of loans. The Portfolio also held mortgage-backed securities of federal agencies that performed well as the Fed purchased them to support mortgage lending and the housing markets. Its allocation to high yield corporate bonds, commonly called “junk” bonds, worked
The Portfolio of Investments following this report shows the size of the Portfolio’s positions at period-end.
| | |
| THE TARGET PORTFOLIO TRUST | | 19 |
Strategy and Performance Overview (continued)
well too. The low interest-rate environment fueled strong investor demand for below investment-grade corporate bonds and their prices soared higher.
Finally, the Portfolio benefited from having an overweight exposure to Japanese Inflation-Linked Bonds, which gained in value as real interest rates (interest rates minus the rate of inflation) declined in Japan during the reporting period. Buyers purchased Japanese Inflation-Linked Bonds as liquidity in the market improved and the Japanese Ministry of Finance continued to support the market.
The Portfolio of Investments following this report shows the size of the Portfolio’s positions at period-end.
| | |
| 20 | | THE TARGET PORTFOLIO TRUST |
Total Return Bond Portfolio
The Total Return Bond Portfolio’s Class T shares gained 25.15% for the 12-month reporting period ended October 31, 2009, outperforming the 13.79% gain of the Barclays Capital U.S. Aggregate Bond Index (the Index). However, the Portfolio’s Class T shares lagged the 26.85% gain of the Lipper Corporate Debt BBB-Rated Funds Average. Pacific Investment Management Company LLC (PIMCO) managed the Portfolio.
Conditions in the credit markets improved during the reporting period that began November 1, 2008. A flight to quality that favored highly rated bonds, such as government securities of economically developed nations, began to fade early in the reporting period and was later replaced by investors’ preference for riskier bonds that provided more attractive yields. This shift occurred as the world financial system began to recover from a crisis of historic proportions whose roots were in the troubled U.S. housing market, and the global economy began to emerge from its worst recession since World War II.
Early in the reporting period, the Portfolio’s duration exposure (interest-rate sensitivity) to debt securities markets of the United States, the United Kingdom, and the euro zone was such that it benefited when the flight to quality drove interest rates lower, particularly on short-term debt securities. This caused their prices to gain as bond prices move inversely to yields. Later in the reporting period, yields on longer-term debt securities rose, causing yield curves to become steeper. The Portfolio was also positioned in the U.S. and euro zone debt securities markets to benefit from this development.
PIMCO’s allocation strategy helped the Portfolio by emphasizing bond markets that outperformed the U.S. Treasury market. For example, the Portfolio had a larger exposure than the Index to mortgage-backed securities of federal agencies, which performed well as the Federal Reserve (the Fed) purchased them to support mortgage lending and the housing markets. The Portfolio had a larger exposure than the Index to investment-grade corporate bonds of financial companies, which performed well as the financial system stabilized. However, the positive impact from this position was partially offset because, overall, the Portfolio had a smaller exposure than the Index to the investment-grade corporate bond market. Treasury Inflation-Protected Securities (TIPS) also outperformed conventional Treasury securities amid concern that the Fed’s massive injections of liquidity into the economy will eventually boost inflation in the United States.
The Portfolio of Investments following this report shows the size of the Portfolio’s positions at period-end.
| | |
| THE TARGET PORTFOLIO TRUST | | 21 |
Strategy and Performance Overview (continued)
The Portfolio was also invested in other bond markets that outperformed the Treasury market. Allocations to high yield corporate bonds, which are commonly called “junk” bonds because they are rated below investment grade, and emerging market bonds, which are debt securities of issuers from developing nations, added to the Portfolio’s return. In the low interest-rate environment, strong investor demand for the attractive yields provided by these debt securities fueled powerful rallies in both bond markets.
The Portfolio of Investments following this report shows the size of the Portfolio’s positions at period-end.
| | |
| 22 | | THE TARGET PORTFOLIO TRUST |
Intermediate-Term Bond Portfolio
The Intermediate-Term Bond Portfolio’s Class T shares gained 17.01% for the 12-month reporting period ended October 31, 2009, outperforming the 12.03% gain of the Barclays Capital Intermediate Government/Credit Bond Index (the Index). However, the Portfolio’s Class T shares lagged the 17.30% gain of the Lipper Intermediate Investment-Grade Debt Funds Average. Pacific Investment Management Company LLC (PIMCO) managed the Portfolio.
Conditions in the credit markets improved during the reporting period that began November 1, 2008. A flight to quality that favored highly rated bonds, such as government securities of economically developed nations, began to fade early in the reporting period and was later replaced by investors’ preference for riskier bonds that provided more attractive yields. This shift occurred as the world financial system began to recover from a crisis of historic proportions whose roots were in the troubled U.S. housing market, and the global economy began to emerge from its worst recession since World War II.
Early in the reporting period, the Portfolio’s duration exposure (interest-rate sensitivity) to debt securities markets of the United States, the United Kingdom, and the euro zone was such that it benefited when the flight to quality drove interest rates lower, particularly on short-term debt securities. This caused their prices to gain as bond price move inversely to yields. Later in the reporting period, yields on longer-term government securities rose, causing yield curves to become steeper. The Portfolio was also positioned in the U.S. and euro zone debt securities markets to benefit from this development.
PIMCO’s allocation strategy helped the Portfolio by emphasizing bond markets that outperformed the U.S. Treasury market. For example, the Portfolio had a larger exposure than the Index to mortgage-backed securities of federal agencies, which performed well as the Federal Reserve (the Fed) purchased them to support mortgage lending and the housing markets. The Portfolio had a larger exposure than the Index to investment-grade corporate bonds of financial companies, which performed well as the financial system stabilized. However, the positive impact from this position was partially offset because, overall, the Portfolio had a smaller exposure than the Index to the investment-grade corporate bond market. Treasury Inflation-Protected Securities (TIPS) also outperformed conventional Treasury securities amid concern that the Fed’s massive injections of liquidity into the economy will eventually boost inflation in the United States.
The Portfolio of Investments following this report shows the size of the Portfolio’s positions at period-end.
| | |
| THE TARGET PORTFOLIO TRUST | | 23 |
Strategy and Performance Overview (continued)
The Portfolio had exposures to other bond markets that outperformed the Treasury market. An allocation to high yield corporate bonds, commonly called “junk” bonds because they are rated below investment grade, added to the Portfolio’s return. The Portfolio also had a small allocation to emerging market bonds, which are debt securities of issuers from developing nations. In the low interest-rate environment, strong investor demand fueled powerful rallies in both bond markets.
The Portfolio of Investments following this report shows the size of the Portfolio’s positions at period-end.
| | |
| 24 | | THE TARGET PORTFOLIO TRUST |
Mortgage Backed Securities Portfolio
The Mortgage Backed Securities Portfolio’s Class T shares gained 16.20% for the 12-month reporting period ended October 31, 2009, outperforming the 12.05% gain of the Barclays Capital Mortgage-Backed Securities Index (the Index) and the 11.01% gain of the Lipper U.S. Mortgage Funds Average. Wellington Management Company, LLP (Wellington Management) managed the Portfolio.
Conditions in the U.S. bond markets improved during the reporting period that began November 1, 2008. A flight-to-quality that favored highly rated bonds, particularly U.S. Treasury securities, began to fade early in the reporting period and was later replaced by investors’ preference for riskier bonds that provided more attractive yields. This shift occurred as the U.S. financial system began to recover from a crisis of historic proportions, whose roots were in the nation’s troubled housing sector, and the economy began to emerge from its worst recession since the 1930s.
The Portfolio outperformed the Index because it owned Inverse Interest Only (IIO) bonds, which, as the name implies, do not receive principal payments from the underlying mortgages. IIO bonds gained in value, helped by a material decline in the London interbank offered rate and slower-than-expected prepayments on mortgage-backed securities.
The Portfolio also outperformed the Index because of its exposure to commercial mortgage-backed securities, which rallied strongly because the Federal Reserve launched a program that provides loans on favorable terms to investors who purchase high-quality debt securities backed by auto loans, commercial mortgages, and certain other types of loans and leases. The Portfolio’s strong relative performance also reflected its favorable allocation to mortgage pass-through securities of federal agencies. In late 2008 and early 2009, it had a larger exposure than the Index to higher and lower coupon pass-through securities, but in the third quarter of 2009, it had an underweight exposure to lower coupon pass-through securities.
Meanwhile, the Portfolio’s performance versus the Index was hurt by its allocation to non-agency mortgage-backed securities, which are issued by banks and mortgage originators, among others. The Portfolio held prime non-agency mortgage-backed securities that were rated AAA and priced at a deep discount to par. Wellington Management believed the sector would benefit from policy actions supportive of the
The Portfolio of Investments following this report shows the size of the Portfolio’s positions at period-end.
| | |
| THE TARGET PORTFOLIO TRUST | | 25 |
Strategy and Performance Overview (continued)
mortgage market. In late 2008, the sector suffered a setback because the focus of the Troubled Asset Relief Program shifted away from the purchase of illiquid mortgage assets and conditions in the housing market continued to deteriorate. Valuations of non-agency mortgage-backed securities improved in 2009 but not enough to completely erase losses incurred late in the previous year.
The Portfolio of Investments following this report shows the size of the Portfolio’s positions at period-end.
| | |
| 26 | | THE TARGET PORTFOLIO TRUST |
U.S. Government Money Market Portfolio
The U.S. Government Money Market Portfolio’s Class T shares returned 0.38% for the 12-month period ended October 31, 2009, which outperformed the 0.20% return of the Lipper U.S. Government Money Market Funds Average. Wellington Management Company, LLP (Wellington Management) managed the Portfolio.
The reporting period that began November 1, 2008, was initially marked by deterioration in financial systems around the world and heightened aversion to risky investments. A bursting housing bubble in the United States, among other factors, kept eroding the value of the nation’s housing stock, causing vast amounts of debt securities linked to troubled residential mortgages to tumble in value. This posed a serious threat to the U.S. financial system and broader economy, which sank into its worst recession since the 1930s.
The Federal Reserve and the U.S. Department of the Treasury took unprecedented steps to shore up the nation’s financial system and encourage business activity. The Federal Open Market Committee (FOMC), which had repeatedly eased monetary policy earlier in 2008, lowered its target for the federal funds rate on overnight loans between banks from 1.00% to a record low range of zero to 0.25% in December 2008, where it remained for the rest of the reporting period.
Stresses in the credit markets began to subside in 2009. One of several developments that helped boost investor confidence occurred in March 2009, when the U.S. Treasury Department announced details of its plan to unclog the flow of credit by encouraging private investors to purchase distressed assets held on banks’ balance sheets. Also, the U.S. economy began to grow again during third quarter of 2009. However, doubts about the pace and shape of the recovery postponed a reversal of the near zero interest-rate environment, particularly as the U.S. jobless rate continued to grind higher. Indeed, the FOMC has reiterated its desire to keep interest rates low for an extended period of time. As a result, yields on money market securities moved lower during the reporting period.
Under Wellington Management’s investment strategy, the Portfolio maintained its liquidity while selectively increasing its exposure to government agency notes with maturities greater than 90 days. This proved beneficial as the Portfolio was able to lock in comparatively high yields on money market securities prior to the cut in short-term rates that occurred in late 2008.
The Portfolio of Investments following this report shows the size of the Portfolio’s positions at period-end.
| | |
| THE TARGET PORTFOLIO TRUST | | 27 |
Fees and Expenses (Unaudited)
As a shareholder of the Trust, you incur two types of costs: (1) transaction costs, including sales charges (loads) on purchase payments and redemptions, as applicable, and (2) ongoing costs, including management fees, and other Trust expenses, as applicable. This example is intended to help you understand your ongoing costs (in dollars) of investing in the Trust and to compare these costs with the ongoing costs of investing in other mutual funds.
The example is based on an investment of $1,000 invested on May 1, 2009, at the beginning of the period, and held through the six-month period ended October 31, 2009. The example is for illustrative purposes only; you should consult the Prospectus for information on initial and subsequent minimum investment requirements.
The Trust’s transfer agent may charge additional fees to holders of certain accounts that are not included in the expenses shown in the table on the following page. These fees apply to individual retirement accounts (IRAs) and Section 403(b) accounts. As of the close of the six-month period covered by the table, IRA fees included an annual maintenance fee of $15 per account (subject to a maximum annual maintenance fee of $25 for all accounts held by the same shareholder). Section 403(b) accounts are charged an annual $25 fiduciary maintenance fee. Some of the fees may vary in amount, or may be waived, based on your total account balance or the number of JennisonDryden funds, including the Trust, that you own. You should consider the additional fees that were charged to your Trust account over the six-month period when you estimate the total ongoing expenses paid over the period and the impact of these fees on your ending account value, as these additional expenses are not reflected in the information provided in the expense table. Additional fees have the effect of reducing investment returns.
Actual Expenses
The first line for each share class in the table on the following pages provides information about actual account values and actual expenses. You may use the information on this line, together with the amount you invested, to estimate the expenses that you paid over the period. Simply divide your account value by $1,000 (for example, an $8,600 account value ÷ $1,000 = 8.6), then multiply the result by the number on the first line under the heading “Expenses Paid During the Six-Month Period” to estimate the expenses you paid on your account during this period.
| | |
| 28 | | THE TARGET PORTFOLIO TRUST |
Hypothetical Example for Comparison Purposes
The second line for each share class in the table below and on the following pages provides information about hypothetical account values and hypothetical expenses based on the Trust’s actual expense ratio and an assumed rate of return of 5% per year before expenses, which is not the Trust’s actual return. The hypothetical account values and expenses may not be used to estimate the actual ending account balance or expenses you paid for the period. You may use this information to compare the ongoing costs of investing in the Trust and other funds. To do so, compare this 5% hypothetical example with the 5% hypothetical examples that appear in the shareholder reports of the other funds.
Please note that the expenses shown in the table are meant to highlight your ongoing costs only and do not reflect any transactional costs such as sales charges (loads). Therefore, the second line for each share class in the table is useful in comparing ongoing costs only and will not help you determine the relative total costs of owning different funds. In addition, if these transactional costs were included, your costs would have been higher.
| | | | | | | | | | | | |
Large
Capitalization
Growth Portfolio | | Beginning Account
Value
May 1, 2009 | | Ending Account
Value October 31, 2009 | | Annualized
Expense Ratio
Based on the
Six-Month Period | | | Expenses Paid
During the Six-
Month Period* |
| | | | | | | | | | | | |
| Class R | | | | | | | | | | | | |
| Actual | | $ | 1,000.00 | | $ | 1,167.90 | | 1.35 | % | | $ | 7.38 |
| Hypothetical | | $ | 1,000.00 | | $ | 1,018.40 | | 1.35 | % | | $ | 6.87 |
| Class T | | | | | | | | | | | | |
| Actual | | $ | 1,000.00 | | $ | 1,170.20 | | 0.85 | % | | $ | 4.65 |
| Hypothetical | | $ | 1,000.00 | | $ | 1,020.92 | | 0.85 | % | | $ | 4.33 |
| | | | | | | | | | | | |
Large
Capitalization
Value Portfolio | | Beginning Account
Value
May 1, 2009 | | Ending Account
Value
October 31, 2009 | | Annualized
Expense Ratio
Based on the
Six-Month Period | | | Expenses Paid
During the Six-
Month Period* |
| | | | | | | | | | | | |
| Class R | | | | | | | | | | | | |
| Actual | | $ | 1,000.00 | | $ | 1,199.20 | | 1.33 | % | | $ | 7.37 |
| Hypothetical | | $ | 1,000.00 | | $ | 1,018.50 | | 1.33 | % | | $ | 6.77 |
| Class T | | | | | | | | | | | | |
| Actual | | $ | 1,000.00 | | $ | 1,201.40 | | 0.83 | % | | $ | 4.61 |
| Hypothetical | | $ | 1,000.00 | | $ | 1,021.02 | | 0.83 | % | | $ | 4.23 |
| | |
| THE TARGET PORTFOLIO TRUST | | 29 |
Fees and Expenses (continued)
| | | | | | | | | | | | |
Small
Capitalization
Growth Portfolio | | Beginning Account
Value
May 1, 2009 | | Ending Account
Value
October 31, 2009 | | Annualized
Expense Ratio
Based on the
Six-Month Period | | | Expenses Paid
During the Six-
Month Period* |
| | | | | | | | | | | | |
| Class R | | | | | | | | | | | | |
| Actual | | $ | 1,000.00 | | $ | 1,177.10 | | 1.50 | % | | $ | 8.23 |
| Hypothetical | | $ | 1,000.00 | | $ | 1,017.64 | | 1.50 | % | | $ | 7.63 |
| Class T | | | | | | | | | | | | |
| Actual | | $ | 1,000.00 | | $ | 1,179.50 | | 1.00 | % | | $ | 5.49 |
| Hypothetical | | $ | 1,000.00 | | $ | 1,020.16 | | 1.00 | % | | $ | 5.09 |
| | | | | | | | | | | | |
Small
Capitalization
Value Portfolio | | Beginning Account
Value
May 1, 2009 | | Ending Account
Value
October 31, 2009 | | Annualized
Expense Ratio
Based on the
Six-Month Period | | | Expenses Paid
During the Six-
Month Period* |
| | | | | | | | | | | | |
| Class R | | | | | | | | | | | | |
| Actual | | $ | 1,000.00 | | $ | 1,181.70 | | 1.29 | % | | $ | 7.09 |
| Hypothetical | | $ | 1,000.00 | | $ | 1,018.70 | | 1.29 | % | | $ | 6.56 |
| Class T | | | | | | | | | | | | |
| Actual | | $ | 1,000.00 | | $ | 1,184.00 | | 0.79 | % | | $ | 4.35 |
| Hypothetical | | $ | 1,000.00 | | $ | 1,021.22 | | 0.79 | % | | $ | 4.02 |
| | | | | | | | | | | | |
International
Equity Portfolio | | Beginning Account
Value
May 1, 2009 | | Ending Account
Value
October 31, 2009 | | Annualized
Expense Ratio
Based on the
Six-Month Period | | | Expenses Paid
During the Six-
Month Period* |
| | | | | | | | | | | | |
| Class R | | | | | | | | | | | | |
| Actual | | $ | 1,000.00 | | $ | 1,311.40 | | 1.47 | % | | $ | 8.56 |
| Hypothetical | | $ | 1,000.00 | | $ | 1,017.80 | | 1.47 | % | | $ | 7.48 |
| Class T | | | | | | | | | | | | |
| Actual | | $ | 1,000.00 | | $ | 1,314.30 | | 0.97 | % | | $ | 5.66 |
| Hypothetical | | $ | 1,000.00 | | $ | 1,020.32 | | 0.97 | % | | $ | 4.94 |
| | | | | | | | | | | | |
International
Bond Portfolio | | Beginning Account
Value
May 1, 2009 | | Ending Account
Value
October 31, 2009 | | Annualized
Expense Ratio
Based on the
Six-Month Period | | | Expenses Paid
During the Six-
Month Period* |
| | | | | | | | | | | | |
| Class T | | | | | | | | | | | | |
| Actual | | $ | 1,000.00 | | $ | 1,112.30 | | 1.99 | % | | $ | 10.60 |
| Hypothetical | | $ | 1,000.00 | | $ | 1,015.17 | | 1.99 | % | | $ | 10.11 |
| | |
| 30 | | THE TARGET PORTFOLIO TRUST |
| | | | | | | | | | | | |
Total Return
Bond Portfolio | | Beginning Account
Value
May 1, 2009 | | Ending Account
Value
October 31, 2009 | | Annualized
Expense Ratio
Based on the
Six-Month Period | | | Expenses Paid
During the Six-
Month Period* |
| | | | | | | | | | | | |
| Class R | | | | | | | | | | | | |
| Actual | | $ | 1,000.00 | | $ | 1,125.50 | | 1.31 | % | | $ | 7.02 |
| Hypothetical | | $ | 1,000.00 | | $ | 1,018.60 | | 1.31 | % | | $ | 6.67 |
| Class T | | | | | | | | | | | | |
| Actual | | $ | 1,000.00 | | $ | 1,129.70 | | 0.81 | % | | $ | 4.35 |
| Hypothetical | | $ | 1,000.00 | | $ | 1,021.12 | | 0.81 | % | | $ | 4.13 |
| | | | | | | | | | | | |
Intermediate-Term
Bond Portfolio | | Beginning Account
Value
May 1, 2009 | | Ending Account
Value
October 31, 2009 | | Annualized
Expense Ratio
Based on the
Six-Month Period | | | Expenses Paid
During the Six-
Month Period* |
| | | | | | | | | | | | |
| Class T | | | | | | | | | | | | |
| Actual | | $ | 1,000.00 | | $ | 1,079.50 | | 0.71 | % | | $ | 3.72 |
| Hypothetical | | $ | 1,000.00 | | $ | 1,021.63 | | 0.71 | % | | $ | 3.62 |
| | | | | | | | | | | | |
Mortgage Backed
Securities Portfolio | | Beginning Account
Value
May 1, 2009 | | Ending Account
Value
October 31, 2009 | | Annualized
Expense Ratio
Based on the
Six-Month Period | | | Expenses Paid
During the Six-
Month Period* |
| | | | | | | | | | | | |
| Class T | | | | | | | | | | | | |
| Actual | | $ | 1,000.00 | | $ | 1,119.10 | | 0.89 | % | | $ | 4.75 |
| Hypothetical | | $ | 1,000.00 | | $ | 1,020.72 | | 0.89 | % | | $ | 4.53 |
| | | | | | | | | | | | |
U.S. Government
Money Market
Portfolio | | Beginning Account
Value
May 1, 2009 | | Ending Account
Value October 31, 2009 | | Annualized
Expense Ratio
Based on the
Six-Month Period | | | Expenses Paid
During the Six-
Month Period* |
| | | | | | | | | | | | |
| Class T | | | | | | | | | | | | |
| Actual | | $ | 1,000.00 | | $ | 1,000.20 | | 0.32 | % | | $ | 1.61 |
| Hypothetical | | $ | 1,000.00 | | $ | 1,023.59 | | 0.32 | % | | $ | 1.63 |
* Portfolio expenses (net of fee waivers or subsidies, if any) for each share class are equal to the annualized expense ratio for each share class (provided in the table), multiplied by the average account value over the period, multiplied by the 184 days in the six-month period ended October 31, 2009, and divided by 365 days to reflect the six-month period. Expenses presented in the table include the expenses of any underlying portfolios in which the Fund may invest.
| | |
| THE TARGET PORTFOLIO TRUST | | 31 |
| | |
Portfolio of Investments
As of October 31, 2009 | | Large Capitalization Growth Portfolio |
| | | | | |
| SHARES | | DESCRIPTION | | VALUE (NOTE 1) |
| | LONG-TERM INVESTMENTS—94.3% | | | |
| | |
| | COMMON STOCKS—94.1% | | | |
| | |
| | Aerospace & Defense—2.3% | | | |
| 61,260 | | General Dynamics Corp. | | $ | 3,841,002 |
| 11,320 | | United Technologies Corp. | | | 695,614 |
| | | | | |
| | | | | 4,536,616 |
| | | | | |
| | |
| | Agriculture/Heavy Equipment—0.3% | | | |
| 9,240 | | Monsanto Co. | | | 620,743 |
| | | | | |
| | |
| | Beverages—1.2% | | | |
| 6,100 | | Anheuser-Busch Cos, Inc., ADR (Belgium)*(a) | | | 287,798 |
| 12,520 | | Coca-Cola Co. (The) | | | 667,441 |
| 21,650 | | PepsiCo, Inc. | | | 1,310,908 |
| | | | | |
| | | | | 2,266,147 |
| | | | | |
| | |
| | Biotechnology—0.6% | | | |
| 6,700 | | Amgen, Inc.* | | | 359,991 |
| 5,680 | | Celgene Corp.* | | | 289,964 |
| 12,030 | | Genzyme Corp.* | | | 608,718 |
| | | | | |
| | | | | 1,258,673 |
| | | | | |
| | |
| | Broadcasting—0.2% | | | |
| 14,060 | | Discovery Communications, Inc. (Class A Stock)* | | | 386,650 |
| | | | | |
| | |
| | Business Services—2.1% | | | |
| 18,716 | | MasterCard, Inc. (Class A Stock)(a) | | | 4,099,178 |
| | | | | |
| | |
| | Chemicals—6.6% | | | |
| 21,731 | | Air Products & Chemicals, Inc. | | | 1,676,112 |
| 163,657 | | Dow Chemical Co. (The)(a) | | | 3,842,666 |
| 7,230 | | Ecolab, Inc. | | | 317,831 |
| 15,116 | | Potash Corp. of Saskatchewan, Inc. (Canada) | | | 1,402,463 |
| 32,489 | | PPG Industries, Inc. | | | 1,833,354 |
| 46,515 | | Praxair, Inc. | | | 3,695,152 |
| 81,000 | | Yingde Gases (China)* | | | 96,570 |
| | | | | |
| | | | | 12,864,148 |
| | | | | |
| | |
| | Clothing & Apparel—0.6% | | | |
| 24,000 | | Avon Products, Inc. | | | 769,200 |
| 9,700 | | Coach, Inc. | | | 319,809 |
| | | | | |
| | | | | 1,089,009 |
| | | | | |
| | |
| | Commercial Banks—1.1% | | | |
| 89,063 | | U.S. Bancorp | | | 2,068,043 |
| | | | | |
See Notes to Financial Statements.
| | |
| THE TARGET PORTFOLIO TRUST | | 33 |
| | |
Large Capitalization Growth Portfolio (continued) | | Portfolio of Investments
As of October 31, 2009 |
| | | | | |
| SHARES | | DESCRIPTION | | VALUE (NOTE 1) |
| | COMMON STOCKS (continued) | | | |
| | |
| | Commercial Services—0.4% | | | |
| 17,440 | | Moody’s Corp.(a) | | $ | 412,979 |
| 12,490 | | Verisk Analytics, Inc. (Class A Stock)* | | | 342,601 |
| | | | | |
| | | | | 755,580 |
| | | | | |
| | |
| | Communication Equipment—1.0% | | | |
| 74,355 | | Juniper Networks, Inc.*(a) | | | 1,896,796 |
| | | | | |
| | |
| | Computer Hardware—7.7% | | | |
| 47,242 | | Apple, Inc.* | | | 8,905,117 |
| 4,900 | | Dell, Inc.* | | | 71,001 |
| 23,870 | | Hewlett-Packard Co. | | | 1,132,870 |
| 40,863 | | International Business Machines Corp. | | | 4,928,487 |
| | | | | |
| | | | | 15,037,475 |
| | | | | |
| | |
| | Computer Services & Software—3.0% | | | |
| 7,900 | | Accenture Ltd. (Class A Stock) (Ireland) | | | 292,932 |
| 28,845 | | Amazon.com, Inc.* | | | 3,427,074 |
| 16,770 | | Cognizant Technology Solutions Corp. (Class A Stock)* | | | 648,161 |
| 11,510 | | DreamWorks Animation SKG, Inc. (Class A Stock)*(a) | | | 368,320 |
| 41,080 | | Microsoft Corp. | | | 1,139,148 |
| | | | | |
| | | | | 5,875,635 |
| | | | | |
| | |
| | Computers & Peripherals—0.4% | | | |
| 43,740 | | EMC Corp.* | | | 720,398 |
| | | | | |
| | |
| | Consumer Finance—0.9% | | | |
| 50,510 | | American Express Co. | | | 1,759,768 |
| | | | | |
| | |
| | Containers & Packaging—0.1% | | | |
| 5,320 | | Owens-Illinois, Inc.* | | | 169,602 |
| | | | | |
| | |
| | Diversified—0.4% | | | |
| 9,970 | | 3M Co. | | | 733,493 |
| | | | | |
| | |
| | Diversified Financial Services—1.1% | | | |
| 4,520 | | Affiliated Managers Group, Inc.*(a) | | | 286,975 |
| 3,430 | | CME Group, Inc.(a) | | | 1,037,952 |
| 3,600 | | Franklin Resources, Inc.(a) | | | 376,668 |
| 10,800 | | Morgan Stanley | | | 346,896 |
| | | | | |
| | | | | 2,048,491 |
| | | | | |
| | |
| | Electronic Components—0.5% | | | |
| 15,200 | | Flextronics International Ltd. (Singapore)* | | | 98,496 |
| 12,130 | | Thermo Fisher Scientific, Inc.* | | | 545,850 |
| 12,910 | | Tyco Electronics Ltd. (Switzerland) | | | 274,337 |
| | | | | |
| | | | | 918,683 |
| | | | | |
See Notes to Financial Statements.
| | |
| 34 | | THE TARGET PORTFOLIO TRUST |
| | | | | |
| SHARES | | DESCRIPTION | | VALUE (NOTE 1) |
| | COMMON STOCKS (continued) | | | |
| | |
| | Entertainment & Leisure—0.3% | | | |
| 17,270 | | International Game Technology | | $ | 308,097 |
| 5,100 | | Las Vegas Sands Corp.*(a) | | | 76,959 |
| 14,600 | | Royal Caribbean Cruises Ltd. (Liberia)*(a) | | | 295,358 |
| | | | | |
| | | | | 680,414 |
| | | | | |
| | |
| | Financial—Bank & Trust—4.4% | | | |
| 56,000 | | Banco Santander Brasil SA (Brazil)* | | | 664,160 |
| 33,600 | | Bank of America Corp. | | | 489,888 |
| 26,680 | | Charles Schwab Corp. (The) | | | 462,631 |
| 43,600 | | HSBC Holdings PLC (United Kingdom)(a) | | | 2,415,004 |
| 164,257 | | Wells Fargo & Co. | | | 4,520,353 |
| | | | | |
| | | | | 8,552,036 |
| | | | | |
| | |
| | Financial Services—9.4% | | | |
| 33,410 | | Goldman Sachs Group, Inc. (The) | | | 5,685,380 |
| 165,209 | | JPMorgan Chase & Co. | | | 6,900,780 |
| 64,294 | | Visa, Inc. (Class A Stock)(a) | | | 4,870,913 |
| 38,700 | | Western Union Co. (The) | | | 703,179 |
| | | | | |
| | | | | 18,160,252 |
| | | | | |
| | |
| | Food Products—0.4% | | | |
| 4,100 | | General Mills, Inc. | | | 270,272 |
| 9,306 | | Nestle SA (Switzerland) | | | 432,744 |
| | | | | |
| | | | | 703,016 |
| | | | | |
| | |
| | Healthcare Services—0.3% | | | |
| 5,500 | | Henry Schein, Inc.*(a) | | | 290,565 |
| 8,300 | | Lincare Holdings, Inc.* | | | 260,703 |
| | | | | |
| | | | | 551,268 |
| | | | | |
| | |
| | Healthcare-Products—0.6% | | | |
| 21,000 | | Covidien PLC (Ireland) | | | 884,520 |
| 1,600 | | Hospira, Inc.* | | | 71,424 |
| 3,700 | | Inverness Medical Innovations, Inc.* | | | 140,637 |
| | | | | |
| | | | | 1,096,581 |
| | | | | |
| | |
| | Hotels, Restaurants & Leisure—4.2% | | | |
| 9,370 | | Carnival Corp. (Panama) | | | 272,854 |
| 101,827 | | McDonald’s Corp. | | | 5,968,081 |
| 35,005 | | Wynn Resorts Ltd.*(a) | | | 1,897,971 |
| | | | | |
| | | | | 8,138,906 |
| | | | | |
| | |
| | Household Products—0.1% | | | |
| 2,500 | | Kimberly-Clark Corp. | | | 152,900 |
| | | | | |
| | |
| | Insurance—0.2% | | | |
| 8,200 | | Aflac, Inc. | | | 340,218 |
| | | | | |
See Notes to Financial Statements.
| | |
| THE TARGET PORTFOLIO TRUST | | 35 |
| | |
Large Capitalization Growth Portfolio (continued) | | Portfolio of Investments
As of October 31, 2009 |
| | | | | |
| SHARES | | DESCRIPTION | | VALUE (NOTE 1) |
| | COMMON STOCKS (continued) | | | |
| | |
| | Internet—1.8% | | | |
| 5,576 | | Baidu, Inc., ADR (Cayman Islands)*(a) | | $ | 2,107,282 |
| 82,908 | | Yahoo!, Inc.* | | | 1,318,237 |
| | | | | |
| | | | | 3,425,519 |
| | | | | |
| | |
| | Internet Software & Services—5.1% | | | |
| 15,413 | | Google, Inc. (Class A Stock)* | | | 8,263,217 |
| 57,470 | | Oracle Corp. | | | 1,212,617 |
| 2,730 | | Priceline.com, Inc.*(a) | | | 430,767 |
| 3,100 | | VeriSign, Inc.*(a) | | | 70,711 |
| | | | | |
| | | | | 9,977,312 |
| | | | | |
| | |
| | Media—0.8% | | | |
| 42,417 | | DIRECTV Group, Inc. (The)*(a) | | | 1,115,567 |
| 5,000 | | McGraw-Hill Cos., Inc. (The) | | | 143,900 |
| 10,600 | | Walt Disney Co. (The) | | | 290,122 |
| | | | | |
| | | | | 1,549,589 |
| | | | | |
| | |
| | Medical Supplies & Equipment—1.1% | | | |
| 14,870 | | Baxter International, Inc. | | | 803,872 |
| 16,190 | | Medtronic, Inc. | | | 577,983 |
| 20,260 | | St. Jude Medical, Inc.* | | | 690,461 |
| | | | | |
| | | | | 2,072,316 |
| | | | | |
| | |
| | Metals & Mining—1.7% | | | |
| 50,400 | | BHP Billiton PLC, ADR (United Kingdom)(a) | | | 2,731,680 |
| 2,790 | | Freeport-McMoRan Copper & Gold, Inc.* | | | 204,674 |
| 4,600 | | Precision Castparts Corp. | | | 439,438 |
| | | | | |
| | | | | 3,375,792 |
| | | | | |
| | |
| | Mining—0.2% | | | |
| 10,600 | | Gold Fields Ltd. ADR (South Africa) | | | 135,150 |
| 9,400 | | Teck Resources Ltd. (Canada)* | | | 271,848 |
| | | | | |
| | | | | 406,998 |
| | | | | |
| | |
| | Miscellaneous Manufacturers—0.7% | | | |
| 18,640 | | Danaher Corp. | | | 1,271,807 |
| | | | | |
| | |
| | Oil, Gas & Consumable Fuels—7.2% | | | |
| 5,500 | | Anadarko Petroleum Corp. | | | 335,115 |
| 5,386 | | EOG Resources, Inc. | | | 439,821 |
| 17,100 | | Halliburton Co. | | | 499,491 |
| 2,600 | | National Oilwell Varco, Inc.* | | | 106,574 |
| 6,400 | | Noble Energy, Inc. | | | 420,032 |
| 7,400 | | Occidental Petroleum Corp. | | | 561,512 |
| 87,796 | | Petroleo Brasileiro SA, ADR (Brazil) | | | 4,057,931 |
See Notes to Financial Statements.
| | |
| 36 | | THE TARGET PORTFOLIO TRUST |
| | | | | |
| SHARES | | DESCRIPTION | | VALUE (NOTE 1) |
| | COMMON STOCKS (continued) | | | |
| | |
| | Oil, Gas & Consumable Fuels (continued) | | | |
| 4,000 | | Schlumberger Ltd. (Netherlands) | | $ | 248,800 |
| 12,760 | | Southwestern Energy Co.* | | | 556,081 |
| 68,844 | | Transocean Ltd. (Switzerland)* | | | 5,776,700 |
| 3,700 | | Ultra Petroleum Corp.* | | | 179,635 |
| 13,400 | | Weatherford International Ltd.* | | | 234,902 |
| 13,767 | | XTO Energy, Inc. | | | 572,156 |
| | | | | |
| | | | | 13,988,750 |
| | | | | |
| | |
| | Pharmaceuticals—7.2% | | | |
| 104,828 | | Abbott Laboratories | | | 5,301,152 |
| 13,310 | | Allergan, Inc. | | | 748,687 |
| 16,710 | | Express Scripts, Inc.* | | | 1,335,463 |
| 73,225 | | Gilead Sciences, Inc.* | | | 3,115,724 |
| 11,480 | | Mead Johnson Nutrition Co. (Class A Stock) | | | 482,619 |
| 4,640 | | Medco Health Solutions, Inc.*(a) | | | 260,397 |
| 67,476 | | Merck & Co., Inc. | | | 2,087,033 |
| 11,900 | | Teva Pharmaceutical Industries Ltd., ADR (Israel) | | | 600,712 |
| | | | | |
| | | | | 13,931,787 |
| | | | | |
| | |
| | Restaurants—0.5% | | | |
| 7,400 | | Starbucks Corp.* | | | 140,452 |
| 23,554 | | Yum! Brands, Inc. | | | 776,104 |
| | | | | |
| | | | | 916,556 |
| | | | | |
| | |
| | Retail & Merchandising—3.2% | | | |
| 10,710 | | Colgate-Palmolive Co. | | | 842,127 |
| 12,480 | | CVS Caremark Corp. | | | 440,544 |
| 11,800 | | GameStop Corp. (Class A Stock)* | | | 286,622 |
| 38,620 | | Lowe’s Cos., Inc. | | | 755,794 |
| 10,040 | | Nordstrom, Inc. | | | 319,071 |
| 22,610 | | Target Corp. | | | 1,095,002 |
| 3,900 | | Tiffany & Co. | | | 153,231 |
| 15,620 | | TJX Cos., Inc. | | | 583,407 |
| 16,730 | | Wal-Mart Stores, Inc. | | | 831,147 |
| 25,800 | | Walgreen Co. | | | 976,014 |
| | | | | |
| | | | | 6,282,959 |
| | | | | |
| | |
| | Schools—0.2% | | | |
| 2,350 | | Apollo Group, Inc. (Class A Stock)* | | | 134,185 |
| 6,300 | | DeVry, Inc. | | | 348,327 |
| | | | | |
| | | | | 482,512 |
| | | | | |
| | |
| | Semiconductors—0.9% | | | |
| 44,890 | | Intel Corp. | | | 857,848 |
| 15,060 | | Marvell Technology Group Ltd. (Bermuda)*(a) | | | 206,623 |
| 1,552 | | Samsung Electronics Co., Ltd., GDR, 144A (South Korea)* | | | 474,560 |
See Notes to Financial Statements.
| | |
| THE TARGET PORTFOLIO TRUST | | 37 |
| | |
Large Capitalization Growth Portfolio (continued) | | Portfolio of Investments
As of October 31, 2009 |
| | | | | |
| SHARES | | DESCRIPTION | | VALUE (NOTE 1) |
| | COMMON STOCKS (continued) | | | |
| | |
| | Semiconductors (continued) | | | |
| 1,710 | | Silicon Laboratories, Inc.* | | $ | 71,649 |
| 9,300 | | Texas Instruments, Inc. | | | 218,085 |
| | | | | |
| | | | | 1,828,765 |
| | | | | |
| | |
| | Software—1.3% | | | |
| 53,801 | | Adobe Systems, Inc.* | | | 1,772,205 |
| 8,300 | | Check Point Software Technologies (Israel)* | | | 257,881 |
| 9,100 | | Citrix Systems, Inc.* | | | 334,516 |
| 5,100 | | Intuit, Inc.*(a) | | | 148,257 |
| 2,700 | | VMware, Inc.*(a) | | | 103,761 |
| | | | | |
| | | | | 2,616,620 |
| | | | | |
| | |
| | Specialty Retail—0.4% | | | |
| 10,500 | | Limited Brands, Inc. | | | 184,800 |
| 32,010 | | Staples, Inc. | | | 694,617 |
| | | | | |
| | | | | 879,417 |
| | | | | |
| | |
| | Telecommunications—5.1% | | | |
| 75,822 | | American Tower Corp. (Class A Stock)* | | | 2,791,766 |
| 94,310 | | Cisco Systems, Inc.* | | | 2,154,983 |
| 2,560 | | Nuance Communications, Inc.*(a) | | | 33,562 |
| 117,300 | | QUALCOMM, Inc. | | | 4,857,393 |
| | | | | |
| | | | | 9,837,704 |
| | | | | |
| | |
| | Textiles, Apparel & Luxury Goods—2.0% | | | |
| 63,112 | | NIKE, Inc. (Class B Stock)(a) | | | 3,924,304 |
| | | | | |
| | |
| | Tobacco—0.5% | | | |
| 19,080 | | Philip Morris International, Inc. | | | 903,629 |
| | | | | |
| | |
| | Transportation—3.4% | | | |
| 3,870 | | FedEx Corp. | | | 281,310 |
| 28,651 | | Norfolk Southern Corp. | | | 1,335,710 |
| 92,058 | | Union Pacific Corp.(a) | | | 5,076,078 |
| | | | | |
| | | | | 6,693,098 |
| | | | | |
| | |
| | Utilities—0.4% | | | |
| 26,280 | | AES Corp. (The)* | | | 343,480 |
| 21,900 | | NRG Energy, Inc.*(a) | | | 503,481 |
| | | | | |
| | | | | 846,961 |
| | | | | |
| | TOTAL COMMON STOCKS
(cost $153,284,225) | | | 182,693,114 |
| | | | | |
See Notes to Financial Statements.
| | |
| 38 | | THE TARGET PORTFOLIO TRUST |
| | | | | | |
| SHARES | | DESCRIPTION | | VALUE (NOTE 1) | |
| | PREFERRED STOCK—0.2% | | | | |
| | |
| | Financial—Bank & Trust | | | | |
| 19,825 | | Wells Fargo & Co., Series J, 8.00%
(cost $380,428) | | $ | 484,721 | |
| | | | | | |
| | TOTAL LONG-TERM INVESTMENTS
(cost $153,664,653) | | | 183,177,835 | |
| | | | | | |
| | SHORT-TERM INVESTMENT—22.8% | | | | |
| | |
| | AFFILIATED MONEY MARKET MUTUAL FUND | | | | |
| 44,241,424 | | Dryden Core Investment Fund—Taxable Money Market Series
(cost $44,241,424; includes $35,300,754 of cash collateral for securities on loan)(b)(w) | | | 44,241,424 | |
| | | | | | |
| | TOTAL INVESTMENTS(o)—117.1%
(cost $197,906,077; Note 5) | | | 227,419,259 | |
| | Liabilities in excess of other assets—(17.1%) | | | (33,200,441 | ) |
| | | | | | |
| | NET ASSETS—100% | | $ | 194,218,818 | |
| | | | | | |
The following abbreviations are used in Portfolio descriptions:
144A—Security was purchased pursuant to Rule 144A under the Securities Act of 1933 and may not be resold subject to that rule except to qualified institutional buyers. Unless otherwise noted,144A securities are deemed to be liquid.
ADR—American Depositary Receipt
GDR—Global Depositary Receipt
| * | Non-income producing security. |
| (a) | All or a portion of security is on loan. The aggregate market value of such securities is $33,352,021; cash collateral of $35,300,754 (included with liabilities) was received with which the Portfolio purchased highly liquid short-term investments. |
| (b) | Represents security, or a portion thereof, purchased with cash collateral received for securities on loan. |
| (o) | As of October 31, 2009, 1 security representing $432,744 and 0.2% of net assets was fair valued in accordance with the policies adopted by the Board of Trustees. |
| (w) | Prudential Investments LLC, the manager of the Portfolio, also serves as manager of the Dryden Core Investment Fund-Taxable Money Market Series. |
Various inputs are used in determining the value of the Portfolio’s investments. These inputs are summarized in the three broad levels listed below.
Level 1—quoted prices in active markets for identical securities
Level 2—other significant observable inputs (including quoted prices for similar securities, interest rates, prepayment speeds, credit risk, etc.)
Level 3—significant unobservable inputs (including the Portfolio’s own assumptions in determining the fair value of investments)
The following is a summary of the inputs used as of October 31, 2009 in valuing the Portfolio’s assets carried at fair value:
| | | | | | | | | |
Investments in Securities | | Level 1 | | Level 2 | | Level 3 |
Common Stocks | | $ | 182,260,370 | | $ | 432,744 | | $ | — |
Preferred Stock | | | 484,721 | | | — | | | — |
Affiliated Money Market Mutual Fund | | | 44,241,424 | | | — | | | — |
| | | | | | | | | |
| | $ | 226,986,515 | | $ | 432,744 | | $ | — |
Other Financial Instruments* | | | — | | | — | | | — |
| | | | | | | | | |
Total | | $ | 226,986,515 | | $ | 432,744 | | $ | — |
| | | | | | | | | |
See Notes to Financial Statements.
| | |
| THE TARGET PORTFOLIO TRUST | | 39 |
| | |
Large Capitalization Growth Portfolio (continued) | | Portfolio of Investments
As of October 31, 2009 |
| * | Other financial instruments are derivative instruments not reflected in the Portfolio of Investments, such as futures, forwards and swap contracts, which are valued at the unrealized appreciation/depreciation on the instrument. |
As of October 31, 2008 and October 31, 2009, the Portfolio did not use any significant unobservable inputs (Level 3) in determining the value of investments.
The industry classification of investments and liabilities in excess of other assets shown as a percentage of net assets as of October 31, 2009 were as follows:
| | | |
Affiliated Money Market Mutual Fund (18.2% represents investments purchased from securities on loan) | | 22.8 | % |
Financial Services | | 9.4 | |
Computer Hardware | | 7.7 | |
Oil, Gas & Consumable Fuels | | 7.2 | |
Pharmaceuticals | | 7.2 | |
Chemicals | | 6.6 | |
Internet Software & Services | | 5.1 | |
Telecommunications | | 5.1 | |
Financial—Bank & Trust | | 4.6 | |
Hotels, Restaurants & Leisure | | 4.2 | |
Transportation | | 3.4 | |
Retail & Merchandising | | 3.2 | |
Computer Services & Software | | 3.0 | |
Aerospace & Defense | | 2.3 | |
Business Services | | 2.1 | |
Textiles, Apparel & Luxury Goods | | 2.0 | |
Internet | | 1.8 | |
Metals & Mining | | 1.7 | |
Software | | 1.3 | |
Beverages | | 1.2 | |
Medical Supplies & Equipment | | 1.1 | |
Commercial Banks | | 1.1 | |
Diversified Financial Services | | 1.1 | |
Communication Equipment | | 1.0 | |
Semiconductors | | 0.9 | |
Consumer Finance | | 0.9 | |
Media | | 0.8 | |
Miscellaneous Manufacturers | | 0.7 | |
Biotechnology | | 0.6 | |
Healthcare-Products | | 0.6 | |
Clothing & Apparel | | 0.6 | |
Electronic Components | | 0.5 | |
Restaurants | | 0.5 | |
Tobacco | | 0.5 | |
Specialty Retail | | 0.4 | |
Utilities | | 0.4 | |
Commercial Services | | 0.4 | |
Diversified | | 0.4 | |
Computers & Peripherals | | 0.4 | |
See Notes to Financial Statements.
| | |
| 40 | | THE TARGET PORTFOLIO TRUST |
| | | |
Industry (cont’d.) | | | |
Food Products | | 0.4 | % |
Entertainment & Leisure | | 0.3 | |
Agriculture/Heavy Equipment | | 0.3 | |
Healthcare Services | | 0.3 | |
Schools | | 0.2 | |
Mining | | 0.2 | |
Broadcasting | | 0.2 | |
Insurance | | 0.2 | |
Containers & Packaging | | 0.1 | |
Household Products | | 0.1 | |
| | | |
| | 117.1 | |
Liabilities in excess of other assets | | (17.1 | ) |
| | | |
| | 100.0 | % |
| | | |
See Notes to Financial Statements.
| | |
| THE TARGET PORTFOLIO TRUST | | 41 |
| | |
Large Capitalization Value Portfolio | | Portfolio of Investments
As of October 31, 2009 |
| | | | | |
| SHARES | | DESCRIPTION | | VALUE (NOTE 1) |
| | LONG-TERM INVESTMENTS—98.6% | | | |
| | |
| | COMMON STOCKS | | | |
| | |
| | Aerospace & Defense—4.0% | | | |
| 5,100 | | Boeing Co. (The) | | $ | 243,780 |
| 29,800 | | Embraer-Empresa Brasileira de Aeronautica SA, ADR (Brazil)* | | | 603,450 |
| 24,036 | | General Dynamics Corp. | | | 1,507,057 |
| 14,700 | | Lockheed Martin Corp. | | | 1,011,213 |
| 52,600 | | Northrop Grumman Corp. | | | 2,636,838 |
| 32,964 | | United Technologies Corp. | | | 2,025,638 |
| | | | | |
| | | | | 8,027,976 |
| | | | | |
| | |
| | Air Freight & Couriers—0.2% | | | |
| 6,700 | | FedEx Corp. | | | 487,023 |
| | | | | |
| | |
| | Auto Components—0.2% | | | |
| 20,200 | | Johnson Controls, Inc. | | | 483,184 |
| | | | | |
| | |
| | Automobile—0.4% | | | |
| 30,200 | | Harley-Davidson, Inc.(a) | | | 752,584 |
| | | | | |
| | |
| | Banks—0.3% | | | |
| 13,735 | | Northern Trust Corp. | | | 690,184 |
| | | | | |
| | |
| | Beverages—0.8% | | | |
| 10,700 | | Molson Coors Brewing Co. (Class B Stock)(a) | | | 523,979 |
| 18,885 | | PepsiCo, Inc. | | | 1,143,487 |
| | | | | |
| | | | | 1,667,466 |
| | | | | |
| | |
| | Biotechnology—0.4% | | | |
| 13,735 | | Amgen, Inc.* | | | 737,982 |
| | | | | |
| | |
| | Business Services—0.6% | | | |
| 5,151 | | MasterCard, Inc. (Class A Stock)(a) | | | 1,128,172 |
| | | | | |
| | |
| | Capital Markets—0.5% | | | |
| 18,100 | | Bank of New York Mellon Corp. | | | 482,546 |
| 15,100 | | Morgan Stanley | | | 485,012 |
| | | | | |
| | | | | 967,558 |
| | | | | |
| | |
| | Chemicals—1.4% | | | |
| 10,301 | | Air Products & Chemicals, Inc. | | | 794,516 |
| 9,400 | | Eastman Chemical Co. | | | 493,594 |
| 26,000 | | PPG Industries, Inc. | | | 1,467,180 |
| | | | | |
| | | | | 2,755,290 |
| | | | | |
| | |
| | Commercial Banks—6.0% | | | |
| 307,836 | | Bank of America Corp. | | | 4,488,249 |
| 80,977 | | Fifth Third Bancorp(a) | | | 723,934 |
See Notes to Financial Statements.
| | |
| 42 | | THE TARGET PORTFOLIO TRUST |
| | | | | |
| SHARES | | DESCRIPTION | | VALUE (NOTE 1) |
| | COMMON STOCKS (continued) | | | |
| | |
| | Commercial Banks (continued) | | | |
| 95,100 | | KeyCorp | | $ | 512,589 |
| 92,500 | | Regions Financial Corp. | | | 447,700 |
| 41,204 | | U.S. Bancorp | | | 956,757 |
| 171,070 | | Wells Fargo & Co. | | | 4,707,847 |
| | | | | |
| | | | | 11,837,076 |
| | | | | |
| | |
| | Commercial Services—1.2% | | | |
| 82,372 | | Waste Management, Inc. | | | 2,461,275 |
| | | | | |
| | |
| | Computers & Peripherals—2.6% | | | |
| 55,738 | | Hewlett-Packard Co. | | | 2,645,325 |
| 20,818 | | International Business Machines Corp. | | | 2,510,859 |
| | | | | |
| | | | | 5,156,184 |
| | | | | |
| | |
| | Diversified Financial Services—6.1% | | | |
| 22,662 | | American Express Co. | | | 789,544 |
| 37,771 | | Capital One Financial Corp. | | | 1,382,419 |
| 229,838 | | Citigroup, Inc. | | | 940,037 |
| 16,939 | | Goldman Sachs Group, Inc. (The) | | | 2,882,510 |
| 144,740 | | JPMorgan Chase & Co. | | | 6,045,790 |
| | | | | |
| | | | | 12,040,300 |
| | | | | |
| | |
| | Diversified Machinery—0.2% | | | |
| 9,942 | | Deere & Co. | | | 452,858 |
| | | | | |
| | |
| | Diversified Telecommunication Services—3.8% | | | |
| 139,175 | | AT&T, Inc. | | | 3,572,622 |
| 15,900 | | CenturyTel, Inc.(a) | | | 516,114 |
| 116,007 | | Verizon Communications, Inc. | | | 3,432,647 |
| | | | | |
| | | | | 7,521,383 |
| | | | | |
| | |
| | Electric—0.6% | | | |
| 40,459 | | Public Service Enterprise Group, Inc. | | | 1,205,678 |
| | | | | |
| | |
| | Electric Utilities—3.9% | | | |
| 29,734 | | American Electric Power Co., Inc. | | | 898,562 |
| 71,700 | | Edison International | | | 2,281,494 |
| 39,100 | | Exelon Corp. | | | 1,836,136 |
| 19,648 | | FirstEnergy Corp. | | | 850,365 |
| 20,600 | | FPL Group, Inc. | | | 1,011,460 |
| 21,178 | | PG&E Corp. | | | 865,968 |
| | | | | |
| | | | | 7,743,985 |
| | | | | |
| | |
| | Electrical Equipment—0.5% | | | |
| 24,987 | | Emerson Electric Co. | | | 943,259 |
| | | | | |
| | |
| | Electronic Components & Equipment—0.3% | | | |
| 12,018 | | Thermo Fisher Scientific, Inc.* | �� | | 540,810 |
| | | | | |
See Notes to Financial Statements.
| | |
| THE TARGET PORTFOLIO TRUST | | 43 |
| | |
Large Capitalization Value Portfolio (continued) | | Portfolio of Investments
As of October 31, 2009 |
| | | | | |
| SHARES | | DESCRIPTION | | VALUE (NOTE 1) |
| | COMMON STOCKS (continued) | | | |
| | |
| | Electronic Equipment & Instruments—0.6% | | | |
| 60,525 | | Tyco Electronics Ltd. (Switzerland) | | $ | 1,286,156 |
| | | | | |
| | |
| | Energy Equipment & Services—1.6% | | | |
| 15,200 | | Diamond Offshore Drilling, Inc.(a) | | | 1,447,800 |
| 60,860 | | Halliburton Co. | | | 1,777,721 |
| | | | | |
| | | | | 3,225,521 |
| | | | | |
| | |
| | Financial—Bank & Trust—1.7% | | | |
| 67,138 | | PNC Financial Services Group, Inc. | | | 3,285,734 |
| | | | | |
| | |
| | Food & Drug Retailing—0.9% | | | |
| 51,578 | | CVS Caremark Corp. | | | 1,820,703 |
| | | | | |
| | |
| | Food & Staples Retailing—1.7% | | | |
| 109,400 | | Safeway, Inc. | | | 2,442,902 |
| 19,915 | | Wal-Mart Stores, Inc. | | | 989,377 |
| | | | | |
| | | | | 3,432,279 |
| | | | | |
| | |
| | Food Products—1.0% | | | |
| 41,092 | | Nestle SA, ADR (Switzerland) | | | 1,911,600 |
| | | | | |
| | |
| | Healthcare Equipment & Supplies—0.5% | | | |
| 65,240 | | Boston Scientific Corp.* | | | 529,749 |
| 14,300 | | Medtronic, Inc. | | | 510,510 |
| | | | | |
| | | | | 1,040,259 |
| | | | | |
| | |
| | Healthcare Products—0.3% | | | |
| 13,041 | | Covidien PLC (Ireland) | | | 549,287 |
| | | | | |
| | |
| | Healthcare Providers & Services—1.1% | | | |
| 37,300 | | Cardinal Health, Inc. | | | 1,057,082 |
| 18,900 | | CIGNA Corp. | | | 526,176 |
| 19,915 | | UnitedHealth Group, Inc. | | | 516,794 |
| | | | | |
| | | | | 2,100,052 |
| | | | | |
| | |
| | Hotels, Restaurants & Leisure—1.7% | | | |
| 22,319 | | Carnival Corp. (Panama) | | | 649,929 |
| 45,154 | | McDonald’s Corp. | | | 2,646,476 |
| | | | | |
| | | | | 3,296,405 |
| | | | | |
| | |
| | Household Durables—0.4% | | | |
| 18,200 | | Fortune Brands, Inc. | | | 708,890 |
| | | | | |
| | |
| | Household Products—0.5% | | | |
| 16,700 | | Kimberly-Clark Corp. | | | 1,021,372 |
| | | | | |
See Notes to Financial Statements.
| | |
| 44 | | THE TARGET PORTFOLIO TRUST |
| | | | | |
| SHARES | | DESCRIPTION | | VALUE (NOTE 1) |
| | COMMON STOCKS (continued) | | | |
| | |
| | Industrial Conglomerates—1.5% | | | |
| 7,000 | | 3M Co. | | $ | 514,990 |
| 73,825 | | General Electric Co. | | | 1,052,745 |
| 42,606 | | Tyco International Ltd. (Switzerland) | | | 1,429,431 |
| | | | | |
| | | | | 2,997,166 |
| | | | | |
| | |
| | Insurance—6.5% | | | |
| 12,545 | | ACE Ltd. (Switzerland)* | | | 644,311 |
| 68,900 | | Allstate Corp. (The) | | | 2,037,373 |
| 68,700 | | Genworth Financial, Inc. (Class A Stock)* | | | 729,594 |
| 53,736 | | Lincoln National Corp. | | | 1,280,529 |
| 14,900 | | Loews Corp. | | | 493,190 |
| 21,400 | | Marsh & McLennan Cos., Inc. | | | 502,044 |
| 110,004 | | MetLife, Inc. | | | 3,743,436 |
| 43,415 | | Travelers Cos., Inc. (The) | | | 2,161,633 |
| 18,000 | | Unum Group | | | 359,100 |
| 55,400 | | XL Capital Ltd. (Class A Stock) (Cayman Islands) | | | 909,114 |
| | | | | |
| | | | | 12,860,324 |
| | | | | |
| | |
| | Machinery—1.6% | | | |
| 8,523 | | Caterpillar, Inc. | | | 469,277 |
| 23,100 | | Cummins, Inc. | | | 994,686 |
| 46,603 | | PACCAR, Inc.(a) | | | 1,743,418 |
| | | | | |
| | | | | 3,207,381 |
| | | | | |
| | |
| | Media—1.6% | | | |
| 40,900 | | CBS Corp. (Class B Stock) | | | 481,393 |
| 80,800 | | Comcast Corp. (Class A Stock) | | | 1,132,816 |
| 33,000 | | Time Warner, Inc. | | | 993,960 |
| 22,319 | | Walt Disney Co. (The) | | | 610,871 |
| | | | | |
| | | | | 3,219,040 |
| | | | | |
| | |
| | Metals & Mining—1.6% | | | |
| 18,885 | | Freeport-McMoRan Copper & Gold, Inc.* | | | 1,385,403 |
| 27,595 | | Nucor Corp. | | | 1,099,661 |
| 15,108 | | Peabody Energy Corp. | | | 598,126 |
| | | | | |
| | | | | 3,083,190 |
| | | | | |
| | |
| | Mining—0.6% | | | |
| 17,169 | | BHP Billiton Ltd., ADR (Australia)(a) | | | 1,125,943 |
| | | | | |
| | |
| | Multi-Utilities—0.5% | | | |
| 15,500 | | Dominion Resources, Inc. | | | 528,395 |
| 12,900 | | Wisconsin Energy Corp. | | | 563,343 |
| | | | | |
| | | | | 1,091,738 |
| | | | | |
| | |
| | Multiline Retail—0.5% | | | |
| 28,600 | | JCPenney Co., Inc. | | | 947,518 |
| | | | | |
See Notes to Financial Statements.
| | |
| THE TARGET PORTFOLIO TRUST | | 45 |
| | |
Large Capitalization Value Portfolio (continued) | | Portfolio of Investments
As of October 31, 2009 |
| | | | | |
| SHARES | | DESCRIPTION | | VALUE (NOTE 1) |
| | COMMON STOCKS (continued) | | | |
| | |
| | Office Electronics—0.5% | | | |
| 131,200 | | Xerox Corp.(a) | | $ | 986,624 |
| | | | | |
| | |
| | Oil, Gas & Consumable Fuels—15.1% | | | |
| 37,771 | | Anadarko Petroleum Corp. | | | 2,301,387 |
| 36,202 | | Apache Corp. | | | 3,407,332 |
| 63,954 | | Chevron Corp. | | | 4,895,039 |
| 60,700 | | ConocoPhillips | | | 3,045,926 |
| 36,741 | | Exxon Mobil Corp. | | | 2,633,227 |
| 37,771 | | Hess Corp. | | | 2,067,585 |
| 46,000 | | Marathon Oil Corp. | | | 1,470,620 |
| 33,307 | | Occidental Petroleum Corp. | | | 2,527,335 |
| 42,500 | | Royal Dutch Shell PLC, ADR (Class B Stock) (United Kingdom) | | | 2,471,800 |
| 25,990 | | Total SA (France) | | | 1,561,219 |
| 13,391 | | Transocean Ltd. (Switzerland)* | | | 1,123,639 |
| 54,200 | | Valero Energy Corp. | | | 981,020 |
| 37,535 | | XTO Energy, Inc. | | | 1,559,955 |
| | | | | |
| | | | | 30,046,084 |
| | | | | |
| | |
| | Pharmaceuticals—7.6% | | | |
| 30,903 | | Abbott Laboratories | | | 1,562,765 |
| 92,837 | | Bristol-Myers Squibb Co. | | | 2,023,847 |
| 94,900 | | Eli Lilly & Co. | | | 3,227,549 |
| 16,200 | | Johnson & Johnson | | | 956,610 |
| 73,538 | | Merck & Co., Inc. | | | 2,274,530 |
| 260,530 | | Pfizer, Inc. | | | 4,436,826 |
| 18,100 | | Schering-Plough Corp. | | | 510,420 |
| | | | | |
| | | | | 14,992,547 |
| | | | | |
| | |
| | Real Estate Investment Trusts—2.5% | | | |
| 90,500 | | Annaly Capital Management, Inc. | | | 1,530,355 |
| 13,735 | | AvalonBay Communities, Inc.(a) | | | 944,693 |
| 9,271 | | Boston Properties, Inc.(a) | | | 563,399 |
| 20,602 | | Equity Residential | | | 594,986 |
| 7,900 | | Simon Property Group, Inc. | | | 536,331 |
| 12,018 | | Vornado Realty Trust(a) | | | 715,792 |
| | | | | |
| | | | | 4,885,556 |
| | | | | |
| | |
| | Retail & Merchandising—1.9% | | | |
| 51,506 | | Best Buy Co., Inc. | | | 1,966,499 |
| 23,006 | | Target Corp. | | | 1,114,180 |
| 20,602 | | TJX Cos., Inc. | | | 769,485 |
| | | | | |
| | | | | 3,850,164 |
| | | | | |
| | |
| | Road & Rail—1.0% | | | |
| 26,115 | | Burlington Northern Santa Fe Corp. | | | 1,966,982 |
| | | | | |
See Notes to Financial Statements.
| | |
| 46 | | THE TARGET PORTFOLIO TRUST |
| | | | | | |
| SHARES | | DESCRIPTION | | VALUE (NOTE 1) | |
| | COMMON STOCKS (continued) | | | | |
| | |
| | Semiconductors & Semiconductor Equipment—0.7% | | | | |
| 49,102 | | Applied Materials, Inc. | | $ | 599,045 | |
| 42,921 | | Intel Corp. | | | 820,220 | |
| | | | | | |
| | | | | 1,419,265 | |
| | | | | | |
| | |
| | Software—3.3% | | | | |
| 6,700 | | BMC Software, Inc.* | | | 248,972 | |
| 97,358 | | CA, Inc. | | | 2,036,729 | |
| 133,135 | | Microsoft Corp. | | | 3,691,834 | |
| 25,066 | | Oracle Corp. | | | 528,893 | |
| | | | | | |
| | | | | 6,506,428 | |
| | | | | | |
| | |
| | Specialty Retail—2.3% | | | | |
| 35,100 | | Gap, Inc. (The) | | | 749,034 | |
| 68,811 | | Home Depot, Inc. (The) | | | 1,726,468 | |
| 54,100 | | Limited Brands, Inc. | | | 952,160 | |
| 54,939 | | Staples, Inc. | | | 1,192,176 | |
| | | | | | |
| | | | | 4,619,838 | |
| | | | | | |
| | |
| | Telecommunications—0.7% | | | | |
| 32,620 | | Cisco Systems, Inc.* | | | 745,367 | |
| 61,806 | | Telefonaktiebolaget LM Ericsson, ADR (Sweden)(a) | | | 642,782 | |
| | | | | | |
| | | | | 1,388,149 | |
| | | | | | |
| | |
| | Textiles, Apparel & Luxury Goods—1.0% | | | | |
| 35,500 | | Jones Apparel Group, Inc. | | | 635,095 | |
| 20,602 | | NIKE, Inc. (Class B Stock)(a) | | | 1,281,032 | |
| | | | | | |
| | | | | 1,916,127 | |
| | | | | | |
| | |
| | Tobacco—0.9% | | | | |
| 58,600 | | Altria Group, Inc. | | | 1,061,246 | |
| 14,900 | | Philip Morris International, Inc. | | | 705,664 | |
| | | | | | |
| | | | | 1,766,910 | |
| | | | | | |
| | |
| | Wireless Telecommunication Services—0.7% | | | | |
| 66,900 | | Vodafone Group PLC, ADR (United Kingdom)(a) | | | 1,484,511 | |
| | | | | | |
| | TOTAL LONG-TERM INVESTMENTS
(cost $181,181,216) | | | 195,639,970 | |
| | | | | | |
| | |
| | SHORT-TERM INVESTMENT—15.8% | | | | |
| | |
| | AFFILIATED MONEY MARKET MUTUAL FUND | | | | |
| 31,319,177 | | Dryden Core Investment Fund—Taxable Money Market Series
(cost $31,319,177; includes $12,438,708 of cash collateral for securities on loan)(b)(w) | | | 31,319,177 | |
| | | | | | |
| | TOTAL INVESTMENTS—114.4%
(cost $212,500,393; Note 5) | | | 226,959,147 | |
| | Liabilities in excess of other assets—(14.4)% | | | (28,481,273 | ) |
| | | | | | |
| | NET ASSETS—100% | | $ | 198,477,874 | |
| | | | | | |
See Notes to Financial Statements.
| | |
| THE TARGET PORTFOLIO TRUST | | 47 |
| | |
Large Capitalization Value Portfolio (continued) | | Portfolio of Investments
As of October 31, 2009 |
The following abbreviation is used in Portfolio descriptions:
| ADR—American | Depositary Receipt |
| * | Non-income producing security. |
| (a) | All or a portion of security is on loan. The aggregate market value of such securities is $11,691,870; cash collateral of $12,438,708 (included with liabilities) was received with which the Portfolio purchased highly liquid short-term investments. |
| (b) | Represents security, or a portion thereof, purchased with cash collateral received for securities on loan. |
| (w) | Prudential Investments LLC, the manager of the Portfolio, also serves as manager of the Dryden Core Investment Fund-Taxable Money Market Series. |
Various inputs are used in determining the value of the Portfolio’s investments. These inputs are summarized in the three broad levels listed below.
Level 1—quoted prices in active markets for identical securities
Level 2—other significant observable inputs (including quoted prices for similar securities, interest rates, prepayment speeds, credit risk, etc.)
Level 3—significant unobservable inputs (including the Portfolio’s own assumptions in determining the fair value of investments)
The following is a summary of the inputs used as of October 31, 2009 in valuing the Portfolio’s assets carried at fair value:
| | | | | | | | | |
Investments in Securities | | Level 1 | | Level 2 | | Level 3 |
Common Stocks | | $ | 195,639,970 | | $ | — | | $ | — |
Affiliated Money Market Mutual Fund | | | 31,319,177 | | | — | | | — |
| | | | | | | | | |
| | $ | 226,959,147 | | $ | — | | $ | — |
Other Financial Instruments* | | | — | | | — | | | — |
| | | | | | | | | |
Total | | $ | 226,959,147 | | $ | — | | $ | — |
| | | | | | | | | |
| * | Other financial instruments are derivative instruments not reflected in the Portfolio of Investments, such as futures, forwards and swap contracts, which are valued at the unrealized appreciation/depreciation on the instrument. |
As of October 31, 2008 and October 31, 2009, the Portfolio did not use any significant unobservable inputs (Level 3) in determining the value of investments.
The industry classification of investments and liabilities in excess of other assets shown as a percentage of net assets as of October 31, 2009 were as follows:
| | | |
Affiliated Money Market Mutual Fund (6.3% represents investments purchased from securities on loan) | | 15.8 | % |
Oil, Gas & Consumable Fuels | | 15.1 | |
Pharmaceuticals | | 7.6 | |
Insurance | | 6.5 | |
Diversified Financial Services | | 6.1 | |
Commercial Banks | | 6.0 | |
Aerospace & Defense | | 4.0 | |
Electric Utilities | | 3.9 | |
Diversified Telecommunication Services | | 3.8 | |
Software | | 3.3 | |
Computers & Peripherals | | 2.6 | |
Real Estate Investment Trusts | | 2.5 | |
Specialty Retail | | 2.3 | |
See Notes to Financial Statements.
| | |
| 48 | | THE TARGET PORTFOLIO TRUST |
| | | |
Industry (cont’d.) | | | |
Retail & Merchandising | | 1.9 | % |
Food & Staples Retailing | | 1.7 | |
Hotels, Restaurants & Leisure | | 1.7 | |
Financial—Bank & Trust | | 1.7 | |
Energy Equipment & Services | | 1.6 | |
Media | | 1.6 | |
Machinery | | 1.6 | |
Metals & Mining | | 1.6 | |
Industrial Conglomerates | | 1.5 | |
Chemicals | | 1.4 | |
Commercial Services | | 1.2 | |
Healthcare Providers & Services | | 1.1 | |
Road & Rail | | 1.0 | |
Textiles, Apparel & Luxury Goods | | 1.0 | |
Food Products | | 1.0 | |
Food & Drug Retailing | | 0.9 | |
Tobacco | | 0.9 | |
Beverages | | 0.8 | |
Wireless Telecommunication Services | | 0.7 | |
Semiconductors & Semiconductor Equipment | | 0.7 | |
Telecommunications | | 0.7 | |
Electronic Equipment & Instruments | | 0.6 | |
Electric | | 0.6 | |
Business Services | | 0.6 | |
Mining | | 0.6 | |
Multi-Utilities | | 0.5 | |
Healthcare Equipment & Supplies | | 0.5 | |
Household Products | | 0.5 | |
Office Electronics | | 0.5 | |
Capital Markets | | 0.5 | |
Multiline Retail | | 0.5 | |
Electrical Equipment | | 0.5 | |
Automobile | | 0.4 | |
Biotechnology | | 0.4 | |
Household Durables | | 0.4 | |
Banks | | 0.3 | |
Healthcare Products | | 0.3 | |
Electronic Components & Equipment | | 0.3 | |
Air Freight & Couriers | | 0.2 | |
Auto Components | | 0.2 | |
Diversified Machinery | | 0.2 | |
| | | |
| | 114.4 | |
Liabilities in excess of other assets | | (14.4 | ) |
| | | |
| | 100.0 | % |
| | | |
See Notes to Financial Statements.
| | |
| THE TARGET PORTFOLIO TRUST | | 49 |
| | |
Small Capitalization Growth Portfolio | | Portfolio of Investments
As of October 31, 2009 |
| | | | | |
| SHARES | | DESCRIPTION | | VALUE (NOTE 1) |
| | LONG-TERM INVESTMENTS—99.3% | | | |
| | |
| | COMMON STOCKS | | | |
| | |
| | Aerospace & Defense—0.6% | | | |
| 13,686 | | Cubic Corp. | | $ | 475,041 |
| | | | | |
| | |
| | Airlines—0.7% | | | |
| 6,408 | | Copa Holdings, SA (Panama) | | | 270,610 |
| 31,625 | | Gol Linhas Aereas Inteligentes SA ADR (Brazil)(a) | | | 324,789 |
| | | | | |
| | | | | 595,399 |
| | | | | |
| | |
| | Auto Parts & Equipment—0.6% | | | |
| 13,980 | | Fuel Systems Solutions, Inc.*(a) | | | 457,705 |
| | | | | |
| | |
| | Banks—0.3% | | | |
| 6,850 | | UMB Financial Corp. | | | 272,425 |
| | | | | |
| | |
| | Beverages—0.7% | | | |
| 8,410 | | Green Mountain Coffee Roasters, Inc.*(a) | | | 559,686 |
| | | | | |
| | |
| | Biotechnology—1.2% | | | |
| 3,320 | | Bio-Rad Laboratories, Inc. (Class A Stock)* | | | 296,775 |
| 16,144 | | Martek Biosciences Corp.* | | | 289,946 |
| 13,806 | | Regeneron Pharmaceuticals, Inc.* | | | 216,754 |
| 20,101 | | Seattle Genetics, Inc.* | | | 182,517 |
| | | | | |
| | | | | 985,992 |
| | | | | |
| | |
| | Building Materials—0.5% | | | |
| 12,205 | | Texas Industries, Inc. | | | 406,304 |
| | | | | |
| | |
| | Chemicals—3.2% | | | |
| 133,321 | | Huntsman Corp. | | | 1,059,902 |
| 6,910 | | NewMarket Corp. | | | 646,085 |
| 27,645 | | Terra Industries, Inc. | | | 878,282 |
| | | | | |
| | | | | 2,584,269 |
| | | | | |
| | |
| | Clothing & Apparel—2.5% | | | |
| 11,720 | | Gymboree Corp.* | | | 498,920 |
| 60,210 | | True Religion Apparel, Inc.*(a) | | | 1,551,612 |
| | | | | |
| | | | | 2,050,532 |
| | | | | |
| | |
| | Commercial Services—7.7% | | | |
| 11,363 | | Chemed Corp. | | | 514,971 |
| 25,983 | | Coinstar, Inc.*(a) | | | 824,700 |
| 70,620 | | GEO Group, Inc. (The)* | | | 1,493,613 |
| 10,499 | | HMS Holdings Corp.* | | | 450,722 |
| 20,926 | | Lincoln Educational Services Corp.* | | | 414,753 |
| 26,135 | | Monster Worldwide, Inc.*(a) | | | 379,480 |
See Notes to Financial Statements.
| | |
| 50 | | THE TARGET PORTFOLIO TRUST |
| | | | | |
| SHARES | | DESCRIPTION | | VALUE (NOTE 1) |
| | COMMON STOCKS (continued) | | | |
| | |
| | Commercial Services (continued) | | | |
| 35,442 | | Ritchie Bros Auctioneers, Inc. (Canada)(a) | | $ | 776,889 |
| 27,645 | | Sotheby’s(a) | | | 438,450 |
| 5,832 | | VistaPrint NV (Netherlands)*(a) | | | 297,724 |
| 21,070 | | Waste Connections, Inc.* | | | 662,230 |
| | | | | |
| | | | | 6,253,532 |
| | | | | |
| | |
| | Computer Hardware—0.1% | | | |
| 8,115 | | Radiant Systems, Inc.* | | | 79,852 |
| | | | | |
| | |
| | Computer Networking—0.7% | | | |
| 23,926 | | Atheros Communications*(a) | | | 589,058 |
| | | | | |
| | |
| | Computer Services & Software—5.4% | | | |
| 21,655 | | ANSYS, Inc.* | | | 878,760 |
| 28,346 | | Arcsight, Inc.*(a) | | | 700,713 |
| 43,343 | | Compellent Technologies, Inc.*(a) | | | 794,911 |
| 9,997 | | Mantech International Corp. (Class A Stock)* | | | 438,468 |
| 44,058 | | Netezza Corp.*(a) | | | 407,096 |
| 20,870 | | Solera Holdings, Inc. | | | 672,431 |
| 20,955 | | Sykes Enterprises, Inc.* | | | 497,472 |
| | | | | |
| | | | | 4,389,851 |
| | | | | |
| | |
| | Distribution/Wholesale—1.1% | | | |
| 58,055 | | Brightpoint, Inc.* | | | 427,865 |
| 11,194 | | Owens & Minor, Inc. | | | 457,723 |
| | | | | |
| | | | | 885,588 |
| | | | | |
| | |
| | Diversified Financial Services—0.5% | | | |
| 23,196 | | Duff & Phelps Corp. | | | 398,739 |
| | | | | |
| | |
| | Education—1.7% | | | |
| 10,077 | | American Public Education, Inc.* | | | 321,456 |
| 14,495 | | Blackboard, Inc.*(a) | | | 514,138 |
| 8,178 | | Capella Education Co.*(a) | | | 563,464 |
| | | | | |
| | | | | 1,399,058 |
| | | | | |
| | |
| | Electrical Equipment—0.2% | | | |
| 11,070 | | Advanced Energy Industries, Inc.*(a) | | | 135,165 |
| | | | | |
| | |
| | Electronic Components—3.7% | | | |
| 29,485 | | Coherent, Inc.* | | | 740,958 |
| 18,975 | | FEI Co.* | | | 451,795 |
| 19,620 | | OYO Geospace Corp.*(a) | | | 515,025 |
| 18,910 | | Plexus Corp.* | | | 478,423 |
| 40,414 | | Universal Electronics, Inc.* | | | 832,528 |
| | | | | |
| | | | | 3,018,729 |
| | | | | |
| | |
| | Electronic Components & Equipment—1.9% | | | |
| 18,230 | | A123 Systems, Inc.*(a) | | | 358,402 |
| 12,165 | | Canadian Solar, Inc. (Canada)* | | | 177,366 |
See Notes to Financial Statements.
| | |
| THE TARGET PORTFOLIO TRUST | | 51 |
| | |
Small Capitalization Growth Portfolio (continued) | | Portfolio of Investments
As of October 31, 2009 |
| | | | | |
| SHARES | | DESCRIPTION | | VALUE (NOTE 1) |
| | COMMON STOCKS (continued) | | | |
| | |
| | Electronic Components & Equipment (continued) | | | |
| 21,310 | | EnerSys* | | $ | 470,951 |
| 37,490 | | GrafTech International Ltd.* | | | 506,115 |
| | | | | |
| | | | | 1,512,834 |
| | | | | |
| | |
| | Energy-Alternate Sources—0.5% | | | |
| 13,565 | | Trina Solar Ltd., ADR (Cayman Islands)*(a) | | | 440,591 |
| | | | | |
| | |
| | Engineering/Construction—1.1% | | | |
| 25,120 | | Insituform Technologies, Inc. (Class A Stock)* | | | 532,544 |
| 20,775 | | Orion Marine Group, Inc.* | | | 395,556 |
| | | | | |
| | | | | 928,100 |
| | | | | |
| | |
| | Entertainment & Leisure—3.4% | | | |
| 36,793 | | Bally Technologies, Inc.*(a) | | | 1,449,276 |
| 96,570 | | Shuffle Master, Inc.* | | | 754,212 |
| 13,843 | | WMS Industries, Inc.* | | | 553,443 |
| | | | | |
| | | | | 2,756,931 |
| | | | | |
| | |
| | Environmental Services—1.8% | | | |
| 25,438 | | Calgon Carbon Corp.* | | | 402,938 |
| 8,960 | | Clean Harbors, Inc.* | | | 505,792 |
| 20,918 | | Tetra Tech, Inc.* | | | 538,220 |
| | | | | |
| | | | | 1,446,950 |
| | | | | |
| | |
| | Farming & Agriculture—0.6% | | | |
| 15,690 | | Andersons, Inc. (The) | | | 486,861 |
| | | | | |
| | |
| | Financial—Bank & Trust—0.7% | | | |
| 92,270 | | Broadpoint Gleacher Securities, Inc.* | | | 587,760 |
| | | | | |
| | |
| | Financial Services—0.2% | | | |
| 34,985 | | First Commonwealth Financial Corp. | | | 183,671 |
| | | | | |
| | |
| | Hand/Machine Tools—0.8% | | | |
| 12,935 | | Regal-Beloit Corp.(a) | | | 606,393 |
| | | | | |
| | |
| | Healthcare Services—7.0% | | | |
| 11,300 | | Addus HomeCare Corp.* | | | 103,395 |
| 19,733 | | Almost Family, Inc.*(a) | | | 598,896 |
| 15,352 | | Amedisys, Inc.*(a) | | | 610,856 |
| 25,705 | | Centene Corp.* | | | 458,320 |
| 17,350 | | Emergency Medical Services Corp. (Class A Stock)* | | | 833,147 |
| 32,875 | | Genoptix, Inc.*(a) | | | 1,143,721 |
| 23,219 | | ICON PLC, ADR (Ireland)*(a) | | | 573,509 |
| 16,105 | | LHC Group, Inc.* | | | 449,491 |
| 16,055 | | Lincare Holdings, Inc.*(a) | | | 504,288 |
See Notes to Financial Statements.
| | |
| 52 | | THE TARGET PORTFOLIO TRUST |
| | | | | |
| SHARES | | DESCRIPTION | | VALUE (NOTE 1) |
| | COMMON STOCKS (continued) | | | |
| | |
| | Healthcare Services (continued) | | | |
| 19,204 | | Psychiatric Solutions, Inc.*(a) | | $ | 396,371 |
| | | | | |
| | | | | 5,671,994 |
| | | | | |
| | |
| | Healthcare Products—0.8% | | | |
| 12,035 | | ICU Medical, Inc.* | | | 421,225 |
| 8,123 | | SurModics, Inc.*(a) | | | 208,030 |
| | | | | |
| | | | | 629,255 |
| | | | | |
| | |
| | Home Furnishings—1.1% | | | |
| 31,515 | | DTS, Inc.*(a) | | | 890,299 |
| | | | | |
| | |
| | Hotels & Motels—0.3% | | | |
| 6,914 | | Choice Hotels International, Inc. | | | 206,176 |
| | | | | |
| | |
| | Insurance—1.4% | | | |
| 10,400 | | CNinsure, Inc., ADR (China) | | | 210,808 |
| 14,757 | | Tower Group, Inc. | | | 362,727 |
| 26,465 | | Unitrin, Inc. | | | 518,714 |
| | | | | |
| | | | | 1,092,249 |
| | | | | |
| | |
| | Internet Services—6.4% | | | |
| 110,230 | | Art Technology Group, Inc.* | | | 454,147 |
| 9,290 | | AsiaInfo Holdings, Inc.* | | | 204,937 |
| 22,055 | | Blue Coat Systems, Inc.* | | | 491,385 |
| 30,410 | | Cybersource Corp.* | | | 498,116 |
| 24,835 | | NetFlix, Inc.*(a) | | | 1,327,431 |
| 6,973 | | Perfect World Co. Ltd., ADR (Cayman Islands)* | | | 306,882 |
| 92,105 | | Sapient Corp.* | | | 749,735 |
| 91,025 | | TIBCO Software, Inc.* | | | 796,469 |
| 37,550 | | ValueClick, Inc.* | | | 369,492 |
| | | | | |
| | | | | 5,198,594 |
| | | | | |
| | |
| | Medical Supplies & Equipment—5.9% | | | |
| 92,443 | | American Medical Systems Holdings, Inc.*(a) | | | 1,425,471 |
| 43,212 | | Cutera, Inc.* | | | 389,340 |
| 47,167 | | Eclipsys Corp.* | | | 884,381 |
| 10,040 | | Quality Systems, Inc.(a) | | | 612,641 |
| 46,621 | | Thoratec Corp.*(a) | | | 1,224,268 |
| 19,330 | | Vital Images, Inc.* | | | 220,555 |
| | | | | |
| | | | | 4,756,656 |
| | | | | |
| | |
| | Metals & Mining—0.8% | | | |
| 21,228 | | Northwest Pipe Co.* | | | 638,963 |
| | | | | |
| | |
| | Oil, Gas & Consumable Fuels—4.2% | | | |
| 16,110 | | Arena Resources, Inc.* | | | 600,259 |
| 11,445 | | CARBO Ceramics, Inc. | | | 668,273 |
| 24,115 | | Carrizo Oil & Gas, Inc.* | | | 558,986 |
| 18,400 | | Lufkin Industries, Inc. | | | 1,049,720 |
See Notes to Financial Statements.
| | |
| THE TARGET PORTFOLIO TRUST | | 53 |
| | |
Small Capitalization Growth Portfolio (continued) | | Portfolio of Investments
As of October 31, 2009 |
| | | | | |
| SHARES | | DESCRIPTION | | VALUE (NOTE 1) |
| | COMMON STOCKS (continued) | | | |
| | |
| | Oil, Gas & Consumable Fuels (continued) | | | |
| 8,465 | | Whiting Petroleum Corp.* | | $ | 477,426 |
| | | | | |
| | | | | 3,354,664 |
| | | | | |
| | |
| | Pharmaceuticals—5.2% | | | |
| 35,139 | | BioMarin Pharmaceutical, Inc.*(a) | | | 546,763 |
| 18,775 | | Catalyst Health Solutions, Inc.* | | | 588,972 |
| 8,901 | | Cubist Pharmaceuticals, Inc.* | | | 150,783 |
| 12,190 | | Herbalife Ltd. (Cayman Islands) | | | 410,193 |
| 52,860 | | Impax Laboratories, Inc.* | | | 469,397 |
| 13,678 | | Onyx Pharmaceuticals, Inc.* | | | 363,835 |
| 29,810 | | Pharmerica Corp.*(a) | | | 459,968 |
| 12,600 | | United Therapeutics Corp.* | | | 536,004 |
| 64,076 | | Viropharma, Inc.* | | | 483,133 |
| 20,640 | | VIVUS, Inc.*(a) | | | 163,056 |
| | | | | |
| | | | | 4,172,104 |
| | | | | |
| | |
| | Real Estate Investment Trust—0.4% | | | |
| 23,946 | | Redwood Trust, Inc. | | | 333,807 |
| | | | | |
| | |
| | Restaurants—2.7% | | | |
| 46,591 | | BJ’s Restaurants, Inc.*(a) | | | 743,592 |
| 12,107 | | Buffalo Wild Wings, Inc.*(a) | | | 496,508 |
| 26,620 | | California Pizza Kitchen, Inc.* | | | 345,794 |
| 18,523 | | Steak n Shake Co. (The)* | | | 215,793 |
| 38,660 | | Texas Roadhouse, Inc.* | | | 366,110 |
| | | | | |
| | | | | 2,167,797 |
| | | | | |
| | |
| | Retail—5.2% | | | |
| 40,854 | | Cash America International, Inc. | | | 1,236,242 |
| 28,175 | | First Cash Financial Services, Inc.* | | | 484,046 |
| 45,893 | | Genesco, Inc.* | | | 1,196,430 |
| 14,885 | | Group 1 Automotive, Inc.(a) | | | 378,377 |
| 22,450 | | Jo-Ann Stores, Inc.* | | | 597,619 |
| 15,917 | | Vitamin Shoppe Industries, Inc.* | | | 279,662 |
| | | | | |
| | | | | 4,172,376 |
| | | | | |
| | |
| | Retail & Merchandising—2.4% | | | |
| 34,970 | | 99 Cents Only Stores* | | | 397,609 |
| 12,690 | | Aeropostale, Inc.* | | | 476,256 |
| 23,120 | | America’s Car-Mart, Inc.* | | | 479,277 |
| 14,960 | | Steven Madden Ltd.* | | | 605,880 |
| | | | | |
| | | | | 1,959,022 |
| | | | | |
| | |
| | Semiconductors—5.8% | | | |
| 57,240 | | Cirrus Logic, Inc.* | | | 277,041 |
See Notes to Financial Statements.
| | |
| 54 | | THE TARGET PORTFOLIO TRUST |
| | | | | | |
| SHARES | | DESCRIPTION | | VALUE (NOTE 1) | |
| | COMMON STOCKS (continued) | | | | |
| | |
| | Semiconductors (continued) | | | | |
| 25,608 | | Formfactor, Inc.* | | $ | 435,080 | |
| 99,701 | | ON Semiconductor Corp.*(a) | | | 667,000 | |
| 34,915 | | Rovi Corp.* | | | 961,908 | |
| 111,560 | | Teradyne, Inc.*(a) | | | 933,757 | |
| 17,581 | | Tessera Technologies, Inc.* | | | 388,716 | |
| 34,620 | | Varian Semiconductor Equipment Associates, Inc.*(a) | | | 982,862 | |
| | | | | | |
| | | | | 4,646,364 | |
| | | | | | |
| | |
| | Software—3.3% | | | | |
| 25,465 | | Informatica Corp.* | | | 540,622 | |
| 21,261 | | MedAssets, Inc.* | | | 466,466 | |
| 76,198 | | Novell, Inc.* | | | 311,650 | |
| 30,895 | | Phase Forward, Inc.* | | | 405,033 | |
| 16,215 | | SYNNEX Corp.*(a) | | | 417,212 | |
| 26,745 | | Tyler Technologies, Inc.* | | | 508,690 | |
| | | | | | |
| | | | | 2,649,673 | |
| | | | | | |
| | |
| | Telecommunications—2.7% | | | | |
| 37,845 | | EMS Technologies, Inc.* | | | 659,638 | |
| 17,558 | | MasTec, Inc.* | | | 207,184 | |
| 17,668 | | Neutral Tandem, Inc.* | | | 372,618 | |
| 19,335 | | Plantronics, Inc. | | | 466,167 | |
| 33,575 | | VeriFone Holdings, Inc.* | | | 446,548 | |
| | | | | | |
| | | | | 2,152,155 | |
| | | | | | |
| | |
| | Transportation—1.3% | | | | |
| 17,470 | | Genco Shipping & Trading Ltd. (Marshall Islands)(a) | | | 347,478 | |
| 20,310 | | Landstar System, Inc. | | | 715,725 | |
| | | | | | |
| | | | | 1,063,203 | |
| | | | | | |
| | TOTAL LONG-TERM INVESTMENTS
(cost $74,492,170) | | | 80,242,367 | |
| | | | | | |
| | |
| | SHORT-TERM INVESTMENT—29.7% | | | | |
| | |
| | AFFILIATED MONEY MARKET MUTUAL FUND | | | | |
| 24,005,415 | | Dryden Core Investment Fund—Taxable Money Market Series
(cost $24,005,415; includes $22,962,756 of cash collateral for securities on loan)(b)(w) | | | 24,005,415 | |
| | | | | | |
| | TOTAL INVESTMENTS—129.0%
(cost $98,497,585; Note 5) | | | 104,247,782 | |
| | Liabilities in excess of other assets—(29.0%) | | | (23,447,844 | ) |
| | | | | | |
| | NET ASSETS—100% | | $ | 80,799,938 | |
| | | | | | |
The following abbreviation is used in Portfolio descriptions:
ADR—American Depositary Receipt
| * | Non-income producing security. |
| (a) | All or a portion of security is on loan. The aggregate market value of such securities is $21,657,862; cash collateral of $22,962,756 (included with liabilities) was received with which the Portfolio purchased highly liquid short-term investments. |
See Notes to Financial Statements.
| | |
| THE TARGET PORTFOLIO TRUST | | 55 |
| | |
Small Capitalization Growth Portfolio (continued) | | Portfolio of Investments
As of October 31, 2009 |
| (b) | Represents security, or a portion thereof, purchased with cash collateral received for securities on loan. |
| (w) | Prudential Investments LLC, the manager of the Portfolio, also serves as manager of the Dryden Core Investment Fund-Taxable Money Market Series. |
Various inputs are used in determining the value of the Portfolio’s investments. These inputs are summarized in the three broad levels listed below.
Level 1—quoted prices in active markets for identical securities
Level 2—other significant observable inputs (including quoted prices for similar securities, interest rates, prepayment speeds, credit risk, etc.)
Level 3—significant unobservable inputs (including the Portfolio’s own assumptions in determining the fair value of investments)
The following is a summary of the inputs used as of October 31, 2009 in valuing the Portfolio’s assets carried at fair value:
| | | | | | | | | |
Investments in Securities | | Level 1 | | Level 2 | | Level 3 |
Common Stocks | | $ | 80,242,367 | | $ | — | | $ | — |
Affiliated Money Market Mutual Fund | | | 24,005,415 | | | — | | | — |
| | | | | | | | | |
| | $ | 104,247,782 | | $ | — | | $ | — |
Other Financial Instruments* | | | — | | | — | | | — |
| | | | | | | | | |
Total | | $ | 104,247,782 | | $ | — | | $ | — |
| | | | | | | | | |
| * | Other financial instruments are derivative instruments not reflected in the Portfolio of Investments, such as futures, forwards and swap contracts, which are valued at the unrealized appreciation/depreciation on the instrument. |
As of October 31, 2008 and October 31, 2009, the Portfolio did not use any significant unobservable inputs (Level 3) in determining the value of investments.
The industry classification of investments and liabilities in excess of other assets shown as a percentage of net assets as of October 31, 2009 were as follows:
| | | |
Affiliated Money Market Mutual Fund (28.4% represents investments purchased with collateral from securities on loan) | | 29.7 | % |
Commercial Services | | 7.7 | |
Healthcare Services | | 7.0 | |
Internet Services | | 6.4 | |
Medical Supplies & Equipment | | 5.9 | |
Semiconductors | | 5.8 | |
Computer Services & Software | | 5.4 | |
Retail | | 5.2 | |
Pharmaceuticals | | 5.2 | |
Oil, Gas & Consumable Fuels | | 4.2 | |
Electronic Components | | 3.7 | |
Entertainment & Leisure | | 3.4 | |
Software | | 3.3 | |
Chemicals | | 3.2 | |
Restaurants | | 2.7 | |
Telecommunications | | 2.7 | |
Clothing & Apparel | | 2.5 | |
Retail & Merchandising | | 2.4 | |
Electronic Components & Equipment | | 1.9 | |
See Notes to Financial Statements.
| | |
| 56 | | THE TARGET PORTFOLIO TRUST |
| | | |
Industry (cont’d.) | | | |
Environmental Services | | 1.8 | % |
Education | | 1.7 | |
Insurance | | 1.4 | |
Transportation | | 1.3 | |
Biotechnology | | 1.2 | |
Engineering/Construction | | 1.1 | |
Home Furnishings | | 1.1 | |
Distribution/Wholesale | | 1.1 | |
Metals & Mining | | 0.8 | |
Healthcare-Products | | 0.8 | |
Hand/Machine Tools | | 0.8 | |
Airlines | | 0.7 | |
Computer Networking | | 0.7 | |
Financial—Bank & Trust | | 0.7 | |
Beverages | | 0.7 | |
Farming & Agriculture | | 0.6 | |
Aerospace & Defense | | 0.6 | |
Auto Parts & Equipment | | 0.6 | |
Energy—Alternate Sources | | 0.5 | |
Building Materials | | 0.5 | |
Diversified Financial Services | | 0.5 | |
Real Estate Investment Trust | | 0.4 | |
Banks | | 0.3 | |
Hotels & Motels | | 0.3 | |
Financial Services | | 0.2 | |
Electrical Equipment | | 0.2 | |
Computer Hardware | | 0.1 | |
| | | |
| | 129.0 | |
Liabilities in excess of other assets | | (29.0 | ) |
| | | |
| | 100.0 | % |
| | | |
See Notes to Financial Statements.
| | |
| THE TARGET PORTFOLIO TRUST | | 57 |
| | |
Small Capitalization Value Portfolio | | Portfolio of Investments
As of October 31, 2009 |
| | | | | |
| SHARES | | DESCRIPTION | | VALUE (NOTE 1) |
| | LONG-TERM INVESTMENTS—95.8% | | | |
| | |
| | COMMON STOCKS | | | |
| | |
| | Aerospace/Defense—2.6% | | | |
| 104,400 | | AAR Corp.*(a) | | $ | 2,047,284 |
| 69,838 | | BE Aerospace, Inc.*(a) | | | 1,238,228 |
| 60,500 | | Curtiss-Wright Corp. (Class B Stock) | | | 1,804,110 |
| 3,200 | | Ducommun, Inc. | | | 54,464 |
| 3,600 | | Esterline Technologies Corp.* | | | 151,596 |
| 237,125 | | Hexcel Corp.* | | | 2,608,375 |
| 79,475 | | Moog, Inc. (Class A Stock)* | | | 1,984,491 |
| 86,196 | | Teledyne Technologies, Inc.* | | | 2,944,455 |
| 18,650 | | TransDigm Group, Inc. | | | 730,707 |
| 27,228 | | Triumph Group, Inc.(a) | | | 1,274,543 |
| | | | | |
| | | | | 14,838,253 |
| | | | | |
| | |
| | Airlines—0.4% | | | |
| 4,800 | | Airtran Holdings*(a) | | | 20,304 |
| 2,100 | | Alaska Air Group, Inc.* | | | 54,012 |
| 5,200 | | JetBlue Airways Corp.* | | | 25,792 |
| 16,400 | | Republic Airways Holdings, Inc.* | | | 131,364 |
| 154,200 | | SkyWest, Inc.(a) | | | 2,154,174 |
| | | | | |
| | | | | 2,385,646 |
| | | | | |
| | |
| | Apparel—0.1% | | | |
| 3,500 | | Carter’s, Inc.* | | | 82,600 |
| 3,800 | | G-III Apparel Group Ltd.* | | | 60,838 |
| 10,600 | | Jones Apparel Group, Inc. | | | 189,634 |
| | | | | |
| | | | | 333,072 |
| | | | | |
| | |
| | Auto Related—0.2% | | | |
| 57,355 | | Cooper Tire & Rubber Co. | | | 875,237 |
| | | | | |
| | |
| | Automotive Parts—0.4% | | | |
| 50,972 | | ATC Technology Corp.* | | | 1,065,315 |
| 34,100 | | Autoliv, Inc. | | | 1,145,078 |
| 7,700 | | Spartan Motors, Inc. | | | 38,423 |
| 12,400 | | Standard Motor Products, Inc. | | | 103,664 |
| | | | | |
| | | | | 2,352,480 |
| | | | | |
| | |
| | Banks—2.5% | | | |
| 1,390 | | 1st Source Corp. | | | 20,600 |
| 3,023 | | Ameris Bancorp. | | | 17,805 |
| 1,300 | | BancFirst Corp. | | | 46,943 |
| 1,800 | | Bank of the Ozarks, Inc. | | | 40,950 |
| 1,300 | | Banner Corp.(a) | | | 3,991 |
| 76,849 | | Cardinal Financial Corp. | | | 626,319 |
See Notes to Financial Statements.
| | |
| 58 | | THE TARGET PORTFOLIO TRUST |
| | | | | |
| SHARES | | DESCRIPTION | | VALUE (NOTE 1) |
| | COMMON STOCKS (continued) | | | |
| | |
| | Banks (continued) | | | |
| 6,600 | | Central Pacific Financial Corp. | | $ | 9,306 |
| 2,900 | | Chemical Financial Corp. | | | 63,655 |
| 6,000 | | City Holding Co. | | | 183,420 |
| 3,600 | | Columbia Banking System, Inc. | | | 52,920 |
| 3,300 | | Community Bank System, Inc. | | | 61,413 |
| 5,900 | | Community Trust Bancorp, Inc. | | | 145,258 |
| 4,400 | | Dime Community Bancshares | | | 48,356 |
| 5,100 | | East West Bancorp, Inc. | | | 46,053 |
| 1,900 | | Financial Institutions, Inc. | | | 20,064 |
| 11,200 | | First BanCorp. (Puerto Rico)(a) | | | 21,168 |
| 100,614 | | First Financial Bancorp | | | 1,275,786 |
| 2,200 | | First Financial Holdings, Inc. | | | 29,678 |
| 16,300 | | First Niagara Financial Group, Inc. | | | 209,292 |
| 89,553 | | FirstMerit Corp. | | | 1,697,029 |
| 5,100 | | Guaranty Bancorp* | | | 6,681 |
| 23,595 | | Hancock Holding Co. | | | 855,791 |
| 16,833 | | IBERIABANK Corp. | | | 729,037 |
| 5,800 | | Independent Bank Corp. | | | 123,366 |
| 2,600 | | Lakeland Financial Corp. | | | 53,482 |
| 2,180 | | MainSource Financial Group, Inc. | | | 12,709 |
| 14,500 | | Nara Bancorp, Inc. | | | 106,720 |
| 600 | | Old Second Bancorp, Inc. | | | 3,210 |
| 3,800 | | Oriental Financial Group, Inc. (Puerto Rico) | | | 40,470 |
| 1,400 | | Pacific Continental Corp. | | | 15,260 |
| 3,200 | | Peoples Bancorp, Inc. | | | 34,368 |
| 53,825 | | Prosperity Bancshares, Inc. | | | 1,926,397 |
| 2,251 | | Republic Bancorp, Inc. (Class A Stock) | | | 41,396 |
| 500 | | Shore Bancshares, Inc. | | | 8,155 |
| 2,100 | | Sierra Bancorp | | | 18,333 |
| 50,110 | | Signature Bank (NY)*(a) | | | 1,581,472 |
| 1,700 | | Simmons First National Corp. (Class A Stock) | | | 49,742 |
| 3,590 | | Southside Bancshares, Inc. | | | 74,636 |
| 3,400 | | Southwest Bancorp, Inc. | | | 33,456 |
| 10,450 | | Sterling Bancshares, Inc. | | | 58,206 |
| 14,150 | | Sterling Financial Corp.*(a) | | | 11,320 |
| 2,700 | | Trico Bancshares | | | 39,474 |
| 111,283 | | Trustmark Corp.(a) | | | 2,108,813 |
| 6,583 | | Umpqua Holdings Corp. | | | 65,238 |
| 81,900 | | United Bankshares, Inc.(a) | | | 1,461,915 |
| 2,300 | | Washington Trust Bancorp, Inc. | | | 34,546 |
| 3,100 | | WesBanco, Inc. | | | 43,865 |
| 2,900 | | West Bancorp, Inc. | | | 12,760 |
| 4,600 | | Wilshire Bancorp, Inc. | | | 32,384 |
| 1,900 | | WSFS Financial Corp. | | | 52,440 |
| | | | | |
| | | | | 14,255,648 |
| | | | | |
| | |
| | Beverages—0.3% | | | |
| 13,854 | | Boston Beer Co., Inc. (Class A Stock)* | | | 526,452 |
See Notes to Financial Statements.
| | |
| THE TARGET PORTFOLIO TRUST | | 59 |
| | |
Small Capitalization Value Portfolio (continued) | | Portfolio of Investments
As of October 31, 2009 |
| | | | | |
| SHARES | | DESCRIPTION | | VALUE (NOTE 1) |
| | COMMON STOCKS (continued) | | | |
| | |
| | Beverages (continued) | | | |
| 55,000 | | Embotelladora Andina SA, ADR (Chile) | | $ | 1,003,750 |
| | | | | |
| | | | | 1,530,202 |
| | | | | |
| | |
| | Biotechnology | | | |
| 1,800 | | Alexion Pharmaceuticals, Inc.* | | | 79,938 |
| 2,100 | | Celera Corp.* | | | 12,999 |
| 3,300 | | Emergent Biosolutions, Inc.* | | | 47,586 |
| 600 | | InterMune, Inc.* | | | 7,248 |
| 25,200 | | Lexicon Pharmaceuticals, Inc.* | | | 33,012 |
| 3,400 | | Maxygen, Inc.* | | | 18,972 |
| 4,025 | | Protalix BioTherapeutics, Inc.* | | | 38,157 |
| | | | | |
| | | | | 237,912 |
| | | | | |
| | |
| | Broadcasting | | | |
| 6,000 | | Entercom Communications Corp. (Class A Stock)* | | | 42,480 |
| 11,842 | | LIN TV Corp. (Class A Stock)* | | | 46,421 |
| | | | | |
| | | | | 88,901 |
| | | | | |
| | |
| | Building Materials—0.1% | | | |
| 12,300 | | Comfort Systems USA, Inc. | | | 134,070 |
| 12,300 | | Gibraltar Industries, Inc. | | | 133,086 |
| 800 | | Trex Co., Inc.* | | | 12,728 |
| 2,100 | | Tutor Perini Corp.*(a) | | | 37,065 |
| | | | | |
| | | | | 316,949 |
| | | | | |
| | |
| | Building Products—0.4% | | | |
| 3,400 | | Apogee Enterprises, Inc. | | | 45,016 |
| 54,000 | | Lennox International, Inc. | | | 1,818,180 |
| 15,700 | | NCI Building Systems, Inc.* | | | 30,772 |
| 5,000 | | Quanex Building Products Corp. | | | 74,350 |
| 2,600 | | Universal Forest Products, Inc. | | | 92,768 |
| | | | | |
| | | | | 2,061,086 |
| | | | | |
| | |
| | Business Services—0.6% | | | |
| 64,200 | | 3Com Corp.* | | | 329,988 |
| 2,200 | | ABM Industries, Inc. | | | 41,316 |
| 10,700 | | Cabela’s, Inc.*(a) | | | 134,499 |
| 1,300 | | COMSYS IT Partners, Inc.* | | | 8,905 |
| 4,900 | | DHT Maritime, Inc. (Marshall Islands) | | | 16,758 |
| 1,100 | | Medidata Solutions, Inc.* | | | 17,380 |
| 69,400 | | URS Corp.* | | | 2,696,884 |
| | | | | |
| | | | | 3,245,730 |
| | | | | |
See Notes to Financial Statements.
| | |
| 60 | | THE TARGET PORTFOLIO TRUST |
| | | | | |
| SHARES | | DESCRIPTION | | VALUE (NOTE 1) |
| | COMMON STOCKS (continued) | | | |
| | |
| | Capital Markets—0.7% | | | |
| 122,000 | | Apollo Investment Corp. | | $ | 1,098,000 |
| 85,988 | | Federated Investors, Inc. (Class B Stock) | | | 2,257,185 |
| 21,950 | | Waddell & Reed Financial, Inc. (Class A Stock) | | | 615,917 |
| | | | | |
| | | | | 3,971,102 |
| | | | | |
| | |
| | Chemicals—4.5% | | | |
| 7,700 | | Aceto Corp. | | | 42,658 |
| 34,775 | | Airgas, Inc. | | | 1,542,619 |
| 28,600 | | Ashland, Inc. | | | 987,844 |
| 28,569 | | Cabot Corp. | | | 626,518 |
| 32,729 | | Cytec Industries, Inc.(a) | | | 1,085,621 |
| 109,475 | | GrafTech International Ltd.* | | | 1,477,913 |
| 8,500 | | H.B. Fuller Co. | | | 162,435 |
| 102,800 | | Innophos Holdings, Inc. | | | 1,989,180 |
| 3,700 | | Innospec, Inc. | | | 43,734 |
| 65,470 | | International Flavors & Fragrances, Inc. | | | 2,493,752 |
| 33,400 | | ION Geophysical Corp.* | | | 127,922 |
| 28,500 | | Lubrizol Corp. (The) | | | 1,896,960 |
| 124,500 | | Methanex Corp. (Canada)(a) | | | 2,135,175 |
| 1,500 | | Minerals Technologies, Inc. | | | 73,890 |
| 1,300 | | NewMarket Corp. | | | 121,550 |
| 35,348 | | Olin Corp. | | | 539,764 |
| 28,840 | | OM Group, Inc.* | | | 779,257 |
| 14,400 | | PolyOne Corp.* | | | 80,352 |
| 4,000 | | Rockwood Holdings, Inc.* | | | 79,520 |
| 110,500 | | RPM International, Inc. | | | 1,947,010 |
| 3,300 | | Schulman A, Inc. | | | 57,321 |
| 118,925 | | Sensient Technologies Corp. | | | 3,007,613 |
| 10,000 | | Solutia, Inc.* | | | 110,000 |
| 21,300 | | Spartech Corp. | | | 203,841 |
| 57,500 | | Terra Industries, Inc. | | | 1,826,775 |
| 79,000 | | Valspar Corp. (The) | | | 2,004,230 |
| | | | | |
| | | | | 25,443,454 |
| | | | | |
| | |
| | Clothing & Apparel—0.2% | | | |
| 2,800 | | Cato Corp. (The) (Class A Stock) | | | 55,188 |
| 38,977 | | G&K Services, Inc. (Class A Stock) | | | 863,341 |
| 2,000 | | Gymboree Corp.* | | | 85,140 |
| 10,500 | | Iconix Brand Group, Inc.* | | | 122,430 |
| 6,000 | | Maidenform Brands, Inc.* | | | 84,240 |
| | | | | |
| | | | | 1,210,339 |
| | | | | |
| | |
| | Commercial Banks—1.6% | | | |
| 98,670 | | BancorpSouth, Inc.(a) | | | 2,227,969 |
| 46,800 | | Bank of Hawaii Corp.(a) | | | 2,077,920 |
| 39,200 | | Cullen / Frost Bankers, Inc. | | | 1,834,168 |
| 84,353 | | First Horizon National Corp.* | | | 997,896 |
| 109,624 | | National Penn Bancshares, Inc.(a) | | | 616,087 |
See Notes to Financial Statements.
| | |
| THE TARGET PORTFOLIO TRUST | | 61 |
| | |
Small Capitalization Value Portfolio (continued) | | Portfolio of Investments
As of October 31, 2009 |
| | | | | |
| SHARES | | DESCRIPTION | | VALUE (NOTE 1) |
| | COMMON STOCKS (continued) | | | |
| | |
| | Commercial Banks (continued) | | | |
| 3,200 | | Sterling Bancorp NY | | $ | 21,536 |
| 5,225 | | Territorial Bancorp, Inc.* | | | 86,160 |
| 12,075 | | United Financial Bancorp, Inc. | | | 155,164 |
| 64,247 | | Zions Bancorp(a) | | | 909,737 |
| | | | | |
| | | | | 8,926,637 |
| | | | | |
| | |
| | Commercial Services—1.2% | | | |
| 2,500 | | Consolidated Graphics, Inc.* | | | 50,150 |
| 3,400 | | Dynamics Research Corp.* | | | 43,554 |
| 17,000 | | DynCorp International, Inc.* | | | 289,000 |
| 5,600 | | Gartner, Inc.* | | | 104,272 |
| 2,400 | | GEO Group, Inc. (The)* | | | 50,760 |
| 19,400 | | Metalico, Inc.* | | | 78,376 |
| 140,600 | | Pharmaceutical Product Development, Inc. | | | 3,029,930 |
| 9,900 | | Spherion Corp.* | | | 49,005 |
| 18,600 | | Stewart Enterprises, Inc. (Class A Stock) | | | 85,188 |
| 11,700 | | Valassis Communications, Inc.* | | | 213,291 |
| 1,700 | | Viad Corp. | | | 29,750 |
| 88,487 | | Waste Connections, Inc.* | | | 2,781,146 |
| | | | | |
| | | | | 6,804,422 |
| | | | | |
| | |
| | Commercial Services & Supplies—1.1% | | | |
| 74,200 | | Brink’s Co. (The) | | | 1,760,766 |
| 131,400 | | Ennis, Inc. | | | 1,990,710 |
| 15,400 | | PHH Corp.* | | | 248,864 |
| 91,288 | | School Specialty, Inc.*(a) | | | 2,031,158 |
| | | | | |
| | | | | 6,031,498 |
| | | | | |
| | |
| | Communication Equipment—0.3% | | | |
| 60,825 | | Nice Systems Ltd., ADR (Israel)* | | | 1,883,750 |
| 5,100 | | Tekelec* | | | 76,602 |
| | | | | |
| | | | | 1,960,352 |
| | | | | |
| | |
| | Computer Hardware—0.5% | | | |
| 12,600 | | Aspen Technology, Inc.* | | | 132,300 |
| 49,502 | | CACI International, Inc. (Class A Stock)* | | | 2,357,285 |
| 17,600 | | CIBER, Inc.* | | | 56,672 |
| 4,600 | | Mercury Computer Systems, Inc.* | | | 49,220 |
| 1,700 | | PC Connection, Inc.* | | | 9,996 |
| 7,400 | | Perot Systems Corp. (Class A Stock)* | | | 221,556 |
| 29,700 | | Quantum Corp.* | | | 54,945 |
| 1,880 | | Radisys Corp.* | | | 15,999 |
| 3,500 | | Sykes Enterprises, Inc.* | | | 83,090 |
| | | | | |
| | | | | 2,981,063 |
| | | | | |
See Notes to Financial Statements.
| | |
| 62 | | THE TARGET PORTFOLIO TRUST |
| | | | | |
| SHARES | | DESCRIPTION | | VALUE (NOTE 1) |
| | COMMON STOCKS (continued) | | | |
| | |
| | Computer Services & Software—2.2% | | | |
| 4,800 | | Avocent Corp.* | | $ | 119,376 |
| 97,700 | | Global Payments, Inc. | | | 4,809,771 |
| 1,600 | | infoGROUP, Inc.* | | | 10,496 |
| 3,700 | | JDA Software Group, Inc.* | | | 73,408 |
| 1,000 | | Mantech International Corp. (Class A Stock)* | | | 43,860 |
| 57,050 | | MICROS Systems, Inc.*(a) | | | 1,535,786 |
| 2,500 | | Netscout Systems, Inc.* | | | 30,725 |
| 85,522 | | Parametric Technology Corp.* | | | 1,275,133 |
| 1,700 | | PC Mall, Inc.* | | | 12,053 |
| 2,600 | | Progress Software Corp.* | | | 60,060 |
| 2,900 | | Quest Software, Inc.* | | | 48,633 |
| 3,300 | | Semtech Corp.* | | | 51,051 |
| 1,800 | | Solarwinds, Inc.* | | | 32,040 |
| 141,925 | | SRA International, Inc. (Class A Stock)*(a) | | | 2,662,513 |
| 6,300 | | SYNNEX Corp.*(a) | | | 162,099 |
| 26,708 | | Synopsys, Inc.*(a) | | | 587,576 |
| 12,900 | | Take-Two Interactive Software, Inc.*(a) | | | 141,513 |
| 4,110 | | Unisys Corp.* | | | 119,765 |
| 1,200 | | Virtusa Corp.* | | | 10,776 |
| 85,895 | | Xyratex Ltd. (Bermuda)* | | | 897,603 |
| | | | | |
| | | | | 12,684,237 |
| | | | | |
| | |
| | Computers & Peripherals—0.8% | | | |
| 98,279 | | Diebold, Inc.(a) | | | 2,971,957 |
| 103,350 | | QLogic Corp.*(a) | | | 1,812,759 |
| | | | | |
| | | | | 4,784,716 |
| | | | | |
| | |
| | Construction | | | |
| 1,900 | | Brookfield Homes Corp.* | | | 10,697 |
| 18,400 | | Standard Pacific Corp.* | | | 55,200 |
| | | | | |
| | | | | 65,897 |
| | | | | |
| | |
| | Construction & Engineering—0.7% | | | |
| 19,200 | | EMCOR Group, Inc.* | | | 453,504 |
| 58,800 | | Granite Construction, Inc. | | | 1,679,328 |
| 86,000 | | KBR, Inc. | | | 1,760,420 |
| | | | | |
| | | | | 3,893,252 |
| | | | | |
| | |
| | Consumer Finance—0.7% | | | |
| 385,400 | | Advance America Cash Advance Centers, Inc. | | | 1,903,876 |
| 67,600 | | Assured Guaranty Ltd. (Bermuda) | | | 1,120,808 |
| 57,775 | | First Cash Financial Services, Inc.* | | | 992,574 |
| | | | | |
| | | | | 4,017,258 |
| | | | | |
| | |
| | Consumer Products & Services—2.0% | | | |
| 5,600 | | American Greetings Corp. (Class A Stock) | | | 113,904 |
| 61,093 | | Central Garden & Pet Co.*(a) | | | 606,043 |
| 68,986 | | Central Garden & Pet Co. (Class A Stock)* | | | 652,608 |
See Notes to Financial Statements.
| | |
| THE TARGET PORTFOLIO TRUST | | 63 |
| | |
Small Capitalization Value Portfolio (continued) | | Portfolio of Investments
As of October 31, 2009 |
| | | | | |
| SHARES | | DESCRIPTION | | VALUE (NOTE 1) |
| | COMMON STOCKS (continued) | | | |
| | |
| | Consumer Products & Services (continued) | | | |
| 3,700 | | Compass Diversified Holdings | | $ | 37,851 |
| 6,000 | | Helen of Troy Ltd. (Bermuda)* | | | 137,040 |
| 1,093 | | Jarden Corp. | | | 29,937 |
| 12,900 | | La-Z-Boy, Inc. | | | 91,590 |
| 116,800 | | Scotts Miracle-Gro Co. (The) (Class A Stock) | | | 4,744,416 |
| 63,046 | | Snap-on, Inc. | | | 2,303,070 |
| 74,000 | | Toro Co. (The)(a) | | | 2,739,480 |
| | | | | |
| | | | | 11,455,939 |
| | | | | |
| | |
| | Consumer Services—0.1% | | | |
| 15,400 | | Rent-A-Center, Inc.* | | | 282,744 |
| | | | | |
| | |
| | Containers & Packaging—1.1% | | | |
| 72,000 | | Bemis Co., Inc. | | | 1,859,760 |
| 3,900 | | Core-Mark Holding Co., Inc.* | | | 106,743 |
| 62,650 | | Packaging Corp of America | | | 1,145,242 |
| 27,974 | | Silgan Holdings, Inc. | | | 1,503,602 |
| 67,600 | | Sonoco Products Co. | | | 1,808,300 |
| | | | | |
| | | | | 6,423,647 |
| | | | | |
| | |
| | Distribution/Wholesale—0.2% | | | |
| 3,900 | | Brightpoint, Inc.* | | | 28,743 |
| 2,000 | | United Stationers, Inc.* | | | 94,280 |
| 36,710 | | WESCO International, Inc.* | | | 938,308 |
| | | | | |
| | | | | 1,061,331 |
| | | | | |
| | |
| | Diversified Financial Services—0.3% | | | |
| 1,700 | | Altisource Portfolio Solutions SA (Luxembourg)* | | | 25,925 |
| 3,500 | | CompuCredit Holdings Corp.* | | | 11,480 |
| 90,350 | | Conseco, Inc.*(a) | | | 470,723 |
| 240,375 | | E*Trade Financial Corp.* | | | 350,948 |
| 4,500 | | Financial Federal Corp. | | | 91,890 |
| 1,300 | | Marlin Business Services Corp.* | | | 8,723 |
| 117,775 | | MF Global Ltd. (Bermuda)* | | | 838,558 |
| 1,400 | | Oppenheimer Holdings, Inc. | | | 35,700 |
| | | | | |
| | | | | 1,833,947 |
| | | | | |
| | |
| | Diversified Financials—0.6% | | | |
| 138,000 | | Jefferies Group, Inc.*(a) | | | 3,601,800 |
| 9,000 | | Penson Worldwide, Inc.*(a) | | | 87,750 |
| 80 | | Virtus Investment Partners, Inc.* | | | 1,173 |
| | | | | |
| | | | | 3,690,723 |
| | | | | |
| | |
| | Drugs & Healthcare—0.5% | | | |
| 57,400 | | Covance, Inc.*(a) | | | 2,966,432 |
| | | | | |
See Notes to Financial Statements.
| | |
| 64 | | THE TARGET PORTFOLIO TRUST |
| | | | | |
| SHARES | | DESCRIPTION | | VALUE (NOTE 1) |
| | COMMON STOCKS (continued) | | | |
| | |
| | Electric—0.5% | | | |
| 1,600 | | Central Vermont Public Service Corp. | | $ | 31,024 |
| 144,232 | | Great Plains Energy, Inc. | | | 2,495,214 |
| 2,700 | | MGE Energy, Inc. | | | 94,554 |
| | | | | |
| | | | | 2,620,792 |
| | | | | |
| | |
| | Electric Utilities—1.0% | | | |
| 5,500 | | Avista Corp. | | | 104,280 |
| 83,500 | | Cleco Corp. | | | 2,066,625 |
| 9,800 | | El Paso Electric Co.* | | | 183,750 |
| 14,281 | | IDACORP, Inc. | | | 401,153 |
| 2,800 | | UIL Holdings Corp. | | | 71,904 |
| 11,800 | | UniSource Energy Corp. | | | 340,784 |
| 135,250 | | Westar Energy, Inc. | | | 2,590,038 |
| | | | | |
| | | | | 5,758,534 |
| | | | | |
| | |
| | Electrical Equipment—1.2% | | | |
| 150,774 | | Belden, Inc. | | | 3,460,263 |
| 24,700 | | Smith (A.O.) Corp. | | | 978,861 |
| 63,700 | | Acuity Brands, Inc. | | | 2,016,742 |
| 4,700 | | Regal-Beloit Corp.(a) | | | 220,336 |
| | | | | |
| | | | | 6,676,202 |
| | | | | |
| | |
| | Electronic Components—0.9% | | | |
| 139,413 | | Digital River, Inc.* | | | 3,182,799 |
| 4,000 | | FEI Co.* | | | 95,240 |
| 1,500 | | Houston Wire & Cable Co. | | | 18,135 |
| 600 | | OSI Systems, Inc.* | | | 11,778 |
| 1,600 | | Plexus Corp.* | | | 40,480 |
| 106,651 | | Portland General Electric Co. | | | 1,982,642 |
| 2,000 | | Technitrol, Inc. | | | 15,580 |
| | | | | |
| | | | | 5,346,654 |
| | | | | |
| | |
| | Electronic Components & Equipment | | | |
| 11,800 | | EnerSys* | | | 260,780 |
| 2,600 | | PowerSecure International, Inc.* | | | 21,632 |
| | | | | |
| | | | | 282,412 |
| | | | | |
| | |
| | Electronic Equipment & Instruments—0.3% | | | |
| 132,100 | | Jabil Circuit, Inc. | | | 1,767,498 |
| | | | | |
| | |
| | Electronics—1.8% | | | |
| 6,150 | | Benchmark Electronics, Inc.* | | | 103,320 |
| 115,900 | | Checkpoint Systems, Inc.* | | | 1,572,763 |
| 54,481 | | Coherent, Inc.*(a) | | | 1,369,107 |
| 5,800 | | CTS Corp. | | | 51,968 |
| 1,700 | | Encore Wire Corp. | | | 35,275 |
| 181,800 | | FLIR Systems, Inc.*(a) | | | 5,055,858 |
| 47,428 | | Littelfuse, Inc.* | | | 1,307,116 |
See Notes to Financial Statements.
| | |
| THE TARGET PORTFOLIO TRUST | | 65 |
| | |
Small Capitalization Value Portfolio (continued) | | Portfolio of Investments
As of October 31, 2009 |
| | | | | |
| SHARES | | DESCRIPTION | | VALUE (NOTE 1) |
| | COMMON STOCKS (continued) | | | |
| | |
| | Electronics (continued) | | | |
| 12,700 | | TTM Technologies, Inc.* | | $ | 129,159 |
| 27,908 | | Watts Water Technologies, Inc. (Class A Stock)(a) | | | 788,401 |
| | | | | |
| | | | | 10,412,967 |
| | | | | |
| | |
| | Energy Equipment—0.4% | | | |
| 33,175 | | Oil States International, Inc.* | | | 1,142,547 |
| 26,400 | | Unit Corp.* | | | 1,031,712 |
| | | | | |
| | | | | 2,174,259 |
| | | | | |
| | |
| | Energy Equipment & Services—0.7% | | | |
| 3,200 | | Complete Production Services, Inc.* | | | 30,496 |
| 6,900 | | Headwaters, Inc.* | | | 28,428 |
| 256,718 | | Key Energy Services, Inc.* | | | 1,876,608 |
| 1,100 | | Lufkin Industries, Inc. | | | 62,755 |
| 42,100 | | Tidewater, Inc. | | | 1,754,307 |
| 196,975 | | Vantage Drilling Co. (Cayman Islands)* | | | 325,009 |
| | | | | |
| | | | | 4,077,603 |
| | | | | |
| | |
| | Entertainment & Leisure—0.5% | | | |
| 4,200 | | Carmike Cinemas, Inc.* | | | 41,286 |
| 3,300 | | Isle of Capri Casinos, Inc.* | | | 25,575 |
| 101,800 | | Life Time Fitness, Inc.*(a) | | | 2,193,790 |
| 3,300 | | RC2 Corp.* | | | 43,098 |
| 50,079 | | Scientific Games Corp. (Class A Stock)* | | | 704,612 |
| 1,600 | | Steinway Musical Instruments, Inc.* | | | 18,752 |
| | | | | |
| | | | | 3,027,113 |
| | | | | |
| | |
| | Environmental Services—0.4% | | | |
| 11,721 | | Clean Harbors, Inc.* | | | 661,650 |
| 72,090 | | Republic Services, Inc. | | | 1,867,852 |
| 1,400 | | Waste Services, Inc.* | | | 9,184 |
| | | | | |
| | | | | 2,538,686 |
| | | | | |
| | |
| | Equipment Services | | | |
| 3,700 | | MedAssets, Inc.*(a) | | | 81,178 |
| | | | | |
| | |
| | Exchange Traded Funds—0.7% | | | |
| 5,904 | | iShares Russell 2000 Index Fund(a) | | | 332,691 |
| 64,575 | | iShares Russell 2000 Value Index Fund(a) | | | 3,414,080 |
| | | | | |
| | | | | 3,746,771 |
| | | | | |
| | |
| | Farming & Agriculture | | | |
| 5,100 | | Andersons, Inc. (The) | | | 158,253 |
| | | | | |
See Notes to Financial Statements.
| | |
| 66 | | THE TARGET PORTFOLIO TRUST |
| | | | | |
| SHARES | | DESCRIPTION | | VALUE (NOTE 1) |
| | COMMON STOCKS (continued) | | | |
| | |
| | Financial—Bank & Trust—0.5% | | | |
| 4,500 | | Banco Latinoamericano de Exportaciones SA (Panama) | | $ | 63,495 |
| 37,391 | | Boston Private Financial Holdings, Inc. | | | 222,476 |
| 28,475 | | Citizens Republic Bancorp, Inc.* | | | 17,142 |
| 42,200 | | Danvers Bancorp, Inc. | | | 579,406 |
| 2,500 | | First Bancorp | | | 33,900 |
| 1,000 | | First Defiance Financial Corp. | | | 14,420 |
| 2,800 | | First Merchants Corp. | | | 17,136 |
| 2,600 | | Flushing Financial Corp. | | | 29,198 |
| 23,800 | | FNB Corp. | | | 168,504 |
| 1,300 | | Heartland Financial USA, Inc. | | | 16,692 |
| 4,300 | | Lakeland Bancorp, Inc. | | | 26,144 |
| 60,122 | | NewAlliance Bancshares, Inc. | | | 666,152 |
| 1,300 | | Park National Corp.(a) | | | 75,504 |
| 5,342 | | Prospect Capital Corp.(a) | | | 53,046 |
| 2,900 | | S&T Bancorp, Inc.(a) | | | 45,675 |
| 2,200 | | Stifel Financial Corp.*(a) | | | 114,312 |
| 359,803 | | Synovus Financial Corp. | | | 798,763 |
| 2,400 | | Union Bankshares Corp. | | | 29,568 |
| 6,114 | | United Community Banks, Inc.* | | | 24,823 |
| | | | | |
| | | | | 2,996,356 |
| | | | | |
| | |
| | Financial—Regionals | | | |
| 2,414 | | Kayne Anderson Energy Development Co. | | | 30,145 |
| | | | | |
| | |
| | Financial Services—2.3% | | | |
| 500 | | Alliance Financial Corp. | | | 13,020 |
| 13,100 | | Allied Capital Corp.* | | | 40,872 |
| 1,900 | | AZZ, Inc.*(a) | | | 65,094 |
| 1,700 | | Berkshire Hills Bancorp, Inc. | | | 34,935 |
| 15,800 | | BGC Partners, Inc. (Class A Stock) | | | 76,314 |
| 4,100 | | BlackRock Kelso Capital Corp. | | | 29,971 |
| 7,900 | | Brookline Bancorp, Inc. | | | 77,341 |
| 31,700 | | CVB Financial Corp.(a) | | | 253,917 |
| 21,200 | | Deluxe Corp. | | | 301,676 |
| 9,271 | | Dollar Financial Corp.*(a) | | | 174,017 |
| 6,500 | | Doral Financial Corp. (Puerto Rico)*(a) | | | 18,460 |
| 117,000 | | Eaton Vance Corp. | | | 3,321,630 |
| 3,900 | | Encore Capital Group, Inc.* | | | 58,383 |
| 1,200 | | Farmers Capital Bank Corp. | | | 13,344 |
| 65,650 | | Fifth Street Finance Corp. | | | 645,339 |
| 7,000 | | First Community Bancshares, Inc. | | | 81,480 |
| 1,000 | | First South Bancorp, Inc. | | | 10,590 |
| 10,400 | | Global Cash Access Holdings, Inc.* | | | 65,832 |
| 3,100 | | Hallmark Financial Services* | | | 23,777 |
| 10,900 | | Hawaiian Holdings, Inc.* | | | 77,281 |
| 12,300 | | Knight Capital Group, Inc. (Class A Stock)* | | | 207,255 |
| 2,100 | | Koppers Holdings, Inc. | | | 54,852 |
| 1,500 | | National Financial Partners Corp.* | | | 12,225 |
See Notes to Financial Statements.
| | |
| THE TARGET PORTFOLIO TRUST | | 67 |
| | |
Small Capitalization Value Portfolio (continued) | | Portfolio of Investments
As of October 31, 2009 |
| | | | | |
| SHARES | | DESCRIPTION | | VALUE (NOTE 1) |
| | COMMON STOCKS (continued) | | | |
| | |
| | Financial Services (continued) | | | |
| 5,100 | | NBT Bancorp, Inc. | | $ | 111,180 |
| 11,600 | | Nelnet, Inc. (Class A Stock)* | | | 162,748 |
| 2,000 | | Oceanfirst Financial Corp | | | 19,000 |
| 13,000 | | Ocwen Financial Corp.* | | | 142,090 |
| 12,800 | | Pacer International, Inc. | | | 36,608 |
| 6,800 | | Pacific Capital Bancorp(a) | | | 8,772 |
| 75,248 | | PacWest Bancorp(a) | | | 1,277,711 |
| 5,648 | | Patriot Capital Funding, Inc. | | | 21,745 |
| 1,200 | | Piper Jaffray Cos.* | | | 55,668 |
| 300 | | Porter Bancorp, Inc. | | | 4,776 |
| 7,400 | | Provident Financial Services, Inc. | | | 79,550 |
| 170,175 | | Raymond James Financial, Inc.(a) | | | 4,017,832 |
| 6,500 | | Renasant Corp. | | | 95,160 |
| 62,100 | | South Financial Group, Inc. (The) | | | 49,680 |
| 31,900 | | Student Loan Corp. (The) | | | 1,341,395 |
| 1,100 | | Suffolk Bancorp | | | 30,756 |
| 8,700 | | Trustco Bank Corp. NY | | | 51,765 |
| 6,328 | | United Community Financial Corp.* | | | 9,492 |
| 100 | | Waterstone Financial, Inc.* | | | 341 |
| 7,100 | | World Acceptance Corp.*(a) | | | 178,139 |
| | | | | |
| | | | | 13,352,013 |
| | | | | |
| | |
| | Food & Drug Retailing—1.3% | | | |
| 102,000 | | Casey’s General Stores, Inc. | | | 3,216,060 |
| 72,500 | | Ruddick Corp. | | | 1,937,200 |
| 59,500 | | Weis Markets, Inc. | | | 2,106,300 |
| | | | | |
| | | | | 7,259,560 |
| | | | | |
| | |
| | Food Products—1.6% | | | |
| 74,200 | | Cal-Maine Foods, Inc.(a) | | | 2,014,530 |
| 114,473 | | Corn Products International, Inc. | | | 3,225,849 |
| 189,600 | | Del Monte Foods Co. | | | 2,047,680 |
| 5,300 | | Fresh Del Monte Produce, Inc. (Cayman Islands)* | | | 115,063 |
| 28,600 | | JM Smucker Co. (The) | | | 1,508,078 |
| | | | | |
| | | | | 8,911,200 |
| | | | | |
| | |
| | Foods—0.8% | | | |
| 6,400 | | B&G Foods, Inc. | | | 49,984 |
| 16,300 | | Chiquita Brands International, Inc.* | | | 263,897 |
| 82,692 | | Dean Foods Co.* | | | 1,507,475 |
| 65,742 | �� | Dole Food Co., Inc.*(a) | | | 771,811 |
| 35,862 | | Sanderson Farms, Inc. | | | 1,312,191 |
| 51,157 | | Smithfield Foods, Inc.*(a) | | | 682,434 |
| 1,500 | | TreeHouse Foods, Inc.*(a) | | | 56,100 |
| | | | | |
| | | | | 4,643,892 |
| | | | | |
See Notes to Financial Statements.
| | |
| 68 | | THE TARGET PORTFOLIO TRUST |
| | | | | |
| SHARES | | DESCRIPTION | | VALUE (NOTE 1) |
| | COMMON STOCKS (continued) | | | |
| | |
| | Furniture | | | |
| 6,700 | | Knoll, Inc. | | $ | 65,660 |
| | | | | |
| | |
| | Gas & Pipeline Utilities—0.7% | | | |
| 175,460 | | Swift Energy Co.*(a) | | | 3,716,243 |
| | | | | |
| | |
| | Gas Utilities—3.0% | | | |
| 91,348 | | AGL Resources, Inc. | | | 3,193,526 |
| 63,000 | | Atmos Energy Corp. | | | 1,754,550 |
| 40,100 | | Energen Corp. | | | 1,759,588 |
| 39,200 | | National Fuel Gas Co. | | | 1,777,328 |
| 85,300 | | Southwest Gas Corp. | | | 2,131,647 |
| 71,500 | | UGI Corp. | | | 1,707,420 |
| 139,500 | | WGL Holdings, Inc.(a) | | | 4,611,870 |
| | | | | |
| | | | | 16,935,929 |
| | | | | |
| | |
| | Healthcare Equipment & Supplies—2.5% | | | |
| 103,814 | | Cooper Cos., Inc. (The)(a) | | | 2,907,830 |
| 23,000 | | Hill-Rom Holdings, Inc.(a) | | | 450,570 |
| 95,700 | | Invacare Corp. | | | 2,146,551 |
| 66,500 | | STERIS Corp. | | | 1,945,790 |
| 90,279 | | Teleflex, Inc. | | | 4,491,381 |
| 66,675 | | West Pharmaceutical Services, Inc. | | | 2,631,662 |
| | | | | |
| | | | | 14,573,784 |
| | | | | |
| | |
| | Healthcare Providers & Services—0.8% | | | |
| 1,700 | | Alliance Imaging, Inc.* | | | 9,248 |
| 103,700 | | AMERIGROUP Corp.* | | | 2,286,585 |
| 9,600 | | Gentiva Health Services, Inc.* | | | 230,400 |
| 2,600 | | Magellan Health Services, Inc.* | | | 83,538 |
| 45,400 | | Owens & Minor, Inc. | | | 1,856,406 |
| 16,079 | | Res-Care, Inc.* | | | 193,430 |
| | | | | |
| | | | | 4,659,607 |
| | | | | |
| | |
| | Healthcare Services—1.8% | | | |
| 11,200 | | Affymetrix, Inc.* | | | 58,576 |
| 51,600 | | Amedisys, Inc.*(a) | | | 2,053,164 |
| 3,300 | | American Dental Partners, Inc.* | | | 39,237 |
| 39,494 | | AmSurg Corp.*(a) | | | 832,139 |
| 2,900 | | Continucare Corp.* | | | 7,598 |
| 4,900 | | Healthsouth Corp.*(a) | | | 71,589 |
| 6,400 | | HealthSpring, Inc.* | | | 91,712 |
| 118,900 | | Healthways, Inc.* | | | 1,911,912 |
| 93,073 | | MEDNAX, Inc.* | | | 4,832,350 |
| 8,800 | | Nighthawk Radiology Holdings, Inc.* | | | 52,712 |
| 1,700 | | RehabCare Group, Inc.* | | | 31,875 |
| 4,900 | | Triple-S Management Corp. (Puerto Rico)* | | | 81,830 |
| 6,500 | | WellCare Health Plans, Inc.* | | | 169,845 |
| | | | | |
| | | | | 10,234,539 |
| | | | | |
See Notes to Financial Statements.
| | |
| THE TARGET PORTFOLIO TRUST | | 69 |
| | |
Small Capitalization Value Portfolio (continued) | | Portfolio of Investments
As of October 31, 2009 |
| | | | | |
| SHARES | | DESCRIPTION | | VALUE (NOTE 1) |
| | COMMON STOCKS (continued) | | | |
| | |
| | Healthcare—Products | | | |
| 5,300 | | Vital Images, Inc.* | | $ | 60,473 |
| | | | | |
| | |
| | Home Builder—0.2% | | | |
| 63,300 | | Meritage Homes Corp.*(a) | | | 1,154,592 |
| | | | | |
| | |
| | Hotels, Restaurants & Leisure—0.9% | | | |
| 93,200 | | Brinker International, Inc. | | | 1,178,048 |
| 13,500 | | Dover Downs Gaming & Entertainment, Inc. | | | 64,125 |
| 118,425 | | International Speedway Corp. (Class A Stock) | | | 3,021,022 |
| 118,175 | | Sonic Corp.*(a) | | | 1,104,936 |
| | | | | |
| | | | | 5,368,131 |
| | | | | |
| | |
| | Household Durables—0.1% | | | |
| 9,200 | | ACCO Brands Corp.* | | | 55,752 |
| 53,454 | | Ethan Allen Interiors, Inc.(a) | | | 666,037 |
| 9,500 | | Furniture Brands International, Inc.* | | | 40,375 |
| 2,800 | | Tempur-Pedic International, Inc.* | | | 54,236 |
| | | | | |
| | | | | 816,400 |
| | | | | |
| | |
| | Household Products—0.4% | | | |
| 3,200 | | Tupperware Brands Corp. | | | 144,064 |
| 67,000 | | WD-40 Co. | | | 2,109,830 |
| | | | | |
| | | | | 2,253,894 |
| | | | | |
| | |
| | Industrial Products—0.8% | | | |
| 42,277 | | Brady Corp. (Class A Stock) | | | 1,144,861 |
| 2,300 | | CIRCOR International, Inc. | | | 62,675 |
| 81,655 | | Interface, Inc. (Class A Stock) | | | 633,643 |
| 72,926 | | Kaydon Corp. | | | 2,551,681 |
| 4,100 | | Myers Industries, Inc. | | | 35,957 |
| | | | | |
| | | | | 4,428,817 |
| | | | | |
| | |
| | Insurance—6.6% | | | |
| 349,829 | | American Equity Investment Life Holding Co. | | | 2,298,376 |
| 73,000 | | American Financial Group, Inc. | | | 1,795,800 |
| 2,600 | | American Physicians Capital, Inc. | | | 73,528 |
| 500 | | American Safety Insurance Holdings Ltd. (Bermuda)* | | | 7,410 |
| 15,300 | | Amerisafe, Inc.* | | | 283,662 |
| 4,300 | | AmTrust Financial Services, Inc. | | | 48,504 |
| 4,115 | | Argo Group International Holdings Ltd. (Bermuda)* | | | 139,745 |
| 44,225 | | Aspen Insurance Holdings Ltd. (Bermuda) | | | 1,141,005 |
| 199,225 | | Delphi Financial Group, Inc. (Class A Stock) | | | 4,323,182 |
| 134,149 | | Employers Holdings, Inc. | | | 1,988,088 |
| 20,092 | | Endurance Specialty Holdings Ltd. (Bermuda) | | | 723,111 |
| 400 | | FPIC Insurance Group, Inc.* | | | 13,532 |
See Notes to Financial Statements.
| | |
| 70 | | THE TARGET PORTFOLIO TRUST |
| | | | | |
| SHARES | | DESCRIPTION | | VALUE (NOTE 1) |
| | COMMON STOCKS (continued) | | | |
| | |
| | Insurance (continued) | | | |
| 50,725 | | Hanover Insurance Group, Inc. (The) | | $ | 2,134,001 |
| 1,300 | | Harleysville Group, Inc. | | | 40,729 |
| 75,300 | | HCC Insurance Holdings, Inc. | | | 1,987,167 |
| 53,613 | | Horace Mann Educators Corp. | | | 666,410 |
| 77,616 | | Infinity Property & Casualty Corp. | | | 3,001,411 |
| 7,900 | | Max Capital Group Ltd. (Bermuda) | | | 163,135 |
| 4,500 | | Meadowbrook Insurance Group, Inc. | | | 30,285 |
| 10,100 | | MGIC Investment Corp.*(a) | | | 43,531 |
| 2,400 | | Navigators Group, Inc.* | | | 127,368 |
| 1,000 | | NYMAGIC, Inc. | | | 14,290 |
| 47,364 | | Platinum Underwriters Holdings Ltd. (Bermuda) | | | 1,694,210 |
| 6,700 | | PMA Capital Corp. (Class A Stock)* | | | 32,026 |
| 28,428 | | ProAssurance Corp.* | | | 1,429,360 |
| 151,900 | | Protective Life Corp. | | | 2,924,075 |
| 25,600 | | Radian Group, Inc.(a) | | | 148,224 |
| 114,898 | | Reinsurance Group of America, Inc. | | | 5,296,798 |
| 36,600 | | RLI Corp. | | | 1,830,000 |
| 7,700 | | Selective Insurance Group | | | 117,964 |
| 83,200 | | State Auto Financial Corp. | | | 1,352,832 |
| 758 | | Tower Group, Inc. | | | 18,632 |
| 77,500 | | United Fire & Casualty Co. | | | 1,354,700 |
| 30,473 | | Validus Holdings Ltd. (Bermuda) | | | 770,967 |
| | | | | |
| | | | | 38,014,058 |
| | | | | |
| | |
| | Internet Services—0.1% | | | |
| 12,600 | | EarthLink, Inc. | | | 102,060 |
| 1,200 | | i2 Technologies, Inc.* | | | 18,888 |
| 3,000 | | SonicWALL, Inc.* | | | 23,820 |
| 3,800 | | TIBCO Software, Inc.* | | | 33,250 |
| 23,184 | | United Online, Inc. | | | 185,472 |
| 1,200 | | USA Mobility, Inc. | | | 13,080 |
| | | | | |
| | | | | 376,570 |
| | | | | |
| | |
| | Investment Companies | | | |
| 30,500 | | American Capital Ltd.*(a) | | | 81,740 |
| 4,000 | | Gladstone Capital Corp. | | | 32,840 |
| 25,615 | | MCG Capital Corp.* | | | 102,204 |
| 3,404 | | TICC Capital Corp. | | | 16,748 |
| | | | | |
| | | | | 233,532 |
| | | | | |
| | |
| | Leisure—0.2% | | | |
| 110,367 | | Callaway Golf Co. | | | 754,910 |
| 7,600 | | Jakks Pacific, Inc.* | | | 108,148 |
| | | | | |
| | | | | 863,058 |
| | | | | |
| | |
| | Leisure Equipment & Products—0.3% | | | |
| 163,800 | | Sturm Ruger & Co., Inc.(a) | | | 1,739,556 |
| | | | | |
See Notes to Financial Statements.
| | |
| THE TARGET PORTFOLIO TRUST | | 71 |
| | |
Small Capitalization Value Portfolio (continued) | | Portfolio of Investments
As of October 31, 2009 |
| | | | | |
| SHARES | | DESCRIPTION | | VALUE (NOTE 1) |
| | COMMON STOCKS (continued) | | | |
| | |
| | Life Science Tools & Services—0.3% | | | |
| 101,350 | | PerkinElmer, Inc. | | $ | 1,886,124 |
| | | | | |
| | |
| | Machinery—4.9% | | | |
| 85,075 | | Actuant Corp. (Class A Stock) | | | 1,328,021 |
| 150,700 | | Barnes Group, Inc. | | | 2,388,595 |
| 194,925 | | Bucyrus International, Inc. | | | 8,658,568 |
| 500 | | Cascade Corp. | | | 12,420 |
| 81,000 | | Crane Co. | | | 2,255,850 |
| 36,814 | | Gardner Denver, Inc.* | | | 1,321,991 |
| 37,175 | | General Cable Corp.*(a) | | | 1,157,629 |
| 137,700 | | Harsco Corp. | | | 4,336,173 |
| 32,293 | | IDEX Corp. | | | 918,090 |
| 48,458 | | Kadant, Inc.* | | | 624,624 |
| 37,000 | | Lincoln Electric Holdings, Inc. | | | 1,755,280 |
| 12,200 | | Lindsay Corp. | | | 400,526 |
| 1,800 | | Mueller Industries, Inc. | | | 42,588 |
| 13,475 | | Nordson Corp. | | | 711,076 |
| 46,675 | | Robbins & Myers, Inc. | | | 1,082,860 |
| 500 | | Tennant Co. | | | 13,330 |
| 10,275 | | Valmont Industries, Inc. | | | 742,574 |
| 7,800 | | Wabtec Corp.(a) | | | 286,728 |
| | | | | |
| | | | | 28,036,923 |
| | | | | |
| | |
| | Machinery & Equipment—0.2% | | | |
| 4,900 | | Altra Holdings, Inc.* | | | 42,973 |
| 2,500 | | Chart Industries, Inc.* | | | 49,425 |
| 3,200 | | Pioneer Drilling Co.* | | | 21,408 |
| 47,008 | | Terex Corp.*(a) | | | 950,502 |
| | | | | |
| | | | | 1,064,308 |
| | | | | |
| | |
| | Manufacturing—0.3% | | | |
| 1,600 | | Ameron International Corp. | | | 94,368 |
| 2,800 | | Ceradyne, Inc.* | | | 45,136 |
| 8,600 | | EnPro Industries, Inc.* | | | 194,188 |
| 2,000 | | Standex International Corp. | | | 35,160 |
| 1,700 | | Tredegar Corp. | | | 23,171 |
| 47,302 | | Zebra Technologies Corp.* | | | 1,182,550 |
| | | | | |
| | | | | 1,574,573 |
| | | | | |
| | |
| | Media—0.6% | | | |
| 6,100 | | AH Belo Corp. (Class A Stock) | | | 25,010 |
| 131,087 | | Belo Corp. (Class A Stock) | | | 616,109 |
| 26,350 | | Courier Corp. | | | 390,770 |
| 850 | | Cumulus Media, Inc.* | | | 1,794 |
| 3,900 | | LodgeNet Entertainment Corp.* | | | 18,915 |
See Notes to Financial Statements.
| | |
| 72 | | THE TARGET PORTFOLIO TRUST |
| | | | | |
| SHARES | | DESCRIPTION | | VALUE (NOTE 1) |
| | COMMON STOCKS (continued) | | | |
| | |
| | Media (continued) | | | |
| 81,625 | | Regal Entertainment Group (Class A Stock) | | $ | 1,029,291 |
| 27,167 | | Sinclair Broadcast Group, Inc. (Class A Stock) | | | 107,038 |
| 31,850 | | Wiley, (John) & Sons, Inc. (Class A Stock) | | | 1,121,757 |
| | | | | |
| | | | | 3,310,684 |
| | | | | |
| | |
| | Medical Supplies & Equipment—0.9% | | | |
| 5,000 | | Cantel Medical Corp.* | | | 80,300 |
| 45,981 | | Conmed Corp.* | | | 974,337 |
| 2,000 | | Halozyme Therapeutics, Inc.* | | | 12,120 |
| 20,846 | | Kensey Nash Corp.* | | | 498,428 |
| 900 | | Medivation, Inc.* | | | 22,968 |
| 99,657 | | Patterson Cos., Inc.*(a) | | | 2,544,243 |
| 2,200 | | PSS World Medical, Inc.* | | | 44,484 |
| 2,400 | | Seattle Genetics, Inc.* | | | 21,792 |
| 34,575 | | Zoll Medical Corp.* | | | 671,447 |
| | | | | |
| | | | | 4,870,119 |
| | | | | |
| | |
| | Metals & Mining—2.6% | | | |
| 25,000 | | Amcol International Corp. | | | 651,000 |
| 900 | | Ampco-Pittsburgh Corp. | | | 24,210 |
| 33,650 | | Coeur d’Alene Mines Corp.*(a) | | | 675,692 |
| 1,700 | | Columbus McKinnon Corp.* | | | 28,135 |
| 133,000 | | Commercial Metals Co. | | | 1,973,720 |
| 37,400 | | Compass Minerals International, Inc. | | | 2,330,768 |
| 161,100 | | IAMGOLD Corp. (Canada)(a) | | | 2,118,465 |
| 48,900 | | Royal Gold, Inc. | | | 2,159,913 |
| 22,071 | | RTI International Metals, Inc.* | | | 457,090 |
| 8,900 | | Stillwater Mining Co.* | | | 55,180 |
| 106,750 | | Thompson Creek Metals Co., Inc. (Canada)*(a) | | | 1,086,715 |
| 115,200 | | Timken Co. | | | 2,537,856 |
| 4,100 | | USEC, Inc.* | | | 15,826 |
| 15,775 | | Walter Energy, Inc. | | | 922,838 |
| 7,600 | | Worthington Industries, Inc. | | | 83,980 |
| 3,300 | | XOMA Ltd. (Bermuda)* | | | 2,244 |
| | | | | |
| | | | | 15,123,632 |
| | | | | |
| | |
| | Miscellaneous Manufacturers—0.2% | | | |
| 25,902 | | AptarGroup, Inc. | | | 914,600 |
| 400 | | GP Strategies Corp.* | | | 2,816 |
| 400 | | Portec Rail Products, Inc. | | | 3,484 |
| | | | | |
| | | | | 920,900 |
| | | | | |
| | |
| | Multi-Utilities—0.6% | | | |
| 55,500 | | OGE Energy Corp.(a) | | | 1,843,710 |
| 81,500 | | Vectren Corp. | | | 1,837,010 |
| | | | | |
| | | | | 3,680,720 |
| | | | | |
See Notes to Financial Statements.
| | |
| THE TARGET PORTFOLIO TRUST | | 73 |
| | |
Small Capitalization Value Portfolio (continued) | | Portfolio of Investments
As of October 31, 2009 |
| | | | | |
| SHARES | | DESCRIPTION | | VALUE (NOTE 1) |
| | COMMON STOCKS (continued) | | | |
| | |
| | Oil & Gas—0.2% | | | |
| 41,079 | | Goodrich Petroleum Corp.*(a) | | $ | 1,054,498 |
| | | | | |
| | |
| | Oil & Gas Exploration/Production—0.9% | | | |
| 131,800 | | Cabot Oil & Gas Corp. | | | 5,070,346 |
| | | | | |
| | |
| | Oil & Gas Services | | | |
| 2,400 | | Bolt Technology Corp.* | | | 24,408 |
| 12,900 | | Global Industries Ltd.* | | | 94,041 |
| | | | | |
| | | | | 118,449 |
| | | | | |
| | |
| | Oil, Gas & Consumable Fuels—5.1% | | | |
| 35,100 | | Arena Resources, Inc.*(a) | | | 1,307,826 |
| 155,888 | | Berry Petroleum Co. (Class A Stock) | | | 3,953,320 |
| 27,100 | | Cal Dive International, Inc.* | | | 208,128 |
| 45,800 | | Cimarex Energy Co. | | | 1,793,528 |
| 34,410 | | Concho Resources, Inc.* | | | 1,311,365 |
| 30,500 | | Core Laboratories NV (Netherlands)(a) | | | 3,181,150 |
| 500 | | Delek US Holdings, Inc. | | | 3,375 |
| 12,700 | | EXCO Resources, Inc. | | | 198,374 |
| 141,100 | | Frontier Oil Corp.(a) | | | 1,955,646 |
| 54,200 | | GMX Resources, Inc.*(a) | | | 689,966 |
| 27,500 | | Gulfport Energy Corp.* | | | 209,825 |
| 87,400 | | Holly Corp. | | | 2,535,474 |
| 9,750 | | New Jersey Resources Corp. | | | 343,200 |
| 68,000 | | ONEOK, Inc. | | | 2,462,280 |
| 9,400 | | Parker Drilling Co.* | | | 48,880 |
| 84,850 | | Petroquest Energy, Inc.*(a) | | | 520,130 |
| 6,400 | | Rosetta Resources, Inc.* | | | 86,592 |
| 3,100 | | RPC, Inc. | | | 28,985 |
| 25,935 | | South Jersey Industries, Inc. | | | 915,246 |
| 99,100 | | St. Mary Land & Exploration Co. | | | 3,379,310 |
| 5,500 | | Stone Energy Corp.* | | | 84,315 |
| 7,500 | | TETRA Technologies, Inc.* | | | 70,950 |
| 2,300 | | TGC Industries, Inc.* | | | 10,005 |
| 1,900 | | Toreador Resources Corp. | | | 16,207 |
| 103,000 | | Tsakos Energy Navigation Ltd. (Bermuda)(a) | | | 1,598,560 |
| 10,100 | | VAALCO Energy, Inc. | | | 43,026 |
| 6,000 | | Western Refining, Inc.* | | | 33,660 |
| 44,500 | | World Fuel Services Corp.(a) | | | 2,262,825 |
| | | | | |
| | | | | 29,252,148 |
| | | | | |
| | |
| | Paper & Forest Products—0.3% | | | |
| 17,900 | | Buckeye Technologies, Inc.* | | | 160,384 |
| 61,300 | | Louisiana-Pacific Corp.*(a) | | | 321,825 |
| 49,255 | | Neenah Paper, Inc. | | | 509,789 |
See Notes to Financial Statements.
| | |
| 74 | | THE TARGET PORTFOLIO TRUST |
| | | | | |
| SHARES | | DESCRIPTION | | VALUE (NOTE 1) |
| | COMMON STOCKS (continued) | | | |
| | |
| | Paper & Forest Products (continued) | | | |
| 8,100 | | Rock-Tenn Co. (Class A Stock) | | $ | 354,780 |
| 3,300 | | Schweitzer-Mauduit International, Inc. | | | 170,445 |
| | | | | |
| | | | | 1,517,223 |
| | | | | |
| | |
| | Personnel Services | | | |
| 4,500 | | Kforce, Inc.* | | | 52,785 |
| | | | | |
| | |
| | Pharmaceuticals | | | |
| 700 | | Auxilium Pharmaceuticals, Inc.* | | | 22,022 |
| 1,700 | | Cypress Bioscience, Inc.* | | | 10,438 |
| 1,400 | | Par Pharmaceutical Cos., Inc.* | | | 29,358 |
| 900 | | Pharmasset, Inc.* | | | 16,902 |
| 9,800 | | Prestige Brands Holdings, Inc.* | | | 66,248 |
| 1,000 | | United Therapeutics Corp.* | | | 42,540 |
| 1,800 | | Valeant Pharmaceuticals International* | | | 52,920 |
| 900 | | XenoPort, Inc.* | | | 15,039 |
| | | | | |
| | | | | 255,467 |
| | | | | |
| | |
| | Printing & Publishing | | | |
| 17,600 | | Journal Communications, Inc. | | | 62,656 |
| | | | | |
| | |
| | Professional Services—0.6% | | | |
| 83,942 | | Watson Wyatt Worldwide, Inc. (Class A Stock) | | | 3,658,192 |
| | | | | |
| | |
| | Real Estate—0.2% | | | |
| 1,800 | | Government Properties Income Trust | | | 41,904 |
| 19,625 | | Jones Lang LaSalle, Inc. | | | 919,431 |
| | | | | |
| | | | | 961,335 |
| | | | | |
| | |
| | Real Estate Investment Trusts—4.8% | | | |
| 2,300 | | American Campus Communities, Inc. | | | 62,146 |
| 39,000 | | Anthracite Capital, Inc.(a) | | | 28,080 |
| 13,000 | | Anworth Mortgage Asset Corp. | | | 92,690 |
| 10,200 | | Ashford Hospitality Trust, Inc.* | | | 39,168 |
| 5,600 | | Associated Estates Realty Corp. | | | 51,072 |
| 9,300 | | BioMed Realty Trust, Inc.(a) | | | 126,201 |
| 108,384 | | CBL & Associates Properties, Inc.(a) | | | 884,413 |
| 10,200 | | Cedar Shopping Centers, Inc. | | | 61,914 |
| 931,550 | | Chimera Investment Corp. | | | 3,251,110 |
| 7,800 | | Colonial Properties Trust | | | 82,134 |
| 3,100 | | Cypress Sharpridge Investments, Inc. | | | 41,385 |
| 27,700 | | DCT Industrial Trust, Inc.(a) | | | 125,481 |
| 12,500 | | Developers Diversified Realty Corp.(a) | | | 107,375 |
| 73,275 | | DiamondRock Hospitality Co.* | | | 557,623 |
| 119,840 | | Education Realty Trust, Inc. | | | 600,398 |
| 4,600 | | Entertainment Properties Trust | | | 156,492 |
| 3,200 | | Equity LifeStyle Properties, Inc. | | | 148,640 |
| 155,865 | | Equity One, Inc.(a) | | | 2,325,506 |
| 4,900 | | Extra Space Storage, Inc. | | | 46,893 |
See Notes to Financial Statements.
| | |
| THE TARGET PORTFOLIO TRUST | | 75 |
| | |
Small Capitalization Value Portfolio (continued) | | Portfolio of Investments
As of October 31, 2009 |
| | | | | |
| SHARES | | DESCRIPTION | | VALUE (NOTE 1) |
| | COMMON STOCKS (continued) | | | |
| | |
| | Real Estate Investment Trusts (continued) | | | |
| 45,300 | | First Industrial Realty Trust, Inc.(a) | | $ | 197,055 |
| 88,900 | | First Potomac Realty Trust(a) | | | 1,009,015 |
| 149,400 | | Franklin Street Properties Corp.(a) | | | 1,610,532 |
| 22,400 | | Glimcher Realty Trust | | | 60,480 |
| 72,200 | | Healthcare Realty Trust, Inc.(a) | | | 1,503,926 |
| 4,400 | | Hersha Hospitality Trust | | | 11,264 |
| 1,300 | | Home Properties, Inc. | | | 50,934 |
| 105,000 | | HRPT Properties Trust(a) | | | 738,150 |
| 7,300 | | Inland Real Estate Corp. | | | 62,634 |
| 1,100 | | Invesco Mortgage Capital, Inc. | | | 21,934 |
| 19,920 | | iStar Financial, Inc.* | | | 41,633 |
| 28,550 | | LaSalle Hotel Properties | | | 489,918 |
| 45,078 | | Lexington Realty Trust | | | 188,877 |
| 5,100 | | LTC Properties, Inc. | | | 121,125 |
| 222,600 | | Medical Properties Trust, Inc.(a) | | | 1,780,800 |
| 403,826 | | MFA Mortgage Investments, Inc. | | | 2,996,389 |
| 18,948 | | Mid-America Apartment Communities, Inc. | | | 830,301 |
| 15,900 | | National Retail Properties, Inc.(a) | | | 308,142 |
| 52,800 | | Nationwide Health Properties, Inc.(a) | | | 1,702,800 |
| 17,527 | | NorthStar Realty Finance Corp.(a) | | | 61,870 |
| 10,300 | | Omega Healthcare Investors, Inc. | | | 156,148 |
| 8,900 | | Parkway Properties, Inc. | | | 157,085 |
| 19,100 | | Pennsylvania Real Estate Investment Trust(a) | | | 140,003 |
| 40,200 | | PS Business Parks, Inc. | | | 1,968,594 |
| 4,500 | | Resource Capital Corp. | | | 21,780 |
| 2,300 | | Saul Centers, Inc. | | | 70,748 |
| 17,800 | | Senior Housing Properties Trust | | | 343,184 |
| 67,100 | | Sovran Self Storage, Inc. | | | 2,019,710 |
| 10,300 | | Strategic Hotels & Resorts, Inc.* | | | 18,231 |
| 4,700 | | Sun Communities, Inc. | | | 81,968 |
| 10,699 | | Sunstone Hotel Investors, Inc.*(a) | | | 80,778 |
| | | | | |
| | | | | 27,634,729 |
| | | | | |
| | |
| | Restaurants | | | |
| 3,100 | | Einstein Noah Restaurant Group, Inc.* | | | 40,362 |
| 10,900 | | Ruby Tuesday, Inc.* | | | 72,594 |
| 28,300 | | Ruth’s Hospitality Group, Inc.* | | | 88,013 |
| | | | | |
| | | | | 200,969 |
| | | | | |
| | |
| | Retail—1.4% | | | |
| 10,900 | | Asbury Automotive Group, Inc.* | | | 106,166 |
| 84,657 | | Cash America International, Inc. | | | 2,561,721 |
| 5,100 | | CEC Entertainment, Inc.*(a) | | | 148,971 |
| 6,000 | | Group 1 Automotive, Inc. | | | 152,520 |
See Notes to Financial Statements.
| | |
| 76 | | THE TARGET PORTFOLIO TRUST |
| | | | | |
| SHARES | | DESCRIPTION | | VALUE (NOTE 1) |
| | COMMON STOCKS (continued) | | | |
| | |
| | Retail (continued) | | | |
| 5,000 | | Insight Enterprises, Inc.* | | $ | 52,600 |
| 1,100 | | Jo-Ann Stores, Inc.* | | | 29,282 |
| 25,932 | | Men’s Wearhouse, Inc. (The) | | | 600,844 |
| 69,734 | | Pantry, Inc. (The)* | | | 983,947 |
| 60,568 | | PetSmart, Inc. | | | 1,425,165 |
| 130,360 | | Regis Corp.(a) | | | 2,117,046 |
| 8,700 | | Sonic Automotive, Inc. (Class A Stock)(a) | | | 77,778 |
| 11,800 | | Zale Corp.*(a) | | | 55,814 |
| | | | | |
| | | | | 8,311,854 |
| | | | | |
| | |
| | Retail & Merchandising—0.6% | | | |
| 37,609 | | Bebe Stores, Inc. | | | 235,432 |
| 40,300 | | BJ’s Wholesale Club, Inc.* | | | 1,411,709 |
| 95,244 | | Coldwater Creek, Inc.* | | | 547,653 |
| 6,000 | | Collective Brands, Inc.* | | | 111,300 |
| 1,000 | | Deckers Outdoor Corp.* | | | 89,670 |
| 8,600 | | Finish Line, Inc. (The) (Class A Stock) | | | 87,204 |
| 38,415 | | hhgregg, Inc.* | | | 633,464 |
| 8,000 | | Interline Brands, Inc.* | | | 116,800 |
| 2,100 | | Rush Enterprises, Inc.* | | | 22,932 |
| 17,789 | | Saks`s, Inc.*(a) | | | 99,796 |
| | | | | |
| | | | | 3,355,960 |
| | | | | |
| | |
| | Retail Apparel | | | |
| 8,100 | | Dress Barn, Inc.*(a) | | | 146,205 |
| 4,900 | | Jos. A. Bank Clothiers, Inc.* | | | 200,802 |
| 2,700 | | Warnaco Group, Inc. (The)* | | | 109,431 |
| | | | | |
| | | | | 456,438 |
| | | | | |
| | |
| | Road & Rail—0.2% | | | |
| 3,100 | | Arkansas Best Corp. | | | 80,042 |
| 27,625 | | Landstar System, Inc. | | | 973,505 |
| | | | | |
| | | | | 1,053,547 |
| | | | | |
| | |
| | Semiconductors—1.5% | | | |
| 10,100 | | Amkor Technology, Inc.* | | | 55,651 |
| 7,450 | | Applied Micro Circuits Corp.* | | | 58,259 |
| 4,400 | | DSP Group, Inc.* | | | 25,432 |
| 70,243 | | Emulex Corp.* | | | 709,454 |
| 17,758 | | Entegris, Inc.* | | | 66,770 |
| 53,334 | | Itron, Inc.* | | | 3,202,173 |
| 5,900 | | Lattice Semiconductor Corp.* | | | 11,269 |
| 4,600 | | MKS Instruments, Inc.* | | | 71,944 |
| 5,800 | | Photronics, Inc.* | | | 24,244 |
| 14,500 | | PMC - Sierra, Inc.* | | | 123,540 |
| 43,120 | | Richardson Electronics Ltd. | | | 243,628 |
| 3,000 | | Sigma Designs, Inc.* | | | 36,030 |
| 96,425 | | Skyworks Solutions, Inc.* | | | 1,005,713 |
See Notes to Financial Statements.
| | |
| THE TARGET PORTFOLIO TRUST | | 77 |
| | |
Small Capitalization Value Portfolio (continued) | | Portfolio of Investments
As of October 31, 2009 |
| | | | | |
| SHARES | | DESCRIPTION | | VALUE (NOTE 1) |
| | COMMON STOCKS (continued) | | | |
| | |
| | Semiconductors (continued) | | | |
| 140,200 | | TriQuint Semiconductor, Inc.* | | $ | 755,678 |
| 44,475 | | Varian Semiconductor Equipment Associates, Inc.*(a) | | | 1,262,645 |
| 2,600 | | Veeco Instruments, Inc.* | | | 63,310 |
| 86,488 | | Zoran Corp.* | | | 767,149 |
| | | | | |
| | | | | 8,482,889 |
| | | | | |
| | |
| | Semiconductors & Semiconductor Equipment | | | |
| 34,200 | | Himax Technologies, Inc., ADR (Cayman Islands) | | | 90,288 |
| | | | | |
| | |
| | Software—1.0% | | | |
| 3,300 | | CSG Systems International, Inc.* | | | 53,922 |
| 147,339 | | Lawson Software, Inc.* | | | 929,709 |
| 104,537 | | Sybase, Inc.*(a) | | | 4,135,484 |
| 43,750 | | Tyler Technologies, Inc.*(a) | | | 832,125 |
| | | | | |
| | | | | 5,951,240 |
| | | | | |
| | |
| | Specialized Consumer Services—0.1% | | | |
| 26,800 | | Hillenbrand, Inc. | | | 535,464 |
| | | | | |
| | |
| | Specialty Retail—1.4% | | | |
| 204,000 | | Aaron’s, Inc.(a) | | | 5,110,200 |
| 18,293 | | Abercrombie & Fitch Co. (Class A Stock) | | | 600,376 |
| 4,975 | | Brown Shoe Co., Inc. | | | 51,591 |
| 67,800 | | Buckle, Inc. (The)(a) | | | 2,034,678 |
| | | | | |
| | | | | 7,796,845 |
| | | | | |
| | |
| | Telecommunications—1.6% | | | |
| 4,800 | | Adaptec, Inc.* | | | 15,312 |
| 1,400 | | Anixter International, Inc.*(a) | | | 58,590 |
| 300,816 | | Arris Group, Inc.* | | | 3,086,372 |
| 1,300 | | Atlantic Tele-Network, Inc. | | | 59,592 |
| 36,025 | | Black Box Corp. | | | 955,023 |
| 39,500 | | Cincinnati Bell, Inc.* | | | 121,660 |
| 1,700 | | Consolidated Communications Holdings, Inc. | | | 23,494 |
| 1,100 | | CPI International , Inc.* | | | 10,890 |
| 3,100 | | DigitalGlobe, Inc.* | | | 69,223 |
| 4,200 | | Harris Stratex Networks, Inc. (Class A Stock)* | | | 26,460 |
| 1,400 | | LogMeIn, Inc.* | | | 28,140 |
| 6,800 | | MasTec, Inc.* | | | 80,240 |
| 3,200 | | Plantronics, Inc. | | | 77,152 |
| 2,100 | | Polycom, Inc.* | | | 45,087 |
| 9,500 | | Premiere Global Services, Inc.* | | | 70,965 |
| 6,200 | | RF Micro Devices, Inc.* | | | 24,676 |
| 75,900 | | SBA Communications Corp. (Class A Stock)*(a) | | | 2,141,139 |
| 3,600 | | Symmetricon, Inc.* | | | 17,244 |
See Notes to Financial Statements.
| | |
| 78 | | THE TARGET PORTFOLIO TRUST |
| | | | | |
| SHARES | | DESCRIPTION | | VALUE (NOTE 1) |
| | COMMON STOCKS (continued) | | | |
| | |
| | Telecommunications (continued) | | | |
| 120,275 | | Syniverse Holdings, Inc.* | | $ | 2,060,311 |
| 8,500 | | Virgin Mobile USA, Inc.* | | | 34,000 |
| | | | | |
| | | | | 9,005,570 |
| | | | | |
| | |
| | Textiles & Apparel—1.4% | | | |
| 7,800 | | Oxford Industries, Inc. | | | 150,930 |
| 17,250 | | Perry Ellis International, Inc.* | | | 235,808 |
| 185,850 | | Phillips-Van Heusen Corp. | | | 7,461,877 |
| 2,200 | | Quiksilver, Inc.* | | | 4,378 |
| 2,600 | | Skechers USA, Inc. (Class A Stock)* | | | 56,732 |
| | | | | |
| | | | | 7,909,725 |
| | | | | |
| | |
| | Textiles, Apparel & Luxury Goods—1.2% | | | |
| 68,225 | | Hanesbrands, Inc.*(a) | | | 1,475,024 |
| 44,600 | | UniFirst Corp. | | | 1,876,322 |
| 128,750 | | Wolverine World Wide, Inc.(a) | | | 3,293,425 |
| | | | | |
| | | | | 6,644,771 |
| | | | | |
| | |
| | Thrifts & Mortgage Finance—0.7% | | | |
| 216,700 | | Astoria Financial Corp. | | | 2,162,666 |
| 91,450 | | Washington Federal, Inc. | | | 1,568,367 |
| | | | | |
| | | | | 3,731,033 |
| | | | | |
| | |
| | Tobacco—0.4% | | | |
| 49,000 | | Universal Corp. | | | 2,037,910 |
| | | | | |
| | |
| | Trading Companies & Distributors—0.8% | | | |
| 105,350 | | Applied Industrial Technologies, Inc. | | | 2,131,230 |
| 44,800 | | Watsco, Inc. | | | 2,294,656 |
| | | | | |
| | | | | 4,425,886 |
| | | | | |
| | |
| | Transportation—0.3% | | | |
| 6,300 | | Aircastle Ltd. (Bermuda) | | | 49,896 |
| 3,400 | | Atlas Air Worldwide Holdings, Inc.* | | | 89,386 |
| 7,900 | | GulfMark Offshore, Inc.* | | | 218,593 |
| 5,000 | | Heartland Express, Inc. | | | 68,000 |
| 10,800 | | Horizon Lines, Inc. | | | 56,700 |
| 5,100 | | Incyte Corp. Ltd.*(a) | | | 30,039 |
| 2,000 | | International Shipholding Corp. | | | 66,300 |
| 28,630 | | Kansas City Southern*(a) | | | 693,705 |
| 900 | | Knight Transportation, Inc. | | | 14,436 |
| 4,000 | | Knightsbridge Tankers Ltd. (Bermuda) | | | 50,560 |
| 3,200 | | Marten Transport Ltd.* | | | 56,128 |
| 1,600 | | Nordic American Tanker Shipping (Bermuda)(a) | | | 45,280 |
| 1 | | PHI, Inc.* | | | 17 |
| 4,500 | | Saia, Inc.* | | | 65,970 |
| | | | | |
| | | | | 1,505,010 |
| | | | | |
See Notes to Financial Statements.
| | |
| THE TARGET PORTFOLIO TRUST | | 79 |
| | |
Small Capitalization Value Portfolio (continued) | | Portfolio of Investments
As of October 31, 2009 |
| | | | | | | |
| SHARES | | DESCRIPTION | | VALUE (NOTE 1) | |
| | | COMMON STOCKS (continued) | | | | |
| | |
| | | Utilities | | | | |
| | 1,300 | | Chesapeake Utilities Corp. | | $ | 41,184 | |
| | | | | | | |
| | |
| | | Water Utilities—0.3% | | | | |
| | 1,600 | | American States Water Co. | | | 53,040 | |
| | 96,000 | | American Water Works Co., Inc. | | | 1,821,120 | |
| | 2,000 | | California Water Service Group | | | 73,140 | |
| | | | | | | |
| | | | | | 1,947,300 | |
| | | | | | | |
| | | TOTAL LONG-TERM INVESTMENTS
(cost $511,880,434) | | | 547,956,731 | |
| | | | | | | |
PRINCIPAL
AMOUNT (000)# | | SHORT-TERM INVESTMENTS—23.8% | | | |
| | |
| | | U.S. TREASURY OBLIGATION | | | | |
| $ | 230 | | U.S. Treasury Notes(k)
3.125%, 11/30/09 (cost $230,456) | | | 230,521 | |
| | | | | | | |
| SHARES | | | | | |
| | |
| | | AFFILIATED MONEY MARKET MUTUAL FUND—23.8% | | | | |
| | 135,868,408 | | Dryden Core Investment Fund—Taxable Money Market Series
(cost $135,868,408; includes $110,553,795 of cash collateral for securities on loan)(b)(w) | | | 135,868,408 | |
| | | | | | | |
| | | TOTAL SHORT-TERM INVESTMENTS
(cost $136,098,864) | | | 136,098,929 | |
| | | | | | | |
| | | TOTAL INVESTMENTS—119.6%
(cost $647,979,298; Note 5) | | | 684,055,660 | |
| | | Liabilities in excess of other assets(x)—(19.6)% | | | (112,279,339 | ) |
| | | | | | | |
| | | NET ASSETS—100% | | $ | 571,776,321 | |
| | | | | | | |
The following abbreviation is used in Portfolio descriptions:
ADR—American Depositary Receipt
| * | Non-income producing security. |
| # | Principal amount is shown in U.S. dollars unless otherwise stated. |
| (a) | All or a portion of security is on loan. The aggregate market value of such securities is $103,540,932; cash collateral of $110,553,795 (included with liabilities) was received with which the Portfolio purchased highly liquid short-term investments. |
| (b) | Represents security, or a portion thereof, purchased with cash collateral received for securities on loan. |
| (k) | Securities segregated as collateral for futures contracts. |
| (w) | Prudential Investments LLC, the manager of the Portfolio, also serves as manager of the Dryden Core Investment Fund-Taxable Money Market Series. |
| (x) | Liabilities in excess of other assets includes unrealized depreciation on futures contracts as follows: |
See Notes to Financial Statements.
| | |
| 80 | | THE TARGET PORTFOLIO TRUST |
Futures contracts open at October 31, 2009:
| | | | | | | | | | | | | | |
Number of
Contracts | | Type | | Expiration
Date | | Value at
Trade Date | | Value at
October 31, 2009 | | Unrealized
Depreciation | |
| Long Position: | | | | | | | | | | | | | | |
| 22 | | Russell 2000 Mini | | Dec 09 | | $ | 1,303,420 | | $ | 1,235,960 | | $ | (67,460 | ) |
| | | | | | | | | | | | | | |
Various inputs are used in determining the value of the Portfolio’s investments. These inputs are summarized in the three broad levels listed below.
Level 1—quoted prices in active markets for identical securities
Level 2—other significant observable inputs (including quoted prices for similar securities, interest rates, prepayment speeds, credit risk, etc.)
Level 3—significant unobservable inputs (including the Portfolio’s own assumptions in determining the fair value of investments)
The following is a summary of the inputs used as of October 31, 2009 in valuing the Portfolio’s assets carried at fair value:
| | | | | | | | | | |
Investments in Securities | | Level 1 | | | Level 2 | | Level 3 |
Common Stocks | | $ | 547,956,731 | | | $ | — | | $ | — |
U.S. Treasury Obligation | | | — | | | | 230,521 | | | — |
Affiliated Money Market Mutual Fund | | | 135,868,408 | | | | — | | | — |
| | | | | | | | | | |
| | $ | 683,825,139 | | | $ | 230,521 | | $ | — |
Other Financial Instruments* | | | (67,460 | ) | | | — | | | — |
| | | | | | | | | | |
Total | | $ | 683,757,679 | | | $ | 230,521 | | $ | — |
| | | | | | | | | | |
| * | Other financial instruments are derivative instruments not reflected in the Portfolio of Investments, such as futures, forwards and swap contracts, which are valued at the unrealized appreciation/depreciation on the instrument. |
As of October 31, 2008 and October 31, 2009, the Portfolio did not use any significant unobservable inputs (Level 3) in determining the value of investments.
The industry classification of investments and liabilities in excess of other assets shown as a percentage of net assets as of October 31, 2009 were as follows:
| | | |
Affiliated Money Market Mutual Fund (19.3% represents investments purchased with collateral from securities on loan) | | 23.8 | % |
Insurance | | 6.6 | |
Oil, Gas & Consumable Fuels | | 5.1 | |
Machinery | | 4.9 | |
Real Estate Investment Trusts | | 4.8 | |
Chemicals | | 4.5 | |
Gas Utilities | | 3.0 | |
Metals & Mining | | 2.6 | |
Aerospace/Defense | | 2.6 | |
Healthcare Equipment & Supplies | | 2.5 | |
Banks | | 2.5 | |
Financial Services | | 2.3 | |
Computer Services & Software | | 2.2 | |
Consumer Products & Services | | 2.0 | |
Electronics | | 1.8 | |
Healthcare Services | | 1.8 | |
Telecommunications | | 1.6 | |
See Notes to Financial Statements.
| | |
| THE TARGET PORTFOLIO TRUST | | 81 |
| | |
Small Capitalization Value Portfolio (continued) | | Portfolio of Investments
As of October 31, 2009 |
| | | |
Industry (cont’d.) | | | |
Commercial Banks | | 1.6 | % |
Food Products | | 1.6 | |
Semiconductors | | 1.5 | |
Textiles & Apparel | | 1.4 | |
Specialty Retail | | 1.4 | |
Retail | | 1.4 | |
Food & Drug Retailing | | 1.3 | |
Commercial Services | | 1.2 | |
Textiles, Apparel & Luxury Goods | | 1.2 | |
Electrical Equipment | | 1.2 | |
Containers & Packaging | | 1.1 | |
Commercial Services & Supplies | | 1.1 | |
Software | | 1.0 | |
Electric Utilities | | 1.0 | |
Hotels, Restaurants & Leisure | | 0.9 | |
Oil & Gas Exploration/Production | | 0.9 | |
Medical Supplies & Equipment | | 0.9 | |
Electronic Components | | 0.9 | |
Computers & Peripherals | | 0.8 | |
Healthcare Providers & Services | | 0.8 | |
Foods | | 0.8 | |
Industrial Products | | 0.8 | |
Trading Companies & Distributors | | 0.8 | |
Energy Equipment & Services | | 0.7 | |
Consumer Finance | | 0.7 | |
Capital Markets | | 0.7 | |
Construction & Engineering | | 0.7 | |
Exchange Traded Funds | | 0.7 | |
Thrifts & Mortgage Finance | | 0.7 | |
Gas & Pipeline Utilities | | 0.7 | |
Diversified Financials | | 0.6 | |
Multi-Utilities | | 0.6 | |
Professional Services | | 0.6 | |
Retail & Merchandising | | 0.6 | |
Media | | 0.6 | |
Business Services | | 0.6 | |
Entertainment & Leisure | | 0.5 | |
Financial—Bank & Trust | | 0.5 | |
Computer Hardware | | 0.5 | |
Drugs & Healthcare | | 0.5 | |
Electric | | 0.5 | |
Environmental Services | | 0.4 | |
Airlines | | 0.4 | |
Automotive Parts | | 0.4 | |
Household Products | | 0.4 | |
Energy Equipment | | 0.4 | |
Building Products | | 0.4 | |
See Notes to Financial Statements.
| | |
| 82 | | THE TARGET PORTFOLIO TRUST |
| | | |
Industry (cont’d.) | | | |
Tobacco | | 0.4 | % |
Communication Equipment | | 0.3 | |
Water Utilities | | 0.3 | |
Life Science Tools & Services | | 0.3 | |
Diversified Financial Services | | 0.3 | |
Electronic Equipment & Instruments | | 0.3 | |
Leisure Equipment & Products | | 0.3 | |
Manufacturing | | 0.3 | |
Beverages | | 0.3 | |
Paper & Forest Products | | 0.3 | |
Transportation | | 0.3 | |
Clothing & Apparel | | 0.2 | |
Home Builders | | 0.2 | |
Machinery & Equipment | | 0.2 | |
Distribution/Wholesale | | 0.2 | |
Oil & Gas | | 0.2 | |
Road & Rail | | 0.2 | |
Real Estate | | 0.2 | |
Miscellaneous Manufacturers | | 0.2 | |
Auto Related | | 0.2 | |
Leisure | | 0.2 | |
Household Durables | | 0.1 | |
Specialized Consumer Services | | 0.1 | |
Internet Services | | 0.1 | |
Apparel | | 0.1 | |
Building Materials | | 0.1 | |
Consumer Services | | 0.1 | |
| | | |
| | 119.6 | |
Liabilities in excess of other assets | | (19.6 | ) |
| | | |
| | 100.0 | % |
| | | |
See Notes to Financial Statements.
| | |
| THE TARGET PORTFOLIO TRUST | | 83 |
| | |
International Equity Portfolio | | Portfolio of Investments
As of October 31, 2009 |
| | | | | |
| SHARES | | DESCRIPTION | | VALUE (NOTE 1) |
| | LONG-TERM INVESTMENTS—98.6% | | | |
| | |
| | COMMON STOCKS—98.6% | | | |
| | |
| | Australia—3.8% | | | |
| 121,911 | | Amcor Ltd. | | $ | 627,782 |
| 119,400 | | AWB Ltd. | | | 130,376 |
| 61,558 | | BHP Billiton Ltd. | | | 2,018,895 |
| 123,600 | | BlueScope Steel Ltd. | | | 327,559 |
| 122,700 | | Challenger Financial Services Group Ltd. | | | 403,491 |
| 107,200 | | Downer Edi Ltd. | | | 816,049 |
| 8,100 | | Macquarie Group Ltd. | | | 354,745 |
| 75,500 | | Metcash Ltd. | | | 317,430 |
| 97,389 | | OZ Minerals Ltd.* | | | 101,837 |
| 154,900 | | Pacific Brands Ltd.* | | | 180,367 |
| 278,900 | | Qantas Airways Ltd. | | | 693,483 |
| 255,300 | | Telstra Corp. Ltd. | | | 758,655 |
| | | | | |
| | | | | 6,730,669 |
| | | | | |
| | |
| | Belgium—0.6% | | | |
| 28,600 | | AGFA-Gevaert NV* | | | 172,279 |
| 10,800 | | Delhaize Group | | | 733,664 |
| 10,300 | | Dexia SA* | | | 85,613 |
| | | | | |
| | | | | 991,556 |
| | | | | |
| | |
| | Bermuda—0.4% | | | |
| 372,000 | | Noble Group Ltd. | | | 679,849 |
| | | | | |
| | |
| | Brazil—2.9% | | | |
| 191,200 | | BM&F Bovespa SA | | | 1,231,903 |
| 19,700 | | Companhia Brasileira de Meios de Pagamento | | | 181,276 |
| 36,200 | | Empresa Brasileira de Aeronautica SA, ADR* | | | 733,050 |
| 42,600 | | Natura Cosmeticos SA | | | 765,620 |
| 47,900 | | Petroleo Brasileiro SA, ADR | | | 2,213,938 |
| | | | | |
| | | | | 5,125,787 |
| | | | | |
| | |
| | Canada—3.8% | | | |
| 39,400 | | Canadian National Railway Co. | | | 1,904,366 |
| 29,600 | | Canadian Natural Resources Ltd. | | | 1,920,902 |
| 13,300 | | Potash Corp. of Saskatchewan, Inc. | | | 1,233,974 |
| 56,600 | | Rogers Communications, Inc. (Class B Stock) | | | 1,660,783 |
| | | | | |
| | | | | 6,720,025 |
| | | | | |
| | |
| | Cayman Islands—0.7% | | | |
| 2,200 | | Baidu, Inc., ADR* | | | 831,424 |
| 613,600 | | Chaoda Modern Agriculture Holdings Ltd. | | | 474,096 |
| | | | | |
| | | | | 1,305,520 |
| | | | | |
See Notes to Financial Statements.
| | |
| 84 | | THE TARGET PORTFOLIO TRUST |
| | | | | |
| SHARES | | DESCRIPTION | | VALUE (NOTE 1) |
| | COMMON STOCKS (continued) | | | |
| | |
| | China—3.2% | | | |
| 818,689 | | China Merchants Bank Co. Ltd. (Class H Stock) | | $ | 2,094,486 |
| 3,619,700 | | Industrial & Commercial Bank of China Ltd. (Class H Stock) | | | 2,879,888 |
| 164,400 | | Sinopharm Group Co. (Class H Stock)* | | | 598,188 |
| | | | | |
| | | | | 5,572,562 |
| | | | | |
| | |
| | Denmark—2.9% | | | |
| 14,600 | | Danske Bank A/S* | | | 335,312 |
| 25,400 | | H. Lundbeck A/S | | | 491,944 |
| 41,816 | | Novo Nordisk A/S (Class B Stock) | | | 2,597,870 |
| 24,470 | | Vestas Wind Systems A/S* | | | 1,716,241 |
| | | | | |
| | | | | 5,141,367 |
| | | | | |
| | |
| | Finland—1.3% | | | |
| 9,233 | | Fortum Oyj | | | 218,534 |
| 103,000 | | Nokia Oyj | | | 1,301,016 |
| 16,700 | | Rautaruukki Oyj | | | 340,414 |
| 25,900 | | Tieto Oyj | | | 517,272 |
| | | | | |
| | | | | 2,377,236 |
| | | | | |
| | |
| | France—10.2% | | | |
| 16,083 | | Air Liquide SA | | | 1,732,150 |
| 320 | | Arkema SA | | | 12,216 |
| 113,100 | | AXA SA | | | 2,812,815 |
| 35,753 | | BNP Paribas | | | 2,693,421 |
| 2,100 | | Ciments Francais SA | | | 228,857 |
| 32,000 | | Credit Agricole SA | | | 612,965 |
| 33,000 | | France Telecom SA | | | 817,699 |
| 22,972 | | Lafarge SA | | | 1,864,632 |
| 23,917 | | LVMH Moet Hennessy Louis Vuitton SA | | | 2,476,633 |
| 11,300 | | Rallye SA | | | 383,657 |
| 32,800 | | Safran SA | | | 529,155 |
| 21,400 | | Sanofi-Aventis SA | | | 1,568,665 |
| 16,500 | | SCOR SE | | | 419,939 |
| 4,700 | | Societe Generale | | | 312,173 |
| 8,600 | | Thales SA | | | 416,691 |
| 12,800 | | Total SA | | | 765,955 |
| 10,000 | | Vivendi | | | 277,423 |
| | | | | |
| | | | | 17,925,046 |
| | | | | |
| | |
| | Germany—7.8% | | | |
| 5,400 | | Aurubis AG | | | 215,142 |
| 19,300 | | BASF SE | | | 1,033,128 |
| 6,700 | | Daimler AG | | | 325,439 |
| 36,700 | | Deutsche Bank AG | | | 2,666,306 |
| 6,772 | | Deutsche Boerse AG | | | 548,482 |
| 15,100 | | Deutsche Lufthansa AG | | | 233,166 |
| 49,513 | | E.ON AG | | | 1,897,580 |
| 33,300 | | Fresenius Medical Care AG & Co. KGaA | | | 1,616,095 |
See Notes to Financial Statements.
| | |
| THE TARGET PORTFOLIO TRUST | | 85 |
| | |
International Equity Portfolio (continued) | | Portfolio of Investments
As of October 31, 2009 |
| | | | | |
| SHARES | | DESCRIPTION | | VALUE (NOTE 1) |
| | COMMON STOCKS (continued) | | | |
| | |
| | Germany (continued) | | | |
| 8,000 | | Hannover Rueckversicherung AG* | | $ | 360,657 |
| 7,400 | | Heidelberger Druckmaschinen AG* | | | 54,480 |
| 13,400 | | MTU Aero Engines Holding AG | | | 608,912 |
| 5,500 | | Muenchener Rueckversicherungs AG | | | 870,171 |
| 4,000 | | RWE AG | | | 350,851 |
| 48,929 | | SAP AG | | | 2,216,245 |
| 25,700 | | ThyssenKrupp AG | | | 827,842 |
| | | | | |
| | | | | 13,824,496 |
| | | | | |
| | |
| | Greece—1.4% | | | |
| 65,512 | | National Bank of Greece SA* | | | 2,395,140 |
| | | | | |
| | |
| | Guernsey—0.7% | | | |
| 51,400 | | Amdocs Ltd.* | | | 1,295,280 |
| | | | | |
| | |
| | Hong Kong—2.6% | | | |
| 1,286,497 | | CNOOC Ltd. | | | 1,926,704 |
| 134,504 | | Hong Kong Exchanges and Clearing Ltd. | | | 2,367,621 |
| 57,500 | | Orient Overseas International Ltd. | | | 280,544 |
| | | | | |
| | | | | 4,574,869 |
| | | | | |
| | |
| | Ireland—0.7% | | | |
| 37,500 | | Allied Irish Banks PLC* | | | 103,537 |
| 21,500 | | Covidien PLC | | | 905,580 |
| 31,300 | | Irish Life & Permanent PLC* | | | 226,342 |
| | | | | |
| | | | | 1,235,459 |
| | | | | |
| | |
| | Israel—1.7% | | | |
| 59,038 | | Teva Pharmaceutical Industries Ltd., ADR | | | 2,980,238 |
| | | | | |
| | |
| | Italy—1.9% | | | |
| 54,700 | | ENI SpA | | | 1,354,742 |
| 12,200 | | Finmeccanica SpA | | | 204,722 |
| 10,000 | | Fondiaria Sai SpA | | | 182,258 |
| 298,613 | | Intesa Sanpaolo SpA* | | | 1,256,707 |
| 243,800 | | Telecom Italia SpA | | | 387,309 |
| | | | | |
| | | | | 3,385,738 |
| | | | | |
| | |
| | Japan—13.0% | | | |
| 4,800 | | Aeon Credit Service Co. Ltd. | | | 46,215 |
| 4,650 | | Aiful Corp. | | | 6,617 |
| 30,300 | | Alpine Electronics, Inc.* | | | 297,809 |
| 23,800 | | Aoyama Trading Co. Ltd. | | | 381,405 |
| 20,600 | | Astellas Pharma, Inc. | | | 758,572 |
| 18,200 | | Circle K Sunkus Co. Ltd. | | | 249,836 |
See Notes to Financial Statements.
| | |
| 86 | | THE TARGET PORTFOLIO TRUST |
| | | | | |
| SHARES | | DESCRIPTION | | VALUE (NOTE 1) |
| | COMMON STOCKS (continued) | | | |
| | |
| | Japan (continued) | | | |
| 33,000 | | Comsys Holdings Corp. | | $ | 326,147 |
| 32,000 | | Cosmo Oil Co. Ltd. | | | 84,060 |
| 16,875 | | Fanuc Ltd. | | | 1,401,658 |
| 72,000 | | Fukuoka Financial Group, Inc. | | | 263,260 |
| 24,200 | | Hitachi Capital Corp. | | | 307,451 |
| 8,500 | | Honda Motor Co. Ltd. | | | 262,537 |
| 11,800 | | Itochu Techno-Solutions Corp. | | | 324,360 |
| 120 | | KDDI Corp. | | | 636,898 |
| 139,047 | | Komatsu Ltd. | | | 2,710,713 |
| 4,500 | | Konami Corp. | | | 81,874 |
| 93,800 | | Kurabo Industries Ltd. | | | 161,881 |
| 13,300 | | Kyoei Steel Ltd. | | | 297,172 |
| 18,000 | | Kyowa Exeo Corp. | | | 164,860 |
| 145,800 | | Marubeni Corp. | | | 721,357 |
| 45,500 | | Mitsubishi Corp. | | | 964,616 |
| 371,100 | | Mitsubishi UFJ Financial Group, Inc. | | | 1,976,628 |
| 17,000 | | Mitsui & Co. Ltd. | | | 223,260 |
| 99,200 | | Mizuho Financial Group, Inc. | | | 195,665 |
| 18,900 | | Nifco, Inc. | | | 386,783 |
| 3,789 | | Nintendo Co. Ltd. | | | 950,375 |
| 78,000 | | Nippon Express Co. Ltd. | | | 319,383 |
| 34,000 | | Nippon Shokubai Co. Ltd. | | | 285,761 |
| 18,000 | | Nippon Telegraph & Telephone Corp. | | | 742,723 |
| 58,100 | | Nissan Motor Co. Ltd.* | | | 420,420 |
| 300 | | NTT DoCoMo, Inc. | | | 435,079 |
| 26,000 | | Ricoh Co. Ltd. | | | 353,346 |
| 95,000 | | Sankyu, Inc. | | | 416,571 |
| 133,000 | | Sanwa Holdings Corp. | | | 364,670 |
| 30,000 | | Seino Holdings Corp. | | | 221,995 |
| 10,000 | | Shimachu Co. Ltd. | | | 236,409 |
| 38,300 | | Sumitomo Corp. | | | 371,805 |
| 26,900 | | Sumitomo Electric Industries Ltd. | | | 326,425 |
| 73,000 | | Sumitomo Heavy Industries Ltd.* | | | 331,207 |
| 9,200 | | Sumitomo Mitsui Financial Group, Inc. | | | 312,709 |
| 11,200 | | Suzuken Co. Ltd. | | | 396,357 |
| 18,100 | | Takeda Pharmaceutical Co. Ltd. | | | 723,883 |
| 59,800 | | Toyota Motor Corp. | | | 2,360,722 |
| 21,000 | | UNY Co. Ltd. | | | 155,984 |
| | | | | |
| | | | | 22,957,458 |
| | | | | |
| | |
| | Liechtenstein—0.2% | | | |
| 3,300 | | Verwaltungs und Privat Bank AG | | | 352,779 |
| | | | | |
| | |
| | Mexico—1.8% | | | |
| 32,200 | | America Movil SAB de CV (Class L Stock), ADR | | | 1,420,986 |
| 507,300 | | Wal-Mart de Mexico SAB de CV (Class V Stock) | | | 1,769,667 |
| | | | | |
| | | | | 3,190,653 |
| | | | | |
See Notes to Financial Statements.
| | |
| THE TARGET PORTFOLIO TRUST | | 87 |
| | |
International Equity Portfolio (continued) | | Portfolio of Investments
As of October 31, 2009 |
| | | | | |
| SHARES | | DESCRIPTION | | VALUE (NOTE 1) |
| | COMMON STOCKS (continued) | | | |
| | |
| | Netherlands—2.0% | | | |
| 36,600 | | Aegon NV* | | $ | 260,132 |
| 10,580 | | CSM NV | | | 279,673 |
| 59,700 | | ING Groep NV, ADR* | | | 776,914 |
| 13,100 | | Koninklijke DSM NV | | | 573,964 |
| 19,300 | | Oce NV* | | | 122,043 |
| 25,307 | | Schlumberger Ltd. | | | 1,574,095 |
| | | | | |
| | | | | 3,586,821 |
| | | | | |
| | |
| | New Zealand—0.3% | | | |
| 515,100 | | Air New Zealand Ltd. | | | 477,601 |
| | | | | |
| | |
| | Norway—0.6% | | | |
| 39,400 | | DnB NOR ASA* | | | 451,348 |
| 33,400 | | Norsk Hydro ASA* | | | 218,903 |
| 17,900 | | StatoilHydro ASA | | | 421,799 |
| | | | | |
| | | | | 1,092,050 |
| | | | | |
| | |
| | Singapore—0.6% | | | |
| 389,160 | | MobileOne Ltd. | | | 481,421 |
| 52,000 | | Singapore Airlines Ltd. | | | 498,667 |
| 43,493 | | Singapore Airport Terminal Services Ltd. | | | 76,006 |
| | | | | |
| | | | | 1,056,094 |
| | | | | |
| | |
| | South Korea—0.5% | | | |
| 9,161 | | Hyundai Motor Co. | | | 830,944 |
| | | | | |
| | |
| | Spain—3.7% | | | |
| 53,400 | | Banco Bilbao Vizcaya Argentaria SA | | | 954,525 |
| 103,200 | | Banco Santander SA | | | 1,660,720 |
| 33,700 | | Repsol YPF SA | | | 897,138 |
| 105,400 | | Telefonica SA | | | 2,943,452 |
| | | | | |
| | | | | 6,455,835 |
| | | | | |
| | |
| | Sweden—1.7% | | | |
| 11,800 | | Electrolux AB (Class B Stock)* | | | 282,834 |
| 38,187 | | Hennes & Mauritz AB (Class B Stock) | | | 2,169,085 |
| 18,700 | | Svenska Handelsbanken AB | | | 483,244 |
| | | | | |
| | | | | 2,935,163 |
| | | | | |
| | |
| | Switzerland—8.3% | | | |
| 6,500 | | Baloise Holding AG | | | 556,543 |
| 47,800 | | Clariant AG* | | | 456,985 |
| 9,700 | | Credit Suisse Group AG | | | 518,535 |
| 1,300 | | Georg Fischer AG* | | | 341,837 |
| 33,697 | | Julius Baer Group Ltd. | | | 1,268,523 |
See Notes to Financial Statements.
| | |
| 88 | | THE TARGET PORTFOLIO TRUST |
| | | | | |
| SHARES | | DESCRIPTION | | VALUE (NOTE 1) |
| | COMMON STOCKS (continued) | | | |
| | |
| | Switzerland (continued) | | | |
| 53,474 | | Logitech International SA* | | $ | 912,803 |
| 52,700 | | Nestle SA | | | 2,450,633 |
| 64,505 | | Novartis AG | | | 3,359,043 |
| 1,500 | | Rieter Holding AG* | | | 335,870 |
| 10,200 | | Roche Holding AG | | | 1,633,662 |
| 15,000 | | Swiss Reinsurance | | | 610,809 |
| 2,500 | | Swisscom AG | | | 902,295 |
| 5,900 | | Zurich Financial Services AG | | | 1,351,056 |
| | | | | |
| | | | | 14,698,594 |
| | | | | |
| | |
| | Turkey—0.7% | | | |
| 173,300 | | Turkcell Iletisim Hizmet A/S | | | 1,146,616 |
| | | | | |
| | |
| | United Kingdom—17.9% | | | |
| 473,900 | | ARM Holdings PLC | | | 1,151,226 |
| 31,100 | | AstraZeneca PLC | | | 1,396,128 |
| 71,300 | | Aviva PLC | | | 445,851 |
| 372,664 | | Barclays PLC* | | | 1,953,163 |
| 230,589 | | Beazley PLC | | | 404,621 |
| 254,000 | | BP PLC | | | 2,380,050 |
| 137,900 | | Bradford & Bingley PLC* | | | — |
| 56,913 | | British American Tobacco PLC | | | 1,813,592 |
| 185,611 | | British Sky Broadcasting Group PLC | | | 1,618,368 |
| 453,600 | | BT Group PLC | | | 972,045 |
| 58,777 | | Carnival PLC | | | 1,822,168 |
| 86,200 | | Centrica PLC | | | 350,186 |
| 48,200 | | Dairy Crest Group PLC | | | 315,963 |
| 52,400 | | Drax Group PLC | | | 398,671 |
| 185,400 | | GKN PLC* | | | 324,770 |
| 30,700 | | GlaxoSmithKline PLC | | | 629,741 |
| 52,600 | | IMI PLC | | | 371,001 |
| 444,000 | | Kingfisher PLC | | | 1,622,873 |
| 286,800 | | Legal & General Group PLC | | | 368,005 |
| 90,420 | | Marston’s PLC | | | 128,339 |
| 85,600 | | Meggitt PLC | | | 342,726 |
| 184,500 | | Northern Foods PLC | | | 190,912 |
| 366,300 | | Old Mutual PLC | | | 635,758 |
| 85,573 | | Pearson PLC | | | 1,163,176 |
| 39,614 | | Reckitt Benckiser Group PLC | | | 1,967,823 |
| 181,700 | | Royal & Sun Alliance Insurance Group PLC | | | 360,062 |
| 4,300 | | Royal Dutch Shell PLC (Class A Stock) | | | 127,489 |
| 73,212 | | Royal Dutch Shell PLC (Class B Stock) | | | 2,107,592 |
| 58,728 | | SABMiller PLC | | | 1,539,359 |
| 95,411 | | Smith & Nephew PLC | | | 843,420 |
| 15,100 | | Spectris PLC | | | 167,576 |
| 87,851 | | Standard Chartered PLC | | | 2,155,166 |
| 40,100 | | Tate & Lyle PLC | | | 295,209 |
| 100,600 | | Tomkins PLC | | | 275,987 |
See Notes to Financial Statements.
| | |
| THE TARGET PORTFOLIO TRUST | | 89 |
| | |
International Equity Portfolio (continued) | | Portfolio of Investments
As of October 31, 2009 |
| | | | | |
| SHARES | | DESCRIPTION | | VALUE (NOTE 1) |
| | COMMON STOCKS (continued) | | | |
| | |
| | United Kingdom (continued) | | | |
| 54,900 | | TT Electronics PLC* | | $ | 65,551 |
| 355,200 | | Vodafone Group PLC | | | 782,802 |
| | | | | |
| | | | | 31,487,369 |
| | | | | |
| | |
| | United States—0.7% | | | |
| 31,600 | | Southern Copper Corp. | | | 995,400 |
| 2,600 | | Synthes, Inc. | | | 309,192 |
| | | | | |
| | | | | 1,304,592 |
| | | | | |
| | TOTAL COMMON STOCKS
(cost $174,568,863) | | | 173,833,406 |
| | | | | |
| UNITS | | RIGHTS* | | |
| | |
| | Belgium | | | |
| 20,900 | | Fortis, expiring 03/09/14 | | | — |
| | | | | |
| | |
| | Spain | | | |
| 103,200 | | Banco Santander SA, expiring 11/04/09 | | | 18,225 |
| | | | | |
| | TOTAL RIGHTS
(cost $0) | | | 18,225 |
| | | | | |
| | TOTAL LONG-TERM INVESTMENTS
(cost $174,568,863) | | | 173,851,631 |
| | | | | |
| SHARES | | SHORT-TERM INVESTMENT—0.7% | | |
| | |
| | AFFILIATED MONEY MARKET MUTUAL FUND | | | |
| 1,182,657 | | Dryden Core Investment Fund—Taxable Money Market Series
(cost $1,182,657)(w) | | | 1,182,657 |
| | | | | |
| | TOTAL INVESTMENTS(o)—99.3%
(cost $175,751,520; Note 5) | | | 175,034,288 |
| | Other assets in excess of liabilities(x)—0.7% | | | 1,156,083 |
| | | | | |
| | NET ASSETS—100% | | $ | 176,190,371 |
| | | | | |
The following abbreviations are used in Portfolio descriptions:
ADR—American Depositary Receipt
BRL—Brazilian Real
MXN—Mexican Peso
| * | Non-income producing security. |
| (o) | As of October 31, 2009, 192 securities representing $147,973,470 and 84.0% of net assets were fair valued in accordance with the policies adopted by the Board of Trustees. |
| (w) | Prudential Investments LLC, the manager of the Fund also serves as manager of the Dryden Core Investment Fund-Taxable Money Market Series. |
See Notes to Financial Statements.
| | |
| 90 | | THE TARGET PORTFOLIO TRUST |
| (x) | Other assets in excess of liabilities includes net unrealized appreciation (depreciation) on forward foreign currency exchange contracts as follows: |
Forward foreign currency exchange contracts outstanding at October 31, 2009:
| | | | | | | | | | | | | | |
Purchase Contracts | | Counterparty | | Notional
Amount
(000) | | Value at
Settlement
Date Payable | | Current
Value | | Unrealized
Appreciation |
Mexican Peso, | | | | | | | | | | | | | | |
Expiring 11/30/09 | | State Street Bank | | MXN | 5,865 | | $ | 437,817 | | $ | 442,396 | | $ | 4,579 |
Expiring 11/30/09 | | State Street Bank | | MXN | 2,643 | | | 193,774 | | | 199,361 | | | 5,587 |
| | | | | | | | | | | | | | |
| | | | | | | $ | 631,591 | | $ | 641,757 | | $ | 10,166 |
| | | | | | | | | | | | | | |
| | | | | | | | | | | | | | | |
Sale Contracts | | Counterparty | | Notional
Amount
(000) | | Value at
Settlement
Date Receivable | | Current
Value | | Unrealized
Appreciation
(Depreciation) | |
Brazilian Real, | | | | | | | | | | | | | | | |
Expiring 01/22/10 | | State Street Bank | | BRL | 3,985 | | $ | 2,235,858 | | $ | 2,224,389 | | $ | 11,469 | |
Mexican Peso, | | | | | | | | | | | | | | | |
Expiring 11/30/09 | �� | State Street Bank | | MXN | 39,762 | | | 2,945,224 | | | 2,999,243 | | | (54,019 | ) |
Expiring 11/30/09 | | State Street Bank | | MXN | 6,477 | | | 474,483 | | | 488,559 | | | (14,076 | ) |
| | | | | | | | | | | | | | | |
| | | | | | | $ | 5,655,565 | | $ | 5,712,191 | | $ | (56,626 | ) |
| | | | | | | | | | | | | | | |
Various inputs are used in determining the value of the Portfolio’s investments. These inputs are summarized in the three broad levels listed below.
Level 1—quoted prices in active markets for identical securities
Level 2—other significant observable inputs (including quoted prices for similar securities, interest rates, prepayment speeds, credit risk, etc.)
Level 3—significant unobservable inputs (including the Portfolio’s own assumptions in determining the fair value of investments)
The following is a summary of the inputs used as of October 31, 2009 in valuing the Portfolio’s assets carried at fair value:
| | | | | | | | | |
Investments in Securities | | Level 1 | | Level 2 | | Level 3 |
Common Stocks: | | | | | | | | | |
Australia | | $ | — | | $ | 6,730,669 | | $ | — |
Belgium | | | — | | | 991,556 | | | — |
Bermuda | | | — | | | 679,849 | | | — |
Brazil | | | 5,125,787 | | | — | | | — |
Canada | | | 6,720,025 | | | — | | | — |
Cayman Islands | | | 831,424 | | | 474,096 | | | — |
China | | | 598,188 | | | 4,974,374 | | | — |
Denmark | | | — | | | 5,141,367 | | | — |
Finland | | | — | | | 2,377,236 | | | — |
France | | | — | | | 17,925,046 | | | — |
Germany | | | — | | | 13,824,496 | | | — |
Greece | | | — | | | 2,395,140 | | | — |
Guernsey | | | 1,295,280 | | | — | | | — |
Hong Kong | | | — | | | 4,574,869 | | | — |
Ireland | | | 905,580 | | | 329,879 | | | — |
Israel | | | 2,980,238 | | | — | | | — |
Italy | | | — | | | 3,385,738 | | | — |
Japan | | | — | | | 22,957,458 | | | — |
Liechtenstein | | | — | | | 352,779 | | | — |
See Notes to Financial Statements.
| | |
| THE TARGET PORTFOLIO TRUST | | 91 |
| | |
International Equity Portfolio (continued) | | Portfolio of Investments
As of October 31, 2009 |
| | | | | | | | | | |
Investments in Securities | | Level 1 | | Level 2 | | | Level 3 |
Mexico | | $ | 3,190,653 | | $ | — | | | $ | — |
Netherlands | | | 1,574,095 | | | 2,012,726 | | | | — |
New Zealand | | | — | | | 477,601 | | | | — |
Norway | | | — | | | 1,092,050 | | | | — |
Singapore | | | — | | | 1,056,094 | | | | — |
South Korea | | | — | | | 830,944 | | | | — |
Spain | | | — | | | 6,455,835 | | | | — |
Sweden | | | — | | | 2,935,163 | | | | — |
Switzerland | | | 1,268,523 | | | 13,430,071 | | | | — |
Turkey | | | — | | | 1,146,616 | | | | — |
United Kingdom | | | 65,551 | | | 31,421,818 | | | | — |
United States | | | 1,304,592 | | | — | | | | — |
Rights: | | | | | | — | | | | — |
Belgium | | | — | | | — | | | | — |
Spain | | | 18,225 | | | — | | | | — |
Affiliated Money Market Mutual Fund | | | 1,182,657 | | | — | | | | — |
| | | | | | | | | | |
| | $ | 27,060,818 | | $ | 147,973,470 | | | $ | — |
Other Financial Instuments* | | | — | | | (46,460 | ) | | | — |
| | | | | | | | | | |
Total | | $ | 27,060,818 | | $ | 147,927,010 | | | $ | — |
| | | | | | | | | | |
| * | Other financial instruments are derivative instruments not reflected in the Portfolio of Investments, such as futures, forwards and swap contracts, which are valued at the unrealized appreciation/depreciation on the instrument. |
As of October 31, 2008 the Portfolio did not use any significant unobservable inputs (Level 3) in determining the value of investments and at October 31, 2009, the Portfolio had two Level 3 securities with a fair value of $0.
The industry classification of investments and other assets in excess of liabilities shown as a percentage of net assets as of October 31, 2009 were as follows:
| | | |
Commercial Banks | | 16.1 | % |
Pharmaceuticals | | 9.8 | |
Telecommunications | | 9.4 | |
Oil & Gas | | 9.0 | |
Insurance | | 5.8 | |
Retail | | 3.7 | |
Chemicals | | 3.1 | |
Diversified Financial Services | | 3.0 | |
Foods | | 2.7 | |
Automobile Manufacturers | | 2.4 | |
Holding Companies—Diversified | | 2.0 | |
Metals & Mining | | 1.9 | |
Transportation | | 1.8 | |
Media | | 1.8 | |
Aerospace/Defense | | 1.5 | |
Entertainment & Leisure | | 1.5 | |
Machinery—Construction & Mining | | 1.5 | |
Electric | | 1.4 | |
Building Materials | | 1.4 | |
Agriculture | | 1.3 | |
See Notes to Financial Statements.
| | |
| 92 | | THE TARGET PORTFOLIO TRUST |
| | | |
Industry (cont’d.) | | | |
Software | | 1.3 | % |
Distribution/Wholesale | | 1.3 | |
Household Products / Wares | | 1.2 | |
Machinery & Equipment | | 1.2 | |
Healthcare-Products | | 1.2 | |
Airlines | | 1.1 | |
Iron/Steel | | 1.1 | |
Computers | | 1.0 | |
Beverages | | 1.0 | |
Electronic Components | | 0.9 | |
Healthcare Services | | 0.9 | |
Engineering/Construction | | 0.8 | |
Affiliated Money Market Mutual Fund | | 0.7 | |
Semiconductors | | 0.7 | |
Internet | | 0.5 | |
Miscellaneous Manufacturers | | 0.5 | |
Household/Personal Care | | 0.4 | |
Auto Parts And Equipment | | 0.4 | |
Auto Parts & Related | | 0.4 | |
Home Furnishings | | 0.4 | |
Containers & Packaging | | 0.3 | |
Office Equipment | | 0.3 | |
Gas Utilities | | 0.2 | |
Retail & Merchandising | | 0.1 | |
Electronics | | 0.1 | |
Commercial Services | | 0.1 | |
Textiles | | 0.1 | |
| | | |
| | 99.3 | |
Other assets in excess of liabilities | | 0.7 | |
| | | |
| | 100.0 | % |
| | | |
See Notes to Financial Statements.
| | |
| THE TARGET PORTFOLIO TRUST | | 93 |
| | |
International Bond Portfolio | | Portfolio of Investments
As of October 31, 2009 |
| | | | | | | |
PRINCIPAL
AMOUNT (000)# | | DESCRIPTION | | VALUE (NOTE 1) |
| | | | LONG-TERM INVESTMENTS—128.0% | | | |
| | | |
| | | | FOREIGN BONDS—96.6% | | | |
| | | |
| | | | Australia—2.9% | | | |
| $ | | 100 | | Commonwealth Bank of Australia,
Gov’t. Liquid Gtd. Notes, 144A
0.682%(c), 12/10/12 | | $ | 100,564 |
| | 100 | | National Australia Bank Ltd.,
Gov’t. Liquid Gtd. Notes, 144A
3.375%, 07/08/14 | | | 101,891 |
| AUD | | 600 | | New South Wales Treasury Corp.,
Local Gov’t. Gtd. Notes
5.50%, 03/01/17 | | | 521,639 |
| | | | | | | |
| | | | | | | 724,094 |
| | | | | | | |
| | | |
| | | | Canada—1.7% | | | |
| | 100 | | Province of Ontario,
Bonds
4.00%, 10/07/19 | | | 98,683 |
| CAD | | 200 | | 5.85%, 03/08/33 | | | 213,203 |
| CAD | | 100 | | Debs.
6.20%, 06/02/31 | | | 110,295 |
| | | | | | | |
| | | | | | | 422,181 |
| | | | | | | |
| | | |
| | | | Denmark—1.6% | | | |
| DKK | | 1,100 | | Denmark Government Bond
6.00%, 11/15/11 | | | 235,694 |
| DKK | | 949 | | Realkredit Danmark A/S
2.73%(c), 10/01/38 | | | 180,066 |
| | | | | | | |
| | | | | | | 415,760 |
| | | | | | | |
| | | |
| | | | France—16.3% | | | |
| EUR | | 100 | | BNP Paribas Home Loan Covered Bonds SA,
Covered, MTN
3.00%, 07/23/13 | | | 148,747 |
| EUR | | 100 | | 3.75%, 12/13/11 | | | 152,505 |
| EUR | | 100 | | Caisse d’Amortissement de La Dette Sociale,
Sr. Unsec’d. Notes, MTN
4.50%, 09/04/13 | | | 157,964 |
| EUR | | 400 | | Compagnie de Financement Foncier,
Covered, MTN
4.00%, 07/21/11 | | | 610,917 |
| EUR | | 500 | | France Government Bonds
3.75%, 10/25/19 | | | 747,516 |
| EUR | | 200 | | 4.25%, 04/25/19 | | | 313,046 |
| EUR | | 650 | | 5.75%, 10/25/32 | | | 1,175,866 |
See Notes to Financial Statements.
| | |
| 94 | | THE TARGET PORTFOLIO TRUST |
| | | | | | | |
PRINCIPAL
AMOUNT (000)# | | DESCRIPTION | | VALUE (NOTE 1) |
| | | | FOREIGN BONDS (continued) | | | |
| | | |
| | | | France (continued) | | | |
| EUR | | 100 | | General Electric Societe de Credit Foncier,
Covered
3.75%, 07/22/14 | | $ | 150,130 |
| $ | | 200 | | Societe de Financement de l’Economie Francaise,
Gov’t. Liquid Gtd. Notes, 144A
2.25%, 06/11/12 | | | 203,508 |
| | 100 | | 2.875%, 09/22/14 | | | 100,353 |
| | 100 | | 3.375%, 05/05/14 | | | 102,893 |
| EUR | | 100 | | Societe Generale Societe de Credit Fonciere,
MTN
4.00%, 07/07/16 | | | 151,853 |
| | 100 | | Vivendi,
Sr. Unsec’d. Notes, 144A
5.75%, 04/04/13 | | | 106,589 |
| | | | | | | |
| | | | | | | 4,121,887 |
| | | | | | | |
| | | |
| | | | Germany—7.4% | | | |
| EUR | | 200 | | Bundesrepublik Deutschland,
Bonds
4.75%, 07/04/34 | | | 323,483 |
| EUR | | 100 | | 4.75%, 07/04/40 | | | 166,789 |
| EUR | | 400 | | 5.50%, 01/04/31 | | | 701,594 |
| EUR | | 230 | | 5.625%, 01/04/28 | | | 405,850 |
| EUR | | 94 | | Immeo Residential Finance PLC,
Series 2, Class A
0.933%(c), 12/15/16 | | | 120,276 |
| EUR | | 100 | | Kreditanstalt fur Wiederaufbau,
Foreign Gov’t. Gtd. Notes
3.875%, 01/21/19 | | | 150,396 |
| | | | | | | |
| | | | | | | 1,868,388 |
| | | | | | | |
| | | |
| | | | Greece—3.7% | | | |
| EUR | | 600 | | Hellenic Republic Government Bond,
Unsec’d. Notes
4.60%, 05/20/13 | | | 931,845 |
| | | | | | | |
| | | |
| | | | Ireland—0.5% | | | |
| EUR | | 112 | | Atlantes Mortgage PLC,
Series 1, Class A
1.01%(c), 01/17/36 | | | 138,918 |
| | | | | | | |
| | | |
| | | | Italy—6.9% | | | |
| EUR | | 58 | | Argo Mortgages,
Series 1, Class A
1.231%(c), 10/28/36 | | | 83,503 |
| EUR | | 200 | | Italy Buoni Poliennali Del Tesoro,
Bonds
3.75%, 12/15/13 | | | 306,651 |
See Notes to Financial Statements.
| | |
| THE TARGET PORTFOLIO TRUST | | 95 |
| | |
International Bond Portfolio (continued) | | Portfolio of Investments
As of October 31, 2009 |
| | | | | | | |
PRINCIPAL
AMOUNT (000)# | | DESCRIPTION | | VALUE (NOTE 1) |
| | | | FOREIGN BONDS (continued) | | | |
| | | |
| | | | Italy (continued) | | | |
| EUR | | 500 | | 4.25%, 10/15/12 | | $ | 780,187 |
| EUR | | 100 | | 4.25%, 08/01/13 | | | 156,719 |
| EUR | | 200 | | 5.25%, 08/01/11 | | | 313,379 |
| EUR | | 81 | | Locat Securitisation Vehicle,
Series 2006-4, Class A2
0.938%(c), 12/12/28 | | | 104,026 |
| | | | | | | |
| | | | | | | 1,744,465 |
| | | | | | | |
| | | |
| | | | Japan—7.4% | | | |
| JPY | | 1,000 | | Japan Finance Org. for Municipal Enterprises,
Foreign Gov’t. Gtd. Notes
1.55%, 02/21/12 | | | 11,364 |
| JPY | | 10,000 | | Japanese Government Bonds,
Series 19
2.30%, 06/20/35 | | | 112,269 |
| | | | Series 20 | | | |
| JPY | | 20,000 | | 2.50%, 09/20/35 | | | 233,127 |
| | | | Series 82 | | | |
| JPY | | 40,000 | | 0.90%, 03/20/14 | | | 450,152 |
| | | | Series 85 | | | |
| JPY | | 30,000 | | 0.70%, 09/20/14 | | | 333,726 |
| | | | Series 285 | | | |
| JPY | | 50,000 | | 1.70%, 03/20/17 | | | 580,140 |
| | | | Series 289 | | | |
| JPY | | 10,000 | | 1.50%, 12/20/17 | | | 113,954 |
| JPY | | 6,843 | | JLOC Ltd.,
Series 36A, Class A1, 144A
0.661%(c), 02/16/16 | | | 50,221 |
| | | | | | | |
| | | | | | | 1,884,953 |
| | | | | | | |
| | | |
| | | | Netherlands—33.5% | | | |
| EUR | | 500 | | Arena BV,
Series 2003-I, Class A2
4.30%(c), 05/19/55 | | | 740,481 |
| EUR | | 312 | | Dutch MBS BV,
Series X, Class A
1.033%(c), 10/02/79 | | | 457,735 |
| $ | | 200 | | ING Bank NV,
Gov’t. Liquid Gtd. Notes, 144A
3.90%, 03/19/14 | | | 208,827 |
| EUR | | 100 | | Netherlands Government Bonds
3.75%, 07/15/14 | | | 155,006 |
| EUR | | 200 | | 4.00%, 07/15/18 | | | 307,574 |
| EUR | | 188 | | 5.00%, 07/15/11 | | | 293,951 |
See Notes to Financial Statements.
| | |
| 96 | | THE TARGET PORTFOLIO TRUST |
| | | | | | | |
PRINCIPAL
AMOUNT (000)# | | DESCRIPTION | | VALUE (NOTE 1) |
| | | | FOREIGN BONDS (continued) | | | |
| | | |
| | | | Netherlands (continued) | | | |
| EUR | | 4,000 | | 5.50%, 07/15/10 | | $ | 6,081,735 |
| $ | | 175 | | Rabobank Nederland NV,
Jr. Sub. Notes, 144A
11.00%(c), 06/29/49 | | | 219,625 |
| | | | | | | |
| | | | | | | 8,464,934 |
| | | | | | | |
| | | |
| | | | New Zealand—1.2% | | | |
| | 100 | | Westpac Banking Corp.,
Gov’t. Liquid. Gtd. Notes, 144A
0.582%(c), 09/10/14 | | | 100,146 |
| | 200 | | Westpac Securities NZ Ltd.,
Gov’t. Liquid Gtd. Notes, 144A
2.50%, 05/25/12 | | | 203,534 |
| | | | | | | |
| | | | | | | 303,680 |
| | | | | | | |
| | | |
| | | | South Korea—0.6% | | | |
| EUR | | 100 | | Export-Import Bank of Korea,
Sr. Unsec’d. Notes, MTN
5.75%, 05/22/13 | | | 154,504 |
| | | | | | | |
| | | |
| | | | Spain—0.4% | | | |
| | 100 | | Santander Perpetual SA Unipersonal,
Bank Gtd. Notes, 144A
6.671%(c), 10/29/49 | | | 91,249 |
| | | | | | | |
| | | |
| | | | Switzerland—0.8% | | | |
| | 200 | | UBS AG,
Sr. Unsec’d. Notes, MTN
5.75%, 04/25/18 | | | 203,968 |
| | | | | | | |
| | | |
| | | | United Kingdom—11.7% | | | |
| | 200 | | Barclays Bank PLC,
Sub. Notes, 144A
6.05%, 12/04/17 | | | 203,762 |
| | 80 | | 10.179%, 06/12/21 | | | 105,582 |
| EUR | | 200 | | Chester Asset Receivables Dealings No 11,
Series A
6.125%, 12/15/12 | | | 295,176 |
| EUR | | 100 | | HBOS Euro Finance LP,
Bank Gtd. Notes
7.627%(c), 12/29/49 | | | 101,617 |
| | 100 | | Lloyds Banking Group PLC,
Jr. Sub. Notes, 144A
5.92%(c), 09/29/49 | | | 63,000 |
| CAD | | 100 | | National Grid PLC,
Sr. Unsec’d. Notes, MTN (original cost $89,690; purchased 11/03/06)(f)(g)
4.98%, 06/22/11 | | | 95,866 |
See Notes to Financial Statements.
| | |
| THE TARGET PORTFOLIO TRUST | | 97 |
| | |
International Bond Portfolio (continued) | | Portfolio of Investments
As of October 31, 2009 |
| | | | | | | |
PRINCIPAL
AMOUNT (000)# | | DESCRIPTION | | VALUE (NOTE 1) |
| | | | FOREIGN BONDS (continued) | | | |
| | | |
| | | | United Kingdom (continued) | | | |
| EUR | | 100 | | Royal Bank of Scotland PLC (The),
Gov’t. Liquid Gtd. Notes, MTN
3.75%, 11/14/11 | | $ | 152,528 |
| GBP | | 300 | | United Kingdom Gilt,
Bonds
2.25%, 03/07/14 | | | 484,360 |
| GBP | | 300 | | 3.75%, 09/07/19 | | | 493,120 |
| GBP | | 100 | | 4.25%, 03/07/36 | | | 166,316 |
| GBP | | 200 | | 4.50%, 03/07/19 | | | 350,834 |
| GBP | | 100 | | 4.50%, 12/07/42 | | | 175,342 |
| GBP | | 150 | | 4.75%, 12/07/38 | | | 271,435 |
| | | | | | | |
| | | | | | | 2,958,938 |
| | | | | | | |
| | | | TOTAL FOREIGN BONDS
(cost $23,789,508) | | | 24,429,764 |
| | | | | | | |
| | | |
| | | | UNITED STATES BONDS—31.4% | | | |
| | | |
| | | | Asset-Backed Securities—9.6% | | | |
| | | | CIT Group Home Equity Loan Trust,
Series 2002-1, Class AV | | | |
| $ | | 2 | | 0.534%(c), 03/25/33 | | | 1,862 |
| | | | Citibank Credit Card Issuance Trust,
Series 2001-A4, Class A4 | | | |
| EUR | | 650 | | 5.375%, 04/10/13 | | | 950,210 |
| | | | Ford Credit Auto Owner Trust,
Series 2008-C, Class A2B | | | |
| | 88 | | 1.145%(c), 01/15/11 | | | 87,770 |
| | | | Master Asset-Backed Securities Trust,
Series 2006-WMC1, Class A2 | | | |
| | 1 | | 0.354%(c), 02/25/36 | | | 759 |
| | | | MBNA Credit Card Master Note Trust,
Series 2002-A2, Class A | | | |
| EUR | | 550 | | 5.60%, 07/17/14 | | | 833,382 |
| | | | SLM Student Loan Trust, | | | |
| | | | Series 2003-7, Class A5B | | | |
| EUR | | 250 | | 3.80%, 06/17/10 | | | 359,965 |
| | | | Series 2008-7, Class A2 | | | |
| | 200 | | 0.782%(c), 10/25/17 | | | 198,941 |
| | | | | | | |
| | | | | | | 2,432,889 |
| | | | | | | |
| | | |
| | | | Commercial Mortgage-Backed Securities—0.7% | | | |
| | 100 | | Credit Suisse Mortgage Capital Certificates,
Series 2006-C5, Class A3
5.311%, 12/15/39 | | | 86,624 |
See Notes to Financial Statements.
| | |
| 98 | | THE TARGET PORTFOLIO TRUST |
| | | | | | | |
PRINCIPAL
AMOUNT (000)# | | DESCRIPTION | | VALUE (NOTE 1) |
| | | | UNITED STATES BONDS (continued) | | | |
| | | |
| | | | Commercial Mortgage-Backed Securities (continued) | | | |
| $ | | 100 | | Merrill Lynch Floating Trust,
Series 2008-LAQA, Class A1, 144A 0.78%(c), 07/09/21 | | $ | 83,930 |
| | | | | | | |
| | | | | | | 170,554 |
| | | | | | | |
| | | |
| | | | Corporate Bonds—12.7% | | | |
| | | | American International Group, Inc., | | | |
| | | | Jr. Sub. Debs. | | | |
| | 100 | | 8.175%(c), 05/15/68 | | | 60,000 |
| | | | Jr. Sub. Notes | | | |
| EUR | | 100 | | 4.875%(c), 03/15/67 | | | 65,120 |
| GBP | | 100 | | 8.625%(c), 05/22/38 | | | 91,090 |
| | | | Sr. Unsec’d. Notes, MTN | | | |
| EUR | | 100 | | 0.883%(c), 04/26/11 | | | 130,308 |
| | 100 | | 5.85%, 01/16/18 | | | 75,335 |
| | | | Bank of America Corp.,
Sr. Sub. Notes, MTN | | | |
| EUR | | 100 | | 4.75%(c), 05/23/17 | | | 134,335 |
| | | | COX Communications, Inc.,
Sr. Unsec’d. Notes | | | |
| | 100 | | 6.75%, 03/15/11 | | | 105,432 |
| | 48 | | Dynegy Roseton/Danskammer Pass-Through Trust, Series A,
Pass-Through Certificates
7.27%, 11/08/10 | | | 47,631 |
| | 100 | | El Paso Performance-Linked Trust,
Sr. Unsec’d. Notes, 144A
7.75%, 07/15/11 | | | 102,236 |
| | 300 | | Embarq Corp.,
Sr. Unsec’d. Notes
7.082%, 06/01/16 | | | 327,738 |
| CAD | | 100 | | Goldman Sachs Group, Inc. (The),
Sr. Unsec’d. Notes (original cost $90,598; purchased 11/03/06)(f)(g)
5.25%, 06/01/16 | | | 97,434 |
| | 100 | | iStar Financial, Inc.,
Sr. Unsec’d. Notes, REIT
5.15%, 03/01/12 | | | 59,000 |
| | 100 | | Johnson Controls, Inc.,
Sr. Unsec’d. Notes
5.25%, 01/15/11 | | | 103,519 |
| EUR | | 100 | | JPMorgan Chase & Co.,
FDIC Gtd. Notes
3.625%, 12/12/11 | | | 152,319 |
| EUR | | 200 | | JPMorgan Chase Bank NA,
Sub. Notes
4.375%(c), 11/30/21 | | | 284,027 |
| | 100 | | JPMorgan Chase Capital XX,
Gtd. Notes
6.55%, 09/15/66 | | | 93,248 |
See Notes to Financial Statements.
| | |
| THE TARGET PORTFOLIO TRUST | | 99 |
| | |
International Bond Portfolio (continued) | | Portfolio of Investments
As of October 31, 2009 |
| | | | | | | |
PRINCIPAL
AMOUNT (000)# | | DESCRIPTION | | VALUE (NOTE 1) |
| | | | UNITED STATES BONDS (continued) | | | |
| | | |
| | | | Corporate Bonds (continued) | | | |
| $ | | 200 | | Lehman Brothers Holdings, Inc.,
Sr. Unsec’d. Notes, MTN(i)
5.625%, 01/24/13 | | $ | 32,000 |
| EUR | | 50 | | RBS Capital Trust,
Bank Gtd. Notes
6.467%(c), 12/29/49 | | | 41,574 |
| | 100 | | Sabre Holdings Corp.,
Sr. Unsec’d. Notes
7.35%, 08/01/11 | | | 100,000 |
| EUR | | 200 | | SLM Corp.,
Sr. Unsec’d. Notes, MTN
1.123%(c), 11/15/11 | | | 248,709 |
| | 100 | | Sprint Capital Corp.,
Gtd. Notes
8.375%, 03/15/12 | | | 101,250 |
| | 100 | | State Street Capital Trust IV,
Gtd. Notes
1.299%(c), 06/01/77 | | | 67,091 |
| | 250 | | Wells Fargo Bank NA,
Sub. Notes
4.75%, 02/09/15 | | | 255,287 |
| EUR | | 300 | | WM Covered Bond Program,
Covered, MTN
4.00%, 11/26/16 | | | 424,823 |
| | | | | | | |
| | | | | | | 3,199,506 |
| | | | | | | |
| | | |
| | | | Municipal Bond—0.2% | | | |
| | | |
| | | | Washington | | | |
| | 100 | | State of Washington,
General Obligation Unlimited
4.576%(s), 12/01/25 | | | 47,956 |
| | | | | | | |
| | | |
| | | | Residential Mortgage-Backed Securities—6.4% | | | |
| | 87 | | American Home Mortgage Investment Trust,
Series 2005-2, Class 4A1
5.66%(c), 09/25/45 | | | 59,534 |
| | 56 | | Banc of America Mortgage Securities, Inc.,
Series 2006-A, Class 2A1
5.41%(c), 02/25/36 | | | 41,629 |
| | 6 | | Bear Stearns Adjustable Rate Mortgage Trust,
Series 2003-5, Class 1A2
3.747%(c), 08/25/33 | | | 6,204 |
| | | | Series 2004-10, Class 13A1 | | | |
| | 50 | | 4.991%(c), 01/25/35 | | | 42,183 |
See Notes to Financial Statements.
| | |
| 100 | | THE TARGET PORTFOLIO TRUST |
| | | | | | | |
PRINCIPAL
AMOUNT (000)# | | DESCRIPTION | | VALUE (NOTE 1) |
| | | | UNITED STATES BONDS (continued) | | | |
| | | |
| | | | Residential Mortgage-Backed Securities (continued) | | | |
| | | | Series 2005-2, Class A1 | | | |
| $ | | 74 | | 2.83%(c), 03/25/35 | | $ | 66,160 |
| | | | Series 2005-2, Class A2 | | | |
| | 24 | | 2.194%(c), 03/25/35 | | | 21,897 |
| | | | Series 2005-5, Class A1 | | | |
| | 57 | | 2.43%(c), 08/25/35 | | | 50,772 |
| | | | Series 2005-5, Class A2 | | | |
| | 47 | | 4.55%(c), 08/25/35 | | | 41,660 |
| | 45 | | Bear Stearns Alt-A Trust,
Series 2005-7, Class 22A1
5.487%(c), 09/25/35 | | | 30,430 |
| | | | Series 2005-9, Class 24A1 | | | |
| | 48 | | 5.509%(c), 11/25/35 | | | 28,205 |
| | | | Series 2006-5, Class 2A2 | | | |
| | 60 | | 6.25%(c), 08/25/36 | | | 40,465 |
| | | | Series 2006-6, Class 31A1 | | | |
| | 66 | | 5.653%(c), 11/25/36 | | | 40,335 |
| | 23 | | Citigroup Mortgage Loan Trust, Inc.,
Series 2004-HYB2, Class 2A
4.625%(c), 03/25/34 | | | 22,065 |
| | | | Series 2005-6, Class A1 | | | |
| | 31 | | 2.51%(c), 08/25/35 | | | 29,543 |
| | | | Series 2006-AR1, Class 1A1 | | | |
| | 248 | | 4.90%(c), 10/25/35 | | | 208,184 |
| | 102 | | Countrywide Alternative Loan Trust,
Series 2005-59, Class 1A1
0.574%(c), 11/20/35 | | | 54,718 |
| | | | Series 2005-62, Class 2A1 | | | |
| | 117 | | 1.757%(c), 12/25/35 | | | 60,285 |
| | | | Series 2005-76, Class 2A1 | | | |
| | 80 | | 1.757%(c), 02/25/36 | | | 44,926 |
| | 10 | | CS First Boston Mortgage Securities Corp.,
Series 2003-AR20, Class 2A1
3.875%(c), 08/25/33 | | | 9,033 |
| | 36 | | Fannie Mae Whole Loan,
Series 2004-W12, Class 1A1
6.00%, 07/25/44 | | | 37,896 |
| | 2 | | Federal Home Loan Mortgage Corp.,
Series 2395, Class FT
0.695%(c), 12/15/31 | | | 2,068 |
| | | | Series 2682, Class JB | | | |
| | 100 | | 4.50%, 09/15/19 | | | 101,903 |
| | | | Series R006, Class ZA | | | |
| | 123 | | 6.00%, 04/15/36 | | | 132,087 |
| | 128 | | Federal National Mortgage Assoc.,
Series 2006-5, Class 3A2
4.084%(c), 05/25/35 | | | 130,930 |
See Notes to Financial Statements.
| | |
| THE TARGET PORTFOLIO TRUST | | 101 |
| | |
International Bond Portfolio (continued) | | Portfolio of Investments
As of October 31, 2009 |
| | | | | | | |
PRINCIPAL
AMOUNT (000)# | | DESCRIPTION | | VALUE (NOTE 1) |
| | | | UNITED STATES BONDS (continued) | | | |
| | | |
| | | | Residential Mortgage-Backed Securities (continued) | | | |
| $ | | 8 | | Harborview Mortgage Loan Trust,
Series 2003-1, Class A
4.13%(c), 05/19/33 | | $ | 7,367 |
| | 32 | | Indymac Index Mortgage Loan Trust,
Series 2005-AR12, Class 2A1A
0.484%(c), 07/25/35 | | | 17,169 |
| | 4 | | Merrill Lynch Mortgage Investors, Inc.,
Series 2003-A2, Class 1A1
4.436%(c), 02/25/33 | | | 3,876 |
| | 53 | | MLCC Mortgage Investors, Inc.,
Series 2005-2, Class 1A
4.25%(c), 10/25/35 | | | 44,603 |
| | 134 | | Residential Accredit Loans, Inc.,
Series 2006-QO6, Class A1
0.424%(c), 06/25/46 | | | 52,452 |
| | 100 | | Structured Asset Mortgage Investments, Inc.,
Series 2007-AR4, Class A3
0.464%(c), 09/25/47 | | | 37,876 |
| | 165 | | Wells Fargo Mortgage Backed Securities Trust,
Series 2005-AR11, Class 1A1
4.607%(c), 06/25/35 | | | 162,989 |
| | | | | | | |
| | | | | | | 1,629,444 |
| | | | | | | |
| | | |
| | | | U.S. Government Agency Obligations—1.1% | | | |
| | 71 | | Small Business Administration Participation Certificates,
Series 2005-20E, Class 1
4.84%, 05/01/25 | | | 73,884 |
| | | | Series 2008-20E, Class 1 | | | |
| | 94 | | 5.49%, 05/01/28 | | | 100,654 |
| | | | Series 2008-20G, Class 1 | | | |
| | 94 | | 5.87%, 07/01/28 | | | 101,916 |
| | | | | | | |
| | | | | | | 276,454 |
| | | | | | | |
| | | |
| | | | U.S. Government Mortgage-Backed Obligation—0.7% | | | |
| | 168 | | Federal National Mortgage Assoc.
7.00%, 09/01/36 | | | 183,054 |
| | | | | | | |
| | | |
| | | | U.S. Treasury Obligation | | | |
| | 12 | | U.S. Treasury Notes(k)
1.00%, 07/31/11 | | | 12,057 |
| | | | | | | |
| | | | TOTAL UNITED STATES BONDS
(cost $7,976,125) | | | 7,951,914 |
| | | | | | | |
| | | | TOTAL LONG-TERM INVESTMENTS
(cost $31,765,633) | | | 32,381,678 |
| | | | | | | |
See Notes to Financial Statements.
| | |
| 102 | | THE TARGET PORTFOLIO TRUST |
| | | | | | | |
| SHARES | | DESCRIPTION | | VALUE (NOTE 1) |
| | | |
| | | | SHORT-TERM INVESTMENT—0.3% | | | |
| | | |
| | | | AFFILIATED MONEY MARKET MUTUAL FUND | | | |
| | 68,460 | | Dryden Core Investment Fund—Taxable Money Market Series
(cost $68,460)(w) | | $ | 68,460 |
| | | | | | | |
| | | | TOTAL INVESTMENTS, BEFORE OPTIONS WRITTEN—128.3%
(cost $31,834,093; Note 5) | | | 32,450,138 |
| | | | | | | |
| | | | | | | | | | |
CONTRACTS/
NOTIONAL
AMOUNTS (000)# | | OPTIONS WRITTEN | | COUNTERPARTY | | | |
| | | | |
| | | | Call Options | | | | | | |
| $ | | 100 | | Currency Option USD vs BRL,
expiring 03/18/10 @ FX Rate 2.10 | | Citibank | | | (157 | ) |
| | 100 | | Currency Option USD vs KRW,
expiring 03/18/10 @ FX Rate 1,250.00 | | JPMorgan Securities | | | (2,156 | ) |
| | 100 | | expiring 03/18/10 @ FX Rate 1,320.00 | | Royal Bank of Scotland | | | (1,349 | ) |
| | 100 | | Currency Option USD vs MXN,
expiring 03/18/10 @ FX Rate 14.95 | | Citibank | | | (1,623 | ) |
| | 100 | | Currency Option USD vs NOK,
expiring 01/11/10 @ FX Rate 5.95 | | JPMorgan Securities | | | (1,793 | ) |
| | | | | | | | | | |
| | | | | | | | | (7,078 | ) |
| | | | | | | | | | |
| | | | |
| | | | Put Options | | | | | | |
| | 14,000 | | 90 Day Euro Dollar Futures,
expiring 03/15/10, Strike Price $98.50 | | | | | (875 | ) |
| | 1,700 | | Interest Rate Swap Option,
expiring 08/31/10 @ 5.50% | | Deutsche Bank | | | (5,144 | ) |
| | | | | | | | | | |
| | | | | | | | | (6,019 | ) |
| | | | | | | | | | |
| | | | TOTAL OPTIONS WRITTEN
(premiums received $31,733) | | | | | (13,097 | ) |
| | | | | | | | | | |
| | | | TOTAL INVESTMENTS, NET OF OPTIONS WRITTEN—128.3%
(cost $31,802,360) | | | | | 32,437,041 | |
| | | | Other liabilities in excess of other
assets(x)—(28.3)% | | | | | (7,148,766 | ) |
| | | | | | | | | | |
| | | | NET ASSETS—100% | | | | $ | 25,288,275 | |
| | | | | | | | | | |
The following abbreviations are used in Portfolio descriptions:
144A—Security was purchased pursuant to Rule 144A under the Securities Act of 1933 and may not be resold subject to that rule except to qualified institutional buyers. Unless otherwise noted, 144A securities are deemed to be liquid.
FDIC—Federal Deposit Insurance Corp.
MTN—Medium Term Note
REIT—Real Estate Investment Trust
AUD—Australian Dollar
BRL—Brazilian Real
CAD—Canadian Dollar
CNY—Chinese Yuan
DKK—Danish Krone
See Notes to Financial Statements.
| | |
| THE TARGET PORTFOLIO TRUST | | 103 |
| | |
International Bond Portfolio (continued) | | Portfolio of Investments
As of October 31, 2009 |
EUR—Euro
GBP—British Pound
IDR—Indonesian Rupiah
INR—Indian Rupee
JPY—Japanese Yen
KRW—South Korean Won
MXN—Mexican Peso
MYR—Malaysian Ringgit
NOK—Norwegian Krone
NZD—New Zealand Dollar
PHP—Philippine Peso
SGD—Singapore Dollar
USD—United States Dollar
| * | Non-income producing security. |
| # | Principal and Notional amount is shown in U.S. dollars unless otherwise stated. |
| (c) | Indicates a variable rate security. |
| (f) | Private Placement restricted as to resale and does not have a readily available market. The aggregate original cost of such securities is $180,288. The aggregate value of $193,300 is approximately 0.8% of net assets. |
| (g) | Indicates a security that has been deemed illiquid. |
| (i) | Represents issuer in default on interest payments. Non-income producing security. |
| (k) | Securities segregated as collateral for futures contracts. |
| (s) | Represents zero coupon bond or step coupon bond. Rate quoted represents effective yield at October 31, 2009. |
| (w) | Prudential Investments LLC, the manager of the Portfolio, also serves as manager of the Dryden Core Investment Fund-Taxable Money Market Series. |
| (x) | Other liabilities in excess of other assets includes net unrealized appreciation (depreciation) on futures contracts, forward foreign currency exchange contracts, cross currency exchange contracts, interest rate and credit default swap agreements as follows: |
Futures contracts open at October 31, 2009:
| | | | | | | | | | | | | | |
Number of
Contracts | | Type | | Expiration
Date | | Value at
Trade Date | | Value at
October 31, 2009 | | Unrealized
Appreciation
(Depreciation)(1) | |
| Long Positions: | | | | | | | | | | | | | | |
| 1 | | 10 Year Canadian Bond | | Dec 09 | | $ | 110,651 | | $ | 111,409 | | $ | 758 | |
| 2 | | 10 Year Euro-Bund | | Dec 09 | | | 360,436 | | | 358,788 | | | (1,648 | ) |
| | | | | | | | | | | | | | |
| | | | | | | | | | | | $ | (890 | ) |
| | | | | | | | | | | | | | |
| (1) | Cash of $73,600 and U.S. Treasury Notes market value of $12,057 has been segregated to cover requirements for open futures contracts at October 31, 2009. |
Forward foreign currency exchange contracts outstanding at October 31, 2009:
| | | | | | | | | | | | | | | |
Purchase Contracts | | Counterparty | | Notional
Amount
(000) | | Value at
Settlement
Date Payable | | Current
Value | | Unrealized
Appreciation
(Depreciation) | |
Australian Dollar, | | | | | | | | | | | | | | | |
Expiring 11/06/09 | | Deutsche Bank | | AUD | 21 | | $ | 18,931 | | $ | 18,859 | | $ | (72 | ) |
Brazilian Real, | | | | | | | | | | | | | | | |
Expiring 02/02/10 | | Deutsche Bank | | BRL | 313 | | | 162,394 | | | 174,070 | | | 11,676 | |
See Notes to Financial Statements.
| | |
| 104 | | THE TARGET PORTFOLIO TRUST |
Forward currency exchange contracts outstanding at October 31, 2009 (continued):
| | | | | | | | | | | | | | | |
Purchase Contracts
(continued) | | Counterparty | | Notional
Amount
(000) | | Value at
Settlement
Date Payable | | Current
Value | | Unrealized
Appreciation
(Depreciation) | |
Chinese Yuan, | | | | | | | | | | | | | | | |
Expiring 11/30/09 | | Bank of America | | CNY | 198 | | $ | 29,000 | | $ | 29,000 | | | — | |
Expiring 11/30/09 | | Barclays Capital Group | | CNY | 75 | | | 11,000 | | | 10,981 | | $ | (19 | ) |
Expiring 11/30/09 | | JPMorgan Securities | | CNY | 376 | | | 55,000 | | | 54,999 | | | (1 | ) |
Expiring 11/30/09 | | JPMorgan Securities | | CNY | 368 | | | 54,000 | | | 53,912 | | | (88 | ) |
Expiring 11/30/09 | | JPMorgan Securities | | CNY | 259 | | | 38,000 | | | 37,930 | | | (70 | ) |
Expiring 03/16/10 | | Bank of America | | CNY | 157 | | | 23,000 | | | 22,969 | | | (31 | ) |
Expiring 03/16/10 | | Bank of America | | CNY | 34 | | | 5,000 | | | 4,994 | | | (6 | ) |
Expiring 03/16/10 | | JPMorgan Securities | | CNY | 34 | | | 5,000 | | | 4,968 | | | (32 | ) |
Expiring 05/17/10 | | Barclays Capital Group | | CNY | 302 | | | 49,000 | | | 44,332 | | | (4,668 | ) |
Expiring 05/17/10 | | Merrill Lynch Capital
Markets | | CNY | 347 | | | 56,000 | | | 50,830 | | | (5,170 | ) |
Expiring 06/07/10 | | Barclays Capital Group | | CNY | 372 | | | 55,000 | | | 54,635 | | | (365 | ) |
Expiring 06/07/10 | | Barclays Capital Group | | CNY | 190 | | | 28,000 | | | 27,904 | | | (96 | ) |
Expiring 06/07/10 | | Hong Kong &
Shanghai Bank | | CNY | 359 | | | 53,000 | | | 52,710 | | | (290 | ) |
Expiring 11/17/10 | | Barclays Capital Group | | CNY | 1,276 | | | 189,741 | | | 191,492 | | | 1,751 | |
Euro, | | | | | | | | | | | | | | | |
Expiring 11/19/09 | | Barclays Capital Group | | EUR | 368 | | | 549,750 | | | 541,543 | | | (8,207 | ) |
Expiring 11/19/09 | | JPMorgan Securities | | EUR | 1,331 | | | 1,973,353 | | | 1,958,565 | | | (14,788 | ) |
Expiring 11/19/09 | | JPMorgan Securities | | EUR | 319 | | | 474,174 | | | 469,435 | | | (4,739 | ) |
Expiring 11/19/09 | | JPMorgan Securities | | EUR | 111 | | | 162,591 | | | 163,346 | | | 755 | |
Expiring 11/19/09 | | JPMorgan Securities | | EUR | 50 | | | 74,322 | | | 73,579 | | | (743 | ) |
Indian Rupee, | | | | | | | | | | | | | | | |
Expiring 03/24/10 | | Citibank | | INR | 50 | | | 1,029 | | | 1,055 | | | 26 | |
Indonesian Rupiah, | | | | | | | | | | | | | | | |
Expiring 01/22/10 | | Barclays Capital Group | | IDR | 454,020 | | | 46,000 | | | 46,724 | | | 724 | |
Expiring 09/17/10 | | JPMorgan Securities | | IDR | 485,300 | | | 46,000 | | | 47,603 | | | 1,603 | |
Japanese Yen, | | | | | | | | | | | | | | | |
Expiring 11/17/09 | | Barclays Capital Group | | JPY | 644 | | | 7,250 | | | 7,155 | | | (95 | ) |
Expiring 11/17/09 | | Hong Kong &
Shanghai Bank | | JPY | 736 | | | 8,000 | | | 8,181 | | | 181 | |
Malaysian Ringgit, | | | | | | | | | | | | | | | |
Expiring 11/12/09 | | Barclays Capital Group | | MYR | 1 | | | 300 | | | 316 | | | 16 | |
Expiring 11/12/09 | | Barclays Capital Group | | MYR | 1 | | | 200 | | | 210 | | | 10 | |
Expiring 11/12/09 | | Deutsche Bank | | MYR | 1 | | | 267 | | | 278 | | | 11 | |
Expiring 11/12/09 | | JPMorgan Securities | | MYR | 1 | | | 314 | | | 330 | | | 16 | |
Expiring 11/12/09 | | JPMorgan Securities | | MYR | 1 | | | 276 | | | 289 | | | 13 | |
Expiring 02/12/10 | | Deutsche Bank | | MYR | 5 | | | 1,439 | | | 1,418 | | | (21 | ) |
Mexican Peso, | | | | | | | | | | | | | | | |
Expiring 11/27/09 | | Deutsche Bank | | MXN | 296 | | | 21,906 | | | 22,336 | | | 430 | |
Expiring 11/27/09 | | JPMorgan Securities | | MXN | 388 | | | 28,741 | | | 29,280 | | | 539 | |
Expiring 11/27/09 | | JPMorgan Securities | | MXN | 337 | | | 25,000 | | | 25,394 | | | 394 | |
Expiring 11/27/09 | | Hong Kong &
Shanghai Bank | | MXN | 323 | | | 24,000 | | | 24,375 | | | 375 | |
Expiring 11/27/09 | | Hong Kong &
Shanghai Bank | | MXN | 299 | | | 22,000 | | | 22,558 | | | 558 | |
Expiring 11/27/09 | | Hong Kong &
Shanghai Bank | | MXN | 163 | | | 12,000 | | | 12,298 | | | 298 | |
Expiring 04/22/10 | | JPMorgan Securities | | MXN | 1,803 | | | 135,083 | | | 133,257 | | | (1,826 | ) |
See Notes to Financial Statements
| | |
| THE TARGET PORTFOLIO TRUST | | 105 |
| | |
International Bond Portfolio (continued) | | Portfolio of Investments
As of October 31, 2009 |
Forward currency exchange contracts outstanding at October 31, 2009 (continued):
| | | | | | | | | | | | | | | |
Purchase Contracts
(continued) | | Counterparty | | Notional
Amount
(000) | | Value at
Settlement
Date Payable | | Current
Value | | Unrealized
Appreciation
(Depreciation) | |
Norwegian Krone, | | | | | | | | | | | | | | | |
Expiring 12/21/09 | | Goldman Sachs | | NOK | 509 | | $ | 91,383 | | $ | 88,712 | | $ | (2,671 | ) |
Expiring 12/21/09 | | Hong Kong & Shanghai Bank | | NOK | 520 | | | 89,088 | | | 90,629 | | | 1,541 | |
Expiring 12/21/09 | | Royal Bank of Scotland | | NOK | 206 | | | 36,345 | | | 35,903 | | | (442 | ) |
Philippine Peso, | | | | | | | | | | | | | | | |
Expiring 11/16/09 | | Deutsche Bank | | PHP | 5 | | | 108 | | | 105 | | | (3 | ) |
South Korean Won, | | | | | | | | | | | | | | | |
Expiring 11/18/09 | | Bank of America | | KRW | 34,513 | | | 28,000 | | | 29,185 | | | 1,185 | |
Expiring 11/18/09 | | Bank of America | | KRW | 16,029 | | | 13,000 | | | 13,555 | | | 555 | |
Expiring 11/18/09 | | Bank of America | | KRW | 7 | | | 6 | | | 6 | | | — | |
Expiring 11/18/09 | | Barclays Capital Group | | KRW | 108 | | | 85 | | | 92 | | | 7 | |
Expiring 11/18/09 | | Barclays Capital Group | | KRW | 101 | | | 80 | | | 86 | | | 6 | |
Expiring 11/18/09 | | Citibank | | KRW | 162 | | | 127 | | | 137 | | | 10 | |
Expiring 11/18/09 | | Citibank | | KRW | 16 | | | 13 | | | 13 | | | — | |
Expiring 11/18/09 | | JPMorgan Securities | | KRW | 40,417 | | | 33,000 | | | 34,178 | | | 1,178 | |
Expiring 11/18/09 | | JPMorgan Securities | | KRW | 31,831 | | | 26,000 | | | 26,917 | | | 917 | |
Expiring 11/18/09 | | JPMorgan Securities | | KRW | 31,725 | | | 26,000 | | | 26,828 | | | 828 | |
Expiring 11/18/09 | | JPMorgan Securities | | KRW | 26,629 | | | 23,000 | | | 22,519 | | | (481 | ) |
Expiring 11/18/09 | | Morgan Stanley | | KRW | 28,242 | | | 24,000 | | | 23,883 | | | (117 | ) |
Expiring 11/18/09 | | Hong Kong & Shanghai Bank | | KRW | 11,097 | | | 9,000 | | | 9,384 | | | 384 | |
Expiring 11/18/09 | | Royal Bank of Scotland | | KRW | 159 | | | 124 | | | 135 | | | 11 | |
Expiring 02/11/10 | | JPMorgan Securities | | KRW | 32,697 | | | 27,000 | | | 27,636 | | | 636 | |
Expiring 07/28/10 | | Barclays Capital Group | | KRW | 11,000 | | | 9,283 | | | 9,238 | | | (45 | ) |
| | | | | | | | | | | | | | | |
| | | | | | | $ | 4,881,703 | | $ | 4,863,251 | | $ | (18,452 | ) |
| | | | | | | | | | | | | | | |
| | | | | | | | | | | | | | | |
Sale Contracts | | Counterparty | | Notional
Amount
(000) | | Value at
Settlement
Date Receivable | | Current
Value | | Unrealized
Appreciation
(Depreciation) | |
Australian Dollar, | | | | | | | | | | | | | | | |
Expiring 11/05/09 | | JPMorgan Securities | | AUD | 579 | | $ | 503,998 | | $ | 520,894 | | $ | (16,896 | ) |
British Pound, | | | | | | | | | | | | | | | |
Expiring 11/24/09 | | JPMorgan Securities | | GBP | 1,312 | | | 2,144,459 | | | 2,152,973 | | | (8,514 | ) |
Canadian Dollar, | | | | | | | | | | | | | | | |
Expiring 12/10/09 | | JPMorgan Securities | | CAD | 241 | | | 225,955 | | | 222,730 | | | 3,225 | |
Chinese Yuan, | | | | | | | | | | | | | | | |
Expiring 11/30/09 | | Barclays Capital Group | | CNY | 1,276 | | | 187,153 | | | 186,822 | | | 331 | |
Expiring 05/17/10 | | Barclays Capital Group | | CNY | 649 | | | 90,386 | | | 95,162 | | | (4,776 | ) |
Danish Krone, | | | | | | | | | | | | | | | |
Expiring 12/21/09 | | Hong Kong &
Shanghai Bank | | DKK | 2,050 | | | 402,474 | | | 404,953 | | | (2,479 | ) |
Euro, | | | | | | | | | | | | | | | |
Expiring 11/19/09 | | Barclays Capital Group | | EUR | 52 | | | 77,413 | | | 76,522 | | | 891 | |
Expiring 11/19/09 | | Credit Suisse First
Boston Corp. | | EUR | 100 | | | 147,215 | | | 147,158 | | | 57 | |
Expiring 11/19/09 | | JPMorgan Securities | | EUR | 9,380 | | | 13,739,666 | | | 13,803,455 | | | (63,789 | ) |
See Notes to Financial Statements
| | |
| 106 | | THE TARGET PORTFOLIO TRUST |
Forward currency exchange contracts outstanding at October 31, 2009 (continued):
| | | | | | | | | | | | | | | |
Sale Contracts
(continued) | | Counterparty | | Notional
Amount
(000) | | Value at
Settlement
Date Receivable | | Current
Value | | Unrealized
Appreciation
(Depreciation) | |
Expiring 11/19/09 | | JPMorgan Securities | | EUR | 216 | | $ | 319,125 | | $ | 317,862 | | $ | 1,263 | |
Expiring 11/19/09 | | JPMorgan Securities | | EUR | 14 | | | 21,047 | | | 20,602 | | | 445 | |
Expiring 11/19/09 | | Royal Bank of Scotland | | EUR | 1,566 | | | 2,322,676 | | | 2,304,500 | | | 18,176 | |
Expiring 11/19/09 | | Royal Bank of Scotland | | EUR | 529 | | | 787,469 | | | 778,468 | | | 9,001 | |
Japanese Yen, | | | | | | | | | | | | | | | |
Expiring 11/24/09 | | JPMorgan Securities | | JPY | 160,166 | | | 1,769,412 | | | 1,779,551 | | | (10,139 | ) |
Malaysian Ringgit, | | | | | | | | | | | | | | | |
Expiring 11/12/09 | | Deutsche Bank | | MYR | 5 | | | 1,441 | | | 1,424 | | | 17 | |
Mexican Peso, | | | | | | | | | | | | | | | |
Expiring 11/27/09 | | JPMorgan Securities | | MXN | 1,803 | | | 137,888 | | | 136,020 | | | 1,868 | |
Expiring 11/27/09 | | JPMorgan Securities | | MXN | 3 | | | 217 | | | 221 | | | (4 | ) |
New Zealand Dollar, | | | | | | | | | | | | | | | |
Expiring 11/05/09 | | Hong Kong &
Shanghai Bank | | NZD | 6 | | | 4,291 | | | 4,303 | | | (12 | ) |
Philippine Peso, | | | | | | | | | | | | | | | |
Expiring 11/16/09 | | Deutsche Bank | | PHP | 5 | | | 103 | | | 105 | | | (2 | ) |
Expiring 04/16/10 | | Deutsche Bank | | PHP | 5 | | | 107 | | | 104 | | | 3 | |
Singapore Dollar, | | | | | | | | | | | | | | | |
Expiring 11/18/09 | | Hong Kong &
Shanghai Bank | | SGD | 6 | | | 4,197 | | | 4,316 | | | (119 | ) |
South Korean Won, | | | | | | | | | | | | | | | |
Expiring 11/18/09 | | Barclays Capital
Group | | KRW | 11,000 | | | 9,303 | | | 9,251 | | | 52 | |
Expiring 11/18/09 | | Hong Kong &
Shanghai Bank | | KRW | 62,613 | | | 50,000 | | | 52,948 | | | (2,948 | ) |
| | | | | | | | | | | | | | | |
| | | | | | | $ | 22,945,995 | | $ | 23,020,344 | | $ | (74,349 | ) |
| | | | | | | | | | | | | | | |
Cross currency exchange contracts outstanding at October 31, 2009:
| | | | | | | | | | | | |
Settlement | | Counterparty | | Type | | Contracts
(000) | | In Exchange
for (000) | | Unrealized
Depreciation |
11/6/09 | | Goldman Sachs | | Sell | | GBP | 14 | | NOK | 131 | | $ (170) |
11/6/09 | | Barclays Capital Group | | Sell | | GBP | 15 | | NOK | 140 | | (213) |
| | | | | | | | | | | | |
| | | | | | | | | | | | $ (383) |
| | | | | | | | | | | | |
Interest rate swap agreements outstanding at October 31, 2009:
| | | | | | | | | | | | | | | | | | | | | |
Counterparty | | Termination
Date | | Notional
Amount
(000) | | Fixed
Rate | | | Floating
Rate | | Fair
Value | | | Upfront
Premiums
Paid
(Received) | | Unrealized
Appreciation
(Depreciation) | |
Goldman Sachs & Co.(1) | | 01/02/12 | | BRL | 600 | | 11.36 | % | | Brazilian interbank
lending rate | | $ | (611 | ) | | $ | 16 | | $ | (627 | ) |
Merrill Lynch & Co.(1) | | 01/02/12 | | BRL | 200 | | 11.36 | % | | Brazilian interbank lending rate | | | (203 | ) | | | 26 | | | (229 | ) |
Goldman Sachs & Co.(1) | | 06/15/12 | | EUR | 300 | | 2.08 | % | | FRC-Excluding
Tobacco-Non-Revised
Consumer Price Index | | | 9,428 | | | | — | | | 9,428 | |
Barclays Capital(1) | | 12/16/16 | | JPY | 120,000 | | 1.50 | % | | 6 month LIBOR | | | 28,775 | | | | 22,527 | | | 6,248 | |
Deutsche Bank(1) | | 06/16/11 | | JPY | 280,000 | | 1.00 | % | | 6 month LIBOR | | | 14,003 | | | | 8,931 | | | 5,072 | |
See Notes to Financial Statements
| | |
| THE TARGET PORTFOLIO TRUST | | 107 |
| | |
International Bond Portfolio (continued) | | Portfolio of Investments
As of October 31, 2009 |
Interest rate swap agreements outstanding at October 31, 2009 (continued):
| | | | | | | | | | | | | | | | | | | | | | |
Counterparty | | Termination
Date | | Notional
Amount
(000) | | Fixed
Rate | | | Floating
Rate | | Fair
Value | | | Upfront
Premiums
Paid
(Received) | | | Unrealized
Appreciation
(Depreciation) | |
Morgan Stanley Capital Services, Inc.(1) | | 12/16/19 | | JPY | 50,000 | | 1.50 | % | | 6 month LIBOR | | $ | (3,086 | ) | | $ | (423 | ) | | $ | (2,663 | ) |
UBS AG(1) | | 12/16/14 | | JPY | 240,000 | | 1.00 | % | | 6 month LIBOR | | | 11,378 | | | | (1,560 | ) | | | 12,938 | |
UBS AG(1) | | 12/16/19 | | JPY | 20,000 | | 1.50 | % | | 6 month LIBOR | | | (1,235 | ) | | | 512 | | | | (1,747 | ) |
Merrill Lynch & Co.(1) | | 02/07/19 | | MXN | 300 | | 8.30 | % | | 28 day Mexican interbank rate | | | 191 | | | | 178 | | | | 13 | |
| | | | | | | | | | | | | | | | | | | | | | |
| | | | | | | | | | | | $ | 58,640 | | | $ | 30,207 | | | $ | 28,433 | |
| | | | | | | | | | | | | | | | | | | | | | |
| (1) | Porfolio pays the floating rate and receives the fixed rate. |
Credit default swap agreements outstanding at October 31, 2009:
| | | | | | | | | | | | | | | | | | | | | | |
Counterparty | | Termination
Date | | Notional
Amount
(000)#(2) | | Fixed
Rate | | | Reference
Entity/Obligation | | Fair
Value | | | Upfront
Premiums
Paid
(Received) | | | Unrealized
Appreciation
(Depreciation) | |
| Credit default swaps—Buy Protection(1): | | | | | | | | | | | | |
Morgan Stanley Capital Services, Inc. | | 03/20/11 | | $ | 100 | | 0.20 | % | | COX Communications, Inc.,
6.75%, due 03/15/11 | | $ | 489 | | | $ | — | | | $ | 489 | |
Goldman Sachs & Co. | | 06/20/19 | | | 700 | | 1.00 | % | | Dow Jones CDX IG12
10Y Index | | | 12,127 | | | | 30,256 | | | | (18,129 | ) |
Deutsche Bank | | 06/20/14 | | | 1,200 | | 1.00 | % | | Dow Jones CDX IG12
5Y Index | | | 7,225 | | | | 43,257 | | | | (36,032 | ) |
Barclays Capital | | 06/20/17 | | | 781 | | 0.60 | % | | Dow Jones CDX IG8 Index | | | 42,042 | | | | 8,068 | | | | 33,974 | |
Deutsche Bank | | 06/20/19 | | | 300 | | 1.00 | % | | Embarq Corp.,
7.082%, due 06/01/16 | | | (4,911 | ) | | | (5,371 | ) | | | 460 | |
Credit Suisse International | | 03/20/12 | | | 100 | | 0.45 | % | | iStar Financial, Inc.,
5.15%, due 03/01/12 | | | 40,419 | | | | — | | | | 40,419 | |
JPMorgan Chase | | 03/20/11 | | | 100 | | 0.28 | % | | Johnson Controls, Inc.,
5.25%, due 01/15/11 | | | 939 | | | | — | | | | 939 | |
Barclays Capital | | 06/20/11 | | | 100 | | 0.21 | % | | National Grid PLC,
5.00%, due 07/02/18 | | | 928 | | | | — | | | | 928 | |
JPMorgan Chase | | 09/20/11 | | | 100 | | 0.93 | % | | Sabre Holdings Corp.,
7.35%, due 08/01/11 | | | 6,940 | | | | — | | | | 6,940 | |
Merrill Lynch & Co. | | 03/20/12 | | | 100 | | 0.46 | % | | Sprint Capital Corp.,
8.375%, due 03/15/12 | | | 8,829 | | | | — | | | | 8,829 | |
Barclays Capital | | 03/20/19 | | | 100 | | 2.80 | % | | UBS AG, 0.78%,
due 04/18/12(3) | | | (14,331 | ) | | | — | | | | (14,331 | ) |
Deutsche Bank | | 03/20/14 | | EUR | 100 | | 2.20 | % | | UBS AG, 0.78%, due
04/18/12(3) | | | (8,651 | ) | | | — | | | | (8,651 | ) |
| | | | | | | | | | | | | | | | | | | | | | |
| | | | | | | | | | | | $ | 92,045 | | | $ | 76,210 | | | $ | 15,835 | |
| | | | | | | | | | | | | | | | | | | | | | |
| (1) | If the Portfolio is a buyer of protection, it pays the fixed rate. When a credit event occurs, as defined under the terms of that particular swap agreement, the Portfolio will either (i) receive from the seller of protection an amount equal to the |
See Notes to Financial Statements.
| | |
| 108 | | THE TARGET PORTFOLIO TRUST |
| | notional amount of the swap and make delivery of the referenced obligation or underlying securities comprising the referenced index or (ii) receive a net settlement amount in the form of cash or securities equal to the notional amount of the swap less the recovery value of the referenced obligation or underlying securities comprising the referenced index. |
| (2) | Notional amount represents the maximum potential amount the Portfolio could be required to pay as a seller of credit protection or receive as a buyer of credit protection if a credit event occurs as defined under the terms of that particular swap agreement. |
| (3) | Variable rate, displayed rate is as of 10/31/09. |
| # | Notional Amount is shown in U.S. dollars unless otherwise stated. |
Various inputs are used in determining the value of the Portfolio’s investments. These inputs are summarized in the three broad levels listed below.
Level 1—quoted prices in active markets for identical securities
Level 2—other significant observable inputs (including quoted prices for similar securities, interest rates, prepayment speeds, credit risk, etc.)
Level 3—significant unobservable inputs (including the Portfolio’s own assumptions in determining the fair value of investments)
The following is a summary of the inputs used as of October 31, 2009 in valuing the Portfolio’s assets carried at fair value:
| | | | | | | | | | | |
Investments in Securities | | Level 1 | | | Level 2 | | | Level 3 |
Asset-Backed Securities | | $ | — | | | $ | 2,432,889 | | | $ | — |
Commercial Mortgage-Backed Securities | | | — | | | | 170,554 | | | | — |
Corporate Bonds | | | — | | | | 3,199,506 | | | | — |
Foreign Corporate Bonds | | | — | | | | 7,881,220 | | | | — |
Foreign Government Bonds | | | — | | | | 16,548,544 | | | | — |
Municipal Bond | | | — | | | | 47,956 | | | | — |
Residential Mortgage-Backed Securities | | | — | | | | 1,629,444 | | | | — |
U.S. Government Agency Obligations | | | — | | | | 276,454 | | | | — |
U.S. Government Mortgage-Backed Obligation | | | — | | | | 183,054 | | | | — |
U.S. Treasury Obligation | | | — | | | | 12,057 | | | | — |
Written Options | | | — | | | | (13,097 | ) | | | — |
Affiliated Money Market Mutual Fund | | | 68,460 | | | | — | | | | — |
| | | | | | | | | | | |
| | $ | 68,460 | | | $ | 32,368,581 | | | $ | — |
Other Financial Instruments* | | | (890 | ) | | | (58,344 | ) | | | 9,428 |
| | | | | | | | | | | |
Total | | $ | 67,570 | | | $ | 32,310,237 | | | $ | 9,428 |
| | | | | | | | | | | |
| * | Other financial instruments are derivative instruments not reflected in the Portfolio of Investments, such as futures, forwards and swap contracts, which are valued at the unrealized appreciation/depreciation on the instrument. |
The following is a reconciliation of assets in which significant unobservable inputs (Level 3) were used in determining fair value:
| | | | |
| | | Other Financial
Instruments | |
Balance as of 10/31/08 | | $ | 12,572 | |
Accrued discounts/premiums | | | — | |
Realized gain (loss) | | | — | * |
Change in unrealized appreciation (depreciation) | | | (3,144 | ) |
Net purchases (sales) | | | — | |
Transfers in and/or out of Level 3 | | | — | |
| | | | |
Balance as of 10/31/09 | | $ | 9,428 | |
| | | | |
| * | The realized gain earned during the year for other financial instruments was $13,258. |
See Notes to Financial Statements.
| | |
| THE TARGET PORTFOLIO TRUST | | 109 |
| | |
International Bond Portfolio (continued) | | Portfolio of Investments
As of October 31, 2009 |
The industry classification of investments and other liabilities in excess of other assets shown as a percentage of net assets as of October 31, 2009 were as follows:
| | | |
Foreign Bonds | | 96.6 | % |
Asset-Backed Securities | | 9.6 | |
Residential Mortgage-Backed Securities | | 6.4 | |
Financials | | 6.1 | |
Telecommunications | | 1.7 | |
Insurance | | 1.7 | |
Commercial Banks | | 1.6 | |
U.S. Government Agency Obligations | | 1.1 | |
U.S. Government Mortgage-Backed Obligation | | 0.7 | |
Commercial Mortgage-Backed Securities | | 0.7 | |
Media | | 0.4 | |
Auto Parts & Equipment | | 0.4 | |
Leisure | | 0.4 | |
Affiliated Money Market Mutual Fund | | 0.3 | |
Real Estate Investment Trusts | | 0.2 | |
Municipal Bond | | 0.2 | |
Pipelines | | 0.2 | |
| | | |
| | 128.3 | |
Options Written | | — | * |
Other liabilities in excess of other assets | | (28.3 | ) |
| | | |
| | 100.0 | % |
| | | |
See Notes to Financial Statements.
| | |
| 110 | | THE TARGET PORTFOLIO TRUST |
| | |
Portfolio of Investments
As of October 31, 2009 | | Total Return Bond Portfolio |
| | | | | | | | |
MOODY’S
RATINGS†
(UNAUDITED) | | PRINCIPAL
AMOUNT (000)# | | DESCRIPTION | | VALUE (NOTE 1) |
| | | | | | | | |
| | | | | LONG-TERM INVESTMENTS—105.2% | | | |
| | | |
| | | | | ASSET-BACKED SECURITIES—2.0% | | | |
| | | | | Bear Stearns Second Lien Trust,
Series 2007-SV1A, Class A1, 144A | | | |
| B3 | | $ | 312 | | 0.464%(c), 12/25/36 | | $ | 188,761 |
| | | | | SLM Student Loan Trust,
Series 2008-9, Class A | | | |
| Aaa | | | 5,009 | | 1.782%(c), 04/25/23 | | | 5,231,071 |
| | | | | Structured Asset Securities Corp.,
Series 2005-7XS, Class 2A1A | | | |
| Baa1 | | | 579 | | 4.90%(c), 04/25/35 | | | 395,777 |
| | | | | | | | |
| | | | | TOTAL ASSET-BACKED SECURITIES
(cost $5,821,393) | | | 5,815,609 |
| | | | | | | | |
| | | |
| | | | | BANK LOANS(c)—2.2% | | | |
| | | | | Chrysler Financial, Term B | | | |
| CA(d) | | | 4,704 | | 4.25%, 08/03/12 | | | 4,489,704 |
| | | | | CSC Holdings, Inc. | | | |
| BA+(d) | | | 980 | | 2.05%, 03/29/16 | | | 946,571 |
| | | | | CSC Holdings, Inc., Term Bl | | | |
| BA+(d) | | | 3 | | 2.19%, 03/29/16 | | | 2,459 |
| | | | | Ford Motor Co., Term B | | | |
| CAA+(d) | | | 36 | | 3.25%, 11/29/13 | | | 31,795 |
| CAA+(d) | | | 546 | | 3.29%, 11/29/13 | | | 485,593 |
| | | | | TXU Corp., Term B3 | | | |
| B(d) | | | 586 | | 3.74%, 10/10/14 | | | 449,054 |
| B(d) | | | 3 | | 3.78%, 10/10/14 | | | 2,303 |
| | | | | | | | |
| | | | | TOTAL BANK LOANS
(cost $6,706,368) | | | 6,407,479 |
| | | | | | | | |
| | | |
| | | | | CONVERTIBLE BOND—0.4% | | | |
| | | |
| | | | | Financial Services | | | |
| | | | | National City Corp.,
Sr. Unsec’d. Notes
(cost $1,072,980) | | | |
| A3 | | | 1,200 | | 4.00%, 02/01/11 | | | 1,215,000 |
| | | | | | | | |
| | | |
| | | | | CORPORATE BONDS—28.8% | | | |
| | | |
| | | | | Aerospace—0.1% | | | |
| | | | | Goodrich Corp.,
Sr. Unsec’d. Notes | | | |
| Baa2 | | | 200 | | 6.29%, 07/01/16 | | | 218,413 |
| | | | | | | | |
| | | |
| | | | | Airlines—0.1% | | | |
| | | | | United Air Lines, Inc.,
Equipment Trust(g)(i) | | | |
| NR | | | 754 | | 10.85%, 02/19/15 | | | 229,864 |
| | | | | | | | |
See Notes to Financial Statements.
| | |
| THE TARGET PORTFOLIO TRUST | | 111 |
| | |
Total Return Bond Portfolio (continued) | | Portfolio of Investments
As of October 31, 2009 |
| | | | | | | | |
MOODY’S
RATINGS†
(UNAUDITED) | | PRINCIPAL
AMOUNT (000)# | | DESCRIPTION | | VALUE (NOTE 1) |
| | | | | | | | |
| | | | | CORPORATE BONDS (continued) | | | |
| | | |
| | | | | Automobile Manufacturers—0.5% | | | |
| | | | | Daimler Finance North America LLC,
Gtd. Notes | | | |
| A3 | | $ | 1,000 | | 7.75%, 01/18/11 | | $ | 1,062,272 |
| | | | | DaimlerChrysler NA Holding Corp.,
Gtd. Notes, MTN | | | |
| A3 | | | 400 | | 5.75%, 09/08/11 | | | 422,855 |
| | | | | | | | |
| | | | | | | | 1,485,127 |
| | | | | | | | |
| | | |
| | | | | Automotive Parts—0.4% | | | |
| | | | | Autozone, Inc.,
Sr. Unsec’d. Notes | | | |
| Baa2 | | | 1,100 | | 6.95%, 06/15/16 | | | 1,203,904 |
| | | | | | | | |
| | | |
| | | | | Computer Services & Software—0.5% | | | |
| | | | | Electronic Data Systems Corp.,
Sr. Unsec’d. Notes | | | |
| A2 | | | 1,200 | | 6.00%, 08/01/13 | | | 1,329,374 |
| | | | | | | | |
| | | |
| | | | | Electronic Components | | | |
| | | | | General Electric Co.,
Sr. Unsec’d. Notes | | | |
| Aa2 | | | 100 | | 5.25%, 12/06/17 | | | 104,034 |
| | | | | | | | |
| | | |
| | | | | Financial—Bank & Trust—8.1% | | | |
| | | | | American Express Bank FSB,
Sr. Unsec’d. Notes | | | |
| A2 | | | 500 | | 5.50%, 04/16/13 | | | 531,290 |
| | | | | Bank of America Corp., | | | |
| | | | | Sr. Unsec’d. Notes | | | |
| A2 | | | 1,200 | | 0.544%(c), 10/14/16 | | | 977,768 |
| A2 | | | 800 | | 7.625%, 06/01/19 | | | 923,129 |
| | | | | Sr. Unsec’d. Notes, MTN | | | |
| A2 | | | 300 | | 5.65%, 05/01/18 | | | 303,219 |
| | | | | Barclays Bank PLC,
Sub. Notes, 144A (United Kingdom) | | | |
| Baa1 | | | 5,700 | | 6.05%, 12/04/17 | | | 5,807,217 |
| | | | | Citigroup, Inc.,
Sr. Unsec’d. Notes | | | |
| A3 | | | 6,300 | | 5.50%, 04/11/13 | | | 6,565,501 |
| | | | | Export-Import Bank of Korea,
Sr. Notes (South Korea) | | | |
| A2 | | | 2,600 | | 8.125%, 01/21/14 | | | 2,980,500 |
See Notes to Financial Statements.
| | |
| 112 | | THE TARGET PORTFOLIO TRUST |
| | | | | | | | |
MOODY’S
RATINGS†
(UNAUDITED) | | PRINCIPAL
AMOUNT (000)# | | DESCRIPTION | | VALUE (NOTE 1) |
| | | | | | | | |
| | | | | CORPORATE BONDS (continued) | | | |
| | | |
| | | | | Financial—Bank & Trust (continued) | | | |
| | | | | Fortis Bank Nederland NV,
Gov’t. Liquid Gtd. Notes, MTN (Netherlands) | | | |
| Aaa | | GBP | 600 | | 1.737%(c), 06/10/11 | | $ | 884,584 |
| | | | | Goldman Sachs Group, Inc. (The),
Sr. Unsec’d. Notes | | | |
| A1 | | $ | 300 | | 6.15%, 04/01/18 | | | 319,684 |
| A1 | | | 1,100 | | 6.25%, 09/01/17 | | | 1,176,891 |
| | | | | Sr. Unsec’d. Notes, MTN | | | |
| A1 | | | 400 | | 0.683%(c), 07/22/15 | | | 373,816 |
| | | | | Lehman Brothers Holdings, Inc.,
Sr. Unsec’d. Notes, MTN(i) | | | |
| NR | | | 3,500 | | 5.625%, 01/24/13 | | | 560,000 |
| NR | | | 900 | | 6.875%, 05/02/18 | | | 145,125 |
| | | | | Lloyds TSB Bank PLC,
Gov’t. Liquid Gtd. Notes, MTN (United Kingdom) | | | |
| Aaa | | GBP | 400 | | 0.947%(c), 06/09/11 | | | 590,074 |
| | | | | National Australia Bank Ltd.,
Sr. Notes, 144A (Australia) | | | |
| Aa1 | | | 1,200 | | 0.914%(c), 02/08/10 | | | 1,199,711 |
| | | | | | | | |
| | | | | | | | 23,338,509 |
| | | | | | | | |
| | | |
| | | | | Financial Services—9.0% | | | |
| | | | | American General Finance Corp.,
Sr. Unsec’d. Notes, MTN | | | |
| Baa3 | | | 100 | | 5.40%, 12/01/15 | | | 68,950 |
| | | | | ANZ National International Ltd.,
Bank Gtd. Notes, 144A (New Zealand) | | | |
| Aa2 | | | 2,700 | | 6.20%, 07/19/13 | | | 2,950,414 |
| | | | | Caterpillar Financial Services Corp.,
Sr. Unsec’d. Notes, MTN | | | |
| A2 | | | 2,100 | | 1.033%(c), 06/24/11 | | | 2,115,408 |
| | | | | CitiFinancial, Inc.,
Sr. Unsec’d. Notes | | | |
| A3 | | | 400 | | 6.625%, 06/01/15 | | | 399,660 |
| | | | | Ford Motor Credit Co. LLC,
Sr. Unsec’d. Notes | | | |
| B3 | | | 1,100 | | 7.00%, 10/01/13 | | | 1,043,491 |
| | | | | General Electric Capital Corp.,
Sr. Unsec’d. Notes, MTN | | | |
| Aa2 | | | 400 | | 5.875%, 01/14/38 | | | 382,227 |
| | | | | Sub. Notes, 144A | | | |
| Aa3 | | GBP | 1,000 | | 6.50%(c), 09/15/67 | | | 1,345,829 |
| | | | | General Motors Acceptance Corp. LLC,
Sr. Unsec’d. Notes | | | |
| Ca | | | 900 | | 6.75%, 12/01/14 | | | 815,952 |
| Ca | | | 100 | | 8.00%, 11/01/31 | | | 84,893 |
See Notes to Financial Statements.
| | |
| THE TARGET PORTFOLIO TRUST | | 113 |
| | |
Total Return Bond Portfolio (continued) | | Portfolio of Investments
As of October 31, 2009 |
| | | | | | | | |
MOODY’S
RATINGS†
(UNAUDITED) | | PRINCIPAL
AMOUNT (000)# | | DESCRIPTION | | VALUE (NOTE 1) |
| | | | | | | | |
| | | | | CORPORATE BONDS (continued) | | | |
| | | |
| | | | | Financial Services (continued) | | | |
| | | | | International Lease Finance Corp.,
Sr. Unsec’d. Notes | | | |
| Baa3 | | EUR | 1,300 | | 1.248%(c), 08/15/11 | | $ | 1,569,137 |
| | | | | Morgan Stanley,
Sr. Unsec’d. Notes, MTN | | | |
| A2 | | $ | 1,600 | | 2.55%(c), 05/14/10 | | | 1,616,930 |
| A2 | | | 1,800 | | 5.75%, 10/18/16 | | | 1,860,118 |
| A2 | | | 3,200 | | 6.625%, 04/01/18 | | | 3,429,881 |
| | | | | Pearson Dollar Finance PLC,
Gtd. Notes, 144A (United Kingdom) | | | |
| Baa1 | | | 4,200 | | 5.70%, 06/01/14 | | | 4,434,734 |
| | | | | Pemex Project Funding Master Trust,
Gtd. Notes | | | |
| Baa1 | | | 60 | | 9.125%, 10/13/10 | | | 63,605 |
| | | | | Societe Financement de l’Economie Francaise,
Gov’t. Liquid Gtd. Notes, 144A (France) | | | |
| Aaa | | | 3,800 | | 3.375%, 05/05/14 | | | 3,909,917 |
| | | | | | | | |
| | | | | | | | 26,091,146 |
| | | | | | | | |
| | | |
| | | | | Food—0.3% | | | |
| | | | | General Mills, Inc.,
Sr. Unsec’d. Notes | | | |
| Baa1 | | | 800 | | 0.413%(c), 01/22/10 | | | 800,005 |
| | | | | | | | |
| | | |
| | | | | Hotels & Motels—0.9% | | | |
| | | | | Hyatt Hotels Corp.,
Sr. Unsec’d. Notes, 144A | | | |
| Baa1 | | | 2,600 | | 5.75%, 08/15/15 | | | 2,650,014 |
| | | | | | | | |
| | | |
| | | | | Household/Personal Care—0.1% | | | |
| | | | | Newell Rubbermaid, Inc.,
Sr. Unsec’d. Notes | | | |
| Baa3 | | | 200 | | 10.60%, 04/15/19 | | | 246,507 |
| | | | | | | | |
| | | |
| | | | | Insurance—1.8% | | | |
| | | | | American International Group, Inc.,
Jr. Sub. Debs. | | | |
| Ba2 | | | 2,600 | | 8.175%(c), 05/15/68 | | | 1,560,000 |
| | | | | Sr. Unsec’d. Notes | | | |
| A3 | | | 2,300 | | 8.25%, 08/15/18 | | | 1,960,219 |
| | | | | Sr. Unsec’d. Notes, MTN | | | |
| A3 | | EUR | 600 | | 0.915%(c), 07/19/13 | | | 653,790 |
| A3 | | | 1,400 | | 5.85%, 01/16/18 | | | 1,054,694 |
| | | | | | | | |
| | | | | | | | 5,228,703 |
| | | | | | | | |
See Notes to Financial Statements.
| | |
| 114 | | THE TARGET PORTFOLIO TRUST |
| | | | | | | | |
MOODY’S
RATINGS†
(UNAUDITED) | | PRINCIPAL
AMOUNT (000)# | | DESCRIPTION | | VALUE (NOTE 1) |
| | | | | | | | |
| | | | | CORPORATE BONDS (continued) | | | |
| | | |
| | | | | Oil, Gas & Consumable Fuels—0.5% | | | |
| | | | | Suncor Energy, Inc.,
Sr. Unsec’d. Notes (Canada) | | | |
| Baa2 | | $ | 1,300 | | 6.85%, 06/01/39 | | $ | 1,423,903 |
| | | | | | | | |
| | | |
| | | | | Paper & Forest Products—1.2% | | | |
| | | | | International Paper Co.,
Sr. Unsec’d. Notes | | | |
| Baa3 | | | 3,600 | | 5.25%, 04/01/16 | | | 3,600,885 |
| | | | | | | | |
| | | |
| | | | | Pharmaceuticals—0.4% | | | |
| | | | | Cardinal Health, Inc.,
Sr. Unsec’d. Notes | | | |
| Baa3 | | | 1,200 | | 6.00%, 06/15/17 | | | 1,207,768 |
| | | | | | | | |
| | | |
| | | | | Pipelines—0.1% | | | |
| | | | | El Paso Corp.,
Notes | | | |
| Ba3 | | | 300 | | 7.80%, 08/01/31 | | | 281,074 |
| | | | | | | | |
| | | |
| | | | | Printing & Publishing—0.3% | | | |
| | | | | Donnelley (R.R.) & Sons Co.,
Sr. Unsec’d. Notes | | | |
| Baa3 | | | 1,000 | | 6.125%, 01/15/17 | | | 980,259 |
| | | | | | | | |
| | | |
| | | | | Real Estate Investment Trusts | | | |
| | | | | iStar Financial, Inc.,
Sr. Unsec’d. Notes | | | |
| Ca | | | 200 | | 5.80%, 03/15/11 | | | 140,000 |
| | | | | | | | |
| | | |
| | | | | Retail & Merchandising—0.6% | | | |
| | | | | Limited Brands, Inc.,
Sr. Unsec’d. Notes | | | |
| Ba3 | | | 1,900 | | 6.90%, 07/15/17 | | | 1,809,750 |
| | | | | | | | |
| | | |
| | | | | Telecommunications—1.9% | | | |
| | | | | Embarq Corp.,
Sr. Unsec’d. Notes | | | |
| Baa3 | | | 1,600 | | 6.738%, 06/01/13 | | | 1,736,806 |
| Baa3 | | | 1,000 | | 7.082%, 06/01/16 | | | 1,092,461 |
| | | | | Qwest Corp.,
Sr. Unsec’d. Notes | | | |
| Ba1 | | | 1,500 | | 7.625%, 06/15/15 | | | 1,515,000 |
| | | | | Sprint Capital Corp.,
Gtd. Notes | | | |
| Ba2 | | | 1,000 | | 8.375%, 03/15/12 | | | 1,012,500 |
| | | | | | | | |
| | | | | | | | 5,356,767 |
| | | | | | | | |
See Notes to Financial Statements.
| | |
| THE TARGET PORTFOLIO TRUST | | 115 |
| | |
Total Return Bond Portfolio (continued) | | Portfolio of Investments
As of October 31, 2009 |
| | | | | | | | |
MOODY’S
RATINGS†
(UNAUDITED) | | PRINCIPAL
AMOUNT (000)# | | DESCRIPTION | | VALUE (NOTE 1) |
| | | | | | | | |
| | | | | CORPORATE BONDS (continued) | | | |
| | | |
| | | | | Tobacco—0.5% | | | |
| | | | | Altria Group, Inc.,
Gtd. Notes | | | |
| Baa1 | | $ | 400 | | 9.70%, 11/10/18 | | $ | 492,467 |
| | | | | Reynolds American, Inc.,
Gtd. Notes | | | |
| Baa3 | | | 750 | | 7.625%, 06/01/16 | | | 807,867 |
| | | | | | | | |
| | | | | | | | 1,300,334 |
| | | | | | | | |
| | | |
| | | | | Transportation—0.6% | | | |
| | | | | CSX Corp.,
Sr. Unsec’d. Notes | | | |
| Baa3 | | | 1,600 | | 6.25%, 03/15/18 | | | 1,744,358 |
| | | | | | | | |
| | | |
| | | | | Utilities—0.9% | | | |
| | | | | Illinois Power Co.,
Sr. Sec’d. Notes | | | |
| Baa1 | | | 2,500 | | 6.25%, 04/01/18 | | | 2,669,447 |
| | | | | | | | |
| | | | | TOTAL CORPORATE BONDS
(cost $86,296,590) | | | 83,440,145 |
| | | | | | | | |
| | | |
| | | | | FOREIGN GOVERNMENT BONDS—1.3% | | | |
| | | | | France Government Bonds
Bonds (France) | | | |
| AAA(d) | | EUR | 1,300 | | 3.75%, 10/25/19 | | | 1,943,541 |
| | | | | Republic of Brazil,
Sr. Unsec’d. Notes (Brazil) | | | |
| Baa3 | | BRL | 2,200 | | 12.50%, 01/05/22 | | | 1,389,362 |
| | | | | United Kingdom Gilt,
Bonds (United Kingdom) | | | |
| Aaa | | GBP | 200 | | 5.75%, 12/07/09 | | | 329,928 |
| | | | | | | | |
| | | | | TOTAL FOREIGN GOVERNMENT BONDS
(cost $3,561,375) | | | 3,662,831 |
| | | | | | | | |
| | | |
| | | | | MUNICIPAL BONDS—1.3% | | | |
| | | |
| | | | | Georgia—0.2% | | | |
| | | | | Georgia State Road & Tollway Authority,
Revenue Bonds | | | |
| Aaa | | | 500 | | 5.00%, 03/01/21 | | | 535,005 |
| | | | | | | | |
| | | |
| | | | | Illinois—0.6% | | | |
| | | | | Chicago Transit Authority, Series A,
Revenue Bonds | | | |
| A1 | | | 700 | | 6.899%, 12/01/40 | | | 762,559 |
See Notes to Financial Statements.
| | |
| 116 | | THE TARGET PORTFOLIO TRUST |
| | | | | | | | |
MOODY’S
RATINGS†
(UNAUDITED) | | PRINCIPAL
AMOUNT (000)# | | DESCRIPTION | | VALUE (NOTE 1) |
| | | | | | | | |
| | | | | MUNICIPAL BONDS (continued) | | | |
| | | |
| | | | | Illinois (continued) | | | |
| | | | | Chicago Transit Authority, Series B,
Revenue Bonds | | | |
| A1 | | $ | 800 | | 6.899%, 12/01/40 | | $ | 871,496 |
| | | | | | | | |
| | | | | | | | 1,634,055 |
| | | | | | | | |
| | | |
| | | | | New York—0.5% | | | |
| | | | | New York City Trust For Cultural Resources,
Museum of Modern Art,
Revenue Bonds | | | |
| Aa2 | | | 1,500 | | 5.125%, 07/01/31 | | | 1,513,095 |
| | | | | | | | |
| | | | | TOTAL MUNICIPAL BONDS
(cost $3,440,635) | | | 3,682,155 |
| | | | | | | | |
| | | |
| | | | | RESIDENTIAL MORTGAGE-BACKED SECURITIES—2.2% | | | |
| | | | | American Home Mortgage Investment Trust,
Series 2006-1, Class 2A1 | | | |
| Ba2 | | | 1,288 | | 0.434%(c), 05/25/46 | | | 640,212 |
| | | | | American Housing Trust,
Series I, Class 5 | | | |
| AAA(d) | | | 1 | | 8.625%, 08/25/18 | | | 1,510 |
| | | | | Bear Stearns Adjustable Rate Mortgage Trust, | | | |
| | | | | Series 2002-11, Class 1A1 | | | |
| Aaa | | | 58 | | 5.629%(c), 02/25/33 | | | 57,032 |
| | | | | Series 2005-4, Class 23A2 | | | |
| Aa3 | | | 338 | | 5.353%(c), 05/25/35 | | | 257,825 |
| | | | | Series 2007-3, Class 1A1 | | | |
| CCC(d) | | | 1,257 | | 5.434%(c), 05/25/47 | | | 847,177 |
| | | | | Citigroup Mortgage Loan Trust, Inc., | | | |
| | | | | Series 2005-6, Class A2 | | | |
| A3 | | | 512 | | 4.248%(c), 08/25/35 | | | 459,220 |
| | | | | Series 2007-10, Class 22AA | | | |
| AAA(d) | | | 1,262 | | 5.986%(c), 09/25/37 | | | 752,127 |
| | | | | Countrywide Alternative Loan Trust, | | | |
| | | | | Series 2006-OA9, Class 2A1A | | | |
| Caa3 | | | 1,298 | | 0.455%(c), 07/20/46 | | | 572,773 |
| | | | | Series 2006-OA17, Class 1A1A | | | |
| Caa1 | | | 1,321 | | 0.44%(c), 12/20/46 | | | 669,450 |
| | | | | FHLMC Structured Pass-Through Securities, | | | |
| | | | | Series T-61, Class 1A1 | | | |
| Aaa | | | 256 | | 2.301%(c), 07/25/44 | | | 250,278 |
| | | | | Indymac Adjustable Rate Mortgage Trust, | | | |
| | | | | Series 2001-H2, Class A1 | | | |
| Aaa | | | 4 | | 2.907%(c), 01/25/32 | | | 3,023 |
| | | | | Merrill Lynch Mortgage Investors, Inc., | | | |
| | | | | Series 2005-A10, Class A | | | |
| A3 | | | 290 | | 0.454%(c), 02/25/36 | | | 198,594 |
See Notes to Financial Statements.
| | |
| THE TARGET PORTFOLIO TRUST | | 117 |
| | |
Total Return Bond Portfolio (continued) | | Portfolio of Investments
As of October 31, 2009 |
| | | | | | | | |
MOODY’S
RATINGS†
(UNAUDITED) | | PRINCIPAL
AMOUNT (000)# | | DESCRIPTION | | VALUE (NOTE 1) |
| | | | | | | | |
| | | | | RESIDENTIAL MORTGAGE-BACKED SECURITIES (continued) |
| | | | | Residential Funding Mortgage Securities I, | | | |
| | | | | Series 2003-S9, Class A1 | | | |
| Aaa | | $ | 34 | | 6.50%, 03/25/32 | | $ | 33,762 |
| | | | | Washington Mutual Mortgage Pass-Through Certificates, | | | |
| | | | | Series 2003-R1, Class A1 | | | |
| Aaa | | | 1,258 | | 0.784%(c), 12/25/27 | | | 975,545 |
| | | | | Series 2007-OA2, Class 1A | | | |
| B3 | | | 1,098 | | 1.458%(c), 03/25/47 | | | 526,794 |
| | | | | | | | |
| | | | | TOTAL RESIDENTIAL MORTGAGE-BACKED SECURITIES
(cost $7,416,413) | | | 6,245,322 |
| | | | | | | | |
| | |
| | | | | U.S. GOVERNMENT MORTGAGE BACKED OBLIGATIONS—48.9% |
| | | | | Federal Home Loan Mortgage Corp. | | | |
| | | 31 | | 4.388%(c), 01/01/24 | | | 32,044 |
| | | 1,360 | | 5.00%, 01/01/37 | | | 1,413,174 |
| | | 26 | | 5.232%(c), 09/01/35 | | | 26,716 |
| | | 6,226 | | 5.50%, 06/01/31-02/01/39 | | | 6,561,853 |
| | | 54 | | 6.00%, 09/01/22 | | | 58,320 |
| | | 30 | | 7.50%, 09/01/16-07/01/17 | | | 34,693 |
| | | | | Federal National Mortgage Assoc. | | | |
| | | 98 | | 2.992%(c), 01/01/20 | | | 97,864 |
| | | 75 | | 3.827%(c), 05/01/36 | | | 74,644 |
| | | 11,138 | | 4.50%, 06/01/34-10/01/39 | | | 11,317,363 |
| | | 6,500 | | 4.50%, TBA | | | 6,579,222 |
| | | 280 | | 4.57%(c), 12/01/34 | | | 287,896 |
| | | 1,742 | | 5.00%, 09/01/33-06/01/39 | | | 1,809,717 |
| | | 600 | | 5.00%, TBA | | | 621,937 |
| | | 1,000 | | 5.00%, TBA | | | 1,032,188 |
| | | 40,012 | | 5.50%, 07/01/32-06/01/38 | | | 42,225,387 |
| | | 5,279 | | 6.00%, 01/01/23-01/01/39 | | | 5,615,679 |
| | | 120 | | 6.50%, 04/01/21-09/01/21 | | | 130,296 |
| | | | | Government National Mortgage Assoc. | | | |
| | | 86 | | 4.125%, 10/20/26-11/20/29 | | | 87,496 |
| | | 89 | | 4.375%, 02/20/17-02/20/26 | | | 90,819 |
| | | 59 | | 4.625%, 07/20/22-07/20/27 | | | 62,151 |
| | | 800 | | 5.00%, TBA | | | 831,000 |
| | | 700 | | 5.50%, TBA | | | 738,282 |
| | | 55,920 | | 6.00%, 01/15/29-05/15/39 | | | 59,481,230 |
| | | 2,103 | | 6.50%, 05/15/36-06/15/37 | | | 2,239,034 |
| | | 56 | | 8.50%, 06/15/30-08/20/30 | | | 64,835 |
| | | | | | | | |
| | | | | TOTAL U.S. GOVERNMENT MORTGAGE BACKED OBLIGATIONS
(cost $137,207,690) | | | 141,513,840 |
| | | | | | | | |
See Notes to Financial Statements.
| | |
| 118 | | THE TARGET PORTFOLIO TRUST |
| | | | | | | | | |
| | | PRINCIPAL
AMOUNT (000)# | | DESCRIPTION | | VALUE (NOTE 1) | |
| | | | | | | | | |
| | | | | U.S. TREASURY OBLIGATIONS—18.1% | | | | |
| | | | | U.S. Treasury Bonds | | | | |
| | $ | 4,900 | | 4.25%, 05/15/39 | | $ | 4,911,486 | |
| | | 500 | | 4.375%, 02/15/38 | | | 511,719 | |
| | | 8,600 | | 4.50%, 02/15/36-08/15/39 | | | 8,981,876 | |
| | | 300 | | 7.875%, 02/15/21 | | | 416,203 | |
| | | 700 | | 8.125%, 05/15/21 | | | 989,297 | |
| | | | | U.S. Treasury Inflationary Indexed Bonds, TIPS | | | | |
| | | 1,900 | | 1.875%, 07/15/13, RRB | | | 2,337,447 | |
| | | 700 | | 2.125%, 01/15/19, RRB | | | 749,051 | |
| | | 6,300 | | 2.50%, 01/15/29, RRB | | | 6,815,187 | |
| | | | | U.S. Treasury Notes | | | | |
| | | 727 | | 1.00%, 07/31/11(k) | | | 730,465 | |
| | | 2,500 | | 2.25%, 05/31/14 | | | 2,510,742 | |
| | | 9,800 | | 2.375%, 09/30/14 | | | 9,839,004 | |
| | | 900 | | 3.00%, 08/31/16 | | | 903,937 | |
| | | 3,500 | | 3.25%, 07/31/16 | | | 3,576,835 | |
| | | 4,700 | | 3.50%, 02/15/18 | | | 4,789,963 | |
| | | 3,800 | | 4.50%, 05/15/17 | | | 4,163,079 | |
| | | | | | | | | |
| | | | | TOTAL U.S. TREASURY OBLIGATIONS
(cost $52,432,626) | | | 52,226,291 | |
| | | | | | | | | |
| | | | | TOTAL LONG-TERM INVESTMENTS
(cost $303,956,070) | | | 304,208,672 | |
| | | | | | | | | |
| | | |
| | | | | SHORT-TERM INVESTMENTS—1.1% | | | | |
| | | |
| | | | | REPURCHASE AGREEMENT—0.6% | | | | |
| | | 1,700 | | JPMorgan Securities, Inc., 0.08%, dated 10/30/09, due 11/02/09 in the amount of $1,700,011 (cost $1,700,000; collateralized by $1,587,000 Federal National Mortgage Assoc., 4.625%, maturity date 10/15/14, the value of collateral plus accrued interest was $1,742,188) | | | 1,700,000 | |
| | | | | | | | | |
| | | SHARES | | | | | |
| | | | | AFFILIATED MONEY MARKET MUTUAL FUND—0.5% | | | | |
| | | 1,385,150 | | Dryden Core Investment Fund—Taxable Money Market Series (cost $1,385,150)(w) | | | 1,385,150 | |
| | | | | | | | | |
| | | | | TOTAL SHORT-TERM INVESTMENTS
(cost $3,085,150) | | | 3,085,150 | |
| | | | | | | | | |
| | | | | TOTAL INVESTMENTS, BEFORE OPTION
WRITTEN AND SECURITIES SOLD SHORT—106.3%
(cost $307,041,220; Note 5) | | | 307,293,822 | |
| | | | | | | | | |
| | | CONTRACTS/
NOTIONAL
AMOUNTS (000)# | | OPTION WRITTEN* | | | |
| | | |
| | | | | Put Option | | | | |
| | $ | 24,000 | | 90 Day Euro Dollar Futures,
expiring 12/14/09, Strike Price $98.63
(premium received $8,340) | | | (150 | ) |
| | | | | | | | | |
See Notes to Financial Statements.
| | |
| THE TARGET PORTFOLIO TRUST | | 119 |
| | |
Total Return Bond Portfolio (continued) | | Portfolio of Investments
As of October 31, 2009 |
| | | | | | | | | |
| | | PRINCIPAL
AMOUNT (000)# | | DESCRIPTION | | VALUE (NOTE 1) | |
| | | | | | | | | |
| | | | | SECURITIES SOLD SHORT—(18.6)% | | | | |
| | | |
| | | | | U.S. GOVERNMENT MORTGAGE BACKED OBLIGATIONS | | | | |
| | | | | Federal Home Loan Mortgage Corp. | | | | |
| | $ | 6,000 | | 5.50%, TBA | | $ | (6,315,000 | ) |
| | | | | Federal National Mortgage Assoc. | | | | |
| | | 100 | | 5.50%, TBA | | | (105,250 | ) |
| | | 14,800 | | 5.50%, TBA | | | (15,516,882 | ) |
| | | 5,000 | | 6.00%, TBA | | | (5,292,190 | ) |
| | | | | Government National Mortgage Assoc. | | | | |
| | | 25,000 | | 6.00%, TBA | | | (26,546,875 | ) |
| | | | | | | | | |
| | | | | TOTAL SECURITIES SOLD SHORT
(proceeds received $53,553,367) | | | (53,776,197 | ) |
| | | | | | | | | |
| | | | | TOTAL INVESTMENTS, NET OF OPTION
WRITTEN AND SECURITIES SOLD SHORT—87.7%
(cost $253,479,513) | | | 253,517,475 | |
| | | | | Other assets in excess of other liabilities(x)—12.3% | | | 35,722,832 | |
| | | | | | | | | |
| | | | | NET ASSETS—100% | | $ | 289,240,307 | |
| | | | | | | | | |
The following abbreviations are used in Portfolio descriptions:
144A—Security was purchased pursuant to Rule 144A under the Securities Act of 1933 and may not be resold subject to that rule except to qualified institutional buyers. Unless otherwise noted, 144A securities are deemed to be liquid.
FHLMC—Federal Home Loan Mortgage Corp.
FSB—Federal Savings Bank
MTN—Medium Term Note
NR—Not Rated by Moodys or Standard & Poor’s
RRB—Real Return Bonds
TBA—To Be Announced
TIPS—Treasury Inflation Protected Securities
AUD—Australian Dollar
BRL—Brazilian Real
CAD—Canadian Dollar
CNY—Chinese Yuan
EUR—Euro
GBP—British Pound
INR—Indian Rupee
JPY—Japanese Yen
MYR—Malaysian Ringgit
| * | Non-income producing security. |
| # | Principal and notional amount is shown in U.S. dollars unless otherwise stated. |
| † | The rating reflected is as of October 31, 2009. Rating of certain bonds may have changed subsequent to that date. |
| (c) | Indicates a variable rate security. |
| (d) | Standard & Poor’s rating. |
| (g) | Indicates a security that has been deemed illiquid. |
| (i) | Represents issuer in default on interest payments. Non-income producing security. |
See Notes to Financial Statements.
| | |
| 120 | | THE TARGET PORTFOLIO TRUST |
| (k) | Securities segregated as collateral for futures contracts. |
| (w) | Prudential Investments LLC, the manager of the Portfolio, also serves as manager of the Dryden Core Investment Fund-Taxable Money Market Series. |
| (x) | Other assets in excess of other liabilities includes net unrealized appreciation (depreciation) on futures contracts, forward foreign currency contracts, interest rate and credit default swaps as follows: |
Futures contracts open at October 31, 2009:
| | | | | | | | | | | | | |
Number of
Contracts | | Type | | Expiration
Date | | Value at
Trade Date | | Value at
October 31,
2009 | | Unrealized
Appreciation
(Depreciation)(1) |
| Long Positions: | | | | | | | | | | | | | |
| 152 | | 90 Day Euro Dollar | | Jun 10 | | $ | 37,413,950 | | $ | 37,697,900 | | $ | 283,950 |
| 94 | | 90 Day Euro Dollar | | Sep 10 | | | 23,072,325 | | | 23,229,750 | | | 157,425 |
| 3 | | 90 Day Euro EURIBOR | | Jun 10 | | | 1,086,573 | | | 1,089,719 | | | 3,146 |
| 81 | | 90 Day Euro EURIBOR | | Sep 10 | | | 29,150,894 | | | 29,322,580 | | | 171,686 |
| 196 | | 90 Day Sterling | | Jun 10 | | | 39,515,091 | | | 39,716,145 | | | 201,054 |
| 68 | | 90 Day Sterling | | Sep 10 | | | 13,604,876 | | | 13,709,318 | | | 104,442 |
| 49 | | 2 Year Eruo-Schatz | | Dec 09 | | | 7,777,869 | | | 7,802,387 | | | 24,518 |
| 31 | | 2 Year U.S. Treasury Notes | | Dec 09 | | | 6,696,219 | | | 6,745,891 | | | 49,672 |
| 25 | | 5 Year Euro-Bobl | | Dec 09 | | | 4,233,566 | | | 4,253,801 | | | 20,235 |
| 24 | | 5 Year U.S. Treasury Notes | | Dec 09 | | | 2,745,016 | | | 2,794,875 | | | 49,859 |
| 48 | | 10 Year U.S. Treasury Notes | | Dec 09 | | | 5,647,500 | | | 5,693,250 | | | 45,750 |
| | | | | | | | | | | | | |
| | | | | | | | | | | | $ | 1,111,737 |
| | | | | | | | | | | | | |
| (1) | Cash of $92,000 and U.S. Treasury Securities with a market value of $730,465 has been segregated to cover requirements for open futures contracts at October 31, 2009. |
Forward foreign currency exchange contracts outstanding at October 31, 2009:
| | | | | | | | | | | | | | | |
Purchase Contracts | | Counterparty | | Notional
Amount
(000) | | Value at Settlement
Date Payable | | Current
Value | | Unrealized
Appreciation
(Depreciation) | |
Brazilian Real, | | | | | | | | | | | | | | | |
Expiring 11/04/09 | | Deutsche Bank | | BRL | 633 | | $ | 355,000 | | $ | 358,840 | | $ | 3,840 | |
Expiring 11/04/09 | | Deutsche Bank | | BRL | 616 | | | 346,000 | | | 349,056 | | | 3,056 | |
Expiring 02/02/10 | | Deutsche Bank | | BRL | 2,765 | | | 1,436,863 | | | 1,540,166 | | | 103,303 | |
Chinese Yuan, | | | | | | | | | | | | | | | |
Expiring 03/29/10 | | Barclays Capital Group | | CNY | 830 | | | 122,895 | | | 121,632 | | | (1,263 | ) |
Expiring 03/29/10 | | Citibank | | CNY | 5,901 | | | 873,551 | | | 864,316 | | | (9,235 | ) |
Expiring 03/29/10 | | Deutsche Bank | | CNY | 3,945 | | | 584,500 | | | 577,807 | | | (6,693 | ) |
Expiring 03/29/10 | | Deutsche Bank | | CNY | 7 | | | 1,001 | | | 992 | | | (9 | ) |
Expiring 03/29/10 | | Hong Kong & Shanghai Bank | | CNY | 5,678 | | | 839,600 | | | 831,708 | | | (7,892 | ) |
Expiring 03/29/10 | | JPMorgan Securities | | CNY | 53 | | | 7,841 | | | 7,763 | | | (78 | ) |
Expiring 06/07/10 | | Barclays Capital Group | | CNY | 3,988 | | | 592,000 | | | 585,286 | | | (6,714 | ) |
Expiring 06/07/10 | | Barclays Capital Group | | CNY | 3,973 | | | 590,000 | | | 583,049 | | | (6,951 | ) |
Expiring 06/07/10 | | Citibank | | CNY | 1,588 | | | 236,000 | | | 233,012 | | | (2,988 | ) |
Expiring 06/07/10 | | Citibank | | CNY | 1,286 | | | 191,000 | | | 188,750 | | | (2,250 | ) |
Expiring 06/07/10 | | Deutsche Bank | | CNY | 2,391 | | | 355,000 | | | 350,818 | | | (4,182 | ) |
Expiring 06/07/10 | | JPMorgan Securities | | CNY | 4,147 | | | 616,000 | | | 608,562 | | | (7,438 | ) |
Expiring 06/07/10 | | JPMorgan Securities | | CNY | 1,388 | | | 206,000 | | | 203,664 | | | (2,336 | ) |
Expiring 06/07/10 | | Hong Kong & Shanghai Bank | | CNY | 4,503 | | | 669,000 | | | 660,873 | | | (8,127 | ) |
Expiring 06/15/11 | | Hong Kong & Shanghai Bank | | CNY | 2,986 | | | 449,000 | | | 466,869 | | | 17,869 | |
See Notes to Financial Statements.
| | |
| THE TARGET PORTFOLIO TRUST | | 121 |
| | |
Total Return Bond Portfolio (continued) | | Portfolio of Investments
As of October 31, 2009 |
Forward foreign currency exchange contracts outstanding at October 31, 2009 (continued):
| | | | | | | | | | | | | | | |
Purchase Contracts
(continued) | | Counterparty | | Notional
Amount
(000) | | Value at Settlement
Date Payable | | Current
Value | | Unrealized
Appreciation
(Depreciation) | |
Malaysian Ringgit, | | | | | | | | | | | | | | | |
Expiring 11/12/09 | | Deutsche Bank | | MYR | 2 | | $ | 595 | | $ | 585 | | $ | (10 | ) |
Expiring 11/12/09 | | Deutsche Bank | | MYR | 2 | | | 593 | | | 586 | | | (7 | ) |
Expiring 11/12/09 | | Deutsche Bank | | MYR | 2 | | | 554 | | | 550 | | | (4 | ) |
Expiring 11/12/09 | | Deutsche Bank | | MYR | 2 | | | 556 | | | 550 | | | (6 | ) |
| | | | | | | | | | | | | | | |
| | | | | | | $ | 8,473,549 | | $ | 8,535,434 | | $ | 61,885 | |
| | | | | | | | | | | | | | | |
| | | | | | | | | | | | | | | |
Sale Contracts | | Counterparty | | Notional
Amount
(000) | | Value at Settlement
Date Receivable | | Current
Value | | Unrealized
Appreciation
(Depreciation) | |
Australian Dollar, | | | | | | | | | | | | | | | |
Expiring 11/05/09 | | Hong Kong & Shanghai Bank | | AUD | 31 | | $ | 27,000 | | $ | 27,912 | | $ | (912 | ) |
Brazilian Real, | | | | | | | | | | | | | | | |
Expiring 11/04/09 | | Citibank N.A. | | BRL | 616 | | | 346,000 | | | 349,056 | | | (3,056 | ) |
Expiring 11/04/09 | | Deutsche Bank | | BRL | 633 | | | 355,000 | | | 358,840 | | | (3,840 | ) |
Expiring 02/02/10 | | Deutsche Bank | | BRL | 643 | | | 355,000 | | | 358,358 | | | (3,358 | ) |
Expiring 02/02/10 | | Deutsche Bank | | BRL | 626 | | | 346,000 | | | 348,598 | | | (2,598 | ) |
Expiring 02/02/10 | | Goldman Sachs & Co., Inc. | | BRL | 626 | | | 346,000 | | | 348,444 | | | (2,444 | ) |
Expiring 02/02/10 | | Hong Kong & Shanghai Bank | | BRL | 643 | | | 355,000 | | | 358,199 | | | (3,199 | ) |
British Pound, | | | | | | | | | | | | | | | |
Expiring 11/24/09 | | JPMorgan Securities | | GBP | 2,743 | | | 4,483,422 | | | 4,501,222 | | | (17,800 | ) |
Canadian Dollar, | | | | | | | | | | | | | | | |
Expiring 12/10/09 | | JPMorgan Securities | | CAD | 2 | | | 1,875 | | | 1,848 | | | 27 | |
Chinese Yuan, | | | | | | | | | | | | | | | |
Expiring 03/29/10 | | Deutsche Bank | | CNY | 4,957 | | | 735,000 | | | 726,046 | | | 8,954 | |
Expiring 06/07/10 | | Barclays Bank PLC | | CNY | 312 | | | 46,000 | | | 45,777 | | | 223 | |
Expiring 06/07/10 | | Deutsche Bank | | CNY | 1,540 | | | 227,380 | | | 226,069 | | | 1,311 | |
Euro, | | | | | | | | | | | | | | | |
Expiring 11/19/09 | | JPMorgan Securities | | EUR | 3,630 | | | 5,317,162 | | | 5,341,849 | | | (24,687 | ) |
Expiring 11/19/09 | | JPMorgan Securities | | EUR | 1,377 | | | 2,017,007 | | | 2,026,371 | | | (9,364 | ) |
Indian Rupee, | | | | | | | | | | | | | | | |
Expiring 03/24/10 | | Citibank | | INR | 617 | | | 12,656 | | | 12,974 | | | (318 | ) |
Japanese Yen, | | | | | | | | | | | | | | | |
Expiring 11/24/09 | | JPMorgan Securities | | JPY | 886 | | | 9,788 | | | 9,844 | | | (56 | ) |
Malaysian Ringgit, | | | | | | | | | | | | | | | |
Expiring 11/12/09 | | Barclays Bank PLC | | MYR | 3 | | | 900 | | | 948 | | | (48 | ) |
Expiring 11/12/09 | | Barclays Capital Group | | MYR | 3 | | | 700 | | | 735 | | | (35 | ) |
Expiring 11/12/09 | | Deutsche Bank | | MYR | 3 | | | 853 | | | 886 | | | (33 | ) |
Expiring 11/12/09 | | JPMorgan Securities | | MYR | 4 | | | 1,180 | | | 1,240 | | | (60 | ) |
Expiring 11/12/09 | | JPMorgan Securities | | MYR | 4 | | | 1,035 | | | 1,087 | | | (52 | ) |
Expiring 02/12/10 | | Citibank N.A. | | MYR | 1 | | | 151 | | | 156 | | | (5 | ) |
Expiring 02/12/10 | | Deutsche Bank | | MYR | 2 | | | 592 | | | 584 | | | 8 | |
Expiring 02/12/10 | | Deutsche Bank | | MYR | 2 | | | 595 | | | 584 | | | 11 | |
Expiring 02/12/10 | | Deutsche Bank | | MYR | 2 | | | 553 | | | 548 | | | 5 | |
Expiring 02/12/10 | | Deutsche Bank | | MYR | 2 | | | 555 | | | 548 | | | 7 | |
| | | | | | | | | | | | | | | |
| | | | | | | $ | 14,987,404 | | $ | 15,048,723 | | $ | (61,319 | ) |
| | | | | | | | | | | | | | | |
See Notes to Financial Statements.
| | |
| 122 | | THE TARGET PORTFOLIO TRUST |
Interest rate swap agreements outstanding at October 31, 2009:
| | | | | | | | | | | | | | | | | | | | | | |
Counterparty | | Termination
Date | | Notional
Amount
(000) | | Fixed
Rate | | | Floating Rate | | Fair
Value | | | Upfront
Premiums
Paid
(Received) | | | Unrealized
Appreciation
(Depreciation) | |
UBS AG(1) | | 01/02/12 | | BRL | 6,600 | | 10.58 | % | | Brazilian interbank lending rate | | $ | (109,171 | ) | | $ | (62,155 | ) | | $ | (47,016 | ) |
UBS AG(1) | | 01/02/12 | | BRL | 900 | | 11.02 | % | | Brazilian interbank lending rate | | | (2,537 | ) | | | — | | | | (2,537 | ) |
Barclays Capital(1) | | 09/15/10 | | GBP | 4,200 | | 5.00 | % | | 6 month LIBOR | | | 276,452 | | | | (30,697 | ) | | | 307,149 | |
Citigroup(1) | | 03/18/11 | | GBP | 1,100 | | 5.00 | % | | 6 month LIBOR | | | 97,849 | | | | (8,652 | ) | | | 106,501 | |
Deutsche Bank(1) | | 03/18/11 | | GBP | 900 | | 5.00 | % | | 6 month LIBOR | | | 80,059 | | | | (8,011 | ) | | | 88,070 | |
Goldman Sachs & Co.(1) | | 09/17/11 | | GBP | 1,700 | | 4.50 | % | | 6 month LIBOR | | | 151,416 | | | | (22,006 | ) | | | 173,422 | |
| | | | | | | | | | | | | | | | | | | | | | |
| | | | | | | | | | | | $ | 494,068 | | | $ | (131,521 | ) | | $ | 625,589 | |
| | | | | | | | | | | | | | | | | | | | | | |
| (1) | Porfolio pays the floating rate and receives the fixed rate. |
Credit default swap agreements outstanding at October 31, 2009:
| | | | | | | | | | | | | | | | | | | | | | |
Counterparty | | Termination
Date | | Notional
Amount
(000)#(2) | | Fixed
Rate | | | Reference
Entity/Obligation | | Fair
Value | | | Upfront
Premiums
Paid
(Received) | | | Unrealized
Appreciation
(Depreciation) | |
| Credit default swaps—Buy Protection(1): | | | | | | | | | | | | | | | |
Deutsche Bank | | 06/20/16 | | $ | 1,100 | | 0.72 | % | | AutoZone, Inc.,
6.95%, due 06/15/16 | | $ | 1,141 | | | $ | — | | | $ | 1,141 | |
UBS AG | | 06/20/17 | | | 1,200 | | 0.56 | % | | Cardinal Health, Inc., 6.00%, due 06/15/17 | | | 3,131 | | | | — | | | | 3,131 | |
Barclays Bank PLC | | 06/20/15 | | | 400 | | 0.15 | % | | CitiFinancial,
6.625%, 06/01/15 | | | 32,974 | | | | — | | | | 32,974 | |
Goldman Sachs
& Co. | | 03/20/18 | | | 1,600 | | 1.65 | % | | CSX Corp.,
6.25%, due 03/15/18 | | | (115,009 | ) | | | — | | | | (115,009 | ) |
Barclays Bank PLC | | 09/20/11 | | | 400 | | 0.58 | % | | DaimlerChrysler NA Holdings,
5.75%, due 09/08/11 | | | 187 | | | | — | | | | 187 | |
Bank of America Securities LLC | | 03/20/17 | | | 1,000 | | 0.80 | % | | Donnelley (R.R.) & Sons, 6.125%, due 01/15/17 | | | 104,657 | | | | — | | | | 104,657 | |
Merrill Lynch & Co. | | 12/20/11 | | | 363 | | 0.00 | % | | Dow Jones CDX HY7 Index | | | 230,631 | | | | 57,478 | | | | 173,153 | |
Deutsche Bank | | 06/20/18 | | | 4,685 | | 1.50 | % | | Dow Jones CDX IG10 10Y Index | | | (10,994 | ) | | | (67,052 | ) | | | 56,058 | |
Goldman Sachs
& Co. | | 06/20/18 | | | 4,294 | | 1.50 | % | | Dow Jones CDX IG10 10Y Index | | | (9,997 | ) | | | (145,348 | ) | | | 135,351 | |
Morgan Stanley
& Co. | | 06/20/18 | | | 11,126 | | 1.50 | % | | Dow Jones CDX IG10 10Y Index | | | (26,573 | ) | | | (287,908 | ) | | | 261,335 | |
See Notes to Financial Statements.
| | |
| THE TARGET PORTFOLIO TRUST | | 123 |
| | |
Total Return Bond Portfolio (continued) | | Portfolio of Investments
As of October 31, 2009 |
Credit default swap agreements outstanding at October 31, 2009 (continued):
| | | | | | | | | | | | | | | | | | | | | | |
Counterparty | | Termination
Date | | Notional
Amount
(000)#(2) | | Fixed
Rate | | | Reference
Entity/Obligation | | Fair
Value | | | Upfront
Premiums
Paid
(Received) | | | Unrealized
Appreciation
(Depreciation) | |
Goldman Sachs & Co. | | 06/20/13 | | $ | 6,149 | | 1.55 | % | | Dow Jones CDX IG10
5Y Index | | $ | (5,327 | ) | | $ | 62,937 | | | $ | (68,264 | ) |
Barclays Bank PLC | | 12/20/17 | | | 1,269 | | 0.80 | % | | Dow Jones CDX IG9
10Y Index | | | 56,182 | | | | 13,304 | | | | 42,878 | |
Goldman Sachs & Co. | | 12/20/17 | | | 1,659 | | 0.80 | % | | Dow Jones CDX IG9
10Y Index | | | 73,468 | | | | 23,551 | | | | 49,917 | |
Morgan Stanley & Co. | | 12/20/17 | | | 1,854 | | 0.80 | % | | Dow Jones CDX IG9
10Y Index | | | 82,111 | | | | 35,917 | | | | 46,194 | |
Deutsche Bank | | 03/20/14 | | | 700 | | 1.25 | % | | Embarq Corp.,
7.08%, due 06/01/16 | | | (19,693 | ) | | | — | | | | (19,693 | ) |
Deutsche Bank | | 03/20/14 | | | 600 | | 1.27 | % | | Embarq Corp.,
7.08%, due 06/01/16 | | | (17,397 | ) | | | — | | | | (17,397 | ) |
Deutsche Bank | | 03/20/14 | | | 600 | | 1.43 | % | | Embarq Corp.,
7.08%, due 06/01/16 | | | (21,394 | ) | | | — | | | | (21,394 | ) |
Morgan Stanley & Co. | | 03/20/14 | | | 200 | | 1.30 | % | | Embarq Corp.,
7.08%, due 06/01/16 | | | (6,058 | ) | | | — | | | | (6,058 | ) |
Deutsche Bank | | 09/20/16 | | | 200 | | 0.51 | % | | Goodrich Corp.,
6.29%, due 07/01/16 | | | 100 | | | | — | | | | 100 | |
Barclays Bank PLC | | 03/20/11 | | | 200 | | 0.37 | % | | iStar Financial, Inc.,
5.80%, due 03/15/11 | | | 67,968 | | | | — | | | | 67,968 | |
Bank of America Securities LLC | | 09/20/17 | | | 1,900 | | 2.29 | % | | Limited Brands, Inc.,
6.90%, due 07/15/17 | | | 75,796 | | | | — | | | | 75,796 | |
UBS AG | | 06/20/17 | | | 200 | | 0.48 | % | | Newell Rubbermaid, Inc.,
6.75%, due 03/15/12 | | | 15,559 | | | | — | | | | 15,559 | |
Morgan Stanley & Co. | | 06/20/14 | | | 4,200 | | 0.76 | % | | Pearson Dollar,
5.70%, due 06/01/14 | | | (46,354 | ) | | | — | | | | (46,354 | ) |
JPMorgan Chase | | 03/20/12 | | | 1,000 | | 0.55 | % | | Sprint Capital Corp.,
8.375%, due 03/15/12 | | | 86,191 | | | | — | | | | 86,191 | |
Morgan Stanley & Co. | | 06/20/12 | | | 300 | | 0.11 | % | | Target Corp.,
5.875%, due 03/01/12 | | | 2,956 | | | | — | | | | 2,956 | |
| | | | | | | | | | | | | | | | | | | | | | |
| | | | | | | | | | | | $ | 554,256 | | | $ | (307,121 | ) | | $ | 861,377 | |
| | | | | | | | | | | | | | | | | | | | | | |
| (1) | If the Portfolio is a buyer of protection, it pays the fixed rate. When a credit event occurs, as defined under the terms of that particular swap agreement, the Portfolio will either (i) receive from the seller of protection an amount equal to the notional amount of the swap and make delivery of the referenced obligation or underlying securities comprising the referenced index or (ii) receive a net settlement amount in the form of cash or securities equal to the notional amount of the swap less the recovery value of the referenced obligation or underlying securities comprising the referenced index. |
See Notes to Financial Statements.
| | |
| 124 | | THE TARGET PORTFOLIO TRUST |
| (2) | Notional amount represents the maximum potential amount the Portfolio could be required to pay as a seller of credit protection or receive as a buyer of credit protection if a credit event occurs as defined under the terms of that particular swap agreement. |
| # | Notional Amount is shown in U.S. dollars unless otherwise stated. |
Various inputs are used in determining the value of the Portfolio’s investments. These inputs are summarized in the three broad levels listed below.
Level 1—quoted prices in active markets for identical securities
Level 2—other significant observable inputs (including quoted prices for similar securities, interest rates, prepayment speeds, credit risk, etc.)
Level 3—significant unobservable inputs (including the Portfolio’s own assumptions in determining the fair value of investments)
The following is a summary of the inputs used as of October 31, 2009 in valuing the Portfolio’s assets carried at fair value:
| | | | | | | | | | |
Investments in Securities | | Level 1 | | Level 2 | | | Level 3 |
Asset-Backed Securities | | $ | — | | $ | 5,815,609 | | | $ | — |
Bank Loans | | | — | | | 6,407,479 | | | | — |
Convertible Bond | | | — | | | 1,215,000 | | | | — |
Corporate Bonds | | | — | | | 83,440,145 | | | | — |
Foreign Government Bonds | | | — | | | 3,662,831 | | | | — |
Municipal Bonds | | | — | | | 3,682,155 | | | | — |
Residential Mortgage-Backed Securities | | | — | | | 6,245,322 | | | | — |
U.S. Government Mortgage Backed Obligations | | | — | | | 141,513,840 | | | | — |
U.S. Treasury Obligations | | | — | | | 52,226,291 | | | | — |
Repurchase Agreement | | | — | | | 1,700,000 | | | | — |
Option Written | | | — | | | (150 | ) | | | — |
Affiliated Money Market Mutual Fund | | | 1,385,150 | | | — | | | | — |
Securities Sold Short—U.S. Government Mortgage Backed Obligations | | | — | | | (53,776,197 | ) | | | — |
| | | | | | | | | | |
| | $ | 1,385,150 | | $ | 252,132,325 | | | $ | — |
Other Financial Instruments* | | | 1,111,737 | | | 1,487,532 | | | | — |
| | | | | | | | | | |
Total | | $ | 2,496,887 | | $ | 253,619,857 | | | $ | — |
| | | | | | | | | | |
| * | Other financial instruments are derivative instruments not reflected in the Portfolio of Investments, such as futures, forwards and swap contracts, which are valued at the unrealized appreciation/depreciation on the instrument. |
The following is a reconciliation of assets in which significant unobservable inputs (Level 3) were used in determining fair value:
| | | | |
| | | Other Financial
Instruments | |
Balance as of 10/31/08 | | $ | 7,104 | |
Realized gain (loss) | | | — | * |
Change in unrealized appreciation (depreciation) | | | (7,104 | ) |
Net purchases (sales) | | | — | |
Transfers in and/or out of Level 3 | | | — | |
| | | | |
Balance as of 10/31/09 | | $ | — | |
| | | | |
| * | The realized gain during the year was $12,295. |
See Notes to Financial Statements.
| | |
| THE TARGET PORTFOLIO TRUST | | 125 |
| | |
Total Return Bond Portfolio (continued) | | Portfolio of Investments
As of October 31, 2009 |
The industry classification of investments and other assets in excess of other liabilities shown as a percentage of net assets as of October 31, 2009 were as follows:
| | | |
U.S. Government Mortgage Backed Obligations | | 48.9 | % |
U.S. Treasury Obligations | | 18.1 | |
Financial Services | | 9.4 | |
Financial—Bank & Trust | | 8.1 | |
Bank Loans | | 2.2 | |
Residential Mortgage-Backed Securities | | 2.2 | |
Asset-Backed Securities | | 2.0 | |
Telecommunications | | 1.9 | |
Insurance | | 1.8 | |
Municipal Bonds | | 1.3 | |
Foreign Government Bonds | | 1.3 | |
Paper & Forest Products | | 1.2 | |
Utilities | | 0.9 | |
Hotels & Motels | | 0.9 | |
Retail & Merchandising | | 0.6 | |
Transportation | | 0.6 | |
Repurchase Agreements | | 0.6 | |
Automobile Manufacturers | | 0.5 | |
Oil, Gas & Consumable Fuels | | 0.5 | |
Affiliated Money Market Mutual Fund | | 0.5 | |
Computer Services & Software | | 0.5 | |
Tobacco | | 0.5 | |
Pharmaceuticals | | 0.4 | |
Automotive Parts | | 0.4 | |
Printing & Publishing | | 0.3 | |
Food | | 0.3 | |
Pipelines | | 0.1 | |
Household/Personal Care | | 0.1 | |
Airlines | | 0.1 | |
Aerospace | | 0.1 | |
| | | |
| | 106.3 | |
Option Written and Securities Sold Short | | (18.6 | ) |
Other assets in excess of other liabilities | | 12.3 | |
| | | |
| | 100.0 | % |
| | | |
See Notes to Financial Statements.
| | |
| 126 | | THE TARGET PORTFOLIO TRUST |
| | |
Portfolio of Investments
As of October 31, 2009 | | Intermediate-Term Bond Portfolio |
| | | | | | | | |
MOODY’S
RATINGS†
(UNAUDITED) | | PRINCIPAL
AMOUNT (000)# | | DESCRIPTION | | VALUE (NOTE 1) |
| | | | | LONG-TERM INVESTMENTS—97.0% | | | |
| | | |
| | | | | ASSET-BACKED SECURITIES—3.3% | | | |
| | | | | BA Credit Card Trust,
Series 2008-A5, Class A5 | | | |
| Aaa | | $ | 400 | | 1.445%(c), 12/16/13 | | $ | 403,317 |
| | | | | Ford Credit Auto Owner Trust, | | | |
| | | | | Series 2009-A, Class A3B | | | |
| Aaa | | | 2,400 | | 2.745%(c), 05/15/13 | | | 2,456,408 |
| | | | | Series 2009-B, Class A1, 144A | | | |
| A-1+(d) | | | 665 | | 0.988%, 06/15/10 | | | 665,353 |
| | | | | Series 2009-C, Class A1, 144A | | | |
| P-1 | | | 1,534 | | 0.796%, 07/15/10 | | | 1,535,337 |
| | | | | Securitized Asset Backed Receivables LLC Trust,
Series 2007-BR5, Class A2A | | | |
| B3 | | | 486 | | 0.374%(c), 05/25/37 | | | 343,415 |
| | | | | SLM Student Loan Trust, | | | |
| | | | | Series 2006-8, Class A2 | | | |
| Aaa | | | 340 | | 0.282%(c), 10/25/16 | | | 339,604 |
| | | | | Series 2008-9, Class A | | | |
| Aaa | | | 2,226 | | 1.782%(c), 04/25/23 | | | 2,324,920 |
| | | | | Wells Fargo Home Equity Trust,
Series 2005-2, Class AII2 | | | |
| Aaa | | | 83 | | 0.484%(c), 10/25/35 | | | 80,016 |
| | | | | | | | |
| | | | | TOTAL ASSET-BACKED SECURITIES
(cost $8,203,452) | | | 8,148,370 |
| | | | | | | | |
| | | |
| | | | | BANK LOANS(c)—0.4% | | | |
| | | | | First Data Corp., Term B2 | | | |
| B+ | | | 51 | | 3.033%, 09/24/14 | | | 44,090 |
| B+ | | | 931 | | 3.036%, 09/24/14 | | | 797,548 |
| | | | | | | | |
| | | | | TOTAL BANK LOANS
(cost $938,143) | | | 841,638 |
| | | | | | | | |
| | | |
| | | | | COMMERCIAL MORTGAGE-BACKED SECURITIES—0.3% | | | |
| | | | | Credit Suisse First Boston Mortgage Securities Corp.,
Series 2005-C6, Class A1 | | | |
| Aaa | | | 74 | | 4.938%, 12/15/40 | | | 74,151 |
| | | | | GE Capital Commercial Mortgage Corp.,
Series 2002-3A, Class A1 | | | |
| AAA(d) | | | 151 | | 4.229%, 12/10/37 | | | 152,053 |
| | | | | GS Mortgage Securities Corp. II,
Series 2001-1285, Class A1, 144A | | | |
| Aaa | | | 254 | | 6.044%, 08/15/18 | | | 262,286 |
See Notes to Financial Statements.
| | |
| THE TARGET PORTFOLIO TRUST | | 127 |
| | |
Intermediate-Term Bond Portfolio (continued) | | Portfolio of Investments
As of October 31, 2009 |
| | | | | | | | |
MOODY’S
RATINGS†
(UNAUDITED) | | PRINCIPAL
AMOUNT (000)# | | DESCRIPTION | | VALUE (NOTE 1) |
| | | | | COMMERCIAL MORTGAGE-BACKED SECURITIES (continued) |
| | | | | Merrill Lynch Floating Trust,
Series 2008-LAQA, Class A1, 144A | | | |
| Aaa | | $ | 400 | | 0.78%, 07/09/21 | | $ | 335,721 |
| | | | | | | | |
| | | | | TOTAL COMMERCIAL MORTGAGE-BACKED SECURITIES
(cost $873,687) | | | 824,211 |
| | | | | | | | |
| | | |
| | | | | CORPORATE BONDS—55.8% | | | |
| | | |
| | | | | Airlines—1.0% | | | |
| | | | | United Airlines, Inc.,(g)(i)
Equipment Trust | | | |
| NR | | | 1,130 | | 10.85%, 02/19/24 | | | 344,796 |
| | | | | Pass-Through Certificates | | | |
| B2 | | | 1,700 | | 6.831%, 03/01/24 | | | 2,193,000 |
| | | | | | | | |
| | | | | | | | 2,537,796 |
| | | | | | | | |
| | | |
| | | | | Chemicals—0.3% | | | |
| | | | | Potash Corp. of Saskatchewan, Inc.,
Sr. Unsec’d. Notes (Canada) | | | |
| Baa1 | | | 800 | | 5.25%, 05/15/14 | | | 867,976 |
| | | | | | | | |
| | | |
| | | | | Commercial Banks—17.5% | | | |
| | | | | American Express Bank FSB,
Sr. Unsec’d. Notes | | | |
| A2 | | | 950 | | 5.50%, 04/16/13 | | | 1,009,451 |
| | | | | ANZ National International Ltd.,
Bank Gtd. Notes, 144A (New Zealand) | | | |
| Aa2 | | | 2,200 | | 6.20%, 07/19/13 | | | 2,404,041 |
| | | | | Bank of America Corp.,
Sr. Unsec’d. Notes, MTN | | | |
| A2 | | | 2,000 | | 0.629%(c), 09/15/14 | | | 1,839,648 |
| | | | | Barclays Bank PLC,
Sr. Unsec’d. Notes (United Kingdom) | | | |
| Aa3 | | | 2,300 | | 5.45%, 09/12/12 | | | 2,489,347 |
| | | | | Citigroup, Inc.,
FDIC Gtd. Notes | | | |
| Aaa | | | 3,000 | | 2.125%, 04/30/12 | | | 3,057,471 |
| | | | | Sr. Unsec’d. Notes | | | |
| A3 | | | 2,100 | | 0.519%(c), 05/18/11 | | | 2,058,731 |
| A3 | | | 3,600 | | 5.50%, 04/11/13 | | | 3,751,715 |
| A3 | | | 500 | | 6.50%, 08/19/13 | | | 535,974 |
| | | | | Credit Suisse / New York NY,
Sr. Unsec’d. Notes, MTN (Switzerland) | | | |
| Aa1 | | | 2,200 | | 5.00%, 05/15/13 | | | 2,348,344 |
| | | | | National Australia Bank Ltd.,
Gov’t. Liquid Gtd. Notes, 144A (Australia) | | | |
| Aaa | | | 7,000 | | 2.55%, 01/13/12 | | | 7,151,557 |
See Notes to Financial Statements.
| | |
| 128 | | THE TARGET PORTFOLIO TRUST |
| | | | | | | | |
MOODY’S
RATINGS†
(UNAUDITED) | | PRINCIPAL
AMOUNT (000)# | | DESCRIPTION | | VALUE (NOTE 1) |
| | | | | CORPORATE BONDS (continued) | | | |
| | | |
| | | | | Commercial Banks (continued) | | | |
| | | | | Nykredit Realkredit A/S,
Covered (Denmark) | | | |
| Aaa | | DKK | 1,500 | | 4.00%, 01/01/10 | | $ | 297,664 |
| | | | | Rabobank Nederland NV,
Jr. Sub. Notes, 144A (Netherlands) | | | |
| Aa2 | | $ | 1,200 | | 11.00%(c), 06/29/49 | | | 1,506,000 |
| | | | | Royal Bank of Scotland Group PLC,
Sub. Notes (United Kingdom) | | | |
| Ba1 | | | 1,100 | | 5.05%, 01/08/15 | | | 967,926 |
| | | | | Royal Bank of Scotland PLC (The), (United Kingdom)
Gov’t. Liquid Gtd. Notes, 144A | | | |
| Aaa | | | 3,800 | | 2.625%, 05/11/12 | | | 3,884,337 |
| Aaa | | | 2,000 | | 3.00%, 12/09/11 | | | 2,064,588 |
| | | | | Gov’t. Liquid Gtd. Notes, MTN | | | |
| Aaa | | | 2,400 | | 2.65%, 04/23/12 | | | 2,454,485 |
| | | | | Sumitomo Mitsui Banking Corp.,
Sub. Notes, MTN (Japan) | | | |
| NR | | JPY | 100,000 | | 1.239%(c), 11/26/49 | | | 1,110,316 |
| | | | | Westpac Banking Corp.,
Gov’t Liquid Gtd. Notes, 144A (Australia) | | | |
| Aaa | | | 4,000 | | 3.25%, 12/16/11 | | | 4,149,520 |
| | | | | | | | |
| | | | | | | | 43,081,115 |
| | | | | | | | |
| | | |
| | | | | Diversified Financial Services—6.9% | | | |
| | | | | Allstate Life Global Funding Trusts,
Sr. Sec’d. Notes, MTN | | | |
| A1 | | | 2,300 | | 5.375%, 04/30/13 | | | 2,469,423 |
| | | | | American Express Credit Corp.,
Sr. Unsec’d. Notes, MTN | | | |
| A2 | | | 1,800 | | 5.875%, 05/02/13 | | | 1,931,769 |
| | | | | Bear Stearns Cos. LLC (The),
Sr. Unsec’d. Notes | | | |
| Aa3 | | | 600 | | 0.718%(c), 01/31/11 | | | 600,139 |
| | | | | Capital One Bank USA NA,
Sr. Sub. Notes | | | |
| A3 | | | 2,300 | | 6.50%, 06/13/13 | | | 2,452,580 |
| | | | | Countrywide Financial Corp.,
Gtd. Notes, MTN | | | |
| A2 | | | 500 | | 5.80%, 06/07/12 | | | 531,937 |
| | | | | General Electric Capital Corp.,
Sub. Notes, 144A | | | |
| Aa3 | | EUR | 1,000 | | 5.50%(c), 09/15/67 | | | 1,162,603 |
| | | | | HSBC Finance Corp.,
Sr. Unsec’d. Notes | | | |
| A3 | | | 400 | | 0.552%(c), 04/24/12 | | | 384,638 |
| A3 | | | 300 | | 0.791%(c), 06/01/16 | | | 264,493 |
See Notes to Financial Statements.
| | |
| THE TARGET PORTFOLIO TRUST | | 129 |
| | |
Intermediate-Term Bond Portfolio (continued) | | Portfolio of Investments
As of October 31, 2009 |
| | | | | | | | |
MOODY’S
RATINGS†
(UNAUDITED) | | PRINCIPAL
AMOUNT (000)# | | DESCRIPTION | | VALUE (NOTE 1) |
| | | | | CORPORATE BONDS (continued) | | | |
| | | |
| | | | | Diversified Financial Services (continued) | | | |
| | | | | Lehman Brothers Holdings, Inc.,(i)
Sr. Unsec’d. Notes, MTN | | | |
| NR | | $ | 1,800 | | 2.851%, 12/23/24 | | $ | 283,500 |
| NR | | | 600 | | 5.625%, 01/24/24 | | | 96,000 |
| | | | | Macquarie Bank Ltd.,
Gov’t. Liquid Gtd. Notes, 144A (Australia) | | | |
| Aaa | | | 2,300 | | 3.30%, 07/17/14 | | | 2,331,098 |
| | | | | Merrill Lynch & Co., Inc.,
Sr. Unsec’d. Notes, MTN | | | |
| A2 | | | 700 | | 0.482%(c), 07/25/11 | | | 687,857 |
| A2 | | | 1,400 | | 6.15%, 04/25/13 | | | 1,500,737 |
| | | | | Morgan Stanley,
Sr. Unsec’d. Notes | | | |
| A2 | | | 600 | | 0.534%(c), 01/18/11 | | | 594,899 |
| | | | | Sr. Unsec’d. Notes, MTN | | | |
| A2 | | | 1,600 | | 6.00%, 04/28/15 | | | 1,712,048 |
| | | | | | | | |
| | | | | | | | 17,003,721 |
| | | | | | | | |
| | | |
| | | | | Electric—2.4% | | | |
| | | | | Dayton Power & Light Co. (The),
First Mortgage | | | |
| Aa3 | | | 500 | | 5.125%, 10/01/13 | | | 537,195 |
| | | | | Enel Finance International SA,
Gtd. Notes, 144A (Luxembourg) | | | |
| A2 | | | 1,200 | | 5.70%, 01/15/13 | | | 1,302,256 |
| | | | | NiSource Finance Corp.,
Gtd. Notes | | | |
| Baa3 | | | 1,500 | | 0.977%(c), 11/23/09 | | | 1,499,557 |
| | | | | Public Service Electric & Gas Co.,
Sec’d. Notes, MTN | | | |
| A2 | | | 2,300 | | 5.30%, 05/01/18 | | | 2,446,689 |
| | | | | | | | |
| | | | | | | | 5,785,697 |
| | | | | | | | |
| | | |
| | | | | Financial—Bank & Trust—7.5% | | | |
| | | | | Barclays Bank PLC,
Gov’t. Liquid Gtd. Notes, 144A (United Kingdom) | | | |
| Aaa | | | 3,380 | | 2.70%, 03/05/12 | | | 3,468,735 |
| | | | | Dexia Credit Local,
Gov’t. Liquid Gtd. Notes, 144A (France) | | | |
| Aa1 | | | 2,200 | | 0.939%(c), 09/23/11 | | | 2,220,529 |
| | | | | Lloyds TSB Bank PLC,
Gov’t. Liquid Gtd. Notes, 144A (United Kingdom) | | | |
| Aaa | | | 4,500 | | 2.30%, 04/01/11 | | | 4,575,173 |
See Notes to Financial Statements.
| | |
| 130 | | THE TARGET PORTFOLIO TRUST |
| | | | | | | | |
MOODY’S
RATINGS†
(UNAUDITED) | | PRINCIPAL
AMOUNT (000)# | | DESCRIPTION | | VALUE (NOTE 1) |
| | | | | CORPORATE BONDS (continued) | | | |
| | | |
| | | | | Financial—Bank & Trust (continued) | | | |
| | | | | Swedbank AB, (Sweden)
Foreign Gov’t. Gtd. Notes, 144A | | | |
| Aaa | | $ | 2,200 | | 0.734%(c), 01/14/13 | | $ | 2,193,081 |
| | | | | Gov’t. Liquid Gtd. Notes, 144A | | | |
| Aaa | | | 2,300 | | 2.80%, 02/10/12 | | | 2,363,190 |
| | | | | Wachovia Corp.,
Sr. Unsec’d. Notes | | | |
| A1 | | | 1,000 | | 0.419%(c), 03/15/11 | | | 994,191 |
| | | | | Sr. Unsec’d. Notes, MTN | | | |
| A1 | | | 350 | | 2.253%(c), 05/01/13 | | | 355,697 |
| | | | | Westpac Securities NZ Ltd.,
Gov’t. Liquid Gtd. Notes, 144A (New Zealand) | | | |
| Aaa | | | 2,200 | | 3.45%, 07/28/14 | | | 2,242,647 |
| | | | | | | | |
| | | | | | | | 18,413,243 |
| | | | | | | | |
| | | |
| | | | | Financial Services—6.9% | | | |
| | | | | General Electric Capital Corp.,
FDIC Gtd. Notes | | | |
| Aaa | | | 12,000 | | 2.25%, 03/12/12 | | | 12,234,888 |
| | | | | International Lease Finance Corp.,
Sr. Unsec’d. Notes | | | |
| Baa3 | | | 800 | | 4.875%, 09/01/10 | | | 765,157 |
| | | | | Sr. Unsec’d. Notes, MTN | | | |
| Baa3 | | | 700 | | 0.627%(c), 05/24/10 | | | 665,038 |
| Baa3 | | | 1,200 | | 5.625%, 09/15/10 | | | 1,135,707 |
| | | | | Societe Financement de l’Economie Francaise,
Gov’t. Liquid Gtd. Notes, 144A (France) | | | |
| Aaa | | | 2,000 | | 2.25%, 06/11/12 | | | 2,035,084 |
| | | | | | | | |
| | | | | | | | 16,835,874 |
| | | | | | | | |
| | | |
| | | | | Insurance—1.0% | | | |
| | | | | American International Group, Inc.,
Jr. Sub. Debs. | | | |
| Ba2 | | | 500 | | 8.175%(c), 05/15/68 | | | 300,000 |
| | | | | Sr. Unsec’d. Notes | | | |
| A3 | | | 160 | | 4.25%, 05/15/13 | | | 134,654 |
| | | | | Metropolitan Life Global Funding I,
Sr. Sec’d. Notes, 144A | | | |
| Aa2 | | | 2,000 | | 2.202%(c), 06/10/11 | | | 1,996,894 |
| | | | | | | | |
| | | | | | | | 2,431,548 |
| | | | | | | | |
| | | |
| | | | | Metals & Mining—1.0% | | | |
| | | | | BHP Billiton Finance USA Ltd.,
Gtd. Notes (Australia) | | | |
| A1 | | | 2,200 | | 5.125%, 03/29/12 | | | 2,356,622 |
| | | | | | | | |
See Notes to Financial Statements.
| | |
| THE TARGET PORTFOLIO TRUST | | 131 |
| | |
Intermediate-Term Bond Portfolio (continued) | | Portfolio of Investments
As of October 31, 2009 |
| | | | | | | | |
MOODY’S
RATINGS†
(UNAUDITED) | | PRINCIPAL
AMOUNT (000)# | | DESCRIPTION | | VALUE (NOTE 1) |
| | | | | CORPORATE BONDS (continued) | | | |
| | | |
| | | | | Oil, Gas & Consumable Fuels—2.4% | | | |
| | | | | Alberta Energy Co. Ltd.,
Sr. Unsec’d. Notes (Canada) | | | |
| Baa2 | | $ | 2,000 | | 7.65%, 09/15/10 | | $ | 2,104,214 |
| | | | | Cenovus Energy, Inc.,
Sr. Notes, 144A (Canada) | | | |
| Baa2 | | | 1,100 | | 4.50%, 09/15/14 | | | 1,129,478 |
| | | | | XTO Energy, Inc.,
Sr. Unsec’d. Notes | | | |
| Baa2 | | | 2,500 | | 4.625%, 06/15/13 | | | 2,594,622 |
| | | | | | | | |
| | | | | | | | 5,828,314 |
| | | | | | | | |
| | | |
| | | | | Real Estate Investment Trusts—0.5% | | | |
| | | | | Ventas Realty LP,
Gtd. Notes | | | |
| Ba1 | | | 1,200 | | 6.75%, 04/01/17 | | | 1,152,000 |
| | | | | | | | |
| | | |
| | | | | Savings & Loan—0.9% | | | |
| | | | | Nationwide Building Society,
Gov’t. Liquid Gtd. Notes, 144A (United Kingdom) | | | |
| Aaa | | | 2,300 | | 0.62%(c), 05/17/12 | | | 2,293,181 |
| | | | | | | | |
| | | |
| | | | | Telecommunications—6.0% | | | |
| | | | | Cellco Partnership/Verizon Wireless Capital LLC,
Sr. Unsec’d. Notes, 144A | | | |
| A2 | | | 2,700 | | 3.025%(c), 05/20/11 | | | 2,788,390 |
| | | | | Deutsche Telekom International Finance BV,
Gtd. Notes (Netherlands) | | | |
| Baa1 | | | 1,700 | | 8.50%, 06/15/10 | | | 1,775,779 |
| | | | | France Telecom SA,
Sr. Unsec’d. Notes (France) | | | |
| A3 | | | 2,300 | | 7.75%, 03/01/11 | | | 2,486,194 |
| | | | | Sprint Nextel Corp.,
Sr. Unsec’d. Notes | | | |
| Ba2 | | | 500 | | 0.683%(c), 06/28/10 | | | 485,404 |
| | | | | Telecom Italia Capital SA, | | | |
| | | | | Gtd. Notes (Luxembourg) | | | |
| Baa2 | | | 800 | | 4.95%, 09/30/14 | | | 830,306 |
| Baa2 | | | 1,700 | | 6.175%, 06/18/14 | | | 1,844,162 |
| | | | | Telefonica Emisiones SAU,
Gtd. Notes (Spain) | | | |
| Baa1 | | | 1,947 | | 0.809%(c), 02/04/13 | | | 1,909,213 |
| | | | | Vodafone Group PLC,
Sr. Unsec’d. Notes (United Kingdom) | | | |
| Baa1 | | | 2,600 | | 4.15%, 06/10/14 | | | 2,689,154 |
| | | | | | | | |
| | | | | | | | 14,808,602 |
| | | | | | | | |
See Notes to Financial Statements.
| | |
| 132 | | THE TARGET PORTFOLIO TRUST |
| | | | | | | | |
MOODY’S
RATINGS†
(UNAUDITED) | | PRINCIPAL
AMOUNT (000)# | | DESCRIPTION | | VALUE (NOTE 1) |
| | | | | CORPORATE BONDS (continued) | | | |
| | | |
| | | | | Tobacco—0.5% | | | |
| | | | | Altria Group, Inc.,
Gtd. Notes | | | |
| Baa1 | | $ | 1,000 | | 8.50%, 11/10/13 | | $ | 1,160,212 |
| | | | | | | | |
| | | |
| | | | | Utilities—1.0% | | | |
| | | | | Kinder Morgan Energy Partners LP,
Sr. Unsec’d. Notes | | | |
| Baa2 | | | 2,400 | | 5.80%, 03/01/21 | | | 2,472,228 |
| | | | | | | | |
| | | | | TOTAL CORPORATE BONDS
(cost $135,129,067) | | | 137,028,129 |
| | | | | | | | |
| | | |
| | | | | FOREIGN GOVERNMENT BONDS—1.4% | | | |
| | | | | Republic of Brazil,
Sr. Unsec’d. Notes | | | |
| Baa3 | | BRL | 1,200 | | 10.25%, 01/10/28 | | | 679,496 |
| | | | | Republic of Panama,
Sr. Unsec’d. Notes | | | |
| Ba1 | | | 1,500 | | 9.375%, 04/01/29 | | | 2,054,865 |
| | | | | Republic of South Africa,
Sr. Unsec’d. Notes | | | |
| A3 | | | 750 | | 5.875%, 05/30/22 | | | 768,750 |
| | | | | | | | |
| | | | | TOTAL FOREIGN GOVERNMENT BONDS
(cost $2,894,493) | | | 3,503,111 |
| | | | | | | | |
| | | |
| | | | | MUNICIPAL BONDS—2.3% | | | |
| | | |
| | | | | California—0.7% | | | |
| | | | | State of California,
Revenue Bonds | | | |
| Baa1 | | | 1,000 | | 5.65%, 04/01/39 | | | 1,055,870 |
| | | | | Tobacco Securitization Authority of Southern California,
Revenue Bonds | | | |
| Baa3 | | | 800 | | 5.00%, 06/01/37 | | | 599,400 |
| | | | | | | | |
| | | | | | | | 1,655,270 |
| | | | | | | | |
| | | |
| | | | | Illinois—0.4% | | | |
| | | | | Illinois State Toll Highway Authority,
Revenue Bonds | | | |
| Aa3 | | | 1,000 | | 5.293%, 01/01/24 | | | 1,002,020 |
| | | | | | | | |
| | | |
| | | | | Washington—0.9% | | | |
| | | | | Washington State,
General Obligation Bonds | | | |
| Aa1 | | | 2,000 | | 5.00%, 01/01/19 | | | 2,261,960 |
| | | | | | | | |
| | | |
| | | | | West Virginia—0.3% | | | |
| | | | | Tobacco Settlement Financial Authority of West Virginia,
Revenue Bonds | | | |
| Baa3 | | | 965 | | 7.467%, 06/01/47 | | | 732,068 |
| | | | | | | | |
| | | | | TOTAL MUNICIPAL BONDS
(cost $5,812,486) | | | 5,651,318 |
| | | | | | | | |
See Notes to Financial Statements.
| | |
| THE TARGET PORTFOLIO TRUST | | 133 |
| | |
Intermediate-Term Bond Portfolio (continued) | | Portfolio of Investments
As of October 31, 2009 |
| | | | | | | | |
MOODY’S
RATINGS†
(UNAUDITED) | | PRINCIPAL
AMOUNT (000)# | | DESCRIPTION | | VALUE (NOTE 1) |
| | | | | RESIDENTIAL MORTGAGE-BACKED SECURITIES—5.0% | | | |
| | | | | American Home Mortgage Investment Trust,
Series 2004-4, Class 5A | | | |
| Aaa | | $ | 251 | | 4.44%(c), 02/25/45 | | $ | 203,027 |
| | | | | Bank of America Funding Corp.,
Series 2006-A, Class 1A1 | | | |
| AAA(d) | | | 309 | | 4.568%(c), 02/20/36 | | | 271,869 |
| | | | | Bear Stearns Adjustable Rate Mortgage Trust,
Series 2004-8, Class 11A2 | | | |
| A3 | | | 412 | | 3.189%(c), 11/25/34 | | | 386,448 |
| | | | | Series 2004-8, Class 13A1 | | | |
| Baa2 | | | 883 | | 3.798%(c), 11/25/34 | | | 754,426 |
| | | | | Bear Stearns Alt-A Trust,
Series 2006-6, Class 31A1 | | | |
| B3 | | | 786 | | 5.653%(c), 11/25/36 | | | 484,019 |
| | | | | Series 2006-6, Class 32A1 | | | |
| B3 | | | 711 | | 5.643%(c), 11/25/36 | | | 436,860 |
| | | | | Citigroup Mortgage Loan Trust, Inc.,
Series 2005-11, Class A2A | | | |
| AAA(d) | | | 312 | | 4.70%(c), 12/25/35 | | | 286,863 |
| | | | | Series 2006-AR1, Class 1A1 | | | |
| AAA(d) | | | 1,609 | | 4.90%(c), 10/25/35 | | | 1,353,195 |
| | | | | Countrywide Alternative Loan Trust,
Series 2003-J3, Class 2A1 | | | |
| AAA(d) | | | 89 | | 6.25%, 12/25/33 | | | 89,110 |
| | | | | Countrywide Home Loan Mortgage Pass-Through Trust,
Series 2003-R4, Class 2A, 144A | | | |
| Aa3 | | | 140 | | 6.50%(c), 01/25/34 | | | 131,763 |
| | | | | Series 2004-25, Class 1A1 | | | |
| Aaa | | | 831 | | 0.574%(c), 02/25/35 | | | 522,848 |
| | | | | Credit Suisse First Boston Mortgage Securities Corp.,
Series 2003-8, Class 5A1 | | | |
| Aaa | | | 25 | | 6.50%, 04/25/33 | | | 24,059 |
| | | | | Federal Home Loan Mortgage Corp., | | | |
| | | | | Series 2892, Class BL | | | |
| Aaa | | | 319 | | 5.00%, 01/15/18 | | | 330,370 |
| | | | | Series 2931, Class JA | | | |
| Aaa | | | 190 | | 5.00%, 07/15/25 | | | 192,254 |
| | | | | Series 3346, Class FA | | | |
| Aaa | | | 2,734 | | 0.475%(c), 02/15/19 | | | 2,731,859 |
| | | | | Federal National Mortgage Assoc.,
Series 2006-67, Class PA | | | |
| Aaa | | | 424 | | 5.50%, 03/25/28 | | | 438,386 |
See Notes to Financial Statements.
| | |
| 134 | | THE TARGET PORTFOLIO TRUST |
| | | | | | | | |
MOODY’S
RATINGS†
(UNAUDITED) | | PRINCIPAL
AMOUNT (000)# | | DESCRIPTION | | VALUE (NOTE 1) |
| | | | | RESIDENTIAL MORTGAGE-BACKED SECURITIES (continued) | | | |
| | | | | FHLMC Structured Pass-Through Securities, | | | |
| | | | | Series T-59, Class 1A2 | | | |
| Aaa | | $ | 287 | | 7.00%, 10/25/43 | | $ | 315,979 |
| | | | | Series T-75, Class A1 | | | |
| Aaa | | | 964 | | 0.644%(c), 12/25/36 | | | 907,934 |
| | | | | Government National Mortgage Assoc., | | | |
| | | | | Series 1995-2, Class KQ | | | |
| Aaa | | | 68 | | 8.50%, 03/20/25 | | | 75,379 |
| | | | | Series 2000-9, Class FG | | | |
| Aaa | | | 92 | | 0.845%(c), 02/16/30 | | | 91,542 |
| | | | | Series 2000-9, Class FH | | | |
| Aaa | | | 141 | | 0.745%(c), 02/16/30 | | | 140,732 |
| | | | | Series 2000-11, Class PH | | | |
| Aaa | | | 262 | | 7.50%, 02/20/30 | | | 284,934 |
| | | | | Greenpoint Mortgage Funding Trust,
Series 2005-AR2, Class A1 | | | |
| Baa2 | | | 456 | | 0.474%(c), 06/25/45 | | | 240,693 |
| | | | | GSR Mortgage Loan Trust,
Series 2005-AR6, Class 2A1 | | | |
| AAA(d) | | | 422 | | 3.936%(c), 09/25/35 | | | 377,132 |
| | | | | Merrill Lynch Mortgage Investors, Inc.,
Series 2005-A10, Class A | | | |
| A3 | | | 348 | | 0.454%(c), 02/25/36 | | | 238,313 |
| | | | | MLCC Mortgage Investors, Inc.,
Series 2005-2, Class 3A | | | |
| A1 | | | 303 | | 1.246%(c), 10/25/35 | | | 260,179 |
| | | | | Sequoia Mortgage Trust,
Series 10, Class 2A1 | | | |
| Aaa | | | 425 | | 0.625%(c), 10/20/27 | | | 354,493 |
| | | | | Structured Asset Mortgage Investments, Inc.,
Series 2005-AR5, Class A1 | | | |
| Aa1 | | | 125 | | 0.495%(c), 07/19/35 | | | 94,602 |
| | | | | Structured Asset Securities Corp.,
Series 2001-21A, Class 1A1 | | | |
| Baa3 | | | 44 | | 3.384%(c), 01/25/32 | | | 41,227 |
| | | | | Washington Mutual, Inc., Mortgage Pass-Through Certificate, | | | |
| | | | | Series 2002-AR6, Class A | | | |
| A1 | | | 394 | | 2.158%(c), 06/25/42 | | | 302,552 |
| | | | | Series 2002-AR9, Class 1A | | | |
| Aa2 | | | 20 | | 2.158%(c), 08/25/42 | | | 14,894 |
| | | | | | | | |
| | | | | TOTAL RESIDENTIAL MORTGAGE-BACKED SECURITIES
(cost $14,400,413) | | | 12,377,941 |
| | | | | | | | |
| | | |
| | | | | U.S. GOVERNMENT AGENCY OBLIGATIONS—3.6% | | | |
| | | | | Federal Home Loan Mortgage Corp.,
Notes(k) | | | |
| | | 8,000 | | 5.00%, 04/18/17 (cost $8,625,307) | | | 8,846,096 |
| | | | | | | | |
See Notes to Financial Statements.
| | |
| THE TARGET PORTFOLIO TRUST | | 135 |
| | |
Intermediate-Term Bond Portfolio (continued) | | Portfolio of Investments
As of October 31, 2009 |
| | | | | | | | | | |
| | | | | PRINCIPAL
AMOUNT (000)# | | DESCRIPTION | | VALUE (NOTE 1) |
| | | |
| | | | | | | U.S. GOVERNMENT MORTGAGE-BACKED OBLIGATIONS—13.4% |
| | | | | | | Federal National Mortgage Assoc. | | | |
| | | | $ | 115 | | 3.212%(c), 07/01/25 | | $ | 116,812 |
| | | | | 63 | | 3.75%(c), 08/01/24 | | | 63,755 |
| | | | | 7 | | 5.029%(c), 12/01/30 | | | 6,644 |
| | | | | 6,018 | | 5.50%, 07/01/17 - 09/01/38 | | | 6,382,152 |
| | | | | 14,172 | | 5.50%, 09/01/37(k) | | | 14,940,944 |
| | | | | 9,684 | | 6.00%, 09/01/35 - 10/01/38 | | | 10,302,454 |
| | | | | | | Government National Mortgage Assoc. | | | |
| | | | | 61 | | 4.125%, 10/20/24 - 12/20/26 | | | 62,653 |
| | | | | 335 | | 4.25%(c), 03/20/30 | | | 343,704 |
| | | | | 325 | | 4.375%, 05/20/23 - 06/20/27 | | | 333,084 |
| | | | | 207 | | 4.625%, 08/20/26 - 07/20/30 | | | 213,703 |
| | | | | 127 | | 6.50%, 10/15/25 - 06/15/29 | | | 135,340 |
| | | | | | | | | | |
| | | | | | | TOTAL U.S. GOVERNMENT MORTGAGE-BACKED OBLIGATIONS
(cost $31,750,548) | | | 32,901,245 |
| | | | | | | | | | |
| | | | |
| | | | | | | U.S. TREASURY OBLIGATION—11.5% | | | |
| | | | | 28,200 | | U.S. Treasury Notes
1.00%, 09/30/11
(cost $28,206,147) | | | 28,279,298 |
| | | | | | | | | | |
| | | | | | | TOTAL LONG-TERM INVESTMENTS
(cost $236,833,743) | | | 238,401,357 |
| | | | | | | | | | |
| | | | |
| | | | | | | SHORT-TERM INVESTMENTS—1.4% | | | |
| | | | |
| | | | | | | REPURCHASE AGREEMENTS—1.0% | | | |
| | | | | 1,000 | | Bank of America Securities LLC, 0.07%, dated 10/30/09, due 11/02/09 in the amount of 1,000,006 (cost $1,000,000; collateralized by discounted U.S. Treasury Bills .30%, maturity date 08/26/10, value of collateral was $1,022,531) | | | 1,000,000 |
| | | | | 1,400 | | JPMorgan Securities, Inc., 0.08%, dated 10/30/09, due 11/02/09 in the amount of 1,400,009 (cost $1,400,000; collateralized by Federal National Mortgage Assoc., 4.625%, maturity date 10/15/14, the value of collateral plus accrued interest was $1,435,077) | | | 1,400,000 |
| | | | | | | | | | |
| | | | | | | TOTAL REPURCHASE AGREEMENTS
(cost $2,400,000) | | | 2,400,000 |
| | | | | | | | | | |
| | | | | SHARES | | | | |
| | | | | | | AFFILIATED MONEY MARKET MUTUAL FUND—0.4% | | | |
| | | | | 878,101 | | Dryden Core Investment Fund—Taxable Money Market Series
(cost $878,101)(w) | | | 878,101 |
| | | | | | | | | | |
| | | | | | | TOTAL SHORT-TERM INVESTMENTS
(cost $3,278,101) | | | 3,278,101 |
| | | | | | | | | | |
| | | | | | | TOTAL INVESTMENTS, BEFORE OPTIONS
WRITTEN AND SECURITIES SOLD SHORT—98.4%
(cost $240,111,844; Note 5) | | | 241,679,458 |
| | | | | | | | | | |
See Notes to Financial Statements.
| | |
| 136 | | THE TARGET PORTFOLIO TRUST |
| | | | | | | | | | | |
| | | CONTRACTS/
NOTIONAL
AMOUNTS (000)# | | | | COUNTERPARTY | | VALUE (NOTE 1) | |
| | | | |
| | | | | OPTIONS WRITTEN * | | | | | | |
| | | | |
| | | | | Put Options | | | | | | |
| | | | | Interest Rate Swap Option | | | | | | |
| | $ | 6,000 | | expiring 11/23/09 @ 3.42% | | Merrill Lynch | | $ | (730 | ) |
| | | 2,000 | | expiring 11/23/09 @ 3.75% | | Citicorp | | | (20 | ) |
| | | 2,000 | | expiring 11/23/09 @ 3.75% | | Merrill Lynch | | | (21 | ) |
| | | 2,000 | | expiring 11/23/09 @ 3.75% | | Morgan Stanley & Co. Inc. | | | (20 | ) |
| | | 2,000 | | expiring 11/23/09 @ 4.00% | | Barclays Capital Group London | | | (187 | ) |
| | | 2,000 | | expiring 11/23/09 @ 4.00% | | Deutsche Bank | | | (187 | ) |
| | | 6,000 | | expiring 11/23/09 @ 4.00% | | Morgan Stanley & Co., Inc. | | | (560 | ) |
| | | 5,200 | | expiring 11/23/09 @ 4.35% | | Barclays Capital Group London | | | (1,076 | ) |
| | | 700 | | expiring 11/23/09 @ 4.35% | | Merrill Lynch | | | (145 | ) |
| | | 3,000 | | expiring 11/23/09 @ 4.35% | | Morgan Stanley & Co., Inc. | | | (621 | ) |
| | | 4,000 | | expiring 08/31/10 @ 5.50% | | Barclays Capital Group London | | | (12,104 | ) |
| | | | | | | | | | | |
| | | | | TOTAL OPTIONS WRITTEN
(premiums received $260,121) | | | | | (15,671 | ) |
| | | | | | | | | | | |
| | | | | | | | | | |
| | | | | PRINCIPAL
AMOUNT (000)# | | SECURITIES SOLD SHORT—(13.2)% | | | |
| | | | |
| | | | | | U.S. GOVERNMENT MORTGAGE-BACKED OBLIGATIONS | | | | |
| | | | | | Federal National Mortgage Assoc. | | | | |
| | | | 16,000 | | 5.50%, TBA | | | (16,840,000 | ) |
| | | | 3,700 | | 5.50%, TBA | | | (3,932,404 | ) |
| | | | 500 | | 5.50%, TBA | | | (524,219 | ) |
| | | | 6,900 | | 6.00%, TBA | | | (7,303,222 | ) |
| | | | 3,600 | | 6.00%, TBA | | | (3,823,877 | ) |
| | | | | | | | | | |
| | | | | | TOTAL SECURITIES SOLD SHORT
(proceeds received $32,130,508) | | | (32,423,722 | ) |
| | | | | | | | | | |
| | | | | | TOTAL INVESTMENTS, NET OF OPTIONS
WRITTEN AND SECURITIES SOLD SHORT—85.2%
(cost $207,721,215) | | | 209,240,065 | |
| | | | | | Other assets in excess of other liabilities(x)—14.8% | | | 36,276,763 | |
| | | | | | | | | | |
| | | | | | NET ASSETS—100% | | $ | 245,516,828 | |
| | | | | | | | | | |
The following abbreviations were used in Portfolio descriptions:
144A—Security was purchased pursuant to Rule 144A under the Securities Act of 1933 and may not be resold subject to that rule except to qualified institutional buyers. Unless otherwise noted, 144A securities are deemed to be liquid.
FDIC—Federal Deposit Insurance Corp.
FHLMC—Federal Home Loan Mortgage Corp.
FSB—Federal Saving Bank
MTN—Medium Term Note
NR—Not Rated by Moodys or Standard & Poor’s
TBA—To Be Announced
AUD—Australian Dollar
See Notes to Financial Statements.
| | |
| THE TARGET PORTFOLIO TRUST | | 137 |
| | |
Intermediate-Term Bond Portfolio (continued) | | Portfolio of Investments
As of October 31, 2009 |
BRL—Brazilian Real
CNY—Chinese Yuan
DKK—Danish Krone
EUR—Euro
GBP—British Pound
JPY—Japanese Yen
| # | Principal and notional amounts are shown in U.S. dollars unless otherwise stated. |
| † | The rating reflected is as of October 31, 2009. Rating of certain bonds may have changed subsequent to that date. |
| * | Non-income producing security. |
| (c) | Indicates a variable rate security. |
| (d) | Standard & Poor’s rating. |
| (g) | Indicates a security that has been deemed illiquid. |
| (i) | Represents issuer in default on interest payments. Non-income producing security. |
| (k) | Securities segregated as collateral for futures contracts. |
| (w) | Prudential Investments LLC, the manager of the Portfolio, also serves as manager of the Dryden Core Investment Fund-Taxable Money Market Series. |
| (x) | Other assets in excess of other liabilities includes net unrealized appreciation (depreciation) on futures contracts, forward foreign currency exchange contracts, interest rate and credit default swap agreements as follows: |
Futures contracts open at October 31, 2009:
| | | | | | | | | | | | | |
Number of
Contracts | | Type | | Expiration
Date | | Value at
Trade Date | | Value at
October 31,
2009 | | Unrealized
Appreciation |
| Long Positions: | | | | | | | | | | | | | |
| 695 | | 90 Day Euro Futures | | Jun 10 | | $ | 171,559,375 | | $ | 172,368,688 | | $ | 809,313 |
| 571 | | 2 Year U.S. Treasury Notes | | Dec 09 | | | 123,839,000 | | | 124,254,953 | | | 415,953 |
| | | | | | | | | | | | | |
| | | | | | | | | | | | $ | 1,225,266 |
| | | | | | | | | | | | | |
Forward foreign currency exchange contracts outstanding at October 31, 2009:
| | | | | | | | | | | | | | | |
Purchase Contracts | | Counterparty | | Notional
Amount
(000) | | Value at Settlement
Date Payable | | Current
Value | | Unrealized
Appreciation
(Depreciation) | |
Australian Dollar, | | | | | | | | | | | | | | | |
Expiring 11/05/09 | | JPMorgan Securities | | AUD | 144 | | $ | 125,347 | | $ | 129,549 | | $ | 4,202 | |
Chinese Yuan, | | | | | | | | | | | | | | | |
Expiring 03/29/10 | | Deutsche Bank | | CNY | 4,126 | | | 609,943 | | | 604,389 | | | (5,554 | ) |
Expiring 03/29/10 | | Deutsche Bank | | CNY | 1,755 | | | 260,200 | | | 257,030 | | | (3,170 | ) |
| | | | | | | | | | | | | | | |
| | | | | | | $ | 995,490 | | $ | 990,968 | | $ | (4,522 | ) |
| | | | | | | | | | | | | | | |
| | | | | | | | | | | | | | | |
Sale Contracts | | Counterparty | | Notional
Amount
(000) | | Value at Settlement
Date Receivable | | Current
Value | | Unrealized
Depreciation | |
British Pound, | | | | | | | | | | | | | | | |
Expiring 11/24/09 | | JPMorgan Securities | | GBP | 666 | | $ | 1,088,575 | | $ | 1,092,896 | | $ | (4,321 | ) |
Danish Krone, | | | | | | | | | | | | | | | |
Expiring 12/21/09 | | JPMorgan Securities | | DKK | 49 | | | 9,605 | | | 9,679 | | | (74 | ) |
Expiring 01/04/10 | | Royal Bank | | DKK | 1,500 | | | 284,841 | | | 296,233 | | | (11,392 | ) |
See Notes to Financial Statements.
| | |
| 138 | | THE TARGET PORTFOLIO TRUST |
Forward foreign currency exchange contracts outstanding at October 31, 2009 (continued):
| | | | | | | | | | | | | | | |
Sale Contracts
(continued) | | Counterparty | | Notional
Amount
(000) | | Value at Settlement
Date Receivable | | Current
Value | | Unrealized
Depreciation | |
Euro, | | | | | | | | | | | | | | | |
Expiring 11/19/09 | | Chase Securities, Inc. | | EUR | 619 | | $ | 906,700 | | $ | 910,910 | | $ | (4,210 | ) |
| | | | | | | | | | | | | | | |
| | | | | | | $ | 2,289,721 | | $ | 2,309,718 | | $ | (19,997 | ) |
| | | | | | | | | | | | | | | |
Interest rate swap agreements outstanding at October 31, 2009:
| | | | | | | | | | | | | | | | | | | | | | |
Counterparty | | Termination
Date | | Notional
Amount
(000) | | Fixed
Rate | | | Floating Rate | | Fair
Value | | | Upfront
Premiums
Paid
(Received) | | | Unrealized
Depreciation | |
Goldman Sachs(1) | | 01/02/12 | | BRL | 2,400 | | 11.36 | % | | Brazilian interbank lending rate | | $ | (2,443 | ) | | $ | (543 | ) | | $ | (1,900 | ) |
UBS AG(1) | | 06/15/12 | | AUD | 9,300 | | 4.50 | % | | 3 month Australian Bank Bill rate | | | (128,390 | ) | | | (31,910 | ) | | | (96,480 | ) |
| | | | | | | | | | | | | | | | | | | | | | |
| | | | | | | | | | | | $ | (130,833 | ) | | $ | (32,453 | ) | | $ | (98,380 | ) |
| | | | | | | | | | | | | | | | | | | | | | |
| (1) | Porfolio pays the floating rate and receives the fixed rate. |
Credit default swap agreements outstanding at October 31, 2009:
| | | | | | | | | | | | | | | | | | | | | | | | | |
Counterparty | | Termina-
tion
Date | | Notional
Amount
(000)#(2) | | Fixed
Rate | | | Reference
Entity/
Obligation | | Implied
Credit
Spread at
October 31,
2009(3) | | | Fair
Value | | | Upfront
Premiums
Paid
(Received) | | | Unrealized
Apprecia-
tion
(Deprecia-
tion) | |
| Credit default swaps on corporate and/or sovereign issues—Sell Protection(1): | | | | | | | | | |
Barclays Capital | | 03/20/13 | | $ | 2,500 | | 1.00 | % | | Berkshire Hathaway,
4.625%, due 10/15/13 | | 1.171 | % | | $ | (9,138 | ) | | $ | — | | | $ | (9,138 | ) |
Merrill Lynch & Co. | | 06/20/12 | | | 200 | | 0.28 | % | | Enbridge Energy Partners,
4.75%, due 06/01/13 | | 1.456 | % | | | (5,487 | ) | | | — | | | | (5,487 | ) |
Bank of America, N.A. | | 06/20/12 | | | 200 | | 0.33 | % | | Energy Transfer Partners,
5.95%, due 02/01/15 | | 1.414 | % | | | (5,529 | ) | | | — | | | | (5,529 | ) |
Barclays Capital | | 12/20/10 | | | 900 | | 1.00 | % | | Federal Rebublic of Brazil,
12.25%, due 03/06/30 | | 0.766 | % | | | 4,025 | | | | 4,274 | | | | (249 | ) |
Deutsche Bank | | 12/20/10 | | | 700 | | 1.00 | % | | Federal Rebublic of Brazil,
12.25%, due 03/06/30 | | 0.766 | % | | | 1,537 | | | | 3,387 | | | | (1,850 | ) |
Citigroup | | 06/20/12 | | | 275 | | 5.00 | % | | General Electric Captial Corp.,
5.625%, due 09/15/17 | | 1.751 | % | | | 23,671 | | | | (10,553 | ) | | | 34,224 | |
Merrill Lynch & Co. | | 06/20/12 | | | 200 | | 0.29 | % | | Kinder Morgan,
6.75%, due 03/15/11 | | 1.314 | % | | | (4,993 | ) | | | — | | | | (4,993 | ) |
Merrill Lynch & Co. | | 09/20/12 | | | 3,800 | | 0.80 | % | | Morgan Stanley,
6.60%, due 04/01/12 | | 1.170 | % | | | (47,040 | ) | | | — | | | | (47,040 | ) |
See Notes to Financial Statements.
| | |
| THE TARGET PORTFOLIO TRUST | | 139 |
| | |
Intermediate-Term Bond Portfolio (continued) | | Portfolio of Investments
As of October 31, 2009 |
Credit default swap agreements outstanding at October 31, 2009 (continued):
| | | | | | | | | | | | | | | | | | | | | | | | | |
Counterparty | | Termina-
tion
Date | | Notional
Amount
(000)#(2) | | Fixed
Rate | | | Reference
Entity/
Obligation | | Implied
Credit
Spread at
October 31,
2009(3) | | | Fair
Value | | | Upfront
Premiums
Paid
(Received) | | | Unrealized
Apprecia-
tion
(Deprecia-
tion) | |
Bank of America, N.A. | | 06/20/12 | | $ | 200 | | 0.32 | % | | Plains All-American Pipeline,
7.75%, due 10/15/12 | | 1.059 | % | | $ | (3,930 | ) | | $ | — | | | $ | (3,930 | ) |
Barclays Capital | | 12/20/10 | | | 700 | | 1.00 | % | | United Mexican States,
7.50%, due 04/08/33 | | 1.214 | % | | | (1,845 | ) | | | (70 | ) | | | (1,775 | ) |
Deutsche Bank | | 12/20/10 | | | 700 | | 1.00 | % | | United Mexican States,
7.50%, due 04/08/33 | | 1.214 | % | | | (240 | ) | | | (36 | ) | | | (204 | ) |
Bank of America, N.A. | | 06/20/12 | | | 200 | | 0.32 | % | | Valero Energy Corp.,
6.875%, due 04/15/12 | | 1.862 | % | | | (7,541 | ) | | | — | | | | (7,541 | ) |
| | | | | | | | | | | | | | | | | | | | | | | | | |
| | | | | | | | | | | | | | | $ | (56,510 | ) | | $ | (2,998 | ) | | $ | (53,512 | ) |
| | | | | | | | | | | | | | | | | | | | | | | | | |
The Portfolio entered into credit default swap agreements on corporate issues, sovereign issues, asset-backed securities and credit indices as the protection seller to provide a measure of protection against the current portfolio of investments’ exposure to market conditions, or to take an active position with respect to the likelihood of a particular issuer’s default or the referenced entity’s credit soundness
| (1) | If the Portfolio is a seller of protection, it receives the fixed rate. When a credit event occurs, as defined under the terms of that particular swap agreement, the Portfolio will either (i) pay to the buyer of protection an amount equal to the notional amount of the swap and take delivery of the referenced obligation or underlying securities comprising the referenced index or (ii) pay a net settlement amount in the form of cash or securities equal to the notional amount of the swap less the recovery value of the referenced obligation or underlying securities comprising the referenced index. |
| (2) | Notional amount represents the maximum potential amount the Portfolio could be required to pay as a seller of credit protection or receive as a buyer of credit protection if a credit event occurs as defined under the terms of that particular swap agreement. |
| (3) | Implied credit spreads, represented in absolute terms, utilized in determining the fair value of credit default swap agreements on corporate issues or sovereign issues of an emerging country as of reporting date serve as an indicator of the current status of the payment/performance risk and represent the likelihood of risk of default for the credit derivative. The implied credit spread of a particular referenced entity reflects the cost of buying/selling protection and may include up-front payments required to be made to enter into the agreement. Wider credit spreads represent a deterioration of the referenced entity’s credit soundness and a greater likelihood of risk of default or other credit event occurring as defined under the terms of the agreement. |
| # | Notional Amount is shown in U.S. dollars unless otherwise stated. |
Various inputs are used in determining the value of the Portfolio’s investments. These inputs are summarized in the three broad levels listed below.
Level 1—quoted prices in active markets for identical securities
Level 2—other significant observable inputs (including quoted prices for similar securities, interest rates, prepayment speeds, credit risk, etc.)
Level 3—significant unobservable inputs (including the Portfolio’s own assumptions in determining the fair value of investments)
See Notes to Financial Statements.
| | |
| 140 | | THE TARGET PORTFOLIO TRUST |
The following is a summary of the inputs used as of October 31, 2009 in valuing the Portfolio’s assets carried at fair value:
| | | | | | | | | | |
Investments in Securities | | Level 1 | | Level 2 | | | Level 3 |
Asset-Backed Securities | | $ | — | | $ | 8,148,370 | | | $ | — |
Bank Loans | | | — | | | 841,638 | | | | — |
Commercial Mortgage-Backed Securities | | | — | | | 824,211 | | | | — |
Corporate Bonds | | | — | | | 137,028,129 | | | | — |
Foreign Government Bonds | | | — | | | 3,503,111 | | | | — |
Municipal Bonds | | | — | | | 5,651,318 | | | | — |
Residential Mortgage-Backed Securities | | | — | | | 12,377,941 | | | | — |
U.S. Government Agency Obligation | | | — | | | 8,846,096 | | | | — |
U.S. Government Mortgage-Backed Obligations | | | — | | | 32,901,245 | | | | — |
U.S. Treasury Obligation | | | — | | | 28,279,298 | | | | — |
Repurchase Agreements | | | — | | | 2,400,000 | | | | — |
Options Written | | | — | | | (15,671 | ) | | | — |
Affiliated Money Market Mutual Fund | | | 878,101 | | | — | | | | — |
Securities Sold Short—U.S. Government Mortgage Backed Obligations | | | — | | | (32,423,722 | ) | | | — |
| | | | | | | | | | |
| | $ | 878,101 | | $ | 208,361,964 | | | $ | — |
Other Financial Instuments* | | | 1,225,266 | | | (176,411 | ) | | | — |
| | | | | | | | | | |
Total | | $ | 2,103,367 | | $ | 208,185,553 | | | $ | — |
| | | | | | | | | | |
| * | Other financial instruments are derivative instruments not reflected in the Portfolio of Investments, such as futures, forwards and swap contracts, which are valued at the unrealized appreciation/depreciation on the instrument. |
As of October 31, 2008 and October 31, 2009, the Portfolio did not use any significant unobservable inputs (Level 3) in determining the value of investments.
The industry classification of investments and other assets in excess of other liabilities shown as a percentage of net assets as of October 31, 2009 were as follows:
| | | |
Commercial Banks | | 17.5 | % |
U.S. Government Mortgage-Backed Obligations | | 13.4 | |
U.S. Treasury Obligation | | 11.5 | |
Financial—Bank & Trust | | 7.5 | |
Diversified Financial Services | | 6.9 | |
Financial Services | | 6.9 | |
Telecommunications | | 6.0 | |
Residential Mortgage-Backed Securities | | 5.0 | |
U.S. Government Agency Obligations | | 3.6 | |
Asset-Backed Securities | | 3.3 | |
Oil, Gas & Consumable Fuels | | 2.4 | |
Electric | | 2.4 | |
Municipal Bonds | | 2.3 | |
Foreign Government Bonds | | 1.4 | |
Airlines | | 1.0 | |
Utilities | | 1.0 | |
Insurance | | 1.0 | |
Repurchase Agreements | | 1.0 | |
Metals & Mining | | 1.0 | |
Savings & Loan | | 0.9 | |
Tobacco | | 0.5 | |
Real Estate Investment Trusts | | 0.5 | |
Affiliated Money Market Mutual Fund | | 0.4 | |
See Notes to Financial Statements.
| | |
| THE TARGET PORTFOLIO TRUST | | 141 |
| | |
Intermediate-Term Bond Portfolio (continued) | | Portfolio of Investments
As of October 31, 2009 |
| | | |
Industry (cont’d.) | | | |
Bank Loans | | 0.4 | % |
Chemicals | | 0.3 | |
Commercial Mortgage-Backed Securities | | 0.3 | |
| | | |
| | 98.4 | |
Options Written and Securities Sold Short | | (13.2 | ) |
Other assets in excess of other liabilities | | 14.8 | |
| | | |
| | 100.0 | % |
| | | |
See Notes to Financial Statements.
| | |
| 142 | | THE TARGET PORTFOLIO TRUST |
| | |
Portfolio of Investments
As of October 31, 2009 | | Mortgage Backed Securities Portfolio |
| | | | | | | | | |
PRINCIPAL
AMOUNT (000)# | | | DESCRIPTION | | VALUE (NOTE 1) |
| | | | | | LONG-TERM INVESTMENTS—148.4% | | | |
| | | |
| | | | | | U.S. GOVERNMENT MORTGAGE BACKED OBLIGATIONS—115.9% | | | |
| | | | | | Federal Home Loan Mortgage Corp., | | | |
| | $ | 3,500 | | | 4.50%, TBA | | $ | 3,537,187 |
| | | 3,808 | | | 5.00%, 10/01/35 | | | 3,956,057 |
| | | 1,170 | | | 6.00%, 01/01/15-02/01/21 | | | 1,254,226 |
| | | 116 | | | 6.50%, 01/01/18-06/01/22 | | | 127,235 |
| | | 27 | | | 7.50%, 06/01/28 | | | 29,435 |
| | | 3 | | | 8.50%, 04/01/18 | | | 3,714 |
| | | — | (r) | | 9.00%, 03/01/11 | | | 7 |
| | | 21 | | | 11.50%, 03/01/16 | | | 25,061 |
| | | | | | Federal National Mortgage Assoc., | | | |
| | | 1,818 | | | 4.50%, 05/01/35 | | | 1,854,500 |
| | | 3,500 | | | 4.50%, TBA | | | 3,542,658 |
| | | 4,512 | | | 5.00%, 11/01/18-08/01/35 | | | 4,713,180 |
| | | 188 | | | 5.00%, 07/01/33(k) | | | 195,542 |
| | | 1,322 | | | 5.17%, 09/01/19 | | | 1,402,025 |
| | | 7,732 | | | 5.50%, 06/01/33-06/01/36 | | | 8,175,374 |
| | | 2,200 | | | 5.50%, TBA | | | 2,315,500 |
| | | 809 | | | 5.78%, 11/01/11 | | | 860,335 |
| | | 2,137 | | | 6.00%, 04/01/14-10/01/37 | | | 2,291,977 |
| | | 700 | | | 6.00%, TBA | | | 749,657 |
| | | 5,600 | | | 6.00%, TBA | | | 5,948,253 |
| | | 40 | | | 6.095%, 03/01/12 | | | 43,277 |
| | | 1,031 | | | 6.50%, 05/01/14-11/01/37 | | | 1,112,226 |
| | | 7 | | | 7.00%, 05/01/12-07/01/12 | | | 7,432 |
| | | 32 | | | 8.00%, 09/01/22-12/01/22 | | | 36,191 |
| | | 3 | | | 9.75%, 01/01/11-11/01/16 | | | 3,876 |
| | | | | | Government National Mortgage Assoc., | | | |
| | | 500 | | | 4.50%, TBA | | | 507,031 |
| | | 143 | | | 6.00%, 07/15/24-08/15/24 | | | 153,033 |
| | | 2,620 | | | 6.50%, 06/15/23-11/15/36 | | | 2,796,865 |
| | | 1,295 | | | 7.00%, 11/15/31-11/15/33 | | | 1,400,916 |
| | | 24 | | | 7.50%, 09/15/11-12/20/23 | | | 26,656 |
| | | 346 | | | 8.00%, 03/15/17-11/15/30 | | | 392,799 |
| | | 43 | | | 8.25%, 06/20/17-07/20/17 | | | 47,007 |
| | | 46 | | | 8.50%, 04/20/17 | | | 49,895 |
| | | 57 | | | 9.00%, 01/15/20 | | | 64,438 |
| | | 1 | | | 9.50%, 06/15/20 | | | 971 |
| | | 3 | | | 13.50%, 05/15/11 | | | 3,349 |
| | | 5 | | | 14.00%, 06/15/11 | | | 5,402 |
| | | 6 | | | 16.00%, 05/15/12 | | | 6,633 |
| | | | | | | | | |
| | | | | | TOTAL U.S. GOVERNMENT MORTGAGE BACKED OBLIGATIONS
(cost $45,992,126) | | | 47,639,920 |
| | | | | | | | | |
See Notes to Financial Statements.
| | |
| THE TARGET PORTFOLIO TRUST | | 143 |
| | |
Mortgage Backed Securities Portfolio (continued) | | Portfolio of Investments
As of October 31, 2009 |
| | | | | | | | |
PRINCIPAL
AMOUNT (000)# | | DESCRIPTION | | VALUE (NOTE 1) |
| | | | | RESIDENTIAL MORTGAGE-BACKED SECURITIES—30.1% | | | |
| | | | | Citigroup Mortgage Loan Trust, Inc.,
Series 2006-AR1, Class 3A1 | | | |
| | $ | 305 | | 5.50%(c), 03/25/36 | | $ | 227,897 |
| | | | | Countrywide Alternative Loan Trust, | | | |
| | | | | Series 2005-73CB, Class 1A7 | | | |
| | | 361 | | 5.50%, 01/25/36 | | | 271,408 |
| | | | | Series 2005-85CB, Class 2A2 | | | |
| | | 951 | | 5.50%, 02/25/36 | | | 772,563 |
| | | | | Series 2005-J11, Class 1A3 | | | |
| | | 1,171 | | 5.50%, 11/25/35 | | | 867,560 |
| | | | | Series 2007-HY5R, Class 2A1A | | | |
| | | 737 | | 5.544%(c), 03/25/47 | | | 633,205 |
| | | | | Countrywide Home Loan Mortgage Pass-Through Trust, | | | |
| | | | | Series 2006-14, Class A3 | | | |
| | | 1,098 | | 6.25%, 09/25/36 | | | 960,470 |
| | | | | Series 2006-J2, Class 1A6 | | | |
| | | 90 | | 6.00%, 04/25/36 | | | 69,643 |
| | | | | Federal Home Loan Mortgage Corp., | | | |
| | | | | Series 74, Class F | | | |
| | | 17 | | 6.00%, 10/15/20 | | | 17,317 |
| | | | | Series 83, Class Z | | | |
| | | 3 | | 9.00%, 10/15/20 | | | 3,540 |
| | | | | Series 186, Class E | | | |
| | | 27 | | 6.00%, 08/15/21 | | | 26,772 |
| | | | | Series 1058, Class H | | | |
| | | 10 | | 8.00%, 04/15/21 | | | 10,602 |
| | | | | Series 1116, Class I | | | |
| | | 7 | | 5.50%, 08/15/21 | | | 7,438 |
| | | | | Series 1120, Class L | | | |
| | | 33 | | 8.00%, 07/15/21 | | | 35,970 |
| | | | | Series 2809, Class UC | | | |
| | | 425 | | 4.00%, 06/15/19 | | | 432,234 |
| | | | | Series 2852, Class VI, IO | | | |
| | | 325 | | 5.00%, 06/15/24 | | | 3,896 |
| | | | | Series 2882, Class YI, IO | | | |
| | | 39 | | 5.00%, 03/15/24 | | | 63 |
| | | | | Series 2915, Class K1, IO | | | |
| | | 97 | | 5.00%, 06/15/24 | | | 605 |
| | | | | Series 2995, Class ST, IO | | | |
| | | 1,082 | | 6.505%(c), 05/15/29 | | | 175,322 |
| | | | | Series 3279, Class SD, IO | | | |
| | | 3,537 | | 6.185%(c), 02/15/37 | | | 422,741 |
| | | | | Series 3309, Class SC, IO | | | |
| | | 3,027 | | 6.205%(c), 04/15/37 | | | 304,494 |
See Notes to Financial Statements.
| | |
| 144 | | THE TARGET PORTFOLIO TRUST |
| | | | | | | | |
PRINCIPAL
AMOUNT (000)# | | DESCRIPTION | | VALUE (NOTE 1) |
| | | | | RESIDENTIAL MORTGAGE-BACKED SECURITIES (continued) | | | |
| | | | | Federal Home Loan Mortgage Corp. Structured Pass-Through Securities,
Series T-42, Class A5 | | | |
| | $ | 179 | | 7.50%, 02/25/42 | | $ | 199,266 |
| | | | | Federal National Mortgage Assoc., | | | |
| | | | | Series 56, Class 1 | | | |
| | | 12 | | 6.00%, 04/01/19 | | | 12,235 |
| | | | | Series 340, Class 2, IO | | | |
| | | 481 | | 5.00%, 09/01/33 | | | 100,396 |
| | | | | Series 347, Class 2, IO | | | |
| | | 1,035 | | 5.00%, 01/01/34 | | | 215,086 |
| | | | | Series 377, Class 2, IO | | | |
| | | 175 | | 5.00%, 10/01/36 | | | 34,367 |
| | | | | Series 1988-19, Class J | | | |
| | | 12 | | 8.50%, 07/25/18 | | | 13,699 |
| | | | | Series 1990-10, Class L | | | |
| | | 5 | | 8.50%, 02/25/20 | | | 5,626 |
| | | | | Series 1990-108, Class G | | | |
| | | 12 | | 7.00%, 09/25/20 | | | 13,215 |
| | | | | Series 1991-21, Class J | | | |
| | | 12 | | 7.00%, 03/25/21 | | | 13,465 |
| | | | | Series 1992-113, Class Z | | | |
| | | 22 | | 7.50%, 07/25/22 | | | 25,098 |
| | | | | Series 1993-223, Class ZA | | | |
| | | 273 | | 6.50%, 12/25/23 | | | 300,613 |
| | | | | Series 2001-51, Class QN | | | |
| | | 290 | | 6.00%, 10/25/16 | | | 312,009 |
| | | | | Series 2003-33, Class PT | | | |
| | | 146 | | 4.50%, 05/25/33 | | | 151,689 |
| | | | | Series 2007-22, Class SD, IO | | | |
| | | 2,010 | | 6.156%(c), 03/25/37 | | | 226,315 |
| | | | | Series G-14, Class L | | | |
| | | 15 | | 8.50%, 06/25/21 | | | 16,520 |
| | | | | Series G92-24, Class Z | | | |
| | | 16 | | 6.50%, 04/25/22 | | | 16,660 |
| | | | | Series G92-59, Class D | | | |
| | | 79 | | 6.00%, 10/25/22 | | | 86,065 |
| | | | | Series G94-4, Class PG | | | |
| | | 265 | | 8.00%, 05/25/24 | | | 292,135 |
| | | | | First Boston Mortgage Securities Corp., | | | |
| | | | | Series B, Class I-O, IO | | | |
| | | 41 | | 8.00%, 04/25/17 | | | 6,744 |
| | | | | Series B, Class P-O, PO | | | |
| | | 41 | | 1.661%(t), 04/25/17 | | | 39,582 |
| | | | | Government National Mortgage Assoc., | | | |
| | | | | Series 2006-35, Class LO, PO | | | |
| | | 176 | | 6.381%(t), 07/20/36 | | | 145,904 |
| | | | | Series 2006-38, Class XS, IO | | | |
| | | 1,163 | | 7.005%(c), 09/16/35 | | | 141,340 |
See Notes to Financial Statements.
| | |
| THE TARGET PORTFOLIO TRUST | | 145 |
| | |
Mortgage Backed Securities Portfolio (continued) | | Portfolio of Investments
As of October 31, 2009 |
| | | | | | | | | |
PRINCIPAL
AMOUNT (000)# | | | DESCRIPTION | | VALUE (NOTE 1) |
| | | | | | RESIDENTIAL MORTGAGE-BACKED SECURITIES (continued) | | | |
| | | | | | GSR Mortgage Loan Trust, | | | |
| | | | | | Series 2005-AR2, Class 1A2 | | | |
| | $ | 109 | | | 5.118%(c), 04/25/35 | | $ | 89,146 |
| | | | | | Series 2007-AR1, Class 2A1 | | | |
| | | 325 | | | 5.961%(c), 03/25/47 | | | 224,093 |
| | | | | | Series 2007-AR2, Class 1A1 | | | |
| | | 318 | | | 5.765%(c), 05/25/47 | | | 227,084 |
| | | | | | JPMorgan Mortgage Trust,
Series 2007-S2, Class 2A3 | | | |
| | | 679 | | | 5.50%, 06/25/37 | | | 599,454 |
| | | | | | Morgan Stanley Mortgage Loan Trust, | | | |
| | | | | | Series 2004-5AR, Class 3A4 | | | |
| | | 167 | | | 3.584%(c), 07/25/34 | | | 160,504 |
| | | | | | Series 2007-12, Class 3A22 | | | |
| | | 256 | | | 6.00%, 08/25/37 | | | 194,705 |
| | | | | | Residential Asset Securitization Trust, | | | |
| | | | | | Series 2004-A3, Class A7 | | | |
| | | 730 | | | 5.25%, 06/25/34 | | | 533,530 |
| | | | | | Series 2005-A9, Class A3 | | | |
| | | 1,722 | | | 5.50%, 07/25/35 | | | 1,121,517 |
| | | | | | Salomon Brothers Mortgage Securities VI, Inc.,
Series 1986-1, Class A | | | |
| | | — | (r) | | 6.00%, 12/25/11 | | | 218 |
| | | | | | Wells Fargo Mortgage Backed Securities Trust, | | | |
| | | | | | Series 2005-AR13, Class A1 | | | |
| | | 1,500 | | | 5.312%(c), 05/25/35 | | | 1,181,779 |
| | | | | | Series 2006-AR10, Class 5A2 | | | |
| | | 457 | | | 5.591%(c), 07/25/36 | | | 425,776 |
| | | | | | | | | |
| | | | | | TOTAL RESIDENTIAL MORTGAGE-BACKED SECURITIES
(cost $13,555,328) | | | 12,369,575 |
| | | | | | | | | |
| | | |
| | | | | | COMMERCIAL MORTGAGE-BACKED SECURITY—2.4% | | | |
| | | | | | Bear Stearns Commercial Mortgage Securities,
Series 2004-PWR4, Class A2
(cost $790,898) | | | |
| | | 984 | | | 5.286%(c), 06/11/41 | | | 1,011,167 |
| | | | | | | | | |
| | | | | | TOTAL LONG-TERM INVESTMENTS
(cost $60,338,352) | | | 61,020,662 |
| | | | | | | | | |
See Notes to Financial Statements.
| | |
| 146 | | THE TARGET PORTFOLIO TRUST |
| | | | | | | | |
| SHARES | | DESCRIPTION | | VALUE (NOTE 1) | |
| | SHORT-TERM INVESTMENT—3.3% | | | | |
| | | |
| | | | AFFILIATED MONEY MARKET MUTUAL FUND | | | | |
| | 1,348,563 | | Dryden Core Investment Fund—Taxable Money Market Series
(cost $1,348,563)(w) | | $ | 1,348,563 | |
| | | | | | | | |
| | | | TOTAL INVESTMENTS—151.7%
(cost $61,686,915) | | | 62,369,225 | |
| | | | Other liabilities in excess of other assets(x)—(51.7)% | | | (21,257,427 | ) |
| | | | | | | | |
| | | | NET ASSETS—100% | | $ | 41,111,798 | |
| | | | | | | | |
The following abbreviations are used in Portfolio descriptions:
IO Interest Only
PO Principal Only Securities
TBA To Be Announced
| # | Principal amount is shown in U.S. dollars unless otherwise stated. |
| (c) | Indicates a variable rate security. |
| (k) | Securities segregated as collateral for futures contracts. |
| (t) | Represents zero coupon bond or step coupon bond. Rate quoted represents effective yield at October 31, 2009. |
| (w) | Prudential Investments LLC, the manager of the Portfolio also serves as manager of the Dryden Core Investment Fund-Taxable Money Market Series. |
| (x) | Other liabilities in excess of other assets includes net unrealized appreciation (depreciation) on futures contracts, interest rate swaps and reverse repurchase agreement as follows: |
Futures contracts open at October 31, 2009:
| | | | | | | | | | | | | | |
Number of
Contracts | | Type | | Expiration
Date | | Value at
Trade Date | | Value at
October 31,
2009 | | Unrealized
Appreciation
(Depreciation) | |
| Long Positions: | | | | | | | | | | | | | | |
| 13 | | 90 Day Euro Dollar | | Dec 09 | | $ | 3,235,849 | | $ | 3,239,600 | | $ | 3,751 | |
| 37 | | 10 Year U.S. Treasury Notes | | Dec 09 | | | 4,351,422 | | | 4,388,546 | | | 37,124 | |
| | | | | | | | | | | | | | |
| | | | | | | | | | | | | 40,875 | |
| | | | | | | | | | | | | | |
| Short Positions: | | | | | | | | | | | | | | |
| 64 | | 2 Year U.S. Treasury Notes | | Dec 09 | | | 13,815,340 | | | 13,927,000 | | | (111,660 | ) |
| 8 | | 5 Year U.S. Treasury Notes | | Dec 09 | | | 917,360 | | | 931,625 | | | (14,265 | ) |
| | | | | | | | | | | | | | |
| | | | | | | | | | | | | (125,925 | ) |
| | | | | | | | | | | | | | |
| | | | | | | | | | | | $ | (85,050 | ) |
| | | | | | | | | | | | | | |
Reverse Repurchase Agreement outstanding at October 31, 2009:
| | | | | | | | | | | | | |
Broker | | Interest
Rate | | | Trade
Date | | Value at
October 31,
2009 | | Maturity
Date | | Cost |
First Boston Corp. | | 0.27 | % | | 10/14/2009 | | $ | 5,000,000 | | 11/16/2009 | | $ | 5,000,000 |
| | | | | | | | | | | | | |
See Notes to Financial Statements.
| | |
| THE TARGET PORTFOLIO TRUST | | 147 |
| | |
Mortgage Backed Securities Portfolio (continued) | | Portfolio of Investments
As of October 31, 2009 |
Interest rate swap agreements outstanding at October 31, 2009:
| | | | | | | | | | | | | | | | | | | | | |
Counterparty | | Termination
Date | | Notional
Amount
(000)# | | Fixed
Rate | | | Floating
Rate | | Fair
Value | | | Upfront
Premiums
Paid (Received) | | Unrealized
Appreciation
(Depreciation) | |
Goldman Sachs(1) | | 11/07/09 | | $ | 2,725 | | 4.37 | % | | 3 Month LIBOR | | $ | 55,836 | | | $ | — | | $ | 55,836 | |
Goldman Sachs(2) | | 10/31/18 | | | 1,300 | | 4.31 | % | | 3 Month LIBOR | | | (89,298 | ) | | | — | | | (89,298 | ) |
Goldman Sachs(3) | | 05/05/10 | | | 20,000 | | 0.00 | % | | CMM/CMS | | | (2,960 | ) | | | — | | | (2,960 | ) |
Goldman Sachs(3) | | 04/29/10 | | | 24,000 | | 0.00 | % | | CMM/CMS | | | 4,104 | | | | — | | | 4,104 | |
| | | | | | | | | | | | | | | | | | | | | |
| | | | | | | | | | | | $ | (32,318 | ) | | $ | — | | $ | (32,318 | ) |
| | | | | | | | | | | | | | | | | | | | | |
| (1) | Portfolio pays the floating rate and receives the fixed rate. |
| (2) | Portfolio pays the fixed rate and receives the floating rate. |
| (3) | Portfolio pays or receives based on the spread between the two indices. |
| # | Notional Amount is shown in U.S. dollars unless otherwise stated. |
Various inputs are used in determining the value of the Portfolio’s investments. These inputs are summarized in the three broad levels listed below.
Level 1—quoted prices in active markets for identical securities
Level 2—other significant observable inputs (including quoted prices for similar securities, interest rates, prepayment speeds, credit risk, etc.)
Level 3—significant unobservable inputs (including the Portfolio’s own assumptions in determining the fair value of investments)
The following is a summary of the inputs used as of October 31, 2009 in valuing the Portfolio’s assets carried at fair value:
| | | | | | | | | | | |
Investments in Securities | | Level 1 | | | Level 2 | | | Level 3 |
U.S. Government Mortgage Backed Obligations | | $ | — | | | $ | 47,639,920 | | | $ | — |
Residential Mortgage-Backed Securities | | | — | | | | 12,369,575 | | | | — |
Commerical Mortgage-Backed Security | | | — | | | | 1,011,167 | | | | — |
Affiliated Money Market Mutual Fund | | | 1,348,563 | | | | — | | | | — |
Reverse Repurchase Agreements | | | — | | | | (5,000,000 | ) | | | — |
| | | | | | | | | | | |
| | $ | 1,348,563 | | | $ | 56,020,662 | | | $ | — |
Other Financial Instruments* | | | (85,050 | ) | | | (33,462 | ) | | | 1,144 |
| | | | | | | | | | | |
Total | | $ | 1,263,513 | | | $ | 55,987,200 | | | $ | 1,144 |
| | | | | | | | | | | |
| * | Other financial instruments are derivative instruments not reflected in the Portfolio of Investments, such as futures, forwards and swap contracts, which are valued at the unrealized appreciation/depreciation on the instrument. |
The following is a reconciliation of assets in which significant unobservable inputs (Level 3) were used in determining fair value:
| | | |
| | | Other Financial
Instruments |
Balance as of 10/31/08 | | $ | — |
Accrued discounts/premiums | | | — |
Realized gain (loss) | | | — |
Change in unrealized appreciation (depreciation) | | | 1,144 |
Net purchases (sales) | | | — |
Transfers in and/or out of Level 3 | | | — |
| | | |
Balance as of 10/31/09 | | $ | 1,144 |
| | | |
See Notes to Financial Statements.
| | |
| 148 | | THE TARGET PORTFOLIO TRUST |
The industry classification of investments and other liabilities in excess of other assets shown as a percentage of net assets as of October 31, 2009 were as follows:
| | | |
U.S. Government Mortgage Backed Obligations | | 115.9 | % |
Residential Mortgage-Backed Securities | | 30.1 | |
Affiliated Money Market Mutual Fund | | 3.3 | |
Commercial Mortgage-Backed Security | | 2.4 | |
| | | |
| | 151.7 | |
Other liabilities in excess of other assets | | (51.7 | ) |
| | | |
| | 100.0 | % |
| | | |
See Notes to Financial Statements.
| | |
| THE TARGET PORTFOLIO TRUST | | 149 |
| | |
U.S. Government Money Market Portfolio | | Portfolio of Investments
As of October 31, 2009 |
| | | | | | | | |
PRINCIPAL
AMOUNT (000) | | DESCRIPTION | | VALUE (NOTE 1) |
| | | | | FEDERAL FARM CREDIT BANK—2.3% | | | |
| | $ | 1,500 | | 2.375%, 04/07/10
(cost $1,514,141) | | $ | 1,514,141 |
| | | | | | | | |
| | | |
| | | | | FEDERAL HOME LOAN BANK—36.3% | | | |
| | | 2,000 | | 0.203%(n), 04/07/10 | | | 1,998,256 |
| | | 1,100 | | 0.25%(n), 11/30/09 | | | 1,099,778 |
| | | 1,305 | | 0.26%(n), 12/09/09 | | | 1,304,642 |
| | | 2,500 | | 0.269%(n), 02/24/10 | | | 2,497,852 |
| | | 3,000 | | 0.275%(n), 11/24/09 | | | 2,999,473 |
| | | 2,500 | | 0.30%(n), 01/08/10 | | | 2,498,583 |
| | | 2,000 | | 0.31%(n), 11/12/09 | | | 1,999,811 |
| | | 2,000 | | 0.31%(n), 12/04/09 | | | 1,999,432 |
| | | 1,912 | | 0.31%(n), 01/13/10 | | | 1,910,798 |
| | | 1,000 | | 0.32%(n), 12/09/09 | | | 999,662 |
| | | 500 | | 0.38%(n), 01/21/10 | | | 499,572 |
| | | 1,200 | | 1.05%, 03/05/10 | | | 1,200,534 |
| | | 995 | | 2.75%, 03/12/10 | | | 1,001,299 |
| | | 2,000 | | 3.75%, 01/08/10 | | | 2,012,621 |
| | | | | | | | |
| | | | | TOTAL FEDERAL HOME LOAN BANK
(cost $24,022,313) | | | 24,022,313 |
| | | | | | | | |
| | | |
| | | | | FEDERAL HOME LOAN MORTGAGE CORP.—34.8% | | | |
| | | 2,000 | | 0.183%(n), 03/30/10 | | | 1,998,510 |
| | | 2,000 | | 0.203%(n), 04/19/10 | | | 1,998,122 |
| | | 1,000 | | 0.21%(n), 03/22/10 | | | 999,197 |
| | | 1,210 | | 0.235%(n), 03/29/10 | | | 1,208,831 |
| | | 2,000 | | 0.24%(n), 03/01/10 | | | 1,998,400 |
| | | 2,400 | | 0.24%(n), 03/23/10 | | | 2,397,728 |
| | | 2,000 | | 0.245%(n), 03/31/10 | | | 1,997,959 |
| | | 2,500 | | 0.25%(n), 11/16/09 | | | 2,499,740 |
| | | 2,000 | | 0.26%(n), 12/14/09 | | | 1,999,379 |
| | | 3,000 | | 0.30%(n), 01/25/10 | | | 2,997,875 |
| | | 560 | | 0.33%(n), 12/21/09 | | | 559,743 |
| | | 600 | | 0.339%(c), 02/04/10 | | | 600,000 |
| | | 1,800 | | 0.34%(n), 11/02/09 | | | 1,799,983 |
| | | | | | | | |
| | | | | TOTAL FEDERAL HOME LOAN MORTGAGE CORP.
(cost $23,055,467) | | | 23,055,467 |
| | | | | | | | |
| | | |
| | | | | FEDERAL NATIONAL MORTGAGE ASSOCIATION(n)—13.6% | | | |
| | | 2,500 | | 0.26%, 02/17/10 | | | 2,498,050 |
| | | 2,000 | | 0.31%, 01/20/10 | | | 1,998,622 |
| | | 2,500 | | 0.33%, 12/28/09 | | | 2,498,694 |
| | | 2,000 | | 0.35%, 12/29/09 | | | 1,998,872 |
| | | | | | | | |
| | | | | TOTAL FEDERAL NATIONAL MORTGAGE ASSOCIATION
(cost $8,994,238) | | | 8,994,238 |
| | | | | | | | |
See Notes to Financial Statements.
| | |
| 150 | | THE TARGET PORTFOLIO TRUST |
| | | | | | | | |
PRINCIPAL
AMOUNT (000) | | DESCRIPTION | | VALUE (NOTE 1) |
| | | | | REPURCHASE AGREEMENT—11.3% | | | |
| | $ | 7,500 | | JPMorgan Chase Bank, 0.07%, dated 10/30/09, due 11/02/09 in the amount of $7,500,044 (cost $7,500,000; collateralized by $7,776,906 Federal National Mortgage Assoc., 4.50%, maturity date 12/01/35 - 07/01/39, the value of collateral plus accrued interest was $7,652,224) | | $ | 7,500,000 |
| | | | | | | | |
| | | | | TOTAL INVESTMENTS—98.3%
(amortized cost $65,086,159)(h) | | | 65,086,159 |
| | | | | Assets in excess of other Liabilities—1.7% | | | 1,144,931 |
| | | | | | | | |
| | | | | NET ASSETS—100% | | $ | 66,231,090 |
| | | | | | | | |
| (c) | Indicates a variable rate security. |
| (h) | Federal income tax basis is the same as for financial reporting purposes. |
| (n) | Rates shown are the effective yields at purchase date. |
Various inputs are used in determining the value of the Portfolio’s investments. These inputs are summarized in the three broad levels listed below.
Level 1—quoted prices in active markets for identical securities
Level 2—other significant observable inputs (including quoted prices for similar securities, interest rates, prepayment speeds, credit risk, etc.)
Level 3—significant unobservable inputs (including the Portfolio’s own assumptions in determining the fair value of investments)
The following is a summary of the inputs used as of October 31, 2009 in valuing the Portfolio’s assets carried at fair value:
| | | | | | | | | |
Investments in Securities | | Level 1 | | Level 2 | | Level 3 |
U.S. Government Mortgage Backed Obligations | | $ | — | | $ | 57,586,159 | | $ | — |
Repurchase Agreement | | | — | | | 7,500,000 | | | — |
| | | | | | | | | |
| | $ | — | | $ | 65,086,159 | | $ | — |
Other Financial Instruments* | | | — | | | — | | | — |
| | | | | | | | | |
Total | | $ | — | | $ | 65,086,159 | | $ | — |
| | | | | | | | | |
| * | Other financial instruments are derivative instruments not reflected in the Portfolio of Investments, such as futures, forwards and swap contracts, which are valued at the unrealized appreciation/depreciation on the instrument. |
As of October 31, 2008 and October 31, 2009, the Portfolio did not use any significant unobservable inputs (Level 3) in determining the value of investments.
The industry classification of investments and assets in excess of other liabilities shown as a percentage of net assets as of October 31, 2009 were as follows:
| | | |
Federal Home Loan Bank | | 36.3 | % |
Federal Home Loan Mortgage Corp. | | 34.8 | |
Federal National Mortgage Assoc. | | 13.6 | |
Repurchase Agreement | | 11.3 | |
Federal Farm Credit Bank | | 2.3 | |
| | | |
| | 98.3 | |
Assets in excess of other liabilities | | 1.7 | |
| | | |
| | 100.0 | % |
| | | |
See Notes to Financial Statements.
| | |
| THE TARGET PORTFOLIO TRUST | | 151 |
Statements of Assets and Liabilities October 31, 2009
| | | | | | | | | | | | |
| | | LARGE
CAPITALIZATION
GROWTH
PORTFOLIO | | LARGE
CAPITALIZATION
VALUE
PORTFOLIO | | SMALL
CAPITALIZATION
GROWTH
PORTFOLIO | | SMALL
CAPITALIZATION
VALUE
PORTFOLIO |
| | | | |
| ASSETS | | | | | | | | | | | | |
Investments, at value(G): | | | | | | | | | | | | |
Unaffiliated investments(A) | | $ | 183,177,835 | | $ | 195,639,970 | | $ | 80,242,367 | | $ | 548,187,252 |
Affiliated investments(B) | | | 44,241,424 | | | 31,319,177 | | | 24,005,415 | | | 135,868,408 |
Repurchase agreements(C) | | | — | | | — | | | — | | | — |
Cash | | | 867,092 | | | — | | | — | | | 341,551 |
Deposit with broker | | | — | | | — | | | — | | | — |
Foreign currency, at value(D) | | | — | | | — | | | — | | | — |
Receivable for Trust shares sold | | | 738,613 | | | 792,621 | | | 504,118 | | | 1,748,073 |
Dividends and interest receivable | | | 186,787 | | | 321,258 | | | 11,885 | | | 428,902 |
Receivable for investments sold | | | 4,712,039 | | | 1,749,247 | | | 276,154 | | | 1,623,200 |
Receivable for foreign tax reclaim | | | 970 | | | 10,264 | | | — | | | — |
Due from broker for variation margin | | | — | | | — | | | — | | | — |
Payments made for swap agreements | | | — | | | — | | | — | | | — |
Unrealized appreciation on swaps | | | — | | | — | | | — | | | — |
Unrealized appreciation on forward currency contracts | | | — | | | — | | | — | | | — |
Prepaid expenses and other assets | | | 3,177 | | | 6,396 | | | 1,352 | | | 8,949 |
Total assets | | | 233,927,937 | | | 229,838,933 | | | 105,041,291 | | | 688,206,335 |
| | | | |
| LIABILITIES | | | | | | | | | | | | |
Collateral for securities on loan | | | 35,300,754 | | | 12,438,708 | | | 22,962,756 | | | 110,553,795 |
Reverse repurchase agreement | | | — | | | — | | | — | | | — |
Payable for Trust shares reacquired | | | 333,418 | | | 464,414 | | | 174,770 | | | 711,473 |
Payable for investments purchased | | | 3,819,194 | | | 2,488,744 | | | 791,090 | | | 4,636,494 |
Accrued expenses and other liabilities | | | 91,019 | | | 98,145 | | | 81,145 | | | 102,732 |
Management fee payable | | | 102,776 | | | 105,102 | | | 43,835 | | | 311,813 |
Affiliated transfer agent fee payable | | | 21,338 | | | 20,128 | | | 9,996 | | | 56,654 |
Deferred trustees’ fees | | | 10,257 | | | 10,186 | | | 9,856 | | | 9,967 |
Distribution fee payable | | | 30,363 | | | 30,246 | | | 12,516 | | | 14,746 |
Payable to custodian | | | — | | | 15,705,386 | | | 155,389 | | | — |
Interest payable | | | — | | | — | | | — | | | — |
Dividends payable | | | — | | | — | | | — | | | — |
Due to broker for variation margin | | | — | | | — | | | — | | | 32,340 |
Options written(E) | | | — | | | — | | | — | | | — |
Payments received for swap agreements | | | — | | | — | | | — | | | — |
Unrealized depreciation on swaps | | | — | | | — | | | — | | | — |
Unrealized depreciation on forward currency contracts | | | — | | | — | | | — | | | — |
Securities sold short, at value(F) | | | — | | | — | | | — | | | — |
Total liabilities | | | 39,709,119 | | | 31,361,059 | | | 24,241,353 | | | 116,430,014 |
| | | | |
| NET ASSETS | | $ | 194,218,818 | | $ | 198,477,874 | | $ | 80,799,938 | | $ | 571,776,321 |
See Notes to Financial Statements.
| | |
| 152 | | THE TARGET PORTFOLIO TRUST |
Statements of Assets and Liabilities October 31, 2009 (continued)
| | | | | | | | | | | | | | | | |
| | | LARGE
CAPITALIZATION
GROWTH
PORTFOLIO | | | LARGE
CAPITALIZATION
VALUE
PORTFOLIO | | | SMALL
CAPITALIZATION
GROWTH
PORTFOLIO | | | SMALL
CAPITALIZATION
VALUE
PORTFOLIO | |
Net assets were comprised of: | | | | | | | | | | | | | | | | |
Shares of beneficial interest, at par | | $ | 17,823 | | | $ | 22,508 | | | $ | 10,390 | | | $ | 36,877 | |
Paid-in capital, in excess of par | | | 238,376,083 | | | | 289,301,359 | | | | 130,940,332 | | | | 596,795,545 | |
| | | 238,393,906 | | | | 289,323,867 | | | | 130,950,722 | | | | 596,832,422 | |
Undistributed (Distributions in excess of) net investment income | | | 999,436 | | | | 3,091,189 | | | | (9,856 | ) | | | 5,213,735 | |
Accumulated net realized gains (losses) | | | (74,688,023 | ) | | | (108,396,683 | ) | | | (55,891,125 | ) | | | (66,278,738 | ) |
Net unrealized appreciation (depreciation) | | | 29,513,499 | | | | 14,459,501 | | | | 5,750,197 | | | | 36,008,902 | |
Net assets, October 31, 2009 | | $ | 194,218,818 | | | $ | 198,477,874 | | | $ | 80,799,938 | | | $ | 571,776,321 | |
(A) Identified cost of unaffiliated investments | | $ | 153,664,653 | | | $ | 181,181,216 | | | $ | 74,492,170 | | | $ | 512,110,890 | |
(B) Identified cost of affiliated investments | | $ | 44,241,424 | | | $ | 31,319,177 | | | $ | 24,005,415 | | | $ | 135,868,408 | |
(C) Identified cost of repurchase agreements | | | — | | | | — | | | | — | | | | — | |
(D) Identified cost of currency | | | — | | | | — | | | | — | | | | — | |
(E) Premiums received from options written | | | — | | | | — | | | | — | | | | — | |
(F) Proceeds received from short sales | | | — | | | | — | | | | — | | | | — | |
(G) Including securities on loan of | | $ | 33,352,021 | | | $ | 11,691,870 | | | $ | 21,657,862 | | | $ | 103,540,932 | |
| | | | |
| NET ASSET VALUE: | | | | | | | | | | | | | | | | |
Class R: | | | | | | | | | | | | | | | | |
Net Assets | | $ | 70,097,110 | | | $ | 70,291,176 | | | $ | 28,128,912 | | | $ | 33,573,829 | |
Shares Outstanding | | | 6,462,478 | | | | 7,992,810 | | | | 3,650,451 | | | | 2,179,082 | |
Net asset value, offering price and redemption price per share | | $ | 10.85 | | | $ | 8.79 | | | $ | 7.71 | | | $ | 15.41 | |
Class T: | | | | | | | | | | | | | | | | |
Net Assets | | $ | 124,121,708 | | | $ | 128,186,698 | | | $ | 52,671,026 | | | $ | 538,202,492 | |
Shares Outstanding | | | 11,360,290 | | | | 14,515,192 | | | | 6,739,221 | | | | 34,697,514 | |
Net asset value, offering price and redemption price per share | | $ | 10.93 | | | $ | 8.83 | | | $ | 7.82 | | | $ | 15.51 | |
See Notes to Financial Statements.
| | |
| THE TARGET PORTFOLIO TRUST | | 153 |
Statements of Assets and Liabilities October 31, 2009 (continued)
| | | | | | | | | |
| | | INTERNATIONAL
EQUITY
PORTFOLIO | | INTERNATIONAL
BOND
PORTFOLIO | | TOTAL RETURN
BOND
PORTFOLIO |
| | | |
| ASSETS | | | | | | | | | |
Investments, at value(G): | | | | | | | | | |
Unaffiliated investments(A) | | $ | 173,851,631 | | $ | 32,381,678 | | $ | 304,208,672 |
Affiliated investments(B) | | | 1,182,657 | | | 68,460 | | | 1,385,150 |
Repurchase agreements(C) | | | — | | | — | | | 1,700,000 |
Cash | | | — | | | — | | | 493,874 |
Deposit with broker | | | — | | | 73,600 | | | 92,000 |
Foreign currency, at value(D) | | | 649,533 | | | 4,738 | | | 2,499,919 |
Receivable for Trust shares sold | | | 546,898 | | | 222,621 | | | 1,045,444 |
Dividends and interest receivable | | | 426,849 | | | 519,077 | | | 2,576,619 |
Receivable for investments sold | | | 223,634 | | | 861,171 | | | 148,906,088 |
Receivable for foreign tax reclaim | | | 876,708 | | | — | | | — |
Due from broker for variation margin | | | — | �� | | 4,319 | | | 55,244 |
Payments made for swap agreements | | | — | | | 113,771 | | | 193,187 |
Unrealized appreciation on swaps | | | — | | | 126,677 | | | 1,830,688 |
Unrealized appreciation on forward currency contracts | | | 21,635 | | | 61,963 | | | 138,614 |
Prepaid expenses and other assets | | | 2,797 | | | 434 | | | 4,565 |
Total assets | | | 177,782,342 | | | 34,438,509 | | | 465,130,064 |
| | | |
| LIABILITIES | | | | | | | | | |
Collateral for securities on loan | | | — | | | — | | | — |
Loan payable (Note 7) | | | 668,000 | | | — | | | — |
Payable for Trust shares reacquired | | | 332,610 | | | 66,347 | | | 713,492 |
Payable for investments purchased | | | 183,052 | | | 8,080,440 | | | 117,681,089 |
Accrued expenses and other liabilities | | | 114,484 | | | 140,724 | | | 200,549 |
Management fee payable | | | 109,054 | | | 10,760 | | | 109,031 |
Affiliated transfer agent fee payable | | | 16,059 | | | 2,270 | | | 38,002 |
Deferred trustees’ fees | | | 9,963 | | | 9,670 | | | 9,862 |
Distribution fee payable | | | 24,794 | | | — | | | 29,547 |
Payable to custodian | | | 64,860 | | | 52,016 | | | — |
Interest payable | | | 1,000 | | | — | | | — |
Dividends payable | | | — | | | — | | | 498,239 |
Due to broker | | | — | | | 530,000 | | | 1,720,000 |
Due to broker for variation margin | | | — | | | — | | | — |
Options written(E) | | | — | | | 13,097 | | | 150 |
Payments received for swap agreements | | | — | | | 7,354 | | | 631,829 |
Unrealized depreciation on swaps | | | — | | | 82,409 | | | 343,722 |
Unrealized depreciation on forward currency contracts | | | 68,095 | | | 155,147 | | | 138,048 |
Securities sold short, at value(F) | | | — | | | — | | | 53,776,197 |
Total liabilities | | | 1,591,971 | | | 9,150,234 | | | 175,889,757 |
| | | |
| NET ASSETS | | $ | 176,190,371 | | $ | 25,288,275 | | $ | 289,240,307 |
See Notes to Financial Statements.
| | |
| 154 | | THE TARGET PORTFOLIO TRUST |
Statements of Assets and Liabilities October 31, 2009 (continued)
| | | | | | | | | | | |
| | | INTERNATIONAL
EQUITY
PORTFOLIO | | | INTERNATIONAL
BOND
PORTFOLIO | | TOTAL RETURN
BOND
PORTFOLIO | |
Net assets were comprised of: | | | | | | | | | | | |
Shares of beneficial interest, at par | | $ | 16,297 | | | $ | 3,112 | | $ | 26,319 | |
Paid-in capital, in excess of par | | | 208,137,296 | | | | 23,580,001 | | | 280,673,250 | |
| | | 208,153,593 | | | | 23,583,113 | | | 280,699,569 | |
Undistributed (Distributions in excess of) net
investment income | | | 1,299,400 | | | | 916,171 | | | (327,746 | ) |
Accumulated net realized gains (losses) | | | (32,616,842 | ) | | | 208,258 | | | 6,172,480 | |
Net unrealized appreciation (depreciation) | | | (645,780 | ) | | | 580,733 | | | 2,696,004 | |
Net assets, October 31, 2009 | | $ | 176,190,371 | | | $ | 25,288,275 | | $ | 289,240,307 | |
(A) Identified cost of unaffiliated investments | | $ | 174,568,863 | | | $ | 31,765,633 | | $ | 303,956,070 | |
(B) Identified cost of affiliated investments | | $ | 1,182,657 | | | $ | 68,460 | | $ | 1,385,150 | |
(C) Identified cost of repurchase agreements | | | — | | | | — | | $ | 1,700,000 | |
(D) Identified cost of currency | | $ | 631,515 | | | $ | 4,536 | | $ | 2,445,848 | |
(E) Premiums received from options written | | | — | | | $ | 31,733 | | $ | 8,340 | |
(F) Proceeds received from short sales | | | — | | | | — | | $ | 53,553,367 | |
(G) Including securities on loan of | | | — | | | | — | | | — | |
| | | |
| NET ASSET VALUE: | | | | | | | | | | | |
Class R: | | | | | | | | | | | |
Net Assets | | $ | 57,184,160 | | | | — | | $ | 71,456,629 | |
Shares Outstanding | | | 5,306,181 | | | | — | | | 6,535,000 | |
Net asset value, offering price and redemption price per share | | $ | 10.78 | | | | — | | $ | 10.93 | |
Class T: | | | | | | | | | | | |
Net Assets | | $ | 119,006,211 | | | $ | 25,288,275 | | $ | 217,783,678 | |
Shares Outstanding | | | 10,990,406 | | | | 3,112,454 | | | 19,783,982 | |
Net asset value, offering price and redemption price per share | | $ | 10.83 | | | $ | 8.12 | | $ | 11.01 | |
See Notes to Financial Statements.
| | |
| THE TARGET PORTFOLIO TRUST | | 155 |
Statements of Assets and Liabilities October 31, 2009 (continued)
| | | | | | | | | |
| | | INTERMEDIATE-
TERM BOND
PORTFOLIO | | MORTGAGE
BACKED
SECURITIES
PORTFOLIO | | U.S.
GOVERNMENT
MONEY MARKET
PORTFOLIO |
| | | |
| ASSETS | | | | | | | | | |
Investments, at value(G): | | | | | | | | | |
Unaffiliated investments(A) | | $ | 238,401,357 | | $ | 61,020,662 | | $ | 57,586,159 |
Affiliated investments(B) | | | 878,101 | | | 1,348,563 | | | — |
Repurchase agreements(C) | | | 2,400,000 | | | — | | | 7,500,000 |
Cash | | | — | | | — | | | 1,454,262 |
Deposit with broker | | | — | | | — | | | — |
Foreign currency, at value(D) | | | 447,194 | | | — | | | — |
Receivable for Trust shares sold | | | 3,191,756 | | | 21,835 | | | 71,373 |
Dividends and interest receivable | | | 1,550,510 | | | 222,020 | | | 32,503 |
Receivable from Management | | | — | | | — | | | 15,715 |
Receivable for investments sold | | | 63,079,854 | | | 402,939 | | | — |
Receivable for foreign tax reclaim | | | — | | | — | | | — |
Due from broker for variation margin | | | 291,844 | | | 6,078 | | | — |
Payments made for swap agreements | | | 7,661 | | | — | | | — |
Unrealized appreciation on swaps | | | 34,224 | | | 59,940 | | | — |
Unrealized appreciation on forward currency contracts | | | 4,202 | | | — | | | — |
Prepaid expenses and other assets | | | 4,035 | | | 753 | | | 1,600 |
Total assets | | | 310,290,738 | | | 63,082,790 | | | 66,661,612 |
| | | |
| LIABILITIES | | | | | | | | | |
Collateral for securities on loan | | | — | | | — | | | — |
Reverse repurchase agreement | | | — | | | 5,000,000 | | | — |
Payable for Trust shares reacquired | | | 1,436,586 | | | 31,385 | | | 356,456 |
Payable for investments purchased | | | 29,487,673 | | | 16,551,523 | | | — |
Accrued expenses and other liabilities | | | 115,751 | | | 132,197 | | | 56,260 |
Management fee payable | | | 92,831 | | | 15,677 | | | — |
Affiliated transfer agent fee payable | | | 16,385 | | | 2,200 | | | 7,600 |
Deferred trustees’ fees | | | 10,249 | | | 9,783 | | | 9,750 |
Payable to custodian | | | 712,981 | | | 37,033 | | | — |
Dividends payable | | | 204,112 | | | 98,936 | | | 456 |
Due to broker for variation margin | | | — | | | — | | | — |
Options written(E) | | | 15,671 | | | — | | | — |
Payments received for swap agreements | | | 43,112 | | | — | | | — |
Unrealized depreciation on swaps | | | 186,116 | | | 92,258 | | | — |
Unrealized depreciation on forward currency contracts | | | 28,721 | | | — | | | — |
Securities sold short, at value(F) | | | 32,423,722 | | | — | | | — |
Total liabilities | | | 64,773,910 | | | 21,970,992 | | | 430,522 |
| | | |
| NET ASSETS | | $ | 245,516,828 | | $ | 41,111,798 | | $ | 66,231,090 |
See Notes to Financial Statements.
| | |
| 156 | | THE TARGET PORTFOLIO TRUST |
Statements of Assets and Liabilities October 31, 2009 (continued)
| | | | | | | | | | | |
| | | INTERMEDIATE-
TERM BOND
PORTFOLIO | | | MORTGAGE
BACKED
SECURITIES
PORTFOLIO | | | U.S.
GOVERNMENT
MONEY MARKET
PORTFOLIO |
Net assets were comprised of: | | | | | | | | | | | |
Shares of beneficial interest, at par | | $ | 22,626 | | | $ | 4,126 | | | $ | 66,216 |
Paid-in capital, in excess of par | | | 234,093,666 | | | | 45,769,537 | | | | 66,149,218 |
| | | 234,116,292 | | | | 45,773,663 | | | | 66,215,434 |
Undistributed (Distributions in excess of) net
investment income (loss) | | | (241,720 | ) | | | 86,565 | | | | 15,656 |
Accumulated net realized gains (losses) | | | 9,360,776 | | | | (5,313,372 | ) | | | — |
Net unrealized appreciation (depreciation) | | | 2,281,480 | | | | 564,942 | | | | — |
Net assets, October 31, 2009 | | $ | 245,516,828 | | | $ | 41,111,798 | | | $ | 66,231,090 |
(A) Identified cost of unaffiliated investments | | $ | 236,833,743 | | | $ | 60,338,352 | | | $ | 57,586,159 |
(B) Identified cost of affiliated investments | | $ | 878,101 | | | $ | 1,348,563 | | | | — |
(C) Identified cost of repurchase agreements | | $ | 2,400,000 | | | | — | | | $ | 7,500,000 |
(D) Identified cost of currency | | $ | 443,782 | | | | — | | | | — |
(E) Premiums received from options written | | $ | 260,121 | | | | — | | | | — |
(F) Proceeds received from short sales | | $ | 32,130,508 | | | | — | | | | — |
(G) Including securities on loan of | | | — | | | | — | | | | — |
| | | |
| NET ASSET VALUE: | | | | | | | | | | | |
Class R: | | | | | | | | | | | |
Net Assets | | | — | | | | — | | | | — |
Shares Outstanding | | | — | | | | — | | | | — |
Net asset value, offering price and redemption price per share | | | — | | | | — | | | | — |
Class T: | | | | | | | | | | | |
Net Assets | | $ | 245,516,828 | | | $ | 41,111,798 | | | $ | 66,231,090 |
SharesOutstanding | | | 22,625,779 | | | | 4,126,451 | | | | 66,215,641 |
Net asset value, offering price and redemption price per share | | $ | 10.85 | | | $ | 9.96 | | | $ | 1.00 |
See Notes to Financial Statements.
| | |
| THE TARGET PORTFOLIO TRUST | | 157 |
Statements of Operations
Year Ended October 31, 2009
| | | | | | | | | | | | | | | | |
| | | LARGE
CAPITALIZATION
GROWTH
PORTFOLIO | | | LARGE
CAPITALIZATION
VALUE
PORTFOLIO | | | SMALL
CAPITALIZATION
GROWTH
PORTFOLIO | | | SMALL
CAPITALIZATION
VALUE
PORTFOLIO | |
| | | | |
| NET INVESTMENT INCOME (LOSS) | | | | | | | | | | | | | | | | |
Income | | | | | | | | | | | | | | | | |
Unaffiliated dividend income | | $ | 2,716,549 | | | $ | 6,153,757 | | | $ | 278,071 | | | $ | 9,457,611 | |
Affiliated dividend income | | | 82,289 | | | | 32,967 | | | | 13,342 | | | | 220,961 | |
Less: Foreign withholding taxes | | | (19,351 | ) | | | (30,084 | ) | | | (1,076 | ) | | | (19,198 | ) |
Affiliated income from securities lending, net | | | 204,212 | | | | 95,002 | | | | 262,975 | | | | 858,957 | |
Unaffiliated interest | | | 1,016 | | | | — | | | | — | | | | 1,564 | |
Total income | | | 2,984,715 | | | | 6,251,642 | | | | 553,312 | | | | 10,519,895 | |
Expenses | | | | | | | | | | | | | | | | |
Management fee | | | 1,065,991 | | | | 1,097,220 | | | | 438,874 | | | | 2,792,902 | |
Loan interest expense (Note 7) | | | — | | | | 661 | | | | 196 | | | | — | |
Distribution fee—Class R | | | 270,181 | | | | 267,457 | | | | 110,185 | | | | 132,127 | |
Transfer agent’s fees and expenses(a) | | | 178,000 | | | | 147,000 | | | | 88,000 | | | | 480,000 | |
Custodian’s fees and expenses | | | 129,000 | | | | 107,000 | | | | 70,000 | | | | 217,000 | |
Reports to shareholders | | | 40,000 | | | | 46,000 | | | | 60,000 | | | | 85,000 | |
Registration fees | | | 30,000 | | | | 31,000 | | | | 26,000 | | | | 30,000 | |
Legal fees | | | 16,000 | | | | 17,000 | | | | 15,000 | | | | 18,000 | |
Trustees’ fees | | | 19,000 | | | | 21,000 | | | | 15,000 | | | | 29,000 | |
Audit fees | | | 23,000 | | | | 23,000 | | | | 24,000 | | | | 31,000 | |
Miscellaneous | | | 18,990 | | | | 29,405 | | | | 6,954 | | | | 37,240 | |
Total expenses | | | 1,790,162 | | | | 1,786,743 | | | | 854,209 | | | | 3,852,269 | |
| Net investment income (loss) | | | 1,194,553 | | | | 4,464,899 | | | | (300,897 | ) | | | 6,667,626 | |
| | | | |
| REALIZED AND UNREALIZED GAIN (LOSS) ON INVESTMENTS AND FOREIGN CURRENCIES | | | | | | | | | | | | | | | | |
Net realized gain (loss) on: | | | | | | | | | | | | | | | | |
Investment transactions | | | (38,264,165 | ) | | | (71,209,034 | ) | | | (25,907,355 | ) | | | (57,281,461 | ) |
Futures transactions | | | (152,965 | ) | | | — | | | | — | | | | 174,767 | |
Foreign currency transactions | | | 18,727 | | | | 4,288 | | | | — | | | | — | |
Options written transactions | | | — | | | | — | | | | — | | | | — | |
Swap agreement transactions | | | — | | | | — | | | | — | | | | — | |
Short sale transactions | | | — | | | | — | | | | — | | | | — | |
| Total net realized gain (loss) | | | (38,398,403 | ) | | | (71,204,746 | ) | | | (25,907,355 | ) | | | (57,106,694 | ) |
Net change in unrealized appreciation (depreciation) on: | | | | | | | | | | | | | | | | |
Investments | | | 50,098,174 | | | | 71,247,866 | | | | 31,996,132 | | | | 120,701,037 | |
Futures | | | 17,518 | | | | — | | | | — | | | | 4,440 | |
Foreign currencies | | | 317 | | | | 747 | | | | — | | | | — | |
Options written | | | — | | | | — | | | | — | | | | — | |
Swaps | | | — | | | | — | | | | — | | | | — | |
Short sales | | | — | | | | — | | | | — | | | | — | |
| Net change in unrealized appreciation (depreciation) | | | 50,116,009 | | | | 71,248,613 | | | | 31,996,132 | | | | 120,705,477 | |
| Net gain (loss) | | | 11,717,606 | | | | 43,867 | | | | 6,088,777 | | | | 63,598,783 | |
| | | | |
| NET INCREASE (DECREASE) IN NET ASSETS RESULTING FROM OPERATIONS | | $ | 12,912,159 | | | $ | 4,508,766 | | | $ | 5,787,880 | | | $ | 70,266,409 | |
(a) Including affiliated expense of | | $ | 162,000 | | | $ | 139,000 | | | $ | 85,000 | | | $ | 470,000 | |
See Notes to Financial Statements.
| | |
| 158 | | THE TARGET PORTFOLIO TRUST |
Statements of Operations
Year Ended October 31, 2009 (continued)
| | | | | | | | | | | | |
| | | INTERNATIONAL
EQUITY
PORTFOLIO | | | INTERNATIONAL
BOND
PORTFOLIO | | | TOTAL RETURN
BOND
PORTFOLIO | |
| | | |
| NET INVESTMENT INCOME (LOSS) | | | | | | | | | | | | |
Income | | | | | | | | | | | | |
Unaffiliated dividend income | | $ | 4,931,445 | | | $ | — | | | $ | — | |
Affiliated dividend income | | | 34,812 | | | | 1,919 | | | | 11,660 | |
Less: Foreign withholding taxes | | | (440,250 | ) | | | — | | | | — | |
Unaffiliated interest | | | — | | | | 1,223,443 | | | | 14,013,652 | |
Total income | | | 4,526,007 | | | | 1,225,362 | | | | 14,025,312 | |
Expenses | | | | | | | | | | | | |
Management fee | | | 1,073,002 | | | | 126,239 | | | | 1,144,574 | |
Interest expense | | | — | | | | — | | | | 56,692 | |
Loan interest expense (Note 7) | | | 918 | | | | — | | | | — | |
Distribution fee—Class R | | | 216,164 | | | | — | | | | 280,514 | |
Transfer agent’s fees and expenses(a) | | | 110,000 | | | | 27,000 | | | | 386,000 | |
Custodian’s fees and expenses | | | 179,000 | | | | 160,000 | | | | 209,000 | |
Reports to shareholders | | | 44,000 | | | | 29,000 | | | | 125,000 | |
Registration fees | | | 29,000 | | | | 15,000 | | | | 30,000 | |
Legal fees | | | 17,000 | | | | 15,000 | | | | 21,000 | |
Trustees’ fees | | | 19,000 | | | | 13,000 | | | | 23,000 | |
Audit fees | | | 30,000 | | | | 91,000 | | | | 72,000 | |
Miscellaneous | | | 41,457 | | | | 11,322 | | | | 28,353 | |
Total expenses | | | 1,759,541 | | | | 487,561 | | | | 2,376,133 | |
| Net investment income (loss) | | | 2,766,466 | | | | 737,801 | | | | 11,649,179 | |
| | | |
| REALIZED AND UNREALIZED GAIN (LOSS) ON INVESTMENTS AND FOREIGN CURRENCIES | | | | | | | | | | | | |
Net realized gain (loss) on: | | | | | | | | | | | | |
Investment transactions | | | (29,538,402 | ) | | | 1,901,931 | | | | 19,544,664 | |
Futures transactions | | | — | | | | 281,547 | | | | 793,724 | |
Foreign currency transactions | | | 2,379,548 | | | | 379,141 | | | | (984,862 | ) |
Options written transactions | | | — | | | | (746,269 | ) | | | (2,156,150 | ) |
Swap agreement transactions | | | — | | | | (1,216,106 | ) | | | (3,416,052 | ) |
Short sale transactions | | | — | | | | (49,061 | ) | | | (2,119,650 | ) |
| Total net realized gain (loss) | | | (27,158,854 | ) | | | 551,183 | | | | 11,661,674 | |
Net change in unrealized appreciation (depreciation) on: | | | | | | | | | | | | |
Investments and other assets | | | 64,692,701 | | | | 2,262,758 | | | | 35,438,950 | |
Futures | | | — | | | | 21,990 | | | | (1,694,014 | ) |
Foreign currencies | | | (2,936,484 | ) | | | (822,074 | ) | | | 309,565 | |
Options written | | | — | | | | 55,613 | | | | 288,053 | |
Swaps | | | — | | | | 64,008 | | | | (141,211 | ) |
Short sales | | | — | | | | (846 | ) | | | (842,245 | ) |
| Net change in unrealized appreciation (depreciation) | | | 61,756,217 | | | | 1,581,449 | | | | 33,359,098 | |
| Net gain (loss) | | | 34,597,363 | | | | 2,132,632 | | | | 45,020,772 | |
| | | |
| NET INCREASE (DECREASE) IN NET ASSETS RESULTING FROM OPERATIONS | | $ | 37,363,829 | | | $ | 2,870,433 | | | $ | 56,669,951 | |
(a) Including affiliated expense of | | $ | 110,000 | | | $ | 26,500 | | | $ | 357,100 | |
See Notes to Financial Statements.
| | |
| THE TARGET PORTFOLIO TRUST | | 159 |
Statements of Operations
Year Ended October 31, 2009 (continued)
| | | | | | | | | | | | |
| | | INTERMEDIATE-
TERM BOND
PORTFOLIO | | | MORTGAGE
BACKED
SECURITIES
PORTFOLIO | | | U.S.
GOVERNMENT
MONEY MARKET
PORTFOLIO | |
| NET INVESTMENT INCOME (LOSS) | | | | | | | | | | | | |
Income | | | | | | | | | | | | |
Unaffiliated dividend income | | $ | — | | | $ | — | | | $ | — | |
Affiliated dividend income | | | 23,494 | | | | 8,266 | | | | 3,833 | |
Less: Foreign withholding taxes | | | — | | | | — | | | | — | |
Unaffiliated interest | | | 9,197,445 | | | | 3,703,834 | | | | 653,632 | |
Total income | | | 9,220,939 | | | | 3,712,100 | | | | 657,465 | |
Expenses | | | | | | | | | | | | |
Management fee | | | 985,098 | | | | 198,365 | | | | 213,868 | |
Interest expense | | | 111,012 | | | | 124,107 | | | | — | |
Distribution fee—Class R | | | — | | | | — | | | | — | |
Transfer agent’s fees and expenses(a) | | | 183,000 | | | | 25,000 | | | | 104,000 | |
Custodian’s fees and expenses | | | 152,000 | | | | 55,000 | | | | 54,000 | |
Reports to shareholders | | | 50,000 | | | | 15,000 | | | | 35,000 | |
Registration fees | | | 28,000 | | | | 5,000 | | | | 26,000 | |
Legal fees | | | 17,000 | | | | 9,000 | | | | 19,000 | |
Trustees’ fees | | | 20,000 | | | | 9,000 | | | | 16,000 | |
Audit fees | | | 50,000 | | | | 28,000 | | | | 19,000 | |
U.S. Treasury Money Market Fund Guarantee Program fee (Note 8) | | | — | | | | — | | | | 46,511 | |
Miscellaneous | | | 20,971 | | | | 3,967 | | | | 5,887 | |
Total expenses | | | 1,617,081 | | | | 472,439 | | | | 539,266 | |
Less: Management fee waivers | | | — | | | | — | | | | (193,090 | ) |
| Net expenses | | | 1,617,081 | | | | 472,439 | | | | 346,176 | |
| Net investment income (loss) | | | 7,603,858 | | | | 3,239,661 | | | | 311,289 | |
| REALIZED AND UNREALIZED GAIN (LOSS) ON INVESTMENTS AND FOREIGN CURRENCIES | | | | | | | | | | | | |
Net realized gain (loss) on: | | | | | | | | | | | | |
Investment transactions | | | 4,938,315 | | | | 1,422,386 | | | | 1,273 | |
Futures transactions | | | 8,482,531 | | | | (914,666 | ) | | | — | |
Foreign currency transactions | | | 258,212 | | | | — | | | | — | |
Options written transactions | | | (302,318 | ) | | | — | | | | — | |
Swap agreement transactions | | | 5,524,942 | | | | (48,208 | ) | | | — | |
Short sale transactions | | | (3,181,398 | ) | | | (964,956 | ) | | | — | |
| Total net realized gain (loss) | | | 15,720,284 | | | | (505,444 | ) | | | 1,273 | |
Net change in unrealized appreciation (depreciation) on: | | | | | | | | | | | | |
Investments and other assets | | | 16,438,854 | | | | 4,478,387 | | | | — | |
Futures | | | (3,239,464 | ) | | | (353,644 | ) | | | — | |
Foreign currencies | | | (57,037 | ) | | | — | | | | — | |
Options written | | | 224,073 | | | | — | | | | — | |
Swaps | | | (1,846,998 | ) | | | (134,849 | ) | | | — | |
Short sales | | | (555,148 | ) | | | (232,701 | ) | | | — | |
| Net change in unrealized appreciation (depreciation) | | | 10,964,280 | | | | 3,757,193 | | | | — | |
| Net gain (loss) | | | 26,684,564 | | | | 3,251,749 | | | | 1,273 | |
| NET INCREASE (DECREASE) IN NET ASSETS RESULTING FROM OPERATIONS | | $ | 34,288,422 | | | $ | 6,491,410 | | | $ | 312,562 | |
(a) Including affiliated expense of | | $ | 158,300 | | | $ | 25,000 | | | $ | 104,000 | |
See Notes to Financial Statements.
| | |
| 160 | | THE TARGET PORTFOLIO TRUST |
Statement of Changes in Net Assets
| | | | | | | | |
| | | LARGE CAPITALIZATION
GROWTH PORTFOLIO | |
| | | Year
Ended
October 31,
2009 | | | Year
Ended
October 31,
2008 | |
| | |
| INCREASE (DECREASE) IN NET ASSETS | | | | | | | | |
Operations | | | | | | | | |
Net investment income | | $ | 1,194,553 | | | $ | 2,316,713 | |
Net realized loss on investment and foreign currency transactions | | | (38,398,403 | ) | | | (35,507,224 | ) |
Net change in unrealized appreciation (depreciation) of investments | | | 50,116,009 | | | | (94,793,944 | ) |
Net increase (decrease) in net assets resulting from operations | | | 12,912,159 | | | | (127,984,455 | ) |
Dividends and Distributions (Note 1) | | | | | | | | |
Dividends from net investment income | | | | | | | | |
Class R | | | (340,259 | ) | | | (50,148 | ) |
Class T | | | (1,662,723 | ) | | | (1,151,430 | ) |
Total dividends from net investment income | | | (2,002,982 | ) | | | (1,201,578 | ) |
Distributions from net realized gains | | | | | | | | |
Class R | | | — | | | | (1,996,522 | ) |
Class T | | | — | | | | (16,748,866 | ) |
Total distributions from net realized gains | | | — | | | | (18,745,388 | ) |
Trust share transactions (Note 6) | | | | | | | | |
Net proceeds from shares sold | | | 43,086,407 | | | | 68,111,502 | |
Net asset value of shares issued in reinvestment of dividends and distributions | | | 1,999,292 | | | | 19,916,546 | |
Cost of shares reacquired | | | (60,551,781 | ) | | | (87,020,927 | ) |
Net increase (decrease) in net assets from Trust share transactions | | | (15,466,082 | ) | | | 1,007,121 | |
Total decrease | | | (4,556,905 | ) | | | (146,924,300 | ) |
| | |
| NET ASSETS | | | | | | | | |
Beginning of year | | | 198,775,723 | | | | 345,700,023 | |
End of year(a) | | $ | 194,218,818 | | | $ | 198,775,723 | |
(a) Includes undistributed net investment income of | | $ | 999,436 | | | $ | 1,789,138 | |
See Notes to Financial Statements.
| | |
| THE TARGET PORTFOLIO TRUST | | 161 |
Statement of Changes in Net Assets (continued)
| | | | | | | | |
| | | LARGE CAPITALIZATION
VALUE PORTFOLIO | |
| | | Year
Ended
October 31,
2009 | | | Year
Ended
October 31,
2008 | |
| | |
| INCREASE (DECREASE) IN NET ASSETS | | | | | | | | |
Operations | | | | | | | | |
Net investment income | | $ | 4,464,899 | | | $ | 7,584,058 | |
Net realized loss on investment and foreign currency transactions | | | (71,204,746 | ) | | | (35,177,662 | ) |
Net change in unrealized appreciation (depreciation) of investments | | | 71,248,613 | | | | (127,243,378 | ) |
Net increase (decrease) in net assets resulting from operations | | | 4,508,766 | | | | (154,836,982 | ) |
Dividends and Distributions (Note 1) | | | | | | | | |
Dividends from net investment income | | | | | | | | |
Class R | | | (1,487,784 | ) | | | (478,872 | ) |
Class T | | | (5,593,931 | ) | | | (6,667,475 | ) |
Total dividends from net investment income | | | (7,081,715 | ) | | | (7,146,347 | ) |
Distributions from net realized gains | | | | | | | | |
Class R | | | — | | | | (2,552,515 | ) |
Class T | | | — | | | | (26,245,278 | ) |
Total distributions from net realized gains | | | — | | | | (28,797,793 | ) |
Trust share transactions (Note 6) | | | | | | | | |
Net proceeds from shares sold | | | 50,030,153 | | | | 76,462,326 | |
Net asset value of shares issued in reinvestment of dividends and distributions | | | 6,894,855 | | | | 34,220,003 | |
Cost of shares reacquired | | | (70,869,503 | ) | | | (108,763,708 | ) |
Net increase (decrease) in net assets from Trust share transactions | | | (13,944,495 | ) | | | 1,918,621 | |
Total decrease | | | (16,517,444 | ) | | | (188,862,501 | ) |
| | |
| NET ASSETS | | | | | | | | |
Beginning of year | | | 214,995,318 | | | | 403,857,819 | |
End of year(a) | | $ | 198,477,874 | | | $ | 214,995,318 | |
(a) Includes undistributed net investment income of | | $ | 3,091,189 | | | $ | 5,703,717 | |
See Notes to Financial Statements.
| | |
| 162 | | THE TARGET PORTFOLIO TRUST |
Statement of Changes in Net Assets (continued)
| | | | | | | | |
| | | SMALL CAPITALIZATION
GROWTH PORTFOLIO | |
| | | Year
Ended
October 31,
2009 | | | Year
Ended
October 31,
2008 | |
| | |
| INCREASE (DECREASE) IN NET ASSETS | | | | | | | | |
Operations | | | | | | | | |
Net investment income (loss) | | $ | (300,897 | ) | | $ | 93,405 | |
Net realized loss on investment and foreign currency transactions | | | (25,907,355 | ) | | | (18,990,580 | ) |
Net change in unrealized appreciation (depreciation) of investments | | | 31,996,132 | | | | (52,301,656 | ) |
Net increase (decrease) in net assets resulting from operations | | | 5,787,880 | | | | (71,198,831 | ) |
Dividends and Distributions (Note 1) | | | | | | | | |
Dividends from net investment income | | | | | | | | |
Class R | | | — | | | | — | |
Class T | | | (93,303 | ) | | | — | |
Total dividends from net investment income | | | (93,303 | ) | | | — | |
Distributions from net realized gains | | | | | | | | |
Class R | | | — | | | | — | |
Class T | | | — | | | | — | |
Total distributions from net realized gains | | | — | | | | — | |
Trust share transactions (Note 6) | | | | | | | | |
Net proceeds from shares sold | | | 21,929,360 | | | | 31,455,208 | |
Net asset value of shares issued in reinvestment of dividends and distributions | | | 93,098 | | | | — | |
Cost of shares reacquired | | | (23,759,246 | ) | | | (33,985,933 | ) |
Net decrease in net assets from Trust share transactions | | | (1,736,788 | ) | | | (2,530,725 | ) |
Total increase (decrease) | | | 3,957,789 | | | | (73,729,556 | ) |
| | |
| NET ASSETS | | | | | | | | |
Beginning of year | | | 76,842,149 | | | | 150,571,705 | |
End of year(a) | | $ | 80,799,938 | | | $ | 76,842,149 | |
(a) Includes undistributed net investment income of | | | — | | | $ | 81,789 | |
See Notes to Financial Statements.
| | |
| THE TARGET PORTFOLIO TRUST | | 163 |
Statement of Changes in Net Assets (continued)
| | | | | | | | |
| | | SMALL CAPITALIZATION
VALUE PORTFOLIO | |
| | | Year
Ended
October 31,
2009 | | | Year
Ended
October 31,
2008 | |
| | |
| INCREASE (DECREASE) IN NET ASSETS | | | | | | | | |
Operations | | | | | | | | |
Net investment income | | $ | 6,667,626 | | | $ | 5,907,966 | |
Net realized loss on investment and foreign currency transactions | | | (57,106,694 | ) | | | (6,335,092 | ) |
Net change in unrealized appreciation (depreciation) of investments | | | 120,705,477 | | | | (153,060,766 | ) |
Net increase (decrease) in net assets resulting from operations | | | 70,266,409 | | | | (153,487,892 | ) |
Dividends and Distributions (Note 1) | | | | | | | | |
Dividends from net investment income | | | | | | | | |
Class R | | | (266,471 | ) | | | (184,467 | ) |
Class T | | | (6,116,250 | ) | | | (5,212,824 | ) |
Total dividends from net investment income | | | (6,382,721 | ) | | | (5,397,291 | ) |
Distributions from net realized gains | | | | | | | | |
Class R | | | (133,152 | ) | | | (975,462 | ) |
Class T | | | (2,134,010 | ) | | | (22,449,550 | ) |
Total distributions from net realized gains | | | (2,267,162 | ) | | | (23,425,012 | ) |
Trust share transactions (Note 6) | | | | | | | | |
Net proceeds from shares sold | | | 227,724,010 | | | | 254,520,649 | |
Net asset value of shares issued in reinvestment of dividends and distributions | | | 8,251,408 | | | | 28,185,614 | |
Cost of shares reacquired | | | (122,576,875 | ) | | | (130,437,091 | ) |
Net increase in net assets from Trust share transactions | | | 113,398,543 | | | | 152,269,172 | |
Total increase (decrease) | | | 175,015,069 | | | | (30,041,023 | ) |
| | |
| NET ASSETS | | | | | | | | |
Beginning of year | | | 396,761,252 | | | | 426,802,275 | |
End of year(a) | | $ | 571,776,321 | | | $ | 396,761,252 | |
(a) Includes undistributed net investment income of | | $ | 5,213,735 | | | $ | 4,925,952 | |
See Notes to Financial Statements.
| | |
| 164 | | THE TARGET PORTFOLIO TRUST |
Statement of Changes in Net Assets (continued)
| | | | | | | | |
| | | INTERNATIONAL EQUITY
PORTFOLIO | |
| | | Year
Ended
October 31,
2009 | | | Year
Ended
October 31,
2008 | |
| | |
| INCREASE (DECREASE) IN NET ASSETS | | | | | | | | |
Operations | | | | | | | | |
Net investment income | | $ | 2,766,466 | | | $ | 6,220,134 | |
Net realized loss on investment and foreign currency transactions | | | (27,158,854 | ) | | | (4,423,850 | ) |
Net change in unrealized appreciation (depreciation) of investments | | | 61,756,217 | | | | (152,509,990 | ) |
Net increase (decrease) in net assets resulting from operations | | | 37,363,829 | | | | (150,713,706 | ) |
Dividends and Distributions (Note 1) | | | | | | | | |
Dividends from net investment income | | | | | | | | |
Class R | | | (1,723,488 | ) | | | (483,414 | ) |
Class T | | | (6,068,415 | ) | | | (5,909,515 | ) |
Total dividends from net investment income | | | (7,791,903 | ) | | | (6,392,929 | ) |
Distributions from net realized gains | | | | | | | | |
Class R | | | — | | | | (3,376,642 | ) |
Class T | | | — | | | | (31,835,131 | ) |
Total distributions from net realized gains | | | — | | | | (35,211,773 | ) |
Trust share transactions (Note 6) | | | | | | | | |
Net proceeds from shares sold | | | 35,995,759 | | | | 61,750,269 | |
Net asset value of shares issued in reinvestment of dividends and distributions | | | 7,779,809 | | | | 41,528,330 | |
Cost of shares reacquired | | | (56,609,450 | ) | | | (75,402,081 | ) |
Net increase (decrease) in net assets from Trust share transactions | | | (12,833,882 | ) | | | 27,876,518 | |
Total increase (decrease) | | | 16,738,044 | | | | (164,441,890 | ) |
| | |
| NET ASSETS | | | | | | | | |
Beginning of year | | | 159,452,327 | | | | 323,894,217 | |
End of year(a) | | $ | 176,190,371 | | | $ | 159,452,327 | |
(a) Includes undistributed net investment income of | | $ | 1,299,400 | | | $ | 3,945,290 | |
See Notes to Financial Statements.
| | |
| THE TARGET PORTFOLIO TRUST | | 165 |
Statement of Changes in Net Assets (continued)
| | | | | | | | |
| | | INTERNATIONAL BOND
PORTFOLIO | |
| | | Year
Ended October 31,
2009 | | | Year
Ended October 31,
2008 | |
| | |
| INCREASE (DECREASE) IN NET ASSETS | | | | | | | | |
Operations | | | | | | | | |
Net investment income | | $ | 737,801 | | | $ | 1,135,128 | |
Net realized gain on investment and foreign currency transactions | | | 551,183 | | | | 2,831,361 | |
Net change in unrealized appreciation (depreciation) of investments | | | 1,581,449 | | | | (4,532,452 | ) |
Net increase (decrease) in net assets resulting from operations | | | 2,870,433 | | | | (565,963 | ) |
Dividends and Distributions (Note 1) | | | | | | | | |
Dividends from net investment income | | | | | | | | |
Class R | | | — | | | | — | |
Class T | | | (2,979,472 | ) | | | — | |
Total dividends from net investment income | | | (2,979,472 | ) | | | — | |
Distributions from net realized gains | | | | | | | | |
Class R | | | — | | | | — | |
Class T | | | — | | | | — | |
Total distributions from net realized gains | | | — | | | | — | |
Trust share transactions (Note 6) | | | | | | | | |
Net proceeds from shares sold | | | 2,823,974 | | | | 2,097,222 | |
Net asset value of shares issued in reinvestment of dividends and distributions | | | 2,974,395 | | | | — | |
Cost of shares reacquired | | | (9,747,018 | ) | | | (11,195,986 | ) |
Net decrease in net assets from Trust share transactions | | | (3,948,649 | ) | | | (9,098,764 | ) |
Total decrease | | | (4,057,688 | ) | | | (9,664,727 | ) |
| | |
| NET ASSETS | | | | | | | | |
Beginning of year | | | 29,345,963 | | | | 39,010,690 | |
End of year(a) | | $ | 25,288,275 | | | $ | 29,345,963 | |
(a) Includes undistributed net income of | | $ | 916,171 | | | $ | 2,967,697 | |
See Notes to Financial Statements.
| | |
| 166 | | THE TARGET PORTFOLIO TRUST |
Statement of Changes in Net Assets (continued)
| | | | | | | | |
| | | TOTAL RETURN BOND
PORTFOLIO | |
| | | Year
Ended October 31,
2009 | | | Year
Ended October 31,
2008 | |
| | |
| INCREASE (DECREASE) IN NET ASSETS | | | | | | | | |
Operations | | | | | | | | |
Net investment income | | $ | 11,649,179 | | | $ | 11,925,071 | |
Net realized gain on investment and foreign currency transactions | | | 11,661,674 | | | | 13,300,433 | |
Net change in unrealized appreciation (depreciation) of investments | | | 33,359,098 | | | | (33,101,400 | ) |
Net increase (decrease) in net assets resulting from operations | | | 56,669,951 | | | | (7,875,896 | ) |
Dividends and Distributions (Note 1) | | | | | | | | |
Dividends from net investment income | | | | | | | | |
Class R | | | (3,535,132 | ) | | | (1,846,601 | ) |
Class T | | | (13,345,904 | ) | | | (9,917,028 | ) |
Total dividends from net investment income | | | (16,881,036 | ) | | | (11,763,629 | ) |
Distributions from net realized gains | | | | | | | | |
Class R | | | (3,017,305 | ) | | | — | |
Class T | | | (10,520,280 | ) | | | — | |
Total distributions from net realized gains | | | (13,537,585 | ) | | | — | |
Trust share transactions (Note 6) | | | | | | | | |
Net proceeds from shares sold | | | 68,985,781 | | | | 120,139,933 | |
Net asset value of shares issued in reinvestment of dividends and distributions | | | 30,027,837 | | | | 11,740,429 | |
Cost of shares reacquired | | | (84,213,284 | ) | | | (70,984,957 | ) |
Net increase in net assets from Trust share transactions | | | 14,800,334 | | | | 60,895,405 | |
Total increase | | | 41,051,664 | | | | 41,255,880 | |
| | |
| NET ASSETS | | | | | | | | |
Beginning of year | | | 248,188,643 | | | | 206,932,763 | |
End of year(a) | | $ | 289,240,307 | | | $ | 248,188,643 | |
(a) Includes undistributed net investment income of | | | — | | | $ | 2,468,626 | |
See Notes to Financial Statements.
| | |
| THE TARGET PORTFOLIO TRUST | | 167 |
Statement of Changes in Net Assets (continued)
| | | | | | | | |
| | | INTERMEDIATE-TERM
BOND PORTFOLIO | |
| | | Year
Ended
October 31,
2009 | | | Year
Ended
October 31,
2008 | |
| | |
| INCREASE (DECREASE) IN NET ASSETS | | | | | | | | |
Operations | | | | | | | | |
Net investment income | | $ | 7,603,858 | | | $ | 9,586,655 | |
Net realized gain on investment and foreign currency transactions | | | 15,720,284 | | | | 15,125,296 | |
Net change in unrealized appreciation (depreciation) of investments | | | 10,964,280 | | | | (12,686,242 | ) |
Net increase in net assets resulting from operations | | | 34,288,422 | | | | 12,025,709 | |
Dividends and Distributions (Note 1) | | | | | | | | |
Dividends from net investment income | | | | | | | | |
Class R | | | — | | | | — | |
Class T | | | (8,959,248 | ) | | | (10,823,628 | ) |
Total dividends from net investment income | | | (8,959,248 | ) | | | (10,823,628 | ) |
Distributions from net realized gains | | | | | | | | |
Class R | | | — | | | | — | |
Class T | | | (12,273,664 | ) | | | — | |
Total distributions from net realized gains | | | (12,273,664 | ) | | | — | |
Trust share transactions (Note 6) | | | | | | | | |
Net proceeds from shares sold | | | 64,400,801 | | | | 22,926,973 | |
Net asset value of shares issued in reinvestment of dividends and distributions | | | 21,102,156 | | | | 10,817,173 | |
Cost of shares reacquired | | | (57,589,570 | ) | | | (63,821,113 | ) |
Net increase (decrease) in net assets from Trust share transactions | | | 27,913,387 | | | | (30,076,967 | ) |
Total increase (decrease) | | | 40,968,897 | | | | (28,874,886 | ) |
| | |
| NET ASSETS | | | | | | | | |
Beginning of year | | | 204,547,931 | | | | 233,422,817 | |
End of year(a) | | $ | 245,516,828 | | | $ | 204,547,931 | |
(a) Includes undistributed net investment income of | | | — | | | $ | 565,449 | |
See Notes to Financial Statements.
| | |
| 168 | | THE TARGET PORTFOLIO TRUST |
Statement of Changes in Net Assets (continued)
| | | | | | | | |
| | | MORTGAGE BACKED
SECURITIES PORTFOLIO | |
| | | Year
Ended
October 31,
2009 | | | Year
Ended
October 31,
2008 | |
| | |
| INCREASE (DECREASE) IN NET ASSETS | | | | | | | | |
Operations | | | | | | | | |
Net investment income | | $ | 3,239,661 | | | $ | 4,122,927 | |
Net realized loss on investment and foreign currency transactions | | | (505,444 | ) | | | (645,329 | ) |
Net change in unrealized appreciation (depreciation) of investments | | | 3,757,193 | | | | (3,345,859 | ) |
Net increase in net assets resulting from operations | | | 6,491,410 | | | | 131,739 | |
Dividends and Distributions (Note 1) | | | | | | | | |
Dividends from net investment income | | | (3,475,197 | ) | | | (4,312,137 | ) |
Trust share transactions (Note 6) | | | | | | | | |
Net proceeds from shares sold | | | 907,511 | | | | 2,057,259 | |
Net asset value of shares issued in reinvestment of dividends and distributions | | | 3,413,900 | | | | 4,354,324 | |
Cost of shares reacquired | | | (17,594,089 | ) | | | (24,443,690 | ) |
Net decrease in net assets from Trust share transactions | | | (13,272,678 | ) | | | (18,032,107 | ) |
Total decrease | | | (10,256,465 | ) | | | (22,212,505 | ) |
| | |
| NET ASSETS | | | | | | | | |
Beginning of year | | | 51,368,263 | | | | 73,580,768 | |
End of year(a) | | $ | 41,111,798 | | | $ | 51,368,263 | |
(a) Includes undistributed net investment income of | | $ | 86,565 | | | $ | 168,578 | |
See Notes to Financial Statements.
| | |
| THE TARGET PORTFOLIO TRUST | | 169 |
Statement of Changes in Net Assets (continued)
| | | | | | | | |
| | | U.S. GOVERNMENT MONEY
MARKET PORTFOLIO | |
| | | Year
Ended
October 31,
2009 | | | Year
Ended
October 31,
2008 | |
| | |
| INCREASE (DECREASE) IN NET ASSETS | | | | | | | | |
Operations | | | | | | | | |
Net investment income | | $ | 311,289 | | | $ | 2,209,909 | |
Net realized gain on investment and foreign currency transactions | | | 1,273 | | | | 12,197 | |
Net increase in net assets resulting from operations | | | 312,562 | | | | 2,222,106 | |
Dividends and Distributions (Note 1) | | | | | | | | |
Dividends from net investment income | | | (311,289 | ) | | | (2,209,909 | ) |
Trust share transactions (Note 6)(b) | | | | | | | | |
Net proceeds from shares sold | | | 88,398,221 | | | | 151,264,824 | |
Net asset value of shares issued in reinvestment of dividends and distributions | | | 344,156 | | | | 2,249,665 | |
Cost of shares reacquired | | | (91,356,979 | ) | | | (151,749,323 | ) |
Net increase (decrease) in net assets from Trust share transactions | | | (2,614,602 | ) | | | 1,765,166 | |
Total increase (decrease) | | | (2,613,329 | ) | | | 1,777,363 | |
| | |
| NET ASSETS | | | | | | | | |
Beginning of year | | | 68,844,419 | | | | 67,067,056 | |
End of year(a) | | $ | 66,231,090 | | | $ | 68,844,419 | |
(a) Includes undistributed net investment income of | | $ | 15,656 | | | $ | 14,383 | |
(b) Trust share transactions are at $1 per share for the U.S. Government Money Market Portfolio | | | | | | | | |
See Notes to Financial Statements.
| | |
| 170 | | THE TARGET PORTFOLIO TRUST |
Statement of Cash Flows
| | | | |
| | | MORTGAGE BACKED
SECURITIES PORTFOLIO | |
| | | Year Ended
October 31, 2009 | |
| |
| INCREASE (DECREASE) IN CASH | | | | |
Cash flows provided from operating activities: | | | | |
Interest and dividends received | | $ | 3,842,488 | |
Operating expenses paid | | | (444,100 | ) |
Interest expenses paid | | | (124,107 | ) |
Purchases of long-term portfolio investments | | | (291,055,219 | ) |
Proceeds from disposition of short-term portfolio investments | | | 4,945,442 | |
Proceeds from disposition of long-term portfolio investments | | | 347,415,011 | |
Net proceeds from cover of short sales | | | (29,830,984 | ) |
Decrease in other assets | | | (905,460 | ) |
Net cash provided from operating activities | | | 33,843,071 | |
Cash flows from financing activities: | | | | |
Net proceeds from reverse repurchase agreement transactions | | | (17,000,000 | ) |
Cash dividends paid | | | (23,248 | ) |
Proceeds from shares sold | | | 953,069 | |
Payment of shares redeemed | | | (17,772,892 | ) |
Net cash provided by financing activities | | | (33,843,071 | ) |
Net change in cash | | | — | |
Cash at beginning of year | | | — | |
Cash at end of year | | $ | — | |
Reconciliation of Net Change in Net Assets to Net Cash Provided From Operating Activities | |
Net increase in net assets resulting from operations | | $ | 6,491,410 | |
Change in investments | | | 14,423,419 | |
Net realized loss on investments | | | 505,444 | |
Net increase in unrealized appreciation on investments | | | (3,757,193 | ) |
Change in receivable for investments sold | | | 28,463,089 | |
Change in interest receivable | | | 108,557 | |
Change in other assets | | | (299,917 | ) |
Change in payable for investments purchased | | | (11,995,970 | ) |
Change in accrued expenses and other liabilities | | | (95,768 | ) |
Total adjustments | | | 27,351,661 | |
Net cash provided from operating activities | | $ | 33,843,071 | |
See Notes to Financial Statements.
| | |
| THE TARGET PORTFOLIO TRUST | | 171 |
Notes to Financial Statements
The TARGET Portfolio Trust (the “Trust”) is an open-end management investment company. The Trust was established as a Delaware business trust on July 29, 1992 and consists of ten separate portfolios (the “Portfolio” or “Portfolios”). All the Portfolios are diversified, as defined under the Investment Company Act of 1940, except for the International Bond Portfolio. Investment operations commenced on January 5, 1993, with the exception of the International Bond Portfolio, which commenced on May 17, 1994.
The Portfolios and their investment objectives are as follows:
| • | | Large Capitalization Growth Portfolio—long-term capital appreciation through investment primarily in stocks of large corporations that, in the investment adviser’s opinion, should have earnings growth faster than that of the S&P 500; |
| • | | Large Capitalization Value Portfolio—total return consisting of capital appreciation and dividend income through investment primarily in stocks of large corporations that, in the adviser’s opinion, are undervalued; |
| • | | Small Capitalization Growth Portfolio—maximum capital appreciation through investment primarily in small company common stocks that, in the investment adviser’s opinion, should have earnings growth faster than that of the U.S. economy in general; |
| • | | Small Capitalization Value Portfolio—above average capital appreciation through investment in small company common stocks that, in the adviser’s opinion, are undervalued or overlooked in the marketplace; |
| • | | International Equity Portfolio—capital appreciation through investment primarily in stocks of companies domiciled outside the United States; |
| • | | International Bond Portfolio—high total return through investment primarily in high-quality, foreign debt securities; |
| • | | Total Return Bond Portfolio—total return of current income and capital appreciation through investment primarily in fixed-income securities of varying maturities with a dollar-weighted average portfolio maturity of more than four years but not more than fifteen years; |
| • | | Intermediate-Term Bond Portfolio—current income and reasonable stability of principal through investment primarily in high quality fixed-income securities of varying maturities with a dollar-weighted average portfolio maturity of more than three years but not more than ten years; |
| • | | Mortgage Backed Securities Portfolio—high current income primarily and capital appreciation secondarily, each consistent with the protection of capital through investment primarily in mortgage related securities; |
| • | | U.S. Government Money Market Portfolio—maximum current income consistent with maintenance of liquidity and preservation of capital through investment exclusively in short-term securities issued or guaranteed by the U.S. Government, its agencies or instrumentalities. |
The ability of issuers of debt securities (other than those issued or guaranteed by the U.S. Government) held by the Portfolios to meet their obligations may be affected by economic or political developments in a specific industry, region or country.
| | |
| 172 | | THE TARGET PORTFOLIO TRUST |
Note 1. Accounting Policies
The following is a summary of significant accounting policies followed by the Trust and the Portfolios in the preparation of its financial statements.
Securities Valuations: Securities listed on a securities exchange (other than options on securities and indices) are valued at the last sale price on such exchange on the day of valuation or, if there was no sale on such day, at the mean between the last reported bid and asked prices, or at the last bid price on such day in the absence of an asked price. Securities traded via NASDAQ are valued at the NASDAQ official closing price (NOCP) on the day of valuation, or if there was no NOCP, at the last sale price. Securities that are actively traded in the over-the-counter market, including listed securities for which the primary market is believed by Prudential Investments LLC (“PI” or “Manager”), in consultation with the subadvisor(s), to be over-the-counter, are valued at market value using prices provided by an independent pricing agent or principal market maker. Options on securities and indices traded on an exchange are valued at the last sale price as of the close of trading on the applicable exchange or, if there was no sale, at the mean between the most recently quoted bid and ask prices on such exchange or at the last bid price in the absence of an asked price. Futures contracts and options thereon traded on a commodities exchange or board of trade are valued at the last sale price at the close of trading on such exchange or board of trade or, if there was no sale on the applicable commodities exchange or board of trade on such day, at the mean between the most recently quoted bid and asked prices on such exchange or board of trade or at the last bid price in the absence of an asked price. Securities for which reliable market quotations are not readily available, or whose values have been affected by events occurring after the close of the security’s foreign market and before the Portfolio’s pricing time, are valued at fair value in accordance with the Board of Trustees’ approved fair valuation procedures. When determining the fair value of securities, some of the factors influencing the valuation include, the nature of any restrictions on disposition of the securities; assessment of the general liquidity of the securities; the issuer’s financial condition and the markets in which it does business; the cost of the investment; the size of the holding and the capitalization of issuer; the prices of any recent transactions or bids/offers for such securities or any comparable securities; any available analyst media or other reports or information deemed reliable by the investment adviser regarding the issuer or the markets or industry in which it operates. Using fair value to price securities may result in a value that is different from a security’s most recent closing price and from the price used by other mutual funds to calculate their net asset values.
Certain Portfolios held illiquid securities, including those which are restricted as to disposition under securities law (“restricted securities”). Restricted securities are valued pursuant to the valuation procedures noted above. Each Portfolio may hold up to 15% of its net assets in illiquid securities, except for the U.S. Government Money Market Portfolio, which may hold up to 10% of its net assets in illiquid securities.
Investments in mutual funds are valued at their net asset value as of the close of the New York Stock Exchange on the date of the valuation.
U.S. Government securities for which market quotations are available are valued at a price provided by an independent pricing agent or primary dealer (a dealer that trades in U.S. Government securities within the Federal Reserve System).
Securities held by the U.S. Government Money Market Portfolio are valued at amortized cost in accordance with Rule 2a-7 of the Investment Company Act, which approximates fair value. The amortized cost method involves valuing a security at its cost on the date of purchase and thereafter assuming a constant amortization to maturity of the difference between the principal amount due at maturity and the cost.
| | |
| THE TARGET PORTFOLIO TRUST | | 173 |
Short-term debt securities held by the other Portfolios, which mature in 60 days or less, are valued at amortized cost, which approximates fair value. Short-term debt securities held by the other Portfolios, which mature in more than 60 days, are valued at current market quotations.
Repurchase Agreements: In connection with transactions in repurchase agreements with United States financial institutions, it is the Trust’s policy that its custodian or designated sub custodians under tri-party repurchase agreements, as the case may be, take possession of the underlying collateral securities, the value of which exceeds the principal amount of the repurchase transaction, including accrued interest. The value of the collateral is marked-to-market on a daily basis to ensure the adequacy of the collateral. If the seller defaults, and the value of the collateral declines or, if bankruptcy proceedings are commenced with respect to the seller of the security, realization of the collateral by the Trust may be delayed or limited.
Financial Futures Contracts: A financial futures contract is an agreement to purchase (long) or sell (short) an agreed amount of securities at a set price for delivery on a future date. Upon entering into a financial futures contract, the Portfolio is required to pledge to the broker an amount of cash and/or other assets equal to a certain percentage of the contract amount. This amount is known as the “initial margin.” Subsequent payments, known as “variation margin,” are made or received by the Portfolio each day, depending on the daily fluctuations in the value of the underlying security. Such variation margin is recorded for financial statement purposes on a daily basis as an unrealized gain or loss. When the contract expires or is closed, the gain or loss is realized and is presented in the Statements of Operations as a net realized gain or loss on financial futures contracts.
The Portfolio invests in financial futures contracts in order to hedge its existing portfolio securities, or securities the Portfolio intends to purchase, against fluctuations in value caused by changes in prevailing interest rates or market conditions. Should interest rates move unexpectedly, the Portfolio may not achieve the anticipated benefits of the financial futures contracts and may realize a loss. The use of futures transactions involves the risk of imperfect correlation in movements in the price of futures contracts, interest rates and the underlying hedged assets. The Portfolio maintains a segregated account of securities or other liquid assets, the dollar value of which is at least equal to its obligation with respect to financial futures contracts.
Foreign Currency Translation: The books and records of the Portfolios are maintained in U.S. dollars. Foreign currency amounts are translated into U.S. dollars on the following basis:
(i) market value of investment securities, other assets and liabilities—at the current daily rates of exchange;
(ii) purchases and sales of investment securities, income and expenses—at the rates of exchange prevailing on the respective dates of such transactions.
The Portfolios do not isolate that portion of the results of operations arising as a result of changes in the foreign exchange rates from the fluctuations arising from changes in the market prices of long-term securities held at period end. Similarly, the Portfolios do not isolate the effect of changes in foreign exchange rates from the fluctuations arising from changes in the market prices of long-term portfolio securities sold during the period. Accordingly, realized foreign currency gains or losses are included in the reported net realized gains or losses on investment transactions.
Net realized gains or losses on foreign currency transactions represent net foreign exchange gains or losses from the holding of foreign currencies, currency gains or losses realized between the trade date and settlement date on securities transactions, and the difference between the amounts of dividends, interest and foreign withholding taxes recorded on the Portfolios’ books and the U.S. dollar equivalent amounts actually received or paid. Net unrealized currency gains or losses from valuing foreign currency denominated assets
| | |
| 174 | | THE TARGET PORTFOLIO TRUST |
and liabilities (other than investments) at period-end exchange rates are reflected as a component of net unrealized appreciation (depreciation) on investments and foreign currencies.
Foreign security and currency transactions may involve certain considerations and risks not typically associated with those of domestic origin as a result of, among other factors, the possibility of political and economic instability or the level of governmental supervision and regulation of foreign securities markets.
Forward Foreign Currency Contracts: A forward foreign currency contract is a commitment to purchase or sell a foreign currency at a future date at a negotiated forward rate. The Portfolio enters into forward foreign currency contracts in order to hedge its exposure to changes in foreign currency exchange rates on its foreign portfolio holdings or on specific receivables and payables denominated in a foreign currency. The contracts are valued daily at current forward exchange rates and any unrealized gain or loss is included in net unrealized appreciation or depreciation on foreign currency transactions. Gains or losses are realized on the settlement date of the contract equal to the difference between the settlement value of the original and negotiated forward contracts. This gain or loss, if any, is included in net realized gain or loss on foreign currency transactions. Risks may arise upon entering into these contracts from the potential inability of the counterparties to meet the terms of their contracts.
Options: The Portfolio may either purchase or write options in order to hedge against adverse market movements or fluctuations in value caused by changes in prevailing interest rates or foreign currency exchange rates with respect to securities or currencies which the Portfolio currently owns or intends to purchase. The Portfolio’s principal reason for writing options is to realize, through receipt of premiums, a greater current return than would be realized on the underlying security alone. When the Portfolio purchases an option, it pays a premium and an amount equal to that premium is recorded as an asset. When the Portfolio writes an option, it receives a premium and an amount equal to that premium is recorded as a liability. The asset or liability is adjusted daily to reflect the current market value of the option.
If an option expires unexercised, the Portfolio realizes a gain or loss to the extent of the premium received or paid. If an option is exercised, the premium received or paid is recorded as an adjustment to the proceeds from the sale or the cost basis of the purchase in determining whether the Portfolio has realized a gain or loss. The difference between the premium and the amount received or paid on affecting a closing purchase or sale transaction is also treated as a realized gain or loss. Gains or losses on purchased options are included in net realized gains or losses on investment transactions. Gains or losses on written options are presented separately as net realized gains or losses on options written.
The Portfolio, as writer of an option, may have no control over whether the contract may be exercised. As a result, the Portfolio bears the market risk of an unfavorable change in the price of the security or currencies underlying the written option. The Portfolio, as purchaser of an OTC option, bears the risk of the potential inability of the counterparties to meet the terms of their contracts. The Portfolio maintains a segregated account of securities or other liquid assets, the dollar value of which is at least equal to its obligation with respect to options.
Short Sales: Certain portfolios of the Trust may make short sales of securities as a method of hedging potential price declines in similar securities owned. The Portfolio may sell a security it does not own in anticipation of a decline in the market value of that security (short sale). When the Portfolio makes a short sale, it will borrow the security sold short and deliver it to the broker-dealer through which it made the short sale as collateral for its obligation to deliver the security upon conclusion of the sale. The Portfolio may have to pay a fee to borrow the particular security and may be obligated to return any interest or dividends received on such borrowed securities. A gain, limited to the price at which the Portfolio sold the security short, or a loss, unlimited as to dollar amount, will be recognized upon the termination of a short sale if the
| | |
| THE TARGET PORTFOLIO TRUST | | 175 |
market price at termination is less than or greater than the proceeds originally received, respectively, and is presented in the Statement of Operations as net realized gain or loss on short sales. The Portfolio maintains a segregated account of securities or other liquid assets, the dollar value of which is at least equal to its obligation with respect to short sales.
Swap Agreements: The Portfolios may enter into credit default, interest rate, total return and other forms of swap agreements. A swap agreement is an agreement to exchange the return generated by one instrument for the return generated by another instrument. In connection with these agreements, securities may be identified as collateral or received as collateral from the counterparty in accordance with the terms of the respective swap agreements to provide or receive assets of value and serve as a recourse in the event of default or bankruptcy/insolvency of either party.
Interest rate swaps represent an agreement between counterparties to exchange cash flows based on the difference between two interest rates (fixed and variable), applied to a notional principal amount for a specified period.
Credit default swaps involve one party (the protection buyer) making a stream of payments to another party (the protection seller) in exchange for the right to receive a specified payment in the event of a default or as a result of a default (“credit event”) for the referenced party/obligation, typically corporate issues or sovereign issues of an emerging country, on its obligation; or in the event of a write-down, principal shortfall, interest shortfall or default of all or part of the referenced entities comprising a credit index.
A Portfolio may use credit default swaps to provide a measure of protection against defaults of the issuers or to take an active long or short position with respect to the likelihood of a particular issuer’s default. A Portfolio may use credit default swaps on credit indices to hedge a portfolio of credit default swaps or bonds, which is less expensive than it would be to buy many credit default swaps to achieve a similar effect.
As a seller of protection on credit default swap agreements, a Portfolio will generally receive from the buyer of protection an agreed upon payment throughout the term of the swap provided that there is no credit event. As the seller, a Portfolio would effectively increase investment risk to its portfolio because, in addition to its total net assets, a Portfolio may be subject to investment exposure on the notional amount of the swap.
The maximum amount of the payments that a Portfolio as a seller of protection could be required to pay under a credit default swap agreement would be equal to the notional amount of the underlying security or index contract as a result of a credit event. These potential amounts will be partially offset by any recovery values of the respective referenced obligations, or net amounts received from the settlement of buy protection credit default swap agreements entered into by the Portfolio for the same referenced entity or index. As a buyer of protection, the Portfolio generally receives an amount up to the notional value of the swap if a credit event occurs.
Implied credit spreads, represented in absolute terms, utilized in determining the market value of credit default swap agreements on corporate issues or sovereign issues of an emerging country as of period end are disclosed in the footnotes to the Portfolios of Investments and serve as an indicator of the current status of the payment/performance risk and represent the likelihood of risk of default for the credit derivative. The implied credit spread of a particular referenced entity reflects the cost of buying /selling protection and may include upfront payments required to enter into the agreement. For credit default swap agreements on asset-backed securities and credit indices, the fair values serve as the indicator of the current status of the payment/performance risk. Wider credit spreads and increasing market value in absolute terms, when compared to the notional amount of the swap, represent a deterioration of the referenced entity’s credit sound-
| | |
| 176 | | THE TARGET PORTFOLIO TRUST |
ness and a greater likelihood of risk of default or other credit event occurring as defined under the terms of the agreement.
Some Portfolios may enter into total return swaps to manage their exposure to a security, commodity or an index. In a total return swap, one party would receive payments based on the market value of the security or the commodity involved, or total return of a specific referenced asset, such as an equity, index or bond, and in return pay a fixed amount.
These swap agreements involve, to varying degrees, elements of credit, market risk and documentation risk. Such risks involve the possibility that there will be no liquid market for these agreements, that the counterparty to the agreement may default on its obligation to perform or disagree as to the meaning of the contractual terms in the agreement, and that there will be unfavorable changes in net interest rates. The swaps are valued daily at current market value and any change in value is included in the net unrealized appreciation or depreciation on investments. Payments received or paid by the Portfolio are recorded as realized gains or losses upon termination or maturity of the swap. Risk of loss may exceed amounts recognized on the Statement of Assets and Liabilities. Swap agreements outstanding at period end, if any, are listed in the footnotes to the Portfolio of Investments.
Certain Portfolios have entered into over-the-counter derivative agreements. Such agreements include conditions which, when materialized, give the counterparty the right to cause an early termination of the transactions under those agreements. Any election by the counterparty to early terminate the contract(s) may impact the amounts reported on the financial statements. As of October 31, 2009, the Portfolios have not met conditions under such agreements that give the counterparty the right to call for an early termination.
Forward currency contracts, written options, short sales, swaps and financial futures contracts involve elements of both market and credit risk in excess of the amounts reflected on the Statement of Assets and Liabilities.
The Portfolios invested in various derivative instruments during the reporting period. The primary types of risk associated with derivative instruments are commodity risk, credit risk, equity risk, foreign exchange risk and interest rate risk. The effect of such derivative instruments on each Portfolio’s financial position and financial performance as reflected in the Statement of Assets and Liabilities and Statement of Operations is presented in the summary below.
| | |
| THE TARGET PORTFOLIO TRUST | | 177 |
Fair values of derivative instruments as of October 31, 2009 as presented in the Statement of Assets and Liabilities:
| | | | | | | | | | | | |
| | | Asset Derivatives | | | Liability Derivatives | |
Derivatives not accounted for as
hedging instruments, carried at
fair value | | Balance Sheet Location | | Fair Value | | | Balance Sheet Location | | Fair Value | |
Small Capitalization Value | | | | | | | | | | |
Equity contracts | | — | | $ | — | | | Due to broker for variation margin | | $ | 67,460 | * |
| | | | | | | | | | | | |
| | | | |
International Equity | | | | | | | | | | |
Foreign exchange contracts | | Unrealized appreciation on forward currency contracts | | $ | 21,635 | | | Unrealized depreciation on forward currency contracts | | $ | 68,095 | |
Equity contracts | | Unaffiliated investments | | | 18,225 | | | — | | | — | |
| | | | | | | | | | | | |
Total | | | | $ | 39,860 | | | | | $ | 68,095 | |
| | | | | | | | | | | | |
| | | | |
International Bond | | | | | | | | | | |
Interest rate contracts | | Due from broker for variation margin | | $ | 758 | * | | Due from broker for variation margin | | $ | 1,648 | * |
Interest rate contracts | | Unrealized appreciation on swaps | | | 33,699 | | | Unrealized depreciation on swaps | | | 5,266 | |
Interest rate contracts | | Payments made for swap agreements | | | 32,190 | | | Payments received for swap agreements | | | 1,983 | |
Interest rate contracts | | — | | | — | | | Options written | | | 6,019 | |
Foreign exchange contracts | | Unrealized appreciation on forward currency contracts | | | 61,963 | | | Unrealized depreciation on forward currency contracts | | | 155,147 | |
Foreign exchange contracts | | — | | | — | | | Options written | | | 7,078 | |
Credit contracts | | Unrealized appreciation on swaps | | | 92,978 | | | Unrealized depreciation on swaps | | | 77,143 | |
Credit contracts | | Payments made for swap agreements | | | 81,581 | | | Payments received for swap agreements | | | 5,371 | |
| | | | | | | | | | | | |
Total | | | | $ | 303,169 | | | | | $ | 259,655 | |
| | | | | | | | | | | | |
| | | | |
Total Return Bond | | | | | | | | | | |
Interest rate contracts | | Due from broker for variation margin | | $ | 1,111,737 | * | | Payments received for swap agreements | | $ | 131,521 | |
Interest rate contracts | | Unrealized appreciation on swaps | | | 675,142 | | | Unrealized depreciation on swaps | | | 49,553 | |
Interest rate contracts | | — | | | — | | | Options written | | | 150 | |
Foreign exchange contracts | | Unrealized appreciation on forward currency contracts | | | 138,614 | | | Unrealized depreciation on forward currency contracts | | | 138,048 | |
Credit contracts | | Unrealized appreciation on swaps | | | 1,155,546 | | | Unrealized depreciation on swaps | | | 294,169 | |
Credit contracts | | Payments made for swap agreements | | | 193,187 | | | Payments received for swap agreements | | | 500,308 | |
| | | | | | | | | | | | |
Total | | | | $ | 3,274,226 | | | | | $ | 1,113,749 | |
| | | | | | | | | | | | |
| | |
| 178 | | THE TARGET PORTFOLIO TRUST |
| | | | | | | | | | | | |
| | | Asset Derivatives | | | Liability Derivatives | |
Derivatives not accounted for as
hedging instruments, carried at
fair value | | Balance Sheet Location | | Fair Value | | | Balance Sheet Location | | Fair
Value | |
Intermediate-Term Bond | | | | | | | | | | |
Interest rate contracts | | Due from broker for variation margin | | $ | 1,225,266 | * | | Options written | | $ | 15,671 | |
Interest rate contracts | | — | | | — | | | Unrealized depreciation on swaps | | | 98,380 | |
Interest rate contracts | | — | | | — | | | Payments received for swap agreements | | | 32,453 | |
Foreign exchange contracts | | Unrealized appreciation on forward currency contracts | | | 4,202 | | | Unrealized depreciation on forward currency contracts | | | 28,721 | |
Credit contracts | | Unrealized appreciation on swaps | | | 34,224 | | | Unrealized depreciation on swaps | | | 87,736 | |
Credit contracts | | Payments made for swap agreements | | | 7,661 | | | Payments received for swap agreements | | | 10,659 | |
| | | | | | | | | | | | |
Total | | | | $ | 1,271,353 | | | | | $ | 273,620 | |
| | | | | | | | | | | | |
| | | | |
Mortgage Backed Securities | | | | | | | | | | |
Interest rate contracts | | Due from broker for variation margin | | $ | 40,875 | * | | Due from broker for variation margin | | $ | 125,925 | * |
Interest rate contracts | | Unrealized appreciation on swaps | | | 59,940 | | | Unrealized depreciation on swaps | | | 92,258 | |
| | | | | | | | | | | | |
Total | | | | $ | 100,815 | | | | | $ | 218,183 | |
| | | | | | | | | | | | |
| * | Includes cumulative appreciation/depreciation on futures contracts as reported in the Portfolio of Investments. Only unsettled variation margin receivable (payable) is reported within the Statement of Assets and Liabilities. |
The effects of derivative instruments on the Statement of Operations for the year ended October 31, 2009 are as follows:
| | | | | | | | | | | | | | | | | | | | | | | | | | | |
| Amount of Realized Gain or (Loss) on Derivatives Recognized in Income | |
Derivatives not accounted for
as hedging instruments,
carried at fair value | | Rights | | | Warrants | | Purchased
Options | | Futures | | | Written
Options | | Swaps | | Forward
Currency
Contracts | | Total | |
Large Capitalization Growth | | | | | | | | | | | | | | | | | | | |
Equity contracts | | $ | — | | | $ | — | | $ | — | | $ | (152,965 | ) | | $ | — | | $ | — | | $ | — | | $ | (152,965 | ) |
| | | | | | | | | | | | | | | | | | | | | | | | | | | |
Small Capitalization Value | | | | | | | | | | | | | | | | | | | |
Equity contracts | | $ | — | | | $ | — | | $ | — | | $ | 174,767 | | | $ | — | | $ | — | | $ | — | | $ | 174,767 | |
| | | | | | | | | | | | | | | | | | | | | | | | | | | |
International Equity | | | | | | | | | | | | | | | | | | | |
Foreign exchange contracts | | $ | — | | | $ | — | | $ | — | | $ | — | | | $ | — | | $ | — | | $ | 2,510,457 | | $ | 2,510,457 | |
Equity contracts | | | (113,958 | ) | | | 10,443 | | | — | | | — | | | | — | | | — | | | — | | | (103,515 | ) |
| | | | | | | | | | | | | | | | | | | | | | | | | | | |
Total | | $ | (113,958 | ) | | $ | 10,443 | | $ | — | | $ | — | | | $ | — | | $ | — | | $ | 2,510,457 | | $ | 2,406,942 | |
| | | | | | | | | | | | | | | | | | | | | | | | | | | |
| | |
| THE TARGET PORTFOLIO TRUST | | 179 |
| | | | | | | | | | | | | | | | | | | | | | | | | | | | | | |
| Amount of Realized Gain or (Loss) on Derivatives Recognized in Income (continued) | |
Derivatives not
accounted for as
hedging
instruments, carried
at fair value | | Rights | | Warrants | | Purchased
Options | | | Futures | | | Written
Options | | | Swaps | | | Forward
Currency
Contracts | | | Total | |
International Bond | | | | | | | | | | | | | | | | | | | | | | |
Interest rate
contracts | | $ | — | | $ | — | | $ | 968,455 | | | $ | 281,547 | | | $ | (746,269 | ) | | $ | (1,214,201 | ) | | $ | — | | | $ | (710,468 | ) |
Foreign exchange contracts | | | — | | | — | | | — | | | | — | | | | — | | | | — | | | | (2,059,753 | ) | | | (2,059,753 | ) |
Credit contracts | | | — | | | — | | | — | | | | — | | | | — | | | | (1,905 | ) | | | — | | | | (1,905 | ) |
| | | | | | | | | | | | | | | | | | | | | | | | | | | | | | |
Total | | $ | — | | $ | — | | $ | 968,455 | | | $ | 281,547 | | | $ | (746,269 | ) | | $ | (1,216,106 | ) | | $ | (2,059,753 | ) | | $ | (2,772,126 | ) |
| | | | | | | | | | | | | | | | | | | | | | | | | | | | | | |
Total Return Bond | | | | | | | | | | | | | | | | | | | | | | |
Interest rate
contracts | | $ | — | | $ | — | | $ | 2,946,881 | | | $ | 793,724 | | | $ | (2,151,222 | ) | | $ | (3,382,418 | ) | | $ | — | | | $ | (1,793,035 | ) |
Foreign exchange contracts | | | — | | | — | | | 302,900 | | | | — | | | | — | | | | — | | | | (847,725 | ) | | | (544,825 | ) |
Credit contracts | | | — | | | — | | | — | | | | — | | | | — | | | | (33,634 | ) | | | — | | | | (33,634 | ) |
Equity contracts | | | — | | | — | | | (200 | ) | | | — | | | | (4,928 | ) | | | — | | | | — | | | | (5,128 | ) |
| | | | | | | | | | | | | | | | | | | | | | | | | | | | | | |
Total | | $ | — | | $ | — | | $ | 3,249,581 | | | $ | 793,724 | | | $ | (2,156,150 | ) | | $ | (3,416,052 | ) | | $ | (847,725 | ) | | $ | (2,376,622 | ) |
| | | | | | | | | | | | | | | | | | | | | | | | | | | | | | |
Intermediate-Term
Bond | | | | | | | | | | | | | | | | | | | | | | |
Interest rate contracts | | $ | — | | $ | — | | $ | (27,448 | ) | | $ | 8,482,531 | | | $ | (302,318 | ) | | $ | 5,202,001 | | | $ | — | | | $ | 13,354,766 | |
Foreign exchange contracts | | | — | | | — | | | — | | | | — | | | | — | | | | — | | | | 216,303 | | | | 216,303 | |
Credit contracts | | | — | | | — | | | — | | | | — | | | | — | | | | 322,941 | | | | — | | | | 322,941 | |
| | | | | | | | | | | | | | | | | | | | | | | | | | | | | | |
Total | | $ | — | | $ | — | | $ | (27,448 | ) | | $ | 8,482,531 | | | $ | (302,318 | ) | | $ | 5,524,942 | | | $ | 216,303 | | | $ | 13,894,010 | |
| | | | | | | | | | | | | | | | | | | | | | | | | | | | | | |
Mortgage Backed
Securities | | | | | | | | | | | | | | | | | | | | | | |
Interest rate contracts | | $ | — | | $ | — | | $ | — | | | $ | (914,666 | ) | | $ | — | | | $ | (30,892 | ) | | $ | — | | | $ | (945,558 | ) |
Credit contracts | | | — | | | — | | | — | | | | — | | | | — | | | | (17,316 | ) | | | — | | | | (17,316 | ) |
| | | | | | | | | | | | | | | | | | | | | | | | | | | | | | |
Total | | $ | — | | $ | — | | $ | — | | | $ | (914,666 | ) | | $ | — | | | $ | (48,208 | ) | | $ | — | | | $ | (962,874 | ) |
| | | | | | | | | | | | | | | | | | | | | | | | | | | | | | |
|
| Change in Unrealized Appreciation or (Depreciation) on Derivatives Recognized in Income | |
Derivatives not
accounted for as
hedging
instruments, carried
at fair value | | Rights | | Warrants | | Purchased
Options | | | Futures | | | Written
Options | | | Swaps | | | Forward
Currency
Contracts | | | Total | |
Large Capitalization
Growth | | | | | | | | | | | | | | | | | | | | | | |
Equity contracts | | $ | — | | $ | — | | $ | — | | | $ | 17,518 | | | $ | — | | | $ | — | | | $ | — | | | $ | 17,518 | |
| | | | | | | | | | | | | | | | | | | | | | | | | | | | | | |
Small Capitalization
Value | | | | | | | | | | | | | | | | | | | | | | |
Equity contracts | | $ | — | | $ | — | | $ | — | | | $ | 4,440 | | | $ | — | | | $ | — | | | $ | — | | | $ | 4,440 | |
| | | | | | | | | | | | | | | | | | | | | | | | | | | | | | |
| | |
| 180 | | THE TARGET PORTFOLIO TRUST |
| | | | | | | | | | | | | | | | | | | | | | | | | | | | |
| Change in Unrealized Appreciation or (Depreciation) on Derivatives Recognized in Income (continued) | |
Derivatives not accounted for as hedging instruments, carried at fair value | | | Rights | | Warrants | |
| Purchased
Options |
| | | Futures | | |
| Written
Options | | | Swaps | | |
| Forward
Currency
Contracts |
| | | Total | |
International Equity | | | | | | | | | | | | | | | | | | | | | |
Foreign exchange contracts | | $ | — | | $— | | $ | — | | | $ | — | | | $ | — | | $ | — | | | $ | (3,086,529 | ) | | $ | (3,086,529 | ) |
Equity contracts | | | 18,225 | | — | | | — | | | | — | | | | — | | | — | | | | — | | | | 18,225 | |
| | | | | | | | | | | | | | | | | | | | | | | | | | | | |
Total | | $ | 18,225 | | $— | | $ | — | | | $ | — | | | $ | — | | $ | — | | | $ | (3,086,529 | ) | | $ | (3,068,304 | ) |
| | | | | | | | | | | | | | | | | | | | | | | | | | | | |
International Bond | | | | | | | | | | | | | | | | | | | | | |
Interest rate contracts | | $ | — | | $— | | $ | (168,475 | ) | | $ | 21,990 | | | $ | 54,100 | | $ | 264,156 | | | $ | — | | | $ | 171,771 | |
Foreign exchange contracts | | | — | | — | | | — | | | | — | | | | 1,513 | | | — | | | | 264,363 | | | | 265,876 | |
Credit contracts | | | — | | — | | | — | | | | — | | | | — | | | (200,148 | ) | | | — | | | | (200,148 | ) |
| | | | | | | | | | | | | | | | | | | | | | | | | | | | |
Total | | $ | — | | $— | | $ | (168,475 | ) | | $ | 21,990 | | | $ | 55,613 | | $ | 64,008 | | | $ | 264,363 | | | $ | 237,499 | |
| | | | | | | | | | | | | | | | | | | | | | | | | | | | |
Total Return Bond | | | | | | | | | | | | | | | | | | | | | |
Interest rate contracts | | $ | — | | $— | | $ | (2,135,023 | ) | | $ | (1,694,014 | ) | | $ | 288,053 | | $ | — | | | $ | — | | | $ | (3,540,984 | ) |
Foreign exchange contracts | | | — | | — | | | 308,225 | | | | — | | | | — | | | — | | | | 512,899 | | | | 821,124 | |
Credit contracts | | | — | | — | | | — | | | | — | | | | — | | | (2,077,302 | ) | | | — | | | | (2,077,302 | ) |
Equity contracts | | | — | | — | | | — | | | | — | | | | — | | | 1,936,091 | | | | — | | | | 1,936,091 | |
| | | | | | | | | | | | | | | | | | | | | | | | | | | | |
Total | | $ | — | | $— | | $ | (1,826,798 | ) | | $ | (1,694,014 | ) | | $ | 288,053 | | $ | (141,211 | ) | | $ | 512,899 | | | $ | (2,861,071 | ) |
| | | | | | | | | | | | | | | | | | | | | | | | | | | | |
Intermediate-Term
Bond | | | | | | | | | | | | | | | | | | | | | |
Interest rate contracts | | $ | — | | $— | | $ | (14,487 | ) | | $ | (3,239,464 | ) | | $ | 224,073 | | $ | (2,362,279 | ) | | $ | — | | | $ | (5,392,157 | ) |
Foreign exchange contracts | | | — | | — | | | — | | | | — | | | | — | | | — | | | | (114,631 | ) | | | (114,631 | ) |
Credit contracts | | | — | | — | | | — | | | | — | | | | — | | | 515,281 | | | | — | | | | 515,281 | |
| | | | | | | | | | | | | | | | | | | | | | | | | | | | |
Total | | $ | — | | $— | | $ | (14,487 | ) | | $ | (3,239,464 | ) | | $ | 224,073 | | $ | (1,846,998 | ) | | $ | (114,631 | ) | | $ | (4,991,507 | ) |
| | | | | | | | | | | | | | | | | | | | | | | | | | | | |
Mortgage Backed
Securities | | | | | | | | | | | | | | | | | | | | | |
Interest rate contracts | | $ | — | | $— | | $ | — | | | $ | (353,644 | ) | | $ | — | | $ | (134,849 | ) | | $ | — | | | $ | (488,493 | ) |
| | | | | | | | | | | | | | | | | | | | | | | | | | | | |
| | |
| THE TARGET PORTFOLIO TRUST | | 181 |
For the year ended October 31, 2009, the average volumes of derivative activities are as follows:
| | | | | | | | | | | | | | | |
Portfolio | | Purchased
Options(1) | | Written
Options(2) | | Futures
Contracts—Long
Positions(3) | | Futures
Contracts—Short
Positions(3) | | Forward
foreign
currency
exchange
purchase
contracts(4) |
Small Capitalization Value | | $ | — | | $ | — | | $ | 1,155,762 | | $ | — | | $ | — |
International Equity | | | — | | | — | | | — | | | — | | | 4,046,063 |
International Bond | | | 146,703 | | | 160,228 | | | 11,183,235 | | | — | | | 6,444,630 |
Total Return Bond | | | 612,605 | | | 310,563 | | | 231,796,162 | | | 22,977,950 | | | 17,627,410 |
Intermediate-Term Bond | | | 128,655 | | | 153,581 | | | 313,141,807 | | | 9,676,716 | | | 5,283,578 |
Mortgage Backed Securities | | | — | | | — | | | 5,428,070 | | | 9,680,784 | | | — |
| | | | | | | | | | | | |
Portfolio | | Forward
foreign
currency
exchange sale
contracts(5) | | Interest rate
swap
agreements(6) | | Credit default
swap
agreements—Buy
Protection(6) | | Credit default
swap
agreements—Sell
Protection(6) |
Small Capitalization Value | | $ | — | | $ | — | | $ | — | | $ | — |
International Equity | | | 11,930,212 | | | — | | | — | | | — |
International Bond | | | 21,047,317 | | | 29,129,100 | | | 5,798,739 | | | 660,000 |
Total Return Bond | | | 21,168,779 | | | 103,299,701 | | | 50,965,907 | | | 22,597,753 |
Intermediate-Term Bond | | | 6,831,225 | | | 119,280,383 | | | 320,000 | | | 17,276,580 |
Mortgage Backed Securities | | | — | | | 13,345,000 | | | — | | | — |
| (4) | Value at Settlement Date Payable. |
| (5) | Value at Settlement Date Receivable. |
Securities Lending: The Portfolio may lend its portfolio securities to broker-dealers. The loans are secured by collateral at least equal at all times to the market value of the securities loaned. Loans are subject to termination at the option of the borrower or the Portfolio. Upon termination of the loan, the borrower will return to the lender securities identical to the loaned securities. Should the borrower of the securities fail financially, the Portfolio has the right to repurchase the securities using the collateral in the open market. The Portfolio recognizes income, net of any rebate and securities lending agent fees, for lending its securities in the form of fees or interest on the investment of any cash received as collateral. The Portfolio also continues to receive interest and dividends or amounts equivalent thereto on the securities loaned and recognizes any unrealized gain or loss in the market price of the securities loaned that may occur during the term of the loan.
When-Issued/Delayed Delivery Securities: Certain Portfolios may purchase or sell securities on a when-issued or delayed delivery basis. These transactions involve a commitment by the Portfolio to purchase or sell securities for a predetermined price or yield, with payment and delivery taking place beyond the customary settlement period. When delayed delivery purchases are outstanding, the Portfolio will set aside and maintain until the settlement date in a segregated account, liquid assets in an amount sufficient to meet the purchase price. When purchasing a security on a delayed delivery basis, the Portfolio assumes the rights and risks of ownership of the security, including the risk of price and yield fluctuations, and takes such fluctuations into account when determining its net asset value. The Portfolio may dispose of or renegotiate a delayed delivery transaction after it is entered into, and may sell when-issued securities before they are
| | |
| 182 | | THE TARGET PORTFOLIO TRUST |
delivered, which may result in a capital gain or loss. When the Portfolio has sold a security on a delayed delivery basis, the Portfolio does not participate in future gains and losses with respect to the security.
Securities Transactions and Net Investment Income: Securities transactions are recorded on the trade date. Realized and unrealized gains and losses from security and currency transactions are calculated on the identified cost basis. Dividend income is recorded on the ex-dividend date and interest income, including amortization of premium and accretion of discount of debt securities, as required, is recorded on the accrual basis. Expenses are recorded on the accrual basis. The Trust’s expenses are allocated to the respective Portfolios on the basis of relative net assets except for expenses that are charged directly at the Portfolio or class level.
Dividends and Distributions: The Total Return Bond Portfolio, Intermediate-Term Bond Portfolio and Mortgage Backed Securities Portfolio and U.S. Government Money Market Portfolio declare dividends of their net investment income daily and pay such dividends monthly. All other Portfolios declare and pay a dividend from net investment income, if any, at least annually. Each Portfolio declares and pays its net realized capital gains, if any, at least annually. Dividends and distributions to shareholders, which are determined in accordance with federal income tax regulations and which may differ from generally accepted accounting principles, are recorded on ex-dividend date. Permanent book/ tax differences relating to income and gains are reclassified amongst undistributed net investment income, accumulated net realized gain or loss and paid-in capital, in excess of par, as appropriate.
Taxes: For federal income tax purposes, each Portfolio in the Trust is treated as a separate tax-paying entity. It is each Portfolio’s policy to continue to meet the requirements of the Internal Revenue Code applicable to regulated investment companies and to distribute all of its taxable net investment income and capital gains, if any, to its shareholders. Therefore, no federal income tax provision is required.
Withholding taxes on foreign interest and dividends are recorded net of reclaimable amounts, at the time the related income is earned.
Estimates: The preparation of the financial statements requires management to make estimates and assumptions that affect the reported amounts and disclosures in the financial statements. Actual results could differ from those estimates.
Note 2. Agreements
The Trust’s manager is Prudential Investments LLC (“PI”). PI manages the investment operations of the Trust, administers the Trust’s affairs and is responsible for the selection, subject to review and approval of the Trustees, of the advisers. PI supervises the advisers’ performance of advisory services and makes recommendations to the Trustees as to whether the advisers’ contracts should be renewed, modified or terminated. PI pays for the costs pursuant to the advisory agreements, the cost of compensation of officers of the Trust, occupancy and certain clerical and accounting costs of the Trust. The Trust bears all other costs and expenses.
The advisers noted below each furnished investment advisory services in connection with the management of the Portfolios. Each of the advisors of the equity Portfolios—Large Capitalization Growth Portfolio, Large Capitalization Value Portfolio, Small Capitalization Growth Portfolio, Small Capitalization Value Portfolio and International Equity Portfolio—manages a portion of the assets of the respective Portfolios. In general, in order to maintain a division of assets between the advisers as deemed appropriate by PI, all daily
| | |
| THE TARGET PORTFOLIO TRUST | | 183 |
cash inflows (i.e., subscriptions and reinvested distributions) and outflows (i.e., redemptions and expense items) are divided between the advisers, as PI deems appropriate. In order to maintain an approximate allocation between the advisers in the ratio deemed appropriate by PI, a periodic rebalancing of each sub-advisor’s share of Portfolio assets may occur to account for market fluctuations.
At October 31, 2009, the sub-advisors that provide subadvisory services are:
| | |
Portfolio | | Adviser |
Large Capitalization Growth | | Marsico Capital Management, LLC and Massachusetts Financial Services Company (effective 12/15/2008) |
Large Capitalization Value | | NFJ Investment Group, L.P. , Hotchkis and Wiley Capital Management, LLC and Eaton Vance Management (effective 12/15/2008) |
Small Capitalization Growth . . . | | Ashfield Capital Partners, LLC and Eagle Asset Management, Inc. |
Small Capitalization Value | | NFJ Investment Group L.P. , EARNEST Partners, LLC, Lee Munder Investments Limited, J.P. Morgan Investment Management, Inc. and Vaughan Nelson Investment Management, L.P. |
International Equity | | LSV Asset Management and Thornburg Investment Management, Inc. |
International Bond, Total Return Bond and Intermediate-Term Bond | | Pacific Investment Management Company LLC |
Mortgage Backed Securities and U.S. Government Money Market . . . | | Wellington Management Company, LLP |
The management fee payable to PI is computed daily and paid monthly, at an annual rate of the average daily net assets of the Portfolios specified below and PI, in turn, pays each adviser a fee for its services.
| | | |
Portfolio | | Contracted & Effective
Management Fee | |
Large Capitalization Growth | | 0.60 | % |
Large Capitalization Value | | 0.60 | % |
Small Capitalization Growth | | 0.60 | % |
Small Capitalization Value | | 0.60 | % |
International Equity | | 0.70 | % |
International Bond | | 0.50 | % |
Total Return Bond | | 0.45 | % |
Intermediate-Term Bond | | 0.45 | % |
Mortgage Backed Securities | | 0.45 | % |
U.S. Government Money Market | | 0.25 | % |
The Trust has a distribution agreement with Prudential Investment Management Services LLC (“PIMS”) which acts as the distributor of the Class T and Class R shares of the Trust. The Trust compensates PIMS for distributing and servicing the Trust’s Class R shares, pursuant to plan of distribution (the “Class R Plan”), regardless of expenses actually incurred by PIMS. The distribution fee is accrued daily and payable monthly. No distribution or service fees are paid to PIMS as distributor of the Class T shares of the Trust.
Pursuant to the Class R Plan, the Trust compensates PIMS for distribution related activities at an annual rate of up to .75 of 1% of the average daily net assets of the Class R shares. For the year ended October 31, 2009, PIMS has contractually agreed to limit such fees to .50 of 1% of the average daily net assets of the Class R shares through February 28, 2011.
| | |
| 184 | | THE TARGET PORTFOLIO TRUST |
PI has voluntarily agreed to waive the management fees of the U.S. Government Money Market Portfolio such that the annualized 1-day yield (excluding capital gain or loss) does not fall below 0.25%. The threshold was reduced effective March 16, 2009, May 6, 2009 and September 25, 2009 to 0.10%, 0.05% and 0.025%, respectively. The waiver/reimbursement is voluntary and may be modified or terminated by PI at any time without notice. During the year ended October 31, 2009, PI has reimbursed the Fund as a result of this voluntary agreement in the amount of $193,090 or 0.23 of 1% of the U.S. Government Money Market Portfolio’s average daily net assets.
PI and PIMS are indirect, wholly-owned subsidiaries of Prudential Financial, Inc. (“Prudential”).
Note 3. Other Transactions with Affiliates
Prudential Mutual Fund Services LLC (“PMFS”), an affiliate of PI and an indirect, wholly-owned subsidiary of Prudential, serves as the Trust’s transfer agent. Transfer agent fees and expenses in the Statement of Operations also include certain out-of-pocket expenses paid to non-affiliates where applicable.
For the year ended October 31, 2009, the amount of brokerage commissions earned by Wells Fargo Advisors, LLC, (“Wells Fargo”), an affiliate of PI, from portfolio transactions executed on behalf of the Portfolios were as follows:
| | | |
Portfolio | | Wells Fargo |
Small Capitalization Growth | | $ | 292 |
Prudential Investment Management, Inc. (“PIM”), an indirect, wholly-owned subsidiary of Prudential, is the Trust’s security lending agent. For the year ended October 31, 2009, PIM was compensated for these services by the following Portfolios of the Trust:
| | | |
Portfolio | | PIM |
Large Capitalization Growth | | $ | 86,200 |
Large Capitalization Value | | | 39,538 |
Small Capitalization Growth | | | 108,700 |
Small Capitalization Value | | | 355,100 |
Certain Portfolios invest in the Taxable Money Market Series (the “Series”), a portfolio of the Dryden Core Investment Fund. The Series is a money market mutual fund registered under the Investment Company Act of 1940, as amended, and managed by PI.
| | |
| THE TARGET PORTFOLIO TRUST | | 185 |
Note 4. Portfolio Securities
Purchases and sales of portfolio securities, excluding short-term investments and U.S. Government securities, for the year ended October 31, 2009, were as follows:
| | | | | | |
Portfolio | | Purchases | | Sales |
Large Capitalization Growth . . . | | $ | 412,957,212 | | $ | 423,395,455 |
Large Capitalization Value . . . | | | 187,746,529 | | | 203,717,384 |
Small Capitalization Growth | | | 66,595,462 | | | 67,641,292 |
Small Capitalization Value . . . | | | 336,667,597 | | | 209,840,160 |
International Equity . . . | | | 57,074,754 | | | 65,668,936 |
International Bond | | | 164,903,164 | | | 187,781,198 |
Total Return Bond . . . | | | 1,842,637,041 | | | 1,946,719,836 |
Intermediate-Term Bond | | | 923,630,967 | | | 926,384,306 |
Mortgage Backed Securities | | | 302,770,549 | | | 333,209,864 |
Transactions in options written during the year ended October 31, 2009, were as follows:
| | | | | | | |
International Bond | | Number of Contracts/
Notional Amount (000) | | | Premium Received | |
Options outstanding at October 31, 2008 | | 12,900 | | | $ | 346,377 | |
Options written | | 44,980 | | | | 101,145 | |
Options expired | | (28,610 | ) | | | (65,205 | ) |
Options closed | | (13,070 | ) | | | (350,584 | ) |
| | | | | | | |
Options outstanding at October 31, 2009 | | 16,200 | | | $ | 31,733 | |
| | | | | | | |
| | |
Intermediate-Term Bond | | Number of Contracts/
Notional Amount (000) | | | Premium Received | |
Options outstanding at October 31, 2008 | | 6,500 | | | $ | 181,120 | |
Options written | | 73,220 | | | | 366,443 | |
Options expired | | (30,720 | ) | | | (86,992 | ) |
Options closed | | (14,100 | ) | | | (200,450 | ) |
| | | | | | | |
Options outstanding at October 31, 2009 | | 34,900 | | | $ | 260,121 | |
| | | | | | | |
| | |
Total Return Bond | | Number of Contracts/
Notional Amount (000) | | | Premium Received | |
Options outstanding at October 31, 2008 | | 82,900 | | | $ | 1,143,511 | |
Options written | | 67,700 | | | | 95,809 | |
Options expired | | (54,700 | ) | | | (80,862 | ) |
Options closed | | (71,900 | ) | | | (1,150,118 | ) |
| | | | | | | |
Options outstanding at October 31, 2009 | | 24,000 | | | $ | 8,340 | |
| | | | | | | |
| | |
| 186 | | THE TARGET PORTFOLIO TRUST |
Note 5. Distributions and Tax Information
Distributions to shareholders, which are determined in accordance with federal income tax regulations, which may differ from generally accepted accounting principles, are recorded on the ex-dividend date. In order to present undistributed net investment income or loss, accumulated net realized gains or losses and paid-in-capital in excess of par on the Statement of Assets and Liabilities that more closely represent their tax character, certain adjustments have been made to paid-in-capital in excess of par, undistributed net investment income or loss and accumulated net realized gain or loss on investments.
For the fiscal year ended October 31, 2009 the adjustments were as follows:
| | | | | | | | | | | |
| | | Undistributed
Net Investment
Income or Loss | | Accumulated
Net Gain
or Loss | | | Paid-In
Capital In
Excess of Par | |
Large Capitalization Growth(a) | | $ | 18,727 | | $ | (18,727 | ) | | $ | — | |
Large Capitalization Value(a) | | | 4,288 | | | (4,288 | ) | | | — | |
Small Capitalization Growth(b),(g),(h) | | | 302,555 | | | — | | | | (302,555 | ) |
Small Capitalization Value(f),(h) | | | 2,878 | | | (2,045 | ) | | | (833 | ) |
International Equity(a) | | | 2,379,547 | | | (2.379,547 | ) | | | — | |
International Bond(a),(c),(e) | | | 190,145 | | | (190,145 | ) | | | — | |
Total Return Bond(a),(c),(d),(e) | | | 2,435,485 | | | (2,435,485 | ) | | | — | |
Intermediate-Term Bond(a),(c),(d),(e),(f),(h) | | | 548,221 | | | (546,568 | ) | | | (1,653 | ) |
Mortgage Backed Securities(c),(e) | | | 153,523 | | | (153,523 | ) | | | — | |
U.S. Government Money Market(f) | | | 1,273 | | | (1,273 | ) | | | — | |
| (a) | Reclassification of net foreign currency gain (loss). |
| (b) | Reclassification of net operating loss. |
| (c) | Reclassification of swap income. |
| (d) | Reclassification of income from defaulted securities. |
| (e) | Reclassification of paydowns. |
| (f) | Redesignation of distributions. |
| (g) | Distributions in excess of net investment income. |
| (h) | Non-deductible expenses. |
Net investment income or loss, net realized gains or losses and net assets were not affected by these adjustments.
For the fiscal year ended October 31, 2009, the tax character of dividends and distributions paid as reflected in the Statement of Changes in Net Assets were as follows:
| | | | | | | | | | | | |
| | | Ordinary
Income | | Long-Term
Capital Gains | | Distributions
in excess
of Net Investment
Income | | Total
Dividends
and
Distributions |
Large Capitalization Growth | | $ | 2,002,982 | | $ | — | | $ | — | | $ | 2,002,982 |
Large Capitalization Value | | | 7,081,715 | | | — | | | — | | | 7,081,715 |
Small Capitalization Growth | | | 92,701 | | | — | | | 602 | | | 93,303 |
Small Capitalization Value | | | 6,380,676 | | | 2,269,207 | | | — | | | 8,649,883 |
International Equity | | | 7,791,903 | | | — | | | — | | | 7,791,903 |
International Bond | | | 2,979,472 | | | — | | | — | | | 2,979,472 |
Total Return Bond | | | 30,216,702 | | | 201,919 | | | — | | | 30,418,621 |
Intermediate-Term Bond | | | 13,914,499 | | | 7,318,413 | | | — | | | 21,232,912 |
Mortgage Backed Securities | | | 3,475,197 | | | — | | | — | | | 3,475,197 |
U.S. Government Money Market | | | 311,289 | | | — | | | — | | | 311,289 |
| | |
| THE TARGET PORTFOLIO TRUST | | 187 |
For the fiscal year ended October 31, 2008, the tax character of dividends and distributions paid as reflected in the Statement of Changes in Net Assets were as follows:
| | | | | | | | | |
| | | Ordinary
Income | | Long-Term
Capital Gains | | Total
Dividends
and
Distributions |
Large Capitalization Growth | | $ | 2,843,653 | | $ | 17,103,313 | | $ | 19,946,966 |
Large Capitalization Value | | | 14,687,549 | | | 21,256,591 | | | 35,944,140 |
Small Capitalization Value | | | 13,091,103 | | | 15,731,200 | | | 28,822,303 |
International Equity | | | 18,093,678 | | | 23,511,024 | | | 41,604,702 |
Total Return Bond | | | 11,763,629 | | | — | | | 11,763,629 |
Intermediate-Term Bond | | | 10,823,628 | | | — | | | 10,823,628 |
Mortgage Backed Securities | | | 4,312,137 | | | — | | | 4,312,137 |
U.S. Government Money Market | | | 2,209,909 | | | — | | | 2,209,909 |
For federal income tax purposes, dividends from net investment income and distributions from short-term capital gains are taxable as ordinary income. Long-term capital gain distributions are taxable as such.
As of October 31, 2009, the Portfolios had the following amounts of accumulated undistributed earnings on a tax basis:
| | | | | | |
| | | Undistributed
Ordinary
Income | | Undistributed
Long-Term
Capital Gains |
Large Capitalization Growth | | $ | 1,009,692 | | $ | — |
Large Capitalization Value | | | 3,101,375 | | | — |
Small Capitalization Value | | | 5,223,702 | | | — |
International Equity | | | 1,276,400 | | | — |
International Bond | | | 926,314 | | | 213,853 |
Total Return Bond | | | 7,701,159 | | | — |
Intermediate-Term Bond | | | 7,910,420 | | | 4,318,870 |
Mortgage Backed Securities | | | 195,284 | | | — |
U.S. Government Money Market | | | 25,862 | | | — |
This differs from the amounts shown on the Statement of Assets and Liabilities primarily due to cumulative timing differences between financial and tax reporting.
For federal income tax purposes, certain Portfolios had capital loss carryforwards as of October 31, 2009 of approximately:
| | | | | | | | | | | | | | | | | | | | | | | | | | | |
| | | Expiring October 31, |
| | | 2010 | | 2011 | | 2012 | | 2013 | | 2014 | | 2015 | | 2016 | | 2017 | | Total |
Large Capitalization Growth | | $ | — | | $ | — | | $ | — | | $ | — | | $ | — | | $ | — | | $ | 31,755,000 | | $ | 32,835,000 | | $ | 64,590,000 |
Large Capitalization Value | | | — | | | — | | | — | | | — | | | — | | | — | | | 18,709,000 | | | 74,753,000 | | | 93,462,000 |
Small Capitalization Growth | | | 3,809,000 | | | 6,730,000 | | | — | | | — | | | — | | | — | | | 18,082,000 | | | 26,562,000 | | | 55,183,000 |
Small Capitalization Value | | | — | | | — | | | — | | | — | | | — | | | — | | | — | | | 54,590,000 | | | 54,590,000 |
International Equity | | | — | | | — | | | — | | | — | | | — | | | — | | | 2,993,000 | | | 28,616,000 | | | 31,609,000 |
Mortgage Backed Securities | | | — | | | 969,000 | | | 255,000 | | | 65,000 | | | 1,665,000 | | | 900,000 | | | 531,000 | | | 1,013,000 | | | 5,398,000 |
| | |
| 188 | | THE TARGET PORTFOLIO TRUST |
Accordingly, no capital gain distributions are expected to be paid to shareholders until future net gains have been realized in excess of such carryforwards. It is uncertain whether the Portfolios will be able to realize the full benefit prior to expiration dates.
The following Portfolio utilized capital loss carryforward to offset net taxable capital gains realized in the fiscal year ended October 31, 2009 of approximately:
| | | |
International Bond | | $ | 132,000 |
The federal income tax basis of the Portfolio’s investments and the net unrealized appreciation (depreciation) as of October 31, 2009 were as follows:
| | | | | | | | | | | | | | | | | | | | | | |
| | | Tax Basis | | Unrealized
Appreciation | | Unrealized
Depreciation | | | Net
Unrealized
Appreciation/
(Depreciation) | | | Other
Cost
Basis
Adjustments | | | Total Net
Unrealized
Appreciation/
(Depreciation) | |
Large Capitalization Growth | | $ | 208,003,690 | | $ | 32,018,611 | | $ | (12,603,042 | ) | | $ | 19,415,569 | | | $ | 317 | | | $ | 19,415,886 | |
Large Capitalization Value | | | 227,434,656 | | | 23,573,594 | | | (24,049,103 | ) | | | (475,509 | ) | | | 747 | | | | (474,762 | ) |
Small Capitalization Growth | | | 99,205,959 | | | 11,745,755 | | | (6,703,932 | ) | | | 5,041,823 | | | | — | | | | 5,041,823 | |
Small Capitalization Value | | | 659,735,841 | | | 76,334,676 | | | (52,014,857 | ) | | | 24,319,819 | | | | — | | | | 24,319,819 | |
International Equity | | | 176,772,779 | | | 24,440,786 | | | (26,179,277 | ) | | | (1,738,491 | ) | | | 117,912 | | | | (1,620,579 | ) |
International Bond | | | 31,929,082 | | | 1,676,987 | | | (1,155,931 | ) | | | 521,056 | | | | 53,609 | | | | 574,665 | |
Total Return Bond | | | 307,793,585 | | | 9,553,600 | | | (10,053,363 | ) | | | (499,763 | ) | | | 1,847,443 | | | | 1,347,680 | |
Intermediate-Term Bond | | | 241,795,505 | | | 7,503,912 | | | (7,619,959 | ) | | | (116,047 | ) | | | (498,346 | ) | | | (614,393 | ) |
Mortgage Backed Securities | | | 61,686,997 | | | 2,886,849 | | | (2,204,621 | ) | | | 682,228 | | | | (32,318 | ) | | | 649,910 | |
The difference between book basis and tax basis are primarily attributable to deferred losses on wash sales and other book to tax differences. The other cost basis adjustments are primarily attributable to appreciation (depreciation) on written options, futures, swaps, short sales, forward currency contracts and mark-to-market of receivables and payables.
Management has analyzed the Funds’ tax positions taken on federal income tax returns for all open tax years and has concluded that as of October 31, 2009, no provisions for income tax would be required in the Funds’ financial statements. The Funds’ federal and state income and federal excise tax returns for tax years for which the applicable statutes of limitations have not expired are subject to examination by the Internal Revenue Service and state departments of revenue.
| | |
| THE TARGET PORTFOLIO TRUST | | 189 |
Note 6. Capital
The Trust has authorized an unlimited number of shares of beneficial interest at $.001 par value per share. Transactions in shares of beneficial interest were as follows:
| | | | | | | | | | | | | | |
| | | Class R | | | Class T | |
| | | Shares | | | Amount | | | Shares | | | Amount | |
| Large Capitalization Growth | | | | | | | | | | | | | | |
Year Ended October 31, 2009: | | | | | | | | | | | | | | |
Sold | | 3,603,014 | | | $ | 34,452,112 | | | 930,241 | | | $ | 8,634,295 | |
Reinvested | | 37,309 | | | | 340,259 | | | 181,513 | | | | 1,659,033 | |
Redeemed | | (1,959,929 | ) | | | (18,247,063 | ) | | (4,520,602 | ) | | | (42,304,718 | ) |
| | | | | | | | | | | | | | |
Net Increase (Decrease) | | 1,680,394 | | | $ | 16,545,308 | | | (3,408,848 | ) | | $ | (32,011,390 | ) |
| | | | | | | | | | | | | | |
Year Ended October 31, 2008: | | | | | | | | | | | | | | |
Sold | | 4,174,936 | | | $ | 57,482,189 | | | 834,274 | | | $ | 10,629,313 | |
Reinvested | | 130,694 | | | | 2,046,671 | | | 1,137,484 | | | | 17,869,875 | |
Redeemed | | (1,355,025 | ) | | | (17,724,892 | ) | | (5,081,907 | ) | | | (69,296,035 | ) |
| | | | | | | | | | | | | | |
Net Increase (Decrease) | | 2,950,605 | | | $ | 41,803,968 | | | (3,110,149 | ) | | $ | (40,796,847 | ) |
| | | | | | | | | | | | | | |
| Large Capitalization Value | | | | | | | | | | | | | | |
Year Ended October 31, 2009: | | | | | | | | | | | | | | |
Sold | | 4,875,956 | | | $ | 37,563,492 | | | 1,673,548 | | | $ | 12,466,661 | |
Reinvested | | 191,725 | | | | 1,487,784 | | | 696,788 | | | | 5,407,071 | |
Redeemed | | (2,399,695 | ) | | | (18,326,429 | ) | | (6,924,069 | ) | | | (52,543,074 | ) |
| | | | | | | | | | | | | | |
Net Increase (Decrease) | | 2,667,986 | | | $ | 20,724,847 | | | (4,553,733 | ) | | $ | (34,669,342 | ) |
| | | | | | | | | | | | | | |
Year Ended October 31, 2008: | | | | | | | | | | | | | | |
Sold | | 4,691,921 | | | $ | 58,193,466 | | | 1,488,277 | | | $ | 18,268,860 | |
Reinvested | | 216,837 | | | | 3,031,385 | | | 2,230,945 | | | | 31,188,618 | |
Redeemed | | (1,490,199 | ) | | | (17,215,469 | ) | | (7,513,671 | ) | | | (91,548,239 | ) |
| | | | | | | | | | | | | | |
Net Increase (Decrease) | | 3,418,559 | | | $ | 44,009,382 | | | (3,794,449 | ) | | $ | (42,090,761 | ) |
| | | | | | | | | | | | | | |
| Small Capitalization Growth | | | | | | | | | | | | | | |
Year Ended October 31, 2009: | | | | | | | | | | | | | | |
Sold | | 2,294,608 | | | $ | 15,506,271 | | | 988,798 | | | $ | 6,423,089 | |
Reinvested | | — | | | | — | | | 14,592 | | | | 93,098 | |
Redeemed | | (1,238,036 | ) | | | (8,353,022 | ) | | (2,294,512 | ) | | | (15,406,224 | ) |
| | | | | | | | | | | | | | |
Net Increase (Decrease) | | 1,056,572 | | | $ | 7,153,249 | | | (1,291,122 | ) | | $ | (8,890,037 | ) |
| | | | | | | | | | | | | | |
Year Ended October 31, 2008 | | | | | | | | | | | | | | |
Sold | | 2,361,701 | | | $ | 24,783,256 | | | 646,754 | | | $ | 6,671,952 | |
Reinvested | | — | | | | — | | | — | | | | — | |
Redeemed | | (710,100 | ) | | | (6,980,383 | ) | | (2,578,273 | ) | | | (27,005,550 | ) |
| | | | | | | | | | | | | | |
Net Increase (Decrease) | | 1,651,601 | | | $ | 17,802,873 | | | (1,931,519 | ) | | $ | (20,333,598 | ) |
| | | | | | | | | | | | | | |
| | |
| 190 | | THE TARGET PORTFOLIO TRUST |
| | | | | | | | | | | | | | |
| | | Class R | | | Class T | |
| | | Shares | | | Amount | | | Shares | | | Amount | |
| Small Capitalization Value | | | | | | | | | | | | | | |
Year Ended October 31, 2009: | | | | | | | | | | | | | | |
Sold | | 1,336,960 | | | $ | 17,866,327 | | | 16,004,482 | | | $ | 209,857,683 | |
Reinvested | | 31,716 | | | | 399,623 | | | 621,677 | | | | 7,851,785 | |
Redeemed | | (796,286 | ) | | | (10,690,623 | ) | | (8,253,113 | ) | | | (111,886,252 | ) |
| | | | | | | | | | | | | | |
Net Increase (Decrease) | | 572,390 | | | $ | 7,575,327 | | | 8,373,046 | | | $ | 105,823,216 | |
| | | | | | | | | | | | | | |
Year Ended October 31, 2008 | | | | | | | | | | | | | | |
Sold | | 1,444,029 | | | $ | 26,235,024 | | | 12,894,581 | | | $ | 228,285,625 | |
Reinvested | | 62,362 | | | | 1,159,928 | | | 1,449,099 | | | | 27,025,686 | |
Redeemed | | (589,766 | ) | | | (10,315,042 | ) | | (6,735,394 | ) | | | (120,122,049 | ) |
| | | | | | | | | | | | | | |
Net Increase (Decrease) | | 916,625 | | | $ | 17,079,910 | | | 7,608,286 | | | $ | 135,189,262 | |
| | | | | | | | | | | | | | |
| International Equity | | | | | | | | | | | | | | |
Year Ended October 31, 2009: | | | | | | | | | | | | | | |
Sold | | 3,280,109 | | | $ | 29,009,042 | | | 856,044 | | | $ | 6,986,717 | |
Reinvested | | 211,731 | | | | 1,723,489 | | | 744,020 | | | | 6,056,320 | |
Redeemed | | (2,134,619 | ) | | | (19,054,186 | ) | | (4,339,698 | ) | | | (37,555,264 | ) |
| | | | | | | | | | | | | | |
Net Increase (Decrease) | | 1,357,221 | | | $ | 11,678,345 | | | (2,739,634 | ) | | $ | (24,512,227 | ) |
| | | | | | | | | | | | | | |
Year Ended October 31, 2008 | | | | | | | | | | | | | | |
Sold | | 3,397,842 | | | $ | 47,390,921 | | | 1,158,108 | | | $ | 14,359,348 | |
Reinvested | | 237,394 | | | | 3,860,041 | | | 2,315,199 | | | | 37,668,289 | |
Redeemed | | (1,024,230 | ) | | | (13,321,156 | ) | | (4,499,788 | ) | | | (62,080,925 | ) |
| | | | | | | | | | | | | | |
Net Increase (Decrease) | | 2,611,006 | | | $ | 37,929,806 | | | (1,026,481 | ) | | $ | (10,053,288 | ) |
| | | | | | | | | | | | | | |
| International Bond | | | | | | | | | | | | | | |
Year Ended October 31, 2009: | | | | | | | | | | | | | | |
Sold | | — | | | $ | — | | | 360,277 | | | $ | 2,823,974 | |
Reinvested | | — | | | | — | | | 414,839 | | | | 2,974,395 | |
Redeemed | | — | | | | — | | | (1,271,395 | ) | | | (9,747,018 | ) |
| | | | | | | | | | | | | | |
Net Increase (Decrease) | | — | | | $ | — | | | (496,279 | ) | | $ | (3,948,649 | ) |
| | | | | | | | | | | | | | |
Year Ended October 31, 2008: | | | | | | | | | | | | | | |
Sold | | — | | | $ | — | | | 247,183 | | | $ | 2,097,222 | |
Reinvested | | — | | | | — | | | — | | | | — | |
Redeemed | | — | | | | — | | | (1,321,925 | ) | | | (11,195,986 | ) |
| | | | | | | | | | | | | | |
Net Increase (Decrease) | | — | | | $ | — | | | (1,074,742 | ) | | $ | (9,098,764 | ) |
| | | | | | | | | | | | | | |
| Total Return Bond | | | | | | | | | | | | | | |
Year Ended October 31, 2009: | | | | | | | | | | | | | | |
Sold | | 3,396,499 | | | $ | 34,817,492 | | | 3,290,941 | | | $ | 34,168,289 | |
Reinvested | | 657,117 | | | | 6,492,102 | | | 2,365,696 | | | | 23,535,735 | |
Redeemed | | (2,913,476 | ) | | | (28,813,854 | ) | | (5,514,333 | ) | | | (55,399,430 | ) |
| | | | | | | | | | | | | | |
Net Increase (Decrease) | | 1,140,140 | | | $ | 12,495,740 | | | 142,304 | | | $ | 2,304,594 | |
| | | | | | | | | | | | | | |
Year Ended October 31, 2008: | | | | | | | | | | | | | | |
Sold | | 4,964,690 | | | $ | 53,274,308 | | | 6,160,070 | | | $ | 66,865,625 | |
Reinvested | | 171,830 | | | | 1,830,430 | | | 920,683 | | | | 9,909,999 | |
Redeemed | | (1,988,187 | ) | | | (21,055,023 | ) | | (4,724,068 | ) | | | (49,929,934 | ) |
| | | | | | | | | | | | | | |
Net Increase (Decrease) | | 3,148,333 | | | $ | 34,049,715 | | | 2,356,685 | | | $ | 26,845,690 | |
| | | | | | | | | | | | | | |
| | |
| THE TARGET PORTFOLIO TRUST | | 191 |
| | | | | | | | | | | | |
| | | Class R | | Class T | |
| | | Shares | | Amount | | Shares | | | Amount | |
| Intermediate-Term Bond | | | | | | | | | | | | |
Year Ended October 31, 2009: | | | | | | | | | | | | |
Sold | | — | | $ | — | | 6,181,966 | | | $ | 64,400,801 | |
Reinvested | | — | | | — | | 2,083,856 | | | | 21,102,156 | |
Redeemed | | — | | | — | | (5,550,896 | ) | | | (57,589,570 | ) |
| | | | | | | | | | | | |
Net Increase (Decrease) | | — | | $ | — | | 2,714,926 | | | $ | 27,913,387 | |
| | | | | | | | | | | | |
Year Ended October 31, 2008: | | | | | | | | | | | | |
Sold | | — | | $ | — | | 2,182,053 | | | $ | 22,926,973 | |
Reinvested | | — | | | — | | 1,031,563 | | | | 10,817,173 | |
Redeemed | | — | | | — | | (6,075,512 | ) | | | (63,821,113 | ) |
| | | | | | | | | | | | |
Net Increase (Decrease) | | — | | $ | — | | (2,861,896 | ) | | $ | (30,076,967 | ) |
| | | | | | | | | | | | |
| Mortgage Backed Securities | | | | | | | | | | | | |
Year Ended October 31, 2009: | | | | | | | | | | | | |
Sold | | — | | $ | — | | 95,280 | | | $ | 907,511 | |
Reinvested | | — | | | — | | 361,997 | | | | 3,413,900 | |
Redeemed | | — | | | — | | (1,875,165 | ) | | | (17,594,089 | ) |
| | | | | | | | | | | | |
Net Increase (Decrease) | | — | | $ | — | | (1,417,888 | ) | | $ | (13,272,678 | ) |
| | | | | | | | | | | | |
Year Ended October 31, 2008: | | | | | | | | | | | | |
Sold | | — | | $ | — | | 204,617 | | | $ | 2,057,259 | |
Reinvested | | — | | | — | | 442,622 | | | | 4,354,324 | |
Redeemed | | — | | | — | | (2,494,584 | ) | | | (24,443,690 | ) |
| | | | | | | | | | | | |
Net Increase (Decrease) | | — | | $ | — | | (1,847,345 | ) | | $ | (18,032,107 | ) |
| | | | | | | | | | | | |
Note 7. Borrowings
The Trust (excluding U.S. Government Money Market), along with other affiliated registered investment companies (the “Funds”), is a party to a Syndicated Credit Agreement (“SCA”) with two banks. The SCA provides for a commitment of $500 million. Interest on any borrowings under the SCA would be incurred at market rates and a commitment fee for the unused amount is accrued daily and paid quarterly. Effective October 22, 2009, the Funds renewed the SCA with the banks. The commitment under the renewed SCA continues to be $500 million. The Funds pays a commitment fee of .15 of 1% of the unused portion of the renewed SCA. The expiration date of the renewed SCA is October 20, 2010. For the period from October 24, 2008 through October 21, 2009, the Funds paid a commitment fee of .13 of 1% of the unused portion of the agreement. The purpose of the SCA is to provide an alternative source of temporary funding for capital share redemptions.
The following Portfolios utilized the line of credit during the year ended October 31, 2009. The average balance outstanding is for the number of days that each Portfolio had an outstanding balance.
| | | | | | | | | | | |
Portfolio | | Average Advances
Outstanding
During the Period | | Average
Interest
Rate | | | Number of Days
Advances Outstanding
During the Period | | Outstanding
Borrowings at
October 31, 2009 |
Large Capitalization Value | | $ | 802,816 | | 1.56 | % | | 19 | | | — |
Small Capitalization Growth | | | 395,267 | | 1.19 | % | | 15 | | | — |
International Equity . . . | | | 345,201 | | 1.33 | % | | 72 | | $ | 668,000 |
| | |
| 192 | | THE TARGET PORTFOLIO TRUST |
Reverse Repurchase Agreements: Mortgage Backed Securities Portfolio enters into reverse repurchase agreements with qualified, third party broker-dealers as determined by and under the direction of the Trust’s Board of Trustees. Interest on the value of reverse repurchase agreements entered into and outstanding is based upon competitive market rates at the time of execution of the agreement. At the time the Portfolio enters into a reverse repurchase agreement, it establishes and maintains a segregated account with the lender containing liquid investment grade securities having a value not less than the repurchase price, including accrued interest, of the reverse repurchase agreement.
The average daily balance of reverse repurchase agreements outstanding during year ended October 31, 2009 in the Mortgage Backed Securities Portfolio was approximately $14,318,847 at a weighted average interest rate of approximately 0.44%. The average daily balance is based on the number of days the Portfolio had an outstanding balance. The maximum amount of total reverse repurchase agreements outstanding at any month-end during the period was approximately $18,000,000 as of November 30, 2008 which was 36% of total assets.
Note 8. Other
During the reporting period, with the approval of the Board of Trustees, the U.S. Government Money Market Portfolio participated in the U.S. Treasury Department’s Temporary Guarantee Program for Money Market Funds (the “Program”) through its expiration on September 18, 2009. In connection with the participation, the Portfolio incurred $46,511 in fees which was 0.05% of average daily net assets.
Note 9. Subsequent Events
Management has evaluated the impact of all subsequent events on the Portfolios through December 23, 2009, the date the financial statements were issued, and has determined that, except for the following distributions, there were no subsequent events requiring recognition or disclosure in the financial statements:
| | | | | | | | | | | | | | | | | |
Portfolio | | | | Declaration
Date | | Paid to
Shareholders
of Record | | Ex-Dividend
Date | | Ordinary
Income | | Long-Term
Capital
Gains | | Short-Term
Capital
Gains |
Large Capitalization Growth | | Class R | | 12/11/2009 | | 12/14/2009 | | 12/15/2009 | | $ | 0.03777 | | $ | — | | $ | — |
| | Class T | | 12/11/2009 | | 12/14/2009 | | 12/15/2009 | | | 0.08770 | | | — | | | — |
Large Capitalization Value | | Class R | | 12/11/2009 | | 12/14/2009 | | 12/15/2009 | | | 0.14580 | | | — | | | — |
| | Class T | | 12/11/2009 | | 12/14/2009 | | 12/15/2009 | | | 0.18610 | | | — | | | — |
Small Capitalization Value | | Class R | | 12/09/2009 | | 12/10/2009 | | 12/11/2009 | | | 0.12446 | | | — | | | — |
. | | Class T | | 12/09/2009 | | 12/10/2009 | | 12/11/2009 | | | 0.19500 | | | — | | | — |
International Equity | | Class R | | 12/08/2009 | | 12/09/2009 | | 12/10/2009 | | | 0.10950 | | | — | | | — |
| | Class T | | 12/08/2009 | | 12/09/2009 | | 12/10/2009 | | | 0.15660 | | | — | | | — |
International Bond | | Class T | | 12/16/2009 | | 12/17/2009 | | 12/18/2009 | | | 0.35090 | | | 0.0718 | | | — |
Total Return Bond | | Class R | | 12/18/2009 | | 12/21/2009 | | 12/22/2009 | | | — | | | — | | | 0.2680 |
| | Class T | | 12/18/2009 | | 12/21/2009 | | 12/22/2009 | | | — | | | — | | | 0.2680 |
Intermediate-Term Bond | | Class T | | 12/18/2009 | | 12/21/2009 | | 12/22/2009 | | | — | | | 0.1893 | | | 0.3466 |
| | |
| THE TARGET PORTFOLIO TRUST | | 193 |
Financial Highlights
| | | | | | | | | | | | |
| | | LARGE CAPITALIZATION
GROWTH PORTFOLIO | |
| | | Class R | |
| | | Year Ended
October 31, | | | Ten Months
Ended
October 31,
2007(f)(g) | | | August 22,
2006(b)
through
December 31,
2006 | |
| | | 2009 | | | 2008(f) | | | |
| | | | |
| PER SHARE OPERATING PERFORMANCE: | | | | | | | | | | | | |
Net asset value, beginning of period | | $10.11 | | | $17.46 | | | $15.31 | | | $14.32 | |
Income (loss) from investment operations | | | | | | | | | | | | |
Net investment income (loss) | | .05 | | | .05 | | | (.02 | ) | | .03 | |
Net realized and unrealized gain (loss) on investments | | .76 | | | (6.43 | ) | | 2.31 | | | 1.30 | |
Total from investment operations | | .81 | | | (6.38 | ) | | 2.29 | | | 1.33 | |
Less dividends and distributions | | | | | | | | | | | | |
Dividends from net investment income | | (.07 | ) | | (.02 | ) | | — | | | (.05 | ) |
Distributions from net realized gains | | — | | | (.95 | ) | | (.14 | ) | | (.29 | ) |
Total dividends and distributions | | (.07 | ) | | (.97 | ) | | (.14 | ) | | (.34 | ) |
Net asset value, end of period | | $10.85 | | | $10.11 | | | $17.46 | | | $15.31 | |
| | | | |
| TOTAL RETURN(a) | | 8.13 | % | | (38.48 | )% | | 14.95 | % | | 9.34 | % |
| | | | |
| RATIOS/SUPPLEMENTAL DATA: | | | | | | | | | | | | |
Net assets, end of period (000) | | $70,097 | | | $48,348 | | | $31,982 | | | $2,216 | |
Average net assets (000) | | $54,036 | | | $46,321 | | | $14,059 | | | $429 | |
Ratios to average net assets(h) | | | | | | | | | | | | |
Expenses, including distribution and service (12b-1) fees(e) | | 1.36 | % | | 1.24 | % | | 1.18 | %(c) | | 1.25 | %(c) |
Expenses, excluding distribution and service (12b-1) fees | | .86 | % | | .74 | % | | .68 | %(c) | | .75 | %(c) |
Net investment income (loss) | | .28 | % | | .35 | % | | (.14 | %)(c) | | .28 | %(c) |
Portfolio turnover rate | | 243 | % | | 101 | % | | 81 | %(d) | | 69 | %(d) |
| (a) | Total return is calculated assuming a purchase of a share on the first day and a sale on the last day of each period reported and includes reinvestment of dividends and distributions. Total returns may reflect adjustments to conform to generally accepted accounting principles. Total returns for periods less than one full year are not annualized. |
| (b) | Commencement of operations. |
| (e) | The distributor of the Trust has contractually agreed to limit its distribution and service (12b-1) fees to .50 of 1% of the average daily net assets of the Class R shares. |
| (f) | Calculated based upon average shares outstanding during the period. |
| (g) | For the ten month period ended October 31, 2007. The Trust changed its fiscal year end from December 31 to October 31, effective October 31, 2007. |
| (h) | Does not include expenses of the underlying fund in which the Portfolio invests. |
See Notes to Financial Statements.
| | |
| 194 | | THE TARGET PORTFOLIO TRUST |
Financial Highlights (continued)
| | | | | | | | | | | | | | | | | | |
| | | LARGE CAPITALIZATION
GROWTH PORTFOLIO | |
| | | Class T | |
| | | Year Ended
October 31, | | | Ten Months
Ended
October 31,
2007(e)(f) | | | Year Ended
December 31, | |
| | | 2009 | | | 2008(e) | | | | 2006 | | | 2005 | | | 2004 | |
| | | | | | |
| PER SHARE OPERATING PERFORMANCE: | | | | | | | | | | | | | | | | | | |
Net asset value, beginning of period | | $10.19 | | | $17.55 | | | $15.33 | | | $14.60 | | | $15.90 | | | $15.39 | |
Income (loss) from investment operations | | | | | | | | | | | | | | | | | | |
Net investment income | | .10 | | | .13 | | | .04 | | | .08 | | | .03 | | | .07 | |
Net realized and unrealized gain (loss) on investments | | .76 | | | (6.47 | ) | | 2.32 | | | 1.18 | | | 1.06 | | | .51 | |
Total from investment operations | | .86 | | | (6.34 | ) | | 2.36 | | | 1.26 | | | 1.09 | | | .58 | |
Less dividends and distributions | | | | | | | | | | | | | | | | | | |
Dividends from net investment income | | (.12 | ) | | (.07 | ) | | — | (d) | | (.09 | ) | | (.02 | ) | | (.07 | ) |
Distributions from net realized gains | | — | | | (.95 | ) | | (.14 | ) | | (.44 | ) | | (2.37 | ) | | — | |
Total dividends and distributions | | (.12 | ) | | (1.02 | ) | | (.14 | ) | | (.53 | ) | | (2.39 | ) | | (.07 | ) |
Net asset value, end of period | | $10.93 | | | $10.19 | | | $17.55 | | | $15.33 | | | $14.60 | | | $15.90 | |
| | | | | | |
| TOTAL RETURN(a) | | 8.64 | % | | (38.14 | )% | | 15.41 | % | | 8.67 | % | | 6.74 | % | | 3.78 | % |
| | | | | | |
| RATIOS/SUPPLEMENTAL DATA: | | | | | | | | | | | | | | | | | | |
Net assets, end of period (000) | | $124,122 | | | $150,428 | | | $313,718 | | | $301,566 | | | $307,835 | | | $343,760 | |
Average net assets (000) | | $123,629 | | | $237,628 | | | $303,340 | | | $299,597 | | | $310,710 | | | $345,413 | |
Ratios to average net assets(g) | | | | | | | | | | | | | | | | | | |
Expenses, including distribution and service (12b-1) fees | | .86 | % | | .74 | % | | .68 | %(b) | | .75 | % | | .76 | % | | .77 | % |
Expenses, excluding distribution and service (12b-1) fees | | .86 | % | | .74 | % | | .68 | %(b) | | .75 | % | | .76 | % | | .77 | % |
Net investment income | | .84 | % | | .91 | % | | .29 | %(b) | | .51 | % | | .18 | % | | .45 | % |
Portfolio turnover rate | | 243 | % | | 101 | % | | 81 | %(c) | | 69 | % | | 246 | % | | 76 | % |
| (a) | Total return is calculated assuming a purchase of a share on the first day and a sale on the last day of each period reported and includes reinvestment of dividends and distributions. Total returns may reflect adjustments to conform to generally accepted accounting principles. Total returns for periods less than one full year are not annualized. |
| (d) | Less than $0.005 per share. |
| (e) | Calculated based upon average shares outstanding during the period. |
| (f) | For the ten month period ended October 31, 2007. The Trust changed its fiscal year end from December 31 to October 31, effective October 31, 2007. |
| (g) | Does not include expenses of the underlying fund in which the Portfolio invests. |
See Notes to Financial Statements.
| | |
| THE TARGET PORTFOLIO TRUST | | 195 |
Financial Highlights (continued)
| | | | | | | | | | | | |
| | | LARGE CAPITALIZATION
VALUE PORTFOLIO | |
| | | Class R | |
| | | Year Ended
October 31, | | | Ten Months
Ended
October 31,
2007(g)(h) | | | August 22,
2006(b)
through
December 31,
2006(g) | |
| | | 2009(g) | | | 2008(g) | | | |
| | | | |
| PER SHARE OPERATING PERFORMANCE: | | | | | | | | | | | | |
Net asset value, beginning of period | | $8.78 | | | $16.24 | | | $15.60 | | | $15.07 | |
Income (loss) from investment operations | | | | | | | | | | | | |
Net investment income | | .15 | | | .23 | | | .15 | | | .08 | |
Net realized and unrealized gain (loss) on investments | | .13 | | | (6.31 | ) | | .67 | | | 1.48 | |
Total from investment operations | | .28 | | | (6.08 | ) | | .82 | | | 1.56 | |
Less dividends and distributions | | | | | | | | | | | | |
Dividends from net investment income | | (.27 | ) | | (.22 | ) | | — | (f) | | (.24 | ) |
Distributions from net realized gains | | — | | | (1.16 | ) | | (.18 | ) | | (.79 | ) |
Total dividends and distributions | | (.27 | ) | | (1.38 | ) | | (.18 | ) | | (1.03 | ) |
Net asset value, end of period | | $8.79 | | | $8.78 | | | $16.24 | | | $15.60 | |
| | | | |
| TOTAL RETURN(a) | | 3.59 | % | | (40.60 | )% | | 5.24 | % | | 10.44 | % |
| | | | |
| RATIOS/SUPPLEMENTAL DATA: | | | | | | | | | | | | |
Net assets, end of period (000) | | $70,291 | | | $46,778 | | | $30,958 | | | $2,194 | |
Average net assets (000) | | $53,491 | | | $46,282 | | | $14,046 | | | $445 | |
Ratios to average net assets(i) | | | | | | | | | | | | |
Expenses, including distribution and service (12b-1) fees(e) | | 1.33 | % | | 1.21 | % | | 1.19 | %(c) | | 1.22 | %(c) |
Expenses, excluding distribution and service (12b-1) fees | | .83 | % | | .71 | % | | .69 | %(c) | | .72 | %(c) |
Net investment income | | 1.96 | % | | 1.90 | % | | 1.13 | %(c) | | 1.69 | %(c) |
Portfolio turnover rate | | 104 | % | | 77 | % | | 48 | %(d) | | 44 | %(d) |
| (a) | Total return is calculated assuming a purchase of a share on the first day and a sale on the last day of each period reported and includes reinvestment of dividends and distributions. Total returns may reflect adjustments to conform to generally accepted accounting principles. Total returns for periods less than one full year are not annualized. |
| (b) | Commencement of operations. |
| (e) | The distributor of the Trust has contractually agreed to limit its distribution and service (12b-1) fees to .50 of 1% of the average daily net assets of the Class R shares. |
| (f) | Less than $0.005 per share. |
| (g) | Calculated based upon average shares outstanding during the period. |
| (h) | For the ten month period ended October 31, 2007. The Trust changed its fiscal year end from December 31 to October 31, effective October 31, 2007. |
| (i) | Does not include expenses of the underlying fund in which the Portfolio invests. |
See Notes to Financial Statements.
| | |
| 196 | | THE TARGET PORTFOLIO TRUST |
Financial Highlights (continued)
| | | | | | | | | | | | | | | | | | |
| | | LARGE CAPITALIZATION
VALUE PORTFOLIO | |
| | | Class T | |
| | | Year Ended
October 31, | | | Ten Months
Ended
October 31,
2007(e)(f) | | | Year Ended
December 31, | |
| | | 2009(e) | | | 2008(e) | | | | 2006(e) | | | 2005 | | | 2004 | |
| | | | | | |
| PER SHARE OPERATING PERFORMANCE: | | | | | | | | | | | | | | | | | | |
Net asset value, beginning of period | | $8.82 | | | $16.31 | | | $15.60 | | | $15.11 | | | $16.59 | | | $14.13 | |
Income (loss) from investment operations | | | | | | | | | | | | | | | | | | |
Net investment income | | .20 | | | .30 | | | .22 | | | .28 | | | .25 | | | .21 | |
Net realized and unrealized gain (loss) on investments | | .12 | | | (6.33 | ) | | .67 | | | 2.45 | | | .80 | | | 2.45 | |
Total from investment operations | | .32 | | | (6.03 | ) | | .89 | | | 2.73 | | | 1.05 | | | 2.66 | |
Less dividends and distributions | | | | | | | | | | | | | | | | | | |
Dividends from net investment income | | (.31 | ) | | (.30 | ) | | — | (d) | | (.29 | ) | | (.25 | ) | | (.20 | ) |
Distributions from net realized gains | | — | | | (1.16 | ) | | (.18 | ) | | (1.95 | ) | | (2.28 | ) | | — | |
Total dividends and distributions | | (.31 | ) | | (1.46 | ) | | (.18 | ) | | (2.24 | ) | | (2.53 | ) | | (.20 | ) |
Net asset value, end of period | | $8.83 | | | $8.82 | | | $16.31 | | | $15.60 | | | $15.11 | | | $16.59 | |
| | | | | | |
| TOTAL RETURN(a) | | 4.15 | % | | (40.29 | )% | | 5.70 | % | | 19.34 | % | | 6.50 | % | | 18.87 | % |
| | | | | | |
| RATIOS/SUPPLEMENTAL DATA: | | | | | | | | | | | | | | | | | | |
Net assets, end of period (000) | | $128,187 | | | $168,217 | | | $372,900 | | | $393,111 | | | $362,253 | | | $385,414 | |
Average net assets (000) | | $129,379 | | | $279,413 | | | $392,564 | | | $371,251 | | | $366,301 | | | $346,319 | |
Ratios to average net assets(g) | | | | | | | | | | | | | | | | | | |
Expenses, including distribution and service (12b-1) fees | | .83 | % | | .71 | % | | .69 | %(b) | | .72 | % | | .74 | % | | .74 | % |
Expenses, excluding distribution and service (12b-1) fees | | .83 | % | | .71 | % | | .69 | %(b) | | .72 | % | | .74 | % | | .74 | % |
Net investment income | | 2.64 | % | | 2.40 | % | | 1.61 | %(b) | | 1.79 | % | | 1.48 | % | | 1.43 | % |
Portfolio turnover rate | | 104 | % | | 77 | % | | 48 | %(c) | | 44 | % | | 90 | % | | 47 | % |
| (a) | Total return is calculated assuming a purchase of a share on the first day and a sale on the last day of each period reported and includes reinvestment of dividends and distributions. Total returns may reflect adjustments to conform to generally accepted accounting principles. Total returns for periods less than one full year are not annualized. |
| (d) | Less than $0.005 per share. |
| (e) | Calculated based upon average shares outstanding during the period. |
| (f) | For the ten month period ended October 31, 2007. The Trust changed its fiscal year end from December 31 to October 31, effective October 31, 2007. |
| (g) | Does not include expenses of the underlying fund in which the Portfolio invests. |
See Notes to Financial Statements.
| | |
| THE TARGET PORTFOLIO TRUST | | 197 |
Financial Highlights (continued)
| | | | | | | | | | | | |
| | | SMALL CAPITALIZATION
GROWTH PORTFOLIO | |
| | | Class R | |
| | | Year Ended
October 31, | | | Ten Months
Ended
October 31,
2007 (g)(h) | | | August 22,
2006(b)
through
December 31,
2006 | |
| | | 2009 | | | 2008 | | | |
| | | | |
| PER SHARE OPERATING PERFORMANCE: | | | | | | | | | | | | |
Net asset value, beginning of period | | $7.17 | | | $13.73 | | | $12.12 | | | $11.04 | |
Income (loss) from investment operations | | | | | | | | | | | | |
Net investment loss | | (.04 | ) | | (.03 | ) | | (.06 | ) | | — | (c) |
Net realized and unrealized gain (loss) on investments | | .58 | | | (6.53 | ) | | 1.67 | | | 1.08 | |
Total from investment operations | | .54 | | | (6.56 | ) | | 1.61 | | | 1.08 | |
Net asset value, end of period | | $7.71 | | | $7.17 | | | $13.73 | | | $12.12 | |
| | | | |
| TOTAL RETURN(a) | | 7.53 | % | | (47.78 | )% | | 13.28 | % | | 9.78 | % |
| | | |
| RATIOS/SUPPLEMENTAL DATA: | | | | | | | | | | |
Net assets, end of period (000) | | $28,129 | | | $18,607 | | | $12,942 | | | $898 | |
Average net assets (000) | | $22,037 | | | $18,762 | | | $5,725 | | | $186 | |
Ratios to average net assets(i) | | | | | | | | | | | | |
Expenses, including distribution and service (12b-1) fees(f) | | 1.52 | % | | 1.30 | % | | 1.28 | %(d) | | 1.34 | %(d) |
Expenses, excluding distribution and service (12b-1) fees | | 1.02 | % | | .80 | % | | .78 | %(d) | | .84 | %(d) |
Net investment loss | | (.77 | )% | | (.39 | )% | | (.56 | )%(d) | | (.05 | )%(d) |
Portfolio turnover rate | | 92 | % | | 223 | % | | 87 | %(e) | | 96 | %(e) |
| (a) | Total return is calculated assuming a purchase of a share on the first day and a sale on the last day of each period reported and includes reinvestment of dividends and distributions. Total returns may reflect adjustments to conform to generally accepted accounting principles. Total returns for periods less than one full year are not annualized. |
| (b) | Commencement of operations. |
| (c) | Less than $0.005 per share. |
| (f) | The distributor of the Trust has contractually agreed to limit its distribution and service (12b-1) fees to .50 of 1% of the average daily net assets of the Class R shares. |
| (g) | Calculated based upon average shares outstanding during the period. |
| (h) | For the ten month period ended October 31, 2007. The Trust changed its fiscal year end from December 31 to October 31, effective October 31, 2007. |
| (i) | Does not include expenses of the underlying fund in which the Portfolio invests. |
See Notes to Financial Statements.
| | |
| 198 | | THE TARGET PORTFOLIO TRUST |
Financial Highlights (continued)
| | | | | | | | | | | | | | | | | | |
| | | SMALL CAPITALIZATION
GROWTH PORTFOLIO | |
| | | Class T | |
| | | Year Ended
October 31, | | | Ten Months
Ended
October 31,
2007(d)(e) | | | Year Ended
December 31, | |
| | | 2009 | | | 2008 | | | | 2006 | | | 2005 | | | 2004 | |
| | | | | | |
| PER SHARE OPERATING PERFORMANCE: | | | | | | | | | | | | | | | | | | |
Net asset value, beginning of period | | $7.25 | | | $13.82 | | | $12.14 | | | $11.28 | | | $10.79 | | | $9.38 | |
Income (loss) from investment operations | | | | | | | | | | | | | | | | | | |
Net investment income (loss) | | (.02 | ) | | .02 | | | (.01 | ) | | (.05 | ) | | (.07 | ) | | (.06 | ) |
Net realized and unrealized gain (loss) on investments | | .60 | | | (6.59 | ) | | 1.69 | | | .91 | | | .56 | | | 1.47 | |
Total from investment operations | | .58 | | | (6.57 | ) | | 1.68 | | | .86 | | | .49 | | | 1.41 | |
Less dividends from net investment income | | (.01 | ) | | — | | | — | | | — | | | — | | | — | |
Net asset value, end of period | | $7.82 | | | $7.25 | | | $13.82 | | | $12.14 | | | $11.28 | | | $10.79 | |
| | | | | | |
| TOTAL RETURN(a) | | 8.06 | % | | (47.54 | )% | | 13.84 | % | | 7.62 | % | | 4.54 | % | | 15.03 | % |
| | | | | |
| RATIOS/SUPPLEMENTAL DATA: | | | | | | | | | | | | | | | | |
Net assets, end of period (000) | | $52,671 | | | $58,235 | | | $137,630 | | | $136,422 | | | $143,366 | | | $158,757 | |
Average net assets (000) | | $51,109 | | | $97,771 | | | $136,851 | | | $140,489 | | | $144,034 | | | $146,717 | |
Ratios to average net assets(f) | | | | | | | | | | | | | | | | | | |
Expenses, including distribution and service (12b-1) fees | | 1.02 | % | | .80 | % | | .78 | %(b) | | .84 | % | | .91 | % | | .90 | % |
Expenses, excluding distribution and service (12b-1) fees | | 1.02 | % | | .80 | % | | .78 | %(b) | | .84 | % | | .91 | % | | .90 | % |
Net investment income (loss) | | (.26 | )% | | .17 | % | | (.07 | )%(b) | | (.39 | )% | | (.62 | )% | | (.58 | )% |
Portfolio turnover rate | | 92 | % | | 223 | % | | 87 | %(c) | | 96 | % | | 147 | % | | 107 | % |
| (a) | Total return is calculated assuming a purchase of a share on the first day and a sale on the last day of each period reported and includes reinvestment of dividends and distributions. Total returns may reflect adjustments to conform to generally accepted accounting principles. Total returns for periods less than one full year are not annualized. |
| (d) | Calculated based upon average shares outstanding during the period. |
| (e) | For the ten month period ended October 31, 2007. The Trust changed its fiscal year end from December 31 to October 31, effective October 31, 2007. |
| (f) | Does not include expenses of the underlying fund in which the Portfolio invests. |
See Notes to Financial Statements.
| | |
| THE TARGET PORTFOLIO TRUST | | 199 |
Financial Highlights (continued)
| | | | | | | | | | | | |
| | | SMALL CAPITALIZATION
VALUE PORTFOLIO | |
| | | Class R | |
| | | Year Ended
October 31, | | | Ten Months
Ended
October 31,
2007(g)(h) | | | August 22,
2006(b)
through
December 31,
2006 | |
| | | 2009(g) | | | 2008 | | | |
| | | | |
| PER SHARE OPERATING PERFORMANCE: | | | | | | | | | | | | |
Net asset value, beginning of period | | $14.10 | | | $21.90 | | | $20.46 | | | $20.05 | |
Income (loss) from investment operations | | | | | | | | | | | | |
Net investment income | | .13 | | | .16 | | | .13 | | | .14 | |
Net realized and unrealized gain (loss) on investments | | 1.42 | | | (6.52 | ) | | 1.42 | | | 1.74 | |
Total from investment operations | | 1.55 | | | (6.36 | ) | | 1.55 | | | 1.88 | |
Less dividends and distributions | | | | | | | | | | | | |
Dividends from net investment income | | (.16 | ) | | (.23 | ) | | — | (f) | | (.18 | ) |
Distributions from net realized gains | | (.08 | ) | | (1.21 | ) | | (.11 | ) | | (1.29 | ) |
Total dividends and distributions | | (.24 | ) | | (1.44 | ) | | (.11 | ) | | (1.47 | ) |
Net asset value, end of period | | $15.41 | | | $14.10 | | | $21.90 | | | $20.46 | |
| | | | |
| TOTAL RETURN(a) | | 11.37 | % | | (30.57 | )% | | 7.55 | % | | 9.45 | % |
| | | | |
| RATIOS/SUPPLEMENTAL DATA: | | | | | | | | | | | | |
Net assets, end of period (000) | | $33,574 | | | $22,660 | | | $15,112 | | | $1,061 | |
Average net assets (000) | | $26,425 | | | $22,626 | | | $6,828 | | | $217 | |
Ratios to average net assets(i) | | | | | | | | | | | | |
Expenses, including distribution and service (12b-1) fees(e) | | 1.30 | % | | 1.30 | % | | 1.23 | %(c) | | 1.30 | %(c) |
Expenses, excluding distribution and service (12b-1) fees | | .80 | % | | .80 | % | | .73 | %(c) | | .80 | %(c) |
Net investment income | | .96 | % | | .89 | % | | .73 | %(c) | | 1.37 | %(c) |
Portfolio turnover rate | | 48 | % | | 54 | % | | 32 | %(d) | | 36 | %(d) |
| (a) | Total return is calculated assuming a purchase of a share on the first day and a sale on the last day of each period reported and includes reinvestment of dividends and distributions. Total returns may reflect adjustments to conform to generally accepted accounting principles. Total returns for periods less than one full year are not annualized. |
| (b) | Commencement of operations. |
| (e) | The distributor of the Trust has contractually agreed to limit its distribution and service (12b-1) fees to .50 of 1% of the average daily net assets of the Class R shares. |
| (f) | Less than $0.005 per share. |
| (g) | Calculated based upon average shares outstanding during the period. |
| (h) | For the ten month period ended October 31, 2007. The Trust changed its fiscal year end from December 31 to October 31, effective October 31, 2007. |
| (i) | Does not include expenses of the underlying fund in which the Portfolio invests. |
See Notes to Financial Statements.
| | |
| 200 | | THE TARGET PORTFOLIO TRUST |
Financial Highlights (continued)
| | | | | | | | | | | | | | | | | | |
| | | SMALL CAPITALIZATION
VALUE PORTFOLIO | |
| | | Class T | |
| | | Year Ended
October 31, | | | Ten Months
Ended
October 31,
2007(e)(f) | | | Year Ended
December 31, | |
| | | 2009(e) | | | 2008 | | | | 2006 | | | 2005 | | | 2004 | |
| | | | | | |
| PER SHARE OPERATING PERFORMANCE: | | | | | | | | | | | | | | | | | | |
Net asset value, beginning of period | | $14.21 | | | $22.00 | | | $20.47 | | | $18.98 | | | $21.84 | | | $18.78 | |
Income (loss) from investment operations | | | | | | | | | | | | | | | | | | |
Net investment income | | .20 | | | .23 | | | .25 | | | .23 | | | .18 | | | .17 | |
Net realized and unrealized gain (loss) on investments | | 1.41 | | | (6.53 | ) | | 1.39 | | | 3.09 | | | 2.06 | | | 4.27 | |
Total from investment operations | | 1.61 | | | (6.30 | ) | | 1.64 | | | 3.32 | | | 2.24 | | | 4.44 | |
Less dividends and distributions | | | | | | | | | | | | | | | | | | |
Dividends from net investment income | | (.23 | ) | | (.28 | ) | | — | (d) | | (.22 | ) | | (.16 | ) | | (.17 | ) |
Distributions from net realized gains | | (.08 | ) | | (1.21 | ) | | (.11 | ) | | (1.61 | ) | | (4.94 | ) | | (1.21 | ) |
Total dividends and distributions | | (.31 | ) | | (1.49 | ) | | (.11 | ) | | (1.83 | ) | | (5.10 | ) | | (1.38 | ) |
Net asset value, end of period | | $15.51 | | | $14.21 | | | $22.00 | | | $20.47 | | | $18.98 | | | $21.84 | |
| | | | | | |
| TOTAL RETURN(a) | | 11.82 | % | | (30.23 | )% | | 8.04 | % | | 17.72 | % | | 10.10 | % | | 24.02 | % |
| | | | | |
| RATIOS/SUPPLEMENTAL DATA: | | | | | | | | | | | | | | | | |
Net assets, end of period (000) | | $538,202 | | | $374,101 | | | $411,690 | | | $320,728 | | | $259,115 | | | $245,576 | |
Average net assets (000) | | $439,058 | | | $414,364 | | | $403,020 | | | $290,505 | | | $249,661 | | | $218,487 | |
Ratios to average net assets(g) | | | | | | | | | | | | | | | | | | |
Expenses, including distribution and service (12b-1) fees | | .80 | % | | .80 | % | | .73 | %(b) | | .80 | % | | .79 | % | | .82 | % |
Expenses, excluding distribution and service (12b-1) fees | | .80 | % | | .80 | % | | .73 | %(b) | | .80 | % | | .79 | % | | .82 | % |
Net investment income | | 1.46 | % | | 1.38 | % | | 1.38 | %(b) | | 1.17 | % | | .81 | % | | .86 | % |
Portfolio turnover rate | | 48 | % | | 54 | % | | 32 | %(c) | | 36 | % | | 118 | % | | 22 | % |
| (a) | Total return is calculated assuming a purchase of a share on the first day and a sale on the last day of each period reported and includes reinvestment of dividends and distributions. Total returns may reflect adjustments to conform to generally accepted accounting principles. Total returns for periods less than one full year are not annualized. |
| (d) | Less than $0.005 per share. |
| (e) | Calculated based upon average shares outstanding during the period. |
| (f) | For the ten month period ended October 31, 2007. The Trust changed its fiscal year end from December 31 to October 31, effective October 31, 2007. |
| (g) | Does not include expenses of the underlying fund in which the Portfolio invests. |
See Notes to Financial Statements.
| | |
| THE TARGET PORTFOLIO TRUST | | 201 |
Financial Highlights (continued)
| | | | | | | | | | | | |
| | | INTERNATIONAL
EQUITY PORTFOLIO | |
| | | Class R | |
| | | Year Ended
October 31, | | | Ten Months
Ended
October 31,
2007(f)(g) | | | August 22,
2006(b)
through
December 31,
2006 | |
| | | 2009(f) | | | 2008(f) | | | |
| | | | |
| PER SHARE OPERATING PERFORMANCE: | | | | | | | | | | | | |
Net asset value, beginning of period | | $8.99 | | | $20.04 | | | $16.21 | | | $16.09 | |
Income (loss) from investment operations | | | | | | | | | | | | |
Net investment income | | .13 | | | .29 | | | .33 | | | .16 | |
Net realized and unrealized gain (loss) on investments | | 2.08 | | | (8.84 | ) | | 3.68 | | | 1.66 | |
Total from investment operations | | 2.21 | | | (8.55 | ) | | 4.01 | | | 1.82 | |
Less dividends and distributions | | | | | | | | | | | | |
Dividends from net investment income | | (.42 | ) | | (.31 | ) | | — | | | (.25 | ) |
Distributions from net realized gains | | — | | | (2.19 | ) | | (.18 | ) | | (1.45 | ) |
Total dividends and distributions | | (.42 | ) | | (2.50 | ) | | (.18 | ) | | (1.70 | ) |
Net asset value, end of period | | $10.78 | | | $8.99 | | | $20.04 | | | $16.21 | |
| | | | |
| TOTAL RETURN(a) | | 26.13 | % | | (48.30 | )% | | 24.85 | % | | 11.74 | % |
| | | | |
| RATIOS/SUPPLEMENTAL DATA: | | | | | | | | | | | | |
Net assets, end of period (000) | | $57,184 | | | $35,482 | | | $26,811 | | | $1,728 | |
Average net assets (000) | | $43,233 | | | $36,790 | | | $11,612 | | | $346 | |
Ratios to average net assets(h) | | | | | | | | | | | | |
Expenses, including distribution and service (12b-1) fees(e) | | 1.51 | % | | 1.33 | % | | 1.33 | %(c) | | 1.43 | %(c) |
Expenses, excluding distribution and service (12b-1) fees | | 1.01 | % | | .83 | % | | .83 | %(c) | | .93 | %(c) |
Net investment income | | 1.46 | % | | 2.12 | % | | 2.20 | %(c) | | .39 | %(c) |
Portfolio turnover rate | | 38 | % | | 30 | % | | 37 | %(d) | | 41 | %(d) |
| (a) | Total return is calculated assuming a purchase of a share on the first day and a sale on the last day of each period reported and includes reinvestment of dividends and distributions. Total returns may reflect adjustments to conform to generally accepted accounting principles. Total returns for periods less than one full year are not annualized. |
| (b) | Commencement of operations. |
| (e) | The distributor of the Trust has contractually agreed to limit its distribution and service (12b-1) fees to .50 of 1% of the average daily net assets of the Class R shares. |
| (f) | Calculated based upon average shares outstanding during the period. |
| (g) | For the ten month period ended October 31, 2007. The Trust changed its fiscal year end from December 31 to October 31, effective October 31, 2007. |
| (h) | Does not include expenses of the underlying fund in which the Portfolio invests. |
See Notes to Financial Statements.
| | |
| 202 | | THE TARGET PORTFOLIO TRUST |
Financial Highlights (continued)
| | | | | | | | | | | | | | | | | | |
| | | INTERNATIONAL
EQUITY PORTFOLIO | |
| | | Class T | |
| | | Year Ended
October 31, | | | Ten Months
Ended
October 31,
2007(e)(f) | | | Year Ended
December 31, | |
| | | 2009(e) | | | 2008(e) | | | | 2006 | | | 2005 | | | 2004 | |
| | | | | | |
| PER SHARE OPERATING PERFORMANCE: | | | | | | | | | | | | | | | | | | |
Net asset value, beginning of period | | $9.03 | | | $20.13 | | | $16.22 | | | $13.99 | | | $13.13 | | | $11.53 | |
Income (loss) from investment operations | | | | | | | | | | | | | | | | | | |
Net investment income | | .17 | | | .36 | | | .39 | | | .29 | | | .22 | | | .15 | |
Net realized and unrealized gain (loss) on investments | | 2.10 | | | (8.86 | ) | | 3.70 | | | 3.68 | | | 1.59 | | | 1.59 | |
Total from investment operations | | 2.27 | | | (8.50 | ) | | 4.09 | | | 3.97 | | | 1.81 | | | 1.74 | |
Less dividends and distributions | | | | | | | | | | | | | | | | | | |
Dividends from net investment income | | (.47 | ) | | (.41 | ) | | — | | | (.29 | ) | | (.28 | ) | | (.14 | ) |
Distributions from net realized gains | | — | | | (2.19 | ) | | (.18 | ) | | (1.45 | ) | | (.67 | ) | | — | |
Total dividends and distributions | | (.47 | ) | | (2.60 | ) | | (.18 | ) | | (1.74 | ) | | (.95 | ) | | (.14 | ) |
Net asset value, end of period | | $10.83 | | | $9.03 | | | $20.13 | | | $16.22 | | | $13.99 | | | $13.13 | |
| | | | | | |
| TOTAL RETURN(a) | | 26.84 | % | | (47.99 | )% | | 25.33 | % | | 29.02 | % | | 14.12 | % | | 15.23 | % |
| | | | | |
| RATIOS/SUPPLEMENTAL DATA: | | | | | | | | | | | | | | | | |
Net assets, end of period (000) | | $119,006 | | | $123,970 | | | $297,083 | | | $268,314 | | | $233,150 | | | $230,300 | |
Average net assets (000) | | $110,053 | | | $218,670 | | | $277,744 | | | $248,571 | | | $221,543 | | | $209,378 | |
Ratios to average net assets(b) | | | | | | | | | | | | | | | | | | |
Expenses, including distribution and service (12b-1) fees | | 1.01 | % | | .83 | % | | .83 | %(c) | | .93 | % | | .99 | % | | 1.00 | % |
Expenses, excluding distribution and service (12b-1) fees | | 1.01 | % | | .83 | % | | .83 | %(c) | | .93 | % | | .99 | % | | 1.00 | % |
Net investment income | | 1.94 | % | | 2.49 | % | | 2.61 | %(c) | | 1.73 | % | | 1.55 | % | | 1.27 | % |
Portfolio turnover rate | | 38 | % | | 30 | % | | 37 | %(d) | | 41 | % | | 123 | % | | 59 | % |
| (a) | Total return is calculated assuming a purchase of a share on the first day and a sale on the last day of each period reported and includes reinvestment of dividends and distributions. Total returns may reflect adjustments to conform to generally accepted accounting principles. Total returns for periods less than one full year are not annualized. |
| (b) | Does not include expenses of the underlying fund in which the Portfolio invests. |
| (e) | Calculated based upon average shares outstanding during the period. |
| (f) | For the ten month period ended October 31, 2007. The Trust changed its fiscal year end from December 31 to October 31, effective October 31, 2007. |
See Notes to Financial Statements.
| | |
| THE TARGET PORTFOLIO TRUST | | 203 |
Financial Highlights (continued)
| | | | | | | | | | | | | | | | | | |
| | | INTERNATIONAL
BOND PORTFOLIO | |
| | | Class T | |
| | | Year Ended
October 31, | | | Ten Months
Ended
October 31,
2007(d) | | | Year Ended
December 31, | |
| | | 2009 | | | 2008 | | | | 2006 | | | 2005 | | | 2004 | |
| | | | | | |
| PER SHARE OPERATING PERFORMANCE: | | | | | | | | | | | | | | | | | | |
Net asset value, beginning of period | | $8.13 | | | $8.33 | | | $8.22 | | | $8.33 | | | $8.19 | | | $8.45 | |
Income (loss) from investment operations | | | | | | | | | | | | | | | | | | |
Net investment income | | .30 | | | .28 | | | .14 | | | .19 | | | .03 | | | .26 | |
Net realized and unrealized gain (loss) on investments | | .58 | | | (.48 | ) | | (.03 | ) | | (.03 | ) | | .27 | | | .05 | |
Total from investment operations | | .88 | | | (.20 | ) | | .11 | | | .16 | | | .30 | | | .31 | |
Less dividends and distributions | | | | | | | | | | | | | | | | | | |
Dividends from net investment income | | (.89 | ) | | — | | | — | | | (.26 | ) | | (.15 | ) | | (.48 | ) |
Distributions from net realized gains | | — | | | — | | | — | | | (.01 | ) | | (.01 | ) | | (.09 | ) |
Total dividends and distributions | | (.89 | ) | | — | | | — | | | (.27 | ) | | (.16 | ) | | (.57 | ) |
Net asset value, end of period | | $8.12 | | | $8.13 | | | $8.33 | | | $8.22 | | | $8.33 | | | $8.19 | |
| | | | | | |
| TOTAL RETURN(a) | | 12.29 | % | | (2.40 | )% | | 1.34 | % | | 1.84 | % | | 3.95 | % | | 3.71 | % |
| | | | | |
| RATIOS/SUPPLEMENTAL DATA: | | | | | | | | | | | | | | | | |
Net assets, end of period (000) | | $25,288 | | | $29,346 | | | $39,011 | | | $40,944 | | | $42,912 | | | $44,905 | |
Average net assets (000) | | $25,248 | | | $35,921 | | | $39,934 | | | $41,174 | | | $44,072 | | | $43,199 | |
Ratios to average net assets(e) | | | | | | | | | | | | | | | | | | |
Expenses, including distribution and service (12b-1) fees | | 1.93 | % | | 1.15 | % | | 1.08 | %(b) | | 1.19 | % | | 1.51 | % | | 1.49 | % |
Expenses, excluding distribution and service (12b-1) fees | | 1.93 | % | | 1.15 | % | | 1.08 | %(b) | | 1.19 | % | | 1.51 | % | | 1.49 | % |
Net investment income | | 2.92 | % | | 3.16 | % | | 2.37 | %(b) | | 2.32 | % | | 1.71 | % | | 2.15 | % |
Portfolio turnover rate | | 464 | % | | 560 | % | | 595 | %(c) | | 323 | % | | 223 | % | | 169 | % |
| (a) | Total return is calculated assuming a purchase of a share on the first day and a sale on the last day of each period reported and includes reinvestment of dividends and distributions. Total returns may reflect adjustments to conform to generally accepted accounting principles. Total returns for periods less than one full year are not annualized. |
| (d) | For the ten month period ended October 31, 2007. The Trust changed its fiscal year end from December 31 to October 31, effective October 31, 2007. |
| (e) | Does not include expenses of the underlying fund in which the Portfolio invests. |
See Notes to Financial Statements.
| | |
| 204 | | THE TARGET PORTFOLIO TRUST |
Financial Highlights (continued)
| | | | | | | | | | | | |
| | | TOTAL RETURN
BOND PORTFOLIO | |
| | | Class R | |
| | | Year Ended
October 31, | | | Ten Months
Ended
October 31,
2007(f)(g) | | | August 22,
2006(b)
through
December 31,
2006 | |
| | | 2009 | | | 2008 | | | |
| | | | |
| PER SHARE OPERATING PERFORMANCE: | | | | | | | | | | | | |
Net asset value, beginning of period | | $9.86 | | | $10.54 | | | $10.31 | | | $10.31 | |
Income (loss) from investment operations | | | | | | | | | | | | |
Net investment income | | .42 | | | .46 | | | .33 | | | .12 | |
Net realized and unrealized gain (loss) on investments | | 1.82 | | | (.68 | ) | | .24 | | | .01 | |
Total from investment operations | | 2.24 | | | (.22 | ) | | .57 | | | .13 | |
Less dividends and distributions | | | | | | | | | | | | |
Dividends from net investment income | | (.62 | ) | | (.46 | ) | | (.34 | ) | | (.13 | ) |
Distributions from net realized gains | | (.55 | ) | | — | | | — | | | — | |
Total dividends and distributions | | (1.17 | ) | | (.46 | ) | | (.34 | ) | | (.13 | ) |
Net asset value, end of period | | $10.93 | | | $9.86 | | | $10.54 | | | $10.31 | |
| | | | |
| TOTAL RETURN(a) | | 24.57 | % | | (2.24 | )% | | 5.63 | % | | 1.27 | % |
| | | | |
| RATIOS/SUPPLEMENTAL DATA: | | | | | | | | | | | | |
Net assets, end of period (000) | | $71,457 | | | $53,218 | | | $23,670 | | | $1,503 | |
Average net assets (000) | | $56,103 | | | $42,474 | | | $10,429 | | | $246 | |
Ratios to average net assets (h) | | | | | | | | | | | | |
Expenses, including distribution and service (12b-1) fees(e) | | 1.32 | %(i) | | 1.23 | % | | 1.14 | %(c) | | 1.18 | %(c) |
Expenses, excluding distribution and service (12b-1) fees | | .82 | %(j) | | .73 | % | | .64 | %(c) | | .68 | %(c) |
Net investment income | | 4.20 | % | | 4.39 | % | | 3.84 | %(c) | | 3.46 | %(c) |
Portfolio turnover rate | | 657 | % | | 697 | % | | 421 | %(d) | | 483 | %(d) |
| (a) | Total return is calculated assuming a purchase of a share on the first day and a sale on the last day of each period reported and includes reinvestment of dividends and distributions. Total returns may reflect adjustments to conform to generally accepted accounting principles. Total returns for periods less than one full year are not annualized. |
| (b) | Commencement of operations. |
| (e) | The distributor of the Trust has contractually agreed to limit its distribution and service (12b-1) fees to .50 of 1% of the average daily net assets of the Class R shares. |
| (f) | Calculated based upon average shares outstanding during the period. |
| (g) | For the ten month period ended October 31, 2007. The Trust changed its fiscal year end from December 31 to October 31, effective October 31, 2007. |
| (h) | Does not include expenses of the underlying fund in which the Portfolio invests. |
| (i) | The annualized expense ratio without interest expense would have been 1.30% for the year ended October 31, 2009 |
| (j) | The annualized expense ratio without interest expense would have been 0.80% for the year ended October 31, 2009. |
See Notes to Financial Statements.
| | |
| THE TARGET PORTFOLIO TRUST | | 205 |
Financial Highlights (continued)
| | | | | | | | | | | | | | | | | | |
| | | TOTAL RETURN
BOND PORTFOLIO | |
| | | Class T | |
| | | Year Ended
October 31, | | | Ten Months
Ended
October 31,
2007(d)(e) | | | Year Ended
December 31, | |
| | | 2009 | | | 2008 | | | | 2006 | | | 2005 | | | 2004 | |
| | | | | | |
| PER SHARE OPERATING PERFORMANCE: | | | | | | | | | | | | | | | | | | |
Net asset value, beginning of period | | $9.93 | | | $10.60 | | | $10.38 | | | $10.39 | | | $10.64 | | | $10.66 | |
Income (loss) from investment operations | | | | | | | | | | | | | | | | | | |
Net investment income | | .47 | | | .53 | | | .39 | | | .40 | | | .38 | | | .20 | |
Net realized and unrealized gain (loss) on investments | | 1.84 | | | (.68 | ) | | .22 | | | .03 | | | (.12 | ) | | .31 | |
Total from investment operations | | 2.31 | | | (.15 | ) | | .61 | | | .43 | | | .26 | | | .51 | |
Less dividends and distributions | | | | | | | | | | | | | | | | | | |
Dividends from net investment income | | (.68 | ) | | (.52 | ) | | (.39 | ) | | (.44 | ) | | (.43 | ) | | (.44 | ) |
Distributions from net realized gains | | (.55 | ) | | — | | | — | | | — | | | (.08 | ) | | (.09 | ) |
Total dividends and distributions | | (1.23 | ) | | (.52 | ) | | (.39 | ) | | (.44 | ) | | (.51 | ) | | (.53 | ) |
Net asset value, end of period | | $11.01 | | | $9.93 | | | $10.60 | | | $10.38 | | | $10.39 | | | $10.64 | |
| | | | | | |
| TOTAL RETURN(a) | | 25.15 | % | | (1.71 | )% | | 5.94 | % | | 4.27 | % | | 2.60 | % | | 4.73 | % |
| | | | | |
| RATIOS/SUPPLEMENTAL DATA: | | | | | | | | | | | | | | | | |
Net assets, end of period (000) | | $217,784 | | | $194,970 | | | $183,262 | | | $167,154 | | | $161,675 | | | $178,488 | |
Average net assets (000) | | $198,247 | | | $206,986 | | | $174,725 | | | $162,621 | | | $169,616 | | | $170,073 | |
Ratios to average net assets(f) | | | | | | | | | | | | | | | | | | |
Expenses, including distribution and service (12b-1) fees | | .82 | %(g) | | .73 | % | | .64 | %(b) | | .68 | % | | .76 | % | | .75 | % |
Expenses, excluding distribution and service (12b-1) fees | | .82 | %(g) | | .73 | % | | .64 | %(b) | | .68 | % | | .76 | % | | .75 | % |
Net investment income | | 4.71 | % | | 4.86 | % | | 4.53 | %(b) | | 4.14 | % | | 3.72 | % | | 1.82 | % |
Portfolio turnover rate | | 657 | % | | 697 | % | | 421 | %(c) | | 483 | % | | 366 | % | | 587 | % |
| (a) | Total return is calculated assuming a purchase of a share on the first day and a sale on the last day of each period reported and includes reinvestment of dividends and distributions. Total returns may reflect adjustments to conform to generally accepted accounting principles. Total returns for periods less than one full year are not annualized. |
| (d) | Calculated based upon average shares outstanding during the period. |
| (e) | For the ten month period ended October 31, 2007. The Trust changed its fiscal year end from December 31 to October 31, effective October 31, 2007. |
| (f) | Does not include expenses of the underlying fund in which the Portfolio invests. |
| (g) | The annualized expense ratio without interest expense would have been 0.80% for the year ended October 31, 2009. |
See Notes to Financial Statements.
| | |
| 206 | | THE TARGET PORTFOLIO TRUST |
Financial Highlights (continued)
| | | | | | | | | | | | | | | | | | |
| | | INTERMEDIATE-TERM
BOND PORTFOLIO | |
| | | Class T | |
| | | Year Ended
October 31, | | | Ten Months
Ended
October 31,
2007(e) | | | Year Ended
December 31, | |
| | | 2009 | | | 2008 | | | | 2006 | | | 2005 | | | 2004 | |
| | | | | | |
| PER SHARE OPERATING PERFORMANCE: | | | | | | | | | | | | | | | | | | |
Net asset value, beginning of period | | $10.27 | | | $10.25 | | | $10.13 | | | $10.18 | | | $10.36 | | | $10.46 | |
Income (loss) from investment operations | | | | | | | | | | | | | | | | | | |
Net investment income | | .36 | | | .44 | | | .40 | | | .43 | | | .36 | | | .19 | |
Net realized and unrealized gain (loss) on investments | | 1.27 | | | .08 | | | .11 | | | (.03 | ) | | (.16 | ) | | .14 | |
Total from investment operations | | 1.63 | | | .52 | | | .51 | | | .40 | | | .20 | | | .33 | |
Less dividends and distributions | | | | | | | | | | | | | | | | | | |
Dividends from net investment income | | (.42 | ) | | (.50 | ) | | (.39 | ) | | (.45 | ) | | (.38 | ) | | (.24 | ) |
Distributions from net realized gains | | (.63 | ) | | — | | | — | | | — | | | — | (b) | | (.19 | ) |
Total dividends and distributions | | (1.05 | ) | | (.50 | ) | | (.39 | ) | | (.45 | ) | | (.38 | ) | | (.43 | ) |
Net asset value, end of period | | $10.85 | | | $10.27 | | | $10.25 | | | $10.13 | | | $10.18 | | | $10.36 | |
| | | | | | |
| TOTAL RETURN(a) | | 17.01 | % | | 5.07 | % | | 5.13 | % | | 4.12 | % | | 1.88 | % | | 3.19 | % |
| | | | | | |
| RATIOS/SUPPLEMENTAL DATA: | | | | | | | | | | | | | | | | | | |
Net assets, end of period (000) | | $245,517 | | | $204,548 | | | $233,423 | | | $245,223 | | | $262,177 | | | $297,982 | |
Average net assets (000) | | $218,911 | | | $227,475 | | | $235,800 | | | $249,376 | | | $278,441 | | | $318,671 | |
Ratios to average net assets(f) | | | | | | | | | | | | | | | | | | |
Expenses, including distribution and service (12b-1) fees | | .74 | %(g) | | .60 | % | | .58 | %(c) | | .64 | % | | .63 | % | | .64 | % |
Expenses, excluding distribution and service (12b-1) fees | | .74 | %(g) | | .60 | % | | .58 | %(c) | | .64 | % | | .63 | % | | .64 | % |
Net investment income | | 3.47 | % | | 4.21 | % | | 4.71 | %(c) | | 4.23 | % | | 3.48 | % | | 1.86 | % |
Portfolio turnover rate | | 527 | % | | 395 | % | | 284 | %(d) | | 134 | % | | 208 | % | | 133 | % |
| (a) | Total return is calculated assuming a purchase of a share on the first day and a sale on the last day of each period reported and includes reinvestment of dividends and distributions. Total returns may reflect adjustments to conform to generally accepted accounting principles. Total returns for periods less than one full year are not annualized. |
| (b) | Less than $0.005 per share. |
| (e) | For the ten month period ended October 31, 2007. The Trust changed its fiscal year end from December 31 to October 31, effective October 31, 2007. |
| (f) | Does not include expenses of the underlying fund in which the Portfolio invests. |
| (g) | The annualized expense ratio without interest expense would have been 0.69% for the year ended October 31, 2009. |
See Notes to Financial Statements.
| | |
| THE TARGET PORTFOLIO TRUST | | 207 |
Financial Highlights (continued)
| | | | | | | | | | | | | | | | | | |
| | | MORTGAGE BACKED
SECURITIES PORTFOLIO | |
| | | Class T | |
| | | Year Ended
October 31, | | | Ten Months
Ended
October 31,
2007 (e) | | | Year Ended
December 31, | |
| | | 2009 | | | 2008 | | | | 2006 | | | 2005 | | | 2004 | |
| | | | | | |
| PER SHARE OPERATING PERFORMANCE: | | | | | | | | | | | | | | | | | | |
Net asset value, beginning of period | | $9.26 | | | $9.95 | | | $9.99 | | | $10.10 | | | $10.39 | | | $10.45 | |
Income (loss) from investment operations | | | | | | | | | | | | | | | | | | |
Net investment income | | .70 | | | .63 | | | .41 | | | .44 | | | .50 | | | .36 | |
Net realized and unrealized gain (loss) on investments | | .74 | | | (.66 | ) | | (.03 | ) | | (.07 | ) | | (.27 | ) | | .02 | |
Total from investment operations | | 1.44 | | | (.03 | ) | | .38 | | | .37 | | | .23 | | | .38 | |
Less dividends | | | | | | | | | | | | | | | | | | |
Dividends from net investment income | | (.74 | ) | | (.66 | ) | | (.39 | ) | | (.48 | ) | | (.52 | ) | | (.44 | ) |
Tax return of capital | | — | | | — | | | (.03 | ) | | — | | | — | | | — | |
Total dividends | | (.74 | ) | | (.66 | ) | | (.42 | ) | | (.48 | ) | | (.52 | ) | | (.44 | ) |
Net asset value, end of period | | $9.96 | | | $9.26 | | | $9.95 | | | $9.99 | | | $10.10 | | | $10.39 | |
| | | | | | |
| TOTAL RETURN(a) | | 16.20 | % | | (.36 | )% | | 3.89 | % | | 3.82 | % | | 2.29 | % | | 3.68 | % |
| | | | | | |
| RATIOS/SUPPLEMENTAL DATA: | | | | | | | | | | | | | | | | | | |
Net assets, end of period (000) | | $41,112 | | | $51,368 | | | $73,581 | | | $75,471 | | | $82,195 | | | $95,796 | |
Average net assets (000) | | $44,081 | | | $64,999 | | | $75,508 | | | $77,483 | | | $89,756 | | | $103,055 | |
Ratios to average net assets(f) | | | | | | | | | | | | | | | | | | |
Expenses, including distribution and service (12b-1) fees | | 1.07 | %(b) | | 1.94 | %(b) | | 1.82 | %(b)(c) | | 1.89 | %(b) | | 1.70 | %(b) | | .90 | % |
Expenses, excluding distribution and service (12b-1) fees | | 1.07 | %(b) | | 1.94 | %(b) | | 1.82 | %(b)(c) | | 1.89 | %(b) | | 1.70 | %(b) | | .90 | % |
Net investment income | | 7.35 | % | | 6.34 | % | | 4.91 | %(c) | | 4.46 | % | | 4.91 | % | | 3.48 | % |
Portfolio turnover rate | | 425 | % | | 338 | % | | 318 | %(d) | | 471 | % | | 251 | % | | 279 | % |
| (a) | Total return is calculated assuming a purchase of a share on the first day and a sale on the last day of each period reported and includes reinvestment of dividends and distributions. Total returns may reflect adjustments to conform to generally accepted accounting principles. Total returns for periods less than one full year are not annualized. |
| (b) | The annualized expense ratio without interest expense would have been 0.79% for the year ended October 31, 2009, 0.70% for the year ended October 31, 2008, 0.76% for the ten months ended October 31, 2007, and 0.94% and 0.91%, respectively, for the years ended December 31, 2006 and 2005. |
| (e) | For the ten month period ended October 31, 2007. The Trust changed its fiscal year end from December 31 to October 31, effective October 31, 2007. |
| (f) | Does not include expenses of the underlying fund in which the Portfolio invests. |
See Notes to Financial Statements.
| | |
| 208 | | THE TARGET PORTFOLIO TRUST |
Financial Highlights (continued)
| | | | | | | | | | | | | | | | | | |
| | | U.S. GOVERNMENT MONEY
MARKET PORTFOLIO | |
| | | Class T | |
| | | Year Ended
October 31, | | | Ten Months
Ended
October 31,
2007(c) | | | Year Ended
December 31, | |
| | | 2009 | | | 2008 | | | | 2006 | | | 2005 | | | 2004 | |
| | | | | | |
| PER SHARE OPERATING PERFORMANCE: | | | | | | | | | | | | | | | | | | |
Net asset value, beginning of period | | $1.00 | | | $1.00 | | | $1.00 | | | $1.00 | | | $1.00 | | | $1.00 | |
Net investment income and net realized gain on investments | | .004 | | | .026 | | | .040 | | | .043 | | | .026 | | | .008 | |
Less dividends and distributions | | (.004 | ) | | (.026 | ) | | (.040 | ) | | (.043 | ) | | (.026 | ) | | (.008 | ) |
Net asset value, end of period | | $1.00 | | | $1.00 | | | $1.00 | | | $1.00 | | | $1.00 | | | $1.00 | |
| | | | | | |
| TOTAL RETURN(a) | | .38 | % | | 2.63 | % | | 4.04 | % | | 4.36 | % | | 2.59 | % | | .76 | % |
| | | | | |
| RATIOS/SUPPLEMENTAL DATA: | | | | | | | | | | | | | | | | |
Net assets, end of period (000) | | $66,231 | | | $68,844 | | | $67,067 | | | $47,275 | | | $57,207 | | | $74,190 | |
Average net assets (000) | | $85,565 | | | $91,457 | | | $63,409 | | | $47,990 | | | $69,488 | | | $94,854 | |
Ratios to average net assets(d) | | | | | | | | | | | | | | | | | | |
Expenses, including distribution and service (12b-1) fees | | .40 | %(e) | | .47 | % | | .50 | %(b) | | .70 | % | | .71 | % | | .59 | % |
Expenses, excluding distribution and service (12b-1) fees | | .40 | %(e) | | .47 | % | | .50 | %(b) | | .70 | % | | .71 | % | | .59 | % |
Net investment income | | .36 | %(e) | | 2.42 | % | | 4.78 | %(b) | | 4.25 | % | | 2.50 | % | | .72 | % |
| (a) | Total return is calculated assuming a purchase of a share on the first day and a sale on the last day of each period reported and includes reinvestment of dividends and distributions. Total returns may reflect adjustments to conform to generally accepted accounting principles. Total returns for periods less than one full year are not annualized. |
| (c) | For the ten month period ended October 31, 2007. The Trust changed its fiscal year end from December 31 to October 31, effective October 31, 2007. |
| (d) | Does not include expenses of the underlying fund in which the Portfolio invests. |
| (e) | The annualized expense ratios and the net investment income ratio without expense waivers would have been .63%, .63% and .14%, respectively, for the year ended October 31, 2009. |
See Notes to Financial Statements.
| | |
| THE TARGET PORTFOLIO TRUST | | 209 |
Report of Independent Registered Public Accounting Firm
The Board of Trustees and Shareholders
The Target Portfolio Trust:
We have audited the accompanying statements of assets and liabilities of The Target Portfolio Trust (comprised of Large Capitalization Growth Portfolio, Large Capitalization Value Portfolio, Small Capitalization Growth Portfolio, Small Capitalization Value Portfolio, International Equity Portfolio, International Bond Portfolio, Total Return Bond Portfolio, Intermediate-Term Bond Portfolio, Mortgage Backed Securities Portfolio, and U.S. Government Money Market Portfolio, hereafter referred to as the “Funds”), including the portfolios of investments, as of October 31, 2009, and the related statements of operations for the year then ended, the statements of changes in net assets for each of the years in the two-year period then ended and the financial highlights for each of the years in the two-year period then ended, the ten-month period ended October 31, 2007 and each of the years in the three-year period ended December 31, 2006. These financial statements and financial highlights are the responsibility of the Fund’s management. Our responsibility is to express an opinion on these financial statements and financial highlights based on our audits.
We conducted our audits in accordance with the standards of the Public Company Accounting Oversight Board (United States). Those standards require that we plan and perform the audit to obtain reasonable assurance about whether the financial statements and financial highlights are free of material misstatement. An audit includes examining, on a test basis, evidence supporting the amounts and disclosures in the financial statements. Our procedures included confirmation of securities owned as of October 31, 2009, by correspondence with the custodian, transfer agent and brokers or by other appropriate auditing procedures where replies from brokers were not received. An audit also includes assessing the accounting principles used and significant estimates made by management, as well as evaluating the overall financial statement presentation. We believe that our audits provide a reasonable basis for our opinion.
In our opinion, the financial statements and financial highlights referred to above present fairly, in all material respects, the financial position of the Funds as of October 31, 2009, and the results of their operations for the year then ended, the changes in their net assets for each of the years in the two-year period then ended and the financial highlights for each of the years in the two-year period then ended, the ten-month period ended October 31, 2007 and each of the years in the three-year period ended December 31, 2006, in conformity with U.S. generally accepted accounting principles.

New York, New York
December 23, 2009
| | |
| 210 | | THE TARGET PORTFOLIO TRUST |
Federal Tax Information (Unaudited)
We are required by the Internal Revenue Code of 1986, as amended (“the Code”), to advise you within 60 days of the Funds’ fiscal year end (October 31, 2009) as to the federal income tax status of dividends and distributions paid during such fiscal year. We are advising you that during its fiscal year ended October 31, 2009, The Target Portfolio Trust paid ordinary income dividends and designated the maximum amount allowable per share, but not less than the following amounts as a capital gain distributions per share in accordance with Section 852(b)(3)(C) of the Internal Revenue Code for Class R and T shares as follows:
| | | | | | | | | |
| | | | | Ordinary
Income
Dividends | | | Capital Gains
Distributions |
Large Capitalization Growth | | Class R | | $ | 0.07 | | | $ | — |
| | Class T | | | 0.12 | | | | — |
Large Capitalization Value | | Class R | | | 0.27 | | | | — |
| | Class T | | | 0.31 | | | | — |
Small Capitalization Growth | | Class T | | | 0.01 | | | | — |
Small Capitalization Value | | Class R | | | 0.16 | | | | 0.08 |
| | Class T | | | 0.23 | | | | 0.08 |
International Equity | | Class R | | | 0.42 | | | | — |
| | Class T | | | 0.47 | | | | — |
International Bond | | Class T | | | 0.89 | | | | — |
Total Return Bond | | Class R | | | 1.16 | | | | 0.01 |
| | Class T | | | 1.22 | | | | 0.01 |
Intermediate-Term Bond | | Class T | | | 0.65 | | | | 0.40 |
Mortgage Backed Securities | | Class T | | | 0.74 | | | | — |
U.S. Government Money Market | | Class T | | | — | (a) | | | — |
| (a) | The actual amount is less than $0.005. |
For the fiscal year ended October 31, 2009 the Funds designate the maximum amount allowable but not less than the following percentages of their ordinary income dividends paid during the fiscal year as 1) qualified dividend income in accordance with Section 854 of the Internal Revenue Code (‘QDI’), 2) eligible for corporate dividend received deduction in accordance with Section 854 of the Internal Revenue Code ("DRD"), 3) interest related dividends in accordance with Section 871(k)(1) and 881(e)(1) of the Internal Revenue Code (“IR”) and 4) short-term capital gain distributions in accordance with Section 871(k)(2) and 881(e)(2) of the Internal Revenue Code (“STCG”):
| | | | | | | | |
| | | QDI | | DRD | | IR | | STCG |
Large Capitalization Growth | | 100.00% | | 100.00% | | 0.00% | | 0.00% |
Large Capitalization Value | | 100.00% | | 100.00% | | 0.00% | | 0.00% |
Small Capitalization Growth | | 100.00% | | 100.00% | | 0.00% | | 0.00% |
Small Capitalization Value | | 100.00% | | 100.00% | | 0.00% | | 0.00% |
International Equity | | 100.00% | | 0.00% | | 0.00% | | 0.00% |
Total Return Bond | | 0.00% | | 0.00% | | 87.47% | | 77.38% |
Intermediate-Term Bond | | 0.00% | | 0.00% | | 92.45% | | 79.74% |
Mortgage Backed Securities | | 0.00% | | 0.00% | | 82.65% | | 0.00% |
U.S. Government Money Market | | 0.00% | | 0.00% | | 100.00% | | 0.00% |
For the fiscal year ended October 31, 2009, International Equity Portfolio has made an election to pass-through the maximum amount of the portion of the ordinary income dividends paid derived from foreign
| | |
| THE TARGET PORTFOLIO TRUST | | 211 |
Federal Tax Information (Unaudited) (continued)
source income as well as any foreign taxes paid by the Fund in accordance with Section 853 of the Internal Revenue Code of the following amounts: $435,597 foreign tax credit from foreign source income of $4,829,378.
Many states do not tax the portion of mutual fund dividends attributed to interest from U.S. Government obligations. Listed below is the percentage of interest earned by the following Portfolios from U.S. Government obligations for the fiscal year ended October 31, 2009. We are required by Massachusetts, Missouri and Oregon to inform you that dividends which have been derived from interest on federal obligations are not taxable to shareholders providing the mutual fund meets certain requirements mandated by the respective state’s taxing authorities.
| | | |
Portfolio*** | | Percentage of interest from
U.S. Government Obligations | |
Total Return Bond | | 5.17 | % |
Intermediate-Term Bond | | 2.83 | |
U.S. Government Money Market | | 40.60 | |
| *** | Due to certain minimum portfolio holding requirements in California, Connecticut and New York, residents of those states will not be able to exclude 2009 interest income from state and local taxes. |
Please consult your tax adviser or state/local authorities to properly report this information on your tax return. If you have any questions concerning the amounts listed above, please call your financial adviser.
In January 2010, you will be advised on IRS Form 1099 DIV or Substitute 1099 DIV as to the federal tax status of the distributions received by you in calendar 2009.
| | |
| 212 | | THE TARGET PORTFOLIO TRUST |
MANAGEMENT OF THE FUND
(Unaudited)
Information about Fund Directors/Trustees (referred to herein as “Board Members”) and Fund Officers is set forth below. Board Members who are not deemed to be “interested persons,” as defined in the 1940 Act, are referred to as “Independent Board Members.” Board Members who are deemed to be “interested persons” are referred to as “Interested Board Members.” The Board Members are responsible for the overall supervision of the operations of the Fund and perform the various duties imposed on the directors or trustees of investment companies by the 1940 Act.
| | | | |
| Independent Board Members (1) |
| | | |
Name, Address, Age Position(s) Portfolios Overseen | | Principal Occupation(s) During Past Five Years | | Other Directorships Held |
| | | |
Kevin J. Bannon (57) Board Member Portfolios Overseen: 57 | | Managing Director (since April 2008) of Highmount Capital LLC (registered investment adviser); formerly Executive Vice President and Chief Investment Officer (April 1993-August 2007) of Bank of New York Company; President (May 2003-May 2007) of BNY Hamilton Family of Mutual Funds. | | Director of Urstadt Biddle Properties (since September 2008). |
| | | |
Linda W. Bynoe (57) Board Member Portfolios Overseen: 57 | | President and Chief Executive Officer (since March 1995) of Telemat Ltd. (management consulting); formerly Vice President at Morgan Stanley & Co (broker-dealer). | | Director of Simon Property Group, Inc. (real estate investment trust) (since May 2003); Anixter International (communication products distributor) (since January 2006); Director of Northern Trust Corporation (banking) (since April 2006). |
| | | |
David E.A. Carson (75) Board Member Portfolios Overseen: 57 | | Director (since May 2008) of Liberty Bank; Director (since October 2007) of ICI Mutual Insurance Company; formerly President, Chairman and Chief Executive Officer of People’s Bank (1987 – 2000). | | None. |
| | | |
Michael S. Hyland, CFA (64) Board Member Portfolios Overseen: 57 | | Independent Consultant (since February 2005); formerly Senior Managing Director (July 2001-February 2005) of Bear Stearns & Co, Inc.; Global Partner, INVESCO (1999-2001); Managing Director and President Salomon Brothers Asset Management (1989-1999). | | None. |
| | | |
Robert E. La Blanc (75) Board Member Portfolios Overseen: 57 | | President (since 1981) of Robert E. La Blanc Associates, Inc. (telecommunications). | | Director of CA, Inc. (since 2002) (software company); FiberNet Telecom Group, Inc. (since 2003) (telecom company). |
THE TARGET PORTFOLIO TRUST
| | | | |
| | | |
Douglas H. McCorkindale (70) Board Member Portfolios Overseen: 57 | | Formerly Chairman (February 2001-June 2006), Chief Executive Officer (June 2000-July 2005), President (September 1997-July 2005) and Vice Chairman (March 1984-May 2000) of Gannett Co. Inc. (publishing and media). | | Director of Continental Airlines, Inc. (since May 1993); Director of Lockheed Martin Corp. (aerospace and defense) (since May 2001). |
| | | |
Stephen P. Munn (67) Board Member Portfolios Overseen: 57 | | Lead Director (since 2007) and formerly Chairman (1993-2007) of Carlisle Companies Incorporated (manufacturer of industrial products). | | None. |
| | | |
Richard A. Redeker (66) Board Member Portfolios Overseen: 57 | | Retired Mutual Fund Executive (36 years); Management Consultant; Director of Penn Tank Lines, Inc. (since 1999). | | None. |
| | | |
Robin B. Smith (70) Board Member & Independent Chair Portfolios Overseen: 57 | | Chairman of the Board (since January 2003) of Publishers Clearing House (direct marketing); formerly Chairman and Chief Executive Officer (August 1996-January 2003) of Publishers Clearing House. | | Formerly Director of BellSouth Corporation (telecommunications) (1992-2006). |
| | | |
Stephen G. Stoneburn (66) Board Member Portfolios Overseen: 57 | | President and Chief Executive Officer (since June 1996) of Quadrant Media Corp. (publishing company); formerly President (June 1995-June 1996) of Argus Integrated Media, Inc.; Senior Vice President and Managing Director (January 1993-1995) of Cowles Business Media; Senior Vice President of Fairchild Publications, Inc (1975-1989). | | None. |
| | | | |
| Interested Board Member (1) |
| | | |
Judy A. Rice (61) Board Member & President Portfolios Overseen: 57 | | President, Chief Executive Officer, Chief Operating Officer and Officer-In-Charge (since February 2003) of Prudential Investments LLC; President, Chief Executive Officer and Officer-In-Charge (since April 2003) of Prudential Mutual Fund Services LLC; Executive Vice President (since December 2008) of Prudential Investment Management Services LLC; formerly Vice President (February 1999-April 2006) of Prudential Investment Management Services LLC; formerly President, Chief Executive Officer, Chief Operating Officer and Officer-In-Charge (May 2003-June 2005) and Director (May 2003-March 2006) and Executive Vice President (June 2005- March 2006) of AST Investment Services, Inc.; Member of Board of Governors of the Investment Company Institute. | | None. |
THE TARGET PORTFOLIO TRUST
| 1 | The year that each individual joined the Fund’s Board is as follows: |
Linda W. Bynoe, 2005; David E.A. Carson, 2003; Robert E. La Blanc, 1999; Douglas H. McCorkindale, 1996; Richard A. Redeker, 2003; Robin B. Smith, 2003; Stephen G. Stoneburn, 1999; Kevin J. Bannon, 2008; Michael S. Hyland, 2008; Stephen P. Munn, 2008; Judy A. Rice, Board Member and President since 2003.
THE TARGET PORTFOLIO TRUST
| | |
Fund Officers (a)(1) |
| | |
Name, Address and Age
Position with Fund | | Principal Occupation(s) During Past Five Years |
| | |
Scott E. Benjamin (36) Vice President | | Executive Vice President (since June 2009) of Prudential Investments LLC and Prudential Investment Management Services LLC; Senior Vice President Product Development and Marketing, Prudential Investments (since February 2006); Vice President Product Development and Product Management, Prudential Investments (2003-2006). |
| | |
Kathryn L. Quirk (57) Chief Legal Officer | | Vice President and Corporate Counsel (since September 2004) of Prudential; Executive Vice President, Chief Legal Officer and Secretary (since July 2005) of PI and Prudential Mutual Fund Services LLC; Vice President and Corporate Counsel (since June 2005) and Secretary (since February 2006) of AST Investment Services, Inc.; formerly Senior Vice President and Assistant Secretary (November 2004-August 2005) of PI; formerly Assistant Secretary (June 2005-February 2006) of AST Investment Services, Inc.; formerly Managing Director, General Counsel, Chief Compliance Officer, Chief Risk Officer and Corporate Secretary (1997-2002) of Zurich Scudder Investments, Inc. |
| | |
Deborah A. Docs (51) Secretary | | Vice President and Corporate Counsel (since January 2001) of Prudential; Vice President (since December 1996) and Assistant Secretary (since March 1999) of PI; formerly Vice President and Assistant Secretary (May 2003-June 2005) of AST Investment Services, Inc. |
| | |
Jonathan D. Shain (51) Assistant Secretary | | Vice President and Corporate Counsel (since August 1998) of Prudential; Vice President and Assistant Secretary (since May 2001) of PI; Vice President and Assistant Secretary (since February 2001) of PMFS; formerly Vice President and Assistant Secretary (May 2003-June 2005) of AST Investment Services, Inc. |
| | |
Claudia DiGiacomo (35) Assistant Secretary | | Vice President and Corporate Counsel (since January 2005) of Prudential; Vice President and Assistant Secretary of PI (since December 2005); Associate at Sidley Austin Brown & Wood LLP (1999-2004). |
| | |
John P. Schwartz (38) Assistant Secretary | | Vice President and Corporate Counsel (since April 2005) of Prudential; Vice President and Assistant Secretary of PI (since December 2005); Associate at Sidley Austin Brown & Wood LLP (1997-2005). |
| | |
Andrew R. French (47) Assistant Secretary | | Director and Corporate Counsel (since May 2006) of Prudential; Vice President and Assistant Secretary (since January 2007) of PI; Vice President and Assistant Secretary (since January 2007) of PMFS; formerly Senior Legal Analyst of Prudential Mutual Fund Law Department (1997-2006). |
| | |
Timothy J. Knierim (50) Chief Compliance Officer | | Chief Compliance Officer of Prudential Investment Management, Inc. (since July 2007); formerly Chief Risk Officer of PIM and PI (2002-2007) and formerly Chief Ethics Officer of PIM and PI (2006-2007). |
| | |
Valerie M. Simpson (51) Deputy Chief Compliance Officer | | Chief Compliance Officer (since April 2007) of PI and AST Investment Services, Inc.; formerly Vice President-Financial Reporting (June 1999-March 2006) for Prudential Life and Annuities Finance. |
THE TARGET PORTFOLIO TRUST
| | |
| | |
Theresa C. Thompson (47) Deputy Chief Compliance Officer | | Vice President, Compliance, PI (since April 2004); and Director, Compliance, PI (2001-2004). |
| | |
Noreen M. Fierro (45) Anti-Money Laundering Compliance Officer | | Vice President, Corporate Compliance (since May 2006) of Prudential; formerly Corporate Vice President, Associate General Counsel (April 2002-May 2005) of UBS Financial Services, Inc., in their Money Laundering Prevention Group; Senior Manager (May 2005-May 2006) of Deloitte Financial Advisory Services, LLP, in their Forensic and Dispute Services, Anti-Money Laundering Group. |
| | |
Grace C. Torres (50) Treasurer and Principal Financial and Accounting Officer | | Assistant Treasurer (since March 1999) and Senior Vice President (since September 1999) of PI; Assistant Treasurer (since May 2003) and Vice President (since June 2005) of AST Investment Services, Inc.; Senior Vice President and Assistant Treasurer (since May 2003) of Prudential Annuities Advisory Services, Inc.; formerly Senior Vice President (May 2003-June 2005) of AST Investment Services, Inc. |
| | |
M. Sadiq Peshimam (45) Assistant Treasurer | | Vice President (since 2005) and Director (2000-2005) within Prudential Mutual Fund Administration. |
| | |
Peter Parrella (51) Assistant Treasurer | | Vice President (since 2007) and Director (2004-2007) within Prudential Mutual Fund Administration; formerly Tax Manager at SSB Citi Fund Management LLC (1997-2004). |
| (a) | Excludes the interested Board Member who also serve as President. |
| 1 | The year that each individual became an Officer of the Fund is as follows: |
Scott E. Benjamin, 2009; Kathryn L. Quirk, 2005; Deborah A. Docs, 2004; Jonathan D. Shain, 2005; Claudia DiGiacomo, 2005; John P. Schwartz, 2006; Andrew R. French, 2006; Timothy J. Knierim, 2007; Valerie M. Simpson 2007; Theresa C. Thompson, 2008; Noreen M. Fierro, 2006, Grace C. Torres, 2000; M. Sadiq Peshimam, 2006; Peter Parrella, 2007.
Explanatory Notes
| • | | Board Members are deemed to be “Interested,” as defined in the 1940 Act, by reason of their affiliation with Prudential Investments LLC and/or an affiliate of Prudential Investments LLC. |
| • | | Unless otherwise noted, the address of all Board Members and Officers is c/o Prudential Investments LLC, Gateway Center Three, 100 Mulberry Street, Newark, New Jersey 07102. |
| • | | There is no set term of office for Board Members or Officers. The Board Members have adopted a retirement policy, which calls for the retirement of Board Members on December 31st of the year in which they reach the age of 75. |
| • | | “Other Directorships Held” includes only directorships of companies required to register or file reports with the SEC under the Securities Exchange Act of 1934 (that is, “public companies”) or other investment companies registered under the 1940 Act. |
| • | | “Portfolios Overseen” includes all investment companies managed by Prudential Investments LLC. The investment companies for which PI serves as manager include the JennisonDryden Funds, Strategic Partners Funds, The Prudential Variable Contract Accounts, The Target Portfolio Trust, The Prudential Series Fund, Prudential’s Gibraltar Fund, Inc. and the Advanced Series Trust. |
THE TARGET PORTFOLIO TRUST
Approval of Advisory Agreements
The Trust’s Board of Trustees
The Board of Trustees (the “Board”) of The Target Portfolio Trust (the “Trust”) consists of 11 individuals, 10 of whom are not “interested persons” of the Trust, as defined in the Investment Company Act of 1940, as amended (the “1940 Act”) (the “Independent Trustees”). The Board is responsible for the oversight of the Trust and each of its Portfolios and their operations, and performs the various duties imposed on the directors of investment companies by the 1940 Act. The Independent Trustees have retained independent legal counsel to assist them in connection with their duties. The Chair of the Board is an Independent Trustee. The Board has established three standing committees: the Audit Committee, the Nominating and Governance Committee, and the Target Investment Committee. Each committee is chaired by, and composed of, Independent Trustees.
Annual Approval of the Trust’s Advisory Agreements
As required under the 1940 Act, the Board determines annually whether to renew the Trust’s management agreement with Prudential Investments LLC (“PI”) and the each Portfolio’s subadvisory agreement. In considering the renewal of the agreements, the Board, including all of the Independent Trustees, met on June 2-4, 2009 and approved the renewal of the agreements through July 31, 2010, after concluding that renewal of the agreements was in the best interest of each of the Trust’s Portfolios and their shareholders.
In advance of the meetings, the Trustees requested and received materials relating to the agreements, and had the opportunity to ask questions and request further information in connection with its consideration. In approving the agreements, the Trustees, including the Independent Trustees advised by independent legal counsel, considered the factors they deemed relevant, including the nature, quality and extent of services provided by PI and each subadviser, the performance of each Portfolio of the Trust, the profitability of PI and its affiliates, expenses and fees, and the potential for economies of scale that may be shared with each Portfolio and its shareholders. In their deliberations, the Trustees did not identify any single factor which alone was responsible for the Board’s decision to approve the agreements. In connection with its deliberations, the Board considered information provided by PI throughout the year at regular Board meetings, presentations from portfolio managers and other information, as well as information furnished at or in advance of the meetings on June 2-4, 2009.
The Trustees determined that the overall arrangements between the Trust and PI, which serves as the Trust’s investment manager pursuant to a management agreement, and between PI and each subadviser, each of which serves pursuant to
| | |
| THE TARGET PORTFOLIO TRUST | | |
Approval of Advisory Agreements (continued)
the terms of subadvisory agreements with PI, are fair and reasonable in light of the services performed, fees charged and such other matters as the Trustees considered relevant in the exercise of their business judgment.
The material factors and conclusions that formed the basis for the Trustees’ determinations to approve the renewal of the agreements are discussed separately below.
I. Renewal of Existing Management & Subadvisory Agreements
Nature, Quality, and Extent of Services
The Board received and considered information regarding the nature, quality and extent of services provided to the Trust by PI and each subadviser. The Board considered the services provided by PI, including but not limited to the oversight of the subadvisers, as well as the provision of fund recordkeeping and compliance services to the Trust. With respect to PI’s oversight of the subadvisers, the Board noted that PI’s Strategic Investment Research Group (“SIRG”), a business unit of PI, is responsible for screening and recommending new subadvisers when appropriate, as well as monitoring and reporting to the Board on the performance and operations of the subadvisers. The Board also considered that PI pays the salaries of all of the officers and non-independent Trustees of the Fund. The Board also considered the investment subadvisory services provided by each subadviser, as well as compliance with the Trust’s investment restrictions, policies and procedures. The Board considered PI’s evaluation of the subadvisers; as well as PI’s recommendation, based on its review of the subadvisers, to renew the subadvisory agreements or to replace certain subadvisers, as applicable.
The Board reviewed the qualifications, backgrounds and responsibilities of PI’s senior management responsible for the oversight of the Trust and each subadviser, and also reviewed the qualifications, backgrounds and responsibilities of the subadvisers’ portfolio managers who are responsible for the day-to-day management of each Portfolio. The Board was provided with information pertaining to PI’s and each subadviser’s organizational structure, senior management, investment operations, and other relevant information pertaining to both PI and each subadviser. The Board also noted that it received favorable compliance reports from the Fund’s Chief Compliance Officer (“CCO”) as to both PI and each subadviser.
The Board concluded that it was satisfied with the nature, extent and quality of the investment management services provided by PI and the subadvisory services provided to the Portfolios by each subadviser, and that there was a reasonable basis on which to conclude that the Trust and its Portfolios benefit from the services provided by PI and each subadviser under the management and subadvisory agreements.
| | |
| | THE TARGET PORTFOLIO TRUST |
Costs of Services and Profits Realized by PI
The Board was provided with information on the profitability of PI and its affiliates in serving as the Trust’s investment manager. The Board discussed with PI the methodology utilized in assembling the information regarding profitability and considered its reasonableness. The Board recognized that it is difficult to make comparisons of profitability from fund management contracts because comparative information is not generally publicly available and is affected by numerous factors, including the structure of the particular adviser, the types of funds it manages, its business mix, numerous assumptions regarding allocations and the adviser’s capital structure and cost of capital. Taking these factors into account, the Board concluded that the profitability of PI and its affiliates in relation to the services rendered was not unreasonable.
The Board noted that none of the Trust’s subadvisers were affiliated with PI, and concluded that the level of profitability of a subadviser not affiliated with PI may not be as significant as PI’s profitability given the arm’s length nature of the process by which the subadvisory fee rates were negotiated by PI and the unaffiliated subadvisers, as well as the fact that PI compensates the subadvisers out of its management fee.
Economies of Scale
The Board noted that the advisory fee schedule for the Portfolios of the Trust does not contain breakpoints that would reduce the fee rate on assets above specified levels. The Board received and discussed information concerning whether PI realizes economies of scale as each Portfolio’s assets grow beyond current levels. However, because of the nature of PI’s business, the Board could not reach definitive conclusions as to whether PI might realize economies of scale on a particular Portfolio or how great they may be. In light of each Portfolio’s current size and fee rate, the Board concluded that the absence of breakpoints in each Portfolio’s fee schedule is acceptable at this time.
Other Benefits to PI and the Subadvisers
The Board considered potential ancillary benefits that might be received by PI, the subadvisers, and their affiliates as a result of their relationship with the Trust and its Portfolios. The Board concluded that potential benefits to be derived by PI included brokerage commissions received by affiliates of PI, transfer agency fees received by the Trust’s transfer agent (which is affiliated with PI), as well as benefits to the reputation or other intangible benefits resulting from PI’s association with the Fund.
| | |
| THE TARGET PORTFOLIO TRUST | | |
Approval of Advisory Agreements (continued)
The Board concluded that the potential benefits to be derived by the subadvisers included the ability to use soft dollar credits, brokerage commissions received by affiliates of the subadvisers, as well as the potential benefits consistent with those generally resulting from an increase in assets under management, specifically, potential access to additional research resources and benefits to the reputation. The Board concluded that the benefits derived by PI and the subadvisers were consistent with the types of benefits generally derived by investment managers and subadvisers to mutual funds.
Performance of the Portfolios / Fees and Expenses / Other Factors
With respect to each Portfolio of the Trust, the Board also considered certain additional specific factors and related conclusions relating to the performance and fees and expenses of the Portfolios, as detailed below. Among other things, the Board considered comparisons with other mutual funds in relevant Peer Universes and Peer Groups. The mutual funds included in each Peer Universe or Peer Group were objectively determined by Lipper Inc., an independent provider of mutual fund data. To the extent that PI deems appropriate, and for reasons addressed in detail with the Board, PI may provide supplemental data compiled by Lipper for the Board’s consideration. The comparisons placed the Portfolios of the Trust in various quartiles over the one, three, five-, and, where applicable, ten-year periods ending December 31, 2008, with the first quartile being the best 25% of the mutual funds (for performance, the best performing mutual funds and, for expenses, the lowest cost mutual funds).
The Board also considered each Portfolio’s actual management fee (which reflects any subsidies, expense caps or waivers), as well as each Portfolio’s total expenses.
Intermediate-Term Bond Portfolio. The Board received and considered information about the Portfolio’s historical performance, noting that the Portfolio’s gross performance in relation to its Peer Universe (the Lipper Intermediate Investment-Grade Debt Funds Performance Universe) was in the first quartile over the one-, three-, five-, and ten-year periods. The Board also noted that the Portfolio outperformed against its benchmark index over all periods. The Board concluded that, in light of the Portfolio’s competitive performance, it would be in the interest of the Portfolio and its shareholders to renew the agreements.
The Board considered that the Portfolio’s actual management fee (which reflects any subsidies, expense caps or waivers) and total expenses both ranked in the Expense Group’s second quartile. The Board concluded that the management fees and total expenses were reasonable in light of the services provided.
| | |
| | THE TARGET PORTFOLIO TRUST |
International Bond Portfolio. The Board received and considered information about the Portfolio’s historical performance, noting that the Portfolio’s gross performance in relation to its Peer Universe (the Lipper International Income Funds Performance Universe) was in the fourth quartile over the one-, three-, five- and ten-year periods. The Board also noted that the Portfolio underperformed its benchmark index for all periods. The Board noted PI’s explanation that the Portfolio’s performance was significantly impacted by the extraordinary market conditions which occurred during 2008, including market turmoil and investors’ “flight-to-quality.” In addition, the Board considered PI’s explanation that it was exceedingly difficult for the Portfolio and similar funds to outperform the benchmark index used by the Portfolio, because the benchmark index was a government bond index, and the performance of the index was directly impacted by the market turmoil and the “flight-to-quality.” The Board further noted that the Portfolio’s recent performance had improved, with the Portfolio ranking in the first quartile of its Performance Universe during the first quarter of 2009, and that the Portfolio’s recent outperformance positively affected the Fund’s longer-term performance record. The Board concluded that, in light of the market conditions, as well as the Portfolio’s recent improvement in performance, it would be in the interest of the Portfolio and its shareholders to renew the agreements.
The Board considered that the Portfolio’s actual management fee (which reflects any subsidies, expense caps or waivers) ranked in the Expense Group’s second quartile, and that and total expenses ranked in the Expense Group’s fourth quartile. The Board considered PI’s explanation that the fourth quartile ranking for total expenses was primarily attributable to the relatively small size of the Portfolio, and the resulting increased fixed and other costs borne by the Portfolio. The Board concluded that the management fees and total expenses were reasonable in light of the services provided.
International Equity Portfolio. The Board received and considered information about the Portfolio’s historical performance, noting that the Portfolio’s gross performance in relation to its Peer Universe (a custom blend of mutual funds included in the Lipper International Multi-Cap Core Funds and International Large-Cap Core Funds Performance Universe)1 was in the second quartile over the three- and five-year periods, and was in the third quartile over the one- and ten-year periods. The Board noted that the Portfolio outperformed or performed
| 1 | The custom blend was utilized for performance comparisons, although Lipper classifies the Portfolio in its International Large-Cap Value Funds Performance Universe because PI believes that the funds included in this Universe provide a more appropriate basis for Portfolio performance comparisons. |
| | |
| THE TARGET PORTFOLIO TRUST | | |
Approval of Advisory Agreements (continued)
competitively against its benchmark index for all periods. The Board concluded that, in light of the Portfolio’s competitive performance vis-à-vis its benchmark index, it would be in the interest of the Portfolio and its shareholders to renew the agreements.
The Board considered that the Portfolio’s actual management fee (which reflects any subsidies, expense caps or waivers) and total expenses both ranked in the Expense Group’s first quartile. The Board concluded that the management fees and total expenses were reasonable in light of the services provided.
Large Capitalization Growth Portfolio. The Board received and considered information about the Portfolio’s historical performance, noting that the Portfolio’s gross performance in relation to its Peer Universe (the Lipper Large-Cap Growth Funds Performance Universe) was in the second quartile over the ten-year period, in the third quartile over the one- and three-year periods, and in the fourth quartile over the five-year period. The Board noted that the Portfolio outperformed its benchmark index over the ten-year period, though it underperformed the index over the one-, three- and five-year periods. The Board noted that PI had taken action in December 2008 to address the Portfolio’s performance record by replacing one of the Portfolio’s existing subadvisers with a new subadviser, Massachusetts Financial Services Company (MFS). The Board concluded that it was reasonable to renew the agreements, subject to its continued close scrutiny of the Fund’s performance.
The Board considered that the Portfolio’s actual management fee (which reflects any subsidies, expense caps or waivers) and total expenses both ranked in the Expense Group’s first quartile. The Board concluded that the management fees and total expenses were reasonable in light of the services provided.
Large Capitalization Value Portfolio. The Board received and considered information about the Portfolio’s historical performance, noting that the Portfolio’s gross performance in relation to its Peer Universe (the Lipper Large-Cap Value Funds Performance Universe) was in the third quartile over the ten-year period, although performance was in the fourth quartile over the one-, three- and five-year periods. The Board also noted that the Portfolio outperformed its benchmark index over the ten-year period, though it underperformed its benchmark index over the one-, three-, and five-year periods. The Board noted PI’s explanation that the Portfolio’s underperformance was primarily attributable to the fact that the “deep value” style of investing was out of favor during the extraordinary market conditions which occurred in 2008 and, as a result, the Portfolio’s “deep value” sleeve, managed by Hotchkis and Wiley, depressed the
| | |
| | THE TARGET PORTFOLIO TRUST |
Portfolio’s performance. The Board also noted that one of the Portfolio’s existing subadvisers had been replaced in December 2008 by Eaton Vance Management. The Board concluded that it was reasonable to renew the agreements, subject to its continued close scrutiny of the Fund’s performance.
The Board considered that the Portfolio’s actual management fee (which reflects any subsidies, expense caps or waivers) and total expenses both ranked in the Expense Group’s first quartile. The Board concluded that the management fees and total expenses were reasonable in light of the services provided.
Mortgage Backed Securities Portfolio. The Board received and considered information about the Portfolio’s historical performance, noting that the Portfolio’s gross performance in relation to its Peer Universe (the Lipper U.S. Mortgage Funds Performance Universe) was in the second quartile over the five- and ten-year periods, and in the third quartile over the one- and three-year periods. The Board also noted that the Portfolio underperformed its benchmark index over all periods. The Board further noted that the Portfolio’s recent performance had improved, with the Portfolio ranking in the first quartile of its Performance Universe and outperforming its benchmark index for the first quarter of 2009, and that the Portfolio’s recent outperformance positively affected the Fund’s longer-term performance record. The Board determined that, in light of the Portfolio’s competitive long-term performance, as well as the improved recent performance, it would be in the interest of the Portfolio and its shareholders to renew the agreements.
The Board considered that the Portfolio’s actual management fee (which reflects any subsidies, expense caps or waivers) ranked in the Expense Group’s second quartile and that the Portfolio’s total expenses ranked in the Expense Group’s first quartile. The Board concluded that the management fees and total expenses were reasonable in light of the services provided.
Small Capitalization Growth Portfolio. The Board received and considered information about the Portfolio’s historical performance, noting that the Portfolio’s gross performance in relation to its Peer Universe (the Lipper Small-Cap Growth Funds Performance Universe) was in the fourth quartile over the one-, three-, five- and ten-year periods. The Board also noted that the Portfolio underperformed its benchmark index over all periods.
The Board considered that PI had taken action to address the Portfolio’s performance record by replacing both of the Portfolio’s existing subadvisers in
| | |
| THE TARGET PORTFOLIO TRUST | | |
Approval of Advisory Agreements (continued)
July 2008 with two new subadvisers: Eagle Asset Management and Ashfield Capital Partners. The Board concluded that it was reasonable to renew the agreements, subject to its continued close scrutiny of the Fund’s performance.
The Board considered that the Portfolio’s actual management fee (which reflects any subsidies, expense caps or waivers) and total expenses both ranked in the Expense Group’s first quartile. The Board concluded that the management fees and total expenses were reasonable in light of the services provided.
Small Capitalization Value Portfolio. The Board received and considered information about the Portfolio’s historical performance, noting that the Portfolio’s gross performance in relation to its Peer Universe (the Lipper Small-Cap Value Funds Performance Universe) was in the first quartile over the one-, three-, five-, and ten-year periods. The Board also noted that the Portfolio outperformed against its benchmark index over all periods. The Board determined that, in light of the Portfolio’s competitive performance, it would be in the interest of the Portfolio and its shareholders to renew the agreements.
The Board considered that the Portfolio’s actual management fee (which reflects any subsidies, expense caps or waivers) and total expenses both ranked in the Expense Group’s first quartile. The Board concluded that the management fees and total expenses were reasonable in light of the services provided.
Total Return Bond Portfolio. The Board received and considered information about the Portfolio’s historical performance, noting that the Portfolio’s gross performance in relation to its Peer Universe (the Lipper Intermediate Investment-Grade Debt Funds Performance Universe)2 was in the first quartile over the three-, five- and ten-year periods, and in the second quartile over the one-year period. The Board also noted that the Portfolio outperformed its benchmark index over the three-, five-, and ten-year periods, though it underperformed its benchmark index over the one-year period. The Board determined that, in light of the Portfolio’s competitive performance, it would be in the interest of the Portfolio and its shareholders to renew the agreements.
The Board considered that the Portfolio’s actual management fee (which reflects any subsidies, expense caps or waivers) and total expenses both ranked in the
| 2 | Although Lipper classifies the Portfolio in its BBB-rated Corporate Debt Funds Performance Universe, the Intermediate Investment-Grade Debt Funds Performance Universe was utilized for performance comparisons, because PI believes that the funds included in this Universe provide a more appropriate basis for Portfolio performance comparisons. |
| | |
| | THE TARGET PORTFOLIO TRUST |
Expense Group’s second quartile. The Board concluded that the management fees and total expenses were reasonable in light of the services provided.
U.S. Government Money Market Portfolio. The Board received and considered information about the Portfolio’s historical performance, noting that the Portfolio’s gross performance in relation to its Peer Universe (the Lipper U.S. Government Money Market Funds Performance Universe) was in the second quartile over the one-, three- and five-year periods, and in the third quartile over the ten-year period. The Board also considered that the Portfolio outperformed or performed competitively against its benchmark index over all periods. The Board further noted that during the first quarter of 2009 the Portfolio outperformed the benchmark index and ranked in the second quartile of the Peer Universe. The Board determined that, in light of the Portfolio’s competitive performance, it would be in the interest of the Portfolio and its shareholders to renew the agreements.
The Board considered that the Portfolio’s actual management fee (which reflects any subsidies, expense caps or waivers) and total expenses both ranked in the Expense Group’s first quartile. The Board concluded that the management fees and total expenses were reasonable in light of the services provided.
II. Approval of New Subadvisory Agreement: Small Capitalization Value Portfolio
At a special meeting held on July 7, 2009, the Board, including all of the Independent Trustees, approved a new subadvisory agreement for the Small Capitalization Value Portfolio (the “Portfolio”) of the Trust, as explained below.
Pursuant to a recommendation by PI, the Board approved a new subadvisory agreement between PI and Lee Munder Capital Group and the termination of the existing subadvisory agreement with Lee Munder Investments, Ltd. (“Old Lee Munder”).
Reasons for Recommending the New Subadvisory Agreement
PI recommended to the Board that it approve a new subadvisory agreement (the “Subadvisory Agreement”) with Lee Munder Capital Group with respect to the Portfolio in response to the announcement by City National Corporation that it intended to acquire a majority interest in Old Lee Munder, and to merge Old Lee Munder into an existing investment advisory entity owned by City National Corporation (the “Transaction”). The announcement also indicated that the merged entity would be known as Lee Munder Capital Group (“New Lee Munder”), and
| | |
| THE TARGET PORTFOLIO TRUST | | |
Approval of Advisory Agreements (continued)
would be registered as an investment adviser under the Investment Advisers Act of 1940. Pursuant to the provisions of the 1940 Act and the subadvisory agreement between PI and Old Lee Munder, the acquisition of Old Lee Munder by City National Corporation would constitute a change in the control of Old Lee Munder, thereby causing the existing subadvisory agreement to terminate.
The Board considered whether the approval of the Subadvisory Agreement with Lee Munder was in the best interests of the Portfolio and its shareholders. Before approving the Subadvisory Agreement, the Trustees reviewed performance, compliance and organization materials regarding Lee Munder and received presentations from representatives of Lee Munder as well as PI. The Board also received materials relating to the Subadvisory Agreement and had the opportunity to ask questions and request further information in connection with its consideration. In making the determination to retain Lee Munder as a subadviser, the Trustees, including the Independent Trustees advised by independent legal counsel, considered the following information:
Nature, Quality and Extent of services
The Board received and considered information regarding the nature, quality and extent of services provided to the Portfolio by Old Lee Munder and those that would be provided by New Lee Munder (hereafter, jointly referred to as “Lee Munder”). The Board also noted that the nature and extent of services provided to the Portfolio under the prior subadvisory agreement with Lee Munder were identical in all material respects to those to be provided by Lee Munder under the Subadvisory Agreement and generally similar to those provided by the other current subadvisers under their subadvisory agreements.
With respect to the quality of services, the Board considered, among other things, the background and experience of Lee Munder’s portfolio management team, which would be the same team that worked for Lee Munder prior to the Transaction, and was not affected by the Transaction. In connection with the recent annual review of advisory agreements, the Board had reviewed the qualifications, backgrounds and responsibilities of the portfolio managers who are responsible for the day-to-day management of the Portfolio, and the Board was provided with information pertaining to organizational structure, senior management, investment operations, and other relevant information pertaining to Lee Munder. The Board noted that it received a favorable compliance report from the Trust’s Chief Compliance Officer (“CCO”) as to Lee Munder.
The Board concluded that it was satisfied with the nature, extent and quality of the investment subadvisory services provided to the Portfolio by Lee Munder under the
| | |
| | THE TARGET PORTFOLIO TRUST |
prior subadvisory agreement and that there was a reasonable basis on which to conclude that the quality of investment subadvisory services to be provided by Lee Munder under the Subadvisory Agreement should equal the quality of similar services provided by Lee Munder under the prior subadvisory agreement, and that the Portfolio would benefit from the subadvisory services to be provided by Lee Munder under the Subadvisory Agreement.
Performance of the Portfolio
The Board noted that at its June 2009 meetings, it had reviewed the performance of the Portfolio in general, as well as the “sleeve” or segment subadvised by Lee Munder in connection with its annual consideration of the renewal of the Trust’s subadvisory agreements. As part of that review, the Board reviewed the performance record of the Portfolio and concluded that, in light of the Portfolio’s competitive performance, it was in the best interest of the Portfolio and its shareholders for the Portfolio to renew the Portfolio’s subadvisory agreements.
Investment Subadvisory Fee Rates
The Board noted that the subadvisory fee rate payable to Lee Munder would remain unchanged. The Board noted that it had recently reviewed the fee rate paid to Lee Munder in connection with the recent annual review of advisory agreements and determined that the fee rates were reasonable. The Board concluded that Lee Munder’s proposed subadvisory fee rate under the Subadvisory Agreement was reasonable.
Subadviser’s Profitability
In connection with its recent annual review of advisory agreements, the Board considered the profitability of PI and subadvisers affiliated with PI. The Board concluded that the level of profitability of a subadviser not affiliated with PI, such as Lee Munder, may not be as significant as PI’s profitability given the arm’s length nature of the process by which the subadvisory fee rates were negotiated by PI and the unaffiliated subadvisers, as well as the fact that PI compensates the subadvisers out of its management fee.
Economies of Scale
In connection with its recent annual review of advisory agreements, the Board considered economies of scale. The Board noted that there was no proposed change in fee rates and breakpoints and that it would again review economies of scale at the next annual review of advisory agreements.
| | |
| THE TARGET PORTFOLIO TRUST | | |
Approval of Advisory Agreements (continued)
Other Benefits to Lee Munder or its Affiliates from Serving as Subadviser
The Board considered potential ancillary benefits that might be received by Lee Munder and its affiliates as a result of its relationships with the Portfolio. The Board concluded that the potential benefits to be derived by Lee Munder included the ability to use soft dollar credits, brokerage commissions received by affiliates of Lee Munder, as well as the potential benefits consistent with those generally resulting from an increase in assets under management, specifically, potential access to additional research resources and benefits to the reputation. The Board concluded that the benefits to be derived by PI and Lee Munder were consistent with the types of benefits generally derived by subadvisers to mutual funds.
After full consideration of these factors, the Board concluded that the approval of the Subadvisory Agreement was in the best interest of the Portfolio and its shareholders.
| | |
| | THE TARGET PORTFOLIO TRUST |
Growth of a $10,000 Investment
Large Capitalization Growth Portfolio
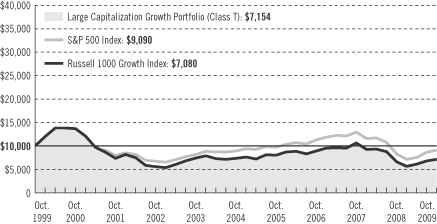
| | | | | | | | | | | |
| Average Annual Total Returns as of 10/31/09 | | | | | | | | | |
| | | One Year | | | Five Years | | | Ten Years | | | Since Inception |
Class R | | 8.13 | % | | N/A | | | N/A | | | –5.45% (8/22/06) |
Class T | | 8.64 | | | –0.48 | % | | –3.29 | % | | — |
Performance data quoted represent past performance. Past performance does not guarantee future results. The investment return and principal value of an investment will fluctuate, so that an investor’s shares, when redeemed, may be worth more or less than their original cost. Current performance may be lower or higher than the past performance data quoted. An investor may obtain performance data as of the most recent month-end by visiting our website at www.prudential.com or by calling (800) 225-1852. Gross operating expenses: Class R, 1.61%; Class T, 0.86%. Net operating expenses apply to: Class R, 1.36%; Class T, 0.86%, after contractual reduction through 2/28/2011.
The returns in the graph and the tables do not reflect the deduction of taxes that a shareholder would pay on Fund distributions or following the redemption of Fund shares.
The graph compares a $10,000 investment in the TARGET Large Capitalization Growth Portfolio (Class T) with a similar investment in the S&P 500 Index and the Russell 1000 Growth Index by portraying the initial account values at the beginning of the 10-year period (October 31, 1999) and the account values at the end of the current fiscal year (October 31, 2009), as measured on a quarterly basis. The average annual total returns in the table and the returns on investment in the graph do not reflect the deduction of taxes that a shareholder would pay on Portfolio distributions or following the redemption of Portfolio shares.
| | |
| | THE TARGET PORTFOLIO TRUST |
The S&P 500 Index is an index of 500 stocks of large U.S. companies. It gives a broad look at how U.S. stock prices have performed. The Russell 1000 Growth Index contains those securities in the Russell 1000 Index with a greater-than-average growth orientation. Companies in this index tend to exhibit higher price-to-book and price-to-earnings ratios, lower dividend yields, and higher forecasted growth rates. These indexes are unmanaged, and the total returns include the reinvestment of all dividends, but do not include the effect of sales charges, operating expenses, or taxes. These returns would be lower if they included the effect of sales charges, operating expenses, or taxes. The securities in these indexes may differ substantially from the securities in the Portfolio. These indexes are not the only ones that may be used to characterize performance of large-capitalization equity funds, and other indexes may portray different comparative performance. Investors cannot invest directly in an index.
| | |
| THE TARGET PORTFOLIO TRUST | | |
Growth of a $10,000 Investment
Large Capitalization Value Portfolio
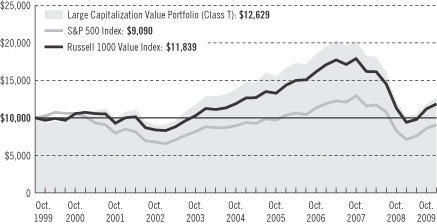
| | | | | | | | | | | |
| Average Annual Total Returns as of 10/31/09 | | | | | | | | | |
| | | One Year | | | Five Years | | | Ten Years | | | Since Inception |
Class R | | 3.59 | % | | N/A | | | N/A | | | –9.96% (8/22/06) |
Class T | | 4.15 | | | –1.66 | % | | 2.36 | % | | — |
Performance data quoted represent past performance. Past performance does not guarantee future results. The investment return and principal value of an investment will fluctuate, so that an investor’s shares, when redeemed, may be worth more or less than their original cost. Current performance may be lower or higher than the past performance data quoted. An investor may obtain performance data as of the most recent month-end by visiting our website at www.prudential.com or by calling (800) 225-1852. Gross operating expenses: Class R, 1.58%; Class T, 0.83%. Net operating expenses apply to: Class R, 1.33%; Class T, 0.83%, after contractual reduction through 2/28/2011.
The returns in the graph and the tables do not reflect the deduction of taxes that a shareholder would pay on Fund distributions or following the redemption of Fund shares.
The graph compares a $10,000 investment in the TARGET Large Capitalization Value Portfolio (Class T) with a similar investment in the S&P 500 Index and the Russell 1000 Value Index by portraying the initial account values at the beginning of the 10-year period (October 31, 1999) and the account values at the end of the current fiscal year (October 31, 2009), as measured on a quarterly basis. The average annual total returns in the table and the returns on investment in the graph do not reflect the deduction of taxes that a shareholder would pay on Portfolio distributions or following the redemption of Portfolio shares.
| | |
| | THE TARGET PORTFOLIO TRUST |
The S&P 500 Index is an index of 500 stocks of large U.S. companies. It gives a broad indication of how U.S. stock prices have performed. The Russell 1000 Value Index contains those securities in the Russell 1000 Index with a less-than-average growth orientation. Companies in this index generally have low price-to-book and price-to-earnings ratios, higher dividend yields, and lower forecasted growth values. These indexes are unmanaged, and the total returns include the reinvestment of all dividends, but do not include the effect of sales charges, operating expenses, or taxes. These returns would be lower if they included the effect of sales charges, operating expenses, or taxes. The securities in these indexes may differ substantially from the securities in the Portfolio. These indexes are not the only ones that may be used to characterize performance of large-capitalization equity funds, and other indexes may portray different comparative performance. Investors cannot invest directly in an index.
| | |
| THE TARGET PORTFOLIO TRUST | | |
Growth of a $10,000 Investment
Small Capitalization Growth Portfolio
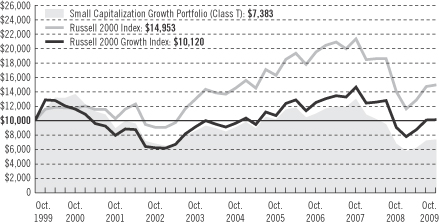
| | | | | | | | | | | |
| Average Annual Total Returns as of 10/31/09 | | | | | | | | | |
| | | One Year | | | Five Years | | | Ten Years | | | Since Inception |
Class R | | 7.53 | % | | N/A | | | N/A | | | –10.63% (8/22/06) |
Class T | | 8.06 | | | –4.08 | % | | –2.99 | % | | — |
Performance data quoted represent past performance. Past performance does not guarantee future results. The investment return and principal value of an investment will fluctuate, so that an investor’s shares, when redeemed, may be worth more or less than their original cost. Current performance may be lower or higher than the past performance data quoted. An investor may obtain performance data as of the most recent month-end by visiting our website at www.prudential.com or by calling (800) 225-1852. Gross operating expenses: Class R, 1.77%; Class T, 1.02%. Net operating expenses apply to: Class R, 1.52%; Class T, 1.02%, after contractual reduction through 2/28/2011.
The returns in the graph and the tables do not reflect the deduction of taxes that a shareholder would pay on Fund distributions or following the redemption of Fund shares.
The graph compares a $10,000 investment in the TARGET Small Capitalization Growth Portfolio (Class T) with a similar investment in the Russell 2000 Index and the Russell 2000 Growth Index by portraying the initial account values at the beginning of the 10-year period (October 31, 1999) and the account values at the end of the current fiscal year (October 31, 2009), as measured on a quarterly basis. The average annual total returns in the
| | |
| | THE TARGET PORTFOLIO TRUST |
table and the returns on investment in the graph do not reflect the deduction of taxes that a shareholder would pay on Portfolio distributions or following the redemption of Portfolio shares.
The Russell 2000 Index is a weighted index that comprises the smallest 2,000 stocks among the largest 3,000 equity-capitalized U.S. corporations and represents approximately 10% of their aggregate market value. The Russell 2000 Growth Index comprises securities in the Russell 2000 Index with a greater-than-average growth orientation. Companies in this index tend to exhibit higher price-to-book ratios and higher forecasted growth values. These indexes are unmanaged, and the total returns include the reinvestment of all dividends, but do not include the effect of sales charges, operating expenses, or taxes. These returns would be lower if they included the effect of sales charges, operating expenses, or taxes. The securities in these indexes may differ substantially from the securities in the Portfolio. These indexes are not the only ones that may be used to characterize performance of small-capitalization equity funds, and other indexes may portray different comparative performance. Investors cannot invest directly in an index.
| | |
| THE TARGET PORTFOLIO TRUST | | |
Growth of a $10,000 Investment
Small Capitalization Value Portfolio
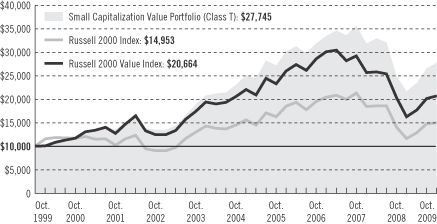
| | | | | | | | | | | |
| Average Annual Total Returns as of 10/31/09 | | | | | | | | | |
| | | One Year | | | Five Years | | | Ten Years | | | Since Inception |
Class R | | 11.29 | % | | N/A | | | N/A | | | –2.92% (8/22/06) |
Class T | | 11.82 | | | 3.84 | % | | 10.74 | % | | — |
Performance data quoted represent past performance. Past performance does not guarantee future results. The investment return and principal value of an investment will fluctuate, so that an investor’s shares, when redeemed, may be worth more or less than their original cost. Current performance may be lower or higher than the past performance data quoted. An investor may obtain performance data as of the most recent month-end by visiting our website at www.prudential.com or by calling (800) 225-1852. Gross operating expenses: Class R, 1.55%; Class T, 0.80%. Net operating expenses apply to: Class R, 1.30%; Class T, 0.80%, after contractual reduction through 2/28/2011.
The returns in the graph and the tables do not reflect the deduction of taxes that a shareholder would pay on Fund distributions or following the redemption of Fund shares.
The graph compares a $10,000 investment in the TARGET Small Capitalization Value Portfolio (Class T) with a similar investment in the Russell 2000 Index and the Russell 2000 Value Index by portraying the initial account values at the beginning of the 10-year period (October 31, 1999) and the account values at the end of the current fiscal year (October 31, 2009), as measured on a quarterly basis. The average annual total returns in the table and the returns on investment in the graph do not reflect the deduction of taxes that a shareholder would pay on Portfolio distributions or following the redemption of Portfolio shares.
| | |
| | THE TARGET PORTFOLIO TRUST |
The Russell 2000 Index is a weighted index that comprises the smallest 2,000 stocks among the largest 3,000 equity-capitalized U.S. corporations and represents approximately 10% of their aggregate market value. The Russell 2000 Value Index comprises securities in the Russell 2000 Index with a less-than-average growth orientation. Companies in this index tend to exhibit lower price-to-book ratios and lower forecasted growth values. These indexes are unmanaged, and the total returns include the reinvestment of all dividends, but do not include the effect of sales charges, operating expenses, or taxes. These returns would be lower if they included the effect of sales charges, operating expenses, or taxes. The securities in these indexes may differ substantially from the securities in the Portfolio. These indexes are not the only ones that may be used to characterize performance of small-capitalization equity funds, and other indexes may portray different comparative performance. Investors cannot invest directly in an index.
| | |
| THE TARGET PORTFOLIO TRUST | | |
Growth of a $10,000 Investment
International Equity Portfolio
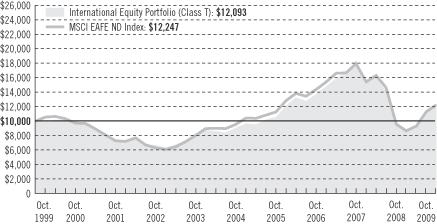
| | | | | | | | | | | |
| Average Annual Total Returns as of 10/31/09 | | | | | | | | | |
| | | One Year | | | Five Years | | | Ten Years | | | Since Inception |
Class R | | 26.27 | % | | N/A | | | N/A | | | –2.88% (8/22/06) |
Class T | | 26.84 | | | 5.98 | % | | 1.92 | % | | — |
Performance data quoted represent past performance. Past performance does not guarantee future results. The investment return and principal value of an investment will fluctuate, so that an investor’s shares, when redeemed, may be worth more or less than their original cost. Current performance may be lower or higher than the past performance data quoted. An investor may obtain performance data as of the most recent month-end by visiting our website at www.prudential.com or by calling (800) 225-1852. Gross operating expenses: Class R, 1.76%; Class T, 1.01%. Net operating expenses apply to: Class R, 1.51%; Class T, 1.01%, after contractual reduction through 2/28/2011.
The returns in the graph and the tables do not reflect the deduction of taxes that a shareholder would pay on Fund distributions or following the redemption of Fund shares.
The graph compares a $10,000 investment in the TARGET International Equity Portfolio (Class T) with a similar investment in the Morgan Stanley Capital International Europe, Australasia, Far East Index (MSCI EAFE ND Index) by portraying the initial account values at the beginning of the 10-year period (October 31, 1999) and the account values at the end of the current fiscal year (October 31, 2009), as measured on a quarterly basis. The average annual total returns in the table and the returns on investment in the graph do not reflect the deduction of taxes that a shareholder would pay on Portfolio distributions or following the redemption of Portfolio shares.
| | |
| | THE TARGET PORTFOLIO TRUST |
The MSCI EAFE ND Index is a weighted index of performance that reflects stock price movements in Europe, Australasia, and the Far East. The MSCI EAFE ND Index is unmanaged, and the total returns include the reinvestment of all dividends, but do not include the effect of sales charges, operating expenses, or taxes. These returns would be lower if they included the effect of sales charges, operating expenses, or taxes. The securities in the MSCI EAFE ND Index may differ substantially from the securities in the Portfolio. The MSCI EAFE ND Index is not the only one that may be used to characterize performance of international equity funds, and other indexes may portray different comparative performance. Investors cannot invest directly in an index.
| | |
| THE TARGET PORTFOLIO TRUST | | |
Growth of a $10,000 Investment
International Bond Portfolio
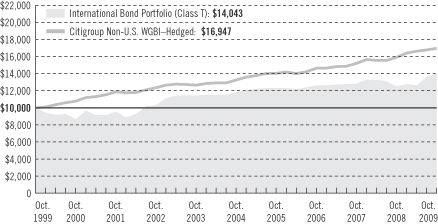
| | | | | | | | | |
| Average Annual Total Returns as of 10/31/09 | | | | | | | | | |
| | | One Year | | | Five Years | | | Ten Years | |
Class T | | 12.29 | % | | 3.59 | % | | 3.45 | % |
Performance data quoted represent past performance. Past performance does not guarantee future results. The investment return and principal value of an investment will fluctuate, so that an investor’s shares, when redeemed, may be worth more or less than their original cost. Current performance may be lower or higher than the past performance data quoted. An investor may obtain performance data as of the most recent month-end by visiting our website at www.prudential.com or by calling (800) 225-1852. Gross operating expenses: Class T, 1.93%. Net operating expenses apply to: Class T, 1.93%.
The returns in the graph and the tables do not reflect the deduction of taxes that a shareholder would pay on Fund distributions or following the redemption of Fund shares.
The graph compares a $10,000 investment in the TARGET International Bond Portfolio (Class T) with a similar investment in the Citigroup Non-U.S. World Government Bond Index–Hedged (Citigroup Non-U.S. WGBI–Hedged) by portraying the initial account values at the beginning of the 10-year period (October 31, 1999) and the account values at the end of the current fiscal year (October 31, 2009), as measured on a quarterly basis. The average annual total returns in the table and the returns on investment in the graph do not reflect the deduction of taxes that a shareholder would pay on Portfolio distributions or following the redemption of Portfolio shares.
The Citigroup Non-U.S. WGBI–Hedged is an unmanaged index of approximately 600 high-quality bonds with foreign currency exposure translated to the U.S. dollar. The index’s total return includes the reinvestment of all
| | |
| | THE TARGET PORTFOLIO TRUST |
dividends, but does not include the effect of sales charges, operating expenses, or taxes. The return would be lower if it included the effect of sales charges, operating expenses, or taxes. The securities in the index may differ substantially from the securities in the Portfolio. The index is not the only one that may be used to characterize performance of international bond funds, and other indexes may portray different comparative performance. Investors cannot invest directly in an index.
| | |
| THE TARGET PORTFOLIO TRUST | | |
Growth of a $10,000 Investment
Total Return Bond Portfolio
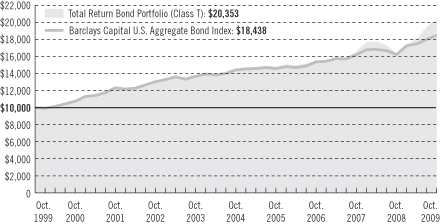
| | | | | | | | | | | |
| Average Annual Total Returns as of 10/31/09 | | | | | | | | | |
| | | One Year | | | Five Years | | | Ten Years | | | Since Inception |
Class R | | 24.44 | % | | N/A | | | N/A | | | 8.60% (8/22/06) |
Class T | | 25.15 | | | 6.95 | % | | 7.36 | % | | — |
Performance data quoted represent past performance. Past performance does not guarantee future results. The investment return and principal value of an investment will fluctuate, so that an investor’s shares, when redeemed, may be worth more or less than their original cost. Current performance may be lower or higher than the past performance data quoted. An investor may obtain performance data current to the most recent month-end by visiting our website at www.prudential.com or by calling (800) 225-1852. Gross operating expenses: Class R, 1.57%; Class T, 0.82%. Net operating expenses apply to: Class R, 1.32%; Class T, 0.82%, after contractual reduction through 2/28/2011.
The returns in the graph and the tables do not reflect the deduction of taxes that a shareholder would pay on Fund distributions or following the redemption of Fund shares.
The graph compares a $10,000 investment in the TARGET Total Return Bond Portfolio (Class T) with a similar investment in the Barclays Capital U.S. Aggregate Bond Index by portraying the initial account values at the beginning of the 10-year period (October 31, 1999) and the account values at the end of the current fiscal year (October 31, 2009), as measured on a quarterly basis. The average annual total returns in the table and the returns on investment in the graph do not reflect the deduction of taxes that a shareholder would pay on Portfolio distributions or following the redemption of Portfolio shares.
| | |
| | THE TARGET PORTFOLIO TRUST |
The Barclays Capital U.S. Aggregate Bond Index is an unmanaged index of investment-grade securities issued by the U.S. government and its agencies and by corporations with between one and 10 years remaining to maturity. It gives a broad look at how bond prices of short- and intermediate-term bonds have performed. This index is unmanaged, and the total returns include the reinvestment of all dividends, but do not include the effect of sales charges, operating expenses, or taxes. These returns would be lower if they included the effect of sales charges, operating expenses, or taxes. The securities in these indexes may differ substantially from the securities in the Portfolio. This index is not the only one that may be used to characterize performance of bond funds, and other indexes may portray different comparative performance. Investors cannot invest directly in an index.
| | |
| THE TARGET PORTFOLIO TRUST | | |
Growth of a $10,000 Investment
Intermediate-Term Bond Portfolio
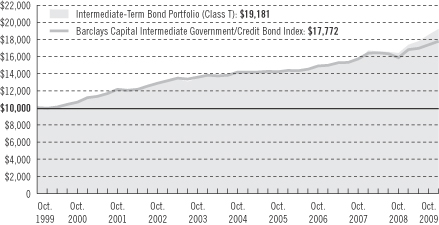
| | | | | | | | | |
| Average Annual Total Returns as of 10/31/09 | | | | | | | | | |
| | | One Year | | | Five Years | | | Ten Years | |
Class T | | 17.01 | % | | 6.53 | % | | 6.73 | % |
Performance data quoted represent past performance. Past performance does not guarantee future results. The investment return and principal value of an investment will fluctuate, so that an investor’s shares, when redeemed, may be worth more or less than their original cost. Current performance may be lower or higher than the past performance data quoted. An investor may obtain performance data as of the most recent month-end by visiting our website at www.prudential.com or by calling (800) 225-1852. Gross operating expenses: Class T, 0.74%. Net operating expenses apply to: Class T, 0.74%.
The returns in the graph and the tables do not reflect the deduction of taxes that a shareholder would pay on Fund distributions or following the redemption of Fund shares.
The graph compares a $10,000 investment in the TARGET Intermediate-Term Bond Portfolio (Class T) with a similar investment in the Barclays Capital Intermediate Government/Credit Bond Index by portraying the initial account values at the beginning of the 10-year period (October 31, 1999) and the account values at the end of the current fiscal year (October 31, 2009), as measured on a quarterly basis. The average annual total returns in the table and the returns on investment in the graph do not reflect the deduction of taxes that a shareholder would pay on Portfolio distributions or following the redemption of Portfolio shares.
The Barclays Capital Intermediate Government/Credit Bond Index is a weighted index comprising securities issued by the U.S. government and its agencies and securities publicly issued by corporations with 1 to 10 years
| | |
| | THE TARGET PORTFOLIO TRUST |
remaining to maturity and rated investment grade. The Barclays Capital Intermediate Government/Credit Bond Index is unmanaged, and the total returns include the reinvestment of all dividends, but do not include the effect of sales charges, operating expenses, or taxes. These returns would be lower if they included the effect of sales charges, operating expenses, or taxes. The securities in the Barclays Capital Intermediate Government/Credit Bond Index may differ substantially from the securities in the Portfolio. The Barclays Capital Intermediate Government/Credit Bond Index is not the only one that may be used to characterize performance of bond funds, and other indexes may portray different comparative performance. Investors cannot invest directly in an index.
| | |
| THE TARGET PORTFOLIO TRUST | | |
Growth of a $10,000 Investment
Mortgage Backed Securities Portfolio
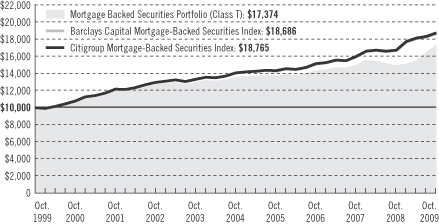
| | | | | | | | | |
| Average Annual Total Returns as of 10/31/09 | | | | | | | | | |
| | | One Year | | | Five Years | | | Ten Years | |
Class T | | 16.20 | % | | 5.07 | % | | 5.68 | % |
Performance data quoted represent past performance. Past performance does not guarantee future results. The investment return and principal value of an investment will fluctuate so that an investor’s shares, when redeemed, may be worth more or less than their original cost. Current performance may be lower or higher than the past performance data quoted. An investor may obtain performance data as of the most recent month-end by visiting our website at www.prudential.com or by calling (800) 225-1852. Gross operating expenses: Class T, 1.07%. Net operating expenses apply to: Class T, 1.07%.
The returns in the graph and the tables do not reflect the deduction of taxes that a shareholder would pay on Fund distributions or following the redemption of Fund shares.
The graph compares a $10,000 investment in the TARGET Mortgage Backed Securities Portfolio (Class T) with a similar investment in the Barclays Capital Mortgage-Backed Securities Index and the Citigroup Mortgage-Backed Securities Index by portraying the initial account values at the beginning of the 10-year period (October 31, 1999) and the account values at the end of the current fiscal year (October 31, 2009), as measured on a quarterly basis. The average annual total returns in the table and the returns on investment in the graph do not reflect the deduction of taxes that a shareholder would pay on Portfolio distributions or following the redemption of Portfolio shares.
| | |
| | THE TARGET PORTFOLIO TRUST |
The Barclays Capital Mortgage-Backed Securities Index is a market capitalization-weighted index of 15-year and 30-year fixed-rate securities backed by the mortgage pools of the GNMA, the FNMA, and the FHLMC, and balloon mortgages with fixed-rate coupons. The Citigroup Mortgage-Backed Securities Index is an index of 30- and 15-year mortgage-related securities issued by U.S. government agencies. It gives a broad indication of how mortgage-backed securities have performed. These indexes are unmanaged, and the total returns include the reinvestment of all dividends, but do not include the effect of sales charges, operating expenses, or taxes. These returns would be lower if they included the effect of sales charges, operating expenses, or taxes. The securities in these indexes may differ substantially from the securities in the Portfolio. These indexes are not the only ones that may be used to characterize performance of bond funds, and other indexes may portray different comparative performance. Investors cannot invest directly in an index.
| | |
| THE TARGET PORTFOLIO TRUST | | |
| | | | |
| n MAIL | | n TELEPHONE | | n WEBSITE |
Gateway Center Three 100 Mulberry Street Newark, NJ 07102 | | (800) 225-1852 | | www.prudential.com |
|
| PROXY VOTING |
| The Board of Trustees of The TARGET Portfolio Trust has delegated to the Trust’s investment subadvisers the responsibility for voting any proxies and maintaining proxy recordkeeping with respect to the Trust. A description of these proxy voting policies and procedures is available without charge, upon request, by calling (800) 225-1852 or by visiting the Securities and Exchange Commission’s website at www.sec.gov. Information regarding how the Trust voted proxies relating to portfolio securities during the most recent 12-month period ended June 30 is available on the Trust’s website and on the Commission’s website. |
|
| TRUSTEES |
Kevin J. Bannon • Linda W. Bynoe • David E.A. Carson • Michael S. Hyland • Robert E. La Blanc • Douglas H. McCorkindale • Stephen P. Munn • Richard A. Redeker • Judy A. Rice •
Robin B. Smith • Stephen G. Stoneburn |
|
| OFFICERS |
| Judy A. Rice, President • Scott E. Benjamin, Vice President • Grace C. Torres, Treasurer and Principal Financial and Accounting Officer • Kathryn L. Quirk, Chief Legal Officer • Deborah A. Docs, Secretary • Timothy J. Knierim, Chief Compliance Officer • Valerie M. Simpson, Deputy Chief Compliance Officer • Theresa C. Thompson, Deputy Chief Compliance Officer • Noreen M. Fierro, Anti-Money Laundering Compliance Officer • Jonathan D. Shain, Assistant Secretary • Claudia DiGiacomo, Assistant Secretary • John P. Schwartz, Assistant Secretary • Andrew R. French, Assistant Secretary • M. Sadiq Peshimam, Assistant Treasurer • Peter Parrella, Assistant Treasurer |
| | | | |
| MANAGER | | Prudential Investments LLC | | Gateway Center Three
100 Mulberry Street Newark, NJ 07102 |
|
| INVESTMENT SUBADVISERS | | Ashfield Capital Partners, LLC | | 750 Battery Street
Suite 600 San Francisco, CA 94111 |
|
| | Eagle Asset Management | | 880 Carillon Parkway
St. Petersburg, FL 33716 |
|
| | EARNEST Partners, LLC | | 1180 Peachtree Street
Suite 2300 Atlanta, GA 30309 |
|
| | Eaton Vance Management | | Two International Place
Boston, MA 02110 |
|
| | Hotchkis and Wiley Capital
Management, LLC | | 725 S. Figueroa Street
Suite 3900 Los Angeles, CA 90017 |
|
| | J.P. Morgan Investment
Management, Inc. | | 245 Park Avenue
New York, NY 10167 |
| | | | |
| | Lee Munder Capital Group | | 200 Clarendon Street
Boston, MA 02116 |
|
| | LSV Asset Management | | One North Wacker Drive
Suite 4000 Chicago, IL 60606 |
|
| | Marsico Capital
Management, LLC | | 1200 17th Street
Suite 1600 Denver, CO 80202 |
|
| | Massachusetts Financial
Services Company | | 500 Boylston Street
Boston, MA 02109 |
|
| | NFJ Investment Group L.P. | | 2100 Ross Avenue
Dallas, TX 75201 |
|
| | Pacific Investment
Management Company LLC | | 840 Newport Center Drive
Newport Beach, CA 92660 |
|
| | Thornburg Investment
Management, Inc. | | 119 East Marcy Street
Santa Fe, NM 87501 |
|
| | Vaughan Nelson Investment
Management, L.P. | | 600 Travis Street
Suite 6300 Houston, TX 77002 |
|
| | Wellington Management
Company, LLP | | 75 State Street
Boston, MA 02109 |
|
| DISTRIBUTOR | | Prudential Investment
Management Services LLC | | Gateway Center Three
100 Mulberry Street
Newark, NJ 07102 |
|
| CUSTODIAN | | PFPC Trust Company | | 400 Bellevue Parkway
Wilmington, DE 19809 |
|
| TRANSFER AGENT | | Prudential Mutual Fund
Services LLC | | PO Box 9658
Providence, RI 02940 |
|
| INDEPENDENT REGISTERED PUBLIC ACCOUNTING FIRM | | KPMG LLP | | 345 Park Avenue
New York, NY 10154 |
|
| FUND COUNSEL | | Willkie Farr & Gallagher LLP | | 787 Seventh Avenue
New York, NY 10019 |
|
| An investor should consider the investment objectives, risks, charges, and expenses of a Portfolio carefully before investing. The prospectuses for the Portfolios contain this and other information about the Portfolios. An investor may obtain a prospectus by visiting our website at www.prudential.com or by calling (800) 225-1852. The prospectus should be read carefully before investing. |
|
| E-DELIVERY |
| To receive your mutual fund documents online, go to www.prudential.com/edelivery/mutualfunds and enroll. Instead of receiving printed documents by mail, you will receive notification via email when new materials are available. You can cancel your enrollment or change your email address at any time by visiting the website address above. |
|
| SHAREHOLDER COMMUNICATIONS WITH TRUSTEES |
| Shareholders can communicate directly with the Board of Trustees by writing to the Chair of the Board, The TARGET Portfolio Trust, Prudential Investments, Attn: Board of Trustees, 100 Mulberry Street, Gateway Center Three, Newark, NJ 07102. Shareholders can communicate directly with an individual Trustee by writing to the same address. Communications are not screened before being delivered to the addressee. |
|
| AVAILABILITY OF PORTFOLIO SCHEDULE |
| The Trust files its complete schedule of portfolio holdings with the Securities and Exchange Commission for the first and third quarters of each fiscal year on Form N-Q. The Trusts’ Forms N-Q are available on the Commission’s website at www.sec.gov. The Trusts’ Forms N-Q may also be reviewed and copied at the Commission’s Public Reference Room in Washington, D.C. Information on the operation and location of the Public Reference Room may be obtained by calling (202) 551-8090. The Trust’s schedule of portfolio holdings is also available on the Trust’s website as of the end of each fiscal quarter. |
|
| The Fund’s Statement of Additional Information contains additional information about the Fund’s Trustees and is available without charge, upon request, by calling (800) 225-1852. |
Mutual Funds:
| | | | |
| ARE NOT INSURED BY THE FDIC OR ANY FEDERAL GOVERNMENT AGENCY | | MAY LOSE VALUE | | ARE NOT A DEPOSIT OF OR GUARANTEED BY ANY BANK OR ANY BANK AFFILIATE |

| | | | | | | | | | | | | | |
| | | The TARGET Portfolio Trust | | NASDAQ | | CUSIP | | | | NASDAQ | | CUSIP | | |
| | Large Capitalization Growth (Class R) | | TLCRX | | 875921868 | | Mortgage Backed Securities (Class T) | | TGMBX | | 875921702 | | |
| | Large Capitalization Growth (Class T) | | TALGX | | 875921207 | | Large Capitalization Value (Class R) | | TLVRX | | 875921850 | | |
| | Small Capitalization Growth (Class R) | | TSCRX | | 875921835 | | Large Capitalization Value (Class T) | | TALVX | | 875921108 | | |
| | Small Capitalization Growth (Class T) | | TASGX | | 875921405 | | Small Capitalization Value (Class R) | | TSVRX | | 875921843 | | |
| | International Equity (Class R) | | TEQRX | | 875921827 | | Small Capitalization Value (Class T) | | TASVX | | 875921306 | | |
| | International Equity (Class T) | | TAIEX | | 875921504 | | International Bond (Class T) | | TIBPX | | 875921876 | | |
| | Total Return Bond (Class R) | | TTBRX | | 875921819 | | Intermediate-Term Bond (Class T) | | TAIBX | | 875921801 | | |
| | Total Return Bond (Class T) | | TATBX | | 875921884 | | U.S. Govt Money Market (Class T) | | PUGXX | | 875921603 | | |
TMF158E 0168208-00001-00
Item 2 – Code of Ethics — See Exhibit (a)
As of the end of the period covered by this report, the registrant has adopted a code of ethics (the “Section 406 Standards for Investment Companies – Ethical Standards for Principal Executive and Financial Officers”) that applies to the registrant’s Principal Executive Officer and Principal Financial Officer; the registrant’s Principal Financial Officer also serves as the Principal Accounting Officer.
The registrant hereby undertakes to provide any person, without charge, upon request, a copy of the code of ethics. To request a copy of the code of ethics, contact the registrant 800-225-1852, and ask for a copy of the Section 406 Standards for Investment Companies - Ethical Standards for Principal Executive and Financial Officers.
Item 3 – Audit Committee Financial Expert –
The registrant’s Board has determined that Mr. David E. A. Carson, member of the Board’s Audit Committee is an “audit committee financial expert,” and that he is “independent,” for purposes of this Item.
Item 4 – Principal Accountant Fees and Services –
For the fiscal years ended October 31, 2009 and October 31, 2008, KPMG LLP (“KPMG”), the Registrant’s principal accountant, billed the Registrant $353,498 and $353,498, respectively, for professional services rendered for the audit of the Registrant’s annual financial statements or services that are normally provided in connection with statutory and regulatory filings.
During the fiscal year ended October 31, 2009, KPMG, the Registrant’s principal accountant, billed the Registrant $15,577 for professional services rendered in connection with agreed upon procedures performed related to a custody conversion. Not applicable for the fiscal year ended October 31, 2008.
None.
None.
| (e) | (1) Audit Committee Pre-Approval Policies and Procedures |
THE PRUDENTIAL MUTUAL FUNDS
AUDIT COMMITTEE POLICY
on
Pre-Approval of Services Provided by the Independent Accountants
The Audit Committee of each Prudential Mutual Fund is charged with the responsibility to monitor the independence of the Fund’s independent accountants. As part of this responsibility, the Audit Committee must pre-approve any independent accounting firm’s engagement to render audit and/or permissible non-audit services, as required by law. In evaluating a proposed engagement of the independent accountants, the Audit Committee will assess the effect that the engagement might reasonably be expected to have on the accountant’s independence. The Committee’s evaluation will be based on:
| | • | | a review of the nature of the professional services expected to be provided, |
| | • | | a review of the safeguards put into place by the accounting firm to safeguard independence, and |
| | • | | periodic meetings with the accounting firm. |
Policy for Audit and Non-Audit Services Provided to the Funds
On an annual basis, the scope of audits for each Fund, audit fees and expenses, and audit-related and non-audit services (and fees proposed in respect thereof) proposed to be performed by the Fund’s independent accountants will be presented by the Treasurer and the independent accountants to the Audit Committee for review and, as appropriate, approval prior to the initiation of such services. Such presentation shall be accompanied by confirmation by both the Treasurer and the independent accountants that the proposed services will not adversely affect the independence of the independent accountants. Proposed services shall be described in sufficient detail to enable the Audit Committee to assess the appropriateness of such services and fees, and the compatibility of the provision of such services with the auditor’s independence. The Committee shall receive periodic reports on the progress of the audit and other services which are approved by the Committee or by the Committee Chair pursuant to authority delegated in this Policy.
The categories of services enumerated under “Audit Services”, “Audit-related Services”, and “Tax Services” are intended to provide guidance to the Treasurer and the independent accountants as to those categories of services which the Committee believes are generally consistent with the independence of the independent accountants and which the Committee (or the Committee Chair) would expect upon the presentation of specific proposals to pre-approve. The enumerated categories are not intended as an exclusive list of audit, audit-related or tax services, which the Committee (or the Committee Chair) would consider for pre-approval.
Audit Services
The following categories of audit services are considered to be consistent with the role of the Fund’s independent accountants:
| | • | | Annual Fund financial statement audits |
| | • | | Seed audits (related to new product filings, as required) |
| | • | | SEC and regulatory filings and consents |
Audit-related Services
The following categories of audit-related services are considered to be consistent with the role of the Fund’s independent accountants:
| | • | | Accounting consultations |
| | • | | Fund merger support services |
| | • | | Agreed Upon Procedure Reports |
| | • | | Other Internal Control Reports |
Individual audit-related services that fall within one of these categories and are not presented to the Audit Committee as part of the annual pre-approval process will be subject to pre-approval by the Committee Chair (or any other Committee member on whom this responsibility has been delegated) so long as the estimated fee for those services does not exceed $50,000.
Tax Services
The following categories of tax services are considered to be consistent with the role of the Fund’s independent accountants:
| | • | | Tax compliance services related to the filing or amendment of the following: |
| | • | | Federal, state and local income tax compliance; and, |
| | • | | Sales and use tax compliance |
| | • | | Timely RIC qualification reviews |
| | • | | Tax distribution analysis and planning |
| | • | | Tax authority examination services |
| | • | | Tax appeals support services |
| | • | | Accounting methods studies |
| | • | | Fund merger support services |
| | • | | Tax consulting services and related projects |
Individual tax services that fall within one of these categories and are not presented to the Audit Committee as part of the annual pre-approval process will be subject to pre-approval by the Committee Chair (or any other Committee member on whom this responsibility has been delegated) so long as the estimated fee for those services does not exceed $50,000.
Other Non-audit Services
Certain non-audit services that the independent accountants are legally permitted to render will be subject to pre-approval by the Committee or by one or more Committee members to whom the Committee has delegated this authority and who will report to the full Committee any pre-approval
decisions made pursuant to this Policy. Non-audit services presented for pre-approval pursuant to this paragraph will be accompanied by a confirmation from both the Treasurer and the independent accountants that the proposed services will not adversely affect the independence of the independent accountants.
Proscribed Services
The Fund’s independent accountants will not render services in the following categories of non-audit services:
| | • | | Bookkeeping or other services related to the accounting records or financial statements of the Fund |
| | • | | Financial information systems design and implementation |
| | • | | Appraisal or valuation services, fairness opinions, or contribution-in-kind reports |
| | • | | Internal audit outsourcing services |
| | • | | Management functions or human resources |
| | • | | Broker or dealer, investment adviser, or investment banking services |
| | • | | Legal services and expert services unrelated to the audit |
| | • | | Any other service that the Public Company Accounting Oversight Board determines, by regulation, is impermissible. |
Pre-approval of Non-Audit Services Provided to Other Entities Within the Prudential Fund Complex
Certain non-audit services provided to Prudential Investments LLC or any of its affiliates that also provide ongoing services to the Prudential Mutual Funds will be subject to pre-approval by the Audit Committee. The only non-audit services provided to these entities that will require pre-approval are those related directly to the operations and financial reporting of the Funds. Individual projects that are not presented to the Audit Committee as part of the annual pre-approval process will be subject to pre-approval by the Committee Chair (or any other Committee member on whom this responsibility has been delegated) so long as the estimated fee for those services does not exceed $50,000. Services presented for pre-approval pursuant to this paragraph will be accompanied by a confirmation from both the Treasurer and the independent accountants that the proposed services will not adversely affect the independence of the independent accountants.
Although the Audit Committee will not pre-approve all services provided to Prudential Investments LLC and its affiliates, the Committee will receive an annual report from the Fund’s independent accounting firm showing the aggregate fees for all services provided to Prudential Investments and its affiliates.
| (e) | (2) Percentage of services referred to in 4(b) – 4(d) that were approved by the audit committee – |
One hundred percent of the services described in Item 4(b) was approved by the audit committee.
| (f) | Percentage of hours expended attributable to work performed by other than full time employees of principal accountant if greater than 50%. |
The percentage of hours expended on the principal accountant’s engagement to audit the registrant’s financial statements for the most recent fiscal year that were attributed to work performed by persons other than the principal accountant’s full-time, permanent employees was 0%.
Not applicable to Registrant for the fiscal years 2009 and 2008. The aggregate non-audit fees billed by KPMG for services rendered to the registrant’s investment adviser and any entity controlling, controlled by, or under common control with the investment adviser that provides ongoing services to the registrant for the fiscal years 2009 and 2008 was $0 and $0, respectively.
| (h) | Principal Accountant’s Independence |
Not applicable as KPMG has not provided non-audit services to the registrant’s investment adviser and any entity controlling, controlled by, or under common control with the investment adviser that provides ongoing services to the registrant that were not pre-approved pursuant to Rule 2-01(c)(7)(ii) of Regulation S-X.
Item 5 – Audit Committee of Listed Registrants – Not applicable.
Item 6 – Schedule of Investments – The schedule is included as part of the report to shareholders filed under Item 1 of this Form.
Item 7 – Disclosure of Proxy Voting Policies and Procedures for Closed-End Management Investment Companies – Not applicable.
Item 8 – Portfolio Managers of Closed-End Management Investment Companies – Not applicable.
Item 9 – Purchases of Equity Securities by Closed-End Management Investment Company and Affiliated Purchasers – Not applicable.
Item 10 – Submission of Matters to a Vote of Security Holders – Not applicable.
Item 11 – Controls and Procedures
| | (a) | It is the conclusion of the registrant’s principal executive officer and principal financial officer that the effectiveness of the registrant’s current disclosure controls and procedures (such disclosure controls and procedures having been evaluated within 90 days of the date of this filing) provide reasonable assurance that the information required to be disclosed by the registrant has been recorded, processed, summarized and reported within the time period specified in the Commission’s rules and forms and that the information required to be disclosed by the registrant has been accumulated and communicated to the registrant’s principal executive officer and principal financial officer in order to allow timely decisions regarding required disclosure. |
| | (b) | There has been no significant change in the registrant’s internal control over financial reporting that occurred during the registrant’s most recent fiscal quarter of the period covered by this report that has materially affected, or is likely to materially affect, the registrant’s internal control over financial reporting. |
Item 12 – Exhibits
| | (a) | (1) Code of Ethics – Attached hereto as Exhibit EX-99.CODE-ETH |
(2) Certifications pursuant to Section 302 of the Sarbanes-Oxley Act – Attached hereto as Exhibit EX-99.CERT.
(3) Any written solicitation to purchase securities under Rule 23c-1. – Not applicable.
| | (b) | Certifications pursuant to Section 906 of the Sarbanes-Oxley Act – Attached hereto as Exhibit EX-99.906CERT. |
SIGNATURES
Pursuant to the requirements of the Securities Exchange Act of 1934 and the Investment Company Act of 1940, the registrant has duly caused this report to be signed on its behalf by the undersigned, thereunto duly authorized.
| | |
| (Registrant) The Target Portfolio Trust |
| |
| By (Signature and Title)* | | /S/ DEBORAH A. DOCS |
| | Deborah A. Docs |
| | Secretary |
|
| Date December 22, 2009 |
Pursuant to the requirements of the Securities Exchange Act of 1934 and the Investment Company Act of 1940, this report has been signed below by the following persons on behalf of the registrant and in the capacities and on the dates indicated.
| | |
| By (Signature and Title)* | | /S/ JUDY A. RICE |
| | Judy A. Rice |
| | President and Principal Executive Officer |
|
| Date December 22, 2009 |
| | |
| By (Signature and Title)* | | /S/ GRACE C. TORRES |
| | Grace C. Torres |
| | Treasurer and Principal Financial Officer |
|
| Date December 22, 2009 |
| * | Print the name and title of each signing officer under his or her signature. |