UNITED STATES
SECURITIES AND EXCHANGE COMMISSION
Washington, D.C. 20549
FORM N-CSR
CERTIFIED SHAREHOLDER REPORT OF REGISTERED
MANAGEMENT INVESTMENT COMPANIES
| | |
| Investment Company Act file number: | | 811-07064 |
| |
| Exact name of registrant as specified in charter: | | The Target Portfolio Trust |
| |
| Address of principal executive offices: | | Gateway Center 3, |
| | 100 Mulberry Street, |
| | Newark, New Jersey 07102 |
| |
| Name and address of agent for service: | | Deborah A. Docs |
| | Gateway Center 3, |
| | 100 Mulberry Street, |
| | Newark, New Jersey 07102 |
| |
| Registrant’s telephone number, including area code: | | 973-367-7521 |
| |
| Date of fiscal year end: | | 12/31/2005 |
| |
| Date of reporting period: | | 12/31/2005 |
Item 1 – Reports to Stockholders – [ INSERT REPORT ]


The TARGETPortfolio Trust®
Annual Report
December 31, 2005
TARGET
A STRUCTURED AND PERSONALIZED INVESTMENT PROGRAM
This report is not authorized for distribution to prospective investors unless preceded or accompanied by a current prospectus.
The views expressed in this report and information about the Trust’s portfolios’ securities are for the period covered by this report and are subject to change thereafter.

February 15, 2006
Dear TARGET Shareholder:
We hope you find the annual report for The TARGET Portfolio Trust informative and useful. Today many investors may be asking where they can find new growth opportunities. We believe that as a TARGET shareholder, you are uniquely positioned for domestic and global growth opportunities because you already have a strategic investment plan in place.
The TARGET program’s structured and professional approach to investing helps you “tune out” the noise of current market developments and allows you to concentrate on what’s really important—your long-term goals. It starts with a personal plan that you and your financial professional construct based on your reasons for investing, the time you have to reach your goals, and the level of risk you are willing to assume. Your financial professional can work closely with you to develop an appropriate asset allocation and select the corresponding TARGET portfolio for each asset class in your investment plan. The managers for each portfolio are carefully chosen, are monitored by our team of experienced investment management analysts, and are among the leading institutional money managers available.
Your TARGET program also evolves with your changing needs. Your financial professional can help you track your plan’s progress, stay informed of important developments, and assist you in determining whether you need to modify your portfolio. In these ways and more, the TARGET program seeks to make your investment goals a reality.
Thank you for your continued confidence.
Sincerely,

Judy A. Rice, President
The TARGET Portfolio Trust
| | |
| THE TARGET PORTFOLIO TRUST | | 1 |
Equity Portfolios Performance
Performance data quoted represent past performance. Past performance does not guarantee future results. The investment return and principal value of an investment will fluctuate, so that an investor’s shares, when redeemed, may be worth more or less than their original cost. Current performance may be lower or higher than the past performance data quoted. An investor may obtain performance data as of the most recent month-end by visiting our website at www.prudential.com or by calling (800) 225-1852. The maximum TARGET program fee for retail investors is 1.50%.
| | | | | | | | | | | | |
| Equity Portfolios for periods ended 12/31/05 | | | | | | | | | | |
| | | Total Returns1
(Without TARGET Program Fee) | | | Average Annual Total Returns1
(With TARGET Program Fee) | |
| | | One Year | | | One Year | | | Five Years | | | Ten Years | |
Large Capitalization Growth Portfolio | | 6.74 | % | | 5.15 | % | | –7.36 | % | | 7.20 | % |
S&P 500 Index2 | | | | | 4.91 | | | 0.54 | | | 9.07 | |
Russell 1000 Growth Index2 | | | | | 5.26 | | | –3.58 | | | 6.73 | |
Lipper Large-Cap Core Funds Avg.3 | | | | | 4.84 | | | –0.95 | | | 7.59 | |
| | | | | | | | | | | | | |
Large Capitalization Value Portfolio | | 6.50 | % | | 4.91 | % | | 6.98 | % | | 8.66 | % |
S&P 500 Index2 | | | | | 4.91 | | | 0.54 | | | 9.07 | |
Russell 1000 Value Index2 | | | | | 7.05 | | | 5.28 | | | 10.94 | |
Lipper Multi-Cap Value Funds Avg.3 | | | | | 6.37 | | | 5.42 | | | 9.70 | |
| | | | | | | | | | | | | |
Small Capitalization Growth Portfolio | | 4.54 | % | | 2.98 | % | | –4.38 | % | | 3.69 | % |
Russell 2000 Index2 | | | | | 4.55 | | | 8.22 | | | 9.26 | |
Russell 2000 Growth Index2 | | | | | 4.15 | | | 2.28 | | | 4.69 | |
Lipper Small-Cap Growth Funds Avg.3 | | | | | 5.66 | | | 1.40 | | | 8.09 | |
| | | | | | | | | | | | | |
Small Capitalization Value Portfolio | | 10.10 | % | | 8.46 | % | | 14.86 | % | | 13.17 | % |
Russell 2000 Index2 | | | | | 4.55 | | | 8.22 | | | 9.26 | |
Russell 2000 Value Index2 | | | | | 4.71 | | | 13.55 | | | 13.08 | |
Lipper Small-Cap Core Funds Avg.3 | | | | | 6.42 | | | 9.15 | | | 10.67 | |
| | | | | | | | | | | | | |
International Equity Portfolio | | 14.12 | % | | 12.42 | % | | 1.26 | % | | 4.96 | % |
MSCI EAFE Index2 | | | | | 13.54 | | | 4.55 | | | 5.84 | |
Lipper International Funds Avg.3 | | | | | 14.00 | | | 4.43 | | | 6.09 | |
1Source: Prudential Investments LLC and Lipper Inc. Total returns assume the reinvestment of all dividends and distributions, and take into account all charges and expenses applicable to an investment in each portfolio. Returns would be lower if the fee were deducted. The average annual total returns for the TARGET portfolios assume the imposition of the maximum TARGET annual advisory fee of 1.50% for equity portfolios for retail investors. The maximum advisory fee for retirement accounts is 1.25% of equity portfolio assets. Returns in the
| | |
| 2 | | THE TARGET PORTFOLIO TRUST |
table do not reflect the deduction of taxes that a shareholder would pay on portfolio distributions or following the redemption of portfolio shares.
2Investors cannot invest directly in an index. The returns for the benchmark indexes would be lower if they reflected deductions for TARGET program fees, portfolio operating expenses, sales charges, or taxes. The Standard & Poor’s 500 Composite Stock Price Index (S&P 500 Index) is an unmanaged index of 500 stocks of large U.S. companies. It gives a broad look at how stock prices have performed. The Russell 1000 Growth Index contains those securities in the Russell 1000 Index with an above-average growth orientation. Companies in this index tend to exhibit higher price-to-book and price-to-earnings ratios, lower dividend yields, and higher forecasted growth rates. The Russell 1000 Value Index contains those securities in the Russell 1000 Index with a below-average growth orientation. Companies in this index generally have low price-to-book and price-to-earnings ratios, higher dividend yields, and lower forecasted growth values. The Russell 2000 Index is an unmanaged index of the stocks of the 2,000 smallest U.S. companies included in the Russell 3000 Index. It gives a broad look at how the stock prices of smaller companies have performed. The Russell 2000 Growth Index contains those securities in the Russell 2000 Index with an above-average growth orientation. Companies in this index generally have higher price-to-book and price-to-earnings ratios. The Russell 2000 Value Index contains those securities in the Russell 2000 Index with a below-average growth orientation. Companies in this index generally have low price-to-earnings ratios, higher dividend yields, and lower forecasted growth values. The Morgan Stanley Capital International Europe, Australasia, and Far East Index (MSCI EAFE Index) is an unmanaged, weighted index that reflects stock price movements in Europe, Australasia, and the Far East. It gives a broad look at how foreign stocks have performed.
3The Lipper averages represent returns based on an average of all funds in the respective Lipper categories for the periods noted. The returns for the Lipper averages would be lower if they reflected deductions for TARGET program fees, portfolio operating expenses, sales charges, or taxes. Large-Cap Core funds invest at least 75% of their equity assets in companies with market capitalizations (on a three-year weighted basis) greater than 300% of the dollar-weighted median market capitalization of the middle 1,000 securities of the S&P SuperComposite 1500 Index. Large-cap core funds have an above-average price-to-earnings ratio, price-to-book ratio, and three-year sales-per-share growth value compared with the S&P 500 Index. Multi-Cap Value funds invest in a variety of market capitalization ranges without concentrating 75% of their equity assets in any one market capitalization range over an extended period of time. Multi-cap funds typically have between 25% and 75% of their assets invested in companies with market capitalizations (on a three-year weighted basis) above 300% of the dollar-weighted median market capitalization of the middle 1,000 securities of the S&P SuperComposite 1500 Index. Multi-cap value funds typically have a below-average price-to-earnings ratio and three-year sales-per-share growth value compared with the S&P 500 Index. Small-Cap Growth funds invest at least 75% of their equity assets in companies with market capitalizations (on a three-year weighted basis) less than 250% of the dollar-weighted median of the smallest 500 of the middle 1,000 securities of the S&P SuperComposite 1500 Index. Small-cap growth funds typically have an above-average price-to-earnings ratio, price-to-book ratio, and three-year sales-per-share growth value compared with the S&P SmallCap 600 Index. Small-Cap Core funds invest at least 75% of their equity assets in companies with market capitalizations (on a three-year weighted basis) less than 250% of the dollar-weighted median of the smallest 500 of the middle 1,000 securities of the S&P SuperComposite 1500 Index. Small-cap core funds have more latitude in the companies in which they invest. These funds typically have an average price-to-earnings ratio and three-year sales-per-share growth value compared with the S&P SmallCap 600 Index. International funds invest their assets in securities with primary trading markets outside of the United States.
| | |
| THE TARGET PORTFOLIO TRUST | | 3 |
Fixed Income Portfolios Performance
Performance data quoted represent past performance. Past performance does not guarantee future results. The investment return and principal value of an investment will fluctuate so that an investor’s shares, when redeemed, may be worth more or less than their original cost. Current performance may be lower or higher than the past performance data quoted. An investor may obtain performance data as of the most recent month-end by visiting our website at www.prudential.com or by calling (800) 225-1852. The maximum TARGET program fee for retirement accounts is 1.35%.
| | | | | | | | | | | | |
| Fixed Income Portfolios for periods ended 12/31/05 | | | | | | | | | | |
| | | Total Returns1
(Without TARGET Program Fee) | | | Average Annual Total Returns1
(with TARGET Program Fee) | |
| | | One Year | | | One Year | | | Five Years | | | Ten Years | |
International Bond Portfolio | | 3.95 | % | | 2.92 | % | | 4.11 | % | | 1.45 | % |
Citigroup Non-U.S. WGBI-Hedged2 | | | | | 5.69 | | | 5.13 | | | 7.21 | |
Lipper International Income Funds Avg.3 | | | | | –4.88 | | | 7.25 | | | 5.73 | |
| | | | | | | | | | | | | |
Total Return Bond Portfolio | | 2.60 | % | | 1.58 | % | | 5.15 | % | | 5.32 | % |
Lehman Brothers U.S. Aggregate Bond Index2 | | | | | 2.43 | | | 5.87 | | | 6.16 | |
Lipper Corporate Debt BBB-Rated Funds Avg.3 | | | | | 1.97 | | | 6.49 | | | 5.96 | |
| | | | | | | | | | | | | |
Intermediate-Term Bond Portfolio | | 1.88 | % | | 0.86 | % | | 4.20 | % | | 4.77 | % |
Lehman Brothers Int. Govt. Credit Bond Index2 | | | | | 1.58 | | | 5.50 | | | 5.80 | |
Lipper Int. Inv.-Grade Debt Funds Avg.3 | | | | | 1.78 | | | 5.27 | | | 5.35 | |
| | | | | | | | | | | | | |
Mortgage Backed Securities Portfolio | | 2.29 | % | | 1.27 | % | | 3.74 | % | | 4.56 | % |
Lehman Brothers Mortgage-Backed Securities Index2 | | | | | 2.61 | | | 5.44 | | | 6.17 | |
Citigroup Mortgage-Backed Securities Index2 | | | | | 2.73 | | | 5.50 | | | 6.20 | |
Lipper U.S. Mortgage Funds Avg.3 | | | | | 1.93 | | | 4.75 | | | 5.21 | |
1Source: Prudential Investments LLC and Lipper Inc. Total returns assume the reinvestment of all dividends and distributions, and take into account all charges and expenses applicable to an investment in each portfolio. Returns would be lower if the fee were deducted. The average annual total returns for the TARGET portfolios assume the imposition of the maximum TARGET annual advisory fee of 1.00% for bond portfolios for retail investors. The maximum advisory fee for retirement accounts is 1.35% of bond portfolio assets. Returns in the table do not reflect the deduction of taxes that a shareholder would pay on Portfolio distributions or following the redemption of Portfolio shares.
| | |
| 4 | | THE TARGET PORTFOLIO TRUST |
2Investors cannot invest directly in an index. The returns for the benchmark indexes would be lower if they reflected deductions for TARGET program fees, portfolio operating expenses, sales charges, or taxes. The Citigroup Non-U.S. World Government Bond Index Hedged (WGBI-Hedged) is an unmanaged index of approximately 600 high-quality bonds with foreign currency exposure translated to the U.S. dollar. It gives a broad look at how foreign bonds have performed. The Lehman Brothers U.S. Aggregate Bond Index is an unmanaged index of investment-grade securities issued by the U.S. government and its agencies and by corporations with between 1 and 10 years remaining to maturity. It gives a broad look at how bond prices of short- and intermediate-term bonds have performed. The Lehman Brothers Intermediate Government/Credit Bond Index is an unmanaged index of publicly traded U.S. government bonds and investment-grade corporate bonds with maturities of up to 10 years. It gives a broad look at how intermediate-term bonds have performed. The Lehman Brothers Mortgage-Backed Securities Index is a market capitalization-weighted index of 15- and 30-year fixed-rate securities backed by GNMA, FNMA, and FHLMC mortgage pools, and balloon mortgages with fixed-rate coupons. The Citigroup Mortgage-Backed Securities Index is an unmanaged index of 15- and 30-year mortgage-related securities issued by U.S. government agencies. Each of them gives a broad look at how mortgage-backed securities have performed.
3The Lipper averages represent returns based on an average of all funds in the respective Lipper categories for the periods noted. The returns for the Lipper averages would be lower if they reflected deductions for TARGET program fees, portfolio operating expenses, sales charges, or taxes. International Income funds invest primarily in U.S. dollar and non-U.S. dollar debt securities of issuers located in at least three countries, excluding the United States, except in periods of market weakness. Corporate Debt BBB-Rated funds invest primarily in corporate and government debt issues rated in the top four grades. Intermediate Investment-Grade Debt funds invest primarily in investment-grade debt issues (rated in the top four grades) with dollar-weighted average maturities of 5 to 10 years. U.S. Mortgage funds invest primarily in mortgages/securities issued or guaranteed as to principal and interest by the U.S. government and certain federal agencies.
| | |
| THE TARGET PORTFOLIO TRUST | | 5 |
Money Market Portfolio Performance
Yields will fluctuate from time to time, and past performance does not guarantee future results. Current performance may be lower or higher than the past performance data quoted. The investment return and principal value will fluctuate, and shares, when sold, may be worth more or less than the original cost. For the most recent month-end performance update, call (800) 225-1852.
| | | | | | | | | |
| Money Market Portfolio as of 12/31/05 | | | | | | |
| | | Total Returns1
(Without Target
Program Fee)
One Year | | | Net Asset Value
(NAV) | | 7-Day Current
Yield | |
U.S. Government Money Market Portfolio | | 2.59 | % | | $ | 1.00 | | 3.62 | % |
Lipper U.S. Government Money Market Funds Avg.2 | | 2.43 | | | | N/A | | N/A | |
iMoneyNet, Inc. All Taxable Money Market Funds Avg.3 | | N/A | | | | N/A | | 3.65 | |
1Source: Prudential Investments LLC and Lipper Inc. Total returns assume the reinvestment of all dividends and distributions, and take into account all charges and expenses applicable to an investment in each portfolio. Returns would be lower if the fee were deducted. The returns in the table do not reflect the deduction of taxes that a shareholder would pay on Portfolio distributions or following the redemption of Portfolio shares.
2The Lipper average represents returns based on an average of all funds in the respective Lipper categories for the periods noted. The return for the Lipper average would be lower if it reflected deductions for TARGET program fees, portfolio operating expenses, sales charges, or taxes. U.S. Government Money Market funds invest principally in financial instruments issued or guaranteed by the U.S. government, its agencies, or instrumentalities with dollar-weighted average maturities of less than 90 days. These funds intend to keep a constant net asset value.
3iMoneyNet, Inc. regularly reports a 7-day current yield on Tuesdays for taxable money market funds. This is the data of all funds in the iMoneyNet, Inc. All Taxable Money Market Funds Average category as of December 27, 2005, the closest date to the end of our reporting period.
An investment in the U.S. Government Money Market Portfolio (the Portfolio) is not insured or guaranteed by the Federal Deposit Insurance Corporation or any other government agency. Although the Portfolio seeks to preserve the value of your investment at $1 per share, it is possible to lose money by investing in the Portfolio.
| | |
| 6 | | THE TARGET PORTFOLIO TRUST |
Investment Manager’s Report
Large Capitalization Growth Portfolio
The total return of the Large Capitalization Growth Portfolio was 6.74% in 2005. During the same period, the S&P 500 Index returned 4.91%, the Russell 1000® Growth Index (the Index) returned 5.26%, and the Lipper Large-Cap Core Funds Average was 4.84%.
On June 28, 2005, we replaced Oak Associates and Columbus Circle Investors as co-managers of the Portfolio with co-managers Marsico Capital Management, LLC and Goldman Sachs Asset Management LP. We strategically paired the new managers to play different roles in the Portfolio’s long-term performance. Goldman Sachs uses a quantitative approach with rigorously applied risk controls that are aimed at limiting deviations from the return of the Russell 1000 Growth Index. Marsico Capital uses a more active strategy to select a smaller number of high-conviction positions from anywhere in the growth investment spectrum. We expect the overall Portfolio’s performance profile to behave like a traditional growth strategy, but to benefit from the separate strengths of each asset manager.
The Russell 1000 Index is much broader than the S&P 500 Index, including firms that may be classified as midcaps. In a generally weak to mediocre U.S. equity market, the performance of midcap stocks stood out and pulled up the benchmark return. Value stocks outperformed growth over most of the year, although growth stocks surged in the fourth quarter. The broad market’s strength was concentrated in energy-related industries, while consumer discretionary (cyclical) stocks were particularly weak.
The Portfolio beat the Index because of good stock selection by three of the year’s four managers, Columbus Circle, Marsico Capital, and Goldman Sachs. Overall returns were above the comparable sectors of the benchmark in the commercial services, financials, and noncyclical sectors, but trailed the benchmark in healthcare and consumer services.
One objective of our changes was to reduce the sensitivity of the Portfolio to movements of the overall market. Unfortunately, the Portfolio was still more vulnerable than average to market direction in the first part of the year, when large-cap growth stocks generally performed poorly. We saw less sensitivity under the new managers later in the year, but this limited the benefit of the spike in growth stocks late in the year.
Sector emphases had a small negative impact, as exposure to the technology sector was mismatched to the market’s strengths during the year. Oak Associates’ large
| | |
| THE TARGET PORTFOLIO TRUST | | 7 |
Investment Manager’s Report (continued)
overweight in technology early in the year, when the technology sector of the Index declined sharply, and Marsico Capital’s underweight in the sector later in the year, when technology outperformed, both detracted from performance. However, Marsico Capital also significantly overweighted the strong financials sector, which mitigated the poor sector distribution.
The Portfolio of Investments following this report shows the size of the Portfolio’s positions at period-end.
| | |
| 8 | | THE TARGET PORTFOLIO TRUST |
Large Capitalization Value Portfolio
The total return of the Large Capitalization Value Portfolio was 6.50% in 2005. During the same period, the S&P 500 Index returned 4.91%, the Russell 1000® Value Index (the Index) returned 7.05%, and the Lipper Multi-Cap Value Funds Average was 6.37%.
Hotchkis and Wiley Capital Management, LLC and J.P. Morgan Investment Management, Inc. subadvised portions of the Portfolio. We added NFJ Investment Group L.P. as a third subadvisor effective December 19, 2005. Whereas JP Morgan has a large portfolio that is generally like the Russell 1000 Value Index in its sector distribution and risk characteristics, the other two subadvisors manage smaller portfolios in complementary value styles. Hotchkis & Wiley focuses on dividends and the profitable reinvestment of retained earnings, whereas NFJ has a “deep value” style emphasizing low ratios of share prices to corporate earnings. We expect the overall Portfolio’s performance profile to behave like a traditional value strategy, but to benefit from the separate strengths of each asset manager.
The Russell 1000 Index is much broader than the S&P 500, including firms that may be classified as midcaps. In a generally weak to mediocre U.S. equity market, the performance of midcap stocks stood out and pulled up the benchmark return. Value stocks outperformed growth over most of the year, although growth stocks surged in the fourth quarter. The broad market’s strength was concentrated in energy-related industries, while consumer discretionary (cyclical) stocks were particularly weak.
The Portfolio underperformed the Index because of weak stock selection, particularly in the consumer cyclical and technology sectors. It also underweighted certain stocks in the benchmark that had exceptionally strong gains.
The risk characteristics of the overall Portfolio added value, offsetting some of the impact of stock selection. Compared with its benchmark, the Portfolio emphasized securities that had greater value characteristics and firms whose earnings and share price had been accelerating; it underweighted firms that paid dividends or had greater growth characteristics. These emphases all were rewarded by the market. In addition, overweights compared with the benchmark in the consumer services and technology sectors improved the Portfolio’s performance. However, the benefit of the sector weightings was reduced by a sizable underweight in energy. Hotchkis & Wiley was responsible for the strong sector distribution.
The Portfolio of Investments following this report shows the size of the Portfolio’s positions at period-end.
| | |
| THE TARGET PORTFOLIO TRUST | | 9 |
Investment Manager’s Report (continued)
Small Capitalization Growth Portfolio
The total return of the Small Capitalization Growth Portfolio was 4.54% in 2005. During the same period, the Russell 2000® Index returned 4.55%, the Russell 2000® Growth Index (the Index) returned 4.15%, and the Lipper Small-Cap Growth Funds Average was 5.66%.
The Portfolio was subadvised by Transamerica Investment Management, Inc. (which acquired Westcap Investors, LLC, a subadvisor to the Portfolio) and RS Investment Management, L.P. Both use traditional growth investment styles, but they tend to look in different parts of the small-cap growth market.
Small-cap stocks, somewhat unexpectedly, outperformed large-caps in 2005, in a generally weak domestic stock market. Value stocks modestly outperformed growth in the small-cap universe. Despite a fourth-quarter reversal, the energy sector was by far the strongest sector in both growth and value components of the small-cap Russell 2000 Index, while the technology sector declined slightly in both. The consumer staples (noncyclical) and utilities sector were also strong in the growth benchmark, but they make up only a small part of it.
The Portfolio’s modest outperformance of the Index was due primarily to good stock selection, particularly in the technology and industrials sectors. Holdings in the consumer discretionary sector, primarily specialty retailers, detracted from performance. Whereas the return of its technology holdings was above-benchmark, the Portfolio would have performed better had it not had as large an overall exposure to this weak sector. It also was hurt by an overweight compared with the benchmark in the commercial services sector and an underweight in the stronger biotechnology industry.
On other characteristics of the overall Portfolio, the emphases of the two subadvisors’ portfolios offset one another, and the overall impact was negligible.
The Portfolio of Investments following this report shows the size of the Portfolio’s positions at period-end.
| | |
| 10 | | THE TARGET PORTFOLIO TRUST |
Small Capitalization Value Portfolio
The total return of the Small Capitalization Value Portfolio was 10.10% in 2005. During the same period, the Russell 2000 Index returned 4.55%, the Russell 2000 Value Index (the Index) returned 4.71%, and the Lipper Small-Cap Core Funds Average was 6.42%.
It is particularly important in small cap value investing to understand the businesses of the companies in which you invest. Small companies are more vulnerable than large to economic trends and unanticipated events, and firms that are inexpensively valued tend to be poorly known. This creates opportunities for substantial payoffs, but it also makes research a critical variable. Moreover, asset managers may reach the limits of the size of the position they can hold in small firms while still remaining uninvolved in control of the firm. For these reasons, it is more common for managers in this asset class to reach the limits of their research capacity than in many others. That is why the Portfolio’s multi-manager structure is so valuable. As subadvisors reach their capacity limits, we may add new subadvisors. We began the year with EARNEST Partners, LLC and NFJ Investment Group LP. Effective July 13, 2005, we added Lee Munder Capital Group Investments Ltd. and JP Morgan Investment Management, Inc. both of which reached their capacity constraints within the year. We added Vaughan Nelson Investment Management as of November 11, 2005.
Small-cap stocks, somewhat unexpectedly, outperformed large-caps in 2005, although the domestic stock markets were generally weak. Value stocks modestly outperformed growth in the small-cap universe. Despite a fourth-quarter reversal, the energy sector was by far the strongest sector in both growth and value components of the small-cap Russell 2000 Index, while the technology sector declined slightly in both. The utilities sector also included many of the strongest performers in the small-cap value benchmark. Consumer-related industries, particularly the automobile industry, were weak.
Many of the Portfolio’s holdings, particularly in the healthcare, energy, industrials, and basic materials sectors, substantially outperformed their sector averages. Earnest and NFJ contributed most of the strongest positions. The Portfolio also benefited from being overweight compared with the Index in the strong energy and basic materials sectors, although these emphases were the consequence of finding more opportunities in those sectors, not of trying to forecast which sectors would perform well. Most of the overweight in these sectors was due to NFJ.
| | |
| THE TARGET PORTFOLIO TRUST | | 11 |
Investment Manager’s Report (continued)
The overall Portfolio was less exposed to firms that paid higher dividends or that had volatile earnings cycles. Both of these characteristics were associated with above-benchmark returns in 2005. NFJ’s investment style emphasizes dividend payments, but it was offset by the choices of other subadvisors.
The Portfolio of Investments following this report shows the size of the Portfolio’s positions at period-end.
| | |
| 12 | | THE TARGET PORTFOLIO TRUST |
International Equity Portfolio
The total return of the International Equity Portfolio was 14.12% in 2005. During the same period, the MSCI EAFE Index rose 13.54% and the Lipper International Large-Cap Value Funds Average was 14.00%.
The Portfolio was subadvised by Lazard Asset Management through April 12, 2005, and thereafter by LSV Asset Management and Thornburg Investment Management, Inc. Both new subadvisors use value styles. LSV uses a purely quantitative style based upon studies of the biases of most investors. Their methods look for undervalued stocks with near-term potential for appreciation. Thornburg’s process is based upon research into the business fundamentals of companies whose stocks are found to be attractive on various measures of value. The Portfolio underperformed its MSCI EAFE Index benchmark in the first quarter of 2005, so its outperformance of the Index over the full year is due to the new team.
Developed market international stocks performed extraordinarily well in 2005. However, the rise of the U.S. dollar against other major currencies eroded the benefit to U.S.-based investors. Even after a substantial reduction by translation into dollars, the foreign markets outperformed domestic stocks by a large margin. The Portfolio’s EAFE benchmark includes stocks of developed markets countries in Europe, Australasia, and the Far East. Value and growth styles in the EAFE Index performed similarly, with a slight edge to value. Stocks of emerging markets countries, boosted by raw materials prices and East Asian electronics industries, performed even better than those of developed countries, and their currencies were more stable against the dollar.
The Portfolio benefited from nonbenchmark exposure to emerging markets, with particularly good returns in Mexico, South Korea, and Brazil. Stock selection within the Portfolio’s core markets was strong across a broad swath of Europe and Asia. The Nordic countries were an exception, however, with good results concentrated in Finland. The Portfolio’s holdings outperformed comparable sectors of the benchmark in all of the Index’s strongest sectors except materials. Its positions in wireless telecommunications firms and diversified financial companies stood out particularly. An emphasis on stocks of smaller companies and good stock selection among smaller firms also helped the Portfolio’s performance.
The Portfolio of Investments following this report shows the size of the Portfolio’s positions at period-end.
| | |
| THE TARGET PORTFOLIO TRUST | | 13 |
Investment Manager’s Report (continued)
International Bond Portfolio
The total return of the International Bond Portfolio was 3.95% in 2005. During the same period, the Citigroup non-U.S. World Government Bond Index (Hedged) returned 5.69%, the Citigroup Non-U.S. World Government Bond Index (Unhedged) returned –9.20%, and the Lipper International Income Funds Average returned –4.88%. The Portfolio was subadvised by Pacific Investment Management Company LLC (PIMCO).
Non-U.S. bond markets, on average, performed better than the domestic markets in 2005, but the rise of the U.S. dollar against the yen, euro, and pound sterling eroded the benefit for unhedged U.S. investors. After years of economic stagnation and then export-driven signs of revival, Japan began a convincing economic recovery based on rising domestic demand. The increased demand for credit pushed interest rates up, edging down the prices of existing Japan bonds. However, economic growth in most of Europe was more sluggish. The region’s bonds outperformed those of the United States and Japan. Yields remained generally low throughout the developed markets countries. As investors searched for incrementally higher yields, they bought emerging markets bonds. The increased demand pushed yields in emerging markets down, aided by improving credit fundamentals as demand for basic materials and Asian electronic goods strengthened emerging markets economies.
The Portfolio benefited from a short position on United States bonds, a market not in the benchmark. The benefit was moderated because it created additional exposure to short-to-intermediate interest rates. Most of the Portfolio’s geographic sector emphases had positive impacts, including overweights in Europe and emerging markets and an underweight in Japan. However, an underweight in Canada detracted somewhat from performance.
An exposure to U.S. mortgage-backed and corporate bonds also reduced performance, as did unhedged exposure to the yen and euro.
The Portfolio of Investments following this report shows the size of the Portfolio’s positions at period-end.
| | |
| 14 | | THE TARGET PORTFOLIO TRUST |
Total Return Bond Portfolio
The Total Return Bond Portfolio returned 2.60% in 2005. During the same period, the Lehman Brothers U.S. Aggregate Bond Index (the Index) returned 2.43% and the Lipper Corporate Debt BBB-Rated Funds Average was 1.97%. The Portfolio was subadvised by Pacific Investment Management Company LLC (PIMCO).
The resilient U.S. bond market posted a modest positive return despite rising short-term interest rates, inflation jitters, and economic uncertainty. The Fed continued its pressure on short-term rates with eight small increases during the year. However, the 10-year Treasury note ended the year with little change from where it began. Treasurys, federal agency securities, mortgage-backed securities, and other major U.S. bond sectors posted modest returns, but investment-grade and high yield corporate bonds faced additional challenges. Meanwhile, strong global economic expansion, investors’ search for attractive yields, and improving credit quality continued to support emerging-market bonds.
The Portfolio’s outperformance of the Index was due in part to an allocation to non-U.S. developed market government debt. Slower economic growth outside the United States meant less upward pressure on interest rates, which drives down the prices of bonds already on the market. The Portfolio also benefited from an underweight versus the Index in investment grade corporate debt and from an exposure to emerging markets debt.
The Portfolio was more sensitive to the movement of interest rates than the Index, hurting its performance during the second half of the year when interest rates rose. Performance also was eroded by an overweight versus the Index in mortgage-backed securities, which trailed Treasurys of similar duration. However, good security selection within the mortgage-backed sector mitigated the impact.
The Portfolio of Investments following this report shows the size of the Portfolio’s positions at period-end.
| | |
| THE TARGET PORTFOLIO TRUST | | 15 |
Investment Manager’s Report (continued)
Intermediate-Term Bond Portfolio
The total return of the Intermediate-Term Bond Portfolio was 1.88% in 2005. During the same period, the Lehman Brothers Intermediate Government/Credit Bond Index (the Index) returned 1.58% and the Lipper Intermediate Investment-Grade Debt Funds Average was 1.78%. The Portfolio was subadvised by Pacific Investment Management Company LLC (PIMCO).
The resilient U.S. bond market posted a modest positive return despite rising short-term interest rates, inflation jitters, and economic uncertainty. The Fed continued its pressure on short-term rates with eight small increases during the year. However, the 10-year Treasury note ended the year with little change from where it began. Treasurys, federal agency securities, mortgage-backed securities, and other major U.S. bond sectors posted modest returns, but investment-grade and high yield corporate bonds faced additional challenges. Meanwhile, strong global economic expansion, investors’ search for attractive yields, and improving credit quality continued to support emerging-markets bonds.
The Portfolio outperformed the Index in part because it had less exposure to investment-grade corporate debt than the Index and an allocation to emerging markets bonds. Both emphases improved its relative performance. Performance also was helped by a modest overweight compared with the Index in bonds with longer maturities. This distribution of maturities worked in its favor as interest rates at longer terms remained relatively stable while shorter terms rose, bringing down the prices of short-term bonds. However, the average exposure to rising interest rates of all of the Portfolio’s holdings was above that of its benchmark late in the year, detracting from its performance as average interest rates rose.
The Portfolio of Investments following this report shows the size of the Portfolio’s positions at period-end.
| | |
| 16 | | THE TARGET PORTFOLIO TRUST |
Mortgage Backed Securities Portfolio
The total return of the Mortgage Backed Securities Portfolio was 2.29% in 2005, versus 2.73% for the Citigroup Mortgage-Backed Securities Index and 1.93% for the Lipper U.S. Mortgage Funds Average. The Portfolio was subadvised by Wellington Management Company, LLP.
The resilient U.S. bond market posted a modest positive return despite rising short-term interest rates, inflation jitters, and economic uncertainty. The Fed continued its pressure on short-term rates with eight small increases during the year. However, the 10-year Treasury note ended the year with little change from where it began. Mortgage-backed securities posted modest returns, better than corporate bonds but less than long-term government bonds or municipals.
The Portfolio’s performance was augmented by the use of strategies that, in effect, allowed Wellington to trade the potential appreciation of its bond holdings for higher yield. These trades used financial contracts that exchange certain risk exposures with other investors for limited periods of time without changing ownership of the underlying securities. They provided flexibility that Wellington used to increase the diversification and yield of the Portfolio.
Bond selection was strong, particularly among securities issued by the Government National Mortgage Association (Ginnie Mae) and general mortgage-backed securities. The Portfolio benefited from Wellington’s close attention to the relationship of risk and yield in search of undervalued securities.
The Portfolio’s distribution along the range of maturities (yield curve positioning) detracted somewhat from its return. It was more exposed than the Index to the sharp rise in short-term interest rates.
The Portfolio of Investments following this report shows the size of the Portfolio’s positions at period-end.
| | |
| THE TARGET PORTFOLIO TRUST | | 17 |
Investment Manager’s Report (continued)
U.S. Government Money Market Portfolio
The U.S. Government Money Market Portfolio returned 2.59% in 2005. During the same period, the Lipper U.S. Government Money Market Portfolio Funds Average was 2.43%. The Portfolio was subadvised by Wellington Management Company, LLP.
Yields on money market securities rose in 2005 reflecting a trend toward higher short-term interest rates in the United States. Policymakers at the Federal Reserve continued their ongoing campaign to increase short-term interest rates to rein in U.S. economic growth and check inflationary pressures. From June 2004 through December 2005, the target for the federal funds rate on overnight loans between banks was raised 13 times in quarter-point increments, from 1.00% to 4.25%. Eight of the increases occurred in 2005.
During the year, the Portfolio increased its exposure to repurchase agreements, a short-term transaction in which it sold U.S. Treasury bills that it agreed to buy back at a specified price within one or two days. In effect, the Portfolio took out short-term loans using its Treasury bills as collateral. It benefited by investing the money in government securities that provided higher yields than Treasury bills. The Portfolio also increased its holdings of federal agency securities, which performed relatively well in 2005.
The Portfolio of Investments following this report shows the size of the Portfolio’s positions at period-end.
| | |
| 18 | | THE TARGET PORTFOLIO TRUST |
Fees and Expenses (Unaudited)
As a shareholder of the Trust, you incur two types of costs: (1) transaction costs, including sales charges (loads) on purchase payments and redemptions, as applicable, and (2) ongoing costs, including management fees, TARGET program fees and other Trust expenses, as applicable. This example is intended to help you understand your ongoing costs (in dollars) of investing in the Trust and to compare these costs with the ongoing costs of investing in other mutual funds. This example does not reflect TARGET program fees. If TARGET program fees were included, the costs would be higher.
The example is based on an investment of $1,000 invested on July 1, 2005, at the beginning of the period, and held through the six-month period ended December 31, 2005.
The Trust’s transfer agent may charge additional fees to holders of certain accounts that are not included in the expenses shown in the table on the following page. These fees apply to Individual Retirement Accounts (IRAs) and Section 403(b) accounts. As of the close of the six-month period covered by the table, IRA fees included an annual maintenance fee of $15 per account (subject to a maximum annual maintenance fee of $25 for all accounts held by the same shareholder). Section 403(b) accounts are charged an annual $25 fiduciary maintenance fee. Some of the fees may vary in amount, or may be waived, based on your total account balance or the number of JennisonDryden or Strategic Partners Funds, including the Trust, that you own. You should consider the additional fees that were charged to your Trust account over the six-month period when you estimate the total ongoing expenses paid over the period and the impact of these fees on your ending account value, as these additional expenses are not reflected in the information provided in the expense table. Additional fees have the effect of reducing investment returns.
Actual Expenses
The first line for each share class in the table on the following page provides information about actual account values and actual expenses. You may use the information on this line, together with the amount you invested, to estimate the expenses that you paid over the period. Simply divide your account value by $1,000 (for example, an $8,600 account value ÷ $1,000 = 8.6), then multiply the result by the number on the first line under the heading “Expenses Paid During the Six-Month Period” to estimate the expenses you paid on your account during this period.
Hypothetical Example for Comparison Purposes
The second line for each share class in the table on the following page provides information about hypothetical account values and hypothetical expenses based on the Trust’s actual expense ratio and an assumed rate of return of 5% per year before
| | |
| THE TARGET PORTFOLIO TRUST | | 19 |
Fees and Expenses (continued)
expenses, which is not the Trust’s actual return. The hypothetical account values and expenses may not be used to estimate the actual ending account balance or expenses you paid for the period. You may use this information to compare the ongoing costs of investing in the Trust and other funds. To do so, compare this 5% hypothetical example with the 5% hypothetical examples that appear in the shareholder reports of the other funds.
Please note that the expenses shown in the table are meant to highlight your ongoing costs only, and do not reflect any transactional costs such as sales charges (loads). Therefore, the second line for each share class in the table is useful in comparing ongoing costs only, and will not help you determine the relative total costs of owning different funds. In addition, if these transactional costs were included, your costs would have been higher.
| | | | | | | | | | | | | | |
Large
Capitalization
Growth Portfolio | | Beginning Account
Value
July 1, 2005 | | Ending Account
Value December 31, 2005 | | Annualized
Expense Ratio
Based on the
Six-Month Period | | | Expenses Paid
During the Six-
Month Period* |
| | | | | | | | | | | | | | | |
| | | Actual | | $ | 1,000.00 | | $ | 1,102.00 | | 0.74 | % | | $ | 3.92 |
| | | Hypothetical | | $ | 1,000.00 | | $ | 1,021.48 | | 0.74 | % | | $ | 3.77 |
| | | | | | | | | | | | | | | |
| | | | | | | | | | | | | | |
Large
Capitalization
Value Portfolio | | Beginning Account
Value
July 1, 2005 | | Ending Account
Value December 31, 2005 | | Annualized
Expense Ratio
Based on the
Six-Month Period | | | Expenses Paid
During the Six-
Month Period* |
| | | | | | | | | | | | | | | |
| | | Actual | | $ | 1,000.00 | | $ | 1,038.10 | | 0.73 | % | | $ | 3.75 |
| | | Hypothetical | | $ | 1,000.00 | | $ | 1,021.53 | | 0.73 | % | | $ | 3.72 |
| | | | | | | | | | | | | | | |
| | | | | | | | | | | | | | |
Small
Capitalization
Growth Portfolio | | Beginning Account
Value
July 1, 2005 | | Ending Account
Value December 31, 2005 | | Annualized
Expense Ratio
Based on the
Six-Month Period | | | Expenses Paid
During the Six-
Month Period* |
| | | | | | | | | | | | | | | |
| | | Actual | | $ | 1,000.00 | | $ | 1,072.20 | | 0.90 | % | | $ | 4.70 |
| | | Hypothetical | | $ | 1,000.00 | | $ | 1,020.67 | | 0.90 | % | | $ | 4.58 |
| | | | | | | | | | | | | | | |
| | | | | | | | | | | | | | |
Small
Capitalization
Value Portfolio | | Beginning Account
Value
July 1, 2005 | | Ending Account
Value December 31, 2005 | | Annualized
Expense Ratio
Based on the
Six-Month Period | | | Expenses Paid
During the Six-
Month Period* |
| | | | | | | | | | | | | | | |
| | | Actual | | $ | 1,000.00 | | $ | 1,044.30 | | 0.78 | % | | $ | 4.02 |
| | | Hypothetical | | $ | 1,000.00 | | $ | 1,021.27 | | 0.78 | % | | $ | 3.97 |
| | |
| 20 | | THE TARGET PORTFOLIO TRUST |
| | | | | | | | | | | | | | |
International
Equity Portfolio | | Beginning Account
Value
July 1, 2005 | | Ending Account
Value December 31, 2005 | | Annualized
Expense Ratio
Based on the
Six-Month Period | | | Expenses Paid
During the Six-
Month Period* |
| | | | | | | | | | | | | | | |
| | | Actual | | $ | 1,000.00 | | $ | 1,159.20 | | 0.98 | % | | $ | 5.33 |
| | | Hypothetical | | $ | 1,000.00 | | $ | 1,020.27 | | 0.98 | % | | $ | 4.99 |
| | | | | | | | | | | | | | | |
International
Bond Portfolio | | Beginning Account
Value
July 1, 2005 | | Ending Account
Value December 31, 2005 | | Annualized
Expense Ratio
Based on the
Six-Month Period | | | Expenses Paid
During the Six-
Month Period* |
| | | | | | | | | | | | | | | |
| | | Actual | | $ | 1,000.00 | | $ | 1,003.60 | | 1.57 | % | | $ | 7.93 |
| | | Hypothetical | | $ | 1,000.00 | | $ | 1,017.29 | | 1.57 | % | | $ | 7.98 |
| | | | | | | | | | | | | | | |
Total Return
Bond Portfolio | | Beginning Account
Value
July 1, 2005 | | Ending Account
Value December 31, 2005 | | Annualized
Expense Ratio
Based on the
Six-Month Period | | | Expenses Paid
During the Six-
Month Period* |
| | | | | | | | | | | | | | | |
| | | Actual | | $ | 1,000.00 | | $ | 1,001.00 | | 0.77 | % | | $ | 3.88 |
| | | Hypothetical | | $ | 1,000.00 | | $ | 1,021.32 | | 0.77 | % | | $ | 3.92 |
| | | | | | | | | | | | | | | |
Intermediate-Term
Bond Portfolio | | Beginning Account
Value
July 1, 2005 | | Ending Account
Value December 31, 2005 | | Annualized
Expense Ratio
Based on the
Six-Month Period | | | Expenses Paid
During the Six-
Month Period* |
| | | | | | | | | | | | | | | |
| | | Actual | | $ | 1,000.00 | | $ | 1,003.60 | | 0.62 | % | | $ | 3.13 |
| | | Hypothetical | | $ | 1,000.00 | | $ | 1,022.08 | | 0.62 | % | | $ | 3.16 |
| | | | | | | | | | | | | | | |
Mortgage Backed
Securities
Portfolio | | Beginning Account
Value
July 1, 2005 | | Ending Account
Value December 31, 2005 | | Annualized
Expense Ratio
Based on the
Six-Month Period | | | Expenses Paid
During the Six-
Month Period* |
| | | | | | | | | | | | | | | |
| | | Actual | | $ | 1,000.00 | | $ | 1,004.70 | | 2.09 | % | | $ | 10.56 |
| | | Hypothetical | | $ | 1,000.00 | | $ | 1,014.67 | | 2.09 | % | | $ | 10.61 |
| | | | | | | | | | | | | | | |
U.S. Government
Money Market Portfolio | | Beginning Account
Value
July 1, 2005 | | Ending Account
Value December 31, 2005 | | Annualized
Expense Ratio
Based on the
Six-Month Period | | | Expenses Paid
During the Six-
Month Period* |
| | | | | | | | | | | | | | | |
| | | Actual | | $ | 1,000.00 | | $ | 1,016.40 | | 0.73 | % | | $ | 3.71 |
| | | Hypothetical | | $ | 1,000.00 | | $ | 1,021.53 | | 0.73 | % | | $ | 3.72 |
* Portfolio expenses (net of fee waivers or subsidies, if any) for each share class are equal to the annualized expense ratio for each share class (provided in the table), multiplied by the average account value over the period, multiplied by the 184 days in the six-month period ended December 31, 2005, and divided by the 365 days in the Portfolio’s fiscal year ended December 31, 2005 (to reflect the six-month period).
| | |
| THE TARGET PORTFOLIO TRUST | | 21 |
This Page Intentionally Left Blank
| | |
Portfolio of Investments
As of December 31, 2005 | | Large Capitalization Growth Portfolio |
| | | | | |
| SHARES | | DESCRIPTION | | VALUE (NOTE 1) |
| | | | | | |
| | | LONG-TERM INVESTMENTS—100.1% | | | |
| | |
| | | Common Stocks | | | |
| | |
| | | Aerospace & Defense—2.5% | | | |
| 41,500 | | Boeing Co | | $ | 2,914,960 |
| 20,800 | | General Dynamics Corp. | | | 2,372,240 |
| 32,900 | | Lockheed Martin Corp. | | | 2,093,427 |
| 6,600 | | Northrop Grumman Corp. | | | 396,726 |
| | | | |
|
|
| | | | | | 7,777,353 |
| | | | |
|
|
| | |
| | | Agriculture/Heavy Equipment—2.1% | | | |
| 39,500 | | Altria Group, Inc. | | | 2,951,440 |
| 61,400 | | Archer-Daniels-Midland Co. | | | 1,514,124 |
| 25,100 | | Monsanto Co. | | | 1,946,003 |
| | | | |
|
|
| | | | | | 6,411,567 |
| | | | |
|
|
| | |
| | | Automobile Manufacturers | | | |
| 258 | | Toyota Motor Corp., ADR | | | 26,992 |
| | | | |
|
|
| | |
| | | Automotive Parts—0.5% | | | |
| 34,000 | | Autoliv, Inc. (Sweden) | | | 1,544,280 |
| | | | |
|
|
| | |
| | | Beverages—0.3% | | | |
| 14,300 | | PepsiCo., Inc. | | | 844,844 |
| | | | |
|
|
| | |
| | | Biotechnology—7.0% | | | |
| 93,267 | | Amgen, Inc.(a) | | | 7,355,036 |
| 116,315 | | Genentech, Inc. | | | 10,759,137 |
| 47,279 | | Genzyme Corp.(a) | | | 3,346,408 |
| | | | |
|
|
| | | | | | 21,460,581 |
| | | | |
|
|
| | |
| | | Broadcasting—0.1% | | | |
| 9,600 | | Clear Channel Communications, Inc. | | | 301,920 |
| | | | |
|
|
| | |
| | | Chemicals—0.6% | | | |
| 32,500 | | Praxair, Inc. | | | 1,721,200 |
| | | | |
|
|
| | |
| | | Clothing & Apparel—0.6% | | | |
| 55,000 | | Coach, Inc.(a) | | | 1,833,700 |
| | | | |
|
|
| | |
| | | Commercial Services—1.2% | | | |
| 19,100 | | Cendant Corp. | | | 329,475 |
| 29,100 | | McKesson Corp. | | | 1,501,269 |
| 28,400 | | Moody’s Corp. | | | 1,744,328 |
| | | | |
|
|
| | | | | | 3,575,072 |
| | | | |
|
|
See Notes to Financial Statements beginning on page 130
| | |
| THE TARGET PORTFOLIO TRUST | | 23 |
| | |
Large Capitalization Growth Portfolio (cont’d) | | Portfolio of Investments
As of December 31, 2005 |
| | | | | |
| SHARES | | DESCRIPTION | | VALUE (NOTE 1) |
| | | | | | |
| | |
| | | Computer Hardware—4.3% | | | |
| 98,123 | | Apple Computer, Inc.(a) | | $ | 7,054,062 |
| 43,500 | | Cadence Design System, Inc. | | | 736,020 |
| 5,500 | | Computer Sciences Corp.(a) | | | 278,520 |
| 9,900 | | Dell, Inc.(a) | | | 296,901 |
| 53,700 | | Hewlett-Packard Co. | | | 1,537,431 |
| 16,400 | | International Business Machines Corp. | | | 1,348,080 |
| 12,700 | | Synopsys, Inc. | | | 254,762 |
| 87,400 | | Western Digital Corp.(a) | | | 1,626,514 |
| | | | |
|
|
| | | | | | 13,132,290 |
| | | | |
|
|
| | |
| | | Computer Services & Software—2.6% | | | |
| 34,320 | | Global Payments, Inc. | | | 1,599,655 |
| 163,200 | | Microsoft Corp. | | | 4,267,680 |
| 8,000 | | DST Systems, Inc.(a) | | | 479,280 |
| 26,200 | | Electronic Data Systems Corp. | | | 629,848 |
| 15,500 | | SanDisk Corp. | | | 973,710 |
| | | | |
|
|
| | | | | | 7,950,173 |
| | | | |
|
|
| | |
| | | Computer Software—0.5% | | | |
| 37,600 | | Autodesk, Inc. | | | 1,614,920 |
| | | | |
|
|
| | |
| | | Construction—1.9% | | | |
| 29,260 | | KB Home | | | 2,126,032 |
| 44,480 | | Lennar Corp. (Class A Shares) | | | 2,714,169 |
| 30,400 | | Toll Brothers, Inc.(a) | | | 1,053,056 |
| | | | |
|
|
| | | | | | 5,893,257 |
| | | | |
|
|
| | |
| | | Consumer Products & Services—3.2% | | | |
| 11,100 | | American Greetings Corp., (Class A shares) | | | 243,867 |
| 157,645 | | Proctor & Gamble Co. | | | 9,124,493 |
| 12,200 | | UST, Inc. | | | 498,126 |
| | | | |
|
|
| | | | | | 9,866,486 |
| | | | |
|
|
| | |
| | | Diversified—0.2% | | | |
| 5,600 | | Illinois Tool Works, Inc. | | | 492,744 |
| 2,000 | | 3M Co. | | | 155,000 |
| | | | |
|
|
| | | | | | 647,744 |
| | | | |
|
|
| | |
| | | Electronic Components—1.9% | | | |
| 54,600 | | Agilent Technologies, Inc. | | | 1,817,634 |
| 31,800 | | Avnet, Inc.(a) | | | 761,292 |
| 16,900 | | Emerson Electric Co. | | | 1,262,430 |
| 28,500 | | Energizer Holdings, Inc.(a) | | | 1,419,015 |
| 14,300 | | Raytheon Co. | | | 574,145 |
| | | | |
|
|
| | | | | | 5,834,516 |
| | | | |
|
|
See Notes to Financial Statements beginning on page 130
| | |
| 24 | | THE TARGET PORTFOLIO TRUST |
| | | | | |
| SHARES | | DESCRIPTION | | VALUE (NOTE 1) |
| | | | | | |
| | |
| | | Energy—0.4% | | | |
| 23,900 | | TXU Corp. | | $ | 1,199,541 |
| | | | |
|
|
| | |
| | | Entertainment & Leisure—0.1% | | | |
| 14,700 | | Regal Entertainment Group (Class A Shares) | | | 279,594 |
| | | | |
|
|
| | |
| | | Environmental Services—0.3% | | | |
| 28,500 | | Republic Services, Inc. | | | 1,070,175 |
| | | | |
|
|
| | |
| | | Financial - Bank & Trust—3.4% | | | |
| 33,200 | | Bank of America Corp. | | | 1,532,180 |
| 3,700 | | Bank of Hawaii Corp. | | | 190,698 |
| 44,792 | | Countrywide Financial Corp. | | | 1,531,438 |
| 6,300 | | Downey Financial Corp. | | | 430,857 |
| 58,500 | | UBS AG (Switzerland) | | | 5,566,275 |
| 5,600 | | UnionBanCal Corp. | | | 384,832 |
| 23,200 | | Washington Mutual, Inc. | | | 1,009,200 |
| | | | |
|
|
| | | | | | 10,645,480 |
| | | | |
|
|
| | |
| | | Financial Services—8.2% | | | |
| 63,500 | | AmeriCredit Corp.(a) | | | 1,627,505 |
| 540 | | Ameriprise Financial, Inc. | | | 22,140 |
| 18,500 | | Ameritrade Holding Corp. | | | 444,000 |
| 17,700 | | Chicago Mercantile Exchange Holdings, Inc. | | | 6,504,573 |
| 43,900 | | Goldman Sachs Group, Inc. | | | 5,606,469 |
| 4,900 | | JPMorgan Chase & Co. | | | 194,481 |
| 38,488 | | Lehman Brothers Holdings, Inc. | | | 4,933,007 |
| 13,300 | | Merrill Lynch & Co., Inc. | | | 900,809 |
| 90,710 | | SLM Corp. | | | 4,997,214 |
| | | | |
|
|
| | | | | | 25,230,198 |
| | | | |
|
|
| | |
| | | Food & Beverage—0.1% | | | |
| 7,200 | | Pilgrim’s Pride Corp. | | | 238,752 |
| | | | |
|
|
| | |
| | | Foods—0.6% | | | |
| 2,800 | | Hershey Co. (The) | | | 154,700 |
| 59,000 | | Kroger Co. (The)(a) | | | 1,113,920 |
| 11,600 | | Supervalue, Inc. | | | 376,768 |
| 9,600 | | Tyson Foods, Inc., (Class A Shares) | | | 164,160 |
| | | | |
|
|
| | | | | | 1,809,548 |
| | | | |
|
|
| | |
| | | Health—0.2% | | | |
| 12,500 | | Coventry Health Care, Inc.(a) | | | 712,000 |
| | | | |
|
|
| | |
| | | Healthcare—0.6% | | | |
| 7,600 | | Guidant Corp. | | | 492,100 |
| 23,500 | | Humana, Inc.(a) | | | 1,276,755 |
| | | | |
|
|
| | | | | | 1,768,855 |
| | | | |
|
|
See Notes to Financial Statements beginning on page 130
| | |
| THE TARGET PORTFOLIO TRUST | | 25 |
| | |
Large Capitalization Growth Portfolio (cont’d) | | Portfolio of Investments
As of December 31, 2005 |
| | | | | |
| SHARES | | DESCRIPTION | | VALUE (NOTE 1) |
| | | | | | |
| | |
| | | Healthcare Services—6.1% | | | |
| 12,100 | | Aetna, Inc. | | $ | 1,141,151 |
| 37,000 | | AmerisourceBergen Corp. | | | 1,531,800 |
| 42,900 | | Quest Diagnostics, Inc. | | | 2,208,492 |
| 222,855 | | UnitedHealth Group, Inc. | | | 13,848,210 |
| | | | |
|
|
| | | | | | 18,729,653 |
| | | | |
|
|
| | |
| | | Hotels & Motels—2.8% | | | |
| 9,800 | | Choice Hotels International, Inc. | | | 409,248 |
| 116,800 | | MGM Mirage(a) | | | 4,283,056 |
| 9,524 | | Station Casinos, Inc. | | | 645,727 |
| 62,500 | | Wynn Resorts Ltd.(a) | | | 3,428,125 |
| | | | |
|
|
| | | | | | 8,766,156 |
| | | | |
|
|
| | |
| | | Insurance—1.8% | | | |
| 7,400 | | Chubb Corp. | | | 722,610 |
| 16,200 | | Loews Corp. | | | 1,536,570 |
| 25,500 | | MBIA, Inc. | | | 1,534,080 |
| 15,062 | | Progressive Corp. | | | 1,758,940 |
| | | | |
|
|
| | | | | | 5,552,200 |
| | | | |
|
|
| | |
| | | Internet Services—1.4% | | | |
| 7,550 | | Google, Inc., (Class A Shares)(a) | | | 3,132,193 |
| 18,300 | | Symantec Corp.(a) | | | 320,250 |
| 16,500 | | Fair Isaac Corp. | | | 728,805 |
| 20,400 | | MPS Group, Inc.(a) | | | 278,868 |
| | | | |
|
|
| | | | | | 4,460,116 |
| | | | |
|
|
| | |
| | | Machinery & Equipment—1.7% | | | |
| 91,391 | | Caterpillar, Inc. | | | 5,279,658 |
| | | | |
|
|
| | |
| | | Manufacturing—4.0% | | | |
| 2,500 | | Eaton Corp. | | | 167,725 |
| 333,511 | | General Electric Co. | | | 11,689,561 |
| 2,400 | | Harsco Corp. | | | 162,024 |
| 3,500 | | ITT Industries, Inc. | | | 359,870 |
| | | | |
|
|
| | | | | | 12,379,180 |
| | | | |
|
|
| | |
| | | Media—2.1% | | | |
| 23,000 | | Comcast Corp., (Class A Shares)(a) | | | 597,080 |
| 217,400 | | Liberty Media Corp., (Class A Shares)(a) | | | 1,710,938 |
| 8,200 | | McGraw-Hill Cos., Inc. | | | 423,366 |
| 94,500 | | Time Warner, Inc.(a) | | | 1,648,080 |
| 15,800 | | Univision Communications, Inc., (Class A Shares)(a) | | | 464,362 |
| 53,700 | | Viacom, Inc., (Class B Shares) | | | 1,750,620 |
| | | | |
|
|
| | | | | | 6,594,446 |
| | | | |
|
|
See Notes to Financial Statements beginning on page 130
| | |
| 26 | | THE TARGET PORTFOLIO TRUST |
| | | | | |
| SHARES | | DESCRIPTION | | VALUE (NOTE 1) |
| | | | | | |
| | | Medical Supplies & Equipment—4.7% | | | |
| 8,200 | | Becton Dickinson & Co. | | $ | 492,656 |
| 95,300 | | Johnson & Johnson | | | 5,727,530 |
| 108,860 | | Medtronic, Inc. | | | 6,267,070 |
| 39,100 | | St. Jude Medical, Inc.(a) | | | 1,962,820 |
| | | | |
|
|
| | | | | | 14,450,076 |
| | | | |
|
|
| | | Metals & Mining—0.5% | | | |
| 22,900 | | Southern Copper Corp. | | | 1,533,842 |
| | | | |
|
|
| | | Oil, Gas & Consumable Fuels—2.5% | | | |
| 24,600 | | Devon Energy Corp. | | | 1,538,484 |
| 8,900 | | EOG Resources, Inc. | | | 652,993 |
| 29,507 | | Halliburton Co. | | | 1,828,254 |
| 19,600 | | Helmerich & Payne, Inc. | | | 1,213,436 |
| 10,900 | | Pogo Producing Co. | | | 542,929 |
| 22,100 | | Sunoco, Inc. | | | 1,732,198 |
| 6,500 | | Ultra Petroleum Corp. | | | 362,700 |
| | | | |
|
|
| | | | | | 7,870,994 |
| | | | |
|
|
| | | Pharmaceuticals—1.8% | | | |
| 6,700 | | Allergan, Inc. | | | 723,332 |
| 29,089 | | Amylin Pharmaceuticals, Inc. | | | 1,161,233 |
| 5,400 | | Endo Pharmaceuticals Holdings, Inc.(a) | | | 163,404 |
| 3,500 | | Hospira, Inc. | | | 149,730 |
| 20,100 | | KOS Pharmaceuticals, Inc.(a) | | | 1,039,773 |
| 48,500 | | Merck & Co., Inc. | | | 1,542,785 |
| 38,900 | | Pfizer, Inc. | | | 907,148 |
| | | | |
|
|
| | | | | | 5,687,405 |
| | | | |
|
|
| | | Pipelines—0.1% | | | |
| 5,000 | | Equitable Resources, Inc. | | | 183,450 |
| | | | |
|
|
| | | Printing & Publishing | | | |
| 2,900 | | Banta Corp. | | | 144,420 |
| | | | |
|
|
| | | Real Estate—0.9% | | | |
| 13,496 | | MDC Holdings, Inc. | | | 836,482 |
| 28,423 | | St. Joe Co. (The) | | | 1,910,594 |
| | | | |
|
|
| | | | | | 2,747,076 |
| | | | |
|
|
| | | Real Estate Investment Trust—0.2% | | | |
| 2,600 | | Camden Property Trust | | | 150,592 |
| 3,600 | | ProLogis | | | 168,192 |
| 2,200 | | Public Storage, Inc. | | | 148,984 |
| | | | |
|
|
| | | | | | 467,768 |
| | | | |
|
|
| | | Restaurants—1.9% | | | |
| 35,648 | | Starbucks Corp.(a) | | | 1,069,797 |
| 100,882 | | Yum! Brands, Inc. | | | 4,729,348 |
| | | | |
|
|
| | | | | | 5,799,145 |
| | | | |
|
|
See Notes to Financial Statements beginning on page 130
| | |
| THE TARGET PORTFOLIO TRUST | | 27 |
| | |
Large Capitalization Growth Portfolio (cont’d) | | Portfolio of Investments
As of December 31, 2005 |
| | | | | |
| SHARES | | DESCRIPTION | | VALUE (NOTE 1) |
| | | | | | |
| | |
| | | Retail & Merchandising—9.6% | | | |
| 76,700 | | Circuit City Stores, Inc. | | $ | 1,732,653 |
| 158,700 | | CVS Corp. | | | 4,192,854 |
| 16,200 | | Colgate-Palmolive Co. | | | 888,570 |
| 43,600 | | Darden Restaurants, Inc. | | | 1,695,168 |
| 11,900 | | Dillard’s, Inc., (Class A Shares) | | | 295,358 |
| 70,645 | | Home Depot, Inc. | | | 2,859,710 |
| 106,200 | | Lowe’s Cos., Inc. | | | 7,079,292 |
| 30,000 | | Nordstrom, Inc. | | | 1,122,000 |
| 10,800 | | Payless Shoesource, Inc.(a) | | | 271,080 |
| 9,200 | | Saks`s Inc. | | | 155,112 |
| 82,900 | | Target Corp. | | | 4,557,013 |
| 17,600 | | The Men’s Wearhouse, Inc.(a) | | | 518,144 |
| 62,200 | | Walgreen Co. | | | 2,752,972 |
| 28,300 | | Wal-Mart Stores, Inc. | | | 1,324,440 |
| | | | |
|
|
| | | | | | 29,444,366 |
| | | | |
|
|
| | |
| | | Retailing—0.6% | | | |
| 19,000 | | Autonation, Inc.(a) | | | 412,870 |
| 30,700 | | Chico’s FAS, Inc.(a) | | | 1,348,651 |
| | | | |
|
|
| | | | | | 1,761,521 |
| | | | |
|
|
| | |
| | | Semiconductors—2.1% | | | |
| 32,700 | | Freescale Semiconductor, Inc., (Class B Shares)(a) | | | 823,059 |
| 206,100 | | Intel Corp. | | | 5,144,256 |
| 17,900 | | Lam Research Corp. | | | 638,672 |
| | | | |
|
|
| | | | | | 6,605,987 |
| | | | |
|
|
| | |
| | | Semiconductors/Semi Cap—1.2% | | | |
| 87,000 | | Texas Instruments, Inc. | | | 2,790,090 |
| 62,600 | | Micron Technology, Inc. | | | 833,206 |
| | | | |
|
|
| | | | | | 3,623,296 |
| | | | |
|
|
| | |
| | | Telecommunications—5.4% | | | |
| 44,300 | | Abbott Laboratories | | | 1,746,749 |
| 12,100 | | America Movil SA de CV, ADR (Mexico) | | | 354,046 |
| 163,400 | | Cisco Systems, Inc.(a) | | | 2,797,408 |
| 33,200 | | Comverse Technology, Inc.(a) | | | 882,788 |
| 77,600 | | Corning, Inc.(a) | | | 1,525,616 |
| 189,874 | | Motorola, Inc. | | | 4,289,254 |
| 10,000 | | NII Holdings, Inc.(a) | | | 436,800 |
| 99,617 | | QUALCOMM, Inc. | | | 4,291,500 |
| 12,207 | | Sprint Nextel Corp. | | | 285,155 |
| | | | |
|
|
| | | | | | 16,609,316 |
| | | | |
|
|
See Notes to Financial Statements beginning on page 130
| | |
| 28 | | THE TARGET PORTFOLIO TRUST |
| | | | | | |
| SHARES | | DESCRIPTION | | VALUE (NOTE 1) | |
| | | | | | | |
| | |
| | | Transportation—4.9% | | | | |
| 37,488 | | Burlington Northern Santa Fe Corp. | | $ | 2,654,900 | |
| 30,200 | | CSX Corp. | | | 1,533,254 | |
| 75,500 | | FedEx Corp. | | | 7,805,945 | |
| 8,200 | | GATX Corp. | | | 295,856 | |
| 30,000 | | Norfolk Southern Corp. | | | 1,344,900 | |
| 17,215 | | Union Pacific Corp. | | | 1,385,980 | |
| | | | |
|
|
|
| | | | | | 15,020,835 | |
| | | | |
|
|
|
| | |
| | | Utilities—0.4% | | | | |
| 30,600 | | PSE&G Corp. | | | 1,135,872 | |
| | | | |
|
|
|
| | | Total long-term investments
(cost $276,549,105) | | | 308,237,816 | |
| | |
| | | SHORT-TERM INVESTMENT—0.1% | | | | |
| | |
| | | Affiliated Money Market Mutual Fund | | | | |
| 210,597 | | Dryden Core Investment Fund - Taxable Money Market Series
(cost $210,597; Note 3)(b) | | | 210,597 | |
| | | | |
|
|
|
| | | Total Investments—100.2%
(cost $276,759,702; Note 5) | | | 308,448,413 | |
| | | Liabilities in excess of other assets—(0.2%) | | | (613,759 | ) |
| | | | |
|
|
|
| | | Net Assets—100% | | $ | 307,834,654 | |
| | | | |
|
|
|
The following abbreviations are used in portfolio descriptions:
ADR—American Depositary Receipt
| (a) | Non-income producing security. |
| (b) | Prudential Investments LLC, the manager of the Fund also serves as manager of the Dryden Core Investment Fund - Taxable Money Market Series. |
The industry classification of long-term portfolio holdings, short-term investments and liabilities in excess of other assets shown as a percentage of net assets as of December 31, 2005 were as follows:
| | | |
Retail & Merchandising | | 9.6 | % |
Financial Services | | 7.9 | |
Biotechnology | | 7.0 | |
Healthcare Services | | 6.1 | |
Telecommunications | | 5.4 | |
Transportation | | 4.9 | |
Medical Supplies & Equipment | | 4.7 | |
Computer Hardware | | 4.3 | |
Manufacturing | | 4.0 | |
Financial—Bank & Trust | | 3.4 | |
Consumer Products & Services | | 3.2 | |
Hotels & Motels | | 2.8 | |
Computer Services & Software | | 2.6 | |
Aerospace & Defense | | 2.5 | |
Oil, Gas & Consumable Fuels | | 2.5 | |
Agriculture/Heavy Equipment | | 2.1 | |
Media | | 2.1 | |
See Notes to Financial Statements beginning on page 130
| | |
| THE TARGET PORTFOLIO TRUST | | 29 |
| | |
Large Capitalization Growth Portfolio (cont’d) | | Portfolio of Investments
As of December 31, 2005 |
| | | |
Semiconductors | | 2.1 | % |
Construction | | 1.9 | |
Electronic Components | | 1.9 | |
Restaurants | | 1.9 | |
Insurance | | 1.8 | |
Pharmaceuticals | | 1.8 | |
Machinery & Equipment | | 1.7 | |
Internet Services | | 1.4 | |
Commercial Services | | 1.2 | |
Semiconductors/Semi Cap | | 1.2 | |
Real Estate | | 0.9 | |
Chemicals | | 0.6 | |
Clothing & Apparel | | 0.6 | |
Foods | | 0.6 | |
Health Care | | 0.6 | |
Retailing | | 0.6 | |
Automotive Parts | | 0.5 | |
Computer Software | | 0.5 | |
Metals & Mining | | 0.5 | |
Energy | | 0.4 | |
Utilities | | 0.4 | |
Banks | | 0.3 | |
Beverages | | 0.3 | |
Environmental Services | | 0.3 | |
Diversified | | 0.2 | |
Health | | 0.2 | |
Real Estate Investment Trust | | 0.2 | |
Broadcasting | | 0.1 | |
Entertainment & Leisure | | 0.1 | |
Food & Beverage | | 0.1 | |
Pipelines | | 0.1 | |
Affiliated Money Market Mutual Fund | | 0.1 | |
| | |
|
|
| | | 100.2 | |
Liabilities in excess of other assets | | (0.2 | ) |
| | |
|
|
Total | | 100.0 | % |
| | |
|
|
See Notes to Financial Statements beginning on page 130
| | |
| 30 | | THE TARGET PORTFOLIO TRUST |
| | |
Portfolio of Investments
As of December 31, 2005 | | Large Capitalization Value Portfolio |
| | | | | |
| SHARES | | DESCRIPTION | | VALUE (NOTE 1) |
| | | | | | |
| | | LONG-TERM INVESTMENTS—98.6% | | | |
| | |
| | | Common Stocks | | | |
| | |
| | | Aerospace/Defense—2.4% | | | |
| 35,700 | | Lockheed Martin Corp. | | $ | 2,271,591 |
| 66,100 | | Northrop Grumman Corp. | | | 3,973,271 |
| 60,100 | | Raytheon Co. | | | 2,413,015 |
| | | | |
|
|
| | | | | | 8,657,877 |
| | | | |
|
|
| | |
| | | Automobiles—0.6% | | | |
| 30,300 | | Paccar, Inc.(a) | | | 2,097,669 |
| | | | |
|
|
| | |
| | | Automotive Components—1.3% | | | |
| 80,762 | | Delphi Corp.(a) | | | 23,502 |
| 44,700 | | Johnson Controls, Inc. | | | 3,259,077 |
| 23,500 | | Lear Corp. | | | 668,810 |
| 10,100 | | Magna International, Inc. (Class “A” Stock)(a) | | | 726,998 |
| | | | |
|
|
| | | | | | 4,678,387 |
| | | | |
|
|
| | |
| | | Beverages—1.3% | | | |
| 48,500 | | Coca-Cola Co. (The) | | | 1,955,035 |
| 94,100 | | Coca-Cola Enterprises, Inc. | | | 1,803,897 |
| 23,900 | | Anheuser-Busch Cos., Inc. | | | 1,026,744 |
| | | | |
|
|
| | | | | | 4,785,676 |
| | | | |
|
|
| | |
| | | Biotechnology | | | |
| 1,700 | | Amgen, Inc.(a) | | | 134,062 |
| | | | |
|
|
| | |
| | | Building Materials—0.9% | | | |
| 111,800 | | Masco Corp. | | | 3,375,242 |
| | | | |
|
|
| | |
| | | Capital Markets | | | |
| 24,100 | | E*Trade Financial Corp.(a) | | | 502,726 |
| | | | |
|
|
| | |
| | | Chemicals—2.9% | | | |
| 30,100 | | Air Products & Chemicals, Inc. | | | 1,781,619 |
| 72,900 | | Dow Chemical Co. | | | 3,194,478 |
| 3,600 | | Du Pont de Nemours & Co. | | | 153,000 |
| 31,900 | | Nalco Holding Co.(a) | | | 564,949 |
| 40,000 | | PPG Industries, Inc. | | | 2,316,000 |
| 28,000 | | Praxair, Inc. | | | 1,482,880 |
| 17,800 | | Rohm & Haas Co. | | | 861,876 |
| | | | |
|
|
| | | | | | 10,354,802 |
| | | | |
|
|
| | |
| | | Commercial Banks—8.1% | | | |
| 2,400 | | BB&T Corp. | | | 100,584 |
| 214,700 | | Bank of America Corp. | | | 9,908,405 |
| 146,100 | | KeyCorp | | | 4,811,073 |
See Notes to Financial Statements beginning on page 130
| | |
| THE TARGET PORTFOLIO TRUST | | 31 |
| | |
| Large Capitalization Value Portfolio (cont’d) | | Portfolio of Investments
As of December 31, 2005 |
| | | | | |
| SHARES | | DESCRIPTION | | VALUE (NOTE 1) |
| | | | | | |
| | |
| | | Commercial Banks (cont’d.) | | | |
| 5,200 | | Marshall & Ilsley Corp. | | $ | 223,808 |
| 63,700 | | Mellon Financial Corp. | | | 2,181,725 |
| 72,400 | | North Fork Bancorporation, Inc. | | | 1,980,864 |
| 19,400 | | State Street Corp. | | | 1,075,536 |
| 113,700 | | U.S. Bancorp | | | 3,398,493 |
| 10,500 | | UnionBanCal Corp. | | | 721,560 |
| 11,900 | | Wachovia Corp. | | | 629,034 |
| 58,300 | | Wells Fargo & Co. | | | 3,662,989 |
| 6,300 | | Zions Bancorp | | | 476,028 |
| | | | |
|
|
| | | | | | 29,170,099 |
| | | | |
|
|
| | |
| | | Commercial Services & Supplies—1.4% | | | |
| 215,600 | | Cendant Corp. | | | 3,719,100 |
| 100 | | McKesson Corp. | | | 5,159 |
| 3,075 | | PHH Corp.(a) | | | 86,161 |
| 38,700 | | Waste Management, Inc. | | | 1,174,545 |
| | | | |
|
|
| | | | | | 4,984,965 |
| | | | |
|
|
| | |
| | | Computers & Peripherals—1.4% | | | |
| 6,100 | | Affiliated Computer Services, Inc. (Class “A” Stock) | | | 360,998 |
| 9,700 | | Dell, Inc.(a) | | | 290,903 |
| 2,300 | | EMC Corp.(a) | | | 31,326 |
| 127,800 | | Hewlett-Packard Co. | | | 3,658,914 |
| 7,500 | | IBM Business Machines Corp. | | | 616,500 |
| 2,100 | | NCR Corp.(a) | | | 71,274 |
| | | | |
|
|
| | | | | | 5,029,915 |
| | | | |
|
|
| | |
| | | Consumer Finance—0.7% | | | |
| 96,900 | | MBNA Corp. | | | 2,630,835 |
| | | | |
|
|
| | |
| | | Consumer Products—0.1% | | | |
| 3,600 | | Procter & Gamble Co. | | | 208,368 |
| | | | |
|
|
| | |
| | | Diversified Financial Services—9.0% | | | |
| 42,200 | | CIT Group, Inc. | | | 2,185,116 |
| 6,100 | | Capital One Financial Corp. | | | 527,040 |
| 239,400 | | Citigroup, Inc. | | | 11,618,082 |
| 108,200 | | Countrywide Credit Industries, Inc. | | | 3,699,358 |
| 23,000 | | Goldman Sachs Group, Inc. | | | 2,937,330 |
| 43,400 | | JPMorgan Chase & Co. | | | 1,722,546 |
| 24,700 | | Lehman Brothers Holdings, Inc. | | | 3,165,799 |
| 18,400 | | MBIA, Inc. | | | 1,106,944 |
| 31,800 | | Merrill Lynch & Co., Inc. | | | 2,153,814 |
| 44,300 | | Morgan Stanley | | | 2,513,582 |
| 23,900 | | Principal Financial Group, Inc. | | | 1,133,577 |
| | | | |
|
|
| | | | | | 32,763,188 |
| | | | |
|
|
See Notes to Financial Statements beginning on page 130
| | |
| 32 | | THE TARGET PORTFOLIO TRUST |
| | | | | |
| SHARES | | DESCRIPTION | | VALUE (NOTE 1) |
| | | | | | |
| | | Diversified Telecommunication Services—0.4% | | | |
| 66,300 | | Sprint Nextel Corp. | | $ | 1,548,768 |
| | | | |
|
|
| | | Electric Utilities—4.5% | | | |
| 1,300 | | American Electric Power Co., Inc. | | | 48,217 |
| 53,100 | | CMS Energy Corp.(a) | | | 770,481 |
| 26,000 | | Consolidated Edison, Inc. | | | 1,204,580 |
| 8,100 | | Constellation Energy Group, Inc. | | | 466,560 |
| 27,300 | | Duke Energy Corp. | | | 749,385 |
| 17,500 | | Edison International | | | 763,175 |
| 16,400 | | Entergy Corp. | | | 1,125,860 |
| 87,500 | | FPL Group, Inc. | | | 3,636,500 |
| 16,496 | | FirstEnergy Corp. | | | 808,139 |
| 16,000 | | PG&E Corp. | | | 593,920 |
| 44,000 | | PPL Corp. | | | 1,293,600 |
| 17,100 | | Pinnacle West Capital Corp. | | | 707,085 |
| 59,400 | | TXU Corp. | | | 2,981,286 |
| 11,900 | | Wisconsin Energy Corp. | | | 464,814 |
| 39,300 | | Xcel Energy, Inc. | | | 725,478 |
| | | | |
|
|
| | | | | | 16,339,080 |
| | | | |
|
|
| | | Exchange Traded Fund—0.3% | | | |
| 14,790 | | iShares Russell 1000 Value Index Fund | | | 1,020,954 |
| | | | |
|
|
| | | Food & Staples Retailing—0.5% | | | |
| 91,300 | | Albertson’s, Inc. | | | 1,949,255 |
| | | | |
|
|
| | | Food Products—2.1% | | | |
| 84,700 | | Archer-Daniels-Midland Co. | | | 2,088,702 |
| 2,800 | | Campbell Soup Co. | | | 83,356 |
| 103,600 | | ConAgra Foods, Inc. | | | 2,101,008 |
| 2,700 | | Heinz Co., H.J. | | | 91,044 |
| 1,600 | | Kellogg Co. | | | 69,152 |
| 41,100 | | Kraft Foods, Inc. (Class “A” Stock) | | | 1,156,554 |
| 35,800 | | Sara Lee Corp. | | | 676,620 |
| 2,600 | | Sysco Corp. | | | 80,730 |
| 35,500 | | Unilever PLC (United Kingdom) | | | 1,424,260 |
| | | | |
|
|
| | | | | | 7,771,426 |
| | | | |
|
|
| | |
| | | Gas & Pipeline Utilities—1.0% | | | |
| 23,800 | | Northeast Utilities | | | 468,622 |
| 58,700 | | Valero Energy Corp. | | | 3,028,920 |
| | | | |
|
|
| | | | | | 3,497,542 |
| | | | |
|
|
| | |
| | | Healthcare Equipment & Supplies—1.4% | | | |
| 4,600 | | Bausch & Lomb, Inc. | | | 312,340 |
| 9,100 | | Boston Scientific Corp.(a) | | | 222,859 |
| 1,900 | | Cooper Cos, Inc. (The) | | | 97,470 |
| 14,600 | | Eli Lilly & Co. | | | 826,214 |
| 12,900 | | Sepracor, Inc.(a) | | | 665,640 |
| 58,800 | | Wyeth | | | 2,708,916 |
| 3,500 | | Zimmer Holdings, Inc.(a) | | | 236,040 |
| | | | |
|
|
| | | | | | 5,069,479 |
| | | | |
|
|
See Notes to Financial Statements beginning on page 130
| | |
| THE TARGET PORTFOLIO TRUST | | 33 |
| | |
Large Capitalization Value Portfolio (cont’d) | | Portfolio of Investments
As of December 31, 2005 |
| | | | | |
| SHARES | | DESCRIPTION | | VALUE (NOTE 1) |
| | | | | | |
| | |
| | | Healthcare Providers & Services—2.1% | | | |
| 6,800 | | Aetna, Inc. | | $ | 641,308 |
| 42,800 | | HCA, Inc. | | | 2,161,400 |
| 127,000 | | Tenet Healthcare Corp.(a) | | | 972,820 |
| 47,300 | | WellPoint, Inc.(a) | | | 3,774,067 |
| | | | |
|
|
| | | | | | 7,549,595 |
| | | | |
|
|
| | |
| | | Hotels, Restaurants & Leisure—1.8% | | | |
| 11,900 | | Carnival Corp. | | | 636,293 |
| 19,696 | | Harrah’s Entertainment, Inc. | | | 1,404,128 |
| 16,100 | | Hilton Hotels Corp. | | | 388,171 |
| 81,400 | | McDonald’s Corp. | | | 2,744,808 |
| 2,100 | | Starwood Hotels & Resorts Worldwide, Inc. | | | 134,106 |
| 22,500 | | Yum! Brands, Inc. | | | 1,054,800 |
| | | | |
|
|
| | | | | | 6,362,306 |
| | | | |
|
|
| | |
| | | Household Durables—1.5% | | | |
| 1,700 | | Centex Corp. | | | 121,533 |
| 79,200 | | Lennar Corp. (Class “A” Stock) | | | 4,832,784 |
| 5,480 | | Lennar Corp. (Class “B” Stock) | | | 310,661 |
| | | | |
|
|
| | | | | | 5,264,978 |
| | | | |
|
|
| | |
| | | Household Products—0.9% | | | |
| 13,600 | | Fortune Brands, Inc. | | | 1,061,072 |
| 39,300 | | Kimberly-Clark Corp. | | | 2,344,245 |
| | | | |
|
|
| | | | | | 3,405,317 |
| | | | |
|
|
| | |
| | | Industrial Conglomerates—2.2% | | | |
| 81,800 | | General Electric Co. | | | 2,867,090 |
| 136,800 | | Tyco International Ltd. (Bermuda) | | | 3,948,048 |
| 13,700 | | 3M Co. | | | 1,061,750 |
| | | | |
|
|
| | | | | | 7,876,888 |
| | | | |
|
|
| | |
| | | Industrial Machinery—1.0% | | | |
| 37,400 | | Deere & Co. | | | 2,547,314 |
| 15,400 | | Eaton Corp. | | | 1,033,186 |
| | | | |
|
|
| | | | | | 3,580,500 |
| | | | |
|
|
| | |
| | | Industrial Products—0.1% | | | |
| 3,400 | | Mohawk Industries, Inc.(a) | | | 295,732 |
| | | | |
|
|
| | |
| | | Insurance—9.6% | | | |
| 4,100 | | AFLAC, Inc. | | | 190,322 |
| 83,200 | | Allstate Corp. (The) | | | 4,498,624 |
| 13,800 | | Ambac Financial Group, Inc. | | | 1,063,428 |
| 18,400 | | American International Group, Inc. | | | 1,255,432 |
| 8,400 | | AON Corp. | | | 301,980 |
See Notes to Financial Statements beginning on page 130
| | |
| 34 | | THE TARGET PORTFOLIO TRUST |
| | | | | |
| SHARES | | DESCRIPTION | | VALUE (NOTE 1) |
| | | | | | |
| | |
| | | Insurance (cont’d.) | | | |
| 23,800 | | Assurant, Inc. | | $ | 1,035,062 |
| 96,800 | | Genworth Financial, Inc. | | | 3,347,344 |
| 23,600 | | Hanover Insurance Group, Inc. | | | 985,772 |
| 25,600 | | Hartford Financial Services Group, Inc. (The) | | | 2,198,784 |
| 16,000 | | Lincoln National Corp. | | | 848,480 |
| 32,900 | | Marsh & McLennan Cos., Inc. | | | 1,044,904 |
| 120,870 | | MetLife, Inc. | | | 5,922,630 |
| 1,500 | | Progressive Corp. (The) | | | 175,170 |
| 8,300 | | Protective Life Corp. | | | 363,291 |
| 162,400 | | St. Paul Travelers Cos., Inc. (The) | | | 7,254,408 |
| 13,400 | | Torchmark Corp. | | | 745,040 |
| 124,000 | | UnumProvident Corp. | | | 2,821,000 |
| 12,400 | | W.R. Berkely Corp. | | | 590,488 |
| 1,000 | | XL Capital Ltd. | | | 67,380 |
| | | | |
|
|
| | | | | | 34,709,539 |
| | | | |
|
|
| | |
| | | Internet & Catalog Retail—0.1% | | | |
| 4,400 | | eBay, Inc.(a) | | | 190,300 |
| | | | |
|
|
| | |
| | | IT Services—1.1% | | | |
| 2,800 | | Computer Sciences Corp.(a) | | | 141,792 |
| 163,800 | | Electronic Data System Corp. | | | 3,937,752 |
| | | | |
|
|
| | | | | | 4,079,544 |
| | | | |
|
|
| | |
| | | Leisure Equipment & Products—0.3% | | | |
| 37,800 | | Eastman Kodak Co. | | | 884,520 |
| 6,600 | | Mattel, Inc. | | | 104,412 |
| | | | |
|
|
| | | | | | 988,932 |
| | | | |
|
|
| | |
| | | Machinery—0.4% | | | |
| 31,300 | | SPX Corp. | | | 1,432,601 |
| | | | |
|
|
| | |
| | | Manufacturing | | | |
| 800 | | Danaher Corp. | | | 44,624 |
| | | | |
|
|
| | |
| | | Media—2.9% | | | |
| 11,900 | | DirecTV Group Inc. (The)(a) | | | 168,028 |
| 2,800 | | Echostar Communications Corp. (Class “A” Stock)(a) | | | 76,076 |
| 7,000 | | E.W. Scripps Co. ( Class “A” Stock) | | | 336,140 |
| 69,700 | | Gannett Co., Inc. | | | 4,221,729 |
| 109,700 | | News Corp., Inc. (Class “A” Stock) | | | 1,705,835 |
| 59,000 | | Time Warner, Inc.(a) | | | 1,028,960 |
| 89,000 | | Viacom, Inc. (Class “B” Stock)(a) | | | 2,901,400 |
| | | | |
|
|
| | | | | | 10,438,168 |
| | | | |
|
|
| | |
| | | Metals & Mining—2.4% | | | |
| 187,376 | | Alcoa, Inc. | | | 5,540,708 |
| 15,000 | | Phelps Dodge Corp. | | | 2,158,050 |
| 18,100 | | United States Steel Corp. | | | 870,067 |
| | | | |
|
|
| | | | | | 8,568,825 |
| | | | |
|
|
See Notes to Financial Statements beginning on page 130
| | |
| THE TARGET PORTFOLIO TRUST | | 35 |
| | |
Large Capitalization Value Portfolio (cont’d) | | Portfolio of Investments
As of December 31, 2005 |
| | | | | |
| SHARES | | DESCRIPTION | | VALUE (NOTE 1) |
| | | | | | |
| | |
| | | Multi-Utilities—0.4% | | | |
| 22,100 | | Public Service Enterprise Group, Inc. | | $ | 1,435,837 |
| | | | |
|
|
| | |
| - | | Multi-Utilities & Unregulated Power—0.8% | | | |
| 28,000 | | Dominion Resources, Inc. | | | 2,161,600 |
| 14,600 | | SCANA Corp. | | | 574,948 |
| | | | |
|
|
| | | | | | 2,736,548 |
| | | | |
|
|
| | |
| | | Multiline Retail—1.1% | | | |
| 4,400 | | Abercrombie & Fitch Co. | | | 286,792 |
| 5,100 | | Federated Department Stores | | | 338,283 |
| 6,800 | | Home Depot, Inc. | | | 275,264 |
| 5,900 | | Kohl’s Corp.(a) | | | 286,740 |
| 5,400 | | Nordstrom, Inc. | | | 201,960 |
| 9,600 | | J. C. Penney Co., Inc. | | | 533,760 |
| 5,100 | | Dollar General Corp. | | | 97,257 |
| 92,700 | | Limited Brands, Inc. | | | 2,071,845 |
| | | | |
|
|
| | | | | | 4,091,901 |
| | | | |
|
|
| | |
| | | Networking Equipment—0.1% | | | |
| 20,600 | | Juniper Networks, Inc.(a) | | | 459,380 |
| | | | |
|
|
| | |
| | | Oil Field / Equipment Services—3.0% | | | |
| 58,600 | | Apache Corp. | | | 4,015,272 |
| 101,400 | | ConocoPhillips | | | 5,899,452 |
| 7,900 | | Devon Energy Corp. | | | 494,066 |
| 8,200 | | Dynegy Inc. (Class “A” Stock) | | | 39,688 |
| 6,100 | | Halliburton Co. | | | 377,956 |
| | | | |
|
|
| | | | | | 10,826,434 |
| | | | |
|
|
| | |
| | | Oil, Gas & Consumable Fuels—6.1% | | | |
| 5,000 | | Anadarko Petroleum Corp. | | | 473,750 |
| 14,200 | | Ashland, Inc.(a) | | | 822,180 |
| 10,900 | | Burlington Resources, Inc. | | | 939,580 |
| 77,300 | | ChevronTexaco Corp. | | | 4,388,321 |
| 7,200 | | EOG Resources, Inc. | | | 528,264 |
| 166,700 | | Exxon Mobil Corp. | | | 9,363,539 |
| 53,600 | | Occidental Petroleum Corp. | | | 4,281,568 |
| 6,100 | | Rowan Cos., Inc.(a) | | | 217,404 |
| 12,900 | | Tesoro Corp. | | | 793,995 |
| 13,600 | | Weatherford International, Inc. Ltd.(c) | | | 492,320 |
| | | | |
|
|
| | | | | | 22,300,921 |
| | | | |
|
|
| | |
| | | Paper & Forest Products—0.5% | | | |
| 4,400 | | Bowater, Inc. | | | 135,168 |
| 15,500 | | International Paper Co. | | | 520,955 |
| 9,600 | | Smurfit-Stone Container Corp.(a) | | | 136,032 |
See Notes to Financial Statements beginning on page 130
| | |
| 36 | | THE TARGET PORTFOLIO TRUST |
| | | | | |
| SHARES | | DESCRIPTION | | VALUE (NOTE 1) |
| | | | | | |
| | |
| | | Paper & Forest Products (cont’d.) | | | |
| 2,800 | | Temple-Inland, Inc. | | $ | 125,580 |
| 14,020 | | Weyerhaeuser Co. | | | 930,087 |
| | | | |
|
|
| | | | | | 1,847,822 |
| | | | |
|
|
| | |
| | | Pharmaceuticals—2.5% | | | |
| 2,400 | | Barr Pharmaceuticals, Inc.(a) | | | 149,496 |
| 2,400 | | Bristol-Myers Squibb Co. | | | 55,152 |
| 1,900 | | Medco Health Solutions(a) | | | 106,020 |
| 70,800 | | Merck & Co., Inc. | | | 2,252,148 |
| 272,600 | | Pfizer, Inc. | | | 6,357,032 |
| 1,400 | | Watson Pharmaceuticals, Inc.(a) | | | 45,514 |
| | | | |
|
|
| | | | | | 8,965,362 |
| | | | |
|
|
| | |
| | | Railroads & Equipment—1.1% | | | |
| 15,700 | | Burlington Northern Santa Fe Corp. | | | 1,111,874 |
| 23,400 | | CSX Corp. | | | 1,188,018 |
| 5,400 | | FedEx Corp. | | | 558,306 |
| 21,300 | | Norfolk Southern Corp. | | | 954,879 |
| | | | |
|
|
| | | | | | 3,813,077 |
| | | | |
|
|
| | |
| | | Real Estate Investment Trust—3.4% | | | |
| 34,800 | | Apartment Investment & Management Co. (Class “A” Stock) | | | 1,317,876 |
| 5,200 | | Camden Property Trust | | | 301,184 |
| 3,100 | | CenterPoint Properties Trust | | | 153,388 |
| 73,000 | | Equity Office Properties Trust | | | 2,214,090 |
| 63,600 | | Host Marriott Corp. | | | 1,205,220 |
| 7,900 | | Liberty Property Trust | | | 338,515 |
| 12,400 | | Mack-Cali Realty Corp. | | | 535,680 |
| 2,600 | | Mills Corp. (The) | | | 109,044 |
| 29,900 | | New Century Financial Corp. | | | 1,078,493 |
| 18,885 | | Plum Creek Timber Co. | | | 680,804 |
| 45,600 | | ProLogis | | | 2,130,432 |
| 29,700 | | Simon Property Group, Inc. | | | 2,275,911 |
| | | | |
|
|
| | | | | | 12,340,637 |
| | | | |
|
|
| | |
| | | Semiconductors & Semiconductor Equipment—0.2% | | | |
| 8,700 | | Altera Corp.(a) | | | 161,211 |
| 6,000 | | Analog Devices, Inc. | | | 215,220 |
| 1,300 | | Linear Technology Corp. | | | 46,891 |
| 2,700 | | Maxim Integrated Products, Inc. | | | 97,848 |
| 700 | | Novellus Systems, Inc.(a) | | | 16,884 |
| 6,800 | | Teradyne, Inc.(a) | | | 99,076 |
| | | | |
|
|
| | | | | | 637,130 |
| | | | |
|
|
| | |
| | | Software—2.3% | | | |
| 92,000 | | BMC Software, Inc.(a) | | | 1,885,080 |
| 130,200 | | Computer Associates International, Inc. | | | 3,670,338 |
| 88,400 | | Microsoft Corp. | | | 2,311,660 |
| 43,600 | | Oracle Corp.(a) | | | 532,356 |
| | | | |
|
|
| | | | | | 8,399,434 |
| | | | |
|
|
See Notes to Financial Statements beginning on page 130
| | |
| THE TARGET PORTFOLIO TRUST | | 37 |
| | |
Large Capitalization Value Portfolio (cont’d) | | Portfolio of Investments
As of December 31, 2005 |
| | | | | |
| SHARES | | DESCRIPTION | | VALUE (NOTE 1) |
| | | | | | |
| | |
| | | Specialty Retail—0.2% | | | |
| 5,400 | | Lowe’s Cos., Inc. | | $ | 359,964 |
| 2,200 | | Ross Stores, Inc. | | | 63,580 |
| 17,000 | | Staples, Inc. | | | 386,070 |
| | | | |
|
|
| | | | | | 809,614 |
| | | | |
|
|
| | |
| | | Telecommunication Services—4.1% | | | |
| 8,300 | | American Tower Corp. (Class “A” Stock)(a) | | | 224,930 |
| 253,916 | | AT&T, Inc. | | | 6,218,403 |
| 1,100 | | BellSouth Corp. | | | 29,810 |
| 59,700 | | Corning, Inc.(a) | | | 1,173,702 |
| 28,600 | | Motorola, Inc. | | | 646,074 |
| 5,000 | | QUALCOMM, Inc. | | | 215,400 |
| 207,600 | | Verizon Communications Inc. | | | 6,252,912 |
| 17,900 | | Tellabs, Inc.(a) | | | 195,110 |
| | | | |
|
|
| | | | | | 14,956,341 |
| | | | |
|
|
| | |
| | | Textiles, Apparel & Luxury Goods—0.6% | | | |
| 300 | | Coach, Inc.(a) | | | 10,002 |
| 43,700 | | Jones Apparel Group, Inc. | | | 1,342,464 |
| 10,700 | | Nike, Inc. (Class “B” Stock) | | | 928,653 |
| | | | |
|
|
| | | | | | 2,281,119 |
| | | | |
|
|
| | |
| | | Thrifts & Mortgage Finance—3.3% | | | |
| 7,300 | | Astoria Financial Corp. | | | 214,620 |
| 59,200 | | Fannie Mae | | | 2,889,552 |
| 48,000 | | Freddie Mac | | | 3,136,800 |
| 133,700 | | Washington Mutual, Inc. | | | 5,815,950 |
| | | | |
|
|
| | | | | | 12,056,922 |
| | | | |
|
|
| | |
| | | Tobacco—2.2% | | | |
| 107,500 | | Altria Group, Inc. | | | 8,032,400 |
| | | | |
|
|
| | | Total long-term investments
(cost $311,573,727) | | | 357,349,043 |
| | |
| | | SHORT-TERM INVESTMENT—0.6% | | | |
| | |
| | | Affiliated Money Market Mutual Fund | | | |
| 2,027,891 | | Dryden Core Investment Fund - Taxable Money Market Series
(cost $2,027,891; Note 3)(b) | | | 2,027,891 |
| | | | |
|
|
| | | Total Investments—99.2%
(cost $313,601,618) | | | 359,376,934 |
| | | Other assets in excess of liabilities—0.8% | | | 2,876,555 |
| | | | |
|
|
| | | Net Assets—100% | | $ | 362,253,489 |
| | | | |
|
|
| (a) | Non-income producing security. |
| (b) | Prudential Investments LLC, the manager of the Fund also serves as the manager of the Dryden Core Investment Fund - Taxable Money Market Series. |
See Notes to Financial Statements beginning on page 130
| | |
| 38 | | THE TARGET PORTFOLIO TRUST |
The industry classification of long-term portfolio holdings, short-term investments and other assets in excess of liabilities shown as a percentage of net assets as of December 31, 2005 were as follows:
| | | |
Insurance | | 9.6 | % |
Diversified Financial Services | | 9.0 | |
Commercial Banks | | 8.1 | |
Oil, Gas & Consumable Fuels | | 6.1 | |
Electric Utilities | | 4.5 | |
Telecommunication Services | | 4.1 | |
Real Estate Investment Trust | | 3.4 | |
Thrifts & Mortgage Finance | | 3.3 | |
Oil Field / Equipment Services | | 3.0 | |
Chemicals | | 2.9 | |
Media | | 2.9 | |
Pharmaceuticals | | 2.5 | |
Aerospace/Defense | | 2.4 | |
Metals & Mining | | 2.4 | |
Software | | 2.3 | |
Industrial Conglomerates | | 2.2 | |
Tobacco | | 2.2 | |
Food Products | | 2.1 | |
Healthcare Providers & Services | | 2.1 | |
Hotels, Restaurants & Leisure | | 1.8 | |
Household Durables | | 1.5 | |
Commercial Services & Supplies | | 1.4 | |
Computers & Peripherals | | 1.4 | |
Healthcare Equipment & Supplies | | 1.4 | |
Automotive Components | | 1.3 | |
Beverages | | 1.3 | |
IT Services | | 1.1 | |
Multiline Retail | | 1.1 | |
Railroads & Equipment | | 1.1 | |
Gas & Pipeline Utilities | | 1.0 | |
Industrial Machinery | | 1.0 | |
Building Materials | | 0.9 | |
Household Products | | 0.9 | |
Multi-Utilities & Unregulated Power | | 0.8 | |
Consumer Finance | | 0.7 | |
Automobiles | | 0.6 | |
Textiles, Apparel & Luxury Goods | | 0.6 | |
Food & Staples Retailing | | 0.5 | |
Paper & Forest Products | | 0.5 | |
Diversified Telecommunication Services | | 0.4 | |
Machinery | | 0.4 | |
Multi-Utilities | | 0.4 | |
Exchange Traded Fund | | 0.3 | |
Leisure Equipment & Products | | 0.3 | |
Semiconductors & Semiconductor Equipment | | 0.2 | |
Specialty Retail | | 0.2 | |
Consumer Products | | 0.1 | |
Industrial Products | | 0.1 | |
Internet & Catalog Retail | | 0.1 | |
Networking Equipment | | 0.1 | |
Affiliated Money Market Mutual Fund | | 0.6 | |
| | |
|
|
| | | 99.2 | |
Other assets in excess of liabilities | | 0.8 | |
| | |
|
|
Total | | 100.0 | % |
| | |
|
|
See Notes to Financial Statements beginning on page 130
| | |
| THE TARGET PORTFOLIO TRUST | | 39 |
| | |
Small Capitalization Growth Portfolio | | Portfolio of Investments
As of December 31, 2005 |
| | | | | |
| SHARES | | DESCRIPTION | | VALUE (NOTE 1) |
| | | | | | |
| | | LONG-TERM INVESTMENTS—97.2% | | | |
| | |
| | | Common Stocks | | | |
| | |
| | | Advertising—1.0% | | | |
| 15,290 | | Marchex, Inc., (Class B Shares) | | $ | 343,872 |
| 82,704 | | Valuevision Media, Inc., (Class A Shares) | | | 1,042,071 |
| | | | |
|
|
| | | | | | 1,385,943 |
| | | | |
|
|
| | |
| | | Aerospace—1.3% | | | |
| 38,214 | | AAR Corp. | | | 915,225 |
| 19,900 | | DRS Technologies, Inc. | | | 1,023,258 |
| | | | |
|
|
| | | | | | 1,938,483 |
| | | | |
|
|
| | |
| | | Biotechnology—1.8% | | | |
| 93,561 | | Cambrex Corp. | | | 1,756,140 |
| 58,955 | | Illumina, Inc. | | | 831,265 |
| | | | |
|
|
| | | | | | 2,587,405 |
| | | | |
|
|
| | |
| | | Business Services—0.9% | | | |
| 7,300 | | Ctrip.com International Ltd., ADR (China)(a) | | | 421,575 |
| 48,839 | | LECG Corp.(a) | | | 848,822 |
| | | | |
|
|
| | | | | | 1,270,397 |
| | | | |
|
|
| | |
| | | Chemicals—0.2% | | | |
| 4,222 | | Minerals Technologies, Inc. | | | 235,968 |
| | | | |
|
|
| | |
| | | Commercial Services—7.0% | | | |
| 44,070 | | AMN Healthcare Services, Inc. | | | 871,705 |
| 31,580 | | Barrett Business Services | | | 789,184 |
| 34,673 | | CRA International, Inc. | | | 1,653,555 |
| 51,420 | | FirstService Corp. (Canada) | | | 1,318,923 |
| 14,780 | | Laureate Education, Inc. | | | 776,098 |
| 37,960 | | McGrath Rentcorp | | | 1,055,288 |
| 21,010 | | Providence Service Corp. | | | 604,878 |
| 58,340 | | Rollins, Inc. | | | 1,149,881 |
| 28,630 | | Steiner Leisure Ltd. | | | 1,018,083 |
| 42,170 | | TNS, Inc. | | | 808,821 |
| | | | |
|
|
| | | | | | 10,046,416 |
| | | | |
|
|
| | |
| | | Computer Hardware—2.8% | | | |
| 25,180 | | M-Systems Flash Disk Pioneers (Israel) | | | 833,962 |
| 70,320 | | Optimal Group, Inc. (Class A Shares) (Canada) | | | 1,424,683 |
| 118,800 | | Synplicity, Inc. | | | 986,040 |
| 40,800 | | Ultimate Software Group, Inc. | | | 778,056 |
| | | | |
|
|
| | | | | | 4,022,741 |
| | | | |
|
|
See Notes to Financial Statements beginning on page 130
| | |
| 40 | | THE TARGET PORTFOLIO TRUST |
| | | | | |
| SHARES | | DESCRIPTION | | VALUE (NOTE 1) |
| | | | | | |
| | |
| | | Computer Networking—0.9% | | | |
| 19,587 | | Websense, Inc.(a) | | $ | 1,285,691 |
| | | | |
|
|
| | |
| | | Computer Services & Software—6.3% | | | |
| 51,500 | | Bottomline Technologies, Inc. | | | 567,530 |
| 39,640 | | Concur Technologies, Inc. | | | 510,960 |
| 63,860 | | Epicor Software Corp. | | | 902,342 |
| 50,099 | | Filenet Corp. | | | 1,295,059 |
| 41,026 | | Hyperion Solutions Corp. | | | 1,469,551 |
| 39,246 | | Informatica, Corp. | | | 470,952 |
| 44,570 | | PDF Solutions, Inc.(a) | | | 724,262 |
| 27,100 | | Retalix Ltd. | | | 662,866 |
| 59,386 | | Take-Two Interactive Software, Inc.(a) | | | 1,051,132 |
| 29,236 | | THQ, Inc. | | | 697,279 |
| 35,190 | | Witness Systems, Inc. | | | 692,187 |
| | | | |
|
|
| | | | | | 9,044,120 |
| | | | |
|
|
| | |
| | | Construction—2.4% | | | |
| 36,857 | | A.S.V., Inc. | | | 920,688 |
| 51,022 | | Monaco Coach Corp. | | | 678,592 |
| 66,118 | | Shaw Group, Inc. | | | 1,923,373 |
| | | | |
|
|
| | | | | | 3,522,653 |
| | | | |
|
|
| | |
| | | Consumer Products & Services—2.6% | | | |
| 25,200 | | Central Garden & Pet Co. | | | 1,157,688 |
| 33,250 | | Jarden Corp. | | | 1,002,488 |
| 26,170 | | Lifeline Systems, Inc. | | | 956,775 |
| 19,210 | | Universal Technical Institute, Inc. | | | 594,357 |
| | | | |
|
|
| | | | | | 3,711,308 |
| | | | |
|
|
| | |
| | | Distribution/Wholesale—1.1% | | | |
| 7,640 | | Building Material Holding Corp. | | | 521,124 |
| 185,815 | | Navarre Corp. | | | 1,027,557 |
| | | | |
|
|
| | | | | | 1,548,681 |
| | | | |
|
|
| | |
| | | Electronic Components—5.4% | | | |
| 37,290 | | Axsys Technologies, Inc. | | | 669,356 |
| 35,914 | | Catapult Communications, Corp.(a) | | | 531,168 |
| 52,340 | | Coherent, Inc. | | | 1,553,451 |
| 68,175 | | Faro Technologies, Inc.(a) | | | 1,363,500 |
| 11,207 | | ICT Group, Inc.(a) | | | 189,959 |
| 21,100 | | Intermagnetics General Corp. | | | 673,090 |
| 29,282 | | Rogers Corp. | | | 1,147,269 |
| 90,040 | | SRS Labs, Inc. | | | 592,463 |
| 11,109 | | Trimble Navigation Ltd.(a) | | | 394,258 |
| 20,784 | | Watts Water Technologies, Inc. (Class A Shares) | | | 629,547 |
| | | | |
|
|
| | | | | | 7,744,061 |
| | | | |
|
|
See Notes to Financial Statements beginning on page 130
| | |
| THE TARGET PORTFOLIO TRUST | | 41 |
| | |
Small Capitalization Growth Portfolio (cont’d) | | Portfolio of Investments
As of December 31, 2005 |
| | | | | |
| SHARES | | DESCRIPTION | | VALUE (NOTE 1) |
| | | | | | |
| | |
| | | Entertainment & Leisure—2.1% | | | |
| 86,020 | | Century Casinos, Inc. | | $ | 739,772 |
| 84,010 | | Mikohn Gaming Corp. | | | 829,179 |
| 53,250 | | Scientific Games Corp. (Class A Shares) | | | 1,452,660 |
| | | | |
|
|
| | | | | | 3,021,611 |
| | | | |
|
|
| | |
| | | Financial - Bank & Trust—1.2% | | | |
| 19,900 | | Boston Private Financial Holdings, Inc. | | | 605,358 |
| 31,700 | | PrivateBancorp, Inc. | | | 1,127,569 |
| | | | |
|
|
| | | | | | 1,732,927 |
| | | | |
|
|
| | |
| | | Financial Services—5.4% | | | |
| 23,349 | | Affiliated Managers Group | | | 1,873,757 |
| 33,813 | | Financial Federal Corp. | | | 1,502,988 |
| 19,499 | | GAMCO Investment, Inc. (Class A Shares) | | | 848,791 |
| 49,999 | | Jefferies Group, Inc. | | | 2,248,955 |
| 16,540 | | Portfolio Recovery Associates, Inc. | | | 768,118 |
| 25,631 | | Texas Capital Banshares, Inc.(a) | | | 574,391 |
| | | | |
|
|
| | | | | | 7,817,000 |
| | | | |
|
|
| | |
| | | Healthcare Services—2.0% | | | |
| 14,350 | | Amedisys, Inc. | | | 606,144 |
| 121,310 | | Five Star Quality Care, Inc. | | | 954,710 |
| 73,060 | | Healthgrades.Com Inc.(a) | | | 458,086 |
| 21,550 | | Matria Healthcare, Inc. | | | 835,278 |
| | | | |
|
|
| | | | | | 2,854,218 |
| | | | |
|
|
| | |
| | | Insurance—1.4% | | | |
| 87,650 | | Amerisafe, Inc.(a) | | | 883,512 |
| 15,150 | | Navigators Group, Inc.(a) | | | 660,691 |
| 22,610 | | Tower Group, Inc. | | | 496,968 |
| | | | |
|
|
| | | | | | 2,041,171 |
| | | | |
|
|
| | |
| | | Internet Services—11.4% | | | |
| 49,506 | | Avocent Corp. | | | 1,346,068 |
| 127,120 | | Cybersource Corp. | | | 838,992 |
| 60,618 | | Digital Insight, Corp. | | | 1,940,988 |
| 76,680 | | Digitas, Inc. | | | 960,034 |
| 32,490 | | Equinix, Inc. | | | 1,324,293 |
| 28,480 | | J2 Global Communications, Inc. | | | 1,217,235 |
| 107,353 | | Jupitermedia Corp. | | | 1,586,677 |
| 66,340 | | Keynote Systems, Inc. | | | 852,469 |
| 85,440 | | Online Resources Corp. | | | 944,112 |
| 36,490 | | Openwave Systems, Inc. | | | 637,480 |
| 47,950 | | RADVision Ltd. (Israel) | | | 795,141 |
| 25,110 | | Rightnow Technologies, Inc.(a) | | | 463,531 |
See Notes to Financial Statements beginning on page 130
| | |
| 42 | | THE TARGET PORTFOLIO TRUST |
| | | | | |
| SHARES | | DESCRIPTION | | VALUE (NOTE 1) |
| | | | | | |
| | |
| | | Internet Services (cont’d.) | | | |
| 150,791 | | Valueclick, Inc. | | $ | 2,730,825 |
| 39,270 | | WebSidestory, Inc. | | | 711,965 |
| | | | |
|
|
| | | | | | 16,349,810 |
| | | | |
|
|
| | |
| | | Machinery & Equipment—3.6% | | | |
| 49,360 | | Hexel Corp.(a) | | | 890,948 |
| 23,293 | | IDEX, Corp. | | | 957,575 |
| 25,397 | | Kennametal, Inc. | | | 1,296,263 |
| 61,490 | | UNOVA, Inc. | | | 2,078,362 |
| | | | |
|
|
| | | | | | 5,223,148 |
| | | | |
|
|
| | |
| | | Medical Supplies & Equipment—11.4% | | | |
| 24,590 | | Adeza Biomedical Corp.(a) | | | 517,619 |
| 107,046 | | American Medical Systems Holdings, Inc. | | | 1,908,630 |
| 8,600 | | Angiodynamics, Inc.(a) | | | 219,558 |
| 128,310 | | Encore Medical Corp. | | | 635,134 |
| 29,050 | | Immucor, Inc.(a) | | | 678,608 |
| 30,147 | | Integra LifeSciences Holdings Corp.(a) | | | 1,069,013 |
| 53,963 | | Inverness Medical Innovations, Inc.(a) | | | 1,279,463 |
| 42,029 | | Kensey Nash Corp. | | | 925,899 |
| 10,170 | | LCA-Vision, Inc. | | | 483,177 |
| 35,597 | | Mentor Corp. | | | 1,640,310 |
| 21,780 | | Merge Technologies, Inc. | | | 545,371 |
| 31,700 | | NuVasive Inc.(a) | | | 573,770 |
| 148,370 | | Orthovita, Inc. | | | 575,676 |
| 30,544 | | PolyMedica Corp. | | | 1,022,308 |
| 76,767 | | PSS World Medical, Inc. | | | 1,139,222 |
| 65,721 | | Serologicals Corp. | | | 1,297,333 |
| 19,150 | | SonoSite, Inc. | | | 670,441 |
| 63,110 | | Spectranetics Corp. | | | 709,987 |
| 14,370 | | Syneron Medical Ltd. (Israel) | | | 456,248 |
| | | | |
|
|
| | | | | | 16,347,767 |
| | | | |
|
|
| | |
| | | Office Equipment—1.5% | | | |
| 61,868 | | Global Imaging Systems, Inc. | | | 2,142,489 |
| | | | |
|
|
| | |
| | | Oil, Gas & Consumable Fuels—7.9% | | | |
| 22,232 | | Cal Dive International, Inc. | | | 797,906 |
| 34,487 | | Dril-Quip, Inc.(a) | | | 1,627,786 |
| 104,630 | | Grey Wolf, Inc. | | | 808,790 |
| 26,019 | | Hydril | | | 1,628,789 |
| 23,120 | | Maverick Tube Corp. | | | 921,563 |
| 53,642 | | Oil States International, Inc. | | | 1,699,379 |
| 23,650 | | Patterson-UTI Energy, Inc. | | | 779,268 |
| 103,737 | | Superior Energy Services, Inc. | | | 2,183,664 |
| 15,030 | | Unit Corp. | | | 827,101 |
| | | | |
|
|
| | | | | | 11,274,246 |
| | | | |
|
|
See Notes to Financial Statements beginning on page 130
| | |
| THE TARGET PORTFOLIO TRUST | | 43 |
| | |
Small Capitalization Growth Portfolio (cont’d) | | Portfolio of Investments
As of December 31, 2005 |
| | | | | |
| SHARES | | DESCRIPTION | | VALUE (NOTE 1) |
| | | | | | |
| | |
| | | Pharmaceuticals—3.1% | | | |
| 28,280 | | Atherogenics, Inc. | | $ | 565,883 |
| 41,820 | | First Horizon Pharmaceutical Corp. | | | 721,395 |
| 31,314 | | HealthExtras, Inc. | | | 785,981 |
| 50,380 | | I-Flow Corp. | | | 736,556 |
| 18,400 | | Martrixx Initatives, Inc.(a) | | | 385,480 |
| 40,190 | | Salix Pharmaceuticals Ltd. | | | 706,540 |
| 31,030 | | Viropharma, Inc.(a) | | | 575,606 |
| | | | |
|
|
| | | | | | 4,477,441 |
| | | | |
|
|
| | |
| | | Real Estate—0.8% | | | |
| 47,100 | | KKR Financial Corp. | | | 1,129,929 |
| | | | |
|
|
| | |
| | | Restaurants—0.8% | | | |
| 35,841 | | Rare Hospitality International, Inc. | | | 1,089,208 |
| | | | |
|
|
| | |
| | | Retail & Merchandising—2.3% | | | |
| 44,920 | | Cache, Inc.(a) | | | 778,014 |
| 42,460 | | Cosi, Inc. | | | 352,418 |
| 18,375 | | Jos. A. Bank Clothiers, Inc. | | | 797,659 |
| 25,482 | | Tractor Supply Co. | | | 1,349,017 |
| | | | |
|
|
| | | | | | 3,277,108 |
| | | | |
|
|
| | |
| | | Semiconductors—3.6% | | | |
| 59,540 | | O2Micro International Ltd., ADR (China)(a) | | | 606,117 |
| 46,220 | | Advanced Analogic Technologies, Inc. | | | 640,147 |
| 103,932 | | Aeroflex, Inc.(a) | | | 1,117,269 |
| 18,760 | | Itron, Inc.(a) | | | 751,150 |
| 28,030 | | Microsemi Corp. | | | 775,310 |
| 38,840 | | Ultratech, Inc. | | | 637,753 |
| 41,340 | | Volterra Semiconductor Corp. | | | 620,100 |
| | | | |
|
|
| | | | | | 5,147,846 |
| | | | |
|
|
| | |
| | | Telecommunications—1.8% | | | |
| 78,191 | | SafeNet, Inc. | | | 2,519,314 |
| | | | |
|
|
| | |
| | | Transportation—2.8% | | | |
| 29,920 | | American Commercial Lines, Inc.(a) | | | 906,277 |
| 19,513 | | Forward Air Corp. | | | 715,151 |
| 31,815 | | Old Dominion Freight Line, Inc. | | | 858,369 |
| 47,207 | | Vitran Corp., Inc. (Canada) | | | 929,978 |
| 29,967 | | Werner Enterprises, Inc. | | | 590,350 |
| | | | |
|
|
| | | | | | 4,000,125 |
| | | | |
|
|
See Notes to Financial Statements beginning on page 130
| | |
| 44 | | THE TARGET PORTFOLIO TRUST |
| | | | | | |
| SHARES | | DESCRIPTION | | VALUE (NOTE 1) | |
| | | | | | | |
| | |
| | | Waste Disposal—0.4% | | | | |
| 14,300 | | Direct Focus Inc | | $ | 266,838 | |
| 9,500 | | Neurometrix, Inc.(a) | | | 259,160 | |
| | | | |
|
|
|
| | | | | | 525,998 | |
| | | | |
|
|
|
| | | Total long-term investments
(cost $118,921,689) | | | 139,315,223 | |
| | |
| | | SHORT-TERM INVESTMENT—3.7% | | | | |
| | |
| | | Affiliated Money Market Mutual Fund | | | | |
| 5,393,980 | | Dryden Core Investment Fund - Taxable Money Market Series
(cost $5,393,980; Note 3)(b) | | | 5,393,980 | |
| | | | |
|
|
|
| | | Total Investments—100.9%
(cost $124,315,669; Note 5) | | | 144,709,203 | |
| | | Liabilities in excess of other assets—(0.9%) | | | (1,343,430 | ) |
| | | | |
|
|
|
| | | Net Assets—100% | | $ | 143,365,773 | |
| | | | |
|
|
|
The following abbreviations are used in portfolio descriptions:
ADR—American Depositary Receipt
| (a) | Non-income producing security. |
| (b) | Prudential Investments LLC, the manager of the Fund also serves as manager of the Dryden Core Investment Fund-Taxable Money Market Series. |
The industry classification of long-term portfolio holdings, short-term investments and liabilities in excess of other assets shown as a percentage of net assets as of December 31, 2005 were as follows:
| | | |
Internet Services | | 11.4 | % |
Medical Supplies & Equipment | | 11.4 | |
Oil, Gas & Consumable Fuels | | 7.9 | |
Commercial Services | | 7.0 | |
Computer Services & Software | | 6.3 | |
Electronic Components | | 5.4 | |
Financial Services | | 5.4 | |
Machinery & Equipment | | 3.6 | |
Semiconductors | | 3.6 | |
Pharmaceuticals | | 3.1 | |
Computer Hardware | | 2.8 | |
Transportation | | 2.8 | |
Consumer Products & Services | | 2.6 | |
Construction | | 2.4 | |
Retail & Merchandising | | 2.3 | |
Entertainment & Leisure | | 2.1 | |
Healthcare Services | | 2.0 | |
Biotechnology | | 1.8 | |
Telecommunications | | 1.8 | |
Office Equipment | | 1.5 | |
Insurance | | 1.4 | |
Aerospace | | 1.3 | |
Financial—Bank & Trust | | 1.2 | |
Distribution/Wholesale | | 1.1 | |
See Notes to Financial Statements beginning on page 130
| | |
| THE TARGET PORTFOLIO TRUST | | 45 |
| | |
Small Capitalization Growth Portfolio (cont’d) | | Portfolio of Investments
As of December 31, 2005 |
| | | |
Advertising | | 1.0 | % |
Business Services | | 0.9 | |
Computer Networking | | 0.9 | |
Real Estate | | 0.8 | |
Restaurants | | 0.8 | |
Waste Disposal | | 0.4 | |
Chemicals | | 0.2 | |
Affiliated Money Market Mutual Fund | | 3.7 | |
| | |
|
|
| | | 100.9 | |
Liabilities in excess of other assets | | (0.9 | ) |
| | |
|
|
Total | | 100.0 | % |
| | |
|
|
See Notes to Financial Statements beginning on page 130
| | |
| 46 | | THE TARGET PORTFOLIO TRUST |
| | |
Portfolio of Investments
As of December 31, 2005 | | Small Capitalization Value Portfolio |
| | | | | |
| SHARES | | DESCRIPTION | | VALUE (NOTE 1) |
| | | | | | |
| | | LONG-TERM INVESTMENTS—97.9% | | | |
| | |
| | | Common Stocks | | | |
| | |
| | | Advertising—0.4% | | | |
| 36,350 | | Advo, Inc. | | $ | 1,024,343 |
| | | | |
|
|
| | |
| | | Aerospace/Defense—1.2% | | | |
| 1,300 | | AAR Corp. | | | 31,135 |
| 1,700 | | Armor Holdings, Inc. | | | 72,505 |
| 18,730 | | CPI Aerostructures, Inc. | | | 188,424 |
| 27,300 | | Curtiss-Wright Corp. | | | 1,490,580 |
| 1,675 | | DRS Technologies, Inc.(a) | | | 86,129 |
| 2,675 | | Esterline Technologies Corp. | | | 99,483 |
| 700 | | Heico Corp. | | | 18,116 |
| 2,700 | | Kaman Corp. (Class A Shares) | | | 53,163 |
| 39,425 | | Moog, Inc. (Class A Shares)(a) | | | 1,118,881 |
| 1,800 | | Orbital Sciences Corp. | | | 23,112 |
| 800 | | Triumph Group, Inc. | | | 29,288 |
| | | | |
|
|
| | | | | | 3,210,816 |
| | | | |
|
|
| | |
| | | Airlines—0.5% | | | |
| 3,000 | | Alaska Air Group, Inc.(a) | | | 107,160 |
| 2,000 | | Continental Airlines, Inc. (Class B Shares) | | | 42,600 |
| 5,700 | | ExpressJet Holdings, Inc. | | | 46,113 |
| 2,200 | | Mesa Air Group, Inc.(a) | | | 23,012 |
| 37,700 | | SkyWest, Inc. | | | 1,012,622 |
| | | | |
|
|
| | | | | | 1,231,507 |
| | | | |
|
|
| | |
| | | Auto Related—1.8% | | | |
| 27,000 | | Aftermarket Technology Corp.(a) | | | 524,880 |
| 23,800 | | American Axle & Manufacturing Holdings, Inc. | | | 436,254 |
| 49,600 | | ArvinMeritor, Inc. | | | 713,744 |
| 43,780 | | Cooper Tire & Rubber Co. | | | 670,710 |
| 3,200 | | Hayes Lemmerz International, Inc.(a) | | | 11,264 |
| 600 | | Keystone Automotive Industries, Inc.(a) | | | 18,888 |
| 2,000 | | Modine Manufacturing Co. | | | 65,180 |
| 800 | | Superior Industries International, Inc. | | | 17,808 |
| 5,900 | | Tenneco, Inc.(a) | | | 115,699 |
| 36,425 | | United Auto Group, Inc. | | | 1,391,435 |
| 2,800 | | Visteon Corp.(a) | | | 17,528 |
| 17,200 | | Winnebago Industries | | | 572,416 |
| | | | |
|
|
| | | | | | 4,555,806 |
| | | | |
|
|
| | |
| | | Automotive Parts | | | |
| 1,100 | | Monro Muffler Brake, Inc.(a) | | | 33,352 |
| | | | |
|
|
See Notes to Financial Statements beginning on page 130
| | |
| THE TARGET PORTFOLIO TRUST | | 47 |
| | |
Small Capitalization Value Portfolio (cont’d) | | Portfolio of Investments
As of December 31, 2005 |
| | | | | |
| SHARES | | DESCRIPTION | | VALUE (NOTE 1) |
| | | | | | |
| | |
| | | Banks—7.0% | | | |
| 900 | | Amcor Financial, Inc. | | $ | 27,369 |
| 500 | | AmericanWest Bancorp(a) | | | 11,815 |
| 700 | | Ameris Bancorp. | | | 13,888 |
| 300 | | Bancfirst Corp. | | | 23,700 |
| 70,460 | | BancorpSouth, Inc. | | | 1,555,052 |
| 66,670 | | Bank Mutual Corp. | | | 706,702 |
| 800 | | Bank of the Ozarks, Inc. | | | 29,520 |
| 60,800 | | BankAtlantic Bancorp, Inc. (Class A Shares) | | | 851,200 |
| 24,200 | | BankUnited Financial Corp. (Class A Shares) | | | 642,994 |
| 400 | | Banner Corp. | | | 12,480 |
| 800 | | Capital Bancorp Ltd | | | 29,952 |
| 500 | | Capital Corp. of The West | | | 16,225 |
| 100 | | Capital Crossing Bank(a) | | | 3,340 |
| 46,570 | | Cardinal Financial Corp. | | | 512,270 |
| 900 | | Cathay General Bancorp | | | 32,346 |
| 1,200 | | Central Pacific Financial Corp. | | | 43,104 |
| 1,700 | | Chemical Financial Corp. | | | 53,992 |
| 1,450 | | City Holding Co. | | | 52,127 |
| 3,000 | | Colonial BancGroup, Inc. (The) | | | 71,460 |
| 800 | | Columbia Banking System, Inc. | | | 22,840 |
| 1,100 | | Commercial Capital Bancorp, Inc. | | | 18,832 |
| 1,900 | | Community Bank System, Inc. | | | 42,845 |
| 700 | | Community Trust Bancorp, Inc. | | | 21,525 |
| 3,300 | | Corus Bankshares, Inc. | | | 185,691 |
| 1,900 | | Cullen Frost Bankers, Inc. | | | 101,992 |
| 2,000 | | Dime Community Bancshares | | | 29,220 |
| 1,700 | | EuroBancshares, Inc.(a) | | | 24,089 |
| 200 | | Financial Institutions, Inc. | | | 3,924 |
| 2,300 | | First Bancorp / Puerto Rico | | | 28,543 |
| 400 | | First Citizens BancShares, Inc. (Class A Shares) | | | 69,768 |
| 33,580 | | First Financial Bancorp. | | | 588,322 |
| 500 | | First Financial Holdings, Inc. | | | 15,360 |
| 7,100 | | First Niagara Financial Group, Inc. | | | 102,737 |
| 400 | | First Oak Brook Bancshares, Inc. | | | 11,180 |
| 1,200 | | First Place Financial Corp. (OH) | | | 28,860 |
| 2,200 | | First Republic Bank (CA) | | | 81,422 |
| 900 | | FirstFed Financial Corp.(a) | | | 49,068 |
| 25,740 | | FirstMerit Corp. | | | 666,923 |
| 2,300 | | Flagstar Bancorp, Inc. | | | 33,120 |
| 300 | | FNB Corp. | | | 9,201 |
| 36,200 | | Fremont General Corp. | | | 840,926 |
| 5,700 | | Gold Banc Corp., Inc. | | | 103,854 |
| 700 | | Great Southern Bancorp, Inc. | | | 19,327 |
| 2,700 | | Greater Bay Bancorp Holding, Co. | | | 69,174 |
| 22,110 | | Hancock Holding Co. | | | 835,979 |
See Notes to Financial Statements beginning on page 130
| | |
| 48 | | THE TARGET PORTFOLIO TRUST |
| | | | | |
| SHARES | | DESCRIPTION | | VALUE (NOTE 1) |
| | | | | | |
| | |
| | | Banks (cont’d.) | | | |
| 9,000 | | Hanmi Financial Corp. | | $ | 160,740 |
| 2,850 | | IBERIABANK Corp. | | | 145,378 |
| 5,225 | | Independent Bank Corp. | | | 145,527 |
| 3,300 | | Irwin Financial Corp. | | | 70,686 |
| 500 | | ITLA Capital Corp.(a) | | | 24,425 |
| 100 | | Lakeland Financial Corp. | | | 4,038 |
| 1,800 | | MAF Bancorp, Inc. | | | 74,484 |
| 500 | | MainSource Financial Group, Inc. | | | 8,925 |
| 1,675 | | MB Financial, Inc. | | | 59,295 |
| 600 | | MBT Financial Corp. | | | 9,720 |
| 735 | | Mercantile Bank Corp. | | | 28,298 |
| 1,700 | | Mid-State Bancshares | | | 45,475 |
| 200 | | Nara Bancorp, Inc. | | | 3,556 |
| 28,256 | | Old National Bancorp | | | 611,460 |
| 400 | | Old Second Bancorp, Inc. | | | 12,228 |
| 19,200 | | Oriental Financial Group, Inc., (Puerto Rico) | | | 237,312 |
| 44,000 | | Pacific Capital Bancorp | | | 1,565,520 |
| 3,700 | | Partners Trust Financial Group, Inc. | | | 44,585 |
| 500 | | Peoples Bancorp, Inc. | | | 14,265 |
| 1,100 | | Prosperity Bancshares, Inc. | | | 31,614 |
| 18,400 | | Provident Bankshares Corp. | | | 621,368 |
| 3,000 | | R & G Financial Corp. (Class B Shares) | | | 39,600 |
| 19,580 | | Rainier Pacific Financial Group Inc. | | | 313,478 |
| 500 | | Republic Bancorp, Inc. (KY) (Class A Shares) | | | 10,725 |
| 10,940 | | Republic Bancorp, Inc. (MI) | | | 130,186 |
| 510 | | Royal Bancshares of Pennsylvania (Class A Shares) | | | 11,812 |
| 200 | | Santander BanCorp (Puerto Rico) | | | 5,024 |
| 300 | | SCBT Financial Corp. | | | 10,026 |
| 900 | | Security Bank Corp. | | | 20,961 |
| 100 | | Sierra Bancorp. | | | 2,279 |
| 35,410 | | Signature Bank(a) | | | 993,959 |
| 700 | | Simmons First National Corp. (Class A Stock) | | | 19,390 |
| 800 | | Southside Bancshares, Inc. | | | 16,160 |
| 500 | | Southwest Bancorp, Inc. | | | 10,000 |
| 3,100 | | Sterling Bancshares, Inc. (TX) | | | 47,864 |
| 38,350 | | Sterling Financial Corp. | | | 948,659 |
| 1,500 | | Summit Bancshares, Inc. | | | 26,970 |
| 400 | | Sun Bancorp, Inc.(a) | | | 7,900 |
| 24,800 | | Susquehanna Bancshares, Inc. | | | 587,264 |
| 900 | | Taylor Capital Group, Inc. | | | 36,360 |
| 2,100 | | Texas Regional Bancshares, Inc. (Class A Shares) | | | 59,430 |
| 1,400 | | TierOne Corp. | | | 41,174 |
| 600 | | Trico Bancshares | | | 14,034 |
| 18,640 | | UMB Financial Corp. | | | 1,191,282 |
| 2,500 | | Umpqua Holdings Corp. | | | 71,325 |
| 1,800 | | United Bankshares, Inc. | | | 63,432 |
| 5,000 | | W Holding Co., Inc. | | | 41,150 |
| 29,540 | | Washington Federal, Inc. | | | 679,125 |
| 4,200 | | West Coast Bancorp | | | 111,090 |
See Notes to Financial Statements beginning on page 130
| | |
| THE TARGET PORTFOLIO TRUST | | 49 |
| | |
Small Capitalization Value Portfolio (cont’d) | | Portfolio of Investments
As of December 31, 2005 |
| | | | | |
| SHARES | | DESCRIPTION | | VALUE (NOTE 1) |
| | | | | | |
| | |
| | | Banks (cont’d.) | | | |
| 300 | | Western Sierra Bancorp(a) | | $ | 10,917 |
| 800 | | WSFS Financial Corp. | | | 49,000 |
| 13 | | Zions Bancorporation | | | 982 |
| | | | |
|
|
| | | | | | 18,184,715 |
| | | | |
|
|
| | |
| | | Beverages—0.2% | | | |
| 28,000 | | PepsiAmericas, Inc. | | | 651,280 |
| | | | |
|
|
| | |
| | | Biotechnology—0.1% | | | |
| 1,300 | | Alexion Pharmaceutcal, Inc.(a) | | | 26,325 |
| 1,100 | | Applera Corp. - Celera Genomics Group(a) | | | 12,056 |
| 1,100 | | Bio-Rad Laboratories (Class A Shares)(a) | | | 71,984 |
| 2,400 | | Cytokinetics, Inc.(a) | | | 15,696 |
| 1,900 | | Genelabs Technologies(a) | | | 3,515 |
| 1,400 | | GTX, Inc.(a) | | | 10,584 |
| 700 | | Human Genome Sciences, Inc.(a) | | | 5,992 |
| 1,100 | | Myogen, Inc.(a) | | | 33,176 |
| 1,100 | | Telik, Inc.(a) | | | 18,689 |
| | | | |
|
|
| | | | | | 198,017 |
| | | | |
|
|
| | |
| | | Building Materials | | | |
| 1,225 | | US Concrete, Inc.(a) | | | 11,613 |
| | | | |
|
|
| | |
| | | Building Products—0.5% | | | |
| 2,200 | | Apogee Enterprises, Inc. | | | 35,684 |
| 700 | | Eagle Materials, Inc. | | | 85,652 |
| 500 | | Genlyte Group, Inc.(a) | | | 26,785 |
| 37,400 | | Lennox International, Inc. | | | 1,054,680 |
| 1,400 | | NCI Buildings Systems, Inc.(a) | | | 59,472 |
| 2,800 | | Universal Forest Products, Inc. | | | 154,700 |
| | | | |
|
|
| | | | | | 1,416,973 |
| | | | |
|
|
| | |
| | | Business Services—1.0% | | | |
| 35,900 | | Administaff, Inc. | | | 1,509,595 |
| 500 | | infoUSA, Inc. | | | 5,465 |
| 22,300 | | John H. Harland Co. | | | 838,480 |
| 11,200 | | Kelly Services, Inc. (Class A Shares) | | | 293,664 |
| 1,525 | | Waste Connections, Inc.(a) | | | 52,551 |
| | | | |
|
|
| | | | | | 2,699,755 |
| | | | |
|
|
| | |
| | | Chemicals—3.4% | | | |
| 25,830 | | Arch Chemicals, Inc. | | | 772,317 |
| 14,000 | | FMC Corp.(a) | | | 744,380 |
| 300 | | Georgia Gulf Corp. | | | 9,126 |
| 2,700 | | H.B. Fuller Co. | | | 86,589 |
| 6,300 | | Hercules, Inc.(a) | | | 71,190 |
See Notes to Financial Statements beginning on page 130
| | |
| 50 | | THE TARGET PORTFOLIO TRUST |
| | | | | |
| SHARES | | DESCRIPTION | | VALUE (NOTE 1) |
| | | | | | |
| | |
| | | Chemicals (cont’d.) | | | |
| 13,000 | | Lubrizol Corp. (The) | | $ | 564,590 |
| 65,000 | | Methanex Corp. | | | 1,218,100 |
| 900 | | Minerals Technologies, Inc. | | | 50,301 |
| 1,800 | | NewMarket Corp.(a) | | | 44,028 |
| 96,200 | | Olin Corp. | | | 1,893,216 |
| 7,500 | | PolyOne Corp.(a) | | | 48,225 |
| 58,000 | | RPM International, Inc. | | | 1,007,460 |
| 95,500 | | Sensient Technologies Corp. | | | 1,709,450 |
| 2,700 | | Terra Industries, Inc.(a) | | | 15,120 |
| 21,000 | | Valspar Corp. (The) | | | 518,070 |
| 5,100 | | W.R. Grace & Co.(a) | | | 47,940 |
| 3,100 | | Wellman, Inc. | | | 21,018 |
| | | | |
|
|
| | | | | | 8,821,120 |
| | | | |
|
|
| | |
| | | Commercial Services—1.5% | | | |
| 1,125 | | Ace Cash Express, Inc.(a) | | | 26,269 |
| 1,500 | | Alderwoods Group, Inc.(a) | | | 23,805 |
| 300 | | Arbitron, Inc. | | | 11,394 |
| 12,200 | | BearingPoint, Inc.(a) | | | 95,892 |
| 2,500 | | CBIZ, Inc.(a) | | | 15,050 |
| 700 | | Clark, Inc. | | | 9,275 |
| 1,000 | | Consolidated Graphics, Inc.(a) | | | 47,340 |
| 400 | | CRA International, Inc.(a) | | | 19,076 |
| 3,269 | | Dollar Thrifty Automotive Group(a) | | | 117,913 |
| 800 | | Electro Rent Corp.(a) | | | 11,928 |
| 2,000 | | Geo Group, Inc., (The)(a) | | | 45,860 |
| 1,900 | | Healthcare Services Group, Inc. | | | 39,349 |
| 300 | | MAXIMUS, Inc. | | | 11,007 |
| 600 | | NCO Group, Inc.(a) | | | 10,152 |
| 40,300 | | Pharmaceutical Product Development, Inc. | | | 2,496,585 |
| 3,000 | | Rent-Way, Inc.(a) | | | 19,170 |
| 35,920 | | Source Interlink Cos., Inc.(a) | | | 399,430 |
| 400 | | Sourcecorp(a) | | | 9,592 |
| 4,700 | | Spherion Corp.(a) | | | 47,047 |
| 500 | | Startek, Inc. | | | 9,000 |
| 8,700 | | Stewart Enterprises, Inc. | | | 47,067 |
| 425 | | Strayer Education, Inc. | | | 39,822 |
| 750 | | Team, Inc. | | | 15,833 |
| 3,600 | | Tele Tech Holdings, Inc.(a) | | | 43,380 |
| 3,700 | | United Rentals, Inc.(a) | | | 86,543 |
| 200 | | Vertrue, Inc.(a) | | | 7,066 |
| 1,700 | | Viad Corp. | | | 49,861 |
| 500 | | Volt Info Sciences, Inc.(a) | | | 9,510 |
| | | | |
|
|
| | | | | | 3,764,216 |
| | | | |
|
|
| | |
| | | Commercial Services & Supplies—2.2% | | | |
| 38,230 | | Banta Corp. | | | 1,903,854 |
| 10,600 | | Cadmus Communications Corp. | | | 213,378 |
| 2,900 | | Gartner, Inc.(a) | | | 37,410 |
See Notes to Financial Statements beginning on page 130
| | |
| THE TARGET PORTFOLIO TRUST | | 51 |
| | |
Small Capitalization Value Portfolio (cont’d) | | Portfolio of Investments
As of December 31, 2005 |
| | | | | |
| SHARES | | DESCRIPTION | | VALUE (NOTE 1) |
| | | | | | |
| | |
| | | Commercial Services & Supplies (cont’d.) | | | |
| 50,000 | | School Specialty, Inc.(a) | | $ | 1,822,000 |
| 20,930 | | Valassis Communications, Inc.(a) | | | 608,435 |
| 36,320 | | Watson Wyatt Worldwide, Inc. | | | 1,013,328 |
| | | | |
|
|
| | | | | | 5,598,405 |
| | | | |
|
|
| | |
| | | Computer Hardware—0.8% | | | |
| 3,100 | | Agilysys, Inc. | | | 56,482 |
| 60,630 | | BISYS Group, Inc. (The)(a) | | | 849,426 |
| 12,600 | | Brocade Communications Systems, Inc.(a) | | | 51,282 |
| 3,000 | | CIBER, Inc.(a) | | | 19,800 |
| 2,100 | | Covansys Corp.(a) | | | 28,581 |
| 1,200 | | Electronics For Imaging, Inc.(a) | | | 31,932 |
| 4,300 | | Gateway, Inc.(a) | | | 10,793 |
| 1,700 | | Hutchinson Technology, Inc.(a) | | | 48,365 |
| 1,800 | | Imation Corp. | | | 82,926 |
| 400 | | Intergraph Corp.(a) | | | 19,924 |
| 1,000 | | Komag, Inc.(a) | | | 34,660 |
| 1,900 | | Magma Design Automation, Inc.(a) | | | 15,979 |
| 5,000 | | McData Corp. (Class A Shares)(a) | | | 19,000 |
| 14,440 | | MTS System Corp. | | | 500,202 |
| 1,500 | | Palm, Inc.(a) | | | 47,700 |
| 4,000 | | Perot Systems Corp. (Class A Shares)(a) | | | 56,560 |
| 18,400 | | Quantum Corp.(a) | | | 56,120 |
| 900 | | Radisys Corp.(a) | | | 15,606 |
| 1,400 | | Silcon Storage Technology, Inc.(a) | | | 7,070 |
| 1,700 | | SYKES Enterprises, Inc.(a) | | | 22,729 |
| 575 | | Synaptics, Inc.(a) | | | 14,214 |
| 500 | | Talx Corp. | | | 22,855 |
| 3,900 | | Tyler Technologies, Inc.(a) | | | 34,242 |
| | | | |
|
|
| | | | | | 2,046,448 |
| | | | |
|
|
| | |
| | | Computer Networking | | | |
| 750 | | NETGEAR, Inc.(a) | | | 14,438 |
| | | | |
|
|
| | |
| | | Computer Services & Software—2.0% | | | |
| 1,000 | | Computer Programs & Systems, Inc. | | | 41,430 |
| 38,300 | | Global Payments, Inc. | | | 1,785,163 |
| 2,300 | | Inter-Tel, Inc. | | | 45,011 |
| 1,200 | | JDA Software Group, Inc.(a) | | | 20,412 |
| 900 | | Mantech International Corp.(a) | | | 25,074 |
| 1,200 | | NetIQ Corp.(a) | | | 14,748 |
| 179,180 | | Parametric Technolgy Corp.(a) | | | 1,092,998 |
| 3,500 | | Per-Se Technologies, Inc.(a) | | | 81,760 |
| 800 | | Phoenix Technologies Ltd.(a) | | | 5,008 |
| 1,300 | | Progress Software Corp.(a) | | | 36,894 |
| 600 | | QAD, Inc. | | | 4,584 |
See Notes to Financial Statements beginning on page 130
| | |
| 52 | | THE TARGET PORTFOLIO TRUST |
| | | | | |
| SHARES | | DESCRIPTION | | VALUE (NOTE 1) |
| | | | | | |
| | |
| | | Computer Services & Software (cont’d.) | | | |
| 1,275 | | Reynolds & Reynolds Co., Class A | | $ | 35,789 |
| 300 | | SPSS, Inc.(a) | | | 9,279 |
| 36,280 | | Sybase, Inc.(a) | | | 793,081 |
| 200 | | SYNNEX Corp.(a) | | | 3,022 |
| 33,030 | | Synopsys, Inc.(a) | | | 662,582 |
| 22,725 | | THQ, Inc.(a) | | | 541,991 |
| | | | |
|
|
| | | | | | 5,198,826 |
| | | | |
|
|
| | |
| | | Conglomerates—0.3% | | | |
| 37,990 | | Griffon Corp.(a) | | | 904,542 |
| | | | |
|
|
| | |
| | | Construction—0.8% | | | |
| 1,100 | | Dycom Industries, Inc.(a) | | | 24,200 |
| 400 | | EMCOR Group, Inc.(a) | | | 27,012 |
| 20,750 | | Insituform Technologies, Inc., (Class A Shares)(a) | | | 401,927 |
| 41,300 | | URS Corp.(a) | | | 1,553,293 |
| 1,400 | | Washington Group International, Inc. | | | 74,158 |
| | | | |
|
|
| | | | | | 2,080,590 |
| | | | |
|
|
| | |
| | | Consumer Products & Services—1.5% | | | |
| 14,950 | | American Greetings Corp., (Class A Shares) | | | 328,451 |
| 22,020 | | Aptargroup, Inc. | | | 1,149,444 |
| 900 | | Audiovox Corp. (Class A Shares)(a) | | | 12,474 |
| 700 | | Ennis, Inc. | | | 12,719 |
| 1,800 | | Kimball International, Inc., (Class B Shares) | | | 19,134 |
| 22,400 | | Scotts Miracle-Gro Co. (Class A Shares) | | | 1,013,376 |
| 27,746 | | Snap-On, Inc. | | | 1,042,140 |
| 2,100 | | Toro Co. | | | 91,917 |
| 5,100 | | Tupperware Corp. | | | 114,240 |
| 600 | | Water Pik Technologies, Inc.(a) | | | 12,882 |
| | | | |
|
|
| | | | | | 3,796,777 |
| | | | |
|
|
| | |
| | | Containers & Packaging—0.3% | | | |
| 20,340 | | Bemis Co. | | | 566,876 |
| 2,400 | | Chesapeake Corp. | | | 40,752 |
| 1,000 | | Greif, Inc. (Class A Shares) | | | 66,280 |
| 3,500 | | Silgan Holdings, Inc. | | | 126,420 |
| | | | |
|
|
| | | | | | 800,328 |
| | | | |
|
|
| | |
| | | Distribution/Wholesale—1.0% | | | |
| 2,700 | | Aviall, Inc.(a) | | | 77,760 |
| 2,100 | | Bell Microproducts, Inc.(a) | | | 16,065 |
| 1,350 | | Brightpoint, Inc.(a) | | | 37,436 |
| 700 | | Building Material Holding Corp. | | | 47,747 |
| 38,500 | | Handleman Co. | | | 478,170 |
| 48,710 | | Owens & Minor, Inc. | | | 1,340,986 |
| 1,700 | | United Stationers, Inc.(a) | | | 82,450 |
| 13,080 | | WESCO International, Inc.(a) | | | 558,908 |
| | | | |
|
|
| | | | | | 2,639,522 |
| | | | |
|
|
See Notes to Financial Statements beginning on page 130
| | |
| THE TARGET PORTFOLIO TRUST | | 53 |
| | |
Small Capitalization Value Portfolio (cont’d) | | Portfolio of Investments
As of December 31, 2005 |
| | | | | |
| SHARES | | DESCRIPTION | | VALUE (NOTE 1) |
| | | | | | |
| | |
| | | Diversified | | | |
| 2,600 | | Walter Industries, Inc. | | $ | 129,272 |
| | | | |
|
|
| | |
| | | Diversified Financial Services—0.1% | | | |
| 1,900 | | CharterMac | | | 40,242 |
| 2,800 | | GATX Corp. | | | 101,024 |
| | | | |
|
|
| | | | | | 141,266 |
| | | | |
|
|
| | |
| | | Drugs & Healthcare—1.7% | | | |
| 21,800 | | Arrow International, Inc. | | | 631,982 |
| 29,000 | | Cooper Cos, Inc. | | | 1,487,700 |
| 35,400 | | Covance Inc.(a) | | | 1,718,670 |
| 28,700 | | Serologicals Corp.(a) | | | 566,538 |
| | | | |
|
|
| | | | | | 4,404,890 |
| | | | |
|
|
| | |
| | | Drugs & Medicine—0.4% | | | |
| 17,425 | | Barr Pharmaceuticals, Inc.(a) | | | 1,085,403 |
| | | | |
|
|
| | |
| | | Electric Utilities—2.4% | | | |
| 1,400 | | Avista Corp. | | | 24,794 |
| 1,400 | | Black Hills Corp. | | | 48,454 |
| 1,000 | | CH Energy Group, Inc. | | | 45,900 |
| 37,400 | | Cleco Corp. | | | 779,790 |
| 38,000 | | Duquesne Light Holdings Inc. | | | 620,160 |
| 4,700 | | El Paso Electric Co.(a) | | | 98,888 |
| 29,830 | | Idacorp, Inc. | | | 874,019 |
| 37,150 | | PNM Resources, Inc. | | | 909,804 |
| 15,800 | | Sierra Pacific Resources(a) | | | 206,032 |
| 300 | | UIL Holdings Corp. | | | 13,797 |
| 5,300 | | Unisource Energy Corp. | | | 165,360 |
| 77,580 | | Westar Energy, Inc. | | | 1,667,970 |
| 22,370 | | Wisconsin Energy Corp. | | | 873,772 |
| | | | |
|
|
| | | | | | 6,328,740 |
| | | | |
|
|
| | |
| | | Electrical Equipment—1.1% | | | |
| 47,070 | | Acuity Brands, Inc. | | | 1,496,826 |
| 40,050 | | Regal-Beloit Corp. | | | 1,417,770 |
| | | | |
|
|
| | | | | | 2,914,596 |
| | | | |
|
|
| | |
| | | Electronic Components | | | |
| 1,050 | | EDO Corp. | | | 28,413 |
| 1,575 | | Pike Electric Corp.(a) | | | 25,546 |
| | | | |
|
|
| | | | | | 53,959 |
| | | | |
|
|
| | |
| | | Electronic Equipment & Instruments | | | |
| 200 | | Global Imaging Systems, Inc.(a) | | | 6,926 |
| | | | |
|
|
See Notes to Financial Statements beginning on page 130
| | |
| 54 | | THE TARGET PORTFOLIO TRUST |
| | | | | |
| SHARES | | DESCRIPTION | | VALUE (NOTE 1) |
| | | | | | |
| | |
| | | Electronics—3.6% | | | |
| 1,100 | | Analogic Corp. | | $ | 52,635 |
| 33,200 | | Avnet, Inc.(a) | | | 794,808 |
| 900 | | Bel Fuse, Inc. (Class B Shares) | | | 28,620 |
| 32,370 | | Belden CDT, Inc. | | | 790,799 |
| 2,100 | | Benchmark Electronics, Inc.(a) | | | 70,623 |
| 48,100 | | Checkpoint Systems, Inc.(a) | | | 1,185,665 |
| 35,760 | | Coherent, Inc.(a) | | | 1,061,356 |
| 3,100 | | CTS Corp. | | | 34,286 |
| 800 | | Electro Scientific Industries, Inc.(a) | | | 19,320 |
| 1,800 | | Encore Wire Corp.(a) | | | 40,968 |
| 68,600 | | FLIR Systems, Inc.(a) | | | 1,531,838 |
| 2,200 | | General Cable Corp.(a) | | | 43,340 |
| 24,780 | | Littelfuse, Inc.(a) | | | 675,255 |
| 21,940 | | Methode Electronics, Inc. | | | 218,742 |
| 18,740 | | Mettler-Toledo International, Inc.(a) | | | 1,034,448 |
| 36,560 | | Paxar Corp.(a) | | | 717,673 |
| 202,900 | | Sanmina-SCI Corp.(a) | | | 864,354 |
| 1,100 | | Sypris Solutions, Inc. | | | 10,978 |
| 800 | | TTM Technologies, Inc.(a) | | | 7,520 |
| 1,200 | | Watts Water Technologies, Inc. (Class A Shares) | | | 36,348 |
| | | | |
|
|
| | | | | | 9,219,576 |
| | | | |
|
|
| | |
| | | Energy Equipment & Services—0.4% | | | |
| 29,200 | | Headwaters Inc.(a) | | | 1,034,848 |
| | | | |
|
|
| | |
| | | Entertainment & Leisure—0.3% | | | |
| 46,760 | | Alliance Gaming Corp.(a) | | | 608,815 |
| 600 | | Carmike Cinemas, Inc. | | | 15,216 |
| 700 | | Isle of Capri Casinos, Inc.(a) | | | 17,052 |
| 4,412 | | K2, Inc.(a) | | | 44,606 |
| 1,400 | | RC2 Corp.(a) | | | 49,728 |
| 2,400 | | Six Flags, Inc.(a) | | | 18,504 |
| 1,000 | | Steinway Musical Instruments(a) | | | 25,510 |
| | | | |
|
|
| | | | | | 779,431 |
| | | | |
|
|
| | |
| | | Environmental Services—0.5% | | | |
| 66,000 | | Allied Waste Industries, Inc. | | | 576,840 |
| 45,580 | | Tetra Tech, Inc.(a) | | | 714,239 |
| | | | |
|
|
| | | | | | 1,291,079 |
| | | | |
|
|
| | |
| | | Financial Services—2.9% | | | |
| 2,100 | | Advanta Corp. (Class B Shares) | | | 68,124 |
| 73,900 | | AmeriCredit Corp.(a) | | | 1,894,057 |
| 1,080 | | Associated Banc-Corp | | | 35,154 |
| 275 | | BKF Capital Group, Inc. | | | 5,211 |
| 1,700 | | CompuCredit Corp.(a) | | | 65,416 |
| 2,700 | | Doral Financial Corp. | | | 28,620 |
| 39,400 | | Eaton Vance Corp. | | | 1,077,984 |
| 300 | | eSpeed, Inc. (Class A Shares)(a) | | | 2,313 |
See Notes to Financial Statements beginning on page 130
| | |
| THE TARGET PORTFOLIO TRUST | | 55 |
| | |
Small Capitalization Value Portfolio (cont’d) | | Portfolio of Investments
As of December 31, 2005 |
| | | | | |
| SHARES | | DESCRIPTION | | VALUE (NOTE 1) |
| | | | | | |
| | |
| | | Financial Services (cont’d.) | | | |
| 400 | | Federal Agricultural Mortgage Corp. (Class C Shares) | | $ | 11,972 |
| 1,675 | | Financial Federal Corp. | | | 74,454 |
| 100 | | Greenhill & Co, Inc. | | | 5,616 |
| 1,300 | | Investment Technology Group, Inc.(a) | | | 46,072 |
| 35,900 | | Jefferies Group, Inc. | | | 1,614,782 |
| 5,800 | | Knight Trading Group, Inc. (Class A Shares)(a) | | | 57,362 |
| 1,300 | | Labranche & Co., Inc.(a) | | | 13,143 |
| 2,300 | | Ocwen Financial Corp.(a) | | | 20,010 |
| 500 | | Piper Jaffray Cos.(a) | | | 20,200 |
| 35,450 | | Raymond James Financial, Inc. | | | 1,335,401 |
| 4,200 | | Student Loan Corp. (The) | | | 878,766 |
| 300 | | SVB Financial Group(a) | | | 14,052 |
| 2,425 | | UCBH Holdings, Inc. | | | 43,359 |
| 3,500 | | World Acceptance Corp.(a) | | | 99,750 |
| | | | |
|
|
| | | | | | 7,411,818 |
| | | | |
|
|
| | |
| | | Food & Staples Retailing—2.4% | | | |
| 30,470 | | Casey’s General Stores, Inc. | | | 755,656 |
| 38,800 | | Chiquita Brands International, Inc. | | | 776,388 |
| 71,710 | | Corn Products International, Inc. | | | 1,713,152 |
| 1,200 | | Flowers Foods, Inc. | | | 33,072 |
| 36,000 | | Fresh Del Monte Produce, Inc. | | | 819,720 |
| 700 | | Gold Kist, Inc.(a) | | | 10,465 |
| 1,300 | | Great Atlantic & Pacific Tea Co., Inc.(a) | | | 41,314 |
| 400 | | J & J Snack Foods Corp. | | | 23,764 |
| 600 | | Nash Finch Co. | | | 15,288 |
| 1,700 | | Pathmark Stores, Inc. | | | 16,983 |
| 17,260 | | Ralcorp Holdings, Inc.(a) | | | 688,846 |
| 32,800 | | Ruddick Corp. | | | 697,984 |
| 23,500 | | Sanderson Farms | | | 717,455 |
| | | | |
|
|
| | | | | | 6,310,087 |
| | | | �� |
|
|
| | |
| | | Gas & Pipeline Utilities—4.0% | | | |
| 28,880 | | AGL Resources, Inc. | | | 1,005,313 |
| 11,800 | | Atlas America, Inc.(a) | | | 710,596 |
| 25,500 | | Atmos Energy Corp. | | | 667,080 |
| 61,570 | | Cascade Natural Gas Corp. | | | 1,201,231 |
| 11,000 | | Energen Corp. | | | 399,520 |
| 14,500 | | National Fuel Gas Co. | | | 452,255 |
| 16,600 | | Peoples Energy Corp. | | | 582,162 |
| 12,200 | | Southwest Gas Corp. | | | 322,080 |
| 54,680 | | Swift Energy Co.(a) | | | 2,464,427 |
| 11,000 | | UGI Corp. | | | 226,600 |
| 36,900 | | W-H Energy Services, Inc.(a) | | | 1,220,652 |
| 38,000 | | WGL Holdings, Inc. | | | 1,142,280 |
| | | | |
|
|
| | | | | | 10,394,196 |
| | | | |
|
|
See Notes to Financial Statements beginning on page 130
| | |
| 56 | | THE TARGET PORTFOLIO TRUST |
| | | | | |
| SHARES | | DESCRIPTION | | VALUE (NOTE 1) |
| | | | | | |
| | |
| | | Healthcare Equipment & Supplies—0.3% | | | |
| 23,784 | | Invacare Corp. | | $ | 748,958 |
| | | | |
|
|
| | |
| | | Healthcare Products & Services—0.4% | | | |
| 6,000 | | Diagnostic Products Corp. | | | 291,300 |
| 12,500 | | Hillenbrand Industries, Inc. | | | 617,625 |
| 300 | | ICU Medical, Inc.(a) | | | 11,763 |
| | | | |
|
|
| | | | | | 920,688 |
| | | | |
|
|
| | |
| | | Healthcare Providers & Services—2.2% | | | |
| 1,800 | | Alliance Imaging, Inc.(a) | | | 10,710 |
| 34,200 | | American Healthways, Inc.(a) | | | 1,547,550 |
| 39,900 | | AMERIGROUP Corp.(a) | | | 776,454 |
| 1,000 | | Gentiva Health Services, Inc.(a) | | | 14,740 |
| 2,200 | | Kindred Healthcare, Inc.(a) | | | 56,672 |
| 700 | | Magellan Health Services, Inc.(a) | | | 22,015 |
| 13,690 | | National Dentex Corp. | | | 308,573 |
| 1,525 | | Pediatrix Medical Group, Inc.(a) | | | 135,069 |
| 31,500 | | Res-Care, Inc.(a) | | | 547,155 |
| 38,300 | | Sunrise Senior Living, Inc.(a) | | | 1,291,093 |
| 10,200 | | Triad Hospitals, Inc.(a) | | | 400,146 |
| 12,250 | | Universal Health Services, Inc. (Class B Shares) | | | 572,565 |
| | | | |
|
|
| | | | | | 5,682,742 |
| | | | |
|
|
| | |
| | | Healthcare Services | | | |
| 2,775 | | Healthsouth Rehabilitation Corp.(a) | | | 13,598 |
| | | | |
|
|
| | |
| | | Home Builders—1.9% | | | |
| 52,500 | | Hovnanian Enterprises, Inc. (Class A Shares)(a) | | | 2,606,100 |
| 1,300 | | Levitt Corp. (Class A Shares) | | | 29,562 |
| 9,300 | | M.D.C. Holdings, Inc. | | | 576,414 |
| 23,900 | | Meritage Homes Corp.(a) | | | 1,503,788 |
| 3,500 | | Technical Olympic USA, Inc. | | | 73,815 |
| 3,300 | | WCI Communities, Inc.(a) | | | 88,605 |
| | | | |
|
|
| | | | | | 4,878,284 |
| | | | |
|
|
| | |
| | | Hotels, Restaurants & Leisure—1.9% | | | |
| 1,200 | | Ameristar Casinos, Inc. | | | 27,240 |
| 22,460 | | Applebee’s International, Inc. | | | 507,371 |
| 900 | | Aztar Corp.(a) | | | 27,351 |
| 16,900 | | Bob Evans Farms, Inc. | | | 389,714 |
| 34,540 | | Brinker International, Inc. | | | 1,335,317 |
| 35,300 | | Intrawest Corp. (Canada) | | | 1,021,935 |
| 2,700 | | Jack in the Box, Inc.(a) | | | 94,311 |
| 27,300 | | Landry’s Seafood Resturants, Inc. | | | 729,183 |
| 500 | | Movie Gallery, Inc. | | | 2,805 |
| 600 | | Papa John’s International, Inc.(a) | | | 35,586 |
| 500 | | Ryan’s Restaurant Group, Inc.(a) | | | 6,030 |
| 26,850 | | Sonic Corp.(a) | | | 792,075 |
| | | | |
|
|
| | | | | | 4,968,918 |
| | | | |
|
|
See Notes to Financial Statements beginning on page 130
| | |
| THE TARGET PORTFOLIO TRUST | | 57 |
| | |
Small Capitalization Value Portfolio (cont’d) | | Portfolio of Investments
As of December 31, 2005 |
| | | | | |
| SHARES | | DESCRIPTION | | VALUE (NOTE 1) |
| | | | | | |
| | |
| | | Household Durables—1.5% | | | |
| 22,800 | | Ethan Allen Interiors, Inc. | | $ | 832,884 |
| 600 | | Furniture Brands International, Inc. | | | 13,398 |
| 19,600 | | Harman International Industries, Inc. | | | 1,917,860 |
| 12,700 | | Lancaster Colony Corp. | | | 470,535 |
| 13,300 | | M/I Homes, Inc. | | | 540,246 |
| | | | |
|
|
| | | | | | 3,774,923 |
| | | | |
|
|
| | |
| | | Industrial Products—2.0% | | | |
| 3,300 | | Angelica Corp. | | | 54,582 |
| 25,160 | | CIRCOR International, Inc. | | | 645,606 |
| 17,100 | | Hughes Supply, Inc. | | | 613,035 |
| 57,960 | | Interface, Inc.(a) | | | 476,431 |
| 84,280 | | Kaydon Corp. | | | 2,708,759 |
| 2,500 | | NN, Inc.(a) | | | 26,500 |
| 25,080 | | Robbins & Myers, Inc. | | | 510,378 |
| 1,000 | | Unifirst Corp. | | | 31,100 |
| | | | |
|
|
| | | | | | 5,066,391 |
| | | | |
|
|
| | |
| | | Insurance—5.9% | | | |
| 400 | | Amercan Physicians Capital, Inc.(a) | | | 18,316 |
| 30,140 | | American Equity Investment Life Holding Co. | | | 393,327 |
| 22,500 | | American Financial Group, Inc. | | | 861,975 |
| 14,600 | | AmerUs Group Co. | | | 827,382 |
| 2,600 | | Argonaut Group, Inc.(a) | | | 85,202 |
| 400 | | Baldwin & Lyons, Inc. (Class B Shares) | | | 9,720 |
| 19,100 | | Commerce Group, Inc., (The) | | | 1,094,048 |
| 38,150 | | Delphi Financial Group, Inc. (Class “A” Shares) | | | 1,755,281 |
| 1,000 | | Direct General Corp. | | | 16,900 |
| 19,775 | | Hilb, Rogal & Hobbs Co. | | | 761,535 |
| 29,840 | | Horace Mann Educators Corp. | | | 565,766 |
| 1,300 | | Infinity Property & Casual Corp. | | | 48,373 |
| 15,300 | | LandAmerica Financial Group, Inc. | | | 954,720 |
| 900 | | Midland Co. | | | 32,436 |
| 200 | | Nationwide Financial Services (Class A Shares) | | | 8,800 |
| 300 | | Navigators Group, Inc.(a) | | | 13,083 |
| 24,900 | | Philadelphia Consolidated Holding Corp.(a) | | | 2,407,581 |
| 1,100 | | Phoenix Cos., Inc. (The) | | | 15,004 |
| 27,510 | | Platinum Underwriters Holdings, Ltd. (Bermuda) | | | 854,736 |
| 9,600 | | PMA Capital Corp. (Class “A” Stock) | | | 87,648 |
| 20,390 | | ProAssurance Corp.(a) | | | 991,770 |
| 12,600 | | Protective Life Corp. | | | 551,502 |
| 52,120 | | Quanta Capital Holdings Ltd. (Bermuda)(a) | | | 265,812 |
| 800 | | RLI Corp. | | | 39,896 |
| 1,800 | | Safety Insurance Group, Inc. | | | 72,666 |
| 1,700 | | Selective Insurance Group | | | 90,270 |
| 600 | | State Auto Financial Corp. | | | 21,876 |
See Notes to Financial Statements beginning on page 130
| | |
| 58 | | THE TARGET PORTFOLIO TRUST |
| | | | | |
| SHARES | | DESCRIPTION | | VALUE (NOTE 1) |
| | | | | | |
| | |
| | | Insurance (cont’d.) | | | |
| 2,300 | | Stewart Information Services Corp. | | $ | 111,941 |
| 19,410 | | The PMI Group, Inc. | | | 797,169 |
| 1,900 | | UICI | | | 67,469 |
| 32,600 | | United Fire & Casualty Co. | | | 1,318,018 |
| 700 | | Universal American Financial Corp. | | | 10,556 |
| 4,300 | | Zenith National Insurance Corp. | | | 198,316 |
| | | | |
|
|
| | | | | | 15,349,094 |
| | | | |
|
|
| | |
| | | Internet | | | |
| 900 | | Ariba, Inc.(a) | | | 6,615 |
| 2,000 | | Interwoven, Inc.(a) | | | 16,940 |
| 900 | | Stellent, Inc.(a) | | | 8,937 |
| | | | |
|
|
| | | | | | 32,492 |
| | | | |
|
|
| | |
| | | Internet Services—0.1% | | | |
| 500 | | aQuantive, Inc.(a) | | | 12,620 |
| 600 | | AsiaInfo Holdings, Inc.(a) | | | 2,388 |
| 3,000 | | Earthlink, Inc. | | | 33,330 |
| 325 | | F5 Networks, Inc.(a) | | | 18,587 |
| 300 | | Internet Security Systems, Inc.(a) | | | 6,285 |
| 1,500 | | Ipass, Inc.(a) | | | 9,840 |
| 500 | | ProQuest Co.(a) | | | 13,955 |
| 1,500 | | Redback Networks, Inc.(a) | | | 21,090 |
| 3,300 | | United Online, Inc. | | | 46,926 |
| | | | |
|
|
| | | | | | 165,021 |
| | | | |
|
|
| | |
| | | Internet Software & Services | | | |
| 700 | | Infospace, Inc.(a) | | | 18,074 |
| 1,325 | | Vignette, Corp.(a) | | | 21,611 |
| | | | |
|
|
| | | | | | 39,685 |
| | | | |
|
|
| | |
| | | Leisure—0.1% | | | |
| 10,870 | | Jakks Pacific, Inc.(a) | | | 227,618 |
| | | | |
|
|
| | |
| | | Machinery—5.6% | | | |
| 4,800 | | AGCO Corp.(a) | | | 79,536 |
| 500 | | Alamo Group, Inc. | | | 10,250 |
| 26,000 | | Albany International Corp. (Class A Shares) | | | 940,160 |
| 8,500 | | Applied Industrial Technologies, Inc. | | | 286,365 |
| 500 | | Astec Industries, Inc.(a) | | | 16,330 |
| 34,200 | | Barnes Group, Inc. | | | 1,128,600 |
| 51,160 | | Briggs & Stratton Corp. | | | 1,984,496 |
| 22,100 | | Bucyrus International, Inc. (Class A Shares) | | | 1,164,670 |
| 900 | | Cascade Corp. | | | 42,219 |
| 50,000 | | Crane Co. | | | 1,763,500 |
| 1,100 | | Flowserve Corp.(a) | | | 43,516 |
| 200 | | Gardner Denver, Inc.(a) | | | 9,860 |
| 500 | | Gehl Co.(a) | | | 13,125 |
| 18,100 | | Harsco Corp. | | | 1,221,931 |
See Notes to Financial Statements beginning on page 130
| | |
| THE TARGET PORTFOLIO TRUST | | 59 |
| | |
Small Capitalization Value Portfolio (cont’d) | | Portfolio of Investments
As of December 31, 2005 |
| | | | | |
| SHARES | | DESCRIPTION | | VALUE (NOTE 1) |
| | | | | | |
| | |
| | | Machinery (cont’d.) | | | |
| 6,100 | | JLG Industries, Inc. | | $ | 278,526 |
| 48,970 | | Kadant, Inc.(a) | | | 905,945 |
| 28,000 | | Kennametal, Inc. | | | 1,429,120 |
| 21,900 | | Lincoln Electric Holdings, Inc. | | | 868,554 |
| 500 | | NACCO Industries, Inc. (Class A Shares) | | | 58,575 |
| 1,325 | | Nordson Corp. | | | 53,676 |
| 1,300 | | Sauer-Danfoss, Inc. | | | 24,453 |
| 11,780 | | Smith A.O. Corp. | | | 413,478 |
| 29,100 | | Tecumseh Products Co. (Class A Shares) | | | 666,681 |
| 35,600 | | Valmont Industries, Inc. | | | 1,191,176 |
| | | | |
|
|
| | | | | | 14,594,742 |
| | | | |
|
|
| | |
| | | Machinery & Equipment | | | |
| 902 | | McGrath Rentcorp | | | 25,076 |
| | | | |
|
|
| | |
| | | Manufacturing—0.3% | | | |
| 900 | | Actuant Corp. (Class A Shares) | | | 50,220 |
| 600 | | Ameron International, Corp. | | | 27,348 |
| 1,300 | | EnPro Industries, Inc.(a) | | | 35,035 |
| 600 | | ESCO Technologies, Inc.(a) | | | 26,694 |
| 41,270 | | Federal Signal Corp. | | | 619,462 |
| 2,500 | | Hexel Corp.(a) | | | 45,125 |
| 9,062 | | Jacuzzi Brands, Inc.(a) | | | 76,121 |
| | | | |
|
|
| | | | | | 880,005 |
| | | | |
|
|
| | |
| | | Media—1.2% | | | |
| 200 | | 4Kids Entertainment, Inc.(a) | | | 3,138 |
| 27,260 | | Belo Corp. (Class A Shares) | | | 583,637 |
| 22,400 | | Charter Communications, Inc. (Class A Shares)(a) | | | 27,328 |
| 13,060 | | Courier Corp. | | | 448,480 |
| 44,700 | | Journal Register Co. | | | 668,265 |
| 3,380 | | Liberty Corp. | | | 158,218 |
| 3,600 | | Lodgenet Entertainment Corp.(a) | | | 50,184 |
| 600 | | Media General, Inc. (Class A Shares) | | | 30,420 |
| 2,600 | | Mediacom Communications Corp.(a) | | | 14,274 |
| 6,600 | | Primedia, Inc.(a) | | | 10,626 |
| 10,000 | | Radio One, Inc. (Class D Shares)(a) | | | 103,500 |
| 900 | | Saga Communications, Inc. (Class A Shares)(a) | | | 9,783 |
| 34,300 | | Scholastic Corp.(a) | | | 977,893 |
| 600 | | Sinclair Broadcast Group, Inc. (Class A Shares) | | | 5,520 |
| | | | |
|
|
| | | | | | 3,091,266 |
| | | | |
|
|
| | |
| | | Medical Supplies & Equipment—0.5% | | | |
| 2,400 | | Conmed Corp.(a) | | | 56,784 |
| 1,500 | | HealthTronics Surgical, Inc.(a) | | | 11,475 |
| 600 | | LCA-Vision, Inc. | | | 28,506 |
See Notes to Financial Statements beginning on page 130
| | |
| 60 | | THE TARGET PORTFOLIO TRUST |
| | | | | |
| SHARES | | DESCRIPTION | | VALUE (NOTE 1) |
| | | | | | |
| | |
| | | Medical Supplies & Equipment (cont’d.) | | | |
| 200 | | Neurometrix, Inc.(a) | | $ | 5,456 |
| 16,500 | | Orthofix International N.V.(a) | | | 658,185 |
| 2,700 | | PSS World Medical, Inc.(a) | | | 40,068 |
| 1,000 | | STERIS Corp. | | | 25,020 |
| 100 | | SurModics, Inc.(a) | | | 3,699 |
| 12,600 | | Sybron Dental Specialties, Inc.(a) | | | 501,606 |
| 600 | | Viasys Healthcare, Inc.(a) | | | 15,420 |
| | | | |
|
|
| | | | | | 1,346,219 |
| | | | |
|
|
| | |
| | | Metals & Mining—2.8% | | | |
| 105,000 | | Agnico-Eagle Mines Ltd. (Canada) | | | 2,074,800 |
| 500 | | Carpenter Technology Corp. | | | 35,235 |
| 975 | | Century Aluminum Co.(a) | | | 25,555 |
| 1,400 | | Chaparral Steel Co.(a) | | | 42,350 |
| 29,200 | | Commercial Metals Co. | | | 1,096,168 |
| 1,875 | | Gibraltar Industries, Inc. | | | 43,012 |
| 14,000 | | Massey Energy Co. | | | 530,180 |
| 35,000 | | Mueller Industries, Inc. | | | 959,700 |
| 1,000 | | NS Group, Inc.(a) | | | 41,810 |
| 700 | | Oregon Steel Mills, Inc.(a) | | | 20,594 |
| 16,200 | | Quanex Corp. | | | 809,514 |
| 2,000 | | Reliance Steel & Aluminum Co. | | | 122,240 |
| 600 | | Ryerson, Inc. | | | 14,592 |
| 800 | | Schnitzer Steel Industries, Inc. (Class A Shares) | | | 24,472 |
| 2,900 | | Steel Dynamics, Inc. | | | 102,979 |
| 41,700 | | Timken Co. | | | 1,335,234 |
| | | | |
|
|
| | | | | | 7,278,435 |
| | | | |
|
|
| | |
| | | Oil & Gas Exploration/Production—2.2% | | | |
| 79,050 | | Cabot Oil & Gas Corp. | | | 3,565,155 |
| 31,900 | �� | St. Mary Land & Exploration Co. | | | 1,174,239 |
| 15,000 | | Tidewater, Inc. | | | 666,900 |
| 4,500 | | Todco (Class A Shares)(a) | | | 171,270 |
| | | | |
|
|
| | | | | | 5,577,564 |
| | | | |
|
|
| | |
| | | Oil, Gas & Consumable Fuels—3.7% | | | |
| 15,610 | | Berry Petroleum Co. (Class A Shares) | | | 892,892 |
| 800 | | Cal Dive International, Inc.(a) | | | 28,712 |
| 700 | | Callon Petroleum Co.(a) | | | 12,355 |
| 3,600 | | Cimarex Energy Co. | | | 154,836 |
| 2,300 | | Comstock Resources, Inc.(a) | | | 70,173 |
| 2,600 | | Energy Partners Ltd.(a) | | | 56,654 |
| 29,900 | | Frontier Oil Corp. | | | 1,122,148 |
| 500 | | Giant Industries, Inc.(a) | | | 25,980 |
| 1,200 | | Hanover Compressor Co.(a) | | | 16,932 |
| 1,500 | | Harvest Natural Resources, Inc.(a) | | | 13,320 |
| 10,000 | | Holly Corp. | | | 588,700 |
| 24,600 | | Houston Explorat, Co.(a) | | | 1,298,880 |
| 800 | | Lone Star Technologies, Inc.(a) | | | 41,328 |
See Notes to Financial Statements beginning on page 130
| | |
| THE TARGET PORTFOLIO TRUST | | 61 |
| | |
Small Capitalization Value Portfolio (cont’d) | | Portfolio of Investments
As of December 31, 2005 |
| | | | | |
| SHARES | | DESCRIPTION | | VALUE (NOTE 1) |
| | | | | | |
| | |
| | | Oil, Gas & Consumable Fuels (cont’d.) | | | |
| 3,000 | | New Jersey Resources Corp. | | $ | 125,670 |
| 2,300 | | Nicor, Inc. | | | 90,413 |
| 1,700 | | Northwest Natural Gas Co. | | | 58,106 |
| 27,900 | | Oceaneering International, Inc.(a) | | | 1,388,862 |
| 3,325 | | Oil States International, Inc.(a) | | | 105,336 |
| 30,600 | | Oneok, Inc. | | | 814,878 |
| 1,950 | | Petrohawk Energy, Corp.(a) | | | 25,779 |
| 31,500 | | Range Resources Corp. | | | 829,710 |
| 400 | | Remington Oil & Gas Corp.(a) | | | 14,600 |
| 1,000 | | RPC, Inc. | | | 26,340 |
| 4,500 | | South Jersey Industries, Inc. | | | 131,130 |
| 2,300 | | Southwestern Energy Co. | | | 82,662 |
| 1,800 | | Stone Energy Corp.(a) | | | 81,954 |
| 2,500 | | Universal Compression Holdings, Inc.(a) | | | 102,800 |
| 1,500 | | Veritas DGC, Inc.(a) | | | 53,235 |
| 4,410 | | Vintage Petroleum, Inc. | | | 235,185 |
| 20,600 | | Western Gas Resources, Inc. | | | 970,054 |
| 975 | | Whiting Petroleum Corp.(a) | | | 39,000 |
| | | | |
|
|
| | | | | | 9,498,624 |
| | | | |
|
|
| | |
| | | Oil, Gas & Consumable Fuels | | | |
| 750 | | GMX Resources, Inc.(a) | | | 27,000 |
| | | | |
|
|
| | |
| | | Paper & Forest Products—1.0% | | | |
| 17,120 | | Neenah Paper, Inc. | | | 479,360 |
| 16,000 | | Potlatch Corp. | | | 815,680 |
| 64,400 | | Rock-Tenn Co. (Class A Shares) | | | 879,060 |
| 14,130 | | Schweit-Maudit International, Inc. | | | 350,141 |
| 2,300 | | Wausau Paper Corp. | | | 27,255 |
| | | | |
|
|
| | | | | | 2,551,496 |
| | | | |
|
|
| | |
| | | Pharmaceuticals—0.3% | | | |
| 1,700 | | Adolor Corp.(a) | | | 24,820 |
| 1,400 | | Alpharma, Inc. (Class A Shares) | | | 39,914 |
| 1,500 | | Atherogenics, Inc.(a) | | | 30,015 |
| 13,600 | | AVANIR Pharmaceuticals (Class A Shares)(a) | | | 46,784 |
| 3,500 | | Cypress Bioscience, Inc.(a) | | | 20,230 |
| 26,250 | | Parexel International Corp.(a) | | | 531,825 |
| 400 | | United Therapeutics Corp.(a) | | | 27,648 |
| 1,000 | | Valeant Pharmaceuticals International. | | | 18,080 |
| 2,600 | | Vertex Pharmaceuticals, Inc.(a) | | | 71,942 |
| | | | |
|
|
| | | | | | 811,258 |
| | | | |
|
|
| | |
| | | Real Estate Investment Trust—4.7% | | | |
| 4,300 | | American Home Mortgage Investment Corp. | | | 140,051 |
| 50,000 | | Annaly Mortgage Management, Inc. | | | 547,000 |
See Notes to Financial Statements beginning on page 130
| | |
| 62 | | THE TARGET PORTFOLIO TRUST |
| | | | | |
| SHARES | | DESCRIPTION | | VALUE (NOTE 1) |
| | | | | | |
| | |
| | | Real Estate Investment Trust (cont’d.) | | | |
| 9,400 | | Anthracite Capital, Inc. | | $ | 98,982 |
| 20,370 | | Arbor Realty Trust, Inc. | | | 527,990 |
| 1,775 | | Ashford Hospital | | | 18,620 |
| 900 | | Boykin Lodging Co.(a) | | | 10,998 |
| 800 | | Capital Trust, Inc. (Class A Shares) | | | 23,424 |
| 7,000 | | CarrAmerica Realty Corp. | | | 242,410 |
| 63,670 | | Education Realty Trust, Inc. | | | 820,706 |
| 18,100 | | Entertainment Properties Trust | | | 737,575 |
| 7,400 | | Equity Inns, Inc. | | | 100,270 |
| 64,080 | | Equity One, Inc. | | | 1,481,530 |
| 900 | | Extra Space Storage, Inc. | | | 13,860 |
| 4,200 | | FelCor Lodging Trust, Inc. | | | 72,282 |
| 15,900 | | First Industrial Realty Trust, Inc. | | | 612,150 |
| 800 | | First Potomac Realty Trust | | | 21,280 |
| 2,100 | | Glenborough Realty Trust, Inc. | | | 38,010 |
| 3,200 | | Government Properties Trust, Inc. | | | 29,856 |
| 11,200 | | Healthcare Realty Trust, Inc. | | | 372,624 |
| 1,688 | | Highland Hospitality Corp. | | | 18,652 |
| 34,000 | | HRPT Properties Trust | | | 351,900 |
| 4,000 | | IMPAC Mortgage Holdings, Inc. | | | 37,640 |
| 8,200 | | Innkeepers USA Trust | | | 131,200 |
| 1,200 | | Jones Lang Lasal, Inc. | | | 60,420 |
| 3,500 | | Kilroy Reality Corp. | | | 216,650 |
| 1,800 | | LaSalle Hotel Properties | | | 66,096 |
| 10,500 | | Lexington Corporate Properties Trust | | | 223,650 |
| 2,100 | | LTC Properties, Inc. | | | 44,163 |
| 1,300 | | Maguire Properties, Inc. | | | 40,170 |
| 12,900 | | MeriStar Hospitality Corp.(a) | | | 121,260 |
| 6,050 | | MFA Mortgage Investments, Inc. | | | 34,485 |
| 5,300 | | Mid-America Apartment Communities, Inc. | | | 257,050 |
| 4,700 | | National Health Investors, Inc. | | | 122,012 |
| 31,100 | | Nationwide Health Properties, Inc. | | | 665,540 |
| 23,000 | | New Plan Excel Realty Trust | | | 533,140 |
| 1,100 | | Novastar Finacial, Inc. | | | 30,921 |
| 1,100 | | Parkway Properties, Inc. | | | 44,154 |
| 4,800 | | Pennsylvania Real Estate Investment Trust | | | 179,328 |
| 3,200 | | Post Properties, Inc. | | | 127,840 |
| 3,700 | | RAIT Investment Trust | | | 95,904 |
| 550 | | Redwood Trust, Inc. | | | 22,693 |
| 2,400 | | Saul Centers, Inc. | | | 86,640 |
| 5,100 | | Senior Housing Properties Trust | | | 86,241 |
| 26,860 | | SL Green Realty Corp. | | | 2,051,836 |
| 4,700 | | Sunstone Hotel Investors, Inc. | | | 124,879 |
| 500 | | Urstadt Biddle Properties (Class A Shares) | | | 8,105 |
| 1,500 | | Ventas, Inc. | | | 48,030 |
| 51,230 | | Winston Hotels, Inc. | | | 507,177 |
| | | | |
|
|
| | | | | | 12,247,394 |
| | | | |
|
|
See Notes to Financial Statements beginning on page 130
| | |
| THE TARGET PORTFOLIO TRUST | | 63 |
| | |
Small Capitalization Value Portfolio (cont’d) | | Portfolio of Investments
As of December 31, 2005 |
| | | | | |
| SHARES | | DESCRIPTION | | VALUE (NOTE 1) |
| | | | | | |
| | |
| | | Registered Investment Companies—0.8% | | | |
| 29,680 | | iShares S&P SmallCap 600 Value Index Fund | | $ | 1,895,959 |
| 5,683 | | Technology Investment Capital Corp. | | | 85,813 |
| | | | |
|
|
| | | | | | 1,981,772 |
| | | | |
|
|
| | |
| | | Restaurants | | | |
| 1,904 | | Triarc Cos., Inc. (Class “B” Stock) | | | 28,274 |
| | | | |
|
|
| | |
| | | Retail—2.3% | | | |
| 5,200 | | Asbury Automotive Group, Inc.(a) | | | 85,592 |
| 600 | | Build-A-Bear Workshop, Inc.(a) | | | 17,784 |
| 400 | | Burlington Coat Factory Warehouse Corp. | | | 16,084 |
| 5,100 | | Cash America International, Inc. | | | 118,269 |
| 20,800 | | CEC Entertainment, Inc.(a) | | | 708,032 |
| 15,700 | | Charming Shoppes, Inc.(a) | | | 207,240 |
| 82,460 | | CSK Auto Corp.(a) | | | 1,243,497 |
| 900 | | Genesco, Inc.(a) | | | 34,911 |
| 1,100 | | Insight Enterprises, Inc.(a) | | | 21,571 |
| 1,400 | | Jo-Ann Stores, Inc.(a) | | | 16,520 |
| 5,900 | | Lithia Motors, Inc. (Class A Shares) | | | 185,496 |
| 1,200 | | Luby’s, Inc.(a) | | | 15,960 |
| 22,890 | | Men’s Wearhouse, Inc. (The)(a) | | | 673,882 |
| 900 | | Movado Group, Inc. | | | 16,470 |
| 1,200 | | O’Charleys, Inc.(a) | | | 18,612 |
| 500 | | Pantry, Inc.(a) | | | 23,495 |
| 32,850 | | Regis Corp. | | | 1,267,024 |
| 2,100 | | Smart & Final, Inc.(a) | | | 27,048 |
| 500 | | Sonic Automotive, Inc. | | | 11,140 |
| 300 | | Sports Authority, Inc. (The)(a) | | | 9,339 |
| 2,700 | | Stage Stores, Inc. | | | 80,406 |
| 63,200 | | Stein Mart, Inc. | | | 1,147,080 |
| 2,300 | | Systemax, Inc.(a) | | | 14,352 |
| 1,200 | | Zale Corp.(a) | | | 30,180 |
| | | | |
|
|
| | | | | | 5,989,984 |
| | | | |
|
|
| | |
| | | Retail Apparel—0.9% | | | |
| 19,800 | | Brown Shoe Co., Inc. | | | 840,114 |
| 8,770 | | Dress Barn, Inc.(a) | | | 338,610 |
| 42,670 | | Foot Locker, Inc. | | | 1,006,585 |
| 1,000 | | Kenneth Cole Productions, Inc. (Class A Shares) | | | 25,500 |
| 2,200 | | Payless Shoesource, Inc.(a) | | | 55,220 |
| | | | |
|
|
| | | | | | 2,266,029 |
| | | | |
|
|
| | |
| | | Road & Rail—0.4% | | | |
| 25,600 | | Arkansas Best Corp. | | | 1,118,208 |
| | | | |
|
|
See Notes to Financial Statements beginning on page 130
| | |
| 64 | | THE TARGET PORTFOLIO TRUST |
| | | | | |
| SHARES | | DESCRIPTION | | VALUE (NOTE 1) |
| | | | | | |
| | |
| | | Semiconductors—0.4% | | | |
| 1,800 | | Actel Corp.(a) | | $ | 22,914 |
| 1,200 | | AMIS Holdings, Inc.(a) | | | 12,780 |
| 1,500 | | Amkor Technology, Inc.(a) | | | 8,400 |
| 8,400 | | Applied Micro Circuits Corp.(a) | | | 21,588 |
| 4,500 | | Asyst Technologies, Corp.(a) | | | 25,740 |
| 7,100 | | Atmel Corp.(a) | | | 21,939 |
| 850 | | ATMI, Inc.(a) | | | 23,775 |
| 3,900 | | Axcelis Technologies, Inc.(a) | | | 18,603 |
| 2,700 | | Cirrus Logic, Inc.(a) | | | 18,036 |
| 1,200 | | Cohu, Inc. | | | 27,444 |
| 3,800 | | Credence System Corp.(a) | | | 26,448 |
| 1,000 | | DSP Group, Inc.(a) | | | 25,060 |
| 900 | | Emulex Corp.(a) | | | 17,811 |
| 7,258 | | Entegris, Inc.(a) | | | 68,370 |
| 700 | | Exar Corp.(a) | | | 8,764 |
| 5,100 | | Fairchild Semiconductor International, Inc.(a) | | | 86,241 |
| 1,400 | | Genesis Microchip, Inc.(a) | | | 25,326 |
| 1,400 | | Integrated Silicon Solution, Inc.(a) | | | 9,016 |
| 5,100 | | Intergrated Device Technology, Inc.(a) | | | 67,218 |
| 2,000 | | Kulicke & Soffa Industries, Inc.(a) | | | 17,680 |
| 3,100 | | Lattice Semiconductor Corp.(a) | | | 13,392 |
| 2,200 | | MKS Instruments, Inc.(a) | | | 39,358 |
| 3,300 | | ON Semiconductor Corp.(a) | | | 18,249 |
| 600 | | Pericom Semiconductor Corp.(a) | | | 4,782 |
| 1,500 | | Photronics, Inc.(a) | | | 22,590 |
| 58,680 | | Richardson Electronics Ltd. | | | 425,430 |
| 2,600 | | Skyworks Solutions, Inc.(a) | | | 13,234 |
| 1,200 | | Standard Microsystems Corp.(a) | | | 34,428 |
| 2,600 | | Vitesse Semiconductor(a) | | | 4,992 |
| | | | |
|
|
| | | | | | 1,129,608 |
| | | | |
|
|
| | |
| | | Specialty Retail—0.9% | | | |
| 3,100 | | Aaron Rents, Inc. | | | 65,348 |
| 34,000 | | Borders Group, Inc. | | | 736,780 |
| 19,300 | | CBRL Group, Inc. | | | 678,395 |
| 31,200 | | Claire’s Stores, Inc. | | | 911,664 |
| | | | |
|
|
| | | | | | 2,392,187 |
| | | | |
|
|
| | |
| | | Telecommunications—1.7% | | | |
| 4,600 | | Adaptec, Inc.(a) | | | 26,772 |
| 64,650 | | Aeroflex, Inc.(a) | | | 694,987 |
| 41,800 | | American Tower Corp. (Class A Shares)(a) | | | 1,132,780 |
| 1,400 | | Anixter International, Inc. | | | 54,768 |
| 46,370 | | Arris Group, Inc.(a) | | | 439,124 |
| 1,100 | | Black Box Corp. | | | 52,118 |
| 3,400 | | Broadwing Corp.(a) | | | 20,570 |
| 600 | | C-COR, Inc.(a) | | | 2,916 |
| 2,100 | | Centennial Communications Corp.(a) | | | 32,592 |
| 30,200 | | Ciena Corp.(a) | | | 89,694 |
See Notes to Financial Statements beginning on page 130
| | |
| THE TARGET PORTFOLIO TRUST | | 65 |
| | |
Small Capitalization Value Portfolio (cont’d) | | Portfolio of Investments
As of December 31, 2005 |
| | | | | |
| SHARES | | DESCRIPTION | | VALUE (NOTE 1) |
| | | | | | |
| | |
| | | Telecommunications (cont’d.) | | | |
| 21,700 | | Cincinnati Bell, Inc.(a) | | $ | 76,167 |
| 14,540 | | Commonwealth Telephone Enterprises, Inc. | | | 491,016 |
| 2,300 | | CommScope, Inc.(a) | | | 46,299 |
| 3,900 | | CT Communications, Inc. | | | 47,346 |
| 1,200 | | Ditech Communications Corp.(a) | | | 10,020 |
| 7,300 | | Dobson Communications Corp. (Class A Shares)(a) | | | 54,750 |
| 7,100 | | Finisar Corp.(a) | | | 14,768 |
| 1,800 | | General Communication, Inc. (Class A Shares)(a) | | | 18,594 |
| 800 | | Hypercom Corp.(a) | | | 5,112 |
| 32,300 | | Iowa Telecommunications Services, Inc. | | | 500,327 |
| 27,900 | | Level 3 Communications Inc.(a) | | | 80,073 |
| 2,300 | | Mastec, Inc.(a) | | | 24,081 |
| 1,800 | | MRV Communications, Inc.(a) | | | 3,690 |
| 2,600 | | Newport Corp.(a) | | | 35,204 |
| 900 | | North Pittsburgh Systems, Inc. | | | 16,983 |
| 5,600 | | Powerwave Technologies, Inc.(a) | | | 70,392 |
| 11,500 | | Premiere Global Services, Inc.(a) | | | 93,495 |
| 6,800 | | RF Micro Devices, Inc.(a) | | | 36,788 |
| 1,000 | | SafeNet, Inc.(a) | | | 32,220 |
| 3,100 | | Sonus Networks, Inc.(a) | | | 11,532 |
| 3,200 | | Sycamore Networks, Inc.(a) | | | 13,824 |
| 1,800 | | Talk America Holdings, Inc.(a) | | | 15,534 |
| 225 | | Tekelec(a) | | | 3,128 |
| 2,800 | | Time Warner Telecom, Inc. (Class A Shares)(a) | | | 27,580 |
| 1,500 | | Utstarcom, Inc.(a) | | | 12,090 |
| | | | |
|
|
| | | | | | 4,287,334 |
| | | | |
|
|
| | |
| | | Textiles & Apparel—1.4% | | | |
| 30,000 | | Kellwood Co. | | | 716,400 |
| 200 | | Oxford Industries, Inc. | | | 10,940 |
| 500 | | Perry Ellis International, Inc.(a) | | | 9,500 |
| 47,500 | | Phillips-Van Heusen | | | 1,539,000 |
| 3,000 | | Quiksilver, Inc. | | | 41,520 |
| 86,660 | | Russell Corp. | | | 1,166,444 |
| 2,500 | | Skechers USA, Inc. (Class A Shares)(a) | | | 38,300 |
| 6,300 | | Too, Inc.(a) | | | 177,723 |
| | | | |
|
|
| | | | | | 3,699,827 |
| | | | |
|
|
| | |
| | | Thrifts & Mortgage Finance—0.8% | | | |
| 25,800 | | Accredited Home Lenders Holding Co.(a) | | | 1,279,164 |
| 24,500 | | Astoria Financial Corp. | | | 720,300 |
| | | | |
|
|
| | | | | | 1,999,464 |
| | | | |
|
|
See Notes to Financial Statements beginning on page 130
| | |
| 66 | | THE TARGET PORTFOLIO TRUST |
| | | | | | |
| SHARES | | DESCRIPTION | | VALUE (NOTE 1) | |
| | | | | | | |
| | |
| | | Tobacco—0.6% | | | | |
| 6,100 | | Alliance One Intertnational, Inc. | | $ | 23,790 | |
| 16,000 | | Loews Corp. - Carolina Group | | | 703,840 | |
| 17,200 | | Universal Corp. | | | 745,792 | |
| | | | |
|
|
|
| | | | | | 1,473,422 | |
| | | | |
|
|
|
| | |
| | | Trading Companies & Distributors—0.6% | | | | |
| 27,575 | | Watsco, Inc. | | | 1,649,261 | |
| | | | |
|
|
|
| | |
| | | Transportation—1.9% | | | | |
| 1,025 | | Amerco, Inc.(a) | | | 73,851 | |
| 705 | | Arlington Tankers, Ltd. | | | 15,334 | |
| 1,000 | | Covenant Transport, Inc. (Class A Shares)(a) | | | 13,980 | |
| 13,300 | | Frontline Ltd. (Bermuda) | | | 504,336 | |
| 29,000 | | General Maritime Corp. | | | 1,074,160 | |
| 4,825 | | Genesee & Wyoming, Inc. (Class A Shares)(a) | | | 181,179 | |
| 800 | | Greenbrier Cos., Inc. | | | 22,720 | |
| 1,100 | | Interpool, Inc. | | | 20,768 | |
| 46,270 | | Kansas City Southern(a) | | | 1,130,376 | |
| 300 | | Kirby Corp.(a) | | | 15,651 | |
| 875 | | Landstar System, Inc.(a) | | | 36,522 | |
| 400 | | Marten Transport Ltd.(a) | | | 7,288 | |
| 1,200 | | Offshore Logistics, Inc.(a) | | | 35,040 | |
| 3,400 | | RailAmerica, Inc.(a) | | | 37,366 | |
| 2,500 | | SCS Transportation, Inc.(a) | | | 53,125 | |
| 4,700 | | SIRVA, Inc.(a) | | | 37,600 | |
| 16,600 | | Teekay Shipping Corp. | | | 662,340 | |
| 1,600 | | U.S. Xpress Enterprises, Inc. (Class A Shares)(a) | | | 27,808 | |
| 43,500 | | Werner Enterprises, Inc. | | | 856,950 | |
| | | | |
|
|
|
| | | | | | 4,806,394 | |
| | | | |
|
|
|
| | |
| | | Unregulated Power—0.3% | | | | |
| 26,200 | | Vectren Corp. | | | 711,592 | |
| | | | |
|
|
|
| | |
| | | Water Utilities | | | | |
| 600 | | American States Water Co. | | | 18,480 | |
| 600 | | California Water Service Group | | | 22,938 | |
| 200 | | SJW Corp. | | | 9,100 | |
| | | | |
|
|
|
| | | | | | 50,518 | |
| | | | |
|
|
|
| | | Total long-term investments
(cost $212,088,244) | | | 253,770,841 | |
| | |
| | | SHORT-TERM INVESTMENT—2.3% | | | | |
| | |
| | | Affiliated Money Market Mutual Fund | | | | |
| 5,904,407 | | Dryden Core Investment Fund - Taxable Money Market Series
(cost $5,904,407; Note 3)(b) | | | 5,904,407 | |
| | | | |
|
|
|
| | | Total Investments—100.2%
(cost $217,992,651; Note 5) | | | 259,675,248 | |
| | | Liabilities in excess of other assets—(0.2%) | | | (560,420 | ) |
| | | | |
|
|
|
| | | Net Assets—100% | | $ | 259,114,828 | |
| | | | |
|
|
|
See Notes to Financial Statements beginning on page 130
| | |
| THE TARGET PORTFOLIO TRUST | | 67 |
| | |
Small Capitalization Value Portfolio (cont’d) | | Portfolio of Investments
As of December 31, 2005 |
The following abbreviations are used in portfolio descriptions
ADR—American Depository Receipt
| (a) | Non-income producing security. |
| (b) | Prudential Investments LLC, the manager of the Fund also serves as manager of the Dryden Core Investment Fund—Taxable Money Market Series. |
The industry classification of long-term portfolio holdings, short-term investments and liabilities in excess of other assets shown as a percentage of net assets as of December 31, 2005 were as follows:
| | | |
Banks | | 7.0 | % |
Insurance | | 5.9 | |
Machinery | | 5.6 | |
Real Estate Investment Trust | | 4.7 | |
Gas & Pipeline Utilities | | 4.0 | |
Oil, Gas & Consumable Fuels | | 3.7 | |
Electronics | | 3.6 | |
Chemicals | | 3.4 | |
Financial Services | | 2.9 | |
Metals & Mining | | 2.8 | |
Electric Utilities | | 2.4 | |
Food & Staples Retailing | | 2.4 | |
Retail | | 2.3 | |
Commercial Services & Supplies | | 2.2 | |
Healthcare Providers & Services | | 2.2 | |
Oil & Gas Exploration/Production | | 2.2 | |
Computer Services & Software | | 2.0 | |
Industrial Products | | 2.0 | |
Home Builders | | 1.9 | |
Hotels, Restaurants & Leisure | | 1.9 | |
Transportation | | 1.9 | |
Auto Related | | 1.8 | |
Drugs & Healthcare | | 1.7 | |
Telecommunications | | 1.7 | |
Commercial Services | | 1.5 | |
Consumer Products & Services | | 1.5 | |
Household Durables | | 1.5 | |
Textiles & Apparel | | 1.4 | |
Aerospace/Defense | | 1.2 | |
Media | | 1.2 | |
Electrical Equipment | | 1.1 | |
Business Services | | 1.0 | |
Distribution/Wholesale | | 1.0 | |
Paper & Forest Products | | 1.0 | |
Retail Apparel | | 0.9 | |
Specialty Retail | | 0.9 | |
Computer Hardware | | 0.8 | |
Construction | | 0.8 | |
Registered Investment Companies | | 0.8 | |
See Notes to Financial Statements beginning on page 130
| | |
| 68 | | THE TARGET PORTFOLIO TRUST |
| | | |
Thrifts & Mortgage Finance | | 0.8 | % |
Tobacco | | 0.6 | |
Trading Companies & Distributors | | 0.6 | |
Airlines | | 0.5 | |
Building Products | | 0.5 | |
Environmental Services | | 0.5 | |
Medical Supplies & Equipment | | 0.5 | |
Advertising | | 0.4 | |
Drugs & Medicine | | 0.4 | |
Energy Equipment & Services | | 0.4 | |
Healthcare Products & Services | | 0.4 | |
Road & Rail | | 0.4 | |
Semiconductors | | 0.4 | |
Conglomerates | | 0.3 | |
Containers & Packaging | | 0.3 | |
Entertainment & Leisure | | 0.3 | |
Healthcare Equipment & Supplies | | 0.3 | |
Manufacturing | | 0.3 | |
Pharmaceuticals | | 0.3 | |
Unregulated Power | | 0.3 | |
Beverages | | 0.2 | |
Biotechnology | | 0.1 | |
Diversified Financial Services | | 0.1 | |
Internet Services | | 0.1 | |
Leisure | | 0.1 | |
Affiliated Money Market Mutual Fund | | 2.3 | |
| | |
|
|
| | | 100.2 | |
Liabilities in excess of other assets | | (0.2 | ) |
| | |
|
|
Total | | 100.0 | % |
| | |
|
|
See Notes to Financial Statements beginning on page 130
| | |
| THE TARGET PORTFOLIO TRUST | | 69 |
| | |
| International Equity Portfolio | | Portfolio of Investments
As of December 31, 2005 |
| | | | | |
| SHARES | | DESCRIPTION | | VALUE (NOTE 1) |
| | | | | | |
| | | | | | |
| | | LONG-TERM INVESTMENTS—99.8% | | | |
| | |
| | | COMMON STOCKS | | | |
| | |
| | | Australia—1.9% | | | |
| 12,000 | | AWB Ltd. | | $ | 53,822 |
| 146,000 | | Bluescope Steel Ltd. | | | 741,069 |
| 29,500 | | Commonwealth Bank of Australia | | | 922,168 |
| 287,600 | | CSR Ltd. | | | 730,110 |
| 57,000 | | David Jones Ltd. | | | 96,964 |
| 125,000 | | Santos Ltd. | | | 1,121,469 |
| 3,700 | | Suncorp-Metway Ltd. | | | 54,235 |
| 238,000 | | Telestra Corp. Ltd. | | | 683,934 |
| | | | |
|
|
| | | | | | 4,403,771 |
| | | | |
|
|
| | |
| | | Austria—0.3% | | | |
| 4,300 | | Boehler-Uddeholm AG(a) | | | 727,468 |
| | | | |
|
|
| | |
| | | Belgium—0.5% | | | |
| 10,300 | | Dexia | | | 237,541 |
| 27,500 | | Fortis | | | 877,414 |
| | | | |
|
|
| | | | | | 1,114,955 |
| | | | |
|
|
| | |
| | | Brazil—1.0% | | | |
| 61,500 | | Empresa Brasileira de Aeronautica SA, ADR | | | 2,404,650 |
| | | | |
|
|
| | |
| | | Canada—3.2% | | | |
| 49,200 | | Canadian Natural Resources Ltd. | | | 2,439,155 |
| 68,300 | | Rogers Communications, Inc. | | | 2,890,757 |
| 95,100 | | Shaw Communications, Inc. | | | 2,064,065 |
| | | | |
|
|
| | | | | | 7,393,977 |
| | | | |
|
|
| | |
| | | Denmark—1.5% | | | |
| 6,300 | | Danisco AS(a) | | | 482,347 |
| 21,000 | | Danske Bank SA | | | 739,765 |
| 41,200 | | Novo Nordisk SA | | | 2,317,582 |
| | | | |
|
|
| | | | | | 3,539,694 |
| | | | |
|
|
| | |
| | | Finland—0.7% | | | |
| 31,500 | | OKO Bank | | | 442,291 |
| 45,100 | | Rautaruukki OYJ | | | 1,097,239 |
| | | | |
|
|
| | | | | | 1,539,530 |
| | | | |
|
|
| | |
| | | France—6.6% | | | |
| 23,900 | | BNP Paribas | | | 1,933,968 |
| 18,000 | | Bouygues SA | | | 880,107 |
| 41,300 | | Carrefour SA | | | 1,935,257 |
| 4,200 | | Ciments Francais SA(a) | | | 545,965 |
See Notes to Financial Statements beginning on page 130
| | |
| 70 | | THE TARGET PORTFOLIO TRUST |
| | | | | |
| SHARES | | DESCRIPTION | | VALUE (NOTE 1) |
| | | | | | |
| | |
| | | France (cont’d.) | | | |
| 11,800 | | CNP Assurances | | $ | 930,399 |
| 16,000 | | Compagnie Generale des Establissements Michelin (Class B Shares) | | | 899,381 |
| 4,600 | | Natexis Banques Populaires(a) | | | 766,240 |
| 15,000 | | Peugeot SA | | | 864,835 |
| 11,300 | | Rallye SA | | | 485,488 |
| 8,200 | | Renault SA(a) | | | 668,876 |
| 33,100 | | Sanofi-Aventis | | | 2,899,831 |
| 4,700 | | Societe Generale | | | 578,131 |
| 53,400 | | Suez SA | | | 1,662,685 |
| 1,700 | | Total SA | | | 427,078 |
| | | | |
|
|
| | | | | | 15,478,241 |
| | | | |
|
|
| | |
| | | Germany—7.7% | | | |
| 14,800 | | Adidas-Salomon AG | | | 2,803,462 |
| 24,500 | | BASF AG | | | 1,876,940 |
| 23,900 | | Bayerische Motoren Werke AG | | | 1,048,333 |
| 17,900 | | Deutsche Bank AG(a) | | | 1,735,601 |
| 22,800 | | Deutsche Boerse AG(a) | | | 2,336,496 |
| 46,485 | | Frankport AG | | | 2,470,996 |
| 3,800 | | Fresenius AG | | | 515,787 |
| 17,900 | | MAN AG(a) | | | 955,322 |
| 14,100 | | Merck KGAA | | | 1,167,669 |
| 18,500 | | Salzgitter AG(a) | | | 998,952 |
| 45,400 | | ThyssenKrup AG | | | 947,054 |
| 31,100 | | TUI AG | | | 636,971 |
| 3,300 | | Verwalt & Privat - Bank AG(a) | | | 552,239 |
| | | | |
|
|
| | | | | | 18,045,822 |
| | | | |
|
|
| | |
| | | Hong Kong—3.8% | | | |
| 1,150,400 | | Chaoda Modern Agriculture Holdings Ltd.(a) | | | 477,797 |
| 620,900 | | China Merchants Holdings International Co. Ltd. | | | 1,347,545 |
| 3,889,600 | | China Petroleum Chemical Corp. | | | 1,938,230 |
| 1,061,037 | | China Shenhua Energy Co. Ltd.(a) | | | 1,168,661 |
| 200,000 | | Citic Pacific Ltd. | | | 552,678 |
| 616,600 | | CNOOC Ltd. | | | 419,030 |
| 577,700 | | Hong Kong Exchanges and Clearing Ltd. | | | 2,395,338 |
| 159,280 | | Orient Overseas International Ltd.(a) | | | 538,873 |
| | | | |
|
|
| | | | | | 8,838,152 |
| | | | |
|
|
| | |
| | | India—0.5% | | | |
| 39,600 | | ICICI Bank Ltd., ADR | | | 1,140,480 |
| | | | |
|
|
| | |
| | | Ireland—0.3% | | | |
| 31,300 | | Irish Life & Permanent PLC | | | 639,585 |
| | | | |
|
|
| | |
| | | Israel—2.0% | | | |
| 62,000 | | Amdocs Ltd.(a) | | | 1,705,000 |
| 71,300 | | Teva Pharmaceutical Industries Ltd., ADR | | | 3,066,613 |
| | | | |
|
|
| | | | | | 4,771,613 |
| | | | |
|
|
See Notes to Financial Statements beginning on page 130
| | |
| THE TARGET PORTFOLIO TRUST | | 71 |
| | |
International Equity Portfolio (cont’d) | | Portfolio of Investments
As of December 31, 2005 |
| | | | | |
| SHARES | | DESCRIPTION | | VALUE (NOTE 1) |
| | | | | | |
| | |
| | | Italy—1.5% | | | |
| 54,200 | | Banca Popolare Italiana SpA | | $ | 480,932 |
| 53,600 | | Benetton Group SpA | | | 610,454 |
| 61,800 | | Eni SpA | | | 1,714,248 |
| 90,400 | | Ifil SpA | | | 386,089 |
| 26,400 | | San Paolo - IMI SpA | | | 412,876 |
| | | | |
|
|
| | | | | | 3,604,599 |
| | | | |
|
|
| | |
| | | Japan—20.4% | | | |
| 4,650 | | Aiful Corp. | | | 388,713 |
| 30,300 | | Alpine Electronics, Inc. | | | 406,565 |
| 37,000 | | Alps Electric Co. Ltd. | | | 516,980 |
| 31,700 | | Asahi Breweries Ltd. | | | 386,513 |
| 9,000 | | Asahi Kasei Corp. | | | 60,901 |
| 276,000 | | Bank of Fukuoka Ltd. (The)(a) | | | 2,365,741 |
| 303,476 | | Bank of Yokohama Ltd. (The) | | | 2,484,033 |
| 3,900 | | Capcom Co. Ltd. | | | 45,553 |
| 21,600 | | CMK Corp. | | | 476,084 |
| 178,000 | | Cosmo Oil Co. Ltd. | | | 890,159 |
| 145,000 | | Denki Kagaku Kogyo KK | | | 640,454 |
| 5,700 | | FamilyMart Co. Ltd. | | | 192,615 |
| 59,700 | | Hitachi Koko Co. Ltd. | | | 986,087 |
| 102,000 | | Hitachi Ltd. | | | 687,219 |
| 30,100 | | Hokkaido Electric Power Co., Inc. | | | 611,972 |
| 80,300 | | Hokuetsu Paper Mills Ltd. | | | 415,232 |
| 24,100 | | Honda Motor Co. Ltd. | | | 1,390,896 |
| 38,000 | | Hosiden Corp. | | | 464,874 |
| 67,000 | | Japan Securities Finance Co. Ltd. | | | 772,131 |
| 94,700 | | Kaken Pharmaceutical Co. Ltd. | | | 736,450 |
| 25,900 | | Kansai Electric Power Co., Inc. (The) | | | 555,646 |
| 190,800 | | Kurabo Industries Ltd. | | | 713,744 |
| 23,600 | | Kyushu Electric Power Co., Inc. | | | 512,071 |
| 187,000 | | Marubeni Corp. | | | 1,001,466 |
| 153 | | Millea Holdings, Inc. | | | 2,638,729 |
| 135,500 | | Mitsubishi Chemical Holdings Corp. | | | 853,661 |
| 68,000 | | Nippon Oil Corp. | | | 526,980 |
| 360 | | Nippon Telegraph and Telephone Corp. | | | 1,633,794 |
| 25,400 | | Nipro Corp. | | | 371,481 |
| 115,100 | | Nissan Motor Co. Ltd. | | | 1,174,105 |
| 166,200 | | NSK Ltd. | | | 1,136,666 |
| 100 | | NTT Docomo, Inc. | | | 152,291 |
| 269,800 | | Osaka Gas Co. Ltd. | | | 930,302 |
| 3,300 | | Promise Co. Ltd. | | | 220,043 |
| 97,100 | | Rengo Co. Ltd. | | | 586,552 |
| 35,300 | | Ricoh Co. Ltd. | | | 618,092 |
| 44,200 | | Rohto Pharmaceutical Co. Ltd.(a) | | | 439,749 |
See Notes to Financial Statements beginning on page 130
| | |
| 72 | | THE TARGET PORTFOLIO TRUST |
| | | | | |
| SHARES | | DESCRIPTION | | VALUE (NOTE 1) |
| | | | | | |
| | |
| | | Japan (cont’d.) | | | |
| 18,400 | | Sanyo Electric Credit Co. Ltd. | | $ | 375,971 |
| 45,700 | | Secom Co. Ltd. | | | 2,393,489 |
| 148,100 | | Sharp Corp. | | | 2,253,399 |
| 66,900 | | Shiseido Company Ltd. | | | 1,244,684 |
| 92,500 | | Sumitomo Trust & Banking Co. Ltd. (The) | | | 943,170 |
| 12,700 | | Takefuji Corp. | | | 862,319 |
| 82,000 | | Tanabe Seiyaku Co. Ltd. | | | 795,567 |
| 24,600 | | Tohoku Electric Power Co., Inc. | | | 499,736 |
| 562,900 | | Tokyo Gas Co. Ltd. | | | 2,505,551 |
| 20,700 | | Tostem Inax Holding Corp. | | | 413,553 |
| 110,200 | | Toyota Motor Corp. | | | 5,757,300 |
| 33,000 | | UNY Co. Ltd. | | | 520,304 |
| | | | |
|
|
| | | | | | 47,549,587 |
| | | | |
|
|
| | |
| | | Korea—3.6% | | | |
| 24,570 | | Hyundai Motor Co. | | | 2,337,396 |
| 24,440 | | Kookmin Bank(a) | | | 1,841,962 |
| 3,115 | | Samsung Electronics Co. Ltd. | | | 2,004,063 |
| 54,560 | | Shinhan Financial Group Co. Ltd.(a) | | | 2,194,391 |
| | | | |
|
|
| | | | | | 8,377,812 |
| | | | |
|
|
| | |
| | | Mexico—2.8% | | | |
| 138,900 | | America Movil SA de CV, ADR Series L | | | 4,064,214 |
| 433,400 | | Wal-Mart de Mexico SA de CV | | | 2,404,947 |
| | | | |
|
|
| | | | | | 6,469,161 |
| | | | |
|
|
| | |
| | | Netherlands—4.1% | | | |
| 40,259 | | ABN AMRO Holding NV | | | 1,052,862 |
| 54,600 | | Euronext NV | | | 2,844,188 |
| 59,700 | | ING Groep NV, ADR | | | 2,070,880 |
| 58,400 | | Koninklijke (Royal) KPN NV | | | 585,611 |
| 28,100 | | Schlumberger Ltd. | | | 2,729,915 |
| 6,600 | | Stork NV | | | 281,996 |
| | | | |
|
|
| | | | | | 9,565,452 |
| | | | |
|
|
| | |
| | | Norway—0.5% | | | |
| 10,500 | | Norsk Hydro ASA(a) | | | 1,078,112 |
| | | | |
|
|
| | |
| | | Portugal—0.2% | | | |
| 151,000 | | Energias de Portugal SA(a) | | | 464,797 |
| | | | |
|
|
| | |
| | | Russia—0.7% | | | |
| 26,700 | | Lukoil, ADR | | | 1,588,650 |
| | | | |
|
|
| | |
| | | Singapore—1.0% | | | |
| 432,400 | | Mobileone Ltd.(a) | | | 551,958 |
| 281,000 | | Neptune Orient Lines Ltd. | | | 568,353 |
| 795,700 | | Singapore Telecommunications Ltd. | | | 1,246,024 |
| | | | |
|
|
| | | | | | 2,366,335 |
| | | | |
|
|
See Notes to Financial Statements beginning on page 130
| | |
| THE TARGET PORTFOLIO TRUST | | 73 |
| | |
International Equity Portfolio (cont’d) | | Portfolio of Investments
As of December 31, 2005 |
| | | | | |
| SHARES | | DESCRIPTION | | VALUE (NOTE 1) |
| | | | | | |
| | |
| | | Spain—3.2% | | | |
| 58,900 | | Banco Bilbao Vizcaya Argentaria SA | | $ | 1,051,549 |
| 47,000 | | Banco Santander Central Hispano SA | | | 620,420 |
| 6,700 | | Compania Espanola de Petroleos SA | | | 306,575 |
| 42,800 | | Endesa SA | | | 1,125,902 |
| 37,600 | | Repsol YPF SA | | | 1,098,171 |
| 59,568 | | Sogecable SA | | | 2,387,882 |
| 22,000 | | Union Fenosa SA | | | 818,616 |
| | | | |
|
|
| | | | | | 7,409,115 |
| | | | |
|
|
| | |
| | | Sweden—1.0% | | | |
| 34,200 | | Electrolux AB, Series B | | | 888,955 |
| 146,400 | | Nordea Bank AB | | | 1,520,297 |
| | | | |
|
|
| | | | | | 2,409,252 |
| | | | |
|
|
| | |
| | | Switzerland—8.0% | | | |
| 2,000 | | Georg Fischer AG(a) | | | 683,384 |
| 3,600 | | Givaudan SA | | | 2,439,633 |
| 55,048 | | Logitech International(a) | | | 2,586,822 |
| 39,950 | | Novartis AG | | | 2,099,271 |
| 1,900 | | Rieter Holdings AG | | | 563,906 |
| 17,200 | | Roche Holding AG | | | 2,582,520 |
| 2,400 | | Swisscom AG | | | 757,505 |
| 3,800 | | Syngenta AG | | | 472,813 |
| 54,700 | | UBS AG | | | 5,207,542 |
| 5,900 | | Zurich Financial Services AG(a) | | | 1,257,182 |
| | | | |
|
|
| | | | | | 18,650,578 |
| | | | |
|
|
| | |
| | | United Kingdom—21.8% | | | |
| 30,000 | | Alliance & Leicester PLC | | | 513,050 |
| 50,900 | | Arriva PLC | | | 510,112 |
| 13,100 | | AstraZeneca PLC | | | 637,612 |
| 115,800 | | Aviva PLC | | | 1,404,590 |
| 143,600 | | BAE SYSTEMS PLC | | | 943,160 |
| 378,400 | | Barclays PLC | | | 3,977,813 |
| 49,900 | | BP PLC, ADR | | | 3,204,578 |
| 137,900 | | Bradford & Bingley PLC | | | 973,934 |
| 453,600 | | BT Group PLC | | | 1,738,372 |
| 219,500 | | Cadbury Schweppes PLC | | | 2,075,172 |
| 48,200 | | Dairy Crest Group PLC | | | 453,614 |
| 231,500 | | DSG International PLC | | | 652,205 |
| 74,000 | | Firstgroup PLC | | | 511,493 |
| 185,400 | | GKN PLC(a) | | | 918,659 |
| 116,800 | | GlaxoSmithkKine PLC | | | 2,952,002 |
| 101,700 | | Hanson PLC | | | 1,118,082 |
| 128,000 | | HBOS PLC | | | 2,186,811 |
See Notes to Financial Statements beginning on page 130
| | |
| 74 | | THE TARGET PORTFOLIO TRUST |
| | | | | | |
| SHARES | | DESCRIPTION | | VALUE (NOTE 1) | |
| | | | | | | |
| | |
| | | United Kingdom (cont’d.) | | | | |
| 103,500 | | House of Fraser PLC(a) | | $ | 201,665 | |
| 80,600 | | Interserve PLC | | | 501,991 | |
| 34,000 | | Kelda Group PLC | | | 452,764 | |
| 286,800 | | Legal & General PLC | | | 601,992 | |
| 490,600 | | Lloyds TSB Group PLC | | | 4,123,292 | |
| 126,000 | | Mitchells & Butlers PLC | | | 906,147 | |
| 95,500 | | Next PLC | | | 2,522,108 | |
| 184,500 | | Northern Foods PLC | | | 480,907 | |
| 183,900 | | Northumbrian Water Group PLC | | | 770,429 | |
| 423,100 | | Old Mutual PLC(a) | | | 1,199,280 | |
| 345,800 | | Pilkington PLC | | | 886,468 | |
| 80,100 | | Royal Bank of Scotland Group PLC | | | 2,418,586 | |
| 41,600 | | Royal Dutch Shell PLC (Class A Shares) | | | 1,269,665 | |
| 73,212 | | Royal Dutch Shell PLC (Class B Shares) | | | 2,340,345 | |
| 113,500 | | Scottish Power PLC | | | 1,061,323 | |
| 124,709 | | Shanks Group PLC | | | 332,569 | |
| 82,500 | | Tate & Lyle PLC | | | 799,124 | |
| 146,100 | | Taylor Woodrow PLC | | | 956,438 | |
| 311,600 | | Tesco PLC | | | 1,777,186 | |
| 54,900 | | TT Electronics PLC(a) | | | 138,849 | |
| 36,000 | | Viridian Group PLC | | | 554,032 | |
| 82,300 | | Vodafone Group PLC, ADR | | | 1,766,981 | |
| | | | |
|
|
|
| | | | | | 50,833,400 | |
| | | | |
|
|
|
| | |
| | | United States—1.0% | | | | |
| 64,200 | | Willis Group Holdings Ltd. | | | 2,371,548 | |
| | | | |
|
|
|
| | | Total long-term investments
(cost $203,203,552) | | | 232,776,336 | |
| | | | |
|
|
|
| | |
| | | SHORT-TERM INVESTMENT—0.5% | | | | |
| | |
| | | Affiliated Money Market Mutual Fund | | | | |
| 1,039,230 | | Dryden Core Investment Fund—Taxable Money Market Series
(cost $1,039,230; Note 3)(b) | | | 1,039,230 | |
| | | | |
|
|
|
| | | Total Investments(c)—100.3%
(cost $204,242,782; Note 5) | | | 233,815,566 | |
| | | Liabilities in excess of other assets(d)—(0.3)% | | | (665,417 | ) |
| | | | |
|
|
|
| | | Net Assets—100% | | $ | 233,150,149 | |
| | | | |
|
|
|
The following abbreviations are used in portfolio descriptions:
ADR—American Depositary Receipt
| (a) | Non-income producing security. |
| (b) | Prudential Investments LLC, the manager of the Fund also serves as manager of the Dryden Core Investment Fund—Taxable Money Market Series. |
| (c) | As of December 31, 2005, 72 securities representing $71,432,035 and 30.6% of the total market value were fair valued in accordance with the policies adopted by the Board of Trustees. |
| (d) | Liabilities in excess of other assets includes net unrealized appreciation on forward foreign currency exchange contracts as follows: |
See Notes to Financial Statements beginning on page 130
| | |
| THE TARGET PORTFOLIO TRUST | | 75 |
| | |
International Equity Portfolio (cont’d) | | Portfolio of Investments
As of December 31, 2005 |
Forward foreign currency exchange contracts outstanding at December 31, 2005:
| | | | | | | | | | |
| Purchase Contracts | | | | | | | |
Description
| | Value at Settlement Date Payable
| | Value at December 31, 2005
| | Unrealized Appreciation (Depreciation)
| |
Australian Dollar, | | | | | | | | | | |
Expiring 1/04/06 | | $ | 64,949 | | $ | 65,526 | | $ | 577 | |
Euros, | | | | | | | | | | |
Expiring 1/04/06 | | | 57,427 | | | 57,419 | | | (8 | ) |
Expiring 1/04/06 | | | 61,449 | | | 61,054 | | | (395 | ) |
Japanese Yen, | | | | | | | | | | |
Expiring 1/06/06 | | | 43,422 | | | 43,396 | | | (26 | ) |
| | |
|
| |
|
| |
|
|
|
| | | $ | 227,247 | | $ | 227,395 | | $ | 148 | |
| | |
|
| |
|
| |
|
|
|
| | | | | | | | | | |
| Sale Contracts | | | | | | | |
Description
| | Value at Settlement Date Receivable
| | Value at December 31, 2005
| | Unrealized Appreciation (Depreciation)
| |
Australian Dollar, | | | | | | | | | | |
Expiring 1/04/06 | | $ | 61,449 | | $ | 61,369 | | $ | 80 | |
Euros, | | | | | | | | | | |
Expiring 1/04/06 | | | 173,973 | | | 173,975 | | | (2 | ) |
Expiring 4/04/06 | | | 6,389,363 | | | 6,308,198 | | | 81,165 | |
Expiring 4/04/06 | | | 3,232,320 | | | 3,249,317 | | | (16,997 | ) |
Pound Sterling, | | | | | | | | | | |
Expiring 6/05/06 | | | 3,975,666 | | | 3,960,052 | | | 15,614 | |
Japanese Yen, | | | | | | | | | | |
Expiring 1/04/06 | | | 45,367 | | | 45,321 | | | 46 | |
Expiring 1/04/06 | | | 85,806 | | | 85,723 | | | 83 | |
Expiring 1/04/06 | | | 64,949 | | | 64,360 | | | 589 | |
Expiring 6/01/06 | | | 6,094,489 | | | 6,070,617 | | | 23,872 | |
Expiring 6/01/06 | | | 3,005,762 | | | 3,035,308 | | | (29,546 | ) |
Mexican Peso, | | | | | | | | | | |
Expiring 6/06/06 | | | 6,235,592 | | | 6,160,198 | | | 75,394 | |
| | |
|
| |
|
| |
|
|
|
| | | $ | 29,364,736 | | $ | 29,214,438 | | $ | 150,298 | |
| | |
|
| |
|
| |
|
|
|
See Notes to Financial Statements beginning on page 130
| | |
| 76 | | THE TARGET PORTFOLIO TRUST |
The industry classification of long-term portfolio holdings, short-term investments and liabilities in excess of other assets shown as a percentage of net assets as of December 31, 2005 were as follows:
| | | |
Industry
| | | |
Banks | | 23.5 | % |
Oil & Gas | | 11.4 | |
Pharmaceuticals | | 8.8 | |
Telecommunications | | 7.7 | |
Auto—Cars/Light Trucks | | 6.8 | |
Insurance | | 5.4 | |
Electric | | 4.9 | |
Computers | | 3.8 | |
Retail | | 3.8 | |
Metals & Mining | | 2.9 | |
Food | | 2.5 | |
Aerospace/Defense | | 2.5 | |
Building Materials | | 2.4 | |
Cable TV | | 1.9 | |
Electronics | | 1.7 | |
Apparel | | 1.5 | |
Media | | 1.2 | |
Water | | 1.2 | |
Diversified Operations | | 1.0 | |
Transportation | | 0.9 | |
Consumer Services | | 0.9 | |
Machinery | | 0.8 | |
Entertainment | | 0.5 | |
Forestry | | 0.4 | |
Import/Export | | 0.4 | |
Textile—Products | | 0.3 | |
Office/Business Equipment | | 0.3 | |
Agricultural Operations | | 0.2 | |
Beverages | | 0.2 | |
Affiliated Money Market Mutual Fund | | 0.5 | |
| | |
|
|
| | | 100.3 | |
Liabilities in excess of other assets | | (0.3 | ) |
| | |
|
|
Total | | 100.0 | % |
| | |
|
|
See Notes to Financial Statements beginning on page 130
| | |
| THE TARGET PORTFOLIO TRUST | | 77 |
| | |
| International Bond Portfolio | | Portfolio of Investments
As of December 31, 2005 |
| | | | | | | | |
PRINCIPAL
AMOUNT (000)# | | DESCRIPTION | | VALUE
(NOTE 1) |
| | | | | | | | | |
| | | | | | | | | |
| | | | | | LONG-TERM INVESTMENTS—137.2% | | | |
| | | |
| | | | | | FOREIGN BONDS | | | |
| | | |
| | | | | | Austria—3.1% | | | |
| | | | | | Austrian Government International Bond | | | |
| | | $ | 560 | | 4.00%, 07/15/09 | | $ | 685,150 |
| | | | 511 | | 7.25%, 05/03/07 | | | 639,193 |
| | | | | | | |
|
|
| | | | | | | | | 1,324,343 |
| | | | | | | |
|
|
| | | |
| | | | | | Belgium—3.2% | | | |
| | | | | | Belgium Government Bond | | | |
| | | | 1,100 | | 4.25%, 09/28/14 | | | 1,396,707 |
| | | | | | | |
|
|
| | | |
| | | | | | Brazil—1.0% | | | |
| | | | | | Brazilian Government International Bond | | | |
| | | | 100 | | 10.271%, 06/29/09 | | | 115,500 |
| | | | 270 | | 10.50%, 07/14/14 | | | 330,885 |
| | | | | | | |
|
|
| | | | | | | | | 446,385 |
| | | | | | | |
|
|
| | | |
| | | | | | Denmark—0.5% | | | |
| | | | | | Denmark Government Bond | | | |
| DKK | | | 1,100 | | 6.00%, 11/15/11 | | | 201,252 |
| | | | | | | |
|
|
| | | |
| | | | | | Finland—15.0% | | | |
| | | | | | Finnish Government Bond | | | |
| | | | 1,590 | | 2.75%, 07/04/06 | | | 1,884,348 |
| | | | 2,010 | | 4.25%, 07/04/15 | | | 2,573,805 |
| | | | 1,450 | | 5.375%, 07/04/13 | | | 1,962,845 |
| | | | | | | |
|
|
| | | | | | | | | 6,420,998 |
| | | | | | | |
|
|
| | | |
| | | | | | France—5.1% | | | |
| | | | | | Credit Suisse Group Capital Guernsey V Ltd. | | | |
| | | | 80 | | 8.847%, 12/31/49 | | | 109,903 |
| | | | | | French Government Bond | | | |
| | | | 1,280 | | 5.75%, 10/25/32 | | | 2,072,683 |
| | | | | | | |
|
|
| | | | | | | | | 2,182,586 |
| | | | | | | |
|
|
| | | |
| | | | | | Germany—16.8% | | | |
| | | | | | Bayerische Hypo-und Vereinsbank AG | | | |
| | | | 400 | | 4.75%, 09/19/07 | | | 487,678 |
| | | | | | Deutsche Bundesrepublik | | | |
| | | | 2,900 | | 4.250%, 01/04/14 - 07/04/14 | | | 3,677,152 |
| | | | 100 | | 4.75%, 07/04/34 | | | 142,617 |
| | | | 200 | | 5.25%, 01/04/11 | | | 260,249 |
| | | | 560 | | 5.625%, 01/04/28 | | | 867,015 |
| | | | 800 | | 6.25%, 01/04/24 | | | 1,289,098 |
See Notes to Financial Statements beginning on page 130
| | |
| 78 | | THE TARGET PORTFOLIO TRUST |
| | | | | | | | |
PRINCIPAL
AMOUNT (000)# | | DESCRIPTION | | VALUE
(NOTE 1) |
| | | | | | | | | |
| | | |
| | | | | | Germany (cont’d) | | | |
| | | $ | 300 | | Deutsche Genossenschafts-Hypothekenbank
5.75%, 01/22/07 | | $ | 365,768 |
| | | | 100 | | German Postal Pensions Securitisation PLC
3.375%, 01/18/16 | | | 117,135 |
| | | | | | | |
|
|
| | | | | | | | | 7,206,712 |
| | | | | | | |
|
|
| | | |
| | | | | | Ireland—0.6% | | | |
| | | | 218 | | Atlantes Mortgage PLC, Series 1, Class A
2.455%, 01/17/36 | | | 254,844 |
| | | | | | | |
|
|
| | | |
| | | | | | Italy—0.7% | | | |
| | | | 245 | | Argo Mortgages Ser. L, Series 1, Class A
2.469%, 10/28/36 | | | 290,610 |
| | | | | | | |
|
|
| | | |
| | | | | | Japan—15.6% | | | |
| | | | 500 | | Development Bank of Japan
4.25%, 06/09/15 | | | 477,858 |
| JPY | | | 1,000 | | Japan Fin. Corp., Gov’t Guart’d
1.55%, 02/21/12 | | | 8,703 |
| JPY | | | 10,000 | | Japanese Government Bond
2.30%, 06/20/35 | | | 84,303 |
| | | | | | Japanese Government Bonds | | | |
| JPY | | | 187,000 | | 0.60%, 03/20/09 | | | 1,588,643 |
| JPY | | | 34,000 | | 1.20%, 09/20/12 | | | 289,645 |
| JPY | | | 145,000 | | 1.40%, 12/20/13 | | | 1,239,359 |
| JPY | | | 290,000 | | 1.600%, 06/20/14 - 09/20/14 | | | 2,504,547 |
| JPY | | | 59,600 | | 2.30%, 05/20/30 | | | 514,553 |
| | | | | | | |
|
|
| | | | | | | | | 6,707,611 |
| | | | | | | |
|
|
| | | |
| | | | | | Luxembourg—2.7% | | | |
| EUR | | | 900 | | Inter-American Development Bank
5.50%, 03/30/10 | | | 1,166,691 |
| | | | | | | |
|
|
| | | |
| | | | | | Netherlands—6.5% | | | |
| | | | 500 | | Arena BV, Series 2003-I, Class A2
4.30%, 05/19/49 | | | 618,508 |
| | | | 70 | | Deutsche Telekom International Finance BV
7.50%, 01/24/33 | | | 115,665 |
| | | | 500 | | Dutch MBS BV, Series X, Class A
2.45%, 10/02/49 | | | 593,972 |
| | | | | | Netherlands Government Bond | | | |
| | | | 600 | | 3.75%, 07/15/09 | | | 728,235 |
| | | | 400 | | 7.50%, 01/15/23 | | | 714,220 |
| | | | | | | |
|
|
| | | | | | | | | 2,770,600 |
| | | | | | | |
|
|
| | | |
| | | | | | Peru—0.3% | | | |
| | | | 100 | | Peru Government International Bond
9.125%, 02/21/12 | | | 114,250 |
| | | | | | | |
|
|
See Notes to Financial Statements beginning on page 130
| | |
| THE TARGET PORTFOLIO TRUST | | 79 |
| | |
International Bond Portfolio (cont’d) | | Portfolio of Investments
As of December 31, 2005 |
| | | | | | | | |
PRINCIPAL
AMOUNT (000)# | | DESCRIPTION | | VALUE
(NOTE 1) |
| | | | | | | | | |
| | | |
| | | | | | Portugal—3.6% | | | |
| EUR | | $ | 1,320 | | Portugese Obrigacoes do Tesouro OT
3.00%, 07/17/06 | | $ | 1,566,129 |
| | | | | | | |
|
|
| | | |
| | | | | | Russia—0.5% | | | |
| | | | 200 | | Russian Government International Bond
5.00%, 03/31/30 | | | 225,780 |
| | | | | | | |
|
|
| | | |
| | | | | | South Africa—0.5% | | | |
| | | | 200 | | South African Government International Bond
7.375%, 04/25/12 | | | 222,500 |
| | | | | | | |
|
|
| | | |
| | | | | | Spain—5.1% | | | |
| | | | | | Spanish Government Bond | | | |
| | | | 100 | | 4.20%, 01/31/37 | | | 131,448 |
| | | | 1,600 | | 4.40%, 01/31/15 | | | 2,059,481 |
| | | | | | | |
|
|
| | | | | | | | | 2,190,929 |
| | | | | | | |
|
|
| | | |
| | | | | | United Kingdom—26.7% | | | |
| | | | 40 | | Bank of Scotland
6.125%, 02/15/13 | | | 55,178 |
| | | | 500 | | Chester Asset Receivables Dealings No 11
6.125%, 10/15/10 | | | 664,120 |
| GBP | | | 5 | | European Investment Bank
7.625%, 12/07/06 | | | 8,855 |
| EUR | | | 60 | | Hilton Group Finance PLC
6.50%, 07/17/09 | | | 75,586 |
| | | | 500 | | Permanent Financing PLC
5.10%, 06/11/07 | | | 608,954 |
| | | | 300 | | Royal Bank of Scotland PLC
4.231%, 07/21/08 | | | 299,973 |
| GBP | | | 3,150 | | United Kingdom Treasury
4.75%, 06/07/10 | | | 5,546,256 |
| GBP | | | 100 | | United Kingdom Treasury Stock
5.00%, 09/07/14 | | | 183,094 |
| GBP | | | 2,200 | | 5.75%, 12/07/09 | | | 3,997,041 |
| | | | | | | |
|
|
| | | | | | | | | 11,439,057 |
| | | | | | | |
|
|
| | | |
| | | | | | UNITED STATES BONDS | | | |
| | | |
| | | | | | Corporate Bonds—6.5% | | | |
| EUR | | | 300 | | Chase Credit Card Master Trust
5.00%, 08/15/08 | | | 371,237 |
| | | | 650 | | Citibank Credit Card Issuance Trust
5.375%, 04/10/13 | | | 843,346 |
| | | | 80 | | Goldman Sachs Group, Inc.
5.125%, 04/24/13 | | | 103,534 |
See Notes to Financial Statements beginning on page 130
| | |
| 80 | | THE TARGET PORTFOLIO TRUST |
| | | | | | | | |
PRINCIPAL
AMOUNT (000)# | | DESCRIPTION | | VALUE
(NOTE 1) |
| | | | | | | | | |
| | | |
| | | | | | Corporate Bonds (cont’d.) | | | |
| | | $ | 550 | | MBNA Credit Card Master Note Trust
5.60%, 07/17/14 | | $ | 729,241 |
| | | | 100 | | Mizuho Financial Group Cayman Ltd.
4.75%, 04/15/14 | | | 123,055 |
| | | | 100 | | Mizuho Preferred Capital Co. LLC
8.79%, 12/31/49 | | | 108,108 |
| EUR | | | 50 | | RBS Capital Trust A
6.467%, 12/31/49 | | | 68,163 |
| | | | 250 | | Student Loan Marketing
3.80%, 06/17/10 | | | 302,290 |
| | | | 100 | | Zurich Finance USA, Inc.
7.355%, 10/02/23 | | | 130,543 |
| | | | | | | |
|
|
| | | | | | | | | 2,779,517 |
| | | | | | | |
|
|
| | | |
| | | | | | U.S. Government Mortgage Backed Obligations—11.2% | | | |
| | | | | | Federal National Mortgage Assoc. | | | |
| | | | 18 | | 3.50%, 03/25/09 | | | 18,311 |
| | | | 1,800 | | 5.50%, TBA | | | 1,782,000 |
| | | | 2,775 | | 5.50%, 04/01/33 - 05/01/35 | | | 2,750,255 |
| | | | 200 | | 8.95%, 02/12/18 | | | 273,585 |
| | | | | | | |
|
|
| | | | | | | | | 4,824,151 |
| | | | | | | |
|
|
| | | |
| | | | | | U.S. Treasury Obligations—10.9% | | | |
| | | | | | U.S. Treasury Bonds | | | |
| | | | 1,000 | | 3.875%, 05/15/10 | | $ | 981,055 |
| | | | 400 | | 4.25%, 08/15/13 | | | 396,422 |
| | | | 100 | | 4.875%, 02/15/12 | | | 102,668 |
| | | | 800 | | 8.75%, 05/15/17 | | | 1,098,562 |
| | | | 1,200 | | 8.875%, 02/15/19 | | | 1,706,437 |
| | | | | | U.S. Treasury Bonds, TIPS | | | |
| | | | 200 | | 1.625%, 01/15/15 | | | 200,957 |
| | | | 200 | | 1.875%, 07/15/15 | | | 201,379 |
| | | | | | | |
|
|
| | | | | | | | | 4,687,480 |
| | | | | | | |
|
|
| | | |
| | | | | | Asset-Backed Securities—0.4% | | | |
| | | | 14 | | Chase Funding Loan Acquisition Trust, Series 2003-C1, Class 2A2 4.521%, 01/25/33 | | | 14,041 |
| | | | 7 | | CIT Group Home Equity Loan Trust, Series 2002-1, Class AV
4.669%, 03/25/33 | | | 6,538 |
| | | | 64 | | Federal National Mortgage Assoc., Series 2005-73, Class A1A
4.419%, 07/25/35 | | | 64,502 |
| | | | 70 | | GMAC Mortgage Corp Loan Trust, Series 2004-J4, Class A1
5.50%, 09/25/34 | | | 69,360 |
See Notes to Financial Statements beginning on page 130
| | |
| THE TARGET PORTFOLIO TRUST | | 81 |
| | |
International Bond Portfolio (cont’d) | | Portfolio of Investments
As of December 31, 2005 |
| | | | | | | | |
PRINCIPAL
AMOUNT (000)# | | DESCRIPTION | | VALUE
(NOTE 1) |
| | | | | | | | | |
| | | |
| | | | | | Asset-Backed Securities (cont’d.) | | | |
| | | $ | 2 | | Long Beach Mortgage Loan Trust, Series 2003-3, Class A
4.511%, 07/25/33 | | $ | 1,620 |
| | | | | | | |
|
|
| | | | | | | | | 156,061 |
| | | | | | | |
|
|
| | | |
| | | | | | Municipal Bond—0.3% | | | |
| | | | 100 | | Liberty Development Corp.
5.25%, 10/01/35 | | | 112,759 |
| | | | | | | |
|
|
| | | |
| | | | | | U.S. Government Agency Obligations—0.4% | | | |
| | | | 74 | | Fannie Mae Whole Loan, Series 2004-W12 Class 1A1
6.00%, 07/25/44 | | | 74,627 |
| | | | 98 | | Small Business Administration Participation Certificates,
Series 2005-20, Class 1
4.84%, 05/01/25 | | | 96,757 |
| | | | | | | |
|
|
| | | | | | | | | 171,384 |
| | | | | | | |
|
|
| | | | | | Total long-term investments
(cost $57,811,356) | | | 58,859,336 |
| | | | | | | |
|
|
| | | |
| | | | | | SHORT-TERM INVESTMENTS—0.7% | | | |
| | | |
| | | | | | U.S. Treasury Obligation—0.4% | | | |
| | | | 180 | | U.S. Treasury Bills(a)
3.83%, 03/16/06 | | | 178,592 |
| | | | | | | |
|
|
| | | |
| | | | | | Commercial Paper—0.2% | | | |
| | | | 100 | | Barclays US Funding
4.20%, 02/27/06 | | | 99,336 |
| | | | | | | |
|
|
Contracts/ Notional Amounts
| | | | |
| | | |
| | | | | | OPTIONS PURCHASED*—0.1% | | | |
| | | |
| | | | | | Put Options | | | |
| | | | 8 | | Eurodollar Futures
expiring 06/19/06 @ $95 | | | 1,400 |
| | | | 10 | | Eurodollar Futures,
expiring 03/13/06 @$95.125 | | | 56 |
| | | | | | | |
|
|
| | | | | | | | | 1,456 |
| | | | | | | |
|
|
| | | |
| | | | | | Call Options | | | |
| | | | 8 | | Eurodollar Futures,
expiring 06/19/06 @$95 | | | 4,450 |
| | | | 5,700,000 | | Interest Rate Swap 3 Month LIBOR
expiring 12/22/06 @ 4.8% | | | 33,875 |
| | | | | | | |
|
|
| | | | | | | | | 38,325 |
| | | | | | | |
|
|
| | | | | | Total Options Purchased | | | 39,781 |
| | | | | | | |
|
|
See Notes to Financial Statements beginning on page 130
| | |
| 82 | | THE TARGET PORTFOLIO TRUST |
| | | | | | | | | |
CONTRACTS/ NOTIONAL AMOUNTS | | DESCRIPTION | | VALUE
(NOTE 1) | |
| | | | | | | | | | |
| | | |
| | | | | | OPTIONS PURCHASED* (cont’d.) | | | | |
| | | | | | Total Short-Term Investments
(cost $316,339) | | $ | 317,709 | |
| | | | | | | |
|
|
|
| | | |
| | | | | | Total Investments, Before Outstanding Options Written and
Securities Sold Short—137.9%
(cost $58,127,695; Note 5) | | | 59,177,045 | |
| | | | | | | |
|
|
|
| | | |
| | | | | | OPTIONS WRITTEN*—(0.1)% | | | | |
| | | | | | Put Options | | | | |
| | | | | | Eurodollar Futures | | | | |
| | | | 10 | | expiring 03/10/06 @ $94.875 | | | (875 | ) |
| | | | | | Eurodollar Futures | | | | |
| | | | 8 | | expiring 06/16/06 @ $94.75 | | | (1,000 | ) |
| | | | | | | |
|
|
|
| | | | | | Total Put Options
(premiums received $1,816) | | | (1,875 | ) |
| | | | | | | |
|
|
|
| | | | | | Call Options—(0.1)% | | | | |
| | | | 2,500,000 | | Interest Rate Swap 3 Month LIBOR, 4.850%
expiring 12/22/06 @ 4.85% | | | (36,085 | ) |
| | | | 8 | | Eurodollar Futures expiring
06/16/2006 @ $95.25 | | | (5,100 | ) |
| | | | | | | |
|
|
|
| | | | | | Total Call Options
(premiums received $37,887) | | | (41,185 | ) |
| | | | | | | |
|
|
|
| | | | | | Total Options Written
(premiums received $39,703) | | | (43,060 | ) |
| | | | | | | |
|
|
|
Principal
Amount (000)#
| | | | | |
| | | |
| | | | | | SECURITIES SOLD SHORT—(13.9)% | | | | |
| | | |
| | | | | | Foreign Government Bonds—(12.7)% | | | | |
| EUR | | | 200 | | Deutsche Bundesrepublik
5.25%, 01/04/11 | | | (260,248 | ) |
| GBP | | | 1,925 | | United Kingdom Gilt
4.75%, 06/07/10 | | | (3,389,378 | ) |
| GBP | | | 1,000 | | United Kingdom Gilt
5.75%, 12/07/09 | | | (1,816,837 | ) |
| | | | | | | |
|
|
|
| | | | | | | | | (5,466,463 | ) |
| | | | | | | |
|
|
|
| | | |
| | | | | | U.S. Treasury Obligations—(1.2)% | | | | |
| | | | 400 | | U.S. Treasury Bond
4.25%, 08/15/13 | | | (396,422 | ) |
| | | | 100 | | U.S. Treasury Bond
4.875%, 02/15/12 | | | (102,668 | ) |
| | | | | | | |
|
|
|
| | | | | | | | | (499,090 | ) |
| | | | | | | |
|
|
|
| | | | | | Total Securities Sold Short
(cost $(6,119,382)) | | | (5,965,553 | ) |
| | | | | | | |
|
|
|
See Notes to Financial Statements beginning on page 130
| | |
| THE TARGET PORTFOLIO TRUST | | 83 |
| | |
International Bond Portfolio (cont’d) | | Portfolio of Investments
As of December 31, 2005 |
| | | | | | | | |
PRINCIPAL
AMOUNT (000)# | | DESCRIPTION | | VALUE
(NOTE 1) | |
| | | | | | | | | |
| | | |
| | | | | Total Investments, Net of Outstanding Options Written and Securities Sold Short—123.9%
(cost $51,968,610) | | $ | 53,168,432 | |
| | | | | Liabilities in excess of other assets(b)—(23.9)% | | | (10,256,842 | ) |
| | | | | | |
|
|
|
| | | | | Net Assets—100% | | $ | 42,911,590 | |
| | | | | | |
|
|
|
| * | Non-income producing security. |
| # | Principal amount is shown in U.S. dollars unless otherwise stated. |
The following abbreviations are used in portfolio descriptions:
NR—Not Rated by Moodys or Standard & Poor’s
TBA—To Be Announced
TIPS—Treasury Inflation Protected Securities
DKK—Denmark Krone
EUR—Euro
GBP—British Pound
JPY—Japanese Yen
| (a) | Segregated as collateral for financial futures contracts. |
| (b) | Liabilities in excess of other assets includes net unrealized appreciation (depreciation) on futures contracts, forward foreign currency contracts, and interest rate swap agreements at December 31, 2005: |
Open futures contracts outstanding at December 31, 2005:
| | | | | | | | | | | | | | |
Number of
Contracts
| | Type
| | Expiration
Month
| | Value at
Trade Date
| | Value at
December 31, 2005
| | Unrealized
Appreciation
(Depreciation)
| |
| Long Positions: | | | | | | | | | | | | | | |
| 30 | | Euro Dollar | | Sep 06 | | $ | 7,138,313 | | $ | 7,137,000 | | $ | (1,313 | ) |
| 2 | | Japanese Government 10 Year Bond | | Mar 06 | | | 2,326,536 | | | 2,329,249 | | | 2,713 | |
| 4 | | U.S. Treasury 5 Year Note | | Mar 06 | | | 423,500 | | | 425,375 | | | 1,875 | |
| 6 | | U.S. Treasury 10 Year Note | | Mar 06 | | | 651,422 | | | 656,438 | | | 5,016 | |
| Short Positions: | | | | | | | | | | | | | | |
| 12 | | Euro 10 Year Bond | | Mar 06 | | | 1,739,330 | | | 1,730,948 | | | (8,382 | ) |
| 4 | | Euro Dollar | | Mar 06 | | | 950,550 | | | 952,250 | | | 1,700 | |
| | | | | | | | | | | | |
|
|
|
| | | | | | | | | | | | | $ | 1,609 | |
| | | | | | | | | | | | |
|
|
|
Forward foreign exchange contracts outstanding at December 31, 2005:
| | | | | | | | | | |
| | | |
Purchase Contracts | | | | | | | | | | |
Description
| | Value at Settlement
Date Payable
| | Value at
December 31, 2005
| | Unrealized
Appreciation
(Depreciation)
| |
Canadian Dollars,
Expiring 1/12/06 | | $ | 30,410 | | $ | 30,121 | | $ | (289 | ) |
Euros,
Expiring 1/18/06 | | | 91,839 | | | 91,160 | | | (679 | ) |
Expiring 1/18/06 | | | 53,408 | | | 53,275 | | | (133 | ) |
See Notes to Financial Statements beginning on page 130
| | |
| 84 | | THE TARGET PORTFOLIO TRUST |
| | | | | | | | | | |
Purchase Contracts Cont’d. | | | | | | | | | | |
Description
| | Value at Settlement
Date Payable
| | Value at
December 31, 2005
| | Unrealized
Appreciation
(Depreciation)
| |
Indonesia Rupiah,
Expiring 1/03/06 | | $ | 38,105 | | $ | 41,780 | | $ | 3,675 | |
India Rupee,
Expiring 3/20/06 | | | 29,588 | | | 28,898 | | | (690 | ) |
Peruvian New Sol,
Expiring 3/13/06 | | | 19,781 | | | 19,025 | | | (756 | ) |
Singapore Dollar,
Expiring 3/20/06 | | | 10,207 | | | 10,253 | | | 46 | |
Taiwan Dollar,
Expiring 3/21/06 | | | 37,125 | | | 37,321 | | | 196 | |
| | |
|
| |
|
| |
|
|
|
| | | $ | 310,463 | | $ | 311,833 | | $ | 1,370 | |
| | |
|
| |
|
| |
|
|
|
| | | | | | | | | | |
Sale Contracts | | | | | | | | | | |
Description
| | Value at Settlement
Date Receivable
| | Value at
December 31, 2005
| | Unrealized
Appreciation
(Depreciation)
| |
Canadian Dollars,
Expiring 1/12/06 | | $ | 29,827 | | $ | 30,109 | | $ | (282 | ) |
Denmark Krone,
Expiring 3/06/06 | | | 209,195 | | | 211,019 | | | (1,824 | ) |
Euros,
Expiring 1/10/06 | | | 263,037 | | | 264,008 | | | (971 | ) |
Expiring 1/18/06 | | | 53,411 | | | 53,275 | | | 136 | |
Expiring 1/18/06 | | | 763,301 | | | 762,428 | | | 873 | |
Expiring 1/18/06 | | | 24,993,345 | | | 25,238,166 | | | (244,821 | ) |
Expiring 1/18/06 | | | 1,324,466 | | | 1,306,056 | | | 18,410 | |
Indonesia Rupiah,
Expiring 1/03/06 | | | 40,304 | | | 41,780 | | | (1,476 | ) |
India Rupee,
Expiring 3/20/06 | | | 28,691 | | | 28,898 | | | (207 | ) |
Japanese Yen
Expiring 1/10/06 | | | 5,038,822 | | | 5,039,327 | | | (505 | ) |
Expiring 1/10/06 | | | 83,993 | | | 82,333 | | | 1,660 | |
Peruvian New Sol,
Expiring 3/13/06 | | | 19,236 | | | 19,025 | | | 211 | |
Pound Sterling,
Expiring 1/12/06 | | | 166,511 | | | 166,878 | | | (367 | ) |
Singapore Dollar,
Expiring 3/20/06 | | | 10,107 | | | 10,253 | | | (146 | ) |
Taiwan Dollar,
Expiring 3/21/06 | | | 36,544 | | | 37,321 | | | (777 | ) |
| | |
|
| |
|
| |
|
|
|
| | | $ | 33,060,790 | | $ | 33,290,876 | | $ | (230,086 | ) |
| | |
|
| |
|
| |
|
|
|
See Notes to Financial Statements beginning on page 130
| | |
| THE TARGET PORTFOLIO TRUST | | 85 |
| | |
International Bond Portfolio (cont’d) | | Portfolio of Investments
As of December 31, 2005 |
Interest rate swap agreements outstanding at December 31, 2005:
| | | | | | | | | | | | | |
Counterparty
| | Termination
Date
| | Notional
Amount
| | Fixed
Rate
| | | Floating Rate
| | Unrealized
Appreciation
(Depreciation)
| |
| Merrill Lynch & Co.(2) | | 12/16/14 | | 500,000 | | 5.50 | % | | 3 Month Canadian
Bank Rate | | $ | (9,150 | ) |
| UBS AG(1) | | 09/15/10 | | 400,000 | | 5.00 | % | | 6 Month LIBOR | | | 13,848 | |
| Barclays Capital(1) | | 09/15/10 | | 700,000 | | 5.00 | % | | 6 Month LIBOR | | | 24,079 | |
| Morgan Stanley(1) | | 12/16/14 | | 400,000 | | 5.50 | % | | 3 Month LIBOR | | | (825 | ) |
| Goldman Sachs & Co(2) | | 06/17/15 | | 3,300,000 | | 4.50 | % | | 6 Month Euribor | | | (328,819 | ) |
| Morgan Stanley Capital Services, Inc.(2) | | 06/17/15 | | 900,000 | | 4.50 | % | | 6 Month LIBOR | | | (94,417 | ) |
| Morgan Stanley Capital Services, Inc.(2) | | 12/15/14 | | 100,000 | | 4.00 | % | | 6 Month Euribor | | | (5,275 | ) |
| Barclays Capital(1) | | 06/18/34 | | 600,000 | | 5.00 | % | | 6 Month LIBOR | | | (29,622 | ) |
| JP Morgan(2) | | 06/18/34 | | 400,000 | | 5.00 | % | | 6 Month LIBOR | | | (16,565 | ) |
| Barclays Capital(1) | | 09/15/10 | | 1,500,000 | | 5.00 | % | | 6 Month LIBOR | | | 28,223 | |
| Morgan Stanley(1) | | 06/21/08 | | 1,800,000 | | 5.00 | % | | 3 Month LIBOR | | | 3,453 | |
| Goldman Sachs & Co(1) | | 06/21/08 | | 10,300,000 | | 5.00 | % | | 3 Month LIBOR | | | 13,140 | |
| JP Morgan(2) | | 12/15/14 | | 600,000 | | 4.00 | % | | 6 Month Euribor | | | (4,110 | ) |
| UBS AG(2) | | 06/21/16 | | 1,100,000 | | 5.00 | % | | 3 Month LIBOR | | | (13,466 | ) |
| JP Morgan(1) | | 09/15/10 | | 800,000 | | 5.00 | % | | 6 Month LIBOR | | | 15,366 | |
| Lehman Brothers Special Financing, Inc.(2) | | 06/21/11 | | 300,000 | | 5.00 | % | | 3 Month LIBOR | | | (1,523 | ) |
| Bank of America N.A.(2) | | 06/21/16 | | 2,800,000 | | 5.00 | % | | 3 Month LIBOR | | | (32,922 | ) |
| Goldman Sachs & Co(2) | | 06/21/16 | | 1,700,000 | | 5.00 | % | | 3 Month LIBOR | | | (9,877 | ) |
| Lehman Brothers Special Financing, Inc.(2) | | 06/21/16 | | 500,000 | | 5.00 | % | | 3 Month LIBOR | | | (6,073 | ) |
| Lehman Brothers Special Financing, Inc.(2) | | 06/21/13 | | 4,200,000 | | 5.00 | % | | 3 Month LIBOR | | | (30,000 | ) |
| Barclays Capital(2) | | 06/21/11 | | 1,400,000 | | 5.00 | % | | 3 Month LIBOR | | | (7,105 | ) |
| UBS AG(1) | | 06/21/11 | | 400,000 | | 5.00 | % | | 6 Month LIBOR | | | (2,030 | ) |
| Lehman Brothers Special Financing, Inc.(2) | | 09/15/10 | | 1,100,000 | | 5.00 | % | | 6 Month LIBOR | | | 37,879 | |
| | | | | | | | | | | |
|
|
|
| | | | | | | | | | | | $ | (455,791 | ) |
| | | | | | | | | | | |
|
|
|
| (1) | Portfolio pays the floating rate and receives the fixed rate. |
| (2) | Portfolio pays the fixed rate and receives the floating rate. |
See Notes to Financial Statements beginning on page 130
| | |
| 86 | | THE TARGET PORTFOLIO TRUST |
The country breakdown of long-term portfolio holdings, short-term investments, securities sold short, outstanding options written and liabilities in excess of other assets shown as a percentage of net assets as of December 31, 2005 were as follows:
| | | |
United States | | 29.7 | % |
United Kingdom | | 26.7 | |
Germany | | 16.8 | |
Japan | | 15.6 | |
Finland | | 15.0 | |
Netherlands | | 6.5 | |
France | | 5.1 | |
Spain | | 5.1 | |
Portugal | | 3.6 | |
Belgium | | 3.2 | |
Austria | | 3.1 | |
Luxembourg | | 2.7 | |
Brazil | | 1.0 | |
Italy | | 0.7 | |
Ireland | | 0.6 | |
Denmark | | 0.5 | |
Russia | | 0.5 | |
South Africa | | 0.5 | |
Peru | | 0.3 | |
Short-Term Investments | | 0.7 | |
| | |
|
|
| | | 137.9 | |
Securities Sold Short | | (13.9 | ) |
Outstanding Options Written | | (0.1 | ) |
Liabilities in excess of other assets | | (23.9 | ) |
| | |
|
|
Total | | 100.0 | % |
| | |
|
|
See Notes to Financial Statements beginning on page 130
| | |
| THE TARGET PORTFOLIO TRUST | | 87 |
| | |
Total Return Bond Portfolio | | Portfolio of Investments
as of December 31, 2005 |
| | | | | | | |
MOODY’S
RATINGS
(UNAUDITED) | | PRINCIPAL
AMOUNT (000)# | | DESCRIPTION | | VALUE (NOTE 1) |
| | | | | | | | |
| | | | | | | | |
| | | | | LONG-TERM INVESTMENTS—104.9% | | | |
| | | |
| | | | | Asset-backed Securities—1.2% | | | |
| Aaa | | 741 | | Argent Securities Inc.,
Series 2005-W3, Class A2A(c)
4.479%, 11/25/35 | | $ | 740,573 |
| Aaa | | 1,230 | | Structured Asset Securities Corp.,
Series 2005-7XS, Class 2A1A(c)
4.90%, 04/25/35 | | | 1,203,752 |
| | | | | | |
|
|
| | | | | Total asset-backed securities
(cost $1,961,036) | | | 1,944,325 |
| | | | | | |
|
|
| | | |
| | | | | Collateralized Mortgage Obligations—3.3% | | | |
| AAA(d) | | 3 | | American Housing Trust,
Series I, Class 5,
8.625%, 08/25/18 | | | 3,036 |
| Aaa | | 143 | | Bear Stearns Adjustable Rate Mortgage Trust,
Series 2002-11, Class 1A1(c)
5.627%, 02/25/33 | | | 143,244 |
| Aaa | | 744 | | Bear Stearns Adjustable Rate Mortgage Trust,
Series 2005-4, Class 23A2(c)
5.424%, 05/25/35 | | | 742,710 |
| Aaa | | 1,700 | | Commercial Mortgage Pass-Thru Cert.,
Series 2005-F10A, Class M0A1(c)
4.549%, 03/15/20 | | | 1,699,781 |
| Aaa | | 17 | | Indymac Adjustable Rate Mortgage Trust,
Series 2001-H2, Class A1(c)
5.07%, 01/25/32 | | | 16,939 |
| Aaa | | 122 | | Residential Funding Mortgage Securities,
Series 2003-S9, Class A1
6.50%, 03/25/32 | | | 123,413 |
| Aaa | | 2,623 | | Washington Mutual, Inc.,
Series 2003-R1, Class A1(c)
4.649%, 12/25/27 | | | 2,621,533 |
| | | | | | |
|
|
| | | | | Total collateralized mortgage obligations
(cost $5,366,043) | | | 5,350,656 |
| | | | | | |
|
|
| | | |
| | | | | Corporate Bonds—8.4% | | | |
| | | |
| | | | | Airlines—0.3% | | | |
| NR | | 1,000 | | United Air Lines, Inc., Equipment Trust(i)
10.85%, 02/19/15 | | | 555,000 |
| | | | | | |
|
|
See Notes to Financial Statements beginning on page 130
| | |
| 88 | | THE TARGET PORTFOLIO TRUST |
| | | | | | | | |
MOODY’S
RATINGS
(UNAUDITED) | | PRINCIPAL
AMOUNT (000)# | | DESCRIPTION | | VALUE (NOTE 1) |
| | | | | | | | | |
| | | | | | Automobile Manufacturers—1.2% | | | |
| A3 | | | 1,800 | | DaimlerChrysler NA Holding Corp., Co. Gtd.(c)
4.70%, 03/07/07 | | $ | 1,798,160 |
| Ba2 | | | 300 | | General Motors Corp., Debs.
8.375%, 07/15/33 | | | 198,000 |
| | | | | | | |
|
|
| | | | | | | | | 1,996,160 |
| | | | | | | |
|
|
| | | | | | Capital Markets—0.9% | | | |
| Aaa | | JPY | 163,000 | | European Investment Bank, Notes
(Multi-National Bond)
3.00%, 09/20/06 | | | 1,410,245 |
| | | | | | | |
|
|
| | | | | | Entertainment & Leisure—0.9% | | | |
| Baa3 | | | 1,500 | | Harrah’s Operating Co., Inc., Bonds
5.625%, 06/01/15 | | | 1,473,633 |
| | | | | | | |
|
|
| | | | | | Financial—Bank & Trust—0.5% | | | |
| Aa2 | | | 800 | | HSBC Bank USA NA, Sr. Notes(c)
4.57%, 09/21/07 | | | 801,356 |
| | | | | | | |
|
|
| | | | | | Financial Services—2.4% | | | |
| Baa3 | | | 900 | | Ford Motor Credit Co., Bonds
7.375%, 02/01/11 | | | 788,866 |
| Baa3 | | | 1,000 | | Ford Motor Credit Co., Notes
7.00%, 10/01/13 | | | 854,457 |
| Ba1 | | | 1,500 | | General Motors Acceptance Corp., Notes
6.875%, 09/15/11 | | | 1,367,918 |
| Baa1 | | | 500 | | Pemex Project Funding Master Trust, Co. Gtd.
8.00%, 11/15/11 | | | 560,500 |
| Baa1 | | | 250 | | 9.125%, 10/13/10 | | | 287,750 |
| | | | | | | |
|
|
| | | | | | | | | 3,859,491 |
| | | | | | | |
|
|
| | | | | | Pipelines—0.8% | | | |
| Caa1 | | | 750 | | El Paso Corp., Sr. Notes
7.75%, 01/15/32 | | | 751,875 |
| Caa1 | | | 500 | | 7.80%, 08/01/31 | | | 498,750 |
| | | | | | | |
|
|
| | | | | | | | | 1,250,625 |
| | | | | | | |
|
|
| | | | | | Telecommunications—1.1% | | | |
| Ba3 | | | 250 | | Qwest Corp., Debs.
7.50%, 06/15/23 | | | 248,437 |
| Ba3 | | | 1,500 | | Qwest Corp., Sr. Notes
7.625%, 06/15/15 | | | 1,605,000 |
| | | | | | | |
|
|
| | | | | | | | | 1,853,437 |
| | | | | | | |
|
|
See Notes to Financial Statements beginning on page 130
| | |
| THE TARGET PORTFOLIO TRUST | | 89 |
| | |
Total Return Bond Portfolio (cont’d) | | Portfolio of Investments
As of December 31, 2005 |
| | | | | | | | |
MOODY’S
RATINGS
(UNAUDITED) | | PRINCIPAL
AMOUNT (000)# | | DESCRIPTION | | VALUE (NOTE 1) |
| | | | | | | | | |
| | | |
| | | | | | Utilities—0.3% | | | |
| Ba1 | | | 200 | | PPL Capital Fund Trust I, Co. Gtd.
7.29%, 05/18/06 | | $ | 201,214 |
| Baa2 | | | 201 | | TXU Energy Co. LLC, Sr. Notes(c)
4.92%, 01/17/06 | | | 200,992 |
| | | | | | | |
|
|
| | | | | | | | | 402,206 |
| | | | | | | |
|
|
| | | | | | Total corporate bonds
(cost $14,515,083) | | | 13,602,153 |
| | | | | | | |
|
|
| | | |
| | | | | | Foreign Government Bonds—4.3% | | | |
| Aa2 | | JPY | 287,000 | | Federal Republic of Italy (Italy)
0.375%, 10/10/06 | | | 2,439,499 |
| B1 | | | 48 | | Republic of Brazil (Brazil)
4.25%, 04/15/06, Brady Bond | | | 47,972 |
| B1 | | | 41 | | 4.313%, 04/15/12, Brady Bond | | | 40,662 |
| B1 | | | 1,000 | | Republic of Brazil (Brazil)
11.00%, 08/17/40 | | | 1,289,000 |
| Ba1 | | | 300 | | Republic of Panama (Panama)
8.875%, 09/30/27 | | | 357,000 |
| Ba1 | | | 450 | | 9.375%, 07/23/12 | | | 526,500 |
| Ba3 | | | 400 | | Republic of Peru (Peru)
9.125%, 01/15/08 | | | 430,000 |
| Baa3 | | | 1,250 | | Russian Federation (Russia)
5.00%, 03/31/30(b) | | | 1,411,125 |
| Aaa | | | GBP 200 | | United Kingdom Treasury (United Kingdom)
5.75%, 12/07/09 | | | 363,367 |
| | | | | | | |
|
|
| | | | | | Total Foreign Government Bonds
(cost $6,428,040) | | | 6,905,125 |
| | | | | | | |
|
|
| | | |
| | | | | | Municipal Bonds—5.6% | | | |
| Aaa | | | 500 | | Du Page County Illinois, Limited Tax
5.00%, 01/01/31 | | | 514,080 |
| Aaa | | | 500 | | Georgia State Road & Tollway Authority Revenue, Governors Transportation Choices
5.00%, 03/01/21 | | | 528,470 |
| Baa3 | | | 500 | | Golden State Tobacco Securitization Corp., Revenue, Series 2003, Class A-1
6.25%, 06/01/33 | | | 544,460 |
| Baa3 | | | 400 | | 6.75%, 06/01/39 | | | 449,512 |
| Aaa | | | 750 | | Massachusetts Water Resources Authority, Series J
5.00%, 08/01/32 | | | 774,592 |
| Aa1 | | | 600 | | Minnesota State Revenue
5.00%, 08/01/13 | | | 653,442 |
See Notes to Financial Statements beginning on page 130
| | |
| 90 | | THE TARGET PORTFOLIO TRUST |
| | | | | | | |
MOODY’S
RATINGS
(UNAUDITED) | | PRINCIPAL
AMOUNT (000)# | | DESCRIPTION | | VALUE (NOTE 1) |
| | | | | | | | |
| | | |
| | | | | Municipal Bonds (cont’d.) | | | |
| Aaa | | 1,500 | | New York City Trust For Cultural Resources, Museum of Modern Art, Series 2001, Class D
5.125%, 07/01/31 | | $ | 1,567,815 |
| Aaa | | 1,100 | | South Carolina State Highway, Series B
5.00%, 04/01/17 | | | 1,171,522 |
| Aaa | | 1,300 | | South Central Regional Water Authority Water System
5.00%, 08/01/26 | | | 1,373,307 |
| Baa3 | | 800 | | Tobacco Settlement Financing Corp., New Jersey State
6.00%, 06/01/37 | | | 829,656 |
| Baa3 | | 500 | | 6.375%, 06/01/32 | | | 549,630 |
| | | | | | |
|
|
| | | | | Total municipal bonds
(cost $8,273,828) | | | 8,956,486 |
| | | | | | |
|
|
| | |
| | | | | U.S. Government Mortgage Backed Obligations—60.7% |
| | | 2,000 | | Federal Home Loan Mortgage Corp.
5.00%, TBA | | | 1,935,624 |
| | | 96 | | 4.41%, 09/01/35(c) | | | 95,215 |
| | | 70 | | 5.089%, 01/01/24(c) | | | 71,044 |
| | | 69 | | 5.50%, 04/01/29 - 06/01/29 | | | 68,441 |
| | | 120 | | 6.00%, 09/01/22 | | | 121,999 |
| | | 97 | | 7.50%, 09/01/16 - 07/01/17 | | | 101,949 |
| | | 1 | | 9.25%, 01/01/10 | | | 981 |
| | | | | Federal National Mortgage Assoc.
| | | |
| | | 17,883 | | 4.00%, 08/01/18 - 06/01/19 | | | 17,101,515 |
| | | 147 | | 4.436%, 05/01/36(c) | | | 147,899 |
| | | 500 | | 4.50%, TBA | | | 470,781 |
| | | 7,160 | | 4.50%, 01/15/33 - 06/01/35 | | | 6,745,290 |
| | | 576 | | 4.707%, 12/01/34(c) | | | 572,293 |
| | | 65 | | 5.00%, 01/01/19 | | | 64,171 |
| | | 224 | | 5.041%, 01/01/20(c) | | | 228,150 |
| | | 31,313 | | 5.50%, 11/01/34 - 02/01/35 | | | 31,036,652 |
| | | 33,900 | | 5.50%, TBA | | | 33,561,000 |
| | | 4,821 | | 6.00%, 11/01/16 - 04/01/35 | | | 4,871,814 |
| | | 284 | | 6.50%, 04/01/21 - 09/01/21 | | | 292,036 |
| | | 225 | | Government National Mortgage Assoc.
4.125%, 10/20/26 - 11/20/29(c) | | | 227,380 |
| | | 223 | | 4.375%, 02/20/17 - 02/20/26(c) | | | 223,788 |
| | | 124 | | 4.75%, 07/20/22 - 07/20/27(c) | | | 123,464 |
| | | 109 | | 8.50%, 06/15/30 - 08/20/30(c) | | | 116,880 |
| | | | | | |
|
|
| | | | | Total U.S. Government mortgage backed obligations
(cost $99,093,900) | | | 98,178,366 |
| | | | | | |
|
|
See Notes to Financial Statements beginning on page 130
| | |
| THE TARGET PORTFOLIO TRUST | | 91 |
| | |
Total Return Bond Portfolio (cont’d) | | Portfolio of Investments
As of December 31, 2005 |
| | | | | | | | |
MOODY’S
RATINGS
(UNAUDITED) | | PRINCIPAL
AMOUNT (000)# | | DESCRIPTION | | VALUE (NOTE 1) |
| | | | | | | | | |
| | | | | | U.S. Treasury Obligations—21.4% | | | |
| | | | 1,900 | | U.S. Treasury Bonds
6.25%, 08/15/23 | | $ | 2,268,868 |
| | | | 1,000 | | 6.50%, 11/15/26 | | | 1,249,688 |
| | | | 1,000 | | 6.625%, 02/15/27 | | | 1,268,672 |
| | | | 3,000 | | 8.125%, 08/15/19 | | | 4,069,923 |
| | | | 1,800 | | 8.875%, 02/15/19 | | | 2,559,656 |
| | | | 12,750 | | U.S. Treasury Notes
3.375%, 02/15/08 - 10/15/09 | | | 12,326,939 |
| | | | 600 | | 3.625%, 01/15/10 | | | 583,547 |
| | | | 2,700 | | 3.75%, 05/15/08 | | | 2,661,609 |
| | | | 960 | | 3.875%, 05/15/10 - 09/15/10 | | | 941,326 |
| | | | 4,750 | | 4.00%, 04/15/10 - 02/15/14 | | | 4,663,368 |
| | | | 600 | | 4.25%, 08/15/14 - 11/15/14 | | | 593,085 |
| | | | 3,000 | | U.S. Treasury Strips, P/O
Zero coupon, 11/15/16 - 02/15/22 | | | 1,489,778 |
| | | | | | | |
|
|
| | | | | | Total U.S. Treasury Obligations
(cost $34,666,626) | | | 34,676,459 |
| | | | | | | |
|
|
| | | | | | Total long-term investments
(cost $170,304,556) | | | 169,613,570 |
| | | | | | | |
|
|
| | | | | SHORT-TERM INVESTMENTS—36.3% | | |
| | | | | | Foreign Government Securities—11.1% | | | |
| | | EUR | 1,730 | | Bank of England Euro Bill (United Kingdom)
2.336%, 01/12/06(b) | | | 2,047,017 |
| | | EUR | 2,910 | | Dutch Treasury Certificate
2.213%, 01/31/06(b) | | | 3,439,138 |
| | | EUR | 6,660 | | 2.216%, 02/28/06(b) | | | 7,857,131 |
| | | EUR | 760 | | French Treasury Bill (France)
2.368%, 03/23/06(b) | | | 895,081 |
| | | EUR | 590 | | French Treasury Note (France)
5.00%, 01/12/06 | | | 698,859 |
| | | EUR | 2,500 | | German Treasury Bill (Germany)
2.074%, 01/18/06(b) | | | 2,957,220 |
| | | | | | | |
|
|
| | | | | | Total Foreign Government Securities
(cost $17,989,148) | | | 17,894,446 |
| | | | | | | |
|
|
| | | |
| | | | | | Commercial Paper—2.9% | | | |
| P-1 | | | 900 | | DNB Nor Bank A.S.A
4.47%, 04/28/06 | | | 887,091 |
| P-1 | | | 3,700 | | Societe Generale N.A.
4.38%, 03/20/06 | | | 3,665,811 |
See Notes to Financial Statements beginning on page 130
| | |
| 92 | | THE TARGET PORTFOLIO TRUST |
| | | | | | | | |
MOODY’S
RATINGS
(UNAUDITED) | | PRINCIPAL
AMOUNT (000)# | | DESCRIPTION | | VALUE (NOTE 1) |
| | | | | | | | | |
| | | | | | Commercial Paper (cont’d) | | | |
| P-1 | | | 200 | | UBS Finance (DE) LLC
4.19%, 01/03/06 | | $ | 199,953 |
| | | | | | | |
|
|
| | | | | | Total commercial paper
(cost $4,751,766) | | | 4,752,855 |
| | | | | | | |
|
|
| | | | | | U.S. Treasury Obligations—0.3% | | | |
| | | | 50 | | U.S. Treasury Bills
3.81%, 03/16/06 | | | 49,609 |
| | | | 65 | | 3.83%, 03/16/06(e) | | | 64,492 |
| | | | 80 | | 3.842%, 03/16/06 | | | 79,374 |
| | | | 20 | | 3.885%, 03/02/06 | | | 19,875 |
| | | | 330 | | 3.895%, 03/02/06(e) | | | 327,945 |
| | | | | | | |
|
|
| | | | | | Total U.S. Treasury obligations
(cost $541,194) | | | 541,295 |
| | | | | | | |
|
|
| | | | | | U.S. Government Agency Obligations—0.3% | | | |
| | | | 500 | | Federal National Mortgage Assoc.
(cost $495,200) | | | 495,385 |
| | | | | | | |
|
|
| | | Shares
| | | | |
| | | | | | Affiliated Money Market Mutual Fund—21.4% | | | |
| | | | 34,557,334 | | Dryden Core Investment Fund—Taxable Money Market Series(w)
(cost $34,557,334) | | | 34,557,334 |
| | | | | | | |
|
|
| | | Contracts/
Notional
Amount
| | OUTSTANDING OPTIONS PURCHASED(a)—0.3% |
| | | | | | Call Options—0.2% | | | |
| | | | 20 | | Euro Futures, Strike Price $95.25, expiring 03/13/06 | | | 28,750 |
| | | | 39 | | Euro Futures, Strike Price $95.25, expiring 06/19/06 | | | 9,750 |
| | | $ | 2,000,000 | | Interest Rate Swap 3 Month LIBOR & Fixed 4.75%,
expiring 08/08/06 | | | 7,442 |
| | | | 2,100,000 | | Interest Rate Swap 3 Month LIBOR & Fixed 5.75%,
expiring 04/27/09 | | | 272,507 |
| | | | 4,700,000 | | Interest Rate Swap 3 Month LIBOR 4.25%,
expiring 10/12/06 | | | 6,721 |
| | | | 4,100,000 | | Interest Rate Swap 3 Month LIBOR 4.25%,
expiring 10/19/06 | | | 6,113 |
| | | | 10,200,000 | | Interest Rate Swap 3 Month LIBOR 4.50%,
expiring 10/18/06 | | | 28,274 |
| | | | | | | |
|
|
| | | | | | | | | 359,557 |
| | | | | | | |
|
|
| | | | | | Put Options—0.1% | | | |
| | | | 22,000,000 | | Euro Futures, Strike Price $92,
expiring 02/06/06 | | | 532 |
| | | | 75 | | Euro Futures, Strike Price $94,
expiring 06/19/06 | | | 188 |
See Notes to Financial Statements beginning on page 130
| | |
| THE TARGET PORTFOLIO TRUST | | 93 |
| | |
Total Return Bond Portfolio (cont’d) | | Portfolio of Investments
As of December 31, 2005 |
| | | | | | | | | |
| | | CONTRACTS/
NOTIONAL
AMOUNT | | | DESCRIPTION | | VALUE (NOTE 1) | |
| | | | | | | | | | |
| | | |
| | | | | | Put Options (cont’d.) | | | | |
| | | 594 | | | Euro Futures, Strike Price $91.75,
expiring 12/18/06 | | $ | 371 | |
| | | 2,100,000 | | | Interest Rate Swap 3 Month LIBOR & Fixed 6.25%,
expiring 04/27/09 | | | 62,849 | |
| | | | | | | |
|
|
|
| | | | | | | | | 63,940 | |
| | | | | | | |
|
|
|
| | | | | | Total Outstanding Options Purchased
(cost $362,289) | | | 423,497 | |
| | | | | | | |
|
|
|
| | | | | | Total Short-Term Investments
(cost $58,696,931) | | | 58,664,812 | |
| | | | | | | |
|
|
|
| | | |
| | | | | | Total Investments, Before Outstanding Options Written and Investments Sold Short—141.2%
(cost $229,001,487; Note 5) | | | 228,278,382 | |
| | | | | | | |
|
|
|
| | | Principal
Amount (000)#
| | | INVESTMENTS SOLD SHORT—(16.5)% | | | |
| | | |
| | | | | | U.S. Treasury Obligations | | | | |
| | | | | | U.S. Treasury Notes | | | | |
| | | (9,700 | ) | | 3.625%, 05/15/13 | | | (9,251,754 | ) |
| | | (4,500 | ) | | 4.00%, 11/15/12 | | | (4,403,146 | ) |
| | | (8,800 | ) | | 4.125%, 05/15/15 | | | (8,607,157 | ) |
| | | (1,900 | ) | | 4.25%, 11/15/14 | | | (1,877,882 | ) |
| | | (750 | ) | | 4.375%, 05/15/07 | | | (749,385 | ) |
| | | (1,700 | ) | | 6.00%, 08/15/09 | | | (1,791,640 | ) |
| | | | | | | |
|
|
|
| | | | | | Total investments sold short
(proceeds received $26,448,010) | | | (26,680,964 | ) |
| | | | | | | |
|
|
|
| | | Contracts/ Notional Amount
| | | OUTSTANDING OPTIONS WRITTEN(a) | | | |
| | | | | | Call Options | | | | |
| | | 20 | | | Euro Futures, Strike Price $95.50,
expiring 03/10/06 | | | (1,800 | ) |
| | | 78 | | | Euro Futures, Strike Price $95.50,
expiring 06/19/06 | | | (3,120 | ) |
| | | 900,000 | | | Interest Rate Swap 3 Month LIBOR & Fixed 4.78%,
expiring 08/08/06 | | | (8,559 | ) |
| | | 2,000,000 | | | Interest Rate Swap 3 Month LIBOR 4.30%,
expiring 10/12/06 | | | (8,018 | ) |
| | | 1,800,000 | | | Interest Rate Swap 3 Month LIBOR 4.31%,
expiring 10/19/06 | | | (7,635 | ) |
See Notes to Financial Statements beginning on page 130
| | |
| 94 | | THE TARGET PORTFOLIO TRUST |
| | | | | | | | |
| | | Contracts/ Notional Amount | | DESCRIPTION | | VALUE (NOTE 1) | |
| | | | | | | | | |
| | | | | OUTSTANDING OPTIONS WRITTEN(a) | | | |
| | | 4,400,000 | | Interest Rate Swap 3 Month LIBOR 4.56%,
expiring 10/19/06 | | $ | (32,921 | ) |
| | | | | | |
|
|
|
| | | | | Total Outstanding Options Written
(premiums received $93,314) | | | (62,053 | ) |
| | | | | | |
|
|
|
| | | |
| | | | | Total Investments, Net of Outstanding Options Written and Investments Sold Short—124.7%
(cost $202,460,163) | | | 201,535,365 | |
| | | | | Other liabilities in excess of other assets(x)—(24.7)% | | | (39,860,394 | ) |
| | | | | | |
|
|
|
| | | | | Net Assets—100% | | $ | 161,674,971 | |
| | | | | | |
|
|
|
The following abbreviations are used in portfolio descriptions:
NR—Not Rated by Moodys or Standard & Poor’s
TBA—To be announced. Such securities are purchased on a forward commitment basis.
GBP—British Pound
JPY—Japanese Yen
| # | Principal amount is denoted in U.S. dollars unless otherwise indicated. |
| (a) | Non-income producing security. |
| (b) | Rate quoted represents yield-to-maturity as of purchase date. |
| (c) | Indicates a variable rate security. |
| (d) | Standard & Poor’s rating. |
| (e) | Security or portion thereof segregated as collateral for open futures contracts at December 31, 2005. |
| (i) | Represents issuer in default on interest payments. Non-income producing security. |
| (w) | Prudential Investments LLC, the manager of the Fund also serves as manager of the Dryden Core Investment Fund - Taxable Money Market Series. |
| (x) | Other liabilities in excess of other assets includes net unrealized appreciation (depreciation) on futures contracts and forward foreign currency contracts as follows: |
See Notes to Financial Statements beginning on page 130
| | |
| THE TARGET PORTFOLIO TRUST | | 95 |
| | |
Total Return Bond Portfolio (cont’d) | | Portfolio of Investments
As of December 31, 2005 |
Open futures contracts outstanding at December 31, 2005:
| | | | | | | | | | | | | | |
Number of
Contracts
| | Type
| | Expiration
Month
| | Value at
Trade Date
| | Value at
December 31,
2005
| | Unrealized
Appreciation
(Depreciation)
| |
| | | Long Positions: | | | | | | | | | | | | |
| 77 | | Euro Dollar | | Sep 06 | | $ | 18,310,363 | | $ | 18,318,300 | | $ | 7,937 | |
| 320 | | Euro Dollar | | Jun 06 | | | 76,102,925 | | | 76,124,000 | | | 21,075 | |
| 94 | | Euro Dollar | | Mar 06 | | | 22,391,563 | | | 22,377,875 | | | (13,688 | ) |
| 34 | | Euro Dollar | | Mar 07 | | | 8,089,025 | | | 8,096,250 | | | 7,225 | |
| 316 | | U.S. Treasury 5 Year Note | | Mar 06 | | | 33,530,203 | | | 33,604,625 | | | 74,422 | |
| | | | |
| | | Short Positions: | | | | | | | | | | |
| 22 | | German Government 10
Year Bond | | Mar 06 | | | 3,158,038 | | | 3,173,405 | | | (15,367 | ) |
| 109 | | U.S. Treasury 10 Year
Note | | Mar 06 | | | 11,823,710 | | | 11,925,281 | | | (101,571 | ) |
| | | | | | | | | | | | |
|
|
|
| | | | | | | | | | | | | $ | (19,967 | ) |
| | | | | | | | | | | | |
|
|
|
Forward foreign currency exchange contracts outstanding at December 31, 2005:
Purchase Contracts
| | | | | | | | | | |
Description
| | Value at Settlement
Date Payable
| | Value at
December 31, 2005
| | Unrealized
Appreciation
(Depreciation)
| |
Euros,
Expiring 1/18/06 | | $ | 3,419,738 | | $ | 3,415,535 | | $ | (4,203 | ) |
Expiring 1/18/06 | | | 2,920,089 | | | 2,923,811 | | | 3,722 | |
Pound Sterling,
Expiring 1/12/06 | | | 3,277,014 | | | 3,284,220 | | | 7,206 | |
Expiring 1/12/06 | | | 86,343 | | | 86,024 | | | (319 | ) |
| | |
|
| |
|
| |
|
|
|
| | | | | | | | | | | |
| | | $ | 9,703,184 | | $ | 9,709,590 | | $ | 6,406 | |
| | |
|
| |
|
| |
|
|
|
Sale Contracts
| | | | | | | | | | |
Description
| | Value at Settlement
Date Receivable
| | Value at
December 31, 2005
| | Unrealized
Appreciation
(Depreciation)
| |
Euros,
Expiring 1/18/06 | | $ | 895,944 | | $ | 895,025 | | $ | 919 | |
Expiring 1/18/06 | | | 3,426,601 | | | 3,415,535 | | | 11,066 | |
Expiring 1/18/06 | | | 21,996,961 | | | 22,212,430 | | | (215,469 | ) |
Expiring 2/28/06 | | | 3,598,504 | | | 3,613,406 | | | (14,902 | ) |
Pound Sterling,
Expiring 1/12/06 | | | 3,700,000 | | | 3,698,833 | | | 1,167 | |
| | |
|
| |
|
| |
|
|
|
| | | $ | 33,618,010 | | $ | 33,835,229 | | $ | (217,219 | ) |
| | |
|
| |
|
| |
|
|
|
See Notes to Financial Statements beginning on page 130
| | |
| 96 | | THE TARGET PORTFOLIO TRUST |
Interest rate swap agreements outstanding at December 31, 2005:
| | | | | | | | | | | | | | |
Counter Party
| | Termination
Date
| | Notional
Amount
| | Fixed
Rate
| | | Floating
Rate
| | Unrealized
Appreciation
(Depreciation)
| |
Merrill Lynch & Co.(2) | | 6/15/15 | | JPY | 90,000,000 | | 1.50 | % | | 6 Month LIBOR | | $ | 4,373 | |
Barclays Capital(2) | | 6/15/15 | | JPY | 40,000,000 | | 1.50 | % | | 6 Month LIBOR | | | 2,161 | |
Barclays Capital(1) | | 9/15/10 | | GBP | 800,000 | | 5.00 | % | | 6 Month LIBOR | | | 43,201 | |
Merrill Lynch & Co.(2) | | 12/15/14 | | EUR | 4,400,000 | | 4.00 | % | | 6 Month Euribor | | | (235,490 | ) |
UBS AG, London Branch.(1) | | 10/15/10 | | EUR | 200,000 | | 2.1455 | % | | 6 Month LIBOR | | | 1,576 | |
Bank of America, N.A.(1) | | 6/15/35 | | | $900,000 | | 6.00 | % | | 3 Month LIBOR | | | 127,436 | |
Bank of America. N.A(1) | | 6/21/16 | | $ | 2,900,000 | | 5.00 | % | | 3 Month LIBOR | | | 35,225 | |
Goldman Sachs Capital Markets, L.P.(2) | | 6/21/11 | | $ | 800,000 | | 5.00 | % | | 3 Month LIBOR | | | (3,951 | ) |
| | | | | | | | | | | | |
|
|
|
| | | | | | | | | | | | | $ | (25,469 | ) |
| | | | | | | | | | | | |
|
|
|
| (1) | Portfolio pays the floating rate and receives the fixed rate. |
| (2) | Portfolio pays the fixed rate and receives the floating rate. |
Credit default swap agreements outstanding at December 31, 2005:
| | | | | | | | | | | | | | |
Counter Party
| | Termination
Date
| | Notional
Amount
| | Fixed
Rate
| | | Underlying
Bond
| | Unrealized
Appreciation
(Depreciation)
| |
Morgan Stanley & Co.(1) | | 12/20/08 | | $ | 500,000 | | 0.26 | % | | Allstate Corp.,
6.125%, due 02/15/12 | | ($ | 2,648 | ) |
Merrill Lynch & Co.(1) | | 12/20/08 | | | 300,000 | | 0.32 | % | | Ingersoll-Rand Co.,
6.48%, due 6/1/25 | | | (1,672 | ) |
Morgan Stanley & Co.(1) | | 12/20/08 | | | 300,000 | | 0.21 | % | | Emerson Electric Co.,
4.625%, due 10/15/12 | | | (482 | ) |
Barclays Bank PLC(1) | | 12/20/08 | | | 500,000 | | 0.16 | % | | Eli Lilly & Co.,
6.00%, due 3/15/12 | | | (1,565 | ) |
Bank of America Securities LLC(1) | | 12/20/08 | | | 300,000 | | 0.13 | % | | E.I. DuPont,
6.875%, due 10/15/09 | | | 37 | |
Bear Stearns International Ltd.(1) | | 12/20/08 | | | 400,000 | | 0.32 | % | | Hewlett Packard Co.,
6.50% due 7/1/12 | | | (2,166 | ) |
Lehman Brothers(1) | | 12/20/08 | | | 400,000 | | 0.11 | % | | Johnson & Johnson,
3.80%, due 5/15/13 | | | (805 | ) |
Lehman Brothers(1) | | 12/20/08 | | | 400,000 | | 0.12 | % | | Home Depot, Inc.
5.375%, due 4/1/06 | | | (469 | ) |
Citigroup(1) | | 12/20/08 | | | 300,000 | | 0.29 | % | | FedEx Corp.,
7.25%, due 2/15/11 | | | (1,367 | ) |
Lehman Brothers(1) | | 12/20/08 | | | 200,000 | | 0.29 | % | | Whirlpool Corp.,
8.60%, due 5/1/10 | | | (79 | ) |
Citigroup(1) | | 12/20/08 | | | 400,000 | | 0.28 | % | | Eaton Corp.,
5.75%, due 7/15/12 | | | (1,508 | ) |
Merrill Lynch & Co.(1) | | 12/20/08 | | | 100,000 | | 0.22 | % | | Gannett Co., Inc.,
6.375%, due 4/1/12 | | | 162 | |
Citigroup(1) | | 12/20/08 | | | 800,000 | | 0.14 | % | | Walmart Stores, Inc.,
6.875%, due 8/10/09 | | | (1,650 | ) |
UBS AG(1) | | 12/20/08 | | | 600,000 | | 0.35 | % | | AutoZone, Inc.,
5.875%, due 10/15/12 | | | 1,868 | |
See Notes to Financial Statements beginning on page 130
| | |
| THE TARGET PORTFOLIO TRUST | | 97 |
| | |
Total Return Bond Portfolio (cont’d) | | Portfolio of Investments
As of December 31, 2005 |
| | | | | | | | | | | | | | |
Counter Party
| | Termination
Date
| | Notional
Amount
| | Fixed
Rate
| | | Underlying
Bond
| | Unrealized
Appreciation
(Depreciation)
| |
Lehman Brothers(1) | | 12/20/08 | | $ | 100,000 | | 0.24 | % | | Costco Wholesale Corp.,
5.50%, due 3/15/07 | | $ | (346 | ) |
Lehman Brothers(1) | | 12/20/08 | | | 300,000 | | 0.30 | % | | Masco Corp.,
5.875%, due 7/15/12 | | | 685 | |
Lehman Brothers(1) | | 12/20/08 | | | 300,000 | | 0.35 | % | | RadioShack Corp.,
7.375%, due 5/15/11 | | | 3,592 | |
Barclays Bank PLC(1) | | 12/20/08 | | | 200,000 | | 0.67 | % | | Walt Disney Co. (The),
6.375%, due 3/1/12 | | | (2,912 | ) |
Bear Stearns International Ltd.(1) | | 12/20/08 | | | 100,000 | | 1.09 | % | | Capital One Bank,
4.875%, due 5/15/08 | | | (2,624 | ) |
Lehman Brothers(1) | | 12/20/08 | | | 200,000 | | 0.48 | % | | Northrop & Grumman Corp.,
7.125%, due 2/15/11 | | | (1,952 | ) |
Lehman Brothers(1) | | 12/20/08 | | | 200,000 | | 0.53 | % | | Lockheed Martin Corp.,
8.20%, due 12/1/09 | | | (2,197 | ) |
Lehman Brothers(1) | | 12/20/08 | | | 200,000 | | 0.97 | % | | Goodrich Corp.,
7.625%, due 12/15/12 | | | (3,919 | ) |
Bear Stearns International Ltd.(1) | | 12/20/08 | | | 200,000 | | 0.24 | % | | Deere & Co.,
7.85%, due 3/15/07 | | | (737 | ) |
UBS AG(1) | | 12/20/08 | | | 200,000 | | 0.37 | % | | RadioShack Corp.,
7.375%, due 5/15/11 | | | 2,284 | |
Bear Stearns International Ltd.(1) | | 12/20/08 | | | 200,000 | | 0.19 | % | | Caterpillar, Inc.,
7.25%, due 9/15/09 | | | (545 | ) |
Morgan Stanley & Co.(1) | | 12/20/08 | | | 200,000 | | 0.22 | % | | Emerson Electric Co.,
7.125%, due 8/15/10 | | | (377 | ) |
Merrill Lynch & Co.(1) | | 12/20/08 | | | 300,000 | | 0.35 | % | | Devon Energy Corp.,
6.875%, due 9/30/11 | | | (1,518 | ) |
Bear Stearns International Ltd.(1) | | 12/20/08 | | | 200,000 | | 0.60 | % | | International Paper Co.,
6.75%, due 9/1/11 | | | (1,321 | ) |
Merrill Lynch & Co.(1) | | 12/20/08 | | | 200,000 | | 0.27 | % | | Anadarko Petroleum Corp.,
5.00%, due 10/1/12 | | | (453 | ) |
UBS AG(1) | | 12/20/08 | | | 200,000 | | 0.44 | % | | Carnival Corp.,
6.15%, due 4/15/08 | | | (1,739 | ) |
Morgan Stanley & Co.(1) | | 12/20/08 | | | 200,000 | | 0.42 | % | | Countrywide Home Loans, Inc.,
5.625%, due 7/15/09 | | | (1,098 | ) |
Merrill Lynch & Co.(1) | | 12/20/08 | | | 200,000 | | 0.28 | % | | Occidental Petoleum Corp.,
6.75%, due 1/15/12 | | | (667 | ) |
UBS AG(1) | | 12/20/08 | | | 200,000 | | 0.44 | % | | Simon Property Group, L.P.,
5.45%, due 3/15/13 | | | (1,045 | ) |
Morgan Stanley & Co.(1) | | 12/20/08 | | | 200,000 | | 0.53 | % | | The Kroger Co.,
4.75%, due 4/15/12 | | | (1,326 | ) |
Bear Stearns International Ltd.(1) | | 12/20/08 | | | 200,000 | | 0.15 | % | | Walmart Stores, Inc.,
6.875%, due 8/10/09 | | | (469 | ) |
Merrill Lynch & Co.(1) | | 12/20/08 | | | 200,000 | | 0.85 | % | | Motorola, Inc,
7.625%, due 11/15/10 | | | (4,134 | ) |
See Notes to Financial Statements beginning on page 130
| | |
| 98 | | THE TARGET PORTFOLIO TRUST |
| | | | | | | | | | | | | | |
Counter Party
| | Termination
Date
| | Notional
Amount
| | Fixed
Rate
| | | Underlying
Bond
| | Unrealized
Appreciation
(Depreciation)
| |
Lehman Brothers(1) | | 6/20/09 | | $ | 1,200,000 | | 0.40 | % | | People’s Republic of China,
6.80%, due 5/23/11 | | $ | (9,956 | ) |
Merrill Lynch International(2) | | 3/20/07 | | | 700,000 | | 0.61 | % | | Russian Federation,
5.00% (step-up),
due 3/31/30 | | | 2,032 | |
Bank of America Securities LLC(2) | | 6/20/10 | | | 3,000,000 | | 0.40 | % | | Dow Jones CDX IG4 Index | | | (12,238 | ) |
Bear Stearns International Ltd.(2) | | 6/20/10 | | | 1,900,000 | | 0.40 | % | | Dow Jones CDX IG4 Index | | | (7,751 | ) |
Goldman Sachs(2) | | 9/20/06 | | | 900,000 | | 1.70 | % | | Ford Motor Credit Co.,
7.00%, due 10/1/13 | | | (21,316 | ) |
Morgan Stanley & Co.(1) | | 9/20/10 | | | 400,000 | | 2.70 | % | | Republic of Turkey,
11.875%, due 1/15/30 | | | (21,240 | ) |
Lehman Brothers(1) | | 9/20/10 | | | 1,000,000 | | 2.26 | % | | Republic of Turkey,
11.875%, due 1/15/30 | | | (34,863 | ) |
| | | | | | | | | | | | |
|
|
|
| | | | | | | | | | | | | $ | (140,494 | ) |
| | | | | | | | | | | | |
|
|
|
| (1) | Portfolio pays the fixed rate and receives from the counterparty, par in the event that the underlying bond defaults. |
| (2) | Portfolio pays the counterparty par in the event that the underlying bond defaults and receives the fixed rate. |
The major asset category of long-term portfolio holdings, short-term investments and other liabilities in excess of other assets shown as a percentage of net assets as of December 31, 2005 were as follows:
| | | |
U.S. Government Mortgage Backed Obligations | | 60.7 | % |
U.S. Treasury Obligations | | 21.7 | |
Foreign Treasury Obligations | | 11.1 | |
Corporate Bonds | | 8.4 | |
Municipal Bonds | | 5.6 | |
Foreign Government Bonds | | 4.3 | |
Collateralized Mortgage Obligations | | 3.3 | |
Commercial Paper | | 2.9 | |
Asset-Backed Securities | | 1.2 | |
U.S. Government Agency Obligations | | 0.3 | |
Call Options | | 0.2 | |
Put Options | | 0.1 | |
Affiliated Money Market Mutual Fund | | 21.4 | |
| | |
|
|
| | | 141.2 | |
Investments sold short | | (16.5 | ) |
Other liabilities in excess of other assets | | (24.7 | ) |
| | |
|
|
Total | | 100.0 | % |
| | |
|
|
See Notes to Financial Statements beginning on page 130
| | |
| THE TARGET PORTFOLIO TRUST | | 99 |
| | |
Intermediate-Term Bond Portfolio | | Portfolio of Investments
As of December 31, 2005 |
| | | | | | | | |
| | | PRINCIPAL
AMOUNT (000) | | DESCRIPTION | | VALUE (NOTE 1) |
| | | | | | | | | |
| | | | | | LONG-TERM INVESTMENTS—84.3% | | | |
| | | |
| | | | | | U.S. Government Agency Obligations—18.5% | | | |
| | | $ | 25,000 | | Federal Home Loan Mortgage Corp.
2.00%, 02/23/06 | | $ | 24,909,150 |
| | | | 7,000 | | Federal National Mortgage Assoc.
3.976%, 01/09/06 | | | 6,999,951 |
| | | | 8,400 | | 3.651%, 09/07/06 | | | 8,399,236 |
| | | | 8,100 | | 4.268%, 05/22/06 | | | 8,098,388 |
| | | | | | | |
|
|
| | | | | | Total U.S. Government agency obligations
(cost $48,435,893) | | | 48,406,725 |
| | | | | | | |
|
|
| | | |
| | | | | | U.S. Government Agency Mortgage Pass-Through Obligations—17.4% | | | |
| | | | | | Federal National Mortgage Assoc. | | | 166,146 |
| | | | 164 | | 4.375%, 08/01/24 | | | |
| | | | 14 | | 4.992%, 12/01/30 | | | 14,251 |
| | | | 34,797 | | 5.00%, 10/01/17 - 08/01/20 | | | 34,446,985 |
| | | | 150 | | 5.033%, 07/01/25 | | | 153,388 |
| | | | 5,071 | | 5.50%, 06/01/33 - 11/01/35 | | | 5,023,824 |
| | | | 1,938 | | 6.00%, 11/01/12 - 09/01/17 | | | 1,979,724 |
| | | | 5 | | 9.25%, 01/01/10 | | | 5,137 |
| | | | 124 | | Government National Mortgage Assoc.
4.125%, 10/20/24 - 12/20/26 | | | 125,034 |
| | | | 858 | | 4.25%, 03/20/30 | | | 858,122 |
| | | | 765 | | 4.375%, 05/20/23 - 06/20/27 | | | 768,653 |
| | | | 406 | | 4.50%, 07/20/30 | | | 406,305 |
| | | | 207 | | 4.75%, 08/20/26 | | | 208,361 |
| | | | 1,005 | | 6.00%, 01/15/29 - 07/15/29 | | | 1,029,648 |
| | | | 290 | | 6.50%, 10/15/25 - 06/15/29 | | | 303,161 |
| | | | 127 | | 8.00%, 09/20/30 - 07/20/31 | | | 135,795 |
| | | | | | | |
|
|
| | | | | | Total U.S. Government agency mortgage pass-through obligations
(cost $46,228,851) | | | 45,624,534 |
| | | | | | | |
|
|
| | | |
| | | | | | U.S. Treasury Obligations—17.1% | | | |
| | | | 30,300 | | U.S. Treasury Notes
3.50%, 12/15/09 | | | 29,356,670 |
| | | | 3,090 | | 3.875%, 09/15/10 | | | 3,025,666 |
| | | | 1,500 | | 4.00%, 03/15/10 | | | 1,478,496 |
| | | | 6,900 | | 4.125%, 05/15/15 | | | 6,748,793 |
| | | | 1,100 | | 4.25%, 08/15/13 | | | 1,090,161 |
| | | | 100 | | U.S. Treasury Bonds, TIPS
2.00%, 01/15/14 | | | 107,169 |
| | | | 2,600 | | 3.375%, 01/15/07 - 01/15/12 | | | 3,141,578 |
| | | | | | | |
|
|
| | | | | | Total U.S. Treasury obligations
(cost $45,140,278) | | | 44,948,533 |
| | | | | | | |
|
|
See Notes to Financial Statements beginning on page 130
| | |
| 100 | | THE TARGET PORTFOLIO TRUST |
| | | | | | | | |
MOODY’S
RATINGS
(UNAUDITED) | | PRINCIPAL
AMOUNT (000) | | DESCRIPTION | | VALUE (NOTE 1) |
| | | | | | | | | |
| | | |
| | | | | | CORPORATE BONDS—17.1% | | | |
| | | |
| | | | | | Airlines—1.4% | | | |
| Baa2 | | $ | 1,500 | | American Air Lines, Inc., Pass-Thru Cert. 7.858%, 10/01/11 | | $ | 1,581,542 |
| NR | | | 1,500 | | United Air Lines, Inc., Equip. Trust(c)(e) 10.85%, 02/19/15 | | | 832,500 |
| NR | | | 1,700 | | United Air Lines, Inc., Pass-Thru Cert.(c)(e) 6.83%, 09/01/08 | | | 1,204,019 |
| | | | | | | |
|
|
| | | | | | | | | 3,618,061 |
| | | | | | | |
|
|
| | | |
| | | | | | Automobiles—1.1% | | | |
| A3 | | | 240 | | DaimlerChrysler NA Holding Corp., Co.
4.026%, 03/07/07 | | | 239,755 |
| A3 | | | 1,500 | | 4.96%, 09/10/07 | | | 1,503,114 |
| A3 | | | 1,120 | | 6.40%, 05/15/06 | | | 1,125,554 |
| | | | | | | |
|
|
| | | | | | | | | 2,868,423 |
| | | | | | | |
|
|
| | | |
| | | | | | Cable Television—0.5% | | | |
| Baa2 | | | 1,350 | | Comcast Cable Communications LLC
6.375%, 01/30/06 | | | 1,351,660 |
| | | | | | | |
|
|
| | | |
| | | | | | Diversified—0.7% | | | |
| Aa3 | | | 1,750 | | Goldman Sachs Group LP(c) | | | |
| | | | | | 4.819%, 06/28/10 | | | 1,755,943 |
| | | | | | | |
|
|
| | | |
| | | | | | Electronic Components—1.2% | | | |
| B1 | | | 600 | | CMS Energy Corp.
8.90%, 07/15/08 | | | 641,250 |
| | | | | | Dominion Resources, Inc. | | | |
| Baa1 | | | 1,050 | | 4.819%, 09/28/07 | | | 1,050,464 |
| | | | | | Nisource Finance Corp., Co. | | | |
| Baa3 | | | 400 | | 3.20%, 11/01/06 | | | 394,215 |
| A3 | | | 1,100 | | Progress Energy Florida, Inc.(a)
4.86%, 11/14/08 | | | 1,099,737 |
| | | | | | | |
|
|
| | | | | | | | | 3,185,666 |
| | | | | | | |
|
|
| | | | | | Entertainment & Leisure—0.4% | | | |
| | | | | | Caesars Entertainment, Inc.,
Sr. Sub. Notes | | | |
| Baa3 | | | 1,070 | | 8.50%, 11/15/06 | | | 1,098,014 |
| | | | | | | |
|
|
| | | | | | Financial – Bank & Trust—2.2% | | | |
| A3 | | | 300 | | Export-Import Bank of Korea,
6.50%, 11/15/06 | | | 304,077 |
| A1 | | | 1,000 | | HSBC Finance Corp.(a)
4.00%, 09/15/08 | | | 1,000,749 |
| A3 | | | 2,670 | | Korea Development Bank
4.75%, 07/20/09 | | | 2,647,068 |
| | | | | | MBNA Europe Funding PLC, Bank | | | |
| Baa1 | | | 1,400 | | 3.876%, 09/07/07 | | | 1,400,518 |
| A3 | | | 400 | | Riggs Capital Trust, Co.
8.625%, 12/31/26 | | | 429,201 |
| | | | | | | |
|
|
| | | | | | | | | 5,781,613 |
| | | | | | | |
|
|
See Notes to Financial Statements beginning on page 130
| | |
| THE TARGET PORTFOLIO TRUST | | 101 |
| | |
Intermediate-Term Bond Portfolio (cont’d) | | Portfolio of Investments
As of December 31, 2005 |
| | | | | | | | |
MOODY’S
RATINGS
(UNAUDITED) | | PRINCIPAL
AMOUNT (000) | | DESCRIPTION | | VALUE (NOTE 1) |
| | | | | | | | | |
| | | | | | Financial Services—4.1% | | | |
| | | | | | Ford Motor Credit Co. | | | |
| Ba2 | | $ | 300 | | 4.68%, 03/13/07 | | $ | 280,740 |
| Ba2 | | | 900 | | 6.875%, 02/01/06 | | | 898,065 |
| | | | | | Ford Motor Credit Co.(a) | | | |
| Ba2 | | | 1,400 | | 5.45%, 03/21/07 | | | 1,333,371 |
| | | | | | General Motors Acceptance Corp. | | | |
| Ba1 | | | 1,950 | | 5.05%, 01/16/07 | | | 1,852,683 |
| Ba1 | | | 60 | | 5.243%, 05/18/06 | | | 58,877 |
| | | | | | Golden West Financial Corp. | | | |
| A1 | | | 1,500 | | 5.50%, 08/08/06 | | | 1,506,063 |
| Aa3 | | | 1,760 | | Goldman Sachs Group, Inc.(a)
4.331%, 08/01/06 | | | 1,760,928 |
| Aaa | | | 500 | | Heller Financial, Inc.
6.375%, 03/15/06 | | | 501,690 |
| Aa3 | | | 2,000 | | Morgan Stanley
4.465%, 02/15/07 | | | 2,001,964 |
| A3 | | | 500 | | Riggs Capital Trust II
8.875%, 03/15/27 | | | 541,696 |
| | | | | | | |
|
|
| | | | | | | | | 10,736,077 |
| | | | | | | |
|
|
| | | | | | Food And Staples Retailing—0.1% | | | |
| Ba1 | | | 300 | | Delhaize America, Inc., Co.
7.375%, 04/15/06 | | | 301,567 |
| | | | | | | |
|
|
| | | | | | Healthcare Providers & Services—0.2% | | | |
| Ba2 | | | 150 | | HCA, Inc.
5.25%, 11/06/08 | | | 148,024 |
| Ba2 | | | 400 | | 7.125%, 06/01/06 | | | 403,280 |
| | | | | | | |
|
|
| | | | | | | | | 551,304 |
| | | | | | | |
|
|
| | | | | | Hotels, Restaurants & Leisure—0.2% | | | |
| Ba2 | | | 500 | | Mandalay Resort Group
6.50%, 07/31/09 | | | 505,625 |
| Ba2 | | | 100 | | Mirage Resorts, Inc.
6.75%, 08/01/07 | | | 101,375 |
| | | | | | | |
|
|
| | | | | | | | | 607,000 |
| | | | | | | |
|
|
| | | | | | Media—0.5% | | | |
| Baa1 | | | 800 | | AOL Time Warner, Co.
6.125%, 04/15/06 | | | 802,405 |
| B1 | | | 500 | | CSC Holdings, Inc.
7.875%, 12/15/07 | | | 508,750 |
| | | | | | | |
|
|
| | | | | | | | | 1,311,155 |
| | | | | | | |
|
|
See Notes to Financial Statements beginning on page 130
| | |
| 102 | | THE TARGET PORTFOLIO TRUST |
| | | | | | | | |
MOODY’S
RATINGS
(UNAUDITED) | | PRINCIPAL
AMOUNT (000) | | DESCRIPTION | | VALUE (NOTE 1) |
| | | | | | | | | |
| | | | | | Oil, Gas & Consumable Fuels—0.3% | | | |
| Ba2 | | $ | 700 | | Transcontinental Gas Pipe Line Corp.(g)
5.43%, 04/15/08 | | $ | 708,225 |
| | | | | | | |
|
|
| | | | | | Paper & Forest Products—0.4% | | | |
| Ba3 | | | 980 | | Georgia-Pacific Corp.
7.50%, 05/15/06 | | | 986,125 |
| | | | | | | |
|
|
| | | | | | Real Estate Investment Trust – Hotels—0.1% | | | |
| Ba3 | | | 350 | | Host Marriott LP, Co.
9.25%, 10/01/07 | | | 369,250 |
| | | | | | | |
|
|
| | | | | | Retail—0.2% | | | |
| Ba1 | | | 500 | | Penney (JC) Corp. Inc.
6.50%, 12/15/07 | | | 508,750 |
| | | | | | | |
|
|
| | | | | | Telecommunication Services—1.2% |
| A3 | | | 2,000 | | France Telecom SA
8.50%, 03/01/31 | | | 2,668,520 |
| B2 | | | 61 | | MCI, Inc., Sr. Notes
6.908%, 05/01/07 | | | 61,458 |
| B2 | | | 411 | | 7.688%, 05/01/09 | | | 424,357 |
| B2 | | | 52 | | 8.735%, 05/01/14 | | | 57,525 |
| | | | | | | |
|
|
| | | | | | | | | 3,211,860 |
| | | | | | | |
|
|
| | | | | | Telecommunications—0.4% | | | |
| Baa2 | | | 1,000 | | Sprint Capital Corp., Co. 7.125%, 01/30/06 | | | 1,001,600 |
| | | | | | | |
|
|
| | | | | | Utilities—1.9% | | | |
| Baa1 | | | 500 | | Dayton Power & Light Co. (The)
5.125%, 10/01/13 | | | 497,721 |
| Baa1 | | | 250 | | Dominion Resources Inc., 3.66%, 11/15/06 | | | 247,065 |
| Baa3 | | | 1,500 | | NiSource Finance Corp., Co. 4.95%, 11/23/09 | | | 1,504,702 |
| Ba3 | | | 300 | | PSEG Energy Holdings LLC
7.75%, 04/16/07 | | | 310,500 |
| Baa1 | | | 1,000 | | PSEG Power LLC, Co.
6.875%, 04/15/06 | | | 1,005,179 |
| Baa2 | | | 1,000 | | TXU Energy Co. LLC
4.92%, 01/17/06 | | | 999,959 |
| A3 | | | 300 | | Virginia Electric and Power Co.
5.75%, 03/31/06 | | | 300,679 |
| | | | | | | |
|
|
| | | | | | | | | 4,865,805 |
| | | | | | | |
|
|
| | | | | | Total Corporate Bonds
(cost $46,475,779) | | | 44,818,098 |
| | | | | | | |
|
|
| | | | | | Collateralized Mortgage Obligations—7.0% | | | |
| Aaa | | | 592 | | American Home Mortgage Investment Trust
4.44%, 02/25/45 | | | 578,117 |
| AAA(d) | | | 352 | | Bank of America Mortgage Securities, Series 2002-K, Class 2A1 5.487%, 10/20/32 | | | 352,160 |
| Aaa | | | 1,849 | | Bear Stearns Adjustable Rate Mortgage Trust,
Series 2004-8, Class 11A2
3.734%, 11/25/34 | | | 1,843,223 |
See Notes to Financial Statements beginning on page 130
| | |
| THE TARGET PORTFOLIO TRUST | | 103 |
| | |
Intermediate-Term Bond Portfolio (cont’d) | | Portfolio of Investments
As of December 31, 2005 |
| | | | | | | |
MOODY’S
RATINGS
(UNAUDITED) | | PRINCIPAL
AMOUNT (000) | | DESCRIPTION | | VALUE (NOTE 1) |
| | | | | | | | |
| | | | | | Collateralized Mortgage Obligations (cont’d.) | | |
| Aaa | | $ | 205 | | Bear Stearns Alternative Loans Trust,
Series 2003-7, Class 2A2
4.659%, 02/25/34 | | 205,203 |
| AAA(d) | | | 342 | | Countrywide Alternative Loan Trust, Series 2003-J3, Class 2A1
6.25%, 12/25/33 | | 343,467 |
| Aaa | | | 308 | | Countrywide Home Loan Mortgage Pass Through Trust,
Series 2003-R4, Class 2A(g)
6.50%, 01/25/34 | | 315,464 |
| Aaa | | | 3,146 | | Pass Through Trust,
Series 2004-25, Class 1A1
4.709%, 02/25/35 | | 3,151,371 |
| Aaa | | | 121 | | CS First Boston Mortgage Securities Corp,
Series 2003-8, Class 5A1
6.50%, 04/25/33 | | 121,075 |
| Aaa | | | 413 | | Federal National Mortgage Association,
Series 2004-41, Class PB
3.50%, 04/25/17 | | 409,184 |
| NR | | | 610 | | FHLMC Structured Pass Through
Securities, Series T-59, Class 1A2
7.00%, 10/25/43 | | 635,683 |
| AAA(d) | | | 446 | | GE Capital Commercial Mortgage
Corp. 2002-3A Class A1
4.229%, 12/10/37 | | 437,474 |
| Aaa | | | 150 | | Government National Mortgage Assoc., Series 1995-2, Class KQ 8.50%, 03/20/25 | | 152,745 |
| Aaa | | | 614 | | Association, Series 2000-11, Class PH
7.50%, 02/20/30 | | 641,672 |
| Aaa | | | 190 | | Association, Series 2000-9, Class FG
4.97%, 02/16/30 | | 191,773 |
| Aaa | | | 293 | | Association, Series 2000-9, Class FH
4.87%, 02/16/30 | | 295,737 |
| Aaa | | | 1,639 | | Greenpoint Mortgage Funding Trust,
Series 2005-AR2, Class A1
4.421%, 06/25/45 | | 1,636,659 |
| Aaa | | | 657 | | GS Mortgage Securities Corp II,
Series 2001-1285, Class A1
6.044%, 08/15/18(g) | | 676,656 |
| Aaa | | | 755 | | GSR Mortgage Loan Trust,
Series 2005-ARG, Class 2A1
4.541%, 09/25/35 | | 742,710 |
| Aaa | | | 2,465 | | Sequoia Mortgage Trust,
Series 10, Class 2A1
4.75%, 10/20/27 | | 2,469,423 |
See Notes to Financial Statements beginning on page 130
| | |
| 104 | | THE TARGET PORTFOLIO TRUST |
| | | | | | | | |
MOODY’S
RATINGS
(UNAUDITED) | | PRINCIPAL
AMOUNT (000) | | DESCRIPTION | | VALUE (NOTE 1) |
| | | | | | | | | |
| | | | | | Collateralized Mortgage Obligations (cont’d.) | | | |
| Aaa | | $ | 297 | | Structured Asset Securities Corp,
Series 2001-21A, Class 1A1
6.25%, 01/25/32 | | $ | 296,517 |
| Aaa | | | 50 | | Superannuation Members Home Loans Global Fund,
Series 1A, Class A2
3.665%, 06/15/26 | | | 49,676 |
| Aaa | | | 2,704 | | Washington Mutual, Inc.,
Series 2002-AR6, Class A
4.563%, 06/25/42 | | | 2,712,895 |
| Aaa | | | 128 | | Series 2002-AR9, Class 1A
4.419%, 08/25/42 | | | 126,828 |
| | | | | | | |
|
|
| | | | | | Total Collateralized Mortgage Obligations
(cost $18,492,173) | | | 18,385,712 |
| | | | | | | |
|
|
| | | |
| | | | | | Foreign Government Bonds—6.4% | | | |
| Aaa | | | JPY 139,000 | | Canadian Government
0.70%, 03/20/06 | | | 1,180,251 |
| B1 | | | 325 | | Federal Republic of Brazil
4.313%, 04/15/09 - 04/15/12, BRB(a) | | | 321,626 |
| B1 | | | 780 | | 10.271%, 06/29/09 | | | 900,900 |
| B1 | | | 1,080 | | 11.00%, 08/17/40 | | | 1,392,120 |
| B1 | | | 500 | | 11.25%, 07/26/07 | | | 542,250 |
| B1 | | | 2,000 | | 11.50%, 03/12/08 | | | 2,237,000 |
| Aa2 | | | JPY 213,000 | | Federal Republic of Italy (Italy)
0.375%, 10/10/06 | | | 1,810,499 |
| NR | | | 1,500 | | Republic of Panama
9.375%, 04/01/29 | | | 1,870,875 |
| Ba3 | | | 3,650 | | Republic of Peru
9.125%, 01/15/08 - 02/21/12 | | | 4,126,250 |
| Baa1 | | | 750 | | Republic of South Africa
9.125%, 05/19/09 | | | 840,938 |
| Baa1 | | | 1,500 | | United Mexico States
6.375%, 01/16/13 | | | 1,593,750 |
| | | | | | | |
|
|
| | | | | | Total Foreign Government Bonds
(cost $15,318,578) | | | 16,816,459 |
| | | | | | | |
|
|
| | | |
| | | | | | Municipal Bonds—0.4% | | | |
| Aaa | | | 1,000 | | City & County of Honolulu HI(a)
4.75%, 07/01/28 | | | |
| | | | | | (cost $843,221) | | | 1,011,300 |
| | | | | | | |
|
|
| | | Shares
| | PREFERRED STOCKS—0.2% | | |
| | | | | | Federal National Mortgage Association—0.2% | | | |
| | | | 9,600 | | Fannie Mae, 7.00%
(cost $480,000) | | | 525,600 |
| | | | | | | |
|
|
See Notes to Financial Statements beginning on page 130
| | |
| THE TARGET PORTFOLIO TRUST | | 105 |
| | |
Intermediate-Term Bond Portfolio (cont’d) | | Portfolio of Investments
As of December 31, 2005 |
| | | | | | | | |
MOODY’S
RATINGS
(UNAUDITED) | | PRINCIPAL
AMOUNT (000) | | DESCRIPTION | | VALUE (NOTE 1) |
| | | | | | | | | |
| | | | | | Asset-Backed Securities—0.1% | | | |
| Aaa | | $ | 130 | | First Franklin Mortgage Loan Asset Backed Certificates, Ser. 2003-FF5, Class A2
2.82%, 03/25/34 | | $ | 130,409 |
| AAA(d) | | | 1 | | Metropolitan Asset Funding, Inc., Series 1999-D, Class A1
4.29%, 04/25/29 | | | 1,275 |
| Aaa | | | 155 | | Residential Asset Mortgage Products, Inc.
4.709%, 12/25/33 | | | 155,549 |
| | | | | | | |
|
|
| | | | | | Total asset-backed securities
(cost $286,899) | | | 287,233 |
| | | | | | | |
|
|
| | | Units
| | | | |
| | | | | | Warrants—0.1% | | | |
| | | | 2,500,000 | | Mexico Value Recovery Rights
Ser. D, expiring 06/30/06 | | | 65,625 |
| | | | 2,500,000 | | Ser. D, expiring 06/30/07 | | | 51,375 |
| | | | | | | |
|
|
| | | | | | Total warrants
(cost $485) | | | 117,000 |
| | | | | | | |
|
|
| | | | | | Total long-term investments
(cost $221,702,157) | | | 220,941,194 |
| | | | | | | |
|
|
| | | Principal
Amount (000)
| | SHORT-TERM INVESTMENTS—17.0% | | |
| | | | | | Commercial Paper—10.7% | | | |
| P-1 | | | 1,800 | | ANZ (Delaware) Inc.
4.085%, 01/17/06 | | | 1,797,095 |
| P-1 | | | 4,700 | | Barclays US Funding Corp
4.23%, 02/10/06 | | | 4,678,618 |
| P-1 | | | 1,000 | | 4.305%, 02/28/06 | | | 993,249 |
| P-1 | | | 6,600 | | Danske Corp 4.26%, 01/09/06 | | | 6,593,752 |
| P-1 | | | 600 | | HBOs Treasury Services PLC
4.285%, 02/23/06 | | | 596,315 |
| P-2 | | | 300 | | Nissan Mtr
4.43%, 01/23/06 | | | 299,188 |
| P-1 | | | 500 | | Nordea North America
4.085%, 01/20/06 | | | 499,013 |
| P-1 | | | 6,200 | | Skandinaviska Enskilda Banken
4.21%, 02/09/06 | | | 6,172,357 |
| P-1 | | | 1,600 | | Societe Generale
4.38%, 03/20/06 | | | 1,585,215 |
| P-1 | | | 600 | | Svenska Handelsbank
4.40%, 03/23/06 | | | 594,228 |
| P-1 | | | 3,100 | | UBS Finance, Inc.
4.22%, 03/02/06 | | | 3,078,344 |
See Notes to Financial Statements beginning on page 130
| | |
| 106 | | THE TARGET PORTFOLIO TRUST |
| | | | | | | | |
MOODY’S
RATINGS
(UNAUDITED) | | PRINCIPAL
AMOUNT (000) | | DESCRIPTION | | VALUE (NOTE 1) |
| | | | | | | | | |
| | | | | | Commercial Paper (cont’d.) | | | |
| P-1 | | $ | 1,200 | | Westpac Banking Corp.
4.33%, 02/21/06 | | $ | 1,192,911 |
| | | | | | | |
|
|
| | | | | | Total commercial paper
(cost $28,077,217) | | | 28,080,285 |
| | | | | | | |
|
|
| | | | | | Foreign Government Bonds—4.8% | | | |
| | | | EUR 3,640 | | Dutch Treasury Certificate Zero, 01/31/06 | | | 4,301,877 |
| | | | EUR 7,000 | | French Treasury Bills Zero, 02/09/06 | | | 8,267,371 |
| | | | | | | |
|
|
| | | | | | Total Foreign Government Bonds
(cost $12,515,787) | | | 12,569,248 |
| | | | | | | |
|
|
| | | Shares
| | | | |
| | | | | | Affiliated Money Market Mutual Fund—1.0% | | | |
| | | | 2,644,435 | | Dryden Core Investment Fund—Taxable Money Market Series(i) | | | 2,644,435 |
| | | | | | | |
|
|
| | | Principal
Amount (000)
| | | | |
| | | | | | U.S. Treasury Obligations—0.5% | | | |
| | | | 970 | | U.S. Treasury Bills(f)
3.83%, 03/16/06 | | | 962,413 |
| | | | 210 | | U.S. Treasury Bills(f)
3.885%, 03/02/06 | | | 208,692 |
| | | | | | | |
|
|
| | | | | | Total U.S. Treasury obligations
(cost $1,171,014) | | | 1,171,105 |
| | | | | | | |
|
|
| | | Contracts/
Notional
Amount#
| | OUTSTANDING OPTIONS PURCHASED | | |
| | | |
| | | | | | Call Options | | | |
| | | | 4,700,000 | | Swap Option on 3 Month LIBOR,
expiring 04/04/06 @ 4.50% | | | 2,609 |
| | | | 5,200,000 | | Swap Option on 3 Month LIBOR,
expiring 10/04/06 @ 4.50% | | | 12,714 |
| | | | 16,400,000 | | Swap Option on 3 month LIBOR,
expiring 10/12/06 @ 4.25% | | | 23,452 |
| | | | 15,100,000 | | Swap Option on 3 Month LIBOR,
expiring 10/18/06 @ 4.50% | | | 41,857 |
| | | | 2,200,000 | | Swap Option on 3 Month LIBOR,
expiring 10/19/06 @ 4.25% | | | 3,280 |
| | | | | | | |
|
|
| | | | | | | | | 83,912 |
| | | | | | | |
|
|
See Notes to Financial Statements beginning on page 130
| | |
| THE TARGET PORTFOLIO TRUST | | 107 |
| | |
Intermediate-Term Bond Portfolio (cont’d) | | Portfolio of Investments
As of December 31, 2005 |
| | | | | | | | | |
| | | CONTRACTS/
NOTIONAL
AMOUNT# | | DESCRIPTION | | VALUE (NOTE 1) | |
| | | | | | | | | | |
| | |
| | | | | | OUTSTANDING OPTIONS PURCHASED (cont’d.) | |
| | | | | | Put Options | | | | |
| | | | 60 | | Eurodollar Futures, expiring 06/19/06 @ $93.00 | | $ | 375 | |
| | | | | | | |
|
|
|
| | | | | | Total Outstanding Options Purchased
(cost $164,955) | | | 84,287 | |
| | | | | | | |
|
|
|
| | | | | | Total Short-Term Investments
(cost $44,573,409) | | | 44,549,360 | |
| | | | | | | |
|
|
|
| | | |
| | | | | | Total Investments, Before Outstanding Options Written—101.3%
(cost $266,275,565; Note 5) | | | 265,490,554 | |
| | | | | | | |
|
|
|
| | | | | | | | | | |
| | | | | OUTSTANDING OPTIONS WRITTEN—(0.1)% | |
| | | | | | Call Options—(0.1)% | | | | |
| | | $ | 2,000,000 | | Swap Option on 3 Month LIBOR, expiring 04/04/06 @ 4.54% | | | (3,894 | ) |
| | | | 2,200,000 | | Swap Option on 3 Month LIBOR, expiring 10/04/06 @ 4.54% | | | (15,085 | ) |
| | | | 7,100,000 | | Swap Option on 3 Month LIBOR, expiring 10/12/06 @ 4.30% | | | (28,464 | ) |
| | | | 6,500,000 | | Swap Option on 3 Month LIBOR, expiring 10/18/06 @ 4.56% | | | (48,633 | ) |
| | | | 900,000 | | Swap Option on 3 Month LIBOR, expiring 10/19/06 @ 4.31% | | | (3,818 | ) |
| | | | 43 | | U.S. Treasury Note Futures, Strike Price $111, expiring 02/24/06 | | | (107,500 | ) |
| | | | 21 | | U.S. Treasury Note Futures, Strike Price $113, expiring 05/26/06 | | | (5,250 | ) |
| | | | | | | |
|
|
|
| | | | | | | | | (212,644 | ) |
| | | | | | | |
|
|
|
| | | |
| | | | | | Put Options | | | | |
| | | | 21 | | U.S. Treasury Note Futures, expiring 05/26/2006 @ $104 | | | (3,281 | ) |
| | | | 43 | | U.S. Treasury Note Futures, expiring 02/24/06 @ $106 | | | (3,360 | ) |
| | | | | | | |
|
|
|
| | | | | | | | | (6,641 | ) |
| | | | | | | |
|
|
|
| | | | | | Total Outstanding Options Written
(premium received $197,277) | | | (219,285 | ) |
| | | | | | | |
|
|
|
| | | |
| | | | | | Total Investments, Net of Outstanding Options
Written—101.2%
(cost $266,078,289) | | | 265,271,269 | |
| | | | | | Other liabilities in excess of other assets(w) (1.2)% | | | (3,093,643 | ) |
| | | | | | | |
|
|
|
| | | | | | Net Assets—100% | | $ | 262,177,626 | |
| | | | | | | |
|
|
|
The following abbreviation are used in the portfolio descriptions:
NR—Not rated by Moody’s or Standard & Poor’s
BRB—Brady Bonds
EUR—Euro Dollar
JYP—Japanese Yen
TIPS—Treasury Inflation Protection Security
See Notes to Financial Statements beginning on page 130
| | |
| 108 | | THE TARGET PORTFOLIO TRUST |
The Fund’s current prospectus contains a description of Moody’s and Standard & Poor’s ratings.
# Principal amount is denoted in U.S. dollars unless otherwise indicated.
| (a) | Rate shown reflects current rate on variable rate instruments. |
| (c) | Represents issues in default on interest payments; non-income producing security. |
| (d) | Standard & Poor’s rating. |
| (f) | All or portion of security pledged as initial margin for financial futures contracts. |
| (g) | Private placement restricted as to resale and does not have a readily available market. The aggregate cost of such securities is $1,776,869. The aggregate value of $1,700,345 is approximately 0.6% of net assets. |
| (i) | Prudential Investments LLC, the manager of the Fund also serves as manager of the Dryden Core Investment Fund - Taxable Money Market Series. |
| (w) | Other liabilities in excess of other assets includes net unrealized appreciation (depreciation) on futures contracts, foreign currency exchange contracts, credit default swaps and interest rate swaps as follows: |
Open futures contracts outstanding at December 31, 2005:
| | | | | | | | | | | | | | |
Number of
Contracts
| | Type
| | Expiration
Month
| | Value at
Trade
Date
| | Value at
December 31,
2005
| | Unrealized
Appreciation
(Depreciation)
| |
| | | Long Positions: | | | | | | | | | | | | |
| 14 | | Euro Dollar | | Jun 06 | | $ | 3,332,000 | | $ | 3,330,425 | | $ | (1,575 | ) |
| 664 | | Euro Dollar | | Sep 06 | | | 158,572,069 | | | 157,965,600 | | | (606,469 | ) |
| 425 | | U.S. Treasury 5 Year Note | | Mar 06 | | | 45,097,219 | | | 45,196,094 | | | 98,875 | |
| | | | | | | | | | | | |
|
|
|
| | | | | | | | | | | | | $ | (509,169 | ) |
| | | | | | | | | | | | |
|
|
|
Forward foreign currency exchange contract outstanding at December 31, 2005:
| | | | | | |
Sale Contract
| | Value at Settlement
Date Receivable
| | Value at December 31,
2005
| | Unrealized Depreciation
|
Euros,
Expiring 1/18/06 | | $12,788,330 | | $12,913,597 | | $(125,267) |
| | |
| |
| |
|
Interest rate swap agreements outstanding at December 31, 2005:
| | | | | | | | | | | | |
Counterparty
| | Termination
Date
| | Notional
Amount (000)
| | Fixed
Rate
| | | Floating
Rate
| | Unrealized
Appreciation
|
Goldman Sachs & Co.(1) | | 06/21/16 | | 600 | | 5.00 | % | | 3 Month LIBOR | | $ | 7,305 |
Goldman Sachs & Co.(1) | | 06/21/11 | | 600 | | 5.00 | % | | 3 Month LIBOR | | | 2,964 |
Bank of America, N.A.(1) | | 06/21/11 | | 6,000 | | 5.00 | % | | 3 Month LIBOR | | | 30,081 |
Morgan Stanley & Co.(1) | | 06/21/08 | | 18,500 | | 5.00 | % | | 3 Month LIBOR | | | 35,496 |
Barclays Bank PLC.(1) | | 06/21/08 | | 11,600 | | 5.00 | % | | 3 Month LIBOR | | | 20,998 |
| | | | | | | | | | | |
|
|
| | | | | | | | | | | | | $96,844 |
| | | | | | | | | | | |
|
|
| (1) | Portfolio pays the floating rate and receives the fixed rate. |
See Notes to Financial Statements beginning on page 130
| | |
| THE TARGET PORTFOLIO TRUST | | 109 |
| | |
Intermediate-Term Bond Portfolio (cont’d) | | Portfolio of Investments
As of December 31, 2005 |
Details of the credit default swap agreements outstanding as of December 31, 2005 were as follows:
| | | | | | | | | | | | | |
Counterparty
| | Termination
Date
| | Notional
Amount (000)
| | Fixed
Rate
| | | Underlying Bond
| | Unrealized
(Depreciation)
| |
Morgan Stanley & Co.(1) | | 9/20/06 | | 500 | | 1.70 | % | | General Motors Acceptance Corp.,
6.875%, due 8/28/12 | | $ | (13,214 | ) |
Bear Stearns(1) | | 9/20/06 | | 1,300 | | 1.75 | % | | General Motors Acceptance Corp.,
6.875%, due 8/28/12 | | | (33,902 | ) |
Morgan Stanley & Co.(1) | | 9/20/06 | | 300 | | 1.80 | % | | General Motors Acceptance Corp.,
6.875%, due 08/28/12 | | | (7,719 | ) |
| | | | | | | | | | | |
|
|
|
| | | | | | | | | | | | | $(54,835) | |
| | | | | | | | | | | |
|
|
|
| (1) | Portfolio pays the fixed rate and receives from the counterparty par in the event that the underlying bond defaults. |
The major asset category of portfolio holdings and other liabilities in excess of other assets shown as a percentage of net assets as of December 31, 2005 were as follows:
| | | |
U.S. Government Agency | | 18.5 | % |
U.S. Treasury Obligations | | 17.6 | |
U.S. Government Agency Mortgage Pass-Through Obligations | | 17.4 | |
Corporate Bonds | | 17.1 | |
Foreign Government Bonds | | 11.2 | |
Commercial Paper | | 10.7 | |
Collateralized Mortgage Obligations | | 7.0 | |
Municipal Bonds | | 0.4 | |
Preferred Stocks | | 0.2 | |
Affiliated Money Market Mutual Fund | | 1.0 | |
Asset Backed Securities | | 0.1 | |
Warrants | | 0.1 | |
| | |
|
|
| | | 101.3 | |
Outstanding Options Written | | (0.1 | ) |
Other liabilities in excess of other assets | | (1.2 | ) |
| | |
|
|
| | | 100.0 | % |
| | |
|
|
See Notes to Financial Statements beginning on page 130
| | |
| 110 | | THE TARGET PORTFOLIO TRUST |
| | |
Portfolio of Investments
As of December 31, 2005 | | Mortgage Backed Securities Portfolio |
| | | | | | | |
PRINCIPAL
AMOUNT (000)# | | | DESCRIPTION | | VALUE (NOTE 1) |
| | | | | | | | |
| | | | | LONG-TERM INVESTMENTS—119.0% | | | |
| | |
| | | | | U.S. Government Mortgage Backed Obligations—97.3% | | | |
| $ | 1,245 | | | Federal Home Loan Mortgage Corp.,
4.809%, 09/01/35 | | $ | 1,207,871 |
| | 471 | | | 5.00%, 08/01/35 | | | 456,114 |
| | 8,896 | | | 6.00%, 05/01/11 - 02/01/34 | | | 9,111,743 |
| | 285 | | | 6.50%, 12/01/14 - 06/01/22 | | | 294,387 |
| | 73 | | | 7.50%, 03/01/08 - 06/01/28 | | | 77,002 |
| | — | (r) | | 8.25%, 10/01/07 | | | 763 |
| | 3 | | | 8.25%, 05/01/08 | | | 3,034 |
| | 21 | | | 8.50%, 12/01/07 - 07/01/21 | | | 22,627 |
| | 8 | | | 8.75%, 12/01/08 | | | 8,125 |
| | 50 | | | 9.00%, 06/01/09 - 03/01/11 | | | 52,384 |
| | 29 | | | 11.50%, 03/01/16 | | | 31,448 |
| | 9 | | | 13.25%, 05/01/13 | | | 10,123 |
| | 3 | | | 14.00%, 06/01/11 | | | 3,005 |
| | 10,287 | | | Federal National Mortgage Assn.,
4.50%, 06/01/19 - 09/01/20 | | | 10,014,404 |
| | 818 | | | 4.874%, 02/01/13 | | | 811,219 |
| | 16,867 | | | 5.00%, 02/01/18 - 09/01/35(a) | | | 16,464,933 |
| | 5,000 | | | 5.00%, TBA | | | 4,843,750 |
| | 11,296 | | | 5.50%, 05/01/33 - 06/01/34 | | | 11,211,006 |
| | 3,000 | | | 5.50%, TBA | | | 2,970,000 |
| | 668 | | | 5.78%, 11/01/11 | | | 689,485 |
| | 1,080 | | | 5.885%, 11/01/11 | | | 1,118,506 |
| | 8,616 | | | 6.00%, 12/01/22 - 04/01/35 | | | 8,707,965 |
| | 74 | | | 6.047%, 03/01/12 | | | 77,147 |
| | 63 | | | 6.34%, 01/01/08 | | | 64,490 |
| | 72 | | | 6.43%, 01/01/08 | | | 73,059 |
| | 6,544 | | | 6.50%, 03/01/16 - 09/01/34 | | | 6,717,786 |
| | 337 | | | 6.55%, 09/01/07 | | | 341,416 |
| | 27 | | | 6.815%, 10/01/07 | | | 27,547 |
| | 127 | | | 7.00%, 09/01/11 - 07/01/12 | | | 131,907 |
| | 65 | | | 8.00%, 09/01/22 - 12/01/22 | | | 69,623 |
| | — | (r) | | 8.00%, 03/01/07 - 06/01/07 | | | 329 |
| | 13 | | | 8.50%, 01/01/07 | | | 12,927 |
| | 11 | | | 9.75%, 08/01/10 - 11/01/16 | | | 11,775 |
| | 64 | | | Government National Mortgage Assoc.,
4.50%, 09/15/33 - 02/01/36 | | | 66,174 |
| | 1,198 | | | 6.00%, 05/15/24 - 08/15/35 | | | 1,255,263 |
| | 1,577 | | | 6.50%, 05/15/23 - 02/01/36 | | | 1,652,476 |
See Notes to Financial Statements beginning on page 130
| | |
| THE TARGET PORTFOLIO TRUST | | 111 |
| | |
Mortgage Backed Securities Portfolio (cont’d) | | Portfolio of Investments
As of December 31, 2005 |
| | | | | | |
PRINCIPAL
AMOUNT (000)# | | DESCRIPTION | | VALUE (NOTE 1) |
| | | | | | | |
| | |
| | | | U.S. Government Mortgage Backed Obligations (cont’d.) | | | |
| $ | 84 | | 7.50%, 09/15/11 - 12/20/23 | | $ | 88,754 |
| | 792 | | 8.00%, 01/15/08 - 11/15/30 | | | 846,701 |
| | 60 | | 8.25%, 06/20/17 - 07/20/17 | | | 64,367 |
| | 59 | | 8.50%, 04/20/17 | | | 63,672 |
| | 133 | | 9.00%, 09/15/08 - 01/15/20 | | | 143,707 |
| | 63 | | 9.50%, 04/15/06 - 06/15/20 | | | 67,039 |
| | 10 | | 13.50%, 05/15/11 | | | 11,532 |
| | 22 | | 14.00%, 06/15/11 | | | 24,501 |
| | 15 | | 16.00%, 05/15/12 | | | 17,675 |
| | | | | |
|
|
| | | | Total U.S. Government mortgage backed obligations
(cost $81,172,230) | | | 79,939,761 |
| | | | | |
|
|
| | |
| | | | Collateralized Mortgage Obligations—21.7% | | | |
| | 450 | | Bank of America Mortgage Securities,
Series 2004, Series 2004, Class J - 2A1(c)
4.79%, 11/25/34 | | | 445,541 |
| | 750 | | Bear Stearns Commercial Mortgage Securities Corp.,
Series 2000 - WF2, Series A2
7.32%, 10/15/32 | | | 812,942 |
| | 219 | | Chase Commercial Mortgage Securities Corp., Series 1998-1, Class A2
6.56%, 05/18/30 | | | 224,685 |
| | 369 | | Federal Home Loan Mortgage Corp., Pass Through Securities,
Series T-42, Class A-5
7.50%, 02/25/42 | | | 386,678 |
| | 19 | | Federal Home Loan Mortgage Corp., Series 1058, Class H
8.00%, 04/15/21 | | | 18,998 |
| | 16 | | Federal Home Loan Mortgage Corp., Series 1116, Class I
5.50%, 08/15/21 | | | 15,718 |
| | 71 | | Federal Home Loan Mortgage Corp., Series 1120, Class L
8.00%, 07/15/21 | | | 70,754 |
| | 89 | | Federal Home Loan Mortgage Corp., Series 1176, Class H
8.00%, 12/15/06 | | | 89,099 |
| | 870 | | Federal Home Loan Mortgage Corp., Series 1630, Class PJ
6.00%, 05/15/23 | | | 877,232 |
| | 62 | | Federal Home Loan Mortgage Corp., Series 186, Class E
6.00%, 08/15/21 | | | 62,482 |
| | 1,600 | | Federal Home Loan Mortgage Corp., Series 2627, Class BG
3.25%, 06/15/17 | | | 1,512,278 |
| | 425 | | Federal Home Loan Mortgage Corp., Series 2809 Class UC
4.00%, 06/15/19 | | | 388,471 |
| | 7 | | Federal Home Loan Mortgage Corp., Series 83, Class Z
9.00%, 10/15/20 | | | 7,418 |
| | 39 | | Federal Home Loan Mortgage Corp., Series 74, Class F
6.00%, 10/15/20 | | | 39,163 |
See Notes to Financial Statements beginning on page 130
| | |
| 112 | | THE TARGET PORTFOLIO TRUST |
| | | | | | |
PRINCIPAL
AMOUNT (000)# | | DESCRIPTION | | VALUE (NOTE 1) |
| | | | | | | |
| | |
| | | | Collateralized Mortgage Obligations (cont’d.) | | | |
| $ | 169 | | Federal National Mortgage Assoc., Series G92-59, Class D
6.00%, 10/25/22 | | $ | 172,469 |
| | 8 | | Federal National Mortgage Assoc., Series 1990-10, Class L
8.50%, 02/25/20 | | | 8,830 |
| | 26 | | Federal National Mortgage Assoc., Series 1990-108, Class G
7.00%, 09/25/20 | | | 27,031 |
| | 27 | | Federal National Mortgage Assoc., Series 1991-21, Class J
7.00%, 03/25/21 | | | 27,820 |
| | 53 | | Federal National Mortgage Assoc., Series 1992-113, Class Z
7.50%, 07/25/22 | | | 55,951 |
| | 39 | | Federal National Mortgage Assoc., Series 1992-61, Class ZB
7.50%, 05/25/07 | | | 39,727 |
| | 5 | | Federal National Mortgage Assoc., Series 1992-7, Class PZ
8.00%, 12/25/21 | | | 4,949 |
| | 276 | | Federal National Mortgage Assoc., Series 1993-223, Class ZA
6.50%, 12/25/23 | | | 283,615 |
| | 23 | | Federal National Mortgage Assoc., Series 1998-19, Class J
8.50%, 07/25/18 | | | 24,833 |
| | 150 | | Federal National Mortgage Assoc., Series 1998-M4, Class C
6.53%, 05/25/30 | | | 154,241 |
| | 775 | | Federal National Mortgage Assoc., Series 2001-51, Class QN
6.00%, 10/25/16 | | | 793,323 |
| | 357 | | Federal National Mortgage Assoc., Series 2003-33, Class PT
4.50%, 05/25/33 | | | 347,275 |
| | 26 | | Federal National Mortgage Assoc., Series 56, Class 1
6.00%, 04/01/19 | | | 26,368 |
| | 172 | | Federal National Mortgage Assoc., Series 93-41, Class H I/O
7.00%, 03/25/23 | | | 5,743 |
| | 31 | | Federal National Mortgage Assoc., Series G-14, Class L
8.50%, 06/25/21 | | | 32,432 |
| | 33 | | Federal National Mortgage Assoc., Series G92-24, Class Z
6.50%, 04/25/22 | | | 33,687 |
| | 317 | | Federal National Mortgage Assoc., Series G94-4, Class PG
8.00%, 05/25/24 | | | 345,983 |
| | 67 | | First Boston Mortgage Securities Corp., Series B, Class PO
Zero, 04/25/17 | | | 59,026 |
| | 1,015 | | Government National Morgage Assoc., Series 2005-74, Class HA
7.50%, 09/16/35 | | | 1,071,086 |
| | 1,080 | | Government National Morgage Assoc., Series 2005-74, Class HB
7.50%, 09/16/35 | | | 1,132,370 |
| | 420 | | Government National Morgage Assoc., Series 2005-74, Class HC
7.50%, 09/16/35 | | | 443,333 |
| | 541 | | GSR Mortgage Loan Trust, Series 2005-AR2, Class 1A2
4.64%, 04/25/35 | | | 534,496 |
See Notes to Financial Statements beginning on page 130
| | |
| THE TARGET PORTFOLIO TRUST | | 113 |
| | |
Mortgage Backed Securities Portfolio (cont’d) | | Portfolio of Investments
As of December 31, 2005 |
| | | | | | | |
PRINCIPAL
AMOUNT (000)# | | DESCRIPTION | | VALUE (NOTE 1) | |
| | | | | | | | |
| | |
| | | | Collateralized Mortgage Obligations (cont’d.) | | | | |
| $ | 839 | | Merrill Lynch Mortgage Investors, Inc., Series 2005-A2, Class A2(c)
4.50%, 02/25/35 | | $ | 823,454 | |
| | 750 | | Morgan Stanley Dean Witter Capital I, Series 200-LIF2, Class A2
7.20%, 10/15/33 | | | 809,162 | |
| | 1,000 | | Morgan Stanley Dean Witter Capital I, Series 2001-TOP3, Class A4
6.39%, 07/15/33 | | | 1,057,854 | |
| | 1,021 | | Morgan Stanley Mortgage Loan Trust, Series 2004-5AR, Class 3A4(c)
4.48%, 07/25/34 | | | 1,010,969 | |
| | 1,000 | | Nomura Asset Securities Corp., Series 1998-D6, Class A1C
6.69%, 03/15/30 | | | 1,081,051 | |
| | 37 | | Salomon Brothers Mortgage Securities, Series 1986-1, Class A
6.00%, 12/25/11 | | | 36,676 | |
| | 151 | | Wells Fargo Mortgage Backed Securities Trust, Series 2005-AR4, Class B1(c)
4.57%, 04/25/35 | | | 145,794 | |
| | 817 | | Wells Fargo Mortgage Backed Securities Trust, Series 2005-AR1, Class 1A1(c)
4.55%, 02/25/35 | | | 802,410 | |
| | 722 | | Wells Fargo Mortgage Backed Securities Trust, Series 2005-AR4, Class 2A2(c)
4.53%, 04/25/35 | | | 707,967 | |
| | 851 | | Wells Fargo Mortgage Backed Securities Trust, Series 2004-B8, Class A2(c)
4.57%, 01/25/35 | | | 833,677 | |
| | | | | |
|
|
|
| | | | Total Collateralized Mortgage Obligations
(cost $17,667,307) | | | 17,885,061 | |
| | | | | |
|
|
|
| | | | Total long-term investments
(cost $98,839,537) | | | 97,824,822 | |
| | | | | |
|
|
|
| | | | | | | | |
| | | | SHORT-TERM INVESTMENTS—2.0% | | | | |
| | |
| | | | Repurchase Agreement | | | | |
| | 1,600 | | Morgan Triparty Mortgage, dated 12/30/05, due 01/03/06 in the amount of $1,600,759 (cost $1,600,000; collateralized by $1,675,364 Federal Home Loan Mortgage Corp.; 4.27%, 12/01/20, value of the collateral including accrued interest was $1,605,955) | | | 1,600,000 | |
| | | | | |
|
|
|
| | | | Total Investments, Before Securities Sold Short—121.0%
(cost $100,439,537; Note 5) | | | 99,424,822 | |
| | | | | |
|
|
|
| | |
| | | | SECURITIES SOLD SHORT—(18.1)% | | | | |
| | 3,808 | | Federal Home Loan Mortgage Corp.
6.50%, 09/01/34 - 09/01/36 | | | (3,894,051 | ) |
See Notes to Financial Statements beginning on page 130
| | |
| 114 | | THE TARGET PORTFOLIO TRUST |
| | | | | | | |
PRINCIPAL
AMOUNT (000)# | | DESCRIPTION | | VALUE (NOTE 1) | |
| | | | | | | | |
| | | | Securities Sold Short (cont’d.) | | | | |
| | | | Federal National Mortgage Association | | | | |
| $ | 10,750 | | 5.50%, TBA | | $ | (10,803,750 | ) |
| | | | Government National Mortgage Assoc. | | | | |
| | 165 | | 7.00%, 07/15/16 - 01/01/36 TBA | | | (165,522 | ) |
| | | | | |
|
|
|
| | | | Total Securities Sold Short
(cost $(14,854,677)) | | | (14,863,323 | ) |
| | | | | |
|
|
|
| | | | Total Investments, Net of Securities Sold Short—102.9%
(cost $85,584,860) | | | 84,561,499 | |
| | | | Liabilities in excess of other assets(w)—(2.9%) | | | (2,366,295 | ) |
| | | | | |
|
|
|
| | | | Net Assets—100% | | $ | 82,195,204 | |
| | | | | |
|
|
|
The following abbreviations are used in portfolio descriptions:
I/O—Interest Only
TBA—To Be Announced
# Principal amount is denoted in U.S. dollars unless otherwise indicated.
| (a) | Security or portion thereof segregated as collateral for open futures contracts at December 31, 2005. |
| (c) | Indicates a variable rate security. |
| (w) | Liabilities in excess of other assets includes net realized appreciation (depreciation) on swaps and futures contracts as follows: |
Open futures contracts outstanding at December 31, 2005:
| | | | | | | | | | | | | |
Number of
Contracts
| | Type
| | Expiration
Month
| | Value at
Trade
Date
| | Value at
December 31,
2005
| | Unrealized
Appreciation
|
| 21 | | Long Positions:
U.S. Treasury
10 Year Note | | Mar 06 | | $ | 2,278,172 | | $ | 2,297,531 | | $ | 19,359 |
| | | | | | | | | | | | |
|
|
Interest rate swap agreement outstanding at December 31, 2005:
| | | | | | | | | | | | |
Counterparty
| | Termination
Date
| | Notional
Amount
| | Fixed
Rate
| | Floating
Rate
| | Unrealized
Appreciation
|
GSCM(1) | | 02/01/06 | | $ | 3,000,000 | | 4.678% | | 4.235% | | $ | 6,516 |
| | | | | | | | | | | |
|
|
| (1) | Portfolio pays the floating rate and receives the fixed rate. |
See Notes to Financial Statements beginning on page 130
| | |
| THE TARGET PORTFOLIO TRUST | | 115 |
| | |
Mortgage Backed Securities Portfolio (cont’d) | | Portfolio of Investments
As of December 31, 2005 |
Credit default swap agreements outstanding at December 31, 2005:
| | | | | | | | | | | | |
Counterparty
| | Termination
Date
| | Notional
Amount
| | Fixed
Rate
| | Underlying
Bond
| | Unrealized
Appreciation
(Depreciation)
| |
Goldman Sachs(1) | | 12/20/10 | | 3,000,000 | | 0.13% | | FNMA 4.375% | | $ | 5,100 | |
Goldman Sachs(2) | | 12/20/10 | | 3,000,000 | | 0.26% | | FNMA 6.25% | | | (6,600 | ) |
| | | | | | | | | | |
|
|
|
| | | | | | | | | | | $ | (1,500 | ) |
| | | | | | | | | | |
|
|
|
| (1) | Portfolio sold credit default protection to the counterparty in the event that the underlying bond defaults. |
| (2) | Portfolio bought credit default protection from the counterparty in the event that the underlying bond defaults. |
Reverse Repurchase Agreements outstanding at December 31, 2005:
| | | | | | | | | | | | |
Broker
| | Interest
Rate
| | Trade
Date
| | Value at
December 31,
2005
| | Maturity
Date
| | Cost
|
Bank of America | | 4.28% | | 12/19/05 | | $ | 16,294,000 | | 01/23/06 | | $ | 16,294,000 |
Bank of America | | 4.35% | | 12/13/05 | | | 18,810,000 | | 01/12/06 | | | 18,810,000 |
| | | | | | |
|
| | | |
|
|
| | | | | | | $ | 35,104,000 | | | | $ | 35,104,000 |
| | | | | | |
|
| | | |
|
|
The major asset category classification of portfolio holdings and liabilities in excess of other assets shown as a percentage of net assets as of December 31, 2005:
| | | |
U.S. Government Mortgage Backed Obligations | | 97.3 | % |
Collateralized Mortgage Obligations | | 21.7 | |
Short-Term Investments | | 2.0 | |
| | |
|
|
| | | 121.0 | |
Securities Sold Short | | (18.1 | ) |
Liabilities in excess of other assets | | (2.9 | ) |
| | |
|
|
Total | | 100.0 | % |
| | |
|
|
See Notes to Financial Statements beginning on page 130
| | |
| 116 | | THE TARGET PORTFOLIO TRUST |
| | |
Portfolio of Investments
As of December 31, 2005 | | U.S. Government Money Market Portfolio |
| | | | | | |
PRINCIPAL
AMOUNT (000) | | DESCRIPTION | | VALUE (NOTE 1) |
| | | | Federal Home Loan Bank—10.8% | | | |
| $ | 320 | | 2.10%, 07/21/06 | | $ | 316,382 |
| | 2,000 | | 2.75%, 05/15/06 | | | 1,987,822 |
| | 1,000 | | 3.25%, 07/21/06 | | | 996,086 |
| | 855 | | 3.875%, 09/12/06 | | | 851,111 |
| | 1,000 | | 4.015%, 08/01/06 | | | 1,000,000 |
| | 1,045 | | 5.125%, 03/06/06 | | | 1,046,294 |
| | | | | |
|
|
| | | | | | | 6,197,695 |
| | | | | |
|
|
| | |
| | | | Federal Home Loan Mortgage Association—11.2% | | | |
| | 2,715 | | 1.875%, 02/15/06 | | | 2,706,371 |
| | 1,000 | | 2.375%, 01/23/06 | | | 998,889 |
| | 2,000 | | 2.81%, 02/02/06 | | | 1,997,275 |
| | 700 | | 5.25%, 01/15/06 | | | 700,380 |
| | | | | |
|
|
| | | | | | | 6,402,915 |
| | | | | |
|
|
| | |
| | | | Federal National Mortgage Association—23.9% | | | |
| | 205 | | 2.00%, 05/04/06 | | | 203,229 |
| | 3,288 | | 2.00%, 01/15/06 | | | 3,285,024 |
| | 425 | | 2.03%, 06/12/06 | | | 420,512 |
| | 1,000 | | 2.30%, 04/28/06 | | | 993,181 |
| | 2,005 | | 2.35%, 04/29/06 | | | 1,990,438 |
| | 1,410 | | 2.74%, 05/05/06 | | | 1,401,203 |
| | 1,000 | | 3.25%, 07/31/06 | | | 996,344 |
| | 1,000 | | 4.00%, 08/08/06 | | | 998,355 |
| | 1,630 | | 5.25%, 06/15/06 | | | 1,639,563 |
| | 1,200 | | 5.50%, 02/15/06 | | | 1,201,540 |
| | 550 | | 5.875%, 02/02/06 | | | 550,785 |
| | | | | |
|
|
| | | | | | | 13,680,174 |
| | | | | |
|
|
| | | | Repurchase Agreements—54.7% | | | |
| | 11,100 | | Gold Triparty Mortgage, 4.35% dated 12/30/05, due 01/03/06 in the amount of $11,105,365 (cost $11,100,000; collateralized by $11,279,111 Federal Home Loan Mortgage Corp.; 4.50%, 10/01/35, value of the collateral including accrued interest was $11,322,000) | | | 11,100,000 |
| | 9,100 | | Morgan Triparty Mortgage, 4.27% dated 12/30/05, due 01/03/06 in the amount of $9,104,317 (cost $9,100,000; collateralized by $9,282,001 Federal Home Loan Mortgage Corp.; 5.50%, 12/01/20, value of the collateral including accrued interest was $9,323,419) | | | 9,100,000 |
| | 11,100 | | SBC Triparty, 4.33% dated 12/30/05, due 01/03/06 in the amount of $11,105,340 (cost $11,100,000; collateralized by $11,091,011 Federal Home Loan Mortgage Corp.; 4.50%, 1/15/14, value of the collateral including accrued interest was $11,322,353) | | | 11,100,000 |
| | | | | |
|
|
| | | | | | | 31,300,000 |
| | | | | |
|
|
See Notes to Financial Statements beginning on page 130
| | |
| THE TARGET PORTFOLIO TRUST | | 117 |
| | |
U.S. Government Money Market Portfolio (cont’d) | | Portfolio of Investments
As of December 31, 2005 |
| | | | | | |
| SHARES | | DESCRIPTION | | VALUE (NOTE 1) | |
| | | Money Market Mutual Fund | | | | |
| 3,591 | | Dryden Core Investment Fund—Taxable Money Market Series(q) | | $ | 3,591 | |
| | | | |
|
|
|
| | | Total Investments—100.6%
(amortized cost $57,584,375)(a) | | | 57,584,375 | |
| | | Liabilities in excess of other assets—(0.6)% | | | (376,941 | ) |
| | | | |
|
|
|
| | | Net Assets—100% | | $ | 57,207,434 | |
| | | | |
|
|
|
(a) Federal income tax basis of portfolio securities is the same as for financial reporting purposes.
| (q) | Prudential Investments LLC, the manager of the Fund also serves as manager of the Dryden Core Investment Fund—Taxable Money Market Series. |
The industry classification of long-term portfolio holdings, short-term investments and liabilities in excess of other assets shown as a percentage of net assets as of December 31, 2005 were as follows:
| | | |
Repurchase Agreements | | 54.7 | % |
Federal National Mortgage Association | | 23.9 | |
Federal Home Loan Mortgage Association | | 11.2 | |
Federal Home Loan Bank | | 10.8 | |
| | |
|
|
| | | 100.6 | |
Liabilities in excess of other assets | | (0.6 | ) |
| | |
|
|
Total | | 100.0 | % |
| | |
|
|
See Notes to Financial Statements beginning on page 130
| | |
| 118 | | THE TARGET PORTFOLIO TRUST |
Statements of Assets and Liabilities December 31, 2005
| | | | | | | | | | |
| | | LARGE
CAPITALIZATION
GROWTH
PORTFOLIO | | LARGE
CAPITALIZATION
VALUE
PORTFOLIO | | SMALL
CAPITALIZATION
GROWTH
PORTFOLIO | |
| | | |
| ASSETS | | | | | | | | | | |
Investments, at value: | | | | | | | | | | |
Unaffiliated investments* | | $ | 308,237,816 | | $ | 357,349,043 | | $ | 139,315,223 | |
Affiliated investments** | | | 210,597 | | | 2,027,891 | | | 5,393,980 | |
Repurchase agreement*** | | | — | | | — | | | — | |
Cash | | | — | | | 3,356,395 | | | 11,652 | |
Receivable for Fund shares sold | | | 46,752 | | | 367,163 | | | 21,952 | |
Dividends and interest receivable | | | 249,841 | | | 478,996 | | | 43,325 | |
Prepaid expenses and other assets | | | 14,218 | | | 20,529 | | | 7,349 | |
Receivable for investments sold | | | 8,506,043 | | | 427,437 | | | 580,163 | |
Receivable for foreign tax reclaim | | | — | | | — | | | — | |
Total assets | | | 317,265,267 | | | 364,027,454 | | | 145,373,644 | |
| | | |
| LIABILITIES | | | | | | | | | | |
Payable for Fund shares reacquired | | | 1,333,370 | | | 335,253 | | | 362,672 | |
Payable for investments purchased | | | 7,522,976 | | | 878,563 | | | 1,267,414 | |
Accrued expenses and other liabilities | | | 317,788 | | | 218,415 | | | 165,529 | |
Management fee payable | | | 160,193 | | | 290,133 | | | 114,560 | |
Transfer agent fee payable | | | 15,800 | | | 51,601 | | | 97,696 | |
Deferred trustees’ fees | | | 11,197 | | | — | | | — | |
Payable to custodian | | | 69,289 | | | — | | | — | |
Outstanding options written**** | | | — | | | — | | | — | |
Premium for swaps written | | | — | | | — | | | — | |
Total liabilities | | | 9,430,613 | | | 1,773,965 | | | 2,007,871 | |
| | | |
| NET ASSETS | | $ | 307,834,654 | | $ | 362,253,489 | | $ | 143,365,773 | |
Net assets were comprised of:
Shares of beneficial interest, at par | | $ | 21,083 | | $ | 23,977 | | $ | 12,715 | |
Paid-in capital, in excess of par | | | 273,402,343 | | | 291,286,108 | | | 157,961,298 | |
| | | | 273,423,426 | | | 291,310,085 | | | 157,974,013 | |
Undistributed net investment income (loss) | | | 144,542 | | | 446,270 | | | — | |
Accumulated net realized gains (losses) | | | 2,577,975 | | | 24,721,818 | | | (35,001,774 | ) |
Net unrealized appreciation (depreciation) | | | 31,688,711 | | | 45,775,316 | | | 20,393,534 | |
Net assets, December 31, 2005 | | $ | 307,834,654 | | $ | 362,253,489 | | $ | 143,365,773 | |
Shares of beneficial interest issued and outstanding | | | 21,082,620 | | | 23,977,016 | | | 12,715,149 | |
Net asset value, offering price and redemption price per share | | $ | 14.60 | | $ | 15.11 | | $ | 11.28 | |
* Identified cost of unaffiliated investments | | $ | 276,549,105 | | $ | 311,573,727 | | $ | 118,921,689 | |
** Identified cost of affiliated investments | | $ | 210,597 | | $ | 2,027,891 | | $ | 5,393,980 | |
*** Identified cost of repurchase agreements | | $ | — | | | — | | $ | — | |
**** Premiums received from options written | | $ | — | | | — | | $ | — | |
See Notes to Financial Statements
| | |
| THE TARGET PORTFOLIO TRUST | | 119 |
Statements of Assets and Liabilities December 31, 2005 (cont’d)
| | | | | | | | | | | |
| | | SMALL
CAPITALIZATION
VALUE
PORTFOLIO | | INTERNATIONAL
EQUITY
PORTFOLIO | | |
INTERNATIONAL
BOND
PORTFOLIO | |
| | | |
| ASSETS | | | | | | | | | | | |
Investments, at value: | | | | | | | | | | | |
Unaffiliated investments* | | $ | 253,770,841 | | $ | 232,776,336 | | | $ | 59,177,045 | |
Affiliated investments** | | | 5,904,407 | | | 1,039,230 | | | | — | |
Repurchase agreement*** | | | — | | | — | | | | — | |
Cash | | | 24,462 | | | — | | | | 172,382 | |
Foreign currency, at value**** | | | — | | | 676,670 | | | | 225,606 | |
Receivable for Fund shares sold | | | 100,287 | | | 18,126 | | | | 8,387 | |
Dividends and interest receivable | | | 345,132 | | | 310,369 | | | | 825,543 | |
Prepaid expenses and other assets | | | 10,215 | | | 7,813 | | | | 1,566 | |
Receivable for investments sold | | | 1,384,202 | | | 96,445 | | | | 1,267,725 | |
Receivable for foreign tax reclaim | | | — | | | 364,849 | | | | — | |
Receivable from investment manager | | | — | | | — | | | | — | |
Unrealized appreciation on swaps | | | — | | | — | | | | 135,988 | |
Due from broker for variation margin | | | — | | | — | | | | 5,809 | |
Premium for swaps purchased | | | — | | | — | | | | — | |
Unrealized appreciation on forward currency contracts | | | — | | | 197,420 | | | | 25,207 | |
Total assets | | | 261,539,546 | | | 235,487,258 | | | | 61,845,258 | |
| LIABILITIES | | | | | | | | | | | |
Payable for Fund shares reacquired | | | 709,951 | | | 905,163 | | | | 134,232 | |
Payable for investments purchased | | | 1,207,028 | | | 457,347 | | | | 11,648,663 | |
Accrued expenses and other liabilities | | | 120,521 | | | 213,663 | | | | 210,726 | |
Management fee payable | | | 286,604 | | | 185,588 | | | | 8,363 | |
Transfer agent fee payable | | | 88,242 | | | 100,670 | | | | 31,870 | |
Deferred trustees’ fees | | | 12,372 | | | 14,400 | | | | — | |
Payable to custodian | | | — | | | 413,304 | | | | — | |
Outstanding options written***** | | | — | | | — | | | | 43,060 | |
Premium for swaps written | | | — | | | — | | | | 45,499 | |
Unrealized depreciation on swaps | | | — | | | — | | | | 591,779 | |
Unrealized depreciation on forward currency contracts | | | — | | | 46,974 | | | | 253,923 | |
Investments sold short, at value****** | | | — | | | — | | | | 5,965,553 | |
Total liabilities | | | 2,424,718 | | | 2,337,109 | | | | 18,933,668 | |
| NET ASSETS | | $ | 259,114,828 | | $ | 233,150,149 | | | $ | 42,911,590 | |
Net assets were comprised of:
Shares of beneficial interest, at par | | $ | 13,649 | | $ | 16,664 | | | $ | 5,151 | |
Paid-in capital, in excess of par | | | 213,071,322 | | | 203,302,762 | | | | 43,498,834 | |
| | | | 213,084,971 | | | 203,319,426 | | | | 43,503,985 | |
Undistributed net investment income (loss) | | | 281,690 | | | 200,879 | | | | (1,085,535 | ) |
Accumulated net realized gains (losses) | | | 4,065,570 | | | (88,949 | ) | | | (43,693 | ) |
Net unrealized appreciation (depreciation) | | | 41,682,597 | | | 29,718,793 | | | | 536,833 | |
Net assets, December 31, 2005 | | $ | 259,114,828 | | $ | 233,150,149 | | | $ | 42,911,590 | |
Shares of beneficial interest issued and outstanding | | | 13,649,305 | | | 16,664,396 | | | | 5,150,987 | |
Net asset value, offering price and redemption price per share | | $ | 18.98 | | $ | 13.99 | | | $ | 8.33 | |
* Identified cost of unaffiliated investments | | $ | 212,088,244 | | $ | 203,203,552 | | | $ | 58,127,695 | |
** Identified cost of affiliated investments | | $ | 5,904,407 | | $ | 1,039,230 | | | $ | — | |
*** Identified cost of repurchase agreements | | $ | — | | $ | — | | | $ | — | |
**** Identified cost of currency | | $ | — | | $ | 682,805 | | | $ | 225,488 | |
***** Premiums received from options written | | $ | — | | $ | — | | | $ | 39,703 | |
****** Proceeds received from short sales | | $ | — | | $ | — | | | $ | 6,119,382 | |
See Notes to Financial Statements
| | |
| 120 | | THE TARGET PORTFOLIO TRUST |
Statements of Assets and Liabilities December 31, 2005 (cont’d)
| | | | | | | | | | | | | | | | |
| | | TOTAL
RETURN BOND PORTFOLIO | | | INTERMEDIATE-
TERM BOND
PORTFOLIO | | | MORTGAGE
BACKED
SECURITIES
PORTFOLIO | | | U.S. GOVERNMENT
MONEY
MARKET
PORTFOLIO | |
| ASSETS | | | | | | | | | | | | | | | | |
Investments, at value: | | | | | | | | | | | | | | | | |
Unaffiliated investments* | | $ | 193,721,048 | | | $ | 262,846,119 | | | $ | 97,824,822 | | | $ | 26,280,784 | |
Affiliated investments** | | | 34,557,334 | | | | 2,644,435 | | | | — | | | | 3,591 | |
Repurchase agreement*** | | | — | | | | — | | | | 1,600,000 | | | | 31,300,000 | |
Cash | | | — | | | | 3,961,584 | | | | 388,618 | | | | — | |
Foreign currency, at value**** | | | 3,202,512 | | | | 605,083 | | | | — | | | | — | |
Receivable for Fund shares sold | | | 784,219 | | | | 155,843 | | | | 20,630 | | | | 43,453 | |
Dividends and interest receivable | | | 1,063,575 | | | | 1,945,796 | | | | 517,188 | | | | 286,419 | |
Prepaid expenses and other assets | | | 7,414 | | | | 13,038 | | | | 6,135 | | | | 3,601 | |
Receivable for investments sold | | | 29,652,631 | | | | — | | | | 59,349,996 | | | | — | |
Receivable for foreign tax reclaim | | | — | | | | — | | | | — | | | | — | |
Due from broker for variation margin | | | — | | | | — | | | | — | | | | — | |
Unrealized appreciation on swaps | | | 224,632 | | | | 96,844 | | | | 11,616 | | | | — | |
Premium for swaps purchased | | | — | | | | 6,856 | | | | — | | | | — | |
Unrealized appreciation on forward currency contracts | | | 24,080 | | | | — | | | | — | | | | — | |
Total assets | | | 263,237,445 | | | | 272,275,598 | | | | 159,719,005 | | | | 57,917,848 | |
| LIABILITIES | | | | | | | | | | | | | | | | |
Payable for Fund shares reacquired | | | 192,321 | | | | 438,362 | | | | 825,175 | | | | 425,187 | |
Payable for investments purchased | | | 46,556,723 | | | | 8,424,660 | | | | 26,254,805 | | | | — | |
Accrued expenses and other liabilities | | | 180,466 | | | | 193,496 | | | | 210,070 | | | | 147,135 | |
Management fee payable | | | 85,582 | | | | 191,087 | | | | 43,789 | | | | 9,023 | |
Transfer agent fee payable | | | 71,015 | | | | 72,946 | | | | 69,371 | | | | 56,979 | |
Payable to custodian | | | 26,821,082 | | | | — | | | | — | | | | 2,720 | |
Reverse repurchase agreement | | | — | | | | — | | | | 35,104,000 | | | | — | |
Dividends payable | | | 236,848 | | | | 332,862 | | | | 143,059 | | | | 69,370 | |
Due to broker for variation margin | | | 10,857 | | | | 45,172 | | | | 3,609 | | | | — | |
Outstanding options written***** | | | 62,053 | | | | 219,285 | | | | — | | | | — | |
Premium for swaps written | | | 39,075 | | | | — | | | | — | | | | — | |
Unrealized depreciation on swaps | | | 390,595 | | | | 54,835 | | | | 6,600 | | | | — | |
Unrealized depreciation on forward currency contracts | | | 234,893 | | | | 125,267 | | | | — | | | | — | |
Investments sold short, at value****** | | | 26,680,964 | | | | — | | | | 14,863,323 | | | | — | |
Total liabilities | | | 101,562,474 | | | | 10,097,972 | | | | 77,523,801 | | | | 710,414 | |
| NET ASSETS | | $ | 161,674,971 | | | $ | 262,177,626 | | | $ | 82,195,204 | | | $ | 57,207,434 | |
Net assets were comprised of:
Shares of beneficial interest, at par | | $ | 15,556 | | | $ | 25,757 | | | $ | 8,141 | | | $ | 57,207 | |
Paid-in capital, in excess of par | | | 163,929,688 | | | | 266,597,136 | | | | 85,117,886 | | | | 57,159,952 | |
| | | | 163,945,244 | | | | 266,622,893 | | | | 85,126,027 | | | | 57,217,159 | |
Undistributed net investment income (loss) | | | 2,030,789 | | | | (233,202 | ) | | | (37,441 | ) | | | (9,319 | ) |
Accumulated net realized gains (losses) | | | (3,002,468 | ) | | | (2,687,058 | ) | | | (1,894,396 | ) | | | (406 | ) |
Net unrealized appreciation (depreciation) | | | (1,298,594 | ) | | | (1,525,007 | ) | | | (998,986 | ) | | | — | |
Net assets, December 31, 2005 | | $ | 161,674,971 | | | $ | 262,177,626 | | | $ | 82,195,204 | | | $ | 57,207,434 | |
Shares of beneficial interest issued and outstanding | | | 15,556,052 | | | | 25,757,439 | | | | 8,140,613 | | | | 57,207,434 | |
Net asset value, offering price and redemption price per share | | $ | 10.39 | | | $ | 10.18 | | | $ | 10.10 | | | $ | 1.00 | |
* Identified cost of unaffiliated investments | | $ | 194,444,153 | | | $ | 263,631,130 | | | $ | 98,839,537 | | | $ | 26,280,784 | |
** Identified cost of affiliated investments | | $ | 34,557,334 | | | $ | 2,644,435 | | | $ | — | | | $ | 3,591 | |
*** Identified cost of repurchase agreements | | $ | — | | | $ | — | | | $ | 1,600,000 | | | $ | 31,300,000 | |
**** Identified cost of currency | | $ | 3,208,062 | | | $ | 605,770 | | | | — | | | | — | |
***** Premiums received from options written | | $ | 93,314 | | | $ | 197,277 | | | $ | — | | | $ | — | |
****** Proceeds received from short sales | | $ | 26,448,010 | | | $ | — | | | $ | 14,854,677 | | | $ | — | |
See Notes to Financial Statements
| | |
| THE TARGET PORTFOLIO TRUST | | 121 |
Statements of Operations
Year Ended December 31, 2005
| | | | | | | | | | | | |
| | | LARGE
CAPITALIZATION
GROWTH
PORTFOLIO | | | LARGE
CAPITALIZATION
VALUE
PORTFOLIO | | | SMALL
CAPITALIZATION
GROWTH
PORTFOLIO | |
| | | |
| NET INVESTMENT INCOME (LOSS) | | | | | | | | | | | | |
Income | | | | | | | | | | | | |
Unaffiliated dividend income | | $ | 2,899,412 | | | $ | 8,053,617 | | | $ | 350,598 | |
Affiliated dividend income | | | 29,779 | | | | 60,037 | | | | 65,168 | |
Less: Foreign withholding taxes | | | (27,067 | ) | | | (191 | ) | | | — | |
Total income | | | 2,902,124 | | | | 8,113,463 | | | | 415,766 | |
Expenses | | | | | | | | | | | | |
Management fee | | | 1,864,258 | | | | 2,197,807 | | | | 864,203 | |
Transfer agent’s fees and expenses(a) | | | 235,000 | | | | 190,000 | | | | 206,000 | |
Custodian’s fees and expenses | | | 100,656 | | | | 104,908 | | | | 95,999 | |
Reports to shareholders | | | 25,000 | | | | 44,500 | | | | 35,000 | |
Registration fees | | | 30,000 | | | | 36,000 | | | | 21,500 | |
Legal fees and expenses | | | 28,000 | | | | 25,000 | | | | 35,000 | |
Trustees’ fees | | | 17,500 | | | | 18,500 | | | | 10,400 | |
Audit fees | | | 17,600 | | | | 66,600 | | | | 16,700 | |
Miscellaneous | | | 34,061 | | | | 15,191 | | | | 23,175 | |
Total expenses | | | 2,352,075 | | | | 2,698,506 | | | | 1,307,977 | |
| Net investment income (loss) | | | 550,049 | | | | 5,414,957 | | | | (892,211 | ) |
| | | |
REALIZED AND UNREALIZED GAIN (LOSS)
ON INVESTMENTS AND FOREIGN
CURRENCY TRANSACTIONS | | | | | | | | | | | | |
Net realized gain (loss) on: | | | | | | | | | | | | |
Investment transactions | | | 61,722,889 | | | | 63,022,342 | | | | 11,287,884 | |
Short sales | | | — | | | | — | | | | — | |
Tax expense on undistributed net realized capital gains | | | — | | | | (203,773 | ) | | | — | |
| Total net realized gain (loss) | | | 61,722,889 | | | | 62,818,569 | | | | 11,287,884 | |
Net change in unrealized appreciation (depreciation) on: | | | — | | | | | | | | | |
Investments | | | (43,590,841 | ) | | | (45,800,873 | ) | | | (4,638,598 | ) |
Options written | | | — | | | | — | | | | — | |
Short sales | | | — | | | | — | | | | — | |
| Net change in unrealized appreciation (depreciation) | | | (43,590,841 | ) | | | (45,800,873 | ) | | | (4,638,598 | ) |
| Net gain (loss) | | | 18,132,048 | | | | 17,017,696 | | | | 6,649,286 | |
| | | |
NET INCREASE (DECREASE) IN NET ASSETS
RESULTING FROM OPERATIONS | | $ | 18,682,097 | | | $ | 22,432,653 | | | $ | 5,757,075 | |
| | | |
(a) Including affiliated expense of | | $ | 211,000 | | | $ | 188,000 | | | $ | 170,000 | |
See Notes to Financial Statements
| | |
| 122 | | THE TARGET PORTFOLIO TRUST |
Statements of Operations
Year Ended December 31, 2005 (cont’d)
| | | | | | | | | | | | |
| | | SMALL
CAPITALIZATION
VALUE
PORTFOLIO | | | INTERNATIONAL
EQUITY
PORTFOLIO | | | INTERNATIONAL
BOND
PORTFOLIO | |
| | | |
| NET INVESTMENT INCOME (LOSS) | | | | | | | | | | | | |
Income | | | | | | | | | | | | |
Unaffiliated dividend income | | $ | 3,933,093 | | | $ | 6,009,331 | | | $ | 88,119 | |
Affiliated dividend income | | | 88,293 | | | | 10,485 | | | | — | |
Less: Foreign withholding taxes | | | (13,889 | ) | | | (502,894 | ) | | | (2,684 | ) |
Unaffiliated Interest | | | — | | | | 105,445 | | | | 1,335,284 | |
Total income | | | 4,007,497 | | | | 5,622,367 | | | | 1,420,719 | |
Expenses | | | | | | | | | | | | |
Management fee | | | 1,497,893 | | | | 1,550,803 | | | | 220,381 | |
Transfer agent’s fees and expenses(a) | | | 250,000 | | | | 198,000 | | | | 76,000 | |
Custodian’s fees and expenses | | | 99,314 | | | | 277,000 | | | | 240,000 | |
Reports to shareholders | | | 12,000 | | | | 25,000 | | | | 27,000 | |
Registration fees | | | 28,000 | | | | 25,000 | | | | 18,000 | |
Legal fees and expenses | | | 27,000 | | | | 24,000 | | | | 27,000 | |
Trustees’ fees | | | 15,500 | | | | 15,000 | | | | 13,000 | |
Audit fees | | | 18,000 | | | | 23,000 | | | | 26,000 | |
Miscellaneous | | | 27,096 | | | | 46,038 | | | | 19,642 | |
Total expenses | | | 1,974,803 | | | | 2,183,841 | | | | 667,023 | |
| Net investment income (loss) | | | 2,032,694 | | | | 3,438,526 | | | | 753,696 | |
| | |
REALIZED AND UNREALIZED GAIN (LOSS)
ON INVESTMENTS AND FOREIGN
CURRENCY TRANSACTIONS | | | | | | | | | |
Net realized gain (loss) on: | | | | | | | | | | | | |
Investment transactions | | | 55,992,751 | | | | 42,253,732 | | | | (382,533 | ) |
Financial futures contracts | | | — | | | | — | | | | 191,770 | |
Foreign currency transactions | | | — | | | | 120,325 | | | | 5,030,134 | |
Options written | | | — | | | | — | | | | 73,413 | |
Swaps | | | — | | | | — | | | | 546,631 | |
Short sales | | | — | | | | — | | | | (3,357 | ) |
Tax expense on undistributed net realized capital gains | | | — | | | | — | | | | — | |
| Total net realized gain (loss) | | | 55,992,751 | | | | 42,374,057 | | | | 5,456,058 | |
Net change in unrealized appreciation (depreciation) on: | | | | | | | | | | | | |
Investments | | | (34,236,849 | ) | | | (16,208,565 | ) | | | (4,392,209 | ) |
Financial futures contracts | | | — | | | | — | | | | 2,602 | |
Foreign currencies | | | — | | | | 56,956 | | | | 136,038 | |
Options written | | | — | | | | — | | | | (27,416 | ) |
Swaps | | | — | | | | — | | | | (472,819 | ) |
Short sales | | | — | | | | — | | | | 153,829 | |
| Net change in unrealized appreciation (depreciation) | | | (34,236,849 | ) | | | (16,151,609 | ) | | | (4,599,975 | ) |
| Net gain (loss) | | | 21,755,902 | | | | 26,222,448 | | | | 856,083 | |
| | | |
| NET INCREASE (DECREASE) IN NET ASSETS RESULTING FROM OPERATIONS | | $ | 23,788,596 | | | $ | 29,660,974 | | | $ | 1,609,779 | |
| | | |
(a) Including affiliated expense of | | $ | 245,000 | | | $ | 156,300 | | | $ | 68,500 | |
See Notes to Financial Statements
| | |
| THE TARGET PORTFOLIO TRUST | | 123 |
Statements of Operations
Year Ended December 31, 2005 (cont’d)
| | | | | | | | | | | | | | | |
| | | TOTAL RETURN BOND
PORTFOLIO | | | INTERMEDIATE-
TERM
BOND
PORTFOLIO | | | MORTGAGE
BACKED
SECURITIES
PORTFOLIO | | | U.S. GOVERNMENT
MONEY
MARKET
PORTFOLIO |
| | | | |
| NET INVESTMENT INCOME (LOSS) | | | | | | | | | | | | | | | |
Income | | | | | | | | | | | | | | | |
Unaffiliated dividend income | | $ | 26,556 | | | $ | 46,975 | | | $ | 13,069 | | | $ | — |
Affiliated dividend income | | | 214,735 | | | | 199,457 | | | | 443 | | | | 3,726 |
Less: Foreign withholding taxes | | | — | | | | (846 | ) | | | — | | | | — |
Unaffiliated interest | | | 7,362,365 | | | | 11,208,012 | | | | 5,916,108 | | | | 2,228,089 |
Total income | | | 7,603,656 | | | | 11,453,598 | | | | 5,929,620 | | | | 2,231,815 |
Expenses | | | | | | | | | | | | | | | |
Management fee | | | 763,295 | | | | 1,252,860 | | | | 403,881 | | | | 173,730 |
Interest Expense (Note 7) | | | — | | | | — | | | | 705,053 | | | | — |
Transfer agent’s fees and expenses(a) | | | 182,000 | | | | 195,998 | | | | 121,000 | | | | 103,000 |
Custodian’s fees and expenses | | | 194,000 | | | | 160,000 | | | | 158,000 | | | | 94,000 |
Reports to shareholders | | | 20,000 | | | | 25,000 | | | | 27,000 | | | | 30,000 |
Registration fees | | | 26,500 | | | | 20,000 | | | | 22,000 | | | | 31,000 |
Legal fees and expenses | | | 35,000 | | | | 27,000 | | | | 23,000 | | | | 12,000 |
Trustees’ fees | | | 12,000 | | | | 16,000 | | | | 12,000 | | | | 12,000 |
Audit fees | | | 22,000 | | | | 23,000 | | | | 22,600 | | | | 15,000 |
Miscellaneous | | | 33,184 | | | | 41,439 | | | | 27,195 | | | | 22,534 |
Total expenses | | | 1,287,979 | | | | 1,761,297 | | | | 1,521,729 | | | | 493,264 |
| Net investment income (loss) | | | 6,315,677 | | | | 9,692,301 | | | | 4,407,891 | | | | 1,738,551 |
| | | |
REALIZED AND UNREALIZED GAIN (LOSS)
ON INVESTMENTS AND FOREIGN
CURRENCY TRANSACTIONS | | | | | | | | | | | | |
Net realized gain (loss) on: | | | | | | | | | | | | | | | |
Investment transactions | | | 2,146,789 | | | | 549,150 | | | | (144,029 | ) | | | — |
Financial futures contracts | | | (2,099,966 | ) | | | (1,546,327 | ) | | | 60,807 | | | | — |
Foreign currency transactions | | | 714,575 | | | | (70,321 | ) | | | — | | | | — |
Options written | | | 593,510 | | | | 493,006 | | | | (1,116 | ) | | | — |
Swaps | | | (228,985 | ) | | | (652,204 | ) | | | (2,162 | ) | | | — |
Short sales | | | (879,097 | ) | | | 11,481 | | | | 46,034 | | | | — |
Tax expense on undistributed net realized capital gains | | | — | | | | — | | | | — | | | | — |
| Total net realized gain (loss) | | | 246,826 | | | | (1,215,215 | ) | | | (40,466 | ) | | | — |
Net change in unrealized appreciation (depreciation) on: | | | | | | | | | | | | | | | |
Investments | | | (2,658,958 | ) | | | (2,100,651 | ) | | | (2,428,624 | ) | | | — |
Financial futures contracts | | | 151,191 | | | | (626,381 | ) | | | 13,021 | | | | — |
Foreign currencies | | | (16,124 | ) | | | (127,586 | ) | | | — | | | | — |
Options written | | | (351,907 | ) | | | (321,322 | ) | | | — | | | | — |
Swaps | | | 752,109 | | | | 11,088 | | | | 3,677 | | | | — |
Short sales | | | (106,559 | ) | | | — | | | | 20,887 | | | | — |
| Net change in unrealized appreciation (depreciation) | | | (2,230,248 | ) | | | (3,164,852 | ) | | | (2,391,039 | ) | | | — |
| Net gain (loss) | | | (1,983,422 | ) | | | (4,380,067 | ) | | | (2,431,505 | ) | | | — |
| | | | |
NET INCREASE (DECREASE) IN NET ASSETS
RESULTING FROM OPERATIONS | | $ | 4,332,255 | | | $ | 5,312,234 | | | $ | 1,976,386 | | | $ | 1,738,551 |
| | | | |
(a) Including affiliated expense of | | $ | 160,000 | | | $ | 184,000 | | | $ | 94,176 | | | $ | 72,000 |
See Notes to Financial Statements
| | |
| 124 | | THE TARGET PORTFOLIO TRUST |
Statements of Changes in Net Assets
| | | | | | | | | | | | | | | | |
| | | LARGE CAPITALIZATION
GROWTH PORTFOLIO
| | | LARGE CAPITALIZATION VALUE PORTFOLIO
| |
| | | Year
Ended
December 31,
2005 | | | Year
Ended
December 31,
2004 | | | Year
Ended
December 31,
2005 | | | Year
Ended
December 31,
2004 | |
| | | | |
INCREASE (DECREASE)
IN NET ASSETS | | | | | | | | | | | | | | | | |
| Operations | | | | | | | | | | | | | | | | |
Net investment income (loss) | | $ | 550,049 | | | $ | 1,544,276 | | | $ | 5,414,957 | | | $ | 4,966,320 | |
Net realized gain (loss) on investment and foreign currency transactions | | | 61,722,889 | | | | 44,858,283 | | | | 62,818,569 | | | | 33,363,731 | |
Net change in unrealized appreciation/(depreciation) of investments | | | (43,590,841 | ) | | | (34,500,918 | ) | | | (45,800,873 | ) | | | 23,851,981 | |
Net increase (decrease) in net assets resulting from operations | | | 18,682,097 | | | | 11,901,641 | | | | 22,432,653 | | | | 62,182,032 | |
| Dividends and distributions (Note 1) | | | | | | | | | | | | | | | | |
Dividends from net investment income | | | (424,776 | ) | | | (1,525,007 | ) | | | (5,359,256 | ) | | | (4,679,699 | ) |
Distributions from net realized gains | | | (44,003,589 | ) | | | — | | | | (49,641,032 | ) | | | — | |
Total distributions | | | (44,428,365 | ) | | | (1,525,007 | ) | | | (55,000,288 | ) | | | (4,679,699 | ) |
| Fund share transactions (Note 6) | | | | | | | | | | | | | | | | |
Net proceeds from shares sold | | | 30,635,551 | | | | 75,709,022 | | | | 40,152,956 | | | | 79,263,751 | |
Net asset value of shares issued in reinvestment of dividends and distributions | | | 44,414,354 | | | | 1,524,328 | | | | 54,877,512 | | | | 4,674,589 | |
Cost of shares reacquired | | | (85,228,600 | ) | | | (92,235,417 | ) | | | (85,622,845 | ) | | | (72,157,795 | ) |
Net increase (decrease) in net assets from Fund share transactions | | | (10,178,695 | ) | | | (15,002,067 | ) | | | 9,407,623 | | | | 11,780,545 | |
Total increase (decrease) | | | (35,924,963 | ) | | | (4,625,433 | ) | | | (23,160,012 | ) | | | 69,282,878 | |
| | | | |
| NET ASSETS | | | | | | | | | | | | | | | | |
Beginning of year | | | 343,759,617 | | | | 348,385,050 | | | | 385,413,501 | | | | 316,130,623 | |
End of year(a) | | $ | 307,834,654 | | | $ | 343,759,617 | | | $ | 362,253,489 | | | $ | 385,413,501 | |
(a) Includes undistributed net investment income of | | $ | 144,542 | | | $ | 19,269 | | | $ | 446,270 | | | $ | 390,569 | |
See Notes to Financial Statements
| | |
| THE TARGET PORTFOLIO TRUST | | 125 |
Statements of Changes in Net Assets (cont’d)
| | | | | | | | | | | | | | | | |
| | | SMALL CAPITALIZATION
GROWTH PORTFOLIO
| | | SMALL CAPITALIZATION
VALUE PORTFOLIO
| |
| | | Year
Ended
December 31,
2005 | | | Year
Ended
December 31,
2004 | | | Year
Ended
December 31,
2005 | | | Year
Ended
December 31,
2004 | |
| | | | |
INCREASE (DECREASE)
IN NET ASSETS | | | | | | | | | | | | | | | | |
| Operations | | | | | | | | | | | | | | | | |
Net investment income (loss) | | $ | (892,211 | ) | | $ | (858,372 | ) | | $ | 2,032,694 | | | $ | 1,874,233 | |
Net realized gain (loss) on investment and foreign currency transactions | | | 11,287,884 | | | | 8,627,807 | | | | 55,992,751 | | | | 14,363,197 | |
Net change in unrealized appreciation/(depreciation) of investments | | | (4,638,598 | ) | | | 13,062,442 | | | | (34,236,849 | ) | | | 32,107,615 | |
Net increase (decrease) in net assets resulting from operations | | | 5,757,075 | | | | 20,831,877 | | | | 23,788,596 | | | | 48,345,045 | |
| Dividends and distributions (Note 1) | | | | | | | | | | | | | | | | |
Dividends from net investment income | | | — | | | | — | | | | (1,786,572 | ) | | | (1,838,665 | ) |
Distributions from net realized gains | | | — | | | | — | | | | (54,378,098 | ) | | | (13,095,907 | ) |
Total distributions | | | — | | | | — | | | | (56,164,670 | ) | | | (14,934,572 | ) |
| Fund share transactions (Note 6) | | | | | | | | | | | | | | | | |
Net proceeds from shares sold | | | 13,851,396 | | | | 32,372,700 | | | | 52,707,779 | | | | 55,190,474 | |
Net asset value of shares issued in reinvestment of dividends and distributions | | | — | | | | — | | | | 55,249,127 | | | | 14,826,689 | |
Cost of shares reacquired | | | (34,999,953 | ) | | | (34,698,634 | ) | | | (62,042,254 | ) | | | (63,840,640 | ) |
Net increase (decrease) in net assets from Fund share transactions | | | (21,148,557 | ) | | | (2,325,934 | ) | | | 45,914,652 | | | | 6,176,523 | |
Total increase (decrease) | | | (15,391,482 | ) | | | 18,505,943 | | | | 13,538,578 | | | | 39,586,996 | |
| | | | |
| NET ASSETS | | | | | | | | | | | | | | | | |
Beginning of year | | | 158,757,255 | | | | 140,251,312 | | | | 245,576,250 | | | | 205,989,254 | |
End of year(a) | | $ | 143,365,773 | | | $ | 158,757,255 | | | $ | 259,114,828 | | | $ | 245,576,250 | |
(a) Includes undistributed net investment income of | | | — | | | | — | | | $ | 281,690 | | | $ | 35,568 | |
See Notes to Financial Statements
| | |
| 126 | | THE TARGET PORTFOLIO TRUST |
Statements of Changes in Net Assets (cont’d)
| | | | | | | | | | | | | | | | |
| | | INTERNATIONAL EQUITY
PORTFOLIO
| | | INTERNATIONAL BOND PORTFOLIO
| |
| | | Year
Ended
December 31,
2005 | | | Year
Ended
December 31,
2004 | | | Year
Ended
December 31, 2005 | | | Year
Ended
December 31,
2004 | |
| | | | |
INCREASE (DECREASE)
IN NET ASSETS | | | | | | | | | | | | | | | | |
| Operations | | | | | | | | | | | | | | | | |
Net investment income (loss) | | $ | 3,438,526 | | | $ | 2,650,441 | | | $ | 753,696 | | | $ | 929,929 | |
Net realized gain (loss) on investment and foreign currency transactions | | | 42,374,057 | | | | 20,398,105 | | | | 5,456,058 | | | | (2,643,357 | ) |
Net change in unrealized appreciation/(depreciation) of investments | | | (16,151,609 | ) | | | 7,843,538 | | | | (4,599,975 | ) | | | 3,325,301 | |
Net increase (decrease) in net assets resulting from operations | | | 29,660,974 | | | | 30,892,084 | | | | 1,609,779 | | | | 1,611,873 | |
| Dividends and Distributions (Note 1) | | | | | | | | | | | | | | | | |
Dividends from net investment income | | | (4,548,361 | ) | | | (2,494,485 | ) | | | (822,648 | ) | | | (2,484,946 | ) |
Distributions from net realized gains | | | (10,649,422 | ) | | | — | | | | (33,394 | ) | | | (456,277 | ) |
Total distributions | | | (15,197,783 | ) | | | (2,494,485 | ) | | | (856,042 | ) | | | (2,941,223 | ) |
| Fund share transactions (Note 6) | | | | | | | | | | | | | | | | |
Net proceeds from shares sold | | | 23,896,686 | | | | 56,273,516 | | | | 8,080,019 | | | | 20,311,661 | |
Net asset value of shares issued in reinvestment of dividends and distributions | | | 15,191,553 | | | | 2,472,659 | | | | 855,615 | | | | 2,925,531 | |
Cost of shares reacquired | | | (50,701,115 | ) | | | (48,752,641 | ) | | | (11,682,782 | ) | | | (15,555,918 | ) |
Net increase (decrease) in net assets from Fund share transactions | | | (11,612,876 | ) | | | 9,993,534 | | | | (2,747,148 | ) | | | 7,681,274 | |
Total increase (decrease) | | | 2,850,315 | | | | 38,391,133 | | | | (1,993,411 | ) | | | 6,351,924 | |
| | | | |
| NET ASSETS | | | | | | | | | | | | | | | | |
Beginning of year | | | 230,299,834 | | | | 191,908,701 | | | | 44,905,001 | | | | 38,553,077 | |
End of year(a) | | $ | 233,150,149 | | | $ | 230,299,834 | | | $ | 42,911,590 | | | $ | 44,905,001 | |
(a) Includes undistributed net investment income of | | $ | 200,879 | | | $ | 436,240 | | | | — | | | | — | |
See Notes to Financial Statements
| | |
| THE TARGET PORTFOLIO TRUST | | 127 |
Statements of Changes in Net Assets (cont’d)
| | | | | | | | | | | | | | | | |
| | | TOTAL RETURN BOND PORTFOLIO
| | | INTERMEDIATE-TERM
BOND PORTFOLIO
| |
| | | Year
Ended
December 31,
2005 | | | Year
Ended
December 31,
2004 | | | Year
Ended
December 31,
2005 | | | Year
Ended
December 31,
2004 | |
| | | | |
INCREASE (DECREASE)
IN NET ASSETS | | | | | | | | | | | | | | | | |
| Operations | | | | | | | | | | | | | | | | |
Net investment income (loss) | | $ | 6,315,677 | | | $ | 3,087,244 | | | $ | 9,692,301 | | | $ | 5,923,653 | |
Net realized gain (loss) on investment and foreign currency transactions | | | 246,826 | | | | 6,530,055 | | | | (1,215,215 | ) | | | 5,739,511 | |
Net change in unrealized appreciation/(depreciation) of investments | | | (2,230,248 | ) | | | (1,701,170 | ) | | | (3,164,852 | ) | | | (1,868,740 | ) |
Net increase (decrease) in net assets resulting from operations | | | 4,332,255 | | | | 7,916,129 | | | | 5,312,234 | | | | 9,794,424 | |
| Dividends and distributions (Note 1) | | | | | | | | | | | | | | | | |
Dividends from net investment income | | | (6,859,355 | ) | | | (7,979,590 | ) | | | (10,131,526 | ) | | | (7,098,116 | ) |
Distributions from net realized gains | | | (1,294,402 | ) | | | (556,213 | ) | | | (128,653 | ) | | | (5,620,690 | ) |
Total distributions | | | (8,153,757 | ) | | | (8,535,803 | ) | | | (10,260,179 | ) | | | (12,718,806 | ) |
| Fund share transactions (Note 6) | | | | | | | | | | | | | | | | |
Net proceeds from shares sold | | | 35,616,451 | | | | 68,049,223 | | | | 40,116,845 | | | | 77,193,471 | |
Net asset value of shares issued in reinvestment of dividends and distributions | | | 8,147,528 | | | | 8,280,441 | | | | 10,256,072 | | | | 12,177,841 | |
Cost of shares reacquired | | | (56,755,679 | ) | | | (55,370,002 | ) | | | (81,229,652 | ) | | | (123,270,731 | ) |
Net increase (decrease) in net assets from Fund share transactions | | | (12,991,700 | ) | | | (55,370,002 | ) | | | (30,856,735 | ) | | | (33,899,419 | ) |
Total increase (decrease) | | | (16,813,202 | ) | | | 20,339,988 | | | | (35,804,680 | ) | | | (36,823,801 | ) |
| | | | |
| NET ASSETS | | | | | | | | | | | | | | | | |
Beginning of year | | | 178,488,173 | | | | 158,148,185 | | | | 297,982,306 | | | | 334,806,107 | |
End of year(a) | | $ | 161,674,971 | | | $ | 178,488,173 | | | $ | 262,177,626 | | | $ | 297,982,306 | |
(a) Includes undistributed net investment income of | | $ | 2,030,789 | | | | — | | | | — | | | $ | 176,503 | |
See Notes to Financial Statements
| | |
| 128 | | THE TARGET PORTFOLIO TRUST |
Statements of Changes in Net Assets (cont’d)
| | | | | | | | | | | | | | | | |
| | | MORTGAGE BACKED
SECURITIES PORTFOLIO
| | | U.S. GOVERNMENT
MONEY MARKET PORTFOLIO
| |
| | | Year
Ended
December 31,
2005 | | | Year
Ended
December 31,
2004 | | | Year
Ended
December 31,
2005 | | | Year
Ended
December 31,
2004 | |
| | | | |
INCREASE (DECREASE)
IN NET ASSETS | | | | | | | | | | | | | | | | |
| Operations | | | | | | | | | | | | | | | | |
Net investment income (loss) | | $ | 4,407,891 | | | $ | 3,587,103 | | | $ | 1,738,551 | | | $ | 709,120 | |
Net realized gain (loss) on investment and foreign currency transactions | | | (40,466 | ) | | | 636,986 | | | | — | | | | (406 | ) |
Net change in unrealized appreciation/(depreciation) of investments | | | (2,391,039 | ) | | | (577,504 | ) | | | — | | | | — | |
Net increase (decrease) in net assets resulting from operations | | | 1,976,386 | | | | 3,646,585 | | | | 1,738,551 | | | | 708,714 | |
| Dividends and distributions (Note 1) | | | | | | | | | | | | | | | | |
Dividends from net investment income | | | (4,564,729 | ) | | | (4,319,318 | ) | | | (1,747,870 | ) | | | (709,120 | ) |
Total distributions | | | (4,564,729 | ) | | | (4,319,318 | ) | | | (1,747,870 | ) | | | (709,120 | ) |
| Fund share transactions (Note 6)(a) | | | | | | | | | | | | | | | | |
Net proceeds from shares sold | | | 7,499,428 | | | | 23,936,870 | | | | 43,342,523 | | | | 131,542,846 | |
Net asset value of shares issued in reinvestment of dividends and distributions | | | 4,564,729 | | | | 3,838,750 | | | | 1,746,159 | | | | 661,498 | |
Cost of shares reacquired | | | (23,076,242 | ) | | | (38,379,255 | ) | | | (62,061,743 | ) | | | (156,477,713 | ) |
Net increase (decrease) in net assets from Fund share transactions | | | (11,012,085 | ) | | | (10,603,635 | ) | | | (16,973,061 | ) | | | (24,273,369 | ) |
Total increase (decrease) | | | (13,600,428 | ) | | | (11,276,368 | ) | | | (16,982,380 | ) | | | (24,273,775 | ) |
| | | | |
| NET ASSETS | | | | | | | | | | | | | | | | |
Beginning of year | | | 95,795,632 | | | | 107,072,000 | | | | 74,189,814 | | | | 98,463,589 | |
End of year(b) | | $ | 82,195,204 | | | $ | 95,795,632 | | | $ | 57,207,434 | | | $ | 74,189,814 | |
(a) Fund share transactions are at $1 per share for the U.S. Government Money. | | | | | |
(b) Includes undistributed net investment income of | | | — | | | | — | | | | — | | | | — | |
See Notes to Financial Statements
| | |
| THE TARGET PORTFOLIO TRUST | | 129 |
Notes to Financial Statements
The TARGET Portfolio Trust (the ‘Fund’) is an open-end management investment company. The Fund was established as a Delaware business trust on July 29, 1992 and consists of ten separate portfolios (the “Portfolio” or “Portfolios”). All the Portfolios are diversified, as defined under the Investment Company Act of 1940, except for the International Bond Portfolio. Investment operations commenced on January 5, 1993, with the exception of the International Bond Portfolio, which commenced on May 17, 1994.
The Portfolios and their investment objectives are as follows:
| • | | Large Capitalization Growth Portfolio—long-term capital appreciation through investment primarily in stocks of large corporations that, in the investment adviser’s opinion, should have earnings growth faster than that of the S&P 500; |
| • | | Large Capitalization Value Portfolio—total return consisting of capital appreciation and dividend income through investment primarily in stocks of large corporations that, in the adviser’s opinion, are undervalued; |
| • | | Small Capitalization Growth Portfolio—maximum capital appreciation through investment primarily in small company common stocks that, in the investment adviser’s opinion, should have earnings growth faster than that of the U.S. economy in general; |
| • | | Small Capitalization Value Portfolio—above average capital appreciation through investment in small company common stocks that, in the adviser’s opinion, are undervalued or overlooked in the marketplace; |
| • | | International Equity Portfolio—capital appreciation through investment primarily in stocks of companies domiciled outside the United States; |
| • | | International Bond Portfolio—high total return through investment primarily in high-quality, foreign debt securities; |
| • | | Total Return Bond Portfolio—total return of current income and capital appreciation through investment primarily in fixed-income securities of varying maturities with a dollar-weighted average portfolio maturity of more than four years but not more than fifteen years; |
| • | | Intermediate-Term Bond Portfolio—current income and reasonable stability of principal through investment primarily in high quality fixed-income securities of varying maturities with a dollar-weighted average portfolio maturity of more than three years but not more than ten years; |
| • | | Mortgage Backed Securities Portfolio—high current income primarily and capital appreciation secondarily, each consistent with the protection of capital through investment primarily in mortgage related securities; |
| • | | U.S. Government Money Market Portfolio—maximum current income consistent with maintenance of liquidity and preservation of capital through investment exclusively in short-term securities issued or guaranteed by the U.S. Government, its agencies or instrumentalities. |
The ability of issuers of debt securities (other than those issued or guaranteed by the U.S. Government) held by the Portfolios to meet their obligations may be affected by economic or political developments in a specific industry, region or country.
| | |
| 130 | | THE TARGET PORTFOLIO TRUST |
Note 1. Accounting Policies
The following is a summary of significant accounting policies followed by the Fund and the Portfolios in the preparation of its financial statements.
Securities Valuations: Securities listed on a securities exchange (other than options on securities and indices) are valued at the last sale price on such exchange on the day of valuation or, if there was no sale on such day, at the mean between the last reported bid and ask prices, or at the last bid price on such day in the absence of an asked price. Securities traded via Nasdaq are valued at the NASDAQ official closing price (NOCP) on the day of valuation, or if there was no NOCP, at the last sale price. Securities that are actively traded in the over-the-counter market, including listed securities for which the primary market is believed by Prudential Investments LLC (“PI” or “Manager”), in consultation with the subadviser(s); to be over-the-counter, are valued at market value using prices provided by an independent pricing agent or principal market maker. Options on securities and indices traded on an exchange are valued at the last sale price as of the close of trading on the applicable exchange or, if there was no sale, at the mean between the most recently quoted bid and asked prices on such exchange or at the last bid price in the absence of an asked price. Futures contracts and options thereon traded on a commodities exchange or board of trade are valued at the last sale price at the close of trading on such exchange or board of trade or, if there was no sale on the applicable commodities exchange or board of trade on such day, at the mean between the most recently quoted bid and asked prices on such exchange or board of trade or at the last bid price in the absence of an asked price. Securities for which reliable market quotations are not readily available, or whose values have been affected by events occurring after the close of the security’s foreign market and before the Portfolio’s pricing time, are valued at fair value in accordance with the Board of Trustees’ approved fair valuation procedures. Using fair value to price securities may result in a value that is different from a security’s most recent closing price and from the price used by other mutual funds to calculate their net asset values. As of December 31, 2005, the International Equity Portfolio held foreign securities whose value required adjustment in accordance with procedures approved by the Board of Trustees.
Certain Portfolios held illiquid securities, including those which are restricted as to disposition under securities law (“restricted securities”). Restricted securities, sometimes referred to as private placements, are valued pursuant to the valuation procedures noted above. Each Portfolio may hold up to 15% of its net assets in illiquid securities, except for the U.S. Government Money Market Portfolio, which may hold up to 10% of its net assets in illiquid securities.
Investments in mutual funds are valued at their net asset value as of the close of the New York Stock Exchange on the date of the valuation.
U.S. Government securities for which market quotations are available are valued at a price provided by an independent pricing agent or primary dealer (a dealer that trades in U.S. Government securities with the Federal Reserve System).
Securities held by the U.S. Government Money Market Portfolio are valued at amortized cost in accordance with Rule 2a-7 of the Investment Company Act, which approximates market value. The amortized cost method involves valuing a security at its cost on the date of purchase and thereafter assuming a constant amortization to maturity of the difference between the principal amount due at maturity and the cost.
Short-term securities held by the other Portfolios which mature in 60 days or less are valued at amortized cost, which approximates market value. Short-term securities held by the other Portfolios which mature in more than 60 days are valued at current market quotations.
| | |
| THE TARGET PORTFOLIO TRUST | | 131 |
Repurchase Agreements: In connection with transactions in repurchase agreements with United States financial institutions, it is the Fund’s policy that its custodian or designated subcustodians under triparty repurchase agreements, as the case may be, take possession of the underlying collateral securities, the value of which exceeds the principal amount of the repurchase transaction, including accrued interest. To the extent that any repurchase transaction exceeds one business day, the value of the collateral is marked-to-market on a daily basis to ensure the adequacy of the collateral. If the seller defaults, and the value of the collateral declines or, if bankruptcy proceedings are commenced with respect to the seller of the security, realization of the collateral by the Fund may be delayed or limited.
Financial Futures Contracts: A financial futures contract is an agreement to purchase (long) or sell (short) an agreed amount of securities at a set price for delivery on a future date. Upon entering into a financial futures contract, the Portfolio is required to pledge to the broker an amount of cash and/or other assets equal to a certain percentage of the contract amount. This amount is known as the “initial margin.” Subsequent payments, known as “variation margin,” are made or received by the Portfolio each day, depending on the daily fluctuations in the value of the underlying security. Such variation margin is recorded for financial statement purposes on a daily basis as an unrealized gain or loss. When the contract expires or is closed, the gain or loss is realized and is presented in the Statements of Operations as a net realized gain or loss on financial futures contracts.
The Portfolio invests in financial futures contracts in order to hedge its existing portfolio securities, or securities the Portfolio intends to purchase, against fluctuations in value caused by changes in prevailing interest rates or market conditions. Should interest rates move unexpectedly, the Portfolio may not achieve the anticipated benefits of the financial futures contracts and may realize a loss. The use of futures transactions involves the risk of imperfect correlation in movements in the price of futures contracts, interest rates and the underlying hedged assets. The Portfolio maintains a segregated account of Securities or other liquid assets, the dollar value of which is at least equal to its obligation with respect to financial futures contracts. The International Equity Portfolio, International Bond Portfolio, Intermediate-Term Bond Portfolio, Mortgage-Backed Securities Portfolio and Total Return Bond Portfolio are the only portfolios that may invest in financial futures contracts.
Foreign Currency Translation: The books and records of the Portfolios are maintained in U.S. dollars. Foreign currency amounts are translated into U.S. dollars on the following basis:
(i) market value of investment securities, other assets and liabilities-at the current daily rates of exchange;
(ii) purchases and sales of investment securities, income and expenses-at the rates of exchange prevailing on the respective dates of such transactions.
Although the net assets of the Portfolios are presented at the foreign exchange rates and market values at the close of the year, the Portfolios do not isolate that portion of the results of operations arising as a result of changes in the foreign exchange rates from the fluctuations arising from changes in the market prices of long-term securities held at year end. Similarly, the Portfolios do not isolate the effect of changes in foreign exchange rates from the fluctuations arising from changes in the market prices of long-term portfolio securities sold during the year. Accordingly, realized foreign currency gains or losses are included in the reported net realized gains or losses on investment transactions.
Net realized gains or losses on foreign currency transactions represent net foreign exchange gains or losses from the holding of foreign currencies, currency gains or losses realized between the trade date and settlement date on securities transactions, and the difference between the amounts of dividends, interest and foreign withholding taxes recorded on the Portfolios’ books and the U.S. dollar equivalent amounts actually
| | |
| 132 | | THE TARGET PORTFOLIO TRUST |
received or paid. Net unrealized currency gains or losses from valuing foreign currency denominated assets and liabilities (other than investments) at year end exchange rates are reflected as a component of net unrealized appreciation (depreciation) on investments and foreign currencies.
Foreign security and currency transactions may involve certain considerations and risks not typically associated with those of domestic origin as a result of, among other factors, the possibility of political and economic instability or the level of governmental supervision and regulation of foreign securities markets.
Forward Foreign Currency Contracts: A forward foreign currency contract is a commitment to purchase or sell a foreign currency at a future date at a negotiated forward rate. The Portfolio enters into forward foreign currency contracts in order to hedge its exposure to changes in foreign currency exchange rates on its foreign portfolio holdings or on specific receivables and payables denominated in a foreign currency. The contracts are valued daily at current forward exchange rates and any unrealized gain or loss is included in net unrealized appreciation or depreciation on foreign currency transactions. Gains or losses are realized on the settlement date of the contract equal to the difference between the settlement value of the original and negotiated forward contracts. This gain or loss, if any, is included in net realized gain or loss on foreign currency transactions. Risks may arise upon entering into these contracts from the potential inability of the counterparties to meet the terms of their contracts. The International Equity Portfolio, International Bond Portfolio, Intermediate-Term Bond Portfolio and Total Return Bond Portfolio may enter into forward foreign currency contracts in order to hedge their exposure to changes in foreign currency exchange rates on their foreign portfolio holdings.
Options: The Portfolio may either purchase or write options in order to hedge against adverse market movements or fluctuations in value caused by changes in prevailing interest rates or foreign currency exchange rates with respect to securities or currencies which the Portfolio currently owns or intends to purchase. The Portfolio’s principal reason for writing options is to realize, through receipt of premiums, a greater current return than would be realized on the underlying security alone. When the Portfolio purchases an option, it pays a premium and an amount equal to that premium is recorded as an asset. When the Portfolio writes an option, it receives a premium and an amount equal to that premium is recorded as a liability. The asset or liability is adjusted daily to reflect the current market value of the option.
If an option expires unexercised, the Portfolio realizes a gain or loss to the extent of the premium received or paid. If an option is exercised, the premium received or paid is recorded as an adjustment to the proceeds from the sale or the cost basis of the purchase in determining whether the Portfolio has realized a gain or loss. The difference between the premium and the amount received or paid on effecting a closing purchase or sale transaction is also treated as a realized gain or loss. Gains or losses on purchased options are included in net realized gains or losses on investment transactions. Gains or losses on written options are presented separately as net realized gains or losses on options written.
The Portfolio, as writer of an option, may have no control over whether the contract may be exercised. As a result, the Portfolio bears the market risk of an unfavorable change in the price of the security or currencies underlying the written option. The Portfolio, as purchaser of an option, bears the risk of the potential inability of the counterparties to meet the terms of their contracts. The Portfolio maintains a segregated account of securities or other liquid assets, the dollar value of which is at least equal to its obligation with respect to options. The International Equity Portfolio, the International Bond Portfolio, the Intermediate-Term Bond Portfolio, the Total Return Bond Portfolio and the Mortgage-Backed Securities Portfolio may either purchase or write options.
Short Sales: Certain portfolios of the Fund may make short sales of securities as a method of hedging potential price declines in similar securities owned. The Portfolio may sell a security, it does not own in
| | |
| THE TARGET PORTFOLIO TRUST | | 133 |
anticipation of a decline in the market value of that security (short sale). When the Portfolio makes a short sale, it will borrow the security sold short and deliver it to the broker-dealer through which it made the short sale as collateral for its obligation to deliver the security upon conclusion of the sale. The Portfolio may have to pay a fee to borrow the particular security and may be obligated to return any interest or dividends received on such borrowed securities. A gain, limited to the price at which the Portfolio sold the security short, or a loss, unlimited as to dollar amount, will be recognized upon the termination of a short sale if the market price at termination is less than or greater than the proceeds originally received, respectively, and is presented in the Statement of Operations as net realized gain or loss on short sales. The Portfolio maintains a segregated account of securities or other liquid assets, the dollar value of which is at least equal to its obligation with respect to short sales. The Total Return Bond Portfolio, Intermediate-Term Bond Portfolio and Mortgage-Backed Securities Portfolio may enter into short sales.
Swap Agreements: Certain Portfolios may enter into interest rate swap agreements, forward swap spread lock agreements, and credit default swap agreements. A swap agreement is an agreement to exchange the return generated by one instrument for the return generated by another instrument. Interest rate swap agreements involve the exchange by the Portfolio with another party of their respective commitments to pay or receive interest. Forward spread lock swap agreements involve commitments to pay or receive a settlement amount calculated as the difference between the swap spread and a fixed spread, multiplied by the notional amount times the duration of the swap. The swap spread is the difference between the benchmark swap rate (market rate) and the specific Treasury rate. In a credit default swap agreement, one party (the protection buyer) makes a stream of payments to another party (the protection seller) in exchange for the right to receive a specified payment in the event of a default by a third party, typically corporate issues or sovereign issues of an emerging country, on its obligation. The maximum amount of the payment may equal the notional, at par, of the underlying index or security as a result of a default (or “credit event”). In addition to bearing the risk that the credit event will occur, the Portfolios could be exposed to market risk due to unfavorable changes in interest rates or in the price of the underlying security or index, the possibility that the fund may be unable to close out its position at the same time or at the same price as if it had purchased comparable publicly traded securities, or that the counterparty may default on it’s obligation to perform. The Portfolios may enter into swap agreements as the protection buyer or the protection seller. The swaps are valued daily at current market value and any change in value is included in net unrealized appreciation or depreciation on investments. Payments received or paid by the Portfolio are recorded as realized gains or losses. Risk of loss may exceed amounts recognized on the statements of assets and liabilities. Swap agreements outstanding at period end, if any, are listed on the Schedule of Investments.
The use of derivative transactions may involve elements of both market and credit risk in excess of the amounts reported in the Statements of Assets and Liabilities.
When-Issued/Delayed Delivery Securities: Certain Portfolios may purchase or sell securities on a when-issued or delayed delivery basis. These transactions involve a commitment by the Portfolio to purchase or sell securities for a predetermined price or yield, with payment and delivery taking place beyond the customary settlement period. When delayed delivery purchases are outstanding, the Portfolio will set aside and maintain until the settlement date in a segregated account, liquid assets in an amount sufficient to meet the purchase price. When purchasing a security on a delayed delivery basis, the Portfolio assumes the rights and risks of ownership of the security, including the risk of price and yield fluctuations, and takes such fluctuations into account when determining its net asset value. The Portfolio may dispose of or renegotiate a delayed delivery transaction after it is entered into, and may sell when-issued securities before they are delivered, which may result in a capital gain or loss. When the Portfolio has sold a security on a delayed delivery basis, the Portfolio does not participate in future gains and losses with respect to the security.
Securities Transactions and Net Investment Income: Securities transactions are recorded on the trade date. Realized and unrealized gains and losses from security and currency transactions are calculated
| | |
| 134 | | THE TARGET PORTFOLIO TRUST |
on the identified cost basis. Dividend income is recorded on the ex-dividend date and interest income, including amortization of premium and accretion of discount of debt securities, as required, is recorded on the accrual basis. Expenses are recorded on the accrual basis. The Fund’s expenses are allocated to the respective Portfolios on the basis of relative net assets except for expenses that are charged directly at the Portfolio or class level.
Dividends and Distributions: The Total Return Bond Portfolio, Intermediate-Term Bond Portfolio and Mortgage Backed Securities Portfolio declare dividends of their net investment income daily and pay such dividends monthly. The U.S. Government Money Market Portfolio declares net investment income and any net capital gain (loss) daily and pays such dividends monthly. Each other Portfolio declares and pays a dividend of its net investment income, if any, at least annually. Each Portfolio except for the U.S. Government Money Market Portfolio declares and pays its net realized capital gains, if any, at least annually. Dividends and distributions to shareholders, which are determined in accordance with federal income tax regulations and which may differ from generally accepted accounting principles, are recorded on exdividend date. Permanent book/ tax differences relating to income and gains are reclassified amongst undistributed net investment income, accumulated net realized gain or loss and paid-in capital, in excess of par, as appropriate.
Taxes: For federal income tax purposes, each Portfolio in the Fund is treated as a separate tax-paying entity. It is each Portfolio’s policy to continue to meet the requirements of the Internal Revenue Code applicable to regulated investment companies and to distribute all of its taxable net investment income and capital gains, if any, to its shareholders. Therefore, no federal income tax provision is required.
Withholding taxes on foreign interest and dividends are recorded net of reclaimable amounts, at the time the related income is earned.
Estimates: The preparation of the financial statements requires management to make estimates and assumptions that affect the reported amounts and disclosures in the financial statements. Actual results could differ from those estimates.
Note 2. Agreements
The Fund’s manager is Prudential Investments LLC (“PI”). PI manages the investment operations of the Fund, administers the Fund’s affairs and is responsible for the selection, subject to review and approval of the Trustees, of the advisers. PI supervises the advisers’ performance of advisory services and makes recommendations to the Trustees as to whether the advisers’ contracts should be renewed, modified or terminated. PI pays for the costs pursuant to the advisory agreements, the cost of compensation of officers of the Fund, occupancy and certain clerical and accounting costs of the Fund. The Fund bears all other costs and expenses.
The advisers noted below each furnished investment advisory services in connection with the management of the Portfolios. Each of the advisors of the equity Portfolios—Large Capitalization Growth Portfolio, Large Capitalization Value Portfolio, Small Capitalization Growth Portfolio, Small Capitalization Value Portfolio and International Equity Portfolio—manages a portion of the assets of the respective Portfolios. In general, in order to maintain a division of assets between the advisers as deemed appropriate by PI, all daily cash inflows (i.e., subscriptions and reinvested distributions) and outflows (i.e., redemptions and expense items) are divided between the advisers as PI deems appropriate. In order to maintain an approximate allocation between the advisers in the ratio deemed appropriate by PI, a periodic rebalancing of each subadviser’s share of Portfolio assets may occur to account for market fluctuations.
| | |
| THE TARGET PORTFOLIO TRUST | | 135 |
| | |
Portfolio
| | Adviser
|
Large Capitalization Growth* | | Goldman Sachs Asset Management LLP (“Goldman”) and Marsico Capital Management, LLC (“Marsico”) |
Large Capitalization Value | | J.P. Morgan Investment Management, Inc. and Hotchkis & Wiley Capital Management, LLC |
Small Capitalization Growth | | Westcap Investors, LLC and RS Investment Management, L.P. |
Small Capitalization Value | | NFJ Investment Group L.P. and EARNEST Partners, LLC (additional advisers effective July 13, 2005: Lee Munder Investments Limited and J.P. Morgan Investment Management, Inc.; effective November 11, 2005: Vaughan Nelson Investment Management, L.P.) |
International Equity** | | LSV Asset Management (“LSV”) and Thornburg Investment Management, Inc. (“Thornburg”) |
| International Bond, Total Return Bond and Intermediate-Term Bond | | Pacific Investment Management Company LLC |
Mortgage Backed Securities and U.S. Government Money Market | | Wellington Management Company, LLP |
| * | Effective June 28, 2005, Goldman and Marsico replaced Oak Associates, Ltd. and Columbus Circle Investors. |
| ** | Effective April 13, 2005, LSV and Thornburg replaced Lazard Asset Management. |
The management fee payable to PI is computed daily and paid monthly, at an annual rate of the average daily net assets of the Portfolios specified below and PI, in turn, pays each adviser a fee for its services.
| | | |
Portfolio
| | Contracted & Effective
Management Fee
| |
Large Capitalization Growth | | 0.60 | % |
Large Capitalization Value | | 0.60 | % |
Small Capitalization Growth | | 0.60 | % |
Small Capitalization Value | | 0.60 | % |
International Equity | | 0.70 | % |
International Bond | | 0.50 | % |
Total Return Bond | | 0.45 | % |
Intermediate-Term Bond | | 0.45 | % |
Mortgage Backed Securities | | 0.45 | % |
U.S. Government Money Market | | 0.25 | % |
The Fund has a distribution agreement with Prudential Investment Management Services LLC (“PIMS”). PIMS serves the Fund without compensation.
PI and PIMS are indirect, wholly-owned subsidiaries of Prudential Financial, Inc. (“Prudential”).
The Fund, along with other affiliated registered investment companies (the “Funds”), is a party to a syndicated credit agreement (“SCA”) with a group of banks. For the period from January 1, 2005 through April 30, 2005 the SCA provided for a commitment of $800 million and allowed the Funds to increase the commitment to $1 billion if necessary. Effective May 1, 2005, the SCA provided for a commitment of $500 million. Interest on any borrowings under the SCA would be incurred at market rates. The Funds paid a commitment fee of .08 of 1% of the unused portion of the SCA. The commitment fee is accrued daily and paid quarterly and is allocated to the Funds pro rata, based on net assets. The purpose of the SCA is to serve as an alternative source of funding for capital share redemptions. The expiration date of the SCA was October 29, 2005. Effective October 29, 2005, the Funds entered into a revised credit agreement with two banks. The commitment under the revised credit agreement continues to be $500 million. The Funds pay a commitment fee of .075 of 1% of the unused portion of the revised credit agreement. The expiration date of
| | |
| 136 | | THE TARGET PORTFOLIO TRUST |
the revised credit agreement is October 28, 2006. The Fund did not borrow any amounts pursuant to the SCA during the year ended December 31, 2005.
Note 3. Other Transactions with Affiliates
Prudential Mutual Fund Services LLC (“PMFS”), an affiliate of PI and an indirect, wholly-owned subsidiary of Prudential, serves as the Fund’s transfer agent. Transfer agent fees and expenses in the Statement of Operations also include certain out-of-pocket expenses paid to non-affiliates where applicable.
The Portfolios pay networking fees to affiliated and unaffiliated broker/dealers, including fees relating to the services of Wachovia Securities, LLC (“Wachovia”), an affiliate of PI. These networking fees are payments made to broker/dealers that clear mutual fund transactions through a national clearing system. These amounts are included in transfer agent’s fees and expenses in the Statement of Operations. For the year ended December 31, 2005, the Portfolios paid networking fees as follows:
| | | |
Portfolio
| | Total
Networking Fees
Incurred
|
Large Capitalization Growth | | $ | 100 |
Large Capitalization Value | | | 300 |
Small Capitalization Growth | | | 300 |
Small Capitalization Value | | | 700 |
International Equity | | | 600 |
International Bond | | | 100 |
Total Return Bond | | | 100 |
Intermediate-Term Bond | | | 400 |
Mortgage Backed Securities | | | 100 |
U.S. Government Money Market | | | 100 |
For the year ended December 31, 2005, the amount of brokerage commissions earned by Wachovia and Prudential Equity Group, LLC, (“PEG”), an indirect, wholly-owned subsidiary of Prudential, from portfolio transactions executed on behalf of the Portfolios were as follows:
| | | | | | |
Portfolio
| | Wachovia
| | PEG
|
Large Capitalization Value | | $ | 534 | | $ | 614 |
Small Capitalization Value | | | — | | | 164 |
Certain Portfolios invest in the Taxable Money Market Series (the “Series”), a portfolio of Dryden Core Investment Fund, pursuant to an exemptive order received from the Securities and Exchange Commission. The Series is a money market mutual fund registered under the Investment Company Act of 1940, as amended, and managed by PI.
| | |
| THE TARGET PORTFOLIO TRUST | | 137 |
Note 4. Portfolio Securities
Purchases and sales of portfolio securities, excluding short-term investments and U.S. Government securities, for the year ended December 31, 2005, were as follows:
| | | | | | |
Portfolio
| | Purchases
| | Sales
|
Large Capitalization Growth | | $ | 766,989,947 | | $ | 812,546,564 |
Large Capitalization Value | | | 327,909,331 | | | 368,600,049 |
Small Capitalization Growth | | | 209,832,947 | | | 231,880,238 |
Small Capitalization Value | | | 301,002,251 | | | 302,467,282 |
International Equity | | | 272,664,405 | | | 285,656,351 |
International Bond | | | 135,926,388 | | | 117,629,713 |
Total Return Bond | | | 896,422,990 | | | 797,170,000 |
Intermediate-Term Bond | | | 528,885,853 | | | 477,873,823 |
Mortgage Backed Securities | | | 159,505,657 | | | 265,138,001 |
Transactions in options written during the year ended December 31, 2005, were as follows:
| | | | | | | |
International Bond
| | Number of Contracts/
Notional Amounts
| | | Premiums Received
| |
Options outstanding at December 31, 2004 | | 46 | | | $ | 29,965 | |
Options written | | 2,500,361 | | | | 85,831 | |
Options closed | | (137 | ) | | | (54,315 | ) |
Options expired | | (244 | ) | | | (21,778 | ) |
| | |
|
| |
|
|
|
Options outstanding at December 31, 2005 | | 2,500,026 | | | $ | 39,703 | |
| | |
|
| |
|
|
|
| | |
Total Return Bond
| | Number of Contracts/
Notional Amount
| | | Premiums Received
| |
Options outstanding at December 31, 2004 | | 32,418 | | | $ | 545,289 | |
Options written | | 9,100,254 | | | | 161,608 | |
Options closed | | (32,558 | ) | | | (609,893 | ) |
Options expired | | (16 | ) | | | (3,690 | ) |
| | |
|
| |
|
|
|
Options outstanding at December 31, 2005 | | 9,100,098 | | | $ | 93,314 | |
| | |
|
| |
|
|
|
| | |
Intermediate-Term Bond
| | Number of Contracts/
Notional Amount
| | | Premiums Received
| |
Options outstanding at December 31, 2004 | | 34,000 | | | $ | 346,443 | |
Options written | | 18,735,163 | | | | 346,100 | |
Options closed | | (69,013 | ) | | | (488,474 | ) |
Options expired | | (22 | ) | | | (6,792 | ) |
| | |
|
| |
|
|
|
Options outstanding at December 31, 2005 | | 18,700,128 | | | $ | 197,277 | |
| | |
|
| |
|
|
|
| | |
| 138 | | THE TARGET PORTFOLIO TRUST |
Note 5. Tax and Distribution Information
In order to present undistributed net investment income or loss and accumulated net realized gains or losses on the Statement of Assets and Liabilities that more closely represent their tax character, certain adjustments have been made to paid-in-capital in excess of par, undistributed net investment income or loss and accumulated net realized gain or loss on investment. For the year ended December 31, 2005, the adjustments were as follows:
| | | | | | | | | | | |
Portfolio
| | Paid-In
Capital In
Excess of Par
| | | Undistributed
Net investment
Income
| | Accumulated
Net Realized
Gain or Loss
| |
Large Capitalization Value Portfolio(i) | | $ | (415,692 | ) | | | — | | $ | 415,692 | |
Small Capitalization Growth Portfolio(b) | | | (904,286 | ) | | $ | 904,286 | | | — | |
International Equity Portfolio(a)(c)(i) | | | — | | | | 874,474 | | $ | (874,474 | ) |
International Bond Portfolio(a)(d) | | | — | | | | 5,469,329 | | | (5,469,329 | ) |
Total Return Bond Portfolio(a)(d)(h)(i) | | | — | | | | 2,865,418 | | | (2,865,418 | ) |
Intermediate-Term Bond Portfolio(a)(d)(h)(g)(i) | | | — | | | | 29,520 | | | (29,520 | ) |
Mortgage Backed Securities Portfolio(d)(h) | | | — | | | | 135,108 | | | (135,108 | ) |
| (a) | Reclassification of net foreign currency gain (loss). |
| (b) | Reclassification of tax operating loss. |
| (c) | Reclassification of book to tax differences due to the sale of passive foreign investment companies. |
| (d) | Reclassification of swap income. |
| (e) | Reclassification for redemptions utilized as distributions for federal income tax purposes. |
| (f) | Reclassification of income from defaulted securities. |
| (g) | Reclassification of overdistribution of ordinary income. |
| (h) | Reclassification of paydowns. |
| (i) | Reclassification due to other adjustments. |
Net investment income, net realized gains and net assets were not affected by these reclassifications.
For federal income tax purposes the following Portfolios elected to treat post-October losses incurred in the period November 1, 2005 through December 31, 2005 as having been incurred in the following fiscal year. Certain Portfolios had capital loss carryforwards as of December 31, 2005. Accordingly, no capital gain distributions are expected to be paid to shareholders until future net gains have been realized in excess of such carryforwards. The approximate amounts were as follows:
| | | | | | | | | | |
| | | Post-October Losses
| | Capital Loss
Carryforward
| |
Portfolio
| | Currency
| | Capital
| |
Large Capitalization Growth Portfolio | | | — | | | — | | | — | (a) |
Large Capitalization Value Portfolio | | | — | | | — | | | — | |
Small Capitalization Growth Portfolio | | | — | | | — | | $ | 34,686,000 | (b) |
International Equity Portfolio | | | — | | | — | | | — | (c) |
International Bond Portfolio | | $ | 146,000 | | | — | | | — | |
Total Return Bond Portfolio | | | | | $ | 2,267,000 | | | 250,000 | (d) |
Intermediate-Term Bond Portfolio | | | 359,000 | | | — | | | 2,388,000 | (e) |
Mortgage Backed Securities Portfolio | | | — | | | 1,000 | | | 1,674,000 | (f) |
U.S. Government Money Market Portfolio | | | — | | | — | | | 400 | (g) |
| (a) | Approximately $13,646,0000 was used to offset net taxable gains realized in the fiscal year ended December 31, 2005. |
| (b) | Approximately $27,956,000 expiring in 2010 and $6,730,000 expiring in 2011. Approximately $11,057,000 was used to offset net taxable gains realized in the fiscal year ended December 31, 2005. |
| | |
| THE TARGET PORTFOLIO TRUST | | 139 |
| (c) | Approximately $30,095,000 was used to offset net taxable gains realized in the fiscal year ended December 31, 2005. |
| (d) | Approximately $250,000 expiring in 2013. |
| (e) | Approximately $2,388,000 expiring in 2013. |
| (f) | Approximately $384,000 expiring in 2008, $970,000 expiring in 2011, $255,000 expiring in 2012 and $65,000 expiring in 2013. |
| (g) | Approximately $400 expiring in 2013. |
For the year ended December 31, 2005, the tax character of distributions paid, as reflected in the Statement of Changes in Net Assets were:
| | | | | | | | | |
Portfolio
| | Ordinary
Income
| | Long-Term
Capital Gain
| | Total
Distributions
|
Large Capitalization Growth Portfolio | | $ | 424,776 | | $ | 44,003,589 | | $ | 44,428,365 |
Large Capitalization Value Portfolio | | | 12,089,901 | | | 42,910,387 | | | 55,000,288 |
Small Capitalization Value Portfolio | | | 6,235,673 | | | 49,928,997 | | | 56,164,670 |
International Equity Portfolio | | | 4,548,361 | | | 10,649,422 | | | 15,197,783 |
International Bond Portfolio | | | 832,969 | | | 23,073 | | | 856,042 |
Total Return Bond Portfolio | | | 6,859,355 | | | 1,294,402 | | | 8,153,757 |
Intermediate-Term Bond Portfolio | | | 10,159,553 | | | 100,626 | | | 10,260,179 |
Mortgage Backed Securities Portfolio | | | 4,564,729 | | | — | | | 4,564,729 |
U.S. Government Money Market Portfolio | | | 1,747,870 | | | — | | | 1,747,870 |
For the year ended December 31, 2004, the tax character of the distributions paid, as reflected in the Statements of Changes in Net Assets were:
| | | | | | | | | |
Portfolio
| | Ordinary
Income
| | Long-Term
Capital Gain
| | Total
Distributions
|
Large Capitalization Growth Portfolio | | $ | 1,525,007 | | | — | | $ | 1,525,007 |
Large Capitalization Value Portfolio | | | 4,679,699 | | | — | | | 4,679,699 |
Small Capitalization Value Portfolio | | | 5,807,652 | | $ | 9,126,920 | | | 14,934,572 |
International Equity Portfolio | | | 2,494,485 | | | — | | | 2,494,485 |
International Bond Portfolio | | | 2,800,864 | | | 140,359 | | | 2,941,223 |
Total Return Bond Portfolio | | | 7,451,540 | | | 1,084,263 | | | 8,535,803 |
Intermediate-Term Bond Portfolio | | | 9,177,935 | | | 3,540,871 | | | 12,718,806 |
Mortgage Backed Securities Portfolio | | | 4,319,318 | | | — | | | 4,319,318 |
U.S. Government Money Market Portfolio | | | 709,120 | | | — | | | 709,120 |
The tax character of distributable earnings at December 31, 2005 was:
| | | | | | |
Portfolio
| | Ordinary
Income
| | Long-Term
Capital Gain
|
Large Capitalization Growth Portfolio | | $ | 2,157,903 | | $ | 980,385 |
Large Capitalization Value Portfolio | | | 3,462,081 | | | 23,674,178 |
Small Capitalization Growth Portfolio | | | — | | | — |
Small Capitalization Value Portfolio | | | 721,295 | | | 4,053,763 |
International Equity Portfolio | | | 447,288 | | | — |
International Bond Portfolio | | | 1,298,115 | | | 54,582 |
Total Return Bond Portfolio | | | 1,833,467 | | | — |
Intermediate-Term Bond Portfolio | | | 116,727 | | | — |
Mortgage Backed Securities Portfolio | | | — | | | — |
U.S. Government Money Market Portfolio | | | — | | | — |
| | |
| 140 | | THE TARGET PORTFOLIO TRUST |
The United States federal income tax basis and unrealized appreciation (depreciation) of the Portfolios’ investments and the total net unrealized appreciation (depreciation) as of December 31, 2005, were as follows:
| | | | | | | | | | | | | | | | | | | | | | |
Portfolio
| | Tax Basis
| | Appreciation
| | Depreciation
| | | Net
Unrealized
Appreciation
(Depreciation)
of Investments
| | | Other
Cost Basis
Adjustments
| | | Total net
Unrealized
Appreciation
(Depreciation)
| |
Large Capitalization Growth Portfolio | | $ | 277,164,276 | | $ | 36,784,654 | | $ | (5,500,517 | ) | | $ | 31,284,137 | | | $ | (11,197 | ) | | $ | 31,272,940 | |
Large Capitalization Value Portfolio | | | 315,569,789 | | | 54,251,805 | | | (10,444,660 | ) | | | 43,807,145 | | | | — | | | | 43,807,145 | |
Small Capitalization Growth Portfolio | | | 124,631,736 | | | 24,244,492 | | | (4,167,025 | ) | | | 20,077,467 | | | | — | | | | 20,077,467 | |
Small Capitalization Value Portfolio | | | 218,408,079 | | | 51,828,465 | | | (10,561,296 | ) | | | 41,267,169 | | | | (12,372 | ) | | | 41,254,797 | |
International Equity Portfolio | | | 204,413,295 | | | 33,378,015 | | | (3,975,744 | ) | | | 29,402,271 | | | | (164,846 | ) | | | 29,237,425 | |
International Bond Portfolio | | | 60,682,969 | | | 2,037,159 | | | (3,543,083 | ) | | | (1,505,924 | ) | | | 73,346 | | | | (1,432,578 | ) |
Total Return Bond Portfolio | | | 229,524,856 | | | 3,256,426 | | | (4,502,900 | ) | | | (1,246,474 | ) | | | (2,031,480 | ) | | | (3,277,954 | ) |
Intermediate-Term Bond Portfolio | | | 266,679,248 | | | 2,839,336 | | | (4,028,030 | ) | | | (1,188,694 | ) | | | (245,264 | ) | | | (1,433,958 | ) |
Mortgage Backed Securities Portfolio | | | 100,639,290 | | | 820,784 | | | (2,035,252 | ) | | | (1,214,468 | ) | | | (20,789 | ) | | | (1,235,257 | ) |
U.S. Government Money Market Portfolio | | | 57,584,375 | | | — | | | — | | | | — | | | | — | | | | — | |
The difference between book basis and tax basis are primarily attributable to deferred losses on wash sales, mark to market on purchased options and mark to market on passive foreign investment companies. The other cost basis adjustments are primarily attributable to appreciation (depreciation) on written options, futures, swaps, short sales, forward currency contracts and mark to market of receivable and payables.
| | |
| THE TARGET PORTFOLIO TRUST | | 141 |
Note 6. Capital
The Fund has authorized an unlimited number of shares of beneficial interest at $.001 par value per share. Transactions in shares of beneficial interest during the year ended December 31, 2005 were as follows:
| | | | | | | | | | |
Portfolio
| | Shares
Sold
| | Shares Issued in
Reinvestment of
Dividends and
Distributions
| | Shares
Reacquired
| | | Increase/
(Decrease)
in Shares
Outstanding
| |
Large Capitalization Growth Portfolio | | 1,994,317 | | 3,017,201 | | (5,542,592 | ) | | (531,074 | ) |
Large Capitalization Value Portfolio | | 2,469,433 | | 3,561,971 | | (5,284,616 | ) | | 746,788 | |
Small Capitalization Growth Portfolio | | 1,326,027 | | — | | (3,325,226 | ) | | (1,999,199 | ) |
Small Capitalization Value Portfolio | | 2,398,957 | | 2,862,304 | | (2,853,930 | ) | | 2,407,331 | |
International Equity Portfolio | | 1,809,451 | | 1,137,351 | | (3,825,186 | ) | | (878,384 | ) |
International Bond Portfolio | | 975,588 | | 103,962 | | (1,410,170 | ) | | (330,620 | ) |
Total Return Bond Portfolio | | 3,374,867 | | 774,847 | | (5,376,334 | ) | | (1,226,620 | ) |
Intermediate-Term Bond Portfolio | | 3,906,750 | | 1,000,697 | | (7,912,087 | ) | | (3,004,640 | ) |
Mortgage Backed Securities Portfolio | | 729,295 | | 446,224 | | (2,250,862 | ) | | (1,075,343 | ) |
Transactions in shares of beneficial interest during the year ended December 31, 2004 were as follows:
| | | | | | | | | | |
Portfolio
| | Shares
Sold
| | Shares Issued in
Reinvestment of
Dividends and
Distributions
| | Shares
Reacquired
| | | Increase/
(Decrease)
in Shares
Outstanding
| |
Large Capitalization Growth Portfolio | | 4,993,871 | | 99,111 | | (6,119,766 | ) | | (1,026,784 | ) |
Large Capitalization Value Portfolio | | 5,414,647 | | 290,776 | | (4,845,605 | ) | | 859,818 | |
Small Capitalization Growth Portfolio | | 3,359,377 | | — | | (3,601,982 | ) | | (242,605 | ) |
Small Capitalization Value Portfolio | | 2,777,541 | | 706,764 | | (3,212,334 | ) | | 271,971 | |
International Equity Portfolio | | 4,804,787 | | 210,635 | | (4,124,087 | ) | | 891,335 | |
International Bond Portfolio | | 2,404,390 | | 358,888 | | (1,843,995 | ) | | 919,283 | |
Total Return Bond Portfolio | | 6,346,880 | | 778,446 | | (5,175,584 | ) | | 1,949,742 | |
Intermediate-Term Bond Portfolio | | 7,378,419 | | 1,172,608 | | (11,802,265 | ) | | (3,251,238 | ) |
Mortgage Backed Securities Portfolio | | 2,296,659 | | 369,469 | | (3,699,112 | ) | | (1,032,984 | ) |
Note 7. Borrowings
Reverse Repurchase Agreements: Mortgage Backed Securities Portfolio enters into reverse repurchase agreements with qualified, third party broker-dealers as determined by and under the direction of the Fund’s Board of Trustees. Interest on the value of reverse repurchase agreements issued and outstanding is based upon competitive market rates at the time of issuance. At the time the Portfolio enters into a reverse repurchase agreement, it establishes and maintains a segregated account with the lender containing liquid investment grade securities having a value not less than the repurchase price, including accrued interest, of the reverse repurchase agreement.
The average daily balance of reverse repurchase agreements outstanding during the year ended December 31, 2005 was approximately $20,576,600 at a weighted average interest rate of approximately 3.51%. The average daily balance is for the number of days the Portfolio had an outstanding balance. The maximum amount of total reverse repurchase agreements outstanding at any month-end during the period was approximately $35,104,000 as of December 31, 2005, which was 22% of total assets.
| | |
| 142 | | THE TARGET PORTFOLIO TRUST |
Financial Highlights
| | | | | | | | | | | | | | | | | | | | |
| | | LARGE CAPITALIZATION
GROWTH PORTFOLIO
| |
| | | Year Ended December 31,
| |
| | | 2005
| | | 2004
| | | 2003
| | | 2002
| | | 2001
| |
| | | | | |
PER SHARE OPERATING
PERFORMANCE: | | | | | | | | | | | | | | | | | | | | |
Net asset value, beginning of year | | | $15.90 | | | | $15.39 | | | | $11.03 | | | | $16.15 | | | | $23.20 | |
Income (loss) from investment operations | | | | | | | | | | | | | | | | | | | | |
Net investment income (loss) | | | .03 | | | | .07 | | | | (.01 | ) | | | (.01 | ) | | | .02 | |
Net realized and unrealized gain (loss)
on investment transactions | | | 1.06 | | | | .51 | | | | 4.37 | | | | (5.11 | ) | | | (7.05 | ) |
Total from investment operations | | | 1.09 | | | | .58 | | | | 4.36 | | | | (5.12 | ) | | | (7.03 | ) |
Less dividends and distributions | | | | | | | | | | | | | | | | | | | | |
Dividends from net investment income | | | (.02 | ) | | | (.07 | ) | | | — | | | | — | | | | (.02 | ) |
Distributions from net realized gains | | | (2.37 | ) | | | — | | | | — | | | | — | | | | — | |
Total dividends and distributions | | | (2.39 | ) | | | (.07 | ) | | | — | | | | — | | | | (.02 | ) |
Net asset value, end of year | | | $14.60 | | | | $15.90 | | | | $15.39 | | | | $11.03 | | | | $16.15 | |
| | | | | |
| TOTAL RETURN(a) | | | 6.74 | % | | | 3.78 | % | | | 39.53 | % | | | (31.70 | )% | | | (30.32 | )% |
| | | | |
| RATIOS/SUPPLEMENTAL DATA: | | | | | | | | | | | | | | | | | |
Net assets, end of year (000) | | $ | 307,835 | | | $ | 343,760 | | | $ | 348,385 | | | $ | 243,748 | | | $ | 358,429 | |
Average net assets (000) | | $ | 310,710 | | | $ | 345,413 | | | $ | 290,985 | | | $ | 297,189 | | | $ | 397,492 | |
Ratios to average net assets | | | | | | | | | | | | | | | | | | | | |
Expenses | | | .76 | % | | | .77 | % | | | .84 | % | | | .81 | % | | | .75 | % |
Net investment income (loss) | | | .18 | % | | | .45 | % | | | (.09 | )% | | | (.11 | )% | | | .08 | % |
Portfolio turnover rate | | | 246 | % | | | 76 | % | | | 49 | % | | | 66 | % | | | 68 | % |
| (a) | Total return is calculated assuming a purchase of shares on the first day and a sale on the last day of each year reported and includes reinvestment of dividends and distributions. |
See Notes to Financial Statements
| | |
| THE TARGET PORTFOLIO TRUST | | 143 |
Financial Highlights (cont’d)
| | | | | | | | | | | | | | | | | | | | |
| | | LARGE CAPITALIZATION
VALUE PORTFOLIO
| |
| | | Year Ended December 31,
| |
| | | 2005 | | | 2004 | | | 2003 | | | 2002 | | | 2001 | |
| | | | | |
| PER SHARE OPERATING PERFORMANCE: | | | | | | | | | | | | | | | | | | | | |
Net asset value, beginning of year | | | $16.59 | | | | $14.13 | | | | $10.49 | | | | $12.45 | | | | $12.64 | |
Income (loss) from investment operations | | | | | | | | | | | | | | | | | | | | |
Net investment income | | | .25 | | | | .21 | | | | .17 | | | | .18 | | | | .19 | |
Net realized and unrealized gain (loss)
on investment transactions | | | .80 | | | | 2.45 | | | | 3.64 | | | | (1.85 | ) | | | (.03 | ) |
Total from investment operations | | | 1.05 | | | | 2.66 | | | | 3.81 | | | | (1.67 | ) | | | .16 | |
Less distributions | | | | | | | | | | | | | | | | | | | | |
Dividends from net investment income | | | (.25 | ) | | | (.20 | ) | | | (.17 | ) | | | (.17 | ) | | | (.19 | ) |
Distributions from net realized gains | | | (2.28 | ) | | | — | | | | — | | | | (.12 | ) | | | (.16 | ) |
Total distributions | | | (2.53 | ) | | | (.20 | ) | | | (.17 | ) | | | (.29 | ) | | | (.35 | ) |
Net asset value, end of year | | | $15.11 | | | | $16.59 | | | | $14.13 | | | | $10.49 | | | | $12.45 | |
| | | | | |
| TOTAL RETURN(a) | | | 6.50 | % | | | 18.87 | % | | | 36.38 | % | | | (13.57 | )% | | | 1.21 | % |
| | | | | |
| RATIOS/SUPPLEMENTAL DATA: | | | | | | | | | | | | | | | | | | | | |
Net assets, end of year (000) | | $ | 362,253 | | | $ | 385,414 | | | $ | 316,131 | | | $ | 229,626 | | | $ | 275,208 | |
Average net assets (000) | | $ | 366,301 | | | $ | 346,319 | | | $ | 253,653 | | | $ | 253,096 | | | $ | 275,773 | |
Ratios to average net assets | | | | | | | | | | | | | | | | | | | | |
Expenses | | | .74 | % | | | .74 | % | | | .80 | % | | | .80 | % | | | .76 | % |
Net investment income | | | 1.48 | % | | | 1.43 | % | | | 1.50 | % | | | 1.49 | % | | | 1.51 | % |
Portfolio turnover rate | | | 90 | % | | | 47 | % | | | 56 | % | | | 56 | % | | | 50 | % |
| (a) | Total return is calculated assuming a purchase of shares on the first day and a sale on the last day of each year reported and includes reinvestment of dividends and distributions. |
See Notes to Financial Statements
| | |
| 144 | | THE TARGET PORTFOLIO TRUST |
Financial Highlights (cont’d)
| | | | | | | | | | | | | | | |
| | | SMALL CAPITALIZATION GROWTH PORTFOLIO
| |
| | | Year Ended December 31,
| |
| | | 2005 | | | 2004 | | | 2003 | | | 2002 | | | 2001 | |
| | | | | |
| PER SHARE OPERATING PERFORMANCE: | | | | | | | | | | | | | | | |
Net asset value, beginning of year | | $10.79 | | | $ 9.38 | | | $7.05 | | | $10.56 | | | $13.09 | |
Income (loss) from investment operations | | | | | | | | | | | | | | | |
Net investment loss | | (.07 | ) | | (.06 | ) | | (.06 | ) | | (.06 | ) | | (.07 | ) |
Net realized and unrealized gain (loss)
on investment transactions | | .56 | | | 1.47 | | | 2.39 | | | (3.45 | ) | | (2.46 | ) |
Total from investment operations | | .49 | | | 1.41 | | | 2.33 | | | (3.51 | ) | | (2.53 | ) |
Less distributions | | | | | | | | | | | | | | | |
Distributions from net realized gains | | — | | | — | | | — | | | — | | | — | |
Net asset value, end of year | | $11.28 | | | $10.79 | | | $9.38 | | | $ 7.05 | | | $10.56 | |
| | | | | |
| TOTAL RETURN(a) | | 4.54 | % | | 15.03 | % | | 33.05 | % | | (33.24 | )% | | (19.33 | )% |
| | | | | |
| RATIOS/SUPPLEMENTAL DATA: | | | | | | | | | | | | | | | |
Net assets, end of year (000) | | $143,366 | | | $158,757 | | | $140,251 | | | $100,868 | | | $145,554 | |
Average net assets (000) | | $144,034 | | | $146,717 | | | $116,632 | | | $122,299 | | | $156,654 | |
Ratios to average net assets | | | | | | | | | | | | | | | |
Expenses | | .91 | % | | .90 | % | | 1.03 | % | | .99 | % | | .88 | % |
Net investment loss | | (.62 | )% | | (.58 | )% | | (.80 | )% | | (.74 | )% | | (.59 | )% |
Portfolio turnover rate | | 147 | % | | 107 | % | | 235 | % | | 153 | % | | 167 | % |
| (a) | Total return is calculated assuming a purchase of shares on the first day and a sale on the last day of each year reported and includes reinvestment of dividends and distributions. |
See Notes to Financial Statements
| | |
| THE TARGET PORTFOLIO TRUST | | 145 |
Financial Highlights (cont’d)
| | | | | | | | | | | | | | | |
| | | SMALL CAPITALIZATION VALUE PORTFOLIO
| |
| | | Year Ended December 31,
| |
| | | 2005 | | | 2004 | | | 2003 | | | 2002 | | | 2001 | |
| | | | | |
| PER SHARE OPERATING PERFORMANCE: | | | | | | | | | | | | | | | |
Net asset value, beginning of year | | $21.84 | | | $18.78 | | | $13.23 | | | $17.54 | | | $16.88 | |
Income (loss) from investment operations | | | | | | | | | | | | | | | |
Net investment income | | .18 | | | .17 | | | .03 | | | .04 | | | .09 | |
Net realized and unrealized gain (loss)
on investment transactions | | 2.06 | | | 4.27 | | | 6.18 | | | (1.41 | ) | | 2.67 | |
Total from investment operations | | 2.24 | | | 4.44 | | | 6.21 | | | (1.37 | ) | | 2.76 | |
Less distributions | | | | | | | | | | | | | | | |
Dividends from net investment income | | (.16 | ) | | (.17 | ) | | (.03 | ) | | (.04 | ) | | (.19 | ) |
Distributions from net realized gains | | (4.94 | ) | | (1.21 | ) | | (.63 | ) | | (2.90 | ) | | (1.91 | ) |
Total distributions | | (5.10 | ) | | (1.38 | ) | | (.66 | ) | | (2.94 | ) | | (2.10 | ) |
Net asset value, end of year | | $18.98 | | | $21.84 | | | $18.78 | | | $13.23 | | | $17.54 | |
| | | | | |
| TOTAL RETURN(a) | | 10.10 | % | | 24.02 | % | | 47.10 | % | | (8.48 | )% | | 17.23 | % |
| | | | | |
| RATIOS/SUPPLEMENTAL DATA: | | | | | | | | | | | | | | | |
Net assets, end of year (000) | | $259,115 | | | $245,576 | | | $205,989 | | | $147,930 | | | $177,088 | |
Average net assets (000) | | $249,661 | | | $218,487 | | | $161,025 | | | $167,945 | | | $161,663 | |
Ratios to average net assets | | | �� | | | | | | | | | | | | |
Expenses | | .79 | % | | .82 | % | | .93 | % | | .88 | % | | .87 | % |
Net investment income | | .81 | % | | .86 | % | | .15 | % | | .23 | % | | .59 | % |
Portfolio turnover rate | | 118 | % | | 22 | % | | 89 | % | | 95 | % | | 114 | % |
| (a) | Total return is calculated assuming a purchase of shares on the first day and a sale on the last day of each year reported and includes reinvestment of dividends and distributions. |
See Notes to Financial Statements
| | |
| 146 | | THE TARGET PORTFOLIO TRUST |
Financial Highlights (cont’d)
| | | | | | | | | | | | | | | |
| | | INTERNATIONAL
EQUITY PORTFOLIO
| |
| | | Year Ended December 31,
| |
| | | 2005 | | | 2004 | | | 2003 | | | 2002 | | | 2001 | |
| | | | | |
| PER SHARE OPERATING PERFORMANCE: | | | | | | | | | | | | | | | |
Net asset value, beginning of year | | $13.13 | | | $11.53 | | | $ 9.07 | | | $10.10 | | | $13.52 | |
Income (loss) from investment operations | | | | | | | | | | | | | | | |
Net investment income | | .22 | | | .15 | | | .16 | | | .11 | | | .09 | |
Net realized and unrealized gain (loss)
on investment transactions | | 1.59 | | | 1.59 | | | 2.43 | | | (1.14 | ) | | (3.39 | ) |
Total from investment operations | | 1.81 | | | 1.74 | | | 2.59 | | | (1.03 | ) | | (3.30 | ) |
Less Distributions | | | | | | | | | | | | | | | |
Dividends from net investment income | | (.28 | ) | | (.14 | ) | | (.13 | ) | | — | (b) | | — | |
Distributions in excess of net investment income | | — | | | — | | | — | | | — | | | — | |
Distributions from net realized gains | | (0.67 | ) | | — | | | — | | | — | | | (.12 | ) |
Total distributions | | (0.95 | ) | | (.14 | ) | | (.13 | ) | | — | | | (.12 | ) |
Net asset value, end of year | | $13.99 | | | $13.13 | | | $11.53 | | | $ 9.07 | | | $10.10 | |
| | | | | |
| TOTAL RETURN(a) | | 14.12 | % | | 15.23 | % | | 28.76 | % | | (10.17 | )% | | (24.56 | )% |
| | | | | |
| RATIOS/SUPPLEMENTAL DATA: | | | | | | | | | | | | | | | |
Net assets, end of year (000) | | $233,150 | | | $230,300 | | | $191,909 | | | $140,392 | | | $158,307 | |
Average net assets (000) | | $221,543 | | | $209,378 | | | $153,435 | | | $150,249 | | | $190,106 | |
Ratios to average net assets | | | | | | | | | | | | | | | |
Expenses | | .99 | % | | 1.00 | % | | 1.07 | % | | 1.09 | % | | 1.01 | % |
Net investment income | | 1.55 | % | | 1.27 | % | | 1.69 | % | | 1.17 | % | | .82 | % |
Portfolio turnover rate | | 123 | % | | 59 | % | | 47 | % | | 55 | % | | 65 | % |
| (a) | Total return is calculated assuming a purchase of shares on the first day and a sale on the last day of each year reported and includes reinvestment of dividends and distributions. |
| (b) | Less than $.005 per share. |
See Notes to Financial Statements
| | |
| THE TARGET PORTFOLIO TRUST | | 147 |
Financial Highlights (cont’d)
| | | | | | | | | | | | | | | |
| | | INTERNATIONAL BOND PORTFOLIO
| |
| | | Year Ended December 31,
| |
| | | 2005 | | | 2004 | | | 2003 | | | 2002 | | | 2001 | |
| | | | | |
PER SHARE OPERATING
PERFORMANCE: | | | | | | | | | | | | | | | |
Net asset value, beginning of year | | $ 8.19 | | | $8.45 | | | $8.83 | | | $7.46 | | | $8.08 | |
Income (loss) from investment operations | | | | | | | | | | | | | | | |
Net investment income | | .03 | | | .26 | | | .21 | | | .15 | | | .18 | |
Net realized and unrealized gain (loss) on investment transactions | | .27 | | | .05 | | | .26 | | | 1.33 | | | (.64 | ) |
Total from investment operations | | .30 | | | .31 | | | .47 | | | 1.48 | | | (.46 | ) |
Less distributions | | | | | | | | | | | | | | | |
Dividends from net investment income | | (.15 | ) | | (.48 | ) | | (.84 | ) | | (.11 | ) | | — | |
Distributions from net realized gains | | — | | | (.09 | ) | | (.01 | ) | | — | | | — | |
Tax return of capital distributions | | — | | | — | | | — | | | — | | | (.16 | ) |
Dividends from net realized gains | | (.01 | ) | | — | | | — | | | — | | | — | |
Total distributions | | (.16 | ) | | (.57 | ) | | (.85 | ) | | (.11 | ) | | (.16 | ) |
Net asset value, end of year | | $ 8.33 | | | $8.19 | | | $8.45 | | | $8.83 | | | $7.46 | |
| | | | | |
| TOTAL RETURN(a) | | 3.95 | % | | 3.71 | % | | 5.31 | % | | 20.14 | % | | (5.73 | )% |
| | | | | |
| RATIOS/SUPPLEMENTAL DATA: | | | | | | | | | | | | | | | |
Net assets, end of year (000) | | $42,912 | | | $44,905 | | | $38,553 | | | $27,648 | | | $18,637 | |
Average net assets (000) | | $44,072 | | | $43,199 | | | $32,992 | | | $22,022 | | | $19,235 | |
Ratios to average net assets | | | | | | | | | | | | | | | |
Expenses | | 1.51 | % | | 1.49 | % | | 1.51 | % | | 1.69 | % | | 1.83 | % |
Net investment income | | 1.71 | % | | 2.15 | % | | 1.88 | % | | 1.88 | % | | 2.31 | % |
Portfolio turnover rate | | 223 | % | | 169 | % | | 235 | % | | 238 | % | | 251 | % |
| (a) | Total return is calculated assuming a purchase of shares on the first day and a sale on the last day of each year reported and includes reinvestment of dividends and distributions. |
See Notes to Financial Statements
| | |
| 148 | | THE TARGET PORTFOLIO TRUST |
Financial Highlights (cont’d)
| | | | | | | | | | | | | | | | | | | | |
| | | TOTAL RETURN BOND PORTFOLIO
| |
| | | Year Ended December 31,
| |
| | | 2005 | | | 2004 | | | 2003 | | | 2002 | | | 2001 | |
| | | | | |
| PER SHARE OPERATING PERFORMANCE: | | | | | | | | | | | | | | | | | | | | |
Net asset value, beginning of year | | | $10.64 | | | | $10.66 | | | | $10.73 | | | | $10.42 | | | | $10.27 | |
Income from investment operations | | | | | | | | | | | | | | | | | | | | |
Net investment income | | | .38 | | | | .20 | | | | .33 | | | | .41 | | | | .52 | |
Net realized and unrealized gain (loss) on investment transactions | | | (.12 | ) | | | .31 | | | | .33 | | | | .57 | | | | .28 | |
Total from investment operations | | | .26 | | | | .51 | | | | .66 | | | | .98 | | | | .80 | |
Less distributions | | | | | | | | | | | | | | | | | | | | |
Dividends from net investment income | | | (.43 | ) | | | (.44 | ) | | | (.36 | ) | | | (.45 | ) | | | (.54 | ) |
Distributions from net realized gains | | | (.08 | ) | | | (.09 | ) | | | (.37 | ) | | | (.22 | ) | | | (.11 | ) |
Total distributions | | | (.51 | ) | | | (.53 | ) | | | (.73 | ) | | | (.67 | ) | | | (.65 | ) |
Net asset value, end of year | | | $10.39 | | | | $10.64 | | | | $10.66 | | | | $10.73 | | | | $10.42 | |
| | | | | |
| TOTAL RETURN(a) | | | 2.60 | % | | | 4.73 | % | | | 6.22 | % | | | 9.65 | % | | | 7.97 | % |
| | | | | |
| RATIOS/SUPPLEMENTAL DATA: | | | | | | | | | | | | | | | | | | | | |
Net assets, end of year (000) | | $ | 161,675 | | | $ | 178,488 | | | $ | 158,148 | | | $ | 139,488 | | | $ | 106,086 | |
Average net assets (000) | | $ | 169,616 | | | $ | 170,073 | | | $ | 151,999 | | | $ | 122,888 | | | $ | 90,698 | |
Ratios to average net assets | | | | | | | | | | | | | | | | | | | | |
Expenses | | | .76 | % | | | .75 | % | | | .76 | % | | | .75 | % | | | .78 | % |
Net investment income | | | 3.72 | % | | | 1.82 | % | | | 2.99 | % | | | 3.89 | % | | | 4.83 | % |
Portfolio turnover rate | | | 366 | % | | | 587 | % | | | 445 | % | | | 429 | % | | | 472 | % |
| (a) | Total return is calculated assuming a purchase of shares on the first day and a sale on the last day of each year reported and includes reinvestment of dividends and distributions. |
See Notes to Financial Statements
| | |
| THE TARGET PORTFOLIO TRUST | | 149 |
Financial Highlights (cont’d)
| | | | | | | | | | | | | | | |
| | | INTERMEDIATE-TERM
BOND PORTFOLIO
| |
| | | Year Ended December 31,
| |
| | | 2005 | | | 2004 | | | 2003 | | | 2002 | | | 2001 | |
| | | | | |
| PER SHARE OPERATING PERFORMANCE: | | | | | | | | | | | | | | | |
Net asset value, beginning of year | | $10.36 | | | $10.46 | | | $10.50 | | | $10.23 | | | $10.23 | |
Income from investment operations | | | | | | | | | | | | | | | |
Net investment income | | .36 | | | .19 | | | .28 | | | .38 | | | .52 | |
Net realized and unrealized gain (loss) on
investment transactions | | (.16 | ) | | .14 | | | .19 | | | .47 | | | .29 | |
Total from investment operations | | .20 | | | .33 | | | .47 | | | .85 | | | .81 | |
Less Distributions | | | | | | | | | | | | | | | |
Dividends from net investment income | | (.38 | ) | | (.24 | ) | | (.34 | ) | | (.39 | ) | | (.54 | ) |
Distributions in excess of net investment income | | — | | | — | | | — | | | — | | | — | |
Distributions from net realized gains | | — | (b) | | (.19 | ) | | (.17 | ) | | (.19 | ) | | (.27 | ) |
Total distributions | | (.38 | ) | | (.43 | ) | | (.51 | ) | | (.58 | ) | | (.81 | ) |
Net asset value, end of year | | $10.18 | | | $10.36 | | | $10.46 | | | $10.50 | | | $10.23 | |
| | | | | |
| TOTAL RETURN(a) | | 1.88 | % | | 3.19 | % | | 4.58 | % | | 8.56 | % | | 8.19 | % |
| | | | |
| RATIOS/SUPPLEMENTAL DATA: | | | | | | | | | | | | | |
Net assets, end of year (000) | | $262,177 | | | $297,982 | | | $334,806 | | | $333,069 | | | $195,233 | |
Average net assets (000) | | $278,441 | | | $318,671 | | | $343,466 | | | $258,072 | | | $167,039 | |
Ratios to average net assets | | | | | | | | | | | | | | | |
Expenses | | .63 | % | | .64 | % | | .68 | % | | .66 | % | | .66 | % |
Net investment income | | 3.48 | % | | 1.86 | % | | 2.64 | % | | 3.58 | % | | 4.91 | % |
Portfolio turnover rate | | 208 | % | | 133 | % | | 422 | % | | 377 | % | | 560 | % |
| (a) | Total return is calculated assuming a purchase of shares on the first day and a sale on the last day of each year reported and includes reinvestment of dividends and distributions. |
| (b) | Less than $0.005 per share. |
See Notes to Financial Statements
| | |
| 150 | | THE TARGET PORTFOLIO TRUST |
Financial Highlights (cont’d)
| | | | | | | | | | | | | | | | | | | | |
| | | MORTGAGE BACKED SECURITIES PORTFOLIO
| |
| | | Year Ended December 31,
| |
| | | 2005 | | | 2004 | | | 2003 | | | 2002 | | | 2001 | |
| | | | | |
PER SHARE OPERATING
PERFORMANCE: | | | | | | | | | | | | | | | | | | | | |
Net asset value, beginning of year | | | $10.39 | | | | $10.45 | | | | $10.70 | | | | $10.44 | | | | $10.31 | |
Income (loss) from investment operations | | | | | | | | | | | | | | | | | | | | |
Net investment income | | | .50 | | | | .36 | | | | .47 | | | | .56 | | | | .61 | |
Net realized and unrealized gain (loss)
on investment transactions | | | (.27 | ) | | | .02 | | | | (.24 | ) | | | .27 | | | | .17 | |
Total from investment operations | | | .23 | | | | .38 | | | | .23 | | | | .83 | | | | .78 | |
Less distributions | | | | | | | | | | | | | | | | | | | | |
Dividends from net investment income | | | (.52 | ) | | | (.44 | ) | | | (.48 | ) | | | (.57 | ) | | | (.65 | ) |
Dividends from net realized gains | | | — | | | | — | | | | — | | | | — | | | | — | |
Total distributions | | | (.52 | ) | | | — | | | | — | | | | — | | | | — | |
Net asset value, end of year | | | $10.10 | | | | $10.39 | | | | $10.45 | | | | $10.70 | | | | $10.44 | |
| | | | | |
| TOTAL RETURN(a) | | | 2.29 | % | | | 3.68 | % | | | 2.20 | % | | | 8.13 | % | | | 7.79 | % |
| | | | | |
| RATIOS/SUPPLEMENTAL DATA: | | | | | | | | | | | | | | | | | | | | |
Net assets, end of year (000) | | $ | 82,195 | | | $ | 95,796 | | | $ | 107,072 | | | $ | 115,546 | | | $ | 75,502 | |
Average net assets (000) | | $ | 89,756 | | | $ | 103,055 | | | $ | 114,526 | | | $ | 94,893 | | | $ | 69,767 | |
Ratios to average net assets | | | | | | | | | | | | | | | | | | | | |
Expenses(b) | | | 1.70 | % | | | .90 | % | | | .84 | % | | | .80 | % | | | .84 | % |
Net investment income | | | 4.91 | % | | | 3.48 | % | | | 4.43 | % | | | 4.43 | % | | | 5.74 | % |
Portfolio turnover rate | | | 251 | % | | | 279 | % | | | 282 | % | | | 184 | % | | | 72 | % |
| (a) | Total return is calculated assuming a purchase of shares on the first day and a sale on the last day of each year reported and includes reinvestment of dividends and distributions. |
| (b) | The annualized expense ratio without interest expense would have been 0.91% for the fiscal year ended December 31, 2005. |
See Notes to Financial Statements
| | |
| THE TARGET PORTFOLIO TRUST | | 151 |
Financial Highlights (cont’d)
| | | | | | | | | | | | | | | |
| | | U.S. GOVERNMENT MONEY MARKET PORTFOLIO
| |
| | | Year Ended December 31,
| |
| | | 2005 | | | 2004 | | | 2003 | | | 2002 | | | 2001 | |
| | | | | |
PER SHARE OPERATING
PERFORMANCE: | | | | | | | | | | | | | | | |
Net asset value, beginning of year | | $ 1.00 | | | $ 1.00 | | | $ 1.00 | | | $ 1.00 | | | $ 1.00 | |
Net investment income and net realized gain on
investment transactions | | .026 | | | .008 | | | .007 | | | .013 | | | .037 | |
Dividends and distributions | | (.026 | ) | | (.008 | ) | | (.007 | ) | | (.013 | ) | | (.037 | ) |
Net asset value, end of year | | $ 1.00 | | | $ 1.00 | | | $ 1.00 | | | $ 1.00 | | | $ 1.00 | |
| | | | | |
| TOTAL RETURN(a) | | 2.59 | % | | 0.76 | % | | 0.70 | % | | 1.31 | % | | 3.77 | % |
| | | | | |
| RATIOS/SUPPLEMENTAL DATA: | | | | | | | | | | | | | | | |
Net assets, end of year (000) | | $57,207 | | | $74,190 | | | $98,464 | | | $127,141 | | | $154,982 | |
Average net assets (000) | | $69,488 | | | $94,854 | | | $114,831 | | | $128,550 | | | $132,704 | |
Ratios to average net assets | | | | | | | | | | | | | | | |
Expenses | | .71 | % | | .59 | % | | .52 | % | | .45 | % | | .51 | % |
Net investment income | | 2.50 | % | | .72 | % | | .71 | % | | 1.31 | % | | 3.52 | % |
| (a) | Total return is calculated assuming a purchase of shares on the first day and a sale on the last day of each year reported and includes reinvestment of dividends and distributions. |
See Notes to Financial Statements
| | |
| 152 | | THE TARGET PORTFOLIO TRUST |
Report of Independent Registered Public Accounting Firm
The Board of Trustees and Shareholders of The Target Portfolio Trust:
We have audited the accompanying statements of assets and liabilities of The Target Portfolio Trust (comprised of Large Capitalization Growth Portfolio, Large Capitalization Value Portfolio, Small Capitalization Growth Portfolio, Small Capitalization Value Portfolio, International Equity Portfolio, International Bond Portfolio, Total Return Bond Portfolio, Intermediate-Term Bond Portfolio, Mortgage Backed Securities Portfolio, and U.S. Government Money Market Portfolio) hereafter referred to as the “Trust”, including the portfolios of investments, as of December 31, 2005, and the related statements of operations for the year then ended, and the statements of changes in net assets and the financial highlights for each of the years in the two-year period then ended. These financial statements and financial highlights are the responsibility of the Trust’s management. Our responsibility is to express an opinion on these financial statements and financial highlights based on our audits. The financial highlights for the periods presented prior to the year ended December 31, 2004 were audited by another independent registered public accounting firm, whose report dated February 24, 2004, expressed an unqualified opinion thereon.
We conducted our audits in accordance with the standards of the Public Company Accounting Oversight Board (United States). Those standards require that we plan and perform the audit to obtain reasonable assurance about whether the financial statements and financial highlights are free of material misstatement. An audit includes examining, on a test basis, evidence supporting the amounts and disclosures in the financial statements. Our procedures included confirmation of securities owned as of December 31, 2005, by correspondence with the custodian and brokers or by other appropriate auditing procedures where replies from brokers were not received. An audit also includes assessing the accounting principles used and significant estimates made by management, as well as evaluating the overall financial statement presentation. We believe that our audits provides a reasonable basis for our opinion.
In our opinion, the financial statements and financial highlights referred to above present fairly, in all material respects, the financial position of the Trust as of December 31, 2005, and the results of its operations for the year then ended, and the changes in its net assets and the financial highlights for each of the years in the two-year period then ended, in conformity with U.S. generally accepted accounting principles.

New York, New York
February 28, 2006
| | |
| THE TARGET PORTFOLIO TRUST | | 153 |
Federal Income Tax Information (Unaudited)
As required by the Internal Revenue Code, we wish to advise you as to the federal tax status of dividends and distributions paid by the Fund during its fiscal year ended December 31, 2005. Further, we wish to advise you of the percentage of the ordinary income dividends (excluding long-term capital gains distributions) paid in 2005 that qualify for the corporate dividends received deduction available to corporate taxpayers.
Detailed below, please find the aggregate dividends and distributions, per share, paid by each portfolio during the year ended December 31, 2005 as well as the corporate dividend received deduction percentage:
| | | | | | | | | | | | | | | | | | |
| | | Ordinary Dividends*
| | | | | | | | | | |
Portfolio
| | Income
| | Short-Term
Capital Gains
| | Long-Term
Capital Gains
Distributions
| | Total Dividends
and Distributions
| | Corporate
Dividend
Received
Deduction
| | | Qualified
Dividend
Income
| |
Large Capitalization Growth Portfolio | | $ | 0.0227 | | | — | | $ | 2.3687 | | $ | 2.3914 | | 100.00 | % | | 100.00 | % |
Large Capitalization Value Portfolio | | | 0.2464 | | $ | 0.3376 | | | 1.9468 | | | 2.5308 | | 67.37 | % | | 66.72 | % |
Small Capitalization Value Portfolio | | | 0.1621 | | | 0.4039 | | | 4.5314 | | | 5.0974 | | 66.80 | % | | 66.58 | % |
International Equity Portfolio | | | 0.2816 | | | — | | | 0.6711 | | | 0.9527 | | 0.00 | % | | 100.00 | % |
International Bond Portfolio | | | 0.1552 | | | 0.0020 | | | 0.0043 | | | 0.1615 | | 0.00 | % | | 0.00 | % |
Total Return Bond Portfolio | | | 0.4308 | | | — | | | 0.0803 | | | 0.5111 | | 0.00 | % | | 0.00 | % |
Intermediate-Term Bond Portfolio | | | 0.3760 | | | 0.0009 | | | 0.0038 | | | 0.3807 | | 0.00 | % | | 0.00 | % |
Mortgage Backed Securities Portfolio | | | 0.5230 | | | — | | | — | | | 0.5230 | | 0.00 | % | | 0.00 | % |
U.S. Government Money Market Portfolio | | | 0.0256 | | | — | | | — | | | 0.0256 | | 0.00 | % | | 0.00 | % |
| * | For federal income tax purposes, ordinary income dividends and short-term capital gains distributions are taxable as capital gains income. |
The International Equity Portfolio has elected to give the benefit tax credit to its shareholders. Accordingly, shareholders who must report their gross income dividends and distributions in a federal income tax return will be entitled to a foreign tax credit, or an itemized deduction in computing their U.S. income tax liability. It is generally more advantageous to claim rather than take a deduction. For the fiscal year ended December 31, 2005 the International Equity Portfolio intends on passing through $444,620 of ordinary income distributions as a foreign tax credit from recognized foreign source income of $6,019,816.
The Total Return Bond Portfolio, Intermediate-Term Bond Portfolio and Mortgage Backed Securities Portfolio intend to designate 100.00%, 97.44% and 96.60%, respectively, of their ordinary income dividends as qualified interest income under The American Jobs Creation Act of 2004.
| | |
| 154 | | THE TARGET PORTFOLIO TRUST |
Important Notice For Certain Shareholders (Unaudited)
Many states do not tax the portion of mutual fund dividends attributed to interest from U.S. Government obligations. Listed below is the percentage of interest earned by the following Target portfolios from U.S. Government obligations for the calendar year 2005.
To determine the amount of your dividends which may be exempt from state and local tax, simply multiply the amount in Box 1 of your 1099-Div (Ordinary Dividends) by the percentage listed below. These percentages do not apply to taxable capital gain distributions paid by the portfolios.
| | | |
Portfolio*
| | Percentage of Interest from
U.S. Government obligations
| |
International Bond Portfolio | | 6.14 | % |
Total Return Bond Portfolio | | 36.16 | % |
Intermediate-Term Bond Portfolio | | 17.93 | % |
Mortgage Backed Securities Portfolio | | 1.57 | % |
U.S. Government Money Market Portfolio | | 6.40 | % |
| * | Due to certain minimum portfolio holding requirements in California, Connecticut and New York, residents of those states will not be able to exclude 2005 interest income from state and local taxes. |
Please consult your tax adviser or state/local authorities to properly report this information on your tax return. If you have any questions concerning the amounts listed above, please call your Wachovia Securities Financial Adviser.
| | |
| THE TARGET PORTFOLIO TRUST | | 155 |
Management of the Trust (Unaudited)
Information pertaining to the Trustees of the Trust is set forth below. Trustees who are not deemed to be “interested persons” of the Trust, as defined in the Investment Company Act of 1940 (the 1940 Act), are referred to as “Independent Trustees.” Trustees who are deemed to be “interested persons” of the Trust are referred to as “Interested Trustees.” “Fund Complex”† consists of the Trust and any other investment companies managed by PI.
Independent Trustees(2)
Linda W. Bynoe (53)(3), Trustee since 2005 Oversees 82 portfolios in Fund complex
Principal occupations (last 5 years): President and Chief Executive Officer (since March 1995) of Telemat, Ltd. (management consulting); formerly Vice President at Morgan Stanley & Co.
Other Directorships held: Director of Dynegy Inc. (energy services) (since September 2002) and Simon Property Group, Inc. (real estate investment trust) (since May 2003); Anixter International (communication products distributor) (since January 2006); Director (since August 2005) of The High Yield Plus Fund, Inc.
David E.A. Carson (71), Trustee since 2003(3) Oversees 86 portfolios in Fund complex
Principal occupations (last 5 years): Formerly Director (January 2000 to May 2000), Chairman (January 1999 to December 1999), Chairman and Chief Executive Officer (January 1998 to December 1998) and President, Chairman and Chief Executive Officer (1983-1997) of People’s Bank.
Other Directorships held.(4) Director (since 2004) of The High Yield Plus Fund, Inc.
Robert E. La Blanc (71), Trustee since 1999(3) Oversees 85 portfolios in Fund complex
Principal occupations (last 5 years): President (since 1981) of Robert E. La Blanc Associates, Inc. (telecommunications).
Other Directorships held:(4) Director of Chartered Semiconductor Manufacturing, Ltd. (since 1998); Computer Associates International, Inc. (software company) (since 2002); FiberNet Telecom Group, Inc. (telecom company) (since 2003); Director (since April 1999) of The High Yield Plus Fund, Inc.
Douglas H. McCorkindale (66), Trustee since 1996(3) Oversees 85 portfolios in Fund complex
Principal occupations (last 5 years): Chairman (since February 2001), formerly Chief Executive Officer (June 2000-July 2005) and President (September 1997-July 2005) of Gannett Co., Inc. (publishing and media); formerly Vice Chairman (March 1984-May 2000) of Gannett Co., Inc.
Other Directorships held:(4) Director of Gannett Co. Inc., Director of Continental Airlines, Inc. (since May 1993); Director of Lockheed Martin Corp. (aerospace and defense) (since May 2001); Director of The High Yield Plus Fund, Inc. (since 1996).
Richard A. Redeker (62), Trustee since 2003(3) Oversees 85 portfolios in Fund complex
Principal occupations (last 5 years): Management Consultant; Director (since 2001) and Chairman of the Board (since 2006) of Invesmart, Inc. and Director of Penn Tank Lines, Inc. (since 1999).
Other Directorships held:(4) Director (since January 2005) of The High Yield Plus Fund, Inc.
Robin B. Smith (66), Trustee since 2003(3) Oversees 85 portfolios in Fund complex
Principal occupations (last 5 years): Chairman of the Board (since January 2003) of Publishers Clearing House (direct marketing); formerly Chairman and Chief Executive Officer (August 1996-January 2003) of Publishers Clearing House.
Other Directorships held:(4) Director of BellSouth Corporation (since 1992). Director (since January 2005) of The High Yield Plus Fund, Inc.
| | |
| 156 | | THE TARGET PORTFOLIO TRUST |
Stephen D. Stoneburn (62), Trustee since 1999(3) Oversees 85 portfolios in Fund complex
Principal occupations (last 5 years): President and Chief Executive Officer (since June 1996) of Quadrant Media Corp. (a publishing company); formerly President (June 1995-June 1996) of Argus Integrated Media, Inc.; Senior Vice President and Managing Director (January 1993-1995) of Cowles Business Media and Senior Vice President of Fairchild Publications, Inc. (1975-1989).
Other Directorships held:(4) Director (since January 2005) of The High Yield Plus Fund, Inc.
Clay T. Whitehead (67), Trustee since 1999(3) Oversees 85 portfolios in Fund complex
Principal occupations (last 5 years): President (since 1983) of National Exchange Inc. (new business development firm).
Other Directorships held:(4) Director (since 2000) of The High Yield Plus Fund, Inc.
Interested Trustees(1)
Judy A. Rice (58), President since 2003 and Director since 2000(3) Oversees 81 portfolios in Fund complex
Principal occupations (last 5 years): President, Chief Executive Officer, Chief Operating Officer and Officer-In-Charge (since February 2003) of Prudential Investments LLC; Vice President (since February 1999) of Prudential Investment Management Services LLC; President, Chief Executive Officer and Officer-In-Charge (since April 2003) of Prudential Mutual Fund Services LLC; Director (since May 2003) and Executive Vice President (since June 2005) of American Skandia Investment Services, Inc.; formerly Executive Vice President (September 1999-February 2003) of Prudential Investments LLC; Member of Board of Governors of the Money Management Institute.
Other Directorships held:(4) Director (since August 2005) of The High Yield Plus Fund, Inc.
Robert F. Gunia (59), Vice President and Trustee since 1999(3) Oversees 158 portfolios in Fund complex
Principal occupations (last 5 years): Chief Administrative Officer (since September 1999) and Executive Vice President (since December 1996) of Prudential Investments LLC; President (since April 1999) of Prudential Investment Management Services LLC; Executive Vice President (since March 1999) and Treasurer (since May 2000) of Prudential Mutual Fund Services LLC.
Other Directorships held:(4) Vice President and Director (since May 1989) and Treasurer (since 1999) of The Asia Pacific Fund, Inc.; Vice President (since 2004) and Director (since August 2005) of The High Yield Plus Fund, Inc.
Information pertaining to the Officers of the Trust who are not also Trustees is set forth below.
Officers(2)
Kathryn L. Quirk (53), Chief Legal Officer since 2005(3)
Principal occupations (last 5 years): Vice President and Corporate Counsel (since September 2004) of Prudential; Executive Vice President, Chief Legal Officer and Secretary (since July 2005) of Prudential Investments LLC and Prudential Mutual Fund Services LLC; formerly Managing Director, General Counsel, Chief Compliance Officer, Chief Risk Officer and Corporate Secretary (1997-2002) of Zurich Scudder Investments, Inc.
Deborah A. Docs (48), Secretary since 2005(3)
Principal occupations (last 5 years): Vice President and Corporate Counsel (since January 2001) of Prudential; Chief Legal Officer of the High Yield Income Fund, Inc. and The High Yield Plus Fund, Inc.; Vice President (since December 1996) and Assistant Secretary (since March 1999) of PI; formerly Vice President and Assistant Secretary (May 2003-June 2005) of American Skandia Investment Services, Inc.
Jonathan D. Shain (47), Assistant Secretary since 2005(3)
Principal occupations (last 5 years): Vice President and Corporate Counsel (since August 1998) of Prudential; Vice President and Assistant Secretary (since May 2001) of PI; Vice President and Assistant Secretary (since February 2001) of
| | |
| THE TARGET PORTFOLIO TRUST | | 157 |
PMFS; formerly Vice President and Assistant Secretary (May 2003-June 2005) of American Skandia Investment Services, Inc.
Claudia DiGiacomo (31), Assistant Secretary since 2005(3)
Principal occupations (last 5 years): Vice President and Corporate Counsel (since January 2005) of Prudential; Vice President and Assistant Secretary of PI (since December 2005); Associate at Sidley Austin Brown Wood LLP (1999-2004).
Helene Gurian (52), Acting Anti-Money Laundering Compliance Officer since 2004(3)
Principal occupations (last 5 years): Vice President, Prudential (since July 1997); Vice President, Compliance (July 1997-January 2001); Vice President, Compliance and Risk Officer, Retail Distribution (January 2001-May 2002); Vice President, Corporate Investigations (May 2002-present) responsible for supervision of Prudential’s fraud investigations, anti-money laundering program and high technology investigation unit.
Lee D. Augsburger (46), Chief Compliance Officer since 2004(3)
Principal occupations (last 5 years): Senior Vice President and Chief Compliance Officer (since April 2003) of PI; Vice President (since November 2000) and Chief Compliance Officer (since October 2000) of Prudential Investment Management, Inc.; Chief Compliance Officer and Senior Vice President (since May 2003) of American Skandia Investment Services, Inc.
Grace C. Torres (46), Treasurer and Principal Financial and Accounting Officer since 2000(3)
Principal occupations (last 5 years): Assistant Treasurer (since March 1999) and Senior Vice President (since September 1999) of PI; Assistant Treasurer (since May 2003) and Vice President (since June 2005) of American Skandia Investment Services, Inc.; Senior Vice President and Assistant Treasurer (since May 2003) of American Skandia Advisory Services, Inc.; formerly Senior Vice President (May 2003-June 2005) of American Skandia Investment Services, Inc.
| | † | The Fund Complex consists of all investment companies managed by PI. The Funds for which PI serves as manager include JennisonDryden Mutual Funds, Strategic Partners Funds, The Prudential Variable Contract Accounts 2, 10, 11. The Target Portfolio Trust, The Prudential Series Fund, American Skandia Trust, The High Yield Income Fund, Inc., The High Yield Plus Fund, Inc. and Prudential’s Gibraltar Fund, Inc. |
| | (1) | “Interested” Trustee, as defined in the 1940 Act, by reason of employment with the Manager (Prudential Investments LLC or PI), the Subadvisers or the Distributor (Prudential Investment Management Services LLC or PIMS). |
| | (2) | Unless otherwise noted, the address of the Trustees and Officers is c/o: Prudential Investments LLC, Gateway Center Three, 100 Mulberry Street, Newark, NJ 07102. |
| | (3) | There is no set term of office for Trustees and Officers. The independent Trustees have adopted a retirement policy, which calls for the retirement of Trustees on December 31 of the year in which they reach the age of 75. The table shows the individuals length of service as Trustee and/or Officer. |
| | (4) | This includes only directorships of companies required to register, or file reports with the SEC under the Securities and Exchange Act of 1934 (that is, “public companies”) or other investment companies registered under the 1940 Act. |
Additional Information about the Trust’s Trustees is included in the Trust’s Statement of Additional Information which is available without charge, upon request, by calling (800) 521-7466 or (732) 482-7555 (Calling from outside the U.S.)
| | |
| 158 | | THE TARGET PORTFOLIO TRUST |
Approval of Advisory Agreements
The Board of Trustees (the “Board”) of The TARGET Portfolio Trust (the “Trust”) oversees the management of each of the Trust’s Portfolios, and, as required by law, is responsible for the approval of each Portfolio’s investment advisory agreements. At meetings held on September 8, 2005 and November 30, 2005, the Board met and approved new investment subadvisory agreements for two of the Trust’s Portfolios. The material factors and conclusions that formed the basis for the Trustees’ determinations to approve the agreements are discussed separately below.
Small Capitalization Value Portfolio
Pursuant to recommendations from the Trust’s investment manager, Prudential Investments LLC (“PI”), the Board approved a new investment subadvisory agreement with Vaughan Nelson Investment Management (“Vaughan Nelson”). PI recommended that the Board approve Vaughan Nelson as an additional subadvisor to join the Portfolio’s existing subadvisors. PI recommended the addition of Vaughan Nelson to join the Portfolio’s existing subadvisors, because the existing subadvisors had or were expected to shortly reach their capacity limits.
Nature, Quality and Extent of Services
The Board received and considered information regarding the nature and extent of services provided to the Portfolio by the current subadvisors under the current subadvisory agreements and those that would be provided to the Portfolio by Vaughan Nelson under the new subadvisory agreement. The Board considered PI’s representation that the nature and extent of services under the existing and new agreements were generally similar in that the current subadvisors and Vaughan Nelson are each required to provide day-to-day portfolio management services and comply with all Trust policies and applicable rules and regulations.
With respect to the quality of services, the Board considered, among other things, the background and experience of Vaughan Nelson’s portfolio management team. The Board had previously met in person with representatives of Vaughan Nelson and reviewed the qualifications, backgrounds and responsibilities of the portfolio managers who would be responsible for the day-to-day management of the Portfolio. The Board was also provided with information pertaining to Vaughan Nelson’s organizational structure, senior management, investment operations, and other relevant information pertaining to Vaughan Nelson. The Board noted that it received favorable compliance reports from the Trust’s Chief Compliance Officer (CCO) as to Vaughan Nelson, summarizing his level of comfort from a compliance perspective with respect to the Manager’s recommendation to hire Vaughan Nelson.
| | |
| THE TARGET PORTFOLIO TRUST | | |
Approval of Advisory Agreements (continued)
The Board concluded that it was satisfied with the nature, extent and quality of the investment subadvisory services anticipated to be provided to the Portfolio by Vaughan Nelson and that there was a reasonable basis on which to conclude that the quality of investment subadvisory services to be provided by Vaughan Nelson under the new subadvisory agreements should be similar to the quality of similar services provided by the existing subadvisors under the existing subadvisory agreements.
Performance of the Portfolio
The Board received and considered information about the Portfolio’s historical performance, noting that for the one-year, three-year and five-year time periods ended December 31, 2004, the Portfolio’s returns outperformed the median of the group of funds that was most similar to the Portfolio (the “Peer Group”), as well as the appropriate benchmark. The funds included in the Peer Group are objectively determined solely by Lipper, Inc., an independent provider of investment company data.
The Board received and considered information regarding the performance of other investment companies managed by Vaughan Nelson utilizing an investment style and strategy similar to that proposed for the Portfolio, noting that Vaughan Nelson had generally outperformed the various benchmarks over the same time period. The Board recognized that past performance is not predictive of future results.
Investment Subadvisory Fee Rate
The Board considered the proposed subadvisory fee rate payable by PI to Vaughan Nelson under the proposed new subadvisory agreement, including, which called for a fee rate of 0.40% to $250 million of average daily net assets, and 0.35% over $250 million of average daily net assets. The Board also considered, among other things, the fee rate payable to Vaughan Nelson by any other funds with investment objective similar to that of the Portfolio for which Vaughan Nelson serves as subadvisor. As a result of the above considerations, the Board concluded that Vaughan Nelson’s proposed fee rate under the new agreement was reasonable.
Subadvisor’s Profitability
Because the engagement of Vaughan Nelson is new, there is no historical profitability with regard to its arrangements with the Portfolio. As a result, this factor was not considered by the Board.
| | |
| | | THE TARGET PORTFOLIO TRUST |
Economies of Scale
The Board considered information about the potential of PI and Vaughan Nelson to experience economies of scale as the Portfolio grows in size. The Board noted that PI’s management fee rate and Vaughan Nelson’s proposed subadvisory fee rate each contained breakpoints, and, accordingly, each reflected the potential for shareholders to share in potential economies of scale as the Portfolio grows.
Other Benefits to the Subadvisor or its Affiliates from Serving as Subadvisor
The Board considered potential “fall-out��� or ancillary benefits anticipated to be received by Vaughan Nelson and its affiliates as a result of Vaughan Nelson’s relationship with the Trust. The Board concluded that any potential benefits to be derived by Vaughan Nelson included potential access to additional research resources, larger assets under management and reputational benefits, which were consistent with those generally derived by subadvisors to mutual funds.
Large Capitalization Value Portfolio
Pursuant to recommendations from PI, the Board approved a new investment subadvisory agreement with NFJ Investment Group, L.P. (“NFJ”). PI recommended that the Board approve NFJ as an additional subadvisor to join the Portfolio’s existing subadvisors. PI recommended the addition of NFJ to join the Portfolio’s existing subadvisors, because one of the Portfolio’s existing subadvisors had reached its capacity limits earlier in the year.
Nature, Quality and Extent of Services
The Board received and considered information regarding the nature and extent of services provided to the Portfolio by the current subadvisors under the current subadvisory agreements and those that would be provided to the Portfolio by NFJ under the new subadvisory agreement. The Board considered PI’s representation that the nature and extent of services under the existing and new agreements were generally similar in that the current subadvisors and NFJ are each required to provide day-to-day portfolio management services and comply with all Trust policies and applicable rules and regulations. With respect to the quality of services, the Board considered, among other things, the background and experience of NFJ’s portfolio management team. The Board had previously met in person with representatives of NFJ and reviewed the qualifications, backgrounds and responsibilities of the portfolio managers who would be responsible for the day-to-day management of the Portfolio.
| | |
| THE TARGET PORTFOLIO TRUST | | |
Approval of Advisory Agreements (continued)
The Board was also provided with information pertaining to NFJ’s organizational structure, senior management, investment operations, and other relevant information pertaining to NFJ. The Board noted that it received favorable compliance reports from the Trust’s Chief Compliance Officer (CCO) as to NFJ, summarizing his level of comfort from a compliance perspective with respect to PI’s recommendation to hire NFJ.
The Board concluded that it was satisfied with the nature, extent and quality of the investment subadvisory services anticipated to be provided to the Portfolio by NFJ and that there was a reasonable basis on which to conclude that the quality of investment subadvisory services to be provided by NFJ under the new subadvisory agreements should be similar to the quality of similar services provided by the existing subadvisors under the existing subadvisory agreements.
Performance of the Portfolio
The Board received and considered information about the Portfolio’s historical performance, noting that for the one-year, three-year, and five-year time periods ended December 31, 2004, the Portfolio’s returns outperformed the median of the group of funds that was most similar to the Portfolio (the “Peer Group”), as well as the appropriate benchmark. The funds included in the Peer Group are objectively determined solely by Lipper, Inc., an independent provider of investment company data.
The Board received and considered information regarding the performance of other investment companies managed by NFJ utilizing an investment style and strategy similar to that proposed for the Portfolio, noting that NFJ had generally outperformed the various benchmarks over the same time period. The Board recognized that past performance is not predictive of future results.
Investment Subadvisory Fee Rate
The Board considered the proposed subadvisory fee rate payable by PI to NFJ under the proposed new subadvisory agreement, including, which called for the following fee rate:
0.40% first $50 million
0.38% next $50 million
0.34% next $50 million
0.30% next $200 million
0.28% over $350 million
| | |
| | | THE TARGET PORTFOLIO TRUST |
The Board further noted that the proposed fee rate called for the assets managed by NFJ in the Portfolio to be aggregated with assets managed by NFJ in the Strategic Partners Style Specific Funds – Strategic Partners Small Capitalization Value Fund and the assets managed by NFJ in the Target Portfolio Trust - Small Capitalization Value Portfolio.
The Board also considered, among other things, the fee rate payable to NFJ by any other funds with investment objective similar to that of the Portfolio for which NFJ serves as subadvisor. As a result of the above considerations, the Board concluded that NFJ’s proposed fee rate under the new agreement was reasonable.
Subadvisor’s Profitability
Because the engagement of NFJ is new, there is no historical profitability with regard to its arrangements with the Portfolio. As a result, this factor was not considered by the Board.
Economies of Scale
The Board considered information about the potential of PI and NFJ to experience economies of scale as the Portfolio grows in size. The Board noted that PI’s management fee rate and NFJ’s proposed subadvisory fee rate each contained breakpoints, and, accordingly, each reflected the potential for shareholders to share in potential economies of scale as the Portfolio grows.
Other Benefits to the Subadvisor or its Affiliates from Serving as Subadvisor
The Board considered potential “fall-out” or ancillary benefits anticipated to be received by NFJ and its affiliates as a result of NFJ’s relationship with the Trust. The Board concluded that any potential benefits to be derived by NFJ included potential access to additional research resources, larger assets under management and reputational benefits, which were consistent with those generally derived by subadvisors to mutual funds.
| | |
| THE TARGET PORTFOLIO TRUST | | |
Growth of a $10,000 Investment
Large Capitalization Growth Portfolio
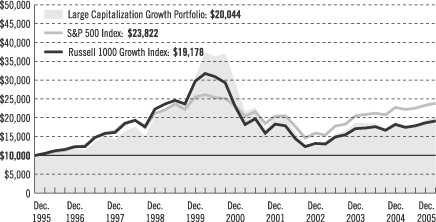
| | | | | | | | | |
| Average Annual Total Returns as of 12/31/05 | |
| | | One Year | | | Five Years | | | Ten Years | |
With TARGET Program Fee | | 5.15 | % | | –7.36 | % | | 7.20 | % |
| | | |
| | | One Year | | | Five Years | | | Ten Years | |
Without TARGET Program Fee | | 6.74 | % | | –5.96 | % | | 8.82 | % |
Performance data quoted represent past performance. Past performance does not guarantee future results. The investment return and principal value of an investment will fluctuate, so that an investor’s shares, when redeemed, may be worth more or less than their original cost. Current performance may be lower or higher than the past performance data quoted. An investor may obtain performance data as of the most recent month-end by visiting our website at www.prudential.com or by calling (800) 225-1852. The maximum TARGET program fee for retail investors is 1.50%.
The returns in the graph and the tables do not reflect the deduction of taxes that a shareholder would pay on Fund distributions or following the redemption of Fund shares.
The graph compares a $10,000 investment in the TARGET Large Capitalization Growth Portfolio with a similar investment in the S&P 500 Index and the Russell 1000 Growth Index by portraying the initial account values at the beginning of the 10-year period (December 31, 1995) and the account values at the end of the current fiscal year (December 31, 2005), as measured on a quarterly basis. The graph takes into account the maximum quarterly TARGET program fee of 1.50% annually for retail investors. For individual retirement plans and qualified employee benefit plans, taking into account the maximum TARGET program fee of 1.25%, the average annual
| | |
| | | THE TARGET PORTFOLIO TRUST |
total return for the 10-year period would have been 7.47% and the growth of a $10,000 investment would have been $20,553. The average annual total returns in the table and the returns on investment in the graph do not reflect the deduction of taxes that a shareholder would pay on Portfolio distributions or following the redemption of Portfolio shares.
The S&P 500 Index is an index of 500 stocks of large U.S. companies. It gives a broad look at how U.S. stock prices have performed. The Russell 1000 Growth Index contains those securities in the Russell 1000 Index with a greater-than-average growth orientation. Companies in this index tend to exhibit higher price-to-book and price-to-earnings ratios, lower dividend yields, and higher forecasted growth rates. These indexes are unmanaged, and the total returns include the reinvestment of all dividends, but do not include the effect of sales charges, operating expenses, or taxes. These returns would be lower if they included the effect of sales charges, operating expenses, or taxes. The securities in these indexes may differ substantially from the securities in the Portfolio. These indexes are not the only ones that may be used to characterize performance of large-capitalization equity funds, and other indexes may portray different comparative performance. Investors cannot invest directly in an index.
| | |
| THE TARGET PORTFOLIO TRUST | | |
Growth of a $10,000 Investment
Large Capitalization Value Portfolio
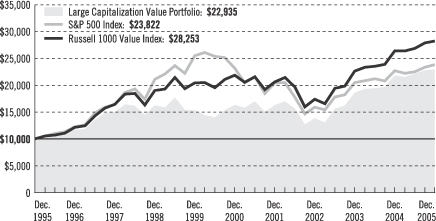
| | | | | | | | | |
| Average Annual Total Returns as of 12/31/05 | | | | | | | | | |
| | | One Year | | | Five Years | | | Ten Years | |
With TARGET Program Fee | | 4.91 | % | | 6.98 | % | | 8.66 | % |
| | | |
| | | One Year | | | Five Years | | | Ten Years | |
Without TARGET Program Fee | | 6.50 | % | | 8.60 | % | | 10.30 | % |
Performance data quoted represent past performance. Past performance does not guarantee future results. The investment return and principal value of an investment will fluctuate, so that an investor’s shares, when redeemed, may be worth more or less than their original cost. Current performance may be lower or higher than the past performance data quoted. An investor may obtain performance data as of the most recent month-end by visiting our website at www.prudential.com or by calling (800) 225-1852. The maximum TARGET program fee for retail investors is 1.50%.
The returns in the graph and the tables do not reflect the deduction of taxes that a shareholder would pay on Fund distributions or following the redemption of Fund shares.
The graph compares a $10,000 investment in the TARGET Large Capitalization Value Portfolio with a similar investment in the S&P 500 Index and the Russell 1000 Value Index by portraying the initial account values at the beginning of the 10-year period (December 31, 1995) and the account values at the end of the current fiscal year (December 31, 2005), as measured on a quarterly basis. The graph takes into account the maximum quarterly TARGET program fee of 1.50% annually for retail investors. For individual retirement plans and qualified employee benefit plans, taking into account the maximum TARGET program fee of 1.25%, the average annual total return
| | |
| | | THE TARGET PORTFOLIO TRUST |
for the 10-year period would have been 8.93% and the growth of a $10,000 investment would have been $23,518. The average annual total returns in the table and the returns on investment in the graph do not reflect the deduction of taxes that a shareholder would pay on Portfolio distributions or following the redemption of Portfolio shares.
The S&P 500 Index is an index of 500 stocks of large U.S. companies. It gives a broad look at how U.S. stock prices have performed. The Russell 1000 Value Index contains those securities in the Russell 1000 Index with a less-than-average growth orientation. Companies in this index generally have low price-to-book and price-to-earnings ratios, higher dividend yields, and lower forecasted growth values. These indexes are unmanaged, and the total returns include the reinvestment of all dividends, but do not include the effect of sales charges, operating expenses, or taxes. These returns would be lower if they included the effect of sales charges, operating expenses, or taxes. The securities in these indexes may differ substantially from the securities in the Portfolio. These indexes are not the only ones that may be used to characterize performance of large-capitalization equity funds, and other indexes may portray different comparative performance. Investors cannot invest directly in an index.
| | |
| THE TARGET PORTFOLIO TRUST | | |
Growth of a $10,000 Investment
Small Capitalization Growth Portfolio
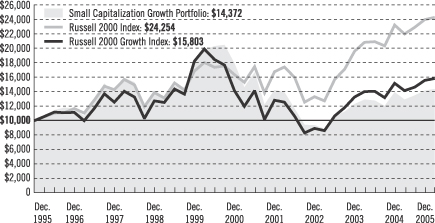
| | | | | | | | | |
| Average Annual Total Returns as of 12/31/05 | | | | | | | | | |
| | | One Year | | | Five Years | | | Ten Years | |
With TARGET Program Fee | | 2.98 | % | | –4.38 | % | | 3.69 | % |
| | | |
| | | One Year | | | Five Years | | | Ten Years | |
Without TARGET Program Fee | | 4.54 | % | | –2.93 | % | | 5.26 | % |
Performance data quoted represent past performance. Past performance does not guarantee future results. The investment return and principal value of an investment will fluctuate, so that an investor’s shares, when redeemed, may be worth more or less than their original cost. Current performance may be lower or higher than the past performance data quoted. An investor may obtain performance data as of the most recent month-end by visiting our website at www.prudential.com or by calling (800) 225-1852. The maximum TARGET program fee for retail investors is 1.50%.
The returns in the graph and the tables do not reflect the deduction of taxes that a shareholder would pay on Fund distributions or following the redemption of Fund shares.
The graph compares a $10,000 investment in the TARGET Small Capitalization Growth Portfolio with a similar investment in the Russell 2000 Index and the Russell 2000 Growth Index by portraying the initial account values at the beginning of the 10-year period (December 31, 1995) and the account values at the end of the current fiscal year (December 31, 2005), as measured on a quarterly basis. The graph takes into account the maximum quarterly TARGET program fee of 1.50% annually for retail investors. For individual retirement plans and qualified employee benefit plans, taking into account the maximum TARGET program fee of 1.25%, the average annual
| | |
| | | THE TARGET PORTFOLIO TRUST |
total return for the 10-year period would have been 3.95% and the growth of a $10,000 investment would have been $14,737. The average annual total returns in the table and the returns on investment in the graph do not reflect the deduction of taxes that a shareholder would pay on Portfolio distributions or following the redemption of Portfolio shares.
The Russell 2000 Index is a weighted index that comprises the smallest 2,000 stocks among the largest 3,000 equity-capitalized U.S. corporations and represents approximately 10% of their aggregate market value. The Russell 2000 Growth Index comprises securities in the Russell 2000 Index with a greater-than-average growth orientation. Companies in this index tend to exhibit higher price-to-book ratios and higher forecasted growth values. These indexes are unmanaged, and the total returns include the reinvestment of all dividends, but do not include the effect of sales charges, operating expenses, or taxes. These returns would be lower if they included the effect of sales charges, operating expenses, or taxes. The securities in these indexes may differ substantially from the securities in the Portfolio. These indexes are not the only ones that may be used to characterize performance of small-capitalization equity funds, and other indexes may portray different comparative performance. Investors cannot invest directly in an index.
| | |
| THE TARGET PORTFOLIO TRUST | | |
Growth of a $10,000 Investment
Small Capitalization Value Portfolio
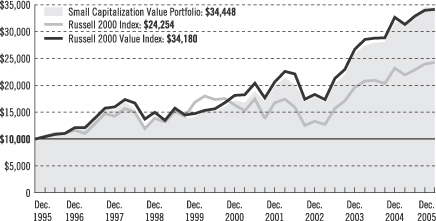
| | | | | | | | | |
| Average Annual Total Returns as of 12/31/05 | | | | | | | | | |
| | | One Year | | | Five Years | | | Ten Years | |
With TARGET Program Fee | | 8.46 | % | | 14.86 | % | | 13.17 | % |
| | | |
| | | One Year | | | Five Years | | | Ten Years | |
Without TARGET Program Fee | | 10.10 | % | | 16.60 | % | | 14.88 | % |
Performance data quoted represent past performance. Past performance does not guarantee future results. The investment return and principal value of an investment will fluctuate, so that an investor’s shares, when redeemed, may be worth more or less than their original cost. Current performance may be lower or higher than the past performance data quoted. An investor may obtain performance data as of the most recent month-end by visiting our website at www.prudential.com or by calling (800) 225-1852. The maximum TARGET program fee for retail investors is 1.50%.
The returns in the graph and the tables do not reflect the deduction of taxes that a shareholder would pay on Fund distributions or following the redemption of Fund shares.
The graph compares a $10,000 investment in the TARGET Small Capitalization Value Portfolio with a similar investment in the Russell 2000 Index and the Russell 2000 Value Index by portraying the initial account values at the beginning of the 10-year period (December 31, 1995) and the account values at the end of the current fiscal year (December 31, 2005), as measured on a quarterly basis. The graph takes into account the maximum quarterly TARGET program fee of 1.50% annually for retail investors. For individual retirement plans and qualified employee benefit plans, taking into account the maximum TARGET program fee of 1.25%, the average annual
| | |
| | | THE TARGET PORTFOLIO TRUST |
total return for the 10-year period would have been 13.45% and the growth of a $10,000 investment would have been $35,323. The average annual total returns in the table and the returns on investment in the graph do not reflect the deduction of taxes that a shareholder would pay on Portfolio distributions or following the redemption of Portfolio shares.
The Russell 2000 Index is a weighted index that comprises the smallest 2,000 stocks among the largest 3,000 equity-capitalized U.S. corporations and represents approximately 10% of their aggregate market value. The Russell 2000 Value Index comprises securities in the Russell 2000 Index with a less-than-average growth orientation. Companies in this index tend to exhibit lower price-to-book ratios and lower forecasted growth values. These indexes are unmanaged, and the total returns include the reinvestment of all dividends, but do not include the effect of sales charges, operating expenses, or taxes. These returns would be lower if they included the effect of sales charges, operating expenses, or taxes. The securities in these indexes may differ substantially from the securities in the Portfolio. These indexes are not the only ones that may be used to characterize performance of small-capitalization equity funds, and other indexes may portray different comparative performance. Investors cannot invest directly in an index.
| | |
| THE TARGET PORTFOLIO TRUST | | |
Growth of a $10,000 Investment
International Equity Portfolio
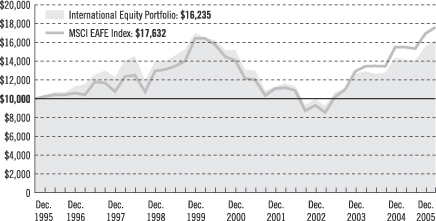
| | | | | | | | | |
| Average Annual Total Returns as of 12/31/05 | | | | | | | | | |
| | | One Year | | | Five Years | | | Ten Years | |
With TARGET Program Fee | | 12.42 | % | | 1.26 | % | | 4.96 | % |
| | | |
| | | One Year | | | Five Years | | | Ten Years | |
Without TARGET Program Fee | | 14.12 | % | | 2.79 | % | | 6.55 | % |
Performance data quoted represent past performance. Past performance does not guarantee future results. The investment return and principal value of an investment will fluctuate, so that an investor’s shares, when redeemed, may be worth more or less than their original cost. Current performance may be lower or higher than the past performance data quoted. An investor may obtain performance data as of the most recent month-end by visiting our website at www.prudential.com or by calling (800) 225-1852. The maximum TARGET program fee for retail investors is 1.50%.
The returns in the graph and the tables do not reflect the deduction of taxes that a shareholder would pay on Fund distributions or following the redemption of Fund shares.
The graph compares a $10,000 investment in the TARGET International Equity Portfolio with a similar investment in the Morgan Stanley Capital International Europe, Australasia, Far East Index (MSCI EAFE Index) by portraying the initial account values at the beginning of the 10-year period (December 31, 1995) and the account values at the end of the current fiscal year (December 31, 2005), as measured on a quarterly basis. The graph takes into account the maximum quarterly TARGET program fee of 1.50% annually for retail investors. For individual retirement plans and qualified employee benefit plans, taking into account the maximum TARGET program fee of
| | |
| | | THE TARGET PORTFOLIO TRUST |
1.25%, the average annual total return for the 10-year period would have been 5.23% and the growth of a $10,000 investment would have been $16,647. The average annual total returns in the table and the returns on investment in the graph do not reflect the deduction of taxes that a shareholder would pay on Portfolio distributions or following the redemption of Portfolio shares.
The MSCI EAFE Index is a weighted index of performance that reflects stock price movements in Europe, Australasia, and the Far East. The MSCI EAFE Index is unmanaged, and the total returns include the reinvestment of all dividends, but do not include the effect of sales charges, operating expenses, or taxes. These returns would be lower if they included the effect of sales charges, operating expenses, or taxes. The securities in the MSCI EAFE Index may differ substantially from the securities in the Portfolio. The MSCI EAFE Index is not the only one that may be used to characterize performance of international equity funds, and other indexes may portray different comparative performance. Investors cannot invest directly in an index.
| | |
| THE TARGET PORTFOLIO TRUST | | |
Growth of a $10,000 Investment
International Bond Portfolio
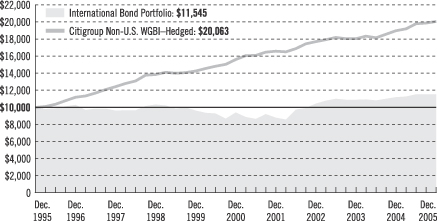
| | | | | | | | |
| Average Annual Total Returns as of 12/31/05 |
| | | One Year | | | Five Years | | | Ten Years |
With TARGET Program Fee | | 2.92 | % | | 4.11 | % | | 1.45% |
| | | |
| | | One Year | | | Five Years | | | Ten Years |
Without TARGET Program Fee | | 3.95 | % | | 5.16 | % | | 2.47% |
Performance data quoted represent past performance. Past performance does not guarantee future results. The investment return and principal value of an investment will fluctuate, so that an investor’s shares, when redeemed, may be worth more or less than their original cost. Current performance may be lower or higher than the past performance data quoted. An investor may obtain performance data as of the most recent month-end by visiting our website at www.prudential.com or by calling (800) 225-1852. The maximum TARGET program fee for retirement accounts is 1.35%.
The returns in the graph and the tables do not reflect the deduction of taxes that a shareholder would pay on Fund distributions or following the redemption of Fund shares.
The graph compares a $10,000 investment in the TARGET International Bond Portfolio with a similar investment in the Citigroup Non-U.S. World Government Bond Index–Hedged (Citigroup Non-U.S. WGBI–Hedged) and the Citigroup Non-U.S. World Government Bond Index–Unhedged (Citigroup Non-U.S. WGBI–Unhedged) by portraying the initial account values at the beginning of the 10-year period (December 31, 1995) and the account values at the end of the current fiscal year (December 31, 2005), as measured on a quarterly basis. The graph takes into account the maximum quarterly TARGET program fee of 1% annually for retail investors. For individual retirement
| | |
| | | THE TARGET PORTFOLIO TRUST |
plans and qualified employee benefit plans, taking into account the maximum TARGET program fee of 1.35%, the average annual total return for the 10-year period would have been 1.09% and the growth of a $10,000 investment would have been $11,146. The average annual total returns in the table and the returns on investment in the graph do not reflect the deduction of taxes that a shareholder would pay on Portfolio distributions or following the redemption of Portfolio shares. Without waiver of fees and/or expense subsidization, the Portfolio’s returns would have been lower, as indicated in parentheses.
The Citigroup Non-U.S. WGBI–Hedged is an unmanaged index of approximately 600 high-quality bonds with foreign currency exposure translated to the U.S. dollar. The Citigroup Non-U.S. WGBI–Unhedged is an unmanaged index of approximately 600 high-quality bonds issued in several different currencies. It gives a broad look at how foreign bonds have performed. The indexes’ total returns include the reinvestment of all dividends, but do not include the effect of sales charges, operating expenses, or taxes. These returns would be lower if they included the effect of sales charges, operating expenses, or taxes. The securities in the indexes may differ substantially from the securities in the Portfolio. These indexes are not the only ones that may be used to characterize performance of international bond funds, and other indexes may portray different comparative performance. Investors cannot invest directly in an index.
| | |
| THE TARGET PORTFOLIO TRUST | | |
Growth of a $10,000 Investment
Total Return Bond Portfolio
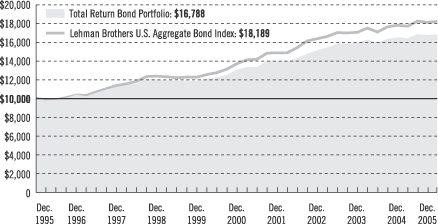
| | | | | | | | | |
| Average Annual Total Returns as of 12/31/05 | |
| | | One Year | | | Five Years | | | Ten Years | |
With TARGET Program Fee | | 1.58 | % | | 5.15 | % | | 5.32 | % |
| | | |
| | | One Year | | | Five Years | | | Ten Years | |
Without TARGET Program Fee | | 2.60 | % | | 6.21 | % | | 6.38 | % |
Performance data quoted represent past performance. Past performance does not guarantee future results. The investment return and principal value of an investment will fluctuate, so that an investor’s shares, when redeemed, may be worth more or less than their original cost. Current performance may be lower or higher than the past performance data quoted. An investor may obtain performance data current to the most recent month-end by visiting our website at www.prudential.com or by calling (800) 225-1852. The maximum TARGET program fee for retirement accounts is 1.35%.
The returns in the graph and the tables do not reflect the deduction of taxes that a shareholder would pay on Fund distributions or following the redemption of Fund shares.
The graph compares a $10,000 investment in the TARGET Total Return Bond Portfolio with a similar investment in the Lehman Brothers U.S. Aggregate Bond Index by portraying the initial account values at the beginning of the 10-year period (December 31, 1995) and the account values at the end of the current fiscal year (December 31, 2005), as measured on a quarterly basis. The graph takes into account the maximum quarterly TARGET program fee of 1% annually for retail investors. For individual retirement plans and qualified employee benefit plans, taking into account the maximum TARGET program fee of 1.35%, the average annual total return for the 10-year
| | |
| | | THE TARGET PORTFOLIO TRUST |
period would have been 4.95% and the growth of a $10,000 investment would have been $16,209. The average annual total returns in the table and the returns on investment in the graph do not reflect the deduction of taxes that a shareholder would pay on Portfolio distributions or following the redemption of Portfolio shares.
The Lehman Brothers U.S. Aggregate Bond Index is an unmanaged index of investment-grade securities issued by the U.S. government and its agencies and by corporations with between 1 and 10 years remaining to maturity. It gives a broad look at how bond prices of short- and intermediate-term bonds have performed. This index is unmanaged, and the total returns include the reinvestment of all dividends, but do not include the effect of sales charges, operating expenses, or taxes. These returns would be lower if they included the effect of sales charges, operating expenses, or taxes. The securities in these indexes may differ substantially from the securities in the Portfolio. This index is not the only one that may be used to characterize performance of bond funds, and other indexes may portray different comparative performance. Investors cannot invest directly in an index.
| | |
| THE TARGET PORTFOLIO TRUST | | |
Growth of a $10,000 Investment
Intermediate-Term Bond Portfolio

| | | | | | | | | |
| Average Annual Total Returns as of 12/31/05 | | | | | | | | | |
| | | One Year | | | Five Years | | | Ten Years | |
With TARGET Program Fee | | 0.86 | % | | 4.20 | % | | 4.77 | % |
| | | |
| | | One Year | | | Five Years | | | Ten Years | |
Without TARGET Program Fee | | 1.88 | % | | 5.25 | % | | 5.83 | % |
Performance data quoted represent past performance. Past performance does not guarantee future results. The investment return and principal value of an investment will fluctuate, so that an investor’s shares, when redeemed, may be worth more or less than their original cost. Current performance may be lower or higher than the past performance data quoted. An investor may obtain performance data as of the most recent month-end by visiting our website at www.prudential.com or by calling (800) 225-1852. The maximum TARGET program fee for retirement accounts is 1.35%.
The returns in the graph and the tables do not reflect the deduction of taxes that a shareholder would pay on Fund distributions or following the redemption of Fund shares.
The graph compares a $10,000 investment in the TARGET Intermediate-Term Bond Portfolio with a similar investment in the Lehman Brothers Intermediate Government/Credit Bond Index (formerly Lehman Brothers Int. Govt/Credit Bond Index) by portraying the initial account values at the beginning of the 10-year period (December 31, 1995) and the account values at the end of the current fiscal year (December 31, 2005), as measured on a quarterly basis. The graph takes into account the maximum quarterly TARGET program fee of 1% annually for retail investors. For individual retirement plans and qualified employee benefit plans, taking into
| | |
| | | THE TARGET PORTFOLIO TRUST |
account the maximum TARGET program fee of 1.35%, the average annual total return for the 10-year period would have been 4.41% and the growth of a $10,000 investment would have been $15,391. The average annual total returns in the table and the returns on investment in the graph do not reflect the deduction of taxes that a shareholder would pay on Portfolio distributions or following the redemption of Portfolio shares.
The Lehman Brothers Intermediate Government/Credit Bond Index is a weighted index comprising securities issued by the U.S. government and its agencies and securities publicly issued by corporations with 1 to 10 years remaining to maturity and rated investment grade. The Lehman Brothers Intermediate Government/Credit Bond Index is unmanaged, and the total returns include the reinvestment of all dividends, but do not include the effect of sales charges, operating expenses, or taxes. These returns would be lower if they included the effect of sales charges, operating expenses, or taxes. The securities in the Lehman Brothers Intermediate Government/Credit Bond Index may differ substantially from the securities in the Portfolio. The Lehman Brothers Intermediate Government/Credit Bond Index is not the only one that may be used to characterize performance of bond funds, and other indexes may portray different comparative performance. Investors cannot invest directly in an index.
| | |
| THE TARGET PORTFOLIO TRUST | | |
Growth of a $10,000 Investment
Mortgage Backed Securities Portfolio
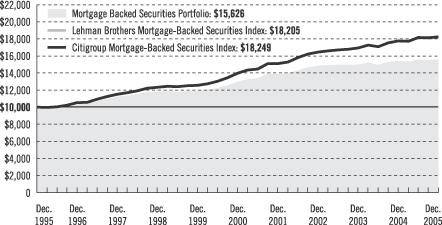
| | | | | | | | |
| Average Annual Total Returns as of 12/31/05 |
| | | One Year | | | Five Years | | | Ten Years |
With TARGET Program Fee | | 1.27 | % | | 3.74 | % | | 4.56% |
| | | |
| | | One Year | | | Five Years | | | Ten Years |
Without TARGET Program Fee | | 2.29 | % | | 4.78 | % | | 5.62% |
Performance data quoted represent past performance. Past performance does not guarantee future results. The investment return and principal value of an investment will fluctuate so that an investor’s shares, when redeemed, may be worth more or less than their original cost. Current performance may be lower or higher than the past performance data quoted. An investor may obtain performance data as of the most recent month-end by visiting our website at www.prudential.com or by calling (800) 225-1852. The maximum TARGET program fee for retirement accounts is 1.35%.
The returns in the graph and the tables do not reflect the deduction of taxes that a shareholder would pay on Fund distributions or following the redemption of Fund shares.
The graph compares a $10,000 investment in the TARGET Mortgage Backed Securities Portfolio with a similar investment in the Lehman Brothers Mortgage-Backed Securities Index and the Citigroup Mortgage-Backed Securities Index by portraying the initial account values at the beginning of the 10-year period (December 31, 1995) and the account values at the end of the current fiscal year (December 31, 2005), as measured on a quarterly basis. The graph takes into account the maximum quarterly TARGET program fee of 1% annually for retail investors. For individual retirement plans and qualified employee benefit plans, taking into account the
| | |
| | | THE TARGET PORTFOLIO TRUST |
maximum TARGET program fee of 1.35%, the average annual total return for the 10-year period would have been 4.20% and the growth of a $10,000 investment would have been $15,087. The average annual total returns in the table and the returns on investment in the graph do not reflect the deduction of taxes that a shareholder would pay on Portfolio distributions or following the redemption of Portfolio shares. Without waiver of management fees and/or expense subsidizations, the Portfolio’s average annual total returns would have been lower, as indicated in parentheses.
The Lehman Brothers Mortgage-Backed Securities Index is a market capitalization-weighted index of 15-year and 30-year fixed-rate securities backed by the mortgage pools of the GNMA, the FNMA, and the FHLMC, and balloon mortgages with fixed-rate coupons. The Citigroup Mortgage-Backed Securities Index is an index of 30- and 15-year mortgage-related securities issued by U.S. government agencies. It gives a broad look at how mortgage-backed securities have performed. These indexes are unmanaged, and the total returns include the reinvestment of all dividends, but do not include the effect of sales charges, operating expenses, or taxes. These returns would be lower if they included the effect of sales charges, operating expenses, or taxes. The securities in these indexes may differ substantially from the securities in the Portfolio. These indexes are not the only ones that may be used to characterize performance of bond funds, and other indexes may portray different comparative performance. Investors cannot invest directly in an index.
| | |
| THE TARGET PORTFOLIO TRUST | | |
| | |
| n MAIL | | n TELEPHONE |
Gateway Center Three 100 Mulberry Street Newark, NJ 07102 | | (800) 225-1852 |
|
| PROXY VOTING |
| The Board of Trustees of The TARGET Portfolio Trust has delegated to the Trust’s investment subadvisors the responsibility for voting any proxies and maintaining proxy recordkeeping with respect to the Trust. A description of these proxy voting policies and procedures is available without charge, upon request, by calling (800) 225-1852 or by visiting the Securities and Exchange Commission’s website at www.sec.gov. Information regarding how the Trust voted proxies relating to portfolio securities during the most recent 12-month period ended June 30 is available on the Trust’s website at www.prudential.com and on the Commission’s website at www.sec.gov. |
|
| TRUSTEES |
| Linda W. Bynoe • David E.A. Carson • Robert F. Gunia • Robert E. La Blanc • Douglas H. McCorkindale • Richard A. Redeker • Judy A. Rice • Robin B. Smith • Stephen G. Stoneburn • Clay T. Whitehead |
|
| OFFICERS |
Judy A. Rice, President • Robert F. Gunia, Vice President • Grace C. Torres, Treasurer and Principal Financial and Accounting Officer • Kathryn L. Quirk, Chief Legal Officer •
Deborah A. Docs, Secretary • Jonathan D. Shain, Assistant Secretary • Claudia DiGiacomo,
Assistant Secretary • Helene Gurian, Acting Anti-Money Laundering Compliance Officer • Lee D. Augsburger, Chief Compliance Officer |
| | | | |
| MANAGER | | Prudential Investments LLC | | Gateway Center Three
100 Mulberry Street
Newark, NJ 07102 |
|
| INVESTMENT SUBADVISORS | | EARNEST Partners, LLC | | 75 14th Street
Suite 2300
Atlanta, GA 30309 |
|
| | | Goldman Sachs Asset
Management LP | | 32 Old Slip
23rd Floor
New York, NY 10005 |
|
| | | Hotchkis and Wiley Capital
Management, LLC | | 725 S. Figueroa Street
Suite 3900
Los Angeles, CA 90017 |
|
| | | J.P. Morgan Investment
Management, Inc. | | 522 Fifth Avenue
New York, NY 10036 |
|
| | | Lee Munder Investments Ltd. | | 200 Clarendon Street
Boston, MA 02116 |
|
| | | LSV Asset Management | | One North Wacker Drive
Suite 4000
Chicago, IL 60606 |
| | | | |
| | | NFJ Investment Group L.P. | | 2121 San Jacinto
Suite 1840
Dallas, TX 75201 |
|
| | | Marsico Capital
Management, LLC | | 1200 17th Street
Suite 1600
Denver, CO 80202 |
|
| | | Pacific Investment
Management Company LLC | | 840 Newport Center Drive
Newport Beach, CA 92660 |
|
| | | RS Investment
Management, L.P. | | 388 Market Street
Suite 1700
San Francisco, CA 94111 |
|
| | | Thornburg Investment
Management, Inc. | | 119 East Marcy Street
Santa Fe, NM 87501 |
|
| | | Transamerica Investment
Management, Inc. | | 11111 Santa Monica
Boulevard
Suite 820
Los Angeles, CA 90025 |
|
| | | Wellington Management
Company, LLP | | 75 State Street
Boston, MA 02109 |
|
| DISTRIBUTOR | | Prudential Investment
Management Services LLC | | Gateway Center Three
100 Mulberry Street
Newark, NJ 07102 |
|
| CUSTODIAN | | PFPC Trust Company | | 400 Bellevue Parkway
Wilmington, DE 19809 |
|
| TRANSFER AGENT | | Prudential Mutual Fund
Services LLC | | PO Box 8098
Philadelphia, PA 19176 |
|
| INDEPENDENT REGISTERED PUBLIC ACCOUNTING FIRM | | KPMG LLP | | 345 Park Avenue
New York, NY 10154 |
|
| FUND COUNSEL | | Willkie, Farr & Gallagher LLP | | 787 Seventh Avenue
New York, NY 10019 |
|
| An investor should consider the investment objectives, risks, charges, and expenses of a Portfolio carefully before investing. The prospectuses for the Portfolios contain this and other information about the Portfolios. An investor may obtain a prospectus by visiting our website at www.prudential.com or by calling (800) 225-1852. The prospectus should be read carefully before investing. |
|
| E-DELIVERY |
To receive your mutual fund documents on-line, go to www.icsdelivery.com/prudential/funds and enroll. Instead of receiving printed documents by mail, you will receive notification via e-mail when new materials are available. You can cancel your enrollment or change your e-mail address at any time by clicking on the change/cancel enrollment option at the icsdelivery website address. |
|
| SHAREHOLDER COMMUNICATIONS WITH TRUSTEES |
| Shareholders can communicate directly with the Board of Trustees by writing to the Chair of the Board, The TARGET Portfolio Trust, PO Box 13964, Philadelphia, PA 19176. Shareholders can communicate directly with an individual Trustee by writing to the same address. Communications are not screened before being delivered to the addressee. |
AVAILABILITY OF PORTFOLIO SCHEDULE
The Trust files its complete schedule of portfolio holdings with the Securities and Exchange Commission for the first and third quarters of each fiscal year on Form N-Q. The Trust Forms N-Q are available on the Commission’s website at www.sec.gov. The Trust Forms N-Q may also be reviewed and copied at the Commission’s Public Reference Room in Washington, D.C. Information on the operation and location of the Public Reference Room may be obtained by calling (800) SEC-0330 (732-0330). The Trust will provide a full list of its portfolio holdings on its website as of the end of the month within approximately 30 days after the end of each month.
|
| The Trust’s Statement of Additional Information contains additional information about the Trust’s Trustees and is available without charge, upon request, by calling (800) 225-1852. |
Mutual Funds:
| | | | |
| ARE NOT INSURED BY THE FDIC OR ANY FEDERAL GOVERNMENT AGENCY | | MAY LOSE VALUE | | ARE NOT A DEPOSIT OF OR GUARANTEED BY ANY BANK OR ANY BANK AFFILIATE |

| | | | | | | | | | | | | | |
| | | The TARGET Portfolio Trust | | NASDAQ | | CUSIP | | | | NASDAQ | | CUSIP | | |
| | | Large Capitalization Growth | | TALGX | | 875921207 | | Large Capitalization Value | | TALVX | | 875921108 | | |
| | | Small Capitalization Growth | | TASGX | | 875921405 | | Small Capitalization Value | | TASVX | | 875921306 | | |
| | | International Equity | | TAIEX | | 875921504 | | International Bond | | TIBPX | | 875921876 | | |
| | | Total Return Bond | | TATBX | | 875921884 | | Intermediate-Term Bond | | TAIBX | | 875921801 | | |
| | | Mortgage Backed Securities | | TGMBX | | 875921702 | | U.S. Govt Money Market | | PUGXX | | 875921603 | | |
TMF158E IFS-A114721 Ed. 02/2006
Item 2 – Code of Ethics – – See Exhibit (a)
As of the end of the period covered by this report, the registrant has adopted a code of ethics (the “Section 406 Standards for Investment Companies – Ethical Standards for Principal Executive and Financial Officers”) that applies to the registrant’s Principal Executive Officer and Principal Financial Officer; the registrant’s Principal Financial Officer also serves as the Principal Accounting Officer.
The registrant hereby undertakes to provide any person, without charge, upon request, a copy of the code of ethics. To request a copy of the code of ethics, contact the registrant 973-367-7521, and ask for a copy of the Section 406 Standards for Investment Companies—Ethical Standards for Principal Executive and Financial Officers.
Item 3 – Audit Committee Financial Expert –
The registrant’s Board has determined that Mr. David Carson, member of the Board’s Audit Committee is an “audit committee financial expert,” and that he is “independent,” for purposes of this Item.
Item 4 – Principal Accountant Fees and Services –
(a) Audit Fees
For the fiscal years ended December 31, 2005 and December 31, 2004, KPMG LLP (“KPMG”), the Registrant’s principal accountant, billed the Registrant $196,200 and $196,200, respectively, for professional services rendered for the audit of the Registrant’s annual financial statements or services that are normally provided in connection with statutory and regulatory filings.
(b) Audit-Related Fees
For the fiscal year ended December 31, 2005, KPMG, the Registrant’s principal accountant, billed the Registrant $9,131 for assurance and related services that are reasonably related to the performance of the audit of the registrant’s financial statements. Professional services rendered included those in connection with additional audit procedures related to the conversion of shareholder accounts. For the fiscal year ended December 31, 2004, KPMG, the Registrant’s principal accountant, did not bill the Registrant for assurance and related services that are reasonably related to the performance of the audit of the registrant’s financial statements.
(c) Tax Fees
None.
(d) All Other Fees
None.
(e) (1) Audit Committee Pre-Approval Policies and Procedures
THE PRUDENTIAL MUTUAL FUNDS
AUDIT COMMITTEE POLICY
on
Pre-Approval of Services Provided by the Independent Accountants
The Audit Committee of each Prudential Mutual Fund is charged with the responsibility to monitor the independence of the Fund’s independent accountants. As part of this responsibility, the Audit Committee must pre-approve any independent accounting firm’s engagement to render audit and/or permissible non-audit services, as required by law. In evaluating a proposed engagement of the independent accountants, the Audit Committee will assess the effect that the engagement might reasonably be expected to have on the accountant’s independence. The Committee’s evaluation will be based on:
| | • | | a review of the nature of the professional services expected to be provided, |
| | • | | a review of the safeguards put into place by the accounting firm to safeguard independence, and |
| | • | | periodic meetings with the accounting firm. |
Policy for Audit and Non-Audit Services Provided to the Funds
On an annual basis, the scope of audits for each Fund, audit fees and expenses, and audit-related and non-audit services (and fees proposed in respect thereof) proposed to be performed by the Fund’s independent accountants will be presented by the Treasurer and the independent accountants to the Audit Committee for review and, as appropriate, approval prior to the initiation of such services. Such presentation shall be accompanied by confirmation by both the Treasurer and the independent accountants that the proposed services will not adversely affect the independence of the independent accountants. Proposed services shall be described in sufficient detail to enable the Audit Committee to assess the appropriateness of such services and fees, and the compatibility of the provision of such services with the auditor’s independence. The Committee shall receive periodic reports on the progress of the audit and other services which are approved by the Committee or by the Committee Chair pursuant to authority delegated in this Policy.
The categories of services enumerated under “Audit Services”, “Audit-related Services”, and “Tax Services” are intended to provide guidance to the Treasurer and the independent accountants as to those categories of services which the Committee believes are generally consistent with the independence of the independent accountants and which the Committee (or the Committee Chair) would expect upon the presentation of specific proposals to pre-approve. The enumerated categories are not intended as an exclusive list of audit, audit-related or tax services which the Committee (or the Committee Chair) would consider for pre-approval.
Audit Services
The following categories of audit services are considered to be consistent with the role of the Fund’s independent accountants:
| | • | | Annual Fund financial statement audits |
| | • | | Seed audits (related to new product filings, as required) |
| | • | | SEC and regulatory filings and consents |
Audit-related Services
The following categories of audit-related services are considered to be consistent with the role of the Fund’s independent accountants:
| | • | | Accounting consultations |
| | • | | Fund merger support services |
| | • | | Agreed Upon Procedure Reports |
| | • | | Other Internal Control Reports |
Individual audit-related services that fall within one of these categories and are not presented to the Audit Committee as part of the annual pre-approval process will be subject to pre-approval by the Committee Chair (or any other Committee member on whom this responsibility has been delegated) so long as the estimated fee for those services does not exceed $50,000.
Tax Services
The following categories of tax services are considered to be consistent with the role of the Fund’s independent accountants:
| | • | | Tax compliance services related to the filing or amendment of the following: |
| | • | | Federal, state and local income tax compliance; and, |
| | • | | Sales and use tax compliance |
| | • | | Timely RIC qualification reviews |
| | • | | Tax distribution analysis and planning |
| | • | | Tax authority examination services |
| | • | | Tax appeals support services |
| | • | | Accounting methods studies |
| | • | | Fund merger support services |
| | • | | Tax consulting services and related projects |
Individual tax services that fall within one of these categories and are not presented to the Audit Committee as part of the annual pre-approval process will be subject to pre-approval by the Committee Chair (or any other Committee member on whom this responsibility has been delegated) so long as the estimated fee for those services does not exceed $50,000.
Other Non-audit Services
Certain non-audit services that the independent accountants are legally permitted to render will be subject to pre-approval by the Committee or by one or more Committee members to whom the Committee has delegated this authority and who will report to the full Committee any pre-approval decisions made pursuant to this Policy. Non-audit services presented for pre-approval pursuant to this paragraph will be accompanied by a confirmation from both the Treasurer and the independent accountants that the proposed services will not adversely affect the independence of the independent accountants.
Proscribed Services
The Fund’s independent accountants will not render services in the following categories of non-audit services:
| | • | | Bookkeeping or other services related to the accounting records or financial statements of the Fund |
| | • | | Financial information systems design and implementation |
| | • | | Appraisal or valuation services, fairness opinions, or contribution-in-kind reports |
| | • | | Internal audit outsourcing services |
| | • | | Management functions or human resources |
| | • | | Broker or dealer, investment adviser, or investment banking services |
| | • | | Legal services and expert services unrelated to the audit |
| | • | | Any other service that the Public Company Accounting Oversight Board determines, by regulation, is impermissible. |
Pre-approval of Non-Audit Services Provided to Other Entities Within the Prudential Fund Complex
Certain non-audit services provided to Prudential Investments LLC or any of its affiliates that also provide ongoing services to the Prudential Mutual Funds will be subject to pre-approval by the Audit Committee. The only non-audit services provided to these entities that will require pre-approval are those related directly to the operations and financial reporting of the Funds. Individual projects that are not presented to the Audit Committee as part of the annual pre-approval process, will be subject to pre-approval by the Committee Chair (or any other Committee member on whom this responsibility has been delegated) so long as the estimated fee for those services does not exceed $50,000. Services presented for pre-approval pursuant to this paragraph will be accompanied by a confirmation from both the Treasurer and the independent accountants that the proposed services will not adversely affect the independence of the independent accountants.
Although the Audit Committee will not pre-approve all services provided to Prudential Investments LLC and its affiliates, the Committee will receive an annual report from the Fund’s independent accounting firm showing the aggregate fees for all services provided to Prudential Investments and its affiliates.
(e) (2) Percentage of services referred to in 4(b)- (4)(d) that were approved by the audit committee –
One hundred percent of the services described in Item 4(b) were approved by the audit committee.
(f) Percentage of hours expended attributable to work performed by other than full time employees of principal accountant if greater than 50%.
Not applicable.
(g) Non-Audit Fees
Not applicable to Registrant for the fiscal years 2005 and 2004. The aggregate non-audit fees billed by KPMG for services rendered to the registrant’s investment adviser and any entity controlling, controlled by, or under common control with the investment adviser that provides ongoing services to the registrant for the fiscal years 2005 and 2004 was $41,869 and $33,500, respectively.
(h) Principal Accountants Independence
Not applicable as KPMG has not provided non-audit services to the registrant’s investment adviser and any entity controlling, controlled by, or under common control with the investment adviser that provides ongoing services to the registrant that were not pre-approved pursuant to Rule 2-01(c)(7)(ii) of Regulation S-X.
Item 5 – Audit Committee of Listed Registrants – Not applicable.
Item 6 – Schedule of Investments – The schedule is included as part of the report to shareholders filed under Item 1 of this Form.
Item 7 – Disclosure of Proxy Voting Policies and Procedures for Closed-End Management Investment Companies – Not applicable.
Item 8 – Portfolio Managers of Closed-End Management Investment Companies – Not applicable.
Item 9 – Purchases of Equity Securities by Closed-End Management Investment Company and Affiliated Purchasers – Not applicable.
Item 10 – Submission of Matters to a Vote of Security Holders – Not applicable.
Item 11 – Controls and Procedures
| | (a) | It is the conclusion of the registrant’s principal executive officer and principal financial officer that the effectiveness of the registrant’s current disclosure controls and procedures (such disclosure controls and procedures having been evaluated within 90 days of the date of this filing) provide reasonable assurance that the information required to be disclosed by the registrant has been recorded, processed, summarized and reported within the time period specified in the Commission’s rules and forms and that the information required to be disclosed by the registrant has been accumulated and communicated to the registrant’s principal executive officer and principal financial officer in order to allow timely decisions regarding required disclosure. |
| | (b) | There has been no significant change in the registrant’s internal control over financial reporting that occurred during the registrant’s most recent fiscal quarter of the period covered by this report that has materially affected, or is likely to materially affect, the registrant’s internal control over financial reporting. |
Item 12 – Exhibits
| | (a) | (1) Code of Ethics – Attached hereto as Exhibit EX-99.CODE-ETH |
(2) Certifications pursuant to Section 302 of the Sarbanes-Oxley Act – Attached hereto as Exhibit EX-99.CERT.
(3) Any written solicitation to purchase securities under Rule 23c-1. – Not applicable.
| | (b) | Certifications pursuant to Section 906 of the Sarbanes-Oxley Act – Attached hereto as Exhibit EX-99.906CERT. |
SIGNATURES
Pursuant to the requirements of the Securities Exchange Act of 1934 and the Investment Company Act of 1940, the registrant has duly caused this report to be signed on its behalf by the undersigned, thereunto duly authorized.
| | | | |
| (Registrant) The Target Portfolio Trust | | |
| | |
| By (Signature and Title)* | | /s/ Deborah A. Docs | | |
| | Deborah A. Docs | | |
| | Secretary | | |
| |
| Date February 24, 2006 | | |
Pursuant to the requirements of the Securities Exchange Act of 1934 and the Investment Company Act of 1940, this report has been signed below by the following persons on behalf of the registrant and in the capacities and on the dates indicated.
| | | | |
| By (Signature and Title)* | | /s/ Judy A. Rice | | |
| | Judy A. Rice | | |
| | President and Principal Executive Officer | | |
| |
| Date February 24, 2006 | | |
| | |
| By (Signature and Title)* | | /s/ Grace C. Torres | | |
| | Grace C. Torres | | |
| | Treasurer and Principal Financial Officer | | |
| |
| Date February 24, 2006 | | |
| * | Print the name and title of each signing officer under his or her signature. |