UNITED STATES
SECURITIES AND EXCHANGE COMMISSION
Washington, D.C. 20549
FORM N-CSR
CERTIFIED SHAREHOLDER REPORT OF REGISTERED MANAGEMENT
INVESTMENT COMPANIES
Investment Company Act File Number 811-07076
| Wilshire Mutual Funds, Inc. |
| (Exact name of registrant as specified in charter) |
| |
Wilshire Associates Incorporated 1299 Ocean Avenue, Suite 700 Santa Monica, CA 90401-1085 |
| (Address of principal executive offices) (Zip code) |
| |
Jamie B. Ohl, President 1299 Ocean Avenue, Suite 700 Santa Monica, CA 90401-1085 |
| (Name and address of agent for service) |
Registrant’s telephone number, including area code: 310-260-6639
Date of fiscal year end: December 31
Date of reporting period: December 31, 2010
Form N-CSR is to be used by management investment companies to file reports with the Commission not later than 10 days after the transmission to stockholders of any report that is required to be transmitted to stockholders under Rule 30e-1 under the Investment Company Act of 1940 (17 CFR 270.30e-1). The Commission may use the information provided on Form N-CSR in its regulatory, disclosure review, inspection, and policymaking roles.
A registrant is required to disclose the information specified by Form N-CSR, and the Commission will make this information public. A registrant is not required to respond to the collection of information contained in Form N-CSR unless the Form displays a currently valid Office of Management and Budget (“OMB”) control number. Please direct comments concerning the accuracy of the information collection burden estimate and any suggestions for reducing the burden to Secretary, Securities and Exchange Commission, 100 F Street, NE, Washington, DC 20549. The OMB has reviewed this collection of information under the clearance requirements of 44 U.S.C. § 3507.
| Item 1. | Reports to Stockholders. |
The Report to Shareholders is attached herewith.
|
| | ANNUAL REPORT Large Company Growth Portfolio Large Company Value Portfolio Small Company Growth Portfolio Small Company Value Portfolio Wilshire 5000 Indexsm Fund Wilshire Large Cap Core 130/30 Fund | |
| | www.wilfunds.com | |
|
Wilshire Mutual Funds, Inc.
| Shareholder Letter | 1 |
| Commentary: | |
| Large Company Growth Portfolio | 2 |
| Large Company Value Portfolio | 6 |
| Small Company Growth Portfolio | 10 |
| Small Company Value Portfolio | 14 |
Wilshire 5000 IndexSM Fund | 18 |
| Wilshire Large Cap Core 130/30 Fund | 24 |
| Disclosure of Fund Expenses | 28 |
| Condensed Schedules of Investments: | |
| Large Company Growth Portfolio | 31 |
| Large Company Value Portfolio | 33 |
| Small Company Growth Portfolio | 35 |
| Small Company Value Portfolio | 37 |
Wilshire 5000 IndexSM Fund | 39 |
| Schedule of Investments: | |
| Wilshire Large Cap Core 130/30 Fund | 41 |
| Schedule of Securities Sold Short: | |
| Wilshire Large Cap Core 130/30 Fund | 47 |
| Statements of Assets and Liabilities | 50 |
| Statements of Operations | 52 |
| Statements of Changes in Net Assets | 53 |
| Statement of Cash Flows | 57 |
| Financial Highlights: | |
| Large Company Growth Portfolio | 58 |
| Large Company Value Portfolio | 60 |
| Small Company Growth Portfolio | 62 |
| Small Company Value Portfolio | 64 |
Wilshire 5000 IndexSM Fund | 66 |
| Wilshire Large Cap Core 130/30 Fund | 70 |
| Notes to Financial Statements | 72 |
| Report of Independent Registered Public Accounting Firm | 82 |
| Additional Fund Information | 83 |
| Tax Information | 88 |
| Board Approval of Subadvisory Agreements | 90 |
This report is for the general information of the shareholders of Large Company Growth Portfolio, Large Company Value Portfolio, Small Company Growth Portfolio, Small Company Value Portfolio, Wilshire 5000 IndexSM Fund and Wilshire Large Cap Core 130/30 Fund. Its use in connection with any offering of a Portfolio’s shares is authorized only if accompanied or preceded by the Portfolio’s current prospectus.
Wilshire Mutual Funds, Inc. are distributed by SEI Investments Distribution Co.
Dear Wilshire Mutual Funds Shareholder:
We are pleased to present the 2010 Annual Report to all shareholders of the Wilshire Mutual Funds, Inc. This report covers the twelve-month period (the “Period”) ended December 31, 2010, for all share classes of the Large Company Growth Portfolio, Large Company Value Portfolio, Small Company Growth Portfolio, Small Company Value Portfolio, Wilshire 5000 IndexSM Fund and Wilshire Large Cap Core 130/30 Fund.
MARKET ENVIRONMENT
A greater than usual number of macro-economic events presented themselves in 2010, greatly influencing investors’ decisions. From the sovereign debt crisis in Greece and Ireland, the oil spill disaster in the Gulf of Mexico, inflation curbing rate hikes in China, the U.S. government’s additional quantitative easing (“QE2”), and more, 2010 can be best categorized by the constant macro uncertainties. This environment made strategic investment decision making a more difficult task than usual. The stock market was volatile for most of the year with investors shifting between “Risk-on” and “Risk-off” modes. Resolutions of macro events combined with positive news on economic fundamentals eventually convinced investors to drive markets higher in the last quarter of the year. As the year came to a close, both equity and fixed income investors cheered as U.S. stocks (as measured by the Wilshire 5000 IndexSM) and bonds (as measured by the Barclays Capital U.S. Aggregate Bond Index) advanced 17.2% and 6.2%, respectively.
With investors becoming more constructive on equities and risk assets in general, small capitalization stocks outperformed large cap counterparts. For the year, the Wilshire Small Cap Index returned 28.9%, handily outperforming the Wilshire Large Cap Index’s 15.8% return. For the second consecutive year, growth stocks outperformed value stocks. The best performing sectors were generally economically sensitive ones, including Consumer Discretionary, Materials, Industrials, and Energy. Fears of rising interest rates and loss of principal were on the minds of fixed income investors. In 2010, interest rates and inflation remained low — the yield on 10-year maturity U.S. Treasury actually declined from 3.85% at the beginning of the Period to 3.3% at the end of the year. While short-term rates are expected to be low in the coming year, investors should stay vigilant on managing interest rate volatility.
FUND PERFORMANCE OVERVIEW
As markets moved past the macro uncertainties, our Funds posted strong positive returns for the year. Led by the strong performance of the small company funds, all Funds were able to deliver another year of double digit returns for shareholders on the back of strong results from the previous year. Consistent with market observations, our small company funds outperformed large company funds and growth company funds outperformed value company funds.
For the moment, the current economic recovery seems to be broadening and investor confidence growing as a result. We are always mindful that markets can behave erratically and current trends shift swiftly. You can expect us to continue to work diligently to manage your investments and seek to generate returns commensurate with the Funds’ investment objectives.
As 2011 unfolds, we sincerely appreciate your continued support and confidence.
Sincerely,
Jamie B. Ohl
President
Large Company Growth Portfolio Commentary |  |
INVESTMENT CLASS SHARES
Average Annual Total Return*
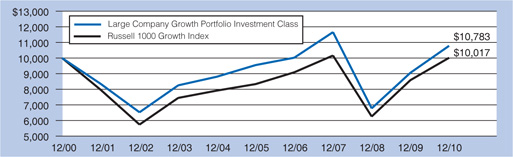
One Year Ended 12/31/10 | 19.10% |
Five Years Ended 12/31/10 | 2.46% |
Ten Years Ended 12/31/10 | 0.76% |
RUSSELL 1000® GROWTH INDEX(1)
Average Annual Total Return
One Year Ended 12/31/10 | 16.71% |
Five Years Ended 12/31/10 | 3.75% |
Ten Years Ended 12/31/10 | 0.02% |
COMPARATIVE PERFORMANCE
Comparison of Change in Value of $10,000 Investment in Shares of Large Company Growth
Portfolio, Investment Class Shares and the Russell 1000 Growth Index through 12/31/10.
The performance data quoted represents past performance and does not guarantee future results. Current performance may be lower or higher. Performance data current to the most recent month end may be obtained at www.wilfunds.com. The investment return and principal value of an investment will fluctuate so that shares, when redeemed, may be worth more or less than their original cost. The table above does not reflect the deduction that a shareholder would pay on Portfolio distributions or the redemption of Portfolio shares.
| * | Assumes reinvestment of all distributions. During certain periods since inception, certain fees and expenses were waived or reimbursed. Without waivers and reimbursements, historical total returns would have been lower. For the year ended December 31, 2010, there were no waivers. |
| (1) | The Russell 1000® Growth Index is an unmanaged index that measures the performance of the largest 1,000 U.S. companies with lower price-to-book ratios and lower forecasted growth values. Index performance is presented for general comparative purposes. Unlike a mutual fund, the performance of an index assumes no taxes, transaction costs, management fees or other expenses. An individual cannot directly invest in any index. |
Large Company Growth Portfolio Commentary - (Continued) | |
INSTITUTIONAL CLASS SHARES
Average Annual Total Return*
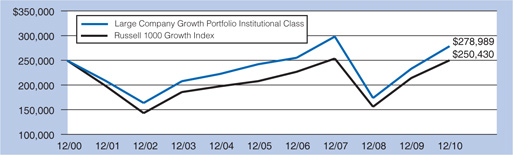
One Year Ended 12/31/10 | 19.55% |
Five Years Ended 12/31/10 | 2.83% |
Ten Years Ended 12/31/10 | 1.10% |
RUSSELL 1000® GROWTH INDEX(1)
Average Annual Total Return
One Year Ended 12/31/10 | 16.71% |
Five Years Ended 12/31/10 | 3.75% |
Ten Years Ended 12/31/10 | 0.02% |
COMPARATIVE PERFORMANCE
Comparison of Change in Value of $250,000 Investment in Shares of Large Company Growth
Portfolio, Institutional Class Shares and the Russell 1000 Growth Index through 12/31/10.
The performance data quoted represents past performance and does not guarantee future results. Current performance may be lower or higher. Performance data current to the most recent month end may be obtained at www.wilfunds.com. The investment return and principal value of an investment will fluctuate so that shares, when redeemed, may be worth more or less than their original cost. The table above does not reflect the deduction that a shareholder would pay on Portfolio distributions or the redemption of Portfolio shares.
| * | Assumes reinvestment of all distributions. During certain periods since inception, certain fees and expenses were waived or reimbursed. Without waivers and reimbursements, historical total returns would have been lower. For the year ended December 31, 2010, there were no waivers. |
| (1) | The Russell 1000® Growth Index is an unmanaged index that measures the performance of the largest 1,000 U.S. companies with lower price-to-book ratios and lower forecasted growth values. Index performance is presented for general comparative purposes. Unlike a mutual fund, the performance of an index assumes no taxes, transaction costs, management fees or other expenses. An individual cannot directly invest in any index. |
Large Company Growth Portfolio Commentary - (Continued) | |
Equity markets exhibited strong returns in 2010 as the markets and economy continued to recover from the financial crisis and subsequent recession witnessed in 2008. Although stocks endured substantial volatility in the first half of the year, a rally in the second half of the year pushed annual returns considerably higher. The S&P 500 Index returned 15.06% for the year. Growth stocks led the markets higher in 2010, continuing the trend from the previous year. The Russell 1000 Growth Index returned 16.71%, outpacing the Russell 1000 Value Index’s return of 15.51%. However, the differential was most notable among smaller-capitalization stocks with the Russell 2000 Growth Index and Russell 2000 Value Index returning 17.11% and 15.36%, respectively. Cyclical-oriented sectors such as Consumer Discretionary, Industrials and Materials advanced the most, each posting returns in excess of 20%. Small cap stocks also posted strong returns in 2010, as the Russell 2000 Index returned 26.85%, largely outperforming larger-cap stocks. The market rebound in 2010 has been generally characterized by investors fluctuating between “risk on” and “risk off” strategies as they processed mixed signals on the strength of global economies and the sustainability of corporate earnings.
The Large Company Growth Portfolio, Institutional Class Shares (the “Fund”) returned 19.55% for the year ended December 31, 2010, outperforming the Fund’s benchmark (the Russell 1000 Growth Index) return of 16.71%. The Fund experienced strong positive contribution from stock selection in 8 out of 10 sectors. More specifically, the Fund exhibited positive stock selection in the Technology, Industrials, Energy, and Materials sectors. On the other hand, sector positioning was a drag on performance as an overweight position in Health Care and an underweight position in Industrials detracted value.
We are pleased with both the absolute return and relative return of the Fund in 2010. We are encouraged by the activities and recent performance of our sub-advisers, who continue to follow through with the disciplined investment approaches that have made them successful over the long-term. With the changes we have implemented in 2010, it is our belief that the Fund is well positioned going into 2011 and should benefit as the market turns its focus away from macro-economic events and instead concentrates on the improving economy and corporate earnings.
Large Company Growth Portfolio Commentary - (Continued) | |
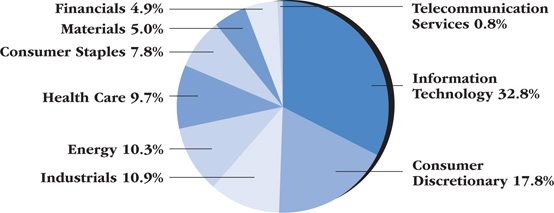
PORTFOLIO SECTOR WEIGHTING†
(As of December 31, 2010)
| † | Based on percent of the Portfolio’s total investments in securities, at value. |
Large Company Value Portfolio Commentary | |
INVESTMENT CLASS SHARES
Average Annual Total Return*
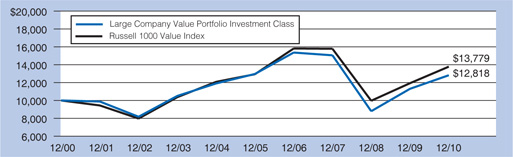
One Year Ended 12/31/10 | 13.40% |
Five Years Ended 12/31/10 | (0.22)% |
Ten Years Ended 12/31/10 | 2.51% |
RUSSELL 1000® VALUE INDEX(1)
Average Annual Total Return
One Year Ended 12/31/10 | 15.51% |
Five Years Ended 12/31/10 | 1.28% |
Ten Years Ended 12/31/10 | 3.26% |
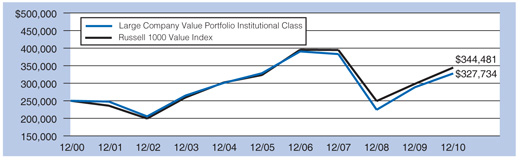
COMPARATIVE PERFORMANCE
Comparison of Change in Value of $10,000 Investment in Shares of Large Company Value
Portfolio, Investment Class Shares and the Russell 1000 Value Index through 12/31/10.
The performance data quoted represents past performance and does not guarantee future results. Current performance may be lower or higher. Performance data current to the most recent month end may be obtained at www.wilfunds.com. The investment return and principal value of an investment will fluctuate so that shares, when redeemed, may be worth more or less than their original cost. The table above does not reflect the deduction that a shareholder would pay on Portfolio distributions or the redemption of Portfolio shares.
| * | Assumes reinvestment of all distributions. During certain periods since inception, certain fees and expenses were waived or reimbursed. Without waivers and reimbursements, historical total returns would have been lower. For the year ended December 31, 2010, there were no waivers. |
| (1) | The Russell 1000® Value Index is an unmanaged index that measures the performance of the largest 1,000 U.S. companies with lower price-to-book ratios and lower forecasted growth values. Index performance is presented for general comparative purposes. Unlike a mutual fund, the performance of an index assumes no taxes, transaction costs, management fees or other expenses. An individual cannot directly invest in any index. |
Large Company Value Portfolio Commentary - (Continued) | |
INSTITUTIONAL CLASS SHARES
Average Annual Total Return*
One Year Ended 12/31/10 | 13.57% |
Five Years Ended 12/31/10 | (0.04)% |
Ten Years Ended 12/31/10 | 2.74% |
RUSSELL 1000® VALUE INDEX(1)
Average Annual Total Return
One Year Ended 12/31/10 | 15.51% |
Five Years Ended 12/31/10 | 1.28% |
Ten Years Ended 12/31/10 | 3.26% |
COMPARATIVE PERFORMANCE
Comparison of Change in Value of $250,000 Investment in Shares of Large Company Value
Portfolio, Institutional Class Shares and the Russell 1000 Value Index through 12/31/10.
The performance data quoted represents past performance and does not guarantee future results. Current performance may be lower or higher. Performance data current to the most recent month end may be obtained at www.wilfunds.com. The investment return and principal value of an investment will fluctuate so that shares, when redeemed, may be worth more or less than their original cost. The table above does not reflect the deduction that a shareholder would pay on Portfolio distributions or the redemption of Portfolio shares.
| * | Assumes reinvestment of all distributions. During certain periods since inception, certain fees and expenses were waived or reimbursed. Without waivers and reimbursements, historical total returns would have been lower. For the year ended December 31, 2010, there were no waivers. |
| (1) | The Russell 1000® Value Index is an unmanaged index that measures the performance of the largest 1,000 U.S. companies with lower price-to-book ratios and lower forecasted growth values. Index performance is presented for general comparative purposes. Unlike a mutual fund, the performance of an index assumes no taxes, transaction costs, management fees or other expenses. An individual cannot directly invest in any index. |
Large Company Value Portfolio Commentary - (Continued) | |
Equity markets exhibited strong returns in 2010 as the markets and economy continued to recover from the financial crisis and subsequent recession witnessed in 2008. Although stocks endured substantial volatility in the first half of the year, a rally in the second half of the year pushed annual returns considerably higher. The S&P 500 Index returned 15.06% for the year. Growth stocks led the markets higher in 2010, continuing the trend from the previous year. The Russell 1000 Growth Index returned 16.71%, outpacing the Russell 1000 Value Index’s return of 15.51%. However, the differential was most notable among smaller-capitalization stocks with the Russell 2000 Growth Index and Russell 2000 Value Index returning 17.11% and 15.36%, respectively. Cyclical-oriented sectors such as Consumer Discretionary, Industrials and Materials advanced the most, each posting returns in excess of 20%. Small cap stocks also posted strong returns in 2010, as the Russell 2000 Index returned 26.85%, largely outperforming larger-cap stocks. The market rebound in 2010 has been generally characterized by investors fluctuating between “risk on” and “risk off” strategies as they processed mixed signals on the strength of global economies and the sustainability of corporate earnings.
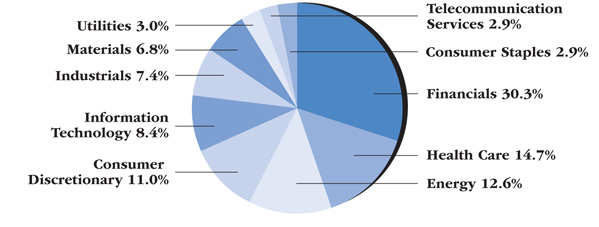
The Large Company Value Portfolio, Institutional Class Shares (the “Fund”) returned 13.57% for the year ended December 31, 2010, underperforming the Fund’s benchmark (the Russell 1000 Value Index) return of 15.51%. The Fund’s performance was hampered by negative stock selection in the Technology and Utilities sectors. On the other hand, an overweight position in the Consumer Discretionary sector and underweight positions in the Utilities and Consumer Staples sectors benefitted performance.
We are pleased with the absolute return of the Fund, yet disappointed by the performance of the Fund versus its benchmark. However, we are encouraged by the activities and current positioning of our sub-advisers, who continue to follow through with the disciplined investment approaches that have made them successful over the long-term. It is our belief that the Fund is well positioned going into 2011 and should benefit as the market turns its focus away from macro-economic events and instead concentrates on the improving economy and corporate earnings.
Large Company Value Portfolio Commentary - (Continued) | |
PORTFOLIO SECTOR WEIGHTING†
(As of December 31, 2010)
| † | Based on percent of the Portfolio’s total investments in securities, at value. |
Small Company Growth Portfolio Commentary | |
INVESTMENT CLASS SHARES
Average Annual Total Return*
One Year Ended 12/31/10 | 26.19% |
Five Years Ended 12/31/10 | 3.80% |
Ten Years Ended 12/31/10 | 5.27% |
RUSSELL 2000® GROWTH INDEX(1)
Average Annual Total Return
One Year Ended 12/31/10 | 29.09% |
Five Years Ended 12/31/10 | 5.30% |
Ten Years Ended 12/31/10 | 3.78% |
COMPARATIVE PERFORMANCE
Comparison of Change in Value of $10,000 Investment in Shares of Small Company Growth
Portfolio, Investment Class Shares and the Russell 2000 Growth Index through 12/31/10.
The performance data quoted represents past performance and does not guarantee future results. Current performance may be lower or higher. Performance data current to the most recent month end may be obtained at www.wilfunds.com. The investment return and principal value of an investment will fluctuate so that shares, when redeemed, may be worth more or less than their original cost. The table above does not reflect the deduction that a shareholder would pay on Portfolio distributions or the redemption of Portfolio shares.
| * | Assumes reinvestment of all distributions. During certain periods since inception, certain fees and expenses were waived or reimbursed. Without waivers and reimbursements, historical total returns would have been lower. For the year ended December 31, 2010, fees totaling 0.73% of average net assets were waived for the Investment Class Shares. |
| (1) | The Russell 2000® Growth Index is an unmanaged index that measures the performance of the 2,000 smallest U.S. companies with higher price-to-book ratios and higher forecasted growth values. Index performance is presented for general comparative purposes. Unlike a mutual fund, the performance of an index assumes no taxes, transaction costs, management fees or other expenses. An individual cannot directly invest in any index. |
Small Company Growth Portfolio Commentary - (Continued) | |
INSTITUTIONAL CLASS SHARES
Average Annual Total Return*
One Year Ended 12/31/10 | 26.60% |
Five Years Ended 12/31/10 | 4.05% |
Ten Years Ended 12/31/10 | 5.51% |
RUSSELL 2000® GROWTH INDEX(1)
Average Annual Total Return
One Year Ended 12/31/10 | 29.09% |
Five Years Ended 12/31/10 | 5.30% |
Ten Years Ended 12/31/10 | 3.78% |
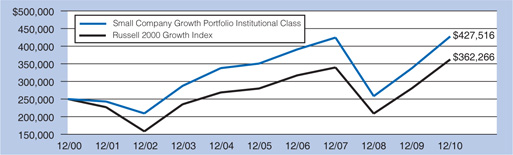
COMPARATIVE PERFORMANCE
Comparison of Change in Value of $250,000 Investment in Shares of Small Company Growth
Portfolio, Institutional Class Shares and the Russell 2000 Growth Index through 12/31/10.
The performance data quoted represents past performance and does not guarantee future results. Current performance may be lower or higher. Performance data current to the most recent month end may be obtained at www.wilfunds.com. The investment return and principal value of an investment will fluctuate so that shares, when redeemed, may be worth more or less than their original cost. The table above does not reflect the deduction that a shareholder would pay on Portfolio distributions or the redemption of Portfolio shares.
| * | Assumes reinvestment of all distributions. During certain periods since inception, certain fees and expenses were waived or reimbursed. Without waivers and reimbursements, historical total returns would have been lower. For the year ended December 31, 2010, fees totaling 0.72% of average net assets were waived for the Institutional Class Shares. |
| (1) | The Russell 2000® Growth Index is an unmanaged index that measures the performance of the 2,000 smallest U.S. companies with higher price-to-book ratios and higher forecasted growth values. Index performance is presented for general comparative purposes. Unlike a mutual fund, the performance of an index assumes no taxes, transaction costs, management fees or other expenses. An individual cannot directly invest in any index. |
Small Company Growth Portfolio Commentary - (Continued) | |
Equity markets exhibited strong returns in 2010 as the markets and economy continued to recover from the financial crisis and subsequent recession witnessed in 2008. Although stocks endured substantial volatility in the first half of the year, a rally in the second half of the year pushed annual returns considerably higher. The S&P 500 Index returned 15.06% for the year. Growth stocks led the markets higher in 2010, continuing the trend from the previous year. The Russell 1000 Growth Index returned 16.71%, outpacing the Russell 1000 Value Index’s return of 15.51%. However, the differential was most notable among smaller-capitalization stocks with the Russell 2000 Growth Index and Russell 2000 Value Index returning 17.11% and 15.36%, respectively. Cyclical-oriented sectors such as Consumer Discretionary, Industrials and Materials advanced the most, each posting returns in excess of 20%. Small cap stocks also posted strong returns in 2010, as the Russell 2000 Index returned 26.85%, largely outperforming larger-cap stocks. The market rebound in 2010 has been generally characterized by investors fluctuating between “risk on” and “risk off” strategies as they processed mixed signals on the strength of global economies and the sustainability of corporate earnings.
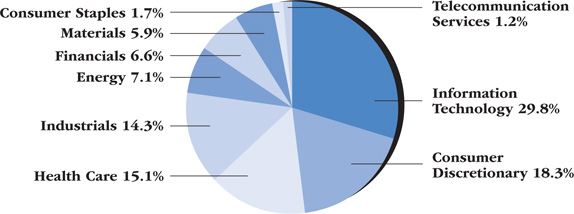
The Small Company Growth Portfolio (the “Fund”), Institutional Class Shares, returned 26.60% for the year ended December 31, 2010, lagging the Fund’s benchmark (the Russell 2000 Growth Index) return of 29.09%. The Fund’s performance was hampered by negative stock selections in several sectors, namely Consumer Discretionary, Health Care and Materials. On the other hand, a modest overweight position in the Energy sector as well as an underweight position in the Health Care sector benefitted performance, and sector positioning on balance was positive for the year.
We are pleased with the absolute return of the Fund, yet disappointed by the performance of the Fund versus its benchmark. However, we are encouraged by the activities and current positioning of our sub-advisers, who continue to follow through with the disciplined investment approaches that have made them successful over the long-term. It is our belief that the Fund is well positioned going into 2011 and should benefit as the market turns its focus away from macro-economic events and instead concentrates on the improving economy and corporate earnings.
Small Company Growth Portfolio Commentary - (Continued) | |
PORTFOLIO SECTOR WEIGHTING†
(As of December 31, 2010)
| † | Based on percent of the Portfolio’s total investments in securities, at value. |
Small Company Value Portfolio Commentary | |
INVESTMENT CLASS SHARES
Average Annual Total Return*
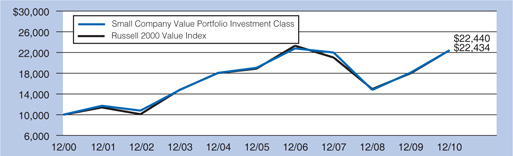
One Year Ended 12/31/10 | 23.60% |
Five Years Ended 12/31/10 | 3.33% |
Ten Years Ended 12/31/10 | 8.42% |
RUSSELL 2000® VALUE INDEX(1)
Average Annual Total Return
One Year Ended 12/31/10 | 24.50% |
Five Years Ended 12/31/10 | 3.52% |
Ten Years Ended 12/31/10 | 8.42% |
COMPARATIVE PERFORMANCE
Comparison of Change in Value of $10,000 Investment in Shares of Small Company Value
Portfolio, Investment Class Shares and the Russell 2000 Value Index through 12/31/10.
The performance data quoted represents past performance and does not guarantee future results. Current performance may be lower or higher. Performance data current to the most recent month end may be obtained at www.wilfunds.com. The investment return and principal value of an investment will fluctuate so that shares, when redeemed, may be worth more or less than their original cost. The table above does not reflect the deduction that a shareholder would pay on Portfolio distributions or the redemption of Portfolio shares.
| * | Assumes reinvestment of all distributions. During certain periods since inception, certain fees and expenses were waived or reimbursed. Without waivers and reimbursements, historical total returns would have been lower. For the year ended December 31, 2010, fees totaling 0.37% of average net assets were waived in the Investment Class Shares. |
| (1) | The Russell 2000® Value Index is an unmanaged index that measures the performance of the 2,000 smallest U.S. companies with lower price-to-book ratios and lower forecasted growth values. Index performance is presented for general comparative purposes. Unlike a mutual fund, the performance of an index assumes no taxes, transaction costs, management fees or other expenses. An individual cannot directly invest in any index. |
Small Company Value Portfolio Commentary - (Continued) | |
INSTITUTIONAL CLASS SHARES
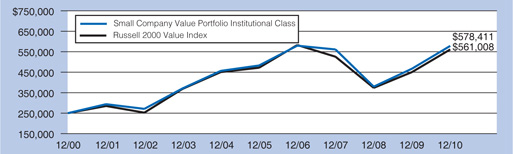
Average Annual Total Return*
One Year Ended 12/31/10 | 23.80% |
Five Years Ended 12/31/10 | 3.68% |
Ten Years Ended 12/31/10 | 8.75% |
RUSSELL 2000® VALUE INDEX(1)
Average Annual Total Return
One Year Ended 12/31/10 | 24.50% |
Five Years Ended 12/31/10 | 3.52% |
Ten Years Ended 12/31/10 | 8.42% |
COMPARATIVE PERFORMANCE
Comparison of Change in Value of $250,000 Investment in Shares of Small Company Value
Portfolio, Institutional Class Shares and the Russell 2000 Value Index through 12/31/10.
The performance data quoted represents past performance and does not guarantee future results. Current performance may be lower or higher. Performance data current to the most recent month end may be obtained at www.wilfunds.com. The investment return and principal value of an investment will fluctuate so that shares, when redeemed, may be worth more or less than their original cost. The table above does not reflect the deduction that a shareholder would pay on Portfolio distributions or the redemption of Portfolio shares.
| * | Assumes reinvestment of all distributions. During certain periods since inception, certain fees and expenses were waived or reimbursed. Without waivers and reimbursements, historical total returns would have been lower. For the year ended December 31, 2010, fees totaling 0.38% of average net assets were waived in the Institutional Class Shares. |
| (1) | The Russell 2000® Value Index is an unmanaged index that measures the performance of the 2,000 smallest U.S. companies with lower price-to-book ratios and lower forecasted growth values. Index performance is presented for general comparative purposes. Unlike a mutual fund, the performance of an index assumes no taxes, transaction costs, management fees or other expenses. An individual cannot directly invest in any index. |
Small Company Value Portfolio Commentary - (Continued) | |
Equity markets exhibited strong returns in 2010 as the markets and economy continued to recover from the financial crisis and subsequent recession witnessed in 2008. Although stocks endured substantial volatility in the first half of the year, a rally in the second half of the year pushed annual returns considerably higher. The S&P 500 Index returned 15.06% for the year. Growth stocks led the markets higher in 2010, continuing the trend from the previous year. The Russell 1000 Growth Index returned 16.71%, outpacing the Russell 1000 Value Index’s return of 15.51%. However, the differential was most notable among smaller-capitalization stocks with the Russell 2000 Growth Index and Russell 2000 Value Index returning 17.11% and 15.36%, respectively. Cyclical-oriented sectors such as Consumer Discretionary, Industrials and Materials advanced the most, each posting returns in excess of 20%. Small cap stocks also posted strong returns in 2010, as the Russell 2000 Index returned 26.85%, largely outperforming larger-cap stocks. The market rebound in 2010 has been generally characterized by investors fluctuating between “risk on” and “risk off” strategies as they processed mixed signals on the strength of global economies and the sustainability of corporate earnings.
The Small Company Value Portfolio (the “Fund”), Institutional Class Shares, returned 23.80% for the year ended December 31, 2010, slightly underperforming the Fund’s benchmark (the Russell 2000 Value Index) return of 24.50%. The Fund’s performance was hampered by negative stock selection in the Materials, Industrials and Health Care sectors. Conversely, the Fund experienced strong positive contribution from stock selection in other sectors including Technology and Energy. Additionally, an overweight position in the Materials sector was a positive factor in relative performance.
We are pleased with the absolute return of the Fund, yet disappointed by the performance of the Fund versus its benchmark. However, we are encouraged by the activities and current positioning of our sub-advisers, who continue to follow through with the disciplined investment approaches that have made them successful over the long-term. It is our belief that the Fund is well positioned going into 2011 and should benefit as the market turns its focus away from macro-economic events and instead concentrates on the improving economy and corporate earnings.
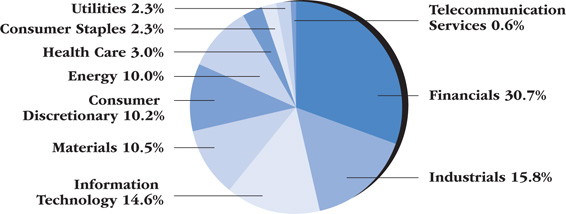
Small Company Value Portfolio Commentary - (Continued) | |
PORTFOLIO SECTOR WEIGHTING†
(As of December 31, 2010)
| † | Based on percent of the Portfolio’s total investments in securities, at value. |
Wilshire 5000 Indexsm Fund Commentary | |
INVESTMENT CLASS SHARES
Average Annual Total Return*
One Year Ended 12/31/10 | 16.44% |
Five Years Ended 12/31/10 | 2.20% |
Ten Years Ended 12/31/10 | 1.68% |
WILSHIRE 5000 INDEXSM(1)
Average Annual Total Return
One Year Ended 12/31/10 | 17.17% |
Five Years Ended 12/31/10 | 2.90% |
Ten Years Ended 12/31/10 | 2.50% |
COMPARATIVE PERFORMANCE
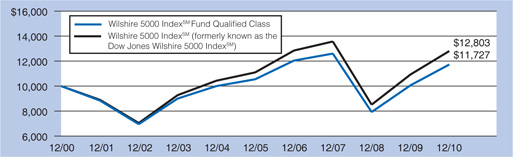
Comparison of Change in Value of $10,000 Investment in Shares of Wilshire 5000 IndexSM
Fund, Investment Class Shares and the Wilshire 5000 IndexSM through 12/31/10.
The performance data quoted represents past performance and does not guarantee future results. Current performance may be lower or higher. Performance data current to the most recent month end may be obtained at www.wilfunds.com. The investment return and principal value of an investment will fluctuate so that shares, when redeemed, may be worth more or less than their original cost. The table above does not reflect the deduction that a shareholder would pay on Fund distributions or the redemption of Fund shares.
| * | Assumes reinvestment of all distributions. During certain periods since inception, certain fees and expenses were waived or reimbursed. Without waivers and reimbursements, historical total returns would have been lower. For the year ended December 31, 2010, there were no waivers. |
| (1) | The Wilshire 5000 IndexSM is an unmanaged index that measures the performance of all U.S. headquartered equity securities with readily available price data. Index performance is presented for general comparative purposes. Unlike a mutual fund, the performance of an index assumes no taxes, transaction costs, management fees or other expenses. An individual cannot directly invest in any index. |
Wilshire 5000 Indexsm Fund Commentary - (Continued) | |
INSTITUTIONAL CLASS SHARES
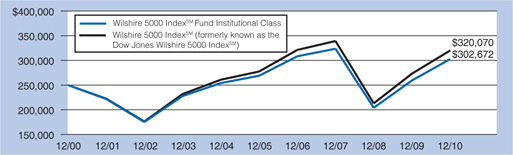
Average Annual Total Return*
One Year Ended 12/31/10 | 16.71% |
Five Years Ended 12/31/10 | 2.40% |
Ten Years Ended 12/31/10 | 1.93% |
WILSHIRE 5000 INDEXSM(1)
Average Annual Total Return
One Year Ended 12/31/10 | 17.17% |
Five Years Ended 12/31/10 | 2.90% |
Ten Years Ended 12/31/10 | 2.50% |
COMPARATIVE PERFORMANCE
Comparison of Change in Value of $250,000 Investment in Shares of Wilshire 5000 IndexSM
Fund, Institutional Class Shares and the Wilshire 5000 IndexSM through 12/31/10.
The performance data quoted represents past performance and does not guarantee future results. Current performance may be lower or higher. Performance data current to the most recent month end may be obtained at www.wilfunds.com. The investment return and principal value of an investment will fluctuate so that shares, when redeemed, may be worth more or less than their original cost. The table above does not reflect the deduction that a shareholder would pay on Fund distributions or the redemption of Fund shares.
| * | Assumes reinvestment of all distributions. During certain periods since inception, certain fees and expenses were waived or reimbursed. Without waivers and reimbursements, historical total returns would have been lower. For the year ended December 31, 2010, there were no waivers. |
| (1) | The Wilshire 5000 IndexSM is an unmanaged index that measures the performance of all U.S. headquartered equity securities with readily available price data. Index performance is presented for general comparative purposes. Unlike a mutual fund, the performance of an index assumes no taxes, transaction costs, management fees or other expenses. An individual cannot directly invest in any index. |
Wilshire 5000 Indexsm Fund Commentary - (Continued) | |
QUALIFIED CLASS SHARES
Average Annual Total Return*
One Year Ended 12/31/10 | 16.56% |
Five Years Ended 12/31/10 | 2.14% |
Ten Years Ended 12/31/10 | 1.61% |
WILSHIRE 5000 INDEXSM(1)
Average Annual Total Return
One Year Ended 12/31/10 | 17.17% |
Five Years Ended 12/31/10 | 2.90% |
Ten Years Ended 12/31/10 | 2.50% |
COMPARATIVE PERFORMANCE
Comparison of Change in Value of $10,000 Investment in Shares of Wilshire 5000 IndexSM
Fund, Qualified Class Shares and the Wilshire 5000 IndexSM through 12/31/10.
The performance data quoted represents past performance and does not guarantee future results. Current performance may be lower or higher. Performance data current to the most recent month end may be obtained at www.wilfunds.com. The investment return and principal value of an investment will fluctuate so that shares, when redeemed, may be worth more or less than their original cost. The table above does not reflect the deduction that a shareholder would pay on Fund distributions or the redemption of Fund shares.
| * | Assumes reinvestment of all distributions. During certain periods since inception, certain fees and expenses were waived or reimbursed. Without waivers and reimbursements, historical total returns would have been lower. For the year ended December 31, 2010, there were no waivers. |
| (1) | The Wilshire 5000 IndexSM is an unmanaged index that measures the performance of all U.S. headquartered equity securities with readily available price data. Index performance is presented for general comparative purposes. Unlike a mutual fund, the performance of an index assumes no taxes, transaction costs, management fees or other expenses. An individual cannot directly invest in any index. |
Wilshire 5000 Indexsm Fund Commentary - (Continued) | |
HORACE MANN CLASS SHARES
Average Annual Total Return*
One Year Ended 12/31/10 | 16.39% |
Five Years Ended 12/31/10 | 2.12% |
Ten Years Ended 12/31/10 | 1.62% |
WILSHIRE 5000 INDEXSM(1)
Average Annual Total Return
One Year Ended 12/31/10 | 17.17% |
Five Years Ended 12/31/10 | 2.90% |
Ten Years Ended 12/31/10 | 2.50% |
COMPARATIVE PERFORMANCE
Comparison of Change in Value of $10,000 Investment in Shares of Wilshire 5000 IndexSM
Fund, Horace Mann Class Shares and the Wilshire 5000 IndexSM through 12/31/10.
The performance data quoted represents past performance and does not guarantee future results. Current performance may be lower or higher. Performance data current to the most recent month end may be obtained at www.wilfunds.com. The investment return and principal value of an investment will fluctuate so that shares, when redeemed, may be worth more or less than their original cost. The table above does not reflect the deduction that a shareholder would pay on Fund distributions or the redemption of Fund shares.
| * | Assumes reinvestment of all distributions. During certain periods since inception, certain fees and expenses were waived or reimbursed. Without waivers and reimbursements, historical total returns would have been lower. For the year ended December 31, 2010, there were no waivers. |
| (1) | The Wilshire 5000 IndexSM is an unmanaged index that measures the performance of all U.S. headquartered equity securities with readily available price data. Index performance is presented for general comparative purposes. Unlike a mutual fund, the performance of an index assumes no taxes, transaction costs, management fees or other expenses. An individual cannot directly invest in any index. |
Wilshire 5000 Indexsm Fund Commentary - (Continued) | |
Equity markets exhibited strong returns in 2010 as the markets and economy continued to recover from the financial crisis and subsequent recession witnessed in 2008. Although stocks endured substantial volatility in the first half of the year, a rally in the second half of the year pushed annual returns considerably higher. The S&P 500 Index returned 15.06% for the year. Growth stocks led the markets higher in 2010, continuing the trend from the previous year. The Russell 1000 Growth Index returned 16.71%, outpacing the Russell 1000 Value Index’s return of 15.51%. However, the differential was most notable among smaller-capitalization stocks with the Russell 2000 Growth Index and Russell 2000 Value Index returning 17.11% and 15.36%, respectively. Cyclical-oriented sectors such as Consumer Discretionary, Industrials and Materials advanced the most, each posting returns in excess of 20%. Small cap stocks also posted strong returns in 2010, as the Russell 2000 Index returned 26.85%, largely outperforming larger-cap stocks. The market rebound in 2010 has been generally characterized by investors fluctuating between “risk on” and “risk off” strategies as they processed mixed signals on the strength of global economies and the sustainability of corporate earnings.
The Wilshire 5000 IndexSM Fund (the “Fund”), Institutional Class Shares, returned 16.71% for the year ended December 31, 2010, slightly trailing the Fund’s benchmark (the Wilshire 5000 IndexSM) return of 17.17%. As the Fund is designed to closely track the performance of the Wilshire 5000 IndexSM, the performance of the Fund is within our expectations.
Wilshire 5000 Indexsm Fund Commentary - (Continued) | |
PORTFOLIO SECTOR WEIGHTING†
(As of December 31, 2010)
| † | Based on percent of the Fund’s total investments in securities, at value. |
Wilshire Large Cap Core 130/30 Fund Commentary | |
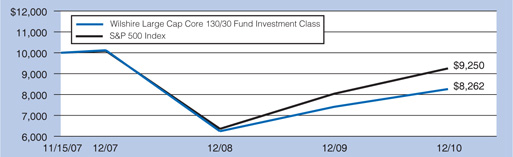
INVESTMENT CLASS SHARES
Average Annual Total Return*
One Year Ended 12/31/10 | 11.47% |
Inception (11/15/07) through 12/31/10 | (5.93)% |
S&P 500 INDEX(1)
Average Annual Total Return
One Year Ended 12/31/10 | 15.06% |
Inception (11/15/07) through 12/31/10 | (2.46)% |
COMPARATIVE PERFORMANCE
Comparison of Change in Value of $10,000 Investment in Shares of Wilshire Large Cap
Core 130/30 Fund, Investment Class Shares and the S&P 500 Index through 12/31/10.
The performance data quoted represents past performance and does not guarantee future results. Current performance may be lower or higher. Performance data current to the most recent month end may be obtained at www.wilfunds.com. The investment return and principal value of an investment will fluctuate so that shares, when redeemed, may be worth more or less than their original cost. The table above does not reflect the deduction that a shareholder would pay on Fund distributions or the redemption of Fund shares.
| * | Assumes reinvestment of all distributions. During certain periods since inception, certain fees and expenses were waived or reimbursed. Without waivers and reimbursements, historical total returns would have been lower. For the year ended December 31, 2010, fees totaling 0.04% of average net assets were waived in the Investment Class Shares. |
| (1) | The S&P 500 Index is an unmanaged index that measures the performance of all U.S. headquartered equity securities with readily available price data. Index performance is presented for general comparative purposes. Unlike a mutual fund, the performance of an index assumes no taxes, transaction costs, management fees or other expenses. |
Wilshire Large Cap Core 130/30 Fund Commentary - (Continued) | |
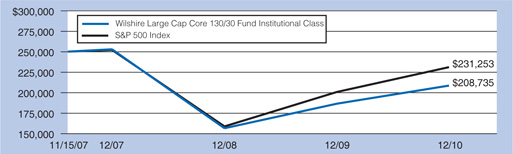
INSTITUTIONAL CLASS SHARES
Average Annual Total Return*
One Year Ended 12/31/10 | 11.82% |
Inception (11/15/07) through 12/31/10 | (5.61)% |
S&P 500 INDEX(1)
Average Annual Total Return
One Year Ended 12/31/10 | 15.06% |
Inception (11/15/07) through 12/31/10 | (2.46)% |
COMPARATIVE PERFORMANCE
Comparison of Change in Value of $250,000 Investment in Shares of Wilshire Large Cap
Core 130/30 Fund, Institutional Class Shares and the S&P 500 Index through 12/31/10.
The performance data quoted represents past performance and does not guarantee future results. Current performance may be lower or higher. Performance data current to the most recent month end may be obtained at www.wilfunds.com. The investment return and principal value of an investment will fluctuate so that shares, when redeemed, may be worth more or less than their original cost. The table above does not reflect the deduction that a shareholder would pay on Fund distributions or the redemption of Fund shares.
| * | Assumes reinvestment of all distributions. During certain periods since inception, certain fees and expenses were waived or reimbursed. Without waivers and reimbursements, historical total returns would have been lower. For the year ended December 31, 2010, fees totaling 0.02% of average net assets were waived in the Institutional Class Shares. |
| (1) | The S&P 500 Index is an unmanaged index that measures the performance of all U.S. headquartered equity securities with readily available price data. Index performance is presented for general comparative purposes. Unlike a mutual fund, the performance of an index assumes no taxes, transaction costs, management fees or other expenses. |
Wilshire Large Cap Core 130/30 Fund Commentary - (Continued) | |
Equity markets exhibited strong returns in 2010 as the markets and economy continued to recover from the financial crisis and subsequent recession witnessed in 2008. Although stocks endured substantial volatility in the first half of the year, a rally in the second half of the year pushed annual returns considerably higher. The S&P 500 Index returned 15.06% for the year. Growth stocks led the markets higher in 2010, continuing the trend from the previous year. The Russell 1000 Growth Index returned 16.71%, outpacing the Russell 1000 Value Index’s return of 15.51%. However, the differential was most notable among smaller-capitalization stocks with the Russell 2000 Growth Index and Russell 2000 Value Index returning 17.11% and 15.36%, respectively. Cyclical-oriented sectors such as Consumer Discretionary, Industrials and Materials advanced the most, each posting returns in excess of 20%. Small cap stocks also posted strong returns in 2010, as the Russell 2000 Index returned 26.85%, largely outperforming larger-cap stocks. The market rebound in 2010 has been generally characterized by investors fluctuating between “risk on” and “risk off” strategies as they processed mixed signals on the strength of global economies and the sustainability of corporate earnings.
The Wilshire Large Cap Core 130/30 Fund (the “Fund”), Institutional Class Shares, returned 11.82% for the year ended December 31, 2010, lagging the Fund’s benchmark (the S&P 500 Index) return of 15.06%. The Fund’s performance was hampered by negative stock selections in several sectors, namely the Technology, Energy, and Consumer Staples sectors. On the other hand, the Fund experienced strong positive contribution from stock selection in other sectors including Industrials and Materials.
We are pleased with the absolute return of the Fund, yet disappointed by the performance of the Fund versus its benchmark. However, we are encouraged by the activities and current positioning of our sub-advisers, who continue to follow through with the disciplined investment approaches that have made them successful over the long-term. With the changes we have implemented in 2010, it is our belief that the Fund is well positioned going into 2011 and should benefit as the market turns its focus away from macro-economic events and instead concentrates on the improving economy and corporate earnings.
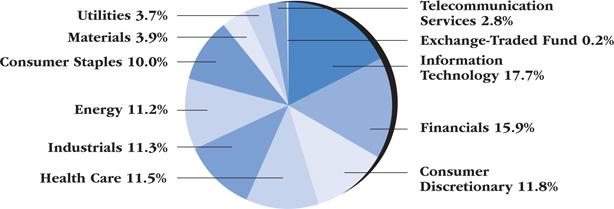
Wilshire Large Cap Core 130/30 Fund Commentary - (Continued) | |
PORTFOLIO SECTOR WEIGHTING†
(As of December 31, 2010)
| † | Based on percent of the Fund’s total investments in securities, at value. |
Wilshire Mutual Funds, Inc. Disclosure of Fund Expenses For the Six Months Ended December 31, 2010 (Unaudited) | |
All mutual funds have operating expenses. As a shareholder of a portfolio (or a “fund”), you incur ongoing costs, which include costs for investment advisory, administrative services, distribution and/or shareholder services and shareholder reports (like this one), among others. Operating expenses, which are deducted from a fund’s gross income, directly reduce the investment return of the fund. A fund’s expenses are expressed as a percentage of its average net assets. This figure is known as the expense ratio. The following examples are intended to help you understand the ongoing fees (in dollars) of investing in your fund and to compare these costs with those of other mutual funds. The examples are based on an investment of $1,000 made at the beginning of the period shown and held for the entire period.
The table on the next page illustrates your Portfolio’s costs in two ways:
Actual Fund Return: This section helps you to estimate the actual expenses, after any applicable fee waivers, that you paid over the period. The “Ending Account Value” shown is derived from the Portfolio’s actual return for the period. The “Expense Ratio” column shows the period’s annualized expense ratio and the “Expenses Paid During Period” column shows the dollar amount that would have been paid by an investor who started with $1,000 in the Portfolio at the beginning of the period.
You may use the information here, together with your account value, to estimate the expenses that you paid over the period. To do so, simply divide your account value by $1,000 (for example, an $8,600 account value divided by $1,000 = 8.6), then multiply the result by the number given for your fund in the first line under the heading entitled “Expenses Paid During Period.”
Hypothetical 5% Return: This section is intended to help you compare your fund’s costs with those of other mutual funds. The “Ending Account Value” shown is derived from hypothetical account values and hypothetical expenses based on the Portfolio’s actual expense ratio and assumed rate of return. It assumes that the Portfolio had an annual return of 5% before expenses, but that the expense ratio is unchanged. In this case, because the return used is not the Portfolio’s actual return, the results do not apply to your investment. This example is useful in making comparisons to other mutual funds because the Securities and Exchange Commission requires all mutual funds to calculate expenses based on an assumed 5% annual return. You can assess your Portfolio’s ongoing costs by comparing this hypothetical example with the hypothetical examples that appear in shareholder reports of other funds.
Please note that the expenses shown in the table are meant to highlight and help you compare your ongoing costs only and do not reflect any transactional costs such as sales charges (loads), redemption fees, or exchange fees. Wilshire Mutual Funds, Inc. has no such charges, but these may be present in other funds to which you compare this data. Therefore, the hypothetical portions of the table are useful in comparing ongoing costs only, and will not help you determine the relative total costs of owning different funds.
Wilshire Mutual Funds, Inc. Disclosure of Fund Expenses - (Continued) For the Six Months Ended December 31, 2010 (Unaudited) | |
| | Beginning Account Value 07/01/10 | | Ending Account Value 12/31/10 | | | | Expenses Paid During Period 07/01/10-12/31/10(2) |
Large Company Growth Portfolio |
| Actual Fund Return | | | | | | | |
| Investment Class | $1,000.00 | | $1,295.60 | | 1.41% | | $8.16 |
| Institutional Class | $1,000.00 | | $1,298.20 | | 1.04% | | $6.02 |
| Hypothetical 5% Return | | | | | | | |
| Investment Class | $1,000.00 | | $1,018.10 | | 1.41% | | $7.17 |
| Institutional Class | $1,000.00 | | $1,019.96 | | 1.04% | | $5.30 |
| | | | | | | | |
Large Company Value Portfolio |
| Actual Fund Return | | | | | | | |
| Investment Class | $1,000.00 | | $1,221.00 | | 1.38% | | $7.73 |
| Institutional Class | $1,000.00 | | $1,221.60 | | 1.27% | | $7.11 |
| Hypothetical 5% Return | | | | | | | |
| Investment Class | $1,000.00 | | $1,018.25 | | 1.38% | | $7.02 |
| Institutional Class | $1,000.00 | | $1,018.80 | | 1.27% | | $6.46 |
| | | | | | | | |
Small Company Growth Portfolio |
| Actual Fund Return | | | | | | | |
| Investment Class | $1,000.00 | | $1,323.70 | | 1.40% | | $8.20 |
| Institutional Class | $1,000.00 | | $1,324.60 | | 1.19% | | $6.97 |
| Hypothetical 5% Return | | | | | | | |
| Investment Class | $1,000.00 | | $1,018.15 | | 1.40% | | $7.12 |
| Institutional Class | $1,000.00 | | $1,019.21 | | 1.19% | | $6.06 |
| | | | | | | | |
Small Company Value Portfolio |
| Actual Fund Return | | | | | | | |
| Investment Class | $1,000.00 | | $1,263.50 | | 1.50% | | $8.56 |
| Institutional Class | $1,000.00 | | $1,265.30 | | 1.30% | | $7.42 |
| Hypothetical 5% Return | | | | | | | |
| Investment Class | $1,000.00 | | $1,017.64 | | 1.50% | | $7.63 |
| Institutional Class | $1,000.00 | | $1,018.65 | | 1.30% | | $6.61 |
Wilshire Mutual Funds, Inc. Disclosure of Fund Expenses - (Continued) For the Six Months Ended December 31, 2010 (Unaudited) | |
| | Beginning Account Value 07/01/10 | | Ending Account Value 12/31/10 | | | | Expenses Paid During Period 07/01/10-12/31/10(2) |
Wilshire 5000 IndexSM Fund |
| Actual Fund Return | | | | | | | |
| Investment Class | $1,000.00 | | $1,239.20 | | 0.71% | | $4.01 |
| Institutional Class | $1,000.00 | | $1,240.80 | | 0.46% | | $2.60 |
| Qualified Class | $1,000.00 | | $1,239.20 | | 0.65% | | $3.67 |
| Horace Mann Class | $1,000.00 | | $1,238.80 | | 0.68% | | $3.84 |
| Hypothetical 5% Return | | | | | | | |
| Investment Class | $1,000.00 | | $1,021.63 | | 0.71% | | $3.62 |
| Institutional Class | $1,000.00 | | $1,022.89 | | 0.46% | | $2.35 |
| Qualified Class | $1,000.00 | | $1,021.93 | | 0.65% | | $3.31 |
| Horace Mann Class | $1,000.00 | | $1,021.78 | | 0.68% | | $3.47 |
| | | | | | | | |
Wilshire Large Cap Core 130/30 Fund |
| Actual Fund Return | | | | | | | |
| Investment Class | $1,000.00 | | $1,235.30 | | 2.24%(3) | | $12.62 |
| Institutional Class | $1,000.00 | | $1,236.70 | | 1.99%(3) | | $11.22 |
| Hypothetical 5% Return | | | | | | | |
| Investment Class | $1,000.00 | | $1,013.91 | | 2.24%(3) | | $11.37 |
| Institutional Class | $1,000.00 | | $1,015.17 | | 1.99%(3) | | $10.11 |
| (1) | Annualized, based on the Portfolio’s most recent fiscal half-year expenses. |
| | |
| (2) | Expenses are equal to the Portfolio’s annualized expense ratio multiplied by the average account value over the period, multiplied by the number of days in the period, then divided by 365. |
| | |
| (3) | The annualized expense ratios include dividend expense, interest expense and rebates on securities sold short during the six-month period. |
Wilshire Mutual Funds, Inc. Large Company Growth Portfolio December 31, 2010 Condensed Schedule of Investments | |
| | Shares | | | | | Percentage of Net Assets (%) | | | | Value | |
| COMMON STOCK — 99.1%†† | |
| Consumer Discretionary — 17.7% | |
| | 23,116 | | Amazon.com, Inc.† | | | 2.1 | | | $ | 4,160,880 | |
| | 35,947 | | Apollo Group, Inc., Class A† | | | 0.7 | | | | 1,419,547 | |
| | 22,500 | | Dollar Tree, Inc.† | | | 0.7 | | | | 1,261,800 | |
| | 28,018 | | McDonald's Corp. | | | 1.1 | | | | 2,150,662 | |
| | 8,975 | | NetFlix, Inc.† | | | 0.8 | | | | 1,576,907 | |
| | 4,910 | | priceline.com, Inc.† | | | 1.0 | | | | 1,961,791 | |
| | 27,900 | | Starwood Hotels & Resorts Worldwide, Inc. | | | 0.9 | | | | 1,695,762 | |
| | 58,936 | | Target Corp. | | | 1.8 | | | | 3,543,822 | |
| | 483,237 | | Other Securities | | | 8.6 | | | | 16,459,933 | |
| | | | | | | | | | | 34,231,104 | |
| Consumer Staples — 7.7% | |
| | 23,334 | | Coca-Cola Co. (The) | | | 0.8 | | | | 1,534,677 | |
| | 26,798 | | Costco Wholesale Corp. | | | 1.0 | | | | 1,935,084 | |
| | 16,504 | | Diageo PLC ADR | | | 0.6 | | | | 1,226,743 | |
| | 63,110 | | Philip Morris International, Inc. | | | 1.9 | | | | 3,693,828 | |
| | 141,189 | | Other Securities | | | 3.4 | | | | 6,593,434 | |
| | | | | | | | | | | 14,983,766 | |
| Energy — 10.2% | |
| | 24,049 | | Anadarko Petroleum Corp. | | | 0.9 | | | | 1,831,572 | |
| | 25,500 | | Cameron International Corp.† | | | 0.7 | | | | 1,293,615 | |
| | 40,718 | | Exxon Mobil Corp. | | | 1.5 | | | | 2,977,300 | |
| | 13,100 | | Occidental Petroleum Corp. | | | 0.7 | | | | 1,285,110 | |
| | 87,206 | | Petrohawk Energy Corp.† | | | 0.8 | | | | 1,591,510 | |
| | 32,307 | | Schlumberger, Ltd. | | | 1.4 | | | | 2,697,635 | |
| | 98,595 | | Weatherford International, Ltd.† | | | 1.2 | | | | 2,247,966 | |
| | 143,025 | | Other Securities | | | 3.0 | | | | 5,789,138 | |
| | | | | | | | | | | 19,713,846 | |
| Financials — 4.9% | |
| | 71,500 | | Charles Schwab Corp. (The) | | | 0.6 | | | | 1,223,365 | |
| | 7,299 | | Goldman Sachs Group, Inc. (The) | | | 0.7 | | | | 1,227,400 | |
| | 95,301 | | TD Ameritrade Holding Corp. | | | 1.0 | | | | 1,809,766 | |
| | 32,220 | | Visa, Inc., Class A | | | 1.2 | | | | 2,267,644 | |
| | 93,821 | | Other Securities | | | 1.4 | | | | 2,890,260 | |
| | | | | | | | | | | 9,418,435 | |
| | Shares | | | | | Percentage of Net Assets (%) | | | | Value | |
| Health Care — 9.7% | |
| | 26,200 | | Allergan, Inc. | | | 0.9 | | | $ | 1,799,154 | |
| | 37,477 | | Celgene Corp.† | | | 1.1 | | | | 2,216,390 | |
| | 30,900 | | Express Scripts, Inc., Class A† | | | 0.9 | | | | 1,670,145 | |
| | 46,590 | | Gilead Sciences, Inc.† | | | 0.9 | | | | 1,688,421 | |
| | 31,696 | | WellPoint, Inc.† | | | 0.9 | | | | 1,802,235 | |
| | 222,983 | | Other Securities | | | 5.0 | | | | 9,548,711 | |
| | | | | | | | | | | 18,725,056 | |
| Industrials — 10.8% | |
| | 35,400 | | Expeditors International of Washington, Inc. | | | 1.0 | | | | 1,932,840 | |
| | 25,695 | | General Dynamics Corp. | | | 1.0 | | | | 1,823,317 | |
| | 20,000 | | Union Pacific Corp. | | | 1.0 | | | | 1,853,200 | |
| | 310,231 | | Other Securities | | | 7.8 | | | | 15,402,911 | |
| | | | | | | | | | | 21,012,268 | |
| Information Technology — 32.4% | |
| | 26,492 | | Acme Packet, Inc.† | | | 0.7 | | | | 1,408,315 | |
| | 35,518 | | Apple, Inc.† | | | 5.9 | | | | 11,456,686 | |
| | 13,363 | | Baidu, Inc. ADR† | | | 0.7 | | | | 1,289,930 | |
| | 29,400 | | Citrix Systems, Inc.† | | | 1.0 | | | | 2,011,254 | |
| | 32,600 | | Cognizant Technology Solutions Corp., Class A† | | | 1.2 | | | | 2,389,254 | |
| | 21,275 | | Cree, Inc.† | | | 0.7 | | | | 1,401,810 | |
| | 18,150 | | F5 Networks, Inc.† | | | 1.2 | | | | 2,362,404 | |
| | 8,510 | | Google, Inc., Class A† | | | 2.6 | | | | 5,054,685 | |
| | 81,330 | | Intel Corp. | | | 0.9 | | | | 1,710,370 | |
| | 23,753 | | International Business Machines Corp. | | | 1.8 | | | | 3,485,991 | |
| | 53,775 | | Juniper Networks, Inc.† | | | 1.0 | | | | 1,985,373 | |
| | 141,396 | | Marvell Technology Group, Ltd.† | | | 1.3 | | | | 2,622,896 | |
| | 163,544 | | Microsoft Corp. | | | 2.4 | | | | 4,566,148 | |
| | 113,646 | | Oracle Corp. | | | 1.8 | | | | 3,557,120 | |
| | 94,999 | | QUALCOMM, Inc. | | | 2.4 | | | | 4,701,500 | |
| | 76,477 | | Western Union Co. (The) | | | 0.8 | | | | 1,420,178 | |
| | 446,948 | | Other Securities | | | 6.0 | | | | 11,494,989 | |
| | | | | | | | | | | 62,918,903 | |
See Notes to Financial Statements.
Wilshire Mutual Funds, Inc. Large Company Growth Portfolio December 31, 2010 Condensed Schedule of Investments - (Continued) | |
| | Shares | | | | | Percentage of Net Assets (%) | | | | Value | |
| Materials — 5.0% | |
| | 12,997 | | Freeport-McMoRan Copper & Gold, Inc. | | | 0.8 | | | $ | 1,560,810 | |
| | 8,350 | | Potash Corp. of Saskatchewan, Inc. | | | 0.7 | | | | 1,292,830 | |
| | 133,812 | | Other Securities | | | 3.5 | | | | 6,771,692 | |
| | | | | | | | | | | 9,625,332 | |
| Telecommunication Services — 0.7% | |
| | 161,100 | | Qwest Communications International, Inc. | | | 0.6 | | | | 1,225,971 | |
| | 22,370 | | Other Securities | | | 0.1 | | | | 220,265 | |
| | | | | | | | | | | 1,446,236 | |
| Total Common Stock | | | | | | | | |
| (Cost $143,418,686) | | | | | | | 192,074,946 | |
| | | | | | | | | | | | |
| Total Investments — 99.1% | | | | | | | | |
| (Cost $143,418,686) | | | | | | | 192,074,946 | |
| Other Assets & Liabilities, Net — 0.9% | | | | | | | 1,836,033 | |
| | | | | | | | | | | | |
| NET ASSETS — 100.0% | | | | | | $ | 193,910,979 | |
| † | Non-income producing security. |
| †† | More narrow industries are utilized for compliance purposes, whereas broad sectors are utilized for reporting purposes. |
| ADR | — American Depositary Receipt |
| PLC | — Public Limited Company |
The Condensed Schedule of Investments does not reflect the complete portfolio holdings. It includes the Portfolio’s 50 largest holdings and each investment of any issuer that exceeds 1% of the Portfolio’s net assets. “Other Securities” represent all issues not required to be disclosed under the rules adopted by the U.S. Securities and Exchange Commission (“SEC”). The complete schedule of portfolio holdings is available (i) without charge, upon request, by calling (800) 607-2200; (ii) on the SEC’s website at http://www.sec.gov; and (iii) on our website at www.wilfunds.com.
As of December 31, 2010, all of the Portfolio’s investments were considered Level 1. Please see Note 2 in Notes to Financial Statements for further information regarding fair value measurements.
See Notes to Financial Statements.
Wilshire Mutual Funds, Inc. Large Company Value Portfolio December 31, 2010 Condensed Schedule of Investments | |
| | Shares | | | | | Percentage of Net Assets (%) | | | | Value | |
| COMMON STOCK — 98.8%†† | |
| Consumer Discretionary — 10.9% | |
| | 18,995 | | Comcast Corp. Special, Class A | | | 1.2 | | | $ | 417,320 | |
| | 12,575 | | J.C. Penney Co., Inc. | | | 1.2 | | | | 406,298 | �� |
| | 7,700 | | Omnicom Group, Inc. | | | 1.0 | | | | 352,660 | |
| | 4,044 | | VF Corp. | | | 1.0 | | | | 348,512 | |
| | 52,742 | | Other Securities | | | 6.5 | | | | 2,282,029 | |
| | | | | | | | | | | 3,806,819 | |
| Consumer Staples — 2.8% | |
| | 14,948 | | Tyson Foods, Inc., Class A | | | 0.7 | | | | 257,405 | |
| | 29,712 | | Other Securities | | | 2.1 | | | | 726,522 | |
| | | | | | | | | | | 983,927 | |
| Energy — 12.5% | |
| | 7,050 | | BP PLC ADR | | | 0.9 | | | | 311,398 | |
| | 11,600 | | Chevron Corp. | | | 3.0 | | | | 1,058,500 | |
| | 8,336 | | ConocoPhillips | | | 1.6 | | | | 567,682 | |
| | 7,113 | | Devon Energy Corp. | | | 1.6 | | | | 558,442 | |
| | 7,898 | | Exxon Mobil Corp. | | | 1.7 | | | | 577,502 | |
| | 22,623 | | Other Securities | | | 3.7 | | | | 1,292,751 | |
| | | | | | | | | | | 4,366,275 | |
| Financials — 29.9% | |
| | 10,313 | | ACE, Ltd. | | | 1.8 | | | | 641,984 | |
| | 18,496 | | Annaly Capital Management, Inc. | | | 0.9 | | | | 331,448 | |
| | 8,219 | | Assurant, Inc. | | | 0.9 | | | | 316,596 | |
| | 10,750 | | Axis Capital Holdings, Ltd. | | | 1.1 | | | | 385,710 | |
| | 19,950 | | Bank of America Corp. | | | 0.7 | | | | 266,133 | |
| | 9,303 | | Capital One Financial Corp. | | | 1.2 | | | | 395,936 | |
| | 197,574 | | Citigroup, Inc.† | | | 2.7 | | | | 934,525 | |
| | 28,800 | | Discover Financial Services | | | 1.5 | | | | 533,664 | |
| | 3,276 | | Everest Re Group, Ltd. | | | 0.8 | | | | 277,870 | |
| | 21,562 | | Fifth Third Bancorp | | | 0.9 | | | | 316,530 | |
| | 1,525 | | Goldman Sachs Group, Inc. (The) | | | 0.7 | | | | 256,444 | |
| | 28,168 | | JPMorgan Chase & Co. | | | 3.4 | | | | 1,194,887 | |
| | 8,654 | | PNC Financial Services Group, Inc. | | | 1.5 | | | | 525,471 | |
| | 6,250 | | Torchmark Corp. | | | 1.1 | | | | 373,375 | |
| | 22,575 | | UBS AG | | | 1.1 | | | | 371,810 | |
| | 10,800 | | Willis Group Holdings PLC | | | 1.1 | | | | 374,004 | |
| | 111,229 | | Other Securities | | | 8.5 | | | | 2,957,921 | |
| | | | | | | | | | | 10,454,308 | |
| | Shares | | | | | Percentage of Net Assets (%) | | | | Value | |
| Health Care — 14.5% | |
| | 4,675 | | Biogen Idec, Inc.† | | | 0.9 | | | $ | 313,459 | |
| | 10,783 | | Bristol-Myers Squibb Co. | | | 0.8 | | | | 285,534 | |
| | 8,955 | | Cardinal Health, Inc. | | | 1.0 | | | | 343,066 | |
| | 11,121 | | Eli Lilly & Co. | | | 1.1 | | | | 389,680 | |
| | 13,559 | | Forest Laboratories, Inc.† | | | 1.2 | | | | 433,617 | |
| | 13,893 | | Johnson & Johnson | | | 2.5 | | | | 859,282 | |
| | 3,650 | | Laboratory Corp. of America Holdings† | | | 0.9 | | | | 320,908 | |
| | 16,877 | | UnitedHealth Group, Inc. | | | 1.8 | | | | 609,428 | |
| | 5,825 | | Zimmer Holdings, Inc.† | | | 0.9 | | | | 312,686 | |
| | 33,925 | | Other Securities | | | 3.4 | | | | 1,217,990 | |
| | | | | | | | | | | 5,085,650 | |
| Industrials — 7.3% | |
| | 4,950 | | L-3 Communications Holdings, Inc. | | | 1.0 | | | | 348,925 | |
| | 26,325 | | Masco Corp. | | | 1.0 | | | | 333,275 | |
| | 10,373 | | Northrop Grumman Corp. | | | 1.9 | | | | 671,963 | |
| | 9,035 | | Oshkosh Corp.† | | | 0.9 | | | | 318,393 | |
| | 33,032 | | Other Securities | | | 2.5 | | | | 893,518 | |
| | | | | | | | | | | 2,566,074 | |
| Information Technology — 8.3% | |
| | 12,450 | | CA, Inc. | | | 0.9 | | | | 304,278 | |
| | 11,300 | | Hewlett-Packard Co. | | | 1.4 | | | | 475,730 | |
| | 2,321 | | International Business Machines Corp. | | | 1.0 | | | | 340,630 | |
| | 11,075 | | Tyco Electronics, Ltd. | | | 1.1 | | | | 392,055 | |
| | 111,792 | | Other Securities | | | 3.9 | | | | 1,402,620 | |
| | | | | | | | | | | 2,915,313 | |
| Materials — 6.7% | |
| | 5,339 | | Domtar Corp. | | | 1.2 | | | | 405,337 | |
| | 4,917 | | Freeport-McMoRan Copper & Gold, Inc. | | | 1.7 | | | | 590,483 | |
| | 4,475 | | PPG Industries, Inc. | | | 1.1 | | | | 376,213 | |
| | 3,350 | | Sherwin-Williams Co. (The) | | | 0.8 | | | | 280,562 | |
| | 22,595 | | Other Securities | | | 1.9 | | | | 686,983 | |
| | | | | | | | | | | 2,339,578 | |
| Telecommunication Services — 2.9% | |
| | 25,004 | | AT&T, Inc. | | | 2.1 | | | | 734,617 | |
| | 19,900 | | Other Securities | | | 0.8 | | | | 275,387 | |
| | | | | | | | | | | 1,010,004 | |
See Notes to Financial Statements.
Wilshire Mutual Funds, Inc. Large Company Value Portfolio December 31, 2010 Condensed Schedule of Investments - (Continued) | |
| | Shares | | | | | Percentage of Net Assets (%) | | | | Value | |
| Utilities — 3.0% | |
| | 8,050 | | Edison International | | | 0.9 | | | $ | 310,730 | |
| | 17,977 | | Questar Corp. | | | 0.9 | | | | 312,979 | |
| | 16,198 | | Other Securities | | | 1.2 | | | | 411,410 | |
| | | | | | | | | | | 1,035,119 | |
| Total Common Stock | | | | | | | | |
| (Cost $28,791,570) | | | | | | | 34,563,067 | |
| | | | | | | | | | | | |
| Total Investments — 98.8% | | | | | | | | |
| (Cost $28,791,570) | | | | | | | 34,563,067 | |
| Other Assets & Liabilities, Net — 1.2% | | | | | | | 428,722 | |
| | | | | | | | | | | | |
| NET ASSETS — 100.0% | | | | | | $ | 34,991,789 | |
| † | Non-income producing security. |
| †† | More narrow industries are utilized for compliance purposes, whereas broad sectors are utilized for reporting purposes. |
| ADR | — American Depositary Receipt |
| PLC | — Public Limited Company |
The Condensed Schedule of Investments does not reflect the complete portfolio holdings. It includes the Portfolio’s 50 largest holdings and each investment of any issuer that exceeds 1% of the Portfolio’s net assets. “Other Securities” represent all issues not required to be disclosed under the rules adopted by the U.S. Securities and Exchange Commission (“SEC”). The complete schedule of portfolio holdings is available (i) without charge, upon request, by calling (800) 607-2200; (ii) on the SEC’s website at http://www.sec.gov; and (iii) on our website at www.wilfunds.com.
As of December 31, 2010, all of the Portfolio’s investments were considered Level 1. Please see Note 2 in Notes to Financial Statements for further information regarding fair value measurements.
See Notes to Financial Statements.
Wilshire Mutual Funds, Inc. Small Company Growth Portfolio December 31, 2010 Condensed Schedule of Investments | |
| | Shares | | | | | Percentage of Net Assets (%) | | | | Value | |
| COMMON STOCK — 98.4%†† | |
| Consumer Discretionary — 18.0% | |
| | 1,565 | | America's Car-Mart, Inc.† | | | 0.5 | | | $ | 42,380 | |
| | 1,000 | | Cracker Barrel Old Country Store, Inc. | | | 0.7 | | | | 54,770 | |
| | 1,000 | | Deckers Outdoor Corp.† | | | 1.0 | | | | 79,740 | |
| | 1,210 | | G-III Apparel Group, Ltd.† | | | 0.6 | | | | 42,531 | |
| | 1,075 | | Group 1 Automotive, Inc. | | | 0.6 | | | | 44,892 | |
| | 1,425 | | Sotheby's | | | 0.8 | | | | 64,125 | |
| | 1,586 | | Steven Madden, Ltd.† | | | 0.9 | | | | 66,168 | |
| | 1,200 | | Tenneco, Inc.† | | | 0.7 | | | | 49,392 | |
| | 3,370 | | Texas Roadhouse, Inc., Class A† | | | 0.8 | | | | 57,863 | |
| | 2,360 | | Wolverine World Wide, Inc. | | | 1.0 | | | | 75,237 | |
| | 35,105 | | Other Securities | | | 10.4 | | | | 807,848 | |
| | | | | | | | | | | 1,384,946 | |
| Consumer Staples — 1.6% | |
| | 1,210 | | TreeHouse Foods, Inc.† | | | 0.8 | | | | 61,819 | |
| | 1,700 | | Other Securities | | | 0.8 | | | | 64,086 | |
| | | | | | | | | | | 125,905 | |
| Energy — 7.0% | |
| | 2,482 | | Approach Resources, Inc.† | | | 0.7 | | | | 57,334 | |
| | 1,505 | | Rosetta Resources, Inc.† | | | 0.7 | | | | 56,648 | |
| | 1,365 | | Superior Energy Services, Inc.† | | | 0.6 | | | | 47,761 | |
| | 1,600 | | World Fuel Services Corp. | | | 0.8 | | | | 57,856 | |
| | 15,961 | | Other Securities | | | 4.2 | | | | 316,553 | |
| | | | | | | | | | | 536,152 | |
| Financials — 6.5% | |
| | 2,310 | | Prosperity Bancshares, Inc. | | | 1.2 | | | | 90,737 | |
| | 3,390 | | Texas Capital Bancshares, Inc.† | | | 0.9 | | | | 72,105 | |
| | 16,184 | | Other Securities | | | 4.4 | | | | 340,862 | |
| | | | | | | | | | | 503,704 | |
| Health Care — 14.9% | |
| | 1,250 | | Catalyst Health Solutions, Inc.† | | | 0.8 | | | | 58,112 | |
| | 1,485 | | Corvel Corp.† | | | 0.9 | | | | 71,800 | |
| | 1,210 | | HMS Holdings Corp.† | | | 1.0 | | | | 78,372 | |
| | 1,535 | | IPC The Hospitalist Co., Inc.† | | | 0.8 | | | | 59,880 | |
| | 1,120 | | Quality Systems, Inc. | | | 1.0 | | | | 78,198 | |
| | 1,000 | | Salix Pharmaceuticals, Ltd.† | | | 0.6 | | | | 46,960 | |
| | Shares | | | | | Percentage of Net Assets (%) | | | | Value | |
| Health Care (continued) | |
| | 2,635 | | SXC Health Solutions Corp.† | | | 1.5 | | | $ | 112,936 | |
| | 30,231 | | Other Securities | | | 8.3 | | | | 639,169 | |
| | | | | | | | | | | 1,145,427 | |
| Industrials — 14.1% | |
| | 1,400 | | BE Aerospace, Inc.† | | | 0.7 | | | | 51,842 | |
| | 2,070 | | EnerSys† | | | 0.9 | | | | 66,489 | |
| | 1,175 | | Nordson Corp. | | | 1.4 | | | | 107,959 | |
| | 780 | | Triumph Group, Inc. | | | 0.9 | | | | 69,740 | |
| | 2,900 | | UTi Worldwide, Inc. | | | 0.8 | | | | 61,480 | |
| | 865 | | Wabtec Corp. | | | 0.6 | | | | 45,750 | |
| | 28,790 | | Other Securities | | | 8.8 | | | | 679,212 | |
| | | | | | | | | | | 1,082,472 | |
| Information Technology — 29.3% | |
| | 1,100 | | Acme Packet, Inc.† | | | 0.8 | | | | 58,476 | |
| | 2,225 | | Aruba Networks, Inc.† | | | 0.6 | | | | 46,458 | |
| | 950 | | Informatica Corp.† | | | 0.5 | | | | 41,829 | |
| | 840 | | MAXIMUS, Inc. | | | 0.7 | | | | 55,087 | |
| | 575 | | MicroStrategy, Inc., Class A† | | | 0.6 | | | | 49,145 | |
| | 3,310 | | MIPS Technologies, Inc., Class A† | | | 0.6 | | | | 50,180 | |
| | 3,122 | | Motricity, Inc.† | | | 0.8 | | | | 57,976 | |
| | 630 | | OpenTable, Inc.† | | | 0.6 | | | | 44,403 | |
| | 1,300 | | Pegasystems, Inc. | | | 0.6 | | | | 47,619 | |
| | 2,389 | | RightNow Technologies, Inc.† | | | 0.7 | | | | 56,547 | |
| | 2,300 | | Riverbed Technology, Inc.† | | | 1.0 | | | | 80,891 | |
| | 4,002 | | Sonic Solutions, Inc.† | | | 0.8 | | | | 60,030 | |
| | 2,473 | | Sourcefire, Inc.† | | | 0.8 | | | | 64,125 | |
| | 1,650 | | SuccessFactors, Inc.† | | | 0.6 | | | | 47,784 | |
| | 1,600 | | Synchronoss Technologies, Inc.† | | | 0.6 | | | | 42,736 | |
| | 1,100 | | Veeco Instruments, Inc.† | | | 0.6 | | | | 47,256 | |
| | 90,928 | | Other Securities | | | 18.4 | | | | 1,406,274 | |
| | | | | | | | | | | 2,256,816 | |
| Materials — 5.8% | |
| | 1,920 | | Kraton Performance Polymers, Inc.† | | | 0.8 | | | | 59,424 | |
| | 2,350 | | TPC Group, Inc.† | | | 0.9 | | | | 71,252 | |
| | 1,650 | | WR Grace & Co.† | | | 0.8 | | | | 57,965 | |
| | 9,925 | | Other Securities | | | 3.3 | | | | 257,343 | |
| | | | | | | | | | | 445,984 | |
See Notes to Financial Statements.
Wilshire Mutual Funds, Inc. Small Company Growth Portfolio �� December 31, 2010 Condensed Schedule of Investments - (Continued) | |
| | Shares | | | | | Percentage of Net Assets (%) | | | | Value | |
| Telecommunication Services — 1.2% | |
| | 4,600 | | Alaska Communications Systems Group, Inc. | | | 0.7 | | | $ | 51,060 | |
| | 3,650 | | Other Securities | | | 0.5 | | | | 42,638 | |
| | | | | | | | | | | 93,698 | |
| Total Common Stock | | | | | | | | |
| (Cost $5,503,404) | | | | | | | 7,575,104 | |
| | | | | | | | | | | | |
| Total Investments — 98.4% | | | | | | | | |
| (Cost $5,503,404) | | | | | | | 7,575,104 | |
| Other Assets & Liabilities, Net — 1.6% | | | | | | | 125,194 | |
| | | | | | | | | | | | |
| NET ASSETS — 100.0% | | | | | | $ | 7,700,298 | |
| † | Non-income producing security. |
| †† | More narrow industries are utilized for compliance purposes, whereas broad sectors are utilized for reporting purposes. |
The Condensed Schedule of Investments does not reflect the complete portfolio holdings. It includes the Portfolio’s 50 largest holdings and each investment of any issuer that exceeds 1% of the Portfolio’s net assets. “Other Securities” represent all issues not required to be disclosed under the rules adopted by the U.S. Securities and Exchange Commission (“SEC”). The complete schedule of portfolio holdings is available (i) without charge, upon request, by calling (800) 607-2200; (ii) on the SEC’s website at http://www.sec.gov; and (iii) on our website at www.wilfunds.com.
As of December 31, 2010, all of the Portfolio’s investments were considered Level 1. Please see Note 2 in Notes to Financial Statements for further information regarding fair value measurements.
See Notes to Financial Statements.
Wilshire Mutual Funds, Inc. Small Company Value Portfolio December 31, 2010 Condensed Schedule of Investments | |
| | Shares | | | | | Percentage of Net Assets (%) | | | | Value | |
| COMMON STOCK — 99.3%†† | |
| Consumer Discretionary — 10.2% | |
| | 5,650 | | Bob Evans Farms, Inc. | | | 1.3 | | | $ | 186,224 | |
| | 6,000 | | California Pizza Kitchen, Inc.† | | | 0.8 | | | | 103,680 | |
| | 4,450 | | Dillard's, Inc., Class A | | | 1.2 | | | | 168,833 | |
| | 59,046 | | Other Securities | | | 6.9 | | | | 958,758 | |
| | | | | | | | | | | 1,417,495 | |
| Consumer Staples — 2.3% | |
| | 6,200 | | Elizabeth Arden, Inc.† | | | 1.0 | | | | 142,662 | |
| | 20,000 | | Smart Balance, Inc.† | | | 0.6 | | | | 86,600 | |
| | 1,775 | | Other Securities | | | 0.7 | | | | 86,824 | |
| | | | | | | | | | | 316,086 | |
| Energy — 9.9% | |
| | 2,000 | | Berry Petroleum Co., Class A | | | 0.6 | | | | 87,400 | |
| | 3,750 | | Carrizo Oil & Gas, Inc.† | | | 0.9 | | | | 129,338 | |
| | 3,800 | | Nordic American Tanker Shipping | | | 0.7 | | | | 98,876 | |
| | 3,200 | | Overseas Shipholding Group, Inc. | | | 0.8 | | | | 113,344 | |
| | 4,000 | | Ship Finance International, Ltd. | | | 0.6 | | | | 86,080 | |
| | 1,350 | | SM Energy Co. | | | 0.6 | | | | 79,556 | |
| | 3,350 | | Subsea 7 SA ADR | | | 0.6 | | | | 81,539 | |
| | 2,750 | | World Fuel Services Corp. | | | 0.7 | | | | 99,440 | |
| | 71,620 | | Other Securities | | | 4.4 | | | | 608,662 | |
| | | | | | | | | | | 1,384,235 | |
| Financials — 30.5% | |
| | 10,350 | | American Capital, Ltd.† | | | 0.6 | | | | 78,246 | |
| | 16,820 | | American Equity Investment Life Holding Co. | | | 1.5 | | | | 211,091 | |
| | 2,300 | | Argo Group International Holdings, Ltd. | | | 0.6 | | | | 86,135 | |
| | 2,850 | | Aspen Insurance Holdings, Ltd. | | | 0.6 | | | | 81,567 | |
| | 8,150 | | Banco Latinoamericano de Comercio Exterior SA, Class E | | | 1.1 | | | | 150,449 | |
| | 5,857 | | Equity One, Inc. | | | 0.8 | | | | 106,480 | |
| | 20,600 | | First Commonwealth Financial Corp. | | | 1.0 | | | | 145,848 | |
| | 3,550 | | FirstMerit Corp. | | | 0.5 | | | | 70,254 | |
| | Shares | | | | | Percentage of Net Assets (%) | | | | Value | |
| Financials (continued) | |
| | 5,700 | | Forestar Group, Inc.† | | | 0.8 | | | $ | 110,010 | |
| | 3,415 | | LTC Properties, Inc. | | | 0.7 | | | | 95,893 | |
| | 5,610 | | MB Financial, Inc. | | | 0.7 | | | | 97,165 | |
| | 8,600 | | NewAlliance Bancshares, Inc. | | | 0.9 | | | | 128,828 | |
| | 1,900 | | StanCorp Financial Group, Inc. | | | 0.6 | | | | 85,766 | |
| | 10,050 | | Susquehanna Bancshares, Inc. | | | 0.7 | | | | 97,284 | |
| | 3,500 | | Texas Capital Bancshares, Inc.† | | | 0.5 | | | | 74,445 | |
| | 198,825 | | Other Securities | | | 18.9 | | | | 2,620,449 | |
| | | | | | | | | | | 4,239,910 | |
| Health Care — 3.0% | |
| | 3,100 | | Emergent Biosolutions, Inc.† | | | 0.5 | | | | 72,726 | |
| | 17,396 | | Other Securities | | | 2.5 | | | | 342,069 | |
| | | | | | | | | | | 414,795 | |
| Industrials — 15.7% | |
| | 17,000 | | Aircastle, Ltd. | | | 1.3 | | | | 177,650 | |
| | 6,500 | | Albany International Corp., Class A | | | 1.1 | | | | 153,985 | |
| | 3,650 | | Belden, Inc. | | | 1.0 | | | | 134,393 | |
| | 2,550 | | CIRCOR International, Inc. | | | 0.8 | | | | 107,814 | |
| | 11,850 | | Griffon Corp.† | | | 1.1 | | | | 150,969 | |
| | 5,100 | | Marten Transport, Ltd. | | | 0.8 | | | | 109,038 | |
| | 66,763 | | Other Securities | | | 9.6 | | | | 1,346,030 | |
| | | | | | | | | | | 2,179,879 | |
| Information Technology — 14.5% | |
| | 19,750 | | Brocade Communications Systems, Inc.† | | | 0.7 | | | | 104,478 | |
| | 2,700 | | Coherent, Inc.† | | | 0.9 | | | | 121,878 | |
| | 5,500 | | Convergys Corp.† | | | 0.5 | | | | 72,435 | |
| | 13,500 | | Entegris, Inc.† | | | 0.7 | | | | 100,845 | |
| | 2,000 | | Mantech International Corp., Class A† | | | 0.6 | | | | 82,660 | |
| | 6,250 | | Methode Electronics, Inc. | | | 0.6 | | | | 81,062 | |
| | 5,486 | | Standard Microsystems Corp.† | | | 1.2 | | | | 158,161 | |
| | 10,990 | | United Online, Inc. | | | 0.5 | | | | 72,534 | |
| | 63,079 | | Other Securities | | | 8.8 | | | | 1,220,757 | |
| | | | | | | | | | | 2,014,810 | |
See Notes to Financial Statements.
Wilshire Mutual Funds, Inc. Small Company Value Portfolio December 31, 2010 Condensed Schedule of Investments - (Continued) | |
| | Shares | | | | | Percentage of Net Assets (%) | | | | Value | |
| Materials — 10.4% | |
| | 4,200 | | Globe Specialty Metals, Inc. | | | 0.5 | | | $ | 71,778 | |
| | 30,550 | | Northgate Minerals Corp.† | | | 0.7 | | | | 97,760 | |
| | 4,450 | | Olin Corp. | | | 0.7 | | | | 91,314 | |
| | 3,450 | | Temple-Inland, Inc. | | | 0.5 | | | | 73,278 | |
| | 8,200 | | Thompson Creek Metals Co., Inc.† | | | 0.9 | | | | 120,704 | |
| | 3,200 | | WR Grace & Co.† | | | 0.8 | | | | 112,416 | |
| | 46,468 | | Other Securities | | | 6.3 | | | | 880,880 | |
| | | | | | | | | | | 1,448,130 | |
| Telecommunication Services — 0.6% | |
| | 6,820 | | Other Securities | | | 0.6 | | | | 85,310 | |
| | | | | | | | | | | | |
| Utilities — 2.2% | |
| | 1,950 | | Unisource Energy Corp. | | | 0.5 | | | | 69,888 | |
| | 9,967 | | Other Securities | | | 1.7 | | | | 245,673 | |
| | | | | | | | | | | 315,561 | |
| Total Common Stock | | | | | | | | |
| (Cost $11,021,607) | | | | | | | 13,816,211 | |
| | | | | | | | | | | | |
| Total Investments — 99.3% | | | | | | | | |
| (Cost $11,021,607) | | | | | | | 13,816,211 | |
| Other Assets & Liabilities, Net — 0.7% | | | | | | | 93,541 | |
| | | | | | | | | | | | |
| NET ASSETS — 100.0% | | | | | | $ | 13,909,752 | |
| † | Non-income producing security. |
| †† | More narrow industries are utilized for compliance purposes, whereas broad sectors are utilized for reporting purposes. |
ADR — American Depositary Receipt
The Condensed Schedule of Investments does not reflect the complete portfolio holdings. It includes the Portfolio’s 50 largest holdings and each investment of any issuer that exceeds 1% of the Portfolio’s net assets. “Other Securities” represent all issues not required to be disclosed under the rules adopted by the U.S. Securities and Exchange Commission (“SEC”). The complete schedule of portfolio holdings is available (i) without charge, upon request, by calling (800) 607-2200; (ii) on the SEC’s website at http://www.sec.gov; and (iii) on our website at www.wilfunds.com.
As of December 31, 2010, all of the Portfolio’s investments were considered Level 1. Please see Note 2 in Notes to Financial Statements for further information regarding fair value measurements.
See Notes to Financial Statements.
Wilshire Mutual Funds, Inc. Wilshire 5000 Indexsm Fund December 31, 2010 Condensed Schedule of Investments | |
| | Shares | | | | | Percentage of Net Assets (%) | | | | Value | |
| COMMON STOCK — 99.5% | |
| Consumer Discretionary — 11.1% | |
| | 4,250 | | Amazon.com, Inc.† | | | 0.5 | | | $ | 765,000 | |
| | 34,785 | | Ford Motor Co.† | | | 0.4 | | | | 584,040 | |
| | 18,650 | | Home Depot, Inc. (The) | | | 0.4 | | | | 653,869 | |
| | 11,800 | | McDonald's Corp. | | | 0.6 | | | | 905,768 | |
| | 21,518 | | Walt Disney Co. (The) | | | 0.5 | | | | 807,140 | |
| | 519,273 | | Other Securities | | | 8.7 | | | | 14,048,330 | |
| | | | | | | | | | | 17,764,147 | |
| Consumer Staples — 9.5% | |
| | 24,575 | | Altria Group, Inc. | | | 0.4 | | | | 605,037 | |
| | 24,820 | | Coca-Cola Co. (The) | | | 1.0 | | | | 1,632,411 | |
| | 16,042 | | CVS Caremark Corp. | | | 0.4 | | | | 557,780 | |
| | 19,371 | | Kraft Foods, Inc., Class A | | | 0.4 | | | | 610,380 | |
| | 18,840 | | PepsiCo, Inc. | | | 0.8 | | | | 1,230,817 | |
| | 20,125 | | Philip Morris International, Inc. | | | 0.7 | | | | 1,177,916 | |
| | 33,552 | | Procter & Gamble Co. (The) | | | 1.3 | | | | 2,158,400 | |
| | 23,895 | | Wal-Mart Stores, Inc. | | | 0.8 | | | | 1,288,657 | |
| | 171,440 | | Other Securities | | | 3.7 | | | | 6,056,212 | |
| | | | | | | | | | | 15,317,610 | |
| Energy — 11.5% | |
| | 4,606 | | Apache Corp. | | | 0.4 | | | | 549,173 | |
| | 23,799 | | Chevron Corp. | | | 1.4 | | | | 2,171,659 | |
| | 17,501 | | ConocoPhillips | | | 0.8 | | | | 1,191,818 | |
| | 60,169 | | Exxon Mobil Corp. | | | 2.8 | | | | 4,399,557 | |
| | 9,610 | | Occidental Petroleum Corp. | | | 0.6 | | | | 942,741 | |
| | 16,229 | | Schlumberger, Ltd. | | | 0.9 | | | | 1,355,121 | |
| | 256,342 | | Other Securities | | | 4.6 | | | | 7,785,567 | |
| | | | | | | | | | | 18,395,636 | |
| Financials — 16.4% | |
| | 118,448 | | Bank of America Corp. | | | 1.0 | | | | 1,580,096 | |
| | 20,100 | | Berkshire Hathaway, Inc., Class B† | | | 1.0 | | | | 1,610,211 | |
| | 249,750 | | Citigroup, Inc.† | | | 0.7 | | | | 1,181,317 | |
| | 6,120 | | Goldman Sachs Group, Inc. (The) | | | 0.7 | | | | 1,029,139 | |
| | 46,859 | | JPMorgan Chase & Co. | | | 1.2 | | | | 1,987,759 | |
| | 22,609 | | U.S. Bancorp | | | 0.4 | | | | 609,765 | |
| | 58,123 | | Wells Fargo & Co. | | | 1.1 | | | | 1,801,232 | |
| | 686,874 | | Other Securities | | | 10.3 | | | | 16,547,744 | |
| | | | | | | | | | | 26,347,263 | |
| | Shares | | | | | Percentage of Net Assets (%) | | | | Value | |
| Health Care — 11.0% | |
| | 18,200 | | Abbott Laboratories | | | 0.6 | | | $ | 871,962 | |
| | 11,302 | | Amgen, Inc.† | | | 0.4 | | | | 620,480 | |
| | 32,585 | | Johnson & Johnson | | | 1.3 | | | | 2,015,382 | |
| | 32,655 | | Merck & Co., Inc. | | | 0.7 | | | | 1,176,886 | |
| | 94,904 | | Pfizer, Inc. | | | 1.0 | | | | 1,661,769 | |
| | 362,953 | | Other Securities | | | 7.0 | | | | 11,312,211 | |
| | | | | | | | | | | 17,658,690 | |
| Industrials — 11.0% | |
| | 7,900 | | 3M Co. | | | 0.4 | | | | 681,770 | |
| | 6,500 | | Caterpillar, Inc. | | | 0.4 | | | | 608,790 | |
| | 126,246 | | General Electric Co. | | | 1.5 | | | | 2,309,039 | |
| | 8,600 | | United Parcel Service, Inc., Class B | | | 0.4 | | | | 624,188 | |
| | 9,544 | | United Technologies Corp. | | | 0.5 | | | | 751,304 | |
| | 339,382 | | Other Securities | | | 7.8 | | | | 12,659,032 | |
| | | | | | | | | | | 17,634,123 | |
| Information Technology — 18.2% | |
| | 10,800 | | Apple, Inc.† | | | 2.2 | | | | 3,483,648 | |
| | 67,423 | | Cisco Systems, Inc.† | | | 0.9 | | | | 1,363,967 | |
| | 22,779 | | EMC Corp.† | | | 0.3 | | | | 521,639 | |
| | 2,750 | | Google, Inc., Class A† | | | 1.0 | | | | 1,633,417 | |
| | 27,177 | | Hewlett-Packard Co. | | | 0.7 | | | | 1,144,152 | |
| | 65,766 | | Intel Corp. | | | 0.9 | | | | 1,383,059 | |
| | 14,170 | | International Business Machines Corp. | | | 1.3 | | | | 2,079,589 | |
| | 95,040 | | Microsoft Corp. | | | 1.7 | | | | 2,653,517 | |
| | 42,730 | | Oracle Corp. | | | 0.8 | | | | 1,337,449 | |
| | 18,925 | | QUALCOMM, Inc. | | | 0.6 | | | | 936,598 | |
| | 603,483 | | Other Securities | | | 7.8 | | | | 12,665,798 | |
| | | | | | | | | | | 29,202,833 | |
| Materials — 4.4% | |
| | 10,750 | | EI du Pont de Nemours & Co. | | | 0.3 | | | | 536,210 | |
| | 5,601 | | Freeport-McMoRan Copper & Gold, Inc. | | | 0.4 | | | | 672,624 | |
| | 167,344 | | Other Securities | | | 3.7 | | | | 5,850,637 | |
| | | | | | | | | | | 7,059,471 | |
| Telecommunication Services — 3.0% | |
| | 69,824 | | AT&T, Inc. | | | 1.3 | | | | 2,051,429 | |
| | 33,359 | | Verizon Communications, Inc. | | | 0.7 | | | | 1,193,585 | |
| | 135,168 | | Other Securities | | | 1.0 | | | | 1,511,553 | |
| | | | | | | | | | | 4,756,567 | |
See Notes to Financial Statements.
Wilshire Mutual Funds, Inc. Wilshire 5000 Indexsm Fund December 31, 2010 Condensed Schedule of Investments - (Continued) | |
| | Shares | | | | | Percentage of Net Assets (%) | | | | Value | |
| Utilities — 3.4% | |
| | 184,943 | | Other Securities | | | 3.4 | | | $ | 5,478,212 | |
| | | | | | | | | | | | |
| Total Common Stock | | | | | | | | |
| (Cost $98,417,344) | | | | | | | 159,614,552 | |
| | | | | | | | | | | | |
| WARRANTS — 0.0% | | | | | | | | |
| | 373 | | Other Securities (Cost $0) | | | | | | | 3,202 | |
| | | | | | | | | | | | |
| PRIVATE COMPANY — 0.0% | |
| | 82 | | Other Securities (Cost $0) | | | | | | | — | |
| | | | | | | | | | | | |
| RIGHTS — 0.0% | |
| | 3,218 | | Other Securities (Cost $900) | | | | | | | 834 | |
| | | | | | | | | | | | |
| Total Investments — 99.5% | | | | | | | | |
| (Cost $98,418,244) | | | | | | | 159,618,588 | |
| Other Assets & Liabilities, Net — 0.5% | | | | | | | 733,191 | |
| | | | | | | | | | | | |
| NET ASSETS — 100.0% | | | | | | $ | 160,351,779 | |
† Non-income producing security.
The Condensed Schedule of Investments does not reflect the complete portfolio holdings. It includes the Portfolio’s 50 largest holdings and each investment of any issuer that exceeds 1% of the Portfolio’s net assets. “Other Securities” represent all issues not required to be disclosed under the rules adopted by the U.S. Securities and Exchange Commission (“SEC”). The complete schedule of portfolio holdings is available (i) without charge, upon request, by calling (800) 607-2200; (ii) on the SEC’s website at http://www.sec.gov; and (iii) on our website at www.wilfunds.com.
As of December 31, 2010 all of the Fund’s investments were considered Level 1, except for Atherogenics, Inc., BearingPoint, Inc., Building Material Holding Corp., Idearc, Inc., Internet Media Services, Inc., Journal Register Co., Lear Corp., Noble International, Ltd., SIRVA, Inc. and Biofuel Energy Rights, which are Level 3. The value of Atherogenics, Inc., BearingPoint, Inc., Building Material Holding Corp., Idearc, Inc., Internet Media Services, Inc., Journal Register Co., Lear Corp., Noble International, Ltd. and SIRVA, Inc. at January 1, 2010 was zero, and the value has remained zero throughout the year ended December 31, 2010.
The following is a reconciliation of the investments in which significant unobservable inputs (Level 3) were used in determining value:
| | | | |
| Beginning balance as of January 1, 2010 | | $ | 6 | |
| Accrued discounts/premiums | | | — | |
| Realized gain/(loss) | | | (3,252 | ) |
| Change in unrealized appreciation/(depreciation) | | | 3,246 | |
| Net purchases/sales | | | — | |
| Net transfer in/or out of Level 3 | | | 760 | |
| Ending balance as of December 31, 2010 | | $ | 760 | |
Amounts designated as “—” are either $0, or have been rounded to $0.
See Notes to Financial Statements.
Wilshire Mutual Funds, Inc. Wilshire Large Cap Core 130/30 Fund December 31, 2010 Schedule of Investments | |
| COMMON STOCK — 126.3% | |
| Consumer Discretionary — 14.9% | |
| | 2,350 | | Advance Auto Parts, Inc. | | $ | 155,453 | |
| | 1,500 | | Amazon.com, Inc. † | | | 270,000 | |
| | 12,850 | | Apollo Group, Inc., Class A †(a) | | | 507,447 | |
| | 17,470 | | Best Buy Co., Inc. (a) | | | 599,046 | |
| | 22,900 | | Carnival Corp. (a) | | | 1,055,919 | |
| | 9,800 | | CBS Corp., Class B (a) | | | 186,690 | |
| | 16,760 | | China Automotive Systems, Inc. † | | | 227,936 | |
| | 11,970 | | Coach, Inc. (a) | | | 662,061 | |
| | 65,500 | | Comcast Corp. Special, Class A (a) | | | 1,439,035 | |
| | 1,950 | | Darden Restaurants, Inc. (a) | | | 90,558 | |
| | 1,200 | | DeVry, Inc. (a) | | | 57,576 | |
| | 5,200 | | Dick's Sporting Goods, Inc. † | | | 195,000 | |
| | 8,850 | | DISH Network Corp., Class A † | | | 173,991 | |
| | 3,850 | | Dollar Tree, Inc. †(a) | | | 215,908 | |
| | 17,670 | | Expedia, Inc. (a) | | | 443,340 | |
| | 22,980 | | Express, Inc. | | | 432,024 | |
| | 3,400 | | Family Dollar Stores, Inc. (a) | | | 169,014 | |
| | 9,050 | | Foot Locker, Inc. | | | 177,561 | |
| | 74,430 | | Ford Motor Co. †(a) | | | 1,249,679 | |
| | 12,600 | | Fortune Brands, Inc. (a) | | | 759,150 | |
| | 33,500 | | GameStop Corp., Class A †(a) | | | 766,480 | |
| | 11,400 | | Gannett Co., Inc. (a) | | | 172,026 | |
| | 7,400 | | Gap, Inc. (The) (a) | | | 163,836 | |
| | 37,130 | | General Motors Co. † | | | 1,368,612 | |
| | 2,900 | | Genuine Parts Co. | | | 148,886 | |
| | 40,740 | | H&R Block, Inc. (a) | | | 485,213 | |
| | 2,650 | | Harman International Industries, Inc. †(a) | | | 122,695 | |
| | 20,180 | | hhgregg, Inc. † | | | 422,771 | |
| | 40,250 | | Home Depot, Inc. (The) (a) | | | 1,411,165 | |
| | 52,230 | | International Game Technology (a) | | | 923,949 | |
| | 54,320 | | Interpublic Group of Cos., Inc. (The) †(a) | | | 576,878 | |
| | 25,250 | | Johnson Controls, Inc. (a) | | | 964,550 | |
| | 1,850 | | Lear Corp. † | | | 182,613 | |
| | 14,250 | | Leggett & Platt, Inc. | | | 324,330 | |
| | 13,040 | | Lennar Corp., Class A (a) | | | 244,500 | |
| | 4,800 | | Liberty Global, Inc., Class A † | | | 169,824 | |
| | 39,850 | | Lowe's Cos., Inc. (a) | | | 999,438 | |
| | 8,350 | | Ltd. Brands, Inc. (a) | | | 256,595 | |
| | 25,080 | | Macy's, Inc. (a) | | | 634,524 | |
| | 6,800 | | Mattel, Inc. (a) | | | 172,924 | |
| Consumer Discretionary (continued) | |
| | 3,600 | | McDonald's Corp. (a) | | $ | 276,336 | |
| | 4,100 | | McGraw-Hill Cos., Inc. (The) (a) | | | 149,281 | |
| | 38,970 | | MGM Resorts International †(a) | | | 578,705 | |
| | 9,950 | | Newell Rubbermaid, Inc. (a) | | | 180,891 | |
| | 18,800 | | News Corp., Class A (a) | | | 273,728 | |
| | 12,340 | | NIKE, Inc., Class B (a) | | | 1,054,083 | |
| | 2,850 | | Omnicom Group, Inc. (a) | | | 130,530 | |
| | 2,900 | | O'Reilly Automotive, Inc. † | | | 175,218 | |
| | 5,000 | | PetSmart, Inc. (a) | | | 199,100 | |
| | 1,850 | | Polo Ralph Lauren Corp., Class A | | | 205,202 | |
| | 650 | | priceline.com, Inc. †(a) | | | 259,708 | |
| | 2,150 | | Ross Stores, Inc. (a) | | | 135,988 | |
| | 4,200 | | Stanley Black & Decker, Inc. (a) | | | 280,854 | |
| | 26,260 | | Staples, Inc. (a) | | | 597,940 | |
| | 8,350 | | Starbucks Corp. (a) | | | 268,285 | |
| | 8,690 | | Starwood Hotels & Resorts Worldwide, Inc. | | | 528,178 | |
| | 3,300 | | Target Corp. (a) | | | 198,429 | |
| | 35,100 | | Time Warner, Inc. (a) | | | 1,129,167 | |
| | 9,780 | | Toll Brothers, Inc. †(a) | | | 185,820 | |
| | 41,710 | | Viacom, Inc., Class B | | | 1,652,133 | |
| | 12,750 | | Walt Disney Co. (The) (a) | | | 478,253 | |
| | 1,800 | | Whirlpool Corp. (a) | | | 159,894 | |
| | 5,300 | | Williams-Sonoma, Inc. | | | 189,157 | |
| | 7,150 | | Wyndham Worldwide Corp. (a) | | | 214,214 | |
| | | | | | | 29,080,291 | |
| Consumer Staples — 12.6% | |
| | 13,000 | | Altria Group, Inc. (a) | | | 320,060 | |
| | 5,600 | | Archer-Daniels-Midland Co. | | | 168,448 | |
| | 46,650 | | Avon Products, Inc. (a) | | | 1,355,649 | |
| | 14,800 | | Coca-Cola Co. (The) (a) | | | 973,396 | |
| | 2,050 | | Colgate-Palmolive Co. (a) | | | 164,759 | |
| | 66,490 | | ConAgra Foods, Inc. (a) | | | 1,501,344 | |
| | 5,800 | | Constellation Brands, Inc., Class A †(a) | | | 128,470 | |
| | 2,150 | | Costco Wholesale Corp. (a) | | | 155,252 | |
| | 66,100 | | CVS Caremark Corp. (a) | | | 2,298,297 | |
| | 35,030 | | Dr. Pepper Snapple Group, Inc. (a) | | | 1,231,655 | |
| | 2,400 | | Estee Lauder Cos., Inc. (The), Class A | | | 193,680 | |
| | 6,400 | | General Mills, Inc. (a) | | | 227,776 | |
| | 4,150 | | Hansen Natural Corp. †(a) | | | 216,962 | |
| | 3,150 | | Hershey Co. (The) (a) | | | 148,523 | |
| | 5,100 | | Hormel Foods Corp. (a) | | | 261,426 | |
See Notes to Financial Statements.
Wilshire Mutual Funds, Inc. Wilshire Large Cap Core 130/30 Fund December 31, 2010 Schedule of Investments - (Continued) | |
| Consumer Staples (continued) | |
| | 2,900 | | JM Smucker Co. (The) (a) | | $ | 190,385 | |
| | 12,900 | | Kellogg Co. (a) | | | 658,932 | |
| | 11,600 | | Kraft Foods, Inc., Class A (a) | | | 365,516 | |
| | 124,820 | | Kroger Co. (The) (a) | | | 2,790,975 | |
| | 4,500 | | Lorillard, Inc. (a) | | | 369,270 | |
| | 2,900 | | Molson Coors Brewing Co., Class B (a) | | | 145,551 | |
| | 29,650 | | PepsiCo, Inc. (a) | | | 1,937,034 | |
| | 12,300 | | Philip Morris International, Inc. (a) | | | 719,919 | |
| | 88,840 | | Procter & Gamble Co. (The) (a) | | | 5,715,077 | |
| | 4,850 | | Reynolds American, Inc. (a) | | | 158,207 | |
| | 7,750 | | Safeway, Inc. (a) | | | 174,297 | |
| | 8,500 | | SUPERVALU, Inc. | | | 81,855 | |
| | 12,900 | | Tyson Foods, Inc., Class A (a) | | | 222,138 | |
| | 17,800 | | Unilever NV, NY Shares (a) | | | 558,920 | |
| | 3,750 | | Universal Corp. (a) | | | 152,625 | |
| | 5,550 | | Walgreen Co. (a) | | | 216,228 | |
| | 9,450 | | Wal-Mart Stores, Inc. (a) | | | 509,638 | |
| | 6,850 | | Whole Foods Market, Inc. | | | 346,542 | |
| | | | | | | 24,658,806 | |
| Energy — 14.2% | |
| | 2,450 | | Apache Corp. (a) | | | 292,114 | |
| | 18,100 | | Baker Hughes, Inc. (a) | | | 1,034,777 | |
| | 13,000 | | BP PLC ADR (a) | | | 574,210 | |
| | 13,620 | | Cameron International Corp. †(a) | | | 690,943 | |
| | 4,300 | | Chesapeake Energy Corp. (a) | | | 111,413 | |
| | 12,400 | | Chevron Corp. (a) | | | 1,131,500 | |
| | 2,550 | | Cimarex Energy Co. (a) | | | 225,751 | |
| | 12,700 | | ConocoPhillips (a) | | | 864,870 | |
| | 3,560 | | Devon Energy Corp. (a) | | | 279,496 | |
| | 9,000 | | Ensco PLC ADR (a) | | | 480,420 | |
| | 76,140 | | Exxon Mobil Corp. (a) | | | 5,567,357 | |
| | 26,490 | | Forest Oil Corp. †(a) | | | 1,005,825 | |
| | 26,760 | | Halliburton Co. (a) | | | 1,092,611 | |
| | 2,850 | | Helmerich & Payne, Inc. (a) | | | 138,168 | |
| | 18,730 | | Hess Corp. (a) | | | 1,433,594 | |
| | 3,450 | | Holly Corp. | | | 140,656 | |
| | 29,020 | | Marathon Oil Corp. (a) | | | 1,074,611 | |
| | 6,900 | | McDermott International, Inc. † | | | 142,761 | |
| | 4,750 | | Nabors Industries, Ltd. † | | | 111,435 | |
| | 17,320 | | National Oilwell Varco, Inc. (a) | | | 1,164,770 | |
| | 10,360 | | Newfield Exploration Co. †(a) | | | 747,060 | |
| | 27,400 | | Nexen, Inc. (a) | | | 627,460 | |
| | 27,900 | | Noble Corp. (a) | | | 997,983 | |
| Energy (continued) | |
| | 11,260 | | Occidental Petroleum Corp. (a) | | $ | 1,104,606 | |
| | 3,150 | | Oil States International, Inc. †(a) | | | 201,883 | |
| | 8,850 | | Patterson-UTI Energy, Inc. (a) | | | 190,717 | |
| | 10,550 | | Peabody Energy Corp. (a) | | | 674,989 | |
| | 9,200 | | Petroleo Brasileiro SA ADR (a) | | | 348,128 | |
| | 17,690 | | Pride International, Inc. †(a) | | | 583,770 | |
| | 4,450 | | Rowan Cos., Inc. †(a) | | | 155,350 | |
| | 15,050 | | Schlumberger, Ltd. (a) | | | 1,256,675 | |
| | 1,650 | | SEACOR Holdings, Inc. | | | 166,799 | |
| | 3,350 | | SM Energy Co. | | | 197,415 | |
| | 10,120 | | Southwestern Energy Co. †(a) | | | 378,792 | |
| | 5,920 | | Transocean, Ltd. †(a) | | | 411,499 | |
| | 19,100 | | Ultra Petroleum Corp. †(a) | | | 912,407 | |
| | 4,450 | | Unit Corp. † | | | 206,836 | |
| | 7,050 | | Valero Energy Corp. (a) | | | 162,996 | |
| | 23,430 | | Weatherford International, Ltd. † | | | 534,204 | |
| | 2,250 | | Whiting Petroleum Corp. †(a) | | | 263,677 | |
| | | | | | | 27,680,528 | |
| Financials — 20.1% | |
| | 12,120 | | ACE, Ltd. | | | 754,470 | |
| | 81,000 | | Aegon NV, NY Shares (a) | | | 496,530 | |
| | 22,950 | | Aflac, Inc. (a) | | | 1,295,069 | |
| | 3,650 | | Allstate Corp. (The) (a) | | | 116,362 | |
| | 5,350 | | American Express Co. (a) | | | 229,622 | |
| | 3,550 | | Ameriprise Financial, Inc. (a) | | | 204,303 | |
| | 2,550 | | Assurant, Inc. (a) | | | 98,226 | |
| | 11,400 | | BancorpSouth, Inc. | | | 181,830 | |
| | 58,800 | | Bank of America Corp. (a) | | | 784,392 | |
| | 32,800 | | Bank of New York Mellon Corp. (The) (a) | | | 990,560 | |
| | 10,550 | | Berkshire Hathaway, Inc., Class B †(a) | | | 845,160 | |
| | 5,850 | | Capital One Financial Corp. (a) | | | 248,976 | |
| | 54,470 | | CB Richard Ellis Group, Inc., Class A †(a) | | | 1,115,546 | |
| | 48,880 | | Charles Schwab Corp. (The) (a) | | | 836,337 | |
| | 2,750 | | Chubb Corp. (a) | | | 164,010 | |
| | 564,570 | | Citigroup, Inc. †(a) | | | 2,670,416 | |
| | 4,230 | | CME Group, Inc., Class A | | | 1,361,003 | |
| | 6,600 | | CNA Financial Corp. †(a) | | | 178,530 | |
| | 7,350 | | Discover Financial Services (a) | | | 136,196 | |
| | 4,250 | | Equity Residential (a) | | | 220,788 | |
| | 3,650 | | Erie Indemnity Co., Class A (a) | | | 238,965 | |
| | 1,650 | | Essex Property Trust, Inc. (a) | | | 188,463 | |
See Notes to Financial Statements.
Wilshire Mutual Funds, Inc. Wilshire Large Cap Core 130/30 Fund December 31, 2010 Schedule of Investments - (Continued) | |
| Financials (continued) | |
| | 9,750 | | Fifth Third Bancorp (a) | | $ | 143,130 | |
| | 26,600 | | First Horizon National Corp. † | | | 313,348 | |
| | 8,300 | | Goldman Sachs Group, Inc. (The) (a) | | | 1,395,728 | |
| | 20,570 | | Interactive Brokers Group, Inc., Class A (a) | | | 366,557 | |
| | 4,750 | | International Bancshares Corp. (a) | | | 95,142 | |
| | 24,500 | | Invesco, Ltd. (a) | | | 589,470 | |
| | 103,100 | | JPMorgan Chase & Co. (a) | | | 4,373,502 | |
| | 4,650 | | Legg Mason, Inc. | | | 168,655 | |
| | 33,880 | | Lincoln National Corp. (a) | | | 942,203 | |
| | 4,300 | | Loews Corp. (a) | | | 167,313 | |
| | 1,550 | | M&T Bank Corp. | | | 134,928 | |
| | 22,900 | | MetLife, Inc. | | | 1,017,676 | |
| | 102,790 | | MF Global Holdings, Ltd. †(a) | | | 859,324 | |
| | 66,950 | | Morgan Stanley (a) | | | 1,821,710 | |
| | 17,350 | | NASDAQ OMX Group, Inc. (The) †(a) | | | 411,368 | |
| | 13,100 | | Platinum Underwriters Holdings, Ltd. (a) | | | 589,107 | |
| | 4,400 | | PNC Financial Services Group, Inc. (a) | | | 267,168 | |
| | 26,550 | | Principal Financial Group, Inc. (a) | | | 864,468 | |
| | 11,650 | | ProLogis | | | 168,226 | |
| | 3,900 | | Prudential Financial, Inc. (a) | | | 228,969 | |
| | 6,460 | | Public Storage (a) | | | 655,173 | |
| | 66,650 | | Regions Financial Corp. (a) | | | 466,550 | |
| | 2,700 | | Reinsurance Group of America, Inc., Class A (a) | | | 145,017 | |
| | 2,200 | | RenaissanceRe Holdings, Ltd. (a) | | | 140,118 | |
| | 2,450 | | SL Green Realty Corp. | | | 165,399 | |
| | 4,050 | | State Street Corp. (a) | | | 187,677 | |
| | 29,990 | | SunTrust Banks, Inc. | | | 885,005 | |
| | 55,800 | | TD Ameritrade Holding Corp. (a) | | | 1,059,642 | |
| | 6,380 | | TradeStation Group, Inc. †(a) | | | 43,065 | |
| | 6,800 | | Travelers Cos., Inc. (The) (a) | | | 378,828 | |
| | 42,500 | | U.S. Bancorp (a) | | | 1,146,225 | |
| | 10,550 | | Unum Group (a) | | | 255,521 | |
| | 25,800 | | Visa, Inc., Class A (a) | | | 1,815,804 | |
| | 16,560 | | Waddell & Reed Financial, Inc., Class A | | | 584,402 | |
| | 83,700 | | Wells Fargo & Co. (a) | | | 2,593,863 | |
| | 590 | | Wesco Financial Corp. (a) | | | 217,362 | |
| | 450 | | White Mountains Insurance Group, Ltd. | | | 151,020 | |
| | 4,600 | | XL Group PLC, Class A (a) | | | 100,372 | |
| | | | | | | 39,264,789 | |
| Health Care — 14.6% | |
| | 7,350 | | Abbott Laboratories (a) | | $ | 352,139 | |
| | 3,600 | | Aetna, Inc. (a) | | | 109,836 | |
| | 3,600 | | Alexion Pharmaceuticals, Inc. † | | | 289,980 | |
| | 19,000 | | Allergan, Inc. (a) | | | 1,304,730 | |
| | 48,800 | | Amarin Corp. PLC ADR †(a) | | | 400,648 | |
| | 8,800 | | AmerisourceBergen Corp., Class A (a) | | | 300,256 | |
| | 14,600 | | Amgen, Inc. †(a) | | | 801,540 | |
| | 9,000 | | Amylin Pharmaceuticals, Inc. †(a) | | | 132,390 | |
| | 15,050 | | Baxter International, Inc. (a) | | | 761,831 | |
| | 2,350 | | Becton Dickinson and Co. (a) | | | 198,622 | |
| | 15,020 | | Biogen Idec, Inc. †(a) | | | 1,007,091 | |
| | 111,570 | | Boston Scientific Corp. †(a) | | | 844,585 | |
| | 2,800 | | C.R. Bard, Inc. (a) | | | 256,956 | |
| | 4,300 | | Cardinal Health, Inc. (a) | | | 164,733 | |
| | 3,800 | | Celgene Corp. † | | | 224,732 | |
| | 9,380 | | Cephalon, Inc. †(a) | | | 578,934 | |
| | 2,350 | | Cerner Corp. †(a) | | | 222,639 | |
| | 4,750 | | CIGNA Corp. (a) | | | 174,135 | |
| | 4,050 | | Cooper Cos., Inc. (The) | | | 228,177 | |
| | 9,850 | | Coventry Health Care, Inc. †(a) | | | 260,040 | |
| | 25,400 | | Covidien PLC (a) | | | 1,159,764 | |
| | 2,730 | | DaVita, Inc. †(a) | | | 189,708 | |
| | 7,900 | | Eli Lilly & Co. (a) | | | 276,816 | |
| | 5,200 | | Endo Pharmaceuticals Holdings, Inc. †(a) | | | 185,692 | |
| | 7,640 | | Express Scripts, Inc., Class A †(a) | | | 412,942 | |
| | 9,150 | | Forest Laboratories, Inc. †(a) | | | 292,617 | |
| | 7,870 | | Genzyme Corp. †(a) | | | 560,344 | |
| | 20,430 | | Gilead Sciences, Inc. †(a) | | | 740,383 | |
| | 8,000 | | Health Net, Inc. †(a) | | | 218,320 | |
| | 5,900 | | Hill-Rom Holdings, Inc. (a) | | | 232,283 | |
| | 14,870 | | Hologic, Inc. †(a) | | | 279,853 | |
| | 3,200 | | Humana, Inc. †(a) | | | 175,168 | |
| | 35,810 | | Johnson & Johnson (a) | | | 2,214,848 | |
| | 9,350 | | Kindred Healthcare, Inc. †(a) | | | 171,759 | |
| | 3,750 | | Kinetic Concepts, Inc. †(a) | | | 157,050 | |
| | 2,450 | | McKesson Corp. (a) | | | 172,431 | |
| | 27,000 | | Medtronic, Inc. (a) | | | 1,001,430 | |
| | 70,710 | | Merck & Co., Inc. (a) | | | 2,548,388 | |
| | 11,290 | | Omnicare, Inc. | | | 286,653 | |
| | 6,620 | | Onyx Pharmaceuticals, Inc. † | | | 244,079 | |
| | 2,950 | | Perrigo Co. (a) | | | 186,824 | |
| | 149,910 | | Pfizer, Inc. (a) | | | 2,624,924 | |
| | 2,750 | | St. Jude Medical, Inc. †(a) | | | 117,563 | |
See Notes to Financial Statements.
Wilshire Mutual Funds, Inc. Wilshire Large Cap Core 130/30 Fund December 31, 2010 Schedule of Investments - (Continued) | |
| Health Care (continued) | |
| | 3,000 | | Stryker Corp. (a) | | $ | 161,100 | |
| | 4,550 | | SXC Health Solutions Corp. † | | | 195,013 | |
| | 16,760 | | Theravance, Inc. † | | | 420,173 | |
| | 11,760 | | Thermo Fisher Scientific, Inc. † (a) | | | 651,034 | |
| | 2,950 | | United Therapeutics Corp. † | | | 186,499 | |
| | 58,900 | | UnitedHealth Group, Inc. (a) | | | 2,126,879 | |
| | 13,800 | | Valeant Pharmaceuticals International, Inc. (a) | | | 390,402 | |
| | 1,750 | | Varian Medical Systems, Inc. †(a) | | | 121,240 | |
| | 4,950 | | Watson Pharmaceuticals, Inc. †(a) | | | 255,668 | |
| | 5,400 | | WellCare Health Plans, Inc. †(a) | | | 163,188 | |
| | 3,900 | | WellPoint, Inc. †(a) | | | 221,754 | |
| | 8,200 | | Zimmer Holdings, Inc. †(a) | | | 440,176 | |
| | | | | | | 28,396,959 | |
| Industrials — 14.3% | |
| | 2,900 | | 3M Co. (a) | | | 250,270 | |
| | 5,910 | | AGCO Corp. †(a) | | | 299,401 | |
| | 17,390 | | BE Aerospace, Inc. † | | | 643,952 | |
| | 3,150 | | Carlisle Cos., Inc. (a) | | | 125,181 | |
| | 14,320 | | Caterpillar, Inc. (a) | | | 1,341,211 | |
| | 18,600 | | CNH Global NV (a) | | | 887,964 | |
| | 11,570 | | CSX Corp. (a) | | | 747,538 | |
| | 14,520 | | Cummins, Inc. (a) | | | 1,597,345 | |
| | 4,000 | | Danaher Corp. (a) | | | 188,680 | |
| | 12,020 | | Deere & Co. (a) | | | 998,261 | |
| | 11,900 | | Delta Air Lines, Inc. †(a) | | | 149,940 | |
| | 5,900 | | Deluxe Corp. (a) | | | 135,818 | |
| | 3,150 | | Donaldson Co., Inc. | | | 183,582 | |
| | 13,400 | | Dover Corp. (a) | | | 783,230 | |
| | 1,950 | | Eaton Corp. (a) | | | 197,944 | |
| | 3,600 | | Emerson Electric Co. (a) | | | 205,812 | |
| | 3,650 | | Expeditors International of Washington, Inc. (a) | | | 199,290 | |
| | 12,850 | | FedEx Corp. (a) | | | 1,195,178 | |
| | 10,460 | | Fluor Corp. | | | 693,080 | |
| | 11,100 | | Foster Wheeler AG † | | | 383,172 | |
| | 2,850 | | Gardner Denver, Inc. (a) | | | 196,137 | |
| | 4,900 | | General Cable Corp. †(a) | | | 171,941 | |
| | 18,850 | | General Dynamics Corp. (a) | | | 1,337,596 | |
| | 69,530 | | General Electric Co. (a) | | | 1,271,704 | |
| | 6,500 | | Honeywell International, Inc. | | | 345,540 | |
| | 24,100 | | Illinois Tool Works, Inc. | | | 1,286,940 | |
| | 6,150 | | ITT Corp. (a) | | | 320,476 | |
| | 7,640 | | Joy Global, Inc. (a) | | | 662,770 | |
| Industrials (continued) | |
| | 16,450 | | Kennametal, Inc. (a) | | $ | 649,117 | |
| | 1,550 | | L-3 Communications Holdings, Inc. (a) | | | 109,260 | |
| | 2,750 | | Nordson Corp. (a) | | | 252,670 | |
| | 3,350 | | Norfolk Southern Corp. (a) | | | 210,447 | |
| | 1,800 | | Northrop Grumman Corp. (a) | | | 116,604 | |
| | 6,600 | | Oshkosh Corp. †(a) | | | 232,584 | |
| | 14,450 | | PACCAR, Inc. (a) | | | 829,719 | |
| | 9,300 | | Pall Corp. (a) | | | 461,094 | |
| | 2,150 | | Parker Hannifin Corp. (a) | | | 185,545 | |
| | 13,600 | | Raytheon Co. (a) | | | 630,224 | |
| | 13,060 | | Rockwell Automation, Inc. (a) | | | 936,533 | |
| | 19,400 | | Ryder System, Inc. (a) | | | 1,021,216 | |
| | 8,600 | | Snap-On, Inc. (a) | | | 486,588 | |
| | 46,550 | | Southwest Airlines Co. (a) | | | 604,219 | |
| | 2,950 | | SPX Corp. | | | 210,896 | |
| | 30,480 | | Swift Transporation Co., Class A † | | | 381,305 | |
| | 26,030 | | Terex Corp. †(a) | | | 807,971 | |
| | 6,000 | | Textron, Inc. | | | 141,840 | |
| | 3,550 | | Towers Watson & Co., Class A (a) | | | 184,813 | |
| | 5,500 | | Trinity Industries, Inc. (a) | | | 146,355 | |
| | 8,800 | | Union Pacific Corp. (a) | | | 815,408 | |
| | 6,350 | | United Parcel Service, Inc., Class B (a) | | | 460,883 | |
| | 9,910 | | United Technologies Corp. (a) | | | 780,115 | |
| | 3,350 | | URS Corp. †(a) | | | 139,393 | |
| | 8,950 | | Werner Enterprises, Inc. (a) | | | 202,270 | |
| | 1,150 | | WW Grainger, Inc. (a) | | | 158,826 | |
| | | | | | | 27,955,848 | |
| Information Technology — 22.3% | |
| | 36,200 | | Adobe Systems, Inc. † | | | 1,114,236 | |
| | 3,850 | | Akamai Technologies, Inc. † | | | 181,143 | |
| | 4,650 | | Altera Corp. (a) | | | 165,447 | |
| | 5,600 | | Analog Devices, Inc. (a) | | | 210,952 | |
| | 7,800 | | AOL, Inc. † | | | 184,938 | |
| | 20,920 | | Apple, Inc. †(a) | | | 6,747,955 | |
| | 55,600 | | Applied Materials, Inc. (a) | | | 781,180 | |
| | 27,270 | | Ariba, Inc. † | | | 640,572 | |
| | 23,900 | | Autodesk, Inc. †(a) | | | 912,980 | |
| | 3,500 | | Automatic Data Processing, Inc. (a) | | | 161,980 | |
| | 12,600 | | AVX Corp. (a) | | | 194,418 | |
| | 7,650 | | Blue Coat Systems, Inc. †(a) | | | 228,505 | |
| | 5,320 | | BMC Software, Inc. †(a) | | | 250,785 | |
| | 22,310 | | Broadcom Corp., Class A (a) | | | 971,600 | |
| | 7,450 | | CA, Inc. (a) | | | 182,078 | |
See Notes to Financial Statements.
Wilshire Mutual Funds, Inc. Wilshire Large Cap Core 130/30 Fund December 31, 2010 Schedule of Investments - (Continued) | |
| Information Technology (continued) | |
| | 99,720 | | Cisco Systems, Inc. †(a) | | $ | 2,017,336 | |
| | 3,700 | | Cognizant Technology Solutions Corp., Class A †(a) | | | 271,173 | |
| | 2,350 | | Computer Sciences Corp. (a) | | | 116,560 | |
| | 15,500 | | Compuware Corp. †(a) | | | 180,885 | |
| | 67,750 | | Dell, Inc. †(a) | | | 918,013 | |
| | 26,260 | | DemandTec, Inc. † | | | 284,658 | |
| | 4,050 | | DST Systems, Inc. (a) | | | 179,617 | |
| | 8,050 | | eBay, Inc. †(a) | | | 224,031 | |
| | 11,750 | | Electronic Arts, Inc. † | | | 192,465 | |
| | 53,030 | | EMC Corp. †(a) | | | 1,214,387 | |
| | 36,660 | | Emulex Corp. †(a) | | | 427,456 | |
| | 1,600 | | Factset Research Systems, Inc. (a) | | | 150,016 | |
| | 5,830 | | Google, Inc., Class A †(a) | | | 3,462,845 | |
| | 1,850 | | Harris Corp. (a) | | | 83,805 | |
| | 38,900 | | Hewlett-Packard Co. (a) | | | 1,637,690 | |
| | 7,000 | | IAC/InterActive Corp. †(a) | | | 200,900 | |
| | 20,200 | | Integrated Device Technology, Inc. †(a) | | | 134,532 | |
| | 69,830 | | Intel Corp. (a) | | | 1,468,525 | |
| | 5,450 | | International Business Machines Corp. (a) | | | 799,842 | |
| | 31,200 | | Intersil Corp., Class A (a) | | | 476,424 | |
| | 8,350 | | Jabil Circuit, Inc. (a) | | | 167,751 | |
| | 8,450 | | JDS Uniphase Corp. † | | | 122,356 | |
| | 3,900 | | Lexmark International, Inc., Class A †(a) | | | 135,798 | |
| | 23,300 | | LSI Corp. †(a) | | | 139,567 | |
| | 56,600 | | Marvell Technology Group, Ltd. †(a) | | | 1,049,930 | |
| | 800 | | Mastercard, Inc., Class A (a) | | | 179,288 | |
| | 9,550 | | Micron Technology, Inc. †(a) | | | 76,591 | |
| | 108,790 | | Microsoft Corp. (a) | | | 3,037,417 | |
| | 6,350 | | Molex, Inc. (a) | | | 144,272 | |
| | 10,350 | | Motorola Solutions, Inc. † | | | 93,874 | |
| | 36,800 | | National Semiconductor Corp. (a) | | | 506,368 | |
| | 11,050 | | NCR Corp. †(a) | | | 169,838 | |
| | 8,750 | | NeuStar, Inc., Class A † | | | 227,938 | |
| | 4,200 | | Novellus Systems, Inc. †(a) | | | 135,744 | |
| | 58,890 | | Oracle Corp. (a) | | | 1,843,257 | |
| | 10,850 | | QLogic Corp. †(a) | | | 184,667 | |
| | 56,480 | | QUALCOMM, Inc. (a) | | | 2,795,195 | |
| | 3,250 | | SanDisk Corp. †(a) | | | 162,045 | |
| | 44,350 | | Seagate Technology PLC †(a) | | | 666,581 | |
| | 27,430 | | SolarWinds, Inc. †(a) | | | 528,028 | |
| | 54,600 | | Symantec Corp. †(a) | | | 914,004 | |
| Information Technology (continued) | |
| | 4,150 | | Tech Data Corp. †(a) | | $ | 182,683 | |
| | 10,000 | | Tellabs, Inc. (a) | | | 67,800 | |
| | 3,850 | | Teradata Corp. †(a) | | | 158,466 | |
| | 10,450 | | Texas Instruments, Inc. (a) | | | 339,625 | |
| | 11,700 | | Vishay Intertechnology, Inc. †(a) | | | 171,756 | |
| | 13,400 | | VistaPrint NV † | | | 616,400 | |
| | 3,550 | | WebMD Health Corp., Class A †(a) | | | 181,263 | |
| | 26,420 | | Western Digital Corp. †(a) | | | 895,638 | |
| | 15,050 | | Xerox Corp. (a) | | | 173,376 | |
| | 8,450 | | Yahoo!, Inc. †(a) | | | 140,524 | |
| | | | | | | 43,577,969 | |
| Materials — 5.0% | |
| | 2,900 | | Air Products & Chemicals, Inc. (a) | | | 263,755 | |
| | 7,000 | | Alcoa, Inc. (a) | | | 107,730 | |
| | 3,250 | | Aptargroup, Inc. (a) | | | 154,603 | |
| | 25,350 | | Celanese Corp., Series A (a) | | | 1,043,660 | |
| | 4,760 | | CF Industries Holdings, Inc. (a) | | | 643,314 | |
| | 2,900 | | Cliffs Natural Resources, Inc. (a) | | | 226,229 | |
| | 42,530 | | Dow Chemical Co. (The) (a) | | | 1,451,974 | |
| | 7,000 | | EI du Pont de Nemours & Co. (a) | | | 349,160 | |
| | 2,450 | | FMC Corp. | | | 195,730 | |
| | 8,440 | | Freeport-McMoRan Copper & Gold, Inc. (a) | | | 1,013,560 | |
| | 7,700 | | Goldcorp, Inc. (a) | | | 354,046 | |
| | 3,450 | | Greif, Inc., Class A (a) | | | 213,555 | |
| | 3,050 | | International Flavors & Fragrances, Inc. (a) | | | 169,550 | |
| | 8,400 | | International Paper Co. (a) | | | 228,816 | |
| | 7,700 | | Monsanto Co. (a) | | | 536,228 | |
| | 3,400 | | Newmont Mining Corp. (a) | | | 208,862 | |
| | 3,650 | | Nucor Corp. | | | 159,943 | |
| | 1,550 | | PPG Industries, Inc. (a) | | | 130,308 | |
| | 5,120 | | Praxair, Inc. (a) | | | 488,806 | |
| | 3,850 | | Reliance Steel & Aluminum Co. (a) | | | 196,735 | |
| | 3,050 | | Scotts Miracle-Gro Co. (The), Class A | | | 154,849 | |
| | 3,600 | | Sealed Air Corp. (a) | | | 91,620 | |
| | 2,050 | | Sherwin-Williams Co. (The) (a) | | | 171,688 | |
| | 4,150 | | Sonoco Products Co. (a) | | | 139,730 | |
| | 35,100 | | Steel Dynamics, Inc. | | | 642,330 | |
| | 1,260 | | Walter Energy, Inc. (a) | | | 161,078 | |
| | 11,700 | | Weyerhaeuser Co. | | | 221,481 | |
| | | | | | | 9,719,340 | |
See Notes to Financial Statements.
Wilshire Mutual Funds, Inc. Wilshire Large Cap Core 130/30 Fund December 31, 2010 Schedule of Investments - (Continued) | |
| Telecommunication Services — 3.5% | |
| | 11,030 | | American Tower Corp., Class A †(a) | | $ | 569,589 | |
| | 95,830 | | AT&T, Inc. (a) | | | 2,815,485 | |
| | 6,000 | | CenturyLink, Inc. (a) | | | 277,020 | |
| | 15,250 | | MetroPCS Communications, Inc. †(a) | | | 192,608 | |
| | 19,700 | | NII Holdings, Inc. †(a) | | | 879,802 | |
| | 164,780 | | Qwest Communications International, Inc. (a) | | | 1,253,976 | |
| | 4,950 | | Telephone & Data Systems, Inc. | | | 180,922 | |
| | 20,150 | | Verizon Communications, Inc. (a) | | | 720,967 | |
| | | | | | | 6,890,369 | |
| Utilities — 4.8% | |
| | 49,980 | | AES Corp. (The) †(a) | | | 608,756 | |
| | 71,100 | | American Electric Power Co., Inc. (a) | | | 2,558,178 | |
| | 4,350 | | American Water Works Co., Inc. (a) | | | 110,012 | |
| | 8,600 | | CMS Energy Corp. (a) | | | 159,960 | |
| | 2,350 | | Consolidated Edison, Inc. (a) | | | 116,490 | |
| | 3,600 | | Constellation Energy Group, Inc. (a) | | | 110,268 | |
| | 2,250 | | Dominion Resources, Inc. (a) | | | 96,120 | |
| | 3,400 | | DTE Energy Co. | | | 154,088 | |
| | 18,950 | | Duke Energy Corp. (a) | | | 337,500 | |
| | 18,250 | | Edison International (a) | | | 704,450 | |
| | 5,550 | | Exelon Corp. (a) | | | 231,102 | |
| | 21,150 | | FirstEnergy Corp. (a) | | | 782,973 | |
| | 6,500 | | IDACORP, Inc. (a) | | | 240,370 | |
| | 3,650 | | Integrys Energy Group, Inc. (a) | | | 177,062 | |
| | 20,100 | | MDU Resources Group, Inc. (a) | | | 407,427 | |
| | 2,000 | | NextEra Energy, Inc. (a) | | | 103,980 | |
| | 3,750 | | Oneok, Inc. | | | 208,012 | |
| | 7,350 | | Pepco Holdings, Inc. | | | 134,137 | |
| | 16,220 | | PG&E Corp. (a) | | | 775,965 | |
| | 3,700 | | Pinnacle West Capital Corp. (a) | | | 153,365 | |
| | 13,800 | | PNM Resources, Inc. | | | 179,676 | |
| | 7,650 | | PPL Corp. (a) | | | 201,348 | |
| | 3,300 | | Progress Energy, Inc. (a) | | | 143,484 | |
| | 6,250 | | Public Service Enterprise Group, Inc. (a) | | | 198,812 | |
| | 4,600 | | Southern Co. (a) | | | 175,858 | |
| | 7,850 | | Xcel Energy, Inc. | | | 184,867 | |
| | | | | | | 9,254,260 | |
| Total Common Stock (Cost $205,711,012) | | | 246,479,159 | |
| EXCHANGE-TRADED FUNDS — 0.2% | |
| | 1,850 | | iShares Russell 1000 Index Fund | | $ | 129,241 | |
| | 2,000 | | SPDR S&P 500 ETF Trust | | | 251,560 | |
| Total Exchange-Traded Funds (Cost $362,078) | | | 380,801 | |
| | | | | | | | |
| Total Investments — 126.5% | | | | |
| (Cost $206,073,090) | | | 246,859,960 | |
| Other Assets & Liabilities, Net — (26.5)% | | | (51,693,437 | ) |
| | | | | | | | |
| NET ASSETS — 100.0% | | $ | 195,166,523 | |
† Non-income producing security.
ADR — American Depositary Receipt
ETF — Exchange-Traded Fund
PLC — Public Limited Company
SPDR — Standard & Poor’s Depositary Receipt
(a) All or a portion of the shares have been committed as collateral for open short positions.
As of December 31, 2010, all of the Fund’s investments were considered Level 1. Please see Note 2 in Notes to Financial Statements for further information regarding fair value measurements.
See Notes to Financial Statements.
Wilshire Mutual Funds, Inc. Wilshire Large Cap Core 130/30 Fund December 31, 2010 Schedule of Securities Sold Short | |
| COMMON STOCK — (27.4)% | |
| Consumer Discretionary — (4.0)% | |
| | 6,500 | | Cablevision Systems Corp., Class A | | $ | 219,960 | |
| | 19,930 | | Chico's FAS, Inc. | | | 239,758 | |
| | 1,200 | | Chipotle Mexican Grill, Inc., Class A † | | | 255,192 | |
| | 3,000 | | Choice Hotels International, Inc. | | | 114,810 | |
| | 3,260 | | Cracker Barrel Old Country Store, Inc. | | | 178,550 | |
| | 5,910 | | Darden Restaurants, Inc. | | | 274,460 | |
| | 6,900 | | Discovery Communications, Inc., Class A † | | | 287,730 | |
| | 13,000 | | Dollar General Corp. † | | | 398,710 | |
| | 28,300 | | Ford Motor Co. † | | | 475,157 | |
| | 5,950 | | Garmin, Ltd. | | | 184,390 | |
| | 6,200 | | Hanesbrands, Inc. † | | | 157,480 | |
| | 5,000 | | J.C. Penney Co., Inc. | | | 161,550 | |
| | 7,250 | | KB Home | | | 97,803 | |
| | 9,100 | | Lamar Advertising Co., Class A † | | | 362,544 | |
| | 7,090 | | Las Vegas Sands Corp. † | | | 325,786 | |
| | 7,100 | | Marriott International, Inc., Class A | | | 294,934 | |
| | 4,950 | | MDC Holdings, Inc. | | | 142,412 | |
| | 4,630 | | NetFlix, Inc. † | | | 813,491 | |
| | 6,500 | | O'Reilly Automotive, Inc. † | | | 392,730 | |
| | 6,350 | | Sears Holdings Corp. † | | | 468,312 | |
| | 4,200 | | Staples, Inc. | | | 95,634 | |
| | 6,300 | | Starwood Hotels & Resorts Worldwide, Inc. | | | 382,914 | |
| | 2,730 | | Tiffany & Co. | | | 169,997 | |
| | 11,080 | | TJX Cos., Inc. | | | 491,841 | |
| | 9,490 | | Urban Outfitters, Inc. † | | | 339,837 | |
| | 7,450 | | Weight Watchers International, Inc. | | | 279,301 | |
| | 2,800 | | WMS Industries, Inc. † | | | 126,672 | |
| | 3,500 | | Yum! Brands, Inc. | | | 171,675 | |
| | | | | | | 7,903,630 | |
| Consumer Staples — (2.2)% | |
| | 7,650 | | Avon Products, Inc. | | | 222,309 | |
| | 3,500 | | Central European Distribution Corp. † | | | 80,150 | |
| | 6,650 | | Church & Dwight Co., Inc. | | | 458,983 | |
| | 3,400 | | Clorox Co. | | | 215,152 | |
| | 1,820 | | Colgate-Palmolive Co. | | | 146,273 | |
| | 12,800 | | Constellation Brands, Inc., Class A † | | | 283,520 | |
| | 2,050 | | Energizer Holdings, Inc. † | | | 149,445 | |
| Consumer Staples (continued) | |
| | 7,450 | | Flowers Foods, Inc. | | $ | 200,479 | |
| | 6,310 | | HJ Heinz Co. | | | 312,093 | |
| | 7,580 | | Hormel Foods Corp. | | | 388,551 | |
| | 3,740 | | Lorillard, Inc. | | | 306,905 | |
| | 2,400 | | Mead Johnson Nutrition Co., Class A | | | 149,400 | |
| | 19,000 | | SABMiller PLC ADR | | | 677,540 | |
| | 7,390 | | TreeHouse Foods, Inc. † | | | 377,555 | |
| | 5,700 | | Weis Markets, Inc. | | | 229,881 | |
| | | | | | | 4,198,236 | |
| Energy — (3.0)% | |
| | 1,950 | | Anadarko Petroleum Corp. | | | 148,512 | |
| | 2,950 | | Baker Hughes, Inc. | | | 168,652 | |
| | 6,500 | | Cabot Oil & Gas Corp. | | | 246,025 | |
| | 20,550 | | Chesapeake Energy Corp. | | | 532,450 | |
| | 2,800 | | Comstock Resources, Inc. † | | | 68,768 | |
| | 6,720 | | ConocoPhillips | | | 457,632 | |
| | 6,350 | | Diamond Offshore Drilling, Inc. | | | 424,624 | |
| | 8,000 | | Exterran Holdings, Inc. † | | | 191,600 | |
| | 3,100 | | FMC Technologies, Inc. † | | | 275,621 | |
| | 17,150 | | Goodrich Petroleum Corp. † | | | 302,526 | |
| | 9,300 | | Halliburton Co. | | | 379,719 | |
| | 7,800 | | Helix Energy Solutions Group, Inc. † | | | 94,692 | |
| | 4,450 | | Massey Energy Co. | | | 238,743 | |
| | 3,450 | | Noble Energy, Inc. | | | 296,976 | |
| | 4,100 | | Occidental Petroleum Corp. | | | 402,210 | |
| | 5,400 | | Pioneer Natural Resources Co. | | | 468,828 | |
| | 7,100 | | Quicksilver Resources, Inc. † | | | 104,654 | |
| | 4,650 | | Range Resources Corp. | | | 209,157 | |
| | 37,470 | | W&T Offshore, Inc. | | | 669,589 | |
| | 7,150 | | Williams Cos., Inc. (The) | | | 176,748 | |
| | | | | | | 5,857,726 | |
| Financials — (3.7)% | |
| | 2,450 | | Affiliated Managers Group, Inc. † | | | 243,089 | |
| | 21,130 | | American International Group, Inc. † | | | 1,217,511 | |
| | 9,200 | | Arthur J. Gallagher & Co. | | | 267,536 | |
| | 10,700 | | BB&T Corp. | | | 281,303 | |
| | 27,980 | | CBOE Holdings, Inc. | | | 639,623 | |
| | 53,960 | | E*Trade Financial Corp. † | | | 863,360 | |
| | 6,150 | | Eaton Vance Corp. | | | 185,915 | |
| | 1,550 | | Franklin Resources, Inc. | | | 172,376 | |
| | 12,100 | | General Growth Properties, Inc. | | | 187,308 | |
See Notes to Financial Statements.
Wilshire Mutual Funds, Inc. Wilshire Large Cap Core 130/30 Fund December 31, 2010 Schedule of Securities Sold Short- (Continued) | |
| Financials (continued) | |
| | 2,350 | | Health Care REIT, Inc. | | $ | 111,954 | |
| | 5,250 | | Mercury General Corp. | | | 225,802 | |
| | 7,550 | | Moody's Corp. | | | 200,377 | |
| | 16,250 | | Northern Trust Corp. | | | 900,412 | |
| | 6,100 | | Omega Healthcare Investors, Inc. | | | 136,884 | |
| | 12,310 | | Taubman Centers, Inc. | | | 621,409 | |
| | 6,500 | | Travelers Cos., Inc. (The) | | | 362,115 | |
| | 1,450 | | Visa, Inc., Class A | | | 102,051 | |
| | 2,900 | | Vornado Realty Trust | | | 241,657 | |
| | 4,000 | | Waddell & Reed Financial, Inc., Class A | | | 141,160 | |
| | 7,850 | | Zions Bancorporation | | | 190,205 | |
| | | | | | | 7,292,047 | |
| Health Care — (3.1)% | |
| | 9,160 | | Acorda Therapeutics, Inc. † | | | 249,702 | |
| | 3,700 | | Allergan, Inc. | | | 254,079 | |
| | 2,600 | | Beckman Coulter, Inc. | | | 195,598 | |
| | 7,390 | | Bristol-Myers Squibb Co. | | | 195,687 | |
| | 7,550 | | Brookdale Senior Living, Inc., Class A † | | | 161,646 | |
| | 4,550 | | Celgene Corp. † | | | 269,087 | |
| | 1,330 | | Cerner Corp. † | | | 126,004 | |
| | 5,300 | | Charles River Laboratories International, Inc. † | | | 188,362 | |
| | 3,100 | | Community Health Systems, Inc. † | | | 115,847 | |
| | 1,950 | | DaVita, Inc. † | | | 135,505 | |
| | 17,190 | | Eli Lilly & Co. | | | 602,338 | |
| | 3,600 | | Emergency Medical Services Corp., Class A † | | | 232,596 | |
| | 2,800 | | Express Scripts, Inc., Class A † | | | 151,340 | |
| | 7,540 | | Forest Laboratories, Inc. † | | | 241,129 | |
| | 4,300 | | Henry Schein, Inc. † | | | 263,977 | |
| | 5,570 | | Hill-Rom Holdings, Inc. | | | 219,291 | |
| | 5,500 | | Hospira, Inc. † | | | 306,295 | |
| | 3,800 | | IDEXX Laboratories, Inc. † | | | 263,036 | |
| | 830 | | Intuitive Surgical, Inc. † | | | 213,933 | |
| | 2,800 | | Laboratory Corp. of America Holdings † | | | 246,176 | |
| | 9,950 | | Life Technologies Corp. † | | | 552,225 | |
| | 4,640 | | Owens & Minor, Inc. | | | 136,555 | |
| | 2,950 | | Quest Diagnostics, Inc. | | | 159,211 | |
| | 4,690 | | Seattle Genetics, Inc. † | | | 70,115 | |
| | 5,450 | | VCA Antech, Inc. † | | | 126,931 | |
| | 4,950 | | Vertex Pharmaceuticals, Inc. † | | | 173,399 | |
| | 6,360 | | Viropharma, Inc. † | | | 110,155 | |
| | | | | | | 5,960,219 | |
| Industrials — (3.6)% | |
| | 3,310 | | 3M Co. | | $ | 285,653 | |
| | 8,640 | | Applied Industrial Technologies, Inc. | | | 280,627 | |
| | 4,950 | | BE Aerospace, Inc. † | | | 183,299 | |
| | 4,720 | | Boeing Co. (The) | | | 308,027 | |
| | 5,850 | | Brink's Co. (The) | | | 157,248 | |
| | 7,350 | | Cintas Corp. | | | 205,506 | |
| | 3,600 | | Con-way, Inc. | | | 131,652 | |
| | 6,900 | | Corrections Corp. of America † | | | 172,914 | |
| | 5,750 | | Covanta Holding Corp. | | | 98,842 | |
| | 4,870 | | Fastenal Co. | | | 291,762 | |
| | 5,150 | | GATX Corp. | | | 181,692 | |
| | 6,020 | | General Dynamics Corp. | | | 427,179 | |
| | 5,500 | | Goodrich Corp. | | | 484,385 | |
| | 5,300 | | Harsco Corp. | | | 150,096 | |
| | 9,100 | | Iron Mountain, Inc. | | | 227,591 | |
| | 3,500 | | JB Hunt Transport Services, Inc. | | | 142,835 | |
| | 2,250 | | Kirby Corp. † | | | 99,113 | |
| | 5,500 | | Landstar System, Inc. | | | 225,170 | |
| | 3,500 | | Lennox International, Inc. | | | 165,515 | |
| | 3,700 | | PACCAR, Inc. | | | 212,454 | |
| | 4,200 | | Pall Corp. | | | 208,236 | |
| | 3,500 | | Pentair, Inc. | | | 127,785 | |
| | 9,700 | | Pitney Bowes, Inc. | | | 234,546 | |
| | 1,450 | | Precision Castparts Corp. | | | 201,854 | |
| | 3,050 | | Regal-Beloit Corp. | | | 203,618 | |
| | 3,900 | | Roper Industries, Inc. | | | 298,077 | |
| | 31,760 | | Spirit Aerosystems Holdings, Inc., Class A † | | | 660,926 | |
| | 2,400 | | Stericycle, Inc. † | | | 194,208 | |
| | 2,800 | | WW Grainger, Inc. | | | 386,708 | |
| | | | | | | 6,947,518 | |
| Information Technology — (4.4)% | |
| | 11,270 | | Adobe Systems, Inc. † | | | 346,891 | |
| | 2,050 | | Alliance Data Systems Corp. † | | | 145,612 | |
| | 2,900 | | ANSYS, Inc. † | | | 151,003 | |
| | 9,600 | | BMC Software, Inc. † | | | 452,544 | |
| | 2,900 | | Citrix Systems, Inc. † | | | 198,389 | |
| | 3,900 | | Cognizant Technology Solutions Corp., Class A † | | | 285,831 | |
| | 24,100 | | Compuware Corp. † | | | 281,247 | |
| | 4,950 | | Diebold, Inc. | | | 158,647 | |
| | 9,600 | | EMC Corp. † | | | 219,840 | |
| | 5,170 | | F5 Networks, Inc. † | | | 672,927 | |
See Notes to Financial Statements.
Wilshire Mutual Funds, Inc. Wilshire Large Cap Core 130/30 Fund December 31, 2010 Schedule of Securities Sold Short- (Continued) | |
| Information Technology (continued) | |
| | 8,250 | | Fair Isaac Corp. | | $ | 192,802 | |
| | 4,950 | | Fiserv, Inc. † | | | 289,872 | |
| | 3,730 | | International Business Machines Corp. | | | 547,415 | |
| | 7,400 | | Intuit, Inc. † | | | 364,820 | |
| | 3,300 | | Itron, Inc. † | | | 182,985 | |
| | 5,000 | | NetApp, Inc. † | | | 274,800 | |
| | 74,200 | | Nokia OYJ ADR | | | 765,744 | |
| | 11,900 | | Novellus Systems, Inc. † | | | 384,608 | |
| | 3,100 | | Paychex, Inc. | | | 95,821 | |
| | 9,300 | | Rambus, Inc. † | | | 190,464 | |
| | 9,500 | | Red Hat, Inc. † | | | 433,675 | |
| | 3,110 | | Salesforce.com, Inc. † | | | 410,520 | |
| | 5,550 | | Silicon Laboratories, Inc. † | | | 255,411 | |
| | 31,100 | | Taiwan Semiconductor Manufacturing Co., Ltd. ADR | | | 389,994 | |
| | 7,100 | | VeriSign, Inc. | | | 231,957 | |
| | 7,330 | | VMware, Inc., Class A † | | | 651,710 | |
| | | | | | | 8,575,529 | |
| Materials — (1.0)% | |
| | 10,250 | | Commercial Metals Co. | | | 170,048 | |
| | 2,250 | | Ecolab, Inc. | | | 113,445 | |
| | 5,890 | | EI du Pont de Nemours & Co. | | | 293,793 | |
| | 850 | | Martin Marietta Materials, Inc. | | | 78,404 | |
| | 3,750 | | Monsanto Co. | | | 261,150 | |
| | 7,100 | | Nalco Holding Co. | | | 226,774 | |
| | 6,600 | | Owens-Illinois, Inc. † | | | 202,620 | |
| | 2,900 | | Praxair, Inc. | | | 276,863 | |
| | 2,750 | | Royal Gold, Inc. | | | 150,232 | |
| | 7,540 | | Valspar Corp. | | | 259,979 | |
| | | | | | | 2,033,308 | |
| Telecommunication Services — (0.7)% | |
| | 8,500 | | America Movil SAB de CV ADR, Series L | | | 487,390 | |
| | 17,050 | | Frontier Communications Corp. | | | 165,896 | |
| | 67,000 | | Qwest Communications International, Inc. | | | 509,870 | |
| | 5,150 | | SBA Communications Corp., Class A † | | | 210,841 | |
| | | | | | | 1,373,997 | |
| Utilities — (1.7)% | |
| | 12,800 | | American Water Works Co., Inc. | | | 323,712 | |
| | 22,950 | | Aqua America, Inc. | | | 515,916 | |
| | 6,640 | | Atmos Energy Corp. | | | 207,168 | |
| Utilities (continued) | |
| | 8,750 | | Calpine Corp. † | | $ | 116,725 | |
| | 8,000 | | Consolidated Edison, Inc. | | | 396,560 | |
| | 8,200 | | Hawaiian Electric Industries, Inc. | | | 186,878 | |
| | 14,720 | | Integrys Energy Group, Inc. | | | 714,067 | |
| | 5,400 | | NSTAR | | | 227,826 | |
| | 10,600 | | NV Energy, Inc. | | | 148,930 | |
| | 7,550 | | Vectren Corp. | | | 191,619 | |
| | 1,800 | | WGL Holdings, Inc. | | | 64,386 | |
| | 3,000 | | Wisconsin Energy Corp. | | | 176,580 | |
| | | | | | | 3,270,367 | |
| | | | | | | | |
| Total Common Stock (Proceeds $45,484,597) | | | 53,412,577 | |
| | | | | | | | |
Total Securities Sold Short — (27.4)% (Proceeds $45,484,597) | | $ | 53,412,577 | |
Percentages are based on Net Assets of $195,166,523.
† Non-income producing security.
ADR — American Depositary Receipt
PLC — Public Limited Company
REIT — Real Estate Investment Trust
As of December 31, 2010, all of the Fund’s securities sold short were considered Level 1. Please see Note 2 in Notes to Financial Statements for further information regarding fair value measurements.
See Notes to Financial Statements.
Wilshire Mutual Funds, Inc. Statements of Assets and Liabilities December 31, 2010 | | |
| | | LARGE COMPANY GROWTH PORTFOLIO | | | LARGE COMPANY VALUE PORTFOLIO | | | SMALL COMPANY GROWTH PORTFOLIO | | | SMALL COMPANY VALUE PORTFOLIO | | | | | | WILSHIRE LARGE CAP CORE 130/30 FUND | |
| ASSETS: | | | | | | | | | | | | | | | | | | |
Investments in securities, at value (Note 2) | | $ | 192,074,946 | | | $ | 34,563,067 | | | $ | 7,575,104 | | | $ | 13,816,211 | | | $ | 159,618,588 | | | $ | 246,859,960 | |
Cash Equivalents | | | 2,835,590 | | | | 469,227 | | | | 167,863 | | | | 102,345 | | | | 726,200 | | | | — | |
Subscriptions receivable | | | 187,153 | | | | — | | | | — | | | | 2,029 | | | | 59,901 | | | | 6,830 | |
| Dividends and interest receivable | | | 142,295 | | | | 37,824 | | | | 4,640 | | | | 23,969 | | | | 186,508 | | | | 222,301 | |
Receivable for investment securities sold | | | 66,652 | | | | 25,214 | | | | — | | | | — | | | | — | | | | 7,898,085 | |
Reclaim receivable | | | — | | | | — | | | | — | | | | — | | | | — | | | | 5,589 | |
| Receivable from Adviser(Note 3) | | | — | | | | — | | | | — | | | | 7,341 | | | | — | | | | — | |
| Prepaid expenses and other assets | | | 10,645 | | | | 7,350 | | | | 6,994 | | | | 7,050 | | | | 21,959 | | | | 31,569 | |
Total assets | | | 195,317,281 | | | | 35,102,682 | | | | 7,754,601 | | | | 13,958,945 | | | | 160,613,156 | | | | 255,024,334 | |
| | | | | | | | | | | | | | | | | | | | | | | | | |
| LIABILITIES: | | | | | | | | | | | | | | | | | | | | | | | | |
| Securities sold short, at value | | | — | | | | — | | | | — | | | | — | | | | — | | | | 53,412,577 | |
Cash overdraft | | | — | | | | — | | | | — | | | | — | | | | — | | | | 4,101,263 | |
Payable for investment securities purchased | | | 572,876 | | | | — | | | | 12,199 | | | | — | | | | — | | | | 1,962,880 | |
Redemptions payable | | | 529,080 | | | | 51,850 | | | | 21,762 | | | | 19,676 | | | | 92,329 | | | | 10,105 | |
Investment advisory fees payable (Note 3) | | | 123,233 | | | | 21,988 | | | | 6,186 | | | | 10,057 | | | | 13,488 | | | | 176,781 | |
Distribution (12b-1) fees payable (Note 4) | | | 23,767 | | | | 7,093 | | | | 2,073 | | | | 3,045 | | | | 23,027 | | | | 20,227 | |
| Service fees payable (Note 4) | | | 19,185 | | | | 2,316 | | | | 468 | | | | 1,788 | | | | 18,582 | | | | 6,713 | |
| Administration fees payable | | | 11,502 | | | | 2,052 | | | | 456 | | | | 828 | | | | 9,441 | | | | 11,758 | |
Trustees’ fees payable | | | 5,710 | | | | 1,019 | | | | 218 | | | | 433 | | | | 4,852 | | | | 5,847 | |
Dividends payable on securities sold short | | | — | | | | — | | | | — | | | | — | | | | — | | | | 33,534 | |
Accrued expenses and other payables | | | 120,949 | | | | 24,575 | | | | 10,941 | | | | 13,366 | | | | 99,658 | | | | 116,126 | |
Total liabilities | | | 1,406,302 | | | | 110,893 | | | | 54,303 | | | | 49,193 | | | | 261,377 | | | | 59,857,811 | |
| | | | | | | | | | | | | | | | | | | | | | | | | |
NET ASSETS | | $ | 193,910,979 | | | $ | 34,991,789 | | | $ | 7,700,298 | | | $ | 13,909,752 | | | $ | 160,351,779 | | | $ | 195,166,523 | |
| | | | | | | | | | | | | | | | | | | | | | | | | |
| NET ASSETS consist of: | | | | | | | | | | | | | | | | | | | | | | | | |
Paid-in capital | | $ | 174,567,974 | | | $ | 46,910,287 | | | $ | 8,149,574 | | | $ | 15,343,266 | | | $ | 155,635,918 | | | $ | 173,268,027 | |
| Undistributed net investment income/(accumulated net investment loss)/(distributions in excess of net investment income) | | | — | | | | (5 | ) | | | (3,885 | ) | | | (15,038 | ) | | | 74,292 | | | | 39,353 | |
| Accumulated net realized loss on investments sold and securities sold short | | | (29,313,255 | ) | | | (17,689,990 | ) | | | (2,517,091 | ) | | | (4,213,080 | ) | | | (56,558,775 | ) | | | (10,999,747 | ) |
| Net unrealized appreciation of investments and securities sold short | | | 48,656,260 | | | | 5,771,497 | | | | 2,071,700 | | | | 2,794,604 | | | | 61,200,344 | | | | 32,858,890 | |
| | | | | | | | | | | | | | | | | | | | | | | | | |
NET ASSETS | | $ | 193,910,979 | | | $ | 34,991,789 | | | $ | 7,700,298 | | | $ | 13,909,752 | | | $ | 160,351,779 | | | $ | 195,166,523 | |
| | | | | | | | | | | | | | | | | | | | | | | | | |
Investments in securities, at cost (Note 2) | | $ | 143,418,686 | | | $ | 28,791,570 | | | $ | 5,503,404 | | | $ | 11,021,607 | | | $ | 98,418,244 | | | $ | 206,073,090 | |
Securities sold short, proceeds receivable | | | — | | | | — | | | | — | | | | — | | | | — | | | | 45,484,597 | |
See Notes to Financial Statements.
Wilshire Mutual Funds, Inc. Statements of Assets and Liabilities - (Continued) December 31, 2010 | | |
| | | LARGE COMPANY GROWTH PORTFOLIO | | | LARGE COMPANY VALUE PORTFOLIO | | | SMALL COMPANY GROWTH PORTFOLIO | | | SMALL COMPANY VALUE PORTFOLIO | | | | | | WILSHIRE LARGE CAP CORE 130/30 FUND | |
| NET ASSETS: | | | | | | | | | | | | | | | | | | |
| Investment Class shares | | $ | 111,903,842 | | | $ | 33,887,154 | | | $ | 7,521,494 | | | $ | 13,753,977 | | | $ | 105,019,026 | | | $ | 91,640,337 | |
(50,000,000 shares authorized, per class, per Portfolio, par value $.001 per share)† | | | | | | | | | | | | | | | | | | | | | | | | |
| Institutional Class shares | | $ | 82,007,137 | | | $ | 1,104,635 | | | $ | 178,804 | | | $ | 155,775 | | | $ | 53,414,493 | | | $ | 103,526,186 | |
(50,000,000 shares authorized, per class, per Portfolio, par value $.001 per share)† | | | | | | | | | | | | | | | | | | | | | | | | |
Qualified Class shares | | | N/A | | | | N/A | | | | N/A | | | | N/A | | | $ | 714,289 | | | | N/A | |
(50,000,000 shares authorized, per class, per Portfolio, par value $.001 per share) | | | | | | | | | | | | | | | | | | | | | | | | |
| Horace Mann Class shares | | | N/A | | | | N/A | | | | N/A | | | | N/A | | | $ | 1,203,971 | | | | N/A | |
(50,000,000 shares authorized, per class, per Portfolio, par value $.001 per share) | | | | | | | | | | | | | | | | | | | | | | | | |
| | | | | | | | | | | | | | | | | | | | | | | | | |
| SHARES OUTSTANDING: | | | | | | | | | | | | | | | | | | | | | | | | |
| Investment Class shares | | | 3,496,535 | | | | 2,350,197 | | | | 471,552 | | | | 841,527 | | | | 9,507,055 | | | | 11,321,208 | |
| Institutional Class shares | | | 2,485,712 | | | | 76,516 | | | | 10,768 | | | | 9,434 | | | | 4,839,523 | | | | 12,721,958 | |
| Qualified Class shares | | | N/A | | | | N/A | | | | N/A | | | | N/A | | | | 64,771 | | | | N/A | |
| Horace Mann Class shares | | | N/A | | | | N/A | | | | N/A | | | | N/A | | | | 109,244 | | | | N/A | |
| | | | | | | | | | | | | | | | | | | | | | | | | |
| INVESTMENT CLASS SHARES: | | | | | | | | | | | | | | | | | | | | | |
Net asset value, offering and redemption price per share | | $ | 32.00 | | | $ | 14.42 | | | $ | 15.95 | | | $ | 16.34 | | | $ | 11.05 | | | $ | 8.09 | |
| | | | | | | | | | | | | | | | | | | | | | | | | |
| INSTITUTIONAL CLASS SHARES: | | | | | | | | | | | | | | | | | | | | | |
Net asset value, offering and redemption price per share | | $ | 32.99 | | | $ | 14.44 | | | $ | 16.61 | | | $ | 16.51 | | | $ | 11.04 | | | $ | 8.14 | |
| | | | | | | | | | | | | | | | | | | | | | | | | |
| QUALIFIED CLASS SHARES: | | | | | | | | | | | | | | | | | | | | | |
Net asset value, offering and redemption price per share | | | N/A | | | | N/A | | | | N/A | | | | N/A | | | $ | 11.03 | | | | N/A | |
| | | | | | | | | | | | | | | | | | | | | | | | | |
| HORACE MANN CLASS SHARES: | | | | | | | | | | | | | | | | | | | | | |
Net asset value, offering and redemption price per share | | | N/A | | | | N/A | | | | N/A | | | | N/A | | | $ | 11.02 | | | | N/A | |
| † | For the Wilshire Large Cap Core 130/30 Fund, (40,000,000 shares authorized, per class, par value $.001 per share). |
See Notes to Financial Statements.
Wilshire Mutual Funds, Inc. Statements of Operations For the Year Ended December 31, 2010 | | |
| | | LARGE COMPANY GROWTH PORTFOLIO | | | LARGE COMPANY VALUE PORTFOLIO | | | SMALL COMPANY GROWTH PORTFOLIO | | | SMALL COMPANY VALUE PORTFOLIO | | | | | | WILSHIRE LARGE CAP CORE 130/30 FUND | |
| INVESTMENT INCOME: | | | | | | | | | | | | | | | | | | |
Dividends | | $ | 2,677,465 | | | $ | 626,180 | | | $ | 69,956 | | | $ | 261,149 | | | $ | 3,067,041 | | | $ | 4,370,622 | |
Interest | | | 1,159 | | | | 172 | | | | 45 | | | | 291 | | | | 972 | | | | — | |
Foreign taxes withheld | | | (5,152 | ) | | | (168 | ) | | | (8 | ) | | | — | | | | (453 | ) | | | (21,418 | ) |
Total income | | | 2,673,472 | | | | 626,184 | | | | 69,993 | | | | 261,440 | | | | 3,067,560 | | | | 4,349,204 | |
| | | | | | | | | | | | | | | | | | | | | | | | | |
| EXPENSES: | | | | | | | | | | | | | | | | | | | | | | | | |
Investment advisory fee (Note 3) | | | 1,373,807 | | | | 243,456 | | | | 57,059 | | | | 95,879 | | | | 155,101 | | | | 1,949,291 | |
Distribution (12b-1) fees (Note 4) | | | | | | | | | | | | | | | | | | | | | | | | |
Investment Class | | | 267,241 | | | | 78,046 | | | | 13,074 | | | | 27,763 | | | | 256,246 | | | | 226,271 | |
Qualified Class | | | N/A | | | | N/A | | | | N/A | | | | N/A | | | | 1,641 | | | | N/A | |
Horace Mann Class | | | N/A | | | | N/A | | | | N/A | | | | N/A | | | | 3,462 | | | | N/A | |
Service fees | | | | | | | | | | | | | | | | | | | | | | | | |
Investment Class | | | 125,986 | | | | 8,542 | | | | 8,414 | | | | 11,684 | | | | 60,340 | | | | 29,387 | |
Institutional Class | | | 411 | | | | 1,867 | | | | 33 | | | | 262 | | | | 45,241 | | | | 8,892 | |
Administration fees (Note 3) | | | 128,222 | | | | 22,722 | | | | 4,699 | | | | 7,877 | | | | 108,571 | | | | 136,346 | |
Directors’ fees and expenses (Note 3) | | | 29,392 | | | | 5,169 | | | | 1,066 | | | | 1,826 | | | | 24,989 | | | | 31,045 | |
Chief compliance officer expenses | | | 702 | | | | 132 | | | | 27 | | | | 43 | | | | 609 | | | | 798 | |
Transfer agent fees (Note 3) | | | 137,828 | | | | 12,524 | | | | 5,625 | | | | 7,997 | | | | 84,157 | | | | 46,839 | |
Professional fees | | | 91,988 | | | | 17,185 | | | | 3,690 | | | | 6,787 | | | | 81,297 | | | | 130,229 | |
Printing fees | | | 57,640 | | | | 7,138 | | | | 1,872 | | | | 4,828 | | | | 33,778 | | | | 42,273 | |
Registration and filing fees | | | 38,725 | | | | 27,946 | | | | 28,943 | | | | 27,208 | | | | 68,349 | | | | 34,763 | |
Custodian fees (Note 3) | | | 31,718 | | | | 15,889 | | | | 11,507 | | | | 6,402 | | | | 14,321 | | | | 32,220 | |
Interest expense (Note 2) | | | — | | | | — | | | | — | | | | — | | | | — | | | | 266,538 | |
Rebates on securities sold short (Note 2) | | | — | | | | — | | | | — | | | | — | | | | — | | | | 156,790 | |
Dividend expense on securities sold short | | | — | | | | — | | | | — | | | | — | | | | — | | | | 926,910 | |
Other | | | 37,081 | | | | 10,032 | | | | 9,563 | | | | 11,981 | | | | 63,294 | | | | 49,721 | |
Total expenses | | | 2,320,741 | | | | 450,648 | | | | 145,572 | | | | 210,537 | | | | 1,001,396 | | | | 4,068,313 | |
Fees waived by Adviser (Note 3) | | | — | | | | — | | | | (48,745 | ) | | | (41,705 | ) | | | — | | | | (63,981 | ) |
Fees recouped by Adviser (Note 3) | | | — | | | | — | | | | — | | | | — | | | | — | | | | 8,803 | |
Net expenses | | | 2,320,741 | | | | 450,648 | | | | 96,827 | | | | 168,832 | | | | 1,001,396 | | | | 4,013,135 | |
| | | | | | | | | | | | | | | | | | | | | | | | | |
Net investment income/(loss) | | | 352,731 | | | | 175,536 | | | | (26,834 | ) | | | 92,608 | | | | 2,066,164 | | | | 336,069 | |
| | | | | | | | | | | | | | | | | | | | | | | | | |
| NET REALIZED AND UNREALIZED GAIN/(LOSS) ON INVESTMENTS AND SECURITIES SOLD SHORT (NOTES 1 and 7): | | | | | | | | | | | | | | | | | | |
| Net realized gain/(loss) from: | | | | | | | | | | | | | | | | | | | | | | | | |
Investments | | | 20,072,678 | | | | 2,330,315 | | | | 762,451 | | | | 807,665 | | | | 2,527,828 | | | | 12,794,971 | |
Securities sold short | | | — | | | | — | | | | — | | | | — | | | | — | | | | (6,791,247 | ) |
| Net change in unrealized appreciation/(depreciation) on: | | | | | | | | | | | | | | | | | | | | | | | | |
Investments | | | 11,507,509 | | | | 1,654,255 | | | | 875,125 | | | | 2,062,626 | | | | 19,319,715 | | | | 20,329,425 | |
Securities sold short | | | — | | | | — | | | | — | | | | — | | | | — | | | | (4,866,328 | ) |
| | | | | | | | | | | | | | | | | | | | | | | | | |
| Net realized and unrealized gain on investments and securities sold short | | | 31,580,187 | | | | 3,984,570 | | | | 1,637,576 | | | | 2,870,291 | | | | 21,847,543 | | | | 21,466,821 | |
| | | | | | | | | | | | | | | | | | | | | | | | | |
| NET INCREASE IN NET ASSETS RESULTING FROM OPERATIONS | | $ | 31,932,918 | | | $ | 4,160,106 | | | $ | 1,610,742 | | | $ | 2,962,899 | | | $ | 23,913,707 | | | $ | 21,802,890 | |
Amounts designated as “—” are either $0, or have been rounded to $0.
See Notes to Financial Statements.
Wilshire Mutual Funds, Inc. Statements of Changes in Net Assets For the Year Ended December 31, 2010 | | |
| | | LARGE COMPANY GROWTH PORTFOLIO | | | LARGE COMPANY VALUE PORTFOLIO | | | SMALL COMPANY GROWTH PORTFOLIO | | | SMALL COMPANY VALUE PORTFOLIO | | | WILSHIRE 5000 INDEXSM FUND | | | WILSHIRE LARGE CAP CORE 130/30 FUND | |
| OPERATIONS: | | | | | | | | | | | | | | | | | | |
Net investment income/(loss) | | $ | 352,731 | | | $ | 175,536 | | | $ | (26,834 | ) | | $ | 92,608 | | | $ | 2,066,164 | | | $ | 336,069 | |
| Net realized gain on investments and securities sold short | | | 20,072,678 | | | | 2,330,315 | | | | 762,451 | | | | 807,665 | | | | 2,527,828 | | | | 6,003,724 | |
| Net change in unrealized appreciation on investments and securities sold short | | | 11,507,509 | | | | 1,654,255 | | | | 875,125 | | | | 2,062,626 | | | | 19,319,715 | | | | 15,463,097 | |
Net increase in net assets resulting
from operations | | | 31,932,918 | | | | 4,160,106 | | | | 1,610,742 | | | | 2,962,899 | | | | 23,913,707 | | | | 21,802,890 | |
| DISTRIBUTIONS TO SHAREHOLDERS FROM: | | | | | | | | | | | | | | | | | | |
| Net investment income: | | | | | | | | | | | | | | | | | | | | | | | | |
Investment Class shares | | | (44,463 | ) | | | (169,091 | ) | | | — | | | | (103,932 | ) | | | (1,318,200 | ) | | | (492,236 | ) |
Institutional Class shares | | | (308,268 | ) | | | (6,445 | ) | | | — | | | | (1,329 | ) | | | (784,864 | ) | | | (786,093 | ) |
Qualified Class shares | | | N/A | | | | N/A | | | | N/A | | | | N/A | | | | (9,365 | ) | | | N/A | |
Horace Mann Class shares | | | N/A | | | | N/A | | | | N/A | | | | N/A | | | | (15,317 | ) | | | N/A | |
| Net realized capital gains: | | | | | | | | | | | | | | | | | | | | | | | | |
Investment Class shares | | | — | | | | ��� | | | | — | | | | — | | | | — | | | | (982,815 | ) |
Institutional Class shares | | | — | | | | — | | | | — | | | | — | | | | — | | | | (1,050,757 | ) |
| Return of capital: | | | | | | | | | | | | | | | | | | | | | | | | |
Investment Class shares | | | (7,088 | ) | | | (1,840 | ) | | | — | | | | — | | | | — | | | | — | |
Institutional Class shares | | | (5,058 | ) | | | (73 | ) | | | — | | | | — | | | | — | | | | — | |
Total distributions to shareholders | | | (364,877 | ) | | | (177,449 | ) | | | — | | | | (105,261 | ) | | | (2,127,746 | ) | | | (3,311,901 | ) |
| CAPITAL STOCK TRANSACTIONS (DOLLARS): | | | | | | | | | | | | | | | | | | |
| Investment Class shares: | | | | | | | | | | | | | | | | | | | | | | | | |
Shares sold | | | 4,315,864 | | | | 1,929,294 | | | | 370,534 | | | | 6,809,631 | | | | 16,153,766 | | | | 5,403,581 | |
Shares issued as reinvestment of distributions | | | 50,650 | | | | 170,235 | | | | — | | | | 102,880 | | | | 1,288,288 | | | | 1,471,983 | |
Shares redeemed | | | (27,750,991 | ) | | | (2,733,950 | ) | | | (936,476 | ) | | | (5,495,953 | ) | | | (35,939,696 | ) | | | (18,157,214 | ) |
| Net increase/(decrease) in net assets from Investment Class share transactions | | | (23,384,477 | ) | | | (634,421 | ) | | | (565,942 | ) | | | 1,416,558 | | | | (18,497,642 | ) | | | (11,281,650 | ) |
| Institutional Class shares: | | | | | | | | | | | | | | | | | | | | | | | | |
Shares sold | | | 11,771,372 | | | | 21,561 | | | | 13,333 | | | | 13,361 | | | | 3,300,621 | | | | 5,218,490 | |
Shares issued as reinvestment of distributions | | | 173,019 | | | | 5,311 | | | | — | | | | 1,301 | | | | 776,835 | | | | 1,836,850 | |
Shares redeemed | | | (32,064,571 | ) | | | (521,719 | ) | | | (5,499 | ) | | | (60,188 | ) | | | (24,747,016 | ) | | | (22,715,586 | ) |
| Net increase/(decrease) in net assets from Institutional Class share transactions | | | (20,120,180 | ) | | | (494,847 | ) | | | 7,834 | | | | (45,526 | ) | | | (20,669,560 | ) | | | (15,660,246 | ) |
| Qualified Class shares: | | | | | | | | | | | | | | | | | | | | | | | | |
Shares sold | | | N/A | | | | N/A | | | | N/A | | | | N/A | | | | 66,781 | | | | N/A | |
Shares issued as reinvestment of distributions | | | N/A | | | | N/A | | | | N/A | | | | N/A | | | | 9,364 | | | | N/A | |
Shares redeemed | | | N/A | | | | N/A | | | | N/A | | | | N/A | | | | (69,535 | ) | | | N/A | |
| Net increase in net assets from Qualified Class share transactions | | | N/A | | | | N/A | | | | N/A | | | | N/A | | | | 6,610 | | | | N/A | |
| Horace Mann Class shares: | | | | | | | | | | | | | | | | | | | | | | | | |
Shares sold | | | N/A | | | | N/A | | | | N/A | | | | N/A | | | | 43,910 | | | | N/A | |
Shares issued as reinvestment of distributions | | | N/A | | | | N/A | | | | N/A | | | | N/A | | | | 15,317 | | | | N/A | |
Shares redeemed | | | N/A | | | | N/A | | | | N/A | | | | N/A | | | | (125,159 | ) | | | N/A | |
| Net decrease in net assets from Horace Mann Class share transactions | | | N/A | | | | N/A | | | | N/A | | | | N/A | | | | (65,932 | ) | | | N/A | |
| Net increase/(decrease) in net assets from capital stock transactions | | | (43,504,657 | ) | | | (1,129,268 | ) | | | (558,108 | ) | | | 1,371,032 | | | | (39,226,524 | ) | | | (26,941,896 | ) |
Net increase/(decrease) in net assets | | | (11,936,616 | ) | | | 2,853,389 | | | | 1,052,634 | | | | 4,228,670 | | | | (17,440,563 | ) | | | (8,450,907 | ) |
Amounts designated as “—” are either $0, or have been rounded to $0.
See Notes to Financial Statements.
Wilshire Mutual Funds, Inc Statements of Changes in Net Assets - (Continued) For the Year Ended December 31, 2010 | | |
| | | LARGE COMPANY GROWTH PORTFOLIO | | | LARGE COMPANY VALUE PORTFOLIO | | | SMALL COMPANY GROWTH PORTFOLIO | | | SMALL COMPANY VALUE PORTFOLIO | | | WILSHIRE 5000 INDEXSM FUND | | | WILSHIRE LARGE CAP CORE 130/30 FUND | |
| NET ASSETS: | | | | | | | | | | | | | | | | | | |
Beginning of year | | $ | 205,847,595 | | | $ | 32,138,400 | | | $ | 6,647,664 | | | $ | 9,681,082 | | | $ | 177,792,342 | | | $ | 203,617,430 | |
End of year | | $ | 193,910,979 | | | $ | 34,991,789 | | | $ | 7,700,298 | | | $ | 13,909,752 | | | $ | 160,351,779 | | | $ | 195,166,523 | |
Undistributed net investment income/(accumulated net investment loss)/(distributions in excess of net investment income) at end of year | | $ | — | | | $ | (5 | ) | | $ | (3,885 | ) | | $ | (15,038 | ) | | $ | 74,292 | | | $ | 39,353 | |
| | | | | | | | | | | | | | | | | | | | | | | | | |
| CAPITAL SHARE TRANSACTIONS: | | | | | | | | | | | | | | | | | | | | |
| Investment Class shares: | | | | | | | | | | | | | | | | | | | | | | | | |
Shares sold | | | 154,299 | | | | 145,789 | | | | 26,143 | | | | 484,722 | | | | 1,638,373 | | | | 801,864 | |
Shares issued as reinvestment of distributions | | | 1,578 | | | | 11,781 | | | | — | | | | 6,246 | | | | 116,376 | | | | 181,428 | |
Shares redeemed | | | (1,004,663 | ) | | | (207,382 | ) | | | (69,854 | ) | | | (363,274 | ) | | | (3,623,799 | ) | | | (2,361,115 | ) |
| Net increase/(decrease) in Investment Class shares outstanding | | | (848,786 | ) | | | (49,812 | ) | | | (43,711 | ) | | | 127,694 | | | | (1,869,050 | ) | | | (1,377,823 | ) |
| Institutional Class shares: | | | | | | | | | | | | | | | | | | | | | | | | |
Shares sold | | | 410,502 | | | | 1,602 | | | | 890 | | | | 821 | | | | 334,109 | | | | 695,199 | |
Shares issued as reinvestment of distributions | | | 5,230 | | | | 367 | | | | — | | | | 78 | | | | 70,238 | | | | 224,908 | |
Shares redeemed | | | (1,144,750 | ) | | | (39,689 | ) | | | (408 | ) | | | (4,126 | ) | | | (2,519,678 | ) | | | (3,060,849 | ) |
| Net increase/(decrease) in Institutional Class shares outstanding | | | (729,018 | ) | | | (37,720 | ) | | | 482 | | | | (3,227 | ) | | | (2,115,331 | ) | | | (2,140,742 | ) |
| Qualified Class shares: | | | | | | | | | | | | | | | | | | | | | | | | |
Shares sold | | | N/A | | | | N/A | | | | N/A | | | | N/A | | | | 6,610 | | | | N/A | |
Shares issued as reinvestment of distributions | | | N/A | | | | N/A | | | | N/A | | | | N/A | | | | 847 | | | | N/A | |
Shares redeemed | | | N/A | | | | N/A | | | | N/A | | | | N/A | | | | (6,686 | ) | | | N/A | |
| Net increase in Qualified Class shares outstanding | | | N/A | | | | N/A | | | | N/A | | | | N/A | | | | 771 | | | | N/A | |
| Horace Mann Class shares: | | | | | | | | | | | | | | | | | | | | | | | | |
Shares sold | | | N/A | | | | N/A | | | | N/A | | | | N/A | | | | 4,403 | | | | N/A | |
Shares issued as reinvestment of distributions | | | N/A | | | | N/A | | | | N/A | | | | N/A | | | | 1,387 | | | | N/A | |
Shares redeemed | | | N/A | | | | N/A | | | | N/A | | | | N/A | | | | (12,381 | ) | | | N/A | |
Net decrease in Horace Mann Class shares outstanding | | | N/A | | | | N/A | | | | N/A | | | | N/A | | | | (6,591 | ) | | | N/A | |
Amounts designated as “—” are either $0, or have been rounded to $0.
See Notes to Financial Statements.
Wilshire Mutual Funds, Inc. Statements of Changes in Net Assets For the Year Ended December 31, 2009 | | |
| | | LARGE COMPANY GROWTH PORTFOLIO | | | LARGE COMPANY VALUE PORTFOLIO | | | SMALL COMPANY GROWTH PORTFOLIO | | | SMALL COMPANY VALUE PORTFOLIO | | | WILSHIRE 5000 INDEXSM FUND | | | WILSHIRE LARGE CAP CORE 130/30 FUND | |
| OPERATIONS: | | | | | | | | | | | | | | | | | | |
Net investment income/(loss) | | $ | 241,309 | | | $ | 228,182 | | | $ | (39,872 | ) | | $ | 44,139 | | | $ | 2,288,436 | | | $ | 598,230 | |
| Net realized loss on investments and securities sold short | | | (14,933,724 | ) | | | (5,088,842 | ) | | | (675,234 | ) | | | (845,150 | ) | | | (16,056,044 | ) | | | (6,312,962 | ) |
| Net change in unrealized appreciation on investments and securities sold short | | | 72,746,085 | | | | 11,879,782 | | | | 2,279,036 | | | | 2,586,315 | | | | 52,416,695 | | | | 19,466,638 | |
| Net increase in net assets resulting from operations | | | 58,053,670 | | | | 7,019,122 | | | | 1,563,930 | | | | 1,785,304 | | | | 38,649,087 | | | | 13,751,906 | |
| DISTRIBUTIONS TO SHAREHOLDERS FROM: | | | | | | | | | | | | | | | | | | | |
| Net investment income: | | | | | | | | | | | | | | | | | | | | | | | | |
Investment Class shares | | | — | | | | (223,917 | ) | | | — | | | | (73,103 | ) | | | (1,468,618 | ) | | | (338,355 | ) |
Institutional Class shares | | | (245,689 | ) | | | (9,360 | ) | | | — | | | | (1,470 | ) | | | (1,005,577 | ) | | | (531,249 | ) |
Qualified Class shares | | | N/A | | | | N/A | | | | N/A | | | | N/A | | | | (9,173 | ) | | | N/A | |
Horace Mann Class shares | | | N/A | | | | N/A | | | | N/A | | | | N/A | | | | (14,605 | ) | | | N/A | |
| Return of Capital: | | | | | | | | | | | | | | | | | | | | | | | | |
Investment Class shares | | | — | | | | (1,018 | ) | | | — | | | | (959 | ) | | | — | | | | (6,941 | ) |
Institutional Class shares | | | (11,747 | ) | | | (121 | ) | | | — | | | | (24 | ) | | | — | | | | (6,137 | ) |
Total distributions to shareholders | | | (257,436 | ) | | | (234,416 | ) | | | — | | | | (75,556 | ) | | | (2,497,973 | ) | | | (882,682 | ) |
| CAPITAL STOCK TRANSACTIONS (DOLLARS): | | | | | | | | | | | | | | | | | | |
| Investment Class shares: | | | | | | | | | | | | | | | | | | | | | | | | |
Shares sold | | | 7,197,835 | | | | 2,316,748 | | | | 361,843 | | | | 1,223,157 | | | | 45,051,170 | | | | 57,354,459 | |
| Shares issued as reinvestment of distributions | | | — | | | | 224,189 | | | | — | | | | 72,574 | | | | 1,281,791 | | | | 344,754 | |
Shares redeemed | | | (43,033,789 | ) | | | (3,125,453 | ) | | | (650,683 | ) | | | (1,719,061 | ) | | | (57,415,231 | ) | | | (7,789,457 | ) |
| Net increase/(decrease) in net assets from Investment Class share transactions | | | (35,835,954 | ) | | | (584,516 | ) | | | (288,840 | ) | | | (423,330 | ) | | | (11,082,270 | ) | | | 49,909,756 | |
| Institutional Class shares: | | | | | | | | | | | | | | | | | | | | | | | | |
Shares sold | | | 12,128,208 | | | | 1,931,310 | | | | — | | | | 2,501 | | | | 10,670,239 | | | | 18,086,842 | |
| Shares issued in connection with in-kind transfer (See Note 9) | | | — | | | | — | | | | — | | | | — | | | | — | | | | 83,027,097 | |
Shares issued as reinvestment of distributions | | | 149,142 | | | | 7,597 | | | | — | | | | 1,494 | | | | 1,000,644 | | | | 537,331 | |
Shares redeemed | | | (28,752,836 | ) | | | (5,527,969 | ) | | | (54,650 | ) | | | (261,128 | ) | | | (13,439,596 | ) | | | (21,785,716 | ) |
| Net increase/(decrease) in net assets from Institutional Class share transactions | | | (16,475,486 | ) | | | (3,589,062 | ) | | | (54,650 | ) | | | (257,133 | ) | | | (1,768,713 | ) | | | 79,865,554 | |
| Qualified Class shares: | | | | | | | | | | | | | | | | | | | | | | | | |
Shares sold | | | N/A | | | | N/A | | | | N/A | | | | N/A | | | | 80,070 | | | | N/A | |
| Shares issued as reinvestment of distributions | | | N/A | | | | N/A | | | | N/A | | | | N/A | | | | 9,172 | | | | N/A | |
Shares redeemed | | | N/A | | | | N/A | | | | N/A | | | | N/A | | | | (29,750 | ) | | | N/A | |
Net increase in net assets from Qualified Class share transactions | | | N/A | | | | N/A | | | | N/A | | | | N/A | | | | 59,492 | | | | N/A | |
| Horace Mann Class shares: | | | | | | | | | | | | | | | | | | | | | | | | |
Shares sold | | | N/A | | | | N/A | | | | N/A | | | | N/A | | | | 45,600 | | | | N/A | |
| Shares issued as reinvestment of distributions | | | N/A | | | | N/A | | | | N/A | | | | N/A | | | | 14,605 | | | | N/A | |
Shares redeemed | | | N/A | | | | N/A | | | | N/A | | | | N/A | | | | (130,757 | ) | | | N/A | |
Net decrease in net assets from Horace Mann Class share transactions | | | N/A | | | | N/A | | | | N/A | | | | N/A | | | | (70,552 | ) | | | N/A | |
| Net increase/(decrease) in net assets from capital stock transactions | | | (52,311,440 | ) | | | (4,173,578 | ) | | | (343,490 | ) | | | (680,463 | ) | | | (12,862,043 | ) | | | 129,775,310 | |
Net increase in net assets | | | 5,484,794 | | | | 2,611,128 | | | | 1,220,440 | | | | 1,029,285 | | | | 23,289,071 | | | | 142,644,534 | |
Amounts designated as “—” are either $0, or have been rounded to $0.
See Notes to Financial Statements.
Wilshire Mutual Funds, Inc. Statements of Changes in Net Assets - (Continued) For the Year Ended December 31, 2009 | | |
| | | LARGE COMPANY GROWTH PORTFOLIO | | | LARGE COMPANY VALUE PORTFOLIO | | | SMALL COMPANY GROWTH PORTFOLIO | | | SMALL COMPANY VALUE PORTFOLIO | | | WILSHIRE 5000 INDEXSM FUND | | | WILSHIRE LARGE CAP CORE 130/30 FUND | |
| NET ASSETS: | | | | | | | | | | | | | | | | | | |
Beginning of year | | $ | 200,362,801 | | | $ | 29,527,272 | | | $ | 5,427,224 | | | $ | 8,651,797 | | | $ | 154,503,271 | | | $ | 60,972,896 | |
End of year | | $ | 205,847,595 | | | $ | 32,138,400 | | | $ | 6,647,664 | | | $ | 9,681,082 | | | $ | 177,792,342 | | | $ | 203,617,430 | |
Undistributed net investment income/(distributions in excess of net investment income) at end of year | | $ | — | | | $ | (180 | ) | | $ | — | | | $ | (3,180 | ) | | $ | 122,817 | | | $ | — | |
| | | | | | | | | | | | | | | | | | | | | | | | | |
| CAPITAL SHARE TRANSACTIONS: | | | | | | | | | | | | | | | | | | | | |
| Investment Class shares: | | | | | | | | | | | | | | | | | | | | | | | | |
Shares sold | | | 332,104 | | | | 229,200 | | | | 34,113 | | | | 111,054 | | | | 5,822,400 | | | | 8,127,067 | |
Shares issued as reinvestment of distributions | | | — | | | | 17,367 | | | | — | | | | 5,364 | | | | 132,143 | | | | 46,338 | |
Shares redeemed | | | (1,885,328 | ) | | | (319,963 | ) | | | (62,661 | ) | | | (154,021 | ) | | | (7,353,779 | ) | | | (1,313,243 | ) |
| Net increase/(decrease) in Investment Class shares outstanding | | | (1,553,224 | ) | | | (73,396 | ) | | | (28,548 | ) | | | (37,603 | ) | | | (1,399,236 | ) | | | 6,860,162 | |
| | | | | | | | | | | | | | | | | | | | | | | | | |
| Institutional Class shares: | | | | | | | | | | | | | | | | | | | | | | | | |
Shares sold | | | 532,104 | | | | 199,225 | | | | — | | | | 199 | | | | 1,400,334 | | | | 2,728,984 | |
Shares issued in connection with in-kind transfer (See Note 9) | | | — | | | | — | | | | — | | | | — | | | | — | | | | 11,693,957 | |
Shares issued as reinvestment of distributions | | | 5,334 | | | | 588 | | | | — | | | | 109 | | | | 103,159 | | | | 71,836 | |
Shares redeemed | | | (1,264,082 | ) | | | (558,775 | ) | | | (5,100 | ) | | | (27,691 | ) | | | (1,735,615 | ) | | | (3,569,303 | ) |
| Net increase/(decrease) in Institutional Class shares outstanding | | | (726,644 | ) | | | (358,962 | ) | | | (5,100 | ) | | | (27,383 | ) | | | (232,122 | ) | | | 10,925,474 | |
| | | | | | | | | | | | | | | | | | | | | | | | | |
| Qualified Class shares: | | | | | | | | | | | | | | | | | | | | | | | | |
Shares sold | | | N/A | | | | N/A | | | | N/A | | | | N/A | | | | 10,512 | | | | N/A | |
Shares issued as reinvestment of distributions | | | N/A | | | | N/A | | | | N/A | | | | N/A | | | | 947 | | | | N/A | |
Shares redeemed | | | N/A | | | | N/A | | | | N/A | | | | N/A | | | | (3,613 | ) | | | N/A | |
| Net increase in Qualified Class shares outstanding | | | N/A | | | | N/A | | | | N/A | | | | N/A | | | | 7,846 | | | | N/A | |
| | | | | | | | | | | | | | | | | | | | | | | | | |
| Horace Mann Class shares: | | | | | | | | | | | | | | | | | | | | | | | | |
Shares sold | | | N/A | | | | N/A | | | | N/A | | | | N/A | | | | 5,758 | | | | N/A | |
Shares issued as reinvestment of distributions | | | N/A | | | | N/A | | | | N/A | | | | N/A | | | | 1,509 | | | | N/A | |
Shares redeemed | | | N/A | | | | N/A | | | | N/A | | | | N/A | | | | (15,774 | ) | | | N/A | |
Net decrease in Horace Mann Class shares outstanding | | | N/A | | | | N/A | | | | N/A | | | | N/A | | | | (8,507 | ) | | | N/A | |
Amounts designated as “—” are either $0, or have been rounded to $0.
See Notes to Financial Statements.
Wilshire Mutual Funds, Inc. Statement of Cash Flows For the Year Ended December 31, 2010 | | |
| | | WILSHIRE LARGE CAP CORE 130/30 FUND | |
| INCREASE (DECREASE) IN CASH | | | |
| Cash Flows From Operating Activities: | | | |
| Net increase in net assets resulting from operations | | $ | 21,802,890 | |
| Adjustments to reconcile net increase in net assets resulting from operations to net cash provided by operating activities: | | | | |
| Purchases of investment securities | | | (385,656,538 | ) |
| Proceeds from disposition of investment securities | | | 429,395,597 | |
| Purchases to cover securities sold short | | | (136,266,927 | ) |
| Proceeds from securities sold short | | | 123,230,023 | |
| Net sales of short-term investment securities | | | 54,215 | |
| Net realized (gain)/loss from: | | | | |
| Investments | | | (12,794,971 | ) |
| Securities sold short | | | 6,791,247 | |
| Net change in unrealized (appreciation)/depreciation on: | | | | |
| Investments | | | (20,329,425 | ) |
| Securities sold short | | | 4,866,328 | |
| Increase in receivable for investment securities sold | | | (7,898,085 | ) |
| Decrease in dividends and interest receivable | | | 224,490 | |
| Increase in prepaid expenses and other assets | | | (12,358 | ) |
| Increase in reclaim receivable | | | (5,589 | ) |
| Increase in payable for investment securities purchased | | | 1,520,506 | |
| Increase in investment advisory fees payable | | | 11,154 | |
| Increase in distribution (12b-1) fees payable | | | 6,334 | |
| Increase in service fees payable | | | 6,713 | |
| Decrease in administration fees payable | | | (402 | ) |
| Increase in trustees’ fees payable | | | 2,328 | |
| Decrease in dividends payable on securities sold short | | | (51,142 | ) |
| Decrease in chief compliance officer expenses payable | | | (249 | ) |
| Increase in accrued expenses and other payables | | | 31,129 | |
| Net cash provided by operating activities | | | 24,927,268 | |
| | | | | |
| Cash Flows From Financing Activities: | | | | |
| Proceeds from shares sold | | | 10,635,411 | |
| Payments on shares redeemed | | | (40,863,132 | ) |
| Distributions to shareholders* | | | (3,068 | ) |
| Net cash flows used in financing activities | | | (30,230,789 | ) |
| Net decrease in cash | | | (5,303,521 | ) |
| | | | | |
| Cash at beginning of year | | | 1,202,258 | |
| Cash overdraft at end of year | | $ | (4,101,263 | ) |
| * | Non-cash operating and financing activities not included herein consist of reinvestment of dividends and distributions of $3,308,833 and interest paid of $266,538. |
See Notes to Financial Statements.
Wilshire Mutual Funds, Inc. Large Company Growth Portfolio Financial Highlights | | |
| For a Portfolio Share Outstanding Throughout Each Year. | |
| | | | |
| | | | | | | | | | | | | | | | |
Net asset value, beginning of year | | $ | 26.88 | | | $ | 20.12 | | | $ | 35.34 | | | $ | 36.20 | | | $ | 34.49 | |
| | | | | | | | | | | | | | | | | | | | | |
| Income/(loss) from investment operations: | | | | | | | | | | | | | | | | | | | | |
Net investment income/(loss)1 | | | 0.01 | | | | 0.00 | | | | (0.09 | ) | | | (0.13 | ) | | | (0.06 | ) |
| Net realized and unrealized gain/(loss) on investments | | | 5.12 | | | | 6.76 | | | | (14.73 | ) | | | 6.18 | | | | 1.77 | |
Total from investment operations | | | 5.13 | | | | 6.76 | | | | (14.82 | ) | | | 6.05 | | | | 1.71 | |
| | | | | | | | | | | | | | | | | | | | | |
| Less distributions: | | | | | | | | | | | | | | | | | | | | |
From net investment income | | | (0.01 | ) | | | 0.00 | | | | 0.00 | | | | 0.00 | | | | 0.00 | |
Return of capital | | | (0.00 | )2 | | | 0.00 | | | | 0.00 | | | | 0.00 | | | | 0.00 | |
From capital gains | | | 0.00 | | | | 0.00 | | | | (0.40 | ) | | | (6.91 | ) | | | 0.00 | |
Total distributions | | | (0.01 | ) | | | 0.00 | | | | (0.40 | ) | | | (6.91 | ) | | | 0.00 | |
| | | | | | | | | | | | | | | | | | | | | |
Net asset value, end of year | | $ | 32.00 | | | $ | 26.88 | | | $ | 20.12 | | | $ | 35.34 | | | $ | 36.20 | |
| | | | | | | | | | | | | | | | | | | | | |
Total return | | | 19.10 | % | | | 33.60 | % | | | (41.88 | )% | | | 16.33 | % | | | 4.96 | % |
| | | | | | | | | | | | | | | | | | | | | |
| Ratios to average net assets/supplemental data: | | | | | | | | | | | | | | | | | | | | |
Net assets, end of year (in 000’s) | | $ | 111,904 | | | $ | 116,799 | | | $ | 118,683 | | | $ | 312,297 | | | $ | 379,226 | |
Operating expenses | | | 1.42 | % | | | 1.43 | % | | | 1.43 | % | | | 1.41 | % | | | 1.34 | % |
Net investment income/(loss) | | | 0.04 | % | | | (0.02 | )% | | | (0.31 | )% | | | (0.32 | )% | | | (0.18 | )% |
Portfolio turnover rate | | | 167 | % | | | 84 | % | | | 178 | % | | | 129 | % | | | 62 | % |
| 1 | The selected per share data was calculated using the average shares outstanding method for the year. |
| | |
| 2 | Amount is less than $0.01 per share. |
See Notes to Financial Statements.
Wilshire Mutual Funds, Inc. Large Company Growth Portfolio Financial Highlights - (Continued) | | |
| For a Portfolio Share Outstanding Throughout Each Year. | |
| | | Institutional Class Shares | |
| | | | | | | | | | | | | | | | |
Net asset value, beginning of year | | $ | 27.70 | | | $ | 20.72 | | | $ | 36.25 | | | $ | 36.84 | | | $ | 34.97 | |
| | | | | | | | | | | | | | | | | | | | | |
| Income/(loss) from investment operations: | | | | | | | | | | | | | | | | | | | | |
Net investment income1 | | | 0.12 | | | | 0.08 | | | | 0.02 | | | | 0.03 | | | | 0.07 | |
| Net realized and unrealized gain/(loss) on investments | | | 5.30 | | | | 6.98 | | | | (15.15 | ) | | | 6.29 | | | | 1.80 | |
Total from investment operations | | | 5.42 | | | | 7.06 | | | | (15.13 | ) | | | 6.32 | | | | 1.87 | |
| | | | | | | | | | | | | | | | | | | | | |
| Less distributions: | | | | | | | | | | | | | | | | | | | | |
From net investment income | | | (0.13 | ) | | | (0.08 | ) | | | 0.00 | | | | 0.00 | | | | 0.00 | |
Return of capital | | | (0.00 | )2 | | | 0.00 | | | | 0.00 | | | | 0.00 | | | | 0.00 | |
From capital gains | | | 0.00 | | | | 0.00 | | | | (0.40 | ) | | | (6.91 | ) | | | 0.00 | |
Total distributions | | | (0.13 | ) | | | (0.08 | ) | | | (0.40 | ) | | | (6.91 | ) | | | 0.00 | |
| | | | | | | | | | | | | | | | | | | | | |
Net asset value, end of year | | $ | 32.99 | | | $ | 27.70 | | | $ | 20.72 | | | $ | 36.25 | | | $ | 36.84 | |
| | | | | | | | | | | | | | | | | | | | | |
Total return | | | 19.55 | % | | | 34.07 | % | | | (41.70 | )% | | | 16.80 | % | | | 5.35 | % |
| | | | | | | | | | | | | | | | | | | | | |
| Ratios to average net assets/supplemental data: | | | | | | | | | | | | | | | | | | | | |
Net assets, end of year (in 000’s) | | $ | 82,007 | | | $ | 89,049 | | | $ | 81,680 | | | $ | 169,017 | | | $ | 225,390 | |
Operating expenses | | | 1.05 | % | | | 1.09 | % | | | 1.06 | % | | | 1.02 | % | | | 0.98 | % |
Net investment income | | | 0.40 | % | | | 0.33 | % | | | 0.07 | % | | | 0.08 | % | | | 0.19 | % |
Portfolio turnover rate | | | 167 | % | | | 84 | % | | | 178 | % | | | 129 | % | | | 62 | % |
| 1 | The selected per share data was calculated using the average shares outstanding method for the year. |
| | |
| 2 | Amount is less than $0.01 per share. |
See Notes to Financial Statements.
Wilshire Mutual Funds, Inc. Large Company Value Portfolio Financial Highlights | | |
| For a Portfolio Share Outstanding Throughout Each Year. | |
| | | | |
| | | | | | | | | | | | | | | | |
Net asset value, beginning of year | | $ | 12.78 | | | $ | 10.02 | | | $ | 17.51 | | | $ | 22.99 | | | $ | 21.17 | |
| | | | | | | | | | | | | | | | | | | | | |
| Income/(loss) from investment operations: | | | | | | | | | | | | | | | | | | | | |
Net investment income1 | | | 0.07 | | | | 0.08 | | | | 0.17 | | | | 0.20 | | | | 0.20 | |
| Net realized and unrealized gain/(loss) on investments | | | 1.64 | | | | 2.77 | | | | (7.45 | ) | | | (0.58 | ) | | | 3.71 | |
Total from investment operations | | | 1.71 | | | | 2.85 | | | | (7.28 | ) | | | (0.38 | ) | | | 3.91 | |
| | | | | | | | | | | | | | | | | | | | | |
| Less distributions: | | | | | | | | | | | | | | | | | | | | |
From net investment income | | | (0.07 | ) | | | (0.09 | ) | | | (0.21 | ) | | | (0.23 | ) | | | (0.19 | ) |
Return of capital | | | (0.00 | )2 | | | 0.00 | | | | 0.00 | | | | (0.00 | )2 | | | 0.00 | |
From capital gains | | | 0.00 | | | | 0.00 | | | | 0.00 | 2 | | | (4.87 | ) | | | (1.90 | ) |
Total distributions | | | (0.07 | ) | | | (0.09 | ) | | | (0.21 | ) | | | (5.10 | ) | | | (2.09 | ) |
| | | | | | | | | | | | | | | | | | | | | |
Net asset value, end of year | | $ | 14.42 | | | $ | 12.78 | | | $ | 10.02 | | | $ | 17.51 | | | $ | 22.99 | |
| | | | | | | | | | | | | | | | | | | | | |
Total return | | | 13.40 | % | | | 28.48 | % | | | (41.55 | )% | | | (2.00 | )% | | | 18.49 | % |
| | | | | | | | | | | | | | | | | | | | | |
| Ratios to average net assets/supplemental data: | | | | | | | | | | | | | | | | | | | | |
Net assets, end of year (in 000’s) | | $ | 33,887 | | | $ | 30,677 | | | $ | 24,791 | | | $ | 57,314 | | | $ | 76,481 | |
Operating expenses | | | 1.39 | % | | | 1.48 | % | | | 1.49 | % | | | 1.42 | % | | | 1.39 | % |
Net investment income | | | 0.54 | % | | | 0.75 | % | | | 1.22 | % | | | 0.85 | % | | | 0.87 | % |
Portfolio turnover rate | | | 140 | % | | | 188 | % | | | 183 | % | | | 120 | % | | | 50 | % |
| 1 | The selected per share data was calculated using the average shares outstanding method for the year. |
| | |
| 2 | Amount is less than $0.01 per share. |
See Notes to Financial Statements.
Wilshire Mutual Funds, Inc. Large Company Value Portfolio Financial Highlights - (Continued) | | |
| For a Portfolio Share Outstanding Throughout Each Year. | |
| | | Institutional Class Shares | |
| | | | | | | | | | | | | | | | |
Net asset value, beginning of year | | $ | 12.79 | | | $ | 10.01 | | | $ | 17.49 | | | $ | 23.04 | | | $ | 21.19 | |
| | | | | | | | | | | | | | | | | | | | | |
| Income/(loss) from investment operations: | | | | | | | | | | | | | | | | | | | | |
Net investment income1 | | | 0.08 | | | | 0.10 | | | | 0.20 | | | | 0.27 | | | | 0.27 | |
| Net realized and unrealized gain/(loss) on investments | | | 1.66 | | | | 2.76 | | | | (7.45 | ) | | | (0.64 | ) | | | 3.74 | |
Total from investment operations | | | 1.74 | | | | 2.86 | | | | (7.25 | ) | | | (0.37 | ) | | | 4.01 | |
| | | | | | | | | | | | | | | | | | | | | |
| Less distributions: | | | | | | | | | | | | | | | | | | | | |
From net investment income | | | (0.09 | ) | | | (0.08 | ) | | | (0.23 | ) | | | (0.31 | ) | | | (0.26 | ) |
Return of capital | | | (0.00 | )2 | | | 0.00 | | | | 0.00 | | | | (0.00 | )2 | | | 0.00 | |
From capital gains | | | 0.00 | | | | 0.00 | | | | 0.00 | 2 | | | (4.87 | ) | | | (1.90 | ) |
Total distributions | | | (0.09 | ) | | | (0.08 | ) | | | (0.23 | ) | | | (5.18 | ) | | | (2.16 | ) |
| | | | | | | | | | | | | | | | | | | | | |
Net asset value, end of year | | $ | 14.44 | | | $ | 12.79 | | | $ | 10.01 | | | $ | 17.49 | | | $ | 23.04 | |
| | | | | | | | | | | | | | | | | | | | | |
Total return | | | 13.57 | % | | | 28.60 | % | | | (41.41 | )% | | | (1.92 | )% | | | 18.94 | % |
| | | | | | | | | | | | | | | | | | | | | |
| Ratios to average net assets/supplemental data: | | | | | | | | | | | | | | | | | | | | |
Net assets, end of year (in 000’s) | | $ | 1,105 | | | $ | 1,461 | | | $ | 4,736 | | | $ | 8,469 | | | $ | 7,399 | |
Operating expenses | | | 1.27 | % | | | 1.36 | % | | | 1.30 | % | | | 1.12 | % | | | 1.08 | % |
Net investment income | | | 0.65 | % | | | 0.97 | % | | | 1.34 | % | | | 1.15 | % | | | 1.18 | % |
Portfolio turnover rate | | | 140 | % | | | 188 | % | | | 183 | % | | | 120 | % | | | 50 | % |
| 1 | The selected per share data was calculated using the average shares outstanding method for the year. |
| | |
| 2 | Amount is less than $0.01 per share. |
See Notes to Financial Statements.
Wilshire Mutual Funds, Inc. Small Company Growth Portfolio Financial Highlights | | |
| For a Portfolio Share Outstanding Throughout Each Year. | |
| | | | |
| | | | | | | | | | | | | | | | |
Net asset value, beginning of year | | $ | 12.64 | | | $ | 9.70 | | | $ | 16.94 | | | $ | 17.46 | | | $ | 16.88 | |
| | | | | | | | | | | | | | | | | | | | | |
| Income/(loss) from investment operations: | | | | | | | | | | | | | | | | | | | | |
Net investment loss1 | | | (0.05 | ) | | | (0.08 | ) | | | (0.10 | ) | | | (0.09 | ) | | | (0.17 | ) |
| Net realized and unrealized gain/(loss) on investments | | | 3.36 | | | | 3.02 | | | | (6.56 | ) | | | 1.60 | | | | 2.04 | |
Total from investment operations | | | 3.31 | | | | 2.94 | | | | (6.66 | ) | | | 1.51 | | | | 1.87 | |
| | | | | | | | | | | | | | | | | | | | | |
| Less distributions: | | | | | | | | | | | | | | | | | | | | |
From capital gains | | | 0.00 | | | | 0.00 | | | | (0.58 | ) | | | (2.03 | ) | | | (1.29 | ) |
Total distributions | | | 0.00 | | | | 0.00 | | | | (0.58 | ) | | | (2.03 | ) | | | (1.29 | ) |
| | | | | | | | | | | | | | | | | | | | | |
Net asset value, end of year | | $ | 15.95 | | | $ | 12.64 | | | $ | 9.70 | | | $ | 16.94 | | | $ | 17.46 | |
| | | | | | | | | | | | | | | | | | | | | |
Total return | | | 26.19 | % | | | 30.31 | % | | | (39.13 | )% | | | 8.36 | % | | | 11.12 | % |
| | | | | | | | | | | | | | | | | | | | | |
| Ratios to average net assets/supplemental data: | | | | | | | | | | | | | | | | | | | | |
Net assets, end of year (in 000’s) | | $ | 7,521 | | | $ | 6,513 | | | $ | 5,273 | | | $ | 18,702 | | | $ | 15,553 | |
| Operating expenses including reimbursement/waiver | | | 1.45 | % | | | 1.50 | % | | | 1.47 | % | | | 1.46 | % | | | 1.43 | % |
| Operating expenses excluding reimbursement/waiver | | | 2.18 | % | | | 2.41 | % | | | 2.07 | % | | | 2.06 | % | | | 2.05 | % |
Net investment loss | | | (0.41 | )% | | | (0.74 | )% | | | (0.66 | )% | | | (1.09 | )% | | | (0.96 | )% |
Portfolio turnover rate | | | 83 | % | | | 98 | % | | | 87 | % | | | 99 | % | | | 62 | % |
| 1 | The selected per share data was calculated using the average shares outstanding method for the year. |
See Notes to Financial Statements.
Wilshire Mutual Funds, Inc. Small Company Growth Portfolio Financial Highlights - (Continued) | | |
| For a Portfolio Share Outstanding Throughout Each Year. | |
| | | Institutional Class Shares | |
| | | | | | | | | | | | | | | | |
Net asset value, beginning of year | | $ | 13.12 | | | $ | 10.03 | | | $ | 17.50 | | | $ | 17.93 | | | $ | 17.25 | |
| | | | | | | | | | | | | | | | | | | | | |
| Income/(loss) from investment operations: | | | | | | | | | | | | | | | | | | | | |
Net investment loss1 | | | (0.01 | ) | | | (0.04 | ) | | | (0.06 | ) | | | (0.06 | ) | | | (0.12 | ) |
| Net realized and unrealized gain/(loss) on investments | | | 3.50 | | | | 3.13 | | | | (6.83 | ) | | | 1.66 | | | | 2.09 | |
Total from investment operations | | | 3.49 | | | | 3.09 | | | | (6.89 | ) | | | 1.60 | | | | 1.97 | |
| | | | | | | | | | | | | | | | | | | | | |
| Less distributions: | | | | | | | | | | | | | | | | | | | | |
From capital gains | | | 0.00 | | | | 0.00 | | | | (0.58 | ) | | | (2.03 | ) | | | (1.29 | ) |
Total distributions | | | 0.00 | | | | 0.00 | | | | (0.58 | ) | | | (2.03 | ) | | | (1.29 | ) |
| | | | | | | | | | | | | | | | | | | | | |
Net asset value, end of year | | $ | 16.61 | | | $ | 13.12 | | | $ | 10.03 | | | $ | 17.50 | | | $ | 17.93 | |
| | | | | | | | | | | | | | | | | | | | | |
Total return | | | 26.60 | % | | | 30.81 | % | | | (39.17 | )% | | | 8.58 | % | | | 11.46 | % |
| | | | | | | | | | | | | | | | | | | | | |
| Ratios to average net assets/supplemental data: | | | | | | | | | | | | | | | | | | | | |
| Net assets, end of year (in 000’s) | | $ | 179 | | | $ | 135 | | | $ | 154 | | | $ | 298 | | | $ | 196 | |
| Operating expenses including reimbursement/waiver | | | 1.15 | % | | | 1.18 | % | | | 1.24 | % | | | 1.21 | % | | | 1.15 | % |
| Operating expenses excluding reimbursement/waiver | | | 1.87 | % | | | 2.09 | % | | | 1.78 | % | | | 1.81 | % | | | 1.77 | % |
Net investment loss | | | (0.09 | )% | | | (0.43 | )% | | | (0.39 | )% | | | (0.92 | )% | | | (0.68 | )% |
Portfolio turnover rate | | | 83 | % | | | 98 | % | | | 87 | % | | | 99 | % | | | 62 | % |
| 1 | The selected per share data was calculated using the average shares outstanding method for the year. |
See Notes to Financial Statements.
Wilshire Mutual Funds, Inc. Small Company Value Portfolio Financial Highlights | | |
| For a Portfolio Share Outstanding Throughout Each Year. | |
| | | | |
| | | | | | | | | | | | | | | | |
Net asset value, beginning of year | | $ | 13.32 | | | $ | 10.93 | | | $ | 16.49 | | | $ | 18.77 | | | $ | 17.46 | |
| | | | | | | | | | | | | | | | | | | | | |
| Income/(loss) from investment operations: | | | | | | | | | | | | | | | | | | | | |
Net investment income1 | | | 0.12 | | | | 0.05 | | | | 0.09 | | | | 0.10 | | | | 0.03 | |
| Net realized and unrealized gain/(loss) on investments | | | 3.02 | | | | 2.44 | | | | (5.51 | ) | | | (0.70 | ) | | | 3.38 | |
Total from investment operations | | | 3.14 | | | | 2.49 | | | | (5.42 | ) | | | (0.60 | ) | | | 3.41 | |
| | | | | | | | | | | | | | | | | | | | | |
| Less distributions: | | | | | | | | | | | | | | | | | | | | |
From net investment income | | | (0.12 | ) | | | (0.10 | ) | | | (0.14 | ) | | | (0.11 | ) | | | (0.03 | ) |
From capital gains | | | 0.00 | | | | 0.00 | | | | 0.00 | 2 | | | (1.57 | ) | | | (2.07 | ) |
Total distributions | | | (0.12 | ) | | | (0.10 | ) | | | (0.14 | ) | | | (1.68 | ) | | | (2.10 | ) |
| | | | | | | | | | | | | | | | | | | | | |
Net asset value, end of year | | $ | 16.34 | | | $ | 13.32 | | | $ | 10.93 | | | $ | 16.49 | | | $ | 18.77 | |
| | | | | | | | | | | | | | | | | | | | | |
Total return | | | 23.60 | % | | | 22.81 | % | | | (32.81 | )% | | | (3.45 | )% | | | 19.64 | % |
| | | | | | | | | | | | | | �� | | | | | | | |
| Ratios to average net assets/supplemental data: | | | | | | | | | | | | | | | | | | | | |
Net assets, end of year (in 000’s) | | $ | 13,754 | | | $ | 9,511 | | | $ | 8,211 | | | $ | 21,630 | | | $ | 23,639 | |
| Operating expenses including reimbursement/waiver | | | 1.50 | % | | | 1.50 | % | | | 1.34 | % | | | 1.19 | % | | | 1.31 | % |
| Operating expenses excluding reimbursement/waiver | | | 1.87 | % | | | 2.01 | % | | | 1.94 | % | | | 1.79 | % | | | 1.92 | % |
Net investment income/(loss) | | | 0.82 | % | | | 0.49 | % | | | 0.62 | % | | | (0.05 | )% | | | 0.15 | % |
Portfolio turnover rate | | | 89 | % | | | 61 | % | | | 83 | % | | | 68 | % | | | 72 | % |
| 1 | The selected per share data was calculated using the average shares outstanding method for the year. |
| | |
| 2 | Amount is less than $0.01 per share |
See Notes to Financial Statements.
Wilshire Mutual Funds, Inc. Small Company Value Portfolio Financial Highlights - (Continued) | | |
| For a Portfolio Share Outstanding Throughout Each Year. | |
| | | Institutional Class Shares | |
| | | | | | | | | | | | | | | | |
Net asset value, beginning of year | | $ | 13.45 | | | $ | 11.02 | | | $ | 16.61 | | | $ | 18.90 | | | $ | 17.56 | |
| | | | | | | | | | | | | | | | | | | | | |
| Income/(loss) from investment operations: | | | | | | | | | | | | | | | | | | | | |
Net investment income1 | | | 0.14 | | | | 0.07 | | | | 0.12 | | | | 0.17 | | | | 0.09 | |
| Net realized and unrealized gain/(loss) on investments | | | 3.06 | | | | 2.48 | | | | (5.51 | ) | | | (0.72 | ) | | | 3.41 | |
Total from investment operations | | | 3.20 | | | | 2.55 | | | | (5.39 | ) | | | (0.55 | ) | | | 3.50 | |
| | | | | | | | | | | | | | | | | | | | | |
| Less distributions: | | | | | | | | | | | | | | | | | | | | |
From net investment income | | | (0.14 | ) | | | (0.12 | ) | | | (0.20 | ) | | | (0.17 | ) | | | (0.09 | ) |
From capital gains | | | 0.00 | | | | 0.00 | | | | 0.00 | 2 | | | (1.57 | ) | | | (2.07 | ) |
Total distributions | | | (0.14 | ) | | | (0.12 | ) | | | (0.20 | ) | | | (1.74 | ) | | | (2.16 | ) |
| | | | | | | | | | | | | | | | | | | | | |
Net asset value, end of year | | $ | 16.51 | | | $ | 13.45 | | | $ | 11.02 | | | $ | 16.61 | | | $ | 18.90 | |
| | | | | | | | | | | | | | | | | | | | | |
Total return | | | 23.80 | % | | | 23.11 | % | | | (32.37 | )% | | | (3.18 | )% | | | 20.05 | % |
| | | | | | | | | | | | | | | | | | | | | |
| Ratios to average net assets/supplemental data: | | | | | | | | | | | | | | | | | | | | |
Net assets, end of year (in 000’s) | | $ | 156 | | | $ | 170 | | | $ | 441 | | | $ | 5,652 | | | $ | 1,375 | |
| Operating expenses including reimbursement/waiver | | | 1.29 | % | | | 1.30 | % | | | 1.00 | % | | | 0.91 | % | | | 1.02 | % |
| Operating expenses excluding reimbursement/waiver | | | 1.67 | % | | | 1.71 | % | | | 1.61 | % | | | 1.51 | % | | | 1.62 | % |
Net investment income | | | 0.96 | % | | | 0.65 | % | | | 0.82 | % | | | 0.30 | % | | | 0.44 | % |
Portfolio turnover rate | | | 89 | % | | | 61 | % | | | 83 | % | | | 68 | % | | | 72 | % |
| 1 | The selected per share data was calculated using the average shares outstanding method for the year. |
| | |
| 2 | Amount is less than $0.01 per share |
See Notes to Financial Statements.
Wilshire Mutual Funds, Inc. Wilshire 5000 Indexsm Fund Financial Highlights | | |
| For a Fund Share Outstanding Throughout Each Year. | |
| | | | |
| | | | | | | | | | | | | | | | |
Net asset value, beginning of year | | $ | 9.61 | | | $ | 7.67 | | | $ | 12.42 | | | $ | 12.02 | | | $ | 10.59 | |
| | | | | | | | | | | | | | | | | | | | | |
| Income/(loss) from investment operations: | | | | | | | | | | | | | | | | | | | | |
Net investment income1 | | | 0.13 | | | | 0.11 | | | | 0.15 | | | | 0.15 | | | | 0.12 | |
| Net realized and unrealized gain/(loss) on investments | | | 1.45 | | | | 1.96 | | | | (4.77 | ) | | | 0.42 | | | | 1.41 | |
Total from investment operations | | | 1.58 | | | | 2.07 | | | | (4.62 | ) | | | 0.57 | | | | 1.53 | |
| | | | | | | | | | | | | | | | | | | | | |
| Less distributions: | | | | | | | | | | | | | | | | | | | | |
From net investment income | | | (0.14 | ) | | | (0.13 | ) | | | (0.13 | ) | | | (0.17 | ) | | | (0.10 | ) |
Total distributions | | | (0.14 | ) | | | (0.13 | ) | | | (0.13 | ) | | | (0.17 | ) | | | (0.10 | ) |
| | | | | | | | | | | | | | | | | | | | | |
Net asset value, end of year | | $ | 11.05 | | | $ | 9.61 | | | $ | 7.67 | | | $ | 12.42 | | | $ | 12.02 | |
| | | | | | | | | | | | | | | | | | | | | |
Total return | | | 16.44 | % | | | 26.98 | % | | | (37.11 | )% | | | 4.75 | % | | | 14.46 | % |
| | | | | | | | | | | | | | | | | | | | | |
| Ratios to average net assets/supplemental data: | | | | | | | | | | | | | | | | | | | | |
Net assets, end of year (in 000’s) | | $ | 105,019 | | | $ | 109,304 | | | $ | 98,032 | | | $ | 143,090 | | | $ | 145,952 | |
Operating expenses | | | 0.72 | % | | | 0.77 | % | | | 0.78 | % | | | 0.68 | % | | | 0.74 | % |
Net investment income | | | 1.26 | % | | | 1.36 | % | | | 1.48 | % | | | 1.20 | % | | | 1.08 | % |
Portfolio turnover rate | | | 2 | % | | | 57 | % | | | 52 | % | | | 60 | % | | | 69 | % |
| 1 | The selected per share data was calculated using the average shares outstanding method for the year. |
See Notes to Financial Statements.
Wilshire Mutual Funds, Inc. Wilshire 5000 Indexsm Fund Financial Highlights - (Continued) | | |
| For a Fund Share Outstanding Throughout Each Year. | |
| | | Institutional Class Shares | |
| | | | | | | | | | | | | | | | |
Net asset value, beginning of year | | $ | 9.60 | | | $ | 7.67 | | | $ | 12.41 | | | $ | 12.02 | | | $ | 10.60 | |
| | | | | | | | | | | | | | | | | | | | | |
| Income/(loss) from investment operations: | | | | | | | | | | | | | | | | | | | | |
Net investment income1 | | | 0.15 | | | | 0.13 | | | | 0.17 | | | | 0.19 | | | | 0.15 | |
| Net realized and unrealized gain/(loss) on investments | | | 1.45 | | | | 1.95 | | | | (4.76 | ) | | | 0.41 | | | | 1.40 | |
Total from investment operations | | | 1.60 | | | | 2.08 | | | | (4.59 | ) | | | 0.60 | | | | 1.55 | |
| | | | | | | | | | | | | | | | | | | | | |
| Less distributions: | | | | | | | | | | | | | | | | | | | | |
From net investment income | | | (0.16 | ) | | | (0.15 | ) | | | (0.15 | ) | | | (0.21 | ) | | | (0.13 | ) |
Total distributions | | | (0.16 | ) | | | (0.15 | ) | | | (0.15 | ) | | | (0.21 | ) | | | (0.13 | ) |
| | | | | | | | | | | | | | | | | | | | | |
Net asset value, end of year | | $ | 11.04 | | | $ | 9.60 | | | $ | 7.67 | | | $ | 12.41 | | | $ | 12.02 | |
| | | | | | | | | | | | | | | | | | | | | |
Total return | | | 16.71 | % | | | 27.10 | % | | | (36.95 | )% | | | 4.97 | % | | | 14.66 | % |
| | | | | | | | | | | | | | | | | | | | | |
| Ratios to average net assets/supplemental data: | | | | | | | | | | | | | | | | | | | | |
Net assets, end of year (in 000’s) | | $ | 53,415 | | | $ | 66,764 | | | $ | 55,088 | | | $ | 113,721 | | | $ | 65,177 | |
Operating expenses | | | 0.50 | % | | | 0.54 | % | | | 0.59 | % | | | 0.39 | % | | | 0.47 | % |
Net investment income | | | 1.48 | % | | | 1.59 | % | | | 1.62 | % | | | 1.49 | % | | | 1.35 | % |
Portfolio turnover rate | | | 2 | % | | | 57 | % | | | 52 | % | | | 60 | % | | | 69 | % |
| 1 | The selected per share data was calculated using the average shares outstanding method for the year. |
See Notes to Financial Statements.
Wilshire Mutual Funds, Inc. Wilshire 5000 Indexsm Fund Financial Highlights - (Continued) | | |
| For a Fund Share Outstanding Throughout Each Year. | |
| | | | |
| | | | | | | | | | | | | | | | |
Net asset value, beginning of year | | $ | 9.59 | | | $ | 7.67 | | | $ | 12.42 | | | $ | 12.02 | | | $ | 10.61 | |
| | | | | | | | | | | | | | | | | | | | | |
| Income/(loss) from investment operations: | | | | | | | | | | | | | | | | | | | | |
Net investment income1 | | | 0.13 | | | | 0.12 | | | | 0.15 | | | | 0.14 | | | | 0.11 | |
| Net realized and unrealized gain/(loss) on investments | | | 1.46 | | | | 1.95 | | | | (4.76 | ) | | | 0.42 | | | | 1.39 | |
Total from investment operations | | | 1.59 | | | | 2.07 | | | | (4.61 | ) | | | 0.56 | | | | 1.50 | |
| | | | | | | | | | | | | | | | | | | | | |
| Less distributions: | | | | | | | | | | | | | | | | | | | | |
From net investment income | | | (0.15 | ) | | | (0.15 | ) | | | (0.14 | ) | | | (0.16 | ) | | | (0.09 | ) |
Total distributions | | | (0.15 | ) | | | (0.15 | ) | | | (0.14 | ) | | | (0.16 | ) | | | (0.09 | ) |
| | | | | | | | | | | | | | | | | | | | | |
Net asset value, end of year | | $ | 11.03 | | | $ | 9.59 | | | $ | 7.67 | | | $ | 12.42 | | | $ | 12.02 | |
| | | | | | | | | | | | | | | | | | | | | |
Total return | | | 16.56 | % | | | 26.91 | % | | | (37.09 | )% | | | 4.63 | % | | | 14.18 | % |
| | | | | | | | | | | | | | | | | | | | | |
| Ratios to average net assets/supplemental data: | | | | | | | | | | | | | | | | | | | | |
Net assets, end of year (in 000’s) | | $ | 714 | | | $ | 614 | | | $ | 431 | | | $ | 607 | | | $ | 1,114 | |
Operating expenses | | | 0.66 | % | | | 0.61 | % | | | 0.84 | % | | | 0.79 | % | | | 0.83 | % |
Net investment income | | | 1.32 | % | | | 1.51 | % | | | 1.40 | % | | | 1.08 | % | | | 0.99 | % |
Portfolio turnover rate | | | 2 | % | | | 57 | % | | | 52 | % | | | 60 | % | | | 69 | % |
| 1 | The selected per share data was calculated using the average shares outstanding method for the year. |
See Notes to Financial Statements.
Wilshire Mutual Funds, Inc. Wilshire 5000 Indexsm Fund Financial Highlights - (Continued) | | |
| For a Fund Share Outstanding Throughout Each Year. | |
| | | | |
| | | | | | | | | | | | | | | | |
Net asset value, beginning of year | | $ | 9.59 | | | $ | 7.66 | | | $ | 12.38 | | | $ | 11.99 | | | $ | 10.57 | |
| | | | | | | | | | | | | | | | | | | | | |
| Income/(loss) from investment operations: | | | | | | | | | | | | | | | | | | | | |
Net investment income1 | | | 0.13 | | | | 0.11 | | | | 0.15 | | | | 0.14 | | | | 0.12 | |
| Net realized and unrealized gain/(loss) on investments | | | 1.44 | | | | 1.95 | | | | (4.75 | ) | | | 0.41 | | | | 1.39 | |
Total from investment operations | | | 1.57 | | | | 2.06 | | | | (4.60 | ) | | | 0.55 | | | | 1.51 | |
| | | | | | | | | | | | | | | | | | | | | |
| Less distributions: | | | | | | | | | | | | | | | | | | | | |
From net investment income | | | (0.14 | ) | | | (0.13 | ) | | | (0.12 | ) | | | (0.16 | ) | | | (0.09 | ) |
Total distributions | | | (0.14 | ) | | | (0.13 | ) | | | (0.12 | ) | | | (0.16 | ) | | | (0.09 | ) |
| | | | | | | | | | | | | | | | | | | | | |
Net asset value, end of year | | $ | 11.02 | | | $ | 9.59 | | | $ | 7.66 | | | $ | 12.38 | | | $ | 11.99 | |
| | | | | | | | | | | | | | | | | | | | | |
Total return | | | 16.39 | % | | | 26.85 | % | | | (37.08 | )% | | | 4.60 | % | | | 14.32 | % |
| | | | | | | | | | | | | | | | | | | | | |
| Ratios to average net assets/supplemental data: | | | | | | | | | | | | | | | | | | | | |
Net assets, end of year (in 000’s) | | $ | 1,204 | | | $ | 1,111 | | | $ | 952 | | | $ | 1,593 | | | $ | 1,817 | |
Operating expenses | | | 0.72 | % | | | 0.80 | % | | | 0.82 | % | | | 0.74 | % | | | 0.77 | % |
Net investment income | | | 1.26 | % | | | 1.34 | % | | | 1.41 | % | | | 1.14 | % | | | 1.05 | % |
Portfolio turnover rate | | | 2 | % | | | 57 | % | | | 52 | % | | | 60 | % | | | 69 | % |
| 1 | The selected per share data was calculated using the average shares outstanding method for the year. |
See Notes to Financial Statements.
Wilshire Mutual Funds, Inc. Wilshire Large Cap Core 130/30 Fund Financial Highlights | | |
| For a Fund Share Outstanding Throughout Each Period. | |
| | | | |
| | | | | | | | | | | | | |
Net asset value, beginning of period | | $ | 7.37 | | | $ | 6.23 | | | $ | 10.12 | | | $ | 10.00 | |
| | | | | | | | | | | | | | | | | |
| Income/(loss) from investment operations: | | | | | | | | | | | | | | | | |
Net investment income/(loss)2 | | | 0.00 | 3 | | | 0.04 | | | | 0.02 | | | | (0.02 | ) |
| Net realized and unrealized gain/(loss) on investments | | | 0.84 | | | | 1.13 | | | | (3.90 | ) | | | 0.14 | |
Total from investment operations | | | 0.84 | | | | 1.17 | | | | (3.88 | ) | | | 0.12 | |
| | | | | | | | | | | | | | | | | |
| Less distributions: | | | | | | | | | | | | | | | | |
From net investment income | | | (0.04 | ) | | | (0.03 | ) | | | (0.01 | ) | | | 0.00 | 3 |
From capital gains | | | (0.08 | ) | | | 0.00 | | | | 0.00 | | | | 0.00 | |
Total distributions | | | (0.12 | ) | | | (0.03 | ) | | | (0.01 | ) | | | 0.00 | |
| | | | | | | | | | | | | | | | | |
Net asset value, end of period | | $ | 8.09 | | | $ | 7.37 | | | $ | 6.23 | | | $ | 10.12 | |
| | | | | | | | | | | | | | | | | |
Total return | | | 11.47 | % | | | 18.73 | % | | | (38.31 | )% | | | 1.21 | %4 |
| | | | | | | | | | | | | | | | | |
| Ratios to average net assets/ supplemental data: | | | | | | | | | | | | | | | | |
Net assets, end of period (in 000’s) | | $ | 91,641 | | | $ | 93,553 | | | $ | 36,356 | | | $ | 7,196 | |
| Operating expenses excluding dividends and rebates on securities sold short and interest expense, after expense reimbursement/waiver | | | 1.50 | % | | | 1.50 | % | | | 1.50 | % | | | 1.50 | %5 |
| Operating expenses including dividends and rebates on securities sold short and interest expense, after expense reimbursement/waiver | | | 2.19 | % | | | 2.17 | % | | | 2.70 | % | | | 3.51 | %5 |
| Operating expenses including dividends and rebates on securities sold short and interest expense, before expense reimbursement/waiver | | | 2.23 | % | | | 2.33 | % | | | 3.79 | % | | | 5.00 | %5 |
Net investment income/(loss) | | | 0.05 | % | | | 0.61 | % | | | 0.20 | % | | | (1.24 | )%5 |
Portfolio turnover rate | | | 283 | % | | | 289 | % | | | 175 | % | | | 84 | %4 |
| 1 | The Wilshire Large Cap Core 130/30 Fund commenced operations November 15, 2007. |
| | |
| 2 | The selected per share data was calculated using the average shares outstanding method for the period. |
| | |
| 3 | Amount is less than $0.01 per share. |
| | |
| 4 | Not annualized. |
| | |
| 5 | Annualized. |
See Notes to Financial Statements.
Wilshire Mutual Funds, Inc. Wilshire Large Cap Core 130/30 Fund Financial Highlights - (Continued) | | |
| For a Fund Share Outstanding Throughout Each Period. | |
| | | Institutional Class Shares | |
| | | | | | | | | | | | | |
Net asset value, beginning of period | | $ | 7.41 | | | $ | 6.25 | | | $ | 10.12 | | | $ | 10.00 | |
| | | | | | | | | | | | | | | | | |
| Income/(loss) from investment operations: | | | | | | | | | | | | | | | | |
Net investment income/(loss)2 | | | 0.02 | | | | 0.06 | | | | 0.04 | | | | (0.01 | ) |
| Net realized and unrealized gain/(loss) on investments | | | 0.85 | | | | 1.14 | | | | (3.89 | ) | | | 0.13 | |
Total from investment operations | | | 0.87 | | | | 1.20 | | | | (3.85 | ) | | | 0.12 | |
| | | | | | | | | | | | | | | | | |
| Less distributions: | | | | | | | | | | | | | | | | |
From net investment income | | | (0.06 | ) | | | (0.04 | ) | | | (0.02 | ) | | | 0.00 | 3 |
From capital gains | | | (0.08 | ) | | | 0.00 | | | | 0.00 | | | | 0.00 | |
Total distributions | | | (0.14 | ) | | | (0.04 | ) | | | (0.02 | ) | | | 0.00 | |
| | | | | | | | | | | | | | | | | |
Net asset value, end of period | | $ | 8.14 | | | $ | 7.41 | | | $ | 6.25 | | | $ | 10.12 | |
| | | | | | | | | | | | | | | | | |
Total return | | | 11.82 | % | | | 19.14 | % | | | (38.09 | )% | | | 1.23 | %4 |
| | | | | | | | | | | | | | | | | |
| Ratios to average net assets/ supplemental data: | | | | | | | | | | | | | | | | |
Net assets, end of period (in 000’s) | | $ | 103,526 | | | $ | 110,064 | | | $ | 24,617 | | | $ | 12,870 | |
| Operating expenses excluding dividends and rebates on securities sold short and interest expense, after expense reimbursement/waiver | | | 1.25 | % | | | 1.25 | % | | | 1.21 | % | | | 1.25 | %5 |
| Operating expenses including dividends and rebates on securities sold short and interest expense, after expense reimbursement/waiver | | | 1.94 | % | | | 1.92 | % | | | 2.41 | % | | | 3.09 | %5 |
| Operating expenses including dividends and rebates on securities sold short and interest expense, before expense reimbursement/waiver | | | 1.96 | % | | | 2.03 | % | | | 3.50 | % | | | 4.38 | %5 |
Net investment income/(loss) | | | 0.30 | % | | | 0.85 | % | | | 0.49 | % | | | (0.79 | )%5 |
Portfolio turnover rate | | | 283 | % | | | 289 | % | | | 175 | % | | | 84 | %4 |
| 1 | The Wilshire Large Cap Core 130/30 Fund commenced operations November 15, 2007. |
| | |
| 2 | The selected per share data was calculated using the average shares outstanding method for the period. |
| | |
| 3 | Amount is less than $0.01 per share. |
| | |
| 4 | Not annualized. |
| | |
| 5 | Annualized. |
See Notes to Financial Statements.
Wilshire Mutual Funds, Inc. Notes to Financial Statements December 31, 2010 | | |
1. Organization.
Wilshire Mutual Funds, Inc. (the “Company”) is registered under the Investment Company Act of 1940, as amended (the “1940 Act”), as an open-end diversified investment company, which was incorporated under Maryland law on July 30, 1992. The Company operates as a series company and presently offers six series, all of which had operations during the annual period: Large Company Growth Portfolio, Large Company Value Portfolio, Small Company Growth Portfolio, Small Company Value Portfolio, Wilshire 5000 IndexSM Fund and Wilshire Large Cap Core 130/30 Fund (collectively the “Portfolios”, each a “Portfolio”). The Company accounts separately for the assets, liabilities and operations of each series.
Each of the Portfolios offers Investment and Institutional Class shares, each of which has equal rights as to voting privileges. The Wilshire 5000 IndexSM Fund also offers Qualified Class Shares and Horace Mann Class Shares. Each of the Investment Class, Qualified Class and Horace Mann Class has exclusive voting rights with respect to its particular service and distribution plan. Investment income, realized and unrealized capital gains and losses and the common expenses of each Portfolio are allocated on a pro-rata basis to each class based on the relative net assets of each class to the total net assets of each Portfolio. Each class of shares differs in its respective service and distribution expenses.
2. Significant Accounting Policies.
Use of estimates – The preparation of financial statements in accordance with accounting principles generally accepted in the United States of America (“GAAP”) requires management to make estimates and assumptions that affect the reported amounts of assets and liabilities and disclosure of contingent assets and liabilities at the date of the financial statements and the reported amounts of revenues and expenses during the reporting period. Actual results could differ from those estimates. The following is a summary of significant accounting policies consistently followed by the Portfolios in the preparation of their financial statements.
Security valuation – A security listed or traded on U.S. exchanges is valued at its last sales price on the exchange where it is principally traded. In the absence of a current quotation, the security is valued at the mean between the last bid and asked prices on that exchange. Securities quoted on the National Association of Securities Dealers Automatic Quotation (NASDAQ) System, for which there have been sales, are valued at the NASDAQ official closing price. If there are no such sales, the most recent bid quotation is used. Securities traded over-the-counter (other than on NASDAQ) are valued at the last current sale price. Equity securities primarily traded on a foreign exchange or market are valued daily at the price, which is an estimate of the fair value price, as provided by an independent pricing service. In the event market quotations are not readily available, securities are valued at fair value according to procedures established by the Board of Directors or as determined in good faith by the Pricing Committee, whose members include at least two representatives of the Adviser, one of whom is an officer of the Company, or by the Company’s Valuation Committee. Fair value is defined as the amount the owner of a security might reasonably expect to receive upon a current sale. Securities whose value using the procedures outlined above do not reflect fair value because a significant valuation event has occurred may be valued at fair value by the Pricing Committee or by the Company’s Valuation Committee. Significant events include, but are not limited to
Wilshire Mutual Funds, Inc. Notes to Financial Statements - (Continued) December 31, 2010 | | |
the following: significant fluctuations in domestic markets, foreign markets or foreign currencies; occurrences not directly tied to the securities markets such as natural disasters, armed conflicts or significant governmental actions; and major announcements affecting a single issuer or an entire market or market sector.
In accordance with the authoritative guidance on fair value measurements and disclosures under U.S. GAAP, the Portfolios disclose fair value of their investments in a hierarchy that prioritizes the inputs to valuation techniques used to measure the fair value. The objective of a fair value measurement is to determine the price that would be received to sell an asset or paid to transfer a liability in an orderly transaction between market participants at the measurement date (an exit price). Accordingly, the fair value hierarchy gives the highest priority to quoted prices (unadjusted) in active markets for identical assets or liabilities (Level 1) and the lowest priority to unobservable inputs (Level 3). The guidance establishes three levels of the fair value hierarchy as follows:
| | • | Level 1 – Unadjusted quoted prices in active markets for identical, unrestricted assets or liabilities that the Portfolios have the ability to access at the measurement date; |
| | • | Level 2 – Other significant observable inputs (including quoted prices for similar securities, interest rates, prepayment speeds, credit risk, referenced indices, quoted prices in inactive markets, adjusted quoted prices in active markets, etc.); and |
| | • | Level 3 – Prices, inputs or exotic modeling techniques which are both significant to the fair value measurement and unobservable (supported by little or no market activity). |
The inputs or methodology used for valuing securities are not necessarily an indication of the risk associated with investing in those securities. For the year ended December 31, 2010, there have been no significant changes to the Portfolios’ fair value methodologies and there have been no significant transfers between Level 1 and Level 2 assets and liabilities.
Fair value measurement classifications are summarized in each Portfolio’s Schedule of Investments, Condensed Schedule of Investments and Schedule of Securities Sold Short.
Securities sold short – The Wilshire Large Cap Core 130/30 Fund engages in short selling. To complete a short sale transaction, the Portfolio must borrow the security to make delivery to the buyer. The Portfolio then is obligated to replace the security borrowed by purchasing the security at the market price at the time of replacement. The price at such time may be more or less than the price at which the security was sold by the Portfolio. Until the security is replaced, the Portfolio is required to pay to the lender amounts equal to any dividends or interest, which accrue during the period of the loan. To borrow the security, the Portfolio also may be required to pay a premium, which would increase the cost of the security sold. The Portfolio pays interest to the lender for borrowing the security. This amount is reflected as interest expense in the Statements of Operations.
Until the Portfolio closes its short position or replaces the borrowed security, the Portfolio will: (a) maintain a segregated account containing cash or liquid securities at such a level that (i) the amount deposited in the account plus the amount deposited with the custodian as collateral will equal the current value of the security sold short and (ii) the amount deposited in the segregated account as collateral will not be less than the market value of the security at the time the security was sold short; or (b) otherwise cover the Portfolio’s short position.
Wilshire Mutual Funds, Inc. Notes to Financial Statements - (Continued) December 31, 2010 | | |
The rebates on securities sold short presented in the Statements of Operations represent the net income earned on the short sale proceeds held on deposit with the Portfolio’s custodian. The Portfolio is subject to risk of loss if the broker were to fail to perform its obligation under contractual terms. Dividends on short positions are recorded on the ex-dividend date as an expense on the Statements of Operations. Short sales transactions result in off-balance sheet risk because the ultimate obligation may exceed the amount shown in the Statements of Assets and Liabilities. The Portfolio will incur a loss if the price of the security increases between the date of the short sale and the date on which the Portfolio replaces the borrowed security. The Portfolio will realize a gain if the price of the security declines between those dates. Short selling involves the risk of a potentially unlimited increase in the market value of the security sold short, which could result in a potentially unlimited loss for the Portfolio.
Securities transactions and investment income – Securities transactions are recorded on a trade date basis. Realized gains and losses from securities transactions are recorded on the identified cost basis. Dividend income is recognized on the ex-dividend date and interest income, including, where applicable, accretion of discount and amortization of premium on investments, is recognized on the accrual basis from settlement date. Distributions received on securities that represent a return of capital or capital gain are reclassed as a reduction of cost of investments and/or as a realized gain. The actual character of income, realized gain and return of capital distributions received from Real Estate Investment Trusts (“REITs”) are not known until after the end of the fiscal year, at which time such distribution estimates are appropriately adjusted.
Expenses policy – Distribution and Service fees directly attributable to a class of shares are charged to that class’ operations. Expenses of the Portfolios other than Distribution and Service fees are prorated among the classes to which the expense relates based on the relative net assets of each class of shares. Expenses directly attributable to a Portfolio are charged to that Portfolio. Expenses not directly attributable to a Portfolio are allocated proportionately among all Portfolios daily in relation to the net assets of each Portfolio or another reasonable basis. Expenses which are attributable to the Company and the Wilshire Variable Insurance Trust are allocated across the Company and the Wilshire Variable Insurance Trust based upon relative net assets or another reasonable basis. Expenses and fees, including the advisory fees, are accrued daily and taken into account for the purpose of determining the net asset value of each Portfolio’s shares.
Cash and cash equivalents – Idle cash may be swept into various money market sweep accounts and is classified as cash equivalents on the Statement of Assets and Liabilities. The Company maintains cash in bank deposit accounts which, at times, may exceed United States federally insured limits. Amounts invested are available on the same business day. At certain points during a reporting period, the Portfolios’ bank deposit accounts may be overdrawn. As of December 31, 2010, the Wilshire Large Cap Core 130/30 Fund had a cash overdraft of $4,101,263 due to a large redemption on December 31, 2010. The amount was funded into the cash account the following day.
Investments in REITs – With respect to the Portfolios, dividend income is recorded based on the income included in distributions received from the REIT investments using published REIT reclassifications including some management estimates when actual amounts are not available. Distributions received in excess of these estimated amounts are recorded as a reduction of the cost of investments or reclassified to capital gains. The actual amounts of income, return of capital, and capital gains are only determined by each REIT after its fiscal year end, and may differ from the estimated amounts.
Wilshire Mutual Funds, Inc. Notes to Financial Statements - (Continued) December 31, 2010 | | |
Distributions to shareholders – Distributions to shareholders are recorded on the ex-dividend date. Distributions from net investment income, if any, are declared and paid annually. The Portfolios’ net realized capital gains, unless offset by any available capital loss carryforward, are distributed to shareholders annually. Additional distributions of net investment income and capital gains may be made at the discretion of the Board of Directors in order to avoid the application of a 4% non-deductible Federal excise tax.
3. Investment Advisory Fee and Other Transactions.
Pursuant to the Advisory Agreement (the “Agreement”) between the Company and Wilshire Associates Incorporated (“Wilshire” or the “Adviser”), Wilshire charges annual fees of 0.75% of average daily net assets for the Large Company Growth and Large Company Value Portfolios, 0.85% of average daily net assets for the Small Company Growth and Small Company Value Portfolios, 0.10% of average daily net assets for the Wilshire 5000 IndexSM Fund and 1.00% for the Wilshire Large Cap Core 130/30 Fund. For the Wilshire Small Company Growth Portfolio and Wilshire Small Company Value Portfolio, Wilshire voluntarily agreed to limit Total Annual Portfolio Operating Expenses for the Institutional Class to 1.50% less an equivalent ratio of Investment Class share-specific expenses. These voluntary limits are expected to continue through December 31, 2011 dependent on growth in assets of the Funds, and may be changed by Wilshire at any time, subject to approval by the Board of Directors. Wilshire will not seek recoupment from the Company for expenses previously waived or reimbursed for such Portfolios. Wilshire has entered into a contractual expense limitation agreement with the Wilshire Large Cap Core 130/30 Fund to waive a portion of its management fee and/or reimburse expenses to limit expenses (excluding taxes, brokerage expenses, dividend expenses on securities sold short, rebates on securities sold short, interest expense, and extraordinary expenses) to 1.50% and 1.25% of average daily net assets for Investment Class shares and Institutional Class shares, respectively. This agreement to limit expenses continues through at least April 30, 2011. Wilshire may recoup the amount of any management fee waived within three years after the year in which Wilshire incurred the expense if the recoupment does not exceed the existing expense limitation for the Wilshire Large Cap Core 130/30 Fund. At December 31, 2010, the amounts of waivers subject to recoupment for Wilshire Large Cap Core 130/30 Fund are $63,981, expiring in 2013, $111,656, expiring in 2012, $233,238, expiring in 2011.
For the year ended December 31, 2010, Wilshire waived advisory fees as follows:
| | |
Small Company Growth Portfolio | $48,745 | $ — |
Small Company Value Portfolio | 41,705 | — |
Wilshire Large Cap Core 130/30 Fund | 63,981 | 8,803 |
The Board of Directors of the Company has approved Los Angeles Capital Management and Equity Research (“L.A. Capital”), Cornerstone Capital Management, Inc. (“Cornerstone”), UBS Global Asset Management (Americas) Inc. (“UBS”), Pyramis Global Advisors, LLC (“Pyramis”), Victory Capital Management Inc. (“Victory”), Pzena Investment Management, LLC (“Pzena”), Acadian Asset Management, Inc. (“Acadian”), Systematic Financial Management, L.P. (“Systematic”), Ranger Investment Management, L.P., NWQ Investment Management Company, LP (“NWQ”), AXA Rosenberg Investment Management LLC (“AXA”) and TWIN Capital Management, Inc. (“TWIN”) (collectively the “Sub-Advisers”) to provide sub-advisory services with respect to the Portfolios. L.A. Capital, Cornerstone and
Wilshire Mutual Funds, Inc. Notes to Financial Statements - (Continued) December 31, 2010 | | |
Victory each manage a portion of the Large Company Growth Portfolio. Pzena, Acadian and Systematic each manage a portion of the Large Company Value Portfolio. L.A. Capital and Ranger each manage a portion of the Small Company Growth Portfolio. L.A. Capital and NWQ each manage a portion of the Small Company Value Portfolio. L.A. Capital is the sole sub-adviser for the Wilshire 5000 IndexSM Fund. AXA, Pyramis, TWIN and UBS each manage a portion of the Wilshire Large Cap Core 130/30 Fund.
Wilshire continues to oversee the Sub-Advisers. The fees of the Sub-Advisers are paid by Wilshire.
SEI Investments Global Funds Services (“SEI”) serves as the Company’s administrator and accounting agent pursuant to an administration agreement dated May 31, 2008. DST Systems, Inc. serves as the Company’s transfer agent and dividend disbursing agent. PNCGIS serves as the Company’s custodian for all Portfolios except the Wilshire Large Cap Core 130/30 Fund. Prior to June 15, 2009, Custodial Trust Company served as the custodian for the Wilshire Large Cap Core 130/30 Fund. Effective June 15, 2009, JPMorgan Chase Bank, N.A. serves as the custodian for the Wilshire Large Cap Core 130/30 Fund. SEI Investments Distribution Co. serves as the Company’s distributor.
Officers’ and Directors’ Expenses – The officers of the Company receive remuneration from the Adviser. The Company does not pay any remuneration to its officers. The Company and Wilshire Variable Insurance Trust together pay each independent director an annual retainer of $14,000, an annual additional Board Chair retainer of $12,000, a Board in-person meeting fee of $1,500, a Board telephonic meeting fee of $1,000, an annual Committee Member retainer of $4,000, an annual Committee Chairperson retainer of $8,000 in lieu of the $4,000 Committee Member retainer, and a Committee telephonic meeting fee of $500.
4. Distribution and Shareholder Services Plans.
The Directors of the Company have adopted shareholder services and/or distribution plans (the “Plans”) pursuant to Rule 12b-1 under the 1940 Act, with respect to the Investment Class Shares of each Portfolio and the Qualified Class Shares of the Wilshire 5000 IndexSM Fund. Under the Plans, each such Portfolio reimburses SEI Investments Distribution Co. (the “Distributor”), at an annual rate of up to 0.25% of the value of the average daily net assets attributable to the Investment Class Shares and Qualified Class Shares of each Portfolio for certain service fees provided by securities dealers or other financial intermediaries (“service fees”) or for certain distribution expenses for the purpose of financing any activity intended to result in the sale of Investment Class Shares or Qualified Class Shares. For the year ended December 31, 2010, the distribution and service fee expenses incurred for each such class of the Large Company Growth Portfolio, Large Company Value Portfolio, Small Company Value Portfolio, Wilshire 5000 IndexSM Fund and Wilshire Large Cap Core 130/30 was 0.25% of the respective average net assets of each Portfolio. For the year ended December 31, 2010, the distribution and services fee expenses incurred for each such class of the Small Company Growth Portfolio was 0.20% of its respective average net assets.
The Directors of the Company have adopted a shareholder services and distribution plan pursuant to Rule 12b-1 with respect to the Horace Mann Class Shares of the Wilshire 5000 IndexSM Fund. Under such Plan, the Company reimburses the Distributor for its shareholder service and distribution payments at an annual rate of up to 0.35% of the value of the average daily net assets of the Wilshire 5000 IndexSM Fund attributable to the Horace Mann Class Shares. For the year ended December 31, 2010, the distribution fees for the Horace Mann Class Shares were 0.31% of average net assets.
Wilshire Mutual Funds, Inc. Notes to Financial Statements - (Continued) December 31, 2010 | | |
In addition, Investment Class Shares and Institutional Class Shares pay the expenses associated with certain shareholder servicing arrangements with third parties, provided that payment of such fees to any such shareholder service provider does not exceed in any year 0.20% and 0.15% for the Investment and Institutional Class Shares, respectively, of the Portfolio’s average net assets attributable to the shares whose holders are serviced by such provider. For the year ended December 31, 2010, the shareholder service provider fees were as follows (as a percent of average net assets of each class):
| | |
Large Company Growth Portfolio | 0.12% | 0.00% |
Large Company Value Portfolio | 0.03% | 0.15% |
Small Company Growth Portfolio | 0.13% | 0.02% |
Small Company Value Portfolio | 0.11% | 0.15% |
Wilshire 5000 IndexSM Fund | 0.06% | 0.09% |
Wilshire Large Cap Core 130/30 Fund | 0.03% | 0.01% |
The Qualified Class Shares of the Wilshire 5000 IndexSM Fund has adopted a shareholder services plan which authorizes payments by the Qualified Class Shares of up to 0.15% of the average daily net assets attributable to the Portfolio’s Qualified Class Shares for certain shareholder services provided by insurers or other financial intermediaries. For the year ended December 31, 2010, the shareholder service provider fees for the Qualified Class Shares were 0.00% of average net assets.
5. Securities Transactions.
For the year ended December 31, 2010, aggregate cost of purchases and proceeds from sales of securities, other than short-term investments, short sales and purchases to cover, were as follows:
| | |
Large Company Growth Portfolio | $299,134,176 | $341,997,012 |
Large Company Value Portfolio | 44,635,467 | 45,894,309 |
Small Company Growth Portfolio | 5,464,725 | 6,047,736 |
Small Company Value Portfolio | 11,402,084 | 9,986,587 |
Wilshire 5000 IndexSM Fund | 3,009,550 | 40,849,877 |
Wilshire Large Cap Core 130/30 Fund | 385,656,538 | 429,395,597 |
For Wilshire Large Cap Core 130/30 Fund, short sales and purchases to cover were $123,230,023 and $136,266,927, respectively.
Wilshire Mutual Funds, Inc. Notes to Financial Statements - (Continued) December 31, 2010 | | |
6. Significant Shareholder Activity.
On December 31, 2010, the Portfolios had the following concentrations of shareholders holding 10% or more of the outstanding shares of the Portfolios. These represent omnibus shareholder accounts comprised of many individual shareholders.
| |
| Large Company Growth Portfolio (2 omnibus shareholders) | 61% |
| Large Company Value Portfolio (1 omnibus shareholder) | 86% |
| Small Company Growth Portfolio (2 omnibus shareholders) | 64% |
| Small Company Value Portfolio (3 omnibus shareholders) | 77% |
Wilshire 5000 IndexSM Fund (4 omnibus shareholders) | 68% |
| Wilshire Large Cap Core 130/30 Fund (2 omnibus shareholders) | 95% |
7. Tax Information.
No provision for federal income taxes is required because each Portfolio has qualified and intends to continue to qualify, as a regulated investment company under Subchapter M of the Internal Revenue Code of 1986, as amended, and distribute to shareholders all of its taxable income and gains. Federal income tax regulations differ from accounting principles generally accepted in the United States of America; therefore, distributions determined in accordance with tax regulations may differ in amount or character from net investment income and realized gains for financial reporting purposes. Financial reporting records are adjusted for permanent book/tax differences to reflect tax character. Financial records are not adjusted for temporary differences.
The Portfolios evaluate tax positions taken or expected to be taken in the course of preparing the Portfolios’ tax returns to determine whether it is “more-likely than-not” (i.e., greater than 50-percent) that each tax position will be sustained upon examination by a taxing authority based on the technical merits of the position. Tax positions not deemed to meet the more-likely-than-not threshold are recorded as a tax benefit or expense in the current year. The Portfolios did not record any tax provision in the current period. However, management’s conclusions regarding tax positions taken may be subject to review and adjustment at a later date based on factors including, but not limited to, examination by tax authorities (i.e., the last 3 tax year ends, as applicable), on-going analysis of and changes to tax laws, regulations and interpretations thereof.
Under current tax law, capital and currency losses realized after October 31 may be deferred and treated as occurring on the first day of the following fiscal year. For the year ended December 31, 2010, the following Portfolios had post-October capital loss deferrals as follows:
| |
Large Company Value Portfolio | $136,787 |
Wilshire 5000 IndexSM Fund | 862,255 |
Wilshire Mutual Funds, Inc. Notes to Financial Statements - (Continued) December 31, 2010 | | |
The federal tax cost, unrealized appreciation and depreciation at December 31, 2010 for each Portfolio are as follows (excluding securities sold short):
| | | | | Aggregate Gross Unrealized Appreciation | | | Aggregate Gross Unrealized Depreciation | | | Net Unrealized Appreciation (Depreciation) | |
| Large Company Growth Portfolio | | $ | 145,526,429 | | | $ | 50,445,563 | | | $ | (3,897,046 | ) | | $ | 46,548,517 | |
| Large Company Value Portfolio | | | 30,041,944 | | | | 6,212,382 | | | | (1,691,259 | ) | | | 4,521,123 | |
| Small Company Growth Portfolio | | | 5,537,770 | | | | 2,192,343 | | | | (155,009 | ) | | | 2,037,334 | |
| Small Company Value Portfolio | | | 11,131,553 | | | | 3,114,594 | | | | (429,936 | ) | | | 2,684,658 | |
Wilshire 5000 IndexSM Fund | | | 104,808,672 | | | | 67,627,114 | | | | (12,817,198 | ) | | | 54,809,916 | |
| Wilshire Large Cap Core 130/30 Fund | | | 220,646,968 | | | | 42,132,295 | | | | (15,919,303 | ) | | | 26,212,992 | |
The differences between book and tax-basis unrealized appreciation/(depreciation) are attributable primarily to the tax deferral of losses on wash sales on all Portfolios as well as PFIC mark-to-market on the Small Company Growth Portfolio, Small Company Value Portfolio, and the Wilshire 5000 IndexSM Fund.
The Portfolios intend to retain realized gains to the extent of available capital loss carryforwards. At December 31, 2010, the following Portfolios had available for federal income tax purposes unused capital losses as follows:
| | | | |
| | | | | | | | | | | | | | | | | | |
| Large Company Growth Portfolio | | $ | — | | | $ | — | | | $ | — | | | $ | — | | | $ | 27,205,512 | | | $ | — | |
| Large Company Value Portfolio | | | — | | | | — | | | | — | | | | 9,570,341 | | | | 6,732,493 | | | | — | |
| Small Company Growth Portfolio | | | — | | | | — | | | | — | | | | 1,182,838 | | | | 1,303,772 | | | | — | |
| Small Company Value Portfolio | | | — | | | | — | | | | — | | | | 2,000,850 | | | | 2,132,218 | | | | — | |
Wilshire 5000 IndexSM Fund | | | 3,810,802 | | | | 5,509,772 | | | | 108,266 | | | | 9,735,193 | | | | 30,139,483 | | | | 2,464 | |
During the year ended December 31, 2010, the Large Company Growth Portfolio, the Large Company Value Portfolio, the Small Company Growth Portfolio, the Small Company Value Portfolio, and the Wilshire Large Cap Core 130/30 Fund utilized capital loss carryforwards of $17,253,936, $1,910,088, $745,644, $758,200, and $7,700,429, respectively, to offset capital gains.
Wilshire Mutual Funds, Inc. Notes to Financial Statements - (Continued) December 31, 2010 | | |
The tax character of distributions declared were:
| | | | | | | | | | | | | | | | | | |
| Large Company Growth Portfolio | | $ | 352,731 | | | $ | — | | | $ | 12,146 | | | $ | 245,689 | | | $ | — | | | $ | 11,747 | |
| Large Company Value Portfolio | | | 175,536 | | | | — | | | | 1,913 | | | | 233,277 | | | | — | | | | 1,139 | |
| Small Company Value Portfolio | | | 105,261 | | | | — | | | | — | | | | 74,573 | | | | — | | | | 983 | |
Wilshire 5000 IndexSM Fund | | | 2,127,746 | | | | — | | | | — | | | | 2,497,973 | | | | — | | | | — | |
| Wilshire Large Cap Core 130/30 Fund | | | 1,985,225 | | | | 1,326,676 | | | | — | | | | 869,604 | | | | — | | | | 13,078 | |
At December 31, 2010, the components of distributable earnings/(accumulated losses) on a tax basis were as follows:
| | | Large Company Growth Portfolio | | | Large Company Value Portfolio | | | Small Company Growth Portfolio | | | Small Company Value Portfolio | | | | | | Wilshire Large Cap Core 130/30 Fund | |
| Undistributed ordinary income | | $ | — | | | $ | — | | | $ | — | | | $ | 14,896 | | | $ | 74,180 | | | $ | 2,749,633 | |
| Undistributed long-term capital gain | | | — | | | | — | | | | — | | | | — | | | | — | | | | 863,851 | |
| Capital loss carryforwards | | | (27,205,512 | ) | | | (16,302,834 | ) | | | (2,486,610 | ) | | | (4,133,068 | ) | | | (49,305,980 | ) | | | — | |
| Post October losses | | | — | | | | (136,787 | ) | | | — | | | | — | | | | (862,255 | ) | | | — | |
| Unrealized appreciation | | | 46,548,517 | | | | 4,521,123 | | | | 2,037,334 | | | | 2,684,658 | | | | 54,809,916 | | | | 18,285,012 | |
Total distributable earnings/ (accumulated losses) | | $ | 19,343,005 | | | $ | (11,918,498 | ) | | $ | (449,276 | ) | | $ | (1,433,514 | ) | | $ | 4,715,861 | | | $ | 21,898,496 | |
8. Reclassifications
Accounting principles generally accepted in the United States of America require that certain components of net assets be reclassified between financial and tax reporting. These reclassifications have no effect on net assets or net asset values per share. The permanent differences are primarily attributable to the net realized gain on sale of partnerships, PFIC capital gain to ordinary income, write-off of net operating losses and the recharacterization of distributions. As of December 31, 2010, the reclassifications were as follows:
Wilshire Mutual Funds, Inc. Notes to Financial Statements - (Continued) December 31, 2010 | | |
| | | | | Increase Undistributed Net Investment Income | | | Increase/(Decrease) Realized Capital Gains | |
Large Company Growth Portfolio | | $ | (12,146 | ) | | $ | 12,146 | | | $ | — | |
Large Company Value Portfolio | | | (1,913 | ) | | | 2,088 | | | | (175 | ) |
Small Company Growth Portfolio | | | (22,949 | ) | | | 22,949 | | | | — | |
Small Company Value Portfolio | | | — | | | | 795 | | | | (795 | ) |
Wilshire 5000 IndexSM Fund | | | (2,960,736 | ) | | | 13,057 | | | | 2,947,679 | |
Wilshire Large Cap Core 130/30 Fund | | | — | | | | 981,613 | | | | (981,613 | ) |
9. In-Kind Transfer.
On October 8, 2009, the Wilshire Large Cap Core 130/30 Fund received an in-kind contribution from the Wilshire Variable Insurance Trust Equity Fund. The in-kind contribution consisted of $83,027,097 of securities transferred at value and $8,060,000 of cash. As a result of the in-kind contribution the Wilshire Large Cap Core 130/30 Fund Institutional Class issued 11,693,957 shares and 1,135,211 shares as a result of the contribution of securities and cash, respectively.
10. Indemnifications.
In the normal course of business, the Company, on behalf of the Portfolios, enters into contracts that provide general indemnifications. The Portfolios’ maximum exposure under these arrangements is dependent on claims that may be made against the Portfolios in the future and, therefore, cannot be estimated; however, based on experience, the risk of material loss from such claims is considered remote.
11. Recent Accounting Pronoucement.
In January 2010, the Financial Accounting Standards Board issued Accounting Standards Update (“ASU”) No. 2010-06, “Improving Disclosures about Fair Value Measurements.” ASU No. 2010-06 will require reporting entities to make new disclosures about purchases, sales, issuances, and settlements in the roll forward of activity in Level 3 fair value measurements. The new and revised disclosures are effective for interim and annual reporting periods beginning after December 15, 2010. At this time, management is evaluating the implications of ASU No. 2010-06 and its impact on the financial statements has not been determined.
12. Subsequent Event Evaluation.
The Portfolios have evaluated the need for additional disclosures and/or adjustments resulting from subsequent events. Based on this evaluation, no additional disclosures or adjustments were required to the financial statements.
Wilshire Mutual Funds, Inc. Report of Independent Registered Public Accounting Firm | |
To the Shareholders and Board of Directors
of Wilshire Mutual Funds, Inc.:
In our opinion, the accompanying statements of assets and liabilities, including the condensed schedules of investments of Large Company Growth Portfolio, Large Company Value Portfolio, Small Company Growth Portfolio, Small Company Value Portfolio and Wilshire 5000 Index Portfolio and the schedule of investments of Wilshire Large Cap Core 130/30 Fund and the schedule of securities sold short of Wilshire Large Cap Core 130/30 Fund (constituting Wilshire Mutual Funds, Inc., hereafter referred to as the “Portfolios”) and the related statements of operations, of changes in net assets and of cash flows of Wilshire Large Cap Core 130/30 Fund and the financial highlights present fairly, in all material respects, the financial position of the Portfolios at December 31, 2010 and the results of each of their operations, the changes in each of their net assets, the cash flows of Wilshire Large Cap Core 130/30 Fund and each of their financial highlights for each of the periods indicated, in conformity with accounting principles generally accepted in the United States of America. These financial statements and financial highlights (hereafter referred to as “financial statements”) are the responsibility of the Portfolios’ management; our responsibility is to express an opinion on these financial statements based on our audits. We conducted our audits of these financial statements in accordance with the standards of the Public Company Accounting Oversight Board (United States). Those standards require that we plan and perform the audit to obtain reasonable assurance about whether the financial statements are free of material misstatement. An audit includes examining, on a test basis, evidence supporting the amounts and disclosures in the financial statements, assessing the accounting principles used and significant estimates made by management, and evaluating the overall financial statement presentation. We believe that our audits, which included confirmation of securities at December 31, 2010 by correspondence with the custodians and brokers, provide a reasonable basis for our opinion.
PricewaterhouseCoopers LLP
Philadelphia, Pennsylvania
March 1, 2011
Wilshire Mutual Funds, Inc. Additional Fund Information | | |
The Board of Directors has responsibility for the overall management and operations of the Company. The Board establishes the Company’s policies and meets regularly to review the activities of the officers, who are responsible for the day-to-day operations of the Company.
Set forth below are the names of the Directors and executive officers of the Company, their ages, positions and terms of office, their principal occupations during the past five years, and other directorships held by them. The address of each Director and Officer is 1299 Ocean Avenue, Suite 700, Santa Monica, California 90401.
| Name and Age | Position Held with the Company | Term of Office(1) and Length of Time Served | Principal Occupations During the Past Five Years | Number of Funds/ Funds in Complex Overseen by Director | Other Directorships Held by Director |
| INTERESTED DIRECTOR |
Lawrence E. Davanzo, 57(2) | Director | Since 2005 | President, Wilshire Associates Incorporated, October 2007-Present; Senior Managing Director, October 2004-October 2007, Wilshire Associates Incorporated; President, 2005- Present, Wilshire Variable Insurance Trust; Managing Director, August 2004-October 2004, Guggenheim Partners, independent investor, August 2001-August 2004. | 15 | Wilshire Variable Insurance Trust (9 Funds); Wilshire Associates Incorporated |
Wilshire Mutual Funds, Inc. Additional Fund Information - (Continued) | | |
| Name and Age | Position Held with the Company | Term of Office(1) and Length of Time Served | Principal Occupations During the Past Five Years | Number of Funds/ Funds in Complex Overseen by Director | Other Directorships Held by Director |
| NON-INTERESTED DIRECTORS |
| Margaret M. Cannella, 59 | Director | Since 2011 | Adjunct Professor, Columbia Business School. Formerly, Managing Director, Head, Global Credit Research and Corporate Strategy, JPMorgan Securities, Inc. and Managing Director, Head US Corporate Research, JP Morgan Securities, Inc. | 15 | Wilshire Variable Insurance Trust, Inc. (9 Funds); Schroder Series Trust; Schroder Global Series Trust; Schroder Capital Funds (Delaware); CHF Finance International (for profit joint venture of the World Bank and CHF); Advanced Pierre Foods; Princeton-in-Asia |
| | | | | | |
| Roger A. Formisano, 62 | Director | Since 2006 | Vice President, University Medical Foundation, 2006- Present; formerly Director, The Center for Leadership and Applied Business, UW-Madison School of Business; Principal, R.A. Formisano & Company, LLC | 15 | Integrity Mutual Insurance Company, Wilshire Variable Insurance Trust (9 Funds) |
| | | | | | |
| Richard A. Holt, 68 | Director | Since 2006 | Retired; formerly Senior Relationship Manager, Scudder Insurance Asset Management. | 15 | Wilshire Variable Insurance Trust (9 Funds) |
| | | | | | |
| Suanne K. Luhn, 55 | Director | Since 2008 | Retired; formerly Chief Compliance Officer, Bahl & Gaynor (investment adviser) (1990 to 2006) | 15 | Wilshire Variable Insurance Trust (9 Funds) |
| | | | | | |
| Harriet A. Russell, 68 | Director | Since 2006 | President, Greater Cincinnati Credit Union; formerly Vice President, Cincinnati Board of Education; formerly teacher, Walnut Hills High School. | 15 | Greater Cincinnati Credit Union Board; Wilshire Variable Insurance Trust (9 Funds) |
| | | | | | |
| George J. Zock, 60 | Director, Chairman of the Board | Since 2006 | Independent Consultant; Consultant, Horace Mann Service Corporation (2004 to 2005); Executive Vice President, Horace Mann Life Insurance Company and Horace Mann Service Corporation (1997 to 2003). | 15 | Wilshire Variable Insurance Trust (9 Funds) |
Wilshire Mutual Funds, Inc. Additional Fund Information - (Continued) | | |
| Name and Age | Position Held with the Company | Term of Office(1) and Length of Time Served | Principal Occupations During the Past Five Years | Number of Funds/ Funds in Complex Overseen by Director | Other Directorships Held by Director |
| OFFICERS |
| Jamie B. Ohl, 45 | President | Since 2010 | Chief Operating Officer and Managing Director, Wilshire Funds Management since 2010; Senior Vice President and Director of the Retirement Plans Group, Hartford Life Insurance Co. from 2006-2010. | N/A | N/A |
| | | | | | |
| Aaron W.L. Eubanks, 48 | Chief Compliance Officer | Since 2009 | Chief Compliance Officer and Managing Director, Wilshire Associates, Incorporated (since 2009). Chief Operating Officer and Chief Compliance Officer, Provident Investment Counsel (1992-2009) | N/A | N/A |
| | | | | | |
| Reena S. Lalji, 39 | Secretary | Since 2009 | Managing Director and General Counsel, Wilshire Associates Incorporated (Since 2009); Senior Counsel, Royal Bank of Canada (2003 – 2008) | N/A | N/A |
| | | | | | |
| James E. St. Aubin, 33 | Vice President | Since 2009 | Senior Portfolio Manager in Wilshire's Funds Management Group. 2004 – 2008, Senior Consultant at Ibbotson Associates – a division Morningstar Inc. | N/A | N/A |
| | | | | | |
| Helen Thompson, 43 | Vice President | Since 2008 | Managing Director, Wilshire Associates Incorporated. (since 2003); Associate Director, First Quadrant, L.P. (2001 to 2003); Chief Investment Accountant, Financial Controller, Company Secretary, Associate Director, Compliance Officer (1996 to 2003), First Quadrant Limited | N/A | N/A |
Wilshire Mutual Funds, Inc. Additional Fund Information - (Continued) | | |
| Name and Age | Position Held with the Company | Term of Office(1) and Length of Time Served | Principal Occupations During the Past Five Years | Number of Funds/ Funds in Complex Overseen by Director | Other Directorships Held by Director |
| OFFICERS |
| Michael Wauters, 45 | Treasurer | Since 2009 | Controller, Wilshire Associates Incorporated (since 2009); Assistant Vice President- Financial Operations, Pacific Life Insurance Company (2000-2009) | N/A | N/A |
| | | | | | |
| Victor Zhang, 38 | Vice President | Since 2009 | Head of Portfolio Management, Member of Wilshire Funds Management Investment Committee, Wilshire Associates Incorporated, January 2006 to Present; Director of Investments, Harris myCFO Investment Advisory Services, LLC, 2001 to 2006. | N/A | N/A |
| (1) | Each director serves until the next shareholders’ meeting (and until the election and qualification of a successor), or until death, resignation, removal or retirement which takes effect no later than May 1 following his or her 70th birthday. Officers are elected by the board on an annual basis to serve until their successors have been elected and qualified. |
| (2) | Mr. Davanzo is an interested person because of his position with the company’s investment adviser, Wilshire Associates Incorporated. |
The Company’s Statement of Additional Information includes additional information about the Directors of the Company and is available, without charge, upon request, by calling 1-888-200-6796.
Wilshire Mutual Funds, Inc. Additional Fund Information - (Continued) | | |
Information on Proxy Voting
The Securities and Exchange Commission (“SEC”) has adopted the requirement that all funds file their complete proxy voting records with the SEC on an annual basis on Form N-PX. Such filing, for the 12-month period ended June 30, must be made no later than August 31 of each year.
A description of policies and procedures that the Portfolios use to determine how to vote proxies relating to portfolio securities, along with each Portfolio’s proxy voting record relating to portfolio securities held during most recent 12-month period ended June 30 is available at no charge, upon request by calling 1-888-200-6796, by e-mailing us at www.wilfunds.com or on the SEC’s website at http://www.sec.gov.
Information on Form N-Q
The Company files its complete schedule of portfolio holdings with the SEC for the first and third quarters of each fiscal year on Form N-Q within sixty days after the end of period. The Company’s Form N-Q is available on the SEC’s website at http://www.sec.gov, and may be reviewed and copied at the SEC’s Public Reference Room in Washington, DC. Information on the operation of the Public Reference Room may be obtained by calling 1-202-551-8090.
Householding Policy
In order to reduce printing and mailing expenses, only one copy of each prospectus, annual and semi-annual report will be sent to all related accounts at a common address, unless you have indicated otherwise on your Account Application. Shareholders may revoke their consent to householding at any time by calling 1-888-200-6796. Upon receipt of a shareholder’s revocation, the Company will begin mailing individual copies of the above-referenced documents to the shareholder’s attention within 30 days.
Wilshire Mutual Funds, Inc. Tax Information (Unaudited) | | |
Of the distributions made by the following Portfolios, the corresponding percentage represents the amount of each distribution which will qualify for the dividends received deduction available to corporate shareholders:
| |
Large Company Growth Portfolio | 100.00% |
Large Company Value Portfolio | 100.00% |
Small Company Growth Portfolio | 0.00% |
Small Company Value Portfolio | 100.00% |
Wilshire 5000 IndexSM Fund | 100.00% |
Wilshire Large Cap Core 130/30 Fund | 89.55% |
Pursuant to the Jobs and Growth Tax Relief Reconciliation Act of 2003, the Portfolios listed below designate the following percentages of their income dividends distributed in 2006 as qualified dividend income as defined in Section 1(h)(II) of the Internal Revenue Code.
| |
Large Company Growth Portfolio | 100.00% |
Large Company Value Portfolio | 100.00% |
Small Company Growth Portfolio | 0.00% |
Small Company Value Portfolio | 100.00% |
Wilshire 5000 IndexSM Fund | 100.00% |
Wilshire Large Cap Core 130/30 Fund | 87.77% |
Pursuant to the American Jobs Creation Act of 2004, the Funds listed below designate the following percentages of income distributions as qualified interest income that is exempt from U.S. withholding tax when paid to foreign investors.
| |
Large Company Growth Portfolio | 0.00% |
Large Company Value Portfolio | 0.00% |
Small Company Growth Portfolio | 0.00% |
Small Company Value Portfolio | 0.00% |
Wilshire 5000 IndexSM Fund | 0.00% |
Wilshire Large Cap Core 130/30 Fund | 0.00% |
Wilshire Mutual Funds, Inc. Tax Information - (Continued) | | |
Pursuant to the American Jobs Creation Act of 2004, the Funds listed below designate the following percentages of short-term capital gain distributions as qualified short-term capital gain that is exempt from U.S. withholding tax when paid to foreign investors.
| |
Large Company Growth Portfolio | 0.00% |
Large Company Value Portfolio | 0.00% |
Small Company Growth Portfolio | 0.00% |
Small Company Value Portfolio | 0.00% |
Wilshire 5000 IndexSM Fund | 0.00% |
Wilshire Large Cap Core 130/30 Fund | 0.00% |
Wilshire Mutual Funds, Inc. Board Approval of Subadvisory Agreements | | |
During the six months ended December 31, 2010, the Board of Directors (the “Board”) of Wilshire Mutual Funds, Inc. (the “Company”) approved the renewal for an additional one-year term of the Company’s advisory agreement (the “Advisory Agreement”) with Wilshire Associates Incorporated (“Wilshire” or the “Adviser”) with respect to each of the Large Company Growth Portfolio, Large Company Value Portfolio, Small Company Growth Portfolio, Small Company Value Portfolio, Wilshire 5000 Index Fund and Wilshire Large Cap Core 130/30 Fund (the “Funds”). The Board also approved the renewal for additional one-year terms of Wilshire’s Subadvisory Agreements with the Company’s subadvisers: Acadian Asset Management, Inc. (“Acadian”) with respect to the Large Company Value Portfolio, AXA Rosenberg Investment Management, LLC (“AXA Rosenberg”) with respect to the Wilshire Large Cap Core 130/30 Fund, Los Angeles Capital Management and Equity Research, Inc. (“LA Capital”) with respect to each of the Small Company Value Portfolio, Small Company Growth Portfolio, Large Company Growth Portfolio and Wilshire 5000 Index Fund, NWQ Investment Management Company, LLC (“NWQ”) with respect to the Small Company Value Portfolio, Pzena Investment Management, LLC (“Pzena”) with respect to the Small Company Value Portfolio, Ranger Investment Management, L.P. (“Ranger”) with respect to the Small Company Growth Portfolio, Systematic Financial Management, L.P. (“Systematic”) with respect to the Wilshire Large Company Value Portfolio, TWIN Capital Management, Inc. (“TWIN”) with respect to the Wilshire Large Cap Core 130/30 Fund, and Victory Capital Management, Inc. (“Victory”) with respect to the Wilshire Large Company Growth Portfolio. In the following text, the subadvisers are referred to as “Subadvisers” and the Subadvisory Agreements between Wilshire and each Subadviser are referred to as “Subadvisory Agreements.”
The information in this summary outlines the Board’s considerations associated with its approval of the Advisory Agreement and each of the Subadvisory Agreements. In connection with its deliberations regarding the continuation of their relationships, the Board considered such information and factors as it believed to be relevant. As described below, the Board considered the nature, extent and quality of the services performed by Wilshire and the Subadvisers under the existing advisory arrangements; with respect to Wilshire, comparative fees and expense ratios; the profits to be realized by Wilshire and the Subadvisers; the extent to which Wilshire and the Subadvisers realize economies of scale as a Fund grows; and whether any fall-out benefits are being realized by Wilshire and the Subadvisers. In considering these matters, the Board was advised with respect to relevant legal standards by independent counsel. In addition, the Directors who are not “interested persons” of the Company as defined in the Investment Company Act of 1940 (the “Independent Directors”) met with counsel in private sessions at which no representatives of Wilshire were present and discussed renewal of the Subadvisory Agreements with management and in private session with counsel at which no representatives of the Subadvisers were present.
As required by the Investment Company Act of 1940, each approval was confirmed by the separate vote of the Independent Directors. In deciding to approve renewal of the Advisory Agreement and the Subadvisory Agreements, the Board did not identify any single factor as controlling and this summary does not describe all of the matters considered. However, the Board concluded that each of the various factors referred to below favored such approval.
Wilshire Mutual Funds, Inc. Board Approval of Subadvisory Agreements (Continued) | | |
Information Requested and Received
The Board, including all the Independent Directors, considered the renewal of the Subadvisory Agreements pursuant to a process that concluded at the Board’s August 21, 2010 meeting and the renewal of the Advisory Agreement pursuant to a process that concluded at the Board’s December 3, 2010 meeting, in each case following an extensive process. At the direction of the Independent Directors, counsel to the Company and the Independent Directors sent a memorandum to the Adviser requesting information regarding the Subadvisory Agreements and the Advisory Agreement to be provided to the Directors in advance of meetings of the Contract Review Committee (which is comprised of all the Independent Directors) held on August 26, 2010 and December 2, 2010, respectively.
In response to the requests for information, the Directors received information from the Adviser as to each of the Funds describing: (i) the nature, extent and quality of services provided; (ii) the investment performance of each Fund as provided by Wilshire based upon data gathered from the Morningstar Direct database (“Morningstar”); (iii) the costs of services provided and estimated profits realized by the Adviser; (iv) the extent to which economies of scale are realized as a Fund grows; (v) whether fee levels reflect any possible economies of scale for the benefit of Fund shareholders; (vi) comparisons of services rendered and amounts paid to other registered investment companies as provided by Wilshire based upon data gathered from Morningstar; and (vii) benefits realized by the Adviser from its relationship with each Fund. The Directors received information from the Adviser regarding the factors underlying the recommendations to continue each Subadvisory Agreement. The Directors also received information from each Subadviser as to each Fund it managed describing: (i) the nature, extent and quality of services provided, (ii) the investment performance of the Subadviser in connection with the Fund, (iii) the financial condition of the Subadviser, (iv) the extent to which economies of scale are realized as a Fund grows, (v) whether fee levels reflect any possible economies of scale for the benefit of Fund shareholders, (vi) comparisons of services rendered and amounts paid by other registered investment companies and any comparable advisory clients, and (vii) benefits realized by the Subadviser from its relationship with the Fund. At each meeting, the Independent Directors also received a memorandum from counsel describing their duties in connection with contract approvals, and they were assisted in their review by independent legal counsel.
Prior to consideration by the Board, the Contract Review Committee met on August 26, 2010 and December 2, 2010, respectively, to discuss the information provided. With respect to Wilshire and as a part of its evaluation, it considered the assessment of performance made by the Investment Committee (which is comprised solely of Independent Directors), which also met on December 2, 2010 to review the data Wilshire had prepared on performance. Following its evaluation of all materials provided, the Contract Review Committee concluded that it was in the best interests of each Fund to renew the Advisory and Subadvisory Agreements and recommended to the Board that the Advisory and Subadvisory Agreements be renewed. At its meeting on August 27, 2010 and December 3, 2010, as applicable, the Board considered the recommendation of the Contract Review Committee along with the other factors that the Board deemed relevant.
Wilshire Mutual Funds, Inc. Board Approval of Subadvisory Agreements (Continued) | | |
Nature, Extent and Quality of Services — Wilshire
With respect to the nature, extent and quality of services provided by the Adviser, the Board reviewed the functions performed by the Adviser. The Board considered the experience and skills of the senior management leading fund operations, the experience and skills of the personnel performing the functions under the Advisory Agreement and the resources made available to such personnel. The Board also considered the compliance program established by the Adviser and the level of compliance maintained for the Funds. The Board reviewed the processes used by the Adviser to select, monitor and replace subadvisers. The Board concluded that the Adviser was successful in negotiating favorable subadvisory agreements on behalf of the Funds. The Board concluded that the Adviser had a robust system in place for selecting, monitoring and terminating subadvisers. The Board also reviewed the Adviser’s financial condition, and considered the financial support provided by the Adviser to the Small Company Growth and Small Company Value Portfolios through voluntary expense caps and to the Wilshire Large Cap Core 130/30 through an expense limitation agreement. Based upon all relevant factors, the Board concluded that the nature, quality and extent of the services provided by the Adviser to each Fund support renewal of the contract.
The Board reviewed information on the performance of each Fund for the annualized one-, three-, five- and ten-year periods ended September 30, 2010, as applicable, along with performance information of a peer group of funds determined by Wilshire based upon the Morningstar database for the same periods and in comparison to its benchmark. For the Large Company Growth Portfolio, Small Company Growth Portfolio and Wilshire 5000 Index Fund, the Board determined that each Fund met or exceeded acceptable levels of performance as compared to their respective peer groups and benchmarks for all time periods. For the Large Company Value Portfolio, the Board determined that performance was satisfactory based upon competitive performance with its peer group for all time periods and with its benchmark for the one- and ten-year periods. For the Small Company Value Portfolio, the Board noted that although the Fund underperformed its peer group during the one- and ten-year periods and its benchmark for the one-, three-, and five-year periods, the Fund’s performance was satisfactory as compared to its peer group during the three- and five-year periods. For the Wilshire Large Cap Core 130/30 Fund, the Board noted the Fund underperformed the median of its peer group and underperformed its benchmark for the one-year period, but took into consideration the steps taken by the Adviser to address performance issues by engaging new subadvisers for the Fund, effective March 2010.
Advisory Fees
The Board reviewed each Fund’s advisory fee and total expense ratio and reviewed information comparing the advisory fee and total expense ratio to those of the peer group of funds. The Board determined that the advisory fee for each Fund was within a competitive range, with the exception of the Large Company Value Portfolio. The Board considered that, although the Large Company Value Portfolio has a relatively high advisory fee in comparison to its peer group, the Fund is the smallest
Wilshire Mutual Funds, Inc. Board Approval of Subadvisory Agreements (Continued) | | |
fund in its peer group and that, relative to the peer group funds with assets below $250 million, the Fund’s advisory fee was within a competitive range. As to total expenses, the Board noted that total expenses are influenced by the small size of the complex. The Board received information regarding fees charged by the Adviser to other registered investment companies advised by the Adviser and similar to certain Funds and determined such fees were comparable to those of the applicable Funds. The Board concluded that the advisory fee for each Fund was reasonable and appropriate in amount.
Profitability to Wilshire and Economies of Scale
With respect to the profitability of the Advisory Agreement, the Board primarily considered the fee structure of the Advisory Agreement, including the costs of the services provided and the profits realized by the Adviser from its relationship with the Funds. The Board concluded that the profits realized by the Adviser were reasonable in comparison with the costs of providing investment advisory services to the Funds. In addition, the Board considered the extent to which economies of scale are realized as the Funds grow and whether fee levels reasonably reflect economies of scale for the benefit of shareholders. The Board reviewed each Fund’s asset size, each Fund’s expense ratio, the voluntary expense caps in place for the Small Company Growth and Small Company Value Portfolios, the expense limitation agreement in place for the Wilshire Large Cap Core 130/30 Fund and whether the investment process produced economies of scale. The Board concluded that each Fund’s advisory fee reasonably reflected appropriate recognition of any economies of scale.
Fall-Out Benefits — Wilshire
The Board considered the nature and amount of any benefits derived by the Adviser from its relationship with the Funds. The Board determined that the advisory fees were reasonable in light of these fall-out benefits.
Nature, Extent and Quality of Services — Subadvisers
As to each Subadvisory Agreement, the Board considered the nature, extent and quality of services provided. The Board considered the reputation, qualifications and background of the Subadviser, investment approach of the Subadviser, the experience and skills of investment personnel responsible for the day-to-day management of each Fund, and the resources made available to such personnel. The Board also considered the Subadviser’s compliance with investment policies and general legal compliance. In addition, the Board considered the analysis provided by the Adviser, which concluded that each Subadviser was providing reasonable services and recommended that each Subadvisory Agreement for each Fund be continued.
The Board reviewed information comparing each Subadviser’s gross investment performance to a relevant benchmark. Based upon all relevant factors, the Board determined to approve the Subadvisory Agreement with Acadian, with respect to the Large Company Value Portfolio, although the Fund underperformed for the annualized one-year period ended June 30, 2010 and for the inception-to-date period (since October 31, 2007), noting that the Adviser is satisfied with the level of services provided
Wilshire Mutual Funds, Inc. Board Approval of Subadvisory Agreements (Continued) | | |
by Acadian and performance is in line with the Adviser’s expectations given market conditions. The Board concluded that the investment performance of LA Capital, with respect to the Small Company Growth, Small Company Value and Large Company Growth Portfolios, met or exceeded acceptable levels of investment performance, and therefore, was satisfactory. The Board also determined that although LA Capital underperformed with respect to the Wilshire 5000 Index Fund, its performance only slightly lagged its benchmark and, therefore concluded that investment performance was satisfactory. With respect to NWQ and Ranger’s performance for the Small Company Value Portfolio, the Board determined that although these Subadvisers underperformed for the annualized three-year period ended June 30, 2010, outperformance for the annualized one-year and five-year periods ended June 30, 2010 resulted in a conclusion that performance was satisfactory. The Board determined that, although Pzena with respect to the Large Company Value Portfolio had underperformed for the annualized three-year period ended June 30, 2010, outperformance for the annualized one-year period ended June 30, 2010 resulted in the conclusion that performance was satisfactory. The Board also determined that although TWIN, with respect to the Wilshire Large Cap Core 130/30 Fund, had underperformed for the inception-to-date period (since November 30, 2007), outperformance for the annualized one-year period ended June 30, 2010 resulted in a conclusion that overall performance was satisfactory. The Board concluded that, although Systematic’s performance with respect to the Large Company Value Portfolio trailed that of its benchmark for the annualized one-year period ended June 30, 2010, inception-to-date outperformance (since October 31, 2007) resulted in a conclusion that performance was satisfactory. Although AXA, with respect to the Large Cap Core 130/30 Fund, underperformed for the one-year annualized period ended June 30, 2010 and the inception-to-date period (since November 30, 2007), the Board determined to approve continuation of the Subadvisory Agreement as it awaits Wilshire’s further analysis on AXA’s performance while AXA addresses organizational issues. Furthermore, the Board considered that AXA currently has been allocated 0% of the Fund’s assets.
Subadvisory Fees
The Board considered each Fund’s subadvisory fees. The Board evaluated the competitiveness of the subadvisory fees based upon data supplied by each Subadviser about the fees charged to other clients. The Board also considered that the subadvisory fee rates were negotiated at arm’s length between the Adviser and each Subadviser, that the Adviser compensates the Subadviser from its fees and that the aggregate advisory fee was deemed reasonable by the Board.
For the Subadvisers that reported fees for “Other Clients” with comparable investment policies and services, the Board noted that most Subadvisers did not charge higher fees to the Adviser for the Funds than were charged to their Other Clients. For the Subadvisers where the fees charged to the Adviser were higher than that charged to Other Clients, the Board determined that the fees charged to the Adviser were competitive.
Based upon all of the above, the Board determined that the subadvisory fees for each Fund were reasonable.
Wilshire Mutual Funds, Inc. Board Approval of Subadvisory Agreements (Continued) | | |
Profitability to the Subadvisers
The Board noted that the Adviser compensates each Subadviser from its own advisory fees and that the fees were negotiated at arm’s length between the Adviser and each Subadviser. In addition, the Board noted that the revenues to the various Subadvisers were limited due to the size of the Funds. The Board took these factors into consideration in concluding that the subadvisory fees were reasonable.
Economies of Scale — Subadvisers
The Board considered whether there are economies of scale with respect to the subadvisory services provided to each Fund and whether the subadvisory fees reflect such economies of scale through breakpoints in fees. The Board also considered whether the effective subadvisory fee rate for each Fund under the Subadvisory Agreement is reasonable in relation to the asset size of such Fund. The Board concluded that the fee schedule for each Fund reflects an appropriate recognition of any economies of scale.
Fall-Out Benefits — Subadvisers
The Board also considered the character and amount of other incidental benefits received by each Subadviser. The Board considered each Subadviser’s soft dollar practices, as applicable. The Board concluded that, taking into account the benefits arising from these practices, the fees charged under each Subadvisory Agreement were reasonable.
Conclusion
Based upon all of the information considered and the conclusions reached, the Board determined that the terms of the Advisory Agreement and each Subadvisory Agreement continue to be fair and reasonable and that the continuation of the Advisory Agreement and each Subadvisory Agreement is in the best interests of each Fund.
[This page intentionally left blank]
Wilshire Mutual Funds, Inc. Privacy Statement | | |
At Wilshire Mutual Funds, Inc., we appreciate the privacy concerns of our customers. We have established the following policies to maintain the privacy of information you share with us.
INFORMATION WE COLLECT
We collect and retain nonpublic personal information about you that may include:
| | • | Information we receive on your account applications or other forms such as your name, address, financial information and/or social security number; |
| | • | Information we receive about your mutual fund transactions, such as purchases, sales, exchanges and account balances; and |
| | • | Information we collect through the use of Internet “cookies” when you access our website. Cookies are a collection of information stored on the local hard drive of an Internet user, used primarily by web servers to identify previous users and their preferences. A web server can not find out a user’s name or email address, or anything about the user’s computer using cookies. |
INFORMATION WE MAY SHARE
We do not sell any of your nonpublic personal information to third parties. We may share the information we collect with affiliates or with non-affiliated third parties only when those parties are acting on our behalf in servicing your account, or as required by law. These third parties may include:
| | • | Administrative service providers who, for example, process transactions for your account, print checks or prepare account statements; |
| | • | Companies that provide services for us to help market our products to you; and |
| | • | Governmental or other legal agencies, as required by law. |
When information is shared with third parties, they are legally obligated to maintain the confidentiality of the information and to limit their use of it to servicing your account, except as permitted or required by law.
CONFIDENTIALITY AND SECURITY
Within our organization, we restrict access to your nonpublic personal information to authorized employees who need to access such information in order to provide services or products to you. We maintain physical, electronic and procedural safeguards to protect your nonpublic personal information.
As previously mentioned, we may collect information through the use of Internet “cookies” on our website. In addition, in order to provide you with access to your account via the web, it is necessary for us to collect certain nonpublic personal information such as your name, social security number and account information. Special measures such as data encryption and authentication apply to all nonpublic personal information and communications on our website.
APPLICABILITY
Our privacy policies apply only to those individual investors who have a direct customer relationship with us. If you are an individual shareholder of record of any of the Portfolios, we consider you to be our customer. Shareholders purchasing or owning shares of any of the Portfolios through their bank, broker, or other financial institution should also consult that financial institution’s privacy policies.
Wilshire Mutual Funds, Inc. values your business. We understand the importance of maintaining the integrity of your personal information and are committed to keeping your trust. Please contact us at 1-888-200-6796 if you have any questions concerning our policy, or visit us at www.wilshirefunds.com for additional copies of this policy.
Wilshire Associates Incorporated
1299 Ocean Avenue
Santa Monica, CA 90401
1-888-200-6796
www.wilfunds.com
WIL-AR-001-0300
| | (a) | The registrant, as of the end of the period covered by this report, has adopted a code of ethics that applies to the registrant’s principal executive officer, principal financial officer, principal accounting officer or controller, or persons performing similar functions, regardless of whether these individuals are employed by the registrant or a third party. |
| | (c) | During the period covered by this report, the code of ethics was amended to address changes in the registrant’s covered officers. |
| | (d) | The registrant has not granted any waivers, including an implicit waiver, from a provision of the code of ethics that applies to the registrant’s principal executive officer, principal financial officer, principal accounting officer or controller, or persons performing similar functions, regardless of whether these individuals are employed by the registrant or a third party, that relates to one or more of the items set forth in paragraph (b) of this item’s instructions. |
| Item 3. | Audit Committee Financial Expert. |
The Registrant’s Board of Directors has determined that the Registrant has at least one “audit committee financial expert” (as defined by Item 3 of Form N-CSR) serving on its audit committee. Mr. Roger A. Formisano, the Registrant’s audit committee financial expert, is “independent,” for purposes of Item 3 of Form N-CSR.
An “audit committee financial expert” is not an “expert” for any purpose, including for purposes of Section 11 of the Securities Act of 1933, as a result of being designated as an “audit committee financial expert.” Further, the designation of a person as an “audit committee financial expert” does not mean that the person has any greater duties, obligations, or liability than those imposed on the person without the “audit committee financial expert” designation. Similarly, the designation of a person as an “audit committee financial expert” does not affect the duties, obligations, or liability of any other member of the audit committee or Board of Directors.
| Item 4. | Principal Accountant Fees and Services. |
Audit Fees
| | (a) | The aggregate fees billed for each of the last two fiscal years for professional services rendered by the principal accountant for the audit of the registrant’s annual financial statements or services that are normally provided by the accountant in connection with statutory and regulatory filings or engagements for those fiscal years are $157,738 for 2009 and $168,700 for 2010. |
Audit-Related Fees
| | (b) | The aggregate fees billed in each of the last two fiscal years for assurance and related services by the principal accountant that are reasonably related to the performance of the audit of the registrant’s financial statements and are not reported under paragraph (a) of this Item are $0 for 2009 and $0 for 2010. |
Tax Fees
| | (c) | The aggregate fees billed in each of the last two fiscal years for professional services rendered by the principal accountant for tax compliance, tax advice, tax planning and tax training are $25,413 for 2009 and $22,325 for 2010. Such services consisted of quarterly diversification review, annual distribution review and tax return review. |
All Other Fees
| | (d) | The aggregate fees billed in each of the last two fiscal years for products and services provided by the principal accountant, other than the services reported in paragraphs (a) through (c) of this Item are $0 for 2009 and $0 for 2010. |
| | (e)(1) | Audit Committee Pre-Approval Policies and Procedures. |
Pursuant to Registrant’s Audit Committee Charter (the “Charter”), the Audit Committee is responsible for pre-approving any engagement of the principal accountant to provide non-prohibited services to the Registrant, including the fees and other compensation to be paid to the principal accountant, to the extent required by Rule 2-01(c)(7) of Regulation S-X. The Chairman of the Audit Committee may grant pre-approval for engagements of less than $5,000. All such delegated pre-approvals will be presented to the Audit Committee no later than the next Audit Committee meeting.
Pursuant to the Charter, the Audit Committee is also responsible for pre-approving any engagement of the principal accountant, including the fees and other compensation to be paid to the principal accountant, to provide non-audit services to the Registrant’s investment adviser (or any entity controlling, controlled by, or under common control with the adviser that provides ongoing services to the Registrant), if the engagement relates directly to the operations and financial reporting of the Registrant, to the extent required by Rule 2-01(c)(7) of Regulation S-X. The Chairman of the Audit Committee may grant pre-approval for engagements of less than $5,000. All such delegated pre-approvals will be presented to the Audit Committee no later than the next Audit Committee meeting.
| | (e)(2) | The percentage of services described in each of paragraphs (b) through (d) of this Item that were approved by the audit committee pursuant to paragraph (c)(7)(i)(C) of Rule 2-01 of Regulation S-X are as follows: |
(b) Not Applicable
(c) 0%
(d) Not Applicable
| | (f) | The percentage of hours expended on the principal accountant’s engagement to audit the registrant’s financial statements for the most recent fiscal year that were attributed to work performed by persons other than the principal accountant’s full-time, permanent employees was (0%) zero percent. |
| | (g) | The aggregate non-audit fees billed by the registrant’s accountant for services rendered to the registrant, and rendered to the registrant’s investment adviser (not including any sub-adviser whose role is primarily portfolio management and is subcontracted with or overseen by another investment adviser), and any entity controlling, controlled by, or under common control with the adviser that provides ongoing services to the registrant for each of the last two fiscal years of the registrant was $1,129,744 for 2009 and $789,665 for 2010. |
| | (h) | The registrant’s audit committee of the board of directors has considered whether the provision of non-audit services that were rendered to the registrant’s investment adviser (not including any sub-adviser whose role is primarily portfolio management and is subcontracted with or overseen by another investment adviser), and any entity controlling, controlled by, or under common control with the investment adviser that provides ongoing services to the registrant that were not pre-approved pursuant to paragraph (c)(7)(ii) of Rule 2-01 of Regulation S-X is compatible with maintaining the principal accountant’s independence. |
| Item 5. | Audit Committee of Listed Registrants. |
Not applicable.
| Item 6. | Schedule of Investments. |
| | (a) | The Schedules of Investments in securities of unaffiliated issuers as of the close of the reporting period for the Wilshire 5000 IndexSM Fund, the Large Company Growth Portfolio, the Large Company Value Portfolio, the Small Company Growth Portfolio and the Small Company Value Portfolio are listed below. The Schedule of Investments in securities of unaffiliated issuers as of the close of the reporting period for the Wilshire Large Cap Core 130/30 Fund is included as part of the report to shareholders filed under Item 1 of this form. |
| Wilshire Mutual Funds, Inc. | |
| Large Company Growth Portfolio | December 31, 2010 |
| Schedule of Investments | |
| Shares | | | | Value | |
| | |
| COMMON STOCK — 99.1%†† | | | |
| Consumer Discretionary — 17.7% | | | |
| | 1,290 | | Abercrombie & Fitch Co., Class A | | $ | 74,343 | |
| | 23,116 | | Amazon.com, Inc. † | | | 4,160,880 | |
| | 11,630 | | American Eagle Outfitters, Inc. | | | 170,147 | |
| | 35,947 | | Apollo Group, Inc., Class A † | | | 1,419,547 | |
| | 130 | | Autoliv, Inc. SDR | | | 10,262 | |
| | 60 | | AutoZone, Inc. † | | | 16,355 | |
| | 1,400 | | Brinker International, Inc. | | | 29,232 | |
| | 26,290 | | Burberry Group PLC ADR | | | 922,779 | |
| | 26,100 | | Cablevision Systems Corp., Class A | | | 883,224 | |
| | 13,500 | | CBS Corp., Class B | | | 257,175 | |
| | 10,400 | | Chico's FAS, Inc. | | | 125,112 | |
| | 510 | | Chipotle Mexican Grill, Inc., Class A † | | | 108,457 | |
| | 12,000 | | Coach, Inc. | | | 663,720 | |
| | 31,595 | | Dick's Sporting Goods, Inc. † | | | 1,184,812 | |
| | 6,544 | | Discovery Communications, Inc., Class A † | | | 272,885 | |
| | 21,320 | | Discovery Communications, Inc., Class C † | | | 782,231 | |
| | 15,500 | | DISH Network Corp., Class A † | | | 304,730 | |
| | 22,500 | | Dollar Tree, Inc. † | | | 1,261,800 | |
| | 4,900 | | Expedia, Inc. | | | 122,941 | |
| | 10,200 | | Ford Motor Co. † | | | 171,258 | |
| | 5,400 | | Fortune Brands, Inc. | | | 325,350 | |
| | 20,800 | | Gap, Inc. (The) | | | 460,512 | |
| | 7,950 | | Garmin, Ltd. | | | 246,371 | |
| | 13,400 | | Gentex Corp. | | | 396,104 | |
| | 5,700 | | Guess?, Inc. | | | 269,724 | |
| | 700 | | H&R Block, Inc. | | | 8,337 | |
| | 12,200 | | Harley-Davidson, Inc. | | | 422,974 | |
| | 5,500 | | International Game Technology | | | 97,295 | |
| | 8,400 | | Interpublic Group of Cos., Inc. (The) † | | | 89,208 | |
| | 25,000 | | Johnson Controls, Inc. | | | 955,000 | |
| | 6,610 | | Kohl's Corp. † | | | 359,187 | |
| | 7,300 | | Las Vegas Sands Corp. † | | | 335,435 | |
| | 3,900 | | Lear Corp. † | | | 384,969 | |
| | 17,900 | | Leggett & Platt, Inc. | | | 407,404 | |
| | 14,150 | | Ltd. Brands, Inc. | | | 434,829 | |
| | 1,800 | | Marriott International, Inc., Class A | | | 74,772 | |
| | 4,400 | | Mattel, Inc. | | | 111,892 | |
| | 28,018 | | McDonald's Corp. | | | 2,150,662 | |
| | 2,300 | | Morningstar, Inc. | | | 122,084 | |
| | 8,975 | | NetFlix, Inc. † | | | 1,576,907 | |
| | 4,600 | | Newell Rubbermaid, Inc. | | | 83,628 | |
| | 800 | | News Corp., Class A | | | 11,648 | |
| | 4,000 | | Nordstrom, Inc. | | | 169,520 | |
| | 7,100 | | Omnicom Group, Inc. | | | 325,180 | |
| | 1,100 | | PetSmart, Inc. | | | 43,802 | |
| | 1,000 | | Phillips-Van Heusen Corp. | | | 63,010 | |
| | 4,910 | | priceline.com, Inc. † | | | 1,961,791 | |
| | 5,200 | | RadioShack Corp. | | | 96,148 | |
| | 1,300 | | Royal Caribbean Cruises, Ltd. † | | | 61,100 | |
| | 15,100 | | Scripps Networks Interactive, Inc., Class A | | | 781,425 | |
| | 2,500 | | Starbucks Corp. | | | 80,325 | |
| | 27,900 | | Starwood Hotels & Resorts Worldwide, Inc. | | | 1,695,762 | |
| | 217 | | Strayer Education, Inc. | | | 33,032 | |
| | 58,936 | | Target Corp. | | | 3,543,822 | |
| | 700 | | Time Warner Cable, Inc., Class A | | | 46,221 | |
| | 3,500 | | Time Warner, Inc. | | | 112,595 | |
| | 2,281 | | TJX Companies, Inc. | | | 101,254 | |
| | 1,150 | | Tractor Supply Co. | | | 55,764 | |
| | 20,777 | | Urban Outfitters, Inc. † | | | 744,024 | |
| Shares | | | | Value | |
| Consumer Discretionary (continued) | | | |
| | 7,200 | | Virgin Media, Inc. | | $ | 196,128 | |
| | 30,923 | | Walt Disney Co. (The) | | | 1,159,921 | |
| | 10,100 | | Weight Watchers International, Inc. | | | 378,649 | |
| | 5,900 | | Williams-Sonoma, Inc. | | | 210,571 | |
| | 1,010 | | Wynn Resorts, Ltd. | | | 104,878 | |
| | | | | | | 34,231,104 | |
| Consumer Staples — 7.7% | | | | |
| | 16,172 | | Altria Group, Inc. | | | 398,155 | |
| | 19,668 | | Avon Products, Inc. | | | 571,552 | |
| | 23,334 | | Coca-Cola Co. (The) | | | 1,534,677 | |
| | 26,798 | | Costco Wholesale Corp. | | | 1,935,084 | |
| | 16,504 | | Diageo PLC ADR | | | 1,226,743 | |
| | 33,542 | | General Mills, Inc. | | | 1,193,760 | |
| | 6,700 | | Herbalife, Ltd. | | | 458,079 | |
| | 4,974 | | Lorillard, Inc. | | | 408,166 | |
| | 11,900 | | Mead Johnson Nutrition Co., Class A | | | 740,775 | |
| | 16,046 | | PepsiCo, Inc. | | | 1,048,285 | |
| | 63,110 | | Philip Morris International, Inc. | | | 3,693,828 | |
| | 9,400 | | Procter & Gamble Co. (The) | | | 604,702 | |
| | 2,200 | | Sysco Corp. | | | 64,680 | |
| | 19,097 | | Wal-Mart Stores, Inc. | | | 1,029,901 | |
| | 1,490 | | Whole Foods Market, Inc. | | | 75,379 | |
| | | | | | | 14,983,766 | |
| Energy — 10.2% | | | | |
| | 11,020 | | Alpha Natural Resources, Inc. † | | | 661,531 | |
| | 24,049 | | Anadarko Petroleum Corp. | | | 1,831,572 | |
| | 8,940 | | Arch Coal, Inc. | | | 313,436 | |
| | 8,600 | | Atlas Energy, Inc. † | | | 378,142 | |
| | 25,500 | | Cameron International Corp. † | | | 1,293,615 | |
| | 7,900 | | Cobalt International Energy, Inc. † | | | 96,459 | |
| | 5,100 | | Concho Resources, Inc. † | | | 447,117 | |
| | 1,010 | | Continental Resources, Inc. † | | | 59,438 | |
| | 3,380 | | Core Laboratories NV | | | 300,989 | |
| | 3,700 | | Dresser-Rand Group, Inc. † | | | 157,583 | |
| | 40,718 | | Exxon Mobil Corp. | | | 2,977,300 | |
| | 31,520 | | Frontline, Ltd. | | | 799,662 | |
| | 4,000 | | Halliburton Co. | | | 163,320 | |
| | 4,200 | | Holly Corp. | | | 171,234 | |
| | 100 | | Massey Energy Co. | | | 5,365 | |
| | 7,995 | | Noble Energy, Inc. | | | 688,210 | |
| | 13,100 | | Occidental Petroleum Corp. | | | 1,285,110 | |
| | 2,800 | | Oceaneering International, Inc. † | | | 206,164 | |
| | 1,400 | | Oil States International, Inc. † | | | 89,726 | |
| | 5,300 | | Patterson-UTI Energy, Inc. | | | 114,215 | |
| | 87,206 | | Petrohawk Energy Corp. † | | | 1,591,510 | |
| | 19,500 | | Quicksilver Resources, Inc. † | | | 287,430 | |
| | 32,307 | | Schlumberger, Ltd. | | | 2,697,635 | |
| | 2,700 | | SM Energy Co. | | | 159,111 | |
| | 3,600 | | Spectra Energy Corp. | | | 89,964 | |
| | 2,200 | | Superior Energy Services, Inc. † | | | 76,978 | |
| | 4,900 | | Tidewater, Inc. | | | 263,816 | |
| | 1,600 | | Ultra Petroleum Corp. † | | | 76,432 | |
| | 98,595 | | Weatherford International, Ltd. † | | | 2,247,966 | |
| | 1,560 | | Whiting Petroleum Corp. † | | | 182,816 | |
| | | | | | | 19,713,846 | |
| Financials — 4.9% | | | | |
| | 36,994 | | Bank of America Corp. | | | 493,500 | |
| | 1,350 | | BlackRock, Inc., Class A | | | 257,283 | |
| | 71,500 | | Charles Schwab Corp. (The) | | | 1,223,365 | |
| | 3,800 | | Endurance Specialty Holdings, Ltd. | | | 175,066 | |
| | 7,299 | | Goldman Sachs Group, Inc. (The) | | | 1,227,400 | |
| | 5,537 | | IntercontinentalExchange, Inc. † | | | 659,733 | |
| | 2,900 | | Marsh & McLennan Cos., Inc. | | | 79,286 | |
| | 1,820 | | PartnerRe, Ltd. | | | 146,237 | |
| Wilshire Mutual Funds, Inc. | |
| Large Company Growth Portfolio | December 31, 2010 |
| Schedule of Investments | |
| Shares | | | | Value | |
| Financials (continued) | | | |
| | 24,620 | | Protective Life Corp. | | $ | 655,877 | |
| | 95,301 | | TD Ameritrade Holding Corp. | | | 1,809,766 | |
| | 500 | | Ventas, Inc. | | | 26,240 | |
| | 32,220 | | Visa, Inc., Class A | | | 2,267,644 | |
| | 6,600 | | Waddell & Reed Financial, Inc., Class A | | | 232,914 | |
| | 9,700 | | Washington Federal, Inc. | | | 164,124 | |
| | | | | | | 9,418,435 | |
| Health Care — 9.7% | | | | |
| | 1,700 | | Alere, Inc. † | | | 62,220 | |
| | 12,250 | | Alexion Pharmaceuticals, Inc. † | | | 986,737 | |
| | 26,200 | | Allergan, Inc. | | | 1,799,154 | |
| | 13,400 | | Allscripts Healthcare Solutions, Inc. † | | | 258,218 | |
| | 3,268 | | Becton Dickinson and Co. | | | 276,212 | |
| | 28,060 | | Bristol-Myers Squibb Co. | | | 743,029 | |
| | 1,600 | | Brookdale Senior Living, Inc., Class A † | | | 34,256 | |
| | 37,477 | | Celgene Corp. † | | | 2,216,390 | |
| | 1,300 | | Cerner Corp. † | | | 123,162 | |
| | 1,958 | | DENTSPLY International, Inc. | | | 66,905 | |
| | 7,800 | | Eli Lilly & Co. | | | 273,312 | |
| | 30,900 | | Express Scripts, Inc., Class A † | | | 1,670,145 | |
| | 46,590 | | Gilead Sciences, Inc. † | | | 1,688,421 | |
| | 3,200 | | Hill-Rom Holdings, Inc. | | | 125,984 | |
| | 314 | | IDEXX Laboratories, Inc. † | | | 21,735 | |
| | 4,283 | | Intuitive Surgical, Inc. † | | | 1,103,943 | |
| | 18,578 | | Johnson & Johnson | | | 1,149,049 | |
| | 1,117 | | Laboratory Corp. of America Holdings † | | | 98,207 | |
| | 1,301 | | Mednax, Inc. † | | | 87,544 | |
| | 18,074 | | Medtronic, Inc. | | | 670,365 | |
| | 40,096 | | Myriad Genetics, Inc. † | | | 915,793 | |
| | 35,765 | | NuVasive, Inc. † | | | 917,372 | |
| | 790 | | Omnicare, Inc. | | | 20,058 | |
| | 4,613 | | Patterson Cos., Inc. | | | 141,296 | |
| | 18,850 | | Perrigo Co. | | | 1,193,770 | |
| | 866 | | ResMed, Inc. † | | | 29,998 | |
| | 3,800 | | Techne Corp. | | | 249,546 | |
| | 31,696 | | WellPoint, Inc. † | | | 1,802,235 | |
| | | | | | | 18,725,056 | |
| Industrials — 10.8% | | | | |
| | 11,001 | | 3M Co. | | | 949,386 | |
| | 2,400 | | Bucyrus International, Inc., Class A | | | 214,560 | |
| | 12,800 | | Caterpillar, Inc. | | | 1,198,848 | |
| | 5,000 | | CH Robinson Worldwide, Inc. | | | 400,950 | |
| | 5,700 | | Crane Co. | | | 234,099 | |
| | 2,800 | | CSX Corp. | | | 180,908 | |
| | 3,460 | | Cummins, Inc. | | | 380,634 | |
| | 4,100 | | Deere & Co. | | | 340,505 | |
| | 300 | | Donaldson Co., Inc. | | | 17,484 | |
| | 2,000 | | Emerson Electric Co. | | | 114,340 | |
| | 35,400 | | Expeditors International of Washington, Inc. | | | 1,932,840 | |
| | 13,500 | | Fastenal Co. | | | 808,785 | |
| | 300 | | FedEx Corp. | | | 27,903 | |
| | 16,431 | | Fluor Corp. | | | 1,088,718 | |
| | 2,100 | | General Cable Corp. † | | | 73,689 | |
| | 25,695 | | General Dynamics Corp. | | | 1,823,317 | |
| | 10,869 | | Goodrich Corp. | | | 957,233 | |
| | 6,720 | | Graco, Inc. | | | 265,104 | |
| | 1,100 | | Honeywell International, Inc. | | | 58,476 | |
| | 3,839 | | Hubbell, Inc., Class B | | | 230,839 | |
| | 4,664 | | Illinois Tool Works, Inc. | | | 249,058 | |
| | 3,881 | | ITT Corp. | | | 202,239 | |
| | 15,000 | | JB Hunt Transport Services, Inc. | | | 612,150 | |
| | 7,989 | | Joy Global, Inc. | | | 693,046 | |
| | 900 | | KAR Auction Services, Inc. † | | | 12,420 | |
| Shares | | | | Value | |
| Industrials (continued) | | | |
| | 10,670 | | Manitowoc Co., Inc. (The) | | $ | 139,884 | |
| | 3,700 | | Navistar International Corp. † | | | 214,267 | |
| | 1,300 | | Norfolk Southern Corp. | | | 81,666 | |
| | 4,010 | | Oshkosh Corp. † | | | 141,312 | |
| | 1,500 | | Owens Corning † | | | 46,725 | |
| | 4,000 | | PACCAR, Inc. | | | 229,680 | |
| | 29,119 | | Pentair, Inc. | | | 1,063,135 | |
| | 300 | | Regal-Beloit Corp. | | | 20,028 | |
| | 6,300 | | Rockwell Automation, Inc. | | | 451,773 | |
| | 35,906 | | Terex Corp. † | | | 1,114,522 | |
| | 51,543 | | Textron, Inc. | | | 1,218,477 | |
| | 900 | | TransDigm Group, Inc. † | | | 64,809 | |
| | 20,000 | | Union Pacific Corp. | | | 1,853,200 | |
| | 8,800 | | United Parcel Service, Inc., Class B | | | 638,704 | |
| | 3,229 | | United Technologies Corp. | | | 254,187 | |
| | 12,100 | | Verisk Analytics, Inc., Class A † | | | 412,368 | |
| | | | | | | 21,012,268 | |
| Information Technology — 32.4% | | | | |
| | 26,492 | | Acme Packet, Inc. † | | | 1,408,315 | |
| | 3,899 | | Altera Corp. | | | 138,726 | |
| | 5,610 | | ANSYS, Inc. † | | | 292,113 | |
| | 35,518 | | Apple, Inc. † | | | 11,456,686 | |
| | 58,500 | | ARM Holdings PLC ADR | | | 1,213,875 | |
| | 5,650 | | AVX Corp. | | | 87,180 | |
| | 13,363 | | Baidu, Inc. ADR † | | | 1,289,930 | |
| | 4,479 | | BMC Software, Inc. † | | | 211,140 | |
| | 16,245 | | Broadcom Corp., Class A | | | 707,470 | |
| | 11,800 | | Broadridge Financial Solutions, Inc. | | | 258,774 | |
| | 6,100 | | Brocade Communications Systems, Inc. † | | | 32,269 | |
| | 30,000 | | Cadence Design Systems, Inc. † | | | 247,800 | |
| | 22,931 | | Cisco Systems, Inc. † | | | 463,894 | |
| | 29,400 | | Citrix Systems, Inc. † | | | 2,011,254 | |
| | 32,600 | | Cognizant Technology Solutions Corp., Class A † | | | 2,389,254 | |
| | 10,000 | | Compuware Corp. † | | | 116,700 | |
| | 1,400 | | CoreLogic, Inc. | | | 25,928 | |
| | 21,275 | | Cree, Inc. † | | | 1,401,810 | |
| | 4,900 | | Cypress Semiconductor Corp. † | | | 91,042 | |
| | 8,000 | | Diebold, Inc. | | | 256,400 | |
| | 1,977 | | Dolby Laboratories, Inc., Class A † | | | 131,866 | |
| | 4,940 | | DST Systems, Inc. | | | 219,089 | |
| | 4,910 | | EchoStar Corp., Class A † | | | 122,603 | |
| | 16,400 | | EMC Corp. † | | | 375,560 | |
| | 270 | | Equinix, Inc. † | | | 21,940 | |
| | 18,150 | | F5 Networks, Inc. † | | | 2,362,404 | |
| | 1,100 | | Factset Research Systems, Inc. | | | 103,136 | |
| | 200 | | First Solar, Inc. † | | | 26,028 | |
| | 1,311 | | FLIR Systems, Inc. † | | | 39,002 | |
| | 8,510 | | Google, Inc., Class A † | | | 5,054,685 | |
| | 81,330 | | Intel Corp. | | | 1,710,370 | |
| | 23,753 | | International Business Machines Corp. | | | 3,485,991 | |
| | 18,200 | | Intersil Corp., Class A | | | 277,914 | |
| | 5,130 | | Itron, Inc. † | | | 284,458 | |
| | 53,775 | | Juniper Networks, Inc. † | | | 1,985,373 | |
| | 20,100 | | Lender Processing Services, Inc. | | | 593,352 | |
| | 800 | | Linear Technology Corp. | | | 27,672 | |
| | 141,396 | | Marvell Technology Group, Ltd. † | | | 2,622,896 | |
| | 1,900 | | McAfee, Inc. † | | | 87,989 | |
| | 163,544 | | Microsoft Corp. | | | 4,566,148 | |
| | 10,000 | | National Instruments Corp. | | | 376,400 | |
| | 113,646 | | Oracle Corp. | | | 3,557,120 | |
| | 7,800 | | Paychex, Inc. | | | 241,098 | |
| | 11,490 | | Polycom, Inc. † | | | 447,880 | |
| | 18,750 | | QLogic Corp. † | | | 319,125 | |
| | 94,999 | | QUALCOMM, Inc. | | | 4,701,500 | |
| Wilshire Mutual Funds, Inc. | |
| Large Company Growth Portfolio | December 31, 2010 |
| Schedule of Investments | |
| Shares | | | | Value | |
| Information Technology (continued) | | | |
| | 15,240 | | Rambus, Inc. † | | $ | 312,115 | |
| | 1,300 | | Salesforce.com, Inc. † | | | 171,600 | |
| | 6,700 | | Tech Data Corp. † | | | 294,934 | |
| | 11,100 | | Teradyne, Inc. † | | | 155,844 | |
| | 22,101 | | Texas Instruments, Inc. | | | 718,282 | |
| | 1,900 | | VeriSign, Inc. | | | 62,073 | |
| | 8,650 | | Vishay Intertechnology, Inc. † | | | 126,982 | |
| | 24,035 | | VistaPrint NV † | | | 1,105,610 | |
| | 730 | | WebMD Health Corp., Class A † | | | 37,274 | |
| | 76,477 | | Western Union Co. (The) | | | 1,420,178 | |
| | 40,400 | | Yahoo!, Inc. † | | | 671,852 | |
| | | | | | | 62,918,903 | |
| Materials — 5.0% | | | | |
| | 2,100 | | Air Products & Chemicals, Inc. | | | 190,995 | |
| | 6,800 | | AK Steel Holding Corp. | | | 111,316 | |
| | 4,200 | | Cabot Corp. | | | 158,130 | |
| | 5,200 | | Compass Minerals International, Inc. | | | 464,204 | |
| | 2,800 | | Cytec Industries, Inc. | | | 148,568 | |
| | 5,390 | | Domtar Corp. | | | 409,209 | |
| | 17,442 | | Dow Chemical Co. (The) | | | 595,470 | |
| | 18,219 | | Ecolab, Inc. | | | 918,602 | |
| | 12,997 | | Freeport-McMoRan Copper & Gold, Inc. | | | 1,560,810 | |
| | 5,000 | | Greif, Inc., Class A | | | 309,500 | |
| | 4,831 | | Monsanto Co. | | | 336,431 | |
| | 3,000 | | Mosaic Co. (The) | | | 229,080 | |
| | 1,600 | | Nalco Holding Co. | | | 51,104 | |
| | 10,200 | | Newmont Mining Corp. | | | 626,586 | |
| | 4,200 | | Packaging Corp. of America | | | 108,528 | |
| | 8,350 | | Potash Corp. of Saskatchewan, Inc. | | | 1,292,830 | |
| | 6,800 | | Praxair, Inc. | | | 649,196 | |
| | 12,100 | | RPM International, Inc. | | | 267,410 | |
| | 20,600 | | Southern Copper Corp. | | | 1,004,044 | |
| | 2,180 | | Temple-Inland, Inc. | | | 46,303 | |
| | 1,150 | | Walter Energy, Inc. | | | 147,016 | |
| | | | | | | 9,625,332 | |
| Telecommunication Services — 0.7% | | | | |
| | 22,270 | | Frontier Communications Corp. | | | 216,687 | |
| | 161,100 | | Qwest Communications International, Inc. | | | 1,225,971 | |
| | 100 | | Verizon Communications, Inc. | | | 3,578 | |
| | | | | | | 1,446,236 | |
| Total Common Stock (Cost $143,418,686) | | | 192,074,946 |
| | | | |
| Total Investments — 99.1% | | | | |
| (Cost $143,418,686) | | | 192,074,946 |
| Other Assets & Liabilities, Net — 0.9% | | | 1,836,033 |
| NET ASSETS — 100.0% | | $ | 193,910,979 |
| † | Non-income producing security. |
| †† | More narrow industries are utilized for compliance purposes, whereas broad sectors are utilized for reporting purposes. |
ADR — American Depositary Receipt
PLC — Public Limited Company
SDR — Swedish Depositary Receipt
| Wilshire Mutual Funds, Inc. | |
| Large Company Value Portfolio | December 31, 2010 |
| Schedule of Investments | |
| Shares | | | | Value | |
| | |
| COMMON STOCK — 98.8%†† | | | |
| Consumer Discretionary — 10.9% | | | |
| | 3,217 | | Autoliv, Inc. SDR | | $ | 253,950 | |
| | 94 | | AutoZone, Inc. † | | | 25,623 | |
| | 4,500 | | CBS Corp., Class B | | | 85,725 | |
| | 18,995 | | Comcast Corp. Special, Class A | | | 417,320 | |
| | 91 | | Dillard's, Inc., Class A | | | 3,453 | |
| | 448 | | Flexsteel Industries | | | 7,921 | |
| | 3,400 | | Ford Motor Co. † | | | 57,086 | |
| | 3,900 | | Fortune Brands, Inc. | | | 234,975 | |
| | 1,100 | | General Motors Co. † | | | 40,546 | |
| | 2,665 | | ITT Educational Services, Inc. † | | | 169,734 | |
| | 12,575 | | J.C. Penney Co., Inc. | | | 406,298 | |
| | 107 | | Jo-Ann Stores, Inc. † | | | 6,444 | |
| | 2,300 | | Lear Corp. † | | | 227,033 | |
| | 3,900 | | Macy's, Inc. | | | 98,670 | |
| | 2,800 | | News Corp., Class A | | | 40,768 | |
| | 7,700 | | Omnicom Group, Inc. | | | 352,660 | |
| | 4,345 | | Oxford Industries, Inc. | | | 111,275 | |
| | 2,900 | | Phillips-Van Heusen Corp. | | | 182,729 | |
| | 2,800 | | Pre-Paid Legal Services, Inc. † | | | 168,700 | |
| | 172 | | Quiksilver, Inc. † | | | 872 | |
| | 1,000 | | Signet Jewelers, Ltd. † | | | 43,400 | |
| | 4,303 | | TRW Automotive Holdings Corp. † | | | 226,768 | |
| | 4,044 | | VF Corp. | | | 348,512 | |
| | 3,700 | | Viacom, Inc., Class B | | | 146,557 | |
| | 5,000 | | Wyndham Worldwide Corp. | | | 149,800 | |
| | | | | | | 3,806,819 | |
| Consumer Staples — 2.8% | | | | |
| | 1,712 | | Avon Products, Inc. | | | 49,751 | |
| | 9,822 | | Central Garden and Pet Co., Class A † | | | 97,041 | |
| | 1,800 | | Coca-Cola Co. (The) | | | 118,386 | |
| | 6,700 | | Constellation Brands, Inc., Class A † | | | 148,405 | |
| | 2,673 | | John B. Sanfilippo & Son, Inc. † | | | 33,252 | |
| | 596 | | Oil-Dri Corp. of America | | | 12,808 | |
| | 1,550 | | Procter & Gamble Co. (The) | | | 99,712 | |
| | 1,800 | | Reynolds American, Inc. | | | 58,716 | |
| | 359 | | Schiff Nutrition International, Inc. | | | 3,259 | |
| | 14,948 | | Tyson Foods, Inc., Class A | | | 257,405 | |
| | 2,700 | | Walgreen Co. | | | 105,192 | |
| | | | | | | 983,927 | |
| Energy — 12.5% | | | | |
| | 2,075 | | Apache Corp. | | | 247,402 | |
| | 7,050 | | BP PLC ADR | | | 311,398 | |
| | 11,600 | | Chevron Corp. | | | 1,058,500 | |
| | 8,336 | | ConocoPhillips | | | 567,682 | |
| | 7,113 | | Devon Energy Corp. | | | 558,442 | |
| | 7,898 | | Exxon Mobil Corp. | | | 577,502 | |
| | 2,800 | | Hess Corp. | | | 214,312 | |
| | 3,000 | | McDermott International, Inc. † | | | 62,070 | |
| | 1,200 | | National Oilwell Varco, Inc. | | | 80,700 | |
| | 2,300 | | Newfield Exploration Co. † | | | 165,853 | |
| | 1,075 | | Occidental Petroleum Corp. | | | 105,457 | |
| | 823 | | SEACOR Holdings, Inc. | | | 83,197 | |
| | 8,100 | | Valero Energy Corp. | | | 187,272 | |
| | 1,250 | | Whiting Petroleum Corp. † | | | 146,488 | |
| | | | | | | 4,366,275 | |
| Financials — 29.9% | | | | |
| | 10,313 | | ACE, Ltd. | | | 641,984 | |
| | 1,900 | | Aflac, Inc. | | | 107,217 | |
| | 5,450 | | Allstate Corp. (The) | | | 173,746 | |
| | 2,250 | | Ameriprise Financial, Inc. | | | 129,487 | |
| | 18,496 | | Annaly Capital Management, Inc. | | | 331,448 | |
| Shares | | | | Value | |
| Financials (continued) | | | |
| | 2,099 | | Aspen Insurance Holdings, Ltd. | | $ | 60,073 | |
| | 8,219 | | Assurant, Inc. | | | 316,596 | |
| | 10,750 | | Axis Capital Holdings, Ltd. | | | 385,710 | |
| | 19,950 | | Bank of America Corp. | | | 266,133 | |
| | 2,400 | | Calamos Asset Management, Inc., Class A | | | 33,600 | |
| | 9,303 | | Capital One Financial Corp. | | | 395,936 | |
| | 2,048 | | Chubb Corp. | | | 122,143 | |
| | 197,574 | | Citigroup, Inc. † | | | 934,525 | |
| | 2,008 | | Community Bank System, Inc. | | | 55,762 | |
| | 28,800 | | Discover Financial Services | | | 533,664 | |
| | 3,276 | | Everest Re Group, Ltd. | | | 277,870 | |
| | 17,339 | | Fidelity National Financial, Inc., Class A | | | 237,198 | |
| | 21,562 | | Fifth Third Bancorp | | | 316,530 | |
| | 4,017 | | Gladstone Capital Corp. | | | 46,276 | |
| | 1,525 | | Goldman Sachs Group, Inc. (The) | | | 256,444 | |
| | 9,525 | | Hartford Financial Services Group, Inc. | | | 252,317 | |
| | 2,600 | | HCP, Inc. | | | 95,654 | |
| | 4,500 | | Invesco, Ltd. | | | 108,270 | |
| | 28,168 | | JPMorgan Chase & Co. | | | 1,194,887 | |
| | 17,700 | | KeyCorp | | | 156,645 | |
| | 5,025 | | MetLife, Inc. | | | 223,311 | |
| | 4,675 | | Morgan Stanley | | | 127,207 | |
| | 2,633 | | NGP Capital Resources Co. | | | 24,224 | |
| | 8,654 | | PNC Financial Services Group, Inc. | | | 525,471 | |
| | 2,806 | | Prosperity Bancshares, Inc. | | | 110,220 | |
| | 2,250 | | Prudential Financial, Inc. | | | 132,097 | |
| | 1,400 | | Raymond James Financial, Inc. | | | 45,780 | |
| | 950 | | Simon Property Group, Inc. | | | 94,516 | |
| | 5,325 | | State Street Corp. | | | 246,760 | |
| | 6,250 | | Torchmark Corp. | | | 373,375 | |
| | 1,029 | | Travelers Cos., Inc. (The) | | | 57,326 | |
| | 22,575 | | UBS AG | | | 371,810 | |
| | 7,800 | | Wells Fargo & Co. | | | 241,722 | |
| | 10,800 | | Willis Group Holdings PLC | | | 374,004 | |
| | 3,500 | | XL Group PLC, Class A | | | 76,370 | |
| | | | | | | 10,454,308 | |
| Health Care — 14.5% | | | | |
| | 7,300 | | Aetna, Inc. | | | 222,723 | |
| | 5,100 | | AmerisourceBergen Corp., Class A | | | 174,012 | |
| | 2,700 | | Amgen, Inc. † | | | 148,230 | |
| | 1,600 | | Baxter International, Inc. | | | 80,992 | |
| | 4,675 | | Biogen Idec, Inc. † | | | 313,459 | |
| | 10,783 | | Bristol-Myers Squibb Co. | | | 285,534 | |
| | 8,955 | | Cardinal Health, Inc. | | | 343,066 | |
| | 100 | | CIGNA Corp. | | | 3,666 | |
| | 11,121 | | Eli Lilly & Co. | | | 389,680 | |
| | 1,955 | | Endo Pharmaceuticals Holdings, Inc. † | | | 69,813 | |
| | 13,559 | | Forest Laboratories, Inc. † | | | 433,617 | |
| | 1,500 | | Gilead Sciences, Inc. † | | | 54,360 | |
| | 3,675 | | Humana, Inc. † | | | 201,170 | |
| | 1,519 | | Impax Laboratories, Inc. † | | | 30,547 | |
| | 13,893 | | Johnson & Johnson | | | 859,282 | |
| | 876 | | KV Pharmaceutical Co., Class A † | | | 2,233 | |
| | 3,650 | | Laboratory Corp. of America Holdings † | | | 320,908 | |
| | 800 | | Medco Health Solutions, Inc. † | | | 49,016 | |
| | 1,500 | | Novartis AG ADR | | | 88,425 | |
| | 5,300 | | Pfizer, Inc. | | | 92,803 | |
| | 16,877 | | UnitedHealth Group, Inc. | | | 609,428 | |
| | 5,825 | | Zimmer Holdings, Inc. † | | | 312,686 | |
| | | | | | | 5,085,650 | |
| Industrials — 7.3% | | | | |
| | 1,800 | | AGCO Corp. † | | | 91,188 | |
| | 1,650 | | Caterpillar, Inc. | | | 154,539 | |
| | 24 | | Chart Industries, Inc. † | | | 811 | |
| Wilshire Mutual Funds, Inc. | |
| Large Company Value Portfolio | December 31, 2010 |
| Schedule of Investments | |
| Shares | | | | Value | |
| Industrials (continued) | | | |
| | 1,882 | | Courier Corp. | | $ | 29,209 | |
| | 425 | | Cummins, Inc. | | | 46,754 | |
| | 600 | | Eaton Corp. | | | 60,906 | |
| | 11,300 | | General Electric Co. | | | 206,677 | |
| | 12,500 | | Hertz Global Holdings, Inc. † | | | 181,125 | |
| | 1,142 | | Honeywell International, Inc. | | | 60,709 | |
| | 4,950 | | L-3 Communications Holdings, Inc. | | | 348,925 | |
| | 22 | | Layne Christensen Co. † | | | 757 | |
| | 26,325 | | Masco Corp. | | | 333,275 | |
| | 10,373 | | Northrop Grumman Corp. | | | 671,963 | |
| | 9,035 | | Oshkosh Corp. † | | | 318,393 | |
| | 111 | | Regal-Beloit Corp. | | | 7,410 | |
| | 354 | | Standard Register Co. (The) | | | 1,207 | |
| | 900 | | Timken Co. | | | 42,957 | |
| | 100 | | Tredegar Corp. | | | 1,938 | |
| | 222 | | VSE Corp. | | | 7,331 | |
| | | | | | | 2,566,074 | |
| Information Technology — 8.3% | | | | |
| | 1,400 | | Accenture PLC, Class A | | | 67,886 | |
| | 32,300 | | Alcatel-Lucent ADR | | | 95,608 | |
| | 182 | | Apple, Inc. † | | | 58,706 | |
| | 14,400 | | Atmel Corp. † | | | 177,408 | |
| | 12,450 | | CA, Inc. | | | 304,278 | |
| | 14,200 | | Dell, Inc. † | | | 192,410 | |
| | 3,600 | | EMC Corp. † | | | 82,440 | |
| | 11,300 | | Hewlett-Packard Co. | | | 475,730 | |
| | 14 | | Hutchinson Technology, Inc. † | | | 52 | |
| | 2,321 | | International Business Machines Corp. | | | 340,630 | |
| | 765 | | Lexmark International, Inc., Class A † | | | 26,637 | |
| | 3,100 | | Marvell Technology Group, Ltd. † | | | 57,505 | |
| | 8,199 | | Microsoft Corp. | | | 228,916 | |
| | 16,800 | | Motorola Solutions, Inc. † | | | 152,376 | |
| | 90 | | PRGX Global, Inc. † | | | 570 | |
| | 2,500 | | Skyworks Solutions, Inc. † | | | 71,575 | |
| | 4,300 | | Symantec Corp. † | | | 71,982 | |
| | 200 | | TeleTech Holdings, Inc. † | | | 4,118 | |
| | 11,075 | | Tyco Electronics, Ltd. | | | 392,055 | |
| | 600 | | Vishay Intertechnology, Inc. † | | | 8,808 | |
| | 42 | | Vishay Precision Group, Inc. † | | | 791 | |
| | 9,100 | | Xerox Corp. | | | 104,832 | |
| | | | | | | 2,915,313 | |
| Materials — 6.7% | | | | |
| | 1,400 | | Agrium, Inc. | | | 128,450 | |
| | 4,400 | | Alcoa, Inc. | | | 67,716 | |
| | 600 | | Ball Corp. | | | 40,830 | |
| | 800 | | Clearwater Paper Corp. † | | | 62,640 | |
| | 5,339 | | Domtar Corp. | | | 405,337 | |
| | 1,900 | | EI du Pont de Nemours & Co. | | | 94,772 | |
| | 4,917 | | Freeport-McMoRan Copper & Gold, Inc. | | | 590,483 | |
| | 5,700 | | Huntsman Corp. | | | 88,977 | |
| | 7,000 | | KapStone Paper and Packaging Corp. † | | | 107,100 | |
| | 245 | | Lubrizol Corp. | | | 26,186 | |
| | 4,475 | | PPG Industries, Inc. | | | 376,213 | |
| | 3,350 | | Sherwin-Williams Co. (The) | | | 280,562 | |
| | 550 | | Walter Energy, Inc. | | | 70,312 | |
| | | | | | | 2,339,578 | |
| Telecommunication Services — 2.9% | | | | |
| | 25,004 | | AT&T, Inc. | | | 734,617 | |
| | 15,500 | | Qwest Communications International, Inc. | | | 117,955 | |
| | 4,400 | | Verizon Communications, Inc. | | | 157,432 | |
| | | | | | | 1,010,004 | |
| Shares | | | | Value | |
| Utilities — 3.0% | | | |
| | 4,700 | | American Water Works Co., Inc. | | $ | 118,863 | |
| | 3,600 | | CMS Energy Corp. | | | 66,960 | |
| | 8,050 | | Edison International | | | 310,730 | |
| | 3,598 | | Exelon Corp. | | | 149,821 | |
| | 4,300 | | NiSource, Inc. | | | 75,766 | |
| | 17,977 | | Questar Corp. | | | 312,979 | |
| | | | | | | 1,035,119 | |
| Total Common Stock (Cost $28,791,570) | | | 34,563,067 | |
| | | | | |
| Total Investments — 98.8% | | | | |
| (Cost $28,791,570) | | | 34,563,067 | |
| Other Assets & Liabilities, Net — 1.2% | | | 428,722 | |
| NET ASSETS — 100.0% | | $ | 34,991,789 | |
| † | Non-income producing security. |
| †† | More narrow industries are utilized for compliance purposes, whereas broad sectors are utilized for reporting purposes. |
| ADR — American Depositary Receipt |
| PLC — Public Limited Company |
| SDR — Swedish Depositary Receipt |
| Wilshire Mutual Funds, Inc. | |
| Small Company Growth Portfolio | December 31, 2010 |
| Schedule of Investments | |
| Shares | | | | Value | |
| | |
| COMMON STOCK — 98.4%†† | | | |
| Consumer Discretionary — 18.0% | | | |
| | 950 | | American Axle & Manufacturing Holdings, Inc. † | | $ | 12,217 | |
| | 600 | | American Greetings Corp., Class A | | | 13,296 | |
| | 1,565 | | America's Car-Mart, Inc. † | | | 42,380 | |
| | 950 | | Ameristar Casinos, Inc. | | | 14,848 | |
| | 550 | | AnnTaylor Stores Corp. † | | | 15,065 | |
| | 700 | | Arbitron, Inc. | | | 29,064 | |
| | 743 | | Ascena Retail Group, Inc. † | | | 19,630 | |
| | 210 | | Big 5 Sporting Goods Corp. | | | 3,207 | |
| | 960 | | BJ's Restaurants, Inc. † | | | 34,013 | |
| | 305 | | Blue Nile, Inc. † | | | 17,403 | |
| | 100 | | Bob Evans Farms, Inc. | | | 3,296 | |
| | 1,371 | | Bravo Brio Restaurant Group, Inc. † | | | 26,282 | |
| | 950 | | Brown Shoe Co., Inc. | | | 13,233 | |
| | 800 | | Buckle, Inc. (The) | | | 30,216 | |
| | 1,500 | | Cato Corp. (The), Class A | | | 41,115 | |
| | 100 | | CEC Entertainment, Inc. † | | | 3,883 | |
| | 300 | | Cheesecake Factory, Inc. (The) † | | | 9,198 | |
| | 710 | | Children's Place Retail Stores, Inc. (The) † | | | 35,244 | |
| | 850 | | Christopher & Banks Corp. | | | 5,227 | |
| | 44 | | Churchill Downs, Inc. | | | 1,910 | |
| | 200 | | Cinemark Holdings, Inc. | | | 3,448 | |
| | 1,650 | | Cooper Tire & Rubber Co. | | | 38,907 | |
| | 875 | | Corinthian Colleges, Inc. † | | | 4,559 | |
| | 1,000 | | Cracker Barrel Old Country Store, Inc. | | | 54,770 | |
| | 1,000 | | Deckers Outdoor Corp. † | | | 79,740 | |
| | 200 | | Dillard's, Inc., Class A | | | 7,588 | |
| | 700 | | Ethan Allen Interiors, Inc. | | | 14,007 | |
| | 1,210 | | G-III Apparel Group, Ltd. † | | | 42,531 | |
| | 400 | | Grand Canyon Education, Inc. † | | | 7,836 | |
| | 1,075 | | Group 1 Automotive, Inc. | | | 44,892 | |
| | 400 | | J. Crew Group, Inc. † | | | 17,256 | |
| | 500 | | Jo-Ann Stores, Inc. † | | | 30,110 | |
| | 300 | | Jones Group, Inc. (The) | | | 4,662 | |
| | 650 | | Leapfrog Enterprises, Inc., Class A † | | | 3,608 | |
| | 900 | | Lee Enterprises, Inc. † | | | 2,214 | |
| | 125 | | Matthews International Corp., Class A | | | 4,373 | |
| | 150 | | Mediacom Communications Corp., Class A † | | | 1,269 | |
| | 300 | | Men's Wearhouse, Inc. (The) | | | 7,494 | |
| | 150 | | Modine Manufacturing Co. † | | | 2,325 | |
| | 700 | | National CineMedia, Inc. | | | 13,937 | |
| | 1,200 | | Nutrisystem, Inc. | | | 25,236 | |
| | 750 | | OfficeMax, Inc. † | | | 13,275 | |
| | 700 | | Overstock.com, Inc. † | | | 11,536 | |
| | 979 | | Oxford Industries, Inc. | | | 25,072 | |
| | 400 | | Panera Bread Co., Class A † | | | 40,484 | |
| | 200 | | PetMed Express, Inc. | | | 3,562 | |
| | 755 | | PF Chang's China Bistro, Inc. | | | 36,587 | |
| | 400 | | Polaris Industries, Inc. | | | 31,208 | |
| | 3,100 | | Quiksilver, Inc. † | | | 15,717 | |
| | 100 | | Regis Corp. | | | 1,660 | |
| | 300 | | Saks, Inc. † | | | 3,210 | |
| | 500 | | Scholastic Corp. | | | 14,770 | |
| | 850 | | Sinclair Broadcast Group, Inc., Class A | | | 6,953 | |
| | 200 | | Skechers U.S.A., Inc., Class A † | | | 4,000 | |
| | 1,425 | | Sotheby's | | | 64,125 | |
| | 540 | | Stage Stores, Inc. | | | 9,364 | |
| | 1,586 | | Steven Madden, Ltd. † | | | 66,168 | |
| | 500 | | Stewart Enterprises, Inc., Class A | | | 3,345 | |
| | 61 | | Strayer Education, Inc. | | | 9,285 | |
| | 500 | | Superior Industries International, Inc. | | | 10,610 | |
| | 550 | | Talbots, Inc. † | | | 4,686 | |
| | 1,200 | | Tenneco, Inc. † | | | 49,392 | |
| Shares | | | | Value | |
| Consumer Discretionary (continued) | | | |
| | 3,370 | | Texas Roadhouse, Inc., Class A † | | $ | 57,863 | |
| | 400 | | Tupperware Brands Corp. | | | 19,068 | |
| | 200 | | Valassis Communications, Inc. † | | | 6,470 | |
| | 127 | | Warnaco Group, Inc. (The) † | | | 6,994 | |
| | 2,360 | | Wolverine World Wide, Inc. | | | 75,237 | |
| | 900 | | World Wrestling Entertainment, Inc., Class A | | | 12,816 | |
| | | | | | | 1,384,946 | |
| Consumer Staples — 1.6% | | | | |
| | 50 | | Andersons, Inc. (The) | | | 1,817 | |
| | 200 | | Casey's General Stores, Inc. | | | 8,502 | |
| | 300 | | Pricesmart, Inc. | | | 11,409 | |
| | 1,100 | | Ruddick Corp. | | | 40,524 | |
| | 1,210 | | TreeHouse Foods, Inc. † | | | 61,819 | |
| | 50 | | United Natural Foods, Inc. † | | | 1,834 | |
| | | | | | | 125,905 | |
| Energy — 7.0% | | | | |
| | 2,482 | | Approach Resources, Inc. † | | | 57,334 | |
| | 200 | | Berry Petroleum Co., Class A | | | 8,740 | |
| | 600 | | Brigham Exploration Co. † | | | 16,344 | |
| | 400 | | CARBO Ceramics, Inc. | | | 41,416 | |
| | 1,700 | | Clean Energy Fuels Corp. † | | | 23,528 | |
| | 700 | | Complete Production Services, Inc. † | | | 20,685 | |
| | 700 | | Crosstex Energy, Inc. | | | 6,202 | |
| | 200 | | Dril-Quip, Inc. † | | | 15,544 | |
| | 1,000 | | Energy XXI Bermuda, Ltd. † | | | 27,670 | |
| | 1,700 | | Houston American Energy Corp. | | | 30,753 | |
| | 300 | | James River Coal Co. † | | | 7,599 | |
| | 163 | | L&L Energy, Inc. † | | | 1,761 | |
| | 200 | | Lufkin Industries, Inc. | | | 12,478 | |
| | 1,840 | | McMoRan Exploration Co. † | | | 31,538 | |
| | 600 | | Newpark Resources, Inc. † | | | 3,696 | |
| | 600 | | Nordic American Tanker Shipping | | | 15,612 | |
| | 2,010 | | Petroquest Energy, Inc. † | | | 15,135 | |
| | 298 | | RAM Energy Resources, Inc. † | | | 548 | |
| | 1,505 | | Rosetta Resources, Inc. † | | | 56,648 | |
| | 900 | | Ship Finance International, Ltd. | | | 19,368 | |
| | 1,365 | | Superior Energy Services, Inc. † | | | 47,761 | |
| | 1,050 | | USEC, Inc. † | | | 6,321 | |
| | 100 | | Vaalco Energy, Inc. † | | | 716 | |
| | 500 | | W&T Offshore, Inc. | | | 8,935 | |
| | 200 | | Willbros Group, Inc. † | | | 1,964 | |
| | 1,600 | | World Fuel Services Corp. | | | 57,856 | |
| | | | | | | 536,152 | |
| Financials — 6.5% | | | | |
| | 1,900 | | American Equity Investment Life Holding Co. | | | 23,845 | |
| | 350 | | Apollo Investment Corp. † | | | 3,875 | |
| | 900 | | Banco Latinoamericano de Comercio Exterior SA, Class E | | | 16,614 | |
| | 535 | | BOK Financial Corp. | | | 28,569 | |
| | 100 | | CBL & Associates Properties, Inc. | | | 1,750 | |
| | 800 | | CVB Financial Corp. | | | 6,936 | |
| | 100 | | Highwoods Properties, Inc. | | | 3,185 | |
| | 605 | | Iberiabank Corp. | | | 35,774 | |
| | 500 | | LTC Properties, Inc. | | | 14,040 | |
| | 1,630 | | MarketAxess Holdings, Inc. | | | 33,920 | |
| | 1,500 | | MFA Financial, Inc. | | | 12,240 | |
| | 125 | | optionsXpress Holdings, Inc. | | | 1,959 | |
| | 100 | | Potlatch Corp. | | | 3,255 | |
| | 1,930 | | PrivateBancorp, Inc., Class A | | | 27,753 | |
| | 350 | | Prospect Capital Corp. | | | 3,780 | |
| | 2,310 | | Prosperity Bancshares, Inc. | | | 90,737 | |
| | 250 | | Redwood Trust, Inc. | | | 3,733 | |
| | 600 | | Signature Bank † | | | 30,000 | |
| Wilshire Mutual Funds, Inc. | |
| Small Company Growth Portfolio | December 31, 2010 |
| Schedule of Investments | |
| Shares | | | | Value | |
| Financials (continued) | | | |
| | 560 | | SVB Financial Group † | | $ | 29,708 | |
| | 3,390 | | Texas Capital Bancshares, Inc. † | | | 72,105 | |
| | 369 | | Trustco Bank Corp. | | | 2,339 | |
| | 500 | | Walter Investment Management Corp. | | | 8,970 | |
| | 2,130 | | Washington Banking Co. | | | 29,202 | |
| | 350 | | Westamerica Bancorporation | | | 19,415 | |
| | | | | | | 503,704 | |
| Health Care — 14.9% | | | | |
| | 200 | | Acorda Therapeutics, Inc. † | | | 5,452 | |
| | 200 | | Air Methods Corp. † | | | 11,254 | |
| | 224 | | Amedisys, Inc. † | | | 7,504 | |
| | 700 | | American Medical Systems Holdings, Inc. † | | | 13,202 | |
| | 900 | | AMERIGROUP Corp. † | | | 39,528 | |
| | 400 | | Arthrocare Corp. † | | | 12,424 | |
| | 1,000 | | Bio-Reference Labs, Inc. † | | | 22,180 | |
| | 1,256 | | Bruker Corp. † | | | 20,850 | |
| | 1,250 | | Catalyst Health Solutions, Inc. † | | | 58,112 | |
| | 1,420 | | Cepheid, Inc. † | | | 32,305 | |
| | 625 | | Chemed Corp. | | | 39,694 | |
| | 1,485 | | Corvel Corp. † | | | 71,800 | |
| | 375 | | Cubist Pharmaceuticals, Inc. † | | | 8,025 | |
| | 250 | | Dionex Corp. † | | | 29,502 | |
| | 250 | | Haemonetics Corp. † | | | 15,795 | |
| | 1,000 | | Healthsouth Corp. † | | | 20,710 | |
| | 1,210 | | HMS Holdings Corp. † | | | 78,372 | |
| | 1,900 | | Immucor, Inc. † | | | 37,677 | |
| | 350 | | Impax Laboratories, Inc. † | | | 7,039 | |
| | 1,000 | | Incyte Corp., Ltd. † | | | 16,560 | |
| | 1,535 | | IPC The Hospitalist Co., Inc. † | | | 59,880 | |
| | 250 | | LHC Group, Inc. † | | | 7,500 | |
| | 100 | | MedAssets, Inc. † | | | 2,019 | |
| | 550 | | Medicines Co. (The) † | | | 7,772 | |
| | 700 | | Medicis Pharmaceutical Corp., Class A | | | 18,753 | |
| | 1,200 | | Meridian Bioscience, Inc. | | | 27,792 | |
| | 500 | | Momenta Pharmaceuticals, Inc. † | | | 7,485 | |
| | 960 | | Nektar Therapeutics † | | | 12,336 | |
| | 400 | | NuVasive, Inc. † | | | 10,260 | |
| | 950 | | Obagi Medical Products, Inc. † | | | 10,972 | |
| | 551 | | Omnicell, Inc. † | | | 7,962 | |
| | 550 | | Onyx Pharmaceuticals, Inc. † | | | 20,279 | |
| | 900 | | Osiris Therapeutics, Inc. † | | | 7,011 | |
| | 450 | | Par Pharmaceutical Cos., Inc. † | | | 17,329 | |
| | 300 | | Parexel International Corp. † | | | 6,369 | |
| | 5,400 | | PDL BioPharma, Inc. | | | 33,642 | |
| | 700 | | Pharmacyclics, Inc. † | | | 4,256 | |
| | 1,120 | | Quality Systems, Inc. | | | 78,198 | |
| | 1,000 | | Salix Pharmaceuticals, Ltd. † | | | 46,960 | |
| | 300 | | Seattle Genetics, Inc. † | | | 4,485 | |
| | 200 | | Sirona Dental Systems, Inc. † | | | 8,356 | |
| | 400 | | Staar Surgical Co. † | | | 2,440 | |
| | 525 | | STERIS Corp. | | | 19,142 | |
| | 2,635 | | SXC Health Solutions Corp. † | | | 112,936 | |
| | 200 | | Targacept, Inc. † | | | 5,300 | |
| | 700 | | Universal American Corp. | | | 14,315 | |
| | 200 | | Vanda Pharmaceuticals, Inc. † | | | 1,892 | |
| | 150 | | Viropharma, Inc. † | | | 2,598 | |
| | 75 | | West Pharmaceutical Services, Inc. | | | 3,090 | |
| | 970 | | Zoll Medical Corp. † | | | 36,113 | |
| | | | | | | 1,145,427 | |
| Industrials — 14.1% | | | | |
| | 1,380 | | Acacia Research-Acacia Technologies † | | | 35,797 | |
| | 900 | | Actuant Corp., Class A | | | 23,958 | |
| | 675 | | Administaff, Inc. | | | 19,777 | |
| | 2,100 | | Aircastle, Ltd. | | | 21,945 | |
| Shares | | | | Value | |
| Industrials (continued) | | | |
| | 1,000 | | Altra Holdings, Inc. † | | $ | 19,860 | |
| | 100 | | American Science & Engineering, Inc. | | | 8,523 | |
| | 400 | | American Superconductor Corp. † | | | 11,436 | |
| | 850 | | ArvinMeritor, Inc. † | | | 17,442 | |
| | 1,400 | | BE Aerospace, Inc. † | | | 51,842 | |
| | 100 | | Belden, Inc. | | | 3,682 | |
| | 1,200 | | Blount International, Inc. † | | | 18,912 | |
| | 425 | | Brady Corp., Class A | | | 13,859 | |
| | 614 | | Briggs & Stratton Corp. | | | 12,090 | |
| | 580 | | Chart Industries, Inc. † | | | 19,592 | |
| | 175 | | Columbus McKinnon Corp. † | | | 3,556 | |
| | 1,300 | | Deluxe Corp. | | | 29,926 | |
| | 100 | | DigitalGlobe, Inc. † | | | 3,171 | |
| | 400 | | EnerNOC, Inc. † | | | 9,564 | |
| | 2,070 | | EnerSys † | | | 66,489 | |
| | 200 | | Foster (L.B.) Co., Class A † | | | 8,188 | |
| | 100 | | GenCorp, Inc. † | | | 517 | |
| | 100 | | HEICO Corp. | | | 5,103 | |
| | 1,200 | | Hexcel Corp. † | | | 21,708 | |
| | 850 | | HUB Group, Inc., Class A † | | | 29,869 | |
| | 389 | | Kaman Corp. | | | 11,308 | |
| | 175 | | Knight Transportation, Inc. | | | 3,325 | |
| | 940 | | Miller Industries, Inc. | | | 13,376 | |
| | 1,050 | | Mine Safety Appliances Co. | | | 32,687 | |
| | 1,500 | | Mistras Group, Inc. † | | | 20,220 | |
| | 1,175 | | Nordson Corp. | | | 107,959 | |
| | 300 | | Pacer International, Inc. † | | | 2,052 | |
| | 300 | | Polypore International, Inc. † | | | 12,219 | |
| | 100 | | RBC Bearings, Inc. † | | | 3,908 | |
| | 2,011 | | Rollins, Inc. | | | 39,717 | |
| | 175 | | Sun Hydraulics Corp. | | | 6,615 | |
| | 1,000 | | TAL International Group, Inc. | | | 30,870 | |
| | 1,000 | | Tennant Co. | | | 38,410 | |
| | 400 | | Textainer Group Holdings, Ltd. | | | 11,396 | |
| | 276 | | Titan International, Inc. | | | 5,393 | |
| | 875 | | Tredegar Corp. | | | 16,958 | |
| | 780 | | Triumph Group, Inc. | | | 69,740 | |
| | 650 | | United Continental Holdings, Inc. † | | | 15,483 | |
| | 1,400 | | US Ecology, Inc. | | | 24,332 | |
| | 2,900 | | UTi Worldwide, Inc. | | | 61,480 | |
| | 865 | | Wabtec Corp. | | | 45,750 | |
| | 200 | | Watsco, Inc. | | | 12,616 | |
| | 600 | | Werner Enterprises, Inc. | | | 13,560 | |
| | 700 | | Woodward Governor Co. | | | 26,292 | |
| | | | | | | 1,082,472 | |
| Information Technology — 29.3% | | | | |
| | 1,100 | | Acme Packet, Inc. † | | | 58,476 | |
| | 675 | | Actuate Corp. † | | | 3,847 | |
| | 200 | | ADTRAN, Inc. | | | 7,242 | |
| | 100 | | Advanced Energy Industries, Inc. † | | | 1,364 | |
| | 1,043 | | Allot Communications, Ltd. † | | | 12,141 | |
| | 3,150 | | Amkor Technology, Inc. † | | | 23,278 | |
| | 200 | | Anixter International, Inc. | | | 11,946 | |
| | 1,680 | | Ariba, Inc. † | | | 39,463 | |
| | 1,244 | | Art Technology Group, Inc. † | | | 7,439 | |
| | 2,225 | | Aruba Networks, Inc. † | | | 46,458 | |
| | 600 | | ATMI, Inc. † | | | 11,964 | |
| | 502 | | Blackbaud, Inc. | | | 13,002 | |
| | 200 | | Blackboard, Inc. † | | | 8,260 | |
| | 650 | | Blue Coat Systems, Inc. † | | | 19,415 | |
| | 4,500 | | Brightpoint, Inc. † | | | 39,285 | |
| | 320 | | Cabot Microelectronics Corp. † | | | 13,264 | |
| | 675 | | CACI International, Inc., Class A † | | | 36,045 | |
| | 700 | | Cardtronics, Inc. † | | | 12,390 | |
| | 1,000 | | Cirrus Logic, Inc. † | | | 15,980 | |
| | 350 | | Cognex Corp. | | | 10,297 | |
| Wilshire Mutual Funds, Inc. | |
| Small Company Growth Portfolio | December 31, 2010 |
| Schedule of Investments | |
| Shares | | | | Value | |
| Information Technology (continued) | | | |
| | 200 | | CommVault Systems, Inc. † | | $ | 5,724 | |
| | 200 | | Constant Contact, Inc. † | | | 6,198 | |
| | 556 | | CSG Systems International, Inc. † | | | 10,531 | |
| | 703 | | CTS Corp. | | | 7,775 | |
| | 625 | | Cymer, Inc. † | | | 28,169 | |
| | 1,125 | | Daktronics, Inc. | | | 17,910 | |
| | 615 | | Digital River, Inc. † | | | 21,168 | |
| | 200 | | Diodes, Inc. † | | | 5,398 | |
| | 2,175 | | Earthlink, Inc. | | | 18,705 | |
| | 375 | | Emulex Corp. † | | | 4,372 | |
| | 650 | | Entegris, Inc. † | | | 4,855 | |
| | 300 | | Euronet Worldwide, Inc. † | | | 5,232 | |
| | 50 | | FARO Technologies, Inc. † | | | 1,642 | |
| | 300 | | FEI Co. † | | | 7,923 | |
| | 200 | | Finisar Corp. † | | | 5,938 | |
| | 357 | | GSI Commerce, Inc. † | | | 8,282 | |
| | 50 | | Harmonic, Inc. † | | | 429 | |
| | 1,379 | | Heartland Payment Systems, Inc. | | | 21,264 | |
| | 75 | | Hittite Microwave Corp. † | | | 4,578 | |
| | 900 | | iGate Corp. | | | 17,739 | |
| | 1,150 | | Infinera Corp. † | | | 11,880 | |
| | 950 | | Informatica Corp. † | | | 41,829 | |
| | 350 | | Insight Enterprises, Inc. † | | | 4,606 | |
| | 125 | | IPG Photonics Corp. † | | | 3,952 | |
| | 2,070 | | Ixia † | | | 34,735 | |
| | 775 | | j2 Global Communications, Inc. † | | �� | 22,436 | |
| | 100 | | Jack Henry & Associates, Inc. | | | 2,915 | |
| | 550 | | Kenexa Corp. † | | | 11,984 | |
| | 1,750 | | L-1 Identity Solutions, Inc. † | | | 20,842 | |
| | 6,030 | | Limelight Networks, Inc. † | | | 35,034 | |
| | 100 | | Littelfuse, Inc. | | | 4,706 | |
| | 2,650 | | LivePerson, Inc. † | | | 29,945 | |
| | 100 | | LogMeIn, Inc. † | | | 4,434 | |
| | 650 | | Manhattan Associates, Inc. † | | | 19,851 | |
| | 300 | | Mantech International Corp., Class A † | | | 12,399 | |
| | 2,350 | | Marchex, Inc., Class B | | | 22,419 | |
| | 840 | | MAXIMUS, Inc. | | | 55,087 | |
| | 1,550 | | Methode Electronics, Inc. | | | 20,103 | |
| | 850 | | Micrel, Inc. | | | 11,042 | |
| | 1,520 | | Microsemi Corp. † | | | 34,808 | |
| | 575 | | MicroStrategy, Inc., Class A † | | | 49,145 | |
| | 3,310 | | MIPS Technologies, Inc., Class A † | | | 50,180 | |
| | 50 | | ModusLink Global Solutions, Inc. † | | | 335 | |
| | 650 | | Monolithic Power Systems, Inc. † | | | 10,738 | |
| | 3,122 | | Motricity, Inc. † | | | 57,976 | |
| | 38 | | Multi-Fineline Electronix, Inc. † | | | 1,007 | |
| | 428 | | Netgear, Inc. † | | | 14,415 | |
| | 50 | | Netscout Systems, Inc. † | | | 1,150 | |
| | 350 | | Newport Corp. † | | | 6,080 | |
| | 900 | | Oclaro, Inc. † | | | 11,835 | |
| | 630 | | OpenTable, Inc. † | | | 44,403 | |
| | 1,300 | | Pegasystems, Inc. | | | 47,619 | |
| | 1,550 | | Photronics, Inc. † | | | 9,161 | |
| | 200 | | Plantronics, Inc. | | | 7,444 | |
| | 175 | | Plexus Corp. † | | | 5,415 | |
| | 1,952 | | Power-One, Inc. † | | | 19,910 | |
| | 385 | | Progress Software Corp. † | | | 16,293 | |
| | 5,200 | | Quantum Corp. † | | | 19,344 | |
| | 1,300 | | Quest Software, Inc. † | | | 36,062 | |
| | 1,000 | | Rackspace Hosting, Inc. † | | | 31,410 | |
| | 1,650 | | RF Micro Devices, Inc. † | | | 12,127 | |
| | 2,389 | | RightNow Technologies, Inc. † | | | 56,547 | |
| | 2,300 | | Riverbed Technology, Inc. † | | | 80,891 | |
| | 100 | | Rofin-Sinar Technologies, Inc. † | | | 3,544 | |
| | 350 | | Rogers Corp. † | | | 13,388 | |
| | 1,100 | | Sanmina-SCI Corp. † | | | 12,628 | |
| Shares | | | | Value | |
| Information Technology (continued) | | | |
| | 400 | | Scansource, Inc. † | | $ | 12,760 | |
| | 450 | | Solera Holdings, Inc. | | | 23,094 | |
| | 4,002 | | Sonic Solutions, Inc. † | | | 60,030 | |
| | 2,473 | | Sourcefire, Inc. † | | | 64,125 | |
| | 225 | | Standard Microsystems Corp. † | | | 6,487 | |
| | 300 | | STEC, Inc. † | | | 5,295 | |
| | 1,650 | | SuccessFactors, Inc. † | | | 47,784 | |
| | 746 | | Synaptics, Inc. † | | | 21,918 | |
| | 1,600 | | Synchronoss Technologies, Inc. † | | | 42,736 | |
| | 255 | | Syntel, Inc. | | | 12,186 | |
| | 1,480 | | Taleo Corp., Class A † | | | 40,922 | |
| | 1,475 | | TeleTech Holdings, Inc. † | | | 30,370 | |
| | 1,724 | | TIBCO Software, Inc. † | | | 33,980 | |
| | 1,600 | | Ultra Clean Holdings † | | | 14,896 | |
| | 50 | | Unisys Corp. † | | | 1,295 | |
| | 4,150 | | United Online, Inc. | | | 27,390 | |
| | 500 | | Universal Display Corp. † | | | 15,325 | |
| | 2,150 | | ValueClick, Inc. † | | | 34,465 | |
| | 300 | | VASCO Data Security International, Inc. † | | | 2,439 | |
| | 1,100 | | Veeco Instruments, Inc. † | | | 47,256 | |
| | 1,064 | | VeriFone Systems, Inc. † | | | 41,028 | |
| | 400 | | VirnetX Holding Corp. | | | 5,940 | |
| | 1,337 | | Volterra Semiconductor Corp. † | | | 30,965 | |
| | 2,900 | | Wave Systems Corp., Class A † | | | 11,426 | |
| | 200 | | Xyratex, Ltd. † | | | 3,262 | |
| | | | | | | 2,256,816 | |
| Materials — 5.8% | | | | |
| | 300 | | A Schulman, Inc. | | | 6,867 | |
| | 500 | | Allied Nevada Gold Corp. † | | | 13,155 | |
| | 325 | | Arch Chemicals, Inc. | | | 12,327 | |
| | 200 | | Calgon Carbon Corp. † | | | 3,024 | |
| | 250 | | Compass Minerals International, Inc. | | | 22,317 | |
| | 200 | | Domtar Corp. | | | 15,184 | |
| | 250 | | Ferro Corp. † | | | 3,660 | |
| | 1,100 | | Golden Star Resources, Ltd. † | | | 5,049 | |
| | 650 | | HB Fuller Co. | | | 13,338 | |
| | 300 | | KMG Chemicals, Inc. | | | 4,971 | |
| | 300 | | Koppers Holdings, Inc. | | | 10,734 | |
| | 1,920 | | Kraton Performance Polymers, Inc. † | | | 59,424 | |
| | 1,050 | | Myers Industries, Inc. | | | 10,227 | |
| | 300 | | NewMarket Corp. | | | 37,011 | |
| | 1,200 | | Olin Corp. | | | 24,624 | |
| | 500 | | Omnova Solutions, Inc. † | | | 4,180 | |
| | 100 | | Rock-Tenn Co., Class A | | | 5,395 | |
| | 300 | | Rockwood Holdings, Inc. † | | | 11,736 | |
| | 400 | | Sensient Technologies Corp. | | | 14,692 | |
| | 1,000 | | Solutia, Inc. † | | | 23,080 | |
| | 300 | | Spartech Corp. † | | | 2,808 | |
| | 200 | | Stillwater Mining Co. † | | | 4,270 | |
| | 2,350 | | TPC Group, Inc. † | | | 71,252 | |
| | 200 | | Westlake Chemical Corp. | | | 8,694 | |
| | 1,650 | | WR Grace & Co. † | | | 57,965 | |
| | | | | | | 445,984 | |
| Telecommunication Services — 1.2% | | | | |
| | 4,600 | | Alaska Communications Systems Group, Inc. | | | 51,060 | |
| | 900 | | Consolidated Communications Holdings, Inc. | | | 17,370 | |
| | 1,250 | | Global Crossing, Ltd. † | | | 16,150 | |
| | 1,250 | | PAETEC Holding Corp. † | | | 4,675 | |
| Wilshire Mutual Funds, Inc. | |
| Small Company Growth Portfolio | December 31, 2010 |
| Schedule of Investments | |
| Shares | | | | Value | |
| Telecommunication Services (continued) | | | |
| | 250 | | USA Mobility, Inc. | | $ | 4,443 | |
| | | | | | | 93,698 | |
| Total Common Stock (Cost $5,503,404) | | | 7,575,104 | |
| | | | | |
| Total Investments — 98.4% | | | | |
| (Cost $5,503,404) | | | 7,575,104 | |
| Other Assets & Liabilities, Net — 1.6% | | | 125,194 | |
| NET ASSETS — 100.0% | | $ | 7,700,298 | |
| † | Non-income producing security. |
| †† | More narrow industries are utilized for compliance purposes, whereas broad sectors are utilized for reporting purposes. |
| Wilshire Mutual Funds, Inc. | |
| Small Company Value Portfolio | December 31, 2010 |
| Schedule of Investments | |
| Shares | | | | Value | |
| | |
| COMMON STOCK — 99.3%†† | | | |
| Consumer Discretionary — 10.2% | | | |
| | 1,100 | | American Greetings Corp., Class A | | $ | 24,376 | |
| | 1,250 | | Ameristar Casinos, Inc. | | | 19,538 | |
| | 75 | | Ascena Retail Group, Inc. † | | | 1,982 | |
| | 70 | | Blue Nile, Inc. † | | | 3,994 | |
| | 800 | | Bluegreen Corp. † | | | 2,576 | |
| | 200 | | Blyth, Inc. | | | 6,896 | |
| | 5,650 | | Bob Evans Farms, Inc. | | | 186,224 | |
| | 415 | | Books-A-Million, Inc., Class A | | | 2,407 | |
| | 350 | | Boyd Gaming Corp. † | | | 3,710 | |
| | 1,700 | | Brown Shoe Co., Inc. | | | 23,681 | |
| | 260 | | Cabela's, Inc. † | | | 5,655 | |
| | 6,000 | | California Pizza Kitchen, Inc. † | | | 103,680 | |
| | 450 | | Callaway Golf Co. | | | 3,631 | |
| | 1,720 | | Cato Corp. (The), Class A | | | 47,145 | |
| | 700 | | Christopher & Banks Corp. | | | 4,305 | |
| | 250 | | Cinemark Holdings, Inc. | | | 4,310 | |
| | 200 | | Columbia Sportswear Co. | | | 12,060 | |
| | 1,000 | | Cooper Tire & Rubber Co. | | | 23,580 | |
| | 150 | | Corinthian Colleges, Inc. † | | | 781 | |
| | 900 | | Cracker Barrel Old Country Store, Inc. | | | 49,293 | |
| | 410 | | Deckers Outdoor Corp. † | | | 32,693 | |
| | 4,450 | | Dillard's, Inc., Class A | | | 168,833 | |
| | 1,050 | | Domino's Pizza, Inc. † | | | 16,748 | |
| | 6,600 | | Golfsmith International Holdings, Inc. † | | | 15,972 | |
| | 1,000 | | Grand Canyon Education, Inc. † | | | 19,590 | |
| | 3,850 | | Hooker Furniture Corp. | | | 54,401 | |
| | 100 | | Jo-Ann Stores, Inc. † | | | 6,022 | |
| | 3,250 | | Jones Group, Inc. (The) | | | 50,505 | |
| | 50 | | M/I Homes, Inc. † | | | 769 | |
| | 1,450 | | Men's Wearhouse, Inc. (The) | | | 36,221 | |
| | 300 | | Morningstar, Inc. | | | 15,924 | |
| | 450 | | National American University Holdings, Inc. | | | 3,303 | |
| | 2,100 | | National CineMedia, Inc. | | | 41,811 | |
| | 650 | | Nutrisystem, Inc. | | | 13,669 | |
| | 1,150 | | Orbitz Worldwide, Inc. † | | | 6,429 | |
| | 50 | | Orient-Express Hotels, Ltd., Class A † | | | 649 | |
| | 1,000 | | Overstock.com, Inc. † | | | 16,480 | |
| | 800 | | PetMed Express, Inc. | | | 14,248 | |
| | 1,800 | | Pool Corp. | | | 40,572 | |
| | 7,250 | | Quiksilver, Inc. † | | | 36,758 | |
| | 1,800 | | Regis Corp. | | | 29,880 | |
| | 1,250 | | Saks, Inc. † | | | 13,375 | |
| | 1,100 | | Sotheby's | | | 49,500 | |
| | 600 | | Speedway Motorsports, Inc. | | | 9,192 | |
| | 1,900 | | Stage Stores, Inc. | | | 32,946 | |
| | 50 | | Standard Motor Products, Inc. | | | 685 | |
| | 900 | | Stewart Enterprises, Inc., Class A | | | 6,021 | |
| | 1,250 | | Superior Industries International, Inc. | | | 26,525 | |
| | 1,010 | | Tenneco, Inc. † | | | 41,572 | |
| | 1,720 | | True Religion Apparel, Inc. † | | | 38,287 | |
| | 300 | | Tupperware Brands Corp. | | | 14,301 | |
| | 566 | | Unifi, Inc. † | | | 9,582 | |
| | 1,700 | | World Wrestling Entertainment, Inc., Class A | | | 24,208 | |
| | | | | | | 1,417,495 | |
| Consumer Staples — 2.3% | | | | |
| | 450 | | Casey's General Stores, Inc. | | | 19,130 | |
| | 6,200 | | Elizabeth Arden, Inc. † | | | 142,662 | |
| | 20,000 | | Smart Balance, Inc. † | | | 86,600 | |
| | 1,325 | | TreeHouse Foods, Inc. † | | | 67,694 | |
| | | | | | | 316,086 | |
| Shares | | | | Value | |
| Energy — 9.9% | | | |
| | 2,000 | | Berry Petroleum Co., Class A | | $ | 87,400 | |
| | 200 | | Bristow Group, Inc. † | | | 9,470 | |
| | 900 | | Cal Dive International, Inc. † | | | 5,103 | |
| | 3,750 | | Carrizo Oil & Gas, Inc. † | | | 129,338 | |
| | 2,800 | | Cheniere Energy, Inc. † | | | 15,456 | |
| | 2,300 | | Clean Energy Fuels Corp. † | | | 31,832 | |
| | 2,250 | | Complete Production Services, Inc. † | | | 66,487 | |
| | 2,760 | | Crosstex Energy, Inc. | | | 24,454 | |
| | 2,150 | | Delek US Holdings, Inc. | | | 15,652 | |
| | 3,150 | | DHT Holdings, Inc. | | | 14,647 | |
| | 350 | | Energy XXI Bermuda, Ltd. † | | | 9,684 | |
| | 500 | | Golar LNG, Ltd. | | | 7,505 | |
| | 2,100 | | Green Plains Renewable Energy, Inc. † | | | 23,646 | |
| | 100 | | Helix Energy Solutions Group, Inc. † | | | 1,214 | |
| | 470 | | Houston American Energy Corp. | | | 8,502 | |
| | 2,200 | | International Coal Group, Inc. † | | | 17,028 | |
| | 150 | | L&L Energy, Inc. † | | | 1,620 | |
| | 460 | | McMoRan Exploration Co. † | | | 7,884 | |
| | 2,450 | | Miller Petroleum, Inc. † | | | 12,740 | |
| | 2,500 | | Newpark Resources, Inc. † | | | 15,400 | |
| | 3,800 | | Nordic American Tanker Shipping | | | 98,876 | |
| | 3,200 | | Overseas Shipholding Group, Inc. | | | 113,344 | |
| | 450 | | Penn Virginia Corp. | | | 7,569 | |
| | 8,130 | | Petroquest Energy, Inc. † | | | 61,219 | |
| | 550 | | REX American Resources Corp. † | | | 8,448 | |
| | 650 | | Rosetta Resources, Inc. † | | | 24,466 | |
| | 4,000 | | Ship Finance International, Ltd. | | | 86,080 | |
| | 1,350 | | SM Energy Co. | | | 79,556 | |
| | 1,220 | | Stone Energy Corp. † | | | 27,194 | |
| | 3,350 | | Subsea 7 SA ADR | | | 81,539 | |
| | 350 | | Swift Energy Co. † | | | 13,702 | |
| | 30 | | Tetra Technologies, Inc. † | | | 356 | |
| | 10,350 | | USEC, Inc. † | | | 62,307 | |
| | 400 | | Vaalco Energy, Inc. † | | | 2,864 | |
| | 17,450 | | Vantage Drilling Co. † | | | 35,424 | |
| | 1,450 | | Venoco, Inc. † | | | 26,753 | |
| | 2,800 | | W&T Offshore, Inc. | | | 50,036 | |
| | 2,750 | | World Fuel Services Corp. | | | 99,440 | |
| | | | | | | 1,384,235 | |
| Financials — 30.5% | | | | |
| | 1,780 | | Advance America Cash Advance Centers, Inc. | | | 10,039 | |
| | 450 | | Alterra Capital Holdings, Ltd. | | | 9,738 | |
| | 1,410 | | American Capital Agency Corp. | | | 40,523 | |
| | 10,350 | | American Capital, Ltd. † | | | 78,246 | |
| | 16,820 | | American Equity Investment Life Holding Co. | | | 211,091 | |
| | 4,450 | | Apollo Investment Corp. † | | | 49,261 | |
| | 2,300 | | Argo Group International Holdings, Ltd. | | | 86,135 | |
| | 2,850 | | Aspen Insurance Holdings, Ltd. | | | 81,567 | |
| | 50 | | Astoria Financial Corp. | | | 696 | |
| | 8,150 | | Banco Latinoamericano de Comercio Exterior SA, Class E | | | 150,449 | |
| | 6,200 | | Bank Mutual Corp. | | | 29,636 | |
| | 300 | | Bank of the Ozarks, Inc. | | | 13,005 | |
| | 350 | | BGC Partners, Inc., Class A | | | 2,909 | |
| | 2,000 | | BioMed Realty Trust, Inc. | | | 37,300 | |
| | 430 | | BofI Holding, Inc. † | | | 6,669 | |
| | 7,600 | | Boston Private Financial Holdings, Inc. | | | 49,780 | |
| | 900 | | Brookline Bancorp, Inc. | | | 9,765 | |
| | 2,970 | | Calamos Asset Management, Inc., Class A | | | 41,580 | |
| | 2,470 | | Capstead Mortgage Corp. | | | 31,097 | |
| | 3,319 | | CBL & Associates Properties, Inc. | | | 58,083 | |
| | 920 | | Centerstate Banks, Inc. | | | 7,286 | |
| | 1,700 | | Chemical Financial Corp. | | | 37,655 | |
| Wilshire Mutual Funds, Inc. | |
| Small Company Value Portfolio | December 31, 2010 |
| Schedule of Investments | |
| Shares | | | | Value | |
| Financials (continued) | | | |
| | 7,000 | | CNO Financial Group, Inc. † | | $ | 47,460 | |
| | 3,050 | | Cogdell Spencer, Inc. | | | 17,690 | |
| | 350 | | Colonial Properties Trust | | | 6,317 | |
| | 1,250 | | Community Bank System, Inc. | | | 34,713 | |
| | 60 | | Credit Acceptance Corp. † | | | 3,758 | |
| | 2,800 | | CVB Financial Corp. | | | 24,276 | |
| | 440 | | DuPont Fabros Technology, Inc. | | | 9,359 | |
| | 290 | | E*Trade Financial Corp. † | | | 4,640 | |
| | 1,500 | | Education Realty Trust, Inc. | | | 11,655 | |
| | 175 | | Enterprise Financial Services Corp. | | | 1,831 | |
| | 1,200 | | Entertainment Properties Trust | | | 55,500 | |
| | 5,857 | | Equity One, Inc. | | | 106,480 | |
| | 700 | | Extra Space Storage, Inc. | | | 12,180 | |
| | 1,250 | | FBL Financial Group, Inc., Class A | | | 35,838 | |
| | 260 | | First Citizens BancShares, Inc., Class A | | | 49,153 | |
| | 20,600 | | First Commonwealth Financial Corp. | | | 145,848 | |
| | 1,450 | | First Financial Bancorp | | | 26,796 | |
| | 887 | | First Financial Bankshares, Inc. | | | 45,397 | |
| | 700 | | First Midwest Bancorp, Inc. | | | 8,064 | |
| | 500 | | First Niagara Financial Group, Inc. | | | 6,990 | |
| | 3,550 | | FirstMerit Corp. | | | 70,254 | |
| | 430 | | Flagstar Bancorp, Inc. † | | | 701 | |
| | 3,860 | | Flagstone Reinsurance Holdings SA | | | 48,636 | |
| | 4,250 | | FNB Corp. | | | 41,735 | |
| | 5,700 | | Forestar Group, Inc. † | | | 110,010 | |
| | 1,350 | | Glacier Bancorp, Inc. | | | 20,399 | |
| | 1,800 | | Glimcher Realty Trust | | | 15,120 | |
| | 1,440 | | Hancock Holding Co. | | | 50,198 | |
| | 1,000 | | Hanover Insurance Group, Inc. (The) | | | 46,720 | |
| | 1,310 | | Hatteras Financial Corp. | | | 39,654 | |
| | 1,551 | | Hercules Technology Growth Capital, Inc. | | | 16,068 | |
| | 1,564 | | Highwoods Properties, Inc. | | | 49,813 | |
| | 900 | | Home Properties, Inc. | | | 49,941 | |
| | 1,600 | | Horace Mann Educators Corp. | | | 28,864 | |
| | 311 | | Independent Bank Corp. | | | 8,413 | |
| | 300 | | Infinity Property & Casualty Corp. | | | 18,540 | |
| | 2,800 | | Inland Real Estate Corp. | | | 24,640 | |
| | 1,250 | | Invesco Mortgage Capital, Inc. | | | 27,300 | |
| | 450 | | Kite Realty Group Trust | | | 2,435 | |
| | 150 | | Knight Capital Group, Inc., Class A † | | | 2,069 | |
| | 7,600 | | LaBranche & Co., Inc. † | | | 27,360 | |
| | 1,550 | | LaSalle Hotel Properties | | | 40,920 | |
| | 2,520 | | Lexington Realty Trust | | | 20,034 | |
| | 3,415 | | LTC Properties, Inc. | | | 95,893 | |
| | 387 | | M&T Bank Corp. | | | 33,688 | |
| | 4,990 | | Maiden Holdings, Ltd. | | | 39,221 | |
| | 5,610 | | MB Financial, Inc. | | | 97,165 | |
| | 4,600 | | MCG Capital Corp. | | | 32,062 | |
| | 500 | | Meadowbrook Insurance Group, Inc. | | | 5,125 | |
| | 1,050 | | Medical Properties Trust, Inc. | | | 11,372 | |
| | 6,868 | | MFA Financial, Inc. | | | 56,043 | |
| | 650 | | Montpelier Re Holdings, Ltd. | | | 12,961 | |
| | 550 | | National Retail Properties, Inc. | | | 14,575 | |
| | 916 | | NBT Bancorp, Inc. | | | 22,121 | |
| | 550 | | Nelnet, Inc., Class A | | | 13,030 | |
| | 8,600 | | NewAlliance Bancshares, Inc. | | | 128,828 | |
| | 5,000 | | Northwest Bancshares, Inc. | | | 58,800 | |
| | 1,755 | | Old National Bancorp | | | 20,867 | |
| | 837 | | One Liberty Properties, Inc. | | | 13,978 | |
| | 2,850 | | PacWest Bancorp | | | 60,933 | |
| | 450 | | Parkway Properties, Inc. | | | 7,884 | |
| | 710 | | People's United Financial, Inc. | | | 9,947 | |
| | 700 | | PHH Corp. † | | | 16,205 | |
| | 650 | | Piper Jaffray Cos. † | | | 22,756 | |
| | 350 | | Platinum Underwriters Holdings, Ltd. | | | 15,740 | |
| Shares | | | | Value | |
| Financials (continued) | | | |
| | 750 | | Potlatch Corp. | | $ | 24,413 | |
| | 4,400 | | PrivateBancorp, Inc., Class A | | | 63,272 | |
| | 900 | | Prospect Capital Corp. | | | 9,720 | |
| | 1,500 | | Provident Financial Services, Inc. | | | 22,695 | |
| | 1,150 | | Pzena Investment Management, Inc., Class A | | | 8,452 | |
| | 700 | | Radian Group, Inc. | | | 5,649 | |
| | 2,600 | | RAIT Financial Trust † | | | 5,694 | |
| | 2,400 | | Redwood Trust, Inc. | | | 35,832 | |
| | 800 | | Resource Capital Corp. | | | 5,904 | |
| | 300 | | RLI Corp. | | | 15,771 | |
| | 700 | | S&T Bancorp, Inc. | | | 15,813 | |
| | 2,800 | | SeaBright Holdings, Inc. | | | 25,816 | |
| | 3,050 | | Selective Insurance Group, Inc. | | | 55,357 | |
| | 1,100 | | Sovran Self Storage, Inc. | | | 40,491 | |
| | 1,900 | | StanCorp Financial Group, Inc. | | | 85,766 | |
| | 2,050 | | Stewart Information Services Corp. | | | 23,637 | |
| | 900 | | Sun Communities, Inc. | | | 29,979 | |
| | 10,050 | | Susquehanna Bancshares, Inc. | | | 97,284 | |
| | 5,900 | | SWS Group, Inc. | | | 29,795 | |
| | 3,500 | | Texas Capital Bancshares, Inc. † | | | 74,445 | |
| | 200 | | Tower Group, Inc. | | | 5,116 | |
| | 9,250 | | Trustco Bank Corp. | | | 58,645 | |
| | 900 | | United Bankshares, Inc. | | | 26,280 | |
| | 9,350 | | Universal Insurance Holdings, Inc. | | | 45,534 | |
| | 1,310 | | Walter Investment Management Corp. | | | 23,501 | |
| | 1,450 | | Webster Financial Corp. | | | 28,565 | |
| | 900 | | Westamerica Bancorporation | | | 49,923 | |
| | 9,200 | | Western Alliance Bancorp † | | | 67,712 | |
| | 455 | | Wilshire Bancorp, Inc. | | | 3,467 | |
| | 300 | | Wintrust Financial Corp. | | | 9,909 | |
| | | | | | | 4,239,910 | |
| Health Care — 3.0% | | | | |
| | 100 | | Acorda Therapeutics, Inc. † | | | 2,726 | |
| | 389 | | Bio-Rad Laboratories, Inc., Class A † | | | 40,398 | |
| | 1,150 | | Bruker Corp. † | | | 19,090 | |
| | 650 | | Cepheid, Inc. † | | | 14,788 | |
| | 357 | | Chemed Corp. | | | 22,673 | |
| | 3,100 | | Emergent Biosolutions, Inc. † | | | 72,726 | |
| | 700 | | Emeritus Corp. † | | | 13,797 | |
| | 700 | | Kindred Healthcare, Inc. † | | | 12,859 | |
| | 550 | | Magellan Health Services, Inc. † | | | 26,004 | |
| | 550 | | MedAssets, Inc. † | | | 11,104 | |
| | 900 | | Medicis Pharmaceutical Corp., Class A | | | 24,111 | |
| | 1,250 | | NuVasive, Inc. † | | | 32,062 | |
| | 6,500 | | PDL BioPharma, Inc. | | | 40,495 | |
| | 550 | | Quality Systems, Inc. | | | 38,401 | |
| | 1,300 | | Staar Surgical Co. † | | | 7,930 | |
| | 1,700 | | Universal American Corp. | | | 34,765 | |
| | 50 | | Viropharma, Inc. † | | | 866 | |
| | | | | | | 414,795 | |
| Industrials — 15.7% | | | | |
| | 550 | | Acuity Brands, Inc. | | | 31,719 | |
| | 17,000 | | Aircastle, Ltd. | | | 177,650 | |
| | 6,500 | | Albany International Corp., Class A | | | 153,985 | |
| | 140 | | American Science & Engineering, Inc. | | | 11,932 | |
| | 900 | | American Superconductor Corp. † | | | 25,731 | |
| | 230 | | Ameron International Corp. | | | 17,565 | |
| | 1,850 | | ArvinMeritor, Inc. † | | | 37,962 | |
| | 3,650 | | Belden, Inc. | | | 134,393 | |
| | 150 | | Blount International, Inc. † | | | 2,364 | |
| | 350 | | Brady Corp., Class A | | | 11,413 | |
| | 2,614 | | Briggs & Stratton Corp. | | | 51,470 | |
| | 250 | | Ceradyne, Inc. † | | | 7,883 | |
| Wilshire Mutual Funds, Inc. | |
| Small Company Value Portfolio | December 31, 2010 |
| Schedule of Investments | |
| Shares | | | | Value | |
| Industrials (continued) | | | |
| | 2,550 | | CIRCOR International, Inc. | | $ | 107,814 | |
| | 600 | | Columbus McKinnon Corp. † | | | 12,192 | |
| | 2,100 | | Deluxe Corp. | | | 48,342 | |
| | 350 | | Dynamic Materials Corp. | | | 7,899 | |
| | 100 | | EMCOR Group, Inc. † | | | 2,898 | |
| | 1,000 | | EnerNOC, Inc. † | | | 23,910 | |
| | 350 | | Ennis, Inc. | | | 5,985 | |
| | 650 | | EnPro Industries, Inc. † | | | 27,014 | |
| | 5,700 | | Excel Maritime Carriers, Ltd., Class A † | | | 32,091 | |
| | 1,020 | | Foster (L.B.) Co., Class A † | | | 41,759 | |
| | 2,250 | | Genco Shipping & Trading, Ltd. † | | | 32,400 | |
| | 2,350 | | GenCorp, Inc. † | | | 12,150 | |
| | 1,100 | | Great Lakes Dredge & Dock Corp. | | | 8,107 | |
| | 11,850 | | Griffon Corp. † | | | 150,969 | |
| | 1,860 | | Hexcel Corp. † | | | 33,647 | |
| | 910 | | Higher One Holdings, Inc. † | | | 18,409 | |
| | 2,900 | | Horizon Lines, Inc., Class A | | | 12,673 | |
| | 422 | | Kaman Corp. | | | 12,268 | |
| | 5,100 | | Marten Transport, Ltd. | | | 109,038 | |
| | 600 | | MasTec, Inc. † | | | 8,754 | |
| | 500 | | Met-Pro Corp. | | | 5,905 | |
| | 425 | | Middleby Corp. † | | | 35,879 | |
| | 1,500 | | Miller Industries, Inc. | | | 21,345 | |
| | 1,250 | | Mine Safety Appliances Co. | | | 38,913 | |
| | 800 | | Mistras Group, Inc. † | | | 10,784 | |
| | 640 | | Mueller Industries, Inc. | | | 20,928 | |
| | 4,600 | | Mueller Water Products, Inc., Class A | | | 19,182 | |
| | 550 | | Nordson Corp. | | | 50,534 | |
| | 137 | | Northwest Pipe Co. † | | | 3,292 | |
| | 2,050 | | Orbital Sciences Corp. † | | | 35,116 | |
| | 5,350 | | Orion Marine Group, Inc. † | | | 62,060 | |
| | 300 | | Quanex Building Products Corp. | | | 5,691 | |
| | 1,780 | | Robbins & Myers, Inc. | | | 63,688 | |
| | 690 | | Skywest, Inc. | | | 10,778 | |
| | 1,650 | | TAL International Group, Inc. | | | 50,935 | |
| | 1,350 | | Tennant Co. | | | 51,853 | |
| | 2,000 | | Tredegar Corp. | | | 38,760 | |
| | 1,550 | | Tutor Perini Corp. | | | 33,186 | |
| | 900 | | Unifirst Corp. | | | 49,545 | |
| | 1,000 | | United Rentals, Inc. † | | | 22,750 | |
| | 1,050 | | US Airways Group, Inc. † | | | 10,510 | |
| | 1,900 | | US Ecology, Inc. | | | 33,022 | |
| | 625 | | WABCO Holdings, Inc. † | | | 38,081 | |
| | 720 | | Watsco, Inc. | | | 45,418 | |
| | 2,100 | | Werner Enterprises, Inc. | | | 47,460 | |
| | 50 | | Woodward Governor Co. | | | 1,878 | |
| | | | | | | 2,179,879 | |
| Information Technology — 14.5% | | | | |
| | 900 | | Acme Packet, Inc. † | | | 47,844 | |
| | 2,000 | | Acxiom Corp. † | | | 34,300 | |
| | 200 | | ADTRAN, Inc. | | | 7,242 | |
| | 1,150 | | Advanced Energy Industries, Inc. † | | | 15,686 | |
| | 4,450 | | Amkor Technology, Inc. † | | | 32,886 | |
| | 700 | | Anixter International, Inc. | | | 41,811 | |
| | 383 | | Arris Group, Inc. † | | | 4,297 | |
| | 350 | | Aruba Networks, Inc. † | | | 7,308 | |
| | 1,800 | | Blackbaud, Inc. | | | 46,620 | |
| | 1,200 | | Blackboard, Inc. † | | | 49,560 | |
| | 3,500 | | Brightpoint, Inc. † | | | 30,555 | |
| | 19,750 | | Brocade Communications Systems, Inc. † | | | 104,478 | |
| | 1,290 | | Cavium Networks, Inc. † | | | 48,607 | |
| | 450 | | Cognex Corp. | | | 13,239 | |
| | 2,700 | | Coherent, Inc. † | | | 121,878 | |
| | 580 | | Comtech Telecommunications Corp. | | | 16,083 | |
| | 100 | | Constant Contact, Inc. † | | | 3,099 | |
| Shares | | | | Value | |
| Information Technology (continued) | | | |
| | 5,500 | | Convergys Corp. † | | $ | 72,435 | |
| | 4,080 | | CTS Corp. | | | 45,125 | |
| | 700 | | Daktronics, Inc. | | | 11,144 | |
| | 4,420 | | Earthlink, Inc. | | | 38,012 | |
| | 2,250 | | Emulex Corp. † | | | 26,235 | |
| | 13,500 | | Entegris, Inc. † | | | 100,845 | |
| | 1,350 | | Finisar Corp. † | | | 40,082 | |
| | 250 | | GSI Commerce, Inc. † | | | 5,800 | |
| | 1,450 | | iGate Corp. | | | 28,579 | |
| | 516 | | Imation Corp. † | | | 5,320 | |
| | 1,800 | | Insight Enterprises, Inc. † | | | 23,688 | |
| | 2,000 | | Mantech International Corp., Class A † | | | 82,660 | |
| | 1,350 | | Maxwell Technologies, Inc. † | | | 25,501 | |
| | 6,250 | | Methode Electronics, Inc. | | | 81,062 | |
| | 2,250 | | Micrel, Inc. | | | 29,228 | |
| | 1,000 | | Monotype Imaging Holdings, Inc. † | | | 11,100 | |
| | 300 | | MTS Systems Corp. | | | 11,238 | |
| | 710 | | Multi-Fineline Electronix, Inc. † | | | 18,808 | |
| | 200 | | Netgear, Inc. † | | | 6,736 | |
| | 1,450 | | Omnivision Technologies, Inc. † | | | 42,935 | |
| | 300 | | OpenTable, Inc. † | | | 21,144 | |
| | 1,370 | | Pegasystems, Inc. | | | 50,183 | |
| | 4,800 | | Photronics, Inc. † | | | 28,368 | |
| | 200 | | Plantronics, Inc. | | | 7,444 | |
| | 230 | | Power-One, Inc. † | | | 2,346 | |
| | 650 | | Quest Software, Inc. † | | | 18,031 | |
| | 1,200 | | Riverbed Technology, Inc. † | | | 42,204 | |
| | 550 | | Rogers Corp. † | | | 21,038 | |
| | 2,100 | | Scansource, Inc. † | | | 66,990 | |
| | 250 | | SolarWinds, Inc. † | | | 4,813 | |
| | 5,486 | | Standard Microsystems Corp. † | | | 158,161 | |
| | 2,350 | | STEC, Inc. † | | | 41,477 | |
| | 550 | | Syntel, Inc. | | | 26,285 | |
| | 500 | | Take-Two Interactive Software, Inc. † | | | 6,120 | |
| | 2,420 | | TIBCO Software, Inc. † | | | 47,698 | |
| | 350 | | TriQuint Semiconductor, Inc. † | | | 4,091 | |
| | 1,380 | | Unisys Corp. † | | | 35,728 | |
| | 10,990 | | United Online, Inc. | | | 72,534 | |
| | 100 | | Universal Display Corp. † | | | 3,065 | |
| | 650 | | VeriFone Systems, Inc. † | | | 25,064 | |
| | | | | | | 2,014,810 | |
| Materials — 10.4% | | | | |
| | 200 | | A Schulman, Inc. | | | 4,578 | |
| | 1,218 | | Arch Chemicals, Inc. | | | 46,199 | |
| | 9,500 | | Aurizon Mines, Ltd. † | | | 69,540 | |
| | 1,150 | | Boise, Inc. | | | 9,119 | |
| | 300 | | Brush Engineered Materials, Inc. † | | | 11,592 | |
| | 3,100 | | Buckeye Technologies, Inc. | | | 65,131 | |
| | 1,350 | | Century Aluminum Co. † | | | 20,966 | |
| | 960 | | Coeur d'Alene Mines Corp. † | | | 26,227 | |
| | 4,200 | | Globe Specialty Metals, Inc. | | | 71,778 | |
| | 200 | | Haynes International, Inc. | | | 8,366 | |
| | 2,190 | | HB Fuller Co. | | | 44,939 | |
| | 3,700 | | Hecla Mining Co. † | | | 41,662 | |
| | 1,800 | | Horsehead Holding Corp. † | | | 23,472 | |
| | 350 | | Innophos Holdings, Inc. | | | 12,628 | |
| | 1,000 | | Kaiser Aluminum Corp. | | | 50,090 | |
| | 1,450 | | Koppers Holdings, Inc. | | | 51,881 | |
| | 300 | | Minerals Technologies, Inc. | | | 19,623 | |
| | 1,900 | | Myers Industries, Inc. | | | 18,506 | |
| | 30,550 | | Northgate Minerals Corp. † | | | 97,760 | |
| | 4,450 | | Olin Corp. | | | 91,314 | |
| | 550 | | Olympic Steel, Inc. | | | 15,774 | |
| | 1,300 | | Packaging Corp. of America | | | 33,592 | |
| | 450 | | PH Glatfelter Co. | | | 5,522 | |
| Wilshire Mutual Funds, Inc. | |
| Small Company Value Portfolio | December 31, 2010 |
| Schedule of Investments | |
| Shares | | | | Value | |
| Materials (continued) | | | |
| | 450 | | PolyOne Corp. † | | $ | 5,621 | |
| | 1,300 | | Rockwood Holdings, Inc. † | | | 50,856 | |
| | 1,000 | | Royal Gold, Inc. | | | 54,630 | |
| | 1,750 | | Sensient Technologies Corp. | | | 64,277 | |
| | 350 | | Solutia, Inc. † | | | 8,078 | |
| | 2,350 | | Spartech Corp. † | | | 21,996 | |
| | 3,450 | | Temple-Inland, Inc. | | | 73,278 | |
| | 8,200 | | Thompson Creek Metals Co., Inc. † | | | 120,704 | |
| | 4,850 | | Wausau Paper Corp. | | | 41,758 | |
| | 1,100 | | Westlake Chemical Corp. | | | 47,817 | |
| | 350 | | Worthington Industries, Inc. | | | 6,440 | |
| | 3,200 | | WR Grace & Co. † | | | 112,416 | |
| | | | | | | 1,448,130 | |
| Telecommunication Services — 0.6% | | | | |
| | 4,170 | | Alaska Communications Systems Group, Inc. | | | 46,287 | |
| | 750 | | Consolidated Communications Holdings, Inc. | | | 14,475 | |
| | 1,900 | | Global Crossing, Ltd. † | | | 24,548 | |
| | | | | | | 85,310 | |
| Utilities — 2.2% | | | | |
| | 1,767 | | Black Hills Corp. | | | 53,010 | |
| | 650 | | IDACORP, Inc. | | | 24,037 | |
| | 1,000 | | Nicor, Inc. | | | 49,920 | |
| | 950 | | Otter Tail Corp. | | | 21,413 | |
| | 4,250 | | PNM Resources, Inc. | | | 55,335 | |
| | 450 | | Portland General Electric Co. | | | 9,765 | |
| | 1,950 | | Unisource Energy Corp. | | | 69,888 | |
| | 900 | | WGL Holdings, Inc. | | | 32,193 | |
| | | | | | | 315,561 | |
| Total Common Stock (Cost $11,021,607) | | | 13,816,211 | |
| | | | | |
| Total Investments — 99.3% | | | | |
| (Cost $11,021,607) | | | 13,816,211 | |
| Other Assets & Liabilities, Net — 0.7% | | | 93,541 | |
| NET ASSETS — 100.0% | | $ | 13,909,752 | |
| † | Non-income producing security. |
| †† | More narrow industries are utilized for compliance purposes, whereas broadsectors are utilized for reporting purposes. |
| ADR — American Depositary Receipt |
| Wilshire Mutual Funds, Inc. | |
Wilshire 5000 Indexsm Fund | December 31, 2010 |
| Schedule of Investments | |
| Shares | | | | Value | |
| | |
| COMMON STOCK — 99.5% | | | |
| Consumer Discretionary — 11.1% | | | |
| | 300 | | 1-800-Flowers.com, Inc., Class A † | | $ | 807 | |
| | 200 | | 4Kids Entertainment, Inc. † | | | 82 | |
| | 800 | | 99 Cents Only Stores † | | | 12,752 | |
| | 975 | | Aaron's, Inc. | | | 19,880 | |
| | 900 | | Abercrombie & Fitch Co., Class A | | | 51,867 | |
| | 300 | | Acme United Corp. | | | 2,856 | |
| | 800 | | Advance Auto Parts, Inc. | | | 52,920 | |
| | 2,150 | | Aeropostale, Inc. † | | | 52,976 | |
| | 100 | | AFC Enterprises, Inc. † | | | 1,390 | |
| | 90 | | AH Belo Corp., Class A † | | | 783 | |
| | 200 | | Aldila, Inc. | | | 1,000 | |
| | 600 | | All American Group, Inc. † | | | 129 | |
| | 4,250 | | Amazon.com, Inc. † | | | 765,000 | |
| | 400 | | Ambassadors Group, Inc. | | | 4,600 | |
| | 3,500 | | American Apparel, Inc. † | | | 5,810 | |
| | 2,400 | | American Axle & Manufacturing Holdings, Inc. † | | | 30,864 | |
| | 2,625 | | American Eagle Outfitters, Inc. | | | 38,404 | |
| | 450 | | American Greetings Corp., Class A | | | 9,972 | |
| | 829 | | American Public Education, Inc. † | | | 30,872 | |
| | 700 | | America's Car-Mart, Inc. † | | | 18,956 | |
| | 1,500 | | Ameristar Casinos, Inc. | | | 23,445 | |
| | 964 | | AnnTaylor Stores Corp. † | | | 26,404 | |
| | 1,750 | | Apollo Group, Inc., Class A † | | | 69,108 | |
| | 564 | | Ascena Retail Group, Inc. † | | | 14,901 | |
| | 200 | | Ascent Media Corp., Class A † | | | 7,752 | |
| | 2,250 | | AutoNation, Inc. † | | | 63,450 | |
| | 500 | | AutoZone, Inc. † | | | 136,295 | |
| | 500 | | Bally Technologies, Inc. † | | | 21,095 | |
| | 1,000 | | Beazer Homes USA, Inc. † | | | 5,390 | |
| | 1,400 | | Bebe Stores, Inc. | | | 8,344 | |
| | 2,925 | | Bed Bath & Beyond, Inc. † | | | 143,764 | |
| | 950 | | Belo Corp., Class A † | | | 6,726 | |
| | 4,400 | | Best Buy Co., Inc. | | | 150,876 | |
| | 200 | | Big 5 Sporting Goods Corp. | | | 3,054 | |
| | 1,500 | | Big Lots, Inc. † | | | 45,690 | |
| | 2 | | Biglari Holdings, Inc. † | | | 820 | |
| | 250 | | Blue Nile, Inc. † | | | 14,265 | |
| | 300 | | Bluegreen Corp. † | | | 966 | |
| | 112 | | Blyth, Inc. | | | 3,862 | |
| | 400 | | Bon-Ton Stores, Inc. (The) | | | 5,064 | |
| | 100 | | Books-A-Million, Inc., Class A | | | 580 | |
| | 400 | | Borders Group, Inc. † | | | 360 | |
| | 1,580 | | BorgWarner, Inc. † | | | 114,329 | |
| | 2,000 | | Boyd Gaming Corp. † | | | 21,200 | |
| | 500 | | Bridgepoint Education, Inc. † | | | 9,500 | |
| | 875 | | Brinker International, Inc. | | | 18,270 | |
| | 1,000 | | Brookfield Homes Corp. † | | | 9,400 | |
| | 500 | | Brunswick Corp. | | | 9,370 | |
| | 1,500 | | Cabela's, Inc. † | | | 32,625 | |
| | 3,525 | | Cablevision Systems Corp., Class A | | | 119,286 | |
| | 200 | | Cache, Inc. † | | | 888 | |
| | 400 | | California Coastal Communities, Inc. † | | | 5 | |
| | 375 | | California Pizza Kitchen, Inc. † | | | 6,480 | |
| | 500 | | Callaway Golf Co. | | | 4,035 | |
| | 1,500 | | Career Education Corp. † | | | 31,095 | |
| | 1,900 | | Caribou Coffee Co., Inc. † | | | 19,152 | |
| | 1,755 | | CarMax, Inc. † | | | 55,949 | |
| | 4,200 | | Carnival Corp. | | | 193,662 | |
| | 850 | | Carter's, Inc. † | | | 25,084 | |
| | 8,937 | | CBS Corp., Class B | | | 170,250 | |
| | 977 | | CEC Entertainment, Inc. † | | | 37,937 | |
| | 362 | | Charles & Colvard, Ltd. † | | | 1,093 | |
| | 2,550 | | Charming Shoppes, Inc. † | | | 9,053 | |
| | 600 | | Cheesecake Factory, Inc. (The) † | | | 18,396 | |
| | 2,450 | | Chico's FAS, Inc. | | | 29,474 | |
| Shares | | | | Value | |
| Consumer Discretionary (continued) | | | |
| | 200 | | Children's Place Retail Stores, Inc. (The) † | | $ | 9,928 | |
| | 300 | | Chipotle Mexican Grill, Inc., Class A † | | | 63,798 | |
| | 800 | | Cinemark Holdings, Inc. | | | 13,792 | |
| | 50 | | Citi Trends, Inc. † | | | 1,228 | |
| | 700 | | CKX, Inc. † | | | 2,821 | |
| | 1,000 | | Clear Channel Outdoor Holdings, Inc., Class A † | | | 14,040 | |
| | 3,900 | | Coach, Inc. | | | 215,709 | |
| | 100 | | Cobra Electronics Corp. † | | | 320 | |
| | 200 | | Coinstar, Inc. † | | | 11,288 | |
| | 1,450 | | Coldwater Creek, Inc. † | | | 4,597 | |
| | 550 | | Collective Brands, Inc. † | | | 11,605 | |
| | 110 | | Collectors Universe | | | 1,530 | |
| | 23,383 | | Comcast Corp. Special, Class A | | | 513,725 | |
| | 500 | | Conn's, Inc. † | | | 2,340 | |
| | 2,450 | | Corinthian Colleges, Inc. † | | | 12,764 | |
| | 200 | | CROCS, Inc. † | | | 3,424 | |
| | 200 | | Crown Media Holdings, Inc., Class A † | | | 524 | |
| | 50 | | CSS Industries, Inc. | | | 1,030 | |
| | 5 | | CTM Media Holdings, Inc., Class B | | | 11 | |
| | 300 | | Cumulus Media, Inc., Class A † | | | 1,293 | |
| | 2,500 | | Dana Holding Corp. † | | | 43,025 | |
| | 1,500 | | Darden Restaurants, Inc. | | | 69,660 | |
| | 450 | | Deckers Outdoor Corp. † | | | 35,883 | |
| | 775 | | DeVry, Inc. | | | 37,184 | |
| | 1,002 | | Dick's Sporting Goods, Inc. † | | | 37,575 | |
| | 100 | | Dillard's, Inc., Class A | | | 3,794 | |
| | 10,368 | | DIRECTV, Class A † | | | 413,994 | |
| | 1,600 | | Discovery Communications, Inc., Class A † | | | 66,720 | |
| | 3,025 | | DISH Network Corp., Class A † | | | 59,472 | |
| | 100 | | Dixie Group, Inc. † | | | 359 | |
| | 1,275 | | Dollar Tree, Inc. † | | | 71,502 | |
| | 850 | | Domino's Pizza, Inc. † | | | 13,557 | |
| | 650 | | Dover Downs Gaming & Entertainment, Inc. | | | 2,210 | |
| | 3,623 | | DR Horton, Inc. | | | 43,222 | |
| | 200 | | DreamWorks Animation SKG, Inc., Class A † | | | 5,894 | |
| | 600 | | DSW, Inc., Class A † | | | 23,460 | |
| | 3,625 | | Eastman Kodak Co. † | | | 19,430 | |
| | 642 | | Education Management Corp. † | | | 11,620 | |
| | 219 | | Emmis Communications Corp., Class A † | | | 166 | |
| | 300 | | Empire Resorts, Inc. † | | | 309 | |
| | 250 | | Entercom Communications Corp., Class A † | | | 2,895 | |
| | 100 | | Entravision Communications Corp., Class A † | | | 257 | |
| | 1,366 | | EW Scripps Co. (The), Class A † | | | 13,865 | |
| | 2,600 | | Exide Technologies † | | | 24,466 | |
| | 3,115 | | Expedia, Inc. | | | 78,155 | |
| | 1,600 | | Family Dollar Stores, Inc. | | | 79,536 | |
| | 200 | | Famous Dave's of America, Inc. † | | | 2,230 | |
| | 1,500 | | Federal-Mogul Corp. † | | | 30,975 | |
| | 100 | | Finish Line, Inc. (The), Class A | | | 1,719 | |
| | 1,900 | | Foot Locker, Inc. | | | 37,278 | |
| | 34,785 | | Ford Motor Co. † | | | 584,040 | |
| | 1,500 | | Fortune Brands, Inc. | | | 90,375 | |
| | 300 | | Forward Industries, Inc. † | | | 966 | |
| | 1,700 | | Fred's, Inc., Class A | | | 23,392 | |
| | 200 | | Furniture Brands International, Inc. † | | | 1,028 | |
| | 600 | | Gaiam, Inc., Class A | | | 4,620 | |
| | 2,625 | | GameStop Corp., Class A † | | | 60,060 | |
| | 600 | | Gaming Partners International Corp. | | | 3,708 | |
| | 2,800 | | Gannett Co., Inc. | | | 42,252 | |
| | 6,750 | | Gap, Inc. (The) | | | 149,445 | |
| | 275 | | Genesco, Inc. † | | | 10,310 | |
| | 2,010 | | Gentex Corp. | | | 59,415 | |
| | 1,900 | | Genuine Parts Co. | | | 97,546 | |
| Wilshire Mutual Funds, Inc. | |
Wilshire 5000 Indexsm Fund | December 31, 2010 |
| Schedule of Investments | |
| Shares | | | | Value | |
| Consumer Discretionary (continued) | | | |
| | 701 | | G-III Apparel Group, Ltd. † | | $ | 24,640 | |
| | 2,875 | | Goodyear Tire & Rubber Co. (The) † | | | 34,069 | |
| | 500 | | Grand Canyon Education, Inc. † | | | 9,795 | |
| | 1,000 | | Gray Television, Inc. † | | | 1,870 | |
| | 300 | | Great Wolf Resorts, Inc. † | | | 786 | |
| | 400 | | Guess?, Inc. | | | 18,928 | |
| | 3,760 | | H&R Block, Inc. | | | 44,782 | |
| | 1,696 | | Hanesbrands, Inc. † | | | 43,078 | |
| | 2,475 | | Harley-Davidson, Inc. | | | 85,808 | |
| | 600 | | Harman International Industries, Inc. † | | | 27,780 | |
| | 1,000 | | Harte-Hanks, Inc. | | | 12,770 | |
| | 1,300 | | Hasbro, Inc. | | | 61,334 | |
| | 500 | | hhgregg, Inc. † | | | 10,475 | |
| | 200 | | Hibbett Sports, Inc. † | | | 7,380 | |
| | 300 | | Hillenbrand, Inc. | | | 6,243 | |
| | 18,650 | | Home Depot, Inc. (The) | | | 653,869 | |
| | 200 | | Hooker Furniture Corp. | | | 2,826 | |
| | 100 | | HOT Topic, Inc. | | | 627 | |
| | 1,000 | | Hovnanian Enterprises, Inc., Class A † | | | 4,090 | |
| | 743 | | HSN, Inc. † | | | 22,766 | |
| | 600 | | Hyatt Hotels Corp., Class A † | | | 27,456 | |
| | 450 | | Iconix Brand Group, Inc. † | | | 8,689 | |
| | 4,450 | | International Game Technology | | | 78,720 | |
| | 237 | | International Speedway Corp., Class A | | | 6,202 | |
| | 4,372 | | Interpublic Group of Cos., Inc. (The) † | | | 46,431 | |
| | 743 | | Interval Leisure Group, Inc. † | | | 11,992 | |
| | 500 | | J. Crew Group, Inc. † | | | 21,570 | |
| | 2,292 | | J.C. Penney Co., Inc. | | | 74,055 | |
| | 775 | | Jackson Hewitt Tax Service, Inc. † | | | 1,690 | |
| | 1,500 | | Jarden Corp. | | | 46,305 | |
| | 500 | | John Wiley & Sons, Inc., Class A | | | 22,620 | |
| | 6,650 | | Johnson Controls, Inc. | | | 254,030 | |
| | 378 | | Jones Group, Inc. (The) | | | 5,874 | |
| | 300 | | JOS A Bank Clothiers, Inc. † | | | 12,096 | |
| | 600 | | Journal Communications, Inc., Class A † | | | 3,030 | |
| | 900 | | Journal Register Co (a). † | | | — | |
| | 300 | | K12, Inc. † | | | 8,598 | |
| | 800 | | KB Home | | | 10,792 | |
| | 1,800 | | Kenneth Cole Productions, Inc., Class A † | | | 22,482 | |
| | 200 | | Kid Brands, Inc. † | | | 1,710 | |
| | 50 | | Knology, Inc. † | | | 781 | |
| | 3,600 | | Kohl's Corp. † | | | 195,624 | |
| | 300 | | Krispy Kreme Doughnuts, Inc. † | | | 2,094 | |
| | 550 | | K-Swiss, Inc., Class A † | | | 6,859 | |
| | 200 | | Lakes Entertainment, Inc. † | | | 568 | |
| | 500 | | Lamar Advertising Co., Class A † | | | 19,920 | |
| | 3,200 | | Las Vegas Sands Corp. † | | | 147,040 | |
| | 200 | | La-Z-Boy, Inc. † | | | 1,804 | |
| | 100 | | Leapfrog Enterprises, Inc., Class A † | | | 555 | |
| | 450 | | Lear Corp. (a)† | | | — | |
| | 500 | | Learning Tree International, Inc. | | | 4,780 | |
| | 750 | | Lee Enterprises, Inc. † | | | 1,845 | |
| | 1,410 | | Leggett & Platt, Inc. | | | 32,092 | |
| | 3,100 | | Lennar Corp., Class A | | | 58,125 | |
| | 1,000 | | Libbey, Inc. † | | | 15,470 | |
| | 3,551 | | Liberty Global, Inc., Class A † | | | 125,634 | |
| | 1,035 | | Liberty Media Corp. - Capital, Ser A † | | | 64,750 | |
| | 6,675 | | Liberty Media Corp. - Interactive, Class A † | | | 105,265 | |
| | 729 | | Liberty Media Corp. - Starz, Ser A † | | | 48,464 | |
| | 200 | | Life Time Fitness, Inc. † | | | 8,198 | |
| | 700 | | Lifetime Brands, Inc. † | | | 9,828 | |
| | 200 | | LIN TV Corp., Class A † | | | 1,060 | |
| | 200 | | Lincoln Educational Services Corp. | | | 3,102 | |
| | 1,537 | | Live Nation Entertainment, Inc. † | | | 17,553 | |
| | 800 | | Liz Claiborne, Inc. † | | | 5,728 | |
| | 1,800 | | LKQ Corp. † | | | 40,896 | |
| | 16,781 | | Lowe's Cos., Inc. | | | 420,867 | |
| | 3,540 | | Ltd. Brands, Inc. | | | 108,784 | |
| Shares | | | | Value | |
| Consumer Discretionary (continued) | | | |
| | 5,998 | | Macy's, Inc. | | $ | 151,749 | |
| | 881 | | Madison Square Garden, Inc., Class A † | | | 22,712 | |
| | 100 | | Marcus Corp. | | | 1,327 | |
| | 700 | | Marine Products Corp. † | | | 4,662 | |
| | 3,577 | | Marriott International, Inc., Class A | | | 148,589 | |
| | 3,100 | | Martha Stewart Living Omnimedia, Class A † | | | 13,702 | |
| | 3,730 | | Mattel, Inc. | | | 94,854 | |
| | 100 | | Matthews International Corp., Class A | | | 3,498 | |
| | 496 | | McClatchy Co. (The), Class A † | | | 2,316 | |
| | 1,500 | | McCormick & Schmick's Seafood Restaurants, Inc. † | | | 13,635 | |
| | 11,800 | | McDonald's Corp. | | | 905,768 | |
| | 3,700 | | McGraw-Hill Cos., Inc. (The) | | | 134,717 | |
| | 271 | | MDC Holdings, Inc. | | | 7,797 | |
| | 500 | | Media General, Inc., Class A † | | | 2,890 | |
| | 1,467 | | Mediacom Communications Corp., Class A † | | | 12,411 | |
| | 500 | | Meritage Homes Corp. † | | | 11,100 | |
| | 4,200 | | MGM Resorts International † | | | 62,370 | |
| | 577 | | Mohawk Industries, Inc. † | | | 32,750 | |
| | 1,600 | | Monarch Casino & Resort, Inc. † | | | 20,000 | |
| | 750 | | Monro Muffler Brake, Inc. | | | 25,942 | |
| | 150 | | Morgans Hotel Group Co. † | | | 1,360 | |
| | 300 | | Morton's Restaurant Group, Inc. † | | | 1,944 | |
| | 700 | | MTR Gaming Group, Inc. † | | | 1,414 | |
| | 591 | | Multimedia Games, Inc. † | | | 3,298 | |
| | 500 | | National CineMedia, Inc. | | | 9,955 | |
| | 50 | | Nautilus, Inc. † | | | 89 | |
| | 100 | | Navarre Corp. † | | | 212 | |
| | 1,300 | | New York & Co., Inc. † | | | 5,746 | |
| | 2,100 | | New York Times Co. (The), Class A † | | | 20,580 | |
| | 2,926 | | Newell Rubbermaid, Inc. | | | 53,195 | |
| | 19,438 | | News Corp., Class A | | | 283,017 | |
| | 200 | | Nexstar Broadcasting Group, Inc., Class A † | | | 1,198 | |
| | 4,550 | | NIKE, Inc., Class B | | | 388,661 | |
| | 700 | | Noble International, Ltd. (a) † | | | — | |
| | 2,800 | | Nordstrom, Inc. | | | 118,664 | |
| | 5,525 | | Office Depot, Inc. † | | | 29,835 | |
| | 1,100 | | OfficeMax, Inc. † | | | 19,470 | |
| | 3,500 | | Omnicom Group, Inc. | | | 160,300 | |
| | 2,900 | | Orbitz Worldwide, Inc. † | | | 16,211 | |
| | 1,560 | | O'Reilly Automotive, Inc. † | | | 94,255 | |
| | 650 | | Orleans Homebuilders, Inc. † | | | 39 | |
| | 500 | | Outdoor Channel Holdings, Inc. | | | 3,585 | |
| | 300 | | Overstock.com, Inc. † | | | 4,944 | |
| | 50 | | Oxford Industries, Inc. | | | 1,281 | |
| | 200 | | Pacific Sunwear of California, Inc. † | | | 1,084 | |
| | 600 | | Palm Harbor Homes, Inc. † | | | 45 | |
| | 300 | | Panera Bread Co., Class A † | | | 30,363 | |
| | 1,500 | | Penn National Gaming, Inc. † | | | 52,725 | |
| | 400 | | Penske Automotive Group, Inc. † | | | 6,968 | |
| | 1,500 | | PEP Boys-Manny Moe & Jack | | | 20,145 | |
| | 1,300 | | Perry Ellis International, Inc. † | | | 35,711 | |
| | 2,050 | | PetSmart, Inc. | | | 81,631 | |
| | 1,900 | | Pier 1 Imports, Inc. † | | | 19,950 | |
| | 800 | | Pinnacle Entertainment, Inc. † | | | 11,216 | |
| | 565 | | Playboy Enterprises, Inc., Class B † | | | 2,949 | |
| | 300 | | Polaris Industries, Inc. | | | 23,406 | |
| | 700 | | Polo Ralph Lauren Corp., Class A | | | 77,644 | |
| | 275 | | Premier Exhibitions, Inc. † | | | 542 | |
| | 200 | | Pre-Paid Legal Services, Inc. † | | | 12,050 | |
| | 500 | | priceline.com, Inc. † | | | 199,775 | |
| | 1,000 | | PRIMEDIA, Inc. | | | 4,200 | |
| | 100 | | Princeton Review, Inc. † | | | 118 | |
| | 3,840 | | Pulte Group, Inc. † | | | 28,877 | |
| | 50 | | Quiksilver, Inc. † | | | 253 | |
| | 850 | | RadioShack Corp. | | | 15,716 | |
| Wilshire Mutual Funds, Inc. | |
Wilshire 5000 Indexsm Fund | December 31, 2010 |
| Schedule of Investments | |
| Shares | | | | Value | |
| Consumer Discretionary (continued) | | | |
| | 2,600 | | Regal Entertainment Group, Class A | | $ | 30,524 | |
| | 200 | | Regis Corp. | | | 3,320 | |
| | 250 | | Rent-A-Center, Inc., Class A | | | 8,070 | |
| | 100 | | Retail Ventures, Inc. † | | | 1,630 | |
| | 1,500 | | Rick's Cabaret International, Inc. † | | | 11,745 | |
| | 100 | | Rocky Brands, Inc. † | | | 1,004 | |
| | 1,250 | | Ross Stores, Inc. | | | 79,062 | |
| | 1,625 | | Royal Caribbean Cruises, Ltd. † | | | 76,375 | |
| | 500 | | Ruby Tuesday, Inc. † | | | 6,530 | |
| | 2,200 | | Ruth's Hospitality Group, Inc. † | | | 10,186 | |
| | 1,500 | | Ryland Group, Inc. (The) | | | 25,545 | |
| | 1,800 | | Saks, Inc. † | | | 19,260 | |
| | 100 | | Salem Communications Corp., Class A | | | 317 | |
| | 1,000 | | Sally Beauty Holdings, Inc. † | | | 14,530 | |
| | 2,500 | | Scientific Games Corp., Class A † | | | 24,900 | |
| | 1,300 | | Scripps Networks Interactive, Inc., Class A | | | 67,275 | |
| | 200 | | Sealy Corp. † | | | 584 | |
| | 925 | | Sears Holdings Corp. † | | | 68,219 | |
| | 188 | | Select Comfort Corp. † | | | 1,716 | |
| | 4,375 | | Service Corp. International | | | 36,094 | |
| | 400 | | Shoe Carnival, Inc. † | | | 10,800 | |
| | 100 | | Shuffle Master, Inc. † | | | 1,145 | |
| | 776 | | Signet Jewelers, Ltd. † | | | 33,678 | |
| | 900 | | Sinclair Broadcast Group, Inc., Class A | | | 7,362 | |
| | 1,000 | | Sonic Automotive, Inc., Class A | | | 13,240 | |
| | 800 | | Sonic Corp. † | | | 8,096 | |
| | 603 | | Sotheby's | | | 27,135 | |
| | 75 | | Spartan Motors, Inc. | | | 457 | |
| | 400 | | Speedway Motorsports, Inc. | | | 6,128 | |
| | 552 | | Stage Stores, Inc. | | | 9,572 | |
| | 1,892 | | Stanley Black & Decker, Inc. | | | 126,518 | |
| | 200 | | Stanley Furniture Co., Inc. † | | | 622 | |
| | 8,075 | | Staples, Inc. | | | 183,868 | |
| | 8,100 | | Starbucks Corp. | | | 260,253 | |
| | 1,473 | | Starwood Hotels & Resorts Worldwide, Inc. | | | 89,529 | |
| | 100 | | Steinway Musical Instruments, Inc. † | | | 1,985 | |
| | 900 | | Stewart Enterprises, Inc., Class A | | | 6,021 | |
| | 150 | | Superior Industries International, Inc. | | | 3,183 | |
| | 1,300 | | Syms Corp. † | | | 9,399 | |
| | 600 | | Systemax, Inc. † | | | 8,460 | |
| | 1,500 | | Talbots, Inc. † | | | 12,780 | |
| | 8,200 | | Target Corp. | | | 493,066 | |
| | 1,500 | | Tempur-Pedic International, Inc. † | | | 60,090 | |
| | 450 | | Tenneco, Inc. † | | | 18,522 | |
| | 500 | | Thor Industries, Inc. | | | 16,980 | |
| | 1,500 | | Tiffany & Co. | | | 93,405 | |
| | 400 | | Timberland Co. (The), Class A † | | | 9,836 | |
| | 4,099 | | Time Warner Cable, Inc., Class A | | | 270,657 | |
| | 11,558 | | Time Warner, Inc. | | | 371,821 | |
| | 5,000 | | TJX Cos., Inc. | | | 221,950 | |
| | 1,600 | | Toll Brothers, Inc. † | | | 30,400 | |
| | 200 | | Trans World Entertainment Corp. † | | | 340 | |
| | 300 | | True Religion Apparel, Inc. † | | | 6,678 | |
| | 1,000 | | TRW Automotive Holdings Corp. † | | | 52,700 | |
| | 200 | | Tuesday Morning Corp. † | | | 1,056 | |
| | 900 | | Ulta Salon Cosmetics & Fragrance, Inc. † | | | 30,600 | |
| | 200 | | Universal Electronics, Inc. † | | | 5,674 | |
| | 500 | | Universal Technical Institute, Inc. | | | 11,010 | |
| | 2,500 | | Urban Outfitters, Inc. † | | | 89,525 | |
| | 200 | | Value Line, Inc. | | | 2,890 | |
| | 300 | | Valuevision Media, Inc., Class A † | | | 1,833 | |
| | 1,350 | | VF Corp. | | | 116,343 | |
| | 7,137 | | Viacom, Inc., Class B | | | 282,697 | |
| | 2,825 | | Virgin Media, Inc. | | | 76,953 | |
| | 800 | | Volcom, Inc. | | | 15,096 | |
| | 21,518 | | Walt Disney Co. (The) | | | 807,140 | |
| | 500 | | Warnaco Group, Inc. (The) † | | | 27,535 | |
| Shares | | | | Value | |
| Consumer Discretionary (continued) | | | |
| | 1,150 | | Warner Music Group Corp. † | | $ | 6,474 | |
| | 296 | | Weight Watchers International, Inc. | | | 11,097 | |
| | 6,000 | | Wendy's/Arby's Group, Inc., Class A | | | 27,720 | |
| | 5 | | Westwood One, Inc. † | | | 46 | |
| | 572 | | Whirlpool Corp. | | | 50,811 | |
| | 1,100 | | Williams-Sonoma, Inc. | | | 39,259 | |
| | 500 | | Winnebago Industries, Inc. † | | | 7,600 | |
| | 400 | | Wolverine World Wide, Inc. | | | 12,752 | |
| | 600 | | World Wrestling Entertainment, Inc., Class A | | | 8,544 | |
| | 2,085 | | Wyndham Worldwide Corp. | | | 62,467 | |
| | 800 | | Wynn Resorts, Ltd. | | | 83,072 | |
| | 5,850 | | Yum! Brands, Inc. | | | 286,943 | |
| | 1,900 | | Zale Corp. † | | | 8,094 | |
| | | | | | | 17,764,147 | |
| Consumer Staples — 9.5% | | | | |
| | 1,000 | | Alberto-Culver Co., Class B | | | 37,040 | |
| | 200 | | Alico, Inc. | | | 4,768 | |
| | 2,200 | | Alliance One International, Inc. † | | | 9,328 | |
| | 24,575 | | Altria Group, Inc. | | | 605,037 | |
| | 250 | | Andersons, Inc. (The) | | | 9,087 | |
| | 7,786 | | Archer-Daniels-Midland Co. | | | 234,203 | |
| | 4,950 | | Avon Products, Inc. | | | 143,847 | |
| | 500 | | BJ's Wholesale Club, Inc. † | | | 23,950 | |
| | 312 | | Boston Beer Co., Inc., Class A † | | | 29,668 | |
| | 1,700 | | Brown-Forman Corp., Class B | | | 118,354 | |
| | 1,900 | | Bunge, Ltd. | | | 124,488 | |
| | 3,175 | | Campbell Soup Co. | | | 110,331 | |
| | 1,500 | | Central European Distribution Corp. † | | | 34,350 | |
| | 1,100 | | Church & Dwight Co., Inc. | | | 75,922 | |
| | 1,700 | | Clorox Co. | | | 107,576 | |
| | 24,820 | | Coca-Cola Co. (The) | | | 1,632,411 | |
| | 4,120 | | Coca-Cola Enterprises, Inc. | | | 103,124 | |
| | 5,280 | | Colgate-Palmolive Co. | | | 424,354 | |
| | 5,573 | | ConAgra Foods, Inc. | | | 125,838 | |
| | 2,550 | | Constellation Brands, Inc., Class A † | | | 56,483 | |
| | 800 | | Corn Products International, Inc. | | | 36,800 | |
| | 4,650 | | Costco Wholesale Corp. | | | 335,776 | |
| | 16,042 | | CVS Caremark Corp. | | | 557,780 | |
| | 650 | | Darling International, Inc. † | | | 8,632 | |
| | 2,134 | | Dean Foods Co. † | | | 18,865 | |
| | 2,305 | | Del Monte Foods Co. | | | 43,334 | |
| | 1,500 | | Dole Food Co., Inc. † | | | 20,265 | |
| | 2,500 | | Dr. Pepper Snapple Group, Inc. | | | 87,900 | |
| | 800 | | Energizer Holdings, Inc. † | | | 58,320 | |
| | 1,600 | | Estee Lauder Cos., Inc. (The), Class A | | | 129,120 | |
| | 1,125 | | Flowers Foods, Inc. | | | 30,274 | |
| | 7,400 | | General Mills, Inc. | | | 263,366 | |
| | 1,500 | | Hain Celestial Group, Inc. (The) † | | | 40,590 | |
| | 1,100 | | Hansen Natural Corp. † | | | 57,508 | |
| | 800 | | Herbalife, Ltd. | | | 54,696 | |
| | 2,600 | | Hershey Co. (The) | | | 122,590 | |
| | 4,150 | | HJ Heinz Co. | | | 205,259 | |
| | 1,050 | | Hormel Foods Corp. | | | 53,823 | |
| | 1,550 | | Ingles Markets, Inc., Class A | | | 29,760 | |
| | 2,139 | | Inter Parfums, Inc. | | | 40,320 | |
| | 1,500 | | JM Smucker Co. (The) | | | 98,475 | |
| | 3,250 | | Kellogg Co. | | | 166,010 | |
| | 5,274 | | Kimberly-Clark Corp. | | | 332,473 | |
| | 19,371 | | Kraft Foods, Inc., Class A | | | 610,380 | |
| | 8,125 | | Kroger Co. (The) | | | 181,675 | |
| | 1,825 | | Lorillard, Inc. | | | 149,760 | |
| | 700 | | Mannatech, Inc. † | | | 1,260 | |
| | 1,750 | | McCormick & Co., Inc. | | | 81,428 | |
| | 2,300 | | Mead Johnson Nutrition Co., Class A | | | 143,175 | |
| | 200 | | MGP Ingredients, Inc. | | | 2,208 | |
| | 1,500 | | Molson Coors Brewing Co., Class B | | | 75,285 | |
| | 700 | | Nu Skin Enterprises, Inc., Class A | | | 21,182 | |
| Wilshire Mutual Funds, Inc. | |
Wilshire 5000 Indexsm Fund | December 31, 2010 |
| Schedule of Investments | |
| Shares | | | | Value | |
| Consumer Staples (continued) | | | |
| | 50 | | Parametric Sound Corp. † | | $ | 20 | |
| | 18,840 | | PepsiCo, Inc. | | | 1,230,817 | |
| | 20,125 | | Philip Morris International, Inc. | | | 1,177,916 | |
| | 1,200 | | Prestige Brands Holdings, Inc. † | | | 14,340 | |
| | 585 | | Pricesmart, Inc. | | | 22,248 | |
| | 33,552 | | Procter & Gamble Co. (The) | | | 2,158,400 | |
| | 700 | | Ralcorp Holdings, Inc. † | | | 45,507 | |
| | 100 | | Reliv International, Inc. | | | 189 | |
| | 3,628 | | Reynolds American, Inc. | | | 118,345 | |
| | 7,050 | | Rite Aid Corp. † | | | 6,227 | |
| | 70 | | Rocky Mountain Chocolate Factory, Inc. | | | 676 | |
| | 4,900 | | Safeway, Inc. | | | 110,201 | |
| | 50 | | Sanderson Farms, Inc. | | | 1,957 | |
| | 9,520 | | Sara Lee Corp. | | | 166,695 | |
| | 700 | | SIRVA, Inc. (a) † | | | — | |
| | 1,200 | | Smithfield Foods, Inc. † | | | 24,756 | |
| | 3,036 | | SUPERVALU, Inc. | | | 29,237 | |
| | 7,700 | | Sysco Corp. | | | 226,380 | |
| | 3,805 | | Tyson Foods, Inc., Class A | | | 65,522 | |
| | 198 | | USANA Health Sciences, Inc. † | | | 8,603 | |
| | 11,450 | | Walgreen Co. | | | 446,092 | |
| | 23,895 | | Wal-Mart Stores, Inc. | | | 1,288,657 | |
| | 600 | | WD-40 Co. | | | 24,168 | |
| | 1,625 | | Whole Foods Market, Inc. | | | 82,209 | |
| | | | | | | 15,317,610 | |
| Energy — 11.5% | | | | |
| | 3,550 | | Allis-Chalmers Energy, Inc. † | | | 25,170 | |
| | 1,500 | | Alon USA Energy, Inc. | | | 8,970 | |
| | 1,350 | | Alpha Natural Resources, Inc. † | | | 81,041 | |
| | 6,056 | | Anadarko Petroleum Corp. | | | 461,225 | |
| | 4,606 | | Apache Corp. | | | 549,173 | |
| | 1,000 | | Approach Resources, Inc. † | | | 23,100 | |
| | 2,000 | | Arch Coal, Inc. | | | 70,120 | |
| | 880 | | Atlas Energy, Inc. † | | | 38,694 | |
| | 3,820 | | Baker Hughes, Inc. | | | 218,389 | |
| | 600 | | Barnwell Industries, Inc. † | | | 2,196 | |
| | 900 | | Basic Energy Services, Inc. † | | | 14,832 | |
| | 400 | | Berry Petroleum Co., Class A | | | 17,480 | |
| | 900 | | BioFuel Energy Corp. † | | | 1,566 | |
| | 900 | | Bolt Technology Corp. † | | | 11,853 | |
| | 3,100 | | BPZ Resources, Inc. † | | | 14,756 | |
| | 1,400 | | Brigham Exploration Co. † | | | 38,136 | |
| | 200 | | Bristow Group, Inc. † | | | 9,470 | |
| | 375 | | Bronco Drilling Co., Inc. † | | | 3,000 | |
| | 900 | | Cabot Oil & Gas Corp. | | | 34,065 | |
| | 1,218 | | Cal Dive International, Inc. † | | | 6,906 | |
| | 4,500 | | Callon Petroleum Co. † | | | 26,640 | |
| | 3,300 | | Cameron International Corp. † | | | 167,409 | |
| | 150 | | CARBO Ceramics, Inc. | | | 15,531 | |
| | 200 | | Cheniere Energy, Inc. † | | | 1,104 | |
| | 8,600 | | Chesapeake Energy Corp. | | | 222,826 | |
| | 23,799 | | Chevron Corp. | | | 2,171,659 | |
| | 1,047 | | Cimarex Energy Co. | | | 92,691 | |
| | 1,600 | | Clean Energy Fuels Corp. † | | | 22,144 | |
| | 800 | | Complete Production Services, Inc. † | | | 23,640 | |
| | 400 | | Comstock Resources, Inc. † | | | 9,824 | |
| | 800 | | Concho Resources, Inc. † | | | 70,136 | |
| | 17,501 | | ConocoPhillips | | | 1,191,818 | |
| | 1,700 | | Consol Energy, Inc. | | | 82,858 | |
| | 200 | | Cross Timbers Royalty Trust | | | 7,976 | |
| | 2,500 | | Crosstex Energy, Inc. | | | 22,150 | |
| | 1,000 | | CVR Energy, Inc. † | | | 15,180 | |
| | 400 | | Dawson Geophysical Co. † | | | 12,760 | |
| | 1,000 | | Delek US Holdings, Inc. | | | 7,280 | |
| | 2,500 | | Delta Petroleum Corp. † | | | 1,900 | |
| | 4,779 | | Denbury Resources, Inc. † | | | 91,231 | |
| | 4,536 | | Devon Energy Corp. | | | 356,121 | |
| | 2,477 | | DHT Holdings, Inc. | | | 11,518 | |
| Shares | | | | Value | |
| Energy (continued) | | | |
| | 250 | | Diamond Offshore Drilling, Inc. | | $ | 16,717 | |
| | 1,500 | | Dresser-Rand Group, Inc. † | | | 63,885 | |
| | 300 | | Dril-Quip, Inc. † | | | 23,316 | |
| | 9,164 | | El Paso Corp. | | | 126,097 | |
| | 15 | | Energy Partners, Ltd. † | | | 223 | |
| | 2,975 | | EOG Resources, Inc. | | | 271,945 | |
| | 1,600 | | EQT Corp. | | | 71,744 | |
| | 2,700 | | EXCO Resources, Inc. | | | 52,434 | |
| | 812 | | Exterran Holdings, Inc. † | | | 19,447 | |
| | 60,169 | | Exxon Mobil Corp. | | | 4,399,557 | |
| | 1,278 | | FMC Technologies, Inc. † | | | 113,627 | |
| | 950 | | Forest Oil Corp. † | | | 36,071 | |
| | 1,100 | | Frontier Oil Corp. | | | 19,811 | |
| | 1,500 | | General Maritime Corp. | | | 4,875 | |
| | 2,100 | | Geokinetics, Inc. † | | | 19,509 | |
| | 100 | | GeoMet, Inc. † | | | 115 | |
| | 500 | | Georesources, Inc. † | | | 11,105 | |
| | 1,450 | | Global Industries, Ltd. † | | | 10,049 | |
| | 1,500 | | Goodrich Petroleum Corp. † | | | 26,460 | |
| | 381 | | Gulf Island Fabrication, Inc. | | | 10,737 | |
| | 300 | | Gulfmark Offshore, Inc., Class A † | | | 9,120 | |
| | 1,250 | | Gulfport Energy Corp. † | | | 27,063 | |
| | 10,781 | | Halliburton Co. | | | 440,188 | |
| | 1,000 | | Helix Energy Solutions Group, Inc. † | | | 12,140 | |
| | 1,750 | | Helmerich & Payne, Inc. | | | 84,840 | |
| | 1,900 | | Hercules Offshore, Inc. † | | | 6,574 | |
| | 3,265 | | Hess Corp. | | | 249,903 | |
| | 500 | | Hornbeck Offshore Services, Inc. † | | | 10,440 | |
| | 2,325 | | International Coal Group, Inc. † | | | 17,995 | |
| | 1,750 | | ION Geophysical Corp. † | | | 14,840 | |
| | 450 | | James River Coal Co. † | | | 11,398 | |
| | 1,200 | | Key Energy Services, Inc. † | | | 15,576 | |
| | 7,300 | | Kodiak Oil & Gas Corp. † | | | 48,180 | |
| | 8,822 | | Marathon Oil Corp. | | | 326,679 | |
| | 900 | | Massey Energy Co. | | | 48,285 | |
| | 450 | | Matrix Service Co. † | | | 5,481 | |
| | 2,875 | | McDermott International, Inc. † | | | 59,484 | |
| | 1,500 | | McMoRan Exploration Co. † | | | 25,710 | |
| | 2,400 | | Murphy Oil Corp. | | | 178,920 | |
| | 3,100 | | Nabors Industries, Ltd. † | | | 72,726 | |
| | 5,345 | | National Oilwell Varco, Inc. | | | 359,451 | |
| | 1,525 | | Newfield Exploration Co. † | | | 109,968 | |
| | 875 | | Newpark Resources, Inc. † | | | 5,390 | |
| | 100 | | NGAS Resources, Inc. † | | | 56 | |
| | 1,400 | | Noble Energy, Inc. | | | 120,512 | |
| | 400 | | Oasis Petroleum, Inc. † | | | 10,848 | |
| | 9,610 | | Occidental Petroleum Corp. | | | 942,741 | |
| | 850 | | Oceaneering International, Inc. † | | | 62,586 | |
| | 500 | | Oil States International, Inc. † | | | 32,045 | |
| | 113 | | OYO Geospace Corp. † | | | 11,199 | |
| | 100 | | Pacific Ethanol, Inc. † | | | 72 | |
| | 3,600 | | Parker Drilling Co. † | | | 16,452 | |
| | 730 | | Patriot Coal Corp. † | | | 14,140 | |
| | 1,950 | | Patterson-UTI Energy, Inc. | | | 42,023 | |
| | 3,550 | | Peabody Energy Corp. | | | 227,129 | |
| | 3,147 | | Petrohawk Energy Corp. † | | | 57,433 | |
| | 496 | | Petroleum Development Corp. † | | | 20,936 | |
| | 2,300 | | Petroquest Energy, Inc. † | | | 17,319 | |
| | 1,350 | | Pioneer Drilling Co. † | | | 11,894 | |
| | 1,325 | | Pioneer Natural Resources Co. | | | 115,036 | |
| | 1,553 | | Plains Exploration & Production Co. † | | | 49,913 | |
| | 2,050 | | Pride International, Inc. † | | | 67,650 | |
| | 1,700 | | Pyramid Oil Co. † | | | 8,704 | |
| | 2,200 | | QEP Resources, Inc. | | | 79,882 | |
| | 1,700 | | Quicksilver Resources, Inc. † | | | 25,058 | |
| | 1,900 | | Range Resources Corp. | | | 85,462 | |
| | 600 | | Rex Energy Corp. † | | | 8,190 | |
| | 600 | | Rosetta Resources, Inc. † | | | 22,584 | |
| | 1,600 | | Rowan Cos., Inc. † | | | 55,856 | |
| Wilshire Mutual Funds, Inc. | |
Wilshire 5000 Indexsm Fund | December 31, 2010 |
| Schedule of Investments | |
| Shares | | | | Value | |
| Energy (continued) | | | |
| | 1,875 | | RPC, Inc. | | $ | 33,975 | |
| | 3,400 | | SandRidge Energy, Inc. † | | | 24,888 | |
| | 16,229 | | Schlumberger, Ltd. | | | 1,355,121 | |
| | 750 | | SM Energy Co. | | | 44,198 | |
| | 1,172 | | Southern Union Co. | | | 28,210 | |
| | 3,800 | | Southwestern Energy Co. † | | | 142,234 | |
| | 8,341 | | Spectra Energy Corp. | | | 208,442 | |
| | 1,065 | | Sunoco, Inc. | | | 42,930 | |
| | 950 | | Superior Energy Services, Inc. † | | | 33,240 | |
| | 3,500 | | Syntroleum Corp. † | | | 6,475 | |
| | 500 | | T-3 Energy Services, Inc. † | | | 19,915 | |
| | 1,500 | | Tesoro Corp. | | | 27,810 | |
| | 212 | | TGC Industries, Inc. † | | | 806 | |
| | 750 | | Tidewater, Inc. | | | 40,380 | |
| | 500 | | Toreador Resources Corp. † | | | 7,760 | |
| | 1,600 | | Trico Marine Services, Inc. † | | | 195 | |
| | 1,765 | | Ultra Petroleum Corp. † | | | 84,314 | |
| | 200 | | Union Drilling, Inc. † | | | 1,456 | |
| | 500 | | Unit Corp. † | | | 23,240 | |
| | 1,150 | | USEC, Inc. † | | | 6,923 | |
| | 1,100 | | Vaalco Energy, Inc. † | | | 7,876 | |
| | 8,114 | | Valero Energy Corp. | | | 187,596 | |
| | 1,550 | | Venoco, Inc. † | | | 28,597 | |
| | 8 | | Verenium Corp. † | | | 26 | |
| | 800 | | W&T Offshore, Inc. | | | 14,296 | |
| | 300 | | Warren Resources, Inc. † | | | 1,356 | |
| | 1,500 | | Western Refining, Inc. † | | | 15,870 | |
| | 500 | | Westmoreland Coal Co. † | | | 5,970 | |
| | 7,050 | | Williams Cos., Inc. (The) | | | 174,276 | |
| | 800 | | World Fuel Services Corp. | | | 28,928 | |
| | | | | | | 18,395,636 | |
| Financials — 16.4% | | | | |
| | 200 | | 21st Century Holding Co. | | | 640 | |
| | 900 | | Abington Bancorp, Inc. | | | 10,737 | |
| | 1 | | Acadia Realty Trust | | | 18 | |
| | 600 | | Advance America Cash Advance Centers, Inc. | | | 3,384 | |
| | 200 | | Affirmative Insurance Holdings, Inc. † | | | 534 | |
| | 5,950 | | Aflac, Inc. | | | 335,759 | |
| | 7,175 | | Allstate Corp. (The) | | | 228,739 | |
| | 800 | | Alterra Capital Holdings, Ltd. | | | 17,312 | |
| | 100 | | Altisource Portfolio Solutions SA † | | | 2,871 | |
| | 1,725 | | AMB Property Corp. | | | 54,700 | |
| | 411 | | Amcore Financial, Inc. † | | | — | |
| | 807 | | American Campus Communities, Inc. | | | 25,630 | |
| | 1,100 | | American Equity Investment Life Holding Co. | | | 13,805 | |
| | 11,550 | | American Express Co. | | | 495,726 | |
| | 1,100 | | American Financial Group, Inc. | | | 35,519 | |
| | 1,900 | | American International Group, Inc. † | | | 109,478 | |
| | 300 | | American National Insurance Co. | | | 25,686 | |
| | 3,080 | | Ameriprise Financial, Inc. | | | 177,254 | |
| | 310 | | Anchor Bancorp Wisconsin, Inc. † | | | 372 | |
| | 8,225 | | Annaly Capital Management, Inc. | | | 147,392 | |
| | 1,500 | | Anworth Mortgage Asset Corp. | | | 10,500 | |
| | 2,450 | | AON Corp. | | | 112,724 | |
| | 1,256 | | Apartment Investment & Management Co., Class A | | | 32,455 | |
| | 2,200 | | Apollo Investment Corp. † | | | 24,354 | |
| | 200 | | Arbor Realty Trust, Inc. † | | | 1,192 | |
| | 400 | | Arch Capital Group, Ltd. † | | | 35,220 | |
| | 4 | | Arlington Asset Investment Corp., Class A | | | 96 | |
| | 1,150 | | Arthur J. Gallagher & Co. | | | 33,442 | |
| | 544 | | Ashford Hospitality Trust, Inc. † | | | 5,250 | |
| | 1,100 | | Aspen Insurance Holdings, Ltd. | | | 31,482 | |
| | 400 | | Asset Acceptance Capital Corp. † | | | 2,372 | |
| | 1,354 | | Associated Banc-Corp | | | 20,513 | |
| Shares | | | | Value | |
| Financials (continued) | | | |
| | 300 | | Associated Estates Realty Corp. | | $ | 4,587 | |
| | 1,400 | | Assurant, Inc. | | | 53,928 | |
| | 600 | | Assured Guaranty, Ltd. | | | 10,620 | |
| | 700 | | Astoria Financial Corp. | | | 9,737 | |
| | 847 | | AvalonBay Communities, Inc. | | | 95,330 | |
| | 600 | | Avatar Holdings, Inc. † | | | 11,892 | |
| | 1,700 | | Axis Capital Holdings, Ltd. | | | 60,996 | |
| | 50 | | Bancorp, Inc. † | | | 509 | |
| | 1,150 | | BancorpSouth, Inc. | | | 18,343 | |
| | 118,448 | | Bank of America Corp. | | | 1,580,096 | |
| | 450 | | Bank of Hawaii Corp. | | | 21,244 | |
| | 14,363 | | Bank of New York Mellon Corp. (The) | | | 433,763 | |
| | 80 | | BankAtlantic Bancorp, Inc., Class A † | | | 92 | |
| | 700 | | BankFinancial Corp. | | | 6,825 | |
| | 8,725 | | BB&T Corp. | | | 229,380 | |
| | 500 | | Beneficial Mutual Bancorp, Inc. † | | | 4,415 | |
| | 20,100 | | Berkshire Hathaway, Inc., Class B † | | | 1,610,211 | |
| | 1,000 | | BGC Partners, Inc., Class A | | | 8,310 | |
| | 1,000 | | BioMed Realty Trust, Inc. | | | 18,650 | |
| | 1,000 | | Boston Private Financial Holdings, Inc. | | | 6,550 | |
| | 1,625 | | Boston Properties, Inc. | | | 139,913 | |
| | 2,988 | | Brandywine Realty Trust | | | 34,810 | |
| | 1,325 | | BRE Properties, Inc. | | | 57,637 | |
| | 3,075 | | Brookfield Properties Corp. | | | 53,905 | |
| | 1,500 | | Brookline Bancorp, Inc. | | | 16,275 | |
| | 1,400 | | Brown & Brown, Inc. | | | 33,516 | |
| | 100 | | Camden National Corp. | | | 3,623 | |
| | 1,425 | | Camden Property Trust | | | 76,921 | |
| | 350 | | Capital City Bank Group, Inc. | | | 4,410 | |
| | 5,350 | | Capital One Financial Corp. | | | 227,696 | |
| | 3,839 | | CapitalSource, Inc. | | | 27,257 | |
| | 700 | | CapLease, Inc. | | | 4,074 | |
| | 1,700 | | Capstead Mortgage Corp. | | | 21,403 | |
| | 100 | | Cardinal Financial Corp. | | | 1,163 | |
| | 288 | | Cathay General Bancorp | | | 4,810 | |
| | 2,825 | | CB Richard Ellis Group, Inc., Class A † | | | 57,856 | |
| | 1,780 | | CBL & Associates Properties, Inc. | | | 31,150 | |
| | 650 | | Cedar Shopping Centers, Inc. | | | 4,089 | |
| | 12,914 | | Charles Schwab Corp. (The) | | | 220,959 | |
| | 400 | | Charter Financial Corp. | | | 3,560 | |
| | 1,500 | | Chemical Financial Corp. | | | 33,225 | |
| | 6,900 | | Chimera Investment Corp. | | | 28,359 | |
| | 4,200 | | Chubb Corp. | | | 250,488 | |
| | 2,394 | | Cincinnati Financial Corp. | | | 75,866 | |
| | 2,400 | | CIT Group, Inc. † | | | 113,040 | |
| | 249,750 | | Citigroup, Inc. † | | | 1,181,317 | |
| | 2,500 | | City Bank † | | | 300 | |
| | 600 | | City National Corp. | | | 36,816 | |
| | 775 | | CME Group, Inc., Class A | | | 249,356 | |
| | 500 | | CNA Surety Corp. † | | | 11,840 | |
| | 2,900 | | CNO Financial Group, Inc. † | | | 19,662 | |
| | 750 | | CoBiz Financial, Inc. | | | 4,560 | |
| | 1,000 | | Cogdell Spencer, Inc. | | | 5,800 | |
| | 350 | | Cohen & Steers, Inc. | | | 9,135 | |
| | 429 | | Colonial Properties Trust | | | 7,743 | |
| | 276 | | Columbia Banking System, Inc. | | | 5,813 | |
| | 2,173 | | Comerica, Inc. | | | 91,788 | |
| | 1,181 | | Commerce Bancshares, Inc. | | | 46,921 | |
| | 1,293 | | CommonWealth REIT | | | 32,984 | |
| | 500 | | Community Bank System, Inc. | | | 13,885 | |
| | 100 | | Community Trust Bancorp, Inc. | | | 2,896 | |
| | 200 | | CompuCredit Holdings Corp. † | | | 1,396 | |
| | 850 | | Corporate Office Properties Trust | | | 29,708 | |
| | 1,863 | | Cousins Properties, Inc. | | | 15,537 | |
| | 5,500 | | Crawford & Co., Class B † | | | 18,700 | |
| | 950 | | Cullen/Frost Bankers, Inc. | | | 58,064 | |
| | 1,000 | | CVB Financial Corp. | | | 8,670 | |
| | 6,450 | | DCT Industrial Trust, Inc. | | | 34,250 | |
| | 23 | | Deerfield Capital Corp. † | | | 149 | |
| Wilshire Mutual Funds, Inc. | |
Wilshire 5000 Indexsm Fund | December 31, 2010 |
| Schedule of Investments | |
| Shares | | | | Value | |
| Financials (continued) | | | |
| | 322 | | Delphi Financial Group, Inc., Class A | | $ | 9,286 | |
| | 3,995 | | Developers Diversified Realty Corp. | | | 56,290 | |
| | 3,502 | | DiamondRock Hospitality Co. † | | | 42,024 | |
| | 1,000 | | Digital Realty Trust, Inc. | | | 51,540 | |
| | 7,425 | | Discover Financial Services | | | 137,585 | |
| | 1,100 | | Donegal Group, Inc., Class A | | | 15,928 | |
| | 1,100 | | Douglas Emmett, Inc. | | | 18,260 | |
| | 400 | | Duff & Phelps Corp., Class A | | | 6,744 | |
| | 3,101 | | Duke Realty Corp. | | | 38,638 | |
| | 700 | | DuPont Fabros Technology, Inc. | | | 14,889 | |
| | 2,778 | | E*Trade Financial Corp. † | | | 44,448 | |
| | 2,000 | | East West Bancorp, Inc. | | | 39,100 | |
| | 1,325 | | Eaton Vance Corp. | | | 40,055 | |
| | 1,000 | | Education Realty Trust, Inc. | | | 7,770 | |
| | 1,500 | | eHealth, Inc. † | | | 21,285 | |
| | 200 | | Encore Capital Group, Inc. † | | | 4,690 | |
| | 700 | | Endurance Specialty Holdings, Ltd. | | | 32,249 | |
| | 50 | | Enterprise Financial Services Corp. | | | 523 | |
| | 300 | | Entertainment Properties Trust | | | 13,875 | |
| | 3,679 | | Equity Residential | | | 191,124 | |
| | 700 | | Everest Re Group, Ltd. | | | 59,374 | |
| | 500 | | Extra Space Storage, Inc. | | | 8,700 | |
| | 974 | | FBL Financial Group, Inc., Class A | | | 27,925 | |
| | 900 | | Federal Realty Investment Trust | | | 70,137 | |
| | 1,200 | | Federated Investors, Inc., Class B | | | 31,404 | |
| | 1,000 | | FelCor Lodging Trust, Inc. † | | | 7,040 | |
| | 3,291 | | Fidelity National Financial, Inc., Class A | | | 45,021 | |
| | 11,701 | | Fifth Third Bancorp | | | 171,771 | |
| | 1,200 | | Financial Institutions, Inc. | | | 22,764 | |
| | 100 | | First Acceptance Corp. † | | | 178 | |
| | 1,827 | | First American Financial Corp. | | | 27,295 | |
| | 300 | | First Bancorp | | | 4,593 | |
| | 2,500 | | First BanCorp † | | | 1,150 | |
| | 500 | | First Cash Financial Services, Inc. † | | | 15,495 | |
| | 800 | | First Commonwealth Financial Corp. | | | 5,664 | |
| | 425 | | First Community Bancshares, Inc. | | | 6,349 | |
| | 100 | | First Financial Corp. | | | 3,514 | |
| | 2,432 | | First Horizon National Corp. † | | | 28,653 | |
| | 650 | | First Industrial Realty Trust, Inc. † | | | 5,694 | |
| | 50 | | First Marblehead Corp. (The) † | | | 109 | |
| | 2,008 | | First Niagara Financial Group, Inc. | | | 28,072 | |
| | 800 | | First Potomac Realty Trust | | | 13,456 | |
| | 1,007 | | FirstMerit Corp. | | | 19,929 | |
| | 950 | | Flagstone Reinsurance Holdings SA | | | 11,970 | |
| | 1,500 | | FNB Corp. | | | 14,730 | |
| | 2,100 | | Forest City Enterprises, Inc., Class A † | | | 35,049 | |
| | 1,950 | | Franklin Resources, Inc. | | | 216,859 | |
| | 950 | | Franklin Street Properties Corp. | | | 13,537 | |
| | 490 | | Frontier Financial Corp. † | | | 49 | |
| | 2,734 | | Fulton Financial Corp. | | | 28,270 | |
| | 456 | | General Growth Properties, Inc. | | | 7,059 | |
| | 5,850 | | Genworth Financial, Inc., Class A † | | | 76,869 | |
| | 400 | | Getty Realty Corp. | | | 12,512 | |
| | 900 | | Glacier Bancorp, Inc. | | | 13,599 | |
| | 1,000 | | Gleacher & Co., Inc. † | | | 2,370 | |
| | 800 | | Glimcher Realty Trust | | | 6,720 | |
| | 325 | | Global Indemnity PLC, Class A † | | | 6,646 | |
| | 6,120 | | Goldman Sachs Group, Inc. (The) | | | 1,029,139 | |
| | 435 | | Gramercy Capital Corp. † | | | 1,005 | |
| | 338 | | Green Bankshares, Inc. † | | | 1,082 | |
| | 300 | | Grubb & Ellis Co. † | | | 381 | |
| | 1,000 | | Guaranty Bancorp † | | | 1,410 | |
| | 100 | | Hallmark Financial Services † | | | 910 | |
| | 550 | | Hanmi Financial Corp. † | | | 632 | |
| | 700 | | Hanover Insurance Group, Inc. (The) | | | 32,704 | |
| | 200 | | Harleysville Group, Inc. | | | 7,348 | |
| | 4,750 | | Hartford Financial Services Group, Inc. | | | 125,827 | |
| | 1,175 | | HCC Insurance Holdings, Inc. | | | 34,005 | |
| | 3,825 | | HCP, Inc. | | | 140,722 | |
| Shares | | | | Value | |
| Financials (continued) | | | |
| | 1,200 | | Health Care REIT, Inc. | | $ | 57,168 | |
| | 1,500 | | Healthcare Realty Trust, Inc. | | | 31,755 | |
| | 50 | | Heritage Commerce Corp. † | | | 224 | |
| | 700 | | Hersha Hospitality Trust, Class A | | | 4,620 | |
| | 650 | | Highwoods Properties, Inc. | | | 20,702 | |
| | 1,500 | | Hilltop Holdings, Inc. † | | | 14,880 | |
| | 660 | | Home Bancshares, Inc. | | | 14,540 | |
| | 500 | | Home Properties, Inc. | | | 27,745 | |
| | 1,000 | | Horace Mann Educators Corp. | | | 18,040 | |
| | 2,500 | | Hospitality Properties Trust | | | 57,600 | |
| | 7,624 | | Host Hotels & Resorts, Inc. | | | 136,241 | |
| | 44 | | Howard Hughes Corp. (The) † | | | 2,394 | |
| | 6,626 | | Hudson City Bancorp, Inc. | | | 84,415 | |
| | 7,351 | | Huntington Bancshares, Inc. | | | 50,501 | |
| | 85 | | IMPAC Mortgage Holdings, Inc. † | | | 234 | |
| | 300 | | Infinity Property & Casualty Corp. | | | 18,540 | |
| | 1,100 | | Inland Real Estate Corp. | | | 9,680 | |
| | 1,500 | | Interactive Brokers Group, Inc., Class A | | | 26,730 | |
| | 875 | | IntercontinentalExchange, Inc. † | | | 104,256 | |
| | 500 | | International Assets Holding Corp. † | | | 11,800 | |
| | 700 | | International Bancshares Corp. | | | 14,021 | |
| | 100 | | Internet Capital Group, Inc. † | | | 1,422 | |
| | 550 | | Intervest Bancshares Corp., Class A † | | | 1,617 | |
| | 5,700 | | Invesco, Ltd. | | | 137,142 | |
| | 2,000 | | Investment Technology Group, Inc. † | | | 32,740 | |
| | 800 | | Investors Bancorp, Inc. † | | | 10,496 | |
| | 1,800 | | Investors Real Estate Trust | | | 16,146 | |
| | 1,564 | | iStar Financial, Inc. † | | | 12,230 | |
| | 2,475 | | Janus Capital Group, Inc. | | | 32,101 | |
| | 1,700 | | Jefferies Group, Inc. | | | 45,271 | |
| | 46,859 | | JPMorgan Chase & Co. | | | 1,987,759 | |
| | 600 | | Kearny Financial Corp. | | | 5,160 | |
| | 12,173 | | KeyCorp | | | 107,731 | |
| | 700 | | Kilroy Realty Corp. | | | 25,529 | |
| | 4,625 | | Kimco Realty Corp. | | | 83,435 | |
| | 800 | | Kite Realty Group Trust | | | 4,328 | |
| | 400 | | Knight Capital Group, Inc., Class A † | | | 5,516 | |
| | 200 | | LaBranche & Co., Inc. † | | | 720 | |
| | 1,500 | | LaSalle Hotel Properties | | | 39,600 | |
| | 1,700 | | Legg Mason, Inc. | | | 61,659 | |
| | 2,505 | | Leucadia National Corp. | | | 73,096 | |
| | 1,626 | | Lexington Realty Trust | | | 12,927 | |
| | 1,450 | | Liberty Property Trust | | | 46,284 | |
| | 3,700 | | Lincoln National Corp. | | | 102,897 | |
| | 4,200 | | Loews Corp. | | | 163,422 | |
| | 937 | | M&T Bank Corp. | | | 81,566 | |
| | 1,287 | | Macerich Co. (The) | | | 60,965 | |
| | 1,500 | | Mack-Cali Realty Corp. | | | 49,590 | |
| | 1,000 | | Maiden Holdings, Ltd. | | | 7,860 | |
| | 5,370 | | Marsh & McLennan Cos., Inc. | | | 146,816 | |
| | 9,732 | | Marshall & Ilsley Corp. | | | 67,345 | |
| | 244 | | MB Financial, Inc. | | | 4,226 | |
| | 1,900 | | MBIA, Inc. † | | | 22,781 | |
| | 967 | | Meadowbrook Insurance Group, Inc. | | | 9,912 | |
| | 600 | | Medallion Financial Corp. | | | 4,920 | |
| | 500 | | Medical Properties Trust, Inc. | | | 5,415 | |
| | 10,521 | | MetLife, Inc. | | | 467,553 | |
| | 2,600 | | MF Global Holdings, Ltd. † | | | 21,736 | |
| | 3,000 | | MFA Financial, Inc. | | | 24,480 | |
| | 1,500 | | MGIC Investment Corp. † | | | 15,285 | |
| | 100 | | Mid-America Apartment Communities, Inc. | | | 6,349 | |
| | 400 | | Montpelier Re Holdings, Ltd. | | | 7,976 | |
| | 2,575 | | Moody's Corp. | | | 68,341 | |
| | 14,825 | | Morgan Stanley | | | 403,388 | |
| | 7,800 | | MPG Office Trust, Inc. † | | | 21,450 | |
| | 1,072 | | MSCI, Inc., Class A † | | | 41,765 | |
| | 600 | | Nara Bancorp, Inc. † | | | 5,892 | |
| | 2,450 | | NASDAQ OMX Group, Inc. (The) † | | | 58,090 | |
| Wilshire Mutual Funds, Inc. | |
Wilshire 5000 Indexsm Fund | December 31, 2010 |
| Schedule of Investments | |
| Shares | | | | Value | |
| Financials (continued) | | | |
| | 400 | | National Interstate Corp. | | $ | 8,560 | |
| | 2,500 | | National Penn Bancshares, Inc. | | | 20,075 | |
| | 1,500 | | National Retail Properties, Inc. | | | 39,750 | |
| | 1,450 | | Nationwide Health Properties, Inc. | | | 52,751 | |
| | 500 | | NBT Bancorp, Inc. | | | 12,075 | |
| | 4,312 | | New York Community Bancorp, Inc. | | | 81,281 | |
| | 2,600 | | NewAlliance Bancshares, Inc. | | | 38,948 | |
| | 350 | | Newcastle Investment Corp. † | | | 2,345 | |
| | 10 | | North Valley Bancorp † | | | 83 | |
| | 2,850 | | Northern Trust Corp. | | | 157,918 | |
| | 156 | | NorthStar Realty Finance Corp. | | | 741 | |
| | 875 | | Northwest Bancshares, Inc. | | | 10,290 | |
| | 3,350 | | NYSE Euronext | | | 100,433 | |
| | 300 | | Ocwen Financial Corp. † | | | 2,862 | |
| | 1,500 | | Old National Bancorp | | | 17,835 | |
| | 3,236 | | Old Republic International Corp. | | | 44,107 | |
| | 400 | | Old Second Bancorp, Inc. | | | 644 | |
| | 800 | | Omega Healthcare Investors, Inc. | | | 17,952 | |
| | 600 | | OneBeacon Insurance Group, Ltd., Class A | | | 9,096 | |
| | 432 | | Oriental Financial Group, Inc. | | | 5,396 | |
| | 400 | | Oritani Financial Corp. | | | 4,896 | |
| | 200 | | Parkway Properties, Inc. | | | 3,504 | |
| | 900 | | PartnerRe, Ltd. | | | 72,315 | |
| | 4,347 | | People's United Financial, Inc. | | | 60,901 | |
| | 123 | | PHH Corp. † | | | 2,847 | |
| | 1,250 | | Phoenix Cos., Inc. (The) † | | | 3,175 | |
| | 1,500 | | Pinnacle Financial Partners, Inc. † | | | 20,370 | |
| | 500 | | Platinum Underwriters Holdings, Ltd. | | | 22,485 | |
| | 2,684 | | Plum Creek Timber Co., Inc. | | | 100,516 | |
| | 1,725 | | PMI Group, Inc. (The) † | | | 5,692 | |
| | 11,575 | | Popular, Inc. † | | | 36,345 | |
| | 600 | | Post Properties, Inc. | | | 21,780 | |
| | 1,000 | | Preferred Bank † | | | 1,760 | |
| | 100 | | Primus Guaranty, Ltd. † | | | 508 | |
| | 4,400 | | Principal Financial Group, Inc. | | | 143,264 | |
| | 1,222 | | PrivateBancorp, Inc., Class A | | | 17,572 | |
| | 265 | | ProAssurance Corp. † | | | 16,059 | |
| | 7,125 | | Progressive Corp. (The) | | | 141,574 | |
| | 6,744 | | ProLogis | | | 97,383 | |
| | 1,000 | | Protective Life Corp. | | | 26,640 | |
| | 1,500 | | Provident Financial Services, Inc. | | | 22,695 | |
| | 1,050 | | Provident New York Bancorp | | | 11,015 | |
| | 5,850 | | Prudential Financial, Inc. | | | 343,453 | |
| | 1,639 | | Public Storage | | | 166,227 | |
| | 2,077 | | Pzena Investment Management, Inc., Class A | | | 15,266 | |
| | 1,370 | | Radian Group, Inc. | | | 11,056 | |
| | 200 | | RAIT Financial Trust † | | | 438 | |
| | 1,000 | | Ramco-Gershenson Properties Trust | | | 12,450 | |
| | 1,200 | | Raymond James Financial, Inc. | | | 39,240 | |
| | 1,001 | | Rayonier, Inc. | | | 52,573 | |
| | 1,300 | | Realty Income Corp. | | | 44,460 | |
| | 2,200 | | Redwood Trust, Inc. | | | 32,846 | |
| | 1,025 | | Regency Centers Corp. | | | 43,296 | |
| | 18,606 | | Regions Financial Corp. | | | 130,242 | |
| | 850 | | Reinsurance Group of America, Inc., Class A | | | 45,653 | |
| | 700 | | RenaissanceRe Holdings, Ltd. | | | 44,583 | |
| | 50 | | Renasant Corp. | | | 846 | |
| | 315 | | Republic Bancorp, Inc., Class A | | | 7,481 | |
| | 250 | | Resource America, Inc., Class A | | | 1,713 | |
| | 200 | | Resource Capital Corp. | | | 1,476 | |
| | 1,700 | | Roma Financial Corp. | | | 18,020 | |
| | 233 | | Sabra Healthcare REIT, Inc. | | | 4,287 | |
| | 200 | | Saul Centers, Inc. | | | 9,470 | |
| | 700 | | SeaBright Holdings, Inc. | | | 6,454 | |
| | 750 | | Seacoast Banking Corp. of Florida † | | | 1,095 | |
| | 600 | | Selective Insurance Group, Inc. | | | 10,890 | |
| Shares | | | | Value | |
| Financials (continued) | | | |
| | 1,650 | | Senior Housing Properties Trust | | $ | 36,201 | |
| | 400 | | Signature Bank † | | | 20,000 | |
| | 200 | | Simmons First National Corp., Class A | | | 5,700 | |
| | 3,496 | | Simon Property Group, Inc. | | | 347,817 | |
| | 1,000 | | SL Green Realty Corp. | | | 67,510 | |
| | 5,500 | | SLM Corp. † | | | 69,245 | |
| | 50 | | Southwest Bancorp, Inc. | | | 620 | |
| | 316 | | Sovran Self Storage, Inc. | | | 11,632 | |
| | 1,500 | | St. Joe Co. (The) † | | | 32,775 | |
| | 490 | | StanCorp Financial Group, Inc. | | | 22,119 | |
| | 400 | | State Auto Financial Corp. | | | 6,968 | |
| | 6,315 | | State Street Corp. | | | 292,637 | |
| | 50 | | Sterling Bancorp | | | 523 | |
| | 1,100 | | Sterling Bancshares, Inc. | | | 7,722 | |
| | 300 | | Stewart Information Services Corp. | | | 3,459 | |
| | 427 | | Stifel Financial Corp. † | | | 26,491 | |
| | 100 | | Strategic Hotels & Resorts, Inc. † | | | 529 | |
| | 50 | | Suffolk Bancorp | | | 1,234 | |
| | 822 | | Sun Bancorp, Inc. † | | | 3,814 | |
| | 500 | | Sun Communities, Inc. | | | 16,655 | |
| | 2,595 | | Sunstone Hotel Investors, Inc. † | | | 26,806 | |
| | 6,580 | | SunTrust Banks, Inc. | | | 194,176 | |
| | 150 | | Superior Bancorp † | | | 86 | |
| | 2,190 | | Susquehanna Bancshares, Inc. | | | 21,199 | |
| | 450 | | SVB Financial Group † | | | 23,872 | |
| | 10,831 | | Synovus Financial Corp. | | | 28,594 | |
| | 3,525 | | T Rowe Price Group, Inc. | | | 227,504 | |
| | 500 | | Taubman Centers, Inc. | | | 25,240 | |
| | 500 | | Taylor Capital Group, Inc. † | | | 6,575 | |
| | 1,500 | | TCF Financial Corp. | | | 22,215 | |
| | 4,103 | | TD Ameritrade Holding Corp. | | | 77,916 | |
| | 50 | | Tejon Ranch Co. † | | | 1,378 | |
| | 784 | | Texas Capital Bancshares, Inc. † | | | 16,676 | |
| | 1,250 | | TFS Financial Corp. | | | 11,275 | |
| | 1,000 | | Torchmark Corp. | | | 59,740 | |
| | 100 | | TowneBank | | | 1,589 | |
| | 100 | | TradeStation Group, Inc. † | | | 675 | |
| | 5,259 | | Travelers Cos., Inc. (The) | | | 292,979 | |
| | 90 | | Tree.com, Inc. † | | | 850 | |
| | 400 | | Trico Bancshares | | | 6,460 | |
| | 1,208 | | Trustco Bank Corp. | | | 7,659 | |
| | 22,609 | | U.S. Bancorp | | | 609,765 | |
| | 2,328 | | UDR, Inc. | | | 54,755 | |
| | 760 | | UMB Financial Corp. | | | 31,479 | |
| | 2,300 | | Umpqua Holdings Corp. | | | 28,014 | |
| | 2,374 | | United Community Banks, Inc. † | | | 4,629 | |
| | 317 | | United Community Financial Corp. † | | | 409 | |
| | 403 | | United Financial Bancorp, Inc. | | | 6,154 | |
| | 300 | | United Fire & Casualty Co. | | | 6,696 | |
| | 400 | | United PanAm Financial Corp. † | | | 2,740 | |
| | 327 | | United Security Bancshares † | | | 1,230 | |
| | 350 | | Unitrin, Inc. | | | 8,589 | |
| | 200 | | Universal Health Realty Income Trust | | | 7,306 | |
| | 3,407 | | Unum Group | | | 82,518 | |
| | 500 | | Urstadt Biddle Properties, Inc., Class A | | | 9,725 | |
| | 937 | | U-Store-It Trust | | | 8,930 | |
| | 300 | | Validus Holdings, Ltd. | | | 9,183 | |
| | 1,661 | | Valley National Bancorp | | | 23,752 | |
| | 1,775 | | Ventas, Inc. | | | 93,152 | |
| | 565 | | Virginia Commerce Bancorp, Inc. † | | | 3,492 | |
| | 157 | | Virtus Investment Partners, Inc. † | | | 7,123 | |
| | 5,450 | | Visa, Inc., Class A | | | 383,571 | |
| | 2,377 | | Vornado Realty Trust | | | 198,075 | |
| | 15 | | W Holding Co., Inc. † | | | 3 | |
| | 2,187 | | W.R. Berkley Corp. | | | 59,880 | |
| | 1,400 | | Waddell & Reed Financial, Inc., Class A | | | 49,406 | |
| | 219 | | Walter Investment Management Corp. | | | 3,929 | |
| | 1,333 | | Washington Federal, Inc. | | | 22,554 | |
| | 250 | | Washington Real Estate Investment Trust | | | 7,748 | |
| Wilshire Mutual Funds, Inc. | |
Wilshire 5000 Indexsm Fund | December 31, 2010 |
| Schedule of Investments | |
| Shares | | | | Value | |
| Financials (continued) | | | |
| | 400 | | Washington Trust Bancorp, Inc. | | $ | 8,752 | |
| | 550 | | Waterstone Financial, Inc. † | | | 1,788 | |
| | 1,700 | | Weingarten Realty Investors | | | 40,392 | |
| | 58,123 | | Wells Fargo & Co. | | | 1,801,232 | |
| | 383 | | Westamerica Bancorporation | | | 21,245 | |
| | 1,150 | | Western Alliance Bancorp † | | | 8,464 | |
| | 200 | | Westfield Financial, Inc. | | | 1,850 | |
| | 1,500 | | Whitney Holding Corp. | | | 21,225 | |
| | 700 | | Wilmington Trust Corp. | | | 3,038 | |
| | 700 | | Wilshire Bancorp, Inc. | | | 5,334 | |
| | 500 | | Wintrust Financial Corp. | | | 16,515 | |
| | 10 | | WP Stewart & Co., Ltd. † | | | 80 | |
| | 1,630 | | Zions Bancorporation | | | 39,495 | |
| | 400 | | ZipRealty, Inc. † | | | 1,040 | |
| | | | | | | 26,347,263 | |
| Health Care — 11.0% | | | | |
| | 18,200 | | Abbott Laboratories | | | 871,962 | |
| | 100 | | Acadia Pharmaceuticals, Inc. † | | | 119 | |
| | 546 | | Accelrys, Inc. † | | | 4,532 | |
| | 100 | | ADAM, Inc. † | | | 719 | |
| | 100 | | Adolor Corp. † | | | 121 | |
| | 5,200 | | Aetna, Inc. | | | 158,652 | |
| | 200 | | Affymetrix, Inc. † | | | 1,006 | |
| | 3,746 | | Agilent Technologies, Inc. † | | | 155,197 | |
| | 300 | | Air Methods Corp. † | | | 16,881 | |
| | 400 | | Akorn, Inc. † | | | 2,428 | |
| | 700 | | Albany Molecular Research, Inc. † | | | 3,934 | |
| | 1,500 | | Alere, Inc. † | | | 54,900 | |
| | 900 | | Alexion Pharmaceuticals, Inc. † | | | 72,495 | |
| | 2,150 | | Align Technology, Inc. † | | | 42,011 | |
| | 3,580 | | Allergan, Inc. | | | 245,839 | |
| | 700 | | Alliance HealthCare Services, Inc. † | | | 2,968 | |
| | 1,600 | | Allos Therapeutics, Inc. † | | | 7,376 | |
| | 1,500 | | Allscripts Healthcare Solutions, Inc. † | | | 28,905 | |
| | 1,321 | | Alnylam Pharmaceuticals, Inc. † | | | 13,025 | |
| | 100 | | AMAG Pharmaceuticals, Inc. † | | | 1,810 | |
| | 201 | | Amedisys, Inc. † | | | 6,733 | |
| | 1,800 | | American Caresource Holdings, Inc. † | | | 2,520 | |
| | 900 | | American Medical Systems Holdings, Inc. † | | | 16,974 | |
| | 500 | | AMERIGROUP Corp. † | | | 21,960 | |
| | 4,180 | | AmerisourceBergen Corp., Class A | | | 142,622 | |
| | 11,302 | | Amgen, Inc. † | | | 620,480 | |
| | 300 | | Amicus Therapeutics, Inc. † | | | 1,383 | |
| | 250 | | AMN Healthcare Services, Inc. † | | | 1,535 | |
| | 400 | | Amsurg Corp., Class A † | | | 8,380 | |
| | 1,250 | | Amylin Pharmaceuticals, Inc. † | | | 18,387 | |
| | 600 | | Angeion Corp. † | | | 3,180 | |
| | 500 | | Anika Therapeutics, Inc. † | | | 3,315 | |
| | 300 | | Arena Pharmaceuticals, Inc. † | | | 516 | |
| | 2,400 | | ARYx Therapeutics, Inc. † | | | 648 | |
| | 500 | | AspenBio Pharma, Inc. † | | | 302 | |
| | 200 | | Atherogenics, Inc. (a) † | | | — | |
| | 6,888 | | Baxter International, Inc. | | | 348,671 | |
| | 800 | | Beckman Coulter, Inc. | | | 60,184 | |
| | 2,575 | | Becton Dickinson and Co. | | | 217,639 | |
| | 800 | | Biodel, Inc. † | | | 1,464 | |
| | 2,055 | | Biogen Idec, Inc. † | | | 137,788 | |
| | 1,000 | | BioMarin Pharmaceutical, Inc. † | | | 26,930 | |
| | 500 | | Bio-Rad Laboratories, Inc., Class A † | | | 51,925 | |
| | 16,439 | | Boston Scientific Corp. † | | | 124,443 | |
| | 19,050 | | Bristol-Myers Squibb Co. | | | 504,444 | |
| | 1,000 | | Brookdale Senior Living, Inc., Class A † | | | 21,410 | |
| | 1,000 | | Bruker Corp. † | | | 16,600 | |
| | 200 | | BSD Medical Corp. † | | | 924 | |
| | 1,225 | | C.R. Bard, Inc. | | | 112,418 | |
| | 700 | | Cadence Pharmaceuticals, Inc. † | | | 5,285 | |
| | 3,100 | | Cambrex Corp. † | | | 16,027 | |
| Shares | | | | Value | |
| Health Care (continued) | | | |
| | 100 | | Capital Senior Living Corp. † | | $ | 670 | |
| | 1,150 | | Caraco Pharmaceutical Laboratories, Ltd. † | | | 5,221 | |
| | 3,986 | | Cardinal Health, Inc. | | | 152,704 | |
| | 2,293 | | CareFusion Corp. † | | | 58,930 | |
| | 500 | | Catalyst Health Solutions, Inc. † | | | 23,245 | |
| | 1,500 | | Celera Corp. † | | | 9,450 | |
| | 5,676 | | Celgene Corp. † | | | 335,679 | |
| | 6,800 | | Cell Therapeutics, Inc. † | | | 2,482 | |
| | 27 | | Celldex Therapeutics, Inc. † | | | 111 | |
| | 825 | | Cephalon, Inc. † | | | 50,919 | |
| | 1,500 | | Cepheid, Inc. † | | | 34,125 | |
| | 800 | | Cerner Corp. † | | | 75,792 | |
| | 1,000 | | Charles River Laboratories International, Inc. † | | | 35,540 | |
| | 3,400 | | CIGNA Corp. | | | 124,644 | |
| | 200 | | Cleveland Biolabs, Inc. † | | | 1,444 | |
| | 37 | | Codexis, Inc. † | | | 392 | |
| | 1,100 | | Community Health Systems, Inc. † | | | 41,107 | |
| | 100 | | Computer Programs & Systems, Inc. | | | 4,684 | |
| | 243 | | Conceptus, Inc. † | | | 3,353 | |
| | 300 | | CONMED Corp. † | | | 7,929 | |
| | 400 | | Cooper Cos., Inc. (The) | | | 22,536 | |
| | 1,500 | | Cornerstone Therapeutics, Inc. † | | | 8,685 | |
| | 550 | | Covance, Inc. † | | | 28,275 | |
| | 2,416 | | Coventry Health Care, Inc. † | | | 63,782 | |
| | 500 | | Cubist Pharmaceuticals, Inc. † | | | 10,700 | |
| | 1,500 | | Cyberonics, Inc. † | | | 46,530 | |
| | 1,477 | | Cynosure, Inc., Class A † | | | 15,110 | |
| | 2,300 | | Cytori Therapeutics, Inc. † | | | 11,937 | |
| | 1,075 | | DaVita, Inc. † | | | 74,702 | |
| | 1,700 | | Dendreon Corp. † | | | 59,364 | |
| | 2,075 | | DENTSPLY International, Inc. | | | 70,903 | |
| | 200 | | Dionex Corp. † | | | 23,602 | |
| | 100 | | Dyax Corp. † | | | 214 | |
| | 1,100 | | Edwards Lifesciences Corp. † | | | 88,924 | |
| | 10,395 | | Eli Lilly & Co. | | | 364,241 | |
| | 1,243 | | Emdeon, Inc., Class A † | | | 16,830 | |
| | 200 | | Emergency Medical Services Corp., Class A † | �� | | 12,922 | |
| | 793 | | Emergent Biosolutions, Inc. † | | | 18,604 | |
| | 3,500 | | Emergent Group, Inc. | | | 22,435 | |
| | 889 | | Emeritus Corp. † | | | 17,522 | |
| | 1,650 | | Endo Pharmaceuticals Holdings, Inc. † | | | 58,921 | |
| | 1,100 | | eResearchTechnology, Inc. † | | | 8,085 | |
| | 800 | | Exelixis, Inc. † | | | 6,568 | |
| | 6,200 | | Express Scripts, Inc., Class A † | | | 335,110 | |
| | 100 | | Five Star Quality Care, Inc. † | | | 707 | |
| | 2,600 | | Forest Laboratories, Inc. † | | | 83,148 | |
| | 116 | | Furiex Pharmaceuticals, Inc. † | | | 1,676 | |
| | 1,500 | | Genomic Health, Inc. † | | | 32,085 | |
| | 300 | | Genoptix, Inc. † | | | 5,706 | |
| | 575 | | Gen-Probe, Inc. † | | | 33,551 | |
| | 50 | | Gentiva Health Services, Inc. † | | | 1,330 | |
| | 3,305 | | Genzyme Corp. † | | | 235,316 | |
| | 1,100 | | Geron Corp. † | | | 5,687 | |
| | 10,700 | | Gilead Sciences, Inc. † | | | 387,768 | |
| | 450 | | GTx, Inc. † | | | 1,193 | |
| | 1,700 | | Halozyme Therapeutics, Inc. † | | | 13,464 | |
| | 3,350 | | Health Management Associates, Inc., Class A † | | | 31,959 | |
| | 1,700 | | Health Net, Inc. † | | | 46,393 | |
| | 1,000 | | Healthsouth Corp. † | | | 20,710 | |
| | 1,500 | | Healthspring, Inc. † | | | 39,795 | |
| | 1,100 | | Henry Schein, Inc. † | | | 67,529 | |
| | 300 | | Hill-Rom Holdings, Inc. | | | 11,811 | |
| | 2,452 | | Hologic, Inc. † | | | 46,147 | |
| | 1,740 | | Hospira, Inc. † | | | 96,901 | |
| | 1,650 | | Human Genome Sciences, Inc. † | | | 39,418 | |
| Wilshire Mutual Funds, Inc. | |
Wilshire 5000 Indexsm Fund | December 31, 2010 |
| Schedule of Investments | |
| Shares | | | | Value | |
| Health Care (continued) | | | |
| | 1,500 | | Humana, Inc. † | | $ | 82,110 | |
| | 200 | | ICU Medical, Inc. † | | | 7,300 | |
| | 1,300 | | Idenix Pharmaceuticals, Inc. † | | | 6,552 | |
| | 1,888 | | Illumina, Inc. † | | | 119,586 | |
| | 780 | | Immucor, Inc. † | | | 15,467 | |
| | 3,500 | | Incyte Corp., Ltd. † | | | 57,960 | |
| | 600 | | Infinity Pharmaceuticals, Inc. † | | | 3,558 | |
| | 300 | | Integra LifeSciences Holdings Corp. † | | | 14,190 | |
| | 450 | | InterMune, Inc. † | | | 16,380 | |
| | 300 | | Intuitive Surgical, Inc. † | | | 77,325 | |
| | 200 | | IRIS International, Inc. † | | | 2,046 | |
| | 700 | | Isis Pharmaceuticals, Inc. † | | | 7,084 | |
| | 2,300 | | Jazz Pharmaceuticals, Inc. † | | | 45,264 | |
| | 32,585 | | Johnson & Johnson | | | 2,015,382 | |
| | 300 | | Kendle International, Inc. † | | | 3,267 | |
| | 300 | | Keryx Biopharmaceuticals, Inc. † | | | 1,374 | |
| | 650 | | Kinetic Concepts, Inc. † | | | 27,222 | |
| | 3,624 | | King Pharmaceuticals, Inc. † | | | 50,917 | |
| | 4,500 | | KV Pharmaceutical Co., Class A † | | | 11,475 | |
| | 1,475 | | Laboratory Corp. of America Holdings † | | | 129,682 | |
| | 200 | | LCA-Vision, Inc. † | | | 1,150 | |
| | 600 | | LHC Group, Inc. † | | | 18,000 | |
| | 2,233 | | Life Technologies Corp. † | | | 123,932 | |
| | 565 | | LifePoint Hospitals, Inc. † | | | 20,764 | |
| | 16 | | Ligand Pharmaceuticals, Inc., Class B † | | | 143 | |
| | 1,050 | | Lincare Holdings, Inc. | | | 28,172 | |
| | 400 | | Magellan Health Services, Inc. † | | | 18,912 | |
| | 500 | | MAKO Surgical Corp. † | | | 7,610 | |
| | 1,600 | | MannKind Corp. † | | | 12,896 | |
| | 50 | | Marina Biotech, Inc. † | | | 78 | |
| | 300 | | Martek Biosciences Corp. † | | | 9,390 | |
| | 600 | | Masimo Corp. | | | 17,442 | |
| | 200 | | Maxygen, Inc. | | | 786 | |
| | 2,900 | | McKesson Corp. | | | 204,102 | |
| | 400 | | MedAssets, Inc. † | | | 8,076 | |
| | 4,648 | | Medco Health Solutions, Inc. † | | | 284,783 | |
| | 600 | | Medicis Pharmaceutical Corp., Class A | | | 16,074 | |
| | 600 | | Mednax, Inc. † | | | 40,374 | |
| | 12,868 | | Medtronic, Inc. | | | 477,274 | |
| | 32,655 | | Merck & Co., Inc. | | | 1,176,886 | |
| | 100 | | Merge Healthcare, Inc. † | | | 373 | |
| | 400 | | Molina Healthcare, Inc. † | | | 11,140 | |
| | 1,200 | | Momenta Pharmaceuticals, Inc. † | | | 17,964 | |
| | 4,150 | | Mylan, Inc. † | | | 87,690 | |
| | 375 | | Myrexis, Inc. † | | | 1,560 | |
| | 1,500 | | Myriad Genetics, Inc. † | | | 34,260 | |
| | 300 | | National Healthcare Corp. | | | 13,881 | |
| | 950 | | Nektar Therapeutics † | | | 12,207 | |
| | 200 | | Neurocrine Biosciences, Inc. † | | | 1,528 | |
| | 900 | | Oculus Innovative Sciences, Inc. † | | | 1,521 | |
| | 2,500 | | Omnicare, Inc. | | | 63,475 | |
| | 1,325 | | Onyx Pharmaceuticals, Inc. † | | | 48,853 | |
| | 1,500 | | Optimer Pharmaceuticals, Inc. † | | | 16,965 | |
| | 750 | | Orexigen Therapeutics, Inc. † | | | 6,060 | |
| | 700 | | Owens & Minor, Inc. | | | 20,601 | |
| | 50 | | Palomar Medical Technologies, Inc. † | | | 710 | |
| | 500 | | Parexel International Corp. † | | | 10,615 | |
| | 1,950 | | Patterson Cos., Inc. | | | 59,729 | |
| | 800 | | PDI, Inc. † | | | 8,432 | |
| | 1,100 | | PDL BioPharma, Inc. | | | 6,853 | |
| | 1,517 | | PerkinElmer, Inc. | | | 39,169 | |
| | 1,100 | | Perrigo Co. | | | 69,663 | |
| | 94,904 | | Pfizer, Inc. | | | 1,661,769 | |
| | 1,400 | | Pharmaceutical Product Development, Inc. | | | 37,996 | |
| | 381 | | PharMerica Corp. † | | | 4,362 | |
| | 400 | | Pozen, Inc. † | | | 2,660 | |
| | 800 | | Progenics Pharmaceuticals, Inc. † | | | 4,368 | |
| | 200 | | Providence Service Corp. (The) † | | | 3,214 | |
| Shares | | | | Value | |
| Health Care (continued) | | | |
| | 500 | | PSS World Medical, Inc. † | | $ | 11,300 | |
| | 200 | | Pure Bioscience † | | | 444 | |
| | 2,325 | | Quest Diagnostics, Inc. | | | 125,480 | |
| | 1,000 | | Questcor Pharmaceuticals, Inc. † | | | 14,730 | |
| | 600 | | Regeneron Pharmaceuticals, Inc. † | | | 19,698 | |
| | 1,800 | | ResMed, Inc. † | | | 62,352 | |
| | 1,600 | | Rigel Pharmaceuticals, Inc. † | | | 12,048 | |
| | 418 | | RTI Biologics, Inc. † | | | 1,116 | |
| | 500 | | RXi Pharmaceuticals Corp. † | | | 1,290 | |
| | 600 | | Salix Pharmaceuticals, Ltd. † | | | 28,176 | |
| | 300 | | Sangamo Biosciences, Inc. † | | | 1,992 | |
| | 800 | | Savient Pharmaceuticals, Inc. † | | | 8,912 | |
| | 1,500 | | Seattle Genetics, Inc. † | | | 22,425 | |
| | 1,500 | | Sequenom, Inc. † | | | 12,030 | |
| | 600 | | Simulations Plus, Inc. † | | | 1,614 | |
| | 350 | | Sirona Dental Systems, Inc. † | | | 14,623 | |
| | 700 | | Skilled Healthcare Group, Inc., Class A † | | | 6,286 | |
| | 600 | | Solta Medical, Inc. † | | | 1,830 | |
| | 100 | | Somaxon Pharmaceuticals, Inc. † | | | 315 | |
| | 4,250 | | St. Jude Medical, Inc. † | | | 181,688 | |
| | 650 | | STERIS Corp. | | | 23,699 | |
| | 3,070 | | Stryker Corp. | | | 164,859 | |
| | 233 | | Sun Healthcare Group, Inc. † | | | 2,950 | |
| | 200 | | Symmetry Medical, Inc. † | | | 1,850 | |
| | 400 | | Synta Pharmaceuticals Corp. † | | | 2,448 | |
| | 1,500 | | Talecris Biotherapeutics Holdings Corp. † | | | 34,950 | |
| | 500 | | Techne Corp. | | | 32,835 | |
| | 500 | | Teleflex, Inc. | | | 26,905 | |
| | 5,626 | | Tenet Healthcare Corp. † | | | 37,638 | |
| | 5,159 | | Thermo Fisher Scientific, Inc. † | | | 285,602 | |
| | 600 | | Thoratec Corp. † | | | 16,992 | |
| | 1,000 | | TranS1, Inc. † | | | 2,070 | |
| | 50 | | Transcend Services, Inc. † | | | 979 | |
| | 80 | | Transcept Pharmaceuticals, Inc. † | | | 592 | |
| | 600 | | Triple-S Management Corp., Class B † | | | 11,448 | |
| | 600 | | United American Healthcare Corp. † | | | 162 | |
| | 12,512 | | UnitedHealth Group, Inc. | | | 451,808 | |
| | 500 | | Universal American Corp. | | | 10,225 | |
| | 1,600 | | Varian Medical Systems, Inc. † | | | 110,848 | |
| | 1,500 | | VCA Antech, Inc. † | | | 34,935 | |
| | 2,100 | | Vertex Pharmaceuticals, Inc. † | | | 73,563 | |
| | 800 | | Viropharma, Inc. † | | | 13,856 | |
| | 500 | | Volcano Corp. † | | | 13,655 | |
| | 1,200 | | Waters Corp. † | | | 93,252 | |
| | 1,350 | | Watson Pharmaceuticals, Inc. † | | | 69,728 | |
| | 5,091 | | WellPoint, Inc. † | | | 289,474 | |
| | 2,400 | | Zimmer Holdings, Inc. † | | | 128,832 | |
| | 1,300 | | Zoll Medical Corp. † | | | 48,399 | |
| | | | | | | 17,658,690 | |
| Industrials — 11.0% | | | | |
| | 7,900 | | 3M Co. | | | 681,770 | |
| | 1,500 | | A123 Systems, Inc. † | | | 14,310 | |
| | 300 | | Acacia Research-Acacia Technologies † | | | 7,782 | |
| | 240 | | Actuant Corp., Class A | | | 6,389 | |
| | 300 | | Acuity Brands, Inc. | | | 17,301 | |
| | 36 | | Administaff, Inc. | | | 1,055 | |
| | 1,100 | | Aecom Technology Corp. † | | | 30,767 | |
| | 1,200 | | AeroCentury Corp. † | | | 21,720 | |
| | 850 | | AGCO Corp. † | | | 43,061 | |
| | 3,200 | | Aircastle, Ltd. | | | 33,440 | |
| | 1,500 | | AirTran Holdings, Inc. † | | | 11,085 | |
| | 300 | | Alaska Air Group, Inc. † | | | 17,007 | |
| | 1,000 | | Albany International Corp., Class A | | | 23,690 | |
| | 350 | | Alexander & Baldwin, Inc. | | | 14,011 | |
| | 250 | | Alliant Techsystems, Inc. | | | 18,608 | |
| | 100 | | Amerco, Inc. † | | | 9,604 | |
| | 151 | | Ameron International Corp. | | | 11,532 | |
| | 1,575 | | AMETEK, Inc. | | | 61,819 | |
| Wilshire Mutual Funds, Inc. | |
Wilshire 5000 Indexsm Fund | December 31, 2010 |
| Schedule of Investments | |
| Shares | | | | Value | |
| Industrials (continued) | | | |
| | 3,275 | | AMR Corp. † | | $ | 25,512 | |
| | 1,500 | | Amrep Corp. † | | | 18,045 | |
| | 500 | | Apogee Enterprises, Inc. | | | 6,735 | |
| | 200 | | Applied Signal Technology, Inc. | | | 7,578 | |
| | 200 | | Armstrong World Industries, Inc. | | | 8,600 | |
| | 550 | | ArvinMeritor, Inc. † | | | 11,286 | |
| | 250 | | Ascent Solar Technologies, Inc. † | | | 840 | |
| | 200 | | Astec Industries, Inc. † | | | 6,482 | |
| | 1,100 | | Avery Dennison Corp. | | | 46,574 | |
| | 992 | | Avis Budget Group, Inc. † | | | 15,436 | |
| | 300 | | AZZ, Inc. | | | 12,003 | |
| | 1,437 | | Babcock & Wilcox Co. † | | | 36,773 | |
| | 200 | | Badger Meter, Inc. | | | 8,844 | |
| | 500 | | Baldor Electric Co. | | | 31,520 | |
| | 600 | | Barnes Group, Inc. | | | 12,402 | |
| | 1,075 | | BE Aerospace, Inc. † | | | 39,807 | |
| | 500 | | Blount International, Inc. † | | | 7,880 | |
| | 900 | | BlueLinx Holdings, Inc. † | | | 3,294 | |
| | 6,600 | | Boeing Co. (The) | | | 430,716 | |
| | 445 | | Brady Corp., Class A | | | 14,511 | |
| | 450 | | Brink's Co. (The) | | | 12,096 | |
| | 1,100 | | Bucyrus International, Inc., Class A | | | 98,340 | |
| | 450 | | Builders FirstSource, Inc. † | | | 886 | |
| | 150 | | Building Materials Holding Corp. (a)† | | | — | |
| | 137 | | C&D Technologies, Inc. † | | | 26 | |
| | 500 | | Carlisle Cos., Inc. | | | 19,870 | |
| | 100 | | Casella Waste Systems, Inc., Class A † | | | 709 | |
| | 6,500 | | Caterpillar, Inc. | | | 608,790 | |
| | 1,300 | | CBIZ, Inc. † | | | 8,112 | |
| | 400 | | CDI Corp. | | | 7,436 | |
| | 400 | | Ceco Environmental Corp. † | | | 2,384 | |
| | 300 | | Celadon Group, Inc. † | | | 4,437 | |
| | 800 | | Cenveo, Inc. † | | | 4,272 | |
| | 2,150 | | CH Robinson Worldwide, Inc. | | | 172,408 | |
| | 2,032 | | Cintas Corp. | | | 56,815 | |
| | 400 | | CLARCOR, Inc. | | | 17,156 | |
| | 300 | | Coleman Cable, Inc. † | | | 1,884 | |
| | 1,000 | | Colfax Corp. † | | | 18,410 | |
| | 400 | | Columbus McKinnon Corp. † | | | 8,128 | |
| | 900 | | Comfort Systems USA, Inc. | | | 11,853 | |
| | 300 | | Commercial Vehicle Group, Inc. † | | | 4,875 | |
| | 100 | | Competitive Technologies, Inc. † | | | 130 | |
| | 550 | | Con-way, Inc. | | | 20,114 | |
| | 700 | | Copart, Inc. † | | | 26,145 | |
| | 1,800 | | Corrections Corp. of America † | | | 45,108 | |
| | 1,750 | | Covanta Holding Corp. | | | 30,082 | |
| | 100 | | Covenant Transportation Group, Inc., Class A † | | | 972 | |
| | 300 | | Crane Co. | | | 12,321 | |
| | 3,950 | | CSX Corp. | | | 255,209 | |
| | 2,000 | | Cummins, Inc. | | | 220,020 | |
| | 300 | | Curtiss-Wright Corp. | | | 9,960 | |
| | 6,636 | | Danaher Corp. | | | 313,020 | |
| | 5,050 | | Deere & Co. | | | 419,403 | |
| | 8,050 | | Delta Air Lines, Inc. † | | | 101,430 | |
| | 200 | | Document Security Systems, Inc. † | | | 1,066 | |
| | 1,500 | | Dolan Co. (The) † | | | 20,880 | |
| | 500 | | Dollar Thrifty Automotive Group, Inc. † | | | 23,630 | |
| | 900 | | Donaldson Co., Inc. | | | 52,452 | |
| | 2,550 | | Dover Corp. | | | 149,047 | |
| | 100 | | DXP Enterprises, Inc. † | | | 2,400 | |
| | 1,000 | | Dycom Industries, Inc. † | | | 14,750 | |
| | 400 | | Dynamic Materials Corp. | | | 9,028 | |
| | 1,800 | | Eagle Bulk Shipping, Inc. † | | | 8,964 | |
| | 1,900 | | Eaton Corp. | | | 192,869 | |
| | 1,500 | | EMCOR Group, Inc. † | | | 43,470 | |
| | 8,300 | | Emerson Electric Co. | | | 474,511 | |
| | 700 | | Empire Resources, Inc. | | | 3,640 | |
| | 550 | | Encore Wire Corp. | | | 13,794 | |
| Shares | | | | Value | |
| Industrials (continued) | | | |
| | 1,300 | | Ener1, Inc. † | | $ | 4,927 | |
| | 500 | | Energy Recovery, Inc. † | | | 1,830 | |
| | 2,500 | | EnergySolutions, Inc. | | | 13,925 | |
| | 300 | | EnerNOC, Inc. † | | | 7,173 | |
| | 50 | | Ennis, Inc. | | | 855 | |
| | 711 | | EnPro Industries, Inc. † | | | 29,549 | |
| | 1,375 | | Equifax, Inc. | | | 48,950 | |
| | 200 | | ESCO Technologies, Inc. | | | 7,568 | |
| | 1,500 | | Excel Maritime Carriers, Ltd., Class A † | | | 8,445 | |
| | 2,825 | | Expeditors International of Washington, Inc. | | | 154,245 | |
| | 1,950 | | Fastenal Co. | | | 116,825 | |
| | 1,000 | | Federal Signal Corp. | | | 6,860 | |
| | 3,182 | | FedEx Corp. | | | 295,958 | |
| | 200 | | Flanders Corp. † | | | 628 | |
| | 700 | | Flowserve Corp. | | | 83,454 | |
| | 2,000 | | Fluor Corp. | | | 132,520 | |
| | 300 | | Franklin Electric Co., Inc. | | | 11,676 | |
| | 500 | | FreightCar America, Inc. | | | 14,470 | |
| | 100 | | Frozen Food Express Industries † | | | 444 | |
| | 600 | | FTI Consulting, Inc. † | | | 22,368 | |
| | 700 | | Fuel Tech, Inc. † | | | 6,797 | |
| | 500 | | FuelCell Energy, Inc. † | | | 1,155 | |
| | 300 | | Furmanite Corp. † | | | 2,073 | |
| | 750 | | Gardner Denver, Inc. | | | 51,615 | |
| | 200 | | GATX Corp. | | | 7,056 | |
| | 1,500 | | GenCorp, Inc. † | | | 7,755 | |
| | 1,425 | | General Cable Corp. † | | | 50,003 | |
| | 3,840 | | General Dynamics Corp. | | | 272,486 | |
| | 126,246 | | General Electric Co. | | | 2,309,039 | |
| | 1,625 | | Goodrich Corp. | | | 143,114 | |
| | 325 | | Gorman-Rupp Co. (The) | | | 10,504 | |
| | 487 | | Graco, Inc. | | | 19,212 | |
| | 1,350 | | GrafTech International, Ltd. † | | | 26,784 | |
| | 400 | | Granite Construction, Inc. | | | 10,972 | |
| | 1,500 | | Great Lakes Dredge & Dock Corp. | | | 11,055 | |
| | 550 | | Greenbrier Cos., Inc. † | | | 11,544 | |
| | 350 | | Griffon Corp. † | | | 4,459 | |
| | 850 | | Hardinge, Inc. | | | 8,279 | |
| | 1,200 | | Harsco Corp. | | | 33,984 | |
| | 1,500 | | Hawaiian Holdings, Inc. † | | | 11,760 | |
| | 200 | | Heidrick & Struggles International, Inc. | | | 5,730 | |
| | 200 | | Herley Industries, Inc. † | | | 3,464 | |
| | 1,150 | | Hertz Global Holdings, Inc. † | | | 16,663 | |
| | 550 | | Hexcel Corp. † | | | 9,949 | |
| | 300 | | Hill International, Inc. † | | | 1,941 | |
| | 600 | | Hoku Corp. † | | | 1,584 | |
| | 8,225 | | Honeywell International, Inc. | | | 437,241 | |
| | 1,050 | | Horizon Lines, Inc., Class A | | | 4,588 | |
| | 300 | | Hubbell, Inc., Class B | | | 18,039 | |
| | 400 | | Hurco Cos., Inc. † | | | 9,460 | |
| | 1,600 | | Huron Consulting Group, Inc. † | | | 42,320 | |
| | 975 | | IDEX Corp. | | | 38,142 | |
| | 450 | | IHS, Inc., Class A † | | | 36,175 | |
| | 5,966 | | Illinois Tool Works, Inc. | | | 318,584 | |
| | 875 | | Industrial Services of America, Inc. † | | | 10,719 | |
| | 2,500 | | Innerworkings, Inc. † | | | 16,375 | |
| | 500 | | Innovaro, Inc. † | | | 690 | |
| | 100 | | Innovative Solutions & Support, Inc. † | | | 567 | |
| | 500 | | Integrated Electrical Services, Inc. † | | | 1,745 | |
| | 300 | | Interface, Inc., Class A | | | 4,695 | |
| | 500 | | Interline Brands, Inc. † | | | 11,385 | |
| | 1,200 | | International Shipholding Corp. | | | 30,480 | |
| | 400 | | Intersections, Inc. | | | 4,184 | |
| | 2,650 | | Iron Mountain, Inc. | | | 66,276 | |
| | 2,200 | | ITT Corp. | | | 114,642 | |
| | 2,000 | | Jacobs Engineering Group, Inc. † | | | 91,700 | |
| | 1,875 | | JB Hunt Transport Services, Inc. | | | 76,519 | |
| | 2,525 | | JetBlue Airways Corp. † | | | 16,690 | |
| Wilshire Mutual Funds, Inc. | |
Wilshire 5000 Indexsm Fund | December 31, 2010 |
| Schedule of Investments | |
| Shares | | | | Value | |
| Industrials (continued) | | | |
| | 251 | | John Bean Technologies Corp. | | $ | 5,053 | |
| | 1,075 | | Joy Global, Inc. | | | 93,256 | |
| | 200 | | Kadant, Inc. † | | | 4,714 | |
| | 1,323 | | Kansas City Southern † | | | 63,319 | |
| | 1,550 | | KBR, Inc. | | | 47,228 | |
| | 400 | | Kelly Services, Inc., Class A † | | | 7,520 | |
| | 500 | | Kennametal, Inc. | | | 19,730 | |
| | 150 | | Kforce, Inc. † | | | 2,427 | |
| | 700 | | Kimball International, Inc., Class B | | | 4,830 | |
| | 600 | | Kirby Corp. † | | | 26,430 | |
| | 387 | | Knight Transportation, Inc. | | | 7,353 | |
| | 500 | | Knoll, Inc. | | | 8,365 | |
| | 10 | | Kratos Defense & Security Solutions, Inc. † | | | 132 | |
| | 1,375 | | L-3 Communications Holdings, Inc. | | | 96,924 | |
| | 100 | | LaBarge, Inc. † | | | 1,571 | |
| | 600 | | Landstar System, Inc. | | | 24,564 | |
| | 600 | | Layne Christensen Co. † | | | 20,652 | |
| | 100 | | LECG Corp. † | | | 138 | |
| | 657 | | Lennox International, Inc. | | | 31,070 | |
| | 500 | | Lincoln Electric Holdings, Inc. | | | 32,635 | |
| | 200 | | Lindsay Corp. | | | 11,886 | |
| | 1,500 | | LMI Aerospace, Inc. † | | | 23,985 | |
| | 3,150 | | Lockheed Martin Corp. | | | 220,216 | |
| | 700 | | LSI Industries, Inc. | | | 5,922 | |
| | 400 | | M&F Worldwide Corp. † | | | 9,240 | |
| | 3,000 | | Manitowoc Co., Inc. (The) | | | 39,330 | |
| | 1,002 | | Manpower, Inc. | | | 62,886 | |
| | 100 | | Marten Transport, Ltd. | | | 2,138 | |
| | 4,250 | | Masco Corp. | | | 53,805 | |
| | 3,150 | | Metalico, Inc. † | | | 18,522 | |
| | 300 | | Mfri, Inc. † | | | 3,087 | |
| | 200 | | Michael Baker Corp. † | | | 6,220 | |
| | 1,081 | | Mobile Mini, Inc. † | | | 21,285 | |
| | 300 | | MSC Industrial Direct Co., Class A | | | 19,407 | |
| | 1,900 | | Mueller Water Products, Inc., Class A | | | 7,923 | |
| | 200 | | NACCO Industries, Inc., Class A | | | 21,674 | |
| | 1,500 | | Navigant Consulting, Inc. † | | | 13,800 | |
| | 700 | | Navistar International Corp. † | | | 40,537 | |
| | 500 | | NCI Building Systems, Inc. † | | | 6,995 | |
| | 300 | | Nordson Corp. | | | 27,564 | |
| | 4,600 | | Norfolk Southern Corp. | | | 288,972 | |
| | 3,150 | | Northrop Grumman Corp. | | | 204,057 | |
| | 100 | | On Assignment, Inc. † | | | 815 | |
| | 500 | | Orion Energy Systems, Inc. † | | | 1,665 | |
| | 1,000 | | Oshkosh Corp. † | | | 35,240 | |
| | 1,250 | | Owens Corning † | | | 38,938 | |
| | 4,755 | | PACCAR, Inc. | | | 273,032 | |
| | 3,000 | | Pacer International, Inc. † | | | 20,520 | |
| | 2,050 | | Pall Corp. | | | 101,639 | |
| | 1,993 | | Parker Hannifin Corp. | | | 171,996 | |
| | 1,300 | | Pentair, Inc. | | | 47,463 | |
| | 600 | | Pike Electric Corp. † | | | 5,148 | |
| | 2,125 | | Pitney Bowes, Inc. | | | 51,382 | |
| | 300 | | Polypore International, Inc. † | | | 12,219 | |
| | 250 | | PowerSecure International, Inc. † | | | 1,945 | |
| | 1,700 | | Precision Castparts Corp. | | | 236,657 | |
| | 1,000 | | Quanex Building Products Corp. | | | 18,970 | |
| | 2,450 | | Quanta Services, Inc. † | | | 48,804 | |
| | 300 | | Raven Industries, Inc. | | | 14,307 | |
| | 4,500 | | Raytheon Co. | | | 208,530 | |
| | 400 | | Regal-Beloit Corp. | | | 26,704 | |
| | 1,500 | | Republic Airways Holdings, Inc. † | | | 10,980 | |
| | 4,818 | | Republic Services, Inc., Class A | | | 143,865 | |
| | 200 | | Resources Connection, Inc. | | | 3,718 | |
| | 1,700 | | Robert Half International, Inc. | | | 52,020 | |
| | 1,800 | | Rockwell Automation, Inc. | | | 129,078 | |
| | 1,825 | | Rockwell Collins, Inc. | | | 106,325 | |
| | 1,050 | | Rollins, Inc. | | | 20,737 | |
| Shares | | | | Value | |
| Industrials (continued) | | | |
| | 1,350 | | Roper Industries, Inc. | | $ | 103,181 | |
| | 2,850 | | RR Donnelley & Sons Co. | | | 49,789 | |
| | 1,200 | | RSC Holdings, Inc. † | | | 11,688 | |
| | 75 | | Rush Enterprises, Inc., Class A † | | | 1,533 | |
| | 400 | | Ryder System, Inc. | | | 21,056 | |
| | 150 | | Saia, Inc. † | | | 2,488 | |
| | 400 | | School Specialty, Inc. † | | | 5,572 | |
| | 500 | | SFN Group, Inc. † | | | 4,880 | |
| | 1,200 | | Shaw Group, Inc. (The) † | | | 41,076 | |
| | 300 | | SIFCO Industries, Inc. | | | 4,893 | |
| | 50 | | Simpson Manufacturing Co., Inc. | | | 1,545 | |
| | 2,100 | | Skywest, Inc. | | | 32,802 | |
| | 8,318 | | Southwest Airlines Co. | | | 107,968 | |
| | 1,000 | | Spirit Aerosystems Holdings, Inc., Class A † | | | 20,810 | |
| | 584 | | SPX Corp. | | | 41,750 | |
| | 1,350 | | Standard Register Co. (The) | | | 4,603 | |
| | 50 | | Standex International Corp. | | | 1,496 | |
| | 1,000 | | Steelcase, Inc., Class A | | | 10,570 | |
| | 1,075 | | Stericycle, Inc. † | | | 86,989 | |
| | 500 | | Sun Hydraulics Corp. | | | 18,900 | |
| | 102 | | SYKES Enterprises, Inc. † | | | 2,067 | |
| | 100 | | Sypris Solutions, Inc. † | | | 426 | |
| | 500 | | TAL International Group, Inc. | | | 15,435 | |
| | 200 | | Taser International, Inc. † | | | 940 | |
| | 500 | | Team, Inc. † | | | 12,100 | |
| | 500 | | Tecumseh Products Co., Class A † | | | 6,525 | |
| | 250 | | Tennant Co. | | | 9,603 | |
| | 1,300 | | Terex Corp. † | | | 40,352 | |
| | 743 | | Tetra Tech, Inc. † | | | 18,620 | |
| | 700 | | Textainer Group Holdings, Ltd. | | | 19,943 | |
| | 3,200 | | Textron, Inc. | | | 75,648 | |
| | 600 | | Thomas & Betts Corp. † | | | 28,980 | |
| | 800 | | Timken Co. | | | 38,184 | |
| | 312 | | Titan International, Inc. | | | 6,096 | |
| | 300 | | Toro Co. (The) | | | 18,492 | |
| | 1,000 | | Towers Watson & Co., Class A | | | 52,060 | |
| | 100 | | TRC Cos., Inc. † | | | 350 | |
| | 1,071 | | Tredegar Corp. | | | 20,756 | |
| | 300 | | Trex Co., Inc. † | | | 7,188 | |
| | 100 | | Trimas Corp. † | | | 2,046 | |
| | 900 | | Trinity Industries, Inc. | | | 23,949 | |
| | 800 | | TrueBlue, Inc. † | | | 14,392 | |
| | 500 | | Tutor Perini Corp. | | | 10,705 | |
| | 400 | | Twin Disc, Inc. | | | 11,944 | |
| | 200 | | Ultralife Corp. † | | | 1,322 | |
| | 200 | | Unifirst Corp. | | | 11,010 | |
| | 5,350 | | Union Pacific Corp. | | | 495,731 | |
| | 2,805 | | United Continental Holdings, Inc. † | | | 66,815 | |
| | 8,600 | | United Parcel Service, Inc., Class B | | | 624,188 | |
| | 100 | | United Rentals, Inc. † | | | 2,275 | |
| | 9,544 | | United Technologies Corp. | | | 751,304 | |
| | 850 | | URS Corp. † | | | 35,369 | |
| | 1,500 | | US Airways Group, Inc. † | | | 15,015 | |
| | 500 | | US Ecology, Inc. | | | 8,690 | |
| | 200 | | US Home Systems, Inc. † | | | 978 | |
| | 900 | | USG Corp. † | | | 15,147 | |
| | 900 | | UTi Worldwide, Inc. | | | 19,080 | |
| | 3,400 | | Valence Technology, Inc. † | | | 5,712 | |
| | 1,500 | | Verisk Analytics, Inc., Class A † | | | 51,120 | |
| | 400 | | Viad Corp. | | | 10,188 | |
| | 300 | | Vicor Corp. | | | 4,920 | |
| | 750 | | Volt Information Sciences, Inc. † | | | 6,488 | |
| | 50 | | Wabash National Corp. † | | | 593 | |
| | 591 | | WABCO Holdings, Inc. † | | | 36,010 | |
| | 300 | | Wabtec Corp. | | | 15,867 | |
| | 1,462 | | Waste Connections, Inc. | | | 40,249 | |
| | 5,050 | | Waste Management, Inc. | | | 186,194 | |
| | 300 | | Watts Water Technologies, Inc., Class A | | | 10,977 | |
| Wilshire Mutual Funds, Inc. | |
Wilshire 5000 Indexsm Fund | December 31, 2010 |
| Schedule of Investments | |
| Shares | | | | Value | |
| Industrials (continued) | | | |
| | 250 | | Werner Enterprises, Inc. | | $ | 5,650 | |
| | 1,500 | | Woodward Governor Co. | | | 56,340 | |
| | 800 | | WW Grainger, Inc. | | | 110,488 | |
| | | | | | | 17,634,123 | |
| Information Technology — 18.2% | | | | |
| | 600 | | Acme Packet, Inc. † | | | 31,896 | |
| | 6,638 | | Activision Blizzard, Inc. | | | 82,577 | |
| | 800 | | Acxiom Corp. † | | | 13,720 | |
| | 600 | | ADDvantage Technologies Group, Inc. † | | | 1,884 | |
| | 6,484 | | Adobe Systems, Inc. † | | | 199,578 | |
| | 2,700 | | ADPT Corp. † | | | 7,911 | |
| | 600 | | ADTRAN, Inc. | | | 21,726 | |
| | 500 | | Advanced Analogic Technologies, Inc. † | | | 2,005 | |
| | 700 | | Advanced Energy Industries, Inc. † | | | 9,548 | |
| | 9,750 | | Advanced Micro Devices, Inc. † | | | 79,755 | |
| | 500 | | Aehr Test Systems † | | | 600 | |
| | 500 | | Agilysys, Inc. † | | | 2,815 | |
| | 2,559 | | Akamai Technologies, Inc. † | | | 120,401 | |
| | 650 | | Alliance Data Systems Corp. † | | | 46,170 | |
| | 3,650 | | Altera Corp. | | | 129,867 | |
| | 1,050 | | Amkor Technology, Inc. † | | | 7,760 | |
| | 2,025 | | Amphenol Corp., Class A | | | 106,879 | |
| | 300 | | Anadigics, Inc. † | | | 2,079 | |
| | 4,050 | | Analog Devices, Inc. | | | 152,563 | |
| | 200 | | Anaren, Inc. † | | | 4,170 | |
| | 700 | | Answers Corp. † | | | 5,432 | |
| | 922 | | ANSYS, Inc. † | | | 48,009 | |
| | 1,441 | | AOL, Inc. † | | | 34,166 | |
| | 10,800 | | Apple, Inc. † | | | 3,483,648 | |
| | 15,383 | | Applied Materials, Inc. | | | 216,131 | |
| | 1,500 | | Applied Micro Circuits Corp. † | | | 16,020 | |
| | 2,500 | | Ariba, Inc. † | | | 58,725 | |
| | 2,854 | | Arris Group, Inc. † | | | 32,022 | |
| | 1,350 | | Arrow Electronics, Inc. † | | | 46,238 | |
| | 1,000 | | Art Technology Group, Inc. † | | | 5,980 | |
| | 1,500 | | Aruba Networks, Inc. † | | | 31,320 | |
| | 700 | | Aspen Technology, Inc. † | | | 8,890 | |
| | 100 | | Astea International, Inc. † | | | 269 | |
| | 600 | | Atheros Communications, Inc. † | | | 21,552 | |
| | 5,250 | | Atmel Corp. † | | | 64,680 | |
| | 486 | | ATMI, Inc. † | | | 9,691 | |
| | 3,200 | | Autodesk, Inc. † | | | 122,240 | |
| | 6,125 | | Automatic Data Processing, Inc. | | | 283,465 | |
| | 1,778 | | Aviat Networks, Inc. † | | | 9,014 | |
| | 1,825 | | Avnet, Inc. † | | | 60,280 | |
| | 289 | | Axcelis Technologies, Inc. † | | | 1,000 | |
| | 22 | | BearingPoint, Inc. (a) † | | | — | |
| | 300 | | Bel Fuse, Inc., Class B | | | 7,170 | |
| | 150 | | Benchmark Electronics, Inc. † | | | 2,724 | |
| | 150 | | BigBand Networks, Inc. † | | | 420 | |
| | 600 | | Bitstream, Inc., Class A † | | | 4,338 | |
| | 298 | | Black Box Corp. | | | 11,410 | |
| | 300 | | Blackbaud, Inc. | | | 7,770 | |
| | 1,942 | | BMC Software, Inc. † | | | 91,546 | |
| | 2,600 | | Brightpoint, Inc. † | | | 22,698 | |
| | 5,965 | | Broadcom Corp., Class A | | | 259,776 | |
| | 2,750 | | Broadridge Financial Solutions, Inc. | | | 60,308 | |
| | 7,350 | | Brocade Communications Systems, Inc. † | | | 38,882 | |
| | 106 | | Brooks Automation, Inc. † | | | 961 | |
| | 100 | | BTU International, Inc. † | | | 899 | |
| | 5,322 | | CA, Inc. | | | 130,070 | |
| | 100 | | Cabot Microelectronics Corp. † | | | 4,145 | |
| | 4,402 | | Cadence Design Systems, Inc. † | | | 36,361 | |
| | 200 | | Callidus Software, Inc. † | | | 1,008 | |
| | 200 | | Cascade Microtech, Inc. † | | | 864 | |
| | 900 | | Ciber, Inc. † | | | 4,212 | |
| | 2,797 | | Ciena Corp. † | | | 58,877 | |
| | 200 | | Cinedigm Digital Cinema Corp., Class A † | | | 330 | |
| Shares | | | | Value | |
| Information Technology (continued) | | | |
| | 400 | | Cirrus Logic, Inc. † | | $ | 6,392 | |
| | 67,423 | | Cisco Systems, Inc. † | | | 1,363,967 | |
| | 1,725 | | Citrix Systems, Inc. † | | | 118,007 | |
| | 500 | | Cognex Corp. | | | 14,710 | |
| | 3,625 | | Cognizant Technology Solutions Corp., Class A † | | | 265,676 | |
| | 400 | | Coherent, Inc. † | | | 18,056 | |
| | 1,500 | | CommScope, Inc. † | | | 46,830 | |
| | 1,880 | | Computer Sciences Corp. | | | 93,248 | |
| | 4,025 | | Compuware Corp. † | | | 46,972 | |
| | 400 | | comScore, Inc. † | | | 8,924 | |
| | 100 | | Comtech Telecommunications Corp. | | | 2,773 | |
| | 400 | | Constant Contact, Inc. † | | | 12,396 | |
| | 1,300 | | Convergys Corp. † | | | 17,121 | |
| | 1,827 | | CoreLogic, Inc. | | | 33,836 | |
| | 17,869 | | Corning, Inc. | | | 345,229 | |
| | 500 | | CPI International, Inc. † | | | 9,675 | |
| | 100 | | Cray, Inc. † | | | 715 | |
| | 900 | | Cree, Inc. † | | | 59,301 | |
| | 1,128 | | CSG Systems International, Inc. † | | | 21,364 | |
| | 100 | | CTS Corp. | | | 1,106 | |
| | 3,425 | | Cypress Semiconductor Corp. † | | | 63,636 | |
| | 800 | | Daktronics, Inc. | | | 12,736 | |
| | 600 | | Datalink Corp. † | | | 2,898 | |
| | 500 | | DealerTrack Holdings, Inc. † | | | 10,035 | |
| | 20,200 | | Dell, Inc. † | | | 273,710 | |
| | 403 | | Deltek, Inc. † | | | 2,926 | |
| | 388 | | Dice Holdings, Inc. † | | | 5,568 | |
| | 850 | | Diebold, Inc. | | | 27,242 | |
| | 400 | | Digital Ally, Inc. † | | | 700 | |
| | 700 | | Digital River, Inc. † | | | 24,094 | |
| | 1,500 | | Diodes, Inc. † | | | 40,485 | |
| | 300 | | Ditech Networks, Inc. † | | | 429 | |
| | 500 | | Dolby Laboratories, Inc., Class A † | | | 33,350 | |
| | 400 | | DST Systems, Inc. | | | 17,740 | |
| | 1,421 | | Earthlink, Inc. | | | 12,221 | |
| | 13,850 | | eBay, Inc. † | | | 385,446 | |
| | 300 | | Ebix, Inc. † | | | 7,101 | |
| | 150 | | Echelon Corp. † | | | 1,529 | |
| | 100 | | Electro Scientific Industries, Inc. † | | | 1,603 | |
| | 3,600 | | Electronic Arts, Inc. † | | | 58,968 | |
| | 729 | | Electronics for Imaging, Inc. † | | | 10,432 | |
| | 22,779 | | EMC Corp. † | | | 521,639 | |
| | 500 | | Emcore Corp. † | | | 540 | |
| | 300 | | EMS Technologies, Inc. † | | | 5,934 | |
| | 1,000 | | Emulex Corp. † | | | 11,660 | |
| | 100 | | EndWave Corp. † | | | 225 | |
| | 836 | | Entegris, Inc. † | | | 6,245 | |
| | 16 | | Entorian Technologies, Inc. † | | | 58 | |
| | 400 | | Epicor Software Corp. † | | | 4,040 | |
| | 1,500 | | EPIQ Systems, Inc. | | | 20,595 | |
| | 225 | | Evergreen Solar, Inc. † | | | 131 | |
| | 500 | | Exar Corp. † | | | 3,490 | |
| | 200 | | Extreme Networks † | | | 618 | |
| | 900 | | F5 Networks, Inc. † | | | 117,144 | |
| | 550 | | Factset Research Systems, Inc. | | | 51,568 | |
| | 1,250 | | Fairchild Semiconductor International, Inc., Class A † | | | 19,512 | |
| | 900 | | FalconStor Software, Inc. † | | | 3,015 | |
| | 200 | | FARO Technologies, Inc. † | | | 6,568 | |
| | 2,610 | | Fidelity National Information Services, Inc. | | | 71,488 | |
| | 700 | | First Solar, Inc. † | | | 91,098 | |
| | 2,128 | | Fiserv, Inc. † | | | 124,616 | |
| | 1,500 | | FLIR Systems, Inc. † | | | 44,625 | |
| | 350 | | Formfactor, Inc. † | | | 3,108 | |
| | 255 | | Forrester Research, Inc. | | | 8,999 | |
| | 1,100 | | Gartner, Inc. † | | | 36,520 | |
| | 1,000 | | Genpact, Ltd. † | | | 15,200 | |
| Wilshire Mutual Funds, Inc. | |
Wilshire 5000 Indexsm Fund | December 31, 2010 |
| Schedule of Investments | |
| Shares | | | | Value | |
| Information Technology (continued) | | | |
| | 12 | | GigOptix, Inc. † | | $ | 33 | |
| | 1,850 | | Global Cash Access Holdings, Inc. † | | | 5,901 | |
| | 1,050 | | Global Payments, Inc. | | | 48,520 | |
| | 200 | | Globecomm Systems, Inc. † | | | 2,000 | |
| | 400 | | Glu Mobile, Inc. † | | | 828 | |
| | 2,750 | | Google, Inc., Class A † | | | 1,633,417 | |
| | 450 | | GSI Commerce, Inc. † | | | 10,440 | |
| | 4,000 | | GT Solar International, Inc. † | | | 36,480 | |
| | 200 | | Guidance Software, Inc. † | | | 1,438 | |
| | 800 | | Harmonic, Inc. † | | | 6,856 | |
| | 1,225 | | Harris Corp. | | | 55,493 | |
| | 27,177 | | Hewlett-Packard Co. | | | 1,144,152 | |
| | 200 | | Hittite Microwave Corp. † | | | 12,208 | |
| | 1,100 | | Hutchinson Technology, Inc. † | | | 4,081 | |
| | 500 | | Hypercom Corp. † | | | 4,185 | |
| | 1,000 | | IAC/InterActive Corp. † | | | 28,700 | |
| | 100 | | ID Systems, Inc. † | | | 331 | |
| | 1,399 | | Idearc, Inc. (a) † | | | — | |
| | 100 | | iGO, Inc. † | | | 384 | |
| | 50 | | Ikanos Communications, Inc. † | | | 67 | |
| | 200 | | Imergent, Inc. | | | 898 | |
| | 600 | | Infinera Corp. † | | | 6,198 | |
| | 1,075 | | Informatica Corp. † | | | 47,332 | |
| | 100 | | Infosonics Corp. † | | | 76 | |
| | 250 | | Infospace, Inc. † | | | 2,075 | |
| | 2,100 | | Ingram Micro, Inc., Class A † | | | 40,089 | |
| | 1,500 | | Insight Enterprises, Inc. † | | | 19,740 | |
| | 3,560 | | Integrated Device Technology, Inc. † | | | 23,710 | |
| | 400 | | Integrated Silicon Solution, Inc. † | | | 3,212 | |
| | 65,766 | | Intel Corp. | | | 1,383,059 | |
| | 350 | | Interactive Intelligence, Inc. † | | | 9,156 | |
| | 600 | | InterDigital, Inc. | | | 24,984 | |
| | 200 | | Intermec, Inc. † | | | 2,532 | |
| | 371 | | Internap Network Services Corp. † | | | 2,256 | |
| | 14,170 | | International Business Machines Corp. | | | 2,079,589 | |
| | 350 | | International Rectifier Corp. † | | | 10,391 | |
| | 600 | | Interphase Corp. † | | | 1,080 | |
| | 2,850 | | Intersil Corp., Class A | | | 43,519 | |
| | 3,225 | | Intuit, Inc. † | | | 158,992 | |
| | 300 | | INX, Inc. † | | | 1,875 | |
| | 381 | | IPG Photonics Corp. † | | | 12,047 | |
| | 500 | | Itron, Inc. † | | | 27,725 | |
| | 1,200 | | Ixia † | | | 20,136 | |
| | 800 | | IXYS Corp. † | | | 9,296 | |
| | 450 | | j2 Global Communications, Inc. † | | | 13,027 | |
| | 2,400 | | Jabil Circuit, Inc. | | | 48,216 | |
| | 1,000 | | Jack Henry & Associates, Inc. | | | 29,150 | |
| | 550 | | JDA Software Group, Inc. † | | | 15,400 | |
| | 3,203 | | JDS Uniphase Corp. † | | | 46,379 | |
| | 6,165 | | Juniper Networks, Inc. † | | | 227,612 | |
| | 233 | | Kemet Corp. † | | | 3,397 | |
| | 600 | | KEY Tronic Corp. † | | | 3,132 | |
| | 100 | | Keynote Systems, Inc. | | | 1,462 | |
| | 1,025 | | KLA-Tencor Corp. | | | 39,606 | |
| | 800 | | Knot, Inc. (The) † | | | 7,904 | |
| | 400 | | Kulicke & Soffa Industries, Inc. † | | | 2,880 | |
| | 1,573 | | L-1 Identity Solutions, Inc. † | | | 18,734 | |
| | 1,225 | | Lam Research Corp. † | | | 63,430 | |
| | 200 | | Lattice Semiconductor Corp. † | | | 1,212 | |
| | 1,250 | | Lawson Software, Inc. † | | | 11,563 | |
| | 100 | | LeCroy Corp. † | | | 984 | |
| | 1,500 | | Lender Processing Services, Inc. | | | 44,280 | |
| | 375 | | Lexmark International, Inc., Class A † | | | 13,058 | |
| | 2,100 | | Limelight Networks, Inc. † | | | 12,201 | |
| | 1,725 | | Linear Technology Corp. | | | 59,668 | |
| | 200 | | Littelfuse, Inc. | | | 9,412 | |
| | 10 | | LiveWire Mobile, Inc. | | | 27 | |
| | 193 | | Local.com Corp. † | | | 1,253 | |
| | 200 | | LoJack Corp. † | | | 1,292 | |
| Shares | | | | Value | |
| Information Technology (continued) | | | |
| | 700 | | LoopNet, Inc. † | | $ | 7,777 | |
| | 300 | | Loral Space & Communications, Inc. † | | | 22,950 | |
| | 100 | | LRAD Corp. † | | | 269 | |
| | 8,510 | | LSI Corp. † | | | 50,975 | |
| | 50 | | Magma Design Automation, Inc. † | | | 251 | |
| | 600 | | MakeMusic, Inc. † | | | 3,156 | |
| | 200 | | Marchex, Inc., Class B | | | 1,908 | |
| | 700 | | Market Leader, Inc. † | | | 1,232 | |
| | 6,750 | | Marvell Technology Group, Ltd. † | | | 125,213 | |
| | 925 | | Mastercard, Inc., Class A | | | 207,302 | |
| | 400 | | Mattson Technology, Inc. † | | | 1,200 | |
| | 2,900 | | Maxim Integrated Products, Inc. | | | 68,498 | |
| | 1,650 | | McAfee, Inc. † | | | 76,411 | |
| | 200 | | Measurement Specialties, Inc. † | | | 5,870 | |
| | 3,575 | | MEMC Electronic Materials, Inc. † | | | 40,255 | |
| | 3,000 | | Mentor Graphics Corp. † | | | 36,000 | |
| | 100 | | Mercury Computer Systems, Inc. † | | | 1,838 | |
| | 400 | | Methode Electronics, Inc. | | | 5,188 | |
| | 600 | | Micrel, Inc. | | | 7,794 | |
| | 1,537 | | Microchip Technology, Inc. | | | 52,581 | |
| | 10,552 | | Micron Technology, Inc. † | | | 84,627 | |
| | 1,400 | | Micronetics, Inc. † | | | 6,160 | |
| | 1,500 | | MICROS Systems, Inc. † | | | 65,790 | |
| | 650 | | Microsemi Corp. † | | | 14,885 | |
| | 95,040 | | Microsoft Corp. | | | 2,653,517 | |
| | 200 | | MIPS Technologies, Inc., Class A † | | | 3,032 | |
| | 1,175 | | Molex, Inc. | | | 26,696 | |
| | 300 | | MoneyGram International, Inc. † | | | 813 | |
| | 500 | | Monolithic Power Systems, Inc. † | | | 8,260 | |
| | 1,550 | | Monster Worldwide, Inc. † | | | 36,627 | |
| | 100 | | MoSys, Inc. † | | | 569 | |
| | 27,166 | | Motorola Solutions, Inc. † | | | 246,396 | |
| | 4 | | Move, Inc. † | | | 10 | |
| | 328 | | Multi-Fineline Electronix, Inc. † | | | 8,689 | |
| | 200 | | Nanometrics, Inc. † | | | 2,566 | |
| | 900 | | NAPCO Security Technologies, Inc. † | | | 1,611 | |
| | 1,475 | | National Instruments Corp. | | | 55,519 | |
| | 2,425 | | National Semiconductor Corp. | | | 33,368 | |
| | 200 | | NaviSite, Inc. † | | | 738 | |
| | 1,925 | | NCR Corp. † | | | 29,587 | |
| | 4,350 | | NetApp, Inc. † | | | 239,076 | |
| | 500 | | Netlist, Inc. † | | | 1,275 | |
| | 800 | | Netlogic Microsystems, Inc. † | | | 25,128 | |
| | 400 | | Netscout Systems, Inc. † | | | 9,204 | |
| | 600 | | NetSuite, Inc. † | | | 15,000 | |
| | 100 | | Network Equipment Technologies, Inc. † | | | 463 | |
| | 750 | | NeuStar, Inc., Class A † | | | 19,537 | |
| | 200 | | Newport Corp. † | | | 3,474 | |
| | 1,000 | | NIC, Inc. | | | 9,710 | |
| | 50 | | Novatel Wireless, Inc. † | | | 477 | |
| | 4,859 | | Novell, Inc. † | | | 28,765 | |
| | 1,500 | | Novellus Systems, Inc. † | | | 48,480 | |
| | 2,050 | | Nuance Communications, Inc. † | | | 37,269 | |
| | 100 | | NVE Corp. † | | | 5,783 | |
| | 6,825 | | NVIDIA Corp. † | | | 105,105 | |
| | 600 | | Occam Networks, Inc. † | | | 5,202 | |
| | 500 | | Omnivision Technologies, Inc. † | | | 14,805 | |
| | 5,105 | | ON Semiconductor Corp. † | | | 50,437 | |
| | 100 | | Online Resources Corp. † | | | 465 | |
| | 311 | | Openwave Systems, Inc. † | | | 659 | |
| | 100 | | Opnet Technologies, Inc. | | | 2,677 | |
| | 50 | | Opnext, Inc. † | | | 88 | |
| | 700 | | Optelecom-NKF, Inc. † | | | 1,687 | |
| | 42,730 | | Oracle Corp. | | | 1,337,449 | |
| | 200 | | OSI Systems, Inc. † | | | 7,272 | |
| | 33 | | Overland Storage, Inc. † | | | 49 | |
| | 100 | | PAR Technology Corp. † | | | 571 | |
| | 1,240 | | Parametric Technology Corp. † | | | 27,937 | |
| | 600 | | Park Electrochemical Corp. | | | 18,000 | |
| Wilshire Mutual Funds, Inc. | |
Wilshire 5000 Indexsm Fund | December 31, 2010 |
| Schedule of Investments | |
| Shares | | | | Value | |
| Information Technology (continued) | | | |
| | 200 | | Parkervision, Inc. † | | $ | 88 | |
| | 3,650 | | Paychex, Inc. | | | 112,821 | |
| | 400 | | PC Mall, Inc. † | | | 3,028 | |
| | 300 | | Pegasystems, Inc. | | | 10,989 | |
| | 100 | | Pericom Semiconductor Corp. † | | | 1,098 | |
| | 8 | | Pfsweb, Inc. † | | | 32 | |
| | 33 | | Pixelworks, Inc. † | | | 116 | |
| | 100 | | Planar Systems, Inc. † | | | 204 | |
| | 350 | | Plantronics, Inc. | | | 13,027 | |
| | 974 | | Plexus Corp. † | | | 30,136 | |
| | 100 | | PLX Technology, Inc. † | | | 361 | |
| | 4,225 | | PMC - Sierra, Inc. † | | | 36,293 | |
| | 950 | | Polycom, Inc. † | | | 37,031 | |
| | 300 | | Power Integrations, Inc. | | | 12,042 | |
| | 200 | | Power-One, Inc. † | | | 2,040 | |
| | 380 | | Powerwave Technologies, Inc. † | | | 965 | |
| | 220 | | PRGX Global, Inc. † | | | 1,393 | |
| | 160 | | QAD, Inc., Class A † | | | 1,456 | |
| | 40 | | QAD, Inc., Class B † | | | 398 | |
| | 1,650 | | QLogic Corp. † | | | 28,083 | |
| | 18,925 | | QUALCOMM, Inc. | | | 936,598 | |
| | 1,500 | | Quest Software, Inc. † | | | 41,610 | |
| | 900 | | Rackspace Hosting, Inc. † | | | 28,269 | |
| | 100 | | Radiant Systems, Inc. † | | | 1,957 | |
| | 1,000 | | Rambus, Inc. † | | | 20,480 | |
| | 2,726 | | RealNetworks, Inc. † | | | 11,449 | |
| | 1,490 | | Red Hat, Inc. † | | | 68,018 | |
| | 600 | | Relm Wireless Corp. † | | | 1,080 | |
| | 600 | | Renaissance Learning, Inc. | | | 7,104 | |
| | 5,627 | | RF Micro Devices, Inc. † | | | 41,358 | |
| | 200 | | RightNow Technologies, Inc. † | | | 4,734 | |
| | 1,400 | | Riverbed Technology, Inc. † | | | 49,238 | |
| | 300 | | Rosetta Stone, Inc. † | | | 6,366 | |
| | 1,020 | | Rovi Corp. † | | | 63,250 | |
| | 340 | | Rudolph Technologies, Inc. † | | | 2,798 | |
| | 900 | | S1 Corp. † | | | 6,210 | |
| | 5,925 | | SAIC, Inc. † | | | 93,971 | |
| | 600 | | Salesforce.com, Inc. † | | | 79,200 | |
| | 2,325 | | SanDisk Corp. † | | | 115,924 | |
| | 1,833 | | Sanmina-SCI Corp. † | | | 21,043 | |
| | 1,650 | | Sapient Corp. | | | 19,965 | |
| | 1,000 | | SAVVIS, Inc. † | | | 25,520 | |
| | 300 | | Scansource, Inc. † | | | 9,570 | |
| | 500 | | Semtech Corp. † | | | 11,320 | |
| | 300 | | ShoreTel, Inc. † | | | 2,343 | |
| | 100 | | Silicon Image, Inc. † | | | 735 | |
| | 500 | | Silicon Laboratories, Inc. † | | | 23,010 | |
| | 1,707 | | Skyworks Solutions, Inc. † | | | 48,871 | |
| | 200 | | SMART Modular Technologies WWH, Inc. † | | | 1,152 | |
| | 300 | | Smith Micro Software, Inc. † | | | 4,722 | |
| | 1,500 | | SolarWinds, Inc. † | | | 28,875 | |
| | 800 | | Solera Holdings, Inc. | | | 41,056 | |
| | 1,414 | | Sonic Solutions, Inc. † | | | 21,210 | |
| | 4,725 | | Sonus Networks, Inc. † | | | 12,616 | |
| | 1,500 | | Sourcefire, Inc. † | | | 38,895 | |
| | 900 | | Spire Corp. † | | | 4,689 | |
| | 200 | | STEC, Inc. † | | | 3,530 | |
| | 600 | | SuccessFactors, Inc. † | | | 17,376 | |
| | 1,000 | | SunPower Corp., Class A † | | | 12,830 | |
| | 430 | | Sycamore Networks, Inc. | | | 8,854 | |
| | 9,983 | | Symantec Corp. † | | | 167,115 | |
| | 100 | | Symmetricom, Inc. † | | | 709 | |
| | 300 | | SYNNEX Corp. † | | | 9,360 | |
| | 1,417 | | Synopsys, Inc. † | | | 38,131 | |
| | 300 | | Syntel, Inc. | | | 14,337 | |
| | 550 | | Take-Two Interactive Software, Inc. † | | | 6,732 | |
| | 900 | | Tech Data Corp. † | | | 39,618 | |
| | 800 | | TechTarget, Inc. † | | | 6,344 | |
| Shares | | | | Value | |
| Information Technology (continued) | | | |
| | 1,500 | | Tekelec † | | $ | 17,865 | |
| | 5,404 | | Tellabs, Inc. | | | 36,639 | |
| | 2,200 | | Teradata Corp. † | | | 90,552 | |
| | 4,425 | | Teradyne, Inc. † | | | 62,127 | |
| | 200 | | Terremark Worldwide, Inc. † | | | 2,590 | |
| | 1,000 | | Tessco Technologies, Inc. | | | 15,950 | |
| | 400 | | Tessera Technologies, Inc. † | | | 8,860 | |
| | 13,272 | | Texas Instruments, Inc. | | | 431,340 | |
| | 1,000 | | THQ, Inc. † | | | 6,060 | |
| | 1,825 | | TIBCO Software, Inc. † | | | 35,971 | |
| | 800 | | TiVo, Inc. † | | | 6,904 | |
| | 200 | | TNS, Inc. † | | | 4,160 | |
| | 1,937 | | Total System Services, Inc. | | | 29,791 | |
| | 700 | | Travelzoo, Inc. † | | | 28,854 | |
| | 150 | | Trident Microsystems, Inc. † | | | 267 | |
| | 2,067 | | Trimble Navigation, Ltd. † | | | 82,535 | |
| | 500 | | Trio-Tech International † | | | 2,080 | |
| | 3,300 | | TriQuint Semiconductor, Inc. † | | | 38,577 | |
| | 200 | | TTM Technologies, Inc. † | | | 2,982 | |
| | 500 | | Tyler Technologies, Inc. † | | | 10,380 | |
| | 400 | | Ultimate Software Group, Inc. † | | | 19,452 | |
| | 427 | | Unisys Corp. † | | | 11,055 | |
| | 800 | | United Online, Inc. | | | 5,280 | |
| | 700 | | Universal Display Corp. † | | | 21,455 | |
| | 200 | | UTStarcom, Inc. † | | | 412 | |
| | 2,505 | | ValueClick, Inc. † | | | 40,155 | |
| | 850 | | Varian Semiconductor Equipment Associates, Inc. † | | | 31,425 | |
| | 450 | | VASCO Data Security International, Inc. † | | | 3,658 | |
| | 900 | | VeriFone Systems, Inc. † | | | 34,704 | |
| | 1,416 | | VeriSign, Inc. | | | 46,261 | |
| | 55 | | Viasystems Group, Inc. † | | | 1,108 | |
| | 425 | | Vicon Industries, Inc. † | | | 1,925 | |
| | 1,000 | | Virtusa Corp. † | | | 16,360 | |
| | 1,806 | | Vishay Intertechnology, Inc. † | | | 26,512 | |
| | 129 | | Vishay Precision Group, Inc. † | | | 2,430 | |
| | 800 | | VMware, Inc., Class A † | | | 71,128 | |
| | 300 | | Volterra Semiconductor Corp. † | | | 6,948 | |
| | 200 | | Web.com Group, Inc. † | | | 1,690 | |
| | 958 | | WebMD Health Corp., Class A † | | | 48,915 | |
| | 300 | | WebMediaBrands, Inc. † | | | 480 | |
| | 3,025 | | Western Digital Corp. † | | | 102,548 | |
| | 7,854 | | Western Union Co. (The) | | | 145,849 | |
| | 200 | | Wireless Ronin Technologies, Inc. † | | | 290 | |
| | 100 | | WPCS International, Inc. † | | | 268 | |
| | 15,678 | | Xerox Corp. | | | 180,610 | |
| | 3,175 | | Xilinx, Inc. | | | 92,012 | |
| | 900 | | X-Rite, Inc. † | | | 4,113 | |
| | 13,700 | | Yahoo!, Inc. † | | | 227,831 | |
| | 825 | | Zebra Technologies Corp., Class A † | | | 31,342 | |
| | 1,000 | | Zygo Corp. † | | | 12,230 | |
| | | | | | | 29,202,833 | |
| Materials — 4.4% | | | | |
| | 81 | | A Schulman, Inc. | | | 1,854 | |
| | 2,500 | | Air Products & Chemicals, Inc. | | | 227,375 | |
| | 1,020 | | Airgas, Inc. | | | 63,709 | |
| | 875 | | AK Steel Holding Corp. | | | 14,324 | |
| | 1,000 | | Albemarle Corp. | | | 55,780 | |
| | 13,398 | | Alcoa, Inc. | | | 206,195 | |
| | 1,650 | | Allegheny Technologies, Inc. | | | 91,047 | |
| | 900 | | Allied Nevada Gold Corp. † | | | 23,679 | |
| | 500 | | AM Castle & Co. † | | | 9,205 | |
| | 400 | | American Vanguard Corp. | | | 3,416 | |
| | 850 | | Aptargroup, Inc. | | | 40,435 | |
| | 50 | | Arch Chemicals, Inc. | | | 1,896 | |
| | 1,017 | | Ashland, Inc. | | | 51,725 | |
| | 348 | | Balchem Corp. | | | 11,766 | |
| Wilshire Mutual Funds, Inc. | |
Wilshire 5000 Indexsm Fund | December 31, 2010 |
| Schedule of Investments | |
| Shares | | | | Value | |
| Materials (continued) | | | |
| | 1,000 | | Ball Corp. | | $ | 68,050 | |
| | 1,350 | | Bemis Co., Inc. | | | 44,091 | |
| | 300 | | Buckeye Technologies, Inc. | | | 6,303 | |
| | 700 | | Cabot Corp. | | | 26,355 | |
| | 500 | | Carpenter Technology Corp. | | | 20,120 | |
| | 1,000 | | Celanese Corp., Ser A | | | 41,170 | |
| | 600 | | Century Aluminum Co. † | | | 9,318 | |
| | 900 | | CF Industries Holdings, Inc. | | | 121,635 | |
| | 4 | | Chemtura Corp. † | | | 64 | |
| | 1,700 | | Cliffs Natural Resources, Inc. | | | 132,617 | |
| | 1,110 | | Coeur d'Alene Mines Corp. † | | | 30,325 | |
| | 1,300 | | Commercial Metals Co. | | | 21,567 | |
| | 400 | | Compass Minerals International, Inc. | | | 35,708 | |
| | 1,800 | | Core Molding Technologies, Inc. † | | | 10,368 | |
| | 2,000 | | Crown Holdings, Inc. † | | | 66,760 | |
| | 600 | | Cytec Industries, Inc. | | | 31,836 | |
| | 14,261 | | Dow Chemical Co. (The) | | | 486,871 | |
| | 700 | | Eastman Chemical Co. | | | 58,856 | |
| | 2,800 | | Ecolab, Inc. | | | 141,176 | |
| | 10,750 | | EI du Pont de Nemours & Co. | | | 536,210 | |
| | 1,000 | | Ferro Corp. † | | | 14,640 | |
| | 3,300 | | Flotek Industries, Inc. † | | | 17,985 | |
| | 800 | | FMC Corp. | | | 63,912 | |
| | 5,601 | | Freeport-McMoRan Copper & Gold, Inc. | | | 672,624 | |
| | 1,000 | | Friedman Industries | | | 8,750 | |
| | 1,500 | | Globe Specialty Metals, Inc. | | | 25,635 | |
| | 2,900 | | Graphic Packaging Holding Co. † | | | 11,281 | |
| | 2,000 | | Headwaters, Inc. † | | | 9,160 | |
| | 3,400 | | Hecla Mining Co. † | | | 38,284 | |
| | 300 | | Horsehead Holding Corp. † | | | 3,912 | |
| | 4,250 | | Huntsman Corp. | | | 66,343 | |
| | 1,000 | | International Flavors & Fragrances, Inc. | | | 55,590 | |
| | 5,542 | | International Paper Co. | | | 150,964 | |
| | 400 | | Intrepid Potash, Inc. † | | | 14,916 | |
| | 500 | | Kronos Worldwide, Inc. | | | 21,245 | |
| | 1,100 | | Louisiana-Pacific Corp. † | | | 10,406 | |
| | 800 | | Lubrizol Corp. | | | 85,504 | |
| | 2,476 | | MeadWestvaco Corp. | | | 64,772 | |
| | 6,430 | | Monsanto Co. | | | 447,785 | |
| | 2,200 | | Mosaic Co. (The) | | | 167,992 | |
| | 200 | | Myers Industries, Inc. | | | 1,948 | |
| | 2,200 | | Nalco Holding Co. | | | 70,268 | |
| | 100 | | NewMarket Corp. | | | 12,337 | |
| | 5,050 | | Newmont Mining Corp. | | | 310,222 | |
| | 2,200 | | NL Industries, Inc. | | | 24,552 | |
| | 3,670 | | Nucor Corp. | | | 160,819 | |
| | 770 | | Olin Corp. | | | 15,800 | |
| | 2,475 | | Owens-Illinois, Inc. † | | | 75,982 | |
| | 550 | | Packaging Corp. of America | | | 14,212 | |
| | 1,000 | | PolyOne Corp. † | | | 12,490 | |
| | 2,100 | | PPG Industries, Inc. | | | 176,547 | |
| | 3,600 | | Praxair, Inc. | | | 343,692 | |
| | 1,000 | | Reliance Steel & Aluminum Co. | | | 51,100 | |
| | 400 | | Rock-Tenn Co., Class A | | | 21,580 | |
| | 1,300 | | RPM International, Inc. | | | 28,730 | |
| | 700 | | Scotts Miracle-Gro Co. (The), Class A | | | 35,539 | |
| | 1,300 | | Sealed Air Corp. | | | 33,085 | |
| | 100 | | Senomyx, Inc. † | | | 713 | |
| | 1,000 | | Sherwin-Williams Co. (The) | | | 83,750 | |
| | 1,200 | | Sigma-Aldrich Corp. | | | 79,872 | |
| | 700 | | Silgan Holdings, Inc. | | | 25,067 | |
| | 800 | | Solutia, Inc. † | | | 18,464 | |
| | 775 | | Sonoco Products Co. | | | 26,094 | |
| | 2,100 | | Southern Copper Corp. | | | 102,354 | |
| | 500 | | Spartech Corp. † | | | 4,680 | |
| | 2,800 | | Steel Dynamics, Inc. | | | 51,240 | |
| | 600 | | Stillwater Mining Co. † | | | 12,810 | |
| | 1,925 | | Temple-Inland, Inc. | | | 40,887 | |
| | 192 | | Texas Industries, Inc. | | | 8,790 | |
| Shares | | | | Value | |
| Materials (continued) | | | |
| | 1,273 | | Titanium Metals Corp. † | | $ | 21,870 | |
| | 500 | | UFP Technologies, Inc. † | | | 6,095 | |
| | 50 | | United States Lime & Minerals, Inc. † | | | 2,106 | |
| | 1,900 | | United States Steel Corp. | | | 110,998 | |
| | 1,000 | | US Energy Corp. † | | | 6,080 | |
| | 5,800 | | US Gold Corp. † | | | 46,806 | |
| | 500 | | Valhi, Inc. | | | 11,055 | |
| | 1,300 | | Valspar Corp. | | | 44,824 | |
| | 1,000 | | Verso Paper Corp. † | | | 3,420 | |
| | 3,200 | | Vista Gold Corp. † | | | 7,648 | |
| | 944 | | Vulcan Materials Co. | | | 41,876 | |
| | 700 | | Walter Energy, Inc. | | | 89,488 | |
| | 1,300 | | Wausau Paper Corp. | | | 11,193 | |
| | 400 | | Westlake Chemical Corp. | | | 17,388 | |
| | 7,208 | | Weyerhaeuser Co. | | | 136,448 | |
| | 400 | | WR Grace & Co. † | | | 14,052 | |
| | 50 | | Zep, Inc. | | | 994 | |
| | | | | | | 7,059,471 | |
| Telecommunication Services — 3.0% | | | | |
| | 600 | | Alaska Communications Systems Group, Inc. | | | 6,660 | |
| | 5,475 | | American Tower Corp., Class A † | | | 282,729 | |
| | 69,824 | | AT&T, Inc. | | | 2,051,429 | |
| | 200 | | Atlantic Tele-Network, Inc. | | | 7,668 | |
| | 3,581 | | CenturyLink, Inc. | | | 165,335 | |
| | 1,425 | | Cincinnati Bell, Inc. † | | | 3,990 | |
| | 1,600 | | Clearwire Corp., Class A † | | | 8,240 | |
| | 200 | | Cogent Communications Group, Inc. † | | | 2,828 | |
| | 3,500 | | Crown Castle International Corp. † | | | 153,405 | |
| | 10 | | FiberTower Corp. † | | | 45 | |
| | 14,886 | | Frontier Communications Corp. | | | 144,841 | |
| | 600 | | General Communication, Inc., Class A † | | | 7,596 | |
| | 555 | | Global Crossing, Ltd. † | | | 7,171 | |
| | 7,400 | | Globalstar, Inc. † | | | 10,730 | |
| | 16 | | IDT Corp., Class B | | | 410 | |
| | 1,500 | | Leap Wireless International, Inc. † | | | 18,390 | |
| | 29,036 | | Level 3 Communications, Inc. † | | | 28,455 | |
| | 2,700 | | MetroPCS Communications, Inc. † | | | 34,101 | |
| | 1,500 | | Neutral Tandem, Inc. † | | | 21,660 | |
| | 1,825 | | NII Holdings, Inc. † | | | 81,504 | |
| | 2,600 | | PAETEC Holding Corp. † | | | 9,724 | |
| | 14,920 | | Qwest Communications International, Inc. | | | 113,541 | |
| | 2,000 | | SBA Communications Corp., Class A † | | | 81,880 | |
| | 27,071 | | Sprint Nextel Corp. † | | | 114,510 | |
| | 200 | | SureWest Communications † | | | 2,140 | |
| | 1,500 | | Syniverse Holdings, Inc. † | | | 46,275 | |
| | 998 | | Telephone & Data Systems, Inc. | | | 36,477 | |
| | 400 | | TerreStar Corp. † | | | 56 | |
| | 975 | | tw telecom, Inc., Class A † | | | 16,624 | |
| | 400 | | USA Mobility, Inc. | | | 7,108 | |
| | 33,359 | | Verizon Communications, Inc. | | | 1,193,585 | |
| | 600 | | Vonage Holdings Corp. † | | | 1,344 | |
| | 6,895 | | Windstream Corp. | | | 96,116 | |
| | | | | | | 4,756,567 | |
| Utilities — 3.4% | | | | |
| | 7,860 | | AES Corp. (The) † | | | 95,735 | |
| | 1,100 | | AGL Resources, Inc. | | | 39,435 | |
| | 2,000 | | Allegheny Energy, Inc. | | | 48,480 | |
| | 1,500 | | Alliant Energy Corp. | | | 55,155 | |
| | 3,100 | | Ameren Corp. | | | 87,389 | |
| | 5,780 | | American Electric Power Co., Inc. | | | 207,964 | |
| | 1,500 | | American Water Works Co., Inc. | | | 37,935 | |
| | 2,721 | | Aqua America, Inc. | | | 61,168 | |
| | 1,100 | | Atmos Energy Corp. | | | 34,320 | |
| | 6,000 | | Calpine Corp. † | | | 80,040 | |
| | 4,600 | | CenterPoint Energy, Inc. | | | 72,312 | |
| | 1,500 | | Central Vermont Public Service Corp. | | | 32,790 | |
| Wilshire Mutual Funds, Inc. | |
Wilshire 5000 Indexsm Fund | December 31, 2010 |
| Schedule of Investments | |
| Shares | | | | Value | |
| Utilities (continued) | | | |
| | 400 | | Cleco Corp. | | $ | 12,304 | |
| | 3,350 | | CMS Energy Corp. | | | 62,310 | |
| | 3,750 | | Consolidated Edison, Inc. | | | 185,887 | |
| | 1,900 | | Constellation Energy Group, Inc. | | | 58,197 | |
| | 7,040 | | Dominion Resources, Inc. | | | 300,749 | |
| | 1,500 | | DPL, Inc. | | | 38,565 | |
| | 2,000 | | DTE Energy Co. | | | 90,640 | |
| | 16,382 | | Duke Energy Corp. | | | 291,763 | |
| | 1,448 | | Dynegy, Inc., Class A † | | | 8,138 | |
| | 3,050 | | Edison International | | | 117,730 | |
| | 890 | | Energen Corp. | | | 42,951 | |
| | 2,050 | | Entergy Corp. | | | 145,201 | |
| | 7,524 | | Exelon Corp. | | | 313,299 | |
| | 3,246 | | FirstEnergy Corp. | | | 120,167 | |
| | 6,479 | | GenOn Energy, Inc. † | | | 24,685 | |
| | 1,305 | | Great Plains Energy, Inc. | | | 25,304 | |
| | 750 | | Hawaiian Electric Industries, Inc. | | | 17,093 | |
| | 600 | | IDACORP, Inc. | | | 22,188 | |
| | 700 | | Integrys Energy Group, Inc. | | | 33,957 | |
| | 2,125 | | MDU Resources Group, Inc. | | | 43,074 | |
| | 950 | | National Fuel Gas Co. | | | 62,339 | |
| | 5,210 | | NextEra Energy, Inc. | | | 270,868 | |
| | 500 | | Nicor, Inc. | | | 24,960 | |
| | 4,215 | | NiSource, Inc. | | | 74,268 | |
| | 2,000 | | Northeast Utilities | | | 63,760 | |
| | 3,425 | | NRG Energy, Inc. † | | | 66,924 | |
| | 1,290 | | NSTAR | | | 54,425 | |
| | 3,150 | | NV Energy, Inc. | | | 44,258 | |
| | 1,400 | | OGE Energy Corp. | | | 63,756 | |
| | 1,325 | | Oneok, Inc. | | | 73,498 | |
| | 2,650 | | Pepco Holdings, Inc. | | | 48,362 | |
| | 4,850 | | PG&E Corp. | | | 232,024 | |
| | 1,700 | | Piedmont Natural Gas Co., Inc. | | | 47,532 | |
| | 1,300 | | Pinnacle West Capital Corp. | | | 53,885 | |
| | 700 | | PNM Resources, Inc. | | | 9,114 | |
| | 900 | | Portland General Electric Co. | | | 19,530 | |
| | 4,450 | | PPL Corp. | | | 117,124 | |
| | 3,291 | | Progress Energy, Inc. | | | 143,093 | |
| | 6,350 | | Public Service Enterprise Group, Inc. | | | 201,994 | |
| | 2,200 | | Questar Corp. | | | 38,302 | |
| | 1,379 | | SCANA Corp. | | | 55,987 | |
| | 3,050 | | Sempra Energy | | | 160,064 | |
| | 9,800 | | Southern Co. | | | 374,654 | |
| | 2,700 | | TECO Energy, Inc. | | | 48,060 | |
| | 1,300 | | UGI Corp. | | | 41,054 | |
| | 933 | | Vectren Corp. | | | 23,680 | |
| | 950 | | Westar Energy, Inc. | | | 23,902 | |
| | 350 | | WGL Holdings, Inc. | | | 12,520 | |
| | 1,350 | | Wisconsin Energy Corp. | | | 79,461 | |
| | 6,025 | | Xcel Energy, Inc. | | | 141,889 | |
| | | | | | | 5,478,212 | |
| Total Common Stock (Cost $98,417,344) | | | 159,614,552 | |
| | |
| WARRANTS — 0.0% | |
| | 6 | | Krispy Kreme Doughnuts, Inc., Expires 03/12 † | | | 2 | |
| | 367 | | Raytheon Co., Expires 06/11 † | | | 3,200 | |
| | | | Total Warrants (Cost $0) | | | 3,202 | |
| | |
| PRIVATE COMPANY —0.0% | | | | |
| | 82 | | Internet Media Services, Inc. (a) † (Cost $0) | | | — | |
| Shares | | | | Value | |
| RIGHTS — 0.0% | |
| | 2,268 | | BioFuel Energy Corp., Expires 01/11 †(a) | | $ | 760 | |
| | 900 | | Fresenius Kabi Pharmaceuticals Holding, Inc., Expires 06/11† | | | 37 | |
| | 50 | | Heritage Commerce Co., Expires 01/11† | | | 37 | |
| Total Rights (Cost $900) | | | 834 | |
| | | | | |
| Total Investments — 99.5% | | | | |
| (Cost $98,418,244) | | | 159,618,588 | |
| Other Assets & Liabilities, Net — 0.5% | | | 733,191 | |
| NET ASSETS — 100.0% | | $ | 160,351,779 | |
| † | Non-income producing security. |
REIT — Real Estate Investment Trust
(a) Security fair valued using methods determined in good faith by the Pricing Committee. As of December 31, 2010, the total market value of these securities was $760, representing 0.0% of net assets.
Amounts designated as “—” are either $0, or have been rounded to $0.
Report of Independent Registered Public Accounting Firm
To the Shareholders and Board of Directors
of Wilshire Mutual Funds, Inc.:
We have audited, in accordance with the standards of the Public Company Accounting Oversight Board (United States), the financial statements of Large Company Growth Portfolio, Large Company Value Portfolio, Small Company Growth Portfolio, Small Company Value Portfolio and Wilshire 5000 Index, (five of the funds constituting Wilshire Mutual Funds, Inc., hereafter referred to as the “Funds”) as of December 31, 2010, and for the year then ended and have issued our unqualified report thereon dated March 1, 2011 (which report and financial statements are included in Item 1 of this Certified Shareholder Report on Form N-CSR). Our audit included an audit of the Fund's schedule of investments (the “Statement”) as of December 31, 2010 appearing in Item 6 of this Form N-CSR. This Statement is the responsibility of the Fund’s management. Our responsibility is to express an opinion on this Statement based on our audit.
In our opinion, the Statement referred to above, when read in conjunction with the financial statements of the Funds referred to above, presents fairly, in all material respects, the information set forth therein.
PricewaterhouseCoopers LLP
Philadelphia, Pennsylvania
March 1, 2011
| Item 7. | Disclosure of Proxy Voting Policies and Procedures for Closed-End Management Investment Companies. |
Not applicable.
| Item 8. | Portfolio Managers of Closed-End Management Investment Companies. |
Not applicable.
| Item 9. | Purchases of Equity Securities by Closed-End Management Investment Company and Affiliated Purchasers. |
Not applicable.
| Item 10. | Submission of Matters to a Vote of Security Holders. |
There have been no changes to the procedures by which shareholders may recommend nominees to the registrant’s Board of Directors since the registrant last disclosed such procedures in the definitive proxy statement filed with the SEC on January 10, 2006.
| Item 11. | Controls and Procedures. |
| | (a) | The registrant’s principal executive and principal financial officers, or persons performing similar functions, have concluded that the registrant’s disclosure controls and procedures (as defined in Rule 30a-3(c) under the Investment Company Act of 1940, as amended (the “1940 Act”) (17 CFR 270.30a-3(c))) are effective, as of a date within 90 days of the filing date of the report that includes the disclosure required by this paragraph, based on their evaluation of these controls and procedures required by Rule 30a-3(b) under the 1940 Act (17 CFR 270.30a-3(b)) and Rules 13a-15(b) or 15d-15(b) under the Securities Exchange Act of 1934, as amended (17 CFR 240.13a-15(b) or 240.15d-15(b)). |
| | (b) | There were no changes in the registrant’s internal control over financial reporting (as defined in Rule 30a-3(d) under the 1940 Act (17 CFR 270.30a-3(d)) that occurred during the registrant’s second fiscal quarter of the period covered by this report that has materially affected, or is reasonably likely to materially affect, the registrant’s internal control over financial reporting. |
| | (a)(1) | Code of ethics, or any amendment thereto, that is the subject of disclosure required by Item 2 is attached hereto. | |
| | (a)(2) | Certifications pursuant to Rule 30a-2(a) under the 1940 Act and Section 302 of the Sarbanes-Oxley Act of 2002 are attached hereto. |
| | (b) | Certifications pursuant to Rule 30a-2(b) under the 1940 Act and Section 906 of the Sarbanes-Oxley Act of 2002 are attached hereto. |
SIGNATURES
Pursuant to the requirements of the Securities Exchange Act of 1934 and the Investment Company Act of 1940, the registrant has duly caused this report to be signed on its behalf by the undersigned, thereunto duly authorized.
| (Registrant) | Wilshire Mutual Funds, Inc. | |
| | | |
| | | |
| By (Signature and Title)* | /s/ Jamie B. Ohl | |
| | Jamie B. Ohl, President | |
| | (principal executive officer) | |
| | | |
| Date: March 11, 2011 | | |
Pursuant to the requirements of the Securities Exchange Act of 1934 and the Investment Company Act of 1940, this report has been signed below by the following persons on behalf of the registrant and in the capacities and on the dates indicated.
| By (Signature and Title)* | /s/ Jamie B. Ohl | |
| | Jamie B. Ohl, President | |
| | (principal executive officer) | |
| | | |
| Date: March 11, 2011 | | |
| | | |
| | | |
| By (Signature and Title)* | /s/ Michael Wauters | |
| | Michael Wauters, Treasurer | |
| | (principal financial officer) | |
| | | |
| Date: March 11, 2011 | | |
* Print the name and title of each signing officer under his or her signature.