Wilshire Mutual Funds |
ANNUAL REPORT Large Company Growth Portfolio Large Company Value Portfolio Small Company Growth Portfolio Small Company Value Portfolio Wilshire 5000 Indexsm Fund Wilshire Large Cap Core Plus Fund |
http://advisor.wilshire.com |
Wilshire Mutual Funds Table of Contents |  |
| Shareholder Letter | 1 |
| Commentary: | |
| Large Company Growth Portfolio | 3 |
| Large Company Value Portfolio | 7 |
| Small Company Growth Portfolio | 11 |
| Small Company Value Portfolio | 15 |
Wilshire 5000 IndexSM Fund | 19 |
| Wilshire Large Cap Core Plus Fund | 25 |
| Disclosure of Fund Expenses | 29 |
| Condensed Schedules of Investments: | |
| Large Company Growth Portfolio | 32 |
| Large Company Value Portfolio | 34 |
| Small Company Growth Portfolio | 36 |
| Small Company Value Portfolio | 38 |
Wilshire 5000 IndexSM Fund | 40 |
| Schedule of Investments: | |
| Wilshire Large Cap Core Plus Fund | 42 |
| Schedule of Securities Sold Short: | |
| Wilshire Large Cap Core Plus Fund | 47 |
| Statements of Assets and Liabilities | 50 |
| Statements of Operations | 52 |
| Statements of Changes in Net Assets | 53 |
| Statement of Cash Flows | 57 |
| Financial Highlights: | |
| Large Company Growth Portfolio | 58 |
| Large Company Value Portfolio | 60 |
| Small Company Growth Portfolio | 62 |
| Small Company Value Portfolio | 64 |
Wilshire 5000 IndexSM Fund | 66 |
| Wilshire Large Cap Core Plus Fund | 70 |
| Notes to Financial Statements | 72 |
| Report of Independent Registered Public Accounting Firm | 83 |
| Additional Fund Information | 84 |
| Tax Information | 89 |
| Board Approval of Advisory and Subadvisory Agreements | 91 |
This report is for the general information of the shareholders of Large Company Growth Portfolio, Large Company Value Portfolio, Small Company Growth Portfolio, Small Company Value Portfolio, Wilshire 5000 IndexSM Fund and Wilshire Large Cap Core Plus Fund. Its use in connection with any offering of a Portfolio’s shares is authorized only if accompanied or preceded by the Portfolio’s current prospectus.
Wilshire Mutual Funds, Inc. are distributed by SEI Investments Distribution Co.
Wilshire Mutual Funds Letter to Shareholders | |
Dear Wilshire Mutual Fund Shareholder:
We are pleased to present this annual report to all shareholders of the Wilshire Mutual Funds. This report covers the period from January 1, 2012 to December 31, 2012, for all share classes of the Large Company Growth Fund, Large Company Value Fund, Small Company Growth Fund, Small Company Value Fund, Wilshire 5000 IndexSM Fund, and Wilshire Large Cap Core Plus Fund.
Market Environment
U.S. Equity Market
Despite short-term volatility in equities mainly due to uncertainty surrounding the situation in the euro-zone, domestic markets were able to push ahead in 2012, with the Wilshire 5000 IndexSM gaining 15.54% for the year. This advance marked the Wilshire 5000’s fourth consecutive year of positive returns, and a 76.17% advance since the end of 2008. All style and size segments delivered very strong returns across the board, with growth stocks outpacing value in the large cap segment (16.90% v. 14.56%), and small cap outperforming large cap for the year (18.76% v. 15.74%). Markets suffered through the months of October and November as concerns over the outcome of the Presidential election, as well as the fallout from Superstorm Sandy, began to weigh on investor sentiment. In the fourth quarter, markets remained volatile as the “fiscal cliff” negotiations heated up, but ultimately rose when an agreement was reached. Financials was the best performing sector for the year, returning 26.44%, while the Energy and Utilities sectors lagged, returning 3.85% and 2.17%, respectively.
International Equity Market
Despite continued fiscal upheaval in Europe, 2012 proved to be a good year for global stocks overall, with the MSCI EAFE Index and MSCI Emerging Markets Index gaining 17.32% and 18.23%, respectively. In July, European Central Bank President Mario Draghi said he would do “whatever it takes” to preserve the euro, boosting investor confidence worldwide. The euro received additional support from the European Central Bank through several stimulus packages, averting a potential breakup of the euro-zone. European stocks rallied at the end of the year, with the MSCI Europe Index rising 19.12% for 2012, its strongest annual gain since 2009. China also made headlines as investors grew nervous about a possible slowdown in the world’s second largest economy. While China’s economy did cool down, expanding at an annualized rate of 7.4% in the third quarter, by the end of the year the country was showing increasing signs of renewed economic growth.
Bond Market
Fixed income securities rallied in 2012, with all sectors of the debt market gaining and the Barclays U.S. Aggregate Bond Index returning 4.22%. As Federal Reserve policy kept Treasury yields depressed, investors in search of higher yield ventured farther out on the yield curve. The 10-year Treasury yield remained volatile over the year, soaring to over 2.39% in March, and then falling to an all-time low of 1.38% in July as concerns over the euro-zone debt crisis rapidly escalated. At the end of the year, the 10-year Treasury ended up just about where it started at 1.76%. High yield and corporate sectors performed well, as the Barclays U.S. Corporate High Yield Index and Barclays U.S. Credit Index rose 15.81% and 9.89%, respectively. The Barclays EM Local Currency Government Universal Index posted strong performance, returning 11.21%. However, the Barclays Global Aggregate Index posted returns in line with its U.S. counterpart, gaining 4.32%.
Fund Performance Review
The Wilshire Mutual Funds turned in mixed performance in 2012. The Wilshire Large Company Growth Portfolio Institutional Class returned 14.04% for the year, underperforming the Russell 1000 Growth Index return of 15.26%. The Wilshire Large Company Value Portfolio Institutional Class returned 16.18% for the year, underperforming the Russell
Wilshire Mutual Funds Letter to Shareholders - (Continued) | |
1000 Value Index return of 17.51%. The Wilshire Small Company Growth Portfolio Institutional Class returned 13.80% for the year, underperforming the Russell 2000 Growth Index return of 14.59%. The Wilshire Small Company Value Portfolio Institutional Class returned 17.41% for the year, underperforming the Russell 2000 Value Index return of 18.05%. The Wilshire 5000 IndexSM Fund Institutional Class returned 15.54% for the year, underperforming the Wilshire 5000 IndexSM return of 16.07%. Lastly, the Wilshire Large Cap Core Plus Fund Institutional Class returned 13.63% for the year, underperforming the S&P 500 Index return of 16.00%.
We are mindful that markets can behave erratically and current trends shift swiftly. You can expect us to continue to work diligently to manage your investments and seek to generate returns commensurate with the Funds’ investment objectives. As always, we sincerely appreciate your continued support and confidence in Wilshire Associates.
Sincerely,
Jason Schwarz
President
Wilshire Mutual Funds, Inc.
Large Company Growth Portfolio Commentary | |
INVESTMENT CLASS SHARES
Average Annual Total Return*
| One Year Ended 12/31/12 | 13.72% |
| Five Years Ended 12/31/12 | 0.72% |
| Ten Years Ended 12/31/12 | 6.36% |
RUSSELL 1000® GROWTH INDEX(1)
Average Annual Total Return
| One Year Ended 12/31/12 | 15.26% |
| Five Years Ended 12/31/12 | 3.12% |
| Ten Years Ended 12/31/12 | 7.52% |
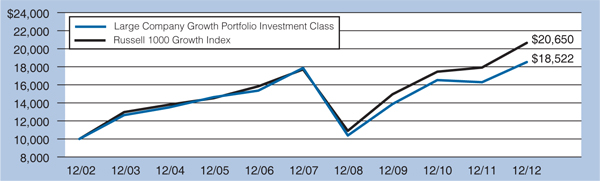
COMPARATIVE PERFORMANCE
Comparison of Change in Value of $10,000 Investment in Shares of Large Company Growth
Portfolio, Investment Class Shares and the Russell 1000 Growth Index through 12/31/12.
The performance data quoted represents past performance and does not guarantee future results. Current performance may be lower or higher. Performance data current to the most recent month end may be obtained at http://advisor.wilshire.com. The investment return and principal value of an investment will fluctuate so that shares, when redeemed, may be worth more or less than their original cost. The table above does not reflect the deduction of taxes that a shareholder would pay on Portfolio distributions or the redemption of Portfolio shares.
| * | Assumes reinvestment of all distributions. During certain periods since inception, certain fees and expenses were waived or reimbursed. Without waivers and reimbursements, historical total returns would have been lower. For the year ended December 31, 2012, there were no waivers. |
| | |
| (1) | The Russell 1000® Growth Index is an unmanaged index that measures the performance of the largest 1,000 U.S. companies with higher price-to-book ratios and higher forecasted growth values. Index performance is presented for general comparative purposes. Unlike a mutual fund, the performance of an index assumes no taxes, transaction costs, management fees or other expenses. An individual cannot directly invest in any index. |
Large Company Growth Portfolio Commentary - (Continued) | |
INSTITUTIONAL CLASS SHARES
Average Annual Total Return*
| One Year Ended 12/31/12 | 14.04% |
| Five Years Ended 12/31/12 | 1.06% |
| Ten Years Ended 12/31/12 | 6.73% |
RUSSELL 1000® GROWTH INDEX(1)
Average Annual Total Return
| One Year Ended 12/31/12 | 15.26% |
| Five Years Ended 12/31/12 | 3.12% |
| Ten Years Ended 12/31/12 | 7.52% |
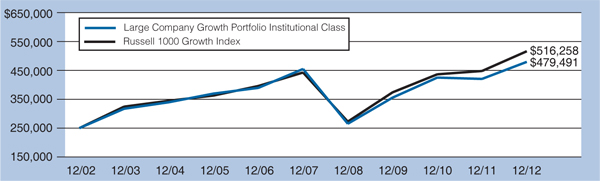
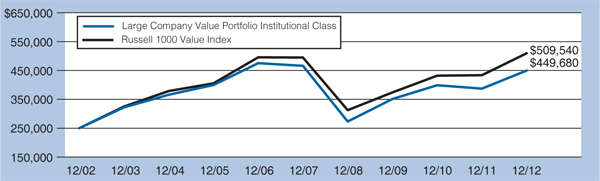
COMPARATIVE PERFORMANCE
Comparison of Change in Value of $250,000 Investment in Shares of Large Company Growth
Portfolio, Institutional Class Shares and the Russell 1000 Growth Index through 12/31/12.
The performance data quoted represents past performance and does not guarantee future results. Current performance may be lower or higher. Performance data current to the most recent month end may be obtained at http://advisor.wilshire.com. The investment return and principal value of an investment will fluctuate so that shares, when redeemed, may be worth more or less than their original cost. The table above does not reflect the deduction of taxes that a shareholder would pay on Portfolio distributions or the redemption of Portfolio shares.
| * | Assumes reinvestment of all distributions. During certain periods since inception, certain fees and expenses were waived or reimbursed. Without waivers and reimbursements, historical total returns would have been lower. For the year ended December 31, 2012, there were no waivers. |
| | |
| (1) | The Russell 1000® Growth Index is an unmanaged index that measures the performance of the largest 1,000 U.S. companies with higher price-to-book ratios and higher forecasted growth values. Index performance is presented for general comparative purposes. Unlike a mutual fund, the performance of an index assumes no taxes, transaction costs, management fees or other expenses. An individual cannot directly invest in any index. |
Large Company Growth Portfolio Commentary - (Continued) | |
Stock markets around the world rallied in 2012 as stimulus measures by central banks overshadowed continuing concerns about a slowing global economy. After getting off to a fast start in the first quarter, equity markets sold off in the second quarter as fears over the European debt crisis and a “hard-landing” in the Chinese economy rattled investors. Markets reversed course in July as concerns over a euro-zone breakup subsided when European Central Bank President Mario Draghi declared that the ECB would do “whatever it takes” to preserve the monetary union. Markets trended downwards to start the fourth quarter as election jitters and worries about the upcoming “fiscal cliff” weakened investor confidence. Equity markets rallied on the final trading day of the year as U.S. political leaders hinted that an agreement to avoid the “fiscal cliff” was imminent. Supported by generally strong corporate earnings, investors shifted out of defensive sectors and into the more cyclical, economically-sensitive areas of the market in 2012. Financials and Consumer Discretionary were the best performing sectors for the year, returning 26.4% and 23.9%, respectively, while Utilities was the worst, returning 2.2%. For 2012, small capitalization stocks outperformed large capitalization stocks returning 18.8% and 15.7%, respectively, and across market capitalizations, value stocks generally outperformed growth stocks. The small value style delivered the best returns for the year, up 21.5%, while large value and mid growth trailed other styles, returning 14.6% and 13.5%, respectively.
The Wilshire Large Company Growth Portfolio Institutional Class (the “Fund”) returned 14.04% for the year ended December 31, 2012, underperforming the benchmark (the Russell 1000 Growth Index) return of 15.26%. Underperformance was driven by poor stock selection in Information Technology, Consumer Discretionary and Materials. Underperformance was modestly offset by strong stock selection in Health Care and Consumer Staples.
Large Company Growth Portfolio Commentary - (Continued) | |
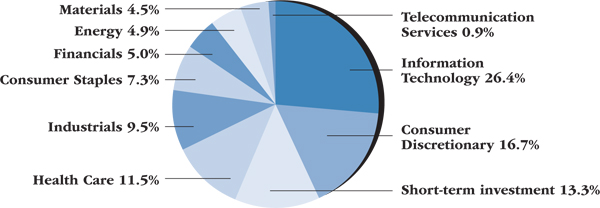
PORTFOLIO SECTOR WEIGHTING†
(As of December 31, 2012)
| † | Based on percent of the Portfolio’s total investments in securities, at value. |
Large Company Value Portfolio Commentary | |
INVESTMENT CLASS SHARES
Average Annual Total Return*
| One Year Ended 12/31/12 | 15.92% |
| Five Years Ended 12/31/12 | (0.94)% |
| Ten Years Ended 12/31/12 | 5.79% |
RUSSELL 1000® VALUE INDEX(1)
Average Annual Total Return
| One Year Ended 12/31/12 | 17.51% |
| Five Years Ended 12/31/12 | 0.59% |
| Ten Years Ended 12/31/12 | 7.38% |
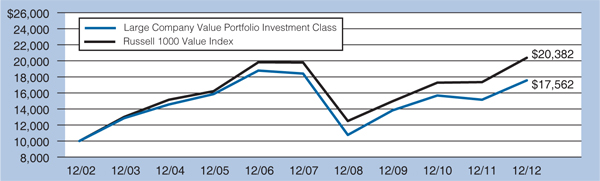
COMPARATIVE PERFORMANCE
Comparison of Change in Value of $10,000 Investment in Shares of Large Company Value
Portfolio, Investment Class Shares and the Russell 1000 Value Index through 12/31/12.
The performance data quoted represents past performance and does not guarantee future results. Current performance may be lower or higher. Performance data current to the most recent month end may be obtained at http://advisor.wilshire.com. The investment return and principal value of an investment will fluctuate so that shares, when redeemed, may be worth more or less than their original cost. The table above does not reflect the deduction of taxes that a shareholder would pay on Portfolio distributions or the redemption of Portfolio shares.
| * | Assumes reinvestment of all distributions. During certain periods since inception, certain fees and expenses were waived or reimbursed. Without waivers and reimbursements, historical total returns would have been lower. For the year ended December 31, 2012, there were no waivers. |
| | |
| (1) | The Russell 1000® Value Index is an unmanaged index that measures the performance of the largest 1,000 U.S. companies with lower price-to-book ratios and lower forecasted growth values. Index performance is presented for general comparative purposes. Unlike a mutual fund, the performance of an index assumes no taxes, transaction costs, management fees or other expenses. An individual cannot directly invest in any index. |
Large Company Value Portfolio Commentary - (Continued) | |
INSTITUTIONAL CLASS SHARES
Average Annual Total Return*
| One Year Ended 12/31/12 | 16.18% |
| Five Years Ended 12/31/12 | (0.71)% |
| Ten Years Ended 12/31/12 | 6.05% |
RUSSELL 1000® VALUE INDEX(1)
Average Annual Total Return
| One Year Ended 12/31/12 | 17.51% |
| Five Years Ended 12/31/12 | 0.59% |
| Ten Years Ended 12/31/12 | 7.38% |
COMPARATIVE PERFORMANCE
Comparison of Change in Value of $250,000 Investment in Shares of Large Company Value
Portfolio, Institutional Class Shares and the Russell 1000 Value Index through 12/31/12.
The performance data quoted represents past performance and does not guarantee future results. Current performance may be lower or higher. Performance data current to the most recent month end may be obtained at http://advisor.wilshire.com. The investment return and principal value of an investment will fluctuate so that shares, when redeemed, may be worth more or less than their original cost. The table above does not reflect the deduction of taxes that a shareholder would pay on Portfolio distributions or the redemption of Portfolio shares.
| * | Assumes reinvestment of all distributions. During certain periods since inception, certain fees and expenses were waived or reimbursed. Without waivers and reimbursements, historical total returns would have been lower. For the year ended December 31, 2012, there were no waivers. |
| | |
| (1) | The Russell 1000® Value Index is an unmanaged index that measures the performance of the largest 1,000 U.S. companies with lower price-to-book ratios and lower forecasted growth values. Index performance is presented for general comparative purposes. Unlike a mutual fund, the performance of an index assumes no taxes, transaction costs, management fees or other expenses. An individual cannot directly invest in any index. |
Large Company Value Portfolio Commentary - (Continued) | |
Stock markets around the world rallied in 2012 as stimulus measures by central banks overshadowed continuing concerns about a slowing global economy. After getting off to a fast start in the first quarter, equity markets sold off in the second quarter as fears over the European debt crisis and a “hard-landing” in the Chinese economy rattled investors. Markets reversed course in July as concerns over a euro-zone breakup subsided when European Central Bank President Mario Draghi declared that the ECB would do “whatever it takes” to preserve the monetary union. Markets trended downwards to start the fourth quarter as election jitters and worries about the upcoming “fiscal cliff” weakened investor confidence. Equity markets rallied on the final trading day of the year as U.S. political leaders hinted that an agreement to avoid the “fiscal cliff” was imminent. Supported by generally strong corporate earnings, investors shifted out of defensive sectors and into the more cyclical, economically-sensitive areas of the market in 2012. Financials and Consumer Discretionary were the best performing sectors for the year, returning 26.4% and 23.9%, respectively, while Utilities was the worst, returning 2.2%. For 2012, small capitalization stocks outperformed large capitalization stocks returning 18.8% and 15.7%, respectively, and across market capitalizations, value stocks generally outperformed growth stocks. The small value style delivered the best returns for the year, up 21.5%, while large value and mid growth trailed other styles, returning 14.6% and 13.5%, respectively.
The Wilshire Large Company Value Portfolio Institutional Class (the “Fund”) returned 16.18% for the year ended December 31, 2012, underperforming the benchmark (the Russell 1000 Value Index) return of 17.51%. Underperformance was driven by poor stock selection in Consumer Discretionary and Consumer Staples, as well as an overweight allocation to Information Technology. Underperformance was modestly offset by strong stock selection in Energy, Materials and Industrials.
Large Company Value Portfolio Commentary - (Continued) | |
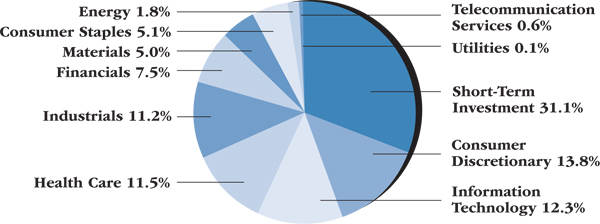
PORTFOLIO SECTOR WEIGHTING†
(As of December 31 2012)
| † | Based on percent of the Portfolio’s total investments in securities, at value. |
Small Company Growth Portfolio Commentary | |
INVESTMENT CLASS SHARES
Average Annual Total Return*
| One Year Ended 12/31/12 | 13.58% |
| Five Years Ended 12/31/12 | 2.53% |
| Ten Years Ended 12/31/12 | 8.53% |
RUSSELL 2000® GROWTH INDEX(1)
Average Annual Total Return
| One Year Ended 12/31/12 | 14.59% |
| Five Years Ended 12/31/12 | 3.49% |
| Ten Years Ended 12/31/12 | 9.80% |
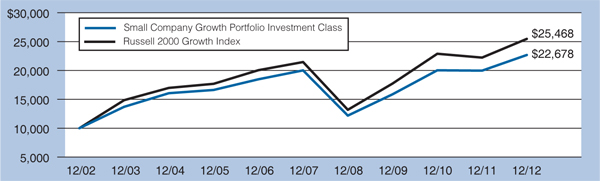
COMPARATIVE PERFORMANCE
Comparison of Change in Value of $10,000 Investment in Shares of Small Company Growth
Portfolio, Investment Class Shares and the Russell 2000 Growth Index through 12/31/12.
The performance data quoted represents past performance and does not guarantee future results. Current performance may be lower or higher. Performance data current to the most recent month end may be obtained at http://advisor.wilshire.com. The investment return and principal value of an investment will fluctuate so that shares, when redeemed, may be worth more or less than their original cost. The table above does not reflect the deduction of taxes that a shareholder would pay on Portfolio distributions or the redemption of Portfolio shares.
| * | Assumes reinvestment of all distributions. During certain periods since inception, certain fees and expenses were waived or reimbursed. Without waivers and reimbursements, historical total returns would have been lower. For the year ended December 31, 2012, fees totaling 0.49% of average net assets were waived for the Investment Class Shares. |
| | |
| (1) | The Russell 2000® Growth Index is an unmanaged index that measures the performance of the 2,000 smallest U.S. companies with higher price-to-book ratios and higher forecasted growth values. Index performance is presented for general comparative purposes. Unlike a mutual fund, the performance of an index assumes no taxes, transaction costs, management fees or other expenses. An individual cannot directly invest in any index. |
Small Company Growth Portfolio Commentary - (Continued) | |
INSTITUTIONAL CLASS SHARES
Average Annual Total Return*
| One Year Ended 12/31/12 | 13.80% |
| Five Years Ended 12/31/12 | 2.76% |
| Ten Years Ended 12/31/12 | 8.80% |
RUSSELL 2000® GROWTH INDEX(1)
Average Annual Total Return
| One Year Ended 12/31/12 | 14.59% |
| Five Years Ended 12/31/12 | 3.49% |
| Ten Years Ended 12/31/12 | 9.80% |
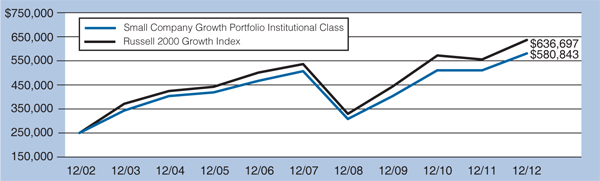
COMPARATIVE PERFORMANCE
Comparison of Change in Value of $250,000 Investment in Shares of Small Company Growth
Portfolio, Institutional Class Shares and the Russell 2000 Growth Index through 12/31/12.
The performance data quoted represents past performance and does not guarantee future results. Current performance may be lower or higher. Performance data current to the most recent month end may be obtained at http://advisor.wilshire.com. The investment return and principal value of an investment will fluctuate so that shares, when redeemed, may be worth more or less than their original cost. The table above does not reflect the deduction of taxes that a shareholder would pay on Portfolio distributions or the redemption of Portfolio shares.
| * | Assumes reinvestment of all distributions. During certain periods since inception, certain fees and expenses were waived or reimbursed. Without waivers and reimbursements, historical total returns would have been lower. For the year ended December 31, 2012, fees totaling 0.50% of average net assets were waived for the Institutional Class Shares. |
| | |
| (1) | The Russell 2000® Growth Index is an unmanaged index that measures the performance of the 2,000 smallest U.S. companies with higher price-to-book ratios and higher forecasted growth values. Index performance is presented for general comparative purposes. Unlike a mutual fund, the performance of an index assumes no taxes, transaction costs, management fees or other expenses. An individual cannot directly invest in any index. |
Small Company Growth Portfolio Commentary - (Continued) | |
Stock markets around the world rallied in 2012 as stimulus measures by central banks overshadowed continuing concerns about a slowing global economy. After getting off to a fast start in the first quarter, equity markets sold off in the second quarter as fears over the European debt crisis and a “hard-landing” in the Chinese economy rattled investors. Markets reversed course in July as concerns over a euro-zone breakup subsided when European Central Bank President Mario Draghi declared that the ECB would do “whatever it takes” to preserve the monetary union. Markets trended downwards to start the fourth quarter as election jitters and worries about the upcoming “fiscal cliff” weakened investor confidence. Equity markets rallied on the final trading day of the year as U.S. political leaders hinted that an agreement to avoid the “fiscal cliff” was imminent. Supported by generally strong corporate earnings, investors shifted out of defensive sectors and into the more cyclical, economically-sensitive areas of the market in 2012. Financials and Consumer Discretionary were the best performing sectors for the year, returning 26.4% and 23.9%, respectively, while Utilities was the worst, returning 2.2%. For 2012, small capitalization stocks outperformed large capitalization stocks returning 18.8% and 15.7%, respectively, and across market capitalizations, value stocks generally outperformed growth stocks. The small value style delivered the best returns for the year, up 21.5%, while large value and mid growth trailed other styles, returning 14.6% and 13.5%, respectively.
The Wilshire Small Company Growth Portfolio Institutional Class (the “Fund”) returned 13.80% for the year ended December 31, 2012, underperforming the benchmark (the Russell 2000 Growth Index) return of 14.59%. Underperformance was driven primarily by poor stock selection in Health Care and Financials, as well as an underweight in Industrials. Underperformance was modestly offset by strong stock selection in Information Technology and Energy.
Small Company Growth Portfolio Commentary - (Continued) | |
PORTFOLIO SECTOR WEIGHTING†
(As of December 31 2012)
| † | Based on percent of the Portfolio’s total investments in securities, at value. |
Small Company Value Portfolio Commentary | |
INVESTMENT CLASS SHARES
Average Annual Total Return*
| One Year Ended 12/31/12 | 17.20% |
| Five Years Ended 12/31/12 | 2.02% |
| Ten Years Ended 12/31/12 | 8.47% |
RUSSELL 2000® VALUE INDEX(1)
Average Annual Total Return
| One Year Ended 12/31/12 | 18.05% |
| Five Years Ended 12/31/12 | 3.55% |
| Ten Years Ended 12/31/12 | 9.50% |
COMPARATIVE PERFORMANCE
Comparison of Change in Value of $10,000 Investment in Shares of Small Company Value
Portfolio, Investment Class Shares and the Russell 2000 Value Index through 12/31/12.
The performance data quoted represents past performance and does not guarantee future results. Current performance may be lower or higher. Performance data current to the most recent month end may be obtained at http://advisor.wilshire.com. The investment return and principal value of an investment will fluctuate so that shares, when redeemed, may be worth more or less than their original cost. The table above does not reflect the deduction of taxes that a shareholder would pay on Portfolio distributions or the redemption of Portfolio shares.
| * | Assumes reinvestment of all distributions. During certain periods since inception, certain fees and expenses were waived or reimbursed. Without waivers and reimbursements, historical total returns would have been lower. For the year ended December 31, 2012, fees totaling 0.34% of average net assets were waived in the Investment Class Shares. |
| | |
| (1) | The Russell 2000® Value Index is an unmanaged index that measures the performance of the 2,000 smallest U.S. companies with lower price-to-book ratios and lower forecasted growth values. Index performance is presented for general comparative purposes. Unlike a mutual fund, the performance of an index assumes no taxes, transaction costs, management fees or other expenses. An individual cannot directly invest in any index. |
Small Company Value Portfolio Commentary - (Continued) | |
INSTITUTIONAL CLASS SHARES
Average Annual Total Return*
| One Year Ended 12/31/12 | 17.41% |
| Five Years Ended 12/31/12 | 2.40% |
| Ten Years Ended 12/31/12 | 8.83% |
RUSSELL 2000® VALUE INDEX(1)
Average Annual Total Return
| One Year Ended 12/31/12 | 18.05% |
| Five Years Ended 12/31/12 | 3.55% |
| Ten Years Ended 12/31/12 | 9.50% |
COMPARATIVE PERFORMANCE
Comparison of Change in Value of $250,000 Investment in Shares of Small Company Value
Portfolio, Institutional Class Shares and the Russell 2000 Value Index through 12/31/12.
The performance data quoted represents past performance and does not guarantee future results. Current performance may be lower or higher. Performance data current to the most recent month end may be obtained at http://advisor.wilshire.com. The investment return and principal value of an investment will fluctuate so that shares, when redeemed, may be worth more or less than their original cost. The table above does not reflect the deduction of taxes that a shareholder would pay on Portfolio distributions or the redemption of Portfolio shares.
| * | Assumes reinvestment of all distributions. During certain periods since inception, certain fees and expenses were waived or reimbursed. Without waivers and reimbursements, historical total returns would have been lower. For the year ended December 31, 2012, fees totaling 0.34% of average net assets were waived in the Institutional Class Shares. |
| | |
| (1) | The Russell 2000® Value Index is an unmanaged index that measures the performance of the 2,000 smallest U.S. companies with lower price-to-book ratios and lower forecasted growth values. Index performance is presented for general comparative purposes. Unlike a mutual fund, the performance of an index assumes no taxes, transaction costs, management fees or other expenses. An individual cannot directly invest in any index. |
Small Company Value Portfolio Commentary - (Continued) | |
Stock markets around the world rallied in 2012 as stimulus measures by central banks overshadowed continuing concerns about a slowing global economy. After getting off to a fast start in the first quarter, equity markets sold off in the second quarter as fears over the European debt crisis and a “hard-landing” in the Chinese economy rattled investors. Markets reversed course in July as concerns over a euro-zone breakup subsided when European Central Bank President Mario Draghi declared that the ECB would do “whatever it takes” to preserve the monetary union. Markets trended downwards to start the fourth quarter as election jitters and worries about the upcoming “fiscal cliff” weakened investor confidence. Equity markets rallied on the final trading day of the year as U.S. political leaders hinted that an agreement to avoid the “fiscal cliff” was imminent. Supported by generally strong corporate earnings, investors shifted out of defensive sectors and into the more cyclical, economically-sensitive areas of the market in 2012. Financials and Consumer Discretionary were the best performing sectors for the year, returning 26.4% and 23.9%, respectively, while Utilities was the worst, returning 2.2%. For 2012, small capitalization stocks outperformed large capitalization stocks returning 18.8% and 15.7%, respectively, and across market capitalizations, value stocks generally outperformed growth stocks. The small value style delivered the best returns for the year, up 21.5%, while large value and mid growth trailed other styles, returning 14.6% and 13.5%, respectively.
The Wilshire Small Company Value Portfolio, Institutional Class (the “Fund”) returned 17.41% for the year ended December 31, 2012, underperforming the benchmark (the Russell 2000 Value Index) return of 18.05%. Underperformance was driven by poor stock selection in Financials and Health Care. Underperformance was modestly offset by an underweight allocation and strong stock selection in Information Technology, as well as strong stock selection in Energy.
Small Company Value Portfolio Commentary - (Continued) | |
PORTFOLIO SECTOR WEIGHTING†
(As of December 31 2012)
| † | Based on percent of the Portfolio’s total investments in securities, at value. |
Wilshire 5000 Indexsm Fund Commentary | |
INVESTMENT CLASS SHARES
Average Annual Total Return*
| One Year Ended 12/31/12 | 15.36% |
| Five Years Ended 12/31/12 | 1.46% |
| Ten Years Ended 12/31/12 | 6.97% |
WILSHIRE 5000 INDEXSM(1)
Average Annual Total Return
| One Year Ended 12/31/12 | 16.07% |
| Five Years Ended 12/31/12 | 2.04% |
| Ten Years Ended 12/31/12 | 7.85% |
COMPARATIVE PERFORMANCE
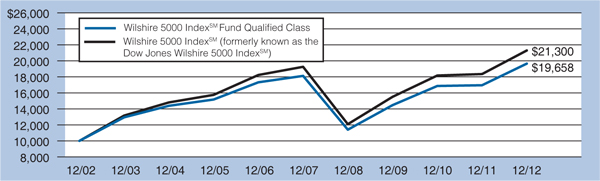
Comparison of Change in Value of $10,000 Investment in Shares of Wilshire 5000 IndexSM
Fund, Investment Class Shares and the Wilshire 5000 IndexSM through 12/31/12.
The performance data quoted represents past performance and does not guarantee future results. Current performance may be lower or higher. Performance data current to the most recent month end may be obtained at http://advisor.wilshire.com. The investment return and principal value of an investment will fluctuate so that shares, when redeemed, may be worth more or less than their original cost. The table above does not reflect the deduction of taxes that a shareholder would pay on Fund distributions or the redemption of Fund shares.
| * | Assumes reinvestment of all distributions. During certain periods since inception, certain fees and expenses were waived or reimbursed. Without waivers and reimbursements, historical total returns would have been lower. For the year ended December 31, 2012, there were no waivers. |
| | |
| (1) | The Wilshire 5000 IndexSM is an unmanaged index that measures the performance of all U.S. headquartered equity securities with readily available price data. Index performance is presented for general comparative purposes. Unlike a mutual fund, the performance of an index assumes no taxes, transaction costs, management fees or other expenses. An individual cannot directly invest in any index. |
Wilshire 5000 Indexsm Fund Commentary - (Continued) | |
INSTITUTIONAL CLASS SHARES
Average Annual Total Return*
| One Year Ended 12/31/12 | 15.54% |
| Five Years Ended 12/31/12 | 1.65% |
| Ten Years Ended 12/31/12 | 7.21% |
WILSHIRE 5000 INDEXSM(1)
Average Annual Total Return
| One Year Ended 12/31/12 | 16.07% |
| Five Years Ended 12/31/12 | 2.04% |
| Ten Years Ended 12/31/12 | 7.85% |
COMPARATIVE PERFORMANCE
Comparison of Change in Value of $250,000 Investment in Shares of Wilshire 5000 IndexSM
Fund, Institutional Class Shares and the Wilshire 5000 IndexSM through 12/31/12.
The performance data quoted represents past performance and does not guarantee future results. Current performance may be lower or higher. Performance data current to the most recent month end may be obtained at http://advisor.wilshire.com. The investment return and principal value of an investment will fluctuate so that shares, when redeemed, may be worth more or less than their original cost. The table above does not reflect the deduction of taxes that a shareholder would pay on Fund distributions or the redemption of Fund shares.
| * | Assumes reinvestment of all distributions. During certain periods since inception, certain fees and expenses were waived or reimbursed. Without waivers and reimbursements, historical total returns would have been lower. For the year ended December 31, 2012, there were no waivers. |
| | |
| (1) | The Wilshire 5000 IndexSM is an unmanaged index that measures the performance of all U.S. headquartered equity securities with readily available price data. Index performance is presented for general comparative purposes. Unlike a mutual fund, the performance of an index assumes no taxes, transaction costs, management fees or other expenses. An individual cannot directly invest in any index. |
Wilshire 5000 Indexsm Fund Commentary - (Continued) | |
QUALIFIED CLASS SHARES
Average Annual Total Return*
| One Year Ended 12/31/12 | 15.93% |
| Five Years Ended 12/31/12 | 1.64% |
| Ten Years Ended 12/31/12 | 6.99% |
WILSHIRE 5000 INDEXSM(1)
Average Annual Total Return
| One Year Ended 12/31/12 | 16.07% |
| Five Years Ended 12/31/12 | 2.04% |
| Ten Years Ended 12/31/12 | 7.85% |
COMPARATIVE PERFORMANCE
Comparison of Change in Value of $10,000 Investment in Shares of Wilshire 5000 IndexSM
Fund, Qualified Class Shares and the Wilshire 5000 IndexSM through 12/31/12.
The performance data quoted represents past performance and does not guarantee future results. Current performance may be lower or higher. Performance data current to the most recent month end may be obtained at http://advisor.wilshire.com. The investment return and principal value of an investment will fluctuate so that shares, when redeemed, may be worth more or less than their original cost. The table above does not reflect the deduction of taxes that a shareholder would pay on Fund distributions or the redemption of Fund shares.
| * | Assumes reinvestment of all distributions. During certain periods since inception, certain fees and expenses were waived or reimbursed. Without waivers and reimbursements, historical total returns would have been lower. For the year ended December 31, 2012, there were no waivers. |
| | |
| (1) | The Wilshire 5000 IndexSM is an unmanaged index that measures the performance of all U.S. headquartered equity securities with readily available price data. Index performance is presented for general comparative purposes. Unlike a mutual fund, the performance of an index assumes no taxes, transaction costs, management fees or other expenses. An individual cannot directly invest in any index. |
Wilshire 5000 Indexsm Fund Commentary - (Continued) | |
HORACE MANN CLASS SHARES
Average Annual Total Return*
| One Year Ended 12/31/12 | 15.31% |
| Five Years Ended 12/31/12 | 1.43% |
| Ten Years Ended 12/31/12 | 6.91% |
WILSHIRE 5000 INDEXSM(1)
Average Annual Total Return
| One Year Ended 12/31/12 | 16.07% |
| Five Years Ended 12/31/12 | 2.04% |
| Ten Years Ended 12/31/12 | 7.85% |
COMPARATIVE PERFORMANCE
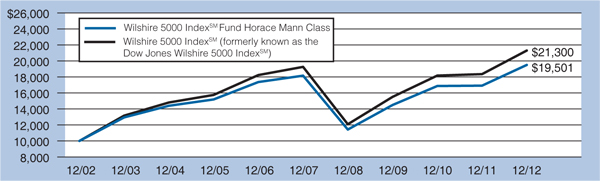
Comparison of Change in Value of $10,000 Investment in Shares of Wilshire 5000 IndexSM
Fund, Horace Mann Class Shares and the Wilshire 5000 IndexSM through 12/31/12.
The performance data quoted represents past performance and does not guarantee future results. Current performance may be lower or higher. Performance data current to the most recent month end may be obtained at http://advisor.wilshire.com. The investment return and principal value of an investment will fluctuate so that shares, when redeemed, may be worth more or less than their original cost. The table above does not reflect the deduction of taxes that a shareholder would pay on Fund distributions or the redemption of Fund shares.
| * | Assumes reinvestment of all distributions. During certain periods since inception, certain fees and expenses were waived or reimbursed. Without waivers and reimbursements, historical total returns would have been lower. For the year ended December 31, 2012, there were no waivers. |
| | |
| (1) | The Wilshire 5000 IndexSM is an unmanaged index that measures the performance of all U.S. headquartered equity securities with readily available price data. Index performance is presented for general comparative purposes. Unlike a mutual fund, the performance of an index assumes no taxes, transaction costs, management fees or other expenses. An individual cannot directly invest in any index. |
Wilshire 5000 Indexsm Fund Commentary - (Continued) | |
Stock markets around the world rallied in 2012 as stimulus measures by central banks overshadowed continuing concerns about a slowing global economy. After getting off to a fast start in the first quarter, equity markets sold off in the second quarter as fears over the European debt crisis and a “hard-landing” in the Chinese economy rattled investors. Markets reversed course in July as concerns over a euro-zone breakup subsided when European Central Bank President Mario Draghi declared that the ECB would do “whatever it takes” to preserve the monetary union. Markets trended downwards to start the fourth quarter as election jitters and worries about the upcoming “fiscal cliff” weakened investor confidence. Equity markets rallied on the final trading day of the year as U.S. political leaders hinted that an agreement to avoid the “fiscal cliff” was imminent. Supported by generally strong corporate earnings, investors shifted out of defensive sectors and into the more cyclical, economically-sensitive areas of the market in 2012. Financials and Consumer Discretionary were the best performing sectors for the year, returning 26.4% and 23.9%, respectively, while Utilities was the worst, returning 2.2%. For 2012, small capitalization stocks outperformed large capitalization stocks returning 18.8% and 15.7%, respectively, and across market capitalizations, value stocks generally outperformed growth stocks. The small value style delivered the best returns for the year, up 21.5%, while large value and mid growth trailed other styles, returning 14.6% and 13.5%, respectively.
The Wilshire 5000 IndexSM Fund Institutional Class returned 15.54% for the year ended December 31, 2012, underperforming the Fund’s benchmark (the Wilshire 5000 IndexSM) return of 16.07% by 0.53%. The slight underperformance is well within the range of historical experience.
Wilshire 5000 Indexsm Fund Commentary - (Continued) | |
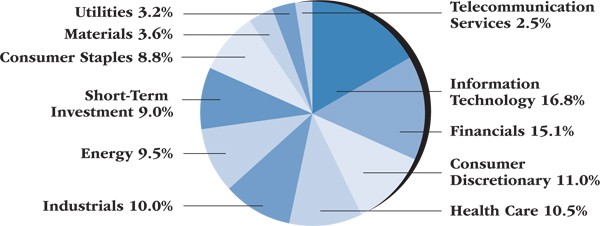
PORTFOLIO SECTOR WEIGHTING†
(As of December 31 2012)
| † | Based on percent of the Fund’s total investments in securities, at value. |
Wilshire Large Cap Core Plus Fund Commentary | |
INVESTMENT CLASS SHARES
Average Annual Total Return*
| One Year Ended 12/31/12 | 13.36% |
| Five Years Ended 12/31/12 | (1.99)% |
| Inception (11/15/07) through 12/31/12 | (1.71)% |
S&P 500 INDEX(1)
Average Annual Total Return
| One Year Ended 12/31/12 | 16.00% |
| Five Years Ended 12/31/12 | 1.66% |
| Inception (11/15/07) through 12/31/12 | 1.80% |
COMPARATIVE PERFORMANCE
Comparison of Change in Value of $10,000 Investment in Shares of Wilshire Large Cap
Core Plus Fund, Investment Class Shares and the S&P 500 Index through 12/31/12.
The performance data quoted represents past performance and does not guarantee future results. Current performance may be lower or higher. Performance data current to the most recent month end may be obtained at http://advisor.wilshire.com. The investment return and principal value of an investment will fluctuate so that shares, when redeemed, may be worth more or less than their original cost. The table above does not reflect the deduction of taxes that a shareholder would pay on Fund distributions or the redemption of Fund shares.
| * | Assumes reinvestment of all distributions. During certain periods since inception, certain fees and expenses were waived or reimbursed. Without waivers and reimbursements, historical total returns would have been lower. For the year ended December 31, 2012, fees totaling 0.04% of average net assets were waived in the Investment Class Shares. |
| | |
| (1) | The S&P 500 Index consists of 500 stocks chosen for market size, liquidity, and industry group representation. It is a market-value weighted index (stock price times the number of shares outstanding), with each stock’s weight in the index proportionate to its market value. Index performance is presented for general comparative purposes. Unlike a mutual fund, the performance of an index assumes no taxes, transaction costs, management fees or other expenses. An individual cannot directly invest in any index. |
Wilshire Large Cap Core Plus Fund Commentary - (Continued) | |
INSTITUTIONAL CLASS SHARES
Average Annual Total Return*
| One Year Ended 12/31/12 | 13.63% |
| Five Years Ended 12/31/12 | (1.71)% |
| Inception (11/15/07) through 12/31/12 | (1.43)% |
S&P 500 INDEX(1)
Average Annual Total Return
| One Year Ended 12/31/12 | 16.00% |
| Five Years Ended 12/31/12 | 1.66% |
| Inception (11/15/07) through 12/31/12 | 1.80% |
COMPARATIVE PERFORMANCE
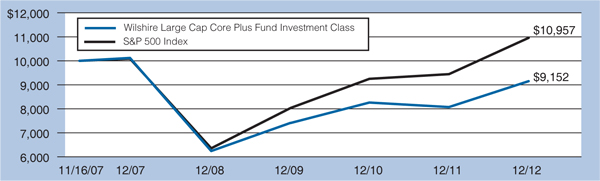
Comparison of Change in Value of $250,000 Investment in Shares of Wilshire Large Cap
Core Plus Fund, Institutional Class Shares and the S&P 500 Index through 12/31/12.
The performance data quoted represents past performance and does not guarantee future results. Current performance may be lower or higher. Performance data current to the most recent month end may be obtained at http://advisor.wilshire.com. The investment return and principal value of an investment will fluctuate so that shares, when redeemed, may be worth more or less than their original cost. The table above does not reflect the deduction of taxes that a shareholder would pay on Fund distributions or the redemption of Fund shares.
| * | Assumes reinvestment of all distributions. During certain periods since inception, certain fees and expenses were waived or reimbursed. Without waivers and reimbursements, historical total returns would have been lower. For the year ended December 31, 2012, there were no waivers in the Institutional Class Shares. |
| | |
| (1) | The S&P 500 Index consists of 500 stocks chosen for market size, liquidity, and industry group representation. It is a market-value weighted index (stock price times the number of shares outstanding), with each stock’s weight in the index proportionate to its market value. Index performance is presented for general comparative purposes. Unlike a mutual fund, the performance of an index assumes no taxes, transaction costs, management fees or other expenses. An individual cannot directly invest in any index. |
Wilshire Large Cap Core Plus Fund Commentary - (Continued) | |
Stock markets around the world rallied in 2012 as stimulus measures by central banks overshadowed continuing concerns about a slowing global economy. After getting off to a fast start in the first quarter, equity markets sold off in the second quarter as fears over the European debt crisis and a “hard-landing” in the Chinese economy rattled investors. Markets reversed course in July as concerns over a euro-zone breakup subsided when European Central Bank President Mario Draghi declared that the ECB would do “whatever it takes” to preserve the monetary union. Markets trended downwards to start the fourth quarter as election jitters and worries about the upcoming “fiscal cliff” weakened investor confidence. Equity markets rallied on the final trading day of the year as U.S. political leaders hinted that an agreement to avoid the “fiscal cliff” was imminent. Supported by generally strong corporate earnings, investors shifted out of defensive sectors and into the more cyclical, economically-sensitive areas of the market in 2012. Financials and Consumer Discretionary were the best performing sectors for the year, returning 26.4% and 23.9%, respectively, while Utilities was the worst, returning 2.2%. For 2012, small capitalization stocks outperformed large capitalization stocks returning 18.8% and 15.7%, respectively, and across market capitalizations, value stocks generally outperformed growth stocks. The small value style delivered the best returns for the year, up 21.5%, while large value and mid growth trailed other styles, returning 14.6% and 13.5%, respectively.
The Wilshire Large Cap Core Plus Fund Institutional Class (the “Fund”) returned 13.63% for the year ended December 31, 2012, underperforming the benchmark (the S&P 500 Index) return of 16.00%. Underperformance was driven by poor stock selection and an underweight allocation in Financials, as well as poor stock selection in Information Technology. Underperformance was modestly offset by strong stock selection in Health Care and Energy.
Wilshire Large Cap Core Plus Fund Commentary - (Continued) | |
PORTFOLIO SECTOR WEIGHTING†
(As of December 31 2012)
| † | Based on percent of the Fund’s total investments in securities, at value. |
Wilshire Mutual Funds, Inc. Disclosure of Fund Expenses For the Six Months Ended December 31, 2012 (Unaudited) | |
All mutual funds have operating expenses. As a shareholder of a portfolio (or a “fund”), you incur ongoing costs, which include costs for investment advisory, administrative services, distribution and/or shareholder services and shareholder reports (like this one), among others. Operating expenses, which are deducted from a fund’s gross income, directly reduce the investment return of the fund. A fund’s expenses are expressed as a percentage of its average net assets. This figure is known as the expense ratio. The following examples are intended to help you understand the ongoing fees (in dollars) of investing in your fund and to compare these costs with those of other mutual funds. The examples are based on an investment of $1,000 made at the beginning of the period shown and held for the entire period.
The table on the next page illustrates your Portfolio’s costs in two ways:
Actual Fund Return: This section helps you to estimate the actual expenses, after any applicable fee waivers, that you paid over the period. The “Ending Account Value” shown is derived from the Portfolio’s actual return for the period. The “Expense Ratio” column shows the period’s annualized expense ratio and the “Expenses Paid During Period” column shows the dollar amount that would have been paid by an investor who started with $1,000 in the Portfolio at the beginning of the period.
You may use the information here, together with your account value, to estimate the expenses that you paid over the period. To do so, simply divide your account value by $1,000 (for example, an $8,600 account value divided by $1,000 = 8.6), then multiply the result by the number given for your Portfolio in the first line under the heading entitled “Expenses Paid During Period.”
Hypothetical 5% Return: This section is intended to help you compare your Portfolio’s costs with those of other mutual funds. The “Ending Account Value” shown is derived from hypothetical account values and hypothetical expenses based on the Portfolio’s actual expense ratio and assumed rate of return. It assumes that the Portfolio had an annual return of 5% before expenses, but that the expense ratio is unchanged. In this case, because the return used is not the Portfolio’s actual return, the results do not apply to your investment. This example is useful in making comparisons to other mutual funds because the Securities and Exchange Commission (“SEC”) requires all mutual funds to calculate expenses based on an assumed 5% annual return. You can assess your Portfolio’s ongoing costs by comparing this hypothetical example with the hypothetical examples that appear in shareholder reports of other funds.
Please note that the expenses shown in the table are meant to highlight and help you compare your ongoing costs only and do not reflect any transactional costs such as sales charges (loads), redemption fees, or exchange fees. Wilshire Mutual Funds, Inc. has no such charges, but these may be present in other funds to which you compare this data. Therefore, the hypothetical portions of the table are useful in comparing ongoing costs only, and will not help you determine the relative total costs of owning different funds.
Wilshire Mutual Funds, Inc. Disclosure of Fund Expenses - (Continued) For the Six Months Ended December 31, 2012 (Unaudited) | |
| | Beginning Account Value 07/01/12 | | Ending Account Value 12/31/12 | | | | Expenses Paid During Period 07/01/12-12/31/12(2) |
Large Company Growth Portfolio |
| Actual Fund Return | | | | | | | |
| Investment Class | $1,000.00 | | $1,033.00 | | 1.35% | | $6.91 |
| Institutional Class | $1,000.00 | | $1,034.20 | | 1.15% | | $5.87 |
| Hypothetical 5% Return | | | | | | | |
| Investment Class | $1,000.00 | | $1,018.33 | | 1.35% | | $6.87 |
| Institutional Class | $1,000.00 | | $1,019.37 | | 1.15% | | $5.82 |
Large Company Value Portfolio |
| Actual Fund Return | | | | | | | |
| Investment Class | $1,000.00 | | $1,077.40 | | 1.36% | | $7.11 |
| Institutional Class | $1,000.00 | | $1,079.20 | | 1.14% | | $5.96 |
| Hypothetical 5% Return | | | | | | | |
| Investment Class | $1,000.00 | | $1,018.29 | | 1.36% | | $6.91 |
| Institutional Class | $1,000.00 | | $1,019.40 | | 1.14% | | $5.79 |
Small Company Growth Portfolio |
| Actual Fund Return | | | | | | | |
| Investment Class | $1,000.00 | | $1,062.40 | | 1.48% | | $7.68 |
| Institutional Class | $1,000.00 | | $1,062.40 | | 1.32% | | $6.85 |
| Hypothetical 5% Return | | | | | | | |
| Investment Class | $1,000.00 | | $1,017.69 | | 1.48% | | $7.51 |
| Institutional Class | $1,000.00 | | $1,018.49 | | 1.32% | | $6.70 |
Small Company Value Portfolio |
| Actual Fund Return | | | | | | | |
| Investment Class | $1,000.00 | | $1,096.20 | | 1.48% | | $7.82 |
| Institutional Class | $1,000.00 | | $1,097.50 | | 1.30% | | $6.85 |
| Hypothetical 5% Return | | | | | | | |
| Investment Class | $1,000.00 | | $1,017.67 | | 1.48% | | $7.53 |
| Institutional Class | $1,000.00 | | $1,018.60 | | 1.30% | | $6.60 |
Wilshire Mutual Funds, Inc. Disclosure of Fund Expenses - (Continued) For the Six Months Ended December 31, 2012 (Unaudited) | |
| | Beginning Account Value 07/01/12 | | Ending Account Value 12/31/12 | | | | Expenses Paid During Period 07/01/12-12/31/12(2) |
Wilshire 5000 IndexSM Fund |
| Actual Fund Return | | | | | | | |
| Investment Class | $1,000.00 | | $1,060.40 | | 0.67% | | $3.49 |
| Institutional Class | $1,000.00 | | $1,060.30 | | 0.43% | | $2.24 |
| Qualified Class | $1,000.00 | | $1,063.40 | | 0.00%(4) | | $0.00 |
| Horace Mann Class | $1,000.00 | | $1,059.90 | | 0.73% | | $3.79 |
| Hypothetical 5% Return | | | | | | | |
| Investment Class | $1,000.00 | | $1,021.75 | | 0.67% | | $3.43 |
| Institutional Class | $1,000.00 | | $1,022.96 | | 0.43% | | $2.20 |
| Qualified Class | $1,000.00 | | $1,025.14 | | 0.00%(4) | | $0.00 |
| Horace Mann Class | $1,000.00 | | $1,021.45 | | 0.73% | | $3.72 |
Wilshire Large Cap Core Plus Fund |
| Actual Fund Return | | | | | | | |
| Investment Class | $1,000.00 | | $1,056.10 | | 1.49%(3) | | $7.68 |
| Institutional Class | $1,000.00 | | $1,056.40 | | 1.24%(3) | | $6.39 |
| Hypothetical 5% Return | | | | | | | |
| Investment Class | $1,000.00 | | $1,017.67 | | 1.49%(3) | | $7.54 |
| Institutional Class | $1,000.00 | | $1,018.92 | | 1.24%(3) | | $6.28 |
| (1) | Annualized, based on the Portfolio’s most recent fiscal half-year expenses. |
| | |
| (2) | Expenses are equal to the Portfolio’s annualized expense ratio multiplied by the average account value over the period, multiplied by the number of days in the period, then divided by 366. |
| | |
| (3) | The annualized expense ratios include dividend expense, interest expense and rebates on securities sold short during the six-month period. |
| | |
| (4) | There were no expenses accrued in the Wilshire 5000 IndexSM Fund Qualified Class for the six months ended December 31, 2012 due to the low average net assets (of approximately $125) relative to the other classes of this Fund. |
Wilshire Mutual Funds, Inc. Large Company Growth Portfolio Condensed Schedule of Investments | December 31, 2012 | |
| | | | Percentage of Net Assets (%) | | | | |
| COMMON STOCK — 99.0%†† | |
| Consumer Discretionary — 19.1% | | | | | | |
| | 14,058 | | Amazon.com, Inc. | | | 1.9 | | | $ | 3,530,526 | |
| | 96,772 | | Apollo Group, Inc., Class A(a) | | | 1.1 | | | | 2,024,470 | |
| | 47,932 | | Dollar General Corp. | | | 1.1 | | | | 2,113,322 | |
| | 82,131 | | Johnson Controls, Inc.(a) | | | 1.3 | | | | 2,521,422 | |
| | 38,880 | | NIKE, Inc., Class B | | | 1.1 | | | | 2,006,208 | |
| | 2,280 | | priceline.com, Inc.† | | | 0.8 | | | | 1,416,336 | |
| | 31,668 | | Starbucks Corp. | | | 0.9 | | | | 1,698,038 | |
| | 29,870 | | Walt Disney Co. (The) | | | 0.8 | | | | 1,487,227 | |
| | 430,857 | | Other Securities | | | 10.1 | | | | 18,834,216 | |
| | | | | | | | | | | 35,631,765 | |
| Consumer Staples — 8.3% | | | | | | | | |
| | 90,625 | | Coca-Cola Co. (The) | | | 1.8 | | | | 3,285,156 | |
| | 14,135 | | Costco Wholesale Corp. | | | 0.8 | | | | 1,396,114 | |
| | 17,422 | | Diageo PLC ADR | | | 1.1 | | | | 2,031,057 | |
| | 40,974 | | Philip Morris International, Inc. | | | 1.8 | | | | 3,427,065 | |
| | 93,120 | | Other Securities | | | 2.8 | | | | 5,312,924 | |
| | | | | | | | | | | 15,452,316 | |
| Energy — 5.6% | | | | | | | | |
| | 91,814 | | Cobalt International Energy, Inc.† | | | 1.2 | | | | 2,254,952 | |
| | 53,154 | | Schlumberger, Ltd. | | | 2.0 | | | | 3,683,040 | |
| | 156,657 | | Other Securities | | | 2.4 | | | | 4,528,003 | |
| | | | | | | | | | | 10,465,995 | |
| Financials — 5.7% | | | | | | | | |
| | 22,106 | | Camden Property Trust‡ | | | 0.8 | | | | 1,507,850 | |
| | 33,478 | | Capital One Financial Corp. | | | 1.0 | | | | 1,939,381 | |
| | 210,973 | | Other Securities | | | 3.9 | | | | 7,249,356 | |
| | | | | | | | | | | 10,696,587 | |
| Health Care — 13.1% | | | | | | | | |
| | 19,560 | | Alexion Pharmaceuticals, Inc.† (a) | | | 1.0 | | | | 1,834,923 | |
| | 14,833 | | Allergan, Inc. | | | 0.7 | | | | 1,360,631 | |
| | 11,784 | | Biogen Idec, Inc. | | | 0.9 | | | | 1,728,359 | |
| | 18,237 | | Celgene Corp.† | | | 0.8 | | | | 1,435,617 | |
| | 46,762 | | Express Scripts Holding Co. | | | 1.4 | | | | 2,525,148 | |
| | 78,613 | | Hologic, Inc.(a) | | | 0.9 | | | | 1,574,618 | |
| | 45,329 | | Teva Pharmaceutical Industries, Ltd. ADR | | | 0.9 | | | | 1,692,585 | |
| | 48,164 | | WellPoint, Inc.(a) | | | 1.6 | | | | 2,934,151 | |
| | 154,397 | | Other Securities | | | 4.9 | | | | 9,361,168 | |
| | | | | | | | | | | 24,447,200 | |
| | | Percentage of Net Assets (%) | | | | |
| Industrials — 10.9% | | | | | | | | |
| | 19,825 | | Caterpillar, Inc. | | | 1.0 | | | $ | 1,775,924 | |
| | 89,490 | | CSX Corp. | | | 0.9 | | | | 1,765,638 | |
| | 28,545 | | Fastenal Co.(a) | | | 0.7 | | | | 1,332,766 | |
| | 36,664 | | Fluor Corp. | | | 1.2 | | | | 2,153,643 | |
| | 26,785 | | Joy Global, Inc.(a) | | | 0.9 | | | | 1,708,347 | |
| | 14,255 | | Union Pacific Corp. | | | 1.0 | | | | 1,792,139 | |
| | 166,202 | | Other Securities | | | 5.2 | | | | 9,692,615 | |
| | | | | | | | | | | 20,221,072 | |
| Information Technology — 30.1% | | | | | | | | |
| | 62,744 | | Acme Packet, Inc.† (a) | | | 0.7 | | | | 1,387,897 | |
| | 27,532 | | Apple, Inc. | | | 7.9 | | | | 14,675,382 | |
| | 23,305 | | Baidu, Inc. ADR† (a) | | | 1.3 | | | | 2,337,258 | |
| | 44,164 | | Citrix Systems, Inc.(a) | | | 1.6 | | | | 2,903,783 | |
| | 17,750 | | Cognizant Technology Solutions Corp., Class A† | | | 0.7 | | | | 1,314,388 | |
| | 62,495 | | eBay, Inc.† | | | 1.7 | | | | 3,188,495 | |
| | 58,920 | | EMC Corp.† | | | 0.8 | | | | 1,490,676 | |
| | 4,564 | | Google, Inc., Class A† | | | 1.7 | | | | 3,237,565 | |
| | 11,933 | | International Business Machines Corp. | | | 1.2 | | | | 2,285,766 | |
| | 86,085 | | Microsoft Corp. | | | 1.2 | | | | 2,301,052 | |
| | 41,992 | | Oracle Corp. | | | 0.7 | | | | 1,399,173 | |
| | 98,613 | | QUALCOMM, Inc. | | | 3.3 | | | | 6,115,978 | |
| | 29,824 | | Visa, Inc., Class A | | | 2.4 | | | | 4,520,722 | |
| | 174,532 | | Western Union Co. (The) | | | 1.3 | | | | 2,375,381 | |
| | 164,748 | | Other Securities | | | 3.6 | | | | 6,619,653 | |
| | | | | | | | | | | 56,153,169 | |
| Materials — 5.2% | | | | | | | | |
| | 22,766 | | Monsanto Co. | | | 1.2 | | | | 2,154,802 | |
| | 35,360 | | Mosaic Co. (The) | | | 1.1 | | | | 2,002,437 | |
| | 8,293 | | Sherwin-Williams Co. (The) | | | 0.7 | | | | 1,275,629 | |
| | 91,088 | | Other Securities | | | 2.2 | | | | 4,151,812 | |
| | | | | | | | | | | 9,584,680 | |
| Telecommunication Services — 1.0% | | | | | | | | |
| | 32,850 | | Verizon Communications, Inc. | | | 0.8 | | | | 1,421,420 | |
| | 11,450 | | Other Securities | | | 0.2 | | | | 469,004 | |
| | | | | | | | | | | 1,890,424 | |
| Utilities — 0.0% | | | | | | | | |
| | 1,480 | | Other Securities | | | 0.0 | | | | 63,270 | |
| | | | | | | | | | | | |
| Total Common Stock | | | | | | | | |
| (Cost $151,523,255) | | | | | | | 184,606,478 | |
See Notes to Financial Statements.
Wilshire Mutual Funds, Inc. Large Company Growth Portfolio Condensed Schedule of Investments - (Continued) | December 31, 2012 | |
| | | Percentage of Net Assets (%) | | | | |
| SHORT-TERM INVESTMENTS — 15.2% | | | | | | | | |
| | 26,397,533 | | Northern Institutional Liquid Asset Portfolio, 0.010% (b),(c) | | | 14.1 | | | $ | 26,397,533 | |
| | 2,007,875 | | Northern Trust Institutional Government Select Portfolio, 0.010% (c) | | | 1.1 | | | | 2,007,875 | |
| | | | | | | | | | | | |
| Total Short-Term Investments | | | | | | | | |
| (Cost $28,405,408) | | | | | | | 28,405,408 | |
| | | | | | | | | | | | |
| Total Investments — 114.2% | | | | | | | | |
| (Cost $179,928,663) | | | | | | | 213,011,886 | |
| Other Assets & Liabilities, Net — (14.2)% | | | | | | | (26,419,056 | ) |
| | | | | | | | | | | | |
| NET ASSETS — 100.0% | | | | | | $ | 186,592,830 | |
| † | Non-income producing security. |
| †† | More narrow industries are utilized for compliance purposes, whereas broad sectors are utilized for reporting purposes. |
| (a) | This security or a partial position of this security is on loan at December 31, 2012. The total market value of securities on loan at December 31, 2012 was $26,432,210. |
| (b) | This security was purchased with cash collateral held from securities on loan. The total value of such securities as of December 31, 2012 was $26,397,533. Securities on loan are also collateralized by various U.S. Treasury obligations in the amount of $124,857 (Note 6). |
| (c) | Rate shown is the 7-day effective yield as of December 31, 2012. |
ADR — American Depositary Receipt
Ltd. — Limited
PLC — Public Limited Company
The Condensed Schedule of Investments does not reflect the complete portfolio holdings. It includes the Portfolio’s 50 largest holdings and each investment of any issuer that exceeds 1% of the Portfolio’s net assets. “Other Securities” represent all issues not required to be disclosed under the rules adopted by the U.S. Securities and Exchange Commission (“SEC”). The complete schedule of portfolio holdings is available (i) without charge, upon request, by calling (800) 607-2200; (ii) on the SEC’s website at http://www.sec.gov; and (iii) on our website at http://advisor.wilshire.com.
As of December 31, 2012, all of the Portfolio’s investments were considered Level 1. For the year ended December 31. 2012, there have been no transfers between Level 1 and Level 2 assets and liabilities. For the year ended December 31, 2012, there have been no transfers between Level 2 and Level 3 assets and liabilities. Please see Note 2 in Notes to Financial Statements for further information regarding fair value measurements.
See Notes to Financial Statements.
Wilshire Mutual Funds, Inc. Large Company Value Portfolio Condensed Schedule of Investments | December 31, 2012 | |
| | | | Percentage of Net Assets (%) | | | | |
| COMMON STOCK — 98.7%†† | |
| Consumer Discretionary — 9.3% | | | | | | |
| | 10,891 | | Comcast Corp., Class A | | | 0.9 | | | $ | 407,106 | |
| | 17,300 | | Delphi Automotive PLC(a) | | | 1.5 | | | | 661,725 | |
| | 10,800 | | Omnicom Group, Inc. | | | 1.2 | | | | 539,568 | |
| | 47,875 | | Staples, Inc.(a) | | | 1.2 | | | | 545,775 | |
| | 83,652 | | Other Securities | | | 4.5 | | | | 2,013,650 | |
| | | | | | | | | | | 4,167,824 | |
| Consumer Staples — 7.3% | | | | | | | | |
| | 13,266 | | CVS Caremark Corp. | | | 1.4 | | | | 641,411 | |
| | 11,090 | | Procter & Gamble Co. (The) | | | 1.7 | | | | 752,900 | |
| | 56,776 | | Other Securities | | | 4.2 | | | | 1,873,872 | |
| | | | | | | | | | | 3,268,183 | |
| Energy — 16.4% | | | | | | | | |
| | 11,525 | | Baker Hughes, Inc. | | | 1.0 | | | | 470,681 | |
| | 16,343 | | BP PLC ADR(a) | | | 1.5 | | | | 680,523 | |
| | 4,675 | | Chevron Corp.(a) | | | 1.1 | | | | 505,554 | |
| | 9,291 | | ConocoPhillips | | | 1.2 | | | | 538,785 | |
| | 16,674 | | Exxon Mobil Corp. | | | 3.2 | | | | 1,443,135 | |
| | 6,209 | | Marathon Petroleum Corp. | | | 0.9 | | | | 391,167 | |
| | 10,049 | | Royal Dutch Shell PLC ADR, Class A(a) | | | 1.5 | | | | 692,852 | |
| | 10,340 | | Valero Energy Corp. | | | 0.8 | | | | 352,801 | |
| | 67,528 | | Other Securities | | | 5.2 | | | | 2,310,106 | |
| | | | | | | | | | | 7,385,604 | |
| Financials — 27.8% | | | | | | | | |
| | 15,450 | | Allstate Corp. (The) | | | 1.4 | | | | 620,626 | |
| | 29,632 | | American International Group, Inc.† | | | 2.3 | | | | 1,046,010 | |
| | 15,650 | | Axis Capital Holdings, Ltd.(a) | | | 1.2 | | | | 542,116 | |
| | 56,300 | | Bank of America Corp. | | | 1.4 | | | | 653,080 | |
| | 5,639 | | Berkshire Hathaway, Inc., Class B | | | 1.1 | | | | 505,818 | |
| | 29,396 | | Citigroup, Inc. | | | 2.6 | | | | 1,162,906 | |
| | 17,873 | | Discover Financial Services(a) | | | 1.5 | | | | 689,004 | |
| | 15,575 | | Invesco, Ltd. | | | 0.9 | | | | 406,352 | |
| | 30,510 | | JPMorgan Chase & Co. | | | 3.0 | | | | 1,341,524 | |
| | 23,225 | | MetLife, Inc. | | | 1.7 | | | | 765,032 | |
| | 17,425 | | Morgan Stanley | | | 0.7 | | | | 333,166 | |
| | 12,279 | | PNC Financial Services Group, Inc. | | | 1.6 | | | | 715,989 | |
| | 29,875 | | UBS AG(a) | | | 1.0 | | | | 470,232 | |
| | | Percentage of Net Assets (%) | | | | |
| Financials (continued) | | | | | | | | |
| | 115,811 | | Other Securities | | | 7.4 | | | $ | 3,273,699 | |
| | | | | | | | | | | 12,525,554 | |
| Health Care — 11.1% | | | | | | | | |
| | 10,737 | | Abbott Laboratories | | | 1.6 | | | | 703,273 | |
| | 5,575 | | Becton Dickinson and Co.(a) | | | 1.0 | | | | 435,909 | |
| | 9,268 | | Eli Lilly & Co. | | | 1.0 | | | | 457,098 | |
| | 17,009 | | Merck & Co., Inc.(a) | | | 1.5 | | | | 696,348 | |
| | 35,471 | | Pfizer, Inc. | | | 2.0 | | | | 889,613 | |
| | 37,746 | | Other Securities | | | 4.0 | | | | 1,824,687 | |
| | | | | | | | | | | 5,006,928 | |
| Industrials — 8.3% | | | | | | | | |
| | 6,300 | | Eaton Corp. PLC(a) | | | 0.8 | | | | 341,460 | |
| | 23,050 | | General Electric Co. | | | 1.1 | | | | 483,820 | |
| | 4,675 | | L-3 Communications Holdings, Inc., Class 3 | | | 0.8 | | | | 358,199 | |
| | 19,550 | | Masco Corp. | | | 0.7 | | | | 325,703 | |
| | 9,137 | | Northrop Grumman Corp. | | | 1.4 | | | | 617,478 | |
| | 89,333 | | Other Securities | | | 3.5 | | | | 1,617,566 | |
| | | | | | | | | | | 3,744,226 | |
| Information Technology — 10.8% | | | | | | | | |
| | 18,700 | | Cisco Systems, Inc. | | | 0.8 | | | | 367,455 | |
| | 575 | | Google, Inc., Class A† | | | 0.9 | | | | 407,888 | |
| | 46,700 | | Hewlett-Packard Co. | | | 1.5 | | | | 665,475 | |
| | 13,098 | | Microsoft Corp. | | | 0.8 | | | | 350,109 | |
| | 17,700 | | Oracle Corp. | | | 1.3 | | | | 589,764 | |
| | 14,825 | | TE Connectivity, Ltd. | | | 1.2 | | | | 550,304 | |
| | 92,428 | | Other Securities | | | 4.3 | | | | 1,933,488 | |
| | | | | | | | | | | 4,864,483 | |
| Materials — 3.0% | | | | | | | | |
| | 6,870 | | LyondellBasell Industries NV, Class A | | | 0.9 | | | | 392,208 | |
| | 15,392 | | Other Securities | | | 2.1 | | | | 940,172 | |
| | | | | | | | | | | 1,332,380 | |
| Telecommunication Services — 2.0% | | | | | | | | |
| | 11,950 | | AT&T, Inc. | | | 0.9 | | | | 402,834 | |
| | 8,537 | | Verizon Communications, Inc.(a) | | | 0.8 | | | | 369,396 | |
| | 6,435 | | Other Securities | | | 0.3 | | | | 142,471 | |
| | | | | | | | | | | 914,701 | |
| Utilities — 2.7% | | | | | | | | |
| | 6,075 | | Entergy Corp.(a) | | | 0.8 | | | | 387,281 | |
| | 18,370 | | PPL Corp.(a) | | | 1.2 | | | | 525,933 | |
See Notes to Financial Statements.
Wilshire Mutual Funds, Inc. Large Company Value Portfolio Condensed Schedule of Investments - (Continued) | December 31, 2012 | |
| | | Percentage of Net Assets (%) | | | | |
| Utilities (continued) | | | | | | | | |
| | 11,485 | | Other Securities | | | 0.7 | | | $ | 305,518 | |
| | | | | | | | | | | 1,218,732 | |
| Total Common Stock | | | | | | | | |
| (Cost $40,099,694) | | | | | | | 44,428,615 | |
| | | | | | | | | | | | |
| SHORT-TERM INVESTMENTS — 22.6% | | | | | | | | |
| | 9,489,195 | | Northern Institutional Liquid Asset Portfolio, 0.010% (b),(c) | | | 21.1 | | | | 9,489,195 | |
| | 678,662 | | Northern Trust Institutional Government Select Portfolio, 0.010% (c) | | | 1.5 | | | | 678,662 | |
| | | | | | | | | | | | |
| Total Short-Term Investments | | | | | | | | |
| (Cost $10,167,857) | | | | | | | 10,167,857 | |
| | | | | | | | | | | | |
| Total Investments — 121.3% | | | | | | | | |
| (Cost $50,267,551) | | | | | | | 54,596,472 | |
| Other Assets & Liabilities, Net — (21.3)% | | | | | | | (9,576,440 | ) |
| | | | | | | | | | | | |
| NET ASSETS — 100.0% | | | | | | $ | 45,020,032 | |
| † | Non-income producing security. |
| †† | More narrow industries are utilized for compliance purposes, whereas broad sectors are utilized for reporting purposes. |
| (a) | This security or a partial position of this security is on loan at December 31, 2012. The total market value of securities on loan at December 31, 2012 was $9,367,300 (Note 6). |
| (b) | This security was purchased with cash collateral held from securities on loan. The total value of such securities as of December 31, 2012 was $9,489,195. Securities on loan are also collateralized by various U.S. Treasury obligations in the amount of $5,424 (Note 6). |
| (c) | Rate shown is the 7-day effective yield as of December 31, 2012. |
ADR — American Depositary Receipt
Ltd. — Limited
PLC — Public Limited Company
The Condensed Schedule of Investments does not reflect the complete portfolio holdings. It includes the Portfolio’s 50 largest holdings and each investment of any issuer that exceeds 1% of the Portfolio’s net assets. “Other Securities” represent all issues not required to be disclosed under the rules adopted by the U.S. Securities and Exchange Commission (“SEC”). The complete schedule of portfolio holdings is available (i) without charge, upon request, by calling (800) 607-2200; (ii) on the SEC’s website at http://www.sec.gov; and (iii) on our website at http://advisor.wilshire.com.
As of December 31, 2012, all of the Portfolio’s investments were considered Level 1. For the year ended December 31. 2012, there have been no transfers between Level 1 and Level 2 assets and liabilities. For the year ended December 31, 2012, there have been no transfers between Level 2 and Level 3 assets and liabilities. Please see Note 2 in Notes to Financial Statements for further information regarding fair value measurements.
See Notes to Financial Statements.
Wilshire Mutual Funds, Inc. Small Company Growth Portfolio Condensed Schedule of Investments | December 31, 2012 | |
| | | | Percentage of Net Assets (%) | | | | |
| COMMON STOCK — 99.1%†† | |
| Consumer Discretionary — 19.8% | | | | | | |
| | 1,676 | | Ameristar Casinos, Inc.(a) | | | 0.6 | | | $ | 43,978 | |
| | 812 | | ANN, Inc. | | | 0.4 | | | | 27,478 | |
| | 750 | | Cabela's, Inc. | | | 0.4 | | | | 31,312 | |
| | 992 | | Cheesecake Factory, Inc. (The)(a) | | | 0.4 | | | | 32,458 | |
| | 587 | | Coinstar, Inc.(a) | | | 0.4 | | | | 30,530 | |
| | 461 | | Cracker Barrel Old Country Store, Inc. | | | 0.4 | | | | 29,624 | |
| | 788 | | Domino's Pizza, Inc.(a) | | | 0.5 | | | | 34,317 | |
| | 530 | | Hibbett Sports, Inc.† (a) | | | 0.4 | | | | 27,931 | |
| | 490 | | HSN, Inc.(a) | | | 0.4 | | | | 26,989 | |
| | 600 | | Life Time Fitness, Inc.† (a) | | | 0.4 | | | | 29,526 | |
| | 1,510 | | Pier 1 Imports, Inc.(a) | | | 0.4 | | | | 30,200 | |
| | 62,739 | | Other Securities | | | 15.1 | | | | 1,091,787 | |
| | | | | | | | | | | 1,436,130 | |
| Consumer Staples — 7.3% | | | | | | | | |
| | 990 | | B&G Foods, Inc., Class A(a) | | | 0.4 | | | | 28,027 | |
| | 27,128 | | Other Securities | | | 6.9 | | | | 499,854 | |
| | | | | | | | | | | 527,881 | |
| Energy — 2.6% | | | | | | | | |
| | 11,210 | | Other Securities | | | 2.6 | | | | 189,193 | |
| | | | | | | | | | | 189,193 | |
| Financials — 10.8% | | | | | | | | |
| | 1,424 | | CBL & Associates Properties, Inc.(a) | | | 0.4 | | | | 30,203 | |
| | 2,840 | | Glimcher Realty Trust | | | 0.4 | | | | 31,496 | |
| | 1,280 | | Greenlight Capital Re, Ltd., Class A | | | 0.4 | | | | 29,542 | |
| | 1,270 | | Omega Healthcare Investors, Inc. (a) | | | 0.4 | | | | 30,289 | |
| | 495 | | SVB Financial Group | | | 0.4 | | | | 27,705 | |
| | 670 | | Texas Capital Bancshares, Inc.† (a) | | | 0.4 | | | | 30,029 | |
| | 469 | | World Acceptance Corp.(a) | | | 0.5 | | | | 34,969 | |
| | 33,212 | | Other Securities | | | 7.9 | | | | 570,019 | |
| | | | | | | | | | | 784,252 | |
| Health Care — 16.5% | | | | | | | | |
| | 894 | | Air Methods Corp.(a) | | | 0.5 | | | | 32,980 | |
| | 1,564 | | Alkermes PLC(a) | | | 0.4 | | | | 28,965 | |
| | 806 | | Centene Corp.† | | | 0.5 | | | | 33,046 | |
| | 1,243 | | Cubist Pharmaceuticals, Inc.(a) | | | 0.7 | | | | 52,281 | |
| | Percentage of Net Assets (%) | | | |
| Health Care (continued) | | | | | | | | |
| | 1,390 | | Emeritus Corp. | | | 0.5 | | | $ | 34,361 | |
| | 1,290 | | HealthSouth Corp.(a) | | | 0.4 | | | | 27,232 | |
| | 512 | | Jazz Pharmaceuticals PLC(a) | | | 0.4 | | | | 27,238 | |
| | 1,080 | | Owens & Minor, Inc.(a) | | | 0.4 | | | | 30,791 | |
| | 903 | | Pharmacyclics, Inc.† | | | 0.7 | | | | 52,284 | |
| | 790 | | STERIS Corp. | | | 0.4 | | | | 27,437 | |
| | 57,003 | | Other Securities | | | 11.6 | | | | 848,048 | |
| | | | | | | | | | | 1,194,663 | |
| Industrials — 16.1% | | | | | | | | |
| | 566 | | 3D Systems Corp.† (a) | | | 0.4 | | | | 30,196 | |
| | 1,380 | | Avis Budget Group, Inc.† (a) | | | 0.4 | | | | 27,352 | |
| | 1,260 | | CAI International, Inc.† (a) | | | 0.4 | | | | 27,657 | |
| | 419 | | Chart Industries, Inc.† | | | 0.4 | | | | 27,935 | |
| | 803 | | HEICO Corp.(a) | | | 0.5 | | | | 35,942 | |
| | 1,090 | | MasTec, Inc.(a) | | | 0.4 | | | | 27,174 | |
| | 885 | | Old Dominion Freight Line, Inc. | | | 0.4 | | | | 30,338 | |
| | 1,896 | | TAL International Group, Inc.(a) | | | 0.9 | | | | 68,977 | |
| | 2,330 | | US Airways Group, Inc.(a) | | | 0.4 | | | | 31,455 | |
| | 1,250 | | USG Corp.(a) | | | 0.5 | | | | 35,087 | |
| | 42,633 | | Other Securities | | | 11.4 | | | | 825,884 | |
| | | | | | | | | | | 1,167,997 | |
| Information Technology — 17.7% | | | | | | | | |
| | 1,027 | | Cirrus Logic, Inc. | | | 0.4 | | | | 29,752 | |
| | 426 | | CommVault Systems, Inc.† (a) | | | 0.4 | | | | 29,696 | |
| | 934 | | Fair Isaac Corp. | | | 0.5 | | | | 39,256 | |
| | 1,594 | | Heartland Payment Systems, Inc.(a) | | | 0.6 | | | | 47,023 | |
| | 481 | | Manhattan Associates, Inc. | | | 0.4 | | | | 29,023 | |
| | 430 | | MAXIMUS, Inc. | | | 0.4 | | | | 27,184 | |
| | 440 | | WEX, Inc.(a) | | | 0.5 | | | | 33,163 | |
| | 65,581 | | Other Securities | | | 14.5 | | | | 1,042,217 | |
| | | | | | | | | | | 1,277,314 | |
| Materials — 7.3% | | | | | | | | |
| | 3,675 | | Myers Industries, Inc.(a) | | | 0.8 | | | | 55,676 | |
| | 700 | | Schweitzer-Mauduit International, Inc. | | | 0.4 | | | | 27,321 | |
| | 22,313 | | Other Securities | | | 6.1 | | | | 443,518 | |
| | | | | | | | | | | 526,515 | |
| Telecommunication Services — 0.9% | | | | | | | | |
| | 6,300 | | Other Securities | | | 0.9 | | | | 65,434 | |
| | | | | | | | | | | 65,434 | |
See Notes to Financial Statements.
Wilshire Mutual Funds, Inc. Small Company Growth Portfolio Condensed Schedule of Investments - (Continued) | December 31, 2012 | |
| | | Percentage of Net Assets (%) | | | | |
| Utilities — 0.1% | | | | | | | | |
| | 360 | | Other Securities | | | 0.1 | | | $ | 9,576 | |
| | | | | | | | | | | | |
| Total Common Stock | | | | | | | | |
| (Cost $6,349,114) | | | | | | | 7,178,955 | |
| | | | | | | | | | | | |
| SHORT-TERM INVESTMENTS — 44.7% | | | | | | | | |
| | 3,153,425 | | Northern Institutional Liquid Asset Portfolio, 0.010% (b),(c) | | | 43.6 | | | | 3,153,425 | |
| | 80,931 | | Northern Trust Institutional Government Select Portfolio, 0.010% (c) | | | 1.1 | | | | 80,931 | |
| | | | | | | | | | | | |
| Total Short-Term Investments | | | | | | | | |
| (Cost $3,234,356) | | | | | | | 3,234,356 | |
| | | | | | | | | | | | |
| Total Investments — 143.8% | | | | | | | | |
| (Cost $9,583,470) | | | | | | | 10,413,311 | |
| Other Assets & Liabilities, Net — (43.8)% | | | | | | | (3,172,920 | ) |
| | | | | | | | | | | | |
| NET ASSETS — 100.0% | | | | | | $ | 7,240,391 | |
| † | Non-income producing security. |
| †† | More narrow industries are utilized for compliance purposes, whereas broad sectors are utilized for reporting purposes. |
| ‡ | Real Estate Investment Trust |
| (a) | This security or a partial position of this security is on loan at December 31, 2012. The total market value of securities on loan at December 31, 2012 was $3,154,548 (Note 6). |
| (b) | This security was purchased with cash collateral held from securities on loan. The total value of such securities as of December 31, 2012 was $3,153,425. Securities on loan are also collateralized by various U.S. Treasury obligations in the amount of $33,599 (Note 6). |
| (c) | Rate shown is the 7-day effective yield as of December 31, 2012. |
PLC — Public Limited Company
The Condensed Schedule of Investments does not reflect the complete portfolio holdings. It includes the Portfolio’s 50 largest holdings and each investment of any issuer that exceeds 1% of the Portfolio’s net assets. “Other Securities” represent all issues not required to be disclosed under the rules adopted by the U.S. Securities and Exchange Commission (“SEC”). The complete schedule of portfolio holdings is available (i) without charge, upon request, by calling (800) 607-2200; (ii) on the SEC’s website at http://www.sec.gov; and (iii) on our website at http://advisor.wilshire.com.
As of December 31, 2012, all of the Portfolio’s investments were considered Level 1. For the year ended December 31. 2012, there have been no transfers between Level 1 and Level 2 assets and liabilities. For the year ended December 31, 2012, there have been no transfers between Level 2 and Level 3 assets and liabilities. Please see Note 2 in Notes to Financial Statements for further information regarding fair value measurements.
See Notes to Financial Statements.
Wilshire Mutual Funds, Inc. Small Company Value Portfolio Condensed Schedule of Investments | December 31, 2012 | |
| | | | Percentage of Net Assets (%) | | | | |
| COMMON STOCK — 99.1%†† | | | | |
| Consumer Discretionary — 16.0% | | | | | | |
| | 2,175 | | Ameristar Casinos, Inc. | | | 0.6 | | | $ | 57,072 | |
| | 1,223 | | Bob Evans Farms, Inc. | | | 0.5 | | | | 49,165 | |
| | 670 | | Group 1 Automotive, Inc. | | | 0.4 | | | | 41,533 | |
| | 1,767 | | Scholastic Corp. | | | 0.5 | | | | 52,233 | |
| | 89,596 | | Other Securities | | | 14.0 | | | | 1,355,363 | |
| | | | | | | | | | | 1,555,366 | |
| Consumer Staples — 4.4% | | | | | | | | |
| | 4,387 | | Pantry, Inc. (The) | | | 0.6 | | | | 53,214 | |
| | 880 | | Universal Corp. | | | 0.5 | | | | 43,921 | |
| | 21,953 | | Other Securities | | | 3.3 | | | | 328,427 | |
| | | | | | | | | | | 425,562 | |
| Energy — 0.9% | | | | | | | | |
| | 3,946 | | Other Securities | | | 0.9 | | | | 89,045 | |
| | | | | | | | | | | 89,045 | |
| Financials — 42.3% | | | | | | | | |
| | 1,450 | | Alterra Capital Holdings, Ltd. | | | 0.4 | | | | 40,876 | |
| | 6,399 | | American Equity Investment Life Holding Co. | | | 0.8 | | | | 78,132 | |
| | 8,810 | | Ashford Hospitality Trust, Inc. | | | 1.0 | | | | 92,593 | |
| | 6,906 | | Boston Private Financial Holdings, Inc. | | | 0.6 | | | | 62,223 | |
| | 6,869 | | Calamos Asset Management, Inc., Class A | | | 0.7 | | | | 72,605 | |
| | 2,028 | | CBL & Associates Properties, Inc. | | | 0.4 | | | | 43,014 | |
| | 1,891 | | Chemical Financial Corp. | | | 0.5 | | | | 44,930 | |
| | 6,544 | | CNO Financial Group, Inc. | | | 0.6 | | | | 61,056 | |
| | 1,703 | | DuPont Fabros Technology, Inc. | | | 0.4 | | | | 41,144 | |
| | 1,329 | | EPR Properties | | | 0.6 | | | | 61,280 | |
| | 2,534 | | Equity One, Inc. | | | 0.5 | | | | 53,239 | |
| | 1,519 | | FBL Financial Group, Inc., Class A | | | 0.5 | | | | 51,965 | |
| | 10,726 | | First Busey Corp. | | | 0.5 | | | | 49,876 | |
| | 11,715 | | First Commonwealth Financial Corp. | | | 0.8 | | | | 79,896 | |
| | 1,149 | | First Financial Bankshares, Inc. | | | 0.5 | | | | 44,822 | |
| | 3,961 | | FirstMerit Corp. | | | 0.6 | | | | 56,207 | |
| | 3,947 | | FNB Corp. | | | 0.4 | | | | 41,917 | |
| | | Percentage of Net Assets (%) | | | | |
| Financials (continued) | | | | | | | | |
| | 4,780 | | Hanmi Financial Corp. | | | 0.7 | | | $ | 64,960 | |
| | 2,090 | | Invesco Mortgage Capital, Inc. | | | 0.4 | | | | 41,194 | |
| | 7,050 | | iStar Financial, Inc.† | | | 0.6 | | | | 57,458 | |
| | 5,348 | | Maiden Holdings, Ltd. | | | 0.5 | | | | 49,148 | |
| | 4,560 | | MB Financial, Inc. | | | 0.9 | | | | 90,060 | |
| | 9,594 | | National Penn Bancshares, Inc. | | | 0.9 | | | | 89,416 | |
| | 8,320 | | NorthStar Realty Finance Corp. | | | 0.6 | | | | 58,573 | |
| | 2,698 | | Pennsylvania Real Estate Investment Trust | | | 0.5 | | | | 47,593 | |
| | 2,820 | | PrivateBancorp, Inc., Class A | | | 0.5 | | | | 43,202 | |
| | 2,059 | | Republic Bancorp, Inc., Class A | | | 0.5 | | | | 43,507 | |
| | 4,525 | | Susquehanna Bancshares, Inc. | | | 0.5 | | | | 47,422 | |
| | 4,649 | | Webster Financial Corp. | | | 1.0 | | | | 95,537 | |
| | 168,717 | | Other Securities | | | 24.9 | | | | 2,394,997 | |
| | | | | | | | | | | 4,098,842 | |
| Health Care — 6.5% | | | | | | | | |
| | 1,513 | | Magellan Health Services, Inc.† | | | 0.8 | | | | 74,137 | |
| | 50,732 | | Other Securities | | | 5.7 | | | | 554,562 | |
| | | | | | | | | | | 628,699 | |
| Industrials — 10.3% | | | | | | | | |
| | 9,669 | | Aircastle, Ltd. | | | 1.3 | | | | 121,249 | |
| | 926 | | Belden, Inc. | | | 0.4 | | | | 41,661 | |
| | 1,680 | | Layne Christensen Co. | | | 0.4 | | | | 40,773 | |
| | 2,787 | | Miller Industries, Inc. | | | 0.5 | | | | 42,502 | |
| | 2,650 | | SeaCube Container Leasing, Ltd. | | | 0.5 | | | | 49,952 | |
| | 2,198 | | TAL International Group, Inc. | | | 0.8 | | | | 79,963 | |
| | 34,039 | | Other Securities | | | 6.4 | | | | 621,133 | |
| | | | | | | | | | | 997,233 | |
| Information Technology — 6.8% | | | | | | | | |
| | 2,894 | | OmniVision Technologies, Inc. | | | 0.4 | | | | 40,748 | |
| | 1,778 | | ScanSource, Inc.† | | | 0.6 | | | | 56,487 | |
| | 4,668 | | XO Group, Inc.† | | | 0.4 | | | | 43,412 | |
| | 41,435 | | Other Securities | | | 5.4 | | | | 515,221 | |
| | | | | | | | | | | 655,868 | |
See Notes to Financial Statements.
Wilshire Mutual Funds, Inc. Small Company Value Portfolio Condensed Schedule of Investments - (Continued) | December 31, 2012 | |
| | | Percentage of Net Assets (%) | | | | |
| Materials — 7.7% | | | | | | | | |
| | 1,818 | | Coeur d'Alene Mines Corp. | | | 0.5 | | | $ | 44,723 | |
| | 950 | | Kaiser Aluminum Corp. | | | 0.6 | | | | 58,605 | |
| | 3,124 | | Myers Industries, Inc. | | | 0.5 | | | | 47,328 | |
| | 1,721 | | Sensient Technologies Corp. | | | 0.6 | | | | 61,199 | |
| | 37,194 | | Other Securities | | | 5.5 | | | | 536,560 | |
| | | | | | | | | | | 748,415 | |
| Telecommunication Services — 0.4% | | | | | | | | |
| | 4,304 | | Other Securities | | | 0.4 | | | | 44,621 | |
| | | | | | | | | | | 44,621 | |
| Utilities — 3.8% | | | | | | | | |
| | 11,865 | | Other Securities | | | 3.8 | | | | 364,962 | |
| | | | | | | | | | | 364,962 | |
| Total Common Stock | | | | | | | | |
| (Cost $8,474,923) | | | | | | | 9,608,613 | |
| | | | | | | | | | | | |
| SHORT-TERM INVESTMENT — 0.8% | | | | | | | | |
| | 77,029 | | Northern Trust Institutional Government Select Portfolio, 0.010% (a) | | | 0.8 | | | | 77,029 | |
| | | | | | | | | | | | |
| Total Short-Term Investment | | | | | | | | |
| (Cost $77,029) | | | | | | | 77,029 | |
| | | | | | | | | | | | |
| Total Investments — 99.9% | | | | | | | | |
| (Cost $8,551,952) | | | | | | | 9,685,642 | |
| Other Assets & Liabilities, Net — 0.1% | | | | | | | 9,228 | |
| | | | | | | | | | | | |
| NET ASSETS — 100.0% | | | | | | $ | 9,694,870 | |
| † | Non-income producing security. |
| †† | More narrow industries are utilized for compliance purposes, whereas broad sectors are utilized for reporting purposes. |
| (a) | Rate shown is the 7-day effective yield as of December 31, 2012. |
Ltd. — Limited
The Condensed Schedule of Investments does not reflect the complete portfolio holdings. It includes the Portfolio’s 50 largest holdings and each investment of any issuer that exceeds 1% of the Portfolio’s net assets. “Other Securities” represent all issues not required to be disclosed under the rules adopted by the U.S. Securities and Exchange Commission (“SEC”). The complete schedule of portfolio holdings is available (i) without charge, upon request, by calling (800) 607-2200; (ii) on the SEC’s website at http://www.sec.gov; and (iii) on our website at http://advisor.wilshire.com.
As of December 31, 2012, all of the Portfolio’s investments were considered Level 1. For the year ended December 31. 2012, there have been no transfers between Level 1 and Level 2 assets and liabilities. For the year ended December 31, 2012, there have been no transfers between Level 2 and Level 3 assets and liabilities. Please see Note 2 in Notes to Financial Statements for further information regarding fair value measurements.
See Notes to Financial Statements.
Wilshire Mutual Funds, Inc. Wilshire 5000 Indexsm Fund Condensed Schedule of Investments | December 31, 2012 | |
| | | | Percentage of Net Assets (%) | | | | |
| COMMON STOCK — 99.2% | |
| Consumer Discretionary — 12.0% | | | | | | |
| | 3,762 | | Amazon.com, Inc. | | | 0.6 | | | $ | 944,789 | |
| | 20,821 | | Comcast Corp., Class A | | | 0.5 | | | | 778,289 | |
| | 13,470 | | Home Depot, Inc. (The) | | | 0.5 | | | | 833,119 | |
| | 10,704 | | McDonald's Corp. | | | 0.6 | | | | 944,200 | |
| | 17,668 | | Walt Disney Co. (The) | | | 0.6 | | | | 879,690 | |
| | 513,188 | | Other Securities | | | 9.2 | | | | 14,713,246 | |
| | | | | | | | | | | 19,093,333 | |
| Consumer Staples — 9.6% | | | | | | | | |
| | 20,975 | | Altria Group, Inc. | | | 0.4 | | | | 659,035 | |
| | 44,365 | | Coca-Cola Co. (The) | | | 1.0 | | | | 1,608,231 | |
| | 13,542 | | CVS Caremark Corp. | | | 0.4 | | | | 654,756 | |
| | 16,757 | | PepsiCo, Inc. | | | 0.7 | | | | 1,146,682 | |
| | 17,257 | | Philip Morris International, Inc. | | | 0.9 | | | | 1,443,375 | |
| | 29,702 | | Procter & Gamble Co. (The) | | | 1.3 | | | | 2,016,469 | |
| | 17,795 | | Wal-Mart Stores, Inc. | | | 0.8 | | | | 1,214,153 | |
| | 164,150 | | Other Securities | | | 4.1 | | | | 6,538,202 | |
| | | | | | | | | | | 15,280,903 | |
| Energy — 10.4% | | | | | | | | |
| | 21,299 | | Chevron Corp. | | | 1.5 | | | | 2,303,274 | |
| | 13,181 | | ConocoPhillips | | | 0.5 | | | | 764,366 | |
| | 49,512 | | Exxon Mobil Corp. | | | 2.7 | | | | 4,285,264 | |
| | 8,916 | | Occidental Petroleum Corp. | | | 0.4 | | | | 683,055 | |
| | 14,604 | | Schlumberger, Ltd. | | | 0.7 | | | | 1,011,911 | |
| | 228,142 | | Other Securities | | | 4.6 | | | | 7,530,222 | |
| | | | | | | | | | | 16,578,092 | |
| Financials — 16.5% | | | | | | | | |
| | 9,875 | | American Express Co. | | | 0.4 | | | | 567,615 | |
| | 117,248 | | Bank of America Corp. | | | 0.9 | | | | 1,360,077 | |
| | 20,222 | | Berkshire Hathaway, Inc., Class B | | | 1.2 | | | | 1,813,913 | |
| | 31,840 | | Citigroup, Inc. | | | 0.8 | | | | 1,259,590 | |
| | 4,950 | | Goldman Sachs Group, Inc. (The) | | | 0.4 | | | | 631,422 | |
| | 41,309 | | JPMorgan Chase & Co. | | | 1.1 | | | | 1,816,357 | |
| | 19,409 | | U.S. Bancorp | | | 0.4 | | | | 619,923 | |
| | 52,592 | | Wells Fargo & Co. | | | 1.2 | | | | 1,797,595 | |
| | 625,837 | | Other Securities | | | 10.0 | | | | 16,532,302 | |
| | | | | | | | | | | 26,398,794 | |
| | | Percentage of Net Assets (%) | | | | |
| Health Care — 11.4% | | | | | | | | |
| | 17,125 | | Abbott Laboratories | | | 0.7 | | | $ | 1,121,687 | |
| | 6,575 | | Amgen, Inc. | | | 0.4 | | | | 567,554 | |
| | 30,060 | | Johnson & Johnson | | | 1.3 | | | | 2,107,206 | |
| | 30,730 | | Merck & Co., Inc. | | | 0.8 | | | | 1,258,086 | |
| | 79,912 | | Pfizer, Inc. | | | 1.3 | | | | 2,004,193 | |
| | 282,864 | | Other Securities | | | 6.9 | | | | 11,152,373 | |
| | | | | | | | | | | 18,211,099 | |
| Industrials — 10.9% | | | | | | | | |
| | 7,385 | | 3M Co. | | | 0.4 | | | | 685,697 | |
| | 7,515 | | Boeing Co. (The) | | | 0.4 | | | | 566,330 | |
| | 7,299 | | Caterpillar, Inc. | | | 0.4 | | | | 653,844 | |
| | 113,921 | | General Electric Co. | | | 1.5 | | | | 2,391,202 | |
| | 4,572 | | Union Pacific Corp. | | | 0.4 | | | | 574,792 | |
| | 7,921 | | United Parcel Service, Inc., Class B | | | 0.4 | | | | 584,015 | |
| | 10,187 | | United Technologies Corp. | | | 0.5 | | | | 835,436 | |
| | 318,736 | | Other Securities | | | 6.9 | | | | 11,119,458 | |
| | | | | | | | | | | 17,410,774 | |
| Information Technology — 18.3% | | | | | | | | |
| | 10,200 | | Apple, Inc. | | | 3.4 | | | | 5,436,906 | |
| | 57,648 | | Cisco Systems, Inc. | | | 0.7 | | | | 1,132,783 | |
| | 12,050 | | eBay, Inc.† | | | 0.4 | | | | 614,791 | |
| | 22,779 | | EMC Corp.† | | | 0.3 | | | | 576,309 | |
| | 2,720 | | Google, Inc., Class A† | | | 1.2 | | | | 1,929,486 | |
| | 54,018 | | Intel Corp. | | | 0.7 | | | | 1,114,391 | |
| | 11,525 | | International Business Machines Corp. | | | 1.4 | | | | 2,207,614 | |
| | 86,862 | | Microsoft Corp. | | | 1.5 | | | | 2,321,821 | |
| | 40,280 | | Oracle Corp. | | | 0.9 | | | | 1,342,130 | |
| | 18,750 | | QUALCOMM, Inc. | | | 0.8 | | | | 1,162,875 | |
| | 5,550 | | Visa, Inc., Class A | | | 0.5 | | | | 841,269 | |
| | 477,723 | | Other Securities | | | 6.5 | | | | 10,537,671 | |
| | | | | | | | | | | 29,218,046 | |
| Materials — 3.9% | | | | | | | | |
| | 167,149 | | Other Securities | | | 3.9 | | | | 6,300,384 | |
| | | | | | | | | | | 6,300,384 | |
| Telecommunication Services — 2.7% | | | | | | | | |
| | 61,699 | | AT&T, Inc. | | | 1.3 | | | | 2,079,873 | |
| | 31,013 | | Verizon Communications, Inc. | | | 0.9 | | | | 1,341,933 | |
| | 80,760 | | Other Securities | | | 0.5 | | | | 945,425 | |
| | | | | | | | | | | 4,367,231 | |
See Notes to Financial Statements.
Wilshire Mutual Funds, Inc. Wilshire 5000 Indexsm Fund Condensed Schedule of Investments - (Continued) | December 31, 2012 | |
| | | Percentage of Net Assets (%) | | | | |
| Utilities — 3.5% | | | | | | | | |
| | 154,989 | | Other Securities | | | 3.5 | | | $ | 5,597,640 | |
| | | | | | | | | | | 5,597,640 | |
| Total Common Stock | | | | | | | | |
| (Cost $88,191,615) | | | | | | | 158,456,296 | |
| | | | | | | | | | | | |
| RIGHT — 0.0% | | | | | | | | |
| | | | | | | | | |
| | | | | | | | | | |
| | 1,600 | | Other Securities (Cost $—) | | | 0.0 | | | | 176 | |
| | | | | | | | | | | | |
| WARRANT — 0.0% | | | | | | | | |
| | 1 | | Other Securities (Cost $—) | | | 0.0 | | | | — | |
| | | | | | | | | | | | |
| SHORT-TERM INVESTMENT — 9.9% | | | | | | | | |
| | 15,766,844 | | Northern Institutional Liquid Asset Portfolio, 0.010% (a),(b) | | | 9.9 | | | | 15,766,844 | |
| | | | | | | | | | | | |
| Total Short-Term Investment | | | | | | | | |
| (Cost $15,766,844) | | | | | | | 15,766,844 | |
| | | | | | | | | | | | |
| Total Investments — 109.1% | | | | | | | | |
| (Cost $103,958,459) | | | | | | | 174,223,316 | |
| Other Assets & Liabilities, Net — (9.1)% | | | | | | | (14,459,628 | ) |
| | | | | | | | | | | | |
| NET ASSETS — 100.0% | | | | | | $ | 159,763,688 | |
| † | Non-income producing security. |
| (a) | This security was purchased with cash collateral held from securities on loan. The total value of such securities as of December 31, 2012 was $15,766,844. Securities on loan are also collateralized by various U.S. Treasury obligations in the amount of $40,620 (Note 6). |
| (b) | Rate shown is the 7-day effective yield as of December 31, 2012. |
Ltd. — Limited
Amounts designated as “—“ are either $0, or have been rounded to $0.
The Condensed Schedule of Investments does not reflect the complete portfolio holdings. It includes the Portfolio’s 50 largest holdings and each investment of any issuer that exceeds 1% of the Portfolio’s net assets. “Other Securities” represent all issues not required to be disclosed under the rules adopted by the U.S. Securities and Exchange Commission (“SEC”). The complete schedule of portfolio holdings is available (i) without charge, upon request, by calling (800) 607-2200; (ii) on the SEC’s website at http://www.sec.gov; and (iii) on our website at http://advisor.wilshire.com.
As of December 31, 2012, all of the Portfolio’s investments were considered Level 1, except for Allos Therapeutics Rights, Hyster-Yale Materials Handling, Inc., Magnum Hunter Resources Corp. Warrant, Orleans Homebuilders, Inc. and Trico Marine Services, Inc. which are Level 3. At December 31, 2012, these investments were valued at $9,936. The value of Level 3 investments at December 31, 2011 was zero. A reconciliation of Level 3 investments is only presented when the Portfolio has a significant amount of Level 3 investments at the beginning and/or end of the period in relation to net assets. For the year ended December 31, 2012, there have been no transfers between Level 1 and Level 2 assets and liabilities. For the year ended December 31, 2012, there have been no transfers between Level 2 and Level 3 assets and liabilities. Please see Note 2 in Notes to Financial Statements for further information regarding fair value measurements.
See Notes to Financial Statements.
Wilshire Mutual Funds, Inc. Wilshire Large Cap Core Plus Fund Schedule of Investments | December 31, 2012 | |
| | | | | |
| COMMON STOCK — 119.4% | |
| Consumer Discretionary — 14.2% | | | |
| | 2,600 | | Advance Auto Parts, Inc.(a) | | $ | 188,110 | |
| | 4,100 | | Amazon.com, Inc.(a) | | | 1,029,674 | |
| | 4,800 | | Bed Bath & Beyond, Inc.(a) | | | 268,368 | |
| | 7,800 | | CBS Corp., Class B(a) | | | 296,790 | |
| | 7,210 | | Coach, Inc.(a) | | | 400,227 | |
| | 45,550 | | Comcast Corp., Class A(a) | | | 1,702,658 | |
| | 5,100 | | Dick's Sporting Goods, Inc.(a)(b) | | | 231,999 | |
| | 9,300 | | Dollar Tree, Inc.(a) | | | 377,208 | |
| | 10,100 | | DR Horton, Inc.(a)(b) | | | 199,778 | |
| | 8,750 | | Foot Locker, Inc.(a) | | | 281,050 | |
| | 16,900 | | Ford Motor Co.(a)(b) | | | 218,855 | |
| | 7,650 | | GameStop Corp., Class A(a)(b) | | | 191,939 | |
| | 7,300 | | Gannett Co., Inc.(a) | | | 131,473 | |
| | 10,500 | | Gap, Inc. (The)(a) | | | 325,920 | |
| | 2,950 | | Genuine Parts Co.(a) | | | 187,561 | |
| | 24,840 | | Home Depot, Inc. (The)(a) | | | 1,536,354 | |
| | 4,200 | | Jarden Corp.(a)(b) | | | 217,140 | |
| | 4,100 | | Lear Corp.(a) | | | 192,044 | |
| | 6,600 | | Lennar Corp., Class A(a)(b) | | | 255,222 | |
| | 3,000 | | Liberty Global, Inc., Class A †(a) | | | 188,970 | |
| | 38,600 | | Lowe's Cos., Inc. | | | 1,371,072 | |
| | 7,100 | | Macy's, Inc.(a) | | | 277,042 | |
| | 7,550 | | Mattel, Inc.(a)(b) | | | 276,481 | |
| | 14,130 | | McDonald's Corp.(a) | | | 1,246,407 | |
| | 5,550 | | Meredith Corp.(a)(b) | | | 191,198 | |
| | 4,000 | | Michael Kors Holdings, Ltd.(a)(b) | | | 204,120 | |
| | 11,600 | | News Corp., Class A(a) | | | 296,264 | |
| | 21,860 | | NIKE, Inc., Class B(a) | | | 1,127,976 | |
| | 5,200 | | Omnicom Group, Inc.(a) | | | 259,792 | |
| | 4,000 | | PetSmart, Inc.(a) | | | 273,360 | |
| | 400 | | priceline.com, Inc. †(a) | | | 248,480 | |
| | 2,290 | | Ralph Lauren Corp., Class A(a) | | | 343,317 | |
| | 10,600 | | Regis Corp.(a)(b) | | | 179,352 | |
| | 4,350 | | Ross Stores, Inc.(a) | | | 235,553 | |
| | 2,400 | | Stanley Black & Decker, Inc.(a) | | | 177,528 | |
| | 25,420 | | Staples, Inc.(a)(b) | | | 289,788 | |
| | 17,860 | | Starbucks Corp.(a) | | | 957,653 | |
| | 15,000 | | Time Warner Cable, Inc., Class A | | | 1,457,850 | |
| | 22,790 | | Time Warner, Inc.(a) | | | 1,090,046 | |
| | 10,500 | | TJX Cos., Inc.(a) | | | 445,725 | |
| | 5,700 | | Urban Outfitters, Inc.(a) | | | 224,352 | |
| | 9,200 | | VF Corp. | | | 1,388,924 | |
| | 22,960 | | Viacom, Inc., Class B(a) | | | 1,210,910 | |
| Consumer Discretionary (continued) | | | | |
| | 10,400 | | Walt Disney Co. (The)(a) | | $ | 517,816 | |
| | 5,900 | | Williams-Sonoma, Inc.(a) | | | 258,243 | |
| | 4,600 | | Wyndham Worldwide Corp.(a) | | | 244,766 | |
| | 24,000 | | Yum! Brands, Inc.(a) | | | 1,593,600 | |
| | | | | | | 24,808,955 | |
| Consumer Staples — 12.8% | | | | |
| | 9,350 | | Altria Group, Inc.(a) | | | 293,777 | |
| | 68,400 | | Coca-Cola Co. (The)(a) | | | 2,479,500 | |
| | 1,800 | | Colgate-Palmolive Co.(a) | | | 188,172 | |
| | 3,700 | | Costco Wholesale Corp.(a) | | | 365,449 | |
| | 68,690 | | CVS Caremark Corp.(a) | | | 3,321,161 | |
| | 10,500 | | Dr. Pepper Snapple Group, Inc.(a) | | | 463,890 | |
| | 17,490 | | Estee Lauder Cos., Inc. (The), Class A(a) | | | 1,046,951 | |
| | 4,500 | | Hormel Foods Corp.(a)(b) | | | 140,445 | |
| | 3,750 | | Kimberly-Clark Corp.(a) | | | 316,613 | |
| | 10,546 | | Kraft Foods Group, Inc.(a) | | | 479,527 | |
| | 16,200 | | Kroger Co. (The)(a)(b) | | | 421,524 | |
| | 12,880 | | Lorillard, Inc.(a) | | | 1,502,710 | |
| | 18,400 | | McCormick & Co., Inc.(b) | | | 1,168,952 | |
| | 10,800 | | Mondelez International, Inc., Class A(a) | | | 275,076 | |
| | 2,900 | | Monster Beverage Corp.(a) | | | 153,352 | |
| | 29,400 | | PepsiCo, Inc.(a) | | | 2,011,842 | |
| | 41,710 | | Philip Morris International, Inc.(a) | | | 3,488,623 | |
| | 23,420 | | Procter & Gamble Co. (The)(a) | | | 1,589,984 | |
| | 4,900 | | Reynolds American, Inc.(a) | | | 203,007 | |
| | 7,850 | | Safeway, Inc.(a)(b) | | | 142,007 | |
| | 6,600 | | Tyson Foods, Inc., Class A(a) | | | 128,040 | |
| | 4,150 | | Universal Corp.(a)(b) | | | 207,127 | |
| | 8,000 | | Walgreen Co.(a) | | | 296,080 | |
| | 21,110 | | Wal-Mart Stores, Inc.(a) | | | 1,440,335 | |
| | 2,450 | | Whole Foods Market, Inc.(a) | | | 223,759 | |
| | | | | | | 22,347,903 | |
| Energy — 13.1% | | | | |
| | 7,490 | | Apache Corp.(a) | | | 587,965 | |
| | 5,000 | | Atwood Oceanics, Inc. †(a)(b) | | | 228,950 | |
| | 9,980 | | Cameron International Corp.(a) | | | 563,471 | |
| | 25,450 | | Chevron Corp.(a) | | | 2,752,163 | |
| | 5,290 | | Concho Resources, Inc.(a)(b) | | | 426,162 | |
| | 7,500 | | ConocoPhillips(a) | | | 434,925 | |
See Notes to Financial Statements.
Wilshire Mutual Funds, Inc. Wilshire Large Cap Core Plus Fund Schedule of Investments - (Continued) | December 31, 2012 | |
| Energy (continued) | | | | |
| | 4,300 | | Diamond Offshore Drilling, Inc.(a)(b) | | $ | 292,228 | |
| | 8,960 | | Ensco PLC, Class A(a) | | | 531,149 | |
| | 3,100 | | EOG Resources, Inc.(a) | | | 374,449 | |
| | 30,230 | | EQT Corp.(a)(b) | | | 1,782,965 | |
| | 51,740 | | Exxon Mobil Corp.(a) | | | 4,478,097 | |
| | 18,300 | | Halliburton Co.(a) | | | 634,827 | |
| | 3,800 | | Helmerich & Payne, Inc.(a)(b) | | | 212,838 | |
| | 6,500 | | HollyFrontier Corp.(a) | | | 302,575 | |
| | 30,200 | | Kinder Morgan, Inc.(a) | | | 1,066,966 | |
| | 11,100 | | Marathon Oil Corp.(a) | | | 340,326 | |
| | 18,855 | | Marathon Petroleum Corp.(a) | | | 1,187,865 | |
| | 7,850 | | Murphy Oil Corp.(a)(b) | | | 467,468 | |
| | 12,340 | | National Oilwell Varco, Inc.(a) | | | 843,439 | |
| | 14,820 | | Occidental Petroleum Corp.(a) | | | 1,135,360 | |
| | 16,130 | | Phillips 66(a) | | | 856,503 | |
| | 18,200 | | Royal Dutch Shell PLC ADR, Class A(b) | | | 1,254,890 | |
| | 4,900 | | Schlumberger, Ltd.(a) | | | 339,521 | |
| | 37,700 | | Seadrill, Ltd.(b) | | | 1,387,360 | |
| | 7,100 | | Valero Energy Corp.(a) | | | 242,252 | |
| | | | | | | 22,724,714 | |
| Financials — 17.1% | | | | |
| | 4,300 | | American Express Co.(a) | | | 247,164 | |
| | 6,450 | | American Financial Group, Inc. | | | 254,904 | |
| | 5,200 | | American International Group, Inc. †(a) | | | 183,560 | |
| | 10,790 | | American Tower Corp., Class A(a) | | | 833,743 | |
| | 13,890 | | Ameriprise Financial, Inc.(a)(b) | | | 869,931 | |
| | 19,800 | | Apartment Investment & Management Co., Class A(a) | | | 535,788 | |
| | 5,200 | | Assurant, Inc.(a) | | | 180,440 | |
| | 12,650 | | BancorpSouth, Inc.(a)(b) | | | 183,931 | |
| | 61,800 | | Bank of America Corp. | | | 716,880 | |
| | 18,980 | | Berkshire Hathaway, Inc., Class B(a) | | | 1,702,506 | |
| | 7,400 | | BlackRock, Inc., Class A(a) | | | 1,529,654 | |
| | 3,400 | | Boston Properties, Inc.(a)(b) | | | 359,754 | |
| | 21,940 | | Capital One Financial Corp.(a) | | | 1,270,984 | |
| | 12,100 | | Charles Schwab Corp. (The)(a)(b) | | | 173,756 | |
| | 5,200 | | Chubb Corp. (The)(a) | | | 391,664 | |
| | 29,600 | | Citigroup, Inc.(a) | | | 1,170,976 | |
| | 7,300 | | CNA Financial Corp.(a) | | | 204,473 | |
| | 6,338 | | Commerce Bancshares, Inc.(a)(b) | | | 222,210 | |
| Financials (continued) | | | | |
| | 19,000 | | Cullen/Frost Bankers, Inc.(b) | | $ | 1,031,130 | |
| | 7,450 | | Discover Financial Services(a) | | | 287,198 | |
| | 8,600 | | Equity One, Inc.(a) | | | 180,686 | |
| | 13,800 | | Fifth Third Bancorp(a) | | | 209,622 | |
| | 1,500 | | Franklin Resources, Inc.(a) | | | 188,550 | |
| | 4,000 | | Goldman Sachs Group, Inc. (The) | | | 510,240 | |
| | 14,610 | | Hartford Financial Services Group, Inc.(a) | | | 327,848 | |
| | 46,930 | | Huntington Bancshares, Inc.(a) | | | 299,883 | |
| | 9,000 | | International Bancshares Corp.(a)(b) | | | 162,450 | |
| | 31,900 | | Invesco, Ltd.(a) | | | 832,271 | |
| | 81,090 | | JPMorgan Chase & Co.(a) | | | 3,565,527 | |
| | 6,800 | | Legg Mason, Inc.(b) | | | 174,896 | |
| | 6,000 | | Leucadia National Corp.(a)(b) | | | 142,740 | |
| | 19,450 | | Lincoln National Corp.(a)(b) | | | 503,755 | |
| | 2,680 | | M&T Bank Corp.(a)(b) | | | 263,900 | |
| | 22,410 | | MetLife, Inc.(a) | | | 738,185 | |
| | 33,750 | | NASDAQ OMX Group, Inc. (The)(a) | | | 844,088 | |
| | 91,000 | | New York Community Bancorp, Inc.(b) | | | 1,192,100 | |
| | 8,700 | | Platinum Underwriters Holdings, Ltd.(a) | | | 400,200 | |
| | 17,330 | | PNC Financial Services Group, Inc.(a) | | | 1,010,512 | |
| | 3,600 | | Prudential Financial, Inc.(a) | | | 191,988 | |
| | 13,020 | | Raymond James Financial, Inc.(a) | | | 501,661 | |
| | 27,280 | | Regions Financial Corp.(a) | | | 194,234 | |
| | 3,000 | | Reinsurance Group of America, Inc., Class A(a) | | | 160,560 | |
| | 2,400 | | RenaissanceRe Holdings, Ltd.(a) | | | 195,024 | |
| | 5,000 | | State Street Corp.(a) | | | 235,050 | |
| | 7,800 | | SunTrust Banks, Inc.(a) | | | 221,130 | |
| | 10,800 | | U.S. Bancorp(a) | | | 344,952 | |
| | 9,300 | | Unum Group(a) | | | 193,626 | |
| | 98,230 | | Wells Fargo & Co.(a) | | | 3,357,501 | |
| | 7,700 | | XL Group PLC, Class A(a) | | | 192,962 | |
| | | | | | | 29,686,787 | |
| Health Care — 13.4% | | | | |
| | 42,510 | | Abbott Laboratories(a) | | | 2,784,404 | |
| | 4,600 | | Aetna, Inc.(a)(b) | | | 212,980 | |
| | 5,000 | | Agilent Technologies, Inc.(a) | | | 204,700 | |
| | 1,700 | | Alexion Pharmaceuticals, Inc. †(a) | | | 159,477 | |
See Notes to Financial Statements.
Wilshire Mutual Funds, Inc. Wilshire Large Cap Core Plus Fund Schedule of Investments - (Continued) | December 31, 2012 | |
| Health Care (continued) | | | | |
| | 4,100 | | Allergan, Inc.(a) | | $ | 376,093 | |
| | 4,700 | | AmerisourceBergen Corp., Class A(a)(b) | | | 202,946 | |
| | 5,700 | | Amgen, Inc.(a) | | | 492,024 | |
| | 4,270 | | Baxter International, Inc.(a) | | | 284,638 | |
| | 2,000 | | Biogen Idec, Inc.(a) | | | 293,340 | |
| | 7,110 | | BioMarin Pharmaceutical, Inc.(a) | | | 350,168 | |
| | 35,000 | | Boston Scientific Corp. †(a) | | | 200,550 | |
| | 6,600 | | Bristol-Myers Squibb Co.(a)(b) | | | 215,094 | |
| | 4,400 | | Cardinal Health, Inc.(a) | | | 181,192 | |
| | 5,200 | | Catamaran Corp.(a) | | | 244,972 | |
| | 5,300 | | Celgene Corp. †(a) | | | 417,216 | |
| | 3,200 | | Cerner Corp.(a) | | | 248,448 | |
| | 4,150 | | Cigna Corp.(a) | | | 221,859 | |
| | 5,000 | | Covance, Inc. †(a)(b) | | | 288,850 | |
| | 3,900 | | Covidien PLC(a) | | | 225,186 | |
| | 18,700 | | Elan Corp. PLC ADR †(a) | | | 190,927 | |
| | 10,400 | | Eli Lilly & Co.(a) | | | 512,928 | |
| | 10,670 | | Express Scripts Holding Co.(a) | | | 576,180 | |
| | 11,930 | | Gilead Sciences, Inc.(a) | | | 876,259 | |
| | 6,360 | | Hanger, Inc. †(a)(b) | | | 174,010 | |
| | 13,550 | | HCA Holdings, Inc.(a) | | | 408,804 | |
| | 9,250 | | Hospira, Inc.(a) | | | 288,970 | |
| | 5,500 | | Illumina, Inc. †(a)(b) | | | 305,745 | |
| | 16,500 | | Johnson & Johnson(a) | | | 1,156,650 | |
| | 2,450 | | McKesson Corp.(a) | | | 237,552 | |
| | 3,570 | | Medivation, Inc. †(a)(b) | | | 182,641 | |
| | 7,300 | | Medtronic, Inc.(a) | | | 299,446 | |
| | 21,000 | | Merck & Co., Inc.(a) | | | 859,740 | |
| | 5,400 | | Mylan, Inc. †(a) | | | 148,392 | |
| | 7,100 | | Novo Nordisk ADR | | | 1,158,791 | |
| | 6,660 | | Onyx Pharmaceuticals, Inc. †(a)(b) | | | 503,030 | |
| | 157,560 | | Pfizer, Inc.(a) | | | 3,951,604 | |
| | 456 | | Prothena Corp. PLC(a) | | | 3,343 | |
| | 3,210 | | Regeneron Pharmaceuticals, Inc.(a) | | | 549,135 | |
| | 3,400 | | Teleflex, Inc.(a) | | | 242,454 | |
| | 10,630 | | Thoratec Corp. †(a) | | | 398,838 | |
| | 4,000 | | United Therapeutics Corp.(a)(b) | | | 213,680 | |
| | 7,300 | | UnitedHealth Group, Inc.(a) | | | 395,952 | |
| | 10,300 | | Valeant Pharmaceuticals International, Inc.(a) | | | 615,631 | |
| | 2,360 | | Varian Medical Systems, Inc.(a)(b) | | | 165,766 | |
| | 4,700 | | Watson Pharmaceuticals, Inc.(a) | | | 404,200 | |
| Health Care (continued) | | | | |
| | 3,200 | | WellCare Health Plans, Inc.(a) | | $ | 155,808 | |
| | 8,730 | | WellPoint, Inc.(a)(b) | | | 531,832 | |
| | 4,300 | | Zimmer Holdings, Inc.(a)(b) | | | 286,638 | |
| | | | | | | 23,399,083 | |
| Industrials — 13.0% | | | | |
| | 5,300 | | 3M Co.(a) | | | 492,105 | |
| | 7,000 | | Babcock & Wilcox Co. (The)(a) | | | 183,400 | |
| | 14,940 | | Boeing Co. (The)(a) | | | 1,125,878 | |
| | 3,500 | | Carlisle Cos., Inc.(a) | | | 205,660 | |
| | 17,300 | | Caterpillar, Inc.(a) | | | 1,549,734 | |
| | 5,300 | | Chicago Bridge & Iron Co. NV(a)(b) | | | 245,655 | |
| | 11,000 | | Covanta Holding Corp.(a) | | | 202,620 | |
| | 5,950 | | Cummins, Inc.(a) | | | 644,683 | |
| | 18,600 | | Danaher Corp.(a) | | | 1,039,740 | |
| | 13,000 | | Delta Air Lines, Inc.(a) | | | 154,310 | |
| | 9,000 | | Deluxe Corp.(a)(b) | | | 290,160 | |
| | 7,000 | | Donaldson Co., Inc.(a) | | | 229,880 | |
| | 24,900 | | Eaton Corp. PLC(a) | | | 1,349,580 | |
| | 27,400 | | Emerson Electric Co.(a) | | | 1,451,104 | |
| | 5,840 | | FedEx Corp.(a) | | | 535,645 | |
| | 1,750 | | Flowserve Corp.(a) | | | 256,900 | |
| | 3,150 | | Gardner Denver, Inc.(a) | | | 215,775 | |
| | 4,400 | | General Dynamics Corp.(a) | | | 304,788 | |
| | 96,510 | | General Electric Co.(a) | | | 2,025,745 | |
| | 5,900 | | Honeywell International, Inc.(a) | | | 374,473 | |
| | 1 | | Huntington Ingalls Industries, Inc.(a) | | | 43 | |
| | 3,150 | | Illinois Tool Works, Inc.(a) | | | 191,552 | |
| | 17,500 | | Ingersoll-Rand PLC(a) | | | 839,300 | |
| | 3,700 | | Landstar System, Inc.(a)(b) | | | 194,102 | |
| | 3,000 | | Northrop Grumman Corp.(a)(b) | | | 202,740 | |
| | 7,500 | | Oshkosh Corp.(a) | | | 222,375 | |
| | 23,100 | | PACCAR, Inc.(b) | | | 1,044,351 | |
| | 2,150 | | Parker Hannifin Corp.(a) | | | 182,879 | |
| | 3,710 | | Precision Castparts Corp.(a) | | | 702,748 | |
| | 9,850 | | Raytheon Co.(a) | | | 566,966 | |
| | 1,900 | | Rockwell Automation, Inc.(a) | | | 159,581 | |
| | 4,350 | | Snap-on, Inc.(a) | | | 343,607 | |
| | 20,150 | | Southwest Airlines Co.(a) | | | 206,336 | |
| | 3,000 | | Triumph Group, Inc.(a)(b) | | | 195,900 | |
| | 19,110 | | Union Pacific Corp.(a) | | | 2,402,509 | |
| | 6,100 | | United Parcel Service, Inc., Class B(a) | | | 449,753 | |
See Notes to Financial Statements.
Wilshire Mutual Funds, Inc. Wilshire Large Cap Core Plus Fund Schedule of Investments - (Continued) | December 31, 2012 | |
| Industrials (continued) | | | | |
| | 14,640 | | United Technologies Corp.(a) | | $ | 1,200,626 | |
| | 3,700 | | URS Corp.(a) | | | 145,262 | |
| | 2,700 | | Wabtec Corp.(a) | | | 236,358 | |
| | 1,000 | | WW Grainger, Inc.(a)(b) | | | 202,370 | |
| | | | | | | 22,567,193 | |
| Information Technology — 22.3% | | | | |
| | 31,600 | | Accenture PLC, Class A(a) | | | 2,101,400 | |
| | 15,400 | | Activision Blizzard, Inc.(a)(b) | | | 163,548 | |
| | 11,520 | | Adobe Systems, Inc.(a) | | | 434,074 | |
| | 14,970 | | ADTRAN, Inc.(a)(b) | | | 292,514 | |
| | 14,410 | | Altera Corp.(a)(b) | | | 496,280 | |
| | 12,235 | | Apple, Inc.(a) | | | 6,521,621 | |
| | 5,070 | | Atmel Corp.(a) | | | 33,209 | |
| | 22,890 | | Broadcom Corp., Class A(a) | | | 760,177 | |
| | 6,100 | | CA, Inc.(a) | | | 134,078 | |
| | 15,000 | | Cadence Design Systems, Inc.(a) | | | 202,650 | |
| | 7,000 | | Check Point Software Technologies, Ltd.(a)(b) | | | 333,480 | |
| | 34,500 | | Cisco Systems, Inc.(a) | | | 677,925 | |
| | 4,990 | | Citrix Systems, Inc.(a) | | | 328,093 | |
| | 12,030 | | Cognizant Technology Solutions Corp., Class A †(a) | | | 890,822 | |
| | 26,200 | | Corning, Inc.(a) | | | 330,644 | |
| | 18,200 | | Dell, Inc.(a) | | | 184,366 | |
| | 4,800 | | Diebold, Inc.(a) | | | 146,928 | |
| | 7,250 | | eBay, Inc. †(a) | | | 369,895 | |
| | 11,000 | | Electronic Arts, Inc. †(a)(b) | | | 159,830 | |
| | 30,280 | | EMC Corp. †(a) | | | 766,084 | |
| | 1,800 | | FactSet Research Systems, Inc.(a)(b) | | | 158,508 | |
| | 30,000 | | Fidelity National Information Services, Inc. | | | 1,044,300 | |
| | 7,500 | | Fortinet, Inc.(a) | | | 158,025 | |
| | 13,000 | | Genpact, Ltd.(a) | | | 201,500 | |
| | 3,360 | | Google, Inc., Class A †(a) | | | 2,383,483 | |
| | 9,000 | | Hewlett-Packard Co.(a) | | | 128,250 | |
| | 5,650 | | IAC/InterActiveCorp.(a) | | | 267,245 | |
| | 32,200 | | Intel Corp.(a) | | | 664,286 | |
| | 13,350 | | International Business Machines Corp.(a) | | | 2,557,192 | |
| | 31,280 | | Juniper Networks, Inc.(a) | | | 615,278 | |
| | 4,300 | | KLA-Tencor Corp.(a)(b) | | | 205,368 | |
| | 2,000 | | LinkedIn Corp., Class A †(a) | | | 229,640 | |
| | 25,750 | | LSI Corp.(a) | | | 182,310 | |
| Information Technology (continued) | | | | |
| | 500 | | Mastercard, Inc., Class A(a) | | $ | 245,640 | |
| | 7,190 | | Maxim Integrated Products, Inc.(a) | | | 211,386 | |
| | 36,800 | | Microchip Technology, Inc.(b) | | | 1,199,312 | |
| | 3,900 | | MICROS Systems, Inc.(a) | | | 165,516 | |
| | 93,200 | | Microsoft Corp.(a) | | | 2,491,235 | |
| | 5,200 | | Molex, Inc.(a)(b) | | | 142,116 | |
| | 35,760 | | Motorola Solutions, Inc.(a) | | | 1,991,117 | |
| | 5,700 | | NetApp, Inc. †(a) | | | 191,235 | |
| | 9,600 | | NXP Semiconductor NV(a) | | | 253,152 | |
| | 42,730 | | Oracle Corp.(a) | | | 1,423,764 | |
| | 5,200 | | Paychex, Inc.(a)(b) | | | 161,928 | |
| | 4,900 | | Plantronics, Inc.(a) | | | 180,663 | |
| | 45,310 | | QUALCOMM, Inc.(a) | | | 2,810,125 | |
| | 7,350 | | Sourcefire, Inc.(a)(b) | | | 347,067 | |
| | 29,000 | | STMicroelectronics NV, Class Y(a)(b) | | | 209,960 | |
| | 4,600 | | Tech Data Corp.(a) | | | 209,438 | |
| | 12,000 | | Teradyne, Inc.(a)(b) | | | 202,680 | |
| | 9,040 | | Visa, Inc., Class A(a) | | | 1,370,283 | |
| | 4,462 | | VMware, Inc., Class A(a)(b) | | | 420,053 | |
| | 25,000 | | Xerox Corp.(a) | | | 170,500 | |
| | 17,100 | | Yahoo!, Inc.(a) | | | 340,290 | |
| | | | | | | 38,860,463 | |
| Materials — 4.8% | | | | |
| | 7,060 | | Albemarle Corp.(a) | | | 438,567 | |
| | 26,300 | | Alcoa, Inc.(a) | | | 228,284 | |
| | 6,100 | | Bemis Co., Inc.(a)(b) | | | 204,106 | |
| | 2,340 | | CF Industries Holdings, Inc.(a) | | | 475,394 | |
| | 3,660 | | Ecolab, Inc.(a) | | | 263,154 | |
| | 3,900 | | FMC Corp.(a) | | | 228,228 | |
| | 6,100 | | Freeport-McMoRan Copper & Gold, Inc.(a) | | | 208,620 | |
| | 2,700 | | International Flavors & Fragrances, Inc.(a)(b) | | | 179,658 | |
| | 4,200 | | International Paper Co.(a) | | | 167,328 | |
| | 12,000 | | Louisiana-Pacific Corp.(a) | | | 231,840 | |
| | 15,200 | | LyondellBasell Industries NV, Class A(a) | | | 867,768 | |
| | 5,300 | | MeadWestvaco Corp.(a) | | | 168,911 | |
| | 5,800 | | Monsanto Co.(a) | | | 548,970 | |
| | 6,060 | | PPG Industries, Inc.(a) | | | 820,221 | |
| | 3,850 | | Praxair, Inc.(a)(b) | | | 421,383 | |
| | 5,100 | | Sensient Technologies Corp.(a) | | | 181,356 | |
| | 1,200 | | Sherwin-Williams Co. (The)(a) | | | 184,584 | |
See Notes to Financial Statements.
Wilshire Mutual Funds, Inc. Wilshire Large Cap Core Plus Fund Schedule of Investments - (Continued) | December 31, 2012 | |
| Materials (continued) | | | | |
| | 42,481 | | Southern Copper Corp.(b) | | $ | 1,608,331 | |
| | 5,700 | | United States Steel Corp.(a)(b) | | | 136,059 | |
| | 3,600 | | Valspar Corp.(a) | | | 224,640 | |
| | 21,900 | | Weyerhaeuser Co.(a) | | | 609,258 | |
| | | | | | | 8,396,660 | |
| Telecommunication Services — 3.5% | | | | |
| | 81,570 | | AT&T, Inc.(a) | | | 2,749,725 | |
| | 18,109 | | CenturyLink, Inc.(a)(b) | | | 708,424 | |
| | 72,820 | | Frontier Communications Corp.(a)(b) | | | 311,670 | |
| | 6,920 | | SBA Communications Corp., Class A(a)(b) | | | 491,458 | |
| | 10,000 | | Telephone & Data Systems, Inc.(a)(b) | | | 221,400 | |
| | 4,700 | | United States Cellular Corp. †(a)(b) | | | 165,628 | |
| | 31,640 | | Verizon Communications, Inc.(a) | | | 1,369,063 | |
| | | | | | | 6,017,368 | |
| Utilities — 5.2% | | | | |
| | 15,000 | | AES Corp. (The)(a) | | | 160,500 | |
| | 13,100 | | Ameren Corp.(a) | | | 402,432 | |
| | 7,100 | | American Electric Power Co., Inc.(a) | | | 303,028 | |
| | 5,000 | | American Water Works Co., Inc.(a) | | | 185,650 | |
| | 11,440 | | Dominion Resources, Inc.(a)(b) | | | 592,592 | |
| | 3,500 | | DTE Energy Co.(a) | | | 210,175 | |
| | 5,300 | | Duke Energy Corp.(a) | | | 338,140 | |
| | 21,260 | | Edison International(a)(b) | | | 960,739 | |
| | 6,100 | | Exelon Corp.(a) | | | 181,414 | |
| | 9,100 | | Great Plains Energy, Inc.(a) | | | 184,821 | |
| | 5,700 | | IDACORP, Inc.(b) | | | 247,095 | |
| | 13,830 | | ITC Holdings Corp.(a)(b) | | | 1,063,665 | |
| | 24,300 | | NextEra Energy, Inc.(a) | | | 1,681,317 | |
| | 9,500 | | NRG Energy, Inc.(a) | | | 218,405 | |
| | 23,700 | | ONEOK, Inc. | | | 1,013,175 | |
| | 3,800 | | Pinnacle West Capital Corp.(a)(b) | | | 193,724 | |
| | 21,940 | | PPL Corp.(a)(b) | | | 628,142 | |
| | 11,500 | | Public Service Enterprise Group, Inc.(a) | | | 351,900 | |
| | 4,050 | | Southern Co. (The)(a)(b) | | | 173,381 | |
| | | | | | | 9,090,295 | |
| Total Common Stock | | | | |
| (Cost $167,954,972) | | | 207,899,421 | |
| SHORT-TERM INVESTMENTS — 16.9% | | | | |
| | 27,847,290 | | Northern Institutional Liquid Asset Portfolio, 0.010% (c)(d) | | $ | 27,847,290 | |
| | 1,556,014 | | Northern Trust Institutional Government Select Portfolio, 0.010% (d) | | | 1,556,014 | |
| | | | | | | | |
| Total Short-Term Investments | | | | |
| (Cost $29,403,304) | | | 29,403,304 | |
| | | | | | | | |
| Total Investments — 136.3% | | | | |
| (Cost $197,358,276) | | | 237,302,725 | |
| Other Assets & Liabilities, Net — (36.3)% | | | (63,198,106 | ) |
| | | | | | | | |
| NET ASSETS — 100.0% | | $ | 174,104,619 | |
| † | Non-income producing security. |
| (a) | All or a portion of the shares have been committed as collateral for open short positions. |
| (b) | This security or a partial position of this security is on loan at December 31, 2012. The total market value of securities on loan at December 31, 2012 was $26,550,859 (Note 6). |
| (c) | This security was purchased with cash collateral held from securities on loan. The total value of such security at December 31, 2012 was $27,847,290 (Note 6). |
| (d) | Rate shown is the 7-day effective yield as of December 31, 2012. |
ADR — American Depositary Receipt
Ltd. — Limited
PLC — Public Limited Company
As of December 31, 2012, all of the Portfolio’s investments in securities were considered Level 1. For the year ended December 31, 2012, there have been no transfers between Level 1 and Level 2 assets and liabilities. For the year ended December 31, 2012, there have been no transfers between Level 2 and Level 3 assets and liabilities. Please see Note 2 in Notes to Financial Statements for further information regarding fair value measurements.
See Notes to Financial Statements.
Wilshire Mutual Funds, Inc. Wilshire Large Cap Core Plus Fund Schedule of Securities Sold Short | December 31, 2012 | |
| | | | | |
| SECURITIES SOLD SHORT — (20.3)% | |
| Consumer Discretionary — (2.9)% | | | |
| | 4,500 | | AMC Networks, Inc., Class A † | | $ | 222,750 | |
| | 2,650 | | Bed Bath & Beyond, Inc. | | | 148,162 | |
| | 2,900 | | BorgWarner, Inc. | | | 207,698 | |
| | 2,140 | | Buffalo Wild Wings, Inc. | | | 155,835 | |
| | 3,350 | | Choice Hotels International, Inc. | | | 112,627 | |
| | 2,370 | | Darden Restaurants, Inc. | | | 106,816 | |
| | 4,250 | | DIRECTV † | | | 213,180 | |
| | 2,800 | | DSW, Inc., Class A | | | 183,932 | |
| | 2,500 | | Family Dollar Stores, Inc. | | | 158,525 | |
| | 4,970 | | Gap, Inc. (The) | | | 154,269 | |
| | 8,800 | | Gentex Corp. | | | 165,616 | |
| | 7,100 | | Guess, Inc. | | | 174,234 | |
| | 6,900 | | Hanesbrands, Inc. | | | 247,158 | |
| | 5,200 | | Hyatt Hotels Corp., Class A † | | | 200,564 | |
| | 17,450 | | J.C. Penney Co., Inc. | | | 343,939 | |
| | 4,550 | | Life Time Fitness, Inc. † | | | 223,906 | |
| | 3,900 | | Luxottica Group ADR | | | 161,265 | |
| | 4,030 | | Macy's, Inc. | | | 157,251 | |
| | 3,000 | | Mohawk Industries, Inc. | | | 271,409 | |
| | 2,890 | | Nordstrom, Inc. | | | 154,615 | |
| | 6,100 | | Rent-A-Center, Inc., Class A | | | 209,596 | |
| | 14,840 | | Saks, Inc. † | | | 155,968 | |
| | 6,300 | | Sally Beauty Holdings, Inc. | | | 148,491 | |
| | 5,600 | | Sotheby's | | | 188,272 | |
| | 2,460 | | Tiffany & Co. | | | 141,056 | |
| | 7,860 | | Under Armour, Inc., Class A | | | 381,445 | |
| | 5,400 | | Valassis Communications, Inc. | | | 139,212 | |
| | | | | | | 5,127,791 | |
| Consumer Staples — (1.8)% | | | | |
| | 7,000 | | Archer-Daniels-Midland Co. | | | 191,730 | |
| | 2,600 | | Energizer Holdings, Inc. | | | 207,948 | |
| | 6,970 | | General Mills, Inc. | | | 281,658 | |
| | 10,280 | | HJ Heinz Co. | | | 592,950 | |
| | 2,500 | | Kellogg Co. | | | 139,625 | |
| | 3,000 | | Ralcorp Holdings, Inc. | | | 268,950 | |
| | 2,500 | | Reynolds American, Inc. | | | 103,575 | |
| | 8,000 | | SABMiller PLC ADR | | | 374,320 | |
| | 15,700 | | Sysco Corp. | | | 497,062 | |
| | 8,240 | | Tootsie Roll Industries, Inc. | | | 213,581 | |
| | 3,770 | | Walgreen Co. | | | 139,528 | |
| | 1,610 | | Whole Foods Market, Inc. | | | 147,041 | |
| | | | | | | 3,157,968 | |
| Energy — (1.6)% | | | | |
| | 30,960 | | Chesapeake Energy Corp. | | $ | 514,555 | |
| | 10,100 | | ConocoPhillips | | | 585,700 | |
| | 5,800 | | FMC Technologies, Inc. † | | | 248,414 | |
| | 4,900 | | Kinder Morgan, Inc. | | | 173,117 | |
| | 23,200 | | Kodiak Oil & Gas Corp. | | | 205,320 | |
| | 13,920 | | Northern Oil and Gas, Inc. † | | | 234,134 | |
| | 3,000 | | Range Resources Corp. | | | 188,490 | |
| | 1,800 | | SEACOR Holdings, Inc. | | | 150,840 | |
| | 7,400 | | Southwestern Energy Co. | | | 247,234 | |
| | 9,200 | | Ultra Petroleum Corp. | | | 166,796 | |
| | | | | | | 2,714,600 | |
| Financials — (2.7)% | | | | |
| | 2,300 | | Affiliated Managers Group, Inc. | | | 299,345 | |
| | 4,500 | | Alexander & Baldwin, Inc. † | | | 132,165 | |
| | 9,860 | | Annaly Capital Management, Inc. | | | 138,434 | |
| | 3,400 | | Aon PLC | | | 189,040 | |
| | 7,400 | | BankUnited, Inc. | | | 180,856 | |
| | 32,530 | | BGC Partners, Inc., Class A | | | 112,554 | |
| | 6,600 | | Brown & Brown, Inc. | | | 168,036 | |
| | 15,860 | | CNO Financial Group, Inc. | | | 147,974 | |
| | 6,850 | | Eaton Vance Corp. | | | 218,173 | |
| | 5,000 | | First Republic Bank | | | 163,900 | |
| | 5,100 | | Hancock Holding Co. | | | 161,874 | |
| | 2,600 | | Health Care REIT, Inc. | | | 159,354 | |
| | 31,790 | | Janus Capital Group, Inc. | | | 270,851 | |
| | 16,870 | | Northern Trust Corp. | | | 846,198 | |
| | 6,800 | | Omega Healthcare Investors, Inc. | | | 162,180 | |
| | 8,300 | | Progressive Corp. (The) | | | 175,130 | |
| | 25,470 | | Protective Life Corp. | | | 727,933 | |
| | 3,500 | | SL Green Realty Corp. | | | 268,275 | |
| | 2,160 | | T Rowe Price Group, Inc. | | | 140,681 | |
| | | | | | | 4,662,953 | |
| Health Care — (2.8)% | | | | |
| | 2,700 | | Allergan, Inc. | | | 247,671 | |
| | 9,600 | | AmerisourceBergen Corp., Class A | | | 414,528 | |
| | 1,490 | | Amgen, Inc. | | | 128,617 | |
| | 3,950 | | Becton Dickinson and Co. | | | 308,851 | |
| | 1,800 | | Bio-Rad Laboratories, Inc., Class A † | | | 189,090 | |
| | 13,360 | | Bristol-Myers Squibb Co. | | | 435,401 | |
| | 8,400 | | Brookdale Senior Living, Inc., Class A † | | | 212,688 | |
See Notes to Financial Statements.
Wilshire Mutual Funds, Inc. Wilshire Large Cap Core Plus Fund Schedule of Securities Sold Short - (Continued) | December 31, 2012 | |
| Health Care (continued) | | | | |
| | 5,900 | | Charles River Laboratories International, Inc. † | | $ | 221,073 | |
| | 1,900 | | DaVita HealthCare Partners, Inc. † | | | 210,007 | |
| | 3,500 | | Gilead Sciences, Inc. | | | 257,075 | |
| | 2,450 | | IDEXX Laboratories, Inc. | | | 227,360 | |
| | 11,300 | | Immunogen, Inc. | | | 144,075 | |
| | 3,090 | | Johnson & Johnson | | | 216,609 | |
| | 2,650 | | Laboratory Corp. of America Holdings † | | | 229,543 | |
| | 4,800 | | Life Technologies Corp. | | | 235,584 | |
| | 7,000 | | Owens & Minor, Inc. | | | 199,570 | |
| | 4,500 | | Quest Diagnostics, Inc. | | | 262,215 | |
| | 8,170 | | St. Jude Medical, Inc. | | | 295,264 | |
| | 6,050 | | VCA Antech, Inc. † | | | 127,353 | |
| | 5,550 | | Warner Chilcott PLC, Class A | | | 66,822 | |
| | 2,000 | | Waters Corp. | | | 174,240 | |
| | | | | | | 4,803,636 | |
| Industrials — (2.7)% | | | | |
| | 1,650 | | 3M Co. | | | 153,203 | |
| | 4,800 | | Armstrong World Industries, Inc. | | | 243,504 | |
| | 5,500 | | B/E Aerospace, Inc. | | | 271,700 | |
| | 7,700 | | Corrections Corp. of America | | | 273,119 | |
| | 2,000 | | Deere & Co. | | | 172,840 | |
| | 6,780 | | Fastenal Co. | | | 316,558 | |
| | 4,000 | | General Dynamics Corp. | | | 277,080 | |
| | 8,400 | | Granite Construction, Inc. | | | 282,408 | |
| | 7,077 | | Iron Mountain, Inc. | | | 219,741 | |
| | 4,100 | | JB Hunt Transport Services, Inc. | | | 244,811 | |
| | 5,360 | | Kennametal, Inc. | | | 214,400 | |
| | 4,510 | | Northrop Grumman Corp. | | | 304,786 | |
| | 5,250 | | Owens Corning | | | 194,198 | |
| | 8,180 | | PACCAR, Inc. | | | 369,817 | |
| | 1,000 | | Precision Castparts Corp. | | | 189,420 | |
| | 3,900 | | Rockwell Collins, Inc. | | | 226,863 | |
| | 2,500 | | Stericycle, Inc. † | | | 233,175 | |
| | 9,000 | | United Continental Holdings, Inc. | | | 210,420 | |
| | 4,500 | | Verisk Analytics, Inc., Class A | | | 229,500 | |
| | | | | | | 4,627,543 | |
| Information Technology — (3.3)% | | | | |
| | 17,400 | | ARM Holdings PLC ADR | | | 658,241 | |
| | 4,700 | | Arrow Electronics, Inc. † | | | 178,976 | |
| | 6,710 | | Autodesk, Inc. | | | 237,199 | |
| | 10,710 | | CA, Inc. | | | 235,406 | |
| Information Technology (continued) | | | | |
| | 2,800 | | Citrix Systems, Inc. | | $ | 184,100 | |
| | 2,700 | | Concur Technologies, Inc. † | | | 182,304 | |
| | 7,800 | | Cree, Inc. | | | 265,044 | |
| | 7,500 | | Jabil Circuit, Inc. | | | 144,675 | |
| | 6,810 | | KLA-Tencor Corp. | | | 325,246 | |
| | 6,860 | | MKS Instruments, Inc. | | | 176,851 | |
| | 9,500 | | NCR Corp. | | | 242,060 | |
| | 3,410 | | NetSuite, Inc. † | | | 229,493 | |
| | 5,500 | | SanDisk Corp. | | | 239,580 | |
| | 6,200 | | Silicon Laboratories, Inc. | | | 259,222 | |
| | 4,000 | | Solera Holdings, Inc. | | | 213,880 | |
| | 31,900 | | Taiwan Semiconductor Manufacturing Co., Ltd. ADR | | | 547,403 | |
| | 9,480 | | Texas Instruments, Inc. | | | 293,311 | |
| | 4,200 | | VeriFone Systems, Inc. | | | 124,656 | |
| | 6,000 | | VeriSign, Inc. | | | 232,920 | |
| | 1,900 | | VMware, Inc., Class A | | | 178,866 | |
| | 8,720 | | Western Digital Corp. | | | 370,513 | |
| | 10,500 | | Western Union Co. (The) | | | 142,905 | |
| | 5,200 | | Zebra Technologies Corp., Class A | | | 204,256 | |
| | | | | | | 5,867,107 | |
| Materials — (1.0)% | | | | |
| | 7,000 | | Allied Nevada Gold Corp. | | | 210,910 | |
| | 7,120 | | EI du Pont de Nemours & Co. | | | 320,187 | |
| | 2,900 | | Martin Marietta Materials, Inc. | | | 273,412 | |
| | 2,200 | | Praxair, Inc. | | | 240,790 | |
| | 2,500 | | Royal Gold, Inc. | | | 203,275 | |
| | 1,560 | | Sherwin-Williams Co. (The) | | | 239,959 | |
| | 4,000 | | Silgan Holdings, Inc. | | | 166,360 | |
| | 5,800 | | Sonoco Products Co. | | | 172,434 | |
| | | | | | | 1,827,327 | |
| Telecommunication Services — (0.5)% | | | | |
| | 10,400 | | America Movil SAB de CV ADR, Ser L | | | 240,656 | |
| | 2,500 | | Crown Castle International Corp. | | | 180,400 | |
| | 5,000 | | Level 3 Communications, Inc. | | | 115,550 | |
| | 5,000 | | tw telecom, Inc., Class A † | | | 127,350 | |
| | 25,950 | | Windstream Corp. | | | 214,866 | |
| | | | | | | 878,822 | |
| Utilities — (1.0)% | | | | |
| | 3,600 | | AGL Resources, Inc. | | | 143,892 | |
| | 1,600 | | Cia de Saneamento Basico do Estado de Sao Paulo ADR | | | 133,712 | |
See Notes to Financial Statements.
Wilshire Mutual Funds, Inc. Wilshire Large Cap Core Plus Fund Schedule of Securities Sold Short - (Continued) | December 31, 2012 | |
| Utilities (continued) | | | | |
| | 3,000 | | ITC Holdings Corp. | | $ | 230,730 | |
| | 9,600 | | MDU Resources Group, Inc. | | | 203,904 | |
| | 8,050 | | National Fuel Gas Co. | | | 408,055 | |
| | 3,200 | | OGE Energy Corp. | | | 180,192 | |
| | 5,190 | | Public Service Enterprise Group, Inc. | | | 158,814 | |
| | 6,500 | | UGI Corp. | | | 212,615 | |
| | | | | | | 1,671,914 | |
| | | | | | | | |
| Securities Sold Short | | | | |
| (Proceeds $32,439,322) | | $ | 35,339,661 | |
Percentages are based on Net Assets of $174,104,619.
| † | Non-income producing security. |
ADR — American Depositary Receipt
Ltd. — Limited
PLC— Public Limited Company
REIT — Real Estate Investment Trust
As of December 31, 2012, all of the Fund’s securities sold short were considered Level 1. For the year ended December 31, 2012, there have been no transfers between Level 1 and Level 2 assets and liabilities. For the year ended December 31, 2012, there have been no transfers between Level 2 and Level 3 assets and liabilities. Please see Note 2 in Notes to Financial Statements for further information regarding fair value measurements.
See Notes to Financial Statements.
Wilshire Mutual Funds, Inc. Statements of Assets and Liabilities December 31, 2012 | |
| | | LARGE COMPANY GROWTH PORTFOLIO | | | LARGE COMPANY VALUE PORTFOLIO | | | SMALL COMPANY GROWTH PORTFOLIO | | | SMALL COMPANY VALUE PORTFOLIO | | | WILSHIRE 5000 INDEXSM FUND | | | WILSHIRE LARGE CAP CORE PLUS FUND | |
| ASSETS: | | | | | | | | | | | | | | | | | | |
| Investments in securities, at value (Note 2) | $ | 213,011,886 | * | | $ | 54,596,472 | * | | $ | 10,413,311 | * | | $ | 9,685,642 | * | | $ | 174,223,316 | * | | $ | 237,302,725 | * |
| Receivable for investment securities sold | 586,923 | | | | 74,205 | | | | — | | | | — | | | | 2,033,864 | | | | 196,325 | |
| Dividends and interest receivable | | | 132,457 | | | | 50,023 | | | | 2,538 | | | | 14,458 | | | | 182,480 | | | | 192,042 | |
| Receivable for Portfolio shares sold | | | 378,635 | | | | 40,447 | | | | — | | | | 7,950 | | | | 170,158 | | | | — | |
| Dividend reclaim receivable | | | — | | | | — | | | | — | | | | — | | | | — | | | | 27 | |
| Receivable from Adviser (Note 3) | | | — | | | | — | | | | 85 | | | | — | | | | — | | | | — | |
| Prepaid expenses and other assets | | | 18,637 | | | | 14,305 | | | | 13,519 | | | | 13,519 | | | | 27,359 | | | | 21,564 | |
| Total Assets | | | 214,128,538 | | | | 54,775,452 | | | | 10,429,453 | | | | 9,721,569 | | | | 176,637,177 | | | | 237,712,683 | |
| | | | | | | | | | | | | | | | | | | | | | | | | |
| LIABILITIES: | | | | | | | | | | | | | | | | | | | | | | | | |
| Securities sold short, at value | | | — | | | | — | | | | — | | | | — | | | | — | | | | 35,339,661 | |
| Payable upon return on securities loaned | | | 26,397,533 | | | | 9,489,195 | | | | 3,153,425 | | | | — | | | | 15,766,844 | | | | 27,847,290 | |
| Payable for investment securities purchased | | | 545,433 | | | | 129,697 | | | | 11,363 | | | | — | | | | 589,205 | | | | 87,794 | |
| Payable for Portfolio shares redeemed | | | 297,613 | | | | 66,100 | | | | 4,432 | | | | 5,999 | | | | 160,311 | | | | 1,179 | |
| Investment advisory fees payable (Note 3) | | | 118,039 | | | | 28,283 | | | | 5,112 | | | | 7,064 | | | | 13,644 | | | | 161,516 | |
| Distribution fees payable (Note 4) | | | 22,249 | | | | 9,352 | | | | 3,460 | | | | 2,128 | | | | 31,283 | | | | 15,232 | |
| Shareholder Service fees payable (Note 4) | | | 25,287 | | | | 1,792 | | | | — | | | | 335 | | | | 16,339 | | | | 1,518 | |
| Administration fees payable | | | 11,017 | | | | 2,640 | | | | 421 | | | | 564 | | | | 9,550 | | | | 10,282 | |
| Directors’ fees payable | | | 3,913 | | | | 934 | | | | 147 | | | | 197 | | | | 3,398 | | | | 3,649 | |
| Dividends payable on securities sold short | | | — | | | | — | | | | — | | | | — | | | | — | | | | 26,292 | |
| Cash overdraft | | | — | | | | — | | | | — | | | | — | | | | 191,071 | | | | — | |
| Accrued expenses and other payables | | | 114,624 | | | | 27,427 | | | | 10,702 | | | | 10,412 | | | | 91,844 | | | | 113,651 | |
| Total Liabilities | | | 27,535,708 | | | | 9,755,420 | | | | 3,189,062 | | | | 26,699 | | | | 16,873,489 | | | | 63,608,064 | |
| | | | | | | | | | | | | | | | | | | | | | | | | |
| NET ASSETS | | $ | 186,592,830 | | | $ | 45,020,032 | | | $ | 7,240,391 | | | $ | 9,694,870 | | | $ | 159,763,688 | | | $ | 174,104,619 | |
| | | | | | | | | | | | | | | | | | | | | | | | | |
| NET ASSETS consist of: | | | | | | | | | | | | | | | | | | | | | | | | |
| Paid-in capital | | $ | 152,014,791 | | | $ | 53,316,680 | | | $ | 6,709,348 | | | $ | 10,521,497 | | | $ | 133,702,460 | | | $ | 145,406,958 | |
| Undistributed net investment income/(accumulated net investment loss) | | | 12,246 | | | | 6,444 | | | | 38,906 | | | | (32,028 | ) | | | 461,031 | | | | (3 | ) |
| Accumulated net realized gain/(loss) on investments sold and securities sold short | | | 1,482,570 | | | | (12,632,013 | ) | | | (337,704 | ) | | | (1,928,289 | ) | | | (44,664,660 | ) | | | (8,346,446 | ) |
| Net unrealized appreciation of investments and securities sold short | | | 33,083,223 | | | | 4,328,921 | | | | 829,841 | | | | 1,133,690 | | | | 70,264,857 | | | | 37,044,110 | |
| NET ASSETS | | $ | 186,592,830 | | | $ | 45,020,032 | | | $ | 7,240,391 | | | $ | 9,694,870 | | | $ | 159,763,688 | | | $ | 174,104,619 | |
| | | | | | | | | | | | | | | | | | | | | | | | | |
| Investments in securities, at cost (Note 2) | | $ | 153,531,130 | | | $ | 40,778,356 | | | $ | 6,430,045 | | | $ | 8,551,952 | | | $ | 88,191,615 | | | $ | 169,510,986 | |
| Securities on Loan | | | 26,397,533 | | | | 9,489,195 | | | | 3,153,425 | | | | — | | | | 15,766,844 | | | | 27,847,290 | |
| Securities sold short, proceeds receivable | | | — | | | | — | | | | — | | | | — | | | | — | | | | 32,439,322 | |
| | | | | | | | | | | | | | | | | | | | | | | | | |
| * Includes Market Value of Securities on Loan | | $ | 26,432,210 | | | $ | 9,367,300 | | | $ | 3,154,548 | | | $ | 220,721 | | | $ | 15,628,179 | | | $ | 26,550,859 | |
Amounts designated as “—” are either $0, or have been rounded to $0.
See Notes to Financial Statements.
Wilshire Mutual Funds, Inc. Statements of Assets and Liabilities - (Continued) December 31, 2012 | |
| | | LARGE COMPANY GROWTH PORTFOLIO | | | LARGE COMPANY VALUE PORTFOLIO | | | SMALL COMPANY GROWTH PORTFOLIO | | | SMALL COMPANY VALUE PORTFOLIO | | | WILSHIRE 5000 INDEXSM FUND | | | WILSHIRE LARGE CAP CORE PLUS FUND | |
| NET ASSETS: | | | | | | | | | | | | | | | | | | |
| Investment Class shares | | $ | 100,852,963 | | | $ | 44,219,971 | | | $ | 7,225,428 | | | $ | 9,641,065 | | | $ | 107,888,023 | | | $ | 74,999,100 | |
| (50,000,000 shares authorized, per class, per Portfolio, par value $.001 per share)† | | | | | | | | | | | | | | | | | | | | | | | | |
| Institutional Class shares | | $ | 85,739,867 | | | $ | 800,061 | | | $ | 14,963 | | | $ | 53,805 | | | $ | 50,632,942 | | | $ | 99,105,519 | |
| (50,000,000 shares authorized, per class, per Portfolio, par value $.001 per share)† | | | | | | | | | | | | | | | | | | | | | | | | |
| Qualified Class shares | | | N/A | | | | N/A | | | | N/A | | | | N/A | | | $ | 127 | | | | N/A | |
| (50,000,000 shares authorized, per class, per Portfolio, par value $.001 per share) | | | | | | | | | | | | | | | | | | | | | | | | |
| Horace Mann Class shares | | | N/A | | | | N/A | | | | N/A | | | | N/A | | | $ | 1,242,596 | | | | N/A | |
| (50,000,000 shares authorized, per class, per Portfolio, par value $.001 per share) | | | | | | | | | | | | | | | | | | | | | | | | |
| | | | | | | | | | | | | | | | | | | | | | | | | |
| SHARES OUTSTANDING: | | | | | | | | | | | | | | | | | | | | | | | | |
| Investment Class shares | | | 2,906,453 | | | | 2,787,867 | | | | 400,082 | | | | 554,079 | | | | 8,682,744 | | | | 8,988,861 | |
| Institutional Class shares | | | 2,385,536 | | | | 50,361 | | | | 792 | | | | 3,061 | | | | 4,078,485 | | | | 11,822,049 | |
| Qualified Class shares | | | N/A | | | | N/A | | | | N/A | | | | N/A | | | | 10 | | | | N/A | |
| Horace Mann Class shares | | | N/A | | | | N/A | | | | N/A | | | | N/A | | | | 100,233 | | | | N/A | |
| | | | | | | | | | | | | | | | | | | | | | | | | |
| INVESTMENT CLASS SHARES: | | | | | | | | | | | | | | | | | | | | | | | | |
| Net asset value, offering and redemption price per share | | $ | 34.70 | | | $ | 15.86 | | | $ | 18.06 | | | $ | 17.40 | | | $ | 12.43 | | | $ | 8.34 | |
| | | | | | | | | | | | | | | | | | | | | | | | | |
| INSTITUTIONAL CLASS SHARES: | | | | | | | | | | | | | | | | | | | | | | | | |
| Net asset value, offering and redemption price per share | | $ | 35.94 | | | $ | 15.89 | | | $ | 18.89 | | | $ | 17.58 | | | $ | 12.41 | | | $ | 8.38 | |
| | | | | | | | | | | | | | | | | | | | | | | | | |
| QUALIFIED CLASS SHARES: | | | | | | | | | | | | | | | | | | | | | | | | |
| Net asset value, offering and redemption price per share | | | N/A | | | | N/A | | | | N/A | | | | N/A | | | $ | 12.64 | * | | | N/A | |
| | | | | | | | | | | | | | | | | | | | | | | | | |
| HORACE MANN CLASS SHARES: | | | | | | | | | | | | | | | | | | | | | | | | |
| Net asset value, offering and redemption price per share | | | N/A | | | | N/A | | | | N/A | | | | N/A | | | $ | 12.40 | | | | N/A | |
| † | For the Wilshire Large Cap Core Plus Fund, (40,000,000 shares authorized, per class, par value $.001 per share). |
| | |
| * | Difference in net asset value recalculation and net asset value stated is caused by rounding differences. |
| | |
| N/A — Not Applicable. Share classes currently not offered. |
See Notes to Financial Statements.
Wilshire Mutual Funds, Inc. Statements of Operations For the Year Ended December 31, 2012 | |
| | | LARGE COMPANY GROWTH PORTFOLIO | | | LARGE COMPANY VALUE PORTFOLIO | | | SMALL COMPANY GROWTH PORTFOLIO | | | SMALL COMPANY VALUE PORTFOLIO | | | WILSHIRE 5000 INDEXSM FUND | | | WILSHIRE LARGE CAP CORE PLUS FUND | |
| INVESTMENT INCOME: | | | | | | | | | | | | | | | | | | |
| Dividends | | $ | 2,902,094 | | | $ | 980,581 | | | $ | 129,698 | | | $ | 241,922 | | | $ | 3,629,320 | | | $ | 5,202,534 | |
| Interest | | | 275 | | | | 71 | | | | 4 | | | | 5 | | | | 3,318 | | | | 56 | |
| Income from Security Lending | | | 79,817 | | | | 7,600 | | | | 12,442 | | | | 4,382 | | | | 71,708 | | | | 134,761 | |
| Foreign taxes withheld | | | (5,560 | ) | | | (6,315 | ) | | | (93 | ) | | | (63 | ) | | | (192 | ) | | | (26,177 | ) |
| Total income | | | 2,976,626 | | | | 981,937 | | | | 142,051 | | | | 246,246 | | | | 3,704,154 | | | | 5,311,174 | |
| EXPENSES: | | | | | | | | | | | | | | | | | | | | | | | | |
| Investment advisory fee (Note 3) | | | 1,393,647 | | | | 298,212 | | | | 59,919 | | | | 76,593 | | | | 160,525 | | | | 1,764,013 | |
Investment advisory fee waiver recapture (Note 3) | | | — | | | | — | | | | — | | | | — | | | | — | | | | 14,634 | |
| Distribution (12b-1) fees (Note 4) | | | | | | | | | | | | | | | | | | | | | | | | |
| Investment Class | | | 259,752 | | | | 97,293 | | | | 16,186 | | | | 22,386 | | | | 259,432 | | | | 198,205 | |
| Horace Mann Class | | | N/A | | | | N/A | | | | N/A | | | | N/A | | | | 3,503 | | | | N/A | |
| Shareholder Service fees (Note 4) | | | | | | | | | | | | | | | | | | | | | | | | |
| Investment Class | | | 95,874 | | | | 14,416 | | | | 6,608 | | | | 7,235 | | | | 63,652 | | | | 27,497 | |
| Institutional Class | | | 44,959 | | | | 634 | | | | 28 | | | | 84 | | | | 35,793 | | | | 104 | |
| Administration and accounting fees (Note 3) | | | 130,074 | | | | 27,833 | | | | 4,934 | | | | 6,308 | | | | 112,367 | | | | 123,481 | |
| Directors' fees and expenses (Note 3) | | | 35,953 | | | | 7,526 | | | | 1,373 | | | | 1,752 | | | | 31,134 | | | | 34,389 | |
| Transfer agent fees (Note 3) | | | 147,736 | | | | 14,848 | | | | 5,315 | | | | 6,564 | | | | 77,250 | | | | 42,490 | |
| Professional fees | | | 101,190 | | | | 22,564 | | | | 3,808 | | | | 4,868 | | | | 87,383 | | | | 95,151 | |
| Printing fees | | | 39,276 | | | | 8,518 | | | | 2,428 | | | | 4,880 | | | | 32,026 | | | | 29,575 | |
| Registration and filing fees | | | 34,445 | | | | 27,626 | | | | 27,922 | | | | 26,706 | | | | 54,619 | | | | 39,401 | |
| Custodian fees (Note 3) | | | 39,112 | | | | 9,874 | | | | 2,079 | | | | 716 | | | | 33,110 | | | | 45,814 | |
| Dividend expense on securities sold short | | | — | | | | — | | | | — | | | | — | | | | — | | | | 877,089 | |
| Interest expense for securities sold short | | | — | | | | — | | | | — | | | | — | | | | — | | | | 440,492 | |
| Other | | | 34,433 | | | | 10,452 | | | | 8,139 | | | | 7,916 | | | | 52,148 | | | | 36,833 | |
| Total expenses | | | 2,356,451 | | | | 539,796 | | | | 138,739 | | | | 166,008 | | | | 1,002,942 | | | | 3,769,168 | |
| Fees waived by investment Adviser (Note 3) | | | — | | | | — | | | | (34,426 | ) | | | (30,950 | ) | | | — | | | | (48,140 | ) |
| Fees paid indirectly (Note 4) | | | (3,202 | ) | | | (4,969 | ) | | | (972 | ) | | | (885 | ) | | | (244 | ) | | | (19,546 | ) |
| Net expenses | | | 2,353,249 | | | | 534,827 | | | | 103,341 | | | | 134,173 | | | | 1,002,698 | | | | 3,701,482 | |
| Net investment income | | | 623,377 | | | | 447,110 | | | | 38,710 | | | | 112,073 | | | | 2,701,456 | | | | 1,609,692 | |
| NET REALIZED AND UNREALIZED GAIN/(LOSS) ON INVESTMENTS AND SECURITIES SOLD SHORT (NOTES 2 and 5): | | | | | | | | | | | | | | | | | | | | | |
| Net realized gain/(loss) from: | | | | | | | | | | | | | | | | | | | | | | | | |
| Investments | | | 17,311,562 | | | | 2,505,781 | | | | 563,911 | | | | 689,932 | | | | 4,299,258 | | | | 11,233,827 | |
| Securities sold short | | | — | | | | — | | | | — | | | | — | | | | — | | | | (2,323,357 | ) |
| Net change in unrealized appreciation/(depreciation) on: | | | | | | | | | | | | | | | | | | | | | | | | |
| Investments | | | 5,203,680 | | | | 2,460,131 | | | | 306,564 | | | | 652,206 | | | | 15,612,259 | | | | 14,852,237 | |
| Securities sold short | | | — | | | | — | | | | — | | | | — | | | | — | | | | (2,392,162 | ) |
| Net realized and unrealized gain on investments and securities sold short | | | 22,515,242 | | | | 4,965,912 | | | | 870,475 | | | | 1,342,138 | | | | 19,911,517 | | | | 21,370,545 | |
| NET INCREASE IN NET ASSETS RESULTING FROM OPERATIONS | | $ | 23,138,619 | | | $ | 5,413,022 | | | $ | 909,185 | | | $ | 1,454,211 | | | $ | 22,612,973 | | | $ | 22,980,237 | |
Amounts designated as “—” are either $0, or have been rounded to $0.
See Notes to Financial Statements.
Wilshire Mutual Funds, Inc. Statements of Changes in Net Assets For the Year Ended December 31, 2012 | |
| | | LARGE COMPANY GROWTH PORTFOLIO | | | LARGE COMPANY VALUE PORTFOLIO | | | SMALL COMPANY GROWTH PORTFOLIO | | | SMALL COMPANY VALUE PORTFOLIO | | | WILSHIRE 5000 INDEXSM FUND | | | WILSHIRE LARGE CAP CORE PLUS FUND | |
| OPERATIONS: | | | | | | | | | | | | | | | | | | |
| Net investment income | | $ | 623,377 | | | $ | 447,110 | | | $ | 38,710 | | | $ | 112,073 | | | $ | 2,701,456 | | | $ | 1,609,692 | |
| Net realized gain on investments and securities sold short | | | 17,311,562 | | | | 2,505,781 | | | | 563,911 | | | | 689,932 | | | | 4,299,258 | | | | 8,910,470 | |
| Net change in unrealized appreciation on investments and securities sold short | | | 5,203,680 | | | | 2,460,131 | | | | 306,564 | | | | 652,206 | | | | 15,612,259 | | | | 12,460,075 | |
| Net increase in net assets resulting from operations | | | 23,138,619 | | | | 5,413,022 | | | | 909,185 | | | | 1,454,211 | | | | 22,612,973 | | | | 22,980,237 | |
| DISTRIBUTIONS TO SHAREHOLDERS FROM: | | | | | | | | | | | | | | | | | | | | | |
| Net Investment Income: | | | | | | | | | | | | | | | | | | | | | | | | |
| Investment Class shares | | | (207,623 | ) | | | (436,965 | ) | | | — | | | | (122,348 | ) | | | (1,516,208 | ) | | | (760,719 | ) |
| Institutional Class shares | | | (414,871 | ) | | | (9,553 | ) | | | — | | | | (754 | ) | | | (820,042 | ) | | | (1,293,440 | ) |
| Qualified Class shares | | | N/A | | | | N/A | | | | N/A | | | | N/A | | | | (2 | ) | | | N/A | |
| Horace Mann Class shares | | | N/A | | | | N/A | | | | N/A | | | | N/A | | | | (17,537 | ) | | | N/A | |
| Net Realized Capital Gains: | | | | | | | | | | | | | | | | | | | | | | | | |
| Investment Class shares | | | (3,063,311 | ) | | | — | | | | — | | | | — | | | | — | | | | (1,929,117 | ) |
| Institutional Class shares | | | (2,497,458 | ) | | | — | | | | — | | | | — | | | | — | | | | (2,509,275 | ) |
| Total Distributions to Shareholders | | | (6,183,263 | ) | | | (446,518 | ) | | | — | | | | (123,102 | ) | | | (2,353,789 | ) | | | (6,492,551 | ) |
| CAPITAL STOCK TRANSACTIONS (DOLLARS): | | | | | | | | �� | | | | | | | | | | | | | |
| Investment Class shares: | | | | | | | | | | | | | | | | | | | | | | | | |
| Shares sold | | | 11,793,130 | | | | 13,519,969 | | | | 786,424 | | | | 1,624,892 | | | | 11,067,308 | | | | 63,126 | |
| Shares issued as reinvestment of distributions | | | 3,172,026 | | | | 420,868 | | | | — | | | | 118,798 | | | | 1,464,906 | | | | 2,687,099 | |
| Shares redeemed | | | (18,467,813 | ) | | | (5,541,689 | ) | | | (1,281,207 | ) | | | (2,219,348 | ) | | | (17,517,591 | ) | | | (15,416,348 | ) |
| Net increase/(decrease) in net assets from Investment Class share transactions | | | (3,502,657 | ) | | | 8,399,148 | | | | (494,783 | ) | | | (475,658 | ) | | | (4,985,377 | ) | | | (12,666,123 | ) |
| Institutional Class shares: | | | | | | | | | | | | | | | | | | | | | | | | |
| Shares sold | | | 19,163,786 | | | | 65,848 | | | | 10,209 | | | | 14,151 | | | | 3,190,784 | | | | 878,374 | |
| Shares issued as reinvestment of distributions | | | 1,588,657 | | | | 8,333 | | | | — | | | | 703 | | | | 809,809 | | | | 3,802,713 | |
| Shares redeemed | | | (16,685,654 | ) | | | (161,013 | ) | | | (10,419 | ) | | | (52,016 | ) | | | (10,400,423 | ) | | | (7,533,378 | ) |
| Net increase/(decrease) in net assets from Institutional Class share transactions | | | 4,066,789 | | | | (86,832 | ) | | | (210 | ) | | | (37,162 | ) | | | (6,399,830 | ) | | | (2,852,291 | ) |
| Qualified Class shares: | | | | | | | | | | | | | | | | | | | | | | | | |
| Shares sold | | | N/A | | | | N/A | | | | N/A | | | | N/A | | | | — | | | | N/A | |
| Shares issued as reinvestment of distributions | | | N/A | | | | N/A | | | | N/A | | | | N/A | | | | 1 | | | | N/A | |
| Shares redeemed | | | N/A | | | | N/A | | | | N/A | | | | N/A | | | | — | | | | N/A | |
| Net increase in net assets from Qualified Class share transactions | | | N/A | | | | N/A | | | | N/A | | | | N/A | | | | 1 | | | | N/A | |
| Horace Mann Class shares: | | | | | | | | | | | | | | | | | | | | | | | | |
| Shares sold | | | N/A | | | | N/A | | | | N/A | | | | N/A | | | | 38,750 | | | | N/A | |
| Shares issued as reinvestment of distributions | | | N/A | | | | N/A | | | | N/A | | | | N/A | | | | 17,537 | | | | N/A | |
| Shares redeemed | | | N/A | | | | N/A | | | | N/A | | | | N/A | | | | (71,640 | ) | | | N/A | |
| Net decrease in net assets from Horace Mann Class share transactions | | | N/A | | | | N/A | | | | N/A | | | | N/A | | | | (15,353 | ) | | | N/A | |
| Net increase/(decrease) in net assets from capital stock transactions | | | 564,132 | | | | 8,312,316 | | | | (494,993 | ) | | | (512,820 | ) | | | (11,400,559 | ) | | | (15,518,414 | ) |
| Net increase in net assets | | | 17,519,488 | | | | 13,278,820 | | | | 414,192 | | | | 818,289 | | | | 8,858,625 | | | | 969,272 | |
N/A — Not Applicable. Share classes currently not offered.
Amounts designated as “—” are either $0, or have been rounded to $0.
See Notes to Financial Statements.
Wilshire Mutual Funds, Inc. Statements of Changes in Net Assets - (Continued) For the Year Ended December 31, 2012 | |
| | | LARGE COMPANY GROWTH PORTFOLIO | | | LARGE COMPANY VALUE PORTFOLIO | | | SMALL COMPANY GROWTH PORTFOLIO | | | SMALL COMPANY VALUE PORTFOLIO | | | WILSHIRE 5000 INDEXSM FUND | | | WILSHIRE LARGE CAP CORE PLUS FUND | |
| NET ASSETS: | | | | | | | | | | | | | | | | | | |
| Beginning of year | | $ | 169,073,342 | | | $ | 31,741,212 | | | $ | 6,826,199 | | | $ | 8,876,581 | | | $ | 150,905,063 | | | $ | 173,135,347 | |
| End of year | | $ | 186,592,830 | | | $ | 45,020,032 | | | $ | 7,240,391 | | | $ | 9,694,870 | | | $ | 159,763,688 | | | $ | 174,104,619 | |
| Undistributed net investment income/(accumulated net investment loss) at end of year | | $ | 12,246 | | | $ | 6,444 | | | $ | 38,906 | | | $ | (32,028 | ) | | $ | 461,031 | | | $ | (3 | ) |
| | | | | | | | | | | | | | | | | | | | | | | | | |
| CAPITAL SHARE TRANSACTIONS: | | | | | | | | | | | | | | | | | | | | | | | | |
| Investment Class shares: | | | | | | | | | | | | | | | | | | | | | | | | |
| Shares sold | | | 331,181 | | | | 883,883 | | | | 45,393 | | | | 97,624 | | | | 917,410 | | | | 7,296 | |
| Shares issued as reinvestment of distributions | | | 92,654 | | | | 26,996 | | | | — | | | | 6,951 | | | | 119,878 | | | | 322,809 | |
| Shares redeemed | | | (525,217 | ) | | | (363,633 | ) | | | (73,894 | ) | | | (135,097 | ) | | | (1,459,038 | ) | | | (1,830,002 | ) |
| Net increase/(decrease) in Investment Class shares outstanding | | | (101,382 | ) | | | 547,246 | | | | (28,501 | ) | | | (30,522 | ) | | | (421,750 | ) | | | (1,499,897 | ) |
| | | | | | | | | | | | | | | | | | | | | | | | | |
| Institutional Class shares: | | | | | | | | | | | | | | | | | | | | | | | | |
| Shares sold | | | 524,356 | | | | 4,343 | | | | 563 | | | | 843 | | | | 265,860 | | | | 106,110 | |
| Shares issued as reinvestment of distributions | | | 44,711 | | | | 534 | | | | — | | | | 41 | | | | 66,324 | | | | 454,631 | |
| Shares redeemed | | | (457,410 | ) | | | (10,396 | ) | | | (560 | ) | | | (3,206 | ) | | | (854,070 | ) | | | (886,522 | ) |
| Net increase/(decrease) in Institutional Class shares outstanding | | | 111,657 | | | | (5,519 | ) | | | 3 | | | | (2,322 | ) | | | (521,886 | ) | | | (325,781 | ) |
| | | | | | | | | | | | | | | | | | | | | | | | | |
| Qualified Class shares: | | | | | | | | | | | | | | | | | | | | | | | | |
| Shares sold | | | N/A | | | | N/A | | | | N/A | | | | N/A | | | | — | | | | N/A | |
| Shares issued as reinvestment of distributions | | | N/A | | | | N/A | | | | N/A | | | | N/A | | | | — | | | | N/A | |
| Shares redeemed | | | N/A | | | | N/A | | | | N/A | | | | N/A | | | | — | | | | N/A | |
| Net increase/(decrease) in Qualified Class shares outstanding | | | N/A | | | | N/A | | | | N/A | | | | N/A | | | | — | | | | N/A | |
| | | | | | | | | | | | | | | | | | | | | | | | | |
| Horace Mann Class shares: | | | | | | | | | | | | | | | | | | | | | | | | |
| Shares sold | | | N/A | | | | N/A | | | | N/A | | | | N/A | | | | 3,232 | | | | N/A | |
| Shares issued as reinvestment of distributions | | | N/A | | | | N/A | | | | N/A | | | | N/A | | | | 1,439 | | | | N/A | |
| Shares redeemed | | | N/A | | | | N/A | | | | N/A | | | | N/A | | | | (5,967 | ) | | | N/A | |
| Net decrease in Horace Mann Class shares outstanding | | | N/A | | | | N/A | | | | N/A | | | | N/A | | | | (1,296 | ) | | | N/A | |
N/A — Not Applicable. Share classes currently not offered.
Amounts designated as “—” are either $0, or have been rounded to $0.
See Notes to Financial Statements.
Wilshire Mutual Funds, Inc. Statements of Changes in Net Assets For the Year Ended December 31, 2011 | |
| | | LARGE COMPANY GROWTH PORTFOLIO | | | LARGE COMPANY VALUE PORTFOLIO | | | SMALL COMPANY GROWTH PORTFOLIO | | | SMALL COMPANY VALUE PORTFOLIO | | | WILSHIRE 5000 INDEXSM FUND | | | WILSHIRE LARGE CAP CORE PLUS FUND | |
| OPERATIONS: | | | | | | | | | | | | | | | | | | |
| Net investment income/(loss) | | $ | (210,394 | ) | | $ | 266,177 | | | $ | (63,919 | ) | | $ | (1,008 | ) | | $ | 2,071,889 | | | $ | 370,987 | |
| Net realized gain on investments and securities sold short | | | 19,056,395 | | | | 2,558,053 | | | | 1,625,193 | | | | 1,630,319 | | | | 4,689,955 | | | | 4,373,844 | |
| Net change in unrealized depreciation on investments and securities sold short | | | (20,776,717 | ) | | | (3,902,707 | ) | | | (1,548,423 | ) | | | (2,313,120 | ) | | | (6,547,746 | ) | | | (8,274,855 | ) |
| Net increase/(decrease) in net assets resulting from operations | | | (1,930,716 | ) | | | (1,078,477 | ) | | | 12,851 | | | | (683,809 | ) | | | 214,098 | | | | (3,530,024 | ) |
| DISTRIBUTIONS TO SHAREHOLDERS FROM: | | | | | | | | | | | | | | | | | | | | | |
| Net Investment Income: | | | | | | | | | | | | | | | | | | | | | | | | |
| Investment Class shares | | | — | | | | (256,861 | ) | | | — | | | | (39,491 | ) | | | (1,299,378 | ) | | | (619,283 | ) |
| Institutional Class shares | | | — | | | | (9,947 | ) | | | — | | | | (922 | ) | | | (764,700 | ) | | | (994,442 | ) |
| Qualified Class shares | | | N/A | | | | N/A | | | | N/A | | | | N/A | | | | — | | | | N/A | |
| Horace Mann Class shares | | | N/A | | | | N/A | | | | N/A | | | | N/A | | | | (13,865 | ) | | | N/A | |
| Net Realized Capital Gains: | | | | | | | | | | | | | | | | | | | | | | | | |
| Investment Class shares | | | — | | | | — | | | | — | | | | — | | | | — | | | | (2,109,433 | ) |
| Institutional Class shares | | | — | | | | — | | | | — | | | | — | | | | — | | | | (2,435,339 | ) |
| Total Distributions to Shareholders | | | — | | | | (266,808 | ) | | | — | | | | (40,413 | ) | | | (2,077,943 | ) | | | (6,158,497 | ) |
| CAPITAL STOCK TRANSACTIONS (DOLLARS): | | | | | | | | | | | | | | | | | | | | | | | | |
| Investment Class shares: | | | | | | | | | | | | | | | | | | | | | | | | |
| Shares sold | | | 4,042,266 | | | | 1,719,606 | | | | 790,076 | | | | 1,454,740 | | | | 19,394,996 | | | | 35,639 | |
| Shares issued as reinvestment of distributions | | | — | | | | 255,796 | | | | — | | | | 39,014 | | | | 1,267,385 | | | | 2,721,826 | |
| Shares redeemed | | | (19,884,541 | ) | | | (3,578,375 | ) | | | (1,495,115 | ) | | | (5,735,611 | ) | | | (24,678,838 | ) | | | (9,997,018 | ) |
| Net decrease in net assets from Investment Class share transactions | | | (15,842,275 | ) | | | (1,602,973 | ) | | | (705,039 | ) | | | (4,241,857 | ) | | | (4,016,457 | ) | | | (7,239,553 | ) |
| Institutional Class shares: | | | | | | | | | | | | | | | | | | | | | | | | |
| Shares sold | | | 9,873,214 | | | | 13,915 | | | | 4,074 | | | | 35 | | | | 6,781,426 | | | | 3,205,807 | |
| Shares issued as reinvestment of distributions | | | — | | | | 8,942 | | | | — | | | | 888 | | | | 760,788 | | | | 3,429,780 | |
| Shares redeemed | | | (16,937,860 | ) | | | (325,176 | ) | | | (185,985 | ) | | | (68,015 | ) | | | (10,288,790 | ) | | | (11,738,689 | ) |
| Net decrease in net assets from Institutional Class share transactions | | | (7,064,646 | ) | | | (302,319 | ) | | | (181,911 | ) | | | (67,092 | ) | | | (2,746,576 | ) | | | (5,103,102 | ) |
| Qualified Class shares: | | | | | | | | | | | | | | | | | | | | | | | | |
| Shares sold | | | N/A | | | | N/A | | | | N/A | | | | N/A | | | | 43,978 | | | | N/A | |
| Shares issued as reinvestment of distributions | | | N/A | | | | N/A | | | | N/A | | | | N/A | | | | — | | | | N/A | |
| Shares redeemed | | | N/A | | | | N/A | | | | N/A | | | | N/A | | | | (778,666 | ) | | | N/A | |
| Net decrease in net assets from Qualified Class share transactions | | | N/A | | | | N/A | | | | N/A | | | | N/A | | | | (734,688 | ) | | | N/A | |
| Horace Mann Class shares: | | | | | | | | | | | | | | | | | | | | | | | | |
| Shares sold | | | N/A | | | | N/A | | | | N/A | | | | N/A | | | | 42,075 | | | | N/A | |
| Shares issued as reinvestment of distributions | | | N/A | | | | N/A | | | | N/A | | | | N/A | | | | 13,865 | | | | N/A | |
| Shares redeemed | | | N/A | | | | N/A | | | | N/A | | | | N/A | | | | (141,090 | ) | | | N/A | |
| Net decrease in net assets from Horace Mann Class share transactions | | | N/A | | | | N/A | | | | N/A | | | | N/A | | | | (85,150 | ) | | | N/A | |
| Net decrease in net assets from capital stock transactions | | | (22,906,921 | ) | | | (1,905,292 | ) | | | (886,950 | ) | | | (4,308,949 | ) | | | (7,582,871 | ) | | | (12,342,655 | ) |
| Net decrease in net assets | | | (24,837,637 | ) | | | (3,250,577 | ) | | | (874,099 | ) | | | (5,033,171 | ) | | | (9,446,716 | ) | | | (22,031,176 | ) |
Amounts designated as “—” are either $0, or have been rounded to $0.
See Notes to Financial Statements.
Wilshire Mutual Funds, Inc. Statements of Changes in Net Assets - (Continued) For the Year Ended December 31, 2011 | |
| | | LARGE COMPANY GROWTH PORTFOLIO | | | LARGE COMPANY VALUE PORTFOLIO | | | SMALL COMPANY GROWTH PORTFOLIO | | | SMALL COMPANY VALUE PORTFOLIO | | | WILSHIRE 5000 INDEXSM FUND | | | WILSHIRE LARGE CAP CORE PLUS FUND | |
| NET ASSETS: | | | | | | | | | | | | | | | | | | |
| Beginning of year | | $ | 193,910,979 | | | $ | 34,991,789 | | | $ | 7,700,298 | | | $ | 13,909,752 | | | $ | 160,351,779 | | | $ | 195,166,523 | |
| End of year | | $ | 169,073,342 | | | $ | 31,741,212 | | | $ | 6,826,199 | | | $ | 8,876,581 | | | $ | 150,905,063 | | | $ | 173,135,347 | |
| Undistributed net investment income/(accumulated net investment loss)/(distributions in excess of net investment income) at end of year | | $ | — | | | $ | (5 | ) | | $ | (4,503 | ) | | $ | (32,934 | ) | | $ | 73,463 | | | $ | (2 | ) |
| | | | | | | | | | | | | | | | | | | | | | | | | |
| CAPITAL SHARE TRANSACTIONS: | | | | | | | | | | | | | | | | | | | | | | | | |
| Investment Class shares: | | | | | | | | | | | | | | | | | | | | | | | | |
| Shares sold | | | 124,807 | | | | 121,345 | | | | 45,137 | | | | 91,474 | | | | 1,711,879 | | | | 4,334 | |
| Shares issued as reinvestment of distributions | | | — | | | | 18,416 | | | | — | | | | 2,574 | | | | 115,427 | | | | 364,597 | |
| Shares redeemed | | | (613,507 | ) | | | (249,337 | ) | | | (88,106 | ) | | | (350,974 | ) | | | (2,229,867 | ) | | | (1,201,381 | ) |
| Net decrease in Investment Class shares outstanding | | | (488,700 | ) | | | (109,576 | ) | | | (42,969 | ) | | | (256,926 | ) | | | (402,561 | ) | | | (832,450 | ) |
| | | | | | | | | | | | | | | | | | | | | | | | | |
| Institutional Class shares: | | | | | | | | | | | | | | | | | | | | | | | | |
| Shares sold | | | 296,601 | | | | 922 | | | | 225 | | | | 2 | | | | 605,494 | | | | 397,872 | |
| Shares issued as reinvestment of distributions | | | — | | | | 643 | | | | — | | | | 58 | | | | 69,351 | | | | 455,164 | |
| Shares redeemed | | | (508,434 | ) | | | (22,201 | ) | | | (10,204 | ) | | | (4,111 | ) | | | (913,997 | ) | | | (1,427,164 | ) |
| Net decrease in Institutional Class shares outstanding | | | (211,833 | ) | | | (20,636 | ) | | | (9,979 | ) | | | (4,051 | ) | | | (239,152 | ) | | | (574,128 | ) |
| | | | | | | | | | | | | | | | | | | | | | | | | |
| Qualified Class shares: | | | | | | | | | | | | | | | | | | | | | | | | |
| Shares sold | | | N/A | | | | N/A | | | | N/A | | | | N/A | | | | 3,756 | | | | N/A | |
| Shares issued as reinvestment of distributions | | | N/A | | | | N/A | | | | N/A | | | | N/A | | | | — | | | | N/A | |
| Shares redeemed | | | N/A | | | | N/A | | | | N/A | | | | N/A | | | | (68,517 | ) | | | N/A | |
| Net decrease in Qualified Class shares outstanding | | | N/A | | | | N/A | | | | N/A | | | | N/A | | | | (64,761 | ) | | | N/A | |
| | | | | | | | | | | | | | | | | | | | | | | | | |
| Horace Mann Class shares: | | | | | | | | | | | | | | | | | | | | | | | | |
| Shares sold | | | N/A | | | | N/A | | | | N/A | | | | N/A | | | | 3,772 | | | | N/A | |
| Shares issued as reinvestment of distributions | | | N/A | | | | N/A | | | | N/A | | | | N/A | | | | 1,266 | | | | N/A | |
| Shares redeemed | | | N/A | | | | N/A | | | | N/A | | | | N/A | | | | (12,754 | ) | | | N/A | |
| Net decrease in Horace Mann Class shares outstanding | | | N/A | | | | N/A | | | | N/A | | | | N/A | | | | (7,716 | ) | | | N/A | |
Amounts designated as “—” are either $0, or have been rounded to $0.
See Notes to Financial Statements.
Wilshire Mutual Funds, Inc. Statement of Cash Flows For the Year Ended December 31, 2012 | |
| | | WILSHIRE LARGE CAP CORE PLUS FUND | |
| INCREASE (DECREASE) IN CASH | | | |
| Cash Flows From Operating Activities: | | | |
| Net increase in net assets from operations | | $ | 22,980,237 | |
| Adjustments to reconcile net increase in net assets from operations to net cash provided by in operating activities: | | | | |
| Purchases of investment securities | | | (194,205,683 | ) |
| Proceeds from disposition of investment securities | | | 190,670,979 | |
| Purchases to cover securities sold short | | | (60,770,149 | ) |
| Proceeds from securities sold short | | | 56,742,255 | |
| Net realized (gain)/loss from: | | | | |
| Investments | | | (11,233,827 | ) |
| Securities sold short | | | 2,323,357 | |
| Net change in unrealized (appreciation)/depreciation on: | | | | |
| Investments | | | (14,852,237 | ) |
| Securities sold short | | | 2,392,162 | |
| Decrease in dividends and interest receivable | | | 84,647 | |
| Decrease in reimbursements from advisor | | | 36,752 | |
| Increase in prepaid expenses and other assets | | | (2,924 | ) |
| Decrease in dividend reclaim receivable | | | 208 | |
| Increase in payable upon return of securities loaned | | | 27,847,290 | |
| Increase in investment advisory fees payable | | | 16,268 | |
| Decrease in distribution (12b-1) fees payable | | | (2,108 | ) |
| Decrease in service fees payable | | | (2,017 | ) |
| Increase in administration fees payable | | | 115 | |
| Increase in trustees' fees payable | | | 1,071 | |
| Decrease in dividends payable on securities sold short | | | (18,317 | ) |
| Decrease in chief compliance officer expenses payable | | | (909 | ) |
| Decrease accrued expenses and other payables | | | (804 | ) |
| Net cash provided by operating activities | | | 22,006,366 | |
| | | | | |
| Cash Flows From Financing Activities: | | | | |
| Proceeds from shares sold | | | 954,451 | |
| Payments on shares redeemed | | | (22,958,395 | ) |
| Distributions to shareholders* | | | (2,739 | ) |
| Net cash flows used in financing activities | | | (22,006,683 | ) |
| Net decrease in cash | | | (317 | ) |
| | | | | |
| Cash at beginning of year | | | 317 | |
| Cash at end of year | | $ | — | |
| * | Non cash operating activities not included herein consist of reinvestment of dividends and distributions of $6,489,812 and interest paid of $440,492. |
See Notes to Financial Statements.
Wilshire Mutual Funds, Inc. Large Company Growth Portfolio Financial Highlights | |
| For a Fund Share Outstanding Throughout Each Year. | |
| | | | |
| | | | | | | | | | | | | | | | |
| Net asset value, beginning of year | | $ | 31.54 | | | $ | 32.00 | | | $ | 26.88 | | | $ | 20.12 | | | $ | 35.34 | |
| | | | | | | | | | | | | | | | | | | | | |
| Income/(loss) from investment operations: | | | | | | | | | | | | | | | | | | | | |
Net investment income/(loss)1 | | | 0.07 | | | | (0.09 | ) | | | 0.01 | | | | 0.00 | | | | (0.09 | ) |
| Net realized and unrealized gain/(loss) on investments | | | 4.24 | | | | (0.37 | ) | | | 5.12 | | | | 6.76 | | | | (14.73 | ) |
| Total from investment operations | | | 4.31 | | | | (0.46 | ) | | | 5.13 | | | | 6.76 | | | | (14.82 | ) |
| | | | | | | | | | | | | | | | | | | | | |
| Less distributions: | | | | | | | | | | | | | | | | | | | | |
| From net investment income | | | (0.07 | ) | | | 0.00 | | | | (0.01 | ) | | | 0.00 | | | | 0.00 | |
| Return of capital | | | 0.00 | | | | 0.00 | | | | (0.00 | )2 | | | 0.00 | | | | 0.00 | |
| From capital gains | | | (1.08 | ) | | | 0.00 | | | | 0.00 | | | | 0.00 | | | | (0.40 | ) |
| Total distributions | | | (1.15 | ) | | | 0.00 | | | | (0.01 | ) | | | 0.00 | | | | (0.40 | ) |
| | | | | | | | | | | | | | | | | | | | | |
| Net asset value, end of year | | $ | 34.70 | | | $ | 31.54 | | | $ | 32.00 | | | $ | 26.88 | | | $ | 20.12 | |
| | | | | | | | | | | | | | | | | | | | | |
| Total return | | | 13.72 | % | | | (1.44 | )% | | | 19.10 | % | | | 33.60 | % | | | (41.88 | )% |
| | | | | | | | | | | | | | | | | | | | | |
| Ratios to average net assets/supplemental data: | | | | | | | | | | | | | | | | | | | | |
| Net assets, end of year (in 000’s) | | $ | 100,853 | | | $ | 94,872 | | | $ | 111,904 | | | $ | 116,799 | | | $ | 118,683 | |
| Operating expenses including reimbursement/fees paid indirectly | | | 1.39 | % | | | 1.41 | % | | | 1.42 | % | | | 1.43 | % | | | 1.43 | % |
Operating expenses excluding reimbursement/fees paid indirectly3 | | | 1.39 | % | | | 1.41 | % | | | 1.42 | % | | | 1.43 | % | | | 1.43 | % |
| Net investment income/(loss) | | | 0.20 | % | | | (0.27 | )% | | | 0.04 | % | | | (0.02 | )% | | | (0.31 | )% |
| Portfolio turnover rate | | | 71 | % | | | 104 | % | | | 167 | % | | | 84 | % | | | 178 | % |
| 1 | The selected per share data was calculated using the average shares outstanding method for the period. |
| | |
| 2 | Amount is less than $0.01 per share. |
| | |
| 3 | The ratio of operating expenses excluding reimbursement/waiver for the year ended December 31, 2012, excludes the effect of fees paid indirectly. If this expense offset was included the ratio would have been 1.39%. |
See Notes to Financial Statements.
Wilshire Mutual Funds, Inc. Large Company Growth Portfolio Financial Highlights - (Continued) | |
| For a Fund Share Outstanding Throughout Each Year. | |
| | | Institutional Class Shares | |
| | | | | | | | | | | | | | | | |
| Net asset value, beginning of year | | $ | 32.63 | | | $ | 32.99 | | | $ | 27.70 | | | $ | 20.72 | | | $ | 36.25 | |
| | | | | | | | | | | | | | | | | | | | | |
| Income/(loss) from investment operations: | | | | | | | | | | | | | | | | | | | | |
Net investment income1 | | | 0.18 | | | | 0.03 | | | | 0.12 | | | | 0.08 | | | | 0.02 | |
| Net realized and unrealized gain/(loss) on investments | | | 4.38 | | | | (0.39 | ) | | | 5.30 | | | | 6.98 | | | | (15.15 | ) |
| Total from investment operations | | | 4.56 | | | | (0.36 | ) | | | 5.42 | | | | 7.06 | | | | (15.13 | ) |
| | | | | | | | | | | | | | | | | | | | | |
| Less distributions: | | | | | | | | | | | | | | | | | | | | |
| From net investment income | | | (0.17 | ) | | | 0.00 | | | | (0.13 | ) | | | (0.08 | ) | | | 0.00 | |
| Return of capital | | | 0.00 | | | | 0.00 | | | | (0.00 | )2 | | | 0.00 | | | | 0.00 | |
| From capital gains | | | (1.08 | ) | | | 0.00 | | | | 0.00 | | | | 0.00 | | | | (0.40 | ) |
| Total distributions | | | (1.25 | ) | | | 0.00 | | | | (0.13 | ) | | | (0.08 | ) | | | (0.40 | ) |
| | | | | | | | | | | | | | | | | | | | | |
| Net asset value, end of year | | $ | 35.94 | | | $ | 32.63 | | | $ | 32.99 | | | $ | 27.70 | | | $ | 20.72 | |
| | | | | | | | | | | | | | | | | | | | | |
| Total return | | | 14.04 | % | | | (1.09 | )% | | | 19.55 | % | | | 34.07 | % | | | (41.70 | )% |
| | | | | | | | | | | | | | | | | | | | | |
| Ratios to average net assets/supplemental data: | | | | | | | | | | | | | | | | | | | | |
| Net assets, end of year (in 000’s) | | $ | 85,740 | | | $ | 74,201 | | | $ | 82,007 | | | $ | 89,049 | | | $ | 81,680 | |
| Operating expenses including reimbursement/fees paid indirectly | | | 1.11 | % | | | 1.05 | % | | | 1.05 | % | | | 1.09 | % | | | 1.06 | % |
Operating expenses excluding reimbursement/fees paid indirectly3 | | | 1.11 | % | | | 1.05 | % | | | 1.05 | % | | | 1.09 | % | | | 1.06 | % |
| Net investment income | | | 0.50 | % | | | 0.09 | % | | | 0.40 | % | | | 0.33 | % | | | 0.07 | % |
| Portfolio turnover rate | | | 71 | % | | | 104 | % | | | 167 | % | | | 84 | % | | | 178 | % |
| 1 | The selected per share data was calculated using the average shares outstanding method for the period. |
| | |
| 2 | Amount is less than $0.01 per share. |
| | |
| 3 | The ratio of operating expenses excluding reimbursement/waiver for the year ended December 31, 2012, excludes the effect of fees paid indirectly. If this expense offset was included the ratio would have been 1.11%. |
See Notes to Financial Statements.
Wilshire Mutual Funds, Inc. Large Company Value Portfolio Financial Highlights | |
| For a Fund Share Outstanding Throughout Each Year. | |
| | | | |
| | | | | | | | | | | | | | | | |
| Net asset value, beginning of year | | $ | 13.82 | | | $ | 14.42 | | | $ | 12.78 | | | $ | 10.02 | | | $ | 17.51 | |
| | | | | | | | | | | | | | | | | | | | | |
| Income/(loss) from investment operations: | | | | | | | | | | | | | | | | | | | | |
Net investment income1 | | | 0.17 | | | | 0.11 | | | | 0.07 | | | | 0.08 | | | | 0.17 | |
| Net realized and unrealized gain/(loss) on investments | | | 2.03 | | | | (0.59 | ) | | | 1.64 | | | | 2.77 | | | | (7.45 | ) |
| Total from investment operations | | | 2.20 | | | | (0.48 | ) | | | 1.71 | | | | 2.85 | | | | (7.28 | ) |
| | | | | | | | | | | | | | | | | | | | | |
| Less distributions: | | | | | | | | | | | | | | | | | | | | |
| From net investment income | | | (0.16 | ) | | | (0.12 | ) | | | (0.07 | ) | | | (0.09 | ) | | | (0.21 | ) |
| Return of capital | | | 0.00 | | | | 0.00 | | | | (0.00 | )2 | | | 0.00 | | | | 0.00 | 2 |
| From capital gains | | | 0.00 | | | | 0.00 | | | | 0.00 | | | | 0.00 | | | | 0.00 | 2 |
| Total distributions | | | (0.16 | ) | | | (0.12 | ) | | | (0.07 | ) | | | (0.09 | ) | | | (0.21 | ) |
| | | | | | | | | | | | | | | | | | | | | |
| Net asset value, end of year | | $ | 15.86 | | | $ | 13.82 | | | $ | 14.42 | | | $ | 12.78 | | | $ | 10.02 | |
| | | | | | | | | | | | | | | | | | | | | |
| Total return | | | 15.92 | % | | | (3.36 | )% | | | 13.40 | % | | | 28.48 | % | | | (41.55 | )% |
| | | | | | | | | | | | | | | | | | | | | |
| Ratios to average net assets/supplemental data: | | | | | | | | | | | | | | | | | | | | |
| Net assets, end of year (in 000’s) | | $ | 44,220 | | | $ | 30,968 | | | $ | 33,887 | | | $ | 30,677 | | | $ | 24,791 | |
| Operating expenses including reimbursement/fees paid indirectly | | | 1.35 | % | | | 1.39 | % | | | 1.39 | % | | | 1.48 | % | | | 1.49 | % |
Operating expenses excluding reimbursement/fees paid indirectly3 | | | 1.36 | % | | | 1.39 | % | | | 1.39 | % | | | 1.48 | % | | | 1.49 | % |
| Net investment income | | | 1.12 | % | | | 0.77 | % | | | 0.54 | % | | | 0.75 | % | | | 1.22 | % |
| Portfolio turnover rate | | | 97 | % | | | 140 | % | | | 140 | % | | | 188 | % | | | 183 | % |
| 1 | The selected per share data was calculated using the average shares outstanding method for the period. |
| | |
| 2 | Amount is less than $0.01 per share. |
| | |
| 3 | The ratio of operating expenses excluding reimbursement/waiver for the year ended December 31, 2012 excludes the effect of fees paid indirectly. If this expense offset was included, the ratio would have been 1.35%. |
See Notes to Financial Statements.
Wilshire Mutual Funds, Inc. Large Company Value Portfolio Financial Highlights - (Continued) | |
| For a Fund Share Outstanding Throughout Each Year. | |
| | | Institutional Class Shares | |
| | | | | | | | | | | | | | | | |
| Net asset value, beginning of year | | $ | 13.84 | | | $ | 14.44 | | | $ | 12.79 | | | $ | 10.01 | | | $ | 17.49 | |
| | | | | | | | | | | | | | | | | | | | | |
| Income/(loss) from investment operations: | | | | | | | | | | | | | | | | | | | | |
Net investment income1 | | | 0.20 | | | | 0.16 | | | | 0.08 | | | | 0.10 | | | | 0.20 | |
| Net realized and unrealized gain/(loss) on investments | | | 2.04 | | | | (0.58 | ) | | | 1.66 | | | | 2.76 | | | | (7.45 | ) |
| Total from investment operations | | | 2.24 | | | | (0.42 | ) | | | 1.74 | | | | 2.86 | | | | (7.25 | ) |
| | | | | | | | | | | | | | | | | | | | | |
| Less distributions: | | | | | | | | | | | | | | | | | | | | |
| From net investment income | | | (0.19 | ) | | | (0.18 | ) | | | (0.09 | ) | | | (0.08 | ) | | | (0.23 | ) |
| Return of capital | | | 0.00 | | | | 0.00 | | | | (0.00 | )2 | | | 0.00 | | | | 0.00 | |
| From capital gains | | | 0.00 | | | | 0.00 | | | | 0.00 | | | | 0.00 | | | | 0.00 | 2 |
| Total distributions | | | (0.19 | ) | | | (0.18 | ) | | | (0.09 | ) | | | (0.08 | ) | | | (0.23 | ) |
| | | | | | | | | | | | | | | | | | | | | |
| Net asset value, end of year | | $ | 15.89 | | | $ | 13.84 | | | $ | 14.44 | | | $ | 12.79 | | | $ | 10.01 | |
| | | | | | | | | | | | | | | | | | | | | |
| Total return | | | 16.18 | % | | | (2.95 | )% | | | 13.57 | % | | | 28.60 | % | | | (41.41 | )% |
| | | | | | | | | | | | | | | | | | | | | |
| Ratios to average net assets/supplemental data: | | | | | | | | | | | | | | | | | | | | |
| Net assets, end of year (in 000’s) | | $ | 800 | | | $ | 773 | | | $ | 1,105 | | | $ | 1,461 | | | $ | 4,736 | |
| Operating expenses including reimbursement/fees paid indirectly | | | 1.14 | % | | | 1.00 | % | | | 1.27 | % | | | 1.36 | % | | | 1.30 | % |
Operating expenses excluding reimbursement/fees paid indirectly3 | | | 1.15 | % | | | 1.16 | % | | | 1.27 | % | | | 1.36 | % | | | 1.30 | % |
| Net investment income | | | 1.32 | % | | | 1.13 | % | | | 0.65 | % | | | 0.97 | % | | | 1.34 | % |
| Portfolio turnover rate | | | 97 | % | | | 140 | % | | | 140 | % | | | 188 | % | | | 183 | % |
| 1 | The selected per share data was calculated using the average shares outstanding method for the period. |
| | |
| 2 | Amount is less than $0.01 per share. |
| | |
| 3 | The ratio of operating expenses excluding reimbursement/waiver for the year ended December 31, 2012 excludes the effect of fees paid indirectly. If this expense offset was included, the ratio would have been 1.14%. |
See Notes to Financial Statements.
Wilshire Mutual Funds, Inc. Small Company Growth Portfolio Financial Highlights | |
| For a Fund Share Outstanding Throughout Each Year. | |
| | | | |
| | | | | | | | | | | | | | | | |
| Net asset value, beginning of year | | $ | 15.90 | | | $ | 15.95 | | | $ | 12.64 | | | $ | 9.70 | | | $ | 16.94 | |
| | | | | | | | | | | | | | | | | | | | | |
| Income/(loss) from investment operations: | | | | | | | | | | | | | | | | | | | | |
Net investment income/(loss)1 | | | 0.09 | | | | (0.14 | ) | | | (0.05 | ) | | | (0.08 | ) | | | (0.10 | ) |
| Net realized and unrealized gain/(loss) on investments | | | 2.07 | | | | 0.09 | 2 | | | 3.36 | | | | 3.02 | | | | (6.56 | ) |
| Total from investment operations | | | 2.16 | | | | (0.05 | ) | | | 3.31 | | | | 2.94 | | | | (6.66 | ) |
| | | | | | | | | | | | | | | | | | | | | |
| Less distributions: | | | | | | | | | | | | | | | | | | | | |
| From capital gains | | | 0.00 | | | | 0.00 | | | | 0.00 | | | | 0.00 | | | | (0.58 | ) |
| Total distributions | | | 0.00 | | | | 0.00 | | | | 0.00 | | | | 0.00 | | | | (0.58 | ) |
| | | | | | | | | | | | | | | | | | | | | |
| Net asset value, end of year | | $ | 18.06 | | | $ | 15.90 | | | $ | 15.95 | | | $ | 12.64 | | | $ | 9.70 | |
| | | | | | | | | | | | | | | | | | | | | |
| Total return | | | 13.58 | % | | | (0.31 | )% | | | 26.19 | % | | | 30.31 | % | | | (39.13 | )% |
| | | | | | | | | | | | | | | | | | | | | |
| Ratios to average net assets/supplemental data: | | | | | | | | | | | | | | | | | | | | |
| Net assets, end of year (in 000’s) | | $ | 7,225 | | | $ | 6,813 | | | $ | 7,521 | | | $ | 6,513 | | | $ | 5,273 | |
| Operating expenses including reimbursement/waiver and fees paid indirectly | | | 1.47 | % | | | 1.50 | % | | | 1.45 | % | | | 1.50 | % | | | 1.47 | % |
Operating expenses excluding reimbursement/waiver and fees paid indirectly3 | | | 1.97 | % | | | 2.02 | % | | | 2.18 | % | | | 2.41 | % | | | 2.07 | % |
| Net investment income/(loss) | | | 0.55 | % | | | (0.85 | )% | | | (0.41 | )% | | | (0.74 | )% | | | (0.66 | )% |
| Portfolio turnover rate | | | 99 | % | | | 177 | % | | | 83 | % | | | 98 | % | | | 87 | % |
| 1 | The selected per share data was calculated using the average shares outstanding method for the period. |
| | |
| 2 | The amount shown for a share outstanding throughout the year ended December 31, 2011, does not accord with the aggregate net gains on investments for the year because of the sales and repurchases of Portfolio shares in relation to fluctuating market value of the investments of the Portfolio. |
| | |
| 3 | The ratio of operating expenses excluding reimbursement/waiver for the year ended December 31, 2012 excludes the effect of fees paid indirectly. If this expense offset was included, the ratio would have been 1.95%. |
See Notes to Financial Statements.
Wilshire Mutual Funds, Inc. Small Company Growth Portfolio Financial Highlights - (Continued) | |
| For a Fund Share Outstanding Throughout Each Year. | |
| | | Institutional Class Shares | |
| | | | | | | | | | | | | | | | |
| Net asset value, beginning of year | | $ | 16.60 | | | $ | 16.61 | | | $ | 13.12 | | | $ | 10.03 | | | $ | 17.50 | |
| | | | | | | | | | | | | | | | | | | | | |
| Income/(loss) from investment operations: | | | | | | | | | | | | | | | | | | | | |
Net investment income/(loss)1 | | | 0.11 | | | | (0.12 | ) | | | (0.01 | ) | | | (0.04 | ) | | | (0.06 | ) |
| Net realized and unrealized gain/(loss) on investments | | | 2.18 | | | | 0.11 | 2 | | | 3.50 | | | | 3.13 | | | | (6.83 | ) |
| Total from investment operations | | | 2.29 | | | | (0.01 | ) | | | 3.49 | | | | 3.09 | | | | (6.89 | ) |
| | | | | | | | | | | | | | | | | | | | | |
| Less distributions: | | | | | | | | | | | | | | | | | | | | |
| From capital gains | | | 0.00 | | | | 0.00 | | | | 0.00 | | | | 0.00 | | | | (0.58 | ) |
| Total distributions | | | 0.00 | | | | 0.00 | | | | 0.00 | | | | 0.00 | | | | (0.58 | ) |
| | | | | | | | | | | | | | | | | | | | | |
| Net asset value, end of year | | $ | 18.89 | | | $ | 16.60 | | | $ | 16.61 | | | $ | 13.12 | | | $ | 10.03 | |
| | | | | | | | | | | | | | | | | | | | | |
| Total return | | | 13.80 | % | | | (0.06 | )% | | | 26.60 | % | | | 30.81 | % | | | (39.17 | )% |
| | | | | | | | | | | | | | | | | | | | | |
| Ratios to average net assets/supplemental data: | | | | | | | | | | | | | | | | | | | | |
| Net assets, end of year (in 000’s) | | $ | 15 | | | $ | 13 | | | $ | 179 | | | $ | 135 | | | $ | 154 | |
| Operating expenses including reimbursement/waiver and fees paid indirectly | | | 1.28 | % | | | 1.23 | % | | | 1.15 | % | | | 1.18 | % | | | 1.24 | % |
Operating expenses excluding reimbursement/waiver and fees paid indirectly3 | | | 1.79 | % | | | 1.69 | % | | | 1.87 | % | | | 2.09 | % | | | 1.78 | % |
| Net investment income/(loss) | | | 0.60 | % | | | (0.68 | )% | | | (0.09 | )% | | | (0.43 | )% | | | (0.39 | )% |
| Portfolio turnover rate | | | 99 | % | | | 177 | % | | | 83 | % | | | 98 | % | | | 87 | % |
| 1 | The selected per share data was calculated using the average shares outstanding method for the period. |
| | |
| 2 | The amount shown for a share outstanding throughout the year ended December 31, 2011, does not accord with the aggregate net gains on investments for the year because of the sales and repurchases of Portfolio shares in relation to fluctuating market value of the investments of the Portfolio. |
| | |
| 3 | The ratio of operating expenses excluding reimbursement/waiver for the year ended December 31, 2012, excludes the effect of fees paid indirectly. If this expense offset was included the ratio would have been 1.78%. |
See Notes to Financial Statements.
Wilshire Mutual Funds, Inc. Small Company Value Portfolio Financial Highlights | |
| For a Fund Share Outstanding Throughout Each Year. | |
| | | | |
| | | | | | | | | | | | | | | | |
| Net asset value, beginning of year | | $ | 15.04 | | | $ | 16.34 | | | $ | 13.32 | | | $ | 10.93 | | | $ | 16.49 | |
| | | | | | | | | | | | | | | | | | | | | |
| Income/(loss) from investment operations: | | | | | | | | | | | | | | | | | | | | |
Net investment income1 | | | 0.20 | | | | 0.00 | | | | 0.12 | | | | 0.05 | | | | 0.09 | |
| Net realized and unrealized gain/(loss) on investments | | | 2.38 | | | | (1.23 | ) | | | 3.02 | | | | 2.44 | | | | (5.51 | ) |
| Total from investment operations | | | 2.58 | | | | (1.23 | ) | | | 3.14 | | | | 2.49 | | | | (5.42 | ) |
| | | | | | | | | | | | | | | | | | | | | |
| Less distributions: | | | | | | | | | | | | | | | | | | | | |
| From net investment income | | | (0.22 | ) | | | (0.07 | ) | | | (0.12 | ) | | | (0.10 | ) | | | (0.14 | ) |
| From capital gains | | | 0.00 | | | | 0.00 | | | | 0.00 | | | | 0.00 | | | | 0.00 | 2 |
| Total distributions | | | (0.22 | ) | | | (0.07 | ) | | | (0.12 | ) | | | (0.10 | ) | | | (0.14 | ) |
| | | | | | | | | | | | | | | | | | | | | |
| Net asset value, end of year | | $ | 17.40 | | | $ | 15.04 | | | $ | 16.34 | | | $ | 13.32 | | | $ | 10.93 | |
| | | | | | | | | | | | | | | | | | | | | |
| Total return | | | 17.20 | % | | | (7.54 | )% | | | 23.60 | % | | | 22.81 | % | | | (32.81 | )% |
| | | | | | | | | | | | | | | | | | | | | |
| Ratios to average net assets/supplemental data: | | | | | | | | | | | | | | | | | | | | |
| Net assets, end of year (in 000’s) | | $ | 9,641 | | | $ | 8,795 | | | $ | 13,754 | | | $ | 9,511 | | | $ | 8,211 | |
| Operating expenses including reimbursement/waiver and fees paid indirectly | | | 1.49 | % | | | 1.50 | % | | | 1.50 | % | | | 1.50 | % | | | 1.34 | % |
Operating expenses excluding reimbursement/waiver and fees paid indirectly3 | | | 1.84 | % | | | 1.90 | % | | | 1.87 | % | | | 2.01 | % | | | 1.94 | % |
| Net investment income/(loss) | | | 1.24 | % | | | (0.02 | )% | | | 0.82 | % | | | 0.49 | % | | | 0.62 | % |
| Portfolio turnover rate | | | 68 | % | | | 118 | % | | | 89 | % | | | 61 | % | | | 83 | % |
| 1 | The selected per share data was calculated using the average shares outstanding method for the period. |
| | |
| 2 | Amount is less than $0.01 per share |
| | |
| 3 | The ratio of operating expenses excluding reimbursement/waiver for the year ended December 31, 2012, excludes the effect of fees paid indirectly. If this expense offset was included the ratio would have been 1.83%. |
See Notes to Financial Statements.
Wilshire Mutual Funds, Inc. Small Company Value Portfolio Financial Highlights - (Continued) | |
| For a Fund Share Outstanding Throughout Each Year. | |
| | | Institutional Class Shares | |
| | | | | | | | | | | | | | | | |
| Net asset value, beginning of year | | $ | 15.19 | | | $ | 16.51 | | | $ | 13.45 | | | $ | 11.02 | | | $ | 16.61 | |
| | | | | | | | | | | | | | | | | | | | | |
| Income/(loss) from investment operations: | | | | | | | | | | | | | | | | | | | | |
Net investment income1 | | | 0.22 | | | | 0.09 | | | | 0.14 | | | | 0.07 | | | | 0.12 | |
| Net realized and unrealized gain/(loss) on investments | | | 2.42 | | | | (1.24 | ) | | | 3.06 | | | | 2.48 | | | | (5.51 | ) |
| Total from investment operations | | | 2.64 | | | | (1.15 | ) | | | 3.20 | | | | 2.55 | | | | (5.39 | ) |
| | | | | | | | | | | | | | | | | | | | | |
| Less distributions: | | | | | | | | | | | | | | | | | | | | |
| From net investment income | | | (0.25 | ) | | | (0.17 | ) | | | (0.14 | ) | | | (0.12 | ) | | | (0.20 | ) |
| From capital gains | | | 0.00 | | | | 0.00 | | | | 0.00 | | | | 0.00 | | | | 0.00 | 2 |
| Total distributions | | | (0.25 | ) | | | (0.17 | ) | | | (0.14 | ) | | | (0.12 | ) | | | (0.20 | ) |
| | | | | | | | | | | | | | | | | | | | | |
| Net asset value, end of year | | $ | 17.58 | | | $ | 15.19 | | | $ | 16.51 | | | $ | 13.45 | | | $ | 11.02 | |
| | | | | | | | | | | | | | | | | | | | | |
| Total return | | | 17.41 | % | | | (6.95 | )% | | | 23.80 | % | | | 23.11 | % | | | (32.37 | )% |
| | | | | | | | | | | | | | | | | | | | | |
| Ratios to average net assets/supplemental data: | | | | | | | | | | | | | | | | | | | | |
| Net assets, end of year (in 000’s) | | $ | 54 | | | $ | 82 | | | $ | 156 | | | $ | 170 | | | $ | 441 | |
| Operating expenses including reimbursement/waiver and fees paid indirectly | | | 1.31 | % | | | 0.94 | % | | | 1.29 | % | | | 1.30 | % | | | 1.00 | % |
Operating expenses excluding reimbursement/waiver and fees paid indirectly3 | | | 1.66 | % | | | 1.64 | % | | | 1.67 | % | | | 1.71 | % | | | 1.61 | % |
| Net investment income | | | 1.33 | % | | | 0.53 | % | | | 0.96 | % | | | 0.65 | % | | | 0.82 | % |
| Portfolio turnover rate | | | 68 | % | | | 118 | % | | | 89 | % | | | 61 | % | | | 83 | % |
| 1 | The selected per share data was calculated using the average shares outstanding method for the period. |
| | |
| 2 | Amount is less than $0.01 per share. |
| | |
| 3 | The ratio of operating expenses excluding reimbursement/waiver for the year ended December 31, 2012, excludes the effect of fees paid indirectly. If this expense offset was included the ratio would have been 1.65%. |
See Notes to Financial Statements.
Wilshire Mutual Funds, Inc. Wilshire 5000 Indexsm Fund Financial Highlights | |
| For a Fund Share Outstanding Throughout Each Year. | |
| | | | |
| | | | | | | | | | | | | | | | |
| Net asset value, beginning of year | | $ | 10.93 | | | $ | 11.05 | | | $ | 9.61 | | | $ | 7.67 | | | $ | 12.42 | |
| | | | | | | | | | | | | | | | | | | | | |
| Income/(loss) from investment operations: | | | | | | | | | | | | | | | | | | | | |
Net investment income1 | | | 0.19 | | | | 0.14 | | | | 0.13 | | | | 0.11 | | | | 0.15 | |
| Net realized and unrealized gain/(loss) on investments | | | 1.49 | | | | (0.12 | ) | | | 1.45 | | | | 1.96 | | | | (4.77 | ) |
| Total from investment operations | | | 1.68 | | | | 0.02 | | | | 1.58 | | | | 2.07 | | | | (4.62 | ) |
| | | | | | | | | | | | | | | | | | | | | |
| Less distributions: | | | | | | | | | | | | | | | | | | | | |
| From net investment income | | | (0.18 | ) | | | (0.14 | ) | | | (0.14 | ) | | | (0.13 | ) | | | (0.13 | ) |
| Total distributions | | | (0.18 | ) | | | (0.14 | ) | | | (0.14 | ) | | | (0.13 | ) | | | (0.13 | ) |
| | | | | | | | | | | | | | | | | | | | | |
| Net asset value, end of year | | $ | 12.43 | | | $ | 10.93 | | | $ | 11.05 | | | $ | 9.61 | | | $ | 7.67 | |
| | | | | | | | | | | | | | | | | | | | | |
| Total return | | | 15.36 | % | | | 0.21 | % | | | 16.44 | % | | | 26.98 | % | | | (37.11 | )% |
| | | | | | | | | | | | | | | | | | | | | |
| Ratios to average net assets/supplemental data: | | | | | | | | | | | | | | | | | | | | |
| Net assets, end of year (in 000’s) | | $ | 107,888 | | | $ | 99,545 | | | $ | 105,019 | | | $ | 109,304 | | | $ | 98,032 | |
| Operating expenses including reimbursement/fees paid indirectly | | | 0.70 | % | | | 0.74 | % | | | 0.72 | % | | | 0.77 | % | | | 0.78 | % |
| Operating expenses excluding reimbursement/fees paid indirectly | | | 0.70 | % | | | 0.74 | % | | | 0.72 | % | | | 0.77 | % | | | 0.78 | % |
| Net investment income | | | 1.61 | % | | | 1.22 | % | | | 1.26 | % | | | 1.36 | % | | | 1.48 | % |
| Portfolio turnover rate | | | 2 | % | | | 9 | % | | | 2 | % | | | 57 | % | | | 52 | % |
| 1 | The selected per share data was calculated using the average shares outstanding method for the period. |
See Notes to Financial Statements.
Wilshire Mutual Funds, Inc. Wilshire 5000 Indexsm Fund Financial Highlights - (Continued) | |
| For a Fund Share Outstanding Throughout Each Year. | |
| | | Institutional Class Shares | |
| | | | | | | | | | | | | | | | |
| Net asset value, beginning of year | | $ | 10.92 | | | $ | 11.04 | | | $ | 9.60 | | | $ | 7.67 | | | $ | 12.41 | |
| | | | | | | | | | | | | | | | | | | | | |
| Income/(loss) from investment operations: | | | | | | | | | | | | | | | | | | | | |
Net investment income1 | | | 0.22 | | | | 0.16 | | | | 0.15 | | | | 0.13 | | | | 0.17 | |
| Net realized and unrealized gain/(loss) on investments | | | 1.47 | | | | (0.11 | ) | | | 1.45 | | | | 1.95 | | | | (4.76 | ) |
| Total from investment operations | | | 1.69 | | | | 0.05 | | | | 1.60 | | | | 2.08 | | | | (4.59 | ) |
| | | | | | | | | | | | | | | | | | | | | |
| Less distributions: | | | | | | | | | | | | | | | | | | | | |
| From net investment income | | | (0.20 | ) | | | (0.17 | ) | | | (0.16 | ) | | | (0.15 | ) | | | (0.15 | ) |
| Total distributions | | | (0.20 | ) | | | (0.17 | ) | | | (0.16 | ) | | | (0.15 | ) | | | (0.15 | ) |
| | | | | | | | | | | | | | | | | | | | | |
| Net asset value, end of year | | $ | 12.41 | | | $ | 10.92 | | | $ | 11.04 | | | $ | 9.60 | | | $ | 7.67 | |
| | | | | | | | | | | | | | | | | | | | | |
| Total return | | | 15.54 | % | | | 0.43 | % | | | 16.71 | % | | | 27.10 | % | | | (36.95 | )% |
| | | | | | | | | | | | | | | | | | | | | |
| Ratios to average net assets/supplemental data: | | | | | | | | | | | | | | | | | | | | |
| Net assets, end of year (in 000’s) | | $ | 50,633 | | | $ | 50,252 | | | $ | 53,415 | | | $ | 66,764 | | | $ | 55,088 | |
| Operating expenses including reimbursement/fees paid indirectly | | | 0.47 | % | | | 0.53 | % | | | 0.50 | % | | | 0.54 | % | | | 0.59 | % |
| Operating expenses excluding reimbursement/fees paid indirectly | | | 0.47 | % | | | 0.53 | % | | | 0.50 | % | | | 0.54 | % | | | 0.59 | % |
| Net investment income | | | 1.84 | % | | | 1.43 | % | | | 1.48 | % | | | 1.59 | % | | | 1.62 | % |
| Portfolio turnover rate | | | 2 | % | | | 9 | % | | | 2 | % | | | 57 | % | | | 52 | % |
| 1 | The selected per share data was calculated using the average shares outstanding method for the period. |
See Notes to Financial Statements.
Wilshire Mutual Funds, Inc. Wilshire 5000 Indexsm Fund Financial Highlights - (Continued) | |
| For a Fund Share Outstanding Throughout Each Year. | |
| | | | |
| | | | | | | | | | | | | | | | |
| Net asset value, beginning of year | | $ | 11.09 | | | $ | 11.03 | | | $ | 9.59 | | | $ | 7.67 | | | $ | 12.42 | |
| | | | | | | | | | | | | | | | | | | | | |
| Income/(loss) from investment operations: | | | | | | | | | | | | | | | | | | | | |
Net investment income1 | | | 0.26 | | | | 0.14 | | | | 0.13 | | | | 0.12 | | | | 0.15 | |
| Net realized and unrealized gain/(loss) on investments | | | 1.50 | | | | (0.08 | ) | | | 1.46 | | | | 1.95 | | | | (4.76 | ) |
| Total from investment operations | | | 1.76 | | | | 0.06 | | | | 1.59 | | | | 2.07 | | | | (4.61 | ) |
| | | | | | | | | | | | | | | | | | | | | |
| Less distributions: | | | | | | | | | | | | | | | | | | | | |
| From net investment income | | | (0.21 | ) | | | 0.00 | | | | (0.15 | ) | | | (0.15 | ) | | | (0.14 | ) |
| Total distributions | | | (0.21 | ) | | | 0.00 | | | | (0.15 | ) | | | (0.15 | ) | | | (0.14 | ) |
| | | | | | | | | | | | | | | | | | | | | |
| Net asset value, end of year | | $ | 12.64 | | | $ | 11.09 | | | $ | 11.03 | | | $ | 9.59 | | | $ | 7.67 | |
| | | | | | | | | | | | | | | | | | | | | |
| Total return | | | 15.93 | %3 | | | 0.54 | % | | | 16.56 | % | | | 26.91 | % | | | (37.09 | )% |
| | | | | | | | | | | | | | | | | | | | | |
| Ratios to average net assets/supplemental data: | | | | | | | | | | | | | | | | | | | | |
| Net assets, end of year (in 000’s) | | $ | — | 2 | | $ | — | 2 | | $ | 714 | | | $ | 614 | | | $ | 431 | |
| Operating expenses including reimbursement/fees paid indirectly | | | 0.00 | %3 | | | 0.65 | % | | | 0.66 | % | | | 0.61 | % | | | 0.84 | % |
| Operating expenses excluding reimbursement/fees paid indirectly | | | 0.00 | %3 | | | 0.65 | % | | | 0.66 | % | | | 0.61 | % | | | 0.84 | % |
| Net investment income | | | 2.16 | % | | | 1.21 | % | | | 1.32 | % | | | 1.51 | % | | | 1.40 | % |
| Portfolio turnover rate | | | 2 | % | | | 9 | % | | | 2 | % | | | 57 | % | | | 52 | % |
| 1 | The selected per share data was calculated using the average shares outstanding method for the period. |
| | |
| 2 | Amounts designated as "—" have been rounded to 0. |
| | |
| 3 | Results not considered meaningful due to low level of assets. |
See Notes to Financial Statements.
Wilshire Mutual Funds, Inc. Wilshire 5000 Indexsm Fund Financial Highlights - (Continued) | |
| For a Fund Share Outstanding Throughout Each Year. | |
| | | | |
| | | | | | | | | | | | | | | | |
| Net asset value, beginning of year | | $ | 10.91 | | | $ | 11.02 | | | $ | 9.59 | | | $ | 7.66 | | | $ | 12.38 | |
| | | | | | | | | | | | | | | | | | | | | |
| Income/(loss) from investment operations: | | | | | | | | | | | | | | | | | | | | |
Net investment income1 | | | 0.19 | | | | 0.13 | | | | 0.13 | | | | 0.11 | | | | 0.15 | |
| Net realized and unrealized gain/(loss) on investments | | | 1.48 | | | | (0.10 | ) | | | 1.44 | | | | 1.95 | | | | (4.75 | ) |
| Total from investment operations | | | 1.67 | | | | 0.03 | | | | 1.57 | | | | 2.06 | | | | (4.60 | ) |
| | | | | | | | | | | | | | | | | | | | | |
| Less distributions: | | | | | | | | | | | | | | | | | | | | |
| From net investment income | | | (0.18 | ) | | | (0.14 | ) | | | (0.14 | ) | | | (0.13 | ) | | | (0.12 | ) |
| Total distributions | | | (0.18 | ) | | | (0.14 | ) | | | (0.14 | ) | | | (0.13 | ) | | | (0.12 | ) |
| | | | | | | | | | | | | | | | | | | | | |
| Net asset value, end of year | | $ | 12.40 | | | $ | 10.91 | | | $ | 11.02 | | | $ | 9.59 | | | $ | 7.66 | |
| | | | | | | | | | | | | | | | | | | | | |
| Total return | | | 15.31 | % | | | 0.25 | % | | | 16.39 | % | | | 26.85 | % | | | (37.08 | )% |
| | | | | | | | | | | | | | | | | | | | | |
| Ratios to average net assets/supplemental data: | | | | | | | | | | | | | | | | | | | | |
| Net assets, end of year (in 000’s) | | $ | 1,243 | | | $ | 1,108 | | | $ | 1,204 | | | $ | 1,111 | | | $ | 952 | |
| Operating expenses including reimbursement/fees paid indirectly | | | 0.69 | % | | | 0.78 | % | | | 0.72 | % | | | 0.80 | % | | | 0.82 | % |
| Operating expenses excluding reimbursement/fees paid indirectly | | | 0.69 | % | | | 0.78 | % | | | 0.72 | % | | | 0.80 | % | | | 0.82 | % |
| Net investment income | | | 1.62 | % | | | 1.17 | % | | | 1.26 | % | | | 1.34 | % | | | 1.41 | % |
| Portfolio turnover rate | | | 2 | % | | | 9 | % | | | 2 | % | | | 57 | % | | | 52 | % |
| 1 | The selected per share data was calculated using the average shares outstanding method for the period. |
See Notes to Financial Statements.
Wilshire Mutual Funds, Inc. Wilshire Large Cap Core Plus Fund Financial Highlights | |
| For a Fund Share Outstanding Throughout Each Year. | |
| | | | |
| | | | | | | | | | | | | | | | |
| Net asset value, beginning of year | | $ | 7.63 | | | $ | 8.09 | | | $ | 7.37 | | | $ | 6.23 | | | $ | 10.12 | |
| | | | | | | | | | | | | | | | | | | | | |
| Income/(loss) from investment operations: | | | | | | | | | | | | | | | | | | | | |
Net investment income1 | | | 0.06 | | | | 0.00 | 2 | | | 0.00 | 2 | | | 0.04 | | | | 0.02 | |
| Net realized and unrealized gain/(loss) on investments | | | 0.96 | | | | (0.19 | ) | | | 0.84 | | | | 1.13 | | | | (3.90 | ) |
| Total from investment operations | | | 1.02 | | | | (0.19 | ) | | | 0.84 | | | | 1.17 | | | | (3.88 | ) |
| | | | | | | | | | | | | | | | | | | | | |
| Less distributions: | | | | | | | | | | | | | | | | | | | | |
| From net investment income | | | (0.09 | ) | | | (0.06 | ) | | | (0.04 | ) | | | (0.03 | ) | | | (0.01 | ) |
| From capital gains | | | (0.22 | ) | | | (0.21 | ) | | | (0.08 | ) | | | 0.00 | | | | 0.00 | |
| Total distributions | | | (0.31 | ) | | | (0.27 | ) | | | (0.12 | ) | | | (0.03 | ) | | | (0.01 | ) |
| | | | | | | | | | | | | | | | | | | | | |
| Net asset value, end of year | | $ | 8.34 | | | $ | 7.63 | | | $ | 8.09 | | | $ | 7.37 | | | $ | 6.23 | |
| | | | | | | | | | | | | | | | | | | | | |
| Total return | | | 13.36 | % | | | (2.28 | )% | | | 11.47 | % | | | 18.73 | % | | | (38.31 | )% |
| | | | | | | | | | | | | | | | | | | | | |
Ratios to average net assets/supplemental data3: | | | | | | | | | | | | | | | | | | | | |
| Net assets, end of year (in 000’s) | | $ | 74,999 | | | $ | 80,004 | | | $ | 91,641 | | | $ | 93,553 | | | $ | 36,356 | |
| Operating expenses including dividends and rebates on securities sold short and interest expense, after expense reimbursement/waiver and fees paid indirectly | | | 2.24 | % | | | 2.27 | % | | | 2.19 | % | | | 2.17 | % | | | 2.70 | % |
Operating expenses including dividends and rebates on securities sold short and interest expense, before expense reimbursement/waiver and fees paid indirectly4 | | | 2.29 | % | | | 2.33 | % | | | 2.23 | % | | | 2.33 | % | | | 3.79 | % |
| Net investment income/(loss) | | | 0.77 | % | | | 0.06 | % | | | 0.05 | % | | | 0.61 | % | | | 0.20 | % |
| Portfolio turnover rate | | | 45 | % | | | 134 | % | | | 283 | % | | | 289 | % | | | 175 | % |
| 1 | The selected per share data was calculated using the average shares outstanding method for the period. |
| | |
| 2 | Amount is less than $0.01 per share. |
| | |
| 3 | The operating expense ratios reflect the expenses related to investing in securities sold short. Had these expenses been excluded, the expense ratio (after waiver and fees paid indirectly) would have been 1.50% for each of the last five years. |
| | |
| 4 | The ratio of operating expenses including dividends and rebates on securities sold short and interest expense, before reimbursement/waiver for the year ended December 31, 2012, excludes the effect of fees paid indirectly. If this expense offset was included the ratio would have been 2.28%. |
See Notes to Financial Statements.
Wilshire Mutual Funds, Inc. Wilshire Large Cap Core Plus Fund Financial Highlights - (Continued) | |
| For a Fund Share Outstanding Throughout Each Year. | |
| | | Institutional Class Shares | |
| | | | | | | | | | | | | | | | |
| Net asset value, beginning of year | | $ | 7.67 | | | $ | 8.14 | | | $ | 7.41 | | | $ | 6.25 | | | $ | 10.12 | |
| | | | | | | | | | | | | | | | | | | | | |
| Income/(loss) from investment operations: | | | | | | | | | | | | | | | | | | | | |
Net investment income1 | | | 0.09 | | | | 0.02 | | | | 0.02 | | | | 0.06 | | | | 0.04 | |
| Net realized and unrealized gain/(loss) on investments | | | 0.95 | | | | (0.20 | ) | | | 0.85 | | | | 1.14 | | | | (3.89 | ) |
| Total from investment operations | | | 1.04 | | | | (0.18 | ) | | | 0.87 | | | | 1.20 | | | | (3.85 | ) |
| | | | | | | | | | | | | | | | | | | | | |
| Less distributions: | | | | | | | | | | | | | | | | | | | | |
| From net investment income | | | (0.11 | ) | | | (0.08 | ) | | | (0.06 | ) | | | (0.04 | ) | | | (0.02 | ) |
| From capital gains | | | (0.22 | ) | | | (0.21 | ) | | | (0.08 | ) | | | 0.00 | | | | 0.00 | |
| Total distributions | | | (0.33 | ) | | | (0.29 | ) | | | (0.14 | ) | | | (0.04 | ) | | | (0.02 | ) |
| | | | | | | | | | | | | | | | | | | | | |
| Net asset value, end of year | | $ | 8.38 | | | $ | 7.67 | | | $ | 8.14 | | | $ | 7.41 | | | $ | 6.25 | |
| | | | | | | | | | | | | | | | | | | | | |
| Total return | | | 13.63 | % | | | (2.11 | )% | | | 11.82 | % | | | 19.14 | % | | | (38.09 | )% |
| | | | | | | | | | | | | | | | | | | | | |
Ratios to average net assets/supplemental data2: | | | | | | | | | | | | | | | | | | | | |
| Net assets, end of year (in 000’s) | | $ | 99,106 | | | $ | 93,132 | | | $ | 103,526 | | | $ | 110,064 | | | $ | 24,617 | |
| Operating expenses including dividends and rebates on securities sold short and interest expense, after expense reimbursement/waiver and fees paid indirectly | | | 1.99 | % | | | 2.02 | % | | | 1.94 | % | | | 1.92 | % | | | 2.41 | % |
Operating expenses including dividends and rebates on securities sold short and interest expense, before expense reimbursement/ waiver and fees paid indirectly3 | | | 2.01 | % | | | 2.05 | % | | | 1.96 | % | | | 2.03 | % | | | 3.50 | % |
| Net investment income/(loss) | | | 1.03 | % | | | 0.32 | % | | | 0.30 | % | | | 0.85 | % | | | 0.49 | % |
| Portfolio turnover rate | | | 45 | % | | | 134 | % | | | 283 | % | | | 289 | % | | | 175 | % |
| 1 | The selected per share data was calculated using the average shares outstanding method for the period. |
| | |
| 2 | The operating expense ratios reflect the expenses related to investing in securities sold short. Had these expenses been excluded, the expense ratio (after waiver and fees paid indirectly) would have been 1.25% for each of the last five years. |
| | |
| 3 | The ratio of operating expenses including dividends and rebates on securities sold short and interest expense, before reimbursement/waiver for the year ended December 31, 2012, excludes the effect of fees paid indirectly. If this expense offset was included, the ratio would have been 2.00%. |
See Notes to Financial Statements.
Wilshire Mutual Funds, Inc. Notes to Financial Statements December 31, 2012 | |
1. Organization.
Wilshire Mutual Funds, Inc. (the “Company”) is registered under the Investment Company Act of 1940, as amended (the “1940 Act”), as an open-end diversified investment company, which was incorporated under Maryland law on July 30, 1992. The Company operates as a series company and presently offers six series, all of which had operations during the annual period: Large Company Growth Portfolio, Large Company Value Portfolio, Small Company Growth Portfolio, Small Company Value Portfolio, Wilshire 5000 IndexSM Fund and Wilshire Large Cap Core Plus Fund (each a “Portfolio” and collectively the “Portfolios”). The Company accounts separately for the assets, liabilities and operations of each series.
Each of the Portfolios offers Investment and Institutional Class shares, each of which has equal rights as to voting privileges. The Wilshire 5000 IndexSM Fund also offers Qualified Class Shares and Horace Mann Class Shares. Each of the Investment Class, Qualified Class and Horace Mann Class has exclusive voting rights with respect to its particular service and distribution plan. Investment income, realized and unrealized capital gains and losses and the common expenses of each Portfolio are allocated on a pro-rata basis to each class based on the relative net assets of each class to the total net assets of each Portfolio. Each class of shares differs in its respective service and distribution expenses.
2. Significant Accounting Policies.
Use of estimates – The preparation of financial statements in accordance with accounting principles generally accepted in the United States of America (“U.S. GAAP”) requires management to make estimates and assumptions that affect the reported amounts of assets and liabilities and disclosure of contingent assets and liabilities at the date of the financial statements and the reported amounts of revenues and expenses during the reporting period. Actual results could differ from those estimates and those differences could be material. The following is a summary of significant accounting policies consistently followed by the Portfolios in the preparation of their financial statements.
Security valuation – A security listed or traded on U.S. exchanges is valued at its last sales price on the exchange where it is principally traded. In the absence of a current quotation, the security is valued at the mean between the last bid and asked prices on that exchange. Securities quoted on the National Association of Securities Dealers Automatic Quotation (NASDAQ) System, for which there have been sales, are valued at the NASDAQ official closing price. If there are no such sales, the most recent bid quotation is used. Securities traded over-the-counter (other than on NASDAQ) are valued at the last current sale price; and if there are no such sales, the most recent bid quotation is used. Equity securities primarily traded on a foreign exchange or market are valued daily at the price, which is an estimate of the fair value price, as provided by an independent pricing service. In the event market quotations are not readily available, for whose value does not reflect fair value because a significant valuation event has occurred, such securities are valued at fair value according to procedures established by the Board of Directors or as determined in good faith by the Pricing Committee, whose members include at least two representatives of the Adviser, one of whom is an officer of the Company, or by the Company’s Valuation Committee. Fair value is defined as the amount the owner of a security might reasonably expect to receive upon a current sale. Significant events may include, but are not limited to, the following: significant fluctuations in
Wilshire Mutual Funds, Inc. Notes to Financial Statements - (Continued) December 31, 2012 | |
domestic markets, foreign markets or foreign currencies; occurrences not directly tied to the securities markets such as natural disasters, armed conflicts or significant governmental actions; and major announcements affecting a single issuer or an entire market or market sector.
In accordance with the authoritative guidance on fair value measurements and disclosures under U.S. GAAP, the Portfolios disclose fair value of their investments in a hierarchy that prioritizes the inputs to valuation techniques used to measure the fair value. The objective of a fair value measurement is to determine the price that would be received to sell an asset or paid to transfer a liability in an orderly transaction between market participants at the measurement date (an exit price). Accordingly, the fair value hierarchy gives the highest priority to quoted prices (unadjusted) in active markets for identical assets or liabilities (Level 1) and the lowest priority to unobservable inputs (Level 3). The guidance establishes three levels of the fair value hierarchy as follows:
| | • | Level 1 – Unadjusted quoted prices in active markets for identical, unrestricted assets or liabilities that the Portfolios have the ability to access at the measurement date; |
| | • | Level 2 – Other significant observable inputs (including quoted prices for similar securities, interest rates, prepayment speeds, credit risk, referenced indices, quoted prices in inactive markets, adjusted quoted prices in active markets, etc.); and |
| | • | Level 3 – Prices, inputs or exotic modeling techniques which are both significant to the fair value measurement and unobservable (supported by little or no market activity). |
The inputs or methodology used for valuing securities are not necessarily an indication of the risk associated with investing in those securities. For the year ended December 31, 2012, there have been no significant changes to the Portfolios’ fair value methodologies and there have been no transfers between Level 1 and Level 2 assets and liabilities.
Fair value measurement classifications are summarized in each Portfolio’s Condensed Schedule of Investments, Schedule of Investments and/or Schedule of Securities Sold Short, as applicable.
Securities sold short – The Wilshire Large Cap Core Plus Fund engages in short selling. To complete a short sale transaction, the Portfolio must borrow the security to make delivery to the buyer. The Portfolio then is obligated to replace the security borrowed by purchasing the security at the market price at the time of replacement. The price at such time may be more or less than the price at which the security was sold by the Portfolio. Until the security is replaced, the Portfolio is required to pay to the lender amounts equal to any dividends or interest, which accrue during the period of the loan. To borrow the security, the Portfolio also may be required to pay a premium, which would increase the cost of the security sold. The Portfolio pays interest to the lender for borrowing the security. This amount is reflected as interest expense in the Statements of Operations.
Until the Portfolio closes its short position or replaces the borrowed security, the Portfolio will: (a) maintain a segregated account containing cash or liquid securities at such a level that (i) the amount deposited in the account plus the amount deposited with the custodian as collateral will equal the current value of the security sold short and (ii) the amount deposited in the segregated account as collateral will not be less than the market value of the security at the time the security was sold short; or (b) otherwise cover the Portfolio’s short position.
Wilshire Mutual Funds, Inc. Notes to Financial Statements - (Continued) December 31, 2012 | |
Dividends on short positions are recorded on the ex-dividend date as an expense on the Statements of Operations. Short sale transactions result in off-balance sheet risk because the ultimate obligation may exceed the amount shown in the Statements of Assets and Liabilities. The Portfolio will incur a loss if the price of the security increases between the date of the short sale and the date on which the Portfolio replaces the borrowed security. The Portfolio will realize a gain if the price of the security declines between those dates. Short selling involves the risk of a potentially unlimited increase in the market value of the security sold short, which could result in a potentially unlimited loss for the Portfolio.
Securities transactions and investment income – Securities transactions are recorded on a trade date basis. Realized gains and losses from securities transactions are recorded on the identified cost basis. Dividend income is recognized on the ex-dividend date and interest income, including, where applicable, accretion of discount and amortization of premium on investments, is recognized on the accrual basis from settlement date. Distributions received on securities that represent a return of capital or capital gain are reclassed as a reduction of cost of investments and/or as a realized gain. The actual character of income, realized gain and return of capital distributions received from Real Estate Investment Trusts (“REITs”) is not known until after the end of the fiscal year, at which time such distribution estimates are appropriately adjusted.
Expenses policy – Distribution and Service fees directly attributable to a class of shares are charged to that class’ operations. Expenses of the Portfolios other than Distribution and Service fees are prorated among the classes to which the expense relates based on the relative net assets of each class of shares. Expenses directly attributable to a Portfolio are charged to that Portfolio. Expenses not directly attributable to a Portfolio are allocated proportionately among all Portfolios daily in relation to the net assets of each Portfolio or another reasonable basis. Expenses which are attributable to the Company and the Wilshire Variable Insurance Trust are allocated across the Company and the Wilshire Variable Insurance Trust based upon relative net assets or another reasonable basis. Expenses and fees, including the advisory fees, are accrued daily and taken into account for the purpose of determining the net asset value of each Portfolio’s shares.
Investments in REITs – With respect to the Portfolios, dividend income is recorded based on the income included in distributions received from the REIT investments using published REIT reclassifications including some management estimates when actual amounts are not available. Distributions received in excess of these estimated amounts are recorded as a reduction of the cost of investments or reclassified to capital gains. The actual amounts of income, return of capital, and capital gains are only determined by each REIT after its fiscal year end, and may differ from the estimated amounts.
Distributions to shareholders – Distributions to shareholders are recorded on the ex-dividend date. Distributions from net investment income, if any, are declared and paid annually. The Portfolios’ net realized capital gains, unless offset by any available capital loss carryforward, are distributed to shareholders annually. Additional distributions of net investment income and capital gains may be made at the discretion of the Board of Directors in order to avoid the application of a 4% non-deductible Federal excise tax.
Wilshire Mutual Funds, Inc. Notes to Financial Statements - (Continued) December 31, 2012 | |
3. Investment Advisory Fee and Other Transactions.
Pursuant to the Advisory Agreement (the “Agreement”) between the Company and Wilshire Associates Incorporated (“Wilshire” or the “Adviser”), Wilshire charges annual fees of 0.75% of average daily net assets for the first $1 billion and 0.65% thereafter for the Large Company Growth Portfolio and Large Company Value Portfolio, 0.85% of average daily net assets for the first $1 billion and 0.75% thereafter for the Small Company Growth Portfolio and Small Company Value Portfolio, 0.10% of the average daily net assets for the first $1 billion and 0.07% thereafter for the Index Fund and 1.00% of the average daily net assets for the first $1 billion and 0.90% thereafter for the Large Cap Core Plus Fund. For the Wilshire Small Company Growth Portfolio and Wilshire Small Company Value Portfolio, Wilshire voluntarily agreed to limit Total Annual Portfolio Operating Expenses for the Institutional Class to 1.50% less an equivalent ratio of Investment Class share-specific expenses. These voluntary limits are expected to continue through December 31, 2013 and may be changed by Wilshire at any time, subject to approval by the Board of Directors. Wilshire will not seek recoupment from the Company for expenses previously waived or reimbursed for such Portfolios. Wilshire has entered into a contractual expense limitation agreement with the Wilshire Large Cap Core Plus Fund to waive a portion of its management fee and/or reimburse expenses to limit expenses (excluding taxes, brokerage expenses, dividend expenses on securities sold short, rebates on securities sold short, interest expense, and extraordinary expenses) to 1.50% and 1.25% of average daily net assets for Investment Class shares and Institutional Class shares, respectively. This agreement to limit expenses continues through at least April 30, 2014. Wilshire may recoup the amount of any management fee waived within three years after the year in which Wilshire incurred the expense if the recoupment does not exceed the existing expense limitation for the Wilshire Large Cap Core Plus Fund. At December 31, 2012, the amounts of waivers subject to recoupment for Wilshire Large Cap Core Plus Fund were $48,140 expiring in 2015, $75,863 expiring in 2014, $63,981, expiring in 2013. As of December 31, 2012, Wilshire had not recouped any management fees previously waived.
For the year ended December 31, 2012, Wilshire waived advisory fees as follows:
| | |
| Small Company Growth Portfolio | $34,426 | N/A |
| Small Company Value Portfolio | 30,950 | N/A |
| Wilshire Large Cap Core Plus Fund | 48,140 | 14,634 |
The Board of Directors of the Company has approved Los Angeles Capital Management and Equity Research, Inc. (“L.A. Capital”), Cornerstone Capital Management, Inc. (“Cornerstone”), Santa Barbara Asset Management, LLC (“Santa Barbara”), Pyramis Global Advisors, LLC (“Pyramis”), Victory Capital Management Inc. (“Victory”), Pzena Investment Management, LLC (“Pzena”), Acadian Asset Management, Inc. (“Acadian”), Systematic Financial Management, L.P. (“Systematic”), Ranger Investment Management, L.P. (“Ranger”), NWQ Investment Management Company, LP (“NWQ”), and TWIN Capital Management, Inc. (“TWIN”) (collectively the “Sub-Advisers”) to provide sub-advisory services with respect to the Portfolios. L.A. Capital, Cornerstone and Victory each manage a portion of the Large Company Growth Portfolio. Pzena, Acadian and Systematic each manage a portion of the Large Company Value Portfolio. L.A. Capital and Ranger each manage a portion of the Small Company Growth Portfolio. L.A. Capital and NWQ each manage a portion of the Small Company Value Portfolio. L.A. Capital is the sole sub-adviser
Wilshire Mutual Funds, Inc. Notes to Financial Statements - (Continued) December 31, 2012 | |
for the Wilshire 5000 IndexSM Fund. Pyramis, TWIN and Santa Barbara each manage a portion of the Wilshire Large Cap Core Plus Fund. As of December 31, 2012, Ranger and NWQ were allocated 0.00% of the assets of the Small Company Growth Portfolio and Small Company Value Portfolio, respectively.
Wilshire continues to oversee the Sub-Advisers. The fees of the Sub-Advisers are paid by Wilshire.
SEI Investments Global Funds Services (“SEI”) serves as the Company’s administrator and accounting agent pursuant to an administration agreement dated May 31, 2008. DST Systems, Inc. serves as the Company’s transfer agent and dividend disbursing agent. Effective June 10, 2011, The Northern Trust Company (“NTC”) serves as the Company’s custodian for all Portfolios. SEI Investments Distribution Co. serves as the Company’s distributor.
Officers’ and Directors’ Expenses – The officers of the Company are affiliated with and receive remuneration from the Adviser. The Company does not pay any remuneration to its officers. For the year ended December 31, 2012, the Company and Wilshire Variable Insurance Trust together paid each independent director an annual retainer of $14,000, an annual additional Board Chair retainer of $12,000, a Board in-person meeting fee of $1,500, a Board telephonic meeting fee of $1,000, an annual Committee Member retainer of $4,000, an annual Committee Chairperson retainer of $8,000 in lieu of the $4,000 Committee Member retainer, and a Committee telephonic meeting fee of $500.
4. Distribution Plan, Shareholder Services Plan and Fees Paid Indirectly.
The Directors of the Company have adopted shareholder services and/or distribution plans (the “Plans”) pursuant to Rule 12b-1 under the 1940 Act, with respect to the Investment Class Shares of each Portfolio and the Qualified Class Shares of the Wilshire 5000 IndexSM Fund. Under the Plans, each such Portfolio reimburses SEI Investments Distribution Co. (the “Distributor”), at an annual rate of up to 0.25% of the value of the average daily net assets attributable to the Investment Class Shares and Qualified Class Shares of each Portfolio for certain services provided by securities dealers or other financial intermediaries or for certain distribution expenses for the purpose of financing any activity intended to result in the sale of Investment Class Shares or Qualified Class Shares. For the year ended December 31, 2012, the distribution and service fee expenses incurred for each such class of the Large Company Growth Portfolio, Large Company Value Portfolio, Small Company Value Portfolio, Wilshire 5000 IndexSM Fund and Wilshire Large Cap Core Plus was 0.25% of the respective average net assets of each Portfolio. For the year ended December 31, 2012, the distribution and services fee expenses incurred for Investment Class Shares of the Small Company Growth Portfolio was 0.23% of its respective average net assets.
The Directors of the Company have adopted a shareholder services and distribution plan pursuant to Rule 12b-1 with respect to the Horace Mann Class Shares of the Wilshire 5000 IndexSM Fund. Under such Plan, the Company reimburses the Distributor for its shareholder service and distribution payments at an annual rate of up to 0.35% of the value of the average daily net assets of the Wilshire 5000 IndexSM Fund attributable to the Horace Mann Class Shares. For the year ended December 31, 2012, the distribution fees for the Horace Mann Class Shares were 0.29% of average net assets.
Wilshire Mutual Funds, Inc. Notes to Financial Statements - (Continued) December 31, 2012 | |
In addition, Investment Class Shares and Institutional Class Shares pay the expenses associated with certain shareholder servicing arrangements with third parties, provided that payment of such fees does not exceed in any year 0.20% and 0.15% for the Investment and Institutional Class Shares, respectively, of the average net assets of each class. For the year ended December 31, 2012, the net shareholder service provider fees were as follows (as a percent of average net assets of each class):
| | |
| Large Company Growth Portfolio | 0.09% | 0.05% |
| Large Company Value Portfolio | 0.04% | 0.08% |
| Small Company Growth Portfolio | 0.09% | 0.14% |
| Small Company Value Portfolio | 0.08% | 0.15% |
Wilshire 5000 IndexSM Fund | 0.06% | 0.07% |
| Wilshire Large Cap Core Plus Fund | 0.03% | 0.00% |
The Directors of the Company have adopted a shareholder services plan with respect to the Qualified Class Shares of the Wilshire 5000 IndexSM Fund which authorizes payments by the Qualified Class Shares of up to 0.15% of the average daily net assets attributable to the Portfolio’s Qualified Class Shares for certain shareholder services provided by insurers or other financial intermediaries. For the year ended December 31, 2012, there were no shareholder service provider fees for the Qualified Class Shares.
Fees paid indirectly – The Company has entered into a brokerage commission recapture program with the Distributor, pursuant to which a portion of the Portfolios’ commissions generated from transactions directed to the Distributor are used to reduce the Portfolios’ expenses. Under such program, the Distributor, as introducing broker, retains a portion of the Portfolios’ commissions.
Such commissions for the year ended December 31, 2012 were as follows:
| Wilshire Large Company Growth Portfolio | | $ | 3,202 | |
| Wilshire Large Company Value Portfolio | | | 4,969 | |
| Wilshire Small Company Growth Portfolio | | | 972 | |
| Wilshire Small Company Value Portfolio | | | 885 | |
Wilshire 5000 IndexSM Fund | | | 244 | |
| Wilshire Large Cap Core Plus Fund | | | 19,546 | |
Wilshire Mutual Funds, Inc. Notes to Financial Statements - (Continued) December 31, 2012 | |
5. Securities Transactions.
For the year ended December 31, 2012, aggregate cost of purchases and proceeds from sales of securities, other than short-term investments, short sales and purchases to cover, were as follows:
| | | | | | |
| Large Company Growth Portfolio | | $ | 128,885,640 | | | $ | 134,149,341 | |
| Large Company Value Portfolio | | | 45,676,522 | | | | 37,674,004 | |
| Small Company Growth Portfolio | | | 6,944,677 | | | | 7,434,056 | |
| Small Company Value Portfolio | | | 6,075,100 | | | | 6,603,016 | |
Wilshire 5000 IndexSM Fund | | | 2,877,552 | | | | 14,760,393 | |
| Wilshire Large Cap Core Plus Fund | | | 134,987,030 | | | | 159,661,717 | |
For Wilshire Large Cap Core Plus Fund, short sales and purchases to cover were $56,742,255 and $60,770,149, respectively.
6. Securities Lending.
The Portfolios may seek additional income by lending their securities on a short-term basis to banks, brokers and dealers in return for cash collateral, which is invested in short-term securities. A Portfolio may return a portion of the interest earned to the borrower or a third party which is unaffiliated with the Company and acting as a “placing broker.” A Portfolio receives compensation for lending securities in the form of fees. A Portfolio also continues to receive dividends on the securities loaned. Security loans are secured at all times by collateral. It is the Company’s policy that the collateral be equal to at least 102% of the market value of the securities loaned (105% if the collateral and securities loaned are denominated in different currencies) plus accrued interest when the transaction is entered into, and that the collateral supporting loans be valued daily. However, due to market fluctuations during the day, the value of securities loaned on a particular day may, during the course of the day, exceed the value of collateral. On each business day, the amount of collateral is adjusted based on the prior day’s market fluctuations and the current day’s lending activity. Gain or loss in the market price of the securities loaned that may occur during the term of the loan are reflected in the value of the Portfolio. The risks from securities lending are that the borrower may not provide additional collateral when required or return the securities when due or when called for by the Portfolio. Lending securities entails a risk of loss to the Portfolio if and to the extent that the market value of securities loans were to increase and the borrower did not increase the collateral accordingly, and the borrower fails to return the securities. NTC, the Portfolios’ custodian, acts as the securities lending agent for the Portfolios. The value of the securities on loan and the value of the related collateral at December 31, 2012 are shown on the Statement of Assets and Liabilities. The Northern Trust Institutional Liquid Asset Portfolio was purchased with proceeds from collateral received from securities on loan. At December 31, 2012, $26,397,533, $9,489,195, $3,153,425, $0, $15,766,844, and $27,847,290 of this cash equivalent represents the collateral received for securities on loan in the Wilshire Large Company Growth Portfolio, Wilshire Large Company Value Portfolio, Wilshire Small Company Growth Portfolio, Wilshire Small Company Value Portfolio, Wilshire 5000 Index Fund, and the Wilshire Large Cap Core Plus Fund, respectively.
Wilshire Mutual Funds, Inc. Notes to Financial Statements - (Continued) December 31, 2012 | |
7. Significant Shareholder Activity.
On December 31, 2012, the Portfolios had the following concentrations of shareholders holding 10% or more of the outstanding shares of the Portfolios. These represent omnibus shareholder accounts comprised of many individual shareholders.
| |
| Large Company Growth Portfolio (2 omnibus shareholders) | 56% |
| Large Company Value Portfolio (2 omnibus shareholder) | 82% |
| Small Company Growth Portfolio (2 omnibus shareholders) | 62% |
| Small Company Value Portfolio (3 omnibus shareholders) | 75% |
Wilshire 5000 IndexSM Fund (3 omnibus shareholders) | 64% |
| Wilshire Large Cap Core Plus Fund (2 omnibus shareholders) | 100% |
8. Tax Information.
No provision for federal income taxes is required because each Portfolio has qualified and intends to continue to qualify, as a regulated investment company under Subchapter M of the Internal Revenue Code of 1986, as amended, and distributes to shareholders all of its taxable income and gains. Federal income tax regulations differ from accounting principles generally accepted in the United States of America; therefore, distributions determined in accordance with tax regulations may differ in amount or character from net investment income and realized gains for financial reporting purposes. Financial reporting records are adjusted for permanent book/tax differences to reflect tax character. Financial records are not adjusted for temporary differences.
The Portfolios evaluate tax positions taken or expected to be taken in the course of preparing the Portfolios’ tax returns to determine whether it is “more-likely than-not” (i.e., greater than 50 percent) that each tax position will be sustained upon examination by a taxing authority based on the technical merits of the position. Tax positions not deemed to meet the more-likely-than-not threshold are recorded as a tax benefit or expense in the current year. The Portfolios did not record any tax provision in the current period. However, management’s conclusions regarding tax positions taken may be subject to review and adjustment at a later date based on factors including, but not limited to, examination by tax authorities (i.e., the last 3 tax year ends, as applicable), on-going analysis of and changes to tax laws, regulations and interpretations thereof.
Under current tax law, capital and specified losses realized after October 31 may be deferred and treated as occurring on the first day of the following fiscal year. For the year ended December 31, 2012, the following Portfolio had post-October capital loss deferrals as follows:
| | | |
| Wilshire Large Cap Core Plus Fund | | $ | 1,420,454 | |
Wilshire Mutual Funds, Inc. Notes to Financial Statements - (Continued) December 31, 2012 | |
The federal tax cost, unrealized appreciation and depreciation at December 31, 2012 for each Portfolio are as follows (excluding securities sold short):
| | | | | Aggregate Gross Unrealized Appreciation | | | Aggregate Gross Unrealized Depreciation | | | Net Unrealized Appreciation | |
| Large Company Growth Portfolio | | $ | 181,584,261 | | | $ | 37,388,343 | | | $ | (5,960,718 | ) | | $ | 31,427,625 | |
| Large Company Value Portfolio | | | 51,199,974 | | | | 5,734,652 | | | | (2,338,154 | ) | | | 3,396,498 | |
| Small Company Growth Portfolio | | | 9,609,559 | | | | 1,075,111 | | | | (271,359 | ) | | | 803,752 | |
| Small Company Value Portfolio | | | 8,610,737 | | | | 1,369,173 | | | | (294,268 | ) | | | 1,074,905 | |
Wilshire 5000 IndexSM Fund | | | 108,638,424 | | | | 75,877,208 | | | | (10,292,316 | ) | | | 65,584,892 | |
| Wilshire Large Cap Core Plus Fund | | | 205,315,580 | | | | 42,445,538 | | | | (10,458,393 | ) | | | 31,987,145 | |
The differences between book and tax-basis unrealized appreciation/(depreciation) are attributable primarily to the tax deferral of losses on wash sales and investment in passive foreign investment companies, straddles, constructive sales and 263(h) reclassifications.
Under the recently enacted Regulated Investment Company Modernization Act of 2010, the Portfolios will be permitted to carry forward capital losses incurred in taxable years beginning after December 22, 2010 for an unlimited period. However, any losses incurred during those future taxable years will be required to be utilized prior to the losses incurred in pre-enactment taxable years. As a result of this ordering rule, pre-enactment capital loss carryforwards may be more likely to expire unused. Additionally, post-enactment capital losses that are carried forward will retain their character as either short-term or long-term capital losses rather than being considered all short-term as under previous law.
The Portfolios intend to retain realized gains to the extent of available capital loss carryforwards. At December 31, 2012, the following Portfolios had available for federal income tax purposes unused capital losses as follows:
| | | | |
| | | | | | | | | | | | |
| Large Company Growth Portfolio | | $ | — | | | $ | — | | | $ | — | | | $ | — | |
| Large Company Value Portfolio | | | — | | | | 4,967,113 | | | | 6,732,491 | | | | — | |
| Small Company Growth Portfolio | | | — | | | | — | | | | 314,984 | | | | — | |
| Small Company Value Portfolio | | | — | | | | — | | | | 1,913,980 | | | | — | |
Wilshire 5000 IndexSM Fund | | | 108,266 | | | | 9,735,193 | | | | 30,139,484 | | | | 2,464 | |
During the year ended December 31, 2012, the Large Company Growth Portfolio, the Large Company Value Portfolio, the Small Company Growth Portfolio, the Small Company Value Portfolio, and the Wilshire 5000 IndexSM Fund utilized capital loss carryforwards of $8,205,794, $2,478,884, $561,132, $650,114, and $3,529,176, respectively, to offset capital gains. For the year ended December 31, 2012, the Wilshire 5000 IndexSM Fund had pre-enactment RIC modernization capital losses expire of $1,980,596.
Wilshire Mutual Funds, Inc. Notes to Financial Statements - (Continued) December 31, 2012 | |
The tax character of distributions declared during the years ended December 31, 2012 and 2011 were as follows:
| | | | | | | | | | | | | | | | | | |
| Large Company Growth Portfolio | | $ | 622,494 | | | $ | 5,560,769 | | | $ | — | | | $ | — | | | $ | — | | | $ | — | |
| Large Company Value Portfolio | | | 446,518 | | | | — | | | | — | | | | 266,100 | | | | — | | | | 708 | |
| Small Company Growth Portfolio | | | — | | | | — | | | | — | | | | — | | | | — | | | | — | |
| Small Company Value Portfolio | | | 123,102 | | | | — | | | | — | | | | 40,413 | | | | — | | | | — | |
Wilshire 5000 IndexSM Fund | | | 2,353,789 | | | | — | | | | — | | | | 2,077,943 | | | | — | | | | — | |
| Wilshire Large Cap Core Plus Fund | | | 1,718,664 | | | | 4,773,887 | | | | — | | | | 4,135,949 | | | | 2,022,548 | | | | — | |
At December 31, 2012, the components of distributable earnings/(accumulated losses) on a tax basis were as follows:
| | | Large Company Growth Portfolio | | | Large Company Value Portfolio | | | Small Company Growth Portfolio | | | Small Company Value Portfolio | | | | | | Wilshire Large Cap Core Plus Fund | |
| Undistributed ordinary income | | $ | 12,246 | | | $ | 6,459 | | | $ | 42,276 | | | $ | 12,445 | | | $ | 461,743 | | | $ | — | |
| Undistributed long-term capital gain | | | 3,138,168 | | | | — | | | | — | | | | — | | | | — | | | | 1,031,307 | |
| Capital loss carryforwards | | | — | | | | (11,699,604 | ) | | | (314,984 | ) | | | (1,913,980 | ) | | | (39,985,407 | ) | | | — | |
| Post October losses | | | — | | | | — | | | | — | | | | — | | | | — | | | | (1,420,454 | ) |
| Unrealized appreciation | | | 31,427,625 | | | | 3,396,498 | | | | 803,752 | | | | 1,074,905 | | | | 65,584,892 | | | | 29,086,808 | |
| Other temporary differences | | | — | | | | (1 | ) | | | (1 | ) | | | 3 | | | | — | | | | — | |
| Total distributable earnings/ (accumulated losses) | | $ | 34,578,039 | | | $ | (8,296,648 | ) | | $ | 531,043 | | | $ | (826,627 | ) | | $ | 26,061,228 | | | $ | 28,697,661 | |
9. Reclassifications
Accounting principles generally accepted in the United States of America require that certain components of net assets be reclassified between financial and tax reporting. The reclassifications primarily include investments in real estate investment trusts, sales of passive foreign investment companies, investments in Master Limited Partnerships, investment in Grantor Trusts and expiration of capital loss carryforwards. These reclassifications have no effect on net assets or net asset values per share. As of December 31, 2012, the reclassifications were as follows:
| | | | | Increase/(Decrease) Undistributed Investment Income | | | Increase/(Decrease) Net Realized Capital Gains/(Losses) | |
| Large Company Growth Portfolio | | $ | — | | | $ | 11,363 | | | $ | (11,363 | ) |
| Large Company Value Portfolio | | | — | | | | 5,857 | | | | (5,857 | ) |
| Small Company Growth Portfolio | | | — | | | | 4,699 | | | | (4,699 | ) |
| Small Company Value Portfolio | | | — | | | | 11,935 | | | | (11,935 | ) |
Wilshire 5000 IndexSM Fund | | | (1,980,596 | ) | | | 39,901 | | | | 1,940,695 | |
| Wilshire Large Cap Core Plus Fund | | | — | | | | 444,466 | | | | (444,466 | ) |
Wilshire Mutual Funds, Inc. Notes to Financial Statements - (Continued) December 31, 2012 | |
10. Indemnifications
In the normal course of business, the Company, on behalf of the Portfolios, enters into contracts that provide general indemnifications. The Portfolios’ maximum exposure under these arrangements is dependent on claims that may be made against the Portfolios in the future and, therefore, cannot be estimated; however, based on experience, the risk of material loss from such claims is considered remote.
11. Contingencies
The Wilshire 5000 Index Fund was named as a defendant and a putative member of a proposed defendant class of shareholders in a lawsuit filed on December 7, 2010, in the U.S. Bankruptcy Court for the District of Delaware and on March 6, 2012, in the District Court for the Southern District of New York, in connection with Tribune Company’s Chapter 11 bankruptcy proceeding. The 2010 lawsuit was brought by the official Committee of Unsecured Creditors of the Tribune Company and the 2012 lawsuit was brought by Deutsche Bank, as trustee for senior noteholders of Tribune Company. Both lawsuits relate to a leveraged buyout transaction by which Tribune Company converted to a privately-held company in 2007 less than a year prior to Tribune Company’s bankruptcy filing. The putative defendant class is comprised of beneficial owners of shares of Tribune Company who meet certain jurisdictional requirements and received proceeds of the leveraged buyout. The plaintiffs seek to recover those proceeds, together with interest and attorneys’ fees and expenses, as fraudulent transfers under the Bankruptcy Act or various state laws, respectively. The Adviser does not expect the Portfolio to be materially impacted by the lawsuits.
12. Recent Accounting Pronouncement
In December 2011, the Financial Accounting Standards Board issued a further update to the guidance “Balance Sheet — Disclosures about Offsetting Assets and Liabilities”. The amendments to this standard require an entity to disclose information about offsetting and related arrangements to enable users of its financial statements to understand the effect of those arrangements on its financial position. The amended guidance is effective for interim and annual reporting periods beginning after January 1, 2013. At this time, management is evaluating the implications of this update and its impact on the financial statements has not been determined.
13. Subsequent Event Evaluation.
The Portfolios have evaluated the need for additional disclosures resulting from subsequent events as follows: Effective on or about March 24, 2013, the Wilshire Large Cap Core Plus Fund will be restructured and the Fund’s name will change to the Wilshire International Equity Fund. As a result of the restructuring, the Fund’s principal investment strategy will be changed to allow the Fund to invest in equity securities of companies, wherever organized, which do business primarily outside the United States. The Fund’s subadvisers and benchmark will also change in connection with the restructuring. Based on this evaluation, no additional disclosures or adjustments were required to the financial statements.
Wilshire Mutual Funds, Inc. Report of Independent Registered Public Accounting Firm | |
To the Board of Directors Wilshire Mutual Funds, Inc. and the Shareholders of
Large Company Growth Portfolio, Large Company Value Portfolio, Small Company Growth Portfolio,
Small Company Value Portfolio, Wilshire 5000 IndexSM Fund and Wilshire Large Cap Core Plus Fund:
In our opinion, the accompanying statements of assets and liabilities, including the condensed schedules of investments of Large Company Growth Portfolio, Large Company Value Portfolio, Small Company Growth Portfolio, Small Company Value Portfolio and Wilshire 5000 IndexSM Fund and the schedule of investments of Wilshire Large Cap Core Plus Fund and the schedule of securities sold short of Wilshire Large Cap Core Plus Fund (six portfolios/funds constituting the Wilshire Mutual Funds, Inc., hereafter referred to as the “Portfolios”) and the related statements of operations, of changes in net assets, of cash flows of the Wilshire Large Cap Core Plus Fund and the financial highlights present fairly, in all material respects, the financial position of the Portfolios at December 31, 2012 and the results of each of their operations for the year then ended, the changes in each of their net assets for each of the two years in the period then ended, the cash flows of Wilshire Large Cap Core Plus Fund, for the year then ended, and each of their financial highlights for each of the five years in the period ended, in conformity with accounting principles generally accepted in the United States of America. These financial statements and financial highlights (hereafter referred to as “financial statements”) are the responsibility of the Portfolios’ management; our responsibility is to express an opinion on these financial statements based on our audits. We conducted our audits of these financial statements in accordance with the standards of the Public Company Accounting Oversight Board (United States). Those standards require that we plan and perform the audit to obtain reasonable assurance about whether the financial statements are free of material misstatement. An audit includes examining, on a test basis, evidence supporting the amounts and disclosures in the financial statements, assessing the accounting principles used and significant estimates made by management, and evaluating the overall financial statement presentation. We believe that our audits, which included confirmation of securities at December 31, 2012 by correspondence with the custodian and brokers, provide a reasonable basis for our opinion.
PricewaterhouseCoopers LLP
Philadelphia, Pennsylvania
February 28, 2013
Wilshire Mutual Funds, Inc. Additional Fund Information | |
The Board of Directors has responsibility for the overall management and operations of the Company. The Board establishes the Company’s policies and meets regularly to review the activities of the officers, who are responsible for the day-to-day operations of the Company.
Set forth below are the names of the Directors and executive officers of the Company, their ages, positions and terms of office, their principal occupations during the past five years, and other directorships held by them. The address of each Director and Officer is 1299 Ocean Avenue, Suite 700, Santa Monica, California 90401.
| Name and Age | Position Held with the Company | Term of Office(1) and Length of Time Served | Principal Occupations During the Past Five Years | Number of Funds/ Funds in Complex Overseen by Director | Other Directorships Held by Director |
| INTERESTED DIRECTOR |
Victor Zhang, 40(2) | Vice President Director | Since 2009 Since 2012 | President, Wilshire Funds Management, Head of Investments, Wilshire Associates Incorporated, (Since 2006); Director of Investments, Harris myCFO Investment Advisory Services, LLC (2001 to 2006). | 6 | Wilshire Associates Incorporated; Guggenheim Beta Plus Solution Fund SPC; Wilshire Institutional Master Fund SPC; Wilshire Institutional Master Fund II SPC |
Wilshire Mutual Funds, Inc. Additional Fund Information - (Continued) | |
| Name and Age | Position Held with the Company | Term of Office(1) and Length of Time Served | Principal Occupations During the Past Five Years | Number of Funds/ Funds in Complex Overseen by Director | Other Directorships Held by Director |
| NON-INTERESTED DIRECTORS |
| Margaret M. Cannella, 61 | Director | Since 2011 | Adjunct Professor, Columbia Business School. Formerly, Managing Director, Head, Global Credit Research and Corporate Strategy, JPMorgan Securities, Inc. and Managing Director, Head US Corporate Research, JP Morgan Securities, Inc. | 15 | Wilshire Variable Insurance Trust, Inc. (9 Funds); Schroder Series Trust; Schroder Global Series Trust; Schroder Capital Funds (Delaware); CHF Finance International (for profit joint venture of the World Bank and CHF); Advanced Pierre Foods; Princeton-in-Asia |
| | | | | | |
| Roger A. Formisano, 64 | Director | Since 2006 | Vice President, University Medical Foundation, 2006- Present; formerly Director, The Center for Leadership and Applied Business, UW-Madison School of Business; Principal, R.A. Formisano & Company, LLC | 15 | Integrity Mutual Insurance Company, Wilshire Variable Insurance Trust (9 Funds) |
| | | | | | |
| Edward Gubman, 61 | Director | Since 2011 | Founder and Principal, Strategic Talent Solutions | 15 | Wilshire Variable Insurance Trust (9 Funds) |
| | | | | | |
| Suanne K. Luhn, 58 | Director | Since 2008 | Retired; formerly Chief Compliance Officer, Bahl & Gaynor (investment adviser) (1990 to 2006) | 15 | Wilshire Variable Insurance Trust (9 Funds) |
| | | | | | |
| George J. Zock, 62 | Director, Chairman of the Board | Since 2006 | Independent Consultant; Consultant, Horace Mann Service Corporation (2004 to 2005); Executive Vice President, Horace Mann Life Insurance Company and Horace Mann Service Corporation (1997 to 2003). | 15 | Wilshire Variable Insurance Trust (9 Funds) |
Wilshire Mutual Funds, Inc. Additional Fund Information - (Continued) | |
| Name and Age | Position Held with the Company | Term of Office(1) and Length of Time Served | Principal Occupations During the Past Five Years | Number of Funds/ Funds in Complex Overseen by Director | Other Directorships Held by Director |
| OFFICERS |
| Jason Schwarz, 38 | President | Since 2012 | Managing Director, Wilshire Associates Incorporated (Since 2005); Head of Wilshire Funds Management’s Client Service, Sales, Marketing and Distribution functions (Since 2005). | N/A | N/A |
| | | | | | |
| Reena S. Lalji, 41 | Secretary | Since 2009 | Managing Director and General Counsel, Wilshire Associates Incorporated (Since 2009); Senior Counsel, Royal Bank of Canada (2003 – 2008) | N/A | N/A |
| | | | | | |
| James E. St. Aubin, 35 | Vice President | Since 2009 | Senior Portfolio Manager in Wilshire's Funds Management Group. 2004 – 2008, Senior Consultant at Ibbotson Associates – a division Morningstar Inc. | N/A | N/A |
| | | | | | |
| Helen Thompson, 45 | Chief Compliance Officer Vice President | Since 2013 Since 2008 | Managing Director, Wilshire Associates Incorporated (since 2003); Associate Director, First Quadrant, L.P. (2001 to 2003); Chief Compliance Officer, Financial Controller, Company Secretary, Associate Director (1996 to 2003), First Quadrant Limited | N/A | N/A |
| | | | | | |
| Michael Wauters, 47 | Treasurer | Since 2009 | Chief Financial Officer, Wilshire Associates Incorporated (since 2009); Assistant Vice President- Financial Operations, Pacific Life Insurance Company (2000-2009) | N/A | N/A |
Wilshire Mutual Funds, Inc. Additional Fund Information - (Continued) | |
| Name and Age | Position Held with the Company | Term of Office(1) and Length of Time Served | Principal Occupations During the Past Five Years | Number of Funds/ Funds in Complex Overseen by Director | Other Directorships Held by Director |
| OFFICERS |
| Nathan R. Palmer, 37 | Vice President | Since 2011 | Vice President, Wilshire Funds Management (since 2011); Senior Investment Management Associate, Convergent Wealth Advisors (2009 to 2010); Director of Public Markets, Investment Office, California Institute of Technology (2008 to 2009); Treasury Manager, Retirement Investments, Intel Corporation (2004 to 2008). | N/A | N/A |
| (1) | Each director serves until the next shareholders’ meeting (and until the election and qualification of a successor), or until death, resignation, removal or retirement which takes effect no later than May 1 following his or her 70th birthday. Officers are elected by the board on an annual basis to serve until their successors have been elected and qualified. |
| | |
| (2) | Mr. Zhang is an interested person because of his position with the company’s investment adviser, Wilshire Associates Incorporated. |
The Company’s Statement of Additional Information includes additional information about the Directors of the Company and is available, without charge, upon request, by calling 1-888-200-6796.
Wilshire Mutual Funds, Inc. Additional Fund Information - (Continued) | |
Information on Proxy Voting
The Securities and Exchange Commission (“SEC”) has adopted the requirement that all funds file their complete proxy voting records with the SEC on an annual basis on Form N-PX. Such filing, for the 12-month period ended June 30, must be made no later than August 31 of each year.
A description of policies and procedures that the Portfolios use to determine how to vote proxies relating to portfolio securities, along with each Portfolio’s proxy voting record relating to portfolio securities held during most recent 12-month period ended June 30 is available at no charge, upon request by calling 1-888-200-6796, by e-mailing us at http://advisor.wilshire.com or on the SEC’s website at http://www.sec.gov.
Information on Form N-Q
The Company files its complete schedule of portfolio holdings with the SEC for the first and third quarters of each fiscal year on Form N-Q within sixty days after the end of period. The Company’s Forms N-Q are available on the SEC’s website at http://www.sec.gov, and may be reviewed and copied at the SEC’s Public Reference Room in Washington, DC. Information on the operation of the Public Reference Room may be obtained by calling 1-202-551-8090.
Householding Policy
In order to reduce printing and mailing expenses, only one copy of each prospectus, annual and semi-annual report will be sent to all related accounts at a common address, unless you have indicated otherwise on your Account Application. Shareholders may revoke their consent to householding at any time by calling 1-888-200-6796. Upon receipt of a shareholder’s revocation, the Company will begin mailing individual copies of the above-referenced documents to the shareholder’s attention within 30 days.
Wilshire Mutual Funds, Inc. Tax Information - (Unaudited) | |
Of the distributions made by the following Portfolios, the corresponding percentage represents the amount of each distribution which will qualify for the dividends received deduction available to corporate shareholders:
| |
| Large Company Growth Portfolio | 100.00% |
| Large Company Value Portfolio | 100.00% |
| Small Company Growth Portfolio | 0.00% |
| Small Company Value Portfolio | 100.00% |
Wilshire 5000 IndexSM Fund | 100.00% |
| Wilshire Large Cap Core Plus Fund | 100.00% |
Pursuant to the Jobs and Growth Tax Relief Reconciliation Act of 2003, and as extended by Tax Relief, Unemployment Insurance Reauthorization and Jobs Creation Act of 2010, the Portfolios listed below designate the following percentages of their income dividends distributed in 2012 as qualified dividend income as defined in Section 1(h)(II) of the Internal Revenue Code.
| |
| Large Company Growth Portfolio | 100.00% |
| Large Company Value Portfolio | 100.00% |
| Small Company Growth Portfolio | 0.00% |
| Small Company Value Portfolio | 100.00% |
Wilshire 5000 IndexSM Fund | 100.00% |
| Wilshire Large Cap Core Plus Fund | 100.00% |
Pursuant to the American Jobs Creation Act of 2004, and as extended by Tax Relief, Unemployment Insurance Reauthorization and Jobs Creation Act of 2010, the Funds listed below designate the following percentages of income distributions as qualified interest income that is exempt from U.S. withholding tax when paid to foreign investors.
| |
| Large Company Growth Portfolio | 0.00% |
| Large Company Value Portfolio | 0.00% |
| Small Company Growth Portfolio | 0.00% |
| Small Company Value Portfolio | 0.00% |
Wilshire 5000 IndexSM Fund | 0.00% |
| Wilshire Large Cap Core Plus Fund | 0.00% |
Wilshire Mutual Funds, Inc. Tax Information - (Unaudited) (Continued) | |
Pursuant to the American Jobs Creation Act of 2004, and as extended by Tax Relief, Unemployment Insurance Reauthorization and Jobs Creation Act of 2010, the Funds listed below designate the following percentages of short-term capital gain distributions as qualified short-term capital gain that is exempt from U.S. withholding tax when paid to foreign investors.
| |
| Large Company Growth Portfolio | 0.00% |
| Large Company Value Portfolio | 0.00% |
| Small Company Growth Portfolio | 0.00% |
| Small Company Value Portfolio | 0.00% |
Wilshire 5000 IndexSM Fund | 0.00% |
| Wilshire Large Cap Core Plus Fund | 0.00% |
Wilshire Mutual Funds, Inc. Board Approval of Advisory and Subadvisory Agreements | |
During the six months ended December 31, 2012, the Board of Directors (the “Board”) of Wilshire Mutual Funds, Inc. (the “Company”) approved the renewal for an additional one-year term of the Company’s advisory agreement (the “Advisory Agreement”) with Wilshire Associates Incorporated (“Wilshire” or the “Adviser”) with respect to each of the Large Company Growth Portfolio, Large Company Value Portfolio, Small Company Growth Portfolio, Small Company Value Portfolio, Wilshire 5000 Index Fund and Wilshire Large Cap Core Plus Fund (the “Funds”). The Board also approved the renewal for additional one-year terms of Wilshire’s subadvisory agreements with each of the following subadvisers: Acadian Asset Management, Inc. (“Acadian”) with respect to the Large Company Value Portfolio, Cornerstone Capital Management, Inc. (“Cornerstone”) with respect to the Large Company Growth Portfolio, Los Angeles Capital Management and Equity Research, Inc. (“LA Capital”) with respect to each of the Small Company Value Portfolio, Small Company Growth Portfolio, Large Company Growth Portfolio and Wilshire 5000 Index Fund, NWQ Investment Management Company, LLC (“NWQ”) with respect to the Small Company Value Portfolio, Pyramis Global Advisors, LLC (“Pyramis”) with respect to the Wilshire Large Cap Core Plus Fund, Pzena Investment Management, LLC (“Pzena”) with respect to the Large Company Value Portfolio, Ranger Investment Management, L.P. (“Ranger”) with respect to the Small Company Growth Portfolio, Santa Barbara Asset Management, LLC (“Santa Barbara”) with respect to the Wilshire Large Cap Core Plus Fund, Systematic Financial Management, L.P. (“Systematic”) with respect to the Wilshire Large Company Value Portfolio, TWIN Capital Management, Inc. (“TWIN”) with respect to the Wilshire Large Cap Core Plus Fund, and Victory Capital Management, Inc. (“Victory”) with respect to the Wilshire Large Company Growth Portfolio. In the following text, the subadvisers are referred to as “Subadvisers” and the subadvisory agreements between Wilshire and each Subadviser are referred to as “Subadvisory Agreements.”
The information in this summary outlines the Board’s considerations associated with its approval of the Advisory Agreement and each of the Subadvisory Agreements. In connection with its deliberations regarding the continuation of these relationships, the Board considered such information and factors as it believed to be relevant. As described below, the Board considered the nature, extent and quality of the services performed by Wilshire and the Subadvisers under the advisory arrangements; with respect to Wilshire, comparative fees and expense ratios; the profits to be realized by Wilshire and the Subadvisers; the extent to which Wilshire and the Subadvisers realize economies of scale as a Fund grows; and whether any fall-out benefits are being realized by Wilshire and the Subadvisers. In considering these matters, the Board was advised with respect to relevant legal standards by independent counsel. In addition, the Directors who are not “interested persons” of the Company as defined in the Investment Company Act of 1940 (the “Independent Directors”) met with counsel in private sessions at which no representatives of Wilshire were present and discussed the approval of the Subadvisory Agreements with management and in private sessions with counsel at which no representatives of the Subadvisers were present.
As required by the Investment Company Act of 1940, each approval was confirmed by the separate vote of the Independent Directors. In deciding to approve the Advisory and Subadvisory Agreements, the Board did not identify any single factor as controlling and this summary does not describe all of the matters considered. However, the Board concluded that each of the various factors referred to below favored such approval.
Wilshire Mutual Funds, Inc. Board Approval of Advisory and Subadvisory Agreements - (Continued) | |
Information Requested and Received
The Board, including all the Independent Directors, considered the renewal of the Subadvisory Agreements pursuant to a process that concluded at the Board’s August 24, 2012 meeting and the renewal of the Advisory Agreement pursuant to a process that concluded at the Board’s November 30, 2012 meeting, in each case following an extensive process. At the direction of the Independent Directors, counsel to the Company and the Independent Directors sent memoranda to the Adviser requesting information regarding the Subadvisory Agreements and the Advisory Agreement to be provided to the Directors in advance of meetings of the Independent Directors held on August 24, 2012 and November 30, 2012, respectively.
In response to the requests for information, the Directors received information from the Adviser as to each of the Funds describing: (i) the nature, extent and quality of services provided; (ii) the investment performance of each Fund as provided by Wilshire based upon data gathered from the Morningstar Direct database (“Morningstar”), along with the comparison to its benchmark index; (iii) the costs of services provided and estimated profits realized by the Adviser; (iv) the extent to which economies of scale are realized as a Fund grows; (v) whether fee levels reflect any possible economies of scale for the benefit of Fund shareholders; (vi) comparisons of services rendered and amounts paid by other registered investment companies as provided by Wilshire based upon data gathered from Morningstar; and (vii) benefits realized by the Adviser from its relationship with each Fund. The Directors received information from the Adviser regarding the factors underlying the recommendations to approve each Subadvisory Agreement. The Directors also received information from each Subadviser as to each Fund it managed describing: (i) the nature, extent and quality of services provided, (ii) the investment performance of the Subadviser in connection with the Fund; (iii) the financial condition of the Subadviser, (iv) the extent to which economies of scale are realized as a Fund grows, (v) whether fee levels reflect any possible economies of scale for the benefit of Fund shareholders, (vi) comparisons of services rendered and amounts paid by other registered investment companies and any comparable advisory clients, and (vii) benefits realized by the Subadviser from its relationship with the Fund. At each meeting, the Independent Directors also received a memorandum from counsel describing their duties in connection with contract approvals, and they were assisted in their review by independent legal counsel.
As a part of its evaluation, the Board considered the assessment of performance made by the Investment Committee (which is comprised solely of Independent Directors), which met on August 23, 2012 and November 30, 2012, respectively, to review the data Wilshire had prepared on performance and on the Subadvisers’ performance. Based upon its evaluation of all materials provided, the Board concluded that it was in the best interests of each Fund to renew the Advisory and Subadvisory Agreements.
Nature, Extent and Quality of Services – Wilshire
With respect to the nature, extent and quality of services provided by the Adviser, the Board reviewed the functions performed by the Adviser. The Board considered the experience and skills of the senior management leading fund operations, the experience and skills of the personnel performing the functions under the Advisory Agreement and the resources made available to such personnel. The Board considered the recent transition in senior management personnel and determined that the current personnel had the requisite skill sets. The Board also considered the compliance program established by the Adviser and the level of compliance maintained for the Funds. The Board reviewed the processes used by the Adviser to select, monitor and replace subadvisers, which system appeared
Wilshire Mutual Funds, Inc. Board Approval of Advisory and Subadvisory Agreements - (Continued) | |
to be reasonable. The Board concluded that the Adviser was successful in negotiating favorable subadvisory agreements on behalf of the Funds. The Board concluded that the Adviser had a robust system in place for selecting, monitoring and terminating subadvisers. The Board also reviewed the Adviser’s financial condition, and considered the financial support provided by the Adviser to the Small Company Growth and Small Company Value Portfolios through voluntary expense caps and to the Wilshire Large Cap Core Plus Fund through an expense limitation agreement. Based upon all relevant factors, the Board concluded that the nature, quality and extent of the services provided by the Adviser to each Fund support renewal of the contract.
The Board reviewed information on the performance of each Fund for the annualized one-, three, five- and ten-year periods ended September 30, 2012, as applicable, along with performance information of a peer group of funds determined by Wilshire based upon the Morningstar database and in comparison to its benchmark for the same periods. For the Large Company Growth Portfolio, the Board noted that the Fund outperformed the median of its peer group for all time periods and the benchmark for the one-year period. For the Large Company Value Portfolio, the Board noted that although the Fund underperformed the median of its peer group for the three-, five- and 10 year periods and its benchmark for the one-, three-, five- and ten-year periods, the Board took into consideration the Fund’s outperformance relative to the median of its benchmark for the one-year period. For the Small Company Growth Portfolio, the Board noted that the Fund outperformed the median of its peer group for the one-, three- and five-year periods and its benchmark for the three-year period, and that the Fund’s performance was competitive to its peer group for the ten-year period. For the Small Company Value Portfolio, the Board noted that, although the Fund underperformed the median of its peer group during the five- and ten-year periods and benchmark for the one-, three-, five- and ten-year periods, it outperformed the median of its peer group for the one-year period and its performance was competitive relative to its peer group for the three-year period. For the Wilshire 5000 Index Fund, the Board noted the competitive levels of performance as compared to the median of its peer group and its benchmark for the one-year period. Although performance for longer periods was below the median of the peer group, the Board noted that the small size of the Fund contributed to that ranking. For the Wilshire Large Cap Core Plus Fund, the Board noted that the Fund outperformed the median of its peer group for the one-year period and its performance was competitive relative to the median of its peer group for the three-year period, although the Fund underperformed its benchmark for the one- and three-year periods. Based upon the above, the Board determined that for each Fund performance was satisfactory.
Advisory Fees
The Board reviewed each Fund’s advisory fee and total expense ratio and reviewed information comparing the advisory fee and total expense ratio to those of the peer group of funds. The Board determined that the actual advisory fee paid for each Fund was within a competitive range. As to total expenses, the Board noted that total expenses are influenced by the small size of the complex. The Board received information regarding contractual fees charged by the Adviser to other registered investment companies advised by the Adviser that were similar to certain Funds and determined such fees were comparable to those of the applicable Funds. The Board concluded that the advisory fee for each Fund was reasonable and appropriate in amount.
Wilshire Mutual Funds, Inc. Board Approval of Advisory and Subadvisory Agreements - (Continued) | |
Profitability to Wilshire and Economies of Scale
With respect to the profitability of the Advisory Agreement, the Board primarily considered the fee structure of the Advisory Agreement, including the costs of the services provided and the profits realized by the Adviser from its relationship with the Funds. The Board concluded that the profits realized by the Adviser were reasonable in comparison with the costs of providing investment advisory services to the Funds. In addition, the Board considered the extent to which economies of scale are realized as the Funds grow and whether fee levels reasonably reflect economies of scale for the benefit of shareholders. The Board reviewed each Fund’s asset size, each Fund’s expense ratio, the voluntary expense caps in place for the Small Company Growth and Small Company Value Portfolios, the expense limitation agreement in place for the Wilshire Large Cap Core Plus Fund and whether the investment process produced economies of scale. The Board noted that the advisory fee for all Funds includes a breakpoint. The Board concluded that each Fund’s advisory fee reasonably reflected appropriate recognition of any economies of scale.
Fall-Out Benefits – Wilshire
The Board considered the nature and amount of any benefits derived by the Adviser from its relationship with the Funds. The Board determined that the advisory fees were reasonable in light of these fall-out benefits.
Nature, Extent and Quality of Services – Subadvisers
As to each Subadvisory Agreement, the Board considered the nature, extent and quality of services provided. The Board considered the reputation, qualifications and background of the Subadviser, investment approach of the Subadviser, the experience and skills of investment personnel responsible for the day-to-day management of each Fund, and the resources made available to such personnel. The Board also considered the Subadviser’s compliance with investment policies and general legal compliance. In addition, the Board considered the analysis provided by the Adviser, which concluded that each Subadviser was providing or would provide reasonable services and recommended that each Subadvisory Agreement for each Fund be renewed.
The Board reviewed information comparing each Subadviser’s gross investment performance to a relevant benchmark. Based upon all relevant factors, the Board determined to approve the Subadvisory Agreement with Acadian, with respect to the Large Company Value Portfolio, noting that Acadian outperformed for the annualized one- and three-year periods ended June 30, 2012. The Board concluded that the investment performance of Cornerstone, with respect to the Large Company Growth Portfolio, met acceptable levels of investment performance for the year-to-date period ended June 30, 2012, and therefore, was satisfactory. With respect to the Small Company Growth Portfolio, the Board noted LA Capital’s outperformance for the annualized one-, three-, five- and ten-year periods ended June 30, 2012. With respect to the Large Company Growth Portfolio, the Board noted LA Capital’s outperformance for the annualized one- and three-year periods ended June 30, 2012. With respect to the Small Company Value Portfolio, the Board determined that although LA Capital underperformed for the annualized one and five-year periods ended June 30, 2012, outperformance for the annualized three- and ten-year periods ended June 30, 2012 resulted in a conclusion that performance was satisfactory. The Board considered that NWQ and Ranger currently have been allocated 0% of the Small Company Value Portfolio and Small Company Growth Portfolio’s assets, respectively, due to the small size of each Fund and determined to approve each Subadvisory Agreement based on the Adviser’s recommendation. The Board noted that Pzena, with respect to the Large Company Value Portfolio, had underperformed for all periods reviewed but considered
Wilshire Mutual Funds, Inc. Board Approval of Advisory and Subadvisory Agreements - (Continued) | |
that the Adviser is satisfied with the level of services provided based upon its assessment that performance is within expectations given Pzena’s investment style, and that the Adviser has committed to monitor Pzena’s performance. With respect to Victory’s performance for the Large Company Growth Portfolio, the Board noted Victory’s outperformance for the annualized three-year period ended June 30, 2012. With respect to Systematic’s performance for the Large Company Value Portfolio, the Board noted underperformance for the annualized one- and three-year periods ended June 30, 2012, but outperformance for the year-to-date period ended June 30, 2012, which resulted in a conclusion that performance was satisfactory. With respect to the Wilshire 5000 Index Fund, the Board noted LA Capital’s underperformance for most periods reviewed but considered LA Capital’s outperformance for the annualized three-year period ended June 30, 2012, that the Adviser is satisfied with the level of services provided and performance is within the Adviser’s expectations. With respect to the Wilshire Large Cap Core Plus Fund, the Board noted that TWIN and Pyramis underperformed for the annualized one- and three-year periods ended June 30, 2012. The Board concluded it was appropriate to approve the continuation of TWIN’s Subadvisory Agreement due to the Adviser’s satisfaction with the level of services provided given TWIN’s investment style. The Board also concluded that it was appropriate to approve the continuation of Pyramis’ Subadvisory Agreement given improved recent performance and the Adviser’s recommendation of approval and its commitment to monitor underperformance. The Board determined that Santa Barbara’s performance with respect to the Wilshire Large Cap Core Plus Fund was too new to judge, and, therefore, it was appropriate to approve continuation of the Subadvisory Agreement.
Subadvisory Fees
The Board considered each Fund’s subadvisory fees. The Board evaluated the competitiveness of the subadvisory fees based upon data supplied by each Subadviser about the fees charged to other clients. The Board also considered that the subadvisory fee rates were negotiated at arm’s length between the Adviser and each Subadviser, that the Adviser compensates the Subadviser from its fees and that the aggregate advisory fee had been deemed reasonable by the Board.
For the Subadvisers that reported fees for “Other Clients” with comparable investment policies and services, the Board noted that most Subadvisers did not charge higher fees to the Adviser for the Funds than were charged to their Other Clients. For the Subadvisers where the fees charged to the Adviser were higher than that charged to Other Clients, the Board determined that the fees charged to the Adviser were competitive.
Based upon all of the above, the Board determined that the subadvisory fees for each Fund were reasonable.
Profitability to the Subadvisers
The Board noted that the Adviser compensates each Subadviser from its own advisory fees and that the fees were negotiated at arm’s length between the Adviser and each Subadviser. In addition, the Board noted that the revenues to the various Subadvisers were limited due to the size of the Funds. The Board took these factors into consideration in concluding that the subadvisory fees were reasonable.
Wilshire Mutual Funds, Inc. Board Approval of Advisory and Subadvisory Agreements - (Continued) | |
Economies of Scale – Subadvisers
The Board considered whether there are or may be economies of scale with respect to the subadvisory services provided to each Fund and whether the subadvisory fees reflect such economies of scale through breakpoints in fees. The Board also considered whether the effective subadvisory fee rate for each Fund under the Subadvisory Agreement is reasonable in relation to the asset size of such Fund. The Board concluded that the fee schedule for each Fund reflects an appropriate recognition of any economies of scale.
Fall-Out Benefits – Subadvisers
The Board also considered the character and amount of other incidental benefits received or to be received by each Subadviser. The Board considered each Subadviser’s soft dollar practices. The Board concluded that, taking into account the benefits arising from these practices, the fees charged under each Subadvisory Agreement were reasonable.
Conclusion
Based upon all of the information considered and the conclusions reached, the Board determined that the terms of the Advisory Agreement and each Subadvisory Agreement are fair and reasonable and that the continuation of the Advisory Agreement and each Subadvisory Agreement is in the best interests of each Fund.
Wilshire Mutual Funds, Inc. Privacy Statement | |
At Wilshire Mutual Funds, Inc., we appreciate the privacy concerns of our customers. We have established the following policies to maintain the privacy of information you share with us.
INFORMATION WE COLLECT
We collect and retain nonpublic personal information about you that may include:
| | • | Information we receive on your account applications or other forms such as your name, address, financial information and/or social security number; |
| | • | Information we receive about your mutual fund transactions, such as purchases, sales, exchanges and account balances; and |
| | • | Information we collect through the use of Internet “cookies” when you access our website. Cookies are a collection of information stored on the local hard drive of an Internet user, used primarily by web servers to identify previous users and their preferences. A web server can not find out a user’s name or email address, or anything about the user’s computer using cookies. |
INFORMATION WE MAY SHARE
We do not sell any of your nonpublic personal information to third parties. We may share the information we collect with affiliates or with non-affiliated third parties only when those parties are acting on our behalf in servicing your account, or as required by law. These third parties may include:
| | • | Administrative service providers who, for example, process transactions for your account, print checks or prepare account statements; |
| | • | Companies that provide services for us to help market our products to you; and |
| | • | Governmental or other legal agencies, as required by law. |
When information is shared with third parties, they are legally obligated to maintain the confidentiality of the information and to limit their use of it to servicing your account, except as permitted or required by law.
CONFIDENTIALITY AND SECURITY
Within our organization, we restrict access to your nonpublic personal information to authorized employees who need to access such information in order to provide services or products to you. We maintain physical, electronic and procedural safeguards to protect your nonpublic personal information.
As previously mentioned, we may collect information through the use of Internet “cookies” on our website. In addition, in order to provide you with access to your account via the web, it is necessary for us to collect certain nonpublic personal information such as your name, social security number and account information. Special measures such as data encryption and authentication apply to all nonpublic personal information and communications on our website.
APPLICABILITY
Our privacy policies apply only to those individual investors who have a direct customer relationship with us. If you are an individual shareholder of record of any of the Portfolios, we consider you to be our customer. Shareholders purchasing or owning shares of any of the Portfolios through their bank, broker, or other financial institution should also consult that financial institution’s privacy policies.
Wilshire Mutual Funds, Inc. values your business. We understand the importance of maintaining the integrity of your personal information and are committed to keeping your trust. Please contact us at 1-888-200-6796 if you have any questions concerning our policy, or visit us at www.wilshirefunds.com for additional copies of this policy.
Wilshire Mutual Funds
Wilshire Associates Incorporated
1299 Ocean Avenue
Santa Monica, CA 90401
1-888-200-6796
http://advisor.wilshire.com