UNITED STATES
SECURITIES AND EXCHANGE COMMISSION
Washington, D.C. 20549
FORM N-CSR
CERTIFIED SHAREHOLDER REPORT OF REGISTERED MANAGEMENT
INVESTMENT COMPANIES
Investment Company Act File Number 811-07076
Wilshire Mutual Funds, Inc.
(Exact name of Registrant as specified in charter)
Wilshire Associates Incorporated
1299 Ocean Avenue, Suite 700
Santa Monica, CA 90401-1085
(Address of principal executive offices) (Zip code)
Jason A. Schwarz, President
1299 Ocean Avenue, Suite 700
Santa Monica, CA 90401-1085
(Name and address of agent for service)
Registrant’s telephone number, including area code: 310-451-3051
Date of fiscal year end: December 31
Date of reporting period: December 31, 2014
| Item 1. | Reports to Stockholders. |
The Report to Shareholders is attached herewith.
 Wilshire Mutual Funds | ||||
ANNUAL REPORT Large Company Growth Portfolio Large Company Value Portfolio Small Company Growth Portfolio Small Company Value Portfolio Wilshire 5000 Indexsm Fund Wilshire International Equity Fund December 31, 2014 http://advisor.wilshire.com | ||||
Wilshire Mutual Funds Table of Contents |  |
| Shareholder Letter | 1 |
| Commentary: | |
| Large Company Growth Portfolio | 4 |
| Large Company Value Portfolio | 8 |
| Small Company Growth Portfolio | 12 |
| Small Company Value Portfolio | 16 |
Wilshire 5000 IndexSM Fund | 20 |
| Wilshire International Equity Fund | 26 |
| Disclosure of Fund Expenses | 32 |
| Condensed Schedules of Investments: | |
| Large Company Growth Portfolio | 35 |
| Large Company Value Portfolio | 37 |
| Small Company Growth Portfolio | 39 |
| Small Company Value Portfolio | 41 |
Wilshire 5000 IndexSM Fund | 43 |
| Wilshire International Equity Fund | 45 |
| Statements of Assets and Liabilities | 49 |
| Statements of Operations | 52 |
| Statements of Changes in Net Assets | 54 |
| Financial Highlights: | |
| Large Company Growth Portfolio | 60 |
| Large Company Value Portfolio | 62 |
| Small Company Growth Portfolio | 64 |
| Small Company Value Portfolio | 66 |
Wilshire 5000 IndexSM Fund | 68 |
| Wilshire International Equity Fund | 72 |
| Notes to Financial Statements | 74 |
| Report of Independent Registered Public Accounting Firm | 87 |
| Additional Fund Information | 88 |
| Tax Information | 91 |
| Board Approval of Advisory Agreement | 93 |
This report is for the general information of the shareholders of Large Company Growth Portfolio, Large Company Value Portfolio, Small Company Growth Portfolio, Small Company Value Portfolio, Wilshire 5000 IndexSM Fund and Wilshire International Equity Fund. Its use in connection with any offering of a Portfolio’s shares is authorized only if accompanied or preceded by the Portfolio’s current prospectus.
Wilshire Mutual Funds, Inc. are distributed by SEI Investments Distribution Co.
Wilshire Mutual Funds Letter to Shareholders (Unaudited) | |
Dear Wilshire Mutual Fund Shareholder:
We are pleased to present this annual report to all shareholders of the Wilshire Mutual Funds. This report covers the period from January 1, 2014 to December 31, 2014, for all share classes of the Large Company Growth Fund, Large Company Value Fund, Small Company Growth Fund, Small Company Value Fund, Wilshire 5000 Index Fund, and Wilshire International Equity Fund.
Market Environment
U.S. Equity Market
2014 was another strong year for the domestic equity market with the Wilshire 5000 IndexSM gaining 12.71%. This advance marked the Wilshire 5000’s sixth consecutive year of positive returns and a 164.21%** advance since the end of 2008. All style and size segments delivered positive returns, with large capitalization securities outperforming their smaller capitalization counterparts across all style segments. Growth stocks outpaced value stocks within the large capitalization space while value outpaced growth for small capitalization securities.
After a strong first half of the year, the market stalled in the third quarter. A strong positive return in August prevented the first down quarter in two years as the market lost ground in both July and September. Equity markets experienced a volatile third quarter, despite the relatively mild quarter-end return numbers, as investors were confronted with numerous geopolitical events, including continued problems in Ukraine, U.S. military involvement in Iraq and Syria, and pro-democracy protests in Hong Kong. Stocks advanced in the fourth quarter as oil prices fell, U.S. economic growth accelerated, the U.S. Dollar strengthened, and the Federal Reserve said that it would be “patient” in raising interest rates. The Utilities, Health Care, and Information Technology sectors were the best performing sectors for the year, returning 26.56%, 24.90%, and 16.47%, respectively, while the Energy and Telecom Services sectors had negative yearly performance, returning -6.28% and -1.52%, respectively.
International Equity Market
Developed international markets, as represented by the MSCI EAFE Index, struggled in 2014, returning -4.90%. After lingering concerns over economic and political uncertainty and turmoil between Russia and Ukraine put pressure on markets in the first quarter, global markets marched solidly upward in the second quarter. Europe’s fiscal woes continued into the second half of the year as investors digested weak economic data and the European Central Bank drove short-term rates into negative territory. European markets closed 2014 in negative territory as the euro hit a two year low against the U.S. Dollar. Similarly, after advancing in the second quarter, Japanese equities retracted in the second half of the year against the backdrop of a rapidly depreciating currency and fading enthusiasm for Prime Minister Abe’s economic program. Emerging markets again lagged in 2014 as rising geopolitical risk, deflating currencies and the end of U.S. quantitative easing rattled investors. The MSCI Emerging Markets Index returned -2.19% for the year.
Bond Market
Fixed income performance was strong in 2014 as falling interest rates and disappointing economic data from international markets created a favorable backdrop for bonds, driving investors to safe-haven U.S. assets. The Barclays U.S. Aggregate Bond Index returned 5.97%, its highest yearly return since 2011. Treasury inflation-protected securities (TIPS) performed well during the first half of the year but struggled during the second half as the price of oil rapidly declined. Similar to TIPS, high yield securities lagged during the second half of the year as lower crude oil prices worried investors as many issuers of high yield securities are Energy sector companies. Despite declining in the third and fourth quarter, both the Barclays U.S. TIPS Index and the Barclays U.S. High Yield Index had positive performance for the year, returning 3.64% and 2.45%, respectively. Throughout 2014, the 10-year Treasury yield declined 87 basis points to end 2014 at 2.17%.
1
Wilshire Mutual Funds Letter to Shareholders (Unaudited) - (Continued) | |
During the fourth quarter, the Federal Reserve ended its bond-purchase program. With quantitative easing complete, investors turned their focus to the Federal Reserve’s likely timetable for increasing short-term interest rates. The Central Bank stated that it would be “patient in beginning to normalize the stance of monetary policy”, with the exact timing of rate increases to be ultimately dictated by economic factors.
Fund Performance Review
The Wilshire Mutual Funds turned in mixed performance in 2014. The Wilshire Large Company Growth Portfolio Institutional Class returned 8.32% for the year, underperforming the Russell 1000 Growth Index return of 13.05%. The Wilshire Large Company Value Portfolio Institutional Class returned 11.05% for the year, underperforming the Russell 1000 Value Index return of 13.45%. The Wilshire Small Company Growth Portfolio Institutional Class returned 3.75% for the year, underperforming the Russell 2000 Growth Index return of 5.60%. The Wilshire Small Company Value Portfolio Institutional Class returned 6.47% for the year, outperforming the Russell 2000 Value Index return of 4.22%. The Wilshire 5000 IndexSM Fund Institutional Class returned 12.60% for the year, modestly underperforming the Wilshire 5000 IndexSM return of 12.73%. Lastly, the Wilshire International Equity Fund Institutional Class returned -6.16% for the year, underperforming the MSCI All Country World ex U.S. Index return of -3.87%.
We are mindful that markets can behave erratically and trends shift swiftly. You can expect us to continue to work diligently to manage your investments and seek to generate returns commensurate with the Funds’ investment objectives. As always, we appreciate your continued support and confidence.
As always, we sincerely appreciate your continued support and confidence in Wilshire Associates.
Sincerely,

Jason Schwarz
President, Wilshire Mutual Funds, Inc.
President, Wilshire Mutual Funds, Inc.
Index returns are for illustrative purposes only and do not represent actual fund performance. Index performance returns do not reflect any management fees, transactions costs or expenses. Indexes are unmanaged and one cannot invest directly in an index. Past performance does not guarantee future results.
In addition to the normal risks associated with investing, international investments may involves risk of capital loss from unfavorable fluctuation in currency values, from differences in generally accepted accounting principles or from social, economic or political instability in other nations. Investments in smaller companies typically exhibit higher volatility.
Investing involves risk including loss of principal. This report identifies the Portfolios’ investments on December 31, 2014. These holdings are subject to change. Not all investments in each Portfolio performed the same, nor is there any guarantee that these investments will perform as well in the future. Market forecasts provided in this report may not occur.
2
Wilshire Mutual Funds Letter to Shareholders (Unaudited) - (Continued) | |
** | Expense Ratios: Wilshire Large Company Growth Portfolio: Institutional Class – 1.06%; Investment Class – 1.36%. Wilshire Large Company Value Portfolio: Institutional Class – 0.97%; Investment Class – 1.25%. Wilshire Small Company Growth Portfolio: Institutional Class – 1.20%; Investment Class – 1.62% (gross), 1.50% (net). Wilshire Small Company Value Portfolio: Institutional Class – 1.20%; Investment Class – 1.58% (gross), 1.50% (net). Wilshire 5000 Index Fund: Institutional Class – 0.46%; Investment Class – 0.68%. Wilshire International Equity Fund: Institutional Class – 1.50% (gross), 1.25% (net); Investment Class – 1.58% (gross), 1.50% (net). For the Small Company Growth Portfolio, the Small Company Value Portfolio, and the Wilshire International Equity Fund, Wilshire Associates Incorporated, the Fund’s investment adviser, has entered into contractual agreements to limit expenses through April 30, 2016. For the Small Company Growth Portfolio, the Small Company Value Portfolio and the Wilshire International Equity Fund, the expense ratio does not reflect the ability of the Adviser to recover all or a portion of prior waivers, which would result in higher expenses for the investor. This option is available contractually to the Adviser until three years after the year in which Wilshire waived fees or reimbursed the expenses if the recoupment does not exceed the existing expense limitation. |
MSCI Emerging Markets Index is a free float-adjusted market capitalization index that is designed to measure equity market performance of emerging markets. Barclays U.S. Aggregate Bond Index is made up of the Barclays U.S. Government/Corporate Bond Index, Mortgage-Backed Securities Index, and Asset-Backed Securities Index, including securities that are of investment grade quality or better, have at least one year to maturity, and have an outstanding par value of at least $100 million. Barclays U.S. TIPS Index is an unmanaged index comprised of U.S. Treasury Inflation Protected Securities with at least $1 billion in outstanding face value and a remaining term to final maturity of at least 1 year and less than 5 years. Barclays U.S. High Yield Index is composed of fixed-rate, publicly issued, non-investment grade debt. |
3
Large Company Growth Portfolio Commentary (Unaudited) | |
INVESTMENT CLASS SHARES
Average Annual Total Return*
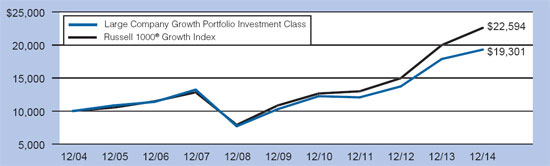
| One Year Ended 12/31/14 | 7.97% | ||
| Five Years Ended 12/31/14 | 13.42% | ||
| Ten Years Ended 12/31/14 | 6.80% |
RUSSELL 1000® GROWTH INDEX(1)
Average Annual Total Return
| One Year Ended 12/31/14 | 13.05% | ||
| Five Years Ended 12/31/14 | 15.81% | ||
| Ten Years Ended 12/31/14 | 8.49% |
COMPARATIVE PERFORMANCE
Comparison of Change in Value of $10,000 Investment in Shares of Large Company Growth Portfolio,
Investment Class Shares and the Russell 1000 Growth Index through 12/31/14.
The performance data quoted represents past performance and does not guarantee future results. Current performance may be lower or higher. Performance data current to the most recent month end may be obtained at http://advisor.wilshire.com. The investment return and principal value of an investment will fluctuate so that shares, when redeemed, may be worth more or less than their original cost. The table above does not reflect the deduction of taxes that a shareholder would pay on Portfolio distributions or the redemption of Portfolio shares.
* | Assumes reinvestment of all distributions. During certain periods since inception, certain fees and expenses were waived or reimbursed. Without waivers and reimbursements, historical total returns would have been lower. For the year ended December 31, 2014, there were no waivers. |
(1) | The Russell 1000® Growth Index is an unmanaged index that measures the performance of the largest 1,000 U.S. companies with higher price-to-book ratios and higher forecasted growth values. Index performance is presented for general comparative purposes. Unlike a mutual fund, the performance of an index assumes no taxes, transaction costs, management fees or other expenses. An individual cannot directly invest in any index. |
4
Large Company Growth Portfolio Commentary (Unaudited) - (Continued) | |
INSTITUTIONAL CLASS SHARES
Average Annual Total Return*
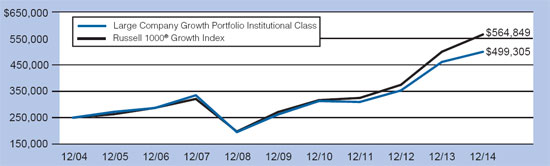
| One Year Ended 12/31/14 | 8.32% | ||
| Five Years Ended 12/31/14 | 13.79% | ||
| Ten Years Ended 12/31/14 | 7.16% |
RUSSELL 1000® GROWTH INDEX(1)
Average Annual Total Return
| One Year Ended 12/31/14 | 13.05% | ||
| Five Years Ended 12/31/14 | 15.81% | ||
| Ten Years Ended 12/31/14 | 8.49% |
COMPARATIVE PERFORMANCE
Comparison of Change in Value of $250,000 Investment in Shares of Large Company Growth Portfolio,
Institutional Class Shares and the Russell 1000 Growth Index through 12/31/14.
The performance data quoted represents past performance and does not guarantee future results. Current performance may be lower or higher. Performance data current to the most recent month end may be obtained at http://advisor.wilshire.com. The investment return and principal value of an investment will fluctuate so that shares, when redeemed, may be worth more or less than their original cost. The table above does not reflect the deduction of taxes that a shareholder would pay on Portfolio distributions or the redemption of Portfolio shares.
* | Assumes reinvestment of all distributions. During certain periods since inception, certain fees and expenses were waived or reimbursed. Without waivers and reimbursements, historical total returns would have been lower. For the year ended December 31, 2014, there were no waivers. |
(1) | The Russell 1000® Growth Index is an unmanaged index that measures the performance of the largest 1,000 U.S. companies with higher price-to-book ratios and higher forecasted growth values. Index performance is presented for general comparative purposes. Unlike a mutual fund, the performance of an index assumes no taxes, transaction costs, management fees or other expenses. An individual cannot directly invest in any index. |
5
Large Company Growth Portfolio Commentary (Unaudited) - (Continued) | |
The U.S. stock market, as represented by the Wilshire 5000 IndexSM, finished 2014 strong, and returned 12.71% for the year. Equity investors were not troubled by a few notable events during the year, including a negative quarter for real GDP growth, numerous geopolitical events and the end of the Federal Reserve’s third round of quantitative easing. The U.S. stock market has not suffered a negative quarter for 2.5 years now, the second longest “winning” streak in the history of the Wilshire 5000 Index (the longest streak being 3.5 years during the second part of the 1990’s). The second half of 2014 brought transformational shifts in two major economic factors: oil prices and the U.S. dollar. Oil began its steep decline in June and finished the year with West Texas Intermediate (WTI) below $55, a level that has not been sustained since 2004. The U.S. dollar began its rise shortly after the drop in oil commenced, and by year end, the U.S. Dollar Index versus major currencies was up 12%. Meanwhile, the shale boom in the U.S. has increased the supply of energy broadly. Finally, a strong U.S. dollar will typically put negative pressure on commodity prices.
During 2014, large capitalization stocks outperformed small capitalization stocks, returning 13.46% and 6.80%, respectively. Results for growth stocks versus value during the year were mixed, as growth led in the large-cap segment but trailed value stocks within small caps. The large growth style delivered the best returns for the year, up 13.96%, while micro caps and small growth trailed other styles, returning 2.74% and 4.23%, respectively. Within the Wilshire 5000 Index, Utilities and Health Care were the top performing sectors for the year, returning 26.56% and 24.90% respectively. Conversely, Energy and Telecom Services underperformed during 2014 returning -6.28% and -1.52%, respectively.
The Wilshire Large Company Growth Portfolio Institutional Class (the “Fund”) returned 8.32% for the year ended December 31, 2014, underperforming the Russell 1000 Growth Index return of 13.05%. Fund performance was hindered by poor stock selection in the Consumer Discretionary, Information Technology, and Industrials sectors. Relative underperformance was partially mitigated by an overweight allocation to the Health Care sector.
Despite the Fund’s underperformance versus its benchmark, we believe the Fund is well positioned going into 2015 as the market deals with ongoing macroeconomic and geopolitical issues.
Investing involves risk including loss of principal.
6
Large Company Growth Portfolio Commentary (Unaudited) - (Continued) | |
PORTFOLIO SECTOR WEIGHTING†
(As of December 31, 2014)
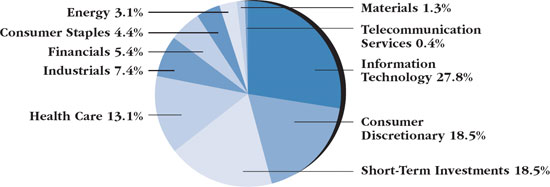
| † | Based on percent of the Portfolio’s total investments in securities, at value. Includes investments held as collateral for securities on loan (see Note 6 in Notes to Financial Statements). |
7
Large Company Value Portfolio Commentary (Unaudited) | |
INVESTMENT CLASS SHARES
Average Annual Total Return*
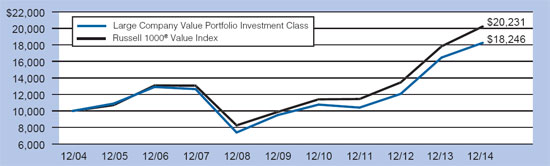
| One Year Ended 12/31/14 | 10.77% | ||
| Five Years Ended 12/31/14 | 13.95% | ||
| Ten Years Ended 12/31/14 | 6.20% |
RUSSELL 1000® VALUE INDEX(1)
Average Annual Total Return
| One Year Ended 12/31/14 | 13.45% | ||
| Five Years Ended 12/31/14 | 15.42% | ||
| Ten Years Ended 12/31/14 | 7.30% |
COMPARATIVE PERFORMANCE
Comparison of Change in Value of $10,000 Investment in Shares of Large Company Value Portfolio,
Investment Class Shares and the Russell 1000 Value Index through 12/31/14.
The performance data quoted represents past performance and does not guarantee future results. Current performance may be lower or higher. Performance data current to the most recent month end may be obtained at http://advisor.wilshire.com. The investment return and principal value of an investment will fluctuate so that shares, when redeemed, may be worth more or less than their original cost. The table above does not reflect the deduction of taxes that a shareholder would pay on Portfolio distributions or the redemption of Portfolio shares.
| * | Assumes reinvestment of all distributions. During certain periods since inception, certain fees and expenses were waived or reimbursed. Without waivers and reimbursements, historical total returns would have been lower. For the year ended December 31, 2014, there were no waivers. |
| (1) | The Russell 1000® Value Index is an unmanaged index that measures the performance of the largest 1,000 U.S. companies with lower price-to-book ratios and lower forecasted growth values. Index performance is presented for general comparative purposes. Unlike a mutual fund, the performance of an index assumes no taxes, transaction costs, management fees or other expenses. An individual cannot directly invest in any index. |
8
Large Company Value Portfolio Commentary (Unaudited) - (Continued) | |
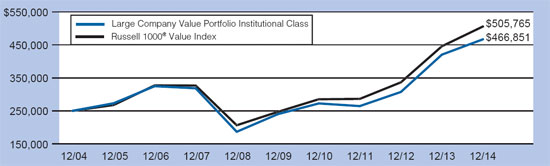
INSTITUTIONAL CLASS SHARES
Average Annual Total Return*
| One Year Ended 12/31/14 | 11.05% | ||
| Five Years Ended 12/31/14 | 14.24% | ||
| Ten Years Ended 12/31/14 | 6.44% |
RUSSELL 1000® VALUE INDEX(1)
Average Annual Total Return
| One Year Ended 12/31/14 | 13.45% | ||
| Five Years Ended 12/31/14 | 15.42% | ||
| Ten Years Ended 12/31/14 | 7.30% |
COMPARATIVE PERFORMANCE
Comparison of Change in Value of $250,000 Investment in Shares of Large Company Value Portfolio,
Institutional Class Shares and the Russell 1000 Value Index through 12/31/14.
The performance data quoted represents past performance and does not guarantee future results. Current performance may be lower or higher. Performance data current to the most recent month end may be obtained at http://advisor.wilshire.com. The investment return and principal value of an investment will fluctuate so that shares, when redeemed, may be worth more or less than their original cost. The table above does not reflect the deduction of taxes that a shareholder would pay on Portfolio distributions or the redemption of Portfolio shares.
| * | Assumes reinvestment of all distributions. During certain periods since inception, certain fees and expenses were waived or reimbursed. Without waivers and reimbursements, historical total returns would have been lower. For the year ended December 31, 2014, there were no waivers. |
| (1) | The Russell 1000® Value Index is an unmanaged index that measures the performance of the largest 1,000 U.S. companies with lower price-to-book ratios and lower forecasted growth values. Index performance is presented for general comparative purposes. Unlike a mutual fund, the performance of an index assumes no taxes, transaction costs, management fees or other expenses. An individual cannot directly invest in any index. |
9
Large Company Value Portfolio Commentary (Unaudited) - (Continued) | |
The U.S. stock market, as represented by the Wilshire 5000 IndexSM, finished 2014 strong, and returned 12.71% for the year. Equity investors were not troubled by a few notable events during the year, including a negative quarter for real GDP growth, numerous geopolitical events and the end of the Federal Reserve’s third round of quantitative easing. The U.S. stock market has not suffered a negative quarter for 2.5 years now, the second longest “winning” streak in the history of the Wilshire 5000 Index (the longest streak being 3.5 years during the second part of the 1990’s). The second half of 2014 brought transformational shifts in two major economic factors, oil prices and the U.S. dollar. Oil began its steep decline in June and finished the year with Texas Intermediate (WTI) below $55, a level that has not been sustained since 2004. The U.S. dollar began its rise shortly after the drop in oil commenced and by year end the U.S. Dollar Index versus major currencies was up 12%. Meanwhile, the shale boom in the U.S. has increased the supply of energy broadly. Finally, a strong U.S. dollar will typically put negative pressure on commodity prices.
During 2014, large capitalization stocks outperformed small capitalization stocks, returning 13.46% and 6.80%, respectively. Results for growth stocks versus value during the year were mixed, as growth led in the large-cap segment but trailed value stocks within small caps. The large growth style delivered the best returns for the year, up 13.96%, while micro caps and small growth trailed other styles, returning 2.74% and 4.23%, respectively. Within the Wilshire 5000 Index, Utilities and Health Care were the top performing sectors for the year, returning 26.56% and 24.90% respectively. Conversely, Energy and Telecom Services underperformed during 2014 returning -6.28% and -1.52%, respectively.
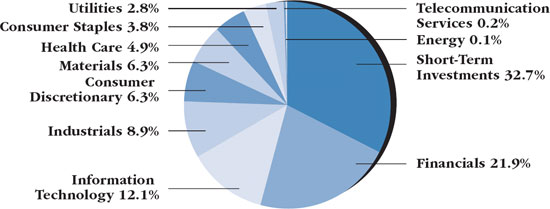
The Wilshire Large Company Value Portfolio Institutional Class (the “Fund”) returned 11.05% for the year ended December 31, 2014, underperforming the Russell 1000 Value Index return of 13.45%. Fund performance was hindered by poor stock selection in the Financials and Consumer Discretionary sectors. Relative underperformance was partially mitigated by strong stock selection in Industrials and Information Technology sectors.
Despite the Fund’s underperformance versus its benchmark, we believe the Fund is well positioned going into 2015 as the market deals with ongoing macroeconomic and geopolitical issues.
Investing involves risk including loss of principal.
10
Large Company Value Portfolio Commentary (Unaudited) - (Continued) | |
PORTFOLIO SECTOR WEIGHTING†
(As of December 31, 2014)
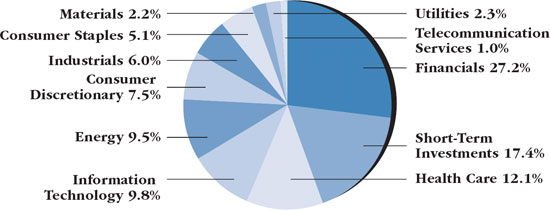
| † | Based on percent of the Portfolio’s total investments in securities, at value. Includes investments held as collateral for securities on loan (see Note 6 in Notes to Financial Statements). |
11
Small Company Growth Portfolio Commentary (Unaudited) | |
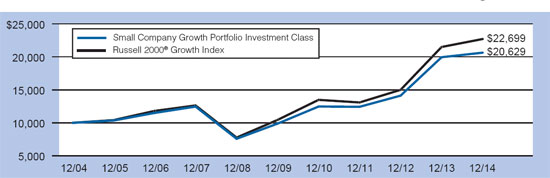
INVESTMENT CLASS SHARES
Average Annual Total Return*
| One Year Ended 12/31/14 | 3.44% | ||
| Five Years Ended 12/31/14 | 15.86% | ||
| Ten Years Ended 12/31/14 | 7.51% |
RUSSELL 2000® GROWTH INDEX(1)
Average Annual Total Return
| One Year Ended 12/31/14 | 5.60% | ||
| Five Years Ended 12/31/14 | 16.80% | ||
| Ten Years Ended 12/31/14 | 8.54% |
COMPARATIVE PERFORMANCE
Comparison of Change in Value of $10,000 Investment in Shares of Small Company Growth Portfolio,
Investment Class Shares and the Russell 2000 Growth Index through 12/31/14.
The performance data quoted represents past performance and does not guarantee future results. Current performance may be lower or higher. Performance data current to the most recent month end may be obtained at http://advisor.wilshire.com. The investment return and principal value of an investment will fluctuate so that shares, when redeemed, may be worth more or less than their original cost. The table above does not reflect the deduction of taxes that a shareholder would pay on Portfolio distributions or the redemption of Portfolio shares.
| * | Assumes reinvestment of all distributions. During certain periods since inception, certain fees and expenses were waived or reimbursed. Without waivers and reimbursements, historical total returns would have been lower. For the year ended December 31, 2014, 0.05% of average net assets was waived or reimbursed through other expenses for the Investment Class Shares. |
| (1) | The Russell 2000® Growth Index is an unmanaged index that measures the performance of the 2,000 smallest U.S. companies with higher price-to-book ratios and higher forecasted growth values. Index performance is presented for general comparative purposes. Unlike a mutual fund, the performance of an index assumes no taxes, transaction costs, management fees or other expenses. An individual cannot directly invest in any index. |
12
Small Company Growth Portfolio Commentary (Unaudited) - (Continued) | |
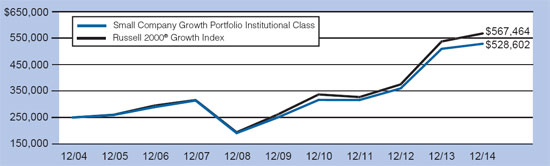
INSTITUTIONAL CLASS SHARES
Average Annual Total Return*
| One Year Ended 12/31/14 | 3.75% | ||
| Five Years Ended 12/31/14 | 16.16% | ||
| Ten Years Ended 12/31/14 | 7.78% |
RUSSELL 2000® GROWTH INDEX(1)
Average Annual Total Return
| One Year Ended 12/31/14 | 5.60% | ||
| Five Years Ended 12/31/14 | 16.80% | ||
| Ten Years Ended 12/31/14 | 8.54% |
COMPARATIVE PERFORMANCE
Comparison of Change in Value of $250,000 Investment in Shares of Small Company Growth Portfolio,
Institutional Class Shares and the Russell 2000 Growth Index through 12/31/14.
The performance data quoted represents past performance and does not guarantee future results. Current performance may be lower or higher. Performance data current to the most recent month end may be obtained at http://advisor.wilshire.com. The investment return and principal value of an investment will fluctuate so that shares, when redeemed, may be worth more or less than their original cost. The table above does not reflect the deduction of taxes that a shareholder would pay on Portfolio distributions or the redemption of Portfolio shares.
| * | Assumes reinvestment of all distributions. During certain periods since inception, certain fees and expenses were waived or reimbursed. Without waivers and reimbursements, historical total returns would have been lower. For the year ended December 31, 2014, 0.05% of average net assets was waived or reimbursed through other expenses for the Institutional Class Shares. |
| (1) | The Russell 2000® Growth Index is an unmanaged index that measures the performance of the 2,000 smallest U.S. companies with higher price-to-book ratios and higher forecasted growth values. Index performance is presented for general comparative purposes. Unlike a mutual fund, the performance of an index assumes no taxes, transaction costs, management fees or other expenses. An individual cannot directly invest in any index. |
13
Small Company Growth Portfolio Commentary (Unaudited) - (Continued) | |
The U.S. stock market, as represented by the Wilshire 5000 IndexSM, finished 2014 strong, and returned 12.71% for the year. Equity investors were not troubled by a few notable events during the year, including a negative quarter for real GDP growth, numerous geopolitical events and the end of the Federal Reserve’s third round of quantitative easing. The U.S. stock market has not suffered a negative quarter for 2.5 years now, the second longest “winning” streak in the history of the Wilshire 5000 Index (the longest streak being 3.5 years during the second part of the 1990’s). The second half of 2014 brought transformational shifts in two major economic factors, oil prices and the U.S. dollar. Oil began its steep decline in June and finished the year with West Texas Intermediate (WTI) below $55, a level that has not been sustained since 2004. The U.S. dollar began its rise shortly after the drop in oil commenced and by year end the U.S. Dollar Index versus major currencies was up 12%. Meanwhile, the shale boom in the U.S. has increased the supply of energy broadly. Finally, a strong U.S. dollar will typically put negative pressure on commodity prices.
During 2014, large capitalization stocks outperformed small capitalization stocks, returning 13.46% and 6.80%, respectively. Results for growth stocks versus value during the year were mixed, as growth led in the large-cap segment but trailed value stocks within small caps. The large growth style delivered the best returns for the year, up 13.96%, while micro caps and small growth trailed other styles, returning 2.74% and 4.23%, respectively. Within the Wilshire 5000 Index, Utilities and Health Care were the top performing sectors for the year, returning 26.56% and 24.90% respectively. Conversely, Energy and Telecom Services underperformed during 2014 returning -6.28% and -1.52%, respectively.
The Wilshire Small Company Growth Portfolio Institutional Class (the “Fund”) returned 3.75% for the year ended December 31, 2014, underperforming the Russell 2000 Growth Index return of 5.60%. Fund performance was hindered by poor stock selection in the Information Technology and Industrials sectors. Relative underperformance was partially mitigated by strong stock selection in the Consumer Discretionary sector and an underweight allocation to the Materials sector.
Despite the Fund’s underperformance versus its benchmark, we believe the Fund is well positioned going into 2015 as the market deals with ongoing macroeconomic and geopolitical issues.
Investing involves risk including loss of principal.
14
Small Company Growth Portfolio Commentary (Unaudited) - (Continued) | |
PORTFOLIO SECTOR WEIGHTING†
(As of December 31, 2014)
| † | Based on percent of the Portfolio’s total investments in securities, at value. Includes investments held as collateral for securities on loan (see Note 6 in Notes to Financial Statements). |
15
Small Company Value Portfolio Commentary (Unaudited) | |
INVESTMENT CLASS SHARES
Average Annual Total Return*
| One Year Ended 12/31/14 | 6.17% | ||
| Five Years Ended 12/31/14 | 15.38% | ||
| Ten Years Ended 12/31/14 | 7.47% |
RUSSELL 2000® VALUE INDEX(1)
Average Annual Total Return
| One Year Ended 12/31/14 | 4.22% | ||
| Five Years Ended 12/31/14 | 14.26% | ||
| Ten Years Ended 12/31/14 | 6.89% |
COMPARATIVE PERFORMANCE
Comparison of Change in Value of $10,000 Investment in Shares of Small Company Value Portfolio,
Investment Class Shares and the Russell 2000 Value Index through 12/31/14.
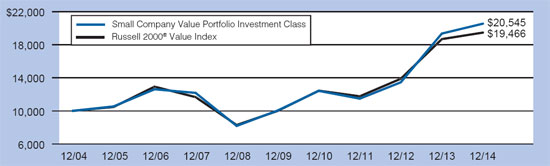
The performance data quoted represents past performance and does not guarantee future results. Current performance may be lower or higher. Performance data current to the most recent month end may be obtained at http://advisor.wilshire.com. The investment return and principal value of an investment will fluctuate so that shares, when redeemed, may be worth more or less than their original cost. The table above does not reflect the deduction of taxes that a shareholder would pay on Portfolio distributions or the redemption of Portfolio shares.
| * | Assumes reinvestment of all distributions. During certain periods since inception, certain fees and expenses were waived or reimbursed. Without waivers and reimbursements, historical total returns would have been lower. For the year ended December 31, 2014, 0.07% of average net assets was waived or reimbursed through other expenses in the Investment Class Shares. |
| (1) | The Russell 2000® Value Index is an unmanaged index that measures the performance of the 2,000 smallest U.S. companies with lower price-to-book ratios and lower forecasted growth values. Index performance is presented for general comparative purposes. Unlike a mutual fund, the performance of an index assumes no taxes, transaction costs, management fees or other expenses. An individual cannot directly invest in any index. |
16
Small Company Value Portfolio Commentary (Unaudited) - (Continued) | |
INSTITUTIONAL CLASS SHARES
Average Annual Total Return*
| One Year Ended 12/31/14 | 6.47% | ||
| Five Years Ended 12/31/14 | 15.73% | ||
| Ten Years Ended 12/31/14 | 7.82% |
RUSSELL 2000® VALUE INDEX(1)
Average Annual Total Return
| One Year Ended 12/31/14 | 4.22% | ||
| Five Years Ended 12/31/14 | 14.26% | ||
| Ten Years Ended 12/31/14 | 6.89% |
COMPARATIVE PERFORMANCE
Comparison of Change in Value of $250,000 Investment in Shares of Small Company Value Portfolio,
Institutional Class Shares and the Russell 2000 Value Index through 12/31/14.
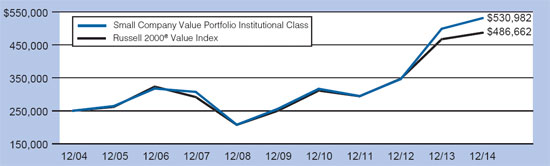
The performance data quoted represents past performance and does not guarantee future results. Current performance may be lower or higher. Performance data current to the most recent month end may be obtained at http://advisor.wilshire.com. The investment return and principal value of an investment will fluctuate so that shares, when redeemed, may be worth more or less than their original cost. The table above does not reflect the deduction of taxes that a shareholder would pay on Portfolio distributions or the redemption of Portfolio shares.
| * | Assumes reinvestment of all distributions. During certain periods since inception, certain fees and expenses were waived or reimbursed. Without waivers and reimbursements, historical total returns would have been lower. For the year ended December 31, 2014, 0.06% of average net assets was waived or reimbursed through other expenses in the Institutional Class Shares. |
| (1) | The Russell 2000® Value Index is an unmanaged index that measures the performance of the 2,000 smallest U.S. companies with lower price-to-book ratios and lower forecasted growth values. Index performance is presented for general comparative purposes. Unlike a mutual fund, the performance of an index assumes no taxes, transaction costs, management fees or other expenses. An individual cannot directly invest in any index. |
17
Small Company Value Portfolio Commentary (Unaudited) - (Continued) | |
The U.S. stock market, as represented by the Wilshire 5000 IndexSM, finished 2014 strong, and returned 12.71% for the year. Equity investors were not troubled by a few notable events during the year, including a negative quarter for real GDP growth, numerous geopolitical events and the end of the Federal Reserve’s third round of quantitative easing. The U.S. stock market has not suffered a negative quarter for 2.5 years now, the second longest “winning” streak in the history of the Wilshire 5000 Index (the longest streak being 3.5 years during the second part of the 1990’s). The second half of 2014 brought transformational shifts in two major economic factors, oil prices and the U.S. dollar. Oil began its steep decline in June and finished the year with West Texas Intermediate (WTI) below $55, a level that has not been sustained since 2004. The U.S. dollar began its rise shortly after the drop in oil commenced and by year end the U.S. Dollar Index versus major currencies was up 12%. Meanwhile, the shale boom in the U.S. has increased the supply of energy broadly. Finally, a strong U.S. dollar will typically put negative pressure on commodity prices.
During 2014, large capitalization stocks outperformed small capitalization stocks, returning 13.46% and 6.80%, respectively. Results for growth stocks versus value during the year were mixed, as growth led in the large-cap segment but trailed value stocks within small caps. The large growth style delivered the best returns for the year, up 13.96%, while micro caps and small growth trailed other styles, returning 2.74% and 4.23%, respectively. Within the Wilshire 5000 Index, Utilities and Health Care were the top performing sectors for the year, returning 26.56% and 24.90% respectively. Conversely, Energy and Telecom Services underperformed during 2014 returning -6.28% and -1.52%, respectively.
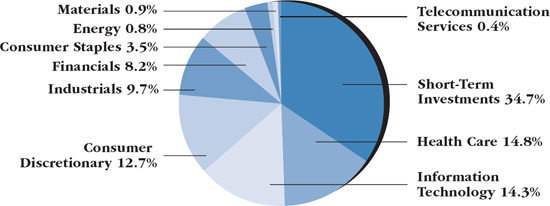
The Wilshire Small Company Value Portfolio Institutional Class returned 6.47% for the year ended December 31, 2014, outperforming the Russell 2000 Value Index return of 4.22%. Performance during the annual period was primarily attributable to the Fund’s holding of Integrated Device Technology and International Rectifier (specifically during the third quarter). The Fund also benefitted from strong stock selection in the Information Technology, Industrials, and Materials sectors as well as an underweight allocation to the Energy sector.
We are pleased with the Fund’s outperformance for the year and believe the Fund is well positioned going into 2015 as the market deals with ongoing macroeconomic and geopolitical uncertainties.
Investing involves risk including loss of principal.
18
Small Company Value Portfolio Commentary (Unaudited) - (Continued) | |
PORTFOLIO SECTOR WEIGHTING†
(As of December 31, 2014)
| † | Based on percent of the Portfolio’s total investments in securities, at value. Includes investments held as collateral for securities on loan (see Note 6 in Notes to Financial Statements). |
19
Wilshire 5000 Indexsm Fund Commentary (Unaudited) | |
INVESTMENT CLASS SHARES
Average Annual Total Return*
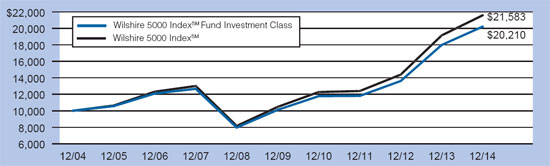
| One Year Ended 12/31/14 | 12.38% | ||
| Five Years Ended 12/31/14 | 14.85% | ||
| Ten Years Ended 12/31/14 | 7.29% |
WILSHIRE 5000 INDEXSM(1)
Average Annual Total Return
| One Year Ended 12/31/14 | 12.73% | ||
| Five Years Ended 12/31/14 | 15.56% | ||
| Ten Years Ended 12/31/14 | 8.00% |
COMPARATIVE PERFORMANCE
Comparison of Change in Value of $10,000 Investment in Shares of Wilshire 5000 IndexSM Fund,
Investment Class Shares and the Wilshire 5000 IndexSM through 12/31/14.
The performance data quoted represents past performance and does not guarantee future results. Current performance may be lower or higher. Performance data current to the most recent month end may be obtained at http://advisor.wilshire.com. The investment return and principal value of an investment will fluctuate so that shares, when redeemed, may be worth more or less than their original cost. The table above does not reflect the deduction of taxes that a shareholder would pay on Fund distributions or the redemption of Fund shares.
| * | Assumes reinvestment of all distributions. During certain periods since inception, certain fees and expenses were waived or reimbursed. Without waivers and reimbursements, historical total returns would have been lower. For the year ended December 31, 2014, there were no waivers. |
| (1) | The Wilshire 5000 IndexSM is an unmanaged index that measures the performance of all U.S. headquartered equity securities with readily available price data. Index performance is presented for general comparative purposes. Unlike a mutual fund, the performance of an index assumes no taxes, transaction costs, management fees or other expenses. An individual cannot directly invest in any index. |
20
Wilshire 5000 Indexsm Fund Commentary (Unaudited) - (Continued) | |
INSTITUTIONAL CLASS SHARES
Average Annual Total Return*
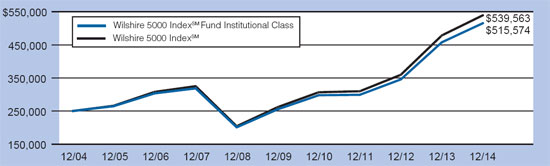
| One Year Ended 12/31/14 | 12.60% | ||
| Five Years Ended 12/31/14 | 15.10% | ||
| Ten Years Ended 12/31/14 | 7.51% |
WILSHIRE 5000 INDEXSM(1)
Average Annual Total Return
| One Year Ended 12/31/14 | 12.73% | ||
| Five Years Ended 12/31/14 | 15.56% | ||
| Ten Years Ended 12/31/14 | 8.00% |
COMPARATIVE PERFORMANCE
Comparison of Change in Value of $250,000 Investment in Shares of Wilshire 5000 IndexSM Fund,
Institutional Class Shares and the Wilshire 5000 IndexSM through 12/31/14.
The performance data quoted represents past performance and does not guarantee future results. Current performance may be lower or higher. Performance data current to the most recent month end may be obtained at http://advisor.wilshire.com. The investment return and principal value of an investment will fluctuate so that shares, when redeemed, may be worth more or less than their original cost. The table above does not reflect the deduction of taxes that a shareholder would pay on Fund distributions or the redemption of Fund shares.
| * | Assumes reinvestment of all distributions. During certain periods since inception, certain fees and expenses were waived or reimbursed. Without waivers and reimbursements, historical total returns would have been lower. For the year ended December 31, 2014, there were no waivers. |
| (1) | The Wilshire 5000 IndexSM is an unmanaged index that measures the performance of all U.S. headquartered equity securities with readily available price data. Index performance is presented for general comparative purposes. Unlike a mutual fund, the performance of an index assumes no taxes, transaction costs, management fees or other expenses. An individual cannot directly invest in any index. |
21
Wilshire 5000 Indexsm Fund Commentary (Unaudited) - (Continued) | |
QUALIFIED CLASS SHARES
Average Annual Total Return*
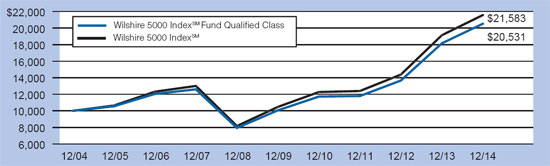
| One Year Ended 12/31/14 | 13.01% | ||
| Five Years Ended 12/31/14 | 15.34% | ||
| Ten Years Ended 12/31/14 | 7.46% |
WILSHIRE 5000 INDEXSM(1)
Average Annual Total Return
| One Year Ended 12/31/14 | 12.73% | ||
| Five Years Ended 12/31/14 | 15.56% | ||
| Ten Years Ended 12/31/14 | 8.00% |
COMPARATIVE PERFORMANCE
Comparison of Change in Value of $10,000 Investment in Shares of Wilshire 5000 IndexSM Fund,
Qualified Class Shares and the Wilshire 5000 IndexSM through 12/31/14.
The performance data quoted represents past performance and does not guarantee future results. Current performance may be lower or higher. Performance data current to the most recent month end may be obtained at http://advisor.wilshire.com. The investment return and principal value of an investment will fluctuate so that shares, when redeemed, may be worth more or less than their original cost. The table above does not reflect the deduction of taxes that a shareholder would pay on Fund distributions or the redemption of Fund shares.
| * | Assumes reinvestment of all distributions. During certain periods since inception, certain fees and expenses were waived or reimbursed. Without waivers and reimbursements, historical total returns would have been lower. For the year ended December 31, 2014, there were no waivers. |
| (1) | The Wilshire 5000 IndexSM is an unmanaged index that measures the performance of all U.S. headquartered equity securities with readily available price data. Index performance is presented for general comparative purposes. Unlike a mutual fund, the performance of an index assumes no taxes, transaction costs, management fees or other expenses. An individual cannot directly invest in any index. |
22
Wilshire 5000 Indexsm Fund Commentary (Unaudited) - (Continued) | |
HORACE MANN CLASS SHARES
Average Annual Total Return*
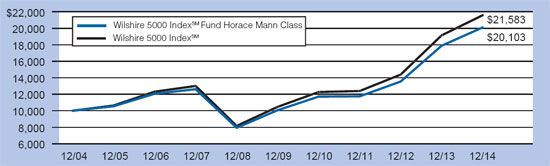
| One Year Ended 12/31/14 | 12.38% | ||
| Five Years Ended 12/31/14 | 14.83% | ||
| Ten Years Ended 12/31/14 | 7.23% |
WILSHIRE 5000 INDEXSM(1)
Average Annual Total Return
| One Year Ended 12/31/14 | 12.73% | ||
| Five Years Ended 12/31/14 | 15.56% | ||
| Ten Years Ended 12/31/14 | 8.00% |
COMPARATIVE PERFORMANCE
Comparison of Change in Value of $10,000 Investment in Shares of Wilshire 5000 IndexSM Fund,
Horace Mann Class Shares and the Wilshire 5000 IndexSM through 12/31/14.
The performance data quoted represents past performance and does not guarantee future results. Current performance may be lower or higher. Performance data current to the most recent month end may be obtained at http://advisor.wilshire.com. The investment return and principal value of an investment will fluctuate so that shares, when redeemed, may be worth more or less than their original cost. The table above does not reflect the deduction of taxes that a shareholder would pay on Fund distributions or the redemption of Fund shares.
| * | Assumes reinvestment of all distributions. During certain periods since inception, certain fees and expenses were waived or reimbursed. Without waivers and reimbursements, historical total returns would have been lower. For the year ended December 31, 2014, there were no waivers. |
| (1) | The Wilshire 5000 IndexSM is an unmanaged index that measures the performance of all U.S. headquartered equity securities with readily available price data. Index performance is presented for general comparative purposes. Unlike a mutual fund, the performance of an index assumes no taxes, transaction costs, management fees or other expenses. An individual cannot directly invest in any index. |
23
Wilshire 5000 Indexsm Fund Commentary (Unaudited) - (Continued) | |
The U.S. stock market, as represented by the Wilshire 5000 IndexSM, finished 2014 strong, and returned 12.71% for the year. Equity investors were not troubled by a few notable events during the year, including a negative quarter for real GDP growth, numerous geopolitical events and the end of the Federal Reserve’s third round of quantitative easing. The U.S. stock market has not suffered a negative quarter for 2.5 years now, the second longest “winning” streak in the history of the Wilshire 5000 Index (the longest streak being 3.5 years during the second part of the 1990’s). The second half of 2014 brought transformational shifts in two major economic factors, oil prices and the U.S. dollar. Oil began its steep decline in June and finished the year with West Texas Intermediate (WTI) below $55, a level that has not been sustained since 2004. The U.S. dollar began its rise shortly after the drop in oil commenced and by year end the U.S. Dollar Index versus major currencies was up 12%. Meanwhile, the shale boom in the U.S. has increased the supply of energy broadly. Finally, a strong U.S. dollar will typically put negative pressure on commodity prices.
During 2014, large capitalization stocks outperformed small capitalization stocks, returning 13.46% and 6.80%, respectively. Results for growth stocks versus value during the year were mixed, as growth led in the large-cap segment but trailed value stocks within small caps. The large growth style delivered the best returns for the year, up 13.96%, while micro caps and small growth trailed other styles, returning 2.74% and 4.23%, respectively. Within the Wilshire 5000 Index, Utilities and Health Care were the top performing sectors for the year, returning 26.56% and 24.90% respectively. Conversely, Energy and Telecom Services underperformed during 2014 returning -6.28% and -1.52%, respectively.
The Wilshire 5000 IndexSM Fund Institutional Class (the “Fund”) returned 12.60% for the year ended December 31, 2014, underperforming the Wilshire 5000 Index return of 12.73%. Underperformance is attributable to both Fund expenses as well as the optimization approach utilized by Los Angeles Capital Management and Equity Research, Inc., subadviser to the Fund, and is well within the range of historical experience.
Investing involves risk including loss of principal.
24
Wilshire 5000 Indexsm Fund Commentary (Unaudited) - (Continued) | |
PORTFOLIO SECTOR WEIGHTING†
(As of December 31, 2014)
| † | Based on percent of the Fund’s total investments in securities, at value. Includes investments held as collateral for securities on loan (see Note 6 in Notes to Financial Statements). |
25
Wilshire International Equity Fund Commentary (Unaudited) | |
INVESTMENT CLASS SHARES
Average Annual Total Return*
| One Year Ended 12/31/14 | (6.38)% | ||
| Five Years Ended 12/31/14 | 6.58% | ||
| Inception (11/16/07) through 12/31/14 | 0.27% |
MSCI ALL COUNTRY WORLD INDEX EX-U.S.(1)
Average Annual Total Return
| One Year Ended 12/31/14 | (3.87)% | ||
| Five Years Ended 12/31/14 | 4.43% | ||
| Inception (11/16/07) through 12/31/14 | (0.57)% |
| * | Assumes reinvestment of all distributions. During certain periods since inception, certain fees and expenses were waived or reimbursed. Without waivers and reimbursements, historical total returns would have been lower. For the year ended December 31, 2014, 0.21% of average net assets was waived or reimbursed through other expenses in the Investment Class Shares. |
| (1) | The MSCI All Country World Ex-U.S. Index is an unmanaged capitalization weighted measure of stock markets of developed and emerging markets, with the exception of U.S.-based companies. Unlike a mutual fund, the performance of an index assumes no taxes, transaction costs, management fees or other expenses. An individual cannot invest directly in an index. Index performance is presented for general comparative purposes. |
26
Wilshire International Equity Fund Commentary (Unaudited) | |
COMPARATIVE PERFORMANCE
Comparison of Change in Value of $10,000 Investment in Shares of Wilshire International Equity Fund,
Investment Class Shares and the MSCI ACWI ex-US Index through 12/31/14.

The performance data quoted represents past performance and does not guarantee future results. Current performance may be lower or higher. Performance data current to the most recent month end may be obtained at http://advisor.wilshire.com. The investment return and principal value of an investment will fluctuate so that shares, when redeemed, may be worth more or less than their original cost. The table above does not reflect the deduction of taxes that a shareholder would pay on Fund distributions or the redemption of Fund shares.
27
Wilshire International Equity Fund Commentary (Unaudited) - (Continued) | |
INSTITUTIONAL CLASS SHARES
Average Annual Total Return*
| One Year Ended 12/31/14 | (6.16)% | ||
| Five Years Ended 12/31/14 | 6.81% | ||
| Inception (11/16/07) through 12/31/14 | 0.52% |
MSCI ALL COUNTRY WORLD INDEX EX-U.S.(1)
Average Annual Total Return
| One Year Ended 12/31/14 | (3.87)% | ||
| Five Years Ended 12/31/14 | 4.43% | ||
| Inception (11/16/07) through 12/31/14 | (0.57)% |
| * | Assumes reinvestment of all distributions. During certain periods since inception, certain fees and expenses were waived or reimbursed. Without waivers and reimbursements, historical total returns would have been lower. For the year ended December 31, 2014, 0.06% of average net assets was waived or reimbursed through other expenses in the Institutional Class Shares. |
| (1) | The MSCI All Country World Ex-U.S. Index is an unmanaged capitalization weighted measure of stock markets of developed and emerging markets, with the exception of U.S.-based companies. Unlike a mutual fund, the performance of an index assumes no taxes, transaction costs, management fees or other expenses. An individual cannot invest directly in an index. Index performance is presented for general comparative purposes. |
28
Wilshire International Equity Fund Commentary (Unaudited) | |
COMPARATIVE PERFORMANCE
Comparison of Change in Value of $250,000 Investment in Shares of Wilshire International Equity Fund,
Institutional Class Shares and the MSCI ACWI ex-US Index through 12/31/14.
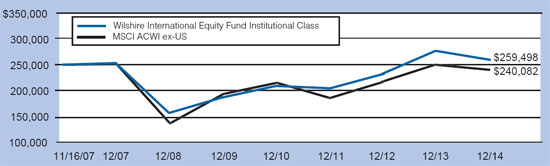
The performance data quoted represents past performance and does not guarantee future results. Current performance may be lower or higher. Performance data current to the most recent month end may be obtained at http://advisor.wilshire.com. The investment return and principal value of an investment will fluctuate so that shares, when redeemed, may be worth more or less than their original cost. The table above does not reflect the deduction of taxes that a shareholder would pay on Fund distributions or the redemption of Fund shares.
29
Wilshire International Equity Fund Commentary (Unaudited) - (Continued) | |
International stock markets underperformed the U.S. market as the MSCI All Country World ex U.S. Index returned -3.87% in 2014. Europe closed 2014 in negative territory as regional economic growth slowed down markedly in relation to the U.S. economy. Inflation rates in Europe have fallen to levels that have raised the specter of deflation, leading many analysts to expect further intervention by central banks to jump-start economic growth. Pacific regional markets, in contrast, continued their strong performance despite Japan’s recent descent into recession. China’s own economic slowdown, combined with Russia’s recent struggles with a sagging ruble and sinking oil prices, held back emerging market performance overall. The U.S. dollar’s appreciation against other world currencies in 2014 reduced dollar-based investors’ gains.
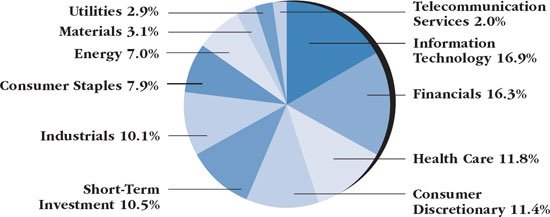
Within the MSCI All Country World ex U.S. Index, sector performance was mixed for the year. Health Care, Information Technology, and Utilities performed strongly, returning 7.84%, 5.39%, and 4.22%, respectively. Hurt by decreasing commodity prices, Energy and Materials lagged all other sectors, returning -18.46% and -12.64%, respectively.
The Wilshire International Equity Fund Institutional Class Institutional Class (the “Fund”) returned -6.16% for the year ended December 31, 2014, underperforming the MSCI All Country World ex U.S. Index return of -3.87%. Fund performance was hindered by poor stock selection in the Energy and Consumer Staples sectors and regionally within Switzerland and France. Relative underperformance was partially mitigated by strong stock selection in the Industrials sector and regionally within Canada as well as an underweight allocation to the Energy sector.
Despite the Fund’s underperformance versus its benchmark, we believe the Fund is well positioned going into 2015 as the market deals with ongoing macroeconomic and geopolitical issues.
Investing involves risk including loss of principal.
30
Wilshire International Equity Fund Commentary (Unaudited) - (Continued) | |
PORTFOLIO SECTOR WEIGHTING†
(As of December 31, 2014)
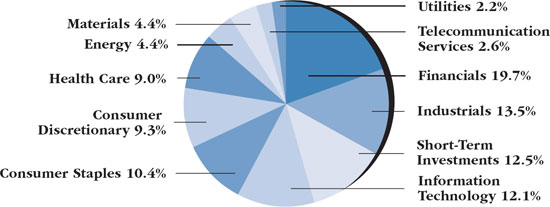
| † | Based on percent of the Fund’s total investments in securities, at value. Includes investments held as collateral for securities on loan (see Note 6 in Notes to Financial Statements). |
31
Wilshire Mutual Funds, Inc. Disclosure of Fund Expenses For the Six Months Ended December 31, 2014 (Unaudited) | |
All mutual funds have operating expenses. As a shareholder of a portfolio (or a “fund”), you incur ongoing costs, which include costs for investment advisory, administrative services, distribution and/or shareholder services and shareholder reports (like this one), among others. Operating expenses, which are deducted from a fund’s gross income, directly reduce the investment return of the fund. A fund’s expenses are expressed as a percentage of its average net assets. This figure is known as the expense ratio. The following examples are intended to help you understand the ongoing fees (in dollars) of investing in your fund and to compare these costs with those of other mutual funds. The examples are based on an investment of $1,000 made at the beginning of the period shown and held for the entire period.
The table on the next page illustrates your Portfolio’s costs in two ways:
Actual Fund Return: This section helps you to estimate the actual expenses, after any applicable fee waivers, that you paid over the period. The “Ending Account Value” shown is derived from the Portfolio’s actual return for the period. The “Expense Ratio” column shows the period’s annualized expense ratio and the “Expenses Paid During Period” column shows the dollar amount that would have been paid by an investor who started with $1,000 in the Portfolio at the beginning of the period.
You may use the information here, together with your account value, to estimate the expenses that you paid over the period. To do so, simply divide your account value by $1,000 (for example, an $8,600 account value divided by $1,000 = 8.6), then multiply the result by the number given for your Portfolio in the first line under the heading entitled “Expenses Paid During Period.”
Hypothetical 5% Return: This section is intended to help you compare your Portfolio’s costs with those of other mutual funds. The “Ending Account Value” shown is derived from hypothetical account values and hypothetical expenses based on the Portfolio’s actual expense ratio and assumed rate of return. It assumes that the Portfolio had an annual return of 5% before expenses, but that the expense ratio is unchanged. In this case, because the return used is not the Portfolio’s actual return, the results do not apply to your investment. This example is useful in making comparisons to other mutual funds because the Securities and Exchange Commission (“SEC”) requires all mutual funds to calculate expenses based on an assumed 5% annual return. You can assess your Portfolio’s ongoing costs by comparing this hypothetical example with the hypothetical examples that appear in shareholder reports of other funds.
Please note that the expenses shown in the table are meant to highlight and help you compare your ongoing costs only and do not reflect any transactional costs such as sales charges (loads), redemption fees, or exchange fees. Wilshire Mutual Funds, Inc. has no such charges, but these may be present in other funds to which you compare this data. Therefore, the hypothetical portions of the table are useful in comparing ongoing costs only, and will not help you determine the relative total costs of owning different funds.
32
Wilshire Mutual Funds, Inc. Disclosure of Fund Expenses - (Continued) For the Six Months Ended December 31, 2014 | |
Beginning Account Value 07/01/14 | Ending Account Value 12/31/14 | Expense Ratio(1) | Expenses Paid During Period 07/01/14-12/31/14(2) | |
| Large Company Growth Portfolio | ||||
| Actual Fund Return | ||||
| Investment Class | $1,000.00 | $1,052.90 | 1.41% | $7.29 |
| Institutional Class | $1,000.00 | $1,054.70 | 1.07% | $5.55 |
| Hypothetical 5% Return | ||||
| Investment Class | $1,000.00 | $1,018.10 | 1.41% | $7.16 |
| Institutional Class | $1,000.00 | $1,019.81 | 1.07% | $5.45 |
| Large Company Value Portfolio | ||||
| Actual Fund Return | ||||
| Investment Class | $1,000.00 | $1,033.50 | 1.37% | $7.00 |
| Institutional Class | $1,000.00 | $1,034.90 | 1.08% | $5.52 |
| Hypothetical 5% Return | ||||
| Investment Class | $1,000.00 | $1,018.32 | 1.37% | $6.95 |
| Institutional Class | $1,000.00 | $1,019.78 | 1.08% | $5.48 |
| Small Company Growth Portfolio | ||||
| Actual Fund Return | ||||
| Investment Class | $1,000.00 | $1,025.00 | 1.60% | $8.19 |
| Institutional Class | $1,000.00 | $1,026.90 | 1.28% | $6.55 |
| Hypothetical 5% Return | ||||
| Investment Class | $1,000.00 | $1,017.12 | 1.60% | $8.16 |
| Institutional Class | $1,000.00 | $1,018.74 | 1.28% | $6.52 |
| Small Company Value Portfolio | ||||
| Actual Fund Return | ||||
| Investment Class | $1,000.00 | $1,023.50 | 1.57% | $8.02 |
| Institutional Class | $1,000.00 | $1,024.70 | 1.24% | $6.33 |
| Hypothetical 5% Return | ||||
| Investment Class | $1,000.00 | $1,017.28 | 1.57% | $7.99 |
| Institutional Class | $1,000.00 | $1,018.95 | 1.24% | $6.31 |
33
Wilshire Mutual Funds, Inc. Disclosure of Fund Expenses - (Concluded) For the Six Months Ended December 31, 2014 | |
Beginning Account Value 07/01/14 | Ending Account Value 12/31/14 | Expense Ratio(1) | Expenses Paid During Period 07/01/14-12/31/14(2) | |
Wilshire 5000 IndexSM Fund | ||||
| Actual Fund Return | ||||
| Investment Class | $1,000.00 | $1,050.00 | 0.69% | $3.56 |
| Institutional Class | $1,000.00 | $1,050.80 | 0.46% | $2.39 |
| Qualified Class | $1,000.00 | $1,053.20 | 0.00% | $ —(3) |
| Horace Mann Class | $1,000.00 | $1,049.20 | 0.74% | $3.84 |
| Hypothetical 5% Return | ||||
| Investment Class | $1,000.00 | $1,021.74 | 0.69% | $3.51 |
| Institutional Class | $1,000.00 | $1,022.87 | 0.46% | $2.36 |
| Qualified Class | $1,000.00 | $1,025.21 | 0.00% | $ —(3) |
| Horace Mann Class | $1,000.00 | $1,021.45 | 0.74% | $3.79 |
| Wilshire International Equity Fund | ||||
| Actual Fund Return | ||||
| Investment Class | $1,000.00 | $911.80 | 1.52% | $7.35 |
| Institutional Class | $1,000.00 | $912.80 | 1.27% | $6.13 |
| Hypothetical 5% Return | ||||
| Investment Class | $1,000.00 | $1,017.52 | 1.52% | $7.75 |
| Institutional Class | $1,000.00 | $1,018.80 | 1.27% | $6.47 |
(1) | Annualized, based on the Portfolio’s most recent fiscal half-year expenses. |
| (2) | Expenses are equal to the Portfolio’s annualized expense ratio multiplied by the average account value over the period, multiplied by the number of days in the period, then divided by 365. |
| (3) | There were no expenses accrued in the Wilshire 5000 IndexSM Fund Qualified Class for the six months ended December 31, 2014 due to the low average net assets (of approximately $185) relative to the other classes of this Fund. |
34
Wilshire Mutual Funds, Inc. Large Company Growth Portfolio Condensed Schedule of Investments | December 31, 2014 | |
| Shares | Percentage of Net Assets (%) | Value | |||||||||
| COMMON STOCK — 98.5%†† | |||||||||||
| Consumer Discretionary — 22.4% | |||||||||||
| 18,800 | Advance Auto Parts, Inc. (a) | 1.3 | $ | 2,994,464 | |||||||
| 17,609 | Amazon.com, Inc.† | 2.3 | 5,464,953 | ||||||||
| 50,461 | Comcast Corp., Class A (a) | 1.2 | 2,927,243 | ||||||||
| 27,327 | Home Depot, Inc. (The) | 1.2 | 2,868,515 | ||||||||
| 36,375 | Michael Kors Holdings, Ltd.† | 1.2 | 2,731,762 | ||||||||
| 22,838 | NIKE, Inc., Class B | 0.9 | 2,195,874 | ||||||||
| 3,735 | Priceline Group, Inc.† | 1.8 | 4,258,684 | ||||||||
| 93,613 | PulteGroup, Inc. | 0.9 | 2,008,935 | ||||||||
| 89,333 | Starbucks Corp. | 3.1 | 7,329,773 | ||||||||
| 12,669 | Time Warner Cable, Inc., Class A | 0.8 | 1,926,448 | ||||||||
| 40,500 | Tractor Supply Co. (a) | 1.3 | 3,192,210 | ||||||||
| 30,927 | Walt Disney Co. (The) | 1.2 | 2,913,014 | ||||||||
| 202,085 | Other Securities | 5.2 | 12,505,794 | ||||||||
| 53,317,669 | |||||||||||
| Consumer Staples — 5.3% | |||||||||||
| 24,602 | Estee Lauder Cos., Inc. (The), Class A | 0.8 | 1,874,673 | ||||||||
| 28,825 | Monster Beverage Corp.† | 1.3 | 3,123,189 | ||||||||
| 129,716 | Other Securities | 3.2 | 7,530,301 | ||||||||
| 12,528,163 | |||||||||||
| Energy — 3.8% | |||||||||||
| 22,599 | Anadarko Petroleum Corp. | 0.8 | 1,864,417 | ||||||||
| 44,594 | EOG Resources, Inc. | 1.7 | 4,105,770 | ||||||||
| 52,725 | FMC Technologies, Inc.† (a) | 1.0 | 2,469,639 | ||||||||
| 62,020 | Other Securities | 0.3 | 612,868 | ||||||||
| 9,052,694 | |||||||||||
| Financials — 6.6% | |||||||||||
| 23,975 | Affiliated Managers Group, Inc.† | 2.1 | 5,088,454 | ||||||||
| 15,367 | Ameriprise Financial, Inc. | 0.9 | 2,032,286 | ||||||||
| 110,100 | Charles Schwab Corp. (The) | 1.4 | 3,323,919 | ||||||||
| 36,112 | First Republic Bank | 0.8 | 1,882,158 | ||||||||
| 43,447 | Other Securities | 1.4 | 3,354,622 | ||||||||
| 15,681,439 | |||||||||||
| Health Care — 15.8% | |||||||||||
| 23,302 | Alexion Pharmaceuticals, Inc.† | 1.8 | 4,311,569 | ||||||||
| 8,705 | Biogen Idec, Inc.† | 1.2 | 2,954,912 | ||||||||
| 73,794 | Catamaran Corp.† (a) | 1.6 | 3,818,840 | ||||||||
| 50,863 | Celgene Corp.† (a) | 2.4 | 5,689,535 | ||||||||
| Shares | Percentage of Net Assets (%) | Value | |||||||||
| 44,625 | Cerner Corp.† | 1.2 | $ | 2,885,452 | |||||||
| 64,947 | Gilead Sciences, Inc.† (a) | 2.6 | 6,121,904 | ||||||||
| 170,066 | Other Securities | 5.0 | 11,903,397 | ||||||||
| 37,685,609 | |||||||||||
| Industrials — 8.9% | |||||||||||
| 16,475 | Canadian Pacific Railway, Ltd (a) | 1.4 | 3,174,568 | ||||||||
| 57,812 | Fastenal Co. (a) | 1.1 | 2,749,539 | ||||||||
| 22,974 | Precision Castparts Corp. | 2.3 | 5,533,977 | ||||||||
| 29,434 | United Rentals, Inc.† | 1.3 | 3,002,562 | ||||||||
| 93,732 | Other Securities | 2.8 | 6,738,526 | ||||||||
| 21,199,172 | |||||||||||
| Information Technology — 33.6% | |||||||||||
| 47,075 | Adobe Systems, Inc.† | 1.5 | 3,422,353 | ||||||||
| 32,181 | Alibaba Group Holding, Ltd. ADR† | 1.4 | 3,344,893 | ||||||||
| 11,250 | Alliance Data Systems Corp.† | 1.3 | 3,218,063 | ||||||||
| 91,534 | Apple, Inc. | 4.2 | 10,103,523 | ||||||||
| 90,204 | Facebook, Inc., Class A† | 3.0 | 7,037,716 | ||||||||
| 11,451 | Google, Inc., Class A† | 2.6 | 6,076,588 | ||||||||
| 6,265 | Google, Inc., Class C† | 1.4 | 3,297,896 | ||||||||
| 89,803 | Micron Technology, Inc.† (a) | 1.3 | 3,144,003 | ||||||||
| 88,050 | Rackspace Hosting, Inc.† (a) | 1.7 | 4,121,620 | ||||||||
| 73,494 | Salesforce.com, Inc.† (a) | 1.8 | 4,358,929 | ||||||||
| 27,325 | SanDisk Corp. (a) | 1.1 | 2,677,304 | ||||||||
| 38,175 | Skyworks Solutions, Inc. (a) | 1.2 | 2,775,704 | ||||||||
| 30,846 | Stratasys, Ltd.† (a) | 1.1 | 2,563,611 | ||||||||
| 71,937 | Trimble Navigation, Ltd.† (a) | 0.8 | 1,909,208 | ||||||||
| 33,782 | Visa, Inc., Class A (a) | 3.7 | 8,857,640 | ||||||||
| 23,475 | VMware, Inc., Class A† | 0.8 | 1,937,157 | ||||||||
| 188,567 | Other Securities | 4.7 | 11,119,626 | ||||||||
| 79,965,834 | |||||||||||
| Materials — 1.6% | |||||||||||
| 10,645 | Sherwin-Williams Co. (The) (a) | 1.2 | 2,800,061 | ||||||||
| 17,025 | Other Securities | 0.4 | 1,077,981 | ||||||||
| 3,878,042 | |||||||||||
| Telecommunication Services — 0.5% | |||||||||||
| 28,557 | Other Securities | 0.5 | 1,276,850 | ||||||||
| 1,276,850 | |||||||||||
| Total Common Stock | |||||||||||
| (Cost $167,804,039) | 234,585,472 | ||||||||||
See Notes to Financial Statements.
35
Wilshire Mutual Funds, Inc. Large Company Growth Portfolio Condensed Schedule of Investments - (Continued) | December 31, 2014 | |
| Shares | Percentage of Net Assets (%) | Value | |||||||||
| SHORT-TERM INVESTMENTS (b) — 22.3% | |||||||||||
| 4,141,760 | Northern Trust Institutional Government Select Portfolio, 0.010% | 1.7 | $ | 4,141,760 | |||||||
| 49,108,032 | Northern Trust Institutional Liquid Asset Portfolio, 0.010% (c) | 20.6 | 49,108,032 | ||||||||
| Total Short-Term Investments | |||||||||||
| (Cost $53,249,792) | 53,249,792 | ||||||||||
| Total Investments — 120.8% | |||||||||||
| (Cost $221,053,831) | 287,835,264 | ||||||||||
| Other Assets & Liabilities, Net — (20.8)% | (49,568,840 | ) | |||||||||
| NET ASSETS — 100.0% | $ | 238,266,424 | |||||||||
| † | Non-income producing security. |
| †† | More narrow industries are utilized for compliance purposes, whereas broad sectors are utilized for reporting purposes. |
| (a) | This security or a partial position of this security is on loan at December 31, 2014. The total market value of securities on loan at December 31, 2014 was $50,961,501 (Note 6). |
| (b) | Rate shown is the 7-day effective yield as of December 31, 2014. |
| (c) | This security was purchased with cash collateral held from securities on loan. The total value of such securities as of December 31, 2014 was $49,108,032. Securities on loan are also collateralized by various U.S. Treasury obligations in the amount of $3,367,201 (Note 6). |
Ltd. — Limited
The Condensed Schedule of Investments does not reflect the complete portfolio holdings. It includes the Portfolio’s 50 largest holdings and each investment of any issuer that exceeds 1% of the Portfolio’s net assets. “Other Securities” represent all issues not required to be disclosed under the rules adopted by the U.S. Securities and Exchange Commission (“SEC”). The complete schedule of portfolio holdings is available (i) without charge, upon request, by calling (800) 607-2200; (ii) on the SEC’s website at http://www.sec.gov; and (iii) on our website at http://advisor.wilshire.com.
As of December 31, 2014, all of the Portfolio’s investments were considered Level 1. For the year ended December 31, 2014, there have been no transfers between Level 1 and Level 2 assets and liabilities. For the year ended December 31, 2014, there have been no transfers between Level 2 and Level 3 assets and liabilities. Please see Note 2 in Notes to Financial Statements for further information regarding fair value measurements.
See Notes to Financial Statements.
36
Wilshire Mutual Funds, Inc. Large Company Value Portfolio Condensed Schedule of Investments | December 31, 2014 | |
| Shares | Percentage of Net Assets (%) | Value | |||||||||
| COMMON STOCK — 97.4%†† | |||||||||||
| Consumer Discretionary — 8.8% | |||||||||||
| 60,476 | Ford Motor Co. | 0.8 | $ | 937,378 | |||||||
| 53,975 | News Corp., Class A† (a) | 0.7 | 846,868 | ||||||||
| 8,139 | Stanley Black & Decker, Inc. | 0.6 | 781,995 | ||||||||
| 44,263 | Staples, Inc. | 0.6 | 802,046 | ||||||||
| 8,325 | TRW Automotive Holdings Corp.† | 0.7 | 856,226 | ||||||||
| 148,025 | Other Securities | 5.4 | 6,820,835 | ||||||||
| 11,045,348 | |||||||||||
| Consumer Staples — 6.0% | |||||||||||
| 11,438 | CVS Health Corp. | 0.9 | 1,101,594 | ||||||||
| 10,149 | Procter & Gamble Co. (The) | 0.7 | 924,472 | ||||||||
| 16,912 | Wal-Mart Stores, Inc. (a) | 1.2 | 1,452,403 | ||||||||
| 146,203 | Other Securities | 3.2 | 4,033,670 | ||||||||
| 7,512,139 | |||||||||||
| Energy — 11.2% | |||||||||||
| 41,078 | BP PLC (a) | 1.3 | 1,565,894 | ||||||||
| 6,684 | Chevron Corp. (a) | 0.6 | 749,811 | ||||||||
| 45,203 | Exxon Mobil Corp. | 3.3 | 4,179,017 | ||||||||
| 31,914 | Royal Dutch Shell PLC ADR, Class A (a) | 1.7 | 2,136,642 | ||||||||
| 123,239 | Other Securities | 4.3 | 5,365,355 | ||||||||
| 13,996,719 | |||||||||||
| Financials — 32.1% | |||||||||||
| 26,940 | American International Group, Inc. | 1.2 | 1,508,909 | ||||||||
| 195,103 | Bank of America Corp. | 2.8 | 3,490,393 | ||||||||
| 6,097 | Berkshire Hathaway, Inc., Class B† | 0.7 | 915,465 | ||||||||
| 48,037 | Citigroup, Inc. | 2.1 | 2,599,282 | ||||||||
| 61,400 | Fifth Third Bancorp | 1.0 | 1,251,025 | ||||||||
| 6,723 | Goldman Sachs Group, Inc. (The) | 1.0 | 1,303,119 | ||||||||
| 22,134 | Hartford Financial Services Group, Inc. (a) | 0.7 | 922,766 | ||||||||
| 52,842 | JPMorgan Chase & Co. | 2.6 | 3,306,852 | ||||||||
| 36,387 | MetLife, Inc. (a) | 1.6 | 1,968,173 | ||||||||
| 24,225 | Morgan Stanley | 0.7 | 939,930 | ||||||||
| 20,023 | PNC Financial Services Group, Inc. | 1.5 | 1,826,698 | ||||||||
| 84,375 | Regions Financial Corp. | 0.7 | 891,000 | ||||||||
| Shares | Percentage of Net Assets (%) | Value | |||||||||
| 11,985 | State Street Corp. | 0.8 | $ | 940,822 | |||||||
| 51,775 | UBS Group AG† | 0.7 | 882,764 | ||||||||
| 30,200 | Voya Financial, Inc. | 1.0 | 1,279,876 | ||||||||
| 27,898 | Wells Fargo & Co. | 1.2 | 1,529,368 | ||||||||
| 586,276 | Other Securities | 11.8 | 14,557,062 | ||||||||
| 40,113,504 | |||||||||||
| Health Care — 14.3% | |||||||||||
| 24,618 | Abbott Laboratories | 0.9 | 1,108,302 | ||||||||
| 12,380 | Aetna, Inc. | 0.9 | 1,099,715 | ||||||||
| 10,869 | Cigna Corp. | 0.9 | 1,118,529 | ||||||||
| 8,702 | Express Scripts Holding Co.† | 0.6 | 736,798 | ||||||||
| 17,444 | Johnson & Johnson | 1.5 | 1,824,119 | ||||||||
| 8,089 | Laboratory Corp. of America Holdings† | 0.7 | 872,803 | ||||||||
| 26,697 | Merck & Co., Inc. | 1.2 | 1,516,123 | ||||||||
| 67,387 | Pfizer, Inc. | 1.7 | 2,099,105 | ||||||||
| 107,616 | Other Securities | 5.9 | 7,473,800 | ||||||||
| 17,849,294 | |||||||||||
| Industrials — 7.0% | |||||||||||
| 68,346 | General Electric Co. | 1.4 | 1,727,103 | ||||||||
| 7,900 | Parker Hannifin Corp. (a) | 0.8 | 1,018,705 | ||||||||
| 128,317 | Other Securities | 4.8 | 6,037,913 | ||||||||
| 8,783,721 | |||||||||||
| Information Technology — 11.5% | |||||||||||
| 40,111 | Cisco Systems, Inc. | 0.9 | 1,115,687 | ||||||||
| 31,944 | Corning, Inc. | 0.6 | 732,476 | ||||||||
| 78,406 | Hewlett-Packard Co. | 2.5 | 3,146,433 | ||||||||
| 39,447 | Intel Corp. | 1.1 | 1,431,532 | ||||||||
| 21,265 | Micron Technology, Inc.† (a) | 0.6 | 744,488 | ||||||||
| 24,282 | Microsoft Corp. | 0.9 | 1,127,899 | ||||||||
| 24,850 | Oracle Corp. | 0.9 | 1,117,505 | ||||||||
| 6,829 | Western Digital Corp. | 0.6 | 755,970 | ||||||||
| 131,055 | Other Securities | 3.4 | 4,258,360 | ||||||||
| 14,430,350 | |||||||||||
| Materials — 2.6% | |||||||||||
| 105,413 | Other Securities | 2.6 | 3,236,422 | ||||||||
| 3,236,422 | |||||||||||
| Telecommunication Services — 1.2% | |||||||||||
| 22,863 | AT&T, Inc. (a) | 0.6 | 767,968 | ||||||||
| 23,089 | Other Securities | 0.6 | 723,478 | ||||||||
| 1,491,446 | |||||||||||
See Notes to Financial Statements.
37
Wilshire Mutual Funds, Inc. Large Company Value Portfolio Condensed Schedule of Investments - (Continued) | December 31, 2014 | |
| Shares | Percentage of Net Assets (%) | Value | |||||||||
| Utilities — 2.7% | |||||||||||
| 9,825 | Entergy Corp. | 0.7 | $ | 859,491 | |||||||
| 52,103 | Other Securities | 2.0 | 2,527,088 | ||||||||
| 3,386,579 | |||||||||||
| Total Common Stock | |||||||||||
| (Cost $96,726,828) | 121,845,522 | ||||||||||
| SHORT-TERM INVESTMENTS (b) — 20.5% | |||||||||||
| 3,452,723 | Northern Trust Institutional Government Select Portfolio, 0.010% | 2.8 | 3,452,723 | ||||||||
| 22,142,303 | Northern Trust Institutional Liquid Asset Portfolio, 0.010% (c) | 17.7 | 22,142,303 | ||||||||
| Total Short-Term Investments | |||||||||||
| (Cost $25,595,026) | 25,595,026 | ||||||||||
| Total Investments — 117.9% | |||||||||||
| (Cost $122,321,854) | 147,440,548 | ||||||||||
Other Assets & Liabilities, Net — (17.9)% | (22,374,999 | ) | |||||||||
| NET ASSETS — 100.0% | $ | 125,065,549 | |||||||||
| † | Non-income producing security. |
| †† | More narrow industries are utilized for compliance purposes, whereas broad sectors are utilized for reporting purposes. |
| (a) | This security or a partial position of this security is on loan at December 31, 2014. The total market value of securities on loan at December 31, 2014 was $21,437,933 (Note 6). |
| (b) | Rate shown is the 7-day effective yield as of December 31, 2014. |
| (c) | This security was purchased with cash collateral held from securities on loan. The total value of such securities as of December 31, 2014 was $22,142,303. Securities on loan are also collateralized by various U.S. Treasury obligations in the amount of $3,183 (Note 6). |
ADR — American Depositary Receipt
PLC — Public Limited Company
The Condensed Schedule of Investments does not reflect the complete portfolio holdings. It includes the Portfolio’s 50 largest holdings and each investment of any issuer that exceeds 1% of the Portfolio’s net assets. “Other Securities” represent all issues not required to be disclosed under the rules adopted by the U.S. Securities and Exchange Commission (“SEC”). The complete schedule of portfolio holdings is available (i) without charge, upon request, by calling (800) 607-2200; (ii) on the SEC’s website at http://www.sec.gov; and (iii) on our website at http://advisor.wilshire.com.
As of December 31, 2014, all of the Portfolio’s investments were considered Level 1. For the year ended December 31, 2014, there have been no transfers between Level 1 and Level 2 assets and liabilities. For the year ended December 31, 2014, there have been no transfers between Level 2 and Level 3 assets and liabilities. Please see Note 2 in Notes to Financial Statements for further information regarding fair value measurements.
See Notes to Financial Statements.
38
Wilshire Mutual Funds, Inc. Small Company Growth Portfolio Condensed Schedule of Investments | December 31, 2014 | |
| Shares | Percentage of Net Assets (%) | Value | |||||||||
| COMMON STOCK — 98.8% | |||||||||||
| Consumer Discretionary — 19.2% | |||||||||||
| 2,494 | Asbury Automotive Group, Inc.† (a) | 0.7 | $ | 189,344 | |||||||
| 3,840 | Capella Education Co. | 1.1 | 295,526 | ||||||||
| 4,010 | Deckers Outdoor Corp.† (a) | 1.4 | 365,070 | ||||||||
| 4,090 | Dorman Products, Inc.† (a) | 0.7 | 197,424 | ||||||||
| 4,580 | G-III Apparel Group, Ltd.† | 1.7 | 462,626 | ||||||||
| 14,405 | Krispy Kreme Doughnuts, Inc.† (a) | 1.1 | 284,355 | ||||||||
| 5,650 | Monro Muffler Brake, Inc. (a) | 1.2 | 326,570 | ||||||||
| 22,805 | Sonic Corp. (a) | 2.3 | 620,980 | ||||||||
| 10,411 | Steven Madden, Ltd.† | 1.2 | 331,382 | ||||||||
| 16,309 | Tuesday Morning Corp.† (a) | 1.3 | 353,905 | ||||||||
| 59,167 | Other Securities | 6.5 | 1,735,562 | ||||||||
| 5,162,744 | |||||||||||
| Consumer Staples — 5.3% | |||||||||||
| 3,400 | J&J Snack Foods Corp. | 1.4 | 369,818 | ||||||||
| 7,694 | TreeHouse Foods, Inc.† (a) | 2.4 | 658,068 | ||||||||
| 11,734 | Other Securities | 1.5 | 394,517 | ||||||||
| 1,422,403 | |||||||||||
| Energy — 1.3% | |||||||||||
| 10,270 | Matador Resources Co.† (a) | 0.8 | 207,762 | ||||||||
| 3,577 | Other Securities | 0.5 | 132,621 | ||||||||
| 340,383 | |||||||||||
| Financials — 12.3% | |||||||||||
| 18,030 | BancorpSouth, Inc. (a) | 1.5 | 405,855 | ||||||||
| 9,550 | Bank of the Ozarks, Inc. (a) | 1.3 | 362,136 | ||||||||
| 6,460 | Iberiabank Corp. | 1.6 | 418,931 | ||||||||
| 5,037 | MarketAxess Holdings, Inc. (a) | 1.3 | 361,203 | ||||||||
| 3,970 | Pinnacle Financial Partners, Inc. (a) | 0.6 | 156,974 | ||||||||
| 17,710 | PrivateBancorp, Inc., Class A (a) | 2.2 | 591,514 | ||||||||
| 37,072 | Other Securities | 3.8 | 1,020,677 | ||||||||
| 3,317,290 | |||||||||||
| Health Care — 22.4% | |||||||||||
| 7,600 | Air Methods Corp.† (a) | 1.3 | 334,628 | ||||||||
| 11,029 | Akorn, Inc.† (a) | 1.5 | 399,250 | ||||||||
| 4,800 | Anika Therapeutics, Inc.† (a) | 0.7 | 195,552 | ||||||||
| 12,194 | Cambrex Corp.† | 1.0 | 263,634 | ||||||||
| 5,825 | Cantel Medical Corp. (a) | 0.9 | 251,990 | ||||||||
| 3,510 | Centene Corp.† | 1.4 | 364,514 | ||||||||
| Shares | Percentage of Net Assets (%) | Value | |||||||||
| 10,737 | ICON PLC† | 2.0 | $ | 547,480 | |||||||
| 4,334 | Lannett Co., Inc.† (a) | 0.7 | 185,842 | ||||||||
| 8,010 | Medidata Solutions, Inc.† (a) | 1.4 | 382,478 | ||||||||
| 3,710 | Neogen Corp.† (a) | 0.7 | 183,979 | ||||||||
| 13,159 | Prestige Brands Holdings, Inc.† (a) | 1.7 | 456,880 | ||||||||
| 7,517 | Sagent Pharmaceuticals, Inc.† (a) | 0.7 | 188,752 | ||||||||
| 105,478 | Other Securities | 8.4 | 2,270,873 | ||||||||
| 6,025,852 | |||||||||||
| Industrials — 14.7% | |||||||||||
| 12,609 | Aceto Corp. (a) | 1.0 | 273,615 | ||||||||
| 7,220 | Celadon Group, Inc. (a) | 0.6 | 163,822 | ||||||||
| 4,790 | EnerSys, Inc. (a) | 1.1 | 295,639 | ||||||||
| 6,330 | Engility Holdings, Inc.† (a) | 1.0 | 270,924 | ||||||||
| 7,350 | Proto Labs, Inc.† (a) | 1.8 | 493,626 | ||||||||
| 7,382 | Saia, Inc.† (a) | 1.5 | 408,668 | ||||||||
| 21,435 | Wabash National Corp.† (a) | 1.0 | 264,937 | ||||||||
| 7,010 | WageWorks, Inc.† (a) | 1.7 | 452,636 | ||||||||
| 53,810 | Other Securities | 5.0 | 1,330,736 | ||||||||
| 3,954,603 | |||||||||||
| Information Technology — 21.7% | |||||||||||
| 15,829 | Aruba Networks, Inc.† | 1.1 | 287,771 | ||||||||
| 10,260 | CEVA, Inc.† (a) | 0.7 | 186,116 | ||||||||
| 11,793 | Ellie Mae, Inc.† (a) | 1.8 | 475,494 | ||||||||
| 8,630 | Envestnet, Inc.† (a) | 1.6 | 424,078 | ||||||||
| 19,720 | InvenSense, Inc., Class A† (a) | 1.2 | 320,647 | ||||||||
| 8,263 | MAXIMUS, Inc. | 1.7 | 453,143 | ||||||||
| 22,060 | Ruckus Wireless, Inc.† | 1.0 | 265,161 | ||||||||
| 10,630 | Silicon Laboratories, Inc.† | 1.9 | 506,201 | ||||||||
| 3,280 | SPS Commerce, Inc.† (a) | 0.7 | 185,746 | ||||||||
| 107,539 | Other Securities | 10.0 | 2,714,969 | ||||||||
| 5,819,326 | |||||||||||
| Materials — 1.4% | |||||||||||
| 18,314 | Other Securities | 1.4 | 374,966 | ||||||||
| 374,966 | |||||||||||
| Telecommunication Services — 0.5% | |||||||||||
| 14,683 | Other Securities | 0.5 | 143,608 | ||||||||
| 143,608 | |||||||||||
| Total Common Stock | |||||||||||
| (Cost $20,985,737) | 26,561,175 | ||||||||||
See Notes to Financial Statements.
39
Wilshire Mutual Funds, Inc. Small Company Growth Portfolio Condensed Schedule of Investments - (Continued) | December 31, 2014 | |
| Shares | Percentage of Net Assets (%) | Value | |||||||||
| SHORT-TERM INVESTMENTS (b) — 52.4% | |||||||||||
| 361,279 | Northern Trust Institutional Government Select Portfolio, 0.010% | 1.3 | $ | 361,279 | |||||||
| 13,730,764 | Northern Trust Institutional Liquid Asset Portfolio, 0.010% (c) | 51.1 | 13,730,764 | ||||||||
| Total Short-Term Investments | |||||||||||
| (Cost $14,092,043) | 14,092,043 | ||||||||||
| RIGHTS — 0.0% | |||||||||||
Number of Rights | |||||||||||
| United States — 0.0% | |||||||||||
| 180 | Other Securities | 0.0 | 360 | ||||||||
| Total Rights | |||||||||||
| (Cost $—) | 360 | ||||||||||
| Total Investments — 151.2% | |||||||||||
| (Cost $35,077,780) | 40,653,578 | ||||||||||
Other Assets & Liabilities, Net — (51.2)% | (13,772,205 | ) | |||||||||
| NET ASSETS — 100.0% | $ | 26,881,373 | |||||||||
| † | Non-income producing security. |
| (a) | This security or a partial position of this security is on loan at December 31, 2014. The total market value of securities on loan at December 31, 2014 was $13,300,025 (Note 6). |
| (b) | Rate shown is the 7-day effective yield as of December 31, 2014. |
(c) | This security was purchased with cash collateral held from securities on loan. The total value of such securities as of December 31, 2014 was $13,730,764. Securities on loan are also collateralized by various U.S. Treasury obligations in the amount of $3,919 (Note 6). |
Ltd. — Limited
PLC — Public Limited Company
The Condensed Schedule of Investments does not reflect the complete portfolio holdings. It includes the Portfolio’s 50 largest holdings and each investment of any issuer that exceeds 1% of the Portfolio’s net assets. “Other Securities” represent all issues not required to be disclosed under the rules adopted by the U.S. Securities and Exchange Commission (“SEC”). The complete schedule of portfolio holdings is available (i) without charge, upon request, by calling (800) 607-2200; (ii) on the SEC’s website at http://www.sec.gov; and (iii) on our website at http://advisor.wilshire.com.
As of December 31, 2014, all of the Portfolio’s investments were considered Level 1, except for Trius Contingent Value Rights was Level 3. At December 31, 2014, the investment was valued at $360. A reconciliation of Level 3 investments is only presented when the Portfolio has a significant amount of Level 3 investments at the beginning and/or end of the period in relation to net assets. For the year ended December 31, 2014, there have been no transfers between Level 1 and Level 2 assets and liabilities. For the year ended December 31, 2014, there have been no transfers between Level 2 and Level 3 assets and liabilities. Please see Note 2 in Notes to Financial Statements for further information regarding fair value measurements.
See Notes to Financial Statements.
40
Wilshire Mutual Funds, Inc. Small Company Value Portfolio Condensed Schedule of Investments | December 31, 2014 | |
| Shares | Percentage of Net Assets (%) | Value | |||||||||
| COMMON STOCK — 97.0%†† | |||||||||||
| Consumer Discretionary — 9.1% | |||||||||||
| 11,035 | Express, Inc.† | 0.5 | $ | 162,104 | |||||||
| 20,381 | Hooker Furniture Corp. | 1.2 | 349,942 | ||||||||
| 31,820 | Stoneridge, Inc.† (a) | 1.4 | 409,205 | ||||||||
| 15,525 | TRI Pointe Homes, Inc.† (a) | 0.8 | 236,756 | ||||||||
| 66,195 | Other Securities | 5.2 | 1,546,821 | ||||||||
| 2,704,828 | |||||||||||
| Consumer Staples — 5.5% | |||||||||||
| 22,935 | Elizabeth Arden, Inc.† (a) | 1.7 | 490,580 | ||||||||
| 9,100 | Inter Parfums, Inc. (a) | 0.8 | 249,795 | ||||||||
| 6,028 | TreeHouse Foods, Inc.† (a) | 1.7 | 515,575 | ||||||||
| 13,569 | Other Securities | 1.3 | 363,565 | ||||||||
| 1,619,515 | |||||||||||
| Energy — 0.1% | |||||||||||
| 21,830 | Other Securities | 0.1 | 38,087 | ||||||||
| 38,087 | |||||||||||
| Financials — 31.6% | |||||||||||
| 14,040 | Astoria Financial Corp. (a) | 0.6 | 187,574 | ||||||||
| 27,625 | Brandywine Realty Trust‡ | 1.5 | 441,448 | ||||||||
| 15,275 | Capital Bank Financial Corp., Class A† (a) | 1.4 | 409,370 | ||||||||
| 4,224 | First American Financial Corp. (a) | 0.5 | 143,194 | ||||||||
| 30,625 | Forestar Group, Inc.† (a) | 1.6 | 471,625 | ||||||||
| 4,895 | MB Financial, Inc. (a) | 0.5 | 160,850 | ||||||||
| 10,005 | PacWest Bancorp (a) | 1.5 | 454,827 | ||||||||
| 10,527 | PrivateBancorp, Inc., Class A | 1.2 | 351,602 | ||||||||
| 16,780 | Ramco-Gershenson Properties Trust‡ (a) | 1.1 | 314,457 | ||||||||
| 5,839 | Webster Financial Corp. (a) | 0.6 | 189,943 | ||||||||
| 18,263 | Western Alliance Bancorp† | 1.7 | 507,711 | ||||||||
| 311,617 | Other Securities | 19.4 | 5,780,420 | ||||||||
| 9,413,021 | |||||||||||
| Health Care — 7.0% | |||||||||||
| 5,655 | Analogic Corp. (a) | 1.6 | 478,469 | ||||||||
| 8,030 | Impax Laboratories, Inc.† (a) | 0.9 | 254,310 | ||||||||
| 6,320 | Sagent Pharmaceuticals, Inc.† (a) | 0.5 | 158,695 | ||||||||
| 6,064 | Triple-S Management Corp., Class B† (a) | 0.5 | 144,990 | ||||||||
| 2,114 | WellCare Health Plans, Inc.† (a) | 0.6 | 173,475 | ||||||||
| Shares | Percentage of Net Assets (%) | Value | |||||||||
| 30,331 | Other Securities | 2.9 | $ | 874,922 | |||||||
| 2,084,861 | |||||||||||
| Industrials — 12.9% | |||||||||||
| 10,110 | Albany International Corp., Class A (a) | 1.3 | 384,079 | ||||||||
| 6,847 | Astronics Corp.† (a) | 1.3 | 378,707 | ||||||||
| 2,320 | Curtiss-Wright Corp. | 0.5 | 163,769 | ||||||||
| 5,865 | EnerSys, Inc. | 1.2 | 361,988 | ||||||||
| 8,980 | GP Strategies Corp.† | 1.0 | 304,691 | ||||||||
| 19,095 | Marten Transport, Ltd. (a) | 1.4 | 417,417 | ||||||||
| 9,430 | Orbital Sciences Corp.† | 0.9 | 253,573 | ||||||||
| 91,923 | Other Securities | 5.3 | 1,575,173 | ||||||||
| 3,839,397 | |||||||||||
| Information Technology — 17.4% | |||||||||||
| 9,965 | Coherent, Inc.† (a) | 2.0 | 605,075 | ||||||||
| 24,490 | Entegris, Inc.† | 1.1 | 323,513 | ||||||||
| 2,600 | Euronet Worldwide, Inc.† (a) | 0.5 | 142,740 | ||||||||
| 31,100 | GSI Group, Inc.† (a) | 1.5 | 457,792 | ||||||||
| 26,145 | Integrated Device Technology, Inc.† | 1.7 | 512,442 | ||||||||
| 64,415 | Lattice Semiconductor Corp.† (a) | 1.5 | 443,819 | ||||||||
| 22,485 | Microsemi Corp.† (a) | 2.1 | 638,124 | ||||||||
| 40,865 | Mitel Networks Corp.† | 1.5 | 436,847 | ||||||||
| 84,042 | Other Securities | 5.5 | 1,630,570 | ||||||||
| 5,190,922 | |||||||||||
| Materials — 9.1% | |||||||||||
| 9,335 | Boise Cascade Co.† | 1.2 | 346,795 | ||||||||
| 3,070 | Deltic Timber Corp. (a) | 0.7 | 209,988 | ||||||||
| 16,185 | Landec Corp.† (a) | 0.8 | 223,515 | ||||||||
| 17,595 | Louisiana-Pacific Corp.† (a) | 1.0 | 291,373 | ||||||||
| 9,245 | Materion Corp. (a) | 1.1 | 325,701 | ||||||||
| 5,869 | Neenah Paper, Inc. (a) | 1.2 | 353,725 | ||||||||
| 20,490 | PH Glatfelter Co. (a) | 1.7 | 523,929 | ||||||||
| 14,746 | Other Securities | 1.4 | 435,059 | ||||||||
| 2,710,085 | |||||||||||
| Telecommunication Services — 0.2% | |||||||||||
| 18,030 | Other Securities | 0.2 | 68,709 | ||||||||
| 68,709 | |||||||||||
| Utilities — 4.1% | |||||||||||
| 2,694 | Cleco Corp. | 0.5 | 146,931 | ||||||||
| 6,895 | Laclede Group, Inc. | 1.2 | 366,814 | ||||||||
| 5,094 | UIL Holdings Corp. (a) | 0.7 | 221,793 | ||||||||
See Notes to Financial Statements.
41
Wilshire Mutual Funds, Inc. Small Company Value Portfolio Condensed Schedule of Investments - (Continued) | December 31, 2014 | |
| Shares | Percentage of Net Assets (%) | Value | |||||||||
| 12,368 | Other Securities | 1.7 | $ | 482,707 | |||||||
| 1,218,245 | |||||||||||
| Total Common Stock | |||||||||||
| (Cost $23,298,033) | 28,887,670 | ||||||||||
| SHORT-TERM INVESTMENTS (b) — 47.1% | |||||||||||
| 862,168 | Northern Trust Institutional Government Select Portfolio, 0.010% | 2.9 | 862,168 | ||||||||
| 13,164,136 | Northern Trust Institutional Liquid Asset Portfolio, 0.010% (c) | 44.2 | 13,164,136 | ||||||||
| Total Short-Term Investments | |||||||||||
| (Cost $14,026,304) | 14,026,304 | ||||||||||
| Total Investments — 144.1% | |||||||||||
| (Cost $37,324,337) | 42,913,974 | ||||||||||
Other Assets & Liabilities, Net — (44.1)% | (13,138,258 | ) | |||||||||
| NET ASSETS — 100.0% | $ | 29,775,716 | |||||||||
| † | Non-income producing security. |
| †† | More narrow industries are utilized for compliance purposes, whereas broad sectors are utilized for reporting purposes. |
| ‡ | Real Estate Investment Trust. |
| (a) | This security or a partial position of this security is on loan at December 31, 2014. The total market value of securities on loan at December 31, 2014 was $12,700,131 (Note 6). |
| (b) | Rate shown is the 7-day effective yield as of December 31, 2014. |
| (c) | This security was purchased with cash collateral held from securities on loan. The total value of such securities as of December 31, 2014 was $13,164,136. Securities on loan are also collateralized by various U.S. Treasury obligations in the amount of $19,307 (Note 6). |
Ltd. — Limited
The Condensed Schedule of Investments does not reflect the complete portfolio holdings. It includes the Portfolio’s 50 largest holdings and each investment of any issuer that exceeds 1% of the Portfolio’s net assets. “Other Securities” represent all issues not required to be disclosed under the rules adopted by the U.S. Securities and Exchange Commission (“SEC”). The complete schedule of portfolio holdings is available (i) without charge, upon request, by calling (800) 607-2200; (ii) on the SEC’s website at http://www.sec.gov; and (iii) on our website at http://advisor.wilshire.com.
As of December 31, 2014, all of the Portfolio’s investments were considered Level 1. For the year ended December 31, 2014, there have been no transfers between Level 1 and Level 2 assets and liabilities. For the year ended December 31, 2014, there have been no transfers between Level 2 and Level 3 assets and liabilities. Please see Note 2 in Notes to Financial Statements for further information regarding fair value measurements.
See Notes to Financial Statements.
42
Wilshire Mutual Funds, Inc. Wilshire 5000 Indexsm Fund Condensed Schedule of Investments | December 31, 2014 | |
| Shares | Percentage of Net Assets (%) | Value | |||||||||
| COMMON STOCK — 99.8% | |||||||||||
| Consumer Discretionary — 12.7% | |||||||||||
| 4,760 | Amazon.com, Inc.† | 0.5 | $ | 1,477,266 | |||||||
| 26,046 | Comcast Corp., Class A | 0.6 | 1,510,928 | ||||||||
| 15,855 | Home Depot, Inc. (The) | 0.6 | 1,664,299 | ||||||||
| 12,544 | McDonald’s Corp. | 0.5 | 1,175,373 | ||||||||
| 21,360 | Walt Disney Co. (The) | 0.7 | 2,011,898 | ||||||||
| 595,166 | Other Securities | 9.8 | 27,050,952 | ||||||||
| 34,890,716 | |||||||||||
| Consumer Staples — 8.9% | |||||||||||
| 23,475 | Altria Group, Inc. (a) | 0.4 | 1,156,613 | ||||||||
| 51,315 | Coca-Cola Co. (The) | 0.8 | 2,166,519 | ||||||||
| 14,792 | CVS Health Corp. | 0.5 | 1,424,618 | ||||||||
| 19,158 | PepsiCo, Inc. | 0.7 | 1,811,580 | ||||||||
| 18,707 | Philip Morris International, Inc. | 0.6 | 1,523,685 | ||||||||
| 34,952 | Procter & Gamble Co. (The) | 1.2 | 3,183,778 | ||||||||
| 21,504 | Wal-Mart Stores, Inc. | 0.7 | 1,846,764 | ||||||||
| 202,101 | Other Securities | 4.0 | 11,131,881 | ||||||||
| 24,245,438 | |||||||||||
| Energy — 7.8% | |||||||||||
| 24,500 | Chevron Corp. | 1.0 | 2,748,410 | ||||||||
| 16,017 | ConocoPhillips | 0.4 | 1,106,134 | ||||||||
| 54,222 | Exxon Mobil Corp. | 1.8 | 5,012,824 | ||||||||
| 16,562 | Schlumberger, Ltd. | 0.5 | 1,414,560 | ||||||||
| 284,845 | Other Securities | 4.1 | 10,943,973 | ||||||||
| 21,225,901 | |||||||||||
| Financials — 18.2% | |||||||||||
| 143,198 | Bank of America Corp. | 1.0 | 2,561,812 | ||||||||
| 25,165 | Berkshire Hathaway, Inc., Class B† | 1.4 | 3,778,525 | ||||||||
| 41,365 | Citigroup, Inc. | 0.8 | 2,238,260 | ||||||||
| 48,359 | JPMorgan Chase & Co. | 1.1 | 3,026,306 | ||||||||
| 3,150 | Northern Trust Corp. | 0.1 | 212,310 | ||||||||
| 64,267 | Wells Fargo & Co. | 1.3 | 3,523,117 | ||||||||
| 880,396 | Other Securities | 12.5 | 34,527,221 | ||||||||
| 49,867,551 | |||||||||||
| Health Care — 13.2% | |||||||||||
| 17,125 | AbbVie, Inc. | 0.4 | 1,120,660 | ||||||||
| 8,596 | Amgen, Inc. | 0.5 | 1,369,257 | ||||||||
| 21,825 | Bristol-Myers Squibb Co. | 0.5 | 1,288,330 | ||||||||
| 10,314 | Celgene Corp.† | 0.4 | 1,153,724 | ||||||||
| 16,164 | Gilead Sciences, Inc.† (a) | 0.6 | 1,523,619 | ||||||||
| 35,858 | Johnson & Johnson | 1.4 | 3,749,671 | ||||||||
| Shares | Percentage of Net Assets (%) | Value | |||||||||
| 34,580 | Merck & Co., Inc. | 0.7 | $ | 1,963,798 | |||||||
| 81,487 | Pfizer, Inc. | 0.9 | 2,538,320 | ||||||||
| 12,282 | UnitedHealth Group, Inc. | 0.5 | 1,241,587 | ||||||||
| 300,407 | Other Securities | 7.3 | �� | 20,180,876 | |||||||
| 36,129,842 | |||||||||||
| Industrials — 11.2% | |||||||||||
| 8,203 | 3M Co. | 0.5 | 1,347,917 | ||||||||
| 8,843 | Boeing Co. (The) | 0.4 | 1,149,413 | ||||||||
| 129,896 | General Electric Co. | 1.2 | 3,282,472 | ||||||||
| 10,961 | Union Pacific Corp. | 0.5 | 1,305,784 | ||||||||
| 11,787 | United Technologies Corp. | 0.5 | 1,355,505 | ||||||||
| 379,059 | Other Securities | 8.1 | 22,238,456 | ||||||||
| 30,679,547 | |||||||||||
| Information Technology — 18.8% | |||||||||||
| 75,063 | Apple, Inc. | 3.0 | 8,285,454 | ||||||||
| 66,148 | Cisco Systems, Inc. | 0.6 | 1,839,907 | ||||||||
| 28,469 | Facebook, Inc., Class A† | 0.8 | 2,221,151 | ||||||||
| 7,112 | Google, Inc., Class C† | 1.3 | 3,743,757 | ||||||||
| 63,618 | Intel Corp. | 0.9 | 2,308,697 | ||||||||
| 11,836 | International Business Machines Corp. | 0.7 | 1,898,968 | ||||||||
| 13,394 | MasterCard, Inc., Class A | 0.4 | 1,154,027 | ||||||||
| 112,237 | Microsoft Corp. | 1.9 | 5,213,409 | ||||||||
| 45,230 | Oracle Corp. | 0.8 | 2,033,993 | ||||||||
| 21,455 | QUALCOMM, Inc. | 0.6 | 1,594,750 | ||||||||
| 6,001 | Visa, Inc., Class A | 0.6 | 1,573,462 | ||||||||
| 542,075 | Other Securities | 7.2 | 19,641,344 | ||||||||
| 51,508,919 | |||||||||||
| Materials — 3.5% | |||||||||||
| 195,540 | Other Securities | 3.5 | 9,601,323 | ||||||||
| 9,601,323 | |||||||||||
| Telecommunication Services — 2.2% | |||||||||||
| 67,099 | AT&T, Inc. | 0.8 | 2,253,855 | ||||||||
| 54,563 | Verizon Communications, Inc. | 1.0 | 2,552,457 | ||||||||
| 60,717 | Other Securities | 0.4 | 1,155,516 | ||||||||
| 5,961,828 | |||||||||||
| Utilities — 3.3% | |||||||||||
| 183,593 | Other Securities | 3.3 | 8,970,159 | ||||||||
| 8,970,159 | |||||||||||
| Total Common Stock | |||||||||||
| (Cost $135,669,187) | 273,081,224 | ||||||||||
See Notes to Financial Statements.
43
Wilshire Mutual Funds, Inc. Wilshire 5000 Indexsm Fund Condensed Schedule of Investments - (Continued) | December 31, 2014 | |
| Shares | Percentage of Net Assets (%) | Value | |||||||||
| SHORT-TERM INVESTMENTS (b) — 11.7% | |||||||||||
| 1,175,472 | Northern Trust Institutional Government Select Portfolio, 0.010% | 0.4 | $ | 1,175,472 | |||||||
| 30,860,487 | Northern Trust Institutional Liquid Asset Portfolio, 0.010% (c) | 11.3 | 30,860,487 | ||||||||
| Total Short-Term Investments | |||||||||||
| (Cost $32,035,959) | 32,035,959 | ||||||||||
| WARRANTS — 0.0% | |||||||||||
| 270 | Other Securities (Cost $5,144) | 857 | |||||||||
| RIGHTS — 0.0% | |||||||||||
Number of Rights | |||||||||||
| 2,254 | Other Securities (Cost $—) | 10,215 | |||||||||
| Total Investments — 111.5% | |||||||||||
| (Cost $167,710,290) | 305,128,255 | ||||||||||
Other Assets & Liabilities, Net — (11.5)% | (31,447,848 | ) | |||||||||
| NET ASSETS — 100.0% | $ | 273,680,407 | |||||||||
| † | Non-income producing security. |
| (a) | This security or a partial position of this security is on loan at December 31, 2014. The total market value of securities on loan at December 31, 2014 was $30,150,349 (Note 6). |
| (b) | Rate shown is the 7-day effective yield as of December 31, 2014. |
| (c) | This security was purchased with cash collateral held from securities on loan. The total value of such securities as of December 31, 2014 was $30,860,487. Securities on loan are also collateralized by various U.S. Treasury obligations in the amount of $287,098 (Note 6). |
Ltd. — Limited
Amounts designated as “—” are either $0, or have been rounded to $0.
The Condensed Schedule of Investments does not reflect the complete portfolio holdings. It includes the Fund’s 50 largest holdings and each investment of any issuer that exceeds 1% of the Portfolio’s net assets. “Other Securities” represent all issues not required to be disclosed under the rules adopted by the U.S. Securities and Exchange Commission (“SEC”). The complete schedule of portfolio holdings is available (i) without charge, upon request, by calling (800) 607-2200; (ii) on the SEC’s website at http://www.sec.gov; and (iii) on our website at http://advisor.wilshire.com.
As of December 31, 2014, all of the Fund’s investments were considered Level 1, except Furiex Pharmaceuticals Contingent Value Rights, Leap Wireless Contingent Value Rights, Orleans Homebuilders, Transcript Pharm, Inc. Contingent Value Rights and Trico Marine Services, Inc. which are Level 3. At December 31, 2014, the value of these Level 3 investments was $4,914. A reconciliation of Level 3 investments is only presented when the Portfolio has a significant amount of Level 3 investments at the beginning and/or end of the period in relation to net assets. For the year ended December 31, 2014, there have been no transfers between Level 1 and Level 2 assets and liabilities. For the year ended December 31, 2014, there have been no transfers between Level 2 and Level 3 assets and liabilities. Please see Note 2 in Notes to Financial Statements for further information regarding fair value measurements.
See Notes to Financial Statements.
44
Wilshire Mutual Funds, Inc. Wilshire International Equity Fund Condensed Schedule of Investments | December 31, 2014 | |
| Shares | Percentage of Net Assets (%) | Value | |||||||||
| COMMON STOCK — 96.8% | |||||||||||
| Australia — 2.1% | |||||||||||
| 37,385 | Australia & New Zealand Banking Group, Ltd. | 0.6 | $ | 972,756 | |||||||
| 402,651 | Other Securities | 1.5 | 2,661,000 | ||||||||
| 3,633,756 | |||||||||||
| Austria — 0.5% | |||||||||||
| 31,665 | Other Securities | 0.5 | 840,811 | ||||||||
| Belgium — 1.1% | |||||||||||
| 28,733 | Other Securities | 1.1 | 1,919,833 | ||||||||
| Bermuda — 1.5% | |||||||||||
| 48,985 | Lazard, Ltd., Class A | 1.4 | 2,450,719 | ||||||||
| 346,000 | Other Securities | 0.1 | 230,145 | ||||||||
| 2,680,864 | |||||||||||
| Brazil — 0.7% | |||||||||||
| 126,530 | Other Securities | 0.7 | 1,265,361 | ||||||||
| Canada — 7.9% | |||||||||||
| 32,715 | Canadian National Railway Co. | 1.3 | 2,254,390 | ||||||||
| 20,500 | Canadian National Railway Co. | 0.8 | 1,411,956 | ||||||||
| 1,200 | Canadian Pacific Railway, Ltd. | 0.1 | 231,107 | ||||||||
| 13,585 | Canadian Pacific Railway, Ltd.(a) | 1.5 | 2,617,694 | ||||||||
| 9,800 | Magna International, Inc. | 0.6 | 1,061,906 | ||||||||
| 20,900 | Royal Bank of Canada | 0.8 | 1,443,464 | ||||||||
| 173,303 | Other Securities | 2.8 | 4,973,884 | ||||||||
| 13,994,401 | |||||||||||
| Cayman Islands — 0.2% | |||||||||||
| 1,500 | Other Securities | 0.2 | 341,955 | ||||||||
| China — 5.5% | |||||||||||
| 2,184,000 | Bank of China, Ltd., Class H | 0.7 | 1,225,812 | ||||||||
| 867,000 | China Construction Bank Corp., Class H | 0.4 | 708,151 | ||||||||
| 167,300 | Tencent Holdings, Ltd. | 1.4 | 2,420,652 | ||||||||
| 4,229,642 | Other Securities | 3.0 | 5,432,268 | ||||||||
| 9,786,883 | |||||||||||
| Shares | Percentage of Net Assets (%) | Value | |||||||||
| Denmark — 5.6% | |||||||||||
| 61,278 | Chr Hansen Holding A | 1.5 | $ | 2,714,822 | |||||||
| 5,013 | Novo Nordisk A, Class B | 0.1 | 212,049 | ||||||||
| 50,150 | Novo Nordisk ADR(a) | 1.2 | 2,122,348 | ||||||||
| 44,073 | Novozymes A, Class B | 1.0 | 1,855,189 | ||||||||
| 12,016 | Pandora A | 0.6 | 973,983 | ||||||||
| 157,219 | TDC A | 0.7 | 1,199,095 | ||||||||
| 9,496 | Other Securities | 0.5 | 890,485 | ||||||||
| 9,967,971 | |||||||||||
| Finland — 0.8% | |||||||||||
| 56,529 | Other Securities | 0.8 | 1,365,026 | ||||||||
| France — 2.6% | |||||||||||
| 37,200 | Electricite de France SA | 0.6 | 1,024,059 | ||||||||
| 6,709 | LVMH Moet Hennessy Louis Vuitton SA | 0.6 | 1,062,720 | ||||||||
| 67,977 | Other Securities | 1.4 | 2,481,053 | ||||||||
| 4,567,832 | |||||||||||
| Germany — 4.2% | |||||||||||
| 8,952 | Bayer AG | 0.7 | 1,220,237 | ||||||||
| 136,765 | Other Securities | 3.5 | 6,174,927 | ||||||||
| 7,395,164 | |||||||||||
| Guernsey — 0.0% | |||||||||||
| 7,424 | Other Securities | 0.0 | 42,163 | ||||||||
| Hong Kong — 3.1% | |||||||||||
| 110,000 | Hutchison Whampoa, Ltd. | 0.7 | 1,257,473 | ||||||||
| 3,057,400 | Other Securities | 2.4 | 4,277,409 | ||||||||
| 5,534,882 | |||||||||||
| India — 0.8% | |||||||||||
| 40,000 | Other Securities | 0.8 | 1,397,978 | ||||||||
| Indonesia — 0.8% | |||||||||||
| 2,080,000 | Other Securities | 0.8 | 1,435,261 | ||||||||
| Ireland — 2.6% | |||||||||||
| 126,141 | Experian PLC | 1.2 | 2,126,358 | ||||||||
| 14,215 | Perrigo Co. PLC(a) | 1.4 | 2,376,179 | ||||||||
| 4,502,537 | |||||||||||
| Israel — 0.0% | |||||||||||
| 1,202 | Other Securities | 0.0 | 5,619 | ||||||||
See Notes to Financial Statements.
45
Wilshire Mutual Funds, Inc. Wilshire International Equity Fund Condensed Schedule of Investments - (Continued) | December 31, 2014 | |
| Shares | Percentage of Net Assets (%) | Value | |||||||||
| Italy — 1.1% | |||||||||||
| 640,684 | Other Securities | 1.1 | $ | 1,915,813 | |||||||
| Japan — 12.6% | |||||||||||
| 11,000 | FANUC Corp. | 1.0 | 1,813,684 | ||||||||
| 112,700 | Nissan Motor Co., Ltd. | 0.6 | 982,943 | ||||||||
| 44,300 | Sysmex Corp. | 1.1 | 1,966,145 | ||||||||
| 1,265,500 | Other Securities | 9.9 | 17,479,172 | ||||||||
| 22,241,944 | |||||||||||
| Malaysia — 0.1% | |||||||||||
| 105,800 | Other Securities | 0.1 | 268,016 | ||||||||
| Mexico — 1.9% | |||||||||||
| 483,800 | Wal-Mart de Mexico SAB de CV | 0.6 | 1,040,152 | ||||||||
| 663,300 | Other Securities | 1.3 | 2,332,778 | ||||||||
| 3,372,930 | |||||||||||
| Netherlands — 5.9% | |||||||||||
| 24,755 | ASML Holding NV, Class G(a) | 1.5 | 2,669,332 | ||||||||
| 13,620 | Core Laboratories NV(a) | 0.9 | 1,639,031 | ||||||||
| 44,150 | Sensata Technologies Holding NV† (a) | 1.3 | 2,313,901 | ||||||||
| 187,145 | Other Securities | 2.2 | 3,747,274 | ||||||||
| 10,369,538 | |||||||||||
| New Zealand — 0.1% | |||||||||||
| 30,552 | Other Securities | 0.1 | 105,552 | ||||||||
| Norway — 1.0% | |||||||||||
| 67,347 | Statoil ASA | 0.7 | 1,185,768 | ||||||||
| 47,730 | Other Securities | 0.3 | 507,620 | ||||||||
| 1,693,388 | |||||||||||
| Panama — 0.3% | |||||||||||
| 19,100 | Other Securities | 0.3 | 574,910 | ||||||||
| Russia — 0.4% | |||||||||||
| 1,833,212 | Other Securities | 0.4 | 688,950 | ||||||||
| Singapore — 0.6% | |||||||||||
| 89,500 | Other Securities | 0.6 | 1,044,486 | ||||||||
| South Africa — 2.4% | |||||||||||
| 54,485 | Remgro, Ltd. | 0.7 | 1,191,952 | ||||||||
| 72,290 | Shoprite Holdings, Ltd. | 0.6 | 1,046,235 | ||||||||
| Shares | Percentage of Net Assets (%) | Value | |||||||||
| 351,000 | Other Securities | 1.1 | $ | 1,931,609 | |||||||
| 4,169,796 | |||||||||||
| South Korea — 2.0% | |||||||||||
| 75,384 | Other Securities | 2.0 | 3,476,240 | ||||||||
| Spain — 3.3% | |||||||||||
| 172,372 | Banco Santander SA | 0.8 | 1,446,742 | ||||||||
| 68,157 | Inditex SA(a) | 1.1 | 1,944,210 | ||||||||
| 164,528 | Other Securities | 1.4 | 2,444,870 | ||||||||
| 5,835,822 | |||||||||||
| Sweden — 2.5% | |||||||||||
| 68,279 | Svenska Cellulosa AB, Class B | 0.8 | 1,472,006 | ||||||||
| 52,546 | Swedbank AB, Class A | 0.8 | 1,303,715 | ||||||||
| 112,073 | Other Securities | 0.9 | 1,684,045 | ||||||||
| 4,459,766 | |||||||||||
| Switzerland — 7.4% | |||||||||||
| 23,605 | ACE, Ltd. | 1.5 | 2,711,742 | ||||||||
| 33,912 | Nestle SA | 1.4 | 2,472,219 | ||||||||
| 10,624 | Novartis AG | 0.5 | 985,307 | ||||||||
| 5,037 | Roche Holding AG | 0.8 | 1,364,736 | ||||||||
| 932 | SGS SA | 1.1 | 1,903,116 | ||||||||
| 2,420 | Swatch Group AG (The) | 0.6 | 1,075,101 | ||||||||
| 62,019 | Other Securities | 1.5 | 2,559,790 | ||||||||
| 13,072,011 | |||||||||||
| Taiwan — 3.7% | |||||||||||
| 205,320 | Taiwan Semiconductor Manufacturing Co., Ltd. ADR(a) | 2.6 | 4,595,062 | ||||||||
| 1,905,000 | Other Securities | 1.1 | 1,978,962 | ||||||||
| 6,574,024 | |||||||||||
| Thailand — 0.2% | |||||||||||
| 525,500 | Other Securities | 0.2 | 360,523 | ||||||||
| Turkey — 0.3% | |||||||||||
| 117,400 | Other Securities | 0.3 | 509,600 | ||||||||
| United Kingdom — 9.8% | |||||||||||
| 6,698 | ARM Holdings PLC | 0.1 | 102,897 | ||||||||
| 43,165 | ARM Holdings PLC ADR | 1.1 | 1,998,540 | ||||||||
| 218,560 | BP PLC | 0.8 | 1,387,329 | ||||||||
| 32,861 | British American Tobacco PLC | 1.0 | 1,780,772 | ||||||||
| 206,854 | BT Group PLC, Class A | 0.7 | 1,286,648 | ||||||||
See Notes to Financial Statements.
46
Wilshire Mutual Funds, Inc. Wilshire International Equity Fund Condensed Schedule of Investments - (Continued) | December 31, 2014 | |
| Shares | Percentage of Net Assets (%) | Value | |||||||||
| 50,856 | Prudential PLC | 0.7 | $ | 1,175,767 | |||||||
| 28,456 | Reckitt Benckiser Group PLC | 1.3 | 2,304,767 | ||||||||
| 906,669 | Other Securities | 4.1 | 7,329,751 | ||||||||
| 17,366,471 | |||||||||||
| United States — 1.2% | |||||||||||
| 46,875 | Coca-Cola Enterprises, Inc. | 1.2 | 2,072,812 | ||||||||
| Total Common Stock | |||||||||||
| (Cost $173,938,457) | 170,850,889 | ||||||||||
| SHORT-TERM INVESTMENTS (b) — 14.0% | |||||||||||
| 1,773,196 | Northern Trust Institutional Government Select Portfolio, 0.010% | 1.0 | 1,773,196 | ||||||||
| 22,850,165 | Northern Trust Institutional Liquid Asset Portfolio, 0.010% (c) | 13.0 | 22,850,165 | ||||||||
| Total Short-Term Investments | |||||||||||
| (Cost $24,623,361) | 24,623,361 | ||||||||||
| PREFERRED STOCK — 1.2% | |||||||||||
| Brazil — 0.5% | |||||||||||
| 135,800 | Other Securities | 0.5 | 931,670 | ||||||||
| Germany — 0.5% | |||||||||||
| 8,063 | Other Securities | 0.5 | 868,532 | ||||||||
| Russia — 0.1% | |||||||||||
| 174,500 | Other Securities | 0.1 | 83,029 | ||||||||
| South Korea — 0.1% | |||||||||||
| 862 | Other Securities | 0.1 | 235,281 | ||||||||
| Total Preferred Stock | |||||||||||
| (Cost $2,622,175) | 2,118,512 | ||||||||||
| Shares | Percentage of Net Assets (%) | Value | |||||||||
| EXCHANGE TRADED FUND — 0.5% | |||||||||||
| United States — 0.5% | |||||||||||
| 29,913 | iShares MSCI India ETF | 0.5 | $ | 900,082 | |||||||
| Total Exchange Traded Funds | |||||||||||
| (Cost $907,190) | 900,082 | ||||||||||
| RIGHTS — 0.0% | |||||||||||
Number of Rights | |||||||||||
| Spain — 0.0% | |||||||||||
| 18,044 | Other Securities | 0.0 | 1,725 | ||||||||
| Total Rights | |||||||||||
| (Cost $—) | 1,725 | ||||||||||
| PRIVATE COMPANY — 0.0% | |||||||||||
| Malta — 0.0% | |||||||||||
| 4,007 | Other Securities | 0.0 | — | ||||||||
| Total Private Company | — | ||||||||||
| (Cost $ —) | |||||||||||
| Total Investments — 112.5% | |||||||||||
| (Cost $202,091,183) | 198,494,569 | ||||||||||
| Other Assets & Liabilities, Net — (12.5)% | (22,075,747 | ) | |||||||||
| NET ASSETS — 100.0% | $ | 176,418,822 | |||||||||
| † | Non-income producing security. |
| (a) | This security or a partial position of this security is on loan at December 31, 2014. The total market value of securities on loan at December 31, 2014 was $21,689,780 (Note 6). |
| (b) | Rate shown in the 7-day effective yield as of December 31, 2014. |
| (c) | This security was purchased with cash collateral held from securities on loan. The total value of such securities as of December 31, 2014 was $22,850,165. Securities on loan are also collateralized by various U.S. Treasury obligations in the amount of $19,883 (Note 6). |
ADR — American Depositary Receipt
Ltd. — Limited
PLC — Public Limited Company
See Notes to Financial Statements.
47
Wilshire Mutual Funds, Inc. Wilshire International Equity Fund Condensed Schedule of Investments - (Concluded) | December 31, 2014 | |
Amounts designated as “—” are either $0 or have been rounded to $0.
The Condensed Schedule of Investments does not reflect the complete portfolio holdings. It includes the Fund’s 50 largest holdings and each investment of any issuer that exceeds 1% of the Portfolio’s net assets. “Other Securities” represent all issues not required to be disclosed under the rules adopted by the U.S. Securities and Exchange Commission (“SEC”). The complete schedule of portfolio holdings is available (i) without charge, upon request, by calling (800) 607-2200; (ii) on the SEC’s website at http://www.sec.gov; and (iii) on our website at http://advisor.wilshire.com.
The following is a summary of the inputs used as of December 31, 2014 in valuing the Fund’s investments carried at value:
| Investments in Securities | Level 1 | Level 2 | Level 3 | Total | ||||||||||||
| Common Stock | $ | — | $ | — | $ | — | $ | — | ||||||||
| Australia | — | 3,633,756 | * | — | 3,633,756 | |||||||||||
| Austria | — | 840,811 | * | — | 840,811 | |||||||||||
| Belgium | — | 1,919,833 | * | — | 1,919,833 | |||||||||||
| Bermuda | 2,450,719 | 230,145 | * | — | 2,680,864 | |||||||||||
| Brazil | 1,265,361 | — | — | 1,265,361 | ||||||||||||
| Canada | 13,994,401 | — | — | 13,994,401 | ||||||||||||
| Cayman Islands | 341,955 | — | — | 341,955 | ||||||||||||
| China | 1,355,388 | 8,431,495 | * | — | 9,786,883 | |||||||||||
| Denmark | 2,122,348 | 7,845,623 | * | — | 9,967,971 | |||||||||||
| Finland | — | 1,365,026 | * | — | 1,365,026 | |||||||||||
| France | — | 4,567,832 | * | — | 4,567,832 | |||||||||||
| Germany | 84,633 | 7,310,531 | * | — | 7,395,164 | |||||||||||
| Guernsey | — | 42,163 | * | — | 42,163 | |||||||||||
| Hong Kong | — | 5,534,882 | * | — | 5,534,882 | |||||||||||
| India | 1,397,978 | — | — | 1,397,978 | ||||||||||||
| Indonesia | — | 1,435,261 | * | — | 1,435,261 | |||||||||||
| Ireland | 2,376,179 | 2,126,358 | * | — | 4,502,537 | |||||||||||
| Israel | — | 5,619 | * | — | 5,619 | |||||||||||
| Italy | — | 1,915,813 | * | — | 1,915,813 | |||||||||||
| Japan | — | 22,241,944 | * | — | 22,241,944 | |||||||||||
| Malaysia | — | 268,016 | * | — | 268,016 | |||||||||||
| Mexico | 3,372,930 | — | — | 3,372,930 | ||||||||||||
| Netherlands | 7,492,785 | 2,876,753 | * | — | 10,369,538 | |||||||||||
| New Zealand | — | 105,552 | * | — | 105,552 | |||||||||||
| Norway | — | 1,693,388 | * | — | 1,693,388 | |||||||||||
| Panama | 574,910 | — | — | 574,910 | ||||||||||||
| Russia | 684,669 | 4,281 | * | — | 688,950 | |||||||||||
| Singapore | — | 1,044,486 | * | — | 1,044,486 | |||||||||||
| Investments in Securities | Level 1 | Level 2 | Level 3 | Total | ||||||||||||
| South Africa | — | 4,169,796 | * | — | 4,169,796 | |||||||||||
| South Korea | 13,574 | 3,462,666 | * | — | 3,476,240 | |||||||||||
| Spain | — | 5,835,822 | * | — | 5,835,822 | |||||||||||
| Sweden | — | 4,459,766 | * | — | 4,459,766 | |||||||||||
| Switzerland | 2,711,742 | 10,360,269 | * | — | 13,072,011 | |||||||||||
| Taiwan | 4,595,062 | 1,978,962 | * | — | 6,574,024 | |||||||||||
| Thailand | — | 360,523 | * | — | 360,523 | |||||||||||
| Turkey | — | 509,600 | * | — | 509,600 | |||||||||||
| United Kingdom | 2,064,801 | 15,301,670 | * | — | 17,366,471 | |||||||||||
| United States | 2,072,812 | — | — | 2,072,812 | ||||||||||||
| Total Common Stock | 48,972,247 | 121,878,642 | — | 170,850,889 | ||||||||||||
| Short-Term Investments | 24,623,361 | — | — | 24,623,361 | ||||||||||||
| Preferred Stock | 1,014,699 | 1,103,813 | * | — | 2,118,512 | |||||||||||
| Exchange Traded Fund | 900,082 | — | — | 900,082 | ||||||||||||
| Rights | — | 1,725 | — | 1,725 | ||||||||||||
| Private Company Malta | — | — | — | ^ | — | |||||||||||
| Total Investments in Securities | $ | 75,510,389 | $ | 122,984,180 | $ | — | $ | 198,494,569 | ||||||||
| * | Represents securities trading primarily outside the United States, the value of which were adjusted as a result of local trading through the application of a third-party vendor. |
| ^ | This security was categorized as Level 3 and had a market value of $0 as of December 31, 2014 and the value has remained $0 throughout the year ended December 31, 2014. There were no accrued discounts/premiums, realized gain/(loss), change in unrealized appreciation/(depreciation), purchases, sales or transfers in or out of Level 3 during the year ended December 31, 2014. |
For the year ended December 31, 2014, the transfers out of Level 1 and into Level 2 and the transfers out of Level 2 into Level 1 were related to the fair value of certain foreign securities.
See Notes to Financial Statements.
48
Wilshire Mutual Funds, Inc. Statements of Assets and Liabilities December 31, 2014 | |
LARGE COMPANY GROWTH PORTFOLIO | LARGE COMPANY VALUE PORTFOLIO | SMALL COMPANY GROWTH PORTFOLIO | SMALL COMPANY VALUE PORTFOLIO | WILSHIRE 5000 INDEXSM FUND | WILSHIRE INTERNATIONAL EQUITY FUND | |||||||||||||||||||
| ASSETS: | ||||||||||||||||||||||||
| Investments in securities, at value (Note 2) | $ | 287,835,264 | * | $ | 147,440,548 | * | $ | 40,653,578 | * | $ | 42,913,974 | * | $ | 305,128,255 | * | $ | 198,494,569 | * | ||||||
| Foreign currency, at value | — | — | — | — | — | 503,967 | ||||||||||||||||||
| Receivable for investment securities sold | 819,973 | — | 14,716 | — | 1,052,329 | 1,284,470 | ||||||||||||||||||
| Dividends and interest receivable | 104,965 | 184,630 | 11,927 | 46,533 | 361,945 | 149,378 | ||||||||||||||||||
| Receivable for Portfolio shares sold | 212,165 | 13,974 | 1,655 | 31,657 | 278,351 | 7,497 | ||||||||||||||||||
| Dividend reclaim receivable | 16 | 2,969 | — | — | 1 | 84,149 | ||||||||||||||||||
| Prepaid expenses and other assets | 23,909 | 15,556 | 10,834 | 10,498 | 21,484 | 14,710 | ||||||||||||||||||
| Total Assets | 288,996,292 | 147,657,677 | 40,692,710 | 43,002,662 | 306,842,365 | 200,538,740 | ||||||||||||||||||
| LIABILITIES: | ||||||||||||||||||||||||
| Payable upon return on securities loaned | 49,108,032 | 22,142,303 | 13,730,764 | 13,164,136 | 30,860,487 | 22,850,165 | ||||||||||||||||||
| Payable for investment securities purchased | 1,129,858 | 246,358 | 26,988 | 8,340 | 1,797,807 | 585,651 | ||||||||||||||||||
| Payable for Portfolio shares redeemed | 189,623 | 57,756 | 9,574 | 8,813 | 285,558 | 6,161 | ||||||||||||||||||
| Investment advisory fees payable (Note 3) | 148,787 | 77,532 | 13,415 | 15,300 | 23,283 | 135,372 | ||||||||||||||||||
| Custodian fee payable | — | — | — | — | — | 446,459 | ||||||||||||||||||
| Distribution fees payable (Note 4) | 23,117 | 12,967 | 4,455 | 3,369 | 55,760 | 1,850 | ||||||||||||||||||
| Shareholder Service fees payable (Note 4) | 18,984 | 947 | 501 | 681 | 19,236 | 1,870 | ||||||||||||||||||
| Administration fees payable | 13,887 | 7,236 | 1,563 | 1,712 | 16,298 | 11,176 | ||||||||||||||||||
| Directors’ fees payable | 1,779 | 919 | 199 | 219 | 2,060 | 1,447 | ||||||||||||||||||
| Accrued expenses and other payables | 95,801 | 46,110 | 23,878 | 24,376 | 101,469 | 79,767 | ||||||||||||||||||
| Total Liabilities | 50,729,868 | 22,592,128 | 13,811,337 | 13,226,946 | 33,161,958 | 24,119,918 | ||||||||||||||||||
| NET ASSETS | $ | 238,266,424 | $ | 125,065,549 | $ | 26,881,373 | $ | 29,775,716 | $ | 273,680,407 | $ | 176,418,822 | ||||||||||||
| * Includes Market Value of Securities on Loan | $ | 50,961,501 | $ | 21,437,933 | $ | 13,300,025 | $ | 12,700,131 | $ | 30,150,349 | $ | 21,689,780 | ||||||||||||
| Amounts designated as “—” are either $0, or have been rounded to $0. |
See Notes to Financial Statements.
49
Wilshire Mutual Funds, Inc. Statements of Assets and Liabilities - (Continued) December 31, 2014 | |
LARGE COMPANY GROWTH PORTFOLIO | LARGE COMPANY VALUE PORTFOLIO | SMALL COMPANY GROWTH PORTFOLIO | SMALL COMPANY VALUE PORTFOLIO | WILSHIRE 5000 INDEXSM FUND | WILSHIRE INTERNATIONAL EQUITY FUND | |||||||||||||||||||
| NET ASSETS consist of: | ||||||||||||||||||||||||
| Paid-in capital | $ | 168,652,184 | $ | 99,197,641 | $ | 21,398,474 | $ | 23,573,635 | $ | 174,061,330 | $ | 188,461,330 | ||||||||||||
| Undistributed net investment income/(accumulated net investment loss) | (6 | ) | (8 | ) | (1 | ) | (7 | ) | 404,516 | (6,930 | ) | |||||||||||||
| Accumulated net realized gain/(loss) on investments sold and foreign currency transactions | 2,832,813 | 749,222 | (92,898 | ) | 612,451 | (38,203,404 | ) | (8,431,360 | ) | |||||||||||||||
| Net unrealized appreciation/depreciation on investments | 66,781,433 | 25,118,694 | 5,575,798 | 5,589,637 | 137,417,965 | (3,596,614 | ) | |||||||||||||||||
| Net unrealized depreciation on other assets and liabilities denominated in foreign currencies | — | — | — | — | — | (7,604 | ) | |||||||||||||||||
| NET ASSETS | $ | 238,266,424 | $ | 125,065,549 | $ | 26,881,373 | $ | 29,775,716 | $ | 273,680,407 | $ | 176,418,822 | ||||||||||||
| Investments in securities, at cost (Note 2) | 171,945,799 | 100,179,551 | 21,347,016 | 24,160,201 | 136,849,803 | 179,241,018 | ||||||||||||||||||
| Cash collateral for securities on loan, at cost | 49,108,032 | 22,142,303 | 13,730,764 | 13,164,136 | 30,860,487 | 22,850,165 | ||||||||||||||||||
| Foreign currency, at cost | — | — | — | — | — | 118,457 | ||||||||||||||||||
| NET ASSETS: | ||||||||||||||||||||||||
| Investment Class shares | $ | 103,732,716 | $ | 61,566,495 | $ | 11,398,090 | $ | 14,120,463 | $ | 204,464,597 | $ | 11,370,694 | ||||||||||||
| (50,000,000 shares authorized, per class, per Portfolio, par value $.001 per share)† | ||||||||||||||||||||||||
| Institutional Class shares | $ | 134,533,708 | $ | 63,499,054 | $ | 15,483,283 | $ | 15,655,253 | $ | 67,500,404 | $ | 165,048,128 | ||||||||||||
| (50,000,000 shares authorized, per class, per Portfolio, par value $.001 per share)† | ||||||||||||||||||||||||
| Qualified Class shares | N/A | N/A | N/A | N/A | $ | 191 | N/A | |||||||||||||||||
| (50,000,000 shares authorized, per class, per Portfolio, par value $.001 per share) | ||||||||||||||||||||||||
| Horace Mann Class shares | N/A | N/A | N/A | N/A | 1,715,215 | N/A | ||||||||||||||||||
| (50,000,000 shares authorized, per class, per Portfolio, par value $.001 per share) | ||||||||||||||||||||||||
| † | For the Wilshire International Equity Fund, (40,000,000 shares authorized, per class, par value $.001 per share). |
N/A — Not Applicable. Share classes currently not offered.
See Notes to Financial Statements.
50
Wilshire Mutual Funds, Inc. Statements of Assets and Liabilities - (Continued) December 31, 2014 | |
LARGE COMPANY GROWTH PORTFOLIO | LARGE COMPANY VALUE PORTFOLIO | SMALL COMPANY GROWTH PORTFOLIO | SMALL COMPANY VALUE PORTFOLIO | WILSHIRE 5000 INDEXSM FUND | WILSHIRE INTERNATIONAL EQUITY FUND | |||||||||||||||||||
| SHARES OUTSTANDING: | ||||||||||||||||||||||||
| Investment Class shares | 2,683,384 | 2,905,799 | 486,200 | 617,732 | 11,355,734 | 1,255,522 | ||||||||||||||||||
| Institutional Class shares | 3,311,963 | 2,989,780 | 625,624 | 674,366 | 3,750,189 | 18,363,811 | ||||||||||||||||||
| Qualified Class shares | N/A | N/A | N/A | N/A | 10 | N/A | ||||||||||||||||||
| Horace Mann Class shares | N/A | N/A | N/A | N/A | 95,469 | N/A | ||||||||||||||||||
| INVESTMENT CLASS SHARES: | ||||||||||||||||||||||||
| Net asset value, offering and redemption price per share | $ | 38.66 | $ | 21.19 | $ | 23.44 | $ | 22.86 | $ | 18.01 | $ | 9.06 | ||||||||||||
| INSTITUTIONAL CLASS SHARES: | ||||||||||||||||||||||||
| Net asset value, offering and redemption price per share | $ | 40.62 | $ | 21.24 | $ | 24.75 | $ | 23.21 | $ | 18.00 | $ | 8.99 | ||||||||||||
| QUALIFIED CLASS SHARES: | ||||||||||||||||||||||||
| Net asset value, offering and redemption price per share | N/A | N/A | N/A | N/A | $ | 18.45 | * | N/A | ||||||||||||||||
| HORACE MANN CLASS SHARES: | ||||||||||||||||||||||||
| Net asset value, offering and redemption price per share | N/A | N/A | N/A | N/A | $ | 17.97 | N/A | |||||||||||||||||
| * | Difference in net asset value recalculation and net asset value stated is caused by rounding differences. |
N/A — Not Applicable. Share classes currently not offered.
See Notes to Financial Statements.
51
Wilshire Mutual Funds, Inc. Statements of Operations For the Year Ended December 31, 2014 | |
LARGE COMPANY GROWTH PORTFOLIO | LARGE COMPANY VALUE PORTFOLIO | SMALL COMPANY GROWTH PORTFOLIO | SMALL COMPANY VALUE PORTFOLIO | WILSHIRE 5000 INDEXSM FUND | WILSHIRE INTERNATIONAL EQUITY FUND | |||||||||||||||||||
| INVESTMENT INCOME: | ||||||||||||||||||||||||
| Dividends | $ | 2,092,442 | $ | 3,120,271 | $ | 113,466 | $ | 347,917 | $ | 4,751,096 | $ | 2,702,434 | ||||||||||||
| Interest | 151 | 156 | 50 | 59 | 2,166 | 532 | ||||||||||||||||||
| Income from Security Lending | 63,917 | 35,104 | 33,871 | 17,121 | 82,044 | 30,493 | ||||||||||||||||||
| Foreign taxes withheld | (4,396 | ) | (30,465 | ) | (315 | ) | (666 | ) | (947 | ) | (282,973 | ) | ||||||||||||
| Total income | 2,152,114 | 3,125,066 | 147,072 | 364,431 | 4,834,359 | 2,450,486 | ||||||||||||||||||
| EXPENSES: | ||||||||||||||||||||||||
| Investment advisory fee (Note 3) | 2,090,095 | 1,122,438 | 253,223 | 278,455 | 245,076 | 1,094,534 | ||||||||||||||||||
| Distribution (12b-1) fees (Note 4) | ||||||||||||||||||||||||
| Investment Class | 265,898 | 152,044 | 24,610 | 33,250 | 449,357 | 26,953 | ||||||||||||||||||
| Horace Mann Class | — | — | — | — | 4,985 | — | ||||||||||||||||||
| Shareholder Service fees (Note 4) | ||||||||||||||||||||||||
| Investment Class | 96,311 | 9,414 | 6,465 | 7,605 | 78,889 | 17,057 | ||||||||||||||||||
| Institutional Class | 50,206 | 680 | — | 73 | 48,329 | 56 | ||||||||||||||||||
| Administration and accounting fees (Note 3) | 195,075 | 104,761 | 20,854 | 22,932 | 171,553 | 76,616 | ||||||||||||||||||
| Directors’ fees and expenses (Note 3) | 43,185 | 22,971 | 4,526 | 5,000 | 35,216 | 14,238 | ||||||||||||||||||
| Chief compliance officer expenses | 176 | 228 | 37 | 40 | 588 | 294 | ||||||||||||||||||
| Transfer agent fees (Note 3) | 135,210 | 39,232 | 21,291 | 21,973 | 96,030 | 29,510 | ||||||||||||||||||
| Professional fees | 87,660 | 45,565 | 18,399 | 19,078 | 91,860 | 57,125 | ||||||||||||||||||
| Printing fees | 78,913 | 43,401 | 8,512 | 9,366 | 67,533 | 27,400 | ||||||||||||||||||
| Registration and filing fees | 77,679 | 41,993 | 18,895 | 18,099 | 46,081 | 30,783 | ||||||||||||||||||
| Custodian fees (Note 3) | 133,390 | 81,770 | 18,009 | 20,900 | 78,495 | 69,576 | ||||||||||||||||||
| Other | 47,692 | 27,582 | 10,050 | 9,642 | 50,964 | 29,563 | ||||||||||||||||||
| Total expenses | 3,301,490 | 1,692,079 | 404,871 | 446,413 | 1,464,956 | 1,473,705 | ||||||||||||||||||
| Advisory waiver recapture (Note 3) | — | — | 2,871 | — | — | — | ||||||||||||||||||
| Fees waived by investment Adviser (Note 3) | — | — | (16,159 | ) | (17,655 | ) | — | (78,351 | ) | |||||||||||||||
| Fees paid indirectly (Note 4) | (11,104 | ) | (21,394 | ) | (2,136 | ) | (3,729 | ) | (1,598 | ) | — | |||||||||||||
| Net expenses | 3,290,386 | 1,670,685 | 389,447 | 425,029 | 1,463,358 | 1,395,354 | ||||||||||||||||||
| Net investment income/(loss) | (1,138,272 | ) | 1,454,381 | (242,375 | ) | (60,598 | ) | 3,371,001 | 1,055,132 | |||||||||||||||
Amounts designated as “—” are either $0, or have been rounded to $0.
N/A – Not Applicable. Share classes currently not offered.
See Notes to Financial Statements.
52
Wilshire Mutual Funds, Inc. Statements of Operations - (Continued) For the Year Ended December 31, 2014 | |
LARGE COMPANY GROWTH PORTFOLIO | LARGE COMPANY VALUE PORTFOLIO | SMALL COMPANY GROWTH PORTFOLIO | SMALL COMPANY VALUE PORTFOLIO | WILSHIRE 5000 INDEXSM FUND | WILSHIRE INTERNATIONAL EQUITY FUND | |||||||||||||||||||
| NET REALIZED AND UNREALIZED GAIN/(LOSS) ON INVESTMENTS AND FOREIGN CURRENCY TRANSACTIONS (NOTES 2 and 5): | ||||||||||||||||||||||||
| Net realized gain/(loss) from: | ||||||||||||||||||||||||
Investments1 | $ | 37,612,925 | $ | 19,795,935 | $ | 2,488,960 | $ | 4,154,913 | $ | 2,714,435 | $ | (6,595,909 | ) | |||||||||||
| Foreign currency transactions | — | — | — | — | — | (3,244 | ) | |||||||||||||||||
| Net change in unrealized appreciation/(depreciation) on: | ||||||||||||||||||||||||
| Investments | (15,391,639 | ) | (5,478,728 | ) | (1,322,416 | ) | (2,249,172 | ) | 23,346,934 | (5,776,421 | ) | |||||||||||||
| Other assets and liabilities denominated in foreign currencies | — | — | — | — | — | (8,831 | ) | |||||||||||||||||
| Net realized and unrealized gain/(loss) on investments and foreign currencies | 22,221,286 | 14,317,207 | 1,166,544 | 1,905,741 | 26,061,369 | (12,384,405 | ) | |||||||||||||||||
| NET INCREASE (DECREASE) IN NET ASSETS RESULTING FROM OPERATIONS | $ | 21,083,014 | $ | 15,771,588 | $ | 924,169 | $ | 1,845,143 | $ | 29,432,370 | $ | (11,329,273 | ) | |||||||||||
Amounts designated as “—” are either $0, or have been rounded to $0.
| 1 | Includes realized gain/(loss) as a result of in-kind transactions. See Note 10 in Notes to Financial Statements. |
See Notes to Financial Statements.
53
Wilshire Mutual Funds, Inc. Statements of Changes in Net Assets For the Year Ended December 31, 2014 | |
LARGE COMPANY GROWTH PORTFOLIO | LARGE COMPANY VALUE PORTFOLIO | SMALL COMPANY GROWTH PORTFOLIO | SMALL COMPANY VALUE PORTFOLIO | WILSHIRE 5000 INDEXSM FUND | WILSHIRE INTERNATIONAL EQUITY FUND | |||||||||||||||||||
| OPERATIONS: | ||||||||||||||||||||||||
| Net investment income/(loss) | $ | (1,138,272 | ) | $ | 1,454,381 | $ | (242,375 | ) | $ | (60,598 | ) | $ | 3,371,001 | $ | 1,055,132 | |||||||||
Net realized gain/(loss) on investments and foreign currency transactions1 | 37,612,925 | 19,795,935 | 2,488,960 | 4,154,913 | 2,714,435 | (6,599,153 | ) | |||||||||||||||||
| Net change in unrealized appreciation/(depreciation) on investments and other assets and liabilities denominated in foreign currencies | (15,391,639 | ) | (5,478,728 | ) | (1,322,416 | ) | (2,249,172 | ) | 23,346,934 | (5,785,252 | ) | |||||||||||||
| Net increase/decrease in net assets resulting from operations | 21,083,014 | 15,771,588 | 924,169 | 1,845,143 | 29,432,370 | (11,329,273 | ) | |||||||||||||||||
| DISTRIBUTIONS TO SHAREHOLDERS FROM: | ||||||||||||||||||||||||
| Net Investment Income: | ||||||||||||||||||||||||
| Investment Class shares | — | (651,594 | ) | — | — | (2,481,169 | ) | (26,717 | ) | |||||||||||||||
| Institutional Class shares | (12,208 | ) | (833,097 | ) | — | — | (949,278 | ) | (1,039,566 | ) | ||||||||||||||
| Qualified Class shares | N/A | N/A | N/A | N/A | (3 | ) | N/A | |||||||||||||||||
| Horace Mann Class shares | N/A | N/A | N/A | N/A | (20,294 | ) | N/A | |||||||||||||||||
| Net Realized Capital Gains: | ||||||||||||||||||||||||
| Investment Class shares | (14,643,447 | ) | (6,065,315 | ) | (1,040,728 | ) | (1,598,464 | ) | — | — | ||||||||||||||
| Institutional Class shares | (17,516,210 | ) | (6,025,428 | ) | (1,342,084 | ) | (1,746,140 | ) | — | — | ||||||||||||||
| Total Distributions to Shareholders | (32,171,865 | ) | (13,575,434 | ) | (2,382,812 | ) | (3,344,604 | ) | (3,450,744 | ) | (1,066,283 | ) | ||||||||||||
CAPITAL STOCK TRANSACTIONS (DOLLARS):2 | ||||||||||||||||||||||||
| Investment Class shares: | ||||||||||||||||||||||||
| Shares sold | 5,921,915 | 7,924,035 | 3,606,707 | 2,374,779 | 67,507,638 | 14,389,483 | ||||||||||||||||||
Shares issued as reinvestment of distributions | 14,284,315 | 6,608,197 | 1,018,961 | 1,578,890 | 2,410,271 | 24,739 | ||||||||||||||||||
| Shares redeemed | (23,319,294 | ) | (14,252,531 | ) | (2,171,469 | ) | (2,738,445 | ) | (24,247,283 | ) | (4,803,477 | ) | ||||||||||||
| Net increase/(decrease) in net assets from Investment Class share transactions | (3,113,064 | ) | 279,701 | 2,454,199 | 1,215,224 | 45,670,626 | 9,610,745 | |||||||||||||||||
| Institutional Class shares: | ||||||||||||||||||||||||
| Shares sold | 59,395,731 | 46,114,964 | 10,505,619 | 10,564,201 | 8,566,723 | 189,140,359 | ||||||||||||||||||
Shares issued as reinvestment of distributions | 14,806,421 | 6,848,930 | 1,342,076 | 1,745,522 | 499,120 | 1,039,565 | ||||||||||||||||||
| Shares redeemed | (178,850,572 | ) | (103,724,127 | ) | (19,556,780 | ) | (20,871,705 | ) | (7,502,183 | ) | (59,283,107 | ) | ||||||||||||
| Net increase/(decrease) in net assets from Institutional Class share transactions | (104,648,420 | ) | (50,760,233 | ) | (7,709,085 | ) | (8,561,982 | ) | 1,563,660 | 130,896,817 | ||||||||||||||
N/A — Not Applicable. Share classes currently not offered.
Amounts designated as “—” are either $0, or have been rounded to $0.
| 1 | Includes realized gain/(loss) as a result of in-kind transactions. See Note 10 in Notes to Financial Statements. |
| 2 | Includes shares sold/shares redeemed as a result of in-kind transactions. See Note 10 in Notes to Financial Statements. |
See Notes to Financial Statements.
54
Wilshire Mutual Funds, Inc. Statements of Changes in Net Assets - (Continued) For the Year Ended December 31, 2014 | |
LARGE COMPANY GROWTH PORTFOLIO | LARGE COMPANY VALUE PORTFOLIO | SMALL COMPANY GROWTH PORTFOLIO | SMALL COMPANY VALUE PORTFOLIO | WILSHIRE 5000 INDEXSM FUND | WILSHIRE INTERNATIONAL EQUITY FUND | |||||||||||||||||||
| CAPITAL STOCK TRANSACTIONS (DOLLARS) (Continued): | ||||||||||||||||||||||||
| Qualified Class shares: | ||||||||||||||||||||||||
| Shares sold | N/A | N/A | N/A | N/A | 1 | N/A | ||||||||||||||||||
| Shares issued as reinvestment of distributions | N/A | N/A | N/A | N/A | 1 | N/A | ||||||||||||||||||
| Shares redeemed | N/A | N/A | N/A | N/A | — | N/A | ||||||||||||||||||
| Net increase in net assets from Qualified Class share transactions | N/A | N/A | N/A | N/A | 2 | N/A | ||||||||||||||||||
| Horace Mann Class shares: | ||||||||||||||||||||||||
| Shares sold | N/A | N/A | N/A | N/A | 31,450 | N/A | ||||||||||||||||||
| Shares issued as reinvestment of distributions | N/A | N/A | N/A | N/A | 20,294 | N/A | ||||||||||||||||||
| Shares redeemed | N/A | N/A | N/A | N/A | (66,118 | ) | N/A | |||||||||||||||||
| Net decrease in net assets from Horace Mann Class share transactions | N/A | N/A | N/A | N/A | (14,374 | ) | N/A | |||||||||||||||||
| Net increase/(decrease) in net assets from capital stock transactions | (107,761,484 | ) | (50,480,532 | ) | (5,254,886 | ) | (7,346,758 | ) | 47,219,914 | 140,507,562 | ||||||||||||||
| Net increase/(decrease) in net assets | (118,850,335 | ) | (48,284,378 | ) | (6,713,529 | ) | (8,846,219 | ) | 73,201,540 | 128,112,006 | ||||||||||||||
| NET ASSETS: | ||||||||||||||||||||||||
| Beginning of year | 357,116,759 | 173,349,927 | 33,594,902 | 38,621,935 | 200,478,867 | 48,306,816 | ||||||||||||||||||
| End of year | $ | 238,266,424 | $ | 125,065,549 | $ | 26,881,373 | $ | 29,775,716 | $ | 273,680,407 | $ | 176,418,822 | ||||||||||||
| Undistributed net investment income/(accumulated net income loss) at end of year | $ | (6 | ) | $ | (8 | ) | $ | (1 | ) | $ | (7 | ) | $ | 404,516 | $ | (6,930 | ) | |||||||
N/A — Not Applicable. Share classes currently not offered.
Amounts designated as “—” are either $0, or have been rounded to $0.
See Notes to Financial Statements.
55
Wilshire Mutual Funds, Inc. Statements of Changes in Net Assets - (Continued) For the Year Ended December 31, 2014 | |
LARGE COMPANY GROWTH PORTFOLIO | LARGE COMPANY VALUE PORTFOLIO | SMALL COMPANY GROWTH PORTFOLIO | SMALL COMPANY VALUE PORTFOLIO | WILSHIRE 5000 INDEXSM FUND | WILSHIRE INTERNATIONAL EQUITY FUND | |||||||||||||||||||
| CAPITAL SHARE TRANSACTIONS: | ||||||||||||||||||||||||
| Investment Class shares: | ||||||||||||||||||||||||
| Shares sold | 141,322 | 355,455 | 147,053 | 98,245 | 4,049,034 | 1,508,963 | ||||||||||||||||||
| Shares issued as reinvestment of distributions | 367,584 | 308,029 | 43,808 | 70,204 | 132,505 | 2,719 | ||||||||||||||||||
| Shares redeemed | (553,806 | ) | (639,727 | ) | (88,741 | ) | (113,434 | ) | (1,417,005 | ) | (504,565 | ) | ||||||||||||
| Net increase/(decrease) in Investment Class shares outstanding | (44,900 | ) | 23,757 | 102,120 | 55,015 | 2,764,534 | 1,007,117 | |||||||||||||||||
| Institutional Class shares: | ||||||||||||||||||||||||
| Shares sold | 1,333,936 | 1,972,639 | 407,529 | 425,268 | 488,663 | 19,755,735 | ||||||||||||||||||
| Shares issued as reinvestment of distributions | 362,636 | 317,755 | 54,667 | 76,424 | 27,454 | 115,124 | ||||||||||||||||||
| Shares redeemed | (4,013,075 | ) | (4,493,655 | ) | (755,317 | ) | (841,471 | ) | (440,459 | ) | (6,266,104 | ) | ||||||||||||
| Net increase/(decrease) in Institutional Class shares outstanding | (2,316,503 | ) | (2,203,261 | ) | (293,121 | ) | (339,779 | ) | 75,658 | 13,604,755 | ||||||||||||||
| Qualified Class shares: | ||||||||||||||||||||||||
| Shares sold | N/A | N/A | N/A | N/A | — | N/A | ||||||||||||||||||
| Shares issued as reinvestment of distributions | N/A | N/A | N/A | N/A | — | N/A | ||||||||||||||||||
| Shares redeemed | N/A | N/A | N/A | N/A | — | N/A | ||||||||||||||||||
| Net increase/(decrease) in Qualified Class shares outstanding | N/A | N/A | N/A | N/A | — | N/A | ||||||||||||||||||
| Horace Mann Class shares: | ||||||||||||||||||||||||
| Shares sold | N/A | N/A | N/A | N/A | 1,857 | N/A | ||||||||||||||||||
| Shares issued as reinvestment of distributions | N/A | N/A | N/A | N/A | 1,118 | N/A | ||||||||||||||||||
| Shares redeemed | N/A | N/A | N/A | N/A | (3,917 | ) | N/A | |||||||||||||||||
| Net decrease in Horace Mann Class shares outstanding | N/A | N/A | N/A | N/A | (942 | ) | N/A | |||||||||||||||||
N/A — Not Applicable. Share classes currently not offered.
Amounts designated as “—” are either $0, or have been rounded to $0.
See Notes to Financial Statements.
56
Wilshire Mutual Funds, Inc. Statements of Changes in Net Assets For the Year Ended December 31, 2013 | |
LARGE COMPANY GROWTH PORTFOLIO | LARGE COMPANY VALUE PORTFOLIO | SMALL COMPANY GROWTH PORTFOLIO | SMALL COMPANY VALUE PORTFOLIO | WILSHIRE 5000 INDEXSM FUND | WILSHIRE INTERNATIONAL EQUITY FUND | |||||||||||||||||||
| OPERATIONS: | ||||||||||||||||||||||||
| Net investment income/(loss) | $ | 384,582 | $ | 1,324,303 | $ | (149,140 | ) | $ | (16,339 | ) | $ | 2,529,289 | $ | 539,968 | ||||||||||
Net realized gain on investments and securities sold short1,2 | 29,028,147 | 9,827,087 | 1,400,274 | 2,527,969 | 3,827,546 | 52,643,115 | ||||||||||||||||||
Net change in unrealized appreciation/(depreciation) on investments and securities sold short2 | 49,089,849 | 26,268,501 | 6,068,373 | 6,705,119 | 43,806,174 | (32,911,207 | ) | |||||||||||||||||
| Net increase in net assets resulting from operations | 78,502,578 | 37,419,891 | 7,319,507 | 9,216,749 | 50,163,009 | 20,271,876 | ||||||||||||||||||
| DISTRIBUTIONS TO SHAREHOLDERS FROM: | ||||||||||||||||||||||||
| Net Investment Income: | ||||||||||||||||||||||||
| Investment Class shares | — | (388,038 | ) | — | (1,497 | ) | (1,697,976 | ) | — | |||||||||||||||
| Institutional Class shares | (402,755 | ) | (947,789 | ) | (42,279 | ) | (66,562 | ) | (870,173 | ) | (563,726 | ) | ||||||||||||
| Qualified Class shares | N/A | N/A | N/A | N/A | (2 | ) | N/A | |||||||||||||||||
| Horace Mann Class shares | N/A | N/A | N/A | N/A | (18,635 | ) | N/A | |||||||||||||||||
| Net Realized Capital Gains: | ||||||||||||||||||||||||
| Investment Class shares | (8,765,455 | ) | (221,033 | ) | (205,408 | ) | (363,659 | ) | — | (52,555 | ) | |||||||||||||
| Institutional Class shares | (18,229,730 | ) | (396,695 | ) | (484,005 | ) | (654,126 | ) | — | (978,768 | ) | |||||||||||||
| Total Distributions to Shareholders | (27,397,940 | ) | (1,953,555 | ) | (731,692 | ) | (1,085,844 | ) | (2,586,786 | ) | (1,595,049 | ) | ||||||||||||
CAPITAL STOCK TRANSACTIONS (DOLLARS)3: | ||||||||||||||||||||||||
| Investment Class shares: | ||||||||||||||||||||||||
| Shares sold | 7,868,400 | 9,693,427 | 631,663 | 2,314,939 | 15,399,418 | 2,560,782 | ||||||||||||||||||
| Shares issued as reinvestment of distributions | 8,433,006 | 582,986 | 196,966 | 355,347 | 1,638,026 | 23,876 | ||||||||||||||||||
| Shares redeemed | (23,010,451 | ) | (8,208,991 | ) | (1,174,680 | ) | (2,482,775 | ) | (17,931,153 | ) | (82,287,376 | ) | ||||||||||||
| Net increase/(decrease) in net assets from Investment Class share transactions | (6,709,045 | ) | 2,067,422 | (346,051 | ) | 187,511 | (893,709 | ) | (79,702,718 | ) | ||||||||||||||
| Institutional Class shares: | ||||||||||||||||||||||||
| Shares sold | 137,094,195 | 97,812,273 | 20,768,047 | 21,059,214 | 3,559,358 | 44,130,663 | ||||||||||||||||||
| Shares issued as reinvestment of distributions | 13,128,582 | 1,343,062 | 526,283 | 720,537 | 398,883 | 1,542,491 | ||||||||||||||||||
| Shares redeemed | (24,094,441 | ) | (8,359,198 | ) | (1,181,583 | ) | (1,171,102 | ) | (9,874,233 | ) | (110,445,066 | ) | ||||||||||||
| Net increase/(decrease) in net assets from Institutional Class share transactions | 126,128,336 | 90,796,137 | 20,112,747 | 20,608,649 | (5,915,992 | ) | (64,771,912 | ) | ||||||||||||||||
1 | Includes realized gain/(loss) as a result of in-kind transactions. See Note 10 in Notes to Financial Statements. |
| 2 | Effective April 2, 2013, the Wilshire International Equity Fund no longer engages in short selling. |
3 | Includes shares sold/shares redeemed as a result of in-kind transactions. See Note 10 in Notes to Financial Statements. |
N/A — Not Applicable. Share classes currently not offered.
Amounts designated as “—” are either $0, or have been rounded to $0.
See Notes to Financial Statements.
57
Wilshire Mutual Funds, Inc. Statements of Changes in Net Assets - (Continued) For the Year Ended December 31, 2013 | |
LARGE COMPANY GROWTH PORTFOLIO | LARGE COMPANY VALUE PORTFOLIO | SMALL COMPANY GROWTH PORTFOLIO | SMALL COMPANY VALUE PORTFOLIO | WILSHIRE 5000 INDEXSM FUND | WILSHIRE INTERNATIONAL EQUITY FUND | |||||||||||||||||||
| CAPITAL STOCK TRANSACTIONS (DOLLARS) (Continued): | ||||||||||||||||||||||||
| Qualified Class shares: | ||||||||||||||||||||||||
| Shares sold | N/A | N/A | N/A | N/A | 1 | N/A | ||||||||||||||||||
| Shares issued as reinvestment of distributions | N/A | N/A | N/A | N/A | 1 | N/A | ||||||||||||||||||
| Shares redeemed | N/A | N/A | N/A | N/A | — | N/A | ||||||||||||||||||
| Net increase in net assets from Qualified Class share transactions | N/A | N/A | N/A | N/A | 2 | N/A | ||||||||||||||||||
| Horace Mann Class shares: | ||||||||||||||||||||||||
| Shares sold | N/A | N/A | N/A | N/A | 30,100 | N/A | ||||||||||||||||||
| Shares issued as reinvestment of distributions | N/A | N/A | N/A | N/A | 18,635 | N/A | ||||||||||||||||||
| Shares redeemed | N/A | N/A | N/A | N/A | (100,080 | ) | N/A | |||||||||||||||||
| Net decrease in net assets from Horace Mann Class share transactions | N/A | N/A | N/A | N/A | (51,345 | ) | N/A | |||||||||||||||||
| Net increase/(decrease) in net assets from capital stock transactions | 119,419,291 | 92,863,559 | 19,766,696 | 20,796,160 | (6,861,044 | ) | (144,474,630 | ) | ||||||||||||||||
| Net increase/(decrease) in net assets | 170,523,929 | 128,329,895 | 26,354,511 | 28,927,065 | 40,715,179 | (125,797,803 | ) | |||||||||||||||||
| NET ASSETS: | ||||||||||||||||||||||||
| Beginning of year | 186,592,830 | 45,020,032 | 7,240,391 | 9,694,870 | 159,763,688 | 174,104,619 | ||||||||||||||||||
| End of year | $ | 357,116,759 | $ | 173,349,927 | $ | 33,594,902 | $ | 38,621,935 | $ | 200,478,867 | $ | 48,306,816 | ||||||||||||
| Undistributed/(distributions in excess of) net investment income at end of year | $ | 12,182 | $ | (3 | ) | $ | — | $ | (4 | ) | $ | 439,759 | $ | 2,147 | ||||||||||
N/A — Not Applicable. Share classes currently not offered.
Amounts designated as “—” are either $0, or have been rounded to $0.
See Notes to Financial Statements.
58
Wilshire Mutual Funds, Inc. Statements of Changes in Net Assets - (Continued) For the Year Ended December 31, 2013 | |
LARGE COMPANY GROWTH PORTFOLIO | LARGE COMPANY VALUE PORTFOLIO | SMALL COMPANY GROWTH PORTFOLIO | SMALL COMPANY VALUE PORTFOLIO | WILSHIRE 5000 INDEXSM FUND | WILSHIRE INTERNATIONAL EQUITY FUND | |||||||||||||||||||
CAPITAL SHARE TRANSACTIONS1: | ||||||||||||||||||||||||
| Investment Class shares: | ||||||||||||||||||||||||
| Shares sold | 202,933 | 512,296 | 29,538 | 111,331 | 1,050,077 | 279,429 | ||||||||||||||||||
| Shares issued as reinvestment of distributions | 210,352 | 27,525 | 8,187 | 15,094 | 101,363 | 2,548 | ||||||||||||||||||
| Shares redeemed | (591,454 | ) | (445,646 | ) | (53,727 | ) | (117,787 | ) | (1,242,984 | ) | (9,022,433 | ) | ||||||||||||
| Net increase/(decrease) in Investment Class shares outstanding | (178,169 | ) | 94,175 | (16,002 | ) | 8,638 | (91,544 | ) | (8,740,456 | ) | ||||||||||||||
| Institutional Class shares: | ||||||||||||||||||||||||
| Shares sold | 3,511,797 | 5,514,835 | 946,389 | 1,033,605 | 246,653 | 4,790,649 | ||||||||||||||||||
| Shares issued as reinvestment of distributions | 314,035 | 63,160 | 20,792 | 30,136 | 24,699 | 162,392 | ||||||||||||||||||
| Shares redeemed | (582,902 | ) | (435,315 | ) | (49,228 | ) | (52,657 | ) | (675,306 | ) | (12,016,034 | ) | ||||||||||||
| Net increase/(decrease) in Institutional Class shares outstanding | 3,242,930 | 5,142,680 | 917,953 | 1,011,084 | (403,954 | ) | (7,062,993 | ) | ||||||||||||||||
| Qualified Class shares: | ||||||||||||||||||||||||
| Shares sold | N/A | N/A | N/A | N/A | — | N/A | ||||||||||||||||||
| Shares issued as reinvestment of distributions | N/A | N/A | N/A | N/A | — | N/A | ||||||||||||||||||
| Shares redeemed | N/A | N/A | N/A | N/A | — | N/A | ||||||||||||||||||
| Net increase/(decrease) in Qualified Class shares outstanding | N/A | N/A | N/A | N/A | — | N/A | ||||||||||||||||||
| Horace Mann Class shares: | ||||||||||||||||||||||||
| Shares sold | N/A | N/A | N/A | N/A | 2,095 | N/A | ||||||||||||||||||
| Shares issued as reinvestment of distributions | N/A | N/A | N/A | N/A | 1,156 | N/A | ||||||||||||||||||
| Shares redeemed | N/A | N/A | N/A | N/A | (7,073 | ) | N/A | |||||||||||||||||
| Net decrease in Horace Mann Class shares outstanding | N/A | N/A | N/A | N/A | (3,822 | ) | N/A | |||||||||||||||||
1 | Includes shares sold/shares redeemed as a result of in-kind transactions. See Note 9 in Notes to Financial Statements. |
N/A — Not Applicable. Share classes currently not offered.
Amounts designated as “—” are either $0, or have been rounded to $0.
See Notes to Financial Statements.
59
Wilshire Mutual Funds, Inc. Large Company Growth Portfolio Financial Highlights | |
| For a Fund Share Outstanding Throughout Each Year. | ||||||||||||||||||||
| Investment Class Shares | ||||||||||||||||||||
Year Ended 12/31/2014 | Year Ended 12/31/2013 | Year Ended 12/31/2012 | Year Ended 12/31/2011 | Year Ended 12/31/2010 | ||||||||||||||||
| Net asset value, beginning of period | $ | 41.60 | $ | 34.70 | $ | 31.54 | $ | 32.00 | $ | 26.88 | ||||||||||
| Income/(loss) from investment operations: | ||||||||||||||||||||
Net investment income/(loss)1 | (0.26 | ) | (0.02 | ) | 0.07 | (0.09 | ) | 0.01 | ||||||||||||
| Net realized and unrealized gain/(loss) on investments | 3.61 | 10.38 | 4.24 | (0.37 | ) | 5.12 | ||||||||||||||
| Total from investment operations | 3.35 | 10.36 | 4.31 | (0.46 | ) | 5.13 | ||||||||||||||
| Less distributions: | ||||||||||||||||||||
| From net investment income | 0.00 | 0.00 | (0.07 | ) | 0.00 | (0.01 | ) | |||||||||||||
| Return of capital | 0.00 | 0.00 | 0.00 | 0.00 | (0.00 | )2 | ||||||||||||||
| From capital gains | (6.29 | ) | (3.46 | ) | (1.08 | ) | 0.00 | 0.00 | ||||||||||||
| Total distributions | (6.29 | ) | (3.46 | ) | (1.15 | ) | 0.00 | (0.01 | ) | |||||||||||
| Net asset value, end of period | $ | 38.66 | $ | 41.60 | $ | 34.70 | $ | 31.54 | $ | 32.00 | ||||||||||
| Total return | 7.97 | % | 30.22 | % | 13.72 | % | (1.44 | )% | 19.10 | % | ||||||||||
| Ratios to average net assets/supplemental data: | ||||||||||||||||||||
| Net assets, end of period (in 000’s) | $ | 103,733 | $ | 113,495 | $ | 100,853 | $ | 94,872 | $ | 111,904 | ||||||||||
| Operating expenses including reimbursement/waiver and fees paid indirectly | 1.38 | % | 1.36 | % | 1.39 | % | 1.41 | % | 1.42 | % | ||||||||||
| Operating expenses excluding reimbursement/waiver and fees paid indirectly | 1.38 | %3 | 1.36 | %3 | 1.39 | %3 | 1.41 | % | 1.42 | % | ||||||||||
| Net investment income/(loss) | (0.61 | )% | (0.05 | )% | 0.20 | % | (0.27 | )% | 0.04 | % | ||||||||||
| Portfolio turnover rate | 62 | % | 136 | % | 71 | % | 104 | % | 167 | % | ||||||||||
| 1 | The selected per share data was calculated using the average shares outstanding method for the period. |
| 2 | Amount is less than $0.01 per share. |
| 3 | The ratio of operating expenses excluding reimbursement/waiver excludes the effect of fees paid indirectly. If this expense offset was included, the ratio would have been 1.38%, 1.36% and 1.39% for 2014, 2013 and 2012, respectively. |
See Notes to Financial Statements.
60
Wilshire Mutual Funds, Inc. Large Company Growth Portfolio Financial Highlights - (Continued) | |
| For a Fund Share Outstanding Throughout Each Year. | ||||||||||||||||||||
| Institutional Class Shares | ||||||||||||||||||||
Year Ended 12/31/2014 | Year Ended 12/31/2013 | Year Ended 12/31/2012 | Year Ended 12/31/2011 | Year Ended 12/31/2010 | ||||||||||||||||
| Net asset value, beginning of period | $ | 43.28 | $ | 35.94 | $ | 32.63 | $ | 32.99 | $ | 27.70 | ||||||||||
| Income/(loss) from investment operations: | ||||||||||||||||||||
Net investment income/(loss)1 | (0.13 | ) | 0.10 | 0.18 | 0.03 | 0.12 | ||||||||||||||
| Net realized and unrealized gain/(loss) on investments | 3.76 | 10.77 | 4.38 | (0.39 | ) | 5.30 | ||||||||||||||
| Total from investment operations | 3.63 | 10.87 | 4.56 | (0.36 | ) | 5.42 | ||||||||||||||
| Less distributions: | ||||||||||||||||||||
| From net investment income | (0.00 | )2 | (0.07 | ) | (0.17 | ) | 0.00 | (0.13 | ) | |||||||||||
| Return of capital | 0.00 | 0.00 | 0.00 | 0.00 | (0.00 | )2 | ||||||||||||||
| From capital gains | (6.29 | ) | (3.46 | ) | (1.08 | ) | 0.00 | 0.00 | ||||||||||||
| Total distributions | (6.29 | ) | (3.53 | ) | (1.25 | ) | 0.00 | (0.13 | ) | |||||||||||
| Net asset value, end of period | $ | 40.62 | $ | 43.28 | $ | 35.94 | $ | 32.63 | $ | 32.99 | ||||||||||
| Total return | 8.32 | % | 30.60 | % | 14.04 | % | (1.09 | )% | 19.55 | % | ||||||||||
| Ratios to average net assets/supplemental data: | ||||||||||||||||||||
| Net assets, end of period (in 000’s) | $ | 134,534 | $ | 243,622 | $ | 85,740 | $ | 74,201 | $ | 82,007 | ||||||||||
| Operating expenses including reimbursement/waiver and fees paid indirectly | 1.06 | % | 1.05 | % | 1.11 | % | 1.05 | % | 1.05 | % | ||||||||||
| Operating expenses excluding reimbursement/waiver and fees paid indirectly | 1.06 | %3 | 1.06 | %3 | 1.11 | %3 | 1.05 | % | 1.05 | % | ||||||||||
| Net investment income/(loss) | (0.29 | )% | 0.23 | % | 0.50 | % | 0.09 | % | 0.40 | % | ||||||||||
| Portfolio turnover rate | 62 | % | 136 | % | 71 | % | 104 | % | 167 | % | ||||||||||
| 1 | The selected per share data was calculated using the average shares outstanding method for the period. |
| 2 | Amount is less than $0.01 per share. |
| 3 | The ratio of operating expenses excluding reimbursement/waiver excludes the effect of fees paid indirectly. If this expense offset was included, the ratio would have been 1.06%, 1.05% and 1.11% for 2014, 2013 and 2012, respectively. |
See Notes to Financial Statements.
61
Wilshire Mutual Funds, Inc. Large Company Value Portfolio Financial Highlights | |
| For a Fund Share Outstanding Throughout Each Year. | ||||||||||||||||||||
| Investment Class Shares | ||||||||||||||||||||
Year Ended 12/31/2014 | Year Ended 12/31/2013 | Year Ended 12/31/2012 | Year Ended 12/31/2011 | Year Ended 12/31/2010 | ||||||||||||||||
| Net asset value, beginning of period | $ | 21.44 | $ | 15.86 | $ | 13.82 | $ | 14.42 | $ | 12.78 | ||||||||||
| Income/(loss) from investment operations: | ||||||||||||||||||||
Net investment income1 | 0.18 | 0.16 | 0.17 | 0.11 | 0.07 | |||||||||||||||
| Net realized and unrealized gain/(loss) on investments | 2.14 | 5.64 | 2.03 | (0.59 | ) | 1.64 | ||||||||||||||
| Total from investment operations | 2.32 | 5.80 | 2.20 | (0.48 | ) | 1.71 | ||||||||||||||
| Less distributions: | ||||||||||||||||||||
| From net investment income | (0.23 | ) | (0.14 | ) | (0.16 | ) | (0.12 | ) | (0.07 | ) | ||||||||||
| Return of capital | 0.00 | 0.00 | 0.00 | 0.00 | (0.00 | )2 | ||||||||||||||
| From capital gains | (2.34 | ) | (0.08 | ) | 0.00 | 0.00 | 0.00 | |||||||||||||
| Total distributions | (2.57 | ) | (0.22 | ) | (0.16 | ) | (0.12 | ) | (0.07 | ) | ||||||||||
| Net asset value, end of period | $ | 21.19 | $ | 21.44 | $ | 15.86 | $ | 13.82 | $ | 14.42 | ||||||||||
| Total return | 10.77 | % | 36.54 | % | 15.92 | % | (3.36 | )% | 13.40 | % | ||||||||||
| Ratios to average net assets/supplemental data: | ||||||||||||||||||||
| Net assets, end of period (in 000’s) | $ | 61,566 | $ | 61,800 | $ | 44,220 | $ | 30,968 | $ | 33,887 | ||||||||||
| Operating expenses including reimbursement/waiver and fees paid indirectly | 1.29 | % | 1.24 | % | 1.35 | % | 1.39 | % | 1.39 | % | ||||||||||
| Operating expenses excluding reimbursement/waiver and fees paid indirectly | 1.30 | %3 | 1.25 | %3 | 1.36 | %3 | 1.39 | % | 1.39 | % | ||||||||||
| Net investment income | 0.80 | % | 0.87 | % | 1.12 | % | 0.77 | % | 0.54 | % | ||||||||||
| Portfolio turnover rate | 57 | % | 101 | % | 97 | % | 140 | % | 140 | % | ||||||||||
| 1 | The selected per share data was calculated using the average shares outstanding method for the period. |
| 2 | Amount is less than $0.01 per share. |
| 3 | The ratio of operating expenses excluding reimbursement/waiver excludes the effect of fees paid indirectly. If this expense offset was included, the ratio would have been 1.29%, 1.24% and 1.35% for 2014, 2013 and 2012, respectively. |
See Notes to Financial Statements.
62
Wilshire Mutual Funds, Inc. Large Company Value Portfolio Financial Highlights - (Continued) | |
| For a Fund Share Outstanding Throughout Each Year. | ||||||||||||||||||||
| Institutional Class Shares | ||||||||||||||||||||
Year Ended 12/31/2014 | Year Ended 12/31/2013 | Year Ended 12/31/2012 | Year Ended 12/31/2011 | Year Ended 12/31/2010 | ||||||||||||||||
| Net asset value, beginning of period | $ | 21.48 | $ | 15.89 | $ | 13.84 | $ | 14.44 | $ | 12.79 | ||||||||||
| Income/(loss) from investment operations: | ||||||||||||||||||||
Net investment income1 | 0.24 | 0.22 | 0.20 | 0.16 | 0.08 | |||||||||||||||
| Net realized and unrealized gain/(loss) on investments | 2.14 | 5.63 | 2.04 | (0.58 | ) | 1.66 | ||||||||||||||
| Total from investment operations | 2.38 | 5.85 | 2.24 | (0.42 | ) | 1.74 | ||||||||||||||
| Less distributions: | ||||||||||||||||||||
| From net investment income | (0.28 | ) | (0.18 | ) | (0.19 | ) | (0.18 | ) | (0.09 | ) | ||||||||||
| Return of capital | 0.00 | 0.00 | 0.00 | 0.00 | (0.00 | )2 | ||||||||||||||
| From capital gains | (2.34 | ) | (0.08 | ) | 0.00 | 0.00 | 0.00 | |||||||||||||
| Total distributions | (2.62 | ) | (0.26 | ) | (0.19 | ) | (0.18 | ) | (0.09 | ) | ||||||||||
| Net asset value, end of period | $ | 21.24 | $ | 21.48 | $ | 15.89 | $ | 13.84 | $ | 14.44 | ||||||||||
| Total return | 11.05 | % | 36.85 | % | 16.18 | % | (2.95 | )% | 13.57 | % | ||||||||||
| Ratios to average net assets/supplemental data: | ||||||||||||||||||||
| Net assets, end of period (in 000’s) | $ | 63,499 | $ | 111,550 | $ | 800 | $ | 773 | $ | 1,105 | ||||||||||
| Operating expenses including reimbursement/waiver and fees paid indirectly | 1.00 | % | 0.95 | % | 1.14 | % | 1.00 | % | 1.27 | % | ||||||||||
| Operating expenses excluding reimbursement/waiver and fees paid indirectly | 1.01 | %3 | 0.97 | %3 | 1.15 | %3 | 1.16 | % | 1.27 | % | ||||||||||
| Net investment income | 1.09 | % | 1.13 | % | 1.32 | % | 1.13 | % | 0.65 | % | ||||||||||
| Portfolio turnover rate | 57 | % | 101 | % | 97 | % | 140 | % | 140 | % | ||||||||||
| 1 | The selected per share data was calculated using the average shares outstanding method for the period. |
| 2 | Amount is less than $0.01 per share. |
| 3 | The ratio of operating expenses excluding reimbursement/waiver excludes the effect of fees paid indirectly. If this expense offset was included, the ratio would have been 1.00%, 0.95% and 1.14% for 2014, 2013 and 2012, respectively. |
See Notes to Financial Statements.
63
Wilshire Mutual Funds, Inc. Small Company Growth Portfolio Financial Highlights | |
| For a Fund Share Outstanding Throughout Each Year. | ||||||||||||||||||||
| Investment Class Shares | ||||||||||||||||||||
Year Ended 12/31/2014 | Year Ended 12/31/2013 | Year Ended 12/31/2012 | Year Ended 12/31/2011 | Year Ended 12/31/2010 | ||||||||||||||||
| Net asset value, beginning of period | $ | 24.95 | $ | 18.06 | $ | 15.90 | $ | 15.95 | $ | 12.64 | ||||||||||
| Income/(loss) from investment operations: | ||||||||||||||||||||
Net investment income/(loss)1 | (0.25 | ) | (0.16 | ) | 0.09 | (0.14 | ) | (0.05 | ) | |||||||||||
| Net realized and unrealized gain on investments | 1.09 | 7.59 | 2.07 | 0.09 | 2 | 3.36 | ||||||||||||||
| Total from investment operations | 0.84 | 7.43 | 2.16 | (0.05 | ) | 3.31 | ||||||||||||||
| Less distributions: | ||||||||||||||||||||
| From capital gains | (2.35 | ) | (0.54 | ) | 0.00 | 0.00 | 0.00 | |||||||||||||
| Total distributions | (2.35 | ) | (0.54 | ) | 0.00 | 0.00 | 0.00 | |||||||||||||
| Net asset value, end of period | $ | 23.44 | $ | 24.95 | $ | 18.06 | $ | 15.90 | $ | 15.95 | ||||||||||
| Total return | 3.44 | % | 41.25 | % | 13.58 | % | (0.31 | )% | 26.19 | % | ||||||||||
| Ratios to average net assets/supplemental data: | ||||||||||||||||||||
| Net assets, end of period (in 000’s) | $ | 11,398 | $ | 9,582 | $ | 7,225 | $ | 6,813 | $ | 7,521 | ||||||||||
| Operating expenses including reimbursement/waiver and fees paid indirectly | 1.50 | % | 1.47 | % | 1.47 | % | 1.50 | % | 1.45 | % | ||||||||||
| Operating expenses excluding reimbursement/waiver and fees paid indirectly | 1.55 | %3 | 1.62 | %3 | 1.97 | %3 | 2.02 | % | 2.18 | % | ||||||||||
| Net investment income/(loss) | (1.00 | )% | (0.75 | )% | 0.55 | % | (0.85 | )% | (0.41 | )% | ||||||||||
| Portfolio turnover rate | 77 | % | 88 | % | 99 | % | 177 | % | 83 | % | ||||||||||
| 1 | The selected per share data was calculated using the average shares outstanding method for the period. |
| 2 | The amount shown for a share outstanding throughout the year ended December 31, 2011, does not accord with the aggregate net gains on investments for the year because of the sales and repurchases of Portfolio shares in relation to fluctuating market value of the investments of the Portfolio. |
| 3 | The ratio of operating expenses excluding reimbursement/waiver excludes the effect of fees paid indirectly. If this expense offset was included, the ratio would have been 1.54%, 1.61% and 1.95% for 2014, 2013 and 2012, respectively. |
See Notes to Financial Statements.
64
Wilshire Mutual Funds, Inc. Small Company Growth Portfolio Financial Highlights - (Continued) | |
| For a Fund Share Outstanding Throughout Each Year. | ||||||||||||||||||||
| Institutional Class Shares | ||||||||||||||||||||
Year Ended 12/31/2014 | Year Ended 12/31/2013 | Year Ended 12/31/2012 | Year Ended 12/31/2011 | Year Ended 12/31/2010 | ||||||||||||||||
| Net asset value, beginning of period | $ | 26.14 | $ | 18.89 | $ | 16.60 | $ | 16.61 | $ | 13.12 | ||||||||||
| Income/(loss) from investment operations: | ||||||||||||||||||||
Net investment income/(loss)1 | (0.18 | ) | (0.15 | ) | 0.11 | (0.12 | ) | (0.01 | ) | |||||||||||
| Net realized and unrealized gain on investments | 1.14 | 7.99 | 2.18 | 0.11 | 2 | 3.50 | ||||||||||||||
| Total from investment operations | 0.96 | 7.84 | 2.29 | (0.01 | ) | 3.49 | ||||||||||||||
| Less distributions: | ||||||||||||||||||||
| From net investment income | 0.00 | (0.05 | ) | 0.00 | 0.00 | 0.00 | ||||||||||||||
| From capital gains | (2.35 | ) | (0.54 | ) | 0.00 | 0.00 | 0.00 | |||||||||||||
| Total distributions | (2.35 | ) | (0.59 | ) | 0.00 | 0.00 | 0.00 | |||||||||||||
| Net asset value, end of period | $ | 24.75 | $ | 26.14 | $ | 18.89 | $ | 16.60 | $ | 16.61 | ||||||||||
| Total return | 3.75 | % | 41.58 | % | 13.80 | % | (0.06 | )% | 26.60 | % | ||||||||||
| Ratios to average net assets/supplemental data: | ||||||||||||||||||||
| Net assets, end of period (in 000’s) | $ | 15,483 | $ | 24,013 | $ | 15 | $ | 13 | $ | 179 | ||||||||||
| Operating expenses including reimbursement/waiver and fees paid indirectly | 1.20 | % | 1.19 | % | 1.28 | % | 1.23 | % | 1.15 | % | ||||||||||
| Operating expenses excluding reimbursement/waiver and fees paid indirectly | 1.24 | %3 | 1.20 | %3 | 1.79 | %3 | 1.69 | % | 1.87 | % | ||||||||||
| Net investment income/(loss) | (0.70 | )% | (0.54 | )% | 0.60 | % | (0.68 | )% | (0.09 | )% | ||||||||||
| Portfolio turnover rate | 77 | % | 88 | % | 99 | % | 177 | % | 83 | % | ||||||||||
| 1 | The selected per share data was calculated using the average shares outstanding method for the period. |
| 2 | The amount shown for a share outstanding throughout the year ended December 31, 2011, does not accord with the aggregate net gains on investments for the year because of the sales and repurchases of Portfolio shares in relation to fluctuating market value of the investments of the Portfolio. |
| 3 | The ratio of operating expenses excluding reimbursement/waiver excludes the effect of fees paid indirectly. If this expense offset was included, the ratio would have been 1.19%, 1.18% and 1.78% for 2014, 2013 and 2012, respectively. |
See Notes to Financial Statements.
65
Wilshire Mutual Funds, Inc. Small Company Value Portfolio Financial Highlights | |
| For a Fund Share Outstanding Throughout Each Year. | ||||||||||||||||||||
| Investment Class Shares | ||||||||||||||||||||
Year Ended 12/31/2014 | Year Ended 12/31/2013 | Year Ended 12/31/2012 | Year Ended 12/31/2011 | Year Ended 12/31/2010 | ||||||||||||||||
| Net asset value, beginning of period | $ | 24.33 | $ | 17.40 | $ | 15.04 | $ | 16.34 | $ | 13.32 | ||||||||||
| Income/(loss) from investment operations: | ||||||||||||||||||||
Net investment income/(loss)1 | (0.08 | ) | (0.03 | ) | 0.20 | 0.00 | 0.12 | |||||||||||||
| Net realized and unrealized gain/(loss) on investments | 1.53 | 7.62 | 2.38 | (1.23 | ) | 3.02 | ||||||||||||||
| Total from investment operations | 1.45 | 7.59 | 2.58 | (1.23 | ) | 3.14 | ||||||||||||||
| Less distributions: | ||||||||||||||||||||
| From net investment income | 0.00 | 0.00 | 2 | (0.22 | ) | (0.07 | ) | (0.12 | ) | |||||||||||
| From capital gains | (2.92 | ) | (0.66 | ) | 0.00 | 0.00 | 0.00 | |||||||||||||
| Total distributions | (2.92 | ) | (0.66 | ) | (0.22 | ) | (0.07 | ) | (0.12 | ) | ||||||||||
| Net asset value, end of period | $ | 22.86 | $ | 24.33 | $ | 17.40 | $ | 15.04 | $ | 16.34 | ||||||||||
| Total return | 6.17 | % | 43.79 | % | 17.20 | % | (7.54 | )% | 23.60 | % | ||||||||||
| Ratios to average net assets/supplemental data: | ||||||||||||||||||||
| Net assets, end of period (in 000’s) | $ | 14,120 | $ | 13,688 | $ | 9,641 | $ | 8,795 | $ | 13,754 | ||||||||||
| Operating expenses including reimbursement/waiver and fees paid indirectly | 1.49 | % | 1.49 | % | 1.49 | % | 1.50 | % | 1.50 | % | ||||||||||
| Operating expenses excluding reimbursement/waiver and fees paid indirectly | 1.56 | %3 | 1.58 | %3 | 1.84 | %3 | 1.90 | % | 1.87 | % | ||||||||||
| Net investment income/(loss) | (0.35 | )% | (0.13 | )% | 1.24 | % | (0.02 | )% | 0.82 | % | ||||||||||
| Portfolio turnover rate | 53 | % | 60 | % | 68 | % | 118 | % | 89 | % | ||||||||||
| 1 | The selected per share data was calculated using the average shares outstanding method for the period. |
| 2 | Amount is less than $0.01 per share. |
| 3 | The ratio of operating expenses excluding reimbursement/waiver excludes the effect of fees paid indirectly. If this expense offset was included, the ratio would have been 1.55%, 1.57% and 1.83% for 2014, 2013 and 2012, respectively. |
See Notes to Financial Statements.
66
Wilshire Mutual Funds, Inc. Small Company Value Portfolio Financial Highlights - (Continued) | |
| For a Fund Share Outstanding Throughout Each Year. | ||||||||||||||||||||
| Institutional Class Shares | ||||||||||||||||||||
Year Ended 12/31/2014 | Year Ended 12/31/2013 | Year Ended 12/31/2012 | Year Ended 12/31/2011 | Year Ended 12/31/2010 | ||||||||||||||||
| Net asset value, beginning of period | $ | 24.59 | $ | 17.58 | $ | 15.19 | $ | 16.51 | $ | 13.45 | ||||||||||
| Income/(loss) from investment operations: | ||||||||||||||||||||
Net investment income/(loss)1 | (0.02 | ) | 0.00 | 0.22 | 0.09 | 0.14 | ||||||||||||||
| Net realized and unrealized gain/(loss) on investments | 1.56 | 7.74 | 2.42 | (1.24 | ) | 3.06 | ||||||||||||||
| Total from investment operations | 1.54 | 7.74 | 2.64 | (1.15 | ) | 3.20 | ||||||||||||||
| Less distributions: | ||||||||||||||||||||
| From net investment income | 0.00 | (0.07 | ) | (0.25 | ) | (0.17 | ) | (0.14 | ) | |||||||||||
| From capital gains | (2.92 | ) | (0.66 | ) | 0.00 | 0.00 | 0.00 | |||||||||||||
| Total distributions | (2.92 | ) | (0.73 | ) | (0.25 | ) | (0.17 | ) | (0.14 | ) | ||||||||||
| Net asset value, end of period | $ | 23.21 | $ | 24.59 | $ | 17.58 | $ | 15.19 | $ | 16.51 | ||||||||||
| Total return | 6.47 | % | 44.16 | % | 17.41 | % | (6.95 | )% | 23.80 | % | ||||||||||
| Ratios to average net assets/supplemental data: | ||||||||||||||||||||
| Net assets, end of period (in 000’s) | $ | 15,655 | $ | 24,934 | $ | 54 | $ | 82 | $ | 156 | ||||||||||
| Operating expenses including reimbursement/waiver and fees paid indirectly | 1.17 | % | 1.20 | % | 1.31 | % | 0.94 | % | 1.29 | % | ||||||||||
| Operating expenses excluding reimbursement/waiver and fees paid indirectly | 1.23 | %2 | 1.19 | %2 | 1.66 | %2 | 1.64 | % | 1.67 | % | ||||||||||
| Net investment income/(loss) | (0.07 | )% | (0.01 | )% | 1.33 | % | 0.53 | % | 0.96 | % | ||||||||||
| Portfolio turnover rate | 53 | % | 60 | % | 68 | % | 118 | % | 89 | % | ||||||||||
| 1 | The selected per share data was calculated using the average shares outstanding method for the period. |
| 2 | The ratio of operating expenses excluding reimbursement/waiver excludes the effect of fees paid indirectly. If this expense offset was included, the ratio would have been 1.21%, 1.18% and 1.65% for 2014, 2013 and 2012, respectively. |
See Notes to Financial Statements.
67
Wilshire Mutual Funds, Inc. Wilshire 5000 Indexsm Fund Financial Highlights | |
| For a Fund Share Outstanding Throughout Each Year. | ||||||||||||||||||||
| Investment Class Shares | ||||||||||||||||||||
Year Ended 12/31/2014 | Year Ended 12/31/2013 | Year Ended 12/31/2012 | Year Ended 12/31/2011 | Year Ended 12/31/2010 | ||||||||||||||||
| Net asset value, beginning of period | $ | 16.22 | $ | 12.43 | $ | 10.93 | $ | 11.05 | $ | 9.61 | ||||||||||
| Income/(loss) from investment operations: | ||||||||||||||||||||
Net investment income1 | 0.23 | 0.19 | 0.19 | 0.14 | 0.13 | |||||||||||||||
| Net realized and unrealized gain/(loss) on investments | 1.78 | 3.80 | 1.49 | (0.12 | ) | 1.45 | ||||||||||||||
| Total from investment operations | 2.01 | 3.99 | 1.68 | 0.02 | 1.58 | |||||||||||||||
| Less distributions: | ||||||||||||||||||||
| From net investment income | (0.22 | ) | (0.20 | ) | (0.18 | ) | (0.14 | ) | (0.14 | ) | ||||||||||
| Total distributions | (0.22 | ) | (0.20 | ) | (0.18 | ) | (0.14 | ) | (0.14 | ) | ||||||||||
| Net asset value, end of period | $ | 18.01 | $ | 16.22 | $ | 12.43 | $ | 10.93 | $ | 11.05 | ||||||||||
| Total return | 12.38 | % | 32.10 | % | 15.36 | % | 0.21 | % | 16.44 | % | ||||||||||
| Ratios to average net assets/supplemental data: | ||||||||||||||||||||
| Net assets, end of period (in 000’s) | $ | 204,465 | $ | 139,354 | $ | 107,888 | $ | 99,545 | $ | 105,019 | ||||||||||
| Operating expenses including reimbursement/fees paid indirectly | 0.65 | % | 0.68 | % | 0.70 | % | 0.74 | % | 0.72 | % | ||||||||||
| Operating expenses excluding reimbursement/fees paid indirectly | 0.65 | % | 0.68 | % | 0.70 | % | 0.74 | % | 0.72 | % | ||||||||||
| Net investment income | 1.32 | % | 1.33 | % | 1.61 | % | 1.22 | % | 1.26 | % | ||||||||||
| Portfolio turnover rate | 3 | % | 2 | % | 2 | % | 9 | % | 2 | % | ||||||||||
| 1 | The selected per share data was calculated using the average shares outstanding method for the period. |
See Notes to Financial Statements.
68
Wilshire Mutual Funds, Inc. Wilshire 5000 Indexsm Fund Financial Highlights - (Continued) | |
| For a Fund Share Outstanding Throughout Each Year. | ||||||||||||||||||||
| Institutional Class Shares | ||||||||||||||||||||
Year Ended 12/31/2014 | Year Ended 12/31/2013 | Year Ended 12/31/2012 | Year Ended 12/31/2011 | Year Ended 12/31/2010 | ||||||||||||||||
| Net asset value, beginning of period | $ | 16.21 | $ | 12.41 | $ | 10.92 | $ | 11.04 | $ | 9.60 | ||||||||||
| Income/(loss) from investment operations: | ||||||||||||||||||||
Net investment income1 | 0.26 | 0.22 | 0.22 | 0.16 | 0.15 | |||||||||||||||
| Net realized and unrealized gain/(loss) on investments | 1.79 | 3.81 | 1.47 | (0.11 | ) | 1.45 | ||||||||||||||
| Total from investment operations | 2.05 | 4.03 | 1.69 | 0.05 | 1.60 | |||||||||||||||
| Less distributions: | ||||||||||||||||||||
| From net investment income | (0.26 | ) | (0.23 | ) | (0.20 | ) | (0.17 | ) | (0.16 | ) | ||||||||||
| Total distributions | (0.26 | ) | (0.23 | ) | (0.20 | ) | (0.17 | ) | (0.16 | ) | ||||||||||
| Net asset value, end of period | $ | 18.00 | $ | 16.21 | $ | 12.41 | $ | 10.92 | $ | 11.04 | ||||||||||
| Total return | 12.60 | % | 32.48 | % | 15.54 | % | 0.43 | % | 16.71 | % | ||||||||||
| Ratios to average net assets/supplemental data: | ||||||||||||||||||||
| Net assets, end of period (in 000’s) | $ | 67,500 | $ | 59,565 | $ | 50,633 | $ | 50,252 | $ | 53,415 | ||||||||||
| Operating expenses including reimbursement/fees paid indirectly | 0.44 | % | 0.46 | % | 0.47 | % | 0.53 | % | 0.50 | % | ||||||||||
| Operating expenses excluding reimbursement/fees paid indirectly | 0.44 | % | 0.46 | % | 0.47 | % | 0.53 | % | 0.50 | % | ||||||||||
| Net investment income | 1.53 | % | 1.55 | % | 1.84 | % | 1.43 | % | 1.48 | % | ||||||||||
| Portfolio turnover rate | 3 | % | 2 | % | 2 | % | 9 | % | 2 | % | ||||||||||
| 1 | The selected per share data was calculated using the average shares outstanding method for the period. |
See Notes to Financial Statements.
69
Wilshire Mutual Funds, Inc. Wilshire 5000 Indexsm Fund Financial Highlights - (Continued) | |
| For a Fund Share Outstanding Throughout Each Year. | ||||||||||||||||||||
| Qualified Class Shares | ||||||||||||||||||||
Year Ended 12/31/2014 | Year Ended 12/31/2013 | Year Ended 12/31/2012 | Year Ended 12/31/2011 | Year Ended 12/31/2010 | ||||||||||||||||
| Net asset value, beginning of period | $ | 16.56 | $ | 12.64 | $ | 11.09 | $ | 11.03 | $ | 9.59 | ||||||||||
| Income/(loss) from investment operations: | ||||||||||||||||||||
Net investment income1 | 0.33 | 0.28 | 0.26 | 0.14 | 0.13 | |||||||||||||||
| Net realized and unrealized gain/(loss) on investments | 1.83 | 3.88 | 1.50 | (0.08 | ) | 1.46 | ||||||||||||||
| Total from investment operations | 2.16 | 4.16 | 1.76 | 0.06 | 1.59 | |||||||||||||||
| Less distributions: | ||||||||||||||||||||
| From net investment income | (0.27 | ) | (0.24 | ) | (0.21 | ) | 0.00 | (0.15 | ) | |||||||||||
| Total distributions | (0.27 | ) | (0.24 | ) | (0.21 | ) | 0.00 | (0.15 | ) | |||||||||||
| Net asset value, end of period | $ | 18.45 | $ | 16.56 | $ | 12.64 | $ | 11.09 | $ | 11.03 | ||||||||||
| Total return | 13.01 | % | 32.94 | %3 | 15.93 | %3 | 0.54 | % | 16.56 | % | ||||||||||
| Ratios to average net assets/supplemental data: | ||||||||||||||||||||
| Net assets, end of period (in 000’s) | $ | — | 2 | $ | — | 2 | $ | — | 2 | $ | — | 2 | $ | 714 | ||||||
| Operating expenses including reimbursement/fees paid indirectly | 0.00 | %3 | 0.00 | %3 | 0.00 | %3 | 0.65 | % | 0.66 | % | ||||||||||
| Operating expenses excluding reimbursement/fees paid indirectly | 0.00 | %3 | 0.00 | %3 | 0.00 | %3 | 0.65 | % | 0.66 | % | ||||||||||
| Net investment income | 1.90 | % | 1.92 | % | 2.16 | % | 1.21 | % | 1.32 | % | ||||||||||
| Portfolio turnover rate | 3 | % | 2 | % | 2 | % | 9 | % | 2 | % | ||||||||||
| 1 | The selected per share data was calculated using the average shares outstanding method for the period. |
| 2 | Amounts designated as “—” have been rounded to $0. |
| 3 | Results not considered meaningful due to low level of assets. |
See Notes to Financial Statements.
70
Wilshire Mutual Funds, Inc. Wilshire 5000 Indexsm Fund Financial Highlights - (Continued) | |
| For a Fund Share Outstanding Throughout Each Year. | ||||||||||||||||||||
| Horace Mann Class Shares | ||||||||||||||||||||
Year Ended 12/31/2014 | Year Ended 12/31/2013 | Year Ended 12/31/2012 | Year Ended 12/31/2011 | Year Ended 12/31/2010 | ||||||||||||||||
| Net asset value, beginning of period | $ | 16.18 | $ | 12.40 | $ | 10.91 | $ | 11.02 | $ | 9.59 | ||||||||||
| Income/(loss) from investment operations: | ||||||||||||||||||||
Net investment income1 | 0.22 | 0.19 | 0.19 | 0.13 | 0.13 | |||||||||||||||
| Net realized and unrealized gain/(loss) on investments | 1.79 | 3.79 | 1.48 | (0.10 | ) | 1.44 | ||||||||||||||
| Total from investment operations | 2.01 | 3.98 | 1.67 | 0.03 | 1.57 | |||||||||||||||
| Less distributions: | ||||||||||||||||||||
| From net investment income | (0.22 | ) | (0.20 | ) | (0.18 | ) | (0.14 | ) | (0.14 | ) | ||||||||||
| Total distributions | (0.22 | ) | (0.20 | ) | (0.18 | ) | (0.14 | ) | (0.14 | ) | ||||||||||
| Net asset value, end of period | $ | 17.97 | $ | 16.18 | $ | 12.40 | $ | 10.91 | $ | 11.02 | ||||||||||
| Total return | 12.38 | % | 32.07 | % | 15.31 | % | 0.25 | % | 16.39 | % | ||||||||||
| Ratios to average net assets/supplemental data: | ||||||||||||||||||||
| Net assets, end of period (in 000’s) | $ | 1,715 | $ | 1,560 | $ | 1,243 | $ | 1,108 | $ | 1,204 | ||||||||||
| Operating expenses including reimbursement/fees paid indirectly | 0.67 | % | 0.70 | % | 0.69 | % | 0.78 | % | 0.72 | % | ||||||||||
| Operating expenses excluding reimbursement/fees paid indirectly | 0.67 | % | 0.70 | % | 0.69 | % | 0.78 | % | 0.72 | % | ||||||||||
| Net investment income | 1.30 | % | 1.31 | % | 1.62 | % | 1.17 | % | 1.26 | % | ||||||||||
| Portfolio turnover rate | 3 | % | 2 | % | 2 | % | 9 | % | 2 | % | ||||||||||
| 1 | The selected per share data was calculated using the average shares outstanding method for the period. |
See Notes to Financial Statements.
71
Wilshire Mutual Funds, Inc. Wilshire International Equity Fund Financial Highlights | |
| For a Fund Share Outstanding Throughout Each Year. | ||||||||||||||||||||
| Investment Class Shares | ||||||||||||||||||||
Year Ended 12/31/2014 | Year Ended 12/31/2013 | Year Ended 12/31/2012 | Year Ended 12/31/2011 | Year Ended 12/31/2010 | ||||||||||||||||
| Net asset value, beginning of period | $ | 9.70 | $ | 8.34 | $ | 7.63 | $ | 8.09 | $ | 7.37 | ||||||||||
| Income/(loss) from investment operations: | ||||||||||||||||||||
Net investment income1 | 0.09 | 0.03 | 0.06 | 0.00 | 2 | 0.00 | 2 | |||||||||||||
| Net realized and unrealized gain/(loss) on investments and foreign currency transactions | (0.71 | ) | 1.54 | 0.96 | (0.19 | ) | 0.84 | |||||||||||||
| Total from investment operations | (0.62 | ) | 1.57 | 1.02 | (0.19 | ) | 0.84 | |||||||||||||
| Less distributions: | ||||||||||||||||||||
| From net investment income | (0.02 | ) | 0.00 | (0.09 | ) | (0.06 | ) | (0.04 | ) | |||||||||||
| From capital gains | 0.00 | (0.21 | ) | (0.22 | ) | (0.21 | ) | (0.08 | ) | |||||||||||
| Total distributions | (0.02 | ) | (0.21 | ) | (0.31 | ) | (0.27 | ) | (0.12 | ) | ||||||||||
| Net asset value, end of period | $ | 9.06 | $ | 9.70 | $ | 8.34 | $ | 7.63 | $ | 8.09 | ||||||||||
| Total return | (6.38 | )% | 18.95 | % | 13.36 | % | (2.28 | )% | 11.47 | % | ||||||||||
| Ratios to average net assets/supplemental data: | ||||||||||||||||||||
| Net assets, end of period (in 000’s) | $ | 11,371 | $ | 2,410 | $ | 74,999 | $ | 80,004 | $ | 91,641 | ||||||||||
Operating expenses including dividends and rebates on securities sold short and interest expense, after expense reimbursement/waiver and fees paid indirectly4 | 1.50 | % | 1.85 | %3 | 2.24 | %3 | 2.27 | %3 | 2.19 | %3 | ||||||||||
Operating expenses including dividends and rebates on securities sold short and interest expense, before expense reimbursement/waiver and fees paid indirectly4 | 1.71 | %5 | 1.93 | %5 | 2.29 | %5 | 2.33 | % | 2.23 | % | ||||||||||
| Net investment income | 0.97 | % | 0.38 | % | 0.77 | % | 0.06 | % | 0.05 | % | ||||||||||
| Portfolio turnover rate | 176 | % | 368 | % | 45 | % | 134 | % | 283 | % | ||||||||||
| 1 | The selected per share data was calculated using the average shares outstanding method for the period. |
| 2 | Amount is less than $0.01 per share. |
| 3 | The operating expense ratios reflect the expenses related to investing in securities sold short. Had these expenses been excluded, the expense ratio (after waiver and fees paid indirectly) would have been 1.50% for 2013, 2012, 2011 and 2010, respectively. |
| 4 | Effective April 2, 2013, the Wilshire International Equity Fund no longer engages in short selling. |
| 5 | The ratio of operating expenses including dividends and rebates on securities sold short and interest expense, before reimbursement/waiver excludes the effect of fees paid indirectly. If this expense offset was included, the ratio would have been 1.71%, 1.93% and 2.28% for 2014, 2013 and 2012, respectively. |
See Notes to Financial Statements.
72
Wilshire Mutual Funds, Inc. Wilshire International Equity Fund Financial Highlights - (Continued) | |
| For a Fund Share Outstanding Throughout Each Year. | ||||||||||||||||||||
| Institutional Class Shares | ||||||||||||||||||||
Year Ended 12/31/2014 | Year Ended 12/31/2013 | Year Ended 12/31/2012 | Year Ended 12/31/2011 | Year Ended 12/31/2010 | ||||||||||||||||
| Net asset value, beginning of period | $ | 9.64 | $ | 8.38 | $ | 7.67 | $ | 8.14 | $ | 7.41 | ||||||||||
| Income/(loss) from investment operations: | ||||||||||||||||||||
Net investment income1 | 0.09 | 0.08 | 0.09 | 0.02 | 0.02 | |||||||||||||||
| Net realized and unrealized gain/(loss) on investments and foreign currency transactions | (0.68 | ) | 1.51 | 0.95 | (0.20 | ) | 0.85 | |||||||||||||
| Total from investment operations | (0.59 | ) | 1.59 | 1.04 | (0.18 | ) | 0.87 | |||||||||||||
| Less distributions: | ||||||||||||||||||||
| From net investment income | (0.06 | ) | (0.12 | ) | (0.11 | ) | (0.08 | ) | (0.06 | ) | ||||||||||
| From capital gains | 0.00 | (0.21 | ) | (0.22 | ) | (0.21 | ) | (0.08 | ) | |||||||||||
| Total distributions | (0.06 | ) | (0.33 | ) | (0.33 | ) | (0.29 | ) | (0.14 | ) | ||||||||||
| Net asset value, end of period | $ | 8.99 | $ | 9.64 | $ | 8.38 | $ | 7.67 | $ | 8.14 | ||||||||||
| Total return | (6.16 | )% | 19.10 | % | 13.63 | % | (2.11 | )% | 11.82 | % | ||||||||||
Ratios to average net assets/supplemental data2: | ||||||||||||||||||||
| Net assets, end of period (in 000’s) | $ | 165,048 | $ | 45,897 | $ | 99,106 | $ | 93,132 | $ | 103,526 | ||||||||||
Operating expenses including dividends and rebates on securities sold short and interest expense, after expense reimbursement/waiver and fees paid indirectly3 | 1.25 | % | 1.61 | %2 | 1.99 | %2 | 2.02 | %2 | 1.94 | %2 | ||||||||||
Operating expenses including dividends and rebates on securities sold short and interest expense, before expense reimbursement/ waiver and fees paid indirectly3 | 1.31 | %4 | 1.87 | % | 2.01 | %4 | 2.05 | % | 1.96 | % | ||||||||||
| Net investment income | 0.96 | % | 0.88 | % | 1.03 | % | 0.32 | % | 0.30 | % | ||||||||||
| Portfolio turnover rate | 176 | % | 368 | % | 45 | % | 134 | % | 283 | % | ||||||||||
| 1 | The selected per share data was calculated using the average shares outstanding method for the period. |
| 2 | The operating expense ratios reflect the expenses related to investing in securities sold short. Had these expenses been excluded, the expense ratio (after waiver and fees paid indirectly) would have been 1.25% for 2013, 2012, 2011 and 2010, respectively. |
| 3 | Effective April 2, 2013, the Wilshire International Equity Fund no longer engages in short selling. |
| 4 | The ratio of operating expenses including dividends and rebates on securities sold short and interest expense, before reimbursement/waiver excludes the effect of fees paid indirectly. If this expense offset was included, the ratio would have been 1.31%, 1.87% and 2.00% for 2014, 2013 and 2012, respectively. |
See Notes to Financial Statements.
73
Wilshire Mutual Funds, Inc. Notes to Financial Statements December 31, 2014 | |
1. Organization.
Wilshire Mutual Funds, Inc. (the “Company”) is registered under the Investment Company Act of 1940, as amended (the “1940 Act”), as an open-end diversified investment company, which was incorporated under Maryland law on July 30, 1992. The Company operates as a series company and presently offers six series, all of which had operations during the period: Large Company Growth Portfolio, Large Company Value Portfolio, Small Company Growth Portfolio, Small Company Value Portfolio, Wilshire 5000 IndexSM Fund and Wilshire International Equity Fund (each a “Portfolio” and collectively the “Portfolios”). The Company accounts separately for the assets, liabilities and operations of each series.
Each of the Portfolios offers Investment and Institutional Class shares, each of which has equal rights as to voting privileges. The Wilshire 5000 IndexSM Fund also offers Qualified Class Shares and Horace Mann Class Shares. Each of the Investment Class, Qualified Class and Horace Mann Class has exclusive voting rights with respect to its particular service and distribution plan. Investment income, realized and unrealized capital gains and losses and the common expenses of each Portfolio are allocated on a pro-rata basis to each class based on the relative net assets of each class to the total net assets of each Portfolio. Each class of shares differs in its respective service and distribution expenses.
2. Significant Accounting Policies.
Use of estimates – Each Portfolio is an investment company in conformity with U.S. generally accepted accounting principles (U.S. GAAP). Therefore, each Portfolio follows the accounting and reporting guidelines for investment companies. The preparation of financial statements in accordance with U.S. GAAP requires management to make estimates and assumptions that affect the reported amounts of assets and liabilities and disclosure of contingent assets and liabilities at the date of the financial statements and the reported amounts of revenues and expenses during the reporting period. Actual results could differ from those estimates and those differences could be material. The following is a summary of significant accounting policies consistently followed by the Portfolios in the preparation of their financial statements.
Security valuation – A security listed or traded on U.S. exchanges is valued at its last sales price on the exchange where it is principally traded. In the absence of a current quotation, the security is valued at the mean between the last bid and asked prices on that exchange. Securities quoted on the National Association of Securities Dealers Automatic Quotation (NASDAQ) System, for which there have been sales, are valued at the NASDAQ official closing price. If there are no such sales, the most recent bid quotation is used. Securities traded over-the-counter (other than on NASDAQ) are valued at the last current sale price; and if there are no such sales, the most recent bid quotation is used. Equity securities primarily traded on a foreign exchange or market are valued daily at the price, which is an estimate of the fair value price, as provided by an independent pricing service. In the event market quotations are not readily available, such securities are valued at fair value according to procedures adopted by the Board of Directors or as determined in good faith by the Pricing Committee, whose members include at least two representatives of Wilshire Associates Incorporated (“Wilshire” or the “Adviser”), one of whom is an officer of the Company, or by the Company’s Valuation Committee. Fair value is defined as the amount the owner of a security might reasonably expect to receive upon a current sale. Securities whose value does not reflect fair value because a significant valuation event has occurred may be valued at fair value by the Pricing Committee or the
74
Wilshire Mutual Funds, Inc. Notes to Financial Statements - (Continued) December 31, 2014 | |
Valuation Committee in accordance with the Company’s valuation procedures. Significant events may include, but are not limited to, the following: significant fluctuations in domestic markets, foreign markets or foreign currencies; occurrences not directly tied to the securities markets such as natural disasters, armed conflicts or significant governmental actions; and major announcements affecting a single issuer or an entire market or market sector.
The Wilshire International Equity Fund uses Interactive Data Pricing and Reference Data, Inc. (formerly FT Interactive Data Corp.) (“Interactive Data”) as a third party fair valuation vendor daily. Interactive Data provides a fair value for foreign securities in the Wilshire International Equity Fund based on certain factors and methodologies (involving, generally, tracking valuation correlations between the U.S. market and each non-U.S. security) applied by Interactive Data. These factors are used to value the Wilshire International Equity Fund without holding a Pricing Committee meeting. In the event that the Adviser believes that the fair values provided by Interactive Data are not reliable, the Adviser contacts the Wilshire International Equity Fund’s administrator and may request that a meeting of the Pricing Committee be held.
In accordance with the authoritative guidance on fair value measurements and disclosures under U.S. GAAP, the Portfolios disclose fair value of their investments in a hierarchy that prioritizes the inputs to valuation techniques used to measure the fair value. The objective of a fair value measurement is to determine the price that would be received to sell an asset or paid to transfer a liability in an orderly transaction between market participants at the measurement date (an exit price). Accordingly, the fair value hierarchy gives the highest priority to quoted prices (unadjusted) in active markets for identical assets or liabilities (Level 1) and the lowest priority to unobservable inputs (Level 3). The guidance establishes three levels of the fair value hierarchy as follows:
| ● | Level 1 – Unadjusted quoted prices in active markets for identical, unrestricted assets or liabilities that the Portfolios have the ability to access at the measurement date; |
| ● | Level 2 – Other significant observable inputs (including quoted prices for similar securities, interest rates, prepayment speeds, credit risk, referenced indices, quoted prices in inactive markets, adjusted quoted prices in active markets, etc.); and |
| ● | Level 3 – Prices, inputs or exotic modeling techniques which are both significant to the fair value measurement and unobservable (supported by little or no market activity). |
The inputs or methodology used for valuing securities are not necessarily an indication of the risk associated with investing in those securities. For the year ended December 31, 2014, there have been no significant changes to the Portfolios’ fair value methodologies.
Fair value measurement classifications are summarized in each Portfolio’s Condensed Schedule of Investments, as applicable.
Securities transactions and investment income – Securities transactions are recorded on a trade date basis. Realized gains and losses from securities transactions are recorded on the identified cost basis. Dividend income is recognized on the ex-dividend date and interest income, including, where applicable, accretion of discount and amortization of premium on investments, is recognized on the accrual basis from settlement date. Distributions received on securities that represent a return of capital or capital gain are reclassed as a reduction of
75
Wilshire Mutual Funds, Inc. Notes to Financial Statements - (Continued) December 31, 2014 | |
cost of investments and/or as a realized gain. The actual character of income, realized gain and return of capital distributions received from Real Estate Investment Trusts (“REITs”) is not known until after the end of the fiscal year, at which time such distribution estimates are appropriately adjusted.
Foreign currency transactions – The books and records of the Funds are maintained in U.S. dollars. Foreign currency transactions are translated into U.S. dollars on the following basis:
| ● | market value of investment securities, other assets and other liabilities at the daily rates of exchange and |
| ● | purchases and sales of investment securities, dividend and interest income and certain expenses at the rates of exchange prevailing on the respective dates of such transactions. |
Net realized and unrealized gain (loss) from foreign currency related transactions includes gains and losses between trade and settlement dates on securities transactions, gains and losses arising from the sales of foreign currency and gains and losses between the ex-dividend and payment dates on dividends, interest and foreign withholding taxes. The effect of changes in foreign exchange rates on realized and unrealized gains or losses is reflected as a component of such gains or losses.
Expense policy – Distribution and Service fees directly attributable to a class of shares are charged to that class’ operations. Expenses of the Portfolios other than Distribution and Service fees are prorated among the classes to which the expense relates based on the relative net assets of each class of shares. Expenses directly attributable to a Portfolio are charged to that Portfolio. Expenses not directly attributable to a Portfolio are allocated proportionately among all Portfolios daily in relation to the net assets of each Portfolio or another reasonable basis. Expenses which are attributable to the Company and the Wilshire Variable Insurance Trust are allocated across the Company and the Wilshire Variable Insurance Trust based upon relative net assets or another reasonable basis. Expenses and fees, including the advisory fees, are accrued daily and taken into account for the purpose of determining the net asset value of each Portfolio’s shares.
Investments in REITs – With respect to the Portfolios, dividend income is recorded based on the income included in distributions received from the REIT investments using published REIT reclassifications including some management estimates when actual amounts are not available. Distributions received in excess of these estimated amounts are recorded as a reduction of the cost of investments or reclassified to capital gains. The actual amounts of income, return of capital, and capital gains are only determined by each REIT after its fiscal year end, and may differ from the estimated amounts.
Distributions to shareholders – Distributions to shareholders are recorded on the ex-dividend date. Distributions from net investment income, if any, are declared and paid annually. The Portfolios’ net realized capital gains, unless offset by any available capital loss carryforward, are distributed to shareholders annually. Additional distributions of net investment income and capital gains may be made at the discretion of the Board of Directors in order to avoid the application of a 4% non-deductible Federal excise tax.
Redemption fees – The Wilshire International Equity Fund charges a redemption fee of 1% on redemption of capital shares held for sixty days or less, subject to certain exceptions. For the year ended December 31, 2014, the Wilshire International Equity Fund did not charge any redemption fees.
76
Wilshire Mutual Funds, Inc. Notes to Financial Statements - (Continued) December 31, 2014 | |
3. Investment Advisory Fee and Other Transactions.
Pursuant to the Advisory Agreement (the “Agreement”) between the Company and the Adviser, Wilshire charges annual fees of 0.75% of average daily net assets for the first $1 billion and 0.65% thereafter for the Large Company Growth Portfolio and Large Company Value Portfolio, 0.85% of average daily net assets for the first $1 billion and 0.75% thereafter for the Small Company Growth Portfolio and Small Company Value Portfolio, 0.10% of the average daily net assets for the first $1 billion and 0.07% thereafter for the Wilshire 5000 IndexSM Fund and 1.00% of the average daily net assets for the first $1 billion and 0.90% thereafter for the Wilshire International Equity Fund. Wilshire has entered into contractual expense limitation agreements with the Small Company Growth Portfolio, the Small Company Value Portfolio and the Wilshire International Equity Fund to waive a portion of its management fees or reimburse expenses to limit expenses of such Portfolios (excluding taxes, brokerage expenses, dividend expenses on short securities, and extraordinary expenses) to 1.50% and 1.25% of average daily net assets for Investment Class Shares and Institutional Class Shares, respectively. These agreements to limit expenses continue through at least April 30, 2016. Wilshire may recoup the amount of any management fee waived or expenses reimbursed within three years after the year in which Wilshire waived fees or reimbursed the expenses if the recoupment does not exceed the existing expense limitation. At December 31, 2014, the amounts of waivers/reimbursements subject to recoupment for Wilshire International Equity Fund were $78,351 expiring in 2017, $152,161 expiring in 2016, and $48,410 expiring in 2015. For the year ended December 31, 2014, the Adviser recaptured previously waived fees of $2,871 from Small Company Growth Portfolio. As of the year ended December 31, 2014, the Wilshire Small Company Growth and Wilshire Small Company Value have no fees subject to recoupment.
For the year ended December 31, 2014, Wilshire waived advisory fees or reimbursed expenses as follows:
| Portfolio | Fees Waived/ Reimbursed | Fees Recouped | ||||||
| Wilshire Small Company Growth | $ | 16,159 | $ | 2,871 | ||||
| Wilshire Small Company Value | 17,655 | N/A | ||||||
| Wilshire International Equity Fund | 78,351 | N/A | ||||||
The Board of Directors of the Company has approved Los Angeles Capital Management and Equity Research, Inc. (“L.A. Capital”), Cornerstone Capital Management, Inc. (“Cornerstone”), Victory Capital Management Inc. (“Victory”), Pzena Investment Management, LLC (“Pzena”), Systematic Financial Management, L.P. (“Systematic”), Ranger Investment Management, LLC (“Ranger”), NWQ Investment Management Company, LP (“NWQ”), Thomas White International Ltd. (“Thomas White”), and WCM Investment Management (“WCM”) (collectively the “Sub-Advisers”) to provide sub-advisory services with respect to the Portfolios. L.A. Capital, Cornerstone and Victory each manage a portion of the Large Company Growth Portfolio. L.A. Capital, Pzena and Systematic each manage a portion of the Large Company Value Portfolio. L.A. Capital and Ranger each manage a portion of the Small Company Growth Portfolio. L.A. Capital and NWQ each manage a portion of the Small Company Value Portfolio. L.A. Capital is the sole sub-adviser for the Wilshire 5000 IndexSM Fund. L.A. Capital, Thomas White and WCM each manage a portion of the Wilshire International Equity Fund.
The Sub-Advisers are subject to Wilshire oversight. The fees of the Sub-Advisers are paid by Wilshire.
77
Wilshire Mutual Funds, Inc. Notes to Financial Statements - (Continued) December 31, 2014 | |
SEI Investments Global Funds Services (“SEI”) serves as the Company’s administrator and accounting agent pursuant to an administration agreement dated May 31, 2008. DST Systems, Inc. serves as the Company’s transfer agent and dividend disbursing agent. The Northern Trust Company (“NTC”) serves as the Company’s custodian for all Portfolios. SEI Investments Distribution Co. serves as the Company’s distributor.
Officers’ and Directors’ Expenses – Certain officers of the Company are affiliated with and receive remuneration from the Adviser. The Company does not pay any remuneration to its officers. The Company and the Wilshire Variable Insurance Trust together pay each independent director an annual retainer of $18,000, an annual additional Board chair retainer of $12,000, a Board in-person meeting fee of $2,000, a Board telephonic meeting fee of $1,000, an annual Committee Member retainer of $8,000 and a Committee telephonic meeting fee of $500.
4. Distribution Plan, Shareholder Services Plan and Fees Paid Indirectly.
The Directors of the Company have adopted shareholder services and/or distribution plans (the “Plans”) pursuant to Rule 12b-1 under the 1940 Act, with respect to the Investment Class Shares of each Portfolio and the Qualified Class Shares of the Wilshire 5000 IndexSM Fund. Under the Plans, each such Portfolio reimburses SEI Investments Distribution Co. (the “Distributor”), at an annual rate of up to 0.25% of the value of the average daily net assets attributable to the Investment Class Shares and Qualified Class Shares of each Portfolio for certain services provided by securities dealers or other financial intermediaries or for certain distribution expenses for the purpose of financing any activity intended to result in the sale of Investment Class Shares or Qualified Class Shares. For the year ended December 31, 2014, the distribution and service fee expenses incurred for the Investment Class of the Large Company Growth Portfolio, Large Company Value Portfolio, Small Company Value Portfolio, Wilshire 5000 IndexSM Fund and Wilshire International Equity was 0.25% of the respective average net assets of each Portfolio. For the year ended December 31, 2014, the distribution and services fee expenses incurred for Investment Class Shares of the Small Company Growth Portfolio was 0.22% of its respective average net assets. For the year ended December 31, 2014, there were no distribution and service fee expenses incurred for Qualified Class Shares of the Wilshire 5000 IndexSM Fund.
The Directors of the Company have adopted a shareholder services and distribution plan pursuant to Rule 12b-1 with respect to the Horace Mann Class Shares of the Wilshire 5000 IndexSM Fund. Under such Plan, the Company reimburses the Distributor for its shareholder service and distribution payments at an annual rate of up to 0.35% of the value of the average daily net assets of the Wilshire 5000 IndexSM Fund attributable to the Horace Mann Class Shares. For the year ended December 31, 2014, the shareholder services and distribution fees for the Horace Mann Class Shares were 0.31% of average net assets.
78
Wilshire Mutual Funds, Inc. Notes to Financial Statements - (Continued) December 31, 2014 | |
In addition, Investment Class Shares and Institutional Class Shares pay the expenses associated with certain shareholder servicing arrangements with third parties, provided that payment of such fees does not exceed in any year 0.20% and 0.15% for the Investment and Institutional Class Shares, respectively, of the average net assets of each class. For the year ended December 31, 2014, the net shareholder service provider fees were as follows (as a percent of average net assets of each class):
| Portfolio | Investment Class | Institutional Class |
| Large Company Growth Portfolio | 0.09% | 0.03% |
| Large Company Value Portfolio | 0.02% | 0.00% |
| Small Company Growth Portfolio | 0.06% | 0.00% |
| Small Company Value Portfolio | 0.06% | 0.00% |
Wilshire 5000 IndexSM Fund | 0.04% | 0.08% |
| Wilshire International Equity Fund | 0.16% | 0.00% |
The Directors of the Company have adopted a shareholder services plan with respect to the Qualified Class Shares of the Wilshire 5000 IndexSM Fund which authorizes payments by the Qualified Class Shares of up to 0.15% of the average daily net assets attributable to the Portfolio’s Qualified Class Shares for certain shareholder services provided by insurers or other financial intermediaries. For the year ended December 31, 2014, there were no shareholder service provider fees for the Qualified Class Shares.
Fees paid indirectly – The Company has entered into a brokerage commission recapture program with the Distributor, pursuant to which a portion of the Portfolios’ commissions generated from transactions directed to the Distributor are used to reduce the Portfolios’ expenses. Under such program, the Distributor, as introducing broker, retains a portion of the Portfolios’ commissions.
Such commissions rebated to the Portfolios for the year ended December 31, 2014 were as follows:
| Large Company Growth Portfolio | $ | 11,104 | ||
| Large Company Value Portfolio | 21,394 | |||
| Small Company Growth Portfolio | 2,136 | |||
| Small Company Value Portfolio | 3,729 | |||
Wilshire 5000 IndexSM Fund | 1,598 | |||
| Wilshire International Equity Fund | — |
For the year ended December 31, 2014, the Distributor retained the following commissions:
| Large Company Growth Portfolio | $ | 17,614 | ||
| Large Company Value Portfolio | 31,677 | |||
| Small Company Growth Portfolio | 5,191 | |||
| Small Company Value Portfolio | 7,063 | |||
Wilshire 5000 IndexSM Fund | 4,603 | |||
| Wilshire International Equity Fund | — |
79
Wilshire Mutual Funds, Inc. Notes to Financial Statements - (Continued) December 31, 2014 | |
5. Securities Transactions.
For the year ended December 31, 2014, aggregate cost of purchases and proceeds from sales of securities, other than short-term investments, short sales and purchases to cover, were as follows:
| Portfolio | Purchases | Sales | ||||||
| Large Company Growth Portfolio | $ | 172,755,705 | $ | 312,657,446 | ||||
| Large Company Value Portfolio | 83,830,187 | 147,883,727 | ||||||
| Small Company Growth Portfolio | 22,597,903 | 30,247,856 | ||||||
| Small Company Value Portfolio | 17,086,527 | 27,621,961 | ||||||
Wilshire 5000 IndexSM Fund | 56,362,334 | 8,323,851 | ||||||
| Wilshire International Equity Fund | 331,892,302 | 192,951,493 | ||||||
6. Securities Lending.
The Portfolios may seek additional income by lending their securities on a short-term basis to banks, brokers and dealers in return for cash collateral, which is invested in short-term securities. A Portfolio may return a portion of the interest earned to the borrower or a third party which is unaffiliated with the Company and acting as a “placing broker.” A Portfolio receives compensation for lending securities in the form of fees. A Portfolio also continues to receive dividends on the securities loaned. Security loans are secured at all times by collateral. It is the Company’s policy that the collateral be equal to at least 102% of the market value of the securities loaned (105% if the collateral and securities loaned are denominated in different currencies) plus accrued interest when the transaction is entered into, and that the collateral supporting loans be valued daily. However, due to market fluctuations during the day, the value of securities loaned on a particular day may, during the course of the day, exceed the value of collateral. On each business day, the amount of collateral is adjusted based on the prior day’s market fluctuations and the current day’s lending activity. Gain or loss in the market price of the securities loaned that may occur during the term of the loan are reflected in the value of the Portfolio. The risks from securities lending are that the borrower may not provide additional collateral when required or return the securities when due or when called for by the Portfolio. Lending securities entails a risk of loss to the Portfolio if and to the extent that the market value of securities loans were to increase and the borrower did not increase the collateral accordingly, and the borrower fails to return the securities. NTC, the Portfolios’ custodian, acts as the securities lending agent for the Portfolios. The value of the securities on loan and the value of the related collateral at December 31, 2014 are shown on the Statement of Assets and Liabilities. The Northern Trust Institutional Liquid Asset Portfolio was purchased with proceeds from collateral received from securities on loan. At December 31, 2014, $49,108,032, $22,142,303, $13,730,764, $13,164,136, $30,860,487, and $22,850,165 of this cash equivalent represents the collateral received for securities on loan in the Wilshire Large Company Growth Portfolio, Wilshire Large Company Value Portfolio, Wilshire Small Company Growth Portfolio, Wilshire Small Company Value Portfolio, Wilshire 5000 IndexSM Fund, and the Wilshire International Equity Fund, respectively. Securities on loan are also collateralized by various U.S. Treasury obligations. At December 31, 2014, $3,367,201, $3,183, $3,919, $19,307 and $287,098 represent the collateral received for securities on loan in the Wilshire Large Company Growth Portfolio, Wilshire Large Company Value Portfolio, Wilshire Small Company Growth Portfolio, Wilshire Small Company Value Portfolio and the Wilshire 5000 IndexSM Fund, respectively.
80
Wilshire Mutual Funds, Inc. Notes to Financial Statements - (Continued) December 31, 2014 | |
7. Significant Shareholder Activity.
On December 31, 2014, the Portfolios had the following concentrations of shareholders holding 10% or more of the outstanding shares of the Portfolios. These represent omnibus shareholder accounts comprised of many individual shareholders.
Portfolio | ||||
| Large Company Growth Portfolio (3 omnibus shareholders) | 75% | |||
| Large Company Value Portfolio (2 omnibus shareholder) | 83% | |||
| Small Company Growth Portfolio (2 omnibus shareholders) | 72% | |||
| Small Company Value Portfolio (2 omnibus shareholders) | 75% | |||
Wilshire 5000 IndexSM Fund (3 omnibus shareholders) | 48% | |||
| Wilshire International Equity Fund (1 omnibus shareholders) | 94% | |||
8. Tax Information.
No provision for federal income taxes is required because each Portfolio has qualified and intends to continue to qualify, as a regulated investment company under Subchapter M of the Internal Revenue Code of 1986, as amended, and distributes to shareholders all of its taxable income and gains. Federal income tax regulations differ from accounting principles generally accepted in the United States of America; therefore, distributions determined in accordance with tax regulations may differ in amount or character from net investment income and realized gains for financial reporting purposes. Financial reporting records are adjusted for permanent book/tax differences to reflect tax character. Financial records are not adjusted for temporary differences.
The Portfolios evaluate tax positions taken or expected to be taken in the course of preparing the Portfolios’ tax returns to determine whether it is “more-likely than-not” (i.e., greater than 50 percent) that each tax position will be sustained upon examination by a taxing authority based on the technical merits of the position. Tax positions not deemed to meet the more-likely-than-not threshold are recorded as a tax benefit or expense in the current year. The Portfolios did not record any tax provision in the current period. However, management’s conclusions regarding tax positions taken may be subject to review and adjustment at a later date based on factors including, but not limited to, examination by tax authorities (i.e., the last 3 tax year ends, as applicable), on-going analysis of and changes to tax laws, regulations and interpretations thereof.
81
Wilshire Mutual Funds, Inc. Notes to Financial Statements - (Continued) December 31, 2014 | |
The federal tax cost, unrealized appreciation and depreciation at December 31, 2014 for each Portfolio are as follows:
| Portfolio | Tax Cost | Aggregate Gross Unrealized Appreciation | Aggregate Gross Unrealized Depreciation | Net Unrealized Appreciation | ||||||||||||
| Large Company Growth Portfolio | $ | 222,106,299 | $ | 67,403,412 | $ | (1,674,447 | ) | $ | 65,728,965 | |||||||
| Large Company Value Portfolio | 123,103,360 | 26,298,488 | (1,961,300 | ) | 24,337,188 | |||||||||||
| Small Company Growth Portfolio | 35,113,930 | 5,948,812 | (409,164 | ) | 5,539,648 | |||||||||||
| Small Company Value Portfolio | 37,440,171 | 6,141,898 | (668,095 | ) | 5,473,803 | |||||||||||
Wilshire 5000 IndexSM Fund | 171,999,490 | 136,512,278 | (3,383,513 | ) | 133,128,765 | |||||||||||
| Wilshire International Equity Fund | 202,759,545 | 6,598,722 | (10,863,698 | ) | (4,264,976 | ) | ||||||||||
The differences between book and tax-basis unrealized appreciation/(depreciation) are attributable primarily to the tax deferral of losses on wash sales, investment in passive foreign investment companies, investments in Master Limited Partnerships and investment in Grantor Trusts.
Under the Regulated Investment Company Modernization Act of 2010 (“RIC Modernization”), the Portfolios are permitted to carry forward capital losses incurred in taxable years beginning after December 22, 2010 for an unlimited period. However, any losses incurred during those future taxable years will be required to be utilized prior to the losses incurred in pre-enactment taxable years. As a result of this ordering rule, pre-enactment capital loss carryforwards may be more likely to expire unused. Additionally, post-enactment capital losses that are carried forward will retain their character as either short-term or long-term capital losses rather than being considered all short-term as under previous law.
The Portfolios intend to retain realized gains to the extent of available capital loss carryforwards. At December 31, 2014, the following Portfolios had available for federal income tax purposes unused capital losses as follows:
| Expiring December 31 | ||||||||||||
| Portfolio | 2016 | 2017 | 2018 | |||||||||
Wilshire 5000 IndexSM Fund | $ | 3,750,586 | $ | 30,139,484 | $ | 2,464 | ||||||
Losses carried forward under these new provisions are as follows:
| Portfolio | Short-Term Loss | Long-Term Loss | Total* | |||||||||
| Wilshire International Equity Fund | $ | 3,800,304 | $ | 49,221 | $ | 3,849,525 | ||||||
| * | This table should be used in conjunction with the capital loss carryforwards table. |
82
Wilshire Mutual Funds, Inc. Notes to Financial Statements - (Continued) December 31, 2014 | |
During the year ended December 31, 2014, the Large Company Value Portfolio and the Wilshire 5000 IndexSM Fund utilized capital loss carryforwards of $1,957,417 and $2,531,484, respectively, to offset capital gains.
The tax character of distributions declared during the years ended December 31, 2014 and 2013 were as follows:
| Portfolio | 2014 Ordinary Income | 2014 Capital Gains | 2014 Return of Capital | 2013 Ordinary Income | 2013 Capital Gains | 2013 Return of Capital | ||||||||||||||||||
| Large Company Growth Portfolio | $ | 10,600,458 | $ | 21,571,407 | $ | — | $ | 9,364,862 | $ | 18,033,078 | $ | — | ||||||||||||
| Large Company Value Portfolio | 6,224,189 | 7,351,245 | — | 1,953,555 | — | — | ||||||||||||||||||
| Small Company Growth Portfolio | 747,668 | 1,635,144 | — | 51,168 | 680,524 | — | ||||||||||||||||||
| Small Company Value Portfolio | 538,712 | 2,805,892 | — | 573,301 | 512,543 | — | ||||||||||||||||||
Wilshire 5000 IndexSM Fund | 3,450,744 | — | — | 2,586,786 | — | — | ||||||||||||||||||
| Wilshire International Equity Fund | 1,062,512 | — | 3,771 | 563,737 | 1,031,312 | — | ||||||||||||||||||
At December 31, 2014, the components of distributable earnings/(accumulated losses) on a tax basis were as follows:
Large Company Growth Portfolio | Large Company Value Portfolio | Small Company Growth Portfolio | Small Company Value Portfolio | Wilshire 5000 IndexSM Fund | Wilshire International Equity Fund | |||||||||||||||||||
| Undistributed ordinary income | $ | 73,052 | $ | 269,855 | $ | — | $ | 409,329 | $ | 413,909 | $ | — | ||||||||||||
| Undistributed long-term capital gain | 3,812,226 | 1,260,870 | 444,579 | 318,950 | — | — | ||||||||||||||||||
| Capital loss carryforwards | — | — | — | — | (33,892,534 | ) | (3,849,525 | ) | ||||||||||||||||
| Post October losses | — | — | (501,328 | ) | — | (31,085 | ) | (3,920,400 | ) | |||||||||||||||
| Unrealized appreciation | 65,728,965 | 24,337,188 | 5,539,648 | 5,473,803 | 133,128,765 | (4,272,580 | ) | |||||||||||||||||
| Other temporary differences | (3 | ) | (5 | ) | — | (1 | ) | 22 | (3 | ) | ||||||||||||||
| Total distributable earnings/ (accumulated losses) | $ | 69,614,240 | $ | 25,867,908 | $ | 5,482,899 | $ | 6,202,081 | $ | 99,619,077 | $ | (12,042,508 | ) | |||||||||||
83
Wilshire Mutual Funds, Inc. Notes to Financial Statements - (Continued) December 31, 2014 | |
9. Reclassifications.
Accounting principles generally accepted in the United States of America require that certain components of net assets be reclassified between financial and tax reporting. The reclassifications primarily include investments in real estate investment trusts, sales of passive foreign investment companies, investments in Master Limited Partnerships, investment in Grantor Trusts, net operating losses and redemptions/ transfers in-kind. These reclassifications have no effect on net assets or net asset values per share. As of December 31, 2014, the reclassifications were as follows:
| Portfolio | Increase/(Decrease) Paid in Capital | Increase/(Decrease) Undistributed Investment Income | Increase/(Decrease) Net Realized Capital Gains/(Losses) | |||||||||
| Large Company Growth Portfolio | $ | 4,979,586 | $ | 1,138,292 | $ | (6,117,878 | ) | |||||
| Large Company Value Portfolio | 4,111,566 | 30,305 | (4,141,871 | ) | ||||||||
| Small Company Growth Portfolio | 177,316 | 242,374 | (419,690 | ) | ||||||||
| Small Company Value Portfolio | 107,722 | 60,595 | (168,317 | ) | ||||||||
Wilshire 5000 IndexSM Fund | — | 44,500 | (44,500 | ) | ||||||||
| Wilshire International Equity Fund | (3,771 | ) | 2,074 | 1,697 | ||||||||
10. In-Kind Transfers.
During the year ended, December 31, 2014, the VIT Equity Fund sold 35,999,390 of the Wilshire Large Company Growth Portfolio and it received 34,822,983 dollars’ worth of securities from the Wilshire Large Company Growth Portfolio and 1,176,407 in cash. The Equity Fund also sold 32,482,802 of the Wilshire Large Company Value Porfoltio and it received 30,202,110 in securities and $2,280,692 in cash.
During the year ended, December 31, 2014, the Wilshire VIT Small Cap Fund sold 3,250,952 dollars’ worth of the Wilshire Small Company Growth Portfolio. It received 3,004,352 dollars’ worth of securities from the Wilshire Small Company Growth Portfolio and $246,600 in cash. It also sold 4,267,931 dollars’ worth of the Wilshire Small Company Value Portfolio. It received 1,897,931 dollars’ worth of securities from the Wilshire Small Company Value Portfolio and $2,370,000 in cash.
During the year ended, December 31, 2014, the Wilshire VIT International Equity Fund purchased 16,089,894 dollars’ worth of the Wilshire International Equity Fund. The Wilshire VIT International Equity Fund moved 15,809,310 worth of securities and $280,583 in cash.
During the year ended December 31, 2013, the Portfolios issued and redeemed shares of common stock through affiliated in-kind transfers of investment securities and cash. The securities were transferred at their current value on the date of such transactions, with the exception of the Wilshire International Equity Fund, which transferred securities on a tax-free basis. Included in this transfer was total net unrealized depreciation of $1,951,869 for the Wilshire International Equity Fund.
84
Wilshire Mutual Funds, Inc. Notes to Financial Statements - (Continued) December 31, 2014 | |
During the year ended December 31, 2013, Wilshire International Equity Fund distributed securities as a redemption in-kind to the Wilshire Variable Insurance Trust (“VIT”) Equity Fund and VIT Balanced Fund. As a result, the Wilshire International Equity Fund realized a gain of $45,078,780 (net of related wash sale adjustments). Pursuant to Internal Revenue Code 852(b)(6), the transaction qualifies as a non-taxable transaction, thus no taxable event has occurred.
Receiving Portfolio | Contributing Portfolio | Date of Transfer | Value of Investment Securities | Cash | Total Assets | Shares Issued/ (Redeemed) | Realized Gain/ (Loss) Earned by Contributing Portfolio | |||||||||||||||
| Large Company Growth Portfolio | VIT Equity Fund | 4/8/2013 | $ | 64,025,634 | $ | 1,097,110 | $ | 65,122,744 | 1,695,627 | $ | 2,590,858 | |||||||||||
| Large Company Growth Portfolio | VIT Balanced Fund | 4/8/2013 | 29,580,794 | 1,017,251 | 30,598,045 | 796,693 | (251,486 | ) | ||||||||||||||
| Large Company Value Portfolio | VIT Equity Fund | 4/8/2013 | 64,037,268 | 1,432,638 | 65,469,906 | 3,690,691 | 3,344,532 | |||||||||||||||
| Large Company Value Portfolio | VIT Balanced Fund | 4/8/2013 | 29,678,783 | 1,016,141 | 30,694,924 | 1,730,344 | (122,322 | ) | ||||||||||||||
| Small Company Growth Portfolio | VIT Small Cap Fund | 4/8/2013 | 6,996,577 | 167,384 | 7,163,961 | 343,333 | 1,035,447 | |||||||||||||||
| Small Company Growth Portfolio | VIT Balanced Fund | 4/8/2013 | 7,279,152 | 378,324 | 7,657,476 | 366,985 | (82,358 | ) | ||||||||||||||
| Small Company Growth Portfolio | VIT Small Cap Fund | 9/18/2013 | 5,845,013 | 101,543 | 5,946,556 | 236,068 | 1,058,636 | |||||||||||||||
| Small Company Value Portfolio | VIT Small Cap Fund | 4/8/2013 | 6,862,541 | 367,373 | 7,229,914 | 369,257 | 104,637 | |||||||||||||||
| Small Company Value Portfolio | VIT Balanced Fund | 4/8/2013 | 7,139,924 | 628,186 | 7,768,110 | 396,745 | 15,070 | |||||||||||||||
| Small Company Value Portfolio | VIT Small Cap Fund | 9/18/2013 | 5,933,650 | 126,389 | 6,060,039 | 267,551 | 466,397 | |||||||||||||||
| Wilshire International Equity Fund | VIT International Equity Fund | 4/2/2013 | 5,931,173 | — | 5,931,173 | 645,387 | (1,951,869 | ) | ||||||||||||||
| Wilshire International Equity Fund | VIT Balanced Fund | 4/3/2013 | — | 25,551,553 | 25,551,553 | 2,817,958 | — | |||||||||||||||
| Wilshire International Equity Fund | VIT International Equity Fund | 10/9/2013 | 7,140,649 | 212,009 | 7,352,658 | 784,702 | 933,113 | |||||||||||||||
| Wilshire International Equity Fund | VIT International Equity Fund | 10/31/2013 | 5,038,472 | 229,615 | 5,268,087 | 539,763 | 91,639 | |||||||||||||||
| VIT Equity Fund | Wilshire International Equity Fund | 4/2/2013 | 108,142,870 | 279,665 | 108,422,535 | (11,797,754 | ) | 22,029,945 | ||||||||||||||
| VIT Balanced Fund | Wilshire International Equity Fund | 4/2/2013 | 77,077,919 | 212,167 | 77,290,086 | (8,455,321 | ) | 25,597,135 | ||||||||||||||
| VIT - Wilshire Variable Insurance Trust |
85
Wilshire Mutual Funds, Inc. Notes to Financial Statements - (Continued) December 31, 2014 | |
11. Indemnifications.
In the normal course of business, the Company, on behalf of the Portfolios, enters into contracts that provide general indemnifications. The Portfolios’ maximum exposure under these arrangements is dependent on claims that may be made against the Portfolios in the future and, therefore, cannot be estimated; however, based on experience, the risk of material loss from such claims is considered remote.
12. Risks.
Foreign security risk – The Wilshire International Equity Fund invests in securities of foreign issuers in various countries. These investments may involve certain considerations and risks not typically associated with investments in the United States, as a result of, among other factors, the possibility of future political and economic developments and the level of governmental supervision and regulation of securities markets in the respective countries.
13. Contingencies.
The Wilshire 5000 IndexSM Fund was named as a defendant and a putative member of a proposed defendant class of shareholders in a lawsuit filed on December 7, 2010, in the U.S. Bankruptcy Court for the District of Delaware and on March 6, 2012, in the District Court for the Southern District of New York, in connection with Tribune Company’s Chapter 11 bankruptcy proceeding. The 2010 lawsuit was brought by the official Committee of Unsecured Creditors of the Tribune Company and the 2012 lawsuit was brought by Deutsche Bank, as trustee for senior noteholders of Tribune Company. Both lawsuits relate to a leveraged buyout transaction by which Tribune Company converted to a privately-held company in 2007 less than a year prior to Tribune Company’s bankruptcy filing. The putative defendant class is comprised of beneficial owners of shares of Tribune Company who meet certain jurisdictional requirements and received proceeds of the leveraged buyout. The plaintiffs seek to recover those proceeds, together with interest and attorneys’ fees and expenses, as fraudulent transfers under the Bankruptcy Act or various state laws, respectively. On September 2013, the District Court dismissed the 2012 lawsuit and this decision is on appeal to the Second Circuit Court of Appeals. The 2010 lawsuit continues in the District Court. The Adviser does not expect the Portfolio to be materially impacted by the lawsuits.
14. Subsequent Event Evaluation.
The Portfolios have evaluated the need for additional disclosures and/or adjustments resulting from subsequent events through the date the financial statements were issued. Based on this evaluation, no additional disclosures or adjustments were required to the financial statements.
86
Wilshire Mutual Funds, Inc. Report of Independent Registered Public Accounting Firm | |
To the Board of Directors of Wilshire Mutual Funds, Inc. and the Shareholders of
Large Company Growth Portfolio, Large Company Value Portfolio, Small Company Growth Portfolio,
Small Company Value Portfolio, Wilshire International Equity Fund and Wilshire 5000 IndexSM Fund:
Large Company Growth Portfolio, Large Company Value Portfolio, Small Company Growth Portfolio,
Small Company Value Portfolio, Wilshire International Equity Fund and Wilshire 5000 IndexSM Fund:
In our opinion, the accompanying statements of assets and liabilities, including the condensed schedules of investments, and the related statements of operations and of changes in net assets and the financial highlights present fairly, in all material respects, the financial position of the Large Company Growth Portfolio, Large Company Value Portfolio, Small Company Growth Portfolio, Small Company Value Portfolio, Wilshire International Equity Fund, and Wilshire 5000 IndexSM Fund (six portfolios/funds constituting the Wilshire Mutual Funds, Inc., hereafter referred to as the “Portfolios”) at December 31, 2014, the results of each of their operations for the year then ended, the changes in each of their net assets for each of the two years in the period then ended and the financial highlights for each of the five years in the period then ended, in conformity with accounting principles generally accepted in the United States of America. These financial statements and financial highlights (hereafter referred to as “financial statements”) are the responsibility of the Portfolios’ management. Our responsibility is to express an opinion on these financial statements based on our audits. We conducted our audits of these financial statements in accordance with the standards of the Public Company Accounting Oversight Board (United States). Those standards require that we plan and perform the audit to obtain reasonable assurance about whether the financial statements are free of material misstatement. An audit includes examining, on a test basis, evidence supporting the amounts and disclosures in the financial statements, assessing the accounting principles used and significant estimates made by management, and evaluating the overall financial statement presentation. We believe that our audits, which included confirmation of securities at December 31, 2014 by correspondence with the custodian and brokers, provide a reasonable basis for our opinion.
PricewaterhouseCoopers LLP
Philadelphia, Pennsylvania
March 2, 2015
March 2, 2015
87
Wilshire Mutual Funds, Inc. Additional Fund Information | |
The Board of Directors has responsibility for the overall management and operations of the Company. The Board establishes the Company’s policies and meets regularly to review the activities of the officers, who are responsible for the day-to-day operations of the Company.
Set forth below are the names of the Directors and executive officers of the Company, their ages, positions and terms of office, their principal occupations during the past five years, and other directorships held by them. The address of each Director and Officer is 1299 Ocean Avenue, Suite 700, Santa Monica, California 90401.
| Name and Age | Position Held with the Company | Term of Office(1) and Length of Time Served | Principal Occupations During the Past Five Years | Number of Funds/ Funds in Complex Overseen by Director | Other Directorships Held by Director | |||||
| INTERESTED DIRECTOR | ||||||||||
| John C. Hindman, 44 | Director | Since 2014 | President, Wilshire Associates; formerly, Executive Vice President, Allianz Global Investors of America | 10 | Wilshire Associates; Wilshire Variable Insurance Trust (4 Funds) | |||||
| NON-INTERESTED DIRECTORS | ||||||||||
| Roger A. Formisano, 66 | Director | Since 2006 | Vice President, University Medical Foundation, 2006- Present; formerly Director, The Center for Leadership and Applied Business, UW-Madison School of Business; Principal, R.A. Formisano & Company, LLC | 10 | Integrity Mutual Insurance Company, Wilshire Variable Insurance Trust (4 Funds) | |||||
| Edward Gubman, 63 | Director | Since 2011 | Founder and Principal, Strategic Talent Solutions | 10 | Wilshire Variable Insurance Trust (4 Funds) | |||||
| Suanne K. Luhn, 60 | Director | Since 2008 | Retired; formerly Chief Compliance Officer, Bahl & Gaynor (investment adviser) (1990 to 2006) | 10 | Wilshire Variable Insurance Trust (4 Funds) | |||||
| George J. Zock, 64 | Director, Chairman of the Board | Since 2006 | Independent Consultant; Consultant, Horace Mann Service Corporation (2004 to 2005); Executive Vice President, Horace Mann Life Insurance Company and Horace Mann Service Corporation (1997 to 2003). | 10 | Wilshire Variable Insurance Trust (4 Funds), Armed Forces Insurance Exchange | |||||
88
Wilshire Mutual Funds, Inc. Additional Fund Information - (Continued) | |
| Name and Age | Position Held with the Company | Term of Office(1) and Length of Time Served | Principal Occupations During the Past Five Years | |||
| OFFICERS | ||||||
| Jason Schwarz, 40 | President | Since 2012 | President, Wilshire Funds Management Group (Since 2005). | |||
| Reena S. Lalji, 43 | Secretary | Since 2009 | Managing Director and General Counsel, Wilshire Associates Incorporated | |||
| Helen Thompson, 47 | Chief Compliance Officer Vice President | Since 2013 Since 2008 | Managing Director, Wilshire Associates Incorporated (since 2003) | |||
| Michael Wauters, 49 | Treasurer | Since 2009 | Chief Financial Officer, Wilshire Associates Incorporated (since 2009) | |||
| Nathan R. Palmer, 39 | Vice President | Since 2011 | Managing Director, Wilshire Associates Incorporated; Senior Investment Management Associate, Convergent Wealth Advisors (2009 to 2010) | |||
(1) | Each director serves until the next shareholders’ meeting (and until the election and qualification of a successor), or until death, resignation, removal or retirement which takes effect no later than May 1 following his or her 70th birthday. Officers are elected by the board on an annual basis to serve until their successors have been elected and qualified. |
The Company’s Statement of Additional Information includes additional information about the Directors of the Company and is available, without charge, upon request, by calling 1-888-200-6796.
89
Wilshire Mutual Funds, Inc. Additional Fund Information - (Continued) | |
Information on Proxy Voting
The Securities and Exchange Commission (“SEC”) has adopted the requirement that all funds file their complete proxy voting records with the SEC on an annual basis on Form N-PX. Such filing, for the 12-month period ended June 30, must be made no later than August 31 of each year.
A description of policies and procedures that the Portfolios use to determine how to vote proxies relating to portfolio securities, along with each Portfolio’s proxy voting record relating to portfolio securities held during most recent 12-month period ended June 30 is available at no charge, upon request by calling 1-888-200-6796, by e-mailing us at http://advisor.wilshire.com or on the SEC’s website at http://www.sec.gov.
Information on Form N-Q
The Company files its complete schedule of portfolio holdings with the SEC for the first and third quarters of each fiscal year on Form N-Q within sixty days after the end of period. The Company’s Forms N-Q are available on the SEC’s website at http://www.sec.gov, and may be reviewed and copied at the SEC’s Public Reference Room in Washington, DC. Information on the operation of the Public Reference Room may be obtained by calling 1-202-551-8090.
Householding Policy
In order to reduce printing and mailing expenses, only one copy of each prospectus, annual and semi-annual report will be sent to all related accounts at a common address, unless you have indicated otherwise on your Account Application. Shareholders may revoke their consent to householding at any time by calling 1-888-200-6796. Upon receipt of a shareholder’s revocation, the Company will begin mailing individual copies of the above-referenced documents to the shareholder’s attention within 30 days.
90
Wilshire Mutual Funds, Inc. Tax Information - (Unaudited) | |
Of the distributions made by the following Portfolios, the corresponding percentage represents the amount of each distribution which will qualify for the dividends received deduction available to corporate shareholders:
| Portfolio | Percentage | |
| Large Company Growth Portfolio | 25.31% | |
| Large Company Value Portfolio | 42.65% | |
| Small Company Growth Portfolio | 34.29% | |
| Small Company Value Portfolio | 58.57% | |
Wilshire 5000 IndexSM Fund | 100.00% | |
| Wilshire International Equity Fund | 0.16% |
Pursuant to the Jobs and Growth Tax Relief Reconciliation Act of 2003, and as extended by Tax Relief, Unemployment Insurance Reauthorization and Jobs Creation Act of 2010, the Portfolios listed below designate the following percentages of their income dividends distributed in 2013 as qualified dividend income as defined in Section 1(h)(II) of the Internal Revenue Code.
| Portfolio | Percentage | |
| Large Company Growth Portfolio | 26.12% | |
| Large Company Value Portfolio | 47.38% | |
| Small Company Growth Portfolio | 34.17% | |
| Small Company Value Portfolio | 58.32% | |
Wilshire 5000 IndexSM Fund | 100.00% | |
| Wilshire International Equity Fund | 100.00% |
Pursuant to the American Jobs Creation Act of 2004, and as extended by Tax Relief, Unemployment Insurance Reauthorization and Jobs Creation Act of 2010, the Funds listed below designate the following percentages of income distributions as qualified interest income that is exempt from U.S. withholding tax when paid to foreign investors.
| Portfolio | Percentage | |
| Large Company Growth Portfolio | 0.00% | |
| Large Company Value Portfolio | 0.00% | |
| Small Company Growth Portfolio | 0.00% | |
| Small Company Value Portfolio | 0.00% | |
Wilshire 5000 IndexSM Fund | 0.00% | |
| Wilshire International Equity Fund | 0.00% |
91
Wilshire Mutual Funds, Inc. Tax Information - (Unaudited) (continued) | |
Pursuant to the American Jobs Creation Act of 2004, and as extended by Tax Relief, Unemployment Insurance Reauthorization and Jobs Creation Act of 2010, the Funds listed below designate the following percentages of short-term capital gain distributions as qualified short-term capital gain that is exempt from U.S. withholding tax when paid to foreign investors.
| Portfolio | Percentage | |
| Large Company Growth Portfolio | 100.00% | |
| Large Company Value Portfolio | 100.00% | |
| Small Company Growth Portfolio | 100.00% | |
| Small Company Value Portfolio | 100.00% | |
Wilshire 5000 IndexSM Fund | 0.00% | |
| Wilshire International Equity Fund | 0.00% |
Wilshire International Equity Fund intends to pass through a foreign tax credit to shareholders. For the fiscal year ended December 31, 2014, the total amount of foreign tax paid is $215,238.
92
Wilshire Mutual Funds, Inc. Board Approval of Advisory Agreement | |
During the six months ended December 31, 2014, the Board of Directors (the “Board”) of Wilshire Mutual Funds, Inc. (the “Company”) approved the renewal for an additional one-year term of the Company’s advisory agreement (the “Advisory Agreement”) with Wilshire Associates Incorporated (“Wilshire” or the “Adviser”) with respect to each of the Large Company Growth Portfolio, Large Company Value Portfolio, Small Company Growth Portfolio, Small Company Value Portfolio, Wilshire 5000 Index Fund and Wilshire International Equity Fund (the “Funds”). The Board also approved the renewal for additional one-year terms of Wilshire’s subadvisory agreements with each of the following subadvisers: Cornerstone Capital Management, LLC (“Cornerstone”) with respect to the Large Company Growth Portfolio, Los Angeles Capital Management and Equity Research, Inc. (“LA Capital”) with respect to each of the Small Company Value Portfolio, Small Company Growth Portfolio, Large Company Value Portfolio, Large Company Growth Portfolio and Wilshire 5000 Index Fund, NWQ Investment Management Company, LLC (“NWQ”) with respect to the Small Company Value Portfolio, Pzena Investment Management, LLC (“Pzena”) with respect to the Large Company Value Portfolio, Ranger Investment Management, L.P. (“Ranger”) with respect to the Small Company Growth Portfolio, Systematic Financial Management, L.P. (“Systematic”) with respect to the Large Company Value Portfolio, Thomas White International, Ltd. (“Thomas White”) with respect to the Wilshire International Equity Fund, Victory Capital Management, Inc. (“Victory”) with respect to the Large Company Growth Portfolio, and WCM Investment Management (“WCM”) with respect to the Wilshire International Equity Fund. In the following text, the subadvisers are referred to as “Subadvisers” and the subadvisory agreements between Wilshire and each Subadviser are referred to as “Subadvisory Agreements.”
The information in this summary outlines the Board’s considerations associated with its approval of the Advisory Agreement and each of the Subadvisory Agreements. In connection with its deliberations regarding the continuation of these relationships, the Board considered such information and factors as it believed to be relevant. As described below, the Board considered the nature, extent and quality of the services performed by Wilshire and the Subadvisers under the existing advisory arrangements; with respect to Wilshire, comparative fees and expense ratios; the profits to be realized by Wilshire and the Subadvisers; the extent to which Wilshire and the Subadvisers realize economies of scale; and whether any fall-out benefits are being realized by Wilshire and the Subadvisers. In considering these matters, the Board was advised with respect to relevant legal standards by independent legal counsel. In addition, the Directors who are not “interested persons” of the Company as defined in the Investment Company Act of 1940 (the “Independent Directors”) discussed the renewal of the Advisory Agreement with management and in private sessions with independent legal counsel at which no representatives of Wilshire were present and discussed the approval of the Subadvisory Agreements with management and in private sessions with counsel at which no representatives of the Subadvisers were present.
As required by the Investment Company Act of 1940, each approval was confirmed by a vote of the Independent Directors. In deciding to approve the renewal of the Advisory Agreement and each Subadvisory Agreement, the Board did not identify any single factor as controlling and this summary does not describe all of the matters considered. However, the Board concluded that each of the various factors referred to below favored such approval.
Information Requested and Received
The Board, including all the Independent Directors, considered the approval of the Subadvisory Agreements pursuant to a process that concluded at the Board’s August 20, 2014 meeting and the renewal of the Advisory Agreement pursuant to a process that concluded at the Board’s November 19, 2014 meeting, in each case following an extensive process. At the direction of the Independent Directors, independent legal counsel sent memoranda
93
Wilshire Mutual Funds, Inc. Board Approval of Advisory Agreement - (continued) | |
to the Adviser requesting information regarding the Subadvisory Agreements and the Advisory Agreement to be provided to the Directors in advance of meetings of the Independent Directors held prior to the Board meetings on August 20, 2014 and November 18, 2014, respectively.
In response to the requests for information, the Directors received information from the Adviser as to each of the Funds describing: (I) the nature, extent and quality of services provided; (ii) the investment performance of each Fund as provided by Wilshire based upon data gathered from the Morningstar Direct database (“Morningstar”), along with the comparison to its benchmark index; (iii) the costs of services provided and estimated profits realized by the Adviser; (iv) the extent to which economies of scale are realized; (v) any economies of scale realized by the Adviser and any sharing of such for the benefit of Fund shareholders; (vi) comparisons of services rendered and amounts paid by other registered investment companies as provided by Wilshire based upon data gathered from Morningstar; and (vii) benefits realized by the Adviser from its relationship with each Fund. The Directors received information from the Adviser regarding the factors underlying its recommendations to approve each Subadvisory Agreement. The Directors also received information from each Subadviser as to each Fund it managed describing: (i) the nature, extent and quality of services provided, (ii) the investment performance of the Subadviser in connection with the Fund; (iii) the financial condition of the Subadviser, (iv) the extent to which economies of scale are realized as a Fund grows, (v) whether fee levels reflect any possible economies of scale for the benefit of Fund shareholders, (vi) where applicable, comparisons of services rendered and amounts paid by other registered investment companies and any comparable advisory clients, and (vii) benefits realized by the Subadviser from its relationship with the Fund. At such meeting, the Independent Directors also received a memorandum from independent legal counsel describing their duties in connection with contract approvals, and they were assisted in their review by such counsel.
As a part of its evaluation, the Board considered the assessment of performance made by the Investment Committee (which is comprised solely of Independent Directors), which met on August 19, 2014 and November 18, 2014, respectively, to review the data on the Subadvisers’ performance and data Wilshire had prepared on performance. With respect to Wilshire, the Board also considered that it was currently reviewing potential alternative structures and arrangements for the Funds. Based upon its evaluation of all materials provided, the Board concluded that it was in the best interests of each Fund to renew the Advisory Agreement and each Subadvisory Agreement.
Nature, Extent and Quality of Services – Wilshire
With respect to the nature, extent and quality of services provided by the Adviser, the Board reviewed the functions performed by the Adviser. The Board considered the experience and skills of the senior management leading Fund operations, the experience and skills of the personnel performing the functions under the Advisory Agreement and the resources made available to such personnel. The Board also considered the compliance program established by the Adviser and the level of compliance maintained for the Funds. The Board reviewed the processes used by the Adviser to select, monitor and replace subadvisers, which system appeared to be reasonable. The Board concluded that the Adviser was successful in negotiating favorable subadvisory agreements on behalf of the Funds. The Board concluded that the Adviser had a robust system in place for selecting, monitoring and terminating subadvisers, which system appeared to be reasonable. The Board also reviewed the Adviser’s financial condition, and considered the financial support provided by the Adviser to the Small Company Growth Portfolio, Small
94
Wilshire Mutual Funds, Inc. Board Approval of Advisory Agreement - (continued) | |
Company Value Portfolio and the Wilshire International Equity Fund through expense limitation agreements. Based upon all relevant factors, the Board concluded that the nature, quality and extent of the services provided by the Adviser to each Fund support renewal of the contract.
The Board reviewed information on the performance of each Fund for the annualized one-, three-, five- and ten-year periods ended September 30, 2014, as applicable, along with performance information of a peer group of funds determined by Wilshire based upon the Morningstar database and in comparison to its benchmark for the same periods.
For the Large Company Growth Portfolio, the Board noted that although the Fund underperformed the median of its peer group and its benchmark for all periods, the performance relative to its peers ranked in the third or fourth quintile during all periods. The Board took into consideration the Adviser’s explanation for the underperformance and the response by the Adviser.
For the Large Company Value Portfolio, the Board noted that the Fund outperformed the median of its peer group for the one, three- and five-year periods but underperformed its benchmark for all periods reviewed.
For the Small Company Growth Portfolio, the Board noted that the Fund outperformed the median of its peer group for the three- and five-year periods, was competitive relative to the median of its peer group for the one-year period, outperformed its benchmark for the five-year period and was competitive relative to its benchmark for the three- and ten-year periods.
For the Small Company Value Portfolio, the Board noted that the Fund outperformed the median of its peer group for the one-, three- and five-year periods, was at the median of its peer group for the ten-year period and outperformed its benchmark for the one-, three- five- and ten-year periods.
For the Wilshire 5000 Index Fund, the Board noted that, although the Fund underperformed its benchmark for the one-, three-, five- and ten-year periods, and the Fund’s tracking error to the Wilshire 5000 Index was higher than the median of its peer group, underperformance relative to the benchmark was primarily due to the Fund’s expenses.
For the Wilshire International Equity Fund, the Board noted that the Fund changed its investment mandate from a domestic large cap core fund to an international large cap fund in April 2013 and changed its benchmark to the MSC CAW-ex U.S. Index at the same time so annualized peer returns and performance relative to the Index are not comparable for the three- and five-year periods. The Board also noted that the Wilshire International Equity Fund underperformed the median of its peer group and benchmark for the one-year period. The Board took into consideration the Adviser’s explanation for the underperformance and the response by the Adviser.
Based upon the above performance, the Board determined that it was in the best interests of each Fund to continue the Advisory Agreement.
95
Wilshire Mutual Funds, Inc. Board Approval of Advisory Agreement - (continued) | |
Advisory Fees
The Board reviewed each Fund’s advisory fee and total expense ratio and reviewed information comparing the actual advisory fee paid and total expense ratio to those of the peer group of funds. For each Fund other than the Large Company Value Portfolio and the Wilshire International Equity Fund, the advisory fee was below the median. With respect to each of the Large Company Value Portfolio and the Wilshire International Equity Fund, the Board noted that the actual advisory fee was in the fourth quintile of its peer group. As to total expenses, the Board noted that total expenses for each Fund, which were fourth quintile or better, are influenced by the small size of the complex. The Board received information regarding contractual fees charged by the Adviser to other registered investment companies advised by the Adviser that were similar to certain Funds and determined such fees were comparable to those of the applicable Funds. The Board concluded that the advisory fee for each Fund was reasonable.
Profitability to Wilshire and Economies of Scale
With respect to the profitability of the Advisory Agreement, the Board primarily considered the fee structure of the Advisory Agreement, including the costs of the services provided and the profits realized by the Adviser from its relationship with the Funds. The Board concluded that the profits realized by the Adviser were not unreasonable in comparison with the costs of providing investment advisory services to the Funds. In addition, the Board considered the extent to which economies of scale are realized and whether fee levels reasonably reflect economies of scale for the benefit of shareholders. The Board reviewed each Fund’s asset size, each Fund’s expense ratio, the expense limitation agreements in place for the Small Company Growth Portfolio, Small Company Value Portfolio and Wilshire International Equity Fund and whether the investment process produced economies of scale. The Board noted that the advisory fee for all Funds includes a breakpoint. The Board concluded that each Fund’s advisory fee reasonably reflected appropriate recognition of any economies of scale.
Fall-Out Benefits – Wilshire
The Board considered the nature and amount of any benefits derived by the Adviser from its relationship with the Funds. The Board determined that the advisory fees were reasonable in light of these fall-out benefits.
Nature, Extent and Quality of Services – Subadvisers
As to each Subadvisory Agreement, the Board considered the nature, extent and quality of services provided. The Board considered the reputation, qualifications and background of the Subadviser, investment approach of the Subadviser, the experience and skills of investment personnel responsible for the day-to-day management of each Fund, and the resources made available to such personnel. The Board also considered the Subadviser’s compliance with investment policies and general legal compliance. In addition, the Board considered the analysis provided by the Adviser, which concluded that each Subadviser was providing reasonable services and recommended that each Subadvisory Agreement for each Fund be approved.
The Board reviewed information comparing each Subadviser’s gross investment performance to a relevant benchmark (except for LA Capital with respect to the Wilshire 5000 Index Fund for which the Subadviser’s net performance was compared to the benchmark). Based upon all relevant factors, the Board determined to approve the Subadvisory Agreement with Cornerstone, with respect to the Large Company Growth Portfolio, noting Cornerstone’s underperformance for the one- and three-year periods ended June 30, 2014, and given
96
Wilshire Mutual Funds, Inc. Board Approval of Advisory Agreement - (continued) | |
the Adviser’s recommendation for renewal and commitment to monitor closely Cornerstone’s performance. With respect to the Large Company Growth Portfolio, the Board noted LA Capital’s outperformance for the three- and five-year periods ended June 30, 2014, which resulted in a conclusion that performance was satisfactory. With respect to Victory’s performance for the Large Company Growth Portfolio, the Board determined to approve the continuation of Victory’s Subadvisory Agreement given outperformance for the one-year period ended June 30, 2014 and the Adviser’s recommendation for renewal, although the Board noted Victory’s underperformance for the three- and five-year periods ended June 30, 2014.
With respect to Systematic’s performance for the Large Company Value Portfolio, the Board noted underperformance for the annualized three- and five-year periods ended June 30, 2014, but outperformance for the one-year period ended, quarter ended and year-to-date period ended June 30, 2014, which resulted in a conclusion that performance was satisfactory. With respect to LA Capital’s performance for the Large Company Value Portfolio, the Fund noted LA Capital’s outperformance for the one-year and since inception (April 30, 2013) periods ended June 30, 2014, which resulted in a conclusion that performance was satisfactory. The Board noted that Pzena, with respect to the Large Company Value Portfolio, had underperformed for all periods reviewed except the five-year period ended June 30, 2014. The Board considered that the Adviser is satisfied with the level of services provided and assesses performance to be within its expectations given market conditions. The Board also considered the Adviser’s representations that it intended to reduce the assets allocated to Pzena and its commitment to continue to monitor Pzena’s performance.
The Board considered that Ranger, with respect to the Small Company Growth Portfolio, underperformed for the one-year and since inception (April 30, 2013) periods ended June 30, 2014, but determined that performance was over too short of a period to evaluate and determined to approve the Subadvisory Agreement given the Adviser’s commitment to monitor closely Ranger’s performance. With respect to LA Capital’s performance for the Small Company Growth Portfolio and Small Company Value Portfolio, the Board noted LA Capital’s outperformance for the one-, three-, five- and ten-year periods ended June 30, 2014, which resulted in a conclusion that performance was satisfactory. With respect to NWQ’s performance for the Small Company Value Portfolio, the Board noted that outperformance for all periods reviewed resulted in a conclusion that performance was satisfactory.
With respect to the Wilshire 5000 Index Fund, the Board noted LA Capital’s underperformance for all periods reviewed except the year-to-date period ended June 30, 2014, but considered that the Adviser is satisfied with the level of services provided and that underperformance was primarily due to Fund expenses.
The Board considered that Thomas White and WCM, with respect to the Wilshire International Equity Fund, underperformed since inception (April 30, 2013 and October 31, 2013, respectively), but determined that performance was over too short of a period to evaluate and determined to approve the Subadvisory Agreements.
Subadvisory Fees
The Board considered each Fund’s subadvisory fees. The Board evaluated the competitiveness of the subadvisory fees based upon data supplied by each Subadviser about the fees charged to other clients. The Board also considered that the subadvisory fee rates were negotiated at arm’s length between the Adviser and each Subadviser, that the Adviser compensates the Subadviser from its fees and that the aggregate advisory fee had been deemed reasonable by the Board.
97
Wilshire Mutual Funds, Inc. Board Approval of Advisory Agreement - (Concluded) | |
For the Subadvisers that reported fees for “Other Clients” with comparable investment policies and services, the Board noted that most Subadvisers did not charge higher fees to the Adviser for the Funds than were charged to their Other Clients. For the Subadvisers where the fees charged to the Adviser were higher than that charged to Other Clients, the Board determined that the fees charged to the Adviser were competitive.
Based upon all of the above, the Board determined that the subadvisory fees for each Fund were reasonable.
Profitability to the Subadvisers
The Board noted that the Adviser compensates each Subadviser from its own advisory fees and that the fees were negotiated at arm’s length between the Adviser and each Subadviser. In addition, the Board noted that the revenues to the various Subadvisers were limited due to the size of the Funds. The Board took these factors into consideration in concluding that the subadvisory fees were reasonable.
Economies of Scale – Subadvisers
The Board considered whether there are economies of scale with respect to the subadvisory services provided to each Fund and whether the subadvisory fees reflect such economies of scale through breakpoints in fees. The Board also considered whether the effective subadvisory fee rate for each Fund under the Subadvisory Agreement is reasonable in relation to the asset size of such Fund. The Board concluded that the fee schedule for each Fund reflects an appropriate recognition of any economies of scale.
Fall-Out Benefits – Subadvisers
The Board also considered the character and amount of other incidental benefits received by each Subadviser. The Board considered each Subadviser’s soft dollar practices. The Board concluded that, taking into account the benefits arising from these practices, the fees charged under each Subadvisory Agreement were reasonable.
Conclusion
Based upon all of the information considered and the conclusions reached, the Board determined that the terms of the Advisory Agreement and each Subadvisory Agreement continue to be fair and reasonable and that the continuation of the Advisory Agreement and each Subadvisory Agreement is in the best interests of each Fund.
98
Wilshire Mutual Funds, Inc. Privacy Statement | |
At Wilshire Mutual Funds, Inc., we appreciate the privacy concerns of our customers. We have established the following policies to maintain the privacy of information you share with us.
INFORMATION WE COLLECT
We collect and retain nonpublic personal information about you that may include:
| ● | Information we receive on your account applications or other forms such as your name, address, financial information and/or social security number; |
| ● | Information we receive about your mutual fund transactions, such as purchases, sales, exchanges and account balances; and |
| ● | Information we collect through the use of Internet “cookies” when you access our website. Cookies are a collection of information stored on the local hard drive of an Internet user, used primarily by web servers to identify previous users and their preferences. A web server can not find out a user’s name or email address, or anything about the user’s computer using cookies. |
INFORMATION WE MAY SHARE
We do not sell any of your nonpublic personal information to third parties. We may share the information we collect with affiliates or with non-affiliated third parties only when those parties are acting on our behalf in servicing your account, or as required by law. These third parties may include:
| ● | Administrative service providers who, for example, process transactions for your account, print checks or prepare account statements; |
| ● | Companies that provide services for us to help market our products to you; and |
| ● | Governmental or other legal agencies, as required by law. |
When information is shared with third parties, they are legally obligated to maintain the confidentiality of the information and to limit their use of it to servicing your account, except as permitted or required by law.
CONFIDENTIALITY AND SECURITY
Within our organization, we restrict access to your nonpublic personal information to authorized employees who need to access such information in order to provide services or products to you. We maintain physical, electronic and procedural safeguards to protect your nonpublic personal information.
As previously mentioned, we may collect information through the use of Internet “cookies” on our website. In addition, in order to provide you with access to your account via the web, it is necessary for us to collect certain nonpublic personal information such as your name, social security number and account information. Special measures such as data encryption and authentication apply to all nonpublic personal information and communications on our website.
APPLICABILITY
Our privacy policies apply only to those individual investors who have a direct customer relationship with us. If you are an individual shareholder of record of any of the Portfolios, we consider you to be our customer. Shareholders purchasing or owning shares of any of the Portfolios through their bank, broker, or other financial institution should also consult that financial institution’s privacy policies.
Wilshire Mutual Funds, Inc. values your business. We understand the importance of maintaining the integrity of your personal information and are committed to keeping your trust. Please contact us at 1-888-200-6796 if you have any questions concerning our policy, or visit us at www.wilshirefunds.com for additional copies of this policy.
[This page intentionally left blank]
[This page intentionally left blank]

Wilshire Mutual Funds
Wilshire Associates Incorporated
1299 Ocean Avenue
Santa Monica, CA 90401
1-888-200-6796
http://advisor.wilshire.com
WIL-AR-001-0800
| Item 2. | Code of Ethics. |
| (a) | The Registrant, as of the end of the period covered by this report, has adopted a code of ethics that applies to the Registrant’s principal executive officer, principal financial officer, principal accounting officer or controller, or persons performing similar functions, regardless of whether these individuals are employed by the Registrant or a third party. |
| (c) | During the period covered by this report, the code of ethics was amended to address changes in the Registrant’s covered officers. |
| (d) | The Registrant has not granted any waivers, including an implicit waiver, from a provision of the code of ethics that applies to the Registrant’s principal executive officer, principal financial officer, principal accounting officer or controller, or persons performing similar functions, regardless of whether these individuals are employed by the Registrant or a third party, that relates to one or more of the items set forth in paragraph (b) of this item’s instructions. |
| Item 3. | Audit Committee Financial Expert. |
The Registrant’s Board of Directors has determined that the Registrant has at least one “audit committee financial expert” (as defined by Item 3 of Form N-CSR) serving on its audit committee. Mr. Roger A. Formisano, the Registrant’s audit committee financial expert, is “independent,” for purposes of Item 3 of Form N-CSR.
An “audit committee financial expert” is not an “expert” for any purpose, including for purposes of Section 11 of the Securities Act of 1933, as a result of being designated as an “audit committee financial expert.” Further, the designation of a person as an “audit committee financial expert” does not mean that the person has any greater duties, obligations, or liability than those imposed on the person without the “audit committee financial expert” designation. Similarly, the designation of a person as an “audit committee financial expert” does not affect the duties, obligations, or liability of any other member of the audit committee or Board of Directors.
| Item 4. | Principal Accountant Fees and Services. |
Audit Fees
| (a) | The aggregate fees billed for each of the last two fiscal years for professional services rendered by the principal accountant for the audit of the Registrant’s annual financial statements or services that are normally provided by the accountant in connection with statutory and regulatory filings or engagements for those fiscal years are $324,140 for 2013 and $212,180 for 2014. |
Audit-Related Fees
| (b) | The aggregate fees billed in each of the last two fiscal years for assurance and related services by the principal accountant that are reasonably related to the performance of the audit of the Registrant’s financial statements and are not reported under paragraph (a) of this Item are $0 for 2013 and $0 for 2014. |
Tax Fees
| (c) | The aggregate fees billed in each of the last two fiscal years for professional services rendered by the principal accountant for tax compliance, tax advice, tax planning and tax training are $51,750 for 2013 and $49,950 for 2014. Such services consisted of quarterly diversification review, annual distribution review and tax return review. |
All Other Fees
| (d) | The aggregate fees billed in each of the last two fiscal years for products and services provided by the principal accountant, other than the services reported in paragraphs (a) through (c) of this Item are $0 for 2013 and $0 for 2014. |
| (e)(1) | Audit Committee Pre-Approval Policies and Procedures. |
Pursuant to Registrant’s Audit Committee Charter (the “Charter”), the Audit Committee is responsible for pre-approving any engagement of the principal accountant to provide non-prohibited services to the Registrant, including the fees and other compensation to be paid to the principal accountant, to the extent required by Rule 2-01(c)(7) of Regulation S-X. The Chairman of the Audit Committee may grant pre-approval for engagements of less than $5,000. All such delegated pre-approvals will be presented to the Audit Committee no later than the next Audit Committee meeting.
Pursuant to the Charter, the Audit Committee is also responsible for pre-approving any engagement of the principal accountant, including the fees and other compensation to be paid to the principal accountant, to provide non-audit services to the Registrant’s investment adviser (or any entity controlling, controlled by, or under common control with the adviser that provides ongoing services to the Registrant), if the engagement relates directly to the operations and financial reporting of the Registrant, to the extent required by Rule 2-01(c)(7) of Regulation S-X. The Chairman of the Audit Committee may grant pre-approval for engagements of less than $5,000. All such delegated pre-approvals will be presented to the Audit Committee no later than the next Audit Committee meeting.
| (e)(2) | The percentage of services described in each of paragraphs (b) through (d) of this Item that were approved by the audit committee pursuant to paragraph (c)(7)(i)(C) of Rule 2-01 of Regulation S-X are as follows: |
| (b) | Not Applicable |
| (c) | 0% |
| (d) | Not Applicable |
| (f) | The percentage of hours expended on the principal accountant’s engagement to audit the Registrant’s financial statements for the most recent fiscal year that were attributed to work performed by persons other than the principal accountant’s full-time, permanent employees was (0%) zero percent. |
| (g) | The aggregate non-audit fees billed by the Registrant’s accountant for services rendered to the Registrant, and rendered to the Registrant’s investment adviser (not including any sub-adviser whose role is primarily portfolio management and is subcontracted with or overseen by another investment adviser), and any entity controlling, controlled by, or under common control with the investment adviser that provides ongoing services to the Registrant for each of the last two fiscal years of the Registrant was $1,261,766 for 2013 and $1,199,361 for 2014. |
| (h) | The Registrant’s audit committee of the board of directors has considered whether the provision of non-audit services that were rendered to the Registrant’s investment adviser (not including any sub-adviser whose role is primarily portfolio management and is subcontracted with or overseen by another investment adviser), and any entity controlling, controlled by, or under common control with the investment adviser that provides ongoing services to the Registrant that were not pre-approved pursuant to paragraph (c)(7)(ii) of Rule 2-01 of Regulation S-X is compatible with maintaining the principal accountant’s independence. |
| Item 5. | Audit Committee of Listed Registrants. |
Not applicable.
| Item 6. | Schedule of Investments. |
| (a) | The Schedules of Investments in securities of unaffiliated issuers as of the close of the reporting period for the Wilshire 5000 IndexSM Fund, the Large Company Growth Portfolio, the Large Company Value Portfolio, the Small Company Growth Portfolio, the Small Company Value Portfolio and the Wilshire International Equity Fund are listed below. |
Report of Independent Registered Public Accounting Firm
To the Board of Directors of Wilshire Mutual Funds, Inc. and the Shareholders of Large Company Growth Portfolio, Large Company Value Portfolio, Small Company Growth Portfolio, Small Company Value Portfolio, Wilshire International Equity Fund and Wilshire 5000 IndexSM Fund:
In our opinion, the accompanying statements of assets and liabilities, including the condensed schedules of investments, and the related statements of operations and of changes in net assets and the financial highlights (included in Item 1 of this Form N-CSR) and the schedules of investments (included in Item 6 of this Form N-CSR) present fairly, in all material respects, the financial position of the Large Company Growth Portfolio, Large Company Value Portfolio, Small Company Growth Portfolio, Small Company Value Portfolio, Wilshire International Equity Fund, and Wilshire 5000 IndexSM Fund (six portfolios/funds constituting the Wilshire Mutual Funds, Inc., hereafter referred to as the “Portfolios”) at December 31, 2014, the results of each of their operations for the year then ended, the changes in each of their net assets for each of the two years in the period then ended and the financial highlights for each of the five years in the period then ended, in conformity with accounting principles generally accepted in the United States of America. These financial statements, financial highlights, and schedule of investments in securities (hereafter referred to as "financial statements") are the responsibility of the Portfolios’ management. Our responsibility is to express an opinion on these financial statements based on our audits. We conducted our audits of these financial statements in accordance with the standards of the Public Company Accounting Oversight Board (United States). Those standards require that we plan and perform the audit to obtain reasonable assurance about whether the financial statements are free of material misstatement. An audit includes examining, on a test basis, evidence supporting the amounts and disclosures in the financial statements, assessing the accounting principles used and significant estimates made by management, and evaluating the overall financial statement presentation. We believe that our audits, which included confirmation of securities at December 31, 2014 by correspondence with the custodian and brokers, provide a reasonable basis for our opinion.
March 2, 2015
PricewaterhouseCoopers LLP, Two Commerce Square, Suite 1700, 2001 Market Street, Philadelphia PA 19103
T: (267) 330 3000, F: (267) 330 3300 www.pwc.com
Wilshire Mutual Funds, Inc. Large Company Growth Portfolio Schedule of Investments | December 31, 2014 |
| Shares | Value | ||||||
COMMON STOCK — 98.5%†† | |||||||
Consumer Discretionary — 22.4% | |||||||
| 18,800 | Advance Auto Parts, Inc.(a) | $ | 2,994,464 | ||||
| 17,609 | Amazon.com, Inc.† | 5,464,953 | |||||
| 1,020 | Brinker International, Inc. | 59,864 | |||||
| 15,700 | Cablevision Systems Corp., Class A(a) | 324,048 | |||||
| 20,872 | CBS Corp., Class B(a) | 1,155,056 | |||||
| 300 | Choice Hotels International, Inc.(a) | 16,806 | |||||
| 50,461 | Comcast Corp., Class A(a) | 2,927,243 | |||||
| 841 | Darden Restaurants, Inc.(a) | 49,308 | |||||
| 4,923 | Delphi Automotive PLC | 358,000 | |||||
| 5,331 | DIRECTV† | 462,198 | |||||
| 7,415 | Discovery Communications, Inc., Class C†(a) | 250,034 | |||||
| 1,679 | Discovery Communications, Inc., Class A†(a) | 57,841 | |||||
| 24,771 | Dollar General Corp.† | 1,751,310 | |||||
| 1,707 | Domino's Pizza, Inc. | 160,748 | |||||
| 1,197 | Expedia, Inc.(a) | 102,176 | |||||
| 3,680 | Gap, Inc. (The)(a) | 154,965 | |||||
| 3,960 | Gentex Corp. | 143,075 | |||||
| 3,734 | Genuine Parts Co.(a) | 397,933 | |||||
| 870 | Harley-Davidson, Inc. | 57,342 | |||||
| 27,327 | Home Depot, Inc. (The) | 2,868,515 | |||||
| 4,753 | Jarden Corp.†(a) | 227,574 | |||||
| 158 | John Wiley & Sons, Inc., Class A(a) | 9,360 | |||||
| 2,110 | Kohl's Corp.(a) | 128,794 | |||||
| 370 | L Brands, Inc.(a) | 32,023 | |||||
| 28,765 | Las Vegas Sands Corp. | 1,672,972 | |||||
| 11,975 | Liberty Interactive Corp., Class A† | 352,305 | |||||
| 1,702 | Liberty Ventures, Ser A† | 64,199 | |||||
| 100 | LKQ Corp.†(a) | 2,812 | |||||
| 9,725 | Lowe's Cos., Inc. | 669,080 | |||||
| 1,910 | Macy's, Inc. | 125,583 | |||||
| 1,330 | Mattel, Inc.(a) | 41,157 | |||||
| 4,694 | McDonald's Corp. | 439,828 | |||||
| 36,375 | Michael Kors Holdings, Ltd.† | 2,731,762 | |||||
| 650 | Netflix, Inc.†(a) | 222,047 | |||||
| 22,838 | NIKE, Inc., Class B | 2,195,874 | |||||
| 254 | NVR, Inc.† | 323,934 | |||||
| 3,896 | Omnicom Group, Inc.(a) | 301,823 | |||||
| 3,735 | Priceline Group, Inc.† | 4,258,684 | |||||
| 93,613 | PulteGroup, Inc. | 2,008,935 | |||||
| 1,540 | Scripps Networks Interactive, Inc., Class A(a) | 115,916 | |||||
| 3,633 | Service Corp. International(a) | 82,469 | |||||
| 370 | Six Flags Entertainment Corp. | 15,965 | |||||
| 6,772 | Staples, Inc. | 122,709 | |||||
| 89,333 | Starbucks Corp. | 7,329,773 | |||||
| 1,030 | Target Corp.(a) | 78,187 | |||||
| 3,142 | Tesla Motors, Inc.†(a) | 698,812 | |||||
| 12,669 | Time Warner Cable, Inc., Class A | 1,926,448 | |||||
| 4,195 | TJX Cos., Inc.(a) | 287,693 | |||||
| 40,500 | Tractor Supply Co.(a) | 3,192,210 | |||||
| 3,223 | Viacom, Inc., Class B | 242,531 | |||||
| 30,927 | Walt Disney Co. (The) | 2,913,014 | |||||
| 992 | Whirlpool Corp.(a) | 192,190 | |||||
| 3,110 | Wyndham Worldwide Corp.(a) | 266,714 | |||||
| 262 | Wynn Resorts, Ltd. | 38,975 | |||||
| 3,424 | Yum! Brands, Inc. | 249,438 | |||||
| 53,317,669 | |||||||
Consumer Staples — 5.3% | |||||||
| 12,737 | Altria Group, Inc. | 627,552 | |||||
| Shares | Value | ||||||
| Consumer Staples (continued) | |||||||
| 1,085 | Archer-Daniels-Midland Co. | $ | 56,420 | ||||
| 5,183 | Avon Products, Inc.(a) | 48,668 | |||||
| 2,053 | Campbell Soup Co. | 90,332 | |||||
| 550 | Clorox Co. (The)(a) | 57,315 | |||||
| 22,011 | Coca-Cola Co. (The) | 929,304 | |||||
| 3,675 | Coca-Cola Enterprises, Inc. | 162,509 | |||||
| 20 | Colgate-Palmolive Co. | 1,384 | |||||
| 299 | ConAgra Foods, Inc. | 10,848 | |||||
| 2,170 | Costco Wholesale Corp. | 307,597 | |||||
| 3,991 | CVS Health Corp. | 384,373 | |||||
| 8,258 | Diageo PLC ADR(a) | 942,155 | |||||
| 700 | Dr. Pepper Snapple Group, Inc. | 50,176 | |||||
| 24,602 | Estee Lauder Cos., Inc. (The), Class A | 1,874,673 | |||||
| 1,230 | General Mills, Inc. | 65,596 | |||||
| 710 | Hershey Co. (The) | 73,790 | |||||
| 375 | JM Smucker Co. (The) | 37,867 | |||||
| 100 | Kimberly-Clark Corp. | 11,554 | |||||
| 735 | Kraft Foods Group, Inc. | 46,055 | |||||
| 9,100 | Kroger Co. (The) | 584,311 | |||||
| 28,825 | Monster Beverage Corp.† | 3,123,189 | |||||
| 6,473 | PepsiCo, Inc. | 612,087 | |||||
| 7,088 | Philip Morris International, Inc. | 577,317 | |||||
| 830 | Procter & Gamble Co. (The) | 75,605 | |||||
| 3,840 | Reynolds American, Inc.(a) | 246,797 | |||||
| 11,010 | Rite Aid Corp.† | 82,795 | |||||
| 11,493 | SABMiller PLC ADR | 592,579 | |||||
| 6,259 | Sysco Corp.(a) | 248,420 | |||||
| 550 | Tyson Foods, Inc., Class A | 22,050 | |||||
| 3,380 | Walgreens Boots Alliance, Inc. | 257,556 | |||||
| 3,811 | Wal-Mart Stores, Inc.(a) | 327,289 | |||||
| 12,528,163 | |||||||
Energy — 3.8% | |||||||
| 22,599 | Anadarko Petroleum Corp. | 1,864,417 | |||||
| 1,000 | Cheniere Energy, Inc.† | 70,400 | |||||
| 61,020 | Cobalt International Energy, Inc.† | 542,468 | |||||
| 44,594 | EOG Resources, Inc. | 4,105,770 | |||||
| 52,725 | FMC Technologies, Inc.†(a) | 2,469,639 | |||||
| 9,052,694 | |||||||
Financials — 6.6% | |||||||
| 23,975 | Affiliated Managers Group, Inc.† | 5,088,454 | |||||
| 5,830 | Allied World Assurance Co. Holdings AG | 221,074 | |||||
| 2,859 | American Express Co. | 266,001 | |||||
| 15,367 | Ameriprise Financial, Inc. | 2,032,286 | |||||
| 4,153 | Aon PLC | 393,829 | |||||
| 280 | BlackRock, Inc., Class A | 100,117 | |||||
| 110,100 | Charles Schwab Corp. (The) | 3,323,919 | |||||
| 2,785 | Equity Lifestyle Properties, Inc.(b) | 143,567 | |||||
| 8,785 | Erie Indemnity Co., Class A | 797,414 | |||||
| 1,924 | Extra Space Storage, Inc.(b) | 112,823 | |||||
| 36,112 | First Republic Bank | 1,882,158 | |||||
| 30 | Gaming and Leisure Properties, Inc.(b) | 880 | |||||
| 681 | Hanover Insurance Group, Inc. (The) | 48,569 | |||||
| 130 | Howard Hughes Corp. (The)† | 16,955 | |||||
| 865 | Jones Lang LaSalle, Inc.(a) | 129,689 | |||||
| 3,330 | Lamar Advertising Co., Class A(a) (b) | 178,621 | |||||
| 3,076 | Legg Mason, Inc. | 164,166 | |||||
| 1,130 | Marsh & McLennan Cos., Inc. | 64,681 | |||||
| 819 | Plum Creek Timber Co., Inc.(a) (b) | 35,045 | |||||
| 506 | Public Storage(b) | 93,534 | |||||
| 2,076 | Simon Property Group, Inc. | 378,060 | |||||
| 61 | StanCorp Financial Group, Inc. | 4,261 | |||||
| 3,005 | Validus Holdings, Ltd.(a) | 124,888 | |||||
| 1,122 | Ventas, Inc.(b) | 80,448 | |||||
| 15,681,439 | |||||||
Wilshire Mutual Funds, Inc. Large Company Growth Portfolio Schedule of Investments | December 31, 2014 |
| Shares | Value | ||||||
Health Care — 15.8% | |||||||
| 6,301 | Abbott Laboratories | $ | 283,671 | ||||
| 8,750 | AbbVie, Inc. | 572,600 | |||||
| 10 | Aetna, Inc. | 888 | |||||
| 2,998 | Agilent Technologies, Inc. | 122,738 | |||||
| 23,302 | Alexion Pharmaceuticals, Inc.† | 4,311,569 | |||||
| 2,406 | AmerisourceBergen Corp., Class A | 216,925 | |||||
| 5,196 | Amgen, Inc. | 827,671 | |||||
| 2,027 | Baxter International, Inc. | 148,559 | |||||
| 949 | Becton Dickinson and Co. | 132,063 | |||||
| 8,705 | Biogen Idec, Inc.† | 2,954,912 | |||||
| 2,937 | Boston Scientific Corp.† | 38,915 | |||||
| 9,254 | Bristol-Myers Squibb Co. | 546,263 | |||||
| 3,293 | Cardinal Health, Inc. | 265,844 | |||||
| 73,794 | Catamaran Corp.†(a) | 3,818,840 | |||||
| 50,863 | Celgene Corp.†(a) | 5,689,535 | |||||
| 44,625 | Cerner Corp.† | 2,885,452 | |||||
| 2,950 | Cigna Corp. | 303,584 | |||||
| 1,224 | DaVita HealthCare Partners, Inc.† | 92,706 | |||||
| 2,865 | Endo International PLC†(a) | 206,624 | |||||
| 35,180 | Envision Healthcare Holdings, Inc.†(a) | 1,220,394 | |||||
| 8,284 | Express Scripts Holding Co.† | 701,406 | |||||
| 64,947 | Gilead Sciences, Inc.†(a) | 6,121,904 | |||||
| 2,729 | HCA Holdings, Inc.† | 200,281 | |||||
| 20,238 | Hologic, Inc.†(a) | 541,164 | |||||
| 2,430 | Hospira, Inc.†(a) | 148,838 | |||||
| 1,153 | Illumina, Inc.†(a) | 212,821 | |||||
| 2,766 | Johnson & Johnson | 289,241 | |||||
| 2,794 | Laboratory Corp. of America Holdings† | 301,473 | |||||
| 1,884 | McKesson Corp. | 391,081 | |||||
| 6,245 | Merck & Co., Inc. | 354,653 | |||||
| 382 | Mettler-Toledo International, Inc.†(a) | 115,540 | |||||
| 6,767 | Mylan, Inc.†(a) | 381,456 | |||||
| 1,644 | PerkinElmer, Inc. | 71,892 | |||||
| 7,457 | Perrigo Co. PLC | 1,246,512 | |||||
| 12,014 | Pharmacyclics, Inc.†(a) | 1,468,832 | |||||
| 1,835 | Premier, Inc., Class A† | 61,528 | |||||
| 2,400 | Quest Diagnostics, Inc.(a) | 160,944 | |||||
| 480 | Regeneron Pharmaceuticals, Inc.†(a) | 196,920 | |||||
| 2,124 | Seattle Genetics, Inc.†(a) | 68,244 | |||||
| 100 | Universal Health Services, Inc., Class B | 11,126 | |||||
| 37,685,609 | |||||||
Industrials — 8.9% | |||||||
| 3,147 | 3M Co. | 517,115 | |||||
| 1 | Allegion PLC | 55 | |||||
| 2,415 | AO Smith Corp. | 136,230 | |||||
| 40 | Avis Budget Group, Inc.†(a) | 2,653 | |||||
| 1,608 | Babcock & Wilcox Co. (The)(a) | 48,723 | |||||
| 3,956 | Boeing Co. (The)(a) | 514,201 | |||||
| 16,475 | Canadian Pacific Railway, Ltd.(a) | 3,174,568 | |||||
| 1,561 | CH Robinson Worldwide, Inc.(a) | 116,903 | |||||
| 4,215 | Emerson Electric Co. | 260,192 | |||||
| 55 | Exelis, Inc. | 964 | |||||
| 57,812 | Fastenal Co.(a) | 2,749,539 | |||||
| 800 | FedEx Corp. | 138,928 | |||||
| 3,967 | Honeywell International, Inc. | 396,383 | |||||
| 9 | Ingersoll-Rand PLC(a) | 571 | |||||
| 3,115 | Landstar System, Inc.(a) | 225,931 | |||||
| 4,072 | Lockheed Martin Corp. | 784,145 | |||||
| 310 | Norfolk Southern Corp.(a) | 33,979 | |||||
| 8,642 | Pitney Bowes, Inc.(a) | 210,605 | |||||
| 22,974 | Precision Castparts Corp. | 5,533,977 | |||||
| 6,789 | Rollins, Inc. | 224,716 | |||||
| 4,380 | Southwest Airlines Co. | 185,362 | |||||
| Shares | Value | ||||||
| Industrials (continued) | |||||||
| 1,125 | Spirit AeroSystems Holdings, Inc., Class A† | $ | 48,420 | ||||
| 1,100 | Spirit Airlines, Inc.† | 83,138 | |||||
| 27,785 | Textron, Inc. | 1,170,026 | |||||
| 4,164 | Union Pacific Corp. | 496,057 | |||||
| 4,270 | United Parcel Service, Inc., Class B(a) | 474,696 | |||||
| 29,434 | United Rentals, Inc.† | 3,002,562 | |||||
| 5,498 | United Technologies Corp. | 632,270 | |||||
| 3 | Vectrus, Inc.†(a) | 82 | |||||
| 705 | Waste Management, Inc. | 36,181 | |||||
| 21,199,172 | |||||||
Information Technology — 33.6% | |||||||
| 2,574 | Accenture PLC, Class A(a) | 229,884 | |||||
| 47,075 | Adobe Systems, Inc.† | 3,422,353 | |||||
| 32,181 | Alibaba Group Holding, Ltd. ADR†(a) | 3,344,893 | |||||
| 11,250 | Alliance Data Systems Corp.† | 3,218,063 | |||||
| 91,534 | Apple, Inc. | 10,103,523 | |||||
| 2,565 | ARRIS Group, Inc.† | 77,437 | |||||
| 2,282 | Atmel Corp.† | 19,158 | |||||
| 2,137 | Automatic Data Processing, Inc. | 178,162 | |||||
| 7,540 | Booz Allen Hamilton Holding Corp., Class A | 200,036 | |||||
| 712 | CDK Global, Inc.(a) | 29,021 | |||||
| 1,744 | Citrix Systems, Inc.† | 111,267 | |||||
| 1,521 | CommScope Holding Co., Inc.† | 34,725 | |||||
| 3,370 | Computer Sciences Corp.(a) | 212,478 | |||||
| 9,379 | CoStar Group, Inc.† | 1,722,266 | |||||
| 375 | Diebold, Inc.(a) | 12,990 | |||||
| 910 | DST Systems, Inc. | 85,676 | |||||
| 90,204 | Facebook, Inc., Class A† | 7,037,716 | |||||
| 1,187 | Fidelity National Information Services, Inc.(a) | 73,831 | |||||
| 5,391 | Global Payments, Inc. | 435,215 | |||||
| 6,265 | Google, Inc., Class C† | 3,297,896 | |||||
| 11,451 | Google, Inc., Class A† | 6,076,588 | |||||
| 3,689 | Hewlett-Packard Co. | 148,040 | |||||
| 5,496 | International Business Machines Corp. | 881,778 | |||||
| 756 | Intuit, Inc.(a) | 69,696 | |||||
| 1,499 | Keysight Technologies, Inc.† | 50,621 | |||||
| 630 | Lam Research Corp. | 49,984 | |||||
| 4,635 | MasterCard, Inc., Class A | 399,352 | |||||
| 11,773 | MercadoLibre, Inc. | 1,503,059 | |||||
| 89,803 | Micron Technology, Inc.†(a) | 3,144,003 | |||||
| 35,690 | Microsoft Corp. | 1,657,800 | |||||
| 267 | Motorola Solutions, Inc. | 17,910 | |||||
| 2,110 | NetApp, Inc. | 87,459 | |||||
| 25,281 | Oracle Corp. | 1,136,887 | |||||
| 3,040 | Paychex, Inc. | 140,357 | |||||
| 5,559 | QUALCOMM, Inc. | 413,201 | |||||
| 88,050 | Rackspace Hosting, Inc.†(a) | 4,121,620 | |||||
| 73,494 | Salesforce.com, Inc.†(a) | 4,358,929 | |||||
| 27,325 | SanDisk Corp.(a) | 2,677,304 | |||||
| 38,175 | Skyworks Solutions, Inc.(a) | 2,775,704 | |||||
| 2,904 | Solera Holdings, Inc. | 148,627 | |||||
| 30,846 | Stratasys, Ltd.†(a) | 2,563,611 | |||||
| 2,915 | Symantec Corp. | 74,784 | |||||
| 2,980 | Texas Instruments, Inc. | 159,326 | |||||
| 71,937 | Trimble Navigation, Ltd.†(a) | 1,909,208 | |||||
| 4,615 | Vantiv, Inc., Class A†(a) | 156,541 | |||||
| 33,782 | Visa, Inc., Class A(a) | 8,857,640 | |||||
| 23,475 | VMware, Inc., Class A† | 1,937,157 | |||||
| 285 | Western Digital Corp. | 31,549 | |||||
| 18,083 | Western Union Co. (The)(a) | 323,867 | |||||
| 13,653 | Xerox Corp. | 189,230 | |||||
Wilshire Mutual Funds, Inc. Large Company Growth Portfolio Schedule of Investments | December 31, 2014 |
| Shares | Value | ||||||
| Information Technology (continued) | |||||||
| 950 | Yelp, Inc., Class A†(a) | $ | 51,993 | ||||
| 70 | Zebra Technologies Corp., Class A† | 5,419 | |||||
| 79,965,834 | |||||||
Materials — 1.6% | |||||||
| 3,392 | Ball Corp. | 231,233 | |||||
| 1,347 | Compass Minerals International, Inc. | 116,960 | |||||
| 1,394 | Dow Chemical Co. (The) | 63,580 | |||||
| 3,097 | EI du Pont de Nemours & Co. | 228,992 | |||||
| 140 | LyondellBasell Industries NV, Class A | 11,115 | |||||
| 1,454 | Monsanto Co. | 173,709 | |||||
| 10,645 | Sherwin-Williams Co. (The)(a) | 2,800,061 | |||||
| 417 | TimkenSteel Corp. | 15,442 | |||||
| 984 | Vulcan Materials Co. | 64,678 | |||||
| 4,800 | Weyerhaeuser Co., Class REIT | 172,272 | |||||
| 3,878,042 | |||||||
Telecommunication Services — 0.5% | |||||||
| 8,743 | CenturyLink, Inc. | 346,048 | |||||
| 61 | SBA Communications Corp., Class A† | 6,757 | |||||
| 19,753 | Verizon Communications, Inc. | 924,045 | |||||
| 1,276,850 | |||||||
| Total Common Stock | |||||||
| (Cost $167,804,039) | 234,585,472 | ||||||
SHORT-TERM INVESTMENTS (c) — 22.3% | |||||||
| 4,141,760 | Northern Trust Institutional Government Select Portfolio, 0.010% | 4,141,760 | |||||
| 49,108,032 | Northern Trust Institutional Liquid Asset Portfolio, 0.010%(d) | 49,108,032 | |||||
| Total Short-Term Investments | |||||||
| (Cost $53,249,792) | 53,249,792 | ||||||
Total Investments — 120.8% | |||||||
| (Cost $221,053,831) | 287,835,264 | ||||||
Other Assets & Liabilities, Net — (20.8)% | (49,568,840 | ) | |||||
NET ASSETS — 100.0% | $ | 238,266,424 | |||||
| † | Non-income producing security. |
| †† | More narrow industries are utilized for compliance purposes, whereas broad sectors are utilized for reporting purposes. |
| (a) | This security or a partial position of this security is on loan at December 31, 2014. The total market value of securities on loan at December 31, 2014 was $50,961,501 (Note 6). |
| (b) | Real Estate Investment Trust. |
| (c) | Rate shown is the 7-day effective yield as of December 31, 2014. |
| (d) | This security was purchased with cash collateral held from securities on loan. The total value of such securities as of December 31, 2014 was $49,108,032. Securities on loan are also collateralized by various U.S. Treasury obligations in the amount of $3,367,201 (Note 6). |
ADR — American Depositary Receipt |
ETF — Exchange Traded Fund |
Ltd. — Limited |
PLC— Public Limited Company |
Wilshire Mutual Funds, Inc. Large Company Value Portfolio Schedule of Investments | December 31, 2014 |
| Shares | Value | ||||||
COMMON STOCK — 97.4%†† | |||||||
Consumer Discretionary — 8.8% | |||||||
| 1,423 | Apollo Education Group, Inc., Class A† | $ | 48,539 | ||||
| 3,725 | Bed Bath & Beyond, Inc.† | 283,733 | |||||
| 8,693 | Cablevision Systems Corp., Class A(a) | 179,423 | |||||
| 6,640 | Choice Hotels International, Inc.(a) | 371,973 | |||||
| 3,700 | Columbia Sportswear Co.(a) | 164,798 | |||||
| 1,360 | Comcast Corp., Class A(a) | 78,894 | |||||
| 530 | DeVry Education Group, Inc.(a) | 25,159 | |||||
| 99 | Discovery Communications, Inc., Class C† | 3,338 | |||||
| 99 | Discovery Communications, Inc., Class A†(a) | 3,411 | |||||
| 6,075 | Foot Locker, Inc.(a) | 341,293 | |||||
| 60,476 | Ford Motor Co. | 937,378 | |||||
| 8,675 | Gannett Co., Inc.(a) | 276,993 | |||||
| 18,972 | General Motors Co. | 662,313 | |||||
| 2,109 | Gentex Corp.(a) | 76,198 | |||||
| 328 | Genuine Parts Co.(a) | 34,955 | |||||
| 23,534 | Interpublic Group of Cos., Inc. (The) | 488,801 | |||||
| 90 | John Wiley & Sons, Inc., Class A(a) | 5,332 | |||||
| 239 | Johnson Controls, Inc. | 11,553 | |||||
| 6,294 | Kohl's Corp.(a) | 384,186 | |||||
| 3,310 | Lear Corp. | 324,645 | |||||
| 8,640 | Macy's, Inc. | 568,080 | |||||
| 2,585 | Magna International, Inc., Class A(a) | 280,964 | |||||
| 2,099 | MGM Resorts International†(a) | 44,876 | |||||
| 350 | Murphy USA, Inc.†(a) | 24,101 | |||||
| 250 | Newell Rubbermaid, Inc. | 9,523 | |||||
| 5,085 | News Corp., Class B† | 76,682 | |||||
| 53,975 | News Corp., Class A†(a) | 846,868 | |||||
| 9,088 | Omnicom Group, Inc.(a) | 704,047 | |||||
| 2,420 | Ross Stores, Inc. | 228,109 | |||||
| 9,950 | Sony Corp. ADR(a) | 203,676 | |||||
| 8,139 | Stanley Black & Decker, Inc. | 781,995 | |||||
| 44,263 | Staples, Inc. | 802,046 | |||||
| 3,222 | Thomson Reuters Corp.(a) | 129,975 | |||||
| 1,187 | Time Warner Cable, Inc., Class A | 180,495 | |||||
| 4,054 | Time Warner, Inc. | 346,293 | |||||
| 515 | Time, Inc. | 12,674 | |||||
| 8,325 | TRW Automotive Holdings Corp.† | 856,226 | |||||
| 20 | Visteon Corp.† | 2,137 | |||||
| 1,793 | Walt Disney Co. (The) | 168,883 | |||||
| 872 | Wyndham Worldwide Corp.(a) | 74,783 | |||||
| 11,045,348 | |||||||
Consumer Staples — 6.0% | |||||||
| 1,510 | Altria Group, Inc. | 74,398 | |||||
| 1,039 | Archer-Daniels-Midland Co. | 54,028 | |||||
| 1,537 | Bunge, Ltd.(a) | 139,729 | |||||
| 800 | Campbell Soup Co. | 35,200 | |||||
| 3,368 | Coca-Cola Enterprises, Inc. | 148,933 | |||||
| 11,438 | CVS Health Corp. | 1,101,594 | |||||
| 238 | JM Smucker Co. (The) | 24,033 | |||||
| 9,700 | Kellogg Co. | 634,768 | |||||
| 7,175 | Kroger Co. (The) | 460,707 | |||||
| 3,060 | Molson Coors Brewing Co., Class B(a) | 228,031 | |||||
| 8,021 | Mondelez International, Inc., Class A | 291,363 | |||||
| 2,330 | Philip Morris International, Inc. | 189,779 | |||||
| 10,149 | Procter & Gamble Co. (The) | 924,472 | |||||
| 590 | Reynolds American, Inc.(a) | 37,919 | |||||
| 81,758 | Rite Aid Corp.† | 614,820 | |||||
| 1,118 | Safeway, Inc. | 39,264 | |||||
| 5,037 | Sysco Corp.(a) | 199,918 | |||||
| Shares | Value | ||||||
| Consumer Staples (continued) | |||||||
| 12,897 | Tyson Foods, Inc., Class A | $ | 517,041 | ||||
| 1,550 | Walgreens Boots Alliance, Inc. | 118,110 | |||||
| 16,912 | Wal-Mart Stores, Inc.(a) | 1,452,403 | |||||
| 4,475 | Whole Foods Market, Inc.(a) | 225,629 | |||||
| 7,512,139 | |||||||
Energy — 11.2% | |||||||
| 676 | Anadarko Petroleum Corp. | 55,770 | |||||
| 4,375 | Apache Corp. | 274,181 | |||||
| 12,150 | Baker Hughes, Inc. | 681,250 | |||||
| 41,078 | BP PLC(a) | 1,565,894 | |||||
| 927 | California Resources Corp.†(a) | 5,108 | |||||
| 4,140 | Cameron International Corp.† | 206,793 | |||||
| 26,925 | Chesapeake Energy Corp.(a) | 526,922 | |||||
| 6,684 | Chevron Corp.(a) | 749,811 | |||||
| 2,055 | Cimarex Energy Co.(a) | 217,830 | |||||
| 3,739 | ConocoPhillips | 258,215 | |||||
| 8,025 | Devon Energy Corp. | 491,210 | |||||
| 45,203 | Exxon Mobil Corp. | 4,179,017 | |||||
| 3,490 | Hess Corp. | 257,632 | |||||
| 3,351 | Kinder Morgan, Inc. | 141,781 | |||||
| 478 | Marathon Petroleum Corp. | 43,144 | |||||
| 7,425 | Murphy Oil Corp.(a) | 375,111 | |||||
| 18,475 | Nabors Industries, Ltd.(a) | 239,806 | |||||
| 7,049 | Occidental Petroleum Corp. | 568,220 | |||||
| 969 | Phillips 66 | 69,477 | |||||
| 31,914 | Royal Dutch Shell PLC ADR, Class A(a) | 2,136,642 | |||||
| 2,675 | Schlumberger, Ltd. | 228,472 | |||||
| 11,275 | Valero Energy Corp. | 558,113 | |||||
| 5,040 | Whiting Petroleum Corp.† | 166,320 | |||||
| 13,996,719 | |||||||
Financials — 32.1% | |||||||
| 1,593 | Aflac, Inc. | 97,316 | |||||
| 4,028 | Allied World Assurance Co. Holdings AG | 152,742 | |||||
| 9,310 | Allstate Corp. (The) | 654,028 | |||||
| 7,020 | American Capital Agency Corp. | 153,247 | |||||
| 26,940 | American International Group, Inc. | 1,508,909 | |||||
| 1,853 | Ameriprise Financial, Inc. | 245,059 | |||||
| 45,009 | Annaly Capital Management, Inc.(a) | 486,547 | |||||
| 2,347 | Aon PLC | 222,566 | |||||
| 9,485 | Aspen Insurance Holdings, Ltd. | 415,158 | |||||
| 5,508 | Assurant, Inc. | 376,912 | |||||
| 8,375 | Assured Guaranty, Ltd. | 217,666 | |||||
| 13,675 | Axis Capital Holdings, Ltd. | 698,656 | |||||
| 195,103 | Bank of America Corp. | 3,490,393 | |||||
| 530 | Bank of Hawaii Corp.(a) | 31,434 | |||||
| 2,006 | BB&T Corp. | 78,013 | |||||
| 6,097 | Berkshire Hathaway, Inc., Class B† | 915,465 | |||||
| 280 | BlackRock, Inc., Class A | 100,117 | |||||
| 8,034 | Capital One Financial Corp. | 663,207 | |||||
| 100,224 | Chimera Investment Corp.(b) | 318,712 | |||||
| 1,166 | Chubb Corp. (The) | 120,646 | |||||
| 8,215 | CIT Group, Inc. | 392,924 | |||||
| 48,037 | Citigroup, Inc. | 2,599,282 | |||||
| 9,650 | Citizens Financial Group, Inc.(a) | 239,899 | |||||
| 9,875 | Comerica, Inc.(a) | 462,545 | |||||
| 10,848 | Discover Financial Services | 710,435 | |||||
| 4,820 | Duke Realty Corp.(b) | 97,364 | |||||
| 650 | East West Bancorp, Inc.(a) | 25,162 | |||||
| 400 | Endurance Specialty Holdings, Ltd. | 23,936 | |||||
| 1,618 | Equity Lifestyle Properties, Inc.(b) | 83,408 | |||||
| 370 | Erie Indemnity Co., Class A(a) | 33,585 | |||||
| 61,400 | Fifth Third Bancorp | 1,251,025 | |||||
| 3,875 | Franklin Resources, Inc.(a) | 214,559 | |||||
| 7,436 | Fulton Financial Corp.(a) | 91,909 | |||||
Wilshire Mutual Funds, Inc. Large Company Value Portfolio Schedule of Investments | December 31, 2014 |
| Shares | Value | ||||||
| Financials (continued) | |||||||
| 8,211 | General Growth Properties, Inc.(a) | $ | 230,976 | ||||
| 30,750 | Genworth Financial, Inc., Class A† | 261,375 | |||||
| 6,723 | Goldman Sachs Group, Inc. (The) | 1,303,119 | |||||
| 1,189 | Hanover Insurance Group, Inc. (The) | 84,800 | |||||
| 22,134 | Hartford Financial Services Group, Inc.(a) | 922,766 | |||||
| 5 | HealthCare Trust of America†(a) (b) | 135 | |||||
| 4,316 | Host Hotels & Resorts, Inc., Class REIT(a) | 102,591 | |||||
| 120 | Howard Hughes Corp. (The)† | 15,650 | |||||
| 34,825 | Huntington Bancshares, Inc. | 366,359 | |||||
| 5,900 | Invesco, Ltd. | 233,168 | |||||
| 1,559 | Jones Lang LaSalle, Inc.(a) | 233,741 | |||||
| 52,842 | JPMorgan Chase & Co. | 3,306,852 | |||||
| 4,927 | Kemper Corp.(a) | 177,914 | |||||
| 31,825 | KeyCorp | 442,368 | |||||
| 1,316 | Legg Mason, Inc. | 70,235 | |||||
| 100 | Liberty Property Trust(b) | 3,763 | |||||
| 5,885 | Lincoln National Corp.(a) | 339,388 | |||||
| 20 | Macerich Co. (The)(a) (b) | 1,668 | |||||
| 6,384 | MBIA, Inc.† | 60,903 | |||||
| 546 | Mercury General Corp.(a) | 30,942 | |||||
| 36,387 | MetLife, Inc.(a) | 1,968,173 | |||||
| 28,344 | MFA Financial, Inc., Class REIT(b) | 226,469 | |||||
| 24,225 | Morgan Stanley | 939,930 | |||||
| 1,740 | New York Community Bancorp, Inc.(a) | 27,840 | |||||
| 20,838 | Old Republic International Corp.(a) | 304,860 | |||||
| 24 | PartnerRe, Ltd. | 2,739 | |||||
| 8,897 | People's United Financial, Inc.(a) | 135,056 | |||||
| 515 | Plum Creek Timber Co., Inc.(a) (b) | 22,037 | |||||
| 20,023 | PNC Financial Services Group, Inc. | 1,826,698 | |||||
| 50 | Principal Financial Group, Inc. | 2,597 | |||||
| 22,475 | Progressive Corp. (The) | 606,600 | |||||
| 2,150 | Prologis, Inc.(b) | 92,515 | |||||
| 4,195 | Prudential Financial, Inc. | 379,480 | |||||
| 120 | Raymond James Financial, Inc.(a) | 6,875 | |||||
| 84,375 | Regions Financial Corp. | 891,000 | |||||
| 3,769 | RenaissanceRe Holdings, Ltd.(a) | 366,422 | |||||
| 2,928 | Retail Properties of America, Inc., Class A | 48,868 | |||||
| 520 | Simon Property Group, Inc. | 94,697 | |||||
| 150 | Starwood Property Trust, Inc.(a) (b) | 3,486 | |||||
| 11,985 | State Street Corp. | 940,822 | |||||
| 9,600 | Synchrony Financial†(a) | 285,600 | |||||
| 9,580 | TCF Financial Corp. | 152,226 | |||||
| 634 | Travelers Cos., Inc. (The) | 67,109 | |||||
| 16,088 | Two Harbors Investment Corp.(b) | 161,202 | |||||
| 3,863 | U.S. Bancorp | 173,642 | |||||
| 51,775 | UBS Group AG† | 882,764 | |||||
| 400 | Ventas, Inc.(a) (b) | 28,680 | |||||
| 634 | Vornado Realty Trust | 74,628 | |||||
| 30,200 | Voya Financial, Inc. | 1,279,876 | |||||
| 2,609 | Weingarten Realty Investors(a) (b) | 91,106 | |||||
| 27,898 | Wells Fargo & Co. | 1,529,368 | |||||
| 10,050 | Willis Group Holdings PLC(a) | 450,341 | |||||
| 20,025 | XL Group PLC, Class A | 688,259 | |||||
| 40,113,504 | |||||||
Health Care — 14.3% | |||||||
| 24,618 | Abbott Laboratories | 1,108,302 | |||||
| 5,130 | AbbVie, Inc. | 335,707 | |||||
| 12,380 | Aetna, Inc. | 1,099,715 | |||||
| 450 | Agilent Technologies, Inc. | 18,423 | |||||
| 623 | AmerisourceBergen Corp., Class A | 56,170 | |||||
| 2,985 | Amgen, Inc. | 475,481 | |||||
| 4,199 | Anthem, Inc. | 527,688 | |||||
| 6,075 | Baxter International, Inc. | 445,237 | |||||
| Shares | Value | ||||||
| Health Care (continued) | |||||||
| 3,075 | Becton Dickinson and Co. | $ | 427,917 | ||||
| 841 | Biogen Idec, Inc.† | 285,477 | |||||
| 13,929 | Boston Scientific Corp.† | 184,559 | |||||
| 7,020 | Bristol-Myers Squibb Co.(a) | 414,390 | |||||
| 2,838 | Cardinal Health, Inc. | 229,112 | |||||
| 10,869 | Cigna Corp. | 1,118,529 | |||||
| 900 | DaVita HealthCare Partners, Inc.† | 68,166 | |||||
| 2,660 | Edwards Lifesciences Corp.† | 338,831 | |||||
| 8,615 | Eli Lilly & Co. | 594,349 | |||||
| 8,702 | Express Scripts Holding Co.† | 736,798 | |||||
| 4,005 | Gilead Sciences, Inc.†(a) | 377,511 | |||||
| 5,510 | HCA Holdings, Inc.† | 404,379 | |||||
| 861 | Health Net, Inc.† | 46,089 | |||||
| 6,935 | Hologic, Inc.†(a) | 185,442 | |||||
| 17,444 | Johnson & Johnson | 1,824,119 | |||||
| 8,089 | Laboratory Corp. of America Holdings† | 872,803 | |||||
| 158 | McKesson Corp. | 32,798 | |||||
| 2,545 | Medtronic, Inc.(a) | 183,749 | |||||
| 26,697 | Merck & Co., Inc. | 1,516,123 | |||||
| 5,380 | Mylan, Inc.†(a) | 303,271 | |||||
| 1,649 | Omnicare, Inc.(a) | 120,261 | |||||
| 159 | PerkinElmer, Inc. | 6,953 | |||||
| 67,387 | Pfizer, Inc. | 2,099,105 | |||||
| 244 | Quest Diagnostics, Inc.(a) | 16,363 | |||||
| 4,960 | Quintiles Transnational Holdings, Inc.† | 291,995 | |||||
| 190 | Teleflex, Inc.(a) | 21,816 | |||||
| 11,815 | Teva Pharmaceutical Industries, Ltd. | 679,481 | |||||
| 453 | Thermo Fisher Scientific, Inc. | 56,757 | |||||
| 3,362 | UnitedHealth Group, Inc. | 339,865 | |||||
| 50 | Universal Health Services, Inc., Class B | 5,563 | |||||
| 17,849,294 | |||||||
Industrials — 7.0% | |||||||
| 3,785 | AerCap Holdings NV†(a) | 146,934 | |||||
| 9,280 | American Airlines Group, Inc.(a) | 497,687 | |||||
| 140 | AO Smith Corp. | 7,897 | |||||
| 865 | Babcock & Wilcox Co. (The)(a) | 26,210 | |||||
| 1,389 | Caterpillar, Inc. | 127,135 | |||||
| 238 | CH Robinson Worldwide, Inc.(a) | 17,824 | |||||
| 8,100 | CSX Corp. | 293,463 | |||||
| 1,455 | Cummins, Inc. | 209,767 | |||||
| 9,620 | Delta Air Lines, Inc. | 473,208 | |||||
| 388 | Dun & Bradstreet Corp.(a) | 46,932 | |||||
| 159 | Emerson Electric Co. | 9,815 | |||||
| 182 | Exelis, Inc. | 3,191 | |||||
| 1,219 | FedEx Corp. | 211,691 | |||||
| 1,559 | General Dynamics Corp. | 214,550 | |||||
| 68,346 | General Electric Co. | 1,727,103 | |||||
| 813 | Harsco Corp. | 15,358 | |||||
| 872 | Huntington Ingalls Industries, Inc. | 98,065 | |||||
| 79 | Ingersoll-Rand PLC(a) | 5,008 | |||||
| 3,360 | KAR Auction Services, Inc. | 116,424 | |||||
| 2,759 | L-3 Communications Holdings, Inc., Class 3 | 348,213 | |||||
| 1,390 | Lockheed Martin Corp. | 267,672 | |||||
| 160 | Manpowergroup, Inc. | 10,907 | |||||
| 27,350 | Masco Corp. | 689,220 | |||||
| 909 | Northrop Grumman Corp. | 133,978 | |||||
| 1,430 | Oshkosh Corp.(a) | 69,569 | |||||
| 2,575 | PACCAR, Inc.(a) | 175,126 | |||||
| 7,900 | Parker Hannifin Corp.(a) | 1,018,705 | |||||
| 16,354 | Pitney Bowes, Inc.(a) | 398,547 | |||||
| 720 | Raytheon Co. | 77,882 | |||||
| 84 | RR Donnelley & Sons Co. | 1,412 | |||||
| 10,360 | Southwest Airlines Co. | 438,435 | |||||
Wilshire Mutual Funds, Inc. Large Company Value Portfolio Schedule of Investments | December 31, 2014 |
| Shares | Value | ||||||
| Industrials (continued) | |||||||
| 180 | Spirit AeroSystems Holdings, Inc., Class A† | $ | 7,747 | ||||
| 11,050 | Trinity Industries, Inc.(a) | 309,510 | |||||
| 6,525 | United Continental Holdings, Inc.† | 436,457 | |||||
| 10 | Vectrus, Inc.†(a) | 274 | |||||
| 2,958 | Waste Management, Inc. | 151,805 | |||||
| 8,783,721 | |||||||
Information Technology — 11.5% | |||||||
| 1,956 | Apple, Inc. | 215,903 | |||||
| 1,029 | AVX Corp. | 14,406 | |||||
| 5,007 | Booz Allen Hamilton Holding Corp., Class A | 132,836 | |||||
| 4,085 | Broadcom Corp., Class A | 177,003 | |||||
| 9,446 | Brocade Communications Systems, Inc. | 111,841 | |||||
| 1,829 | CA, Inc. | 55,693 | |||||
| 40,111 | Cisco Systems, Inc. | 1,115,687 | |||||
| 1,779 | Computer Sciences Corp.(a) | 112,166 | |||||
| 31,944 | Corning, Inc. | 732,476 | |||||
| 1,279 | Diebold, Inc.(a) | 44,305 | |||||
| 2,419 | DST Systems, Inc. | 227,749 | |||||
| 4,825 | Electronic Arts, Inc.†(a) | 226,847 | |||||
| 1,480 | Fidelity National Information Services, Inc.(a) | 92,056 | |||||
| 1,381 | Global Payments, Inc. | 111,488 | |||||
| 78,406 | Hewlett-Packard Co. | 3,146,433 | |||||
| 520 | Informatica Corp.† | 19,830 | |||||
| 1,214 | Ingram Micro, Inc., Class A† | 33,555 | |||||
| 39,447 | Intel Corp. | 1,431,532 | |||||
| 1,854 | Juniper Networks, Inc. | 41,381 | |||||
| 225 | Keysight Technologies, Inc.† | 7,598 | |||||
| 2,720 | Lam Research Corp. | 215,805 | |||||
| 920 | Lexmark International, Inc., Class A | 37,968 | |||||
| 21,265 | Micron Technology, Inc.†(a) | 744,488 | |||||
| 24,282 | Microsoft Corp. | 1,127,899 | |||||
| 5,709 | NetApp, Inc. | 236,638 | |||||
| 6,720 | NXP Semiconductor NV† | 513,408 | |||||
| 7,338 | ON Semiconductor Corp.† | 74,334 | |||||
| 24,850 | Oracle Corp. | 1,117,505 | |||||
| 1,120 | Paychex, Inc. | 51,710 | |||||
| 2,365 | Skyworks Solutions, Inc. | 171,959 | |||||
| 3,340 | SunEdison, Inc.†(a) | 65,163 | |||||
| 150 | Symantec Corp. | 3,848 | |||||
| 6,850 | TE Connectivity, Ltd. | 433,263 | |||||
| 1,022 | Tech Data Corp.†(a) | 64,621 | |||||
| 1,080 | Total System Services, Inc. | 36,677 | |||||
| 1,159 | Vishay Intertechnology, Inc.(a) | 16,400 | |||||
| 6,829 | Western Digital Corp. | 755,970 | |||||
| 3,868 | Western Union Co. (The)(a) | 69,276 | |||||
| 46,366 | Xerox Corp. | 642,633 | |||||
| 14,430,350 | |||||||
Materials — 2.6% | |||||||
| 15,925 | Alcoa, Inc.(a) | 251,456 | |||||
| 2,000 | Ashland, Inc. | 239,520 | |||||
| 1,901 | Ball Corp.(a) | 129,591 | |||||
| 24,400 | Barrick Gold Corp.(a) | 262,300 | |||||
| 396 | Bemis Co., Inc.(a) | 17,903 | |||||
| 308 | Cabot Corp. | 13,509 | |||||
| 476 | Cytec Industries, Inc. | 21,977 | |||||
| 15,730 | Dow Chemical Co. (The) | 717,445 | |||||
| 1,569 | Freeport-McMoRan Copper & Gold, Inc. | 36,652 | |||||
| 5,455 | LyondellBasell Industries NV, Class A | 433,072 | |||||
| 2,848 | Mosaic Co. (The) | 130,011 | |||||
| 12,100 | Newmont Mining Corp. | 228,690 | |||||
| 986 | Nucor Corp.(a) | 48,363 | |||||
| Shares | Value | ||||||
| Materials (continued) | |||||||
| 760 | Sonoco Products Co. | $ | 33,212 | ||||
| 330 | Steel Dynamics, Inc. | 6,514 | |||||
| 8,575 | United States Steel Corp.(a) | 229,296 | |||||
| 740 | Westlake Chemical Corp. | 45,207 | |||||
| 10,914 | Weyerhaeuser Co., Class REIT(a) | 391,704 | |||||
| 3,236,422 | |||||||
Telecommunication Services — 1.2% | |||||||
| 22,863 | AT&T, Inc.(a) | 767,968 | |||||
| 9,728 | CenturyLink, Inc. | 385,034 | |||||
| 5,925 | Verizon Communications, Inc. | 277,171 | |||||
| 7,436 | Windstream Holdings, Inc.(a) | 61,273 | |||||
| 1,491,446 | |||||||
Utilities — 2.7% | |||||||
| 367 | AGL Resources, Inc. | 20,005 | |||||
| 6,886 | Ameren Corp.(a) | 317,651 | |||||
| 1,822 | American Electric Power Co., Inc. | 110,632 | |||||
| 2,898 | Atmos Energy Corp.(a) | 161,534 | |||||
| 2,238 | CenterPoint Energy, Inc. | 52,436 | |||||
| 2,060 | Dominion Resources, Inc.(a) | 158,414 | |||||
| 555 | DTE Energy Co.(a) | 47,935 | |||||
| 7,192 | Duke Energy Corp.(a) | 600,820 | |||||
| 80 | Edison International | 5,238 | |||||
| 9,825 | Entergy Corp. | 859,491 | |||||
| 15,550 | Exelon Corp.(a) | 576,594 | |||||
| 840 | MDU Resources Group, Inc. | 19,740 | |||||
| 714 | NextEra Energy, Inc. | 75,891 | |||||
| 730 | Northeast Utilities(a) | 39,070 | |||||
| 629 | PG&E Corp.(a) | 33,488 | |||||
| 1,109 | Public Service Enterprise Group, Inc. | 45,924 | |||||
| 5,927 | Questar Corp.(a) | 149,835 | |||||
| 921 | Southern Co. (The) | 45,230 | |||||
| 380 | TECO Energy, Inc.(a) | 7,786 | |||||
| 720 | Vectren Corp. | 33,286 | |||||
| 485 | Wisconsin Energy Corp.(a) | 25,579 | |||||
| 3,386,579 | |||||||
| Total Common Stock | – | ||||||
| (Cost $96,726,828) | 121,845,522 | ||||||
SHORT-TERM INVESTMENTS (c) — 20.5% | |||||||
| 3,452,723 | Northern Trust Institutional Government Select Portfolio, 0.010% | 3,452,723 | |||||
| 22,142,303 | Northern Trust Institutional Liquid Asset Portfolio, 0.010%(d) | 22,142,303 | |||||
| Total Short-Term Investments | |||||||
| (Cost $25,595,026) | 25,595,026 | ||||||
Total Investments — 117.9% | |||||||
| (Cost $122,321,854) | 147,440,548 | ||||||
Other Assets & Liabilities, Net — (17.9)% | (22,374,999 | ) | |||||
NET ASSETS — 100.0% | $ | 125,065,549 | |||||
| † | Non-income producing security. |
| †† | More narrow industries are utilized for compliance purposes, whereas broad sectors are utilized for reporting purposes. |
| (a) | This security or a partial position of this security is on loan at December 31, 2014. The total market value of securities on loan at December 31, 2014 was $21,437,933 (Note 6). |
| (b) | Real Estate Investment Trust. |
| (c) | Rate shown is the 7-day effective yield as of December 31, 2014. |
Wilshire Mutual Funds, Inc. Large Company Value Portfolio Schedule of Investments | December 31, 2014 |
| (d) | This security was purchased with cash collateral held from securities on loan. The total value of such securities as of September 30, 2014 was $22,142,303. Securities on loan are also collateralized by various U.S. Treasury obligations in the amount of $3,183 (Note 6). |
| ADR — American Depositary Receipt |
| Ltd. — Limited |
| PLC — Public Limited Company |
Wilshire Mutual Funds, Inc. Small Company Growth Portfolio Schedule of Investments | December 31, 2014 |
| Shares | Value | ||||||
COMMON STOCK — 98.8%†† | |||||||
Consumer Discretionary — 19.2% | |||||||
| 2,494 | Asbury Automotive Group, Inc.†(a) | $ | 189,344 | ||||
| 210 | Ascent Capital Group, Inc., Class A†(a) | 11,115 | |||||
| 70 | Big 5 Sporting Goods Corp.(a) | 1,024 | |||||
| 685 | Bloomin' Brands, Inc.†(a) | 16,960 | |||||
| 220 | Blue Nile, Inc.†(a) | 7,922 | |||||
| 540 | Bright Horizons Family Solutions, Inc.†(a) | 25,385 | |||||
| 445 | Brown Shoe Co., Inc.(a) | 14,307 | |||||
| 1,102 | Brunswick Corp.(a) | 56,489 | |||||
| 370 | Buffalo Wild Wings, Inc.†(a) | 66,741 | |||||
| 350 | Build-A-Bear Workshop, Inc., Class A† | 7,035 | |||||
| 3,840 | Capella Education Co. | 295,526 | |||||
| 80 | Cato Corp. (The), Class A(a) | 3,374 | |||||
| 306 | Cheesecake Factory, Inc. (The)(a) | 15,395 | |||||
| 140 | Children's Place Retail Stores, Inc. (The)(a) | 7,980 | |||||
| 1,440 | Columbia Sportswear Co.(a) | 64,138 | |||||
| 769 | Cooper Tire & Rubber Co. | 26,646 | |||||
| 104 | Cracker Barrel Old Country Store, Inc.(a) | 14,639 | |||||
| 5,780 | Cumulus Media, Inc., Class A†(a) | 24,450 | |||||
| 582 | Dana Holding Corp.(a) | 12,653 | |||||
| 4,010 | Deckers Outdoor Corp.†(a) | 365,070 | |||||
| 6,465 | Denny's Corp.†(a) | 66,654 | |||||
| 1,120 | DineEquity, Inc. | 116,077 | |||||
| 142 | Domino's Pizza, Inc. | 13,372 | |||||
| 4,090 | Dorman Products, Inc.†(a) | 197,424 | |||||
| 1,015 | Entravision Communications Corp., Class A(a) | 6,577 | |||||
| 100 | Fiesta Restaurant Group, Inc.†(a) | 6,080 | |||||
| 1,225 | Finish Line, Inc. (The), Class A(a) | 29,780 | |||||
| 164 | Genesco, Inc.†(a) | 12,566 | |||||
| 1,310 | Gentherm, Inc.† | 47,972 | |||||
| 4,580 | G-III Apparel Group, Ltd.† | 462,626 | |||||
| 2,314 | Grand Canyon Education, Inc.† | 107,971 | |||||
| 10 | Group 1 Automotive, Inc.(a) | 896 | |||||
| 985 | Hillenbrand, Inc.(a) | 33,983 | |||||
| 90 | HSN, Inc.(a) | 6,840 | |||||
| 2,545 | Iconix Brand Group, Inc.†(a) | 85,995 | |||||
| 1,445 | Jack in the Box, Inc. | 115,542 | |||||
| 859 | Kirkland's, Inc.†(a) | 20,307 | |||||
| 14,405 | Krispy Kreme Doughnuts, Inc.†(a) | 284,355 | |||||
| 1,875 | La-Z-Boy, Inc., Class Z(a) | 50,325 | |||||
| 849 | Libbey, Inc.†(a) | 26,693 | |||||
| 167 | Lithia Motors, Inc., Class A(a) | 14,477 | |||||
| 270 | Malibu Boats, Inc., Class A†(a) | 5,203 | |||||
| 210 | Matthews International Corp., Class A(a) | 10,221 | |||||
| 606 | MDC Partners, Inc., Class A(a) | 13,768 | |||||
| 5 | Monarch Casino & Resort, Inc.† | 83 | |||||
| 5,650 | Monro Muffler Brake, Inc.(a) | 326,570 | |||||
| 200 | Motorcar Parts of America, Inc.† | 6,218 | |||||
| 740 | Movado Group, Inc.(a) | 20,994 | |||||
| 1,330 | Nautilus, Inc.†(a) | 20,189 | |||||
| 1,205 | New York & Co., Inc.† | 3,181 | |||||
| 2,985 | Nutrisystem, Inc.(a) | 58,357 | |||||
| 105 | Office Depot, Inc.†(a) | 900 | |||||
| 2,725 | Orbitz Worldwide, Inc.† | 22,427 | |||||
| 676 | Papa John's International, Inc.(a) | 37,721 | |||||
| 470 | Penske Automotive Group, Inc.(a) | 23,063 | |||||
| 594 | Pier 1 Imports, Inc.(a) | 9,148 | |||||
| 350 | Pool Corp. | 22,204 | |||||
| 55 | Quiksilver, Inc.†(a) | 122 | |||||
| 494 | Red Robin Gourmet Burgers, Inc.†(a) | 38,026 | |||||
| 2,203 | Ruth's Hospitality Group, Inc.(a) | 33,045 | |||||
| Shares | Value | ||||||
| Consumer Discretionary (continued) | |||||||
| 900 | Skechers U.S.A., Inc., Class A†(a) | $ | 49,725 | ||||
| 22,805 | Sonic Corp.(a) | 620,980 | |||||
| 1,024 | Sotheby's(a) | 44,216 | |||||
| 10,411 | Steven Madden, Ltd.† | 331,382 | |||||
| 1,405 | Tenneco, Inc.† | 79,537 | |||||
| 787 | Tower International, Inc.†(a) | 20,108 | |||||
| 3,290 | TRI Pointe Homes, Inc.† | 50,172 | |||||
| 16,309 | Tuesday Morning Corp.†(a) | 353,905 | |||||
| 380 | Vitamin Shoppe, Inc.†(a) | 18,460 | |||||
| 100 | Weyco Group, Inc.(a) | 2,967 | |||||
| 185 | Zumiez, Inc.† | 7,147 | |||||
| 5,162,744 | |||||||
Consumer Staples — 5.3% | |||||||
| 619 | B&G Foods, Inc., Class A(a) | 18,508 | |||||
| 648 | Cal-Maine Foods, Inc. | 25,291 | |||||
| 99 | Coca-Cola Bottling Co. Consolidated(a) | 8,715 | |||||
| 159 | Craft Brew Alliance, Inc.†(a) | 2,121 | |||||
| 1,245 | Farmer Bros Co.† | 36,665 | |||||
| 748 | Hain Celestial Group, Inc. (The)†(a) | 43,601 | |||||
| 1,040 | Harbinger Group, Inc.†(a) | 14,726 | |||||
| 1,440 | IGI Laboratories, Inc.†(a) | 12,672 | |||||
| 3,400 | J&J Snack Foods Corp. | 369,818 | |||||
| 247 | Lancaster Colony Corp. | 23,129 | |||||
| 435 | Omega Protein Corp.†(a) | 4,598 | |||||
| 70 | PriceSmart, Inc.(a) | 6,385 | |||||
| 855 | Revlon, Inc., Class A†(a) | 29,207 | |||||
| 2,367 | Rite Aid Corp.† | 17,800 | |||||
| 834 | Sanderson Farms, Inc.(a) | 70,077 | |||||
| 454 | Spectrum Brands Holdings, Inc.(a) | 43,439 | |||||
| 7,694 | TreeHouse Foods, Inc.†(a) | 658,068 | |||||
| 354 | United Natural Foods, Inc.†(a) | 27,373 | |||||
| 120 | WD-40 Co.(a) | 10,210 | |||||
| 1,422,403 | |||||||
Energy — 1.3% | |||||||
| 40 | Adams Resources & Energy, Inc. | 1,998 | |||||
| 10,270 | Matador Resources Co.†(a) | 207,762 | |||||
| 810 | Matrix Service Co.† | 18,079 | |||||
| 2,727 | PDC Energy, Inc.†(a) | 112,544 | |||||
| 340,383 | |||||||
Financials — 12.3% | |||||||
| 310 | Aviv REIT, Inc.(b) | 10,689 | |||||
| 18,030 | BancorpSouth, Inc.(a) | 405,855 | |||||
| 9,550 | Bank of the Ozarks, Inc.(a) | 362,136 | |||||
| 770 | BofI Holding, Inc.†(a) | 59,914 | |||||
| 485 | Crawford & Co., Class B(a) | 4,986 | |||||
| 413 | Credit Acceptance Corp.†(a) | 56,222 | |||||
| 2,420 | DuPont Fabros Technology, Inc.(b) | 80,441 | |||||
| 840 | Employers Holdings, Inc.(a) | 19,748 | |||||
| 214 | Encore Capital Group, Inc.†(a) | 9,502 | |||||
| 345 | Enterprise Financial Services Corp.(a) | 6,807 | |||||
| 490 | Evercore Partners, Inc., Class A | 25,662 | |||||
| 632 | Federated National Holding Co. | 15,269 | |||||
| 3,646 | FelCor Lodging Trust, Inc.(b) | 39,450 | |||||
| 80 | GAMCO Investors, Inc., Class A(a) | 7,115 | |||||
| 340 | Geo Group, Inc. (The)(b) | 13,722 | |||||
| 1,509 | Greenlight Capital Re, Ltd., Class A† | 49,269 | |||||
| 85 | Hallmark Financial Services, Inc.†(a) | 1,027 | |||||
| 210 | HFF, Inc., Class A | 7,543 | |||||
| 6,460 | Iberiabank Corp. | 418,931 | |||||
| 5,037 | MarketAxess Holdings, Inc.(a) | 361,203 | |||||
| 5,365 | MGIC Investment Corp.†(a) | 50,002 | |||||
| 230 | Moelis & Co., Class A | 8,034 | |||||
| 1,470 | National Health Investors, Inc.(a) (b) | 102,841 | |||||
Wilshire Mutual Funds, Inc. Small Company Growth Portfolio Schedule of Investments | December 31, 2014 |
| Shares | Value | ||||||
| Financials (continued) | |||||||
| 3,130 | Oritani Financial Corp.(a) | $ | 48,202 | ||||
| 3,970 | Pinnacle Financial Partners, Inc.(a) | 156,974 | |||||
| 2,400 | Potlatch Corp. | 100,488 | |||||
| 622 | PRA Group, Inc.†(a) | 36,032 | |||||
| 17,710 | PrivateBancorp, Inc., Class A(a) | 591,514 | |||||
| 35 | Pzena Investment Management, Inc., Class A(a) | 331 | |||||
| 3,650 | Radian Group, Inc. | 61,028 | |||||
| 100 | Sabra Health Care REIT, Inc.(b) | 3,037 | |||||
| 500 | Sovran Self Storage, Inc.(b) | 43,610 | |||||
| 435 | State Auto Financial Corp.(a) | 9,666 | |||||
| 1,802 | Strategic Hotels & Resorts, Inc.†(a) (b) | 23,840 | |||||
| 70 | United Fire Group, Inc.(a) | 2,081 | |||||
| 1,364 | Universal Insurance Holdings, Inc.(a) | 27,894 | |||||
| 70 | Virtus Investment Partners, Inc.(a) | 11,934 | |||||
| 1,580 | Washington Real Estate Investment Trust(a) (b) | 43,703 | |||||
| 1,460 | Western Alliance Bancorp† | 40,588 | |||||
| 3,317,290 | |||||||
Health Care — 22.4% | |||||||
| 180 | Acadia Healthcare Co., Inc.† | 11,018 | |||||
| 508 | Accuray, Inc.†(a) | 3,836 | |||||
| 1,640 | Acorda Therapeutics, Inc.†(a) | 67,027 | |||||
| 170 | Addus HomeCare Corp.†(a) | 4,126 | |||||
| 7,600 | Air Methods Corp.†(a) | 334,628 | |||||
| 11,029 | Akorn, Inc.†(a) | 399,250 | |||||
| 919 | Align Technology, Inc.†(a) | 51,381 | |||||
| 475 | Alliance HealthCare Services, Inc.† | 9,970 | |||||
| 345 | AMAG Pharmaceuticals, Inc.†(a) | 14,704 | |||||
| 704 | Amsurg Corp., Class A†(a) | 38,530 | |||||
| 40 | Anacor Pharmaceuticals, Inc.†(a) | 1,290 | |||||
| 4,800 | Anika Therapeutics, Inc.†(a) | 195,552 | |||||
| 1,925 | Array BioPharma, Inc.†(a) | 9,105 | |||||
| 320 | Biospecifics Technologies Corp.†(a) | 12,358 | |||||
| 3,480 | BioTelemetry, Inc.†(a) | 34,905 | |||||
| 12,194 | Cambrex Corp.† | 263,634 | |||||
| 5,825 | Cantel Medical Corp.(a) | 251,990 | |||||
| 400 | Cardiovascular Systems, Inc.†(a) | 12,032 | |||||
| 390 | Celldex Therapeutics, Inc.†(a) | 7,117 | |||||
| 3,510 | Centene Corp.† | 364,514 | |||||
| 1,528 | Cepheid, Inc.†(a) | 82,726 | |||||
| 410 | Chimerix, Inc.† | 16,506 | |||||
| 270 | Computer Programs & Systems, Inc.(a) | 16,403 | |||||
| 304 | CorVel Corp.† | 11,315 | |||||
| 249 | CryoLife, Inc.(a) | 2,821 | |||||
| 604 | Cyberonics, Inc.†(a) | 33,631 | |||||
| 1,745 | DexCom, Inc.†(a) | 96,062 | |||||
| 4,020 | Dyax Corp.† | 56,521 | |||||
| 1,567 | Emergent Biosolutions, Inc.†(a) | 42,669 | |||||
| 650 | Enzo Biochem, Inc.†(a) | 2,886 | |||||
| 15 | ExamWorks Group, Inc.†(a) | 624 | |||||
| 520 | GenMark Diagnostics, Inc.†(a) | 7,077 | |||||
| 900 | Gentiva Health Services, Inc.†(a) | 17,145 | |||||
| 1,920 | Globus Medical, Inc., Class A† | 45,639 | |||||
| 1,045 | Halozyme Therapeutics, Inc.†(a) | 10,084 | |||||
| 430 | Hanger, Inc.†(a) | 9,417 | |||||
| 2,829 | HealthSouth Corp.(a) | 108,803 | |||||
| 375 | HealthStream, Inc.†(a) | 11,055 | |||||
| 285 | Healthways, Inc.†(a) | 5,666 | |||||
| 10,737 | ICON PLC† | 547,480 | |||||
| 355 | Insmed, Inc.† | 5,492 | |||||
| 130 | Insulet Corp.† | 5,988 | |||||
| 130 | Insys Therapeutics, Inc.†(a) | 5,481 | |||||
| 260 | Integra LifeSciences Holdings Corp.†(a) | 14,100 | |||||
| Shares | Value | ||||||
| Health Care (continued) | |||||||
| 90 | Intercept Pharmaceuticals, Inc.†(a) | $ | 14,040 | ||||
| 260 | IPC The Hospitalist Co., Inc.†(a) | 11,931 | |||||
| 1,565 | Isis Pharmaceuticals, Inc.†(a) | 96,623 | |||||
| 720 | Landauer, Inc.(a) | 24,581 | |||||
| 4,334 | Lannett Co., Inc.†(a) | 185,842 | |||||
| 190 | LDR Holding Corp.† | 6,228 | |||||
| 18,089 | Lexicon Pharmaceuticals, Inc.†(a) | 16,459 | |||||
| 880 | Ligand Pharmaceuticals, Inc., Class B†(a) | 46,825 | |||||
| 10 | Luminex Corp.†(a) | 187 | |||||
| 710 | MacroGenics, Inc.† | 24,900 | |||||
| 120 | Magellan Health, Inc.† | 7,204 | |||||
| 2,380 | Masimo Corp.†(a) | 62,689 | |||||
| 1,904 | MedAssets, Inc.† | 37,623 | |||||
| 355 | Medicines Co. (The)†(a) | 9,823 | |||||
| 8,010 | Medidata Solutions, Inc.†(a) | 382,478 | |||||
| 3,215 | Merge Healthcare, Inc.†(a) | 11,445 | |||||
| 380 | Molina Healthcare, Inc.†(a) | 20,341 | |||||
| 2,134 | Natus Medical, Inc.† | 76,909 | |||||
| 250 | Nektar Therapeutics† | 3,875 | |||||
| 3,710 | Neogen Corp.†(a) | 183,979 | |||||
| 870 | Neurocrine Biosciences, Inc.†(a) | 19,436 | |||||
| 3,045 | NPS Pharmaceuticals, Inc.† | 108,920 | |||||
| 520 | NuVasive, Inc.† | 24,523 | |||||
| 1,875 | NxStage Medical, Inc.† | 33,619 | |||||
| 361 | Omnicell, Inc.†(a) | 11,956 | |||||
| 110 | Pacira Pharmaceuticals, Inc.†(a) | 9,752 | |||||
| 1,514 | PAREXEL International Corp.†(a) | 84,118 | |||||
| 1,633 | PDL BioPharma, Inc.(a) | 12,590 | |||||
| 480 | Portola Pharmaceuticals, Inc.†(a) | 13,594 | |||||
| 1,840 | Pozen, Inc.† | 14,720 | |||||
| 13,159 | Prestige Brands Holdings, Inc.†(a) | 456,880 | |||||
| 1,060 | Prothena Corp. PLC† | 22,006 | |||||
| 130 | Providence Service Corp. (The)†(a) | 4,737 | |||||
| 280 | Puma Biotechnology, Inc.†(a) | 52,996 | |||||
| 1,385 | Quality Systems, Inc. | 21,592 | |||||
| 2,255 | Repligen Corp.†(a) | 44,649 | |||||
| 7,517 | Sagent Pharmaceuticals, Inc.†(a) | 188,752 | |||||
| 1,070 | Sangamo BioSciences, Inc.† | 16,275 | |||||
| 2,013 | SciClone Pharmaceuticals, Inc.† | 17,634 | |||||
| 5,090 | Select Medical Holdings Corp. | 73,296 | |||||
| 580 | Spectranetics Corp.†(a) | 20,056 | |||||
| 1,024 | STERIS Corp.(a) | 66,406 | |||||
| 44 | Synageva BioPharma Corp.†(a) | 4,083 | |||||
| 925 | Team Health Holdings, Inc.† | 53,215 | |||||
| 1,625 | Thoratec Corp.†(a) | 52,748 | |||||
| 75 | Triple-S Management Corp., Class B†(a) | 1,793 | |||||
| 250 | U.S. Physical Therapy, Inc.(a) | 10,490 | |||||
| 615 | Vascular Solutions, Inc.†(a) | 16,703 | |||||
| 366 | WellCare Health Plans, Inc.†(a) | 30,034 | |||||
| 783 | West Pharmaceutical Services, Inc.(a) | 41,687 | |||||
| 8,371 | XOMA Corp.†(a) | 30,052 | |||||
| 6,025,852 | |||||||
Industrials — 14.7% | |||||||
| 4,650 | Accuride Corp.†(a) | 20,181 | |||||
| 12,609 | Aceto Corp.(a) | 273,615 | |||||
| 146 | Alaska Air Group, Inc. | 8,725 | |||||
| 10 | Allegiant Travel Co., Class A | 1,503 | |||||
| 260 | Altra Industrial Motion Corp.(a) | 7,381 | |||||
| 3,175 | ARC Document Solutions, Inc.†(a) | 32,448 | |||||
| 40 | ArcBest Corp.(a) | 1,855 | |||||
| 365 | Argan, Inc.(a) | 12,278 | |||||
| 44 | Barrett Business Services, Inc.(a) | 1,206 | |||||
| 2,949 | Blount International, Inc.†(a) | 51,814 | |||||
| 1,364 | Brink's Co. (The) | 33,295 | |||||
Wilshire Mutual Funds, Inc. Small Company Growth Portfolio Schedule of Investments | December 31, 2014 |
| Shares | Value | ||||||
| Industrials (continued) | |||||||
| 835 | Casella Waste Systems, Inc., Class A†(a) | $ | 3,373 | ||||
| 7,220 | Celadon Group, Inc.(a) | 163,822 | |||||
| 160 | CLARCOR, Inc.(a) | 10,662 | |||||
| 745 | Commercial Vehicle Group, Inc.†(a) | 4,962 | |||||
| 44 | Corporate Executive Board Co. (The) | 3,191 | |||||
| 130 | Cubic Corp. | 6,843 | |||||
| 510 | Deluxe Corp.(a) | 31,748 | |||||
| 1,095 | Douglas Dynamics, Inc.(a) | 23,466 | |||||
| 4,790 | EnerSys, Inc.(a) | 295,639 | |||||
| 6,330 | Engility Holdings, Inc.†(a) | 270,924 | |||||
| 224 | Exponent, Inc. | 18,480 | |||||
| 475 | Franklin Covey Co.†(a) | 9,196 | |||||
| 1,430 | Furmanite Corp.†(a) | 11,183 | |||||
| 567 | Gorman-Rupp Co. (The)(a) | 18,212 | |||||
| 209 | H&E Equipment Services, Inc. | 5,871 | |||||
| 130 | Harsco Corp. | 2,456 | |||||
| 1,296 | HEICO Corp.(a) | 78,279 | |||||
| 205 | Herman Miller, Inc.(a) | 6,033 | |||||
| 340 | Hyster-Yale Materials Handling, Inc.(a) | 24,888 | |||||
| 1,315 | Interface, Inc., Class A(a) | 21,658 | |||||
| 659 | John Bean Technologies Corp. | 21,655 | |||||
| 5,514 | KEYW Holding Corp.†(a) | 57,235 | |||||
| 880 | Kforce, Inc.(a) | 21,234 | |||||
| 909 | Knight Transportation, Inc.(a) | 30,597 | |||||
| 1,675 | Knoll, Inc. | 35,460 | |||||
| 439 | MasTec, Inc.†(a) | 9,926 | |||||
| 1,945 | Matson, Inc. | 67,141 | |||||
| 2,595 | Meritor, Inc.†(a) | 39,314 | |||||
| 395 | Middleby Corp.†(a) | 39,144 | |||||
| 180 | Moog, Inc., Class A†(a) | 13,326 | |||||
| 128 | Mueller Industries, Inc.(a) | 4,370 | |||||
| 260 | Multi-Color Corp.(a) | 14,409 | |||||
| 200 | Nortek, Inc.†(a) | 16,266 | |||||
| 210 | On Assignment, Inc.†(a) | 6,970 | |||||
| 820 | Park-Ohio Holdings Corp.(a) | 51,685 | |||||
| 1,090 | Patrick Industries, Inc.† | 47,938 | |||||
| 7,350 | Proto Labs, Inc.†(a) | 493,626 | |||||
| 1,993 | Quality Distribution, Inc.† | 21,205 | |||||
| 7,382 | Saia, Inc.†(a) | 408,668 | |||||
| 255 | SP Plus Corp.†(a) | 6,434 | |||||
| 240 | Spirit Airlines, Inc.† | 18,139 | |||||
| 180 | Standex International Corp.(a) | 13,907 | |||||
| 2,445 | Steelcase, Inc., Class A | 43,888 | |||||
| 3,134 | Swift Transportation Co., Class A†(a) | 89,726 | |||||
| 510 | Teledyne Technologies, Inc.† | 52,397 | |||||
| 1,107 | Tennant Co.(a) | 79,892 | |||||
| 110 | Trex Co., Inc.†(a) | 4,684 | |||||
| 190 | TrueBlue, Inc.†(a) | 4,228 | |||||
| 21,435 | Wabash National Corp.†(a) | 264,937 | |||||
| 7,010 | WageWorks, Inc.†(a) | 452,636 | |||||
| 180 | Watts Water Technologies, Inc., Class A | 11,419 | |||||
| 255 | Werner Enterprises, Inc.(a) | 7,943 | |||||
| 1,760 | Wesco Aircraft Holdings, Inc.†(a) | 24,605 | |||||
| 334 | Woodward, Inc.(a) | 16,443 | |||||
| 505 | Xerium Technologies, Inc.†(a) | 7,969 | |||||
| 3,954,603 | |||||||
Information Technology — 21.7% | |||||||
| 2,512 | ACI Worldwide, Inc.†(a) | 50,667 | |||||
| 1,544 | Advent Software, Inc.(a) | 47,308 | |||||
| 2,220 | Amkor Technology, Inc.† | 15,762 | |||||
| 683 | Anixter International, Inc.† | 60,418 | |||||
| 15,829 | Aruba Networks, Inc.† | 287,771 | |||||
| 3,390 | Aspen Technology, Inc.† | 118,718 | |||||
| 1,320 | AVG Technologies NV† | 26,057 | |||||
| Shares | Value | ||||||
| Information Technology (continued) | |||||||
| 500 | Badger Meter, Inc.(a) | $ | 29,675 | ||||
| 704 | Belden, Inc. | 55,482 | |||||
| 655 | Blackbaud, Inc.(a) | 28,335 | |||||
| 259 | Blucora, Inc.†(a) | 3,587 | |||||
| 385 | BroadSoft, Inc.†(a) | 11,173 | |||||
| 60 | Cabot Microelectronics Corp.† | 2,839 | |||||
| 120 | CACI International, Inc., Class A† | 10,342 | |||||
| 5,800 | CalAmp Corp.†(a) | 106,140 | |||||
| 1,516 | Callidus Software, Inc.†(a) | 24,756 | |||||
| 1,941 | Cardtronics, Inc.†(a) | 74,884 | |||||
| 623 | Cass Information Systems, Inc.(a) | 33,175 | |||||
| 1,909 | Cavium, Inc.†(a) | 118,014 | |||||
| 10,260 | CEVA, Inc.†(a) | 186,116 | |||||
| 1,269 | Ciena Corp.†(a) | 24,631 | |||||
| 2,850 | Cirrus Logic, Inc.†(a) | 67,175 | |||||
| 1,353 | CommVault Systems, Inc.†(a) | 69,937 | |||||
| 1,185 | Comverse, Inc.†(a) | 22,254 | |||||
| 905 | Constant Contact, Inc.† | 33,213 | |||||
| 16 | CoStar Group, Inc.†(a) | 2,938 | |||||
| 1,022 | CSG Systems International, Inc.(a) | 25,622 | |||||
| 290 | Demandware, Inc.†(a) | 16,687 | |||||
| 1,780 | Dice Holdings, Inc.†(a) | 17,818 | |||||
| 2,030 | Diodes, Inc.†(a) | 55,967 | |||||
| 1,065 | DTS, Inc.†(a) | 32,749 | |||||
| 11,793 | Ellie Mae, Inc.†(a) | 475,494 | |||||
| 550 | EnerNOC, Inc.†(a) | 8,497 | |||||
| 8,630 | Envestnet, Inc.†(a) | 424,078 | |||||
| 350 | EPAM Systems, Inc.†(a) | 16,713 | |||||
| 980 | Euronet Worldwide, Inc.†(a) | 53,802 | |||||
| 808 | Fair Isaac Corp. | 58,418 | |||||
| 29 | FEI Co.(a) | 2,620 | |||||
| 1,449 | Global Cash Access Holdings, Inc.† | 10,360 | |||||
| 220 | Guidewire Software, Inc.† | 11,139 | |||||
| 554 | Hackett Group, Inc. (The)(a) | 4,870 | |||||
| 1,335 | iGATE Corp.†(a) | 52,706 | |||||
| 1,289 | Immersion Corp.†(a) | 12,207 | |||||
| 200 | Infoblox, Inc.† | 4,042 | |||||
| 1,515 | Inphi Corp.† | 27,997 | |||||
| 800 | Integrated Device Technology, Inc.† | 15,680 | |||||
| 1,019 | InterDigital, Inc. | 53,905 | |||||
| 19,720 | InvenSense, Inc., Class A†(a) | 320,647 | |||||
| 3,040 | Ixia†(a) | 34,200 | |||||
| 253 | j2 Global, Inc.(a) | 15,686 | |||||
| 2,075 | Lionbridge Technologies, Inc.†(a) | 11,931 | |||||
| 490 | Littelfuse, Inc. | 47,368 | |||||
| 830 | LogMeIn, Inc.†(a) | 40,952 | |||||
| 2,700 | Manhattan Associates, Inc.† | 109,944 | |||||
| 8,263 | MAXIMUS, Inc. | 453,143 | |||||
| 1,109 | MaxLinear, Inc., Class A† | 8,218 | |||||
| 1,014 | Mentor Graphics Corp.(a) | 22,227 | |||||
| 1,160 | Methode Electronics, Inc. | 42,352 | |||||
| 698 | Microsemi Corp.† | 19,809 | |||||
| 850 | Model N, Inc.†(a) | 9,027 | |||||
| 1,679 | MoneyGram International, Inc.†(a) | 15,262 | |||||
| 600 | MTS Systems Corp.(a) | 45,018 | |||||
| 162 | NETGEAR, Inc.†(a) | 5,764 | |||||
| 605 | NetScout Systems, Inc.†(a) | 22,107 | |||||
| 620 | OmniVision Technologies, Inc.†(a) | 16,120 | |||||
| 70 | PDF Solutions, Inc.† | 1,040 | |||||
| 530 | Pegasystems, Inc.(a) | 11,008 | |||||
| 995 | Perficient, Inc.†(a) | 18,537 | |||||
| 240 | Plantronics, Inc.(a) | 12,725 | |||||
| 819 | Plexus Corp.† | 33,751 | |||||
| 3,080 | PMC - Sierra, Inc.† | 28,213 | |||||
Wilshire Mutual Funds, Inc. Small Company Growth Portfolio Schedule of Investments | December 31, 2014 |
| Shares | Value | ||||||
| Information Technology (continued) | |||||||
| 3,680 | Polycom, Inc.† | $ | 49,680 | ||||
| 540 | Power Integrations, Inc.(a) | 27,940 | |||||
| 110 | Proofpoint, Inc.† | 5,305 | |||||
| 1,310 | PTC, Inc.† | 48,012 | |||||
| 310 | Qlik Technologies, Inc.† | 9,576 | |||||
| 240 | Qualys, Inc.†(a) | 9,060 | |||||
| 3,144 | Rambus, Inc.†(a) | 34,867 | |||||
| 2,567 | RF Micro Devices, Inc.†(a) | 42,587 | |||||
| 365 | Rofin-Sinar Technologies, Inc.†(a) | 10,501 | |||||
| 22,060 | Ruckus Wireless, Inc.† | 265,161 | |||||
| 650 | ScanSource, Inc.†(a) | 26,104 | |||||
| 225 | Semtech Corp.†(a) | 6,203 | |||||
| 2,234 | ShoreTel, Inc.† | 16,420 | |||||
| 90 | Shutterstock, Inc.† | 6,219 | |||||
| 4,223 | Silicon Image, Inc.†(a) | 23,311 | |||||
| 10,630 | Silicon Laboratories, Inc.† | 506,201 | |||||
| 3,608 | Sonus Networks, Inc.†(a) | 14,324 | |||||
| 3,280 | SPS Commerce, Inc.†(a) | 185,746 | |||||
| 480 | SS&C Technologies Holdings, Inc. | 28,075 | |||||
| 145 | Super Micro Computer, Inc.†(a) | 5,058 | |||||
| 834 | Synaptics, Inc.† | 57,412 | |||||
| 278 | Syntel, Inc.†(a) | 12,504 | |||||
| 1,148 | TeleTech Holdings, Inc.† | 27,185 | |||||
| 150 | Tyler Technologies, Inc.† | 16,416 | |||||
| 1,910 | Ultra Clean Holdings, Inc.† | 17,725 | |||||
| 615 | Unisys Corp.† | 18,130 | |||||
| 344 | Verint Systems, Inc.†(a) | 20,048 | |||||
| 360 | Virtusa Corp.† | 15,001 | |||||
| 679 | Web.com Group, Inc.†(a) | 12,894 | |||||
| 569 | WEX, Inc.†(a) | 56,285 | |||||
| 2,108 | Zix Corp.† | 7,589 | |||||
| 5,819,326 | |||||||
Materials — 1.4% | |||||||
| 1,955 | Berry Plastics Group, Inc.† | 61,680 | |||||
| 115 | Calgon Carbon Corp.† | 2,390 | |||||
| 279 | Chemtura Corp.†(a) | 6,900 | |||||
| 994 | Clearwater Paper Corp.† | 68,139 | |||||
| 940 | Ferro Corp.†(a) | 12,182 | |||||
| 905 | Globe Specialty Metals, Inc. | 15,593 | |||||
| 2,320 | Graphic Packaging Holding Co.† | 31,599 | |||||
| 274 | HB Fuller Co.(a) | 12,201 | |||||
| 995 | KapStone Paper and Packaging Corp. | 29,164 | |||||
| 640 | Kronos Worldwide, Inc. | 8,333 | |||||
| 60 | Minerals Technologies, Inc. | 4,167 | |||||
| 694 | Neenah Paper, Inc.(a) | 41,827 | |||||
| 1,249 | OMNOVA Solutions, Inc.†(a) | 10,167 | |||||
| 139 | PolyOne Corp.(a) | 5,269 | |||||
| 3,590 | Rentech, Inc.†(a) | 4,523 | |||||
| 90 | Schweitzer-Mauduit International, Inc.(a) | 3,807 | |||||
| 1,140 | Stillwater Mining Co.†(a) | 16,803 | |||||
| 730 | Worthington Industries, Inc.(a) | 21,966 | |||||
| 1,205 | Zep, Inc.(a) | 18,256 | |||||
| 374,966 | |||||||
Telecommunication Services — 0.5% | |||||||
| 320 | Atlantic Tele-Network, Inc.(a) | 21,629 | |||||
| 8,478 | Cincinnati Bell, Inc.†(a) | 27,045 | |||||
| 992 | General Communication, Inc., Class A†(a) | 13,640 | |||||
| 1,698 | HC2 Holdings, Inc.† | 14,161 | |||||
| 2,815 | Inteliquent, Inc.(a) | 55,258 | |||||
| 380 | Shenandoah Telecommunications Co.(a) | 11,875 | |||||
| 143,608 | |||||||
| Total Common Stock | |||||||
| (Cost $20,985,737) | 26,561,175 | ||||||
| Shares | Value | ||||||
SHORT-TERM INVESTMENTS (c) — 52.4% | |||||||
| 361,279 | Northern Trust Institutional Government Select Portfolio, 0.010% | $ | 361,279 | ||||
| 13,730,764 | Northern Trust Institutional Liquid Asset Portfolio, 0.010%(d) | 13,730,764 | |||||
| Total Short-Term Investments | |||||||
| (Cost $14,092,043) | 14,092,043 | ||||||
RIGHT — 0.0% | |||||||
United States — 0.0% | |||||||
| 180 | Trius Contingent Value † | 360 | |||||
Total Right (Cost $–) | 360 | ||||||
Total Investments — 151.2% | |||||||
| (Cost $35,077,780) | 40,653,578 | ||||||
Other Assets & Liabilities, Net — (51.2)% | (13,772,205 | ) | |||||
NET ASSETS — 100.0% | $ | 26,881,373 | |||||
| Ltd. — Limited |
| PLC — Public Limited Company |
| † | Non-income producing security. |
| (a) | This security or a partial position of this security is on loan at December 31, 2014. The total market value of securities on loan at September 30, 2014 was $13,300,025 (Note 6). |
| (b) | Real Estate Investment Trust. |
| (c) | Rate shown is the 7-day effective yield as of December 31, 2014. |
| (d) | This security was purchased with cash collateral held from securities on loan. The total value of such securities as of December 31, 2014 was $13,730,764. Securities on loan are also collateralized by various U.S. Treasury obligations in the amount of $3,919 (Note 6). |
Wilshire Mutual Funds, Inc. Small Company Value Portfolio Schedule of Investments | December 31, 2014 |
| Shares | Value | ||||||
COMMON STOCK — 97.0%†† | |||||||
Consumer Discretionary — 9.1% | |||||||
| 1,158 | American Axle & Manufacturing Holdings, Inc.†(a) | $ | 26,159 | ||||
| 510 | Ascent Capital Group, Inc., Class A† | 26,994 | |||||
| 1,220 | Barnes & Noble, Inc.† | 28,328 | |||||
| 100 | Brown Shoe Co., Inc. | 3,215 | |||||
| 1,120 | Cato Corp. (The), Class A(a) | 47,242 | |||||
| 450 | Children's Place Retail Stores, Inc. (The)(a) | 25,650 | |||||
| 680 | Citi Trends, Inc.† | 17,170 | |||||
| 1,880 | Cooper Tire & Rubber Co. | 65,142 | |||||
| 270 | Cracker Barrel Old Country Store, Inc.(a) | 38,005 | |||||
| 3,168 | Dana Holding Corp. | 68,872 | |||||
| 7,220 | Denny's Corp.† | 74,438 | |||||
| 1,050 | DineEquity, Inc. | 108,822 | |||||
| 11,035 | Express, Inc.† | 162,104 | |||||
| 730 | Federal-Mogul Holdings Corp.†(a) | 11,746 | |||||
| 289 | Flexsteel Industries, Inc.(a) | 9,320 | |||||
| 514 | Group 1 Automotive, Inc.(a) | 46,065 | |||||
| 4,733 | Harte-Hanks, Inc.(a) | 36,634 | |||||
| 20,381 | Hooker Furniture Corp. | 349,942 | |||||
| 1,704 | Iconix Brand Group, Inc.†(a) | 57,578 | |||||
| 340 | Jack in the Box, Inc. | 27,186 | |||||
| 6,393 | Journal Communications, Inc., Class A† | 73,072 | |||||
| 1,730 | La-Z-Boy, Inc., Class Z | 46,433 | |||||
| 1,314 | Libbey, Inc.† | 41,312 | |||||
| 14 | Lifetime Brands, Inc. | 241 | |||||
| 2,083 | Live Nation Entertainment, Inc.† | 54,387 | |||||
| 714 | Marriott Vacations Worldwide Corp. | 53,222 | |||||
| 570 | Matthews International Corp., Class A(a) | 27,742 | |||||
| 10 | MDC Partners, Inc., Class A(a) | 227 | |||||
| 210 | Meritage Homes Corp.†(a) | 7,558 | |||||
| 640 | Movado Group, Inc.(a) | 18,157 | |||||
| 620 | National CineMedia, Inc.(a) | 8,909 | |||||
| 750 | Nautilus, Inc.†(a) | 11,385 | |||||
| 2,410 | Office Depot, Inc.† | 20,666 | |||||
| 3,350 | Orbitz Worldwide, Inc.† | 27,571 | |||||
| 1,049 | Penske Automotive Group, Inc.(a) | 51,474 | |||||
| 2,916 | Reading International, Inc., Class A†(a) | 38,666 | |||||
| 769 | Red Robin Gourmet Burgers, Inc.†(a) | 59,194 | |||||
| 983 | Regis Corp.†(a) | 16,475 | |||||
| 664 | Rent-A-Center, Inc., Class A(a) | 24,117 | |||||
| 2,660 | Ruth's Hospitality Group, Inc.(a) | 39,900 | |||||
| 485 | Scholastic Corp. | 17,664 | |||||
| 1,259 | Shiloh Industries, Inc.†(a) | 19,804 | |||||
| 1,060 | Skechers U.S.A., Inc., Class A† | 58,565 | |||||
| 1,960 | Sonic Corp.(a) | 53,371 | |||||
| 2,385 | Spartan Motors, Inc.(a) | 12,545 | |||||
| 90 | Speedway Motorsports, Inc.(a) | 1,968 | |||||
| 1,100 | Stein Mart, Inc.(a) | 16,082 | |||||
| 31,820 | Stoneridge, Inc.†(a) | 409,205 | |||||
| 191 | Tenneco, Inc.† | 10,813 | |||||
| 680 | Time, Inc. | 16,735 | |||||
| 15,525 | TRI Pointe Homes, Inc.†(a) | 236,756 | |||||
| 2,704,828 | |||||||
Consumer Staples — 5.5% | |||||||
| 176 | Andersons, Inc. (The)(a) | 9,353 | |||||
| 22,935 | Elizabeth Arden, Inc.†(a) | 490,580 | |||||
| 2,455 | Harbinger Group, Inc.†(a) | 34,763 | |||||
| 109 | Ingles Markets, Inc., Class A | 4,043 | |||||
| 9,100 | Inter Parfums, Inc.(a) | 249,795 | |||||
| 2,851 | Omega Protein Corp.†(a) | 30,135 | |||||
| Shares | Value | ||||||
| Consumer Staples (continued) | |||||||
| 1,187 | Pantry, Inc. (The)†(a) | $ | 43,990 | ||||
| 1,470 | Revlon, Inc., Class A† | 50,215 | |||||
| 1,070 | Sanderson Farms, Inc.(a) | 89,907 | |||||
| 111 | Seneca Foods Corp., Class A†(a) | 3,000 | |||||
| 1,070 | SpartanNash Co.(a) | 27,970 | |||||
| 470 | Spectrum Brands Holdings, Inc. | 44,969 | |||||
| 2,600 | SUPERVALU, Inc.†(a) | 25,220 | |||||
| 6,028 | TreeHouse Foods, Inc.†(a) | 515,575 | |||||
| 1,619,515 | |||||||
Energy — 0.1% | |||||||
| 9,480 | Forest Oil Corp.†(a) | 2,133 | |||||
| 11,250 | ION Geophysical Corp.†(a) | 30,938 | |||||
| 1,100 | VAALCO Energy, Inc.†(a) | 5,016 | |||||
| 38,087 | |||||||
Financials — 31.6% | |||||||
| 5,690 | AG Mortgage Investment Trust, Inc.(a) (b) | 105,663 | |||||
| 490 | Agree Realty Corp.(b) | 15,234 | |||||
| 1,480 | Alexander & Baldwin, Inc.(a) | 58,105 | |||||
| 3,370 | Altisource Residential Corp., Class B(a) (b) | 65,378 | |||||
| 1,150 | Ambac Financial Group, Inc.†(a) | 28,175 | |||||
| 3,460 | American Capital Mortgage Investment Corp.(a) (b) | 65,186 | |||||
| 644 | Amerisafe, Inc. | 27,280 | |||||
| 80 | Anworth Mortgage Asset Corp.(b) | 420 | |||||
| 4,800 | Apollo Commercial Real Estate Finance, Inc.(a) (b) | 78,528 | |||||
| 5,630 | Apollo Residential Mortgage, Inc.(a) (b) | 88,785 | |||||
| 1,439 | Argo Group International Holdings, Ltd. | 79,821 | |||||
| 3,870 | Armada Hoffler Properties, Inc.(a) (b) | 36,726 | |||||
| 2,790 | Ashford Hospitality Prime, Inc.(b) | 47,876 | |||||
| 1,340 | Associated Estates Realty Corp.(a) (b) | 31,101 | |||||
| 14,040 | Astoria Financial Corp.(a) | 187,574 | |||||
| 3,330 | BancorpSouth, Inc.(a) | 74,958 | |||||
| 2,297 | Bank Mutual Corp.(a) | 15,757 | |||||
| 1,290 | Bank of the Ozarks, Inc.(a) | 48,917 | |||||
| 8,689 | Boston Private Financial Holdings, Inc.(a) | 117,041 | |||||
| 27,625 | Brandywine Realty Trust(b) | 441,448 | |||||
| 1,320 | Calamos Asset Management, Inc., Class A(a) | 17,583 | |||||
| 15,275 | Capital Bank Financial Corp., Class A†(a) | 409,370 | |||||
| 4,300 | Capitol Federal Financial, Inc. | 54,954 | |||||
| 7,566 | Capstead Mortgage Corp.(a) (b) | 92,910 | |||||
| 590 | Cash America International, Inc.(a) | 13,346 | |||||
| 1,150 | CatchMark Timber Trust, Inc., Class A(b) | 13,018 | |||||
| 1,844 | Cathay General Bancorp(a) | 47,188 | |||||
| 8,918 | Cedar Realty Trust, Inc.(a) (b) | 65,458 | |||||
| 1,895 | Centerstate Banks, Inc.(a) | 22,569 | |||||
| 900 | Central Pacific Financial Corp.(a) | 19,350 | |||||
| 3,060 | Chambers Street Properties(a) (b) | 24,664 | |||||
| 850 | Chatham Lodging Trust(a) (b) | 24,624 | |||||
| 294 | Chemical Financial Corp.(a) | 9,008 | |||||
| 440 | Chesapeake Lodging Trust(b) | 16,372 | |||||
| 110 | Citizens & Northern Corp. | 2,274 | |||||
| 244 | City Holding Co. | 11,353 | |||||
| 5,220 | CNO Financial Group, Inc.(a) | 89,888 | |||||
| 1,735 | Community Bank System, Inc.(a) | 66,156 | |||||
| 11,450 | Cowen Group, Inc., Class A†(a) | 54,960 | |||||
| 700 | CubeSmart, Class Comdty (histrt)(a) (b) | 15,449 | |||||
| 720 | CyrusOne, Inc.(b) | 19,836 | |||||
| 9,670 | CYS Investments, Inc.(a) (b) | 84,322 | |||||
| 62 | DCT Industrial Trust, Inc. | 2,211 | |||||
| 1,050 | Dime Community Bancshares, Inc.(a) | 17,094 | |||||
| 2,166 | DuPont Fabros Technology, Inc.(a) (b) | 71,998 | |||||
Wilshire Mutual Funds, Inc. Small Company Value Portfolio Schedule of Investments | December 31, 2014 |
| Shares | Value | ||||||
| Financials (continued) | |||||||
| 1,243 | Eagle Bancorp, Inc.† | $ | 44,151 | ||||
| 240 | EastGroup Properties, Inc.(a) (b) | 15,197 | |||||
| 394 | Employers Holdings, Inc.(a) | 9,263 | |||||
| 594 | Enova International, Inc.†(a) | 13,222 | |||||
| 1,094 | Enterprise Financial Services Corp.(a) | 21,585 | |||||
| 1,258 | EPR Properties(a) | 72,499 | |||||
| 796 | Equity One, Inc.(b) | 20,187 | |||||
| 1,869 | EverBank Financial Corp. | 35,623 | |||||
| 1,907 | FBL Financial Group, Inc., Class A(a) | 110,663 | |||||
| 900 | Federated National Holding Co. | 21,744 | |||||
| 10,290 | FelCor Lodging Trust, Inc.(b) | 111,338 | |||||
| 4,224 | First American Financial Corp.(a) | 143,194 | |||||
| 1,230 | First Bancorp(a) | 22,718 | |||||
| 13,480 | First Busey Corp.(a) | 87,755 | |||||
| 57 | First Citizens BancShares, Inc., Class A | 14,409 | |||||
| 5,533 | First Commonwealth Financial Corp.(a) | 51,014 | |||||
| 2,005 | First Financial Bancorp | 37,273 | |||||
| 2,303 | First Industrial Realty Trust, Inc.(a) (b) | 47,350 | |||||
| 1,550 | First Midwest Bancorp, Inc. | 26,520 | |||||
| 480 | Flagstar Bancorp, Inc.†(a) | 7,550 | |||||
| 790 | Flushing Financial Corp.(a) | 16,013 | |||||
| 4,953 | FNB Corp.(a) | 65,974 | |||||
| 30,625 | Forestar Group, Inc.†(a) | 471,625 | |||||
| 1,024 | Fox Chase Bancorp, Inc. | 17,070 | |||||
| 1,490 | Franklin Financial Corp.†(a) | 31,558 | |||||
| 450 | Geo Group, Inc. (The)(b) | 18,162 | |||||
| 5,460 | Getty Realty Corp.(a) (b) | 99,427 | |||||
| 1,839 | Glacier Bancorp, Inc.(a) | 51,069 | |||||
| 1,158 | Global Indemnity PLC, Class A†(a) | 32,852 | |||||
| 5,070 | Government Properties Income Trust(a) (b) | 116,661 | |||||
| 1,534 | Greenlight Capital Re, Ltd., Class A†(a) | 50,085 | |||||
| 1,998 | Hanmi Financial Corp.(a) | 43,576 | |||||
| 320 | Hatteras Financial Corp.(b) | 5,898 | |||||
| 470 | Healthcare Realty Trust, Inc.(a) (b) | 12,840 | |||||
| 1,800 | Highwoods Properties, Inc.(a) | 79,704 | |||||
| 1,840 | Home BancShares, Inc.(a) | 59,174 | |||||
| 3,180 | HomeStreet, Inc.(a) | 55,364 | |||||
| 800 | Horace Mann Educators Corp. | 26,544 | |||||
| 1,070 | Independent Bank Corp.(a) | 13,964 | |||||
| 503 | Infinity Property & Casualty Corp.(a) | 38,862 | |||||
| 2,230 | Inland Real Estate Corp.(a) (b) | 24,419 | |||||
| 1,986 | Investment Technology Group, Inc.†(a) | 41,349 | |||||
| 1,146 | LTC Properties, Inc.(a) (b) | 49,473 | |||||
| 2,568 | Maiden Holdings, Ltd.(a) | 32,845 | |||||
| 1,900 | Manning & Napier, Inc., Class A | 26,258 | |||||
| 4,895 | MB Financial, Inc.(a) | 160,850 | |||||
| 924 | Mercantile Bank Corp. | 19,422 | |||||
| 3,380 | MGIC Investment Corp.†(a) | 31,502 | |||||
| 1,400 | Moelis & Co., Class A | 48,902 | |||||
| 749 | Montpelier Re Holdings, Ltd. | 26,829 | |||||
| 12,064 | National Penn Bancshares, Inc.(a) | 126,974 | |||||
| 124 | National Western Life Insurance Co., Class A(a) | 33,387 | |||||
| 464 | Navigators Group, Inc. (The)† | 34,030 | |||||
| 1,291 | NBT Bancorp, Inc.(a) | 33,915 | |||||
| 5,640 | New Residential Investment Corp.(a) (b) | 72,023 | |||||
| 2,132 | Old National Bancorp(a) | 31,724 | |||||
| 1,001 | Oppenheimer Holdings, Inc., Class A(a) | 23,273 | |||||
| 871 | Oritani Financial Corp.(a) | 13,413 | |||||
| 1,342 | Pacific Continental Corp. | 19,030 | |||||
| 10,005 | PacWest Bancorp(a) | 454,827 | |||||
| 4,330 | PennyMac Mortgage Investment Trust(a) (b) | 91,320 | |||||
| 1,149 | Pinnacle Financial Partners, Inc. | 45,431 | |||||
| Shares | Value | ||||||
| Financials (continued) | |||||||
| 834 | Piper Jaffray Cos.†(a) | $ | 48,447 | ||||
| 1,334 | Platinum Underwriters Holdings, Ltd. | 97,942 | |||||
| 1,560 | Potlatch Corp. | 65,317 | |||||
| 839 | Primerica, Inc. | 45,524 | |||||
| 10,527 | PrivateBancorp, Inc., Class A | 351,602 | |||||
| 1,340 | Prosperity Bancshares, Inc.(a) | 74,182 | |||||
| 2,384 | Provident Financial Services, Inc. | 43,055 | |||||
| 6,080 | Radian Group, Inc. | 101,658 | |||||
| 16,780 | Ramco-Gershenson Properties Trust(a) (b) | 314,457 | |||||
| 1,337 | Republic Bancorp, Inc., Class A(a) | 33,051 | |||||
| 5,060 | Resource Capital Corp.(a) (b) | 25,502 | |||||
| 1,012 | RLI Corp.(a) | 49,993 | |||||
| 1,604 | RLJ Lodging Trust(b) | 53,782 | |||||
| 948 | S&T Bancorp, Inc.(a) | 28,260 | |||||
| 1,310 | Sabra Health Care REIT, Inc.(a) (b) | 39,785 | |||||
| 2,990 | Select Income REIT(a) (b) | 72,986 | |||||
| 1,170 | Selective Insurance Group, Inc. | 31,789 | |||||
| 849 | Simmons First National Corp., Class A(a) | 34,512 | |||||
| 992 | Southwest Bancorp, Inc.(a) | 17,221 | |||||
| 150 | Square 1 Financial, Inc., Class A†(a) | 3,705 | |||||
| 990 | State Auto Financial Corp.(a) | 21,998 | |||||
| 170 | Stifel Financial Corp.†(a) | 8,673 | |||||
| 3,788 | Strategic Hotels & Resorts, Inc.† (b) | 50,115 | |||||
| 2,530 | Sunstone Hotel Investors, Inc.(b) | 41,770 | |||||
| 4,240 | Symetra Financial Corp.(a) | 97,732 | |||||
| 1,010 | Territorial Bancorp, Inc.(a) | 21,766 | |||||
| 1,014 | Trico Bancshares | 25,046 | |||||
| 3,644 | TrustCo Bank Corp. | 26,456 | |||||
| 1,101 | Umpqua Holdings Corp. | 18,728 | |||||
| 761 | United Fire Group, Inc.(a) | 22,625 | |||||
| 400 | Universal Insurance Holdings, Inc. | 8,180 | |||||
| 1,010 | Urstadt Biddle Properties, Inc., Class A(b) | 22,099 | |||||
| 2,550 | Washington Federal, Inc.(a) | 56,483 | |||||
| 3,070 | Washington Real Estate Investment Trust(a) (b) | 84,916 | |||||
| 5,839 | Webster Financial Corp.(a) | 189,943 | |||||
| 18,263 | Western Alliance Bancorp† | 507,711 | |||||
| 3,700 | Wilshire Bancorp, Inc. | 37,481 | |||||
| 2,090 | Wintrust Financial Corp.(a) | 97,728 | |||||
| 9,413,021 | |||||||
Health Care — 7.0% | |||||||
| 2,530 | Addus HomeCare Corp.† | 61,403 | |||||
| 140 | Almost Family, Inc.†(a) | 4,053 | |||||
| 320 | Amedisys, Inc.†(a) | 9,392 | |||||
| 911 | Amsurg Corp., Class A†(a) | 49,859 | |||||
| 270 | Anacor Pharmaceuticals, Inc.†(a) | 8,708 | |||||
| 5,655 | Analogic Corp.(a) | 478,469 | |||||
| 2,740 | BioTelemetry, Inc.† | 27,482 | |||||
| 241 | Centene Corp.† | 25,028 | |||||
| 1,004 | CONMED Corp.(a) | 45,140 | |||||
| 2,091 | HealthSouth Corp.(a) | 80,420 | |||||
| 1,740 | Healthways, Inc.†(a) | 34,591 | |||||
| 8,030 | Impax Laboratories, Inc.†(a) | 254,310 | |||||
| 3,194 | Kindred Healthcare, Inc. | 58,067 | |||||
| 2,181 | Magellan Health, Inc.† | 130,926 | |||||
| 1,378 | Molina Healthcare, Inc.†(a) | 73,764 | |||||
| 474 | National Healthcare Corp. | 29,786 | |||||
| 1,320 | NuVasive, Inc.† | 62,251 | |||||
| 1,030 | Orthofix International NV†(a) | 30,962 | |||||
| 2,468 | PharMerica Corp.†(a) | 51,112 | |||||
| 100 | Prothena Corp. PLC† | 2,076 | |||||
| 100 | Prothena Corp. PLC† | 2,076 | |||||
| 6,320 | Sagent Pharmaceuticals, Inc.†(a) | 158,695 | |||||
Wilshire Mutual Funds, Inc. Small Company Value Portfolio Schedule of Investments | December 31, 2014 |
| Shares | Value | ||||||
| Health Care (continued) | |||||||
| 6,099 | Select Medical Holdings Corp.(a) | $ | 87,826 | ||||
| 6,064 | Triple-S Management Corp., Class B†(a) | 144,990 | |||||
| 2,114 | WellCare Health Plans, Inc.†(a) | 173,475 | |||||
| 2,084,861 | |||||||
Industrials — 12.9% | |||||||
| 1,064 | AAR Corp.(a) | 29,558 | |||||
| 10,320 | ACCO Brands Corp.†(a) | 92,983 | |||||
| 3,270 | Accuride Corp.†(a) | 14,192 | |||||
| 3,220 | Actuant Corp., Class A(a) | 87,713 | |||||
| 1,020 | Aerovironment, Inc.† | 27,795 | |||||
| 1,210 | Air Transport Services Group, Inc.†(a) | 10,358 | |||||
| 10,110 | Albany International Corp., Class A(a) | 384,079 | |||||
| 1,054 | Ampco-Pittsburgh Corp.(a) | 20,289 | |||||
| 3,900 | ARC Document Solutions, Inc.† | 39,858 | |||||
| 1,264 | Argan, Inc.(a) | 42,521 | |||||
| 6,847 | Astronics Corp.†(a) | 378,707 | |||||
| 580 | Barnes Group, Inc. | 21,466 | |||||
| 3,702 | Blount International, Inc.† | 65,044 | |||||
| 1,305 | Brady Corp., Class A(a) | 35,679 | |||||
| 3,860 | Brink's Co. (The)(a) | 94,223 | |||||
| 7,059 | Casella Waste Systems, Inc., Class A†(a) | 28,518 | |||||
| 1,908 | Comfort Systems USA, Inc.(a) | 32,665 | |||||
| 1,480 | CRA International, Inc.†(a) | 44,874 | |||||
| 830 | Cubic Corp. | 43,691 | |||||
| 2,320 | Curtiss-Wright Corp. | 163,769 | |||||
| 1,200 | Deluxe Corp.(a) | 74,700 | |||||
| 1,370 | Douglas Dynamics, Inc.(a) | 29,359 | |||||
| 790 | Ducommun, Inc.†(a) | 19,971 | |||||
| 472 | EMCOR Group, Inc. | 20,999 | |||||
| 5,865 | EnerSys, Inc. | 361,988 | |||||
| 169 | FTI Consulting, Inc.†(a) | 6,528 | |||||
| 8,980 | GP Strategies Corp.† | 304,691 | |||||
| 3,242 | Great Lakes Dredge & Dock Corp.(a) | 27,752 | |||||
| 5,767 | Griffon Corp.(a) | 76,701 | |||||
| 337 | HEICO Corp.(a) | 20,355 | |||||
| 654 | Hyster-Yale Materials Handling, Inc. | 47,873 | |||||
| 4,293 | JetBlue Airways Corp.†(a) | 68,087 | |||||
| 2,000 | Knoll, Inc.(a) | 42,340 | |||||
| 1,160 | Kratos Defense & Security Solutions, Inc.†(a) | 5,823 | |||||
| 19,095 | Marten Transport, Ltd.(a) | 417,417 | |||||
| 560 | Matson, Inc. | 19,331 | |||||
| 4,390 | Meritor, Inc.†(a) | 66,509 | |||||
| 754 | Miller Industries, Inc.(a) | 15,676 | |||||
| 9,430 | Orbital Sciences Corp.† | 253,573 | |||||
| 7,720 | Performant Financial Corp.†(a) | 51,338 | |||||
| 690 | Quad | 15,842 | |||||
| 3,540 | Quality Distribution, Inc.† | 37,665 | |||||
| 2,382 | Republic Airways Holdings, Inc.†(a) | 34,753 | |||||
| 1,540 | Steelcase, Inc., Class A | 27,643 | |||||
| 540 | Teledyne Technologies, Inc.† | 55,480 | |||||
| 797 | Tennant Co.(a) | 57,519 | |||||
| 510 | United Stationers, Inc. | 21,502 | |||||
| 3,839,397 | |||||||
Information Technology — 17.4% | |||||||
| 3,294 | Acxiom Corp.† | 66,769 | |||||
| 3,320 | Amkor Technology, Inc.† | 23,572 | |||||
| 190 | Anixter International, Inc.† | 16,807 | |||||
| 1,300 | Benchmark Electronics, Inc.†(a) | 33,072 | |||||
| 1,630 | Black Box Corp.(a) | 38,957 | |||||
| 438 | CACI International, Inc., Class A† | 37,747 | |||||
| 550 | Cardtronics, Inc.† | 21,219 | |||||
| 1,350 | Cascade Microtech, Inc.† | 19,724 | |||||
| Shares | Value | ||||||
| Information Technology (continued) | |||||||
| 80 | Checkpoint Systems, Inc.† | $ | 1,098 | ||||
| 2,240 | Cirrus Logic, Inc.†(a) | 52,797 | |||||
| 9,965 | Coherent, Inc.†(a) | 605,075 | |||||
| 2,460 | Computer Task Group, Inc.(a) | 23,444 | |||||
| 1,134 | Comtech Telecommunications Corp.(a) | 35,743 | |||||
| 4,780 | Convergys Corp.(a) | 97,369 | |||||
| 1,193 | CTS Corp. | 21,271 | |||||
| 700 | Diodes, Inc.† | 19,299 | |||||
| 3,290 | EarthLink Holdings Corp.(a) | 14,443 | |||||
| 970 | EnerNOC, Inc.†(a) | 14,987 | |||||
| 24,490 | Entegris, Inc.† | 323,513 | |||||
| 2,600 | Euronet Worldwide, Inc.†(a) | 142,740 | |||||
| 2,410 | Global Cash Access Holdings, Inc.† | 17,231 | |||||
| 31,100 | GSI Group, Inc.†(a) | 457,792 | |||||
| 2,510 | Higher One Holdings, Inc.† | 10,567 | |||||
| 290 | iGATE Corp.† | 11,449 | |||||
| 2,172 | Insight Enterprises, Inc.† | 56,233 | |||||
| 26,145 | Integrated Device Technology, Inc.† | 512,442 | |||||
| 1,770 | Intersil Corp., Class A | 25,612 | |||||
| 1,490 | IXYS Corp.(a) | 18,774 | |||||
| 64,415 | Lattice Semiconductor Corp.†(a) | 443,819 | |||||
| 1,270 | ManTech International Corp., Class A | 38,392 | |||||
| 22,485 | Microsemi Corp.†(a) | 638,124 | |||||
| 40,865 | Mitel Networks Corp.† | 436,847 | |||||
| 2,030 | MKS Instruments, Inc. | 74,298 | |||||
| 1,680 | Model N, Inc.†(a) | 17,842 | |||||
| 4,373 | MoneyGram International, Inc.†(a) | 39,751 | |||||
| 580 | Monster Worldwide, Inc.†(a) | 2,679 | |||||
| 574 | NETGEAR, Inc.†(a) | 20,423 | |||||
| 1,340 | Newport Corp.†(a) | 25,607 | |||||
| 2,146 | OmniVision Technologies, Inc.†(a) | 55,796 | |||||
| 3,274 | Photronics, Inc.†(a) | 27,207 | |||||
| 670 | Plexus Corp.†(a) | 27,611 | |||||
| 2,270 | PMC - Sierra, Inc.†(a) | 20,793 | |||||
| 6,610 | Polycom, Inc.† | 89,235 | |||||
| 2,510 | Progress Software Corp.† | 67,820 | |||||
| 990 | QLogic Corp.† | 13,187 | |||||
| 310 | Reis, Inc.(a) | 8,113 | |||||
| 1,404 | Sanmina Corp.†(a) | 33,036 | |||||
| 2,236 | ScanSource, Inc.† | 89,798 | |||||
| �� | 1,354 | SYNNEX Corp.(a) | 105,829 | ||||
| 3,600 | Take-Two Interactive Software, Inc.†(a) | 100,908 | |||||
| 3,020 | Ultra Clean Holdings, Inc.† | 28,026 | |||||
| 2,240 | Unisys Corp.† | 66,035 | |||||
| 5,190,922 | |||||||
Materials — 9.1% | |||||||
| 1,090 | A Schulman, Inc. | 44,178 | |||||
| 330 | Axiall Corp.(a) | 14,015 | |||||
| 850 | Berry Plastics Group, Inc.† | 26,818 | |||||
| 9,335 | Boise Cascade Co.† | 346,795 | |||||
| 494 | Clearwater Paper Corp.† | 33,864 | |||||
| 3,070 | Deltic Timber Corp.(a) | 209,988 | |||||
| 3,190 | Globe Specialty Metals, Inc. | 54,964 | |||||
| 310 | KMG Chemicals, Inc. | 6,200 | |||||
| 16,185 | Landec Corp.†(a) | 223,515 | |||||
| 17,595 | Louisiana-Pacific Corp.†(a) | 291,373 | |||||
| 9,245 | Materion Corp.(a) | 325,701 | |||||
| 874 | Minerals Technologies, Inc. | 60,699 | |||||
| 5,869 | Neenah Paper, Inc.(a) | 353,725 | |||||
| 4,260 | Olin Corp.(a) | 97,000 | |||||
| 954 | OM Group, Inc.(a) | 28,429 | |||||
| 20,490 | PH Glatfelter Co.(a) | 523,929 | |||||
| 80 | RTI International Metals, Inc.†(a) | 2,021 | |||||
Wilshire Mutual Funds, Inc. Small Company Value Portfolio Schedule of Investments | December 31, 2014 |
| Shares | Value | ||||||
| Materials (continued) | |||||||
| 704 | Sensient Technologies Corp.(a) | $ | 42,479 | ||||
| 1,610 | Zep, Inc.(a) | 24,392 | |||||
| 2,710,085 | |||||||
Telecommunication Services — 0.2% | |||||||
| 16,970 | Cincinnati Bell, Inc.†(a) | 54,134 | |||||
| 1,060 | General Communication, Inc., Class A† | 14,575 | |||||
| 68,709 | |||||||
Utilities — 4.1% | |||||||
| 509 | American States Water Co.(a) | 19,169 | |||||
| 380 | Avista Corp. | 13,433 | |||||
| 990 | California Water Service Group | 24,364 | |||||
| 2,694 | Cleco Corp. | 146,931 | |||||
| 10 | Connecticut Water Service, Inc.(a) | 363 | |||||
| 2,180 | Dynegy, Inc., Class A† | 66,163 | |||||
| 694 | El Paso Electric Co. | 27,802 | |||||
| 954 | IDACORP, Inc.(a) | 63,145 | |||||
| 6,895 | Laclede Group, Inc. | 366,814 | |||||
| 358 | MGE Energy, Inc.(a) | 16,328 | |||||
| 173 | Middlesex Water Co.(a) | 3,989 | |||||
| 50 | New Jersey Resources Corp. | 3,060 | |||||
| 280 | NorthWestern Corp.(a) | 15,842 | |||||
| 1,629 | Ormat Technologies, Inc.(a) | 44,276 | |||||
| 974 | PNM Resources, Inc. | 28,859 | |||||
| 1,449 | Portland General Electric Co.(a) | 54,816 | |||||
| 290 | South Jersey Industries, Inc.(a) | 17,090 | |||||
| 684 | Southwest Gas Corp. | 42,278 | |||||
| 5,094 | UIL Holdings Corp.(a) | 221,793 | |||||
| 764 | WGL Holdings, Inc.(a) | 41,730 | |||||
| 1,218,245 | |||||||
| Total Common Stock | |||||||
| (Cost $23,298,033) | 28,887,670 | ||||||
SHORT-TERM INVESTMENTS (c) — 47.1% | |||||||
| 862,168 | Northern Trust Institutional Government Select Portfolio, 0.010% | 862,168 | |||||
| 13,164,136 | Northern Trust Institutional Liquid Asset Portfolio, 0.010%(d) | 13,164,136 | |||||
| Total Short-Term Investments | |||||||
| (Cost $14,026,304) | 14,026,304 | ||||||
Total Investments — 144.1% | |||||||
| (Cost $37,324,337) | 42,913,974 | ||||||
Other Assets & Liabilities, Net — (44.1)% | (13,138,258 | ) | |||||
NET ASSETS — 100.0% | $ | 29,775,716 | |||||
| † | Non-income producing security. | |
| †† | More narrow industries are utilized for compliance purposes, whereas broad sectors are utilized for reporting purposes. | |
| (a) | This security or a partial position of this security is on loan at December 31, 2014. The total market value of securities on loan at December 31, 2014 was $12,700,131 (Note 6). | |
| (b) | Real Estate Investment Trust. | |
| (c) | Rate shown is the 7-day effective yield as of December 31, 2014. | |
| (d) | This security was purchased with cash collateral held from securities on loan. The total value of such securities as of December 31, 2014 was $13,164,136. Securities on loan are also collateralized by various U.S. Treasury obligations in the amount of $19,307 (Note 6). | |
| Ltd. — Limited | ||
PLC — Public Limited Company | ||
Wilshire Mutual Funds, Inc. Wilshire 5000 IndexSM Fund Schedule of Investments | December 31, 2014 |
| Shares | Value | ||||||
COMMON STOCK — 99.8% | |||||||
Consumer Discretionary — 12.7% | |||||||
| 300 | 1-800-Flowers.com, Inc., Class A†(a) | $ | 2,472 | ||||
| 975 | Aaron's, Inc. | 29,806 | |||||
| 900 | Abercrombie & Fitch Co., Class A(a) | 25,776 | |||||
| 900 | Advance Auto Parts, Inc. | 143,352 | |||||
| 850 | Aeropostale, Inc.†(a) | 1,972 | |||||
| 90 | AH Belo Corp., Class A | 934 | |||||
| 4,760 | Amazon.com, Inc.† | 1,477,266 | |||||
| 400 | Ambassadors Group, Inc.† | 1,000 | |||||
| 656 | AMC Networks, Inc., Class A†(a) | 41,833 | |||||
| 1,400 | American Axle & Manufacturing Holdings, Inc.† | 31,626 | |||||
| 2,625 | American Eagle Outfitters, Inc.(a) | 36,435 | |||||
| 300 | American Public Education, Inc.†(a) | 11,061 | |||||
| 964 | ANN, Inc.† | 35,167 | |||||
| 1,350 | Apollo Education Group, Inc., Class A† | 46,048 | |||||
| 450 | Aramark | 14,017 | |||||
| 300 | Asbury Automotive Group, Inc.†(a) | 22,776 | |||||
| 1,853 | Ascena Retail Group, Inc.† | 23,274 | |||||
| 200 | Ascent Capital Group, Inc., Class A†(a) | 10,586 | |||||
| 1,117 | Autoliv, Inc.(a) | 118,536 | |||||
| 1,250 | AutoNation, Inc.† | 75,512 | |||||
| 406 | AutoZone, Inc.† | 251,359 | |||||
| 550 | Barnes & Noble, Inc.†(a) | 12,771 | |||||
| 200 | Beazer Homes USA, Inc.† | 3,872 | |||||
| 1,400 | bebe stores, Inc.(a) | 3,066 | |||||
| 2,700 | Bed Bath & Beyond, Inc.† | 205,659 | |||||
| 3,050 | Best Buy Co., Inc. | 118,889 | |||||
| 200 | Big 5 Sporting Goods Corp.(a) | 2,926 | |||||
| 500 | Big Lots, Inc. | 20,010 | |||||
| 40 | Biglari Holdings, Inc.†(a) | 15,980 | |||||
| 55 | Biotime† | 58 | |||||
| 300 | BJ's Restaurants, Inc.†(a) | 15,063 | |||||
| 250 | Blue Nile, Inc.†(a) | 9,002 | |||||
| 224 | Blyth, Inc.(a) | 2,050 | |||||
| 300 | Bob Evans Farms, Inc.(a) | 15,354 | |||||
| 400 | Bon-Ton Stores, Inc. (The)(a) | 2,964 | |||||
| 100 | Books-A-Million, Inc., Class A†(a) | 171 | |||||
| 2,860 | BorgWarner, Inc. | 157,157 | |||||
| 2,000 | Boyd Gaming Corp.†(a) | 25,560 | |||||
| 1,000 | Bravo Brio Restaurant Group, Inc.† | 13,910 | |||||
| 500 | Bridgepoint Education, Inc.†(a) | 5,660 | |||||
| 300 | Bright Horizons Family Solutions, Inc.†(a) | 14,103 | |||||
| 775 | Brinker International, Inc. | 45,485 | |||||
| 764 | Brookfield Residential Properties, Inc.† | 18,382 | |||||
| 425 | Brown Shoe Co., Inc. | 13,664 | |||||
| 850 | Brunswick Corp.(a) | 43,571 | |||||
| 350 | Buckle, Inc. (The)(a) | 18,382 | |||||
| 166 | Buffalo Wild Wings, Inc.† | 29,943 | |||||
| 300 | Burlington Stores, Inc.† | 14,178 | |||||
| 500 | Cabela's, Inc.†(a) | 26,355 | |||||
| 2,625 | Cablevision Systems Corp., Class A | 54,180 | |||||
| 500 | Callaway Golf Co.(a) | 3,850 | |||||
| 500 | Career Education Corp.† | 3,480 | |||||
| 2,680 | CarMax, Inc.†(a) | 178,434 | |||||
| 300 | Carmike Cinemas, Inc.† | 7,881 | |||||
| 5,375 | Carnival Corp. | 243,649 | |||||
| 550 | Carter's, Inc. | 48,020 | |||||
| 300 | Cato Corp. (The), Class A | 12,654 | |||||
| 6,783 | CBS Corp., Class B(a) | 375,371 | |||||
| 362 | Charles & Colvard, Ltd.† | 666 | |||||
| 1,136 | Charter Communications, Inc., Class A† | 189,280 | |||||
| 600 | Cheesecake Factory, Inc. (The)(a) | 30,186 | |||||
| 2,450 | Chico's FAS, Inc. | 39,714 | |||||
| Shares | Value | ||||||
| Consumer Discretionary (continued) | |||||||
| 200 | Children's Place Retail Stores, Inc. (The)(a) | $ | 11,400 | ||||
| 337 | Chipotle Mexican Grill, Inc., Class A† | 230,680 | |||||
| 450 | Choice Hotels International, Inc. | 25,209 | |||||
| 181 | Churchill Downs, Inc. | 17,249 | |||||
| 1,125 | Cinemark Holdings, Inc. | 40,027 | |||||
| 50 | Citi Trends, Inc.† | 1,263 | |||||
| 1,000 | Clear Channel Outdoor Holdings, Inc., Class A | 10,590 | |||||
| 3,450 | Coach, Inc. | 129,582 | |||||
| 110 | Collectors Universe, Inc.(a) | 2,295 | |||||
| 400 | Columbia Sportswear Co. | 17,816 | |||||
| 26,046 | Comcast Corp., Class A | 1,510,928 | |||||
| 500 | Conn's, Inc.†(a) | 9,345 | |||||
| 1,000 | Cooper Tire & Rubber Co. | 34,650 | |||||
| 272 | Core-Mark Holding Co., Inc. | 16,845 | |||||
| 291 | Cracker Barrel Old Country Store, Inc.(a) | 40,961 | |||||
| 1,200 | Crocs, Inc.†(a) | 14,988 | |||||
| 6,200 | Crown Media Holdings, Inc., Class A†(a) | 21,948 | |||||
| 50 | CSS Industries, Inc.(a) | 1,382 | |||||
| 679 | CST Brands, Inc. | 29,611 | |||||
| 1,725 | Cumulus Media, Inc., Class A† | 7,297 | |||||
| 2,025 | Dana Holding Corp. | 44,023 | |||||
| 1,375 | Darden Restaurants, Inc.(a) | 80,616 | |||||
| 325 | Deckers Outdoor Corp.†(a) | 29,588 | |||||
| 200 | Demand Media, Inc.† | 1,224 | |||||
| 775 | DeVry Education Group, Inc. | 36,789 | |||||
| 1,302 | Dick's Sporting Goods, Inc. | 64,644 | |||||
| 347 | Dillard's, Inc., Class A | 43,437 | |||||
| 144 | DineEquity, Inc. | 14,924 | |||||
| 5,511 | DIRECTV† | 477,804 | |||||
| 1,298 | Discovery Communications, Inc., Class A† | 44,716 | |||||
| 1,298 | Discovery Communications, Inc., Class C† | 43,769 | |||||
| 2,800 | DISH Network Corp., Class A† | 204,092 | |||||
| 100 | Dixie Group, Inc. (The)†(a) | 917 | |||||
| 1,000 | Dollar General Corp.† | 70,700 | |||||
| 2,700 | Dollar Tree, Inc.† | 190,026 | |||||
| 528 | Domino's Pizza, Inc. | 49,722 | |||||
| 300 | Dorman Products, Inc.†(a) | 14,481 | |||||
| 3,848 | DR Horton, Inc. | 97,316 | |||||
| 1,200 | DreamWorks Animation SKG, Inc., Class A†(a) | 26,796 | |||||
| 300 | Drew Industries, Inc.† | 15,321 | |||||
| 1,150 | DSW, Inc., Class A | 42,895 | |||||
| 528 | Eldorado Resorts, Inc.†(a) | 2,138 | |||||
| 219 | Emmis Communications Corp., Class A†(a) | 410 | |||||
| 100 | Empire Resorts, Inc.†(a) | 776 | |||||
| 250 | Entercom Communications Corp., Class A†(a) | 3,040 | |||||
| 100 | Entravision Communications Corp., Class A | 648 | |||||
| 300 | EVINE Live, Inc.†(a) | 1,977 | |||||
| 1,366 | EW Scripps Co. (The), Class A†(a) | 30,530 | |||||
| 1,057 | Expedia, Inc.(a) | 90,226 | |||||
| 1,000 | Express, Inc.† | 14,690 | |||||
| 1,200 | Family Dollar Stores, Inc. | 95,052 | |||||
| 200 | Famous Dave's of America, Inc.†(a) | 5,254 | |||||
| 1,500 | Federal-Mogul Holdings Corp.†(a) | 24,135 | |||||
| 300 | Fiesta Restaurant Group, Inc.† | 18,240 | |||||
| 525 | Finish Line, Inc. (The), Class A | 12,763 | |||||
| 1,900 | Foot Locker, Inc. | 106,742 | |||||
| 51,060 | Ford Motor Co. | 791,430 | |||||
| 300 | Forward Industries, Inc.†(a) | 312 | |||||
Wilshire Mutual Funds, Inc. Wilshire 5000 IndexSM Fund Schedule of Investments | December 31, 2014 |
| Shares | Value | ||||||
| Consumer Discretionary (continued) | |||||||
| 600 | Fossil Group, Inc.† | $ | 66,444 | ||||
| 700 | Fred's, Inc., Class A(a) | 12,187 | |||||
| 160 | FTD, Inc.† | 5,571 | |||||
| 600 | Gaiam, Inc., Class A†(a) | 4,278 | |||||
| 1,625 | GameStop Corp., Class A(a) | 54,925 | |||||
| 600 | Gaming Partners International Corp.†(a) | 5,046 | |||||
| 2,800 | Gannett Co., Inc.(a) | 89,404 | |||||
| 3,975 | Gap, Inc. (The) | 167,387 | |||||
| 18,225 | General Motors Co. | 636,235 | |||||
| 275 | Genesco, Inc.†(a) | 21,071 | |||||
| 2,010 | Gentex Corp.(a) | 72,621 | |||||
| 375 | Gentherm, Inc.† | 13,733 | |||||
| 1,761 | Genuine Parts Co.(a) | 187,670 | |||||
| 300 | G-III Apparel Group, Ltd.† | 30,303 | |||||
| 300 | GNC Holdings, Inc., Class A | 14,088 | |||||
| 3,325 | Goodyear Tire & Rubber Co. (The) | 94,995 | |||||
| 300 | GoPro, Inc., Class A†(a) | 18,966 | |||||
| 500 | Grand Canyon Education, Inc.† | 23,330 | |||||
| 1,000 | Gray Television, Inc.† | 11,200 | |||||
| 45 | Green Brick Partners, Inc.† | 369 | |||||
| 200 | Group 1 Automotive, Inc. | 17,924 | |||||
| 400 | Guess, Inc. | 8,432 | |||||
| 3,035 | H&R Block, Inc. | 102,219 | |||||
| 1,155 | Hanesbrands, Inc. | 128,921 | |||||
| 2,775 | Harley-Davidson, Inc. | 182,900 | |||||
| 700 | Harman International Industries, Inc. | 74,697 | |||||
| 1,000 | Harte-Hanks, Inc. | 7,740 | |||||
| 1,300 | Hasbro, Inc.(a) | 71,487 | |||||
| 200 | Helen of Troy, Ltd.† | 13,012 | |||||
| 500 | hhgregg, Inc.†(a) | 3,785 | |||||
| 200 | Hibbett Sports, Inc.† | 9,686 | |||||
| 625 | Hillenbrand, Inc. | 21,562 | |||||
| 1,425 | Hilton Worldwide Holdings, Inc.† | 37,178 | |||||
| 15,855 | Home Depot, Inc. (The) | 1,664,299 | |||||
| 200 | Hooker Furniture Corp. | 3,434 | |||||
| 1,000 | Hovnanian Enterprises, Inc., Class A†(a) | 4,130 | |||||
| 418 | HSN, Inc. | 31,768 | |||||
| 600 | Hyatt Hotels Corp., Class A† | 36,126 | |||||
| 450 | Iconix Brand Group, Inc.†(a) | 15,205 | |||||
| 3,450 | International Game Technology | 59,513 | |||||
| 237 | International Speedway Corp., Class A | 7,501 | |||||
| 5,372 | Interpublic Group of Cos., Inc. (The) | 111,576 | |||||
| 743 | Interval Leisure Group, Inc.(a) | 15,521 | |||||
| 300 | iRobot Corp.† | 10,416 | |||||
| 340 | ITT Educational Services, Inc.†(a) | 3,267 | |||||
| 3,442 | J.C. Penney Co., Inc.†(a) | 22,304 | |||||
| 350 | Jack in the Box, Inc. | 27,986 | |||||
| 2,250 | Jarden Corp.† | 107,730 | |||||
| 500 | John Wiley & Sons, Inc., Class A | 29,620 | |||||
| 8,450 | Johnson Controls, Inc. | 408,473 | |||||
| 600 | Journal Communications, Inc., Class A† | 6,858 | |||||
| 300 | K12, Inc.† | 3,561 | |||||
| 1,275 | Kate Spade & Co.†(a) | 40,813 | |||||
| 800 | KB Home(a) | 13,240 | |||||
| 2,700 | Kohl's Corp.(a) | 164,808 | |||||
| 300 | Krispy Kreme Doughnuts, Inc.† | 5,922 | |||||
| 2,840 | L Brands, Inc. | 245,802 | |||||
| 100 | Lakes Entertainment, Inc.† | 670 | |||||
| 278 | Lands' End, Inc.† | 15,001 | |||||
| 5,227 | Las Vegas Sands Corp. | 304,002 | |||||
| 525 | La-Z-Boy, Inc., Class Z | 14,091 | |||||
| 100 | LeapFrog Enterprises, Inc., Class A† | 472 | |||||
| 1,018 | Lear Corp. | 99,845 | |||||
| 500 | Learning Tree International, Inc.† | 875 | |||||
| 750 | Lee Enterprises, Inc.†(a) | 2,760 | |||||
| 1,710 | Leggett & Platt, Inc.(a) | 72,863 | |||||
| Shares | Value | ||||||
| Consumer Discretionary (continued) | |||||||
| 1,850 | Lennar Corp., Class A(a) | $ | 82,898 | ||||
| 1,000 | Libbey, Inc.† | 31,440 | |||||
| 638 | Liberty Broadband Corp., Class C† | 31,785 | |||||
| 2,150 | Liberty Broadband Corp., Class A† | 107,693 | |||||
| 3,487 | Liberty Global PLC† | 168,457 | |||||
| 2,687 | Liberty Global PLC, Class A† | 134,901 | |||||
| 5,725 | Liberty Interactive Corp., Class A† | 168,430 | |||||
| 2,554 | Liberty Media Corp.† | 89,467 | |||||
| 4,302 | Liberty Media Corp.† | 151,732 | |||||
| 790 | Liberty TripAdvisor Holdings, Inc., Class A† | 21,251 | |||||
| 1,603 | Liberty Ventures, Ser A† | 60,465 | |||||
| 500 | Life Time Fitness, Inc.†(a) | 28,310 | |||||
| 700 | Lifetime Brands, Inc. | 12,040 | |||||
| 200 | Lincoln Educational Services Corp. | 564 | |||||
| 1,675 | Lions Gate Entertainment Corp.(a) | 53,634 | |||||
| 300 | Lithia Motors, Inc., Class A | 26,007 | |||||
| 1,512 | Live Nation Entertainment, Inc.† | 39,478 | |||||
| 3,600 | LKQ Corp.† | 101,232 | |||||
| 200 | Loral Space & Communications, Inc.†(a) | 15,742 | |||||
| 12,656 | Lowe's Cos., Inc. | 870,733 | |||||
| 241 | Lumber Liquidators Holdings, Inc.†(a) | 15,981 | |||||
| 4,473 | Macy's, Inc. | 294,100 | |||||
| 881 | Madison Square Garden Co. (The), Class A†(a) | 66,304 | |||||
| 100 | Marcus Corp. | 1,851 | |||||
| 700 | Marine Products Corp.(a) | 5,908 | |||||
| 2,877 | Marriott International, Inc., Class A(a) | 224,492 | |||||
| 257 | Marriott Vacations Worldwide Corp. | 19,157 | |||||
| 3,100 | Martha Stewart Living Omnimedia, Inc., Class A†(a) | 13,361 | |||||
| 4,155 | Mattel, Inc. | 128,576 | |||||
| 400 | Matthews International Corp., Class A | 19,468 | |||||
| 300 | Mattress Firm Holding Corp.†(a) | 17,424 | |||||
| 496 | McClatchy Co. (The), Class A†(a) | 1,647 | |||||
| 12,544 | McDonald's Corp. | 1,175,373 | |||||
| 571 | MDC Holdings, Inc.(a) | 15,114 | |||||
| 794 | Media General, Inc.†(a) | 13,288 | |||||
| 675 | Men's Wearhouse, Inc. (The)(a) | 29,801 | |||||
| 300 | Meredith Corp.(a) | 16,296 | |||||
| 500 | Meritage Homes Corp.†(a) | 17,995 | |||||
| 4,625 | MGM Resorts International†(a) | 98,883 | |||||
| 832 | Mohawk Industries, Inc.† | 129,260 | |||||
| 1,600 | Monarch Casino & Resort, Inc.† | 26,544 | |||||
| 325 | Monro Muffler Brake, Inc.(a) | 18,785 | |||||
| 150 | Morgans Hotel Group Co.†(a) | 1,176 | |||||
| 207 | Morningstar, Inc. | 13,395 | |||||
| 300 | Movado Group, Inc.(a) | 8,511 | |||||
| 518 | Murphy USA, Inc.†(a) | 35,669 | |||||
| 500 | National CineMedia, Inc.(a) | 7,185 | |||||
| 50 | Nautilus, Inc.† | 759 | |||||
| 727 | Netflix, Inc.† | 248,350 | |||||
| 301 | New Media Investment | 7,113 | |||||
| 1,300 | New York & Co., Inc.† | 3,432 | |||||
| 2,100 | New York Times Co. (The), Class A(a) | 27,762 | |||||
| 3,351 | Newell Rubbermaid, Inc. | 127,640 | |||||
| 4,353 | News Corp., Class A† | 68,299 | |||||
| 200 | Nexstar Broadcasting Group, Inc., Class A(a) | 10,358 | |||||
| 8,677 | NIKE, Inc., Class B | 834,294 | |||||
| 2,000 | Nordstrom, Inc. | 158,780 | |||||
| 300 | Norwegian Cruise Line Holdings, Ltd.†(a) | 14,028 | |||||
| 40 | NVR, Inc.† | 51,013 | |||||
| 8,484 | Office Depot, Inc.† | 72,750 | |||||
| 3,525 | Omnicom Group, Inc.(a) | 273,082 | |||||
| 2,900 | Orbitz Worldwide, Inc.† | 23,867 | |||||
Wilshire Mutual Funds, Inc. Wilshire 5000 IndexSM Fund Schedule of Investments | December 31, 2014 |
| Shares | Value | ||||||
| Consumer Discretionary (continued) | |||||||
| 1,342 | O'Reilly Automotive, Inc.† | $ | 258,496 | ||||
| 650 | Orleans Homebuilders, Inc.† | — | |||||
| 200 | Outerwall, Inc.†(a) | 15,044 | |||||
| 300 | Overstock.com, Inc.†(a) | 7,281 | |||||
| 50 | Oxford Industries, Inc.(a) | 2,761 | |||||
| 200 | Pacific Sunwear of California, Inc.†(a) | 436 | |||||
| 300 | Panera Bread Co., Class A†(a) | 52,440 | |||||
| 300 | Papa John's International, Inc.(a) | 16,740 | |||||
| 700 | Penn National Gaming, Inc.†(a) | 9,611 | |||||
| 700 | Penske Automotive Group, Inc.(a) | 34,349 | |||||
| 1,500 | Pep Boys-Manny Moe & Jack (The)†(a) | 14,730 | |||||
| 100 | Perry Ellis International, Inc.†(a) | 2,593 | |||||
| 1,250 | PetSmart, Inc. | 101,619 | |||||
| 825 | Pier 1 Imports, Inc.(a) | 12,705 | |||||
| 800 | Pinnacle Entertainment, Inc.†(a) | 17,800 | |||||
| 740 | Polaris Industries, Inc.(a) | 111,918 | |||||
| 450 | Pool Corp. | 28,548 | |||||
| 400 | Popeyes Louisiana Kitchen, Inc.† | 22,508 | |||||
| 725 | Priceline Group, Inc.† | 826,652 | |||||
| 3,965 | PulteGroup, Inc. | 85,089 | |||||
| 943 | PVH Corp. | 120,864 | |||||
| 1,600 | Quiksilver, Inc.†(a) | 3,536 | |||||
| 780 | Ralph Lauren Corp., Class A | 144,425 | |||||
| 1,500 | RCI Hospitality Holdings, Inc.†(a) | 15,030 | |||||
| 1,000 | ReachLocal, Inc.†(a) | 3,440 | |||||
| 300 | Red Robin Gourmet Burgers, Inc.†(a) | 23,093 | |||||
| 1,200 | Regal Entertainment Group, Class A(a) | 25,632 | |||||
| 200 | Regis Corp.† | 3,352 | |||||
| 575 | Rent-A-Center, Inc., Class A(a) | 20,884 | |||||
| 47 | Restaurant Brands† | 1,748 | |||||
| 4,604 | Restaurant Brands International, Inc.† | 179,721 | |||||
| 116 | Restoration Hardware Holdings, Inc.† | 11,137 | |||||
| 100 | Rocky Brands, Inc. | 1,326 | |||||
| 2,375 | Ross Stores, Inc. | 223,868 | |||||
| 2,025 | Royal Caribbean Cruises, Ltd.(a) | 166,921 | |||||
| 500 | Ruby Tuesday, Inc.† | 3,420 | |||||
| 500 | Ryland Group, Inc. (The)(a) | 19,280 | |||||
| 100 | Salem Communications Corp., Class A(a) | 782 | |||||
| 1,000 | Sally Beauty Holdings, Inc.† | 30,740 | |||||
| 325 | Scholastic Corp. | 11,837 | |||||
| 1,500 | Scientific Games Corp., Class A†(a) | 19,095 | |||||
| 1,226 | Scripps Networks Interactive, Inc., Class A(a) | 92,281 | |||||
| 925 | Sears Holdings Corp.†(a) | 30,507 | |||||
| 325 | SeaWorld Entertainment, Inc. | 5,818 | |||||
| 188 | Select Comfort Corp.† | 5,082 | |||||
| 2,000 | Service Corp. International(a) | 45,400 | |||||
| 475 | ServiceMaster Global Holdings, Inc.† | 12,716 | |||||
| 600 | Shoe Carnival, Inc. | 15,414 | |||||
| 400 | Shutterfly, Inc.†(a) | 16,678 | |||||
| 993 | Signet Jewelers, Ltd.(a) | 130,649 | |||||
| 900 | Sinclair Broadcast Group, Inc., Class A(a) | 24,624 | |||||
| 32,175 | Sirius XM Holdings, Inc.† | 112,613 | |||||
| 900 | Six Flags Entertainment Corp. | 38,835 | |||||
| 400 | Skechers U.S.A., Inc., Class A†(a) | 22,100 | |||||
| 1,000 | Sonic Automotive, Inc., Class A | 27,040 | |||||
| 800 | Sonic Corp. | 21,784 | |||||
| 903 | Sotheby's(a) | 38,992 | |||||
| 75 | Spartan Motors, Inc. | 395 | |||||
| 400 | Speedway Motorsports, Inc.(a) | 8,748 | |||||
| 552 | Stage Stores, Inc. | 11,426 | |||||
| 300 | Standard Motor Products, Inc.(a) | 11,436 | |||||
| 1,625 | Standard Pacific Corp.†(a) | 11,846 | |||||
| 1,819 | Stanley Black & Decker, Inc. | 174,770 | |||||
| 200 | Stanley Furniture Co., Inc.† | 548 | |||||
| 6,975 | Staples, Inc.(a) | 126,387 | |||||
| Shares | Value | ||||||
| Consumer Discretionary (continued) | |||||||
| 9,449 | Starbucks Corp. | $ | 775,290 | ||||
| 2,403 | Starwood Hotels & Resorts Worldwide, Inc. | 194,811 | |||||
| 1,177 | Starz†(a) | 34,957 | |||||
| 600 | Steven Madden, Ltd.† | 19,098 | |||||
| 300 | Sturm Ruger & Co., Inc.(a) | 10,389 | |||||
| 150 | Superior Industries International, Inc. | 2,969 | |||||
| 100 | Sypris Solutions, Inc. | 264 | |||||
| 600 | Systemax, Inc.†(a) | 8,100 | |||||
| 8,152 | Target Corp. | 618,818 | |||||
| 700 | Tempur Sealy International, Inc.† | 38,437 | |||||
| 750 | Tenneco, Inc.† | 42,458 | |||||
| 725 | Tesla Motors, Inc.†(a) | 161,247 | |||||
| 1,000 | Texas Roadhouse, Inc., Class A(a) | 33,760 | |||||
| 4,400 | Thomson Reuters Corp.(a) | 177,496 | |||||
| 500 | Thor Industries, Inc. | 27,935 | |||||
| 1,335 | Tiffany & Co. | 142,658 | |||||
| 3,016 | Time Warner Cable, Inc., Class A | 458,613 | |||||
| 11,622 | Time Warner, Inc. | 992,751 | |||||
| 1,304 | Time, Inc. | 32,091 | |||||
| 7,950 | TJX Cos., Inc. | 545,211 | |||||
| 1,900 | Toll Brothers, Inc.† | 65,113 | |||||
| 1,600 | Tractor Supply Co. | 126,112 | |||||
| 200 | Trans World Entertainment Corp. | 658 | |||||
| 1,900 | TRI Pointe Homes, Inc.†(a) | 28,975 | |||||
| 1,471 | TripAdvisor, Inc.†(a) | 109,825 | |||||
| 1,331 | TRW Automotive Holdings Corp.† | 136,893 | |||||
| 200 | Tuesday Morning Corp.†(a) | 4,340 | |||||
| 600 | Tupperware Brands Corp.(a) | 37,800 | |||||
| 10 | Turtle Beach Corp.† | 32 | |||||
| 16,438 | Twenty-First Century Fox, Inc., Class A | 631,301 | |||||
| 763 | Ulta Salon Cosmetics & Fragrance, Inc.† | 97,542 | |||||
| 1,900 | Under Armour, Inc., Class A†(a) | 129,010 | |||||
| 200 | Universal Electronics, Inc.† | 13,006 | |||||
| 500 | Universal Technical Institute, Inc.(a) | 4,920 | |||||
| 1,400 | Urban Outfitters, Inc.†(a) | 49,182 | |||||
| 138 | Vail Resorts, Inc. | 12,576 | |||||
| 200 | Value Line, Inc. | 3,330 | |||||
| 3,275 | VF Corp. | 245,298 | |||||
| 4,757 | Viacom, Inc., Class B | 357,964 | |||||
| 600 | Visteon Corp.† | 64,116 | |||||
| 300 | Vitamin Shoppe, Inc.†(a) | 14,574 | |||||
| 21,360 | Walt Disney Co. (The) | 2,011,898 | |||||
| 296 | Weight Watchers International, Inc.†(a) | 7,353 | |||||
| 4,600 | Wendy's Co. (The)(a) | 41,538 | |||||
| 1,029 | Whirlpool Corp. | 199,358 | |||||
| 800 | Williams-Sonoma, Inc. | 60,544 | |||||
| 500 | Winnebago Industries, Inc. | 10,880 | |||||
| 1,175 | Wolverine World Wide, Inc.(a) | 34,627 | |||||
| 600 | World Wrestling Entertainment, Inc., Class A(a) | 7,404 | |||||
| 1,476 | Wyndham Worldwide Corp. | 126,582 | |||||
| 1,104 | Wynn Resorts, Ltd. | 164,231 | |||||
| 5,841 | Yum! Brands, Inc. | 425,517 | |||||
| 300 | Zumiez, Inc.† | 11,589 | |||||
| 34,890,716 | |||||||
Consumer Staples — 8.9% | |||||||
| 200 | Alico, Inc.(a) | 10,006 | |||||
| 2,200 | Alliance One International, Inc.†(a) | 3,476 | |||||
| 23,475 | Altria Group, Inc.(a) | 1,156,613 | |||||
| 375 | Andersons, Inc. (The)(a) | 19,927 | |||||
| 7,461 | Archer-Daniels-Midland Co. | 387,972 | |||||
| 4,725 | Avon Products, Inc.(a) | 44,368 | |||||
| 550 | B&G Foods, Inc., Class A(a) | 16,445 | |||||
| 100 | Boston Beer Co., Inc. (The), Class A†(a) | 28,954 | |||||
| 600 | Boulder Brands, Inc.†(a) | 6,636 | |||||
Wilshire Mutual Funds, Inc. Wilshire 5000 IndexSM Fund Schedule of Investments | December 31, 2014 |
| Shares | Value | ||||||
| Consumer Staples (continued) | |||||||
| 1,609 | Brown-Forman Corp., Class B | $ | 141,335 | ||||
| 1,550 | Bunge, Ltd. | 140,910 | |||||
| 300 | Calavo Growers, Inc. | 14,190 | |||||
| 318 | Cal-Maine Foods, Inc. | 12,412 | |||||
| 2,475 | Campbell Soup Co.(a) | 108,900 | |||||
| 400 | Casey's General Stores, Inc. | 36,128 | |||||
| 1,700 | Church & Dwight Co., Inc. | 133,977 | |||||
| 1,474 | Clorox Co. (The)(a) | 153,605 | |||||
| 51,315 | Coca-Cola Co. (The) | 2,166,519 | |||||
| 2,995 | Coca-Cola Enterprises, Inc. | 132,439 | |||||
| 11,636 | Colgate-Palmolive Co. | 805,095 | |||||
| 5,473 | ConAgra Foods, Inc. | 198,560 | |||||
| 2,072 | Constellation Brands, Inc., Class A† | 203,408 | |||||
| 5,775 | Costco Wholesale Corp. | 818,606 | |||||
| 725 | Coty, Inc., Class A | 14,978 | |||||
| 14,792 | CVS Health Corp. | 1,424,618 | |||||
| 1,525 | Darling Ingredients, Inc.† | 27,694 | |||||
| 1,067 | Dean Foods Co.(a) | 20,678 | |||||
| 400 | Diamond Foods, Inc.† | 11,292 | |||||
| 2,300 | Dr. Pepper Snapple Group, Inc.(a) | 164,864 | |||||
| 792 | Energizer Holdings, Inc. | 101,819 | |||||
| 2,700 | Estee Lauder Cos., Inc. (The), Class A | 205,740 | |||||
| 2,530 | Flowers Foods, Inc. | 48,551 | |||||
| 400 | Fresh Del Monte Produce, Inc. | 13,420 | |||||
| 7,925 | General Mills, Inc. | 422,640 | |||||
| 1,200 | Hain Celestial Group, Inc. (The)†(a) | 69,948 | |||||
| 2,500 | Harbinger Group, Inc.† | 35,400 | |||||
| 1,200 | Herbalife, Ltd.(a) | 45,240 | |||||
| 2,142 | Hershey Co. (The) | 222,618 | |||||
| 1,800 | Hormel Foods Corp.(a) | 93,780 | |||||
| 550 | Ingles Markets, Inc., Class A | 20,399 | |||||
| 800 | Ingredion, Inc. | 67,872 | |||||
| 300 | Inter Parfums, Inc. | 8,235 | |||||
| 170 | J&J Snack Foods Corp. | 18,491 | |||||
| 1,319 | JM Smucker Co. (The)(a) | 133,193 | |||||
| 3,775 | Kellogg Co. | 247,036 | |||||
| 1,313 | Keurig Green Mountain, Inc.(a) | 173,835 | |||||
| 4,777 | Kimberly-Clark Corp. | 551,935 | |||||
| 7,707 | Kraft Foods Group, Inc. | 482,921 | |||||
| 6,000 | Kroger Co. (The) | 385,260 | |||||
| 212 | Lancaster Colony Corp. | 19,852 | |||||
| 3,430 | Lorillard, Inc. | 215,884 | |||||
| 70 | Mannatech, Inc.† | 1,866 | |||||
| 1,225 | McCormick & Co., Inc.(a) | 91,017 | |||||
| 2,476 | Mead Johnson Nutrition Co., Class A | 248,937 | |||||
| 200 | MGP Ingredients, Inc. | 3,172 | |||||
| 1,800 | Molson Coors Brewing Co., Class B | 134,136 | |||||
| 22,671 | Mondelez International, Inc., Class A | 823,524 | |||||
| 1,600 | Monster Beverage Corp.† | 173,360 | |||||
| 700 | Nu Skin Enterprises, Inc., Class A | 30,590 | |||||
| 19,158 | PepsiCo, Inc. | 1,811,580 | |||||
| 18,707 | Philip Morris International, Inc. | 1,523,685 | |||||
| 1,150 | Pilgrim's Pride Corp.†(a) | 37,708 | |||||
| 375 | Pinnacle Foods, Inc. | 13,237 | |||||
| 350 | Post Holdings, Inc.†(a) | 14,661 | |||||
| 217 | PriceSmart, Inc.(a) | 19,795 | |||||
| 34,952 | Procter & Gamble Co. (The) | 3,183,778 | |||||
| 100 | Reliv International, Inc.†(a) | 117 | |||||
| 4,103 | Reynolds American, Inc.(a) | 263,700 | |||||
| 12,075 | Rite Aid Corp.† | 90,804 | |||||
| 70 | Rocky Mountain Chocolate Factory, Inc. | 924 | |||||
| 2,075 | Safeway, Inc. | 72,874 | |||||
| 243 | Sanderson Farms, Inc. | 20,418 | |||||
| 1,000 | Snyder's-Lance, Inc. | 30,550 | |||||
| 400 | SpartanNash Co. | 10,456 | |||||
| 300 | Sprouts Farmers Market, Inc.†(a) | 10,194 | |||||
| 3,036 | SUPERVALU, Inc.† | 29,449 | |||||
| Shares | Value | ||||||
| Consumer Staples (continued) | |||||||
| 8,000 | Sysco Corp.(a) | $ | 317,520 | ||||
| 309 | Tootsie Roll Industries, Inc.(a) | 9,471 | |||||
| 501 | TreeHouse Foods, Inc.†(a) | 42,851 | |||||
| 3,830 | Tyson Foods, Inc., Class A | 153,545 | |||||
| 450 | United Natural Foods, Inc.†(a) | 34,796 | |||||
| 300 | Universal Corp.(a) | 13,194 | |||||
| 198 | USANA Health Sciences, Inc.† | 20,313 | |||||
| 1,214 | Vector Group, Ltd.(a) | 25,871 | |||||
| 11,200 | Walgreens Boots Alliance, Inc. | 853,440 | |||||
| 21,504 | Wal-Mart Stores, Inc. | 1,846,764 | |||||
| 145 | WD-40 Co. | 12,337 | |||||
| 1,621 | WhiteWave Foods Co., Class A† | 56,719 | |||||
| 4,550 | Whole Foods Market, Inc.(a) | 229,411 | |||||
| 24,245,438 | |||||||
Energy — 7.8% | |||||||
| 250 | Alon USA Energy, Inc.(a) | 3,167 | |||||
| 2,272 | Alpha Natural Resources, Inc.†(a) | 3,794 | |||||
| 1,000 | Amyris, Inc.†(a) | 2,060 | |||||
| 6,464 | Anadarko Petroleum Corp. | 533,280 | |||||
| 800 | Antero Resources Corp.†(a) | 32,464 | |||||
| 4,938 | Apache Corp. | 309,464 | |||||
| 300 | Approach Resources, Inc.†(a) | 1,917 | |||||
| 3,000 | Arch Coal, Inc.(a) | 5,340 | |||||
| 600 | Atwood Oceanics, Inc.(a) | 17,022 | |||||
| 5,245 | Baker Hughes, Inc. | 294,087 | |||||
| 600 | Barnwell Industries, Inc.†(a) | 1,602 | |||||
| 400 | Bill Barrett Corp.†(a) | 4,556 | |||||
| 300 | BP Prudhoe Bay Royalty Trust | 20,292 | |||||
| 450 | BreitBurn Energy Partners, LP(A) | 3,150 | |||||
| 500 | Bristow Group, Inc.(a) | 32,895 | |||||
| 4,800 | Cabot Oil & Gas Corp. | 142,128 | |||||
| 3,964 | California Resources Corp.†(a) | 21,842 | |||||
| 1,500 | Callon Petroleum Co.†(a) | 8,175 | |||||
| 2,750 | Cameron International Corp.† | 137,362 | |||||
| 150 | CARBO Ceramics, Inc.(a) | 6,007 | |||||
| 400 | Carrizo Oil & Gas, Inc.†(a) | 16,640 | |||||
| 2,900 | Cheniere Energy, Inc.† | 204,160 | |||||
| 8,075 | Chesapeake Energy Corp.(a) | 158,028 | |||||
| 24,500 | Chevron Corp. | 2,748,410 | |||||
| 986 | Cimarex Energy Co.(a) | 104,516 | |||||
| 113 | Clayton Williams Energy, Inc.†(a) | 7,209 | |||||
| 600 | Clean Energy Fuels Corp.†(a) | 2,997 | |||||
| 1,000 | Cloud Peak Energy, Inc.†(a) | 9,180 | |||||
| 400 | Comstock Resources, Inc.(a) | 2,724 | |||||
| 1,222 | Concho Resources, Inc.† | 121,894 | |||||
| 16,017 | ConocoPhillips | 1,106,134 | |||||
| 2,600 | Consol Energy, Inc.(a) | 87,906 | |||||
| 830 | Continental Resources, Inc.†(a) | 31,839 | |||||
| 200 | Cross Timbers Royalty Trust | 3,464 | |||||
| 175 | Delek US Holdings, Inc. | 4,774 | |||||
| 3,779 | Denbury Resources, Inc.(a) | 30,723 | |||||
| 5,416 | Devon Energy Corp. | 331,513 | |||||
| 206 | DHT Holdings, Inc.(a) | 1,506 | |||||
| 850 | Diamond Offshore Drilling, Inc.(a) | 31,204 | |||||
| 300 | Diamondback Energy, Inc.†(a) | 17,934 | |||||
| 800 | Dresser-Rand Group, Inc.†(a) | 65,440 | |||||
| 445 | Dril-Quip, Inc.† | 34,145 | |||||
| 722 | Enbridge Energy Management LLC | 28,006 | |||||
| 890 | Energen Corp. | 56,746 | |||||
| 525 | Energy Transfer Partners, LP(A) | 34,125 | |||||
| 1,271 | Energy XXI Bermuda, Ltd.(a) | 4,143 | |||||
| 2,250 | EnLink Midstream LLC | 80,010 | |||||
| 5,963 | EOG Resources, Inc. | 549,013 | |||||
| 1,860 | EQT Corp. | 140,802 | |||||
| 300 | Era Group, Inc.† | 6,345 | |||||
| 2,700 | EXCO Resources, Inc.(a) | 5,859 | |||||
Wilshire Mutual Funds, Inc. Wilshire 5000 IndexSM Fund Schedule of Investments | December 31, 2014 |
| Shares | Value | ||||||
| Energy (continued) | |||||||
| 812 | Exterran Holdings, Inc. | $ | 26,455 | ||||
| 54,222 | Exxon Mobil Corp. | 5,012,824 | |||||
| 2,206 | FMC Technologies, Inc.†(a) | 103,329 | |||||
| 300 | Forum Energy Technologies, Inc.† | 6,219 | |||||
| 226 | Geospace Technologies Corp.†(a) | 5,989 | |||||
| 500 | Goodrich Petroleum Corp.†(a) | 2,220 | |||||
| 300 | Green Plains, Inc.(a) | 7,434 | |||||
| 1,725 | Gulf Coast Ultra Deep Royalty Trust† | 2,174 | |||||
| 381 | Gulf Island Fabrication, Inc.(a) | 7,388 | |||||
| 300 | Gulfmark Offshore, Inc., Class A(a) | 7,326 | |||||
| 900 | Gulfport Energy Corp.† | 37,566 | |||||
| 3,775 | Halcon Resources Corp.†(a) | 6,720 | |||||
| 11,131 | Halliburton Co. | 437,782 | |||||
| 1,000 | Helix Energy Solutions Group, Inc.†(a) | 21,700 | |||||
| 1,150 | Helmerich & Payne, Inc. | 77,533 | |||||
| 1,900 | Hercules Offshore, Inc.†(a) | 1,900 | |||||
| 3,649 | Hess Corp. | 269,369 | |||||
| 2,108 | HollyFrontier Corp. | 79,008 | |||||
| 500 | Hornbeck Offshore Services, Inc., Class Comdty (histrt)†(a) | 12,485 | |||||
| 1,750 | ION Geophysical Corp.†(a) | 4,813 | |||||
| 2,200 | Key Energy Services, Inc.† | 3,674 | |||||
| 16,260 | Kinder Morgan, Inc.(a) | 687,961 | |||||
| 825 | Laredo Petroleum, Inc.†(a) | 8,539 | |||||
| 672 | LinnCo LLC(a) | 6,969 | |||||
| 1,859 | Magnum Hunter Resources Corp.†(a) | 5,837 | |||||
| 8,772 | Marathon Oil Corp. | 248,160 | |||||
| 3,803 | Marathon Petroleum Corp. | 343,259 | |||||
| 375 | Matador Resources Co.†(a) | 7,586 | |||||
| 450 | Matrix Service Co.† | 10,044 | |||||
| 2,875 | McDermott International, Inc.† | 8,366 | |||||
| 550 | Memorial Resource Development Corp.† | 9,917 | |||||
| 2,075 | Murphy Oil Corp. | 104,829 | |||||
| 3,100 | Nabors Industries, Ltd. | 40,238 | |||||
| 5,661 | National Oilwell Varco, Inc.(a) | 370,965 | |||||
| 1,525 | Newfield Exploration Co.† | 41,358 | |||||
| 875 | Newpark Resources, Inc.† | 8,348 | |||||
| 3,512 | Noble Energy, Inc. | 166,574 | |||||
| 1,000 | Northern Oil and Gas, Inc.†(a) | 5,650 | |||||
| 400 | Northern Tier Energy | 8,856 | |||||
| 700 | Oasis Petroleum, Inc.†(a) | 11,578 | |||||
| 9,912 | Occidental Petroleum Corp. | 799,006 | |||||
| 1,200 | Oceaneering International, Inc. | 70,572 | |||||
| 500 | Oil States International, Inc.† | 24,450 | |||||
| 2,650 | ONEOK, Inc. | 131,944 | |||||
| 1 | Pacific Ethanol, Inc.†(a) | 10 | |||||
| 1,325 | Parker Drilling Co.† | 4,068 | |||||
| 650 | Parsley Energy, Inc., Class A† | 10,374 | |||||
| 1,950 | Patterson-UTI Energy, Inc. | 32,351 | |||||
| 675 | PBF Energy, Inc., Class A(a) | 17,982 | |||||
| 350 | PDC Energy, Inc.†(a) | 14,445 | |||||
| 3,150 | Peabody Energy Corp.(a) | 24,381 | |||||
| 700 | Penn Virginia Corp.†(a) | 4,676 | |||||
| 2,300 | PetroQuest Energy, Inc.† | 8,602 | |||||
| 7,281 | Phillips 66 | 522,048 | |||||
| 675 | Pioneer Energy Services Corp.† | 3,740 | |||||
| 1,784 | Pioneer Natural Resources Co. | 265,548 | |||||
| 2,200 | QEP Resources, Inc. | 44,484 | |||||
| 2,208 | Range Resources Corp.(a) | 118,018 | |||||
| 109 | Renewable Energy Group, Inc.†(a) | 1,058 | |||||
| 600 | Rex Energy Corp.†(a) | 3,060 | |||||
| 675 | Rice Energy, Inc.†(a) | 14,155 | |||||
| 600 | Rosetta Resources, Inc.† | 13,386 | |||||
| 1,600 | Rowan PLC, Class A | 37,312 | |||||
| 1,012 | RPC, Inc. | 13,196 | |||||
| 325 | Sanchez Energy Corp.†(a) | 3,019 | |||||
| Shares | Value | ||||||
| Energy (continued) | |||||||
| 4,400 | SandRidge Energy, Inc.†(a) | $ | 8,008 | ||||
| 16,562 | Schlumberger, Ltd. | 1,414,560 | |||||
| 217 | SEACOR Holdings, Inc.†(a) | 16,017 | |||||
| 450 | SemGroup Corp., Class A | 30,776 | |||||
| 576 | Seventy Seven Energy, Inc.†(a) | 3,116 | |||||
| 1,000 | Ship Finance International, Ltd.(a) | 14,120 | |||||
| 750 | SM Energy Co. | 28,935 | |||||
| 1,000 | Solazyme, Inc.†(a) | 2,580 | |||||
| 4,225 | Southwestern Energy Co.†(a) | 115,300 | |||||
| 8,741 | Spectra Energy Corp.(a) | 317,298 | |||||
| 475 | Stone Energy Corp.†(a) | 8,018 | |||||
| 1,706 | Superior Energy Services, Inc. | 34,376 | |||||
| 925 | Synergy Resources Corp.†(a) | 11,600 | |||||
| – | Syntroleum Corp.†(a) | — | |||||
| 201 | Targa Resources Corp. | 21,316 | |||||
| 775 | Teekay Corp.(a) | 39,440 | |||||
| 1,500 | Tesoro Corp. | 111,525 | |||||
| 850 | TETRA Technologies, Inc.†(a) | 5,678 | |||||
| 233 | TGC Industries, Inc.† | 503 | |||||
| 525 | Tidewater, Inc.(a) | 17,015 | |||||
| 1,600 | Trico Marine Services, Inc.† | — | |||||
| 1,765 | Ultra Petroleum Corp.†(a) | 23,227 | |||||
| 500 | Unit Corp.† | 17,050 | |||||
| 1,000 | US Energy Corp. Wyoming† | 1,480 | |||||
| 1,100 | VAALCO Energy, Inc.†(a) | 5,016 | |||||
| 6,864 | Valero Energy Corp. | 339,768 | |||||
| 800 | W&T Offshore, Inc. | 5,872 | |||||
| 300 | Warren Resources, Inc.†(a) | 483 | |||||
| 1,150 | Western Refining, Inc. | 43,447 | |||||
| 300 | Westmoreland Coal Co.† | 9,963 | |||||
| 1,922 | Whiting Petroleum Corp.† | 63,431 | |||||
| 9,550 | Williams Cos., Inc. (The) | 429,177 | |||||
| 800 | World Fuel Services Corp. | 37,544 | |||||
| 2,350 | WPX Energy, Inc.† | 27,331 | |||||
| 1,700 | Yuma Energy, Inc.†(a) | 3,111 | |||||
| 21,225,901 | |||||||
Financials — 18.2% | |||||||
| 676 | Acadia Realty Trust(a) (b) | 21,652 | |||||
| 700 | Affiliated Managers Group, Inc.† | 148,568 | |||||
| 5,625 | Aflac, Inc. | 343,631 | |||||
| 450 | Alexander & Baldwin, Inc.(a) | 17,667 | |||||
| 859 | Alexandria Real Estate Equities, Inc.(b) | 76,228 | |||||
| 227 | Alleghany Corp.† | 105,214 | |||||
| 5,825 | Allstate Corp. (The) | 409,206 | |||||
| 10 | Altisource Asset Management Corp.†(a) | 3,101 | |||||
| 100 | Altisource Portfolio Solutions SA†(a) | 3,379 | |||||
| 33 | Altisource Residential Corp., Class B(b) | 640 | |||||
| 425 | American Assets Trust, Inc.(b) | 16,919 | |||||
| 1,282 | American Campus Communities, Inc.(b) | 53,024 | |||||
| 4,475 | American Capital Agency Corp. | 97,689 | |||||
| 575 | American Capital Mortgage Investment Corp.(b) | 10,833 | |||||
| 4,200 | American Capital, Ltd.†(a) | 61,362 | |||||
| 1,100 | American Equity Investment Life Holding Co.(a) | 32,109 | |||||
| 11,183 | American Express Co. | 1,040,466 | |||||
| 1,100 | American Financial Group, Inc. | 66,792 | |||||
| 1,700 | American Homes 4 Rent, Class A(b) | 28,951 | |||||
| 6,850 | American International Group, Inc. | 383,668 | |||||
| 300 | American National Insurance Co. | 34,278 | |||||
| 11,075 | American Realty Capital Properties, Inc.(b) | 100,229 | |||||
| 5,214 | American Tower Corp., Class A | 515,404 | |||||
| 2,352 | Ameriprise Financial, Inc. | 311,052 | |||||
| 332 | AmTrust Financial Services, Inc.(a) | 18,675 | |||||
| 11,050 | Annaly Capital Management, Inc. | 119,450 | |||||
Wilshire Mutual Funds, Inc. Wilshire 5000 IndexSM Fund Schedule of Investments | December 31, 2014 |
| Shares | Value | ||||||
| Financials (continued) | |||||||
| 1,500 | Anworth Mortgage Asset Corp.(b) | $ | 7,875 | ||||
| 2,081 | Apartment Investment & Management Co., Class A | 77,309 | |||||
| 600 | Apollo Commercial Real Estate Finance, Inc.(b) | 9,816 | |||||
| 2,200 | Apollo Investment Corp.(a) | 16,324 | |||||
| 200 | Arbor Realty Trust, Inc.(a) (b) | 1,354 | |||||
| 1,500 | Arch Capital Group, Ltd.† | 88,650 | |||||
| 3,675 | Ares Capital Corp. | 57,348 | |||||
| 300 | Argo Group International Holdings, Ltd. | 16,641 | |||||
| 4 | Arlington Asset Investment Corp., Class A(a) | 106 | |||||
| 3,325 | ARMOUR Residential, Inc., Class REIT(a) (b) | 12,236 | |||||
| 2,050 | Arthur J. Gallagher & Co. | 96,514 | |||||
| 300 | Artisan Partners Asset Management, Inc., Class A(a) | 15,159 | |||||
| 108 | Ashford Hospitality Prime, Inc.(b) | 1,853 | |||||
| 544 | Ashford Hospitality Trust, Inc.(b) | 5,701 | |||||
| 6 | Ashford, Inc.† | 564 | |||||
| 650 | Aspen Insurance Holdings, Ltd. | 28,451 | |||||
| 1,354 | Associated Banc-Corp(a) | 25,225 | |||||
| 300 | Associated Estates Realty Corp.(b) | 6,963 | |||||
| 900 | Assurant, Inc. | 61,587 | |||||
| 2,075 | Assured Guaranty, Ltd. | 53,929 | |||||
| 700 | Astoria Financial Corp. | 9,352 | |||||
| 200 | Atlanticus Holdings Corp.†(a) | 490 | |||||
| 600 | AV Homes, Inc.† | 8,742 | |||||
| 1,808 | AvalonBay Communities, Inc. | 295,409 | |||||
| 1,175 | Axis Capital Holdings, Ltd. | 60,031 | |||||
| 50 | Bancorp, Inc.† | 544 | |||||
| 1,150 | BancorpSouth, Inc.(a) | 25,886 | |||||
| 143,198 | Bank of America Corp. | 2,561,812 | |||||
| 450 | Bank of Hawaii Corp.(a) | 26,689 | |||||
| 15,313 | Bank of New York Mellon Corp. (The) | 621,248 | |||||
| 950 | Bank of the Ozarks, Inc.(a) | 36,024 | |||||
| 700 | BankFinancial Corp. | 8,302 | |||||
| 375 | BankUnited, Inc. | 10,864 | |||||
| 300 | Banner Corp. | 12,906 | |||||
| 9,775 | BB&T Corp. | 380,150 | |||||
| 600 | BBCN Bancorp, Inc. | 8,628 | |||||
| 16 | BBX Capital Corp., Class A†(a) | 263 | |||||
| 500 | Beneficial Mutual Bancorp, Inc.†(a) | 6,135 | |||||
| 25,165 | Berkshire Hathaway, Inc., Class B† | 3,778,525 | |||||
| 2,300 | BGC Partners, Inc., Class A | 21,045 | |||||
| 2,525 | BioMed Realty Trust, Inc.(b) | 54,388 | |||||
| 1,583 | BlackRock, Inc., Class A | 566,017 | |||||
| 450 | Blackstone Mortgage Trust, Inc., Class A(b) | 13,113 | |||||
| 168 | BofI Holding, Inc.†(a) | 13,072 | |||||
| 300 | BOK Financial Corp.(a) | 18,012 | |||||
| 1,000 | Boston Private Financial Holdings, Inc. | 13,470 | |||||
| 2,057 | Boston Properties, Inc. | 264,715 | |||||
| 1,988 | Brandywine Realty Trust(b) | 31,768 | |||||
| 525 | Brixmor Property Group, Inc. | 13,041 | |||||
| 3,075 | Brookfield Property Partners(A) | 70,325 | |||||
| 1,500 | Brookline Bancorp, Inc. | 15,045 | |||||
| 1,400 | Brown & Brown, Inc. | 46,074 | |||||
| 100 | Camden National Corp. | 3,984 | |||||
| 1,125 | Camden Property Trust(b) | 83,070 | |||||
| 30 | Capital Bank Financial Corp., Class A† | 804 | |||||
| 350 | Capital City Bank Group, Inc. | 5,439 | |||||
| 7,531 | Capital One Financial Corp. | 621,684 | |||||
| 1,000 | Capitol Federal Financial, Inc. | 12,780 | |||||
| 1,700 | Capstead Mortgage Corp.(a) (b) | 20,876 | |||||
| 100 | Cardinal Financial Corp.(a) | 1,983 | |||||
| 403 | CareTrust REIT, Inc.(a) (b) | 4,969 | |||||
| Shares | Value | ||||||
| Financials (continued) | |||||||
| 325 | Cash America International, Inc.(a) | $ | 7,351 | ||||
| 763 | Cathay General Bancorp | 19,525 | |||||
| 2,305 | CBL & Associates Properties, Inc.(b) | 44,763 | |||||
| 600 | CBOE Holdings, Inc. | 38,052 | |||||
| 3,825 | CBRE Group, Inc., Class A† | 131,006 | |||||
| 650 | Cedar Realty Trust, Inc.(b) | 4,771 | |||||
| 2,875 | Chambers Street Properties(b) | 23,172 | |||||
| 15,339 | Charles Schwab Corp. (The) | 463,084 | |||||
| 498 | Charter Financial Corp.(a) | 5,702 | |||||
| 425 | Chatham Lodging Trust(a) (b) | 12,312 | |||||
| 500 | Chemical Financial Corp. | 15,320 | |||||
| 500 | Chesapeake Lodging Trust(b) | 18,605 | |||||
| 11,900 | Chimera Investment Corp.(b) | 37,842 | |||||
| 3,071 | Chubb Corp. (The) | 317,756 | |||||
| 23 | CIFC Corp.(a) | 190 | |||||
| 1,694 | Cincinnati Financial Corp. | 87,800 | |||||
| 2,450 | CIT Group, Inc. | 117,183 | |||||
| 41,365 | Citigroup, Inc. | 2,238,260 | |||||
| 1,875 | Citizens Financial Group, Inc.(a) | 46,612 | |||||
| 300 | City Holding Co. | 13,959 | |||||
| 600 | City National Corp.(a) | 48,486 | |||||
| 3,772 | CME Group, Inc., Class A | 334,388 | |||||
| 300 | CNA Financial Corp. | 11,613 | |||||
| 2,900 | CNO Financial Group, Inc. | 49,938 | |||||
| 750 | CoBiz Financial, Inc. | 9,847 | |||||
| 350 | Cohen & Steers, Inc.(a) | 14,728 | |||||
| 1,250 | Colony Financial, Inc.(a) (b) | 29,775 | |||||
| 276 | Columbia Banking System, Inc. | 7,620 | |||||
| 1,625 | Columbia Property Trust, Inc.(b) | 41,194 | |||||
| 2,083 | Comerica, Inc.(a) | 97,568 | |||||
| 1,435 | Commerce Bancshares, Inc.(a) | 62,408 | |||||
| 500 | Community Bank System, Inc.(a) | 19,065 | |||||
| 110 | Community Trust Bancorp, Inc.(a) | 4,027 | |||||
| 300 | CoreSite Realty Corp., Class Comdty (b) | 11,715 | |||||
| 850 | Corporate Office Properties Trust(b) | 24,114 | |||||
| 1,199 | Corrections Corp. of America(b) | 43,572 | |||||
| 2,613 | Cousins Properties, Inc.(b) | 29,840 | |||||
| 199 | Cowen Group, Inc., Class A† | 955 | |||||
| 200 | Crawford & Co., Class B | 2,056 | |||||
| 112 | Credit Acceptance Corp.†(a) | 15,247 | |||||
| 4,050 | Crown Castle International Corp.(b) | 318,735 | |||||
| 1,737 | CubeSmart, Class Comdty (histrt)(b) | 38,336 | |||||
| 732 | Cullen/Frost Bankers, Inc. | 51,708 | |||||
| 1,000 | CVB Financial Corp. | 16,020 | |||||
| 1,000 | CYS Investments, Inc.(a) (b) | 8,720 | |||||
| 1,187 | DCT Industrial Trust, Inc. | 42,328 | |||||
| 3,845 | DDR Corp.(a) (b) | 70,594 | |||||
| 2,502 | DiamondRock Hospitality Co.(b) | 37,205 | |||||
| 1,850 | Digital Realty Trust, Inc.(a) (b) | 122,655 | |||||
| 6,150 | Discover Financial Services | 402,763 | |||||
| 1,100 | Donegal Group, Inc., Class A(a) | 17,578 | |||||
| 1,725 | Douglas Emmett, Inc.(b) | 48,990 | |||||
| 4,626 | Duke Realty Corp.(b) | 93,445 | |||||
| 700 | DuPont Fabros Technology, Inc.(a) (b) | 23,268 | |||||
| 3,778 | E*Trade Financial Corp.† | 91,635 | |||||
| 300 | Eagle Bancorp, Inc.† | 10,656 | |||||
| 2,000 | East West Bancorp, Inc. | 77,420 | |||||
| 375 | EastGroup Properties, Inc.(a) (b) | 23,745 | |||||
| 1,325 | Eaton Vance Corp. | 54,232 | |||||
| 633 | Education Realty Trust, Inc.(b) | 23,174 | |||||
| 175 | eHealth, Inc.† | 4,361 | |||||
| 425 | Ellington Financial LLC(c) (A) | 8,483 | |||||
| 1,100 | Empire State Realty Trust, Inc., Class A(b) | 19,338 | |||||
| 375 | Employers Holdings, Inc. | 8,816 | |||||
| 200 | Encore Capital Group, Inc.†(a) | 8,880 | |||||
| 700 | Endurance Specialty Holdings, Ltd. | 41,888 | |||||
| 297 | Enova International, Inc.† | 6,611 | |||||
Wilshire Mutual Funds, Inc. Wilshire 5000 IndexSM Fund Schedule of Investments | December 31, 2014 |
| Shares | Value | ||||||
| Financials (continued) | |||||||
| 120 | Enstar Group, Ltd.† | $ | 18,347 | ||||
| 50 | Enterprise Financial Services Corp. | 986 | |||||
| 600 | EPR Properties | 34,578 | |||||
| 1,293 | Equity Commonwealth(b) | 33,191 | |||||
| 1,000 | Equity Lifestyle Properties, Inc.(b) | 51,550 | |||||
| 1,000 | Equity One, Inc.(b) | 25,360 | |||||
| 5,054 | Equity Residential | 363,079 | |||||
| 300 | Erie Indemnity Co., Class A | 27,231 | |||||
| 919 | Essex Property Trust, Inc. | 189,865 | |||||
| 350 | Evercore Partners, Inc., Class A | 18,330 | |||||
| 536 | Everest Re Group, Ltd. | 91,281 | |||||
| 725 | Excel Trust, Inc.(b) | 9,708 | |||||
| 1,500 | Extra Space Storage, Inc.(b) | 87,960 | |||||
| 1,000 | Ezcorp, Inc., Class A†(a) | 11,750 | |||||
| 14,375 | Fannie Mae† | 29,541 | |||||
| 890 | Federal Realty Investment Trust, Class REIT(b) | 118,779 | |||||
| 1,200 | Federated Investors, Inc., Class B | 39,516 | |||||
| 200 | Federated National Holding Co. | 4,832 | |||||
| 1,000 | FelCor Lodging Trust, Inc.(b) | 10,820 | |||||
| 1,700 | Fifth Street Finance Corp. | 13,617 | |||||
| 10,401 | Fifth Third Bancorp | 211,920 | |||||
| 525 | Financial Engines, Inc.(a) | 19,189 | |||||
| 1,200 | Financial Institutions, Inc. | 30,180 | |||||
| 100 | First Acceptance Corp.† | 255 | |||||
| 827 | First American Financial Corp. | 28,035 | |||||
| 300 | First Bancorp | 5,541 | |||||
| 2,516 | First BanCorp† | 14,769 | |||||
| 500 | First Cash Financial Services, Inc.† | 27,835 | |||||
| 50 | First Citizens BancShares, Inc., Class A | 12,639 | |||||
| 800 | First Commonwealth Financial Corp. | 7,376 | |||||
| 425 | First Community Bancshares, Inc. | 7,000 | |||||
| 575 | First Financial Bancorp | 10,689 | |||||
| 600 | First Financial Bankshares, Inc.(a) | 17,928 | |||||
| 100 | First Financial Corp. | 3,562 | |||||
| 2,433 | First Horizon National Corp.(a) | 33,040 | |||||
| 1,375 | First Industrial Realty Trust, Inc.(b) | 28,270 | |||||
| 425 | First Merchants Corp. | 9,669 | |||||
| 800 | First Midwest Bancorp, Inc. | 13,688 | |||||
| 3,424 | First Niagara Financial Group, Inc. | 28,864 | |||||
| 800 | First Potomac Realty Trust(a) (b) | 9,888 | |||||
| 150 | First Republic Bank | 7,818 | |||||
| 1,582 | FirstMerit Corp.(a) | 29,884 | |||||
| 1,500 | FNB Corp.(a) | 19,980 | |||||
| 3,784 | FNF Group | 130,359 | |||||
| 1,152 | FNFV Group† | 18,133 | |||||
| 2,100 | Forest City Enterprises, Inc., Class A† | 44,730 | |||||
| 5,646 | Franklin Resources, Inc. | 312,619 | |||||
| 950 | Franklin Street Properties Corp.(b) | 11,656 | |||||
| 8,075 | Freddie Mac† | 16,635 | |||||
| 2,734 | Fulton Financial Corp. | 33,792 | |||||
| 550 | FXCM, Inc., Class A(a) | 9,114 | |||||
| 1,137 | Gaming and Leisure Properties, Inc.(b) | 33,360 | |||||
| 5,115 | General Growth Properties, Inc. | 143,885 | |||||
| 5,850 | Genworth Financial, Inc., Class A† | 49,725 | |||||
| 1,152 | Geo Group, Inc. (The)(b) | 46,495 | |||||
| 400 | Getty Realty Corp.(a) (b) | 7,284 | |||||
| 900 | Glacier Bancorp, Inc. | 24,993 | |||||
| 50 | Gleacher & Co., Inc. | 353 | |||||
| 1,800 | Glimcher Realty Trust(b) | 24,732 | |||||
| 5,638 | Goldman Sachs Group, Inc. (The) | 1,092,814 | |||||
| 475 | Golub Capital BDC, Inc. | 8,517 | |||||
| 550 | Government Properties Income Trust(a) (b) | 12,655 | |||||
| 2,210 | Gramercy Property Trust, Inc.(a) (b) | 15,249 | |||||
| 550 | Green Dot Corp., Class A† | 11,270 | |||||
| 300 | Greenhill & Co., Inc. | 13,080 | |||||
| Shares | Value | ||||||
| Financials (continued) | |||||||
| 200 | Guaranty Bancorp(a) | $ | 2,888 | ||||
| 100 | Hallmark Financial Services, Inc.† | 1,209 | |||||
| 927 | Hancock Holding Co. | 28,459 | |||||
| 69 | Hanmi Financial Corp.(a) | 1,505 | |||||
| 700 | Hanover Insurance Group, Inc. (The) | 49,924 | |||||
| 5,525 | Hartford Financial Services Group, Inc. | 230,337 | |||||
| 1,000 | Hatteras Financial Corp.(b) | 18,430 | |||||
| 1,175 | HCC Insurance Holdings, Inc. | 62,886 | |||||
| 6,150 | HCP, Inc.(b) | 270,785 | |||||
| 4,462 | Health Care REIT, Inc.(a) | 337,640 | |||||
| 1,175 | Healthcare Realty Trust, Inc.(b) | 32,101 | |||||
| 1,025 | HealthCare Trust of America† (b) | 27,613 | |||||
| 775 | Hercules Technology Growth Capital, Inc. | 11,532 | |||||
| 50 | Heritage Commerce Corp. | 441 | |||||
| 2,525 | Hersha Hospitality Trust, Class A(b) | 17,751 | |||||
| 375 | HFF, Inc., Class A | 13,470 | |||||
| 1,100 | Highwoods Properties, Inc. | 48,708 | |||||
| 1,500 | Hilltop Holdings, Inc.†(a) | 29,925 | |||||
| 670 | Home BancShares, Inc. | 21,547 | |||||
| 800 | Home Properties, Inc.(b) | 52,480 | |||||
| 1,000 | Horace Mann Educators Corp. | 33,180 | |||||
| 1,850 | Hospitality Properties Trust | 57,350 | |||||
| 9,974 | Host Hotels & Resorts, Inc., Class REIT | 237,082 | |||||
| 544 | Howard Hughes Corp. (The)† | 70,949 | |||||
| 5,676 | Hudson City Bancorp, Inc. | 57,441 | |||||
| 700 | Hudson Pacific Properties, Inc.(b) | 21,042 | |||||
| 9,351 | Huntington Bancshares, Inc. | 98,373 | |||||
| 325 | Iberiabank Corp. | 21,076 | |||||
| 85 | Impac Mortgage Holdings, Inc.† (b) | 527 | |||||
| 300 | Independent Bank Corp. | 12,843 | |||||
| 1,100 | Inland Real Estate Corp.(b) | 12,045 | |||||
| 500 | Interactive Brokers Group, Inc., Class A | 14,580 | |||||
| 1,517 | Intercontinental Exchange, Inc. | 332,663 | |||||
| 700 | International Bancshares Corp. | 18,578 | |||||
| 550 | Intervest Bancshares Corp., Class A | 5,528 | |||||
| 500 | INTL FCStone, Inc.†(a) | 10,285 | |||||
| 1,000 | Invesco Mortgage Capital, Inc.(b) | 15,460 | |||||
| 5,525 | Invesco, Ltd. | 218,348 | |||||
| 1,000 | Investment Technology Group, Inc.† | 20,820 | |||||
| 1,838 | Investors Bancorp, Inc. | 20,632 | |||||
| 1,800 | Investors Real Estate Trust(a) (b) | 14,706 | |||||
| 1,564 | iStar Financial, Inc.†(a) (b) | 21,349 | |||||
| 2,475 | Janus Capital Group, Inc.(a) | 39,922 | |||||
| 500 | Jones Lang LaSalle, Inc. | 74,965 | |||||
| 48,359 | JPMorgan Chase & Co. | 3,026,306 | |||||
| 134 | KCG Holdings, Inc., Class A† | 1,561 | |||||
| 600 | Kearny Financial Corp.†(a) | 8,250 | |||||
| 650 | Kemper Corp. | 23,471 | |||||
| 925 | Kennedy-Wilson Holdings, Inc. | 23,403 | |||||
| 10,823 | KeyCorp | 150,440 | |||||
| 1,300 | Kilroy Realty Corp.(b) | 89,791 | |||||
| 5,550 | Kimco Realty Corp.(b) | 139,527 | |||||
| 1,125 | Kite Realty Group Trust(a) (b) | 32,333 | |||||
| 1,000 | Lamar Advertising Co., Class A(b) | 53,640 | |||||
| 1,500 | LaSalle Hotel Properties(b) | 60,705 | |||||
| 1,700 | Legg Mason, Inc. | 90,729 | |||||
| 4,282 | Leucadia National Corp. | 96,002 | |||||
| 1,626 | Lexington Realty Trust, Class REIT(a) (b) | 17,853 | |||||
| 2,125 | Liberty Property Trust(b) | 79,964 | |||||
| 3,175 | Lincoln National Corp. | 183,102 | |||||
| 4,825 | Loews Corp. | 202,747 | |||||
| 200 | LPL Financial Holdings, Inc.(a) | 8,910 | |||||
| 350 | LTC Properties, Inc.(a) (b) | 15,110 | |||||
| 1,472 | M&T Bank Corp.(a) | 184,913 | |||||
| 2,151 | Macerich Co. (The)(b) | 179,415 | |||||
| 1,500 | Mack-Cali Realty Corp.(b) | 28,590 | |||||
| 1,000 | Maiden Holdings, Ltd.(a) | 12,790 | |||||
Wilshire Mutual Funds, Inc. Wilshire 5000 IndexSM Fund Schedule of Investments | December 31, 2014 |
| Shares | Value | ||||||
| Financials (continued) | |||||||
| 475 | Main Street Capital Corp.(a) | $ | 13,889 | ||||
| 135 | Markel Corp.† | 92,183 | |||||
| 350 | MarketAxess Holdings, Inc. | 25,099 | |||||
| 6,920 | Marsh & McLennan Cos., Inc. | 396,101 | |||||
| 865 | MB Financial, Inc. | 28,424 | |||||
| 1,900 | MBIA, Inc.†(a) | 18,126 | |||||
| 2,931 | McGraw Hill Financial, Inc. | 260,800 | |||||
| 967 | Meadowbrook Insurance Group, Inc.(a) | 8,181 | |||||
| 600 | Medallion Financial Corp.(a) | 6,006 | |||||
| 1,500 | Medical Properties Trust, Inc.(a) (b) | 20,670 | |||||
| 300 | Mercury General Corp. | 17,001 | |||||
| 12,996 | MetLife, Inc. | 702,954 | |||||
| 4,000 | MFA Financial, Inc., Class REIT(b) | 31,960 | |||||
| 1,500 | MGIC Investment Corp.†(a) | 13,980 | |||||
| 914 | Mid-America Apartment Communities, Inc. | 68,258 | |||||
| 2,300 | Monogram Residential Trust, Inc.(b) | 21,298 | |||||
| 400 | Montpelier Re Holdings, Ltd.(a) | 14,328 | |||||
| 2,184 | Moody's Corp. | 209,249 | |||||
| 20,725 | Morgan Stanley | 804,130 | |||||
| 1,372 | MSCI, Inc., Class A(a) | 65,088 | |||||
| 1,750 | NASDAQ OMX Group, Inc. (The) | 83,930 | |||||
| 625 | National Health Investors, Inc.(b) | 43,725 | |||||
| 400 | National Interstate Corp.(a) | 11,920 | |||||
| 2,500 | National Penn Bancshares, Inc. | 26,313 | |||||
| 1,200 | National Retail Properties, Inc., Class REIT | 47,244 | |||||
| 4,300 | Navient Corp. | 92,923 | |||||
| 500 | NBT Bancorp, Inc.(a) | 13,135 | |||||
| 325 | Nelnet, Inc., Class A | 15,057 | |||||
| 650 | New Mountain Finance Corp. | 9,711 | |||||
| 1,462 | New Residential Investment Corp.(b) | 18,670 | |||||
| 695 | New Senior Investment Group, Inc.(b) | 11,433 | |||||
| 5,087 | New York Community Bancorp, Inc.(a) | 81,392 | |||||
| 2,325 | New York REIT, Inc.(b) | 24,622 | |||||
| 695 | Newcastle Investment Corp.(a) (b) | 3,121 | |||||
| 3,150 | Northern Trust Corp. | 212,310 | |||||
| 2,153 | NorthStar Asset Management Group, Inc. | 48,593 | |||||
| 2,978 | NorthStar Realty Finance Corp.(b) | 52,353 | |||||
| 875 | Northwest Bancshares, Inc. | 10,964 | |||||
| 1,400 | Oaktree Capital Group LLC, Class A(A) | 72,562 | |||||
| 1,475 | Ocwen Financial Corp., Class Comdty (histrt)†(a) | 22,273 | |||||
| 432 | OFG Bancorp(a) | 7,193 | |||||
| 1,500 | Old National Bancorp | 22,320 | |||||
| 3,236 | Old Republic International Corp. | 47,343 | |||||
| 400 | Old Second Bancorp, Inc.† | 2,148 | |||||
| 1,275 | Omega Healthcare Investors, Inc.(a) (b) | 49,814 | |||||
| 600 | OneBeacon Insurance Group, Ltd., Class A | 9,720 | |||||
| 400 | Oritani Financial Corp. | 6,160 | |||||
| 336 | Outfront Media, Inc.(b) | 9,031 | |||||
| 1,267 | PacWest Bancorp | 57,598 | |||||
| 1,800 | Paramount Group, Inc.† (b) | 33,462 | |||||
| 187 | Park National Corp. | 16,546 | |||||
| 1,100 | Parkway Properties, Inc.(b) | 20,229 | |||||
| 625 | PartnerRe, Ltd. | 71,331 | |||||
| 1,000 | Pebblebrook Hotel Trust(b) | 45,630 | |||||
| 825 | PennantPark Investment Corp. | 7,862 | |||||
| 825 | Pennsylvania Real Estate Investment Trust(b) | 19,355 | |||||
| 775 | PennyMac Mortgage Investment Trust(b) | 16,345 | |||||
| 4,347 | People's United Financial, Inc.(a) | 65,987 | |||||
| 573 | PHH Corp.†(a) | 13,729 | |||||
| 62 | Phoenix, Inc.† | 4,270 | |||||
| 2,100 | Piedmont Office Realty Trust, Inc., Class A(a) (b) | 39,564 | |||||
| Shares | Value | ||||||
| Financials (continued) | |||||||
| 900 | Pinnacle Financial Partners, Inc. | $ | 35,586 | ||||
| 300 | Piper Jaffray Cos.†(a) | 17,427 | |||||
| 200 | Platinum Underwriters Holdings, Ltd. | 14,684 | |||||
| 2,184 | Plum Creek Timber Co., Inc.(a) (b) | 93,453 | |||||
| 6,906 | PNC Financial Services Group, Inc. | 630,034 | |||||
| 1,157 | Popular, Inc.† | 39,396 | |||||
| 600 | Post Properties, Inc.(b) | 35,262 | |||||
| 400 | Potlatch Corp. | 16,748 | |||||
| 600 | PRA Group, Inc.†(a) | 34,758 | |||||
| 200 | Preferred Bank | 5,578 | |||||
| 600 | Primerica, Inc. | 32,556 | |||||
| 3,050 | Principal Financial Group, Inc. | 158,417 | |||||
| 1,222 | PrivateBancorp, Inc., Class A | 40,815 | |||||
| 830 | ProAssurance Corp. | 37,475 | |||||
| 6,775 | Progressive Corp. (The) | 182,857 | |||||
| 6,660 | Prologis, Inc.(b) | 286,580 | |||||
| 3,375 | Prospect Capital Corp.(a) | 27,878 | |||||
| 800 | Prosperity Bancshares, Inc. | 44,288 | |||||
| 1,000 | Protective Life Corp. | 69,650 | |||||
| 1,500 | Provident Financial Services, Inc. | 27,090 | |||||
| 6,056 | Prudential Financial, Inc. | 547,826 | |||||
| 249 | PS Business Parks, Inc. | 19,805 | |||||
| 1,955 | Public Storage(b) | 361,382 | |||||
| 2,077 | Pzena Investment Management, Inc., Class A(a) | 19,648 | |||||
| 2,145 | Radian Group, Inc. | 35,864 | |||||
| 66 | RAIT Financial Trust(b) | 506 | |||||
| 1,000 | Ramco-Gershenson Properties Trust(b) | 18,740 | |||||
| 1,525 | Raymond James Financial, Inc. | 87,367 | |||||
| 1,501 | Rayonier, Inc.(a) (b) | 41,938 | |||||
| 2,500 | Realty Income Corp., Class REIT(a) (b) | 119,275 | |||||
| 1,200 | Redwood Trust, Inc.(a) (b) | 23,640 | |||||
| 1,325 | Regency Centers Corp.(b) | 84,509 | |||||
| 16,506 | Regions Financial Corp. | 174,303 | |||||
| 850 | Reinsurance Group of America, Inc., Class A | 74,477 | |||||
| 400 | RenaissanceRe Holdings, Ltd.(a) | 38,888 | |||||
| 400 | Renasant Corp. | 11,572 | |||||
| 315 | Republic Bancorp, Inc., Class A(a) | 7,787 | |||||
| 250 | Resource America, Inc., Class A(a) | 2,260 | |||||
| 200 | Resource Capital Corp.(a) (b) | 1,008 | |||||
| 725 | Retail Opportunity Investments Corp.(a) (b) | 12,173 | |||||
| 725 | Retail Properties of America, Inc., Class A | 12,100 | |||||
| 425 | RLI Corp.(a) | 20,995 | |||||
| 1,500 | RLJ Lodging Trust(b) | 50,295 | |||||
| 174 | Rouse Properties, Inc.(a) (b) | 3,222 | |||||
| 825 | Ryman Hospitality Properties, Inc.(a) | 43,511 | |||||
| 608 | Sabra Health Care REIT, Inc.(b) | 18,465 | |||||
| 200 | Saul Centers, Inc.(b) | 11,438 | |||||
| 150 | Seacoast Banking Corp of Florida†(a) (B) | 2,063 | |||||
| 2,000 | SEI Investments Co. | 80,080 | |||||
| 350 | Select Income REIT(a) (b) | 8,544 | |||||
| 600 | Selective Insurance Group, Inc. | 16,302 | |||||
| 2,750 | Senior Housing Properties Trust(b) | 60,803 | |||||
| 606 | Signature Bank† | 76,332 | |||||
| 152 | Silver Bay Realty Trust Corp.(b) | 2,517 | |||||
| 200 | Simmons First National Corp., Class A | 8,130 | |||||
| 4,193 | Simon Property Group, Inc. | 763,587 | |||||
| 1,357 | SL Green Realty Corp.(b) | 161,510 | |||||
| 4,300 | SLM Corp. | 43,817 | |||||
| 500 | Solar Capital, Ltd. | 9,005 | |||||
| 300 | South State Corp. | 20,124 | |||||
| 300 | Southside Bancshares, Inc. | 8,673 | |||||
| 50 | Southwest Bancorp, Inc. | 868 | |||||
| 450 | Sovran Self Storage, Inc.(b) | 39,249 | |||||
| 4,000 | Spirit Realty Capital, Inc.(b) | 47,560 | |||||
Wilshire Mutual Funds, Inc. Wilshire 5000 IndexSM Fund Schedule of Investments | December 31, 2014 |
| Shares | Value | ||||||
| Financials (continued) | |||||||
| 300 | Springleaf Holdings, Inc., Class A†(a) | $ | 10,851 | ||||
| 500 | St. Joe Co. (The)†(a) | 9,195 | |||||
| 450 | STAG Industrial, Inc.(a) (b) | 11,025 | |||||
| 490 | StanCorp Financial Group, Inc. | 34,231 | |||||
| 2,550 | Starwood Property Trust, Inc.(b) | 59,262 | |||||
| 415 | Starwood Waypoint Residential Trust(b) | 10,944 | |||||
| 400 | State Auto Financial Corp. | 8,888 | |||||
| 5,665 | State Street Corp. | 444,703 | |||||
| 1,113 | Sterling Bancorp(a) | 16,005 | |||||
| 300 | Stewart Information Services Corp. | 11,112 | |||||
| 640 | Stifel Financial Corp.† | 32,653 | |||||
| 3,025 | Strategic Hotels & Resorts, Inc.† (b) | 40,021 | |||||
| 50 | Suffolk Bancorp(a) | 1,136 | |||||
| 1,050 | Summit Hotel Properties, Inc.(b) | 13,062 | |||||
| 164 | Sun Bancorp, Inc.†(a) | 3,182 | |||||
| 500 | Sun Communities, Inc.(a) (b) | 30,230 | |||||
| 2,595 | Sunstone Hotel Investors, Inc.(b) | 42,843 | |||||
| 7,105 | SunTrust Banks, Inc. | 297,700 | |||||
| 1,728 | Susquehanna Bancshares, Inc. | 23,207 | |||||
| 650 | SVB Financial Group† | 75,446 | |||||
| 1,000 | Symetra Financial Corp. | 23,050 | |||||
| 1,650 | Synchrony Financial† | 49,088 | |||||
| 1,547 | Synovus Financial Corp. | 41,908 | |||||
| 3,254 | T Rowe Price Group, Inc.(a) | 279,388 | |||||
| 1,300 | Tanger Factory Outlet Centers, Inc. | 48,048 | |||||
| 800 | Taubman Centers, Inc.(b) | 61,136 | |||||
| 1,500 | TCF Financial Corp. | 23,835 | |||||
| 3,853 | TD Ameritrade Holding Corp. | 137,860 | |||||
| 50 | Tejon Ranch Co.† | 1,473 | |||||
| 575 | Terreno Realty Corp.(b) | 11,862 | |||||
| 384 | Texas Capital Bancshares, Inc.†(a) | 20,863 | |||||
| 1,250 | TFS Financial Corp. | 18,606 | |||||
| 300 | Tompkins Financial Corp. | 16,590 | |||||
| 1,650 | Torchmark Corp. | 89,381 | |||||
| 103 | TowneBank(a) | 1,557 | |||||
| 4,422 | Travelers Cos., Inc. (The) | 468,069 | |||||
| 90 | Tree.com, Inc.† | 4,351 | |||||
| 350 | Triangle Capital Corp. | 7,102 | |||||
| 409 | Trico Bancshares | 10,102 | |||||
| 1,300 | Trinity Place Holdings, Inc.† | 8,190 | |||||
| 1,208 | TrustCo Bank Corp. | 8,770 | |||||
| 1,000 | Trustmark Corp.(a) | 24,540 | |||||
| 4,125 | Two Harbors Investment Corp.(b) | 41,333 | |||||
| 23,009 | U.S. Bancorp | 1,034,255 | |||||
| 3,403 | UDR, Inc., Class REIT(b) | 104,880 | |||||
| 400 | UMB Financial Corp. | 22,756 | |||||
| 2,275 | Umpqua Holdings Corp. | 38,698 | |||||
| 575 | Union Bankshares Corp.(a) | 13,846 | |||||
| 832 | United Bankshares, Inc.(a) | 31,158 | |||||
| 474 | United Community Banks, Inc. | 8,978 | |||||
| 317 | United Community Financial Corp.(a) | 1,702 | |||||
| 542 | United Financial Bancorp, Inc. | 7,783 | |||||
| 300 | United Fire Group, Inc. | 8,919 | |||||
| 375 | United Security Bancshares† | 2,044 | |||||
| 200 | Universal Health Realty Income Trust(a) (b) | 9,624 | |||||
| 2,832 | Unum Group | 98,780 | |||||
| 500 | Urstadt Biddle Properties, Inc., Class A(a) (b) | 10,940 | |||||
| 1,083 | Validus Holdings, Ltd. | 45,009 | |||||
| 1,831 | Valley National Bancorp(a) | 17,779 | |||||
| 3,915 | Ventas, Inc.(b) | 280,706 | |||||
| 375 | ViewPoint Financial Group, Inc. | 8,944 | |||||
| 48 | Virtus Investment Partners, Inc.(a) | 8,184 | |||||
| 2,572 | Vornado Realty Trust | 302,750 | |||||
| 2,250 | Voya Financial, Inc. | 95,355 | |||||
| 1,187 | W.R. Berkley Corp. | 60,846 | |||||
| Shares | Value | ||||||
| Financials (continued) | |||||||
| 1,125 | Waddell & Reed Financial, Inc., Class A | $ | 56,048 | ||||
| 220 | Walter Investment Management Corp.†(a) | 3,632 | |||||
| 1,333 | Washington Federal, Inc.(a) | 29,526 | |||||
| 1,934 | Washington Prime Group, Inc.(b) | 33,303 | |||||
| 1,250 | Washington Real Estate Investment Trust(a) (b) | 34,575 | |||||
| 400 | Washington Trust Bancorp, Inc.(a) | 16,072 | |||||
| 603 | Waterstone Financial, Inc.(a) | 7,929 | |||||
| 1,100 | Webster Financial Corp. | 35,783 | |||||
| 1,700 | Weingarten Realty Investors(a) (b) | 59,364 | |||||
| 64,267 | Wells Fargo & Co. | 3,523,117 | |||||
| 350 | WesBanco, Inc.(a) | 12,180 | |||||
| 383 | Westamerica Bancorporation(a) | 18,775 | |||||
| 1,150 | Western Alliance Bancorp† | 31,970 | |||||
| 200 | Westfield Financial, Inc. | 1,468 | |||||
| 80 | White Mountains Insurance Group, Ltd. | 50,409 | |||||
| 700 | Wilshire Bancorp, Inc. | 7,091 | |||||
| 500 | Wintrust Financial Corp. | 23,380 | |||||
| 750 | WisdomTree Investments, Inc.(a) | 11,756 | |||||
| 100 | World Acceptance Corp.†(a) | 7,945 | |||||
| 2,280 | Zions Bancorporation | 65,003 | |||||
| 49,867,551 | |||||||
Health Care — 13.2% | |||||||
| 300 | Abaxis, Inc. | 17,049 | |||||
| 19,300 | Abbott Laboratories | 868,886 | |||||
| 17,125 | AbbVie, Inc. | 1,120,660 | |||||
| 350 | ABIOMED, Inc.† | 13,321 | |||||
| 475 | Acadia Healthcare Co., Inc.†(a) | 29,075 | |||||
| 625 | ACADIA Pharmaceuticals, Inc.†(a) | 19,844 | |||||
| 300 | Accretive Health, Inc.†(a) | 2,058 | |||||
| 375 | Acorda Therapeutics, Inc.†(a) | 15,326 | |||||
| 2,989 | Actavis PLC† | 769,398 | |||||
| 300 | Aegerion Pharmaceuticals, Inc.†(a) | 6,282 | |||||
| 4,768 | Aetna, Inc. | 423,541 | |||||
| 200 | Affymetrix, Inc.†(a) | 1,974 | |||||
| 4,046 | Agilent Technologies, Inc. | 165,643 | |||||
| 300 | Agios Pharmaceuticals, Inc.†(a) | 33,612 | |||||
| 300 | Air Methods Corp.†(a) | 13,209 | |||||
| 900 | Akorn, Inc.†(a) | 32,580 | |||||
| 700 | Albany Molecular Research, Inc.†(a) | 11,396 | |||||
| 850 | Alere, Inc.†(a) | 32,300 | |||||
| 2,029 | Alexion Pharmaceuticals, Inc.† | 375,426 | |||||
| 750 | Align Technology, Inc.† | 41,932 | |||||
| 1,600 | Alkermes PLC† | 93,696 | |||||
| 3,493 | Allergan, Inc. | 742,577 | |||||
| 140 | Alliance HealthCare Services, Inc.† | 2,939 | |||||
| 1,500 | Allscripts Healthcare Solutions, Inc.†(a) | 19,155 | |||||
| 796 | Alnylam Pharmaceuticals, Inc.†(a) | 77,212 | |||||
| 100 | AMAG Pharmaceuticals, Inc.†(a) | 4,262 | |||||
| 201 | Amedisys, Inc.† | 5,899 | |||||
| 600 | American CareSource Holdings, Inc.†(a) | 1,752 | |||||
| 2,440 | AmerisourceBergen Corp., Class A | 219,990 | |||||
| 8,596 | Amgen, Inc. | 1,369,257 | |||||
| 300 | Amicus Therapeutics, Inc.† | 2,496 | |||||
| 250 | AMN Healthcare Services, Inc.† | 4,900 | |||||
| 400 | Amsurg Corp., Class A† | 21,892 | |||||
| 475 | Anacor Pharmaceuticals, Inc.†(a) | 15,319 | |||||
| 130 | Analogic Corp. | 10,999 | |||||
| 300 | ANI Pharmaceuticals, Inc.† | 16,917 | |||||
| 500 | Anika Therapeutics, Inc.† | 20,370 | |||||
| 3,685 | Anthem, Inc. | 463,094 | |||||
| 2,325 | Arena Pharmaceuticals, Inc.†(a) | 8,068 | |||||
| 1,000 | ARIAD Pharmaceuticals, Inc.†(a) | 6,870 | |||||
| 600 | Arrowhead Research Corp.†(a) | 4,428 | |||||
| 45 | Asterias Biotherapeutics, Inc.† | 145 | |||||
| 443 | athenahealth, Inc.†(a) | 64,545 | |||||
Wilshire Mutual Funds, Inc. Wilshire 5000 IndexSM Fund Schedule of Investments | December 31, 2014 |
| Shares | Value | ||||||
| Health Care (continued) | |||||||
| 500 | Auxilium Pharmaceuticals, Inc.†(a) | $ | 17,192 | ||||
| 1,800 | AVANIR Pharmaceuticals, Inc., Class A†(a) | 30,510 | |||||
| 7,138 | Baxter International, Inc. | 523,144 | |||||
| 2,493 | Becton Dickinson and Co. | 346,926 | |||||
| 200 | Biodel, Inc.†(a) | 266 | |||||
| 2,581 | Biogen Idec, Inc.† | 876,120 | |||||
| 1,475 | BioMarin Pharmaceutical, Inc.† | 133,340 | |||||
| 300 | Bio-Rad Laboratories, Inc., Class A† | 36,168 | |||||
| 500 | Bio-Techne Corp. | 46,200 | |||||
| 286 | Bluebird Bio, Inc.† | 26,232 | |||||
| 14,439 | Boston Scientific Corp.† | 191,317 | |||||
| 21,825 | Bristol-Myers Squibb Co. | 1,288,330 | |||||
| 2,194 | Brookdale Senior Living, Inc., Class A† | 80,454 | |||||
| 1,500 | Bruker Corp.† | 29,430 | |||||
| 925 | C.R. Bard, Inc. | 154,123 | |||||
| 350 | Cambrex Corp.† | 7,567 | |||||
| 350 | Cantel Medical Corp. | 15,141 | |||||
| 100 | Capital Senior Living Corp.†(a) | 2,491 | |||||
| 4,213 | Cardinal Health, Inc. | 340,115 | |||||
| 325 | Cardiovascular Systems, Inc.†(a) | 9,776 | |||||
| 2,593 | CareFusion Corp.† | 153,869 | |||||
| 550 | Catalent, Inc.† | 15,334 | |||||
| 2,785 | Catamaran Corp.† | 144,124 | |||||
| 10,314 | Celgene Corp.† | 1,153,724 | |||||
| 927 | Celldex Therapeutics, Inc.†(a) | 16,918 | |||||
| 630 | Centene Corp.† | 65,425 | |||||
| 500 | Cepheid, Inc.†(a) | 27,070 | |||||
| 3,350 | Cerner Corp.† | 216,611 | |||||
| 500 | Charles River Laboratories International, Inc.† | 31,820 | |||||
| 136 | Chemed Corp. | 14,371 | |||||
| 3,363 | Cigna Corp. | 346,086 | |||||
| 300 | Clovis Oncology, Inc.†(a) | 16,800 | |||||
| 1,332 | Community Health Systems, Inc.† | 71,821 | |||||
| 100 | Computer Programs & Systems, Inc.(a) | 6,075 | |||||
| 300 | CONMED Corp. | 13,488 | |||||
| 500 | Cooper Cos., Inc. (The)(a) | 81,045 | |||||
| 650 | Covance, Inc.† | 67,496 | |||||
| 226 | CTI BioPharma Corp.† | 533 | |||||
| 800 | Cubist Pharmaceuticals, Inc.†(a) | 80,520 | |||||
| 300 | Cyberonics, Inc.† | 16,704 | |||||
| 91 | Cynosure, Inc., Class A† | 2,495 | |||||
| 2,208 | DaVita HealthCare Partners, Inc.† | 167,234 | |||||
| 1,900 | DENTSPLY International, Inc. | 101,213 | |||||
| 675 | Depomed, Inc.† | 10,874 | |||||
| 950 | DexCom, Inc.† | 52,297 | |||||
| 1,175 | Dyax Corp.† | 16,520 | |||||
| 1,100 | Edwards Lifesciences Corp.† | 140,118 | |||||
| 12,645 | Eli Lilly & Co. | 872,379 | |||||
| 793 | Emergent Biosolutions, Inc.†(a) | 21,593 | |||||
| 1,100 | Endo International PLC†(a) | 79,332 | |||||
| 700 | Endologix, Inc.†(a) | 10,703 | |||||
| 300 | Ensign Group, Inc. (The) | 13,317 | |||||
| 625 | Envision Healthcare Holdings, Inc.†(a) | 21,681 | |||||
| 775 | Exact Sciences Corp.†(a) | 21,266 | |||||
| 800 | Exelixis, Inc.†(a) | 1,152 | |||||
| 9,715 | Express Scripts Holding Co.† | 822,569 | |||||
| 100 | Five Star Quality Care, Inc.† | 415 | |||||
| 500 | Galena Biopharma, Inc.†(a) | 755 | |||||
| 500 | Genomic Health, Inc.†(a) | 15,985 | |||||
| 50 | Gentiva Health Services, Inc.† | 952 | |||||
| 1,100 | Geron Corp.†(a) | 3,575 | |||||
| 16,164 | Gilead Sciences, Inc.†(a) | 1,523,619 | |||||
| 300 | Greatbatch, Inc.† | 14,790 | |||||
| 550 | Haemonetics Corp.†(a) | 20,581 | |||||
| Shares | Value | ||||||
| Health Care (continued) | |||||||
| 1,700 | Halozyme Therapeutics, Inc.†(a) | $ | 16,405 | ||||
| 597 | Halyard Health, Inc.†(a) | 27,146 | |||||
| 350 | Hanger, Inc.†(a) | 7,665 | |||||
| 500 | HCA Holdings, Inc.† | 36,695 | |||||
| 1,000 | Health Net, Inc.† | 53,530 | |||||
| 1,100 | HealthSouth Corp. | 42,306 | |||||
| 170 | HeartWare International, Inc.†(a) | 12,483 | |||||
| 872 | Henry Schein, Inc.†(a) | 118,723 | |||||
| 600 | Hill-Rom Holdings, Inc. | 27,372 | |||||
| 925 | HMS Holdings Corp.†(a) | 19,555 | |||||
| 2,452 | Hologic, Inc.†(a) | 65,566 | |||||
| 1,125 | Horizon Pharma PLC† | 14,501 | |||||
| 2,040 | Hospira, Inc.† | 124,950 | |||||
| 1,876 | Humana, Inc. | 269,450 | |||||
| 200 | ICU Medical, Inc.† | 16,380 | |||||
| 509 | IDEXX Laboratories, Inc.† | 75,469 | |||||
| 1,462 | Illumina, Inc.† | 269,856 | |||||
| 1,000 | ImmunoGen, Inc.† | 6,100 | |||||
| 1,000 | Impax Laboratories, Inc.† | 31,670 | |||||
| 825 | IMS Health Holdings, Inc.† | 21,153 | |||||
| 2,200 | Incyte Corp., Ltd.† | 160,842 | |||||
| 600 | Infinity Pharmaceuticals, Inc.† | 10,134 | |||||
| 475 | Insulet Corp.† | 21,878 | |||||
| 300 | Integra LifeSciences Holdings Corp.† | 16,269 | |||||
| 137 | Intercept Pharmaceuticals, Inc.†(a) | 21,372 | |||||
| 400 | Intrexon Corp.†(a) | 11,012 | |||||
| 365 | Intuitive Surgical, Inc.† | 193,063 | |||||
| 300 | IPC The Hospitalist Co., Inc.†(a) | 13,767 | |||||
| 1,000 | Ironwood Pharmaceuticals, Inc., Class A†(a) | 15,320 | |||||
| 1,000 | Isis Pharmaceuticals, Inc.†(a) | 61,740 | |||||
| 35,858 | Johnson & Johnson | 3,749,671 | |||||
| 975 | Keryx Biopharmaceuticals, Inc.†(a) | 13,796 | |||||
| 575 | Kindred Healthcare, Inc. | 10,454 | |||||
| 300 | Kite Pharma, Inc.† | 17,301 | |||||
| 1,075 | Laboratory Corp. of America Holdings† | 115,993 | |||||
| 300 | Lannett Co., Inc.† | 12,864 | |||||
| 600 | LHC Group, Inc.† | 18,708 | |||||
| 565 | LifePoint Hospitals, Inc.† | 40,629 | |||||
| 316 | Ligand Pharmaceuticals, Inc., Class B†(a) | 16,814 | |||||
| 400 | Magellan Health, Inc.† | 24,012 | |||||
| 513 | Mallinckrodt PLC†(a) | 50,802 | |||||
| 2,975 | MannKind Corp.†(a) | 15,515 | |||||
| 600 | Masimo Corp.†(a) | 15,804 | |||||
| 2,986 | McKesson Corp. | 619,834 | |||||
| 400 | MedAssets, Inc.† | 7,904 | |||||
| 650 | Medicines Co. (The)†(a) | 17,986 | |||||
| 500 | Medidata Solutions, Inc.†(a) | 23,875 | |||||
| 847 | Medivation, Inc.† | 84,370 | |||||
| 1,200 | MEDNAX, Inc.† | 79,332 | |||||
| 12,372 | Medtronic, Inc.(a) | 893,258 | |||||
| 34,580 | Merck & Co., Inc. | 1,963,798 | |||||
| 100 | Merge Healthcare, Inc.† | 356 | |||||
| 375 | Meridian Bioscience, Inc. | 6,172 | |||||
| 300 | Mettler-Toledo International, Inc.† | 90,738 | |||||
| 600 | MGC Diagnostics Corp.† | 3,840 | |||||
| 1,175 | MiMedx Group, Inc.† | 13,548 | |||||
| 600 | Molina Healthcare, Inc.†(a) | 32,118 | |||||
| 200 | Momenta Pharmaceuticals, Inc.† | 2,408 | |||||
| 136 | MWI Veterinary Supply, Inc.†(a) | 23,108 | |||||
| 4,575 | Mylan, Inc.†(a) | 257,893 | |||||
| 800 | Myriad Genetics, Inc.†(a) | 27,248 | |||||
| 300 | National Healthcare Corp. | 18,852 | |||||
| 375 | Natus Medical, Inc.† | 13,515 | |||||
| 950 | Nektar Therapeutics† | 14,725 | |||||
Wilshire Mutual Funds, Inc. Wilshire 5000 IndexSM Fund Schedule of Investments | December 31, 2014 |
| Shares | Value | ||||||
| Health Care (continued) | |||||||
| 350 | Neogen Corp.† | $ | 17,356 | ||||
| 800 | Neurocrine Biosciences, Inc.†(a) | 17,872 | |||||
| 300 | NewLink Genetics Corp.†(a) | 11,925 | |||||
| 2,150 | Novavax, Inc.†(a) | 12,750 | |||||
| 775 | NPS Pharmaceuticals, Inc.† | 27,722 | |||||
| 1,000 | NuVasive, Inc.† | 47,160 | |||||
| 1,000 | NxStage Medical, Inc.† | 17,930 | |||||
| 128 | Oculus Innovative Sciences, Inc.†(a) | 183 | |||||
| 1,000 | Omnicare, Inc.(a) | 72,930 | |||||
| 375 | Omnicell, Inc.† | 12,420 | |||||
| 300 | Ophthotech Corp.† | 13,461 | |||||
| 3,000 | OPKO Health, Inc.†(a) | 29,970 | |||||
| 750 | Orexigen Therapeutics, Inc.†(a) | 4,545 | |||||
| 300 | Orthofix International NV† | 9,018 | |||||
| 700 | Owens & Minor, Inc. | 24,577 | |||||
| 375 | Pacira Pharmaceuticals, Inc.† | 33,248 | |||||
| 6 | Paratek Pharmaceuticals, Inc. | 231 | |||||
| 600 | PAREXEL International Corp.†(a) | 33,336 | |||||
| 950 | Patterson Cos., Inc.(a) | 45,695 | |||||
| 800 | PDI, Inc.† | 1,432 | |||||
| 1,100 | PDL BioPharma, Inc.(a) | 8,481 | |||||
| 1,517 | PerkinElmer, Inc. | 66,339 | |||||
| 5 | Pernix Therapeutics Holdings, Inc.† | 47 | |||||
| 81,487 | Pfizer, Inc. | 2,538,320 | |||||
| 825 | Pharmacyclics, Inc.†(a) | 100,865 | |||||
| 381 | PharMerica Corp.† | 7,891 | |||||
| 400 | Pozen, Inc.† | 3,200 | |||||
| 350 | Premier, Inc., Class A† | 11,736 | |||||
| 650 | Prestige Brands Holdings, Inc.†(a) | 22,568 | |||||
| 800 | Progenics Pharmaceuticals, Inc.†(a) | 6,048 | |||||
| 200 | Providence Service Corp. (The)†(a) | 7,288 | |||||
| 354 | Puma Biotechnology, Inc.†(a) | 67,002 | |||||
| 575 | Quality Systems, Inc. | 8,964 | |||||
| 1,875 | Quest Diagnostics, Inc.(a) | 125,738 | |||||
| 300 | Quidel Corp.† | 8,676 | |||||
| 750 | Quintiles Transnational Holdings, Inc.†(a) | 44,153 | |||||
| 675 | Raptor Pharmaceutical Corp.†(a) | 7,101 | |||||
| 100 | Receptos, Inc.† | 12,251 | |||||
| 897 | Regeneron Pharmaceuticals, Inc.†(a) | 367,994 | |||||
| 1,800 | ResMed, Inc.(a) | 100,908 | |||||
| 1,600 | Rigel Pharmaceuticals, Inc.†(a) | 3,632 | |||||
| 418 | RTI Surgical, Inc.†(a) | 2,174 | |||||
| 600 | Sagent Pharmaceuticals, Inc.†(a) | 15,066 | |||||
| 700 | Salix Pharmaceuticals, Ltd.†(a) | 80,458 | |||||
| 300 | Sangamo BioSciences, Inc.† | 4,563 | |||||
| 400 | Sarepta Therapeutics, Inc.†(a) | 5,788 | |||||
| 925 | Seattle Genetics, Inc.†(a) | 29,720 | |||||
| 1,000 | Select Medical Holdings Corp.(a) | 14,400 | |||||
| 1,500 | Sequenom, Inc.†(a) | 5,550 | |||||
| 600 | Simulations Plus, Inc. | 4,008 | |||||
| 650 | Sirona Dental Systems, Inc.† | 56,791 | |||||
| 700 | Skilled Healthcare Group, Inc., Class A†(a) | 5,999 | |||||
| 475 | Spectranetics Corp.†(a) | 16,426 | |||||
| 3,450 | St. Jude Medical, Inc. | 224,354 | |||||
| 650 | STERIS Corp.(a) | 42,153 | |||||
| 4,491 | Stryker Corp. | 423,636 | |||||
| 50 | Symmetry Surgical, Inc.† | 390 | |||||
| 303 | Synageva BioPharma Corp.†(a) | 28,115 | |||||
| 400 | Synta Pharmaceuticals Corp.†(a) | 1,060 | |||||
| 1,000 | Team Health Holdings, Inc.† | 57,530 | |||||
| 500 | Teleflex, Inc.(a) | 57,410 | |||||
| 1,231 | Tenet Healthcare Corp.†(a) | 62,375 | |||||
| 300 | Tetraphase Pharmaceuticals, Inc.† | 11,913 | |||||
| 285 | Theravance Biopharma, Inc.†(a) | 4,252 | |||||
| 1,000 | Theravance, Inc. | 14,150 | |||||
| Shares | Value | ||||||
| Health Care (continued) | |||||||
| 5,256 | Thermo Fisher Scientific, Inc. | $ | 658,524 | ||||
| 600 | Thoratec Corp.†(a) | 19,476 | |||||
| 600 | Triple-S Management Corp., Class B†(a) | 14,346 | |||||
| 600 | United Therapeutics Corp.†(a) | 77,694 | |||||
| 12,282 | UnitedHealth Group, Inc. | 1,241,587 | |||||
| 500 | Universal American Corp.†(a) | 4,640 | |||||
| 1,100 | Universal Health Services, Inc., Class B | 122,386 | |||||
| 1,200 | Varian Medical Systems, Inc.†(a) | 103,812 | |||||
| 825 | VCA, Inc.† | 40,235 | |||||
| 425 | Veeva Systems, Inc., Class A† | 11,224 | |||||
| 17 | Venaxis, Inc.† | 30 | |||||
| 2,514 | Vertex Pharmaceuticals, Inc.† | 298,663 | |||||
| 500 | Volcano Corp.†(a) | 8,940 | |||||
| 1,100 | Waters Corp.† | 123,992 | |||||
| 450 | WellCare Health Plans, Inc.† | 36,927 | |||||
| 650 | West Pharmaceutical Services, Inc. | 34,606 | |||||
| 750 | Wright Medical Group, Inc.†(a) | 20,153 | |||||
| 2,271 | Zimmer Holdings, Inc. | 257,577 | |||||
| 1,250 | Zoetis, Inc., Class A | 53,788 | |||||
| 36,129,842 | |||||||
Industrials — 11.2% | |||||||
| 1,423 | 3D Systems Corp.†(a) | 46,774 | |||||
| 8,203 | 3M Co. | 1,347,917 | |||||
| 525 | AAON, Inc. | 11,755 | |||||
| 375 | AAR Corp. | 10,417 | |||||
| 500 | ABM Industries, Inc. | 14,325 | |||||
| 300 | Acacia Research Corp. | 5,082 | |||||
| 453 | ACCO Brands Corp.† | 4,082 | |||||
| 300 | Acme United Corp.(a) | 5,997 | |||||
| 590 | Actuant Corp., Class A | 16,072 | |||||
| 500 | Acuity Brands, Inc. | 70,035 | |||||
| 2,375 | ADT Corp.(a) | 86,046 | |||||
| 375 | Advisory Board Co. (The)† | 18,367 | |||||
| 1,427 | AECOM Technology Corp.†(a) | 43,338 | |||||
| 1,150 | AGCO Corp.(a) | 51,980 | |||||
| 1,000 | Air Lease Corp., Class A | 34,310 | |||||
| 1,200 | Aircastle, Ltd.(a) | 25,644 | |||||
| 1,434 | Alaska Air Group, Inc. | 85,696 | |||||
| 400 | Albany International Corp., Class A | 15,196 | |||||
| 153 | Allegiant Travel Co., Class A | 23,000 | |||||
| 350 | Alliant Techsystems, Inc.(a) | 40,688 | |||||
| 325 | Allison Transmission Holdings, Inc. | 11,018 | |||||
| 300 | Altra Industrial Motion Corp.(a) | 8,517 | |||||
| 100 | AMERCO | 28,426 | |||||
| 9,311 | American Airlines Group, Inc. | 499,349 | |||||
| 300 | American Railcar Industries, Inc.(a) | 15,450 | |||||
| 3,012 | AMETEK, Inc. | 158,522 | |||||
| 3,275 | AMR Corp., Escrow† | — | |||||
| 1,500 | AMREP Corp.†(a) | 5,760 | |||||
| 950 | AO Smith Corp. | 53,590 | |||||
| 500 | Apogee Enterprises, Inc. | 21,185 | |||||
| 425 | Applied Industrial Technologies, Inc.(a) | 19,376 | |||||
| 300 | ArcBest Corp. | 13,911 | |||||
| 200 | Armstrong World Industries, Inc.†(a) | 10,224 | |||||
| 200 | Astec Industries, Inc. | 7,862 | |||||
| 300 | Astronics Corp.† | 16,593 | |||||
| 300 | Atlas Air Worldwide Holdings, Inc.†(a) | 14,790 | |||||
| 1,292 | Avis Budget Group, Inc.† | 85,698 | |||||
| 600 | AZZ, Inc. | 28,152 | |||||
| 1,234 | B/E Aerospace, Inc.† | 71,597 | |||||
| 1,437 | Babcock & Wilcox Co. (The)(a) | 43,541 | |||||
| 600 | Barnes Group, Inc. | 22,206 | |||||
| 500 | Beacon Roofing Supply, Inc.† | 13,900 | |||||
| 500 | Blount International, Inc.† | 8,785 | |||||
| 900 | BlueLinx Holdings, Inc.† | 1,044 | |||||
| 8,843 | Boeing Co. (The) | 1,149,413 | |||||
Wilshire Mutual Funds, Inc. Wilshire 5000 IndexSM Fund Schedule of Investments | December 31, 2014 |
| Shares | Value | ||||||
| Industrials (continued) | |||||||
| 445 | Brady Corp., Class A | $ | 12,166 | ||||
| 450 | Briggs & Stratton Corp.(a) | 9,189 | |||||
| 450 | Brink's Co. (The)(a) | 10,984 | |||||
| 450 | Builders FirstSource, Inc.† | 3,091 | |||||
| 623 | Carlisle Cos., Inc. | 56,220 | |||||
| 100 | Casella Waste Systems, Inc., Class A†(a) | 404 | |||||
| 7,936 | Caterpillar, Inc. | 726,382 | |||||
| 1,300 | CBIZ, Inc.†(a) | 11,128 | |||||
| 400 | CDI Corp.(a) | 7,084 | |||||
| 400 | Ceco Environmental Corp.(a) | 6,216 | |||||
| 300 | Celadon Group, Inc.(a) | 6,807 | |||||
| 800 | Cenveo, Inc.†(a) | 1,680 | |||||
| 1,825 | CH Robinson Worldwide, Inc.(a) | 136,674 | |||||
| 400 | Chart Industries, Inc.† | 13,680 | |||||
| 77 | Chicago Bridge & Iron Co. NV(a) | 3,232 | |||||
| 1,032 | Cintas Corp. | 80,950 | |||||
| 184 | CIRCOR International, Inc. | 11,092 | |||||
| 1,000 | Civeo Corp. | 4,110 | |||||
| 400 | CLARCOR, Inc.(a) | 26,656 | |||||
| 540 | Clean Harbors, Inc.†(a) | 25,947 | |||||
| 1,425 | Colfax Corp.† | 73,487 | |||||
| 400 | Columbus McKinnon Corp. | 11,216 | |||||
| 900 | Comfort Systems USA, Inc. | 15,408 | |||||
| 300 | Commercial Vehicle Group, Inc.† | 1,998 | |||||
| 550 | Con-way, Inc. | 27,049 | |||||
| 1,400 | Copart, Inc.† | 51,086 | |||||
| 306 | Corporate Executive Board Co. (The) | 22,194 | |||||
| 1,750 | Covanta Holding Corp. | 38,517 | |||||
| 100 | Covenant Transportation Group, Inc., Class A† | 2,711 | |||||
| 625 | Crane Co. | 36,687 | |||||
| 12,350 | CSX Corp. | 447,440 | |||||
| 300 | Cubic Corp. | 15,792 | |||||
| 2,162 | Cummins, Inc. | 311,696 | |||||
| 600 | Curtiss-Wright Corp. | 42,354 | |||||
| 7,538 | Danaher Corp. | 646,082 | |||||
| 4,255 | Deere & Co.(a) | 376,440 | |||||
| 11,325 | Delta Air Lines, Inc. | 557,077 | |||||
| 500 | Deluxe Corp. | 31,125 | |||||
| 825 | DigitalGlobe, Inc.†(a) | 25,550 | |||||
| 1,525 | Donaldson Co., Inc.(a) | 58,911 | |||||
| 2,118 | Dover Corp. | 151,903 | |||||
| 500 | Dun & Bradstreet Corp. | 60,480 | |||||
| 100 | DXP Enterprises, Inc.†(a) | 5,053 | |||||
| 350 | Dycom Industries, Inc.†(a) | 12,281 | |||||
| 400 | Dynamic Materials Corp.(a) | 6,408 | |||||
| 5 | Eagle Bulk Shipping, Inc.† | 73 | |||||
| 6,571 | Eaton Corp. PLC | 446,565 | |||||
| 800 | EMCOR Group, Inc. | 35,592 | |||||
| 9,003 | Emerson Electric Co. | 555,755 | |||||
| 700 | Empire Resources, Inc.(a) | 3,346 | |||||
| 550 | Encore Wire Corp. | 20,531 | |||||
| 500 | Energy Recovery, Inc.†(a) | 2,635 | |||||
| 500 | EnerSys, Inc. | 30,860 | |||||
| 179 | Engility Holdings, Inc.† | 7,661 | |||||
| 50 | Ennis, Inc. | 674 | |||||
| 178 | EnPro Industries, Inc.† | 11,171 | |||||
| 1,493 | Equifax, Inc. | 120,739 | |||||
| 200 | ESCO Technologies, Inc. | 7,380 | |||||
| 290 | Esterline Technologies Corp.†(a) | 31,807 | |||||
| 2,200 | Exelis, Inc. | 38,566 | |||||
| 2,425 | Expeditors International of Washington, Inc. | 108,179 | |||||
| 135 | Exponent, Inc. | 11,138 | |||||
| 3,600 | Fastenal Co.(a) | 171,216 | |||||
| 1,000 | Federal Signal Corp. | 15,440 | |||||
| 3,132 | FedEx Corp. | 543,903 | |||||
| Shares | Value | ||||||
| Industrials (continued) | |||||||
| 1,515 | Flowserve Corp. | $ | 90,642 | ||||
| 1,686 | Fluor Corp. | 102,222 | |||||
| 1,900 | Fortune Brands Home & Security, Inc.(a) | 86,013 | |||||
| 300 | Forward Air Corp. | 15,111 | |||||
| 600 | Franklin Electric Co., Inc. | 22,518 | |||||
| 500 | FreightCar America, Inc. | 13,155 | |||||
| 600 | FTI Consulting, Inc.† | 23,178 | |||||
| 700 | Fuel Tech, Inc.† | 2,681 | |||||
| 500 | FuelCell Energy, Inc.†(a) | 770 | |||||
| 300 | Furmanite Corp.† | 2,346 | |||||
| 300 | G&K Services, Inc., Class A | 21,255 | |||||
| 500 | GATX Corp. | 28,770 | |||||
| 1,500 | GenCorp, Inc.† | 27,450 | |||||
| 625 | General Cable Corp.(a) | 9,312 | |||||
| 3,388 | General Dynamics Corp. | 466,257 | |||||
| 129,896 | General Electric Co. | 3,282,472 | |||||
| 585 | Genessee & Wyoming, Inc., Class A† | 52,603 | |||||
| 507 | Gorman-Rupp Co. (The)(a) | 16,285 | |||||
| 662 | Graco, Inc. | 53,079 | |||||
| 1,350 | GrafTech International, Ltd.† | 6,831 | |||||
| 400 | Granite Construction, Inc. | 15,208 | |||||
| 1,500 | Great Lakes Dredge & Dock Corp. | 12,840 | |||||
| 550 | Greenbrier Cos., Inc.(a) | 29,551 | |||||
| 350 | Griffon Corp.(a) | 4,655 | |||||
| 325 | H&E Equipment Services, Inc.(a) | 9,129 | |||||
| 850 | Hardinge, Inc. | 10,132 | |||||
| 1,200 | Harsco Corp. | 22,668 | |||||
| 1,500 | Hawaiian Holdings, Inc.†(a) | 39,075 | |||||
| 775 | HD Supply Holdings, Inc.† | 22,855 | |||||
| 725 | Healthcare Services Group, Inc.(a) | 22,424 | |||||
| 625 | Heartland Express, Inc.(a) | 16,881 | |||||
| 300 | HEICO Corp., Class A | 14,208 | |||||
| 200 | Heidrick & Struggles International, Inc. | 4,610 | |||||
| 600 | Herman Miller, Inc. | 17,658 | |||||
| 2,150 | Hertz Global Holdings, Inc.† | 53,621 | |||||
| 1,550 | Hexcel Corp.†(a) | 64,310 | |||||
| 300 | Hill International, Inc.† | 1,152 | |||||
| 400 | HNI Corp.(a) | 20,424 | |||||
| 10,659 | Honeywell International, Inc. | 1,065,047 | |||||
| 350 | Hub Group, Inc., Class A†(a) | 13,328 | |||||
| 538 | Hubbell, Inc., Class B | 57,475 | |||||
| 525 | Huntington Ingalls Industries, Inc. | 59,042 | |||||
| 400 | Hurco Cos., Inc. | 13,636 | |||||
| 200 | Huron Consulting Group, Inc.†(a) | 13,678 | |||||
| 118 | Hyster-Yale Materials Handling, Inc. | 8,638 | |||||
| 975 | IDEX Corp.(a) | 75,894 | |||||
| 794 | IHS, Inc., Class A† | 90,421 | |||||
| 4,420 | Illinois Tool Works, Inc. | 418,574 | |||||
| 875 | Industrial Services of America, Inc.† | 5,171 | |||||
| 500 | InnerWorkings, Inc.† | 3,895 | |||||
| 100 | Innovative Solutions & Support, Inc.† | 318 | |||||
| 336 | Insperity, Inc.(a) | 11,387 | |||||
| 500 | Integrated Electrical Services, Inc.†(a) | 3,900 | |||||
| 1,300 | Interface, Inc., Class A | 21,411 | |||||
| 400 | International Shipholding Corp.(a) | 5,960 | |||||
| 400 | Intersections, Inc.(a) | 1,564 | |||||
| 2,247 | Iron Mountain, Inc.(a) (b) | 86,869 | |||||
| 1,100 | ITT Corp. | 44,506 | |||||
| 1,725 | Jacobs Engineering Group, Inc.† | 77,090 | |||||
| 1,075 | JB Hunt Transport Services, Inc.(a) | 90,569 | |||||
| 2,525 | JetBlue Airways Corp.†(a) | 40,046 | |||||
| 251 | John Bean Technologies Corp. | 8,248 | |||||
| 1,375 | Joy Global, Inc.(a) | 63,965 | |||||
| 200 | Kadant, Inc. | 8,538 | |||||
| 300 | Kaman Corp.(a) | 12,027 | |||||
| 1,352 | Kansas City Southern | 164,985 | |||||
| 1,000 | KAR Auction Services, Inc. | 34,650 | |||||
Wilshire Mutual Funds, Inc. Wilshire 5000 IndexSM Fund Schedule of Investments | December 31, 2014 |
| Shares | Value | ||||||
| Industrials (continued) | |||||||
| 1,550 | KBR, Inc.(a) | $ | 26,273 | ||||
| 400 | Kelly Services, Inc., Class A(a) | 6,808 | |||||
| 800 | Kennametal, Inc. | 28,632 | |||||
| 150 | Kforce, Inc.(a) | 3,620 | |||||
| 700 | Kimball International, Inc., Class B | 6,384 | |||||
| 600 | Kirby Corp.† | 48,444 | |||||
| 617 | KLX, Inc.†(a) | 25,451 | |||||
| 762 | Knight Transportation, Inc.(a) | 25,649 | |||||
| 500 | Knoll, Inc. | 10,585 | |||||
| 525 | Korn/Ferry International† | 15,099 | |||||
| 10 | Kratos Defense & Security Solutions, Inc.†(a) | 50 | |||||
| 1,075 | L-3 Communications Holdings, Inc., Class 3 | 135,676 | |||||
| 600 | Landstar System, Inc.(a) | 43,518 | |||||
| 600 | Layne Christensen Co.†(a) | 5,724 | |||||
| 657 | Lennox International, Inc. | 62,461 | |||||
| 1,000 | Lincoln Electric Holdings, Inc. | 69,090 | |||||
| 200 | Lindsay Corp. | 17,148 | |||||
| 100 | LMI Aerospace, Inc.†(a) | 1,410 | |||||
| 3,844 | Lockheed Martin Corp. | 740,239 | |||||
| 700 | LSI Industries, Inc.(a) | 4,753 | |||||
| 1,600 | Manitowoc Co., Inc. (The)(a) | 35,360 | |||||
| 1,002 | Manpowergroup, Inc. | 68,306 | |||||
| 150 | Marten Transport, Ltd. | 3,279 | |||||
| 3,825 | Masco Corp. | 96,390 | |||||
| 1,000 | MasTec, Inc.†(a) | 22,610 | |||||
| 450 | Matson, Inc. | 15,534 | |||||
| 300 | McGrath RentCorp(a) | 10,758 | |||||
| 1,550 | Meritor, Inc.†(a) | 23,482 | |||||
| 300 | MFRI, Inc.† | 2,103 | |||||
| 728 | Middleby Corp.† | 72,145 | |||||
| 406 | Mobile Mini, Inc.(a) | 16,447 | |||||
| 325 | Moog, Inc., Class A† | 24,060 | |||||
| 350 | MSA Safety, Inc. | 18,582 | |||||
| 508 | MSC Industrial Direct Co., Inc., Class A(a) | 41,275 | |||||
| 600 | Mueller Industries, Inc. | 20,484 | |||||
| 1,900 | Mueller Water Products, Inc., Class A | 19,456 | |||||
| 300 | Multi-Color Corp. | 16,626 | |||||
| 200 | NACCO Industries, Inc., Class A | 11,872 | |||||
| 1,500 | Navigant Consulting, Inc.† | 23,055 | |||||
| 1,000 | Navistar International Corp.†(a) | 33,480 | |||||
| 500 | NCI Building Systems, Inc.† | 9,260 | |||||
| 600 | Nordson Corp. | 46,776 | |||||
| 3,935 | Norfolk Southern Corp.(a) | 431,315 | |||||
| 162 | Nortek, Inc.†(a) | 13,175 | |||||
| 2,628 | Northrop Grumman Corp. | 387,341 | |||||
| 1,299 | NOW, Inc.†(a) | 33,423 | |||||
| 900 | Old Dominion Freight Line, Inc.† | 69,876 | |||||
| 550 | On Assignment, Inc.† | 18,255 | |||||
| 575 | Orbital Sciences Corp.† | 15,462 | |||||
| 500 | Orion Energy Systems, Inc.† | 2,750 | |||||
| 1,000 | Oshkosh Corp.(a) | 48,650 | |||||
| 1,550 | Owens Corning(a) | 55,506 | |||||
| 4,380 | PACCAR, Inc.(a) | 297,884 | |||||
| 1,380 | Pall Corp.(a) | 139,670 | |||||
| 1,807 | Parker Hannifin Corp. | 233,013 | |||||
| 2,325 | Pentair PLC(a) | 154,426 | |||||
| 2,125 | Pitney Bowes, Inc.(a) | 51,786 | |||||
| 2,075 | Plug Power, Inc.†(a) | 6,225 | |||||
| 300 | Polypore International, Inc.† | 14,115 | |||||
| 250 | PowerSecure International, Inc.†(a) | 2,912 | |||||
| 1,864 | Precision Castparts Corp. | 449,000 | |||||
| 475 | Primoris Services Corp. | 11,039 | |||||
| 1,000 | Quanex Building Products Corp.(a) | 18,780 | |||||
| Shares | Value | ||||||
| Industrials (continued) | |||||||
| 2,750 | Quanta Services, Inc.† | $ | 78,073 | ||||
| 600 | Raven Industries, Inc.(a) | 15,000 | |||||
| 4,016 | Raytheon Co. | 434,411 | |||||
| 300 | RBC Bearings, Inc.(a) | 19,359 | |||||
| 400 | Regal-Beloit Corp. | 30,080 | |||||
| 1,500 | Republic Airways Holdings, Inc.† | 21,885 | |||||
| 3,518 | Republic Services, Inc., Class A | 141,600 | |||||
| 200 | Resources Connection, Inc. | 3,290 | |||||
| 325 | Rexnord Corp.† | 9,168 | |||||
| 350 | Roadrunner Transportation Systems, Inc.† | 8,173 | |||||
| 1,700 | Robert Half International, Inc. | 99,246 | |||||
| 1,784 | Rockwell Automation, Inc.(a) | 198,381 | |||||
| 1,425 | Rockwell Collins, Inc. | 120,384 | |||||
| 1,050 | Rollins, Inc. | 34,755 | |||||
| 1,222 | Roper Industries, Inc. | 191,060 | |||||
| 1,000 | RPX Corp., Class Comdty (histrt)† | 13,780 | |||||
| 1,850 | RR Donnelley & Sons Co. | 31,089 | |||||
| 375 | Rush Enterprises, Inc., Class A† | 12,019 | |||||
| 534 | Ryder System, Inc. | 49,582 | |||||
| 225 | Saia, Inc.† | 12,456 | |||||
| 300 | SIFCO Industries, Inc.(a) | 8,745 | |||||
| 400 | Simpson Manufacturing Co., Inc. | 13,840 | |||||
| 1,100 | SkyWest, Inc. | 14,608 | |||||
| 700 | Snap-on, Inc. | 95,718 | |||||
| 300 | SolarCity Corp.†(a) | 16,044 | |||||
| 7,474 | Southwest Airlines Co. | 316,300 | |||||
| 1,925 | Spirit AeroSystems Holdings, Inc., Class A† | 82,852 | |||||
| 100 | Spirit Airlines, Inc.† | 7,558 | |||||
| 584 | SPX Corp. | 50,177 | |||||
| 270 | Standard Register Co.†(a) | 880 | |||||
| 50 | Standex International Corp. | 3,863 | |||||
| 1,000 | Steelcase, Inc., Class A | 17,950 | |||||
| 1,116 | Stericycle, Inc.† | 146,285 | |||||
| 300 | Sun Hydraulics Corp. | 11,814 | |||||
| 1,000 | Swift Transportation Co., Class A†(a) | 28,630 | |||||
| 500 | TAL International Group, Inc.(a) | 21,785 | |||||
| 650 | Taser International, Inc.†(a) | 17,212 | |||||
| 500 | Team, Inc.† | 20,230 | |||||
| 500 | Tecumseh Products Co.† | 1,545 | |||||
| 333 | Teledyne Technologies, Inc.† | 34,212 | |||||
| 250 | Tennant Co. | 18,042 | |||||
| 1,300 | Terex Corp.(a) | 36,244 | |||||
| 743 | Tetra Tech, Inc. | 19,838 | |||||
| 700 | Textainer Group Holdings, Ltd. | 24,024 | |||||
| 3,275 | Textron, Inc. | 137,910 | |||||
| 1,100 | Timken Co. | 46,948 | |||||
| 312 | Titan International, Inc.(a) | 3,317 | |||||
| 600 | Toro Co. (The) | 38,286 | |||||
| 700 | Towers Watson & Co., Class A(a) | 79,219 | |||||
| 600 | TransDigm Group, Inc.(a) | 117,810 | |||||
| 100 | TRC Cos., Inc.† | 634 | |||||
| 600 | Trex Co., Inc.†(a) | 25,548 | |||||
| 475 | TriMas Corp.† | 14,863 | |||||
| 1,800 | Trinity Industries, Inc.(a) | 50,418 | |||||
| 556 | Triumph Group, Inc. | 37,374 | |||||
| 800 | TrueBlue, Inc.† | 17,800 | |||||
| 500 | Tutor Perini Corp.† | 12,035 | |||||
| 400 | Twin Disc, Inc.(a) | 7,944 | |||||
| 200 | Ultralife Corp.† | 626 | |||||
| 200 | UniFirst Corp. | 24,290 | |||||
| 10,961 | Union Pacific Corp. | 1,305,784 | |||||
| 4,230 | United Continental Holdings, Inc.† | 282,945 | |||||
| 9,067 | United Parcel Service, Inc., Class B | 1,007,978 | |||||
| 1,277 | United Rentals, Inc.† | 130,267 | |||||
| 350 | United Stationers, Inc. | 14,756 | |||||
Wilshire Mutual Funds, Inc. Wilshire 5000 IndexSM Fund Schedule of Investments | December 31, 2014 |
| Shares | Value | ||||||
| Industrials (continued) | |||||||
| 11,787 | United Technologies Corp. | $ | 1,355,505 | ||||
| 300 | Universal Forest Products, Inc. | 15,960 | |||||
| 500 | US Ecology, Inc.(a) | 20,060 | |||||
| 1,075 | USG Corp.†(a) | 30,089 | |||||
| 900 | UTi Worldwide, Inc.†(a) | 10,863 | |||||
| 259 | Valmont Industries, Inc.(a) | 32,893 | |||||
| 122 | Vectrus, Inc.†(a) | 3,343 | |||||
| 1,800 | Verisk Analytics, Inc., Class A†(a) | 115,290 | |||||
| 97 | Veritiv Corp.† | 5,031 | |||||
| 400 | Viad Corp. | 10,664 | |||||
| 300 | Vicor Corp.†(a) | 3,630 | |||||
| 750 | Volt Information Sciences, Inc.†(a) | 7,973 | |||||
| 50 | Wabash National Corp.† | 618 | |||||
| 691 | WABCO Holdings, Inc.† | 72,403 | |||||
| 1,159 | Wabtec Corp. | 100,706 | |||||
| 1,462 | Waste Connections, Inc. | 64,313 | |||||
| 5,650 | Waste Management, Inc. | 289,958 | |||||
| 328 | Watsco, Inc. | 35,096 | |||||
| 300 | Watts Water Technologies, Inc., Class A | 19,032 | |||||
| 250 | Werner Enterprises, Inc.(a) | 7,788 | |||||
| 600 | WESCO International, Inc.†(a) | 45,726 | |||||
| 425 | West Corp. | 14,025 | |||||
| 800 | Woodward, Inc. | 39,384 | |||||
| 785 | WW Grainger, Inc.(a) | 200,089 | |||||
| 655 | XPO Logistics, Inc.†(a) | 26,777 | |||||
| 2,200 | Xylem, Inc. | 83,754 | |||||
| 30,679,547 | |||||||
Information Technology — 18.8% | |||||||
| 1,185 | ACI Worldwide, Inc.† | 23,901 | |||||
| 6,088 | Activision Blizzard, Inc.(a) | 122,673 | |||||
| 100 | Actua Corporation†(a) | 1,847 | |||||
| 800 | Acxiom Corp.† | 16,216 | |||||
| 600 | ADDvantage Technologies Group, Inc.†(a) | 1,464 | |||||
| 6,162 | Adobe Systems, Inc.† | 447,977 | |||||
| 600 | ADTRAN, Inc.(a) | 13,080 | |||||
| 700 | Advanced Energy Industries, Inc.† | 16,590 | |||||
| 6,750 | Advanced Micro Devices, Inc.†(a) | 18,022 | |||||
| 1,000 | Advent Software, Inc. | 30,640 | |||||
| 500 | Aehr Test Systems† | 1,275 | |||||
| 500 | Agilysys, Inc.†(a) | 6,295 | |||||
| 2,259 | Akamai Technologies, Inc.† | 142,227 | |||||
| 708 | Alliance Data Systems Corp.† | 202,523 | |||||
| 4,000 | Altera Corp. | 147,760 | |||||
| 1,050 | Amkor Technology, Inc.† | 7,455 | |||||
| 3,250 | Amphenol Corp., Class A | 174,882 | |||||
| 3,550 | Analog Devices, Inc. | 197,096 | |||||
| 285 | Anixter International, Inc.† | 25,211 | |||||
| 922 | ANSYS, Inc.† | 75,604 | |||||
| 1,016 | AOL, Inc.† | 46,909 | |||||
| 75,063 | Apple, Inc. | 8,285,454 | |||||
| 14,208 | Applied Materials, Inc. | 354,063 | |||||
| 1,500 | Applied Micro Circuits Corp.†(a) | 9,780 | |||||
| 1,529 | ARRIS Group, Inc.† | 46,161 | |||||
| 1,150 | Arrow Electronics, Inc.† | 66,573 | |||||
| 1,500 | Aruba Networks, Inc.† | 27,270 | |||||
| 1,000 | Aspen Technology, Inc.† | 35,020 | |||||
| 100 | Astea International, Inc.† | 175 | |||||
| 5,250 | Atmel Corp.† | 44,074 | |||||
| 2,850 | Autodesk, Inc.† | 171,171 | |||||
| 6,114 | Automatic Data Processing, Inc. | 509,724 | |||||
| 1,778 | Aviat Networks, Inc.†(a) | 2,667 | |||||
| 1,575 | Avnet, Inc. | 67,756 | |||||
| 1,000 | AVX Corp. | 14,000 | |||||
| 289 | Axcelis Technologies, Inc.† | 740 | |||||
| 200 | Badger Meter, Inc. | 11,870 | |||||
| Shares | Value | ||||||
| Information Technology (continued) | |||||||
| 300 | Bel Fuse, Inc., Class B | $ | 8,202 | ||||
| 400 | Belden, Inc. | 31,524 | |||||
| 1,150 | Benchmark Electronics, Inc.† | 29,256 | |||||
| 298 | Black Box Corp. | 7,122 | |||||
| 300 | Blackbaud, Inc. | 12,978 | |||||
| 460 | Blackhawk Network Holdings, Inc., Class B†(a) | 17,337 | |||||
| 250 | Blucora, Inc.†(a) | 3,462 | |||||
| 1,000 | Booz Allen Hamilton Holding Corp., Class A | 26,530 | |||||
| 375 | Bottomline Technologies, Inc.†(a) | 9,480 | |||||
| 6,765 | Broadcom Corp., Class A | 293,127 | |||||
| 1,550 | Broadridge Financial Solutions, Inc. | 71,579 | |||||
| 5,075 | Brocade Communications Systems, Inc. | 60,088 | |||||
| 106 | Brooks Automation, Inc. | 1,351 | |||||
| 100 | BTU International, Inc.†(a) | 329 | |||||
| 4,322 | CA, Inc. | 131,605 | |||||
| 100 | Cabot Microelectronics Corp.† | 4,732 | |||||
| 199 | CACI International, Inc., Class A† | 17,150 | |||||
| 3,177 | Cadence Design Systems, Inc.†(a) | 60,268 | |||||
| 400 | CalAmp Corp.†(a) | 7,320 | |||||
| 175 | Calix, Inc.† | 1,753 | |||||
| 200 | Callidus Software, Inc.† | 3,266 | |||||
| 475 | Cardtronics, Inc.†(a) | 18,325 | |||||
| 200 | Cascade Microtech, Inc.† | 2,922 | |||||
| 500 | Cavium, Inc.†(a) | 30,910 | |||||
| 1,990 | CDK Global, Inc. | 81,112 | |||||
| 300 | CDW Corp. | 10,551 | |||||
| 900 | CIBER, Inc.† | 3,195 | |||||
| 997 | Ciena Corp.†(a) | 19,352 | |||||
| 200 | Cinedigm Corp., Class A†(a) | 324 | |||||
| 400 | Cirrus Logic, Inc.†(a) | 9,428 | |||||
| 66,148 | Cisco Systems, Inc. | 1,839,907 | |||||
| 2,275 | Citrix Systems, Inc.† | 145,145 | |||||
| 1,000 | Cognex Corp.† | 41,330 | |||||
| 7,848 | Cognizant Technology Solutions Corp., Class A† | 413,276 | |||||
| 400 | Coherent, Inc.† | 24,288 | |||||
| 1,150 | CommScope Holding Co., Inc.† | 26,254 | |||||
| 375 | CommVault Systems, Inc.†(a) | 19,384 | |||||
| 1,655 | Computer Sciences Corp.(a) | 104,348 | |||||
| – | Compuware Corp.(a) | — | |||||
| 400 | comScore, Inc.† | 18,572 | |||||
| 100 | Comtech Telecommunications Corp. | 3,152 | |||||
| 300 | Comverse, Inc.† | 5,634 | |||||
| 400 | Constant Contact, Inc.† | 14,680 | |||||
| 1,300 | Convergys Corp.(a) | 26,481 | |||||
| 1,152 | CoreLogic, Inc.† | 36,392 | |||||
| 500 | Cornerstone OnDemand, Inc.†(a) | 17,600 | |||||
| 16,444 | Corning, Inc. | 377,061 | |||||
| 425 | CoStar Group, Inc.†(a) | 78,043 | |||||
| 284 | Covisint Corp.†(a) | 753 | |||||
| 425 | Cray, Inc.†(a) | 14,654 | |||||
| 1,200 | Cree, Inc.†(a) | 38,664 | |||||
| 200 | Crexendo, Inc.†(a) | 368 | |||||
| 378 | CSG Systems International, Inc. | 9,476 | |||||
| 100 | CTS Corp. | 1,783 | |||||
| 1,625 | Cypress Semiconductor Corp.(a) | 23,205 | |||||
| 800 | Daktronics, Inc. | 10,008 | |||||
| 600 | Datalink Corp.† | 7,740 | |||||
| 500 | Dealertrack Technologies, Inc.† | 22,155 | |||||
| 300 | Demandware, Inc.†(a) | 17,262 | |||||
| 388 | Dice Holdings, Inc.† | 3,884 | |||||
| 650 | Diebold, Inc.(a) | 22,516 | |||||
| 51 | Digital Ally, Inc.† | 781 | |||||
| 700 | Digital River, Inc.†(a) | 17,311 | |||||
Wilshire Mutual Funds, Inc. Wilshire 5000 IndexSM Fund Schedule of Investments | December 31, 2014 |
| Shares | Value | ||||||
| Information Technology (continued) | |||||||
| 300 | Diodes, Inc.† | $ | 8,271 | ||||
| 600 | Dolby Laboratories, Inc., Class A | 25,872 | |||||
| 400 | DST Systems, Inc. | 37,660 | |||||
| 1,421 | EarthLink Holdings Corp. | 6,238 | |||||
| 15,575 | eBay, Inc.† | 874,069 | |||||
| 331 | Ebix, Inc.(a) | 5,624 | |||||
| 150 | Echelon Corp.†(a) | 255 | |||||
| 700 | EchoStar Corp., Class A† | 36,750 | |||||
| 100 | Electro Scientific Industries, Inc. | 776 | |||||
| 3,575 | Electronic Arts, Inc.† | 168,079 | |||||
| 729 | Electronics For Imaging, Inc.† | 31,223 | |||||
| 350 | Ellie Mae, Inc.†(a) | 14,112 | |||||
| 26,979 | EMC Corp. | 802,355 | |||||
| 125 | Emcore Corp.† | 663 | |||||
| 1,000 | Emulex Corp.†(a) | 5,670 | |||||
| 300 | EnerNOC, Inc.†(a) | 4,635 | |||||
| 1,836 | Entegris, Inc.† | 24,254 | |||||
| 325 | Envestnet, Inc.†(a) | 15,970 | |||||
| 300 | EPAM Systems, Inc.† | 14,325 | |||||
| 1,500 | Epiq Systems, Inc. | 25,620 | |||||
| 616 | Equinix, Inc. | 139,666 | |||||
| 400 | Euronet Worldwide, Inc.† | 21,960 | |||||
| 500 | Exar Corp.†(a) | 5,100 | |||||
| 200 | Extreme Networks, Inc.† | 706 | |||||
| 968 | F5 Networks, Inc.† | 126,290 | |||||
| 28,469 | Facebook, Inc., Class A† | 2,221,151 | |||||
| 550 | FactSet Research Systems, Inc. | 77,412 | |||||
| 200 | Fair Isaac Corp. | 14,460 | |||||
| 1,250 | Fairchild Semiconductor International, Inc., Class A† | 21,100 | |||||
| 900 | FalconStor Software, Inc.† | 1,206 | |||||
| 200 | FARO Technologies, Inc.†(a) | 12,536 | |||||
| 406 | FEI Co.(a) | 36,682 | |||||
| 3,235 | Fidelity National Information Services, Inc. | 201,217 | |||||
| 1,200 | Finisar Corp.†(a) | 23,292 | |||||
| 600 | FireEye, Inc.† | 18,948 | |||||
| 700 | First Solar, Inc.† | 31,216 | |||||
| 3,246 | Fiserv, Inc.† | 230,369 | |||||
| 450 | FleetCor Technologies, Inc.† | 66,919 | |||||
| 1,500 | FLIR Systems, Inc. | 48,465 | |||||
| 350 | FormFactor, Inc.† | 3,010 | |||||
| 255 | Forrester Research, Inc. | 10,037 | |||||
| 1,675 | Fortinet, Inc.† | 51,355 | |||||
| 1,000 | Freescale Semiconductor, Ltd.†(a) | 25,230 | |||||
| 1,100 | Gartner, Inc.† | 92,631 | |||||
| 2,100 | Genpact, Ltd.† | 39,753 | |||||
| 102 | GigOptix, Inc.† | 122 | |||||
| 1,850 | Global Cash Access Holdings, Inc.† | 13,228 | |||||
| 725 | Global Payments, Inc. | 58,529 | |||||
| 400 | Glu Mobile, Inc.† | 1,560 | |||||
| 7,112 | Google, Inc., Class C† | 3,743,757 | |||||
| 200 | Guidance Software, Inc.†(a) | 1,450 | |||||
| 300 | Guidewire Software, Inc.† | 15,189 | |||||
| 800 | Harmonic, Inc.† | 5,608 | |||||
| 1,225 | Harris Corp. | 87,980 | |||||
| 300 | Heartland Payment Systems, Inc.(a) | 16,185 | |||||
| 24,652 | Hewlett-Packard Co. | 989,285 | |||||
| 1,100 | Hutchinson Technology, Inc.† | 3,850 | |||||
| 1,000 | IAC/InterActiveCorp. | 60,790 | |||||
| 100 | ID Systems, Inc.†(a) | 669 | |||||
| 625 | iGATE Corp.† | 24,675 | |||||
| 1,000 | II-VI, Inc.†(a) | 13,650 | |||||
| 600 | Infinera Corp.†(a) | 8,832 | |||||
| 1,075 | Informatica Corp.† | 40,995 | |||||
| 1,600 | Ingram Micro, Inc., Class A† | 44,224 | |||||
| Shares | Value | ||||||
| Information Technology (continued) | |||||||
| 500 | Insight Enterprises, Inc.† | $ | 12,945 | ||||
| 1,560 | Integrated Device Technology, Inc.† | 30,576 | |||||
| 400 | Integrated Silicon Solution, Inc. | 6,628 | |||||
| 63,618 | Intel Corp. | 2,308,697 | |||||
| 350 | Interactive Intelligence Group, Inc.†(a) | 16,765 | |||||
| 600 | InterDigital, Inc. | 31,740 | |||||
| 371 | Internap Network Services Corp.† | 2,953 | |||||
| 11,836 | International Business Machines Corp. | 1,898,968 | |||||
| 350 | International Rectifier Corp.† | 13,965 | |||||
| 600 | Interphase Corp.†(a) | 1,362 | |||||
| 850 | Intersil Corp., Class A | 12,300 | |||||
| 3,417 | Intuit, Inc. | 315,013 | |||||
| 381 | IPG Photonics Corp.†(a) | 28,545 | |||||
| 500 | Itron, Inc.† | 21,145 | |||||
| 1,200 | Ixia†(a) | 13,500 | |||||
| 800 | IXYS Corp. | 10,080 | |||||
| 450 | j2 Global, Inc.(a) | 27,900 | |||||
| 2,400 | Jabil Circuit, Inc. | 52,392 | |||||
| 1,000 | Jack Henry & Associates, Inc. | 62,140 | |||||
| 3,203 | JDS Uniphase Corp.†(a) | 43,945 | |||||
| 5,865 | Juniper Networks, Inc. | 130,907 | |||||
| 233 | Kemet Corp.†(a) | 979 | |||||
| 600 | Key Tronic Corp.† | 4,764 | |||||
| 2,023 | Keysight Technologies, Inc.† | 68,317 | |||||
| 525 | Kimball Electronics, Inc.†(a) | 6,311 | |||||
| 1,600 | KLA-Tencor Corp.(a) | 112,512 | |||||
| 983 | Knowles Corp.†(a) | 23,150 | |||||
| 400 | Kulicke & Soffa Industries, Inc.† | 5,784 | |||||
| 1,787 | Lam Research Corp. | 141,781 | |||||
| 200 | Lattice Semiconductor Corp.† | 1,378 | |||||
| 981 | Leidos Holdings, Inc. | 42,693 | |||||
| 675 | Lexmark International, Inc., Class A(a) | 27,857 | |||||
| 2,100 | Limelight Networks, Inc.†(a) | 5,817 | |||||
| 2,650 | Linear Technology Corp. | 120,840 | |||||
| 1,380 | LinkedIn Corp., Class A† | 317,000 | |||||
| 300 | Littelfuse, Inc. | 29,001 | |||||
| 193 | Local Corp.† | 201 | |||||
| 300 | LogMeIn, Inc.†(a) | 14,802 | |||||
| 200 | LoJack Corp.†(a) | 506 | |||||
| 100 | LRAD Corp.†(a) | 270 | |||||
| 650 | Manhattan Associates, Inc.† | 26,468 | |||||
| 300 | ManTech International Corp., Class A | 9,069 | |||||
| 200 | Marchex, Inc., Class B | 918 | |||||
| 5,525 | Marvell Technology Group, Ltd. | 80,113 | |||||
| 13,394 | MasterCard, Inc., Class A | 1,154,027 | |||||
| 400 | Mattson Technology, Inc.† | 1,360 | |||||
| 3,125 | Maxim Integrated Products, Inc. | 99,594 | |||||
| 725 | MAXIMUS, Inc. | 39,759 | |||||
| 1,200 | Mentor Graphics Corp. | 26,304 | |||||
| 100 | Mercury Systems, Inc.† | 1,392 | |||||
| 400 | Methode Electronics, Inc. | 14,604 | |||||
| 600 | Micrel, Inc. | 8,706 | |||||
| 2,537 | Microchip Technology, Inc.(a) | 114,444 | |||||
| 13,752 | Micron Technology, Inc.†(a) | 481,458 | |||||
| 650 | Microsemi Corp.† | 18,447 | |||||
| 112,237 | Microsoft Corp. | 5,213,409 | |||||
| 100 | MicroStrategy, Inc., Class A† | 16,240 | |||||
| 600 | MKS Instruments, Inc. | 21,960 | |||||
| 662 | MoneyGram International, Inc.†(a) | 6,018 | |||||
| 500 | Monolithic Power Systems, Inc. | 24,870 | |||||
| 350 | Monotype Imaging Holdings, Inc. | 10,090 | |||||
| 1,550 | Monster Worldwide, Inc.†(a) | 7,161 | |||||
| 100 | MoSys, Inc.†(a) | 187 | |||||
| 3,235 | Motorola Solutions, Inc. | 217,004 | |||||
| 328 | Multi-Fineline Electronix, Inc.† | 3,683 | |||||
| 200 | Nanometrics, Inc.†(a) | 3,364 | |||||
Wilshire Mutual Funds, Inc. Wilshire 5000 IndexSM Fund Schedule of Investments | December 31, 2014 |
| Shares | Value | ||||||
| Information Technology (continued) | |||||||
| 900 | NAPCO Security Technologies, Inc.†(a) | $ | 4,230 | ||||
| 1,312 | National Instruments Corp. | 40,790 | |||||
| 1,925 | NCR Corp.† | 56,095 | |||||
| 4,200 | NetApp, Inc. | 174,090 | |||||
| 350 | NETGEAR, Inc.† | 12,453 | |||||
| 400 | NetScout Systems, Inc.†(a) | 14,616 | |||||
| 600 | NetSuite, Inc.†(a) | 65,502 | |||||
| 750 | NeuStar, Inc., Class A†(a) | 20,850 | |||||
| 200 | Newport Corp.† | 3,822 | |||||
| 1,000 | NIC, Inc. | 17,990 | |||||
| 50 | Novatel Wireless, Inc.† | 161 | |||||
| 4,325 | Nuance Communications, Inc.†(a) | 61,718 | |||||
| 100 | NVE Corp.† | 7,079 | |||||
| 5,825 | NVIDIA Corp.(a) | 116,791 | |||||
| 21 | Oclaro, Inc.†(a) | 37 | |||||
| 600 | OmniVision Technologies, Inc.† | 15,600 | |||||
| 5,105 | ON Semiconductor Corp.† | 51,714 | |||||
| 45,230 | Oracle Corp. | 2,033,993 | |||||
| 200 | OSI Systems, Inc.† | 14,154 | |||||
| 100 | Palo Alto Networks, Inc.† | 12,257 | |||||
| 425 | Pandora Media, Inc.†(a) | 7,578 | |||||
| 100 | PAR Technology Corp.† | 615 | |||||
| 600 | Park Electrochemical Corp. | 14,958 | |||||
| 4,325 | Paychex, Inc. | 199,685 | |||||
| 400 | PCM, Inc.† | 3,808 | |||||
| 600 | Pegasystems, Inc.(a) | 12,462 | |||||
| 100 | Pericom Semiconductor Corp.† | 1,354 | |||||
| 8 | PFSweb, Inc.† | 101 | |||||
| 33 | Pixelworks, Inc.† | 150 | |||||
| 100 | Planar Systems, Inc.† | 837 | |||||
| 450 | Plantronics, Inc. | 23,859 | |||||
| 300 | Plexus Corp.† | 12,363 | |||||
| 2,225 | PMC - Sierra, Inc.† | 20,381 | |||||
| 1,900 | Polycom, Inc.† | 25,650 | |||||
| 300 | Power Integrations, Inc. | 15,522 | |||||
| 220 | PRGX Global, Inc.†(a) | 1,258 | |||||
| 500 | Progress Software Corp.† | 13,510 | |||||
| 300 | PROS Holdings, Inc.†(a) | 8,244 | |||||
| 1,240 | PTC, Inc.† | 45,446 | |||||
| 40 | QAD, Inc., Class B | 796 | |||||
| 1,000 | Qlik Technologies, Inc.† | 30,890 | |||||
| 1,650 | QLogic Corp.† | 21,978 | |||||
| 21,455 | QUALCOMM, Inc. | 1,594,750 | |||||
| 300 | Qualys, Inc.†(a) | 11,325 | |||||
| 1,275 | Rackspace Hosting, Inc.†(a) | 59,683 | |||||
| 1,000 | Rambus, Inc.†(a) | 11,090 | |||||
| 1,000 | RealD, Inc.†(a) | 11,800 | |||||
| 681 | RealNetworks, Inc.† | 4,794 | |||||
| 625 | RealPage, Inc.†(a) | 13,725 | |||||
| 2,240 | Red Hat, Inc.† | 154,874 | |||||
| 600 | RELM Wireless Corp.†(a) | 2,880 | |||||
| 2,627 | RF Micro Devices, Inc.†(a) | 43,582 | |||||
| 200 | Rightside Group, Ltd.†(a) | 1,344 | |||||
| 1,427 | Riverbed Technology, Inc.† | 29,125 | |||||
| 300 | Rogers Corp.† | 24,432 | |||||
| 300 | Rosetta Stone, Inc.† | 2,928 | |||||
| 1,020 | Rovi Corp.† | 23,042 | |||||
| 340 | Rudolph Technologies, Inc.† | 3,478 | |||||
| 6,600 | Salesforce.com, Inc.† | 391,446 | |||||
| 2,772 | SanDisk Corp. | 271,601 | |||||
| 633 | Sanmina Corp.† | 14,894 | |||||
| 1,650 | Sapient Corp.† | 41,052 | |||||
| 300 | ScanSource, Inc.† | 12,048 | |||||
| 560 | Science Applications International Corp. | 27,737 | |||||
| 600 | Semtech Corp.† | 16,542 | |||||
| Shares | Value | ||||||
| Information Technology (continued) | |||||||
| 300 | ServiceNow, Inc.†(a) | $ | 20,355 | ||||
| 300 | ShoreTel, Inc.† | 2,205 | |||||
| 122 | Shutterstock, Inc.†(a) | 8,430 | |||||
| 100 | Silicon Image, Inc.† | 552 | |||||
| 500 | Silicon Laboratories, Inc.† | 23,810 | |||||
| 2,307 | Skyworks Solutions, Inc. | 167,742 | |||||
| 800 | SolarWinds, Inc.† | 39,864 | |||||
| 800 | Solera Holdings, Inc. | 40,944 | |||||
| 4,725 | Sonus Networks, Inc.†(a) | 18,758 | |||||
| 650 | Spansion, Inc., Class A† | 22,243 | |||||
| 100 | Speed Commerce, Inc.†(a) | 309 | |||||
| 193 | Splunk, Inc.†(a) | 11,377 | |||||
| 300 | SPS Commerce, Inc.†(a) | 16,989 | |||||
| 100 | SS&C Technologies Holdings, Inc. | 5,849 | |||||
| 3,575 | SunEdison, Inc.†(a) | 69,748 | |||||
| 1,300 | SunPower Corp., Class A†(a) | 33,579 | |||||
| 375 | Super Micro Computer, Inc.† | 13,080 | |||||
| 102 | SYKES Enterprises, Inc.† | 2,394 | |||||
| 8,883 | Symantec Corp. | 227,893 | |||||
| 350 | Synaptics, Inc.† | 24,094 | |||||
| 325 | Synchronoss Technologies, Inc.†(a) | 13,605 | |||||
| 300 | SYNNEX Corp.(a) | 23,448 | |||||
| 1,717 | Synopsys, Inc.† | 74,638 | |||||
| 600 | Syntel, Inc.†(a) | 26,988 | |||||
| 1,025 | Take-Two Interactive Software, Inc.†(a) | 28,731 | |||||
| 325 | Tech Data Corp.†(a) | 20,550 | |||||
| 800 | TechTarget, Inc.† | 9,096 | |||||
| 1,800 | Teradata Corp.†(a) | 78,624 | |||||
| 2,425 | Teradyne, Inc. | 47,991 | |||||
| 100 | Tessco Technologies, Inc. | 2,900 | |||||
| 400 | Tessera Technologies, Inc. | 14,304 | |||||
| 10,110 | Texas Instruments, Inc. | 540,531 | |||||
| 800 | TiVo, Inc.†(a) | 9,472 | |||||
| 2,237 | Total System Services, Inc. | 75,969 | |||||
| 100 | Travelzoo, Inc.† | 1,262 | |||||
| 2,859 | Trimble Navigation, Ltd.† | 75,878 | |||||
| 1,300 | TriQuint Semiconductor, Inc.† | 35,815 | |||||
| 408 | Trulia, Inc.†(a) | 18,780 | |||||
| 1,200 | TTM Technologies, Inc.†(a) | 9,036 | |||||
| 1,100 | Twitter, Inc.†(a) | 39,457 | |||||
| 500 | Tyler Technologies, Inc.† | 54,720 | |||||
| 265 | Ultimate Software Group, Inc.†(a) | 38,906 | |||||
| 427 | Unisys Corp.† | 12,588 | |||||
| 114 | United Online, Inc. | 1,659 | |||||
| 700 | Universal Display Corp.†(a) | 19,425 | |||||
| 66 | UTStarcom Holdings Corp.† | 187 | |||||
| 825 | Vantiv, Inc., Class A†(a) | 27,984 | |||||
| 450 | VASCO Data Security International, Inc.†(a) | 12,695 | |||||
| 400 | Veeco Instruments, Inc.†(a) | 13,952 | |||||
| 1,665 | VeriFone Systems, Inc.† | 61,938 | |||||
| 375 | Verint Systems, Inc.† | 21,855 | |||||
| 1,416 | VeriSign, Inc.†(a) | 80,712 | |||||
| 375 | ViaSat, Inc.†(a) | 23,636 | |||||
| 55 | Viasystems Group, Inc.†(a) | 895 | |||||
| 475 | VirnetX Holding Corp.†(a) | 2,608 | |||||
| 400 | Virtusa Corp.† | 16,668 | |||||
| 6,001 | Visa, Inc., Class A | 1,573,462 | |||||
| 1,806 | Vishay Intertechnology, Inc. | 25,555 | |||||
| 129 | Vishay Precision Group, Inc.† | 2,214 | |||||
| 1,145 | VMware, Inc., Class A†(a) | 94,485 | |||||
| 500 | Web.com Group, Inc.† | 9,495 | |||||
| 458 | WebMD Health Corp., Class A†(a) | 18,114 | |||||
| 2,826 | Western Digital Corp. | 312,838 | |||||
| 4,979 | Western Union Co. (The)(a) | 89,174 | |||||
| 459 | WEX, Inc.† | 45,404 | |||||
Wilshire Mutual Funds, Inc. Wilshire 5000 IndexSM Fund Schedule of Investments | December 31, 2014 |
| Shares | Value | ||||||
| Information Technology (continued) | |||||||
| 195 | Workday, Inc., Class A†(a) | $ | 15,914 | ||||
| 13,095 | Xerox Corp. | 181,497 | |||||
| 3,350 | Xilinx, Inc. | 145,022 | |||||
| 800 | XO Group, Inc.† | 14,568 | |||||
| 11,625 | Yahoo!, Inc.† | 587,179 | |||||
| 241 | Yelp, Inc., Class A†(a) | 13,190 | |||||
| 525 | Zebra Technologies Corp., Class A† | 40,640 | |||||
| 343 | Zillow, Inc., Class A†(a) | 36,320 | |||||
| 7,125 | Zynga, Inc., Class A† | 18,953 | |||||
| 51,508,919 | |||||||
Materials — 3.5% | |||||||
| 381 | A Schulman, Inc. | 15,442 | |||||
| 2,535 | Air Products & Chemicals, Inc. | 365,623 | |||||
| 735 | Airgas, Inc. | 84,657 | |||||
| 1,875 | AK Steel Holding Corp.†(a) | 11,137 | |||||
| 600 | Albemarle Corp.(a) | 36,078 | |||||
| 14,523 | Alcoa, Inc.(a) | 229,318 | |||||
| 1,350 | Allegheny Technologies, Inc. | 46,940 | |||||
| 500 | AM Castle & Co.†(a) | 3,990 | |||||
| 400 | American Vanguard Corp.(a) | 4,648 | |||||
| 550 | AptarGroup, Inc.(a) | 36,762 | |||||
| 914 | Ashland, Inc. | 109,461 | |||||
| 1,100 | Avery Dennison Corp.(a) | 57,068 | |||||
| 675 | Axalta Coating Systems, Ltd.† | 17,564 | |||||
| 575 | Axiall Corp. | 24,420 | |||||
| 348 | Balchem Corp.(a) | 23,191 | |||||
| 1,600 | Ball Corp. | 109,072 | |||||
| 1,150 | Bemis Co., Inc. | 51,991 | |||||
| 400 | Berry Plastics Group, Inc.† | 12,620 | |||||
| 700 | Cabot Corp. | 30,702 | |||||
| 500 | Calgon Carbon Corp.† | 10,390 | |||||
| 500 | Carpenter Technology Corp.(a) | 24,625 | |||||
| 1,800 | Celanese Corp., Class A | 107,928 | |||||
| 600 | Century Aluminum Co.†(a) | 14,640 | |||||
| 619 | CF Industries Holdings, Inc. | 168,702 | |||||
| 1,005 | Chemtura Corp.†(a) | 24,854 | |||||
| 300 | Clearwater Paper Corp.† | 20,565 | |||||
| 1,400 | Cliffs Natural Resources, Inc.(a) | 9,996 | |||||
| 37 | Codexis, Inc.† | 93 | |||||
| 1,110 | Coeur Mining, Inc.†(a) | 5,672 | |||||
| 1,300 | Commercial Metals Co.(a) | 21,177 | |||||
| 400 | Compass Minerals International, Inc. | 34,732 | |||||
| 1,800 | Core Molding Technologies, Inc.† | 24,840 | |||||
| 2,000 | Crown Holdings, Inc.† | 101,800 | |||||
| 716 | Cytec Industries, Inc. | 33,058 | |||||
| 100 | Deltic Timber Corp.(a) | 6,840 | |||||
| 800 | Domtar Corp.(a) | 32,176 | |||||
| 15,261 | Dow Chemical Co. (The) | 696,054 | |||||
| 534 | Eagle Materials, Inc. | 40,600 | |||||
| 1,715 | Eastman Chemical Co.(a) | 130,100 | |||||
| 3,462 | Ecolab, Inc. | 361,848 | |||||
| 11,796 | EI du Pont de Nemours & Co. | 872,196 | |||||
| 1,000 | Ferro Corp.† | 12,960 | |||||
| 550 | Flotek Industries, Inc.†(a) | 10,301 | |||||
| 1,275 | FMC Corp. | 72,713 | |||||
| 13,344 | Freeport-McMoRan Copper & Gold, Inc. | 311,716 | |||||
| 1,000 | Friedman Industries, Inc.(a) | 7,010 | |||||
| 500 | Globe Specialty Metals, Inc. | 8,615 | |||||
| 2,900 | Graphic Packaging Holding Co.† | 39,498 | |||||
| 300 | Greif, Inc., Class A | 14,169 | |||||
| 450 | HB Fuller Co. | 20,038 | |||||
| 2,000 | Headwaters, Inc.† | 29,980 | |||||
| 3,400 | Hecla Mining Co.(a) | 9,486 | |||||
| 300 | Horsehead Holding Corp.†(a) | 4,749 | |||||
| 2,575 | Huntsman Corp.(a) | 58,658 | |||||
| 300 | Innophos Holdings, Inc. | 17,535 | |||||
| Shares | Value | ||||||
| Materials (continued) | |||||||
| 300 | Innospec, Inc. | $ | 12,810 | ||||
| 910 | International Flavors & Fragrances, Inc.(a) | 92,238 | |||||
| 5,417 | International Paper Co. | 290,243 | |||||
| 400 | Intrepid Potash, Inc.†(a) | 5,552 | |||||
| 138 | Kaiser Aluminum Corp.(a) | 9,857 | |||||
| 950 | KapStone Paper and Packaging Corp. | 27,844 | |||||
| 300 | Koppers Holdings, Inc. | 7,794 | |||||
| 1,100 | Louisiana-Pacific Corp.†(a) | 18,216 | |||||
| 300 | LSB Industries, Inc.†(a) | 9,432 | |||||
| 845 | Martin Marietta Materials, Inc.(a) | 93,220 | |||||
| 300 | Materion Corp.(a) | 10,569 | |||||
| 1,200 | McEwen Mining, Inc.† | 1,332 | |||||
| 1,676 | MeadWestvaco Corp. | 74,398 | |||||
| 380 | Minerals Technologies, Inc. | 26,391 | |||||
| 5,800 | Monsanto Co. | 692,926 | |||||
| 3,975 | Mosaic Co. (The) | 181,459 | |||||
| 200 | Myers Industries, Inc.(a) | 3,520 | |||||
| 300 | Neenah Paper, Inc. | 18,081 | |||||
| 100 | NewMarket Corp.(a) | 40,353 | |||||
| 6,000 | Newmont Mining Corp. | 113,400 | |||||
| 100 | NL Industries, Inc. | 860 | |||||
| 1,000 | Noranda Aluminum Holding Corp. | 3,520 | |||||
| 3,395 | Nucor Corp. | 166,525 | |||||
| 770 | Olin Corp.(a) | 17,533 | |||||
| 300 | OM Group, Inc.(a) | 8,940 | |||||
| 1,875 | Owens-Illinois, Inc.† | 50,606 | |||||
| 1,275 | Packaging Corp. of America | 99,514 | |||||
| 1,000 | PH Glatfelter Co. | 25,570 | |||||
| 1,158 | PolyOne Corp. | 43,900 | |||||
| 1,721 | PPG Industries, Inc. | 397,809 | |||||
| 3,461 | Praxair, Inc. | 448,407 | |||||
| 300 | Quaker Chemical Corp. | 27,612 | |||||
| 500 | Rayonier Advanced Materials, Inc.(a) | 11,150 | |||||
| 1,000 | Reliance Steel & Aluminum Co.(a) | 61,270 | |||||
| 1,364 | Rock-Tenn Co., Class A | 83,177 | |||||
| 900 | Rockwood Holdings, Inc. | 70,920 | |||||
| 900 | Royal Gold, Inc.(a) | 56,430 | |||||
| 1,600 | RPM International, Inc.(a) | 81,136 | |||||
| 300 | RTI International Metals, Inc.†(a) | 7,578 | |||||
| 300 | Schweitzer-Mauduit International, Inc. | 12,690 | |||||
| 700 | Scotts Miracle-Gro Co. (The), Class A | 43,624 | |||||
| 2,525 | Sealed Air Corp.(a) | 107,136 | |||||
| 100 | Senomyx, Inc.†(a) | 601 | |||||
| 500 | Sensient Technologies Corp. | 30,170 | |||||
| 1,072 | Sherwin-Williams Co. (The) | 281,979 | |||||
| 1,300 | Sigma-Aldrich Corp. | 178,451 | |||||
| 700 | Silgan Holdings, Inc. | 37,520 | |||||
| 1,075 | Sonoco Products Co. | 46,977 | |||||
| 2,122 | Southern Copper Corp.(a) | 59,840 | |||||
| 2,800 | Steel Dynamics, Inc. | 55,272 | |||||
| 300 | Stepan Co. | 12,024 | |||||
| 1,600 | Stillwater Mining Co.† | 23,584 | |||||
| 564 | SunCoke Energy, Inc. | 10,908 | |||||
| 900 | Tahoe Resources, Inc.(a) | 12,483 | |||||
| 400 | TimkenSteel Corp. | 14,812 | |||||
| 671 | Tredegar Corp.(a) | 15,091 | |||||
| 500 | UFP Technologies, Inc.†(a) | 12,293 | |||||
| 50 | United States Lime & Minerals, Inc. | 3,643 | |||||
| 1,625 | United States Steel Corp. | 43,453 | |||||
| 900 | Valspar Corp. | 77,832 | |||||
| 1,244 | Vulcan Materials Co. | 81,768 | |||||
| 700 | Walter Energy, Inc. | 966 | |||||
| 1,300 | Wausau Paper Corp.(a) | 14,781 | |||||
| 502 | Westlake Chemical Corp. | 30,667 | |||||
| 7,083 | Weyerhaeuser Co., Class REIT | 254,209 | |||||
| 1,000 | Worthington Industries, Inc.(a) | 30,090 | |||||
| 887 | WR Grace & Co.† | 84,611 | |||||
Wilshire Mutual Funds, Inc. Wilshire 5000 IndexSM Fund Schedule of Investments | December 31, 2014 |
| Shares | Value | ||||||
| Materials (continued) | |||||||
| 50 | Zep, Inc. | $ | 758 | ||||
| 9,601,323 | |||||||
Telecommunication Services — 2.2% | |||||||
| 1,000 | 8x8, Inc.† | 9,160 | |||||
| 600 | Alaska Communications Systems Group, Inc.†(a) | 1,074 | |||||
| 67,099 | AT&T, Inc. | 2,253,855 | |||||
| 200 | Atlantic Tele-Network, Inc. | 13,518 | |||||
| 6,610 | CenturyLink, Inc. | 261,624 | |||||
| 1,425 | Cincinnati Bell, Inc.† | 4,546 | |||||
| 500 | Cogent Communications Holdings, Inc.(a) | 17,695 | |||||
| 612 | Consolidated Communications Holdings, Inc.(a) | 17,032 | |||||
| 11,886 | Frontier Communications Corp.(a) | 79,280 | |||||
| 600 | General Communication, Inc., Class A† | 8,250 | |||||
| 2,875 | Globalstar, Inc.† | 7,877 | |||||
| 16 | IDT Corp., Class B | 325 | |||||
| 500 | Inteliquent, Inc. | 9,815 | |||||
| 3,011 | Level 3 Communications, Inc.†(a) | 148,683 | |||||
| 1,611 | SBA Communications Corp., Class A† | 178,434 | |||||
| 400 | Spok Holdings, Inc. | 6,944 | |||||
| 10,622 | Sprint Corp.†(a) | 44,081 | |||||
| 8 | Straight Path Communications, Inc.† | 152 | |||||
| 1,050 | Telephone & Data Systems, Inc. | 26,513 | |||||
| 9,200 | T-Mobile US, Inc.† | 247,848 | |||||
| 300 | United States Cellular Corp.†(a) | 11,949 | |||||
| 54,563 | Verizon Communications, Inc. | 2,552,457 | |||||
| 600 | Vonage Holdings Corp.†(a) | 2,286 | |||||
| 7,091 | Windstream Holdings, Inc.(a) | 58,430 | |||||
| 5,961,828 | |||||||
Utilities — 3.3% | |||||||
| 8,135 | AES Corp. (The) | 112,019 | |||||
| 1,519 | AGL Resources, Inc. | 82,801 | |||||
| 425 | ALLETE, Inc. | 23,434 | |||||
| 1,400 | Alliant Energy Corp. | 92,988 | |||||
| 3,100 | Ameren Corp. | 143,003 | |||||
| 6,405 | American Electric Power Co., Inc. | 388,912 | |||||
| 400 | American States Water Co. | 15,064 | |||||
| 2,300 | American Water Works Co., Inc. | 122,590 | |||||
| 2,151 | Aqua America, Inc. | 57,432 | |||||
| 1,100 | Atmos Energy Corp. | 61,314 | |||||
| 1,000 | Avista Corp. | 35,350 | |||||
| 600 | Black Hills Corp. | 31,824 | |||||
| 525 | California Water Service Group | 12,920 | |||||
| 5,000 | Calpine Corp.† | 110,650 | |||||
| 4,600 | CenterPoint Energy, Inc. | 107,778 | |||||
| 300 | Chesapeake Utilities Corp.(a) | 14,898 | |||||
| 700 | Cleco Corp. | 38,178 | |||||
| 2,850 | CMS Energy Corp., Class REIT | 99,037 | |||||
| 3,850 | Consolidated Edison, Inc.(a) | 254,139 | |||||
| 7,590 | Dominion Resources, Inc. | 583,671 | |||||
| 1,975 | DTE Energy Co. | 170,581 | |||||
| 9,035 | Duke Energy Corp. | 754,784 | |||||
| 11 | Dynegy, Inc., Class A† | 334 | |||||
| 4,050 | Edison International | 265,194 | |||||
| 400 | El Paso Electric Co. | 16,024 | |||||
| 475 | Empire District Electric Co.(a) | 14,126 | |||||
| 2,050 | Entergy Corp. | 179,334 | |||||
| 10,041 | Exelon Corp. | 372,320 | |||||
| 4,280 | FirstEnergy Corp. | 166,877 | |||||
| 16 | Genie Energy, Ltd., Class B | 99 | |||||
| 1,705 | Great Plains Energy, Inc. | 48,439 | |||||
| 1,100 | Hawaiian Electric Industries, Inc. | 36,828 | |||||
| 500 | IDACORP, Inc. | 33,095 | |||||
| 700 | Integrys Energy Group, Inc. | 54,495 | |||||
| 1,800 | ITC Holdings Corp. | 72,774 | |||||
| Shares | Value | ||||||
| Utilities (continued) | |||||||
| 650 | Laclede Group, Inc. | $ | 34,580 | ||||
| 2,125 | MDU Resources Group, Inc. | 49,938 | |||||
| 450 | MGE Energy, Inc. | 20,525 | |||||
| 950 | National Fuel Gas Co.(a) | 66,053 | |||||
| 400 | New Jersey Resources Corp. | 24,480 | |||||
| 5,607 | NextEra Energy, Inc. | 595,968 | |||||
| 3,915 | NiSource, Inc. | 166,074 | |||||
| 3,867 | Northeast Utilities(a) | 206,962 | |||||
| 300 | Northwest Natural Gas Co. | 14,970 | |||||
| 400 | NorthWestern Corp. | 22,632 | |||||
| 3,877 | NRG Energy, Inc. | 104,485 | |||||
| 300 | NRG Yield, Inc., Class A | 14,142 | |||||
| 2,400 | OGE Energy Corp. | 85,152 | |||||
| 587 | ONE Gas, Inc. | 24,196 | |||||
| 1,000 | Ormat Technologies, Inc.(a) | 27,180 | |||||
| 350 | Otter Tail Corp. | 10,836 | |||||
| 2,650 | Pepco Holdings, Inc. | 71,365 | |||||
| 5,600 | PG&E Corp.(a) | 298,144 | |||||
| 1,000 | Piedmont Natural Gas Co., Inc. | 39,410 | |||||
| 1,300 | Pinnacle West Capital Corp. | 88,803 | |||||
| 700 | PNM Resources, Inc. | 20,741 | |||||
| 1,100 | Portland General Electric Co.(a) | 41,613 | |||||
| 8,925 | PPL Corp. | 324,245 | |||||
| 6,425 | Public Service Enterprise Group, Inc. | 266,059 | |||||
| 2,200 | Questar Corp. | 55,616 | |||||
| 1,379 | SCANA Corp.(a) | 83,292 | |||||
| 3,140 | Sempra Energy | 349,670 | |||||
| 325 | South Jersey Industries, Inc.(a) | 19,152 | |||||
| 11,600 | Southern Co. (The)(a) | 569,676 | |||||
| 475 | Southwest Gas Corp. | 29,360 | |||||
| 2,700 | TECO Energy, Inc. | 55,323 | |||||
| 1,950 | UGI Corp. | 74,061 | |||||
| 550 | UIL Holdings Corp.(a) | 23,947 | |||||
| 933 | Vectren Corp. | 43,133 | |||||
| 1,675 | Westar Energy, Inc., Class A(a) | 69,077 | |||||
| 650 | WGL Holdings, Inc. | 35,503 | |||||
| 2,700 | Wisconsin Energy Corp.(a) | 142,398 | |||||
| 6,350 | Xcel Energy, Inc.(a) | 228,092 | |||||
| 8,970,159 | |||||||
| Total Common Stock | – | ||||||
| (Cost $135,669,187) | 273,081,224 | ||||||
SHORT-TERM INVESTMENTS (d) — 11.7% | |||||||
| 1,175,472 | Northern Trust Institutional Government Select Portfolio, 0.010% | 1,175,472 | |||||
| 30,860,487 | Northern Trust Institutional Liquid Asset Portfolio, 0.010% | 30,860,487 | |||||
| Total Short-Term Investments | |||||||
| (Cost $32,035,959) | 32,035,959 | ||||||
WARRANTS — 0.0% | |||||||
| 183 | Dynegy, Inc., Expires 10/04/17† | 737 | |||||
| 79 | Eagle Bulk Shipping, Inc. † Expires | 108 | |||||
| 1 | Magnum Hunter WTS, Expires 04/20/16† | — | |||||
| 7 | Tejon Ranch Co., Expires 08/31/16† | 12 | |||||
| 857 | |||||||
| Total Warrants (Cost $5,144) | 857 | ||||||
RIGHTS — 0.0% | |||||||
United States — 0.0% | |||||||
| 116 | Furiex Pharmaceuticals† (e) | 1,134 | |||||
| 1,500 | Leap Wireless† (e) | 3,780 | |||||
| 558 | Liberty Broadband Corp. † | 5,301 | |||||
| 80 | Transcept Pharmaceuticals Inc † (e) | — | |||||
Wilshire Mutual Funds, Inc. Wilshire 5000 IndexSM Fund Schedule of Investments | December 31, 2014 |
| Shares | Value | ||||||
| $ | 10,215 | ||||||
Total Rights (Cost $–) | 10,215 | ||||||
Total Investments — 111.5% | |||||||
| (Cost $167,710,290) | 305,128,255 | ||||||
Other Assets & Liabilities, Net — (11.5)% | (31,447,848 | ) | |||||
NET ASSETS — 100.0% | $ | 273,680,407 | |||||
| † | Non-income producing security. |
| (a) | This security or a partial position of this security is on loan at December 31, 2014. The total market value of securities on loan at December 31, 2014 was $30,150,349 (Note 6). |
| (b) | Real Estate Investment Trust. |
| (c) | Rate shown is the 7-day effective yield as of December 31, 2014. |
| (d) | This security was purchased with cash collateral held from securities on loan. The total value of such securities as of December 31, 2014 was $30,860,487. Securities on loan are also collateralized by various U.S. Treasury obligations in the amount of $287,098 (Note 6). |
| (e) | Securities fair valued using methods determined in good faith by the Pricing Committee. The total market value of such securities as of December 31, 2014 was $4,914 and represents 0.0% of Net Assets. |
| LLC— Limited Liability Company |
| LP — Limited Partnership Investment |
| Ltd. — Limited |
| PLC— Public Limited Company |
Amounts designated as “—” are either $0, or have been rounded to $0.
Wilshire Mutual Funds, Inc. Wilshire International Equity Fund Schedule of Investments | December 31, 2014 |
| Shares | Value | ||||||
COMMON STOCK — 96.8% | |||||||
Australia — 2.1% | |||||||
| 15,894 | Amcor, Ltd. | $ | 174,871 | ||||
| 30,437 | AMP, Ltd. | 135,559 | |||||
| 30,591 | Aurizon Holdings, Ltd. | 114,480 | |||||
| 37,385 | Australia & New Zealand Banking Group, Ltd. | 972,756 | |||||
| 23,272 | Bank of Queensland, Ltd. | 229,274 | |||||
| 1,002 | Bendigo and Adelaide Bank, Ltd. | 10,419 | |||||
| 3,297 | Boral, Ltd. | 14,149 | |||||
| 3,663 | Cochlear, Ltd. | 231,087 | |||||
| 1,566 | Commonwealth Bank of Australia | 108,804 | |||||
| 17,540 | Computershare, Ltd. | 167,782 | |||||
| 3,686 | Macquarie Group, Ltd. | 173,820 | |||||
| 143,347 | Qantas Airways, Ltd.† | 278,425 | |||||
| 125 | Ramsay Health Care, Ltd. | 5,795 | |||||
| 17,214 | Stockland(a) | 57,527 | |||||
| 33,890 | Suncorp Group, Ltd. | 387,152 | |||||
| 9,699 | Tabcorp Holdings, Ltd. | 32,741 | |||||
| 49,466 | Tatts Group, Ltd. | 139,123 | |||||
| 3,879 | TPG Telecom, Ltd. | 21,219 | |||||
| 14,083 | Westpac Banking Corp. | 378,773 | |||||
| 3,633,756 | |||||||
Austria — 0.5% | |||||||
| 31,665 | OMV AG | 840,811 | |||||
Belgium — 1.1% | |||||||
| 5,944 | Ageas | 211,341 | |||||
| 2,254 | Anheuser-Busch InBev NV | 253,669 | |||||
| 728 | Colruyt SA | 33,844 | |||||
| 4,654 | Delhaize Group SA | 338,930 | |||||
| 1,981 | KBC Groep NV | 110,560 | |||||
| 1,510 | Telenet Group Holding NV† | 84,738 | |||||
| 11,662 | UCB SA | 886,751 | |||||
| 1,919,833 | |||||||
Bermuda — 1.5% | |||||||
| 48,985 | Lazard, Ltd., Class A | 2,450,719 | |||||
| 346,000 | Sihuan Pharmaceutical Holdings Group, Ltd. | 230,145 | |||||
| 2,680,864 | |||||||
Brazil — 0.7% | |||||||
| 48,430 | Banco Bradesco SA ADR | 647,509 | |||||
| 700 | Banco Santander Brasil SA | 3,545 | |||||
| 1,300 | Cia de Saneamento Basico do Estado de Sao Paulo | 8,319 | |||||
| 1,900 | Cielo SA | 29,785 | |||||
| 43,400 | Embraer SA | 399,028 | |||||
| 2,200 | JBS SA | 9,269 | |||||
| 22,500 | Kroton Educacional SA | 131,198 | |||||
| 2,500 | Petroleo Brasileiro SA | 9,019 | |||||
| 500 | Porto Seguro SA | 5,718 | |||||
| 3,100 | Transmissora Alianca de Energia Eletrica SA | 21,971 | |||||
| 1,265,361 | |||||||
Canada — 7.9% | |||||||
| 600 | Agrium, Inc. | 56,808 | |||||
| 17,700 | Alimentation Couche Tard, Inc., Class B | 741,791 | |||||
| 2,300 | Atco, Ltd., Class I | 94,352 | |||||
| 37,000 | Bombardier, Inc., Class B | 132,165 | |||||
| 7,900 | CAE, Inc. | 102,541 | |||||
| 2,400 | Canadian Imperial Bank of Commerce | 206,245 | |||||
| 32,715 | Canadian National Railway Co. | 2,254,390 | |||||
| Shares | Value | ||||||
| Canada (continued) | |||||||
| 20,500 | Canadian National Railway Co. | $ | 1,411,956 | ||||
| 2,700 | Canadian Oil Sands, Ltd. | 24,216 | |||||
| 1,200 | Canadian Pacific Railway, Ltd. | 231,107 | |||||
| 13,585 | Canadian Pacific Railway, Ltd.(b) | 2,617,694 | |||||
| 300 | Canadian Tire Corp., Ltd., Class A | 31,694 | |||||
| 6,500 | Cenovus Energy, Inc. | 134,106 | |||||
| 7,900 | CGI Group, Inc., Class A† | 301,163 | |||||
| 1,203 | Constellation Software, Inc. | 357,690 | |||||
| 2,600 | Dollarama, Inc. | 132,932 | |||||
| 200 | Fairfax Financial Holdings, Ltd. | 104,800 | |||||
| 8,000 | First Capital Realty, Inc. | 128,490 | |||||
| 3,500 | Husky Energy, Inc. | 82,846 | |||||
| 1,100 | Intact Financial Corp., Class Common Subscription Receipt | 79,390 | |||||
| 10,300 | Kinross Gold Corp.† | 28,902 | |||||
| 9,800 | Magna International, Inc. | 1,061,906 | |||||
| 7,800 | Manulife Financial Corp., Class Common Subscription Receipt | 148,910 | |||||
| 900 | Methanex Corp. | 41,344 | |||||
| 1,600 | Onex Corp. | 92,904 | |||||
| 200 | Potash Corp. of Saskatchewan | 7,070 | |||||
| 1,800 | Power Corp of Canada | 49,206 | |||||
| 7,800 | Power Financial Corp. | 242,902 | |||||
| 20,900 | Royal Bank of Canada | 1,443,464 | |||||
| 15,800 | Suncor Energy, Inc. | 501,825 | |||||
| 4,400 | Toronto-Dominion Bank | 210,229 | |||||
| 15,200 | TransAlta Corp(b). | 137,635 | |||||
| 5,600 | Valeant Pharmaceuticals International, Inc.† | 801,728 | |||||
| 13,994,401 | |||||||
Cayman Islands — 0.2% | |||||||
| 1,500 | Baidu, Inc. ADR† | 341,955 | |||||
China — 5.5% | |||||||
| 757,000 | Agricultural Bank of China, Ltd., Class H | 380,745 | |||||
| 72,000 | ANTA Sports Products, Ltd. | 126,567 | |||||
| 2,184,000 | Bank of China, Ltd., Class H | 1,225,812 | |||||
| 104,000 | Beijing Capital International Airport Co., Ltd., Class H | 82,904 | |||||
| 144,000 | China CITIC Bank Corp., Ltd., Class H | 114,802 | |||||
| 867,000 | China Construction Bank Corp., Class H | 708,151 | |||||
| 75,000 | China Everbright Bank Co., Ltd., Class H | 40,632 | |||||
| 110,500 | China Merchants Bank Co., Ltd., Class H | 275,825 | |||||
| 143,000 | China Railway Group, Ltd., Class H | 116,956 | |||||
| 115,000 | Fosun International | 149,900 | |||||
| 13,100 | Hollysys Automation Technologies, Ltd.† | 320,033 | |||||
| 1,158,000 | Industrial & Commercial Bank of China, Ltd., Class H | 845,563 | |||||
| 10,000 | Jiangsu Expressway Co., Ltd., Class H | 11,906 | |||||
| 4,500 | NetEase, Inc. ADR | 446,130 | |||||
| 468,542 | PICC Property & Casualty Co., Ltd., Class H | 904,157 | |||||
| 11,000 | Shimao Property Holdings, Ltd. | 24,360 | |||||
| 113,000 | SOHO China, Ltd. | 79,699 | |||||
| 809,500 | Sun Art Retail Group, Ltd.(b) | 802,425 | |||||
| 167,300 | Tencent Holdings, Ltd. | 2,420,652 | |||||
| 17,500 | WuXi PharmaTech Cayman, Inc.†(b) | 589,225 | |||||
| 104,000 | Zhejiang Expressway Co., Ltd., Class H | 120,439 | |||||
| 9,786,883 | |||||||
Denmark — 5.6% | |||||||
| 61,278 | Chr Hansen Holding A | 2,714,822 | |||||
| 1,177 | DSV A/S | 35,838 | |||||
| 5,013 | Novo Nordisk A, Class B | 212,049 | |||||
Wilshire Mutual Funds, Inc. Wilshire International Equity Fund Schedule of Investments | December 31, 2014 |
| Shares | Value | ||||||
| Denmark (continued) | |||||||
| 50,150 | Novo Nordisk ADR(b) | $ | 2,122,348 | ||||
| 44,073 | Novozymes A, Class B | 1,855,189 | |||||
| 12,016 | Pandora A | 973,983 | |||||
| 157,219 | TDC A | 1,199,095 | |||||
| 7,326 | Tryg A | 818,585 | |||||
| 993 | Vestas Wind Systems A/S† | 36,062 | |||||
| 9,967,971 | |||||||
Finland — 0.8% | |||||||
| 3,595 | Sampo, Class A | 168,298 | |||||
| 14,838 | Stora Enso OYJ, Class R | 132,666 | |||||
| 22,596 | UPM-Kymmene OYJ | 370,308 | |||||
| 15,500 | Wartsila OYJ Abp | 693,754 | |||||
| 1,365,026 | |||||||
France — 2.6% | |||||||
| 7,343 | Alcatel-Lucent†(b) | 26,268 | |||||
| 5,948 | AXA SA | 137,060 | |||||
| 2,352 | BNP Paribas | 138,848 | |||||
| 3,747 | Christian Dior SA | 641,256 | |||||
| 5,763 | Cie Generale des Etablissements Michelin, Class B(b) | 520,208 | |||||
| 37,200 | Electricite de France SA | 1,024,059 | |||||
| 4,293 | Eutelsat Communications SA(b) | 138,835 | |||||
| 243 | Hermes International | 86,528 | |||||
| 6,709 | LVMH Moet Hennessy Louis Vuitton SA | 1,062,720 | |||||
| 27,900 | Natixis SA | 184,102 | |||||
| 645 | Renault SA | 46,980 | |||||
| 3,683 | Safran SA | 227,223 | |||||
| 4,436 | Societe Generale | 185,648 | |||||
| 1,037 | Sodexo | 101,506 | |||||
| 72 | Unibail-Rodamco SE(a) | 18,471 | |||||
| 515 | Vinci SA | 28,120 | |||||
| 4,567,832 | |||||||
Germany — 4.2% | |||||||
| 3,334 | Allianz SE | 552,199 | |||||
| 1,798 | Axel Springer SE | 108,446 | |||||
| 9,220 | BASF SE | 773,384 | |||||
| 8,952 | Bayer AG | 1,220,237 | |||||
| 4,584 | Bayerische Motoren Werke AG | 494,699 | |||||
| 2,369 | Brenntag AG | 132,451 | |||||
| 3,327 | Celesio AG | 107,232 | |||||
| 3,209 | Continental AG | 676,853 | |||||
| 2,878 | Daimler AG | 239,030 | |||||
| 3,228 | Deutsche Bank AG | 96,661 | |||||
| 32,424 | Deutsche Telekom AG | 518,796 | |||||
| 37,678 | E.ON SE | 643,983 | |||||
| 12,209 | Fresenius SE & Co. KGaA | 634,797 | |||||
| 3,905 | Hannover Rueck SE | 352,277 | |||||
| 1,031 | Muenchener Rueckversicherungs AG | 205,311 | |||||
| 1,054 | SAP AG | 73,599 | |||||
| 530 | Siemens AG | 59,468 | |||||
| 5,267 | TUI AG† | 84,633 | |||||
| 8,720 | Wincor Nixdorf AG | 421,108 | |||||
| 7,395,164 | |||||||
Guernsey — 0.0% | |||||||
| 7,424 | Friends Life Group, Ltd. | 42,163 | |||||
Hong Kong — 3.1% | |||||||
| 43,600 | Beijing Enterprises Holdings, Ltd. | 340,983 | |||||
| 308,000 | Beijing Enterprises Water Group, Ltd. | 208,118 | |||||
| 83,500 | BOC Hong Kong Holdings, Ltd. | 278,234 | |||||
| 168,000 | China Everbright International, Ltd. | 248,035 | |||||
| 9,000 | China Mobile, Ltd. | 105,415 | |||||
| 298,000 | China Unicom Hong Kong, Ltd. | 399,362 | |||||
| Shares | Value | ||||||
| Hong Kong (continued) | |||||||
| 6,000 | CNOOC, Ltd. | $ | 8,113 | ||||
| 806,000 | GOME Electrical Appliances Holding, Ltd(b). | 117,809 | |||||
| 182,000 | Guangdong Investment, Ltd. | 236,765 | |||||
| 150,000 | Haier Electronics Group Co., Ltd. | 354,853 | |||||
| 64,000 | Hanergy Thin Film Power Group, Ltd. | 23,175 | |||||
| 22,800 | Hang Seng Bank, Ltd. | 378,946 | |||||
| 110,000 | Hutchison Whampoa, Ltd. | 1,257,473 | |||||
| 43,000 | Kerry Properties, Ltd. | 155,122 | |||||
| 348,000 | Lenovo Group, Ltd. | 454,353 | |||||
| 284,000 | PCCW, Ltd. | 193,373 | |||||
| 241,500 | Techtronic Industries Co. | 774,753 | |||||
| 5,534,882 | |||||||
India — 0.8% | |||||||
| 27,100 | Infosys, Ltd. ADR(b) | 852,566 | |||||
| 12,900 | Tata Motors, Ltd. ADR(b) | 545,412 | |||||
| 1,397,978 | |||||||
Indonesia — 0.8% | |||||||
| 626,700 | Astra International | 373,754 | |||||
| 463,900 | Bank Mandiri | 403,425 | |||||
| 300,600 | Bank Rakyat Indonesia | 282,558 | |||||
| 688,800 | Indofood Sukses Makmur | 375,524 | |||||
| 1,435,261 | |||||||
Ireland — 2.6% | |||||||
| 126,141 | Experian PLC | 2,126,358 | |||||
| 14,215 | Perrigo Co. PLC(b) | 2,376,179 | |||||
| 4,502,537 | |||||||
Israel — 0.0% | |||||||
| 1,188 | Bezeq The Israeli Telecommunication Corp., Ltd. | 2,107 | |||||
| 14 | Delek Group, Ltd. | 3,512 | |||||
| 5,619 | |||||||
Italy — 1.1% | |||||||
| 14,573 | Assicurazioni Generali SpA | 299,226 | |||||
| 63,189 | Enel SPA | 281,667 | |||||
| 4,300 | Fiat Chrysler Automobiles NV† | 49,965 | |||||
| 205,734 | Intesa Sanpaolo SpA | 596,816 | |||||
| 65,483 | Snam SpA | 324,091 | |||||
| 109,499 | Telecom Italia SpA | 116,779 | |||||
| 151,320 | Telecom Italia SpA | 126,511 | |||||
| 26,586 | Terna Rete Elettrica Nazionale SpA | 120,758 | |||||
| 1,915,813 | |||||||
Japan — 12.6% | |||||||
| 6,000 | Aozora Bank, Ltd. | 18,573 | |||||
| 35,300 | Astellas Pharma, Inc. | 491,450 | |||||
| 7,500 | Bridgestone Corp. | 260,115 | |||||
| 13,700 | Brother Industries, Ltd. | 248,345 | |||||
| 5,900 | Calbee, Inc. | 203,236 | |||||
| 800 | Central Japan Railway Co. | 119,901 | |||||
| 13,400 | Citizen Holdings Co., Ltd. | 103,105 | |||||
| 1,000 | Dai Nippon Printing Co., Ltd. | 9,007 | |||||
| 29,000 | Dai-ichi Life Insurance Co., Ltd. | 440,216 | |||||
| 500 | Daikin Industries, Ltd. | 32,062 | |||||
| 6,000 | Daito Trust Construction Co., Ltd. | 680,627 | |||||
| 11,000 | FANUC Corp. | 1,813,684 | |||||
| 12,000 | Fuji Heavy Industries, Ltd. | 424,632 | |||||
| 40,000 | Fujitsu, Ltd. | 213,267 | |||||
| 28,500 | GungHo Online Entertainment, Inc.(b) | 103,187 | |||||
| 2,600 | Hirose Electric Co., Ltd. | 301,660 | |||||
| 6,000 | Hitachi Metals, Ltd. | 101,945 | |||||
| 89,000 | Hitachi, Ltd. | 656,888 | |||||
| 45,300 | INPEX Corp. | 504,324 | |||||
| 84,200 | ITOCHU Corp. | 898,843 | |||||
Wilshire Mutual Funds, Inc. Wilshire International Equity Fund Schedule of Investments | December 31, 2014 |
| Shares | Value | ||||||
| Japan (continued) | |||||||
| 3,000 | Japan Airlines Co., Ltd. | $ | 88,947 | ||||
| 32,000 | Japan Tobacco, Inc. | 880,729 | |||||
| 38,300 | JFE Holdings, Inc. | 854,124 | |||||
| 17,000 | JGC Corp. | 349,976 | |||||
| 3,500 | JSR Corp. | 60,075 | |||||
| 3,000 | Kamigumi Co., Ltd. | 26,723 | |||||
| 32,000 | Kansai Paint Co., Ltd. | 495,743 | |||||
| 12,000 | Keikyu Corp. | 88,786 | |||||
| 11,000 | Keisei Electric Railway Co., Ltd. | 133,754 | |||||
| 300 | Keyence Corp. | 133,679 | |||||
| 8,000 | Kikkoman Corp. | 196,072 | |||||
| 77,000 | Kobe Steel, Ltd. | 132,633 | |||||
| 7,200 | Koito Manufacturing Co., Ltd. | 220,261 | |||||
| 2,400 | Lawson, Inc. | 145,028 | |||||
| 2,200 | Makita Corp. | 99,136 | |||||
| 4,300 | Maruichi Steel Tube, Ltd. | 91,518 | |||||
| 6,600 | Mazda Motor Corp. | 158,503 | |||||
| 3,200 | Miraca Holdings, Inc. | 137,661 | |||||
| 1,500 | Mitsubishi Motors Corp. | 13,703 | |||||
| 97,000 | Mitsubishi UFJ Financial Group, Inc. | 532,940 | |||||
| 7,200 | MS&AD Insurance Group Holdings, Inc. | 170,627 | |||||
| 6,000 | NH Foods, Ltd. | 131,270 | |||||
| 9,900 | NHK Spring Co., Ltd. | 86,143 | |||||
| 1,400 | Nidec Corp. | 90,420 | |||||
| 1,000 | Nippon Paint Holdings Co., Ltd. | 28,978 | |||||
| 9,000 | Nippon Steel & Sumitomo Metal Corp. | 22,326 | |||||
| 14,000 | Nippon Yusen KK | 39,543 | |||||
| 112,700 | Nissan Motor Co., Ltd. | 982,943 | |||||
| 7,200 | Nitto Denko Corp. | 402,304 | |||||
| 129,100 | Nomura Holdings, Inc. | 730,581 | |||||
| 2,200 | Nomura Research Institute, Ltd. | 67,287 | |||||
| 600 | Oriental Land Co., Ltd. | 138,368 | |||||
| 7,200 | ORIX Corp. | 90,596 | |||||
| 1,600 | Otsuka Corp. | 50,734 | |||||
| 22,300 | Resona Holdings, Inc. | 112,649 | |||||
| 46,300 | Ricoh Co., Ltd. | 468,049 | |||||
| 1,900 | Santen Pharmaceutical Co., Ltd. | 102,286 | |||||
| 1,200 | Seiko Epson Corp. | 50,213 | |||||
| 31,400 | Sekisui House, Ltd. | 413,161 | |||||
| 12,200 | Seven & I Holdings Co., Ltd. | 438,850 | |||||
| 1,800 | Shimamura Co., Ltd. | 155,335 | |||||
| 1,400 | Shimano, Inc. | 181,330 | |||||
| 500 | SMC Corp. | 131,112 | |||||
| 13,600 | Softbank Corp. | 809,517 | |||||
| 12,900 | Sundrug Co., Ltd. | 527,328 | |||||
| 4,800 | Suntory Beverage & Food, Ltd. | 165,837 | |||||
| 44,300 | Sysmex Corp. | 1,966,145 | |||||
| 10,300 | T&D Holdings, Inc. | 123,475 | |||||
| 22,000 | Taiheiyo Cement Corp. | 69,022 | |||||
| 11,000 | Taisei Corp. | 62,392 | |||||
| 1,900 | THK Co., Ltd. | 45,661 | |||||
| 4,400 | Toho Co., Ltd. | 99,834 | |||||
| 4,100 | Tokio Marine Holdings, Inc. | 133,158 | |||||
| 1,500 | Toyota Motor Corp. | 93,476 | |||||
| 13,700 | USS Co., Ltd. | 210,496 | |||||
| 34,700 | Yahoo Japan Corp. | 124,362 | |||||
| 13,000 | Yamaguchi Financial Group, Inc. | 133,603 | |||||
| 14,000 | Yokohama Rubber Co., Ltd. | 127,475 | |||||
| 22,241,944 | |||||||
Malaysia — 0.1% | |||||||
| 105,800 | Genting BHD | 268,016 | |||||
Mexico — 1.9% | |||||||
| 277,900 | Alfa SAB de CV, Class A† | 620,454 | |||||
| 94,700 | Cemex SAB de CV, Class Preference† | 96,537 | |||||
| Shares | Value | ||||||
| Mexico (continued) | |||||||
| 28,900 | Controladora Comercial Mexicana SAB de CV | $ | 102,211 | ||||
| 11,300 | Gruma SAB de CV, Class B | 120,493 | |||||
| 21,000 | Grupo Aeroportuario del Pacifico SAB de CV, Class B | 131,975 | |||||
| 4,700 | Grupo Carso SAB de CV | 23,125 | |||||
| 138,800 | Grupo Financiero Banorte SAB de CV, Class O | 763,912 | |||||
| 17,700 | Grupo Televisa SAB† | 120,677 | |||||
| 46,000 | OHL Mexico SAB de CV† | 85,273 | |||||
| 22,300 | Promotora y Operadora de Infraestructura SAB de CV† | 268,121 | |||||
| 483,800 | Wal-Mart de Mexico SAB de CV | 1,040,152 | |||||
| 3,372,930 | |||||||
Netherlands — 5.9% | |||||||
| 19,302 | Aegon NV | 145,074 | |||||
| 5,175 | Airbus Group NV | 255,842 | |||||
| 24,755 | ASML Holding NV, Class G(b) | 2,669,332 | |||||
| 13,620 | Core Laboratories NV(b) | 1,639,031 | |||||
| 15,599 | Delta Lloyd NV | 343,028 | |||||
| 2,192 | Heineken Holding NV | 137,223 | |||||
| 721 | Heineken NV | 51,197 | |||||
| 70,816 | ING Groep NV, CVA† | 914,921 | |||||
| 12,949 | Randstad Holding NV | 623,061 | |||||
| 4,649 | Royal Dutch Shell PLC, Class A | 155,151 | |||||
| 7,272 | Royal Dutch Shell PLC, Class B | 251,256 | |||||
| 44,150 | Sensata Technologies Holding NV†(b) | 2,313,901 | |||||
| 48,470 | Yandex NV, Class A†(b) | 870,521 | |||||
| 10,369,538 | |||||||
New Zealand — 0.1% | |||||||
| 5,808 | Fletcher Building, Ltd. | 37,420 | |||||
| 1,936 | Ryman Healthcare, Ltd. | 12,842 | |||||
| 22,808 | Spark New Zealand, Ltd. | 55,290 | |||||
| 105,552 | |||||||
Norway — 1.0% | |||||||
| 11,677 | DnB NOR ASA | 172,243 | |||||
| 4,106 | Norsk Hydro ASA | 23,129 | |||||
| 25,123 | Orkla ASA(b) | 171,024 | |||||
| 67,347 | Statoil ASA | 1,185,768 | |||||
| 6,693 | Telenor ASA(b) | 135,390 | |||||
| 131 | Yara International ASA(b) | 5,834 | |||||
| 1,693,388 | |||||||
Panama — 0.3% | |||||||
| 19,100 | Banco Latinoamericano de Comercio Exterior SA, Class E | 574,910 | |||||
Russia — 0.4% | |||||||
| 39 | AK Transneft OAO† | 80,150 | |||||
| 1,627,000 | Federal Hydrogenerating Company (Rushydro)† | 14,176 | |||||
| 12,613 | Lukoil OAO ADR | 483,709 | |||||
| 4,440 | Moscow Exchange MICEX-RTS OAO | 4,281 | |||||
| 610 | Severstal PAO | 4,954 | |||||
| 179,900 | Surgutneftegas† | 69,459 | |||||
| 8,610 | Tatneft† | 32,221 | |||||
| 688,950 | |||||||
Singapore — 0.6% | |||||||
| 41,100 | Keppel Corp., Ltd. | 273,947 | |||||
| 8,000 | StarHub, Ltd. | 24,995 | |||||
| 40,400 | United Overseas Bank, Ltd. | 745,544 | |||||
| 1,044,486 | |||||||
Wilshire Mutual Funds, Inc. Wilshire International Equity Fund Schedule of Investments | December 31, 2014 |
| Shares | Value | ||||||
South Africa — 2.4% | |||||||
| 14,890 | Coronation Fund Managers, Ltd. | $ | 147,357 | ||||
| 150,806 | FirstRand, Ltd. | 655,585 | |||||
| 47,583 | Growthpoint Properties, Ltd.(a) | 113,057 | |||||
| 7,736 | Liberty Holdings, Ltd. | 81,976 | |||||
| 921 | Mr Price Group, Ltd. | 18,631 | |||||
| 62,633 | Netcare, Ltd. | 204,692 | |||||
| 23,900 | Redefine Properties, Ltd.(a) | 22,106 | |||||
| 54,485 | Remgro, Ltd. | 1,191,952 | |||||
| 22,223 | Sanlam, Ltd. | 133,722 | |||||
| 12,559 | Sasol, Ltd. | 468,738 | |||||
| 72,290 | Shoprite Holdings, Ltd. | 1,046,235 | |||||
| 7,749 | Vodacom Group, Ltd. | 85,745 | |||||
| 4,169,796 | |||||||
South Korea — 2.0% | |||||||
| 2,599 | Daewoo Securities Co., Ltd.† | 22,967 | |||||
| 100 | Dongbu Insurance Co., Ltd.† | 4,994 | |||||
| 1,500 | Hanwha Corp.† | 42,410 | |||||
| 1,790 | Hyundai Motor Co.† | 273,433 | |||||
| 4,500 | Industrial Bank of Korea† | 57,567 | |||||
| 1,000 | Kangwon Land, Inc.† | 27,563 | |||||
| 1,947 | KB Financial Group, Inc.† | 63,655 | |||||
| 21,079 | Korea Electric Power Corp.† | 812,238 | |||||
| 800 | KT&G Corp.† | 55,547 | |||||
| 21,270 | LG Display Co., Ltd.† | 645,106 | |||||
| 106 | Mirae Asset Securities Co., Ltd.† | 4,124 | |||||
| 699 | NAVER Corp.† | 447,664 | |||||
| 100 | Samsung Electronics Co., Ltd. | 120,224 | |||||
| 1,504 | Samsung Securities Co., Ltd.† | 60,477 | |||||
| 683 | Shinhan Financial Group Co., Ltd.† | 27,453 | |||||
| 8,705 | SK Hynix, Inc.† | 372,012 | |||||
| 3,900 | SK Networks Co., Ltd.† | 31,437 | |||||
| 1,610 | SK Telecom Co., Ltd. | 393,795 | |||||
| 1,492 | Woori Bank† | 13,574 | |||||
| 3,476,240 | |||||||
Spain — 3.3% | |||||||
| 1,509 | ACS Actividades de Construccion y Servicios SA | 52,596 | |||||
| 3,114 | Amadeus IT Holding SA, Class A | 124,023 | |||||
| 18,044 | Banco Bilbao Vizcaya Argentaria SA | 170,415 | |||||
| 172,372 | Banco Santander SA | 1,446,742 | |||||
| 76,500 | Bankinter SA | 614,581 | |||||
| 12,509 | CaixaBank SA | 65,546 | |||||
| 6,731 | Enagas SA | 212,303 | |||||
| 31,536 | Ferrovial SA | 623,411 | |||||
| 14,585 | Grifols SA | 581,995 | |||||
| 68,157 | Inditex SA(b) | 1,944,210 | |||||
| 5,835,822 | |||||||
Sweden — 2.5% | |||||||
| 7,022 | Boliden AB | 112,245 | |||||
| 8,920 | Electrolux AB, Class B | 260,636 | |||||
| 9,501 | Elekta AB, Class B | 97,030 | |||||
| 11,068 | Hennes & Mauritz AB, Class B | 459,820 | |||||
| 22,941 | Husqvarna AB, Class B | 168,627 | |||||
| 2,360 | Nordea Bank AB | 27,319 | |||||
| 3,181 | Sandvik AB | 30,929 | |||||
| 26,151 | Skandinaviska Enskilda Banken AB, Class A | 332,080 | |||||
| 68,279 | Svenska Cellulosa AB, Class B | 1,472,006 | |||||
| 1,181 | Svenska Handelsbanken AB, Class A | 55,257 | |||||
| 52,546 | Swedbank AB, Class A | 1,303,715 | |||||
| 2,313 | Telefonaktiebolaget LM Ericsson, Class B | 28,006 | |||||
| 17,435 | TeliaSonera AB | 112,096 | |||||
| 4,459,766 | |||||||
| Shares | Value | ||||||
Switzerland — 7.4% | |||||||
| 23,605 | ACE, Ltd. | $ | 2,711,742 | ||||
| 1,750 | Actelion, Ltd. | 201,462 | |||||
| 10,718 | Aryzta AG | 823,673 | |||||
| 4,381 | Credit Suisse Group AG | 110,056 | |||||
| 3,598 | Lonza Group AG | 405,105 | |||||
| 33,912 | Nestle SA | 2,472,219 | |||||
| 10,624 | Novartis AG | 985,307 | |||||
| 5,037 | Roche Holding AG | 1,364,736 | |||||
| 932 | SGS SA | 1,903,116 | |||||
| 17,091 | STMicroelectronics NV | 127,525 | |||||
| 2,420 | Swatch Group AG (The) | 1,075,101 | |||||
| 1,556 | Swiss Re, Ltd. | 130,349 | |||||
| 21,630 | UBS AG | 356,929 | |||||
| 1,295 | Zurich Insurance Group AG | 404,691 | |||||
| 13,072,011 | |||||||
Taiwan — 3.7% | |||||||
| 14,000 | Advanced Semiconductor Engineering, Inc. | 16,627 | |||||
| 93,000 | Asia Cement Corp. | 114,524 | |||||
| 4,000 | Asustek Computer, Inc. | 43,644 | |||||
| 222,000 | AU Optronics Corp. | 112,680 | |||||
| 32,000 | Chicony Electronics Co., Ltd. | 89,108 | |||||
| 36,000 | China Motor Corp. | 31,798 | |||||
| 18,000 | China Steel Corp. | 14,931 | |||||
| 204,000 | Chunghwa Telecom Co., Ltd. | 604,663 | |||||
| 36,000 | Far Eastern New Century Corp. | 35,606 | |||||
| 36,000 | Innolux Corp. | 17,399 | |||||
| 2,000 | Novatek Microelectronics Corp. | 11,176 | |||||
| 61,000 | Pegatron Corp. | 139,430 | |||||
| 1,000 | Phison Electronics Corp. | 6,861 | |||||
| 30,000 | Realtek Semiconductor Corp. | 99,625 | |||||
| 17,000 | Ruentex Industries, Ltd. | 35,649 | |||||
| 446,000 | Shin Kong Financial Holding Co., Ltd. | 126,332 | |||||
| 132,000 | SinoPac Financial Holdings Co., Ltd. | 54,091 | |||||
| 21,000 | Standard Foods Corp. | 46,519 | |||||
| 260,000 | Taiwan Business Bank† | 75,324 | |||||
| 4,000 | Taiwan Cement Corp. | 5,468 | |||||
| 56,000 | Taiwan Cooperative Financial Holding Co., Ltd. | 28,788 | |||||
| 205,320 | Taiwan Semiconductor Manufacturing Co., Ltd. ADR(b) | 4,595,062 | |||||
| 13,000 | Transcend Information, Inc. | 40,340 | |||||
| 21,000 | Uni-President Enterprises Corp. | 33,210 | |||||
| 54,000 | Vanguard International Semiconductor Corp. | 88,362 | |||||
| 92,000 | WPG Holdings, Ltd. | 106,807 | |||||
| 6,574,024 | |||||||
Thailand — 0.2% | |||||||
| 525,500 | Krung Thai Bank PCL | 360,523 | |||||
Turkey — 0.3% | |||||||
| 117,400 | Haci Omer Sabanci Holding AS | 509,600 | |||||
United Kingdom — 9.8% | |||||||
| 4,469 | 3i Group PLC | 31,161 | |||||
| 5,916 | Aberdeen Asset Management PLC | 39,531 | |||||
| 1,241 | Admiral Group PLC | 25,459 | |||||
| 2,362 | AMEC PLC | 31,194 | |||||
| 6,698 | ARM Holdings PLC | 102,897 | |||||
| 43,165 | ARM Holdings PLC ADR | 1,998,540 | |||||
| 5,468 | AstraZeneca PLC | 386,210 | |||||
| 25,411 | BAE Systems PLC | 185,836 | |||||
| 2,885 | BHP Billiton PLC | 61,830 | |||||
| 218,560 | BP PLC | 1,387,329 | |||||
Wilshire Mutual Funds, Inc. Wilshire International Equity Fund Schedule of Investments | December 31, 2014 |
| Shares | Value | ||||||
| United Kingdom (continued) | |||||||
| 32,861 | British American Tobacco PLC | $ | 1,780,772 | ||||
| 17,245 | British Sky Broadcasting Group PLC | 240,677 | |||||
| 206,854 | BT Group PLC, Class A | 1,286,648 | |||||
| 1,006 | Burberry Group PLC | 25,524 | |||||
| 1,865 | Capita Group PLC (The) | 31,272 | |||||
| 46,348 | Centrica PLC | 200,754 | |||||
| 10,611 | Diageo PLC | 303,975 | |||||
| 11,400 | easyJet PLC | 295,022 | |||||
| 105,800 | G4S PLC | 456,382 | |||||
| 23,919 | GlaxoSmithKline PLC | 513,150 | |||||
| 54,521 | HSBC Holdings PLC | 515,211 | |||||
| 19,356 | ICAP PLC | 135,534 | |||||
| 28,456 | Indivior PLC† | 66,261 | |||||
| 52,200 | International Consolidated Airlines Group SA† | 392,966 | |||||
| 9,448 | ITV PLC | 31,516 | |||||
| 6,577 | Legal & General Group PLC | 25,395 | |||||
| 292,790 | Lloyds Banking Group PLC† | 344,398 | |||||
| 4,849 | London Stock Exchange Group PLC | 166,850 | |||||
| 10,548 | National Grid PLC | 149,669 | |||||
| 1,027 | Next PLC | 108,921 | |||||
| 1,640 | Persimmon PLC | 40,055 | |||||
| 50,856 | Prudential PLC | 1,175,767 | |||||
| 28,456 | Reckitt Benckiser Group PLC | 2,304,767 | |||||
| 1,291 | Rio Tinto PLC | 59,511 | |||||
| 37,879 | Rolls-Royce Holdings PLC | 508,861 | |||||
| 3,902 | Scottish & Southern Energy PLC | 98,592 | |||||
| 10,258 | Segro PLC(a) | 58,765 | |||||
| 35,496 | Smith & Nephew PLC | 640,084 | |||||
| 2,828 | Travis Perkins PLC | 81,401 | |||||
| 20,089 | Vodafone Group PLC | 68,878 | |||||
| 1,826 | Weir Group PLC | 52,362 | |||||
| 45,742 | WH Smith PLC | 956,544 | |||||
| 17,366,471 | |||||||
United States — 1.2% | |||||||
| 46,875 | Coca-Cola Enterprises, Inc. | 2,072,812 | |||||
| Total Common Stock | – | ||||||
| (Cost $173,938,457) | 170,850,889 | ||||||
SHORT-TERM INVESTMENTS (c) — 14.0% | |||||||
| 1,773,196 | Northern Trust Institutional Government Select Portfolio, 0.010% | 1,773,196 | |||||
| 22,850,165 | Northern Trust Institutional Liquid Asset Portfolio, 0.010%(d) | 22,850,165 | |||||
| Total Short-Term Investments | |||||||
| (Cost $24,623,361) | 24,623,361 | ||||||
PREFERRED STOCK — 1.2% | |||||||
Brazil — 0.5% | |||||||
| 3,200 | AES Tiete SA | 21,813 | |||||
| 1,100 | Banco Bradesco SA, Class Preference | 14,508 | |||||
| 9,200 | Cia Brasileira de Distribuicao, Class Preference | 341,357 | |||||
| 600 | Cia Energetica de Minas Gerais | 2,966 | |||||
| 5,700 | Cia Energetica de Sao Paulo, Class Preference | 57,489 | |||||
| 5,600 | Itau Unibanco Holding SA | 72,892 | |||||
| 19,900 | Itausa - Investimentos Itau SA | 70,296 | |||||
| 2,000 | Metalurgica Gerdau SA, Class A | 8,502 | |||||
| 83,000 | Petroleo Brasileiro SA | 312,866 | |||||
| 3,600 | Suzano Papel e Celulose SA, Class A | 15,236 | |||||
| Shares | Value | ||||||
| Brazil (continued) | |||||||
| 1,900 | Vale SA | $ | 13,745 | ||||
| 931,670 | |||||||
Germany — 0.5% | |||||||
| 8,063 | Henkel AG & Co. KGAA | 868,532 | |||||
Russia — 0.1% | |||||||
| 174,500 | Surgutneftegas† | 83,029 | |||||
South Korea — 0.1% | |||||||
| 300 | Hyundai Motor Co.† | 34,254 | |||||
| 400 | Hyundai Motor Co.† | 48,655 | |||||
| 162 | Samsung Electronics Co., Ltd., Class Preference | 152,372 | |||||
| 235,281 | |||||||
| Total Preferred Stock | |||||||
| (Cost $2,622,175) | 2,118,512 | ||||||
EXCHANGE TRADED FUND — 0.5% | |||||||
| 29,913 | iShares MSCI India ETF(b) | 900,082 | |||||
Total Exchange Traded Fund | |||||||
| (Cost $907,190) | 900,082 | ||||||
RIGHT — 0.0% | |||||||
Spain — 0.0% | |||||||
| 18,044 | Banco Bilbao Vizcaya Argentaria SA† | 1,725 | |||||
Total Right (Cost $–) | 1,725 | ||||||
PRIVATE COMPANY — 0.0% | |||||||
Malta — 0.0% | |||||||
| 4,007 | BGP Holdings PLC†(e) | — | |||||
| Total Private Company | |||||||
(Cost $–) | — | ||||||
Total Investments — 112.5% | |||||||
| (Cost $202,091,183) | 198,494,569 | ||||||
Other Assets & Liabilities, Net — (12.5)% | (22,075,747 | ) | |||||
NET ASSETS — 100.0% | $ | 176,418,822 | |||||
| † | Non-income producing security. |
| (a) | Real Estate Investment Trust. |
| (b) | This security or a partial position of this security is on loan at December 31, 2014. The total market value of securities on loan at December 31, 2014 was $21,689,780 (Note 6). |
| (c) | Rate shown is the 7-day effective yield as of September 30, 2014. |
| (d) | This security was purchased with cash collateral held from securities on loan. The total value of such securities as of December 31, 2014 was $22,850,165. Securities on loan are also collateralized by various U.S. Treasury obligations in the amount of $19,883 (Note 6). |
| (e) | Securities fair valued using methods determined in good faith by the Pricing Committee. The total market value of such securities as of December 31, 2014 was $0 and represented 0.0% of Net Assets. |
| ADR — American Depositary Receipt |
| ETF — Exchange Traded Fund |
| Ltd. — Limited |
| PLC — Public Limited Company |
Amounts designated as “—“ are either $0 or have been rounded to $0.
Wilshire Mutual Funds, Inc. Wilshire International Equity Fund Schedule of Investments | December 31, 2014 |
The following is a summary of the inputs used as of September 30, 2014 valuing the Portfolio’s investments carried at value:
| Investments in Securities | Level 1 | Level 2 | Level 3 | Total | ||||||||||||
| Common Stock | $ | — | $ | — | $ | — | $ | — | ||||||||
| Australia | — | 3,633,756 | * | — | 3,633,756 | |||||||||||
| Austria | — | 840,811 | * | — | 840,811 | |||||||||||
| Belgium | — | 1,919,833 | * | — | 1,919,833 | |||||||||||
| Bermuda | 2,450,719 | 230,145 | * | — | 2,680,864 | |||||||||||
| Brazil | 1,265,361 | — | — | 1,265,361 | ||||||||||||
| Canada | 13,994,401 | — | — | 13,994,401 | ||||||||||||
| Cayman Islands | 341,955 | — | — | 341,955 | ||||||||||||
| China | 1,355,388 | 8,431,495 | * | — | 9,786,883 | |||||||||||
| Denmark | 2,122,348 | 7,845,623 | * | — | 9,967,971 | |||||||||||
| Finland | — | 1,365,026 | * | — | 1,365,026 | |||||||||||
| France | — | 4,567,832 | * | — | 4,567,832 | |||||||||||
| Germany | 84,633 | 7,310,531 | * | — | 7,395,164 | |||||||||||
| Guernsey | — | 42,163 | * | — | 42,163 | |||||||||||
| Hong Kong | — | 5,534,882 | * | — | 5,534,882 | |||||||||||
| India | 1,397,978 | — | — | 1,397,978 | ||||||||||||
| Indonesia | — | 1,435,261 | * | — | 1,435,261 | |||||||||||
| Ireland | 2,376,179 | 2,126,358 | * | — | 4,502,537 | |||||||||||
| Israel | — | 5,619 | * | — | 5,619 | |||||||||||
| Italy | — | 1,915,813 | * | — | 1,915,813 | |||||||||||
| Japan | — | 22,241,944 | * | — | 22,241,944 | |||||||||||
| Malaysia | — | 268,016 | * | — | 268,016 | |||||||||||
| Mexico | 3,372,930 | — | — | 3,372,930 | ||||||||||||
| Netherlands | 7,492,785 | 2,876,753 | * | — | 10,369,538 | |||||||||||
| New Zealand | — | 105,552 | * | — | 105,552 | |||||||||||
| Norway | — | 1,693,388 | * | — | 1,693,388 | |||||||||||
| Panama | 574,910 | — | — | 574,910 | ||||||||||||
| Russia | 684,669 | 4,281 | * | — | 688,950 | |||||||||||
| Singapore | — | 1,044,486 | * | — | 1,044,486 | |||||||||||
| South Africa | — | 4,169,796 | * | — | 4,169,796 | |||||||||||
| South Korea | 13,574 | 3,462,666 | * | — | 3,476,240 | |||||||||||
| Spain | — | 5,835,822 | * | — | 5,835,822 | |||||||||||
| Sweden | — | 4,459,766 | * | — | 4,459,766 | |||||||||||
| Switzerland | 2,711,742 | 10,360,269 | * | — | 13,072,011 | |||||||||||
| Taiwan | 4,595,062 | 1,978,962 | * | — | 6,574,024 | |||||||||||
| Thailand | — | 360,523 | * | — | 360,523 | |||||||||||
| Turkey | — | 509,600 | * | — | 509,600 | |||||||||||
| United Kingdom | 2,064,801 | 15,301,670 | * | — | 17,366,471 | |||||||||||
| United States | 2,072,812 | — | — | 2,072,812 | ||||||||||||
| Total Common Stock | 48,972,247 | 121,878,642 | — | 170,850,889 | ||||||||||||
| Short-Term Investments | 24,623,361 | — | — | 24,623,000 | ||||||||||||
| Preferred Stock | 1,014,699 | 1,103,813 | * | — | 2,118,512 | |||||||||||
| Exchange Traded Fund | 900,082 | — | — | 900,082 | ||||||||||||
| Right | — | 1,725 | — | 1,725 | ||||||||||||
| Private Company | ||||||||||||||||
| Malta | — | — | — | ^ | — | |||||||||||
| Total Investments in Securities | $ | 75,510,389 | $ | 122,984,180 | $ | — | $ | 198,494,569 | ||||||||
| * | Represents securities trading primarily outside the United States, the values of which were adjusted as a result of local trading through the application of a third-party vendor. |
| ^ | This security was categorized as Level 3 and had a market value of $0 as of December 31, 2014 and the value has remained $0 throughout the period ended December 31, 2014. There were no accrued discounts/premiums, realized gain/(loss), change in unrealized appreciation/(depreciation), purchases, sales or transfers in or out of Level 3 during the period ended December 31, 2014. |
| (b) | Not applicable |
| Item 7. | Disclosure of Proxy Voting Policies and Procedures for Closed-End Management Investment Companies. |
Not applicable.
| Item 8. | Portfolio Managers of Closed-End Management Investment Companies. |
Not applicable.
| Item 9. | Purchases of Equity Securities by Closed-End Management Investment Company and Affiliated Purchasers. |
Not applicable.
| Item 10. | Submission of Matters to a Vote of Security Holders. |
There have been no changes to the procedures by which shareholders may recommend nominees to the Registrant’s Board of Directors since the Registrant last disclosed such procedures in the definitive proxy statement filed with the SEC on March 29, 2011.
| Item 11. | Controls and Procedures. |
| (a) | The Registrant’s principal executive and principal financial officers, or persons performing similar functions, have concluded that the Registrant’s disclosure controls and procedures (as defined in Rule 30a-3(c) under the Investment Company Act of 1940, (the “1940 Act”)) are effective, as of a date within 90 days of the filing date of the report that includes the disclosure required by this paragraph, based on their evaluation of these controls and procedures required by Rule 30a-3(b) under the 1940 Act and Rules 13a-15(b) or 15d-15(b) under the Securities Exchange Act of 1934. |
| (b) | There were no changes in the Registrant’s internal control over financial reporting (as defined in Rule 30a-3(d) under the 1940 Act) that occurred during the Registrant’s second fiscal quarter of the period covered by this report that has materially affected, or is reasonably likely to materially affect, the Registrant’s internal control over financial reporting. |
| Item 12. | Exhibits. |
| (a)(1) | Code of ethics, or any amendment thereto, that is the subject of disclosure required by Item 2 is attached hereto. |
| (a)(2) | Certifications pursuant to Rule 30a-2(a) under the 1940 Act and Section 302 of the Sarbanes-Oxley Act of 2002 are attached hereto. |
| (a)(3) | Not applicable. |
| (b) | Certifications pursuant to Rule 30a-2(b) under the 1940 Act and Section 906 of the Sarbanes-Oxley Act of 2002 are attached hereto. |
SIGNATURES
Pursuant to the requirements of the Securities Exchange Act of 1934 and the Investment Company Act of 1940, the Registrant has duly caused this report to be signed on its behalf by the undersigned, thereunto duly authorized.
| (Registrant) | Wilshire Mutual Funds, Inc. | |
| By (Signature and Title)* | /s/ Jason A. Schwarz | |
| Jason A. Schwarz, President | ||
| (principal executive officer) | ||
| Date: March 11, 2015 | ||
| Pursuant to the requirements of the Securities Exchange Act of 1934 and the Investment Company Act of 1940, this report has been signed below by the following persons on behalf of the Registrant and in the capacities and on the dates indicated. | ||
| By (Signature and Title)* | /s/ Jason A. Schwarz | |
| Jason A. Schwarz, President | ||
| (principal executive officer) | ||
| Date: March 11, 2015 | ||
| By (Signature and Title)* | /s/ Michael Wauters | |
| Michael Wauters, Treasurer | ||
| (principal financial officer) | ||
| Date: March 11, 2015 | ||
* Print the name and title of each signing officer under his or her signature.