| OMB APPROVAL |
OMB Number: 3235-0570 Expires: August 31, 2020 Estimated average burden hours per response: 20.6 |
UNITED STATES
SECURITIES AND EXCHANGE COMMISSION
Washington, D.C. 20549
FORM N-CSR
CERTIFIED SHAREHOLDER REPORT OF REGISTERED
MANAGEMENT INVESTMENT COMPANIES
| Investment Company Act file number | 811-07076 | |
| Wilshire Mutual Funds, Inc. |
| (Exact name of registrant as specified in charter) |
| 1299 Ocean Avenue, Suite 700 Santa Monica, CA | 90401-1085 |
| (Address of principal executive offices) | (Zip code) |
Jason A. Schwarz
| Wilshire Associates Incorporated, 1299 Ocean Avenue, Suite 700, Santa Monica, CA 90401-1085 |
| (Name and address of agent for service) |
| Registrant's telephone number, including area code: | (310) 451-3051 | |
| Date of fiscal year end: | December 31 | |
| | | |
| Date of reporting period: | December 31, 2017 | |
Form N-CSR is to be used by management investment companies to file reports with the Commission not later than 10 days after the transmission to stockholders of any report that is required to be transmitted to stockholders under Rule 30e-1 under the Investment Company Act of 1940 (17 CFR 270.30e-1). The Commission may use the information provided on Form N-CSR in its regulatory, disclosure review, inspection, and policymaking roles.
A registrant is required to disclose the information specified by Form N-CSR, and the Commission will make this information public. A registrant is not required to respond to the collection of information contained in Form N-CSR unless the Form displays a currently valid Office of Management and Budget ("OMB") control number. Please direct comments concerning the accuracy of the information collection burden estimate and any suggestions for reducing the burden to the Secretary, Securities and Exchange Commission, 450 Fifth Street, NW, Washington, DC 20549-0609. The OMB has reviewed this collection of information under the clearance requirements of 44 U.S.C. § 3507.
| Item 1. | Reports to Stockholders. |

Wilshire Mutual Funds, Inc. |
ANNUAL REPORT Large Company Growth Portfolio Large Company Value Portfolio Small Company Growth Portfolio Small Company Value Portfolio Wilshire 5000 Indexsm Fund Wilshire International Equity Fund Wilshire Income Opportunities Fund |
December 31, 2017 |
http://advisor.wilshire.com
Wilshire Mutual Funds, Inc. Table of Contents | 
|
Letter to Shareholders | 1 |
Commentary: | |
Large Company Growth Portfolio | 4 |
Large Company Value Portfolio | 8 |
Small Company Growth Portfolio | 12 |
Small Company Value Portfolio | 16 |
Wilshire 5000 IndexSM Fund | 20 |
Wilshire International Equity Fund | 24 |
Wilshire Income Opportunities Fund | 30 |
Disclosure of Fund Expenses | 36 |
Schedules of Investments/Condensed Schedules of Investments: | |
Large Company Growth Portfolio | 39 |
Large Company Value Portfolio | 41 |
Small Company Growth Portfolio | 43 |
Small Company Value Portfolio | 45 |
Wilshire 5000 IndexSM Fund | 47 |
Wilshire International Equity Fund | 49 |
Wilshire Income Opportunities Fund | 52 |
Statements of Assets and Liabilities | 71 |
Statements of Operations | 74 |
Statements of Changes in Net Assets | 76 |
Financial Highlights: | |
Large Company Growth Portfolio | 81 |
Large Company Value Portfolio | 83 |
Small Company Growth Portfolio | 85 |
Small Company Value Portfolio | 87 |
Wilshire 5000 IndexSM Fund | 89 |
Wilshire International Equity Fund | 91 |
Wilshire Income Opportunities Fund | 93 |
Notes to Financial Statements | 95 |
Report of Independent Registered Public Accounting Firm | 121 |
Additional Fund Information | 122 |
Tax Information | 125 |
Board Approval of Advisory and Subadvisory Agreements | 127 |
This report is for the general information of the shareholders of Large Company Growth Portfolio, Large Company Value Portfolio, Small Company Growth Portfolio, Small Company Value Portfolio, Wilshire 5000 IndexSM Fund, Wilshire International Equity Fund and Wilshire Income Opportunities Fund. Its use in connection with any offering of a Portfolio’s shares is authorized only if accompanied or preceded by the Portfolio’s current prospectus.
Wilshire Mutual Funds, Inc. are distributed by Ultimus Fund Distributors, LLC.
Wilshire Mutual Funds, Inc. Letter to Shareholders (Unaudited) |
|
Dear Wilshire Mutual Fund Shareholder:
We are pleased to present this annual report to all shareholders of the Wilshire Mutual Funds. This report covers the period from January 1, 2017 to December 31, 2017, for all share classes of Large Company Growth Fund, Large Company Value Fund, Small Company Growth Fund, Small Company Value Fund, Wilshire 5000 IndexSM Fund, Wilshire International Equity Fund and Wilshire Income Opportunities Fund.
MARKET ENVIRONMENT
U.S. Equity Market
The US stock market, represented by the Wilshire 5000 Total Market IndexSM, was up 6.4% for the fourth quarter and 21.0% for 2017. This marks the Index’s ninth straight annual gain. Several factors contributed to this success, including a rebound in global economic growth and continued strength domestically. Investors also responded positively to the largest overhaul of the US tax system in 30 years. What also made the past year particularly impressive was the relative lack of volatility. The largest drawdown for the year was -2.75%, and there were only four trading days where the market was down 1% or more, making 2017 one of the least volatile years in nearly four decades.
During the year, large-cap stocks outpaced small-cap stocks, with the Wilshire US Large-Cap IndexSM and the Wilshire US Small-Cap IndexSM returning 21.8% and 13.5%, respectively. The strong overall return for the Wilshire 5000 Total Market Index masked a wide performance dispersion between investment styles and among industries for the year. Growth oriented stocks handedly outpaced growth stocks across the capitalization spectrum. The Wilshire US Large-Cap Growth IndexSM and the Wilshire US. Small-Cap Growth IndexSM outpaced their growth oriented counterparts by 940 basis points and 1,213 basis points, respectively. Sector-wise, renewed enthusiasm over long-term growth prospects and strong earnings growth expectations drove Information Technology (+37.4%) and Health Care (+23.9%) higher. Materials (+24.2%) and Industrials (+22.1%) also had strong performance on a brighter outlook for global economic growth.
International Equity Market
Markets rallied in 2017 behind synchronized global growth, strong corporate earnings growth, improved investor sentiment and signs of diminishing political risks globally. After four years lagging US equities, international equities outperformed US equities during the year with the MSCI ACWI ex US Index returning 27.2%. The US dollar weakened in 2017, providing a boost for US investors holding foreign currencies – the MSCI ACWI ex US Index in local currency terms returned 18.2%.
For the second year in a row, emerging markets outpaced foreign developed markets with the MSCI Emerging Markets Index returning 37.3%, largely driven by a weakening US dollar, strong profits from technology companies, strengthening global economy and rising commodities prices. 2017’s return was the strongest year for broad emerging markets equity since they recovered from the global financial crisis in 2009.
1
Wilshire Mutual Funds, Inc. Letter to Shareholders (Unaudited) - (Continued) |
|
Bond Market
The US fixed income market was positive for 2017 with the Bloomberg Barclays US Aggregate Bond Index returning 3.5%. Investment grade corporate securities led the rally during the year as credit overall did well over the period. The ICE Bank of America US High Yield Index returned 4.5% as spreads continued to tighten and remain near historical lows. Reflecting an improved outlook for growth, the Federal Reserve pushed forward with its plan to normalize short-term interest rates and raised the federal funds rate by 0.25% at its March, June and December meetings of its Federal Open Market Committee increasing the overnight rate to a range of 1.25% to 1.50% by the end of 2017. Additionally, the Federal Open Market Committee began to shrink its $4.5T balance sheet starting in October 2017.
During the first quarter, anticipation for quick and swift fiscal policy reforms from the Trump Administration fueled Treasury yields higher and the 10 Year US Treasury yield peaked at just over 2.60% in mid-March before falling to end the first quarter. The US Treasury curve continued to flatten over the remainder of the year with the bellwether 10-year Treasury yield ended the quarter at 2.40%, up slightly but approximately equal to year-end 2016. Globally, continued accommodative monetary policy, a weaker US Dollar, positive economic outlooks and subdued inflation boosted global fixed income. The Bloomberg Barclays Global Aggregate ex US Index returned 10.5% for the year.
Fund Performance Review
The Large Company Growth Portfolio Institutional Class returned 27.35%, underperforming the Russell 1000 Growth Index by 2.86%. The Large Company Value Portfolio Institutional Class returned 14.99%, outperforming the Russell 1000 Value Index by 1.33%. The Small Company Growth Portfolio Institutional Class returned 13.96%, underperforming the Russell 2000 Growth Index by 8.21%. The Small Company Value Portfolio Institutional Class returned 8.97%, outperforming the Russell 2000 Value Index by 1.13%. The Wilshire 5000 IndexSM Fund Institutional Class returned 20.57%, underperforming the Wilshire 5000 Total Market Index by 0.43%. The Wilshire International Equity Fund Institutional Class returned 25.92%, underperforming the MSCI All Country World ex-US Index by 1.27%. The Wilshire Income Opportunities Fund Institutional Class returned 5.84%, outperforming the Bloomberg Barclays US Universal Index by 1.75%. We are pleased with the Funds’ performance for 2017 and we are confident that each Fund is well positioned for future growth.
As always, we sincerely appreciate your continued support and confidence in Wilshire Associates.
Sincerely,

Jason Schwarz
President, Wilshire Mutual Funds
2
Wilshire Mutual Funds, Inc. Letter to Shareholders (Unaudited) - (Continued) | |
The performance data quoted represents past performance and does not guarantee future results. Current performance may be lower or higher. The investment return and principal value of an investment will fluctuate so that shares, when redeemed, may be worth more or less than their original cost. Returns assume reinvestment of all distributions.
Index returns are for illustrative purposes only and do not represent actual Fund performance. Index performance returns do not reflect any management fees, transactions costs or expenses. Indexes are unmanaged and one cannot invest directly in an index. Past performance does not guarantee future results.
Bonds and bond funds are subject to interest rate risk and will decline in value as interest rates rise.
In addition to the normal risks associated with investing, international investments may involve risk of capital loss from unfavorable fluctuation in currency values, from differences in generally accepted accounting principles or from social, economic or political instability in other nations. Investments in smaller companies typically exhibit higher volatility.
Investing involves risk including loss of principal. This report identifies each Portfolio’s investments on December 31, 2017. These holdings are subject to change. Not all investments in each Portfolio performed the same, nor is there any guarantee that these investments will perform as well in the future. Market forecasts provided in this report may not occur.
The MSCI EAFE Index is an equity index which captures large and mid-cap representation across developed markets countries around the world, excluding the U.S. and Canada.
MSCI Emerging Markets Index is a free float-adjusted market capitalization index that is designed to measure equity market performance of emerging markets.
The Wilshire 5000 Total Market IndexSM is widely accepted as the definitive benchmark for the U.S. equity market, and measures performance of all U.S. equity securities with readily available price data.
3
Large Company Growth Portfolio Commentary (Unaudited) |
|
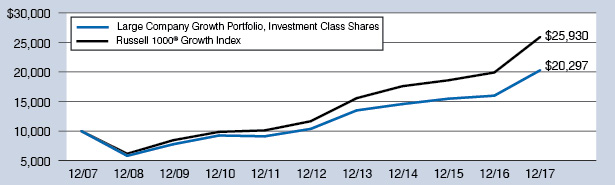
INVESTMENT CLASS SHARES
Average Annual Total Returns
One Year Ended 12/31/17 | 26.93% |
Five Years Ended 12/31/17 | 14.38% |
Ten Years Ended 12/31/17 | 7.34% |
RUSSELL 1000® GROWTH INDEX(1)
Average Annual Total Returns
One Year Ended 12/31/17 | 30.21% |
Five Years Ended 12/31/17 | 17.33% |
Ten Years Ended 12/31/17 | 10.00% |
COMPARATIVE PERFORMANCE
Comparison of Change in Value of $10,000 Investment in Shares of Large Company Growth Portfolio, Investment Class Shares and the Russell 1000® Growth Index through 12/31/17.
The performance data quoted represents past performance and does not guarantee future results. Current performance may be lower or higher. Performance data current to the most recent month end may be obtained at http://advisor.wilshire.com. The investment return and principal value of an investment will fluctuate so that shares, when redeemed, may be worth more or less than their original cost. The table above does not reflect the deduction of taxes that a shareholder would pay on Portfolio distributions or the redemption of Portfolio shares.
| (1) | The Russell 1000® Growth Index is an unmanaged index that measures the performance of the largest 1,000 U.S. companies with higher price-to-book ratios and higher forecasted growth values. Index performance is presented for general comparative purposes. Unlike a mutual fund, the performance of an index assumes no transaction costs, management fees or other expenses. An individual cannot directly invest in any index. |
4
Large Company Growth Portfolio Commentary (Unaudited) - (Continued) |
|
INSTITUTIONAL CLASS SHARES
Average Annual Total Returns
One Year Ended 12/31/17 | 27.35% |
Five Years Ended 12/31/17 | 14.74% |
Ten Years Ended 12/31/17 | 7.68% |
RUSSELL 1000® GROWTH INDEX(1)
Average Annual Total Returns
One Year Ended 12/31/17 | 30.21% |
Five Years Ended 12/31/17 | 17.33% |
Ten Years Ended 12/31/17 | 10.00% |
COMPARATIVE PERFORMANCE
Comparison of Change in Value of $250,000 Investment in Shares of Large Company Growth Portfolio, Institutional Class Shares and the Russell 1000® Growth Index through 12/31/17.

The performance data quoted represents past performance and does not guarantee future results. Current performance may be lower or higher. Performance data current to the most recent month end may be obtained at http://advisor.wilshire.com. The investment return and principal value of an investment will fluctuate so that shares, when redeemed, may be worth more or less than their original cost. The table above does not reflect the deduction of taxes that a shareholder would pay on Portfolio distributions or the redemption of Portfolio shares.
| (1) | The Russell 1000® Growth Index is an unmanaged index that measures the performance of the largest 1,000 U.S. companies with higher price-to-book ratios and higher forecasted growth values. Index performance is presented for general comparative purposes. Unlike a mutual fund, the performance of an index assumes no transaction costs, management fees or other expenses. An individual cannot directly invest in any index. |
5
Large Company Growth Portfolio Commentary (Unaudited) - (Continued) |
|
The Wilshire 5000 Total Market IndexSM returned 21.0% in 2017 marking the ninth consecutive year of positive gains for the broad US equity market. Several factors contributed to this success, including a rebound in global economic growth and continued strength domestically. Investors also responded positively to the largest overhaul of the US tax system in 30 years. What also made the past year particularly impressive was the relative lack of volatility. The largest drawdown for the year was -2.75%, and there were only four trading days where the market was down 1% or more, making 2017 one of the least volatile years in nearly four decades. Reflecting an improved outlook for growth, the Federal Reserve pushed forward with its plan to normalize short-term interest rates and raised the federal funds rate by 0.25% at its March, June and December meetings of its Federal Open Market Committee increasing the overnight rate to a range of 1.25% to 1.50% by the end of 2017. Additionally, the Federal Open Market Committee began to shrink their $4.5T balance sheet starting in October 2017. For the year, growth securities strongly outperformed value stocks and large capitalization stocks outperformed their smaller capitalization counterparts marking a sharp reversal from calendar year 2016 when value meaningfully outperformed growth across market capitalizations.
Sector performance for the Wilshire 5000 Total Market Index was mostly positive for 2017. Renewed enthusiasm over long-term growth prospects and strong earnings growth expectations drove Information Technology (+37.4%) and Health Care (+23.9%) higher. Materials (+24.2%) and Industrials (+22.1%) also had strong performance on a brighter outlook for global economic growth. Conversely, Energy (-2.5%) was the worst performing sector. After retracting to start the year, crude oil prices moved higher towards the end of the year pushing above the $60-per-barrel mark by the end of the period. However, weak natural gas prices and concerns about companies’ ability to replace production with new reserves weighed on performance.
The Wilshire Large Company Growth Portfolio Institutional Class returned 27.35% in 2017, underperforming the Russell 1000 Growth Index return of 30.21% by 2.86%. The Portfolio was weighed down by weak stock selection in the Health Care and Industrials sectors as well as an underweight allocation to the Energy sector. Conversely, strong stock selection in the Consumer Staples and Materials sectors helped mitigate relative underperformance.
Despite the Portfolio’s underperformance versus its benchmark, we believe the Portfolio is well positioned going into 2018 as the market deals with ongoing macroeconomic and geopolitical issues.
6
Large Company Growth Portfolio Commentary (Unaudited) - (Continued) |
|
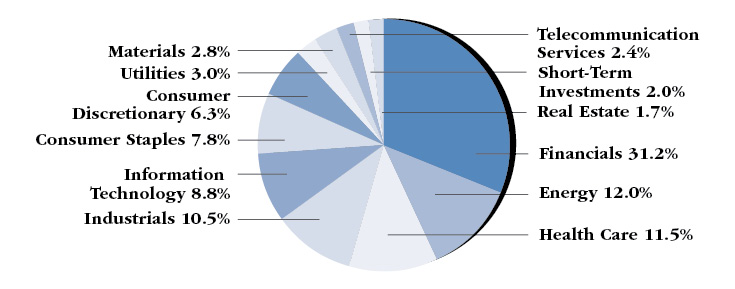
PORTFOLIO SECTOR WEIGHTING†
(As of December 31, 2017)
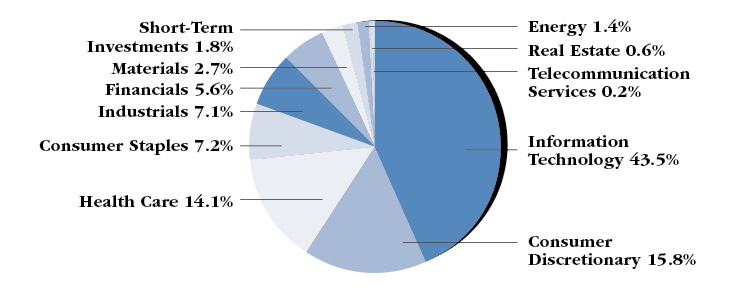
| † | Based on percent of the Portfolio’s total investments in securities at value. Includes investments held as collateral for securities on loan (see Note 7 in Notes to Financial Statements). |
7
Large Company Value Portfolio Commentary (Unaudited) |
|
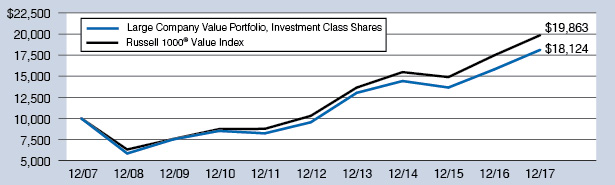
INVESTMENT CLASS SHARES
Average Annual Total Returns
One Year Ended 12/31/17 | 14.64% |
Five Years Ended 12/31/17 | 13.69% |
Ten Years Ended 12/31/17 | 6.13% |
RUSSELL 1000® VALUE INDEX(1)
Average Annual Total Returns
One Year Ended 12/31/17 | 13.66% |
Five Years Ended 12/31/17 | 14.04% |
Ten Years Ended 12/31/17 | 7.10% |
COMPARATIVE PERFORMANCE
Comparison of Change in Value of $10,000 Investment in Shares of Large Company Value Portfolio, Investment Class Shares and the Russell 1000® Value Index through 12/31/17.
The performance data quoted represents past performance and does not guarantee future results. Current performance may be lower or higher. Performance data current to the most recent month end may be obtained at http://advisor.wilshire.com. The investment return and principal value of an investment will fluctuate so that shares, when redeemed, may be worth more or less than their original cost. The table above does not reflect the deduction of taxes that a shareholder would pay on Portfolio distributions or the redemption of Portfolio shares.
| (1) | The Russell 1000® Value Index is an unmanaged index that measures the performance of the largest 1,000 U.S. companies with lower price-to-book ratios and lower forecasted growth values. Index performance is presented for general comparative purposes. Unlike a mutual fund, the performance of an index assumes no transaction costs, management fees or other expenses. An individual cannot directly invest in any index. |
8
Large Company Value Portfolio Commentary (Unaudited) - (Continued) |
|
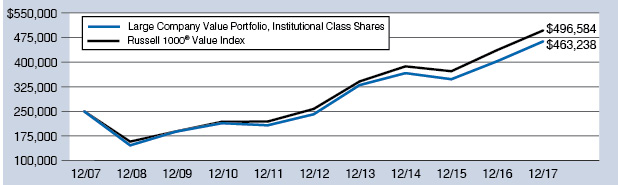
INSTITUTIONAL CLASS SHARES
Average Annual Total Returns
One Year Ended 12/31/17 | 14.99% |
Five Years Ended 12/31/17 | 13.94% |
Ten Years Ended 12/31/17 | 6.36% |
RUSSELL 1000® VALUE INDEX(1)
Average Annual Total Returns
One Year Ended 12/31/17 | 13.66% |
Five Years Ended 12/31/17 | 14.04% |
Ten Years Ended 12/31/17 | 7.10% |
COMPARATIVE PERFORMANCE
Comparison of Change in Value of $250,000 Investment in Shares of Large Company Value Portfolio, Institutional Class Shares and the Russell 1000® Value Index through 12/31/17.
The performance data quoted represents past performance and does not guarantee future results. Current performance may be lower or higher. Performance data current to the most recent month end may be obtained at http://advisor.wilshire.com. The investment return and principal value of an investment will fluctuate so that shares, when redeemed, may be worth more or less than their original cost. The table above does not reflect the deduction of taxes that a shareholder would pay on Portfolio distributions or the redemption of Portfolio shares.
| (1) | The Russell 1000® Value Index is an unmanaged index that measures the performance of the largest 1,000 U.S. companies with lower price-to-book ratios and lower forecasted growth values. Index performance is presented for general comparative purposes. Unlike a mutual fund, the performance of an index assumes no transaction costs, management fees or other expenses. An individual cannot directly invest in any index. |
9
Large Company Value Portfolio Commentary (Unaudited) - (Continued) |
|
The Wilshire 5000 Total Market IndexSM returned 21.0% in 2017 marking the ninth consecutive year of positive gains for the broad US equity market. Several factors contributed to this success, including a rebound in global economic growth and continued strength domestically. Investors also responded positively to the largest overhaul of the US tax system in 30 years. What also made the past year particularly impressive was the relative lack of volatility. The largest drawdown for the year was -2.75%, and there were only four trading days where the market was down 1% or more, making 2017 one of the least volatile years in nearly four decades. Reflecting an improved outlook for growth, the Federal Reserve pushed forward with its plan to normalize short-term interest rates and raised the federal funds rate by 0.25% at its March, June and December meetings of its Federal Open Market Committee increasing the overnight rate to a range of 1.25% to 1.50% by the end of 2017. Additionally, the Federal Open Market Committee began to shrink their $4.5T balance sheet starting in October 2017. For the year, growth securities strongly outperformed value stocks and large capitalization stocks outperformed their smaller capitalization counterparts marking a sharp reversal from calendar year 2016 when value meaningfully outperformed growth across market capitalizations.
Sector performance for the Wilshire 5000 Total Market Index was mostly positive for 2017. Renewed enthusiasm over long-term growth prospects and strong earnings growth expectations drove Information Technology (+37.4%) and Health Care (+23.9%) higher. Materials (+24.2%) and Industrials (+22.1%) also had strong performance on a brighter outlook for global economic growth. Conversely, Energy (-2.5%) was the worst performing sector. After retracting to start the year, crude oil prices moved higher towards the end of the year pushing above the $60-per-barrel mark by the end of the period. However, weak natural gas prices and concerns about companies’ ability to replace production with new reserves weighed on performance.
The Wilshire Large Company Value Portfolio Institutional Class returned 14.99% in 2017, outperforming the Russell 1000 Value Index return of 13.66% by 1.33%. The Portfolio benefited from strong stock selection in the Energy, Industrials and Consumer Staples sectors. Conversely, weak stock selection in the Financials and Information Technology sectors detracted from relative performance.
We are pleased with the Portfolio’s outperformance for 2017 and believe the Portfolio is well positioned going into 2018 as the market deals with ongoing macroeconomic and geopolitical uncertainties.
10
Large Company Value Portfolio Commentary (Unaudited) - (Continued) |
|
PORTFOLIO SECTOR WEIGHTING†
(As of December 31, 2017)
| † | Based on percent of the Portfolio’s total investments in securities at value. Includes investments held as collateral for securities on loan (see Note 7 in Notes to Financial Statements). |
11
Small Company Growth Portfolio Commentary (Unaudited) |
|
INVESTMENT CLASS SHARES
Average Annual Total Returns*
One Year Ended 12/31/17 | 13.66% |
Five Years Ended 12/31/17 | 15.39% |
Ten Years Ended 12/31/17 | 8.77% |
RUSSELL 2000® GROWTH INDEX(1)
Average Annual Total Returns
One Year Ended 12/31/17 | 22.17% |
Five Years Ended 12/31/17 | 15.21% |
Ten Years Ended 12/31/17 | 9.19% |
COMPARATIVE PERFORMANCE
Comparison of Change in Value of $10,000 Investment in Shares of Small Company Growth Portfolio, Investment Class Shares and the Russell 2000® Growth Index through 12/31/17.
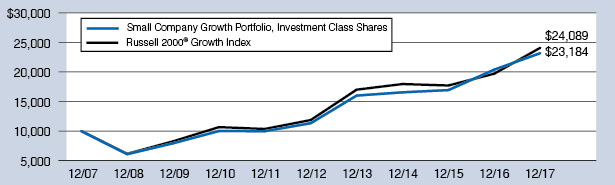
The performance data quoted represents past performance and does not guarantee future results. Current performance may be lower or higher. Performance data current to the most recent month end may be obtained at http://advisor.wilshire.com. The investment return and principal value of an investment will fluctuate so that shares, when redeemed, may be worth more or less than their original cost. The table above does not reflect the deduction of taxes that a shareholder would pay on Portfolio distributions or the redemption of Portfolio shares.
| * | During the ten years ended December 31, 2017, certain fees and expenses were reduced or reimbursed. Without fee reductions and expense reimbursements (excluding fees paid indirectly), historical total returns would have been lower. For the year ended December 31, 2017, the investment adviser reduced its fees or reimbursed expenses in the amount of 0.16% of average net assets. |
| (1) | The Russell 2000® Growth Index is an unmanaged index that measures the performance of the 2,000 smallest U.S. companies with higher price-to-book ratios and higher forecasted growth values. Index performance is presented for general comparative purposes. Unlike a mutual fund, the performance of an index assumes no transaction costs, management fees or other expenses. An individual cannot directly invest in any index. |
12
Small Company Growth Portfolio Commentary (Unaudited) - (Continued) |
|
INSTITUTIONAL CLASS SHARES
Average Annual Total Returns*
One Year Ended 12/31/17 | 13.96% |
Five Years Ended 12/31/17 | 15.70% |
Ten Years Ended 12/31/17 | 9.04% |
RUSSELL 2000® GROWTH INDEX(1)
Average Annual Total Returns
One Year Ended 12/31/17 | 22.17% |
Five Years Ended 12/31/17 | 15.21% |
Ten Years Ended 12/31/17 | 9.19% |
COMPARATIVE PERFORMANCE
Comparison of Change in Value of $250,000 Investment in Shares of Small Company Growth Portfolio, Institutional Class Shares and the Russell 2000® Growth Index through 12/31/17.

The performance data quoted represents past performance and does not guarantee future results. Current performance may be lower or higher. Performance data current to the most recent month end may be obtained at http://advisor.wilshire.com. The investment return and principal value of an investment will fluctuate so that shares, when redeemed, may be worth more or less than their original cost. The table above does not reflect the deduction of taxes that a shareholder would pay on Portfolio distributions or the redemption of Portfolio shares.
| * | During the ten years ended December 31, 2017, certain fees and expenses were waived or reimbursed. Without waivers and reimbursements (excluding fees paid indirectly), historical total returns would have been lower. For the year ended December 31, 2017, the investment adviser reduced its fees or reimbursed expenses in the amount of 0.11% of average net assets. |
| (1) | The Russell 2000® Growth Index is an unmanaged index that measures the performance of the 2,000 smallest U.S. companies with higher price-to-book ratios and higher forecasted growth values. Index performance is presented for general comparative purposes. Unlike a mutual fund, the performance of an index assumes no transaction costs, management fees or other expenses. An individual cannot directly invest in any index. |
13
Small Company Growth Portfolio Commentary (Unaudited) - (Continued) |
|
The Wilshire 5000 Total Market IndexSM returned 21.0% in 2017 marking the ninth consecutive year of positive gains for the broad US equity market. Several factors contributed to this success, including a rebound in global economic growth and continued strength domestically. Investors also responded positively to the largest overhaul of the US tax system in 30 years. What also made the past year particularly impressive was the relative lack of volatility. The largest drawdown for the year was -2.75%, and there were only four trading days where the market was down 1% or more, making 2017 one of the least volatile years in nearly four decades. Reflecting an improved outlook for growth, the Federal Reserve pushed forward with its plan to normalize short-term interest rates and raised the federal funds rate by 0.25% at its March, June and December meetings of its Federal Open Market Committee increasing the overnight rate to a range of 1.25% to 1.50% by the end of 2017. Additionally, the Federal Open Market Committee began to shrink their $4.5T balance sheet starting in October 2017. For the year, growth securities strongly outperformed value stocks and large capitalization stocks outperformed their smaller capitalization counterparts marking a sharp reversal from calendar year 2016 when value meaningfully outperformed growth across market capitalizations.
Sector performance for the Wilshire 5000 Total Market Index was mostly positive for 2017. Renewed enthusiasm over long-term growth prospects and strong earnings growth expectations drove Information Technology (+37.4%) and Health Care (+23.9%) higher. Materials (+24.2%) and Industrials (+22.1%) also had strong performance on a brighter outlook for global economic growth. Conversely, Energy (-2.5%) was the worst performing sector. After retracting to start the year, crude oil prices moved higher towards the end of the year pushing above the $60-per-barrel mark by the end of the period. However, weak natural gas prices and concerns about companies’ ability to replace production with new reserves weighed on performance.
The Wilshire Small Company Growth Portfolio Institutional Class returned 13.96% in 2017, underperforming the Russell 2000 Growth Index return of 22.17% by 8.21%. The Portfolio was weighed down by weak stock selection in the Health Care, Financials, and Consumer Discretionary sectors. Conversely, strong stock selection in the Consumer Staples, Industrials, and Information Technology sectors boosted absolute performance.
Despite the Portfolio’s underperformance versus its benchmark, we believe the Portfolio is well positioned going into 2018 as the market deals with ongoing macroeconomic and geopolitical issues.
14
Small Company Growth Portfolio Commentary (Unaudited) - (Continued) |
|
PORTFOLIO SECTOR WEIGHTING†
(As of December 31, 2017)

† | Based on percent of the Portfolio’s total investments in securities at value. Includes investments held as collateral for securities on loan (see Note 7 in Notes to Financial Statements). |
15
Small Company Value Portfolio Commentary (Unaudited) |
|
INVESTMENT CLASS SHARES
Average Annual Total Returns*
One Year Ended 12/31/17 | 8.65% |
Five Years Ended 12/31/17 | 14.77% |
Ten Years Ended 12/31/17 | 8.21% |
RUSSELL 2000® VALUE INDEX(1)
Average Annual Total Returns
One Year Ended 12/31/17 | 7.84% |
Five Years Ended 12/31/17 | 13.01% |
Ten Years Ended 12/31/17 | 8.17% |
COMPARATIVE PERFORMANCE
Comparison of Change in Value of $10,000 Investment in Shares of Small Company Value Portfolio, Investment Class Shares and the Russell 2000® Value Index through 12/31/17.
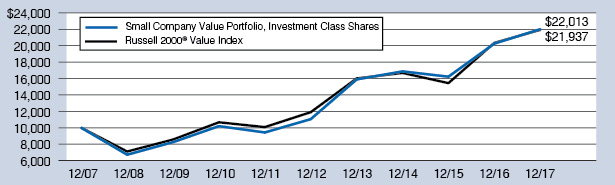
The performance data quoted represents past performance and does not guarantee future results. Current performance may be lower or higher. Performance data current to the most recent month end may be obtained at http://advisor.wilshire.com. The investment return and principal value of an investment will fluctuate so that shares, when redeemed, may be worth more or less than their original cost. The table above does not reflect the deduction of taxes that a shareholder would pay on Portfolio distributions or the redemption of Portfolio shares.
* | During the ten years ended December 31, 2017, certain fees and expenses were reduced or reimbursed. Without fee reductions and expense reimbursements (excluding fees paid indirectly), historical total returns would have been lower. For the year ended December 31, 2017, the investment adviser reduced its fees or reimbursed expenses in the amount of 0.22% of average net assets. |
(1) | The Russell 2000® Value Index is an unmanaged index that measures the performance of the 2,000 smallest U.S. companies with lower price-to-book ratios and lower forecasted growth values. Index performance is presented for general comparative purposes. Unlike a mutual fund, the performance of an index assumes no transaction costs, management fees or other expenses. An individual cannot directly invest in any index. |
16
Small Company Value Portfolio Commentary (Unaudited) - (Continued) |
|
INSTITUTIONAL CLASS SHARES
Average Annual Total Returns*
One Year Ended 12/31/17 | 8.97% |
Five Years Ended 12/31/17 | 15.10% |
Ten Years Ended 12/31/17 | 8.56% |
RUSSELL 2000® VALUE INDEX(1)
Average Annual Total Returns
One Year Ended 12/31/17 | 7.84% |
Five Years Ended 12/31/17 | 13.01% |
Ten Years Ended 12/31/17 | 8.17% |
COMPARATIVE PERFORMANCE
Comparison of Change in Value of $250,000 Investment in Shares of Small Company Value Portfolio, Institutional Class Shares and the Russell 2000® Value Index through 12/31/17.

The performance data quoted represents past performance and does not guarantee future results. Current performance may be lower or higher. Performance data current to the most recent month end may be obtained at http://advisor.wilshire.com. The investment return and principal value of an investment will fluctuate so that shares, when redeemed, may be worth more or less than their original cost. The table above does not reflect the deduction of taxes that a shareholder would pay on Portfolio distributions or the redemption of Portfolio shares.
| * | During the ten years ended December 31, 2017, certain fees and expenses were reduced or reimbursed. Without fee reductions and expense reimbursements (excluding fees paid indirectly), historical total returns would have been lower. For the year ended December 31, 2017, the investment adviser reduced its fees or reimbursed expenses in the amount of 0.16% of average net assets. |
| (1) | The Russell 2000® Value Index is an unmanaged index that measures the performance of the 2,000 smallest U.S. companies with lower price-to-book ratios and lower forecasted growth values. Index performance is presented for general comparative purposes. Unlike a mutual fund, the performance of an index assumes no transaction costs, management fees or other expenses. An individual cannot directly invest in any index. |
17
Small Company Value Portfolio Commentary (Unaudited) - (Continued) |
|
The Wilshire 5000 Total Market IndexSM returned 21.0% in 2017 marking the ninth consecutive year of positive gains for the broad US equity market. Several factors contributed to this success, including a rebound in global economic growth and continued strength domestically. Investors also responded positively to the largest overhaul of the US tax system in 30 years. What also made the past year particularly impressive was the relative lack of volatility. The largest drawdown for the year was -2.75%, and there were only four trading days where the market was down 1% or more, making 2017 one of the least volatile years in nearly four decades. Reflecting an improved outlook for growth, the Federal Reserve pushed forward with its plan to normalize short-term interest rates and raised the federal funds rate by 0.25% at its March, June and December meetings of its Federal Open Market Committee increasing the overnight rate to a range of 1.25% to 1.50% by the end of 2017. Additionally, the Federal Open Market Committee began to shrink their $4.5T balance sheet starting in October 2017. For the year, growth securities strongly outperformed value stocks and large capitalization stocks outperformed their smaller capitalization counterparts marking a sharp reversal from calendar year 2016 when value meaningfully outperformed growth across market capitalizations.
Sector performance for the Wilshire 5000 Total Market Index was mostly positive for 2017. Renewed enthusiasm over long-term growth prospects and strong earnings growth expectations drove Information Technology (+37.4%) and Health Care (+23.9%) higher. Materials (+24.2%) and Industrials (+22.1%) also had strong performance on a brighter outlook for global economic growth. Conversely, Energy (-2.5%) was the worst performing sector. After retracting to start the year, crude oil prices moved higher towards the end of the year pushing above the $60-per-barrel mark by the end of the period. However, weak natural gas prices and concerns about companies’ ability to replace production with new reserves weighed on performance.
The Wilshire Small Company Value Portfolio Institutional Class returned 8.97% in 2017, outperforming the Russell 2000 Value Index return of 7.84% by 1.13%. The Portfolio benefited from strong selection in the Information Technology and Materials sectors. Conversely, weak stock selection in the Consumer Staples sector as well as an underweight allocation to Health Care detracted from relative performance.
We are pleased with the Portfolio’s outperformance for 2017 and believe the Portfolio is well positioned going into 2018 as the market deals with ongoing macroeconomic and geopolitical uncertainties.
18
Small Company Value Portfolio Commentary (Unaudited) - (Continued) |
|
PORTFOLIO SECTOR WEIGHTING†
(As of December 31, 2017)
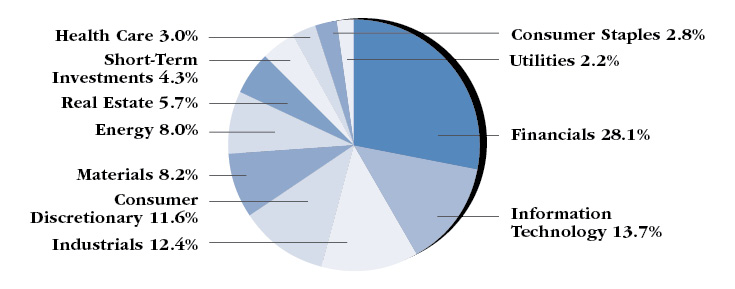
| † | Based on percent of the Portfolio’s total investments in securities at value. Includes investments held as collateral for securities on loan (see Note 7 in Notes to Financial Statements). |
19
Wilshire 5000 Indexsm Fund Commentary (Unaudited) |
|
INVESTMENT CLASS SHARES
Average Annual Total Returns
One Year Ended 12/31/17 | 20.20% |
Five Years Ended 12/31/17 | 14.98% |
Ten Years Ended 12/31/17 | 8.00% |
WILSHIRE 5000 INDEXSM(1)
Average Annual Total Returns
One Year Ended 12/31/17 | 21.00% |
Five Years Ended 12/31/17 | 15.67% |
Ten Years Ended 12/31/17 | 8.64% |
COMPARATIVE PERFORMANCE
Comparison of Change in Value of $10,000 Investment in Shares of Wilshire 5000 IndexSM Fund, Investment Class Shares and the Wilshire 5000 IndexSM through 12/31/17.

The performance data quoted represents past performance and does not guarantee future results. Current performance may be lower or higher. Performance data current to the most recent month end may be obtained at http://advisor.wilshire.com. The investment return and principal value of an investment will fluctuate so that shares, when redeemed, may be worth more or less than their original cost. The table above does not reflect the deduction of taxes that a shareholder would pay on Fund distributions or the redemption of Fund shares.
| (1) | The Wilshire 5000 IndexSM is an unmanaged index that measures the performance of all U.S. headquartered equity securities with readily available price data. Index performance is presented for general comparative purposes. Unlike a mutual fund, the performance of an index assumes no transaction costs, management fees or other expenses. An individual cannot directly invest in any index. |
20
Wilshire 5000 Indexsm Fund Commentary (Unaudited) - (Continued) |
|
INSTITUTIONAL CLASS SHARES
Average Annual Total Returns
One Year Ended 12/31/17 | 20.57% |
Five Years Ended 12/31/17 | 15.28% |
Ten Years Ended 12/31/17 | 8.25% |
WILSHIRE 5000 INDEXSM(1)
Average Annual Total Returns
One Year Ended 12/31/17 | 21.00% |
Five Years Ended 12/31/17 | 15.67% |
Ten Years Ended 12/31/17 | 8.64% |
COMPARATIVE PERFORMANCE
Comparison of Change in Value of $250,000 Investment in Shares of Wilshire 5000 IndexSM Fund, Institutional Class Shares and the Wilshire 5000 IndexSM through 12/31/17.

The performance data quoted represents past performance and does not guarantee future results. Current performance may be lower or higher. Performance data current to the most recent month end may be obtained at http://advisor.wilshire.com. The investment return and principal value of an investment will fluctuate so that shares, when redeemed, may be worth more or less than their original cost. The table above does not reflect the deduction of taxes that a shareholder would pay on Fund distributions or the redemption of Fund shares.
| (1) | The Wilshire 5000 IndexSM is an unmanaged index that measures the performance of all U.S. headquartered equity securities with readily available price data. Index performance is presented for general comparative purposes. Unlike a mutual fund, the performance of an index assumes no transaction costs, management fees or other expenses. An individual cannot directly invest in any index. |
21
Wilshire 5000 Indexsm Fund Commentary (Unaudited) - (Continued) |
|
The Wilshire 5000 Total Market IndexSM returned 21.0% in 2017 marking the ninth consecutive year of positive gains for the broad US equity market. Several factors contributed to this success, including a rebound in global economic growth and continued strength domestically. Investors also responded positively to the largest overhaul of the US tax system in 30 years. What also made the past year particularly impressive was the relative lack of volatility. The largest drawdown for the year was -2.75%, and there were only four trading days where the market was down 1% or more, making 2017 one of the least volatile years in nearly four decades. Reflecting an improved outlook for growth, the Federal Reserve pushed forward with its plan to normalize short-term interest rates and raised the federal funds rate by 0.25% at its March, June and December meetings of its Federal Open Market Committee increasing the overnight rate to a range of 1.25% to 1.50% by the end of 2017. Additionally, the Federal Open Market Committee began to shrink their $4.5T balance sheet starting in October 2017. For the year, growth securities strongly outperformed value stocks and large capitalization stocks outperformed their smaller capitalization counterparts marking a sharp reversal from calendar year 2016 when value meaningfully outperformed growth across market capitalizations.
Sector performance for the Wilshire 5000 Total Market Index was mostly positive for 2017. Renewed enthusiasm over long-term growth prospects and strong earnings growth expectations drove Information Technology (+37.4%) and Health Care (+23.9%) higher. Materials (+24.2%) and Industrials (+22.1%) also had strong performance on a brighter outlook for global economic growth. Conversely, Energy (-2.5%) was the worst performing sector. After retracting to start the year, crude oil prices moved higher towards the end of the year pushing above the $60-per-barrel mark by the end of the period. However, weak natural gas prices and concerns about companies’ ability to replace production with new reserves weighed on performance.
The Wilshire 5000 Index Fund Institutional Class returned 20.57% in 2017, underperforming the Wilshire 5000 Index return of 21.00% by 0.43%. Underperformance is attributable to Portfolio expenses and is well within the range of historical experiences.
22
Wilshire 5000 Indexsm Fund Commentary (Unaudited) - (Continued) |
|
PORTFOLIO SECTOR WEIGHTING†
(As of December 31, 2017)
| † | Based on percent of the Fund’s total investments in securities at value. Includes investments held as collateral for securities on loan (see Note 7 in Notes to Financial Statements). |
23
Wilshire International Equity Fund Commentary (Unaudited) |
|
INVESTMENT CLASS SHARES
Average Annual Total Returns*
One Year Ended 12/31/17 | 25.54% |
Five Years Ended 12/31/17 | 6.99% |
Ten Years Ended 12/31/17 | 2.40% |
MSCI ALL COUNTRY WORLD INDEX EX-U.S.(1)
Average Annual Total Returns
One Year Ended 12/31/17 | 27.19% |
Five Years Ended 12/31/17 | 6.80% |
Ten Years Ended 12/31/17 | 1.84% |
On April 2, 2013, the Wilshire International Equity Fund’s investment strategy was changed. Consequently, prior period performance may have been different if the new investment strategy had been in effect during these periods.
| * | During the ten years ended December 31, 2017, certain fees and expenses were reduced or reimbursed. Without fee reductions and expense reimbursements, historical total returns would have been lower. For the year ended December 31, 2017, the investment adviser reduced its fees or reimbursed expenses in the amount of 0.04% of average net assets. |
| (1) | The MSCI All Country World Ex-U.S. Index is an unmanaged capitalization-weighted measure of stock markets of developed and emerging markets, with the exception of U.S.-based companies. Unlike a mutual fund, the performance of an index assumes no transaction costs, management fees or other expenses. An individual cannot invest directly in an index. Index performance is presented for general comparative purposes. |
24
Wilshire International Equity Fund Commentary (Unaudited) - (Continued) |
|
COMPARATIVE PERFORMANCE
Comparison of Change in Value of $10,000 Investment in Shares of Wilshire International Equity Fund, Investment Class Shares and the MSCI All Country World Index Ex-U.S. through 12/31/17.
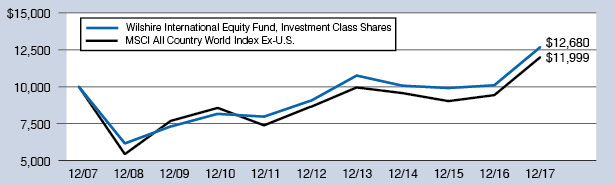
The performance data quoted represents past performance and does not guarantee future results. Current performance may be lower or higher. Performance data current to the most recent month end may be obtained at http://advisor.wilshire.com. The investment return and principal value of an investment will fluctuate so that shares, when redeemed, may be worth more or less than their original cost. The table above does not reflect the deduction of taxes that a shareholder would pay on Fund distributions or the redemption of Fund shares.
25
Wilshire International Equity Fund Commentary (Unaudited) - (Continued) |
|
INSTITUTIONAL CLASS SHARES
Average Annual Total Returns*
One Year Ended 12/31/17 | 25.92% |
Five Years Ended 12/31/17 | 7.24% |
Ten Years Ended 12/31/17 | 2.67% |
MSCI ALL COUNTRY WORLD INDEX EX-U.S.(1)
Average Annual Total Returns
One Year Ended 12/31/17 | 27.19% |
Five Years Ended 12/31/17 | 6.80% |
Ten Years Ended 12/31/17 | 1.84% |
On April 2, 2013, the Wilshire International Equity Fund’s investment strategy was changed. Consequently, prior period performance may have been different if the new investment strategy had been in effect during these periods.
| * | During the ten years ended December 31, 2017, certain fees and expenses were reduced or reimbursed. Without fee reductions and expense reimbursements, historical total returns would have been lower. For the year ended December 31, 2017, the investment adviser did not reduce its fees or reimburse expenses. |
| (1) | The MSCI All Country World Ex-U.S. Index is an unmanaged capitalization-weighted measure of stock markets of developed and emerging markets, with the exception of U.S.-based companies. Unlike a mutual fund, the performance of an index assumes no transaction costs, management fees or other expenses. An individual cannot invest directly in an index. Index performance is presented for general comparative purposes. |
26
Wilshire International Equity Fund Commentary (Unaudited) - (Continued) |
|
COMPARATIVE PERFORMANCE
Comparison of Change in Value of $250,000 Investment in Shares of Wilshire International Equity Fund, Institutional Class Shares and the MSCI All Country World Index Ex-U.S. through 12/31/17.
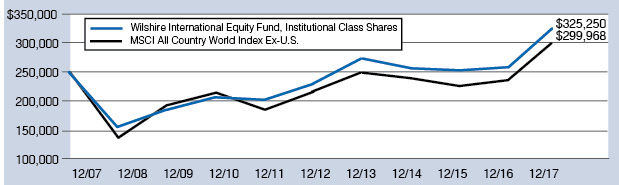
The performance data quoted represents past performance and does not guarantee future results. Current performance may be lower or higher. Performance data current to the most recent month end may be obtained at http://advisor.wilshire.com. The investment return and principal value of an investment will fluctuate so that shares, when redeemed, may be worth more or less than their original cost. The table above does not reflect the deduction of taxes that a shareholder would pay on Fund distributions or the redemption of Fund shares.
27
Wilshire International Equity Fund Commentary (Unaudited) - (Continued) |
|
Markets rallied in 2017 behind synchronized global growth, strong corporate earnings growth, improved investor sentiment and signs of diminishing political risks globally. After four years lagging US equities, international equities outperformed US equities during the year with the MSCI ACWI ex US Index returning 27.2%. The US dollar weakened in 2017, providing a boost for US investors holding foreign currencies – the MSCI ACWI ex US Index in local currency terms returned 18.2%. The first half of the year was marked by increasing political risks as the U.K. officially triggered Article 50 launching the process to formally withdraw from the European Union and centrist Emmanuel Macron defeated anti-European Union nationalist Marine Le Pen in the French presidential election. The second half of the year saw rising political tensions in North Korea, however the market advanced higher amidst these concerns. In the third quarter investors cheered the re-election of German Chancellor Angela Merkel as she won her fourth term in office. For the second year in a row, emerging markets outpaced foreign developed markets with the MSCI Emerging Markets Index returning 37.3%, largely driven by a weakening US dollar, strong profits from technology companies, strengthening global economy and rising commodities prices. 2017’s return was the strongest year for broad emerging markets equity since they recovered from the global financial crisis in 2009.
All sectors of the MSCI ACWI ex US Index had positive performance in 2017. Information Technology (+50.5%) was the top performing sector lead by securities such as Chinese companies Alibaba Group and Tencent Holdings as well as Samsung Electronics (South Korea) and Nintendo (Japan). Materials (+32.6%) and Industrials (29.8%) also performed well as most commodities prices advanced for the year. Additionally, Energy closed out the second half of the year strong after being the worst performing, and only negatively returning, sector in the first half of the year. Energy returned 21.5% over the last six months of 2017 and 17.3% for the year.
The Wilshire International Equity Fund Institutional Class returned 25.92% in 2017, underperforming the MSCI ACWI ex US Index return of 27.19% by 1.27%. The Portfolio was weighed down by weak stock selection in the Consumer Discretionary and Industrials sectors and regionally within Japan. Additionally, an underweight allocation to emerging markets hurt performance. Conversely, strong stock selection in the Health Care and Materials sectors and regionally within Hong Kong and Australia helped mitigate relative underperformance.
Despite the Portfolio’s underperformance versus its benchmark, we believe the Portfolio is well positioned going into 2018 as the market deals with ongoing macroeconomic and geopolitical issues.
28
Wilshire International Equity Fund Commentary (Unaudited) - (Continued) |
|
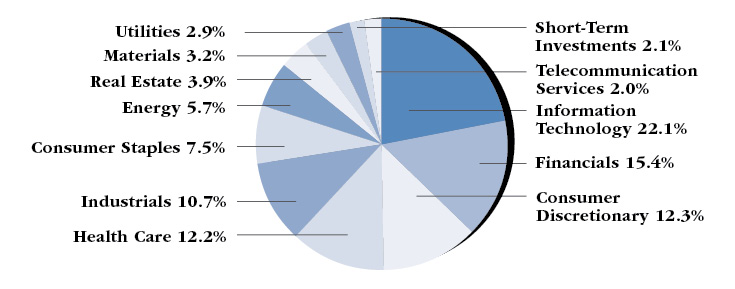
PORTFOLIO SECTOR WEIGHTING†
(As of December 31, 2017)
| † | Based on percent of the Fund’s total investments in securities at value. Includes investments held as collateral for securities on loan (see Note 7 in Notes to Financial Statements). |
29
Wilshire Income Opportunities Fund Commentary (Unaudited) |
|
INVESTMENT CLASS SHARES
Average Annual Total Returns*
One Year Ended 12/31/17 | 5.60% |
Inception (03/30/16) through 12/31/17 | 5.43% |
Bloomberg Barclays U.S. Universal Index(1)
Average Annual Total Returns
One Year Ended 12/31/17 | 4.09% |
Inception (03/30/16) through 12/31/17 | 2.92% |
| * | During certain periods since inception, certain fees and expenses were reduced or reimbursed. Without fee reductions and expense reimbursements, historical returns would have been lower. For the year ended December 31, 2017, the investment adviser reduced its fees or reimbursed expenses in the amount of 0.06% of average net assets. |
| (1) | The Bloomberg Barclays U.S. Universal Index represents the union of the U.S. Aggregate Index, U.S. Corporate High Yield Index, Investment Grade 144A Index, Eurodollar Index, U.S. Emerging Markets Index, and the non-ERISA eligible portion of the CMBS Index. The index covers USD-denominated, taxable bonds that are rated either investment grade or high-yield. Some U.S. Universal Index constituents may be eligible for one or more of its contributing subcomponents that are not mutually exclusive. The Bloomberg Barclays U.S. Universal Index includes Treasury securities, Government agency bonds, mortgage-backed bonds, corporate bonds, and a small amount of foreign bonds traded in U.S. |
30
Wilshire Income Opportunities Fund Commentary (Unaudited) - (Continued) |
|
COMPARATIVE PERFORMANCE
Comparison of Change in Value of $10,000 Investment in Shares of Wilshire Income Opportunities Fund, Investment Class Shares and the Bloomberg Barclays U.S. Universal Index through 12/31/17.

The performance data quoted represents past performance and does not guarantee future results. Current performance may be lower or higher. Performance data current to the most recent month end may be obtained at http://advisor.wilshire.com. The investment return and principal value of an investment will fluctuate so that shares, when redeemed, may be worth more or less than their original cost. The table above does not reflect the deduction of taxes that a shareholder would pay on Fund distributions or the redemption of Fund shares.
31
Wilshire Income Opportunities Fund Commentary (Unaudited) - (Continued) |
|
INSTITUTIONAL CLASS SHARES
Average Annual Total Returns
One Year Ended 12/31/17 | 5.84% |
Inception (03/30/16) through 12/31/17 | 5.52% |
Bloomberg Barclays U.S. Universal Index(1)
Average Annual Total Returns
One Year Ended 12/31/17 | 4.09% |
Inception (03/30/16) through 12/31/17 | 2.92% |
| (1) | The Bloomberg Barclays U.S. Universal Index represents the union of the U.S. Aggregate Index, U.S. Corporate High Yield Index, Investment Grade 144A Index, Eurodollar Index, U.S. Emerging Markets Index, and the non-ERISA eligible portion of the CMBS Index. The index covers USD-denominated, taxable bonds that are rated either investment grade or high-yield. Some U.S. Universal Index constituents may be eligible for one or more of its contributing subcomponents that are not mutually exclusive. The Bloomberg Barclays U.S. Universal Index includes Treasury securities, Government agency bonds, mortgage-backed bonds, corporate bonds, and a small amount of foreign bonds traded in U.S. |
32
Wilshire Income Opportunities Fund Commentary (Unaudited) - (Continued) |
|
COMPARATIVE PERFORMANCE
Comparison of Change in Value of $250,000 Investment in Shares of Wilshire Income Opportunities Fund, Institutional Class Shares and the Bloomberg Barclays U.S. Universal Index through 12/31/17.

The performance data quoted represents past performance and does not guarantee future results. Current performance may be lower or higher. Performance data current to the most recent month end may be obtained at http://advisor.wilshire.com. The investment return and principal value of an investment will fluctuate so that shares, when redeemed, may be worth more or less than their original cost. The table above does not reflect the deduction of taxes that a shareholder would pay on Fund distributions or the redemption of Fund shares.
33
Wilshire Income Opportunities Fund Commentary (Unaudited) - (Continued) |
|
The US fixed income market was positive for 2017 with the Bloomberg Barclays US Aggregate Bond Index returning 3.5%. Investment grade corporate securities led the rally during the year as credit overall did well over the period. The ICE Bank of America US High Yield Index returned 4.5% as spreads continued to tighten and remain near historical lows. Reflecting an improved outlook for growth, the Federal Reserve pushed forward with its plan to normalize short-term interest rates and raised the federal funds rate by 0.25% at its March, June and December meetings of its Federal Open Market Committee increasing the overnight rate to a range of 1.25% to 1.50% by the end of 2017. Additionally, the Federal Open Market Committee began to shrink its $4.5T balance sheet starting in October 2017. During the first quarter, anticipation for quick and swift fiscal policy reforms from the Trump Administration fueled Treasury yields higher and the 10 Year US Treasury yield peaked at just over 2.60% in mid-March before falling to end the first quarter. The US Treasury curve continued to flatten over the remainder of the year with the bellwether 10-year Treasury yield ending the year at 2.40%, up slightly but approximately equal to year-end 2016. Globally, continued accommodative monetary policy, a weaker US Dollar, positive economic outlooks and subdued inflation boosted global fixed income. The Bloomberg Barclays Global Aggregate ex US Index returned 10.5% for the year.
The Wilshire Income Opportunities Fund Institutional Class returned 5.84% for the year, outperforming the Bloomberg Barclays US Universal Index return of 4.09%. Positive yield carry, spread compression, particularly in RMBS, and positioning in high yield and investment grade corporates boosted overall performance. Holdings in bank loans weighed on performance for the period.
We are pleased with the Portfolio’s outperformance for 2017 and believe the Portfolio is well positioned going into 2018 as the market deals with ongoing macroeconomic and geopolitical uncertainties.
34
Wilshire Income Opportunities Fund Commentary (Unaudited) - (Continued) |
|
PORTFOLIO SECTOR WEIGHTING†
(As of December 31, 2017)
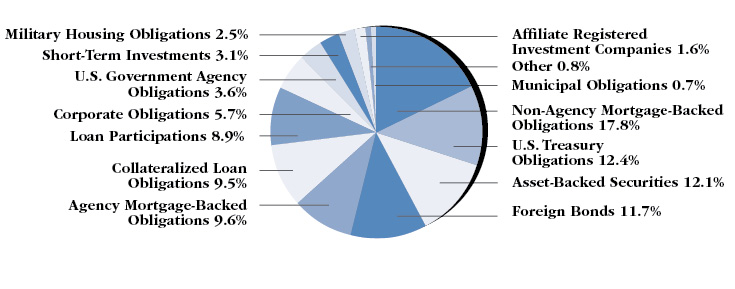
| † | Based on percent of the Fund’s total investments in securities at value. |
35
Wilshire Mutual Funds, Inc. Disclosure of Fund Expenses (Unaudited) |
|
All mutual funds have operating expenses. As a shareholder of a portfolio (or a “fund”), you incur ongoing costs, which include costs for investment advisory, administrative services, distribution and/or shareholder services and shareholder reports (like this one), among others. Operating expenses, which are deducted from a fund’s gross income, directly reduce the investment return of the fund. A fund’s expenses are expressed as a percentage of its average net assets. This figure is known as the expense ratio. The following examples are intended to help you understand the ongoing fees (in dollars) of investing in the Portfolios and to compare these costs with those of other mutual funds. The examples are based on an investment of $1,000 made at the beginning of the period and held for the entire period from July 1, 2017 to December 31, 2017.
The table on the next page illustrates the Portfolios’ costs in two ways:
Actual Fund Return: This section helps you to estimate the actual expenses, after any applicable fee waivers, that you paid over the period. The “Ending Account Value” shown is derived from each Portfolio’s actual return for the period. The “Expense Ratio” column shows the period’s annualized expense ratio and the “Expenses Paid During Period” column shows the dollar amount that would have been paid by an investor who started with $1,000 in the Portfolios at the beginning of the period.
You may use the information here, together with your account value, to estimate the expenses that you paid over the period. To do so, simply divide your account value by $1,000 (for example, an $8,600 account value divided by $1,000 = 8.6), then multiply the result by the number given for the Portfolio in the first line under the heading entitled “Expenses Paid During Period.”
Hypothetical 5% Return: This section is intended to help you compare the Portfolios’ costs with those of other mutual funds. The “Ending Account Value” shown is derived from hypothetical account values and hypothetical expenses based on the Portfolio’s actual expense ratio and assumed rate of return. It assumes that each Portfolio had an annual return of 5% before expenses, but that the expense ratio is unchanged. In this case, because the return used is not each Portfolio’s actual return, the results do not apply to your investment. This example is useful in making comparisons to other mutual funds because the Securities and Exchange Commission (“SEC”) requires all mutual funds to calculate expenses based on an assumed 5% annual return. You can assess the Portfolios’ ongoing costs by comparing this hypothetical example with the hypothetical examples that appear in shareholder reports of other funds.
Please note that the expenses shown in the table are meant to highlight and help you compare your ongoing costs only and do not reflect any transactional costs such as sales charges (loads), redemption fees, or exchange fees. Wilshire Mutual Funds, Inc. has no such charges, but these may be present in other funds to which you compare this data. Therefore, the hypothetical portions of the table are useful in comparing ongoing costs only, and will not help you determine the relative total costs of owning different funds.
36
Wilshire Mutual Funds, Inc. Disclosure of Fund Expenses (Unaudited) - (Continued) |
|
| | Beginning
Account
Value
07/01/2017 | Ending
Account
Value
12/31/2017 | Net
Expense
Ratio(1) | Expenses Paid
During Period
07/01/17-12/31/17(2) |
Large Company Growth Portfolio |
Based on Actual Fund Return | | | | |
Investment Class | $ 1,000.00 | $ 1,108.30 | 1.29% | $ 6.86 |
Institutional Class | $ 1,000.00 | $ 1,110.00 | 0.97% | $ 5.16 |
Based on Hypothetical 5% Return | | | | |
Investment Class | $ 1,000.00 | $ 1,018.70 | 1.29% | $ 6.56 |
Institutional Class | $ 1,000.00 | $ 1,020.32 | 0.97% | $ 4.94 |
Large Company Value Portfolio |
Based on Actual Fund Return | | | | |
Investment Class | $ 1,000.00 | $ 1,095.40 | 1.25% | $ 6.60 |
Institutional Class | $ 1,000.00 | $ 1,096.60 | 0.98% | $ 5.18 |
Based on Hypothetical 5% Return | | | | |
Investment Class | $ 1,000.00 | $ 1,018.90 | 1.25% | $ 6.36 |
Institutional Class | $ 1,000.00 | $ 1,020.27 | 0.98% | $ 4.99 |
Small Company Growth Portfolio |
Based on Actual Fund Return | | | | |
Investment Class | $ 1,000.00 | $ 1,079.20 | 1.47% | $ 7.70 |
Institutional Class | $ 1,000.00 | $ 1,080.60 | 1.20% | $ 6.29 |
Based on Hypothetical 5% Return | | | | |
Investment Class | $ 1,000.00 | $ 1,017.80 | 1.47% | $ 7.48 |
Institutional Class | $ 1,000.00 | $ 1,019.16 | 1.20% | $ 6.11 |
Small Company Value Portfolio |
Based on Actual Fund Return | | | | |
Investment Class | $ 1,000.00 | $ 1,095.20 | 1.43% | $ 7.55 |
Institutional Class | $ 1,000.00 | $ 1,097.00 | 1.17% | $ 6.18 |
Based on Hypothetical 5% Return | | | | |
Investment Class | $ 1,000.00 | $ 1,018.00 | 1.43% | $ 7.27 |
Institutional Class | $ 1,000.00 | $ 1,019.31 | 1.17% | $ 5.96 |
37
Wilshire Mutual Funds, Inc. Disclosure of Fund Expenses (Unaudited) - (Continued) |
|
| | Beginning
Account
Value
07/01/2017 | Ending
Account
Value
12/31/2017 | Net
Expense
Ratio(1) | Expenses Paid
During Period
07/01/17-12/31/17(2) |
Wilshire 5000 IndexSM Fund |
Based on Actual Fund Return | | | | |
Investment Class | $ 1,000.00 | $ 1,109.60 | 0.61% | $ 3.24 |
Institutional Class | $ 1,000.00 | $ 1,110.80 | 0.32% | $ 1.70 |
Based on Hypothetical 5% Return | | | | |
Investment Class | $ 1,000.00 | $ 1,022.13 | 0.61% | $ 3.11 |
Institutional Class | $ 1,000.00 | $ 1,023.59 | 0.32% | $ 1.63 |
Wilshire International Equity Fund |
Based on Actual Fund Return | | | | |
Investment Class | $ 1,000.00 | $ 1,102.20 | 1.51% | $ 8.00 |
Institutional Class | $ 1,000.00 | $ 1,103.80 | 1.26% | $ 6.68 |
Based on Hypothetical 5% Return | | | | |
Investment Class | $ 1,000.00 | $ 1,017.59 | 1.51% | $ 7.68 |
Institutional Class | $ 1,000.00 | $ 1,018.85 | 1.26% | $ 6.41 |
Wilshire Income Opportunities Fund |
Based on Actual Fund Return | | | | |
Investment Class | $ 1,000.00 | $ 1,019.80 | 1.16% | $ 5.91 |
Institutional Class | $ 1,000.00 | $ 1,020.10 | 0.96% | $ 4.89 |
Based on Hypothetical 5% Return | | | | |
Investment Class | $ 1,000.00 | $ 1,019.36 | 1.16% | $ 5.90 |
Institutional Class | $ 1,000.00 | $ 1,020.37 | 0.96% | $ 4.89 |
| (1) | Annualized, based on the Portfolio’s most recent fiscal half-year expenses. |
| (2) | Expenses are equal to the Portfolio’s annualized net expense ratio multiplied by the average account value over the period, multiplied by 184/365 (to reflect the one-half year period). |
38
Wilshire Mutual Funds, Inc. Large Company Growth Portfolio Condensed Schedule of Investments | December 31, 2017 |
|
| | | Shares | | | Value | |
| COMMON STOCKS — 98.9% (a) |
| Consumer Discretionary — 15.9% |
| Amazon.com, Inc. (b) | | | 11,301 | | | $ | 13,216,181 | |
| Priceline Group, Inc. (The) (b) | | | 1,965 | | | | 3,414,659 | |
| Starbucks Corp. | | | 40,875 | | | | 2,347,452 | |
| TJX Cos., Inc. (The) | | | 32,400 | | | | 2,477,304 | |
| Ulta Beauty, Inc. (b) | | | 9,425 | | | | 2,107,996 | |
| Yum! Brands, Inc. | | | 25,902 | | | | 2,113,863 | |
| Other Securities (c) (d) | | | | | | | 11,638,801 | |
| | | | | | | | 37,316,256 | |
| Consumer Staples — 7.2% | | | | | | | | |
| Coca-Cola Co. (The) | | | 61,907 | | | | 2,840,293 | |
| Danone S.A. - ADR (d) | | | 169,441 | | | | 2,841,526 | |
| Monster Beverage Corp. (b) | | | 107,045 | | | | 6,774,878 | |
| Procter & Gamble Co. (The) | | | 25,655 | | | | 2,357,182 | |
| Other Securities (c) (d) | | | | | | | 2,154,018 | |
| | | | | | | | 16,967,897 | |
| Energy — 1.5% | | | | | | | | |
| Schlumberger Ltd. | | | 40,815 | | | | 2,750,522 | |
| Other Securities (c) | | | | | | | 672,579 | |
| | | | | | | | 3,423,101 | |
| Financials — 5.7% | | | | | | | | |
| Charles Schwab Corp. (The) | | | 35,300 | | | | 1,813,361 | |
| First Republic Bank | | | 22,650 | | | | 1,962,396 | |
| Goldman Sachs Group, Inc. (The) | | | 6,725 | | | | 1,713,261 | |
| SEI Investments Co. | | | 39,931 | | | | 2,869,441 | |
| Other Securities (c) | | | | | | | 4,950,357 | |
| | | | | | | | 13,308,816 | |
| Health Care — 14.1% | | | | | | | | |
| Alexion Pharmaceuticals, Inc. (b) | | | 15,625 | | | | 1,868,594 | |
| Align Technology, Inc. (b) | | | 13,933 | | | | 3,095,773 | |
| Celgene Corp. (b) | | | 19,035 | | | | 1,986,493 | |
| Cerner Corp. (b) | | | 27,458 | | | | 1,850,395 | |
| Edwards Lifesciences Corp. (b) | | | 20,875 | | | | 2,352,821 | |
| Novartis AG - ADR | | | 18,777 | | | | 1,576,517 | |
| Novo Nordisk A/S - ADR | | | 54,960 | | | | 2,949,702 | |
| Regeneron Pharmaceuticals, Inc. (b) | | | 6,163 | | | | 2,317,040 | |
| Varian Medical Systems, Inc. (b) | | | 17,425 | | | | 1,936,789 | |
| Zoetis, Inc. | | | 33,025 | | | | 2,379,121 | |
| Other Securities (c) | | | | | | | 10,911,108 | |
| | | | | | | | 33,224,353 | |
| Industrials — 7.1% | | | | | | | | |
| CSX Corp. | | | 41,375 | | | | 2,276,039 | |
| Deere & Co. | | | 21,839 | | | | 3,418,021 | |
| Expeditors International of Washington, Inc. | | | 38,512 | | | | 2,491,342 | |
| United Parcel Service, Inc. - Class B | | | 16,435 | | | | 1,958,230 | |
| Other Securities (c) | | | | | | | 6,622,250 | |
| | | | | | | | 16,765,882 | |
| Information Technology — 43.8% |
| Activision Blizzard, Inc. | | | 42,805 | | | | 2,710,413 | |
| Adobe Systems, Inc. (b) | | | 12,215 | | | | 2,140,557 | |
| Alibaba Group Holding Ltd. - ADR (b) (d) | | | 31,128 | | | | 5,367,401 | |
| Alphabet, Inc. - Class A (b) | | | 4,148 | | | | 4,369,503 | |
| Alphabet, Inc. - Class C (b) | | | 8,154 | | | | 8,532,346 | |
| Apple, Inc. | | | 33,932 | | | | 5,742,312 | |
| Applied Materials, Inc. | | | 45,175 | | | | 2,309,346 | |
| Arista Networks, Inc. (b) | | | 8,325 | | | | 1,961,204 | |
| Autodesk, Inc. (b) | | | 28,897 | | | | 3,029,273 | |
| Cisco Systems, Inc. | | | 110,305 | | | | 4,224,681 | |
| Cognex Corp. | | | 35,350 | | | | 2,162,006 | |
| Facebook, Inc. - Class A (b) | | | 73,137 | | | | 12,905,755 | |
| Microsoft Corp. | | | 74,840 | | | | 6,401,813 | |
| NVIDIA Corp. | | | 11,906 | | | | 2,303,811 | |
| Oracle Corp. | | | 95,569 | | | | 4,518,501 | |
| PayPal Holdings, Inc. (b) | | | 41,285 | | | | 3,039,402 | |
| QUALCOMM, Inc. | | | 43,396 | | | | 2,778,211 | |
| Red Hat, Inc. (b) | | | 26,125 | | | | 3,137,612 | |
| Salesforce.com, Inc. (b) | | | 23,465 | | | | 2,398,827 | |
| ServiceNow, Inc. (b) | | | 11,950 | | | | 1,558,161 | |
| Visa, Inc. - Class A (d) | | | 84,725 | | | | 9,660,344 | |
| Other Securities (c) (d) | | | | | | | 11,643,555 | |
| | | | | | | | 102,895,034 | |
| Materials — 2.8% | | | | | | | | |
| Sherwin-Williams Co. (The) | | | 6,500 | | | | 2,665,260 | |
| Other Securities (c) (d) | | | | | | | 3,779,906 | |
| | | | | | | | 6,445,166 | |
| Real Estate — 0.6% | | | | | | | | |
| Other Securities (c) | | | | | | | 1,367,480 | |
| | | | | | | | | |
| Telecommunication Services — 0.2% | | | | | | | | |
| Other Securities (c) | | | | | | | 427,621 | |
| | | | | | | | | |
| Utilities — 0.0% (e) | | | | | | | | |
| Other Securities (c) | | | | | | | 17,658 | |
| | | | | | | | | |
| Total Common Stocks (Cost $148,649,726) | | | | | | | 232,159,264 | |
See Notes to Financial Statements.
39
Wilshire Mutual Funds, Inc. Large Company Growth Portfolio Condensed Schedule of Investments - (Continued) | December 31, 2017 |
|
| | | Shares | | | Value | |
| MONEY MARKET FUNDS — 1.8% | | | |
| Northern Trust Institutional Government Select Portfolio - Institutional Class, 1.13% (f) | | | 2,635,435 | | | $ | 2,635,435 | |
| Northern Trust Institutional Liquid Asset Portfolio - Institutional Class, 1.09% (f) (g) | | | 1,614,019 | | | | 1,614,019 | |
| | | | | | | | | |
| Total Money Market Funds (Cost $4,249,454) | | | | | | | 4,249,454 | |
| | | | | | | | | |
| Total Investments at Value — 100.7% (Cost $152,899,180) | | | | | | | 236,408,718 | |
| | | | | | | | | |
| Liabilities in Excess of Other Assets — (0.7%) | | | | | | | (1,570,391 | ) |
| | | | | | | | | |
| Net Assets — 100.0% | | | | | | $ | 234,838,327 | |
The Condensed Schedule of Investments does not reflect the complete portfolio holdings. It includes the Portfolio’s 50 largest holdings and each investment of any issue that exceeds 1% of the Portfolio’s net assets. “Other Securities” represent all issues not required to be disclosed under the rules adopted by the U.S. Securities and Exchange commission (“SEC”). The complete schedule of portfolio holdings is available (i) without charge, upon request, by calling (800)607-2200; (ii) on the SEC’s website at http://www.sec.gov; and (iii) on our website at http://advisor.wilshire.com.
ADR — American Depositary Receipt.
(a) | More narrow industries are utilized for compliance purposes, whereas broad sectors are utilized for reporting purposes. |
(b) | Non-income producing security. |
(c) | Represents issuers not identified as a top 50 holding in terms of market value and issues or issuers not exceeding 1% of net assets individually or in the aggregate, respectively, as of December 31, 2017. |
(d) | This security or a partial position of this security is on loan at December 31, 2017. The total value of securities on loan at December 31, 2017 was $15,985,353 (Note 7). |
(e) | Percentage rounds to less than 0.1%. |
(f) | The rate shown is the 7-day effective yield as of December 31, 2017. |
(g) | This security was purchased with cash collateral held from securities on loan. The total value of such securities as of December 31, 2017 was $1,614,019. Securities on loan are also collateralized by various U.S. Treasury obligations in the amount of $14,796,474 (Note 7). |
See Notes to Financial Statements.
40
Wilshire Mutual Funds, Inc. Large Company Value Portfolio Condensed Schedule of Investments | December 31, 2017 |
|
| | | Shares | | | Value | |
| COMMON STOCKS — 97.9% (a) |
| Consumer Discretionary — 6.3% |
| Omnicom Group, Inc. | | | 17,637 | | | $ | 1,284,502 | |
| Target Corp. (b) | | | 16,600 | | | | 1,083,149 | |
| Other Securities (b) (c) | | | | | | | 7,592,608 | |
| | | | | | | | 9,960,259 | |
| Consumer Staples — 7.8% | | | | | | | | |
| Altria Group, Inc. | | | 22,800 | | | | 1,628,148 | |
| CVS Health Corp. | | | 19,395 | | | | 1,406,138 | |
| Philip Morris International, Inc. | | | 23,706 | | | | 2,504,539 | |
| Wal-Mart Stores, Inc. | | | 37,643 | | | | 3,717,246 | |
| Other Securities (b) (c) | | | | | | | 3,107,644 | |
| | | | | | | | 12,363,715 | |
| Energy — 12.0% | | | | | | | | |
| BP plc - ADR | | | 75,697 | | | | 3,181,544 | |
| Chevron Corp. | | | 14,999 | | | | 1,877,725 | |
| ConocoPhillips | | | 26,697 | | | | 1,465,398 | |
| Exxon Mobil Corp. | | | 35,958 | | | | 3,007,527 | |
| Halliburton Co. | | | 21,916 | | | | 1,071,035 | |
| Occidental Petroleum Corp. | | | 22,400 | | | | 1,649,984 | |
| Phillips 66 | | | 17,600 | | | | 1,780,240 | |
| Royal Dutch Shell plc - Class A - ADR (b) | | | 35,705 | | | | 2,381,881 | |
| Other Securities (b) (c) | | | | | | | 2,545,648 | |
| | | | | | | | 18,960,982 | |
| Financials — 31.2% | | | | | | | | |
| American Express Co. | | | 21,068 | | | | 2,092,263 | |
| American International Group, Inc. | | | 23,065 | | | | 1,374,213 | |
| Bank of America Corp. | | | 164,175 | | | | 4,846,446 | |
| Berkshire Hathaway, Inc. - Class B (d) | | | 6,282 | | | | 1,245,219 | |
| Capital One Financial Corp. | | | 19,481 | | | | 1,939,918 | |
| Citigroup, Inc. | | | 32,621 | | | | 2,427,329 | |
| Franklin Resources, Inc. | | | 38,834 | | | | 1,682,677 | |
| Goldman Sachs Group, Inc. (The) | | | 5,810 | | | | 1,480,156 | |
| JPMorgan Chase & Co. | | | 50,843 | | | | 5,437,149 | |
| Loews Corp. | | | 28,000 | | | | 1,400,840 | |
| MetLife, Inc. | | | 21,133 | | | | 1,068,484 | |
| Morgan Stanley | | | 25,386 | | | | 1,332,003 | |
| State Street Corp. | | | 25,529 | | | | 2,491,886 | |
| UBS Group AG (b) | | | 57,466 | | | | 1,056,800 | |
| Voya Financial, Inc. | | | 24,747 | | | | 1,224,234 | |
| Wells Fargo & Co. | | | 72,054 | | | | 4,371,516 | |
| XL Group Ltd. | | | 51,619 | | | | 1,814,925 | |
| Other Securities (b) (c) | | | | | | | 12,117,477 | |
| | | | | | | | 49,403,535 | |
| Health Care — 11.5% | | | | | | | | |
| Cigna Corp. | | | 6,106 | | | | 1,240,068 | |
| Express Scripts Holding Co. (d) | | | 17,200 | | | | 1,283,808 | |
| Johnson & Johnson | | | 21,465 | | | | 2,999,090 | |
| McKesson Corp. | | | 6,935 | | | | 1,081,513 | |
| Merck & Co., Inc. | | | 50,811 | | | | 2,859,135 | |
| Mylan N.V. (d) | | | 37,572 | | | | 1,589,671 | |
| Pfizer, Inc. | | | 110,487 | | | | 4,001,839 | |
| Other Securities (c) | | | | | | | 3,234,508 | |
| | | | | | | | 18,289,632 | |
| Industrials — 10.5% | | | | | | | | |
| Dover Corp. | | | 14,222 | | | | 1,436,280 | |
| Johnson Controls International plc | | | 40,216 | | | | 1,532,632 | |
| Southwest Airlines Co. | | | 20,300 | | | | 1,328,635 | |
| Stanley Black & Decker, Inc. | | | 14,038 | | | | 2,382,108 | |
| United Technologies Corp. | | | 16,205 | | | | 2,067,271 | |
| Other Securities (c) | | | | | | | 7,900,707 | |
| | | | | | | | 16,647,633 | |
| Information Technology — 8.8% |
| Cisco Systems, Inc. | | | 28,082 | | | | 1,075,541 | |
| Hewlett Packard Enterprise Co. | | | 95,119 | | | | 1,365,909 | |
| Oracle Corp. | | | 55,115 | | | | 2,605,836 | |
| QUALCOMM, Inc. | | | 28,701 | | | | 1,837,437 | |
| Other Securities (b) (c) | | | | | | | 7,079,913 | |
| | | | | | | | 13,964,636 | |
| Materials — 2.8% | | | | | | | | |
| DowDuPont, Inc. | | | 31,800 | | | | 2,264,795 | |
| Other Securities (b) (c) | | | | | | | 2,139,335 | |
| | | | | | | | 4,404,130 | |
| Real Estate — 1.7% | | | | | | | | |
| Other Securities (b) (c) | | | | | | | 2,735,483 | |
| | | | | | | | | |
| Telecommunication Services — 2.3% |
| AT&T, Inc. | | | 48,020 | | | | 1,867,017 | |
| Verizon Communications, Inc. | | | 34,460 | | | | 1,823,968 | |
| Other Securities (c) | | | | | | | 49,234 | |
| | | | | | | | 3,740,219 | |
| Utilities — 3.0% | | | | | | | | |
| Entergy Corp. | | | 14,020 | | | | 1,141,089 | |
| Other Securities (b) (c) | | | | | | | 3,587,783 | |
| | | | | | | | 4,728,872 | |
| Total Common Stocks (Cost $117,991,953) | | | | | | | 155,199,096 | |
See Notes to Financial Statements.
41
Wilshire Mutual Funds, Inc. Large Company Value Portfolio Condensed Schedule of Investments - (Continued) | December 31, 2017 |
|
| | | Shares | | | Value | |
| RIGHTS — 0.0% (e) | | | | | | |
| Safeway CVR - Casa Ley (d) (f) | | | 1,118 | | | $ | 1,135 | |
| Safeway CVR - PDC (d) (f) | | | 1,118 | | | | 0 | |
| Total Rights (Cost $—) | | | | | | | 1,135 | |
| | | | | | | | | |
| MONEY MARKET FUNDS — 2.0% | | | | | | | | |
| Northern Trust Institutional Government Select Portfolio - Institutional Class, 1.13% (g) | | | 3,055,851 | | | | 3,055,851 | |
| Northern Trust Institutional Liquid Asset Portfolio - Institutional Class, 1.09% (g) (h) | | | 127,466 | | | | 127,466 | |
| | | | | | | | | |
| Total Money Market Funds (Cost $3,183,317) | | | | | | | 3,183,317 | |
| | | | | | | | | |
| Total Investments at Value — 99.9% (Cost $121,175,270) | | | | | | | 158,383,548 | |
| | | | | | | | | |
| Other Assets in Excess of Liabilities — 0.1% | | | | | | | 86,264 | |
| | | | | | | | | |
| Net Assets — 100.0% | | | | | | $ | 158,469,812 | |
The Condensed Schedule of Investments does not reflect the complete portfolio holdings. It includes the Portfolio’s 50 largest holdings and each investment of any issue that exceeds 1% of the Portfolio’s net assets. “Other Securities” represent all issues not required to be disclosed under the rules adopted by the U.S. Securities and Exchange commission (“SEC”). The complete schedule of portfolio holdings is available (i) without charge, upon request, by calling (800)607-2200; (ii) on the SEC’s website at http://www.sec.gov; and (iii) on our website at http://advisor.wilshire.com.
ADR — American Depositary Receipt.
CVR — Contingent Value Right.
(a) | More narrow industries are utilized for compliance purposes, whereas broad sectors are utilized for reporting purposes. |
(b) | This security or a partial position of this security is on loan at December 31, 2017. The total value of securities on loan at December 31, 2017 was $5,439,871 (Note 7). |
(c) | Represents issuers not identified as a top 50 holding in terms of market value and issues or issuers not exceeding 1% of net assets individually or in the aggregate, respectively, as of December 31, 2017. |
(d) | Non-income producing security. |
(e) | Percentage rounds to less than 0.1%. |
(f) | Level 3 security. Security has been valued at fair value in accordance with the procedures adopted by and under the general supervision of the Board of Directors. The total value of such securities is $1,135 as of December 31, 2017, representing 0.0% (e) of net assets (Note 2). |
(g) | The rate shown is the 7-day effective yield as of December 31, 2017. |
(h) | This security was purchased with cash collateral held from securities on loan. The total value of such securities as of December 31, 2017 was $127,466. Securities on loan are also collateralized by various U.S. Treasury obligations in the amount of $5,448,268 (Note 7). |
See Notes to Financial Statements.
42
Wilshire Mutual Funds, Inc. Small Company Growth Portfolio Condensed Schedule of Investments | December 31, 2017 |
|
| | | Shares | | | Value | |
| COMMON STOCKS — 97.4% (a) |
| Consumer Discretionary — 9.8% |
| LCI Industries | | | 4,877 | | | $ | 634,010 | |
| Sonic Corp. (b) | | | 10,335 | | | | 284,006 | |
| Steven Madden Ltd. (c) | | | 23,377 | | | | 1,091,707 | |
| TopBuild Corp. (c) | | | 3,067 | | | | 232,294 | |
| Other Securities (b) (d) | | | | | | | 2,445,752 | |
| | | | | | | | 4,687,769 | |
| Consumer Staples — 5.8% | | | | | | | | |
| Calavo Growers, Inc. (b) | | | 12,306 | | | | 1,038,626 | |
| Inter Parfums, Inc. | | | 16,205 | | | | 704,106 | |
| J & J Snack Foods Corp. | | | 3,360 | | | | 510,149 | |
| Other Securities (b) (d) | | | | | | | 520,515 | |
| | | | | | | | 2,773,396 | |
| Energy — 3.1% | | | | | | | | |
| Callon Petroleum Co. (b) (c) | | | 32,845 | | | | 399,067 | |
| WildHorse Resource Development Corp. (b) (c) | | | 41,990 | | | | 773,035 | |
| Other Securities (b) (d) | | | | | | | 314,311 | |
| | | | | | | | 1,486,413 | |
| Financials — 8.8% | | | | | | | | |
| Banc of California, Inc. (b) | | | 51,510 | | | | 1,063,682 | |
| CenterState Bank Corp. (b) | | | 17,699 | | | | 455,395 | |
| Essent Group Ltd. (c) | | | 5,485 | | | | 238,159 | |
| LegacyTexas Financial Group, Inc. | | | 18,945 | | | | 799,668 | |
| South State Corp. | | | 3,970 | | | | 345,986 | |
| Veritex Holdings, Inc. (c) | | | 9,520 | | | | 262,657 | |
| Other Securities (b) (d) | | | | | | | 1,054,767 | |
| | | | | | | | 4,220,314 | |
| Health Care — 21.8% | | | | | | | | |
| Cambrex Corp. (c) | | | 17,089 | | | | 820,272 | |
| Cantel Medical Corp. | | | 6,565 | | | | 675,343 | |
| Cotiviti Holdings, Inc. (c) | | | 13,139 | | | | 423,207 | |
| Heska Corp. (c) | | | 2,870 | | | | 230,203 | |
| LeMaitre Vascular, Inc. | | | 7,450 | | | | 237,208 | |
| Masimo Corp. (c) | | | 2,425 | | | | 205,640 | |
| Medidata Solutions, Inc. (b) (c) | | | 8,705 | | | | 551,636 | |
| Neogen Corp. (c) | | | 4,285 | | | | 352,270 | |
| PRA Health Sciences, Inc. (c) | | | 14,820 | | | | 1,349,657 | |
| Prestige Brands Holdings, Inc. (c) | | | 13,800 | | | | 612,857 | |
| Repligen Corp. (b) (c) | | | 17,489 | | | | 634,500 | |
| Supernus Pharmaceuticals, Inc. (b) (c) | | | 13,560 | | | | 540,366 | |
| Tabula Rasa HealthCare, Inc. (c) | | | 14,792 | | | | 414,916 | |
| Other Securities (b) (d) | | | | | | | 3,403,727 | |
| | | | | | | | 10,451,802 | |
| Industrials — 18.6% | | | | | | | | |
| Insteel Industries, Inc. | | | 15,547 | | | | 440,290 | |
| Knoll, Inc. | | | 28,775 | | | | 662,976 | |
| Mercury Systems, Inc. (c) | | | 9,550 | | | | 490,392 | |
| PGT Innovations, Inc. (c) | | | 24,540 | | | | 413,498 | |
| Saia, Inc. (c) | | | 16,040 | | | | 1,134,831 | |
| SiteOne Landscape Supply, Inc. (b) (c) | | | 11,791 | | | | 904,369 | |
| WageWorks, Inc. (c) | | | 12,250 | | | | 759,501 | |
| Other Securities (b) (d) | | | | | | | 4,117,882 | |
| | | | | | | | 8,923,739 | |
| Information Technology — 23.0% | | | | | | | | |
| BroadSoft, Inc. (b) (c) | | | 9,038 | | | | 496,186 | |
| Cabot Microelectronics Corp. | | | 5,420 | | | | 509,914 | |
| CEVA, Inc. (c) | | | 11,189 | | | | 516,371 | |
| Ellie Mae, Inc. (b) (c) | | | 4,718 | | | | 421,789 | |
| Inphi Corp. (b) (c) | | | 10,665 | | | | 390,339 | |
| MAXIMUS, Inc. | | | 9,615 | | | | 688,241 | |
| MaxLinear, Inc. - Class A (c) | | | 16,190 | | | | 427,740 | |
| MINDBODY, Inc. - Class A (b) (c) | | | 19,067 | | | | 580,589 | |
| Pegasystems, Inc. (b) | | | 21,069 | | | | 993,403 | |
| Qualys, Inc. (c) | | | 16,531 | | | | 981,115 | |
| Silicon Laboratories, Inc. (c) | | | 4,315 | | | | 381,015 | |
| WNS Holdings Ltd. - ADR (c) | | | 12,797 | | | | 513,544 | |
| Other Securities (b) (d) | | | | | | | 4,187,024 | |
| | | | | | | | 11,087,270 | |
| Materials — 4.1% | | | | | | | | |
| Louisiana-Pacific Corp. (c) | | | 9,280 | | | | 243,693 | |
| Quaker Chemical Corp. | | | 4,750 | | | | 716,253 | |
| Trinseo S.A. (b) | | | 2,960 | | | | 214,896 | |
| Other Securities (b) (d) | | | | | | | 804,286 | |
| | | | | | | | 1,979,128 | |
| Real Estate — 0.9% | | | | | | | | |
| Other Securities (b) (d) | | | | | | | 427,510 | |
| | | | | | | | | |
| Telecommunication Services — 1.1% | | | | | | | | |
| Cogent Communications Holdings, Inc. | | | 9,605 | | | | 435,106 | |
| Other Securities (d) | | | | | | | 96,445 | |
| | | | | | | | 531,551 | |
See Notes to Financial Statements.
43
Wilshire Mutual Funds, Inc. Small Company Growth Portfolio Condensed Schedule of Investments - (Continued) | December 31, 2017 |
|
| | | Shares | | | Value | |
| COMMON STOCKS — 97.4% (a) (Continued) |
| Utilities — 0.4% | | | | | | |
| Other Securities (d) | | | | | | $ | 174,935 | |
| | | | | | | | | |
| Total Common Stocks (Cost $36,852,914) | | | | | | | 46,743,827 | |
| | | | | | | | | |
| RIGHTS — 0.0% (e) | | | | | | | | |
| Dyax Corp. (c) (f) (Cost $—) | | | 860 | | | | 0 | |
| | | | | | | | | |
| MONEY MARKET FUNDS — 10.4% | | | | | | | | |
| Northern Trust Institutional Government Select Portfolio - Institutional Class, 1.13% (g) | | | 1,624,978 | | | | 1,624,978 | |
| Northern Trust Institutional Liquid Asset Portfolio - Institutional Class, 1.09% (g) (h) | | | 3,365,468 | | | | 3,365,468 | |
| | | | | | | | | |
| Total Money Market Funds (Cost $4,990,446) | | | | | | | 4,990,446 | |
| | | | | | | | | |
| Total Investments at Value — 107.8% (Cost $41,843,360) | | | | | | | 51,734,273 | |
| | | | | | | | | |
| Liabilities in Excess of Other Assets — (7.8%) | | | | | | | (3,749,822 | ) |
| | | | | | | | | |
| Net Assets — 100.0% | | | | | | $ | 47,984,451 | |
The Condensed Schedule of Investments does not reflect the complete portfolio holdings. It includes the Portfolio’s 50 largest holdings and each investment of any issue that exceeds 1% of the Portfolio’s net assets. “Other Securities” represent all issues not required to be disclosed under the rules adopted by the U.S. Securities and Exchange commission (“SEC”). The complete schedule of portfolio holdings is available (i) without charge, upon request, by calling (800)607-2200; (ii) on the SEC’s website at http://www.sec.gov; and (iii) on our website at http://advisor.wilshire.com.
ADR — American Depositary Receipt.
(a) | More narrow industries are utilized for compliance purposes, whereas broad sectors are utilized for reporting purposes. |
(b) | This security or a partial position of this security is on loan at December 31, 2017. The total value of securities on loan at December 31, 2017 was $10,257,245 (Note 7). |
(c) | Non-income producing security. |
(d) | Represents issuers not identified as a top 50 holding in terms of market value and issues or issuers not exceeding 1% of net assets individually or in the aggregate, respectively, as of December 31, 2017. |
(e) | Percentage rounds to less than 0.1%. |
(f) | Level 3 security. Security has been valued at fair value in accordance with the procedures adopted by and under the general supervision of the Board of Directors. The total value of such securities is $0 as of December 31, 2017, representing 0.0% (e) of net assets (Note 2). |
(g) | The rate shown is the 7-day effective yield as of December 31, 2017. |
(h) | This security was purchased with cash collateral held from securities on loan. The total value of such securities as of December 31, 2017 was $3,365,468. Securities on loan are also collateralized by various U.S. Treasury obligations in the amount of $7,237,842 (Note 7). |
See Notes to Financial Statements.
44
Wilshire Mutual Funds, Inc. Small Company Value Portfolio Condensed Schedule of Investments | December 31, 2017 |
|
| | | Shares | | | Value | |
| COMMON STOCKS — 98.1% (a) |
| Consumer Discretionary — 11.8% |
| Aaron's, Inc. | | | 5,491 | | | $ | 218,816 | |
| Deckers Outdoor Corp. (b) | | | 4,299 | | | | 344,995 | |
| Hooker Furniture Corp. | | | 14,777 | | | | 627,284 | |
| Stoneridge, Inc. (b) | | | 19,013 | | | | 434,637 | |
| Taylor Morrison Home Corp. - Class A (b) | | | 17,550 | | | | 429,449 | |
| TRI Pointe Group, Inc. (b) (c) | | | 43,796 | | | | 784,824 | |
| Other Securities (c) (d) | | | | | | | 1,921,796 | |
| | | | | | | | 4,761,801 | |
| Consumer Staples — 2.8% | | | | | | | | |
| John B. Sanfilippo & Son, Inc. (c) | | | 3,974 | | | | 251,355 | |
| Landec Corp. (b) | | | 41,105 | | | | 517,922 | |
| Other Securities (c) (d) | | | | | | | 373,107 | |
| | | | | | | | 1,142,384 | |
| Energy — 8.2% | | | | | | | | |
| Carrizo Oil & Gas, Inc. (b) (c) | | | 41,555 | | | | 884,290 | |
| PDC Energy, Inc. (b) | | | 15,396 | | | | 793,510 | |
| SRC Energy, Inc. (b) (c) | | | 51,302 | | | | 437,606 | |
| Other Securities (c) (d) | | | | | | | 1,174,042 | |
| | | | | | | | 3,289,448 | |
| Financials — 28.8% | | | | | | | | |
| Ameris Bancorp | | | 8,675 | | | | 418,135 | |
| Aspen Insurance Holdings Ltd. | | | 12,580 | | | | 510,747 | |
| Bank of N.T. Butterfield & Son Ltd. (The) | | | 18,575 | | | | 674,087 | |
| BankUnited, Inc. | | | 5,875 | | | | 239,230 | |
| Banner Corp. | | | 3,775 | | | | 208,078 | |
| Hilltop Holdings, Inc. (c) | | | 9,030 | | | | 228,730 | |
| HomeStreet, Inc. (b) (c) | | | 19,476 | | | | 563,831 | |
| Hope Bancorp, Inc. | | | 18,660 | | | | 340,545 | |
| Meridian Bancorp, Inc. | | | 11,780 | | | | 242,668 | |
| PacWest Bancorp | | | 10,520 | | | | 530,208 | |
| Radian Group, Inc. | | | 9,961 | | | | 205,296 | |
| Texas Capital Bancshares, Inc. (b) (c) | | | 2,520 | | | | 224,028 | |
| Western Alliance Bancorp (b) | | | 15,030 | | | | 851,000 | |
| Other Securities (c) (d) | | | | | | | 6,333,358 | |
| | | | | | | | 11,569,941 | |
| Health Care — 3.1% | | | | | | | | |
| Globus Medical, Inc. - Class A (b) (c) | | | 7,360 | | | | 302,496 | |
| LivaNova plc (b) | | | 3,230 | | | | 258,142 | |
| Other Securities (c) (d) | | | | | | | 688,753 | |
| | | | | | | | 1,249,391 | |
| Industrials — 12.7% | | | | | | | | |
| Albany International Corp. - Class A | | | 10,365 | | | | 636,929 | |
| Apogee Enterprises, Inc. (c) | | | 4,470 | | | | 204,413 | |
| EnerSys | | | 7,197 | | | | 501,127 | |
| GP Strategies Corp. (b) | | | 10,895 | | | | 252,764 | |
| Orbital ATK, Inc. | | | 2,337 | | | | 307,317 | |
| Other Securities (c) (d) | | | | | | | 3,216,509 | |
| | | | | | | | 5,119,059 | |
| Information Technology — 14.1% |
| Coherent, Inc. (b) | | | 2,055 | | | | 579,961 | |
| Cray, Inc. (b) (c) | | | 13,090 | | | | 316,778 | |
| Entegris, Inc. | | | 13,280 | | | | 404,376 | |
| Integrated Device Technology, Inc. (b) | | | 12,935 | | | | 384,558 | |
| Lattice Semiconductor Corp. (b) | | | 65,455 | | | | 378,330 | |
| Mellanox Technologies Ltd. (b) (c) | | | 11,720 | | | | 758,284 | |
| Mitel Networks Corp. (b) | | | 60,925 | | | | 501,413 | |
| Novanta, Inc. (b) | | | 5,920 | | | | 296,000 | |
| Other Securities (c) (d) | | | | | | | 2,038,222 | |
| | | | | | | | 5,657,922 | |
| Materials — 8.4% | | | | | | | | |
| Boise Cascade Co. | | | 11,430 | | | | 456,057 | |
| Kaiser Aluminum Corp. | | | 4,277 | | | | 456,998 | |
| Louisiana-Pacific Corp. (b) | | | 18,872 | | | | 495,578 | |
| Materion Corp. | | | 5,668 | | | | 275,465 | |
| P.H. Glatfelter Co. | | | 11,170 | | | | 239,485 | |
| Trinseo S.A. | | | 2,839 | | | | 206,111 | |
| Other Securities (c) (d) | | | | | | | 1,244,569 | |
| | | | | | | | 3,374,263 | |
| Real Estate — 5.9% | | | | | | | | |
| Brandywine Realty Trust | | | 17,338 | | | | 315,378 | |
| Getty Realty Corp. | | | 11,667 | | | | 316,876 | |
| Ramco-Gershenson Properties Trust | | | 29,250 | | | | 430,852 | |
| Sabra Health Care REIT, Inc. | | | 18,131 | | | | 340,318 | |
| Other Securities (c) (d) | | | | | | | 985,103 | |
| | | | | | | | 2,388,527 | |
| Telecommunication Services — 0.0% (e) |
| Other Securities (d) | | | | | | | 2,925 | |
See Notes to Financial Statements.
45
Wilshire Mutual Funds, Inc. Small Company Value Portfolio Condensed Schedule of Investments - (Continued) | December 31, 2017 |
|
| | | Shares | | | Value | |
| COMMON STOCKS — 98.1% (a) (Continued) |
| Utilities — 2.3% | | | | | | |
| Ormat Technologies, Inc. | | | 3,982 | | | $ | 254,689 | |
| Other Securities (c) (d) | | | | | | | 655,063 | |
| | | | | | | | 909,752 | |
| Total Common Stocks (Cost $31,716,297) | | | | | | | 39,465,413 | |
| | | | | | | | | |
| MONEY MARKET FUNDS — 4.4% | | | | | | | | |
| Northern Trust Institutional Government Select Portfolio - Institutional Class, 1.13% (f) | | | 782,990 | | | | 782,990 | |
| Northern Trust Institutional Liquid Asset Portfolio - Institutional Class, 1.09% (f) (g) | | | 1,001,671 | | | | 1,001,671 | |
| | | | | | | | | |
| Total Money Market Funds (Cost $1,784,661) | | | | | | | 1,784,661 | |
| | | | | | | | | |
| Total Investments at Value — 102.5% (Cost $33,500,958) | | | | | | | 41,250,074 | |
| | | | | | | | | |
| Liabilities in Excess of Other Assets — (2.5%) | | | | | | | (1,025,723 | ) |
| | | | | | | | | |
| Net Assets — 100.0% | | | | | | $ | 40,224,351 | |
The Condensed Schedule of Investments does not reflect the complete portfolio holdings. It includes the Portfolio’s 50 largest holdings and each investment of any issue that exceeds 1% of the Portfolio’s net assets. “Other Securities” represent all issues not required to be disclosed under the rules adopted by the U.S. Securities and Exchange commission (“SEC”). The complete schedule of portfolio holdings is available (i) without charge, upon request, by calling (800)607-2200; (ii) on the SEC’s website at http://www.sec.gov; and (iii) on our website at http://advisor.wilshire.com.
(a) | More narrow industries are utilized for compliance purposes, whereas broad sectors are utilized for reporting purposes. |
(b) | Non-income producing security. |
(c) | This security or a partial position of this security is on loan at December 31, 2017. The total value of securities on loan at December 31, 2017 was $6,418,286 (Note 7). |
(d) | Represents issuers not identified as a top 50 holding in terms of market value and issues or issuers not exceeding 1% of net assets individually or in the aggregate, respectively, as of December 31, 2017. |
(e) | Percentage rounds to less than 0.1%. |
(f) | The rate shown is the 7-day effective yield as of December 31, 2017. |
(g) | This security was purchased with cash collateral held from securities on loan. The total value of such securities as of December 31, 2017 was $1,001,671. Securities on loan are also collateralized by various U.S. Treasury obligations in the amount of $5,625,851 (Note 7). |
See Notes to Financial Statements.
46
Wilshire Mutual Funds, Inc. Wilshire 5000 Indexsm Fund Condensed Schedule of Investments | December 31, 2017 |
|
| | | Shares | | | Value | |
| COMMON STOCKS — 99.4% (a) |
| Consumer Discretionary — 12.5% |
| Amazon.com, Inc. (b) | | | 2,908 | | | $ | 3,400,818 | |
| Comcast Corp. - Class A | | | 29,648 | | | | 1,187,401 | |
| Home Depot, Inc. (The) | | | 8,054 | | | | 1,526,474 | |
| McDonald's Corp. | | | 6,068 | | | | 1,044,425 | |
| Walt Disney Co. (The) | | | 10,918 | | | | 1,173,794 | |
| Other Securities (c) (d) | | | | | | | 14,672,678 | |
| | | | | | | | 23,005,591 | |
| Consumer Staples — 7.6% | | | | | | | | |
| Altria Group, Inc. | | | 11,691 | | | | 834,854 | |
| Coca-Cola Co. (The) | | | 27,490 | | | | 1,261,241 | |
| PepsiCo, Inc. | | | 9,699 | | | | 1,163,104 | |
| Philip Morris International, Inc. | | | 10,726 | | | | 1,133,202 | |
| Procter & Gamble Co. (The) | | | 17,430 | | | | 1,601,468 | |
| Wal-Mart Stores, Inc. | | | 10,939 | | | | 1,080,225 | |
| Other Securities (c) (d) | | | | | | | 6,900,116 | |
| | | | | | | | 13,974,210 | |
| Energy — 5.8% | | | | | | | | |
| Chevron Corp. | | | 13,833 | | | | 1,731,752 | |
| Exxon Mobil Corp. | | | 30,298 | | | | 2,534,124 | |
| Other Securities (c) (d) | | | | | | | 6,380,424 | |
| | | | | | | | 10,646,300 | |
| Financials — 15.6% | | | | | | | | |
| Bank of America Corp. | | | 72,498 | | | | 2,140,140 | |
| Berkshire Hathaway, Inc. - Class B (b) | | | 15,706 | | | | 3,113,242 | |
| Citigroup, Inc. | | | 20,065 | | | | 1,493,036 | |
| Goldman Sachs Group, Inc. (The) | | | 2,765 | | | | 704,410 | |
| JPMorgan Chase & Co. | | | 24,732 | | | | 2,644,839 | |
| Wells Fargo & Co. | | | 32,147 | | | | 1,950,357 | |
| Other Securities (c) (d) | | | | | | | 16,749,579 | |
| | | | | | | | 28,795,603 | |
| Health Care — 12.4% | | | | | | | | |
| Abbott Laboratories | | | 12,635 | | | | 721,079 | |
| AbbVie, Inc. | | | 10,100 | | | | 976,770 | |
| Amgen, Inc. | | | 4,500 | | | | 782,549 | |
| Bristol-Myers Squibb Co. | | | 12,225 | | | | 749,148 | |
| Gilead Sciences, Inc. | | | 9,017 | | | | 645,977 | |
| Johnson & Johnson | | | 19,625 | | | | 2,742,004 | |
| Merck & Co., Inc. | | | 20,155 | | | | 1,134,121 | |
| Pfizer, Inc. | | | 43,962 | | | | 1,592,303 | |
| UnitedHealth Group, Inc. | | | 6,576 | | | | 1,449,744 | |
| Other Securities (c) (d) | | | | | | | 12,062,679 | |
| | | | | | | | 22,856,374 | |
| Industrials — 10.8% | | | | | | | | |
| 3M Co. | | | 4,256 | | | | 1,001,735 | |
| Boeing Co. (The) | | | 4,038 | | | | 1,190,846 | |
| Caterpillar, Inc. | | | 4,331 | | | | 682,478 | |
| General Electric Co. | | | 60,816 | | | | 1,061,239 | |
| Honeywell International, Inc. | | | 5,622 | | | | 862,190 | |
| Union Pacific Corp. | | | 5,627 | | | | 754,580 | |
| United Technologies Corp. | | | 5,952 | | | | 759,296 | |
| Other Securities (c) (d) | | | | | | | 13,719,773 | |
| | | | | | | | 20,032,137 | |
| Information Technology — 22.4% |
| Alphabet, Inc. - Class C (b) | | | 4,183 | | | | 4,377,090 | |
| Apple, Inc. | | | 37,983 | | | | 6,427,862 | |
| Cisco Systems, Inc. | | | 36,598 | | | | 1,401,702 | |
| Facebook, Inc. - Class A (b) | | | 16,349 | | | | 2,884,944 | |
| Intel Corp. | | | 34,918 | | | | 1,611,814 | |
| International Business Machines Corp. | | | 6,425 | | | | 985,723 | |
| MasterCard, Inc. - Class A | | | 6,945 | | | | 1,051,194 | |
| Microsoft Corp. | | | 56,162 | | | | 4,804,096 | |
| NVIDIA Corp. | | | 3,547 | | | | 686,345 | |
| Oracle Corp. | | | 23,530 | | | | 1,112,497 | |
| QUALCOMM, Inc. | | | 10,805 | | | | 691,736 | |
| Texas Instruments, Inc. | | | 6,205 | | | | 648,050 | |
| Visa, Inc. - Class A (d) | | | 11,316 | | | | 1,290,249 | |
| Other Securities (c) (d) | | | | | | | 13,401,529 | |
| | | | | | | | 41,374,831 | |
| Materials — 3.3% | | | | | | | | |
| DowDuPont, Inc. | | | 15,951 | | | | 1,136,029 | |
| Other Securities (c) (d) | | | | | | | 4,922,652 | |
| | | | | | | | 6,058,681 | |
| Real Estate — 4.0% | | | | | | | | |
| Other Securities (c) (d) | | | | | | | 7,341,414 | |
| | | | | | | | | |
| Telecommunication Services — 2.1% |
| AT&T, Inc. | | | 44,270 | | | | 1,721,217 | |
| Verizon Communications, Inc. | | | 28,643 | | | | 1,516,074 | |
| Other Securities (c) (d) | | | | | | | 574,684 | |
| | | | | | | | 3,811,975 | |
| Utilities — 2.9% | | | | | | | | |
| Other Securities (c) (d) | | | | | | | 5,407,926 | |
| | | | | | | | | |
| Total Common Stocks (Cost $56,161,419) | | | | | | | 183,305,042 | |
See Notes to Financial Statements.
47
Wilshire Mutual Funds, Inc. Wilshire 5000 Indexsm Fund Condensed Schedule of Investments - (Continued) | December 31, 2017 |
|
| | | Shares | | | Value | |
| RIGHTS — 0.0% (e) | | | | | | |
| AMR Corp., Escrow (b) (f) | | | 3,275 | | | $ | 6,353 | |
| Dyax Corp. (b) (d) (f) | | | 1,200 | | | | — | |
| Media General, Inc. - CVR (b) (f) | | | 794 | | | | — | |
| Safeway CVR - Casa Ley (b) (f) | | | 2,075 | | | | 2,106 | |
| Safeway CVR - PDC (b) (f) | | | 2,075 | | | | 1 | |
| Total Rights (Cost $—) | | | | | | | 8,460 | |
| | | | | | | | | |
| MONEY MARKET FUNDS — 2.1% |
| Northern Trust Institutional Government Select Portfolio - Institutional Class, 1.13% (g) | | | 2,069,284 | | | | 2,069,284 | |
| Northern Trust Institutional Liquid Asset Portfolio - Institutional Class, 1.09% (g) (h) | | | 1,815,226 | | | | 1,815,226 | |
| | | | | | | | | |
| Total Money Market Funds (Cost $3,884,510) | | | | | | | 3,884,510 | |
| | | | | | | | | |
| Total Investments at Value — 101.5% (Cost $60,045,929) | | | | | | | 187,198,012 | |
| | | | | | | | | |
| Liabilities in Excess of Other Assets — (1.5%) | | | | | | | (2,790,304 | ) |
| | | | | | | | | |
| Net Assets — 100.0% | | | | | | $ | 184,407,708 | |
The Condensed Schedule of Investments does not reflect the complete portfolio holdings. It includes the Portfolio’s 50 largest holdings and each investment of any issue that exceeds 1% of the Portfolio’s net assets. “Other Securities” represent all issues not required to be disclosed under the rules adopted by the U.S. Securities and Exchange commission (“SEC”). The complete schedule of portfolio holdings is available (i) without charge, upon request, by calling (800)607-2200; (ii) on the SEC’s website at http://www.sec.gov; and (iii) on our website at http://advisor.wilshire.com.
CVR — Contingent Value Right.
(a) | More narrow industries are utilized for compliance purposes, whereas broad sectors are utilized for reporting purposes. |
(b) | Non-income producing security. |
(c) | Represents issuers not identified as a top 50 holding in terms of market value and issues or issuers not exceeding 1% of net assets individually or in the aggregate, respectively, as of December 31, 2017. |
(d) | This security or a partial position of this security is on loan at December 31, 2017. The total value of securities on loan at December 31, 2017 was $11,934,916 (Note 7). |
(e) | Percentage rounds to less than 0.1%. |
(f) | Level 3 security. Security has been valued at fair value in accordance with the procedures adopted by and under the general supervision of the Board of Directors. The total value of such securities is $8,460 as of December 31, 2017, representing 0.0% (e) of net assets (Note 2). |
(g) | The rate shown is the 7-day effective yield as of December 31, 2017. |
(h) | This security was purchased with cash collateral held from securities on loan. The total value of such securities as of December 31, 2017 was $1,815,226. Securities on loan are also collateralized by various U.S. Treasury obligations in the amount of $10,476,789 (Note 7). |
See Notes to Financial Statements.
48
Wilshire Mutual Funds, Inc. Wilshire International Equity Fund Condensed Schedule of Investments | December 31, 2017 |
|
| | | Shares | | | Value | |
| COMMON STOCKS — 96.4% |
| Australia — 3.1% |
| CSL Ltd. (a) | | | 52,442 | | | $ | 5,763,677 | |
| Other Securities (a) (b) | | | | | | | 5,226,278 | |
| | | | | | | | 10,989,955 | |
| Austria — 0.1% | | | | | | | | |
| Other Securities (a) (b) | | | | | | | 396,445 | |
| | | | | | | | | |
| Belgium — 0.3% | | | | | | | | |
| Other Securities (a) (b) | | | | | | | 1,074,265 | |
| | | | | | | | | |
| Bermuda — 0.3% | | | | | | | | |
| Other Securities (a) (b) | | | | | | | 968,774 | |
| | | | | | | | | |
| Brazil — 1.8% | | | | | | | | |
| Raia Drogasil S.A. (a) | | | 99,310 | | | | 2,751,557 | |
| Other Securities (b) (f) | | | | | | | 3,654,167 | |
| | | | | | | | 6,405,724 | |
| Canada — 4.4% | | | | | | | | |
| Canadian Pacific Railway Ltd. | | | 24,798 | | | | 4,532,083 | |
| Dollarama, Inc. | | | 22,443 | | | | 2,803,612 | |
| Other Securities (a) (b) (f) | | | | | | | 8,327,215 | |
| | | | | | | | 15,662,910 | |
| Cayman Islands — 4.9% | | | | | | | | |
| Baidu.com, Inc. - ADR (c) | | | 17,127 | | | | 4,011,314 | |
| Tencent Holdings Ltd. (a) | | | 117,455 | | | | 6,079,222 | |
| Other Securities (a) (b) (f) | | | | | | | 7,501,351 | |
| | | | | | | | 17,591,887 | |
| Chile — 0.2% | | | | | | | | |
| Other Securities (a) (b) | | | | | | | 580,881 | |
| | | | | | | | | |
| China — 0.9% | | | | | | | | |
| Other Securities (a) (b) | | | | | | | 3,150,986 | |
| | | | | | | | | |
| Colombia — 0.1% | | | | | | | | |
| Other Securities (a) (b) | | | | | | | 256,066 | |
| | | | | | | | | |
| Curacao — 0.9% | | | | | | | | |
| Schlumberger Ltd. | | | 45,846 | | | | 3,089,561 | |
| | | | | | | | | |
| Denmark — 3.7% | | | | | | | | |
| Carlsberg A/S - Series B (a) | | | 22,421 | | | | 2,689,049 | |
| Chr. Hansen Holding A/S (a) | | | 40,176 | | | | 3,766,476 | |
| Novozymes A/S (a) | | | 57,770 | | | | 3,297,829 | |
| Other Securities (a) (b) | | | | | | | 3,342,355 | |
| | | | | | | | 13,095,709 | |
| Finland — 0.4% | | | | | | | | |
| Other Securities (a) (b) | | | | | | | 1,507,261 | |
| | | | | | | | | |
| France — 8.3% | | | | | | | | |
| AXA S.A. (a) | | | 91,048 | | | | 2,697,845 | |
| Engie S.A. (a) (c) | | | 154,030 | | | | 2,647,811 | |
| Essilor International S.A. (a) | | | 37,796 | | | | 5,205,690 | |
| Hermes International (a) | | | 6,150 | | | | 3,289,838 | |
| LVMH Moet Hennessy Louis Vuitton SE (a) | | | 16,127 | | | | 4,733,008 | |
| Other Securities (a) (b) | | | | | | | 10,998,925 | |
| | | | | | | | 29,573,116 | |
| Germany — 4.6% | | | | | | | | |
| adidas AG (a) | | | 16,343 | | | | 3,268,188 | |
| Deutsche Boerse AG (a) | | | 21,747 | | | | 2,516,930 | |
| Other Securities (a) (b) | | | | | | | 10,430,677 | |
| | | | | | | | 16,215,795 | |
| Greece — 0.0% (d) | | | | | | | | |
| Other Securities (a) (b) | | | | | | | 93,525 | |
| | | | | | | | | |
| Hong Kong — 2.8% | | | | | | | | |
| AIA Group Ltd. (a) | | | 836,000 | | | | 7,110,712 | |
| Other Securities (a) (b) | | | | | | | 2,815,794 | |
| | | | | | | | 9,926,506 | |
| Hungary — 0.1% | | | | | | | | |
| Other Securities (a) (b) | | | | | | | 188,636 | |
| | | | | | | | | |
| India — 2.3% | | | | | | | | |
| HDFC Bank Ltd. - ADR | | | 41,569 | | | | 4,226,319 | |
| Tata Motors Ltd. - ADR (c) | | | 77,650 | | | | 2,567,886 | |
| Other Securities (a) (b) | | | | | | | 1,230,040 | |
| | | | | | | | 8,024,245 | |
| Indonesia — 0.1% | | | | | | | | |
| Other Securities (a) (b) | | | | | | | 497,894 | |
| | | | | | | | | |
| Ireland — 2.7% | | | | | | | | |
| Accenture plc - Class A | | | 31,053 | | | | 4,753,903 | |
| ICON plc (c) | | | 25,037 | | | | 2,807,900 | |
| Other Securities (b) | | | | | | | 2,205,911 | |
| | | | | | | | 9,767,714 | |
| Isle of Man — 0.1% | | | | | | | | |
| Other Securities (b) | | | | | | | 437,909 | |
See Notes to Financial Statements.
49
Wilshire Mutual Funds, Inc. Wilshire International Equity Fund Condensed Schedule of Investments - (Continued) | December 31, 2017 |
|
| | | Shares | | | Value | |
| COMMON STOCKS — 96.4% (Continued) |
| Israel — 0.2% | | | | | | |
| Other Securities (a) (b) | | | | | | $ | 702,717 | |
| | | | | | | | | |
| Italy — 1.8% | | | | | | | | |
| Other Securities (a) (b) | | | | | | | 6,269,868 | |
| | | | | | | | | |
| Japan — 14.6% | | | | | | | | |
| Fast Retailing Co. Ltd. (a) | | | 6,700 | | | | 2,663,775 | |
| Keyence Corp. (a) | | | 9,660 | | | | 5,395,900 | |
| Panasonic Corp. (a) | | | 258,348 | | | | 3,769,975 | |
| Secom Co. Ltd. (a) | | | 40,900 | | | | 3,085,340 | |
| Sumitomo Mitsui Financial Group, Inc. (a) | | | 93,900 | | | | 4,047,154 | |
| Sysmex Corp. (a) | | | 32,955 | | | | 2,587,430 | |
| Other Securities (a) (b) (f) | | | | | | | 30,479,340 | |
| | | | | | | | 52,028,914 | |
| Jersey — 1.6% | | | | | | | | |
| Experian plc (a) | | | 228,707 | | | | 5,040,967 | |
| Other Securities (a) (b) | | | | | | | 503,221 | |
| | | | | | | | 5,544,188 | |
| Korea (Republic of) — 1.6% | | | | | | | | |
| Other Securities (a) (b) | | | | | | | 5,865,872 | |
| | | | | | | | | |
| Luxembourg — 1.0% | | | | | | | | |
| ArcelorMittal (a) | | | 109,153 | | | | 3,541,015 | |
| | | | | | | | | |
| Malaysia — 0.1% | | | | | | | | |
| Other Securities (a) (b) | | | | | | | 322,853 | |
| | | | | | | | | |
| Mexico — 0.8% | | | | | | | | |
| Wal-Mart de Mexico S.A.B. de C.V. | | | 1,139,575 | | | | 2,794,818 | |
| Other Securities (b) | | | | | | | 4,703 | |
| | | | | | | | 2,799,521 | |
| Netherlands — 6.5% | | | | | | | | |
| AerCap Holdings N.V. (c) | | | 72,057 | | | | 3,790,919 | |
| Core Laboratories N.V. (f) | | | 24,883 | | | | 2,725,933 | |
| Koninklijke DSM N.V. (a) | | | 29,016 | | | | 2,771,514 | |
| Yandex N.V. - Class A (c) | | | 96,789 | | | | 3,169,840 | |
| Other Securities (a) (b) (f) | | | | | | | 10,659,567 | |
| | | | | | | | 23,117,773 | |
| New Zealand — 0.0% (d) | | | | | | | | |
| Other Securities (a) (b) | | | | | | | 11,617 | |
| | | | | | | | | |
| Norway — 0.9% | | | | | | | | |
| DNB ASA (a) | | | 144,985 | | | | 2,683,940 | |
| Other Securities (a) (b) (f) | | | | | | | 496,247 | |
| | | | | | | | 3,180,187 | |
| Philippines — 0.1% | | | | | | | | |
| Other Securities (a) (b) | | | | | | | 360,622 | |
| | | | | | | | | |
| Poland — 0.2% | | | | | | | | |
| Other Securities (a) (b) | | | | | | | 778,889 | |
| | | | | | | | | |
| Portugal — 0.1% | | | | | | | | |
| Other Securities (a) (b) | | | | | | | 220,559 | |
| | | | | | | | | |
| Russian Federation — 0.5% | | | | | | | | |
| Other Securities (b) | | | | | | | 1,728,578 | |
| | | | | | | | | |
| Singapore — 1.1% | | | | | | | | |
| DBS Group Holdings Ltd. (a) | | | 173,810 | | | | 3,214,720 | |
| Other Securities (a) (b) | | | | | | | 786,461 | |
| | | | | | | | 4,001,181 | |
| South Africa — 0.4% | | | | | | | | |
| Other Securities (a) (b) | | | | | | | 1,527,133 | |
| | | | | | | | | |
| Spain — 3.0% | | | | | | | | |
| ACS Actividades de Construccion y Servicios S.A. (a) | | | 68,758 | | | | 2,685,735 | |
| Other Securities (a) (b) (f) | | | | | | | 7,987,560 | |
| | | | | | | | 10,673,295 | |
| Sweden — 1.6% | | | | | | | | |
| Atlas Copco AB - A Shares (a) | | | 92,300 | | | | 3,983,271 | |
| Other Securities (a) (b) | | | | | | | 1,629,137 | |
| | | | | | | | 5,612,408 | |
| Switzerland — 6.2% | | | | | | | | |
| Chubb Ltd. | | | 31,580 | | | | 4,614,785 | |
| Nestlé S.A. (a) | | | 56,987 | | | | 4,900,133 | |
| Roche Holdings AG (a) (c) | | | 12,087 | | | | 3,056,639 | |
| Sika AG (a) | | | 332 | | | | 2,634,412 | |
| Other Securities (a) (b) (f) | | | | | | | 6,862,506 | |
| | | | | | | | 22,068,475 | |
| Taiwan — 1.7% | | | | | | | | |
| Taiwan Semiconductor Manufacturing Co. Ltd. - ADR (f) | | | 105,071 | | | | 4,166,065 | |
| Other Securities (a) (b) (f) | | | | | | | 1,801,975 | |
| | | | | | | | 5,968,040 | |
See Notes to Financial Statements.
50
Wilshire Mutual Funds, Inc. Wilshire International Equity Fund Condensed Schedule of Investments - (Continued) | December 31, 2017 |
|
| | | Shares | | | Value | |
| COMMON STOCKS — 96.4% (Continued) |
| Thailand — 0.1% | | | | | | |
| Other Securities (a) (b) | | | | | | $ | 184,703 | |
| | | | | | | | | |
| Turkey — 0.1% | | | | | | | | |
| Other Securities (a) (b) | | | | | | | 472,600 | |
| | | | | | | | | |
| United Kingdom — 10.0% | | | | | | | | |
| BHP Billiton plc (a) | | | 186,259 | | | | 3,765,959 | |
| British American Tobacco plc (a) | | | 63,402 | | | | 4,285,600 | |
| Compass Group plc (a) | | | 209,024 | | | | 4,506,706 | |
| HSBC Holdings plc - ADR (f) | | | 48,374 | | | | 2,498,034 | |
| Reckitt Benckiser Group plc (a) | | | 55,477 | | | | 5,175,282 | |
| Royal Dutch Shell plc - Class A - ADR (f) | | | 37,967 | | | | 2,532,779 | |
| Other Securities (a) (b) (f) | | | | | | | 12,880,085 | |
| | | | | | | | 35,644,445 | |
| United States — 0.1% | | | | | | | | |
| Other Securities (b) (f) | | | | | | | 519,394 | |
| | | | | | | | | |
| Total Common Stocks (Cost $277,042,617) | | | | | | | 342,640,611 | |
| | | | | | | | | |
| PREFERRED STOCKS — 0.3% | | | | | | | | |
| Brazil — 0.2% | | | | | | | | |
| Other Securities (a) (b) | | | 57,900 | | | | 672,466 | |
| | | | | | | | | |
| Korea (Republic of) — 0.1% | | | | | | | | |
| Other Securities (a) (b) | | | | | | | 316,569 | |
| | | | | | | | | |
| Total Preferred Stocks (Cost $850,747) | | | | | | | 989,035 | |
| | | | | | | | | |
| RIGHTS — 0.0% (d) | | | | | | | | |
| Other Securities (b) (Cost $—) | | | | | | | 11,588 | |
| | | | | | | | | |
| MONEY MARKET FUNDS — 4.4% |
| Northern Trust Institutional Government Select Portfolio - Institutional Class, 1.13%(e) | | | 10,252,870 | | | | 10,252,870 | |
| Northern Trust Institutional Liquid Asset Portfolio - Institutional Class, 1.09%(e) (g) | | | 5,530,010 | | | | 5,530,010 | |
| | | | | | | | | |
| Total Money Market Funds (Cost $15,782,880) | | | | | | | 15,782,880 | |
| | | | | | | | | |
| Total Investments at Value — 101.1% (Cost $293,676,244) | | | | | | | 359,424,114 | |
| | | | | | | | | |
| Liabilities in Excess of Other Assets — (1.1%) | | | | | | | (4,112,086 | ) |
| | | | | | | | | |
| Net Assets — 100.0% | | | | | | $ | 355,312,028 | |
The Condensed Schedule of Investments does not reflect the complete portfolio holdings. It includes the Fund’s 50 largest holdings and each investment of any issuer that exceeds 1% of the Fund’s net assets. “Other Securities” represent all issues not required to be disclosed under the rules adopted by the U.S. Securities and Exchange Commission (“SEC”). The complete schedule of portfolio holdings is available (i) without charge, upon request, by calling (800)607-2200; (ii) on the SEC’s website at http://www.sec.gov; and (iii) on our website at http://advisor.wilshire.com.
ADR — American Depositary Receipt.
(a) | Level 2 security (Note 2). |
(b) | Represents issuers not identified as a top 50 holding in terms of market value and issues or issuers not exceeding 1% of net assets individually or in the aggregate, respectively, as of December 31, 2017. |
(c) | Non-income producing security. |
(d) | Percentage rounds to less than 0.1% |
(e) | The rate shown is the 7-day effective yield as of December 31, 2017. |
(f) | This security or a partial position of this security is on loan at December 31, 2017. The total value of securities on loan at December 31, 2017 was $19,812,414 (Note 7). |
(g) | This security was purchased with cash collateral held from securities on loan. The total value of such securities as of December 31, 2017 was $5,530,010. Securities on loan are also collateralized by various U.S. Treasury obligations in the amount of $14,820,487 (Note 7). |
See Notes to Financial Statements.
51
Wilshire Mutual Funds, Inc. Wilshire Income Opportunities Fund Schedule of Investments | December 31, 2017 |
|
| | | Par Value | | | Value | |
| U.S. TREASURY OBLIGATIONS — 12.6% |
| U.S. Treasury Bills — 1.2% |
| 1.259%, due 03/08/18 (a) | | $ | 3,540,000 | | | $ | 3,531,731 | |
| 1.463%, due 06/07/18 (a) | | | 300,000 | | | | 298,092 | |
| | | | | | | | 3,829,823 | |
| U.S. Treasury Bonds — 1.9% | | | | | | | | |
| 2.250%, due 10/31/24 | | | 1,110,000 | | | | 1,104,884 | |
| 2.750%, due 11/15/42 | | | 1,470,000 | | | | 1,479,302 | |
| 3.625%, due 08/15/43 | | | 1,100,000 | | | | 1,283,820 | |
| 2.875%, due 08/15/45 | | | 1,890,000 | | | | 1,938,284 | |
| | | | | | | | 5,806,290 | |
| U.S. Treasury Notes — 6.2% | | | | | | | | |
| 0.750%, due 10/31/18 | | | 2,890,000 | | | | 2,866,180 | |
| 1.250%, due 11/30/18 | | | 1,920,000 | | | | 1,910,625 | |
| 1.125%, due 01/15/19 | | | 950,000 | | | | 943,098 | |
| 1.125%, due 09/30/21 | | | 670,000 | | | | 646,471 | |
| 1.250%, due 10/31/21 | | | 1,630,000 | | | | 1,579,063 | |
| 1.750%, due 11/30/21 | | | 1,600,000 | | | | 1,577,688 | |
| 2.000%, due 12/31/21 | | | 1,580,000 | | | | 1,571,977 | |
| 1.875%, due 01/31/22 | | | 1,600,000 | | | | 1,583,375 | |
| 1.750%, due 03/31/22 | | | 1,930,000 | | | | 1,898,336 | |
| 1.875%, due 08/31/24 | | | 1,330,000 | | | | 1,294,204 | |
| 2.125%, due 09/30/24 | | | 1,610,000 | | | | 1,589,749 | |
| 2.375%, due 05/15/27 | | | 550,000 | | | | 548,432 | |
| 2.250%, due 08/15/27 | | | 1,610,000 | | | | 1,587,359 | |
| | | | | | | | 19,596,557 | |
| U.S. Treasury Inflation-Protected Notes — 0.7% |
| 0.125%, due 04/15/22 | | | 2,282,130 | | | | 2,266,059 | |
| | | | | | | | | |
| U.S. Treasury Strips — 2.6% | | | | | | | | |
| 3.140%, due 11/15/44 (a) | | | 8,230,000 | | | | 3,907,005 | |
| 2.959%, due 11/15/46 (a) | | | 9,815,000 | | | | 4,386,236 | |
| | | | | | | | 8,293,241 | |
| Total U.S. Treasury Obligations (Cost $39,215,201) | | | | | | | 39,791,970 | |
| | | | | | | | | |
| U.S. GOVERNMENT AGENCY OBLIGATIONS — 3.7% |
| Federal Home Loan Bank — 0.3% | | | | | | | | |
| 1.241%, due 01/05/18 (a) | | | 1,000,000 | | | | 999,862 | |
| | | | | | | | | |
| Federal Home Loan Mortgage Corp. — 1.3% |
| 2.874%, due 09/15/29 (a) | | | 3,000,000 | | | | 2,124,851 | |
| 3.068%, due 12/14/29 (a) | | | 1,450,000 | | | | 1,016,628 | |
| 4.288%, due 03/15/31 (a) | | | 1,250,000 | | | | 837,210 | |
| | | | | | | | 3,978,689 | |
| Federal National Mortgage Association — 1.6% |
| 2.948%, due 05/15/29 (a) | | | 3,700,000 | | | | 2,639,944 | |
| 3.018%, due 01/15/30 (a) | | | 775,000 | | | | 541,384 | |
| 3.075%, due 05/15/30 (a) | | | 2,900,000 | | | | 1,999,407 | |
| | | | | | | | 5,180,735 | |
| Tennessee Valley Authority — 0.5% | | | | | | | | |
| 5.375%, due 04/01/56 | | | 410,000 | | | | 582,087 | |
| 4.250%, due 09/15/65 | | | 700,000 | | | | 827,577 | |
| | | | | | | | 1,409,664 | |
| Total U.S. Government Agency Obligations (Cost $11,500,303) | | | | | | | 11,568,950 | |
| | | | | | | | | |
| AGENCY MORTGAGE-BACKED OBLIGATIONS — 9.7% |
| Federal Home Loan Mortgage Corp. — 3.6% |
| Series K070, Class A2, 3.303%, due 11/25/27 (b) | | | 1,300,000 | | | | 1,344,713 | |
| Series 4249, Class CS, 4.300%, due 09/15/43 | | | 1,303,316 | | | | 1,134,254 | |
| Series 4355, Class ZX, 4.000%, due 05/15/44 | | | 5,175,027 | | | | 5,517,749 | |
| Series 2015-R1, Class B1, 144A, 2.660% due 11/01/55 (b) | | | 977,433 | | | | 1,100,223 | |
| Series 17-3, Class MT, 2.999%, due 07/25/56 (b) | | | 978,805 | | | | 960,823 | |
| Series 17-4, Class HT, 2.250%, due 06/25/57 (b) | | | 1,600,000 | | | | 1,594,150 | |
| | | | | | | | 11,651,912 | |
| Federal Home Loan Mortgage Corp. Interest-Only Strips — 0.3% |
| Series K-722, Class X1, 1.442%, due 03/01/23 (b) | | | 2,266,072 | | | | 125,631 | |
| Series 4077, Class TS, 4.749% (1MO LIBOR + 600), due 05/15/41 (b) | | | 1,618,980 | | | | 216,874 | |
| Series 3966, Class SA, 4.649% (1MO LIBOR + 590), due 12/15/41 (b) | | | 2,229,907 | | | | 297,554 | |
| Series 4089, Class SH, 4.749% (1MO LIBOR + 600), due 08/15/42 (b) | | | 1,788,033 | | | | 268,330 | |
| | | | | | | | 908,389 | |
| Federal National Mortgage Association — 5.3% |
| Series KGX1, Class AFX, 2.999%, due 10/25/27 (b) | | | 1,500,000 | | | | 1,500,416 | |
| Pool #FN AN7918, 3.010%, due 12/01/27 | | | 1,600,000 | | | | 1,615,430 | |
| Pool #FN AN6349, 2.990%, due 09/01/29 | | | 500,000 | | | | 498,162 | |
See Notes to Financial Statements.
52
Wilshire Mutual Funds, Inc. Wilshire Income Opportunities Fund Schedule of Investments - (continued) | December 31, 2017 |
|
| | | Par Value | | | Value | |
| AGENCY MORTGAGE-BACKED OBLIGATIONS — 9.7% (Continued) |
| Federal National Mortgage Association — 5.3% (Continued) |
| Pool #FN AN6807, 2.960%, due 11/01/29 | | $ | 500,000 | | | $ | 495,898 | |
| Pool #FN AN7885, 3.000%, due 12/01/29 | | | 1,000,000 | | | | 998,559 | |
| Pool #FN AN7889, 3.120%, due 01/01/30 (c) | | | 1,000,000 | | | | 1,011,527 | |
| Pool #FN AN7947, 3.160%, due 01/01/30 (c) | | | 1,600,000 | | | | 1,613,976 | |
| TBA, 3.170%, due 01/01/30 | | | 850,000 | | | | 858,766 | |
| TBA, 3.220%, due 01/01/30 | | | 650,000 | | | | 659,953 | |
| TBA, 3.230%, due 01/01/30 | | | 1,000,000 | | | | 1,021,797 | |
| TBA, 3.030%, due 02/01/30 (c) | | | 800,000 | | | | 799,741 | |
| Pool #FN AN6651, 2.940%, due 10/01/32 | | | 1,445,897 | | | | 1,428,710 | |
| Pool #FN AN6696, 3.120%, due 10/01/32 (c) | | | 500,000 | | | | 496,405 | |
| TBA, 3.250%, due 01/01/33 | | | 1,000,000 | | | | 1,008,125 | |
| Series 2016-75, Class ZP, 3.000%, due 10/25/46 | | | 1,419,855 | | | | 1,260,792 | |
| TBA, 3.030%, due 12/01/47 | | | 1,500,000 | | | | 1,500,938 | |
| | | | | | | | 16,769,195 | |
| Federal National Mortgage Association Interest-Only Strips — 0.5% |
| Series 2011-124, Class NS, 5.172% (1MO LIBOR + 650), due 12/25/41 (b) | | | 1,910,865 | | | | 307,256 | |
| Series 2012-20, Class SA, 4.897% (1MO LIBOR + 645), due 03/25/42 (b) | | | 1,797,200 | | | | 271,225 | |
| Series 2012-76, Class SC, 4.447% (1MO LIBOR + 600), due 07/25/42 (b) | | | 856,994 | | | | 133,339 | |
| Series 2014-28, Class SD, 4.722% (1MO LIBOR + 650), due 05/25/44 (b) | | | 5,921,575 | | | | 901,279 | |
| | | | | | | | 1,613,099 | |
| Total Agency Mortgage-Backed Obligations (Cost $31,715,527) | | | | | | | 30,942,595 | |
| | | | | | | | | |
| NON-AGENCY MORTGAGE-BACKED OBLIGATIONS — 15.3% |
| A10, LLC, Series 2016-1, Class A-1, 2.420%, due 03/15/35 | | | 25,601 | | | | 25,636 | |
| Alliance Bancorp Trust, Series 2007-OA1, Class A-1, 1.568% (1MO LIBOR + 24), due 07/25/37 (b) | | | 1,063,508 | | | | 866,804 | |
| American Home Mortgage Assets, Series 2006-4, Class I-A1-1, 1.517% (1MO LIBOR + 19), due 10/25/46 (b) | | | 1,145,203 | | | | 835,174 | |
| American Home Mortgage Assets, Series 2006-6, Class A-1-A, 1.518% (1MO LIBOR + 19), due 12/25/46 (b) | | | 795,909 | | | | 667,156 | |
| Americold, LLC Trust, Series 2010-ART, Class C, 6.811%, due 01/14/29 | | | 50,000 | | | | 54,604 | |
| Arbor Realty Commercial Real Estate, Series 2016-FL1, Class B, 4.200% (1MO LIBOR + 295), due 09/15/26 (b) | | | 302,000 | | | | 305,997 | |
| Atrium Hotel Portfolio Trust, Series 2017-ATRM, Class E, 144A, 4.528%, due 11/15/19 (b) | | | 94,000 | | | | 93,891 | |
| Barclays Commercial Mortgage Securities, Series 2014-BX0, Class E, 3.811% (1MO LIBOR + 375), due 08/15/27 (b) | | | 236,000 | | | | 236,669 | |
| Bayview Opportunity Master Fund, Series 2017-RN1, Class A-1, 3.597%, due 02/28/32 (b) | | | 302,603 | | | | 302,610 | |
| BCAPB, LLC Trust, Series 2007-AB1, Class A-5, 5.010%, due 03/25/37 (b) | | | 4,451,761 | | | | 3,060,826 | |
| Bear Stearns Adjustable Rate Mortgage Trust, Series 2004-10, Class I-M-1, 3.564%, due 01/25/35 (b) | | | 656,250 | | | | 646,300 | |
| CFCRE Commercial Mortgage Trust, Series 2016-C4, Class C, 4.878%, due 05/10/58 | | | 120,000 | | | | 123,820 | |
| CIM Trust, Series 2016-1, Class B2, 9.707%, due 07/26/55 (b) | | | 1,000,000 | | | | 933,100 | |
| CIM Trust, Series 2016-2, Class B2, 9.363%, due 02/01/56 (b) | | | 1,000,000 | | | | 915,323 | |
| CIM Trust, Series 2016-3, Class B2, 12.173%, due 02/27/56 | | | 1,000,000 | | | | 898,846 | |
| Citigroup Commercial Mortgage Trust, Series 2008-C7, Class A-MA, 6.421%, due 12/10/49 (b) | | | 120,000 | | | | 119,275 | |
| Citigroup Commercial Mortgage Trust, Series 2008-C7, Class A-M, 6.421%, due 12/10/49 (b) | | | 287,646 | | | | 288,095 | |
| Citi-Mortgage Alternative Loan Trust, Series 2006-A1, Class IA-6, 6.000%, due 04/25/36 | | | 2,980,232 | | | | 2,849,938 | |
| Citi-Mortgage Alternative Loan Trust, Series 2007-A5, Class IA-6, 6.000%, due 05/25/37 (b) | | | 3,257,456 | | | | 3,052,329 | |
See Notes to Financial Statements.
53
Wilshire Mutual Funds, Inc. Wilshire Income Opportunities Fund Schedule of Investments - (continued) | December 31, 2017 |
|
| | | Par Value | | | Value | |
| NON-AGENCY MORTGAGE-BACKED OBLIGATIONS — 15.3% (Continued) |
| CLNS Trust, Series 2017-IKPR, Class D, 3.294% (1MO LIBOR + 205), due 06/11/32 (b) | | $ | 84,000 | | | $ | 84,079 | |
| CLNS Trust, Series 2017-IKPR, Class E, 4.744% (1MO LIBOR + 350), due 06/11/32 (b) | | | 84,000 | | | | 84,184 | |
| CLNS Trust, Series 2017-IKPR, Class F, 5.744% (1MO LIBOR + 450), due 06/11/32 (b) | | | 84,000 | | | | 84,289 | |
| Commercial Mortgage Trust, Series 2012-CCRE4, Class C, 4.442%, due 10/15/45 | | | 69,000 | | | | 62,933 | |
| Countrywide Alternative Loan, Inc., Series 2007-16CB, Class 5-A-4, 6.250%, due 08/25/37 (b) | | | 813,787 | | | | 708,124 | |
| Countrywide Alternative Loan, Inc., Series 2007-OA7, Class A-1-A, 1.507% (1MO LIBOR + 18), due 05/25/47 (b) | | | 984,320 | | | | 955,715 | |
| Countrywide Asset Backed Securities, Inc., Series 2006-6, Class 1-A-1, 1.498% (1MO LIBOR + 175), due 09/25/36 (b) | | | 1,735,114 | | | | 1,632,056 | |
| Countrywide Home Loan Mortgage Trust, Series 2007-HY5, Class 3-A-1, 3.367%, due 09/25/37 (b) | | | 2,419,660 | | | | 2,283,796 | |
| Credit Suisse Commercial Mortgage Trust, Series 2014-WIN2, Class A-3, 3.500%, due 10/25/44 | | | 578,250 | | | | 587,195 | |
| Credit Suisse Commercial Mortgage Trust, Series 2016-PR1, Class A-1, 5.500%, due 07/25/56 (b) | | | 787,872 | | | | 776,882 | |
| Credit Suisse Mortgage Trust, Series 2017-CHOP, Class E, 4.550% (1MO LIBOR + 330), due 07/15/32 (b) | | | 169,000 | | | | 169,419 | |
| Credit Suisse Mortgage Trust, Series 2017-LSTK, Class E, 3.441%, due 04/05/33 (b) | | | 170,000 | | | | 168,358 | |
| Deutsche Bank Alt-A Securities, Series 2006-AF1, Class A-4, 1.628% (3MO LIBOR + 30), due 04/25/36 (b) | | | 921,183 | | | | 827,540 | |
| Dryden Senior Loan Fund, Series 14-33A, Class DR, 144A, 5.709%, due 10/15/28 (b) | | | 500,000 | | | | 513,386 | |
| First Franklin Mortgage Trust, Series 2004-FF10, Class M-1, 2.603% (1MO LIBOR + 127.50), due 07/25/34 (b) | | | 561,253 | | | | 569,054 | |
| FirstKey Mortgage Trust, Series 2014-1, Class A-8, 3.500%, due 11/25/44 | | | 412,327 | | | | 418,965 | |
| Fort CRE, LLC, Series 2016-1, Class B, 3.250%, due 05/21/36 | | | 181,000 | | | | 181,406 | |
| GAHR Commercial Mortgage Trust, Series 2015-NRF, Class G-FX, 3.494%, due 12/15/34 (b) | | | 581,224 | | | | 570,626 | |
| GCAT, LLC, Series 2017-1, Class A-1, 144A, 3.375%, due 03/25/47 | | | 350,001 | | | | 349,787 | |
| GE Business Loan Trust, Series 2007-1, Class C, 1.927% (1MO LIBOR + 45), due 04/16/35 (b) | | | 551,672 | | | | 507,844 | |
| GMAC Commercial Mortgage Securities, Series 2004-C3, Class D, 5.043%, due 12/10/41 (b) | | | 96,000 | | | | 97,085 | |
| GMAC Commercial Mortgage Securities, Series 2004-C3, Class E, 5.141%, due 12/10/41 (b) | | | 160,000 | | | | 157,795 | |
| Goldman Sachs Mortgage Securities Trust, Series 2013-GC13, Class D, 4.225%, due 07/10/46 (b) | | | 60,000 | | | | 55,465 | |
| GSAA Home Equity Trust, Series 2005-6, Class M-1, 1.758% (1MO LIBOR + 43), due 06/25/35 (b) | | | 1,300,000 | | | | 1,192,343 | |
| GSAA Home Equity Trust, Series 2007-7, Class A4, 1.598%, due 07/25/37 (b) | | | 816,461 | | | | 776,855 | |
| Harborview Mortgage Loan Trust, Series 2006-14, Class 2A-1A, 1.432% (1MO LIBOR + 15), due 01/25/47 (b) | | | 968,838 | | | | 876,217 | |
| IMT Trust, Series 2017-APTS, Class EFL, 3.627% (1MO LIBOR + 215), due 06/15/34 (b) | | | 56,000 | | | | 55,931 | |
| IMT Trust, Series 2017-APTS, Class FFL, 4.327% (1MO LIBOR + 285), due 06/15/34 (b) | | | 56,000 | | | | 55,955 | |
| JPMBB Commercial Mortgage Securities Trust, Series 2013-C15, Class D, 5.250%, due 11/15/45 (b) | | | 84,000 | | | | 82,251 | |
See Notes to Financial Statements.
54
Wilshire Mutual Funds, Inc. Wilshire Income Opportunities Fund Schedule of Investments - (continued) | December 31, 2017 |
|
| | | Par Value | | | Value | |
| NON-AGENCY MORTGAGE-BACKED OBLIGATIONS — 15.3% (Continued) |
| JPMCC Commercial Mortgage Securities Trust, Series 2014-FRR1, Class B702, 144A, 4.234%, due 04/27/44 | | $ | 168,000 | | | $ | 166,833 | |
| JPMCC Commercial Mortgage Trust, Series 2016-ASH, Class B, 3.400% (1MO LIBOR + 215), due 10/15/34 (b) | | | 115,000 | | | | 115,413 | |
| JPMCC Commercial Mortgage Trust, Series 2016-ASH, Class C, 4.000% (1MO LIBOR + 275), due 10/15/34 (b) | | | 65,000 | | | | 65,309 | |
| JPMCC RE-REMIC Trust, Series 2014-FRR1, Class A-K707, 4.347%, due 01/27/47 | | | 181,000 | | | | 180,871 | |
| JPMorgan Chase Commercial Mortgage, Series 2015-MAR7, Class D, 144A, 5.227%, due 06/05/32 (b) | | | 113,000 | | | | 114,765 | |
| JPMorgan Chase Commercial Mortgage, Series 2017-MAUI, Class C, 144A, 2.500% (1MO LIBOR + 125), due 07/15/34 (b) | | | 43,000 | | | | 43,000 | |
| JPMorgan Chase Commercial Mortgage, Series 2017-MAUI, Class D, 3.200% (1MO LIBOR + 195), due 07/15/34 (b) | | | 40,000 | | | | 40,013 | |
| JPMorgan Chase Commercial Mortgage, Series 2017-MAUI, Class E, 144A, 4.200% (1MO LIBOR + 295), due 07/15/34 (b) | | | 36,000 | | | | 36,012 | |
| JPMorgan Chase Commercial Mortgage, Series 2017-MAUI, Class F, 144A, 5.000% (1MO LIBOR + 375), due 07/15/34 (b) | | | 50,000 | | | | 50,032 | |
| JPMorgan Chase Commercial Mortgage, Series 2015-JP1, Class F, 4.900%, due 01/15/49 (b) | | | 240,000 | | | | 177,926 | |
| JPMorgan Chase Commercial Mortgage, Series 2007-LDPX, Class A-M, 5.464%, due 01/15/49 (b) | | | 51,361 | | | | 51,500 | |
| JPMorgan Chase Commercial Trust, Series 2016-WPT, Class E, 6.250% (1MO LIBOR + 500), due 10/15/33 (b) | | | 181,000 | | | | 182,300 | |
| JPMorgan Commercial Mortgage Trust, Series 2004-CIBC10, Class D, 5.097%, due 01/12/37 | | | 189,000 | | | | 192,024 | |
| JPMorgan Commercial Mortgage Trust, Series 2006-LDP9, Class A-MS, 5.337%, due 05/15/47 | | | 176,000 | | | | 176,107 | |
| LSTAR Commercial Mortgage Trust, Series 2016-4, Class C, 4.701%, due 03/10/49 | | | 274,000 | | | | 252,898 | |
| Luminent Mortgage Trust, Series 2006-2, Class A-1-A, 1.528% (1MO LIBOR + 20), due 02/25/46 (b) | | | 1,380,338 | | | | 1,118,344 | |
| Merrill Lynch Mortgage Trust, Series 2007-C1, Class A-M, 6.006%, due 06/12/50 (b) | | | 181,000 | | | | 181,861 | |
| Morgan Stanley BAML Trust, Series 2014-C19, Class LNC-3, 4.749%, due 12/15/46 (b) (c) | | | 990,347 | | | | 1,006,106 | |
| Morgan Stanley BAML Trust, Series 2014-C17, Class C, 4.607%, due 08/15/47 (b) | | | 117,000 | | | | 116,259 | |
| Morgan Stanley BAML Trust, Series 2015-C20, Class D, 3.071%, due 02/15/48 (b) | | | 232,000 | | | | 179,437 | |
| Morgan Stanley Capital I Trust, Series 2006-NC1, Class M-1, 1.708% (1MO LIBOR + 380), due 12/25/35 (b) | | | 1,000,000 | | | | 974,369 | |
| Morgan Stanley REMIC Trust, Series 2010-R5, Class 4-B, 2.558%, due 06/26/36 (b) | | | 766,042 | | | | 647,047 | |
| PR Mortgage Loan Trust, Series 2014-1, Class APT, 5.913%, due 10/25/49 (b) | | | 2,189,687 | | | | 2,027,450 | |
| Rait Trust, Series 2017-FL7, Class B, 2.838% (1MO LIBOR + 160), due 06/15/37 (b) | | | 169,000 | | | | 169,000 | |
| Residential Accredited Loans, Inc., Series 2006-QS15, Class A-3, 6.500%, due 10/25/36 | | | 1,287,104 | | | | 1,196,388 | |
| Residential Accredited Loans, Inc., Series 2006-QO2, Class A-1, 1.548% (1MO LIBOR + 22), due 02/25/46 (b) | | | 2,041,903 | | | | 900,398 | |
| Residential Accredited Loans, Inc., Series 2006-Q05, Class I-A-1, 1.543% (1MO LIBOR + 21.50), due 05/25/46 (b) | | | 1,071,532 | | | | 997,032 | |
| Resource Capital Corp. Ltd., Series 2017-CRE5, Class B, 144A, 3.477% (1MO LIBOR + 200), due 07/15/34 (b) | | | 130,000 | | | | 130,000 | |
See Notes to Financial Statements.
55
Wilshire Mutual Funds, Inc. Wilshire Income Opportunities Fund Schedule of Investments - (continued) | December 31, 2017 |
|
| | | Par Value | | | Value | |
| NON-AGENCY MORTGAGE-BACKED OBLIGATIONS — 15.3% (Continued) |
| Stanwich Mortgage Loan Trust, Series 2017-NPA1, Class A-1, 3.597%, due 03/16/22 (b) | | $ | 412,683 | | | $ | 413,152 | |
| Structured Asset Investment Loan, Series 2005-11, Class A7, 2.048% (1MO LIBOR + 36), due 01/25/36 (b) | | | 715,988 | | | | 708,351 | |
| UBS-Citigroup Commercial Mortgage Trust, Series 2011-C1, Class D, 6.250%, due 01/10/45 (b) | | | 142,000 | | | | 152,664 | |
| Velocity Commercial Capital Loan Trust, Series 2016-1, Class A-FX, 3.533%, due 04/25/46 | | | 302,764 | | | | 303,505 | |
| Wachovia Asset Securitization, Series 2007-HE2, Class A, 1.458% (1MO LIBOR + 13), due 07/25/37 (b) | | | 1,631,967 | | | | 1,498,205 | |
| Wachovia Asset Securitization, Series 2007-HE1, Class A, 1.468% (1MO LIBOR + 14), due 07/25/37 (b) | | | 1,361,456 | | | | 1,298,363 | |
| Wachovia Bank Commercial Mortgage Trust, Series 2006-C25, Class F, 5.364%, due 05/15/43 (b) | | | 92,595 | | | | 92,510 | |
| Wachovia Bank Commercial Mortgage Trust, Series 2006-C26, Class A-M, 6.200%, due 06/15/45 (b) | | | 24,713 | | | | 24,839 | |
| Wachovia Bank Commercial Mortgage Trust, Series 2006-C27, Class A-J, 5.825%, due 07/15/45 | | | 56,326 | | | | 56,575 | |
| Wachovia Bank Commercial Mortgage Trust, Series 2006-C28, Class A-J, 5.632%, due 10/15/48 | | | 102,179 | | | | 102,759 | |
| Wachovia Bank Commercial Mortgage Trust, Series 2007-C33, Class AJ, 6.205%, due 02/15/51 (b) | | | 175,000 | | | | 177,923 | |
| Waldorf Astoria Boca Raton Trust, Series 2016-BOCA, Class B, 3.300% (1MO LIBOR + 205), due 06/15/29 (b) | | | 148,000 | | | | 148,228 | |
| Waldorf Astoria Boca Raton Trust, Series 2016-BOCA, Class C, 3.750% (1MO LIBOR + 205), due 06/15/29 (b) | | | 125,000 | | | | 125,193 | |
| Wells Fargo Commercial Mortgage Trust, Series 2016-C34, Class C, 5.029%, due 06/15/49 | | | 141,000 | | | | 146,510 | |
| WF-RBS Commercial Mortgage Trust, Series 2012-C6, Class D, 5.766%, due 04/15/45 (b) | | | 89,000 | | | | 87,701 | |
| Winwater Mortgage Loan Trust, Series 2016-1, Class 2A-3, 3.000%, due 12/20/30 | | | 351,047 | | | | 348,785 | |
| | | | | | | | | |
| Total Non-Agency Mortgage-Backed Obligations (Cost $47,282,424) | | | | | | | 48,335,885 | |
| | | | | | | | | |
| NON-AGENCY MORTGAGE-BACKED OBLIGATION INTEREST-ONLY STRIPS — 2.8% |
| American Home Mortgage Assets Trust, Series 2007-1, Class IO-P, 2.078%, due 05/25/47 (b) | | | 7,678,535 | | | | 1,554,138 | |
| Barclays Commercial Mortgage Securities Trust, Series 2017-C1, Class X-A, 1.691%, due 02/01/27 (b) | | | 1,975,607 | | | | 201,808 | |
| BofA Merrill Lynch Commercial Mortgage Trust, Series 2016-UBS10, Class X-A, 2.161%, due 06/15/49 (b) | | | 1,109,432 | | | | 115,237 | |
| CD Commercial Mortgage Trust, Series 2016-CD1, Class X-A, 1.571%, due 08/10/26 (b) | | | 1,981,166 | | | | 181,391 | |
| CD Commercial Mortgage Trust, Series 2017-CD4, Class X-A, 1.482%, due 05/01/50 (b) | | | 1,757,938 | | | | 158,379 | |
| CFCRE Commercial Mortgage Trust, Series 2017-C8, Class X-A, 1.841%, due 06/15/50 (b) | | | 1,430,561 | | | | 163,089 | |
| CFCRE Commercial Mortgage Trust, Series 2016-C4, Class X-A, 1.915%, due 05/10/58 (b) | | | 1,281,280 | | | | 132,728 | |
| Citigroup Commercial Mortgage Trust, Series 2016-P4, Class X-A, 2.165%, due 08/10/26 (b) | | | 1,227,367 | | | | 150,555 | |
| Citigroup Commercial Mortgage Trust, Series 2016-GC37, Class X-A, 1.805%, due 04/10/49 (b) | | | 3,811,317 | | | | 430,666 | |
| Citigroup Commercial Mortgage Trust, Series 2016-C1, Class X-A, 2.099%, due 05/10/49 (b) | | | 1,165,428 | | | | 140,993 | |
| Citigroup Commercial Mortgage Trust, Series 2016-C2, Class X-A, 1.938%, due 08/10/49 (b) | | | 1,884,656 | | | | 221,879 | |
See Notes to Financial Statements.
56
Wilshire Mutual Funds, Inc. Wilshire Income Opportunities Fund Schedule of Investments - (continued) | December 31, 2017 |
|
| | | Par Value | | | Value | |
| NON-AGENCY MORTGAGE-BACKED OBLIGATION INTEREST-ONLY STRIPS — 2.8% (Continued) |
| Commercial Mortgage Trust, Series 2013-CCRE12, Class X-A, 1.490%, due 10/01/46 (b) | | $ | 3,868,865 | | | $ | 197,315 | |
| ommercial Mortgage Trust, Series 2015-LC21, Class X-A, 0.993%, due 07/10/48 (b) | | | 1,897,794 | | | | 76,219 | |
| CSAIL Commercial Mortgage Trust, Series 2016-C6, Class X-A, 1.967%, due 01/15/49 (b) | | | 987,768 | | | | 103,202 | |
| Goldman Sachs Mortgage Securities Trust, Series 2013-GC10, Class X-A, 1.706%, due 01/10/23 (b) | | | 2,261,454 | | | | 137,706 | |
| Goldman Sachs Mortgage Securities Trust, Series 2016-GS2, Class X-A, 1.817%, due 05/10/49 (b) | | | 1,037,955 | | | | 102,356 | |
| JPMCC Commercial Mortgage Trust, Series 2016-JP2, Class X-A, 2.008%, due 08/15/49 (b) | | | 1,926,372 | | | | 225,231 | |
| JPMDB Commercial Mortgage Securities, Series 2016-C2, Class X-A, 1.858%, due 06/01/49 (b) | | | 1,252,370 | | | | 114,950 | |
| LSTAR Commercial Mortgage Trust, Series 2016-4, Class X-A, 2.104%, due 03/01/49 (b) | | | 1,615,215 | | | | 120,640 | |
| LSTAR Commercial Mortgage Trust, Series 2017-5, Class X, 1.391%, due 03/10/50 (b) | | | 2,962,970 | | | | 147,474 | |
| Morgan Stanley BofA Mortgage Loan Trust, Series 2014-C19, Class X-A, 1.275%, due 12/01/47 (b) | | | 3,474,815 | | | | 164,312 | |
| Morgan Stanley BofA Mortgage Loan Trust, Series 2015-C27, Class X-A, 1.170%, due 12/15/47 (b) | | | 25,805,681 | | | | 1,506,327 | |
| Morgan Stanley Capital I Trust, Series 2016-UBS11, Class X-A, 1.805%, due 08/15/49 (b) | | | 5,775,069 | | | | 559,700 | |
Morgan Stanley Capital I Trust, Series 2016-UB12, Class X-A, 0.963%,
due 12/15/49 (b) | | | 3,242,721 | | | | 161,446 | |
| SG Commercial Mortgage Securities Trust, Series 2016-C5, Class X-A, 2.180%, due 10/01/48 (b) | | | 8,092,822 | | | | 952,649 | |
| Wells Fargo Commercial Mortgage Trust, Series 2016-C35, Class X-A, 2.154%, due 07/15/48 (b) | | | 6,800,276 | | | | 854,504 | |
| | | | | | | | | |
| Total Non-Agency Mortgage-Backed Obligation Interest-Only Strips (Cost $8,177,422) | | | | | | | 8,874,894 | |
| | | | | | | | | |
| ASSET-BACKED SECURITIES — 12.3% |
| AABS Ltd., Series 2013-1, Class A, 4.875%, due 01/15/38 | | | 343,622 | | | | 347,015 | |
| Anchorage Credit Funding Ltd., Series 2016-3A, Class A, 3.850%, due 10/28/33 | | | 1,000,000 | | | | 994,746 | |
| Anchorage Credit Funding Ltd., Series 2016-4A, Class A, 3.500%, due 02/15/35 | | | 2,000,000 | | | | 1,982,338 | |
| Apollo Aviation Securitization Equity Trust, Series 2014-1, Class A, 5.125%, due 12/15/29 | | | 975,722 | | | | 975,722 | |
| Apollo Aviation Securitization Equity Trust, Series 2014-1, Class B, 7.375%, due 12/15/29 | | | 493,142 | | | | 493,142 | |
| Apollo Aviation Securitization Equity Trust, Series 2016-1A, Class A, 4.875%, due 03/17/36 (b) | | | 825,000 | | | | 840,064 | |
| Apollo Aviation Securitization Equity Trust, Series 2016-2, Class A, 4.212%, due 11/15/41 | | | 1,534,590 | | | | 1,540,197 | |
| Arcadia Receivables Credit Trust, Series 2017-1, Class A, 144A, 3.250%, due 06/15/23 | | | 206,501 | | | | 207,155 | |
| Benefit Street Partners, Series 2017-FL2, Class A, 144A, 2.070%, due 10/01/34 (b) | | | 1,000,000 | | | | 996,660 | |
| Capital Automotive REIT, Series 2017-1, Class A-1, 144A, 3.870%, due 04/15/47 (b) | | | 1,887,333 | | | | 1,913,736 | |
| Castle Air Securities Trust, Series 2015-1, Class A, 4.703%, due 12/15/40 | | | 984,053 | | | | 988,980 | |
| Castlelake Aircraft Securitization, Series 2017-1, Class A, 3.966%, due 07/15/42 (b) | | | 1,249,710 | | | | 1,239,852 | |
| Cerberus Loan Funding XVII, Series 2016-17, Class A, 3.688% (3MO LIBOR + 253), due 01/15/28 (b) | | | 1,000,000 | | | | 1,006,448 | |
See Notes to Financial Statements.
57
Wilshire Mutual Funds, Inc. Wilshire Income Opportunities Fund Schedule of Investments - (continued) | December 31, 2017 |
|
| | | Par Value | | | Value | |
| ASSET-BACKED SECURITIES — 12.3% (Continued) |
| Chesterfield Financial Holding, LLC, Series 2014-1A, Class A, 4.500%, due 12/15/34 (b) | | $ | 726,000 | | | $ | 725,862 | |
| Diamond Head Aviation Ltd., Series 2015-1, Class A, 3.810%, due 07/14/28 | | | 567,648 | | | | 565,430 | |
| Domino's Pizza Master Issuer, LLC, Series 2017-1A, Class A23, 144A, 4.118%, due 07/25/47 (b) | | | 997,500 | | | | 1,019,126 | |
| Drug Royalty III, L.P., Series 2016-1, Class NT, 3.979%, due 04/15/27 | | | 681,556 | | | | 680,463 | |
| Dryden Senior Loan Fund, Series 2015-37, Class COMB, 5.378%, due 04/15/27 | | | 1,000,000 | | | | 930,240 | |
| Earnest Student Loan Program, LLC, Series 2016-C, Class B, 4.460%, due 01/26/37 | | | 683,910 | | | | 692,773 | |
| ECAF I Ltd., Series 2015-1, Class A-2, 4.947%, due 06/15/40 | | | 924,112 | | | | 919,592 | |
| Falcon Aerospace Ltd., Series 2017-1-A, Class A, 4.581%, due 02/15/42 (b) | | | 708,300 | | | | 716,362 | |
| FDF Ltd., Series 2016-2A, Class A, 4.285%, due 05/12/31 (b) | | | 1,000,000 | | | | 1,013,524 | |
| Halcyon Loan Advisors Funding, Series 2012-2, Class C, 4.174% (3MO LIBOR + 285), due 12/20/24 (b) | | | 1,500,000 | | | | 1,504,047 | |
| Helios Issuer, LLC, Series 2017-1A, Class A, 4.939%, due 09/20/49 (b) | | | 1,173,452 | | | | 1,214,061 | |
| Ivy Hill Middle Market Credit, Series 9A, Class BR, 144A, 3.189%, due 01/18/30 (b) | | | 2,000,000 | | | | 1,999,274 | |
| Jimmy John's Funding, LLC, Series 2017-1A, Class A2I, 144A, 3.610%, due 07/30/47 (b) | | | 997,500 | | | | 1,001,340 | |
| Kabbage Funding, LLC, Series 2017-1, Class A, 144A, 4.571%, due 03/15/22 | | | 1,000,000 | | | | 1,021,851 | |
| OZLM Funding IX Ltd., Series 2014-9A, Class A2-R, 2.956% (3MO LIBOR + 165), due 01/20/27 (b) | | | 1,000,000 | | | | 1,008,892 | |
| PFP Ltd., Series 2015-2, Class A-S, 3.263% (1MO LIBOR + 200), due 07/14/34 (b) | | | 1,000,000 | | | | 999,413 | |
| Putnam Structured Product Funding, Series 2003-1, Class A2, 144A, 2.477% (1MO LIBOR + 100), due 10/15/38 (b) | | | 1,186,578 | | | | 1,131,483 | |
| Raspro Trust, Series 2005-1A, Class B, 1.987% (1MO LIBOR + 62.5), due 03/23/24 (b) | | | 787,907 | | | | 752,451 | |
| Rise Ltd., Series 2014-1A, Class A, 4.750%, due 02/15/39 | | | 901,279 | | | | 911,419 | |
| Springfield Funding Trust, Series 2015-A, Class A, 3.160%, due 11/15/24 | | | 1,000,000 | | | | 1,003,971 | |
| Store Master Funding I, Series 2016-1, Class A-1, 3.960%, due 10/20/46 (b) | | | 2,007,740 | | | | 1,986,722 | |
| Taco Bell Funding, LLC, Series 2016-1, Class A-2-II, 4.377%, due 05/25/46 | | | 1,036,875 | | | | 1,069,661 | |
| Textainer Marine Containers Ltd., Series 2017-2A, Class A, 144A, 3.520%, due 06/20/42 (b) | | | 1,633,843 | | | | 1,634,542 | |
| Wendy's Funding, LLC, Series 2015-1, Class A2-III, 4.497%, due 06/15/45 | | | 977,500 | | | | 999,963 | |
| | | | | | | | | |
| Total Asset-Backed Securities (Cost $38,804,484) | | | | | | | 39,028,517 | |
| | | | | | | | | |
| COLLATERALIZED LOAN OBLIGATIONS — 9.6% |
| ALM Loan Funding, Series 2016-19A, Class B, 4.359% (3MO LIBOR + 300), due 07/15/28 (b) | | | 250,000 | | | | 253,558 | |
| Annisa CLO Ltd., Series 2016, Class B, 3.462% (3MO LIBOR + 210), due 07/20/28 (b) | | | 500,000 | | | | 502,345 | |
| Apidos CLO, Series 2016-24A, Class C, 5.312% (3MO LIBOR + 395), due 07/20/27 (b) | | | 500,000 | | | | 509,932 | |
| Atrium CDO Corp., Series 2013-9R, Class D-R, 144A, 5.067% (3MO LIBOR + 360), due 05/28/30 (b) | | | 500,000 | | | | 508,312 | |
| Babson CLO Ltd., Series 2012-II, Class SUB, 0.000%, due 05/15/23 | | | 1,000,000 | | | | 12,111 | |
| BlueMountain CLO Ltd., Series 2016-2, Class C, 5.535% (3MO LIBOR + 410), due 08/20/28 (b) | | | 500,000 | | | | 503,815 | |
| Canyon Capital CLO Ltd., Series 2014-1A, Class C, 4.627% (3MO LIBOR + 325), due 04/30/25 (b) | | | 250,000 | | | | 250,219 | |
| Cent CLO, L.P., Series 2012-16A, Class A-2R, 3.560% (3MO LIBOR + 225), due 08/01/24 (b) | | | 500,000 | | | | 500,829 | |
See Notes to Financial Statements.
58
Wilshire Mutual Funds, Inc. Wilshire Income Opportunities Fund Schedule of Investments - (continued) | December 31, 2017 |
|
| | | Par Value | | | Value | |
| COLLATERALIZED LOAN OBLIGATIONS — 9.6% (Continued) |
| Cent CLO, L.P., Series 2012-16A, Class B-R, 4.510% (3MO LIBOR + 320), due 08/01/24 (b) | | $ | 1,000,000 | | | $ | 1,000,542 | |
| Cerberus Onshore II CLO, LLC, Series 2015-1A, Class B, 4.353% (3MO LIBOR + 305), due 11/06/25 (b) | | | 2,000,000 | | | | 1,999,706 | |
| Flagship CLO, Series 2013-7A, Class C-R, 3.656% (3MO LIBOR + 235), due 01/20/26 (b) | | | 1,500,000 | | | | 1,502,758 | |
| Flagship CLO VIII, Series 2014-8A, Class B-R, 3.003% (3MO LIBOR +170), due 01/16/26 (b) | | | 1,300,000 | | | | 1,303,035 | |
| Fortress Credit Opportunities CLO, L.P., Series 2013-2A, Class B-R, 144A, 2.956% (3MO LIBOR + 165), due 10/19/25 (b) | | | 1,500,000 | | | | 1,503,314 | |
| Fortress Credit Opportunities CLO, L.P., Series 2014-5A, Class B-R, 3.510% (3MO LIBOR + 235), due 10/15/26 (b) | | | 1,000,000 | | | | 1,002,241 | |
| Fortress Credit Opportunities CLO, L.P., Series 2016-7A, Class B, 4.269% (3MO LIBOR + 295), due 12/15/28 (b) | | | 1,000,000 | | | | 1,001,658 | |
| Fortress Credit Opportunities CLO, L.P., Series 2017-9A, Class A1T, 2.931% (3MO LIBOR + 155), due 11/15/29 (b) | | | 1,000,000 | | | | 998,176 | |
| Galaxy XXII CLO Ltd., Series 2016-22A, Class D, 5.608% (3MO LIBOR + 445), due 07/16/28 (b) | | | 500,000 | | | | 505,119 | |
| Golub Capital Partners CLO, Series 2015-25, Class A-1, 3.111% (3MO LIBOR + 180), due 08/05/27 (b) | | | 1,000,000 | | | | 1,001,229 | |
| Golub Capital Partners CLO, Series 2016-33I, Class A, 3.920% (3MO LIBOR + 248), due 11/21/28 (b) | | | 1,500,000 | | | | 1,503,770 | |
| Great Lakes CLO Ltd., Series 2015-1A, Class A-1, 3.253% (3MO LIBOR + 195), due 07/15/26 (b) | | | 1,000,000 | | | | 1,002,423 | |
| Keuka Park CLO Ltd., Series 2013, 0.000%, due 10/21/24 | | | 1,250,000 | | | | 115,456 | |
| KVK CLO Ltd., Series 2013-1A, Class SUB, 0.000%, due 04/14/25 | | | 1,150,000 | | | | 505,512 | |
| Marathon CLO Ltd., Series 13-5A, Class A2R, 144A, 2.890% (3MO LIBOR + 145), due 11/21/27 (b) | | | 1,000,000 | | | | 998,439 | |
| Nelder Grove CLO Ltd., Series 2014-1A, Class B-R, 3.267% (3MO LIBOR + 180), due 08/28/26 (b) | | | 1,000,000 | | | | 1,001,248 | |
| NXT Capital CLO, LLC, Series 2017-1A, Class A, 3.062% (3MO LIBOR + 170), due 04/20/29 (b) | | | 1,200,000 | | | | 1,204,217 | |
| Octagon Investment Partners XXI, Series 2014-21, Class D, 7.909% (3MO LIBOR + 660), due 11/14/26 (b) | | | 250,000 | | | | 252,212 | |
| Steele Creek CLO Ltd., Series 2014-1A, Class B-R, 3.166% (3MO LIBOR + 185), due 08/21/26 (b) | | | 1,000,000 | | | | 1,002,355 | |
| Symphony CLO XIV Ltd., Series 2014-14A, Class D-2, 4.745% (3MO LIBOR + 360), due 07/14/26 (b) | | | 500,000 | | | | 502,856 | |
| TCI-Cent CLO, Series 2016-1A, Class C, 5.316% (3MO LIBOR + 400), due 12/21/29 (b) | | | 500,000 | | | | 507,931 | |
| TCI-Flatiron, Series 2016-1A, Class C, 4.403% (3MO LIBOR + 305), due 07/17/28 (b) | | | 250,000 | | | | 250,472 | |
| TCP Waterman CLO, LLC, Series 2016-1A, Class A-1J, 3.620% (3MO LIBOR + 230), due 12/15/28 (b) | | | 1,000,000 | | | | 1,004,360 | |
| Treman Park CLO Ltd., Series 2015, Class COMB, 4.500%, due 04/20/27 | | | 500,000 | | | | 428,315 | |
| Venture CDO Ltd., Series 2012-12A, Class B-R, 2.947% (3MO LIBOR + 163), due 02/28/26 (b) | | | 1,000,000 | | | | 1,005,580 | |
| Venture CDO Ltd., Series 2016-23A, Class B, 3.657% (3MO LIBOR + 230), due 07/19/28 (b) | | | 500,000 | | | | 500,863 | |
| Vibrant CLO II Ltd., Series 2013-2A, Class A2AR, 144A, 2.762% (3MO LIBOR + 145), due 07/24/24 (b) | | | 1,000,000 | | | | 1,000,309 | |
| Voya CLO IV Ltd., Series 2007-4A, Class C, 3.512% (3MO LIBOR + 220), due 06/14/22 (b) | | | 1,500,000 | | | | 1,501,796 | |
| Voya CLO Ltd., Series 2016-2A, Class C, 5.556% (3MO LIBOR + 425), due 07/19/28 (b) | | | 500,000 | | | | 505,546 | |
| Westcott Park CLO, Series 2016, Class D, 5.712% (3MO LIBOR + 435), due 07/20/28 (b) | | | 500,000 | | | | 505,906 | |
See Notes to Financial Statements.
59
Wilshire Mutual Funds, Inc. Wilshire Income Opportunities Fund Schedule of Investments - (continued) | December 31, 2017 |
|
| | | Par Value | | | Value | |
| COLLATERALIZED LOAN OBLIGATIONS — 9.6% (Continued) |
| Wind River CLO I Ltd., Series 2012-1A, Class D-R, 5.403% (3MO LIBOR + 410), due 01/15/26 (b) | | $ | 250,000 | | | $ | 251,356 | |
| | | | | | | | | |
| Total Collateralized Loan Obligations (Cost $32,321,364) | | | | | | | 30,409,821 | |
| | | | | | | | | |
| INVESTMENT-GRADE CORPORATE OBLIGATIONS — 3.5% |
| Consumer Discretionary — 0.2% | | | | | | | | |
| Amazon.com, Inc., 144A, 4.050%, due 08/22/47 | | | 110,000 | | | | 118,549 | |
| Comcast Corp., 4.400%, due 08/15/35 | | | 115,000 | | | | 125,729 | |
| Ford Motor Co., 7.450%, due 07/16/31 | | | 170,000 | | | | 222,226 | |
| General Motors Co., 2.191% (3MO LIBOR + 80), due 08/07/20 (b) | | | 40,000 | | | | 40,240 | |
| Hasbro, Inc., 3.500%, due 09/15/27 | | | 25,000 | | | | 24,432 | |
| Omnicom Group, Inc., 3.600%, due 04/15/26 | | | 155,000 | | | | 156,810 | |
| Royal Caribbean Cruises Ltd., 3.700%, due 03/15/28 | | | 80,000 | | | | 79,274 | |
| | | | | | | | 767,260 | |
| Consumer Staples — 0.1% | | | | | | | | |
| Anheuser-Busch InBev S.A./N.V., 4.900%, due 02/01/46 | | | 65,000 | | | | 75,334 | |
| BAT Capital Corp., 144A, 2.295% (3MO LIBOR + 100), due 08/15/22 (b) | | | 20,000 | | | | 20,239 | |
| Kraft Heinz Co. (The), 2.000%, due 07/02/18 | | | 80,000 | | | | 79,998 | |
| Smithfield Foods, Inc., 144A, 4.250%, due 02/01/27 | | | 120,000 | | | | 123,143 | |
| | | | | | | | 298,714 | |
| Energy — 0.8% | | | | | | | | |
| Canadian Natural Resources Ltd., 2.950%, due 01/15/23 | | | 145,000 | | | | 144,351 | |
| CNOOC Finance (2015) U.S.A., LLC, 3.500%, due 05/05/25 | | | 500,000 | | | | 503,953 | |
| Enable Midstream Partners, L.P., 4.400%, due 03/15/27 | | | 85,000 | | | | 86,434 | |
| Energy Transfer Partners, L.P., 4.750%, due 01/15/26 | | | 75,000 | | | | 77,811 | |
| Energy Transfer Partners, L.P., 4.200%, due 04/15/27 | | | 15,000 | | | | 14,922 | |
| Kinder Morgan Energy Partners, 6.950%, due 01/15/38 | | | 125,000 | | | | 155,418 | |
| Phillips 66, 5.875%, due 05/01/42 | | | 55,000 | | | | 69,999 | |
| Reliance Holdings USA, 5.400%, due 02/14/22 | | | 800,000 | | | | 868,894 | |
| Sabine Pass Liquefaction, LLC, 5.000%, due 03/15/27 | | | 150,000 | | | | 160,961 | |
| Schlumberger Holdings Corp., 144A, 2.350%, due 12/21/18 | | | 65,000 | | | | 65,146 | |
| Sunoco Logistics Partners, 5.950%, due 12/01/25 | | | 194,000 | | | | 216,628 | |
| Valero Energy Corp., 6.625%, due 06/15/37 | | | 50,000 | | | | 65,896 | |
| Williams Partners, L.P., 3.750%, due 06/15/27 | | | 60,000 | | | | 60,125 | |
| | | | | | | | 2,490,538 | |
| Financials — 0.9% | | | | | | | | |
| Ally Financial, Inc., 4.125%, due 03/30/20 | | | 125,000 | | | | 127,500 | |
| American Express Co., 2.500%, due 08/01/22 | | | 190,000 | | | | 187,707 | |
| Athene Global Funding, 144A, 3.000%, due 07/01/22 | | | 110,000 | | | | 108,875 | |
| Bank of Montreal, 3.803%, due 12/15/32 | | | 60,000 | | | | 59,318 | |
| Citigroup, Inc., 2.521% (3MO LIBOR + 110), due 05/17/24 (b) | | | 190,000 | | | | 192,923 | |
| Crown Castle International Corp., 3.650%, due 09/01/27 | | | 105,000 | | | | 104,743 | |
| Discover Financial Services, 4.100%, due 02/09/27 | | | 155,000 | | | | 158,771 | |
| Liberty Mutual Group, Inc., 144A, 6.500%, due 05/01/42 | | | 100,000 | | | | 133,439 | |
| Manufacturing Americas Holding Corp., 2.250%, due 02/10/20 | | | 65,000 | | | | 64,647 | |
| MetLife, Inc., 144A, 9.250%, due 04/08/38 | | | 250,000 | | | | 368,749 | |
| Morgan Stanley, 2.750%, due 05/19/22 | | | 80,000 | | | | 79,706 | |
| Morgan Stanley, 3.591%, due 07/22/28 | | | 80,000 | | | | 80,736 | |
| New York Life Global Funding, 144A, 2.300%, due 06/10/22 | | | 215,000 | | | | 211,989 | |
| Royal Bank of Scotland Group plc, 3.498%, due 05/15/23 | | | 200,000 | | | | 200,436 | |
| S&P Global, Inc., 4.400%, due 02/15/26 | | | 65,000 | | | | 70,428 | |
| Santander Holdings USA, Inc., 144A, 3.400%, due 01/18/23 | | | 160,000 | | | | 159,377 | |
See Notes to Financial Statements.
60
Wilshire Mutual Funds, Inc. Wilshire Income Opportunities Fund Schedule of Investments - (continued) | December 31, 2017 |
|
| | | Par Value | | | Value | |
| INVESTMENT-GRADE CORPORATE OBLIGATIONS — 3.5% (Continued) |
| Financials — 0.9% (Continued) | | | | | | |
| Synchrony Financial, 3.000%, due 08/15/19 | | $ | 120,000 | | | $ | 120,834 | |
| Synchrony Financial, 3.950%, due 12/01/27 | | | 205,000 | | | | 204,138 | |
| TIAA Asset Management Finance Co., LLC, 144A, 2.950%, due 11/01/19 | | | 80,000 | | | | 80,765 | |
| | | | | | | | 2,715,081 | |
| Health Care — 0.1% | | | | | | | | |
| AbbVie, Inc., 4.700%, due 05/14/45 | | | 85,000 | | | | 95,308 | |
| Teva Pharmaceuticals Financial Co. BV, 2.800%, due 07/21/23 | | | 170,000 | | | | 148,038 | |
| Zimmer Biomet Holdings, Inc., 2.700%, due 04/01/20 | | | 125,000 | | | | 125,061 | |
| | | | | | | | 368,407 | |
| Industrials — 0.3% | | | | | | | | |
| Boeing Co., 6.875%, due 03/15/39 | | | 90,000 | | | | 132,360 | |
| Burlington North Santa Fe Corp., 4.550%, due 09/01/44 | | | 100,000 | | | | 114,495 | |
| CSX Corp., 3.800%, due 11/01/46 | | | 90,000 | | | | 89,486 | |
| Delta Airlines, Inc., 3.625%, due 03/15/22 | | | 55,000 | | | | 55,950 | |
| General Motors Financial Corp., 3.950%, due 04/13/24 | | | 130,000 | | | | 133,834 | |
| Lockheed Martin Corp., 4.700%, due 05/15/46 | | | 115,000 | | | | 134,172 | |
| Penske Truck Leasing Co., L.P., 144A, 4.200%, due 04/01/27 | | | 155,000 | | | | 161,115 | |
| Reynolds American, Inc., 4.000%, due 06/12/22 | | | 70,000 | | | | 73,138 | |
| | | | | | | | 894,550 | |
| Information Technology — 0.2% | | | | | | | | |
| Arrow Electronics, Inc., 3.875%, due 01/12/28 | | | 160,000 | | | | 159,520 | |
| Fidelity National Information Services, Inc., 3.625%, due 10/15/20 | | | 53,000 | | | | 54,456 | |
| Oracle Corp., 4.125%, due 05/15/45 | | | 150,000 | | | | 161,780 | |
| VMware, Inc., 2.950%, due 08/21/22 | | | 205,000 | | | | 204,428 | |
| | | | | | | | 580,184 | |
| Materials — 0.5% | | | | | | | | |
| Applied Materials, Inc., 4.350%, due 04/01/47 | | | 75,000 | | | | 84,134 | |
| BHP Billiton Finance USA Ltd., 144A, 6.750%, due 10/19/75 | | | 450,000 | | | | 525,416 | |
| Mosaic Co. (The), 4.050%, due 11/15/27 | | | 160,000 | | | | 160,419 | |
| Tamaha Gold, Inc., 4.950%, due 07/15/24 | | | 745,000 | | | | 779,371 | |
| Vale Overseas Ltd., 5.875%, due 06/10/21 | | | 90,000 | | | | 98,010 | |
| | | | | | | | 1,647,350 | |
| Real Estate — 0.1% | | | | | | | | |
| Hospitality Properties Trust, 5.250%, due 02/15/26 | | | 154,000 | | | | 165,399 | |
| | | | | | | | | |
| Telecommunication Services — 0.2% | | | | | | | | |
| AT&T, Inc., 5.250%, due 03/01/37 | | | 205,000 | | | | 216,813 | |
| British Telecommunications plc, 5.950%, due 01/15/18 | | | 285,000 | | | | 285,381 | |
| Charter Communications, LLC, 4.908%, due 07/23/25 | | | 75,000 | | | | 79,739 | |
| Orange S.A., 2.750%, due 02/06/19 | | | 100,000 | | | | 100,553 | |
| Verizon Communications, Inc., 4.400%, due 11/01/34 | | | 85,000 | | | | 86,618 | |
| | | | | | | | 769,104 | |
| Utilities — 0.1% | | | | | | | | |
| American Electric Power Company, Inc., 3.200%, due 11/13/27 | | | 25,000 | | | | 24,822 | |
| Exelon Corp., 3.400%, due 04/15/26 | | | 75,000 | | | | 75,025 | |
| Fortis, Inc., 144A, 2.100%, due 10/04/21 | | | 140,000 | | | | 136,657 | |
| Nextera Energy Capital Holding, Inc., 3.550%, due 05/01/27 | | | 65,000 | | | | 66,212 | |
| Southern Co. (The), 2.450%, due 09/01/18 | | | 146,000 | | | | 146,425 | |
| | | | | | | | 449,141 | |
| Total Investment-Grade Corporate Obligations (Cost $10,955,840) | | | | | | | 11,145,728 | |
| | | | | | | | | |
| HIGH YIELD CORPORATE OBLIGATIONS — 2.3% |
| Consumer Discretionary — 0.4% | | | | | | | | |
| Beacon Escrow Corp., 144A, 4.875%, due 11/01/25 | | | 60,000 | | | | 60,225 | |
| Cengage Learning, Inc., 144A, 9.500%, due 06/15/24 | | | 60,000 | | | | 54,300 | |
| Constellation Merger Sub, Inc., 144A, 8.500%, due 09/15/25 | | | 35,000 | | | | 34,125 | |
| CRC Escrow Issuer, LLC, 144A, 5.250%, due 10/15/25 | | | 70,000 | | | | 70,525 | |
See Notes to Financial Statements.
61
Wilshire Mutual Funds, Inc. Wilshire Income Opportunities Fund Schedule of Investments - (continued) | December 31, 2017 |
|
| | | Par Value | | | Value | |
| HIGH YIELD CORPORATE OBLIGATIONS — 2.3% (Continued) |
| Consumer Discretionary — 0.4% (Continued) |
| Eldorado Resorts, Inc., 6.000%, due 04/01/25 | | $ | 65,000 | | | $ | 67,925 | |
| GLP Capital, L.P./Financing II, 5.375%, due 04/15/26 | | | 75,000 | | | | 80,438 | |
| Hilton Domestic Operating Co., Inc., 144A, 4.250%, due 09/01/24 | | | 80,000 | | | | 80,800 | |
| Netflix, Inc., 144A, 4.875%, due 04/15/28 | | | 25,000 | | | | 24,500 | |
| New Red Finance, Inc., 144A, 4.250%, due 05/15/24 | | | 65,000 | | | | 64,838 | |
| PetSmart, Inc., 144A, 7.125%, due 03/15/23 | | | 40,000 | | | | 23,700 | |
| PetSmart, Inc., 144A, 5.875%, due 06/01/25 | | | 40,000 | | | | 30,700 | |
| Pinnacle Entertainment, Inc., 5.625%, due 05/01/24 | | | 80,000 | | | | 85,600 | |
| Prime Securities Service Borrower, LLC, 144A, 9.250%, due 05/15/23 | | | 70,000 | | | | 77,700 | |
| Seminole Hard Rock Entertainment, Inc., 144A, 5.875%, due 05/15/21 | | | 325,000 | | | | 329,874 | |
| Six Flags Entertainment Corp., 144A, 4.875%, due 07/31/24 | | | 80,000 | | | | 81,200 | |
| Viking Cruises Ltd., 144A, 5.875%, due 09/15/27 | | | 65,000 | | | | 66,138 | |
| | | | | | | | 1,232,588 | |
| Consumer Staples — 0.1% | | | | | | | | |
| B&G Foods, Inc., 5.250%, due 04/01/25 | | | 65,000 | | | | 66,115 | |
| JBS USA LUX S.A./JBS USA Finance, Inc., 144A, 7.250%, due 06/01/21 | | | 80,000 | | | | 81,300 | |
| Kronos Acquisition Holdings, Inc., 144A, 9.000%, due 08/15/23 | | | 85,000 | | | | 79,475 | |
| Pilgrim's Pride Corp., 144A, 5.750%, due 03/15/25 | | | 75,000 | | | | 77,531 | |
| Post Holdings, Inc., 144A, 5.500%, due 03/01/25 | | | 65,000 | | | | 67,275 | |
| | | | | | | | 371,696 | |
| Energy — 0.3% | | | | | | | | |
| Cheniere Energy Partners, 144A, 5.250%, due 10/01/25 | | | 65,000 | | | | 66,138 | |
| Dynagas LNG Partners, 6.250%, due 10/30/19 (d) | | | 500,000 | | | | 503,750 | |
| MEG Energy Corp., 144A, 7.000%, due 03/31/24 (d) | | | 35,000 | | | | 29,531 | |
| Peabody Securities Finance Corp., 144A, 6.000%, due 03/31/22 | | | 75,000 | | | | 77,813 | |
| QEP Resources, Inc., 5.250%, due 05/01/23 | | | 35,000 | | | | 35,415 | |
| QEP Resources, Inc., 5.625%, due 03/01/26 | | | 35,000 | | | | 35,481 | |
| Sanchez Energy Corp., 6.125%, due 01/15/23 | | | 85,000 | | | | 71,825 | |
| Vine Oil & Gas, L.P. / Vine Oil & Gas Finance Corp., 144A, 8.750%, due 04/15/23 | | | 30,000 | | | | 29,100 | |
| Whiting Petroleum Corp., 144A, 6.625%, due 01/15/26 | | | 35,000 | | | | 35,700 | |
| | | | | | | | 884,753 | |
| Financials — 0.7% | | | | | | | | |
| Alliant Holdings Intermediate, LLC, 144A, 8.250%, due 08/01/23 | | | 55,000 | | | | 57,750 | |
| American Equity Investment Life Holding Co., 5.000%, due 06/15/27 | | | 750,000 | | | | 777,146 | |
| DAE Funding, LLC, 144A, 5.000%, due 08/01/24 | | | 40,000 | | | | 39,500 | |
| ESH Hospitality, Inc., 144A, 5.250%, due 05/01/25 | | | 80,000 | | | | 80,800 | |
| Fidelity & Guaranty Life Holdings, Inc., 144A, 6.375%, due 04/01/21 | | | 200,000 | | | | 204,500 | |
| Hexion, Inc., 144A, 10.375%, due 02/01/22 | | | 75,000 | | | | 69,797 | |
| Jeffries Finance, LLC, 7.250%, due 08/15/24 | | | 500,000 | | | | 513,125 | |
| Lincoln Finance Ltd., 7.375%, due 04/15/21 | | | 500,000 | | | | 521,250 | |
| National Financial Partners Corp., 144A, 6.875%, due 07/15/25 | | | 65,000 | | | | 65,488 | |
| | | | | | | | 2,329,356 | |
| Health Care — 0.1% | | | | | | | | |
| Centene Corp., 4.750%, due 01/15/25 | | | 35,000 | | | | 35,613 | |
| Polaris Intermediate Corp., 144A, 8.500%, due 12/01/22 | | | 15,000 | | | | 15,563 | |
| Universal Hospital Services, Inc., 7.625%, due 08/15/20 | | | 75,000 | | | | 74,999 | |
| Valeant Pharmaceuticals International, Inc., 144A, 5.500%, due 11/01/25 | | | 60,000 | | | | 61,050 | |
| | | | | | | | 187,225 | |
See Notes to Financial Statements.
62
Wilshire Mutual Funds, Inc. Wilshire Income Opportunities Fund Schedule of Investments - (continued) | December 31, 2017 |
|
| | | Par Value | | | Value | |
| HIGH YIELD CORPORATE OBLIGATIONS — 2.3% (Continued) |
| Industrials — 0.1% | | | | | | |
| Avantor, Inc., 144A, 6.000%, due 10/01/24 | | $ | 35,000 | | | $ | 34,869 | |
| Avantor, Inc., 144A, 9.000%, due 10/01/25 | | | 35,000 | | | | 34,475 | |
| Blueline Rental Corp., 9.250%, due 03/15/24 | | | 75,000 | | | | 80,062 | |
| Brand Industrial Services, Inc., 144A, 8.500%, due 07/15/25 | | | 45,000 | | | | 47,250 | |
| Delphi Jersey Holdings plc, 144A, 5.000%, due 10/01/25 | | | 65,000 | | | | 65,813 | |
| Transdigm, Inc., 6.375%, due 06/15/26 | | | 45,000 | | | | 45,450 | |
| | | | | | | | 307,919 | |
| Information Technology — 0.1% | | | | | | | | |
| Ensemble S Merger Sub, Inc., 144A, 9.000%, due 09/30/23 | | | 75,000 | | | | 79,312 | |
| Greeneden U.S. Holdings II, LLC, 144A, 10.000%, due 11/30/24 | | | 70,000 | | | | 76,475 | |
| Riverbed Technology, Inc., 144A, 8.875%, due 03/01/23 | | | 35,000 | | | | 33,031 | |
| Solera, LLC/Solera Finance, Inc., 144A, 10.500%, due 03/01/24 | | | 25,000 | | | | 28,125 | |
| | | | | | | | 216,943 | |
| Materials — 0.0% (e) | | | | | | | | |
| Ashland, Inc., 4.750%, due 08/15/22 | | | 65,000 | | | | 67,600 | |
| Plastipak Holdings, Inc., 144A, 6.250%, due 10/15/25 | | | 35,000 | | | | 35,788 | |
| Platform Specialty Products Corp., 144A, 5.875%, due 12/01/25 | | | 30,000 | | | | 29,775 | |
| | | | | | | | 133,163 | |
| Telecommunication Services — 0.4% | | | | | | | | |
| CB Escrow Corp., 144A, 8.000%, due 10/15/25 | | | 15,000 | | | | 15,225 | |
| Cincinnati Bell, Inc., 144A, 7.000%, due 07/15/24 | | | 50,000 | | | | 49,625 | |
| Dish DBS Corp., 7.750%, due 07/01/26 | | | 100,000 | | | | 105,125 | |
| Frontier Communications Corp., 8.500%, due 04/15/20 | | | 35,000 | | | | 29,050 | |
| GTT Communications, Inc., 144A, 7.875%, due 12/31/24 | | | 40,000 | | | | 42,200 | |
| Intelsat Jackson Holdings S.A., 7.250%, due 10/15/20 | | | 85,000 | | | | 79,900 | |
| Level 3 Financing, Inc., 5.375%, due 01/15/24 | | | 65,000 | | | | 64,919 | |
| MDC Partners, Inc., 144A, 6.500%, due 05/01/24 | | | 450,000 | | | | 452,249 | |
| SFR Group S.A., 144A, 7.375%, due 05/01/26 | | | 350,000 | | | | 359,187 | |
| Telesat Canada, LLC, 144A, 8.875%, due 11/15/24 | | | 70,000 | | | | 78,400 | |
| | | | | | | | 1,275,880 | |
| Utilities — 0.1% | | | | | | | | |
| Ferrellgas, L.P., 6.750%, due 01/15/22 | | | 236,000 | | | | 218,300 | |
| NextEra Energy Operating Partners, L.P., 144A, 4.500%, due 09/15/27 | | | 65,000 | | | | 64,675 | |
| NGL Energy Partners, L.P., 144A, 7.500%, due 11/01/23 | | | 80,000 | | | | 82,600 | |
| | | | | | | | 365,575 | |
| Total High Yield Corporate Obligations (Cost $7,296,961) | | | | | | | 7,305,098 | |
| | | | | | | | | |
| FOREIGN BONDS — 11.9% | | | | | | | | |
| Bermuda — 0.2% | | | | | | | | |
| Digicel Group Ltd., 7.125%, due 04/01/22 | | | 600,000 | | | | 555,606 | |
| | | | | | | | | |
| Cayman Islands — 1.0% | | | | | | | | |
| CK Hutchison International 17 Ltd., 144A, 2.250%, due 09/29/20 | | | 200,000 | | | | 198,054 | |
| CK Hutchison International 17 Ltd., 2.875%, due 04/05/22 | | | 200,000 | | | | 199,263 | |
| CK Hutchison International 17 Ltd., 144A, 2.750%, due 03/29/23 | | | 200,000 | | | | 196,186 | |
| CK Hutchison International 17 Ltd., 144A, 3.500%, due 04/05/27 | | | 200,000 | | | | 199,857 | |
| Cosan Overseas Ltd., 8.250%, due 11/29/49 | | | 200,000 | | | | 204,730 | |
| Guanay Finance Ltd., 6.000%, due 12/15/20 | | | 635,316 | | | | 652,501 | |
| Hutchison Whampoa International 12 Ltd., 3.250%, due 11/08/22 | | | 200,000 | | | | 202,166 | |
| Industrial Senior Trust, 5.500%, due 11/01/22 | | | 200,000 | | | | 204,000 | |
| SPARC EM SPC Panama Metroline 2 SP, 1.843%, due 12/05/22 (a) | | | 1,100,000 | | | | 1,009,250 | |
| | | | | | | | 3,066,007 | |
See Notes to Financial Statements.
63
Wilshire Mutual Funds, Inc. Wilshire Income Opportunities Fund Schedule of Investments - (continued) | December 31, 2017 | 
|
| | | Par Value | | | Value | |
| FOREIGN BONDS — 11.9% (Continued) |
| Chile — 1.6% | | | | | | |
| Banco de Credito e Inversiones, 4.000%, due 02/11/23 | | $ | 300,000 | | | $ | 312,416 | |
| Banco del Estado de Chile, 4.125%, due 10/07/20 | | | 300,000 | | | | 312,836 | |
| Banco del Estado de Chile, 3.875%, due 02/08/22 | | | 150,000 | | | | 156,278 | |
| Banco Latinamericano S.A., 3.250%, due 05/07/20 | | | 300,000 | | | | 303,375 | |
| Embotelladora Andina S.A., 5.000%, due 10/01/23 | | | 600,000 | | | | 660,235 | |
| Engie Energia Chile S.A., 5.625%, due 01/15/21 | | | 400,000 | | | | 432,205 | |
| Inversiones CMPC S.A., 4.500%, due 04/25/22 | | | 300,000 | | | | 314,050 | |
| Itau CorpBanc, 3.875%, due 09/22/19 | | | 800,000 | | | | 815,687 | |
| Republic of Chile, 3.125%, due 03/27/25 | | | 800,000 | | | | 813,600 | |
| Republic of Chile, 3.125%, due 01/21/26 | | | 900,000 | | | | 912,375 | |
| | | | | | | | 5,033,057 | |
| China — 0.1% | | | | | | | | |
| CNOOC Finance 2011 Ltd., 4.250%, due 01/26/21 | | | 400,000 | | | | 415,743 | |
| | | | | | | | | |
| Colombia — 0.2% | | | | | | | | |
| Bancolombia S.A., 6.125%, due 07/26/20 | | | 100,000 | | | | 106,750 | |
| Empresa de Energia de Bogota S.A., 6.125%, due 11/10/21 | | | 200,000 | | | | 203,750 | |
| Transportadora de Gas Internacional S.A., 5.700%, due 03/20/22 | | | 400,000 | | | | 410,200 | |
| | | | | | | | 720,700 | |
| Costa Rica — 0.3% | | | | | | | | |
| Banco de Costa Rica, 5.250%, due 08/12/18 | | | 200,000 | | | | 200,250 | |
| Bharat Petroleum Corp. Ltd., 4.625%, due 10/25/22 | | | 500,000 | | | | 527,700 | |
| Costa Rica Government International Bond, 9.995%, due 08/01/20 | | | 200,000 | | | | 230,000 | |
| | | | | | | | 957,950 | |
| Dominican Republic — 0.1% | | | | | | | | |
| Banco de Reservas de la Republica Dominicana, 7.000%, due 02/01/23 | | | 300,000 | | | | 316,265 | |
| | | | | | | | | |
| India — 0.9% | | | | | | | | |
| Adani Ports & Special Economic Zone, 3.500%, due 07/29/20 | | | 200,000 | | | | 202,063 | |
| Bharti Airtel Ltd., 5.125%, due 03/11/23 | | | 200,000 | | | | 211,958 | |
| Bharti Airtel Ltd., 4.375%, due 06/10/25 | | | 700,000 | | | | 712,261 | |
| Export-Import Bank of India, 3.125%, due 07/20/21 | | | 400,000 | | | | 401,736 | |
| Export-Import Bank of India, 4.000%, due 01/14/23 | | | 400,000 | | | | 414,208 | |
| Indian Oil Corp. Ltd., 5.625%, due 08/02/21 | | | 200,000 | | | | 217,039 | |
| Indian Oil Corp. Ltd., 5.750%, due 08/01/23 | | | 600,000 | | | | 668,365 | |
| ONGC Videsh Ltd., 3.250%, due 07/15/19 | | | 200,000 | | | | 201,080 | |
| | | | | | | | 3,028,710 | |
| Indonesia — 0.2% | | | | | | | | |
| Perusahaan Penerbit SBSN, 144A, 4.150%, due 03/29/27 | | | 700,000 | | | | 722,820 | |
| | | | | | | | | |
| Israel — 0.4% | | | | | | | | |
| State of Israel, 4.000%, due 06/30/22 | | | 200,000 | | | | 211,861 | |
| State of Israel, 3.150%, due 06/30/23 | | | 200,000 | | | | 204,516 | |
| State of Israel, 2.875%, due 03/16/26 | | | 800,000 | | | | 797,930 | |
| | | | | | | | 1,214,307 | |
| Malaysia — 1.0% | | | | | | | | |
| Axiata SPV2 Berhad, 3.466%, due 11/19/20 | | | 1,100,000 | | | | 1,113,565 | |
| Malayan Banking Berhad, 3.905%, due 10/29/26 | | | 200,000 | | | | 204,213 | |
| Malaysia Sovereign Sukuk, 3.043%, due 04/22/25 | | | 400,000 | | | | 401,200 | |
| Malaysia Sukuk Global, 3.179%, due 04/27/26 | | | 500,000 | | | | 503,700 | |
| Petronas Capital Ltd., 3.500%, due 03/18/25 | | | 500,000 | | | | 512,759 | |
| Petronas Global Sukuk LT, 2.707%, due 03/18/20 | | | 400,000 | | | | 400,313 | |
| | | | | | | | 3,135,750 | |
| Mauritius — 0.1% | | | | | | | | |
| UPL Corp. Ltd., 3.250%, due 10/13/21 | | | 200,000 | | | | 199,264 | |
| | | | | | | | | |
See Notes to Financial Statements.
64
Wilshire Mutual Funds, Inc. Wilshire Income Opportunities Fund Schedule of Investments - (continued) | December 31, 2017 | 
|
| | | Par Value | | | Value | |
| FOREIGN BONDS — 11.9% (Continued) |
| Mexico — 1.0% | | | | | | |
| America Movil SAB de C.V., 5.000%, due 03/30/20 | | $ | 100,000 | | | $ | 105,394 | |
| America Movil SAB de C.V., 3.125%, due 07/16/22 | | | 200,000 | | | | 202,382 | |
| Banco Santander Mexico, 5.950%, due 01/30/24 | | | 600,000 | | | | 624,000 | |
| Grupo Idesa S.A. de C.V., 7.875%, due 12/18/20 | | | 630,000 | | | | 592,200 | |
| Petroleos Mexicanos, 144A, 6.750%, due 09/21/47 | | | 65,000 | | | | 67,850 | |
| United Mexican States, 4.000%, due 10/02/23 | | | 444,000 | | | | 464,646 | |
| United Mexican States, 4.125%, due 01/21/26 | | | 700,000 | | | | 729,750 | |
| United Mexican States, 4.150%, due 03/28/27 | | | 500,000 | | | | 518,500 | |
| | | | | | | | 3,304,722 | |
| Netherlands — 0.5% | | | | | | | | |
| AES Andres Dominicana Ltd., 144A, 7.950%, due 05/11/26 | | | 500,000 | | | | 541,250 | |
| Marfrig Holdings Europe BV, 144A, 8.000%, due 06/08/23 | | | 700,000 | | | | 729,749 | |
| Marfrig Holdings Europe BV, 144A, 7.000%, due 03/15/24 | | | 200,000 | | | | 200,750 | |
| | | | | | | | 1,471,749 | |
| Panama — 0.5% | | | | | | | | |
| Ena Norte Trust, 4.950%, due 04/25/28 | | | 185,178 | | | | 192,585 | |
| Global Bank Corp., 5.125%, due 10/30/19 | | | 600,000 | | | | 620,220 | |
| Republic of Panama, 4.000%, due 09/22/24 | | | 400,000 | | | | 425,400 | |
| Republic of Panama, 3.875%, due 03/17/28 | | | 200,000 | | | | 209,000 | |
| | | | | | | | 1,447,205 | |
| Peru — 0.8% | | | | | | | | |
| Banco Continental S.A., 5.500%, due 11/18/20 | | | 500,000 | | | | 540,000 | |
| Banco de Credito del Peru of Panama, 2.250%, due 10/25/19 | | | 400,000 | | | | 400,000 | |
| Banco de Credito del Peru of Panama, 5.375%, due 09/16/20 | | | 100,000 | | | | 106,500 | |
| Banco Internacional del Peru S.A.A. of Panama, 5.750%, due 10/07/20 | | | 800,000 | | | | 859,999 | |
| Fondo Mivivienda S.A., 3.500%, due 01/31/23 | | | 400,000 | | | | 401,560 | |
| Transportadora de Gas del Peru S.A., 4.250%, due 04/30/28 | | | 300,000 | | | | 310,200 | |
| | | | | | | | 2,618,259 | |
| Philippines — 0.8% | | | | | | | | |
| BDO Unibank, Inc., 2.625%, due 10/24/21 | | | 450,000 | | | | 444,919 | |
| BDO Unibank, Inc., 2.950%, due 03/06/23 | | | 600,000 | | | | 588,277 | |
| Republic of Philippines, 4.200%, due 01/21/24 | | | 1,200,000 | | | | 1,303,336 | |
| Republic of Philippines, 3.700%, due 02/02/42 | | | 200,000 | | | | 198,635 | |
| | | | | | | | 2,535,167 | |
| Singapore — 1.5% | | | | | | | | |
| BPRL International Singapore, 4.375%, due 01/18/27 | | | 500,000 | | | | 515,602 | |
| DBS Group Holdings Ltd., 1.987% (3MO LIBOR + 62), due 07/25/22 (b) | | | 600,000 | | | | 603,213 | |
| DBS Group Holdings Ltd., 3.600%, due 12/29/49 | | | 300,000 | | | | 298,660 | |
| ONGC Videsh Vankorneft, 3.750%, due 07/27/26 | | | 800,000 | | | | 796,008 | |
| Oversea-Chinese Banking Corp. Ltd., 4.000%, due 10/15/24 | | | 400,000 | | | | 405,336 | |
| Singtel Group Treasury Pte. Ltd., 4.500%, due 09/08/21 | | | 200,000 | | | | 212,440 | |
| Temasek Financial I Ltd., 2.375%, due 01/23/23 | | | 1,000,000 | | | | 987,300 | |
| United Overseas Bank Ltd., 3.750%, due 09/19/24 | | | 700,000 | | | | 708,264 | |
| United Overseas Bank Ltd., 3.500%, due 09/16/26 | | | 200,000 | | | | 201,306 | |
| | | | | | | | 4,728,129 | |
| United Kingdom — 0.2% | | | | | | | | |
| Genting Overseas Holding Ltd., 4.250%, due 01/24/27 | | | 700,000 | | | | 717,869 | |
| | | | | | | | | |
| Virgin Islands British — 0.5% | | | | | | | | |
| CNPC HK Overseas Capital Ltd., 4.500%, due 04/28/21 | | | 600,000 | | | | 630,274 | |
| Sinopec Group Overseas Development, 2.750%, due 09/29/26 | | | 800,000 | | | | 759,167 | |
See Notes to Financial Statements.
65
Wilshire Mutual Funds, Inc. Wilshire Income Opportunities Fund Schedule of Investments - (continued) | December 31, 2017 |
|
| | | Par Value | | | Value | |
| FOREIGN BONDS — 11.9% (Continued) |
| Virgin Islands British — 0.5% (Continued) | | | |
| Sinopec Group Overseas Development 2016, 2.750%, due 05/03/21 | | $ | 200,000 | | | $ | 199,323 | |
| | | | | | | | 1,588,764 | |
| Total Foreign Bonds (Cost $37,612,098) | | | | | | | 37,778,043 | |
| | | | | | | | | |
| LOAN PARTICIPATIONS — 9.1% | | | | | | | | |
| Acrisure, LLC, 5.647% (3MO LIBOR + 425), due 11/22/23 (b) | | | 84,700 | | | | 85,441 | |
| A-L Parent, LLC, 4.700% (3MO LIBOR + 325), due 11/02/20 (b) | | | 3,616 | | | | 3,638 | |
| A-L Parent, LLC, 4.700% (3MO LIBOR + 325), due 12/01/23 (b) | | | 26,375 | | | | 26,573 | |
| Albany Molecular Research, Inc., 4.582% (3MO LIBOR + 325), due 08/28/24 (b) | | | 149,625 | | | | 147,007 | |
| Albertson's, LLC, 4.099% (3MO LIBOR + 275), due 08/25/21 (b) | | | 633,033 | | | | 619,866 | |
| AlixPartners, LLP, 4.082% (3MO LIBOR + 300), due 03/17/21 (b) | | | 377,150 | | | | 378,900 | |
| Almonde, Inc., 4.978% (3MO LIBOR + 350), due 04/26/24 (b) | | | 967,625 | | | | 969,975 | |
| Applied Systems, Inc., 4.573% (3MO LIBOR + 325), due 09/13/24 (b) | | | 239,400 | | | | 241,727 | |
| Aristocrat Technologies, Inc., 4.700% (3MO LIBOR + 200), due 09/19/24 (b) | | | 90,000 | | | | 90,113 | |
| AssuredPartners, Inc., 4.849% (3MO LIBOR + 350), due 10/22/24 (b) | | | 364,088 | | | | 366,137 | |
| Avaya, Inc., 6.227% (3MO LIBOR + 475), due 12/31/20 (b) | | | 410,000 | | | | 402,997 | |
| BCP Renaissance Parent, LLC, 5.380% (3MO LIBOR + 450), due 12/31/20 (b) | | | 150,000 | | | | 151,725 | |
| BJ's Wholesale Club, Inc., 4.952% (3MO LIBOR + 375), due 01/27/24 (b) | | | 268,650 | | | | 264,118 | |
| Blount International, Inc., 5.610% (3MO LIBOR + 425), due 12/31/20 (b) | | | 30,000 | | | | 30,328 | |
| Brand Energy & Infrastructure Services, Inc., 5.614% (3MO LIBOR + 425), due 06/14/24 (b) | | | 268,650 | | | | 269,523 | |
| BWAY Holding Co., 4.598% (3MO LIBOR + 325), due 04/03/24 (b) | | | 49,750 | | | | 49,928 | |
| Caesars Resort Collection, LLC, 4.500% (3MO LIBOR + 375), due 10/02/24 (b) | | | 385,000 | | | | 386,513 | |
| Capital Automotive, L.P., 7.350% (3MO LIBOR + 600), due 03/21/25 (b) | | | 39,948 | | | | 40,947 | |
| Capri Acquisitions BidCo Ltd., 4.626% (3MO LIBOR + 325), due 10/04/24 (b) | | | 475,000 | | | | 474,406 | |
| CBS Radio, Inc., 4.171% (3MO LIBOR + 275), due 10/17/23 (b) | | | 225,000 | | | | 226,031 | |
| Cengage Learning, Inc., 5.494% (3MO LIBOR + 425), due 06/07/23 (b) | | | 1,209,638 | | | | 1,152,179 | |
| CenturyLink, Inc., 4.099% (3MO LIBOR + 275), due 02/29/24 (b) | | | 310,000 | | | | 298,666 | |
| Change Healthcare Holdings, LLC, 4.099% (3MO LIBOR + 275), due 03/01/24 (b) | | | 456,898 | | | | 457,529 | |
| CHG Healthcare Services, Inc., 4.476% (3MO LIBOR + 300), due 06/07/23 (b) | | | 253,855 | | | | 255,680 | |
| Cincinnati Bell, Inc., 5.110% (3MO LIBOR + 375), due 08/16/24 (b) | | | 250,000 | | | | 252,578 | |
| ClubCorp Holdings, Inc., 4.587% (3MO LIBOR + 325), due 08/16/24 (b) | | | 137,098 | | | | 137,547 | |
| Colorado Buyer, Inc., 4.380% (3MO LIBOR + 300), due 03/15/24 (b) | | | 458,850 | | | | 461,433 | |
| Compass Power Generation, LLC, 4.700% (3MO LIBOR + 375), due 12/13/24 (b) | | | 185,000 | | | | 186,079 | |
| Cvent, Inc., 4.700% (3MO LIBOR + 375), due 11/29/23 (b) | | | 310,000 | | | | 310,000 | |
| Digicel International Finance Ltd., 5.079% (3MO LIBOR + 375), due 05/10/24 (b) | | | 224,438 | | | | 225,279 | |
| Diplomat Pharmacy, Inc., 4.700% (3MO LIBOR + 450), due 12/13/24 (b) | | | 45,000 | | | | 45,225 | |
| DJO Finance, LLC, 4.592% (3MO LIBOR + 325), due 06/08/20 (b) | | | 246,222 | | | | 242,573 | |
| Duff & Phelps Corp., 4.500% (3MO LIBOR + 325), due 12/04/24 (b) | | | 250,000 | | | | 250,313 | |
| EAB Global, Inc., 5.015% (3MO LIBOR + 375), due 09/29/24 (b) | | | 410,000 | | | | 412,050 | |
| EIG Investors Corp., 5.462% (3MO LIBOR + 400), due 02/09/23 (b) | | | 275,081 | | | | 276,630 | |
| Epicor Software Corp., 5.100% (3MO LIBOR + 375), due 06/01/22 (b) | | | 653,587 | | | | 654,757 | |
| EXC Holdings III Corp., 5.160% (3MO LIBOR + 350), due 11/15/24 (b) | | | 50,000 | | | | 50,328 | |
| Exgen Renewables IV, LLC, 4.467% (3MO LIBOR + 300), due 12/31/20 (b) | | | 145,000 | | | | 146,450 | |
See Notes to Financial Statements.
66
Wilshire Mutual Funds, Inc. Wilshire Income Opportunities Fund Schedule of Investments - (continued) | December 31, 2017 |
|
| | | Par Value | | | Value | |
| LOAN PARTICIPATIONS — 9.1% (Continued) |
| Federal-Mogul Corp., 5.024% (3MO LIBOR + 375), due 04/15/21 (b) | | $ | 310,190 | | | $ | 312,342 | |
| Filtration Group Corp., 4.380% (3MO LIBOR + 300), due 11/23/20 (b) | | | 462,586 | | | | 466,056 | |
| Golden Nugget, Inc., 4.598% (3MO LIBOR + 325), due 10/04/23 (b) | | | 59,849 | | | | 60,261 | |
| Greeneden U.S. Holdings II, LLC, 5.082% (3MO LIBOR + 375), due 12/01/23 (b) | | | 254,363 | | | | 255,634 | |
| Hardware Holdings, LLC, 7.832% (3MO LIBOR + 650), due 03/30/20 (b) (d) | | | 531,375 | | | | 515,434 | |
| Hayward Industries, Inc., 4.849% (3MO LIBOR + 350), due 12/31/20 (b) | | | 375,000 | | | | 375,469 | |
| HCA, Inc., 3.599% (3MO LIBOR + 225), due 02/15/24 (b) | | | 377,453 | | | | 379,635 | |
| Intelsat Jackson Holdings, S.A., 4.500% (3MO LIBOR + 375), due 11/30/23 (b) | | | 460,000 | | | | 449,977 | |
| Intralinks, Inc., 5.249% (3MO LIBOR + 400), due 11/11/24 (b) | | | 235,000 | | | | 233,531 | |
| Intrawest Resorts Holdings, Inc., 4.599% (3MO LIBOR + 325), due 12/31/20 (b) | | | 315,000 | | | | 317,167 | |
| Jaguar Holding Company II, 4.090% (3MO LIBOR + 275), due 08/18/22 (b) | | | 385,234 | | | | 385,585 | |
| Kenan Advantage Group, Inc. (The), 4.349% (3MO LIBOR + 300), due 07/29/22 (b) | | | 457,661 | | | | 458,613 | |
| Klockner Pentaplast of America, Inc., 5.582% (3MO LIBOR + 425), due 06/29/22 (b) | | | 384,038 | | | | 387,398 | |
| Kraton Polymers, LLC, 4.349% (3MO LIBOR + 300), due 01/06/22 (b) | | | 276,758 | | | | 279,381 | |
| Kronos Acquisition Holdings, Inc., 5.827% (3MO LIBOR + 450), due 08/26/22 (b) | | | 460,000 | | | | 462,760 | |
| Kronos, Inc., 4.902% (3MO LIBOR + 350), due 11/01/23 (b) | | | 457,694 | | | | 460,527 | |
| Life Time Fitness, Inc., 4.228% (3MO LIBOR + 300), due 06/10/22 (b) | | | 457,697 | | | | 458,937 | |
| Lineage Logistics, LLC, 5.069% (3MO LIBOR + 350), due 04/07/21 (b) | | | 434,211 | | | | 435,161 | |
| Mission Broadcasting, Inc., 3.860% (3MO LIBOR + 250), due 01/17/24 (b) | | | 36,661 | | | | 36,739 | |
| Mitchell International, Inc., 4.500% (3MO LIBOR + 325), due 12/31/20 (b) | | | 21,269 | | | | 21,250 | |
| Mitchell International, Inc., 4.610% (3MO LIBOR + 325), due 11/20/24 (b) | | | 263,731 | | | | 263,497 | |
| Mitchell International, Inc., 4.500% (3MO LIBOR + 725), due 11/20/25 (b) | | | 90,000 | | | | 90,585 | |
| MPH Acquisition Holdings, LLC, 4.332% (3MO LIBOR + 300), due 06/07/23 (b) | | | 450,261 | | | | 450,887 | |
| Nexstar Broadcasting, Inc., 3.860% (3MO LIBOR + 250), due 01/17/24 (b) | | | 290,404 | | | | 291,025 | |
| Optiv, Inc., 4.624% (3MO LIBOR + 325), due 01/05/21 (b) | | | 28,922 | | | | 27,006 | |
| Parexel International Corp., 4.349% (3MO LIBOR + 300), due 12/31/20 (b) | | | 144,638 | | | | 145,210 | |
| Peak 10 Holding Corp., 4.810% (3MO LIBOR + 350), due 07/24/24 (b) | | | 309,225 | | | | 308,743 | |
| PetSmart, Inc., 4.240% (3MO LIBOR + 300), due 03/11/22 (b) | | | 491,184 | | | | 391,567 | |
| Pike Corp., 4.849% (3MO LIBOR + 350), due 12/31/20 (b) | | | 84,788 | | | | 85,918 | |
| Playa Resorts Holding, BV, 4.500% (3MO LIBOR + 325), due 04/29/24 (b) | | | 419,474 | | | | 421,135 | |
| PODS, LLC, 4.403% (3MO LIBOR + 300), due 12/31/20 (b) | | | 115,000 | | | | 115,575 | |
| Prime Security Services Borrower, LLC, 4.099% (3MO LIBOR + 275), due 05/02/22 (b) | | | 144,275 | | | | 145,237 | |
| Project Alpha Intermediate Holding, Inc., 5.040% (3MO LIBOR + 350), due 04/04/21 (b) | | | 383,075 | | | | 374,295 | |
| Quest Software US Holdings, Inc., 6.918% (3MO LIBOR + 550), due 10/31/22 (b) | | | 425,272 | | | | 431,575 | |
| Radiate HoldCo, LLC, 4.349% (3MO LIBOR + 300), due 02/01/24 (b) | | | 467,644 | | | | 463,721 | |
| Ranpak Corp., 8.532% (3MO LIBOR + 725), due 09/22/22 (b) | | | 122,222 | | | | 121,000 | |
| Reynolds Group Holdings, Inc., 4.099% (3MO LIBOR + 300), due 01/23/20 (b) | | | 162,005 | | | | 162,677 | |
| RP Crown Parent, LLC, 4.349% (3MO LIBOR + 350), due 09/22/23 (b) | | | 457,688 | | | | 459,405 | |
See Notes to Financial Statements.
67
Wilshire Mutual Funds, Inc. Wilshire Income Opportunities Fund Schedule of Investments - (continued) | December 31, 2017 |
|
| | | Par Value | | | Value | |
| LOAN PARTICIPATIONS — 9.1% (Continued) |
| Scientific Games International, Inc., 4.657% (3MO LIBOR + 350), due 08/14/24 (b) | | $ | 314,213 | | | $ | 316,569 | |
| SCS Holdings I, Inc., 5.599% (3MO LIBOR + 425), due 10/30/22 (b) | | | 78,047 | | | | 78,340 | |
| Securus Technologies Holdings, Inc., 5.849% (3MO LIBOR + 450), due 06/15/24 (b) | | | 470,000 | | | | 474,409 | |
| Select Medical Corp., 4.850% (3MO LIBOR + 350), due 02/13/24 (b) | | | 328,350 | | | | 331,223 | |
| Sinclair Television Group, Inc., 4.700% (3MO LIBOR + 250), due 12/31/20 (b) | | | 375,000 | | | | 374,299 | |
| Solera, LLC, 4.599% (3MO LIBOR + 375), due 03/03/23 (b) | | | 387,053 | | | | 389,333 | |
| Sophia, L.P., 4.582% (3MO LIBOR + 325), due 09/30/22 (b) | | | 381,806 | | | | 381,967 | |
| Southern Graphics, Inc., 4.500% (3MO LIBOR + 350), due 11/22/22 (b) | | | 460,000 | | | | 461,610 | |
| Team Health Holdings, Inc., 4.099% (3MO LIBOR + 275), due 01/12/24 (b) | | | 585,575 | | | | 569,841 | |
| Telesat Canada, 4.320% (3MO LIBOR + 300), due 11/17/23 (b) | | | 474,012 | | | | 475,344 | |
| TKC Holdings, Inc., 5.672% (3MO LIBOR + 425), due 02/01/23 (b) | | | 393,025 | | | | 395,603 | |
| Transdigm Group, Inc., 4.346% (3MO LIBOR + 300), due 08/16/24 (b) | | | 89,550 | | | | 89,923 | |
| Transdigm, Inc., 4.500% (3MO LIBOR + 275), due 06/09/23 (b) | | | 59,850 | | | | 59,916 | |
| Traverse Midstream Partners, LLC., 5.330% (3MO LIBOR + 400), due 09/11/21 (b) | | | 75,000 | | | | 75,975 | |
| Tribune Media Co., 4.399% (3MO LIBOR + 300), due 12/27/20 (b) | | | 572,490 | | | | 572,731 | |
| Wink Holdco, Inc., 4.500% (3MO LIBOR + 300), due 11/01/24 (b) | | | 90,000 | | | | 90,394 | |
| York Risk Services Holding Corp., 5.319% (3MO LIBOR + 375), due 10/01/21 (b) (d) | | | 967,500 | | | | 945,488 | |
| | | | | | | | | |
| Total Loan Participations (Cost $28,763,971) | | | | | | | 28,625,069 | |
| | | | | | | | | |
| MILITARY HOUSING OBLIGATIONS — 2.5% |
| Atlantic Marine Corps Communities Military Housing, 144A, 5.433% due 12/01/50 (d) (f) | | | 705,676 | | | | 715,332 | |
| Capmark Military Housing Trust, Series 2007-AETC, Class A-1, 5.746% due 02/10/52 (d) (f) | | | 1,902,764 | | | | 1,929,518 | |
| Capmark Military Housing Trust, Series 2007-ROBS, Class A, 6.059% due 10/10/52 (d) (f) | | | 477,783 | | | | 500,514 | |
| Fort Benning Family Communities, LLC, 144A, 5.810% due 01/15/51 (d) (f) | | | 1,050,000 | | | | 1,010,975 | |
| GMAC Commercial Military Housing Trust, Series 2007-HCKM, Class A, 6.107% due 08/10/52 (d) (f) | | | 1,115,422 | | | | 1,261,544 | |
| HP Communities, LLC, 5.630% due 09/15/34 (d) (f) | | | 650,000 | | | | 718,544 | |
| Mid-Atlantic Military Co., 144A, 5.300% due 08/01/50 | | | 939,322 | | | | 942,644 | |
| Northeast Housing, LLC, 6.298% due 10/15/49 (c) (d) | | | 725,000 | | | | 798,532 | |
| | | | | | | | | |
| Total Military Housing Obligations (Cost $7,721,447) | | | | | | | 7,877,603 | |
| | | | | | | | | |
| MUNICIPAL OBLIGATIONS — 0.7% | | | | | | | | |
| Beverly Hills Unified School District, GO, 14.046% due 08/01/37 (a) | | | 645,000 | | | | 313,128 | |
| Illinois State, GO, 5.650% due 12/01/38 | | | 1,310,000 | | | | 1,500,317 | |
| Newport Mesa CA Unified School District, GO, 3.960% due 08/01/41 (a) | | | 1,000,000 | | | | 409,590 | |
| | | | | | | | | |
| Total Municipal Obligations (Cost $2,025,118) | | | | | | | 2,223,035 | |
See Notes to Financial Statements.
68
Wilshire Mutual Funds, Inc. Wilshire Income Opportunities Fund Schedule of Investments - (continued) | December 31, 2017 |
|
| | | Shares | | | Value | |
| COMMON STOCKS — 0.0% (e) |
| Energy — 0.0% (e) | | | | | | |
| Titan Energy, LLC (d) (Cost $502,500) | | | 3,370 | | | $ | 5,122 | |
| | | | | | | | | |
| PREFERRED STOCKS — 0.8% | | | | | | | | |
| Bank of America Corp., 6.300% | | | 400,000 | | | | 452,000 | |
| Citigroup, Inc., 6.250% | | | 1,195,000 | | | | 1,318,085 | |
| JPMorgan Chase & Co., 6.000% | | | 87,291 | | | | 93,842 | |
| JPMorgan Chase & Co., 6.100% | | | 151,000 | | | | 165,919 | |
| KeyCorp, 5.000% | | | 418,000 | | | | 430,540 | |
| | | | | | | | | |
| Total Preferred Stocks (Cost $2,293,417) | | | | | | | 2,460,386 | |
| | | | | | | | | |
| AFFILIATED REGISTERED INVESTMENT COMPANIES — 1.7% |
| Guggenheim Floating Rate Strategies Fund | | | 46,994 | | | | 1,222,303 | |
| Guggenheim Strategy Fund I | | | 160,984 | | | | 4,034,258 | |
| | | | | | | | | |
| Total Affiliated Registered Investment Companies (Cost $5,259,051) | | | | | | | 5,256,561 | |
| | | | | | | | | |
| | | | Par Value | | | | | |
| COMMERCIAL PAPER — 2.5% | | | | | | | | |
| Bemis Company, Inc., 1.852%, due 01/08/18 (a) | | $ | 1,000,000 | | | | 999,640 | |
| Deutsche Telekom AG, 1.602%, due 01/12/18 (a) | | | 2,500,000 | | | | 2,498,778 | |
| Marriott International, Inc., 1.752%, due 01/12/18 (a) | | | 1,000,000 | | | | 999,465 | |
| Molex Electronics Technologies, LLC, 2.001%, due 01/09/18 (a) | | | 1,000,000 | | | | 999,556 | |
| Rogers Communications, Inc., 1.801%, due 01/03/18 (a) | | | 2,500,000 | | | | 2,499,750 | |
| | | | | | | | | |
| Total Commercial Paper (Cost $7,997,189) | | | | | | | 7,997,189 | |
| | | | | | | | | |
| MONEY MARKET FUNDS — 0.6% | | | | | | | | |
| Northern Trust Institutional Government Select Portfolio - Institutional Class, 1.13% (g) (Cost $1,972,722) | | | 1,972,722 | | | | 1,972,722 | |
| | | | | | | | | |
| Total Investments at Value — 101.6% (Cost $321,417,039) | | | | | | | 321,599,188 | |
| | | | | | | | | |
| Liabilities in Excess of Other Assets — (1.6%) | | | | | | | (4,962,720 | ) |
| | | | | | | | | |
| Net Assets — 100.0% | | | | | | $ | 316,636,468 | |
(a) | Zero coupon security. The rate reported on the Schedule of Investments is the effective yield at the time of purchase. |
(b) | Variable rate security. Interest rate resets periodically. The rate shown is the effective interest rate as of December 31, 2017. For securities based on a published reference rate and spread, the reference rate and spread are indicated parenthetically. Certain variable rate securities are not based on a published reference rate and spread but are determined by the issuer or agent and are based on current market conditions. These securities do not indicate a reference rate and spread. |
(c) | Security has been valued at fair value in accordance with the procedures adopted by and under the general supervision of the Board of Directors. The total value of such securities is $5,726,287 at December 31, 2017, representing 1.8% of net assets (Note 2). |
(d) | Illiquid security. The total value of such securities is $8,934,284 at December 31, 2017, representing 2.8% of net assets. |
(e) | Percentage rounds to less than 0.1%. |
(f) | 144A securities that are restricted securities not registered under the Securities Act of 1933. The total fair value of these securities as of December 31, 2017 was $6,136,427, representing 1.9% of net assets. |
(g) | The rate shown is the 7-day effective yield as of December 31, 2017. |
CV — Convertible Security.
Ltd. — Limited.
plc — Public Limited Company.
CDO — Collateralized Debt Obligation.
CLO — Collateralized Loan Obligation.
GO — General Obligation.
See Notes to Financial Statements.
69
Wilshire Mutual Funds, Inc. Wilshire Income Opportunities Fund Schedule of Investments - (continued) | December 31, 2017 |
|
LIBOR — London Interbank Offered Rate.
LLC — Limited Liability Corporation.
Re-REMIC — Re-securitization of Real Estate Mortgage Investment Conduit.
STRIPS — Separately Traded Registered Interest and Principal Securities.
TBA — Security has been traded on a “to-be-announced” basis. In a TBA transaction, the Fund has committed to purchase a security for which all specific information is not yet known at the time of the trade, particularly the face amount in mortgage-backed securities transactions.
144A — Security was traded in a transaction exempt from Rule 144A of the Securities Act of 1933. This security may be sold in transactions exempt from registration, normally to qualified institutional buyers.
LIBOR rates as of December 31, 2017: |
1MO LIBOR | 1.56425% |
3MO LIBOR | 1.69428% |
Wilshire Mutual Funds, Inc. Wilshire Income Opportunities Fund Schedule of Centrally Cleared Swap Contracts | December 31, 2017 |
|
| Counter Party | | Contract Type | | Fund Pays | | | Fund Receives | | | Termination Date | | Upfront Payments | | | Notional Amount | | | Net Unrealized Appreciation (Depreciation) | |
Bank of America
Merrill Lynch | | Interest Rate Swap | | | 1.7267% Fixed | | | | 3MO LIBOR | | | 7/31/2020 | | $ | — | | | $ | 8,500,000 | | | $ | 86,599 | |
| | | Interest Rate Swap | | | 1.6738% Fixed | | | | 3MO LIBOR | | | 8/16/2020 | | | 43,893 | | | | 7,400,000 | | | | 42,923 | |
| | | Interest Rate Swap | | | 1.9325% Fixed | | | | 3MO LIBOR | | | 7/31/2022 | | | — | | | | 4,700,000 | | | | 62,160 | |
| | | Interest Rate Swap | | | 1.8953% Fixed | | | | 3MO LIBOR | | | 8/11/2022 | | | 53,546 | | | | 5,900,000 | | | | 34,511 | |
| | | Interest Rate Swap | | | 2.2840% Fixed | | | | 3MO LIBOR | | | 1/30/2024 | | | 3,458 | | | | 1,500,000 | | | | (1,978 | ) |
| | | Interest Rate Swap | | | 1.9914% Fixed | | | | 3MO LIBOR | | | 8/22/2024 | | | 47,110 | | | | 3,700,000 | | | | 25,671 | |
| | | Interest Rate Swap | | | 2.3500% Fixed | | | | 3MO LIBOR | | | 2/13/2027 | | | 35 | | | | 6,400,000 | | | | 23,213 | |
| | | Interest Rate Swap | | | 2.2365% Fixed | | | | 3MO LIBOR | | | 8/11/2027 | | | 137,941 | | | | 19,600,000 | | | | 149,797 | |
| | | Interest Rate Swap | | | 2.1477% Fixed | | | | 3MO LIBOR | | | 8/29/2027 | | | 306 | | | | 800,000 | | | | 17,896 | |
| | | Interest Rate Swap | | | 2.5919% Fixed | | | | 3MO LIBOR | | | 11/13/2047 | | | 312 | | | | 700,000 | | | | (3,452 | ) |
| | | | | | | | | | | | | | | | | | | | | | | $ | 437,340 | |
LIBOR — London Interbank Offered Rate.
LIBOR rates as of December 31, 2017: |
3MO LIBOR | 1.69428% |
See Notes to Financial Statements.
70
Wilshire Mutual Funds, Inc. Statements of Assets and Liabilities December 31, 2017 |
|
| | | LARGE
COMPANY
GROWTH PORTFOLIO | | | LARGE
COMPANY
VALUE
PORTFOLIO | | | SMALL
COMPANY
GROWTH
PORTFOLIO | | | SMALL
COMPANY
VALUE
PORTFOLIO | | | WILSHIRE
5000
INDEXSM
FUND | | | WILSHIRE
INTERNATIONAL EQUITY
FUND | | | WILSHIRE
INCOME
OPPORTUNITIES FUND | |
| ASSETS: | | | | | | | | | | | | | | | | | | | | | |
| Investments in unaffiliated securities, at value (Note 2) | | $ | 236,408,718 | * | | $ | 158,383,548 | * | | $ | 51,734,273 | * | | $ | 41,250,074 | * | | $ | 187,198,012 | * | | $ | 359,424,114 | * | | $ | 316,342,627 | |
| Investments in affiliated funds, at value (Note 5) | | | — | | | | — | | | | — | | | | — | | | | — | | | | — | | | | 5,256,561 | |
| Cash | | | — | | | | 673 | | | | — | | | | — | | | | — | | | | 510 | | | | — | |
| Cash pledged as collateral | | | — | | | | — | | | | — | | | | — | | | | — | | | | — | | | | 1,056,000 | |
| Foreign currency, at value | | | — | | | | — | | | | — | | | | — | | | | — | | | | 15,540 | | | | — | |
| Receivable for investment securities sold | | | — | | | | — | | | | 49,554 | | | | 12,750 | | | | 99,204 | | | | — | | | | 3,003,970 | |
| Net swap premiums paid | | | — | | | | — | | | | — | | | | — | | | | — | | | | — | | | | 286,601 | |
| Dividends and interest receivable | | | 96,470 | | | | 293,549 | | | | 30,182 | | | | 31,672 | | | | 197,537 | | | | 350,247 | | | | 1,765,746 | |
| Receivable for capital shares sold | | | 199,457 | | | | 163,291 | | | | 50,579 | | | | 15,712 | | | | 18,670 | | | | 674,693 | | | | 448,819 | |
| Dividend reclaim receivable | | | 10,256 | | | | 106 | | | | — | | | | — | | | | 207 | | | | 810,721 | | | | — | |
| Other assets | | | 30,854 | | | | 26,347 | | | | 26,896 | | | | 25,050 | | | | 33,355 | | | | 64,792 | | | | 19,573 | |
| Total Assets | | | 236,745,755 | | | | 158,867,514 | | | | 51,891,484 | | | | 41,335,258 | | | | 187,546,985 | | | | 361,340,617 | | | | 328,179,897 | |
| | | | | | | | | | | | | | | | | | | | | | | | | | | | | |
| LIABILITIES: | | | | | | | | | | | | | | | | | | | | | | | | | | | | |
| Payable upon return of securities loaned (Note 7) | | | 1,614,019 | | | | 127,466 | | | | 3,365,468 | | | | 1,001,671 | | | | 1,815,226 | | | | 5,530,010 | | | | — | |
| Payable for investment securities purchased | | | — | | | | 81,493 | | | | 454,925 | | | | 36,913 | | | | — | | | | — | | | | 10,818,404 | |
| Payable for capital shares redeemed | | | 63,697 | | | | 34,544 | | | | 7,458 | | | | 7,420 | | | | 1,183,625 | | | | 96,444 | | | | 104,237 | |
| Net variation margin payable | | | — | | | | — | | | | — | | | | — | | | | — | | | | — | | | | 334,275 | |
| Investment advisory fees payable (Note 3) | | | 149,958 | | | | 99,965 | | | | 30,930 | | | | 26,149 | | | | 15,835 | | | | 297,716 | | | | 169,097 | |
| Distribution fees payable (Note 4) | | | 8,823 | | | | — | | | | 8,027 | | | | 239 | | | | 60,188 | | | | — | | | | — | |
| Shareholder Service fees payable (Note 4) | | | 14,100 | | | | 7,300 | | | | 2,740 | | | | 2,340 | | | | 8,510 | | | | 13,310 | | | | 16,120 | |
| Administration fees payable | | | 8,400 | | | | 5,700 | | | | 1,700 | | | | 1,500 | | | | 6,600 | | | | 12,300 | | | | 11,400 | |
| Accrued expenses and other payables | | | 48,431 | | | | 41,234 | | | | 35,785 | | | | 34,675 | | | | 49,293 | | | | 78,809 | | | | 89,896 | |
| Total Liabilities | | | 1,907,428 | | | | 397,702 | | | | 3,907,033 | | | | 1,110,907 | | | | 3,139,277 | | | | 6,028,589 | | | | 11,543,429 | |
| | | | | | | | | | | | | | | | | | | | | | | | | | | | | |
| NET ASSETS | | $ | 234,838,327 | | | $ | 158,469,812 | | | $ | 47,984,451 | | | $ | 40,224,351 | | | $ | 184,407,708 | | | $ | 355,312,028 | | | $ | 316,636,468 | |
| | | | | | | | | | | | | | | | | | | | | | | | | | | | | |
| * Includes value of securities on loan | | $ | 15,985,353 | | | $ | 5,439,871 | | | $ | 10,257,245 | | | $ | 6,418,286 | | | $ | 11,934,916 | | | $ | 19,812,414 | | | $ | — | |
See Notes to Financial Statements.
71
Wilshire Mutual Funds, Inc. Statements of Assets and Liabilities - (Continued) December 31, 2017 |
|
| | | LARGE
COMPANY
GROWTH PORTFOLIO | | | LARGE
COMPANY
VALUE
PORTFOLIO | | | SMALL
COMPANY
GROWTH
PORTFOLIO | | | SMALL
COMPANY
VALUE
PORTFOLIO | | | WILSHIRE
5000
INDEXSM
FUND | | | WILSHIRE INTERNATIONAL EQUITY
FUND | | | WILSHIRE INCOME OPPORTUNITIES FUND | |
| NET ASSETS CONSIST OF: | | | | | | | | | | | | | | | | | | | |
| Paid-in capital | | $ | 145,803,100 | | | $ | 118,999,301 | | | $ | 37,538,592 | | | $ | 31,781,842 | | | $ | 57,455,003 | | | $ | 295,227,234 | | | $ | 314,730,429 | |
| Accumulated (distributions in excess of) net investment income | | | — | | | | — | | | | — | | | | 1,156 | | | | 223,005 | | | | 1,164,230 | | | | (393,090 | ) |
| Accumulated net realized gains (losses) from investment transactions | | | 5,525,689 | | | | 2,262,233 | | | | 554,946 | | | | 692,237 | | | | (422,383 | ) | | | (6,860,000 | ) | | | 1,679,640 | |
| Net unrealized appreciation (depreciation) on: | | | | | | | | | | | | | | | | | | | | | | | | | | | | |
| Unaffiliated investments | | | 83,509,538 | | | | 37,208,278 | | | | 9,890,913 | | | | 7,749,116 | | | | 127,152,083 | | | | 65,747,870 | | | | 184,639 | |
| Investments in affiliated funds | | | — | | | | — | | | | — | | | | — | | | | — | | | | — | | | | (2,490 | ) |
| Swap contracts | | | — | | | | — | | | | — | | | | — | | | | — | | | | — | | | | 437,340 | |
| Net unrealized appreciation on assets and liabilities denominated in foreign currencies | | | — | | | | — | | | | — | | | | — | | | | — | | | | 32,694 | | | | — | |
| | | | | | | | | | | | | | | | | | | | | | | | | | | | | |
| NET ASSETS | | $ | 234,838,327 | | | $ | 158,469,812 | | | $ | 47,984,451 | | | $ | 40,224,351 | | | $ | 184,407,708 | | | $ | 355,312,028 | | | $ | 316,636,468 | |
| | | | | | | | | | | | | | | | | | | | | | | | | | | | | |
| Investments in unaffiliated securities, at cost (Note 2) | | $ | 151,285,161 | | | $ | 121,047,804 | | | $ | 38,477,892 | | | $ | 32,499,287 | | | $ | 58,230,703 | | | $ | 288,146,234 | | | $ | 316,157,988 | |
| Investments in affiliated funds, at cost | | | — | | | | — | | | | — | | | | — | | | | — | | | | — | | | | 5,259,051 | |
| Cash collateral for securities on loan, at cost | | | 1,614,019 | | | | 127,466 | | | | 3,365,468 | | | | 1,001,671 | | | | 1,815,226 | | | | 5,530,010 | | | | — | |
| Foreign currency, at cost | | | — | | | | — | | | | — | | | | — | | | | — | | | | 15,386 | | | | — | |
See Notes to Financial Statements.
72
Wilshire Mutual Funds, Inc. Statements of Assets and Liabilities - (Continued) December 31, 2017 |
|
| | | LARGE
COMPANY
GROWTH PORTFOLIO | | | LARGE
COMPANY
VALUE
PORTFOLIO | | | SMALL
COMPANY
GROWTH
PORTFOLIO | | | SMALL
COMPANY
VALUE
PORTFOLIO | | | WILSHIRE
5000
INDEXSM
FUND | | | WILSHIRE INTERNATIONAL EQUITY
FUND | | | WILSHIRE INCOME OPPORTUNITIES FUND | |
| NET ASSET VALUE PER SHARE: | | | | | | | | | | | | | | | | | | | |
| INVESTMENT CLASS | | | | | | | | | | | | | | | | | | | |
| Net assets applicable to Investment Class | | $ | 64,130,461 | | | $ | 6,546,792 | | | $ | 11,385,755 | | | $ | 6,304,910 | | | $ | 149,342,024 | | | $ | 4,176,424 | | | $ | 6,409,413 | |
| Investment Class shares of beneficial interest outstanding | | | | | | | | | | | | | | | | | | | | | | | | | | | | |
| (50,000,000 shares authorized, per class, per Portfolio, par value $.001 per share)† | | | 1,622,279 | | | | 309,031 | | | | 454,494 | | | | 274,222 | | | | 7,170,420 | | | | 373,194 | | | | 625,181 | |
| | | | | | | | | | | | | | | | | | | | | | | | | | | | | |
Net asset value, offering and redemption price per share (a) | | $ | 39.53 | | | $ | 21.18 | | | $ | 25.05 | | | $ | 22.99 | | | $ | 20.83 | | | $ | 11.19 | | | $ | 10.25 | |
| | | | | | | | | | | | | | | | | | | | | | | | | | | | | |
| INSTITUTIONAL CLASS | | | | | | | | | | | | | | | | | | | | | | | | | | |
| Net assets applicable to Institutional Class | | $ | 170,707,866 | | | $ | 151,923,020 | | | $ | 36,598,696 | | | $ | 33,919,441 | | | $ | 35,065,684 | | | $ | 351,135,604 | | | $ | 310,227,055 | |
| Institutional Class shares of beneficial interest outstanding | | | | | | | | | | | | | | | | | | | | | | | | | | | | |
| (50,000,000 shares authorized, per class, per Portfolio, par value $.001 per share)† | | | 4,013,802 | | | | 7,250,711 | | | | 1,348,322 | | | | 1,444,294 | | | | 1,683,570 | | | | 31,800,035 | | | | 30,340,537 | |
| | | | | | | | | | | | | | | | | | | | | | | | | | | | | |
Net asset value, offering and redemption price per share (a) | | $ | 42.53 | | | $ | 20.95 | | | $ | 27.14 | | | $ | 23.49 | | | $ | 20.83 | | | $ | 11.04 | | | $ | 10.22 | |
| † | For Wilshire International Equity Fund, (40,000,000 shares authorized, per class, par value $.001 per share). |
| (a) | For Wilshire International Equity Fund, a redemption fee may apply to redemptions of shares held for sixty days or less, subject to certain exceptions (Note 2). |
See Notes to Financial Statements.
73
Wilshire Mutual Funds, Inc. Statements of Operations For the Year Ended December 31, 2017 |
|
| | | LARGE
COMPANY
GROWTH PORTFOLIO | | | LARGE
COMPANY
VALUE
PORTFOLIO | | | SMALL
COMPANY
GROWTH
PORTFOLIO | | | SMALL
COMPANY
VALUE
PORTFOLIO | | | WILSHIRE
5000
INDEXSM
FUND | | | WILSHIRE INTERNATIONAL EQUITY
FUND | | | WILSHIRE INCOME OPPORTUNITIES FUND | |
| INVESTMENT INCOME: | | | | | | | | | | | | | | | | | | | |
| Dividends | | $ | 2,553,890 | | | $ | 4,424,731 | | | $ | 293,433 | | | $ | 428,642 | | | $ | 3,575,089 | | | $ | 7,918,110 | | | $ | 1,313,728 | |
| Interest | | | — | | | | — | | | | — | | | | — | | | | 3 | | | | — | | | | 14,780,588 | |
| Income from securities lending | | | 34,343 | | | | 19,306 | | | | 16,677 | | | | 17,913 | | | | 37,431 | | | | 46,789 | | | | — | |
| Income distributions from affiliated investments | | | — | | | | — | | | | — | | | | — | | | | — | | | | — | | | | 213,937 | |
| Foreign taxes withheld | | | (51,269 | ) | | | (8,305 | ) | | | — | | | | — | | | | (1,728 | ) | | | (809,798 | ) | | | — | |
| Total income | | | 2,536,964 | | | | 4,435,732 | | | | 310,110 | | | | 446,555 | | | | 3,610,795 | | | | 7,155,101 | | | | 16,308,253 | |
| | | | | | | | | | | | | | | | | | | | | | | | | | | | | |
| EXPENSES: | | | | | | | | | | | | | | | | | | | | | | | | | | | | |
| Investment advisory fee (Note 3) | | | 1,740,176 | | | | 1,254,058 | | | | 351,218 | | | | 299,905 | | | | 179,696 | | | | 3,138,372 | (a) | | | 2,164,887 | |
| Shareholder Service fees (Note 4) | | | | | | | | | | | | | | | | | | | | | | | | | | | | |
| Investment Class | | | 80,681 | | | | 5,563 | | | | 13,984 | | | | 8,745 | | | | 92,879 | | | | 4,912 | | | | 3,272 | |
| Institutional Class | | | 88,673 | | | | 82,279 | | | | 15,856 | | | | 15,253 | | | | 7,805 | | | | 136,617 | | | | 208,710 | |
| Distribution (12b-1) fees (Note 4) | | | | | | | | | | | | | | | | | | | | | | | | | | | | |
| Investment Class | | | 157,771 | | | | 19,038 | | | | 32,580 | | | | 19,072 | | | | 357,300 | | | | 15,862 | | | | 11,321 | |
| Administration and accounting fees (Note 3) | | | 97,350 | | | | 70,070 | | | | 17,322 | | | | 14,785 | | | | 75,287 | | | | 131,663 | | | | 151,120 | |
| Pricing costs | | | 5,600 | | | | 6,292 | | | | 7,684 | | | | 7,180 | | | | 39,524 | | | | 119,416 | | | | 307,807 | |
| Registration and filing fees | | | 42,853 | | | | 43,443 | | | | 36,196 | | | | 34,270 | | | | 50,956 | | | | 53,784 | | | | 90,673 | |
| Transfer agent fees (Note 3) | | | 65,314 | | | | 30,378 | | | | 38,576 | | | | 32,956 | | | | 54,059 | | | | 84,474 | | | | 21,348 | |
| Custodian fees (Note 3) | | | 49,272 | | | | 35,948 | | | | 9,098 | | | | 8,174 | | | | 38,676 | | | | 73,151 | | | | 89,116 | |
| Professional fees | | | 37,192 | | | | 32,402 | | | | 23,092 | | | | 22,700 | | | | 33,304 | | | | 45,938 | | | | 48,224 | |
| Directors’ fees and expenses (Note 3) | | | 40,509 | | | | 29,191 | | | | 7,204 | | | | 6,192 | | | | 31,427 | | | | 54,647 | | | | 63,670 | |
| Postage and supplies | | | 34,759 | | | | 25,545 | | | | 26,448 | | | | 25,328 | | | | 18,326 | | | | 33,102 | | | | 35,040 | |
| Printing expense | | | 12,970 | | | | 12,113 | | | | 4,176 | | | | 3,619 | | | | 10,591 | | | | 15,915 | | | | 22,684 | |
| Insurance expense | | | 12,749 | | | | 11,073 | | | | 2,260 | | | | 2,398 | | | | 10,274 | | | | 15,800 | | | | 23,324 | |
| Interest expense (Note 2) | | | — | | | | — | | | | — | | | | — | | | | — | | | | — | | | | 61,653 | |
| Other | | | 11,701 | | | | 14,702 | | | | 8,955 | | | | 7,225 | | | | 10,157 | | | | 52,722 | | | | 36,023 | |
| Total expenses | | | 2,477,570 | | | | 1,672,095 | | | | 594,649 | | | | 507,802 | | | | 1,010,261 | | | | 3,976,375 | | | | 3,338,872 | |
| Fees reduced and/or expenses reimbursed by Investment Adviser (Note 3) | | | — | | | | — | | | | (53,561 | ) | | | (55,407 | ) | | | — | | | | (2,177 | ) | | | (3,021 | ) |
| Fees paid indirectly (Note 4) | | | (2,976 | ) | | | (3,540 | ) | | | — | | | | (6,996 | ) | | | — | | | | — | | | | — | |
| Net expenses | | | 2,474,594 | | | | 1,668,555 | | | | 541,088 | | | | 445,399 | | | | 1,010,261 | | | | 3,974,198 | | | | 3,335,851 | |
| | | | | | | | | | | | | | | | | | | | | | | | | | | | | |
| Net investment income (loss) | | $ | 62,370 | | | $ | 2,767,177 | | | $ | (230,978 | ) | | $ | 1,156 | | | $ | 2,600,534 | | | $ | 3,180,903 | | | $ | 12,972,402 | |
| (a) | Includes $7,286 of prior years’ investment advisory fee reductions and expense reimbursement recouped by the Adviser (Note 3). |
See Notes to Financial Statements.
74
Wilshire Mutual Funds, Inc. Statements of Operations - (Continued) For the Year Ended December 31, 2017 |
|
| | | LARGE
COMPANY
GROWTH PORTFOLIO | | | LARGE
COMPANY
VALUE
PORTFOLIO | | | SMALL
COMPANY
GROWTH
PORTFOLIO | | | SMALL
COMPANY
VALUE
PORTFOLIO | | | WILSHIRE
5000
INDEXSM
FUND | | | WILSHIRE INTERNATIONAL EQUITY
FUND | | | WILSHIRE INCOME OPPORTUNITIES FUND | |
| NET REALIZED AND UNREALIZED GAIN (LOSS) ON INVESTMENTS AND FOREIGN CURRENCY TRANSACTIONS (NOTES 2 and 5): | | | | | | | | | | | | | | | | | | | | | |
| Net realized gain (loss) from: | | | | | | | | | | | | | | | | | | | | | |
| Unaffiliated investments | | $ | 23,070,730 | | | $ | 13,077,655 | | | $ | 4,094,232 | | | $ | 3,862,700 | | | $ | 12,583,104 | | | $ | 15,476,610 | | | $ | 3,054,395 | |
| Sale of affiliated investment company shares | | | — | | | | — | | | | — | | | | — | | | | — | | | | — | | | | 69,074 | |
| Written option contracts (Note 2) | | | — | | | | — | | | | — | | | | — | | | | — | | | | — | | | | 56,289 | |
| Swap contracts | | | — | | | | — | | | | — | | | | — | | | | — | | | | — | | | | (145,063 | ) |
| Forward currency contracts | | | — | | | | — | | | | — | | | | — | | | | — | | | | — | | | | 5,381 | |
| Foreign currency transactions | | | — | | | | — | | | | — | | | | — | | | | — | | | | (381,684 | ) | | | (81,286 | ) |
| Long-term capital gain distributions from affiliated funds | | | — | | | | — | | | | — | | | | — | | | | — | | | | — | | | | 1,090 | |
| Net change in unrealized appreciation (depreciation) on: | | | | | | | | | | | | | | | | | | | | | | | | | | | | |
| Unaffiliated investments | | | 32,528,372 | | | | 6,970,898 | | | | 1,518,666 | | | | (939,024 | ) | | | 17,971,304 | | | | 52,143,955 | | | | 4,807,365 | |
| Investments in affiliated funds | | | — | | | | — | | | | — | | | | — | | | | — | | | | — | | | | (60,612 | ) |
| Swap contracts | | | — | | | | — | | | | — | | | | — | | | | — | | | | — | | | | 437,340 | |
| Foreign currency transactions and translation of other assets and liabilities denominated in foreign currencies | | | — | | | | — | | | | — | | | | — | | | | — | | | | 60,821 | | | | (14,224 | ) |
| | | | | | | | | | | | | | | | | | | | | | | | | | | | | |
| Net realized and unrealized gains on investments and foreign currency transactions | | | 55,599,102 | | | | 20,048,553 | | | | 5,612,898 | | | | 2,923,676 | | | | 30,554,408 | | | | 67,299,702 | | | | 8,129,749 | |
| | | | | | | | | | | | | | | | | | | | | | | | | | | | | |
| NET INCREASE IN NET ASSETS RESULTING FROM OPERATIONS | | $ | 55,661,472 | | | $ | 22,815,730 | | | $ | 5,381,920 | | | $ | 2,924,832 | | | $ | 33,154,942 | | | $ | 70,480,605 | | | $ | 21,102,151 | |
See Notes to Financial Statements.
75
Wilshire Mutual Funds, Inc. Statements of Changes in Net Assets |
|
| | | LARGE COMPANY
GROWTH PORTFOLIO | | | LARGE COMPANY
VALUE PORTFOLIO | |
| | | Year Ended
December 31, 2017 | | | Year Ended
December 31, 2016 | | | Year Ended
December 31, 2017 | | | Year Ended
December 31, 2016 | |
| OPERATIONS: | | | | | | | | | | | | |
| Net investment income | | $ | 62,370 | | | $ | 701,354 | | | $ | 2,767,177 | | | $ | 3,602,970 | |
| Net realized gains on investments | | | 23,070,730 | | | | 24,110,965 | | | | 13,077,655 | | | | 10,983,831 | |
| Net change in unrealized appreciation (depreciation) on investments | | | 32,528,372 | | | | (9,717,197 | ) | | | 6,970,898 | | | | 18,844,323 | |
| Net increase in net assets resulting from operations | | | 55,661,472 | | | | 15,095,122 | | | | 22,815,730 | | | | 33,431,124 | |
| | | | | | | | | | | | | | | | | |
| DISTRIBUTIONS TO SHAREHOLDERS FROM: | | | | | | | | | | | | | | | | |
| Net investment income: | | | | | | | | | | | | | | | | |
| Investment Class shares | | | — | | | | (23,274 | ) | | | (92,892 | ) | | | (70,117 | ) |
| Institutional Class shares | | | (83,014 | ) | | | (666,107 | ) | | | (2,679,991 | ) | | | (3,529,320 | ) |
| Net realized capital gains: | | | | | | | | | | | | | | | | |
| Investment Class shares | | | (5,345,348 | ) | | | (7,216,123 | ) | | | (529,991 | ) | | | (812,603 | ) |
| Institutional Class shares | | | (13,199,444 | ) | | | (16,461,985 | ) | | | (12,564,148 | ) | | | (8,395,071 | ) |
| Total distributions to shareholders | | | (18,627,806 | ) | | | (24,367,489 | ) | | | (15,867,022 | ) | | | (12,807,111 | ) |
| | | | | | | | | | | | | | | | | |
| CAPITAL STOCK TRANSACTIONS (DOLLARS) (Note 8): | | | | | | | | | | | | | | | | |
| Investment Class shares: | | | | | | | | | | | | | | | | |
| Shares sold | | | 1,303,759 | | | | 9,447,776 | | | | 910,198 | | | | 13,100,295 | |
| Shares issued as reinvestment of distributions | | | 5,238,090 | | | | 7,046,311 | | | | 607,100 | | | | 868,423 | |
| Shares redeemed | | | (14,751,160 | ) | | | (58,801,975 | ) | | | (5,436,320 | ) | | | (60,891,899 | ) |
| Net decrease in net assets from Investment Class share transactions | | | (8,209,311 | ) | | | (42,307,888 | ) | | | (3,919,022 | ) | | | (46,923,181 | ) |
| | | | | | | | | | | | | | | | | |
| Institutional Class shares: | | | | | | | | | | | | | | | | |
| Shares sold | | | 41,145,232 | | | | 112,406,914 | | | | 24,380,834 | | | | 127,227,693 | |
| Shares issued as reinvestment of distributions | | | 12,550,610 | | | | 15,976,819 | | | | 15,150,692 | | | | 11,893,895 | |
| Shares redeemed | | | (62,483,304 | ) | | | (91,601,976 | ) | | | (69,699,659 | ) | | | (33,421,170 | ) |
| Net increase (decrease) in net assets from Institutional Class share transactions | | | (8,787,462 | ) | | | 36,781,757 | | | | (30,168,133 | ) | | | 105,700,418 | |
| | | | | | | | | | | | | | | | | |
| Net increase (decrease) in net assets | | | 20,036,893 | | | | (14,798,498 | ) | | | (27,138,447 | ) | | | 79,401,250 | |
| | | | | | | | | | | | | | | | | |
| NET ASSETS: | | | | | | | | | | | | | | | | |
| Beginning of year | | | 214,801,434 | | | | 229,599,932 | | | | 185,608,259 | | | | 106,207,009 | |
| End of year | | $ | 234,838,327 | | | $ | 214,801,434 | | | $ | 158,469,812 | | | $ | 185,608,259 | |
| | | | | | | | | | | | | | | | | |
| Accumulated net investment income, end of year | | $ | — | | | $ | 11,973 | | | $ | — | | | $ | 3,533 | |
See Notes to Financial Statements.
76
Wilshire Mutual Funds, Inc. Statements of Changes in Net Assets - (Continued) |
|
| | | SMALL COMPANY
GROWTH PORTFOLIO | | | SMALL COMPANY
VALUE PORTFOLIO | |
| | | Year Ended
December 31, 2017 | | | Year Ended
December 31, 2016 | | | Year Ended
December 31, 2017 | | | Year Ended
December 31, 2016 | |
| OPERATIONS: | | | | | | | | | | | | |
| Net investment income (loss) | | $ | (230,978 | ) | | $ | (146,581 | ) | | $ | 1,156 | | | $ | 253,736 | |
| Net realized gains on investments | | | 4,094,232 | | | | 5,246,004 | | | | 3,862,700 | | | | 3,935,633 | |
| Net change in unrealized appreciation (depreciation) on investments | | | 1,518,666 | | | | 3,547,658 | | | | (939,024 | ) | | | 6,014,108 | |
| Net increase in net assets resulting from operations | | | 5,381,920 | | | | 8,647,081 | | | | 2,924,832 | | | | 10,203,477 | |
| | | | | | | | | | | | | | | | | |
| DISTRIBUTIONS TO SHAREHOLDERS FROM: | | | | | | | | | | | | | | | | |
| Net investment income: | | | | | | | | | | | | | | | | |
| Investment Class shares | | | — | | | | — | | | | — | | | | (42,010 | ) |
| Institutional Class shares | | | — | | | | — | | | | — | | | | (249,635 | ) |
| Net realized capital gains: | | | | | | | | | | | | | | | | |
| Investment Class shares | | | (1,097,621 | ) | | | (902,329 | ) | | | (709,839 | ) | | | (879,115 | ) |
| Institutional Class shares | | | (3,329,032 | ) | | | (3,066,404 | ) | | | (3,781,888 | ) | | | (2,443,106 | ) |
| Total distributions to shareholders | | | (4,426,653 | ) | | | (3,968,733 | ) | | | (4,491,727 | ) | | | (3,613,866 | ) |
| | | | | | | | | | | | | | | | | |
| CAPITAL STOCK TRANSACTIONS (DOLLARS) (Note 8): | | | | | | | | | | | | | | | | |
| Investment Class shares: | | | | | | | | | | | | | | | | |
| Shares sold | | | 14,638,488 | | | | 8,090,368 | | | | 1,117,553 | | | | 4,601,966 | |
| Shares issued as reinvestment of distributions | | | 1,041,243 | | | | 883,172 | | | | 689,265 | | | | 900,773 | |
| Shares redeemed | | | (13,152,021 | ) | | | (14,178,884 | ) | | | (4,390,773 | ) | | | (12,548,929 | ) |
| Net increase (decrease) in net assets from Investment Class share transactions | | | 2,527,710 | | | | (5,205,344 | ) | | | (2,583,955 | ) | | | (7,046,190 | ) |
| | | | | | | | | | | | | | | | | |
| Institutional Class shares: | | | | | | | | | | | | | | | | |
| Shares sold | | | 18,566,543 | | | | 23,749,758 | | | | 15,355,723 | | | | 24,015,502 | |
| Shares issued as reinvestment of distributions | | | 3,308,750 | | | | 3,059,039 | | | | 3,772,200 | | | | 2,684,309 | |
| Shares redeemed | | | (14,460,998 | ) | | | (16,251,162 | ) | | | (15,548,502 | ) | | | (13,461,080 | ) |
| Net increase in net assets from Institutional Class share transactions | | | 7,414,295 | | | | 10,557,635 | | | | 3,579,421 | | | | 13,238,731 | |
| | | | | | | | | | | | | | | | | |
| Net increase (decrease) in net assets | | | 10,897,272 | | | | 10,030,639 | | | | (571,429 | ) | | | 12,782,152 | |
| | | | | | | | | | | | | | | | | |
| NET ASSETS: | | | | | | | | | | | | | | | | |
| Beginning of year | | | 37,087,179 | | | | 27,056,540 | | | | 40,795,780 | | | | 28,013,628 | |
| End of year | | $ | 47,984,451 | | | $ | 37,087,179 | | | $ | 40,224,351 | | | $ | 40,795,780 | |
| | | | | | | | | | | | | | | | | |
| Accumulated net investment income, end of year | | $ | — | | | $ | — | | | $ | 1,156 | | | $ | — | |
See Notes to Financial Statements.
77
Wilshire Mutual Funds, Inc. Statements of Changes in Net Assets - (Continued) |
|
| | | WILSHIRE 5000
INDEXSM FUND | | | WILSHIRE INTERNATIONAL
EQUITY FUND | |
| | | Year Ended
December 31, 2017 | | | Year Ended
December 31, 2016 | | | Year Ended
December 31, 2017 | | | Year Ended
December 31, 2016 | |
| OPERATIONS: | | | | | | | | | | | | |
| Net investment income | | $ | 2,600,534 | | | $ | 3,091,458 | | | $ | 3,180,903 | | | $ | 3,980,720 | |
| Net realized gains (losses) on investments and foreign currency transactions | | | 12,583,104 | | | | 32,576,301 | | | | 15,094,926 | | | | (4,042,613 | ) |
| Net change in unrealized appreciation (depreciation) on investments and foreign currency transactions and translation of other assets and liabilities denominated in foreign currencies | | | 17,971,304 | | | | (12,337,006 | ) | | | 52,204,776 | | | | 13,529,543 | |
| Net increase in net assets resulting from operations | | | 33,154,942 | | | | 23,330,753 | | | | 70,480,605 | | | | 13,467,650 | |
| | | | | | | | | | | | | | | | | |
| DISTRIBUTIONS TO SHAREHOLDERS FROM: | | | | | | | | | | | | | | | | |
| Net investment income: | | | | | | | | | | | | | | | | |
| Investment Class shares | | | (1,946,012 | ) | | | (2,761,275 | ) | | | (2,976 | ) | | | (182,252 | ) |
| Institutional Class shares | | | (555,678 | ) | | | (1,004,390 | ) | | | (1,689,353 | ) | | | (4,629,388 | ) |
| Horace Mann Class shares | | | — | | | | (4,577 | ) | | | — | | | | — | |
| Net realized capital gains: | | | | | | | | | | | | | | | | |
| Investment Class shares | | | (10,494,187 | ) | | | (5,106,112 | ) | | | — | | | | — | |
| Institutional Class shares | | | (2,473,623 | ) | | | (1,869,149 | ) | | | — | | | | — | |
| Total distributions to shareholders | | | (15,469,500 | ) | | | (10,745,503 | ) | | | (1,692,329 | ) | | | (4,811,640 | ) |
See Notes to Financial Statements.
78
Wilshire Mutual Funds, Inc. Statements of Changes in Net Assets - (Continued) |
|
| | | WILSHIRE 5000
INDEXSM FUND | | | WILSHIRE INTERNATIONAL
EQUITY FUND | |
| | | Year Ended
December 31, 2017 | | | Year Ended
December 31, 2016 | | | Year Ended
December 31, 2017 | | | Year Ended
December 31, 2016 | |
| CAPITAL STOCK TRANSACTIONS (DOLLARS) (Note 8): | | | | | | | | | | | | |
| Investment Class shares: | | | | | | | | | | | | |
| Shares sold | | | 19,689,466 | | | | 14,468,832 | | | | 2,292,119 | | | | 13,074,344 | |
| Shares issued as reinvestment of distributions | | | 11,943,752 | | | | 7,545,415 | | | | 2,853 | | | | 176,771 | |
| Redemption fees (Note 2) | | | — | | | | — | | | | 10 | | | | 942 | |
| Shares redeemed | | | (28,829,164 | ) | | | (58,715,642 | ) | | | (11,034,460 | ) | | | (5,481,578 | ) |
| Net increase (decrease) in net assets from Investment Class share transactions | | | 2,804,054 | | | | (36,701,395 | ) | | | (8,739,478 | ) | | | 7,770,479 | |
| | | | | | | | | | | | | | | | | |
| Institutional Class shares: | | | | | | | | | | | | | | | | |
| Shares sold | | | 3,066,897 | | | | 10,987,352 | | | | 76,449,497 | | | | 177,914,962 | |
| Shares issued as reinvestment of distributions | | | 2,507,629 | | | | 2,231,465 | | | | 1,646,137 | | | | 4,619,158 | |
| Redemption fees (Note 2) | | | — | | | | — | | | | 635 | | | | 1,948 | |
| Shares redeemed | | | (15,185,693 | ) | | | (34,209,479 | ) | | | (52,433,552 | ) | | | (109,736,709 | ) |
| Net increase (decrease) in net assets from Institutional Class share transactions | | | (9,611,167 | ) | | | (20,990,662 | ) | | | 25,662,717 | | | | 72,799,359 | |
| | | | | | | | | | | | | | | | | |
| Qualified Class shares: | | | | | | | | | | | | | | | | |
| Shares sold | | | — | | | | 1 | | | | — | | | | — | |
| Shares redeemed | | | — | | | | (197 | ) | | | — | | | | — | |
| Net decrease in net assets from Qualified Class share transactions | | | — | | | | (196 | ) | | | — | | | | — | |
| | | | | | | | | | | | | | | | | |
| Horace Mann Class shares: | | | | | | | | | | | | | | | | |
| Shares sold | | | — | | | | 24,850 | | | | — | | | | — | |
| Shares issued as reinvestment of distributions | | | — | | | | 4,577 | | | | — | | | | — | |
| Shares redeemed | | | — | | | | (1,792,892 | ) | | | — | | | | — | |
| Net decrease in net assets from Horace Mann Class share transactions | | | — | | | | (1,763,465 | ) | | | — | | | | — | |
| | | | | | | | | | | | | | | | | |
| Net increase (decrease) in net assets | | | 10,878,329 | | | | (46,870,468 | ) | | | 85,711,515 | | | | 89,225,848 | |
| | | | | | | | | | | | | | | | | |
| NET ASSETS: | | | | | | | | | | | | | | | | |
| Beginning of year | | | 173,529,379 | | | | 220,399,847 | | | | 269,600,513 | | | | 180,374,665 | |
| End of year | | $ | 184,407,708 | | | $ | 173,529,379 | | | $ | 355,312,028 | | | $ | 269,600,513 | |
| | | | | | | | | | | | | | | | | |
| Accumulated (distributions in excess of) net investment income, end of year | | $ | 223,005 | | | $ | (2,459 | ) | | $ | 1,164,230 | | | $ | (104,004 | ) |
See Notes to Financial Statements.
79
Wilshire Mutual Funds, Inc. Statements of Changes in Net Assets - (Continued) |
|
| | | WILSHIRE INCOME
OPPORTUNITIES FUND | |
| | | Year Ended
December 31, 2017 | | | Period Ended
December 31, 2016* | |
| OPERATIONS: | | | | | | |
| Net investment income | | $ | 12,972,402 | | | $ | 8,295,764 | |
| Net realized gains on unaffiliated investments, sale of affiliated investment company shares, written option contracts, swap contracts, forward currency contracts and foreign currency transactions | | | 2,958,790 | | | | 1,719,677 | |
| Long-term capital gain distributions from affiliated funds | | | 1,090 | | | | — | |
| Net change in unrealized appreciation (depreciation) on affiliated and unaffiliated investments, swap contracts and foreign currency transactions and translation of other assets and liabilities denominated in foreign currencies | | | 5,169,869 | | | | (4,550,380 | ) |
| Net increase in net assets resulting from operations | | | 21,102,151 | | | | 5,465,061 | |
| | | | | | | | | |
| DISTRIBUTIONS TO SHAREHOLDERS FROM: | | | | | | | | |
| Net investment income: | | | | | | | | |
| Investment Class shares | | | (252,971 | ) | | | (18,739 | ) |
| Institutional Class shares | | | (12,802,854 | ) | | | (8,022,614 | ) |
| Net realized capital gains: | | | | | | | | |
| Investment Class shares | | | (23,429 | ) | | | (7,570 | ) |
| Institutional Class shares | | | (1,122,003 | ) | | | (2,931,274 | ) |
| Total distributions to shareholders | | | (14,201,257 | ) | | | (10,980,197 | ) |
| | | | | | | | | |
| CAPITAL STOCK TRANSACTIONS (DOLLARS) (Note 8): | | | | | | | | |
| Investment Class shares: | | | | | | | | |
| Shares sold | | | 7,558,909 | | | | 3,002,325 | |
| Issued in connection with in-kind transfer (Note 11) | | | — | | | | 10 | |
| Shares issued as reinvestment of distributions | | | 270,908 | | | | 22,884 | |
| Shares redeemed | | | (2,467,223 | ) | | | (1,932,279 | ) |
| Net increase in net assets from Investment Class share transactions | | | 5,362,594 | | | | 1,092,940 | |
| | | | | | | | | |
| Institutional Class shares: | | | | | | | | |
| Shares sold | | | 43,898,687 | | | | 317,151,289 | |
| Issued in connection with in-kind transfer (Note 11) | | | — | | | | 147,868,290 | |
| Shares issued as reinvestment of distributions | | | 13,781,761 | | | | 10,945,747 | |
| Shares redeemed | | | (151,206,477 | ) | | | (73,644,121 | ) |
| Net increase (decrease) in net assets from Institutional Class share transactions | | | (93,526,029 | ) | | | 402,321,205 | |
| | | | | | | | | |
| Net increase (decrease) in net assets | | | (81,262,541 | ) | | | 397,899,009 | |
| | | | | | | | | |
| NET ASSETS: | | | | | | | | |
| Beginning of period | | | 397,899,009 | | | | — | |
| End of period | | $ | 316,636,468 | | | $ | 397,899,009 | |
| | | | | | | | | |
| Distributions in excess of net investment income, end of period | | $ | (393,090 | ) | | $ | (14,227 | ) |
| * | Commenced operations on March 30, 2016. |
See Notes to Financial Statements.
80
Wilshire Mutual Funds, Inc. Large Company Growth Portfolio Financial Highlights |
|
For a Fund Share Outstanding Throughout Each Year. |
| | | Investment Class Shares | |
| | | Year
Ended
12/31/2017 | | | Year
Ended
12/31/2016 | | | Year
Ended
12/31/2015 | | | Year
Ended
12/31/2014 | | | Year
Ended
12/31/2013 | |
| Net asset value, beginning of year | | $ | 33.93 | | | $ | 36.82 | | | $ | 38.66 | | | $ | 41.60 | | | $ | 34.70 | |
| | | | | | | | | | | | | | | | | | | | | |
| Income (loss) from investment operations: | | | | | | | | | | | | | | | | | | | | |
Net investment income (loss) (a) | | | (0.08 | ) | | | 0.04 | | | | (0.14 | ) | | | (0.26 | ) | | | (0.02 | ) |
| Net realized and unrealized gains on investments | | | 9.24 | | | | 1.26 | | | | 2.53 | | | | 3.61 | | | | 10.38 | |
| Total from investment operations | | | 9.16 | | | | 1.30 | | | | 2.39 | | | | 3.35 | | | | 10.36 | |
| | | | | | | | | | | | | | | | | | | | | |
| Less distributions: | | | | | | | | | | | | | | | | | | | | |
| From net investment income | | | — | | | | (0.01 | ) | | | — | | | | — | | | | — | |
| From realized capital gains | | | (3.56 | ) | | | (4.18 | ) | | | (4.23 | ) | | | (6.29 | ) | | | (3.46 | ) |
| Total distributions | | | (3.56 | ) | | | (4.19 | ) | | | (4.23 | ) | | | (6.29 | ) | | | (3.46 | ) |
| | | | | | | | | | | | | | | | | | | | | |
| Net asset value, end of year | | $ | 39.53 | | | $ | 33.93 | | | $ | 36.82 | | | $ | 38.66 | | | $ | 41.60 | |
| | | | | | | | | | | | | | | | | | | | | |
Total return (b) | | | 26.93 | % | | | 3.33 | % | | | 6.18 | % | | | 7.97 | % | | | 30.22 | % |
| | | | | | | | | | | | | | | | | | | | | |
| Ratios to average net assets/supplemental data: | | | | | | | | | | | | | | | | | �� | | | |
| Net assets, end of year (in 000’s) | | $ | 64,130 | | | $ | 62,634 | | | $ | 107,381 | | | $ | 103,733 | | | $ | 113,495 | |
| Operating expenses after fee reductions and expense reimbursements and fees paid indirectly | | | 1.30 | % | | | 1.32 | % | | | 1.33 | % | | | 1.38 | % | | | 1.36 | % |
Operating expenses before fee reductions and expense reimbursements and fees paid indirectly (c) | | | 1.30 | % | | | 1.32 | % | | | 1.33 | % | | | 1.38 | % | | | 1.36 | % |
| Net investment income (loss) | | | (0.21 | %) | | | 0.10 | % | | | (0.34 | %) | | | (0.61 | %) | | | (0.05 | %) |
| Portfolio turnover rate | | | 51 | % | | | 75 | % | | | 104 | % | | | 62 | % | | | 136 | % |
| (a) | The selected per share data was calculated using the average shares outstanding method for the period. |
| (b) | Total return is a measure of the change in value of an investment in the Portfolio over the period covered. The returns shown do not reflect the deduction of taxes a shareholder would pay on Portfolio distributions, if any, or the redemption of Portfolio shares. |
| (c) | The ratio of operating expenses before fee reductions and expense reimbursements excludes the effect of fees paid indirectly. If this expense offset was included, the ratio would have been 1.30%, 1.32%, 1.34%, 1.38% and 1.36% for the years ended December 31, 2017, 2016, 2015, 2014 and 2013, respectively (Notes 3 and 4). |
See Notes to Financial Statements.
81
Wilshire Mutual Funds, Inc. Large Company Growth Portfolio Financial Highlights - (Continued) |
|
For a Fund Share Outstanding Throughout Each Year. |
| | | Institutional Class Shares | |
| | | Year
Ended
12/31/2017 | | | Year
Ended
12/31/2016 | | | Year
Ended
12/31/2015 | | | Year
Ended
12/31/2014 | | | Year
Ended
12/31/2013 | |
| Net asset value, beginning of year | | $ | 36.19 | | | $ | 39.04 | | | $ | 40.62 | | | $ | 43.28 | | | $ | 35.94 | |
| | | | | | | | | | | | | | | | | | | | | |
| Income (loss) from investment operations: | | | | | | | | | | | | | | | | | | | | |
Net investment income (loss) (a) | | | 0.05 | | | | 0.15 | | | | (0.01 | ) | | | (0.13 | ) | | | 0.10 | |
| Net realized and unrealized gains on investments | | | 9.87 | | | | 1.34 | | | | 2.66 | | | | 3.76 | | | | 10.77 | |
| Total from investment operations | | | 9.92 | | | | 1.49 | | | | 2.65 | | | | 3.63 | | | | 10.87 | |
| | | | | | | | | | | | | | | | | | | | | |
| Less distributions: | | | | | | | | | | | | | | | | | | | | |
| From net investment income | | | (0.02 | ) | | | (0.16 | ) | | | — | | | | (0.00 | )(b) | | | (0.07 | ) |
| From realized capital gains | | | (3.56 | ) | | | (4.18 | ) | | | (4.23 | ) | | | (6.29 | ) | | | (3.46 | ) |
| Total distributions | | | (3.58 | ) | | | (4.34 | ) | | | (4.23 | ) | | | (6.29 | ) | | | (3.53 | ) |
| | | | | | | | | | | | | | | | | | | | | |
| Net asset value, end of year | | $ | 42.53 | | | $ | 36.19 | | | $ | 39.04 | | | $ | 40.62 | | | $ | 43.28 | |
| | | | | | | | | | | | | | | | | | | | | |
Total return (c) | | | 27.35 | % | | | 3.61 | % | | | 6.52 | % | | | 8.32 | % | | | 30.60 | % |
| | | | | | | | | | | | | | | | | | | | | |
| Ratios to average net assets/supplemental data: | | | | | | | | | | | | | | | | | | | | |
| Net assets, end of year (in 000’s) | | $ | 170,708 | | | $ | 152,167 | | | $ | 122,219 | | | $ | 134,534 | | | $ | 243,622 | |
| Operating expenses after fee reductions and expense reimbursements and fees paid indirectly | | | 0.98 | % | | | 1.04 | % | | | 1.01 | % | | | 1.06 | % | | | 1.05 | % |
Operating expenses before fee reductions and expense reimbursements and fees paid indirectly (d) | | | 0.98 | % | | | 1.04 | % | | | 1.01 | % | | | 1.06 | % | | | 1.06 | % |
| Net investment income (loss) | | | 0.11 | % | | | 0.37 | % | | | (0.02 | %) | | | (0.29 | %) | | | 0.23 | % |
| Portfolio turnover rate | | | 51 | % | | | 75 | % | | | 104 | % | | | 62 | % | | | 136 | % |
| (a) | The selected per share data was calculated using the average shares outstanding method for the period. |
| (b) | Amount is less than $0.01 per share. |
| (c) | Total return is a measure of the change in value of an investment in the Portfolio over the period covered. The returns shown do not reflect the deduction of taxes a shareholder would pay on Portfolio distributions, if any, or the redemption of Portfolio shares. |
| (d) | The ratio of operating expenses before fee reductions and expense reimbursements excludes the effect of fees paid indirectly. If this expense offset was included, the ratio would have been 0.98%, 1.04%, 1.02%, 1.06% and 1.05% for years ended December 31, 2017, 2016, 2015, 2014 and 2013, respectively (Notes 3 and 4). |
See Notes to Financial Statements.
82
Wilshire Mutual Funds, Inc. Large Company Value Portfolio Financial Highlights |
|
For a Fund Share Outstanding Throughout Each Year. |
| | | Investment Class Shares | |
| | | Year
Ended
12/31/2017 | | | Year
Ended
12/31/2016 | | | Year
Ended
12/31/2015 | | | Year
Ended
12/31/2014 | | | Year
Ended
12/31/2013 | |
| Net asset value, beginning of year | | $ | 20.40 | | | $ | 18.62 | | | $ | 21.19 | | | $ | 21.44 | | | $ | 15.86 | |
| | | | | | | | | | | | | | | | | | | | | |
| Income (loss) from investment operations: | | | | | | | | | | | | | | | | | | | | |
Net investment income (a) | | | 0.30 | | | | 0.37 | | | | 0.20 | | | | 0.18 | | | | 0.16 | |
| Net realized and unrealized gains (losses) on investments | | | 2.67 | | | | 2.56 | | | | (1.33 | ) | | | 2.14 | | | | 5.64 | |
| Total from investment operations | | | 2.97 | | | | 2.93 | | | | (1.13 | ) | | | 2.32 | | | | 5.80 | |
| | | | | | | | | | | | | | | | | | | | | |
| Less distributions: | | | | | | | | | | | | | | | | | | | | |
| From net investment income | | | (0.30 | ) | | | (0.14 | ) | | | (0.19 | ) | | | (0.23 | ) | | | (0.14 | ) |
| From realized capital gains | | | (1.89 | ) | | | (1.01 | ) | | | (1.25 | ) | | | (2.34 | ) | | | (0.08 | ) |
| Total distributions | | | (2.19 | ) | | | (1.15 | ) | | | (1.44 | ) | | | (2.57 | ) | | | (0.22 | ) |
| | | | | | | | | | | | | | | | | | | | | |
| Net asset value, end of year | | $ | 21.18 | | | $ | 20.40 | | | $ | 18.62 | | | $ | 21.19 | | | $ | 21.44 | |
| | | | | | | | | | | | | | | | | | | | | |
Total return (b) | | | 14.64 | % | | | 15.73 | % | | | (5.33 | %) | | | 10.77 | % | | | 36.54 | % |
| | | | | | | | | | | | | | | | | | | | | |
| Ratios to average net assets/supplemental data: | | | | | | | | | | | | | | | | | | | | |
| Net assets, end of year (in 000’s) | | $ | 6,547 | | | $ | 10,112 | | | $ | 52,864 | | | $ | 61,566 | | | $ | 61,800 | |
| Operating expenses after fee reductions and expense reimbursements and fees paid indirectly | | | 1.26 | % | | | 1.26 | % | | | 1.27 | % | | | 1.29 | % | | | 1.24 | % |
Operating expenses before fee reductions and expense reimbursements and fees paid indirectly (c) | | | 1.26 | % | | | 1.27 | % | | | 1.29 | % | | | 1.30 | % | | | 1.25 | % |
| Net investment income | | | 1.38 | % | | | 1.87 | % | | | 0.96 | % | | | 0.80 | % | | | 0.87 | % |
| Portfolio turnover rate | | | 39 | % | | | 174 | % | | | 55 | % | | | 57 | % | | | 101 | % |
| (a) | The selected per share data was calculated using the average shares outstanding method for the period. |
| (b) | Total return is a measure of the change in value of an investment in the Portfolio over the period covered. The returns shown do not reflect the deduction of taxes a shareholder would pay on Portfolio distributions, if any, or the redemption of Portfolio shares. |
| (c) | The ratio of operating expenses before fee reductions and expense reimbursements excludes the effect of fees paid indirectly. If this expense offset was included, the ratio would have been 1.26%, 1.26%, 1.27%, 1.29% and 1.24% for the years ended December 31, 2017, 2016, 2015, 2014 and 2013, respectively (Notes 3 and 4). |
See Notes to Financial Statements.
83
Wilshire Mutual Funds, Inc. Large Company Value Portfolio Financial Highlights - (Continued) |
|
For a Fund Share Outstanding Throughout Each Year. |
| | | Institutional Class Shares | |
| | | Year
Ended
12/31/2017 | | | Year
Ended
12/31/2016 | | | Year
Ended
12/31/2015 | | | Year
Ended
12/31/2014 | | | Year
Ended
12/31/2013 | |
| Net asset value, beginning of year | | $ | 20.20 | | | $ | 18.67 | | | $ | 21.24 | | | $ | 21.48 | | | $ | 15.89 | |
| | | | | | | | | | | | | | | | | | | | | |
| Income (loss) from investment operations: | | | | | | | | | | | | | | | | | | | | |
Net investment income (a) | | | 0.36 | | | | 0.40 | | | | 0.26 | | | | 0.24 | | | | 0.22 | |
| Net realized and unrealized gains (losses) on investments | | | 2.65 | | | | 2.55 | | | | (1.33 | ) | | | 2.14 | | | | 5.63 | |
| Total from investment operations | | | 3.01 | | | | 2.95 | | | | (1.07 | ) | | | 2.38 | | | | 5.85 | |
| | | | | | | | | | | | | | | | | | | | | |
| Less distributions: | | | | | | | | | | | | | | | | | | | | |
| From net investment income | | | (0.37 | ) | | | (0.41 | ) | | | (0.25 | ) | | | (0.28 | ) | | | (0.18 | ) |
| From realized capital gains | | | (1.89 | ) | | | (1.01 | ) | | | (1.25 | ) | | | (2.34 | ) | | | (0.08 | ) |
| Total distributions | | | (2.26 | ) | | | (1.42 | ) | | | (1.50 | ) | | | (2.62 | ) | | | (0.26 | ) |
| | | | | | | | | | | | | | | | | | | | | |
| Net asset value, end of year | | $ | 20.95 | | | $ | 20.20 | | | $ | 18.67 | | | $ | 21.24 | | | $ | 21.48 | |
| | | | | | | | | | | | | | | | | | | | | |
Total return (b) | | | 14.99 | % | | | 15.78 | % | | | (5.07 | %) | | | 11.05 | % | | | 36.85 | % |
| | | | | | | | | | | | | | | | | | | | | |
| Ratios to average net assets/supplemental data: | | | | | | | | | | | | | | | | | | | | |
| Net assets, end of year (in 000’s) | | $ | 151,923 | | | $ | 175,497 | | | $ | 53,343 | | | $ | 63,499 | | | $ | 111,550 | |
| Operating expenses after fee reductions and expense reimbursements and fees paid indirectly | | | 0.98 | % | | | 1.04 | % | | | 1.01 | % | | | 1.00 | % | | | 0.95 | % |
Operating expenses before fee reductions and expense reimbursements and fees paid indirectly (c) | | | 0.98 | % | | | 1.05 | % | | | 1.02 | % | | | 1.01 | % | | | 0.97 | % |
| Net investment income | | | 1.67 | % | | | 2.09 | % | | | 1.23 | % | | | 1.09 | % | | | 1.13 | % |
| Portfolio turnover rate | | | 39 | % | | | 174 | % | | | 55 | % | | | 57 | % | | | 101 | % |
| (a) | The selected per share data was calculated using the average shares outstanding method for the period. |
| (b) | Total return is a measure of the change in value of an investment in the Portfolio over the period covered. The returns shown do not reflect the deduction of taxes a shareholder would pay on Portfolio distributions, if any, or the redemption of Portfolio shares. |
| (c) | The ratio of operating expenses before fee reductions and expense reimbursements excludes the effect of fees paid indirectly. If this expense offset was included, the ratio would have been 0.98%, 1.04%, 1.01%, 1.00% and 0.95% for the years ended December 31, 2017, 2016, 2015, 2014 and 2013, respectively (Notes 3 and 4). |
See Notes to Financial Statements.
84
Wilshire Mutual Funds, Inc. Small Company Growth Portfolio Financial Highlights |
|
For a Fund Share Outstanding Throughout Each Year. |
| | | Investment Class Shares | |
| | | Year
Ended
12/31/2017 | | | Year
Ended
12/31/2016 | | | Year
Ended
12/31/2015 | | | Year
Ended
12/31/2014 | | | Year
Ended
12/31/2013 | |
| Net asset value, beginning of year | | $ | 24.41 | | | $ | 22.64 | | | $ | 23.44 | | | $ | 24.95 | | | $ | 18.06 | |
| | | | | | | | | | | | | | | | | | | | | |
| Income (loss) from investment operations: | | | | | | | | | | | | | | | | | | | | |
Net investment loss (a) | | | (0.19 | ) | | | (0.15 | ) | | | (0.15 | ) | | | (0.25 | ) | | | (0.16 | ) |
| Net realized and unrealized gains on investments | | | 3.51 | | | | 4.80 | | | | 0.70 | | | | 1.09 | | | | 7.59 | |
| Total from investment operations | | | 3.32 | | | | 4.65 | | | | 0.55 | | | | 0.84 | | | | 7.43 | |
| | | | | | | | | | | | | | | | | | | | | |
| Less distributions: | | | | | | | | | | | | | | | | | | | | |
| From realized capital gains | | | (2.68 | ) | | | (2.88 | ) | | | (1.35 | ) | | | (2.35 | ) | | | (0.54 | ) |
| | | | | | | | | | | | | | | | | | | | | |
| Net asset value, end of year | | $ | 25.05 | | | $ | 24.41 | | | $ | 22.64 | | | $ | 23.44 | | | $ | 24.95 | |
| | | | | | | | | | | | | | | | | | | | | |
Total return (b) | | | 13.66 | % | | | 20.44 | % | | | 2.29 | % | | | 3.44 | % | | | 41.25 | % |
| | | | | | | | | | | | | | | | | | | | | |
| Ratios to average net assets/supplemental data: | | | | | | | | | | | | | | | | | | | | |
| Net assets, end of year (in 000’s) | | $ | 11,386 | | | $ | 8,633 | | | $ | 12,642 | | | $ | 11,398 | | | $ | 9,582 | |
| Operating expenses after fee reductions and expense reimbursements and fees paid indirectly | | | 1.48 | % | | | 1.51 | % | | | 1.46 | % | | | 1.50 | % | | | 1.47 | % |
Operating expenses before fee reductions and expense reimbursements and fees paid indirectly (c) | | | 1.64 | % | | | 1.60 | % | | | 1.64 | % | | | 1.55 | % | | | 1.62 | % |
| Net investment income (loss) | | | (0.75 | %) | | | (0.57 | %) | | | (0.59 | %) | | | (1.00 | %) | | | (0.75 | %) |
| Portfolio turnover rate | | | 110 | % | | | 114 | % | | | 63 | % | | | 77 | % | | | 88 | % |
| (a) | The selected per share data was calculated using the average shares outstanding method for the period. |
| (b) | Total return is a measure of the change in value of an investment in the Portfolio over the period covered. The returns shown do not reflect the deduction of taxes a shareholder would pay on Portfolio distributions, if any, or the redemption of Portfolio shares. |
| (c) | The ratio of operating expenses before fee reductions and expense reimbursements excludes the effect of fees paid indirectly. If this expense offset was included, the ratio would have been 1.60%, 1.64%, 1.54% and 1.61% for the years ended December 31, 2016, 2015, 2014 and 2013, respectively (Notes 3 and 4). |
See Notes to Financial Statements.
85
Wilshire Mutual Funds, Inc. Small Company Growth Portfolio Financial Highlights - (Continued) |
|
For a Fund Share Outstanding Throughout Each Year. |
| | | Institutional Class Shares | |
| | | Year
Ended
12/31/2017 | | | Year
Ended
12/31/2016 | | | Year
Ended
12/31/2015 | | | Year
Ended
12/31/2014 | | | Year
Ended
12/31/2013 | |
| Net asset value, beginning of year | | $ | 26.18 | | | $ | 24.04 | | | $ | 24.75 | | | $ | 26.14 | | | $ | 18.89 | |
| | | | | | | | | | | | | | | | | | | | | |
| Income (loss) from investment operations: | | | | | | | | | | | | | | | | | | | | |
Net investment loss (a) | | | (0.14 | ) | | | (0.08 | ) | | | (0.07 | ) | | | (0.18 | ) | | | (0.15 | ) |
| Net realized and unrealized gains on investments | | | 3.78 | | | | 5.10 | | | | 0.71 | | | | 1.14 | | | | 7.99 | |
| Total from investment operations | | | 3.64 | | | | 5.02 | | | | 0.64 | | | | 0.96 | | | | 7.84 | |
| | | | | | | | | | | | | | | | | | | | | |
| Less distributions: | | | | | | | | | | | | | | | | | | | | |
| From net investment income | | | — | | | | — | | | | — | | | | — | | | | (0.05 | ) |
| From realized capital gains | | | (2.68 | ) | | | (2.88 | ) | | | (1.35 | ) | | | (2.35 | ) | | | (0.54 | ) |
| Total distributions | | | (2.68 | ) | | | (2.88 | ) | | | (1.35 | ) | | | (2.35 | ) | | | (0.59 | ) |
| | | | | | | | | | | | | | | | | | | | | |
| Net asset value, end of year | | $ | 27.14 | | | $ | 26.18 | | | $ | 24.04 | | | $ | 24.75 | | | $ | 26.14 | |
| | | | | | | | | | | | | | | | | | | | | |
Total return (b) | | | 13.96 | % | | | 20.79 | % | | | 2.53 | % | | | 3.75 | % | | | 41.58 | % |
| | | | | | | | | | | | | | | | | | | | | |
| Ratios to average net assets/supplemental data: | | | | | | | | | | | | | | | | | | | | |
| Net assets, end of year (in 000’s) | | $ | 36,599 | | | $ | 28,454 | | | $ | 14,414 | | | $ | 15,483 | | | $ | 24,013 | |
| Operating expenses after fee reductions and expense reimbursements and fees paid indirectly | | | 1.23 | % | | | 1.27 | % | | | 1.19 | % | | | 1.20 | % | | | 1.19 | % |
Operating expenses before fee reductions and expense reimbursements and fees paid indirectly (c) | | | 1.34 | % | | | 1.33 | % | | | 1.36 | % | | | 1.24 | % | | | 1.20 | % |
| Net investment loss | | | (0.47 | %) | | | (0.32 | %) | | | (0.28 | %) | | | (0.70 | %) | | | (0.54 | %) |
| Portfolio turnover rate | | | 110 | % | | | 114 | % | | | 63 | % | | | 77 | % | | | 88 | % |
| (a) | The selected per share data was calculated using the average shares outstanding method for the period. |
| (b) | Total return is a measure of the change in value of an investment in the Portfolio over the period covered. The returns shown do not reflect the deduction of taxes a shareholder would pay on Portfolio distributions, if any, or the redemption of Portfolio shares. |
| (c) | The ratio of operating expenses before fee reductions and expense reimbursements excludes the effect of fees paid indirectly. If this expense offset was included, the ratio would have been 1.33%, 1.35%, 1.19% and 1.18% for the years ended December 31, 2016, 2015, 2014 and 2013, respectively (Notes 3 and 4). |
See Notes to Financial Statements.
86
Wilshire Mutual Funds, Inc. Small Company Value Portfolio Financial Highlights |
|
For a Fund Share Outstanding Throughout Each Year. |
| | | Investment Class Shares | |
| | | Year
Ended
12/31/2017 | | | Year
Ended
12/31/2016 | | | Year
Ended
12/31/2015 | | | Year
Ended
12/31/2014 | | | Year
Ended
12/31/2013 | |
| Net asset value, beginning of year | | $ | 23.75 | | | $ | 20.74 | | | $ | 22.86 | | | $ | 24.33 | | | $ | 17.40 | |
| | | | | | | | | | | | | | | | | | | | | |
| Income (loss) from investment operations: | | | | | | | | | | | | | | | | | | | | |
Net investment income (loss) (a) | | | (0.05 | ) | | | 0.10 | | | | 0.01 | | | | (0.08 | ) | | | (0.03 | ) |
| Net realized and unrealized gains (losses) on investments | | | 2.09 | | | | 4.99 | | | | (0.89 | ) | | | 1.53 | | | | 7.62 | |
| Total from investment operations | | | 2.04 | | | | 5.09 | | | | (0.88 | ) | | | 1.45 | | | | 7.59 | |
| | | | | | | | | | | | | | | | | | | | | |
| Less distributions: | | | | | | | | | | | | | | | | | | | | |
| From net investment income | | | — | | | | (0.09 | ) | | | (0.00 | )(b) | | | — | | | | (0.00 | )(b) |
| From capital gains | | | (2.80 | ) | | | (1.99 | ) | | | (1.24 | ) | | | (2.92 | ) | | | (0.66 | ) |
| Total distributions | | | (2.80 | ) | | | (2.08 | ) | | | (1.24 | ) | | | (2.92 | ) | | | (0.66 | ) |
| | | | | | | | | | | | | | | | | | | | | |
| Net asset value, end of year | | $ | 22.99 | | | $ | 23.75 | | | $ | 20.74 | | | $ | 22.86 | | | $ | 24.33 | |
| | | | | | | | | | | | | | | | | | | | | |
Total return (c) | | | 8.65 | % | | | 24.86 | % | | | (3.83 | %) | | | 6.17 | % | | | 43.79 | % |
| | | | | | | | | | | | | | | | | | | | | |
| Ratios to average net assets/supplemental data: | | | | | | | | | | | | | | | | | | | | |
| Net assets, end of year (in 000’s) | | $ | 6,305 | | | $ | 9,097 | | | $ | 14,287 | | | $ | 14,120 | | | $ | 13,688 | |
| Operating expenses after fee reductions and expense reimbursements and fees paid indirectly | | | 1.45 | % | | | 1.51 | % | | | 1.49 | % | | | 1.49 | % | | | 1.49 | % |
Operating expenses before fee reductions and expense reimbursements and fees paid indirectly (d) | | | 1.69 | % | | | 1.60 | % | | | 1.67 | % | | | 1.56 | % | | | 1.58 | % |
| Net investment income (loss) | | | (0.25 | %) | | | 0.48 | % | | | 0.06 | % | | | (0.35 | %) | | | (0.13 | %) |
| Portfolio turnover rate | | | 88 | % | | | 99 | % | | | 49 | % | | | 53 | % | | | 60 | % |
| (a) | The selected per share data was calculated using the average shares outstanding method for the period. |
| (b) | Amount is less than $0.01 per share. |
| (c) | Total return is a measure of the change in value of an investment in the Portfolio over the period covered. The returns shown do not reflect the deduction of taxes a shareholder would pay on Portfolio distributions, if any, or the redemption of Portfolio shares. |
| (d) | The ratio of operating expenses before fee reductions and expense reimbursements excludes the effect of fees paid indirectly. If this expense offset was included, the ratio would have been 1.67%, 1.59%, 1.67%, 1.55% and 1.57% for the years ended December 31, 2017, 2016, 2015, 2014 and 2013, respectively (Notes 3 and 4). |
See Notes to Financial Statements.
87
Wilshire Mutual Funds, Inc. Small Company Value Portfolio Financial Highlights - (Continued) |
|
For a Fund Share Outstanding Throughout Each Year. |
| | | Institutional Class Shares | |
| | | Year
Ended
12/31/2017 | | | Year
Ended
12/31/2016 | | | Year
Ended
12/31/2015 | | | Year
Ended
12/31/2014 | | | Year
Ended
12/31/2013 | |
| Net asset value, beginning of year | | $ | 24.14 | | | $ | 21.08 | | | $ | 23.21 | | | $ | 24.59 | | | $ | 17.58 | |
| | | | | | | | | | | | | | | | | | | | | |
| Income (loss) from investment operations: | | | | | | | | | | | | | | | | | | | | |
Net investment income (loss) (a) | | | 0.01 | | | | 0.16 | | | | 0.08 | | | | (0.02 | ) | | | 0.00 | (b) |
| Net realized and unrealized gains (losses) on investments | | | 2.14 | | | | 5.08 | | | | (0.90 | ) | | | 1.56 | | | | 7.74 | |
| Total from investment operations | | | 2.15 | | | | 5.24 | | | | (0.82 | ) | | | 1.54 | | | | 7.74 | |
| | | | | | | | | | | | | | | | | | | | | |
| Less distributions: | | | | | | | | | | | | | | | | | | | | |
| From net investment income | | | — | | | | (0.19 | ) | | | (0.07 | ) | | | — | | | | (0.07 | ) |
| From realized capital gains | | | (2.80 | ) | | | (1.99 | ) | | | (1.24 | ) | | | (2.92 | ) | | | (0.66 | ) |
| Total distributions | | | (2.80 | ) | | | (2.18 | ) | | | (1.31 | ) | | | (2.92 | ) | | | (0.73 | ) |
| | | | | | | | | | | | | | | | | | | | | |
| Net asset value, end of year | | $ | 23.49 | | | $ | 24.14 | | | $ | 21.08 | | | $ | 23.21 | | | $ | 24.59 | |
| | | | | | | | | | | | | | | | | | | | | |
Total return (c) | | | 8.97 | % | | | 25.16 | % | | | (3.52 | %) | | | 6.47 | % | | | 44.16 | % |
| | | | | | | | | | | | | | | | | | | | | |
| Ratios to average net assets/supplemental data: | | | | | | | | | | | | | | | | | | | | |
| Net assets, end of year (in 000’s) | | $ | 33,919 | | | $ | 31,698 | | | $ | 13,727 | | | $ | 15,655 | | | $ | 24,934 | |
| Operating expenses after fee reductions and expense reimbursements and fees paid indirectly | | | 1.19 | % | | | 1.27 | % | | | 1.18 | % | | | 1.17 | % | | | 1.20 | % |
Operating expenses before fee reductions and expense reimbursements and fees paid indirectly (d) | | | 1.37 | % | | | 1.33 | % | | | 1.36 | % | | | 1.23 | % | | | 1.19 | % |
| Net investment income (loss) | | | 0.07 | % | | | 0.73 | % | | | 0.36 | % | | | (0.07 | %) | | | (0.01 | %) |
| Portfolio turnover rate | | | 88 | % | | | 99 | % | | | 49 | % | | | 53 | % | | | 60 | % |
| (a) | The selected per share data was calculated using the average shares outstanding method for the period. |
| (b) | Amount rounds to less than $0.01 per share. |
| (c) | Total return is a measure of the change in value of an investment in the Portfolio over the period covered. The returns shown do not reflect the deduction of taxes a shareholder would pay on Portfolio distributions, if any, or the redemption of Portfolio shares. |
| (d) | The ratio of operating expenses before fee reductions and expense reimbursements excludes the effect of fees paid indirectly. If this expense offset was included, the ratio would have been 1.35%, 1.32%, 1.35%, 1.21% and 1.18% for the years ended December 31, 2017, 2016, 2015, 2014 and 2013, respectively (Notes 3 and 4). |
See Notes to Financial Statements.
88
Wilshire Mutual Funds, Inc. Wilshire 5000 Indexsm Fund Financial Highlights |
|
For a Fund Share Outstanding Throughout Each Year. |
| | | Investment Class Shares | |
| | | Year
Ended
12/31/2017 | | | Year
Ended
12/31/2016 | | | Year
Ended
12/31/2015 | | | Year
Ended
12/31/2014 | | | Year
Ended
12/31/2013 | |
| Net asset value, beginning of year | | $ | 18.86 | | | $ | 17.78 | | | $ | 18.01 | | | $ | 16.22 | | | $ | 12.43 | |
| | | | | | | | | | | | | | | | | | | | | |
| Income (loss) from investment operations: | | | | | | | | | | | | | | | | | | | | |
Net investment income (a) | | | 0.29 | | | | 0.27 | | | | 0.24 | | | | 0.23 | | | | 0.19 | |
| Net realized and unrealized gains (losses) on investments | | | 3.52 | | | | 1.96 | | | | (0.22 | ) | | | 1.78 | | | | 3.80 | |
| Total from investment operations | | | 3.81 | | | | 2.23 | | | | 0.02 | | | | 2.01 | | | | 3.99 | |
| | | | | | | | | | | | | | | | | | | | | |
| Less distributions: | | | | | | | | | | | | | | | | | | | | |
| From net investment income | | | (0.27 | ) | | | (0.39 | ) | | | (0.25 | ) | | | (0.22 | ) | | | (0.20 | ) |
| From realized capital gains | | | (1.57 | ) | | | (0.76 | ) | | | — | | | | — | | | | — | |
| Total distributions | | | (1.84 | ) | | | (1.15 | ) | | | (0.25 | ) | | | (0.22 | ) | | | (0.20 | ) |
| | | | | | | | | | | | | | | | | | | | | |
| Net asset value, end of year | | $ | 20.83 | | | $ | 18.86 | | | $ | 17.78 | | | $ | 18.01 | | | $ | 16.22 | |
| | | | | | | | | | | | | | | | | | | | | |
Total return (b) | | | 20.20 | % | | | 12.51 | % | | | 0.08 | % | | | 12.38 | % | | | 32.10 | % |
| | | | | | | | | | | | | | | | | | | | | |
| Ratios to average net assets/supplemental data: | | | | | | | | | | | | | | | | | | | | |
| Net assets, end of year (in 000’s) | | $ | 149,342 | | | $ | 132,669 | | | $ | 159,709 | | | $ | 204,465 | | | $ | 139,354 | |
| Operating expenses after fee reductions and expense reimbursements and fees paid indirectly | | | 0.62 | % | | | 0.67 | % | | | 0.64 | % | | | 0.65 | % | | | 0.68 | % |
| Operating expenses before fee reductions and expense reimbursements and fees paid indirectly | | | 0.62 | % | | | 0.67 | %(c) | | | 0.64 | %(c) | | | 0.65 | % | | | 0.68 | % |
| Net investment income | | | 1.39 | % | | | 1.49 | % | | | 1.35 | % | | | 1.32 | % | | | 1.33 | % |
| Portfolio turnover rate | | | 3 | % | | | 5 | % | | | 6 | % | | | 3 | % | | | 2 | % |
| (a) | The selected per share data was calculated using the average shares outstanding method for the period. |
| (b) | Total return is a measure of the change in value of an investment in the Portfolio over the period covered. The returns shown do not reflect the deduction of taxes a shareholder would pay on Fund distributions, if any, or the redemption of Portfolio shares. |
| (c) | The ratio of operating expenses before fee reductions and expense reimbursements excludes the effect of fees paid indirectly. If this expense offset was included, the ratio would have been 0.67% and 0.64% for the years ended December 31, 2016 and 2015, respectively (Notes 3 and 4). |
See Notes to Financial Statements.
89
Wilshire Mutual Funds, Inc. Wilshire 5000 Indexsm Fund Financial Highlights - (Continued) |
|
For a Fund Share Outstanding Throughout Each Year. |
| | | Institutional Class Shares | |
| | | Year
Ended
12/31/2017 | | | Year
Ended
12/31/2016 | | | Year
Ended
12/31/2015 | | | Year
Ended
12/31/2014 | | | Year
Ended
12/31/2013 | |
| Net asset value, beginning of year | | $ | 18.85 | | | $ | 17.78 | | | $ | 18.00 | | | $ | 16.21 | | | $ | 12.41 | |
| | | | | | | | | | | | | | | | | | | | | |
| Income (loss) from investment operations: | | | | | | | | | | | | | | | | | | | | |
Net investment income (a) | | | 0.35 | | | | 0.33 | | | | 0.29 | | | | 0.26 | | | | 0.22 | |
| Net realized and unrealized gains (losses) on investments | | | 3.53 | | | | 1.95 | | | | (0.22 | ) | | | 1.79 | | | | 3.81 | |
| Total from investment operations | | | 3.88 | | | | 2.28 | | | | 0.07 | | | | 2.05 | | | | 4.03 | |
| | | | | | | | | | | | | | | | | | | | | |
| Less distributions: | | | | | | | | | | | | | | | | | | | | |
| From net investment income | | | (0.33 | ) | | | (0.45 | ) | | | (0.29 | ) | | | (0.26 | ) | | | (0.23 | ) |
| From realized capital gains | | | (1.57 | ) | | | (0.76 | ) | | | — | | | | — | | | | — | |
| Total distributions | | | (1.90 | ) | | | (1.21 | ) | | | (0.29 | ) | | | (0.26 | ) | | | (0.23 | ) |
| | | | | | | | | | | | | | | | | | | | | |
| Net asset value, end of year | | $ | 20.83 | | | $ | 18.85 | | | $ | 17.78 | | | $ | 18.00 | | | $ | 16.21 | |
| | | | | | | | | | | | | | | | | | | | | |
Total return (b) | | | 20.57 | % | | | 12.81 | % | | | 0.36 | % | | | 12.60 | % | | | 32.48 | % |
| | | | | | | | | | | | | | | | | | | | | |
| Ratios to average net assets/supplemental data: | | | | | | | | | | | | | | | | | | | | |
| Net assets, end of year (in 000’s) | | $ | 35,066 | | | $ | 40,860 | | | $ | 59,065 | | | $ | 67,500 | | | $ | 59,565 | |
| Operating expenses after fee reductions and expense reimbursements and fees paid indirectly | | | 0.33 | % | | | 0.36 | % | | | 0.41 | % | | | 0.44 | % | | | 0.46 | % |
| Operating expenses before fee reductions and expense reimbursements and fees paid indirectly | | | 0.33 | % | | | 0.36 | %(c) | | | 0.41 | %(c) | | | 0.44 | % | | | 0.46 | % |
| Net investment income | | | 1.67 | % | | | 1.80 | % | | | 1.59 | % | | | 1.53 | % | | | 1.55 | % |
| Portfolio turnover rate | | | 3 | % | | | 5 | % | | | 6 | % | | | 3 | % | | | 2 | % |
| (a) | The selected per share data was calculated using the average shares outstanding method for the period. |
| (b) | Total return is a measure of the change in value of an investment in the Portfolio over the period covered. The returns shown do not reflect the deduction of taxes a shareholder would pay on Fund distributions, if any, or the redemption of Portfolio shares. |
| (c) | The ratio of operating expenses before fee reductions and expense reimbursements excludes the effect of fees paid indirectly. If this expense offset was included, the ratio would have been 0.36% and 0.41% for the years ended December 31, 2016 and 2015, respectively (Notes 3 and 4). |
See Notes to Financial Statements.
90
Wilshire Mutual Funds, Inc. Wilshire International Equity Fund Financial Highlights |
|
For a Fund Share Outstanding Throughout Each Year. |
| | | Investment Class Shares | |
| | | Year
Ended
12/31/2017 | | | Year
Ended
12/31/2016 | | | Year
Ended
12/31/2015 | | | Year
Ended
12/31/2014 | | | Year
Ended
12/31/2013 | |
| Net asset value, beginning of year | | $ | 8.92 | | | $ | 8.90 | | | $ | 9.06 | | | $ | 9.70 | | | $ | 8.34 | |
| | | | | | | | | | | | | | | | | | | | | |
| Income (loss) from investment operations: | | | | | | | | | | | | | | | | | | | | |
Net investment income (a) | | | 0.08 | | | | 0.10 | | | | 0.09 | | | | 0.09 | | | | 0.03 | |
| Net realized and unrealized gains (losses) on investments and foreign currency transactions | | | 2.20 | | | | 0.07 | | | | (0.23 | ) | | | (0.71 | ) | | | 1.54 | |
| Total from investment operations | | | 2.28 | | | | 0.17 | | | | (0.14 | ) | | | (0.62 | ) | | | 1.57 | |
| | | | | | | | | | | | | | | | | | | | | |
| Less distributions: | | | | | | | | | | | | | | | | | | | | |
| From net investment income | | | (0.01 | ) | | | (0.15 | ) | | | (0.02 | ) | | | (0.02 | ) | | | (0.00 | )(b) |
| From realized capital gains | | | — | | | | — | | | | — | | | | — | | | | (0.21 | ) |
| Total distributions | | | (0.01 | ) | | | (0.15 | ) | | | (0.02 | ) | | | (0.02 | ) | | | (0.21 | ) |
| | | | | | | | | | | | | | | | | | | | | |
| Redemption fees (Note 2) | | | 0.00 | (b) | | | 0.00 | (b) | | | 0.00 | (b) | | | — | | | | — | |
| | | | | | | | | | | | | | | | | | | | | |
| Net asset value, end of year | | $ | 11.19 | | | $ | 8.92 | | | $ | 8.90 | | | $ | 9.06 | | | $ | 9.70 | |
| | | | | | | | | | | | | | | | | | | | | |
Total return (c) | | | 25.54 | % | | | 1.88 | % | | | (1.55 | %) | | | (6.38 | %) | | | 18.95 | % |
| | | | | | | | | | | | | | | | | | | | | |
| Ratios to average net assets/supplemental data: | | | | | | | | | | | | | | | | | | | | |
| Net assets, end of year (in 000’s) | | $ | 4,176 | | | $ | 11,290 | | | $ | 3,438 | | | $ | 11,371 | | | $ | 2,410 | |
Operating expenses including dividends and rebates on securities sold short and interest expense, after fee reductions and expense reimbursements and fees paid indirectly (d) | | | 1.51 | %(e) | | | 1.52 | % | | | 1.50 | % | | | 1.50 | % | | | 1.85 | %(e) |
Operating expenses including dividends and rebates on securities sold short and interest expense, before fee reductions and expense reimbursements and fees paid indirectly (d) | | | 1.55 | % | | | 1.65 | % | | | 1.75 | % | | | 1.71 | %(f) | | | 1.93 | %(f) |
| Net investment income | | | 0.87 | % | | | 1.19 | % | | | 0.99 | % | | | 0.97 | % | | | 0.38 | % |
| Portfolio turnover rate | | | 62 | % | | | 79 | % | | | 84 | % | | | 176 | % | | | 368 | % |
| (a) | The selected per share data was calculated using the average shares outstanding method for the period. |
| (b) | Amount rounds to less than $0.01 per share. |
| (c) | Total return is a measure of the change in value of an investment in the Portfolio over the period covered. The returns shown do not reflect the deduction of taxes a shareholder would pay on Fund distributions, if any, or the redemption of Portfolio shares. |
| (d) | Effective April 2, 2013, the Wilshire International Equity Fund no longer engages in short selling. |
| (e) | The operating expense ratios reflect the expenses related to foreign currency exchange contracts or investing in securities sold short. Had these expenses been excluded, the expense ratio (after fee reductions and fees paid indirectly) would have been 1.50% for years ended December 31, 2017 and 2013. |
| (f) | The ratio of operating expenses including dividends and rebates on securities sold short and interest expense, before fee reductions and expense reimbursements excludes the effect of fees paid indirectly. If this expense offset was included, the ratio would have been 1.71% and 1.93% for the years ended December 31, 2014 and 2013, respectively (Notes 3 and 4). |
See Notes to Financial Statements.
91
Wilshire Mutual Funds, Inc. Wilshire International Equity Fund Financial Highlights - (Continued) |
|
For a Fund Share Outstanding Throughout Each Year. |
| | | Institutional Class Shares | |
| | | Year
Ended
12/31/2017 | | | Year
Ended
12/31/2016 | | | Year
Ended
12/31/2015 | | | Year
Ended
12/31/2014 | | | Year
Ended
12/31/2013 | |
| Net asset value, beginning of year | | $ | 8.81 | | | $ | 8.78 | | | $ | 8.99 | | | $ | 9.64 | | | $ | 8.38 | |
| | | | | | | | | | | | | | | | | | | | | |
| Income (loss) from investment operations: | | | | | | | | | | | | | | | | | | | | |
Net investment income (a) | | | 0.10 | | | | 0.12 | | | | 0.09 | | | | 0.09 | | | | 0.08 | |
| Net realized and unrealized gains (losses) on investments and foreign currency transactions | | | 2.18 | | | | 0.07 | | | | (0.21 | ) | | | (0.68 | ) | | | 1.51 | |
| Total from investment operations | | | 2.28 | | | | 0.19 | | | | (0.12 | ) | | | (0.59 | ) | | | 1.59 | |
| | | | | | | | | | | | | | | | | | | | | |
| Less distributions: | | | | | | | | | | | | | | | | | | | | |
| From net investment income | | | (0.05 | ) | | | (0.16 | ) | | | (0.09 | ) | | | (0.06 | ) | | | (0.12 | ) |
| From realized capital gains | | | — | | | | — | | | | — | | | | — | | | | (0.21 | ) |
| Total distributions | | | (0.05 | ) | | | (0.16 | ) | | | (0.09 | ) | | | (0.06 | ) | | | (0.33 | ) |
| | | | | | | | | | | | | | | | | | | | | |
| Redemption fees (Note 2) | | | 0.00 | (b) | | | 0.00 | (b) | | | 0.00 | (b) | | | — | | | | — | |
| | | | | | | | | | | | | | | | | | | | | |
| Net asset value, end of year | | $ | 11.04 | | | $ | 8.81 | | | $ | 8.78 | | | $ | 8.99 | | | $ | 9.64 | |
| | | | | | | | | | | | | | | | | | | | | |
Total return (c) | | | 25.92 | % | | | 2.16 | % | | | (1.37 | %) | | | (6.16 | %) | | | 19.10 | % |
| | | | | | | | | | | | | | | | | | | | | |
Ratios to average net assets/supplemental data2: | | | | | | | | | | | | | | | | | | | | |
| Net assets, end of year (in 000’s) | | $ | 351,136 | | | $ | 258,311 | | | $ | 176,937 | | | $ | 165,048 | | | $ | 45,897 | |
Operating expenses including dividends and rebates on securities sold short and interest expense, after fee reductions and expense reimbursements and fees paid indirectly (d) | | | 1.26 | %(e) | | | 1.27 | % | | | 1.25 | % | | | 1.25 | % | | | 1.61 | %(e) |
Operating expenses including dividends and rebates on securities sold short and interest expense, before fee reductions and expense reimbursements and fees paid indirectly (d) | | | 1.26 | % | | | 1.32 | % | | | 1.29 | % | | | 1.31 | %(f) | | | 1.87 | %(f) |
| Net investment income | | | 1.02 | % | | | 1.44 | % | | | 1.00 | % | | | 0.96 | % | | | 0.88 | % |
| Portfolio turnover rate | | | 62 | % | | | 79 | % | | | 84 | % | | | 176 | % | | | 368 | % |
| (a) | The selected per share data was calculated using the average shares outstanding method for the period. |
| (b) | Amount is less than $0.01 per share. |
| (c) | Total return is a measure of the change in value of an investment in the Portfolio over the period covered. The returns shown do not reflect the deduction of taxes a shareholder would pay on Fund distributions, if any, or the redemption of Portfolio shares. |
| (d) | Effective April 2, 2013, the Wilshire International Equity Fund no longer engages in short selling. |
| (e) | The operating expense ratio reflects the expenses related to foreign currency exchange contracts or investing in securities sold short. Had these expenses been excluded, the expense ratio (after fee reductions and fees paid indirectly) would have been 1.25% for the years ended December 31, 2017 and 2013. |
| (f) | The ratio of operating expenses including dividends and rebates on securities sold short and interest expense, before fee reductions and expense reimbursements excludes the effect of fees paid indirectly. If this expense offset was included, the ratio would have been 1.31% and 1.87% for the years ended December 31, 2014 and 2013, respectively (Notes 3 and 4). |
See Notes to Financial Statements.
92
Wilshire Mutual Funds, Inc. Wilshire Income Opportunities Fund Financial Highlights |
|
For a Fund Share Outstanding Throughout Each Period. |
| | | Investment Class Shares | |
| | | Year
Ended
12/31/2017 | | | Period
Ended
12/31/2016* | |
| Net asset value, beginning of period | | $ | 10.14 | | | $ | 10.00 | |
| | | | | | | | | |
| Income from investment operations: | | | | | | | | |
Net investment income (a) | | | 0.35 | | | | 0.21 | |
| Net realized and unrealized gains on investments and foreign currency transactions | | | 0.22 | | | | 0.18 | |
| Total from investment operations | | | 0.57 | | | | 0.39 | |
| | | | | | | | | |
| Less distributions: | | | | | | | | |
| From net investment income | | | (0.42 | ) | | | (0.18 | ) |
| From realized capital gains | | | (0.04 | ) | | | (0.07 | ) |
| Total distributions | | | (0.46 | ) | | | (0.25 | ) |
| | | | | | | | | |
| Net asset value, end of period | | $ | 10.25 | | | $ | 10.14 | |
| | | | | | | | | |
Total return (b) | | | 5.60 | % | | | 3.92 | %(c) |
| | | | | | | | | |
| Ratios to average net assets/supplemental data: | | | | | | | | |
| Net assets, end of period (in 000’s) | | $ | 6,409 | | | $ | 1,102 | |
Operating expenses after expense reimbursements (d) | | | 1.17 | %(e) | | | 1.15 | %(f) |
Operating expense before expense reimbursements (d) | | | 1.23 | % | | | 1.26 | %(f) |
| Net investment income | | | 3.28 | % | | | 2.83 | %(f) |
| Portfolio turnover rate | | | 88 | % | | | 74 | %(c) |
| * | Commenced operations on March 30, 2016. |
| (a) | The selected per share data was calculated using the average shares outstanding method for the period. |
| (b) | Total return is a measure of the change in value of an investment in the Portfolio over the period covered. The returns shown do not reflect the deduction of taxes a shareholder would pay on Fund distributions, if any, or the redemption of Portfolio shares. |
| (d) | Ratio does not include expenses from underlying funds. |
| (e) | Includes interest incurred from reverse repurchase agreements during the year ended December 31, 2017 of 0.02%. |
See Notes to Financial Statements.
93
Wilshire Mutual Funds, Inc. Wilshire Income Opportunities Fund Financial Highlights - (Continued) |
|
For a Fund Share Outstanding Throughout Each Period. |
| | | Institutional Class Shares | |
| | | Year
Ended
12/31/2017 | | | Period
Ended
12/31/2016* | |
| Net asset value, beginning of period | | $ | 10.10 | | | $ | 10.00 | |
| | | | | | | | | |
| Income from investment operations: | | | | | | | | |
Net investment income (a) | | | 0.37 | | | | 0.25 | |
| Net realized and unrealized gains on investments and foreign currency transactions | | | 0.22 | | | | 0.13 | |
| Total from investment operations | | | 0.59 | | | | 0.38 | |
| | | | | | | | | |
| Less distributions: | | | | | | | | |
| From net investment income | | | (0.43 | ) | | | (0.21 | ) |
| From realized capital gains | | | (0.04 | ) | | | (0.07 | ) |
| Total distributions | | | (0.47 | ) | | | (0.28 | ) |
| | | | | | | | | |
| Net asset value, end of period | | $ | 10.22 | | | $ | 10.10 | |
| | | | | | | | | |
Total return (b) | | | 5.84 | % | | | 3.82 | %(c) |
| | | | | | | | | |
| Ratios to average net assets/supplemental data: | | | | | | | | |
| Net assets, end of period (in 000’s) | | $ | 310,227 | | | $ | 396,797 | |
Operating expenses (d) | | | 0.92 | %(e) | | | 0.86 | %(f) |
| Net investment income | | | 3.49 | % | | | 3.11 | %(f) |
| Portfolio turnover rate | | | 88 | % | | | 74 | %(c) |
| * | Commenced operations on March 30, 2016. |
| (a) | The selected per share data was calculated using the average shares outstanding method for the period. |
| (b) | Total return is a measure of the change in value of an investment in the Portfolio over the period covered. The returns shown do not reflect the deduction of taxes a shareholder would pay on Fund distributions, if any, or the redemption of Portfolio shares. |
| (d) | Ratio does not include expenses from underlying funds. |
| (e) | Includes interest incurred from reverse repurchase agreements during the year ended December 31, 2017 of 0.02%. |
See Notes to Financial Statements.
94
Wilshire Mutual Funds, Inc. Notes to Financial Statements December 31, 2017 |
|
1. Organization.
Wilshire Mutual Funds, Inc. (the “Company”) is registered under the Investment Company Act of 1940, as amended (the “1940 Act”), as an open-end diversified investment company, which was incorporated under Maryland law on July 30, 1992. The Company operates as a series company and presently offers seven series: Large Company Growth Portfolio, Large Company Value Portfolio, Small Company Growth Portfolio, Small Company Value Portfolio, Wilshire 5000 IndexSM Fund, Wilshire International Equity Fund and Wilshire Income Opportunities Fund (each a “Portfolio” and collectively the “Portfolios”). The Company accounts separately for the assets, liabilities and operations of each series.
The investment objective of Large Company Growth Portfolio is to provide investment results of a portfolio of publicly traded common stocks of companies in the applicable sub-category of the Wilshire 5000 IndexSM. The applicable sub-category of the Wilshire 5000 IndexSM is the large cap growth sub-category.
The investment objective of Large Company Value Portfolio is to provide investment results of a portfolio of publicly traded common stocks of companies in the applicable sub-category of the Wilshire 5000 IndexSM. The applicable sub-category of the Wilshire 5000 IndexSM is the large cap value sub-category.
The investment objective of Small Company Growth Portfolio is to provide investment results of a portfolio of publicly traded common stocks of companies in the applicable sub-category of the Wilshire 5000 IndexSM. The applicable sub-category of the Wilshire 5000 IndexSM is the small-cap growth sub-category.
The investment objective of Small Company Value Portfolio is to provide investment results of a portfolio of publicly traded common stocks of companies in the applicable sub-category of the Wilshire 5000 IndexSM. The applicable sub-category of the Wilshire 5000 IndexSM is the small-cap value sub-category.
The investment objective of Wilshire 5000 IndexSM Fund is to replicate as closely as possible the performance of the Wilshire 5000 IndexSM before the deduction of the Portfolio’s expenses.
The investment objective of Wilshire International Equity Fund is capital appreciation.
The primary investment objective of Wilshire Income Opportunities Fund is to maximize current income. Long-term capital appreciation is a secondary objective.
Each of the Portfolios currently offers Investment and Institutional Class shares, each of which has equal rights as to voting privileges except that the Investment Class has exclusive voting rights for its service and distribution plan. Investment income, realized and unrealized capital gains and losses and the common expenses of each Portfolio are allocated on a pro-rata basis to each class based on the relative net assets of each class to the total net assets of each Portfolio. Each class of shares differs with respect to its service and distribution expenses.
95
Wilshire Mutual Funds, Inc. Notes to Financial Statements - (Continued) December 31, 2017 |
|
2. Significant Accounting Policies.
In October 2016, the U.S. Securities and Exchange Commission (the “SEC”) adopted amendments to Regulation S-X, which impact financial statement presentation, particularly the presentation of derivative investments. The Portfolios have adopted these amendments, which were effective August 1, 2017, with these financial statements.
The following is a summary of significant accounting policies consistently followed by the Portfolios in the preparation of their financial statements. These policies are in conformity with accounting principles generally accepted in the United States of America (“U.S. GAAP”). The Portfolios follow accounting and reporting guidance under Financial Accounting Standards Board Accounting Standards Codification Topic 946, “Financial Services – Investment Companies.”
Use of estimates – The preparation of financial statements in accordance with U.S. GAAP requires management to make estimates and assumptions that affect the reported amounts of assets and liabilities and disclosure of contingent assets and liabilities at the date of the financial statements and the reported amounts of revenues and expenses during the reporting period. Actual results could differ from those estimates and those differences could be material.
Security valuation – Securities listed or traded on U.S. exchanges, including options and swap contracts, are valued at the last sales price on the exchange where they are principally traded. In the absence of a current quotation, a security is valued at the mean between the last bid and asked prices on that exchange. Securities quoted on the National Association of Securities Dealers Automatic Quotation (NASDAQ) System, for which there have been sales, are valued at the NASDAQ official closing price. If there are no such sales, a security is valued at the mean between the last bid and asked prices. Securities traded over-the-counter (other than on NASDAQ) are valued at the last current sale price; and if there are no such sales, a security is valued at the mean between the last bid and asked prices. Debt securities are typically valued at an evaluated bid price by a third-party pricing agent employing methodologies that utilize actual market transactions, broker-supplied valuations, or other inputs designed to identify the market value for such securities. Third-party pricing agents often utilize proprietary models that are subjective and require the use of judgment and the application of various assumptions including, but not limited to, interest rates, prepayment speeds, and default rate assumptions. Debt securities that have a remaining maturity of 60 days or less are valued at prices supplied by the Portfolios’ pricing agent for such securities, if available. Otherwise such securities are valued at amortized cost if the Pricing Committee concludes it approximates fair value. Equity securities primarily traded on a foreign exchange are typically valued daily at a price as provided by an independent pricing service, which is an estimate of the fair value price. Foreign currency contracts, including forward contracts, are valued at the applicable translation rates as supplied by the third-party pricing vendor. In the event market quotations are not readily available, such securities are valued at fair value according to procedures adopted by the Board of Directors (the “Board”) or as determined in good faith by the Pricing Committee, whose members include at least two representatives of Wilshire Associates Incorporated (the “Adviser”), one of whom is an officer of the Company, or by the Company’s Valuation Committee. Fair value is defined as the amount the owner of a security might reasonably expect to receive upon a current sale. Securities whose value does not reflect fair value because a significant valuation event has occurred may be valued at fair value by the Pricing Committee or the Valuation Committee in accordance with the Company’s valuation procedures. Significant events may include, but are not limited to, the following: significant fluctuations in domestic
96
Wilshire Mutual Funds, Inc. Notes to Financial Statements - (Continued) December 31, 2017 |
|
markets, foreign markets or foreign currencies; occurrences not directly tied to the securities markets such as natural disasters, armed conflicts or significant governmental actions; and major announcements affecting a single issuer or an entire market or market sector. The value of fair valued securities may be different from the last sale price (or the mean between the last bid and asked prices), and there is no guarantee that a fair valued security will be sold at the price at which a Portfolio is carrying the security.
Wilshire International Equity Fund uses ICE Data Services (“ICE”) as a third-party pricing agent. ICE provides a daily fair value for foreign securities in Wilshire International Equity Fund based on certain factors and methodologies (involving, generally, tracking valuation correlations between the U.S. market and each non-U.S. security) applied by ICE. These factors are used to value Wilshire International Equity Fund without holding a Pricing Committee meeting. In the event that the Adviser believes that the fair values provided by ICE are not reliable, the Adviser contacts the Company’s administrator and may request that a meeting of the Pricing Committee be held.
In accordance with the authoritative guidance on fair value measurements and disclosures under U.S. GAAP, the Portfolios disclose the fair value of their investments in a hierarchy that prioritizes the inputs to valuation techniques used to measure the fair value. The objective of a fair value measurement is to determine the price that would be received to sell an asset or paid to transfer a liability in an orderly transaction between market participants at the measurement date (an exit price). Accordingly, the fair value hierarchy gives the highest priority to quoted prices (unadjusted) in active markets for identical assets or liabilities (Level 1) and the lowest priority to unobservable inputs (Level 3). The guidance establishes three levels of the fair value hierarchy as follows:
| | ● | Level 1 – Unadjusted quoted prices in active markets for identical, unrestricted assets or liabilities that the Portfolios have the ability to access at the measurement date; |
| | ● | Level 2 – Other significant observable inputs (including quoted prices for similar securities, interest rates, prepayment speeds, credit risk, referenced indices, quoted prices in inactive markets, adjusted quoted prices in active markets, etc.); and |
| | ● | Level 3 – Prices, inputs or exotic modeling techniques which are both significant to the fair value measurement and unobservable (supported by little or no market activity). |
The inputs or methodology used for valuing securities are not necessarily an indication of the risks associated with investing in those securities. During the year ended December 31, 2017, there have been no significant changes to the Portfolios’ fair value methodologies.
The following is a summary of the inputs used to value the Portfolios’ investments as of December 31, 2017:
| Large Company Growth Portfolio | | Level 1 | | | Level 2 | | | Level 3 | | | Total | |
| Common Stocks | | $ | 232,159,264 | | | $ | — | | | $ | — | | | $ | 232,159,264 | |
| Money Market Funds | | | 4,249,454 | | | | — | | | | — | | | | 4,249,454 | |
| Total | | $ | 236,408,718 | | | $ | — | | | $ | — | | | $ | 236,408,718 | |
97
Wilshire Mutual Funds, Inc. Notes to Financial Statements - (Continued) December 31, 2017 |
|
| Large Company Value Portfolio | | Level 1 | | | Level 2 | | | Level 3 | | | Total | |
| Common Stocks | | $ | 155,199,096 | | | $ | — | | | $ | — | | | $ | 155,199,096 | |
| Rights | | | — | | | | — | | | | 1,135 | * | | | 1,135 | |
| Money Market Funds | | | 3,183,317 | | | | — | | | | — | | | | 3,183,317 | |
| Total | | $ | 158,382,413 | | | $ | — | | | $ | 1,135 | | | $ | 158,383,548 | |
| Small Company Growth Portfolio | | Level 1 | | | Level 2 | | | Level 3 | | | Total | |
| Common Stocks | | $ | 46,743,827 | | | $ | — | | | $ | — | | | $ | 46,743,827 | |
| Rights | | | — | | | | — | | | | 0 | * | | | 0 | |
| Money Market Funds | | | 4,990,446 | | | | — | | | | — | | | | 4,990,446 | |
| Total | | $ | 51,734,273 | | | $ | — | | | $ | 0 | | | $ | 51,734,273 | |
| Small Company Value Portfolio | | Level 1 | | | Level 2 | | | Level 3 | | | Total | |
| Common Stocks | | $ | 39,465,413 | | | $ | — | | | $ | — | | | $ | 39,465,413 | |
| Money Market Funds | | | 1,784,661 | | | | — | | | | — | | | | 1,784,661 | |
| Total | | $ | 41,250,074 | | | $ | — | | | $ | — | | | $ | 41,250,074 | |
Wilshire 5000 IndexSM Fund | | Level 1 | | | Level 2 | | | Level 3 | | | Total | |
| Common Stocks | | $ | 183,305,042 | | | $ | — | | | $ | — | | | $ | 183,305,042 | |
| Rights | | | — | | | | — | | | | 8,460 | * | | | 8,460 | |
| Money Market Funds | | | 3,884,510 | | | | — | | | | — | | | | 3,884,510 | |
| Total | | $ | 187,189,552 | | | $ | — | | | $ | 8,460 | | | $ | 187,198,012 | |
| Wilshire International Equity Fund | | Level 1 | | | Level 2 | | | Level 3 | | | Total | |
| Common Stocks | | $ | 81,819,954 | | | $ | 260,820,657 | | | $ | — | | | $ | 342,640,611 | |
| Preferred Stocks | | | — | | | | 989,035 | | | | — | | | | 989,035 | |
| Rights | | | 11,588 | | | | — | | | | — | | | | 11,588 | |
| Money Market Funds | | | 15,782,880 | | | | — | | | | — | | | | 15,782,880 | |
| Total | | $ | 97,614,422 | | | $ | 261,809,692 | | | $ | — | | | $ | 359,424,114 | |
| * | Includes securities that have been fair valued at $0. |
98
Wilshire Mutual Funds, Inc. Notes to Financial Statements - (Continued) December 31, 2017 |
|
| Wilshire Income Opportunities Fund | | Level 1 | | | Level 2 | | | Level 3 | | | Total | |
| Investments in Securities | | | | | | | | | | | | |
| U.S. Treasury Obligations | | $ | — | | | $ | 39,791,970 | | | $ | — | | | $ | 39,791,970 | |
| U.S. Government Agency Obligations | | | — | | | | 11,568,950 | | | | — | | | | 11,568,950 | |
| Agency Mortgage-Backed Obligations | | | — | | | | 30,942,595 | | | | — | | | | 30,942,595 | |
| Non-Agency Mortgage-Backed Obligations | | | — | | | | 48,335,885 | | | | — | | | | 48,335,885 | |
| Non-Agency Mortgage-Backed Obligation Interest-Only Strips | | | — | | | | 8,874,894 | | | | — | | | | 8,874,894 | |
| Asset-Backed Securities | | | — | | | | 39,028,517 | | | | — | | | | 39,028,517 | |
| Collateralized Loan Obligations | | | — | | | | 30,409,821 | | | | — | | | | 30,409,821 | |
| Investment Grade Corporate Obligations | | | — | | | | 11,145,728 | | | | — | | | | 11,145,728 | |
| High Yield Corporate Obligations | | | — | | | | 7,305,098 | | | | — | | | | 7,305,098 | |
| Foreign Bonds | | | — | | | | 37,778,043 | | | | — | | | | 37,778,043 | |
| Loan Participations | | | — | | | | 28,625,069 | | | | — | | | | 28,625,069 | |
| Military Housing Obligations | | | — | | | | 7,877,603 | | | | — | | | | 7,877,603 | |
| Municipal Obligations | | | — | | | | 2,223,035 | | | | — | | | | 2,223,035 | |
| Common Stocks | | | 5,122 | | | | — | | | | — | | | | 5,122 | |
| Preferred Stocks | | | — | | | | 2,460,386 | | | | — | | | | 2,460,386 | |
| Affiliated Registered Investment Companies | | | 5,256,561 | | | | — | | | | — | | | | 5,256,561 | |
| Commerical Paper | | | — | | | | 7,997,189 | | | | — | | | | 7,997,189 | |
| Money Market Funds | | | 1,972,722 | | | | — | | | | — | | | | 1,972,722 | |
| Total | | $ | 7,234,405 | | | $ | 314,364,783 | | | $ | — | | | $ | 321,599,188 | |
| Other Financial Instruments** | | | | | | | | | | | | | | | | |
| Swaps - Interest Rate | | $ | — | | | $ | 437,340 | | | $ | — | | | $ | 437,340 | |
| ** | Other financial instruments are derivative financial instruments not reflected in the Schedules of Investments, such as swap contracts. Swap contracts are valued at the unrealized appreciation (depreciation) on the instrument. |
Refer to the Portfolios’ Schedules of Investments for a listing of the securities by industry or sector type. It is the Portfolios’ policy to recognize transfers between Levels at the end of the reporting period. As of December 31, 2017, the Portfolios, other than Wilshire Income Opportunities Fund, did not have any transfers between Levels. In addition, Large Company Growth Portfolio, Small Company Value Portfolio and Wilshire International Equity Fund did not hold any assets or liabilities that were measured at fair value on a recurring basis using significant unobservable inputs (Level 3) as of December 31, 2017. Large Company Value Portfolio and Small Company Growth Portfolio held rights and Wilshire 5000 IndexSM Fund held common stocks and rights that were measured at fair value on a recurring basis using significant unobservable inputs (Level 3) totaling $1,135, $0 and $8,460, respectively. A reconciliation of Level 3 investments, including certain disclosures related to significant inputs used in valuing Level 3 investments, is only presented when the Portfolio has over 1% of Level 3 investments at the beginning and/or end of the period in relation to net assets.
99
Wilshire Mutual Funds, Inc. Notes to Financial Statements - (Continued) December 31, 2017 |
|
The following is a reconciliation of Level 3 investments of Wilshire Income Opportunities Fund for which significant unobservable inputs were used to determine fair value for the year ended December 31, 2017:
| Wilshire Income Opportunities Fund | | | | | | | | | | | | | | | |
| Investments in Securities | | Value as of December 31,
2016 | | | Transfers into
(out of) Level 3 | | | Purchases | | | Net change in unrealized appreciation | | | Value as of December 31,
2017 | |
| Military Housing Obligations | | $ | 1,850,978 | | | $ | (1,850,978 | ) | | $ | — | | | $ | — | | | | — | |
| Total | | $ | 1,850,978 | | | $ | (1,850,978 | ) | | $ | — | | | $ | — | | | $ | — | |
Option Transactions – Wilshire Income Opportunities Fund may purchase and write call and put options on securities, securities indices, swaps (“swaptions”) and foreign currencies, provided such options are traded on a national securities exchange or an over-the-counter market. When the Portfolio writes or purchases a covered call or put option, an amount equal to the premium received is included as a liability in the Portfolio’s statement of assets and liabilities. The amount of the liability is subsequently marked-to-market to reflect the current value of the option. If an option expires on its stipulated expiration date or if the Portfolio enters into a closing purchase transaction, a gain or loss is realized. If a written call option is exercised, a gain or loss is realized for the sale of the underlying security and the proceeds from the sale are increased by the premium originally received. If a written put option is exercised, the cost of the security acquired is decreased by the premium originally received. As a writer of an option, the Portfolio has no control over whether the underlying securities are subsequently sold (call) or purchased (put). As a result, the Portfolio bears the market risk of an unfavorable change in the price of the security or index underlying the written option. When the Portfolio purchases a call or put option, an amount equal to the premium paid is included as an investment in the Portfolio’s statement of assets and liabilities, and is subsequently marked-to-market to reflect the current value of the option. If an option expires on the stipulated expiration date or if the Portfolio enters into a closing sale transaction, a gain or loss is realized. If the Portfolio exercises a call, the cost of the security acquired is increased by the premium paid for the call. If the Portfolio exercises a put option, a gain or loss is realized from the sale of the underlying security, and the proceeds from such sale are decreased by the premium originally paid. Written and purchased options are non-income producing securities. The option techniques utilized are generally to hedge against changes in interest rates, foreign currency exchange rates or securities prices in order to establish more definitely the effective return on securities or currencies held or intended to be acquired by the Portfolio, to reduce the volatility of the currency exposure associated with an investment in non-U.S. securities, or as an efficient means of adjusting exposure to the bond, equity and currency markets.
100
Wilshire Mutual Funds, Inc. Notes to Financial Statements - (Continued) December 31, 2017 |
|
Transactions in options purchased by Wilshire Income Opportunities Fund during the year ended December 31, 2017 were as follows:
| | | Option
Contracts | | | Option
Premiums | |
| Options outstanding at beginning of year | | | — | | | $ | — | |
| Options purchased | | | 10,341 | | | | 1,283,937 | |
| Options expired | | | (3,019 | ) | | | (249,885 | ) |
| Options sold | | | (7,322 | ) | | | (1,034,052 | ) |
| Options outstanding at end of year | | | — | | | $ | — | |
Transactions in options written by Wilshire Income Opportunities Fund during the year ended December 31, 2017 were as follows:
| | | Option
Contracts | | | Option
Premiums | |
| Options outstanding at beginning of year | | | — | | | $ | — | |
| Options written | | | 6,556 | | | | 523,971 | |
| Options expired | | | (1,033 | ) | | | (74,376 | ) |
| Options cancelled in a closing purchase transaction | | | (5,523 | ) | | | (449,595 | ) |
| Options outstanding at end of year | | | — | | | $ | — | |
Interest Rate Swaps – Wilshire Income Opportunities Fund is subject to interest rate risk exposure in the normal course of pursuing its investment objectives. Because the Portfolio holds fixed-rate bonds, the value of these bonds may decrease if interest rates rise. In order to reduce such risks, the Portfolio may enter into interest rate swaps.
Interest rate swaps involve the exchange of commitments to pay and receive a fixed or floating rate of interest based on a notional principal amount. The risks of interest rate swaps include changes in market conditions that will affect their value or cash flows and the possible inability of the counterparty to fulfill its obligations under the agreement. The Portfolio’s maximum risk of loss from counterparty credit risk is the discounted net value of the cash flows to be received from the counterparty over the swap’s remaining life. Upon entering into a swap contract, the Portfolio is required to satisfy an initial margin requirement by delivering cash to the counterparty. Net periodic interest payments to be received or paid are accrued and settled daily and are recorded as interest income on the Statements of Operations. Interest rate swaps are marked-to-market daily and the change is recorded as unrealized gain (loss) on swap contracts on the Statements of Operations. The average monthly notional value of interest rate swaps for Wilshire Income Opportunities Fund during the year ended December 31, 2017 was $30,239,167.
Reverse Repurchase Agreements – Wilshire Income Opportunities Fund may enter into reverse repurchase agreements for investment purposes. A reverse repurchase agreement involves the sale of portfolio assets together with an agreement to repurchase the same assets later at a fixed price. At the time the Portfolio enters into a reverse repurchase agreement, it segregates cash, cash equivalents, or other liquid assets, including equity securities and debt securities, at least equal in value to the repurchase price. In the event the buyer of securities under a reverse repurchase agreement files for bankruptcy or becomes insolvent, the Portfolio’s use of the proceeds under the
101
Wilshire Mutual Funds, Inc. Notes to Financial Statements - (Continued) December 31, 2017 |
|
agreement may be restricted pending a determination by the other party, or its trustee, or receiver, whether to enforce the obligation to repurchase the securities. Interest incurred from the sale of reverse repurchase agreements is listed as Interest Expense on the Statements of Operations. Wilshire Income Opportunities Fund had no reverse repurchase agreements outstanding as of December 31, 2017.
For the year ended December 31, 2017, the average amount of reverse repurchase agreements outstanding and the daily weighted average interest rate for Wilshire Income Opportunities Fund were $6,907,910 and 0.89%, respectively.
Securities traded on a “to-be-announced” basis – Wilshire Income Opportunities Fund occasionally trades securities on a “to-be-announced” (“TBA”) basis. In a TBA transaction, the Portfolio has committed to purchase securities for which all specific information is not yet known at the time of the trade, particularly the face amount in mortgage-backed securities transactions. Securities purchased on a TBA basis are not settled until they are delivered to the Portfolio, normally 15 to 45 days later. These transactions are subject to market fluctuations and their current value is determined in the same manner as for other portfolio securities. TBA securities are noted as such on the Portfolio’s Schedule of Investments.
Investment transactions and investment income – Investment transactions are recorded on a trade-date basis. Realized gains and losses from investment transactions are recorded on the identified cost basis. Dividend income is recognized on the ex-dividend date and interest income is accrued as earned. Discounts and premiums on fixed income securities purchased are accreted or amortized using the effective interest method. Gains and losses on paydowns of mortgage-backed securities are reflected in interest income on the Statements of Operations. Distributions received on investments that represent a return of capital or capital gain are reclassed as a reduction of cost of investments and/or as a realized gain. Withholding taxes on foreign dividends have been provided for in accordance with the Company’s understanding of the applicable country’s tax rules and rates.
Mortgage, asset-backed and collateralized loan securities – Wilshire Income Opportunities Fund may invest in mortgage, asset-backed and collateralized loan securities which represent shares in a pool of mortgages or other debt. These securities are generally pass-through securities, which means that principal and interest payments on the underlying securities (less servicing fees) are passed through to owners on a pro rata basis. These securities involve prepayment risk, which is the risk that the underlying mortgages or other debt may be refinanced or paid off before they mature, particularly during periods of declining interest rates. In that case, proceeds from the securities may have to be reinvested at a lower interest rate. This could lower the Portfolio’s return and result in losses to the Portfolio if some securities were acquired at a premium. Potential market gains on a security subject to prepayment risk may be more limited than potential market gains on a comparable security that is not subject to prepayment risk. The Portfolio may also invest in collateralized mortgage obligations (“CMOs”). In a CMO, a series of bonds or certificates is issued in multiple classes, which have varying levels of risks.
Stripped Mortgage-Backed Securities (“SMBS”) – Wilshire Income Opportunities Fund may invest in SMBS. SMBS are derivative multi-class mortgage-backed securities which are usually structured with two classes that receive different proportions of the interest and principal distributions on a pool of mortgage assets. An SMBS will have one class that will receive all of the interest (the interest-only or “IO” class), while the other class will receive the entire principal (the principal-only or “PO” class). IOs are more volatile and sensitive to the rate of prepayments
102
Wilshire Mutual Funds, Inc. Notes to Financial Statements - (Continued) December 31, 2017 |
|
than other types of mortgage-backed securities, and their value can fall dramatically in response to rapid or unexpected changes in the mortgage, interest rate or economic environment. Payments received for IOs are included in interest income on the Statements of Operations. Because no principal will be received at the maturity of an IO, adjustments are made to the cost of the security on a monthly basis until maturity. These adjustments are included in interest income on the Statements of Operations. Additionally, any prepayment penalties received for an IO are included in interest income on the Statements of Operations.
Loan participations and assignments – Wilshire Income Opportunities Fund may invest in direct debt instruments which are interests in amounts owed to lenders and lending syndicates by corporate, governmental, or other borrowers. The Portfolio’s investments in loans may be in the form of participations in loans or assignments of all or a portion of loans from third parties. A loan is often administered by a bank or other financial institution (the “lender”) that acts as agent for all holders. The agent administers the terms of the loan, as specified in the loan agreement. The Portfolio may invest in multiple series or tranches of a loan, which may have varying terms and carry different associated risks. The Portfolio will generally purchase assignments of these loans, in which case it will typically become a lender for purposes of the relevant loan agreement with direct contractual rights against the borrower, including the right to receive payments of principal and interest. Which purchasing participation interests in a loan, the Portfolio generally has no right to enforce compliance with the terms of the loan agreement with the borrower. As a result, the Portfolio may be subject to the credit risk of both the borrower and the lender that is selling the loan agreement. The Portfolio may enter into unfunded loan commitments, which are contractual obligations for future funding. Unfunded loan commitments represent a future obligation in full, even though a percentage of the notional loan accounts may not be utilized by the borrower. When investing in a loan participation, the Portfolio has the right to receive payments of principal, interest and any fees to which it is entitled only from the lender selling the loan agreement and only upon receipt of payments by the lender from the borrower. In certain circumstances, the Portfolio may receive a penalty fee upon the prepayment of a floating rate loan by a borrower. Fees earned are recorded as a component of interest income on the Statements of Operations. At December 31, 2017, the Portfolio had $872,063 in net unsettled loan commitments.
Foreign currency transactions – The books and records of the Portfolios are maintained in U.S. dollars. Foreign currency transactions are translated into U.S. dollars on the following basis:
| | ● | fair value of investment securities, other assets and liabilities at the daily rates of exchange and |
| | ● | purchases and sales of investment securities, dividend and interest income and certain expenses at the rates of exchange prevailing on the respective dates of such transactions. |
The portion of the results of operations caused by changes in foreign exchange rates on investments are not isolated from those caused by changes in market prices of securities held. Such fluctuations are included with the net realized and unrealized gains or losses on investments. Net realized and unrealized gains (losses) from foreign currency related transactions include gains and losses between trade and settlement dates on investment transactions, gains and losses arising from the sales of foreign currency and gains and losses between the ex-dividend and payment dates on dividends, interest and foreign withholding taxes. The effect of changes in foreign exchange rates on realized and unrealized gains or losses is reflected as a component of such gains or losses.
103
Wilshire Mutual Funds, Inc. Notes to Financial Statements - (Continued) December 31, 2017 |
|
Forward Foreign Currency Contracts – Wilshire Income Opportunities Fund may enter into forward foreign currency contracts as hedges against either specific transactions, Portfolio positions or anticipated Portfolio positions. The Portfolio may also engage in currency transactions to enhance the Portfolio’s returns. All commitments are marked-to-market daily at the applicable foreign exchange rate, and any resulting unrealized gains or losses are recorded. The Portfolio realizes gains and losses at the time forward foreign currency contracts are closed. Unrealized gains or losses on outstanding positions in forward foreign currency contracts held at the close of the period are recognized as ordinary income or loss for federal income tax purposes. Finally, the risk exists that losses could exceed amounts disclosed on the Statements of Assets and Liabilities. There were no outstanding open forward foreign currency contracts as of December 31, 2017.
For the year ended December 31, 2017, the average volume of activity of forward foreign currency contracts was as follows:
| Average Monthly Notional Amount Purchased | | $ | 58,270 | |
| Average Monthly Notional Amount Sold | | | 222,167 | |
Over-the-Counter (“OTC”) Derivative Contracts – To reduce counterparty risk for OTC transactions, Wilshire Income Opportunities Fund has entered into master netting arrangements, established within the International Swap Dealers Association, Inc. (“ISDA”) master agreements, which allow the Portfolio to make (or to have an entitlement to receive) a single net payment in the event of default (close-out netting) for outstanding payables and receivables for certain OTC positions for each individual counterparty. In addition, the Portfolio may require that certain counterparties post cash and/or securities in collateral accounts to cover their net payment obligations for those derivative contracts subject to ISDA master agreements. If the counterparty fails to perform under these contracts and agreements, the cash and/or securities will be made available to the Portfolio. For financial reporting purposes, the Portfolio does not offset derivative assets and derivative liabilities that are subject to netting arrangements in the Statement of Assets and Liabilities. Bankruptcy or insolvency laws of a particular jurisdiction may impose restrictions on or prohibitions against the right of offset in bankruptcy, insolvency or other events.
Collateral terms are contract-specific for OTC derivatives. For derivatives traded under an ISDA master agreement or other similar agreement, the collateral requirements are typically calculated by netting the mark-to-market amount of each transaction under such agreement and comparing that amount to the value of any collateral currently pledged by the Portfolio or the counterparty.
For financial reporting purposes, cash collateral that has been pledged to cover obligations of the Portfolio, if any, is reported separately as Cash Pledged as Collateral on the Statements of Assets and Liabilities. Non-cash collateral pledged by the Portfolio, if any, is noted in the Schedule of Investments. Generally, the amount of collateral due from or to a party must exceed a minimum transfer amount before a transfer has to be made. To the extent amounts due to the Portfolio from its counterparties are not fully collateralized, contractually or otherwise, the Portfolio bears the risk of loss from counterparty nonperformance.
104
Wilshire Mutual Funds, Inc. Notes to Financial Statements - (Continued) December 31, 2017 |
|
The following table presents, by derivative type, Wilshire Income Opportunities Fund’s OTC financial derivative instruments net of the related collateral (received)/pledged by counterparty at December 31, 2017:
| Counterparty | | Financial Derivative Assets | | | Financial Derivative Liabilities | | | Derivatives Available for Offset | | | Collateral Pledged or (Received)* | | | Net
Amount | |
| Interest rate swap contracts** | | | | | | | | | | | | | | | |
| Bank of America Merrill Lynch | | $ | 442,770 | | | $ | (5,430 | ) | | $ | 437,340 | | | $ | — | | | $ | 437,340 | |
| Total | | $ | 442,770 | | | $ | (5,430 | ) | | $ | 437,340 | | | $ | — | | | $ | 437,340 | |
| * | Collateral pledged is limited to the net outstanding amount from an individual counterparty. The actual collateral amount pledged may exceed the amount and may fluctuate in value. |
| ** | Includes cumulative appreciation (depreciation) of swap contracts as reported in the Schedule of Centrally Cleared Swap Contracts. Only current days variation margin is reported within the Statement of Assets and Liabilities. |
Expense policy – Distribution and shareholder service fees directly attributable to a Class of shares are charged to that class’ operating expenses. Expenses of the Portfolios other than distribution and service fees are prorated among the classes to which the expense relates based on the relative net assets of each class of shares. Expenses directly attributable to a Portfolio are charged to that Portfolio. Expenses not directly attributable to a Portfolio are allocated proportionately among all Portfolios daily in relation to the net assets of each Portfolio or another reasonable basis.
Expenses that are attributable to the Company and the Wilshire Variable Insurance Trust (an affiliated investment company) are allocated across the Company and the Wilshire Variable Insurance Trust based upon relative net assets or another reasonable basis. Expenses and fees, including the advisory fees, are accrued daily and taken into account for the purpose of determining the net asset value of each Class of each Portfolio’s shares.
Investments in REITs – With respect to each Portfolio, dividend income is recorded based on the income included in distributions received from its REIT investments using published REIT reclassifications including some management estimates when actual amounts are not available. Distributions received in excess of these estimated amounts are recorded as a reduction of the cost of investments or reclassified to capital gains. The actual amounts of income, return of capital, and capital gains are only determined by each REIT after its fiscal year end, and may differ from the estimated amounts.
Master Limited Partnerships (“MLPs”) – The Portfolios may invest in MLPs, which are limited partnerships or limited liability companies whose partnership units or limited liability interests are listed and traded on a U.S. securities exchange. MLPs are treated as publicly traded partnerships for federal income tax purposes. To qualify to be treated as a partnership for tax purposes, an MLP must receive at least 90% of its income from qualifying sources as set forth in Section 7704(d) of the Internal Revenue Code of 1986, as amended (the “Code”). These qualifying sources include activities such as the exploration, development, mining, production, processing, refining, transportation, storage and marketing of mineral or natural resources. MLPs generally have two classes of owners, the general partner and limited partners. MLPs that are formed as limited liability companies generally have two analogous classes of owners, the managing member and the members. For purposes of this section, references to
105
Wilshire Mutual Funds, Inc. Notes to Financial Statements - (Continued) December 31, 2017 |
|
general partners also apply to managing members and references to limited partners also apply to members. The general partner is typically owned by a major energy company, an investment fund, the direct management of the MLP, or is an entity owned by one or more of such parties. The general partner may be structured as a private or publicly traded corporation or other entity. The general partner typically controls the operations and management of the MLP through an equity interest in the MLP of as much as 2% plus, in many cases, ownership of common units and subordinated units. Limited partners own the remainder of the MLP through ownership of common units and have a limited role in the MLP’s operations and management.
Distributions to shareholders – Distributions to shareholders are recorded on the ex-dividend date. Distributions from net investment income, if any, are declared and paid annually. The Portfolios’ net realized capital gains, unless offset by any available capital loss carryforward, are distributed to shareholders annually. Additional distributions of net investment income and net realized capital gains may be made at the discretion of the Board in order to avoid the application of a 4% non-deductible Federal excise tax.
Redemption fees – Wilshire International Equity Fund charges a redemption fee of 1% on redemption of its shares held for sixty days or less, subject to certain exceptions. During the years ended December 31, 2017 and 2016, Wilshire International Equity Fund collected $635 and $1,984, respectively, in redemption fees.
3. Investment Adviser Fee and Other Service Providers.
Pursuant to the Advisory Agreement between the Company and the Adviser, the Adviser charges annual fees of 0.75% of average daily net assets for the first $1 billion and 0.65% thereafter for the Large Company Growth Portfolio and Large Company Value Portfolio, 0.85% of average daily net assets for the first $1 billion and 0.75% thereafter for the Small Company Growth Portfolio and Small Company Value Portfolio, 0.10% of the average daily net assets for the first $1 billion and 0.07% thereafter for Wilshire 5000 IndexSM Fund, 1.00% of the average daily net assets for the first $1 billion and 0.90% thereafter for Wilshire International Equity Fund, and 0.60% of average daily net assets for Wilshire Income Opportunities Fund.
Effective October 1, 2017, the Adviser has entered into expense limitation agreements with Small Company Growth Portfolio and Small Company Value Portfolio requiring the Adviser to reduce its management fees or reimburse expenses to limit expenses of such Portfolios (excluding taxes, brokerage expenses, dividend expenses on short securities, and extraordinary expenses) to 1.35% and 1.10% of average daily net assets for Investment Class Shares and Institutional Class Shares, respectively. Prior to October 1, 2017, the Adviser reduced its management fees or reimbursed expenses to limit expenses of such Portfolios to 1.50% and 1.25% of average daily net assets for Investment Class Shares and Institutional Class Shares, respectively. The Adviser has also entered into an expense limitation agreement with Wilshire International Equity Fund requiring the Adviser to reduce its management fees or reimburse expenses to limit expenses of the Portfolio (excluding taxes, brokerage expenses, dividend expenses on short securities, and extraordinary expenses) to 1.50% and 1.25% of average daily net assets for Investment Class Shares and Institutional Class Shares, respectively. These agreements to limit expenses continue through at least April 30, 2019. The Adviser may recoup the amount of any fee reductions or expense reimbursements within three years after the year in which it reduced fees or reimbursed the expenses if the recoupment does not cause a portfolio’s expenses to exceed the expense limitation that was in place at the time of the fee reduction or expense reimbursement. At December 31, 2017, the amounts of fee reductions and expense reimbursements subject to
106
Wilshire Mutual Funds, Inc. Notes to Financial Statements - (Continued) December 31, 2017 |
|
recoupment for Small Company Growth Portfolio were $53,561 expiring in 2020, $26,249 expiring in 2019 and $48,753 expiring in 2018. At December 31, 2017, the amounts of fee reductions and expense reimbursements subject to recoupment for Small Company Value Portfolio were $55,407 expiring in 2020, $23,509 expiring in 2019 and $52,909 expiring in 2018. At December 31, 2017, the amounts of fee reductions and expense reimbursements subject to recoupment for Wilshire International Equity Fund were $2,177 expiring in 2020, $144,932 expiring in 2019 and $81,678 expiring in 2018. The Adviser has entered into an expense limitation agreement with Wilshire Income Opportunities Fund requiring the Adviser to reduce its management fee or reimburse expenses to limit expenses of the Portfolio (excluding taxes, brokerage expenses, dividend expenses on short securities, acquired fund fees and expenses and extraordinary expenses) to 1.15% and 0.90% of average daily net assets for Investment Class Shares and Institutional Class Shares, respectively. This agreement to limit expenses continues through at least April 30, 2019. The Adviser may recoup the amount of any fee reductions or expense reimbursements within three years after the year in which the reduction or expense reimbursement occurred if the recoupment does not cause the Portfolio’s expenses to exceed the expense limitation that was in place at the time of the fee reduction or expense reimbursement. At December 31, 2017, the amounts of fee reductions and expense reimbursements subject to recoupment for Wilshire Income Opportunities Fund was $3,021 expiring in 2020 and $723 expiring in 2019.
For the year ended December 31, 2017, the Adviser reduced fees, reimbursed expenses or recouped fees as follows:
| Portfolio | | Fees Reductions/ Reimbursements | | | Fees Recouped | |
| Small Company Growth Portfolio | | $ | 53,561 | | | | N/A | |
| Small Company Value Portfolio | | | 55,407 | | | | N/A | |
| International Equity Fund | | | 2,177 | | | $ | 7,286 | |
| Wilshire Income Opportunities Fund | | | 3,021 | | | | N/A | |
The Board has approved Los Angeles Capital Management and Equity Research, Inc. (“L.A. Capital”), Victory Capital Management Inc. (“Victory”), Pzena Investment Management, LLC (“Pzena”), Barrow, Hanley, Mewhinney and Strauss, LLC (“BHMS”), Ranger Investment Management, LLC (“Ranger”), NWQ Investment Management Company, LP (“NWQ”), Cambiar Investors, LLC (“Cambiar”), Loomis, Sayles & Company, L.P. (“Loomis Sayles”), DoubleLine® Capital LP (“DoubleLine”), Guggenheim Partners Investment Management, LLC (“Guggenheim”) and WCM Investment Management (“WCM”) (collectively the “Sub-Advisers”) to provide sub-advisory services with respect to the Portfolios. L.A. Capital, Loomis Sayles and Victory each manage a portion of Large Company Growth Portfolio. L.A. Capital, Pzena and BHMS each manage a portion of Large Company Value Portfolio. L.A. Capital and Ranger each manage a portion of Small Company Growth Portfolio. L.A. Capital and NWQ each manage a portion of Small Company Value Portfolio. L.A. Capital is the sole sub-adviser for Wilshire 5000 IndexSM Fund. L.A. Capital, Cambiar and WCM each manage a portion of Wilshire International Equity Fund. DoubleLine® and Guggenheim each manage a portion of Wilshire Income Opportunities Fund.
The Sub-Advisers are subject to the Adviser’s oversight. The fees of the Sub-Advisers are paid by the Adviser.
107
Wilshire Mutual Funds, Inc. Notes to Financial Statements - (Continued) December 31, 2017 |
|
DST Systems, Inc. serves as the Company’s transfer agent and dividend disbursing agent. The Northern Trust Company (“NTC”) serves as the Company’s custodian. Ultimus Fund Solutions, LLC (the “Administrator”) serves as the Company’s administrator and accounting agent and Ultimus Fund Distributors, LLC, an affiliate of the Administrator, serves as the Company’s distributor.
Officers’ and Directors’ Expenses – Certain officers of the Company are affiliated with and receive remuneration from the Adviser or the Administrator. The Company does not pay any remuneration to its officers. The Company and the Wilshire Variable Insurance Trust together pay each director who is not an interested person of the Company (“Independent Director”) an annual retainer of $48,000, an annual additional retainer for each Committee chair of $12,000 and an annual additional retainer to the Board chair of $12,000. In addition, each Independent Director is compensated for Board and Committee meeting attendance in accordance with the following schedule: a Board in-person meeting fee of $3,000 for Independent Directors and $4,000 for the Board chair, a Board telephonic meeting fee of $1,500 for Independent Directors and $2,000 for the Board chair, and a Committee telephonic meeting fee of $500.
4. Distribution Plan, Shareholder Services Plan and Fees Paid Indirectly.
The Board has adopted a shareholder services and distribution plan (the “Plan”), pursuant to Rule 12b-1 under the 1940 Act, on behalf of the Investment Class Shares of each Portfolio. Under the Plan, each Portfolio may pay up to 0.25% of the value of the average daily net assets attributable to the Investment Class Shares for certain services provided by financial intermediaries or for certain distribution expenses for the purpose of financing any activity intended to result in the sale of Investment Class Shares. For the year ended December 31, 2017, the distribution and service fee expenses incurred for the Investment Class of Large Company Growth Portfolio, Large Company Value Portfolio, Small Company Growth Portfolio, Small Company Value Portfolio, Wilshire 5000 IndexSM Fund, Wilshire International Equity Fund and Wilshire Income Opportunities Fund was 0.25% of the respective average net assets of each Portfolio.
In addition, Investment Class Shares and Institutional Class Shares pay the expenses associated with certain shareholder servicing arrangements with third parties, provided that payment of such fees does not exceed in any year 0.20% and 0.15% of the average daily net assets of Investment Class Shares and Institutional Class Shares, respectively. For the year ended December 31, 2017, the net shareholder service provider fees were as follows (as a percent of average net assets of each class):
Portfolio | Investment Class | Institutional Class |
Wilshire Large Company Growth Portfolio | 0.128% | 0.052% |
Wilshire Large Company Value Portfolio | 0.073% | 0.052% |
Wilshire Small Company Growth Portfolio | 0.107% | 0.056% |
Wilshire Small Company Value Portfolio | 0.115% | 0.055% |
Wilshire 5000 IndexSM Fund | 0.065% | 0.021% |
Wilshire International Equity Fund | 0.078% | 0.044% |
Wilshire Income Opportunities Fund | 0.072% | 0.059% |
108
Wilshire Mutual Funds, Inc. Notes to Financial Statements - (Continued) December 31, 2017 |
|
Fees paid indirectly – The Company has entered into a brokerage commission recapture program with SEI Investments Global Funds Services (“SEI”), pursuant to which a portion of the Portfolios’ commissions generated from transactions directed to SEI are used to reduce the Portfolios’ expenses. Under such program, SEI, as introducing broker, retains a portion of the Portfolios’ commissions.
Such commissions rebated to the Portfolios for the year ended December 31, 2017 were as follows:
| Wilshire Large Company Growth Portfolio | | $ | 2,976 | |
| Wilshire Large Company Value Portfolio | | | 3,540 | |
| Wilshire Small Company Growth Portfolio | | | — | |
| Wilshire Small Company Value Portfolio | | | 6,996 | |
Wilshire 5000 IndexSM Fund | | | — | |
| Wilshire International Equity Fund | | | — | |
| Wilshire Income Opportunities Fund | | | — | |
For the year ended December 31, 2017, SEI retained the following commissions:
| Wilshire Large Company Growth Portfolio | | $ | 856 | |
| Wilshire Large Company Value Portfolio | | | 1,364 | |
| Wilshire Small Company Growth Portfolio | | | — | |
| Wilshire Small Company Value Portfolio | | | 2,412 | |
Wilshire 5000 IndexSM Fund | | | — | |
| Wilshire International Equity Fund | | | — | |
| Wilshire Income Opportunities Fund | | | — | |
5. Securities Transactions.
For the year ended December 31, 2017, aggregate cost of purchases and proceeds from sales and maturities of securities, other than affiliated investments, short-term investments, short sales and purchases to cover short sales, and U.S. Government securities, were as follows:
| Portfolio | | Purchases | | | Sales | |
| Wilshire Large Company Growth Portfolio | | $ | 116,743,985 | | | $ | 152,399,781 | |
| Wilshire Large Company Value Portfolio | | | 65,186,469 | | | | 115,294,705 | |
| Wilshire Small Company Growth Portfolio | | | 49,513,835 | | | | 44,397,153 | |
| Wilshire Small Company Value Portfolio | | | 30,788,487 | | | | 33,938,821 | |
Wilshire 5000 IndexSM Fund | | | 5,403,516 | | | | 25,949,534 | |
| Wilshire International Equity Fund | | | 198,285,731 | | | | 187,048,125 | |
| Wilshire Income Opportunities Fund | | | 208,270,654 | | | | 291,409,805 | |
109
Wilshire Mutual Funds, Inc. Notes to Financial Statements - (Continued) December 31, 2017 |
|
Purchases and sales and maturities of long-term U.S. Government securities during the year ended December 31, 2017 were:
| Portfolio | | Purchases | | | Sales | |
| Wilshire Income Opportunities Fund | | $ | 95,244,208 | | | $ | 115,563,512 | |
Due to Guggenheim managing a portion of Wilshire Income Opportunities Fund, certain securities held by the Portfolio are considered affiliated investments. Purchases and sales of affiliated investments for Wilshire Income Opportunities Fund during the year ended December 31, 2017 and the value of such investments as of December 31, 2017 were as follows:
| Affiliated Investment | | Value as of December 31,
2016 | | | Purchases | | | Proceeds from Sales | | | Realized Gain | | | Change in Unrealized Appreciation (Depreciation) | | | Value as of December 31,
2017 | | | Income Distributions | | | Capital Gain Distributions | |
| Guggenheim Floating Rate Strategies Fund | | $ | 6,049,104 | | | $ | 1,075,994 | | | $ | 5,900,000 | | | $ | 22,603 | | | $ | (25,398 | ) | | $ | 1,222,303 | | | $ | 125,796 | | | $ | — | |
| Guggenheim Strategy Fund I | | $ | 4,699,030 | | | $ | 4,590,778 | | | $ | 5,266,807 | | | $ | 46,471 | | | $ | (35,214 | ) | | $ | 4,034,258 | | | $ | 88,141 | | | $ | 1,090 | |
6. Derivative Transactions.
The Portfolios, other than Wilshire Income Opportunities Fund, did not hold any derivative instruments as of or during the year ended December 31, 2017.
At December 31, 2017, Wilshire Income Opportunities Fund is invested in derivative contracts, which are reflected in the Statements of Assets and Liabilities, as follows:
| | | | | Derivative Assets | | Derivative Liabilities |
| Risk | | Derivative Type | | Statements of Assets and Liabilities Location | | Fair Value
Amount | | | Statements of Assets and Liabilities Location | | Fair Value
Amount | |
| Interest Rate | | Swap contracts* | | Net unrealized appreciation on swap contracts | | $ | 442,770 | | | Net unrealized depreciation on swap contracts | | $ | (5,430 | ) |
| Total | | | | | | $ | 442,770 | | | | | $ | (5,430 | ) |
| * | Includes cumulative appreciation (depreciation) of swap contracts as reported in the Schedule of Centrally Cleared Swap Contracts. Only current days variation margin is reported within the Statement of Assets and Liabilities. |
110
Wilshire Mutual Funds, Inc. Notes to Financial Statements - (Continued) December 31, 2017 |
|
For the year ended December 31, 2017, the effect of derivative contracts in Wilshire Income Opportunities Fund’s Statements of Operations was as follows:
| | | | | Statements of Operations | |
| Risk | | Derivative Type | | Net Realized Gain (Loss) | | | Net Change in Unrealized Gain (Loss) | |
| Equity | | Purchased option contracts(a) | | $ | (217,447 | ) | | $ | — | |
| Equity | | Written option contracts | | | 56,289 | | | | — | |
| Currency | | Forward foreign currency exchange contracts | | | 5,381 | | | | (14,224 | ) |
| Interest Rate | | Swap contracts(b) | | | (145,063 | ) | | | 437,340 | |
| Total | | | | $ | (300,840 | ) | | $ | 423,116 | |
| (a) | The Statement of Operations location for “Purchased option contracts” is “Net realized and unrealized gain on unaffiliated investments.” |
| (b) | Includes cumulative appreciation (depreciation) of swap contracts as reported in the Schedule of Centrally Cleared Swap Contracts. Only current days variation margin is reported within the Statement of Assets and Liabilities. |
7. Securities Lending.
Each Portfolio may seek additional income by lending its securities on a short-term basis to banks, brokers and dealers in return for cash collateral, which is invested in short-term securities. A Portfolio may return a portion of the interest earned to the borrower or a third party that is unaffiliated with the Company and acting as a “placing broker.” A Portfolio receives compensation for lending securities in the form of fees. A Portfolio also continues to receive dividends on the securities loaned. Security loans are secured at all times by collateral. It is the Company’s policy that the collateral be equal to at least 102% of the market value of the securities loaned (105% if the securities loaned are denominated in different currencies) plus accrued interest when the transaction is entered into, and that the collateral supporting loans be valued daily. However, due to market fluctuations during the day, the value of securities loaned on a particular day may, during the course of the day, exceed the value of collateral. On each business day, the amount of collateral is adjusted based on the prior day’s market fluctuations and the current day’s lending activity. Gain or loss in the market price of the securities loaned that may occur during the term of the loan are reflected in the value of the Portfolio. The risks from securities lending are that the borrower may not provide additional collateral when required or return the securities when due or when called for by the Portfolio. Lending securities entails a risk of loss to the Portfolio if and to the extent that the market value of securities loans were to increase, the borrower did not increase the collateral accordingly, and the borrower fails to return the securities. NTC, the Portfolios’ custodian, acts as the securities lending agent for the Portfolios. The value of the securities on loan and the cash collateral at December 31, 2017 are shown on the Statements of Assets and Liabilities. Shares of the Northern Trust Institutional Liquid Asset Portfolio were purchased with proceeds from cash collateral received from securities on loan. Securities on loan are also collateralized by various U.S. Treasury obligations.
111
Wilshire Mutual Funds, Inc. Notes to Financial Statements - (Continued) December 31, 2017 |
|
The following table is a summary of the Funds’ securities lending transactions accounted for as secured borrowings with cash collateral of overnight and continuous maturities and non-cash collateral greater than 90 days, which are subject to offset as of December 31, 2017:
| | | | | | Collateral Received | |
| Portfolio | | Value of Securities on Loan | | | Value of Cash Collateral Received | | | Value of Non-Cash Collateral Received | | | Excess Amount Due to Counterparty | |
| Large Company Growth Portfolio | | $ | 15,985,353 | | | $ | 1,614,019 | | | $ | 14,796,474 | | | $ | 425,140 | |
| Large Company Value Portfolio | | | 5,439,871 | | | | 127,466 | | | | 5,448,268 | | | | 135,863 | |
| Small Company Growth Portfolio | | | 10,257,245 | | | | 3,365,468 | | | | 7,237,842 | | | | 346,065 | |
| Small Company Value Portfolio | | | 6,418,286 | | | | 1,001,671 | | | | 5,625,851 | | | | 209,236 | |
Wilshire 5000 IndexSM Fund | | | 11,934,916 | | | | 1,815,226 | | | | 10,476,789 | | | | 357,099 | |
| Wilshire International Equity Fund | | | 19,812,414 | | | | 5,530,010 | | | | 14,820,487 | | | | 538,083 | |
No non-cash collateral held by the Portfolios has a maturity of less than 90 days as of December 31, 2017.
Wilshire Income Opportunities Fund did not utilize securities lending during the year ended December 31, 2017.
112
Wilshire Mutual Funds, Inc. Notes to Financial Statements - (Continued) December 31, 2017 |
|
8. Capital Share Transactions.
Transactions in shares of the Portfolios are summarized below:
| | LARGE COMPANY GROWTH PORTFOLIO | LARGE COMPANY VALUE PORTFOLIO | SMALL COMPANY GROWTH PORTFOLIO | SMALL COMPANY VALUE PORTFOLIO |
| | Year Ended December 31, 2017 | Year Ended December 31, 2016 | Year Ended December 31, 2017 | Year Ended December 31, 2016 | Year Ended December 31, 2017 | Year Ended December 31, 2016 | Year Ended December 31, 2017 | Year Ended December 31, 2016 |
CAPITAL SHARE TRANSACTIONS: | | | | | | | | |
Investment Class shares: | | | | | | | | |
Shares sold | 33,646 | 258,962 | 42,620 | 723,256 | 573,827 | 330,720 | 46,651 | 217,024 |
Shares issued as reinvestment of distributions | 131,643 | 202,292 | 28,470 | 42,973 | 41,834 | 35,879 | 30,112 | 38,667 |
Shares redeemed | (389,262) | (1,531,665) | (257,831) | (3,109,741) | (514,906) | (571,361) | (185,599) | (561,550) |
Net increase (decrease) in Investment Class shares outstanding | (223,973) | (1,070,411) | (186,741) | (2,343,512) | 100,755 | (204,762) | (108,836) | (305,859) |
Shares outstanding at beginning of year | 1,846,252 | 2,916,663 | 495,772 | 2,839,284 | 353,739 | 558,501 | 383,058 | 688,917 |
Shares outstanding at end of year | 1,622,279 | 1,846,252 | 309,031 | 495,772 | 454,494 | 353,739 | 274,222 | 383,058 |
| | | | | | | | | |
Institutional Class shares: | | | | | | | | |
Shares sold | 1,019,884 | 2,946,276 | 1,164,082 | 6,952,495 | 661,776 | 1,016,072 | 614,219 | 1,155,839 |
Shares issued as reinvestment of distributions | 293,035 | 430,089 | 716,652 | 577,737 | 122,682 | 115,866 | 161,412 | 111,843 |
Shares redeemed | (1,504,242) | (2,302,019) | (3,319,731) | (1,698,028) | (522,936) | (644,708) | (644,308) | (605,842) |
Net increase (decrease) in Institutional Class shares outstanding | (191,323) | 1,074,346 | (1,438,997) | 5,832,204 | 261,522 | 487,230 | 131,323 | 661,840 |
Shares outstanding at beginning of year | 4,205,125 | 3,130,779 | 8,689,708 | 2,857,504 | 1,086,800 | 599,570 | 1,312,971 | 651,131 |
Shares outstanding at end of year | 4,013,802 | 4,205,125 | 7,250,711 | 8,689,708 | 1,348,322 | 1,086,800 | 1,444,294 | 1,312,971 |
113
Wilshire Mutual Funds, Inc. Notes to Financial Statements - (Continued) December 31, 2017 |
|
| | WILSHIRE 5000 INDEXSM FUND | WILSHIRE INTERNATIONAL
EQUITY FUND | WILSHIRE INCOME OPPORTUNITIES FUND* |
| | Year Ended December 31, 2017 | Year Ended December 31, 2016 | Year Ended December 31, 2017 | Year Ended December 31, 2016 | Year Ended December 31, 2017 | Period Ended December 31, 2016 |
CAPITAL SHARE TRANSACTIONS: | | | | | | |
Investment Class shares: | | | | | | |
Shares sold | 984,802 | 800,638 | 226,707 | 1,460,532 | 724,183 | 292,557 |
Issued in connection with in-kind transfer (Note 11) | — | — | — | — | — | 1 |
Shares issued as reinvestment of distributions | 567,184 | 392,549 | 255 | 19,862 | 26,365 | 2,256 |
Shares redeemed | (1,415,579) | (3,141,812) | (1,119,765) | (600,832) | (234,014) | (186,167) |
Net increase (decrease) in Investment Class shares outstanding | 136,407 | (1,948,625) | (892,803) | 879,562 | 516,534 | 108,647 |
Shares outstanding at beginning of period | 7,034,013 | 8,982,638 | 1,265,997 | 386,435 | 108,647 | — |
Shares outstanding at end of period | 7,170,420 | 7,034,013 | 373,194 | 1,265,997 | 625,181 | 108,647 |
| | | | | | | |
Institutional Class shares: | | | | | | |
Shares sold | 151,639 | 572,873 | 7,552,599 | 21,027,280 | 4,212,021 | 31,084,393 |
Issued in connection with in-kind transfer (Note 11) | — | — | — | — | — | 14,275,906 |
Shares issued as reinvestment of distributions | 118,693 | 115,397 | 149,107 | 524,904 | 1,343,981 | 1,080,559 |
Shares redeemed | (753,858) | (1,843,987) | (5,212,955) | (12,387,624) | (14,493,554) | (7,162,769) |
Net increase (decrease) in Institutional Class shares outstanding | (483,526) | (1,155,717) | 2,488,751 | 9,164,560 | (8,937,552) | 39,278,089 |
Shares outstanding at beginning of period | 2,167,096 | 3,322,813 | 29,311,284 | 20,146,724 | 39,278,089 | — |
Shares outstanding at end of period | 1,683,570 | 2,167,096 | 31,800,035 | 29,311,284 | 30,340,537 | 39,278,089 |
| | | | | | | |
Qualified Class shares: | | | | | | |
Shares redeemed | — | (12) | — | — | — | — |
Net decrease in Qualified Class shares outstanding | — | (12) | — | — | — | — |
Shares outstanding at beginning of year | — | 12 | — | — | — | — |
Shares outstanding at end of year | — | — | — | — | — | — |
| | | | | | | |
Horace Mann Class shares: | | | | | | |
Shares sold | — | 1,374 | — | — | — | — |
Shares issued as reinvestment of distributions | — | 240 | — | — | — | — |
Shares redeemed | — | (93,255) | — | — | — | — |
Net decrease in Horace Mann Class shares outstanding | — | (91,641) | — | — | — | — |
Shares outstanding at beginning of year | — | 91,641 | — | — | — | — |
Shares outstanding at end of year | — | — | — | — | — | — |
| * | Wilshire Income Opportunities Fund commenced operations at March 30, 2016. |
114
Wilshire Mutual Funds, Inc. Notes to Financial Statements - (Continued) December 31, 2017 |
|
9. Significant Shareholder Activity.
On December 31, 2017, the Portfolios had the following concentrations of shareholders holding 10% or more of the outstanding shares of the Portfolios. These represent omnibus shareholder accounts comprised of many individual shareholders.
Portfolio | |
Large Company Growth Portfolio (3 omnibus shareholders) | 63% |
Large Company Value Portfolio (4 omnibus shareholder) | 75% |
Small Company Growth Portfolio (3 omnibus shareholders) | 61% |
Small Company Value Portfolio (4 omnibus shareholders) | 79% |
Wilshire 5000 IndexSM Fund (2 omnibus shareholders) | 47% |
Wilshire International Equity Fund (2 omnibus shareholders) | 64% |
Wilshire Income Opportunities Fund (4 omnibus shareholders) | 86% |
On December 31, 2017, certain affiliated funds also advised by the Adviser, owned the following amounts of the outstanding shares of the Portfolios:
Portfolio | |
Large Company Growth Portfolio | 31% |
Large Company Value Portfolio | 46% |
Small Company Growth Portfolio | 31% |
Small Company Value Portfolio | 36% |
Wilshire 5000 IndexSM Fund | — |
Wilshire International Equity Fund | 54% |
Wilshire Income Opportunities Fund | 44% |
10. Tax Information.
No provision for federal income taxes is required because each Portfolio has qualified and intends to continue to qualify as a regulated investment company under Subchapter M of the Code and distributes to shareholders all of its taxable income and net realized gains. Federal income tax regulations differ from U.S. GAAP; therefore, distributions determined in accordance with tax regulations may differ in amount or character from net investment income and realized gains for financial reporting purposes. Financial reporting records are adjusted for permanent book/tax differences to reflect tax character. Financial records are not adjusted for temporary differences.
The Portfolios evaluate tax positions taken or expected to be taken in the course of preparing the Portfolios’ tax returns to determine whether it is “more-likely than-not” (i.e., greater than 50 percent) that each tax position will be sustained upon examination by a taxing authority based on the technical merits of the position. Tax positions not deemed to meet the more-likely-than-not threshold are recorded as a tax benefit or expense in the current year. The Portfolios did not record any tax provision in the current period. However, management’s conclusions regarding tax positions taken may be subject to review and adjustment at a later date based on factors including,
115
Wilshire Mutual Funds, Inc. Notes to Financial Statements - (Continued) December 31, 2017 |
|
but not limited to, examination by tax authorities of returns filed in the last 3 years on-going analysis of and changes to tax laws, regulations and interpretations thereof. The Funds identify their major tax jurisdiction as U.S. Federal.
The federal tax cost of portfolio securities and unrealized appreciation and depreciation at December 31, 2017 for each Portfolio are as follows:
| Portfolio | | Large
Company
Growth
Portfolio | | | Large
Company
Value
Portfolio | | | Small
Company
Growth
Portfolio | | | Small
Company
Value
Portfolio | | | Wilshire
5000
IndexSM
Fund | | | Wilshire
International
Equity
Fund | | | Wilshire
Income
Opportunities Fund | |
| Tax cost of portfolio investments | | $ | 153,758,665 | | | $ | 121,927,224 | | | $ | 42,145,854 | | | $ | 33,865,242 | | | $ | 61,612,941 | | | $ | 294,640,907 | | | $ | 320,118,186 | |
| Gross unrealized appreciation | | $ | 84,349,096 | | | $ | 38,300,988 | | | $ | 10,325,543 | | | $ | 8,385,506 | | | $ | 128,175,430 | | | $ | 68,928,493 | | | $ | 7,002,687 | |
| Gross unrealized depreciation | | | (1,699,043 | ) | | | (1,844,664 | ) | | | (737,124 | ) | | | (1,000,674 | ) | | | (2,590,359 | ) | | | (4,145,286 | ) | | | (5,521,685 | ) |
| Net unrealized appreciation | | $ | 82,650,053 | | | $ | 36,456,324 | | | $ | 9,588,419 | | | $ | 7,384,832 | | | $ | 125,585,071 | | | $ | 64,783,207 | | | $ | 1,481,002 | |
The differences between book and tax-basis unrealized appreciation (depreciation) are attributable primarily to the tax deferral of losses on wash sales and investment in passive foreign investment companies.
The tax character of distributions declared during the years ended December 31, 2017 and 2016 was as follows:
| Portfolio | | 2017
Ordinary Income | | | 2017
Long-Term Capital Gains | | | 2016
Ordinary Income | | | 2016
Long-Term
Capital Gains | | | 2016
Return of Capital | |
| Large Company Growth Portfolio | | $ | 2,084,944 | | | $ | 16,542,862 | | | $ | 5,499,968 | | | $ | 18,867,521 | | | $ | — | |
| Large Company Value Portfolio | | | 9,726,872 | | | | 6,140,150 | | | | 8,155,226 | | | | 4,651,885 | | | | — | |
| Small Company Growth Portfolio | | | 1,210,846 | | | | 3,215,807 | | | | 1,364,686 | | | | 2,604,047 | | | | — | |
| Small Company Value Portfolio | | | 1,049,935 | | | | 3,441,792 | | | | 1,222,049 | | | | 2,391,817 | | | | — | |
Wilshire 5000 IndexSM Fund | | | 2,666,332 | | | | 12,803,168 | | | | 3,645,085 | | | | 7,100,418 | | | | — | |
| Wilshire International Equity Fund | | | 1,692,329 | | | | — | | | | 4,811,640 | | | | — | | | | — | |
| Wilshire Income Opportunities Fund | | | 13,133,583 | | | | 1,067,674 | | | | 10,683,057 | | | | 290,797 | | | | 6,343 | |
116
Wilshire Mutual Funds, Inc. Notes to Financial Statements - (Continued) December 31, 2017 |
|
At December 31, 2017, the components of distributable earnings (accumulated deficit) on a tax basis were as follows:
| Portfolio | | Large Company Growth Portfolio | | | Large Company Value Portfolio | | | Small Company Growth Portfolio | | | Small Company Value Portfolio | | | Wilshire 5000 IndexSM Fund | | | Wilshire International Equity Fund | | | Wilshire
Income Opportunities Fund | |
| Undistributed ordinary income | | $ | 1,305,001 | | | $ | 515,595 | | | $ | 281,540 | | | $ | 402,689 | | | $ | 18,783 | | | $ | 1,387,326 | | | $ | 208,542 | |
| Undistributed long-term gains | | | 5,080,173 | | | | 2,498,592 | | | | 575,900 | | | | 654,988 | | | | 1,348,852 | | | | — | | | | 216,495 | |
| Accumulated capital and other losses | | | — | | | | — | | | | — | | | | — | | | | — | | | | (6,118,433 | ) | | | — | |
| Net unrealized appreciation | | | 82,650,053 | | | | 36,456,324 | | | | 9,588,419 | | | | 7,384,832 | | | | 125,585,071 | | | | 64,783,207 | | | | 1,481,002 | |
| Net unrealized appreciation on foreign currency translation | | | — | | | | — | | | | — | | | | — | | | | — | | | | 32,694 | | | | — | |
| Accumulated earnings | | $ | 89,035,227 | | | $ | 39,470,511 | | | $ | 10,445,859 | | | $ | 8,442,509 | | | $ | 126,952,706 | | | $ | 60,084,794 | | | $ | 1,906,039 | |
As of December 31, 2017, Wilshire International Equity Fund had the following capital loss carryforwards (“CLCFs”) for federal income tax purposes which do not expire:
| Portfolio | | Non-Expiring
Short-Term Loss | | | Non-Expiring
Long-Term Loss | | | Total | |
| Wilshire International Equity Fund | | $ | 6,118,433 | | | $ | — | | | $ | 6,118,433 | |
These CLCFs may be utilized in future years to offset net realized capital gains, if any, prior to distributing such gains to shareholders.
During the year ended December 31, 2017, Wilshire International Equity Fund utilized capital loss carryforwards of $14,450,470, to offset current year capital gains.
For the year ended December 31, 2017, the following reclassifications were made on the Statements of Assets and Liabilities for the Portfolios as a result of permanent differences in the recognition of capital gains or losses under income tax regulations and GAAP:
| Portfolio | | Large Company Growth Portfolio | | �� | Large Company Value Portfolio | | | Small Company Growth Portfolio | | | Small Company Value Portfolio | | | Wilshire 5000 IndexSM Fund | | | Wilshire International Equity Fund | | | Wilshire
Income Opportunities Fund | |
| Paid-in capital | | $ | — | | | $ | — | | | $ | — | | | $ | — | | | $ | 1 | | | $ | — | | | $ | 5,646 | |
| Undistributed net investment income | | | 8,671 | | | | 2,173 | | | | 230,978 | | | | — | | | | 126,620 | | | | (220,340 | ) | | | (295,440 | ) |
| Undistributed net realized gains on investments | | | (8,671 | ) | | | (2,173 | ) | | | (230,978 | ) | | | — | | | | (126,621 | ) | | | 220,340 | | | | 289,794 | |
117
Wilshire Mutual Funds, Inc. Notes to Financial Statements - (Continued) December 31, 2017 |
|
Such reclassifications, the result of permanent differences between financial statement and income tax reporting requirements, have no effect on each Portfolio’s net assets or NAV per share.
11. In-Kind Transfers.
During the year ended December 31, 2016, Wilshire Income Opportunities Fund issued shares of beneficial interest to Wilshire Global Allocation Fund, an affiliated fund, through an affiliated in-kind transfer of investment securities and cash. The securities were transferred at their current value on the date of the transaction.
| Receiving Portfolio | | Contributing Portfolio | | Date of
Transfer | | | Value of
Investment Securities | | | Cash | | | Total
Assets | | | Shares
Issued | |
| Wilshire Income Opportunities Fund | | Wilshire Variable Insurance Trust Global Allocation Fund | | | 3/30/2016 | | | $ | 156,418,546 | | | $ | (13,659,576 | ) | | $ | 142,758,970 | | | | 14,275,906 | |
12. Indemnifications.
In the normal course of business, the Company, on behalf of the Portfolios, enters into contracts that provide general indemnifications. The Portfolios’ maximum exposure under these arrangements is dependent on claims that may be made against the Portfolios in the future and, therefore, cannot be estimated; however, based on experience, the risk of material loss from such claims is considered remote.
13. Certain Investment Risks.
Asset-Backed Securities (“ABS”) Risk – Investors in ABS, including mortgage-backed securities (“MBS”) and structured finance investments, generally receive payments that are part interest and part return of principal. These payments may vary based on the rate at which the underlying borrowers pay off their loans or other future expected receivables of assets or cash flows. Some ABS, including MBS, may have structures that make their reaction to interest rates and other factors difficult to predict, making them subject to liquidity risk.
Collateralized debt obligation (“CDO”) risk – A CDO is an ABS whose underlying collateral is typically a portfolio of bonds, bank loans, other structured finance securities and/or synthetic instruments. Investors in CDOs bear the credit risk of the underlying collateral. Multiple tranches of securities are issued by the CDO, offering investors various maturity and credit risk characteristics. Tranches are categorized as senior, mezzanine, and subordinated/equity, according to their degree of risk. If there are defaults or the CDO’s collateral otherwise underperforms, scheduled payments to senior tranches take precedence over those of mezzanine tranches, and scheduled payments to mezzanine tranches take precedence over those to subordinated/equity tranches. CDOs are subject to the same risk of prepayment described for certain mortgage-related and ABS, and are subject to credit risk, interest rate risk and default risk. The market value of CDOs may be affected by changes in the market’s perception of the creditworthiness of the servicing agent for the pool or the originator.
118
Wilshire Mutual Funds, Inc. Notes to Financial Statements - (Continued) December 31, 2017 |
|
Forward contracts risk – There may be an imperfect correlation between the price of a forward contract and the underlying security, index or currency which will increase the volatility of Wilshire Income Opportunities Fund. The Portfolio bears the risk of loss of the amount expected to be received under a forward contract in the event of the default or bankruptcy of a counterparty. If such a default occurs, the Portfolio will have contractual remedies pursuant to the forward contract, but such remedies may be subject to bankruptcy and insolvency laws that could affect the Portfolio’s rights as a creditor. Forward currency transactions include risks associated with fluctuations in foreign currency.
Interest rate risk – For debt securities, interest rate risk is the possibility that the market price will fall because of changing interest rates. In general, debt securities’ market prices rise or fall inversely to changes in interest rates. If interest rates rise, bond market prices generally fall; if interest rates fall, bond market prices generally rise. In addition, for a given change in interest rates, the market price of longer-maturity bonds fluctuates more (gaining or losing more in value) than shorter-maturity bonds. There may be less governmental intervention in influencing interest rates in the near future. If so, it could cause an increase in interest rates, which would have a negative impact on the market prices of fixed income securities and could negatively affect a Portfolio’s NAV.
Credit risk – A Portfolio’s debt instruments are subject to credit risk, which is the risk that an issuer will be unable, or will be perceived to be unable, to repay its obligations at maturity. Funds that invest primarily in high quality securities generally are subject to less credit risk than funds that invest in lower quality securities. Certain securities are backed by credit enhancements from various financial institutions and financial guarantee assurance agencies. These credit enhancements reinforce the credit quality of the individual securities; however, if any of the financial institutions or financial guarantee assurance agencies’ credit quality should deteriorate, it could cause the individual security’s credit quality to change. Additionally, if a Portfolio concentrates its credit enhancements in any one financial institution, the risk of credit quality deterioration increases. The value of ABS may be affected by the credit risk of the servicing agent for the pool, the originator of the loans or receivables, or the financial institution(s) providing the credit support. In addition to credit risk, ABS and other securities with early redemption features are subject to pre-payment risk. During periods of declining interest rates, prepayment of loans underlying ABS can be expected to accelerate or an issuer may retire an outstanding bond early to reduce interest costs. A Portfolio’s ability to maintain positions in such securities will be affected by reductions in the principal amount of such securities resulting from prepayments, and its ability to reinvest the returns of principal at comparable yields is subject to generally prevailing interest rates at that time.
Counterparty credit risk – Counterparty credit risk is the risk that a counterparty to a financial instrument will fail on a commitment that it has entered into with a Portfolio. A Portfolio’s sub-adviser seeks to minimize counterparty credit risk by monitoring the creditworthiness of each counterparty on an ongoing basis.
Foreign security risk – Wilshire International Equity Fund and Wilshire Income Opportunities Fund invest in securities of foreign issuers in various countries. These investments may involve certain considerations and risks not typically associated with investments in the United States as a result of, among other factors, the possibility of future political and economic developments and the level of governmental supervision and regulation of securities markets in foreign countries. The market values of the Portfolios’ investments will change in response to interest rate changes and other factors. During periods of falling interest rates, the values of fixed income securities generally rise. Conversely, during periods of rising interest rates, the values of such securities generally decline.
119
Wilshire Mutual Funds, Inc. Notes to Financial Statements - (Continued) December 31, 2017 |
|
Changes by recognized rating agencies in the ratings of any fixed income security and in the ability of an issuer to make payments of interest and principal may also affect the value of these investments. Also, the ability of the issuers of debt securities held by the Portfolios to meet their obligations may be affected by economic and political developments in a specific country, industry or region.
Investments in Loans Risk – Investments in loans involve special types of risks, including credit risk, interest rate risk, counterparty risk and prepayment risk. Loans may offer a fixed or floating interest rate. Loans are often generally below investment grade and may be unrated. Loans may be difficult to value and some can be subject to liquidity risk.
Sector Risk – If a Portfolio has significant investments in the securities of issuers in industries within a particular sector, any development affecting that sector will have a greater impact on the value of the net assets of the Portfolio than would be the case if the Portfolio did not have significant investments in that sector. In addition, this may increase the risk of loss of an investment in the Portfolio and increase the volatility of the Portfolio’s net asset value per share. From time to time, circumstances may affect a particular sector and the companies within such sector. For instance, economic or market factors, regulation or deregulation, or other developments may negatively impact all companies in a particular sector and therefore the value of a Portfolio’s holdings would be adversely affected. As of December 31, 2017, Large Company Growth Portfolio had 43.8% of the value of its net assets invested in stocks within the Information Technology sector; Large Company Value Portfolio had 31.2% of the value of its net assets invested in stocks within the Financials sector; and Small Company Value Portfolio had 28.8% of the value of its net assets invested in stocks within the Financials sector.
A more complete description of risks is included in each Portfolio’s prospectus and Statement of Additional Information.
14. Contingencies.
Wilshire 5000 IndexSM Fund was named as a defendant and a putative member of a proposed defendant class of shareholders in a lawsuit filed on December 7, 2010 in the U.S. Bankruptcy Court for the District of Delaware and on March 6, 2012 in the District Court for the Southern District of New York, in connection with Tribune Company’s Chapter 11 bankruptcy proceeding. The 2010 lawsuit was brought by the official Committee of Unsecured Creditors of the Tribune Company and the 2012 lawsuit was brought by Deutsche Bank, as trustee for senior noteholders of Tribune Company. Both lawsuits relate to a leveraged buyout transaction by which Tribune Company converted to a privately-held company in 2007 less than a year prior to Tribune Company’s bankruptcy filing. The putative defendant class is comprised of beneficial owners of shares of Tribune Company who meet certain jurisdictional requirements and received proceeds of the leveraged buyout. The plaintiffs seek to recover those proceeds, together with interest and attorneys’ fees and expenses, as fraudulent transfers under the Bankruptcy Act or various state laws. On September 2013, the District Court dismissed the 2012 lawsuit and in March 2016 the Second Circuit Court of Appeals affirmed this decision. The 2010 lawsuit continues in the District Court. The Adviser does not expect the Portfolio to be materially impacted by the lawsuits.
15. Subsequent Event Evaluation.
The Portfolios have evaluated the need for additional disclosures and/or adjustments resulting from subsequent events through the date these financial statements were issued. Based on this evaluation, no additional disclosures and/or adjustments were required to these financial statements.
120
Wilshire Mutual Funds, Inc. Report of Independent Registered Public Accounting Firm |
|
To the Shareholders and Board of Directors of
Wilshire Mutual Funds, Inc.
Opinion on the Financial Statements
We have audited the accompanying statements of assets and liabilities, including the condensed schedules of investments, of Wilshire Mutual Funds, Inc. comprising Wilshire Large Company Growth Portfolio, Wilshire Large Company Value Portfolio, Wilshire Small Company Growth Portfolio, Wilshire Small Company Value Portfolio, Wilshire 5000 IndexSM Fund, and Wilshire International Equity Fund, and the statement of assets and liabilities, including the schedule of investments of Wilshire Income Opportunities Fund (the “Funds”) as of December 31, 2017, and the related statements of operations and changes in net assets, including the related notes, and financial highlights for the year then ended, (collectively referred to as the “financial statements”). In our opinion, the financial statements present fairly, in all material respects, the financial position of each of the Funds constituting Wilshire Mutual Funds, Inc. as of December 31, 2017, the results of their operations, changes in their net assets, and financial highlights for the year then ended, in conformity with accounting principles generally accepted in the United States of America.
The Funds’ financial statements and financial highlights for the years ended December 31, 2016 and prior, were audited by other auditors whose report dated February 28, 2017, expressed an unqualified opinion on those financial statements and highlights.
Basis for Opinion
These financial statements are the responsibility of the Funds’ management. Our responsibility is to express an opinion on the Funds’ financial statements based on our audit. We are a public accounting firm registered with the Public Company Accounting Oversight Board (United States) (“PCAOB”) and are required to be independent with respect to the Funds in accordance with the U.S. federal securities laws and the applicable rules and regulations of the Securities and Exchange Commission and the PCAOB.
We conducted our audit in accordance with the standards of the PCAOB. Those standards require that we plan and perform the audit to obtain reasonable assurance about whether the financial statements are free of material misstatement, whether due to error or fraud.
Our audit includes performing procedures to assess the risks of material misstatement of the financial statements, whether due to error or fraud, and performing procedures that respond to those risks. Such procedures include examining, on a test basis, evidence regarding the amounts and disclosures in the financial statements and confirmation of securities owned as of December 31, 2017, by correspondence with the custodian, counterparties and brokers or by other appropriate auditing procedures where replies from brokers were not received. Our audit also included evaluating the accounting principles used and significant estimates made by management, as well as evaluating the overall presentation of the financial statements. We believe that our audit provides a reasonable basis for our opinion.
We have served as the Funds’ auditor since 2017.
COHEN & COMPANY, LTD.
Cleveland, Ohio
February 28, 2018
121
Wilshire Mutual Funds, Inc. Additional Fund Information (Unaudited) |
|
The Board of Directors has responsibility for the overall management and operations of the Company. The Board establishes the Company’s policies and meets regularly to review the activities of the officers, who are responsible for the day-to-day operations of the Company.
Set forth below are the names of the Directors and executive officers of the Company, their ages, positions and terms of office, their principal occupations during the past five years, and other directorships held by them. The address of each Director and Officer is 1299 Ocean Avenue, Suite 700, Santa Monica, California 90401.
Name and Age | Position
Held
with the
Company | Term of
Office(1) and
Length of
Time
Served | Principal
Occupations
During the Past
Five Years | Number of
Funds/
Funds in
Complex
Overseen
by Director | Other
Directorships
Held by
Director |
INTERESTED DIRECTOR |
Jason Schwarz,
43 | Director, President | Since 2018
Since 2012 | President, Wilshire Funds Management Group (Since 2005) | 11 | Wilshire Associates; Wilshire Variable Insurance Trust (4 Funds) |
NON-INTERESTED DIRECTORS |
Roger A. Formisano,
69 | Director | Since 2006 | Vice President, University Medical Foundation, 2006- Present; formerly Director, The Center for Leadership and Applied Business, UW-Madison School of Business; Principal, R.A. Formisano & Company, LLC | 11 | Integrity Mutual Insurance Company, Wilshire Variable Insurance Trust (4 Funds) |
Edward Gubman, 66 | Director | Since 2011 | Retired; formerly Founder and Principal, Strategic Talent Solutions | 11 | Wilshire Variable Insurance Trust (4 Funds) |
Suanne K. Luhn,
63 | Director | Since 2008 | Retired; formerly Chief Compliance Officer, Bahl & Gaynor (investment adviser) (1990 to 2006) | 11 | Wilshire Variable Insurance Trust (4 Funds) |
George J. Zock,
67 | Director, Chairman of the Board | Since 2006 | Independent Consultant | 11 | Wilshire Variable Insurance Trust (4 Funds), Armed Forces Insurance Exchange |
122
Wilshire Mutual Funds, Inc. Additional Fund Information (Unaudited) - (Continued) |
|
Name and Age | Position
Held
with the
Company | Term of
Office(1) and
Length of
Time
Served | Principal
Occupations
During the Past
Five Years |
OFFICERS |
Reena S. Lalji,
46 | Secretary | Since 2009 | Managing Director and General Counsel, Wilshire Associates Incorporated |
Benkai Bouey,
47 | Chief Compliance Officer | Since 2015 | Chief Compliance Officer, Wilshire Associates Incorporated. (Since 2012); Attorney, Benkai Bouey, Attorney at Law (2010-2013) |
Michael Wauters,
52 | Treasurer | Since 2009 | Chief Financial Officer, Wilshire Associates Incorporated (Since 2009) |
Nathan R. Palmer,
42 | Vice President | Since 2011 | Managing Director, Wilshire Associates Incorporated |
Josh Emanuel,
37 | Vice President | Since 2015 | Managing Director of Wilshire Associates Incoporated and Chief Investment Officer of Wilshires Funds Management (since 2015); Chief Investment Officer of The Elements Financial Group, LLC (2010-2015) |
Elizabeth Yakes,
33 | Vice President | Since 2015 | Vice President of Wilshire Associates Incorporated and Portfolio Manager of Wilshire Funds Management |
(1) | Each director serves until the next shareholders’ meeting (and until the election and qualification of a successor), or until death, resignation, removal or retirement which takes effect no later than May 1 following his or her 75th birthday. Officers are elected by the board on an annual basis to serve until their successors have been elected and qualified. |
The Company’s Statement of Additional Information includes additional information about the Directors and Officers of the Company and is available, without charge, upon request, by calling 1-888-200-6796.
123
Wilshire Mutual Funds, Inc. Additional Fund Information (Unaudited) - (Continued) |
|
Information on Proxy Voting
The U.S. Securities and Exchange Commission ( the “SEC”) has adopted the requirement that all funds file their complete proxy voting records with the SEC on an annual basis on Form N-PX. Such filing, for the 12-month period ended June 30, must be made no later than August 31 of each year.
A description of policies and procedures that the Portfolios use to determine how to vote proxies relating to portfolio securities, along with each Portfolio’s proxy voting record relating to portfolio securities held during most recent 12-month period ended June 30, is available at no charge, upon request by calling 1-888-200-6796, by e-mailing us at http://advisor.wilshire.com or on the SEC’s website at http://www.sec.gov.
Information on Form N-Q
The Company files its complete schedule of portfolio holdings with the SEC for the first and third quarters of each fiscal year on Form N-Q within sixty days after the end of period. The Company’s Forms N-Q are available on the SEC’s website at http://www.sec.gov, and may be reviewed and copied at the SEC’s Public Reference Room in Washington, DC. Information on the operation of the Public Reference Room may be obtained by calling 1-202-551-8090.
Householding Policy
In order to reduce printing and mailing expenses, only one copy of each prospectus, annual and semi-annual report will be sent to all related accounts at a common address, unless you have indicated otherwise on your Account Application. Shareholders may revoke their consent to householding at any time by calling 1-888-200-6796. Upon receipt of a shareholder’s revocation, the Company will begin mailing individual copies of the above-referenced documents to the shareholder’s attention within 30 days.
Change in Independent Auditor
On February 27, 2017, Cohen & Company, Ltd. (“Cohen”) was selected as the Portfolios’ new independent auditor, replacing PricewaterhouseCoopers LLP (“PwC”) as independent auditor of the Portfolios. The Portfolios’ selection of Cohen as independent auditor was recommended and approved by the Company’s Audit Committee and was ratified by the Company’s Board of Directors.
PwC’s reports on the Portfolios’ financial statements for the prior two fiscal years did not contain an adverse opinion or a disclaimer of opinion, and were not qualified or modified as to uncertainty, audit scope or accounting principles. During such fiscal years, and through the date of PwC’s replacement, there were no disagreements between the Company and PwC on any matter of accounting principles or practices, financial statement disclosure, or auditing scope or procedures, which disagreements, if not resolved to the satisfaction of PwC, would have caused it to make reference to the subject matter of the disagreements in connection with its reports on the financial statements for such years. Prior to February 27, 2017, Cohen was not contacted during the prior two fiscal years regarding the application of accounting principles to any particular financial matter.
124
Wilshire Mutual Funds, Inc. Tax Information (Unaudited) |
|
For the year ended December 31, 2017, the Portfolios designated the following long-term capital gain distributions:
| Portfolio | | Amount | |
| Large Company Growth Portfolio | | $ | 16,542,862 | |
| Large Company Value Portfolio | | $ | 6,140,150 | |
| Small Company Growth Portfolio | | $ | 3,215,807 | |
| Small Company Value Portfolio | | $ | 3,441,792 | |
Wilshire 5000 IndexSM Fund | | $ | 12,803,169 | |
| Wilshire International Equity Fund | | $ | — | |
| Wilshire Income Opportunities Fund | | $ | 1,067,674 | |
Of the distributions made by the following Portfolios, the corresponding percentages represent the amount of each distribution which will qualify for the dividends received deduction available to corporate shareholders:
Portfolio | Percentage |
Large Company Growth Portfolio | 96.93% |
Large Company Value Portfolio | 32.95% |
Small Company Growth Portfolio | 16.17% |
Small Company Value Portfolio | 25.23% |
Wilshire 5000 IndexSM Fund | 100.00% |
Wilshire International Equity Fund | 0.00% |
Wilshire Income Opportunities Fund | 0.00% |
Pursuant to the Jobs and Growth Tax Relief Reconciliation Act of 2003, and as extended by Tax Relief, Unemployment Insurance Reauthorization and Jobs Creation Act of 2010, the Portfolios designate the following percentages of their income dividends distributed in 2017 as qualified dividend income as defined in Section 1(h)(II) of the Internal Revenue Code.
Portfolio | Percentage |
Large Company Growth Portfolio | 96.42% |
Large Company Value Portfolio | 35.06% |
Small Company Growth Portfolio | 12.63% |
Small Company Value Portfolio | 18.06% |
Wilshire 5000 IndexSM Fund | 100.00% |
Wilshire International Equity Fund | 100.00% |
Wilshire Income Opportunities Fund | 0.00% |
125
Wilshire Mutual Funds, Inc. Tax Information (Unaudited) - (Continued) |
|
Pursuant to the American Jobs Creation Act of 2004, and as extended by Tax Relief, Unemployment Insurance Reauthorization and Jobs Creation Act of 2010, the Portfolios listed below designate the following percentages of short-term capital gain distributions as qualified short-term capital gain that is exempt from U.S. withholding tax when paid to foreign investors.
Portfolio | Percentage |
Large Company Growth Portfolio | 96.42% |
Large Company Value Portfolio | 35.06% |
Small Company Growth Portfolio | 12.63% |
Small Company Value Portfolio | 18.06% |
Wilshire 5000 IndexSM Fund | 100.00% |
Wilshire International Equity Fund | 100.00% |
Wilshire Income Opportunities Fund. | 0.00% |
Foreign Tax Credit Pass Through
The Portfolios intend to elect to pass through to shareholders the income tax credit for taxes paid to foreign countries. Wilshire International Equity Fund’s foreign source income per share was $0.24 and the foreign tax expense per share was $0.02. The pass-through of the foreign tax credit will only affect those persons who are shareholders on the dividend record date in December 2017. These shareholders will receive more detailed information along with their 2017 Form 1099-DIV.
126
Wilshire Mutual Funds, Inc. Board Approval of Advisory and Subadvisory Agreements (Unaudited) |
|
During the six months ended December 31, 2017, the Board of Directors (the “Board”) of Wilshire Mutual Funds, Inc. (the “Company”) approved the renewal for an additional one-year term of the Company’s advisory agreement (the “Advisory Agreement”) with Wilshire Associates Incorporated (“Wilshire” or the “Adviser”) with respect to each of the Large Company Growth Portfolio, Large Company Value Portfolio, Small Company Growth Portfolio, Small Company Value Portfolio, Wilshire 5000 Index Fund, Wilshire International Equity Fund and Wilshire Income Opportunities Fund (the “Funds”). The Board also approved the renewal for additional one-year terms of Wilshire subadvisory agreements with each of the following subadvisers: Barrow, Hanley, Mewhinney & Strauss, LLC (“BHMS”) with respect to the Large Company Value Portfolio, Cambiar Investors, LLC (“Cambiar”) with respect to the Wilshire International Equity Fund, DoubleLine Capital LP with respect to the Wilshire Income Opportunities Fund, Guggenheim Partners Investment Management, LLC with respect to the Wilshire Income Opportunities Fund, Loomis, Sayles & Company L.P. (“Loomis Sayles”) with respect to the Large Company Growth Portfolio, Los Angeles Capital Management and Equity Research, Inc. (“LA Capital”) with respect to each of the Small Company Value Portfolio, Small Company Growth Portfolio, Large Company Value Portfolio, Large Company Growth Portfolio, Wilshire International Equity Fund and Wilshire 5000 Index Fund, NWQ Investment Management Company, LLC (“NWQ”) with respect to the Small Company Value Portfolio, Pzena Investment Management, LLC (“Pzena”) with respect to the Large Company Value Portfolio, Ranger Investment Management, L.P. (“Ranger”) with respect to the Small Company Growth Portfolio, Victory Capital Management, Inc. (“Victory”) with respect to the Large Company Growth Portfolio, and WCM Investment Management (“WCM”) with respect to the Wilshire International Equity Fund. In the following text, the subadvisers are referred to as “Subadvisers” and the subadvisory agreements between Wilshire and each Subadviser are referred to as “Subadvisory Agreements.”
The information in this summary outlines the Board’s considerations associated with its approval of the Advisory Agreement and the Subadvisory Agreements. In connection with its deliberations regarding the continuation of these relationships, the Board considered such information and factors as it believed to be relevant. As described below, the Board considered the nature, extent and quality of the services performed by Wilshire and the Subadvisers under the existing advisory and subadvisory arrangements, respectively; with respect to Wilshire, comparative fees and expense ratios; the profits to be realized by Wilshire and the Subadvisers; the extent to which Wilshire and the Subadvisers realize economies of scale; and whether any fall-out benefits are being realized by Wilshire and the Subadvisers. In considering these matters, the Board was advised with respect to relevant legal standards by independent legal counsel. In addition, the Directors who are not “interested persons” of the Company as defined in the Investment Company Act of 1940 (the “Independent Directors”) discussed the renewal of the Advisory Agreement with management and in private sessions with independent legal counsel at which no representatives of Wilshire were present and discussed the approval of the Subadvisory Agreements with management and in private sessions with counsel at which no representatives of the Subadvisers were present.
As required by the Investment Company Act of 1940, each approval was confirmed by a vote of the Independent Directors. In deciding to approve the Advisory Agreement and the Subadvisory Agreements, the Board did not identify any single factor as controlling and this summary does not describe all of the matters considered. However, the Board concluded that each of the various factors referred to below favored such approval.
127
Wilshire Mutual Funds, Inc. Board Approval of Advisory and Subadvisory Agreements (Unaudited) - (continued) |
|
Information Requested and Received
The Board, including all the Independent Directors, considered the renewal of the Subadvisory Agreements pursuant to a process that concluded at the Board’s August 29, 2017 meeting and the renewal of the Advisory Agreement pursuant to a process that concluded at the Board’s November 13, 2017 meeting, in each case following an extensive process. At the direction of the Independent Directors, independent legal counsel sent memoranda to the Adviser requesting information regarding the Subadvisory Agreements and the Advisory Agreement to be provided to the Directors in advance of meetings of the Independent Directors held prior to the Board’s meeting on August 28-29, 2017 and November 13, 2017, respectively.
In response to the requests for information, the Directors received information from the Adviser as to each of the Funds describing: (i) the nature, extent and quality of services provided; (ii) the investment performance of each Fund as provided by Wilshire based upon data gathered from the Morningstar Direct database (“Morningstar”), along with the comparison to its benchmark index; (iii) the costs of services provided and estimated profits realized by the Adviser; (iv) the extent to which economies of scale are realized; (v) whether fee levels reflect any economies of scale realized by the Adviser and any sharing of such for the benefit of Fund shareholders; (vi) comparisons of services rendered and amounts paid by other registered investment companies as provided by Wilshire based upon data gathered from Morningstar; and (vii) benefits realized by the Adviser from its relationship with each Fund. The Directors received information from the Adviser regarding the factors underlying its recommendations to approve each Subadvisory Agreement. The Directors also received information from each Subadviser as to each Fund it managed describing: (i) the nature, extent and quality of services provided, (ii) the investment performance of the Subadviser in connection with the Fund; (iii) the financial condition of the Subadviser, (iv) the extent to which economies of scale are realized as a Fund grows, (v) whether fee levels reflect any possible economies of scale for the benefit of Fund shareholders, (vi) where applicable, comparisons of services rendered and amounts paid by other registered investment companies and any comparable advisory clients, and (vii) benefits realized by the Subadviser from its relationship with the Fund. At each meeting, the Independent Directors also received a memorandum from independent legal counsel describing their duties in connection with contract approvals, and they were assisted in their review by such counsel.
As a part of its evaluation, the Board considered the assessment of performance made by the Investment Committee (which is comprised solely of Independent Directors), which met on August 28, 2017 and November 13, 2017 to review data on the Subadvisers’ performance and the data Wilshire had prepared on performance, respectively. Based upon its evaluation of all materials provided, the Board concluded that it was in the best interests of each Fund to renew the Advisory Agreement and the Subadvisory Agreements.
Nature, Extent and Quality of Services – Wilshire
With respect to the nature, extent and quality of services provided by the Adviser, the Board reviewed the functions currently performed by the Adviser. The Board considered the experience and skills of the senior management leading fund operations, the experience and skills of the personnel performing the functions under the Advisory Agreement and the resources made available to such personnel. The Board determined that the current personnel had the requisite skill sets. The Board also considered the compliance program established by the Adviser and the level of compliance maintained for the Funds. The Board reviewed the processes used by the Adviser to select, monitor and replace subadvisers, as well as the Adviser’s processes and policies for addressing conflicts of
128
Wilshire Mutual Funds, Inc. Board Approval of Advisory and Subadvisory Agreements (Unaudited) - (continued) |
|
interest. The Board concluded that the Adviser was successful in negotiating favorable subadvisory agreements on behalf of the Funds and that the Adviser had a robust system in place for selecting, monitoring and terminating subadvisers, which system appeared to be reasonable. The Board also reviewed the Adviser’s financial condition, and considered the financial support provided by the Adviser to the Small Company Growth Portfolio, the Small Company Value Portfolio, the Wilshire International Equity Fund and the Wilshire Income Opportunities Fund through expense limitation agreements. Based upon all relevant factors, the Board concluded that the nature, quality and extent of the services provided by the Adviser to each Fund support renewal of the contract.
The Board reviewed information on the performance of each Fund’s Investment Class Shares for the annualized one-, three-, five- and ten-year periods ended September 30, 2017, as applicable, along with performance information of a peer group of funds determined by Wilshire based upon the Morningstar database and in comparison to its benchmark for the same periods.
For the Large Company Growth Portfolio, the Board noted that the Fund underperformed the median of its peer group for the one-, five- and ten-year periods and its benchmark for the one-, three-, five- and ten-year periods, but outperformed the median of the peer group for the three-year period and ranked in the fourth quintile relative to its peers for the five- and ten-year periods (the first quintile being the best performers and the fifth quintile being the worst performers). The Board took into consideration the Adviser’s explanation for the recent underperformance.
For the Large Company Value Portfolio, the Board noted that the Fund underperformed the median of its peer group for the three- and ten-year periods and underperformed its benchmark for the three-, five- and ten-year periods, but outperformed the median of its peer group for the one- and five-year periods and its benchmark for the one-year period, and ranked in the fourth quintile relative to its peers for the three- and five-year periods.
For the Small Company Growth Portfolio, the Board noted that, although the Fund underperformed the median of its peer group and its benchmark for the one-year period, the Fund outperformed the median of its peer group and its benchmark for the three-, five- and ten-year periods. The Board took into consideration the Adviser’s explanation for the recent underperformance.
For the Small Company Value Portfolio, the Board noted that, although the Fund underperformed its peer group median for the one-year period and its benchmark for the one- and three-year periods, the Fund outperformed the median of its peer group for the three-, five- and ten-year periods and outperformed its benchmark for the five- and ten-year periods. The Board took into consideration the Adviser’s explanation for the recent underperformance.
For the Wilshire 5000 Index Fund, the Board noted that, although the Fund underperformed its benchmark for the one-, three-, five- and ten-year periods and the Fund’s tracking error to the Wilshire 5000 Index was higher than the median of its peer group for all periods reviewed, the Fund’s underperformance relative to the benchmark was primarily due to the Fund’s expenses.
For the Wilshire International Equity Fund, the Board noted that the Fund changed its investment mandate from a domestic large cap core fund to an international large cap fund in April 2013 and changed its benchmark to the MSCI ACW-ex U.S. Index at the same time so annualized peer returns and performance relative to the Index are not comparable for the five-year period. The Board also noted that, although the Fund underperformed its peer group median and its benchmark for the one- and five-year periods, the Wilshire International Equity Fund outperformed
129
Wilshire Mutual Funds, Inc. Board Approval of Advisory and Subadvisory Agreements (Unaudited) - (continued) |
|
the median of its peer group and its benchmark for the three-year period and was in the fourth quintile relative to its peers for the one-year period. The Board took into consideration the Adviser’s explanation for the recent underperformance.
For the Wilshire Income Opportunities Fund, the Board noted that the Fund commenced operations on March 30, 2016. The Board also noted that the Fund ranked in the fourth quintile relative to its peers for the one-year period and outperformed its benchmark for the one-year period and since inception. The Board took into consideration the Adviser’s explanation for the recent underperformance compared to the Fund’s peer group.
Based upon the above performance, the Board determined that it was in the best interests of the Funds to continue the Advisory Agreement.
Advisory Fees
The Board reviewed each Fund’s advisory fee and total expense ratio for Investment Class Shares and reviewed information comparing the advisory fee and total expense ratio to those of the peer group of funds. For each Fund other than the Large Company Growth Portfolio and the Large Company Value Portfolio, the actual advisory fee was below the median. With respect to the Large Company Growth Portfolio and the Large Company Value Portfolio, the Board concluded that the advisory fee, which was in the third and fourth quintiles of their respective peer groups, was competitive. As to total expenses, the Board noted that total expenses for each Fund are influenced by the small size of the complex. The Board also noted that the Adviser waives advisory fees and reimburses expenses for the Small Company Growth Portfolio, the Small Company Value Portfolio, the Wilshire International Equity Fund and the Wilshire Income Opportunities Fund pursuant to expense imitation agreements. The Board also reviewed the net advisory fee retained by the Adviser after payment of subadvisory fees and advisory fee waivers and expense reimbursements. The Board compared contractual fees charged by the Adviser to the Funds with similar investment styles. The Board was advised that there were no other registered investment companies advised by the Adviser with similar investment strategies. The Board concluded that the advisory fee for each Fund was reasonable.
Profitability to Wilshire and Economies of Scale
With respect to the profitability of the Advisory Agreement, the Board primarily considered the fee structure of the Advisory Agreement, including the costs of the services provided and the profits realized by the Adviser from its relationship with the Funds. The Board concluded that the profits realized by the Adviser were not unreasonable in comparison with the costs of providing investment advisory services to the Funds. In addition, the Board considered the extent to which economies of scale are realized and whether fee levels reasonably reflect economies of scale for the benefit of shareholders. The Board reviewed each Fund’s asset size, each Fund’s expense ratio, the expense limitation agreements in place for the Small Company Growth Portfolio, Small Company Value Portfolio, Wilshire International Equity Fund and Wilshire Income Opportunities Fund and considered whether the investment process produced economies of scale. The Board noted that the advisory fee for all Funds includes a breakpoint. The Board concluded that each Fund’s advisory fee reasonably reflected appropriate recognition of any economies of scale.
130
Wilshire Mutual Funds, Inc. Board Approval of Advisory and Subadvisory Agreements (Unaudited) - (continued) |
|
Fall-Out Benefits – Wilshire
The Board considered the Adviser’s statement that benefits from its relationship with the Funds were limited to the advisory fees paid. The Board determined that the advisory fees were reasonable in light of any fall-out benefits.
Nature, Extent and Quality of Services – Subadvisers
As to each Subadvisory Agreement, the Board considered the nature, extent and quality of services provided. The Board considered the reputation, qualifications and background of the Subadviser, investment approach of the Subadviser, the experience and skills of investment personnel responsible for the day-to-day management of each Fund, and the resources made available to such personnel. The Board also considered the Subadviser’s compliance with investment policies and general legal compliance. In addition, the Board considered the analysis provided by the Adviser, which concluded that each Subadviser was providing reasonable services and had reasonable compliance policies and procedures in place, and that the Adviser recommended that each Subadvisory Agreement for each Fund be approved.
The Board reviewed information comparing each Subadviser’s gross investment performance to a relevant benchmark (except for LA Capital with respect to the Wilshire 5000 Index Fund for which the Subadviser’s net performance was compared to the benchmark). Based upon all relevant factors, the Board determined to approve the Subadvisory Agreement with LA Capital, with respect to the Large Company Growth Portfolio, noting LA Capital’s outperformance for the three- and five-year periods ended June 30, 2017, although the Board noted LA Capital’s underperformance for the one- and ten-year periods ended June 30, 2017. With respect to Victory’s performance for the Large Company Growth Portfolio, the Board determined to approve the continuation of Victory’s Subadvisory Agreement given outperformance for the quarter ended June 30, 2017 and year-to-date through June 30, 2017, although the Board noted Victory’s underperformance for the one-, three-, five- and ten-year periods ended June 30, 2017. The Board considered the Adviser’s recommendation for renewal of LA Capital’s and Victory’s Subadvisory Agreements and the Adviser’s commitment to monitor closely LA Capital’s and Victory’s performance. With respect to Loomis Sayles’ performance for the Large Company Growth Portfolio, the Board noted outperformance for all periods reviewed since inception (August 31, 2015).
With respect to LA Capital’s performance for the Large Company Value Portfolio, the Board determined to approve the continuation of LA Capital’s Subadvisory Agreement given outperformance for the since inception period (April 30, 2013) to June 30, 2017, although the Board noted LA Capital’s underperformance for the one- and three-year periods ended June 30, 2017. The Board noted that Pzena, with respect to the Large Company Value Portfolio, had outperformed for the one-, three- and five-year periods ended June 30, 2017, which resulted in a conclusion that performance was satisfactory. With respect to BHMS’s performance for the Large Company Value Portfolio, the Board noted BHMS’s outperformance for the one-year and since inception (June 15, 2016) periods ended June 30, 2017.
The Board considered that Ranger, with respect to the Small Company Growth Portfolio, outperformed for the three-year and since inception (April 30, 2013) periods ended June 30, 2017, although the Board noted Ranger’s underperformance for the one-year period ended June 30, 2017. With respect to LA Capital’s performance for the Small Company Growth Portfolio, the Board noted outperformance for the three-, five- and ten-year periods ended June 30, 2017, although the Board noted LA Capital’s underperformance for the one-year period ended June 30,
131
Wilshire Mutual Funds, Inc. Board Approval of Advisory and Subadvisory Agreements (Unaudited) - (continued) |
|
2017. The Board determined to approve the continuation of Ranger’s and LA Capital’s Subadvisory Agreements based on the Adviser’s recommendation for renewal and the Adviser’s commitment to monitor closely LA Capital’s performance.
With respect to LA Capital’s performance for the Small Company Value Portfolio, the Board determined to approve the continuation of LA Capital’s Subadvisory Agreement given outperformance for the three-, five- and ten-year periods ended June 30, 2017, although the Board noted underperformance for the one-year period ended June 30, 2017. With respect to NWQ’s performance for the Small Company Value Portfolio, the Board determined to approve continuation of NWQ’s Subadvisory Agreement given outperformance for the three-year and since inception (April 30, 2013) periods ended June 30, 2017, although the Board noted NWQ’s underperformance for the more recent periods. In each case, the Board considered the Adviser’s recommendation for renewal.
With respect to the Wilshire 5000 Index Fund, the Board noted LA Capital’s underperformance for all periods reviewed, but considered that the Adviser is satisfied with the level of services provided and that underperformance was primarily due to Fund expenses.
The Board considered that WCM and LA Capital, with respect to the Wilshire International Equity Fund, outperformed for the three-year and since inception (October 31, 2013 and June 30, 2014, respectively) periods ended June 30, 2017, although the Board noted underperformance for the one-year period ended June 30, 2017. The Board noted that Cambiar, with respect to the Wilshire International Equity Fund, had underperformed since inception (August 31, 2015) to June 30, 2017. In determining to approve the renewal of each Subadvisory Agreement, the Board considered the Adviser’s recommendation for renewal and the Adviser’s commitment to monitor closely Cambiar’s performance.
With respect to Guggenheim’s and DoubleLine’s performance for the Wilshire Income Opportunities Fund, the Board noted outperformance for the one-year and since inception (March 31, 2016 and April 21, 2016, respectively) periods ended June 30, 2017.
Subadvisory Fees
The Board considered each Fund’s subadvisory fees. The Board evaluated the competitiveness of the subadvisory fees based upon data supplied by each Subadviser about the fees charged to other clients. The Board also considered that the subadvisory fee rates were negotiated at arm’s length between the Adviser and each Subadviser, that the Adviser compensates the Subadviser from its fees and that the aggregate advisory fee had been deemed reasonable by the Board.
With respect to the Subadvisers’ reported fees for “Other Clients” with comparable investment policies and services, for the Subadvisers where the fees charged to the Adviser were higher than that charged to Other Clients, the Board determined that the fees charged to the Adviser were competitive.
Based upon all of the above, the Board determined that the subadvisory fees for each Fund were reasonable.
132
Wilshire Mutual Funds, Inc. Board Approval of Advisory and Subadvisory Agreements (Unaudited) - (continued) |
|
Profitability to the Subadvisers
The Board noted that the Adviser compensates each Subadviser from its own advisory fees and that the fees were negotiated at arm’s length between the Adviser and each Subadviser. In addition, the Board noted that the revenues to the various Subadvisers were limited due to the size of the Funds. The Board took these factors into consideration in concluding that the subadvisory fees were reasonable.
Economies of Scale – Subadvisers
The Board considered whether there are economies of scale with respect to the subadvisory services provided to each Fund and whether the subadvisory fees reflect such economies of scale through breakpoints in fees. The Board also considered whether the effective subadvisory fee rate for each Fund under the Subadvisory Agreement is reasonable in relation to the asset size of such Fund. The Board concluded that the fee schedule for each Fund reflects an appropriate recognition of any economies of scale.
Fall-Out Benefits – Subadvisers
The Board also considered the character and amount of other incidental benefits received by each Subadviser. The Board considered each Subadviser’s soft dollar practices, as applicable. The Board concluded that, taking into account the benefits arising from these practices, the fees charged under each Subadvisory Agreement were reasonable.
Conclusion
Based upon all of the information considered and the conclusions reached, the Board determined that the terms of the Advisory Agreement and each Subadvisory Agreement continue to be fair and reasonable and that the continuation of the Advisory Agreement and each Subadvisory Agreement is in the best interests of each Fund.
133

Wilshire Mutual Funds
Wilshire Associates Incorporated
1299 Ocean Avenue
Santa Monica, CA 90401
1-888-200-6796
http://advisor.wilshire.com
As of the end of the period covered by this report, the registrant has adopted a code of ethics that applies to the registrant’s principal executive officer, principal financial officer, principal accounting officer or controller, or persons performing similar functions, regardless of whether these individuals are employed by the registrant or a third party. Pursuant to Item 12(a)(1), a copy of registrant’s code of ethics is filed as an exhibit to this Form N-CSR. During the period covered by this report, the code of ethics has not been amended, and the registrant has not granted any waivers, including implicit waivers, from the provisions of the code of ethics.
| Item 3. | Audit Committee Financial Expert. |
The registrant’s board of trustees has determined that the registrant has at least one audit committee financial expert serving on its audit committee. The name of the audit committee financial expert is Mr. Roger A. Formisano. Mr. Formisano is “independent” for purposes of this Item.
| Item 4. | Principal Accountant Fees and Services. |
| (a) | Audit Fees. The aggregate fees billed for professional services rendered by the principal accountant for the audit of the registrant’s annual financial statements or for services that are normally provided by the accountant in connection with statutory and regulatory filings or engagements were $112,500 and $179,910 with respect to the registrant’s fiscal years ended December 31, 2017 and 2016, respectively. |
| (b) | Audit-Related Fees. No fees were billed in either of the last two fiscal years for assurance and related services by the principal accountant that are reasonably related to the performance of the audit of the registrant’s financial statements and are not reported under paragraph (a) of this Item. |
| (c) | Tax Fees. The aggregate fees billed for professional services rendered by the principal accountant for tax compliance, tax advice, and tax planning were $29,000 and $38,850 with respect to the registrant’s fiscal years ended December 31, 2017 and 2016, respectively. The services comprising these fees are tax consulting and the preparation of the registrant’s federal income and excise tax returns. |
| (d) | All Other Fees. No fees were billed in either of the last two fiscal years for products and services provided by the principal accountant, other than the services reported in paragraphs (a) through (c) of this Item. |
| (e)(1) | The audit committee has not adopted pre-approval policies and procedures described in paragraph (c)(7) of Rule 2-01 of Regulation S-X. |
| (e)(2) | None of the services described in paragraph (b) through (d) of this Item were approved by the audit committee pursuant to paragraph (c)(7)(i)(C) of Rule 2-01 of Regulation S-X. |
| (f) | Less than 50% of hours expended on the principal accountant’s engagement to audit the registrant’s financial statements for the most recent fiscal year were attributed to work performed by persons other than the principal accountant’s full-time, permanent employees. |
| (g) | During the fiscal years ended December 31, 2017 and 2016, aggregate non-audit fees of $29,000 and $38,850, respectively, were billed by the registrant’s principal accountant for services rendered to the registrant. During the fiscal year ended December 31, 2016, aggregate non-audit fees of $1,325,000 were billed by the registrant’s principal accountant for services rendered to the registrant’s investment adviser (not including any sub-adviser whose role is primarily portfolio management and is subcontracted with or overseen by another investment adviser), and any entity controlling, controlled by, or under common control with the adviser that provides ongoing services to the registrant. |
| (h) | The registrant’s audit committee has determined that the provision of non-audit services that were rendered to the registrant’s investment adviser (not including any sub-adviser whose role is primarily portfolio management and is subcontracted with or overseen by another investment adviser), and any entity controlling, controlled by, or under common control with the investment adviser that provides ongoing services to the registrant, that were not pre-approved pursuant to paragraph (c)(7)(ii) of Rule 2-01 of Regulation S-X is compatible with maintaining the principal accountant’s independence. |
| Item 5. | Audit Committee of Listed Registrants. |
Not applicable
| Item 6. | Schedule of Investments. |
| (a) | The Schedules of Investment in securities of unaffiliated issuers as of the close of the reporting period for the Wilshire 5000 IndexSM Fund, the Large Company Growth Portfolio, the Large Company Value Portfolio, the Small Company Growth Portfolio, the Small Company Value Portfolio and the Wilshire International Equity Fund are listed below. |
| WILSHIRE 5000 INDEX FUND | | | |
| SCHEDULE OF INVESTMENTS | | | |
| December 31, 2017 | | | |
| | | | |
| COMMON STOCKS - 99.4% | | Shares | | | Value | |
| Consumer Discretionary - 12.5% | | | | | | |
| 1-800-FLOWERS.COM, Inc. - Class A (a) | | | 300 | | | $ | 3,210 | |
| A.H. Belo Corp. - Class A | | | 90 | | | | 432 | |
| Aaron's, Inc. | | | 400 | | | | 15,940 | |
| Abercrombie & Fitch Co. - Class A (b) | | | 425 | | | | 7,408 | |
| Acme United Corp. (b) | | | 300 | | | | 7,020 | |
| Adtalem Global Education, Inc. (b) | | | 400 | | | | 16,820 | |
| Advance Auto Parts, Inc. | | | 491 | | | | 48,948 | |
| Amazon.com, Inc. (a) | | | 2,908 | | | | 3,400,818 | |
| AMC Entertainment Holdings, Inc. - Class A (b) | | | 107 | | | | 1,616 | |
| AMC Networks, Inc. - Class A (a) | | | 356 | | | | 19,252 | |
| American Axle & Manufacturing Holdings, Inc. (a) | | | 550 | | | | 9,367 | |
| American Eagle Outfitters, Inc. | | | 1,225 | | | | 23,030 | |
| American Outdoor Brands Corp. (a) (b) | | | 475 | | | | 6,099 | |
| American Public Education, Inc. (a) | | | 300 | | | | 7,515 | |
| Aramark | | | 1,675 | | | | 71,590 | |
| Ascent Capital Group, Inc. - Class A (a) (b) | | | 200 | | | | 2,298 | |
| Autoliv, Inc. (b) | | | 648 | | | | 82,347 | |
| AutoNation, Inc. (a) (b) | | | 525 | | | | 26,948 | |
| AutoZone, Inc. (a) | | | 206 | | | | 146,542 | |
| Barnes & Noble Education, Inc. (a) (b) | | | 347 | | | | 2,859 | |
| Barnes & Noble, Inc. | | | 550 | | | | 3,685 | |
| Beazer Homes USA, Inc. (a) | | | 200 | | | | 3,842 | |
| Bed Bath & Beyond, Inc. (b) | | | 1,125 | | | | 24,739 | |
| Best Buy Co., Inc. | | | 1,625 | | | | 111,264 | |
| Big 5 Sporting Goods Corp. (b) | | | 200 | | | | 1,520 | |
| Big Lots, Inc. (b) | | | 200 | | | | 11,230 | |
| BMC Stock Holdings, Inc. (a) | | | 475 | | | | 12,018 | |
| BorgWarner, Inc. | | | 1,310 | | | | 66,928 | |
| Boyd Gaming Corp. (b) | | | 725 | | | | 25,411 | |
| Bridgepoint Education, Inc. (a) | | | 500 | | | | 4,150 | |
| Bright Horizons Family Solutions, Inc. (a) | | | 300 | | | | 28,200 | |
| Brinker International, Inc. (b) | | | 175 | | | | 6,797 | |
| Brunswick Corp. | | | 550 | | | | 30,371 | |
| Buckle, Inc. (The) (b) | | | 350 | | | | 8,313 | |
| Buffalo Wild Wings, Inc. (a) | | | 66 | | | | 10,319 | |
| WILSHIRE 5000 INDEX FUND | | | | | | | | |
| SCHEDULE OF INVESTMENTS (continued) | | | | | | | | |
| | | | | | | | | |
| COMMON STOCKS - 99.4% (Continued) | | | Shares | | | | Value | |
| Consumer Discretionary - 12.5% (Continued) | | | | | | | | |
| Burlington Stores, Inc. (a) | | | 548 | | | $ | 67,420 | |
| CalAtlantic Group, Inc. | | | 534 | | | | 30,112 | |
| Caleres, Inc. | | | 425 | | | | 14,229 | |
| Callaway Golf Co. | | | 500 | | | | 6,965 | |
| Capella Education Co. | | | 100 | | | | 7,740 | |
| Career Education Corp. (a) | | | 500 | | | | 6,040 | |
| CarMax, Inc. (a) | | | 1,080 | | | | 69,260 | |
| Carnival Corp. | | | 2,825 | | | | 187,495 | |
| Carter's, Inc. | | | 382 | | | | 44,881 | |
| Cato Corp. (The) - Class A | | | 300 | | | | 4,776 | |
| Cavco Industries, Inc. (a) | | | 100 | | | | 15,260 | |
| CBS Corp. - Class B | | | 2,533 | | | | 149,447 | |
| Charter Communications, Inc. - Class A (a) | | | 1,538 | | | | 516,707 | |
| Cheesecake Factory, Inc. (The) (b) | | | 300 | | | | 14,454 | |
| Chico's FAS, Inc. (b) | | | 1,300 | | | | 11,466 | |
| Children's Place, Inc. (The) (b) | | | 132 | | | | 19,186 | |
| Chipotle Mexican Grill, Inc. (a) | | | 137 | | | | 39,597 | |
| Choice Hotels International, Inc. | | | 450 | | | | 34,920 | |
| Churchill Downs, Inc. | | | 67 | | | | 15,591 | |
| Cinemark Holdings, Inc. | | | 775 | | | | 26,986 | |
| Citi Trends, Inc. | | | 50 | | | | 1,323 | |
| Clear Channel Outdoor Holdings, Inc. - Class A (b) | | | 1,000 | | | | 4,600 | |
| Collectors Universe, Inc. | | | 110 | | | | 3,150 | |
| Columbia Sportswear Co. | | | 100 | | | | 7,188 | |
| Comcast Corp. - Class A | | | 29,648 | | | | 1,187,403 | |
| Conn's, Inc. (a) (b) | | | 500 | | | | 17,775 | |
| Cooper Tire & Rubber Co. (b) | | | 425 | | | | 15,024 | |
| Core-Mark Holding Co., Inc. | | | 206 | | | | 6,505 | |
| Cracker Barrel Old Country Store, Inc. (b) | | | 191 | | | | 30,348 | |
| Crocs, Inc. (a) (b) | | | 1,200 | | | | 15,168 | |
| CSS Industries, Inc. | | | 50 | | | | 1,392 | |
| D.R. Horton, Inc. | | | 2,073 | | | | 105,867 | |
| Dana, Inc. | | | 900 | | | | 28,809 | |
| Darden Restaurants, Inc. | | | 823 | | | | 79,024 | |
| Dave & Buster's Entertainment, Inc. (a) (b) | | | 300 | | | | 16,551 | |
| Deckers Outdoor Corp. (a) | | | 25 | | | | 2,006 | |
| WILSHIRE 5000 INDEX FUND | | | | | | | | |
| SCHEDULE OF INVESTMENTS (continued) | | | | | | | | |
| | | | | | | | | |
| COMMON STOCKS - 99.4% (Continued) | | | Shares | | | | Value | |
| Consumer Discretionary - 12.5% (Continued) | | | | | | | | |
| Dick's Sporting Goods, Inc. | | | 527 | | | $ | 15,146 | |
| Dillard's, Inc. - Class A (b) | | | 347 | | | | 20,837 | |
| Discovery Communications, Inc. - Series A (a) (b) | | | 798 | | | | 17,859 | |
| DISH Network Corp. - Class A (a) | | | 1,375 | | | | 65,656 | |
| Dollar General Corp. | | | 1,696 | | | | 157,745 | |
| Dollar Tree, Inc. (a) | | | 1,736 | | | | 186,290 | |
| Domino's Pizza, Inc. (b) | | | 279 | | | | 52,720 | |
| Dorman Products, Inc. (a) | | | 200 | | | | 12,228 | |
| DSW, Inc. - Class A (b) | | | 550 | | | | 11,776 | |
| Dunkin' Brands Group, Inc. | | | 600 | | | | 38,682 | |
| E.W. Scripps Co. (The) - Class A (a) (b) | | | 526 | | | | 8,221 | |
| Empire Resorts, Inc. (a) (b) | | | 20 | | | | 540 | |
| Entercom Communications Corp. - Class A | | | 250 | | | | 2,700 | |
| Entravision Communications Corp. - Class A | | | 100 | | | | 715 | |
| Expedia, Inc. | | | 757 | | | | 90,666 | |
| Express, Inc. (a) | | | 1,000 | | | | 10,150 | |
| Fiesta Restaurant Group, Inc. (a) (b) | | | 300 | | | | 5,700 | |
| Foot Locker, Inc. | | | 1,025 | | | | 48,052 | |
| Ford Motor Co. | | | 28,110 | | | | 351,094 | |
| Fossil Group, Inc. (a) (b) | | | 400 | | | | 3,108 | |
| Fred's, Inc. - Class A (b) | | | 700 | | | | 2,835 | |
| Gaia, Inc. (a) (b) | | | 600 | | | | 7,440 | |
| GameStop Corp. - Class A (b) | | | 550 | | | | 9,873 | |
| Gannett Co., Inc. | | | 1,050 | | | | 12,170 | |
| Gap, Inc. (The) | | | 1,550 | | | | 52,793 | |
| General Motors Co. | | | 10,000 | | | | 409,900 | |
| Gentex Corp. | | | 2,195 | | | | 45,985 | |
| Gentherm, Inc. (a) | | | 75 | | | | 2,381 | |
| Genuine Parts Co. | | | 1,007 | | | | 95,676 | |
| G-III Apparel Group Ltd. (a) | | | 275 | | | | 10,145 | |
| Golden Entertainment, Inc. (a) | | | 100 | | | | 3,265 | |
| Goodyear Tire & Rubber Co. (The) | | | 1,825 | | | | 58,966 | |
| GoPro, Inc. - Class A (a) (b) | | | 300 | | | | 2,271 | |
| Grand Canyon Education, Inc. (a) | | | 200 | | | | 17,906 | |
| Gray Television, Inc. (a) | | | 500 | | | | 8,375 | |
| Green Brick Partners, Inc. (a) | | | 45 | | | | 509 | |
| WILSHIRE 5000 INDEX FUND | | | | | | | | |
| SCHEDULE OF INVESTMENTS (continued) | | | | | | | | |
| | | | | | | | | |
| COMMON STOCKS - 99.4% (Continued) | | | Shares | | | | Value | |
| Consumer Discretionary - 12.5% (Continued) | | | | | | | | |
| Group 1 Automotive, Inc. | | | 223 | | | $ | 15,826 | |
| Guess?, Inc. (b) | | | 400 | | | | 6,752 | |
| H&R Block, Inc. | | | 1,310 | | | | 34,348 | |
| Hanesbrands, Inc. (b) | | | 2,695 | | | | 56,352 | |
| Harley-Davidson, Inc. (b) | | | 1,150 | | | | 58,512 | |
| Hasbro, Inc. | | | 700 | | | | 63,622 | |
| Helen of Troy Ltd. (a) (b) | | | 119 | | | | 11,466 | |
| Hibbett Sports, Inc. (a) | | | 200 | | | | 4,080 | |
| Hilton Grand Vacations, Inc. (a) | | | 105 | | | | 4,405 | |
| Hilton Worldwide Holdings, Inc. | | | 350 | | | | 27,951 | |
| Home Depot, Inc. (The) | | | 8,054 | | | | 1,526,474 | |
| Hooker Furniture Corp. | | | 200 | | | | 8,490 | |
| HSN, Inc. | | | 118 | | | | 4,761 | |
| Hyatt Hotels Corp. - Class A (a) | | | 300 | | | | 22,062 | |
| ILG, Inc. | | | 541 | | | | 15,408 | |
| International Speedway Corp. - Class A | | | 237 | | | | 9,444 | |
| Interpublic Group of Cos., Inc. (The) | | | 2,422 | | | | 48,828 | |
| iRobot Corp. (a) (b) | | | 167 | | | | 12,809 | |
| Jack in the Box, Inc. | | | 236 | | | | 23,154 | |
| John Wiley & Sons, Inc. - Class A | | | 200 | | | | 13,150 | |
| K12, Inc. (a) | | | 300 | | | | 4,770 | |
| KB Home (b) | | | 375 | | | | 11,981 | |
| Kohl's Corp. (b) | | | 1,075 | | | | 58,297 | |
| L Brands, Inc. (b) | | | 1,484 | | | | 89,366 | |
| Lands' End, Inc. (a) (b) | | | 278 | | | | 5,435 | |
| Las Vegas Sands Corp. | | | 2,727 | | | | 189,499 | |
| La-Z-Boy, Inc. | | | 425 | | | | 13,260 | |
| LCI Industries | | | 154 | | | | 20,020 | |
| Lear Corp. | | | 500 | | | | 88,329 | |
| Leggett & Platt, Inc. | | | 910 | | | | 43,434 | |
| Lennar Corp. - Class A | | | 1,250 | | | | 79,050 | |
| Libbey, Inc. | | | 250 | | | | 1,880 | |
| Liberty Braves Group - Series A (a) | | | 360 | | | | 7,938 | |
| Liberty Broadband Corp. (a) (b) | | | 1,381 | | | | 117,454 | |
| Liberty Expedia Holdings, Inc. - Class A (a) | | | 381 | | | | 16,890 | |
| Liberty Formula One Group - Series A (a) | | | 600 | | | | 19,632 | |
| WILSHIRE 5000 INDEX FUND | | | | | | | | |
| SCHEDULE OF INVESTMENTS (continued) | | | | | | | | |
| | | | | | | | | |
| COMMON STOCKS - 99.4% (Continued) | | | Shares | | | | Value | |
| Consumer Discretionary - 12.5% (Continued) | | | | | | | | |
| Liberty Interactive Corp. QVC Group - Series A (a) | | | 2,725 | | | $ | 66,545 | |
| Liberty SiriusXM Group - Series A (a) | | | 2,252 | | | | 89,314 | |
| Liberty TripAdvisor Holdings, Inc. - Series A (a) | | | 790 | | | | 7,446 | |
| Liberty Ventures - Class A (a) | | | 571 | | | | 30,971 | |
| Lions Gate Entertainment Corp. - Class B (a) (b) | | | 1,033 | | | | 32,787 | |
| Lithia Motors, Inc. - Class A (b) | | | 134 | | | | 15,221 | |
| Live Nation Entertainment, Inc. (a) | | | 1,137 | | | | 48,402 | |
| LKQ Corp. (a) | | | 2,100 | | | | 85,407 | |
| Loral Space & Communications, Inc. (a) (b) | | | 300 | | | | 13,215 | |
| Lowe's Cos., Inc. | | | 6,056 | | | | 562,844 | |
| Lumber Liquidators Holdings, Inc. (a) (b) | | | 241 | | | | 7,565 | |
| Macy's, Inc. (b) | | | 2,223 | | | | 55,997 | |
| Madison Square Garden Co. (The) - Class A (a) | | | 93 | | | | 19,609 | |
| Marcus Corp. (The) | | | 100 | | | | 2,735 | |
| Marine Products Corp. (b) | | | 700 | | | | 8,918 | |
| Marriott International, Inc. | | | 2,349 | | | | 318,830 | |
| Marriott Vacations Worldwide Corp. | | | 155 | | | | 20,958 | |
| Mattel, Inc. (b) | | | 2,255 | | | | 34,682 | |
| Matthews International Corp. - Class A (b) | | | 100 | | | | 5,280 | |
| McDonald's Corp. | | | 6,068 | | | | 1,044,425 | |
| MDC Holdings, Inc. | | | 306 | | | | 9,755 | |
| Meredith Corp. (b) | | | 300 | | | | 19,815 | |
| Meritage Homes Corp. (a) | | | 200 | | | | 10,240 | |
| MGM Resorts International | | | 3,300 | | | | 110,187 | |
| Mohawk Industries, Inc. (a) | | | 392 | | | | 108,152 | |
| Monro, Inc. (b) | | | 325 | | | | 18,509 | |
| Motorcar Parts of America, Inc. (a) | | | 300 | | | | 7,497 | |
| Movado Group, Inc. (b) | | | 300 | | | | 9,660 | |
| MSG Networks, Inc. - Class A (a) | | | 581 | | | | 11,765 | |
| Murphy USA, Inc. (a) | | | 296 | | | | 23,787 | |
| National CineMedia, Inc. | | | 500 | | | | 3,430 | |
| Nautilus, Inc. (a) | | | 50 | | | | 668 | |
| Netflix, Inc. (a) | | | 2,752 | | | | 528,274 | |
| New Media Investment Group, Inc. (b) | | | 301 | | | | 5,051 | |
| New York Times Co. (The) - Class A | | | 1,050 | | | | 19,425 | |
| Newell Brands, Inc. | | | 3,415 | | | | 105,524 | |
| WILSHIRE 5000 INDEX FUND | | | | | | | | |
| SCHEDULE OF INVESTMENTS (continued) | | | | | | | | |
| | | | | | | | | |
| COMMON STOCKS - 99.4% (Continued) | | | Shares | | | | Value | |
| Consumer Discretionary - 12.5% (Continued) | | | | | | | | |
| News Corp. - Class A | | | 2,853 | | | $ | 46,247 | |
| Nexstar Media Group, Inc. - Class A (b) | | | 399 | | | | 31,202 | |
| NIKE, Inc. - Class B | | | 9,749 | | | | 609,800 | |
| Nordstrom, Inc. (b) | | | 1,000 | | | | 47,380 | |
| Norwegian Cruise Line Holdings Ltd. (a) | | | 325 | | | | 17,306 | |
| Nutrisystem, Inc. | | | 300 | | | | 15,780 | |
| NVR, Inc. (a) | | | 40 | | | | 140,328 | |
| Omnicom Group, Inc. | | | 1,714 | | | | 124,831 | |
| O'Reilly Automotive, Inc. (a) | | | 650 | | | | 156,351 | |
| Overstock.com, Inc. (a) (b) | | | 300 | | | | 19,170 | |
| Oxford Industries, Inc. | | | 50 | | | | 3,760 | |
| Papa John's International, Inc. (b) | | | 173 | | | | 9,707 | |
| Penske Automotive Group, Inc. | | | 350 | | | | 16,748 | |
| Perry Ellis International, Inc. (a) | | | 100 | | | | 2,504 | |
| Pinnacle Entertainment, Inc. (a) | | | 425 | | | | 13,910 | |
| Polaris Industries, Inc. | | | 340 | | | | 42,157 | |
| Pool Corp. | | | 313 | | | | 40,580 | |
| Priceline Group, Inc. (The) (a) | | | 308 | | | | 535,223 | |
| PulteGroup, Inc. (b) | | | 1,915 | | | | 63,674 | |
| PVH Corp. | | | 543 | | | | 74,505 | |
| Ralph Lauren Corp. (b) | | | 406 | | | | 42,098 | |
| RCI Hospitality Holdings, Inc. | | | 300 | | | | 8,394 | |
| Regal Entertainment Group - Class A (b) | | | 575 | | | | 13,231 | |
| Regis Corp. (a) | | | 200 | | | | 3,072 | |
| RH (a) (b) | | | 116 | | | | 10,000 | |
| Rocky Brands, Inc. | | | 100 | | | | 1,890 | |
| Ross Stores, Inc. | | | 2,575 | | | | 206,644 | |
| Royal Caribbean Cruises Ltd. | | | 1,087 | | | | 129,657 | |
| Salem Media Group, Inc. | | | 100 | | | | 450 | |
| Sally Beauty Holdings, Inc. (a) (b) | | | 700 | | | | 13,132 | |
| Scholastic Corp. | | | 325 | | | | 13,036 | |
| Scripps Networks Interactive, Inc. - Class A | | | 626 | | | | 53,448 | |
| Sears Holdings Corp. (a) (b) | | | 625 | | | | 2,238 | |
| SeaWorld Entertainment, Inc. (b) | | | 325 | | | | 4,410 | |
| Service Corp. International | | | 1,250 | | | | 46,650 | |
| ServiceMaster Global Holdings, Inc. (a) | | | 975 | | | | 49,989 | |
| WILSHIRE 5000 INDEX FUND | | | | | | | | |
| SCHEDULE OF INVESTMENTS (continued) | | | | | | | | |
| | | | | | | | | |
| COMMON STOCKS - 99.4% (Continued) | | | Shares | | | | Value | |
| Consumer Discretionary - 12.5% (Continued) | | | | | | | | |
| Shoe Carnival, Inc. | | | 600 | | | $ | 16,050 | |
| Shutterfly, Inc. (a) | | | 100 | | | | 4,975 | |
| Signet Jewelers Ltd. (b) | | | 620 | | | | 35,061 | |
| Sinclair Broadcast Group, Inc. - Class A (b) | | | 425 | | | | 16,086 | |
| Sirius XM Holdings, Inc. (b) | | | 12,225 | | | | 65,526 | |
| Six Flags Entertainment Corp. (b) | | | 600 | | | | 39,942 | |
| Skechers U.S.A., Inc. - Class A (a) | | | 750 | | | | 28,380 | |
| Sleep Number Corporation (a) (b) | | | 188 | | | | 7,067 | |
| Sonic Automotive, Inc. - Class A | | | 300 | | | | 5,535 | |
| Sonic Corp. (b) | | | 350 | | | | 9,618 | |
| Sotheby's (a) | | | 428 | | | | 22,085 | |
| Spartan Motors, Inc. | | | 75 | | | | 1,181 | |
| Speedway Motorsports, Inc. | | | 400 | | | | 7,548 | |
| Starbucks Corp. | | | 10,073 | | | | 578,493 | |
| Steven Madden Ltd. (a) | | | 300 | | | | 14,010 | |
| Superior Industries International, Inc. | | | 150 | | | | 2,228 | |
| Tailored Brands, Inc. | | | 475 | | | | 10,369 | |
| Tapestry, Inc. | | | 1,900 | | | | 84,037 | |
| Target Corp. (b) | | | 4,111 | | | | 268,244 | |
| TEGNA, Inc. | | | 1,725 | | | | 24,288 | |
| Tempur Sealy International, Inc. (a) (b) | | | 298 | | | | 18,682 | |
| Tenneco, Inc. | | | 450 | | | | 26,343 | |
| Tesla, Inc. (a) (b) | | | 643 | | | | 200,198 | |
| Texas Roadhouse, Inc. | | | 475 | | | | 25,023 | |
| Thomson Reuters Corp. (b) | | | 2,325 | | | | 101,347 | |
| Thor Industries, Inc. | | | 381 | | | | 57,424 | |
| Tiffany & Co. | | | 735 | | | | 76,403 | |
| Time Warner, Inc. | | | 5,719 | | | | 523,117 | |
| Time, Inc. | | | 654 | | | | 12,066 | |
| TJX Cos., Inc. (The) | | | 4,283 | | | | 327,477 | |
| Toll Brothers, Inc. | | | 1,050 | | | | 50,421 | |
| TopBuild Corp. (a) | | | 325 | | | | 24,616 | |
| Tractor Supply Co. | | | 1,061 | | | | 79,310 | |
| TRI Pointe Group, Inc. (a) | | | 1,100 | | | | 19,712 | |
| TripAdvisor, Inc. (a) (b) | | | 634 | | | | 21,848 | |
| Tupperware Brands Corp. | | | 300 | | | | 18,810 | |
| WILSHIRE 5000 INDEX FUND | | | | | | | | |
| SCHEDULE OF INVESTMENTS (continued) | | | | | | | | |
| | | | | | | | | |
| COMMON STOCKS - 99.4% (Continued) | | | Shares | | | | Value | |
| Consumer Discretionary - 12.5% (Continued) | | | | | | | | |
| Twenty-First Century Fox, Inc. - Class A | | | 6,588 | | | $ | 227,484 | |
| Ulta Beauty, Inc. (a) | | | 369 | | | | 82,531 | |
| Under Armour, Inc. - Class A (a) (b) | | | 2,425 | | | | 34,993 | |
| Universal Electronics, Inc. (a) | | | 200 | | | | 9,450 | |
| Urban Outfitters, Inc. (a) | | | 800 | | | | 28,048 | |
| Vail Resorts, Inc. | | | 190 | | | | 40,369 | |
| Value Line, Inc. (b) | | | 200 | | | | 3,870 | |
| VF Corp. (b) | | | 2,375 | | | | 175,750 | |
| Viacom, Inc. - Class B | | | 2,082 | | | | 64,146 | |
| Vista Outdoor, Inc. (a) (b) | | | 400 | | | | 5,828 | |
| Visteon Corp. (a) | | | 261 | | | | 32,662 | |
| Vitamin Shoppe, Inc. (a) | | | 300 | | | | 1,320 | |
| Walt Disney Co. (The) | | | 10,918 | | | | 1,173,794 | |
| Wayfair, Inc. - Class A (a) (b) | | | 300 | | | | 24,081 | |
| Weight Watchers International, Inc. (a) (b) | | | 296 | | | | 13,107 | |
| Wendy's Co. (The) (b) | | | 1,925 | | | | 31,609 | |
| Whirlpool Corp. | | | 504 | | | | 84,995 | |
| Williams-Sonoma, Inc. (b) | | | 500 | | | | 25,850 | |
| Winnebago Industries, Inc. | | | 175 | | | | 9,730 | |
| Wolverine World Wide, Inc. | | | 725 | | | | 23,113 | |
| World Wrestling Entertainment, Inc. - Class A (b) | | | 600 | | | | 18,348 | |
| Wyndham Worldwide Corp. | | | 620 | | | | 71,839 | |
| Wynn Resorts Ltd. | | | 621 | | | | 104,694 | |
| Yum! Brands, Inc. | | | 2,289 | | | | 186,805 | |
| Zumiez, Inc. (a) | | | 300 | | | | 6,248 | |
| | | | | | | | 23,005,591 | |
| Consumer Staples - 7.6% | | | | | | | | |
| Alico, Inc. (b) | | | 200 | | | | 5,900 | |
| Altria Group, Inc. | | | 11,691 | | | | 834,854 | |
| Andersons, Inc. (The) | | | 75 | | | | 2,336 | |
| Archer-Daniels-Midland Co. | | | 3,686 | | | | 147,735 | |
| B&G Foods, Inc. (b) | | | 250 | | | | 8,788 | |
| Blue Buffalo Pet Products, Inc. (a) | | | 725 | | | | 23,773 | |
| Boston Beer Co., Inc. (The) - Class A (a) (b) | | | 100 | | | | 19,110 | |
| Brown-Forman Corp. - Class B | | | 1,556 | | | | 106,851 | |
| Bunge Ltd. | | | 1,050 | | | | 70,434 | |
| WILSHIRE 5000 INDEX FUND | | | | | | | | |
| SCHEDULE OF INVESTMENTS (continued) | | | | | | | | |
| | | | | | | | | |
| COMMON STOCKS - 99.4% (Continued) | | | Shares | | | | Value | |
| Consumer Staples - 7.6% (Continued) | | | | | | | | |
| Cal-Maine Foods, Inc. (a) (b) | | | 18 | | | $ | 800 | |
| Campbell Soup Co. (b) | | | 1,350 | | | | 64,949 | |
| Casey's General Stores, Inc. (b) | | | 287 | | | | 32,127 | |
| Church & Dwight Co., Inc. | | | 1,606 | | | | 80,573 | |
| Clorox Co. (The) | | | 850 | | | | 126,429 | |
| Coca-Cola Co. (The) | | | 27,490 | | | | 1,261,241 | |
| Colgate-Palmolive Co. | | | 6,451 | | | | 486,728 | |
| Conagra Brands, Inc. | | | 3,173 | | | | 119,527 | |
| Constellation Brands, Inc. - Class A | | | 1,236 | | | | 282,513 | |
| Costco Wholesale Corp. | | | 3,201 | | | | 595,770 | |
| Coty, Inc. - Class A (b) | | | 2,800 | | | | 55,692 | |
| CVS Health Corp. | | | 7,245 | | | | 525,263 | |
| Darling Ingredients, Inc. (a) | | | 975 | | | | 17,677 | |
| Dean Foods Co. | | | 567 | | | | 6,555 | |
| Dr. Pepper Snapple Group, Inc. | | | 1,258 | | | | 122,101 | |
| e.l.f. Beauty, Inc. (a) (b) | | | 300 | | | | 6,693 | |
| Edgewell Personal Care Co. (a) (b) | | | 446 | | | | 26,488 | |
| Energizer Holdings, Inc. (b) | | | 592 | | | | 28,404 | |
| Estée Lauder Cos., Inc. (The) - Class A | | | 1,451 | | | | 184,625 | |
| Flowers Foods, Inc. (b) | | | 1,580 | | | | 30,510 | |
| Fresh Del Monte Produce, Inc. | | | 100 | | | | 4,767 | |
| General Mills, Inc. (b) | | | 3,975 | | | | 235,677 | |
| Hain Celestial Group, Inc. (The) (a) | | | 600 | | | | 25,434 | |
| Herbalife Ltd. (a) | | | 650 | | | | 44,018 | |
| Hershey Co. (The) | | | 1,099 | | | | 124,747 | |
| Hormel Foods Corp. (b) | | | 1,875 | | | | 68,231 | |
| HRG Group, Inc. (a) (b) | | | 1,350 | | | | 22,883 | |
| Ingles Markets, Inc. - Class A | | | 150 | | | | 5,190 | |
| Ingredion, Inc. | | | 441 | | | | 61,652 | |
| Inter Parfums, Inc. | | | 300 | | | | 13,035 | |
| J & J Snack Foods Corp. | | | 70 | | | | 10,628 | |
| J.M. Smucker Co. (The) | | | 852 | | | | 105,852 | |
| Kellogg Co. (b) | | | 1,903 | | | | 129,366 | |
| Kimberly-Clark Corp. | | | 2,431 | | | | 293,324 | |
| Kraft Heinz Co. (The) | | | 4,495 | | | | 349,530 | |
| Kroger Co. (The) | | | 6,075 | | | | 166,759 | |
| WILSHIRE 5000 INDEX FUND | | | | | | | | |
| SCHEDULE OF INVESTMENTS (continued) | | | | | | | | |
| | | | | | | | | |
| COMMON STOCKS - 99.4% (Continued) | | | Shares | | | | Value | |
| Consumer Staples - 7.6% (Continued) | | | | | | | | |
| Lamb Weston Holdings, Inc. | | | 1,157 | | | $ | 65,313 | |
| Lancaster Colony Corp. | | | 112 | | | | 14,472 | |
| Mannatech, Inc. | | | 70 | | | | 1,050 | |
| McCormick & Co., Inc. | | | 677 | | | | 68,993 | |
| MGP Ingredients, Inc. (b) | | | 200 | | | | 15,376 | |
| Molson Coors Brewing Co. - Class B | | | 1,163 | | | | 95,447 | |
| Mondelez International, Inc. - Class A | | | 11,271 | | | | 482,398 | |
| Monster Beverage Corp. (a) | | | 2,696 | | | | 170,630 | |
| Nu Skin Enterprises, Inc. - Class A | | | 325 | | | | 22,175 | |
| PepsiCo, Inc. | | | 9,699 | | | | 1,163,104 | |
| Philip Morris International, Inc. | | | 10,726 | | | | 1,133,202 | |
| Pilgrim's Pride Corp. (a) (b) | | | 650 | | | | 20,189 | |
| Pinnacle Foods, Inc. | | | 875 | | | | 52,036 | |
| Post Holdings, Inc. (a) | | | 438 | | | | 34,703 | |
| PriceSmart, Inc. (b) | | | 115 | | | | 9,902 | |
| Procter & Gamble Co. (The) | | | 17,430 | | | | 1,601,468 | |
| Sanderson Farms, Inc. (b) | | | 143 | | | | 19,846 | |
| Snyder's-Lance, Inc. | | | 710 | | | | 35,557 | |
| SpartanNash Co. | | | 400 | | | | 10,672 | |
| Sprouts Farmers Market, Inc. (a) (b) | | | 300 | | | | 7,305 | |
| Sysco Corp. | | | 4,000 | | | | 242,920 | |
| Tootsie Roll Industries, Inc. (b) | | | 27 | | | | 983 | |
| TreeHouse Foods, Inc. (a) (b) | | | 385 | | | | 19,042 | |
| Tyson Foods, Inc. - Class A | | | 1,911 | | | | 154,925 | |
| United Natural Foods, Inc. (a) | | | 150 | | | | 7,391 | |
| US Foods Holding Corp. (a) | | | 475 | | | | 15,167 | |
| USANA Health Sciences, Inc. (a) (b) | | | 118 | | | | 8,738 | |
| Vector Group Ltd. | | | 852 | | | | 19,068 | |
| Walgreen Boots Alliance, Inc. | | | 6,349 | | | | 461,064 | |
| Wal-Mart Stores, Inc. | | | 10,939 | | | | 1,080,225 | |
| WD-40 Co. (b) | | | 45 | | | | 5,310 | |
| | | | | | | | 13,974,210 | |
| Energy - 5.8% | | | | | | | | |
| Anadarko Petroleum Corp. | | | 3,889 | | | | 208,606 | |
| Andeavor | | | 992 | | | | 113,425 | |
| Antero Resources Corp. (a) (b) | | | 800 | | | | 15,200 | |
| WILSHIRE 5000 INDEX FUND | | | | | | | | |
| SCHEDULE OF INVESTMENTS (continued) | | | | | | | | |
| | | | | | | | | |
| COMMON STOCKS - 99.4% (Continued) | | | Shares | | | | Value | |
| Energy - 5.8% (Continued) | | | | | | | | |
| Apache Corp. (b) | | | 2,913 | | | $ | 122,987 | |
| Arch Coal, Inc. - Class A (b) | | | 163 | | | | 15,185 | |
| Archrock, Inc. | | | 812 | | | | 8,526 | |
| Baker Hughes, a GE Co. | | | 2,795 | | | | 88,434 | |
| Bill Barrett Corp. (a) | | | 400 | | | | 2,052 | |
| BP Prudhoe Bay Royalty Trust | | | 300 | | | | 6,030 | |
| Bristow Group, Inc. (b) | | | 200 | | | | 2,694 | |
| Cabot Oil & Gas Corp. | | | 3,325 | | | | 95,095 | |
| California Resources Corp. (a) (b) | | | 472 | | | | 9,176 | |
| Callon Petroleum Co. (a) (b) | | | 1,500 | | | | 18,225 | |
| CARBO Ceramics, Inc. (a) (b) | | | 150 | | | | 1,527 | |
| Carrizo Oil & Gas, Inc. (a) (b) | | | 400 | | | | 8,512 | |
| Cheniere Energy, Inc. (a) (b) | | | 1,625 | | | | 87,490 | |
| Chesapeake Energy Corp. (a) (b) | | | 6,875 | | | | 27,225 | |
| Chevron Corp. | | | 13,833 | | | | 1,731,752 | |
| Cimarex Energy Co. | | | 596 | | | | 72,718 | |
| CNX Resources Corp. (a) (b) | | | 1,650 | | | | 24,140 | |
| Concho Resources, Inc. (a) | | | 828 | | | | 124,382 | |
| ConocoPhillips | | | 8,992 | | | | 493,570 | |
| CONSOL Energy, Inc. (a) | | | 206 | | | | 8,139 | |
| Continental Resources, Inc. (a) | | | 830 | | | | 43,965 | |
| Cross Timbers Royalty Trust | | | 200 | | | | 2,932 | |
| Dawson Geophysical Co. (a) | | | 78 | | | | 388 | |
| Delek US Holdings, Inc. | | | 301 | | | | 10,517 | |
| Devon Energy Corp. | | | 3,766 | | | | 155,912 | |
| Diamond Offshore Drilling, Inc. (a) (b) | | | 850 | | | | 15,802 | |
| Diamondback Energy, Inc. (a) | | | 535 | | | | 67,544 | |
| Dril-Quip, Inc. (a) (b) | | | 145 | | | | 6,917 | |
| Energen Corp. (a) | | | 490 | | | | 28,209 | |
| EOG Resources, Inc. | | | 3,898 | | | | 420,633 | |
| EQT Corp. | | | 1,339 | | | | 76,216 | |
| Era Group, Inc. (a) | | | 300 | | | | 3,225 | |
| Exterran Corp. (a) | | | 406 | | | | 12,765 | |
| Exxon Mobil Corp. | | | 30,298 | | | | 2,534,124 | |
| Fairmount Santrol Holdings, Inc. (a) (b) | | | 1,250 | | | | 6,538 | |
| Forum Energy Technologies, Inc. (a) (b) | | | 300 | | | | 4,665 | |
| WILSHIRE 5000 INDEX FUND | | | | | | | | |
| SCHEDULE OF INVESTMENTS (continued) | | | | | | | | |
| | | | | | | | | |
| COMMON STOCKS - 99.4% (Continued) | | | Shares | | | | Value | |
| Energy - 5.8% (Continued) | | | | | | | | |
| Geospace Technologies Corp. (a) (b) | | | 226 | | | $ | 2,931 | |
| Green Plains, Inc. | | | 300 | | | | 5,055 | |
| Gulf Island Fabrication, Inc. | | | 381 | | | | 5,115 | |
| Gulfport Energy Corp. (a) | | | 900 | | | | 11,484 | |
| Halliburton Co. | | | 5,931 | | | | 289,847 | |
| Helix Energy Solutions Group, Inc. (a) | | | 1,000 | | | | 7,540 | |
| Helmerich & Payne, Inc. (b) | | | 550 | | | | 35,552 | |
| Hess Corp. (b) | | | 2,024 | | | | 96,079 | |
| HollyFrontier Corp. | | | 1,158 | | | | 59,313 | |
| Key Energy Services, Inc. (a) (b) | | | 925 | | | | 10,906 | |
| Kinder Morgan, Inc. | | | 14,560 | | | | 263,099 | |
| Laredo Petroleum, Inc. (a) (b) | | | 800 | | | | 8,488 | |
| Marathon Oil Corp. | | | 5,647 | | | | 95,604 | |
| Marathon Petroleum Corp. | | | 3,531 | | | | 232,975 | |
| Matador Resources Co. (a) (b) | | | 375 | | | | 11,674 | |
| Matrix Service Co. (a) | | | 450 | | | | 8,010 | |
| McDermott International, Inc. (a) | | | 1,575 | | | | 10,364 | |
| Murphy Oil Corp. | | | 1,025 | | | | 31,826 | |
| Nabors Industries Ltd. (b) | | | 1,975 | | | | 13,489 | |
| National Oilwell Varco, Inc. | | | 2,661 | | | | 95,849 | |
| Newfield Exploration Co. (a) | | | 1,225 | | | | 38,624 | |
| Newpark Resources, Inc. (a) | | | 875 | | | | 7,525 | |
| Noble Energy, Inc. | | | 2,476 | | | | 72,151 | |
| Oasis Petroleum, Inc. (a) | | | 1,375 | | | | 11,564 | |
| Occidental Petroleum Corp. | | | 5,700 | | | | 419,862 | |
| Oceaneering International, Inc. | | | 500 | | | | 10,570 | |
| Oil States International, Inc. (a) | | | 200 | | | | 5,660 | |
| ONEOK, Inc. | | | 1,225 | | | | 65,476 | |
| Pacific Ethanol, Inc. (a) | | | 1 | | | | 5 | |
| Parsley Energy, Inc. - Class A (a) | | | 1,425 | | | | 41,952 | |
| Patterson-UTI Energy, Inc. | | | 1,100 | | | | 25,311 | |
| PBF Energy, Inc. - Class A | | | 625 | | | | 22,156 | |
| PDC Energy, Inc. (a) | | | 375 | | | | 19,328 | |
| Phillips 66 | | | 3,213 | | | | 324,995 | |
| Pioneer Natural Resources Co. | | | 1,221 | | | | 211,050 | |
| QEP Resources, Inc. (a) | | | 1,750 | | | | 16,748 | |
| WILSHIRE 5000 INDEX FUND | | | | | | | | |
| SCHEDULE OF INVESTMENTS (continued) | | | | | | | | |
| | | | | | | | | |
| COMMON STOCKS - 99.4% (Continued) | | | Shares | | | | Value | |
| Energy - 5.8% (Continued) | | | | | | | | |
| Range Resources Corp. | | | 1,339 | | | $ | 22,843 | |
| Renewable Energy Group, Inc. (a) (b) | | | 114 | | | | 1,345 | |
| Rowan Cos. plc - Class A (a) (b) | | | 900 | | | | 14,094 | |
| RPC, Inc. (b) | | | 587 | | | | 14,986 | |
| RSP Permian, Inc. (a) | | | 600 | | | | 24,408 | |
| Sanchez Energy Corp. (a) (b) | | | 325 | | | | 1,726 | |
| Schlumberger Ltd. | | | 9,396 | | | | 633,195 | |
| SemGroup Corp. - Class A (b) | | | 450 | | | | 13,590 | |
| Ship Finance International Ltd. (b) | | | 575 | | | | 8,913 | |
| SM Energy Co. (b) | | | 450 | | | | 9,936 | |
| Southwestern Energy Co. (a) | | | 3,325 | | | | 18,554 | |
| SRC Energy, Inc. (a) (b) | | | 1,175 | | | | 10,023 | |
| Superior Energy Services, Inc. (a) | | | 1,131 | | | | 10,892 | |
| Targa Resources Corp. (b) | | | 1,255 | | | | 60,767 | |
| Teekay Corp. (b) | | | 775 | | | | 7,223 | |
| Unit Corp. (a) (b) | | | 500 | | | | 11,000 | |
| Valero Energy Corp. | | | 3,214 | | | | 295,399 | |
| Whiting Petroleum Corp. (a) (b) | | | 480 | | | | 12,710 | |
| Williams Cos., Inc. (The) | | | 5,250 | | | | 160,073 | |
| World Fuel Services Corp. | | | 475 | | | | 13,367 | |
| WPX Energy, Inc. (a) | | | 2,675 | | | | 37,637 | |
| | | | | | | | 10,646,300 | |
| Financials - 15.6% | | | | | | | | |
| Affiliated Managers Group, Inc. | | | 428 | | | | 87,847 | |
| Aflac, Inc. | | | 2,480 | | | | 217,694 | |
| AGNC Investment Corp. | | | 2,175 | | | | 43,913 | |
| Alleghany Corp. (a) | | | 127 | | | | 75,703 | |
| Allstate Corp. (The) | | | 2,255 | | | | 236,121 | |
| Ally Financial, Inc. | | | 3,625 | | | | 105,705 | |
| Altisource Residential Corp. (b) | | | 33 | | | | 391 | |
| American Equity Investment Life Holding Co. | | | 625 | | | | 19,206 | |
| American Express Co. | | | 5,523 | | | | 548,489 | |
| American Financial Group, Inc. | | | 446 | | | | 48,409 | |
| American International Group, Inc. | | | 6,150 | | | | 366,417 | |
| American National Insurance Co. | | | 181 | | | | 23,213 | |
| Ameriprise Financial, Inc. | | | 1,035 | | | | 175,401 | |
| WILSHIRE 5000 INDEX FUND | | | | | | | | |
| SCHEDULE OF INVESTMENTS (continued) | | | | | | | | |
| | | | | | | | | |
| COMMON STOCKS - 99.4% (Continued) | | | Shares | | | | Value | |
| Financials - 15.6% (Continued) | | | | | | | | |
| Ameris Bancorp (b) | | | 300 | | | $ | 14,460 | |
| AmTrust Financial Services, Inc. (b) | | | 664 | | | | 6,686 | |
| Annaly Capital Management, Inc. | | | 6,939 | | | | 82,504 | |
| Anworth Mortgage Asset Corp. | | | 1,500 | | | | 8,160 | |
| Apollo Commercial Real Estate Finance, Inc. (b) | | | 600 | | | | 11,070 | |
| Apollo Investment Corp. | | | 1,725 | | | | 9,764 | |
| Arbor Realty Trust, Inc. (b) | | | 200 | | | | 1,728 | |
| Arch Capital Group Ltd. (a) | | | 619 | | | | 56,187 | |
| Ares Capital Corp. | | | 3,355 | | | | 52,741 | |
| Argo Group International Holdings Ltd. | | | 63 | | | | 3,884 | |
| Arlington Asset Investment Corp. - Class A (b) | | | 4 | | | | 47 | |
| Arthur J. Gallagher & Co. | | | 1,225 | | | | 77,518 | |
| Artisan Partners Asset Management, Inc. - Class A | | | 300 | | | | 11,850 | |
| Ashford, Inc. (a) (b) | | | 6 | | | | 558 | |
| Aspen Insurance Holdings Ltd. | | | 350 | | | | 14,210 | |
| Associated Banc-Corp. | | | 900 | | | | 22,860 | |
| Assurant, Inc. | | | 337 | | | | 33,983 | |
| Assured Guaranty Ltd. | | | 775 | | | | 26,249 | |
| Axis Capital Holdings Ltd. | | | 475 | | | | 23,874 | |
| Bancorp, Inc. (The) (a) | | | 50 | | | | 494 | |
| BancorpSouth Bank | | | 675 | | | | 21,229 | |
| Bank of America Corp. | | | 72,498 | | | | 2,140,140 | |
| Bank of Hawaii Corp. (b) | | | 303 | | | | 25,967 | |
| Bank of New York Mellon Corp. (The) | | | 7,163 | | | | 385,798 | |
| Bank of the Ozarks, Inc. | | | 765 | | | | 37,064 | |
| BankFinancial Corp. | | | 700 | | | | 10,738 | |
| BankUnited, Inc. | | | 825 | | | | 33,594 | |
| Banner Corp. | | | 300 | | | | 16,536 | |
| BB&T Corp. | | | 5,840 | | | | 290,364 | |
| Beneficial Bancorp, Inc. | | | 549 | | | | 9,031 | |
| Berkley (W.R.) Corp. | | | 687 | | | | 49,224 | |
| Berkshire Hathaway, Inc. - Class B (a) | | | 15,706 | | | | 3,113,242 | |
| Berkshire Hills Bancorp, Inc. | | | 300 | | | | 10,980 | |
| BGC Partners, Inc. - Class A | | | 1,650 | | | | 24,932 | |
| BlackRock, Inc. | | | 942 | | | | 483,914 | |
| Blackstone Mortgage Trust, Inc. - Class A (b) | | | 600 | | | | 19,308 | |
| WILSHIRE 5000 INDEX FUND | | | | | | | | |
| SCHEDULE OF INVESTMENTS (continued) | | | | | | | | |
| | | | | | | | | |
| COMMON STOCKS - 99.4% (Continued) | | | Shares | | | | Value | |
| Financials - 15.6% (Continued) | | | | | | | | |
| BofI Holding, Inc. (a) (b) | | | 372 | | | $ | 11,123 | |
| BOK Financial Corp. | | | 169 | | | | 15,602 | |
| Boston Private Financial Holdings, Inc. | | | 500 | | | | 7,725 | |
| Bridge Bancorp, Inc. (b) | | | 300 | | | | 10,500 | |
| Brighthouse Financial, Inc. (a) | | | 608 | | | | 35,653 | |
| Brookline Bancorp, Inc. (b) | | | 500 | | | | 7,850 | |
| Brown & Brown, Inc. | | | 900 | | | | 46,314 | |
| Camden National Corp. (b) | | | 150 | | | | 6,320 | |
| Capital City Bank Group, Inc. | | | 350 | | | | 8,029 | |
| Capital One Financial Corp. | | | 3,012 | | | | 299,935 | |
| Capitol Federal Financial, Inc. | | | 1,000 | | | | 13,410 | |
| Capstead Mortgage Corp. | | | 700 | | | | 6,055 | |
| Cathay General Bancorp | | | 463 | | | | 19,525 | |
| Cboe Global Markets, Inc. | | | 590 | | | | 73,508 | |
| Central Pacific Financial Corp. | | | 300 | | | | 8,949 | |
| Charles Schwab Corp. (The) | | | 8,589 | | | | 441,216 | |
| Charter Financial Corp. | | | 498 | | | | 8,735 | |
| Chemical Financial Corp. | | | 500 | | | | 26,735 | |
| Chimera Investment Corp. | | | 1,455 | | | | 26,888 | |
| Cincinnati Financial Corp. | | | 1,135 | | | | 85,091 | |
| CIT Group, Inc. | | | 1,350 | | | | 66,461 | |
| Citigroup, Inc. | | | 20,065 | | | | 1,493,036 | |
| Citizens Financial Group, Inc. | | | 3,375 | | | | 141,683 | |
| CME Group, Inc. | | | 2,138 | | | | 312,255 | |
| CNA Financial Corp. | | | 300 | | | | 15,915 | |
| CNO Financial Group, Inc. | | | 1,100 | | | | 27,159 | |
| CoBiz Financial, Inc. | | | 750 | | | | 14,993 | |
| Cohen & Steers, Inc. | | | 50 | | | | 2,365 | |
| Columbia Banking System, Inc. (b) | | | 276 | | | | 11,989 | |
| Comerica, Inc. | | | 1,083 | | | | 94,015 | |
| Commerce Bancshares, Inc. | | | 722 | | | | 40,316 | |
| Community Bank System, Inc. (b) | | | 200 | | | | 10,750 | |
| Community Trust Bancorp, Inc. | | | 110 | | | | 5,181 | |
| Crawford & Co. - Class B (b) | | | 200 | | | | 1,924 | |
| Credit Acceptance Corp. (a) (b) | | | 112 | | | | 36,230 | |
| Cullen/Frost Bankers, Inc. (b) | | | 332 | | | | 31,424 | |
| WILSHIRE 5000 INDEX FUND | | | | | | | | |
| SCHEDULE OF INVESTMENTS (continued) | | | | | | | | |
| | | | | | | | | |
| COMMON STOCKS - 99.4% (Continued) | | | Shares | | | | Value | |
| Financials - 15.6% (Continued) | | | | | | | | |
| CVB Financial Corp. (b) | | | 600 | | | $ | 14,136 | |
| CYS Investments, Inc. | | | 1,575 | | | | 12,647 | |
| Discover Financial Services | | | 2,775 | | | | 213,453 | |
| Donnelley Financial Solutions, Inc. (a) | | | 159 | | | | 3,099 | |
| E*TRADE Financial Corp. (a) | | | 2,078 | | | | 103,006 | |
| Eagle Bancorp, Inc. (a) | | | 300 | | | | 17,370 | |
| East West Bancorp, Inc. | | | 1,025 | | | | 62,351 | |
| Eaton Vance Corp. | | | 850 | | | | 47,932 | |
| Education Realty Trust, Inc. (b) | | | 633 | | | | 22,104 | |
| eHealth, Inc. (a) | | | 175 | | | | 3,040 | |
| Employers Holdings, Inc. | | | 75 | | | | 3,330 | |
| Encore Capital Group, Inc. (a) | | | 200 | | | | 8,420 | |
| Enova International, Inc. (a) | | | 297 | | | | 4,514 | |
| Enstar Group Ltd. (a) (b) | | | 120 | | | | 24,090 | |
| Enterprise Financial Services Corp. | | | 50 | | | | 2,258 | |
| Erie Indemnity Co. - Class A | | | 174 | | | | 21,200 | |
| Evercore, Inc. - Class A | | | 350 | | | | 31,500 | |
| Everest Re Group Ltd. | | | 226 | | | | 50,005 | |
| EZCORP, Inc. - Class A (a) (b) | | | 1,000 | | | | 12,200 | |
| F.N.B. Corp. (b) | | | 2,460 | | | | 33,997 | |
| FBL Financial Group, Inc. - Class A | | | 300 | | | | 20,895 | |
| Federated Investors, Inc. - Class B | | | 700 | | | | 25,256 | |
| Federated National Holding Co. | | | 200 | | | | 3,314 | |
| Fifth Third Bancorp | | | 5,276 | | | | 160,074 | |
| Financial Engines, Inc. (b) | | | 225 | | | | 6,818 | |
| Financial Institutions, Inc. | | | 200 | | | | 6,220 | |
| First American Financial Corp. | | | 527 | | | | 29,533 | |
| First BanCorp. (a) | | | 1,366 | | | | 6,967 | |
| First Bancorp/NC | | | 300 | | | | 10,593 | |
| First Busey Corp. | | | 325 | | | | 9,731 | |
| First Citizens BancShares, Inc. - Class A | | | 50 | | | | 20,150 | |
| First Commonwealth Financial Corp. (b) | | | 800 | | | | 11,456 | |
| First Community Bancshares, Inc. | | | 425 | | | | 12,210 | |
| First Financial Bancorp | | | 575 | | | | 15,151 | |
| First Financial Bankshares, Inc. (b) | | | 300 | | | | 13,515 | |
| First Financial Corp. | | | 100 | | | | 4,535 | |
| WILSHIRE 5000 INDEX FUND | | | | | | | | |
| SCHEDULE OF INVESTMENTS (continued) | | | | | | | | |
| | | | | | | | | |
| COMMON STOCKS - 99.4% (Continued) | | | Shares | | | | Value | |
| Financials - 15.6% (Continued) | | | | | | | | |
| First Hawaiian, Inc. | | | 300 | | | $ | 8,754 | |
| First Horizon National Corp. | | | 1,618 | | | | 32,339 | |
| First Interstate BancSystem, Inc. - Class A | | | 300 | | | | 12,015 | |
| First Merchants Corp. (b) | | | 425 | | | | 17,876 | |
| First Midwest Bancorp, Inc. | | | 800 | | | | 19,208 | |
| First Republic Bank | | | 1,013 | | | | 87,766 | |
| FirstCash, Inc. | | | 221 | | | | 14,906 | |
| FNF Group | | | 1,909 | | | | 74,909 | |
| Franklin Resources, Inc. | | | 2,621 | | | | 113,568 | |
| FS Investment Corp. | | | 1,925 | | | | 14,149 | |
| Fulton Financial Corp. | | | 1,250 | | | | 22,375 | |
| Glacier Bancorp, Inc. (b) | | | 550 | | | | 21,665 | |
| Goldman Sachs Group, Inc. (The) | | | 2,765 | | | | 704,410 | |
| Golub Capital BDC, Inc. | | | 475 | | | | 8,645 | |
| Granite Point Mortgage Trust, Inc. | | | 229 | | | | 4,062 | |
| Great Western Bancorp, Inc. | | | 300 | | | | 11,940 | |
| Green Dot Corp. - Class A (a) | | | 250 | | | | 15,065 | |
| Greenhill & Co., Inc. (b) | | | 300 | | | | 5,850 | |
| Guaranty Bancorp | | | 200 | | | | 5,530 | |
| Hallmark Financial Services, Inc. (a) | | | 100 | | | | 1,043 | |
| Hancock Holding Co. | | | 500 | | | | 24,750 | |
| Hanmi Financial Corp. | | | 369 | | | | 11,199 | |
| Hanover Insurance Group, Inc. (The) | | | 300 | | | | 32,424 | |
| Hartford Financial Services Group, Inc. (The) | | | 2,375 | | | | 133,665 | |
| Healthcare Trust of America, Inc. - Class A (b) | | | 1,025 | | | | 30,791 | |
| Heartland Financial USA, Inc. | | | 300 | | | | 16,095 | |
| Hercules Capital, Inc. | | | 775 | | | | 10,168 | |
| Heritage Commerce Corp. | | | 50 | | | | 766 | |
| HFF, Inc. - Class A | | | 75 | | | | 3,648 | |
| Hilltop Holdings, Inc. (b) | | | 550 | | | | 13,932 | |
| Home BancShares, Inc. | | | 950 | | | | 22,088 | |
| HomeStreet, Inc. (a) | | | 300 | | | | 8,685 | |
| Hope Bancorp, Inc. | | | 1,092 | | | | 19,929 | |
| Horace Mann Educators Corp. | | | 375 | | | | 16,538 | |
| Huntington Bancshares, Inc. | | | 7,172 | | | | 104,424 | |
| IBERIABANK Corp. | | | 375 | | | | 29,063 | |
| WILSHIRE 5000 INDEX FUND | | | | | | | | |
| SCHEDULE OF INVESTMENTS (continued) | | | | | | | | |
| | | | | | | | | |
| COMMON STOCKS - 99.4% (Continued) | | | Shares | | | | Value | |
| Financials - 15.6% (Continued) | | | | | | | | |
| Impac Mortgage Holdings, Inc. (a) (b) | | | 85 | | | $ | 864 | |
| Independent Bank Corp. (b) | | | 300 | | | | 20,955 | |
| Interactive Brokers Group, Inc. - Class A (b) | | | 500 | | | | 29,605 | |
| Intercontinental Exchange, Inc. | | | 4,000 | | | | 282,240 | |
| International Bancshares Corp. | | | 400 | | | | 15,880 | |
| INTL FCStone, Inc. (a) | | | 500 | | | | 21,265 | |
| Invesco Ltd. | | | 2,975 | | | | 108,707 | |
| Invesco Mortgage Capital, Inc. | | | 625 | | | | 11,144 | |
| Investment Technology Group, Inc. | | | 1,000 | | | | 19,250 | |
| Investors Bancorp, Inc. | | | 1,325 | | | | 18,391 | |
| JPMorgan Chase & Co. | | | 24,732 | | | | 2,644,839 | |
| Kearny Financial Corp. (b) | | | 828 | | | | 11,965 | |
| Kemper Corp. | | | 300 | | | | 20,670 | |
| KeyCorp | | | 7,726 | | | | 155,833 | |
| Lakeland Financial Corp. | | | 300 | | | | 14,547 | |
| LegacyTexas Financial Group, Inc. | | | 375 | | | | 15,829 | |
| Legg Mason, Inc. (b) | | | 750 | | | | 31,485 | |
| LendingTree, Inc. (a) (b) | | | 90 | | | | 30,641 | |
| Leucadia National Corp. | | | 2,432 | | | | 64,424 | |
| Lincoln National Corp. | | | 1,600 | | | | 122,992 | |
| Loews Corp. | | | 1,955 | | | | 97,809 | |
| LPL Financial Holdings, Inc. | | | 200 | | | | 11,428 | |
| M&T Bank Corp. | | | 967 | | | | 165,347 | |
| Maiden Holdings Ltd. | | | 675 | | | | 4,455 | |
| Main Street Capital Corp. (b) | | | 475 | | | | 18,872 | |
| MainSource Financial Group, Inc. (b) | | | 300 | | | | 10,893 | |
| Markel Corp. (a) | | | 138 | | | | 157,200 | |
| MarketAxess Holdings, Inc. | | | 250 | | | | 50,438 | |
| Marsh & McLennan Cos., Inc. | | | 3,429 | | | | 279,086 | |
| MB Financial, Inc. | | | 540 | | | | 24,041 | |
| MBIA, Inc. (a) (b) | | | 925 | | | | 6,771 | |
| Mercury General Corp. | | | 300 | | | | 16,032 | |
| Meta Financial Group, Inc. (b) | | | 100 | | | | 9,265 | |
| MetLife, Inc. | | | 6,696 | | | | 338,550 | |
| MFA Financial, Inc. | | | 2,250 | | | | 17,820 | |
| MGIC Investment Corp. (a) | | | 1,500 | | | | 21,165 | |
| WILSHIRE 5000 INDEX FUND | | | | | | | | |
| SCHEDULE OF INVESTMENTS (continued) | | | | | | | | |
| | | | | | | | | |
| COMMON STOCKS - 99.4% (Continued) | | | Shares | | | | Value | |
| Financials - 15.6% (Continued) | | | | | | | | |
| Moody's Corp. | | | 1,218 | | | $ | 179,789 | |
| Morgan Stanley | | | 10,300 | | | | 540,440 | |
| Morningstar, Inc. | | | 207 | | | | 20,073 | |
| MSCI, Inc. | | | 519 | | | | 65,674 | |
| MTGE Investment Corp. | | | 575 | | | | 10,638 | |
| Nasdaq, Inc. | | | 725 | | | | 55,702 | |
| National General Holdings Corp. | | | 525 | | | | 10,311 | |
| Navient Corp. | | | 2,050 | | | | 27,306 | |
| Navigators Group, Inc. (The) | | | 200 | | | | 9,740 | |
| NBT Bancorp, Inc. | | | 200 | | | | 7,360 | |
| Nelnet, Inc. - Class A | | | 25 | | | | 1,370 | |
| New Mountain Finance Corp. | | | 650 | | | | 8,808 | |
| New Residential Investment Corp. | | | 1,400 | | | | 25,032 | |
| New York Community Bancorp, Inc. | | | 3,062 | | | | 39,866 | |
| New York REIT, Inc. | | | 1,300 | | | | 5,109 | |
| Northern Trust Corp. | | | 1,738 | | | | 173,609 | |
| Northwest Bancshares, Inc. (b) | | | 875 | | | | 14,639 | |
| Oaktree Special Lending Corp. | | | 1,750 | | | | 8,558 | |
| OFG Bancorp (b) | | | 432 | | | | 4,061 | |
| Old National Bancorp | | | 950 | | | | 16,578 | |
| Old Republic International Corp. | | | 1,661 | | | | 35,512 | |
| Old Second Bancorp, Inc. | | | 400 | | | | 5,460 | |
| OneMain Holdings, Inc. (a) | | | 300 | | | | 7,797 | |
| Oritani Financial Corp. (b) | | | 400 | | | | 6,560 | |
| Pacific Premier Bancorp, Inc. (a) | | | 300 | | | | 12,000 | |
| PacWest Bancorp | | | 817 | | | | 41,177 | |
| Park National Corp. (b) | | | 87 | | | | 9,048 | |
| PennyMac Mortgage Investment Trust (b) | | | 450 | | | | 7,232 | |
| People's United Financial, Inc. (b) | | | 1,983 | | | | 37,082 | |
| PHH Corp. (a) (b) | | | 573 | | | | 5,902 | |
| Physicians Realty Trust | | | 900 | | | | 16,191 | |
| Pinnacle Financial Partners, Inc. | | | 559 | | | | 37,062 | |
| PNC Financial Services Group, Inc. (The) | | | 3,544 | | | | 511,363 | |
| Popular, Inc. | | | 782 | | | | 27,753 | |
| PRA Group, Inc. (a) (b) | | | 300 | | | | 9,960 | |
| Preferred Bank | | | 200 | | | | 11,756 | |
| WILSHIRE 5000 INDEX FUND | | | | | | | | |
| SCHEDULE OF INVESTMENTS (continued) | | | | | | | | |
| | | | | | | | | |
| COMMON STOCKS - 99.4% (Continued) | | | Shares | | | | Value | |
| Financials - 15.6% (Continued) | | | | | | | | |
| Primerica, Inc. | | | 300 | | | $ | 30,465 | |
| Principal Financial Group, Inc. | | | 1,850 | | | | 130,536 | |
| ProAssurance Corp. | | | 230 | | | | 13,145 | |
| Progressive Corp. (The) | | | 3,875 | | | | 218,240 | |
| Prospect Capital Corp. (b) | | | 2,650 | | | | 17,861 | |
| Prosperity Bancshares, Inc. | | | 500 | | | | 35,035 | |
| Provident Financial Services, Inc. | | | 600 | | | | 16,182 | |
| Prudential Financial, Inc. | | | 3,131 | | | | 360,002 | |
| Pzena Investment Management, Inc. - Class A | | | 2,077 | | | | 22,162 | |
| Radian Group, Inc. | | | 1,445 | | | | 29,781 | |
| Raymond James Financial, Inc. | | | 925 | | | | 82,603 | |
| Redwood Trust, Inc. | | | 450 | | | | 6,669 | |
| Regions Financial Corp. | | | 8,081 | | | | 139,640 | |
| Reinsurance Group of America, Inc. | | | 454 | | | | 70,792 | |
| RenaissanceRe Holdings Ltd. | | | 290 | | | | 36,421 | |
| Renasant Corp. (b) | | | 400 | | | | 16,356 | |
| Republic Bancorp, Inc. - Class A | | | 315 | | | | 11,976 | |
| Resource Capital Corp. (b) | | | 50 | | | | 469 | |
| RLI Corp. (b) | | | 425 | | | | 25,781 | |
| S&P Global, Inc. | | | 1,782 | | | | 301,870 | |
| S&T Bancorp, Inc. (b) | | | 350 | | | | 13,934 | |
| Sandy Spring Bancorp, Inc. | | | 300 | | | | 11,706 | |
| Seacoast Banking Corp. of Florida (a) | | | 150 | | | | 3,782 | |
| SEI Investments Co. | | | 975 | | | | 70,064 | |
| Selective Insurance Group, Inc. | | | 300 | | | | 17,610 | |
| ServisFirst Bancshares, Inc. | | | 400 | | | | 16,600 | |
| Signature Bank (a) | | | 387 | | | | 53,120 | |
| Simmons First National Corp. - Class A (b) | | | 219 | | | | 12,505 | |
| SLM Corp. (a) | | | 2,500 | | | | 28,250 | |
| Solar Capital Ltd. (b) | | | 500 | | | | 10,105 | |
| South State Corp. | | | 180 | | | | 15,687 | |
| Southside Bancshares, Inc. (b) | | | 340 | | | | 11,451 | |
| Starwood Property Trust, Inc. | | | 1,825 | | | | 38,964 | |
| State Auto Financial Corp. (b) | | | 400 | | | | 11,648 | |
| State Street Corp. | | | 2,476 | | | | 241,682 | |
| Sterling Bancorp (b) | | | 1,725 | | | | 42,435 | |
| WILSHIRE 5000 INDEX FUND | | | | | | | | |
| SCHEDULE OF INVESTMENTS (continued) | | | | | | | | |
| | | | | | | | | |
| COMMON STOCKS - 99.4% (Continued) | | | Shares | | | | Value | |
| Financials - 15.6% (Continued) | | | | | | | | |
| Stewart Information Services Corp. | | | 300 | | | $ | 12,690 | |
| Stifel Financial Corp. | | | 340 | | | | 20,250 | |
| Stock Yards Bancorp, Inc. | | | 300 | | | | 11,310 | |
| Sun Bancorp, Inc. | | | 164 | | | | 3,985 | |
| SunTrust Banks, Inc. | | | 3,030 | | | | 195,707 | |
| SVB Financial Group (a) | | | 367 | | | | 85,794 | |
| Synchrony Financial | | | 5,775 | | | | 222,973 | |
| Synovus Financial Corp. | | | 947 | | | | 45,399 | |
| T. Rowe Price Group, Inc. | | | 1,890 | | | | 198,318 | |
| TCF Financial Corp. | | | 975 | | | | 19,988 | |
| TD Ameritrade Holding Corp. | | | 2,053 | | | | 104,970 | |
| Texas Capital Bancshares, Inc. (a) (b) | | | 384 | | | | 34,138 | |
| TFS Financial Corp. | | | 525 | | | | 7,844 | |
| Tompkins Financial Corp. (b) | | | 105 | | | | 8,542 | |
| Torchmark Corp. | | | 786 | | | | 71,298 | |
| TowneBank (b) | | | 553 | | | | 17,005 | |
| Travelers Cos., Inc. (The) | | | 1,672 | | | | 226,790 | |
| Triangle Capital Corp. (b) | | | 350 | | | | 3,322 | |
| TriCo Bancshares | | | 109 | | | | 4,127 | |
| TrustCo Bank Corp. | | | 1,208 | | | | 11,114 | |
| Trustmark Corp. (b) | | | 425 | | | | 13,541 | |
| Two Harbors Investment Corp. | | | 1,212 | | | | 19,707 | |
| U.S. Bancorp | | | 10,964 | | | | 587,450 | |
| UMB Financial Corp. (b) | | | 243 | | | | 17,477 | |
| Umpqua Holdings Corp. | | | 1,500 | | | | 31,200 | |
| Union Bankshares Corp. | | | 275 | | | | 9,947 | |
| United Bankshares, Inc. (b) | | | 553 | | | | 19,217 | |
| United Community Banks, Inc. | | | 474 | | | | 13,338 | |
| United Community Financial Corp. | | | 317 | | | | 2,894 | |
| United Financial Bancorp, Inc. | | | 542 | | | | 9,561 | |
| United Fire Group, Inc. | | | 300 | | | | 13,674 | |
| United Security Bancshares | | | 406 | | | | 4,466 | |
| Unum Group | | | 1,407 | | | | 77,230 | |
| Validus Holdings Ltd. | | | 483 | | | | 22,662 | |
| Valley National Bancorp (b) | | | 1,750 | | | | 19,635 | |
| Virtus Investment Partners, Inc. | | | 48 | | | | 5,522 | |
| WILSHIRE 5000 INDEX FUND | | | | | | | | |
| SCHEDULE OF INVESTMENTS (continued) | | | | | | | | |
| | | | | | | | | |
| COMMON STOCKS - 99.4% (Continued) | | | Shares | | | | Value | |
| Financials - 15.6% (Continued) | | | | | | | | |
| Voya Financial, Inc. | | | 1,275 | | | $ | 63,074 | |
| Waddell & Reed Financial, Inc. - Class A (b) | | | 525 | | | | 11,729 | |
| Washington Federal, Inc. | | | 433 | | | | 14,830 | |
| Washington Trust Bancorp, Inc. | | | 100 | | | | 5,325 | |
| Webster Financial Corp. | | | 675 | | | | 37,908 | |
| Wells Fargo & Co. | | | 32,147 | | | | 1,950,357 | |
| WesBanco, Inc. | | | 350 | | | | 14,228 | |
| Westamerica Bancorp. (b) | | | 83 | | | | 4,943 | |
| Western Alliance Bancorp (a) | | | 850 | | | | 48,127 | |
| Western New England Bancorp, Inc. | | | 200 | | | | 2,180 | |
| Wintrust Financial Corp. | | | 425 | | | | 35,007 | |
| WisdomTree Investments, Inc. | | | 750 | | | | 9,413 | |
| World Acceptance Corp. (a) (b) | | | 100 | | | | 8,072 | |
| WSFS Financial Corp. | | | 300 | | | | 14,355 | |
| Xenia Hotel & Resorts, Inc. | | | 900 | | | | 19,431 | |
| Zions Bancorp. | | | 1,480 | | | | 75,228 | |
| | | | | | | | 28,795,603 | |
| Health Care - 12.4% | | | | | | | | |
| Abbott Laboratories | | | 12,635 | | | | 721,079 | |
| AbbVie, Inc. | | | 10,100 | | | | 976,770 | |
| ABIOMED, Inc. (a) | | | 250 | | | | 46,853 | |
| Acadia Healthcare Co., Inc. (a) (b) | | | 475 | | | | 15,499 | |
| ACADIA Pharmaceuticals, Inc. (a) (b) | | | 625 | | | | 18,819 | |
| Acorda Therapeutics, Inc. (a) (b) | | | 375 | | | | 8,044 | |
| Aetna, Inc. | | | 2,105 | | | | 379,720 | |
| Agilent Technologies, Inc. | | | 2,196 | | | | 147,066 | |
| Agios Pharmaceuticals, Inc. (a) (b) | | | 300 | | | | 17,151 | |
| Akorn, Inc. (a) | | | 600 | | | | 19,338 | |
| Alder Biopharmaceuticals, Inc. (a) | | | 300 | | | | 3,435 | |
| Alexion Pharmaceuticals, Inc. (a) | | | 1,349 | | | | 161,327 | |
| Align Technology, Inc. (a) | | | 454 | | | | 100,874 | |
| Alkermes plc (a) (b) | | | 1,000 | | | | 54,730 | |
| Allergan plc | | | 2,419 | | | | 395,700 | |
| Allscripts Healthcare Solutions, Inc. (a) | | | 1,225 | | | | 17,824 | |
| Alnylam Pharmaceuticals, Inc. (a) | | | 413 | | | | 52,472 | |
| AMAG Pharmaceuticals, Inc. (a) | | | 100 | | | | 1,325 | |
| WILSHIRE 5000 INDEX FUND | | | | | | | | |
| SCHEDULE OF INVESTMENTS (continued) | | | | | | | | |
| | | | | | | | | |
| COMMON STOCKS - 99.4% (Continued) | | | Shares | | | | Value | |
| Health Care - 12.4% (Continued) | | | | | | | | |
| Amedisys, Inc. (a) | | | 201 | | | $ | 10,595 | |
| AmerisourceBergen Corp. (b) | | | 1,144 | | | | 105,042 | |
| Amgen, Inc. | | | 4,500 | | | | 782,549 | |
| Amicus Therapeutics, Inc. (a) (b) | | | 1,225 | | | | 17,628 | |
| AMN Healthcare Services, Inc. (a) (b) | | | 250 | | | | 12,313 | |
| Analogic Corp. | | | 130 | | | | 10,888 | |
| Anika Therapeutics, Inc. (a) | | | 100 | | | | 5,391 | |
| Anthem, Inc. | | | 1,960 | | | | 441,019 | |
| Array BioPharma, Inc. (a) | | | 1,175 | | | | 15,040 | |
| athenahealth, Inc. (a) | | | 192 | | | | 25,544 | |
| Baxter International, Inc. | | | 3,963 | | | | 256,168 | |
| Becton, Dickinson and Co. (b) | | | 1,825 | | | | 390,644 | |
| Biogen, Inc. (a) | | | 1,313 | | | | 418,281 | |
| BioMarin Pharmaceutical, Inc. (a) | | | 978 | | | | 87,208 | |
| Bio-Rad Laboratories, Inc. - Class A (a) | | | 99 | | | | 23,628 | |
| Bio-Techne Corp. | | | 232 | | | | 30,056 | |
| Bioverativ, Inc. (a) | | | 766 | | | | 41,303 | |
| Bluebird Bio, Inc. (a) (b) | | | 168 | | | | 29,921 | |
| Boston Scientific Corp. (a) | | | 7,964 | | | | 197,428 | |
| Bristol-Myers Squibb Co. | | | 12,225 | | | | 749,148 | |
| Brookdale Senior Living, Inc. (a) | | | 1,294 | | | | 12,552 | |
| Bruker Corp. | | | 725 | | | | 24,882 | |
| Cambrex Corp. (a) | | | 350 | | | | 16,800 | |
| Cantel Medical Corp. | | | 200 | | | | 20,574 | |
| Capital Senior Living Corp. (a) (b) | | | 100 | | | | 1,349 | |
| Cardinal Health, Inc. | | | 2,048 | | | | 125,481 | |
| Cardiovascular Systems, Inc. (a) | | | 325 | | | | 7,699 | |
| Catalent, Inc. (a) | | | 550 | | | | 22,594 | |
| Celgene Corp. (a) | | | 5,746 | | | | 599,652 | |
| Centene Corp. (a) | | | 1,333 | | | | 134,473 | |
| Cerner Corp. (a) | | | 2,200 | | | | 148,257 | |
| Charles River Laboratories International, Inc. (a) | | | 346 | | | | 37,870 | |
| Chemed Corp. (b) | | | 136 | | | | 33,051 | |
| Chimerix, Inc. (a) | | | 300 | | | | 1,389 | |
| Cigna Corp. | | | 1,772 | | | | 359,875 | |
| Clovis Oncology, Inc. (a) (b) | | | 300 | | | | 20,400 | |
| WILSHIRE 5000 INDEX FUND | | | | | | | | |
| SCHEDULE OF INVESTMENTS (continued) | | | | | | | | |
| | | | | | | | | |
| COMMON STOCKS - 99.4% (Continued) | | | Shares | | | | Value | |
| Health Care - 12.4% (Continued) | | | | | | | | |
| Community Health Systems, Inc. (a) (b) | | | 832 | | | $ | 3,544 | |
| Computer Programs & Systems, Inc. (b) | | | 100 | | | | 3,005 | |
| CONMED Corp. | | | 300 | | | | 15,291 | |
| Cooper Cos., Inc. (The) | | | 300 | | | | 65,364 | |
| Danaher Corp. | | | 4,019 | | | | 373,044 | |
| DaVita, Inc. (a) | | | 1,033 | | | | 74,634 | |
| DENTSPLY SIRONA, Inc. | | | 1,552 | | | | 102,168 | |
| Depomed, Inc. (a) | | | 675 | | | | 5,434 | |
| Dermira, Inc. (a) (b) | | | 300 | | | | 8,343 | |
| DexCom, Inc. (a) (b) | | | 298 | | | | 17,102 | |
| Dynavax Technologies Corp. (a) (b) | | | 425 | | | | 7,948 | |
| Edwards Lifesciences Corp. (a) | | | 1,473 | | | | 166,022 | |
| Eli Lilly & Co. | | | 6,762 | | | | 571,119 | |
| Emergent BioSolutions, Inc. (a) | | | 293 | | | | 13,616 | |
| Endo International plc (a) (b) | | | 922 | | | | 7,146 | |
| Endologix, Inc. (a) (b) | | | 700 | | | | 3,745 | |
| Ensign Group, Inc. (The) | | | 300 | | | | 6,660 | |
| Envision Healthcare Corp. (a) | | | 575 | | | | 19,872 | |
| Exact Sciences Corp. (a) (b) | | | 775 | | | | 40,719 | |
| Exelixis, Inc. (a) | | | 1,875 | | | | 57,000 | |
| Express Scripts Holding Co. (a) | | | 4,236 | | | | 316,175 | |
| Genomic Health, Inc. (a) | | | 200 | | | | 6,840 | |
| Gilead Sciences, Inc. | | | 9,017 | | | | 645,977 | |
| Haemonetics Corp. (a) | | | 250 | | | | 14,520 | |
| Halozyme Therapeutics, Inc. (a) (b) | | | 750 | | | | 15,195 | |
| Halyard Health, Inc. (a) | | | 297 | | | | 13,715 | |
| Hanger, Inc. (a) | | | 350 | | | | 5,513 | |
| HCA Healthcare, Inc. (a) | | | 2,203 | | | | 193,512 | |
| HealthSouth Corp. | | | 650 | | | | 32,117 | |
| Henry Schein, Inc. (a) | | | 890 | | | | 62,193 | |
| Hill-Rom Holdings, Inc. | | | 300 | | | | 25,287 | |
| HMS Holdings Corp. (a) | | | 525 | | | | 8,899 | |
| Hologic, Inc. (a) | | | 1,777 | | | | 75,967 | |
| Horizon Pharma plc (a) | | | 1,125 | | | | 16,425 | |
| Humana, Inc. | | | 848 | | | | 210,363 | |
| ICU Medical, Inc. (a) | | | 100 | | | | 21,600 | |
| WILSHIRE 5000 INDEX FUND | | | | | | | | |
| SCHEDULE OF INVESTMENTS (continued) | | | | | | | | |
| | | | | | | | | |
| COMMON STOCKS - 99.4% (Continued) | | | Shares | | | | Value | |
| Health Care - 12.4% (Continued) | | | | | | | | |
| IDEXX Laboratories, Inc. (a) | | | 599 | | | $ | 93,672 | |
| Illumina, Inc. (a) | | | 752 | | | | 164,304 | |
| Impax Laboratories, Inc. (a) | | | 650 | | | | 10,823 | |
| INC Research Holdings, Inc. - Class A (a) | | | 300 | | | | 13,080 | |
| Incyte Corp. (a) | | | 1,343 | | | | 127,196 | |
| Innoviva, Inc. (a) | | | 1,000 | | | | 14,190 | |
| Insulet Corp. (a) | | | 175 | | | | 12,075 | |
| Integer Holdings Corp. (a) | | | 300 | | | | 13,590 | |
| Integra LifeSciences Holdings Corp. (a) (b) | | | 378 | | | | 18,091 | |
| Intercept Pharmaceuticals, Inc. (a) (b) | | | 137 | | | | 8,004 | |
| Intrexon Corp. (a) (b) | | | 400 | | | | 4,608 | |
| Intuitive Surgical, Inc. (a) | | | 495 | | | | 180,645 | |
| Ionis Pharmaceuticals, Inc. (a) (b) | | | 700 | | | | 35,210 | |
| IQVIA Holdings Inc. (a) | | | 1,031 | | | | 100,935 | |
| Ironwood Pharmaceuticals, Inc. (a) (b) | | | 1,000 | | | | 14,990 | |
| Johnson & Johnson | | | 19,625 | | | | 2,742,004 | |
| Keryx Biopharmaceuticals, Inc. (a) (b) | | | 975 | | | | 4,534 | |
| Kindred Healthcare, Inc. | | | 587 | | | | 5,694 | |
| Laboratory Corp. of America Holdings (a) | | | 670 | | | | 106,872 | |
| Lannett Co., Inc. (a) (b) | | | 300 | | | | 6,960 | |
| LHC Group, Inc. (a) | | | 100 | | | | 6,125 | |
| LifePoint Health, Inc. (a) | | | 265 | | | | 13,197 | |
| Ligand Pharmaceuticals, Inc. (a) (b) | | | 164 | | | | 22,457 | |
| Magellan Health, Inc. (a) | | | 100 | | | | 9,655 | |
| Masimo Corp. (a) | | | 300 | | | | 25,440 | |
| McKesson Corp. | | | 1,508 | | | | 235,173 | |
| Medicines Co. (The) (a) (b) | | | 350 | | | | 9,569 | |
| Medidata Solutions, Inc. (a) (b) | | | 125 | | | | 7,921 | |
| MEDNAX, Inc. (a) | | | 600 | | | | 32,064 | |
| Merck & Co., Inc. | | | 20,155 | | | | 1,134,121 | |
| Meridian Bioscience, Inc. | | | 375 | | | | 5,250 | |
| Mettler-Toledo International, Inc. (a) | | | 200 | | | | 123,904 | |
| MGC Diagnostics Corp. (b) | | | 600 | | | | 6,618 | |
| Molina Healthcare, Inc. (a) | | | 300 | | | | 23,004 | |
| Momenta Pharmaceuticals, Inc. (a) | | | 200 | | | | 2,790 | |
| Myriad Genetics, Inc. (a) (b) | | | 450 | | | | 15,455 | |
| WILSHIRE 5000 INDEX FUND | | | | | | | | |
| SCHEDULE OF INVESTMENTS (continued) | | | | | | | | |
| | | | | | | | | |
| COMMON STOCKS - 99.4% (Continued) | | | Shares | | | | Value | |
| Health Care - 12.4% (Continued) | | | | | | | | |
| Natus Medical, Inc. (a) | | | 75 | | | $ | 2,865 | |
| Nektar Therapeutics (a) (b) | | | 650 | | | | 38,818 | |
| Neogen Corp. (a) | | | 350 | | | | 28,774 | |
| Neurocrine Biosciences, Inc. (a) | | | 500 | | | | 38,795 | |
| Nevro Corp. (a) (b) | | | 162 | | | | 11,184 | |
| NewLink Genetics Corp. (a) (b) | | | 300 | | | | 2,433 | |
| NuVasive, Inc. (a) | | | 290 | | | | 16,962 | |
| Nuvectra Corp. (a) | | | 100 | | | | 776 | |
| NxStage Medical, Inc. (a) | | | 450 | | | | 10,904 | |
| Omnicell, Inc. (a) | | | 375 | | | | 18,188 | |
| OPKO Health, Inc. (a) (b) | | | 3,000 | | | | 14,700 | |
| Owens & Minor, Inc. | | | 275 | | | | 5,192 | |
| Pacira Pharmaceuticals, Inc. (a) (b) | | | 75 | | | | 3,424 | |
| Paratek Pharmaceuticals, Inc. (a) (b) | | | 6 | | | | 107 | |
| Patterson Cos., Inc. (b) | | | 575 | | | | 20,775 | |
| Penumbra, Inc. (a) (b) | | | 196 | | | | 18,444 | |
| PerkinElmer, Inc. | | | 492 | | | | 35,975 | |
| Pfizer, Inc. | | | 43,962 | | | | 1,592,303 | |
| Portola Pharmaceuticals, Inc. (a) | | | 300 | | | | 14,604 | |
| PRA Health Sciences, Inc. (a) | | | 300 | | | | 27,321 | |
| Premier, Inc. - Class A (a) | | | 350 | | | | 10,217 | |
| Prestige Brands Holdings, Inc. (a) | | | 350 | | | | 15,544 | |
| Progenics Pharmaceuticals, Inc. (a) (b) | | | 800 | | | | 4,760 | |
| Providence Service Corp. (The) (a) | | | 200 | | | | 11,868 | |
| Puma Biotechnology, Inc. (a) (b) | | | 254 | | | | 25,108 | |
| Quality Systems, Inc. (a) | | | 575 | | | | 7,809 | |
| Quest Diagnostics, Inc. | | | 877 | | | | 86,376 | |
| Quidel Corp. (a) (b) | | | 300 | | | | 13,005 | |
| Quorum Health Corp. (a) | | | 208 | | | | 1,298 | |
| Regeneron Pharmaceuticals, Inc. (a) | | | 469 | | | | 176,325 | |
| Repligen Corp. (a) (b) | | | 300 | | | | 10,884 | |
| ResMed, Inc. (b) | | | 800 | | | | 67,752 | |
| Sage Therapeutics, Inc. (a) (b) | | | 300 | | | | 49,413 | |
| Sarepta Therapeutics, Inc. (a) (b) | | | 400 | | | | 22,256 | |
| SeaSpine Holdings Corp. (a) (b) | | | 100 | | | | 1,012 | |
| Seattle Genetics, Inc. (a) (b) | | | 625 | | | | 33,438 | |
| WILSHIRE 5000 INDEX FUND | | | | | | | | |
| SCHEDULE OF INVESTMENTS (continued) | | | | | | | | |
| | | | | | | | | |
| COMMON STOCKS - 99.4% (Continued) | | | Shares | | | | Value | |
| Health Care - 12.4% (Continued) | | | | | | | | |
| Select Medical Holdings Corp. (a) | | | 725 | | | $ | 12,796 | |
| Simulations Plus, Inc. | | | 600 | | | | 9,660 | |
| Stryker Corp. | | | 1,986 | | | | 307,512 | |
| Teleflex, Inc. | | | 200 | | | | 49,764 | |
| Tenet Healthcare Corp. (a) (b) | | | 631 | | | | 9,566 | |
| TESARO, Inc. (a) (b) | | | 174 | | | | 14,419 | |
| Tetraphase Pharmaceuticals, Inc. (a) | | | 300 | | | | 1,890 | |
| TherapeuticsMD, Inc. (a) (b) | | | 1,275 | | | | 7,701 | |
| Thermo Fisher Scientific, Inc. | | | 2,901 | | | | 550,842 | |
| Ultragenyx Pharmaceutical, Inc. (a) (b) | | | 207 | | | | 9,601 | |
| United Therapeutics Corp. (a) | | | 288 | | | | 42,610 | |
| UnitedHealth Group, Inc. | | | 6,576 | | | | 1,449,744 | |
| Universal Health Services, Inc. - Class B | | | 562 | | | | 63,703 | |
| Varex Imaging Corp. (a) (b) | | | 282 | | | | 11,328 | |
| Varian Medical Systems, Inc. (a) | | | 607 | | | | 67,468 | |
| Veeva Systems, Inc. - Class A (a) | | | 725 | | | | 40,078 | |
| Vertex Pharmaceuticals, Inc. (a) | | | 1,349 | | | | 202,161 | |
| Waters Corp. (a) | | | 544 | | | | 105,095 | |
| WellCare Health Plans, Inc. (a) | | | 329 | | | | 66,165 | |
| West Pharmaceutical Services, Inc. | | | 505 | | | | 49,828 | |
| Zimmer Biomet Holdings, Inc. | | | 1,472 | | | | 177,626 | |
| ZIOPHARM Oncology, Inc. (a) (b) | | | 64 | | | | 265 | |
| Zoetis, Inc. | | | 3,275 | | | | 235,931 | |
| | | | | | | | 22,856,374 | |
| Industrials - 10.8% | | | | | | | | |
| 3M Co. | | | 4,256 | | | | 1,001,735 | |
| A.O. Smith Corp. | | | 1,040 | | | | 63,731 | |
| AAON, Inc. | | | 225 | | | | 8,258 | |
| AAR Corp. | | | 300 | | | | 11,787 | |
| ABM Industries, Inc. | | | 500 | | | | 18,860 | |
| Acacia Research Corp. (a) (b) | | | 300 | | | | 1,215 | |
| ACCO Brands Corp. (a) | | | 825 | | | | 10,065 | |
| Actuant Corp. - Class A (b) | | | 290 | | | | 7,337 | |
| Acuity Brands, Inc. (b) | | | 275 | | | | 48,400 | |
| AECOM (a) (b) | | | 977 | | | | 36,296 | |
| Aerojet Rocketdyne Holdings, Inc. (a) (b) | | | 500 | | | | 15,600 | |
| WILSHIRE 5000 INDEX FUND | | | | | | | | |
| SCHEDULE OF INVESTMENTS (continued) | | | | | | | | |
| | | | | | | | | |
| COMMON STOCKS - 99.4% (Continued) | | | Shares | | | | Value | |
| Industrials - 10.8% (Continued) | | | | | | | | |
| AGCO Corp. | | | 400 | | | $ | 28,572 | |
| Air Lease Corp. | | | 600 | | | | 28,854 | |
| Aircastle Ltd. | | | 500 | | | | 11,695 | |
| Alaska Air Group, Inc. (b) | | | 834 | | | | 61,307 | |
| Albany International Corp. - Class A | | | 100 | | | | 6,145 | |
| Allegiant Travel Co. (b) | | | 53 | | | | 8,202 | |
| Allison Transmission Holdings, Inc. | | | 1,125 | | | | 48,454 | |
| Altra Industrial Motion Corp. | | | 300 | | | | 15,120 | |
| AMERCO | | | 100 | | | | 37,791 | |
| American Airlines Group, Inc. | | | 3,411 | | | | 177,474 | |
| American Woodmark Corp. (a) | | | 130 | | | | 16,933 | |
| AMETEK, Inc. | | | 1,337 | | | | 96,892 | |
| Apogee Enterprises, Inc. (b) | | | 200 | | | | 9,146 | |
| Applied Industrial Technologies, Inc. | | | 375 | | | | 25,538 | |
| ArcBest Corp. | | | 300 | | | | 10,725 | |
| Arconic, Inc. | | | 3,140 | | | | 85,565 | |
| Armstrong Flooring, Inc. (a) | | | 100 | | | | 1,692 | |
| Armstrong World Industries, Inc. (a) | | | 200 | | | | 12,110 | |
| Astec Industries, Inc. | | | 200 | | | | 11,700 | |
| Astronics Corp. (a) | | | 300 | | | | 12,441 | |
| Astronics Corp. - Class B (a) | | | 96 | | | | 3,998 | |
| Avis Budget Group, Inc. (a) (b) | | | 392 | | | | 17,201 | |
| Axon Enterprise, Inc. (a) (b) | | | 325 | | | | 8,613 | |
| AZZ, Inc. | | | 225 | | | | 11,498 | |
| Babcock & Wilcox Enterprises, Inc. (a) (b) | | | 718 | | | | 4,078 | |
| Barnes Group, Inc. (b) | | | 300 | | | | 18,981 | |
| Beacon Roofing Supply, Inc. (a) | | | 500 | | | | 31,880 | |
| Belden, Inc. | | | 100 | | | | 7,717 | |
| Boeing Co. (The) | | | 4,038 | | | | 1,190,846 | |
| Brady Corp. - Class A | | | 145 | | | | 5,496 | |
| Briggs & Stratton Corp. | | | 150 | | | | 3,806 | |
| Brink's Co. (The) | | | 150 | | | | 11,805 | |
| Builders FirstSource, Inc. (a) | | | 450 | | | | 9,806 | |
| BWX Technologies, Inc. | | | 612 | | | | 37,020 | |
| C.H. Robinson Worldwide, Inc. (b) | | | 900 | | | | 80,181 | |
| Carlisle Cos., Inc. | | | 423 | | | | 48,074 | |
| WILSHIRE 5000 INDEX FUND | | | | | | | | |
| SCHEDULE OF INVESTMENTS (continued) | | | | | | | | |
| | | | | | | | | |
| COMMON STOCKS - 99.4% (Continued) | | | Shares | | | | Value | |
| Industrials - 10.8% (Continued) | | | | | | | | |
| Casella Waste Systems, Inc. - Class A (a) | | | 100 | | | $ | 2,302 | |
| Caterpillar, Inc. | | | 4,331 | | | | 682,478 | |
| CBIZ, Inc. (a) | | | 300 | | | | 4,635 | |
| CECO Environmental Corp. | | | 400 | | | | 2,052 | |
| Chart Industries, Inc. (a) | | | 300 | | | | 14,058 | |
| Cintas Corporation (b) | | | 701 | | | | 109,236 | |
| CIRCOR International, Inc. (b) | | | 184 | | | | 8,957 | |
| Clean Harbors, Inc. (a) | | | 400 | | | | 21,680 | |
| Colfax Corp. (a) | | | 625 | | | | 24,763 | |
| Columbus McKinnon Corp. | | | 400 | | | | 15,992 | |
| Comfort Systems USA, Inc. | | | 300 | | | | 13,095 | |
| Commercial Vehicle Group, Inc. (a) | | | 300 | | | | 3,207 | |
| Copart, Inc. (a) | | | 1,400 | | | | 60,466 | |
| Covanta Holding Corp. (b) | | | 850 | | | | 14,365 | |
| Covenant Transportation Group, Inc. - Class A (a) | | | 100 | | | | 2,873 | |
| Crane Co. | | | 325 | | | | 28,997 | |
| CSX Corp. | | | 6,225 | | | | 342,436 | |
| Cubic Corp. | | | 300 | | | | 17,685 | |
| Cummins, Inc. | | | 1,277 | | | | 225,568 | |
| Curtiss-Wright Corp. | | | 300 | | | | 36,555 | |
| Deere & Co. | | | 1,971 | | | | 308,480 | |
| Delta Air Lines, Inc. | | | 5,250 | | | | 294,000 | |
| Deluxe Corp. | | | 200 | | | | 15,368 | |
| DMC Global, Inc. | | | 400 | | | | 10,020 | |
| Donaldson Co., Inc. | | | 925 | | | | 45,279 | |
| Dover Corp. | | | 1,131 | | | | 114,220 | |
| Dun & Bradstreet Corp. (The) | | | 213 | | | | 25,221 | |
| DXP Enterprises, Inc. (a) (b) | | | 100 | | | | 2,957 | |
| Dycom Industries, Inc. (a) (b) | | | 211 | | | | 23,512 | |
| Eaton Corp. plc | | | 3,321 | | | | 262,392 | |
| EMCOR Group, Inc. | | | 500 | | | | 40,875 | |
| Emerson Electric Co. | | | 4,678 | | | | 326,009 | |
| Encore Wire Corp. | | | 200 | | | | 9,730 | |
| Energy Recovery, Inc. (a) (b) | | | 500 | | | | 4,375 | |
| EnerSys | | | 375 | | | | 26,111 | |
| Engility Holdings, Inc. (a) | | | 179 | | | | 5,078 | |
| WILSHIRE 5000 INDEX FUND | | | | | | | | |
| SCHEDULE OF INVESTMENTS (continued) | | | | | | | | |
| | | | | | | | | |
| COMMON STOCKS - 99.4% (Continued) | | | Shares | | | | Value | |
| Industrials - 10.8% (Continued) | | | | | | | | |
| Ennis, Inc. | | | 50 | | | $ | 1,038 | |
| EnPro Industries, Inc. | | | 178 | | | | 16,645 | |
| Equifax, Inc. | | | 795 | | | | 93,746 | |
| ESCO Technologies, Inc. | | | 200 | | | | 12,050 | |
| Esterline Technologies Corp. (a) | | | 190 | | | | 14,193 | |
| Expeditors International of Washington, Inc. | | | 1,250 | | | | 80,863 | |
| Exponent, Inc. | | | 270 | | | | 19,197 | |
| Fastenal Co. | | | 2,125 | | | | 116,216 | |
| Federal Signal Corp. | | | 475 | | | | 9,543 | |
| FedEx Corp. | | | 1,717 | | | | 428,460 | |
| Flowserve Corp. | | | 815 | | | | 34,336 | |
| Fluor Corp. | | | 1,086 | | | | 56,091 | |
| Fortive Corp. | | | 1,835 | | | | 132,762 | |
| Fortune Brands Home & Security, Inc. | | | 1,000 | | | | 68,440 | |
| Forward Air Corp. | | | 300 | | | | 17,232 | |
| Franklin Electric Co., Inc. | | | 275 | | | | 12,623 | |
| FreightCar America, Inc. | | | 500 | | | | 8,540 | |
| FTI Consulting, Inc. (a) | | | 250 | | | | 10,740 | |
| GATX Corp. (b) | | | 325 | | | | 20,202 | |
| General Cable Corp. | | | 625 | | | | 18,500 | |
| General Dynamics Corp. | | | 1,770 | | | | 360,107 | |
| General Electric Co. | | | 60,816 | | | | 1,061,239 | |
| Genesee & Wyoming, Inc. - Class A (a) | | | 285 | | | | 22,438 | |
| Gibraltar Industries, Inc. (a) (b) | | | 300 | | | | 9,900 | |
| Gorman-Rupp Co. (The) | | | 182 | | | | 5,680 | |
| Graco, Inc. | | | 1,086 | | | | 49,109 | |
| Granite Construction, Inc. | | | 400 | | | | 25,372 | |
| Great Lakes Dredge & Dock Corp. (a) | | | 1,500 | | | | 8,100 | |
| Greenbrier Cos., Inc. (The) (b) | | | 200 | | | | 10,660 | |
| Griffon Corp. | | | 350 | | | | 7,123 | |
| H&E Equipment Services, Inc. | | | 325 | | | | 13,211 | |
| Hardinge, Inc. (b) | | | 850 | | | | 14,807 | |
| Hawaiian Holdings, Inc. | | | 325 | | | | 12,951 | |
| HD Supply Holdings, Inc. (a) | | | 1,400 | | | | 56,042 | |
| Healthcare Services Group, Inc. | | | 375 | | | | 19,770 | |
| Heartland Express, Inc. (b) | | | 325 | | | | 7,586 | |
| WILSHIRE 5000 INDEX FUND | | | | | | | | |
| SCHEDULE OF INVESTMENTS (continued) | | | | | | | | |
| | | | | | | | | |
| COMMON STOCKS - 99.4% (Continued) | | | Shares | | | | Value | |
| Industrials - 10.8% (Continued) | | | | | | | | |
| HEICO Corp. - Class A | | | 437 | | | $ | 34,545 | |
| Heidrick & Struggles International, Inc. | | | 200 | | | | 4,910 | |
| Herc Holdings, Inc. (a) | | | 143 | | | | 8,953 | |
| Herman Miller, Inc. | | | 300 | | | | 12,015 | |
| Hertz Global Holdings, Inc. (a) (b) | | | 430 | | | | 9,503 | |
| Hexcel Corp. | | | 750 | | | | 46,388 | |
| Hill International, Inc. (a) | | | 300 | | | | 1,635 | |
| Hillenbrand, Inc. | | | 325 | | | | 14,528 | |
| HNI Corp. | | | 100 | | | | 3,857 | |
| Honeywell International, Inc. | | | 5,622 | | | | 862,190 | |
| Hub Group, Inc. - Class A (a) | | | 50 | | | | 2,395 | |
| Hubbell, Inc. | | | 338 | | | | 45,745 | |
| Huntington Ingalls Industries, Inc. | | | 319 | | | | 75,188 | |
| Hurco Cos., Inc. | | | 400 | | | | 16,880 | |
| Huron Consulting Group, Inc. (a) | | | 200 | | | | 8,090 | |
| Hyster-Yale Materials Handling, Inc. | | | 118 | | | | 10,049 | |
| IDEX Corp. | | | 437 | | | | 57,671 | |
| IES Holdings, Inc. (a) (b) | | | 500 | | | | 8,625 | |
| Illinois Tool Works, Inc. | | | 2,084 | | | | 347,714 | |
| InnerWorkings, Inc. (a) | | | 500 | | | | 5,015 | |
| Insperity, Inc. | | | 72 | | | | 4,129 | |
| Insteel Industries, Inc. | | | 300 | | | | 8,496 | |
| Interface, Inc. | | | 500 | | | | 12,575 | |
| ITT, Inc. | | | 600 | | | | 32,022 | |
| J.B. Hunt Transport Services, Inc. | | | 670 | | | | 77,037 | |
| Jacobs Engineering Group, Inc. | | | 850 | | | | 56,066 | |
| JetBlue Airways Corp. (a) | | | 1,750 | | | | 39,095 | |
| John Bean Technologies Corp. | | | 151 | | | | 16,731 | |
| Johnson Controls International plc | | | 3,150 | | | | 120,046 | |
| Kaman Corp. (b) | | | 300 | | | | 17,652 | |
| Kansas City Southern | | | 759 | | | | 79,862 | |
| KAR Auction Services, Inc. | | | 975 | | | | 49,247 | |
| KBR, Inc. | | | 925 | | | | 18,343 | |
| Kelly Services, Inc. - Class A | | | 400 | | | | 10,908 | |
| Kennametal, Inc. | | | 475 | | | | 22,995 | |
| Kforce, Inc. | | | 150 | | | | 3,788 | |
| WILSHIRE 5000 INDEX FUND | | | | | | | | |
| SCHEDULE OF INVESTMENTS (continued) | | | | | | | | |
| | | | | | | | | |
| COMMON STOCKS - 99.4% (Continued) | | | Shares | | | | Value | |
| Industrials - 10.8% (Continued) | | | | | | | | |
| Kimball International, Inc. - Class B | | | 700 | | | $ | 13,069 | |
| Kirby Corp. (a) | | | 300 | | | | 20,040 | |
| KLX, Inc. (a) (b) | | | 317 | | | | 21,635 | |
| Knight-Swift Transportation Holdings, Inc. | | | 638 | | | | 27,893 | |
| Knoll, Inc. | | | 500 | | | | 11,520 | |
| Korn/Ferry International | | | 225 | | | | 9,311 | |
| Kratos Defense & Security Solutions, Inc. (a) (b) | | | 10 | | | | 106 | |
| L3 Technologies, Inc. | | | 512 | | | | 101,299 | |
| Landstar System, Inc. | | | 300 | | | | 31,230 | |
| Layne Christensen Co. (a) | | | 600 | | | | 7,530 | |
| Lennox International, Inc. | | | 257 | | | | 53,523 | |
| Lincoln Electric Holdings, Inc. | | | 332 | | | | 30,405 | |
| Lockheed Martin Corp. | | | 1,804 | | | | 579,173 | |
| LSC Communications, Inc. | | | 159 | | | | 2,409 | |
| LSI Industries, Inc. | | | 700 | | | | 4,816 | |
| Manitowoc Company, Inc. (The) (a) (b) | | | 268 | | | | 10,543 | |
| ManpowerGroup, Inc. | | | 413 | | | | 52,083 | |
| Marten Transport Ltd. | | | 250 | | | | 5,075 | |
| Masco Corp. | | | 2,050 | | | | 90,076 | |
| MasTec, Inc. (a) | | | 500 | | | | 24,475 | |
| Matson, Inc. | | | 325 | | | | 9,698 | |
| McGrath RentCorp | | | 300 | | | | 14,094 | |
| Mercury Systems, Inc. (a) | | | 400 | | | | 20,540 | |
| Meritor, Inc. (a) | | | 550 | | | | 12,903 | |
| Middleby Corp. (The) (a) (b) | | | 468 | | | | 63,157 | |
| Mobile Mini, Inc. | | | 406 | | | | 14,007 | |
| Moog, Inc. - Class A (a) | | | 300 | | | | 26,055 | |
| MSA Safety, Inc. | | | 228 | | | | 17,675 | |
| MSC Industrial Direct Co., Inc. - Class A | | | 245 | | | | 23,682 | |
| Mueller Industries, Inc. | | | 300 | | | | 10,629 | |
| Mueller Water Products, Inc. - Series A | | | 1,600 | | | | 20,048 | |
| Navigant Consulting, Inc. (a) | | | 400 | | | | 7,764 | |
| Navistar International Corp. (a) | | | 625 | | | | 26,800 | |
| NCI Building Systems, Inc. (a) | | | 500 | | | | 9,650 | |
| Nordson Corp. | | | 318 | | | | 46,555 | |
| Norfolk Southern Corp. | | | 2,084 | | | | 301,972 | |
| WILSHIRE 5000 INDEX FUND | | | | | | | | |
| SCHEDULE OF INVESTMENTS (continued) | | | | | | | | |
| | | | | | | | | |
| COMMON STOCKS - 99.4% (Continued) | | | Shares | | | | Value | |
| Industrials - 10.8% (Continued) | | | | | | | | |
| Northrop Grumman Corp. | | | 1,267 | | | $ | 388,855 | |
| NOW, Inc. (a) (b) | | | 649 | | | | 7,158 | |
| Old Dominion Freight Line, Inc. | | | 500 | | | | 65,775 | |
| On Assignment, Inc. (a) | | | 250 | | | | 16,068 | |
| Orbital ATK, Inc. | | | 323 | | | | 42,475 | |
| Oshkosh Corp. | | | 350 | | | | 31,812 | |
| Owens Corning | | | 800 | | | | 73,552 | |
| PACCAR, Inc. | | | 2,205 | | | | 156,731 | |
| Parker-Hannifin Corp. | | | 877 | | | | 175,031 | |
| Pentair plc | | | 1,425 | | | | 100,634 | |
| Perma-Pipe International Holdings, Inc. (a) | | | 300 | | | | 2,700 | |
| Pitney Bowes, Inc. | | | 1,375 | | | | 15,373 | |
| Primoris Services Corp. | | | 475 | | | | 12,915 | |
| Quanex Building Products Corp. (b) | | | 1,000 | | | | 23,400 | |
| Quanta Services, Inc. (a) | | | 1,050 | | | | 41,066 | |
| R.R. Donnelley & Sons Co. | | | 425 | | | | 3,953 | |
| Raven Industries, Inc. | | | 275 | | | | 9,446 | |
| Raytheon Co. | | | 2,101 | | | | 394,673 | |
| RBC Bearings, Inc. (a) | | | 165 | | | | 20,856 | |
| Regal Beloit Corp. | | | 100 | | | | 7,660 | |
| Republic Services, Inc. | | | 1,743 | | | | 117,843 | |
| Resources Connection, Inc. | | | 200 | | | | 3,090 | |
| Rexnord Corp. (a) | | | 325 | | | | 8,457 | |
| Roadrunner Transportation Systems, Inc. (a) | | | 350 | | | | 2,699 | |
| Robert Half International, Inc. | | | 1,000 | | | | 55,540 | |
| Rockwell Automation, Inc. | | | 970 | | | | 190,460 | |
| Rockwell Collins, Inc. | | | 1,082 | | | | 146,741 | |
| Rollins, Inc. | | | 900 | | | | 41,877 | |
| Roper Technologies, Inc. | | | 634 | | | | 164,206 | |
| RPX Corp. | | | 1,000 | | | | 13,440 | |
| Rush Enterprises, Inc. - Class A (a) | | | 75 | | | | 3,811 | |
| Ryder System, Inc. | | | 405 | | | | 34,089 | |
| Saia, Inc. (a) | | | 225 | | | | 15,919 | |
| Simpson Manufacturing Co., Inc. | | | 100 | | | | 5,741 | |
| SkyWest, Inc. (b) | | | 375 | | | | 19,913 | |
| Snap-on, Inc. (b) | | | 362 | | | | 63,097 | |
| WILSHIRE 5000 INDEX FUND | | | | | | | | |
| SCHEDULE OF INVESTMENTS (continued) | | | | | | | | |
| | | | | | | | | |
| COMMON STOCKS - 99.4% (Continued) | | | Shares | | | | Value | |
| Industrials - 10.8% (Continued) | | | | | | | | |
| Southwest Airlines Co. | | | 3,524 | | | $ | 230,646 | |
| Spirit AeroSystems Holdings, Inc. - Class A | | | 700 | | | | 61,075 | |
| Spirit Airlines, Inc. (a) | | | 475 | | | | 21,304 | |
| SPX Corp. (a) | | | 312 | | | | 9,794 | |
| SPX FLOW, Inc. (a) | | | 312 | | | | 14,836 | |
| Standex International Corp. | | | 50 | | | | 5,093 | |
| Stanley Black & Decker, Inc. | | | 1,020 | | | | 173,083 | |
| Steelcase, Inc. - Class A | | | 875 | | | | 13,300 | |
| Stericycle, Inc. (a) | | | 575 | | | | 39,094 | |
| Team, Inc. (a) (b) | | | 164 | | | | 2,444 | |
| Teledyne Technologies, Inc. (a) | | | 211 | | | | 38,223 | |
| Terex Corp. | | | 825 | | | | 39,782 | |
| Tetra Tech, Inc. | | | 418 | | | | 20,127 | |
| Textainer Group Holdings Ltd. (a) (b) | | | 700 | | | | 15,050 | |
| Textron, Inc. | | | 1,375 | | | | 77,811 | |
| Timken Co. (The) | | | 375 | | | | 18,431 | |
| Titan International, Inc. | | | 312 | | | | 4,019 | |
| Toro Co. (The) | | | 528 | | | | 34,441 | |
| TransDigm Group, Inc. (b) | | | 298 | | | | 81,837 | |
| TransUnion (a) | | | 650 | | | | 35,724 | |
| Trex Co., Inc. (a) | | | 225 | | | | 24,388 | |
| Trinity Industries, Inc. | | | 1,050 | | | | 39,333 | |
| Triumph Group, Inc. (b) | | | 256 | | | | 6,963 | |
| TrueBlue, Inc. (a) | | | 300 | | | | 8,250 | |
| Tutor Perini Corp. (a) (b) | | | 200 | | | | 5,070 | |
| Twin Disc, Inc. (a) | | | 400 | | | | 10,628 | |
| Ultralife Corp. (a) | | | 200 | | | | 1,310 | |
| UniFirst Corp. | | | 86 | | | | 14,181 | |
| Union Pacific Corp. | | | 5,627 | | | | 754,580 | |
| United Continental Holdings, Inc. (a) | | | 1,851 | | | | 124,757 | |
| United Parcel Service, Inc. - Class B | | | 4,100 | | | | 488,515 | |
| United Rentals, Inc. (a) | | | 542 | | | | 93,175 | |
| United Technologies Corp. | | | 5,952 | | | | 759,296 | |
| Univar, Inc. (a) | | | 575 | | | | 17,802 | |
| Universal Forest Products, Inc. | | | 399 | | | | 15,010 | |
| US Ecology, Inc. (b) | | | 200 | | | | 10,200 | |
| WILSHIRE 5000 INDEX FUND | | | | | | | | |
| SCHEDULE OF INVESTMENTS (continued) | | | | | | | | |
| | | | | | | | | |
| COMMON STOCKS - 99.4% (Continued) | | | Shares | | | | Value | |
| Industrials - 10.8% (Continued) | | | | | | | | |
| USG Corp. (a) (b) | | | 775 | | | $ | 29,884 | |
| Valmont Industries, Inc. | | | 159 | | | | 26,370 | |
| Vectrus, Inc. (a) | | | 122 | | | | 3,764 | |
| Verisk Analytics, Inc. (a) | | | 1,124 | | | | 107,904 | |
| Veritiv Corp. (a) | | | 97 | | | | 2,803 | |
| Viad Corp. | | | 100 | | | | 5,540 | |
| Vicor Corp. (a) | | | 300 | | | | 6,270 | |
| W.W. Grainger, Inc. | | | 423 | | | | 99,934 | |
| Wabash National Corp. | | | 50 | | | | 1,085 | |
| WABCO Holdings, Inc. (a) | | | 303 | | | | 43,481 | |
| WageWorks, Inc. (a) | | | 300 | | | | 18,600 | |
| Waste Management, Inc. | | | 3,075 | | | | 265,372 | |
| Watsco, Inc. | | | 214 | | | | 36,389 | |
| Watts Water Technologies, Inc. - Class A | | | 300 | | | | 22,785 | |
| Welbilt, Inc. (a) | | | 1,075 | | | | 25,273 | |
| Werner Enterprises, Inc. (b) | | | 250 | | | | 9,663 | |
| WESCO International, Inc. (a) | | | 300 | | | | 20,445 | |
| Westinghouse Air Brake Technologies Corp. (b) | | | 559 | | | | 45,519 | |
| Woodward, Inc. | | | 500 | | | | 38,270 | |
| XPO Logistics, Inc. (a) | | | 655 | | | | 59,991 | |
| Xylem, Inc. | | | 1,300 | | | | 88,660 | |
| | | | | | | | 20,032,137 | |
| Information Technology - 22.4% | | | | | | | | |
| 2U, Inc. (a) (b) | | | 325 | | | | 20,966 | |
| 3D Systems Corp. (a) (b) | | | 848 | | | | 7,327 | |
| ACI Worldwide, Inc. (a) | | | 560 | | | | 12,695 | |
| Activision Blizzard, Inc. | | | 4,613 | | | | 292,095 | |
| Actua Corp. (a) (b) | | | 100 | | | | 1,560 | |
| Acxiom Corp. (a) | | | 475 | | | | 13,091 | |
| Adobe Systems, Inc. (a) | | | 3,131 | | | | 548,676 | |
| Advanced Energy Industries, Inc. (a) | | | 300 | | | | 20,244 | |
| Advanced Micro Devices, Inc. (a) (b) | | | 4,575 | | | | 47,031 | |
| Agilysys, Inc. (a) | | | 500 | | | | 6,140 | |
| Akamai Technologies, Inc. (a) | | | 984 | | | | 63,999 | |
| Alliance Data Systems Corp. | | | 408 | | | | 103,420 | |
| Alphabet, Inc. - Class C (a) | | | 4,183 | | | | 4,377,090 | |
| WILSHIRE 5000 INDEX FUND | | | | | | | | |
| SCHEDULE OF INVESTMENTS (continued) | | | | | | | | |
| | | | | | | | | |
| COMMON STOCKS - 99.4% (Continued) | | | Shares | | | | Value | |
| Information Technology - 22.4% (Continued) | | | | | | | | |
| Ambarella, Inc. (a) | | | 300 | | | $ | 17,625 | |
| Amkor Technology, Inc. (a) | | | 1,050 | | | | 10,553 | |
| Amphenol Corp. - Class A | | | 1,600 | | | | 140,479 | |
| Amtech Systems, Inc. (a) | | | 32 | | | | 322 | |
| Analog Devices, Inc. | | | 2,429 | | | | 216,254 | |
| Anixter International, Inc. (a) | | | 167 | | | | 12,692 | |
| ANSYS, Inc. (a) | | | 500 | | | | 73,795 | |
| Apple, Inc. | | | 37,983 | | | | 6,427,862 | |
| Applied Materials, Inc. | | | 7,908 | | | | 404,257 | |
| Arista Networks, Inc. (a) | | | 320 | | | | 75,386 | |
| ARRIS International plc (a) | | | 1,229 | | | | 31,573 | |
| Arrow Electronics, Inc. (a) | | | 500 | | | | 40,205 | |
| Aspen Technology, Inc. (a) | | | 325 | | | | 21,515 | |
| Autodesk, Inc. (a) | | | 1,475 | | | | 154,624 | |
| Automatic Data Processing, Inc. | | | 3,274 | | | | 383,680 | |
| Avnet, Inc. | | | 900 | | | | 35,658 | |
| AVX Corp. | | | 375 | | | | 6,488 | |
| Badger Meter, Inc. | | | 300 | | | | 14,340 | |
| Bel Fuse, Inc. - Class B | | | 300 | | | | 7,553 | |
| Benchmark Electronics, Inc. (a) | | | 475 | | | | 13,823 | |
| Black Knight, Inc. (a) | | | 585 | | | | 25,828 | |
| Blackbaud, Inc. | | | 200 | | | | 18,898 | |
| Blucora, Inc. (a) (b) | | | 250 | | | | 5,525 | |
| Booz Allen Hamilton Holding Corp. | | | 1,000 | | | | 38,130 | |
| Bottomline Technologies (de), Inc. (a) | | | 375 | | | | 13,005 | |
| Broadridge Financial Solutions, Inc. | | | 775 | | | | 70,200 | |
| BroadSoft, Inc. (a) (b) | | | 300 | | | | 16,470 | |
| Brooks Automation, Inc. | | | 106 | | | | 2,528 | |
| CA, Inc. | | | 2,247 | | | | 74,780 | |
| Cabot Microelectronics Corp. | | | 100 | | | | 9,408 | |
| CACI International, Inc. - Class A (a) | | | 99 | | | | 13,103 | |
| Cadence Design Systems, Inc. (a) | | | 1,902 | | | | 79,542 | |
| CalAmp Corp. (a) | | | 400 | | | | 8,572 | |
| Calix, Inc. (a) | | | 175 | | | | 1,041 | |
| Callidus Software, Inc. (a) | | | 200 | | | | 5,730 | |
| Cardtronics plc - Class A (a) | | | 175 | | | | 3,241 | |
| WILSHIRE 5000 INDEX FUND | | | | | | | | |
| SCHEDULE OF INVESTMENTS (continued) | | | | | | | | |
| | | | | | | | | |
| COMMON STOCKS - 99.4% (Continued) | | | Shares | | | | Value | |
| Information Technology - 22.4% (Continued) | | | | | | | | |
| Cars.com, Inc. (a) (b) | | | 575 | | | $ | 16,583 | |
| Cavium, Inc. (a) | | | 558 | | | | 46,777 | |
| CDW Corp. | | | 1,025 | | | | 71,226 | |
| Ciena Corp. (a) | | | 997 | | | | 20,867 | |
| Cirrus Logic, Inc. (a) | | | 400 | | | | 20,744 | |
| Cisco Systems, Inc. | | | 36,598 | | | | 1,401,702 | |
| Citrix Systems, Inc. (a) | | | 1,118 | | | | 98,384 | |
| Cognex Corp. | | | 1,150 | | | | 70,334 | |
| Cognizant Technology Solutions Corp. - Class A | | | 4,298 | | | | 305,244 | |
| Coherent, Inc. (a) | | | 200 | | | | 56,444 | |
| CommerceHub, Inc. (a) (b) | | | 125 | | | | 2,749 | |
| CommerceHub, Inc. (a) | | | 250 | | | | 5,148 | |
| CommScope Holding Co., Inc. (a) | | | 1,150 | | | | 43,505 | |
| CommVault Systems, Inc. (a) | | | 375 | | | | 19,688 | |
| comScore, Inc. (a) | | | 400 | | | | 11,400 | |
| Comtech Telecommunications Corp. (b) | | | 100 | | | | 2,212 | |
| Conduent, Inc. (a) (b) | | | 1,399 | | | | 22,608 | |
| Convergys Corp. | | | 525 | | | | 12,338 | |
| CoreLogic, Inc. (a) | | | 677 | | | | 31,284 | |
| Cornerstone OnDemand, Inc. (a) | | | 500 | | | | 17,665 | |
| Corning, Inc. | | | 6,669 | | | | 213,340 | |
| CoStar Group, Inc. (a) | | | 225 | | | | 66,814 | |
| Cray, Inc. (a) | | | 425 | | | | 10,285 | |
| Cree, Inc. (a) (b) | | | 625 | | | | 23,213 | |
| CSG Systems International, Inc. | | | 78 | | | | 3,418 | |
| CSRA, Inc. | | | 955 | | | | 28,574 | |
| CTS Corp. (b) | | | 100 | | | | 2,575 | |
| Cypress Semiconductor Corp. | | | 1,625 | | | | 24,765 | |
| Daktronics, Inc. (b) | | | 800 | | | | 7,304 | |
| Diebold Nixdorf, Inc. (b) | | | 650 | | | | 10,628 | |
| Diodes, Inc. (a) | | | 300 | | | | 8,601 | |
| Dolby Laboratories, Inc. - Class A | | | 300 | | | | 18,600 | |
| DST Systems, Inc. | | | 368 | | | | 22,842 | |
| DXC Technology Co. | | | 1,978 | | | | 187,712 | |
| eBay, Inc. (a) | | | 7,425 | | | | 280,220 | |
| Ebix, Inc. (b) | | | 31 | | | | 2,457 | |
| WILSHIRE 5000 INDEX FUND | | | | | | | | |
| SCHEDULE OF INVESTMENTS (continued) | | | | | | | | |
| | | | | | | | | |
| COMMON STOCKS - 99.4% (Continued) | | | Shares | | | | Value | |
| Information Technology - 22.4% (Continued) | | | | | | | | |
| EchoStar Corp. - Class A (a) | | | 400 | | | $ | 23,960 | |
| Electro Scientific Industries, Inc. (a) (b) | | | 100 | | | | 2,143 | |
| Electronic Arts, Inc. (a) | | | 1,940 | | | | 203,816 | |
| Electronics For Imaging, Inc. (a) | | | 404 | | | | 11,930 | |
| Ellie Mae, Inc. (a) (b) | | | 219 | | | | 19,579 | |
| EMCORE Corp. (a) | | | 125 | | | | 806 | |
| Entegris, Inc. | | | 1,011 | | | | 30,785 | |
| Envestnet, Inc. (a) | | | 375 | | | | 18,694 | |
| EPAM Systems, Inc. (a) | | | 300 | | | | 32,229 | |
| Euronet Worldwide, Inc. (a) | | | 349 | | | | 29,410 | |
| ExlService Holdings, Inc. (a) | | | 300 | | | | 18,105 | |
| F5 Networks, Inc. (a) | | | 433 | | | | 56,818 | |
| Facebook, Inc. - Class A (a) | | | 16,349 | | | | 2,884,944 | |
| FactSet Research Systems, Inc. (b) | | | 250 | | | | 48,190 | |
| Fair Isaac Corp. | | | 146 | | | | 22,367 | |
| FARO Technologies, Inc. (a) (b) | | | 200 | | | | 9,400 | |
| Fidelity National Information Services, Inc. | | | 2,344 | | | | 220,547 | |
| Finisar Corp. (a) (b) | | | 775 | | | | 15,771 | |
| FireEye, Inc. (a) (b) | | | 600 | | | | 8,520 | |
| First Data Corp. - Class A (a) | | | 1,825 | | | | 30,496 | |
| First Solar, Inc. (a) | | | 400 | | | | 27,008 | |
| Fiserv, Inc. (a) | | | 1,198 | | | | 157,094 | |
| Fitbit, Inc. - Class A (a) (b) | | | 425 | | | | 2,427 | |
| FleetCor Technologies, Inc. (a) | | | 628 | | | | 120,846 | |
| FLIR Systems, Inc. | | | 1,025 | | | | 47,786 | |
| FormFactor, Inc. (a) | | | 480 | | | | 7,512 | |
| Forrester Research, Inc. | | | 255 | | | | 11,271 | |
| Fortinet, Inc. (a) | | | 1,075 | | | | 46,967 | |
| Gartner, Inc. (a) | | | 581 | | | | 71,550 | |
| Genpact Ltd. | | | 1,125 | | | | 35,708 | |
| Global Payments, Inc. | | | 950 | | | | 95,228 | |
| GrubHub, Inc. (a) (b) | | | 550 | | | | 39,490 | |
| Guidewire Software, Inc. (a) (b) | | | 300 | | | | 22,278 | |
| Harris Corp. | | | 892 | | | | 126,351 | |
| Hewlett Packard Enterprise Co. | | | 12,277 | | | | 176,298 | |
| HP, Inc. | | | 12,352 | | | | 259,515 | |
| WILSHIRE 5000 INDEX FUND | | | | | | | | |
| SCHEDULE OF INVESTMENTS (continued) | | | | | | | | |
| | | | | | | | | |
| COMMON STOCKS - 99.4% (Continued) | | | Shares | | | | Value | |
| Information Technology - 22.4% (Continued) | | | | | | | | |
| HubSpot, Inc. (a) (b) | | | 300 | | | $ | 26,520 | |
| I.D. Systems, Inc. (a) | | | 100 | | | | 694 | |
| IAC/InterActiveCorp (a) | | | 450 | | | | 55,026 | |
| II-VI, Inc. (a) (b) | | | 375 | | | | 17,606 | |
| Infinera Corp. (a) (b) | | | 600 | | | | 3,798 | |
| Inphi Corp. (a) (b) | | | 300 | | | | 10,980 | |
| Insight Enterprises, Inc. (a) | | | 200 | | | | 7,658 | |
| Integrated Device Technology, Inc. (a) | | | 985 | | | | 29,284 | |
| Intel Corp. | | | 34,918 | | | | 1,611,814 | |
| InterDigital, Inc. | | | 246 | | | | 18,733 | |
| International Business Machines Corp. | | | 6,425 | | | | 985,723 | |
| Intuit, Inc. | | | 1,589 | | | | 250,712 | |
| IPG Photonics Corp. (a) | | | 281 | | | | 60,171 | |
| Itron, Inc. (a) | | | 200 | | | | 13,640 | |
| IXYS Corp. (a) | | | 800 | | | | 19,160 | |
| j2 Global, Inc. (b) | | | 325 | | | | 24,385 | |
| Jabil, Inc. | | | 1,025 | | | | 26,906 | |
| Jack Henry & Associates, Inc. | | | 486 | | | | 56,843 | |
| Juniper Networks, Inc. | | | 2,190 | | | | 62,415 | |
| Key Tronic Corp. (a) | | | 600 | | | | 4,098 | |
| Keysight Technologies, Inc. (a) | | | 1,298 | | | | 53,997 | |
| Kimball Electronics, Inc. (a) | | | 525 | | | | 9,581 | |
| KLA-Tencor Corp. | | | 956 | | | | 100,447 | |
| Knowles Corp. (a) | | | 458 | | | | 6,714 | |
| Kulicke & Soffa Industries, Inc. (a) | | | 400 | | | | 9,734 | |
| Lam Research Corp. | | | 1,116 | | | | 205,422 | |
| Lattice Semiconductor Corp. (a) | | | 200 | | | | 1,156 | |
| Leaf Group Ltd. (a) | | | 200 | | | | 1,980 | |
| Leidos Holdings, Inc. | | | 931 | | | | 60,115 | |
| Littelfuse, Inc. (b) | | | 118 | | | | 23,343 | |
| LogMeIn, Inc. | | | 356 | | | | 40,762 | |
| Lumentum Holdings, Inc. (a) (b) | | | 340 | | | | 16,626 | |
| MACOM Technology Solutions Holdings, Inc. (a) (b) | | | 463 | | | | 15,066 | |
| Manhattan Associates, Inc. (a) (b) | | | 350 | | | | 17,339 | |
| Marvell Technology Group Ltd. | | | 3,175 | | | | 68,167 | |
| MasterCard, Inc. - Class A | | | 6,945 | | | | 1,051,194 | |
| WILSHIRE 5000 INDEX FUND | | | | | | | | |
| SCHEDULE OF INVESTMENTS (continued) | | | | | | | | |
| | | | | | | | | |
| COMMON STOCKS - 99.4% (Continued) | | | Shares | | | | Value | |
| Information Technology - 22.4% (Continued) | | | | | | | | |
| Match Group, Inc. (a) (b) | | | 1,175 | | | $ | 36,789 | |
| Maxim Integrated Products, Inc. | | | 1,775 | | | | 92,797 | |
| MAXIMUS, Inc. | | | 425 | | | | 30,422 | |
| MaxLinear, Inc. (a) (b) | | | 475 | | | | 12,550 | |
| Methode Electronics, Inc. | | | 100 | | | | 4,010 | |
| Microchip Technology, Inc. (b) | | | 1,574 | | | | 138,323 | |
| Micron Technology, Inc. (a) | | | 7,002 | | | | 287,922 | |
| Microsemi Corp. (a) | | | 650 | | | | 33,573 | |
| Microsoft Corp. | | | 56,162 | | | | 4,804,096 | |
| MicroStrategy, Inc. - Class A (a) | | | 100 | | | | 13,130 | |
| MKS Instruments, Inc. | | | 300 | | | | 28,350 | |
| MoneyGram International, Inc. (a) | | | 662 | | | | 8,725 | |
| Monolithic Power Systems, Inc. | | | 200 | | | | 22,472 | |
| Monotype Imaging Holdings, Inc. | | | 350 | | | | 8,435 | |
| Motorola Solutions, Inc. | | | 1,132 | | | | 102,265 | |
| Nanometrics, Inc. (a) | | | 200 | | | | 4,984 | |
| Napco Security Technologies, Inc. (a) | | | 900 | | | | 7,875 | |
| National Instruments Corp. | | | 812 | | | | 33,804 | |
| NCR Corp. (a) | | | 925 | | | | 31,441 | |
| NetApp, Inc. | | | 1,775 | | | | 98,193 | |
| NETGEAR, Inc. (a) | | | 50 | | | | 2,938 | |
| NetScout Systems, Inc. (a) | | | 700 | | | | 21,315 | |
| NIC, Inc. | | | 375 | | | | 6,225 | |
| Nuance Communications, Inc. (a) | | | 2,175 | | | | 35,561 | |
| NVE Corp. | | | 100 | | | | 8,600 | |
| NVIDIA Corp. | | | 3,547 | | | | 686,345 | |
| Oclaro, Inc. (a) (b) | | | 1,321 | | | | 8,904 | |
| ON Semiconductor Corp. (a) | | | 2,730 | | | | 57,166 | |
| Oracle Corp. | | | 23,530 | | | | 1,112,497 | |
| OSI Systems, Inc. (a) (b) | | | 100 | | | | 6,438 | |
| Palo Alto Networks, Inc. (a) (b) | | | 719 | | | | 104,212 | |
| Pandora Media, Inc. (a) (b) | | | 1,725 | | | | 8,315 | |
| PAR Technology Corp. (a) (b) | | | 100 | | | | 935 | |
| Park Electrochemical Corp. | | | 600 | | | | 11,790 | |
| Paychex, Inc. | | | 2,150 | | | | 146,372 | |
| Paycom Software, Inc. (a) (b) | | | 300 | | | | 24,099 | |
| WILSHIRE 5000 INDEX FUND | | | | | | | | |
| SCHEDULE OF INVESTMENTS (continued) | | | | | | | | |
| | | | | | | | | |
| COMMON STOCKS - 99.4% (Continued) | | | Shares | | | | Value | |
| Information Technology - 22.4% (Continued) | | | | | | | | |
| Paylocity Holding Corp. (a) | | | 300 | | | $ | 14,148 | |
| PayPal Holdings, Inc. (a) | | | 7,725 | | | | 568,714 | |
| PCM, Inc. (a) | | | 400 | | | | 3,960 | |
| Pegasystems, Inc. | | | 300 | | | | 14,145 | |
| PFSweb, Inc. (a) | | | 8 | | | | 59 | |
| Plantronics, Inc. | | | 300 | | | | 15,114 | |
| Plexus Corp. (a) | | | 300 | | | | 18,216 | |
| Power Integrations, Inc. | | | 300 | | | | 22,065 | |
| PRGX Global, Inc. (a) | | | 220 | | | | 1,562 | |
| Progress Software Corp. | | | 200 | | | | 8,514 | |
| Proofpoint, Inc. (a) (b) | | | 316 | | | | 28,064 | |
| PROS Holdings, Inc. (a) (b) | | | 300 | | | | 7,935 | |
| PTC, Inc. (a) | | | 865 | | | | 52,566 | |
| QAD, Inc. - Class B | | | 40 | | | | 1,220 | |
| QUALCOMM, Inc. | | | 10,805 | | | | 691,736 | |
| Qualys, Inc. (a) | | | 300 | | | | 17,805 | |
| Rambus, Inc. (a) | | | 500 | | | | 7,110 | |
| RealNetworks, Inc. (a) | | | 681 | | | | 2,329 | |
| RealPage, Inc. (a) (b) | | | 325 | | | | 14,398 | |
| Red Hat, Inc. (a) | | | 978 | | | | 117,458 | |
| Rosetta Stone, Inc. (a) | | | 300 | | | | 3,741 | |
| Rudolph Technologies, Inc. (a) | | | 340 | | | | 8,126 | |
| Sabre Corp. (b) | | | 1,400 | | | | 28,700 | |
| salesforce.com, Inc. (a) | | | 4,179 | | | | 427,219 | |
| Sanmina Corp. (a) | | | 333 | | | | 10,989 | |
| Science Applications International Corp. | | | 260 | | | | 19,908 | |
| Semtech Corp. (a) | | | 300 | | | | 10,260 | |
| ServiceNow, Inc. (a) | | | 1,203 | | | | 156,859 | |
| Shutterstock, Inc. (a) (b) | | | 122 | | | | 5,250 | |
| Silicon Laboratories, Inc. (a) | | | 200 | | | | 17,660 | |
| Skyworks Solutions, Inc. | | | 1,099 | | | | 104,350 | |
| Splunk, Inc. (a) | | | 918 | | | | 76,047 | |
| SS&C Technologies Holdings, Inc. | | | 1,325 | | | | 53,636 | |
| Stamps.com, Inc. (a) | | | 129 | | | | 24,252 | |
| SunPower Corp. (a) (b) | | | 1,300 | | | | 10,959 | |
| Super Micro Computer, Inc. (a) | | | 375 | | | | 7,847 | |
| WILSHIRE 5000 INDEX FUND | | | | | | | | |
| SCHEDULE OF INVESTMENTS (continued) | | | | | | | | |
| | | | | | | | | |
| COMMON STOCKS - 99.4% (Continued) | | | Shares | | | | Value | |
| Information Technology - 22.4% (Continued) | | | | | | | | |
| Sykes Enterprises, Inc. (a) | | | 102 | | | $ | 3,208 | |
| Symantec Corp. | | | 3,483 | | | | 97,733 | |
| Synaptics, Inc. (a) (b) | | | 333 | | | | 13,300 | |
| Synchronoss Technologies, Inc. (a) (b) | | | 325 | | | | 2,906 | |
| SYNNEX Corp. | | | 163 | | | | 22,160 | |
| Synopsys, Inc. (a) | | | 1,117 | | | | 95,213 | |
| Syntel, Inc. (a) | | | 300 | | | | 6,897 | |
| Systemax, Inc. | | | 600 | | | | 19,962 | |
| Take-Two Interactive Software, Inc. (a) | | | 625 | | | | 68,613 | |
| Tech Data Corp. (a) | | | 211 | | | | 20,672 | |
| TechTarget, Inc. (a) | | | 800 | | | | 11,136 | |
| Teradata Corp. (a) (b) | | | 1,025 | | | | 39,422 | |
| Teradyne, Inc. | | | 1,075 | | | | 45,010 | |
| TESSCO Technologies, Inc. | | | 100 | | | | 2,015 | |
| Texas Instruments, Inc. | | | 6,205 | | | | 648,050 | |
| TiVo Corp. | | | 878 | | | | 13,697 | |
| Total System Services, Inc. | | | 1,337 | | | | 105,743 | |
| Travelzoo, Inc. (a) | | | 100 | | | | 645 | |
| Trimble, Inc. (a) | | | 1,334 | | | | 54,214 | |
| TTM Technologies, Inc. (a) | | | 488 | | | | 7,647 | |
| Twitter, Inc. (a) | | | 5,300 | | | | 127,253 | |
| Tyler Technologies, Inc. (a) | | | 192 | | | | 33,994 | |
| Ultimate Software Group, Inc. (The) (a) (b) | | | 165 | | | | 36,008 | |
| Unisys Corp. (a) (b) | | | 427 | | | | 3,480 | |
| Universal Display Corp. | | | 270 | | | | 46,616 | |
| Vantiv, Inc. - Class A (a) (b) | | | 525 | | | | 38,614 | |
| VASCO Data Security International, Inc. (a) (b) | | | 450 | | | | 6,255 | |
| Veeco Instruments, Inc. (a) (b) | | | 400 | | | | 5,940 | |
| VeriFone Systems, Inc. (a) (b) | | | 965 | | | | 17,090 | |
| Verint Systems, Inc. (a) | | | 375 | | | | 15,694 | |
| VeriSign, Inc. (a) (b) | | | 516 | | | | 59,051 | |
| Versum Materials, Inc. | | | 821 | | | | 31,075 | |
| ViaSat, Inc. (a) (b) | | | 350 | | | | 26,198 | |
| Viavi Solutions, Inc. (a) (b) | | | 1,328 | | | | 11,607 | |
| Virtusa Corp. (a) | | | 400 | | | | 17,632 | |
| Visa, Inc. - Class A (b) | | | 11,316 | | | | 1,290,249 | |
| WILSHIRE 5000 INDEX FUND | | | | | | | | |
| SCHEDULE OF INVESTMENTS (continued) | | | | | | | | |
| | | | | | | | | |
| COMMON STOCKS - 99.4% (Continued) | | | Shares | | | | Value | |
| Information Technology - 22.4% (Continued) | | | | | | | | |
| Vishay Intertechnology, Inc. | | | 806 | | | $ | 16,725 | |
| Vishay Precision Group, Inc. (a) | | | 129 | | | | 3,244 | |
| VMware, Inc. - Class A (a) (b) | | | 594 | | | | 74,440 | |
| Web.com Group, Inc. (a) | | | 200 | | | | 4,360 | |
| Western Digital Corp. | | | 2,020 | | | | 160,651 | |
| Western Union Co. (The) (b) | | | 2,454 | | | | 46,651 | |
| WEX, Inc. (a) | | | 214 | | | | 30,223 | |
| Workday, Inc. - Class A (a) | | | 195 | | | | 19,839 | |
| Xerox Corp. | | | 1,748 | | | | 50,954 | |
| Xilinx, Inc. | | | 1,575 | | | | 106,187 | |
| XO Group, Inc. (a) | | | 800 | | | | 14,768 | |
| Xperi Corp. | | | 400 | | | | 9,760 | |
| Yelp, Inc. (a) | | | 566 | | | | 23,749 | |
| Zebra Technologies Corp. - Class A (a) | | | 225 | | | | 23,355 | |
| Zendesk, Inc. (a) | | | 550 | | | | 18,612 | |
| Zillow Group, Inc. - Class C (a) (b) | | | 748 | | | | 30,608 | |
| | | | | | | | 41,374,831 | |
| Materials - 3.3% | | | | | | | | |
| A. Schulman, Inc. | | | 81 | | | | 3,017 | |
| AdvanSix, Inc. (a) | | | 250 | | | | 10,518 | |
| Air Products & Chemicals, Inc. | | | 1,460 | | | | 239,557 | |
| AK Steel Holding Corp. (a) (b) | | | 1,875 | | | | 10,613 | |
| Albemarle Corp. | | | 745 | | | | 95,278 | |
| Alcoa Corp. | | | 1,163 | | | | 62,651 | |
| Allegheny Technologies, Inc. (a) | | | 775 | | | | 18,709 | |
| American Vanguard Corp. | | | 400 | | | | 7,860 | |
| AptarGroup, Inc. | | | 286 | | | | 24,676 | |
| Ashland Global Holdings, Inc. | | | 467 | | | | 33,250 | |
| Avery Dennison Corp. | | | 590 | | | | 67,767 | |
| Axalta Coating Systems Ltd. (a) | | | 675 | | | | 21,843 | |
| Balchem Corp. (a) | | | 201 | | | | 16,201 | |
| Ball Corp. | | | 1,960 | | | | 74,186 | |
| Bemis Company, Inc. | | | 550 | | | | 26,285 | |
| Berry Global Group, Inc. (a) | | | 900 | | | | 52,803 | |
| Cabot Corp. | | | 400 | | | | 24,636 | |
| Calgon Carbon Corp. | | | 500 | | | | 10,650 | |
| WILSHIRE 5000 INDEX FUND | | | | | | | | |
| SCHEDULE OF INVESTMENTS (continued) | | | | | | | | |
| | | | | | | | | |
| COMMON STOCKS - 99.4% (Continued) | | | Shares | | | | Value | |
| Materials - 3.3% (Continued) | | | | | | | | |
| Carpenter Technology Corp. | | | 200 | | | $ | 10,198 | |
| Celanese Corp. - Series A | | | 945 | | | | 101,191 | |
| Century Aluminum Co. (a) (b) | | | 600 | | | | 11,784 | |
| CF Industries Holdings, Inc. | | | 1,670 | | | | 71,042 | |
| Chemours Co. (The) | | | 1,289 | | | | 64,527 | |
| Cleveland-Cliffs, Inc. (a) (b) | | | 1,400 | | | | 10,094 | |
| Codexis, Inc. (a) (b) | | | 37 | | | | 309 | |
| Coeur Mining, Inc. (a) | | | 1,110 | | | | 8,325 | |
| Commercial Metals Co. | | | 775 | | | | 16,523 | |
| Compass Minerals International, Inc. (b) | | | 100 | | | | 7,225 | |
| Core Molding Technologies, Inc. | | | 200 | | | | 4,340 | |
| Crown Holdings, Inc. (a) | | | 900 | | | | 50,625 | |
| Deltic Timber Corp. | | | 100 | | | | 9,155 | |
| DowDuPont, Inc. | | | 15,951 | | | | 1,136,029 | |
| Eagle Materials, Inc. (b) | | | 333 | | | | 37,729 | |
| Eastman Chemical Co. | | | 990 | | | | 91,714 | |
| Ecolab, Inc. | | | 1,944 | | | | 260,846 | |
| Ferro Corp. (a) | | | 575 | | | | 13,564 | |
| Flotek Industries, Inc. (a) (b) | | | 550 | | | | 2,563 | |
| FMC Corp. | | | 875 | | | | 82,828 | |
| Freeport-McMoRan, Inc. (a) | | | 8,769 | | | | 166,259 | |
| GCP Applied Technologies, Inc. (a) | | | 427 | | | | 13,621 | |
| Graphic Packaging Holding Co. | | | 1,325 | | | | 20,471 | |
| Greif, Inc. - Class A | | | 300 | | | | 18,174 | |
| H.B. Fuller Co. | | | 150 | | | | 8,081 | |
| Hecla Mining Co. (b) | | | 3,150 | | | | 12,506 | |
| Huntsman Corp. | | | 1,575 | | | | 52,432 | |
| Ingevity Corp. (a) | | | 393 | | | | 27,695 | |
| International Flavors & Fragrances, Inc. | | | 471 | | | | 71,879 | |
| International Paper Co. (b) | | | 2,867 | | | | 166,113 | |
| Kaiser Aluminum Corp. | | | 138 | | | | 14,745 | |
| KapStone Paper and Packaging Corp. (b) | | | 575 | | | | 13,047 | |
| Kraton Corp. (a) | | | 300 | | | | 14,451 | |
| Louisiana-Pacific Corp. (a) | | | 825 | | | | 21,664 | |
| LSB Industries, Inc. (a) (b) | | | 300 | | | | 2,628 | |
| Martin Marietta Materials, Inc. | | | 444 | | | | 98,142 | |
| WILSHIRE 5000 INDEX FUND | | | | | | | | |
| SCHEDULE OF INVESTMENTS (continued) | | | | | | | | |
| | | | | | | | | |
| COMMON STOCKS - 99.4% (Continued) | | | Shares | | | | Value | |
| Materials - 3.3% (Continued) | | | | | | | | |
| Minerals Technologies, Inc. | | | 250 | | | $ | 17,213 | |
| Monsanto Co. | | | 3,184 | | | | 371,827 | |
| Mosaic Co. (The) | | | 2,625 | | | | 67,358 | |
| Myers Industries, Inc. | | | 200 | | | | 3,900 | |
| Neenah Paper, Inc. | | | 120 | | | | 10,878 | |
| Newmont Mining Corp. | | | 3,650 | | | | 136,947 | |
| Nucor Corp. | | | 2,045 | | | | 130,020 | |
| Olin Corp. | | | 1,020 | | | | 36,292 | |
| Owens-Illinois, Inc. (a) | | | 1,300 | | | �� | 28,821 | |
| P.H. Glatfelter Co. | | | 325 | | | | 6,968 | |
| Packaging Corp. of America | | | 575 | | | | 69,316 | |
| PolyOne Corp. | | | 483 | | | | 21,011 | |
| PPG Industries, Inc. | | | 1,799 | | | | 210,159 | |
| Praxair, Inc. | | | 1,869 | | | | 289,096 | |
| Quaker Chemical Corp. | | | 100 | | | | 15,079 | |
| Rayonier Advanced Materials, Inc. (b) | | | 500 | | | | 10,225 | |
| Reliance Steel & Aluminum Co. | | | 549 | | | | 47,099 | |
| Royal Gold, Inc. (b) | | | 491 | | | | 40,321 | |
| RPM International, Inc. | | | 1,000 | | | | 52,420 | |
| Schweitzer-Mauduit International, Inc. | | | 300 | | | | 13,608 | |
| Scotts Miracle-Gro Co. (The) | | | 296 | | | | 31,669 | |
| Sealed Air Corp. (b) | | | 1,250 | | | | 61,625 | |
| Sensient Technologies Corp. | | | 335 | | | | 24,505 | |
| Sherwin-Williams Co. (The) | | | 623 | | | | 255,455 | |
| Silgan Holdings, Inc. | | | 150 | | | | 4,409 | |
| Sonoco Products Co. | | | 725 | | | | 38,527 | |
| Southern Copper Corp. (b) | | | 747 | | | | 35,445 | |
| Steel Dynamics, Inc. | | | 1,550 | | | | 66,852 | |
| Stepan Co. | | | 148 | | | | 11,688 | |
| Summit Materials, Inc. - Class A (a) (b) | | | 571 | | | | 17,952 | |
| SunCoke Energy, Inc. (a) | | | 564 | | | | 6,762 | |
| Tahoe Resources, Inc. (b) | | | 1,250 | | | | 5,988 | |
| TimkenSteel Corp. (a) (b) | | | 400 | | | | 6,076 | |
| Tredegar Corp. | | | 671 | | | | 12,883 | |
| Trinseo S.A. | | | 300 | | | | 21,780 | |
| UFP Technologies, Inc. (a) | | | 500 | | | | 13,900 | |
| WILSHIRE 5000 INDEX FUND | | | | | | | | |
| SCHEDULE OF INVESTMENTS (continued) | | | | | | | | |
| | | | | | | | | |
| COMMON STOCKS - 99.4% (Continued) | | | Shares | | | | Value | |
| Materials - 3.3% (Continued) | | | | | | | | |
| United States Lime & Minerals, Inc. | | | 50 | | | $ | 3,855 | |
| United States Steel Corp. | | | 1,350 | | | | 47,507 | |
| Valvoline, Inc. | | | 1,282 | | | | 32,127 | |
| Vulcan Materials Co. | | | 855 | | | | 109,756 | |
| W.R. Grace & Co. | | | 427 | | | | 29,946 | |
| Westlake Chemical Corp. | | | 202 | | | | 21,519 | |
| WestRock Co. | | | 1,534 | | | | 96,964 | |
| Worthington Industries, Inc. | | | 225 | | | | 9,914 | |
| | | | | | | | 6,058,681 | |
| Real Estate - 4.0% | | | | | | | | |
| Acadia Realty Trust | | | 676 | | | | 18,495 | |
| Agree Realty Corp. | | | 300 | | | | 15,432 | |
| Alexander & Baldwin, Inc. | | | 150 | | | | 4,161 | |
| Alexandria Real Estate Equities, Inc. | | | 601 | | | | 78,485 | |
| American Assets Trust, Inc. | | | 425 | | | | 16,252 | |
| American Campus Communities, Inc. | | | 982 | | | | 40,291 | |
| American Homes 4 Rent - Class A | | | 1,700 | | | | 37,128 | |
| American Tower Corp. | | | 2,896 | | | | 413,171 | |
| Apartment Investment & Management Co. - Class A | | | 1,381 | | | | 60,364 | |
| Apple Hospitality REIT, Inc. | | | 1,975 | | | | 38,730 | |
| Ashford Hospitality Prime, Inc. | | | 130 | | | | 1,265 | |
| Ashford Hospitality Trust, Inc. | | | 544 | | | | 3,661 | |
| AV Homes, Inc. (a) | | | 600 | | | | 9,990 | |
| AvalonBay Communities, Inc. | | | 1,099 | | | | 196,073 | |
| Boston Properties, Inc. | | | 1,243 | | | | 161,627 | |
| Brandywine Realty Trust | | | 1,413 | | | | 25,702 | |
| Brixmor Property Group, Inc. | | | 2,275 | | | | 42,452 | |
| Camden Property Trust | | | 725 | | | | 66,744 | |
| CareTrust REIT, Inc. (b) | | | 403 | | | | 6,754 | |
| CBL & Associates Properties, Inc. - Class B (b) | | | 1,205 | | | | 6,820 | |
| CBRE Group, Inc. - Class A (a) | | | 2,425 | | | | 105,027 | |
| Cedar Realty Trust, Inc. | | | 650 | | | | 3,952 | |
| Chatham Lodging Trust | | | 425 | | | | 9,673 | |
| Chesapeake Lodging Trust (b) | | | 625 | | | | 16,931 | |
| Colony NorthStar, Inc. - Class A | | | 3,575 | | | | 40,791 | |
| Columbia Property Trust, Inc. | | | 1,075 | | | | 24,671 | |
| WILSHIRE 5000 INDEX FUND | | | | | | | | |
| SCHEDULE OF INVESTMENTS (continued) | | | | | | | | |
| | | | | | | | | |
| COMMON STOCKS - 99.4% (Continued) | | | Shares | | | | Value | |
| Real Estate - 4.0% (Continued) | | | | | | | | |
| CoreCivic, Inc. | | | 799 | | | $ | 17,978 | |
| CoreSite Realty Corp. (b) | | | 300 | | | | 34,170 | |
| Corporate Office Properties Trust | | | 850 | | | | 24,820 | |
| Cousins Properties, Inc. | | | 3,356 | | | | 31,043 | |
| Crown Castle International Corp. | | | 2,435 | | | | 270,309 | |
| CubeSmart | | | 1,412 | | | | 40,835 | |
| CyrusOne, Inc. (b) | | | 725 | | | | 43,159 | |
| DCT Industrial Trust, Inc. | | | 587 | | | | 34,504 | |
| DDR Corp. | | | 2,820 | | | | 25,267 | |
| DiamondRock Hospitality Co. | | | 1,727 | | | | 19,498 | |
| Digital Realty Trust, Inc. | | | 1,631 | | | | 185,771 | |
| Douglas Emmett, Inc. (b) | | | 1,300 | | | | 53,378 | |
| Duke Realty Corp. | | | 2,726 | | | | 74,174 | |
| EastGroup Properties, Inc. (b) | | | 262 | | | | 23,156 | |
| Empire State Realty Trust, Inc. - Class A | | | 775 | | | | 15,911 | |
| EPR Properties (b) | | | 422 | | | | 27,624 | |
| Equinix, Inc. | | | 530 | | | | 240,207 | |
| Equity Commonwealth (a) | | | 993 | | | | 30,296 | |
| Equity LifeStyle Properties, Inc. | | | 739 | | | | 65,786 | |
| Equity Residential | | | 2,904 | | | | 185,188 | |
| Essex Property Trust, Inc. | | | 472 | | | | 113,927 | |
| Extra Space Storage, Inc. | | | 989 | | | | 86,488 | |
| Federal Realty Investment Trust | | | 520 | | | | 69,061 | |
| First Industrial Realty Trust, Inc. | | | 1,025 | | | | 32,257 | |
| Forest City Realty Trust, Inc. - Class A | | | 2,100 | | | | 50,610 | |
| Four Corners Property Trust, Inc. | | | 444 | | | | 11,411 | |
| Franklin Street Properties Corp. | | | 950 | | | | 10,203 | |
| Gaming and Leisure Properties, Inc. | | | 1,217 | | | | 45,029 | |
| Getty Realty Corp. | | | 402 | | | | 10,918 | |
| GGP, Inc. | | | 3,965 | | | | 92,741 | |
| Government Properties Income Trust | | | 550 | | | | 10,197 | |
| Gramercy Property Trust | | | 912 | | | | 24,314 | |
| HCP, Inc. | | | 3,775 | | | | 98,452 | |
| Healthcare Realty Trust, Inc. (b) | | | 875 | | | | 28,105 | |
| Hersha Hospitality Trust (b) | | | 550 | | | | 9,570 | |
| Highwoods Properties, Inc. | | | 800 | | | | 40,728 | |
| WILSHIRE 5000 INDEX FUND | | | | | | | | |
| SCHEDULE OF INVESTMENTS (continued) | | | | | | | | |
| | | | | | | | | |
| COMMON STOCKS - 99.4% (Continued) | | | Shares | | | | Value | |
| Real Estate - 4.0% (Continued) | | | | | | | | |
| Hospitality Properties Trust | | | 1,325 | | | $ | 39,551 | |
| Host Hotels & Resorts, Inc. | | | 5,974 | | | | 118,584 | |
| Howard Hughes Corp. (The) (a) | | | 321 | | | | 42,138 | |
| Hudson Pacific Properties, Inc. | | | 1,225 | | | | 41,956 | |
| Investors Real Estate Trust | | | 1,800 | | | | 10,224 | |
| Invitation Homes Inc (b) | | | 871 | | | | 20,529 | |
| Iron Mountain, Inc. | | | 1,372 | | | | 51,766 | |
| JBG SMITH Properties (b) | | | 764 | | | | 26,534 | |
| Jones Lang LaSalle, Inc. | | | 284 | | | | 42,296 | |
| Kennedy-Wilson Holdings, Inc. (b) | | | 925 | | | | 16,049 | |
| Kilroy Realty Corp. (b) | | | 700 | | | | 52,255 | |
| Kimco Realty Corp. | | | 3,350 | | | | 60,803 | |
| Kite Realty Group Trust (b) | | | 725 | | | | 14,210 | |
| Lamar Advertising Co. - Class A | | | 400 | | | | 29,696 | |
| LaSalle Hotel Properties | | | 1,000 | | | | 28,070 | |
| Lexington Realty Trust | | | 1,125 | | | | 10,856 | |
| Liberty Property Trust | | | 1,225 | | | | 52,687 | |
| Life Storage, Inc. | | | 350 | | | | 31,175 | |
| LTC Properties, Inc. | | | 50 | | | | 2,178 | |
| Macerich Co. (The) | | | 803 | | | | 52,741 | |
| Mack-Cali Realty Corp. | | | 725 | | | | 15,631 | |
| Medical Properties Trust, Inc. | | | 1,500 | | | | 20,670 | |
| Mid-America Apartment Communities, Inc. | | | 859 | | | | 86,381 | |
| National Health Investors, Inc. (b) | | | 325 | | | | 24,499 | |
| National Retail Properties, Inc. | | | 900 | | | | 38,817 | |
| New Senior Investment Group, Inc. | | | 695 | | | | 5,254 | |
| NorthStar Realty Europe Corp. | | | 542 | | | | 7,279 | |
| Omega Healthcare Investors, Inc. (b) | | | 1,200 | | | | 33,048 | |
| Outfront Media, Inc. | | | 336 | | | | 7,795 | |
| Paramount Group, Inc. (b) | | | 1,800 | | | | 28,530 | |
| Park Hotels & Resorts, Inc. | | | 227 | | | | 6,526 | |
| Pebblebrook Hotel Trust (b) | | | 625 | | | | 23,231 | |
| Pennsylvania Real Estate Investment Trust (b) | | | 775 | | | | 9,215 | |
| Piedmont Office Realty Trust, Inc. - Class A | | | 1,275 | | | | 25,003 | |
| Potlatch Corp. (b) | | | 100 | | | | 4,990 | |
| Prologis, Inc. | | | 4,285 | | | | 276,425 | |
| WILSHIRE 5000 INDEX FUND | | | | | | | | |
| SCHEDULE OF INVESTMENTS (continued) | | | | | | | | |
| | | | | | | | | |
| COMMON STOCKS - 99.4% (Continued) | | | Shares | | | | Value | |
| Real Estate - 4.0% (Continued) | | | | | | | | |
| PS Business Parks, Inc. | | | 200 | | | $ | 25,018 | |
| Public Storage | | | 1,249 | | | | 261,041 | |
| Quality Care Properties, Inc. (a) | | | 815 | | | | 11,255 | |
| Ramco-Gershenson Properties Trust | | | 1,000 | | | | 14,730 | |
| Rayonier, Inc. | | | 826 | | | | 26,126 | |
| Realty Income Corp. (b) | | | 1,700 | | | | 96,934 | |
| Regency Centers Corp. | | | 1,182 | | | | 81,771 | |
| Retail Opportunity Investments Corp. (b) | | | 725 | | | | 14,464 | |
| Retail Properties of America, Inc. - Class A | | | 2,075 | | | | 27,888 | |
| RLJ Lodging Trust | | | 1,633 | | | | 35,877 | |
| RMR Group, Inc. (The) - Class A (b) | | | 71 | | | | 4,210 | |
| Ryman Hospitality Properties, Inc. | | | 525 | | | | 36,236 | |
| Sabra Health Care REIT, Inc. | | | 1,436 | | | | 26,954 | |
| Select Income REIT | | | 350 | | | | 8,796 | |
| Senior Housing Properties Trust | | | 2,075 | | | | 39,736 | |
| Simon Property Group, Inc. (b) | | | 2,553 | | | | 438,451 | |
| SL Green Realty Corp. | | | 776 | | | | 78,322 | |
| Spirit Realty Capital, Inc. | | | 3,000 | | | | 25,740 | |
| St. Joe Co. (The) (a) (b) | | | 500 | | | | 9,025 | |
| STAG Industrial, Inc. | | | 450 | | | | 12,299 | |
| STORE Capital Corp. (b) | | | 675 | | | | 17,577 | |
| Summit Hotel Properties, Inc. | | | 975 | | | | 14,849 | |
| Sun Communities, Inc. | | | 500 | | | | 46,390 | |
| Sunstone Hotel Investors, Inc. (b) | | | 1,840 | | | | 30,415 | |
| Tanger Factory Outlet Centers, Inc. (b) | | | 775 | | | | 20,545 | |
| Taubman Centers, Inc. (b) | | | 500 | | | | 32,715 | |
| Tejon Ranch Co. (a) (b) | | | 50 | | | | 1,038 | |
| Terreno Realty Corp. | | | 275 | | | | 9,642 | |
| UDR, Inc. | | | 2,028 | | | | 78,119 | |
| Uniti Group, Inc. (b) | | | 1,228 | | | | 21,846 | |
| Universal Health Realty Income Trust | | | 200 | | | | 15,022 | |
| Urban Edge Properties | | | 811 | | | | 20,672 | |
| Urstadt Biddle Properties, Inc. - Class A | | | 500 | | | | 10,870 | |
| Ventas, Inc. | | | 2,665 | | | | 159,927 | |
| VEREIT, Inc. | | | 6,175 | | | | 48,103 | |
| Vornado Realty Trust | | | 1,528 | | | | 119,459 | |
| WILSHIRE 5000 INDEX FUND | | | | | | | | |
| SCHEDULE OF INVESTMENTS (continued) | | | | | | | | |
| | | | | | | | | |
| COMMON STOCKS - 99.4% (Continued) | | | Shares | | | | Value | |
| Real Estate - 4.0% (Continued) | | | | | | | | |
| Washington Prime Group, Inc. (b) | | | 1,617 | | | $ | 11,513 | |
| Washington Real Estate Investment Trust | | | 450 | | | | 14,004 | |
| Weingarten Realty Investors (b) | | | 1,050 | | | | 34,514 | |
| Welltower, Inc. (b) | | | 2,820 | | | | 179,831 | |
| Weyerhaeuser Co. | | | 5,677 | | | | 200,171 | |
| | | | | | | | 7,341,414 | |
| Telecommunication Services - 2.1% | | | | | | | | |
| 8x8, Inc. (a) | | | 1,000 | | | | 14,100 | |
| AT&T, Inc. | | | 44,270 | | | | 1,721,217 | |
| CenturyLink, Inc. | | | 6,072 | | | | 101,281 | |
| Cogent Communications Holdings, Inc. | | | 200 | | | | 9,060 | |
| Consolidated Communications Holdings, Inc. (b) | | | 501 | | | | 6,107 | |
| General Communication, Inc. - Class A (a) | | | 175 | | | | 6,829 | |
| IDT Corp. - Class B | | | 16 | | | | 170 | |
| SBA Communications Corp. - Class A (a) | | | 920 | | | | 150,291 | |
| Shenandoah Telecommunications Co. (b) | | | 300 | | | | 10,140 | |
| Spok Holdings, Inc. | | | 400 | | | | 6,260 | |
| Sprint Corp. (a) | | | 5,547 | | | | 32,672 | |
| Straight Path Communications, Inc. - Class B (a) | | | 8 | | | | 1,454 | |
| Telephone & Data Systems, Inc. | | | 700 | | | | 19,460 | |
| T-Mobile US, Inc. (a) | | | 2,125 | | | | 134,959 | |
| United States Cellular Corp. (a) | | | 300 | | | | 11,289 | |
| Verizon Communications, Inc. | | | 28,643 | | | | 1,516,074 | |
| Vonage Holdings Corp. (a) | | | 1,425 | | | | 14,492 | |
| Zayo Group Holdings, Inc. (a) | | | 1,525 | | | | 56,120 | |
| | | | | | | | 3,811,975 | |
| Utilities - 2.9% | | | | | | | | |
| AES Corp. | | | 4,360 | | | | 47,219 | |
| ALLETE, Inc. | | | 425 | | | | 31,603 | |
| Alliant Energy Corp. | | | 1,375 | | | | 58,589 | |
| Ameren Corp. | | | 1,625 | | | | 95,859 | |
| American Electric Power Co., Inc. | | | 3,355 | | | | 246,827 | |
| American States Water Co. | | | 100 | | | | 5,791 | |
| American Water Works Co., Inc. | | | 1,190 | | | | 108,873 | |
| Aqua America, Inc. | | | 1,326 | | | | 52,019 | |
| Atmos Energy Corp. | | | 760 | | | | 65,276 | |
| WILSHIRE 5000 INDEX FUND | | | | | | | | |
| SCHEDULE OF INVESTMENTS (continued) | | | | | | | | |
| | | | | | | | | |
| COMMON STOCKS - 99.4% (Continued) | | | Shares | | | | Value | |
| Utilities - 2.9% (Continued) | | | | | | | | |
| Avangrid, Inc. (b) | | | 550 | | | $ | 27,819 | |
| Avista Corp. (b) | | | 250 | | | | 12,873 | |
| Black Hills Corp. (b) | | | 300 | | | | 18,033 | |
| California Water Service Group (b) | | | 225 | | | | 10,204 | |
| Calpine Corp. (a) | | | 2,000 | | | | 30,260 | |
| CenterPoint Energy, Inc. | | | 2,900 | | | | 82,244 | |
| CMS Energy Corp. | | | 1,800 | | | | 85,140 | |
| Consolidated Edison, Inc. | | | 2,169 | | | | 184,257 | |
| Dominion Energy, Inc. | | | 4,096 | | | | 332,021 | |
| DTE Energy Co. | | | 1,203 | | | | 131,680 | |
| Duke Energy Corp. | | | 5,112 | | | | 429,969 | |
| Dynegy, Inc. (a) | | | 11 | | | | 130 | |
| Edison International | | | 2,291 | | | | 144,883 | |
| El Paso Electric Co. | | | 100 | | | | 5,535 | |
| Entergy Corp. | | | 1,150 | | | | 93,599 | |
| Eversource Energy | | | 2,092 | | | | 132,173 | |
| Exelon Corp. | | | 6,441 | | | | 253,840 | |
| FirstEnergy Corp. | | | 3,030 | | | | 92,779 | |
| Genie Energy Ltd. - Class B (b) | | | 16 | | | | 70 | |
| Great Plains Energy, Inc. | | | 1,405 | | | | 45,297 | |
| Hawaiian Electric Industries, Inc. (b) | | | 800 | | | | 28,920 | |
| IDACORP, Inc. | | | 313 | | | | 28,596 | |
| MDU Resources Group, Inc. | | | 1,075 | | | | 28,896 | |
| MGE Energy, Inc. | | | 150 | | | | 9,465 | |
| National Fuel Gas Co. (b) | | | 650 | | | | 35,692 | |
| New Jersey Resources Corp. | | | 500 | | | | 20,100 | |
| NextEra Energy, Inc. | | | 3,223 | | | | 503,399 | |
| NiSource, Inc. | | | 2,140 | | | | 54,934 | |
| Northwest Natural Gas Co. | | | 300 | | | | 17,895 | |
| NorthWestern Corp. | | | 400 | | | | 23,880 | |
| NRG Energy, Inc. | | | 1,852 | | | | 52,745 | |
| OGE Energy Corp. | | | 1,175 | | | | 38,669 | |
| ONE Gas, Inc. | | | 287 | | | | 21,026 | |
| Ormat Technologies, Inc. | | | 175 | | | | 11,193 | |
| Otter Tail Corp. | | | 350 | | | | 15,558 | |
| PG&E Corp. | | | 3,350 | | | | 150,181 | |
| WILSHIRE 5000 INDEX FUND | | | | | | | | |
| SCHEDULE OF INVESTMENTS (continued) | | | | | | | | |
| | | | | | | | | |
| COMMON STOCKS - 99.4% (Continued) | | | Shares | | | | Value | |
| Utilities - 2.9% (Continued) | | | | | | | | |
| Pinnacle West Capital Corp. | | | 716 | | | $ | 60,989 | |
| PNM Resources, Inc. | | | 400 | | | | 16,180 | |
| Portland General Electric Co. | | | 500 | | | | 22,790 | |
| PPL Corp. | | | 4,700 | | | | 145,465 | |
| Public Service Enterprise Group, Inc. | | | 3,600 | | | | 185,399 | |
| SCANA Corp. | | | 779 | | | | 30,989 | |
| Sempra Energy | | | 1,737 | | | | 185,719 | |
| South Jersey Industries, Inc. (b) | | | 650 | | | | 20,300 | |
| Southern Co. (The) | | | 7,150 | | | | 343,843 | |
| Southwest Gas Holdings, Inc. | | | 325 | | | | 26,156 | |
| Spire, Inc. | | | 350 | | | | 26,303 | |
| UGI Corp. | | | 1,275 | | | | 59,861 | |
| Vectren Corp. | | | 508 | | | | 33,030 | |
| WEC Energy Group, Inc. | | | 2,039 | | | | 135,451 | |
| Westar Energy, Inc. | | | 875 | | | | 46,200 | |
| WGL Holdings, Inc. | | | 350 | | | | 30,044 | |
| Xcel Energy, Inc. | | | 3,600 | | | | 173,196 | |
| | | | | | | | 5,407,926 | |
| | | | | | | | | |
| Total Common Stocks (Cost $56,161,419) | | | | | | $ | 183,305,042 | |
| | | | | | | | | |
| RIGHTS - 0.0% (c) | | | Shares | | | | Value | |
| AMR Corp., Escrow | | | 3,275 | | | $ | 6,353 | |
| Dyax Corp. (b) (d) | | | 1,200 | | | | 0 | |
| Media General, Inc. - CVR | | | 794 | | | | 0 | |
| Safeway CVR - Casa Ley (d) | | | 2,075 | | | | 2,106 | |
| Safeway CVR - PDC (d) | | | 2,075 | | | | 1 | |
| Total Rights (Cost $-) | | | | | | $ | 8,460 | |
| WILSHIRE 5000 INDEX FUND | | | | | | | | |
| SCHEDULE OF INVESTMENTS (Continued) | | | | | | | | |
| | | | | | | | | |
| MONEY MARKET FUNDS - 2.2% (Continued) | | | Shares | | | | Value | |
| Northern Trust Institutional Government Select Portfolio - Institutional Class, 1.13% (e) (f) | | | 2,069,284 | | | $ | 2,069,284 | |
| Northern Trust Institutional Liquid Portfolio - Institutional Class, 1.09% (e) (f) | | | 1,815,226 | | | $ | 1,815,226 | |
| Total Money Market Funds (Cost $3,884,510) | | | | | | $ | 3,884,510 | |
| | | | | | | | | |
| Total Investments at Value - 101.5% (Cost $60,045,929) | | | | | | $ | 187,198,012 | |
| | | | | | | | | |
| Liabilities in Excess of Other Assets - (1.5%) | | | | | | | (2,790,304 | ) |
| | | | | | | | | |
| Net Assets - 100.0% | | | | | | $ | 184,407,708 | |
CVR - Contingent Value Right.
Ltd. - Limited.
plc - Public Limited Company.
| (a) | Non-income producing security. |
| (b) | This security or a partial position of this security is on loan at December 31, 2017. The total value of securities on loan at December 31, 2017 was $11,934,916 (Note 7). |
| (c) | Percentage rounds to less than 0.1%. |
| (d) | Level 3 security. Security has been valued at fair value in accordance with procedures adopted by and under the general supervision of the Board of Directors. The total value of such securities is $8,460 at December 31, 2017, representing 0.0% (c) of net assets (Note 2). |
| (e) | The rate shown is the 7-day effective yield as of December 31, 2017. |
| (f) | This security was purchased with cash collateral held from securities on loan. The total value of such securities as of December 31, 2017 was $1,815,226. Securities on loan are also collateralized by various U.S. Treasury obligations in the amount of $10,476,789 (Note 7). |
| See accompanying notes to financial statements. |
| WILSHIRE LARGE COMPANY GROWTH PORTFOLIO | | | |
| SCHEDULE OF INVESTMENTS | | | |
| December 31, 2017 | | | |
| | | | |
| COMMON STOCKS - 98.9% | | Shares | | | Value | |
| Consumer Discretionary - 15.9% | | | | | | |
| Amazon.com, Inc. (a) | | | 11,301 | | | $ | 13,216,181 | |
| AMC Networks, Inc. - Class A (a) (b) | | | 2,833 | | | | 153,209 | |
| Aptiv plc (a) | | | 750 | | | | 63,623 | |
| BorgWarner, Inc. | | | 1,319 | | | | 67,387 | |
| CBS Corp. - Class B | | | 1,490 | | | | 87,910 | |
| Choice Hotels International, Inc. | | | 3,390 | | | | 263,064 | |
| Comcast Corp. - Class A | | | 13,280 | | | | 531,863 | |
| Delphi Technologies plc (a) | | | 250 | | | | 13,118 | |
| Dick's Sporting Goods, Inc. | | | 2,526 | | | | 72,597 | |
| Domino's Pizza, Inc. (b) | | | 717 | | | | 135,484 | |
| Foot Locker, Inc. | | | 7,160 | | | | 335,661 | |
| H&R Block, Inc. | | | 600 | | | | 15,732 | |
| Home Depot, Inc. (The) | | | 4,306 | | | | 816,116 | |
| Las Vegas Sands Corp. | | | 3,964 | | | | 275,458 | |
| Lowe's Cos., Inc. | | | 7,260 | | | | 674,744 | |
| Lululemon Athletica, Inc. (a) | | | 1,710 | | | | 134,389 | |
| Madison Square Garden Co. (The) - Class A (a) | | | 1,870 | | | | 394,290 | |
| McDonald's Corp. | | | 8,249 | | | | 1,419,818 | |
| Michael Kors Holdings Ltd. (a) | | | 1,980 | | | | 124,641 | |
| Michaels Companies, Inc. (The) (a) | | | 13,710 | | | | 331,645 | |
| Mohawk Industries, Inc. (a) | | | 900 | | | | 248,310 | |
| Netflix, Inc. (a) | | | 1,320 | | | | 253,387 | |
| NVR, Inc. (a) | | | 215 | | | | 754,267 | |
| O'Reilly Automotive, Inc. (a) | | | 530 | | | | 127,486 | |
| Pool Corp. | | | 4,580 | | | | 593,797 | |
| Priceline Group, Inc. (The) (a) | | | 1,965 | | | | 3,414,659 | |
| Ross Stores, Inc. | | | 1,421 | | | | 114,035 | |
| Skechers U.S.A., Inc. - Class A (a) | | | 5,110 | | | | 193,362 | |
| Starbucks Corp. | | | 40,875 | | | | 2,347,452 | |
| TAL Education Group - ADR | | | 38,925 | | | | 1,156,462 | |
| Thor Industries, Inc. | | | 1,320 | | | | 198,950 | |
| TJX Cos., Inc. (The) | | | 32,400 | | | | 2,477,304 | |
| Tupperware Brands Corp. | | | 2,870 | | | | 179,949 | |
| Ulta Beauty, Inc. (a) | | | 9,425 | | | | 2,107,996 | |
| Vail Resorts, Inc. | | | 1,890 | | | | 401,568 | |
| WILSHIRE LARGE COMPANY GROWTH PORTFOLIO | | | | | | | | |
| SCHEDULE OF INVESTMENTS (continued) | | | | | | | | |
| | | | | | | | | |
| COMMON STOCKS - 98.9% (Continued) | | | Shares | | | | Value | |
| Consumer Discretionary - 15.9% (Continued) | | | | | | | | |
| Wyndham Worldwide Corp. | | | 390 | | | $ | 45,189 | |
| Yum China Holdings, Inc. | | | 36,514 | | | | 1,461,290 | |
| Yum! Brands, Inc. | | | 25,902 | | | | 2,113,863 | |
| | | | | | | | 37,316,256 | |
| Consumer Staples - 7.2% | | | | | | | | |
| Altria Group, Inc. | | | 6,228 | | | | 444,741 | |
| Clorox Co. (The) | | | 880 | | | | 130,891 | |
| Coca-Cola Co. (The) | | | 61,907 | | | | 2,840,293 | |
| Costco Wholesale Corp. | | | 310 | | | | 57,697 | |
| Danone S.A. - ADR (b) | | | 169,441 | | | | 2,841,526 | |
| Energizer Holdings, Inc. (b) | | | 1,040 | | | | 49,899 | |
| Kimberly-Clark Corp. | | | 1,253 | | | | 151,187 | |
| Lamb Weston Holdings, Inc. | | | 100 | | | | 5,645 | |
| Monster Beverage Corp. (a) | | | 107,045 | | | | 6,774,878 | |
| PepsiCo, Inc. | | | 3,821 | | | | 458,214 | |
| Philip Morris International, Inc. | | | 4,189 | | | | 442,568 | |
| Procter & Gamble Co. (The) | | | 25,655 | | | | 2,357,182 | |
| Sprouts Farmers Market, Inc. (a) (b) | | | 6,530 | | | | 159,006 | |
| Walgreen Boots Alliance, Inc. | | | 3,500 | | | | 254,170 | |
| | | | | | | | 16,967,897 | |
| Energy - 1.5% | | | | | | | | |
| Cabot Oil & Gas Corp. | | | 5,480 | | | | 156,728 | |
| Diamondback Energy, Inc. (a) | | | 2,071 | | | | 261,464 | |
| Gulfport Energy Corp. (a) | | | 11,970 | | | | 152,737 | |
| Halliburton Co. | | | 2,080 | | | | 101,650 | |
| Schlumberger Ltd. | | | 40,815 | | | | 2,750,522 | |
| | | | | | | | 3,423,101 | |
| Financials - 5.7% | | | | | | | | |
| Allstate Corp. (The) | | | 830 | | | | 86,909 | |
| American Express Co. | | | 13,153 | | | | 1,306,224 | |
| Artisan Partners Asset Management, Inc. - Class A | | | 9,918 | | | | 391,761 | |
| Aspen Insurance Holdings Ltd. | | | 11,370 | | | | 461,623 | |
| Assurant, Inc. | | | 80 | | | | 8,067 | |
| Capital One Financial Corp. | | | 9,713 | | | | 967,221 | |
| Charles Schwab Corp. (The) | | | 35,300 | | | | 1,813,361 | |
| Eaton Vance Corp. | | | 80 | | | | 4,511 | |
| WILSHIRE LARGE COMPANY GROWTH PORTFOLIO | | | | | | | | |
| SCHEDULE OF INVESTMENTS (continued) | | | | | | | | |
| | | | | | | | | |
| COMMON STOCKS - 98.9% (Continued) | | | Shares | | | | Value | |
| Financials - 5.7% (Continued) | | | | | | | | |
| Erie Indemnity Co. - Class A | | | 3,525 | | | $ | 429,486 | |
| Federated Investors, Inc. - Class B | | | 1,900 | | | | 68,552 | |
| First Hawaiian, Inc. | | | 1,450 | | | | 42,311 | |
| First Republic Bank | | | 22,650 | | | | 1,962,396 | |
| Goldman Sachs Group, Inc. (The) | | | 6,725 | | | | 1,713,261 | |
| Intercontinental Exchange, Inc. | | | 830 | | | | 58,565 | |
| Leucadia National Corp. | | | 2,810 | | | | 74,437 | |
| Progressive Corporation (The) | | | 2,500 | | | | 140,800 | |
| S&P Global, Inc. | | | 1,170 | | | | 198,198 | |
| SEI Investments Co. | | | 39,931 | | | | 2,869,441 | |
| Signature Bank (a) | | | 100 | | | | 13,726 | |
| T. Rowe Price Group, Inc. | | | 520 | | | | 54,564 | |
| Western Alliance Bancorp (a) | | | 9,010 | | | | 510,146 | |
| XL Group Ltd. | | | 3,790 | | | | 133,256 | |
| | | | | | | | 13,308,816 | |
| Health Care - 14.1% | | | | | | | | |
| AbbVie, Inc. | | | 2,652 | | | | 256,475 | |
| Agilent Technologies, Inc. | | | 1,950 | | | | 130,592 | |
| Alexion Pharmaceuticals, Inc. (a) | | | 15,625 | | | | 1,868,594 | |
| Align Technology, Inc. (a) | | | 13,933 | | | | 3,095,773 | |
| AmerisourceBergen Corp. | | | 100 | | | | 9,182 | |
| Amgen, Inc. | | | 8,835 | | | | 1,536,407 | |
| Baxter International, Inc. | | | 7,363 | | | | 475,944 | |
| Becton, Dickinson and Co. (b) | | | 1,430 | | | | 306,106 | |
| Biogen, Inc. (a) | | | 980 | | | | 312,199 | |
| BioMarin Pharmaceutical, Inc. (a) | | | 170 | | | | 15,159 | |
| Bioverativ, Inc. (a) | | | 6,228 | | | | 335,814 | |
| Boston Scientific Corp. (a) | | | 14,260 | | | | 353,505 | |
| Bristol-Myers Squibb Co. | | | 5,284 | | | | 323,804 | |
| Bruker Corp. | | | 4,250 | | | | 145,860 | |
| Celgene Corp. (a) | | | 19,035 | | | | 1,986,493 | |
| Centene Corp. (a) | | | 436 | | | | 43,984 | |
| Cerner Corp. (a) | | | 27,458 | | | | 1,850,395 | |
| Cooper Cos., Inc. (The) | | | 2,177 | | | | 474,325 | |
| Danaher Corp. | | | 330 | | | | 30,631 | |
| Edwards Lifesciences Corp. (a) | | | 20,875 | | | | 2,352,821 | |
| WILSHIRE LARGE COMPANY GROWTH PORTFOLIO | | | | | | | | |
| SCHEDULE OF INVESTMENTS (continued) | | | | | | | | |
| | | | | | | | | |
| COMMON STOCKS - 98.9% (Continued) | | | Shares | | | | Value | |
| Health Care - 14.1% (Continued) | | | | | | | | |
| Eli Lilly & Co. | | | 5,215 | | | $ | 440,459 | |
| Exelixis, Inc. (a) | | | 1,600 | | | | 48,640 | |
| Express Scripts Holding Co. (a) | | | 4,089 | | | | 305,203 | |
| Gilead Sciences, Inc. | | | 4,810 | | | | 344,588 | |
| IDEXX Laboratories, Inc. (a) | | | 810 | | | | 126,668 | |
| Illumina, Inc. (a) | | | 1,060 | | | | 231,599 | |
| Incyte Corp. (a) | | | 14,915 | | | | 1,412,600 | |
| Intuitive Surgical, Inc. (a) | | | 90 | | | | 32,845 | |
| Johnson & Johnson | | | 1,279 | | | | 178,702 | |
| Merck & Co., Inc. | | | 17,610 | | | | 990,915 | |
| Mettler-Toledo International, Inc. (a) | | | 350 | | | | 216,832 | |
| Novartis AG | | | 18,777 | | | | 1,576,517 | |
| Novo Nordisk A/S - ADR | | | 54,960 | | | | 2,949,702 | |
| Premier, Inc. - Class A (a) | | | 2,780 | | | | 81,148 | |
| QIAGEN N.V. | | | 1,925 | | | | 59,540 | |
| Regeneron Pharmaceuticals, Inc. (a) | | | 6,163 | | | | 2,317,040 | |
| Teleflex, Inc. | | | 70 | | | | 17,417 | |
| Thermo Fisher Scientific, Inc. | | | 1,110 | | | | 210,767 | |
| UnitedHealth Group, Inc. | | | 4,055 | | | | 893,965 | |
| Varian Medical Systems, Inc. (a) | | | 17,425 | | | | 1,936,789 | |
| Veeva Systems, Inc. - Class A (a) | | | 3,130 | | | | 173,026 | |
| Vertex Pharmaceuticals, Inc. (a) | | | 1,390 | | | | 208,305 | |
| Waters Corp. (a) | | | 610 | | | | 117,846 | |
| West Pharmaceutical Services, Inc. | | | 710 | | | | 70,056 | |
| Zoetis, Inc. | | | 33,025 | | | | 2,379,121 | |
| | | | | | | | 33,224,353 | |
| Industrials - 7.1% | | | | | | | | |
| 3M Co. | | | 3,100 | | | | 729,647 | |
| Allegion plc | | | 1,300 | | | | 103,428 | |
| AMETEK, Inc. | | | 1,194 | | | | 86,529 | |
| Boeing Co. (The) | | | 1,740 | | | | 513,143 | |
| BWX Technologies, Inc. | | | 1,145 | | | | 69,261 | |
| Caterpillar, Inc. | | | 1,580 | | | | 248,976 | |
| Copa Holdings, S.A. - Class A | | | 2,220 | | | | 297,613 | |
| CSX Corp. | | | 41,375 | | | | 2,276,039 | |
| Cummins, Inc. | | | 3,671 | | | | 648,445 | |
| WILSHIRE LARGE COMPANY GROWTH PORTFOLIO | | | | | | | | |
| SCHEDULE OF INVESTMENTS (continued) | | | | | | | | |
| | | | | | | | | |
| COMMON STOCKS - 98.9% (Continued) | | | Shares | | | | Value | |
| Industrials - 7.1% (Continued) | | | | | | | | |
| Deere & Co. | | | 21,839 | | | $ | 3,418,021 | |
| Donaldson Co., Inc. | | | 919 | | | | 44,985 | |
| Dun & Bradstreet Corp. (The) | | | 990 | | | | 117,226 | |
| Expeditors International of Washington, Inc. | | | 38,512 | | | | 2,491,342 | |
| Fortive Corp. | | | 2,353 | | | | 170,240 | |
| General Dynamics Corp. | | | 730 | | | | 148,519 | |
| Graco, Inc. | | | 10,170 | | | | 459,887 | |
| HD Supply Holdings, Inc. (a) | | | 2,360 | | | | 94,471 | |
| Honeywell International, Inc. | | | 3,972 | | | | 609,146 | |
| Illinois Tool Works, Inc. | | | 790 | | | | 131,812 | |
| Landstar System, Inc. | | | 300 | | | | 31,230 | |
| MSC Industrial Direct Co., Inc. - Class A | | | 1,505 | | | | 145,473 | |
| Northrop Grumman Corp. | | | 1,330 | | | | 408,190 | |
| Raytheon Co. | | | 830 | | | | 155,916 | |
| Rockwell Automation, Inc. | | | 870 | | | | 170,825 | |
| Southwest Airlines Co. | | | 3,320 | | | | 217,294 | |
| Toro Co. (The) | | | 4,840 | | | | 315,713 | |
| Union Pacific Corp. | | | 80 | | | | 10,728 | |
| United Parcel Service, Inc. - Class B | | | 16,435 | | | | 1,958,230 | |
| WABCO Holdings, Inc. (a) | | | 2,400 | | | | 344,400 | |
| Waste Management, Inc. | | | 1,110 | | | | 95,793 | |
| Watsco, Inc. | | | 1,490 | | | | 253,360 | |
| | | | | | | | 16,765,882 | |
| Information Technology - 43.8% | | | | | | | | |
| Accenture plc - Class A | | | 3,724 | | | | 570,107 | |
| Activision Blizzard, Inc. | | | 42,805 | | | | 2,710,413 | |
| Adobe Systems, Inc. (a) | | | 12,215 | | | | 2,140,557 | |
| Alibaba Group Holding Ltd. - ADR (a) (b) | | | 31,128 | | | | 5,367,401 | |
| Alphabet, Inc. - Class A (a) | | | 4,148 | | | | 4,369,503 | |
| Alphabet, Inc. - Class C (a) | | | 8,154 | | | | 8,532,346 | |
| Amphenol Corp. - Class A | | | 3,780 | | | | 331,884 | |
| Analog Devices, Inc. | | | 4,583 | | | | 408,024 | |
| ANSYS, Inc. (a) | | | 500 | | | | 73,795 | |
| Apple, Inc. | | | 33,932 | | | | 5,742,312 | |
| Applied Materials, Inc. | | | 45,175 | | | | 2,309,346 | |
| Arista Networks, Inc. (a) | | | 8,325 | | | | 1,961,204 | |
| WILSHIRE LARGE COMPANY GROWTH PORTFOLIO | | | | | | | | |
| SCHEDULE OF INVESTMENTS (continued) | | | | | | | | |
| | | | | | | | | |
| COMMON STOCKS - 98.9% (Continued) | | | Shares | | | | Value | |
| Information Technology - 43.8% (Continued) | | | | | | | | |
| Autodesk, Inc. (a) | | | 28,897 | | | $ | 3,029,273 | |
| Automatic Data Processing, Inc. | | | 6,409 | | | | 751,071 | |
| Booz Allen Hamilton Holding Corp. | | | 6,960 | | | | 265,385 | |
| Broadcom Ltd. | | | 2,723 | | | | 699,539 | |
| CDK Global, Inc. | | | 1,037 | | | | 73,917 | |
| Cisco Systems, Inc. | | | 110,305 | | | | 4,224,681 | |
| Citrix Systems, Inc. (a) | | | 3,569 | | | | 314,072 | |
| Cognex Corp. | | | 35,350 | | | | 2,162,006 | |
| Cognizant Technology Solutions Corp. - Class A | | | 610 | | | | 43,322 | |
| Coherent, Inc. (a) | | | 100 | | | | 28,222 | |
| DST Systems, Inc. | | | 3,960 | | | | 245,797 | |
| Electronic Arts, Inc. (a) | | | 3,400 | | | | 357,204 | |
| Euronet Worldwide, Inc. (a) | | | 2,610 | | | | 219,945 | |
| Facebook, Inc. - Class A (a) | | | 73,137 | | | | 12,905,755 | |
| FactSet Research Systems, Inc. (b) | | | 7,670 | | | | 1,478,469 | |
| IAC/InterActiveCorp (a) | | | 1,660 | | | | 202,985 | |
| Intel Corp. | | | 910 | | | | 42,006 | |
| Intuit, Inc. | | | 720 | | | | 113,602 | |
| IPG Photonics Corp. (a) | | | 160 | | | | 34,261 | |
| Jack Henry & Associates, Inc. | | | 6,028 | | | | 705,035 | |
| KLA-Tencor Corp. | | | 880 | | | | 92,462 | |
| Lam Research Corp. | | | 740 | | | | 136,212 | |
| MasterCard, Inc. - Class A | | | 5,117 | | | | 774,509 | |
| Maxim Integrated Products, Inc. | | | 825 | | | | 43,131 | |
| Micron Technology, Inc. (a) | | | 16,123 | | | | 662,978 | |
| Microsoft Corp. | | | 74,840 | | | | 6,401,813 | |
| Motorola Solutions, Inc. | | | 5,371 | | | | 485,216 | |
| NVIDIA Corp. | | | 11,906 | | | | 2,303,811 | |
| Oracle Corp. | | | 95,569 | | | | 4,518,501 | |
| PayPal Holdings, Inc. (a) | | | 41,285 | | | | 3,039,402 | |
| QUALCOMM, Inc. | | | 43,396 | | | | 2,778,211 | |
| Red Hat, Inc. (a) | | | 26,125 | | | | 3,137,612 | |
| salesforce.com, Inc. (a) | | | 23,465 | | | | 2,398,827 | |
| ServiceNow, Inc. (a) | | | 11,950 | | | | 1,558,161 | |
| Skyworks Solutions, Inc. | | | 2,320 | | | | 220,284 | |
| Square, Inc. - Class A (a) (b) | | | 720 | | | | 24,962 | |
| WILSHIRE LARGE COMPANY GROWTH PORTFOLIO | | | | | | | | |
| SCHEDULE OF INVESTMENTS (continued) | | | | | | | | |
| | | | | | | | | |
| COMMON STOCKS - 98.9% (Continued) | | | Shares | | | | Value | |
| Information Technology - 43.8% (Continued) | | | | | | | | |
| Synopsys, Inc. (a) | | | 323 | | | $ | 27,533 | |
| Take-Two Interactive Software, Inc. (a) | | | 1,980 | | | | 217,364 | |
| Teradyne, Inc. | | | 1,110 | | | | 46,476 | |
| Texas Instruments, Inc. | | | 7,085 | | | | 739,957 | |
| Trimble, Inc. (a) | | | 1,250 | | | | 50,800 | |
| Vantiv, Inc. - Class A (a) (b) | | | 5,865 | | | | 431,371 | |
| Visa, Inc. - Class A (b) | | | 84,725 | | | | 9,660,344 | |
| Western Digital Corp. | | | 4,230 | | | | 336,412 | |
| Workday, Inc. - Class A (a) | | | 270 | | | | 27,470 | |
| Xilinx, Inc. | | | 5,455 | | | | 367,776 | |
| | | | | | | | 102,895,034 | |
| Materials - 2.8% | | | | | | | | |
| AdvanSix, Inc. (a) | | | 216 | | | | 9,087 | |
| Albemarle Corp. | | | 520 | | | | 66,503 | |
| AptarGroup, Inc. | | | 6,413 | | | | 553,313 | |
| Bemis Company, Inc. | | | 6,310 | | | | 301,555 | |
| Celanese Corp. - Series A | | | 850 | | | | 91,018 | |
| Chemours Company (The) | | | 6,843 | | | | 342,561 | |
| Ecolab, Inc. | | | 670 | | | | 89,901 | |
| FMC Corp. | | | 8,861 | | | | 838,782 | |
| Freeport-McMoRan, Inc. (a) | | | 23,440 | | | | 444,422 | |
| GCP Applied Technologies, Inc. (a) | | | 966 | | | | 30,815 | |
| Graphic Packaging Holding Co. | | | 13,150 | | | | 203,168 | |
| Packaging Corporation of America | | | 490 | | | | 59,070 | |
| PPG Industries, Inc. | | | 1,930 | | | | 225,463 | |
| Praxair, Inc. | | | 2,585 | | | | 399,848 | |
| Sherwin-Williams Co. (The) | | | 6,500 | | | | 2,665,260 | |
| Silgan Holdings, Inc. | | | 880 | | | | 25,863 | |
| Southern Copper Corp. (b) | | | 331 | | | | 15,706 | |
| W.R. Grace & Co. | | | 95 | | | | 6,662 | |
| Westlake Chemical Corp. | | | 715 | | | | 76,169 | |
| | | | | | | | 6,445,166 | |
| Real Estate - 0.6% | | | | | | | | |
| American Tower Corp. | | | 5,420 | | | | 773,272 | |
| CBRE Group, Inc. - Class A (a) | | | 230 | | | | 9,961 | |
| Equinix, Inc. | | | 412 | | | | 186,727 | |
| WILSHIRE LARGE COMPANY GROWTH PORTFOLIO | | | | | | | | |
| SCHEDULE OF INVESTMENTS (continued) | | | | | | | | |
| | | | | | | | | |
| COMMON STOCKS - 98.9% (Continued) | | | Shares | | | | Value | |
| Real Estate - 0.6% (Continued) | | | | | | | | |
| Equity LifeStyle Properties, Inc. | | | 2,405 | | | $ | 214,093 | |
| Sabra Health Care REIT, Inc. | | | 8,242 | | | | 154,702 | |
| Senior Housing Properties Trust | | | 1,500 | | | | 28,725 | |
| | | | | | | | 1,367,480 | |
| Telecommunication Services - 0.2% | | | | | | | | |
| SBA Communications Corp. - Class A (a) | | | 220 | | | | 35,939 | |
| Verizon Communications, Inc. | | | 7,400 | | | | 391,682 | |
| | | | | | | | 427,621 | |
| Utilities - 0.0% (c) | | | | | | | | |
| NRG Energy, Inc. | | | 620 | | | | 17,658 | |
| | | | | | | | | |
| Total Common Stocks (Cost $148,649,726) | | | | | | $ | 232,159,264 | |
| WILSHIRE LARGE COMPANY GROWTH PORTFOLIO | | | | | | |
| SCHEDULE OF INVESTMENTS (continued) | | | | | | |
| | | | | | | |
| MONEY MARKET FUNDS - 1.8% | | Shares | | | Value | |
| Northern Trust Institutional Government Select Portfolio - Institutional Class, 1.13% (d) | | | 2,635,435 | | | $ | 2,635,435 | |
| Northern Trust Institutional Liquid Portfolio - Institutional Class, 1.09% (d) (e) | | | 1,614,019 | | | | 1,614,019 | |
| Total Money Market Funds (Cost $4,249,454) | | | | | | $ | 4,249,454 | |
| | | | | | | | | |
| Total Investments at Value - 100.7% (Cost $152,899,180) | | | | | | $ | 236,408,718 | |
| | | | | | | | | |
| Liabilities in Excess of Other Assets - (0.7%) | | | | | | | (1,570,391 | ) |
| | | | | | | | | |
| Net Assets - 100.0% | | | | | | $ | 234,838,327 | |
| (a) | Non-income producing security. |
| (b) | This security or a partial position of this security is on loan at December 31, 2017. The total value of securities on loan at December 31, 2017 was $15,985,353 (Note 7). |
| (c) | Percentage rounds to less than 0.1%. |
| (d) | The rate shown is the 7-day effective yield as of December 31, 2017. |
| (e) | This security was purchased with cash collateral held from securities on loan. The total value of such securities as of December 31, 2017 was $1,614,019. Securities on loan are also collateralized by various U.S. Treasury obligations in the amount of $14,796,474 (Note 7). |
| ADR - | American Depositary Receipt. |
| Ltd. - | Limited. |
| plc - | Public Limited Company. |
| |
| See accompanying notes to financial statements. |
| WILSHIRE LARGE COMPANY VALUE PORTFOLIO | | | |
| SCHEDULE OF INVESTMENTS | | | |
| December 31, 2017 | | | |
| | | | |
| COMMON STOCKS - 97.9% | | Shares | | �� | Value | |
| Consumer Discretionary - 6.3% | | | | | | |
| Adient plc | | | 10,381 | | | $ | 816,985 | |
| Advance Auto Parts, Inc. | | | 60 | | | | 5,981 | |
| Bed Bath & Beyond, Inc. (a) | | | 6,872 | | | | 151,115 | |
| BorgWarner, Inc. | | | 444 | | | | 22,684 | |
| Burlington Stores, Inc. (b) | | | 2,690 | | | | 330,951 | |
| Choice Hotels International, Inc. | | | 2,852 | | | | 221,315 | |
| Comcast Corp. - Class A | | | 60 | | | | 2,403 | |
| Dick's Sporting Goods, Inc. | | | 980 | | | | 28,165 | |
| Foot Locker, Inc. | | | 3,570 | | | | 167,362 | |
| Ford Motor Co. | | | 31,600 | | | | 394,684 | |
| Garmin Ltd. | | | 740 | | | | 44,082 | |
| General Motors Co. | | | 20,879 | | | | 855,830 | |
| H&R Block, Inc. | | | 4,650 | | | | 121,923 | |
| Hilton Worldwide Holdings, Inc. | | | 11,594 | | | | 925,896 | |
| Interpublic Group of Cos., Inc. (The) | | | 47,785 | | | | 963,346 | |
| John Wiley & Sons, Inc. - Class A | | | 390 | | | | 25,643 | |
| Kohl's Corp. (a) | | | 3,803 | | | | 206,237 | |
| L Brands, Inc. | | | 310 | | | | 18,668 | |
| Liberty Broadband Corp. - Series A (a) (b) | | | 1,713 | | | | 145,691 | |
| Macy's, Inc. (a) | | | 1,930 | | | | 48,617 | |
| Michael Kors Holdings Ltd. (b) | | | 130 | | | | 8,184 | |
| Michaels Companies, Inc. (The) (b) | | | 5,080 | | | | 122,885 | |
| Mohawk Industries, Inc. (b) | | | 400 | | | | 110,360 | |
| News Corp. - Class A | | | 37,209 | | | | 603,158 | |
| Norwegian Cruise Line Holdings Ltd. (b) | | | 2,190 | | | | 116,618 | |
| Omnicom Group, Inc. | | | 17,637 | | | | 1,284,502 | |
| Skechers U.S.A., Inc. - Class A (b) | | | 1,827 | | | | 69,133 | |
| Target Corp. (a) | | | 16,600 | | | | 1,083,149 | |
| Tiffany & Co. | | | 90 | | | | 9,356 | |
| Viacom, Inc. - Class B | | | 20 | | | | 616 | |
| Walt Disney Co. (The) | | | 200 | | | | 21,502 | |
| Whirlpool Corp. | | | 3,800 | | | | 640,832 | |
| Yum China Holdings, Inc. | | | 4,360 | | | | 174,487 | |
| Yum! Brands, Inc. | | | 2,670 | | | | 217,899 | |
| | | | | | | | 9,960,259 | |
| WILSHIRE LARGE COMPANY VALUE PORTFOLIO | | | |
| SCHEDULE OF INVESTMENTS (continued) | | | |
| | | | |
| COMMON STOCKS - 97.9% (Continued) | | Shares | | | Value | |
| Consumer Staples - 7.8% | | | | | | |
| Altria Group, Inc. | | | 22,800 | | | $ | 1,628,148 | |
| Coca-Cola Co. (The) | | | 2,510 | | | | 115,159 | |
| Colgate-Palmolive Co. | | | 440 | | | | 33,198 | |
| CVS Health Corp. | | | 19,395 | | | | 1,406,138 | |
| Kellogg Co. (a) | | | 7,675 | | | | 521,747 | |
| Kimberly-Clark Corp. | | | 1,161 | | | | 140,086 | |
| PepsiCo, Inc. | | | 2,964 | | | | 355,443 | |
| Philip Morris International, Inc. | | | 23,706 | | | | 2,504,539 | |
| Pilgrim's Pride Corp. (a) (b) | | | 930 | | | | 28,886 | |
| Pinnacle Foods, Inc. | | | 2,040 | | | | 121,319 | |
| Procter & Gamble Co. (The) | | | 10,292 | | | | 945,629 | |
| Tyson Foods, Inc. - Class A | | | 9,300 | | | | 753,950 | |
| Walgreen Boots Alliance, Inc. | | | 1,270 | | | | 92,227 | |
| Wal-Mart Stores, Inc. | | | 37,643 | | | | 3,717,246 | |
| | | | | | | | 12,363,715 | |
| Energy - 12.0% | | | | | | | | |
| Apache Corp. | | | 90 | | | | 3,800 | |
| Baker Hughes, a GE Co. | | | 2,111 | | | | 66,792 | |
| BP plc - ADR | | | 75,697 | | | | 3,181,544 | |
| Cabot Oil & Gas Corp. | | | 6,440 | | | | 184,184 | |
| Chevron Corp. | | | 14,999 | | | | 1,877,725 | |
| Cimarex Energy Co. | | | 100 | | | | 12,201 | |
| ConocoPhillips | | | 26,697 | | | | 1,465,398 | |
| Devon Energy Corp. | | | 2,200 | | | | 91,080 | |
| Diamondback Energy, Inc. (b) | | | 2,033 | | | | 256,666 | |
| Energen Corp. (b) | | | 250 | | | | 14,393 | |
| Ensco plc - Class A (a) | | | 15,054 | | | | 88,969 | |
| Exxon Mobil Corp. | | | 35,958 | | | | 3,007,527 | |
| Gulfport Energy Corp. (b) | | | 11,219 | | | | 143,154 | |
| Halliburton Co. | | | 21,916 | | | | 1,071,035 | |
| Kinder Morgan, Inc. | | | 3,210 | | | | 58,005 | |
| Marathon Petroleum Corp. | | | 2,070 | | | | 136,579 | |
| Murphy Oil Corp. (a) | | | 20,188 | | | | 626,837 | |
| Nabors Industries Ltd. (a) | | | 11,040 | | | | 75,403 | |
| Occidental Petroleum Corp. | | | 22,400 | | | | 1,649,984 | |
| Patterson-UTI Energy, Inc. | | | 12,270 | | | | 282,333 | |
| WILSHIRE LARGE COMPANY VALUE PORTFOLIO | | | |
| SCHEDULE OF INVESTMENTS (continued) | | | |
| | | | |
| COMMON STOCKS - 97.9% (Continued) | | Shares | | | Value | |
| Energy - 12.0% (Continued) | | | | | | |
| Phillips 66 | | | 17,600 | | | $ | 1,780,240 | |
| QEP Resources, Inc. (b) | | | 4,715 | | | | 45,123 | |
| Royal Dutch Shell plc - Class A (a) | | | 35,705 | | | | 2,381,881 | |
| Southwestern Energy Co. (b) | | | 14,800 | | | | 82,584 | |
| Targa Resources Corp. | | | 730 | | | | 35,347 | |
| Transocean Ltd. (a) (b) | | | 10,330 | | | | 110,324 | |
| World Fuel Services Corp. | | | 8,240 | | | | 231,874 | |
| | | | | | | | 18,960,982 | |
| Financials - 31.2% | | | | | | | | |
| Aflac, Inc. | | | 2,630 | | | | 230,861 | |
| Allstate Corp. (The) | | | 6,378 | | | | 667,840 | |
| American Express Co. | | | 21,068 | | | | 2,092,263 | |
| American Financial Group, Inc. | | | 811 | | | | 88,026 | |
| American International Group, Inc. | | | 23,065 | | | | 1,374,213 | |
| American National Insurance Co. | | | 735 | | | | 94,264 | |
| Arch Capital Group Ltd. (b) | | | 450 | | | | 40,847 | |
| Aspen Insurance Holdings Ltd. | | | 5,701 | | | | 231,461 | |
| Assured Guaranty Ltd. | | | 15,552 | | | | 526,746 | |
| Athene Holding Ltd. - Class A (b) | | | 640 | | | | 33,094 | |
| Axis Capital Holdings Ltd. | | | 20,632 | | | | 1,036,964 | |
| Bank of America Corp. | | | 164,175 | | | | 4,846,446 | |
| Bank of Hawaii Corp. (a) | | | 1,030 | | | | 88,271 | |
| BankUnited, Inc. | | | 390 | | | | 15,881 | |
| Berkshire Hathaway, Inc. - Class B (b) | | | 6,282 | | | | 1,245,219 | |
| BlackRock, Inc. | | | 100 | | | | 51,371 | |
| Brighthouse Financial, Inc. (b) | | | 1,921 | | | | 112,647 | |
| Capital One Financial Corp. | | | 19,481 | | | | 1,939,918 | |
| Chimera Investment Corp. | | | 7,589 | | | | 140,245 | |
| Chubb Ltd. | | | 1,500 | | | | 219,195 | |
| Citigroup, Inc. | | | 32,621 | | | | 2,427,329 | |
| Citizens Financial Group, Inc. | | | 7,082 | | | | 297,302 | |
| Comerica, Inc. | | | 1,080 | | | | 93,755 | |
| Commerce Bancshares, Inc. | | | 2,139 | | | | 119,442 | |
| Discover Financial Services | | | 2,056 | | | | 158,148 | |
| Everest Re Group Ltd. | | | 200 | | | | 44,252 | |
| Fifth Third Bancorp | | | 23,213 | | | | 704,282 | |
| WILSHIRE LARGE COMPANY VALUE PORTFOLIO | | | | | | |
| SCHEDULE OF INVESTMENTS (continued) | | | | | | |
| | | | | | | |
| COMMON STOCKS - 97.9% (Continued) | | Shares | | | Value | |
| Financials - 31.2% (Continued) | | | | | | | | |
| First American Financial Corp. | | | 930 | | | $ | 52,117 | |
| Franklin Resources, Inc. | | | 38,834 | | | | 1,682,677 | |
| Fulton Financial Corp. | | | 286 | | | | 5,119 | |
| Genworth Financial, Inc. - Class A (b) | | | 420 | | | | 1,306 | |
| Goldman Sachs Group, Inc. (The) | | | 5,810 | | | | 1,480,156 | |
| Granite Point Mortgage Trust, Inc. (a) | | | 2,923 | | | | 51,854 | |
| Hanover Insurance Group, Inc. (The) | | | 5,750 | | | | 621,460 | |
| Intercontinental Exchange, Inc. | | | 1,640 | | | | 115,718 | |
| Invesco Ltd. | | | 8,119 | | | | 296,668 | |
| JPMorgan Chase & Co. | | | 50,843 | | | | 5,437,149 | |
| KeyCorp | | | 32,434 | | | | 654,194 | |
| Loews Corp. | | | 28,000 | | | | 1,400,840 | |
| Mercury General Corp. | | | 386 | | �� | | 20,628 | |
| MetLife, Inc. | | | 21,133 | | | | 1,068,484 | |
| MFA Financial, Inc. | | | 49,247 | | | | 390,036 | |
| Morgan Stanley | | | 25,386 | | | | 1,332,003 | |
| PNC Financial Services Group, Inc. (The) | | | 5,620 | | | | 810,910 | |
| Popular, Inc. | | | 16,548 | | | | 587,289 | |
| ProAssurance Corp. | | | 6,113 | | | | 349,358 | |
| Progressive Corp. (The) | | | 3,060 | | | | 172,339 | |
| Regions Financial Corp. | | | 49,403 | | | | 853,684 | |
| State Street Corp. | | | 25,529 | | | | 2,491,886 | |
| Synchrony Financial | | | 10,246 | | | | 395,598 | |
| Synovus Financial Corp. | | | 10,020 | | | | 480,359 | |
| T. Rowe Price Group, Inc. | | | 1,400 | | | | 146,902 | |
| TCF Financial Corp. | | | 3,725 | | | | 76,363 | |
| Torchmark Corp. | | | 100 | | | | 9,071 | |
| U.S. Bancorp | | | 4,568 | | | | 244,753 | |
| UBS Group AG (a) | | | 57,466 | | | | 1,056,800 | |
| Unum Group | | | 40 | | | | 2,196 | |
| Validus Holdings Ltd. | | | 5,025 | | | | 235,773 | |
| Voya Financial, Inc. | | | 24,747 | | | | 1,224,234 | |
| Wells Fargo & Co. | | | 72,054 | | | | 4,371,516 | |
| Western Alliance Bancorp (b) | | | 4,630 | | | | 262,151 | |
| White Mountains Insurance Group Ltd. | | | 29 | | | | 24,687 | |
| Willis Towers Watson plc | | | 1,739 | | | | 262,050 | |
| WILSHIRE LARGE COMPANY VALUE PORTFOLIO | | | |
| SCHEDULE OF INVESTMENTS (continued) | | | |
| | | | |
| COMMON STOCKS - 97.9% (Continued) | | Shares | | | Value | |
| Financials - 31.2% (Continued) | | | | | | |
| XL Group Ltd. | | | 51,619 | | | $ | 1,814,925 | |
| | | | | | | | 49,403,535 | |
| Health Care - 11.5% | | | | | | | | |
| Abbott Laboratories | | | 1,422 | | | | 81,154 | |
| Agilent Technologies, Inc. | | | 665 | | | | 44,535 | |
| Alexion Pharmaceuticals, Inc. (b) | | | 100 | | | | 11,959 | |
| Baxter International, Inc. | | | 6,050 | | | | 391,072 | |
| Biogen, Inc. (b) | | | 130 | | | | 41,414 | |
| Bio-Rad Laboratories, Inc. - Class A (b) | | | 660 | | | | 157,522 | |
| Bristol-Myers Squibb Co. | | | 50 | | | | 3,064 | |
| Centene Corp. (b) | | | 656 | | | | 66,177 | |
| Cigna Corp. | | | 6,106 | | | | 1,240,068 | |
| Cooper Cos., Inc. (The) | | | 2,221 | | | | 483,911 | |
| Danaher Corp. | | | 2,140 | | | | 198,635 | |
| Express Scripts Holding Co. (b) | | | 17,200 | | | | 1,283,808 | |
| Gilead Sciences, Inc. | | | 750 | | | | 53,730 | |
| HCA Healthcare, Inc. (b) | | | 100 | | | | 8,784 | |
| Johnson & Johnson | | | 21,465 | | | | 2,999,090 | |
| McKesson Corp. | | | 6,935 | | | | 1,081,513 | |
| Medtronic plc | | | 149 | | | | 12,032 | |
| Merck & Co., Inc. | | | 50,811 | | | | 2,859,135 | |
| Mylan N.V. (b) | | | 37,572 | | | | 1,589,671 | |
| Perrigo Co. plc | | | 150 | | | | 13,074 | |
| Pfizer, Inc. | | | 110,487 | | | | 4,001,839 | |
| Premier, Inc. - Class A (b) | | | 962 | | | | 28,081 | |
| QIAGEN N.V. | | | 953 | | | | 29,476 | |
| Sanofi - ADR | | | 19,400 | | | | 834,200 | |
| Teleflex, Inc. | | | 650 | | | | 161,733 | |
| Thermo Fisher Scientific, Inc. | | | 1,100 | | | | 208,868 | |
| United Therapeutics Corp. (b) | | | 2,738 | | | | 405,087 | |
| | | | | | | | 18,289,632 | |
| Industrials - 10.5% | | | | | | | | |
| AMETEK, Inc. | | | 3,700 | | | | 268,139 | |
| Arconic, Inc. | | | 7,139 | | | | 194,538 | |
| Caterpillar, Inc. | | | 5,835 | | | | 919,479 | |
| Copa Holdings, S.A. - Class A | | | 950 | | | | 127,357 | |
| WILSHIRE LARGE COMPANY VALUE PORTFOLIO | | | |
| SCHEDULE OF INVESTMENTS (continued) | | | |
| | | | |
| COMMON STOCKS - 97.9% (Continued) | | Shares | | | Value | |
| Industrials - 10.5% (Continued) | | | | | | |
| Crane Co. | | | 900 | | | $ | 80,298 | |
| Cummins, Inc. | | | 1,420 | | | | 250,829 | |
| Deere & Co. | | | 1,440 | | | | 225,374 | |
| Dover Corp. | | | 14,222 | | | | 1,436,280 | |
| Dun & Bradstreet Corp. (The) | | | 220 | | | | 26,050 | |
| Eaton Corp. plc | | | 560 | | | | 44,246 | |
| Fortive Corp. | | | 970 | | | | 70,180 | |
| Fortune Brands Home & Security, Inc. | | | 460 | | | | 31,482 | |
| General Dynamics Corp. | | | 80 | | | | 16,276 | |
| General Electric Co. | | | 59,300 | | | | 1,034,785 | |
| Honeywell International, Inc. | | | 2,940 | | | | 450,878 | |
| Ingersoll-Rand plc | | | 1,244 | | | | 110,952 | |
| Johnson Controls International plc | | | 40,216 | | | | 1,532,632 | |
| Kennametal, Inc. | | | 2,046 | | | | 99,047 | |
| L3 Technologies, Inc. | | | 1,761 | | | | 348,414 | |
| Norfolk Southern Corp. | | | 7,200 | | | | 1,043,280 | |
| Owens Corning | | | 719 | | | | 66,105 | |
| Parker-Hannifin Corp. | | | 4,354 | | | | 868,971 | |
| Quanta Services, Inc. (b) | | | 1,090 | | | | 42,630 | |
| Raytheon Co. | | | 4,970 | | | | 933,615 | |
| Republic Services, Inc. | | | 740 | | | | 50,031 | |
| Roper Technologies, Inc. | | | 760 | | | | 196,840 | |
| Southwest Airlines Co. | | | 20,300 | | | | 1,328,635 | |
| Spirit AeroSystems Holdings, Inc. - Class A | | | 300 | | | | 26,175 | |
| Spirit Airlines, Inc. (b) | | | 3,010 | | | | 134,999 | |
| Stanley Black & Decker, Inc. | | | 14,038 | | | | 2,382,108 | |
| United Technologies Corp. | | | 16,205 | | | | 2,067,271 | |
| Waste Management, Inc. | | | 1,830 | | | | 157,929 | |
| WESCO International, Inc. (b) | | | 650 | | | | 44,298 | |
| Xylem, Inc. | | | 550 | | | | 37,510 | |
| | | | | | | | 16,647,633 | |
| Information Technology - 8.8% | | | | | | | | |
| Apple, Inc. | | | 1,261 | | | | 213,399 | |
| Applied Materials, Inc. | | | 3,890 | | | | 198,857 | |
| Arrow Electronics, Inc. (b) | | | 100 | | | | 8,041 | |
| Autodesk, Inc. (b) | | | 720 | | | | 75,478 | |
| WILSHIRE LARGE COMPANY VALUE PORTFOLIO | | | |
| SCHEDULE OF INVESTMENTS (continued) | | | |
| | | | |
| COMMON STOCKS - 97.9% (Continued) | | Shares | | | Value | |
| Information Technology - 8.8% (Continued) | | | | | | |
| Booz Allen Hamilton Holding Corp. | | | 5,049 | | | $ | 192,518 | |
| Cisco Systems, Inc. | | | 28,082 | | | | 1,075,541 | |
| Cognizant Technology Solutions Corp. - Class A | | | 14,664 | | | | 1,041,438 | |
| Dolby Laboratories, Inc. - Class A | | | 220 | | | | 13,640 | |
| eBay, Inc. (b) | | | 9,640 | | | | 363,814 | |
| Hewlett Packard Enterprise Co. | | | 95,119 | | | | 1,365,909 | |
| Intel Corp. | | | 15,322 | | | | 707,264 | |
| Jabil, Inc. | | | 300 | | | | 7,875 | |
| Juniper Networks, Inc. | | | 5,344 | | | | 152,304 | |
| Marvell Technology Group Ltd. | | | 15,770 | | | | 338,582 | |
| Micro Focus International plc - ADR (b) | | | 13,062 | | | | 438,753 | |
| Micron Technology, Inc. (b) | | | 5,484 | | | | 225,502 | |
| Microsemi Corp. (b) | | | 100 | | | | 5,165 | |
| Microsoft Corp. | | | 10,049 | | | | 859,591 | |
| NetApp, Inc. | | | 4,055 | | | | 224,323 | |
| Oracle Corp. | | | 55,115 | | | | 2,605,836 | |
| QUALCOMM, Inc. | | | 28,701 | | | | 1,837,437 | |
| Seagate Technology plc (a) | | | 8,212 | | | | 343,590 | |
| Synopsys, Inc. (b) | | | 2,629 | | | | 224,096 | |
| TE Connectivity Ltd. | | | 7,736 | | | | 735,230 | |
| Teradyne, Inc. | | | 4,915 | | | | 205,791 | |
| Trimble, Inc. (b) | | | 5,410 | | | | 219,862 | |
| Vishay Intertechnology, Inc. | | | 4 | | | | 83 | |
| Western Digital Corp. | | | 3,580 | | | | 284,717 | |
| | | | | | | | 13,964,636 | |
| Materials - 2.8% | | | | | | | | |
| Air Products & Chemicals, Inc. | | | 790 | | | | 129,623 | |
| Albemarle Corp. | | | 750 | | | | 95,918 | |
| Alcoa Corp. | | | 100 | | | | 5,387 | |
| AptarGroup, Inc. | | | 2,451 | | | | 211,472 | |
| Avery Dennison Corp. | | | 480 | | | | 55,133 | |
| Bemis Company, Inc. | | | 1,881 | | | | 89,893 | |
| Cabot Corp. | | | 1,445 | | | | 88,998 | |
| Celanese Corp. - Series A | | | 1,524 | | | | 163,190 | |
| Domtar Corp. | | | 40 | | | | 1,981 | |
| DowDuPont, Inc. | | | 31,800 | | | | 2,264,795 | |
| WILSHIRE LARGE COMPANY VALUE PORTFOLIO | | | |
| SCHEDULE OF INVESTMENTS (continued) | | | |
| | | | |
| COMMON STOCKS - 97.9% (Continued) | | Shares | | | Value | |
| Materials - 2.8% (Continued) | | | | | | |
| Eastman Chemical Co. | | | 2,025 | | | $ | 187,596 | |
| Freeport-McMoRan, Inc. (b) | | | 16,740 | | | | 317,391 | |
| Newmont Mining Corp. | | | 7,393 | | | | 277,385 | |
| Praxair, Inc. | | | 620 | | | | 95,902 | |
| Sonoco Products Co. | | | 3,903 | | | | 207,405 | |
| Southern Copper Corp. (a) | | | 336 | | | | 15,943 | |
| Tahoe Resources, Inc. (a) | | | 17,000 | | | | 81,430 | |
| W.R. Grace & Co. | | | 10 | | | | 701 | |
| Westlake Chemical Corp. | | | 1,070 | | | | 113,987 | |
| | | | | | | | 4,404,130 | |
| Real Estate - 1.7% | | | | | | | | |
| American Homes 4 Rent - Class A | | | 9,440 | | | | 206,170 | |
| AvalonBay Communities, Inc. | | | 1,170 | | | | 208,740 | |
| Camden Property Trust | | | 720 | | | | 66,283 | |
| CBRE Group, Inc. - Class A (b) | | | 560 | | | | 24,254 | |
| Columbia Property Trust, Inc. | | | 8,440 | | | | 193,698 | |
| DCT Industrial Trust, Inc. | | | 759 | | | | 44,614 | |
| EPR Properties (a) | | | 440 | | | | 28,802 | |
| Equity Residential | | | 3,560 | | | | 227,021 | |
| HCP, Inc. | | | 26,200 | | | | 683,295 | |
| Highwoods Properties, Inc. | | | 3,426 | | | | 174,418 | |
| Hospitality Properties Trust | | | 10,270 | | | | 306,559 | |
| Liberty Property Trust | | | 2,616 | | | | 112,514 | |
| Park Hotels & Resorts, Inc. | | | 7,460 | | | | 214,475 | |
| Quality Care Properties, Inc. (b) | | | 1,517 | | | | 20,950 | |
| Retail Properties of America, Inc. - Class A | | | 16,540 | | | | 222,298 | |
| Sun Communities, Inc. | | | 15 | | | | 1,392 | |
| | | | | | | | 2,735,483 | |
| Telecommunication Services - 2.3% | | | | | | | | |
| AT&T, Inc. | | | 48,020 | | | | 1,867,017 | |
| Telephone & Data Systems, Inc. | | | 1,771 | | | | 49,234 | |
| Verizon Communications, Inc. | | | 34,460 | | | | 1,823,968 | |
| | | | | | | | 3,740,219 | |
| Utilities - 3.0% | | | | | | | | |
| Aqua America, Inc. | | | 2,110 | | | | 82,775 | |
| Avangrid, Inc. | | | 14,430 | | | | 729,869 | |
| WILSHIRE LARGE COMPANY VALUE PORTFOLIO | | | |
| SCHEDULE OF INVESTMENTS (continued) | | | |
| | | | |
| COMMON STOCKS - 97.9% (Continued) | | Shares | | | Value | |
| Utilities - 3.0% (Continued) | | | | | | |
| CenterPoint Energy, Inc. | | | 10,718 | | | $ | 303,962 | |
| Dominion Energy, Inc. | | | 155 | | | | 12,564 | |
| DTE Energy Co. | | | 1,017 | | | | 111,321 | |
| Edison International | | | 8,897 | | | | 562,646 | |
| Entergy Corp. | | | 14,020 | | | | 1,141,089 | |
| Eversource Energy | | | 1,235 | | | | 78,027 | |
| Hawaiian Electric Industries, Inc. (a) | | | 12,965 | | | | 468,685 | |
| National Fuel Gas Co. (a) | | | 710 | | | | 38,986 | |
| NextEra Energy, Inc. | | | 350 | | | | 54,667 | |
| NRG Energy, Inc. | | | 8,680 | | | | 247,206 | |
| PG&E Corp. | | | 10,861 | | | | 486,900 | |
| PPL Corp. | | | 2,480 | | | | 76,756 | |
| Vectren Corp. | | | 4,911 | | | | 319,313 | |
| Vistra Energy Corp. (a) (b) | | | 770 | | | | 14,106 | |
| | | | | | | | 4,728,872 | |
| | | | | | | | | |
| Total Common Stocks (Cost $117,991,953) | | | | | | $ | 155,199,096 | |
| | | | | | | | | |
| RIGHTS - 0.0% (c) | | | Shares | | | | Value | |
| Safeway CVR - Casa Ley (d) | | | 1,118 | | | $ | 1,135 | |
| Safeway CVR - PDC (d) | | | 1,118 | | | | 0 | |
| Total Rights (Cost $-) | | | | | | $ | 1,135 | |
| WILSHIRE LARGE COMPANY VALUE PORTFOLIO | | | |
| SCHEDULE OF INVESTMENTS (continued) | | | |
| | | | |
| MONEY MARKET FUNDS - 2.0% | | Shares | | | Value | |
| Northern Trust Institutional Government Select Portfolio - Institutional Class, 1.13% (e) | | | 3,055,851 | | | $ | 3,055,851 | |
| Northern Trust Institutional Liquid Portfolio - Institutional Class, 1.09% (e) (f) | | | 127,466 | | | | 127,466 | |
| Total Money Market Funds (Cost $3,183,317) | | | | | | $ | 3,183,317 | |
| | | | | | | | | |
| Total Investments at Value - 99.9% (Cost $121,175,270) | | | | | | $ | 158,383,548 | |
| | | | | | | | | |
| Other Assets in Excess of Liabilities - 0.1% | | | | | | | 86,264 | |
| | | | | | | | | |
| Net Assets - 100.0% | | | | | | $ | 158,469,812 | |
| (a) | This security or a partial position of this security is on loan at December 31, 2017. The total value of securities on loan at December 31, 2017 was $5,439,871 (Note 7). |
| (b) | Non-income producing security. |
| (c) | Percentage rounds to less than 0.1%. |
| (d) | Level 3 security. Security has been valued at fair value in accordance with procedures adopted by and under the general supervision of the Board of Directors. The total value of such securities is $1,135 at December 31, 2017, representing 0.0% (c) of net assets (Note 2). |
| (e) | The rate shown is the 7-day effective yield as of December 31, 2017. |
| (f) | This security was purchased with cash collateral held from securities on loan. The total value of such securities as of December 31, 2017 was $127,466. Securities on loan are also collateralized by various U.S. Treasury obligations in the amount of $5,448,268 (Note 7). |
ADR - American Depositary Receipt.
CVR - Contingent Value Right.
Ltd. - Limited.
plc - Public Limited Company.
| See accompanying notes to financial statements. |
| |
| WILSHIRE SMALL COMPANY GROWTH PORTFOLIO | | | | | | |
| SCHEDULE OF INVESTMENTS | | | | | | |
| December 31, 2017 | | | | | | |
| | | | | | | |
| COMMON STOCKS - 97.4% | | Shares | | | Value | |
| Consumer Discretionary - 9.8% | | | | | | |
| BJ's Restaurants, Inc. | | | 25 | | | $ | 910 | |
| Bridgepoint Education, Inc. (a) | | | 252 | | | | 2,092 | |
| Camping World Holdings, Inc. - Class A | | | 2,129 | | | | 95,230 | |
| Capella Education Co. | | | 515 | | | | 39,861 | |
| Cavco Industries, Inc. (a) | | | 255 | | | | 38,913 | |
| Children's Place, Inc. (The) (b) | | | 317 | | | | 46,076 | |
| Columbia Sportswear Co. | | | 150 | | | | 10,782 | |
| Cooper-Standard Holdings, Inc. (a) | | | 480 | | | | 58,800 | |
| Culp, Inc. | | | 226 | | | | 7,571 | |
| Dana, Inc. | | | 365 | | | | 11,684 | |
| Dave & Buster's Entertainment, Inc. (a) | | | 2,205 | | | | 121,650 | |
| Deckers Outdoor Corp. (a) | | | 790 | | | | 63,398 | |
| Denny's Corp. (a) | | | 714 | | | | 9,453 | |
| Dorman Products, Inc. (a) | | | 1,316 | | | | 80,460 | |
| Entravision Communications Corp. - Class A | | | 1,195 | | | | 8,544 | |
| Five Below, Inc. (a) (b) | | | 913 | | | | 60,550 | |
| Fox Factory Holding Corp. (a) | | | 25 | | | | 971 | |
| Francesca's Holdings Corp. (a) | | | 3,410 | | | | 24,927 | |
| Grand Canyon Education, Inc. (a) | | | 1,789 | | | | 160,168 | |
| Groupon, Inc. (a) | | | 6,510 | | | | 33,201 | |
| Horizon Global Corp. (a) | | | 270 | | | | 3,785 | |
| Installed Building Products, Inc. (a) (b) | | | 150 | | | | 11,393 | |
| Jack in the Box, Inc. | | | 360 | | | | 35,320 | |
| KB Home (b) | | | 2,440 | | | | 77,958 | |
| Kirkland's, Inc. (a) | | | 1,290 | | | | 15,435 | |
| La-Z-Boy, Inc. | | | 1,055 | | | | 32,916 | |
| LCI Industries | | | 4,877 | | | | 634,010 | |
| Liberty Tax, Inc. | | | 210 | | | | 2,310 | |
| Lindblad Expeditions Holdings, Inc. (a) (b) | | | 1,765 | | | | 17,279 | |
| M/I Homes, Inc. (a) | | | 1,715 | | | | 58,996 | |
| Malibu Boats, Inc. - Class A (a) | | | 2,245 | | | | 66,744 | |
| Marriott Vacations Worldwide Corp. | | | 120 | | | | 16,225 | |
| MCBC Holdings, Inc. (a) | | | 965 | | �� | | 21,442 | |
| MDC Holdings, Inc. | | | 2,829 | | | | 90,189 | |
| Monarch Casino & Resort, Inc. (a) | | | 10 | | | | 448 | |
| WILSHIRE SMALL COMPANY GROWTH PORTFOLIO | | | |
| SCHEDULE OF INVESTMENTS (continued) | | | |
| | | | |
| COMMON STOCKS - 97.4% (Continued) | | Shares | | | Value | |
| Consumer Discretionary - 9.8% (Continued) | | | | | | |
| New York Times Co. (The) - Class A | | | 3,130 | | | $ | 57,905 | |
| Nexstar Media Group, Inc. - Class A (b) | | | 290 | | | | 22,678 | |
| Nutrisystem, Inc. | | | 1,640 | | | | 86,264 | |
| Papa John's International, Inc. (b) | | | 1,895 | | | | 106,328 | |
| Penn National Gaming, Inc. (a) | | | 810 | | | | 25,377 | |
| Pinnacle Entertainment, Inc. (a) | | | 3,600 | | | | 117,828 | |
| Planet Fitness, Inc. - Class A (a) | | | 870 | | | | 30,128 | |
| Red Rock Resorts, Inc. - Class A | | | 90 | | | | 3,037 | |
| Ruth's Hospitality Group, Inc. (b) | | | 115 | | | | 2,490 | |
| Scientific Games Corp. - Class A (a) | | | 2,230 | | | | 114,399 | |
| Shiloh Industries, Inc. (a) | | | 2,085 | | | | 17,097 | |
| Shutterfly, Inc. (a) | | | 120 | | | | 5,970 | |
| Sleep Number Corporation (a) (b) | | | 1,100 | | | | 41,349 | |
| Sonic Corp. (b) | | | 10,335 | | | | 284,006 | |
| Sotheby's (a) | | | 545 | | | | 28,122 | |
| Standard Motor Products, Inc. | | | 2,515 | | | | 112,949 | |
| Steven Madden Ltd. (a) | | | 23,377 | | | | 1,091,707 | |
| Stoneridge, Inc. (a) | | | 1,000 | | | | 22,860 | |
| Strayer Education, Inc. (b) | | | 70 | | | | 6,271 | |
| Taylor Morrison Home Corp. - Class A (a) | | | 6,945 | | | | 169,943 | |
| Tenneco, Inc. | | | 125 | | | | 7,318 | |
| Texas Roadhouse, Inc. | | | 1,145 | | | | 60,319 | |
| Tile Shop Holdings, Inc. | | | 690 | | | | 6,624 | |
| TopBuild Corp. (a) | | | 3,067 | | | | 232,294 | |
| tronc, Inc. (a) | | | 490 | | | | 8,619 | |
| William Lyon Homes - Class A (a) | | | 70 | | | | 2,036 | |
| Winmark Corp. | | | 330 | | | | 42,702 | |
| Winnebago Industries, Inc. | | | 320 | | | | 17,792 | |
| Wolverine World Wide, Inc. | | | 115 | | | | 3,666 | |
| | | | | | | | 4,687,769 | |
| Consumer Staples - 5.8% | | | | | | | | |
| Calavo Growers, Inc. (b) | | | 12,306 | | | | 1,038,626 | |
| Central Garden & Pet Co. - Class A (a) | | | 1,695 | | | | 63,918 | |
| e.l.f. Beauty, Inc. (a) (b) | | | 8,141 | | | | 181,626 | |
| Inter Parfums, Inc. | | | 16,205 | | | | 704,106 | |
| J & J Snack Foods Corp. | | | 3,360 | | | | 510,149 | |
| WILSHIRE SMALL COMPANY GROWTH PORTFOLIO | | | |
| SCHEDULE OF INVESTMENTS (continued) | | | |
| | | | |
| COMMON STOCKS - 97.4% (Continued) | | Shares | | | Value | |
| Consumer Staples - 5.8% (Continued) | | | | | | |
| Medifast, Inc. | | | 850 | | | $ | 59,339 | |
| National Beverage Corp. (b) | | | 1,340 | | | | 130,570 | |
| Performance Food Group Co. (a) | | | 747 | | | | 24,726 | |
| Primo Water Corp. (a) | | | 4,800 | | | | 60,336 | |
| | | | | | | | 2,773,396 | |
| Energy - 3.1% | | | | | | | | |
| Adams Resources & Energy, Inc. | | | 50 | | | | 2,175 | |
| Bonanza Creek Energy, Inc. (a) | | | 369 | | | | 10,181 | |
| Callon Petroleum Co. (a) (b) | | | 32,845 | | | | 399,067 | |
| Carrizo Oil & Gas, Inc. (a) (b) | | | 930 | | | | 19,790 | |
| Energy XXI Gulf Coast, Inc. (a) | | | 1,778 | | | | 10,206 | |
| Matador Resources Co. (a) | | | 2,000 | | | | 62,260 | |
| SRC Energy, Inc. (a) (b) | | | 10,155 | | | | 86,622 | |
| U.S. Silica Holdings, Inc. (b) | | | 3,780 | | | | 123,077 | |
| WildHorse Resource Development Corp. (a) (b) | | | 41,990 | | | | 773,035 | |
| | | | | | | | 1,486,413 | |
| Financials - 8.8% | | | | | | | | |
| Atlantic Capital Bancshares, Inc. (a) | | | 1,360 | | | | 23,936 | |
| Atlas Financial Holdings, Inc. (a) (b) | | | 1,095 | | | | 22,502 | |
| Banc of California, Inc. (b) | | | 51,510 | | | | 1,063,682 | |
| Bank of N.T. Butterfield & Son Ltd. (The) | | | 370 | | | | 13,427 | |
| CenterState Bank Corp. (b) | | | 17,699 | | | | 455,395 | |
| Central Pacific Financial Corp. | | | 935 | | | | 27,891 | |
| Charter Financial Corp. | | | 896 | | | | 15,716 | |
| County Bancorp, Inc. | | | 105 | | | | 3,125 | |
| Eagle Bancorp, Inc. (a) | | | 433 | | | | 25,071 | |
| Equity Bancshares, Inc. - Class A (a) | | | 1,235 | | | | 43,731 | |
| Essent Group Ltd. (a) | | | 5,485 | | | | 238,159 | |
| Evercore, Inc. - Class A | | | 1,435 | | | | 129,149 | |
| First Connecticut Bancorp, Inc. | | | 1,082 | | | | 28,294 | |
| First Financial Northwest, Inc. | | | 220 | | | | 3,412 | |
| First Foundation, Inc. (a) | | | 395 | | | | 7,323 | |
| GAIN Capital Holdings, Inc. (b) | | | 2,365 | | | | 23,650 | |
| Hallmark Financial Services, Inc. (a) | | | 100 | | | | 1,043 | |
| HCI Group, Inc. | | | 1,695 | | | | 50,681 | |
| Investment Technology Group, Inc. | | | 470 | | | | 9,048 | |
| WILSHIRE SMALL COMPANY GROWTH PORTFOLIO | | | |
| SCHEDULE OF INVESTMENTS (continued) | | | |
| | | | |
| COMMON STOCKS - 97.4% (Continued) | | Shares | | | Value | |
| Financials - 8.8% (Continued) | | | | | | |
| LegacyTexas Financial Group, Inc. | | | 18,945 | | | $ | 799,668 | |
| Maiden Holdings Ltd. | | | 460 | | | | 3,036 | |
| Marlin Business Services Corp. | | | 450 | | | | 10,080 | |
| Meridian Bancorp, Inc. | | | 115 | | | | 2,369 | |
| Meta Financial Group, Inc. | | | 305 | | | | 28,258 | |
| Moelis & Co. - Class A | | | 2,610 | | | | 126,585 | |
| National General Holdings Corp. | | | 115 | | | | 2,259 | |
| Old Line Bancshares, Inc. | | | 360 | | | | 10,598 | |
| Piper Jaffray Cos. | | | 270 | | | | 23,288 | |
| Preferred Bank | | | 635 | | | | 37,325 | |
| Pzena Investment Management, Inc. - Class A | | | 4,505 | | | | 48,068 | |
| RBB Bancorp | | | 140 | | | | 3,832 | |
| Regional Management Corp. (a) | | | 335 | | | | 8,814 | |
| ServisFirst Bancshares, Inc. | | | 315 | | | | 13,073 | |
| Silvercrest Asset Management Group, Inc. - Class A | | | 441 | | | | 7,078 | |
| South State Corp. | | | 3,970 | | | | 345,986 | |
| Texas Capital Bancshares, Inc. (a) | | | 910 | | | | 80,899 | |
| Third Point Reinsurance Ltd. (a) | | | 5,665 | | | | 82,992 | |
| Universal Insurance Holdings, Inc. | | | 3,530 | | | | 96,545 | |
| Veritex Holdings, Inc. (a) | | | 9,520 | | | | 262,657 | |
| Walker & Dunlop, Inc. (a) | | | 405 | | | | 19,238 | |
| Waterstone Financial, Inc. | | | 785 | | | | 13,384 | |
| Western New England Bancorp, Inc. | | | 830 | | | | 9,047 | |
| | | | | | | | 4,220,314 | |
| Health Care - 21.8% | | | | | | | | |
| Acorda Therapeutics, Inc. (a) (b) | | | 2,150 | | | | 46,118 | |
| Addus HomeCare Corp. (a) | | | 910 | | | | 31,668 | |
| Akebia Therapeutics, Inc. (a) | | | 3,135 | | | | 46,617 | |
| Alder Biopharmaceuticals, Inc. (a) (b) | | | 1,395 | | | | 15,973 | |
| Amedisys, Inc. (a) | | | 3,405 | | | | 179,479 | |
| Anika Therapeutics, Inc. (a) | | | 1,135 | | | | 61,188 | |
| Avexis, Inc. (a) (b) | | | 145 | | | | 16,047 | |
| BioSpecifics Technologies Corp. (a) | | | 550 | | | | 23,832 | |
| BioTelemetry, Inc. (a) (b) | | | 970 | | | | 29,003 | |
| Bluebird Bio, Inc. (a) (b) | | | 495 | | | | 88,160 | |
| Calithera Biosciences, Inc. (a) | | | 60 | | | | 501 | |
| WILSHIRE SMALL COMPANY GROWTH PORTFOLIO | | | | | | |
| SCHEDULE OF INVESTMENTS (continued) | | | | | | |
| | | | | | | |
| COMMON STOCKS - 97.4% (Continued) | | Shares | | | Value | |
| Health Care - 21.8% (Continued) | | | | | | |
| Cambrex Corp. (a) | | | 17,089 | | | $ | 820,272 | |
| Cantel Medical Corp. | | | 6,565 | | | | 675,343 | |
| Cardiovascular Systems, Inc. (a) | | | 770 | | | | 18,241 | |
| Catalent, Inc. (a) | | | 3,169 | | | | 130,183 | |
| Chemed Corp. (b) | | | 710 | | | | 172,544 | |
| ChemoCentryx, Inc. (a) (b) | | | 3,058 | | | | 18,195 | |
| Clovis Oncology, Inc. (a) (b) | | | 1,030 | | | | 70,040 | |
| Corcept Therapeutics, Inc. (a) (b) | | | 6,439 | | | | 116,288 | |
| CorVel Corp. (a) (b) | | | 3,009 | | | | 159,176 | |
| Cotiviti Holdings, Inc. (a) | | | 13,139 | | | | 423,207 | |
| Cytokinetics, Inc. (a) | | | 1,799 | | | | 14,662 | |
| CytomX Therapeutics, Inc. (a) (b) | | | 1,265 | | | | 26,704 | |
| Emergent BioSolutions, Inc. (a) | | | 2,625 | | | | 121,984 | |
| Enzo Biochem, Inc. (a) | | | 340 | | | | 2,771 | |
| Exact Sciences Corp. (a) (b) | | | 3,058 | | | | 160,667 | |
| Exelixis, Inc. (a) | | | 520 | | | | 15,808 | |
| FibroGen, Inc. (a) (b) | | | 110 | | | | 5,214 | |
| Genomic Health, Inc. (a) | | | 2,135 | | | | 73,017 | |
| Haemonetics Corp. (a) | | | 1,700 | | | | 98,736 | |
| Halozyme Therapeutics, Inc. (a) (b) | | | 3,805 | | | | 77,089 | |
| HealthEquity, Inc. (a) (b) | | | 965 | | | | 45,027 | |
| HealthSouth Corp. | | | 1,530 | | | | 75,597 | |
| Heska Corp. (a) | | | 2,870 | | | | 230,203 | |
| Innoviva, Inc. (a) (b) | | | 7,435 | | | | 105,503 | |
| Inogen, Inc. (a) | | | 1,240 | | | | 147,659 | |
| Insulet Corp. (a) | | | 430 | | | | 29,670 | |
| Ironwood Pharmaceuticals, Inc. (a) (b) | | | 970 | | | | 14,540 | |
| Lantheus Holdings, Inc. (a) | | | 1,885 | | | | 38,548 | |
| LeMaitre Vascular, Inc. | | | 7,450 | | | | 237,208 | |
| LHC Group, Inc. (a) | | | 930 | | | | 56,963 | |
| Ligand Pharmaceuticals, Inc. (a) (b) | | | 100 | | | | 13,693 | |
| Loxo Oncology, Inc. (a) (b) | | | 120 | | | | 10,102 | |
| Magellan Health, Inc. (a) | | | 615 | | | | 59,378 | |
| Masimo Corp. (a) | | | 2,425 | | | | 205,640 | |
| Medidata Solutions, Inc. (a) (b) | | | 8,705 | | | | 551,636 | |
| Meridian Bioscience, Inc. | | | 3,025 | | | | 42,350 | |
| WILSHIRE SMALL COMPANY GROWTH PORTFOLIO | | | |
| SCHEDULE OF INVESTMENTS (continued) | | | |
| | | | |
| COMMON STOCKS - 97.4% (Continued) | | Shares | | | Value | |
| Health Care - 21.8% (Continued) | | | | | | |
| Merit Medical Systems, Inc. (a) | | | 810 | | | $ | 34,992 | |
| Molina Healthcare, Inc. (a) (b) | | | 1,680 | | | | 128,822 | |
| Natera, Inc. (a) | | | 553 | | | | 4,971 | |
| Nektar Therapeutics (a) (b) | | | 2,430 | | | | 145,120 | |
| Neogen Corp. (a) | | | 4,285 | | | | 352,270 | |
| NuVasive, Inc. (a) | | | 70 | | | | 4,094 | |
| OraSure Technologies, Inc. (a) | | | 220 | | | | 4,149 | |
| Orthofix International N.V. (a) | | | 660 | | | | 36,102 | |
| Phibro Animal Health Corp. - Class A | | | 3,275 | | | | 109,713 | |
| Portola Pharmaceuticals, Inc. (a) | | | 285 | | | | 13,874 | |
| PRA Health Sciences, Inc. (a) | | | 14,820 | | | | 1,349,657 | |
| Prestige Brands Holdings, Inc. (a) | | | 13,800 | | | | 612,857 | |
| Providence Service Corp. (The) (a) | | | 2,435 | | | | 144,493 | |
| Puma Biotechnology, Inc. (a) | | | 80 | | | | 7,908 | |
| Quidel Corp. (a) | | | 810 | | | | 35,114 | |
| Repligen Corp. (a) (b) | | | 17,489 | | | | 634,500 | |
| Sage Therapeutics, Inc. (a) (b) | | | 250 | | | | 41,178 | |
| Sangamo Therapeutics, Inc. (a) (b) | | | 185 | | | | 3,034 | |
| Sarepta Therapeutics, Inc. (a) (b) | | | 20 | | | | 1,113 | |
| Sucampo Pharmaceuticals, Inc. - Class A (a) (b) | | | 955 | | | | 17,142 | |
| Supernus Pharmaceuticals, Inc. (a) (b) | | | 13,560 | | | | 540,366 | |
| Syndax Pharmaceuticals, Inc. (a) | | | 2,136 | | | | 18,711 | |
| Tabula Rasa HealthCare, Inc. (a) | | | 14,792 | | | | 414,916 | |
| Tivity Health, Inc. (a) (b) | | | 2,175 | | | | 79,496 | |
| Triple-S Management Corp. - Class B (a) | | | 1,925 | | | | 47,836 | |
| Vanda Pharmaceuticals, Inc. (a) | | | 1,730 | | | | 26,296 | |
| Versartis, Inc. (a) | | | 736 | | | | 1,619 | |
| Vocera Communications, Inc. (a) | | | 520 | | | | 15,714 | |
| Xencor, Inc. (a) (b) | | | 1,063 | | | | 23,301 | |
| | | | | | | | 10,451,802 | |
| Industrials - 18.6% | | | | | | | | |
| Air Transport Services Group, Inc. (a) | | | 1,625 | | | | 37,603 | |
| American Woodmark Corp. (a) | | | 1,406 | | | | 183,132 | |
| Applied Industrial Technologies, Inc. | | | 2,625 | | | | 178,763 | |
| ARC Document Solutions, Inc. (a) | | | 2,805 | | | | 7,153 | |
| ArcBest Corp. | | | 555 | | | | 19,841 | |
| WILSHIRE SMALL COMPANY GROWTH PORTFOLIO | | | | | | |
| SCHEDULE OF INVESTMENTS (continued) | | | | | | |
| | | | | | | |
| COMMON STOCKS - 97.4% (Continued) | | Shares | | | Value | |
| Industrials - 18.6% (Continued) | | | | | | |
| Argan, Inc. | | | 2,491 | | | $ | 112,095 | |
| Atkore International Group, Inc. (a) | | | 1,230 | | | | 26,384 | |
| Barrett Business Services, Inc. | | | 1,570 | | | | 101,249 | |
| Beacon Roofing Supply, Inc. (a) | | | 100 | | | | 6,376 | |
| Brady Corp. - Class A | | | 1,110 | | | | 42,069 | |
| Brink's Co. (The) | | | 1,390 | | | | 109,393 | |
| Builders FirstSource, Inc. (a) | | | 510 | | | | 11,113 | |
| CAI International, Inc. (a) | | | 2,594 | | | | 73,462 | |
| Casella Waste Systems, Inc. - Class A (a) | | | 1,555 | | | | 35,796 | |
| Comfort Systems USA, Inc. | | | 2,630 | | | | 114,800 | |
| Commercial Vehicle Group, Inc. (a) | | | 8,908 | | | | 95,227 | |
| Continental Building Products, Inc. (a) | | | 3,530 | | | | 99,370 | |
| CSW Industrials, Inc. (a) | | | 680 | | | | 31,246 | |
| DXP Enterprises, Inc. (a) | | | 150 | | | | 4,436 | |
| EMCOR Group, Inc. | | | 1,675 | | | | 136,931 | |
| EnerSys | | | 1,490 | | | | 103,748 | |
| EnPro Industries, Inc. | | | 785 | | | | 73,405 | |
| Exponent, Inc. | | | 1,193 | | | | 84,822 | |
| Forward Air Corp. | | | 1,660 | | | | 95,350 | |
| Gibraltar Industries, Inc. (a) (b) | | | 115 | | | | 3,795 | |
| Gorman-Rupp Co. (The) | | | 507 | | | | 15,823 | |
| Granite Construction, Inc. | | | 2,375 | | | | 150,646 | |
| Harsco Corp. (a) | | | 2,321 | | | | 43,287 | |
| Hawaiian Holdings, Inc. | | | 4,390 | | | | 174,942 | |
| Heritage-Crystal Clean, Inc. (a) | | | 205 | | | | 4,459 | |
| Herman Miller, Inc. | | | 285 | | | | 11,414 | |
| Hudson Technologies, Inc. (a) (b) | | | 3,435 | | | | 20,850 | |
| Insperity, Inc. | | | 1,090 | | | | 62,512 | |
| Insteel Industries, Inc. | | | 15,547 | | | | 440,290 | |
| Interface, Inc. | | | 2,120 | | | | 53,318 | |
| JELD-WEN Holdings, Inc. (a) | | | 3,330 | | | | 131,102 | |
| Kadant, Inc. | | | 778 | | | | 78,111 | |
| Kennametal, Inc. | | | 3,840 | | | | 185,894 | |
| Kimball International, Inc. - Class B | | | 1,950 | | | | 36,407 | |
| Knoll, Inc. | | | 28,775 | | | | 662,976 | |
| Kornit Digital Ltd. (a) (b) | | | 12,543 | | | | 202,568 | |
| WILSHIRE SMALL COMPANY GROWTH PORTFOLIO | | | | | | |
| SCHEDULE OF INVESTMENTS (continued) | | | | | | |
| | | | | | | |
| COMMON STOCKS - 97.4% (Continued) | | Shares | | | Value | |
| Industrials - 18.6% (Continued) | | | | | | |
| Kratos Defense & Security Solutions, Inc. (a) (b) | | | 1,060 | | | $ | 11,225 | |
| Lydall, Inc. (a) | | | 690 | | | | 35,018 | |
| MasTec, Inc. (a) | | | 3,070 | | | | 150,277 | |
| Mercury Systems, Inc. (a) | | | 9,550 | | | | 490,393 | |
| Milacron Holdings Corp. (a) | | | 1,720 | | | | 32,921 | |
| Miller Industries, Inc. | | | 265 | | | | 6,837 | |
| Mistras Group, Inc. (a) | | | 520 | | | | 12,204 | |
| Mueller Industries, Inc. | | | 858 | | | | 30,399 | |
| Multi-Color Corp. | | | 140 | | | | 10,479 | |
| MYR Group, Inc. (a) | | | 1,471 | | | | 52,559 | |
| Navistar International Corp. (a) | | | 630 | | | | 27,014 | |
| NCI Building Systems, Inc. (a) | | | 111 | | | | 2,142 | |
| Orion Group Holdings, Inc. (a) | | | 2,395 | | | | 18,753 | |
| Patrick Industries, Inc. (a) | | | 817 | | | | 56,741 | |
| PGT Innovations, Inc. (a) | | | 24,540 | | | | 413,498 | |
| Ply Gem Holdings, Inc. (a) | | | 2,210 | | | | 40,885 | |
| Quad/Graphics, Inc. (b) | | | 3,425 | | | | 77,405 | |
| Saia, Inc. (a) | | | 16,040 | | | | 1,134,830 | |
| Simpson Manufacturing Co., Inc. | | | 1,415 | | | | 81,235 | |
| SiteOne Landscape Supply, Inc. (a) (b) | | | 11,791 | | | | 904,369 | |
| SPX Corp. (a) | | | 1,328 | | | | 41,686 | |
| SPX FLOW, Inc. (a) | | | 450 | | | | 21,398 | |
| Standex International Corp. | | | 470 | | | | 47,870 | |
| Steelcase, Inc. - Class A | | | 520 | | | | 7,904 | |
| Sterling Construction Co., Inc. (a) | | | 2,230 | | | | 36,304 | |
| TPI Composites, Inc. (a) | | | 2,230 | | | | 45,626 | |
| Trex Co., Inc. (a) | | | 725 | | | | 78,583 | |
| TriNet Group, Inc. (a) | | | 1,765 | | | | 78,260 | |
| TrueBlue, Inc. (a) | | | 980 | | | | 26,950 | |
| Tutor Perini Corp. (a) (b) | | | 680 | | | | 17,238 | |
| Vectrus, Inc. (a) | | | 735 | | | | 22,675 | |
| Wabash National Corp. | | | 1,025 | | | | 22,243 | |
| WageWorks, Inc. (a) | | | 12,250 | | | | 759,501 | |
| Willis Lease Finance Corp. (a) | | | 95 | | | | 2,372 | |
| Woodward, Inc. | | | 545 | | | | 41,714 | |
| WILSHIRE SMALL COMPANY GROWTH PORTFOLIO | | | |
| SCHEDULE OF INVESTMENTS (continued) | | | |
| | | | |
| COMMON STOCKS - 97.4% (Continued) | | Shares | | | Value | |
| Industrials - 18.6% (Continued) | | | | | | |
| YRC Worldwide, Inc. (a) | | | 1,535 | | | $ | 22,073 | |
| | | | | | | | 8,923,739 | |
| Information Technology - 23.0% | | | | | | | | |
| A10 Networks, Inc. (a) (b) | | | 4,290 | | | | 33,119 | |
| ADTRAN, Inc. | | | 2,280 | | | | 44,118 | |
| Advanced Energy Industries, Inc. (a) | | | 2,650 | | | | 178,822 | |
| Alarm.com Holdings, Inc. (a) | | | 100 | | | | 3,775 | |
| Alpha & Omega Semiconductor Ltd. (a) | | | 229 | | | | 3,746 | |
| Amber Road, Inc. (a) | | | 1,000 | | | | 7,340 | |
| Amkor Technology, Inc. (a) | | | 2,130 | | | | 21,407 | |
| Aspen Technology, Inc. (a) | | | 210 | | | | 13,902 | |
| Axcelis Technologies, Inc. (a) | | | 115 | | | | 3,301 | |
| Badger Meter, Inc. | | | 460 | | | | 21,988 | |
| Box, Inc. - Class A (a) | | | 9,506 | | | | 200,767 | |
| Brightcove, Inc. (a) | | | 250 | | | | 1,775 | |
| BroadSoft, Inc. (a) (b) | | | 9,038 | | | | 496,186 | |
| Brooks Automation, Inc. | | | 2,155 | | | | 51,397 | |
| Cabot Microelectronics Corp. | | | 5,420 | | | | 509,914 | |
| Carbonite, Inc. (a) (b) | | | 115 | | | | 2,887 | |
| Care.com, Inc. (a) | | | 4,200 | | | | 75,768 | |
| Cass Information Systems, Inc. | | | 976 | | | | 56,813 | |
| CEVA, Inc. (a) | | | 11,189 | | | | 516,371 | |
| ChannelAdvisor Corp. (a) | | | 1,795 | | | | 16,155 | |
| Cirrus Logic, Inc. (a) | | | 3,730 | | | | 193,438 | |
| CommVault Systems, Inc. (a) | | | 475 | | | | 24,938 | |
| Cornerstone OnDemand, Inc. (a) (b) | | | 2,968 | | | | 104,859 | |
| CSG Systems International, Inc. | | | 1,350 | | | | 59,157 | |
| Daktronics, Inc. | | | 1,420 | | | | 12,965 | |
| DHI Group, Inc. (a) | | | 115 | | | | 219 | |
| Ellie Mae, Inc. (a) (b) | | | 4,718 | | | | 421,789 | |
| Entegris, Inc. | | | 2,585 | | | | 78,713 | |
| Envestnet, Inc. (a) | | | 190 | | | | 9,472 | |
| EPAM Systems, Inc. (a) | | | 1,205 | | | | 129,453 | |
| ePlus, Inc. (a) | | | 15 | | | | 1,128 | |
| Euronet Worldwide, Inc. (a) | | | 830 | | | | 69,944 | |
| Everi Holdings, Inc. (a) | | | 7,437 | | | | 56,075 | |
| WILSHIRE SMALL COMPANY GROWTH PORTFOLIO | | | | | | |
| SCHEDULE OF INVESTMENTS (continued) | | | | | | |
| | | | | | | |
| COMMON STOCKS - 97.4% (Continued) | | Shares | | | Value | |
| Information Technology - 23.0% (Continued) | | | | | | |
| EVERTEC, Inc. | | | 1,475 | | | $ | 20,134 | |
| ExlService Holdings, Inc. (a) | | | 1,553 | | | | 93,724 | |
| Extreme Networks, Inc. (a) (b) | | | 6,190 | | | | 77,498 | |
| Fabrinet (a) (b) | | | 715 | | | | 20,521 | |
| Fair Isaac Corp. | | | 566 | | | | 86,711 | |
| Five9, Inc. (a) | | | 6,517 | | | | 162,142 | |
| Hackett Group, Inc. (The) | | | 1,034 | | | | 16,244 | |
| HubSpot, Inc. (a) | | | 280 | | | | 24,752 | |
| Ichor Holdings Ltd. (a) | | | 1,595 | | | | 39,237 | |
| Imperva, Inc. (a) | | | 2,735 | | | | 108,580 | |
| Information Services Group, Inc. (a) | | | 2,175 | | | | 9,070 | |
| Inphi Corp. (a) (b) | | | 10,665 | | | | 390,339 | |
| Insight Enterprises, Inc. (a) | | | 2,765 | | | | 105,872 | |
| Instructure, Inc. (a) | | | 1,055 | | | | 34,921 | |
| InterDigital, Inc. | | | 100 | | | | 7,615 | |
| Intevac, Inc. (a) | | | 3,525 | | | | 24,146 | |
| Itron, Inc. (a) | | | 350 | | | | 23,870 | |
| KEMET Corp. (a) | | | 7,647 | | | | 115,163 | |
| LogMeIn, Inc. | | | 305 | | | | 34,923 | |
| Lumentum Holdings, Inc. (a) (b) | | | 825 | | | | 40,343 | |
| MAXIMUS, Inc. | | | 9,615 | | | | 688,241 | |
| MaxLinear, Inc. (a) | | | 16,190 | | | | 427,740 | |
| Methode Electronics, Inc. | | | 1,010 | | | | 40,501 | |
| Microsemi Corp. (a) | | | 445 | | | | 22,984 | |
| MINDBODY, Inc. - Class A (a) (b) | | | 19,067 | | | | 580,589 | |
| MKS Instruments, Inc. | | | 2,020 | | | | 190,890 | |
| Nanometrics, Inc. (a) | | | 2,885 | | | | 71,894 | |
| NIC, Inc. | | | 1,720 | | | | 28,552 | |
| NVE Corp. | | | 912 | | | | 78,432 | |
| OSI Systems, Inc. (a) (b) | | | 430 | | | | 27,683 | |
| Paylocity Holding Corp. (a) | | | 340 | | | | 16,034 | |
| PCM, Inc. (a) (b) | | | 1,185 | | | | 11,732 | |
| Pegasystems, Inc. (b) | | | 21,069 | | | | 993,403 | |
| Plantronics, Inc. | | | 1,410 | | | | 71,036 | |
| Plexus Corp. (a) | | | 314 | | | | 19,066 | |
| Progress Software Corp. | | | 2,815 | | | | 119,835 | |
| WILSHIRE SMALL COMPANY GROWTH PORTFOLIO | | | |
| SCHEDULE OF INVESTMENTS (continued) | | | |
| | | | |
| COMMON STOCKS - 97.4% (Continued) | | Shares | | | Value | |
| Information Technology - 23.0% (Continued) | | | | | | |
| Q2 Holdings, Inc. (a) | | | 584 | | | $ | 21,520 | |
| Qualys, Inc. (a) | | | 16,531 | | | | 981,115 | |
| Rapid7, Inc. (a) | | | 1,405 | | | | 26,217 | |
| RealPage, Inc. (a) (b) | | | 2,000 | | | | 88,600 | |
| RingCentral, Inc. - Class A (a) | | | 650 | | | | 31,460 | |
| Rogers Corp. (a) | | | 85 | | | | 13,763 | |
| Science Applications International Corp. | | | 190 | | | | 14,548 | |
| Semtech Corp. (a) | | | 670 | | | | 22,914 | |
| Silicon Laboratories, Inc. (a) | | | 4,315 | | | | 381,015 | |
| SPS Commerce, Inc. (a) | | | 555 | | | | 26,967 | |
| Stamps.com, Inc. (a) | | | 350 | | | | 65,800 | |
| Syntel, Inc. (a) | | | 200 | | | | 4,598 | |
| Take-Two Interactive Software, Inc. (a) | | | 672 | | | | 73,772 | |
| Tech Data Corp. (a) | | | 405 | | | | 39,678 | |
| TeleTech Holdings, Inc. | | | 693 | | | | 27,893 | |
| TTM Technologies, Inc. (a) | | | 3,275 | | | | 51,319 | |
| Ultra Clean Holdings, Inc. (a) (b) | | | 5,890 | | | | 136,000 | |
| Varonis Systems, Inc. (a) | | | 2,247 | | | | 109,092 | |
| WNS Holdings Ltd. - ADR (a) | | | 12,797 | | | | 513,544 | |
| XO Group, Inc. (a) | | | 4,469 | | | | 82,498 | |
| Yelp, Inc. (a) | | | 1,935 | | | | 81,193 | |
| Zix Corp. (a) | | | 10,878 | | | | 47,646 | |
| | | | | | | | 11,087,270 | |
| Materials - 4.1% | | | | | | | | |
| AdvanSix, Inc. (a) | | | 577 | | | | 24,274 | |
| American Vanguard Corp. | | | 1,360 | | | | 26,724 | |
| Century Aluminum Co. (a) (b) | | | 1,155 | | | | 22,684 | |
| Coeur Mining, Inc. (a) | | | 565 | | | | 4,238 | |
| Greif, Inc. - Class A | | | 770 | | | | 46,647 | |
| H.B. Fuller Co. | | | 135 | | | | 7,272 | |
| Ingevity Corp. (a) | | | 1,975 | | | | 139,178 | |
| Innophos Holdings, Inc. | | | 1,235 | | | | 57,712 | |
| Kaiser Aluminum Corp. | | | 835 | | | | 89,219 | |
| KMG Chemicals, Inc. | | | 785 | | | | 51,873 | |
| Koppers Holdings, Inc. (a) | | | 1,830 | | | | 93,147 | |
| Kraton Corp. (a) | | | 125 | | | | 6,021 | |
| WILSHIRE SMALL COMPANY GROWTH PORTFOLIO | | | |
| SCHEDULE OF INVESTMENTS (continued) | | | |
| | | | |
| COMMON STOCKS - 97.4% (Continued) | | Shares | | | Value | |
| Materials - 4.1% (Continued) | | | | | | |
| Kronos Worldwide, Inc. | | | 4,342 | | | $ | 111,893 | |
| Louisiana-Pacific Corp. (a) | | | 9,280 | | | | 243,693 | |
| Minerals Technologies, Inc. | | | 15 | | | | 1,033 | |
| Myers Industries, Inc. | | | 3,920 | | | | 76,440 | |
| Neenah Paper, Inc. | | | 79 | | | | 7,161 | |
| Quaker Chemical Corp. | | | 4,750 | | | | 716,253 | |
| Sensient Technologies Corp. | | | 530 | | | | 38,770 | |
| Trinseo S.A. (b) | | | 2,960 | | | | 214,896 | |
| | | | | | | | 1,979,128 | |
| Real Estate - 0.9% | | | | | | | | |
| CareTrust REIT, Inc. (b) | | | 580 | | | | 9,721 | |
| Forestar Group, Inc. (a) (b) | | | 595 | | | | 13,090 | |
| GEO Group, Inc. (The) | | | 910 | | | | 21,476 | |
| LTC Properties, Inc. | | | 40 | | | | 1,742 | |
| MedEquities Realty Trust, Inc. | | | 1,900 | | | | 21,318 | |
| Potlatch Corp. (b) | | | 1,020 | | | | 50,898 | |
| PS Business Parks, Inc. | | | 660 | | | | 82,559 | |
| RMR Group, Inc./The - Class A | | | 710 | | | | 42,103 | |
| Sabra Health Care REIT, Inc. | | | 9,835 | | | | 184,603 | |
| | | | | | | | 427,510 | |
| Telecommunication Services - 1.1% | | | | | | | | |
| Boingo Wireless, Inc. (a) | | | 2,300 | | | | 51,750 | |
| Cogent Communications Holdings, Inc. | | | 9,605 | | | | 435,106 | |
| IDT Corp. - Class B | | | 1,405 | | | | 14,893 | |
| ORBCOMM, Inc. (a) | | | 320 | | | | 3,258 | |
| Vonage Holdings Corp. (a) | | | 2,610 | | | | 26,544 | |
| | | | | | | | 531,551 | |
| Utilities - 0.4% | | | | | | | | |
| MGE Energy, Inc. | | | 1,110 | | | | 70,041 | |
| Ormat Technologies, Inc. | | | 1,640 | | | | 104,894 | |
| | | | | | | | 174,935 | |
| | | | | | | | | |
| Total Common Stocks (Cost $36,852,914) | | | | | | $ | 46,743,827 | |
| WILSHIRE SMALL COMPANY GROWTH PORTFOLIO | | | |
| SCHEDULE OF INVESTMENTS (continued) | | | |
| | | | |
| RIGHTS – 0.0% (c) | | Shares | | | Value | |
| Dyax Corp. (b) (d) (Cost $-) | | | 860 | | | $ | 0 | |
| | | | | | | | | |
| MONEY MARKET FUNDS - 10.4% | | | Shares | | | | Value | |
| Northern Trust Institutional Government Select Portfolio - Institutional Class, 1.13% (e) | | | 1,624,978 | | | $ | 1,624,978 | |
| Northern Trust Institutional Liquid Portfolio - Institutional Class, 1.09% (e) (f) | | | 3,365,468 | | | | 3,365,468 | |
| Total Money Market Funds (Cost $4,990,446) | | | | | | $ | 4,990,446 | |
| | | | | | | | | |
| Total Investments at Value - 107.8% (Cost $41,843,360) | | | | | | $ | 51,734,273 | |
| | | | | | | | | |
| Liabilities in Excess of Other Assets - (7.8%) | | | | | | | (3,749,822 | ) |
| | | | | | | | | |
| Net Assets - 100.0% | | | | | | $ | 47,984,451 | |
| (a) | Non-income producing security. |
| (b) | This security or a partial position of this security is on loan at December 31, 2017. The total value of securities on loan at December 31, 2017 was $10,257,245 (Note 7). |
| (c) | Percentage rounds to less than 0.1%. |
| (d) | Level 3 security. Security has been valued at fair value in accordance with procedures adopted by and under the general supervision of the Board of Directors. The total value of such securities is $0 at December 31, 2017, representing 0.0% (c) of net assets (Note 2). |
| (e) | The rate shown is the 7-day effective yield as of December 31, 2017. |
| (f) | This security was purchased with cash collateral held from securities on loan. The total value of such securities as of December 31, 2017 was $3,365,468. Securities on loan are also collateralized by various U.S. Treasury obligations in the amount of $7,237,842 (Note 7). |
ADR - American Depositary Receipt.
Ltd. - Limited.
See accompanying notes to financial statements.
| WILSHIRE SMALL COMPANY VALUE PORTFOLIO | | | | | | |
| SCHEDULE OF INVESTMENTS | | | | | | |
| December 31, 2017 | | | | | | |
| | | | | | | |
| COMMON STOCKS - 98.1% | | Shares | | | Value | |
| Consumer Discretionary - 11.8% | | | | | | |
| Aaron's, Inc. | | | 5,491 | | | $ | 218,816 | |
| Abercrombie & Fitch Co. - Class A (a) | | | 4,534 | | | | 79,028 | |
| American Eagle Outfitters, Inc. | | | 4,642 | | | | 87,270 | |
| American Public Education, Inc. (b) | | | 1,314 | | | | 32,916 | |
| Barnes & Noble Education, Inc. (a) (b) | | | 1,676 | | | | 13,810 | |
| Barnes & Noble, Inc. | | | 3,138 | | | | 21,025 | |
| Beazer Homes USA, Inc. (b) | | | 2,660 | | | | 51,099 | |
| BMC Stock Holdings, Inc. (b) | | | 4,310 | | | | 109,043 | |
| Bridgepoint Education, Inc. (b) | | | 200 | | | | 1,660 | |
| Career Education Corp. (b) | | | 1,210 | | | | 14,617 | |
| Century Casinos, Inc. (b) | | | 1,020 | | | | 9,313 | |
| Chico's FAS, Inc. (a) | | | 6,209 | | | | 54,763 | |
| Citi Trends, Inc. | | | 230 | | | | 6,086 | |
| Dana, Inc. | | | 118 | | | | 3,777 | |
| Deckers Outdoor Corp. (b) | | | 4,299 | | | | 344,995 | |
| Del Taco Restaurants, Inc. (b) | | | 200 | | | | 2,424 | |
| Denny's Corp. (b) | | | 514 | | | | 6,805 | |
| DSW, Inc. - Class A (a) | | | 3,636 | | | | 77,847 | |
| Ethan Allen Interiors, Inc. | | | 100 | | | | 2,860 | |
| Express, Inc. (b) | | | 129 | | | | 1,309 | |
| Flexsteel Industries, Inc. (a) | | | 754 | | | | 35,272 | |
| Fred's, Inc. - Class A (a) | | | 20,525 | | | | 83,126 | |
| FTD Companies, Inc. (b) | | | 2,010 | | | | 14,452 | |
| Gannett Company, Inc. | | | 2,860 | | | | 33,147 | |
| G-III Apparel Group Ltd. (b) | | | 1,890 | | | | 69,722 | |
| Guess?, Inc. | | | 2,520 | | | | 42,538 | |
| Hibbett Sports, Inc. (b) | | | 680 | | | | 13,872 | |
| Hooker Furniture Corp. | | | 14,777 | | | | 627,284 | |
| K12, Inc. (b) | | | 126 | | | | 2,003 | |
| KB Home (a) | | | 2,816 | | | | 89,971 | |
| Kirkland's, Inc. (b) | | | 3,196 | | | | 38,240 | |
| La-Z-Boy, Inc. | | | 1,032 | | | | 32,198 | |
| M/I Homes, Inc. (b) | | | 1,130 | | | | 38,872 | |
| MDC Holdings, Inc. | | | 584 | | | | 18,618 | |
| Motorcar Parts of America, Inc. (b) | | | 700 | | | | 17,493 | |
| WILSHIRE SMALL COMPANY VALUE PORTFOLIO | | | |
| SCHEDULE OF INVESTMENTS (continued) | | | |
| | | | |
| COMMON STOCKS - 98.1% (Continued) | | Shares | | | Value | |
| Consumer Discretionary - 11.8% (Continued) | | | | | | |
| Movado Group, Inc. (a) | | | 2,046 | | | $ | 65,881 | |
| MSG Networks, Inc. - Class A (b) | | | 630 | | | | 12,758 | |
| New Home Co., Inc. (The) (b) | | | 886 | | | | 11,102 | |
| New York Times Co. (The) - Class A | | | 7,459 | | | | 137,992 | |
| Office Depot, Inc. | | | 6,700 | | | | 23,718 | |
| Penn National Gaming, Inc. (b) | | | 1,690 | | | | 52,948 | |
| Pinnacle Entertainment, Inc. (b) | | | 4,490 | | | | 146,957 | |
| Scholastic Corp. | | | 4,429 | | | | 177,647 | |
| Shiloh Industries, Inc. (b) | | | 2,499 | | | | 20,492 | |
| Shoe Carnival, Inc. | | | 1,464 | | | | 39,162 | |
| Standard Motor Products, Inc. | | | 906 | | | | 40,688 | |
| Stoneridge, Inc. (b) | | | 19,013 | | | | 434,637 | |
| Strayer Education, Inc. (a) | | | 237 | | | | 21,230 | |
| Superior Industries International, Inc. | | | 1,130 | | | | 16,781 | |
| Taylor Morrison Home Corp. - Class A (b) | | | 17,550 | | | | 429,449 | |
| Tilly's, Inc. - Class A | | | 2,562 | | | | 37,815 | |
| TRI Pointe Group, Inc. (a) (b) | | | 43,796 | | | | 784,824 | |
| Vera Bradley, Inc. (b) | | | 940 | | | | 11,449 | |
| | | | | | | | 4,761,801 | |
| Consumer Staples - 2.8% | | | | | | | | |
| Central Garden & Pet Co. - Class A (b) | | | 1,729 | | | | 65,201 | |
| Dean Foods Co. | | | 2,460 | | | | 28,438 | |
| John B. Sanfilippo & Son, Inc. (a) | | | 3,974 | | | | 251,355 | |
| Landec Corp. (b) | | | 41,105 | | | | 517,922 | |
| Sanderson Farms, Inc. (a) | | | 110 | | | | 15,266 | |
| Seneca Foods Corp. - Class A (b) | | | 360 | | | | 11,070 | |
| SpartanNash Co. | | | 340 | | | | 9,071 | |
| TreeHouse Foods, Inc. (b) | | | 2,199 | | | | 108,763 | |
| United Natural Foods, Inc. (b) | | | 1,120 | | | | 55,183 | |
| Universal Corp. | | | 1,526 | | | | 80,115 | |
| | | | | | | | 1,142,384 | |
| Energy - 8.2% | | | | | | | | |
| Archrock, Inc. | | | 3,518 | | | | 36,939 | |
| Callon Petroleum Co. (a) (b) | | | 120 | | | | 1,458 | |
| Carrizo Oil & Gas, Inc. (a) (b) | | | 41,555 | | | | 884,290 | |
| Contango Oil & Gas Co. (a) (b) | | | 1,380 | | | | 6,500 | |
| WILSHIRE SMALL COMPANY VALUE PORTFOLIO | | | |
| SCHEDULE OF INVESTMENTS (continued) | | | |
| | | | |
| COMMON STOCKS - 98.1% (Continued) | | Shares | | | Value | |
| Energy - 8.2% (Continued) | | | | | | |
| Delek US Holdings, Inc. | | | 3,064 | | | $ | 107,056 | |
| Energy XXI Gulf Coast, Inc. (b) | | | 13,537 | | | | 77,702 | |
| Era Group, Inc. (b) | | | 743 | | | | 7,987 | |
| Exterran Corp. (b) | | | 1,593 | | | | 50,084 | |
| Geospace Technologies Corp. (a) (b) | | | 401 | | | | 5,201 | |
| Helix Energy Solutions Group, Inc. (b) | | | 1,258 | | | | 9,485 | |
| McDermott International, Inc. (b) | | | 16,673 | | | | 109,709 | |
| Midstates Petroleum Co., Inc. (b) | | | 1,904 | | | | 31,568 | |
| Newpark Resources, Inc. (b) | | | 4,414 | | | | 37,960 | |
| Oasis Petroleum, Inc. (b) | | | 6,688 | | | | 56,246 | |
| Overseas Shipholding Group, Inc. - Class A (a) (b) | | | 26,637 | | | | 72,985 | |
| PDC Energy, Inc. (b) | | | 15,396 | | | | 793,510 | |
| Peabody Energy Corp. (b) | | | 3,769 | | | | 148,386 | |
| PHI, Inc. (b) | | | 8,206 | | | | 94,943 | |
| Renewable Energy Group, Inc. (a) (b) | | | 10,446 | | | | 123,263 | |
| SandRidge Energy, Inc. (a) (b) | | | 2,631 | | | | 55,435 | |
| SRC Energy, Inc. (a) (b) | | | 51,302 | | | | 437,606 | |
| U.S. Silica Holdings, Inc. (a) | | | 3,470 | | | | 112,984 | |
| Ultra Petroleum Corp. (a) (b) | | | 810 | | | | 7,339 | |
| Unit Corp. (a) (b) | | | 946 | | | | 20,812 | |
| | | | | | | | 3,289,448 | |
| Financials - 28.8% | | | | | | | | |
| American Equity Investment Life Holding Co. | | | 5,607 | | | | 172,303 | |
| Ameris Bancorp | | | 8,675 | | | | 418,135 | |
| Anworth Mortgage Asset Corp. | | | 17,653 | | | | 96,032 | |
| Argo Group International Holdings Ltd. | | | 1,656 | | | | 102,092 | |
| Arrow Financial Corp. | | | 553 | | | | 18,774 | |
| Aspen Insurance Holdings Ltd. | | | 12,580 | | | | 510,747 | |
| B. Riley Financial, Inc. (a) | | | 6,010 | | | | 108,781 | |
| Baldwin & Lyons, Inc. - Class B | | | 2,443 | | | | 58,510 | |
| Bancorp, Inc. (The) (b) | | | 6,695 | | | | 66,147 | |
| BancorpSouth Bank | | | 1,510 | | | | 47,490 | |
| Bank Mutual Corp. | | | 2,722 | | | | 28,989 | |
| Bank of N.T. Butterfield & Son Ltd. (The) | | | 18,575 | | | | 674,087 | |
| BankFinancial Corp. | | | 587 | | | | 9,005 | |
| BankUnited, Inc. | | | 5,875 | | | | 239,230 | |
| WILSHIRE SMALL COMPANY VALUE PORTFOLIO | | | | | | |
| SCHEDULE OF INVESTMENTS (continued) | | | | | | |
| | | | | | | |
| COMMON STOCKS - 98.1% (Continued) | | Shares | | | Value | |
| Financials - 28.8% (Continued) | | | | | | |
| Banner Corp. | | | 3,775 | | | $ | 208,078 | |
| Beneficial Bancorp, Inc. | | | 1,354 | | | | 22,273 | |
| Berkshire Hills Bancorp, Inc. | | | 2,139 | | | | 78,287 | |
| Capitol Federal Financial, Inc. | | | 10,519 | | | | 141,060 | |
| Carolina Financial Corp. | | | 1,095 | | | | 40,679 | |
| Cathay General Bancorp | | | 496 | | | | 20,916 | |
| CenterState Bank Corp. (a) | | | 2,655 | | | | 68,313 | |
| Central Pacific Financial Corp. | | | 1,319 | | | | 39,346 | |
| Charter Financial Corp. | | | 3,244 | | | | 56,900 | |
| Citizens & Northern Corp. (a) | | | 453 | | | | 10,872 | |
| City Holding Co. | | | 699 | | | | 47,162 | |
| Clifton Bancorp, Inc. | | | 4,213 | | | | 72,042 | |
| CNO Financial Group, Inc. | | | 5,433 | | | | 134,141 | |
| Community Bank System, Inc. (a) | | | 340 | | | | 18,275 | |
| Customers Bancorp, Inc. (b) | | | 3,171 | | | | 82,414 | |
| Dime Community Bancshares, Inc. | | | 4,714 | | | | 98,758 | |
| Donegal Group, Inc. - Class A | | | 2,265 | | | | 39,185 | |
| Dynex Capital, Inc. | | | 12,487 | | | | 87,534 | |
| Eagle Bancorp, Inc. (b) | | | 3,053 | | | | 176,769 | |
| Employers Holdings, Inc. | | | 608 | | | | 26,995 | |
| Enterprise Financial Services Corp. | | | 1,557 | | | | 70,299 | |
| EZCORP, Inc. - Class A (a) (b) | | | 9,261 | | | | 112,984 | |
| FBL Financial Group, Inc. - Class A | | | 1,842 | | | | 128,295 | |
| FCB Financial Holdings, Inc. - Class A (b) | | | 1,140 | | | | 57,912 | |
| Federated National Holding Co. | | | 1,547 | | | | 25,634 | |
| First BanCorp. (b) | | | 27,860 | | | | 142,086 | |
| First Busey Corp. | | | 3,876 | | | | 116,047 | |
| First Citizens BancShares, Inc. - Class A | | | 307 | | | | 123,721 | |
| First Financial Bancorp | | | 2,343 | | | | 61,738 | |
| First Financial Corp. | | | 886 | | | | 40,180 | |
| First Horizon National Corp. (a) | | | 9,692 | | | | 193,752 | |
| First Internet Bancorp | | | 189 | | | | 7,210 | |
| Flagstar Bancorp, Inc. (b) | | | 4,167 | | | | 155,929 | |
| Flushing Financial Corp. | | | 1,183 | | | | 32,533 | |
| GAMCO Investors, Inc. - Class A | | | 433 | | | | 12,838 | |
| Genworth Financial, Inc. - Class A (b) | | | 32,455 | | | | 100,935 | |
| WILSHIRE SMALL COMPANY VALUE PORTFOLIO | | | | | | |
| SCHEDULE OF INVESTMENTS (continued) | | | | | | |
| | | | | | | |
| COMMON STOCKS - 98.1% (Continued) | | Shares | | | Value | |
| Financials - 28.8% (Continued) | | | | | | |
| Glacier Bancorp, Inc. (a) | | | 1,132 | | | $ | 44,589 | |
| Global Indemnity Ltd. (b) | | | 1,664 | | | | 69,921 | |
| Greenlight Capital Re Ltd. - Class A (a) (b) | | | 5,816 | | | | 116,902 | |
| Hallmark Financial Services, Inc. (b) | | | 5,511 | | | | 57,480 | |
| Hancock Holding Co. | | | 121 | | | | 5,990 | |
| Hanmi Financial Corp. | | | 1,093 | | | | 33,173 | |
| HCI Group, Inc. | | | 1,640 | | | | 49,036 | |
| Heritage Financial Corp. | | | 2,855 | | | | 87,934 | |
| Hilltop Holdings, Inc. (a) | | | 9,030 | | | | 228,730 | |
| HomeStreet, Inc. (a) (b) | | | 19,476 | | | | 563,831 | |
| Hope Bancorp, Inc. | | | 18,660 | | | | 340,545 | |
| Independent Bank Corp. | | | 1,923 | | | | 42,979 | |
| Infinity Property & Casualty Corp. | | | 1,020 | | | | 108,120 | |
| Invesco Mortgage Capital, Inc. | | | 1 | | | | 18 | |
| Investment Technology Group, Inc. | | | 1,465 | | | | 28,201 | |
| LegacyTexas Financial Group, Inc. | | | 2,645 | | | | 111,645 | |
| MB Financial, Inc. | | | 340 | | | | 15,137 | |
| Mercantile Bank Corp. | | | 1,348 | | | | 47,679 | |
| Meridian Bancorp, Inc. | | | 11,780 | | | | 242,668 | |
| MGIC Investment Corp. (b) | | | 13,885 | | | | 195,917 | |
| MutualFirst Financial, Inc. | | | 715 | | | | 27,563 | |
| National Western Life Group, Inc. - Class A | | | 536 | | | | 177,427 | |
| Navigators Group, Inc. (The) | | | 2,497 | | | | 121,604 | |
| NBT Bancorp, Inc. | | | 1,828 | | | | 67,270 | |
| NMI Holdings, Inc. - Class A (b) | | | 4,819 | | | | 81,923 | |
| Northfield Bancorp, Inc. | | | 5,627 | | | | 96,109 | |
| OFG Bancorp (a) | | | 7,693 | | | | 72,314 | |
| Oritani Financial Corp. (a) | | �� | 7,480 | | | | 122,672 | |
| Orrstown Financial Services, Inc. | | | 408 | | | | 10,302 | |
| PacWest Bancorp | | | 10,520 | | | | 530,208 | |
| Provident Financial Holdings, Inc. | | | 2,041 | | | | 37,554 | |
| Pzena Investment Management, Inc. - Class A | | | 7,986 | | | | 85,211 | |
| Radian Group, Inc. | | | 9,961 | | | | 205,296 | |
| Republic Bancorp, Inc. - Class A | | | 2,008 | | | | 76,344 | |
| Resource Capital Corp. (a) | | | 11,528 | | | | 108,018 | |
| S&T Bancorp, Inc. (a) | | | 1,377 | | | | 54,818 | |
| WILSHIRE SMALL COMPANY VALUE PORTFOLIO | | | |
| SCHEDULE OF INVESTMENTS (continued) | | | |
| | | | |
| COMMON STOCKS - 98.1% (Continued) | | Shares | | | Value | |
| Financials - 28.8% (Continued) | | | | | | |
| Seacoast Banking Corp. of Florida (b) | | | 1,007 | | | $ | 25,386 | |
| SI Financial Group, Inc. | | | 1,656 | | | | 24,343 | |
| Simmons First National Corp. - Class A (a) | | | 770 | | | | 43,967 | |
| Sterling Bancorp (a) | | | 1,759 | | | | 43,271 | |
| Territorial Bancorp, Inc. | | | 3,330 | | | | 102,797 | |
| Texas Capital Bancshares, Inc. (a) (b) | | | 2,520 | | | | 224,028 | |
| Third Point Reinsurance Ltd. (b) | | | 11,878 | | | | 174,013 | |
| TriState Capital Holdings, Inc. (b) | | | 1,880 | | | | 43,240 | |
| United Fire Group, Inc. (a) | | | 1,302 | | | | 59,345 | |
| Universal Insurance Holdings, Inc. | | | 1,230 | | | | 33,641 | |
| Washington Federal, Inc. | | | 4,955 | | | | 169,709 | |
| Waterstone Financial, Inc. | | | 430 | | | | 7,332 | |
| Western Alliance Bancorp (b) | | | 15,030 | | | | 851,000 | |
| Wintrust Financial Corp. | | | 1,218 | | | | 100,327 | |
| | | | | | | | 11,569,941 | |
| Health Care - 3.1% | | | | | | | | |
| Acorda Therapeutics, Inc. (b) | | | 610 | | | | 13,085 | |
| Addus HomeCare Corp. (b) | | | 189 | | | | 6,577 | |
| AMAG Pharmaceuticals, Inc. (b) | | | 100 | | | | 1,325 | |
| Bluebird Bio, Inc. (a) (b) | | | 245 | | | | 43,634 | |
| Emergent BioSolutions, Inc. (b) | | | 1,412 | | | | 65,615 | |
| Exelixis, Inc. (b) | | | 122 | | | | 3,709 | |
| Globus Medical, Inc. - Class A (a) (b) | | | 7,360 | | | | 302,496 | |
| Haemonetics Corp. (b) | | | 1,364 | | | | 79,221 | |
| Halyard Health, Inc. (b) | | | 1,568 | | | | 72,410 | |
| Lantheus Holdings, Inc. (b) | | | 1,299 | | | | 26,565 | |
| LHC Group, Inc. (b) | | | 846 | | | | 51,818 | |
| LivaNova plc (b) | | | 3,230 | | | | 258,142 | |
| Magellan Health, Inc. (b) | | | 615 | | | | 59,378 | |
| Meridian Bioscience, Inc. | | | 531 | | | | 7,434 | |
| Myriad Genetics, Inc. (a) (b) | | | 680 | | | | 23,355 | |
| National HealthCare Corp. | | | 978 | | | | 59,599 | |
| Owens & Minor, Inc. | | | 720 | | | | 13,594 | |
| Retrophin, Inc. (a) (b) | | | 161 | | | | 3,392 | |
| Syndax Pharmaceuticals, Inc. (b) | | | 31 | | | | 272 | |
| Tivity Health, Inc. (a) (b) | | | 2,111 | | | | 77,157 | |
| WILSHIRE SMALL COMPANY VALUE PORTFOLIO | | | |
| SCHEDULE OF INVESTMENTS (continued) | | | |
| | | | |
| COMMON STOCKS - 98.1% (Continued) | | Shares | | | Value | |
| Health Care - 3.1% (Continued) | | | | | | |
| Triple-S Management Corp. - Class B (b) | | | 3,244 | | | $ | 80,613 | |
| | | | | | | | 1,249,391 | |
| Industrials - 12.7% | | | | | | | | |
| AeroVironment, Inc. (a) (b) | | | 100 | | | | 5,616 | |
| Aircastle Ltd. | | | 4,004 | | | | 93,654 | |
| Albany International Corp. - Class A | | | 10,365 | | | | 636,929 | |
| Apogee Enterprises, Inc. (a) | | | 4,470 | | | | 204,413 | |
| Applied Industrial Technologies, Inc. | | | 1,475 | | | | 100,448 | |
| Astronics Corp. (b) | | | 2,135 | | | | 88,538 | |
| Atlas Air Worldwide Holdings, Inc. (a) (b) | | | 2,755 | | | | 161,581 | |
| Belden, Inc. | | | 199 | | | | 15,357 | |
| Brady Corp. - Class A | | | 1,556 | | | | 58,972 | |
| CAI International, Inc. (b) | | | 5,596 | | | | 158,478 | |
| Casella Waste Systems, Inc. - Class A (b) | | | 723 | | | | 16,643 | |
| Chart Industries, Inc. (a) (b) | | | 1,858 | | | | 87,066 | |
| Comfort Systems USA, Inc. | | | 2,253 | | | | 98,343 | |
| CSW Industrials, Inc. (b) | | | 2,743 | | | | 126,041 | |
| Curtiss-Wright Corp. | | | 705 | | | | 85,904 | |
| EMCOR Group, Inc. | | | 1,827 | | | | 149,358 | |
| EnerSys | | | 7,197 | | | | 501,127 | |
| Ennis, Inc. | | | 8,487 | | | | 176,106 | |
| Essendant, Inc. | | | 3,659 | | | | 33,919 | |
| Exponent, Inc. | | | 443 | | | | 31,497 | |
| Gencor Industries, Inc. (b) | | | 2,499 | | | | 41,358 | |
| Gibraltar Industries, Inc. (a) (b) | | | 297 | | | | 9,801 | |
| GP Strategies Corp. (b) | | | 10,895 | | | | 252,764 | |
| Graham Corp. | | | 2,129 | | | | 44,560 | |
| Harsco Corp. (b) | | | 448 | | | | 8,355 | |
| Hawaiian Holdings, Inc. | | | 3,498 | | | | 139,395 | |
| Heidrick & Struggles International, Inc. | | | 1,349 | | | | 33,118 | |
| Insteel Industries, Inc. | | | 189 | | | | 5,352 | |
| Interface, Inc. | | | 3,378 | | | | 84,957 | |
| Kelly Services, Inc. - Class A | | | 3,785 | | | | 103,217 | |
| Kennametal, Inc. | | | 2,021 | | | | 97,837 | |
| Kimball International, Inc. - Class B | | | 1,608 | | | | 30,021 | |
| Layne Christensen Co. (a) (b) | | | 1,631 | | | | 20,469 | |
| WILSHIRE SMALL COMPANY VALUE PORTFOLIO | | | |
| SCHEDULE OF INVESTMENTS (continued) | | | |
| | | | |
| COMMON STOCKS - 98.1% (Continued) | | Shares | | | Value | |
| Industrials - 12.7% (Continued) | | | | | | |
| LSC Communications, Inc. | | | 2,144 | | | $ | 32,482 | |
| LSI Industries, Inc. | | | 1,784 | | | | 12,274 | |
| Manitowoc Company, Inc. (The) (a) (b) | | | 453 | | | | 17,821 | |
| Meritor, Inc. (b) | | | 2,360 | | | | 55,366 | |
| Miller Industries, Inc. | | | 895 | | | | 23,091 | |
| Moog, Inc. - Class A (b) | | | 557 | | | | 48,375 | |
| MRC Global, Inc. (b) | | | 5,519 | | | | 93,381 | |
| Navistar International Corp. (b) | | | 1,830 | | | | 78,470 | |
| Orbital ATK, Inc. | | | 2,337 | | | | 307,317 | |
| Quad/Graphics, Inc. (a) | | | 1,462 | | | | 33,041 | |
| Rexnord Corp. (b) | | | 1,210 | | | | 31,484 | |
| Simpson Manufacturing Co., Inc. | | | 1,485 | | | | 85,254 | |
| SkyWest, Inc. (a) | | | 3,316 | | | | 176,080 | |
| SPX FLOW, Inc. (b) | | | 1,181 | | | | 56,157 | |
| Sterling Construction Co., Inc. (b) | | | 7,283 | | | | 118,567 | |
| Titan International, Inc. | | | 6,400 | | | | 82,432 | |
| Titan Machinery, Inc. (b) | | | 1,471 | | | | 31,141 | |
| Triton International Ltd. | | | 470 | | | | 17,602 | |
| Triumph Group, Inc. (a) | | | 1,000 | | | | 27,200 | |
| TrueBlue, Inc. (b) | | | 126 | | | | 3,465 | |
| Tutor Perini Corp. (a) (b) | | | 740 | | | | 18,759 | |
| Veritiv Corp. (b) | | | 959 | | | | 27,715 | |
| Wabash National Corp. | | | 670 | | | | 14,539 | |
| Willis Lease Finance Corp. (b) | | | 418 | | | | 10,437 | |
| YRC Worldwide, Inc. (b) | | | 1,072 | | | | 15,415 | |
| | | | | | | | 5,119,059 | |
| Information Technology - 14.1% | | | | | | | | |
| ADTRAN, Inc. | | | 2,946 | | | | 57,005 | |
| Advanced Energy Industries, Inc. (b) | | | 1,035 | | | | 69,842 | |
| Amkor Technology, Inc. (b) | | | 8,328 | | | | 83,696 | |
| Anixter International, Inc. (b) | | | 360 | | | | 27,360 | |
| Benchmark Electronics, Inc. (b) | | | 1,375 | | | | 40,013 | |
| Cabot Microelectronics Corp. | | | 959 | | | | 90,223 | |
| CACI International, Inc. - Class A (b) | | | 325 | | | | 43,014 | |
| ChannelAdvisor Corp. (b) | | | 989 | | | | 8,901 | |
| Coherent, Inc. (b) | | | 2,055 | | | | 579,961 | |
| WILSHIRE SMALL COMPANY VALUE PORTFOLIO | | | |
| SCHEDULE OF INVESTMENTS (continued) | | | |
| | | | |
| COMMON STOCKS - 98.1% (Continued) | | Shares | | | Value | |
| Information Technology - 14.1% (Continued) | | | | | | |
| Cohu, Inc. | | | 3,964 | | | $ | 87,010 | |
| Cray, Inc. (a) (b) | | | 13,090 | | | | 316,778 | |
| Daktronics, Inc. | | | 287 | | | | 2,620 | |
| Digi International, Inc. (b) | | | 3,797 | | | | 36,261 | |
| Electro Scientific Industries, Inc. (a) (b) | | | 310 | | | | 6,643 | |
| Entegris, Inc. | | | 13,280 | | | | 404,376 | |
| Euronet Worldwide, Inc. (b) | | | 2,365 | | | | 199,298 | |
| Insight Enterprises, Inc. (b) | | | 3,670 | | | | 140,524 | |
| Integrated Device Technology, Inc. (b) | | | 12,935 | | | | 384,558 | |
| Lattice Semiconductor Corp. (b) | | | 65,455 | | | | 378,330 | |
| ManTech International Corp. - Class A | | | 121 | | | | 6,073 | |
| Mellanox Technologies Ltd. (a) (b) | | | 11,720 | | | | 758,284 | |
| Mitel Networks Corp. (b) | | | 60,925 | | | | 501,413 | |
| Nanometrics, Inc. (b) | | | 3,458 | | | | 86,173 | |
| Novanta, Inc. (b) | | | 5,920 | | | | 296,000 | |
| NVE Corp. | | | 1,163 | | | | 100,018 | |
| PCM, Inc. (a) (b) | | | 322 | | | | 3,188 | |
| Photronics, Inc. (b) | | | 4,833 | | | | 41,201 | |
| Plexus Corp. (b) | | | 1,040 | | | | 63,149 | |
| Progress Software Corp. | | | 1,518 | | | | 64,621 | |
| QAD, Inc. - Class A | | | 136 | | | | 5,284 | |
| Rogers Corp. (b) | | | 129 | | | | 20,888 | |
| Sanmina Corp. (b) | | | 4,939 | | | | 162,987 | |
| ScanSource, Inc. (b) | | | 1,292 | | | | 46,254 | |
| Sykes Enterprises, Inc. (b) | | | 2,626 | | | | 82,588 | |
| SYNNEX Corp. | | | 1,203 | | | | 163,548 | |
| Tech Data Corp. (b) | | | 1,568 | | | | 153,617 | |
| TiVo Corp. | | | 60 | | | | 936 | |
| TTM Technologies, Inc. (b) | | | 2,401 | | | | 37,624 | |
| VASCO Data Security International, Inc. (a) (b) | | | 2,328 | | | | 32,359 | |
| Vishay Intertechnology, Inc. | | | 1,397 | | | | 28,988 | |
| XO Group, Inc. (b) | | | 2,509 | | | | 46,316 | |
| | | | | | | | 5,657,922 | |
| Materials - 8.4% | | | | | | | | |
| AdvanSix, Inc. (b) | | | 380 | | | | 15,987 | |
| American Vanguard Corp. | | | 7,059 | | | | 138,709 | |
| WILSHIRE SMALL COMPANY VALUE PORTFOLIO | | | |
| SCHEDULE OF INVESTMENTS (continued) | | | |
| | | | |
| COMMON STOCKS - 98.1% (Continued) | | Shares | | | Value | |
| Materials - 8.4% (Continued) | | | | | | |
| Bemis Company, Inc. | | | 2,155 | | | $ | 102,987 | |
| Boise Cascade Co. | | | 11,430 | | | | 456,057 | |
| Century Aluminum Co. (a) (b) | | | 4,671 | | | | 91,738 | |
| Coeur Mining, Inc. (a) (b) | | | 2,166 | | | | 16,245 | |
| Deltic Timber Corp. | | | 1,865 | | | | 170,741 | |
| FutureFuel Corp. | | | 2,409 | | | | 33,943 | |
| Greif, Inc. - Class A | | | 405 | | | | 24,535 | |
| Innophos Holdings, Inc. | | | 1,168 | | | | 54,581 | |
| Kaiser Aluminum Corp. | | | 4,277 | | | | 456,998 | |
| KMG Chemicals, Inc. | | | 229 | | | | 15,132 | |
| Koppers Holdings, Inc. (b) | | | 63 | | | | 3,207 | |
| Kraton Corp. (b) | | | 126 | | | | 6,069 | |
| Louisiana-Pacific Corp. (b) | | | 18,872 | | | | 495,578 | |
| Materion Corp. | | | 5,668 | | | | 275,465 | |
| Neenah Paper, Inc. (a) | | | 1,895 | | | | 171,782 | |
| Olympic Steel, Inc. | | | 3,821 | | | | 82,113 | |
| P.H. Glatfelter Co. | | | 11,170 | | | | 239,485 | |
| Schnitzer Steel Industries, Inc. - Class A | | | 2,280 | | | | 76,380 | |
| Sensient Technologies Corp. | | | 517 | | | | 37,819 | |
| Tredegar Corp. (a) | | | 2,300 | | | | 44,160 | |
| Trinseo S.A. | | | 2,839 | | | | 206,111 | |
| Tronox Ltd. - Class A | | | 3,846 | | | | 78,881 | |
| UFP Technologies, Inc. (b) | | | 1,266 | | | | 35,195 | |
| Warrior Met Coal, Inc. (a) | | | 1,764 | | | | 44,365 | |
| | | | | | | | 3,374,263 | |
| Real Estate - 5.9% | | | | | | | | |
| Ashford Hospitality Prime, Inc. | | | 4,716 | | | | 45,887 | |
| Ashford Hospitality Trust, Inc. | | | 12,522 | | | | 84,273 | |
| Brandywine Realty Trust | | | 17,338 | | | | 315,378 | |
| Cedar Realty Trust, Inc. | | | 13,124 | | | | 79,794 | |
| Chesapeake Lodging Trust (a) | | | 2,713 | | | | 73,495 | |
| DiamondRock Hospitality Co. | | | 697 | | | | 7,869 | |
| Forestar Group, Inc. (a) (b) | | | 4,299 | | | | 94,578 | |
| Four Corners Property Trust, Inc. | | | 1,350 | | | | 34,695 | |
| GEO Group, Inc. (The) | | | 3,176 | | | | 74,954 | |
| Getty Realty Corp. | | | 11,667 | | | | 316,876 | |
| WILSHIRE SMALL COMPANY VALUE PORTFOLIO | | | |
| SCHEDULE OF INVESTMENTS (continued) | | | |
| | | | |
| COMMON STOCKS - 98.1% (Continued) | | Shares | | | Value | |
| Real Estate - 5.9% (Continued) | | | | | | |
| Lexington Realty Trust | | | 4,852 | | | $ | 46,822 | |
| LTC Properties, Inc. | | | 2,170 | | | | 94,504 | |
| National Health Investors, Inc. | | | 356 | | | | 26,835 | |
| PS Business Parks, Inc. | | | 219 | | | | 27,395 | |
| Quality Care Properties, Inc. (b) | | | 8,796 | | | | 121,473 | |
| Ramco-Gershenson Properties Trust | | | 29,250 | | | | 430,852 | |
| RE/MAX Holdings, Inc. - Class A | | | 3,302 | | | | 160,147 | |
| Sabra Health Care REIT, Inc. | | | 18,131 | | | | 340,318 | |
| Summit Hotel Properties, Inc. | | | 813 | | | | 12,382 | |
| | | | | | | | 2,388,527 | |
| Telecommunication Services - 0.0% (c) | | | | | | | | |
| Boingo Wireless, Inc. (b) | | | 130 | | | | 2,925 | |
| | | | | | | | | |
| Utilities - 2.3% | | | | | | | | |
| American States Water Co. | | | 2,302 | | | | 133,309 | |
| Artesian Resources Corp. - Class A (a) | | | 4,774 | | | | 184,085 | |
| MGE Energy, Inc. | | | 836 | | | | 52,752 | |
| Northwest Natural Gas Co. | | | 589 | | | | 35,134 | |
| ONE Gas, Inc. | | | 657 | | | | 48,132 | |
| Ormat Technologies, Inc. | | | 3,982 | | | | 254,689 | |
| Otter Tail Corp. | | | 345 | | | | 15,335 | |
| Portland General Electric Co. | | | 100 | | | | 4,558 | |
| South Jersey Industries, Inc. (a) | | | 691 | | | | 21,580 | |
| Southwest Gas Holdings, Inc. | | | 1,262 | | | | 101,565 | |
| York Water Co. (The) (a) | | | 1,729 | | | | 58,613 | |
| | | | | | | | 909,752 | |
| | | | | | | | | |
| Total Common Stocks (Cost $31,716,297) | | | | | | $ | 39,465,413 | |
| WILSHIRE SMALL COMPANY VALUE PORTFOLIO | | | |
| SCHEDULE OF INVESTMENTS (continued) | | | |
| | | | |
| MONEY MARKET FUNDS - 4.4% | | Shares | | | Value | |
| Northern Trust Institutional Government Select Portfolio - Institutional Class, 1.13% (d) | | | 782,990 | | | $ | 782,990 | |
| Northern Trust Institutional Liquid Portfolio - Institutional Class, 1.09% (d) (e) | | | 1,001,671 | | | | 1,001,671 | |
| Total Money Market Funds (Cost $1,784,661) | | | | | | $ | 1,784,661 | |
| | | | | | | | | |
| Total Investments at Value - 102.5% (Cost $33,500,958) | | | | | | $ | 41,250,074 | |
| | | | | | | | | |
| Liabilities in Excess of Other Assets - (2.5%) | | | | | | | (1,025,723 | ) |
| | | | | | | | | |
| Net Assets - 100.0% | | | | | | $ | 40,224,351 | |
| (a) | This security or a partial position of this security is on loan at December 31, 2017. The total value of securities on loan at December 31, 2017 was $6,418,286 (Note 7). |
| (b) | Non-income producing security. |
| (c) | Percentage rounds to less than 0.1%. |
| (d) | The rate shown is the 7-day effective yield as of December 31, 2017. |
| (e) | This security was purchased with cash collateral held from securities on loan. The total value of such securities as of December 31, 2017 was $1,001,671. Securities on loan are also collateralized by various U.S. Treasury obligations in the amount of $5,625,851 (Note 7). |
Ltd. - Limited.
plc - Public Limited Company.
See accompanying notes to financial statements.
| WILSHIRE INTERNATIONAL EQUITY FUND |
| SCHEDULE OF INVESTMENTS |
| December 31, 2017 (Unaudited) |
| |
| COMMON STOCKS - 96.4% | | Shares | | | Value | |
| Australia - 3.1% |
| AGL Energy Ltd. (a) | | | 33,698 | | | $ | 638,648 | |
| Alumina Ltd. (a) | | | 13,804 | | | | 26,017 | |
| Amcor Ltd. (a) | | | 8,065 | | | | 96,648 | |
| AMP Ltd. (a) | | | 36,409 | | | | 146,981 | |
| Aristocrat Leisure Ltd. (a) | | | 14,319 | | | | 263,702 | |
| BHP Billiton Ltd. (a) | | | 19,810 | | | | 455,104 | |
| BlueScope Steel Ltd. | | | 13,731 | | | | 164,686 | |
| Boral Ltd. (a) | | | 5,676 | | | | 34,365 | |
| CIMIC Group Ltd. (a) | | | 2,560 | | | | 102,400 | |
| Coca-Cola Amatil Ltd. (a) | | | 30,815 | | | | 204,168 | |
| Cochlear Ltd. (a) | | | 2,047 | | | | 272,900 | |
| Computershare Ltd. (a) | | | 7,063 | | | | 89,496 | |
| CSL Ltd. (a) | | | 52,442 | | | | 5,763,677 | |
| Incitec Pivot Ltd. (a) | | | 2,032 | | | | 6,158 | |
| Insurance Australia Group Ltd. (a) | | | 12,739 | | | | 71,757 | |
| Macquarie Group Ltd. (a) | | | 7,378 | | | | 570,713 | |
| Medibank Private Ltd. (a) | | | 86,055 | | | | 220,397 | |
| Newcrest Mining Ltd. (a) | | | 1,516 | | | | 26,991 | |
| Orica Ltd. (a) | | | 2,661 | | | | 37,415 | |
| Origin Energy Ltd. (a) (b) | | | 130,062 | | | | 952,834 | |
| QBE Insurance Group Ltd. (a) | | | 85,618 | | | | 710,753 | |
| Santos Ltd. (a) | | | 6,587 | | | | 27,884 | |
| South32 Ltd. (a) | | | 10,251 | | | | 27,789 | |
| Stockland Corp. Ltd. (a) | | | 6,109 | | | | 21,313 | |
| Telstra Corp. Ltd. (a) | | | 3,104 | | | | 8,776 | |
| Woolworths Ltd. (a) | | | 2,277 | | | | 48,383 | |
| | | | | | | | 10,989,955 | |
| Austria - 0.1% |
| OMV AG (a) | | | 6,266 | | | | 396,445 | |
| | | | | | | | | |
| Belgium - 0.3% |
| AGEAS (a) | | | 2,679 | | | | 130,858 | |
| Belgacom (a) | | | 1,441 | | | | 47,278 | |
| KBC Group N.V. (a) | | | 7,652 | | | | 652,004 | |
| WILSHIRE INTERNATIONAL EQUITY FUND |
| SCHEDULE OF INVESTMENTS (Continued) |
| |
| COMMON STOCKS - 96.4% (Continued) | | Shares | | | Value | |
| Belgium - 0.3% (Continued) |
| UCB S.A. (a) | | | 3,079 | | | $ | 244,125 | |
| | | | | | | | 1,074,265 | |
| Bermuda - 0.3% |
| Hongkong Land Holdings Ltd. (a) | | | 49,400 | | | | 347,472 | |
| Jardine Matheson Holdings Ltd. (a) | | | 300 | | | | 18,202 | |
| Kerry Properties Ltd. (a) | | | 20,000 | | | | 89,846 | |
| Nine Dragons Paper Holdings Ltd. (a) | | | 150,000 | | | | 239,679 | |
| Shangri-La Asia Ltd. (a) | | | 100,000 | | | | 226,459 | |
| Yue Yuen Industrial Holdings Ltd. (a) | | | 12,000 | | | | 47,116 | |
| | | | | | | | 968,774 | |
| Brazil - 1.8% |
| Ambev S.A. (a) | | | 47,300 | | | | 304,060 | |
| Ambev S.A. - ADR (c) | | | 357,463 | | | | 2,309,211 | |
| Banco Santander Brasil S.A. (a) | | | 44,900 | | | | 431,755 | |
| Equatorial Energia S.A. (a) | | | 3,400 | | | | 67,384 | |
| Fibria Celulose S.A. (a) | | | 800 | | | | 11,573 | |
| Lojas Renner S.A. | | | 4,100 | | | | 43,934 | |
| Raia Drogasil S.A. (a) | | | 99,310 | | | | 2,751,557 | |
| Suzano Papel e Celulose S.A. | | | 600 | | | | 3,386 | |
| Vale S.A. (a) | | | 39,797 | | | | 482,864 | |
| | | | | | | | 6,405,724 | |
| Canada - 4.4% |
| ARC Resources Ltd. | | | 100 | | | | 1,173 | |
| Bank of Nova Scotia (The) | | | 2,700 | | | | 174,217 | |
| Barrick Gold Corp. | | | 10,600 | | | | 153,285 | |
| Bombardier, Inc. - Class B (b) | | | 7,400 | | | | 17,835 | |
| Brookfield Asset Management, Inc. - Class A | | | 2,200 | | | | 95,756 | |
| CAE, Inc. | | | 900 | | | | 16,716 | |
| Cameco Corp. (c) | | | 4,200 | | | | 38,787 | |
| Canadian National Railway Co. | | | 5,300 | | | | 436,963 | |
| Canadian Natural Resources Ltd. (c) | | | 63,195 | | | | 2,257,324 | |
| Canadian Pacific Railway Ltd. | | | 24,798 | | | | 4,532,083 | |
| CCL Industries, Inc. | | | 1,600 | | | | 73,917 | |
| CI Financial Corp. | | | 27,700 | | | | 655,930 | |
| Constellation Software, Inc. | | | 100 | | | | 60,613 | |
| Dollarama, Inc. | | | 22,443 | | | | 2,803,612 | |
| WILSHIRE INTERNATIONAL EQUITY FUND |
| SCHEDULE OF INVESTMENTS (Continued) |
| |
| COMMON STOCKS - 96.4% (Continued) | | Shares | | | Value | |
| Canada - 4.4% (Continued) |
| Empire Co. Ltd. - Class A | | | 700 | | | $ | 13,636 | |
| Encana Corp. | | | 10,700 | | | | 142,730 | |
| Finning International, Inc. | | | 7,900 | | | | 199,324 | |
| Franco-Nevada Corp. | | | 2,800 | | | | 223,744 | |
| Goldcorp, Inc. | | | 3,700 | | | | 47,177 | |
| Husky Energy, Inc. (b) | | | 27,434 | | | | 387,335 | |
| Industrial Alliance Insurance & Financial Services, Inc. | | | 1,000 | | | | 47,582 | |
| Keyera Corp. | | | 1,200 | | | | 33,809 | |
| Kinross Gold Corp. (b) | | | 17,000 | | | | 73,290 | |
| Loblaw Cos. Ltd. | | | 1,300 | | | | 70,543 | |
| Manulife Financial Corp. | | | 12,200 | | | | 254,444 | |
| National Bank of Canada | | | 1,800 | | | | 89,800 | |
| Onex Corp. | | | 100 | | | | 7,333 | |
| Restaurant Brands International, Inc. | | | 100 | | | | 6,146 | |
| Royal Bank of Canada | | | 7,300 | | | | 596,048 | |
| Saputo, Inc. | | | 8,800 | | | | 316,248 | |
| Seven Generations Energy Ltd. - Class A (b) | | | 6,100 | | | | 86,270 | |
| Shopify, Inc. - Class A (b) | | | 2,600 | | | | 262,877 | |
| Suncor Energy, Inc. | | | 8,900 | | | | 326,709 | |
| Teck Resources Ltd. - Class B | | | 7,100 | | | | 185,634 | |
| TELUS Corp. | | | 1,100 | | | | 41,666 | |
| Thomson Reuters Corp. (c) | | | 17,200 | | | | 749,599 | |
| TransCanada Corp. | | | 1,600 | | | | 77,863 | |
| West Fraser Timber Co. Ltd. | | | 1,700 | | | | 104,892 | |
| | | | | | | | 15,662,910 | |
| Cayman Islands - 4.9% |
| 58.com, Inc. - ADR (b) | | | 7,273 | | | | 520,529 | |
| Alibaba Group Holding Ltd. - ADR (b) (c) | | | 9,514 | | | | 1,640,499 | |
| ANTA Sports Products Ltd. (a) | | | 5,000 | | | | 22,678 | |
| ASM Pacific Technology Ltd. (a) | | | 9,100 | | | | 126,245 | |
| Autohome, Inc. - ADR (b) | | | 1,530 | | | | 98,945 | |
| Baidu.com, Inc. - ADR (b) | | | 17,127 | | | | 4,011,314 | |
| China Mengniu Dairy Co. Ltd. (a) | | | 65,000 | | | | 193,085 | |
| China Resources Land Ltd. (a) | | | 120,000 | | | | 352,037 | |
| CK Asset Holdings Ltd. (a) | | | 35,000 | | | | 305,101 | |
| CK Hutchison Holdings Ltd. (a) | | | 174,125 | | | | 2,181,835 | |
| WILSHIRE INTERNATIONAL EQUITY FUND |
| SCHEDULE OF INVESTMENTS (Continued) |
| |
| COMMON STOCKS - 96.4% (Continued) | | Shares | | | Value | |
| Cayman Islands - 4.9% (Continued) |
| Geely Automobile Holdings Ltd. (a) | | | 10,000 | | | $ | 34,444 | |
| General Interface Solution Holding Ltd. (a) | | | 17,000 | | | | 112,875 | |
| Hengan International Group Co. Ltd. (a) (c) | | | 16,500 | | | | 182,688 | |
| JD.com, Inc. - ADR (b) (c) | | | 6,356 | | | | 263,266 | |
| Longfor Properties Co. Ltd. (a) | | | 52,500 | | | | 131,346 | |
| Melco Resorts & Entertainment Ltd. - ADR | | | 4,735 | | | | 137,504 | |
| Momo, Inc. - ADR (b) (c) | | | 2 | | | | 49 | |
| New Oriental Education & Technology Group, Inc. - ADR | | | 283 | | | | 26,602 | |
| Shenzhou International Group Holdings Ltd. (a) | | | 31,000 | | | | 294,647 | |
| Sunny Optical Technology Group Co. Ltd. (a) (c) | | | 19,000 | | | | 241,248 | |
| TAL Education Group - ADR | | | 1,974 | | | | 58,648 | |
| Tencent Holdings Ltd. (a) | | | 117,455 | | | | 6,079,222 | |
| Weibo Corp. - ADR (b) (c) | | | 2,518 | | | | 260,512 | |
| YY, Inc. - ADR (b) | | | 2,800 | | | | 316,568 | |
| | | | | | | | 17,591,887 | |
| Chile - 0.2% |
| Compania Cervecerias Unidas S.A. (a) (b) | | | 15,509 | | | | 232,409 | |
| Empresas Copec S.A. (a) | | | 15,094 | | | | 238,247 | |
| Sociedad Quimica y Minera de Chile S.A. (a) | | | 1,858 | | | | 110,225 | |
| | | | | | | | 580,881 | |
| China - 0.9% |
| Agricultural Bank of China Ltd. - H Shares (a) | | | 893,000 | | | | 415,012 | |
| Aluminum Corp. of China Ltd. - H Shares (a) (b) | | | 226,000 | | | | 161,334 | |
| China Construction Bank Corp. - H Shares (a) | | | 1,040,000 | | | | 957,374 | |
| China Life Insurance Co. Ltd. (a) | | | 67,000 | | | | 208,940 | |
| China Shenhua Energy Co. Ltd. - H Shares (a) | | | 171,000 | | | | 441,768 | |
| China Vanke Co. Ltd. - H Shares (a) | | | 6,900 | | | | 27,458 | |
| Jiangxi Copper Co. Ltd. (a) | | | 64,000 | | | | 101,266 | |
| PetroChina Co. Ltd. - H Shares (a) | | | 492,000 | | | | 342,110 | |
| Sinopec Shanghai Petrochemical Co. Ltd. (a) | | | 362,000 | | | | 205,789 | |
| Travelsky Technology Ltd. | | | 15,000 | | | | 45,022 | |
| Weichai Power Co. Ltd. - H Shares (a) | | | 158,000 | | | | 172,609 | |
| Yanzhou Coal Mining Co. Ltd. - H Shares (a) | | | 62,000 | | | | 72,304 | |
| | | | | | | | 3,150,986 | |
| Colombia - 0.1% |
| Ecopetrol S.A. | | | 345,492 | | | | 256,066 | |
| WILSHIRE INTERNATIONAL EQUITY FUND |
| SCHEDULE OF INVESTMENTS (Continued) |
| |
| COMMON STOCKS - 96.4% (Continued) | | Shares | | | Value | |
| Curacao - 0.9% |
| Schlumberger Ltd. | | | 45,846 | | | $ | 3,089,561 | |
| | | | | | | | | |
| Denmark - 3.7% |
| A.P. Moeller-Maerska A/S - Series A (a) | | | 41 | | | | 68,305 | |
| Carlsberg A/S - Series B (a) | | | 22,421 | | | | 2,689,049 | |
| Chr. Hansen Holding A/S (a) | | | 40,176 | | | | 3,766,476 | |
| Coloplast A/S - Series B (a) | | | 22,690 | | | | 1,803,810 | |
| Danske Bank A/S (a) | | | 15,609 | | | | 607,514 | |
| Genmab A/S (a) (b) | | | 1,657 | | | | 274,407 | |
| H. Lundbeck A/S (a) | | | 3,005 | | | | 152,382 | |
| Novo Nordisk A/S - Class B (a) | | | 5,347 | | | | 287,314 | |
| Novozymes A/S - Class B (a) | | | 57,770 | | | | 3,297,829 | |
| William Demant Holding A/S (a) (b) | | | 5,321 | | | | 148,623 | |
| | | | | | | | 13,095,709 | |
| Finland - 0.4% |
| Nokian Renkaat OYJ (a) | | | 8,069 | | | | 366,066 | |
| Orion OYJ - Class B (a) | | | 5,345 | | | | 199,274 | |
| Stora Enso OYJ (a) | | | 7,262 | | | | 115,042 | |
| UPM-Kymmene OYJ (a) | | | 26,637 | | | | 826,879 | |
| | | | | | | | 1,507,261 | |
| France - 8.3% |
| Alstom S.A. (a) | | | 14,022 | | | | 581,192 | |
| Atos SE (a) | | | 4,592 | | | | 667,582 | |
| AXA S.A. (a) | | | 91,048 | | | | 2,697,845 | |
| Carrefour S.A. (a) | | | 96,419 | | | | 2,078,679 | |
| Cie Generale des Etablissements Michelin (a) | | | 928 | | | | 132,745 | |
| CNP Assurances (a) | | | 13,642 | | | | 314,661 | |
| Dassault Systemes S.A. (a) | | | 318 | | | | 33,763 | |
| Engie S.A. (b) | | | 154,030 | | | | 2,647,811 | |
| Essilor International S.A. (a) | | | 37,796 | | | | 5,205,690 | |
| Hermes International (a) | | | 6,150 | | | | 3,289,838 | |
| LVMH Moet Hennessy Louis Vuitton SE (a) | | | 16,127 | | | | 4,733,007 | |
| Orange S.A. (a) | | | 129,734 | | | | 2,248,230 | |
| Peugeot S.A. (a) | | | 8,095 | | | | 164,407 | |
| SCOR SE (a) | | | 5,758 | | | | 231,417 | |
| Sodexo S.A. (a) | | | 1,820 | | | | 243,968 | |
| WILSHIRE INTERNATIONAL EQUITY FUND |
| SCHEDULE OF INVESTMENTS (Continued) |
| |
| COMMON STOCKS - 96.4% (Continued) | | Shares | | | Value | |
| France - 8.3% (Continued) |
| Total S.A. (a) (b) | | | 33,916 | | | $ | 1,872,021 | |
| Total S.A. | | | 35,040 | | | | 1,937,011 | |
| Unibail-Rodamco SE (a) | | | 1,647 | | | | 414,440 | |
| Vinci S.A. (a) | | | 772 | | | | 78,809 | |
| | | | | | | | 29,573,116 | |
| Germany - 4.6% |
| adidas AG (a) | | | 16,343 | | | | 3,268,188 | |
| Allianz SE (a) | | | 2,654 | | | | 607,317 | |
| BASF SE (a) | | | 2,187 | | | | 239,746 | |
| Bayer AG (a) | | | 18,820 | | | | 2,338,459 | |
| Beiersdorf AG (a) | | | 656 | | | | 76,899 | |
| Brenntag AG (a) | | | 5,632 | | | | 355,035 | |
| Continental AG (a) | | | 561 | | | | 150,830 | |
| Deutsche Boerse AG (a) | | | 21,747 | | | | 2,516,930 | |
| Deutsche Post AG (a) | | | 10,860 | | | | 516,176 | |
| E.ON SE (a) (b) | | | 206,985 | | | | 2,242,758 | |
| Fresenius SE & Co. KGaA (a) | | | 2,668 | | | | 207,480 | |
| FUCHS PETROLUB SE (a) | | | 846 | | | | 44,793 | |
| Hannover Rueck SE (a) | | | 2,360 | | | | 296,073 | |
| Hochtief AG (a) | | | 2,010 | | | | 354,954 | |
| Linde AG (a) | | | 558 | | | | 120,930 | |
| MAN SE (a) | | | 3,698 | | | | 423,135 | |
| Metro Wholesale Food Specialist AG (a) (b) | | | 5,257 | | | | 104,705 | |
| Muenchener Rueckversicherungs-Gesellschaft AG (a) | | | 3,936 | | | | 849,915 | |
| Porsche Automobil Holding SE (a) | | | 3,730 | | | | 311,694 | |
| SAP SE (a) | | | 7,707 | | | | 862,159 | |
| Siemens AG (a) | | | 931 | | | | 128,894 | |
| Volkswagon AG (a) | | | 727 | | | | 146,704 | |
| Vonovia SE (a) | | | 1,050 | | | | 52,021 | |
| | | | | | | | 16,215,795 | |
| Greece - 0.0% |
| JUMBO S.A. (a) | | | 5,237 | | | | 93,525 | |
| | | | | | | | | |
| Hong Kong - 2.8% |
| AIA Group Ltd. (a) | | | 836,000 | | | | 7,110,712 | |
| Boc Hong Kong (Holdings) Ltd. (a) | | | 50,500 | | | | 255,215 | |
| WILSHIRE INTERNATIONAL EQUITY FUND |
| SCHEDULE OF INVESTMENTS (Continued) |
| |
| COMMON STOCKS - 96.4% (Continued) | | Shares | | | Value | |
| Hong Kong - 2.8% (Continued) |
| China Mobile Ltd. (a) | | | 20,000 | | | $ | 202,241 | |
| China Overseas Land & Investment Ltd. (a) | | | 188,000 | | | | 603,456 | |
| CNOOC Ltd. (a) | | | 232,000 | | | | 333,063 | |
| Galaxy Entertainment Group Ltd. (a) | | | 19,000 | | | | 151,692 | |
| Guangdong Investment Ltd. (a) | | | 52,000 | | | | 69,524 | |
| Hang Lung Group Ltd. (a) | | | 38,000 | | | | 139,717 | |
| Hang Lung Properties Ltd. (a) | | | 61,000 | | | | 148,594 | |
| Hong Kong Exchanges & Clearing Ltd. (a) | | | 4,100 | | | | 125,412 | |
| Sino-Ocean Group Holding Ltd. (a) | | | 306,000 | | | | 210,715 | |
| Swire Pacific Ltd. - Class A (a) | | | 10,500 | | | | 97,149 | |
| Swire Properties Ltd. (a) | | | 64,600 | | | | 208,143 | |
| Wheelock & Co. Ltd. (a) | | | 38,000 | | | | 270,873 | |
| | | | | | | | 9,926,506 | |
| Hungary - 0.1% |
| MOL Hungarian Oil & Gas plc (a) | | | 14,318 | | | | 165,987 | |
| OTP Bank plc (a) | | | 71 | | | | 2,932 | |
| Richter Gedeon Nyrt (a) | | | 754 | | | | 19,717 | |
| | | | | | | | 188,636 | |
| India - 2.3% |
| Bosch Ltd. (a) | | | 332 | | | | 104,694 | |
| HDFC Bank Ltd. - ADR | | | 41,569 | | | | 4,226,319 | |
| JSW Steel Ltd. (a) | | | 1,892 | | | | 7,974 | |
| Maruti Suzuki India Ltd. (a) | | | 1,753 | | | | 266,813 | |
| Reliance Industries Ltd. (a) | | | 13,013 | | | | 187,493 | |
| Tata Motors Ltd. - ADR (b) | | | 77,650 | | | | 2,567,886 | |
| Titan Co. Ltd. (a) | | | 24,663 | | | | 331,339 | |
| UltraTech Cement Ltd. (a) | | | 1,885 | | | | 127,385 | |
| United Spirits Ltd. (a) (b) | | | 1,313 | | | | 75,326 | |
| Yes Bank Ltd. (a) | | | 26,198 | | | | 129,016 | |
| | | | | | | | 8,024,245 | |
| Indonesia - 0.1% |
| Bank Danamon Indonesia Tbk PT (a) | | | 236,500 | | | | 121,102 | |
| Charoen Pokphand Indonesi Pt (a) (b) | | | 158,300 | | | | 34,986 | |
| Telekomunikasi Indonesia Persero Tbk PT (a) | | | 167,500 | | | | 54,808 | |
| Unilever Indonesia Tbk PT (a) | | | 69,700 | | | | 286,998 | |
| | | | | | | | 497,894 | |
| WILSHIRE INTERNATIONAL EQUITY FUND |
| SCHEDULE OF INVESTMENTS (Continued) |
| |
| COMMON STOCKS - 96.4% (Continued) | | Shares | | | Value | |
| Ireland - 2.7% |
| Accenture plc - Class A | | | 31,053 | | | $ | 4,753,903 | |
| ICON plc (b) | | | 25,037 | | | | 2,807,900 | |
| Ryanair Holdings plc - ADR (b) | | | 21,172 | | | | 2,205,911 | |
| | | | | | | | 9,767,714 | |
| Isle Of Man - 0.1% |
| Genting Singapore plc (a) | | | 448,400 | | | | 437,909 | |
| | | | | | | | | |
| Israel - 0.2% |
| Bank Leumi Le-Israel BM (a) | | | 73,260 | | | | 440,973 | |
| Check Point Software Technologies Ltd. (b) | | | 2,526 | | | | 261,744 | |
| | | | | | | | 702,717 | |
| Italy - 1.8% |
| Assicurazioni Generali SpA (a) | | | 11,254 | | | | 204,824 | |
| Enel SpA (a) | | | 8,923 | | | | 54,866 | |
| Eni SpA (a) | | | 2,458 | | | | 40,672 | |
| Intesa Sanpaolo SpA (a) | | | 703,100 | | | | 2,332,613 | |
| Luxottica Group SpA (a) | | | 36,960 | | | | 2,267,983 | |
| Mediobanca SpA (a) | | | 26,022 | | | | 294,826 | |
| Recordati SpA (a) | | | 11,361 | | | | 504,840 | |
| Snam SpA (a) | | | 45,749 | | | | 224,038 | |
| Terna Rete Elettrica Nazionale SpA (a) | | | 59,389 | | | | 345,206 | |
| | | | | | | | 6,269,868 | |
| Japan - 14.6% |
| Aeon Co. Ltd. (a) (b) | | | 20,700 | | | | 349,130 | |
| Aisin Seiki Co. Ltd. | | | 700 | | | | 39,322 | |
| Alps Electric Co. Ltd. (a) (b) | | | 1,600 | | | | 45,509 | |
| Amada Holdings Co. Ltd. (a) | | | 24,600 | | | | 333,966 | |
| Asahi Glass Co. Ltd. (a) | | | 500 | | | | 21,610 | |
| Asahi Kasei Corp. (a) (b) | | | 1,300 | | | | 16,729 | |
| Astellas Pharma, Inc. (a) | | | 31,100 | | | | 395,037 | |
| Bridgestone Corp. (a) | | | 3,200 | | | | 148,090 | |
| Canon, Inc. (a) | | | 21,800 | | | | 812,154 | |
| Central Japan Railway Co. (a) | | | 3,400 | | | | 608,412 | |
| Daifuku Co. Ltd. (a) (b) | | | 1,800 | | | | 97,787 | |
| Dai-ichi Life Insurance Holdings, Inc. (a) | | | 2,800 | | | | 57,541 | |
| Daikin Industries Ltd. (a) | | | 3,600 | | | | 425,349 | |
| WILSHIRE INTERNATIONAL EQUITY FUND |
| SCHEDULE OF INVESTMENTS (Continued) |
| |
| COMMON STOCKS - 96.4% (Continued) | | Shares | | | Value | |
| Japan - 14.6% (Continued) |
| Denso Corp. (a) | | | 4,000 | | | $ | 239,614 | |
| Disco Corp. (a) | | | 300 | | | | 66,486 | |
| Fast Retailing Co. Ltd. (a) | | | 6,700 | | | | 2,663,775 | |
| Fuji Electric Co. Ltd. (a) | | | 7,000 | | | | 52,582 | |
| Hachijuni Bank Ltd. (The) (a) | | | 21,400 | | | | 122,276 | |
| Hitachi Chemical Co. Ltd. (a) (b) | | | 11,200 | | | | 286,761 | |
| Hitachi High Technologies Corp. | | | 7,200 | | | | 303,501 | |
| Hitachi Ltd. (a) | | | 50,000 | | | | 387,876 | |
| Hoshizaki Corp. (a) | | | 600 | | | | 53,152 | |
| Idemitsu Kosan Co. Ltd. (a) (b) | | | 3,100 | | | | 124,162 | |
| INPEX Corp. (a) | | | 18,200 | | | | 226,497 | |
| Japan Airlines Co. Ltd. (a) | | | 10,700 | | | | 418,010 | |
| Japan Exchange Group, Inc. (a) (b) | | | 23,100 | | | | 400,753 | |
| Japan Post Bank Co. Ltd. (a) | | | 8,500 | | | | 110,386 | |
| JTEKT Corp. (a) | | | 1,400 | | | | 23,986 | |
| JX Holdings, Inc. (a) | | | 18,300 | | | | 117,591 | |
| Kajima Corp. (a) | | | 20,000 | | | | 192,141 | |
| Kamigumi Co. Ltd. (a) | | | 3,500 | | | | 77,341 | |
| Kao Corp. (a) | | | 2,300 | | | | 155,396 | |
| Keyence Corp. (a) | | | 9,660 | | | | 5,395,900 | |
| Kikkoman Corp. (a) | | | 1,200 | | | | 48,523 | |
| Koito Manufacturing Co. Ltd. (a) | | | 10,300 | | | | 721,074 | |
| Komatsu Ltd. (a) | | | 69,100 | | | | 2,497,032 | |
| Konami Corp. (a) (b) | | | 2,300 | | | | 126,471 | |
| Kuboto Corp. (a) | | | 11,800 | | | | 230,781 | |
| Kurita Water Industries Ltd. (a) | | | 5,200 | | | | 168,577 | |
| Kyocera Corp. (a) | | | 3,000 | | | | 195,844 | |
| Lion Corp. (a) | | | 6,900 | | | | 130,412 | |
| Maruichi Steel Tube Ltd. (a) | | | 2,600 | | | | 75,967 | |
| Mebuki Financial Group, Inc. (a) (b) | | | 28,200 | | | | 119,122 | |
| MEIJI Holdings Co. Ltd. (a) | | | 3,100 | | | | 263,814 | |
| MINEBEA MITSUMI, Inc. (a) (b) | | | 10,800 | | | | 225,237 | |
| Mitsubishi Chemical Holdings Corp. (a) (b) | | | 8,200 | | | | 89,716 | |
| Mitsubishi Corp. (a) | | | 400 | | | | 11,029 | |
| Mitsubishi Electric Corp. (a) | | | 15,800 | | | | 261,824 | |
| Mitsubishi Estate Co. Ltd. (a) | | | 130,800 | | | | 2,270,884 | |
| WILSHIRE INTERNATIONAL EQUITY FUND |
| SCHEDULE OF INVESTMENTS (Continued) |
| |
| COMMON STOCKS - 96.4% (Continued) | | Shares | | | Value | |
| Japan - 14.6% (Continued) |
| Mitsubishi Gas Chemical Co. (a) (b) | | | 4,500 | | | $ | 128,846 | |
| Mitsubishi UFJ Financial Group, Inc. (a) | | | 32,500 | | | | 236,513 | |
| Mitsui Chemicals, Inc. (a) (b) | | | 1,400 | | | | 44,890 | |
| Mizuho Financial Group, Inc. (a) | | | 128,200 | | | | 231,777 | |
| MS&AD Insurance Group Holdings, Inc. (a) | | | 19,300 | | | | 650,940 | |
| NGK Insulators Ltd. (a) (b) | | | 2,600 | | | | 48,972 | |
| Nikon Corp. (a) | | | 10,400 | | | | 209,263 | |
| Nintendo Company Ltd (a) | | | 500 | | | | 180,032 | |
| Nippon Electric Glass Co. Ltd. (a) | | | 1,000 | | | | 38,058 | |
| Nippon Paint Holdings Co. Ltd. (a) | | | 1,500 | | | | 47,390 | |
| Nissan Motor Co. Ltd. (a) | | | 6,200 | | | | 61,722 | |
| Nitto Denko Corp. (a) | | | 1,600 | | | | 141,505 | |
| Nomura Holdings, Inc. (a) | | | 3,200 | | | | 18,756 | |
| Nomura Research Institute Ltd. (a) | | | 2,667 | | | | 123,782 | |
| OJI Holdings Corp. (a) | | | 18,000 | | | | 119,525 | |
| Otsuka Holdings Co. Ltd. (a) | | | 46,600 | | | | 2,043,564 | |
| Panasonic Corp. (a) | | | 258,348 | | | | 3,769,975 | |
| Pola Orbis Holdings, Inc. (a) | | | 4,100 | | | | 143,654 | |
| Rakuten, Inc. (a) | | | 5,900 | | | | 53,925 | |
| Recruit Holdings Co. Ltd. (a) (b) | | | 24,700 | | | | 613,246 | |
| Resona Holdings, Inc. (a) | | | 9,000 | | | | 53,624 | |
| Secom Co. Ltd. (a) | | | 40,900 | | | | 3,085,340 | |
| Seven & i Holdings Co. Ltd. (a) | | | 55,900 | | | | 2,315,531 | |
| Sharp Corp. (a) (b) (c) | | | 8,500 | | | | 290,921 | |
| Shimadzu Corp. (a) | | | 500 | | | | 11,342 | |
| Shimamura Co. Ltd. (a) | | | 2,400 | | | | 263,640 | |
| Shin-Etsu Chemical Co. Ltd. (a) | | | 7,600 | | | | 769,987 | |
| Shionogi & Co. Ltd. (a) | | | 10,000 | | | | 540,301 | |
| Shiseido Company Ltd. (a) | | | 7,300 | | | | 351,720 | |
| Showa Shell Sekiyu KK (a) | | | 19,200 | | | | 259,790 | |
| Sompo Holdings, Inc. (a) | | | 2,900 | | | | 111,932 | |
| Sony Corp. (a) | | | 34,300 | | | | 1,539,346 | |
| Sumitomo Chemical Co. Ltd. (a) | | | 10,000 | | | | 71,550 | |
| Sumitomo Heavy Industries Ltd. (a) | | | 400 | | | | 16,853 | |
| Sumitomo Mitsui Financial Group, Inc. (a) | | | 93,900 | | | | 4,047,154 | |
| Sumitomo Rubber Industries Ltd. (a) | | | 1,400 | | | | 25,944 | |
| WILSHIRE INTERNATIONAL EQUITY FUND |
| SCHEDULE OF INVESTMENTS (Continued) |
| |
| COMMON STOCKS - 96.4% (Continued) | | Shares | | | Value | |
| Japan - 14.6% (Continued) |
| Sundrug Co. Ltd. (a) | | | 3,300 | | | $ | 153,061 | |
| Suntory Beverage & Food Ltd. (a) | | | 6,600 | | | | 293,475 | |
| Suruga Bank Ltd. (a) (b) | | | 400 | | | | 8,552 | |
| Suzuki Motor Corp. (a) (b) | | | 2,700 | | | | 156,272 | |
| Sysmex Corp. (a) | | | 32,955 | | | | 2,587,430 | |
| T&D Holdings, Inc. (a) | | | 11,700 | | | | 199,590 | |
| Taisei Corp. (a) | | | 2,600 | | | | 129,289 | |
| Takeda Pharmaceutical Co. Ltd. (a) | | | 200 | | | | 11,323 | |
| TDK Corp. (a) | | | 4,400 | | | | 349,641 | |
| Tokio Marine Holdings, Inc. (a) | | | 5,500 | | | | 250,135 | |
| Tokyo Electron Ltd. (a) | | | 1,200 | | | | 216,448 | |
| Toray Industries Inc (a) (b) | | | 238,700 | | | | 2,246,520 | |
| Tosoh Corp. (b) | | | 17,200 | | | | 389,837 | |
| Toyo Suisan Kaisha Ltd. (a) | | | 200 | | | | 8,537 | |
| Toyoda Gosei Co. Ltd. (a) | | | 6,400 | | | | 162,365 | |
| | | | | | | | 52,028,914 | |
| Jersey - 1.6% |
| Experian plc (a) | | | 228,707 | | | | 5,040,967 | |
| Glencore plc (a) | | | 96,152 | | | | 503,221 | |
| | | | | | | | 5,544,188 | |
| Korea (Republic of) - 1.6% |
| Celltrion, Inc. (a) (b) | | | 1,383 | | | | 286,285 | |
| Dongbu Insurance Co. Ltd. (a) (b) | | | 4,080 | | | | 272,120 | |
| Hana Financial Group, Inc. (a) | | | 23,219 | | | | 1,082,975 | |
| Hanmi Pharmaceutical Co. Ltd. (a) (b) | | | 94 | | | | 51,266 | |
| Hanwha Chemical Corp. (a) | | | 1,609 | | | | 47,632 | |
| Hanwha Life Insurance Co. Ltd. (a) | | | 22,115 | | | | 143,038 | |
| Hyundai Marine & Fire Insurance Co. Ltd. (a) | | | 843 | | | | 37,099 | |
| KB Financial Group, Inc. (a) | | | 4,103 | | | | 243,666 | |
| KT&G Corp. (a) | | | 1,536 | | | | 166,070 | |
| LG Chem Ltd. (a) | | | 340 | | | | 129,009 | |
| LG Corp. (a) (b) | | | 189 | | | | 16,117 | |
| Samsung Electronics Co. Ltd. (a) | | | 954 | | | | 2,274,439 | |
| Samsung SDS Co. Ltd. (a) (b) | | | 160 | | | | 29,936 | |
| Shinhan Financial Group Co. Ltd. (a) | | | 7,842 | | | | 363,214 | |
| SK Innovation Co. Ltd. (a) | | | 2,253 | | | | 431,289 | |
| WILSHIRE INTERNATIONAL EQUITY FUND |
| SCHEDULE OF INVESTMENTS (Continued) |
| |
| COMMON STOCKS - 96.4% (Continued) | | Shares | | | Value | |
| South Korea - 1.6% (Continued) |
| Woori Bank (a) | | | 19,776 | | | $ | 291,717 | |
| | | | | | | | 5,865,872 | |
| Luxembourg - 1.0% |
| ArcelorMittal (a) | | | 109,153 | | | | 3,541,015 | |
| | | | | | | | | |
| Malaysia - 0.1% |
| AirAsia Berhad (a) | | | 65,400 | | | | 53,852 | |
| Genting Berhad (a) | | | 42,400 | | | | 95,801 | |
| Petronas Dagangan Berhad (a) | | | 25,000 | | | | 148,731 | |
| Sime Darby Berhad (a) | | | 45,100 | | | | 24,469 | |
| | | | | | | | 322,853 | |
| Mexico - 0.8% |
| Mexichem S.A.B. de C.V. | | | 1,900 | | | | 4,703 | |
| Wal-Mart de Mexico S.A.B. de C.V. | | | 1,139,575 | | | | 2,794,818 | |
| | | | | | | | 2,799,521 | |
| Netherlands - 6.5% |
| Aegon N.V. (a) | | | 25,755 | | | | 163,634 | |
| AerCap Holdings N.V. (b) | | | 72,057 | | | | 3,790,919 | |
| Airbus SE (a) | | | 22,801 | | | | 2,265,950 | |
| Akzo Nobel N.V. (a) | | | 4,507 | | | | 395,438 | |
| ASML Holding N.V. (a) | | | 3,963 | | | | 688,949 | |
| CNH Industrial N.V. (a) | | | 52,990 | | | | 708,876 | |
| Core Laboratories N.V. (c) | | | 24,883 | | | | 2,725,933 | |
| Exor N.V. (a) | | | 825 | | | | 50,571 | |
| Ferrari N.V. (a) | | | 23,620 | | | | 2,474,725 | |
| Fiat Chrysler Automobiles N.V. (a) | | | 981 | | | | 17,513 | |
| Koninklijke DSM N.V. (a) | | | 29,016 | | | | 2,771,514 | |
| Koninklijke KPN N.V. (a) | | | 710,501 | | | | 2,480,373 | |
| NN Group N.V. (a) | | | 8,338 | | | | 360,621 | |
| Randstad Holding N.V. (a) | | | 5,175 | | | | 317,509 | |
| STMicroelectronics N.V. (a) | | | 9,450 | | | | 206,127 | |
| Unilever N.V. (a) | | | 3,359 | | | | 189,108 | |
| Wolters Kluwer N.V. (a) | | | 6,526 | | | | 340,173 | |
| Yandex N.V. - Class A (b) | | | 96,789 | | | | 3,169,840 | |
| | | | | | | | 23,117,773 | |
| WILSHIRE INTERNATIONAL EQUITY FUND |
| SCHEDULE OF INVESTMENTS (Continued) |
| |
| COMMON STOCKS - 96.4% (Continued) | | Shares | | | Value | |
| New Zealand - 0.0% |
| Auckland International Airport Ltd. (a) | | | 2,531 | | | $ | 11,617 | |
| | | | | | | | | |
| Norway - 0.9% |
| DNB ASA (a) | | | 144,985 | | | | 2,683,940 | |
| Marine Harvest ASA - ADR (a) (c) | | | 8,964 | | | | 151,590 | |
| Norsk Hydro ASA (a) | | | 4,109 | | | | 31,150 | |
| Orkla ASA (a) | | | 12,145 | | | | 128,705 | |
| Statoil ASA (a) | | | 8,632 | | | | 184,802 | |
| | | | | | | | 3,180,187 | |
| Philippines - 0.1% |
| Ayala Land, Inc. (a) | | | 254,500 | | | | 226,675 | |
| PLDT, Inc. (a) | | | 4,280 | | | | 126,750 | |
| SM Prime Holdings, Inc. (a) | | | 9,600 | | | | 7,197 | |
| | | | | | | | 360,622 | |
| Poland - 0.2% |
| CCC S.A. (a) | | | 1,876 | | | | 153,396 | |
| Cyfrowy Polsat S.A. (a) | | | 20,618 | | | | 147,000 | |
| Grupa Lotos S.A. (a) | | | 9,699 | | | | 160,461 | |
| PGE Polska Grupa Energetyczna S.A. (a) | | | 39,048 | | | | 134,949 | |
| Polski Koncern Naftowy Orlen S.A. (a) | | | 2,370 | | | | 72,030 | |
| Polskie Gornictwo Naftowe I Gazownictwo S.A. (a) | | | 61,495 | | | | 111,053 | |
| | | | | | | | 778,889 | |
| Portugal - 0.1% |
| Jeronimo Martins SGPS S.A. (a) | | | 11,358 | | | | 220,559 | |
| | | | | | | | | |
| Russia Federation - 0.5% |
| MMC Norilsk Nickel PJSC | | | 6,033 | | | | 1,135,931 | |
| Novolipetsk Steel PJSC | | | 122,270 | | | | 312,375 | |
| Severstal PJSC | | | 18,200 | | | | 280,272 | |
| | | | | | | | 1,728,578 | |
| Singapore - 1.1% |
| Capitaland Ltd. (a) | | | 13,900 | | | | 36,565 | |
| DBS Group Holdings Ltd. (a) | | | 173,810 | | | | 3,214,720 | |
| Hutchinson Port Holdings Trust (a) | | | 181,800 | | | | 75,264 | |
| Oversea-Chinese Banking Corp. Ltd. (a) | | | 6,100 | | | | 56,351 | |
| Sats Ltd. (a) | | | 34,500 | | | | 133,947 | |
| WILSHIRE INTERNATIONAL EQUITY FUND |
| SCHEDULE OF INVESTMENTS (Continued) |
| |
| COMMON STOCKS - 96.4% (Continued) | | Shares | | | Value | |
| Singapore - 1.1% (Continued) |
| Singapore Exchange Ltd. (a) | | | 79,500 | | | | 441,438 | |
| Singapore Technologies Engineering Ltd. (a) | | | 3,300 | | | | 8,028 | |
| Yangzijiang Shipbuildings Holdings Ltd. (a) | | | 31,800 | | | | 34,868 | |
| | | | | | | | 4,001,181 | |
| South Africa - 0.4% |
| Aspen Pharmacare Holdings Ltd. (a) | | | 30,022 | | | | 672,816 | |
| Capitec Bank Holdings Ltd. (a) | | | 2,819 | | | | 249,811 | |
| Exxaro Resources Ltd. (a) | | | 3,215 | | | | 42,147 | |
| Fortress REIT Ltd. (a) | | | 33,620 | | | | 114,430 | |
| Growthpoint Properties Ltd. (a) | | | 5,230 | | | | 11,673 | |
| Mondi Ltd. (a) | | | 475 | | | | 12,236 | |
| Naspers Ltd. (a) | | | 530 | | | | 146,810 | |
| Standard Bank Group Ltd. (a) | | | 8,565 | | | | 134,833 | |
| Vodacom Group Ltd. (a) | | | 12,143 | | | | 142,377 | |
| | | | | | | | 1,527,133 | |
| Spain - 3.0% |
| ACS Actividades de Construccion y Servicios S.A. (a) | | | 68,758 | | | | 2,685,735 | |
| Amadeus IT Group S.A. (a) | | | 14,442 | | | | 1,039,205 | |
| Banco Bilbao Vizcaya Argentaria S.A. (a) | | | 71,081 | | | | 604,016 | |
| Banco Bilbao Vizcaya Argentaria S.A. - ADR (c) | | | 250,525 | | | | 2,129,462 | |
| Banco Santander S.A. (a) | | | 127,425 | | | | 835,365 | |
| Bankinter S.A. (a) | | | 52,845 | | | | 499,861 | |
| CaixaBank S.A. (a) | | | 147,745 | | | | 686,789 | |
| Iberdrola S.A. (a) | | | 34,851 | | | | 269,772 | |
| Industria de Diseno Textil S.A. (a) | | | 40,828 | | | | 1,419,556 | |
| Repsol S.A. (a) | | | 25,485 | | | | 449,941 | |
| Telefonica S.A. (a) | | | 5,504 | | | | 53,593 | |
| | | | | | | | 10,673,295 | |
| Sweden - 1.6% |
| Alfa Laval AB (a) | | | 4,786 | | | | 113,204 | |
| Atlas Copco AB - A Shares (a) | | | 92,300 | | | | 3,983,271 | |
| Boliden AB (a) | | | 6,678 | | | | 228,370 | |
| Electrolux AB - Series B (a) | | | 5,313 | | | | 171,053 | |
| Investor AB - B Shares (a) | | | 619 | | | | 28,231 | |
| Kinnevik AB - Series B (a) | | | 10,912 | | | | 368,723 | |
| SKF AB - B Shares (a) | | | 24,690 | | | | 548,503 | |
| WILSHIRE INTERNATIONAL EQUITY FUND |
| SCHEDULE OF INVESTMENTS (Continued) |
| |
| COMMON STOCKS - 96.4% (Continued) | | Shares | | | Value | |
| Sweden - 1.6% (Continued) |
| Svenska Handelsbanken AB (a) | | | 5,113 | | | $ | 69,874 | |
| Telia Co. AB (a) | | | 13,032 | | | | 58,088 | |
| Volvo AB - B Shares (a) | | | 2,314 | | | | 43,091 | |
| | | | | | | | 5,612,408 | |
| Switzerland - 6.2% |
| Adecco Group AG (a) | | | 7,211 | | | | 551,133 | |
| Chubb Ltd. | | | 31,580 | | | | 4,614,785 | |
| Compagnie Financiere Richemont S.A. (a) | | | 3,656 | | | | 331,157 | |
| Geberit AG (a) | | | 585 | | | | 257,529 | |
| Givaudan S.A. (a) | | | 57 | | | | 131,682 | |
| Julius Baer Group Ltd. (a) | | | 39,757 | | | | 2,431,522 | |
| Nestlé S.A. (a) | | | 56,987 | | | | 4,900,133 | |
| Novartis AG (a) | | | 3,408 | | | | 286,827 | |
| Partners Group Holding AG (a) (c) | | | 1,438 | | | | 985,429 | |
| Roche Holdings AG (a) | | | 12,087 | | | | 3,056,639 | |
| Schindler Holding AG (a) | | | 1,039 | | | | 238,990 | |
| SGS S.A. (a) | | | 120 | | | | 312,883 | |
| Sika AG (a) | | | 332 | | | | 2,634,412 | |
| Straumann Holding AG (a) | | | 208 | | | | 146,752 | |
| Swatch Group AG (The) (a) | | | 158 | | | | 12,053 | |
| Swiss Life Holding AG (a) (b) | | | 1,012 | | | | 357,760 | |
| Swiss Prime Site AG (a) | | | 2,523 | | | | 233,090 | |
| Swiss Re AG (a) | | | 6,262 | | | | 585,699 | |
| | | | | | | | 22,068,475 | |
| Taiwan - 1.7% |
| Catcher Technology Co. Ltd. (a) | | | 59,000 | | | | 647,560 | |
| China Insurance Co. Ltd. (a) | | | 99,940 | | | | 100,424 | |
| Formosa Chemicals & Fibre Corp. (a) | | | 94,000 | | | | 324,830 | |
| Formosa Petrochemical Corp. (a) | | | 12,000 | | | | 46,491 | |
| Foxconn Technology Co. Ltd. (a) | | | 15,301 | | | | 43,682 | |
| Phison Electronics Corp. (a) | | | 16,000 | | | | 156,582 | |
| Taiwan Semiconductor Manufacturing Co. Ltd. | | | 62,450 | | | | 482,406 | |
| Taiwan Semiconductor Manufacturing Co. Ltd. (c) | | | 105,071 | | | | 4,166,065 | |
| | | | | | | | 5,968,040 | |
| Thailand - 0.1% |
| Advanced Info Service plc (a) | | | 14,000 | | | | 82,050 | |
| WILSHIRE INTERNATIONAL EQUITY FUND |
| SCHEDULE OF INVESTMENTS (Continued) |
| |
| COMMON STOCKS - 96.4% (Continued) | | Shares | | | Value | |
| Thailand - 0.1% (Continued) |
| PTT Exploration & Production PCL N.V. (a) | | | 7,900 | | | $ | 24,225 | |
| Thai Oil Public Co. Ltd. (a) | | | 24,700 | | | | 78,428 | |
| | | | | | | | 184,703 | |
| Turkey - 0.1% |
| Bimas Birlesik Magazalar A/S (a) | | | 9,035 | | | | 185,807 | |
| Eregli Demir ve Celik Fabrikalari TAS (a) | | | 26,286 | | | | 69,357 | |
| Ford Otomotiv Sanayi A/S (a) | | | 807 | | | | 12,822 | |
| Tofas Turk Otomobil Fabrika A/S (a) | | | 6,309 | | | | 54,907 | |
| Turk Telekomunikasyon A/S (a) (b) | | | 23,300 | | | | 39,530 | |
| Turkiye Garanti Bankasi A/S (a) | | | 23,368 | | | | 66,036 | |
| Turkiye Petrol Rafinerileri A/S (a) | | | 1,007 | | | | 32,272 | |
| Ulker Biskuvi Sanayi A/S (a) | | | 2,289 | | | | 11,869 | |
| | | | | | | | 472,600 | |
| United Kingdom - 10.0% |
| 3i Group plc (a) | | | 26,338 | | | | 324,228 | |
| Anglo American plc (a) (c) | | | 10,065 | | | | 209,260 | |
| AstraZeneca plc (a) | | | 1,891 | | | | 130,481 | |
| BAE Systems plc (a) | | | 301,139 | | | | 2,326,536 | |
| Barclays plc (a) | | | 153,294 | | | | 419,593 | |
| Barratt Developments plc (a) | | | 15,024 | | | | 131,052 | |
| BHP Billiton plc (a) | | | 186,259 | | | | 3,765,959 | |
| BP plc (a) | | | 13,205 | | | | 92,630 | |
| British American Tobacco plc (a) | | | 63,402 | | | | 4,285,600 | |
| BT Group plc (a) | | | 93,282 | | | | 341,881 | |
| Bunzl plc (a) | | | 4,304 | | | | 120,246 | |
| Burberry Group plc (a) | | | 1,766 | | | | 42,575 | |
| Centrica plc (a) | | | 81,282 | | | | 150,771 | |
| Compass Group plc (a) | | | 209,024 | | | | 4,506,706 | |
| Croda International plc (a) | | | 10,052 | | | | 599,185 | |
| Diageo plc (a) | | | 18,610 | | | | 682,090 | |
| G4S plc (a) | | | 83,685 | | | | 301,169 | |
| GlaxoSmithKline plc (a) | | | 13,565 | | | | 240,208 | |
| HSBC Holdings plc - ADR (c) | | | 48,374 | | | | 2,498,033 | |
| InterContinental Hotels Group plc | | | 1,501 | | | | 95,627 | |
| Legal & General Group plc (a) | | | 16,205 | | | | 59,656 | |
| Lloyds TSB Group plc (a) | | | 2,551,905 | | | | 2,339,545 | |
| WILSHIRE INTERNATIONAL EQUITY FUND |
| SCHEDULE OF INVESTMENTS (Continued) |
| |
| COMMON STOCKS - 96.4% (Continued) | | Shares | | | Value | |
| United Kingdom - 10.0% (Continued) |
| London Stock Exchange Group plc (a) | | | 1,143 | | | $ | 58,457 | |
| Mondi plc (a) | | | 6,713 | | | | 174,450 | |
| Old Mutual plc (a) | | | 5,602 | | | | 17,496 | |
| Persimmon plc (a) | | | 1,574 | | | | 58,146 | |
| Prudential plc (a) | | | 9,643 | | | | 246,943 | |
| Reckitt Benckiser Group plc (a) | | | 55,477 | | | | 5,175,282 | |
| Rolls-Royce Holdings plc (a) | | | 8,753 | | | | 99,889 | |
| Royal Dutch Shell plc - Class A (c) | | | 37,967 | | | | 2,532,779 | |
| Smith & Nephew plc (a) | | | 12,082 | | | | 209,042 | |
| Smith & Nephew plc - ADR (c) | | | 58,001 | | | | 2,030,614 | |
| Standard Chartered plc (a) | | | 39,724 | | | | 417,136 | |
| Standard Life plc (a) | | | 8,759 | | | | 51,517 | |
| Taylor Wimpey plc (a) (b) | | | 64,494 | | | | 179,424 | |
| Tesco plc (a) (b) | | | 210,959 | | | | 596,789 | |
| Unilever plc | | | 2,396 | | | | 133,449 | |
| | | | | | | | 35,644,445 | |
| United States - 0.1% |
| Southern Copper Corp. (c) | | | 4,758 | | | | 225,767 | |
| Yum China Holdings, Inc. | | | 7,337 | | | | 293,627 | |
| | | | | | | | 519,394 | |
| | | | | | | | | |
| Total Common Stocks (Cost $277,042,617) | | | | | | $ | 342,640,611 | |
| | | | | | | | | |
| PREFERRED STOCKS - 0.3% | | | Shares | | | | Value | |
| Brazil - 0.2% |
| Banco Bradesco S.A. (a) | | | 57,900 | | | $ | 591,302 | |
| Petroleo Brasileiro S.A. (a) (b) | | | 16,700 | | | | 81,164 | |
| | | | | | | | 672,466 | |
| South Korea - 0.1% |
| Samsung Electronics Co. Ltd. (a) | | | 162 | | | | 316,569 | |
| | | | | | | | | |
| Total Preferred Stocks (Cost $850,747) | | | | | | $ | 989,035 | |
| WILSHIRE INTERNATIONAL EQUITY FUND |
| SCHEDULE OF INVESTMENTS (Continued) |
| |
| RIGHTS - 0.0% | | Shares | | | Value | |
| Spain - 0.0% | | | | | | |
| Repsol SA (Cost $-) | | | 25,485 | | | $ | 11,588 | |
| | | | | | | | | |
| Money Market Funds - 4.4% | | | Shares | | | | Value | |
| Northern Trust Institutional Government Select Portfolio - Institutional Class, 1.13% (d) | | | 10,252,870 | | | $ | 10,252,870 | |
| Northern Trust Institutional Liquid Portfolio - Institutional Class, 1.09% (d) (e) | | | 5,530,010 | | | | 5,530,010 | |
| | | | | | | | | |
| Total Money Market Funds (Cost $15,782,880) | | | | | | $ | 15,782,880 | |
| | | | | | | | | |
| Total Investments at Value - 101.1% (Cost $293,676,244) | | | | | | $ | 359,424,114 | |
| | | | | | | | | |
| Liabilities in Excess of Other Assets - (1.1%) | | | | | | | (4,112,086 | ) |
| | | | | | | | | |
| Net Assets - 100.0% | | | | | | $ | 355,312,028 | |
|
| (a) | Level 2 security (Note 2). |
| (b) | Non-income producing security. |
| (c) | This security or a partial position of this security is on loan at December 31, 2017. The total value of securities on loan at December 31, 2017 was $19,812,414 (Note 7). |
| (d) | The rate shown is the 7-day effective yield as of December 31, 2017. |
| (e) | This security was purchased with cash collateral held from securities on loan. The total value of such securities as of December 31, 2017 was $5,530,010. Securities on loan are also collateralized by various U.S. Treasury obligations in the amount of $14,820,487 (Note 7). |
ADR - American Depositary Receipt.
Ltd. - Limited.
plc - Public Limited Company.
See accompanying notes to financial statements.
REPORT OF INDEPENDENT REGISTERED PUBLIC ACCOUNTING FIRM
To the Shareholders of Wilshire Large Company Growth Portfolio, Wilshire Large Company Value Portfolio, Wilshire Small Company Growth Portfolio, Wilshire Small Company Value Portfolio, Wilshire 5000 IndexSM Fund, Wilshire International Equity Fund and
Board of Directors of Wilshire Mutual Funds, Inc.
Opinion on the Financial Statements
We have audited the accompanying statements of assets and liabilities, including the condensed schedules of investments, of Wilshire Mutual Funds, Inc. comprising Wilshire Large Company Growth Portfolio, Wilshire Large Company Value Portfolio, Wilshire Small Company Growth Portfolio, Wilshire Small Company Value Portfolio, Wilshire 5000 IndexSM Fund, and Wilshire International Equity Fund (six of the seven Funds constituting the Wilshire Mutual Funds, Inc., hereafter referred to as the "Funds") and the schedules of investments (included in Item 6 of Form N-CSR) as of December 31, 2017, and the related statements of operations and changes in net assets, including the related notes, and financial highlights for the year then ended (included in Item 1 of Form N-CSR), (collectively referred to as the "financial statements"). In our opinion, the financial statements present fairly, in all material respects, the financial position of each of the Funds identified above as of December 31, 2017, the results of their operations, changes in their net assets, and financial highlights for the year then ended, in conformity with accounting principles generally accepted in the United States of America.
The Funds' financial statements and financial highlights for the years ended December 31, 2016 and prior, were audited by other auditors whose report dated February 28, 2017, expressed an unqualified opinion on those financial statements and highlights.
Basis for Opinion
These financial statements are the responsibility of the Funds' management. Our responsibility is to express an opinion on the Funds' financial statements based on our audit. We are a public accounting firm registered with the Public Company Accounting Oversight Board (United States) ("PCAOB") and are required to be independent with respect to the Funds in accordance with the U.S. federal securities laws and the applicable rules and regulations of the Securities and Exchange Commission and the PCAOB.
We conducted our audit in accordance with the standards of the PCAOB. Those standards require that we plan and perform the audit to obtain reasonable assurance about whether the financial statements are free of material misstatement, whether due to error or fraud.
Our audit includes performing procedures to assess the risks of material misstatement of the financial statements, whether due to error or fraud, and performing procedures that respond to those risks. Such procedures include examining, on a test basis, evidence regarding the amounts and disclosures in the financial statements and confirmation of securities owned as of December 31, 2017, by correspondence with the custodian, counterparties and brokers or by other appropriate auditing procedures where replies from brokers were not received. Our audit also included evaluating the accounting principles used and significant estimates made by management, as well as evaluating the overall presentation of the financial statements. We believe that our audit provides a reasonable basis for our opinion.
We have served as the Funds' auditor since 2017.
COHEN & COMPANY, LTD.
Cleveland, Ohio
February 28, 2018
| Item 7. | Disclosure of Proxy Voting Policies and Procedures for Closed-End Management Investment Companies. |
Not applicable
| Item 8. | Portfolio Managers of Closed-End Management Investment Companies. |
Not applicable
| Item 9. | Purchases of Equity Securities by Closed-End Management Investment Company and Affiliated Purchasers. |
Not applicable
| Item 10. | Submission of Matters to a Vote of Security Holders. |
There have been no changes to the procedures by which shareholders may recommend nominees to the Registrant’s Board of Directors since the Registrant last disclosed such procedures in the definitive proxy statement filed with the SEC on March 29, 2011.
| Item 11. | Controls and Procedures. |
(a) Based on their evaluation of the registrant’s disclosure controls and procedures (as defined in Rule 30a-3(c) under the Investment Company Act of 1940) as of a date within 90 days of the filing date of this report, the registrant’s principal executive officer and principal financial officer have concluded that such disclosure controls and procedures are reasonably designed and are operating effectively to ensure that material information relating to the registrant, including its consolidated subsidiaries, is made known to them by others within those entities, particularly during the period in which this report is being prepared, and that the information required in filings on Form N-CSR is recorded, processed, summarized, and reported on a timely basis.
(b) There were no changes in the registrant’s internal control over financial reporting (as defined in Rule 30a-3(d) under the Investment Company Act of 1940) that occurred during the second fiscal quarter of the period covered by this report that have materially affected, or are reasonably likely to materially affect, the registrant’s internal control over financial reporting.
| Item 12. | Disclosure of Securities Lending Activities for Closed-End Management Investment Companies. |
Not applicable
File the exhibits listed below as part of this Form. Letter or number the exhibits in the sequence indicated.
(a)(1) Any code of ethics, or amendment thereto, that is the subject of the disclosure required by Item 2, to the extent that the registrant intends to satisfy the Item 2 requirements through filing of an exhibit: Attached hereto
(a)(2) A separate certification for each principal executive officer and principal financial officer of the registrant as required by Rule 30a-2(a) under the Act (17 CFR 270.30a-2(a)): Attached hereto
(a)(3) Any written solicitation to purchase securities under Rule 23c-1 under the Act (17 CFR 270.23c-1) sent or given during the period covered by the report by or on behalf of the registrant to 10 or more persons: Not applicable
(a)(4) Change in the registrant’s independent public accountants. Not applicable
(b) Certifications required by Rule 30a-2(b) under the Act (17 CFR 270.30a-2(b)): Attached hereto
Exhibit 99.CODE ETH Code of Ethics
Exhibit 99.CERT Certifications required by Rule 30a-2(a) under the Act
Exhibit 99.906CERT Certifications required by Rule 30a-2(b) under the Act
SIGNATURES
Pursuant to the requirements of the Securities Exchange Act of 1934 and the Investment Company Act of 1940, the registrant has duly caused this report to be signed on its behalf by the undersigned, thereunto duly authorized.
| (Registrant) | Wilshire Mutual Funds, Inc. | | |
| | | | |
| By (Signature and Title)* | /s/ Jason A. Schwarz | |
| | | Jason A. Schwarz, President and Principal Executive Officer | |
| | | | |
| Date | March 12, 2018 | | |
| | | | |
| Pursuant to the requirements of the Securities Exchange Act of 1934 and the Investment Company Act of 1940, this report has been signed below by the following persons on behalf of the registrant and in the capacities and on the dates indicated. |
| | | | |
| By (Signature and Title)* | /s/ Jason A. Schwarz | |
| | | Jason A. Schwarz, President and Principal Executive Officer | |
| | | | |
| Date | March 12, 2018 | | |
| | | | |
| By (Signature and Title)* | /s/ Michael Wauters | |
| | | Michael Wauters, Treasurer, Principal Financial Officer and Principal Accounting Officer | |
| | | | |
| Date | March 12, 2018 | | |
| * | Print the name and title of each signing officer under his or her signature. |