| OMB APPROVAL |
OMB Number: 3235-0570 Expires: March 31, 2017 Estimated average burden hours per response: 20.6 |
UNITED STATES
SECURITIES AND EXCHANGE COMMISSION
Washington, D.C. 20549
FORM N-CSR
CERTIFIED SHAREHOLDER REPORT OF REGISTERED
MANAGEMENT INVESTMENT COMPANIES
| Investment Company Act file number | 811-07076 | |
| Wilshire Mutual Funds, Inc. |
| (Exact name of registrant as specified in charter) |
| 1299 Ocean Avenue, Suite 700 Santa Monica, CA | 90401-1085 |
| (Address of principal executive offices) | (Zip code) |
Jason A. Schwarz
| Wilshire Associates Incorporated, 1299 Ocean Avenue, Suite 700, Santa Monica, CA 90401-1085 |
| (Name and address of agent for service) |
| Registrant's telephone number, including area code: | (310) 451-3051 | |
| Date of fiscal year end: | December 31 | |
| | | |
| Date of reporting period: | December 31, 2016 | |
Form N-CSR is to be used by management investment companies to file reports with the Commission not later than 10 days after the transmission to stockholders of any report that is required to be transmitted to stockholders under Rule 30e-1 under the Investment Company Act of 1940 (17 CFR 270.30e-1). The Commission may use the information provided on Form N-CSR in its regulatory, disclosure review, inspection, and policymaking roles.
A registrant is required to disclose the information specified by Form N-CSR, and the Commission will make this information public. A registrant is not required to respond to the collection of information contained in Form N-CSR unless the Form displays a currently valid Office of Management and Budget ("OMB") control number. Please direct comments concerning the accuracy of the information collection burden estimate and any suggestions for reducing the burden to the Secretary, Securities and Exchange Commission, 450 Fifth Street, NW, Washington, DC 20549-0609. The OMB has reviewed this collection of information under the clearance requirements of 44 U.S.C. § 3507.
| Item 1. | Reports to Stockholders. |

Wilshire Mutual Funds |
ANNUAL REPORT Large Company Growth Portfolio Large Company Value Portfolio Small Company Growth Portfolio Small Company Value Portfolio Wilshire 5000 Indexsm Fund Wilshire International Equity Fund Wilshire Income Opportunities Fund |
December 31, 2016
http://advisor.wilshire.com
|
Wilshire Mutual Funds Table of Contents | 
|
Letter to Shareholders | 1 |
Commentary: | |
Large Company Growth Portfolio | 4 |
Large Company Value Portfolio | 8 |
Small Company Growth Portfolio | 12 |
Small Company Value Portfolio | 16 |
Wilshire 5000 IndexSM Fund | 20 |
Wilshire International Equity Fund | 24 |
Wilshire Income Opportunities Fund | 30 |
Disclosure of Fund Expenses | 34 |
Schedule of Investments/Condensed Schedules of Investments: | |
Large Company Growth Portfolio | 37 |
Large Company Value Portfolio | 39 |
Small Company Growth Portfolio | 41 |
Small Company Value Portfolio | 43 |
Wilshire 5000 IndexSM Fund | 45 |
Wilshire International Equity Fund | 47 |
Wilshire Income Opportunities Fund | 50 |
Statements of Assets and Liabilities | 72 |
Statements of Operations | 75 |
Statements of Changes in Net Assets | 77 |
Financial Highlights: | |
Large Company Growth Portfolio | 84 |
Large Company Value Portfolio | 86 |
Small Company Growth Portfolio | 88 |
Small Company Value Portfolio | 90 |
Wilshire 5000 IndexSM Fund | 92 |
Wilshire International Equity Fund | 94 |
Wilshire Income Opportunities Fund | 96 |
Notes to Financial Statements | 98 |
Report of Independent Registered Public Accounting Firm | 119 |
Additional Fund Information | 120 |
Tax Information | 123 |
Board Approval of Advisory and Subadvisory Agreements | 125 |
This report is for the general information of the shareholders of Large Company Growth Portfolio, Large Company Value Portfolio, Small Company Growth Portfolio, Small Company Value Portfolio, Wilshire 5000 IndexSM Fund, Wilshire International Equity Fund and Wilshire Income Opportunities Fund. Its use in connection with any offering of a Portfolio’s shares is authorized only if accompanied or preceded by the Portfolio’s current prospectus.
Wilshire Mutual Funds, Inc. are distributed by Ultimus Fund Distributors, LLC.
Wilshire Mutual Funds Letter to Shareholders (Unaudited) |
|
Dear Wilshire Mutual Fund Shareholder:
We are pleased to present this annual report to all shareholders of the Wilshire Mutual Funds. This report covers the period from January 1, 2016 to December 31, 2016, for all share classes of the Large Company Growth Portfolio, Large Company Value Portfolio, Small Company Growth Portfolio, Small Company Value Portfolio, Wilshire 5000 Index Fund, Wilshire International Equity Fund, and Wilshire Income Opportunities Fund.
Market Environment
U.S. Equity Market
The U.S. stock market, represented by the Wilshire 5000 Total Market IndexSM, was up 4.5% for the fourth quarter and 13.4% for 2016. This marks the Index’s eighth straight annual gain. A portion of that “winning streak” is due to a rebound from the global financial crisis sell-off. However, the market has continued to produce strong returns after the initial recovery, with a 14% annualized gain over the past four years. Following several rocky months to begin the year, U.S. equities trended upward for the rest of 2016. The fourth quarter benefitted from strong economic growth and signs of confidence from the Federal Reserve.
During the year, small-cap stocks outpaced large-cap stocks, with the Wilshire U.S. Small-Cap IndexSM and the Wilshire U.S. Large-Cap IndexSM returning 22.4% and 12.5%, respectively. The strong overall return for the Wilshire 5000 Total Market Index masked a wide performance dispersion between investment styles and among industries for the year. Value-oriented stocks handedly outpaced growth stocks across the capitalization spectrum. The Wilshire U.S. Large-Cap Value IndexSM and the Wilshire U.S. Small-Cap Value IndexSM outpaced their growth oriented counterparts by 6.47% and 10.71%, respectively. Sector-wise, commodity-influenced and interest rate sensitive sectors rallied as dividend-oriented and higher yielding sectors lagged. For the year, Telecom Services, Energy, Financials, and Materials were the top performing sectors returning 27.1%, 26.5%, 24.6%, and 22.8%, respectively, while Real Estate and Health Care trailed returning -4.6% and -2.8%, respectively.
International Equity Market
International developed equities trailed U.S. equities throughout much of the year, but ended the year in positive territory with the MSCI EAFE Index returning 1.0% for 2016. In local currency terms, non U.S. equity markets were in mostly positive territory for the calendar year. However, a strong U.S. dollar resulted in decreased returns for U.S. investors. Despite a strong 2016, the MSCI Emerging Markets Index returned 11.2% for the year, despite emerging market equities suffering during the fourth quarter following the U.S. election as investors feared weakening prospects for global trade and diminishing exports from emerging market countries. Higher U.S. interest rates and a stronger dollar hurt returns as well.
The first half of the year ended with increased volatility as uncertainty regarding the potential political contagion emanating from the United Kingdom’s “Brexit” vote weighed on markets. Equity markets fell sharply immediately following the referendum, and the British pound slumped to its lowest level in 30 years. As in the U.S., foreign markets bounced back over the last few days of the second quarter erasing some of the earlier losses. During the second half of the year, the European Central Bank announced that it would be buying fewer sovereign bonds per month than previously scheduled as part of its current quantitative easing, but extended the buying period to December 2017. Japan also maintained an accommodative stance with a negative overnight rate.
Bond Market
The U.S. fixed income market, as measured by the Bloomberg Barclays U.S. Aggregate Bond Index, fell 3.0% for the fourth quarter, reversing some gains from the prior quarters, but ended the year in positive territory at 2.7%. After falling for much of the first half of 2016, U.S. Treasury yields reversed course and moved higher for the remainder of the year. The
1
Wilshire Mutual Funds Letter to Shareholders (Unaudited) - (Continued) |
|
bellwether 10-year Treasury yield reached a historic low of 1.37% in early July before climbing to end the year at 2.45%, accelerating its rise after the November election. At its December meeting, the Federal Open Market Committee decided to increase the federal funds rate by 0.25%, to a range of 0.50% to 0.75%, for only the second time since 2008.
After trending downward for nearly three years, the 10-year Treasury yield pushed higher during the fourth quarter. A similar pattern has been evident in the 10-year breakeven inflation rate. Both shifts this year occurred largely after November 8th. Whether it was the U.S. presidential election results or the removal of an unknown factor that spurred the change is uncertain, the timing is unmistakable. It is worth noting that Treasury yields moved higher during the first half of 2015 as well, before retreating on concerns about global economic growth.
Fund Performance Review
The Large Company Growth Portfolio Institutional Class returned 3.61%, underperforming the Russell 1000 Growth Index by 3.47%. The Large Company Value Portfolio Institutional Class returned 15.78%, underperforming the Russell 1000 Value Index by 1.56%. The Small Company Growth Portfolio Institutional Class returned 20.79%, outperforming the Russell 2000 Growth Index by 9.47%. The Small Company Value Portfolio Institutional Class returned 25.18%, underperforming the Russell 2000 Value Index by 6.58%. The Wilshire 5000 Index Fund Institutional Class returned 12.81%, underperforming the Wilshire 5000 Total Market Index by 0.56%. The Wilshire International Equity Fund Institutional Class returned 2.16%, underperforming the MSCI All Country World ex-U.S. Index by 2.34%. The Wilshire Income Opportunities Fund Institutional Class returned 3.82% for its since inception period, outperforming the Bloomberg Barclays U.S. Universal Index by 2.77% over that same period. We are pleased with each Fund’s performance for 2016 and we are confident that each Fund is well-positioned for future growth.
As always, we sincerely appreciate your continued support and confidence in Wilshire Associates.
Sincerely,

Jason Schwarz
President, Wilshire Mutual Funds
The performance data quoted represents past performance and does not guarantee future results. Current performance may be lower or higher. The investment return and principal value of an investment will fluctuate so that shares, when redeemed, may be worth more or less than their original cost. Returns assume reinvestment of all distributions.
Index returns are for illustrative purposes only and do not represent actual Fund performance. Index performance returns do not reflect any management fees, transactions costs or expenses. Indexes are unmanaged and one cannot invest directly in an index. Past performance does not guarantee future results.
Bonds and bond funds are subject to interest rate risk and will decline in value as interest rates rise.
In addition to the normal risks associated with investing, international investments may involves risk of capital loss from unfavorable fluctuation in currency values, from differences in generally accepted accounting principles or from social, economic or political instability in other nations. Investments in smaller companies typically exhibit higher volatility.
2
Wilshire Mutual Funds Letter to Shareholders (Unaudited) - (Continued) |
|
Investing involves risk including loss of principal. This report identifies the Portfolio’s investments on December 31, 2016. These holdings are subject to change. Not all investments in each Portfolio performed the same, nor is there any guarantee that these investments will perform as well in the future. Market forecasts provided in this report may not occur.
The MSCI EAFE Index is an equity index which captures large and mid-cap representation across developed markets countries around the world, excluding the U.S. and Canada.
MSCI Emerging Markets Index is a free float-adjusted market capitalization index that is designed to measure equity market performance of emerging markets.
The MSCI Japan Index is a free float-adjusted market capitalization index that is designed to measure developed market equity performance in Japan.
The Wilshire 5000 Total Market IndexSM is widely accepted as the definitive benchmark for the U.S. equity market, and measures performance of all U.S. equity securities with readily available price data.
3
Large Company Growth Portfolio Commentary (Unaudited) |
|
INVESTMENT CLASS SHARES
Average Annual Total Returns*
One Year Ended 12/31/16 | 3.33% |
Five Years Ended 12/31/16 | 11.90% |
Ten Years Ended 12/31/16 | 6.40% |
RUSSELL 1000® GROWTH INDEX(1)
Average Annual Total Returns
One Year Ended 12/31/16 | 7.08% |
Five Years Ended 12/31/16 | 14.50% |
Ten Years Ended 12/31/16 | 8.33% |
COMPARATIVE PERFORMANCE
Comparison of Change in Value of $10,000 Investment in Shares of Large Company Growth Portfolio,
Investment Class Shares and the Russell 1000® Growth Index through 12/31/16.

The performance data quoted represents past performance and does not guarantee future results. Current performance may be lower or higher. Performance data current to the most recent month end may be obtained at http://advisor.wilshire.com. The investment return and principal value of an investment will fluctuate so that shares, when redeemed, may be worth more or less than their original cost. The table above does not reflect the deduction of taxes that a shareholder would pay on Portfolio distributions or the redemption of Portfolio shares.
* | Assumes reinvestment of all distributions. |
(1) | The Russell 1000® Growth Index is an unmanaged index that measures the performance of the largest 1,000 U.S. companies with higher price-to-book ratios and higher forecasted growth values. Index performance is presented for general comparative purposes. Unlike a mutual fund, the performance of an index assumes no transaction costs, management fees or other expenses. An individual cannot directly invest in any index. |
4
Large Company Growth Portfolio Commentary (Unaudited) - (Continued) |
|
INSTITUTIONAL CLASS SHARES
Average Annual Total Returns*
One Year Ended 12/31/16 | 3.61% |
Five Years Ended 12/31/16 | 12.23% |
Ten Years Ended 12/31/16 | 6.75% |
RUSSELL 1000® GROWTH INDEX(1)
Average Annual Total Returns
One Year Ended 12/31/16 | 7.08% |
Five Years Ended 12/31/16 | 14.50% |
Ten Years Ended 12/31/16 | 8.33% |
COMPARATIVE PERFORMANCE
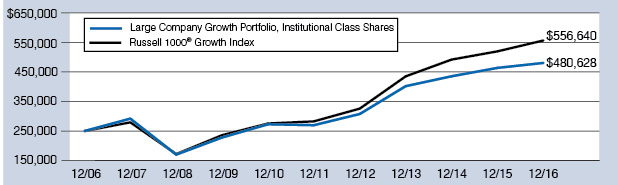
Comparison of Change in Value of $250,000 Investment in Shares of Large Company Growth Portfolio,
Institutional Class Shares and the Russell 1000® Growth Index through 12/31/16.
The performance data quoted represents past performance and does not guarantee future results. Current performance may be lower or higher. Performance data current to the most recent month end may be obtained at http://advisor.wilshire.com. The investment return and principal value of an investment will fluctuate so that shares, when redeemed, may be worth more or less than their original cost. The table above does not reflect the deduction of taxes that a shareholder would pay on Portfolio distributions or the redemption of Portfolio shares.
* | Assumes reinvestment of all distributions. |
(1) | The Russell 1000® Growth Index is an unmanaged index that measures the performance of the largest 1,000 U.S. companies with higher price-to-book ratios and higher forecasted growth values. Index performance is presented for general comparative purposes. Unlike a mutual fund, the performance of an index assumes no transaction costs, management fees or other expenses. An individual cannot directly invest in any index. |
5
Large Company Growth Portfolio Commentary (Unaudited) - (Continued) |
|
The U.S. stock market, as represented by the Wilshire 5000 Total Market IndexSM, returned 13.4% during 2016. The year started with a loss as markets tumbled globally as worries over a slowing Chinese economy, falling oil prices, and weakness in U.S. earnings growth rattled investors. The U.S. market eventually rallied from its trough as investor concerns were met with sound economic data and aggressive action by some of the world’s major central banks. Mid-year markets were again shaken as investors were surprised by the outcome of the United Kingdom referendum to exit the European Union. The second half of the year was dominated by the news surrounding the U.S. presidential election. In November, markets responded favorably as investors cheered Donald Trump’s victory over Hillary Clinton. Stocks rallied to close the year on the hope that the new administration would fulfill campaign promises for reduced taxes, reduced regulation and increased spending on infrastructure. With signs of improving U.S. economic growth, the Federal Reserve raised its target for short-term interest rates in December and increased its predictions from two to three rate hikes for 2017. For the year, value securities significantly outperformed growth across the capitalization spectrum. This was especially prevalent in the second half of the year as investors rotated away from more defensive “bond-proxy” sectors and towards value areas of the market that are generally seen as beneficiaries of rising yields. Stable oil prices and hopes of deregulation further propelled cyclical sectors. Smaller capitalization securities outperformed larger capitalization stocks for the year as smaller cap stocks were seen as larger beneficiaries of the proposed tax cuts, fiscal expenditures, and nationalistic rhetoric.
Sector performance for the Wilshire 5000 Total Market Index was mixed for the year as investors favored risk and moved into pro-cyclical sectors. Telecom Services was the best performing sector, followed by Energy which returned 26.5% as commodity related industries fared well as oil prices rose 45% from their early 2016 lows. Financials was also a top contributor, returning 24.6% as bond yields rallied late in the year. Conversely more defensive, higher yielding sectors trailed, with Health Care and Real Estate returning -2.8% and -4.6%, respectively.
The Wilshire Large Company Growth Portfolio Institutional Class returned 3.61% for 2016, underperforming the Russell 1000 Growth Index return of 7.08% by 3.47%. The Fund was weighed down by poor stock selection in the Health Care and Information Technology sectors as well as an underweight allocation to Industrials and Telecom Services. Conversely, overweight exposure to the Information Technology sector helped mitigate relative losses.
Despite the Fund’s underperformance versus its benchmark, we believe the Fund is well-positioned going into 2017 as the market deals with ongoing macroeconomic and geopolitical issues.
6
Large Company Growth Portfolio Commentary (Unaudited) - (Continued) |
|
PORTFOLIO SECTOR WEIGHTING†
(As of December 31, 2016)
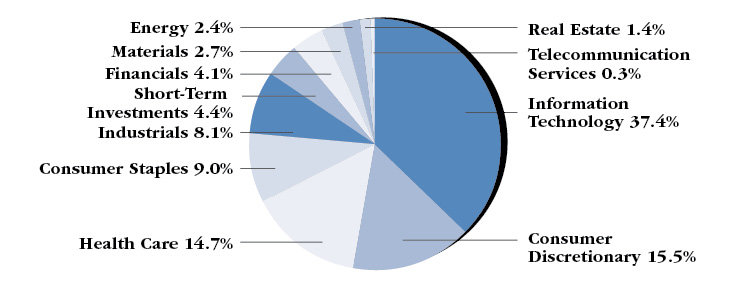
† | Based on percent of the Portfolio’s total investments in securities, at value. Includes investments held as collateral for securities on loan (see Note 6 in Notes to Financial Statements). |
7
Large Company Value Portfolio Commentary (Unaudited) |
|
INVESTMENT CLASS SHARES
Average Annual Total Returns*
One Year Ended 12/31/16 | 15.73% |
Five Years Ended 12/31/16 | 13.95% |
Ten Years Ended 12/31/16 | 4.48% |
RUSSELL 1000® VALUE INDEX(1)
Average Annual Total Returns
One Year Ended 12/31/16 | 17.34% |
Five Years Ended 12/31/16 | 14.80% |
Ten Years Ended 12/31/16 | 5.72% |
COMPARATIVE PERFORMANCE
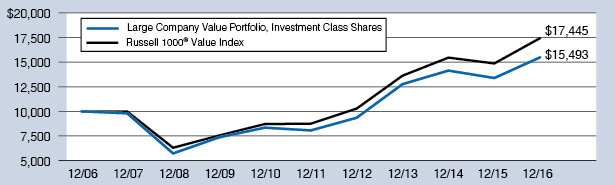
Comparison of Change in Value of $10,000 Investment in Shares of Large Company Value Portfolio,
Investment Class Shares and the Russell 1000® Value Index through 12/31/16.
The performance data quoted represents past performance and does not guarantee future results. Current performance may be lower or higher. Performance data current to the most recent month end may be obtained at http://advisor.wilshire.com. The investment return and principal value of an investment will fluctuate so that shares, when redeemed, may be worth more or less than their original cost. The table above does not reflect the deduction of taxes that a shareholder would pay on Portfolio distributions or the redemption of Portfolio shares.
* | Assumes reinvestment of all distributions. |
(1) | The Russell 1000® Value Index is an unmanaged index that measures the performance of the largest 1,000 U.S. companies with lower price-to-book ratios and lower forecasted growth values. Index performance is presented for general comparative purposes. Unlike a mutual fund, the performance of an index assumes no transaction costs, management fees or other expenses. An individual cannot directly invest in any index. |
8
Large Company Value Portfolio Commentary (Unaudited) - (Continued) |
|
INSTITUTIONAL CLASS SHARES
Average Annual Total Returns*
One Year Ended 12/31/16 | 15.78% |
Five Years Ended 12/31/16 | 14.18% |
Ten Years Ended 12/31/16 | 4.68% |
RUSSELL 1000® VALUE INDEX(1)
Average Annual Total Returns
One Year Ended 12/31/16 | 17.34% |
Five Years Ended 12/31/16 | 14.80% |
Ten Years Ended 12/31/16 | 5.72% |
COMPARATIVE PERFORMANCE
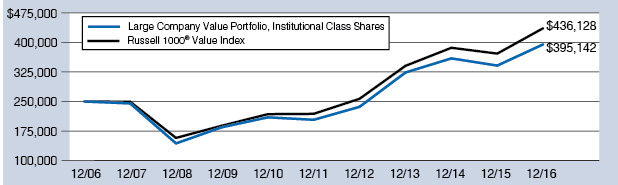
Comparison of Change in Value of $250,000 Investment in Shares of Large Company Value Portfolio,
Institutional Class Shares and the Russell 1000® Value Index through 12/31/16.
The performance data quoted represents past performance and does not guarantee future results. Current performance may be lower or higher. Performance data current to the most recent month end may be obtained at http://advisor.wilshire.com. The investment return and principal value of an investment will fluctuate so that shares, when redeemed, may be worth more or less than their original cost. The table above does not reflect the deduction of taxes that a shareholder would pay on Portfolio distributions or the redemption of Portfolio shares.
* | Assumes reinvestment of all distributions. |
(1) | The Russell 1000® Value Index is an unmanaged index that measures the performance of the largest 1,000 U.S. companies with lower price-to-book ratios and lower forecasted growth values. Index performance is presented for general comparative purposes. Unlike a mutual fund, the performance of an index assumes no transaction costs, management fees or other expenses. An individual cannot directly invest in any index. |
9
Large Company Value Portfolio Commentary (Unaudited) - (Continued) |
|
The U.S. stock market, as represented by the Wilshire 5000 Total Market IndexSM, returned 13.4% during 2016. The year started with a loss as markets tumbled globally as worries over a slowing Chinese economy, falling oil prices, and weakness in U.S. earnings growth rattled investors. The U.S. market eventually rallied from its trough as investor concerns were met with sound economic data and aggressive action by some of the world’s major central banks. Mid-year markets were again shaken as investors were surprised by the outcome of the United Kingdom referendum to exit the European Union. The second half of the year was dominated by the news surrounding the U.S. presidential election. In November, markets responded favorably as investors cheered Donald Trump’s victory over Hillary Clinton. Stocks rallied to close the year on the hope that the new administration would fulfill campaign promises for reduced taxes, reduced regulation and increased spending on infrastructure. With signs of improving U.S. economic growth, the Federal Reserve raised its target for short-term interest rates in December and increased its predictions from two to three rate hikes for 2017. For the year, value securities significantly outperformed growth across the capitalization spectrum. This was especially prevalent in the second half of the year as investors rotated away from more defensive “bond-proxy” sectors and towards value areas of the market that are generally seen as beneficiaries of rising yields. Stable oil prices and hopes of deregulation further propelled cyclical sectors. Smaller capitalization securities outperformed larger capitalization stocks for the year as smaller cap stocks were seen as larger beneficiaries of the proposed tax cuts, fiscal expenditures, and nationalistic rhetoric.
Sector performance for the Wilshire 5000 Total Market Index was mixed for the year as investors favored risk and moved into pro-cyclical sectors. Telecom Services was the best performing sector, followed by Energy which returned 26.5% as commodity related industries fared well as oil prices rose 45% from their early 2016 lows. Financials was also a top contributor, returning 24.6% as bond yields rallied late in the year. Conversely more defensive, higher yielding sectors trailed, with Health Care and Real Estate returning -2.8% and -4.6%, respectively.
The Wilshire Large Company Value Portfolio Institutional Class returned 15.78% for 2016, underperforming the Russell 1000 Value Index return of 17.34% by 1.56%. The Fund was hindered by weak stock selection in the Financials, Industrials, and Energy sectors. Overweight exposure to the Financials sector and underweight exposure to the Real Estate and Consumer Staples sectors helped mitigate relative underperformance.
Despite the Fund’s underperformance versus its benchmark, we believe the Fund is well-positioned going into 2017 as the market deals with ongoing macroeconomic and geopolitical issues.
10
Large Company Value Portfolio Commentary (Unaudited) - (Continued) |
|
PORTFOLIO SECTOR WEIGHTING†
(As of December 31, 2016)

† | Based on percent of the Portfolio’s total investments in securities, at value. Includes investments held as collateral for securities on loan (see Note 6 in Notes to Financial Statements). |
11
Small Company Growth Portfolio Commentary (Unaudited) |
|
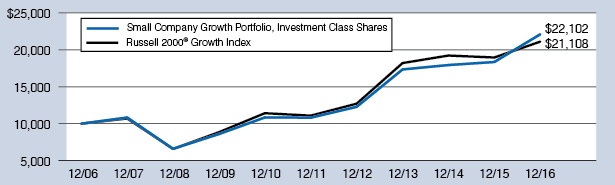
INVESTMENT CLASS SHARES
Average Annual Total Returns*
One Year Ended 12/31/16 | 20.44% |
Five Years Ended 12/31/16 | 15.38% |
Ten Years Ended 12/31/16 | 8.25% |
RUSSELL 2000® GROWTH INDEX(1)
Average Annual Total Returns
One Year Ended 12/31/16 | 11.32% |
Five Years Ended 12/31/16 | 13.74% |
Ten Years Ended 12/31/16 | 7.76% |
COMPARATIVE PERFORMANCE
Comparison of Change in Value of $10,000 Investment in Shares of Small Company Growth Portfolio,
Investment Class Shares and the Russell 2000® Growth Index through 12/31/16.
The performance data quoted represents past performance and does not guarantee future results. Current performance may be lower or higher. Performance data current to the most recent month end may be obtained at http://advisor.wilshire.com. The investment return and principal value of an investment will fluctuate so that shares, when redeemed, may be worth more or less than their original cost. The table above does not reflect the deduction of taxes that a shareholder would pay on Portfolio distributions or the redemption of Portfolio shares.
* | Assumes reinvestment of all distributions. During the ten years ended December 31, 2016, certain fees and expenses were reduced or reimbursed. Without fee reductions and expense reimbursements (excluding fees paid indirectly), historical total returns would have been lower. For the year ended December 31, 2016, the investment adviser reduced its fees or reimbursed expenses in the amount of 0.04% of average net assets. |
(1) | The Russell 2000® Growth Index is an unmanaged index that measures the performance of the 2,000 smallest U.S. companies with higher price-to-book ratios and higher forecasted growth values. Index performance is presented for general comparative purposes. Unlike a mutual fund, the performance of an index assumes no transaction costs, management fees or other expenses. An individual cannot directly invest in any index. |
12
Small Company Growth Portfolio Commentary (Unaudited) - (Continued) |
|
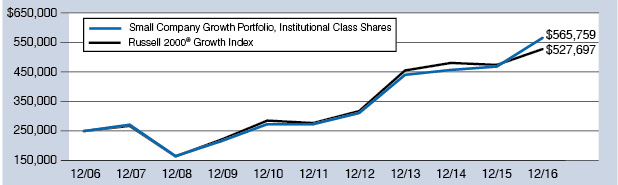
INSTITUTIONAL CLASS SHARES
Average Annual Total Returns*
One Year Ended 12/31/16 | 20.79% |
Five Years Ended 12/31/16 | 15.66% |
Ten Years Ended 12/31/16 | 8.51% |
RUSSELL 2000® GROWTH INDEX(1)
Average Annual Total Returns
One Year Ended 12/31/16 | 11.32% |
Five Years Ended 12/31/16 | 13.74% |
Ten Years Ended 12/31/16 | 7.76% |
COMPARATIVE PERFORMANCE
Comparison of Change in Value of $250,000 Investment in Shares of Small Company Growth Portfolio,
Institutional Class Shares and the Russell 2000® Growth Index through 12/31/16.
The performance data quoted represents past performance and does not guarantee future results. Current performance may be lower or higher. Performance data current to the most recent month end may be obtained at http://advisor.wilshire.com. The investment return and principal value of an investment will fluctuate so that shares, when redeemed, may be worth more or less than their original cost. The table above does not reflect the deduction of taxes that a shareholder would pay on Portfolio distributions or the redemption of Portfolio shares.
* | Assumes reinvestment of all distributions. During the ten years ended December 31, 2016, certain fees and expenses were waived or reimbursed. Without waivers and reimbursements (excluding fees paid indirectly), historical total returns would have been lower. For the year ended December 31, 2016, the investment adviser reduced its fees or reimbursed expenses in the amount of 0.08% of average net assets. |
(1) | The Russell 2000® Growth Index is an unmanaged index that measures the performance of the 2,000 smallest U.S. companies with higher price-to-book ratios and higher forecasted growth values. Index performance is presented for general comparative purposes. Unlike a mutual fund, the performance of an index assumes no transaction costs, management fees or other expenses. An individual cannot directly invest in any index. |
13
Small Company Growth Portfolio Commentary (Unaudited) - (Continued) |
|
The U.S. stock market, as represented by the Wilshire 5000 Total Market IndexSM, returned 13.4% during 2016. The year started with a loss as markets tumbled globally as worries over a slowing Chinese economy, falling oil prices, and weakness in U.S. earnings growth rattled investors. The U.S. market eventually rallied from its trough as investor concerns were met with sound economic data and aggressive action by some of the world’s major central banks. Mid-year markets were again shaken as investors were surprised by the outcome of the United Kingdom referendum to exit the European Union. The second half of the year was dominated by the news surrounding the U.S. presidential election. In November, markets responded favorably as investors cheered Donald Trump’s victory over Hillary Clinton. Stocks rallied to close the year on the hope that the new administration would fulfill campaign promises for reduced taxes, reduced regulation and increased spending on infrastructure. With signs of improving U.S. economic growth, the Federal Reserve raised its target for short-term interest rates in December and increased its predictions from two to three rate hikes for 2017. For the year, value securities significantly outperformed growth across the capitalization spectrum. This was especially prevalent in the second half of the year as investors rotated away from more defensive “bond-proxy” sectors and towards value areas of the market that are generally seen as beneficiaries of rising yields. Stable oil prices and hopes of deregulation further propelled cyclical sectors. Smaller capitalization securities outperformed larger capitalization stocks for the year as smaller cap stocks were seen as larger beneficiaries of the proposed tax cuts, fiscal expenditures, and nationalistic rhetoric.
Sector performance for the Wilshire 5000 Total Market Index was mixed for the year as investors favored risk and moved into pro-cyclical sectors. Telecom Services was the best performing sector, followed by Energy which returned 26.5% as commodity related industries fared well as oil prices rose 45% from their early 2016 lows. Financials was also a top contributor, returning 24.6% as bond yields rallied late in the year. Conversely more defensive, higher yielding sectors trailed, with Health Care and Real Estate returning -2.8% and -4.6%, respectively.
The Wilshire Small Company Growth Portfolio Institutional Class returned 20.79% for 2016, outperforming the Russell 2000 Growth Index return of 11.32% by 9.47%. The Fund benefited from strong stock selection in the Health Care, Industrials and Financials sectors as well as an overweight allocation to the Energy and Financials sectors. Weak stock selection in the Consumer Discretionary Sector sector weighed on relative performance.
We are pleased with the Fund’s outperformance for 2016 and believe the Fund is well-positioned going into 2017 as the market deals with ongoing macroeconomic and geopolitical uncertainties.
14
Small Company Growth Portfolio Commentary (Unaudited) - (Continued) |
|
PORTFOLIO SECTOR WEIGHTING†
(As of December 31, 2016)
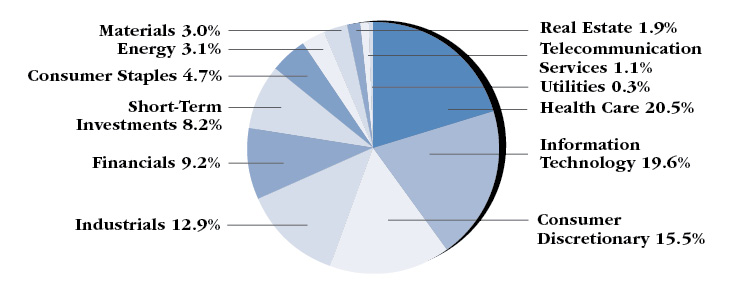
† | Based on percent of the Portfolio’s total investments in securities, at value. Includes investments held as collateral for securities on loan (see Note 6 in Notes to Financial Statements). |
15
Small Company Value Portfolio Commentary (Unaudited) |
|
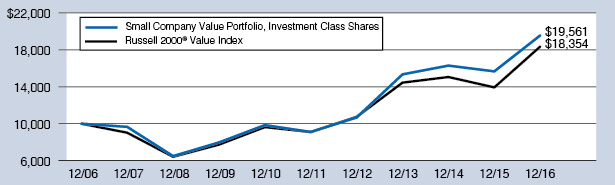
INVESTMENT CLASS SHARES
Average Annual Total Returns*
One Year Ended 12/31/16 | 24.86% |
Five Years Ended 12/31/16 | 16.53% |
Ten Years Ended 12/31/16 | 6.94% |
RUSSELL 2000® VALUE INDEX(1)
Average Annual Total Returns
One Year Ended 12/31/16 | 31.74% |
Five Years Ended 12/31/16 | 15.07% |
Ten Years Ended 12/31/16 | 6.26% |
COMPARATIVE PERFORMANCE
Comparison of Change in Value of $10,000 Investment in Shares of Small Company Value Portfolio,
Investment Class Shares and the Russell 2000® Value Index through 12/31/16.
The performance data quoted represents past performance and does not guarantee future results. Current performance may be lower or higher. Performance data current to the most recent month end may be obtained at http://advisor.wilshire.com. The investment return and principal value of an investment will fluctuate so that shares, when redeemed, may be worth more or less than their original cost. The table above does not reflect the deduction of taxes that a shareholder would pay on Portfolio distributions or the redemption of Portfolio shares.
* | Assumes reinvestment of all distributions. During the ten years ended December 31, 2016, certain fees and expenses were reduced or reimbursed. Without fee reductions and expense reimbursements (excluding fees paid indirectly), historical total returns would have been lower. For the year ended December 31, 2016, the investment adviser reduced its fees or reimbursed expenses in the amount of 0.05% of average net assets. |
(1) | The Russell 2000® Value Index is an unmanaged index that measures the performance of the 2,000 smallest U.S. companies with lower price-to-book ratios and lower forecasted growth values. Index performance is presented for general comparative purposes. Unlike a mutual fund, the performance of an index assumes no transaction costs, management fees or other expenses. An individual cannot directly invest in any index. |
16
Small Company Value Portfolio Commentary (Unaudited) - (Continued) |
|
INSTITUTIONAL CLASS SHARES
Average Annual Total Returns*
One Year Ended 12/31/16 | 25.16% |
Five Years Ended 12/31/16 | 16.83% |
Ten Years Ended 12/31/16 | 7.29% |
RUSSELL 2000® VALUE INDEX(1)
Average Annual Total Returns
One Year Ended 12/31/16 | 31.74% |
Five Years Ended 12/31/16 | 15.07% |
Ten Years Ended 12/31/16 | 6.26% |
COMPARATIVE PERFORMANCE
Comparison of Change in Value of $250,000 Investment in Shares of Small Company Value Portfolio,
Institutional Class Shares and the Russell 2000® Value Index through 12/31/16.

The performance data quoted represents past performance and does not guarantee future results. Current performance may be lower or higher. Performance data current to the most recent month end may be obtained at http://advisor.wilshire.com. The investment return and principal value of an investment will fluctuate so that shares, when redeemed, may be worth more or less than their original cost. The table above does not reflect the deduction of taxes that a shareholder would pay on Portfolio distributions or the redemption of Portfolio shares.
* | Assumes reinvestment of all distributions. During the ten years ended December 31, 2016, certain fees and expenses were reduced or reimbursed. Without fee reductions and expense reimbursements (excluding fees paid indirectly), historical total returns would have been lower. For the year ended December 31, 2016, the investment adviser reduced its fees or reimbursed expenses in the amount of 0.06% of average net assets. |
(1) | The Russell 2000® Value Index is an unmanaged index that measures the performance of the 2,000 smallest U.S. companies with lower price-to-book ratios and lower forecasted growth values. Index performance is presented for general comparative purposes. Unlike a mutual fund, the performance of an index assumes no transaction costs, management fees or other expenses. An individual cannot directly invest in any index. |
17
Small Company Value Portfolio Commentary (Unaudited) - (Continued) |
|
The U.S. stock market, as represented by the Wilshire 5000 Total Market IndexSM, returned 13.4% during 2016. The year started with a loss as markets tumbled globally as worries over a slowing Chinese economy, falling oil prices, and weakness in U.S. earnings growth rattled investors. The U.S. market eventually rallied from its trough as investor concerns were met with sound economic data and aggressive action by some of the world’s major central banks. Mid-year markets were again shaken as investors were surprised by the outcome of the United Kingdom referendum to exit the European Union. The second half of the year was dominated by the news surrounding the U.S. presidential election. In November, markets responded favorably as investors cheered Donald Trump’s victory over Hillary Clinton. Stocks rallied to close the year on the hope that the new administration would fulfill campaign promises for reduced taxes, reduced regulation and increased spending on infrastructure. With signs of improving U.S. economic growth, the Federal Reserve raised its target for short-term interest rates in December and increased its predictions from two to three rate hikes for 2017. For the year, value securities significantly outperformed growth across the capitalization spectrum. This was especially prevalent in the second half of the year as investors rotated away from more defensive “bond-proxy” sectors and towards value areas of the market that are generally seen as beneficiaries of rising yields. Stable oil prices and hopes of deregulation further propelled cyclical sectors. Smaller capitalization securities outperformed larger capitalization stocks for the year as smaller cap stocks were seen as larger beneficiaries of the proposed tax cuts, fiscal expenditures, and nationalistic rhetoric.
Sector performance for the Wilshire 5000 Total Market Index was mixed for the year as investors favored risk and moved into pro-cyclical sectors. Telecom Services was the best performing sector, followed by Energy which returned 26.5% as commodity related industries fared well as oil prices rose 45% from their early 2016 lows. Financials was also a top contributor, returning 24.6% as bond yields rallied late in the year. Conversely more defensive, higher yielding sectors trailed, with Health Care and Real Estate returning -2.8% and -4.6%, respectively.
The Wilshire Small Company Value Portfolio Institutional Class returned 25.16% for 2016, underperforming the Russell 2000 Value Index return of 31.74% by 6.58%. The Fund was weighed down by weak stock selection in the Materials, Financials, and Consumer Staples sectors as well as an underweight exposure to the Financials sector. Conversely, strong stock selection in the Consumer Discretionary sector and an overweight allocation to the Materials sector helped mitigate relative losses.
Despite the Fund’s underperformance versus its benchmark, we believe the Fund is well-positioned going into 2017 as the market deals with ongoing macroeconomic and geopolitical issues.
18
Small Company Value Portfolio Commentary (Unaudited) - (Continued) |
|
PORTFOLIO SECTOR WEIGHTING†
(As of December 31, 2016)
† | Based on percent of the Portfolio’s total investments in securities, at value. Includes investments held as collateral for securities on loan (see Note 6 in Notes to Financial Statements). |
19
Wilshire 5000 Indexsm Fund Commentary (Unaudited) |
|
INVESTMENT CLASS SHARES
Average Annual Total Returns*
One Year Ended 12/31/16 | 12.51% |
Five Years Ended 12/31/16 | 14.04% |
Ten Years Ended 12/31/16 | 6.53% |
WILSHIRE 5000 INDEXSM(1)
Average Annual Total Returns
One Year Ended 12/31/16 | 13.37% |
Five Years Ended 12/31/16 | 14.71% |
Ten Years Ended 12/31/16 | 7.17% |
COMPARATIVE PERFORMANCE
Comparison of Change in Value of $10,000 Investment in Shares of Wilshire 5000 IndexSM Fund,
Investment Class Shares and the Wilshire 5000 IndexSM through 12/31/16.
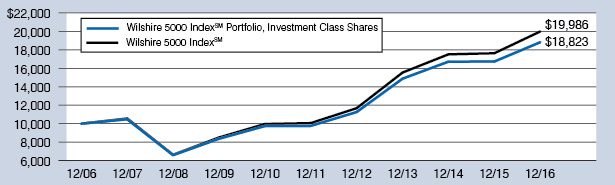
The performance data quoted represents past performance and does not guarantee future results. Current performance may be lower or higher. Performance data current to the most recent month end may be obtained at http://advisor.wilshire.com. The investment return and principal value of an investment will fluctuate so that shares, when redeemed, may be worth more or less than their original cost. The table above does not reflect the deduction of taxes that a shareholder would pay on Fund distributions or the redemption of Fund shares.
* | Assumes reinvestment of all distributions. |
(1) | The Wilshire 5000 IndexSM is an unmanaged index that measures the performance of all U.S. headquartered equity securities with readily available price data. Index performance is presented for general comparative purposes. Unlike a mutual fund, the performance of an index assumes no transaction costs, management fees or other expenses. An individual cannot directly invest in any index. |
20
Wilshire 5000 Indexsm Fund Commentary (Unaudited) - (Continued) |
|
INSTITUTIONAL CLASS SHARES
Average Annual Total Returns*
One Year Ended 12/31/16 | 12.81% |
Five Years Ended 12/31/16 | 14.31% |
Ten Years Ended 12/31/16 | 6.76% |
WILSHIRE 5000 INDEXSM(1)
Average Annual Total Returns
One Year Ended 12/31/16 | 13.37% |
Five Years Ended 12/31/16 | 14.71% |
Ten Years Ended 12/31/16 | 7.17% |
COMPARATIVE PERFORMANCE
Comparison of Change in Value of $250,000 Investment in Shares of Wilshire 5000 IndexSM Fund,
Institutional Class Shares and the Wilshire 5000 IndexSM through 12/31/16.
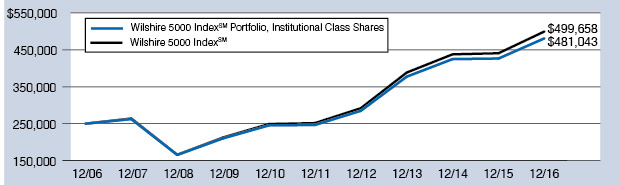
The performance data quoted represents past performance and does not guarantee future results. Current performance may be lower or higher. Performance data current to the most recent month end may be obtained at http://advisor.wilshire.com. The investment return and principal value of an investment will fluctuate so that shares, when redeemed, may be worth more or less than their original cost. The table above does not reflect the deduction of taxes that a shareholder would pay on Fund distributions or the redemption of Fund shares.
* | Assumes reinvestment of all distributions. |
(1) | The Wilshire 5000 IndexSM is an unmanaged index that measures the performance of all U.S. headquartered equity securities with readily available price data. Index performance is presented for general comparative purposes. Unlike a mutual fund, the performance of an index assumes no transaction costs, management fees or other expenses. An individual cannot directly invest in any index. |
21
Wilshire 5000 Indexsm Fund Commentary (Unaudited) - (Continued) |
|
The U.S. stock market, as represented by the Wilshire 5000 Total Market IndexSM, returned 13.4% during 2016. The year started with a loss as markets tumbled globally as worries over a slowing Chinese economy, falling oil prices, and weakness in U.S. earnings growth rattled investors. The U.S. market eventually rallied from its trough as investor concerns were met with sound economic data and aggressive action by some of the world’s major central banks. Mid-year markets were again shaken as investors were surprised by the outcome of the United Kingdom referendum to exit the European Union. The second half of the year was dominated by the news surrounding the U.S. presidential election. In November, markets responded favorably as investors cheered Donald Trump’s victory over Hillary Clinton. Stocks rallied to close the year on the hope that the new administration would fulfill campaign promises for reduced taxes, reduced regulation and increased spending on infrastructure. With signs of improving U.S. economic growth, the Federal Reserve raised its target for short-term interest rates in December and increased its predictions from two to three rate hikes for 2017. For the year, value securities significantly outperformed growth across the capitalization spectrum. This was especially prevalent in the second half of the year as investors rotated away from more defensive “bond-proxy” sectors and towards value areas of the market that are generally seen as beneficiaries of rising yields. Stable oil prices and hopes of deregulation further propelled cyclical sectors. Smaller capitalization securities outperformed larger capitalization stocks for the year as smaller cap stocks were seen as larger beneficiaries of the proposed tax cuts, fiscal expenditures, and nationalistic rhetoric.
Sector performance for the Wilshire 5000 Total Market Index was mixed for the year as investors favored risk and moved into pro-cyclical sectors. Telecom Services was the best performing sector, followed by Energy which returned 26.5% as commodity related industries fared well as oil prices rose 45% from their early 2016 lows. Financials was also a top contributor, returning 24.6% as bond yields rallied late in the year. Conversely more defensive, higher yielding sectors trailed, with Health Care and Real Estate returning -2.8% and -4.6%, respectively.
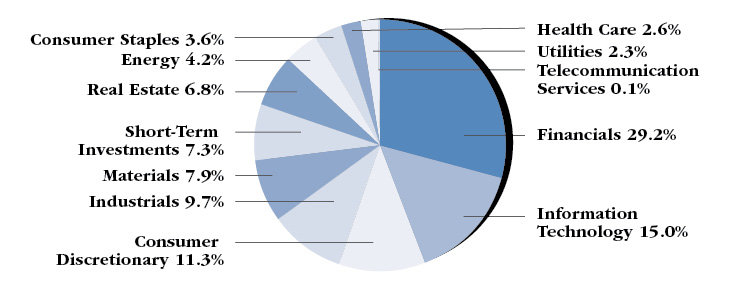
The Wilshire 5000 IndexSM Fund Institutional Class returned 12.81% for 2016, underperforming the Fund’s benchmark (the Wilshire 5000 IndexSM) return of 13.37% by 0.56%. Underperformance is attributable to Fund expenses and is well within the range of historical experiences.
22
Wilshire 5000 Indexsm Fund Commentary (Unaudited) - (Continued) |
|
PORTFOLIO SECTOR WEIGHTING†
(As of December 31, 2016)

† | Based on percent of the Fund’s total investments in securities, at value. Includes investments held as collateral for securities on loan (see Note 6 in Notes to Financial Statements). |
23
Wilshire International Equity Fund Commentary (Unaudited) |
|
INVESTMENT CLASS SHARES
Average Annual Total Returns*
One Year Ended 12/31/16 | 1.88% |
Five Years Ended 12/31/16 | 4.83% |
Inception (11/16/07) through 12/31/16 | 0.24% |
MSCI ALL COUNTRY WORLD INDEX EX-U.S.(1)
Average Annual Total Returns
One Year Ended 12/31/16 | 4.50% |
Five Years Ended 12/31/16 | 5.00% |
Inception (11/16/07) through 12/31/16 | -0.60% |
On April 2, 2013, the Wilshire International Equity Fund’s investment strategy was changed. Consequently, prior period performance may have been different if the new investment strategy had been in effect during these periods.
The performance data quoted represents past performance and does not guarantee future results. Current performance may be lower or higher. Performance data current to the most recent month end may be obtained at http://advisor.wilshire.com. The investment return and principal value of an investment will fluctuate so that shares, when redeemed, may be worth more or less than their original cost. The table above does not reflect the deduction of taxes that a shareholder would pay on Fund distributions or the redemption of Fund shares.
* | Assumes reinvestment of all distributions. During certain periods since inception, certain fees and expenses were reduced or reimbursed. Without fee reductions and expense reimbursements, historical total returns would have been lower. For the year ended December 31, 2016, the investment adviser reduced its fees or reimbursed expenses in the amount of 0.46% of average net assets. |
(1) | The MSCI All Country World Ex-U.S. Index is an unmanaged capitalization-weighted measure of stock markets of developed and emerging markets, with the exception of U.S.-based companies. Unlike a mutual fund, the performance of an index assumes no transaction costs, management fees or other expenses. An individual cannot invest directly in an index. Index performance is presented for general comparative purposes. |
24
Wilshire International Equity Fund Commentary (Unaudited) - (Continued) |
|
COMPARATIVE PERFORMANCE
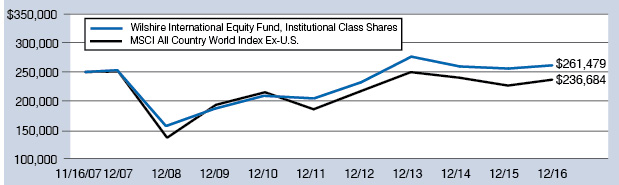
Comparison of Change in Value of $10,000 Investment in Shares of Wilshire International Equity Fund,
Investment Class Shares and the MSCI All Country World Index Ex-U.S. through 12/31/16.
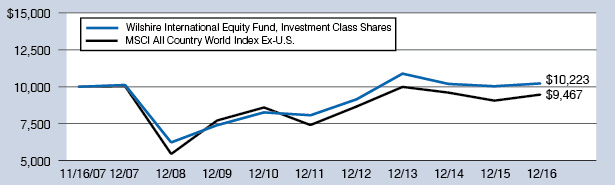
The performance data quoted represents past performance and does not guarantee future results. Current performance may be lower or higher. Performance data current to the most recent month end may be obtained at http://advisor.wilshire.com. The investment return and principal value of an investment will fluctuate so that shares, when redeemed, may be worth more or less than their original cost. The table above does not reflect the deduction of taxes that a shareholder would pay on Fund distributions or the redemption of Fund shares.
25
Wilshire International Equity Fund Commentary (Unaudited) - (Continued) |
|
INSTITUTIONAL CLASS SHARES
Average Annual Total Returns*
One Year Ended 12/31/16 | 2.16% |
Five Years Ended 12/31/16 | 5.05% |
Inception (11/16/07) through 12/31/16 | 0.49% |
MSCI ALL COUNTRY WORLD INDEX EX-U.S.(1)
Average Annual Total Returns
One Year Ended 12/31/16 | 4.50% |
Five Years Ended 12/31/16 | 5.00% |
Inception (11/16/07) through 12/31/16 | -0.60% |
On April 2, 2013, the Wilshire International Equity Fund’s investment strategy was changed. Consequently, prior period performance may have been different if the new investment strategy had been in effect during these periods.
The performance data quoted represents past performance and does not guarantee future results. Current performance may be lower or higher. Performance data current to the most recent month end may be obtained at http://advisor.wilshire.com. The investment return and principal value of an investment will fluctuate so that shares, when redeemed, may be worth more or less than their original cost. The table above does not reflect the deduction of taxes that a shareholder would pay on Fund distributions or the redemption of Fund shares.
* | Assumes reinvestment of all distributions. During certain periods since inception, certain fees and expenses were reduced or reimbursed. Without fee reductions and expense reimbursements, historical total returns would have been lower. For the year ended December 31, 2016, the investment adviser reduced its fees or reimbursed expenses in the amount of 0.04% of average net assets. |
(1) | The MSCI All Country World Ex-U.S. Index is an unmanaged capitalization-weighted measure of stock markets of developed and emerging markets, with the exception of U.S.-based companies. Unlike a mutual fund, the performance of an index assumes no transaction costs, management fees or other expenses. An individual cannot invest directly in an index. Index performance is presented for general comparative purposes. |
26
Wilshire International Equity Fund Commentary (Unaudited) - (Continued) |
|
COMPARATIVE PERFORMANCE
Comparison of Change in Value of $250,000 Investment in Shares of Wilshire International Equity Fund,
Institutional Class Shares and the MSCI All Country World Index Ex-U.S. through 12/31/16.
The performance data quoted represents past performance and does not guarantee future results. Current performance may be lower or higher. Performance data current to the most recent month end may be obtained at http://advisor.wilshire.com. The investment return and principal value of an investment will fluctuate so that shares, when redeemed, may be worth more or less than their original cost. The table above does not reflect the deduction of taxes that a shareholder would pay on Fund distributions or the redemption of Fund shares.
27
Wilshire International Equity Fund Commentary (Unaudited) - (Continued) |
|
International stock markets underperformed the U.S. during 2016 as the MSCI All Country World ex-U.S. Index returned 4.5% for the year. Emerging economy stocks outperformed foreign developed securities for the first calendar year since 2012 with the MSCI Emerging Markets Index and the MSCI EAFE Index returning 11.2% and 1.0%, respectively. Foreign developed economies slumped to start the year as continued slack in the European economy and an anemic pulse related to Japan’s financial markets reforms weighed on returns. The second quarter started off by recording gains on behalf of European equities, only to retrench later in the period in the wake of the United Kingdom’s “Brexit” vote. International equity markets rallied during the third quarter with economically sensitive stocks leading as they surged on the back of heightened risk appetites, amid a low interest rate environment, and favorable monetary policy accommodations. The Bank of England signaled to the market the potential for further interest rates hikes and the Bank of Japan expanded its purchases of exchange-traded funds and its dollar-lending facility, enabling Japanese corporations easier access to U.S. dollars. During the fourth quarter, overseas markets experienced a volatile period as the U.S. presidential election outcome took the world by surprise. Protectionist proclamations regarding U.S. trade roiled emerging markets while discussions on pricing policy in the Health Care sector pummeled large pharmaceutical companies. Rhetoric involving infrastructure spending bolstered certain pockets of the market such as the Materials sector. European markets remained in a cautionary stance as the United Kingdom prepared to enact Article 50 to exit the European Union.
Sector performance for the MSCI All Country World ex-U.S. Index was mixed for 2016 as investors moved into pro-cyclical sectors. Energy and Materials were the leading sectors for the year returning 31.6% and 28.4%, respectively, as oil prices rebounded off early year lows and economic growth indicators favored the mining sector and construction related securities. Conversely, Health Care, Real Estate, and Telecom Services lagged returning -12.5%, -7.2%, and -3.7%, respectively.
The Wilshire International Equity Fund Institutional Class returned 2.16% for 2016, underperforming the MSCI All Country World ex U.S. Index return of 4.50% by 2.34%. Poor stock selection in the Materials and Energy sectors, an overweight exposure to the Health Care sector, and underweight exposures to Canada and Brazil weighed on overall returns for the year. Conversely, strong stock selection in the Information Technology and Consumer Discretionary sectors and regionally within Japan, France, and Switzerland boosted relative results.
Despite the Fund’s underperformance versus its benchmark, we believe the Fund is well-positioned going into 2017 as the market deals with ongoing macroeconomic and geopolitical issues.
28
Wilshire International Equity Fund Commentary (Unaudited) - (Continued) |
|
PORTFOLIO SECTOR WEIGHTING†
(As of December 31, 2016)

† | Based on percent of the Fund’s total investments in securities, at value. Includes investments held as collateral for securities on loan (see Note 6 in Notes to Financial Statements). |
29
Wilshire Income Opportunities Fund(1) Commentary (Unaudited) |
|
INVESTMENT CLASS SHARES
Total Return*
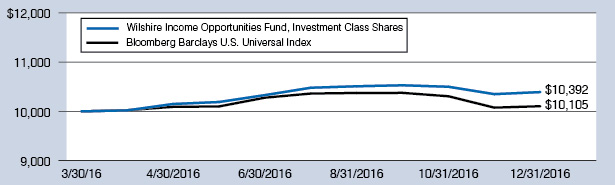
Inception (03/30/16) through 12/31/16** | 3.92% |
Bloomberg Barclays U.S. Universal Index(2)
Total Return
Inception (03/30/16) through 12/31/16** | 1.05% |
COMPARATIVE PERFORMANCE
Comparison of Change in Value of $10,000 Investment in Shares of Wilshire Income Opportunities Fund,
Investment Class Shares and the Bloomberg Barclays U.S. Universal Index through 12/31/16.
The performance data quoted represents past performance and does not guarantee future results. Current performance may be lower or higher. Performance data current to the most recent month end may be obtained at http://advisor.wilshire.com. The investment return and principal value of an investment will fluctuate so that shares, when redeemed, may be worth more or less than their original cost. The table above does not reflect the deduction of taxes that a shareholder would pay on Fund distributions or the redemption of Fund shares.
* | Assumes reinvestment of all distributions. |
** | Not annualized. |
(1) | The Fund commenced operations on March 30, 2016. |
(2) | The Bloomberg Barclays U.S. Universal Index represents the union of the U.S. Aggregate Index, U.S. Corporate High Yield Index, Investment Grade 144A Index, Eurodollar Index, U.S. Emerging Markets Index, and the non-ERISA eligible portion of the CMBS Index. The index covers USD-denominated, taxable bonds that are rated either investment grade or high-yield. Some U.S. Universal Index constituents may be eligible for one or more of its contributing subcomponents that are not mutually exclusive. The Bloomberg Barclays U.S. Universal Index includes Treasury securities, Government agency bonds, Mortgage-backed bonds, corporate bonds, and a small amount of foreign bonds traded in U.S. |
30
Wilshire Income Opportunities Fund(1) Commentary (Unaudited) - (Continued) |
|
INSTITUTIONAL CLASS SHARES
Total Return*
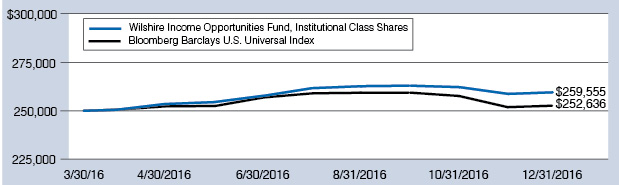
Inception (03/30/16) through 12/31/16** | 3.82% |
Bloomberg Barclays U.S. Universal Index(2)
Total Return
Inception (03/30/16) through 12/31/16** | 1.05% |
COMPARATIVE PERFORMANCE
Comparison of Change in Value of $250,000 Investment in Shares of Wilshire Income Opportunities Fund,
Institutional Class Shares and the Bloomberg Barclays U.S. Universal Index through 12/31/16.
The performance data quoted represents past performance and does not guarantee future results. Current performance may be lower or higher. Performance data current to the most recent month end may be obtained at http://advisor.wilshire.com. The investment return and principal value of an investment will fluctuate so that shares, when redeemed, may be worth more or less than their original cost. The table above does not reflect the deduction of taxes that a shareholder would pay on Fund distributions or the redemption of Fund shares.
* | Assumes reinvestment of all distributions. |
** | Not annualized. |
(1) | The Fund commenced operations on March 30, 2016. |
(2) | The Bloomberg Barclays U.S. Universal Index represents the union of the U.S. Aggregate Index, U.S. Corporate High Yield Index, Investment Grade 144A Index, Eurodollar Index, U.S. Emerging Markets Index, and the non-ERISA eligible portion of the CMBS Index. The index covers USD-denominated, taxable bonds that are rated either investment grade or high-yield. Some U.S. Universal Index constituents may be eligible for one or more of its contributing subcomponents that are not mutually exclusive. The Bloomberg Barclays U.S. Universal Index includes Treasury securities, Government agency bonds, Mortgage-backed bonds, corporate bonds, and a small amount of foreign bonds traded in U.S. |
31
Wilshire Income Opportunities Fund Commentary (Unaudited) - (Continued) |
|
The U.S. fixed income market as represented by the Bloomberg Barclays U.S. Aggregate Bond Index returned 2.7% for the year. Volatility spiked at the start of the year as going concerns heightened for commodity-related companies. Investors pushed U.S. rates lower on the backs of reduced global growth expectations. U.S. Treasury securities extended their rally in the second quarter due to broad investor uncertainty over the United Kingdom’s decision to leave the European Union. Most of the rally occurred after the referendum results as investors sought out safe haven assets in the two trading days after the vote. Relative to the first two quarters of 2016, the third quarter was relatively quiet for fixed income markets. In anticipation if a December interest rate hike, Treasury rates rose across the curve. Yields rallied in the fourth quarter globally, but the sell-off was led by U.S. government bonds. The 10 year U.S. Treasury yield closed the year at 2.45% marking the end to a volatile year which saw yields reach historic lows in July at 1.37% before rallying to a December high of 2.60%. 2016 was a remarkable year for credit as the Bank of America U.S. High Yield Master II Index returned 17.5% and bank debt, as represented by the S&P/LSTA Leveraged Loan Index, returned 10.2%. With signs of improving U.S. economic growth, the Federal Reserve raised its target for short-term interest rates in December and increased its predictions from two to three rate hikes for 2017.
The Wilshire Income Opportunities Fund Institutional Class returned 3.82% for the period since inception, outperforming the Bloomberg Barclays U.S. Universal Index return of 1.05% by 2.77% during that time. The Fund benefited from strong performance from its emerging market debt and collateralized loan obligation holdings as well as shorter duration positioning and positive yield carry.
We are pleased with the Fund’s outperformance for the since inception period and believe the Fund is well-positioned going into 2017 as the market deals with ongoing macroeconomic and geopolitical uncertainties.
32
Wilshire Income Opportunities Fund Commentary (Unaudited) - (Continued) |
|
PORTFOLIO SECTOR WEIGHTING†
(As of December 31, 2016)
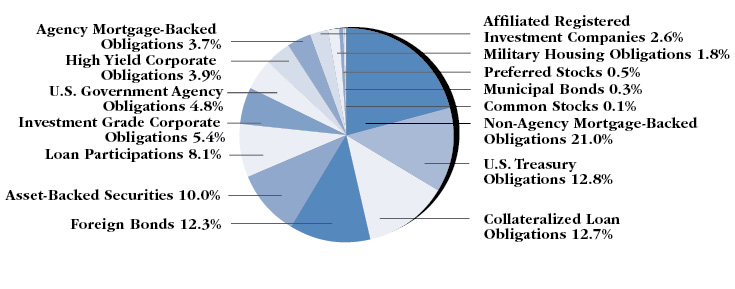
† | Based on percent of the Fund’s total investments in securities, at value. |
33
Wilshire Mutual Funds, Inc. Disclosure of Fund Expenses For the Six Months Ended December 31, 2016 (Unaudited) |
|
All mutual funds have operating expenses. As a shareholder of a portfolio (or a “fund”), you incur ongoing costs, which include costs for investment advisory, administrative services, distribution and/or shareholder services and shareholder reports (like this one), among others. Operating expenses, which are deducted from a fund’s gross income, directly reduce the investment return of the fund. A fund’s expenses are expressed as a percentage of its average net assets. This figure is known as the expense ratio. The following examples are intended to help you understand the ongoing fees (in dollars) of investing in the Portfolios and to compare these costs with those of other mutual funds. The examples are based on an investment of $1,000 made at the beginning of the period and held for the entire period from July 1, 2016 to December 31, 2016.
The table on the next page illustrates the Portfolios’ costs in two ways:
Actual Fund Return: This section helps you to estimate the actual expenses, after any applicable fee waivers, that you paid over the period. The “Ending Account Value” shown is derived from each Portfolio’s actual return for the period. The “Expense Ratio” column shows the period’s annualized expense ratio and the “Expenses Paid During Period” column shows the dollar amount that would have been paid by an investor who started with $1,000 in the Portfolios at the beginning of the period.
You may use the information here, together with your account value, to estimate the expenses that you paid over the period. To do so, simply divide your account value by $1,000 (for example, an $8,600 account value divided by $1,000 = 8.6), then multiply the result by the number given for the Portfolio in the first line under the heading entitled “Expenses Paid During Period.”
Hypothetical 5% Return: This section is intended to help you compare the Portfolios’ costs with those of other mutual funds. The “Ending Account Value” shown is derived from hypothetical account values and hypothetical expenses based on the Portfolio’s actual expense ratio and assumed rate of return. It assumes that each Portfolio had an annual return of 5% before expenses, but that the expense ratio is unchanged. In this case, because the return used is not each Portfolio’s actual return, the results do not apply to your investment. This example is useful in making comparisons to other mutual funds because the Securities and Exchange Commission (“SEC”) requires all mutual funds to calculate expenses based on an assumed 5% annual return. You can assess the Portfolios’ ongoing costs by comparing this hypothetical example with the hypothetical examples that appear in shareholder reports of other funds.
Please note that the expenses shown in the table are meant to highlight and help you compare your ongoing costs only and do not reflect any transactional costs such as sales charges (loads), redemption fees, or exchange fees. Wilshire Mutual Funds, Inc. has no such charges, but these may be present in other funds to which you compare this data. Therefore, the hypothetical portions of the table are useful in comparing ongoing costs only, and will not help you determine the relative total costs of owning different funds.
34
Wilshire Mutual Funds, Inc. Disclosure of Fund Expenses - (Continued) For the Six Months Ended December 31, 2016 (Unaudited) |
|
| | Beginning
Account
Value
07/01/2016 | Ending
Account
Value
12/31/2016 | Net
Expense
Ratio(1) | Expenses Paid
During Period
07/01/16-12/31/16(2) |
Large Company Growth Portfolio |
Based on Actual Fund Return | | | | |
Investment Class | $ 1,000.00 | $ 1,020.80 | 1.35% | $ 6.86 |
Institutional Class | $ 1,000.00 | $ 1,022.00 | 1.11% | $ 5.64 |
Based on Hypothetical 5% Return | | | | |
Investment Class | $ 1,000.00 | $ 1,018.35 | 1.35% | $ 6.85 |
Institutional Class | $ 1,000.00 | $ 1,019.56 | 1.11% | $ 5.63 |
Large Company Value Portfolio |
Based on Actual Fund Return | | | | |
Investment Class | $ 1,000.00 | $ 1,041.10 | 1.12% | $ 6.03 |
Institutional Class | $ 1,000.00 | $ 1,040.10 | 1.13% | $ 6.08 |
Based on Hypothetical 5% Return | | | | |
Investment Class | $ 1,000.00 | $ 1,019.51 | 1.12% | $ 5.69 |
Institutional Class | $ 1,000.00 | $ 1,019.46 | 1.13% | $ 5.74 |
Small Company Growth Portfolio |
Based on Actual Fund Return | | | | |
Investment Class | $ 1,000.00 | $ 1,154.40 | 1.64% | $ 8.88 |
Institutional Class | $ 1,000.00 | $ 1,155.50 | 1.36% | $ 7.37 |
Based on Hypothetical 5% Return | | | | |
Investment Class | $ 1,000.00 | $ 1,016.89 | 1.64% | $ 8.31 |
Institutional Class | $ 1,000.00 | $ 1,018.30 | 1.36% | $ 6.90 |
Small Company Value Portfolio |
Based on Actual Fund Return | | | | |
Investment Class | $ 1,000.00 | $ 1,208.90 | 1.55% | $ 8.61 |
Institutional Class | $ 1,000.00 | $ 1,209.80 | 1.36% | $ 7.55 |
Based on Hypothetical 5% Return | | | | |
Investment Class | $ 1,000.00 | $ 1,017.34 | 1.55% | $ 7.86 |
Institutional Class | $ 1,000.00 | $ 1,018.30 | 1.36% | $ 6.90 |
35
Wilshire Mutual Funds, Inc. Disclosure of Fund Expenses - (Concluded) For the Six Months Ended December 31, 2016 (Unaudited) |
|
| | Beginning
Account
Value
07/01/2016 | Ending
Account
Value
12/31/2016 | Net
Expense
Ratio(1) | Expenses Paid
During Period
07/01/16-12/31/16(2) |
Wilshire 5000 IndexSM Fund |
Based on Actual Fund Return | | | | |
Investment Class | $ 1,000.00 | $ 1,085.40 | 0.69% | $ 3.62 |
Institutional Class | $ 1,000.00 | $ 1,087.20 | 0.36% | $ 1.83 |
Based on Hypothetical 5% Return | | | | |
Investment Class | $ 1,000.00 | $ 1,021.67 | 0.69% | $ 3.51 |
Institutional Class | $ 1,000.00 | $ 1,023.33 | 0.36% | $ 1.83 |
Wilshire International Equity Fund |
Based on Actual Fund Return | | | | |
Investment Class | $ 1,000.00 | $ 1,016.50 | 1.54% | $ 7.81 |
Institutional Class | $ 1,000.00 | $ 1,017.00 | 1.28% | $ 6.49 |
Based on Hypothetical 5% Return | | | | |
Investment Class | $ 1,000.00 | $ 1,017.39 | 1.54% | $ 7.81 |
Institutional Class | $ 1,000.00 | $ 1,018.70 | 1.28% | $ 6.50 |
Wilshire Income Opportunity Fund |
Based on Actual Fund Return | | | | |
Investment Class | $ 1,000.00 | $ 1,006.00 | 1.15% | $ 5.80 |
Institutional Class | $ 1,000.00 | $ 1,007.00 | 0.86% | $ 4.34 |
Based on Hypothetical 5% Return | | | | |
Investment Class | $ 1,000.00 | $ 1,020.31 | 1.15% | $ 5.84 |
Institutional Class | $ 1,000.00 | $ 1,020.81 | 0.86% | $ 4.37 |
(1) | Annualized, based on the Portfolio’s most recent fiscal half-year expenses. |
(2) | Expenses are equal to the Portfolio’s annualized net expense ratio multiplied by the average account value over the period, multiplied by 184/366 (to reflect one-half year period). |
36
Wilshire Mutual Funds, Inc. Large Company Growth Portfolio Condensed Schedule of Investments | December 31, 2016 |
|
| | | Shares | | | Value | |
COMMON STOCKS — 98.9% (a) | |
Consumer Discretionary — 16.1% | |
Amazon.com, Inc. (b) | | | 13,689 | | | $ | 10,264,970 | |
NIKE, Inc. - Class B | | | 39,300 | | | | 1,997,619 | |
O'Reilly Automotive, Inc. (b) | | | 8,700 | | | | 2,422,167 | |
Priceline Group, Inc. (The) (b) | | | 1,400 | | | | 2,052,484 | |
Starbucks Corp. | | | 40,540 | | | | 2,250,781 | |
Ulta Salon, Cosmetics & Fragrance, Inc. (b) | | | 10,575 | | | | 2,695,990 | |
Yum! Brands, Inc. | | | 27,634 | | | | 1,750,061 | |
Other Securities (c) (d) | | | | | | | 11,003,571 | |
| | | | | | | | 34,437,643 | |
Consumer Staples — 9.3% | | | | | | | | |
Coca-Cola Co. (The) | | | 77,454 | | | | 3,211,243 | |
Constellation Brands, Inc. - Class A | | | 11,850 | | | | 1,816,724 | |
Danone SA - ADR | | | 184,005 | | | | 2,314,783 | |
Monster Beverage Corp. (b) | | | 113,826 | | | | 5,047,045 | |
Procter & Gamble Co. (The) | | | 32,285 | | | | 2,714,523 | |
Other Securities (c) | | | | | | | 4,945,019 | |
| | | | | | | | 20,049,337 | |
Energy — 2.5% | | | | | | | | |
Halliburton Co. | | | 42,425 | | | | 2,294,769 | |
Schlumberger Ltd. | | | 26,334 | | | | 2,210,739 | |
Other Securities (c) (d) | | | | | | | 819,355 | |
| | | | | | | | 5,324,863 | |
Financials — 4.2% | | | | | | | | |
Charles Schwab Corp. (The) | | | 75,900 | | | | 2,995,774 | |
Other Securities (c) (d) | | | | | | | 6,113,276 | |
| | | | | | | | 9,109,050 | |
Health Care — 15.2% | | | | | | | | |
Alexion Pharmaceuticals, Inc. (b) | | | 18,105 | | | | 2,215,147 | |
Amgen, Inc. | | | 16,528 | | | | 2,416,559 | |
Celgene Corp. (b) | | | 30,758 | | | | 3,560,239 | |
Cerner Corp. (b) | | | 41,779 | | | | 1,979,071 | |
Edwards Lifesciences Corp. (b) | | | 27,925 | | | | 2,616,572 | |
Merck & Co., Inc. | | | 29,346 | | | | 1,727,599 | |
Novartis AG - ADR | | | 20,227 | | | | 1,473,335 | |
Novo Nordisk A/S - ADR (d) | | | 72,794 | | | | 2,610,394 | |
Regeneron Pharmaceuticals, Inc. (b) | | | 6,472 | | | | 2,375,806 | |
Shire plc - ADR (d) | | | 9,550 | | | | 1,627,129 | |
Varian Medical Systems, Inc. (b) | | | 22,399 | | | $ | 2,010,982 | |
Other Securities (c) (d) | | | | | | | 8,022,407 | |
| | | | | | | | 32,635,240 | |
Industrials — 8.4% | | | | | | | | |
Acuity Brands, Inc. | | | 9,000 | | | | 2,077,740 | |
Canadian Pacific Railway Ltd. | | | 13,425 | | | | 1,916,688 | |
Deere & Co. | | | 33,774 | | | | 3,480,073 | |
Expeditors International of Washington, Inc. | | | 48,010 | | | | 2,542,610 | |
United Parcel Service, Inc. - Class B | | | 22,389 | | | | 2,566,674 | |
Other Securities (c) (d) | | | | | | | 5,503,505 | |
| | | | | | | | 18,087,290 | |
Information Technology — 38.7% | | | | | | | | |
Adobe Systems, Inc. (b) | | | 25,150 | | | | 2,589,192 | |
Alibaba Group Holding Ltd. - ADR (b) (d) | | | 39,351 | | | | 3,455,411 | |
Alphabet, Inc. - Class A (b) | | | 4,261 | | | | 3,376,629 | |
Alphabet, Inc. - Class C (b) | | | 8,396 | | | | 6,480,201 | |
Apple, Inc. | | | 62,992 | | | | 7,295,733 | |
Applied Materials, Inc. | | | 75,800 | | | | 2,446,066 | |
Autodesk, Inc. (b) | | | 34,968 | | | | 2,587,982 | |
Cisco Systems, Inc. | | | 131,755 | | | | 3,981,636 | |
Facebook, Inc. - Class A (b) | | | 82,344 | | | | 9,473,678 | |
International Business Machines Corp. | | | 10,159 | | | | 1,686,292 | |
Microsoft Corp. | | | 71,427 | | | | 4,438,473 | |
Oracle Corp. | | | 97,766 | | | | 3,759,102 | |
Palo Alto Networks, Inc. (b) (d) | | | 14,075 | | | | 1,760,079 | |
QUALCOMM, Inc. | | | 73,245 | | | | 4,775,575 | |
Red Hat, Inc. (b) | | | 24,175 | | | | 1,684,998 | |
Sabre Corp. (d) | | | 74,935 | | | | 1,869,628 | |
salesforce.com, Inc. (b) | | | 34,400 | | | | 2,355,024 | |
Visa, Inc. - Class A (d) | | | 91,744 | | | | 7,157,868 | |
Other Securities (c) (d) | | | | | | | 11,843,095 | |
| | | | | | | | 83,016,662 | |
Materials — 2.8% | | | | | | | | |
Sherwin-Williams Co. (The) | | | 8,800 | | | | 2,364,912 | |
Other Securities (c) (d) | | | | | | | 3,557,993 | |
| | | | | | | | 5,922,905 | |
Real Estate — 1.4% | | | | | | | | |
Other Securities (c) (d) | | | | | | | 3,103,777 | |
See Notes to Financial Statements.
37
Wilshire Mutual Funds, Inc. Large Company Growth Portfolio Condensed Schedule of Investments - (Continued) | December 31, 2016 |
|
| | Shares | | | Value | |
COMMON STOCKS — 98.9% (a) (Continued) | |
Telecommunication Services — 0.3% | | | | |
Other Securities (c) | | | | $ | 608,639 | |
| | | | | | | |
Total Common Stocks (Cost $161,314,240) | | | | | 212,295,406 | |
| | | | | | | |
MONEY MARKET FUNDS — 4.6% | | | | | |
Northern Trust Institutional Government Select Portfolio - Institutional Class, 0.39% (e) | | | 2,111,500 | | | | 2,111,500 | |
Northern Trust Institutional Liquid Asset Portfolio - Institutional Class, 0.01% (e) (f) | | | 7,815,619 | | | | 7,815,619 | |
| | | | | | | | | |
Total Money Market Funds (Cost $9,927,119) | | | | | | | 9,927,119 | |
| | | | | | | | | |
Total Investments at Value — 103.5% (Cost $171,241,359) | | | | 222,222,525 | |
| | | | | | | | | |
Liabilities in Excess of Other Assets — (3.5%) | | | | (7,421,091 | ) |
| | | | | | | | | |
NET ASSETS — 100.0% | | | | | | $ | 214,801,434 | |
The Condensed Schedule of Investments does not reflect the complete portfolio holdings. It includes the Portfolio’s 50 largest holdings and each investment of any issue that exceeds 1% of the Portfolio’s net assets. “Other Securities” represent all issues not required to be disclosed under the rules adopted by the U.S. Securities and Exchange commission (“SEC”). The complete schedule of portfolio holdings is available (i) without charge, upon request, by calling (800)607-2200; (ii) on the SEC’s website at http://www.sec.gov; and (iii) on our website at http://advisor.wilshire.com.
ADR — American Depositary Receipt.
Ltd. — Limited.
plc — Public Limited Company.
(a) | More narrow industries are utilized for compliance purposes, whereas broad sectors are utilized for reporting purposes. |
(b) | Non-income producing security. |
(c) | Represents issuers not identified as a top 50 holding in terms of market value and issues or issuers not exceeding 1% of net assets individually or in the aggregate, respectively, as of December 31, 2016. |
(d) | This security or a partial position of this security is on loan at December 31, 2016. The total market value of securities on loan at December 31, 2016 was $22,586,674. |
(e) | The rate shown is the 7-day effective yield as of December 31, 2016. |
(f) | This security was purchased with cash collateral held from securities on loan. The total value of such securities as of December 31, 2016 was $7,815,619. Securities on loan are also collateralized by various U.S. Treasury obligations in the amount of $15,374,737 (Note 6). |
See Notes to Financial Statements.
38
Wilshire Mutual Funds, Inc. Large Company Value Portfolio Condensed Schedule of Investments | December 31, 2016 |
|
| | | Shares | | | Value | |
COMMON STOCKS — 99.9% (a) | |
Consumer Discretionary — 7.7% | |
Ford Motor Co. | | | 163,064 | | | $ | 1,977,966 | |
Hilton Worldwide Holdings, Inc. | | | 55,675 | | | | 1,514,360 | |
Omnicom Group, Inc. | | | 15,150 | | | | 1,289,416 | |
Target Corp. | | | 21,174 | | | | 1,529,397 | |
Other Securities (b) (c) | | | | | | | 8,026,420 | |
| | | | | | | | 14,337,559 | |
Consumer Staples — 5.2% | |
Altria Group, Inc. | | | 28,100 | | | | 1,900,122 | |
Philip Morris International, Inc. | | | 22,796 | | | | 2,085,606 | |
Wal-Mart Stores, Inc. | | | 44,940 | | | | 3,106,252 | |
Other Securities (b) | | | | | | | 2,569,063 | |
| | | | | | | | 9,661,043 | |
Energy — 12.2% | |
BP plc - ADR (c) | | | 76,603 | | | | 2,863,421 | |
Chevron Corp. | | | 11,459 | | | | 1,348,724 | |
ConocoPhillips | | | 56,225 | | | | 2,819,122 | |
Exxon Mobil Corp. | | | 39,857 | | | | 3,597,494 | |
Occidental Petroleum Corp. | | | 24,900 | | | | 1,773,627 | |
Phillips 66 | | | 16,400 | | | | 1,417,124 | |
Royal Dutch Shell plc - Class A - ADR (c) | | | 49,714 | | | | 2,703,447 | |
Other Securities (b) (c) | | | | | | | 6,110,318 | |
| | | | | | | | 22,633,277 | |
Financials — 33.4% | |
American Express Co. | | | 21,610 | | | | 1,600,869 | |
American International Group, Inc. | | | 31,698 | | | | 2,070,196 | |
Bank of America Corp. | | | 260,335 | | | | 5,753,404 | |
Capital One Financial Corp. | | | 14,025 | | | | 1,223,541 | |
Citigroup, Inc. | | | 50,779 | | | | 3,017,796 | |
Franklin Resources, Inc. | | | 37,545 | | | | 1,486,031 | |
Goldman Sachs Group, Inc. (The) | | | 7,756 | | | | 1,857,174 | |
JPMorgan Chase & Co. | | | 68,352 | | | | 5,898,094 | |
Loews Corp. (c) | | | 50,355 | | | | 2,358,124 | |
MetLife, Inc. | | | 44,715 | | | | 2,409,690 | |
Morgan Stanley | | | 46,535 | | | | 1,966,104 | |
State Street Corp. | | | 50,435 | | | | 3,919,808 | |
UBS Group AG (c) | | | 88,375 | | | | 1,384,836 | |
Voya Financial, Inc. | | | 45,003 | | | | 1,765,017 | |
Wells Fargo & Co. | | | 78,042 | | | | 4,300,895 | |
XL Group Ltd. | | | 60,973 | | | $ | 2,271,854 | |
Other Securities (b) (c) | | | | | | | 18,656,246 | |
| | | | | | | | 61,939,679 | |
Health Care — 9.5% | |
Cigna Corp. | | | 10,550 | | | | 1,407,264 | |
Johnson & Johnson | | | 40,340 | | | | 4,647,571 | |
Medtronic plc | | | 22,120 | | | | 1,575,608 | |
Merck & Co., Inc. | | | 66,054 | | | | 3,888,599 | |
Pfizer, Inc. | | | 118,177 | | | | 3,838,389 | |
Other Securities (b) (c) | | | | | | | 2,187,285 | |
| | | | | | | | 17,544,716 | |
Industrials — 8.7% | |
Dover Corp. | | | 19,775 | | | | 1,481,741 | |
Parker-Hannifin Corp. | | | 12,150 | | | | 1,701,000 | |
Southwest Airlines Co. | | | 31,400 | | | | 1,564,976 | |
Stanley Black & Decker, Inc. | | | 19,125 | | | | 2,193,446 | |
United Technologies Corp. | | | 13,495 | | | | 1,479,322 | |
Other Securities (b) (c) | | | | | | | 7,775,800 | |
| | | | | | | | 16,196,285 | |
Information Technology — 11.1% | |
Cisco Systems, Inc. | | | 59,511 | | | | 1,798,422 | |
Hewlett Packard Enterprise Co. | | | 59,860 | | | | 1,385,160 | |
Intel Corp. | | | 59,697 | | | | 2,165,210 | |
International Business Machines Corp. | | | 16,129 | | | | 2,677,252 | |
Oracle Corp. | | | 77,760 | | | | 2,989,873 | |
QUALCOMM, Inc. | | | 43,706 | | | | 2,849,630 | |
Other Securities (b) (c) | | | | | | | 6,707,250 | |
| | | | | | | | 20,572,797 | |
Materials — 3.6% | |
E.I. du Pont de Nemours and Co. | | | 20,400 | | | | 1,497,361 | |
International Paper Co. (c) | | | 23,695 | | | | 1,257,257 | |
Other Securities (b) (c) | | | | | | | 3,989,375 | |
| | | | | | | | 6,743,993 | |
Real Estate — 2.1% | |
Other Securities (b) | | | | | | | 3,792,558 | |
| | | | | | | | | |
Telecommunication Services — 2.6% | |
AT&T, Inc. | | | 66,676 | | | | 2,835,730 | |
Verizon Communications, Inc. | | | 34,050 | | | | 1,817,589 | |
Other Securities (b) | | | | | | | 239,655 | |
| | | | | | | | 4,892,974 | |
See Notes to Financial Statements.
39
Wilshire Mutual Funds, Inc. Large Company Value Portfolio Condensed Schedule of Investments - (Continued) | December 31, 2016 |
|
| | | Shares | | | Value | |
COMMON STOCKS — 99.9% (a) (Continued) | |
Utilities — 3.8% | |
Entergy Corp. | | | 38,263 | | | $ | 2,811,182 | |
Other Securities (b) | | | | | | | 4,259,583 | |
| | | | | | | | 7,070,765 | |
Total Common Stocks (Cost $155,149,455) | | | | | | | 185,385,646 | |
| | | | | | | | | |
RIGHTS — 0.0% (d) | | | | | |
Other Securities (b) (Cost $0) | | | | | | | 1,189 | |
| | | | | | | | | |
MONEY MARKET FUNDS — 2.5% | | | | | |
Northern Trust Institutional Government Select Portfolio - Institutional Class, 0.39% (e) | | | 9,805 | | | | 9,805 | |
Northern Trust Institutional Liquid Asset Portfolio - Institutional Class, 0.01% (e) (f) | | | 4,729,193 | | | | 4,729,193 | |
| | | | | | | | | |
Total Money Market Funds (Cost $4,738,998) | | | | | | | 4,738,998 | |
| | | | | | | | | |
Total Investments at Value — 102.4% (Cost $159,888,453) | | | | 190,125,833 | |
| | | | | | | | | |
Liabilities in Excess of Other Assets — (2.4%) | | | | (4,517,574 | ) |
| | | | | | | | | |
NET ASSETS — 100.0% | | | | | | $ | 185,608,259 | |
The Condensed Schedule of Investments does not reflect the complete portfolio holdings. It includes the Portfolio’s 50 largest holdings and each investment of any issue that exceeds 1% of the Portfolio’s net assets. “Other Securities” represent all issues not required to be disclosed under the rules adopted by the U.S. Securities and Exchange commission (“SEC”). The complete schedule of portfolio holdings is available (i) without charge, upon request, by calling (800)607-2200; (ii) on the SEC’s website at http://www.sec.gov; and (iii) on our website at http://advisor.wilshire.com.
ADR — American Depositary Receipt.
Ltd. — Limited.
plc — Public Limited Company.
(a) | More narrow industries are utilized for compliance purposes, whereas broad sectors are utilized for reporting purposes. |
(b) | Represents issuers not identified as a top 50 holding in terms of market value and issues or issuers not exceeding 1% of net assets individually or in the aggregate, respectively, as of December 31, 2016. |
(c) | This security or a partial position of this security is on loan at December 31, 2016. The total market value of securities on loan at December 31, 2016 was $14,358,569. |
(d) | Percentage rounds to less than 0.1%. |
(e) | The rate shown is the 7-day effective yield as of December 31, 2016. |
(f) | This security was purchased with cash collateral held from securities on loan. The total value of such securities as of December 31, 2016 was $4,729,193. Securities on loan are also collateralized by various U.S. Treasury obligations in the amount of $9,915,530 (Note 6). |
See Notes to Financial Statements.
40
Wilshire Mutual Funds, Inc. Small Company Growth Portfolio Condensed Schedule of Investments | December 31, 2016 |
|
| | | Shares | | | Value | |
COMMON STOCKS — 97.2% (a) | | | | | | |
Consumer Discretionary — 16.4% | | | | | | |
Chuy's Holdings, Inc. (b) | | | 10,242 | | | $ | 332,352 | |
Dorman Products, Inc. (b) | | | 6,370 | | | | 465,392 | |
Drew Industries, Inc. (b) | | | 4,060 | | | | 437,465 | |
G-III Apparel Group Ltd. (b) (c) | | | 10,692 | | | | 316,056 | |
Monro Muffler Brake, Inc. (c) | | | 6,300 | | | | 360,359 | |
Popeyes Louisiana Kitchen, Inc. (b) | | | 7,453 | | | | 450,756 | |
Sonic Corp. (c) | | | 18,892 | | | | 500,826 | |
Steven Madden Ltd. (b) | | | 16,300 | | | | 582,724 | |
Other Securities (c) (d) | | | | | | | 2,632,264 | |
| | | | | | | | 6,078,194 | |
Consumer Staples — 5.0% | | | | | | | | |
B&G Foods, Inc. (c) | | | 10,140 | | | | 444,132 | |
Calavo Growers, Inc. (c) | | | 5,280 | | | | 324,192 | |
Inter Parfums, Inc. | | | 9,765 | | | | 319,803 | |
J & J Snack Foods Corp. | | | 2,225 | | | | 296,882 | |
Other Securities (c) (d) | | | | | | | 467,658 | |
| | | | | | | | 1,852,667 | |
Energy — 3.3% | | | | | | | | |
Matador Resources Co. (b) (c) | | | 9,060 | | | | 233,386 | |
Oasis Petroleum, Inc. (b) | | | 31,539 | | | | 477,500 | |
PDC Energy, Inc. (b) | | | 3,130 | | | | 227,175 | |
Other Securities (c) (d) | | | | | | | 273,287 | |
| | | | | | | | 1,211,348 | |
Financials — 9.7% | | | | | | | | |
CenterState Banks, Inc. | | | 11,750 | | | | 295,748 | |
LegacyTexas Financial Group, Inc. | | | 5,480 | | | | 235,969 | |
Pinnacle Financial Partners, Inc. | | | 6,680 | | | | 462,923 | |
PrivateBancorp, Inc. | | | 6,415 | | | | 347,628 | |
South State Corp. | | | 7,460 | | | | 652,003 | |
Texas Capital Bancshares, Inc. (b) | | | 3,890 | | | | 304,976 | |
Other Securities (c) (d) | | | | | | | 1,293,750 | |
| | | | | | | | 3,592,997 | |
Health Care — 21.6% | | | | | | | | |
Aceto Corp. (c) | | | 10,150 | | | | 222,995 | |
Cambrex Corp. (b) | | | 10,945 | | | | 590,483 | |
Cantel Medical Corp. | | | 4,560 | | | | 359,100 | |
Cotiviti Holdings, Inc. (b) (c) | | | 13,080 | | | | 449,951 | |
Eagle Pharmaceuticals, Inc. (b) (c) | | | 4,630 | | | | 367,344 | |
ICON plc (b) | | | 5,520 | | | | 415,104 | |
Medidata Solutions, Inc. (b) | | | 7,770 | | | | 385,936 | |
Neogen Corp. (b) | | | 6,470 | | | $ | 427,020 | |
PRA Health Sciences, Inc. (b) | | | 12,925 | | | | 712,427 | |
Prestige Brands Holdings, Inc. (b) | | | 9,134 | | | | 475,881 | |
Repligen Corp. (b) | | | 16,095 | | | | 496,047 | |
Supernus Pharmaceuticals, Inc. (b) | | | 23,270 | | | | 587,567 | |
Vascular Solutions, Inc. (b) | | | 7,920 | | | | 444,312 | |
Other Securities (c) (d) | | | | | | | 2,096,611 | |
| | | | | | | | 8,030,778 | |
Industrials — 13.7% | | | | | | | | |
CEB, Inc. | | | 6,570 | | | | 398,141 | |
Knoll, Inc. | | | 19,498 | | | | 544,578 | |
Saia, Inc. (b) | | | 8,540 | | | | 377,041 | |
SiteOne Landscape Supply, Inc. (b) | | | 7,820 | | | | 271,589 | |
WageWorks, Inc. (b) | | | 9,775 | | | | 708,687 | |
Other Securities (c) (d) | | | | | | | 2,766,012 | |
| | | | | | | | 5,066,048 | |
Information Technology — 20.7% | | | | | | | | |
BroadSoft, Inc. (b) (c) | | | 11,585 | | | | 477,881 | |
CEVA, Inc. (b) | | | 10,694 | | | | 358,783 | |
Ellie Mae, Inc. (b) (c) | | | 5,530 | | | | 462,750 | |
Inphi Corp. (b) (c) | | | 7,195 | | | | 321,041 | |
LogMeIn, Inc. | | | 6,060 | | | | 585,094 | |
MAXIMUS, Inc. | | | 9,570 | | | | 533,910 | |
Pegasystems, Inc. | | | 16,964 | | | | 610,704 | |
Qualys, Inc. (b) | | | 11,480 | | | | 363,342 | |
Silicon Laboratories, Inc. (b) | | | 5,075 | | | | 329,874 | |
SPS Commerce, Inc. (b) | | | 5,300 | | | | 370,417 | |
Other Securities (c) (d) | | | | | | | 3,280,285 | |
| | | | | | | | 7,694,081 | |
Materials — 3.2% | | | | | | | | |
Other Securities (c) (d) | | | | | | | 1,195,313 | |
| | | | | | | | | |
Real Estate — 2.0% | | | | | | | | |
Other Securities (c) (d) | | | | | | | 740,884 | |
| | | | | | | | | |
Telecommunication Services — 1.2% | | | | | |
Cogent Communications Holdings, Inc. | | | 9,945 | | | | 411,226 | |
Other Securities (d) | | | | | | | 20,293 | |
| | | | | | | | 431,519 | |
See Notes to Financial Statements.
41
Wilshire Mutual Funds, Inc. Small Company Growth Portfolio Condensed Schedule of Investments - (Continued) | December 31, 2016 |
|
| | Shares | | | Value | |
COMMON STOCKS — 97.2% (a) (Continued) | |
Utilities — 0.4% | | | | | |
Other Securities (d) | | | | $ | 138,749 | |
| | | | | | | |
Total Common Stocks (Cost $27,660,691) | | | | | 36,032,578 | |
| | | | | | | |
RIGHTS — 0.0% (e) | | | | | | |
Other Securities (d) (Cost $0) | | | | | 360 | |
| | | | | | | |
MONEY MARKET FUNDS — 8.6% | | | | | |
Northern Trust Institutional Government Select Portfolio - Institutional Class, 0.39% (f) | | | 1,076,691 | | | | 1,076,691 | |
Northern Trust Institutional Liquid Asset Portfolio - Institutional Class, 0.01% (f) (g) | | | 2,128,325 | | | | 2,128,325 | |
| | | | | | | | | |
Total Money Market Funds (Cost $3,205,016) | | | | | | | 3,205,016 | |
| | | | | | | | | |
Total Investments at Value — 105.8% (Cost $30,865,707) | | | | 39,237,954 | |
| | | | | | | | | |
Liabilities in Excess of Other Assets — (5.8%) | | | | (2,150,775 | ) |
| | | | | | | | | |
Net Assets — 100.0% | | | | | | $ | 37,087,179 | |
The Condensed Schedule of Investments does not reflect the complete portfolio holdings. It includes the Portfolio’s 50 largest holdings and each investment of any issue that exceeds 1% of the Portfolio’s net assets. “Other Securities” represent all issues not required to be disclosed under the rules adopted by the U.S. Securities and Exchange commission (“SEC”). The complete schedule of portfolio holdings is available (i) without charge, upon request, by calling (800)607-2200; (ii) on the SEC’s website at http://www.sec.gov; and (iii) on our website at http://advisor.wilshire.com.
Ltd. — Limited.
plc — Public Limited Company.
(a) | More narrow industries are utilized for compliance purposes, whereas broad sectors are utilized for reporting purposes. |
(b) | Non-income producing security. |
(c) | This security or a partial position of this security is on loan at December 31, 2016. The total market value of securities on loan at December 31, 2016 was $4,691,378. |
(d) | Represents issuers not identified as a top 50 holding in terms of market value and issues or issuers not exceeding 1% of net assets individually or in the aggregate, respectively, as of December 31, 2016. |
(e) | Percentage rounds to less than 0.1%. |
(f) | The rate shown is the 7-day effective yield as of December 31, 2016. |
(g) | This security was purchased with cash collateral held from securities on loan. The total value of such securities as of December 31, 2016 was $2,128,325. Securities on loan are also collateralized by various U.S. Treasury obligations in the amount of $2,721,691 (Note 6). |
See Notes to Financial Statements.
42
Wilshire Mutual Funds, Inc. Small Company Value Portfolio Condensed Schedule of Investments | December 31, 2016 |
|
| | | Shares | | | Value | |
COMMON STOCKS — 97.6% (a) | | | | | | |
Consumer Discretionary — 11.9% | | | | | | |
Cooper Tire & Rubber Co. | | | 8,370 | | | $ | 325,175 | |
Fred's, Inc. - Class A (b) | | | 18,675 | | | | 346,608 | |
Hooker Furniture Corp. | | | 13,993 | | | | 531,034 | |
M/I Homes, Inc. (c) | | | 10,864 | | | | 273,556 | |
Scholastic Corp. (b) | | | 4,569 | | | | 216,981 | |
Stoneridge, Inc. (c) | | | 22,433 | | | | 396,839 | |
Taylor Morrison Home Corp. - Class A (b) (c) | | | 23,880 | | | | 459,929 | |
TRI Pointe Group, Inc. (c) | | | 43,630 | | | | 500,872 | |
Other Securities (b) (d) | | | | | | | 1,802,333 | |
| | | | | | | | 4,853,327 | |
Consumer Staples — 3.8% | | | | | | | | |
Inter Parfums, Inc. | | | 7,353 | | | | 240,811 | |
John B. Sanfilippo & Son, Inc. (b) | | | 5,854 | | | | 412,062 | |
TreeHouse Foods, Inc. (b) (c) | | | 6,904 | | | | 498,399 | |
Other Securities (b) (d) | | | | | | | 390,733 | |
| | | | | | | | 1,542,005 | |
Energy — 4.4% | | | | | | | | |
PDC Energy, Inc. (c) | | | 6,360 | | | | 461,608 | |
Synergy Resources Corp. (b) (c) | | | 42,730 | | | | 380,724 | |
Other Securities (b) (d) | | | | | | | 946,538 | |
| | | | | | | | 1,788,870 | |
Financials — 30.7% | | | | | | | | |
Ameris Bancorp | | | 8,710 | | | | 379,756 | |
Bank of N.T. Butterfield & Son Ltd. (The) | | | 17,390 | | | | 546,741 | |
Banner Corp. | | | 4,030 | | | | 224,914 | |
Capital Bank Financial Corp. - Class A | | | 13,580 | | | | 533,015 | |
Dime Community Bancshares, Inc. | | | 13,993 | | | | 281,259 | |
Greenhill & Co., Inc. | | | 8,910 | | | | 246,807 | |
Greenlight Capital Re Ltd. - Class A (c) | | | 10,095 | | | | 230,166 | |
Heritage Financial Corp. | | | 14,605 | | | | 376,079 | |
Hilltop Holdings, Inc. | | | 6,995 | | | | 208,451 | |
HomeStreet, Inc. (c) | | | 11,455 | | | | 361,978 | |
PacWest Bancorp | | | 10,160 | | | | 553,110 | |
PrivateBancorp, Inc. | | | 7,920 | | | | 429,185 | |
Western Alliance Bancorp (c) | | | 15,605 | | | | 760,119 | |
Other Securities (b) (d) | | | | | | | 7,399,139 | |
| | | | | | | | 12,530,719 | |
Health Care — 2.7% | | | | | | | | |
Analogic Corp. | | | 6,140 | | | $ | 509,312 | |
Other Securities (b) (d) | | | | | | | 601,397 | |
| | | | | | | | 1,110,709 | |
Industrials — 10.2% | | | | | | | | |
Albany International Corp. - Class A | | | 8,040 | | | | 372,252 | |
Brady Corp. - Class A | | | 5,920 | | | | 222,295 | |
EnerSys | | | 6,270 | | | | 489,687 | |
GP Strategies Corp. (c) | | | 8,150 | | | | 233,089 | |
Orbital ATK, Inc. | | | 4,772 | | | | 418,647 | |
Other Securities (b) (d) | | | | | | | 2,421,158 | |
| | | | | | | | 4,157,128 | |
Information Technology — 15.8% | | | | | |
Coherent, Inc. (c) | | | 3,620 | | | | 497,333 | |
Cray, Inc. (b) (c) | | | 13,925 | | | | 288,248 | |
Electronics For Imaging, Inc. (c) | | | 10,660 | | | | 467,547 | |
Entegris, Inc. (c) | | | 30,695 | | | | 549,441 | |
Integrated Device Technology, Inc. (c) | | | 16,405 | | | | 386,502 | |
Lattice Semiconductor Corp. (b) (c) | | | 81,605 | | | | 600,612 | |
Mitel Networks Corp. (c) | | | 114,850 | | | | 780,979 | |
Novanta, Inc. (c) | | | 22,245 | | | | 467,145 | |
Ultratech, Inc. (c) | | | 10,385 | | | | 249,032 | |
Other Securities (b) (d) | | | | | | | 2,156,017 | |
| | | | | | | | 6,442,856 | |
Materials — 8.4% | | | | | | | | |
Boise Cascade Co. (c) | | | 15,190 | | | | 341,776 | |
Deltic Timber Corp. (b) | | | 2,615 | | | | 201,538 | |
Landec Corp. (c) | | | 35,525 | | | | 490,244 | |
Louisiana-Pacific Corp. (c) | | | 13,530 | | | | 256,124 | |
Materion Corp. | | | 12,490 | | | | 494,604 | |
Schweitzer-Mauduit International, Inc. | | | 5,195 | | | | 236,528 | |
Other Securities (b) (d) | | | | | | | 1,394,831 | |
| | | | | | | | 3,415,645 | |
Real Estate — 7.2% | | | | | | | | |
Brandywine Realty Trust | | | 25,303 | | | | 417,753 | |
Forestar Group, Inc. (c) | | | 35,388 | | | | 470,660 | |
Ramco-Gershenson Properties Trust | | | 30,685 | | | | 508,756 | |
Other Securities (b) (d) | | | | | | | 1,528,844 | |
| | | | | | | | 2,926,013 | |
Telecommunication Services — 0.0% (e) | | | | | |
Other Securities (d) | | | | | | | 22,506 | |
See Notes to Financial Statements.
43
Wilshire Mutual Funds, Inc. Small Company Value Portfolio Condensed Schedule of Investments - (Continued) | December 31, 2016 |
|
| | Shares | | | Value | |
COMMON STOCKS — 97.6% (a) (Continued) | |
Utilities — 2.5% | | | | | |
Other Securities (b) (d) | | | | $ | 1,004,298 | |
| | | | | | | |
Total Common Stocks (Cost $31,105,936) | | | | | 39,794,076 | |
| | | | | | | |
MONEY MARKET FUNDS — 7.7% | | | | | |
Northern Trust Institutional Government Select Portfolio - Institutional Class, 0.39% (f) | | | 927,765 | | | | 927,765 | |
Northern Trust Institutional Liquid Asset Portfolio - Institutional Class, 0.01% (f) (g) | | | 2,227,822 | | | | 2,227,822 | |
| | | | | | | | | |
Total Money Market Funds (Cost $3,155,587) | | | | | | | 3,155,587 | |
| | | | | | | | | |
Total Investments at Value — 105.3% (Cost $34,261,523) | | | | 42,949,663 | |
| | | | | | | | | |
Liabilities in Excess of Other Assets — (5.3%) | | | | (2,153,883 | ) |
| | | | | | | | | |
NET ASSETS — 100.0% | | | | | | $ | 40,795,780 | |
The Condensed Schedule of Investments does not reflect the complete portfolio holdings. It includes the Portfolio’s 50 largest holdings and each investment of any issue that exceeds 1% of the Portfolio’s net assets. “Other Securities” represent all issues not required to be disclosed under the rules adopted by the U.S. Securities and Exchange commission (“SEC”). The complete schedule of portfolio holdings is available (i) without charge, upon request, by calling (800)607-2200; (ii) on the SEC’s website at http://www.sec.gov; and (iii) on our website at http://advisor.wilshire.com.
Ltd. — Limited.
(a) | More narrow industries are utilized for compliance purposes, whereas broad sectors are utilized for reporting purposes. |
(b) | This security or a partial position of this security is on loan at December 31, 2016. The total market value of securities on loan at December 31, 2016 was $3,523,566. |
(c) | Non-income producing security. |
(d) | Represents issuers not identified as a top 50 holding in terms of market value and issues or issuers not exceeding 1% of net assets individually or in the aggregate, respectively, as of December 31, 2016. |
(e) | Percentage rounds to less than 0.1%. |
(f) | The rate shown is the 7-day effective yield as of December 31, 2016. |
(g) | This security was purchased with cash collateral held from securities on loan. The total value of such securities as of December 31, 2016 was $2,227,822. Securities on loan are also collateralized by various U.S. Treasury obligations in the amount of $1,431,817 (Note 6). |
See Notes to Financial Statements.
44
Wilshire Mutual Funds, Inc. Wilshire 5000 Indexsm Fund Condensed Schedule of Investments | December 31, 2016 |
|
| | | Shares | | | Value | |
COMMON STOCKS — 99.9% (a) | |
Consumer Discretionary — 12.5% | |
Amazon.com, Inc. (b) | | | 3,129 | | | $ | 2,346,342 | |
Comcast Corp. - Class A | | | 17,971 | | | | 1,240,897 | |
Home Depot, Inc. (The) | | | 8,948 | | | | 1,199,747 | |
McDonald's Corp. | | | 6,521 | | | | 793,735 | |
Walt Disney Co. (The) | | | 11,556 | | | | 1,204,365 | |
Other Securities (c) (d) | | | | | | | 14,902,048 | |
| | | | | | | | 21,687,134 | |
Consumer Staples — 8.8% | | | | | | | | |
Altria Group, Inc. | | | 15,325 | | | | 1,036,277 | |
Coca-Cola Co. (The) | | | 30,590 | | | | 1,268,260 | |
CVS Health Corp. | | | 8,374 | | | | 660,791 | |
PepsiCo, Inc. | | | 11,262 | | | | 1,178,343 | |
Philip Morris International, Inc. | | | 11,474 | | | | 1,049,756 | |
Procter & Gamble Co. (The) | | | 21,239 | | | | 1,785,774 | |
Wal-Mart Stores, Inc. | | | 12,204 | | | | 843,539 | |
Other Securities (c) (d) | | | | | | | 7,353,709 | |
| | | | | | | | 15,176,449 | |
Energy — 7.0% | | | | | | | | |
Chevron Corp. | | | 14,824 | | | | 1,744,784 | |
Exxon Mobil Corp. | | | 32,562 | | | | 2,939,045 | |
Schlumberger Ltd. | | | 10,103 | | | | 848,148 | |
Other Securities (c) (d) | | | | | | | 6,681,678 | |
| | | | | | | | 12,213,655 | |
Financials — 15.8% | | | | | | | | |
Bank of America Corp. | | | 80,198 | | | | 1,772,375 | |
Berkshire Hathaway, Inc. - Class B (b) | | | 15,617 | | | | 2,545,258 | |
Citigroup, Inc. | | | 22,615 | | | | 1,344,008 | |
Goldman Sachs Group, Inc. (The) | | | 2,988 | | | | 715,476 | |
JPMorgan Chase & Co. | | | 28,098 | | | | 2,424,575 | |
U.S. Bancorp | | | 12,784 | | | | 656,713 | |
Wells Fargo & Co. | | | 36,042 | | | | 1,986,274 | |
Other Securities (c) (d) | | | | | | | 16,051,315 | |
| | | | | | | | 27,495,994 | |
Health Care — 12.5% | | | | | | | | |
AbbVie, Inc. | | | 11,400 | | | | 713,868 | |
Amgen, Inc. | | | 5,213 | | | | 762,192 | |
Bristol-Myers Squibb Co. | | | 13,125 | | | | 767,025 | |
Celgene Corp. (b) | | | 6,153 | | | | 712,210 | |
Gilead Sciences, Inc. | | | 10,467 | | | | 749,541 | |
Johnson & Johnson | | | 21,363 | | | | 2,461,230 | |
Merck & Co., Inc. | | | 21,655 | | | | 1,274,830 | |
Pfizer, Inc. | | | 48,162 | | | $ | 1,564,301 | |
UnitedHealth Group, Inc. | | | 7,072 | | | | 1,131,802 | |
Other Securities (c) (d) | | | | | | | 11,509,212 | |
| | | | | | | | 21,646,211 | |
Industrials — 10.7% | | | | | | | | |
3M Co. | | | 4,723 | | | | 843,386 | |
Boeing Co. (The) | | | 4,481 | | | | 697,602 | |
General Electric Co. | | | 69,471 | | | | 2,195,283 | |
Honeywell International, Inc. | | | 6,049 | | | | 700,777 | |
Union Pacific Corp. | | | 6,123 | | | | 634,832 | |
United Technologies Corp. | | | 6,535 | | | | 716,367 | |
Other Securities (c) (d) | | | | | | | 12,760,422 | |
| | | | | | | | 18,548,669 | |
Information Technology — 19.2% | | | | | |
Alphabet, Inc. - Class C (b) | | | 4,481 | | | | 3,458,524 | |
Apple, Inc. | | | 42,322 | | | | 4,901,733 | |
Cisco Systems, Inc. | | | 39,423 | | | | 1,191,362 | |
Facebook, Inc. - Class A (b) | | | 17,278 | | | | 1,987,833 | |
Intel Corp. | | | 37,618 | | | | 1,364,404 | |
International Business Machines Corp. | | | 6,905 | | | | 1,146,160 | |
Mastercard, Inc. - Class A | | | 7,452 | | | | 769,418 | |
Microsoft Corp. | | | 61,062 | | | | 3,794,392 | |
Oracle Corp. | | | 25,305 | | | | 972,976 | |
QUALCOMM, Inc. | | | 11,605 | | | | 756,645 | |
Visa, Inc. - Class A (d) | | | 12,229 | | | | 954,106 | |
Other Securities (c) (d) | | | | | | | 12,085,231 | |
| | | | | | | | 33,382,784 | |
Materials — 3.2% | | | | | | | | |
Other Securities (c) (d) | | | | | | | 5,497,223 | |
| | | | | | | | | |
Real Estate — 4.4% | | | | | | | | |
Other Securities (c) (d) | | | | | | | 7,679,336 | |
| | | | | | | | | |
Telecommunication Services — 2.6% | | | | | |
AT&T, Inc. | | | 48,750 | | | | 2,073,338 | |
Verizon Communications, Inc. | | | 32,363 | | | | 1,727,537 | |
Other Securities (c) (d) | | | | | | | 639,435 | |
| | | | | | | | 4,440,310 | |
Utilities — 3.2% | | | | | | | | |
Other Securities (c) (d) | | | | | | | 5,539,299 | |
| | | | | | | | | |
Total Common Stocks (Cost $64,138,598) | | | | | | | 173,307,064 | |
See Notes to Financial Statements.
45
Wilshire Mutual Funds, Inc. Wilshire 5000 Indexsm Fund Condensed Schedule of Investments - (Continued) | December 31, 2016 |
|
| | | Shares | | | Value | |
RIGHTS — 0.0% (e) | | | | | | |
Other Securities (c) (d) (Cost $0) | | | | | $ | 12,313 | |
| | | | | | | | |
MONEY MARKET FUNDS — 2.7% | | | | | |
Northern Trust Institutional Government Select Portfolio - Institutional Class, 0.39% (f) | | | 140,499 | | | | 140,499 | |
Northern Trust Institutional Liquid Asset Portfolio - Institutional Class, 0.01% (f) (g) | | | 4,582,659 | | | | 4,582,659 | |
| | | | | | | | | |
Total Money Market Funds (Cost $4,723,158) | | | | | | | 4,723,158 | |
| | | | | | | | | |
Total Investments at Value — 102.6% (Cost $68,861,756) | | | | 178,042,535 | |
| | | | | | | | | |
Liabilities in Excess of Other Assets — (2.6%) | | | | (4,513,156 | ) |
| | | | | | | | | |
NET ASSETS — 100.0% | | | | | | $ | 173,529,379 | |
The Condensed Schedule of Investments does not reflect the complete portfolio holdings. It includes the Portfolio’s 50 largest holdings and each investment of any issue that exceeds 1% of the Portfolio’s net assets. “Other Securities” represent all issues not required to be disclosed under the rules adopted by the U.S. Securities and Exchange commission (“SEC”). The complete schedule of portfolio holdings is available (i) without charge, upon request, by calling (800)607-2200; (ii) on the SEC’s website at http://www.sec.gov; and (iii) on our website at http://advisor.wilshire.com.
Ltd. — Limited.
(a) | More narrow industries are utilized for compliance purposes, whereas broad sectors are utilized for reporting purposes. |
(b) | Non-income producing security. |
(c) | Represents issuers not identified as a top 50 holding in terms of market value and issues or issuers not exceeding 1% of net assets individually or in the aggregate, respectively, as of December 31, 2016. |
(d) | This security or a partial position of this security is on loan at December 31, 2016. The total market value of securities on loan at December 31, 2016 was $10,033,391. |
(e) | Percentage rounds to less than 0.1%. |
(f) | The rate shown is the 7-day effective yield as of December 31, 2016. |
(g) | This security was purchased with cash collateral held from securities on loan. The total value of such securities as of December 31, 2016 was $4,582,659. Securities on loan are also collateralized by various U.S. Treasury obligations in the amount of $5,762,682 (Note 6). |
See Notes to Financial Statements.
46
Wilshire Mutual Funds, Inc. Wilshire International Equity Fund Condensed Schedule of Investments | December 31, 2016 |
|
| | | Shares | | | Value | |
COMMON STOCKS — 97.4% | | | | | | |
Australia — 3.4% | | | | | | |
CSL Ltd. (a) | | | 51,905 | | | $ | 3,753,524 | |
Other Securities (a) (b) (c) | | | | | | | 5,377,476 | |
| | | | | | | | 9,131,000 | |
Austria — 0.1% | | | | | | | | |
Other Securities (a) (b) | | | | | | | 241,359 | |
| | | | | | | | | |
Belgium — 0.2% | | | | | | | | |
Other Securities (a) (b) | | | | | | | 585,858 | |
| | | | | | | | | |
Brazil — 2.1% | | | | | | | | |
Ambev S.A. - ADR | | | 722,901 | | | | 3,549,444 | |
Other Securities (a) (b) (c) | | | | | | | 1,979,492 | |
| | | | | | | | 5,528,936 | |
Canada — 5.1% | | | | | | | | |
Canadian Pacific Railway Ltd. | | | 26,853 | | | | 3,833,804 | |
Constellation Software, Inc. | | | 6,035 | | | | 2,742,046 | |
Other Securities (b) (c) | | | | | | | 7,210,419 | |
| | | | | | | | 13,786,269 | |
Chile — 0.1% | | | | | | | | |
Other Securities (b) | | | | | | | 161,738 | |
| | | | | | | | | |
China — 4.7% | | | | | | | | |
China Mobile Ltd. - ADR (c) | | | 47,000 | | | | 2,464,210 | |
Ctrip.com International Ltd. - ADR (c) (d) | | | 67,397 | | | | 2,695,880 | |
Tencent Holdings Ltd. (a) | | | 129,855 | | | | 3,148,638 | |
Other Securities (a) (b) (c) | | | | | | | 4,416,739 | |
| | | | | | | | 12,725,467 | |
Colombia — 0.0% (e) | | | | | | | | |
Other Securities (b) | | | | | | | 128,031 | |
| | | | | | | | | |
Czech Republic — 0.0% (e) | | | | | | | | |
Other Securities (a) (b) | | | | | | | 24,100 | |
| | | | | | | | | |
Denmark — 3.6% | | | | | | | | |
Carlsberg A/S - Series B (a) | | | 24,511 | | | | 2,110,825 | |
Chr. Hansen Holding A/S (a) | | | 43,850 | | | | 2,424,812 | |
Coloplast A/S - Series B (a) | | | 40,404 | | | | 2,721,188 | |
Novozymes A/S (a) | | | 65,724 | | | | 2,261,382 | |
Other Securities (a) (b) | | | | | | | 214,010 | |
| | | | | | | | 9,732,217 | |
Finland — 0.4% | | | | | | | | |
Other Securities (a) (b) | | | | | | | 1,120,743 | |
| | | | | | | | | |
France — 11.1% | | | | | | | | |
AXA S.A. (a) | | | 123,063 | | | $ | 3,101,889 | |
EADS N.V. (a) | | | 51,910 | | | | 3,428,166 | |
Essilor International S.A. (a) | | | 21,887 | | | | 2,469,168 | |
Hermes International (a) | | | 6,085 | | | | 2,495,868 | |
LVMH Moet Hennessy Louis Vuitton SE (a) | | | 14,975 | | | | 2,854,956 | |
Société Générale S.A. (a) | | | 43,960 | | | | 2,161,987 | |
Total S.A. - ADR (c) | | | 59,970 | | | | 3,056,671 | |
Other Securities (a) (b) (c) | | | | | | | 10,159,936 | |
| | | | | | | | 29,728,641 | |
Germany — 5.1% | | | | | | | | |
adidas AG (a) | | | 13,208 | | | | 2,082,886 | |
E.ON SE (a) (d) | | | 288,760 | | | | 2,031,161 | |
Other Securities (a) (b) (c) | | | | | | | 9,619,386 | |
| | | | | | | | 13,733,433 | |
Greece — 0.0% (e) | | | | | | | | |
Other Securities (a) (b) | | | | | | | 64,627 | |
| | | | | | | | | |
Hong Kong — 1.7% | | | | | | | | |
Other Securities (a) (b) | | | | | | | 4,472,005 | |
| | | | | | | | | |
Hungary — 0.0% (e) | | | | | | | | |
Other Securities (b) | | | | | | | 8,498 | |
| | | | | | | | | |
India — 1.0% | | | | | | | | |
HDFC Bank Ltd. - ADR | | | 45,016 | | | | 2,731,571 | |
| | | | | | | | | |
Indonesia — 0.0% (e) | | | | | | | | |
Other Securities (a) (b) | | | | | | | 64,726 | |
| | | | | | | | | |
Ireland — 2.2% | | | | | | | | |
AerCap Holdings N.V. (d) | | | 53,485 | | | | 2,225,511 | |
Experian plc (a) | | | 186,151 | | | | 3,603,943 | |
| | | | | | | | 5,829,454 | |
Israel — 0.1% | | | | | | | | |
Other Securities (a) (b) | | | | | | | 231,453 | |
| | | | | | | | | |
Italy — 2.1% | | | | | | | | |
Intesa Sanpaolo SpA (a) | | | 1,025,035 | | | | 2,596,240 | |
Luxottica Group SpA (a) | | | 38,825 | | | | 2,086,450 | |
Other Securities (a) (b) (c) | | | | | | | 1,045,081 | |
| | | | | | | | 5,727,771 | |
See Notes to Financial Statements.
47
Wilshire Mutual Funds, Inc. Wilshire International Equity Fund Condensed Schedule of Investments - (Continued) | December 31, 2016 |
|
| | | Shares | | | Value | |
COMMON STOCKS — 97.4% (Continued) | |
Japan — 14.7% | | | | | | |
Keyence Corp. (a) | | | 4,730 | | | $ | 3,236,223 | |
Mazda Motor Corp. (a) | | | 159,400 | | | | 2,595,443 | |
Mitsubishi Estate Company Ltd. (a) | | | 104,000 | | | | 2,065,749 | |
Sysmex Corp. (a) | | | 34,675 | | | | 2,003,332 | |
Other Securities (a) (b) | | | | | | | 29,570,905 | |
| | | | | | | | 39,471,652 | |
Jersey — 0.1% | | | | | | | | |
Other Securities (a) (b) | | | | | | | 351,838 | |
| | | | | | | | | |
Luxembourg — 0.2% | | | | | | | | |
Other Securities (a) (b) | | | | | | | 581,954 | |
| | | | | | | | | |
Malaysia — 0.2% | | | | | | | | |
Other Securities (a) (b) | | | | | | | 495,134 | |
| | | | | | | | | |
Mexico — 0.5% | | | | | | | | |
Other Securities (b) | | | | | | | 1,336,524 | |
| | | | | | | | | |
Netherlands — 5.4% | | | | | | | | |
Aegon N.V. (a) | | | 419,376 | | | | 2,303,622 | |
Royal Dutch Shell plc - Class A - ADR (c) | | | 52,125 | | | | 2,834,557 | |
Other Securities (a) (b) (c) | | | | | | | 9,480,653 | |
| | | | | | | | 14,618,832 | |
Norway — 0.9% | | | | | | | | |
DNB ASA (a) (d) | | | 140,441 | | | | 2,084,747 | |
Other Securities (a) (b) | | | | | | | 365,179 | |
| | | | | | | | 2,449,926 | |
Poland — 0.0% (e) | | | | | | | | |
Other Securities (a) (b) | | | | | | | 59,955 | |
| | | | | | | | | |
Portugal — 0.1% | | | | | | | | |
Other Securities (a) (b) | | | | | | | 145,432 | |
| | | | | | | | | |
Russia — 1.2% | | | | | | | | |
Yandex N.V. - Class A (d) | | | 104,818 | | | | 2,109,987 | |
Other Securities (a) (b) | | | | | | | 1,050,639 | |
| | | | | | | | 3,160,626 | |
Singapore — 0.8% | | | | | | | | |
DBS Group Holdings Ltd. (a) | | | 168,310 | | | | 2,008,122 | |
Other Securities (a) (b) (c) | | | | | | | 272,455 | |
| | | | | | | | 2,280,577 | |
South Africa — 0.9% | | | | | | | | |
Shoprite Holdings Ltd. (a) | | | 172,093 | | | $ | 2,150,630 | |
Other Securities (a) (b) | | | | | | | 346,973 | |
| | | | | | | | 2,497,603 | |
South Korea — 1.7% | | | | | | | | |
Other Securities (a) (b) | | | | | | | 4,471,197 | |
| | | | | | | | | |
Spain — 3.1% | | | | | | | | |
ACS Actividades de Construccion y Servicios S.A. (a) | | | 64,641 | | | | 2,039,663 | |
Other Securities (a) (b) (c) | | | | | | | 6,417,089 | |
| | | | | | | | 8,456,752 | |
Sweden — 1.1% | | | | | | | | |
Other Securities (a) (b) | | | | | | | 2,902,269 | |
| | | | | | | | | |
Switzerland — 6.5% | | | | | | | | |
Julius Baer Group Ltd. (a) | | | 46,577 | | | | 2,063,361 | |
Nestlé S.A. (a) | | | 67,167 | | | | 4,811,492 | |
Roche Holdings AG (a) (d) | | | 15,636 | | | | 3,564,127 | |
SGS S.A. (a) | | | 1,326 | | | | 2,694,013 | |
Other Securities (a) (b) (c) | | | | | | | 4,289,131 | |
| | | | | | | | 17,422,124 | |
Taiwan — 2.7% | | | | | | | | |
Taiwan Semiconductor Manufacturing Co. Ltd. - ADR (c) | | | 152,213 | | | | 4,376,125 | |
Other Securities (a) (b) | | | | | | | 2,907,113 | |
| | | | | | | | 7,283,238 | |
Thailand — 0.1% | | | | | | | | |
Other Securities (a) (b) | | | | | | | 336,560 | |
| | | | | | | | | |
Turkey — 0.1% | | | | | | | | |
Other Securities (a) (b) | | | | | | | 331,172 | |
| | | | | | | | | |
United Kingdom — 7.1% | | | | | | | | |
Compass Group plc (a) | | | 181,338 | | | | 3,351,181 | |
HSBC Holdings plc - ADR | | | 73,235 | | | | 2,942,582 | |
Reckitt Benckiser Group plc (a) | | | 55,665 | | | | 4,714,950 | |
Other Securities (a) (b) | | | | | | | 8,187,152 | |
| | | | | | | | 19,195,865 | |
United States — 7.0% | | | | | | | | |
Accenture plc - Class A | | | 33,629 | | | | 3,938,965 | |
Chubb Ltd. | | | 34,198 | | | | 4,518,240 | |
Core Laboratories N.V. (c) | | | 27,367 | | | | 3,285,134 | |
See Notes to Financial Statements.
48
Wilshire Mutual Funds, Inc. Wilshire International Equity Fund Condensed Schedule of Investments - (Continued) | December 31, 2016 |
|
| | | Shares | | | Value | |
COMMON STOCKS — 97.4% (Continued) | |
United States — 7.0% (Continued) | |
ICON plc (d) | | | 27,115 | | | $ | 2,039,048 | |
Lazard Ltd. - Class A | | | 51,566 | | | | 2,118,847 | |
Schlumberger Ltd. | | | 35,360 | | | | 2,968,472 | |
| | | | | | | | 18,868,706 | |
Total Common Stocks (Cost $248,747,665) | | | | | | | 262,475,833 | |
| | | | | | | | | |
RIGHTS — 0.0% | | | | | | | | |
Other Securities (b) (Cost $0) | | | | | | | 0 | |
| | | | | | | | | |
EXCHANGE-TRADED FUNDS — 0.4% | | | | | |
Other Securities (b) (c) (Cost $1,238,009) | | | | | | | 1,113,756 | |
| | | | | | | | | |
MONEY MARKET FUNDS — 5.8% | | | | | |
Northern Trust Institutional Government Select Portfolio - Institutional Class, 0.39% (f) | | | 6,874,936 | | | | 6,874,936 | |
Northern Trust Institutional Liquid Asset Portfolio - Institutional Class, 0.01% (f) (g) | | | 8,828,715 | | | | 8,828,715 | |
| | | | | | | | | |
Total Money Market Funds (Cost $15,703,651) | | | | | | | 15,703,651 | |
| | | | | | | | | |
Total Investments at Value — 103.6% (Cost $265,689,325) | | | | 279,293,240 | |
| | | | | | | | | |
Liabilities in Excess of Other Assets — (3.6%) | | | | (9,692,727 | ) |
| | | | | | | | | |
NET ASSETS — 100.0% | | | | | | $ | 269,600,513 | |
The Condensed Schedule of Investments does not reflect the complete portfolio holdings. It includes the Fund’s 50 largest holdings and each investment of any issuer that exceeds 1% of the Fund’s net assets. “Other Securities” represent all issues not required to be disclosed under the rules adopted by the U.S. Securities and Exchange Commission (“SEC”). The complete schedule of portfolio holdings is available (i) without charge, upon request, by calling (800)607-2200; (ii) on the SEC’s website at http://www.sec.gov; and (iii) on our website at http://advisor.wilshire.com.
ADR — American Depositary Receipt.
Ltd. — Limited.
plc — Public Limited Company.
(a) | Security value has been determined in good faith in accordance with procedures approved by the Board of Directors. The total value of such securities is $194,652,920 at December 31, 2016, representing 72.2% of net assets. |
(b) | Represents issuers not identified as a top 50 holding in terms of market value and issues or issuers not exceeding 1% of net assets individually or in the aggregate, respectively, as of December 31, 2016. |
(c) | This security or a partial position of this security is on loan at December 31, 2016. The total market value of securities on loan at December 31, 2016 was $19,967,056. |
(d) | Non-income producing security. |
(e) | Percentage rounds to less than 0.1%. |
(f) | The rate shown is the 7-day effective yield as of December 31, 2016. |
(g) | This security was purchased with cash collateral held from securities on loan. The total value of such securities as of December 31, 2016 was $8,828,715. Securities on loan are also collateralized by various U.S. Treasury obligations in the amount of $11,735,202. |
See Notes to Financial Statements.
49
Wilshire Mutual Funds, Inc. Wilshire Income Opportunities Fund Schedule of Investments | December 31, 2016 |
|
| | | Coupon | | Maturity | | Par Value | | | Value | |
U.S. TREASURY OBLIGATIONS — 13.3% | |
U.S. Treasury Bonds — 0.3% | |
U.S. Treasury Bonds | | | 2.750 | % | | 11/15/42 | | $ | 1,180,000 | | | $ | 1,114,501 | |
| | | | | | | | | | | | | | | |
U.S. Treasury Notes — 8.7% | |
U.S. Treasury Notes | | | 0.625 | % | | 05/31/17 | | | 2,450,000 | | | | 2,450,191 | |
U.S. Treasury Notes | | | 1.000 | % | | 02/15/18 | | | 4,280,000 | | | | 4,281,507 | |
U.S. Treasury Notes | | | 2.000 | % | | 11/30/20 | | | 5,030,000 | | | | 5,082,071 | |
U.S. Treasury Notes | | | 2.125 | % | | 01/31/21 | | | 5,080,000 | | | | 5,147,666 | |
U.S. Treasury Notes | | | 2.250 | % | | 03/31/21 | | | 5,590,000 | | | | 5,691,101 | |
U.S. Treasury Notes | | | 1.750 | % | | 03/31/22 | | | 3,030,000 | | | | 2,989,640 | |
U.S. Treasury Notes | | | 1.500 | % | | 03/31/23 | | | 2,780,000 | | | | 2,671,188 | |
U.S. Treasury Notes | | | 2.125 | % | | 05/15/25 | | | 3,430,000 | | | | 3,362,470 | |
U.S. Treasury Notes * | | | 2.000 | % | | 11/15/26 | | | 2,999,000 | | | | 2,885,482 | |
| | | | | | | | | | | | | | 34,561,316 | |
U.S. Treasury Inflation-Protection Notes — 2.8% | |
U.S. Treasury Inflation-Protection Notes | | | 0.125 | % | | 04/15/21 | | | 1,336,043 | | | | 1,343,690 | |
U.S. Treasury Inflation-Protection Notes | | | 0.625 | % | | 01/15/24 | | | 1,947,587 | | | | 1,981,808 | |
U.S. Treasury Inflation-Protection Notes | | | 0.125 | % | | 07/15/24 | | | 2,962,381 | | | | 2,910,228 | |
U.S. Treasury Inflation-Protection Notes | | | 0.125 | % | | 07/15/26 | | | 1,956,337 | | | | 1,891,779 | |
U.S. Treasury Inflation-Protection Notes | | | 1.000 | % | | 02/15/46 | | | 3,060,452 | | | | 3,073,385 | |
| | | | | | | | | | | | | | 11,200,890 | |
U.S. Treasury Strips — 1.5% | |
U.S. Treasury Bonds, Stripped Principal Payment *(a) | | | 2.921 | % | | 11/15/44 | | | 14,084,000 | | | | 5,861,563 | |
| | | | | | | | | | | | | | | |
Total U.S. Treasury Obligations (Cost $53,823,803) | | | | 52,738,270 | |
| | | | | | | | | | | | | | | |
U.S. GOVERNMENT AGENCY OBLIGATIONS — 4.9% | |
Federal Home Loan Mortgage Corp. — 1.5% | |
Federal Home Loan Mortgage Corp. | | | 2.874 | % | | 09/15/29 | | $ | 3,000,000 | | | $ | 1,932,201 | |
Federal Home Loan Mortgage Corp. | | | 3.068 | % | | 12/14/29 | | | 1,450,000 | | | | 945,175 | |
Federal Home Loan Mortgage Corp. | | | 4.288 | % | | 03/15/31 | | | 1,250,000 | | | | 767,039 | |
Federal Home Loan Mortgage Corp. | | | 6.750 | % | | 03/15/31 | | | 249,000 | | | | 350,938 | |
Federal Home Loan Mortgage Corp. | | | 3.000 | % | | 03/01/46 | | | 447,902 | | | | 445,236 | |
Federal Home Loan Mortgage Corp. | | | 3.000 | % | | 04/01/46 | | | 461,394 | | | | 458,925 | |
Federal Home Loan Mortgage Corp. | | | 3.000 | % | | 05/01/46 | | | 945,844 | | | | 940,193 | |
| | | | | | | | | | | | | | 5,839,707 | |
Federal National Mortgage Association — 3.1% | |
Federal National Mortgage Association | | | 2.125 | % | | 04/24/26 | | | 800,000 | | | | 756,553 | |
Federal National Mortgage Association * | | | 1.875 | % | | 09/24/26 | | | 1,400,000 | | | | 1,286,215 | |
Federal National Mortgage Association * | | | 2.948 | % | | 05/15/29 | | | 3,700,000 | | | | 2,413,062 | |
Federal National Mortgage Association | | | 3.018 | % | | 01/15/30 | | | 775,000 | | | | 497,121 | |
Federal National Mortgage Association | | | 3.075 | % | | 05/15/30 | | | 2,900,000 | | | | 1,864,865 | |
Federal National Mortgage Association | | | 3.500 | % | | 07/01/42 | | | 998,156 | | | | 1,026,788 | |
Federal National Mortgage Association | | | 3.000 | % | | 07/01/46 | | | 4,762,701 | | | | 4,701,261 | |
| | | | | | | | | | | | | | 12,545,865 | |
Tennessee Valley Authority — 0.3% | |
Tennessee Valley Authority * | | | 5.375 | % | | 04/01/56 | | | 410,000 | | | | 512,717 | |
Tennessee Valley Authority * | | | 4.250 | % | | 09/15/65 | | | 700,000 | | | | 720,594 | |
| | | | | | | | | | | | | | 1,233,311 | |
Total U.S. Government Agency Obligations (Cost $20,596,508) | | | | 19,618,883 | |
See Notes to Financial Statements.
50
Wilshire Mutual Funds, Inc. Wilshire Income Opportunities Fund Schedule of Investments - (continued) | December 31, 2016 |
|
| | | Coupon | | Maturity | | Par Value | | | Value | |
AGENCY MORTGAGE-BACKED OBLIGATIONS — 3.8% | |
Federal Home Loan Mortgage Corp. — 1.6% | |
Federal Home Loan Mortgage Corp., Series 4249, Class CS | | | 4.300 | % | | 09/15/43 | | $ | 1,336,261 | | | $ | 1,230,387 | |
Federal Home Loan Mortgage Corp., Series 4355, Class ZX | | | 4.000 | % | | 05/15/44 | | | 4,972,442 | | | | 5,264,314 | |
| | | | | | | | | | | | | | 6,494,701 | |
Federal Home Loan Mortgage Corp. Interest-Only Strips — 0.3% | |
Federal Home Loan Mortgage Corp. REMIC, Series K-722, Class X1 (b) | | | 1.311 | % | | 03/01/23 | | | 2,275,418 | | | | 149,547 | |
Federal Home Loan Mortgage Corp., Series 4077, Class TS (b) | | | 5.299 | % | | 05/15/41 | | | 2,154,390 | | | | 339,201 | |
Federal Home Loan Mortgage Corp., Series 3966, Class SA (b) | | | 5.361 | % | | 12/15/41 | | | 2,852,485 | | | | 447,217 | |
Federal Home Loan Mortgage Corp., Series 4089, Class SH | | | 5.518 | % | | 08/15/42 | | | 2,265,064 | | | | 388,130 | |
| | | | | | | | | | | | | | 1,324,095 | |
Federal National Mortgage Association — 1.3% | |
Federal National Mortgage Association, Series 2016-75, Class ZP | | | 3.000 | % | | 10/25/46 | | | 1,402,174 | | | | 1,318,896 | |
Federal National Mortgage Association, Series 2016-73, Class DZ | | | 3.000 | % | | 10/25/46 | | | 4,030,075 | | | | 3,605,845 | |
| | | | | | | | | | | | | | 4,924,741 | |
Federal National Mortgage Association Interest-Only Strips — 0.6% | |
Federal National Mortgage Association, Series 2011-124, Class NS (b) | | | 5.915 | % | | 12/25/41 | | | 2,525,305 | | | | 437,204 | |
Federal National Mortgage Association, Series 2012-20, Class SA (b) | | | 5.865 | % | | 03/25/42 | | $ | 2,327,460 | | | $ | 428,807 | |
Federal National Mortgage Association, Series 2012-76, Class SC (b) | | | 5.415 | % | | 07/25/42 | | | 1,064,505 | | | | 183,575 | |
Federal National Mortgage Association, Series 2014-28, Class SD (b) | | | 5.293 | % | | 05/25/44 | | | 7,521,549 | | | | 1,207,428 | |
| | | | | | | | | | | | | | 2,257,014 | |
Total Agency Mortgage-Backed Obligations (Cost $15,790,630) | | | | 15,000,551 | |
| | | | | | | | | | | | | | | |
NON-AGENCY MORTGAGE-BACKED OBLIGATIONS — 19.4% | |
A10, LLC, Series 2016-1, Class A-1 | | | 2.420 | % | | 03/15/35 | | | 163,000 | | | | 162,544 | |
AABS Ltd., Series 2013-1, Class A | | | 4.875 | % | | 01/15/38 | | | 385,167 | | | | 383,049 | |
Alliance Bancorp Trust, Series 2007-OA1, Class A-1 (b) | | | 0.764 | % | | 07/25/37 | | | 1,203,136 | | | | 868,735 | |
American Home Mortgage Assets, Series 2006-4, Class I-A1-1 (b) | | | 0.774 | % | | 10/25/46 | | | 1,291,712 | | | | 854,336 | |
American Home Mortgage Assets, Series 2006-6, Class A1-A (b) | | | 0.946 | % | | 12/25/46 | | | 932,325 | | | | 659,242 | |
Americold, LLC Trust, Series 2010-ART, Class C | | | 6.811 | % | | 01/14/21 | | | 50,000 | | | | 55,937 | |
Arbor Realty Commercial Real Estate, Series 2016-FL1, Class B (b) | | | 3.488 | % | | 09/15/26 | | | 302,000 | | | | 302,940 | |
See Notes to Financial Statements.
51
Wilshire Mutual Funds, Inc. Wilshire Income Opportunities Fund Schedule of Investments - (continued) | December 31, 2016 |
|
| | | Coupon | | Maturity | | Par Value | | | Value | |
NON-AGENCY MORTGAGE-BACKED OBLIGATIONS — 19.4% (Continued) | |
Banc of America Commercial Mortgage Trust, Series 2007-1, Class A-4 | | | 5.451 | % | | 01/15/49 | | $ | 2,640 | | | $ | 2,639 | |
Banc of America Funding Corp., Series 2013-R1, Class A5 (b) | | | 0.690 | % | | 11/03/41 | | | 925,698 | | | | 843,571 | |
Bank of America RE-REMIC, Series 2010-UBER3, Class A-4B-2 (b) | | | 5.949 | % | | 06/01/46 | | | 218,000 | | | | 220,255 | |
BCAPB, LLC Trust, Series 2007-AB1, Class A-5 (b) | | | 5.084 | % | | 03/25/37 | | | 4,794,640 | | | | 3,369,677 | |
Bear Stearns Adjustable Rate Mortgage Trust, Series 2004-10, Class I-M-1 (b) | | | 3.176 | % | | 01/01/35 | | | 817,220 | | | | 733,089 | |
Bear Stearns Commercial Mortgage Trust, Series 2007-PWR16, Class A-M | | | 5.719 | % | | 06/11/40 | | | 368,000 | | | | 372,816 | |
Bear Stearns Commercial Mortgage Trust, Series 2007-PWR15, Class A-4 | | | 5.331 | % | | 02/11/44 | | | 35,747 | | | | 35,767 | |
Bear Stearns Commercial Mortgage Trust, Series 2007-PWR17, Class A-4 | | | 5.694 | % | | 06/11/50 | | | 182,766 | | | | 185,924 | |
Bear Stearns Commercial Mortgage Trust, Series 2007-PWR18, Class A-4 | | | 5.700 | % | | 06/11/50 | | | 259,727 | | | | 265,297 | |
CD Commercial Mortgage Trust, Series 2007-CD4, Class A-MFX | | | 5.366 | % | | 12/11/49 | | $ | 545,000 | | | $ | 545,548 | |
CFCRE Commercial Mortgage Trust, Series 2016-C4, Class C | | | 4.878 | % | | 05/10/58 | | | 120,000 | | | | 117,632 | |
CIM Trust, Series 2016-1, Class B2 (b) | | | 12.316 | % | | 07/26/55 | | | 1,000,000 | | | | 874,800 | |
CIM Trust, Series 2016-2, Class B2 (b) | | | 12.212 | % | | 02/01/56 | | | 1,000,000 | | | | 875,422 | |
CIM Trust, Series 2016-3, Class B2 | | | 12.173 | % | | 02/27/56 | | | 1,000,000 | | | | 875,493 | |
Citigroup Commercial Mortgage Trust, Series 2008-C7, Class A-MA (b) | | | 6.333 | % | | 12/01/49 | | | 120,000 | | | | 123,001 | |
Citigroup Commercial Mortgage Trust, Series 2008-C7, Class A-M (b) | | | 6.333 | % | | 12/01/49 | | | 334,000 | | | | 343,508 | |
Citigroup Commercial Mortgage Trust, Series 2007-C6, Class A-M | | | 5.711 | % | | 12/10/49 | | | 219,000 | | | | 222,141 | |
Citigroup Commercial Mortgage Trust, Series 2007-C6, Class A-4 | | | 5.711 | % | | 12/10/49 | | | 141,000 | | | | 142,222 | |
Citi-Mortgage Alternative Loan Trust, Series 2006-A1, Class IA-6 | | | 6.000 | % | | 04/25/36 | | | 3,537,063 | | | | 3,236,594 | |
Citi-Mortgage Alternative Loan Trust, Series 2007-A5, Class IA-6 (b) | | | 6.000 | % | | 05/01/37 | | | 3,937,286 | | | | 3,666,888 | |
See Notes to Financial Statements.
52
Wilshire Mutual Funds, Inc. Wilshire Income Opportunities Fund Schedule of Investments - (continued) | December 31, 2016 |
|
| | | Coupon | | Maturity | | Par Value | | | Value | |
NON-AGENCY MORTGAGE-BACKED OBLIGATIONS — 19.4% (Continued) | |
Cobal Commercial Mortgage Trust, Series 2007-C3, Class A-M | | | 5.764 | % | | 05/15/46 | | $ | 120,000 | | | $ | 121,586 | |
Commercial Mortgage Loan Trust,
Series 2008-LS1, Class A-4B | | | 6.093 | % | | 12/10/49 | | | 249,788 | | | | 254,645 | |
Cosmopolitan Hotel Trust, Series 2016-COSMO, Class C (b) | | | 3.353 | % | | 11/15/21 | | | 1,000,000 | | | | 1,005,397 | |
Countrywide Alternative Loan, Inc., Series 2007-16CB, Class 5-A-4 (b) | | | 6.249 | % | | 08/25/37 | | | 944,433 | | | | 827,686 | |
Countrywide Alternative Loan, Inc., Series 2007-OA7, Class A-1-A (b) | | | 0.936 | % | | 05/25/47 | | | 1,122,674 | | | | 948,293 | |
Countrywide Asset Backed Securities, Inc., Series 2006-6, Class 1-A-1 (b) | | | 0.926 | % | | 09/25/36 | | | 2,123,580 | | | | 1,972,844 | |
Countrywide Home Loan Mortgage Trust, Series 2007-HY5, Class 3-A-1 (b) | | | 4.586 | % | | 09/25/37 | | | 2,765,435 | | | | 2,463,947 | |
Credit Suisse Commercial Mortgage Trust, Series 2007-C5, Class A-4 | | | 5.695 | % | | 09/01/40 | | | 69,957 | | | | 70,957 | |
Credit Suisse Commercial Mortgage Trust, Series 2014-WIN2, Class A-3 | | | 3.500 | % | | 10/25/44 | | | 713,554 | | | | 710,474 | |
Credit Suisse Commercial Mortgage Trust, Series 2007-C2, Class A-M | | | 5.603 | % | | 01/15/49 | | | 84,000 | | | | 84,703 | |
Credit Suisse Commercial Mortgage Trust, Series 2016-PR1, Class A-1 (b) | | | 5.126 | % | | 07/01/56 | | $ | 912,553 | | | $ | 891,711 | |
Deutsche Bank Alt-A Securities, Series 2006-AF1, Class A-4 (b) | | | 1.056 | % | | 04/25/36 | | | 1,090,470 | | | | 954,650 | |
First Franklin Mortgage Trust, Series 2004-FF10, Class M-1 (b) | | | 2.031 | % | | 07/25/34 | | | 685,675 | | | | 663,115 | |
FirstKey Mortgage Trust, Series 2014-1, Class A-8 | | | 3.500 | % | | 11/25/44 | | | 502,309 | | | | 506,979 | |
Fort CRE, LLC, Series 2016-1, Class B | | | 3.250 | % | | 05/21/36 | | | 181,000 | | | | 182,229 | |
GE Business Loan Trust, Series 2007-1, Class C (b) | | | 1.153 | % | | 04/16/35 | | | 893,125 | | | | 782,477 | |
GE Commercial Mortgage, Series 2006-C1, Class A-J (b) | | | 5.486 | % | | 03/01/44 | | | 57,021 | | | | 56,879 | |
GMAC Commercial Mortgage Securities, Series 2004-C3, Class E (b) | | | 5.141 | % | | 12/10/41 | | | 160,000 | | | | 159,212 | |
GMAC Commercial Mortgage Securities, Series 2004-C3, Class D (b) | | | 5.043 | % | | 12/10/41 | | | 96,000 | | | | 99,390 | |
Goldman Sachs Mortgage Securities Trust, Series 2013-GC13, Class D (b) | | | 4.065 | % | | 07/10/23 | | | 60,000 | | | | 53,087 | |
Goldman Sachs Mortgage Securities Trust, Series 2016-ICE2, Class C (b) | | | 4.788 | % | | 02/15/33 | | | 1,000,000 | | | | 1,012,568 | |
Goldman Sachs Mortgage Securities Trust, Series 2006-GG8, Class A-M | | | 5.591 | % | | 11/10/39 | | | 27,699 | | | | 27,686 | |
See Notes to Financial Statements.
53
Wilshire Mutual Funds, Inc. Wilshire Income Opportunities Fund Schedule of Investments - (continued) | December 31, 2016 |
|
| | | Coupon | | Maturity | | Par Value | | | Value | |
NON-AGENCY MORTGAGE-BACKED OBLIGATIONS — 19.4% (Continued) | |
Goldman Sachs Mortgage Securities Trust, Series 2007-GG10, Class A-4 | | | 5.794 | % | | 08/10/45 | | $ | 271,271 | | | $ | 272,960 | |
Greenwich Capital Commercial Mortgage, Series 2007-GG9, Class A-M | | | 5.475 | % | | 03/10/39 | | | 121,349 | | | | 121,306 | |
GSAA Home Equity Trust, Series 2005-6, Class M-1 (b) | | | 1.022 | % | | 06/25/35 | | | 1,300,000 | | | | 1,173,148 | |
GSAA Home Equity Trust, Series 2007-7, Class A4 (b) | | | 1.026 | % | | 07/25/37 | | | 1,070,311 | | | | 967,716 | |
Harborview Mortgage Loan Trust, Series 2006-14, Class 2A-1A (b) | | | 0.886 | % | | 01/25/47 | | | 1,088,886 | | | | 892,046 | |
Hilton USA Trust, Series 2013-HLT, Class E-FX, 144A (b) | | | 4.601 | % | | 11/05/18 | | | 1,000,000 | | | | 1,001,492 | |
JPMBB Commercial Mortgage Securities Trust, Series 2013-C15, Class D (b) | | | 5.214 | % | | 10/15/23 | | | 84,000 | | | | 79,984 | |
JPMCC Commercial Mortgage Trust, Series 2016-ASH, Class B (b) | | | 2.688 | % | | 10/15/22 | | | 115,000 | | | | 115,574 | |
JPMCC Commercial Mortgage Trust, Series 2016-ASH, Class C (b) | | | 3.287 | % | | 10/15/22 | | | 65,000 | | | | 65,311 | |
JPMCC Commercial Mortgage Trust, Series 2016-JP2, Class C (b) | | | 3.947 | % | | 08/15/49 | | | 1,000,000 | | | | 954,290 | |
JPMCC RE-REMIC Trust, Series 2014-FRR1, Class A-K707 | | | 4.347 | % | | 12/27/18 | | | 181,000 | | | | 176,977 | |
JPMorgan Chase Commercial Trust, Series 2016-WPT, Class E (b) | | | 5.532 | % | | 10/15/18 | | $ | 181,000 | | | $ | 182,238 | |
JPMorgan Chase Commercial Trust, Series 2016-WIKI, Class E (b) | | | 4.008 | % | | 10/05/21 | | | 1,000,000 | | | | 965,701 | |
JPMorgan Chase Commercial Trust, Series 2007-CIBC18, Class A-4 | | | 5.440 | % | | 06/12/47 | | | 8,301 | | | | 8,295 | |
JPMorgan Chase Commercial Trust, Series 2007-CIBC19, Class A-M (b) | | | 5.880 | % | | 02/12/49 | | | 218,000 | | | | 220,108 | |
JPMorgan Chase Commercial Trust, Series 2007-CIBC20, Class A-M | | | 5.880 | % | | 02/12/51 | | | 273,000 | | | | 279,571 | |
JPMorgan Commercial Mortgage Trust, Series 2004-CIBC10, Class D | | | 5.097 | % | | 01/12/37 | | | 89,000 | | | | 91,186 | |
Lehman Brothers Commercial Mortgage Trust, Series 2007-C3, Class A-4 | | | 5.918 | % | | 07/15/44 | | | 172,902 | | | | 175,200 | |
Lehman Brothers-UBS Commercial Mortgage Trust, Series 2007-C2, Class A-M | | | 5.493 | % | | 02/15/40 | | | 273,000 | | | | 275,262 | |
Lehman Brothers-UBS Commercial Mortgage Trust, Series 2007-C7, Class A-3 | | | 5.866 | % | | 09/15/45 | | | 202,678 | | | | 207,683 | |
Lehman Brothers-UBS Commercial Mortgage Trust, Series 2007-C7, Class A-J | | | 6.243 | % | | 09/15/45 | | | 120,000 | | | | 120,996 | |
See Notes to Financial Statements.
54
Wilshire Mutual Funds, Inc. Wilshire Income Opportunities Fund Schedule of Investments - (continued) | December 31, 2016 |
|
| | | Coupon | | Maturity | | Par Value | | | Value | |
NON-AGENCY MORTGAGE-BACKED OBLIGATIONS — 19.4% (Continued) | |
LSTAR Commercial Mortgage Trust, Series 2016-4, Class C | | | 4.701 | % | | 03/10/49 | | $ | 274,000 | | | $ | 250,430 | |
LSTAR Securities Investments Ltd., Series 2016-4, Class A-1 (b) | | | 2.885 | % | | 10/01/18 | | | 1,955,395 | | | | 1,933,950 | |
LSTAR Securities Investments Ltd., Series 2016-7, Class A-1 (b) | | | 2.605 | % | | 12/01/18 | | | 2,000,000 | | | | 1,970,629 | |
LSTAR Securities Investments Ltd., Series 2015-4, Class A-1 (b) | | | 2.532 | % | | 04/01/20 | | | 576,049 | | | | 574,969 | |
LSTAR Securities Investments Ltd., Series 2016-5, Class A-1, 144A | | | 2.546 | % | | 11/01/21 | | | 978,225 | | | | 965,581 | |
LSTAR Securities Investments Trust, Series 2016-2, Class A, 144A (b) | | | 2.532 | % | | 03/01/21 | | | 1,299,790 | | | | 1,282,993 | |
LSTAR Securities Investments Trust, Series 2016-3, Class A (b) | | | 2.532 | % | | 09/01/21 | | | 2,223,925 | | | | 2,196,821 | |
Luminent Mortgage Trust, Series 2006-2, Class A1A (b) | | | 0.792 | % | | 02/25/46 | | | 1,514,928 | | | | 1,064,302 | |
Merrill Lynch-CFC Commercial Mortgage Trust, Series 2007-9, Class A-4 | | | 5.700 | % | | 09/12/49 | | | 168,093 | | | | 171,446 | |
Merrill Lynch Mortgage Trust, Series 2007-C1, Class AM (b) | | | 6.022 | % | | 06/01/50 | | | 181,000 | | | | 175,582 | |
Merrill Lynch-CFC Commercial Mortgage Trust, Series 2007-7, Class A-4 | | | 5.738 | % | | 06/12/50 | | $ | 55,621 | | | $ | 55,976 | |
Morgan Stanley Capital I Trust, Series 2006-XLF, Class J (b) | | | 1.133 | % | | 07/15/19 | | | 68,327 | | | | 67,689 | |
Morgan Stanley Capital I Trust, Series 2006-NC1, Class M-1 (b) | | | 0.969 | % | | 12/25/35 | | | 1,000,000 | | | | 898,129 | |
Morgan Stanley Capital I Trust, Series 2007-Q11, Class A-M | | | 5.478 | % | | 02/12/44 | | | 92,558 | | | | 92,489 | |
Morgan Stanley Capital I Trust, Series 2006-HQ9, Class A-J | | | 5.793 | % | | 07/12/44 | | | 1,384 | | | | 1,383 | |
Morgan Stanley Capital I Trust, Series 2007-IQ16, Class A-M | | | 6.052 | % | | 12/12/49 | | | 273,000 | | | | 281,172 | |
Morgan Stanley REMIC Trust, Series 2010-R5, Class 4-B (b) | | | 1.053 | % | | 06/26/36 | | | 941,950 | | | | 727,898 | |
Morgan Stanley REMIC Trust, Series 2010-GG10, Class A4B | | | 5.794 | % | | 08/15/45 | | | 218,000 | | | | 218,801 | |
Motel 6 Trust, Series 2015-MTL6, Class E (b) | | | 5.278 | % | | 02/05/20 | | | 1,000,000 | | | | 993,731 | |
PR Mortgage Loan Trust, Series 2014-1, Class APT (b) | | | 5.916 | % | | 10/25/49 | | | 2,359,907 | | | | 2,262,256 | |
Residential Accredited Loans, Inc., Series 2006-QS15, Class A-3 | | | 6.500 | % | | 10/25/36 | | | 1,627,690 | | | | 1,388,776 | |
See Notes to Financial Statements.
55
Wilshire Mutual Funds, Inc. Wilshire Income Opportunities Fund Schedule of Investments - (continued) | December 31, 2016 |
|
| | | Coupon | | Maturity | | Par Value | | | Value | |
NON-AGENCY MORTGAGE-BACKED OBLIGATIONS — 19.4% (Continued) | |
Residential Accredited Loans, Inc., Series 2006-QO2, Class A-1 (b) | | | 0.745 | % | | 02/25/46 | | $ | 2,214,046 | | | $ | 963,265 | |
Rise Ltd., Series 2014-1A, Class A | | | 4.750 | % | | 02/15/39 | | | 1,234,260 | | | | 1,226,237 | |
Springfield Funding Trust, Series 2015-A, Class A | | | 3.160 | % | | 11/15/24 | | | 1,000,000 | | | | 1,007,900 | |
Structured Asset Investment Loan, Series 2005-11, Class A7 (b) | | | 0.951 | % | | 01/25/36 | | | 850,824 | | | | 764,427 | |
Taco Bell Funding, LLC, Series 2016-1, Class A-2-II | | | 4.377 | % | | 05/25/46 | | | 1,695,750 | | | | 1,703,125 | |
Velocity Commercial Capital Loan Trust, Series 2016-1, Class A-FX | | | 3.533 | % | | 04/25/46 | | | 456,895 | | | | 465,474 | |
VOLT L, LLC, Series 2016-NP10, Class A-1, 144A | | | 3.500 | % | | 09/25/46 | | | 1,973,251 | | | | 1,968,013 | |
VOLT LI, LLC, Series 2016-NP11, Class A-1 | | | 3.500 | % | | 10/25/46 | | | 1,088,264 | | | | 1,085,767 | |
VOLT XXVII, LLC, Series 2014-NPL7, Class A-1 | | | 3.375 | % | | 08/27/57 | | | 673,113 | | | | 673,413 | |
Wachovia Asset Securitization, Series 2007-HE2, Class A (b) | | | 0.722 | % | | 07/25/37 | | | 1,913,138 | | | | 1,678,679 | |
Wachovia Asset Securitization, Series 2007-HE1, Class A (b) | | | 0.731 | % | | 07/25/37 | | | 1,605,544 | | | | 1,370,099 | |
Wachovia Bank Commercial Mortgage Trust, Series 2007-C30, Class A-M | | | 5.383 | % | | 12/15/43 | | | 141,000 | | | | 141,032 | |
Wachovia Bank Commercial Mortgage Trust, Series 2006-C26, Class A-M (b) | | | 6.285 | % | | 06/15/45 | | $ | 181,000 | | | $ | 181,015 | |
Wachovia Bank Commercial Mortgage Trust, Series 2006-C27, Class A-J | | | 5.825 | % | | 07/15/45 | | | 179,000 | | | | 181,202 | |
Wachovia Bank Commercial Mortgage Trust, Series 2007-C34, Class A-3 | | | 5.678 | % | | 05/15/46 | | | 255,376 | | | | 257,224 | |
Wachovia Bank Commercial Mortgage Trust, Series 2006-C28, Class A-J | | | 5.632 | % | | 10/15/48 | | | 194,242 | | | | 193,996 | |
Wachovia Bank Commercial Mortgage Trust, Series 2007-C32, Class A-3 (b) | | | 5.890 | % | | 06/15/49 | | | 175,610 | | | | 176,679 | |
Waldorf Astoria Boca Raton Trust, Series 2016-BOCA, Class B (b) | | | 2.588 | % | | 06/15/29 | | | 148,000 | | | | 148,034 | |
Waldorf Astoria Boca Raton Trust, Series 2016-BOCA, Class C (b) | | | 3.038 | % | | 06/15/29 | | | 125,000 | | | | 125,026 | |
Wells Fargo Commercial Mortgage Trust, Series 2016-C34, Class C | | | 5.029 | % | | 06/15/49 | | | 141,000 | | | | 139,688 | |
Wendy's Funding, LLC, Series 2015-1, Class A2-III | | | 4.497 | % | | 06/15/45 | | | 987,500 | | | | 950,583 | |
Winwater Mortgage Loan Trust, Series 2016-1, Class 2A-3 | | | 3.000 | % | | 12/20/30 | | | 431,862 | | | | 432,368 | |
See Notes to Financial Statements.
56
Wilshire Mutual Funds, Inc. Wilshire Income Opportunities Fund Schedule of Investments - (continued) | December 31, 2016 |
|
| | | Coupon | | Maturity | | Par Value | | | Value | |
NON-AGENCY MORTGAGE-BACKED OBLIGATIONS — 19.4% (Continued) | |
Wrightwood Capital Real Estate, Series 2005-1, Class B (b) | | | 1.083 | % | | 11/21/40 | | $ | 1,450,000 | | | $ | 1,365,755 | |
| | | | | | | | | | | | | | | |
Total Non-Agency Mortgage-Backed Obligations (Cost $78,042,061) | | | | 77,310,630 | |
| | | | | | | | | | | | | | | |
NON-AGENCY MORTGAGE-BACKED OBLIGATION INTEREST-ONLY STRIPS — 2.2% | |
American Home Mortgage Assets, Series 2007-1, Class IO-P | | | 2.078 | % | | 05/25/47 | | | 8,513,198 | | | | 1,501,440 | |
BofA Merrill Lynch Commercial Mortgage Trust, Series 2016-UBS10, Class X-A | | | 2.008 | % | | 06/15/49 | | | 1,117,863 | | | | 132,129 | |
CD Commercial Mortgage Trust, Series 2016-CD1, Class X-A (b) | | | 1.581 | % | | 08/10/26 | | | 1,995,557 | | | | 198,465 | |
CFCRE Commercial Mortgage Trust, Series 2016-C4, Class X-A (b) | | | 1.770 | % | | 05/10/58 | | | 1,295,792 | | | | 149,963 | |
Citigroup Commercial Mortgage Trust, Series 2016-P4, Class X-A (b) | | | 2.016 | % | | 08/10/26 | | | 1,234,700 | | | | 164,296 | |
Citigroup Commercial Mortgage Trust, Series 2016-GC37, Class X-A | | | 1.811 | % | | 04/10/49 | | | 3,835,502 | | | | 467,792 | |
Citigroup Commercial Mortgage Trust, Series 2016-C1, Class X-A | | | 1.952 | % | | 05/10/49 | | | 1,177,938 | | | | 153,873 | |
Citigroup Commercial Mortgage Trust, Series 2016-C2, Class X-A | | | 1.949 | % | | 08/10/49 | | $ | 1,896,338 | | | $ | 238,820 | |
Commercial Mortgage Trust, Series 2013-CCRE12, Class X-A (b) | | | 1.538 | % | | 10/01/46 | | | 3,969,019 | | | | 245,288 | |
CSAIL Commercial Mortgage Trust, Series 2016-C6, Class X-A | | | 1.815 | % | | 01/15/49 | | | 991,990 | | | | 114,165 | |
Goldman Sachs Mortgage Securities Trust, Series 2013-GC10, Class X-A (b) | | | 1.598 | % | | 01/10/23 | | | 2,375,806 | | | | 172,029 | |
Goldman Sachs Mortgage Securities Trust, Series 2016-GS2, Class X-A | | | 1.673 | % | | 05/10/49 | | | 1,041,378 | | | | 113,195 | |
JPMCC Commercial Mortgage Trust, Series 2016-JP2, Class X-A (b) | | | 1.866 | % | | 08/15/49 | | | 1,937,417 | | | | 256,483 | |
JPMDB Commercial Mortgage Securities Trust, Series 2016-C2, Class X-A (b) | | | 1.868 | % | | 06/01/49 | | | 1,260,418 | | | | 128,390 | |
LSTAR Commercial Mortgage Trust, Series 2016-4, Class X-A | | | 1.957 | % | | 03/01/49 | | | 1,623,788 | | | | 145,655 | |
Morgan Stanley BofA Mortgage Loan Trust, Series 2014-C19, Class X-A (b) | | | 1.147 | % | | 12/01/47 | | | 3,517,500 | | | | 195,417 | |
Morgan Stanley BofA Mortgage Loan Trust, Series 2015-C27, Class X-A | | | 1.040 | % | | 12/15/47 | | | 26,157,663 | | | | 1,657,751 | |
Morgan Stanley Capital I Trust, Series 2016-UBS11, Class X-A (b) | | | 1.682 | % | | 08/15/49 | | | 5,872,425 | | | | 619,420 | |
See Notes to Financial Statements.
57
Wilshire Mutual Funds, Inc. Wilshire Income Opportunities Fund Schedule of Investments - (continued) | December 31, 2016 |
|
| | | Coupon | | Maturity | | Par Value | | | Value | |
NON-AGENCY MORTGAGE-BACKED OBLIGATION INTEREST-ONLY STRIPS — 2.2% (Continued) | |
Morgan Stanley Capital I Trust, Series 2016-UB12, Class X-A (b) | | | 0.841 | % | | 12/15/49 | | $ | 3,281,000 | | | $ | 178,383 | |
SG Commercial Mortgage Securities Trust, Series 2016-C5, Class X-A (b) | | | 2.197 | % | | 10/01/48 | | | 8,164,325 | | | | 1,030,988 | |
Wells Fargo Commercial Mortgage Trust, Series 2016-C35, Class X-A (b) | | | 2.010 | % | | 07/15/48 | | | 6,867,643 | | | | 921,916 | |
| | | | | | | | | | | | | | | |
Total Non-Agency Mortgage-Backed Obligation Interest-Only Strips (Cost $8,908,168) | | | | 8,785,858 | |
| | | | | | | | | | | | | | | |
ASSET-BACKED SECURITIES — 10.3% | |
Anchorage Credit Funding Ltd. | | | 3.850 | % | | 10/28/33 | | | 1,000,000 | | | | 989,402 | |
Anchorage Credit Funding Ltd., Series 2016-4A, Class A | | | 3.500 | % | | 02/15/35 | | | 2,000,000 | | | | 1,942,602 | |
Apollo Aviation Securitization Equity Trust, Series 2014-1, Class A | | | 5.125 | % | | 12/15/29 | | | 1,269,231 | | | | 1,260,346 | |
Apollo Aviation Securitization Equity Trust, Series 2014-1, Class B | | | 7.375 | % | | 12/15/29 | | | 634,616 | | | | 630,173 | |
Apollo Aviation Securitization Equity Trust, Series 2016-1A, Class A | | | 4.875 | % | | 03/17/36 | | | 925,000 | | | | 938,288 | |
Apollo Aviation Securitization Equity Trust, Series 2016-2, Class A | | | 4.212 | % | | 11/15/41 | | | 1,700,000 | | | | 1,691,204 | |
Castle Air Securities Trust, Series 2015-1, Class A | | | 4.703 | % | | 12/15/40 | | $ | 1,334,144 | | | $ | 1,350,823 | |
Castlelake Aircraft Securitization | | | 5.250 | % | | 02/15/29 | | | 428,726 | | | | 427,011 | |
Castlelake Aircraft Securitization | | | 7.500 | % | | 02/15/29 | | | 384,132 | | | | 383,172 | |
Cerberus Loan Funding XVII, Series 2016-17, Class A (b) | | | 3.483 | % | | 01/15/28 | | | 1,000,000 | | | | 996,341 | |
Chesterfield Financial Holding, LLC (b) | | | 4.500 | % | | 12/15/34 | | | 821,000 | | | | 815,722 | |
CIFC Funding Ltd., Series 2007-I, Class B-1L (b) | | | 2.306 | % | | 05/10/21 | | | 1,300,000 | | | | 1,274,208 | |
CIFC Funding Ltd., Series 2012-I REFI, Class A-3R (b) | | | 3.886 | % | | 08/14/24 | | | 1,000,000 | | | | 1,006,227 | |
CIFC Funding Ltd. (b) | | | 2.735 | % | | 12/05/24 | | | 1,500,000 | | | | 1,499,600 | |
Diamond Head Aviation Ltd., Series 2015-1, Class A | | | 3.810 | % | | 07/14/28 | | | 705,697 | | | | 697,441 | |
Drug Royalty III, L.P., Series 2016-1, Class NT | | | 3.979 | % | | 04/15/27 | | | 931,972 | | | | 923,218 | |
Dryden Senior Loan Fund, Series 2015-37, Class COMB | | | 8.826 | % | | 04/15/27 | | | 1,000,000 | | | | 938,408 | |
Earnest Student Loan Program, LLC, Series 2016-C, Class B | | | 4.460 | % | | 01/26/37 | | | 1,000,000 | | | | 972,124 | |
FDF Ltd. (b) | | | 4.285 | % | | 05/12/61 | | | 1,000,000 | | | | 979,070 | |
Flagship VII Ltd. (b) | | | 3.594 | % | | 01/20/26 | | | 1,500,000 | | | | 1,492,512 | |
Golub Capital Partners, Series 2015-25, Class A-1 (b) | | | 2.432 | % | | 08/05/27 | | | 1,000,000 | | | | 989,698 | |
Halcyon Loan Advisors Funding, Series 2012-2, Class C (b) | | | 3.847 | % | | 12/20/24 | | | 1,500,000 | | | | 1,463,547 | |
Harbour Aircraft Investments Ltd. (b) | | | 4.703 | % | | 07/15/41 | | | 941,300 | | | | 945,402 | |
See Notes to Financial Statements.
58
Wilshire Mutual Funds, Inc. Wilshire Income Opportunities Fund Schedule of Investments - (continued) | December 31, 2016 |
|
| | | Coupon | | Maturity | | Par Value | | | Value | |
ASSET-BACKED SECURITIES — 10.3% (Continued) | |
Highbridge Loan Management (b) | | | 3.247 | % | | 09/20/22 | | $ | 1,000,000 | | | $ | 999,737 | |
Highbridge Loan Management (b) | | | 4.247 | % | | 09/20/22 | | | 1,000,000 | | | | 998,271 | |
Ivy Hill Middle Market Credit Funding, Series 2014-9, Class B-1 (b) | | | 3.082 | % | | 10/18/25 | | | 2,000,000 | | | | 1,974,180 | |
Newmark Capital Funding (b) | | | 4.337 | % | | 06/30/26 | | | 1,159,000 | | | | 1,048,956 | |
PFP Ltd., Series 2015-2, Class A-S (b) | | | 2.707 | % | | 07/14/34 | | | 1,000,000 | | | | 998,000 | |
Putnam Structured Product, Series 2003-1, Class A2 144 (b) | | | 1.703 | % | | 10/15/38 | | | 1,991,815 | | | | 1,792,633 | |
Regatta V Funding Ltd. (b) | | | 3.788 | % | | 10/25/26 | | | 1,500,000 | | | | 1,503,002 | |
Rockwall CDO II Ltd., Series 2007-2, Class A-1LB (b) | | | 1.186 | % | | 08/01/24 | | | 1,500,000 | | | | 1,476,909 | |
SRERS Funding Ltd., Series 2011, Class A1B-1 (b) | | | 0.763 | % | | 05/09/46 | | | 516,098 | | | | 514,034 | |
SRERS Funding Ltd., Series 2011, Class A1B-2 (b) | | | 0.763 | % | | 05/09/46 | | | 500,000 | | | | 314,651 | |
Store Master Funding I (b) | | | 3.960 | % | | 10/20/26 | | | 2,044,083 | | | | 1,953,519 | |
TRIAXX Prime CDO, Series 2006-2, Class A-1A (b) | | | 0.883 | % | | 10/02/39 | | | 794,064 | | | | 764,287 | |
Venture VI CDO Ltd., Series 2006-6, Class C (b) | | | 2.116 | % | | 08/03/20 | | | 2,250,000 | | | | 2,212,967 | |
| | | | | | | | | | | | | | | |
Total Asset-Backed Securities (Cost $41,036,920) | | | | 41,157,685 | |
| | | | | | | | | | | | | | | |
COLLATERALIZED LOAN OBLIGATIONS — 13.1% | |
ABPCI Direct Lending Fund CLO, Series 2016-1A, Class A (b) | | | 3.650 | % | | 12/22/28 | | | 1,000,000 | | | | 995,078 | |
ACAS CLO Ltd. (b) | | | 3.317 | % | | 09/20/23 | | | 1,000,000 | | | | 999,928 | |
ACAS CLO Ltd. (b) | | | 4.247 | % | | 09/20/23 | | $ | 1,000,000 | | | $ | 1,000,800 | |
ALM Loan Funding | | | 3.634 | % | | 07/15/28 | | | 250,000 | | | | 252,764 | |
AMMC CLO XIII Ltd., Series 2013-13, Class A-3L (b) | | | 3.338 | % | | 01/26/26 | | | 1,500,000 | | | | 1,500,821 | |
Annisa CLO Ltd., Series 2016, Class B (b) | | | 2.751 | % | | 07/20/28 | | | 500,000 | | | | 499,493 | |
Apidos CLO (b) | | | 4.647 | % | | 07/20/27 | | | 500,000 | | | | 486,665 | |
ARES XXIII CLO Ltd., Series 2014-23, Class C-R (b) | | | 3.833 | % | | 04/19/23 | | | 1,250,000 | | | | 1,247,434 | |
Avery Point III CLO Ltd. (b) | | | 2.079 | % | | 01/18/25 | | | 500,000 | | | | 500,006 | |
Babson CLO Ltd., Series 2012-II, Class SUB | | | 0.000 | % | | 05/15/23 | | | 1,000,000 | | | | 607,084 | |
Baker Street CLO, Series 2006-2, Class C (b) | | | 1.410 | % | | 10/15/19 | | | 1,500,000 | | | | 1,491,704 | |
BlueMountain CLO Ltd., Series 2014-2, Class A (b) | | | 2.150 | % | | 07/20/26 | | | 250,000 | | | | 249,888 | |
BlueMountain CLO Ltd., Series 2016-2, Class C (b) | | | 4.800 | % | | 08/20/28 | | | 500,000 | | | | 494,653 | |
Canyon Capital CLO Ltd. (b) | | | 4.006 | % | | 04/30/25 | | | 250,000 | | | | 238,720 | |
Carlyle Global Market Strategies, Series 2014-2, Class C (b) | | | 3.666 | % | | 05/15/25 | | | 500,000 | | | | 498,826 | |
Cent CLO, L.P. (b) | | | 2.886 | % | | 08/01/24 | | | 500,000 | | | | 500,031 | |
Cent CLO, L.P. (b) | | | 3.836 | % | | 08/01/24 | | | 1,000,000 | | | | 1,001,150 | |
Cerberus Onshore II CLO, LLC (b) | | | 3.930 | % | | 11/06/25 | | | 2,000,000 | | | | 1,991,457 | |
Duane Street CLO IV, Series 2007-4, Class C (b) | | | 1.816 | % | | 11/14/21 | | | 1,500,000 | | | | 1,485,765 | |
ECAF I Ltd., Series 2015-1, Class A-2 | | | 4.947 | % | | 06/15/40 | | | 991,172 | | | | 999,560 | |
Flagship CLO VI, Series 2007-6, Class D (b) | | | 3.245 | % | | 06/10/21 | | | 2,000,000 | | | | 1,971,869 | |
See Notes to Financial Statements.
59
Wilshire Mutual Funds, Inc. Wilshire Income Opportunities Fund Schedule of Investments - (continued) | December 31, 2016 |
|
| | | Coupon | | Maturity | | Par Value | | | Value | |
COLLATERALIZED LOAN OBLIGATIONS — 13.1% (Continued) | |
Fortress Credit Investments IV CLO (b) | | | 2.532 | % | | 07/17/23 | | $ | 1,250,000 | | | $ | 1,243,833 | |
Fortress Credit Opportunities CLO (b) | | | 3.314 | % | | 10/15/26 | | | 1,000,000 | | | | 981,924 | |
Fortress Credit Opportunities CLO (b) | | | 4.214 | % | | 10/15/26 | | | 1,000,000 | | | | 986,410 | |
Fortress Credit Opportunities CLO (b) | | | 3.884 | % | | 12/15/28 | | | 1,000,000 | | | | 994,087 | |
Galaxy XXII CLO Ltd. (b) | | | 5.105 | % | | 07/16/28 | | | 500,000 | | | | 498,750 | |
Golub Capital Partners CLO (b) | | | 3.164 | % | | 10/25/26 | | | 700,000 | | | | 679,974 | |
Golub Capital Partners CLO (b) | | | 3.365 | % | | 11/21/28 | | | 2,250,000 | | | | 2,241,432 | |
Great Lakes CLO Ltd. (b) | | | 2.630 | % | | 07/15/26 | | | 1,000,000 | | | | 992,991 | |
Jamestown CLO III Ltd., Series 2013-3, Class D (b) | | | 5.280 | % | | 01/15/26 | | | 1,750,000 | | | | 1,469,192 | |
Keuka Park CLO Ltd., Series 2013, Class SUB | | | 0.000 | % | | 10/21/24 | | | 1,250,000 | | | | 612,500 | |
KVK CLO Ltd. | | | 0.000 | % | | 04/14/25 | | | 1,150,000 | | | | 465,862 | |
KVK CLO Ltd. (b) | | | 2.980 | % | | 10/15/26 | | | 1,000,000 | | | | 971,743 | |
Madison Park Funding VI, Series 2007-6, Class C (b) | | | 1.721 | % | | 07/26/21 | | | 250,000 | | | | 245,074 | |
Madison Park Funding XI, Series 2013-11, Class D (b) | | | 4.214 | % | | 10/23/25 | | | 500,000 | | | | 497,471 | |
Marea CLO Ltd., Series 2012-REFI, Class B-R (b) | | | 2.428 | % | | 10/15/23 | | | 1,250,000 | | | | 1,246,666 | |
Neuberger Berman CLO XII, Series 2012-12R, Class C-R (b) | | | 3.981 | % | | 07/25/23 | | | 1,500,000 | | | | 1,496,601 | |
North End CLO Ltd., Series 2013, Class E (b) | | | 5.279 | % | | 07/17/25 | | $ | 1,000,000 | | | $ | 865,137 | |
Ocean Trails CLO IV, LLC (b) | | | 3.817 | % | | 08/13/25 | | | 1,750,000 | | | | 1,749,484 | |
Octagon Investment Partners (b) | | | 2.812 | % | | 07/15/27 | | | 250,000 | | | | 251,069 | |
Octagon Investment Partners XXI, Series 2014-21, Class D (b) | | | 7.502 | % | | 11/14/26 | | | 250,000 | | | | 248,650 | |
Palmer Square Loan Funding (b) | | | 2.817 | % | | 06/21/24 | | | 250,000 | | | | 250,478 | |
Silverado CLO Ltd., Series 2006-II, Class A1J 14 (b) | | | 1.029 | % | | 10/16/20 | | | 300,000 | | | | 299,477 | |
Steele Creek CLO Ltd. (b) | | | 2.903 | % | | 08/21/26 | | | 2,000,000 | | | | 2,000,487 | |
Symphony CLO XIV Ltd. (b) | | | 4.273 | % | | 07/14/26 | | | 500,000 | | | | 496,242 | |
TCI-Cent CLO, Series 2016-1A, Class C (b) | | | 4.934 | % | | 12/21/29 | | | 500,000 | | | | 490,939 | |
TCI-Flatiron (b) | | | 2.862 | % | | 07/17/28 | | | 250,000 | | | | 251,488 | |
TCI-Flatiron (b) | | | 3.712 | % | | 07/17/28 | | | 250,000 | | | | 250,106 | |
TCP Waterman CLO, LLC (b) | | | 3.216 | % | | 12/15/28 | | | 1,000,000 | | | | 998,177 | |
TICP CLO I Ltd. (b) | | | 3.695 | % | | 07/20/26 | | | 1,000,000 | | | | 994,797 | |
Treman Park CLO Ltd., Series 2015, Class COMB | | | 7.000 | % | | 04/20/27 | | | 500,000 | | | | 450,959 | |
Venture CDO Ltd. (b) | | | 2.954 | % | | 07/19/28 | | | 500,000 | | | | 502,642 | |
Venture XII CLO Ltd., Series 2013-12, Class C-1 (b) | | | 3.524 | % | | 02/28/24 | | | 1,000,000 | | | | 1,000,396 | |
Vibrant CLO Ltd. (b) | | | 2.779 | % | | 07/17/24 | | | 1,000,000 | | | | 1,004,537 | |
Voya CLO IV Ltd. (b) | | | 2.837 | % | | 06/14/22 | | | 1,500,000 | | | | 1,505,249 | |
Voya CLO Ltd. (b) | | | 4.932 | % | | 07/19/28 | | | 500,000 | | | | 496,226 | |
Westcott Park CLO, Series 2016, Class D (b) | | | 5.006 | % | | 07/20/28 | | | 500,000 | | | | 503,354 | |
Whitehorse IV Ltd. CLO (b) | | | 2.082 | % | | 01/17/20 | | | 1,500,000 | | | | 1,449,102 | |
Whitehorse VIII Ltd. CLO (b) | | | 2.686 | % | | 05/01/26 | | | 1,100,000 | | | | 1,083,801 | |
See Notes to Financial Statements.
60
Wilshire Mutual Funds, Inc. Wilshire Income Opportunities Fund Schedule of Investments - (continued) | December 31, 2016 |
|
| | | Coupon | | Maturity | | Par Value | | | Value | |
COLLATERALIZED LOAN OBLIGATIONS — 13.1% (Continued) | |
Wind River CLO I Ltd. (b) | | | 4.952 | % | | 01/15/26 | | $ | 250,000 | | | $ | 249,995 | |
| | | | | | | | | | | | | | | |
Total Collateralized Loan Obligations (Cost $52,322,056) | | | | 52,030,998 | |
| | | | | | | | | | | | | | | |
INVESTMENT-GRADE CORPORATE OBLIGATIONS — 5.6% | |
Energy — 1.1% | | | | | | | | | | | | | | |
Buckeye Partners, L.P. | | | 4.350 | % | | 10/15/24 | | | 500,000 | | | | 510,265 | |
Gulfstream Natural Gas Systems, LLC, 144A | | | 4.600 | % | | 09/15/25 | | | 310,000 | | | | 321,178 | |
MPLX, L.P. | | | 4.875 | % | | 12/01/24 | | | 650,000 | | | | 669,301 | |
Occidental Petroleum Corp. | | | 3.400 | % | | 04/15/26 | | | 35,000 | | | | 35,264 | |
Shell International Finance BV | | | 6.375 | % | | 12/15/38 | | | 1,000,000 | | | | 1,289,584 | |
Sunoco Logistics Partners * | | | 5.950 | % | | 12/01/25 | | | 1,300,000 | | | | 1,448,328 | |
| | | | | | | | | | | | | | 4,273,920 | |
Financials — 1.4% | | | | | | | | | | | | | | |
Air Lease Corp. | | | 3.750 | % | | 02/01/22 | | | 165,000 | | | | 169,958 | |
Ally Financial, Inc. | | | 4.125 | % | | 03/30/20 | | | 125,000 | | | | 126,250 | |
American Express Credit Corp. | | | 2.250 | % | | 08/15/19 | | | 20,000 | | | | 20,111 | |
American Express Credit Corp. | | | 2.250 | % | | 05/05/21 | | | 245,000 | | | | 242,080 | |
Australia & New Zealand Banking Group Ltd., 144A | | | 4.875 | % | | 01/12/21 | | | 125,000 | | | | 135,262 | |
Bank of America Corp. | | | 2.000 | % | | 01/11/18 | | | 105,000 | | | | 105,242 | |
Bank of America Corp. | | | 2.503 | % | | 10/21/22 | | | 105,000 | | | | 101,548 | |
Bank of Montreal | | | 1.900 | % | | 08/21/27 | | | 135,000 | | | | 130,818 | |
BB&T Corp. | | | 2.050 | % | | 05/10/21 | | | 210,000 | | | | 206,103 | |
Boston Properties, L.P. | | | 4.125 | % | | 05/15/21 | | | 165,000 | | | | 174,330 | |
Citigroup, Inc. | | | 2.700 | % | | 03/30/21 | | | 205,000 | | | | 204,531 | |
Goldman Sachs Group, Inc. | | | 2.350 | % | | 11/15/21 | | | 140,000 | | | | 135,376 | |
Hospitality Properties Trust | | | 5.250 | % | | 02/15/26 | | | 1,300,000 | | | | 1,315,746 | |
JPMorgan Chase & Co. | | | 2.972 | % | | 01/15/23 | | $ | 140,000 | | | $ | 139,531 | |
JPMorgan Chase & Co. | | | 4.250 | % | | 10/01/27 | | | 125,000 | | | | 128,429 | |
Liberty Mutual Group, Inc., 144A | | | 6.500 | % | | 05/01/42 | | | 155,000 | | | | 183,773 | |
Manufacturing Americas Holding Corp. | | | 2.250 | % | | 02/10/20 | | | 140,000 | | | | 138,509 | |
Morgan Stanley | | | 2.500 | % | | 04/21/21 | | | 60,000 | | | | 59,348 | |
Morgan Stanley | | | 2.625 | % | | 11/17/21 | | | 75,000 | | | | 74,097 | |
Morgan Stanley | | | 3.875 | % | | 01/27/26 | | | 90,000 | | | | 90,910 | |
Morgan Stanley | | | 3.125 | % | | 07/27/26 | | | 50,000 | | | | 47,769 | |
PNC Funding Corp. | | | 3.300 | % | | 03/08/22 | | | 130,000 | | | | 133,645 | |
Royal Bank of Canada | | | 2.500 | % | | 01/19/21 | | | 55,000 | | | | 55,135 | |
Simon Property Group, L.P. | | | 3.300 | % | | 01/15/26 | | | 135,000 | | | | 134,333 | |
State Street Corp. | | | 3.550 | % | | 08/18/25 | | | 100,000 | | | | 102,376 | |
State Street Corp. | | | 2.650 | % | | 05/19/26 | | | 15,000 | | | | 14,226 | |
Sumitomo Mitsui Financial Group, Inc. | | | 2.934 | % | | 03/09/21 | | | 140,000 | | | | 140,812 | |
Sumitomo Mitsui Financial Group, Inc. | | | 2.058 | % | | 07/14/21 | | | 60,000 | | | | 58,031 | |
Synchrony Financial | | | 3.000 | % | | 08/15/19 | | | 120,000 | | | | 121,555 | |
TIAA Asset Management Finance Co., LLC, 144A | | | 2.950 | % | | 11/01/19 | | | 30,000 | | | | 30,518 | |
Toronto-Dominion Bank | | | 1.800 | % | | 07/13/21 | | | 200,000 | | | | 193,674 | |
UnitedHealth Group, Inc. | | | 4.200 | % | | 01/15/47 | | | 130,000 | | | | 131,495 | |
WellPoint, Inc. | | | 2.300 | % | | 07/15/18 | | | 125,000 | | | | 125,817 | |
Wells Fargo & Co. | | | 3.000 | % | | 04/22/26 | | | 210,000 | | | | 200,389 | |
Wells Fargo & Co. | | | 3.000 | % | | 10/23/26 | | | 85,000 | | | | 80,954 | |
Westpac Banking Corp. | | | 2.600 | % | | 11/23/20 | | | 120,000 | | | | 120,485 | |
Westpac Banking Corp. | | | 2.000 | % | | 08/19/21 | | | 15,000 | | | | 14,561 | |
| | | | | | | | | | | | | | 5,587,727 | |
Health Care — 0.3% | | | | | | | | | | | | | | |
WP Carey, Inc. * | | | 4.250 | % | | 10/01/26 | | | 1,150,000 | | | | 1,116,499 | |
See Notes to Financial Statements.
61
Wilshire Mutual Funds, Inc. Wilshire Income Opportunities Fund Schedule of Investments - (continued) | December 31, 2016 |
|
| | | Coupon | | Maturity | | Par Value | | | Value | |
INVESTMENT-GRADE CORPORATE OBLIGATIONS — 5.6% (Continued) | |
Industrials — 2.0% | | | | | | | | | | | |
AbbVie, Inc. | | | 4.700 | % | | 05/14/45 | | $ | 135,000 | | | $ | 132,453 | |
Actavis Funding SCS | | | 2.350 | % | | 03/12/18 | | | 185,000 | | | | 186,069 | |
Amazon.com, Inc. | | | 3.800 | % | | 12/05/24 | | | 65,000 | | | | 68,304 | |
Analog Devices, Inc. | | | 2.500 | % | | 12/05/21 | | | 140,000 | | | | 138,715 | |
Anheuser-Busch InBev SA/NV | | | 4.900 | % | | 02/01/46 | | | 65,000 | | | | 70,257 | |
Apache Corp. | | | 4.750 | % | | 04/15/43 | | | 75,000 | | | | 77,252 | |
AstraZeneca plc | | | 2.375 | % | | 11/16/20 | | | 70,000 | | | | 69,762 | |
Boeing Co. | | | 6.875 | % | | 03/15/39 | | | 90,000 | | | | 127,152 | |
BP Capital Markets plc | | | 3.017 | % | | 01/16/27 | | | 50,000 | | | | 48,253 | |
BP Capital Markets plc | | | 3.723 | % | | 11/28/28 | | | 155,000 | | | | 157,492 | |
British Telecommunications plc | | | 5.950 | % | | 01/15/18 | | | 285,000 | | | | 297,029 | |
Burlington North Santa Fe Corp. | | | 4.550 | % | | 09/01/44 | | | 150,000 | | | | 159,487 | |
Cardinal Health, Inc. | | | 1.950 | % | | 06/15/18 | | | 135,000 | | | | 135,293 | |
Celgene Corp. | | | 3.875 | % | | 08/15/25 | | | 120,000 | | | | 121,717 | |
Chevron Corp. | | | 1.561 | % | | 05/16/19 | | | 135,000 | | | | 134,446 | |
Cisco Systems, Inc. | | | 1.850 | % | | 09/20/21 | | | 145,000 | | | | 141,515 | |
Coca-Cola Co. (The) | | | 1.875 | % | | 10/27/20 | | | 45,000 | | | | 44,618 | |
Coca-Cola Co. (The) | | | 1.550 | % | | 09/01/21 | | | 95,000 | | | | 92,312 | |
Comcast Corp. | | | 4.400 | % | | 08/15/35 | | | 130,000 | | | | 135,998 | |
CSX Corp. | | | 3.800 | % | | 11/01/46 | | | 140,000 | | | | 129,791 | |
CVS Health Corp. | | | 2.875 | % | | 06/01/26 | | | 75,000 | | | | 71,488 | |
Delphi Automotive plc | | | 4.250 | % | | 01/15/26 | | | 130,000 | | | | 134,593 | |
Eli Lilly & Co. | | | 3.700 | % | | 03/01/45 | | | 100,000 | | | | 94,862 | |
Energy Transfer Partners, L.P. | | | 4.750 | % | | 01/15/26 | | | 140,000 | | | | 144,738 | |
EOG Resources, Inc. | | | 4.150 | % | | 01/15/26 | | | 70,000 | | | | 73,255 | |
Express Scripts Holdings Co. | | | 4.500 | % | | 02/25/26 | | | 100,000 | | | | 102,947 | |
Express Scripts Holdings Co. | | | 3.400 | % | | 03/01/27 | | | 25,000 | | | | 23,423 | |
FedEx Corp. | | | 4.750 | % | | 11/15/45 | | | 125,000 | | | | 129,459 | |
Fidelity National Information Services, Inc. | | | 3.625 | % | | 10/15/20 | | | 150,000 | | | | 155,290 | |
Ford Motor Co. | | | 7.450 | % | | 07/16/31 | | | 105,000 | | | | 131,780 | |
General Motors Financial Co., Inc. | | | 2.400 | % | | 05/09/19 | | $ | 165,000 | | | $ | 164,563 | |
General Motors Financial Co., Inc. | | | 3.200 | % | | 07/06/21 | | | 30,000 | | | | 29,750 | |
Georgia-Pacific, LLC, 144A | | | 3.600 | % | | 03/01/25 | | | 267,000 | | | | 270,049 | |
Hewlett Packard Enterprise Co., 144A | | | 3.600 | % | | 10/15/20 | | | 100,000 | | | | 101,731 | |
Home Depot, Inc. (The) | | | 3.000 | % | | 04/01/26 | | | 130,000 | | | | 129,751 | |
Intel Corp. | | | 4.100 | % | | 05/19/46 | | | 90,000 | | | | 89,206 | |
International Paper Co. | | | 3.000 | % | | 02/15/27 | | | 65,000 | | | | 61,323 | |
Kinder Morgan Energy Partners | | | 6.950 | % | | 01/15/38 | | | 95,000 | | | | 110,197 | |
Kraft Heinz Co. (The) | | | 2.000 | % | | 07/02/18 | | | 160,000 | | | | 160,036 | |
Kroger Co. (The) | | | 3.400 | % | | 04/15/22 | | | 170,000 | | | | 173,291 | |
Laboratory Corp. of America Holdings | | | 2.500 | % | | 11/01/18 | | | 135,000 | | | | 136,190 | |
Laboratory Corp. of America Holdings | | | 4.700 | % | | 02/01/45 | | | 130,000 | | | | 128,406 | |
Lockheed Martin Corp. | | | 4.700 | % | | 05/15/46 | | | 130,000 | | | | 141,404 | |
Microsoft Corp. | | | 4.450 | % | | 11/03/45 | | | 120,000 | | | | 127,850 | |
Mylan N.V., 144A | | | 3.150 | % | | 06/15/21 | | | 165,000 | | | | 161,929 | |
Newell Brands, Inc. | | | 3.150 | % | | 04/01/21 | | | 35,000 | | | | 35,619 | |
Omnicom Group, Inc. | | | 3.600 | % | | 04/15/26 | | | 100,000 | | | | 98,967 | |
Oracle Corp. | | | 1.900 | % | | 09/15/21 | | | 160,000 | | | | 156,351 | |
Oracle Corp. | | | 4.125 | % | | 05/15/45 | | | 140,000 | | | | 135,682 | |
Orange S.A. | | | 2.750 | % | | 02/06/19 | | | 100,000 | | | | 101,323 | |
PepsiCo, Inc. | | | 3.450 | % | | 10/06/46 | | | 145,000 | | | | 132,093 | |
Phillips 66 | | | 4.875 | % | | 11/15/44 | | | 65,000 | | | | 68,644 | |
Potash Corp. Saskatchewan, Inc. | | | 4.000 | % | | 12/15/26 | | | 30,000 | | | | 30,190 | |
Reynolds American, Inc. | | | 4.000 | % | | 06/12/22 | | | 165,000 | | | | 172,577 | |
S&P Global, Inc. | | | 4.400 | % | | 02/15/26 | | | 65,000 | | | | 68,761 | |
Schlumberger Holdings Corp., 144A | | | 2.350 | % | | 12/21/18 | | | 70,000 | | | | 70,577 | |
Shell International Finance BV | | | 1.375 | % | | 05/10/19 | | | 140,000 | | | | 138,737 | |
Shire Acquisitions Investments Ireland | | | 2.875 | % | | 09/23/23 | | | 145,000 | | | | 137,570 | |
See Notes to Financial Statements.
62
Wilshire Mutual Funds, Inc. Wilshire Income Opportunities Fund Schedule of Investments - (continued) | December 31, 2016 |
|
| | | Coupon | | Maturity | | Par Value | | | Value | |
INVESTMENT-GRADE CORPORATE OBLIGATIONS — 5.6% (Continued) | |
Industrials — 2.0% (Continued) | |
Teva Pharmaceutical Financial Co. BV | | | 2.800 | % | | 07/21/23 | | $ | 50,000 | | | $ | 47,330 | |
Teva Pharmaceuticals Financial Co. BV | | | 2.950 | % | | 12/18/22 | | | 160,000 | | | | 154,176 | |
Thermo Fisher Scientific, Inc. | | | 3.300 | % | | 02/15/22 | | | 200,000 | | | | 203,195 | |
Tyson Foods, Inc. | | | 3.950 | % | | 08/15/24 | | | 260,000 | | | | 264,886 | |
Verizon Communications, Inc. | | | 4.400 | % | | 11/01/34 | | | 275,000 | | | | 271,422 | |
Waste Management, Inc. | | | 4.100 | % | | 03/01/45 | | | 35,000 | | | | 34,639 | |
Zimmer Biomet Holdings, Inc. | | | 2.700 | % | | 04/01/20 | | | 140,000 | | | | 140,007 | |
| | | | | | | | | | | | | | 7,978,172 | |
Materials — 0.6% | | | | | | | | | | | | | | |
BHP Billiton Finance USA Ltd., 144A | | | 6.750 | % | | 10/19/75 | | | 450,000 | | | | 505,125 | |
Newcrest Finance Property Ltd., 144A | | | 4.200 | % | | 10/01/22 | | | 550,000 | | | | 553,041 | |
Tamaha Gold, Inc. * | | | 4.950 | % | | 07/15/24 | | | 1,450,000 | | | | 1,421,000 | |
| | | | | | | | | | | | | | 2,479,166 | |
Utilities — 0.2% | | | | | | | | | | | | | | |
Duke Energy Corp. | | | 3.750 | % | | 09/01/46 | | | 50,000 | | | | 45,010 | |
Duke Energy Progress, Inc. | | | 4.150 | % | | 12/01/44 | | | 95,000 | | | | 94,384 | |
Exelon Corp. | | | 3.400 | % | | 04/15/26 | | | 65,000 | | | | 63,777 | |
Fortis, Inc., 144A | | | 2.100 | % | | 10/04/21 | | | 140,000 | | | | 135,312 | |
MidAmerican Energy Holdings | | | 6.500 | % | | 09/15/37 | | | 200,000 | | | | 260,335 | |
Southern Co. | | | 2.450 | % | | 09/01/18 | | | 196,000 | | | | 198,013 | |
| | | | | | | | | | | | | | 796,831 | |
Total Investment-Grade Corporate Obligations (Cost $22,515,274) | | | | 22,232,315 | |
| | | | | | | | | | | | | | | |
HIGH YIELD CORPORATE OBLIGATIONS — 4.0% | |
Consumer Discretionary — 0.3% | |
Allison Transmission, Inc., 144A | | | 5.000 | % | | 10/01/24 | | | 25,000 | | | | 25,250 | |
AMC Entertainment Holdings, Inc., 144A | | | 5.875 | % | | 11/15/26 | | | 20,000 | | | | 20,450 | |
American Axle & Manufacturing, Inc. | | | 6.625 | % | | 10/15/22 | | $ | 55,000 | | | $ | 56,716 | |
Argos Merger Sub, Inc., 144A | | | 7.125 | % | | 03/15/23 | | | 50,000 | | | | 51,000 | |
Asbury Automotive Group | | | 6.000 | % | | 12/15/24 | | | 30,000 | | | | 30,675 | |
Dana Holding Corp. | | | 5.500 | % | | 12/15/24 | | | 30,000 | | | | 30,600 | |
Dollar Tree, Inc. | | | 5.750 | % | | 03/01/23 | | | 15,000 | | | | 15,882 | |
Gannett Co., Inc., 144A | | | 4.875 | % | | 09/15/21 | | | 60,000 | | | | 61,050 | |
GLP Capital, L.P. Financing II | | | 5.375 | % | | 04/15/26 | | | 20,000 | | | | 20,858 | |
Goodyear Tire & Rubber Co. | | | 5.125 | % | | 11/15/23 | | | 60,000 | | | | 61,800 | |
Gray Television, Inc., 144A | | | 5.125 | % | | 10/15/24 | | | 25,000 | | | | 24,188 | |
Gray Television, Inc., 144A | | | 5.875 | % | | 07/15/26 | | | 30,000 | | | | 29,775 | |
Hilton Domestic Operating Co., Inc., 144A | | | 4.250 | % | | 09/01/24 | | | 40,000 | | | | 38,800 | |
Jack Ohio Finance, LLC, 144A | | | 6.750 | % | | 11/15/21 | | | 40,000 | | | | 40,500 | |
Levi Strauss & Co. | | | 5.000 | % | | 05/01/25 | | | 15,000 | | | | 15,000 | |
Live Nation Entertainment, Inc., 144A | | | 4.875 | % | | 11/01/24 | | | 40,000 | | | | 40,100 | |
MGM Resorts International, Inc. | | | 4.625 | % | | 09/01/26 | | | 30,000 | | | | 28,875 | |
NCL Corp. Ltd., 144A | | | 4.750 | % | | 12/15/21 | | | 40,000 | | | | 39,975 | |
Pinnacle Entertainment, Inc., 144A | | | 5.625 | % | | 05/01/24 | | | 40,000 | | | | 40,100 | |
Prime Securities Service Borrower, LLC, 144A | | | 9.250 | % | | 05/15/23 | | | 55,000 | | | | 59,881 | |
Sally Holdings, LLC | | | 5.750 | % | | 06/01/22 | | | 55,000 | | | | 57,131 | |
Scientific Games International, Inc., 144A | | | 7.000 | % | | 01/01/22 | | | 20,000 | | | | 21,450 | |
ServiceMaster Co., LLC, 144A | | | 5.125 | % | | 11/15/24 | | | 20,000 | | | | 20,300 | |
Sirius XM Canada Holdings, Inc., 144A | | | 5.625 | % | | 04/23/21 | | | 400,000 | | | | 297,881 | |
Station Casinos, LLC | | | 7.500 | % | | 03/01/21 | | | 40,000 | | | | 41,900 | |
See Notes to Financial Statements.
63
Wilshire Mutual Funds, Inc. Wilshire Income Opportunities Fund Schedule of Investments - (continued) | December 31, 2016 |
|
| | | Coupon | | Maturity | | Par Value | | | Value | |
HIGH YIELD CORPORATE OBLIGATIONS — 4.0% (Continued) | |
Consumer Discretionary — 0.3% (Continued) | |
Viking Cruises Ltd., 144A | | | 8.500 | % | | 10/15/22 | | $ | 60,000 | | | $ | 62,250 | |
| | | | | | | | | | | | | | 1,232,387 | |
Consumer Staples — 0.6% | |
Albertsons Cos., LLC, 144A | | | 5.750 | % | | 03/15/25 | | | 40,000 | | | | 39,600 | |
Bumble Bee Holdings, Inc., 144A | | | 9.000 | % | | 12/15/17 | | | 769,000 | | | | 759,388 | |
HRG Group, Inc. | | | 7.875 | % | | 07/15/19 | | | 415,000 | | | | 432,638 | |
JBS USA, LLC, 144A | | | 5.750 | % | | 06/15/25 | | | 30,000 | | | | 30,375 | |
Kronos Acquisition Holdings, Inc., 144A | | | 9.000 | % | | 08/15/23 | | | 20,000 | | | | 19,950 | |
Pilgrim's Pride Corp., 144A | | | 5.750 | % | | 03/15/25 | | | 60,000 | | | | 59,850 | |
Revlon Consumer Products Corp. (b) | | | 5.750 | % | | 02/15/21 | | | 40,000 | | | | 40,200 | |
Revlon Consumer Products Corp. | | | 6.250 | % | | 08/01/24 | | | 10,000 | | | | 10,250 | |
Rite Aid Corp., 144A | | | 6.125 | % | | 04/01/23 | | | 35,000 | | | | 37,625 | |
Spectrum Brands, Inc. | | | 5.750 | % | | 07/15/25 | | | 60,000 | | | | 62,250 | |
TreeHouse Foods, Inc., 144A | | | 6.000 | % | | 02/15/24 | | | 20,000 | | | | 21,000 | |
Vector Group Ltd. * | | | 7.750 | % | | 02/15/21 | | | 1,000,000 | | | | 1,042,499 | |
| | | | | | | | | | | | | | 2,555,625 | |
Energy — 0.4% | | | | | | | | | | | | | | |
Access Midstream Partners, L.P. | | | 4.875 | % | | 03/15/24 | | | 40,000 | | | | 40,391 | |
Cheniere Corp., 144A | | | 5.875 | % | | 03/31/25 | | | 1,000,000 | | | | 1,020,310 | |
Dynagas LNG Partners (c) | | | 6.250 | % | | 10/30/19 | | | 500,000 | | | | 477,500 | |
Energy Transfer Equity | | | 5.500 | % | | 06/01/27 | | | 30,000 | | | | 29,250 | |
Extraction Oil & Gas Holdings, LLC, 144A | | | 7.875 | % | | 07/15/21 | | | 20,000 | | | | 21,400 | |
Noble Holding International Ltd. | | | 7.750 | % | | 01/15/24 | | | 10,000 | | | | 9,406 | |
PDC Energy, Inc., 144A | | | 6.125 | % | | 09/15/24 | | | 15,000 | | | | 15,338 | |
Sanchez Energy Corp. | | | 6.125 | % | | 01/15/23 | | | 25,000 | | | | 23,750 | |
Targa Resource Partners, 144A | | | 5.370 | % | | 02/01/27 | | | 2,500 | | | | 24,750 | |
| | | | | | | | | | | | | | 1,662,095 | |
Financials — 0.3% | | | | | | | | | | | | | | |
ESH Hospitality, Inc., 144A | | | 5.250 | % | | 05/01/25 | | $ | 60,000 | | | $ | 59,700 | |
Jefferies Finance, LLC | | | 7.500 | % | | 04/15/21 | | | 500,000 | | | | 495,000 | |
Kennedy-Wilson, Inc. | | | 5.875 | % | | 04/01/24 | | | 600,000 | | | | 611,250 | |
MGP Growth, L.P., 144A | | | 5.625 | % | | 05/01/24 | | | 10,000 | | | | 10,475 | |
Nationstar Mortgage, LLC | | | 6.500 | % | | 07/01/21 | | | 20,000 | | | | 20,250 | |
| | | | | | | | | | | | | | 1,196,675 | |
Health Care — 0.4% | | | | | | | | | | | | | | |
Acadia Healthcare Co., Inc. | | | 5.625 | % | | 02/15/23 | | | 40,000 | | | | 40,000 | |
Air Medical Merger Sub, 144A | | | 6.375 | % | | 05/15/23 | | | 60,000 | | | | 57,600 | |
Centene Corp. | | | 5.625 | % | | 02/15/21 | | | 15,000 | | | | 15,771 | |
Centene Corp. | | | 4.750 | % | | 01/15/25 | | | 40,000 | | | | 39,050 | |
DJO Finance, LLC, 144A | | | 8.125 | % | | 06/15/21 | | | 10,000 | | | | 8,675 | |
Endo Finance, LLC, 144A | | | 5.375 | % | | 01/15/23 | | | 45,000 | | | | 38,138 | |
HCA Holdings, Inc. | | | 5.875 | % | | 02/15/26 | | | 20,000 | | | | 20,600 | |
Inventive Group Holdings, Inc., 144A | | | 7.500 | % | | 10/01/24 | | | 40,000 | | | | 41,896 | |
Kinetic Concepts, Inc., 144A | | | 7.875 | % | | 02/15/21 | | | 250,000 | | | | 271,250 | |
LifePoint Health, Inc., 144A | | | 5.375 | % | | 05/01/24 | | | 20,000 | | | | 19,590 | |
MPH Acquisition Holdings, LLC, 144A | | | 7.125 | % | | 06/01/24 | | | 55,000 | | | | 57,893 | |
New Amethyst Corp., 144A | | | 6.250 | % | | 12/01/24 | | | 50,000 | | | | 52,750 | |
RegionalCare Hospital Partners Holdings, Inc., 144A | | | 8.250 | % | | 05/01/23 | | | 25,000 | | | | 24,938 | |
Select Medical Corp. | | | 6.375 | % | | 06/01/21 | | | 60,000 | | | | 60,000 | |
TeamHealth, Inc., 144A | | | 7.250 | % | | 12/15/23 | | | 25,000 | | | | 28,438 | |
Tenet Healthcare Corp. (b) | | | 4.463 | % | | 06/15/20 | | | 800,000 | | | | 805,999 | |
Tenet Healthcare Corp. | | | 6.750 | % | | 06/15/23 | | | 65,000 | | | | 57,363 | |
Vizient, Inc., 144A | | | 10.375 | % | | 03/01/24 | | | 30,000 | | | | 33,975 | |
| | | | | | | | | | | | | | 1,673,926 | |
See Notes to Financial Statements.
64
Wilshire Mutual Funds, Inc. Wilshire Income Opportunities Fund Schedule of Investments - (continued) | December 31, 2016 |
|
| | | Coupon | | Maturity | | Par Value | | | Value | |
HIGH YIELD CORPORATE OBLIGATIONS — 4.0% (Continued) | |
Industrials — 0.1% | | | | | | | | | | | |
Builders FirstSource, Inc., 144A | | | 5.625 | % | | 09/01/24 | | $ | 22,000 | | | $ | 22,110 | |
Gates Global, LLC, 144A | | | 6.000 | % | | 07/15/22 | | | 45,000 | | | | 44,010 | |
Grinding Media, Inc., 144A | | | 7.375 | % | | 12/15/23 | | | 15,000 | | | | 15,759 | |
Milacron, LLC, 144A | | | 7.750 | % | | 02/15/21 | | | 60,000 | | | | 61,650 | |
Novelis Corp., 144A | | | 6.250 | % | | 08/15/24 | | | 25,000 | | | | 26,500 | |
Novelis Corp., 144A | | | 5.875 | % | | 09/30/26 | | | 10,000 | | | | 10,100 | |
OPE KAG Finance, Inc., 144A | | | 7.875 | % | | 07/31/23 | | | 20,000 | | | | 20,200 | |
Signode Industrial Group US, Inc., 144A | | | 6.375 | % | | 05/01/22 | | | 40,000 | | | | 39,900 | |
Terex Corp. | | | 6.000 | % | | 05/15/21 | | | 55,000 | | | | 56,238 | |
TransDigm, Inc. | | | 6.000 | % | | 07/15/22 | | | 60,000 | | | | 62,399 | |
| | | | | | | | | | | | | | 358,866 | |
Information Technology — 0.2% | |
Camelot Finance S.A. | | | 5.500 | % | | 10/15/24 | | | 30,000 | | | | 31,125 | |
CDK Global, Inc. | | | 5.000 | % | | 10/15/24 | | | 100,000 | | | | 96,999 | |
CommScope, Inc., 144A | | | 5.000 | % | | 06/15/21 | | | 60,000 | | | | 61,800 | |
Diamond 1 Financial Corp., 144A | | | 7.125 | % | | 06/15/24 | | | 40,000 | | | | 44,407 | |
Ensemble S Merger Sub, Inc., 144A | | | 9.000 | % | | 09/30/23 | | | 60,000 | | | | 63,750 | |
First Data Corp., 144A | | | 7.000 | % | | 12/01/23 | | | 30,000 | | | | 31,950 | |
First Data Corp., 144A | | | 5.750 | % | | 01/15/24 | | | 30,000 | | | | 30,956 | |
Greeneden US Holdings II, LLC, 144A | | | 10.000 | % | | 11/30/24 | | | 45,000 | | | | 47,813 | |
Infor US, Inc. | | | 6.500 | % | | 05/15/22 | | | 40,000 | | | | 41,700 | |
Microsemi Corp., 144A | | | 9.125 | % | | 04/15/23 | | | 10,000 | | | | 11,650 | |
NXP Funding, LLC, 144A | | | 4.125 | % | | 06/01/21 | | | 45,000 | | | | 46,463 | |
Open Text Corp., 144A | | | 5.875 | % | | 06/01/26 | | | 35,000 | | | | 36,925 | |
Quintiles Transnational Corp., 144A | | | 4.875 | % | | 05/15/23 | | | 40,000 | | | | 40,600 | |
Sabre Global, Inc., 144A | | | 5.250 | % | | 11/15/23 | | | 40,000 | | | | 41,075 | |
Solera, LLC, 144A | | | 10.500 | % | | 03/01/24 | | | 25,000 | | | | 28,125 | |
Western Digital Corp., 144A | | | 7.375 | % | | 04/01/23 | | $ | 20,000 | | | $ | 22,000 | |
| | | | | | | | | | | | | | 677,338 | |
Materials — 0.1% | | | | | | | | | | | | | | |
Alcoa Nederland Holding, 144A | | | 6.750 | % | | 09/30/24 | | | 200,000 | | | | 217,000 | |
Ashland, Inc. | | | 4.750 | % | | 08/15/22 | | | 30,000 | | | | 31,125 | |
Berry Plastics Corp. | | | 5.500 | % | | 05/15/22 | | | 40,000 | | | | 41,600 | |
Plastipak Holdings, Inc., 144A | | | 6.500 | % | | 10/01/21 | | | 40,000 | | | | 41,800 | |
PQ Corp., 144A | | | 6.750 | % | | 11/15/22 | | | 30,000 | | | | 32,100 | |
Reynolds Group, Inc. | | | 8.250 | % | | 02/15/21 | | | 34,679 | | | | 35,806 | |
| | | | | | | | | | | | | | 399,431 | |
Real Estate — 0.1% | | | | | | | | | | | | | | |
Equinix, Inc. | | | 5.875 | % | | 01/15/26 | | | 40,000 | | | | 42,100 | |
Geo Group, Inc. (The) | | | 5.875 | % | | 10/15/24 | | | 440,000 | | | | 433,950 | |
| | | | | | | | | | | | | | 476,050 | |
Telecommunication Services — 1.1% | |
CCO Holdings, LLC | | | 5.250 | % | | 09/30/22 | | | 40,000 | | | | 41,400 | |
CCO Holdings, LLC, 144A | | | 5.125 | % | | 05/01/23 | | | 15,000 | | | | 15,450 | |
Cengage Learning, Inc., 144A | | | 9.500 | % | | 06/15/24 | | | 35,000 | | | | 31,063 | |
Cequel Commercial Capital, 144A | | | 6.375 | % | | 09/15/20 | | | 60,000 | | | | 61,800 | |
Cincinnati Bell, Inc., 144A | | | 7.000 | % | | 07/15/24 | | | 50,000 | | | | 52,875 | |
CSC Holdings, LLC | | | 5.250 | % | | 06/01/24 | | | 20,000 | | | | 19,550 | |
CSC Holdings, LLC, 144A | | | 5.500 | % | | 04/15/27 | | | 20,000 | | | | 20,250 | |
Dish DBS Corp. * | | | 5.875 | % | | 11/15/24 | | | 450,000 | | | | 463,050 | |
Dish DBS Corp., 144A * | | | 7.750 | % | | 07/01/26 | | | 1,000,000 | | | | 1,127,499 | |
Embarq Corp. | | | 7.995 | % | | 06/01/36 | | | 30,000 | | | | 28,125 | |
Geo Group, Inc. (The) | | | 6.000 | % | | 04/15/26 | | | 100,000 | | | | 98,250 | |
Inmarsat Financial plc, 144A | | | 4.875 | % | | 05/15/22 | | | 250,000 | | | | 243,125 | |
Intelsat Jackson Holdings Ltd. | | | 5.500 | % | | 08/01/23 | | | 35,000 | | | | 23,583 | |
Intelsat Jackson Holdings Ltd., 144A | | | 8.000 | % | | 02/15/24 | | | 20,000 | | | | 20,550 | |
Level 3 Communications, Inc. | | | 5.750 | % | | 12/01/22 | | | 60,000 | | | | 61,650 | |
See Notes to Financial Statements.
65
Wilshire Mutual Funds, Inc. Wilshire Income Opportunities Fund Schedule of Investments - (continued) | December 31, 2016 |
|
| | | Coupon | | Maturity | | Par Value | | | Value | |
HIGH YIELD CORPORATE OBLIGATIONS — 4.0% (Continued) | |
Telecommunication Services — 1.1% (Continued) | |
Neptune Finco Corp., 144A | | | 6.625 | % | | 10/15/25 | | $ | 525,000 | | | $ | 573,563 | |
Nexstar Escrow Corp., 144A | | | 5.625 | % | | 08/01/24 | | | 30,000 | | | | 29,775 | |
Numericable Group S.A., 144A | | | 6.000 | % | | 05/15/22 | | | 200,000 | | | | 205,250 | |
Sinclair Television Group, 144A | | | 5.625 | % | | 08/01/24 | | | 60,000 | | | | 61,350 | |
Sirius XM Radio, Inc., 144A | | | 5.375 | % | | 07/15/26 | | CAD 60,000 | | | | 58,650 | |
Sprint Nextel Corp., 144A * | | | 7.000 | % | | 03/01/20 | | | 800,000 | | | | 868,000 | |
Telesat Canada, LLC, 144A | | | 8.875 | % | | 11/15/24 | | | 30,000 | | | | 31,275 | |
WMG Acquisition Corp., 144A | | | 6.750 | % | | 04/15/22 | | | 45,000 | | | | 47,363 | |
| | | | | | | | | | | | | | 4,183,446 | |
Utilities — 0.4% | | | | | | | | | | | | | | |
AES Corp. | | | 6.000 | % | | 05/15/26 | | | 200,000 | | | | 203,000 | |
AmeriGas Partners Finance Corp. | | | 5.500 | % | | 05/20/25 | | | 1,030,000 | | | | 1,040,300 | |
Calpine Corp. | | | 5.750 | % | | 01/15/25 | | | 20,000 | | | | 19,300 | |
Ferrellgas, L.P. | | | 6.750 | % | | 01/15/22 | | | 300,000 | | | | 297,750 | |
NGL Energy Partners, L.P., 144A | | | 7.500 | % | | 11/01/23 | | | 20,000 | | | | 20,650 | |
NRG Energy, Inc., 144A | | | 7.250 | % | | 05/15/26 | | | 40,000 | | | | 39,800 | |
| | | | | | | | | | | | | | 1,620,800 | |
Total High Yield Corporate Obligations (Cost $15,666,957) | | | | 16,036,639 | |
| | | | | | | | | | | | | | | |
FOREIGN BONDS — 12.7% | |
Austria — 0.0% (d) | | | | | | | | | | | | | | |
Eldorado International Finance GmbH, 144A | | | 8.625 | % | | 06/16/21 | | | 200,000 | | | | 171,000 | |
| | | | | | | | | | | | | | | |
Bermuda — 0.2% | | | | | | | | | | | | | | |
Digicel Group Ltd. | | | 7.125 | % | | 04/01/22 | | | 900,000 | | | | 698,166 | |
| | | | | | | | | | | | | | | |
Canada — 0.0% (d) | | | | | | | | | | | | | | |
Lundin Mining Corp. | | | 7.500 | % | | 11/01/20 | | | 40,000 | | | | 42,550 | |
| | | | | | | | | | | | | | | |
Cayman Islands — 1.7% | |
Agromercantil Senior Trust | | | 6.250 | % | | 04/10/19 | | $ | 457,000 | | | $ | 468,672 | |
Cementos Progreso Trust | | | 7.125 | % | | 11/06/23 | | | 800,000 | | | | 839,120 | |
Cosan Overseas Ltd. | | | 8.250 | % | | 11/29/49 | | | 1,200,000 | | | | 1,196,400 | |
Grupo Aval Ltd. | | | 4.750 | % | | 09/26/22 | | | 800,000 | | | | 789,200 | |
Gruposura Finance | | | 5.500 | % | | 04/29/26 | | | 600,000 | | | | 614,400 | |
Guanay Finance Ltd. | | | 6.000 | % | | 12/15/20 | | | 1,028,857 | | | | 1,039,146 | |
Industrial Senior Trust | | | 5.500 | % | | 11/01/22 | | | 1,000,000 | | | | 959,340 | |
Republic of Kenya, 144A | | | 6.875 | % | | 06/24/24 | | | 900,000 | | | | 848,599 | |
| | | | | | | | | | | | | | 6,754,877 | |
Chile — 0.9% | | | | | | | | | | | | | | |
Banco Latinamericano S.A. | | | 3.250 | % | | 05/07/20 | | | 1,000,000 | | | | 1,006,000 | |
Celulosa Arauco y Constitucion S.A. | | | 7.250 | % | | 07/29/19 | | | 400,000 | | | | 442,352 | |
Cencosud S.A. | | | 5.150 | % | | 02/12/25 | | | 500,000 | | | | 505,386 | |
Colbun S.A. | | | 6.000 | % | | 01/21/20 | | | 1,000,000 | | | | 1,078,780 | |
CorpGroup Banking S.A. | | | 6.750 | % | | 03/15/23 | | | 500,000 | | | | 475,065 | |
Empresa Electrica Guacolda S.A. | | | 4.560 | % | | 04/30/25 | | | 200,000 | | | | 182,095 | |
| | | | | | | | | | | | | | 3,689,678 | |
China — 0.1% | | | | | | | | | | | | | | |
CNOOC Finance 2015 Australia Property Ltd. | | | 2.625 | % | | 05/05/20 | | | 300,000 | | | | 298,793 | |
| | | | | | | | | | | | | | | |
Colombia — 0.4% | | | | | | | | | | | | | | |
Banco de Bogota S.A., 144A | | | 6.250 | % | | 05/12/26 | | | 200,000 | | | | 204,000 | |
Empresa de Energia de Bogota S.A. | | | 6.125 | % | | 11/10/21 | | | 1,000,000 | | | | 1,030,000 | |
Empresas Publicas de Medellin | | | 7.625 | % | | 07/29/19 | | | 100,000 | | | | 111,750 | |
Republic of Columbia | | | 4.500 | % | | 01/28/26 | | | 300,000 | | | | 309,000 | |
| | | | | | | | | | | | | | 1,654,750 | |
Costa Rica — 0.7% | | | | | | | | | | | | | | |
Banco de Costa Rica | | | 5.250 | % | | 08/12/18 | | | 1,000,000 | | | | 1,008,700 | |
Banco Nacional de Costa Rica, 144A | | | 5.875 | % | | 04/25/21 | | | 1,000,000 | | | | 1,008,750 | |
See Notes to Financial Statements.
66
Wilshire Mutual Funds, Inc. Wilshire Income Opportunities Fund Schedule of Investments - (continued) | December 31, 2016 |
|
| | | Coupon | | Maturity | | Par Value | | | Value | |
FOREIGN BONDS — 12.7% (Continued) | |
Costa Rica — 0.7% (Continued) | |
Bharat Petroleum Corp., Ltd. | | | 4.625 | % | | 10/25/22 | | $ | 500,000 | | | $ | 522,990 | |
Costa Rica Government International Bond | | | 9.995 | % | | 08/01/20 | | | 200,000 | | | | 235,456 | |
| | | | | | | | | | | | | | 2,775,896 | |
Dominican Republic — 0.6% | |
Banco de Reservas de la Republica Dominicana | | | 7.000 | % | | 02/01/23 | | | 500,000 | | | | 500,095 | |
Dominican Republic | | | 9.040 | % | | 01/23/18 | | | 360,682 | | | | 372,982 | |
Dominican Republic | | | 7.500 | % | | 05/06/21 | | | 800,000 | | | | 868,272 | |
Dominican Republic International Bond, 144A | | | 6.850 | % | | 01/27/45 | | | 700,000 | | | | 661,304 | |
| | | | | | | | | | | | | | 2,402,653 | |
Guatemala — 0.1% | | | | | | | | | | | | | | |
Republic of Columbia | | | 4.875 | % | | 02/13/28 | | | 200,000 | | | | 193,012 | |
| | | | | | | | | | | | | | | |
India — 1.0% | | | | | | | | | | | | | | |
Adani Ports & Special Economic Zone | | | 3.500 | % | | 07/29/20 | | | 1,100,000 | | | | 1,094,513 | |
Export-Import Bank of India | | | 3.125 | % | | 07/20/21 | | | 1,000,000 | | | | 993,717 | |
Indian Oil Corp. Ltd. | | | 5.625 | % | | 08/02/21 | | | 1,000,000 | | | | 1,086,354 | |
Instit Costa de Electric | | | 6.950 | % | | 11/10/21 | | | 750,000 | | | | 781,125 | |
ONGC Videsh Ltd. | | | 3.250 | % | | 07/15/19 | | | 200,000 | | | | 202,620 | |
| | | | | | | | | | | | | | 4,158,329 | |
Israel — 0.3% | | | | | | | | | | | | | | |
Delek & Avner Tamar Bond Ltd. | | | 5.412 | % | | 12/30/25 | | | 200,000 | | | | 202,000 | |
Israel Electric Corp. Ltd. | | | 5.625 | % | | 06/21/18 | | | 400,000 | | | | 416,160 | |
Israel Electric Corp. Ltd. | | | 5.000 | % | | 11/12/24 | | | 600,000 | | | | 624,342 | |
| | | | | | | | | | | | | | 1,242,502 | |
Luxembourg — 0.1% | | | | | | | | | | | | | | |
Minerva Luxembourg S.A. | | | 8.750 | % | | 12/29/49 | | | 500,000 | | | | 511,875 | |
| | | | | | | | | | | | | | | |
Malaysia — 0.5% | | | | | | | | | | | | | | |
Comision Federal de Electricid S.A. | | | 4.750 | % | | 02/23/27 | | $ | 400,000 | | | $ | 384,000 | |
IOI Investment L BHD | | | 4.375 | % | | 06/27/22 | | | 400,000 | | | | 404,248 | |
Malayan Banking BHD (b) | | | 3.250 | % | | 09/20/22 | | | 1,000,000 | | | | 1,004,165 | |
Petoliam Nasional Berhad | | | 2.707 | % | | 03/18/20 | | GBP 300,000 | | | | 299,534 | |
| | | | | | | | | | | | | | 2,091,947 | |
Mexico — 1.8% | | | | | | | | | | | | | | |
Banco Mercantile del Norte S.A. | | | 5.750 | % | | 10/04/31 | | | 200,000 | | | | 185,750 | |
Banco Nacional de Comercia Exterior SNC | | | 3.800 | % | | 08/11/26 | | | 1,100,000 | | | | 1,029,875 | |
Banco Santander Mexico | | | 4.125 | % | | 11/09/22 | | | 500,000 | | | | 497,500 | |
Banco Santander Mexico | | | 5.950 | % | | 01/30/24 | | | 600,000 | | | | 610,500 | |
BBVA Bancomer S.A. Cayman Islands, 144A | | | 6.008 | % | | 05/17/22 | | | 500,000 | | | | 500,000 | |
BBVA Bancomer S.A. Texas | | | 5.350 | % | | 11/12/29 | | | 300,000 | | | | 276,000 | |
Comision Federal de Electricidad, 144A | | | 4.750 | % | | 02/23/27 | | | 300,000 | | | | 288,000 | |
Credito Real SAB de CV, 144A | | | 7.250 | % | | 07/20/23 | | | 500,000 | | | | 510,000 | |
Grupo Idesa SA de CV | | | 7.875 | % | | 12/18/20 | | | 630,000 | | | | 570,150 | |
Grupo Posadas SAB de CV | | | 7.875 | % | | 06/30/22 | | | 250,000 | | | | 247,500 | |
Nemak SAB de CV | | | 5.500 | % | | 02/28/23 | | | 500,000 | | | | 496,250 | |
Petroleos Mexicanos, 144A | | | 6.750 | % | | 09/21/47 | | | 65,000 | | | | 61,412 | |
Petroleos Mexicanos | | | 6.625 | % | | 09/29/49 | | | 500,000 | | | | 470,000 | |
Sixsigma Networks Mexico | | | 8.250 | % | | 11/07/21 | | | 200,000 | | | | 188,000 | |
United Mexican States | | | 4.000 | % | | 10/02/23 | | | 194,000 | | | | 194,466 | |
United Mexican States | | | 4.125 | % | | 01/21/26 | | | 700,000 | | | | 694,400 | |
United Mexican States | | | 4.750 | % | | 03/08/44 | | | 200,000 | | | | 181,860 | |
| | | | | | | | | | | | | | 7,001,663 | |
See Notes to Financial Statements.
67
Wilshire Mutual Funds, Inc. Wilshire Income Opportunities Fund Schedule of Investments - (continued) | December 31, 2016 |
|
| | | Coupon | | Maturity | | Par Value | | | Value | |
FOREIGN BONDS — 12.7% (Continued) | |
Netherlands — 0.4% | | | | | | | | | | | |
AES Andres Dominicana Ltd., 144A | | | 7.950 | % | | 05/11/26 | | $ | 500,000 | | | $ | 515,000 | |
Marfrig Holdings Europe BV, 144A | | | 8.000 | % | | 06/08/23 | | | 700,000 | | | | 724,570 | |
VTR Finance BV | | | 6.875 | % | | 01/15/24 | | | 300,000 | | | | 309,750 | |
| | | | | | | | | | | | | | 1,549,320 | |
Panama — 1.3% | | | | | | | | | | | | | | |
Aeropuerto International de Tocumen | | | 5.750 | % | | 10/09/23 | | | 995,385 | | | | 1,037,688 | |
Avianca Holdings S.A. | | | 8.375 | % | | 05/10/20 | | | 500,000 | | | | 507,500 | |
Ena Norte Trust | | | 4.950 | % | | 04/25/28 | | | 1,052,636 | | | | 1,089,478 | |
Global Bank Corp. | | | 5.125 | % | | 10/30/19 | | | 1,000,000 | | | | 1,020,000 | |
Republic of Panama | | | 5.200 | % | | 01/30/20 | | | 900,000 | | | | 966,601 | |
Republic of Panama | | | 3.875 | % | | 03/17/28 | | | 400,000 | | | | 391,000 | |
| | | | | | | | | | | | | | 5,012,267 | |
Paraguay — 0.1% | | | | | | | | | | | | | | |
Telefon Celuar del Paraguay S.A. | | | 6.750 | % | | 12/13/22 | | | 500,000 | | | | 508,750 | |
| | | | | | | | | | | | | | | |
Peru — 0.8% | | | | | | | | | | | | | | |
Abengoa Transmision SUR S.A., 144A | | | 6.875 | % | | 04/30/43 | | | 498,950 | | | | 511,424 | |
Banco de Credito del Peru, 144A | | | 2.250 | % | | 10/25/19 | | | 200,000 | | | | 197,500 | |
Hungary Government | | | 6.250 | % | | 01/29/20 | | | 1,000,000 | | | | 1,093,750 | |
Peru Enhanced (b) | | | 2.646 | % | | 01/02/25 | | | 1,700,000 | | | | 1,356,582 | |
| | | | | | | | | | | | | | 3,159,256 | |
Poland — 0.1% | | | | | | | | | | | | | | |
Republic of Poland | | | 5.125 | % | | 04/21/21 | | | 500,000 | | | | 545,465 | |
| | | | | | | | | | | | | | | |
Qatar — 0.3% | | | | | | | | | | | | | | |
State of Qatar | | | 2.375 | % | | 06/02/21 | | | 1,100,000 | | | | 1,075,991 | |
| | | | | | | | | | | | | | | |
Singapore — 0.9% | | | | | | | | | | | | | | |
DBS Group Holdings Ltd. | | | 3.600 | % | | 12/29/49 | | | 1,000,000 | | | | 963,021 | |
ONGC Videsh Ltd. | | | 3.750 | % | | 07/27/26 | | | 400,000 | | | | 380,447 | |
Oversea-Chinese Banking Corp. Ltd | | | 4.000 | % | | 10/15/24 | | | 800,000 | | | | 821,000 | |
United Overseas Bank Ltd. | | | 3.500 | % | | 09/16/26 | | $ | 1,500,000 | | | $ | 1,483,577 | |
| | | | | | | | | | | | | | 3,648,045 | |
United Kingdom — 0.1% | |
Moto Finance plc | | | 6.375 | % | | 09/01/20 | | GBP 300,000 | | | | 384,546 | |
| | | | | | | | | | | | | | | |
Virgin Islands British — 0.3% | |
CNOOC Finance 2011, Ltd. | | | 4.250 | % | | 01/26/21 | | | 200,000 | | | | 208,369 | |
Sinopec Group Overseas Development, 144A | | | 2.000 | % | | 09/29/21 | | | 900,000 | | | | 857,183 | |
| | | | | | | | | | | | | | 1,065,552 | |
Total Foreign Bonds (Cost $51,205,947) | | | | 50,636,883 | |
| | | | | | | | | | | | | | | |
LOAN PARTICIPATIONS — 8.4% | |
AdvancePierre Foods, Inc. (b) | | | 3.999 | % | | 05/26/23 | | | 267,535 | | | | 272,184 | |
Albertson's, LLC (b) | | | 3.750 | % | | 08/23/21 | | | 690,719 | | | | 699,857 | |
Albertson's, LLC (b) | | | 4.500 | % | | 08/25/21 | | | 424,662 | | | | 430,280 | |
Albertson's, LLC (b) | | | 4.749 | % | | 06/01/23 | | | 228,571 | | | | 231,825 | |
Asurion, LLC (b) | | | 4.750 | % | | 05/24/19 | | | 308,320 | | | | 311,451 | |
Asurion, LLC (b) | | | 5.000 | % | | 08/04/22 | | | 375,881 | | | | 381,378 | |
Asurion, LLC (b) | | | 4.749 | % | | 10/28/23 | | | 575 | | | | 584 | |
Avago Technologies Cayman Holdings Ltd. (b) | | | 3.703 | % | | 02/01/23 | | | 687,964 | | | | 698,844 | |
B/E Aerospace, Inc. (b) | | | 3.750 | % | | 12/16/21 | | | 695,000 | | | | 699,691 | |
Berry Plastics Corp. (b) | | | 3.750 | % | | 10/01/22 | | | 695,409 | | | | 703,344 | |
BJ's Wholesale Club, Inc. (b) | | | 4.500 | % | | 09/26/19 | | | 585,335 | | | | 591,829 | |
Burger King Corp. (b) | | | 3.750 | % | | 12/10/21 | | | 689,900 | | | | 697,016 | |
Cablevision (b) | | | 3.880 | % | | 10/31/24 | | | 687,895 | | | | 696,493 | |
CareCore National Group, LLC (b) | | | 5.500 | % | | 03/05/21 | | | 158,480 | | | | 156,301 | |
Cengage Learning, Inc. (b) | | | 5.249 | % | | 06/07/23 | | | 1,097,750 | | | | 1,071,169 | |
Charter Communications Operating, LLC (b) | | | 3.004 | % | | 01/24/23 | | | 686,712 | | | | 691,862 | |
See Notes to Financial Statements.
68
Wilshire Mutual Funds, Inc. Wilshire Income Opportunities Fund Schedule of Investments - (continued) | December 31, 2016 |
|
| | | Coupon | | Maturity | | Par Value | | | Value | |
LOAN PARTICIPATIONS — 8.4% (Continued) | |
CHG Healthcare Services, Inc. (b) | | | 4.749 | % | | 05/19/23 | | $ | 992,500 | | | $ | 1,005,527 | |
CompuCom Systems, Inc. (b) | | | 4.250 | % | | 05/09/20 | | | 328,678 | | | | 258,560 | |
Dell, Inc. (b) | | | 3.999 | % | | 06/02/23 | | | 686,000 | | | | 698,636 | |
DJO Finance, LLC (b) | | | 4.250 | % | | 06/08/20 | | | 248,741 | | | | 239,257 | |
EIG Investors Corp. (b) | | | 6.000 | % | | 02/09/23 | | | 467,839 | | | | 464,915 | |
Endo Luxembourg Finance (b) | | | 3.812 | % | | 06/24/22 | | | 694,924 | | | | 699,392 | |
Envision Healthcare Corp. (b) | | | 3.750 | % | | 12/01/23 | | | 900,000 | | | | 911,817 | |
Epicor Software Corp. (b) | | | 4.749 | % | | 06/01/22 | | | 1,028,936 | | | | 1,034,817 | |
First Data Corp. (b) | | | 3.759 | % | | 03/24/21 | | | 689,301 | | | | 698,155 | |
Fitness International, LLC (b) | | | 6.000 | % | | 07/01/20 | | | 482,736 | | | | 484,095 | |
Floor & Decor Outlets of America (b) | | | 5.249 | % | | 09/30/24 | | | 299,250 | | | | 300,372 | |
Gates Global, LLC (b) | | | 4.250 | % | | 07/06/21 | | | 577,987 | | | | 579,282 | |
Generation Brands Holdings, Inc. (b) | | | 6.000 | % | | 05/19/22 | | | 646,750 | | | | 649,580 | |
Harbor Freight Tools USA (b) | | | 4.137 | % | | 08/16/23 | | | 688,288 | | | | 699,135 | |
HBC Hardware Holdings, LLC (b) (c) | | | 6.750 | % | | 03/30/20 | | | 591,500 | | | | 579,670 | |
HCA (b) | | | 3.520 | % | | 02/05/24 | | | 259,350 | | | | 262,815 | |
Hearthside Group Holdings, LLC (b) | | | 4.500 | % | | 06/02/21 | | | 297,716 | | | | 301,437 | |
Jaguar Holdings Co. II (b) | | | 4.250 | % | | 08/18/22 | | | 689,949 | | | | 698,573 | |
Kraton Polymers, LLC (b) | | | 6.000 | % | | 01/06/22 | | | 365,000 | | | | 369,823 | |
Leslie's Poolmart, Inc. (b) | | | 5.249 | % | | 08/09/23 | | | 688,275 | | | | 697,312 | |
Level 3 Financing, Inc. (b) | | | 3.499 | % | | 05/31/22 | | | 690,000 | | | | 699,343 | |
Lightstone Generation, LLC, Class B (b) | | | 6.500 | % | | 12/15/23 | | | 210,000 | | | | 212,975 | |
Lightstone Generation, LLC, Class C (b) | | | 6.500 | % | | 12/15/23 | | | 20,000 | | | | 20,283 | |
Lineage Logistics, LLC (b) | | | 4.500 | % | | 04/07/21 | | $ | 438,722 | | | $ | 436,528 | |
Linxens Microconn (b) | | | 5.000 | % | | 10/14/22 | | | 685 | | | | 687 | |
MGM Growth Properties Operating Partnership, L.P. (b) | | | 3.520 | % | | 04/25/23 | | | 690,149 | | | | 699,145 | |
MultiPlan, Inc. (b) | | | 5.000 | % | | 06/07/23 | | | 665,404 | | | | 678,120 | |
NBTY, Inc. (b) | | | 5.000 | % | | 05/05/23 | | | 691,575 | | | | 698,384 | |
Numericables US, LLC (b) | | | 5.137 | % | | 01/15/24 | | | 248,750 | | | | 252,460 | |
PetSmart, Inc. (b) | | | 3.999 | % | | 01/17/17 | | | 496,222 | | | | 498,308 | |
Press Ganey Holdings, Inc. (b) | | | 4.250 | % | | 10/21/23 | | | 400,000 | | | | 402,876 | |
Quest Software U.S. Holdings, Inc. (b) | | | 4.020 | % | | 09/27/22 | | | 700,000 | | | | 710,504 | |
Ranpack Cov-Lite (b) | | | 8.250 | % | | 09/22/22 | | | 200,000 | | | | 195,000 | |
Revlon Consumer Products Corp. (b) | | | 4.269 | % | | 07/21/23 | | | 688,275 | | | | 696,407 | |
Reynolds Group Holdings, Inc. (b) | | | 4.250 | % | | 01/23/20 | | | 687,322 | | | | 697,398 | |
Scientific Games International, Inc. (b) | | | 6.000 | % | | 09/17/21 | | | 348,717 | | | | 353,704 | |
Sinclair Television (b) | | | 3.500 | % | | 12/31/19 | | | 340,000 | | | | 340,425 | |
Solera, LLC | | | 5.750 | % | | 03/03/23 | | | 297,750 | | | | 302,216 | |
Telesat Canada (b) | | | 4.500 | % | | 11/09/23 | | | 480,000 | | | | 487,646 | |
T-Mobile USA, Inc. (b) | | | 3.520 | % | | 11/03/22 | | | 690,124 | | | | 699,721 | |
Travelport Finance (b) | | | 5.000 | % | | 09/02/21 | | | 1,119,737 | | | | 1,132,688 | |
Tribune Media Co. (b) | | | 3.770 | % | | 12/27/20 | | | 694,936 | | | | 701,972 | |
Univar, Inc. (b) | | | 4.250 | % | | 07/01/22 | | | 694,949 | | | | 702,621 | |
Warner Music (b) | | | 3.750 | % | | 11/21/23 | | | 695,000 | | | | 702,457 | |
York Risk Services Holding Corp. (b) (c) | | | 4.749 | % | | 10/01/21 | | | 977,500 | | | | 929,847 | |
| | | | | | | | | | | | | | | |
Total Loan Participations (Cost $32,968,667) | | | | 33,218,993 | |
| | | | | | | | | | | | | | | |
MILITARY HOUSING OBLIGATIONS — 1.9% | |
Atlantic Marine Corps. Communities Military Housing, 144A (c) | | | 5.433 | % | | 12/01/50 | | | 713,329 | | | | 692,143 | |
See Notes to Financial Statements.
69
Wilshire Mutual Funds, Inc. Wilshire Income Opportunities Fund Schedule of Investments - (continued) | December 31, 2016 |
|
| | | Coupon | | Maturity | | Par Value | | | Value | |
MILITARY HOUSING OBLIGATIONS — 1.9% (Continued) | |
Capmark Military Housing Trust, Series 2007-AETC, Class A1 (c) | | | 5.746 | % | | 02/10/52 | | $ | 1,919,550 | | | $ | 1,966,098 | |
Capmark Military Housing Trust, Series 2007-ROBS, Class A (c) | | | 6.059 | % | | 10/10/52 | | | 481,508 | | | | 480,088 | |
Fort Benning Family Communities, LLC, 144A (c) | | | 5.810 | % | | 01/15/51 | | | 1,050,000 | | | | 970,505 | |
GMAC Commercial Military Housing Trust, Series 2007-HCKM, Class A (b) (c) | | | 6.107 | % | | 08/10/52 | | | 1,124,247 | | | | 1,133,377 | |
HP Communities, LLC (c) | | | 5.630 | % | | 09/15/34 | | | 650,000 | | | | 691,308 | |
Mid-Atlantic Military Company, 144A | | | 5.300 | % | | 08/01/50 | | | 949,453 | | | | 888,147 | |
Northeast Housing, LLC (c) | | | 6.298 | % | | 10/15/49 | | | 725,000 | | | | 717,601 | |
| | | | | | | | | | | | | | | |
Total Military Housing Obligations (Cost $7,773,161) | | | | 7,539,267 | |
| | | | | | | | | | | | | | | |
MUNICIPAL OBLIGATIONS — 0.3% | |
Illinois State, GO (Cost $1,336,602) | | | 5.650 | % | | 12/01/38 | | | 1,310,000 | | | | 1,363,422 | |
| | | Shares | | | Value | |
COMMON STOCKS — 0.0% (d) | |
Energy — 0.0% (d) | | | | | | |
Titan Energy, LLC (c) (e) (Cost $502,500) | | | 3,370 | | | $ | 80,880 | |
| | | | | | | | | |
PREFERRED STOCKS — 0.6% | |
Bank of America Corp., 6.300% | | | 300,000 | | | | 313,500 | |
Citigroup, Inc., 5.900% | | | 500,000 | | | | 504,400 | |
Citigroup, Inc., 5.875% | | | 285,000 | | | | 285,713 | |
Citigroup, Inc., 5.950% | | | 140,000 | | | | 142,093 | |
Citigroup, Inc., 6.250% | | | 910,000 | | | | 936,390 | |
| | | | | | | | | |
Total Preferred Stocks (Cost $2,151,171) | | | | 2,182,096 | |
| | | | | | | | | |
AFFILIATED REGISTERED INVESTMENT COMPANIES — 2.7% | |
Guggenheim Floating Rate Strategies Fund | | | 231,944 | | | | 6,049,104 | |
Guggenheim Strategy Fund I | | | 187,961 | | | | 4,699,030 | |
| | | | | | | | | |
Total Affiliated Registered Investment Companies (Cost $10,690,012) | | | | 10,748,134 | |
| | | | | | | | | |
MONEY MARKET FUNDS — 0.7% | | | | | |
Northern Trust Institutional Government Select Portfolio - Institutional Class, 0.39% (f) (Cost $2,851,244) | | | 2,851,244 | | | | 2,851,244 | |
| �� | | | | | | | | |
Total Investments at Value — 103.9% (Cost $418,097,352) | | | | 413,532,748 | |
Liabilities in Excess of Other Assets — (3.9%) | | | | (15,633,739 | ) |
| | | | | | | | | |
NET ASSETS — 100.0% | | | $ | 397,899,009 | |
* | Security, or a portion thereof, has been pledged as collateral on open reverse repurchase agreements (Note 2). |
(a) | Zero coupon security. The rate reported on the Schedule of Investments is the effective yield at the time of purchase. |
(b) | Variable rate security. The rate shown is the effective interest rate as of December 31, 2016. |
(d) | Percentage rounds to less than 0.1%. |
(e) | Non-income producing security. |
(f) | The rate shown is the 7-day effective yield as of December 31, 2016. |
See Notes to Financial Statements.
70
Wilshire Mutual Funds, Inc. Wilshire Income Opportunities Fund Schedule of Investments - (continued) | December 31, 2016 |
|
A list of the outstanding forward foreign currency contracts held by the Fund at December 31, 2016 is as follows:
Counterparty | Settlement
Date | | Currency
to Deliver | | Currency
to Receive | | Unrealized Appreciation | |
Montgomery/Bank of America | 1/12/17 | | CAD 403,000 | | USD 305,819 | | $ | 5,669 | |
Montgomery/Bank of America | 1/12/17 | | GBP 316,000 | | USD 398,072 | | | 8,557 | |
| | | | | | | | $ | 14,226 | |
For the period ended December 31, 2016, the total amount of all forward foreign currency contracts, as presented in the table above, are representative of the volume of activity for this derivative type during the period.
CDO — Collateralized Debt Obligation.
CLO — Collateralized Loan Obligation.
GO — General Obligation.
LLC — Limited Liability Corporation.
Ltd. — Limited.
plc — Public Limited Company.
Re-REMIC — Re-securitization of Real Estate Mortgage Investment Conduit.
STRIPS — Separately Traded Registered Interest and Principal Securities.
144A — This is a restricted security that was sold in a transaction exempt from Rule 144A of the Securities Act of 1933. This security may be sold in transactions exempt from registration, normally to qualified institutional buyers.
See Notes to Financial Statements.
71
Wilshire Mutual Funds, Inc. Statements of Assets and Liabilities December 31, 2016 |
|
| | | LARGE
COMPANY
GROWTH PORTFOLIO | | | LARGE
COMPANY
VALUE
PORTFOLIO | | | SMALL
COMPANY
GROWTH
PORTFOLIO | | | SMALL
COMPANY
VALUE
PORTFOLIO | | | WILSHIRE
5000
INDEXSM
FUND | | | WILSHIRE INTERNATIONAL EQUITY
FUND | | | WILSHIRE INCOME OPPORTUNITIES FUND | |
ASSETS: | | | | | | | | | | | | | | | | | | | | | |
Investments in unaffiliated securities, at value (Note 2) | | $ | 222,222,525 | * | | $ | 190,125,833 | * | | $ | 39,237,954 | * | | $ | 42,949,663 | * | | $ | 178,042,535 | * | | $ | 279,293,240 | * | | $ | 402,784,614 | |
Investments in affiliated funds, at value | | | — | | | | — | | | | — | | | | — | | | | — | | | | — | | | | 10,748,134 | |
Foreign currency, at value | | | — | | | | — | | | | — | | | | — | | | | — | | | | 20,751 | | | | — | |
Receivable for investment securities sold | | | 645,056 | | | | 931,469 | | | | — | | | | 127,155 | | | | — | | | | 53,649 | | | | 1,619,399 | |
Unrealized gain on forward foreign currency contracts | | | — | | | | — | | | | — | | | | — | | | | — | | | | — | | | | 14,226 | |
Dividends and interest receivable | | | 135,152 | | | | 445,578 | | | | 23,477 | | | | 58,835 | | | | 231,434 | | | | 315,258 | | | | 2,496,932 | |
Receivable for Portfolio shares sold | | | 142,550 | | | | 168,269 | | | | 66,904 | | | | 25,429 | | | | 152,544 | | | | 211,213 | | | | 425,970 | |
Dividend reclaim receivable | | | 10,256 | | | | 106 | | | | — | | | | — | | | | 207 | | | | 519,339 | | | | 1,772 | |
Prepaid expenses and other assets | | | 33,321 | | | | 28,126 | | | | 21,823 | | | | 21,674 | | | | 35,224 | | | | 50,900 | | | | 61,286 | |
Total Assets | | | 223,188,860 | | | | 191,699,381 | | | | 39,350,158 | | | | 43,182,756 | | | | 178,461,944 | | | | 280,464,350 | | | | 418,152,333 | |
| | | | | | | | | | | | | | | | | | | | | | | | | | | | | |
LIABILITIES: | | | | | | | | | | | | | | | | | | | | | | | | | | | | |
Bank overdraft | | | — | | | | 656,540 | | | | — | | | | — | | | | — | | | | 456,244 | | | | — | |
Payable upon return on securities loaned (Note 6) | | | 7,815,619 | | | | 4,729,193 | | | | 2,128,325 | | | | 2,227,822 | | | | 4,582,659 | | | | 8,828,715 | | | | — | |
Reverse repurchase agreements (Note 2) | | | — | | | | — | | | | — | | | | — | | | | — | | | | — | | | | 16,976,454 | |
Payable for investment securities purchased | | | — | | | | 104,617 | | | | — | | | | 15,228 | | | | — | | | | 732,193 | | | | 2,020,081 | |
Payable for Portfolio shares redeemed | | | 307,484 | | | | 396,310 | | | | 60,463 | | | | 65,970 | | | | 176,628 | | | | 499,672 | | | | 868,075 | |
Investment advisory fees payable (Note 3) | | | 140,552 | | | | 121,804 | | | | 22,482 | | | | 28,820 | | | | 15,260 | | | | 224,367 | | | | 203,042 | |
Distribution fees payable (Note 4) | | | 22,823 | | | | 789 | | | | 8,101 | | | | 3,767 | | | | 71,777 | | | | 1,115 | | | | — | |
Shareholder Service fees payable (Note 4) | | | 29,000 | | | | 15,240 | | | | 3,280 | | | | 3,860 | | | | 15,780 | | | | 20,960 | | | | 42,460 | |
Administration fees payable | | | 7,800 | | | | 6,800 | | | | 1,400 | | | | 1,500 | | | | 6,400 | | | | 9,700 | | | | 14,200 | |
Accrued expenses and other payables | | | 64,148 | | | | 59,829 | | | | 38,928 | | | | 40,009 | | | | 64,061 | | | | 90,871 | | | | 129,012 | |
Total Liabilities | | | 8,387,426 | | | | 6,091,122 | | | | 2,262,979 | | | | 2,386,976 | | | | 4,932,565 | | | | 10,863,837 | | | | 20,253,324 | |
| | | | | | | | | | | | | | | | | | | | | | | | | | | | | |
NET ASSETS | | $ | 214,801,434 | | | $ | 185,608,259 | | | $ | 37,087,179 | | | $ | 40,795,780 | | | $ | 173,529,379 | | | $ | 269,600,513 | | | $ | 397,899,009 | |
| | | | | | | | | | | | | | | | | | | | | | | | | | | | | |
* Includes Market Value of Securities on Loan | | $ | 22,586,674 | | | $ | 14,358,569 | | | $ | 4,691,378 | | | $ | 3,523,566 | | | $ | 10,033,391 | | | $ | 19,967,056 | | | $ | — | |
Amounts designated as “—” are either $0, or have been rounded to $0. |
See Notes to Financial Statements.
72
Wilshire Mutual Funds, Inc. Statements of Assets and Liabilities - (Continued) December 31, 2016 |
|
| | | LARGE
COMPANY
GROWTH PORTFOLIO | | | LARGE
COMPANY
VALUE
PORTFOLIO | | | SMALL
COMPANY
GROWTH
PORTFOLIO | | | SMALL
COMPANY
VALUE
PORTFOLIO | | | WILSHIRE
5000
INDEXSM
FUND | | | WILSHIRE INTERNATIONAL EQUITY
FUND | | | WILSHIRE INCOME OPPORTUNITIES FUND | |
NET ASSETS consist of: | | | | | | | | | | | | | | | | | | | | | |
Paid-in capital | | $ | 162,799,873 | | | $ | 153,086,456 | | | $ | 27,596,587 | | | $ | 30,786,376 | | | $ | 64,262,115 | | | $ | 278,303,995 | | | $ | 402,888,218 | |
Undistributed net investment income (accumulated net investment loss) | | | 11,973 | | | | 3,533 | | | | — | | | | — | | | | (2,459 | ) | | | (104,004 | ) | | | (14,227 | ) |
Accumulated net realized gains (losses) on investments sold and foreign currency transactions | | | 1,008,422 | | | | 2,280,890 | | | | 1,118,345 | | | | 1,321,264 | | | | 88,944 | | | | (22,175,266 | ) | | | (424,602 | ) |
Net unrealized appreciation (depreciation) on investments | | | 50,981,166 | | | | 30,237,380 | | | | 8,372,247 | | | | 8,688,140 | | | | 109,180,779 | | | | 13,603,915 | | | | (4,564,604 | ) |
Net unrealized appreciation (depreciation) on assets and liabilities denominated in foreign currencies | | | — | | | | — | | | | — | | | | — | | | | — | | | | (28,127 | ) | | | 14,224 | |
| | | | | | | | | | | | | | | | | | | | | | | | | | | | | |
NET ASSETS | | $ | 214,801,434 | | | $ | 185,608,259 | | | $ | 37,087,179 | | | $ | 40,795,780 | | | $ | 173,529,379 | | | $ | 269,600,513 | | | $ | 397,899,009 | |
| | | | | | | | | | | | | | | | | | | | | | | | | | | | | |
Investments in unaffiliated securities, at cost (Note 2) | | $ | 163,425,740 | | | $ | 155,159,260 | | | $ | 28,737,382 | | | $ | 32,033,701 | | | $ | 64,279,097 | | | $ | 256,860,610 | | | $ | 407,407,340 | |
Investments in affiliated funds, at cost | | | — | | | | — | | | | — | | | | — | | | | — | | | | — | | | | 10,690,012 | |
Cash collateral for securities on loan, at cost | | | 7,815,619 | | | | 4,729,193 | | | | 2,128,325 | | | | 2,227,822 | | | | 4,582,659 | | | | 8,828,715 | | | | — | |
Foreign currency, at cost | | | — | | | | — | | | | — | | | | — | | | | — | | | | 21,305 | | | | — | |
| | | | | | | | | | | | | | | | | | | | | | | | | | | | | |
NET ASSETS: | | | | | | | | | | | | | | | | | | | | | | | | | | | | |
Investment Class shares | | $ | 62,634,450 | | | $ | 10,111,562 | | | $ | 8,633,220 | | | $ | 9,097,361 | | | $ | 132,669,048 | | | $ | 11,289,693 | | | $ | 1,101,883 | |
(50,000,000 shares authorized, per class, per Portfolio, par value $.001 per share)† | | | | | | | | | | | | | | | | | | | | | | | | | | | | |
Institutional Class shares | | $ | 152,166,984 | | | $ | 175,496,697 | | | $ | 28,453,959 | | | $ | 31,698,419 | | | $ | 40,860,331 | | | $ | 258,310,820 | | | $ | 396,797,126 | |
(50,000,000 shares authorized, per class, per Portfolio, par value $.001 per share)† | | | | | | | | | | | | | | | | | | | | | | | | | | | | |
Amounts designated as “—“ are either $0, or have been rounded to $0. |
† | For the Wilshire International Equity Fund, (40,000,000 shares authorized, per class, par value $.001 per share). |
See Notes to Financial Statements.
73
Wilshire Mutual Funds, Inc. Statements of Assets and Liabilities - (Continued) December 31, 2016 |
|
| | | LARGE
COMPANY
GROWTH PORTFOLIO | | | LARGE
COMPANY
VALUE
PORTFOLIO | | | SMALL
COMPANY
GROWTH
PORTFOLIO | | | SMALL
COMPANY
VALUE
PORTFOLIO | | | WILSHIRE
5000
INDEXSM
FUND | | | WILSHIRE INTERNATIONAL EQUITY
FUND | | | WILSHIRE INCOME OPPORTUNITIES FUND | |
SHARES OUTSTANDING: | | | | | | | | | | | | | | | | | | | | | |
Investment Class shares | | | 1,846,252 | | | | 495,772 | | | | 353,739 | | | | 383,058 | | | | 7,034,013 | | | | 1,265,997 | | | | 108,647 | |
Institutional Class shares | | | 4,205,125 | | | | 8,689,708 | | | | 1,086,800 | | | | 1,312,971 | | | | 2,167,096 | | | | 29,311,284 | | | | 39,278,089 | |
| | | | | | | | | | | | | | | | | | | | | | | | | | | | | |
INVESTMENT CLASS SHARES: | | | | | | | | | | | | | | | | | | | | | | | | | | | | |
Net asset value, offering and redemption price per share | | $ | 33.93 | | | $ | 20.40 | | | $ | 24.41 | | | $ | 23.75 | | | $ | 18.86 | | | $ | 8.92 | | | $ | 10.14 | |
| | | | | | | | | | | | | | | | | | | | | | | | | | | | | |
INSTITUTIONAL CLASS SHARES: | | | | | | | | | | | | | | | | | | | | | | | | | | | | |
Net asset value, offering and redemption price per share | | $ | 36.19 | | | $ | 20.20 | | | $ | 26.18 | | | $ | 24.14 | | | $ | 18.85 | | | $ | 8.81 | | | $ | 10.10 | |
See Notes to Financial Statements.
74
Wilshire Mutual Funds, Inc. Statements of Operations For the Year Ended December 31, 2016 |
|
| | | LARGE
COMPANY
GROWTH PORTFOLIO | | | LARGE
COMPANY
VALUE
PORTFOLIO | | | SMALL
COMPANY
GROWTH
PORTFOLIO | | | SMALL
COMPANY
VALUE
PORTFOLIO | | | WILSHIRE
5000
INDEXSM
FUND | | | WILSHIRE INTERNATIONAL EQUITY
FUND | | | WILSHIRE INCOME OPPORTUNITIES FUND* | |
INVESTMENT INCOME: | | | | | | | | | | | | | | | | | | | | | |
Dividends | | $ | 3,565,703 | | | $ | 5,480,643 | | | $ | 309,984 | | | $ | 737,926 | | | $ | 4,182,126 | | | $ | 8,232,063 | | | $ | 489,191 | |
Interest | | | 165 | | | | 1,724 | | | | — | | | | 210 | | | | — | | | | — | | | | 10,026,656 | |
Income from Security Lending | | | 87,834 | | | | 56,215 | | | | 39,918 | | | | 44,839 | | | | 88,145 | | | | 105,600 | | | | — | |
Income distributions from affiliated investments | | | — | | | | — | | | | — | | | | — | | | | — | | | | — | | | | 94,857 | |
Foreign taxes withheld | | | (60,912 | ) | | | (12,844 | ) | | | (11 | ) | | | (873 | ) | | | (725 | ) | | | (825,747 | ) | | | (12,002 | ) |
Total income | | | 3,592,790 | | | | 5,525,738 | | | | 349,891 | | | | 782,102 | | | | 4,269,546 | | | | 7,511,916 | | | | 10,598,702 | |
| | | | | | | | | | | | | | | | | | | | | | | | | | | | | |
EXPENSES: | | | | | | | | | | | | | | | | | | | | | | | | | | | | |
Investment advisory fee (Note 3) | | | 1,893,731 | | | | 1,321,817 | | | | 315,035 | | | | 332,900 | | | | 197,180 | | | | 2,770,494 | | | | 1,593,644 | |
Administration and accounting fees (Note 3) | | | 176,951 | | | | 122,777 | | | | 25,842 | | | | 27,269 | | | | 137,662 | | | | 194,231 | | | | 185,668 | |
Distribution (12b-1) fees (Note 4) | | | | | | | | | | | | | | | | | | | | | | | | | | | | |
Investment Class | | | 226,229 | | | | 102,604 | | | | 26,895 | | | | 31,877 | | | | 368,098 | | | | 18,231 | | | | 1,635 | |
Horace Mann Class | | | N/A | | | | N/A | | | | N/A | | | | N/A | | | | 5,214 | | | | N/A | | | | N/A | |
Shareholder Service fees (Note 4) | | | | | | | | | | | | | | | | | | | | | | | | | | | | |
Investment Class | | | 79,358 | | | | 10,128 | | | | 7,487 | | | | 9,963 | | | | 83,529 | | | | 8,966 | | | | 1,316 | |
Institutional Class | | | 80,814 | | | | 74,297 | | | | 14,631 | | | | 14,674 | | | | — | | | | 114,245 | | | | 149,518 | |
Professional fees | | | 96,917 | | | | 72,977 | | | | 39,475 | | | | 40,068 | | | | 82,171 | | | | 99,966 | | | | 76,962 | |
Custodian fees (Note 3) | | | 90,907 | | | | 57,950 | | | | 15,749 | | | | 15,840 | | | | 67,783 | | | | 160,614 | | | | 80,008 | |
Transfer agent fees (Note 3) | | | 78,039 | | | | 32,166 | | | | 24,806 | | | | 28,551 | | | | 73,190 | | | | 85,666 | | | | 15,788 | |
Registration and filing fees | | | 44,985 | | | | 42,106 | | | | 27,097 | | | | 27,424 | | | | 55,513 | | | | 63,202 | | | | 58,130 | |
Printing fees | | | 56,026 | | | | 40,763 | | | | 11,449 | | | | 12,401 | | | | 35,562 | | | | 47,737 | | | | 21,442 | |
Directors’ fees and expenses (Note 3) | | | 26,745 | | | | 18,825 | | | | 4,026 | | | | 4,255 | | | | 20,697 | | | | 29,714 | | | | 24,636 | |
Insurance expense | | | 18,170 | | | | 8,439 | | | | 2,153 | | | | 2,238 | | | | 17,238 | | | | 14,065 | | | | — | |
Interest expense | | | — | | | | — | | | | — | | | | — | | | | — | | | | 5,364 | | | | 41,533 | |
Chief compliance officer expenses | | | 449 | | | | 538 | | | | 78 | | | | 87 | | | | 180 | | | | 827 | | | | 1,753 | |
Other | | | 28,414 | | | | 29,055 | | | | 8,472 | | | | 8,506 | | | | 34,274 | | | | 62,806 | | | | 51,628 | |
Total expenses | | | 2,897,735 | | | | 1,934,442 | | | | 523,195 | | | | 556,053 | | | | 1,178,291 | | | | 3,676,128 | | | | 2,303,661 | |
Fees reduced and/or reimbursed by Investment Adviser (Note 3) | | | — | | | | — | | | | (26,249 | ) | | | (23,509 | ) | | | — | | | | (144,932 | ) | | | (723 | ) |
Fees paid indirectly (Note 4) | | | (6,299 | ) | | | (11,674 | ) | | | (474 | ) | | | (4,178 | ) | | | (203 | ) | | | — | | | | — | |
Net expenses | | | 2,891,436 | | | | 1,922,768 | | | | 496,472 | | | | 528,366 | | | | 1,178,088 | | | | 3,531,196 | | | | 2,302,938 | |
| | | | | | | | | | | | | | | | | | | | | | | | | | | | | |
Net investment income (loss) | | | 701,354 | | | | 3,602,970 | | | | (146,581 | ) | | | 253,736 | | | | 3,091,458 | | | | 3,980,720 | | | | 8,295,764 | |
* | Commenced operations on March 30, 2016. |
Amounts designated as “—” are either $0, or have been rounded to $0. |
N/A – Not Applicable. Share class not offered during the year. |
See Notes to Financial Statements.
75
Wilshire Mutual Funds, Inc. Statements of Operations - (Continued) For the Year Ended December 31, 2016 |
|
| | | LARGE
COMPANY
GROWTH PORTFOLIO | | | LARGE
COMPANY
VALUE
PORTFOLIO | | | SMALL
COMPANY
GROWTH
PORTFOLIO | | | SMALL
COMPANY
VALUE
PORTFOLIO | | | WILSHIRE
5000
INDEXSM
FUND | | | WILSHIRE INTERNATIONAL EQUITY
FUND | | | WILSHIRE INCOME OPPORTUNITIES FUND* | |
NET REALIZED AND UNREALIZED GAINS (LOSSES) ON INVESTMENTS AND FOREIGN CURRENCY TRANSACTIONS (NOTES 2 and 5): | | | | | | | | | | | | | | | | | | | | | |
Net realized gains (losses) from: | | | | | | | | | | | | | | | | | | | | | |
Unaffiliated investments | | | 24,110,965 | | | | 10,983,831 | | | | 5,246,004 | | | | 3,935,633 | | | | 32,576,301 | | | | (4,186,065 | ) | | | 1,637,055 | |
Sale of affiliated investment company shares | | | — | | | | — | | | | — | | | | — | | | | — | | | | — | | | | 15,724 | |
Foreign currency transactions | | | — | | | | — | | | | — | | | | — | | | | — | | | | 143,452 | | | | 66,898 | |
Net change in unrealized appreciation (depreciation) on: | | | | | | | | | | | | | | | | | | | | | | | | | | | | |
Unaffiliated investments | | | (9,717,197 | ) | | | 18,844,323 | | | | 3,547,658 | | | | 6,014,108 | | | | (12,337,006 | ) | | | 13,545,937 | | | | (4,622,727 | ) |
Investments in affiliated funds | | | — | | | | — | | | | — | | | | — | | | | — | | | | — | | | | 58,123 | |
Foreign currency transactions and translation of other assets and liabilities denominated in foreign currencies | | | — | | | | — | | | | — | | | | — | | | | — | | | | (16,394 | ) | | | 14,224 | |
| | | | | | | | | | | | | | | | | | | | | | | | | | | | | |
Net realized and unrealized gains (losses) on investments and foreign currency transactions | | | 14,393,768 | | | | 29,828,154 | | | | 8,793,662 | | | | 9,949,741 | | | | 20,239,295 | | | | 9,486,930 | | | | (2,830,703 | ) |
| | | | | | | | | | | | | | | | | | | | | | | | | | | | | |
NET INCREASE IN NET ASSETS RESULTING FROM OPERATIONS | | $ | 15,095,122 | | | $ | 33,431,124 | | | $ | 8,647,081 | | | $ | 10,203,477 | | | $ | 23,330,753 | | | $ | 13,467,650 | | | $ | 5,465,061 | |
* | Commenced operations on March 30, 2016. |
Amounts designated as “—” are either $0, or have been rounded to $0. |
See Notes to Financial Statements.
76
Wilshire Mutual Funds, Inc. Statements of Changes in Net Assets For the Year Ended December 31, 2016 |
|
| | | LARGE
COMPANY
GROWTH PORTFOLIO | | | LARGE
COMPANY
VALUE
PORTFOLIO | | | SMALL
COMPANY
GROWTH
PORTFOLIO | | | SMALL
COMPANY
VALUE
PORTFOLIO | | | WILSHIRE
5000
INDEXSM
FUND | | | WILSHIRE INTERNATIONAL EQUITY
FUND | | | WILSHIRE INCOME OPPORTUNITIES FUND* | |
OPERATIONS: | | | | | | | | | | | | | | | | | | | | | |
Net investment income (loss) | | $ | 701,354 | | | $ | 3,602,970 | | | $ | (146,581 | ) | | $ | 253,736 | | | $ | 3,091,458 | | | $ | 3,980,720 | | | $ | 8,295,764 | |
Net realized gains (losses) on unaffiliated investments, sale of affiliated investment company shares and foreign currency transactions | | | 24,110,965 | | | | 10,983,831 | | | | 5,246,004 | | | | 3,935,633 | | | | 32,576,301 | | | | (4,042,613 | ) | | | 1,719,677 | |
Net change in unrealized appreciation (depreciation) on affiliated and unaffiliated investments and foreign currency transactions and translation of other assets and liabilities denominated in foreign currencies | | | (9,717,197 | ) | | | 18,844,323 | | | | 3,547,658 | | | | 6,014,108 | | | | (12,337,006 | ) | | | 13,529,543 | | | | (4,550,380 | ) |
Net increase in net assets resulting from operations | | | 15,095,122 | | | �� | 33,431,124 | | | | 8,647,081 | | | | 10,203,477 | | | | 23,330,753 | | | | 13,467,650 | | | | 5,465,061 | |
| | | | | | | | | | | | | | | | | | | | | | | | | | | | | |
DISTRIBUTIONS TO SHAREHOLDERS FROM: | | | | | | | | | | | | | | | | | | | | | | | | | | | | |
Net investment income: | | | | | | | | | | | | | | | | | | | | | | | | | | | | |
Investment Class shares | | | (23,274 | ) | | | (70,117 | ) | | | — | | | | (42,010 | ) | | | (2,761,275 | ) | | | (182,252 | ) | | | (18,739 | ) |
Institutional Class shares | | | (666,107 | ) | | | (3,529,320 | ) | | | — | | | | (249,635 | ) | | | (1,004,390 | ) | | | (4,629,388 | ) | | | (8,022,614 | ) |
Horace Mann Class shares | | | N/A | | | | N/A | | | | N/A | | | | N/A | | | | (4,577 | ) | | | N/A | | | | N/A | |
Net realized capital gains: | | | | | | | | | | | | | | | | | | | | | | | | | | | | |
Investment Class shares | | | (7,216,123 | ) | | | (812,603 | ) | | | (902,329 | ) | | | (879,115 | ) | | | (5,106,112 | ) | | | — | | | | (7,570 | ) |
Institutional Class shares | | | (16,461,985 | ) | | | (8,395,071 | ) | | | (3,066,404 | ) | | | (2,443,106 | ) | | | (1,869,149 | ) | | | — | | | | (2,931,274 | ) |
Total distributions to shareholders | | | (24,367,489 | ) | | | (12,807,111 | ) | | | (3,968,733 | ) | | | (3,613,866 | ) | | | (10,745,503 | ) | | | (4,811,640 | ) | | | (10,980,197 | ) |
* | Commenced operations on March 30, 2016. |
N/A — Not Applicable. Share classes not offered during the year. |
Amounts designated as “—” are either $0, or have been rounded to $0. |
See Notes to Financial Statements.
77
Wilshire Mutual Funds, Inc. Statements of Changes in Net Assets - (Continued) For the Year Ended December 31, 2016 |
|
| | | LARGE
COMPANY
GROWTH PORTFOLIO | | | LARGE
COMPANY
VALUE
PORTFOLIO | | | SMALL
COMPANY
GROWTH
PORTFOLIO | | | SMALL
COMPANY
VALUE
PORTFOLIO | | | WILSHIRE
5000
INDEXSM
FUND | | | WILSHIRE INTERNATIONAL EQUITY
FUND | | | WILSHIRE INCOME OPPORTUNITIES FUND* | |
CAPITAL SHARE TRANSACTIONS (DOLLARS): | | | | | | | | | | | | | | | | | | | | | |
Investment Class shares: | | | | | | | | | | | | | | | | | | | | | |
Shares sold | | | 9,447,776 | | | | 13,100,295 | | | | 8,090,368 | | | | 4,601,966 | | | | 14,468,832 | | | | 13,074,344 | | | | 3,002,325 | |
Issued in connection with in-kind transfer** | | | — | | | | — | | | | — | | | | — | | | | — | | | | — | | | | 10 | |
Shares issued as reinvestment of distributions | | | 7,046,311 | | | | 868,423 | | | | 883,172 | | | | 900,773 | | | | 7,545,415 | | | | 176,771 | | | | 22,884 | |
Redemption fees (Note 2) | | | — | | | | — | | | | — | | | | — | | | | — | | | | 942 | | | | — | |
Shares redeemed | | | (58,801,975 | ) | | | (60,891,899 | ) | | | (14,178,884 | ) | | | (12,548,929 | ) | | | (58,715,642 | ) | | | (5,481,578 | ) | | | (1,932,279 | ) |
Net increase (decrease) in net assets from Investment Class share transactions | | | (42,307,888 | ) | | | (46,923,181 | ) | | | (5,205,344 | ) | | | (7,046,190 | ) | | | (36,701,395 | ) | | | 7,770,479 | | | | 1,092,940 | |
| | | | | | | | | | | | | | | | | | | | | | | | | | | | | |
Institutional Class shares: | | | | | | | | | | | | | | | | | | | | | | | | | | | | |
Shares sold | | | 112,406,914 | | | | 127,227,693 | | | | 23,749,758 | | | | 24,015,502 | | | | 10,987,352 | | | | 177,914,962 | | | | 317,151,289 | |
Issued in connection with in-kind transfer** | | | — | | | | — | | | | — | | | | — | | | | — | | | | — | | | | 147,868,290 | |
Shares issued as reinvestment of distributions | | | 15,976,819 | | | | 11,893,895 | | | | 3,059,039 | | | | 2,684,309 | | | | 2,231,465 | | | | 4,619,158 | | | | 10,945,747 | |
Redemption fees (Note 2) | | | — | | | | — | | | | — | | | | — | | | | — | | | | 1,948 | | | | — | |
Shares redeemed | | | (91,601,976 | ) | | | (33,421,170 | ) | | | (16,251,162 | ) | | | (13,461,080 | ) | | | (34,209,479 | ) | | | (109,736,709 | ) | | | (73,644,121 | ) |
Net increase (decrease) in net assets from Institutional Class share transactions | | | 36,781,757 | | | | 105,700,418 | | | | 10,557,635 | | | | 13,238,731 | | | | (20,990,662 | ) | | | 72,799,359 | | | | 402,321,205 | |
* | Commenced operations on March 30, 2016. |
** | See Note 9 in Notes to Financial Statements. |
Amounts designated as “—” are either $0, or have been rounded to $0. |
See Notes to Financial Statements.
78
Wilshire Mutual Funds, Inc. Statements of Changes in Net Assets - (Continued) For the Year Ended December 31, 2016 |
|
| | | LARGE
COMPANY
GROWTH PORTFOLIO | | | LARGE
COMPANY
VALUE
PORTFOLIO | | | SMALL
COMPANY
GROWTH
PORTFOLIO | | | SMALL
COMPANY
VALUE
PORTFOLIO | | | WILSHIRE
5000
INDEXSM
FUND | | | WILSHIRE INTERNATIONAL EQUITY
FUND | | | WILSHIRE INCOME OPPORTUNITIES FUND* | |
CAPITAL SHARE TRANSACTIONS (DOLLARS) (Continued): | | | | | | | | | | | | | | | | | | | | | |
Qualified Class shares: | | | | | | | | | | | | | | | | | | | | | |
Shares sold | | | N/A | | | | N/A | | | | N/A | | | | N/A | | | | 1 | | | | N/A | | | | N/A | |
Shares issued as reinvestment of distributions | | | N/A | | | | N/A | | | | N/A | | | | N/A | | | | — | | | | N/A | | | | N/A | |
Shares redeemed | | | N/A | | | | N/A | | | | N/A | | | | N/A | | | | (197 | ) | | | N/A | | | | N/A | |
Net decrease in net assets from Qualified Class share transactions | | | N/A | | | | N/A | | | | N/A | | | | N/A | | | | (196 | ) | | | N/A | | | | N/A | |
| | | | | | | | | | | | | | | | | | | | | | | | | | | | | |
Horace Mann Class shares: | | | | | | | | | | | | | | | | | | | | | | | | | | | | |
Shares sold | | | N/A | | | | N/A | | | | N/A | | | | N/A | | | | 24,850 | | | | N/A | | | | N/A | |
Shares issued as reinvestment of distributions | | | N/A | | | | N/A | | | | N/A | | | | N/A | | | | 4,577 | | | | N/A | | | | N/A | |
Shares redeemed | | | N/A | | | | N/A | | | | N/A | | | | N/A | | | | (1,792,892 | ) | | | N/A | | | | N/A | |
Net decrease in net assets from Horace Mann Class share transactions | | | N/A | | | | N/A | | | | N/A | | | | N/A | | | | (1,763,465 | ) | | | N/A | | | | N/A | |
Net increase (decrease) in net assets from capital stock transactions | | | (5,526,131 | ) | | | 58,777,237 | | | | 5,352,291 | | | | 6,192,541 | | | | (59,455,718 | ) | | | 80,569,838 | | | | 403,414,145 | |
| | | | | | | | | | | | | | | | | | | | | | | | | | | | | |
Net increase (decrease) in net assets | | | (14,798,498 | ) | | | 79,401,250 | | | | 10,030,639 | | | | 12,782,152 | | | | (46,870,468 | ) | | | 89,225,848 | | | | 397,899,009 | |
| | | | | | | | | | | | | | | | | | | | | | | | | | | | | |
NET ASSETS: | | | | | | | | | | | | | | | | | | | | | | | | | | | | |
Beginning of year | | | 229,599,932 | | | | 106,207,009 | | | | 27,056,540 | | | | 28,013,628 | | | | 220,399,847 | | | | 180,374,665 | | | | — | |
End of the year | | $ | 214,801,434 | | | $ | 185,608,259 | | | $ | 37,087,179 | | | $ | 40,795,780 | | | $ | 173,529,379 | | | $ | 269,600,513 | | | $ | 397,899,009 | |
Undistributed net investment income (accumulated net investment loss) at end of the year | | $ | 11,973 | | | $ | 3,533 | | | $ | — | | | $ | — | | | $ | (2,459 | ) | | $ | (104,004 | ) | | $ | (14,227 | ) |
* | Commenced operations on March 30, 2016. |
N/A — Not Applicable. Share classes not offered during the year. |
Amounts designated as “—” are either $0, or have been rounded to $0 |
See Notes to Financial Statements.
79
Wilshire Mutual Funds, Inc. Statements of Changes in Net Assets - (Continued) For the Year Ended December 31, 2016 |
|
| | | LARGE
COMPANY
GROWTH PORTFOLIO | | | LARGE
COMPANY
VALUE
PORTFOLIO | | | SMALL
COMPANY
GROWTH
PORTFOLIO | | | SMALL
COMPANY
VALUE
PORTFOLIO | | | WILSHIRE
5000
INDEXSM
FUND | | | WILSHIRE INTERNATIONAL EQUITY
FUND | | | WILSHIRE INCOME OPPORTUNITIES FUND* | |
CAPITAL SHARE TRANSACTIONS: | | | | | | | | | | | | | | | | | | | | | |
Investment Class shares: | | | | | | | | | | | | | | | | | | | | | |
Shares sold | | | 258,962 | | | | 723,256 | | | | 330,720 | | | | 217,024 | | | | 800,638 | | | | 1,460,532 | | | | 292,557 | |
Issued in connection with in-kind transfer** | | | — | | | | — | | | | — | | | | — | | | | — | | | | — | | | | 1 | |
Shares issued as reinvestment of distributions | | | 202,292 | | | | 42,973 | | | | 35,879 | | | | 38,667 | | | | 392,549 | | | | 19,862 | | | | 2,256 | |
Shares redeemed | | | (1,531,665 | ) | | | (3,109,741 | ) | | | (571,361 | ) | | | (561,550 | ) | | | (3,141,812 | ) | | | (600,832 | ) | | | (186,167 | ) |
Net increase (decrease) in Investment Class shares outstanding | | | (1,070,411 | ) | | | (2,343,512 | ) | | | (204,762 | ) | | | (305,859 | ) | | | (1,948,625 | ) | | | 879,562 | | | | 108,647 | |
| | | | | | | | | | | | | | | | | | | | | | | | | | | | | |
Institutional Class shares: | | | | | | | | | | | | | | | | | | | | | | | | | | | | |
Shares sold | | | 2,946,276 | | | | 6,952,495 | | | | 1,016,072 | | | | 1,155,839 | | | | 572,873 | | | | 21,027,280 | | | | 31,084,393 | |
Issued in connection with in-kind transfer** | | | — | | | | — | | | | — | | | | — | | | | — | | | | — | | | | 14,275,906 | |
Shares issued as reinvestment of distributions | | | 430,089 | | | | 577,737 | | | | 115,866 | | | | 111,843 | | | | 115,397 | | | | 524,904 | | | | 1,080,559 | |
Shares redeemed | | | (2,302,019 | ) | | | (1,698,028 | ) | | | (644,708 | ) | | | (605,842 | ) | | | (1,843,987 | ) | | | (12,387,624 | ) | | | (7,162,769 | ) |
Net increase (decrease) in Institutional Class shares outstanding | | | 1,074,346 | | | | 5,832,204 | | | | 487,230 | | | | 661,840 | | | | (1,155,717 | ) | | | 9,164,560 | | | | 39,278,089 | |
| | | | | | | | | | | | | | | | | | | | | | | | | | | | | |
Qualified Class shares: | | | | | | | | | | | | | | | | | | | | | | | | | | | | |
Shares sold | | | N/A | | | | N/A | | | | N/A | | | | N/A | | | | — | | | | N/A | | | | N/A | |
Shares issued as reinvestment of distributions | | | N/A | | | | N/A | | | | N/A | | | | N/A | | | | — | | | | N/A | | | | N/A | |
Shares redeemed | | | N/A | | | | N/A | | | | N/A | | | | N/A | | | | (12 | ) | | | N/A | | | | N/A | |
Net decrease in Qualified Class shares outstanding | | | N/A | | | | N/A | | | | N/A | | | | N/A | | | | (12 | ) | | | N/A | | | | N/A | |
| | | | | | | | | | | | | | | | | | | | | | | | | | | | | |
Horace Mann Class shares: | | | | | | | | | | | | | | | | | | | | | | | | | | | | |
Shares sold | | | N/A | | | | N/A | | | | N/A | | | | N/A | | | | 1,374 | | | | N/A | | | | N/A | |
Shares issued as reinvestment of distributions | | | N/A | | | | N/A | | | | N/A | | | | N/A | | | | 240 | | | | N/A | | | | N/A | |
Shares redeemed | | | N/A | | | | N/A | | | | N/A | | | | N/A | | | | (93,255 | ) | | | N/A | | | | N/A | |
Net decrease in Horace Mann Class shares outstanding | | | N/A | | | | N/A | | | | N/A | | | | N/A | | | | (91,641 | ) | | | N/A | | | | N/A | |
* | Commenced operations on March 30, 2016. |
** | See Note 9 in Notes to Financial Statements. |
N/A — Not Applicable. Share classes not offered during the year. |
Amounts designated as “—” are either $0, or have been rounded to $0. |
See Notes to Financial Statements.
80
Wilshire Mutual Funds, Inc. Statements of Changes in Net Assets For the Year Ended December 31, 2015* |
|
| | | LARGE
COMPANY
GROWTH PORTFOLIO | | | LARGE
COMPANY
VALUE
PORTFOLIO | | | SMALL
COMPANY
GROWTH
PORTFOLIO | | | SMALL
COMPANY
VALUE
PORTFOLIO | | | WILSHIRE
5000
INDEXSM
FUND | | | WILSHIRE INTERNATIONAL EQUITY
FUND | |
OPERATIONS: | | | | | | | | | | | | | | | | | | |
Net investment income (loss) | | $ | (398,110 | ) | | $ | 1,283,331 | | | $ | (122,687 | ) | | $ | 63,065 | | | $ | 3,259,507 | | | $ | 1,850,892 | |
Net realized gains (losses) on investments and foreign currency transactions | | | 21,237,633 | | | | 6,431,264 | | | | 1,568,318 | | | | 1,708,145 | | | | 12,858,128 | | | | (9,062,137 | ) |
Net change in unrealized appreciation (depreciation) on investments and other assets and liabilities denominated in foreign currencies | | | (6,083,070 | ) | | | (13,725,637 | ) | | | (751,209 | ) | | | (2,915,605 | ) | | | (15,900,180 | ) | | | 3,650,463 | |
Net increase (decrease) in net assets resulting from operations | | | 14,756,453 | | | | (6,011,042 | ) | | | 694,422 | | | | (1,144,395 | ) | | | 217,455 | | | | (3,560,782 | ) |
| | | | | | | | | | | | | | | | | | | | | | | | | |
DISTRIBUTIONS TO SHAREHOLDERS FROM: | | | | | | | | | | | | | | | | | | | | | | | | |
Net Investment Income: | | | | | | | | | | | | | | | | | | | | | | | | |
Investment Class shares | | | — | | | | (559,437 | ) | | | — | | | | (1,177 | ) | | | (2,187,317 | ) | | | (8,401 | ) |
Institutional Class shares | | | — | | | | (692,061 | ) | | | — | | | | (45,631 | ) | | | (944,890 | ) | | | (1,748,013 | ) |
Qualified Class shares | | | N/A | | | | N/A | | | | N/A | | | | N/A | | | | (3 | ) | | | N/A | |
Horace Mann Class shares | | | N/A | | | | N/A | | | | N/A | | | | N/A | | | | (22,310 | ) | | | N/A | |
Net Realized Capital Gains: | | | | | | | | | | | | | | | | | | | | | | | | |
Investment Class shares | | | (11,355,053 | ) | | | (3,397,914 | ) | | | (720,384 | ) | | | (828,980 | ) | | | — | | | | — | |
Institutional Class shares | | | (12,134,652 | ) | | | (3,309,669 | ) | | | (766,658 | ) | | | (762,106 | ) | | | — | | | | — | |
Total distributions to shareholders | | | (23,489,705 | ) | | | (7,959,081 | ) | | | (1,487,042 | ) | | | (1,637,894 | ) | | | (3,154,520 | ) | | | (1,756,414 | ) |
| | | | | | | | | | | | | | | | | | | | | | | | | |
CAPITAL SHARE TRANSACTIONS (DOLLARS): | | | | | | | | | | | | | | | | | | | | | | | | |
Investment Class shares: | | | | | | | | | | | | | | | | | | | | | | | | |
Shares sold | | | 14,431,823 | | | | 9,017,150 | | | | 5,078,365 | | | | 5,800,048 | | | | 28,001,013 | | | | 4,067,254 | |
Shares issued as reinvestment of distributions | | | 11,150,215 | | | | 3,910,990 | | | | 712,109 | | | | 819,947 | | | | 2,059,887 | | | | 6,973 | |
Redemption fees (Note 2) | | | — | | | | — | | | | — | | | | — | | | | — | | | | 220 | |
Shares redeemed | | | (17,010,216 | ) | | | (14,667,095 | ) | | | (4,087,152 | ) | | | (4,997,495 | ) | | | (72,677,521 | ) | | | (12,701,044 | ) |
Net increase (decrease) in net assets from Investment Class share transactions | | | 8,571,822 | | | | (1,738,955 | ) | | | 1,703,322 | | | | 1,622,500 | | | | (42,616,621 | ) | | | (8,626,597 | ) |
| | | | | | | | | | | | | | | | | | | | | | | | | |
Institutional Class shares: | | | | | | | | | | | | | | | | | | | | | | | | |
Shares sold | | | 5,361,481 | | | | 9,153 | | | | 20,061 | | | | 154,125 | | | | 5,224,542 | | | | 40,029,720 | |
Shares issued as reinvestment of distributions | | | 10,859,881 | | | | 3,996,628 | | | | 766,653 | | | | 807,423 | | | | 459,540 | | | | 1,746,693 | |
Redemption fees (Note 2) | | | — | | | | — | | | | — | | | | — | | | | — | | | | 341 | |
Shares redeemed | | | (24,726,424 | ) | | | (7,155,243 | ) | | | (1,522,249 | ) | | | (1,563,847 | ) | | | (13,339,955 | ) | | | (23,877,118 | ) |
Net increase (decrease) in net assets from Institutional Class share transactions | | | (8,505,062 | ) | | | (3,149,462 | ) | | | (735,535 | ) | | | (602,299 | ) | | | (7,655,873 | ) | | | 17,899,636 | |
* | The Wilshire Income Opportunities Fund had not commenced operations at December 31, 2015. |
N/A — Not Applicable. Share classes not offered during the year. |
Amounts designated as “—” are either $0, or have been rounded to $0. |
See Notes to Financial Statements.
81
Wilshire Mutual Funds, Inc. Statements of Changes in Net Assets - (Continued) For the Year Ended December 31, 2015* |
|
| | | LARGE
COMPANY
GROWTH PORTFOLIO | | | LARGE
COMPANY
VALUE
PORTFOLIO | | | SMALL
COMPANY
GROWTH
PORTFOLIO | | | SMALL
COMPANY
VALUE
PORTFOLIO | | | WILSHIRE
5000
INDEXSM
FUND | | | WILSHIRE INTERNATIONAL EQUITY
FUND | |
CAPITAL SHARE TRANSACTIONS
(DOLLARS) (Continued): | | | | | | | | | | | | | | | | | | |
Qualified Class shares: | | | | | | | | | | | | | | | | | | |
Shares sold | | | N/A | | | | N/A | | | | N/A | | | | N/A | | | | 1 | | | | N/A | |
Shares issued as reinvestment of distributions | | | N/A | | | | N/A | | | | N/A | | | | N/A | | | | 2 | | | | N/A | |
Shares redeemed | | | N/A | | | | N/A | | | | N/A | | | | N/A | | | | — | | | | N/A | |
Net increase in net assets from Qualified Class share transactions | | | N/A | | | | N/A | | | | N/A | | | | N/A | | | | 3 | | | | N/A | |
| | | | | | | | | | | | | | | | | | | | | | | | | |
Horace Mann Class shares: | | | | | | | | | | | | | | | | | | | | | | | | |
Shares sold | | | N/A | | | | N/A | | | | N/A | | | | N/A | | | | 30,775 | | | | N/A | |
Shares issued as reinvestment of distributions | | | N/A | | | | N/A | | | | N/A | | | | N/A | | | | 22,309 | | | | N/A | |
Shares redeemed | | | N/A | | | | N/A | | | | N/A | | | | N/A | | | | (124,088 | ) | | | N/A | |
Net decrease in net assets from Horace Mann Class share transactions | | | N/A | | | | N/A | | | | N/A | | | | N/A | | | | (71,004 | ) | | | N/A | |
Net increase (decrease) in net assets from capital stock transactions | | | 66,760 | | | | (4,888,417 | ) | | | 967,787 | | | | 1,020,201 | | | | (50,343,495 | ) | | | 9,273,039 | |
| | | | | | | | | | | | | | | | | | | | | | | | | |
Net increase (decrease) in net assets | | | (8,666,492 | ) | | | (18,858,540 | ) | | | 175,167 | | | | (1,762,088 | ) | | | (53,280,560 | ) | | | 3,955,843 | |
| | | | | | | | | | | | | | | | | | | | | | | | | |
NET ASSETS: | | | | | | | | | | | | | | | | | | | | | | | | |
Beginning of year | | | 238,266,424 | | | | 125,065,549 | | | | 26,881,373 | | | | 29,775,716 | | | | 273,680,407 | | | | 176,418,822 | |
End of year | | $ | 229,599,932 | | | $ | 106,207,009 | | | $ | 27,056,540 | | | $ | 28,013,628 | | | $ | 220,399,847 | | | $ | 180,374,665 | |
Undistributed net investment income (accumulated net investment loss) end of year | | $ | (10 | ) | | $ | (13 | ) | | $ | (3 | ) | | $ | 34,817 | | | $ | 540,069 | | | $ | 81,733 | |
* | The Wilshire Income Opportunities Fund had not commenced operations at December 31, 2015. |
N/A — Not Applicable. Share classes not offered during the year. |
Amounts designated as “—” are either $0, or have been rounded to $0. |
See Notes to Financial Statements.
82
Wilshire Mutual Funds, Inc. Statements of Changes in Net Assets - (Continued) For the Year Ended December 31, 2015* |
|
| | | LARGE
COMPANY
GROWTH PORTFOLIO | | | LARGE
COMPANY
VALUE
PORTFOLIO | | | SMALL
COMPANY
GROWTH
PORTFOLIO | | | SMALL
COMPANY
VALUE
PORTFOLIO | | | WILSHIRE
5000
INDEXSM
FUND | | | WILSHIRE INTERNATIONAL EQUITY
FUND | |
CAPITAL SHARE TRANSACTIONS: | | | | | | | | | | | | | | | | | | |
Investment Class shares: | | | | | | | | | | | | | | | | | | |
Shares sold | | | 362,130 | | | | 438,642 | | | | 207,103 | | | | 255,692 | | | | 1,545,688 | | | | 450,088 | |
Shares issued as reinvestment of distributions | | | 302,995 | | | | 208,652 | | | | 31,233 | | | | 39,706 | | | | 114,741 | | | | 778 | |
Shares redeemed | | | (431,846 | ) | | | (713,809 | ) | | | (166,035 | ) | | | (224,213 | ) | | | (4,033,525 | ) | | | (1,319,953 | ) |
Net increase (decrease) in Investment Class shares outstanding | | | 233,279 | | | | (66,515 | ) | | | 72,301 | | | | 71,185 | | | | (2,373,096 | ) | | | (869,087 | ) |
| | | | | | | | | | | | | | | | | | | | | | | | | |
Institutional Class shares: | | | | | | | | | | | | | | | | | | | | | | | | |
Shares sold | | | 128,974 | | | | 431 | | | | 761 | | | | 6,769 | | | | 287,221 | | | | 4,200,644 | |
Shares issued as reinvestment of distributions | | | 278,388 | | | | 212,174 | | | | 31,653 | | | | 38,323 | | | | 25,615 | | | | 197,366 | |
Shares redeemed | | | (588,546 | ) | | | (344,881 | ) | | | (58,468 | ) | | | (68,327 | ) | | | (740,212 | ) | | | (2,615,097 | ) |
Net increase (decrease) in Institutional Class shares outstanding | | | (181,184 | ) | | | (132,276 | ) | | | (26,054 | ) | | | (23,235 | ) | | | (427,376 | ) | | | 1,782,913 | |
| | | | | | | | | | | | | | | | | | | | | | | | | |
Qualified Class shares: | | | | | | | | | | | | | | | | | | | | | | | | |
Shares sold | | | N/A | | | | N/A | | | | N/A | | | | N/A | | | | 1 | | | | N/A | |
Shares issued as reinvestment of distributions | | | N/A | | | | N/A | | | | N/A | | | | N/A | | | | 1 | | | | N/A | |
Shares redeemed | | | N/A | | | | N/A | | | | N/A | | | | N/A | | | | — | | | | N/A | |
Net increase in Qualified Class shares outstanding | | | N/A | | | | N/A | | | | N/A | | | | N/A | | | | 2 | | | | N/A | |
| | | | | | | | | | | | | | | | | | | | | | | | | |
Horace Mann Class shares: | | | | | | | | | | | | | | | | | | | | | | | | |
Shares sold | | | N/A | | | | N/A | | | | N/A | | | | N/A | | | | 1,699 | | | | N/A | |
Shares issued as reinvestment of distributions | | | N/A | | | | N/A | | | | N/A | | | | N/A | | | | 1,246 | | | | N/A | |
Shares redeemed | | | N/A | | | | N/A | | | | N/A | | | | N/A | | | | (6,773 | ) | | | N/A | |
Net decrease in Horace Mann Class shares outstanding | | | N/A | | | | N/A | | | | N/A | | | | N/A | | | | (3,828 | ) | | | N/A | |
* | The Wilshire Income Opportunities Fund had not commenced operations at December 31, 2015. |
N/A — Not Applicable. Share classes not offered during the year. |
Amounts designated as “—” are either $0, or have been rounded to $0. |
See Notes to Financial Statements.
83
Wilshire Mutual Funds, Inc. Large Company Growth Portfolio Financial Highlights |
|
For a Fund Share Outstanding Throughout Each Year. | |
| | | Investment Class Shares | |
| | | Year
Ended
12/31/2016 | | | Year
Ended
12/31/2015 | | | Year
Ended
12/31/2014 | | | Year
Ended
12/31/2013 | | | Year
Ended
12/31/2012 | |
Net asset value, beginning of year | | $ | 36.82 | | | $ | 38.66 | | | $ | 41.60 | | | $ | 34.70 | | | $ | 31.54 | |
| | | | | | | | | | | | | | | | | | | | | |
Income (loss) from investment operations: | | | | | | | | | | | | | | | | | | | | |
Net investment income (loss)1 | | | 0.04 | | | | (0.14 | ) | | | (0.26 | ) | | | (0.02 | ) | | | 0.07 | |
Net realized and unrealized gains on investments | | | 1.26 | | | | 2.53 | | | | 3.61 | | | | 10.38 | | | | 4.24 | |
Total from investment operations | | | 1.30 | | | | 2.39 | | | | 3.35 | | | | 10.36 | | | | 4.31 | |
| | | | | | | | | | | | | | | | | | | | | |
Less distributions: | | | | | | | | | | | | | | | | | | | | |
From net investment income | | | (0.01 | ) | | | — | | | | — | | | | — | | | | (0.07 | ) |
From realized capital gains | | | (4.18 | ) | | | (4.23 | ) | | | (6.29 | ) | | | (3.46 | ) | | | (1.08 | ) |
Total distributions | | | (4.19 | ) | | | (4.23 | ) | | | (6.29 | ) | | | (3.46 | ) | | | (1.15 | ) |
| | | | | | | | | | | | | | | | | | | | | |
Net asset value, end of year | | $ | 33.93 | | | $ | 36.82 | | | $ | 38.66 | | | $ | 41.60 | | | $ | 34.70 | |
| | | | | | | | | | | | | | | | | | | | | |
Total return | | | 3.33 | % | | | 6.18 | % | | | 7.97 | % | | | 30.22 | % | | | 13.72 | % |
| | | | | | | | | | | | | | | | | | | | | |
Ratios to average net assets/supplemental data: | | | | | | | | | | | | | | | | | | | | |
Net assets, end of year (in 000’s) | | $ | 62,634 | | | $ | 107,381 | | | $ | 103,733 | | | $ | 113,495 | | | $ | 100,853 | |
Operating expenses after fee reductions and expense reimbursements and fees paid indirectly | | | 1.32 | % | | | 1.33 | % | | | 1.38 | % | | | 1.36 | % | | | 1.39 | % |
Operating expenses before fee reductions and expense reimbursements and fees paid indirectly | | | 1.32 | %2 | | | 1.33 | %2 | | | 1.38 | %2 | | | 1.36 | %2 | | | 1.39 | %2 |
Net investment income (loss) | | | 0.10 | % | | | (0.34 | %) | | | (0.61 | %) | | | (0.05 | %) | | | 0.20 | % |
Portfolio turnover rate | | | 75 | % | | | 104 | % | | | 62 | % | | | 136 | % | | | 71 | % |
Amounts designated as “—“ are either $0, or have been rounded to $0. |
1 | The selected per share data was calculated using the average shares outstanding method for the period. |
2 | The ratio of operating expenses before fee reductions and expense reimbursements excludes the effect of fees paid indirectly. If this expense offset was included, the ratio would have been 1.32%, 1.34%, 1.38%, 1.36% and 1.39% for 2016, 2015, 2014, 2013 and 2012, respectively. |
See Notes to Financial Statements.
84
Wilshire Mutual Funds, Inc. Large Company Growth Portfolio Financial Highlights - (Continued) |
|
For a Fund Share Outstanding Throughout Each Year. | |
| | | Institutional Class Shares | |
| | | Year
Ended
12/31/2016 | | | Year
Ended
12/31/2015 | | | Year
Ended
12/31/2014 | | | Year
Ended
12/31/2013 | | | Year
Ended
12/31/2012 | |
Net asset value, beginning of year | | $ | 39.04 | | | $ | 40.62 | | | $ | 43.28 | | | $ | 35.94 | | | $ | 32.63 | |
| | | | | | | | | | | | | | | | | | | | | |
Income (loss) from investment operations: | | | | | | | | | | | | | | | | | | | | |
Net investment income (loss)1 | | | 0.15 | | | | (0.01 | ) | | | (0.13 | ) | | | 0.10 | | | | 0.18 | |
Net realized and unrealized gains on investments | | | 1.34 | | | | 2.66 | | | | 3.76 | | | | 10.77 | | | | 4.38 | |
Total from investment operations | | | 1.49 | | | | 2.65 | | | | 3.63 | | | | 10.87 | | | | 4.56 | |
| | | | | | | | | | | | | | | | | | | | | |
Less distributions: | | | | | | | | | | | | | | | | | | | | |
From net investment income | | | (0.16 | ) | | | — | | | | (0.00 | )2 | | | (0.07 | ) | | | (0.17 | ) |
From realized capital gains | | | (4.18 | ) | | | (4.23 | ) | | | (6.29 | ) | | | (3.46 | ) | | | (1.08 | ) |
Total distributions | | | (4.34 | ) | | | (4.23 | ) | | | (6.29 | ) | | | (3.53 | ) | | | (1.25 | ) |
| | | | | | | | | | | | | | | | | | | | | |
Net asset value, end of year | | $ | 36.19 | | | $ | 39.04 | | | $ | 40.62 | | | $ | 43.28 | | | $ | 35.94 | |
| | | | | | | | | | | | | | | | | | | | | |
Total return | | | 3.61 | % | | | 6.52 | % | | | 8.32 | % | | | 30.60 | % | | | 14.04 | % |
| | | | | | | | | | | | | | | | | | | | | |
Ratios to average net assets/supplemental data: | | | | | | | | | | | | | | | | | | | | |
Net assets, end of year (in 000’s) | | $ | 152,167 | | | $ | 122,219 | | | $ | 134,534 | | | $ | 243,622 | | | $ | 85,740 | |
Operating expenses after fee reductions and expense reimbursements and fees paid indirectly | | | 1.04 | % | | | 1.01 | % | | | 1.06 | % | | | 1.05 | % | | | 1.11 | % |
Operating expenses before fee reductions and expense reimbursements and fees paid indirectly | | | 1.04 | %3 | | | 1.01 | %3 | | | 1.06 | %3 | | | 1.06 | %3 | | | 1.11 | %3 |
Net investment income (loss) | | | 0.37 | % | | | (0.02 | %) | | | (0.29 | %) | | | 0.23 | % | | | 0.50 | % |
Portfolio turnover rate | | | 75 | % | | | 104 | % | | | 62 | % | | | 136 | % | | | 71 | % |
Amounts designated as “—“ are either $0, or have been rounded to $0. |
1 | The selected per share data was calculated using the average shares outstanding method for the period. |
2 | Amount is less than $0.01 per share. |
3 | The ratio of operating expenses before fee reductions and reimbursements excludes the effect of fees paid indirectly. If this expense offset was included, the ratio would have been 1.04%, 1.02%, 1.06%, 1.05% and 1.11% for 2016, 2015, 2014, 2013 and 2012, respectively. |
See Notes to Financial Statements.
85
Wilshire Mutual Funds, Inc. Large Company Value Portfolio Financial Highlights |
|
For a Fund Share Outstanding Throughout Each Year. | |
| | | Investment Class Shares | |
| | | Year
Ended
12/31/2016 | | | Year
Ended
12/31/2015 | | | Year
Ended
12/31/2014 | | | Year
Ended
12/31/2013 | | | Year
Ended
12/31/2012 | |
Net asset value, beginning of year | | $ | 18.62 | | | $ | 21.19 | | | $ | 21.44 | | | $ | 15.86 | | | $ | 13.82 | |
| | | | | | | | | | | | | | | | | | | | | |
Income (loss) from investment operations: | | | | | | | | | | | | | | | | | | | | |
Net investment income1 | | | 0.37 | | | | 0.20 | | | | 0.18 | | | | 0.16 | | | | 0.17 | |
Net realized and unrealized gains (losses) on investments | | | 2.56 | | | | (1.33 | ) | | | 2.14 | | | | 5.64 | | | | 2.03 | |
Total from investment operations | | | 2.93 | | | | (1.13 | ) | | | 2.32 | | | | 5.80 | | | | 2.20 | |
| | | | | | | | | | | | | | | | | | | | | |
Less distributions: | | | | | | | | | | | | | | | | | | | | |
From net investment income | | | (0.14 | ) | | | (0.19 | ) | | | (0.23 | ) | | | (0.14 | ) | | | (0.16 | ) |
From realized capital gains | | | (1.01 | ) | | | (1.25 | ) | | | (2.34 | ) | | | (0.08 | ) | | | — | |
Total distributions | | | (1.15 | ) | | | (1.44 | ) | | | (2.57 | ) | | | (0.22 | ) | | | (0.16 | ) |
| | | | | | | | | | | | | | | | | | | | | |
Net asset value, end of year | | $ | 20.40 | | | $ | 18.62 | | | $ | 21.19 | | | $ | 21.44 | | | $ | 15.86 | |
| | | | | | | | | | | | | | | | | | | | | |
Total return | | | 15.73 | % | | | (5.33 | %) | | | 10.77 | % | | | 36.54 | % | | | 15.92 | % |
| | | | | | | | | | | | | | | | | | | | | |
Ratios to average net assets/supplemental data: | | | | | | | | | | | | | | | | | | | | |
Net assets, end of year (in 000’s) | | $ | 10,112 | | | $ | 52,864 | | | $ | 61,566 | | | $ | 61,800 | | | $ | 44,220 | |
Operating expenses after fee reductions and expense reimbursements and fees paid indirectly | | | 1.26 | % | | | 1.27 | % | | | 1.29 | % | | | 1.24 | % | | | 1.35 | % |
Operating expenses before fee reductions and expense reimbursements and fees paid indirectly | | | 1.27 | %2 | | | 1.29 | %2 | | | 1.30 | %2 | | | 1.25 | %2 | | | 1.36 | %2 |
Net investment income | | | 1.87 | % | | | 0.96 | % | | | 0.80 | % | | | 0.87 | % | | | 1.12 | % |
Portfolio turnover rate | | | 174 | % | | | 55 | % | | | 57 | % | | | 101 | % | | | 97 | % |
Amounts designated as “—“ are either $0, or have been rounded to $0. |
1 | The selected per share data was calculated using the average shares outstanding method for the period. |
2 | The ratio of operating expenses before fee reductions and expense reimbursements excludes the effect of fees paid indirectly. If this expense offset was included, the ratio would have been 1.26%, 1.27%, 1.29%, 1.24% and 1.35% for 2016, 2015, 2014, 2013 and 2012, respectively. |
See Notes to Financial Statements.
86
Wilshire Mutual Funds, Inc. Large Company Value Portfolio Financial Highlights - (Continued) |
|
For a Fund Share Outstanding Throughout Each Year. | |
| | | Institutional Class Shares | |
| | | Year
Ended
12/31/2016 | | | Year
Ended
12/31/2015 | | | Year
Ended
12/31/2014 | | | Year
Ended
12/31/2013 | | | Year
Ended
12/31/2012 | |
Net asset value, beginning of year | | $ | 18.67 | | | $ | 21.24 | | | $ | 21.48 | | | $ | 15.89 | | | $ | 13.84 | |
| | | | | | | | | | | | | | | | | | | | | |
Income (loss) from investment operations: | | | | | | | | | | | | | | | | | | | | |
Net investment income1 | | | 0.40 | | | | 0.26 | | | | 0.24 | | | | 0.22 | | | | 0.20 | |
Net realized and unrealized gains (losses) on investments | | | 2.55 | | | | (1.33 | ) | | | 2.14 | | | | 5.63 | | | | 2.04 | |
Total from investment operations | | | 2.95 | | | | (1.07 | ) | | | 2.38 | | | | 5.85 | | | | 2.24 | |
| | | | | | | | | | | | | | | | | | | | | |
Less distributions: | | | | | | | | | | | | | | | | | | | | |
From net investment income | | | (0.41 | ) | | | (0.25 | ) | | | (0.28 | ) | | | (0.18 | ) | | | (0.19 | ) |
From realized capital gains | | | (1.01 | ) | | | (1.25 | ) | | | (2.34 | ) | | | (0.08 | ) | | | — | |
Total distributions | | | (1.42 | ) | | | (1.50 | ) | | | (2.62 | ) | | | (0.26 | ) | | | (0.19 | ) |
| | | | | | | | | | | | | | | | | | | | | |
Net asset value, end of year | | $ | 20.20 | | | $ | 18.67 | | | $ | 21.24 | | | $ | 21.48 | | | $ | 15.89 | |
| | | | | | | | | | | | | | | | | | | | | |
Total return | | | 15.78 | % | | | (5.07 | %) | | | 11.05 | % | | | 36.85 | % | | | 16.18 | % |
| | | | | | | | | | | | | | | | | | | | | |
Ratios to average net assets/supplemental data: | | | | | | | | | | | | | | | | | | | | |
Net assets, end of year (in 000’s) | | $ | 175,497 | | | $ | 53,343 | | | $ | 63,499 | | | $ | 111,550 | | | $ | 800 | |
Operating expenses after fee reductions and expense reimbursements and fees paid indirectly | | | 1.04 | % | | | 1.01 | % | | | 1.00 | % | | | 0.95 | % | | | 1.14 | % |
Operating expenses before fee reductions and expense reimbursements and fees paid indirectly | | | 1.05 | %2 | | | 1.02 | %2 | | | 1.01 | %2 | | | 0.97 | %2 | | | 1.15 | %2 |
Net investment income | | | 2.09 | % | | | 1.23 | % | | | 1.09 | % | | | 1.13 | % | | | 1.32 | % |
Portfolio turnover rate | | | 174 | % | | | 55 | % | | | 57 | % | | | 101 | % | | | 97 | % |
Amounts designated as “—“ are either $0, or have been rounded to $0. |
1 | The selected per share data was calculated using the average shares outstanding method for the period. |
2 | The ratio of operating expenses before fee reductions and expense reimbursements excludes the effect of fees paid indirectly. If this expense offset was included, the ratio would have been 1.04%, 1.01%, 1.00%, 0.95% and 1.14% for 2016, 2015, 2014, 2013 and 2012, respectively. |
See Notes to Financial Statements.
87
Wilshire Mutual Funds, Inc. Small Company Growth Portfolio Financial Highlights |
|
For a Fund Share Outstanding Throughout Each Year. | |
| | | Investment Class Shares | |
| | | Year
Ended
12/31/2016 | | | Year
Ended
12/31/2015 | | | Year
Ended
12/31/2014 | | | Year
Ended
12/31/2013 | | | Year
Ended
12/31/2012 | |
Net asset value, beginning of year | | $ | 22.64 | | | $ | 23.44 | | | $ | 24.95 | | | $ | 18.06 | | | $ | 15.90 | |
| | | | | | | | | | | | | | | | | | | | | |
Income (loss) from investment operations: | | | | | | | | | | | | | | | | | | | | |
Net investment income (loss)1 | | | (0.15 | ) | | | (0.15 | ) | | | (0.25 | ) | | | (0.16 | ) | | | 0.09 | |
Net realized and unrealized gains on investments | | | 4.80 | | | | 0.70 | | | | 1.09 | | | | 7.59 | | | | 2.07 | |
Total from investment operations | | | 4.65 | | | | 0.55 | | | | 0.84 | | | | 7.43 | | | | 2.16 | |
| | | | | | | | | | | | | | | | | | | | | |
Less distributions: | | | | | | | | | | | | | | | | | | | | |
From realized capital gains | | | (2.88 | ) | | | (1.35 | ) | | | (2.35 | ) | | | (0.54 | ) | | | — | |
| | | | | | | | | | | | | | | | | | | | | |
Net asset value, end of year | | $ | 24.41 | | | $ | 22.64 | | | $ | 23.44 | | | $ | 24.95 | | | $ | 18.06 | |
| | | | | | | | | | | | | | | | | | | | | |
Total return | | | 20.44 | % | | | 2.29 | % | | | 3.44 | % | | | 41.25 | % | | | 13.58 | % |
| | | | | | | | | | | | | | | | | | | | | |
Ratios to average net assets/supplemental data: | | | | | | | | | | | | | | | | | | | | |
Net assets, end of year (in 000’s) | | $ | 8,633 | | | $ | 12,642 | | | $ | 11,398 | | | $ | 9,582 | | | $ | 7,225 | |
Operating expenses after fee reductions and expense reimbursements and fees paid indirectly | | | 1.51 | % | | | 1.46 | % | | | 1.50 | % | | | 1.47 | % | | | 1.47 | % |
Operating expenses before fee reductions and expense reimbursements and fees paid indirectly | | | 1.60 | %2 | | | 1.64 | %2 | | | 1.55 | %2 | | | 1.62 | %2 | | | 1.97 | %2 |
Net investment income (loss) | | | (0.57 | %) | | | (0.59 | %) | | | (1.00 | %) | | | (0.75 | %) | | | 0.55 | % |
Portfolio turnover rate | | | 114 | % | | | 63 | % | | | 77 | % | | | 88 | % | | | 99 | % |
Amounts designated as “—“ are either $0, or have been rounded to $0. |
1 | The selected per share data was calculated using the average shares outstanding method for the period. |
2 | The ratio of operating expenses before fee reductions and expense reimbursements excludes the effect of fees paid indirectly. If this expense offset was included, the ratio would have been 1.60%, 1.64%, 1.54%, 1.61% and 1.95% for 2016, 2015, 2014, 2013 and 2012, respectively. |
See Notes to Financial Statements.
88
Wilshire Mutual Funds, Inc. Small Company Growth Portfolio Financial Highlights - (Continued) |
|
For a Fund Share Outstanding Throughout Each Year. | |
| | | Institutional Class Shares | |
| | | Year
Ended
12/31/2016 | | | Year
Ended
12/31/2015 | | | Year
Ended
12/31/2014 | | | Year
Ended
12/31/2013 | | | Year
Ended
12/31/2012 | |
Net asset value, beginning of year | | $ | 24.04 | | | $ | 24.75 | | | $ | 26.14 | | | $ | 18.89 | | | $ | 16.60 | |
| | | | | | | | | | | | | | | | | | | | | |
Income (loss) from investment operations: | | | | | | | | | | | | | | | | | | | | |
Net investment income (loss)1 | | | (0.08 | ) | | | (0.07 | ) | | | (0.18 | ) | | | (0.15 | ) | | | 0.11 | |
Net realized and unrealized gains on investments | | | 5.10 | | | | 0.71 | | | | 1.14 | | | | 7.99 | | | | 2.18 | |
Total from investment operations | | | 5.02 | | | | 0.64 | | | | 0.96 | | | | 7.84 | | | | 2.29 | |
| | | | | | | | | | | | | | | | | | | | | |
Less distributions: | | | | | | | | | | | | | | | | | | | | |
From net investment income | | | — | | | | — | | | | — | | | | (0.05 | ) | | | — | |
From realized capital gains | | | (2.88 | ) | | | (1.35 | ) | | | (2.35 | ) | | | (0.54 | ) | | | — | |
Total distributions | | | (2.88 | ) | | | (1.35 | ) | | | (2.35 | ) | | | (0.59 | ) | | | — | |
| | | | | | | | | | | | | | | | | | | | | |
Net asset value, end of year | | $ | 26.18 | | | $ | 24.04 | | | $ | 24.75 | | | $ | 26.14 | | | $ | 18.89 | |
| | | | | | | | | | | | | | | | | | | | | |
Total return | | | 20.79 | % | | | 2.53 | % | | | 3.75 | % | | | 41.58 | % | | | 13.80 | % |
| | | | | | | | | | | | | | | | | | | | | |
Ratios to average net assets/supplemental data: | | | | | | | | | | | | | | | | | | | | |
Net assets, end of year (in 000’s) | | $ | 28,454 | | | $ | 14,414 | | | $ | 15,483 | | | $ | 24,013 | | | $ | 15 | |
Operating expenses after fee reductions and expense reimbursements and fees paid indirectly | | | 1.27 | % | | | 1.19 | % | | | 1.20 | % | | | 1.19 | % | | | 1.28 | % |
Operating expenses before fee reductions and expense reimbursements and fees paid indirectly | | | 1.33 | %2 | | | 1.36 | %2 | | | 1.24 | %2 | | | 1.20 | %2 | | | 1.79 | %2 |
Net investment income (loss) | | | (0.32 | %) | | | (0.28 | %) | | | (0.70 | %) | | | (0.54 | %) | | | 0.60 | % |
Portfolio turnover rate | | | 114 | % | | | 63 | % | | | 77 | % | | | 88 | % | | | 99 | % |
Amounts designated as “—“ are either $0, or have been rounded to $0. |
1 | The selected per share data was calculated using the average shares outstanding method for the period. |
2 | The ratio of operating expenses before fee reductions and expense reimbursements excludes the effect of fees paid indirectly. If this expense offset was included, the ratio would have been 1.33%, 1.35%, 1.19%, 1.18% and 1.78% for 2016, 2015, 2014, 2013 and 2012, respectively. |
See Notes to Financial Statements.
89
Wilshire Mutual Funds, Inc. Small Company Value Portfolio Financial Highlights |
|
For a Fund Share Outstanding Throughout Each Year. | |
| | | Investment Class Shares | |
| | | Year
Ended
12/31/2016 | | | Year
Ended
12/31/2015 | | | Year
Ended
12/31/2014 | | | Year
Ended
12/31/2013 | | | Year
Ended
12/31/2012 | |
Net asset value, beginning of year | | $ | 20.74 | | | $ | 22.86 | | | $ | 24.33 | | | $ | 17.40 | | | $ | 15.04 | |
| | | | | | | | | | | | | | | | | | | | | |
Income (loss) from investment operations: | | | | | | | | | | | | | | | | | | | | |
Net investment income (loss)1 | | | 0.10 | | | | 0.01 | | | | (0.08 | ) | | | (0.03 | ) | | | 0.20 | |
Net realized and unrealized gains (losses) on investments | | | 4.99 | | | | (0.89 | ) | | | 1.53 | | | | 7.62 | | | | 2.38 | |
Total from investment operations | | | 5.09 | | | | (0.88 | ) | | | 1.45 | | | | 7.59 | | | | 2.58 | |
| | | | | | | | | | | | | | | | | | | | | |
Less distributions: | | | | | | | | | | | | | | | | | | | | |
From net investment income | | | (0.09 | ) | | | (0.00 | )2 | | | — | | | | (0.00 | )2 | | | (0.22 | ) |
From capital gains | | | (1.99 | ) | | | (1.24 | ) | | | (2.92 | ) | | | (0.66 | ) | | | — | |
Total distributions | | | (2.08 | ) | | | (1.24 | ) | | | (2.92 | ) | | | (0.66 | ) | | | (0.22 | ) |
| | | | | | | | | | | | | | | | | | | | | |
Net asset value, end of year | | $ | 23.75 | | | $ | 20.74 | | | $ | 22.86 | | | $ | 24.33 | | | $ | 17.40 | |
| | | | | | | | | | | | | | | | | | | | | |
Total return | | | 24.86 | % | | | (3.83 | %) | | | 6.17 | % | | | 43.79 | % | | | 17.20 | % |
| | | | | | | | | | | | | | | | | | | | | |
Ratios to average net assets/supplemental data: | | | | | | | | | | | | | | | | | | | | |
Net assets, end of year (in 000’s) | | $ | 9,097 | | | $ | 14,287 | | | $ | 14,120 | | | $ | 13,688 | | | $ | 9,641 | |
Operating expenses after fee reductions and expense reimbursements and fees paid indirectly | | | 1.51 | % | | | 1.49 | % | | | 1.49 | % | | | 1.49 | % | | | 1.49 | % |
Operating expenses before fee reductions and expense reimbursements and fees paid indirectly | | | 1.60 | %3 | | | 1.67 | %3 | | | 1.56 | %3 | | | 1.58 | %3 | | | 1.84 | %3 |
Net investment income (loss) | | | 0.48 | % | | | 0.06 | % | | | (0.35 | %) | | | (0.13 | %) | | | 1.24 | % |
Portfolio turnover rate | | | 99 | % | | | 49 | % | | | 53 | % | | | 60 | % | | | 68 | % |
Amounts designated as “—“ are either $0, or have been rounded to $0. |
1 | The selected per share data was calculated using the average shares outstanding method for the period. |
2 | Amount is less than $0.01 per share. |
3 | The ratio of operating expenses before fee reductions and expense reimbursements excludes the effect of fees paid indirectly. If this expense offset was included, the ratio would have been 1.59%, 1.67%, 1.55%, 1.57% and 1.83% for 2016, 2015, 2014, 2013 and 2012, respectively. |
See Notes to Financial Statements.
90
Wilshire Mutual Funds, Inc. Small Company Value Portfolio Financial Highlights - (Continued) |
|
For a Fund Share Outstanding Throughout Each Year. | |
| | | Institutional Class Shares | |
| | | Year
Ended
12/31/2016 | | | Year
Ended
12/31/2015 | | | Year
Ended
12/31/2014 | | | Year
Ended
12/31/2013 | | | Year
Ended
12/31/2012 | |
Net asset value, beginning of year | | $ | 21.08 | | | $ | 23.21 | | | $ | 24.59 | | | $ | 17.58 | | | $ | 15.19 | |
| | | | | | | | | | | | | | | | | | | | | |
Income (loss) from investment operations: | | | | | | | | | | | | | | | | | | | | |
Net investment income (loss)1 | | | 0.16 | | | | 0.08 | | | | (0.02 | ) | | | 0.00 | | | | 0.22 | |
Net realized and unrealized gains (losses) on investments | | | 5.08 | | | | (0.90 | ) | | | 1.56 | | | | 7.74 | | | | 2.42 | |
Total from investment operations | | | 5.24 | | | | (0.82 | ) | | | 1.54 | | | | 7.74 | | | | 2.64 | |
| | | | | | | | | | | | | | | | | | | | | |
Less distributions: | | | | | | | | | | | | | | | | | | | | |
From net investment income | | | (0.19 | ) | | | (0.07 | ) | | | — | | | | (0.07 | ) | | | (0.25 | ) |
From realized capital gains | | | (1.99 | ) | | | (1.24 | ) | | | (2.92 | ) | | | (0.66 | ) | | | — | |
Total distributions | | | (2.18 | ) | | | (1.31 | ) | | | (2.92 | ) | | | (0.73 | ) | | | (0.25 | ) |
| | | | | | | | | | | | | | | | | | | | | |
Net asset value, end of year | | $ | 24.14 | | | $ | 21.08 | | | $ | 23.21 | | | $ | 24.59 | | | $ | 17.58 | |
| | | | | | | | | | | | | | | | | | | | | |
Total return | | | 25.16 | % | | | (3.52 | %) | | | 6.47 | % | | | 44.16 | % | | | 17.41 | % |
| | | | | | | | | | | | | | | | | | | | | |
Ratios to average net assets/supplemental data: | | | | | | | | | | | | | | | | | | | | |
Net assets, end of year (in 000’s) | | $ | 31,698 | | | $ | 13,727 | | | $ | 15,655 | | | $ | 24,934 | | | $ | 54 | |
Operating expenses after fee reductions and expense reimbursements and fees paid indirectly | | | 1.27 | % | | | 1.18 | % | | | 1.17 | % | | | 1.20 | % | | | 1.31 | % |
Operating expenses before fee reductions and expense reimbursements and fees paid indirectly | | | 1.33 | %2 | | | 1.36 | %2 | | | 1.23 | %2 | | | 1.19 | %2 | | | 1.66 | %2 |
Net investment income (loss) | | | 0.73 | % | | | 0.36 | % | | | (0.07 | %) | | | (0.01 | %) | | | 1.33 | % |
Portfolio turnover rate | | | 99 | % | | | 49 | % | | | 53 | % | | | 60 | % | | | 68 | % |
Amounts designated as “—“ are either $0, or have been rounded to $0. |
1 | The selected per share data was calculated using the average shares outstanding method for the period. |
2 | The ratio of operating expenses before fee reductions and expense reimbursements excludes the effect of fees paid indirectly. If this expense offset was included, the ratio would have been 1.32%, 1.35%, 1.21%, 1.18% and 1.65% for 2016, 2015, 2014, 2013 and 2012, respectively. |
See Notes to Financial Statements.
91
Wilshire Mutual Funds, Inc. Wilshire 5000 Indexsm Fund Financial Highlights |
|
For a Fund Share Outstanding Throughout Each Year. | |
| | | Investment Class Shares | |
| | | Year
Ended
12/31/2016 | | | Year
Ended
12/31/2015 | | | Year
Ended
12/31/2014 | | | Year
Ended
12/31/2013 | | | Year
Ended
12/31/2012 | |
Net asset value, beginning of year | | $ | 17.78 | | | $ | 18.01 | | | $ | 16.22 | | | $ | 12.43 | | | $ | 10.93 | |
| | | | | | | | | | | | | | | | | | | | | |
Income (loss) from investment operations: | | | | | | | | | | | | | | | | | | | | |
Net investment income1 | | | 0.27 | | | | 0.24 | | | | 0.23 | | | | 0.19 | | | | 0.19 | |
Net realized and unrealized gains (losses) on investments | | | 1.96 | | | | (0.22 | ) | | | 1.78 | | | | 3.80 | | | | 1.49 | |
Total from investment operations | | | 2.23 | | | | 0.02 | | | | 2.01 | | | | 3.99 | | | | 1.68 | |
| | | | | | | | | | | | | | | | | | | | | |
Less distributions: | | | | | | | | | | | | | | | | | | | | |
From net investment income | | | (0.39 | ) | | | (0.25 | ) | | | (0.22 | ) | | | (0.20 | ) | | | (0.18 | ) |
From realized capital gains | | | (0.76 | ) | | | — | | | | — | | | | — | | | | — | |
Total distributions | | | (1.15 | ) | | | (0.25 | ) | | | (0.22 | ) | | | (0.20 | ) | | | (0.18 | ) |
| | | | | | | | | | | | | | | | | | | | | |
Net asset value, end of year | | $ | 18.86 | | | $ | 17.78 | | | $ | 18.01 | | | $ | 16.22 | | | $ | 12.43 | |
| | | | | | | | | | | | | | | | | | | | | |
Total return | | | 12.51 | % | | | 0.08 | % | | | 12.38 | % | | | 32.10 | % | | | 15.36 | % |
| | | | | | | | | | | | | | | | | | | | | |
Ratios to average net assets/supplemental data: | | | | | | | | | | | | | | | | | | | | |
Net assets, end of year (in 000’s) | | $ | 132,669 | | | $ | 159,709 | | | $ | 204,465 | | | $ | 139,354 | | | $ | 107,888 | |
Operating expenses after fee reductions and expense reimbursements and fees paid indirectly | | | 0.67 | % | | | 0.64 | % | | | 0.65 | % | | | 0.68 | % | | | 0.70 | % |
Operating expenses before fee reductions and expense reimbursements and fees paid indirectly | | | 0.67 | %2 | | | 0.64 | %2 | | | 0.65 | % | | | 0.68 | % | | | 0.70 | % |
Net investment income | | | 1.49 | % | | | 1.35 | % | | | 1.32 | % | | | 1.33 | % | | | 1.61 | % |
Portfolio turnover rate | | | 5 | % | | | 6 | % | | | 3 | % | | | 2 | % | | | 2 | % |
Amounts designated as “—“ are either $0, or have been rounded to $0. |
1 | The selected per share data was calculated using the average shares outstanding method for the period. |
2 | The ratio of operating expenses before fee reductions and expense reimbursements excludes the effect of fees paid indirectly. If this expense offset was included, the ratio would have been 0.67% and 0.64% for 2016 and 2015, respectively. |
See Notes to Financial Statements.
92
Wilshire Mutual Funds, Inc. Wilshire 5000 Indexsm Fund Financial Highlights - (Continued) |
|
For a Fund Share Outstanding Throughout Each Year. | |
| | | Institutional Class Shares | |
| | | Year
Ended
12/31/2016 | | | Year
Ended
12/31/2015 | | | Year
Ended
12/31/2014 | | | Year
Ended
12/31/2013 | | | Year
Ended
12/31/2012 | |
Net asset value, beginning of year | | $ | 17.78 | | | $ | 18.00 | | | $ | 16.21 | | | $ | 12.41 | | | $ | 10.92 | |
| | | | | | | | | | | | | | | | | | | | | |
Income (loss) from investment operations: | | | | | | | | | | | | | | | | | | | | |
Net investment income1 | | | 0.33 | | | | 0.29 | | | | 0.26 | | | | 0.22 | | | | 0.22 | |
Net realized and unrealized gains (losses) on investments | | | 1.95 | | | | (0.22 | ) | | | 1.79 | | | | 3.81 | | | | 1.47 | |
Total from investment operations | | | 2.28 | | | | 0.07 | | | | 2.05 | | | | 4.03 | | | | 1.69 | |
| | | | | | | | | | | | | | | | | | | | | |
Less distributions: | | | | | | | | | | | | | | | | | | | | |
From net investment income | | | (0.45 | ) | | | (0.29 | ) | | | (0.26 | ) | | | (0.23 | ) | | | (0.20 | ) |
From realized capital gains | | | (0.76 | ) | | | — | | | | — | | | | — | | | | — | |
Total distributions | | | (1.21 | ) | | | (0.29 | ) | | | (0.26 | ) | | | (0.23 | ) | | | (0.20 | ) |
| | | | | | | | | | | | | | | | | | | | | |
Net asset value, end of year | | $ | 18.85 | | | $ | 17.78 | | | $ | 18.00 | | | $ | 16.21 | | | $ | 12.41 | |
| | | | | | | | | | | | | | | | | | | | | |
Total return | | | 12.81 | % | | | 0.36 | % | | | 12.60 | % | | | 32.48 | % | | | 15.54 | % |
| | | | | | | | | | | | | | | | | | | | | |
Ratios to average net assets/supplemental data: | | | | | | | | | | | | | | | | | | | | |
Net assets, end of year (in 000’s) | | $ | 40,860 | | | $ | 59,065 | | | $ | 67,500 | | | $ | 59,565 | | | $ | 50,633 | |
Operating expenses after fee reductions and expense reimbursements and fees paid indirectly | | | 0.36 | % | | | 0.41 | % | | | 0.44 | % | | | 0.46 | % | | | 0.47 | % |
Operating expenses before fee reductions and expense reimbursements and fees paid indirectly | | | 0.36 | %2 | | | 0.41 | %2 | | | 0.44 | % | | | 0.46 | % | | | 0.47 | % |
Net investment income | | | 1.80 | % | | | 1.59 | % | | | 1.53 | % | | | 1.55 | % | | | 1.84 | % |
Portfolio turnover rate | | | 5 | % | | | 6 | % | | | 3 | % | | | 2 | % | | | 2 | % |
Amounts designated as “—“ are either $0, or have been rounded to $0. |
1 | The selected per share data was calculated using the average shares outstanding method for the period. |
2 | The ratio of operating expenses before fee reductions and expense reimbursements excludes the effect of fees paid indirectly. If this expense offset was included, the ratio would have been 0.36% and 0.41% for 2016 and 2015, respectively. |
See Notes to Financial Statements.
93
Wilshire Mutual Funds, Inc. Wilshire International Equity Fund Financial Highlights |
|
For a Fund Share Outstanding Throughout Each Year. | |
| | | Investment Class Shares | |
| | | Year
Ended
12/31/2016 | | | Year
Ended
12/31/2015 | | | Year
Ended
12/31/2014 | | | Year
Ended
12/31/2013 | | | Year
Ended
12/31/2012 | |
Net asset value, beginning of year | | $ | 8.90 | | | $ | 9.06 | | | $ | 9.70 | | | $ | 8.34 | | | $ | 7.63 | |
| | | | | | | | | | | | | | | | | | | | | |
Income (loss) from investment operations: | | | | | | | | | | | | | | | | | | | | |
Net investment income1 | | | 0.10 | | | | 0.09 | | | | 0.09 | | | | 0.03 | | | | 0.06 | |
Net realized and unrealized gains (losses) on investments and foreign currency transactions | | | 0.07 | | | | (0.23 | ) | | | (0.71 | ) | | | 1.54 | | | | 0.96 | |
Total from investment operations | | | 0.17 | | | | (0.14 | ) | | | (0.62 | ) | | | 1.57 | | | | 1.02 | |
| | | | | | | | | | | | | | | | | | | | | |
Less distributions: | | | | | | | | | | | | | | | | | | | | |
From net investment income | | | (0.15 | ) | | | (0.02 | ) | | | (0.02 | ) | | | 0.00 | | | | (0.09 | ) |
From realized capital gains | | | — | | | | — | | | | — | | | | (0.21 | ) | | | (0.22 | ) |
Redemption fee (Note 2) | | | 0.00 | 2 | | | 0.00 | 2 | | | — | | | | — | | | | — | |
Total distributions | | | (0.15 | ) | | | (0.02 | ) | | | (0.02 | ) | | | (0.21 | ) | | | (0.31 | ) |
| | | | | | | | | | | | | | | | | | | | | |
Net asset value, end of year | | $ | 8.92 | | | $ | 8.90 | | | $ | 9.06 | | | $ | 9.70 | | | $ | 8.34 | |
| | | | | | | | | | | | | | | | | | | | | |
Total return | | | 1.88 | % | | | (1.55 | %) | | | (6.38 | %) | | | 18.95 | % | | | 13.36 | % |
| | | | | | | | | | | | | | | | | | | | | |
Ratios to average net assets/supplemental data: | | | | | | | | | | | | | | | | | | | | |
Net assets, end of year (in 000’s) | | $ | 11,290 | | | $ | 3,438 | | | $ | 11,371 | | | $ | 2,410 | | | $ | 74,999 | |
Operating expenses including dividends and rebates on securities sold short and interest expense, after fee reductions and expense reimbursements and fees paid indirectly4 | | | 1.52 | % | | | 1.50 | % | | | 1.50 | % | | | 1.85 | %3 | | | 2.24 | %3 |
Operating expenses including dividends and rebates on securities sold short and interest expense, before fee reductions and expense reimbursements and fees paid indirectly4 | | | 1.65 | % | | | 1.75 | % | | | 1.71 | %5 | | | 1.93 | %5 | | | 2.29 | %5 |
Net investment income | | | 1.19 | % | | | 0.99 | % | | | 0.97 | % | | | 0.38 | % | | | 0.77 | % |
Portfolio turnover rate | | | 79 | % | | | 84 | % | | | 176 | % | | | 368 | % | | | 45 | % |
Amounts designated as “—“ are either $0, or have been rounded to $0. |
1 | The selected per share data was calculated using the average shares outstanding method for the period. |
2 | Amount is less than $0.01 per share. |
3 | The operating expense ratios reflect the expenses related to investing in securities sold short. Had these expenses been excluded, the expense ratio (after waiver and fees paid indirectly) would have been 1.50% for 2013 and 2012. |
4 | Effective April 2, 2013, the Wilshire International Equity Fund no longer engages in short selling. |
5 | The ratio of operating expenses including dividends and rebates on securities sold short and interest expense, before fee reductions and expense reimbursements excludes the effect of fees paid indirectly. If this expense offset was included, the ratio would have been 1.71%, 1.93% and 2.28% for 2014, 2013 and 2012, respectively. |
See Notes to Financial Statements.
94
Wilshire Mutual Funds, Inc. Wilshire International Equity Fund Financial Highlights - (Continued) |
|
For a Fund Share Outstanding Throughout Each Year. | |
| | | Institutional Class Shares | |
| | | Year
Ended
12/31/2016 | | | Year
Ended
12/31/2015 | | | Year
Ended
12/31/2014 | | | Year
Ended
12/31/2013 | | | Year
Ended 12/31/2012 | |
Net asset value, beginning of year | | $ | 8.78 | | | $ | 8.99 | | | $ | 9.64 | | | $ | 8.38 | | | $ | 7.67 | |
| | | | | | | | | | | | | | | | | | | | | |
Income (loss) from investment operations: | | | | | | | | | | | | | | | | | | | | |
Net investment income1 | | | 0.12 | | | | 0.09 | | | | 0.09 | | | | 0.08 | | | | 0.09 | |
Net realized and unrealized gains (losses) on investments and foreign currency transactions | | | 0.07 | | | | (0.21 | ) | | | (0.68 | ) | | | 1.51 | | | | 0.95 | |
Total from investment operations | | | 0.19 | | | | (0.12 | ) | | | (0.59 | ) | | | 1.59 | | | | 1.04 | |
| | | | | | | | | | | | | | | | | | | | | |
Less distributions: | | | | | | | | | | | | | | | | | | | | |
From net investment income | | | (0.16 | ) | | | (0.09 | ) | | | (0.06 | ) | | | (0.12 | ) | | | (0.11 | ) |
From realized capital gains | | | — | | | | — | | | | — | | | | (0.21 | ) | | | (0.22 | ) |
Redemption fee (Note 2) | | | 0.00 | 2 | | | 0.00 | 2 | | | — | | | | — | | | | — | |
Total distributions | | | (0.16 | ) | | | (0.09 | ) | | | (0.06 | ) | | | (0.33 | ) | | | (0.33 | ) |
| | | | | | | | | | | | | | | | | | | | | |
Net asset value, end of year | | $ | 8.81 | | | $ | 8.78 | | | $ | 8.99 | | | $ | 9.64 | | | $ | 8.38 | |
| | | | | | | | | | | | | | | | | | | | | |
Total return | | | 2.16 | % | | | (1.37 | %) | | | (6.16 | %) | | | 19.10 | % | | | 13.63 | % |
| | | | | | | | | | | | | | | | | | | | | |
Ratios to average net assets/supplemental data2: | | | | | | | | | | | | | | | | | | | | |
Net assets, end of year (in 000’s) | | $ | 258,311 | | | $ | 176,937 | | | $ | 165,048 | | | $ | 45,897 | | | $ | 99,106 | |
Operating expenses including dividends and rebates on securities sold short and interest expense, after fee reductions and expense reimbursements and fees paid indirectly4 | | | 1.27 | % | | | 1.25 | % | | | 1.25 | % | | | 1.61 | %3 | | | 1.99 | %3 |
Operating expenses including dividends and rebates on securities sold short and interest expense, before fee reductions and expense reimbursements and fees paid indirectly4 | | | 1.32 | % | | | 1.29 | % | | | 1.31 | %5 | | | 1.87 | %5 | | | 2.01 | %5 |
Net investment income | | | 1.44 | % | | | 1.00 | % | | | 0.96 | % | | | 0.88 | % | | | 1.03 | % |
Portfolio turnover rate | | | 79 | % | | | 84 | % | | | 176 | % | | | 368 | % | | | 45 | % |
Amounts designated as “—“ are either $0, or have been rounded to $0. |
1 | The selected per share data was calculated using the average shares outstanding method for the period. |
2 | Amount is less than $0.01 per share. |
3 | The operating expense ratios reflect the expenses related to investing in securities sold short. Had these expenses been excluded, the expense ratio (after waiver and fees paid indirectly) would have been 1.25% for 2013 and 2012. |
4 | Effective April 2, 2013, the Wilshire International Equity Fund no longer engages in short selling. |
5 | The ratio of operating expenses including dividends and rebates on securities sold short and interest expense, before fee reductions and expense reimbursements excludes the effect of fees paid indirectly. If this expense offset was included, the ratio would have been 1.31%, 1.87% and 2.00% for 2014, 2013 and 2012, respectively. |
See Notes to Financial Statements.
95
Wilshire Mutual Funds, Inc. Wilshire Income Opportunities Fund Financial Highlights |
|
For a Fund Share Outstanding Throughout the Period. | |
| | | Investment Class Shares | |
| | | Period Ended 12/31/2016* | |
Net asset value, beginning of period | | $ | 10.00 | |
| | | | | |
Income from investment operations: | | | | |
Net investment income1 | | | 0.21 | |
Net realized and unrealized gains on investments and foreign currency transactions | | | 0.18 | |
Total from investment operations | | | 0.39 | |
| | | | | |
Less distributions: | | | | |
From net investment income | | | (0.18 | ) |
From realized capital gains | | | (0.07 | ) |
Total distributions | | | (0.25 | ) |
| | | | | |
Net asset value, end of period | | $ | 10.14 | |
| | | | | |
Total return | | | 3.92 | %2 |
| | | | | |
Ratios to average net assets/supplemental data2: | | | | |
Net assets, end of period (in 000’s) | | $ | 1,102 | |
Operating expenses after expense reimbursements† | | | 1.15 | %3 |
Operating expense before expense reimbursements | | | 1.26 | % |
Net investment income | | | 2.83 | %3 |
Portfolio turnover rate | | | 74 | %2 |
* | Commenced operations on March 30, 2016. |
† | Ratio does not include expenses from underlying funds. |
1 | The selected per share data was calculated using the average shares outstanding method for the period. |
2 | Not Annualized. |
3 | Annualized. |
See Notes to Financial Statements.
96
Wilshire Mutual Funds, Inc. Wilshire Income Opportunities Fund Financial Highlights - (Continued) |
|
For a Fund Share Outstanding Throughout the Period. | |
| | | Institutional Class Shares | |
| | | Period Ended 12/31/2016* | |
Net asset value, beginning of period | | $ | 10.00 | |
| | | | | |
Income from investment operations: | | | | |
Net investment income1 | | | 0.25 | |
Net realized and unrealized gains on investments and foreign currency transactions | | | 0.13 | |
Total from investment operations | | | 0.38 | |
| | | | | |
Less distributions: | | | | |
From net investment income | | | (0.21 | ) |
From realized capital gains | | | (0.07 | ) |
Total distributions | | | (0.28 | ) |
| | | | | |
Net asset value, end of period | | $ | 10.10 | |
| | | | | |
Total return | | | 3.82 | %2 |
| | | | | |
Ratios to average net assets/supplemental data2: | | | | |
Net assets, end of period (in 000’s) | | $ | 396,797 | |
Operating expenses† | | | 0.86 | %3 |
Net investment income | | | 3.11 | %3 |
Portfolio turnover rate | | | 74 | %2 |
* | Commenced operations on March 30, 2016. |
† | Ratio does not include expenses from underlying funds. |
1 | The selected per share data was calculated using the average shares outstanding method for the period. |
2 | Not Annualized. |
3 | Annualized. |
See Notes to Financial Statements.
97
Wilshire Mutual Funds, Inc. Notes to Financial Statements December 31, 2016 |
|
1. Organization.
Wilshire Mutual Funds, Inc. (the “Company”) is registered under the Investment Company Act of 1940, as amended (the “1940 Act”), as an open-end diversified investment company, which was incorporated under Maryland law on July 30, 1992. The Company operates as a series company and presently offers seven series, all of which had operations during the period: Large Company Growth Portfolio, Large Company Value Portfolio, Small Company Growth Portfolio, Small Company Value Portfolio, Wilshire 5000 IndexSM Fund, Wilshire International Equity Fund and Wilshire Income Opportunities Fund (each a “Portfolio” and collectively the “Portfolios”). The Company accounts separately for the assets, liabilities and operations of each series.
The Wilshire Income Opportunities Fund commenced operations on March 30, 2016.
Each of the Portfolios currently offers Investment and Institutional Class shares, each of which has equal rights as to voting privileges. The Investment Class has exclusive voting rights for its service and distribution plan. Investment income, realized and unrealized capital gains and losses and the common expenses of each Portfolio are allocated on a pro-rata basis to each class based on the relative net assets of each class to the total net assets of each Portfolio. Each class of shares differs in its respective service and distribution expenses.
2. Significant Accounting Policies.
In October 2016, the Securities and Exchange Commission (the “SEC”) released its final rule on Investment Company Reporting Modernization (the “Rule”). The Rule, which introduces two new regulatory reporting forms for investment companies – Form N-PORT and Form N-CEN, also contains amendments to Regulation S-X, which impact financial statement presentation, particularly the presentation of derivative investments. Although the Company is still evaluating the impact of the Rule, management believes that many of the Regulation S-X amendments are consistent with the Portfolios’ current financial statement presentation and expects that the Portfolios will be able to comply with the Rule’s Regulation S-X amendments by the August 1, 2017 compliance date.
Use of estimates – Each Portfolio is an investment company in conformity with U.S. generally accepted accounting principles (“U.S. GAAP”). Therefore, each Portfolio follows the accounting and reporting guidelines for investment companies. The preparation of financial statements in accordance with U.S. GAAP requires management to make estimates and assumptions that affect the reported amounts of assets and liabilities and disclosure of contingent assets and liabilities at the date of the financial statements and the reported amounts of revenues and expenses during the reporting period. Actual results could differ from those estimates and those differences could be material.
The following is a summary of significant accounting policies consistently followed by the Portfolios in the preparation of their financial statements.
Security valuation – A security listed or traded on U.S. exchanges is valued at its last sales price on the exchange where it is principally traded. In the absence of a current quotation, the security is valued at the mean between the last bid and asked prices on that exchange. Securities quoted on the National Association of Securities Dealers Automatic Quotation (NASDAQ) System, for which there have been sales, are valued at the NASDAQ official closing price. If there are no such sales, the most recent bid quotation is used. Securities traded over-the-counter
98
Wilshire Mutual Funds, Inc. Notes to Financial Statements - (Continued) December 31, 2016 |
|
(other than on NASDAQ) are valued at the last current sale price; and if there are no such sales, the most recent bid quotation is used. Debt securities are valued at an evaluated bid price by employing methodologies that utilize actual market transactions, broker-supplied valuations, or other inputs designed to identify the market value for such securities. Third-party valuation providers often utilize proprietary models that are subjective and require the use of judgment and the application of various assumptions including, but not limited to, interest rates, prepayment speeds, and default rate assumptions. Debt securities that have a remaining maturity of 60 days or less are valued at prices supplied by the Portfolios’ pricing agent for such securities, if available. Otherwise such securities are valued at amortized cost if the Pricing Committee concludes it approximates fair value. Equity securities primarily traded on a foreign exchange are valued daily at a price, as provided by an independent pricing service which is an estimate of the fair value price. In the event market quotations are not readily available, such securities are valued at fair value according to procedures adopted by the Board of Directors (the “Board”) or as determined in good faith by the Pricing Committee, whose members include at least two representatives of Wilshire Associates Incorporated (the “Adviser”), one of whom is an officer of the Company, or by the Company’s Valuation Committee. Fair value is defined as the amount the owner of a security might reasonably expect to receive upon a current sale. Securities whose value does not reflect fair value because a significant valuation event has occurred may be valued at fair value by the Pricing Committee or the Valuation Committee in accordance with the Company’s valuation procedures. Significant events may include, but are not limited to, the following: significant fluctuations in domestic markets, foreign markets or foreign currencies; occurrences not directly tied to the securities markets such as natural disasters, armed conflicts or significant governmental actions; and major announcements affecting a single issuer or an entire market or market sector. The value of fair valued securities may be different from the last sale price (or the mean between the last bid and asked prices), and there is no guarantee that a fair valued security will be sold at the price at which a Portfolio is carrying the security.
The Wilshire International Equity Fund uses ICE Data Services (formerly, Interactive Data Pricing and Reference Data, Inc.) (“ICE”) as a third-party fair valuation vendor. ICE provides a daily fair value for foreign securities in the Wilshire International Equity Fund based on certain factors and methodologies (involving, generally, tracking valuation correlations between the U.S. market and each non-U.S. security) applied by ICE. These factors are used to value the Wilshire International Equity Fund without holding a Pricing Committee meeting. In the event that the Adviser believes that the fair values provided by ICE are not reliable, the Adviser contacts the Wilshire International Equity Fund’s administrator and may request that a meeting of the Pricing Committee be held.
In accordance with the authoritative guidance on fair value measurements and disclosures under U.S. GAAP, the Portfolios disclose the fair value of their investments in a hierarchy that prioritizes the inputs to valuation techniques used to measure the fair value. The objective of a fair value measurement is to determine the price that would be received to sell an asset or paid to transfer a liability in an orderly transaction between market participants at the measurement date (an exit price). Accordingly, the fair value hierarchy gives the highest priority to quoted prices (unadjusted) in active markets for identical assets or liabilities (Level 1) and the lowest priority to unobservable inputs (Level 3). The guidance establishes three levels of the fair value hierarchy as follows:
| | ● | Level 1 – Unadjusted quoted prices in active markets for identical, unrestricted assets or liabilities that the Portfolios have the ability to access at the measurement date; |
99
Wilshire Mutual Funds, Inc. Notes to Financial Statements - (Continued) December 31, 2016 |
|
| | ● | Level 2 – Other significant observable inputs (including quoted prices for similar securities, interest rates, prepayment speeds, credit risk, referenced indices, quoted prices in inactive markets, adjusted quoted prices in active markets, etc.); and |
| | ● | Level 3 – Prices, inputs or exotic modeling techniques which are both significant to the fair value measurement and unobservable (supported by little or no market activity). |
The inputs or methodology used for valuing securities are not necessarily an indication of the risks associated with investing in those securities. During the year ended December 31, 2016, there have been no significant changes to the Portfolios’ fair value methodologies.
The following is a summary of the inputs used to value the Portfolios’ investments as of December 31, 2016:
Large Company Growth Portfolio | | Level 1 | | | Level 2 | | | Level 3 | | | Total | |
Common Stocks | | $ | 212,295,406 | | | $ | — | | | $ | — | | | $ | 212,295,406 | |
Money Market Funds | | | 9,927,119 | | | | — | | | | — | | | | 9,927,119 | |
Total | | $ | 222,222,525 | | | $ | — | | | $ | — | | | $ | 222,222,525 | |
Large Company Value Portfolio | | Level 1 | | | Level 2 | | | Level 3 | | | Total | |
Common Stocks | | $ | 185,385,646 | | | $ | — | | | $ | — | | | $ | 185,385,646 | |
Rights | | | — | | | | — | | | | 1,189 | | | | 1,189 | |
Money Market Funds | | | 4,738,998 | | | | — | | | | — | | | | 4,738,998 | |
Total | | $ | 190,124,644 | | | $ | — | | | $ | 1,189 | | | $ | 190,125,833 | |
Small Company Growth Portfolio | | Level 1 | | | Level 2 | | | Level 3 | | | Total | |
Common Stocks | | $ | 36,032,578 | | | $ | — | | | $ | — | | | $ | 36,032,578 | |
Rights | | | — | | | | — | | | | 360 | * | | | 360 | |
Money Market Funds | | | 3,205,016 | | | | — | | | | — | | | | 3,205,016 | |
Total | | $ | 39,237,594 | | | $ | — | | | $ | 360 | | | $ | 39,237,954 | |
Small Company Value Portfolio | | Level 1 | | | Level 2 | | | Level 3 | | | Total | |
Common Stocks | | $ | 39,794,076 | | | $ | — | | | $ | — | | | $ | 39,794,076 | |
Money Market Funds | | | 3,155,587 | | | | — | | | | — | | | | 3,155,587 | |
Total | | $ | 42,949,663 | | | $ | — | | | $ | — | | | $ | 42,949,663 | |
Wilshire 5000 IndexSM Fund | | Level 1 | | | Level 2 | | | Level 3 | | | Total | |
Common Stocks | | $ | 173,307,064 | | | $ | — | | | $ | — | | | $ | 173,307,064 | |
Rights | | | — | | | | — | | | | 12,313 | * | | | 12,313 | |
Money Market Funds | | | 4,723,158 | | | | — | | | | — | | | | 4,723,158 | |
Total | | $ | 178,030,222 | | | $ | — | | | $ | 12,313 | | | $ | 178,042,535 | |
100
Wilshire Mutual Funds, Inc. Notes to Financial Statements - (Continued) December 31, 2016 |
|
Wilshire International Equity Fund | | Level 1 | | | Level 2 | | | Level 3 | | | Total | |
Common Stocks | | $ | 67,822,913 | | | $ | 194,652,920 | | | $ | — | | | $ | 262,475,833 | |
Rights | | | — | | | | 0 | * | | | — | | | | 0 | |
Exchange-Traded Funds | | | 1,113,756 | | | | — | | | | — | | | | 1,113,756 | |
Money Market Funds | | | 15,703,651 | | | | — | | | | — | | | | 15,703,651 | |
Total | | $ | 84,640,320 | | | $ | 194,652,920 | | | $ | — | | | $ | 279,293,240 | |
Wilshire Income Opportunities Fund | | Level 1 | | | Level 2 | | | Level 3 | | | Total | |
Investments in Securities | | | | | | | | | | | | |
U.S. Treasury Obligations | | $ | — | | | $ | 52,738,270 | | | $ | — | | | $ | 52,738,270 | |
U.S. Government Agency Obligations | | | — | | | | 19,618,883 | | | | — | | | | 19,618,883 | |
Agency Mortgage-Backed Obligations | | | — | | | | 15,000,551 | | | | — | | | | 15,000,551 | |
Non-Agency Mortgage-Backed Obligations | | | — | | | | 86,096,488 | | | | — | | | | 86,096,488 | |
Asset-Backed Securities | | | — | | | | 41,157,685 | | | | — | | | | 41,157,685 | |
Collateralized Loan Obligations | | | — | | | | 52,030,998 | | | | — | | | | 52,030,998 | |
Investment Grade Corporate Obligations | | | — | | | | 22,232,315 | | | | — | | | | 22,232,315 | |
High Yield Corporate Obligations | | | — | | | | 16,036,639 | | | | — | | | | 16,036,639 | |
Foreign Bonds | | | — | | | | 50,636,883 | | | | — | | | | 50,636,883 | |
Loan Participations | | | — | | | | 33,218,993 | | | | — | | | | 33,218,993 | |
Military Housing Obligations | | | — | | | | 5,688,289 | | | | 1,850,978 | | | | 7,539,267 | |
Municipal Obligations | | | — | | | | 1,363,422 | | | | — | | | | 1,363,422 | |
Common Stocks | | | 80,880 | | | | — | | | | — | | | | 80,880 | |
Preferred Stocks | | | — | | | | 2,182,096 | | | | — | | | | 2,182,096 | |
Affiliated Registered Investment Companies | | | 10,748,134 | | | | — | | | | — | | | | 10,748,134 | |
Money Market Funds | | | 2,851,244 | | | | — | | | | — | | | | 2,851,244 | |
Total | | $ | 13,680,258 | | | $ | 398,001,512 | | | $ | 1,850,978 | | | $ | 413,532,748 | |
Other Financial Instruments | | | | | | | | | | | | | | | | |
Forward Contracts Unrealized Appreciation | | $ | — | | | $ | 14,226 | | | $ | — | | | $ | 14,226 | |
Reverse Repurchase Agreements | | | (16,976,454 | ) | | | — | | | | — | | | | (16,976,454 | ) |
Total | | $ | (16,976,454 | ) | | $ | 14,226 | | | $ | — | | | $ | (16,962,228 | ) |
* | Includes Rights which have been fair valued at $0. |
Refer to the Portfolios’ Schedules of Investments for a listing of the securities by industry or sector type. As of December 31, 2016, the Portfolios did not have any transfers between Levels. In addition, Large Company Growth Portfolio, Small Company Value Portfolio and Wilshire International Equity Fund did not hold any derivative instruments or any assets or liabilities that were measured at fair value on a recurring basis using significant unobservable inputs (Level 3) as of December 31, 2016. Large Company Value Portfolio, Small Company Growth Portfolio and Wilshire 5000 IndexSM Fund held Rights and Wilshire Income Opportunities held Military Housing Obligations that were measured at fair value on a recurring basis using significant unobservable inputs (Level 3) at December 31, 2016 totaling $1,189, $360, $12,313 and $1,850,978, respectively. A reconciliation of Level 3 investments, including certain disclosures related to significant inputs used in valuing Level 3 investments, is only
101
Wilshire Mutual Funds, Inc. Notes to Financial Statements - (Continued) December 31, 2016 |
|
presented when the Portfolio has over 1% of Level 3 investments at the beginning and/or end of the period in relation to net assets. It is the Portfolios’ policy to recognize transfers between Levels at the end of the reporting period.
Option Transactions – The Wilshire Income Opportunities Fund may purchase and write call and put options on securities, securities indices, swaps (“swaptions”) and foreign currencies, provided such options are traded on a national securities exchange or an over-the-counter market. When the Portfolio writes or purchases a covered call or put option, an amount equal to the premium received is included as a liability in the Portfolio’s statement of assets and liabilities. The amount of the liability is subsequently marked-to-market to reflect the current market value of the option. If an option expires on its stipulated expiration date or if the Portfolio enters into a closing purchase transaction, a gain or loss is realized. If a written call option is exercised, a gain or loss is realized for the sale of the underlying security and the proceeds from the sale are increased by the premium originally received. If a written put option is exercised, the cost of the security acquired is decreased by the premium originally received. As a writer of an option, the Portfolio has no control over whether the underlying securities are subsequently sold (call) or purchased (put) and, as a result, bears the market risk of an unfavorable change in the price of the security or index underlying the written option. When the Portfolio purchases a call or put option, an amount equal to the premium paid is included as an investment in the Portfolio’s statement of assets and liabilities, and is subsequently marked-to-market to reflect the current market value of the option. If an option expires on the stipulated expiration date or if the Portfolio enters into a closing sale transaction, a gain or loss is realized. If the Portfolio exercises a call, the cost of the security acquired is increased by the premium paid for the call. If the Portfolio exercises a put option, a gain or loss is realized from the sale of the underlying security, and the proceeds from such sale are decreased by the premium originally paid. Written and purchased options are non-income producing securities. The option techniques utilized are generally to hedge against changes in interest rates, foreign currency exchange rates or securities prices in order to establish more definitely the effective return on securities or currencies held or intended to be acquired by the Portfolio, to reduce the volatility of the currency exposure associated with an investment in non-U.S. securities, or as an efficient means of adjusting exposure to the bond, equity and currency markets. As of and during the year ended December 31, 2016, there were no written options transactions.
102
Wilshire Mutual Funds, Inc. Notes to Financial Statements - (Continued) December 31, 2016 |
|
Reverse Repurchase Agreements – The Wilshire Income Opportunities Fund may enter into reverse repurchase agreements for investment purposes. A reverse repurchase agreement involves the sale of portfolio assets together with an agreement to repurchase the same assets later at a fixed price. At the time the Portfolio enters into a reverse repurchase agreement, the Portfolio segregates cash, cash equivalents, or other liquid assets, including equity securities and debt securities, at least equal in value to the repurchase price. In the event the buyer of securities under a reverse repurchase agreement files for bankruptcy or becomes insolvent, the Portfolio’s use of the proceeds under the agreement may be restricted pending a determination by the other party, or its trustee or receiver, whether to enforce the obligation to repurchase the securities. Reverse repurchase agreements outstanding as of December 31, 2016 were as follows:
| | | Reverse Repurchase Agreements | |
| | | Remaining Contractual Maturity of the Agreements | |
Counterparty | | Overnight and Continuous | | | Up to 30 days | | | 30-90 days | | | Greater than 90 days | | | Total | | | Rate | |
Bank of America | | | | | | | | | | | | | | | | | | |
U.S. Treasury Obligations | | $ | (3,056,250 | ) | | $ | — | | | $ | — | | | $ | — | | | $ | (3,056,250 | ) | | | 1.10 | % |
Corporate Bonds | | | — | | | | (1,200,794 | ) | | | — | | | | — | | | | (1,200,794 | ) | | | 1.15 | % |
U.S. Treasury Obligations | | | — | | | | (2,979,660 | ) | | | — | | | | — | | | | (2,979,660 | ) | | | 1.10 | % |
U.S. Treasury Obligations | | | (1,428,750 | ) | | | — | | | | — | | | | — | | | | (1,428,750 | ) | | | (0.25 | %) |
RBC | | | | | | | | | | | | | | | | | | | | | | | | |
U.S. Government Agency Obligations | | | — | | | | (1,922,000 | ) | | | — | | | | — | | | | (1,922,000 | ) | | | 1.05 | % |
Corporate Bonds | | | — | | | | (3,956,625 | ) | | | — | | | | — | | | | (3,956,625 | ) | | | 1.55 | % |
Corporate Bonds | | | — | | | | (2,432,375 | ) | | | — | | | | — | | | | (2,432,375 | ) | | | 1.30 | % |
Total reverse repurchase agreements | | $ | (4,485,000 | ) | | $ | (12,491,454 | ) | | $ | — | | | $ | — | | | $ | (16,976,454 | ) | | | | |
The following table represents the Portfolio’s outstanding reverse repurchase agreements net of the related collateral received by counterparty at December 31, 2016:
Counterparty | | Financial Assets | | | Financial Liabilities | | | Available for Offset | | | Collateral Pledged or (Received)* | | | Net Amount | |
Reverse repurchase agreements | | | | | | | | | | | | | | | |
Bank of America | | $ | — | | | $ | (8,665,454 | ) | | $ | (8,665,454 | ) | | $ | 8,665,454 | | | $ | — | |
RBC | | | — | | | | (8,311,000 | ) | | | (8,311,000 | ) | | | 8,311,000 | | | | — | |
Total | | $ | — | | | $ | (16,976,454 | ) | | $ | (16,976,454 | ) | | $ | 16,976,454 | | | $ | — | |
* | Collateral pledged is limited to the net outstanding amount from an individual counterparty. The actual collateral amount pledged may exceed the amount and may fluctuate in value. |
For the period ended December 31, 2016, the average amount of reverse repurchase agreements outstanding and the daily weighted average interest rate for Wilshire Income Opportunities Fund was $12,355,795 and 0.44%, respectively.
103
Wilshire Mutual Funds, Inc. Notes to Financial Statements - (Continued) December 31, 2016 |
|
When-issued and delayed delivery investments – The Wilshire Income Opportunities Fund may purchase or sell securities on a when-issued or delayed-delivery basis and make contracts to purchase or sell securities for a fixed price at a future date beyond customary settlement time. Securities purchased or sold on a when-issued, delayed-delivery or forward commitment basis involve a risk of loss if the value of the security to be purchased declines prior to the settlement date. Although the Portfolio would generally purchase securities on a when-issued, delayed-delivery or forward commitment basis with the intention of acquiring the securities, the Portfolio may dispose of such securities prior to settlement if a sub-adviser deems it appropriate to do so. The Portfolio may dispose of or negotiate a when-issued or forward commitment after entering into these transactions. Such transactions are generally considered to be derivative transactions. The Portfolio will normally realize a capital gain or loss in connection with these transactions. When the Portfolio purchases securities on a when-issued, delayed-delivery or forward commitment basis, the Portfolio’s custodian will maintain cash or liquid securities having a value (determined daily) at least equal to the amount of the Portfolio’s purchase commitments. In the case of a forward commitment to sell portfolio securities, the custodian will hold the portfolio securities themselves while the commitment is outstanding. These procedures are designed to ensure that the Portfolio will maintain sufficient assets at all times to cover its obligations under when-issued purchases, forward commitments and delayed-delivery transactions. The when-issued market is commonly associated with government bonds that are to be issued as a pending auction. The Portfolio uses when-issued investments as a way to participate in a new issuance. As of, and during the year ended December 31, 2016, the Portfolio held no when-issued or delayed delivery investments.
Securities transactions and investment income – Securities transactions are recorded on a trade-date basis. Realized gains and losses from securities transactions are recorded on the identified cost basis. Dividend income is recognized on the ex-dividend date and interest income, including, where applicable, accretion of discount, and amortization of premium on investments, is recognized on the accrual basis from settlement date. Distributions received on securities that represent a return of capital or capital gain are reclassed as a reduction of cost of investments and/or as a realized gain. The actual character of income, realized gain and return of capital distributions received from Real Estate Investment Trusts (“REITs”) is not known until after the end of the fiscal year, at which time such distribution estimates are appropriately adjusted.
Asset-backed and mortgage securities – The Wilshire Income Opportunities Fund may invest in mortgage and asset-backed securities which represent shares in a pool of mortgages or other debt. These securities are generally pass-through securities, which means that principal and interest payments on the underlying securities (less servicing fees) are passed through to owners on a pro rata basis. These securities involve prepayment risk, which is the risk that the underlying mortgages or other debt may be refinanced or paid off before they mature, particularly during periods of declining interest rates. In that case, proceeds from the securities may have to be reinvested at a lower interest rate. This could lower the Portfolio’s return and result in losses to the Portfolio if some securities were acquired at a premium. Potential market gains on a security subject to prepayment risk may be more limited than potential market gains on a comparable security that is not subject to prepayment risk. The Portfolio may also invest in collateralized mortgage obligations (“CMOs”). In a CMO, a series of bonds or certificates is issued in multiple classes, which have varying levels of risks.
Foreign currency transactions – The books and records of the Portfolios are maintained in U.S. dollars. Foreign currency transactions are translated into U.S. dollars on the following basis:
| | ● | market value of investment securities, other assets and liabilities at the daily rates of exchange and |
104
Wilshire Mutual Funds, Inc. Notes to Financial Statements - (Continued) December 31, 2016 |
|
| | ● | purchases and sales of investment securities, dividend and interest income and certain expenses at the rates of exchange prevailing on the respective dates of such transactions. |
Net realized and unrealized gains (losses) from foreign currency related transactions includes gains and losses between trade and settlement dates on securities transactions, gains and losses arising from the sales of foreign currency and gains and losses between the ex-dividend and payment dates on dividends, interest and foreign withholding taxes. The effect of changes in foreign exchange rates on realized and unrealized gains or losses is reflected as a component of such gains or losses.
Forward Foreign Currency Contracts – The Wilshire Income Opportunities Fund may enter into forward foreign currency contracts as hedges against either specific transactions, Portfolio positions or anticipated Portfolio positions. The Portfolio may also engage in currency transactions to enhance the Portfolio’s returns. All commitments are “marked-to-market” daily at the applicable foreign exchange rate, and any resulting unrealized gains or losses are recorded currently. The Portfolio realizes gains and losses at the time forward contracts are closed. Unrealized gains or losses on outstanding positions in forward foreign currency contracts held at the close of the period are recognized as ordinary income or loss for federal income tax purposes. Finally, the risk exists that losses could exceed amounts disclosed on the Statements of Assets and Liabilities. As of December 31, 2016, the Portfolio had no outstanding open forward foreign currency contracts.
For the year ended December 31, 2016, the average volume of activity of forward foreign currency contracts was as follows:
Average Monthly Notional Amount Purchased | | $ | 292,640 | |
Average Monthly Notional Amount Sold | | | 686,593 | |
Over-the-Counter (“OTC”) Derivative Contracts – To reduce counterparty risk for OTC transactions, the Wilshire Income Opportunities Fund has entered into master netting arrangements, established within the International Swap Dealers Association, Inc. (“ISDA”) master agreements, which allow the Portfolio to make (or to have an entitlement to receive) a single net payment in the event of default (close-out netting) for outstanding payables and receivables for certain OTC positions for each individual counterparty. In addition, the Portfolio may require that certain counterparties post cash and/or securities in collateral accounts to cover their net payment obligations for those derivative contracts subject to ISDA master agreements. If the counterparty fails to perform under these contracts and agreements, the cash and/or securities will be made available to the Portfolio. For financial reporting purposes, the Portfolio does not offset derivative assets and derivative liabilities that are subject to netting arrangements in the Statement of Assets and Liabilities. Bankruptcy or insolvency laws of a particular jurisdiction may impose restrictions on or prohibitions against the right of offset in bankruptcy, insolvency or other events.
Collateral terms are contract-specific for OTC derivatives. For derivatives traded under an ISDA master agreement or other similar agreement, the collateral requirements are typically calculated by netting the mark-to-market amount of each transaction under such agreement and comparing that amount to the value of any collateral currently pledged by the Portfolio or the counterparty.
For financial reporting purposes, cash collateral that has been pledged to cover obligations of the Portfolio, if any, is reported separately as cash pledged as collateral on the Statement of Assets and Liabilities. Non-cash collateral pledged by the Portfolio, if any, is noted in the Schedule of Investments. Generally, the amount of collateral
105
Wilshire Mutual Funds, Inc. Notes to Financial Statements - (Continued) December 31, 2016 |
|
due from or to a party must exceed a minimum transfer amount before a transfer has to be made. To the extent amounts due to the Portfolio from its counterparties are not fully collateralized, contractually or otherwise, the Portfolio bears the risk of loss from counterparty nonperformance.
The following table presents, by derivative type, the Portfolio’s OTC financial derivative instruments net of the related collateral (received)/pledged by counterparty at December 31, 2016:
Counterparty | | Financial Derivative Assets | | | Financial Derivative Liabilities | | | Derivatives Available for Offset | | | Collateral Pledged or (Received)* | | | Net
Amount | |
Forward foreign currency contracts | | | | | | | | | | | | | | | |
Montgomery/Bank of America | | $ | 14,226 | | | $ | — | | | $ | 14,226 | | | $ | — | | | $ | 14,226 | |
Total | | $ | 14,226 | | | $ | — | | | $ | 14,226 | | | $ | — | | | $ | 14,226 | |
* | Collateral pledged is limited to the net outstanding amount from an individual counterparty. The actual collateral amount pledged may exceed the amount and may fluctuate in value. |
Expense policy – Distribution and Service fees directly attributable to Investment Class shares are charged to that class’ operating expenses. Expenses of the Portfolios other than Distribution and Service fees are prorated among the classes to which the expense relates based on the relative net assets of each class of shares. Expenses directly attributable to a Portfolio are charged to that Portfolio. Expenses not directly attributable to a Portfolio are allocated proportionately among all Portfolios daily in relation to the net assets of each Portfolio or another reasonable basis. Expenses that are attributable to the Company and the Wilshire Variable Insurance Trust (an affiliated investment company) are allocated across the Company and the Wilshire Variable Insurance Trust based upon relative net assets or another reasonable basis. Expenses and fees, including the advisory fees, are accrued daily and taken into account for the purpose of determining the net asset value of each Portfolio’s shares.
Investments in REITs – With respect to the Portfolios, dividend income is recorded based on the income included in distributions received from the REIT investments using published REIT reclassifications including some management estimates when actual amounts are not available. Distributions received in excess of these estimated amounts are recorded as a reduction of the cost of investments or reclassified to capital gains. The actual amounts of income, return of capital, and capital gains are only determined by each REIT after its fiscal year end, and may differ from the estimated amounts.
Distributions to shareholders – Distributions to shareholders are recorded on the ex-dividend date. Distributions from net investment income, if any, are declared and paid annually. The Portfolios’ net realized capital gains, unless offset by any available capital loss carryforward, are distributed to shareholders annually. Additional distributions of net investment income and realized capital gains may be made at the discretion of the Board of Directors in order to avoid the application of a 4% non-deductible Federal excise tax.
Master Limited Partnerships (“MLPs”) – The Portfolios may invest in MLPs, which are limited partnerships or limited liability companies whose partnership units or limited liability interests are listed and traded on a U.S. securities exchange. MLPs are treated as publicly traded partnerships for federal income tax purposes. To qualify to be treated as a partnership for tax purposes, an MLP must receive at least 90% of its income from qualifying sources as set forth
106
Wilshire Mutual Funds, Inc. Notes to Financial Statements - (Continued) December 31, 2016 |
|
in Section 7704(d) of the Internal Revenue Code of 1986, as amended (the “Code”). These qualifying sources include activities such as the exploration, development, mining, production, processing, refining, transportation, storage and marketing of mineral or natural resources. MLPs generally have two classes of owners, the general partner and limited partners. MLPs that are formed as limited liability companies generally have two analogous classes of owners, the managing member and the members. For purposes of this section, references to general partners also apply to managing members and references to limited partners also apply to members. The general partner is typically owned by a major energy company, an investment fund, the direct management of the MLP, or is an entity owned by one or more of such parties. The general partner may be structured as a private or publicly traded corporation or other entity. The general partner typically controls the operations and management of the MLP through an equity interest in the MLP of as much as 2% plus, in many cases, ownership of common units and subordinated units. Limited partners own the remainder of the MLP through ownership of common units and have a limited role in the MLP’s operations and management.
Redemption fees – The Wilshire International Equity Fund charges a redemption fee of 1% on redemption of capital shares held for sixty days or less, subject to certain exceptions. For the year ended December 31, 2015, the Wilshire International Equity Fund charged $561 in redemption fees. For the year ended December 31, 2016, the Wilshire International Equity Fund charged $2,890 in redemption fees.
3. Investment Advisory Fee and Other Transactions.
Pursuant to the Advisory Agreement (the “Agreement”) between the Company and the Adviser, the Adviser charges annual fees of 0.75% of average daily net assets for the first $1 billion and 0.65% thereafter for the Large Company Growth Portfolio and Large Company Value Portfolio, 0.85% of average daily net assets for the first $1 billion and 0.75% thereafter for the Small Company Growth Portfolio and Small Company Value Portfolio, 0.10% of the average daily net assets for the first $1 billion and 0.07% thereafter for the Wilshire 5000 IndexSM Fund, 1.00% of the average daily net assets for the first $1 billion and 0.90% thereafter for the Wilshire International Equity Fund, and 0.60% of average daily net assets for the Wilshire Income Opportunities Fund.
The Adviser has entered into contractual expense limitation agreements with the Small Company Growth Portfolio, the Small Company Value Portfolio and the Wilshire International Equity Fund to reduce a portion of its management fees or reimburse expenses to limit expenses of such Portfolios (excluding taxes, brokerage expenses, dividend expenses on short securities, and extraordinary expenses) to 1.50% and 1.25% of average daily net assets for Investment Class Shares and Institutional Class Shares, respectively. These agreements to limit expenses continue through at least April 30, 2017. The Adviser may recoup the amount of any fee reduced or expenses reimbursed within three years after the year in which it reduced fees or reimbursed the expenses if the recoupment does not exceed the expense limitation that was in place at the time of the fee reduction or expense reimbursement. At December 31, 2016, the amounts of fee reductions and expense reimbursements subject to recoupment for Small Company Growth Portfolio were $26,249 expiring in 2019, $48,753 expiring in 2018 and $16,159 expiring in 2017. At December 31, 2016, the amounts of fee reductions and expense reimbursements subject to recoupment for Small Company Value Portfolio were $23,509 expiring in 2019, $52,909 expiring in 2018 and $17,655 expiring in 2017. At December 31, 2016, the amounts of fee reductions and expense reimbursements subject to recoupment for Wilshire International Equity Fund were $144,932 expiring in 2019, $81,678 expiring in 2018 and $78,351 expiring in 2017.
107
Wilshire Mutual Funds, Inc. Notes to Financial Statements - (Continued) December 31, 2016 |
|
The Adviser has entered into a contractual expense limitation agreements with the Wilshire Income Opportunities Fund to reduce a portion of its management fee or reimburse expenses to limit expenses of the Portfolio (excluding taxes, brokerage expenses, dividend expenses on short securities and extraordinary expenses) to 1.15% and 0.90% of average daily net assets for Investment Class Shares and Institutional Class Shares, respectively. This agreement to limit expenses continues through at least April 30, 2017. At December 31, 2016, the amount of expense reimbursements subject to recoupment for the Wilshire Income Opportunities Fund was $723 expiring in 2019.
For the year ended December 31, 2016, the Adviser reduced fees or reimbursed expenses as follows:
Portfolio | | Fees Reduced/ Reimbursed | | | Fees Recouped | |
Small Company Growth Portfolio | | $ | 26,249 | | | | N/A | |
Small Company Value Portfolio | | | 23,509 | | | | N/A | |
International Equity Fund | | | 144,932 | | | | N/A | |
Wilshire Income Opportunities Fund | | | 723 | | | | N/A | |
The Board of the Company has approved Los Angeles Capital Management and Equity Research, Inc. (“L.A. Capital”), Victory Capital Management Inc. (“Victory”), Pzena Investment Management, LLC (“Pzena”), Barrow, Hanley, Mewhinney and Strauss, LLC (“BHMS”), Ranger Investment Management, LLC (“Ranger”), NWQ Investment Management Company, LP (“NWQ”), Cambiar Investors, LLC (“Cambiar”), Loomis, Sayles & Company, L.P. (“Loomis Sayles”), DoubleLine® Capital LP (“DoubleLine”), Guggenheim Partners Investment Management, LLC (“Guggenheim”) and WCM Investment Management (“WCM”) (collectively the “Sub-Advisers”) to provide sub-advisory services with respect to the Portfolios. L.A. Capital, Loomis Sayles and Victory each manage a portion of the Large Company Growth Portfolio. L.A. Capital, Pzena and BHMS each manage a portion of the Large Company Value Portfolio. L.A. Capital and Ranger each manage a portion of the Small Company Growth Portfolio. L.A. Capital and NWQ each manage a portion of the Small Company Value Portfolio. L.A. Capital is the sole sub-adviser for the Wilshire 5000 IndexSM Fund. L.A. Capital, Cambiar and WCM each manage a portion of the Wilshire International Equity Fund. DoubleLine® and Guggenheim each manage a portion of the Wilshire Income Opportunities Fund.
The Sub-Advisers are subject to the Adviser’s oversight. The fees of the Sub-Advisers are paid by the Adviser.
DST Systems, Inc. serves as the Company’s transfer agent and dividend disbursing agent. The Northern Trust Company (“NTC”) serves as the Company’s custodian for all Portfolios. Effective October 1, 2016, Ultimus Fund Solutions LLC (the “Administrator”) serves as the Company’s administrator and accounting agent and Ultimus Fund Distributors LLC (the “Distributor”) serves as the Company’s distributor.
Prior to October 1, 2016, SEI Investments Global Funds Services served as the Company’s administrator and accounting agent and SEI Investments Distribution Co. (“SEI”) served as the Company’s distributor.
Officers’ and Directors’ Expenses – Certain officers of the Company are affiliated with and receive remuneration from the Adviser or the Administrator. The Company does not pay any remuneration to its officers. For the year ended December 31, 2016, the Company and the Wilshire Variable Insurance Trust together paid each independent director
108
Wilshire Mutual Funds, Inc. Notes to Financial Statements - (Continued) December 31, 2016 |
|
an annual retainer of $18,000, an annual additional Board chair retainer of $12,000, a Board in-person meeting fee of $2,000, a Board telephonic meeting fee of $1,000, an annual Committee Member retainer of $8,000 and a Committee telephonic meeting fee of $500.
4. Distribution Plan, Shareholder Services Plan and Fees Paid Indirectly.
The Directors of the Company have adopted shareholder services and/or distribution plans (the “Plans”) pursuant to Rule 12b-1 under the 1940 Act, for the Investment Class Shares of each Portfolio. Under the Plan, each Portfolio reimburses the Distributor, at an annual rate of up to 0.25% of the value of the average daily net assets attributable to the Investment Class Shares for certain services provided by financial intermediaries or for certain distribution expenses for the purpose of financing any activity intended to result in the sale of Investment Class Shares. For the year ended December 31, 2016, the distribution and service fee expenses incurred for the Investment Class of the Large Company Growth Portfolio, Large Company Value Portfolio, Small Company Growth Portfolio, Small Company Value Portfolio, Wilshire 5000 IndexSM Fund, Wilshire International Equity Fund and Wilshire Income Opportunities Fund was 0.25% of the respective average net assets of each Portfolio.
In addition, Investment Class Shares and Institutional Class Shares pay the expenses associated with certain shareholder servicing arrangements with third parties, provided that payment of such fees does not exceed in any year 0.20% and 0.15% for the Investment and Institutional Class Shares, respectively, of the average net assets of each class. For the year ended December 31, 2016, the net shareholder service provider fees were as follows (as a percent of average net assets of each class):
Portfolio | Investment Class | Institutional Class |
Wilshire Large Company Growth Portfolio | 0.090% | 0.050% |
Wilshire Large Company Value Portfolio | 0.025% | 0.055% |
Wilshire Small Company Growth Portfolio | 0.070% | 0.055% |
Wilshire Small Company Value Portfolio | 0.080% | 0.055% |
Wilshire 5000 IndexSM Fund | 0.060% | 0.000% |
Wilshire International Equity Fund | 0.120% | 0.040% |
Wilshire Income Opportunities Fund | 0.200% | 0.055% |
Fees paid indirectly – The Company has entered into a brokerage commission recapture program with SEI, pursuant to which a portion of the Portfolios’ commissions generated from transactions directed to SEI are used to reduce the Portfolios’ expenses. Under such program, SEI, as introducing broker, retains a portion of the Portfolios’ commissions.
109
Wilshire Mutual Funds, Inc. Notes to Financial Statements - (Continued) December 31, 2016 |
|
Such commissions rebated to the Portfolios for the year ended December 31, 2016 were as follows:
Wilshire Large Company Growth Portfolio | | $ | 6,299 | |
Wilshire Large Company Value Portfolio | | | 11,674 | |
Wilshire Small Company Growth Portfolio | | | 474 | |
Wilshire Small Company Value Portfolio | | | 4,178 | |
Wilshire 5000 IndexSM Fund | | | 203 | |
Wilshire International Equity Fund | | | — | |
Wilshire Income Opportunities Fund | | | — | |
For the year ended December 31, 2016, SEI retained the following commissions:
Wilshire Large Company Growth Portfolio | | $ | 2,279 | |
Wilshire Large Company Value Portfolio | | | 4,978 | |
Wilshire Small Company Growth Portfolio | | | 228 | |
Wilshire Small Company Value Portfolio | | | 9,108 | |
Wilshire 5000 IndexSM Fund | | | 131 | |
Wilshire International Equity Fund | | | — | |
Wilshire Income Opportunities Fund | | | — | |
5. Securities Transactions.
For the year ended December 31, 2016, aggregate cost of purchases and proceeds from sales and maturities of securities, other than affiliated investments, short-term investments, short sales and purchases to cover and U.S. Government securities, were as follows:
Portfolio | | Purchases | | | Sales | |
Wilshire Large Company Growth Portfolio | | $ | 184,282,574 | | | $ | 214,105,041 | |
Wilshire Large Company Value Portfolio | | | 343,370,593 | | | | 293,165,483 | |
Wilshire Small Company Growth Portfolio | | | 41,028,301 | | | | 40,377,793 | |
Wilshire Small Company Value Portfolio | | | 39,245,105 | | | | 36,839,590 | |
Wilshire 5000 IndexSM Fund | | | 9,988,545 | | | | 76,386,106 | |
Wilshire International Equity Fund | | | 285,474,435 | | | | 206,834,603 | |
Wilshire Income Opportunities Fund | | | 335,814,080 | | | | 105,114,739 | |
Purchases and sales and maturities of U.S. Government securities during the year ended December 31, 2016 were:
Portfolio | | Purchases | | | Sales | |
Wilshire Income Opportunities Fund | | $ | 167,526,025 | | | $ | 134,284,154 | |
110
Wilshire Mutual Funds, Inc. Notes to Financial Statements - (Continued) December 31, 2016 |
|
Purchases and sales of affiliated investments for the Wilshire Income Opportunities Fund during the year ended December 31, 2016, and value as of December 31, 2016 were:
Affiliated Investment | | Value as of March 30,
2016 | | | Purchases | | | Proceeds from Sales | | | Realized Gain | | | Change in Unrealized Appreciation (Depreciation) | | | Value as of December 31,
2016 | | | Income Distributions | |
Guggenheim Floating Rate Strategies Fund | | $ | — | | | $ | 6,021,365 | | | $ | — | | | $ | — | | | $ | 27,739 | | | $ | 6,049,104 | | | $ | 21,568 | |
Guggenheim Straregy Fund I | | $ | — | | | $ | 13,852,922 | | | $ | (9,200,000 | ) | | $ | 15,724 | | | $ | 30,384 | | | $ | 4,699,030 | | | $ | 73,289 | |
6. Securities Lending.
Each Portfolio may seek additional income by lending its securities on a short-term basis to banks, brokers and dealers in return for cash collateral, which is invested in short-term securities. A Portfolio may return a portion of the interest earned to the borrower or a third party that is unaffiliated with the Company and acting as a “placing broker.” A Portfolio receives compensation for lending securities in the form of fees. A Portfolio also continues to receive dividends on the securities loaned. Security loans are secured at all times by collateral. It is the Company’s policy that the collateral be equal to at least 102% of the market value of the securities loaned (105% if the collateral and securities loaned are denominated in different currencies) plus accrued interest when the transaction is entered into, and that the collateral supporting loans be valued daily. However, due to market fluctuations during the day, the value of securities loaned on a particular day may, during the course of the day, exceed the value of collateral. On each business day, the amount of collateral is adjusted based on the prior day’s market fluctuations and the current day’s lending activity. Gain or loss in the market price of the securities loaned that may occur during the term of the loan are reflected in the value of the Portfolio. The risks from securities lending are that the borrower may not provide additional collateral when required or return the securities when due or when called for by the Portfolio. Lending securities entails a risk of loss to the Portfolio if and to the extent that the market value of securities loans were to increase, the borrower did not increase the collateral accordingly, and the borrower fails to return the securities. NTC, the Portfolios’ custodian, acts as the securities lending agent for the Portfolios. The value of the securities on loan and the value of the related collateral at December 31, 2016 are shown on the Statement of Assets and Liabilities. The Northern Trust Institutional Liquid Asset Portfolio was purchased with proceeds from collateral received from securities on loan. Securities on loan are also collateralized by various U.S. Treasury obligations. The following table represents each type of collateral received from securities on loan as of December 31, 2016 for each Fund:
111
Wilshire Mutual Funds, Inc. Notes to Financial Statements - (Continued) December 31, 2016 |
|
| | | Collateral Received | |
| | | Northern Trust Institutional Liquid Asset Portfolio | | | U.S. Treasury Obligations | | | Total | |
Large Company Growth Portfolio | | $ | 7,815,619 | | | $ | 15,374,737 | | | $ | 23,190,356 | |
Large Company Value Portfolio | | | 4,729,193 | | | | 9,915,530 | | | | 14,644,723 | |
Small Company Growth Portfolio | | | 2,128,325 | | | | 2,721,691 | | | | 4,850,016 | |
Small Company Value Portfolio | | | 2,227,822 | | | | 1,431,817 | | | | 3,659,639 | |
Wilshire 5000 IndexSM Fund | | | 4,582,659 | | | | 5,762,862 | | | | 10,345,521 | |
Wilshire International Equity Fund | | | 8,828,715 | | | | 11,735,202 | | | | 20,563,917 | |
The Wilshire Income Opportunities Fund did not utilize securities lending as of December 31, 2016.
7. Significant Shareholder Activity.
On December 31, 2016, the Portfolios had the following concentrations of shareholders holding 10% or more of the outstanding shares of the Portfolios. These represent omnibus shareholder accounts comprised of many individual shareholders.
Portfolio | |
Large Company Growth Portfolio (3 omnibus shareholders) | 59% |
Large Company Value Portfolio (3 omnibus shareholder) | 67% |
Small Company Growth Portfolio (3 omnibus shareholders) | 66% |
Small Company Value Portfolio (3 omnibus shareholders) | 66% |
Wilshire 5000 IndexSM Fund (2 omnibus shareholders) | 45% |
Wilshire International Equity Fund (2 omnibus shareholders) | 67% |
Wilshire Income Opportunities Fund (3 omnibus shareholders) | 77% |
8. Tax Information.
No provision for federal income taxes is required because each Portfolio has qualified and intends to continue to qualify, as a regulated investment company under Subchapter M of the Code and distributes to shareholders all of its taxable income and gains. Federal income tax regulations differ from GAAP; therefore, distributions determined in accordance with tax regulations may differ in amount or character from net investment income and realized gains for financial reporting purposes. Financial reporting records are adjusted for permanent book/tax differences to reflect tax character. Financial records are not adjusted for temporary differences.
The Portfolios evaluate tax positions taken or expected to be taken in the course of preparing the Portfolios’ tax returns to determine whether it is “more-likely than-not” (i.e., greater than 50 percent) that each tax position will be sustained upon examination by a taxing authority based on the technical merits of the position. Tax positions not deemed to meet the more-likely-than-not threshold are recorded as a tax benefit or expense in the current
112
Wilshire Mutual Funds, Inc. Notes to Financial Statements - (Continued) December 31, 2016 |
|
year. The Portfolios did not record any tax provision in the current period. However, management’s conclusions regarding tax positions taken may be subject to review and adjustment at a later date based on factors including, but not limited to, examination by tax authorities (i.e., the last 3 tax year ends, as applicable), on-going analysis of and changes to tax laws, regulations and interpretations thereof.
The federal tax cost, unrealized appreciation and depreciation at December 31, 2016 for each Portfolio are as follows:
Portfolio | | Large
Company
Growth
Portfolio | | | Large
Company
Value
Portfolio | | | Small
Company
Growth
Portfolio | | | Small
Company
Value
Portfolio | | | Wilshire
5000
IndexSM
Fund | | | Wilshire
International
Equity
Fund | | | Wilshire
Income
Opportunities Fund | |
Tax Cost | | $ | 172,132,828 | | | $ | 160,859,529 | | | $ | 31,055,600 | | | $ | 34,542,396 | | | $ | 70,868,137 | | | $ | 267,397,240 | | | $ | 417,620,838 | |
Aggregate gross unrealized appreciation | | $ | 56,126,590 | | | $ | 33,689,640 | | | $ | 8,794,225 | | | $ | 9,528,623 | | | $ | 110,022,780 | | | $ | 23,321,042 | | | $ | 4,340,785 | |
Aggregate gross unrealized depreciation | | | (6,036,893 | ) | | | (4,423,336 | ) | | | (611,871 | ) | | | (1,121,356 | ) | | | (2,848,382 | ) | | | (11,425,042 | ) | | | (8,428,875 | ) |
Net unrealized appreciation (depreciation) | | $ | 50,089,697 | | | $ | 29,266,304 | | | $ | 8,182,354 | | | $ | 8,407,267 | | | $ | 107,174,398 | | | $ | 11,896,000 | | | $ | (4,088,090 | ) |
The differences between book and tax-basis unrealized appreciation (depreciation) are attributable primarily to the tax deferral of losses on wash sales, investment in passive foreign investment companies, investments in Master Limited Partnerships and investment in Grantor Trusts.
As of December 31, 2016, Wilshire International Equity Fund had the following capital loss carryforwards (“CLCFs”) for federal income tax purposes which do not expire:
Portfolio | | Short-Term Loss | | | Long-Term Loss | | | Total | |
Wilshire International Equity Fund | | $ | 16,807,563 | | | $ | 3,761,340 | | | $ | 20,568,903 | |
These CLCFs may be utilized in future years to offset net realized capital gains, if any, prior to distributing such gains to shareholders.
During the year ended December 31, 2016, the Wilshire 5000 IndexSM Fund utilized capital loss carryforwards of $21,738,354, to offset current year capital gains.
113
Wilshire Mutual Funds, Inc. Notes to Financial Statements - (Continued) December 31, 2016 |
|
Late year losses represent net qualified late year ordinary losses and specified net capital losses incurred after October 31, 2016. These losses are deemed to arise on the first day of the Portfolio’s next taxable year. For the year ended December 31, 2016, the following Portfolios intend to defer late year losses to January 1, 2017 for federal income tax purposes:
Portfolio | | Late Year Ordinary Losses | | | Post-
October Losses | |
Wilshire International Equity Fund | | $ | (2,452 | ) | | $ | — | |
Wilshire Income Opportunities Fund | | | — | | | | (901,116 | ) |
The tax character of distributions declared during the years ended December 31, 2016 and 2015 were as follows:
Portfolio | | 2016 Ordinary Income | | | 2016
Long-Term Capital Gains | | | 2016
Return of Capital | | | 2015 Ordinary Income | | | 2015
Long-Term Capital Gains | | | 2015
Return of Capital | |
Large Company Growth Portfolio | | $ | 5,499,968 | | | $ | 18,867,521 | | | $ | — | | | $ | 73,052 | | | $ | 23,416,653 | | | $ | — | |
Large Company Value Portfolio | | | 8,155,226 | | | | 4,651,885 | | | | — | | | | 1,572,836 | | | | 6,386,245 | | | | — | |
Small Company Growth Portfolio | | | 1,364,686 | | | | 2,604,047 | | | | — | | | | — | | | | 1,487,042 | | | | — | |
Small Company Value Portfolio | | | 1,222,049 | | | | 2,391,817 | | | | — | | | | 456,140 | | | | 1,181,754 | | | | — | |
Wilshire 5000 IndexSM Fund | | | 3,645,085 | | | | 7,100,418 | | | | — | | | | 3,154,520 | | | | — | | | | — | |
Wilshire International Equity Fund | | | 4,811,640 | | | | — | | | | — | | | | 1,756,414 | | | | — | | | | — | |
Wilshire Income Opportunities Fund | | | 10,683,057 | | | | 290,797 | | | | 6,343 | | | | N/A | | | | N/A | | | | N/A | |
At December 31, 2016, the components of distributable earnings (accumulated deficit) on a tax basis were as follows:
Portfolio | | Large Company Growth Portfolio | | | Large Company Value Portfolio | | | Small Company Growth Portfolio | | | Small Company Value Portfolio | | | Wilshire 5000 IndexSM Fund | | | Wilshire International Equity Fund | | | Wilshire
Income Opportunities Fund | |
Undistributed ordinary income | | $ | 287,871 | | | $ | 2,647,713 | | | $ | 659,938 | | | $ | 1,049,785 | | | $ | — | | | $ | — | | | $ | — | |
Undistributed long-term capital gains | | | 1,623,993 | | | | 607,786 | | | | 648,300 | | | | 552,352 | | | | 2,092,866 | | | | — | | | | — | |
Capital loss carryforwards | | | — | | | | — | | | | — | | | | — | | | | — | | | | (20,568,903 | ) | | | — | |
Late year losses | | | — | | | | — | | | | — | | | | — | | | | — | | | | (2,452 | ) | | | (901,116 | ) |
Unrealized appreciation (depreciation) | | | 50,089,697 | | | | 29,266,304 | | | | 8,182,354 | | | | 8,407,267 | | | | 107,174,398 | | | | 11,867,873 | | | | (4,088,093 | ) |
Total distributable earnings (accumulated deficit) | | $ | 52,001,561 | | | $ | 32,521,803 | | | $ | 9,490,592 | | | $ | 10,009,404 | | | $ | 109,267,264 | | | $ | (8,703,482 | ) | | $ | (4,989,209 | ) |
114
Wilshire Mutual Funds, Inc. Notes to Financial Statements - (Continued) December 31, 2016 |
|
GAAP requires that certain components of net assets be reclassified between financial and income tax reporting. These reclassifications are primarily due to investments in real estate investment trusts, sales of passive foreign investment companies, investments in Master Limited Partnerships, investments in Grantor Trusts, the reclassification of net operating losses and the reclassification of distributions paid. These reclassifications have no effect on net assets or the net asset value per share. As of December 31, 2016, the Portfolios made the following reclassifications:
Portfolio | | Large Company Growth Portfolio | | | Large Company Value Portfolio | | | Small Company Growth Portfolio | | | Small Company Value Portfolio | | | Wilshire 5000 IndexSM Fund | | | Wilshire International Equity Fund | | | Wilshire Income Opportunities Fund | |
Paid-in capital | | $ | (6 | ) | | $ | (5 | ) | | $ | (2 | ) | | $ | (1 | ) | | $ | 11 | | | $ | (5 | ) | | $ | (525,927 | ) |
Undistributed net investment income (accumulated net investment loss) | | | 10 | | | | 13 | | | | 146,584 | | | | 3,092 | | | | 136,256 | | | | 645,183 | | | | (268,638 | ) |
Accumulated net realized gains (losses) on investments sold and foreign currency transactions | | | (4 | ) | | | (8 | ) | | | (146,582 | ) | | | (3,091 | ) | | | (136,267 | ) | | | (645,178 | ) | | | 794,565 | |
9. In-Kind Transfers.
During the year ended December 31, 2016, Wilshire Income Opportunities Fund issued shares of beneficial interest to Wilshire Global Allocation Fund, an affiliated fund, through an affiliated in-kind transfer of investment securities and cash. The securities were transferred at their current value on the date of the transaction.
Receiving Portfolio | Contributing Portfolio | Date of
Transfer | | Value of
Investment Securities | | | Cash | | | Total
Assets | | | Shares
Issued | |
Wilshire Income
Opportunities Fund | Wilshire Variable Insurance Trust Global Allocation Fund | 3/30/2016 | | $ | 156,418,546 | | | $ | (13,659,576 | ) | | $ | 142,758,970 | | | | 14,275,906 | |
10. Indemnifications.
In the normal course of business, the Company, on behalf of the Portfolios, enters into contracts that provide general indemnifications. The Portfolios’ maximum exposure under these arrangements is dependent on claims that may be made against the Portfolios in the future and, therefore, cannot be estimated; however, based on experience, the risk of material loss from such claims is considered remote.
115
Wilshire Mutual Funds, Inc. Notes to Financial Statements - (Continued) December 31, 2016 |
|
11. Risks.
Asset-Backed Securities (“ABS”) Risk – Investors in ABS, including mortgage-backed securities (“MBS”) and structured finance investments, generally receive payments that are part interest and part return of principal. These payments may vary based on the rate at which the underlying borrowers pay off their loans or other future expected receivables of assets or cash flows. Some ABS, including MBS, may have structures that make their reaction to interest rates and other factors difficult to predict, making them subject to liquidity risk.
Collateralized debt obligation (“CDO”) risk – A CDO is an ABS whose underlying collateral is typically a portfolio of bonds, bank loans, other structured finance securities and/or synthetic instruments. Investors in CDOs bear the credit risk of the underlying collateral. Multiple tranches of securities are issued by the CDO, offering investors various maturity and credit risk characteristics. Tranches are categorized as senior, mezzanine, and subordinated/equity, according to their degree of risk. If there are defaults or the CDO’s collateral otherwise underperforms, scheduled payments to senior tranches take precedence over those of mezzanine tranches, and scheduled payments to mezzanine tranches take precedence over those to subordinated/equity tranches. CDOs are subject to the same risk of prepayment described for certain mortgage-related and ABS, and are subject to credit risk, interest rate risk and default risk. The market value of CDOs may be affected by changes in the market’s perception of the creditworthiness of the servicing agent for the pool or the originator.
Forward contracts risk – There may be an imperfect correlation between the price of a forward contract and the underlying security, index or currency which will increase the volatility of the Wilshire Income Opportunities Fund. The Portfolio bears the risk of loss of the amount expected to be received under a forward contract in the event of the default or bankruptcy of a counterparty. If such a default occurs, the Portfolio will have contractual remedies pursuant to the forward contract, but such remedies may be subject to bankruptcy and insolvency laws that could affect the Portfolio’s rights as a creditor. Forward currency transactions include risks associated with fluctuations in foreign currency.
Interest rate risk – For debt securities, interest rate risk is the possibility that the market price will fall because of changing interest rates. In general, debt securities’ market prices rise or fall inversely to changes in interest rates. If interest rates rise, bond market prices generally fall; if interest rates fall, bond market prices generally rise. In addition, for a given change in interest rates, the market price of longer-maturity bonds fluctuates more (gaining or losing more in value) than shorter-maturity bonds. There may be less governmental intervention in influencing interest rates in the near future. If so, it could cause an increase in interest rates, which would have a negative impact on the market prices of fixed income securities and could negatively affect a Portfolio’s NAV.
Credit risk – A Portfolio’s debt instruments are subject to credit risk, which is the risk that an issuer will be unable, or will be perceived to be unable, to repay its obligations at maturity. Funds that invest primarily in high quality securities generally are subject to less credit risk than funds that invest in lower quality securities. Certain securities are backed by credit enhancements from various financial institutions and financial guarantee assurance agencies. These credit enhancements reinforce the credit quality of the individual securities; however, if any of the financial institutions or financial guarantee assurance agencies’ credit quality should deteriorate, it could cause the individual security’s credit quality to change. Additionally, if a Portfolio concentrates its credit enhancements in any one financial institution, the risk of credit quality deterioration increases. The value of ABS may be affected
116
Wilshire Mutual Funds, Inc. Notes to Financial Statements - (Continued) December 31, 2016 |
|
by the credit risk of the servicing agent for the pool, the originator of the loans or receivables, or the financial institution(s) providing the credit support. In addition to credit risk, ABS and other securities with early redemption features are subject to pre-payment risk. During periods of declining interest rates, prepayment of loans underlying ABS can be expected to accelerate or an issuer may retire an outstanding bond early to reduce interest costs. A Portfolio’s ability to maintain positions in such securities will be affected by reductions in the principal amount of such securities resulting from prepayments, and its ability to reinvest the returns of principal at comparable yields is subject to generally prevailing interest rates at that time.
Counterparty credit risk – Counterparty credit risk is the risk that a counterparty to a financial instrument will fail on a commitment that it has entered into with a Portfolio. A Portfolio’s sub-adviser seeks to minimize counterparty credit risk by monitoring the creditworthiness of each counterparty on an ongoing basis.
Foreign security risk – The Wilshire International Equity Fund and Wilshire Income Opportunities Fund invest in securities of foreign issuers in various countries. These investments may involve certain considerations and risks not typically associated with investments in the United States as a result of, among other factors, the possibility of future political and economic developments and the level of governmental supervision and regulation of securities markets in the respective countries. The market values of the Portfolios’ investments will change in response to interest rate changes and other factors. During periods of falling interest rates, the values of fixed income securities generally rise. Conversely, during periods of rising interest rates, the values of such securities generally decline. Changes by recognized rating agencies in the ratings of any fixed income security and in the ability of an issuer to make payments of interest and principal may also affect the value of these investments. Also, the ability of the issuers of debt securities held by the Portfolios to meet their obligations may be affected by economic and political developments in a specific country, industry or region.
Investments in Loans Risk – Investments in loans involve special types of risks, including credit risk, interest rate risk, counterparty risk and prepayment risk. Loans may offer a fixed or floating interest rate. Loans are often generally below investment grade and may be unrated. Loans may be difficult to value and some can be subject to liquidity risk.
A more complete description of risks is included in each Portfolio’s prospectus and SAI.
12. Contingencies.
The Wilshire 5000 IndexSM Fund was named as a defendant and a putative member of a proposed defendant class of shareholders in a lawsuit filed on December 7, 2010, in the U.S. Bankruptcy Court for the District of Delaware and on March 6, 2012, in the District Court for the Southern District of New York, in connection with Tribune Company’s Chapter 11 bankruptcy proceeding. The 2010 lawsuit was brought by the official Committee of Unsecured Creditors of the Tribune Company and the 2012 lawsuit was brought by Deutsche Bank, as trustee for senior noteholders of Tribune Company. Both lawsuits relate to a leveraged buyout transaction by which Tribune Company converted to a privately-held company in 2007 less than a year prior to Tribune Company’s bankruptcy filing. The putative defendant class is comprised of beneficial owners of shares of Tribune Company who meet certain jurisdictional requirements and received proceeds of the leveraged buyout. The plaintiffs seek to recover those proceeds, together with interest and attorneys’ fees and expenses, as fraudulent transfers under
117
Wilshire Mutual Funds, Inc. Notes to Financial Statements - (Continued) December 31, 2016 |
|
the Bankruptcy Act or various state laws, respectively. On September 2013, the District Court dismissed the 2012 lawsuit and in March 2016 the Second Circuit Court of Appeals affirmed this decision. The 2010 lawsuit continues in the District Court. The Adviser does not expect the Portfolio to be materially impacted by the lawsuits.
13. Subsequent Event Evaluation.
The Portfolios have evaluated the need for additional disclosures and/or adjustments resulting from subsequent events through the date these financial statements were issued. Based on this evaluation, no additional disclosures and/or adjustments were required to these financial statements.
118
Wilshire Mutual Funds, Inc. Report of Independent Registered Public Accounting Firm |
|
To the Board of Directors of Wilshire Mutual Funds, Inc. and the Shareholders of
Large Company Growth Portfolio, Large Company Value Portfolio, Small Company Growth Portfolio,
Small Company Value Portfolio, Wilshire 5000 IndexSM Fund, Wilshire International Equity Fund,
and Wilshire Income Opportunities Fund:
In our opinion, the accompanying statements of assets and liabilities, including the condensed schedules of investments and with respect to the Wilshire Income Opportunities Fund, the schedule of investments, and the related statements of operations and of changes in net assets and the financial highlights present fairly, in all material respects, the financial position of the Large Company Growth Portfolio, Large Company Value Portfolio, Small Company Growth Portfolio, Small Company Value Portfolio, Wilshire 5000 IndexSM Fund, Wilshire International Equity Fund, and Wilshire Income Opportunities Fund (seven portfolios or funds constituting the Wilshire Mutual Funds, Inc., hereafter referred to as the “Portfolios”) as of December 31, 2016, the results of each of their operations for the year then ended, and with respect to the Wilshire Income Opportunities Fund from March 30, 2016 (commencement of operations) through December 31, 2016, the changes in each of their net assets each of the periods indicated and the financial highlights for each of the periods indicated, in conformity with accounting principles generally accepted in the United States of America. These financial statements and financial highlights (hereafter referred to as “financial statements”) are the responsibility of the Portfolios’ management. Our responsibility is to express an opinion on these financial statements based on our audits. We conducted our audits of these financial statements in accordance with the standards of the Public Company Accounting Oversight Board (United States). Those standards require that we plan and perform the audit to obtain reasonable assurance about whether the financial statements are free of material misstatement. An audit includes examining, on a test basis, evidence supporting the amounts and disclosures in the financial statements, assessing the accounting principles used and significant estimates made by management, and evaluating the overall financial statement presentation. We believe that our audits, which included confirmation of securities as of December 31, 2016 by correspondence with the custodian and brokers, provide a reasonable basis for our opinion.

February 28, 2017
119
Wilshire Mutual Funds, Inc. Additional Fund Information (Unaudited) |
|
The Board of Directors has responsibility for the overall management and operations of the Company. The Board establishes the Company’s policies and meets regularly to review the activities of the officers, who are responsible for the day-to-day operations of the Company.
Set forth below are the names of the Directors and executive officers of the Company, their ages, positions and terms of office, their principal occupations during the past five years, and other directorships held by them. The address of each Director and Officer is 1299 Ocean Avenue, Suite 700, Santa Monica, California 90401.
Name and Age | Position
Held
with the
Company | Term of
Office(1) and
Length of
Time
Served | Principal
Occupations
During the Past
Five Years | Number of
Funds/
Funds in
Complex
Overseen
by Director | Other
Directorships
Held by
Director |
INTERESTED DIRECTOR |
John C. Hindman, 46 | Director | Since 2014 | President, Wilshire Associates; formerly, Executive Vice President, Allianz Global Investors of America | 11 | Wilshire Associates; Wilshire Variable Insurance Trust (4 Funds) |
NON-INTERESTED DIRECTORS |
Roger A. Formisano, 67 | Director | Since 2006 | Vice President, University Medical Foundation, 2006- Present; formerly Director, The Center for Leadership and Applied Business, UW-Madison School of Business; Principal, R.A. Formisano & Company, LLC | 11 | Integrity Mutual Insurance Company, Wilshire Variable Insurance Trust (4 Funds) |
Edward Gubman, 65 | Director | Since 2011 | Founder and Principal, Strategic Talent Solutions | 11 | Wilshire Variable Insurance Trust (4 Funds) |
Suanne K. Luhn, 62 | Director | Since 2008 | Retired; formerly Chief Compliance Officer, Bahl & Gaynor (investment adviser) (1990 to 2006) | 11 | Wilshire Variable Insurance Trust (4 Funds) |
George J. Zock, 65 | Director, Chairman of the Board | Since 2006 | Independent Consultant | 11 | Wilshire Variable Insurance Trust (4 Funds), Armed Forces Insurance Exchange |
120
Wilshire Mutual Funds, Inc. Additional Fund Information (Unaudited) - (Continued) |
|
Name and Age | Position
Held
with the
Company | Term of
Office(1) and
Length of
Time
Served | Principal
Occupations
During the Past
Five Years |
OFFICERS |
Jason Schwarz, 42 | President | Since 2012 | President, Wilshire Funds Management Group (Since 2005). |
Reena S. Lalji, 45 | Secretary | Since 2009 | Managing Director and General Counsel, Wilshire Associates Incorporated |
Benkai Boucy, 46 | Chief Compliance Officer | Since 2015 | Chief Compliance Officer, Wilshire Associates Incorporated. (Since 2012); Attorney, Benkai Bouey, Attorney at Law (2010-2013) |
Michael Wauters, 51 | Treasurer | Since 2009 | Chief Financial Officer, Wilshire Associates Incorporated (Since 2009) |
Nathan R. Palmer, 41 | Vice President | Since 2011 | Managing Director, Wilshire Associates Incorporated |
Josh Emanual,
36 | Vice President | Since 2015 | Managing Director of Wilshire Associates Incoporated and Chief Investment Officer of Wilshires Funds Management (since 2015); Chief Investment Officer of The Elements Financial Group, LLC (2010-2015) |
Elizabeth Yakes,
32 | Vice President | Since 2015 | Vice President of Wilshire Associates Incorporated and Portfolio Manager of Wilshire Funds Management |
(1) | Each director serves until the next shareholders’ meeting (and until the election and qualification of a successor), or until death, resignation, removal or retirement which takes effect no later than May 1 following his or her 70th birthday. Officers are elected by the board on an annual basis to serve until their successors have been elected and qualified. |
The Company’s Statement of Additional Information includes additional information about the Directors and Officers of the Company and is available, without charge, upon request, by calling 1-888-200-6796.
121
Wilshire Mutual Funds, Inc. Additional Fund Information (Unaudited) - (Continued) |
|
Information on Proxy Voting
The Securities and Exchange Commission (“SEC”) has adopted the requirement that all funds file their complete proxy voting records with the SEC on an annual basis on Form N-PX. Such filing, for the 12-month period ended June 30, must be made no later than August 31 of each year.
A description of policies and procedures that the Portfolios use to determine how to vote proxies relating to portfolio securities, along with each Portfolio’s proxy voting record relating to portfolio securities held during most recent 12-month period ended June 30 is available at no charge, upon request by calling 1-888-200-6796, by e-mailing us at http://advisor.wilshire.com or on the SEC’s website at http://www.sec.gov.
Information on Form N-Q
The Company files its complete schedule of portfolio holdings with the SEC for the first and third quarters of each fiscal year on Form N-Q within sixty days after the end of period. The Company’s Forms N-Q are available on the SEC’s website at http://www.sec.gov, and may be reviewed and copied at the SEC’s Public Reference Room in Washington, DC. Information on the operation of the Public Reference Room may be obtained by calling 1-202-551-8090.
Householding Policy
In order to reduce printing and mailing expenses, only one copy of each prospectus, annual and semi-annual report will be sent to all related accounts at a common address, unless you have indicated otherwise on your Account Application. Shareholders may revoke their consent to householding at any time by calling 1-888-200-6796. Upon receipt of a shareholder’s revocation, the Company will begin mailing individual copies of the above-referenced documents to the shareholder’s attention within 30 days.
122
Wilshire Mutual Funds, Inc. Tax Information (Unaudited) |
|
For the year ended December 31, 2016, the Portfolios designated the following long-term capital gain distributions:
Portfolio | Amount |
Large Company Growth Portfolio | $18,867,521 |
Large Company Value Portfolio | $4,651,885 |
Small Company Growth Portfolio | $2,604,047 |
Small Company Value Portfolio | $2,391,817 |
Wilshire 5000 IndexSM Fund | $7,100,418 |
Wilshire International Equity Fund | $— |
Wilshire Income Opportunities Fund | $290,797 |
Of the distributions made by the following Portfolios, the corresponding percentages represent the amount of each distribution which will qualify for the dividends received deduction available to corporate shareholders:
Portfolio | Percentage |
Large Company Growth Portfolio | 43.84% |
Large Company Value Portfolio | 29.18% |
Small Company Growth Portfolio | 7.05% |
Small Company Value Portfolio | 8.60% |
Wilshire 5000 IndexSM Fund | 84.43% |
Wilshire International Equity Fund | 0.00% |
Wilshire Income Opportunities Fund | 0.00% |
Pursuant to the Jobs and Growth Tax Relief Reconciliation Act of 2003, and as extended by Tax Relief, Unemployment Insurance Reauthorization and Jobs Creation Act of 2010, the Portfolios designate the following percentages of their income dividends distributed in 2016 as qualified dividend income as defined in Section 1(h)(II) of the Internal Revenue Code.
Portfolio | Percentage |
Large Company Growth Portfolio | 35.45% |
Large Company Value Portfolio | 31.52% |
Small Company Growth Portfolio | 6.79% |
Small Company Value Portfolio | 6.75% |
Wilshire 5000 IndexSM Fund | 94.98% |
Wilshire International Equity Fund | 46.99% |
Wilshire Income Opportunities Fund | 0.00% |
123
Wilshire Mutual Funds, Inc. Tax Information (Unaudited) - (Continued) |
|
Pursuant to the American Jobs Creation Act of 2004, and as extended by Tax Relief, Unemployment Insurance Reauthorization and Jobs Creation Act of 2010, the Portfolios listed below designate the following percentages of short-term capital gain distributions as qualified short-term capital gain that is exempt from U.S withholding tax when paid to foreign investors.
Portfolio | Percentage |
Large Company Growth Portfolio | 35.45% |
Large Company Value Portfolio | 31.52% |
Small Company Growth Portfolio | 6.79% |
Small Company Value Portfolio | 6.75% |
Wilshire 5000 IndexSM Fund | 0.00% |
Wilshire International Equity Fund | 0.00% |
Wilshire Income Opportunities Fund. | 0.00% |
Foreign Tax Credit Pass Through
The Portfolios intend to elect to pass through to shareholders the income tax credit for taxes paid to foreign countries. The Wilshire International Equity Fund’s foreign source income per share was $0.24 and the foreign tax expense per share was $0.03. The pass-through of the foreign tax credit will only affect those persons who are shareholders on the dividend record date in December 2016. These shareholders will receive more detailed information along with their 2016 Form 1099-DIV.
124
Wilshire Mutual Funds, Inc. Board Approval of Advisory and Subadvisory Agreements (Unaudited) |
|
During the six months ended December 31, 2016, the Board of Directors (the “Board”) of Wilshire Mutual Funds, Inc. (the “Company”) approved the renewal for an additional one-year term of the Company’s advisory agreement (the “Advisory Agreement”) with Wilshire Associates Incorporated (“Wilshire” or the “Adviser”) with respect to each of the Large Company Growth Portfolio, Large Company Value Portfolio, Small Company Growth Portfolio, Small Company Value Portfolio, Wilshire 5000 Index Fund and Wilshire International Equity Fund (the “Funds”). The Board also approved the renewal for additional one-year terms of Wilshire’s subadvisory agreements with each of the following subadvisers: Cambiar Investors, LLC (“Cambiar”) with respect to the Wilshire International Equity Fund; Loomis, Sayles & Company, L.P. (“Loomis Sayles”) with respect to the Large Company Growth Portfolio; Los Angeles Capital Management and Equity Research, Inc. (“LA Capital”) with respect to each of the Small Company Value Portfolio, Small Company Growth Portfolio, Large Company Value Portfolio, Large Company Growth Portfolio, Wilshire International Equity Fund and Wilshire 5000 Index Fund, NWQ Investment Management Company, LLC (“NWQ”) with respect to the Small Company Value Portfolio, Pzena Investment Management, LLC (“Pzena”) with respect to the Large Company Value Portfolio, Ranger Investment Management, L.P. (“Ranger”) with respect to the Small Company Growth Portfolio, Victory Capital Management, Inc. (“Victory”) with respect to the Large Company Growth Portfolio, and WCM Investment Management (“WCM”) with respect to the Wilshire International Equity Fund. In the following text, the subadvisers are referred to as “Subadvisers” and the subadvisory agreements between Wilshire and each Subadviser are referred to as “Subadvisory Agreements.”
The information in this summary outlines the Board’s considerations associated with its approval of the Advisory Agreement and the Subadvisory Agreements. In connection with its deliberations regarding the continuation of these relationships, the Board considered such information and factors as it believed to be relevant. As described below, the Board considered the nature, extent and quality of the services performed by Wilshire and the Subadvisers under the existing advisory and subadvisory arrangements, respectively; with respect to Wilshire, comparative fees and expense ratios; the profits to be realized by Wilshire and the Subadivsers; the extent to which Wilshire and the Subadvisers realize economies of scale; and whether any fall-out benefits are being realized by Wilshire and the Subadvisers. In considering these matters, the Board was advised with respect to relevant legal standards by independent legal counsel. In addition, the Directors who are not “interested persons” of the Company as defined in the Investment Company Act of 1940 (the “Independent Directors”) discussed the renewal of the Advisory Agreement with management and in private sessions with independent legal counsel at which no representatives of Wilshire were present and discussed the approval of the Subadvisory Agreements with management and in private sessions with counsel at which no representatives of the Subadvisers were present.
As required by the Investment Company Act of 1940, each approval was confirmed by a vote of the Independent Directors. In deciding to approve the Advisory Agreement and the Subadvisory Agreements, the Board did not identify any single factor as controlling and this summary does not describe all of the matters considered. However, the Board concluded that each of the various factors referred to below favored such approval.
Information Requested and Received
The Board, including all the Independent Directors, considered the approval of the Subadvisory Agreements pursuant to a process that concluded at the Board’s August 24, 2016 meeting and the renewal of the Advisory Agreement pursuant to a process that concluded at the Board’s November 10-11, 2016 meeting, in each case following an extensive process. At the direction of the Independent Directors, independent legal counsel sent memoranda to the Adviser requesting information regarding the Subadvisory Agreements and the Advisory Agreement to be provided to the Directors in advance of the Board’s meetings held on August 15 16, 2016 and November 10-11, 2016, respectively.
In response to the requests for information, the Directors received information from the Adviser as to each of the Funds describing: (i) the nature, extent and quality of services provided; (ii) the investment performance of each Fund as provided by Wilshire based upon data gathered from the Morningstar Direct database (“Morningstar”), along with the
125
Wilshire Mutual Funds, Inc. Board Approval of Advisory and Subadvisory Agreements (Unaudited) - (continued) |
|
comparison to its benchmark index; (iii) the costs of services provided and estimated profits realized by the Adviser; (iv) the extent to which economies of scale are realized; (v) whether fee levels reflect any economies of scale realized by the Adviser and any sharing of such for the benefit of Fund shareholders; (vi) comparisons of services rendered and amounts paid by other registered investment companies as provided by Wilshire based upon data gathered from Morningstar; and (vii) benefits realized by the Adviser from its relationship with each Fund. The Directors received information from the Adviser regarding the factors underlying its recommendations to approve each Subadvisory Agreement. The Directors also received information from each Subadviser as to each Fund it managed describing: (i) the nature, extent and quality of services provided, (ii) the investment performance of the Subadviser in connection with the Fund; (iii) the financial condition of the Subadviser, (iv) the extent to which economies of scale are realized as a Fund grows, (v) whether fee levels reflect any possible economies of scale for the benefit of Fund shareholders, (vi) where applicable, comparisons of services rendered and amounts paid by other registered investment companies and any comparable advisory clients, and (vii) benefits realized by the Subadviser from its relationship with the Fund. At each meeting, the Independent Directors also received a memorandum from independent legal counsel describing their duties in connection with contract approvals, and they were assisted in their review by such counsel.
As a part of its evaluation, the Board considered the assessment of performance made by the Investment Committee (which is comprised solely of Independent Directors), which met on August 15, 2016 and November 10, 2016 to review data on the Subadvisers’ performance and the data Wilshire had prepared on performance, respectively. Based upon its evaluation of all materials provided, the Board concluded that it was in the best interests of each Fund to approve the Advisory Agreement and the Subadvisory Agreements.
Nature, Extent and Quality of Services – Wilshire
With respect to the nature, extent and quality of services provided by the Adviser, the Board reviewed the functions currently performed by the Adviser. The Board considered the experience and skills of the senior management leading fund operations, the experience and skills of the personnel performing the functions under the Advisory Agreement and the resources made available to such personnel. The Board determined that the current personnel had the requisite skill sets. The Board also considered the compliance program established by the Adviser and the level of compliance maintained for the Funds. The Board reviewed the processes used by the Adviser to select, monitor and replace subadvisers, as well as the Adviser’s revised processes and policies for addressing conflicts of interest. The Board concluded that the Adviser was successful in negotiating favorable subadvisory agreements on behalf of the Funds and that the Adviser had a robust system in place for selecting, monitoring and terminating subadvisers, which system appeared to be reasonable. The Board also reviewed the Adviser’s financial condition, and considered the financial support provided by the Adviser to the Small Company Growth Portfolio, the Small Company Value Portfolio and the Wilshire International Equity Fund through expense limitation agreements. Based upon all relevant factors, the Board concluded that the nature, quality and extent of the services provided by the Adviser to each Fund support renewal of the contract.
The Board reviewed information on the performance of each Fund’s Investment Class Shares for the annualized one-, three-, five- and ten-year periods ended September 30, 2016, as applicable, along with performance information of a peer group of funds determined by Wilshire based upon the Morningstar database and in comparison to its benchmark for the same periods.
For the Large Company Growth Portfolio, the Board noted that the Fund outperformed the median of its peer group for the one-, three-, five- and ten-year periods and its benchmark for the one-year period.
For the Large Company Value Portfolio, the Board noted that the Fund underperformed the median of its peer group for the one-, three- and ten-year periods and underperformed its benchmark for all periods reviewed but outperformed the median of its peer group for the five-year period, and ranked in the third or fourth quintiles relative to its peers for the
126
Wilshire Mutual Funds, Inc. Board Approval of Advisory and Subadvisory Agreements (Unaudited) - (continued) |
|
other periods (the first quintile being the best performers and the fifth quintile being the worst performers). The Board took into consideration the Adviser’s explanation for the recent underperformance and the steps taken by the Adviser to improve performance.
For the Small Company Growth Portfolio, the Board noted that the Fund outperformed the median of its peer group and benchmark for all periods reviewed.
For the Small Company Value Portfolio, the Board noted that the Fund outperformed the median of its peer group for the one-, three-, five- and ten-year periods and outperformed its benchmark for the three- five- and ten-year periods.
For the Wilshire 5000 Index Fund, the Board noted that, although the Fund underperformed its benchmark for the one-, three-, five- and ten-year periods and the Fund’s tracking error to the Wilshire 5000 Index was higher than the median of its peer group for the five- and ten-year periods, the Fund’s tracking error to the Wilshire 5000 Index was the same as the median of its peer group for the one- and three-year periods and underperformance relative to the benchmark was primarily due to the Fund’s expenses.
For the Wilshire International Equity Fund, the Board noted that the Fund changed its investment mandate from a domestic large cap core fund to an international large cap fund in April 2013 and changed its benchmark to the MSCI ACW-ex U.S. Index at the same time so annualized peer returns and performance relative to the Index are not comparable for the five-year period. The Board also noted that the Wilshire International Equity Fund outperformed the median of its peer group and benchmark for the one- and three-year periods.
Based upon the above performance, the Board determined that it was in the best interests of the Funds to continue the Advisory Agreement.
Advisory Fees
The Board reviewed each Fund’s advisory fee and total expense ratio for Investment Class Shares and reviewed information comparing the advisory fee and total expense ratio to those of the peer group of funds. For each Fund other than the Large Company Growth Portfolio and the Large Company Value Portfolio, the actual advisory fee was below the median. With respect to the Large Company Growth Portfolio and the Large Company Value Portfolio, the Board concluded that the advisory fee, which was in the third and fourth quintile of their respective peer groups, was competitive. As to total expenses, the Board noted that total expenses for each Fund are influenced by the small size of the complex. The Board also noted that the Adviser waives advisory fees and reimburses expenses for the Small Company Growth Portfolio, the Small Company Value Portfolio and the Wilshire International Equity Fund pursuant to expense imitation agreements. The Board also reviewed the net advisory fee retained by the Adviser after payment of subadvisory fees and advisory fee waivers and expense reimbursements. The Board compared contractual fees charged by the Adviser to the Funds with similar investment styles. The Board was advised that there were no other registered investment companies advised by the Adviser with similar investment strategies. The Board concluded that the advisory fee for each Fund was reasonable.
Profitability to Wilshire and Economies of Scale
With respect to the profitability of the Advisory Agreement, the Board primarily considered the fee structure of the Advisory Agreement, including the costs of the services provided and the profits realized by the Adviser from its relationship with the Funds. The Board concluded that the profits realized by the Adviser were not unreasonable in comparison with the costs of providing investment advisory services to the Funds. In addition, the Board considered the extent to which economies of scale are realized and whether fee levels reasonably reflect economies of scale for the benefit of shareholders. The Board reviewed each Fund’s asset size, each Fund’s expense ratio, the expense limitation agreements in place for the Small Company Growth Portfolio, Small Company Value Portfolio and Wilshire International
127
Wilshire Mutual Funds, Inc. Board Approval of Advisory and Subadvisory Agreements (Unaudited) - (continued) |
|
Equity Fund and whether the investment process produced economies of scale. The Board noted that the advisory fee for all Funds includes a breakpoint. The Board concluded that each Fund’s advisory fee reasonably reflected appropriate recognition of any economies of scale.
Fall-Out Benefits – Wilshire
The Board considered the Adviser’s statement that benefits from its relationship with the Funds were limited to the advisory fees paid. The Board determined that the advisory fees were reasonable in light of any fall-out benefits.
Nature, Extent and Quality of Services – Subadvisers
As to each Subadvisory Agreement, the Board considered the nature, extent and quality of services provided. The Board considered the reputation, qualifications and background of the Subadviser, investment approach of the Subadviser, the experience and skills of investment personnel responsible for the day-to-day management of each Fund, and the resources made available to such personnel. The Board also considered the Subadviser’s compliance with investment policies and general legal compliance. In addition, the Board considered the analysis provided by the Adviser, which concluded that each Subadviser was providing reasonable services and had reasonable compliance policies and procedures in place, and that the Adviser recommended that each Subadvisory Agreement for each Fund be approved.
The Board reviewed information comparing each existing Subadviser’s gross investment performance to a relevant benchmark (except for LA Capital with respect to the Wilshire 5000 Index Fund for which the Subadviser’s net performance was compared to the benchmark). Based upon all relevant factors, the Board determined to approve the Subadvisory Agreement with LA Capital, with respect to the Large Company Growth Portfolio, noting LA Capital’s outperformance for all periods reviewed, which resulted in a conclusion that performance was satisfactory. With respect to Victory’s performance for the Large Company Growth Portfolio, the Board determined to approve the continuation of Victory’s Subadvisory Agreement given outperformance for the quarter ended June 30, 2016 and the since inspection period (January 31, 2007) to June 30, 2016, although the Board noted Victory’s underperformance for the one-, three- and five-year periods ended June 30, 2016. The Board considered the Adviser’s recommendation for renewal and the Adviser’s commitment to monitor closely Victory’s performance. With respect to Loomis Sayles’ performance for the Large Company Growth Portfolio, the Board noted outperformance for the since inception period (August 31, 2015) to June 30, 2016, which resulted in a conclusion that performance was satisfactory.
With respect to LA Capital’s performance for the Large Company Value Portfolio, the Fund noted LA Capital’s outperformance for the one- and three-year periods ended June 30, 2016, which resulted in a conclusion that performance was satisfactory. The Board noted that Pzena, with respect to the Large Company Value Portfolio, had underperformed for all periods reviewed. The Board considered Pzena’s competitive performance relative to other deep value managers, the Adviser’s recommendation for renewal and the Adviser’s commitment to monitor closely Pzena’s performance. The Board also considered the Adviser’s commitment to consider whether Pzena’s deep value investment strategy continues to be appropriate for the Large Company Value Portfolio.
The Board considered that Ranger, with respect to the Small Company Growth Portfolio, outperformed for all periods reviewed, which resulted in a conclusion that performance was satisfactory. With respect to LA Capital’s performance for the Small Company Growth Portfolio, the Board noted outperformance for all periods reviewed, which resulted in a conclusion that performance was satisfactory.
With respect to LA Capital’s performance for the Small Company Value Portfolio, the Board noted LA Capital’s outperformance for the one-, three-, five- and ten-year periods ended June 30, 2016, which resulted in a conclusion that performance was satisfactory. With respect to NWQ’s performance for the Small Company Value Portfolio, the Board
128
Wilshire Mutual Funds, Inc. Board Approval of Advisory and Subadvisory Agreements (Unaudited) - (continued) |
|
noted outperformance for the three-year and since inception (April 30, 2013) periods ended June 30, 2016, although the Board noted NWQ’s underperformance for the more recent periods. The Board considered the Adviser’s recommendation for renewal and the Adviser’s commitment to monitor closely NWQ’s performance.
With respect to the Wilshire 5000 Index Fund, the Board noted LA Capital’s underperformance for all periods reviewed, but considered that the Adviser is satisfied with the level of services provided and that underperformance was primarily due to Fund expenses.
The Board considered that WCM and LA Capital, with respect to the Wilshire International Equity Fund, outperformed for the one-year and since inception (October 31, 2013 and June 30, 2014, respectively) periods ended June 30, 2016, which resulted in a conclusion that performance was satisfactory. The Board noted that Cambiar, with respect to the Wilshire International Equity Fund, had underperformed for the since inception period (August 31, 2015) to June 30, 2016. The Board considered that it had recently evaluated Cambiar in connection with the initial approval of the Subadviser, the Adviser’s recommendation for renewal and the Adviser’s commitment to monitor closely Cambiar’s performance. The Board determined that Cambiar’s performance was over too short of a period of time to evaluate.
Subadvisory Fees
The Board considered each Fund’s subadvisory fees. The Board evaluated the competitiveness of the subadvisory fees based upon data supplied by each Subadviser about the fees charged to other clients. The Board also considered that the subadvisory fee rates were negotiated at arm’s length between the Adviser and each Subadviser, that the Adviser compensates the Subadviser from its fees and that the aggregate advisory fee had been deemed reasonable by the Board.
With respect to the Subadvisers’ reported fees for “Other Clients” with comparable investment policies and services, for the Subadvisers where the fees charged to the Adviser were higher than that charged to Other Clients, the Board determined that the fees charged to the Adviser were competitive.
Based upon all of the above, the Board determined that the subadvisory fees for each Fund were reasonable.
Profitability to the Subadvisers
The Board noted that the Adviser compensates each Subadviser from its own advisory fees and that the fees were negotiated at arm’s length between the Adviser and each Subadviser. In addition, the Board noted that the revenues to the various Subadvisers were limited due to the size of the Funds. The Board took these factors into consideration in concluding that the subadvisory fees were reasonable.
Economies of Scale – Subadvisers
The Board considered whether there are economies of scale with respect to the subadvisory services provided to each Fund and whether the subadvisory fees reflect such economies of scale through breakpoints in fees. The Board also considered whether the effective subadvisory fee rate for each Fund under the Subadvisory Agreement is reasonable in relation to the asset size of such Fund. The Board concluded that the fee schedule for each Fund reflects an appropriate recognition of any economies of scale.
Fall-Out Benefits – Subadvisers
The Board also considered the character and amount of other incidental benefits received by each Subadviser. The Board considered each Subadviser’s soft dollar practices, as applicable. The Board concluded that, taking into account the benefits arising from these practices, the fees charged under each Subadvisory Agreement were reasonable.
129
Wilshire Mutual Funds, Inc. Board Approval of Advisory and Subadvisory Agreements (Unaudited) - (continued) |
|
Conclusion
Based upon all of the information considered and the conclusions reached, the Board determined that the terms of the Advisory Agreement and each Subadvisory Agreement are fair and reasonable and that the approval of the Advisory Agreement and each Subadvisory Agreement is in the best interests of each Fund.
130
[This page intentionally left blank]
[This page intentionally left blank]
[This page intentionally left blank]

Wilshire Mutual Funds
Wilshire Associates Incorporated
1299 Ocean Avenue
Santa Monica, CA 90401
1-888-200-6796
http://advisor.wilshire.com
WIL-SA-004-0400
As of the end of the period covered by this report, the registrant has adopted a code of ethics that applies to the registrant’s principal executive officer, principal financial officer, principal accounting officer or controller, or persons performing similar functions, regardless of whether these individuals are employed by the registrant or a third party. Pursuant to Item 12(a)(1), a copy of registrant’s code of ethics is filed as an exhibit to this Form N-CSR. During the period covered by this report, the code of ethics has not been amended, and the registrant has not granted any waivers, including implicit waivers, from the provisions of the code of ethics.
| Item 3. | Audit Committee Financial Expert. |
The registrant’s board of trustees has determined that the registrant has at least one audit committee financial expert serving on its audit committee. The name of the audit committee financial expert is Mr. Roger A. Formisano. Mr. Formisano is “independent” for purposes of this Item.
| Item 4. | Principal Accountant Fees and Services. |
| (a) | Audit Fees. The aggregate fees billed for professional services rendered by the principal accountant for the audit of the registrant’s annual financial statements or for services that are normally provided by the accountant in connection with statutory and regulatory filings or engagements were $179,910 and $143,520 with respect to the registrant’s fiscal years ended December 31, 2016 and 2015, respectively. |
| (b) | Audit-Related Fees. No fees were billed in either of the last two fiscal years for assurance and related services by the principal accountant that are reasonably related to the performance of the audit of the registrant’s financial statements and are not reported under paragraph (a) of this Item. |
| (c) | Tax Fees. The aggregate fees billed for professional services rendered by the principal accountant for tax compliance, tax advice, and tax planning were $38,850 and $27,981 with respect to the registrant’s fiscal years ended December 31, 2016 and 2015, respectively. The services comprising these fees are tax consulting and the preparation of the registrant’s federal income and excise tax returns. |
| (d) | All Other Fees. No fees were billed in either of the last two fiscal years for products and services provided by the principal accountant, other than the services reported in paragraphs (a) through (c) of this Item. |
| (e)(1) | The audit committee has not adopted pre-approval policies and procedures described in paragraph (c)(7) of Rule 2-01 of Regulation S-X. |
| (e)(2) | None of the services described in paragraph (b) through (d) of this Item were approved by the audit committee pursuant to paragraph (c)(7)(i)(C) of Rule 2-01 of Regulation S-X. |
| (f) | Less than 50% of hours expended on the principal accountant’s engagement to audit the registrant’s financial statements for the most recent fiscal year were attributed to work performed by persons other than the principal accountant’s full-time, permanent employees. |
| (g) | During the fiscal years ended December 31, 2016 and 2015, aggregate non-audit fees of $38,850 and $27,981, respectively, were billed by the registrant’s principal accountant for services rendered to the registrant. During the fiscal years ended December 31, 2016 and 2015, aggregate non-audit fees of $1,325,000 and $1,298,830 respectively, were billed by the registrant’s principal accountant for services rendered to the registrant’s investment adviser (not including any sub-adviser whose role is primarily portfolio management and is subcontracted with or overseen by another investment adviser), and any entity controlling, controlled by, or under common control with the adviser that provides ongoing services to the registrant. |
| (h) | The registrant’s audit committee has determined that the provision of non-audit services that were rendered to the registrant’s investment adviser (not including any sub-adviser whose role is primarily portfolio management and is subcontracted with or overseen by another investment adviser), and any entity controlling, controlled by, or under common control with the investment adviser that provides ongoing services to the registrant, that were not pre-approved pursuant to paragraph (c)(7)(ii) of Rule 2-01 of Regulation S-X is compatible with maintaining the principal accountant’s independence. |
| Item 5. | Audit Committee of Listed Registrants. |
Not applicable
| Item 6. | Schedule of Investments. |
| (a) | The Schedules of Investments in securities of unaffiliated issuers as of the close of the reporting period for the Wilshire 5000 Index SM Fund, the Large Company Growth Portfolio, the Large Company Value Portfolio, the Small Company Growth Portfolio, the Small Company Value Portfolio and the Wilshire International Equity Fund are listed below. |
WILSHIRE LARGE COMPANY GROWTH PORTFOLIO
SCHEDULE OF INVESTMENTS
December 31, 2016
| COMMON STOCKS - 98.9% | | Shares | | | Value | |
| Consumer Discretionary - 16.1% | | | | | | |
| Auto Components - 0.2% | | | | | | |
BorgWarner, Inc. (a) | | | 790 | | | $ | 31,158 | |
| Gentex Corp. | | | 15,430 | | | | 303,816 | |
| | | | | | | | 334,974 | |
| Automobiles - 0.6% | | | | | | | | |
Harley-Davidson, Inc. (a) | | | 21,510 | | | | 1,254,893 | |
| | | | | | | | | |
| Distributors - 0.1% | | | | | | | | |
| Genuine Parts Co. | | | 2,329 | | | | 222,513 | |
| | | | | | | | | |
| Diversified Consumer Services - 0.1% | | | | | | | | |
| Service Corp. International | | | 6,088 | | | | 172,900 | |
ServiceMaster Global Holdings, Inc. (b) | | | 1,790 | | | | 67,429 | |
| | | | | | | | 240,329 | |
| Hotels, Restaurants & Leisure - 3.2% | | | | | | | | |
| Aramark | | | 3,664 | | | | 130,878 | |
| Choice Hotels International, Inc. | | | 1,200 | | | | 67,260 | |
Las Vegas Sands Corp. (a) | | | 1,764 | | | | 94,215 | |
| McDonald's Corp. | | | 10,149 | | | | 1,235,336 | |
| Six Flags Entertainment Corp. | | | 2,435 | | | | 146,003 | |
| Starbucks Corp. | | | 40,540 | | | | 2,250,781 | |
| Wyndham Worldwide Corp. | | | 3,370 | | | | 257,367 | |
Yum China Holdings, Inc. (b) | | | 37,239 | | | | 972,683 | |
| Yum! Brands, Inc. | | | 27,634 | | | | 1,750,061 | |
| | | | | | | | 6,904,584 | |
| Household Durables - 0.2% | | | | | | | | |
| CalAtlantic Group Inc. | | | 2,920 | | | | 99,309 | |
| D.R. Horton, Inc. | | | 2,230 | | | | 60,946 | |
PulteGroup, Inc. (a) | | | 6,480 | | | | 119,102 | |
Toll Brothers, Inc. (a) (b) | | | 257 | | | | 7,967 | |
| Tupperware Brands Corp. | | | 2,870 | | | | 151,020 | |
| | | | | | | | 438,344 | |
| Internet & Direct Marketing Retail - 6.1% | | | | | | | | |
Amazon.com, Inc. (b) | | | 13,689 | | | | 10,264,970 | |
Liberty Expedia Holdings, Inc. - Series A (b) | | | 5,974 | | | | 236,989 | |
WILSHIRE LARGE COMPANY GROWTH PORTFOLIO
SCHEDULE OF INVESTMENTS (Continued)
| COMMON STOCKS - 98.9% (Continued) | | Shares | | | Value | |
| Consumer Discretionary - 16.1% (Continued) | | | | | | |
| Internet & Direct Marketing Retail - 6.1% (Continued) | | | | | | |
Liberty Interactive Corp. QVC Group - Series A (b) | | | 6,225 | | | $ | 124,376 | |
Liberty Ventures - Series A (b) | | | 8,962 | | | | 330,429 | |
Priceline Group, Inc. (The) (b) | | | 1,400 | | | | 2,052,484 | |
TripAdvisor, Inc. (b) | | | 655 | | | | 30,372 | |
| | | | | | | | 13,039,620 | |
| Leisure Products - 0.3% | | | | | | | | |
| Brunswick Corp. | | | 30 | | | | 1,636 | |
Mattel, Inc. (a) | | | 21,801 | | | | 600,618 | |
| | | | | | | | 602,254 | |
| Media - 0.4% | | | | | | | | |
DISH Network Corp. - Class A (b) | | | 75 | | | | 4,345 | |
Lions Gate Entertainment Corp. - Class B (a) (b) | | | 5,597 | | | | 137,345 | |
| Viacom, Inc. - Class B | | | 17,785 | | | | 624,253 | |
| Walt Disney Co. (The) | | | 44 | | | | 4,586 | |
| | | | | | | | 770,529 | |
| Specialty Retail - 3.6% | | | | | | | | |
| Bed Bath & Beyond, Inc. | | | 10,945 | | | | 444,805 | |
Gap, Inc. (The) (a) | | | 24,997 | | | | 560,933 | |
| Home Depot, Inc. (The) | | | 2,610 | | | | 349,949 | |
| Lowe's Cos., Inc. | | | 3,208 | | | | 228,153 | |
O'Reilly Automotive, Inc. (b) | | | 8,700 | | | | 2,422,167 | |
Signet Jewelers Ltd. (a) | | | 3,509 | | | | 330,758 | |
| TJX Companies, Inc. (The) | | | 4,820 | | | | 362,127 | |
Ulta Salon, Cosmetics & Fragrance, Inc. (b) | | | 10,575 | | | | 2,695,990 | |
Williams-Sonoma, Inc. (a) | | | 7,974 | | | | 385,862 | |
| | | | | | | | 7,780,744 | |
| Textiles, Apparel & Luxury Goods - 1.3% | | | | | | | | |
| Coach, Inc. | | | 20,050 | | | | 702,151 | |
Kate Spade & Co. (b) | | | 795 | | | | 14,843 | |
Michael Kors Holdings Ltd. (b) | | | 980 | | | | 42,120 | |
| NIKE, Inc. - Class B | | | 39,300 | | | | 1,997,619 | |
Ralph Lauren Corp. (a) | | | 1,020 | | | | 92,126 | |
| | | | | | | | 2,848,859 | |
WILSHIRE LARGE COMPANY GROWTH PORTFOLIO
SCHEDULE OF INVESTMENTS (Continued)
| COMMON STOCKS - 98.9% (Continued) | | Shares | | | Value | |
| Consumer Staples - 9.3% | | | | | | |
| Beverages - 4.9% | | | | | | |
| Coca-Cola Co. (The) | | | 77,454 | | | $ | 3,211,243 | |
| Constellation Brands, Inc. - Class A | | | 11,850 | | | | 1,816,724 | |
Monster Beverage Corp. (b) | | | 113,826 | | | | 5,047,045 | |
| PepsiCo, Inc. | | | 5,623 | | | | 588,334 | |
| | | | | | | | 10,663,346 | |
| Food & Staples Retailing - 0.4% | | | | | | | | |
| Costco Wholesale Corp. | | | 2,028 | | | | 324,703 | |
Rite Aid Corp. (b) | | | 10,713 | | | | 88,275 | |
| Whole Foods Market, Inc. | | | 11,180 | | | | 343,897 | |
| | | | | | | | 756,875 | |
| Food Products - 1.6% | | | | | | | | |
| Campbell Soup Co. | | | 2,903 | | | | 175,544 | |
| Danone SA - ADR | | | 184,005 | | | | 2,314,783 | |
| General Mills, Inc. | | | 10,365 | | | | 640,246 | |
| Kellogg Co. | | | 3,577 | | | | 263,661 | |
| Mead Johnson Nutrition Co. | | | 640 | | | | 45,286 | |
| | | | | | | | 3,439,520 | |
| Household Products - 1.8% | | | | | | | | |
| Clorox Co. (The) | | | 2,900 | | | | 348,058 | |
| Colgate-Palmolive Co. | | | 2,760 | | | | 180,614 | |
| Energizer Holdings, Inc. | | | 2,280 | | | | 101,711 | |
| Kimberly-Clark Corp. | | | 5,630 | | | | 642,496 | |
| Procter & Gamble Co. (The) | | | 32,285 | | | | 2,714,523 | |
| | | | | | | | 3,987,402 | |
| Tobacco - 0.6% | | | | | | | | |
| Altria Group, Inc. | | | 2,667 | | | | 180,343 | |
| Philip Morris International, Inc. | | | 11,169 | | | | 1,021,851 | |
| | | | | | | | 1,202,194 | |
| Energy - 2.5% | | | | | | | | |
| Energy Equipment & Services - 2.2% | | | | | | | | |
FMC Technologies, Inc. (b) | | | 4,040 | | | | 143,541 | |
| Halliburton Co. | | | 42,425 | | | | 2,294,769 | |
| Schlumberger Ltd. | | | 26,334 | | | | 2,210,739 | |
| | | | | | | | 4,649,049 | |
WILSHIRE LARGE COMPANY GROWTH PORTFOLIO
SCHEDULE OF INVESTMENTS (Continued)
| COMMON STOCKS - 98.9% (Continued) | | Shares | | | Value | |
| Energy - 2.5% (Continued) | | | | | | |
| Oil, Gas & Consumable Fuels - 0.3% | | | | | | |
| Apache Corp. | | | 7,122 | | | $ | 452,034 | |
HollyFrontier Corp. (a) | | | 4,036 | | | | 132,219 | |
| Range Resources Corp. | | | 176 | | | | 6,047 | |
Southwestern Energy Co. (b) | | | 2,910 | | | | 31,486 | |
| Williams Cos., Inc. (The) | | | 1,735 | | | | 54,028 | |
| | | | | | | | 675,814 | |
| Financials - 4.2% | | | | | | | | |
| Banks - 0.1% | | | | | | | | |
| Citizens Financial Group, Inc. | | | 6,240 | | | | 222,331 | |
| | | | | | | | | |
| Capital Markets - 2.6% | | | | | | | | |
| Ameriprise Financial, Inc. | | | 2,578 | | | | 286,003 | |
| Artisan Partners Asset Management, Inc. - Class A | | | 24,128 | | | | 717,808 | |
| Charles Schwab Corp. (The) | | | 75,900 | | | | 2,995,774 | |
| Eaton Vance Corp. | | | 80 | | | | 3,350 | |
| Federated Investors, Inc. - Class B | | | 18,280 | | | | 516,958 | |
| Goldman Sachs Group, Inc. (The) | | | 4,525 | | | | 1,083,511 | |
| Invesco Ltd. | | | 381 | | | | 11,560 | |
| | | | | | | | 5,614,964 | |
| Consumer Finance - 0.6% | | | | | | | | |
| American Express Co. | | | 16,981 | | | | 1,257,952 | |
| | | | | | | | | |
| Diversified Financial Services - 0.2% | | | | | | | | |
CBOE Holdings, Inc. (a) | | | 1,138 | | | | 84,087 | |
| Leucadia National Corp. | | | 12,540 | | | | 291,555 | |
| | | | | | | | 375,642 | |
| Insurance - 0.7% | | | | | | | | |
| Arthur J. Gallagher & Co. | | | 8,001 | | | | 415,732 | |
| Erie Indemnity Co. - Class A | | | 3,525 | | | | 396,386 | |
| Lincoln National Corp. | | | 10,380 | | | | 687,883 | |
| XL Group Ltd. | | | 3,708 | | | | 138,160 | |
| | | | | | | | 1,638,161 | |
| Health Care - 15.2% | | | | | | | | |
| Biotechnology - 5.7% | | | | | | | | |
| AbbVie, Inc. | | | 8,440 | | | | 528,513 | |
WILSHIRE LARGE COMPANY GROWTH PORTFOLIO
SCHEDULE OF INVESTMENTS (Continued)
| COMMON STOCKS - 98.9% (Continued) | | Shares | | | Value | |
| Health Care - 15.2% (Continued) | | | | | | |
| Biotechnology - 5.7% (Continued) | | | | | | |
Alexion Pharmaceuticals, Inc. (b) | | | 18,105 | | | $ | 2,215,147 | |
| Amgen, Inc. | | | 16,528 | | | | 2,416,559 | |
Biogen, Inc. (b) | | | 347 | | | | 98,402 | |
Celgene Corp. (b) | | | 30,758 | | | | 3,560,239 | |
| Gilead Sciences, Inc. | | | 14,790 | | | | 1,059,112 | |
Regeneron Pharmaceuticals, Inc. (b) | | | 6,472 | | | | 2,375,806 | |
United Therapeutics Corp. (a) (b) | | | 320 | | | | 45,898 | |
| | | | | | | | 12,299,676 | |
| Health Care Equipment & Supplies - 3.3% | | | | | | | | |
| Abbott Laboratories | | | 5,082 | | | | 195,200 | |
| Baxter International, Inc. | | | 15,603 | | | | 691,837 | |
| C.R. Bard, Inc. | | | 990 | | | | 222,413 | |
DexCom, Inc. (a) (b) | | | 22,075 | | | | 1,317,878 | |
Edwards Lifesciences Corp. (b) | | | 27,925 | | | | 2,616,572 | |
Intuitive Surgical, Inc. (b) | | | 30 | | | | 19,025 | |
Varian Medical Systems, Inc. (b) | | | 22,399 | | | | 2,010,982 | |
| | | | | | | | 7,073,907 | |
| Health Care Providers & Services - 0.8% | | | | | | | | |
| AmerisourceBergen Corp. | | | 3,311 | | | | 258,887 | |
| Cardinal Health, Inc. | | | 4,098 | | | | 294,933 | |
Centene Corp. (b) | | | 3,530 | | | | 199,480 | |
DaVita, Inc. (b) | | | 1,349 | | | | 86,606 | |
| McKesson Corp. | | | 5,942 | | | | 834,554 | |
Premier, Inc. - Class A (b) | | | 2,500 | | | | 75,900 | |
| | | | | | | | 1,750,360 | |
| Health Care Technology - 0.9% | | | | | | | | |
Cerner Corp. (b) | | | 41,779 | | | | 1,979,071 | |
| | | | | | | | | |
| Life Sciences Tools & Services - 0.1% | | | | | | | | |
| Bruker Corp. | | | 4,250 | | | | 90,015 | |
| PerkinElmer, Inc. | | | 161 | | | | 8,396 | |
| | | | | | | | 98,411 | |
| Pharmaceuticals - 4.4% | | | | | | | | |
Akorn, Inc. (a) (b) | | | 210 | | | | 4,584 | |
Allergan plc (b) | | | 1,115 | | | | 234,161 | |
WILSHIRE LARGE COMPANY GROWTH PORTFOLIO
SCHEDULE OF INVESTMENTS (Continued)
| COMMON STOCKS - 98.9% (Continued) | | Shares | | | Value | |
| Health Care - 15.2% (Continued) | | | | | | |
| Pharmaceuticals - 4.4% (Continued) | | | | | | |
| Bristol-Myers Squibb Co. | | | 13,284 | | | $ | 776,317 | |
| Eli Lilly & Co. | | | 5,215 | | | | 383,563 | |
| Johnson & Johnson | | | 4,757 | | | | 548,054 | |
| Merck & Co., Inc. | | | 29,346 | | | | 1,727,599 | |
Mylan N.V. (b) | | | 1,276 | | | | 48,679 | |
| Novartis AG - ADR | | | 20,227 | | | | 1,473,335 | |
Novo Nordisk A/S - ADR (a) | | | 72,794 | | | | 2,610,394 | |
Shire plc - ADR (a) | | | 9,550 | | | | 1,627,129 | |
| | | | | | | | 9,433,815 | |
| Industrials - 8.4% | | | | | | | | |
Aerospace & Defense - 0.0% (c) | | | | | | | | |
AdvanSix, Inc. (b) | | | 216 | | | | 4,782 | |
| BWX Technologies, Inc. | | | 525 | | | | 20,843 | |
| | | | | | | | 25,625 | |
| Air Freight & Logistics - 2.3% | | | | | | | | |
| Expeditors International of Washington, Inc. | | | 48,010 | | | | 2,542,610 | |
| United Parcel Service, Inc. - Class B | | | 22,389 | | | | 2,566,674 | |
| | | | | | | | 5,109,284 | |
| Airlines - 0.8% | | | | | | | | |
| Delta Air Lines, Inc. | | | 12,393 | | | | 609,612 | |
JetBlue Airways Corp. (b) | | | 36,810 | | | | 825,280 | |
| Southwest Airlines Co. | | | 5,010 | | | | 249,698 | |
| | | | | | | | 1,684,590 | |
Building Products - 0.0% (c) | | | | | | | | |
| Allegion plc | | | 1,300 | | | | 83,200 | |
| | | | | | | | | |
| Commercial Services & Supplies - 0.6% | | | | | | | | |
| KAR Auction Services, Inc. | | | 15,220 | | | | 648,676 | |
| R.R. Donnelley & Sons Co. | | | 14,370 | | | | 234,518 | |
Stericycle, Inc. (b) | | | 2,990 | | | | 230,350 | |
| Waste Management, Inc. | | | 1,160 | | | | 82,256 | |
| | | | | | | | 1,195,800 | |
| Electrical Equipment - 1.0% | | | | | | | | |
| Acuity Brands, Inc. | | | 9,000 | | | | 2,077,740 | |
WILSHIRE LARGE COMPANY GROWTH PORTFOLIO
SCHEDULE OF INVESTMENTS (Continued)
| COMMON STOCKS - 98.9% (Continued) | | Shares | | | Value | |
| Industrials - 8.4% (Continued) | | | | | | |
| Electrical Equipment - 1.0% (Continued) | | | | | | |
| Emerson Electric Co. | | | 2,425 | | | $ | 135,194 | |
| | | | | | | | 2,212,934 | |
| Industrial Conglomerates - 0.5% | | | | | | | | |
| 3M Co. | | | 2,127 | | | | 379,818 | |
| Honeywell International, Inc. | | | 5,402 | | | | 625,822 | |
| | | | | | | | 1,005,640 | |
| Machinery - 2.0% | | | | | | | | |
| Caterpillar, Inc. | | | 2,880 | | | | 267,091 | |
| Cummins, Inc. | | | 100 | | | | 13,667 | |
| Deere & Co. | | | 33,774 | | | | 3,480,073 | |
Flowserve Corp. (a) | | | 530 | | | | 25,467 | |
| Fortive Corp. | | | 420 | | | | 22,525 | |
| Snap-on, Inc. | | | 809 | | | | 138,557 | |
| Toro Co. (The) | | | 6,960 | | | | 389,412 | |
| | | | | | | | 4,336,792 | |
Professional Services - 0.0% (c) | | | | | | | | |
| Nielsen Holdings plc | | | 20 | | | | 839 | |
| Robert Half International, Inc. | | | 530 | | | | 25,853 | |
| | | | | | | | 26,692 | |
| Road & Rail - 1.1% | | | | | | | | |
| Canadian Pacific Railway Ltd. | | | 13,425 | | | | 1,916,688 | |
Herc Holdings, Inc. (a) (b) | | | 8,740 | | | | 350,998 | |
| | | | | | | | 2,267,686 | |
| Trading Companies & Distributors - 0.1% | | | | | | | | |
MSC Industrial Direct Co., Inc. - Class A (a) | | | 1,505 | | | | 139,047 | |
| | | | | | | | | |
| Information Technology - 38.7% | | | | | | | | |
| Communications Equipment - 3.0% | | | | | | | | |
ARRIS International plc (b) | | | 1,925 | | | | 58,000 | |
| Cisco Systems, Inc. | | | 131,755 | | | | 3,981,636 | |
CommScope Holding Co., Inc. (b) | | | 3,668 | | | | 136,450 | |
| Motorola Solutions, Inc. | | | 6,441 | | | | 533,894 | |
Palo Alto Networks, Inc. (a) (b) | | | 14,075 | | | | 1,760,079 | |
| | | | | | | | 6,470,059 | |
WILSHIRE LARGE COMPANY GROWTH PORTFOLIO
SCHEDULE OF INVESTMENTS (Continued)
| COMMON STOCKS - 98.9% (Continued) | | Shares | | | Value | |
| Information Technology - 38.7% (Continued) | | | | | | |
| Electronic Equipment, Instruments & Components - 0.2% | | | | | | |
| National Instruments Corp. | | | 1,480 | | | $ | 45,614 | |
Trimble, Inc. (b) | | | 10,159 | | | | 306,293 | |
| | | | | | | | 351,907 | |
| Internet Software & Services - 10.8% | | | | | | | | |
Alibaba Group Holding Ltd. - ADR (a) (b) | | | 39,351 | | | | 3,455,411 | |
Alphabet, Inc. - Class A (b) | | | 4,261 | | | | 3,376,629 | |
Alphabet, Inc. - Class C (b) | | | 8,396 | | | | 6,480,201 | |
Facebook, Inc. - Class A (b) | | | 82,344 | | | | 9,473,678 | |
Twitter, Inc. (a) (b) | | | 8,825 | | | | 143,848 | |
Yelp, Inc. (a) (b) | | | 5,727 | | | | 218,371 | |
| | | | | | | | 23,148,138 | |
| IT Services - 7.6% | | | | | | | | |
| Accenture plc - Class A | | | 3,724 | | | | 436,192 | |
Alliance Data Systems Corp. (a) | | | 936 | | | | 213,876 | |
| Automatic Data Processing, Inc. | | | 11,027 | | | | 1,133,355 | |
| Booz Allen Hamilton Holding Corp. | | | 10,740 | | | | 387,392 | |
| Fidelity National Information Services, Inc. | | | 4,491 | | | | 339,699 | |
| International Business Machines Corp. | | | 10,159 | | | | 1,686,292 | |
| Jack Henry & Associates, Inc. | | | 6,028 | | | | 535,166 | |
| Mastercard, Inc. - Class A | | | 3,777 | | | | 389,975 | |
| Paychex, Inc. | | | 4,315 | | | | 262,697 | |
Sabre Corp. (a) | | | 74,935 | | | | 1,869,628 | |
Teradata Corp. (a) (b) | | | 33,590 | | | | 912,640 | |
Vantiv, Inc. - Class A (b) | | | 6,435 | | | | 383,655 | |
Visa, Inc. - Class A (a) | | | 91,744 | | | | 7,157,868 | |
Western Union Co. (The) (a) | | | 26,058 | | | | 565,980 | |
| | | | | | | | 16,274,415 | |
| Semiconductors & Semiconductor Equipment - 4.0% | | | | | | | | |
| Analog Devices, Inc. | | | 5,457 | | | | 396,287 | |
| Applied Materials, Inc. | | | 75,800 | | | | 2,446,066 | |
| Intel Corp. | | | 910 | | | | 33,006 | |
| KLA-Tencor Corp. | | | 780 | | | | 61,370 | |
| Linear Technology Corp. | | | 1,110 | | | | 69,209 | |
| Maxim Integrated Products, Inc. | | | 825 | | | | 31,820 | |
Qorvo, Inc. (b) | | | 1,815 | | | | 95,705 | |
WILSHIRE LARGE COMPANY GROWTH PORTFOLIO
SCHEDULE OF INVESTMENTS (Continued)
| COMMON STOCKS - 98.9% (Continued) | | Shares | | | Value | |
| Information Technology - 38.7% (Continued) | | | | | | |
| Semiconductors & Semiconductor Equipment - 4.0% (Continued) | | | | | | |
| QUALCOMM, Inc. | | | 73,245 | | | $ | 4,775,575 | |
| Skyworks Solutions, Inc. | | | 2,220 | | | | 165,745 | |
| Texas Instruments, Inc. | | | 4,255 | | | | 310,487 | |
| Xilinx, Inc. | | | 5,455 | | | | 329,318 | |
| | | | | | | | 8,714,588 | |
| Software - 9.7% | | | | | | | | |
Adobe Systems, Inc. (b) | | | 25,150 | | | | 2,589,192 | |
ANSYS, Inc. (b) | | | 430 | | | | 39,771 | |
Autodesk, Inc. (b) | | | 34,968 | | | | 2,587,982 | |
Cadence Design Systems, Inc. (b) | | | 685 | | | | 17,276 | |
| CDK Global, Inc. | | | 1,037 | | | | 61,899 | |
Citrix Systems, Inc. (b) | | | 3,569 | | | | 318,747 | |
| FactSet Research Systems, Inc. | | | 8,905 | | | | 1,455,344 | |
| Intuit, Inc. | | | 3,790 | | | | 434,372 | |
| Microsoft Corp. | | | 71,427 | | | | 4,438,473 | |
Nuance Communications, Inc. (b) | | | 16,195 | | | | 241,306 | |
| Oracle Corp. | | | 97,766 | | | | 3,759,102 | |
Red Hat, Inc. (b) | | | 24,175 | | | | 1,684,998 | |
salesforce.com, Inc. (b) | | | 34,400 | | | | 2,355,024 | |
| Symantec Corp. | | | 32,580 | | | | 778,336 | |
| | | | | | | | 20,761,822 | |
| Technology Hardware, Storage & Peripherals - 3.4% | | | | | | | | |
| Apple, Inc. | | | 62,992 | | | | 7,295,733 | |
| | | | | | | | | |
| Materials - 2.8% | | | | | | | | |
| Chemicals - 2.3% | | | | | | | | |
| Ashland Global Holdings, Inc. | | | 3,185 | | | | 348,089 | |
| Celanese Corp. - Series A | | | 960 | | | | 75,590 | |
| Eastman Chemical Co. | | | 2,515 | | | | 189,153 | |
| FMC Corp. | | | 3,865 | | | | 218,604 | |
GCP Applied Technologies, Inc. (b) | | | 2,620 | | | | 70,085 | |
| LyondellBasell Industries N.V. - Class A | | | 830 | | | | 71,197 | |
| Monsanto Co. | | | 7,911 | | | | 832,316 | |
| PPG Industries, Inc. | | | 1,930 | | | | 182,887 | |
| Praxair, Inc. | | | 3,545 | | | | 415,439 | |
WILSHIRE LARGE COMPANY GROWTH PORTFOLIO
SCHEDULE OF INVESTMENTS (Continued)
| COMMON STOCKS - 98.9% (Continued) | | Shares | | | Value | |
| Materials - 2.8% (Continued) | | | | | | |
| Chemicals - 2.3% (Continued) | | | | | | |
| Sherwin-Williams Co. (The) | | | 8,800 | | | $ | 2,364,912 | |
| W.R. Grace & Co. | | | 3,245 | | | | 219,492 | |
| | | | | | | | 4,987,764 | |
| Containers & Packaging - 0.2% | | | | | | | | |
| AptarGroup, Inc. | | | 715 | | | | 52,517 | |
| Bemis Co., Inc. | | | 100 | | | | 4,782 | |
International Paper Co. (a) | | | 5,850 | | | | 310,401 | |
| Sealed Air Corp. | | | 1,510 | | | | 68,463 | |
| | | | | | | | 436,163 | |
| Metals & Mining - 0.3% | | | | | | | | |
Freeport-McMoRan, Inc. (b) | | | 37,830 | | | | 498,978 | |
| | | | | | | | | |
| Real Estate - 1.4% | | | | | | | | |
| Equity Real Estate Investment Trusts (REITs) - 1.4% | | | | | | | | |
Care Capital Properties, Inc. (a) | | | 3,520 | | | | 88,000 | |
| CubeSmart | | | 1,520 | | | | 40,690 | |
| Equity LifeStyle Properties, Inc. | | | 2,405 | | | | 173,401 | |
| Federal Realty Investment Trust | | | 2,468 | | | | 350,727 | |
| Gaming and Leisure Properties, Inc. | | | 13,600 | | | | 416,432 | |
| Iron Mountain, Inc. | | | 1,215 | | | | 39,463 | |
Lamar Advertising Co. - Class A (a) | | | 8,034 | | | | 540,207 | |
| Mid-America Apartment Communities, Inc. | | | 2,581 | | | | 252,717 | |
Omega Healthcare Investors, Inc. (a) | | | 12,703 | | | | 397,096 | |
| Public Storage | | | 976 | | | | 218,136 | |
| Regency Centers Corp. | | | 4,800 | | | | 330,960 | |
| Simon Property Group, Inc. | | | 1,193 | | | | 211,960 | |
| Taubman Centers, Inc. | | | 595 | | | | 43,988 | |
| | | | | | | | 3,103,777 | |
| Telecommunication Services - 0.3% | | | | | | | | |
| Diversified Telecommunication Services - 0.3% | | | | | | | | |
| Verizon Communications, Inc. | | | 11,402 | | | | 608,639 | |
| | | | | | | | | |
Total Common Stocks (Cost $161,314,240) | | | $ | 212,295,406 | |
WILSHIRE LARGE COMPANY GROWTH PORTFOLIO
SCHEDULE OF INVESTMENTS (Continued)
| MONEY MARKET FUNDS - 4.6% | | Shares | | | Value | |
Northern Trust Institutional Government Select Portfolio - Institutional Class, 0.39% (d) | | | 2,111,500 | | | $ | 2,111,500 | |
Northern Trust Institutional Liquid Asset Portfolio - Institutional Class, 0.01% (d) (e) | | | 7,815,619 | | | | 7,815,619 | |
Total Money Market Funds (Cost $9,927,119) | | | $ | 9,927,119 | |
| | | | | | | | | |
Total Investments at Value - 103.5% (Cost $171,241,359) | | | $ | 222,222,525 | |
| | | | | | | | | |
| Liabilities in Excess of Other Assets - (3.5%) | | | | (7,421,091 | ) |
| | | | | | | | | |
| Net Assets - 100.0% | | | $ | 214,801,434 | |
ADR - American Depositary Receipt.
(a) | This security or a partial position of this security is on loan at December 31, 2016. The total market value of securities on loan at December 31, 2016 was $22,586,674. |
(b) | Non-income producing security. |
(c) | Percentage rounds to less than 0.1%. |
(d) | The rate shown is the 7-day effective yield as of December 31, 2016. |
(e) | This security was purchased with cash collateral held from securities on loan. The total value of such securities as of December 31, 2016 was $7,815,619. Securities on loan are also collateralized by various U.S. Treasury obligations in the amount of $15,374,737. |
See accompanying notes to financial statements.
WILSHIRE LARGE COMPANY VALUE PORTFOLIO
SCHEDULE OF INVESTMENTS
December 31, 2016
| COMMON STOCKS - 99.9% | | Shares | | | Value | |
| Consumer Discretionary - 7.7% | | | | | | |
| Auto Components - 0.4% | | | | | | |
Adient plc (a) | | | 11,581 | | | $ | 678,647 | |
| | | | | | | | | |
| Automobiles - 1.5% | | | | | | | | |
| Ford Motor Co. | | | 163,064 | | | | 1,977,966 | |
| General Motors Co. | | | 21,694 | | | | 755,819 | |
| | | | | | | | 2,733,785 | |
Distributors - 0.0% (b) | | | | | | | | |
| Genuine Parts Co. | | | 618 | | | | 59,044 | |
| | | | | | | | | |
| Hotels, Restaurants & Leisure - 0.9% | | | | | | | | |
| Choice Hotels International, Inc. | | | 2,500 | | | | 140,125 | |
| Hilton Worldwide Holdings, Inc. | | | 55,675 | | | | 1,514,360 | |
| | | | | | | | 1,654,485 | |
| Household Durables - 0.4% | | | | | | | | |
Garmin Ltd. (c) | | | 740 | | | | 35,883 | |
| Whirlpool Corp. | | | 4,200 | | | | 763,434 | |
| | | | | | | | 799,317 | |
| Internet & Direct Marketing Retail - 0.1% | | | | | | | | |
Liberty Expedia Holdings, Inc. - Series A (a) | | | 1,095 | | | | 43,439 | |
Liberty Ventures - Series A (a) | | | 1,643 | | | | 60,577 | |
| | | | | | | | 104,016 | |
| Leisure Products - 0.1% | | | | | | | | |
Mattel, Inc. (c) | | | 4,295 | | | | 118,327 | |
| | | | | | | | | |
| Media - 1.7% | | | | | | | | |
| Interpublic Group of Cos., Inc. (The) | | | 27,650 | | | | 647,287 | |
| John Wiley & Sons, Inc. - Class A | | | 390 | | | | 21,255 | |
Liberty Broadband Corp. - Series A (a) | | | 1,333 | | | | 96,589 | |
Liberty Broadband Corp. - Series C (a) | | | 1,780 | | | | 131,845 | |
| News Corp. - Class A | | | 74,565 | | | | 854,515 | |
| Omnicom Group, Inc. | | | 15,150 | | | | 1,289,416 | |
| TEGNA, Inc. | | | 450 | | | | 9,626 | |
| Viacom, Inc. - Class B | | | 3,930 | | | | 137,943 | |
| | | | | | | | 3,188,476 | |
WILSHIRE LARGE COMPANY VALUE PORTFOLIO
SCHEDULE OF INVESTMENTS (Continued)
| COMMON STOCKS - 99.9% (Continued) | | Shares | | | Value | |
| Consumer Discretionary - 7.7% (Continued) | | | | | | |
| Multi-Line Retail - 1.1% | | | | | | |
Kohl's Corp. (c) | | | 6,975 | | | $ | 344,426 | |
| Macy's, Inc. | | | 6,995 | | | | 250,491 | |
| Target Corp. | | | 21,174 | | | | 1,529,397 | |
| | | | | | | | 2,124,314 | |
| Specialty Retail - 1.3% | | | | | | | | |
| Bed Bath & Beyond, Inc. | | | 8,210 | | | | 333,654 | |
| Best Buy Co., Inc. | | | 540 | | | | 23,042 | |
Gap, Inc. (The) (c) | | | 39,220 | | | | 880,097 | |
Signet Jewelers Ltd. (c) | | | 210 | | | | 19,795 | |
| Staples, Inc. | | | 131,896 | | | | 1,193,658 | |
| | | | | | | | 2,450,246 | |
| Textiles, Apparel & Luxury Goods - 0.2% | | | | | | | | |
| Coach, Inc. | | | 3,460 | | | | 121,169 | |
Ralph Lauren Corp. (c) | | | 3,385 | | | | 305,733 | |
| | | | | | | | 426,902 | |
| Consumer Staples - 5.2% | | | | | | | | |
| Food & Staples Retailing - 2.1% | | | | | | | | |
| CVS Health Corp. | | | 6,825 | | | | 538,561 | |
| Wal-Mart Stores, Inc. | | | 44,940 | | | | 3,106,252 | |
| Whole Foods Market, Inc. | | | 8,080 | | | | 248,541 | |
| | | | | | | | 3,893,354 | |
| Food Products - 0.6% | | | | | | | | |
| Bunge Ltd. | | | 3,160 | | | | 228,278 | |
| Kellogg Co. | | | 10,941 | | | | 806,462 | |
| | | | | | | | 1,034,740 | |
| Household Products - 0.4% | | | | | | | | |
| Colgate-Palmolive Co. | | | 640 | | | | 41,882 | |
| Kimberly-Clark Corp. | | | 791 | | | | 90,269 | |
| Procter & Gamble Co. (The) | | | 6,282 | | | | 528,190 | |
| | | | | | | | 660,341 | |
Personal Products - 0.0% (b) | | | | | | | | |
Avon Products, Inc. (a) | | | 4,945 | | | | 24,923 | |
Edgewell Personal Care Co. (a) | | | 515 | | | | 37,589 | |
| Nu Skin Enterprises, Inc. - Class A | | | 510 | | | | 24,368 | |
| | | | | | | | 86,880 | |
WILSHIRE LARGE COMPANY VALUE PORTFOLIO
SCHEDULE OF INVESTMENTS (Continued)
| COMMON STOCKS - 99.9% (Continued) | | Shares | | | Value | |
| Consumer Staples - 5.2% (Continued) | | | | | | |
| Tobacco - 2.1% | | | | | | |
| Altria Group, Inc. | | | 28,100 | | | $ | 1,900,122 | |
| Philip Morris International, Inc. | | | 22,796 | | | | 2,085,606 | |
| | | | | | | | 3,985,728 | |
| Energy - 12.2% | | | | | | | | |
| Energy Equipment & Services - 0.9% | | | | | | | | |
| Baker Hughes, Inc. | | | 5,325 | | | | 345,965 | |
| Ensco plc - Class A | | | 8,344 | | | | 81,104 | |
FMC Technologies, Inc. (a) | | | 8,693 | | | | 308,862 | |
| Halliburton Co. | | | 12,025 | | | | 650,432 | |
| National Oilwell Varco, Inc. | | | 6,080 | | | | 227,635 | |
Rowan Cos. plc - Class A (a) | | | 2,803 | | | | 52,949 | |
| | | | | | | | 1,666,947 | |
| Oil, Gas & Consumable Fuels - 11.3% | | | | | | | | |
| Apache Corp. | | | 5,035 | | | | 319,571 | |
BP plc - ADR (c) | | | 76,603 | | | | 2,863,421 | |
Cenovus Energy, Inc. (c) | | | 40,800 | | | | 617,304 | |
| Chevron Corp. | | | 11,459 | | | | 1,348,724 | |
Cobalt International Energy, Inc. (a) | | | 8,601 | | | | 10,493 | |
| ConocoPhillips | | | 56,225 | | | | 2,819,122 | |
| Devon Energy Corp. | | | 2,985 | | | | 136,325 | |
| Exxon Mobil Corp. | | | 39,857 | | | | 3,597,494 | |
Gulfport Energy Corp. (a) | | | 2,583 | | | | 55,896 | |
| Hess Corp. | | | 4,395 | | | | 273,765 | |
HollyFrontier Corp. (c) | | | 8,480 | | | | 277,805 | |
| Kinder Morgan, Inc. | | | 7,440 | | | | 154,082 | |
| Marathon Oil Corp. | | | 14,955 | | | | 258,871 | |
| Marathon Petroleum Corp. | | | 1,115 | | | | 56,140 | |
Murphy Oil Corp. (c) | | | 31,895 | | | | 992,891 | |
| Noble Energy, Inc. | | | 3,485 | | | | 132,639 | |
| Occidental Petroleum Corp. | | | 24,900 | | | | 1,773,627 | |
PBF Energy, Inc. - Class A (c) | | | 23,100 | | | | 644,028 | |
| Phillips 66 | | | 16,400 | | | | 1,417,124 | |
Royal Dutch Shell plc - Class A - ADR (c) | | | 49,714 | | | | 2,703,447 | |
| Targa Resources Corp. | | | 5,085 | | | | 285,116 | |
| Valero Energy Corp. | | | 2,970 | | | | 202,910 | |
WILSHIRE LARGE COMPANY VALUE PORTFOLIO
SCHEDULE OF INVESTMENTS (Continued)
| COMMON STOCKS - 99.9% (Continued) | | Shares | | | Value | |
| Energy - 12.2% (Continued) | | | | | | |
| Oil, Gas & Consumable Fuels - 11.3% (Continued) | | | | | | |
| Williams Cos., Inc. (The) | | | 820 | | | $ | 25,535 | |
| | | | | | | | 20,966,330 | |
| Financials - 33.4% | | | | | | | | |
| Banks - 14.3% | | | | | | | | |
| Bank of America Corp. | | | 260,335 | | | | 5,753,404 | |
Bank of Hawaii Corp. (c) | | | 1,030 | | | | 91,351 | |
| CIT Group, Inc. | | | 17,737 | | | | 757,015 | |
| Citigroup, Inc. | | | 50,779 | | | | 3,017,796 | |
| Citizens Financial Group, Inc. | | | 19,675 | | | | 701,020 | |
| Comerica, Inc. | | | 12,350 | | | | 841,159 | |
| Commerce Bancshares, Inc. | | | 2,038 | | | | 117,820 | |
| Fifth Third Bancorp | | | 37,775 | | | | 1,018,792 | |
| Fulton Financial Corp. | | | 286 | | | | 5,377 | |
| JPMorgan Chase & Co. | | | 68,352 | | | | 5,898,094 | |
| KeyCorp | | | 45,975 | | | | 839,963 | |
| PacWest Bancorp | | | 180 | | | | 9,799 | |
People's United Financial, Inc. (c) | | | 13,647 | | | | 264,206 | |
| PNC Financial Services Group, Inc. (The) | | | 8,320 | | | | 973,107 | |
| Regions Financial Corp. | | | 73,875 | | | | 1,060,845 | |
| Synovus Financial Corp. | | | 9,380 | | | | 385,330 | |
| TCF Financial Corp. | | | 14,705 | | | | 288,071 | |
| U.S. Bancorp | | | 4,568 | | | | 234,658 | |
| Wells Fargo & Co. | | | 78,042 | | | | 4,300,895 | |
| | | | | | | | 26,558,702 | |
| Capital Markets - 6.7% | | | | | | | | |
| Ameriprise Financial, Inc. | | | 9,500 | | | | 1,053,930 | |
| Franklin Resources, Inc. | | | 37,545 | | | | 1,486,031 | |
| Goldman Sachs Group, Inc. (The) | | | 7,756 | | | | 1,857,174 | |
| Invesco Ltd. | | | 13,350 | | | | 405,039 | |
| Morgan Stanley | | | 46,535 | | | | 1,966,104 | |
| State Street Corp. | | | 50,435 | | | | 3,919,808 | |
UBS Group AG (c) | | | 88,375 | | | | 1,384,836 | |
Waddell & Reed Financial, Inc. - Class A (c) | | | 13,360 | | | | 260,654 | |
| | | | | | | | 12,333,576 | |
WILSHIRE LARGE COMPANY VALUE PORTFOLIO
SCHEDULE OF INVESTMENTS (Continued)
| COMMON STOCKS - 99.9% (Continued) | | Shares | | | Value | |
| Financials - 33.4% (Continued) | | | | | | |
| Consumer Finance - 1.8% | | | | | | |
| Ally Financial, Inc. | | | 2,770 | | | $ | 52,685 | |
| American Express Co. | | | 21,610 | | | | 1,600,869 | |
| Capital One Financial Corp. | | | 14,025 | | | | 1,223,541 | |
| Synchrony Financial | | | 12,599 | | | | 456,966 | |
| | | | | | | | 3,334,061 | |
| Diversified Financial Services - 1.5% | | | | | | | | |
Berkshire Hathaway, Inc. - Class B (a) | | | 2,824 | | | | 460,256 | |
| Leucadia National Corp. | | | 21,557 | | | | 501,200 | |
| Voya Financial, Inc. | | | 45,003 | | | | 1,765,017 | |
| | | | | | | | 2,726,473 | |
| Insurance - 8.2% | | | | | | | | |
| Aflac, Inc. | | | 180 | | | | 12,528 | |
| Allstate Corp. (The) | | | 9,175 | | | | 680,051 | |
| American Financial Group, Inc. | | | 2,131 | | | | 187,784 | |
| American International Group, Inc. | | | 31,698 | | | | 2,070,196 | |
American National Insurance Co. (c) | | | 735 | | | | 91,588 | |
| Aspen Insurance Holdings Ltd. | | | 5,701 | | | | 313,555 | |
| Assurant, Inc. | | | 1,295 | | | | 120,254 | |
| Assured Guaranty Ltd. | | | 7,101 | | | | 268,205 | |
| Axis Capital Holdings Ltd. | | | 18,350 | | | | 1,197,705 | |
| Chubb Ltd. | | | 766 | | | | 101,204 | |
| CNA Financial Corp. | | | 1,825 | | | | 75,738 | |
| Everest Re Group Ltd. | | | 180 | | | | 38,952 | |
Genworth Financial, Inc. - Class A (a) | | | 72,195 | | | | 275,063 | |
| Hanover Insurance Group, Inc. (The) | | | 7,800 | | | | 709,878 | |
| Lincoln National Corp. | | | 1,255 | | | | 83,169 | |
Loews Corp. (c) | | | 50,355 | | | | 2,358,124 | |
| Mercury General Corp. | | | 386 | | | | 23,241 | |
| MetLife, Inc. | | | 44,715 | | | | 2,409,690 | |
| Old Republic International Corp. | | | 2,818 | | | | 53,542 | |
| Principal Financial Group, Inc. | | | 350 | | | | 20,251 | |
| ProAssurance Corp. | | | 6,113 | | | | 343,551 | |
| Progressive Corp. (The) | | | 6,250 | | | | 221,875 | |
| Prudential Financial, Inc. | | | 4,595 | | | | 478,156 | |
| Validus Holdings Ltd. | | | 8,890 | | | | 489,039 | |
WILSHIRE LARGE COMPANY VALUE PORTFOLIO
SCHEDULE OF INVESTMENTS (Continued)
| COMMON STOCKS - 99.9% (Continued) | | Shares | | | Value | |
| Financials - 33.4% (Continued) | | | | | | |
| Insurance - 8.2% (Continued) | | | | | | |
| Willis Towers Watson plc | | | 2,843 | | | $ | 347,642 | |
| XL Group Ltd. | | | 60,973 | | | | 2,271,854 | |
| | | | | | | | 15,242,835 | |
| Mortgage Real Estate Investment Trusts (REITs) - 0.9% | | | | | | | | |
AGNC Investment Corp. (c) | | | 5,095 | | | | 92,372 | |
Annaly Capital Management, Inc. (c) | | | 53,960 | | | | 537,982 | |
| Chimera Investment Corp. | | | 19,669 | | | | 334,766 | |
| MFA Financial, Inc. | | | 42,207 | | | | 322,039 | |
| Starwood Property Trust, Inc. | | | 20,325 | | | | 446,134 | |
| | | | | | | | 1,733,293 | |
Thrifts & Mortgage Finance - 0.0% (b) | | | | | | | | |
| New York Community Bancorp, Inc. | | | 675 | | | | 10,739 | |
| | | | | | | | | |
| Health Care - 9.5% | | | | | | | | |
Biotechnology - 0.0% (b) | | | | | | | | |
United Therapeutics Corp. (a) (c) | | | 370 | | | | 53,069 | |
| | | | | | | | | |
| Health Care Equipment & Supplies - 1.6% | | | | | | | | |
| Abbott Laboratories | | | 24,723 | | | | 949,610 | |
| Baxter International, Inc. | | | 10,730 | | | | 475,768 | |
| Medtronic plc | | | 22,120 | | | | 1,575,608 | |
| | | | | | | | 3,000,986 | |
| Health Care Providers & Services - 1.1% | | | | | | | | |
Brookdale Senior Living, Inc. (a) | | | 280 | | | | 3,478 | |
| Cigna Corp. | | | 10,550 | | | | 1,407,264 | |
DaVita, Inc. (a) | | | 598 | | | | 38,392 | |
| McKesson Corp. | | | 2,450 | | | | 344,103 | |
Patterson Cos., Inc. (c) | | | 910 | | | | 37,337 | |
Premier, Inc. - Class A (a) (c) | | | 5,320 | | | | 161,515 | |
| | | | | | | | 1,992,089 | |
| Pharmaceuticals - 6.8% | | | | | | | | |
| Johnson & Johnson | | | 40,340 | | | | 4,647,571 | |
| Merck & Co., Inc. | | | 66,054 | | | | 3,888,599 | |
Perrigo Co. plc (c) | | | 1,490 | | | | 124,013 | |
WILSHIRE LARGE COMPANY VALUE PORTFOLIO
SCHEDULE OF INVESTMENTS (Continued)
| COMMON STOCKS - 99.9% (Continued) | | Shares | | | Value | |
| Health Care - 9.5% (Continued) | | | | | | |
| Pharmaceuticals - 6.8% (Continued) | | | | | | |
| Pfizer, Inc. | | | 118,177 | | | $ | 3,838,389 | |
| | | | | | | | 12,498,572 | |
| Industrials - 8.7% | | | | | | | | |
| Aerospace & Defense - 1.6% | | | | | | | | |
| Arconic, Inc. | | | 16,052 | | | | 297,604 | |
| L-3 Technologies, Inc. | | | 2,125 | | | | 323,234 | |
| Raytheon Co. | | | 5,600 | | | | 795,200 | |
| United Technologies Corp. | | | 13,495 | | | | 1,479,322 | |
| | | | | | | | 2,895,360 | |
| Airlines - 1.2% | | | | | | | | |
| American Airlines Group, Inc. | | | 7,350 | | | | 343,172 | |
| Delta Air Lines, Inc. | | | 190 | | | | 9,346 | |
JetBlue Airways Corp. (a) | | | 10,005 | | | | 224,312 | |
| Southwest Airlines Co. | | | 31,400 | | | | 1,564,976 | |
United Continental Holdings, Inc. (a) | | | 910 | | | | 66,321 | |
| | | | | | | | 2,208,127 | |
| Building Products - 0.6% | | | | | | | | |
| Johnson Controls International plc | | | 27,816 | | | | 1,145,741 | |
| | | | | | | | | |
| Commercial Services & Supplies - 0.1% | | | | | | | | |
Stericycle, Inc. (a) | | | 1,810 | | | | 139,442 | |
| | | | | | | | | |
| Construction & Engineering - 0.1% | | | | | | | | |
| Fluor Corp. | | | 2,870 | | | | 150,732 | |
| | | | | | | | | |
| Industrial Conglomerates - 0.8% | | | | | | | | |
| General Electric Co. | | | 12,396 | | | | 391,714 | |
| Honeywell International, Inc. | | | 9,700 | | | | 1,123,745 | |
| | | | | | | | 1,515,459 | |
| Machinery - 3.6% | | | | | | | | |
| Caterpillar, Inc. | | | 7,585 | | | | 703,433 | |
| Deere & Co. | | | 5,160 | | | | 531,686 | |
| Dover Corp. | | | 19,775 | | | | 1,481,741 | |
Flowserve Corp. (c) | | | 165 | | | | 7,928 | |
| Fortive Corp. | | | 696 | | | | 37,326 | |
WILSHIRE LARGE COMPANY VALUE PORTFOLIO
SCHEDULE OF INVESTMENTS (Continued)
| COMMON STOCKS - 99.9% (Continued) | | Shares | | | Value | |
| Industrials - 8.7% (Continued) | | | | | | |
| Machinery - 3.6% (Continued) | | | | | | |
| Ingersoll-Rand plc | | | 504 | | | $ | 37,820 | |
| Kennametal, Inc. | | | 2,806 | | | | 87,716 | |
| Parker-Hannifin Corp. | | | 12,150 | | | | 1,701,000 | |
| Stanley Black & Decker, Inc. | | | 19,125 | | | | 2,193,446 | |
| | | | | | | | 6,782,096 | |
| Road & Rail - 0.7% | | | | | | | | |
| Kansas City Southern | | | 942 | | | | 79,929 | |
| Norfolk Southern Corp. | | | 11,200 | | | | 1,210,384 | |
| | | | | | | | 1,290,313 | |
Trading Companies & Distributors - 0.0% (b) | | | | | | | | |
MSC Industrial Direct Co., Inc. - Class A (c) | | | 747 | | | | 69,015 | |
| | | | | | | | | |
| Information Technology - 11.1% | | | | | | | | |
| Communications Equipment - 1.2% | | | | | | | | |
ARRIS International plc (a) | | | 5,975 | | | | 180,027 | |
| Cisco Systems, Inc. | | | 59,511 | | | | 1,798,422 | |
| Juniper Networks, Inc. | | | 6,234 | | | | 176,173 | |
| Motorola Solutions, Inc. | | | 1,113 | | | | 92,257 | |
| | | | | | | | 2,246,879 | |
| Electronic Equipment, Instruments & Components - 0.4% | | | | | | | | |
| Avnet, Inc. | | | 250 | | | | 11,903 | |
| Corning, Inc. | | | 2,564 | | | | 62,228 | |
| TE Connectivity Ltd. | | | 10,325 | | | | 715,316 | |
Vishay Intertechnology, Inc. (c) | | | 4 | | | | 65 | |
| | | | | | | | 789,512 | |
| IT Services - 1.8% | | | | | | | | |
Cognizant Technology Solutions Corp. - Class A (a) | | | 10,550 | | | | 591,117 | |
| International Business Machines Corp. | | | 16,129 | | | | 2,677,252 | |
| | | | | | | | 3,268,369 | |
| Semiconductors & Semiconductor Equipment - 3.0% | | | | | | | | |
| Intel Corp. | | | 59,697 | | | | 2,165,210 | |
| Linear Technology Corp. | | | 3,310 | | | | 206,379 | |
| Marvell Technology Group Ltd. | | | 15,770 | | | | 218,730 | |
| QUALCOMM, Inc. | | | 43,706 | | | | 2,849,630 | |
WILSHIRE LARGE COMPANY VALUE PORTFOLIO
SCHEDULE OF INVESTMENTS (Continued)
| COMMON STOCKS - 99.9% (Continued) | | Shares | | | Value | |
| Information Technology - 11.1% (Continued) | | | | | | |
| Semiconductors & Semiconductor Equipment - 3.0% (Continued) | | | | | | |
| Teradyne, Inc. | | | 7,505 | | | $ | 190,627 | |
| | | | | | | | 5,630,576 | |
| Software - 2.5% | | | | | | | | |
| CA, Inc. | | | 1,259 | | | | 39,998 | |
| Microsoft Corp. | | | 15,973 | | | | 992,562 | |
| Oracle Corp. | | | 77,760 | | | | 2,989,873 | |
| Symantec Corp. | | | 25,836 | | | | 617,222 | |
| | | | | | | | 4,639,655 | |
| Technology Hardware, Storage & Peripherals - 2.2% | | | | | | | | |
| Apple, Inc. | | | 3,161 | | | | 366,107 | |
| Hewlett Packard Enterprise Co. | | | 59,860 | | | | 1,385,160 | |
| HP, Inc. | | | 28,535 | | | | 423,459 | |
| NetApp, Inc. | | | 15,105 | | | | 532,753 | |
Seagate Technology plc (c) | | | 18,050 | | | | 688,969 | |
| Western Digital Corp. | | | 8,850 | | | | 601,358 | |
| | | | | | | | 3,997,806 | |
| Materials - 3.6% | | | | | | | | |
| Chemicals - 2.0% | | | | | | | | |
| Ashland Global Holdings, Inc. | | | 962 | | | | 105,137 | |
| Celanese Corp. - Series A | | | 1,764 | | | | 138,897 | |
CF Industries Holdings, Inc. (c) | | | 9,250 | | | | 291,190 | |
| Dow Chemical Co. (The) | | | 8,200 | | | | 469,204 | |
| E.I. du Pont de Nemours and Co. | | | 20,400 | | | | 1,497,361 | |
| Eastman Chemical Co. | | | 3,545 | | | | 266,619 | |
| FMC Corp. | | | 4,080 | | | | 230,765 | |
GCP Applied Technologies, Inc. (a) | | | 10 | | | | 268 | |
| Mosaic Co. (The) | | | 18,055 | | | | 529,553 | |
| Praxair, Inc. | | | 1,160 | | | | 135,940 | |
| W.R. Grace & Co. | | | 10 | | | | 676 | |
| | | | | | | | 3,665,610 | |
| Containers & Packaging - 0.7% | | | | | | | | |
| AptarGroup, Inc. | | | 580 | | | | 42,601 | |
| Bemis Co., Inc. | | | 1,161 | | | | 55,519 | |
International Paper Co. (c) | | | 23,695 | | | | 1,257,257 | |
| | | | | | | | 1,355,377 | |
WILSHIRE LARGE COMPANY VALUE PORTFOLIO
SCHEDULE OF INVESTMENTS (Continued)
| COMMON STOCKS - 99.9% (Continued) | | Shares | | | Value | |
| Materials - 3.6% (Continued) | | | | | | |
| Metals & Mining - 0.9% | | | | | | |
Freeport-McMoRan, Inc. (a) | | | 16,985 | | | $ | 224,032 | |
| Newmont Mining Corp. | | | 16,650 | | | | 567,266 | |
| Reliance Steel & Aluminum Co. | | | 1,685 | | | | 134,025 | |
Rio Tinto plc - ADR (c) | | | 20,700 | | | | 796,122 | |
| | | | | | | | 1,721,445 | |
Paper & Forest Products - 0.0% (b) | | | | | | | | |
| Domtar Corp. | | | 40 | | | | 1,561 | |
| | | | | | | | | |
| Real Estate - 2.1% | | | | | | | | |
| Equity Real Estate Investment Trusts (REITs) - 2.1% | | | | | | | | |
| American Campus Communities, Inc. | | | 240 | | | | 11,945 | |
| Camden Property Trust | | | 1,345 | | | | 113,074 | |
| DDR Corp. | | | 25,025 | | | | 382,132 | |
Equity Commonwealth (a) | | | 6,110 | | | | 184,766 | |
| Equity Residential | | | 11,530 | | | | 742,071 | |
| Gaming and Leisure Properties, Inc. | | | 7,295 | | | | 223,373 | |
| HCP, Inc. | | | 3,435 | | | | 102,088 | |
| Host Hotels & Resorts, Inc. | | | 7,940 | | | | 149,590 | |
| Kimco Realty Corp. | | | 8,450 | | | | 212,602 | |
| Liberty Property Trust | | | 13,376 | | | | 528,352 | |
| Macerich Co. (The) | | | 5,730 | | | | 405,913 | |
| Mid-America Apartment Communities, Inc. | | | 1 | | | | 83 | |
| Omega Healthcare Investors, Inc. | | | 2,889 | | | | 90,310 | |
| Prologis, Inc. | | | 1,130 | | | | 59,653 | |
Quality Care Properties, Inc. (a) | | | 687 | | | | 10,649 | |
| Regency Centers Corp. | | | 2,499 | | | | 172,306 | |
| Spirit Realty Capital, Inc. | | | 1,135 | | | | 12,326 | |
| VEREIT, Inc. | | | 9,580 | | | | 81,047 | |
| W.P. Carey, Inc. | | | 4,205 | | | | 248,473 | |
| Weyerhaeuser Co. | | | 2,054 | | | | 61,805 | |
| | | | | | | | 3,792,558 | |
| Telecommunication Services - 2.6% | | | | | | | | |
| Diversified Telecommunication Services - 2.6% | | | | | | | | |
| AT&T, Inc. | | | 66,676 | | | | 2,835,730 | |
| CenturyLink, Inc. | | | 10,078 | | | | 239,655 | |
WILSHIRE LARGE COMPANY VALUE PORTFOLIO
SCHEDULE OF INVESTMENTS (Continued)
| COMMON STOCKS - 99.9% (Continued) | | Shares | | | Value | |
| Telecommunication Services - 2.6% (Continued) | | | | | | |
| Diversified Telecommunication Services - 2.6% (Continued) | | | | | | |
| Verizon Communications, Inc. | | | 34,050 | | | $ | 1,817,589 | |
| | | | | | | | 4,892,974 | |
| Utilities - 3.8% | | | | | | | | |
| Electric Utilities - 3.1% | | | | | | | | |
| Duke Energy Corp. | | | 2,359 | | | | 183,106 | |
| Edison International | | | 12,750 | | | | 917,872 | |
| Entergy Corp. | | | 38,263 | | | | 2,811,182 | |
| Eversource Energy | | | 1,235 | | | | 68,209 | |
| Exelon Corp. | | | 14,569 | | | | 517,054 | |
| FirstEnergy Corp. | | | 22,115 | | | | 684,901 | |
| PPL Corp. | | | 2,040 | | | | 69,462 | |
| Southern Co. (The) | | | 10,545 | | | | 518,709 | |
| | | | | | | | 5,770,495 | |
| Independent Power and Renewable Electricity Producers - 0.3% | | | | | | | | |
| AES Corp. | | | 1,350 | | | | 15,687 | |
Calpine Corp. (a) | | | 41,000 | | | | 468,630 | |
| | | | | | | | 484,317 | |
| Multi-Utilities - 0.3% | | | | | | | | |
| CenterPoint Energy, Inc. | | | 11,928 | | | | 293,905 | |
| Dominion Resources, Inc. | | | 2,805 | | | | 214,835 | |
| DTE Energy Co. | | | 1,017 | | | | 100,185 | |
| Public Service Enterprise Group, Inc. | | | 720 | | | | 31,594 | |
| | | | | | | | 640,519 | |
| Water Utilities - 0.1% | | | | | | | | |
| Aqua America, Inc. | | | 5,840 | | | | 175,434 | |
| | | | | | | | | |
Total Common Stocks (Cost $155,149,455) | | | $ | 185,385,646 | |
WILSHIRE LARGE COMPANY VALUE PORTFOLIO
SCHEDULE OF INVESTMENTS (Continued)
RIGHTS - 0.0% (b) | | Shares | | | Value | |
| Safeway CVR - Casa Ley | | | 1,118 | | | $ | 1,134 | |
| Safeway CVR - PDC | | | 1,118 | | | | 55 | |
Total Rights (Cost $0) | | | $ | 1,189 | |
| MONEY MARKET FUNDS – 2.5% | | Shares | | | Value | |
Northern Trust Institutional Government Select Portfolio - Institutional Class, 0.39% (d) | | | 9,805 | | | $ | 9,805 | |
Northern Trust Institutional Liquid Asset Portfolio - Institutional Class, 0.01% (d) (e) | | | 4,729,193 | | | | 4,729,193 | |
Total Money Market Funds (Cost $4,738,998) | | | $ | 4,738,998 | |
| | | | | | | | | |
Total Investments at Value – 102.4% (Cost $159,888,453) | | | $ | 190,125,833 | |
| | | | | | | | | |
| Liabilities in Excess of Other Assets - (2.4%) | | | | (4,517,574 | ) |
| | | | | | | | | |
| Net Assets - 100.0% | | | $ | 185,608,259 | |
ADR - American Depositary Receipt.
CVR - Contingent Value Right.
(a) | Non-income producing security. |
(b) | Percentage rounds to less than 0.1%. |
(c) | This security or a partial position of this security is on loan at December 31, 2016. The total market value of securities on loan at December 31, 2016 was $14,358,569. |
(d) | The rate shown is the 7-day effective yield as of December 31, 2016. |
(e) | This security was purchased with cash collateral held from securities on loan. The total value of such securities as of December 31, 2016 was $4,729,193. Securities on loan are also collateralized by various U.S. Treasury obligations in the amount of $9,915,530. |
See accompanying notes to financial statements.
WILSHIRE SMALL COMPANY GROWTH PORTFOLIO
SCHEDULE OF INVESTMENTS
December 31, 2016
| COMMON STOCKS - 97.2% | | Shares | | | Value | |
| Consumer Discretionary - 16.4% | | | | | | |
| Auto Components - 4.1% | | | | | | |
American Axle & Manufacturing Holdings, Inc. (a) | | | 9,180 | | | $ | 177,174 | |
Cooper-Standard Holdings, Inc. (a) | | | 410 | | | | 42,386 | |
Dorman Products, Inc. (a) | | | 6,370 | | | | 465,392 | |
Drew Industries, Inc. (a) | | | 4,060 | | | | 437,465 | |
Gentherm, Inc. (a) | | | 1,205 | | | | 40,789 | |
| Standard Motor Products, Inc. | | | 1,840 | | | | 97,925 | |
Stoneridge, Inc. (a) | | | 6,490 | | | | 114,808 | |
Tenneco, Inc. (a) | | | 2,180 | | | | 136,185 | |
| | | | | | | | 1,512,124 | |
| Diversified Consumer Services - 0.3% | | | | | | | | |
| Capella Education Co. | | | 515 | | | | 45,216 | |
Grand Canyon Education, Inc. (a) | | | 679 | | | | 39,688 | |
Liberty Tax, Inc. (b) | | | 1,930 | | | | 25,862 | |
Strayer Education, Inc. (a) | | | 60 | | | | 4,838 | |
| | | | | | | | 115,604 | |
| Hotels, Restaurants & Leisure - 5.1% | | | | | | | | |
BJ's Restaurants, Inc. (a) | | | 1,730 | | | | 67,989 | |
| Bloomin' Brands, Inc. | | | 560 | | | | 10,097 | |
| Bob Evans Farms, Inc. | | | 2,565 | | | | 136,484 | |
Boyd Gaming Corp. (a) | | | 540 | | | | 10,892 | |
| Cheesecake Factory, Inc. (The) | | | 711 | | | | 42,575 | |
Chuy's Holdings, Inc. (a) | | | 10,242 | | | | 332,352 | |
| ClubCorp Holdings, Inc. | | | 185 | | | | 2,655 | |
Dave & Buster's Entertainment, Inc. (a) | | | 640 | | | | 36,032 | |
Denny's Corp. (a) | | | 5,985 | | | | 76,788 | |
Fiesta Restaurant Group, Inc. (a) | | | 60 | | | | 1,791 | |
| Jack in the Box, Inc. | | | 95 | | | | 10,606 | |
Lindblad Expeditions Holdings, Inc. (a) (b) | | | 2,340 | | | | 22,113 | |
Monarch Casino & Resort, Inc. (a) | | | 5 | | | | 129 | |
Penn National Gaming, Inc. (a) | | | 11,640 | | | | 160,516 | |
Pinnacle Entertainment, Inc. (a) (b) | | | 1,710 | | | | 24,795 | |
Popeyes Louisiana Kitchen, Inc. (a) | | | 7,453 | | | | 450,756 | |
Potbelly Corp. (a) (b) | | | 590 | | | | 7,611 | |
Red Robin Gourmet Burgers, Inc. (a) | | | 259 | | | | 14,608 | |
WILSHIRE SMALL COMPANY GROWTH PORTFOLIO
SCHEDULE OF INVESTMENTS (Continued)
| COMMON STOCKS - 97.2% (Continued) | | Shares | | | Value | |
| Consumer Discretionary - 16.4% (Continued) | | | | | | |
| Hotels, Restaurants & Leisure - 5.1% (Continued) | | | | | | |
Sonic Corp. (b) | | | 18,892 | | | $ | 500,826 | |
| | | | | | | | 1,909,615 | |
| Household Durables - 1.1% | | | | | | | | |
Century Communities, Inc. (a) | | | 450 | | | | 9,450 | |
Installed Building Products, Inc. (a) | | | 330 | | | | 13,629 | |
| La-Z-Boy, Inc. | | | 1,085 | | | | 33,689 | |
M/I Homes, Inc. (a) | | | 1,590 | | | | 40,036 | |
| MDC Holdings, Inc. | | | 4,599 | | | | 118,010 | |
Meritage Homes Corp. (a) | | | 80 | | | | 2,784 | |
Taylor Morrison Home Corp. - Class A (a) | | | 8,146 | | | | 156,893 | |
TRI Pointe Group, Inc. (a) | | | 3,190 | | | | 36,621 | |
| | | | | | | | 411,112 | |
| Internet & Direct Marketing Retail - 0.2% | | | | | | | | |
| HSN, Inc. | | | 1,940 | | | | 66,542 | |
| | | | | | | | | |
| Leisure Products - 0.2% | | | | | | | | |
Malibu Boats, Inc. - Class A (a) | | | 1,375 | | | | 26,235 | |
Marine Products Corp. (b) | | | 940 | | | | 13,038 | |
| MCBC Holdings, Inc. | | | 840 | | | | 12,247 | |
Smith & Wesson Holding Corp. (a) (b) | | | 10 | | | | 211 | |
Sturm, Ruger & Co., Inc. (b) | | | 330 | | | | 17,391 | |
| | | | | | | | 69,122 | |
| Media - 0.1% | | | | | | | | |
| Entravision Communications Corp. - Class A | | | 1,040 | | | | 7,280 | |
| New Media Investment Group, Inc. | | | 660 | | | | 10,553 | |
| New York Times Co. (The) - Class A | | | 2,715 | | | | 36,110 | |
| | | | | | | | 53,943 | |
| Specialty Retail - 2.4% | | | | | | | | |
American Eagle Outfitters, Inc. (b) | | | 4,960 | | | | 75,243 | |
Big 5 Sporting Goods Corp. (b) | | | 70 | | | | 1,215 | |
| Chico's FAS, Inc. | | | 11,885 | | | | 171,024 | |
| Finish Line, Inc. (The) - Class A | | | 76 | | | | 1,430 | |
Francesca's Holdings Corp. (a) | | | 4,760 | | | | 85,822 | |
| GNC Holdings, Inc. - Class A | | | 740 | | | | 8,170 | |
Kirkland's, Inc. (a) | | | 1,120 | | | | 17,371 | |
WILSHIRE SMALL COMPANY GROWTH PORTFOLIO
SCHEDULE OF INVESTMENTS (Continued)
| COMMON STOCKS - 97.2% (Continued) | | Shares | | | Value | |
| Consumer Discretionary - 16.4% (Continued) | | | | | | |
| Specialty Retail - 2.4% (Continued) | | | | | | |
Monro Muffler Brake, Inc. (b) | | | 6,300 | | | $ | 360,359 | |
| Office Depot, Inc. | | | 105 | | | | 475 | |
| Pier 1 Imports, Inc. | | | 5,625 | | | | 48,038 | |
Sportman's Warehouse Holdings, Inc. (a) (b) | | | 550 | | | | 5,165 | |
| Stein Mart, Inc. | | | 470 | | | | 2,576 | |
Tile Shop Holdings, Inc. (a) | | | 1,695 | | | | 33,137 | |
Vitamin Shoppe, Inc. (a) | | | 550 | | | | 13,063 | |
| Winmark Corp. | | | 465 | | | | 58,660 | |
| | | | | | | | 881,748 | |
| Textiles, Apparel & Luxury Goods - 2.9% | | | | | | | | |
| Columbia Sportswear Co. | | | 225 | | | | 13,118 | |
Crocs, Inc. (a) | | | 9,545 | | | | 65,479 | |
| Culp, Inc. | | | 435 | | | | 16,160 | |
G-III Apparel Group Ltd. (a) (b) | | | 10,692 | | | | 316,056 | |
| Oxford Industries, Inc. | | | 100 | | | | 6,013 | |
Steven Madden Ltd. (a) | | | 16,300 | | | | 582,724 | |
Vera Bradley, Inc. (a) | | | 5,020 | | | | 58,834 | |
| | | | | | | | 1,058,384 | |
| Consumer Staples - 5.0% | | | | | | | | |
Food & Staples Retailing - 0.0% (c) | | | | | | | | |
PriceSmart, Inc. (b) | | | 70 | | | | 5,845 | |
| | | | | | | | | |
| Food Products - 3.4% | | | | | | | | |
| Alico, Inc. | | | 100 | | | | 2,715 | |
B&G Foods, Inc. (b) | | | 10,140 | | | | 444,132 | |
Calavo Growers, Inc. (b) | | | 5,280 | | | | 324,192 | |
Darling Ingredients, Inc. (a) | | | 585 | | | | 7,552 | |
Dean Foods Co. (b) | | | 1,850 | | | | 40,293 | |
| J & J Snack Foods Corp. | | | 2,225 | | | | 296,882 | |
| Lancaster Colony Corp. | | | 922 | | | | 130,362 | |
Lifeway Foods, Inc. (a) | | | 10 | | | | 115 | |
Omega Protein Corp. (a) | | | 420 | | | | 10,521 | |
| | | | | | | | 1,256,764 | |
| Household Products - 0.2% | | | | | | | | |
Orchids Paper Products Co. (b) | | | 15 | | | | 393 | |
WILSHIRE SMALL COMPANY GROWTH PORTFOLIO
SCHEDULE OF INVESTMENTS (Continued)
| COMMON STOCKS - 97.2% (Continued) | | Shares | | | Value | |
| Consumer Staples - 5.0% (Continued) | | | | | | |
| Household Products - 0.2% (Continued) | | | | | | |
| WD-40 Co. | | | 485 | | | $ | 56,696 | |
| | | | | | | | 57,089 | |
| Personal Products - 1.4% | | | | | | | | |
Avon Products, Inc. (a) | | | 17,395 | | | | 87,671 | |
| Inter Parfums, Inc. | | | 9,765 | | | | 319,803 | |
| Medifast, Inc. | | | 2,920 | | | | 121,560 | |
Revlon, Inc. - Class A (a) | | | 135 | | | | 3,935 | |
| | | | | | | | 532,969 | |
| Energy - 3.3% | | | | | | | | |
| Energy Equipment & Services - 0.1% | | | | | | | | |
PHI, Inc. - Non-Voting (a) | | | 310 | | | | 5,586 | |
RigNet, Inc. (a) (b) | | | 1,610 | | | | 37,272 | |
TETRA Technologies, Inc. (a) | | | 670 | | | | 3,363 | |
| | | | | | | | 46,221 | |
| Oil, Gas & Consumable Fuels - 3.2% | | | | | | | | |
| Adams Resources & Energy, Inc. | | | 40 | | | | 1,586 | |
Callon Petroleum Co. (a) | | | 14,140 | | | | 217,332 | |
Matador Resources Co. (a) (b) | | | 9,060 | | | | 233,386 | |
Oasis Petroleum, Inc. (a) | | | 31,539 | | | | 477,500 | |
PDC Energy, Inc. (a) | | | 3,130 | | | | 227,175 | |
Renewable Energy Group, Inc. (a) (b) | | | 840 | | | | 8,148 | |
| | | | | | | | 1,165,127 | |
| Financials - 9.7% | | | | | | | | |
| Banks - 7.1% | | | | | | | | |
Banc of California, Inc. (b) | | | 2,460 | | | | 42,681 | |
| CenterState Banks, Inc. | | | 11,750 | | | | 295,748 | |
County Bancorp, Inc. (b) | | | 710 | | | | 19,149 | |
Eagle Bancorp, Inc. (a) | | | 150 | | | | 9,143 | |
| Home BancShares, Inc. | | | 1,161 | | | | 32,241 | |
| LegacyTexas Financial Group, Inc. | | | 5,480 | | | | 235,969 | |
| National Bank Holdings Corp. - Class A | | | 5,150 | | | | 164,234 | |
| Opus Bank | | | 2,580 | | | | 77,529 | |
| Pinnacle Financial Partners, Inc. | | | 6,680 | | | | 462,923 | |
| PrivateBancorp, Inc. | | | 6,415 | | | | 347,628 | |
| South State Corp. | | | 7,460 | | | | 652,003 | |
WILSHIRE SMALL COMPANY GROWTH PORTFOLIO
SCHEDULE OF INVESTMENTS (Continued)
| COMMON STOCKS - 97.2% (Continued) | | Shares | | | Value | |
| Financials - 9.7% (Continued) | | | | | | |
| Banks - 7.1% (Continued) | | | | | | |
Texas Capital Bancshares, Inc. (a) | | | 3,890 | | | $ | 304,976 | |
| | | | | | | | 2,644,224 | |
| Capital Markets - 1.6% | | | | | | | | |
Associated Capital Group, Inc. - Class A (b) | | | 80 | | | | 2,628 | |
Cohen & Steers, Inc. (b) | | | 610 | | | | 20,496 | |
| Evercore Partners, Inc. - Class A | | | 1,758 | | | | 120,775 | |
| GAMCO Investors, Inc. - Class A | | | 290 | | | | 8,958 | |
| Greenhill & Co., Inc. | | | 5,541 | | | | 153,486 | |
Marcus & Millichap, Inc. (a) | | | 310 | | | | 8,283 | |
| Moelis & Co. - Class A | | | 4,710 | | | | 159,669 | |
| Pzena Investment Management, Inc. - Class A | | | 3,898 | | | | 43,307 | |
| Virtus Investment Partners, Inc. | | | 80 | | | | 9,444 | |
Waddell & Reed Financial, Inc. - Class A (b) | | | 2,720 | | | | 53,067 | |
| | | | | | | | 580,113 | |
| Consumer Finance - 0.2% | | | | | | | | |
| FirstCash, Inc. | | | 1,622 | | | | 76,234 | |
Regional Management Corp. (a) | | | 310 | | | | 8,147 | |
| | | | | | | | 84,381 | |
Diversified Financial Services - 0.0% (c) | | | | | | | | |
| GAIN Capital Holdings, Inc. | | | 2,160 | | | | 14,213 | |
| | | | | | | | | |
| Insurance - 0.3% | | | | | | | | |
Atlas Financial Holdings, Inc. (a) | | | 420 | | | | 7,581 | |
Hallmark Financial Services, Inc. (a) | | | 85 | | | | 989 | |
| State National Cos., Inc. | | | 900 | | | | 12,474 | |
Third Point Reinsurance Ltd. (a) | | | 1,745 | | | | 20,155 | |
| United Insurance Holdings Corp. | | | 3,291 | | | | 49,825 | |
| | | | | | | | 91,024 | |
| Thrifts & Mortgage Finance - 0.5% | | | | | | | | |
Essent Group Ltd. (a) | | | 3,040 | | | | 98,404 | |
| Meridian Bancorp, Inc. | | | 2,745 | | | | 51,881 | |
| Northfield Bancorp, Inc. | | | 1,440 | | | | 28,757 | |
| | | | | | | | 179,042 | |
WILSHIRE SMALL COMPANY GROWTH PORTFOLIO
SCHEDULE OF INVESTMENTS (Continued)
| COMMON STOCKS - 97.2% (Continued) | | Shares | | | Value | |
| Health Care - 21.6% | | | | | | |
| Biotechnology - 4.2% | | | | | | |
Acorda Therapeutics, Inc. (a) (b) | | | 895 | | | $ | 16,826 | |
AMAG Pharmaceuticals, Inc. (a) (b) | | | 825 | | | | 28,710 | |
Applied Genetic Technologies Corp. (a) | | | 1,770 | | | | 16,550 | |
BioSpecifics Technologies Corp. (a) | | | 475 | | | | 26,458 | |
Chimerix, Inc. (a) | | | 4,195 | | | | 19,297 | |
Cytokinetics, Inc. (a) (b) | | | 1,040 | | | | 12,636 | |
Dynavax Technologies Corp. (a) (b) | | | 765 | | | | 3,022 | |
Eagle Pharmaceuticals, Inc. (a) (b) | | | 4,630 | | | | 367,344 | |
Emergent BioSolutions, Inc. (a) | | | 2,810 | | | | 92,280 | |
Five Prime Therapeutics, Inc. (a) | | | 1,660 | | | | 83,183 | |
Genomic Health, Inc. (a) | | | 1,180 | | | | 34,680 | |
ImmunoGen, Inc. (a) (b) | | | 9,055 | | | | 18,472 | |
Infinity Pharmaceuticals, Inc. (a) (b) | | | 3,250 | | | | 4,388 | |
Ironwood Pharmaceuticals, Inc. (a) (b) | | | 285 | | | | 4,358 | |
Ligand Pharmaceuticals, Inc. (a) (b) | | | 510 | | | | 51,821 | |
MacroGenics, Inc. (a) (b) | | | 275 | | | | 5,621 | |
Mirati Therapeutics, Inc. (a) (b) | | | 100 | | | | 475 | |
Momenta Pharmaceuticals, Inc. (a) | | | 1,990 | | | | 29,950 | |
Myriad Genetics, Inc. (a) (b) | | | 8,203 | | | | 136,744 | |
NewLink Genetics Corp. (a) (b) | | | 1,015 | | | | 10,434 | |
Ophthotech Corp. (a) (b) | | | 30 | | | | 145 | |
Progenics Pharmaceuticals, Inc. (a) (b) | | | 1,985 | | | | 17,150 | |
Repligen Corp. (a) | | | 16,095 | | | | 496,047 | |
SciClone Pharmaceuticals, Inc. (a) | | | 4,638 | | | | 50,090 | |
Spectrum Pharmaceuticals, Inc. (a) | | | 100 | | | | 443 | |
TESARO, Inc. (a) (b) | | | 60 | | | | 8,069 | |
Vanda Pharmaceuticals, Inc. (a) | | | 2,140 | | | | 34,133 | |
| | | | | | | | 1,569,326 | |
| Health Care Equipment & Supplies - 4.6% | | | | | | | | |
Anika Therapeutics, Inc. (a) | | | 760 | | | | 37,210 | |
| Cantel Medical Corp. | | | 4,560 | | | | 359,100 | |
Cardiovascular Systems, Inc. (a) | | | 240 | | | | 5,810 | |
Cynosure, Inc. - Class A (a) | | | 189 | | | | 8,618 | |
Globus Medical, Inc. - Class A (a) | | | 4,040 | | | | 100,232 | |
Inogen, Inc. (a) | | | 870 | | | | 58,438 | |
WILSHIRE SMALL COMPANY GROWTH PORTFOLIO
SCHEDULE OF INVESTMENTS (Continued)
| COMMON STOCKS - 97.2% (Continued) | | Shares | | | Value | |
| Health Care - 21.6% (Continued) | | | | | | |
| Health Care Equipment & Supplies - 4.6% (Continued) | | | | | | |
Masimo Corp. (a) | | | 975 | | | $ | 65,715 | |
Meridian Bioscience, Inc. (b) | | | 4,965 | | | | 87,881 | |
Natus Medical, Inc. (a) | | | 1,124 | | | | 39,115 | |
Neogen Corp. (a) | | | 6,470 | | | | 427,020 | |
OraSure Technologies, Inc. (a) | | | 1,935 | | | | 16,989 | |
Orthofix International N.V. (a) | | | 570 | | | | 20,623 | |
Surmodics, Inc. (a) | | | 330 | | | | 8,382 | |
Tandem Diabetes Care, Inc. (a) (b) | | | 4,770 | | | | 10,256 | |
Vascular Solutions, Inc. (a) | | | 7,920 | | | | 444,312 | |
| | | | | | | | 1,689,701 | |
| Health Care Providers & Services - 2.2% | | | | | | | | |
Aceto Corp. (b) | | | 10,150 | | | | 222,995 | |
Addus HomeCare Corp. (a) | | | 45 | | | | 1,577 | |
Adeptus Health, Inc. - Class A (a) (b) | | | 435 | | | | 3,323 | |
Air Methods Corp. (a) (b) | | | 350 | | | | 11,148 | |
Amedisys, Inc. (a) | | | 375 | | | | 15,986 | |
AMN Healthcare Services, Inc. (a) | | | 740 | | | | 28,453 | |
BioTelemetry, Inc. (a) | | | 2,185 | | | | 48,835 | |
Capital Senior Living Corp. (a) | | | 1,079 | | | | 17,318 | |
| Chemed Corp. | | | 510 | | | | 81,809 | |
CorVel Corp. (a) | | | 2,609 | | | | 95,489 | |
Cross Country Healthcare, Inc. (a) | | | 615 | | | | 9,600 | |
HealthSouth Corp. (b) | | | 944 | | | | 38,931 | |
HMS Holdings Corp, (a) | | | 3,180 | | | | 57,749 | |
Landauer, Inc. (b) | | | 820 | | | | 39,442 | |
Magellan Health, Inc. (a) | | | 120 | | | | 9,030 | |
| Owens & Minor, Inc. | | | 310 | | | | 10,940 | |
Providence Service Corp. (The) (a) | | | 1,690 | | | | 64,305 | |
| U.S. Physical Therapy, Inc. | | | 920 | | | | 64,584 | |
| | | | | | | | 821,514 | |
| Health Care Technology - 2.6% | | | | | | | | |
Cotiviti Holdings, Inc. (a) (b) | | | 13,080 | | | | 449,951 | |
Medidata Solutions, Inc. (a) | | | 7,770 | | | | 385,936 | |
| Quality Systems, Inc. | | | 2,990 | | | | 39,319 | |
WILSHIRE SMALL COMPANY GROWTH PORTFOLIO
SCHEDULE OF INVESTMENTS (Continued)
| COMMON STOCKS - 97.2% (Continued) | | Shares | | | Value | |
| Health Care - 21.6% (Continued) | | | | | | |
| Health Care Technology - 2.6% (Continued) | | | | | | |
Vocera Communications, Inc. (a) | | | 4,655 | | | $ | 86,071 | |
| | | | | | | | 961,277 | |
| Life Sciences Tools & Services - 4.7% | | | | | | | | |
Cambrex Corp. (a) | | | 10,945 | | | | 590,483 | |
Enzo Biochem, Inc. (a) | | | 295 | | | | 2,047 | |
ICON plc (a) | | | 5,520 | | | | 415,104 | |
INC Research Holdings, Inc. - Class A (a) | | | 763 | | | | 40,134 | |
PAREXEL International Corp. (a) (b) | | | 49 | | | | 3,220 | |
PRA Health Sciences, Inc. (a) | | | 12,925 | | | | 712,427 | |
| | | | | | | | 1,763,415 | |
| Pharmaceuticals - 3.3% | | | | | | | | |
Amphastar Pharmaceuticals, Inc. (a) | | | 525 | | | | 9,671 | |
Impax Laboratories, Inc. (a) | | | 3,025 | | | | 40,081 | |
| Phibro Animal Health Corp. - Class A | | | 2,840 | | | | 83,212 | |
Prestige Brands Holdings, Inc. (a) | | | 9,134 | | | | 475,881 | |
Sucampo Pharmaceuticals, Inc. - Class A (a) (b) | | | 2,150 | | | | 29,133 | |
Supernus Pharmaceuticals, Inc. (a) | | | 23,270 | | | | 587,567 | |
| | | | | | | | 1,225,545 | |
| Industrials - 13.7% | | | | | | | | |
| Aerospace & Defense - 0.1% | | | | | | | | |
Aerojet Rocketdyne Holdings, Inc. (a) | | | 1,655 | | | | 29,707 | |
Vectrus, Inc. (a) | | | 730 | | | | 17,411 | |
| | | | | | | | 47,118 | |
| Air Freight & Logistics - 0.2% | | | | | | | | |
| Forward Air Corp. | | | 1,440 | | | | 68,227 | |
| | | | | | | | | |
| Airlines - 0.2% | | | | | | | | |
| Allegiant Travel Co. | | | 100 | | | | 16,640 | |
Hawaiian Holdings, Inc. (a) | | | 1,240 | | | | 70,680 | |
| | | | | | | | 87,320 | |
| Building Products - 0.9% | | | | | | | | |
American Woodmark Corp. (a) | | | 90 | | | | 6,773 | |
| Apogee Enterprises, Inc. | | | 100 | | | | 5,356 | |
Continental Building Products, Inc. (a) | | | 100 | | | | 2,310 | |
| Insteel Industries, Inc. | | | 1,475 | | | | 52,569 | |
WILSHIRE SMALL COMPANY GROWTH PORTFOLIO
SCHEDULE OF INVESTMENTS (Continued)
| COMMON STOCKS - 97.2% (Continued) | | Shares | | | Value | |
| Industrials - 13.7% (Continued) | | | | | | |
| Building Products - 0.9% (Continued) | | | | | | |
NCI Building Systems, Inc. (a) | | | 96 | | | $ | 1,502 | |
PGT Innovations, Inc. (a) | | | 615 | | | | 7,042 | |
Ply Gem Holdings, Inc. (a) | | | 1,920 | | | | 31,200 | |
| Simpson Manufacturing Co., Inc. | | | 4,065 | | | | 177,843 | |
Trex Co., Inc. (a) | | | 355 | | | | 22,862 | |
| Universal Forest Products, Inc. | | | 170 | | | | 17,371 | |
| | | | | | | | 324,828 | |
| Commercial Services & Supplies - 3.1% | | | | | | | | |
ARC Document Solutions, Inc. (a) | | | 2,535 | | | | 12,878 | |
| Brady Corp. - Class A | | | 4,565 | | | | 171,416 | |
| Brink's Co. (The) | | | 1,900 | | | | 78,375 | |
Casella Waste Systems, Inc. - Class A (a) | | | 40 | | | | 496 | |
Heritage-Crystal Clean, Inc. (a) (b) | | | 180 | | | | 2,826 | |
| Herman Miller, Inc. | | | 865 | | | | 29,583 | |
| HNI Corp. | | | 1,750 | | | | 97,860 | |
| Interface, Inc. | | | 1,840 | | | | 34,132 | |
| Kimball International, Inc. - Class B | | | 1,690 | | | | 29,676 | |
| Knoll, Inc. | | | 19,498 | | | | 544,578 | |
| Multi-Color Corp. | | | 115 | | | | 8,924 | |
| Quad/Graphics, Inc. | | | 4,160 | | | | 111,821 | |
SP Plus Corp. (a) (b) | | | 5 | | | | 141 | |
| Steelcase, Inc. - Class A | | | 450 | | | | 8,055 | |
| Tetra Tech, Inc. | | | 690 | | | | 29,774 | |
| | | | | | | | 1,160,535 | |
| Construction & Engineering - 0.5% | | | | | | | | |
| Comfort Systems USA, Inc. | | | 2,180 | | | | 72,594 | |
MasTec, Inc. (a) | | | 1,835 | | | | 70,189 | |
| Primoris Services Corp. | | | 100 | | | | 2,278 | |
Tutor Perini Corp. (a) (b) | | | 1,960 | | | | 54,880 | |
| | | | | | | | 199,941 | |
| Electrical Equipment - 0.3% | | | | | | | | |
| Belden, Inc. | | | 360 | | | | 26,917 | |
| General Cable Corp. | | | 3,815 | | | | 72,676 | |
| | | | | | | | 99,593 | |
WILSHIRE SMALL COMPANY GROWTH PORTFOLIO
SCHEDULE OF INVESTMENTS (Continued)
| COMMON STOCKS - 97.2% (Continued) | | Shares | | | Value | |
| Industrials - 13.7% (Continued) | | | | | | |
Industrial Conglomerates - 0.0% (c) | | | | | | |
| Raven Industries, Inc. | | | 355 | | | $ | 8,946 | |
| | | | | | | | | |
| Machinery - 1.6% | | | | | | | | |
| Actuant Corp. - Class A | | | 1,373 | | | | 35,629 | |
| Altra Industrial Motion Corp. | | | 10 | | | | 369 | |
| EnPro Industries, Inc. | | | 1,875 | | | | 126,300 | |
| Global Brass & Copper Holdings, Inc. | | | 1,420 | | | | 48,706 | |
| Gorman-Rupp Co. (The) | | | 442 | | | | 13,680 | |
| Harsco Corp. | | | 1,841 | | | | 25,038 | |
| Hyster-Yale Materials Handling, Inc. | | | 140 | | | | 8,928 | |
Lydall, Inc. (a) | | | 595 | | | | 36,801 | |
| Mueller Industries, Inc. | | | 128 | | | | 5,115 | |
| Standex International Corp. | | | 405 | | | | 35,579 | |
Supreme Industries, Inc. - Class A (b) | | | 2,633 | | | | 41,338 | |
| Tennant Co. | | | 1,407 | | | | 100,178 | |
Wabash National Corp. (a) | | | 6,210 | | | | 98,242 | |
| | | | | | | | 575,903 | |
Marine - 0.0% (c) | | | | | | | | |
| Matson, Inc. | | | 45 | | | | 1,593 | |
| | | | | | | | | |
| Professional Services - 4.0% | | | | | | | | |
Advisory Board Co. (The) (a) (b) | | | 1,280 | | | | 42,560 | |
| Barrett Business Services, Inc. | | | 1,360 | | | | 87,176 | |
| CEB, Inc. | | | 6,570 | | | | 398,141 | |
| Exponent, Inc. | | | 673 | | | | 40,582 | |
Huron Consulting Group, Inc. (a) | | | 600 | | | | 30,390 | |
| Insperity, Inc. | | | 470 | | | | 33,347 | |
| Korn/Ferry International | | | 2,150 | | | | 63,275 | |
On Assignment, Inc. (a) | | | 1,215 | | | | 53,654 | |
TrueBlue, Inc. (a) | | | 940 | | | | 23,171 | |
WageWorks, Inc. (a) | | | 9,775 | | | | 708,687 | |
| | | | | | | | 1,480,983 | |
| Road & Rail - 1.6% | | | | | | | | |
| Knight Transportation, Inc. | | | 6,230 | | | | 205,902 | |
WILSHIRE SMALL COMPANY GROWTH PORTFOLIO
SCHEDULE OF INVESTMENTS (Continued)
| COMMON STOCKS - 97.2% (Continued) | | Shares | | | Value | |
| Industrials - 13.7% (Continued) | | | | | | |
| Road & Rail - 1.6% (Continued) | | | | | | |
Saia, Inc. (a) | | | 8,540 | | | $ | 377,041 | |
| | | | | | | | 582,943 | |
| Trading Companies & Distributors - 1.2% | | | | | | | | |
| Applied Industrial Technologies, Inc. | | | 2,175 | | | | 129,195 | |
SiteOne Landscape Supply, Inc. (a) | | | 7,820 | | | | 271,589 | |
| Triton International Ltd. | | | 1,730 | | | | 27,334 | |
| | | | | | | | 428,118 | |
| Information Technology - 20.7% | | | | | | | | |
| Communications Equipment - 1.6% | | | | | | | | |
| ADTRAN, Inc. | | | 3,265 | | | | 72,973 | |
CalAmp Corp. (a) | | | 2,133 | | | | 30,929 | |
CIENA Corp. (a) (b) | | | 2,550 | | | | 62,246 | |
Ixia (a) | | | 4,625 | | | | 74,462 | |
Lumentum Holdings, Inc. (a) | | | 865 | | | | 33,432 | |
NETGEAR, Inc. (a) | | | 1,630 | | | | 88,590 | |
| Plantronics, Inc. | | | 3,275 | | | | 179,338 | |
ShoreTel, Inc. (a) | | | 3,804 | | | | 27,199 | |
Sonus Networks, Inc. (a) | | | 2,075 | | | | 13,073 | |
| | | | | | | | 582,242 | |
| Electronic Equipment, Instruments & Components - 0.8% | | | | | | | | |
Badger Meter, Inc. (b) | | | 1,420 | | | | 52,469 | |
Fabrinet (a) | | | 860 | | | | 34,658 | |
Itron, Inc. (a) | | | 300 | | | | 18,855 | |
| Littelfuse, Inc. | | | 545 | | | | 82,714 | |
| Methode Electronics, Inc. | | | 355 | | | | 14,679 | |
MTS Systems Corp. (b) | | | 1,030 | | | | 58,401 | |
Plexus Corp. (a) | | | 819 | | | | 44,259 | |
Rogers Corp. (a) | | | 70 | | | | 5,377 | |
| | | | | | | | 311,412 | |
| Internet Software & Services - 3.7% | | | | | | | | |
Brightcove, Inc. (a) | | | 220 | | | | 1,771 | |
Carbonite, Inc. (a) | | | 2,721 | | | | 44,624 | |
Care.com, Inc. (a) | | | 2,720 | | | | 23,310 | |
ChannelAdvisor Corp. (a) | | | 2,900 | | | | 41,615 | |
DHI Group, Inc. (a) | | | 100 | | | | 625 | |
WILSHIRE SMALL COMPANY GROWTH PORTFOLIO
SCHEDULE OF INVESTMENTS (Continued)
| COMMON STOCKS - 97.2% (Continued) | | Shares | | | Value | |
| Information Technology - 20.7% (Continued) | | | | | | |
| Internet Software & Services - 3.7% (Continued) | | | | | | |
| EarthLink Holdings Corp. | | | 11,335 | | | $ | 63,929 | |
Five9, Inc. (a) | | | 1,655 | | | | 23,484 | |
| LogMeIn, Inc. | | | 6,060 | | | | 585,094 | |
| NIC, Inc. | | | 1,490 | | | | 35,611 | |
| Reis, Inc. | | | 35 | | | | 779 | |
SPS Commerce, Inc. (a) | | | 5,300 | | | | 370,417 | |
WebMD Health Corp. (a) (b) | | | 1,020 | | | | 50,561 | |
Xactly Corp. (a) | | | 3,165 | | | | 34,815 | |
XO Group, Inc. (a) (b) | | | 3,419 | | | | 66,500 | |
Zix Corp. (a) (b) | | | 9,438 | | | | 46,624 | |
| | | | | | | | 1,389,759 | |
| IT Services - 2.8% | | | | | | | | |
Cardtronics plc - Class A (a) | | | 1,511 | | | | 82,455 | |
Cass Information Systems, Inc. (b) | | | 768 | | | | 56,502 | |
EPAM Systems, Inc. (a) (b) | | | 470 | | | | 30,226 | |
Euronet Worldwide, Inc. (a) | | | 845 | | | | 61,203 | |
| EVERTEC, Inc. | | | 1,980 | | | | 35,145 | |
ExlService Holdings, Inc. (a) | | | 220 | | | | 11,097 | |
| Hackett Group, Inc. (The) | | | 304 | | | | 5,369 | |
Information Services Group, Inc. (a) | | | 1,890 | | | | 6,880 | |
| MAXIMUS, Inc. | | | 9,570 | | | | 533,910 | |
Syntel, Inc. (b) | | | 8,160 | | | | 161,486 | |
| TeleTech Holdings, Inc. | | | 1,198 | | | | 36,539 | |
Virtusa Corp. (a) | | | 509 | | | | 12,786 | |
| | | | | | | | 1,033,598 | |
| Semiconductors & Semiconductor Equipment - 4.1% | | | | | | | | |
Advanced Energy Industries, Inc. (a) | | | 920 | | | | 50,370 | |
Advanced Micro Devices, Inc. (a) (b) | | | 5,438 | | | | 61,667 | |
Applied Micro Circuits Corp. (a) | | | 685 | | | | 5,651 | |
CEVA, Inc. (a) | | | 10,694 | | | | 358,783 | |
Inphi Corp. (a) (b) | | | 7,195 | | | | 321,041 | |
MaxLinear, Inc. - Class A (a) | | | 803 | | | | 17,505 | |
Monolithic Power Systems, Inc. (b) | | | 370 | | | | 30,314 | |
Nanometrics, Inc. (a) | | | 3,430 | | | | 85,956 | |
| NVE Corp. | | | 837 | | | | 59,787 | |
WILSHIRE SMALL COMPANY GROWTH PORTFOLIO
SCHEDULE OF INVESTMENTS (Continued)
| COMMON STOCKS - 97.2% (Continued) | | Shares | | | Value | |
| Information Technology - 20.7% (Continued) | | | | | | |
| Semiconductors & Semiconductor Equipment - 4.1% (Continued) | | | | | | |
| Power Integrations, Inc. | | | 1,310 | | | $ | 88,884 | |
Semtech Corp. (a) | | | 3,310 | | | | 104,431 | |
Silicon Laboratories, Inc. (a) | | | 5,075 | | | | 329,874 | |
Ultratech, Inc. (a) | | | 575 | | | | 13,789 | |
| | | | | | | | 1,528,052 | |
| Software - 7.6% | | | | | | | | |
A10 Networks, Inc. (a) | | | 220 | | | | 1,828 | |
| American Software, Inc. - Class A | | | 1,190 | | | | 12,293 | |
Aspen Technology, Inc. (a) | | | 1,010 | | | | 55,227 | |
Barracuda Networks, Inc. (a) | | | 2,665 | | | | 57,111 | |
BroadSoft, Inc. (a) (b) | | | 11,585 | | | | 477,881 | |
Callidus Software, Inc. (a) | | | 12,486 | | | | 209,765 | |
CommVault Systems, Inc. (a) | | | 3,125 | | | | 160,625 | |
Ellie Mae, Inc. (a) (b) | | | 5,530 | | | | 462,750 | |
EnerNOC, Inc. (a) (b) | | | 2,560 | | | | 15,360 | |
| Fair Isaac Corp. | | | 235 | | | | 28,017 | |
Gigamon, Inc. (a) | | | 1,065 | | | | 48,511 | |
Jive Software, Inc. (a) | | | 8,075 | | | | 35,126 | |
| Monotype Imaging Holdings, Inc. | | | 890 | | | | 17,667 | |
Paycom Software, Inc. (a) | | | 255 | | | | 11,600 | |
| Pegasystems, Inc. | | | 16,964 | | | | 610,704 | |
Qualys, Inc. (a) | | | 11,480 | | | | 363,342 | |
RealPage, Inc. (a) | | | 3,940 | | | | 118,200 | |
RingCentral, Inc. - Class A (a) | | | 935 | | | | 19,261 | |
Rubicon Project, Inc. (The) (a) | | | 890 | | | | 6,604 | |
Silver Spring Networks, Inc. (a) | | | 4,685 | | | | 62,357 | |
TiVo Corp. (a) | | | 1,587 | | | | 33,168 | |
| | | | | | | | 2,807,397 | |
| Technology Hardware, Storage & Peripherals - 0.1% | | | | | | | | |
Cray, Inc. (a) | | | 1,970 | | | | 40,779 | |
Super Micro Computer, Inc. (a) | | | 30 | | | | 842 | |
| | | | | | | | 41,621 | |
| Materials - 3.2% | | | | | | | | |
| Chemicals - 0.9% | | | | | | | | |
| American Vanguard Corp. | | | 1,180 | | | | 22,597 | |
WILSHIRE SMALL COMPANY GROWTH PORTFOLIO
SCHEDULE OF INVESTMENTS (Continued)
| COMMON STOCKS - 97.2% (Continued) | | Shares | | | Value | |
| Materials - 3.2% (Continued) | | | | | | |
| Chemicals - 0.9% (Continued) | | | | | | |
| Calgon Carbon Corp. | | | 700 | | | $ | 11,900 | |
Chemtura Corp. (a) | | | 2,350 | | | | 78,021 | |
| H.B. Fuller Co. | | | 885 | | | | 42,754 | |
| Innophos Holdings, Inc. | | | 1,070 | | | | 55,918 | |
Koppers Holdings, Inc. (a) | | | 1,610 | | | | 64,883 | |
| PolyOne Corp. | | | 340 | | | | 10,894 | |
Rayonier Advanced Materials, Inc. (b) | | | 616 | | | | 9,523 | |
| Sensient Technologies Corp. | | | 280 | | | | 22,002 | |
| | | | | | | | 318,492 | |
| Construction Materials - 0.2% | | | | | | | | |
Caesarstone Ltd. (a) (b) | | | 2,900 | | | | 83,085 | |
US Concrete, Inc. (a) (b) | | | 70 | | | | 4,585 | |
| | | | | | | | 87,670 | |
| Containers & Packaging - 0.3% | | | | | | | | |
| Myers Industries, Inc. | | | 7,160 | | | | 102,388 | |
| | | | | | | | | |
| Metals & Mining - 0.5% | | | | | | | | |
| Kaiser Aluminum Corp. | | | 2,010 | | | | 156,157 | |
SunCoke Energy, Inc. (a) | | | 920 | | | | 10,433 | |
| Worthington Industries, Inc. | | | 860 | | | | 40,798 | |
| | | | | | | | 207,388 | |
| Paper & Forest Products - 1.3% | | | | | | | | |
Boise Cascade Co. (a) | | | 2,570 | | | | 57,825 | |
| Deltic Timber Corp. | | | 645 | | | | 49,710 | |
| KapStone Paper and Packaging Corp. | | | 1,864 | | | | 41,101 | |
Louisiana-Pacific Corp. (a) | | | 9,965 | | | | 188,637 | |
| Neenah Paper, Inc. | | | 559 | | | | 47,627 | |
| Schweitzer-Mauduit International, Inc. | | | 2,075 | | | | 94,475 | |
| | | | | | | | 479,375 | |
| Real Estate - 2.0% | | | | | | | | |
| Equity Real Estate Investment Trusts (REITs) - 1.7% | | | | | | | | |
| American Assets Trust, Inc. | | | 180 | | | | 7,754 | |
| CareTrust REIT, Inc. | | | 605 | | | | 9,269 | |
| Chesapeake Lodging Trust | | | 2,140 | | | | 55,340 | |
| DuPont Fabros Technology, Inc. | | | 410 | | | | 18,011 | |
WILSHIRE SMALL COMPANY GROWTH PORTFOLIO
SCHEDULE OF INVESTMENTS (Continued)
| COMMON STOCKS - 97.2% (Continued) | | Shares | | | Value | |
| Real Estate - 2.0% (Continued) | | | | | | |
| Equity Real Estate Investment Trusts (REITs) - 1.7% (Continued) | | | | | | |
| FelCor Lodging Trust, Inc. | | | 1,275 | | | $ | 10,213 | |
| Gaming and Leisure Properties, Inc. | | | 846 | | | | 25,905 | |
| Life Storage, Inc. | | | 35 | | | | 2,984 | |
Pennsylvania Real Estate Investment Trust (b) | | | 6,185 | | | | 117,268 | |
| Potlatch Corp. | | | 2,255 | | | | 93,921 | |
| PS Business Parks, Inc. | | | 70 | | | | 8,156 | |
| RLJ Lodging Trust | | | 525 | | | | 12,857 | |
| Sabra Health Care REIT, Inc. | | | 3,720 | | | | 90,842 | |
| Universal Health Realty Income Trust | | | 705 | | | | 46,241 | |
| Urstadt Biddle Properties, Inc. - Class A | | | 5,750 | | | | 138,633 | |
| | | | | | | | 637,394 | |
| Real Estate Management & Development - 0.3% | | | | | | | | |
| RMR Group, Inc. (The) - Class A | | | 2,620 | | | | 103,490 | |
| | | | | | | | | |
| Telecommunication Services - 1.2% | | | | | | | | |
| Diversified Telecommunication Services - 1.2% | | | | | | | | |
8x8, Inc. (a) | | | 720 | | | | 10,296 | |
| Cogent Communications Holdings, Inc. | | | 9,945 | | | | 411,226 | |
Lumos Networks Corp. (a) | | | 640 | | | | 9,997 | |
| | | | | | | | 431,519 | |
| Utilities - 0.4% | | | | | | | | |
| Electric Utilities - 0.1% | | | | | | | | |
| MGE Energy, Inc. | | | 540 | | | | 35,262 | |
| | | | | | | | | |
| Independent Power and Renewable Electricity Producers - 0.3% | | | | | | | | |
| Ormat Technologies, Inc. | | | 1,930 | | | | 103,487 | |
| | | | | | | | | |
Total Common Stocks (Cost $27,660,691) | | | $ | 36,032,578 | |
WILSHIRE SMALL COMPANY GROWTH PORTFOLIO
SCHEDULE OF INVESTMENTS (Continued)
RIGHTS - 0.0% (c) | | Shares | | | Value | |
Dyax Corp. (b) | | | 860 | | | $ | 0 | |
Trius CVR (b) | | | 180 | | | | 360 | |
Total Rights (Cost $0) | | | $ | 360 | |
| MONEY MARKET FUNDS - 8.6% | | Shares | | | Value | |
Northern Trust Institutional Government Select Portfolio - Institutional Class, 0.39% (d) | | | 1,076,691 | | | $ | 1,076,691 | |
Northern Trust Institutional Liquid Asset Portfolio - Institutional Class, 0.01% (d) (e) | | | 2,128,325 | | | | 2,128,325 | |
Total Money Market Funds (Cost $3,205,016) | | | $ | 3,205,016 | |
| | | | | | | | | |
Total Investments at Value - 105.8% (Cost $30,865,707) | | | $ | 39,237,954 | |
| | | | | | | | | |
| Liabilities in Excess of Other Assets - (5.8%) | | | | (2,150,775 | ) |
| | | | | | | | | |
| Net Assets - 100.0% | | | $ | 37,087,179 | |
CVR - Contingent Value Right.
(a) | Non-income producing security. |
(b) | This security or a partial position of this security is on loan at December 31, 2016. The total market value of securities on loan at December 31, 2016 was $4,691,378. |
(c) | Percentage rounds to less than 0.1%. |
(d) | The rate shown is the 7-day effective yield as of December 31, 2016. |
(e) | This security was purchased with cash collateral held from securities on loan. The total value of such securities as of December 31, 2016 was $2,128,325. Securities on loan are also collateralized by various U.S. Treasury obligations in the amount of $2,721,691. |
See accompanying notes to financial statements.
WILSHIRE SMALL COMPANY VALUE PORTFOLIO
SCHEDULE OF INVESTMENTS
December 31, 2016
| COMMON STOCKS - 97.6% | | Shares | | | Value | |
| Consumer Discretionary - 11.9% | | | | | | |
| Auto Components - 2.0% | | | | | | |
| Cooper Tire & Rubber Co. | | | 8,370 | | | $ | 325,175 | |
| Dana, Inc. | | | 1,935 | | | | 36,726 | |
Modine Manufacturing Co. (a) | | | 1,345 | | | | 20,041 | |
Stoneridge, Inc. (a) | | | 22,433 | | | | 396,839 | |
| Superior Industries International, Inc. | | | 920 | | | | 24,242 | |
| | | | | | | | 803,023 | |
| Diversified Consumer Services - 0.3% | | | | | | | | |
American Public Education, Inc. (a) (b) | | | 1,070 | | | | 26,269 | |
K12, Inc. (a) | | | 2,790 | | | | 47,876 | |
Strayer Education, Inc. (a) | | | 810 | | | | 65,310 | |
| | | | | | | | 139,455 | |
| Hotels, Restaurants & Leisure - 0.6% | | | | | | | | |
BJ's Restaurants, Inc. (a) | | | 230 | | | | 9,039 | |
| Bob Evans Farms, Inc. | | | 1,650 | | | | 87,796 | |
Denny's Corp. (a) | | | 6,285 | | | | 80,637 | |
Penn National Gaming, Inc. (a) | | | 4,390 | | | | 60,538 | |
Pinnacle Entertainment, Inc. (a) (b) | | | 1,110 | | | | 16,095 | |
Ruby Tuesday, Inc. (a) | | | 100 | | | | 323 | |
| | | | | | | | 254,428 | |
| Household Durables - 5.1% | | | | | | | | |
Beazer Homes USA, Inc. (a) | | | 5,080 | | | | 67,564 | |
Ethan Allen Interiors, Inc. (b) | | | 1,960 | | | | 72,226 | |
| Flexsteel Industries, Inc. | | | 614 | | | | 37,865 | |
| Hooker Furniture Corp. | | | 13,993 | | | | 531,034 | |
| La-Z-Boy, Inc. | | | 2,180 | | | | 67,689 | |
M/I Homes, Inc. (a) | | | 10,864 | | | | 273,556 | |
| MDC Holdings, Inc. | | | 2,116 | | | | 54,290 | |
Taylor Morrison Home Corp. - Class A (a) (b) | | | 23,880 | | | | 459,929 | |
TRI Pointe Group, Inc. (a) | | | 43,630 | | | | 500,872 | |
| | | | | | | | 2,065,025 | |
| Media - 0.8% | | | | | | | | |
| New York Times Co. (The) - Class A | | | 6,095 | | | | 81,064 | |
Reading International, Inc. - Class A (a) | | | 826 | | | | 13,712 | |
WILSHIRE SMALL COMPANY VALUE PORTFOLIO
SCHEDULE OF INVESTMENTS (Continued)
| COMMON STOCKS - 97.6% (Continued) | | Shares | | | Value | |
| Consumer Discretionary - 11.9% (Continued) | | | | | | |
| Media - 0.8% (Continued) | | | | | | |
Scholastic Corp. (b) | | | 4,569 | | | $ | 216,981 | |
| | | | | | | | 311,757 | |
| Multi-Line Retail - 0.9% | | | | | | | | |
Fred's, Inc. - Class A (b) | | | 18,675 | | | | 346,608 | |
| | | | | | | | | |
| Specialty Retail - 1.7% | | | | | | | | |
Abercrombie & Fitch Co. - Class A (b) | | | 7,255 | | | | 87,060 | |
American Eagle Outfitters, Inc. (b) | | | 4,560 | | | | 69,175 | |
| Barnes & Noble, Inc. | | | 2,565 | | | | 28,600 | |
| Chico's FAS, Inc. | | | 8,590 | | | | 123,610 | |
| DSW, Inc. - Class A | | | 1,228 | | | | 27,814 | |
Express, Inc. (a) | | | 9,222 | | | | 99,229 | |
Guess?, Inc. (b) | | | 3,420 | | | | 41,382 | |
| Pier 1 Imports, Inc. | | | 2,130 | | | | 18,190 | |
Rent-A-Center, Inc. (b) | | | 730 | | | | 8,213 | |
Select Comfort Corp. (a) | | | 7,940 | | | | 179,602 | |
Stage Stores, Inc. (b) | | | 6,045 | | | | 26,417 | |
West Marine, Inc. (a) | | | 180 | | | | 1,885 | |
| | | | | | | | 711,177 | |
| Textiles, Apparel & Luxury Goods - 0.5% | | | | | | | | |
Movado Group, Inc. (b) | | | 1,670 | | | | 48,013 | |
Vera Bradley, Inc. (a) | | | 3,120 | | | | 36,566 | |
Vince Holding Corp. (a) (b) | | | 33,895 | | | | 137,275 | |
| | | | | | | | 221,854 | |
| Consumer Staples - 3.8% | | | | | | | | |
| Food & Staples Retailing - 0.1% | | | | | | | | |
| Ingles Markets, Inc. - Class A | | | 109 | | | | 5,243 | |
Natural Grocers by Vitamin Cottage, Inc. (a) (b) | | | 2,360 | | | | 28,060 | |
| | | | | | | | 33,303 | |
| Food Products - 2.7% | | | | | | | | |
Alico, Inc. (b) | | | 370 | | | | 10,046 | |
Darling Ingredients, Inc. (a) | | | 785 | | | | 10,134 | |
Dean Foods Co. (b) | | | 470 | | | | 10,237 | |
John B. Sanfilippo & Son, Inc. (b) | | | 5,854 | | | | 412,062 | |
| Lancaster Colony Corp. | | | 685 | | | | 96,852 | |
WILSHIRE SMALL COMPANY VALUE PORTFOLIO
SCHEDULE OF INVESTMENTS (Continued)
| COMMON STOCKS - 97.6% (Continued) | | Shares | | | Value | |
| Consumer Staples - 3.8% (Continued) | | | | | | |
| Food Products - 2.7% (Continued) | | | | | | |
Omega Protein Corp. (a) | | | 1,210 | | | $ | 30,311 | |
Seneca Foods Corp. - Class A (a) | | | 290 | | | | 11,615 | |
TreeHouse Foods, Inc. (a) (b) | | | 6,904 | | | | 498,399 | |
| | | | | | | | 1,079,656 | |
| Personal Products - 0.9% | | | | | | | | |
Avon Products, Inc. (a) | | | 21,555 | | | | 108,637 | |
| Inter Parfums, Inc. | | | 7,353 | | | | 240,811 | |
| Nutraceutical International Corp. | | | 800 | | | | 27,960 | |
| | | | | | | | 377,408 | |
| Tobacco - 0.1% | | | | | | | | |
| Universal Corp. | | | 810 | | | | 51,638 | |
| | | | | | | | | |
| Energy - 4.4% | | | | | | | | |
| Energy Equipment & Services - 1.3% | | | | | | | | |
| Archrock, Inc. | | | 2,875 | | | | 37,950 | |
| Bristow Group, Inc. | | | 3,238 | | | | 66,314 | |
Era Group, Inc. (a) | | | 603 | | | | 10,233 | |
Exterran Corp. (a) | | | 360 | | | | 8,604 | |
Helix Energy Solutions Group, Inc. (a) (b) | | | 3,220 | | | | 28,400 | |
Hornbeck Offshore Services, Inc. (a) (b) | | | 520 | | | | 3,754 | |
McDermott International, Inc. (a) | | | 3,980 | | | | 29,412 | |
Newpark Resources, Inc. (a) | | | 3,605 | | | | 27,038 | |
PHI, Inc. - Non-Voting (a) | | | 9,101 | | | | 164,000 | |
SEACOR Holdings, Inc. (a) (b) | | | 460 | | | | 32,789 | |
Unit Corp. (a) | | | 4,870 | | | | 130,857 | |
| | | | | | | | 539,351 | |
| Oil, Gas & Consumable Fuels - 3.1% | | | | | | | | |
Cobalt International Energy, Inc. (a) | | | 17,860 | | | | 21,789 | |
Contango Oil & Gas Co. (a) | | | 8,140 | | | | 76,028 | |
Dorian LPG Ltd. (a) (b) | | | 1,213 | | | | 9,959 | |
International Seaways, Inc. (a) | | | 7,576 | | | | 106,366 | |
| Overseas Shipholding Group, Inc. - Class A | | | 22,730 | | | | 87,056 | |
PDC Energy, Inc. (a) | | | 6,360 | | | | 461,608 | |
Renewable Energy Group, Inc. (a) (b) | | | 3,650 | | | | 35,405 | |
RSP Permian, Inc. (a) | | | 180 | | | | 8,032 | |
WILSHIRE SMALL COMPANY VALUE PORTFOLIO
SCHEDULE OF INVESTMENTS (Continued)
| COMMON STOCKS - 97.6% (Continued) | | Shares | | | Value | |
| Energy - 4.4% (Continued) | | | | | | |
| Oil, Gas & Consumable Fuels - 3.1% (Continued) | | | | | | |
| Scorpio Tankers, Inc. | | | 6,850 | | | $ | 31,031 | |
| SemGroup Corp. - Class A | | | 755 | | | | 31,521 | |
Synergy Resources Corp. (a) (b) | | | 42,730 | | | | 380,724 | |
| | | | | | | | 1,249,519 | |
| Financials - 30.7% | | | | | | | | |
| Banks - 15.5% | | | | | | | | |
| Ameris Bancorp | | | 8,710 | | | | 379,756 | |
| Arrow Financial Corp. | | | 436 | | | | 17,658 | |
| Banco Latinoamericano de Comercio Exterior S.A. - Class E | | | 410 | | | | 12,070 | |
Bancorp, Inc. (The) (a) | | | 9,181 | | | | 72,163 | |
| BancorpSouth, Inc. | | | 3,920 | | | | 121,716 | |
| Banner Corp. | | | 4,030 | | | | 224,914 | |
| Boston Private Financial Holdings, Inc. | | | 10,439 | | | | 172,765 | |
| Capital Bank Financial Corp. - Class A | | | 13,580 | | | | 533,015 | |
| Cathay General Bancorp | | | 400 | | | | 15,212 | |
| CenterState Banks, Inc. | | | 2,170 | | | | 54,619 | |
| Central Pacific Financial Corp. | | | 1,075 | | | | 33,777 | |
Citizens & Northern Corp. (b) | | | 370 | | | | 9,694 | |
| City Holding Co. | | | 569 | | | | 38,464 | |
| Community Bank System, Inc. | | | 275 | | | | 16,992 | |
CU Bancorp (a) | | | 965 | | | | 34,547 | |
Eagle Bancorp, Inc. (a) | | | 1,543 | | | | 94,046 | |
| Enterprise Financial Services Corp. | | | 1,269 | | | | 54,567 | |
| F.N.B. Corp. | | | 5,928 | | | | 95,026 | |
| First Busey Corp. | | | 5,418 | | | | 166,766 | |
| First Citizens BancShares, Inc. - Class A | | | 250 | | | | 88,750 | |
| First Commonwealth Financial Corp. | | | 6,583 | | | | 93,347 | |
| First Financial Bancorp | | | 1,915 | | | | 54,482 | |
| First Financial Corp. | | | 720 | | | | 38,016 | |
| First Midwest Bancorp, Inc. | | | 3,165 | | | | 79,853 | |
| Glacier Bancorp, Inc. | | | 2,214 | | | | 80,213 | |
| Hancock Holding Co. | | | 825 | | | | 35,558 | |
| Hanmi Financial Corp. | | | 2,448 | | | | 85,435 | |
| Heritage Financial Corp. | | | 14,605 | | | | 376,079 | |
| Hilltop Holdings, Inc. | | | 6,995 | | | | 208,451 | |
WILSHIRE SMALL COMPANY VALUE PORTFOLIO
SCHEDULE OF INVESTMENTS (Continued)
| COMMON STOCKS - 97.6% (Continued) | | Shares | | | Value | |
| Financials - 30.7% (Continued) | | | | | | |
| Banks - 15.5% (Continued) | | | | | | |
| Home BancShares, Inc. | | | 2,690 | | | $ | 74,701 | |
HomeTrust Bancshares, Inc. (a) | | | 485 | | | | 12,562 | |
| Hope Bancorp, Inc. | | | 4,935 | | | | 108,027 | |
| Independent Bank Corp. (Michigan) | | | 1,570 | | | | 34,069 | |
| MB Financial, Inc. | | | 2,005 | | | | 94,696 | |
| Mercantile Bank Corp. | | | 1,099 | | | | 41,432 | |
| NBT Bancorp, Inc. | | | 1,491 | | | | 62,443 | |
Northrim BanCorp, Inc. (b) | | | 830 | | | | 26,228 | |
OFG Bancorp (b) | | | 6,290 | | | | 82,399 | |
| Pacific Continental Corp. | | | 682 | | | | 14,902 | |
| PacWest Bancorp | | | 10,160 | | | | 553,110 | |
| PrivateBancorp, Inc. | | | 7,920 | | | | 429,185 | |
| Prosperity Bancshares, Inc. | | | 1,545 | | | | 110,900 | |
| Renasant Corp. | | | 460 | | | | 19,421 | |
| Republic Bancorp, Inc. - Class A | | | 1,637 | | | | 64,727 | |
| S&T Bancorp, Inc. | | | 1,123 | | | | 43,842 | |
| Simmons First National Corp. - Class A | | | 1,149 | | | | 71,410 | |
| Southwest Bancorp, Inc. | | | 1,142 | | | | 33,118 | |
| Sterling Bancorp | | | 1,435 | | | | 33,579 | |
Texas Capital Bancshares, Inc. (a) | | | 1,380 | | | | 108,192 | |
TriState Capital Holdings, Inc. (a) | | | 1,535 | | | | 33,924 | |
| Umpqua Holdings Corp. | | | 4,590 | | | | 86,200 | |
| Univest Corp. of Pennsylvania | | | 2,230 | | | | 68,907 | |
Western Alliance Bancorp (a) | | | 15,605 | | | | 760,119 | |
| Wintrust Financial Corp. | | | 945 | | | | 68,579 | |
| | | | | | | | 6,324,623 | |
| Capital Markets - 1.9% | | | | | | | | |
| Calamos Asset Management, Inc. - Class A | | | 1,495 | | | | 12,782 | |
| FBR & Co. | | | 4,295 | | | | 55,835 | |
| GAMCO Investors, Inc. - Class A | | | 1,370 | | | | 42,319 | |
| Greenhill & Co., Inc. | | | 8,910 | | | | 246,807 | |
KCG Holdings, Inc. - Class A (a) | | | 100 | | | | 1,325 | |
| Manning & Napier, Inc. | | | 12,819 | | | | 96,783 | |
| OM Asset Management plc | | | 910 | | | | 13,195 | |
| Oppenheimer Holdings, Inc. - Class A | | | 1,800 | | | | 33,480 | |
WILSHIRE SMALL COMPANY VALUE PORTFOLIO
SCHEDULE OF INVESTMENTS (Continued)
| COMMON STOCKS - 97.6% (Continued) | | Shares | | | Value | |
| Financials - 30.7% (Continued) | | | | | | |
| Capital Markets - 1.9% (Continued) | | | | | | |
Piper Jaffray Cos. (a) | | | 439 | | | $ | 31,828 | |
| Pzena Investment Management, Inc. - Class A | | | 2,916 | | | | 32,397 | |
Virtus Investment Partners, Inc. (b) | | | 140 | | | | 16,527 | |
Waddell & Reed Financial, Inc. - Class A (b) | | | 9,905 | | | | 193,247 | |
| | | | | | | | 776,525 | |
| Consumer Finance - 0.5% | | | | | | | | |
EZCORP, Inc. - Class A (a) | | | 9,609 | | | | 102,336 | |
| FirstCash, Inc. | | | 2,063 | | | | 96,961 | |
| | | | | | | | 199,297 | |
| Diversified Financial Services - 1.6% | | | | | | | | |
| Bank of N.T. Butterfield & Son Ltd. (The) | | | 17,390 | | | | 546,741 | |
Global Eagle Entertainment, Inc. (a) (b) | | | 1,225 | | | | 7,914 | |
| Marlin Business Services Corp. | | | 1,000 | | | | 20,900 | |
PHH Corp. (a) | | | 4,370 | | | | 66,249 | |
| | | | | | | | 641,804 | |
| Insurance - 3.8% | | | | | | | | |
| American Equity Investment Life Holding Co. | | | 2,508 | | | | 56,530 | |
| Baldwin & Lyons, Inc. - Class B | | | 4,297 | | | | 108,284 | |
| CNO Financial Group, Inc. | | | 6,370 | | | | 121,986 | |
| Donegal Group, Inc. - Class A | | | 120 | | | | 2,098 | |
| Employers Holdings, Inc. | | | 494 | | | | 19,562 | |
| FBL Financial Group, Inc. - Class A | | | 1,502 | | | | 117,381 | |
| Federated National Holding Co. | | | 3,182 | | | | 59,472 | |
Genworth Financial, Inc. - Class A (a) | | | 23,580 | | | | 89,840 | |
Global Indemnity Ltd. (a) (b) | | | 1,358 | | | | 51,889 | |
Greenlight Capital Re Ltd. - Class A (a) | | | 10,095 | | | | 230,166 | |
Hallmark Financial Services, Inc. (a) | | | 4,505 | | | | 52,393 | |
HCI Group, Inc. (b) | | | 230 | | | | 9,080 | |
| Heritage Insurance Holdings, Inc. | | | 850 | | | | 13,320 | |
| Horace Mann Educators Corp. | | | 975 | | | | 41,730 | |
| Infinity Property & Casualty Corp. | | | 828 | | | | 72,781 | |
MBIA, Inc. (a) | | | 5,200 | | | | 55,640 | |
| National Western Life Group, Inc. - Class A | | | 435 | | | | 135,198 | |
| Navigators Group, Inc. (The) | | | 924 | | | | 108,801 | |
| Safety Insurance Group, Inc. | | | 140 | | | | 10,318 | |
WILSHIRE SMALL COMPANY VALUE PORTFOLIO
SCHEDULE OF INVESTMENTS (Continued)
| COMMON STOCKS - 97.6% (Continued) | | Shares | | | Value | |
| Financials - 30.7% (Continued) | | | | | | |
| Insurance - 3.8% (Continued) | | | | | | |
State Auto Financial Corp. (b) | | | 1,190 | | | $ | 31,904 | |
Third Point Reinsurance Ltd. (a) | | | 9,710 | | | | 112,151 | |
| United Fire Group, Inc. | | | 1,061 | | | | 52,169 | |
| United Insurance Holdings Corp. | | | 426 | | | | 6,450 | |
| | | | | | | | 1,559,143 | |
| Mortgage Real Estate Investment Trusts (REITs) - 2.5% | | | | | | | | |
| AG Mortgage Investment Trust, Inc. | | | 5,420 | | | | 92,736 | |
| Altisource Residential Corp. | | | 10,575 | | | | 116,748 | |
Annaly Capital Management, Inc. (b) | | | 1,546 | | | | 15,414 | |
| Anworth Mortgage Asset Corp. | | | 14,435 | | | | 74,629 | |
Apollo Commercial Real Estate Finance, Inc. (b) | | | 4,720 | | | | 78,446 | |
| Ares Commercial Real Estate Corp. | | | 8,295 | | | | 113,890 | |
CYS Investments, Inc. (b) | | | 9,730 | | | | 75,213 | |
| Dynex Capital, Inc. | | | 417 | | | | 2,844 | |
| Invesco Mortgage Capital, Inc. | | | 490 | | | | 7,154 | |
| PennyMac Mortgage Investment Trust | | | 9,225 | | | | 151,013 | |
| Redwood Trust, Inc. | | | 7,395 | | | | 112,478 | |
Resource Capital Corp. (b) | | | 22,443 | | | | 186,951 | |
| | | | | | | | 1,027,516 | |
| Thrifts & Mortgage Finance - 4.9% | | | | | | | | |
| Astoria Financial Corp. | | | 3,145 | | | | 58,654 | |
| Bank Mutual Corp. | | | 2,722 | | | | 25,723 | |
| BankFinancial Corp. | | | 1,908 | | | | 28,277 | |
| Beneficial Bancorp, Inc. | | | 1,105 | | | | 20,332 | |
| Berkshire Hills Bancorp, Inc. | | | 1,745 | | | | 64,303 | |
| Capitol Federal Financial, Inc. | | | 2,000 | | | | 32,920 | |
| Charter Financial Corp. | | | 200 | | | | 3,334 | |
Clifton Bancorp, Inc. (b) | | | 385 | | | | 6,514 | |
| Dime Community Bancshares, Inc. | | | 13,993 | | | | 281,259 | |
| Flushing Financial Corp. | | | 965 | | | | 28,361 | |
HomeStreet, Inc. (a) | | | 11,455 | | | | 361,978 | |
| Meridian Bancorp, Inc. | | | 9,630 | | | | 182,007 | |
MGIC Investment Corp. (a) | | | 16,243 | | | | 165,516 | |
NMI Holdings, Inc. - Class A (a) | | | 3,940 | | | | 41,961 | |
| Northfield Bancorp, Inc. | | | 5,640 | | | | 112,631 | |
WILSHIRE SMALL COMPANY VALUE PORTFOLIO
SCHEDULE OF INVESTMENTS (Continued)
| COMMON STOCKS - 97.6% (Continued) | | Shares | | | Value | |
| Financials - 30.7% (Continued) | | | | | | |
| Thrifts & Mortgage Finance - 4.9% (Continued) | | | | | | |
| Northwest Bancshares, Inc. | | | 3,760 | | | $ | 67,793 | |
| Oritani Financial Corp. | | | 6,116 | | | | 114,675 | |
PennyMac Financial Services, Inc. - Class A (a) | | | 460 | | | | 7,659 | |
| Provident Financial Holdings, Inc. | | | 105 | | | | 2,123 | |
| Radian Group, Inc. | | | 7,893 | | | | 141,916 | |
| Territorial Bancorp, Inc. | | | 3,300 | | | | 108,372 | |
| Washington Federal, Inc. | | | 4,050 | | | | 139,118 | |
| Waterstone Financial, Inc. | | | 347 | | | | 6,385 | |
| | | | | | | | 2,001,811 | |
| Health Care - 2.7% | | | | | | | | |
Biotechnology - 0.0% (c) | | | | | | | | |
Infinity Pharmaceuticals, Inc. (a) (b) | | | 8,230 | | | | 11,111 | |
| | | | | | | | | |
| Health Care Equipment & Supplies - 1.8% | | | | | | | | |
| Analogic Corp. | | | 6,140 | | | | 509,312 | |
| CryoLife, Inc. | | | 1,150 | | | | 22,023 | |
Exactech, Inc. (a) | | | 1,480 | | | | 40,404 | |
Invacare Corp. (b) | | | 1,015 | | | | 13,246 | |
Meridian Bioscience, Inc. (b) | | | 6,450 | | | | 114,165 | |
OraSure Technologies, Inc. (a) | | | 280 | | | | 2,458 | |
Orthofix International N.V. (a) | | | 820 | | | | 29,668 | |
| | | | | | | | 731,276 | |
| Health Care Providers & Services - 0.6% | | | | | | | | |
Almost Family, Inc. (a) | | | 140 | | | | 6,174 | |
Magellan Health, Inc. (a) | | | 1,191 | | | | 89,623 | |
| National HealthCare Corp. | | | 799 | | | | 60,556 | |
| Owens & Minor, Inc. | | | 785 | | | | 27,703 | |
PharMerica Corp. (a) | | | 63 | | | | 1,584 | |
Triple-S Management Corp. - Class B (a) (b) | | | 2,650 | | | | 54,855 | |
| | | | | | | | 240,495 | |
Health Care Technology - 0.0% (c) | | | | | | | | |
| Quality Systems, Inc. | | | 1,680 | | | | 22,092 | |
WILSHIRE SMALL COMPANY VALUE PORTFOLIO
SCHEDULE OF INVESTMENTS (Continued)
| COMMON STOCKS - 97.6% (Continued) | | Shares | | | Value | |
| Health Care - 2.7% (Continued) | | | | | | |
| Pharmaceuticals - 0.3% | | | | | | |
Impax Laboratories, Inc. (a) | | | 7,980 | | | $ | 105,735 | |
| | | | | | | | | |
| Industrials - 10.2% | | | | | | | | |
| Aerospace & Defense - 1.5% | | | | | | | | |
| AAR Corp. | | | 1,032 | | | | 34,108 | |
AeroVironment, Inc. (a) (b) | | | 620 | | | | 16,635 | |
DigitalGlobe, Inc. (a) | | | 2,190 | | | | 62,743 | |
Ducommun, Inc. (a) | | | 580 | | | | 14,825 | |
Esterline Technologies Corp. (a) | | | 206 | | | | 18,375 | |
Moog, Inc. - Class A (a) | | | 453 | | | | 29,753 | |
| Orbital ATK, Inc. | | | 4,772 | | | | 418,647 | |
| | | | | | | | 595,086 | |
| Building Products - 0.5% | | | | | | | | |
| Apogee Enterprises, Inc. | | | 3,100 | | | | 166,036 | |
| Simpson Manufacturing Co., Inc. | | | 1,210 | | | | 52,938 | |
| | | | | | | | 218,974 | |
| Commercial Services & Supplies - 1.8% | | | | | | | | |
ARC Document Solutions, Inc. (a) | | | 2,415 | | | | 12,268 | |
| Brady Corp. - Class A | | | 5,920 | | | | 222,295 | |
Casella Waste Systems, Inc. - Class A (a) | | | 2,959 | | | | 36,721 | |
| Ennis, Inc. | | | 10,666 | | | | 185,055 | |
| Essendant, Inc. | | | 3,855 | | | | 80,570 | |
| HNI Corp. | | | 300 | | | | 16,776 | |
| Interface, Inc. | | | 2,850 | | | | 52,868 | |
| Kimball International, Inc. - Class B | | | 1,315 | | | | 23,091 | |
| Knoll, Inc. | | | 1,675 | | | | 46,783 | |
Mobile Mini, Inc. (b) | | | 200 | | | | 6,050 | |
| Quad/Graphics, Inc. | | | 1,785 | | | | 47,981 | |
| | | | | | | | 730,458 | |
| Construction & Engineering - 0.3% | | | | | | | | |
| Comfort Systems USA, Inc. | | | 2,308 | | | | 76,856 | |
Tutor Perini Corp. (a) (b) | | | 2,350 | | | | 65,800 | |
| | | | | | | | 142,656 | |
| Electrical Equipment - 1.5% | | | | | | | | |
| EnerSys | | | 6,270 | | | | 489,687 | |
WILSHIRE SMALL COMPANY VALUE PORTFOLIO
SCHEDULE OF INVESTMENTS (Continued)
| COMMON STOCKS - 97.6% (Continued) | | Shares | | | Value | |
| Industrials - 10.2% (Continued) | | | | | | |
| Electrical Equipment - 1.5% (Continued) | | | | | | |
| General Cable Corp. | | | 6,010 | | | $ | 114,491 | |
| LSI Industries, Inc. | | | 745 | | | | 7,256 | |
| | | | | | | | 611,434 | |
| Industrial Conglomerates - 0.4% | | | | | | | | |
| Raven Industries, Inc. | | | 6,234 | | | | 157,097 | |
| | | | | | | | | |
| Machinery - 2.4% | | | | | | | | |
| Albany International Corp. - Class A | | | 8,040 | | | | 372,252 | |
| Briggs & Stratton Corp. | | | 43 | | | | 957 | |
Chart Industries, Inc. (a) | | | 3,235 | | | | 116,525 | |
| Federal Signal Corp. | | | 1,915 | | | | 29,893 | |
| Global Brass & Copper Holdings, Inc. | | | 1,240 | | | | 42,532 | |
| Graham Corp. | | | 2,380 | | | | 52,717 | |
| Harsco Corp. | | | 365 | | | | 4,964 | |
| Hyster-Yale Materials Handling, Inc. | | | 954 | | | | 60,837 | |
| Kennametal, Inc. | | | 3,510 | | | | 109,723 | |
| Miller Industries, Inc. | | | 729 | | | | 19,282 | |
| Tennant Co. | | | 1,097 | | | | 78,106 | |
Titan International, Inc. (b) | | | 4,430 | | | | 49,660 | |
Wabash National Corp. (a) | | | 2,425 | | | | 38,364 | |
| | | | | | | | 975,812 | |
| Professional Services - 1.0% | | | | | | | | |
Franklin Covey Co. (a) | | | 1,650 | | | | 33,248 | |
GP Strategies Corp. (a) | | | 8,150 | | | | 233,089 | |
| Kelly Services, Inc. - Class A | | | 5,804 | | | | 133,028 | |
Navigant Consulting, Inc. (a) | | | 650 | | | | 17,017 | |
| | | | | | | | 416,382 | |
| Road & Rail - 0.2% | | | | | | | | |
| Marten Transport Ltd. | | | 3,060 | | | | 71,298 | |
Roadrunner Transportation Systems, Inc. (a) | | | 1,495 | | | | 15,533 | |
| | | | | | | | 86,831 | |
| Trading Companies & Distributors - 0.6% | | | | | | | | |
| Applied Industrial Technologies, Inc. | | | 2,930 | | | | 174,042 | |
CAI International, Inc. (a) | | | 1,960 | | | | 16,993 | |
WILSHIRE SMALL COMPANY VALUE PORTFOLIO
SCHEDULE OF INVESTMENTS (Continued)
| COMMON STOCKS - 97.6% (Continued) | | Shares | | | Value | |
| Industrials - 10.2% (Continued) | | | | | | |
| Trading Companies & Distributors - 0.6% (Continued) | | | | | | |
| Triton International Ltd. | | | 1,985 | | | $ | 31,363 | |
| | | | | | | | 222,398 | |
| Information Technology - 15.8% | | | | | | | | |
| Communications Equipment - 2.9% | | | | | | | | |
| ADTRAN, Inc. | | | 3,225 | | | | 72,079 | |
| Black Box Corp. | | | 1,575 | | | | 24,019 | |
| Comtech Telecommunications Corp. | | | 6,924 | | | | 82,048 | |
Digi International, Inc. (a) | | | 4,806 | | | | 66,083 | |
Ixia (a) | | | 3,365 | | | | 54,177 | |
Mitel Networks Corp. (a) | | | 114,850 | | | | 780,979 | |
NETGEAR, Inc. (a) | | | 634 | | | | 34,458 | |
ShoreTel, Inc. (a) | | | 4,080 | | | | 29,172 | |
Sonus Networks, Inc. (a) | | | 5,655 | | | | 35,627 | |
| | | | | | | | 1,178,642 | |
| Electronic Equipment, Instruments & Components - 4.6% | | | | | | | | |
Anixter International, Inc. (a) | | | 290 | | | | 23,505 | |
| AVX Corp. | | | 12,302 | | | | 192,280 | |
Benchmark Electronics, Inc. (a) | | | 4,120 | | | | 125,660 | |
Coherent, Inc. (a) | | | 3,620 | | | | 497,333 | |
| CTS Corp. | | | 2,098 | | | | 46,995 | |
| Daktronics, Inc. | | | 1,230 | | | | 13,161 | |
FARO Technologies, Inc. (a) | | | 217 | | | | 7,812 | |
Insight Enterprises, Inc. (a) | | | 2,637 | | | | 106,640 | |
Kimball Electronics, Inc. (a) | | | 2,000 | | | | 36,400 | |
MTS Systems Corp. (b) | | | 2,055 | | | | 116,519 | |
Novanta, Inc. (a) | | | 22,245 | | | | 467,145 | |
| Park Electrochemical Corp. | | | 333 | | | | 6,210 | |
Plexus Corp. (a) | | | 2,220 | | | | 119,969 | |
Rogers Corp. (a) | | | 780 | | | | 59,912 | |
ScanSource, Inc. (a) | | | 1,056 | | | | 42,610 | |
Vishay Intertechnology, Inc. (b) | | | 1,140 | | | | 18,468 | |
| | | | | | | | 1,880,619 | |
| Internet Software & Services - 0.4% | | | | | | | | |
Bankrate, Inc. (a) | | | 7,360 | | | | 81,327 | |
ChannelAdvisor Corp. (a) | | | 805 | | | | 11,552 | |
WILSHIRE SMALL COMPANY VALUE PORTFOLIO
SCHEDULE OF INVESTMENTS (Continued)
| COMMON STOCKS - 97.6% (Continued) | | Shares | | | Value | |
| Information Technology - 15.8% (Continued) | | | | | | |
| Internet Software & Services - 0.4% (Continued) | | | | | | |
| EarthLink Holdings Corp. | | | 1,270 | | | $ | 7,163 | |
Liquidity Services, Inc. (a) | | | 7,673 | | | | 74,812 | |
| | | | | | | | 174,854 | |
| IT Services - 0.5% | | | | | | | | |
Euronet Worldwide, Inc. (a) | | | 2,595 | | | | 187,956 | |
| ManTech International Corp. - Class A | | | 95 | | | | 4,014 | |
| | | | | | | | 191,970 | |
| Semiconductors & Semiconductor Equipment - 5.0% | | | | | | | | |
| Cohu, Inc. | | | 4,988 | | | | 69,333 | |
DSP Group, Inc. (a) | | | 561 | | | | 7,321 | |
Entegris, Inc. (a) | | | 30,695 | | | | 549,441 | |
Integrated Device Technology, Inc. (a) | | | 16,405 | | | | 386,502 | |
| IXYS Corp. | | | 165 | | | | 1,964 | |
Lattice Semiconductor Corp. (a) (b) | | | 81,605 | | | | 600,612 | |
Nanometrics, Inc. (a) | | | 2,334 | | | | 58,490 | |
| NVE Corp. | | | 882 | | | | 63,001 | |
Photronics, Inc. (a) | | | 3,949 | | | | 44,624 | |
Semtech Corp. (a) | | | 154 | | | | 4,859 | |
| Tessera Holding Corp. | | | 730 | | | | 32,266 | |
Ultratech, Inc. (a) | | | 10,385 | | | | 249,032 | |
| | | | | | | | 2,067,445 | |
| Software - 0.5% | | | | | | | | |
EnerNOC, Inc. (a) (b) | | | 6,555 | | | | 39,330 | |
| Progress Software Corp. | | | 3,060 | | | | 97,707 | |
Rubicon Project, Inc. (The) (a) | | | 4,060 | | | | 30,125 | |
Silver Spring Networks, Inc. (a) | | | 495 | | | | 6,588 | |
Telenav, Inc. (a) | | | 2,408 | | | | 16,976 | |
| | | | | | | | 190,726 | |
| Technology Hardware, Storage & Peripherals - 1.9% | | | | | | | | |
Cray, Inc. (a) (b) | | | 13,925 | | | | 288,248 | |
Electronics For Imaging, Inc. (a) | | | 10,660 | | | | 467,547 | |
Super Micro Computer, Inc. (a) | | | 100 | | | | 2,805 | |
| | | | | | | | 758,600 | |
WILSHIRE SMALL COMPANY VALUE PORTFOLIO
SCHEDULE OF INVESTMENTS (Continued)
| COMMON STOCKS - 97.6% (Continued) | | Shares | | | Value | |
| Materials - 8.4% | | | | | | |
| Chemicals - 2.8% | | | | | | |
| American Vanguard Corp. | | | 5,770 | | | $ | 110,496 | |
| Calgon Carbon Corp. | | | 5,670 | | | | 96,390 | |
| FutureFuel Corp. | | | 1,968 | | | | 27,355 | |
| Innophos Holdings, Inc. | | | 1,550 | | | | 81,003 | |
| Innospec, Inc. | | | 1,955 | | | | 133,917 | |
| KMG Chemicals, Inc. | | | 185 | | | | 7,195 | |
Landec Corp. (a) | | | 35,525 | | | | 490,244 | |
LSB Industries, Inc. (a) (b) | | | 2,750 | | | | 23,155 | |
| Sensient Technologies Corp. | | | 515 | | | | 40,469 | |
| Tredegar Corp. | | | 1,880 | | | | 45,120 | |
Tronox Ltd. - Class A (b) | | | 10,390 | | | | 107,121 | |
| | | | | | | | 1,162,465 | |
| Containers & Packaging - 0.5% | | | | | | | | |
| Greif, Inc. - Class A | | | 3,807 | | | | 195,337 | |
| | | | | | | | | |
| Metals & Mining - 1.8% | | | | | | | | |
| Carpenter Technology Corp. | | | 337 | | | | 12,189 | |
| Commercial Metals Co. | | | 850 | | | | 18,513 | |
| Kaiser Aluminum Corp. | | | 510 | | | | 39,622 | |
| Materion Corp. | | | 12,490 | | | | 494,604 | |
| Olympic Steel, Inc. | | | 335 | | | | 8,117 | |
| Schnitzer Steel Industries, Inc. - Class A | | | 4,310 | | | | 110,767 | |
SunCoke Energy, Inc. (a) | | | 3,865 | | | | 43,829 | |
| | | | | | | | 727,641 | |
| Paper & Forest Products - 3.3% | | | | | | | | |
Boise Cascade Co. (a) | | | 15,190 | | | | 341,776 | |
Deltic Timber Corp. (b) | | | 2,615 | | | | 201,538 | |
Louisiana-Pacific Corp. (a) | | | 13,530 | | | | 256,124 | |
| Neenah Paper, Inc. | | | 1,150 | | | | 97,980 | |
| P.H. Glatfelter Co. | | | 8,215 | | | | 196,256 | |
| Schweitzer-Mauduit International, Inc. | | | 5,195 | | | | 236,528 | |
| | | | | | | | 1,330,202 | |
| Real Estate - 7.2% | | | | | | | | |
| Equity Real Estate Investment Trusts (REITs) - 5.7% | | | | | | | | |
| Ashford Hospitality Prime, Inc. | | | 12,385 | | | | 169,055 | |
WILSHIRE SMALL COMPANY VALUE PORTFOLIO
SCHEDULE OF INVESTMENTS (Continued)
| COMMON STOCKS - 97.6% (Continued) | | Shares | | | Value | |
| Real Estate - 7.2% (Continued) | | | | | | |
| Equity Real Estate Investment Trusts (REITs) - 5.7% (Continued) | | | | | | |
| Ashford Hospitality Trust, Inc. | | | 1,565 | | | $ | 12,144 | |
| Brandywine Realty Trust | | | 25,303 | | | | 417,753 | |
| CBL & Associates Properties, Inc. | | | 17,155 | | | | 197,283 | |
Cedar Realty Trust, Inc. (b) | | | 10,728 | | | | 70,054 | |
| Chesapeake Lodging Trust | | | 5,075 | | | | 131,240 | |
| DiamondRock Hospitality Co. | | | 570 | | | | 6,572 | |
FelCor Lodging Trust, Inc. (a) | | | 4,130 | | | | 33,081 | |
| Getty Realty Corp. | | | 2,402 | | | | 61,227 | |
Government Properties Income Trust (b) | | | 555 | | | | 10,581 | |
| Gramercy Property Trust | | | 2,610 | | | | 23,960 | |
| Kite Realty Group Trust | | | 480 | | | | 11,270 | |
| LaSalle Hotel Properties | | | 5,210 | | | | 158,749 | |
| Lexington Realty Trust | | | 9,255 | | | | 99,954 | |
| Life Storage, Inc. | | | 75 | | | | 6,395 | |
Parkway, Inc. (a) | | | 235 | | | | 5,229 | |
Pennsylvania Real Estate Investment Trust (b) | | | 1,304 | | | | 24,724 | |
| PS Business Parks, Inc. | | | 175 | | | | 20,391 | |
| Ramco-Gershenson Properties Trust | | | 30,685 | | | | 508,756 | |
| RLJ Lodging Trust | | | 3,404 | | | | 83,364 | |
| Sabra Health Care REIT, Inc. | | | 3,595 | | | | 87,790 | |
| Select Income REIT | | | 2,060 | | | | 51,912 | |
| STORE Capital Corp. | | | 2,880 | | | | 71,165 | |
| Sunstone Hotel Investors, Inc. | | | 2,795 | | | | 42,624 | |
| | | | | | | | 2,305,273 | |
| Real Estate Management & Development - 1.5% | | | | | | | | |
Forestar Group, Inc. (a) | | | 35,388 | | | | 470,660 | |
| RE/MAX Holdings, Inc. - Class A | | | 2,680 | | | | 150,080 | |
| | | | | | | | 620,740 | |
Telecommunication Services - 0.0% (c) | | | | | | | | |
Diversified Telecommunication Services - 0.0% (c) | | | | | | | | |
Cincinnati Bell, Inc. (a) | | | 1,007 | | | | 22,506 | |
| | | | | | | | | |
| Utilities - 2.5% | | | | | | | | |
| Electric Utilities - 0.8% | | | | | | | | |
ALLETE, Inc. (b) | | | 1,715 | | | | 110,085 | |
WILSHIRE SMALL COMPANY VALUE PORTFOLIO
SCHEDULE OF INVESTMENTS (Continued)
| COMMON STOCKS - 97.6% (Continued) | | Shares | | | Value | |
| Utilities - 2.5% (Continued) | | | | | | |
| Electric Utilities - 0.8% (Continued) | | | | | | |
| El Paso Electric Co. | | | 219 | | | $ | 10,184 | |
| MGE Energy, Inc. | | | 683 | | | | 44,600 | |
| Otter Tail Corp. | | | 280 | | | | 11,424 | |
| PNM Resources, Inc. | | | 3,160 | | | | 108,388 | |
| Portland General Electric Co. | | | 603 | | | | 26,128 | |
| | | | | | | | 310,809 | |
| Gas Utilities - 0.4% | | | | | | | | |
| Northwest Natural Gas Co. | | | 765 | | | | 45,747 | |
| ONE Gas, Inc. | | | 804 | | | | 51,424 | |
| Southwest Gas Holdings, Inc. | | | 744 | | | | 57,005 | |
| | | | | | | | 154,176 | |
| Independent Power and Renewable Electricity Producers - 0.6% | | | | | | | | |
Dynegy, Inc. (a) | | | 10,880 | | | | 92,045 | |
| Ormat Technologies, Inc. | | | 2,990 | | | | 160,324 | |
| | | | | | | | 252,369 | |
Multi-Utilities - 0.0% (c) | | | | | | | | |
Avista Corp. (b) | | | 345 | | | | 13,797 | |
| | | | | | | | | |
| Water Utilities - 0.7% | | | | | | | | |
| American States Water Co. | | | 2,079 | | | | 94,719 | |
| Artesian Resources Corp. - Class A | | | 3,900 | | | | 124,566 | |
York Water Co. (The) (b) | | | 1,410 | | | | 53,862 | |
| | | | | | | | 273,147 | |
| | | | | | | | | |
Total Common Stocks (Cost $31,105,936) | | | $ | 39,794,076 | |
WILSHIRE SMALL COMPANY VALUE PORTFOLIO
SCHEDULE OF INVESTMENTS (Continued)
| MONEY MARKET FUNDS - 7.7% | | Shares | | | Value | |
Northern Trust Institutional Government Select Portfolio - Institutional Class, 0.39% (d) | | | 927,765 | | | $ | 927,765 | |
Northern Trust Institutional Liquid Asset Portfolio - Institutional Class, 0.01% (d) (e) | | | 2,227,822 | | | | 2,227,822 | |
Total Money Market Funds (Cost $3,155,587) | | | $ | 3,155,587 | |
| | | | | | | | | |
Total Investments at Value - 105.3% (Cost $34,261,523) | | | $ | 42,949,663 | |
| | | | | | | | | |
| Liabilities in Excess of Other Assets - (5.3%) | | | | (2,153,883 | ) |
| | | | | | | | | |
| Net Assets - 100.0% | | | $ | 40,795,780 | |
(a) | Non-income producing security. |
(b) | This security or a partial position of this security is on loan at December 31, 2016. The total market value of securities on loan at December 31, 2016 was $3,523,566. |
(c) | Percentage rounds to less than 0.1%. |
(d) | The rate shown is the 7-day effective yield as of December 31, 2016. |
(e) | This security was purchased with cash collateral held from securities on loan. The total value of such securities as of December 31, 2016 was $2,227,822. Securities on loan are also collateralized by various U.S. Treasury obligations in the amount of $1,431,817. |
See accompanying notes to financial statements.
| WILSHIRE 5000 INDEX FUND | |
| SCHEDULE OF INVESTMENTS | |
| December 31, 2016 | |
| | |
| COMMON STOCKS - 99.9% | | Shares | | | Value | |
| Consumer Discretionary - 12.5% | | | | | | |
| Auto Components - 0.3% | | | | | | |
American Axle & Manufacturing Holdings, Inc. (a) | | | 550 | | | $ | 10,615 | |
Autoliv, Inc. (b) | | | 748 | | | | 84,635 | |
BorgWarner, Inc. (b) | | | 1,610 | | | | 63,498 | |
| Cooper Tire & Rubber Co. | | | 425 | | | | 16,511 | |
| Dana, Inc. | | | 900 | | | | 17,082 | |
Dorman Products, Inc. (a) | | | 300 | | | | 21,918 | |
Drew Industries, Inc. (a) | | | 154 | | | | 16,594 | |
Federal-Mogul Holdings Corp. (a) (b) | | | 1,500 | | | | 15,465 | |
| Gentex Corp. | | | 2,195 | | | | 43,220 | |
Gentherm, Inc. (a) | | | 375 | | | | 12,694 | |
| Goodyear Tire & Rubber Co. (The) | | | 2,125 | | | | 65,599 | |
| Lear Corp. | | | 500 | | | | 66,184 | |
Motorcar Parts of America, Inc. (a) (b) | | | 300 | | | | 8,076 | |
| Spartan Motors, Inc. | | | 75 | | | | 694 | |
| Standard Motor Products, Inc. | | | 300 | | | | 15,966 | |
| Superior Industries International, Inc. | | | 150 | | | | 3,953 | |
Tenneco, Inc. (a) | | | 450 | | | | 28,112 | |
| Visteon Corp. | | | 261 | | | | 20,969 | |
| | | | | | | | 511,785 | |
| Automobiles - 0.6% | | | | | | | | |
| Ford Motor Co. | | | 30,185 | | | | 366,144 | |
| General Motors Co. | | | 10,950 | | | | 381,498 | |
Harley-Davidson, Inc. (b) | | | 1,450 | | | | 84,593 | |
Tesla Motors, Inc. (a) (b) | | | 861 | | | | 183,987 | |
| Thor Industries, Inc. | | | 381 | | | | 38,119 | |
Winnebago Industries, Inc. (b) | | | 175 | | | | 5,539 | |
| | | | | | | | 1,059,880 | |
| Distributors - 0.1% | | | | | | | | |
| Acme United Corp. | | | 300 | | | | 7,674 | |
BMC Stock Holdings, Inc. (a) | | | 475 | | | | 9,263 | |
| Core-Mark Holding Co., Inc. | | | 206 | | | | 8,872 | |
| Genuine Parts Co. | | | 1,112 | | | | 106,241 | |
LKQ Corp. (a) | | | 2,100 | | | | 64,365 | |
| WILSHIRE 5000 INDEX FUND | |
| SCHEDULE OF INVESTMENTS (Continued) | |
| | |
| COMMON STOCKS - 99.9% (Continued) | | Shares | | | Value | |
| Consumer Discretionary - 12.5% (Continued) | | | | | | |
| Distributors - 0.1% (Continued) | | | | | | |
| Pool Corp. | | | 313 | | | $ | 32,658 | |
| | | | | | | | 229,073 | |
| Diversified Consumer Services - 0.1% | | | | | | | | |
2U, Inc. (a) (b) | | | 325 | | | | 9,799 | |
American Public Education, Inc. (a) | | | 300 | | | | 7,365 | |
Apollo Education Group, Inc. (a) | | | 1,350 | | | | 13,365 | |
Ascent Capital Group, Inc. - Class A (a) (b) | | | 200 | | | | 3,252 | |
Bridgepoint Education, Inc. (a) (b) | | | 500 | | | | 5,065 | |
Bright Horizons Family Solutions, Inc. (a) | | | 300 | | | | 21,006 | |
| Capella Education Co. | | | 100 | | | | 8,780 | |
Career Education Corp. (a) | | | 500 | | | | 5,045 | |
| Collectors Universe, Inc. | | | 110 | | | | 2,335 | |
| DeVry Education Group, Inc. | | | 400 | | | | 12,480 | |
Grand Canyon Education, Inc. (a) | | | 200 | | | | 11,690 | |
H&R Block, Inc. (b) | | | 1,610 | | | | 37,014 | |
K12, Inc. (a) | | | 300 | | | | 5,148 | |
| Matthews International Corp. - Class A | | | 100 | | | | 7,685 | |
Regis Corp. (a) | | | 200 | | | | 2,904 | |
| Service Corp. International | | | 1,250 | | | | 35,500 | |
ServiceMaster Global Holdings, Inc. (a) | | | 175 | | | | 6,592 | |
Sotheby's (b) | | | 428 | | | | 17,060 | |
Weight Watchers International, Inc. (a) (b) | | | 296 | | | | 3,389 | |
| | | | | | | | 215,474 | |
| Hotels, Restaurants & Leisure - 2.0% | | | | | | | | |
| Aramark | | | 450 | | | | 16,074 | |
BJ's Restaurants, Inc. (a) | | | 300 | | | | 11,790 | |
Boyd Gaming Corp. (a) | | | 725 | | | | 14,623 | |
Bravo Brio Restaurant Group, Inc. (a) (b) | | | 1,000 | | | | 3,800 | |
Brinker International, Inc. (b) | | | 175 | | | | 8,668 | |
Buffalo Wild Wings, Inc. (a) (b) | | | 66 | | | | 10,190 | |
| Carnival Corp. | | | 3,125 | | | | 162,688 | |
| Cheesecake Factory, Inc. (The) | | | 300 | | | | 17,964 | |
Chipotle Mexican Grill, Inc. (a) (b) | | | 137 | | | | 51,693 | |
| Choice Hotels International, Inc. | | | 450 | | | | 25,223 | |
| Churchill Downs, Inc. | | | 67 | | | | 10,080 | |
| WILSHIRE 5000 INDEX FUND | |
| SCHEDULE OF INVESTMENTS (Continued) | |
| | |
| COMMON STOCKS - 99.9% (Continued) | | Shares | | | Value | |
| Consumer Discretionary - 12.5% (Continued) | | | | | | |
| Hotels, Restaurants & Leisure - 2.0% (Continued) | | | | | | |
Cracker Barrel Old Country Store, Inc. (b) | | | 191 | | | $ | 31,893 | |
| Darden Restaurants, Inc. | | | 975 | | | | 70,902 | |
| Domino's Pizza, Inc. | | | 279 | | | | 44,428 | |
Eldorado Resorts, Inc. (a) (b) | | | 528 | | | | 8,950 | |
Empire Resorts, Inc. (a) (b) | | | 20 | | | | 455 | |
Famous Dave's of America, Inc. (a) | | | 200 | | | | 990 | |
Fiesta Restaurant Group, Inc. (a) | | | 300 | | | | 8,955 | |
| Golden Entertainment, Inc. | | | 100 | | | | 1,211 | |
| Hilton Worldwide Holdings, Inc. | | | 1,050 | | | | 28,560 | |
Hyatt Hotels Corp. - Class A (a) | | | 300 | | | | 16,578 | |
| ILG, Inc. | | | 541 | | | | 9,830 | |
| International Speedway Corp. - Class A | | | 237 | | | | 8,722 | |
| Jack in the Box, Inc. | | | 236 | | | | 26,347 | |
Las Vegas Sands Corp. (b) | | | 3,027 | | | | 161,672 | |
| Marcus Corp. (The) | | | 100 | | | | 3,150 | |
| Marriott International, Inc. - Class A | | | 2,604 | | | | 215,299 | |
| Marriott Vacations Worldwide Corp. | | | 155 | | | | 13,152 | |
| McDonald's Corp. | | | 6,521 | | | | 793,735 | |
MGM Resorts International (a) | | | 3,600 | | | | 103,788 | |
Monarch Casino & Resort, Inc. (a) | | | 1,600 | | | | 41,248 | |
Norwegian Cruise Line Holdings Ltd. (a) | | | 325 | | | | 13,822 | |
Panera Bread Co. - Class A (a) | | | 100 | | | | 20,509 | |
Papa John's International, Inc. (b) | | | 173 | | | | 14,805 | |
Pinnacle Entertainment, Inc. (a) | | | 800 | | | | 11,600 | |
Popeyes Louisiana Kitchen, Inc. (a) | | | 100 | | | | 6,048 | |
| RCI Hospitality Holdings, Inc. | | | 1,500 | | | | 25,650 | |
Restaurant Brands International, Inc. (b) | | | 4,603 | | | | 219,379 | |
Royal Caribbean Cruises Ltd. (b) | | | 1,087 | | | | 89,177 | |
Scientific Games Corp. - Class A (a) (b) | | | 1,500 | | | | 21,000 | |
| SeaWorld Entertainment, Inc. | | | 325 | | | | 6,152 | |
| Six Flags Entertainment Corp. | | | 600 | | | | 35,976 | |
| Sonic Corp. | | | 350 | | | | 9,279 | |
| Speedway Motorsports, Inc. | | | 400 | | | | 8,668 | |
| Starbucks Corp. | | | 10,823 | | | | 600,893 | |
| Texas Roadhouse, Inc. | | | 475 | | | | 22,914 | |
| WILSHIRE 5000 INDEX FUND | |
| SCHEDULE OF INVESTMENTS (Continued) | |
| | |
| COMMON STOCKS - 99.9% (Continued) | | Shares | | | Value | |
| Consumer Discretionary - 12.5% (Continued) | | | | | | |
| Hotels, Restaurants & Leisure - 2.0% (Continued) | | | | | | |
| Vail Resorts, Inc. | | | 138 | | | $ | 22,261 | |
| Wendy's Co. (The) | | | 2,500 | | | | 33,800 | |
| Wyndham Worldwide Corp. | | | 876 | | | | 66,900 | |
Wynn Resorts Ltd. (b) | | | 721 | | | | 62,374 | |
Yum China Holdings, Inc. (a) | | | 3,189 | | | | 83,297 | |
| Yum! Brands, Inc. | | | 2,889 | | | | 182,960 | |
| | | | | | | | 3,480,122 | |
| Household Durables - 0.5% | | | | | | | | |
Beazer Homes USA, Inc. (a) | | | 200 | | | | 2,660 | |
| CalAtlantic Group Inc. | | | 534 | | | | 18,161 | |
Cavco Industries, Inc. (a) | | | 100 | | | | 9,985 | |
| CSS Industries, Inc. | | | 50 | | | | 1,354 | |
| D.R. Horton, Inc. | | | 2,373 | | | | 64,854 | |
GoPro, Inc. - Class A (a) (b) | | | 300 | | | | 2,613 | |
Green Brick Partners, Inc. (a) (b) | | | 45 | | | | 452 | |
| Harman International Industries, Inc. | | | 461 | | | | 51,245 | |
Helen of Troy Ltd. (a) | | | 219 | | | | 18,495 | |
| Hooker Furniture Corp. | | | 200 | | | | 7,590 | |
iRobot Corp. (a) (b) | | | 300 | | | | 17,535 | |
KB Home (b) | | | 375 | | | | 5,929 | |
| La-Z-Boy, Inc. | | | 425 | | | | 13,196 | |
| Leggett & Platt, Inc. | | | 910 | | | | 44,481 | |
| Lennar Corp. - Class A | | | 1,250 | | | | 53,663 | |
| Libbey, Inc. | | | 250 | | | | 4,865 | |
| Lifetime Brands, Inc. | | | 700 | | | | 12,425 | |
| MDC Holdings, Inc. | | | 285 | | | | 7,302 | |
Meritage Homes Corp. (a) | | | 200 | | | | 6,960 | |
Mohawk Industries, Inc. (a) | | | 492 | | | | 98,243 | |
| Newell Brands, Inc. | | | 3,715 | | | | 165,874 | |
NVR, Inc. (a) | | | 40 | | | | 66,760 | |
Orleans Homebuilders, Inc. (a) | | | 650 | | | | 0 | |
| PulteGroup, Inc. | | | 2,340 | | | | 43,009 | |
Tempur Sealy International, Inc. (a) (b) | | | 298 | | | | 20,347 | |
Toll Brothers, Inc. (a) (b) | | | 1,050 | | | | 32,550 | |
TRI Pointe Group, Inc. (a) | | | 1,100 | | | | 12,628 | |
| WILSHIRE 5000 INDEX FUND | |
| SCHEDULE OF INVESTMENTS (Continued) | |
| | |
| COMMON STOCKS - 99.9% (Continued) | | Shares | | | Value | |
| Consumer Discretionary - 12.5% (Continued) | | | | | | |
| Household Durables - 0.5% (Continued) | | | | | | |
| Tupperware Brands Corp. | | | 300 | | | $ | 15,786 | |
Universal Electronics, Inc. (a) | | | 200 | | | | 12,910 | |
| Whirlpool Corp. | | | 604 | | | | 109,788 | |
| | | | | | | | 921,660 | |
| Internet & Direct Marketing Retail - 2.1% | | | | | | | | |
1-800-FLOWERS.COM, Inc. - Class A (a) | | | 300 | | | | 3,210 | |
Amazon.com, Inc. (a) | | | 3,129 | | | | 2,346,342 | |
Blue Nile, Inc. (b) | | | 250 | | | | 10,158 | |
| Expedia, Inc. | | | 857 | | | | 97,081 | |
Gaia, Inc. (a) (b) | | | 600 | | | | 5,190 | |
HSN, Inc. (b) | | | 118 | | | | 4,047 | |
Lands' End, Inc. (a) (b) | | | 278 | | | | 4,212 | |
Liberty Expedia Holdings, Inc. - Series A (a) | | | 381 | | | | 15,114 | |
Liberty Interactive Corp. QVC Group - Series A (a) | | | 2,725 | | | | 54,446 | |
Liberty TripAdvisor Holdings, Inc. - Series A (a) | | | 790 | | | | 11,890 | |
Liberty Ventures - Series A (a) | | | 571 | | | | 21,053 | |
Netflix, Inc. (a) (b) | | | 2,971 | | | | 367,810 | |
| Nutrisystem, Inc. | | | 300 | | | | 10,395 | |
Overstock.com, Inc. (a) | | | 300 | | | | 5,250 | |
Priceline Group, Inc. (The) (a) | | | 408 | | | | 598,152 | |
Shutterfly, Inc. (a) | | | 100 | | | | 5,018 | |
TripAdvisor, Inc. (a) | | | 634 | | | | 29,399 | |
Wayfair, Inc. - Class A (a) (b) | | | 300 | | | | 10,515 | |
| | | | | | | | 3,599,282 | |
| Leisure Products - 0.1% | | | | | | | | |
| Brunswick Corp. | | | 550 | | | | 29,997 | |
| Callaway Golf Co. | | | 500 | | | | 5,480 | |
Hasbro, Inc. (b) | | | 800 | | | | 62,232 | |
Marine Products Corp. (b) | | | 700 | | | | 9,709 | |
Mattel, Inc. (b) | | | 2,555 | | | | 70,390 | |
Nautilus, Inc. (a) (b) | | | 50 | | | | 925 | |
Polaris Industries, Inc. (b) | | | 440 | | | | 36,252 | |
Smith & Wesson Holding Corp. (a) (b) | | | 475 | | | | 10,013 | |
Vista Outdoor, Inc. (a) | | | 400 | | | | 14,760 | |
| | | | | | | | 239,758 | |
| WILSHIRE 5000 INDEX FUND | |
| SCHEDULE OF INVESTMENTS (Continued) | |
| | |
| COMMON STOCKS - 99.9% (Continued) | | Shares | | | Value | |
| Consumer Discretionary - 12.5% (Continued) | | | | | | |
| Media - 3.2% | | | | | | |
| A.H. Belo Corp. - Class A | | | 90 | | | $ | 572 | |
AMC Entertainment Holdings, Inc. - Class A (b) | | | 107 | | | | 3,604 | |
AMC Networks, Inc. - Class A (a) | | | 356 | | | | 18,633 | |
| CBS Corp. - Class B | | | 2,833 | | | | 180,235 | |
Charter Communications, Inc. - Class A (a) | | | 1,783 | | | | 513,361 | |
| Cinemark Holdings, Inc. | | | 775 | | | | 29,729 | |
| Clear Channel Outdoor Holdings, Inc. - Class A | | | 1,000 | | | | 5,050 | |
| Comcast Corp. - Class A | | | 17,971 | | | | 1,240,897 | |
Discovery Communications, Inc. - Series A (a) (b) | | | 1,098 | | | | 30,096 | |
Discovery Communications, Inc. - Series C (a) | | | 1,298 | | | | 34,760 | |
DISH Network Corp. - Class A (a) | | | 1,675 | | | | 97,033 | |
E.W. Scripps Co. (The) - Class A (a) (b) | | | 526 | | | | 10,168 | |
| Entercom Communications Corp. - Class A | | | 250 | | | | 3,825 | |
| Entravision Communications Corp. - Class A | | | 100 | | | | 700 | |
| Gannett Company, Inc. | | | 1,050 | | | | 10,196 | |
Gray Television, Inc. (a) | | | 1,000 | | | | 10,850 | |
| Interpublic Group of Cos., Inc. (The) | | | 2,722 | | | | 63,722 | |
| John Wiley & Sons, Inc. - Class A | | | 200 | | | | 10,900 | |
Liberty Braves Group - Series A (a) | | | 360 | | | | 7,376 | |
Liberty Braves Group - Series C (a) | | | 255 | | | | 5,250 | |
Liberty Broadband Corp. - Series A (a) | | | 1,525 | | | | 110,502 | |
Liberty Broadband Corp. - Series C (a) | | | 638 | | | | 47,257 | |
Liberty Media Group - Series A (a) (b) | | | 600 | | | | 18,810 | |
Liberty Media Group - Series C (a) (b) | | | 638 | | | | 19,989 | |
Liberty SiriusXM Group - Series A (a) | | | 2,727 | | | | 94,136 | |
Liberty SiriusXM Group - Series C (a) | | | 2,554 | | | | 86,632 | |
Lions Gate Entertainment Corp. - Class A (a) (b) | | | 625 | | | | 16,813 | |
Lions Gate Entertainment Corp. - Class B (a) (b) | | | 1,032 | | | | 25,335 | |
Live Nation Entertainment, Inc. (a) | | | 612 | | | | 16,279 | |
Loral Space & Communications, Inc. (a) (b) | | | 300 | | | | 12,315 | |
Madison Square Garden Co. (The) - Class A (a) | | | 193 | | | | 33,101 | |
Media General, Inc. (a) | | | 794 | | | | 14,951 | |
| Meredith Corp. | | | 300 | | | | 17,745 | |
MSG Networks, Inc. - Class A (a) | | | 581 | | | | 12,492 | |
National CineMedia, Inc. (b) | | | 500 | | | | 7,365 | |
| WILSHIRE 5000 INDEX FUND | |
| SCHEDULE OF INVESTMENTS (Continued) | |
| | |
| COMMON STOCKS - 99.9% (Continued) | | Shares | | | Value | |
| Consumer Discretionary - 12.5% (Continued) | | | | | | |
| Media - 3.2% (Continued) | | | | | | |
| New Media Investment Group, Inc. | | | 301 | | | $ | 4,813 | |
| New York Times Co. (The) - Class A | | | 1,050 | | | | 13,965 | |
| News Corp. - Class A | | | 2,853 | | | | 32,695 | |
| Omnicom Group, Inc. | | | 1,960 | | | | 166,816 | |
Regal Entertainment Group - Class A (b) | | | 575 | | | | 11,845 | |
| Salem Media Group, Inc. | | | 100 | | | | 625 | |
| Scholastic Corp. | | | 325 | | | | 15,434 | |
| Scripps Networks Interactive, Inc. - Class A | | | 626 | | | | 44,678 | |
Sinclair Broadcast Group, Inc. - Class A (b) | | | 425 | | | | 14,174 | |
Sirius XM Holdings, Inc. (b) | | | 15,600 | | | | 69,420 | |
| TEGNA, Inc. | | | 1,725 | | | | 36,898 | |
Thomson Reuters Corp. (b) | | | 2,625 | | | | 114,923 | |
| Time Warner, Inc. | | | 6,120 | | | | 590,763 | |
| Time, Inc. | | | 654 | | | | 11,674 | |
| Twenty-First Century Fox, Inc. - Class A | | | 7,363 | | | | 206,459 | |
Value Line, Inc. (b) | | | 200 | | | | 3,900 | |
| Viacom, Inc. - Class B | | | 2,482 | | | | 87,118 | |
| Walt Disney Co. (The) | | | 11,556 | | | | 1,204,365 | |
World Wrestling Entertainment, Inc. - Class A (b) | | | 600 | | | | 11,040 | |
| | | | | | | | 5,452,284 | |
| Multi-Line Retail - 0.4% | | | | | | | | |
Big Lots, Inc. (b) | | | 200 | | | | 10,042 | |
Burlington Stores, Inc. (a) | | | 300 | | | | 25,425 | |
Dillard's, Inc. - Class A (b) | | | 347 | | | | 21,753 | |
| Dollar General Corp. | | | 446 | | | | 33,035 | |
Dollar Tree, Inc. (a) | | | 1,912 | | | | 147,568 | |
Fred's, Inc. - Class A (b) | | | 700 | | | | 12,992 | |
J. C. Penney Co., Inc. (a) (b) | | | 2,192 | | | | 18,216 | |
Kohl's Corp. (b) | | | 1,075 | | | | 53,084 | |
| Macy's, Inc. | | | 2,523 | | | | 90,349 | |
Nordstrom, Inc. (b) | | | 1,000 | | | | 47,930 | |
| Target Corp. | | | 4,411 | | | | 318,606 | |
Tuesday Morning Corp. (a) | | | 200 | | | | 1,080 | |
| | | | | | | | 780,080 | |
| WILSHIRE 5000 INDEX FUND | |
| SCHEDULE OF INVESTMENTS (Continued) | |
| | |
| COMMON STOCKS - 99.9% (Continued) | | Shares | | | Value | |
| Consumer Discretionary - 12.5% (Continued) | | | | | | |
| Specialty Retail - 2.4% | | | | | | |
| Aaron's, Inc. | | | 400 | | | $ | 12,796 | |
Abercrombie & Fitch Co. - Class A (b) | | | 425 | | | | 5,100 | |
| Advance Auto Parts, Inc. | | | 591 | | | | 99,950 | |
American Eagle Outfitters, Inc. (b) | | | 1,225 | | | | 18,583 | |
Ascena Retail Group, Inc. (a) | | | 1,789 | | | | 11,074 | |
AutoNation, Inc. (a) (b) | | | 525 | | | | 25,541 | |
AutoZone, Inc. (a) (b) | | | 206 | | | | 162,697 | |
Barnes & Noble Education, Inc. (a) | | | 347 | | | | 3,980 | |
| Barnes & Noble, Inc. | | | 550 | | | | 6,133 | |
| Bed Bath & Beyond, Inc. | | | 1,125 | | | | 45,720 | |
| Best Buy Co., Inc. | | | 1,625 | | | | 69,339 | |
| Big 5 Sporting Goods Corp. | | | 200 | | | | 3,470 | |
Buckle, Inc. (The) (b) | | | 350 | | | | 7,980 | |
Cabela's, Inc. (a) (b) | | | 500 | | | | 29,275 | |
| Caleres, Inc. | | | 425 | | | | 13,949 | |
CarMax, Inc. (a) (b) | | | 1,380 | | | | 88,858 | |
| Cato Corp. (The) - Class A | | | 300 | | | | 9,024 | |
| Chico's FAS, Inc. | | | 1,300 | | | | 18,707 | |
Children's Place, Inc. (The) (b) | | | 132 | | | | 13,325 | |
| Citi Trends, Inc. | | | 50 | | | | 942 | |
Conn's, Inc. (a) (b) | | | 500 | | | | 6,325 | |
| CST Brands, Inc. | | | 679 | | | | 32,694 | |
| Dick's Sporting Goods, Inc. | | | 527 | | | | 27,984 | |
| DSW, Inc. - Class A | | | 550 | | | | 12,458 | |
Express, Inc. (a) | | | 1,000 | | | | 10,760 | |
| Foot Locker, Inc. | | | 1,025 | | | | 72,662 | |
GameStop Corp. - Class A (b) | | | 1,025 | | | | 25,892 | |
Gap, Inc. (The) (b) | | | 1,850 | | | | 41,514 | |
Group 1 Automotive, Inc. (b) | | | 223 | | | | 17,381 | |
Guess?, Inc. (b) | | | 400 | | | | 4,840 | |
Hibbett Sports, Inc. (a) (b) | | | 200 | | | | 7,460 | |
| Home Depot, Inc. (The) | | | 8,948 | | | | 1,199,747 | |
| L Brands, Inc. | | | 1,784 | | | | 117,459 | |
| Lithia Motors, Inc. - Class A | | | 134 | | | | 12,975 | |
| Lowe's Cos., Inc. | | | 6,828 | | | | 485,606 | |
| WILSHIRE 5000 INDEX FUND | |
| SCHEDULE OF INVESTMENTS (Continued) | |
| | |
| COMMON STOCKS - 99.9% (Continued) | | Shares | | | Value | |
| Consumer Discretionary - 12.5% (Continued) | | | | | | |
| Specialty Retail - 2.4% (Continued) | | | | | | |
Lumber Liquidators Holdings, Inc. (a) (b) | | | 241 | | | $ | 3,793 | |
| Monro Muffler Brake, Inc. | | | 325 | | | | 18,590 | |
Murphy USA, Inc. (a) (b) | | | 296 | | | | 18,195 | |
| Office Depot, Inc. | | | 3,450 | | | | 15,594 | |
O'Reilly Automotive, Inc. (a) | | | 750 | | | | 208,808 | |
Penske Automotive Group, Inc. (b) | | | 350 | | | | 18,144 | |
Restoration Hardware Holdings, Inc. (a) (b) | | | 116 | | | | 3,561 | |
| Ross Stores, Inc. | | | 2,575 | | | | 168,920 | |
Sally Beauty Holdings, Inc. (a) | | | 700 | | | | 18,494 | |
Sears Holdings Corp. (a) (b) | | | 625 | | | | 5,806 | |
Select Comfort Corp. (a) | | | 188 | | | | 4,253 | |
Shoe Carnival, Inc. (b) | | | 600 | | | | 16,188 | |
Signet Jewelers Ltd. (b) | | | 620 | | | | 58,441 | |
| Sonic Automotive, Inc. - Class A | | | 300 | | | | 6,870 | |
Stage Stores, Inc. (b) | | | 552 | | | | 2,412 | |
| Staples, Inc. | | | 5,675 | | | | 51,359 | |
| Systemax, Inc. | | | 600 | | | | 5,262 | |
| Tailored Brands, Inc. | | | 475 | | | | 12,136 | |
Tiffany & Co. (b) | | | 735 | | | | 56,911 | |
| TJX Cos., Inc. (The) | | | 4,789 | | | | 359,798 | |
| Tractor Supply Company | | | 1,061 | | | | 80,434 | |
Ulta Salon, Cosmetics & Fragrance, Inc. (a) | | | 469 | | | | 119,567 | |
Urban Outfitters, Inc. (a) | | | 800 | | | | 22,784 | |
Vitamin Shoppe, Inc. (a) (b) | | | 300 | | | | 7,125 | |
Williams-Sonoma, Inc. (b) | | | 500 | | | | 24,195 | |
Zumiez, Inc. (a) (b) | | | 300 | | | | 6,555 | |
| | | | | | | | 4,036,395 | |
| Textiles, Apparel & Luxury Goods - 0.7% | | | | | | | | |
| Carter's, Inc. | | | 382 | | | | 33,001 | |
| Coach, Inc. | | | 2,200 | | | | 77,044 | |
| Columbia Sportswear Co. | | | 100 | | | | 5,830 | |
Crocs, Inc. (a) | | | 1,200 | | | | 8,232 | |
Deckers Outdoor Corp. (a) (b) | | | 325 | | | | 18,002 | |
Fossil Group, Inc. (a) (b) | | | 400 | | | | 10,344 | |
G-III Apparel Group Ltd. (a) | | | 275 | | | | 8,129 | |
| WILSHIRE 5000 INDEX FUND | |
| SCHEDULE OF INVESTMENTS (Continued) | |
| | |
| COMMON STOCKS - 99.9% (Continued) | | Shares | | | Value | |
| Consumer Discretionary - 12.5% (Continued) | | | | | | |
| Textiles, Apparel & Luxury Goods - 0.7% (Continued) | | | | | | |
| Hanesbrands, Inc. | | | 2,995 | | | $ | 64,602 | |
Iconix Brand Group, Inc. (a) | | | 450 | | | | 4,203 | |
Kate Spade & Co. (a) | | | 700 | | | | 13,069 | |
Movado Group, Inc. (b) | | | 300 | | | | 8,625 | |
| NIKE, Inc. - Class B | | | 9,699 | | | | 493,000 | |
| Oxford Industries, Inc. | | | 50 | | | | 3,007 | |
Perry Ellis International, Inc. (a) | | | 100 | | | | 2,491 | |
| PVH Corp. | | | 643 | | | | 58,024 | |
Ralph Lauren Corp. (b) | | | 406 | | | | 36,670 | |
| Rocky Brands, Inc. | | | 100 | | | | 1,155 | |
Sequential Brands Group, Inc. (a) | | | 223 | | | | 1,044 | |
Skechers U.S.A., Inc. - Class A (a) | | | 1,050 | | | | 25,809 | |
Steven Madden Ltd. (a) | | | 300 | | | | 10,725 | |
Under Armour, Inc. - Class A (a) (b) | | | 2,725 | | | | 79,161 | |
Under Armour, Inc. - Class C (a) | | | 1,611 | | | | 40,549 | |
| VF Corp. | | | 2,675 | | | | 142,711 | |
| Wolverine World Wide, Inc. | | | 725 | | | | 15,914 | |
| | | | | | | | 1,161,341 | |
| Consumer Staples - 8.8% | | | | | | | | |
| Beverages - 1.9% | | | | | | | | |
Boston Beer Co., Inc. (The) - Class A (a) (b) | | | 100 | | | | 16,985 | |
| Brown-Forman Corp. - Class B | | | 1,856 | | | | 83,372 | |
| Coca-Cola Co. (The) | | | 30,590 | | | | 1,268,260 | |
| Coca-Cola European Partners plc | | | 2,095 | | | | 65,783 | |
| Constellation Brands, Inc. - Class A | | | 1,362 | | | | 208,808 | |
| Dr Pepper Snapple Group, Inc. | | | 1,397 | | | | 126,666 | |
MGP Ingredients, Inc. (b) | | | 200 | | | | 9,996 | |
| Molson Coors Brewing Co. - Class B | | | 1,163 | | | | 113,172 | |
Monster Beverage Corp. (a) | | | 2,996 | | | | 132,843 | |
| PepsiCo, Inc. | | | 11,262 | | | | 1,178,343 | |
| | | | | | | | 3,204,228 | |
| Food & Staples Retailing - 2.0% | | | | | | | | |
| Andersons, Inc. (The) | | | 75 | | | | 3,353 | |
| Casey's General Stores, Inc. | | | 287 | | | | 34,119 | |
| Costco Wholesale Corp. | | | 3,433 | | | | 549,658 | |
| WILSHIRE 5000 INDEX FUND | |
| SCHEDULE OF INVESTMENTS (Continued) | |
| | |
| COMMON STOCKS - 99.9% (Continued) | | Shares | | | Value | |
| Consumer Staples - 8.8% (Continued) | | | | | | |
| Food & Staples Retailing - 2.0% (Continued) | | | | | | |
| CVS Health Corp. | | | 8,374 | | | $ | 660,791 | |
| Ingles Markets, Inc. - Class A | | | 150 | | | | 7,215 | |
| Kroger Co. (The) | | | 6,850 | | | | 236,394 | |
PriceSmart, Inc. (b) | | | 215 | | | | 17,953 | |
Rite Aid Corp. (a) | | | 8,525 | | | | 70,246 | |
| SpartanNash Co. | | | 400 | | | | 15,816 | |
Sprouts Farmers Market, Inc. (a) (b) | | | 300 | | | | 5,676 | |
SUPERVALU, Inc. (a) | | | 2,050 | | | | 9,574 | |
| Sysco Corp. | | | 4,300 | | | | 238,091 | |
United Natural Foods, Inc. (a) | | | 450 | | | | 21,474 | |
US Foods Holding Corp. (a) | | | 475 | | | | 13,053 | |
| Walgreen Boots Alliance, Inc. | | | 7,409 | | | | 613,169 | |
| Wal-Mart Stores, Inc. | | | 12,204 | | | | 843,539 | |
| Whole Foods Market, Inc. | | | 2,725 | | | | 83,821 | |
| | | | | | | | 3,423,942 | |
| Food Products - 1.7% | | | | | | | | |
| Alico, Inc. | | | 200 | | | | 5,430 | |
| Archer-Daniels-Midland Co. | | | 4,311 | | | | 196,797 | |
| B&G Foods, Inc. | | | 550 | | | | 24,090 | |
Blue Buffalo Pet Products, Inc (a) | | | 725 | | | | 17,429 | |
| Bunge Ltd. | | | 1,050 | | | | 75,852 | |
Cal-Maine Foods, Inc. (b) | | | 18 | | | | 795 | |
| Campbell Soup Co. | | | 1,650 | | | | 99,776 | |
| Conagra Brands, Inc. | | | 3,473 | | | | 137,357 | |
Darling Ingredients, Inc. (a) | | | 975 | | | | 12,587 | |
Dean Foods Co. (b) | | | 567 | | | | 12,349 | |
Flowers Foods, Inc. (b) | | | 1,580 | | | | 31,553 | |
| Fresh Del Monte Produce, Inc. | | | 100 | | | | 6,063 | |
| General Mills, Inc. | | | 4,275 | | | | 264,067 | |
Hain Celestial Group, Inc. (The) (a) | | | 900 | | | | 35,127 | |
| Hershey Co. (The) | | | 1,250 | | | | 129,288 | |
| Hormel Foods Corp. | | | 2,175 | | | | 75,712 | |
| Ingredion, Inc. | | | 541 | | | | 67,603 | |
| J & J Snack Foods Corp. | | | 70 | | | | 9,340 | |
| J.M. Smucker Co. (The) | | | 952 | | | | 121,913 | |
| WILSHIRE 5000 INDEX FUND | |
| SCHEDULE OF INVESTMENTS (Continued) | |
| | |
| COMMON STOCKS - 99.9% (Continued) | | Shares | | | Value | |
| Consumer Staples - 8.8% (Continued) | | | | | | |
| Food Products - 1.7% (Continued) | | | | | | |
| Kellogg Co. | | | 1,903 | | | $ | 140,270 | |
| Kraft Heinz Co. (The) | | | 4,831 | | | | 421,843 | |
Lamb Weston Holdings, Inc. (a) | | | 1,157 | | | | 43,792 | |
| Lancaster Colony Corp. | | | 112 | | | | 15,836 | |
| McCormick & Co., Inc. - Non-Voting Shares | | | 777 | | | | 72,517 | |
| Mead Johnson Nutrition Co. | | | 1,224 | | | | 86,610 | |
| Mondelēz International, Inc. - Class A | | | 12,246 | | | | 542,866 | |
Pilgrim's Pride Corp. (b) | | | 650 | | | | 12,344 | |
| Pinnacle Foods, Inc. | | | 375 | | | | 20,044 | |
Post Holdings, Inc. (a) (b) | | | 438 | | | | 35,211 | |
| Rocky Mountain Chocolate Factory, Inc. | | | 70 | | | | 713 | |
Sanderson Farms, Inc. (b) | | | 143 | | | | 13,476 | |
| Snyder's-Lance, Inc. | | | 710 | | | | 27,221 | |
Tootsie Roll Industries, Inc. (b) | | | 27 | | | | 1,073 | |
TreeHouse Foods, Inc. (a) (b) | | | 385 | | | | 27,793 | |
| Tyson Foods, Inc. - Class A | | | 1,911 | | | | 117,870 | |
WhiteWave Foods Co. (The) (a) | | | 821 | | | | 45,648 | |
| | | | | | | | 2,948,255 | |
| Household Products - 1.6% | | | | | | | | |
| Church & Dwight Co., Inc. | | | 1,906 | | | | 84,226 | |
| Clorox Co. (The) | | | 950 | | | | 114,019 | |
| Colgate-Palmolive Co. | | | 6,986 | | | | 457,164 | |
| Energizer Holdings, Inc. | | | 592 | | | | 26,409 | |
HRG Group, Inc. (a) | | | 1,350 | | | | 21,006 | |
| Kimberly-Clark Corp. | | | 2,631 | | | | 300,250 | |
| Procter & Gamble Co. (The) | | | 21,239 | | | | 1,785,774 | |
| WD-40 Co. | | | 45 | | | | 5,261 | |
| | | | | | | | 2,794,109 | |
| Personal Products - 0.2% | | | | | | | | |
Avon Products, Inc. (a) | | | 2,600 | | | | 13,104 | |
| Coty, Inc. - Class A | | | 3,975 | | | | 72,782 | |
e.l.f. Beauty Inc (a) (b) | | | 300 | | | | 8,682 | |
Edgewell Personal Care Co. (a) | | | 446 | | | | 32,554 | |
| Estée Lauder Cos., Inc. (The) - Class A | | | 1,581 | | | | 120,930 | |
Herbalife Ltd. (a) (b) | | | 650 | | | | 31,291 | |
| WILSHIRE 5000 INDEX FUND | |
| SCHEDULE OF INVESTMENTS (Continued) | |
| | |
| COMMON STOCKS - 99.9% (Continued) | | Shares | | | Value | |
| Consumer Staples - 8.8% (Continued) | | | | | | |
| Personal Products - 0.2% (Continued) | | | | | | |
| Inter Parfums, Inc. | | | 300 | | | $ | 9,825 | |
| Mannatech, Inc. | | | 70 | | | | 1,421 | |
| Nu Skin Enterprises, Inc. - Class A | | | 325 | | | | 15,529 | |
USANA Health Sciences, Inc. (a) (b) | | | 118 | | | | 7,222 | |
| | | | | | | | 313,340 | |
| Tobacco - 1.4% | | | | | | | | |
| Altria Group, Inc. | | | 15,325 | | | | 1,036,277 | |
| Philip Morris International, Inc. | | | 11,474 | | | | 1,049,756 | |
| Reynolds American, Inc. | | | 6,925 | | | | 388,077 | |
Vector Group Ltd. (b) | | | 812 | | | | 18,465 | |
| | | | | | | | 2,492,575 | |
| Energy - 7.0% | | | | | | | | |
| Energy Equipment & Services - 1.1% | | | | | | | | |
| Archrock, Inc. | | | 812 | | | | 10,718 | |
Atwood Oceanics, Inc. (b) | | | 600 | | | | 7,878 | |
| Baker Hughes, Inc. | | | 3,095 | | | | 201,082 | |
| Bristow Group, Inc. | | | 200 | | | | 4,096 | |
CARBO Ceramics, Inc. (a) (b) | | | 150 | | | | 1,569 | |
Dawson Geophysical Co. (a) (b) | | | 78 | | | | 627 | |
Diamond Offshore Drilling, Inc. (a) (b) | | | 850 | | | | 15,045 | |
Dril-Quip, Inc. (a) (b) | | | 145 | | | | 8,707 | |
Era Group, Inc. (a) | | | 300 | | | | 5,091 | |
Exterran Corp. (a) | | | 406 | | | | 9,703 | |
Fairmount Santrol Holdings, Inc. (a) (b) | | | 1,250 | | | | 14,738 | |
FMC Technologies, Inc. (a) | | | 1,906 | | | | 67,720 | |
Forum Energy Technologies, Inc. (a) | | | 300 | | | | 6,600 | |
Geospace Technologies Corp. (a) (b) | | | 226 | | | | 4,601 | |
| Gulf Island Fabrication, Inc. | | | 381 | | | | 4,534 | |
| Halliburton Co. | | | 6,231 | | | | 337,035 | |
Helix Energy Solutions Group, Inc. (a) (b) | | | 1,000 | | | | 8,820 | |
Helmerich & Payne, Inc. (b) | | | 550 | | | | 42,570 | |
Hornbeck Offshore Services, Inc. (a) (b) | | | 500 | | | | 3,610 | |
Matrix Service Co. (a) | | | 450 | | | | 10,215 | |
McDermott International, Inc. (a) | | | 1,575 | | | | 11,639 | |
| Nabors Industries Ltd. | | | 1,975 | | | | 32,390 | |
| WILSHIRE 5000 INDEX FUND | |
| SCHEDULE OF INVESTMENTS (Continued) | |
| | |
| COMMON STOCKS - 99.9% (Continued) | | Shares | | | Value | |
| Energy - 7.0% (Continued) | | | | | | |
| Energy Equipment & Services - 1.1% (Continued) | | | | | | |
| National Oilwell Varco, Inc. | | | 2,961 | | | $ | 110,860 | |
Newpark Resources, Inc. (a) | | | 875 | | | | 6,563 | |
| Oceaneering International, Inc. | | | 500 | | | | 14,105 | |
Oil States International, Inc. (a) | | | 200 | | | | 7,800 | |
Patterson-UTI Energy, Inc. (b) | | | 1,100 | | | | 29,612 | |
Pioneer Energy Services Corp. (a) | | | 675 | | | | 4,624 | |
Rowan Cos. plc - Class A (a) | | | 900 | | | | 17,001 | |
RPC, Inc. (b) | | | 587 | | | | 11,628 | |
| Schlumberger Ltd. | | | 10,103 | | | | 848,148 | |
Superior Energy Services, Inc. (b) | | | 1,131 | | | | 19,091 | |
TETRA Technologies, Inc. (a) | | | 850 | | | | 4,267 | |
Trico Marine Services, Inc. (a) | | | 1,600 | | | | 0 | |
Unit Corp. (a) | | | 500 | | | | 13,435 | |
| | | | | | | | 1,896,122 | |
| Oil, Gas & Consumable Fuels - 5.9% | | | | | | | | |
| Alon USA Energy, Inc. | | | 250 | | | | 2,845 | |
| Anadarko Petroleum Corp. | | | 4,189 | | | | 292,099 | |
Antero Resources Corp. (a) | | | 800 | | | | 18,920 | |
| Apache Corp. | | | 2,913 | | | | 184,888 | |
Arch Coal, Inc. - Class A (a) (b) | | | 163 | | | | 12,722 | |
Bill Barrett Corp. (a) | | | 400 | | | | 2,796 | |
| BP Prudhoe Bay Royalty Trust | | | 300 | | | | 7,125 | |
| Cabot Oil & Gas Corp. | | | 3,325 | | | | 77,672 | |
California Resources Corp. (a) | | | 472 | | | | 10,049 | |
Callon Petroleum Co. (a) | | | 1,500 | | | | 23,055 | |
Carrizo Oil & Gas, Inc. (a) | | | 400 | | | | 14,940 | |
Cheniere Energy, Inc. (a) (b) | | | 1,925 | | | | 79,753 | |
Chesapeake Energy Corp. (a) (b) | | | 6,875 | | | | 48,263 | |
| Chevron Corp. | | | 14,824 | | | | 1,744,784 | |
| Cimarex Energy Co. | | | 696 | | | | 94,586 | |
Clayton Williams Energy, Inc. (a) (b) | | | 113 | | | | 13,476 | |
Concho Resources, Inc. (a) (b) | | | 928 | | | | 123,053 | |
| ConocoPhillips | | | 9,717 | | | | 487,210 | |
| CONSOL Energy, Inc. | | | 1,650 | | | | 30,080 | |
Continental Resources, Inc. (a) (b) | | | 830 | | | | 42,778 | |
| WILSHIRE 5000 INDEX FUND | |
| SCHEDULE OF INVESTMENTS (Continued) | |
| | |
| COMMON STOCKS - 99.9% (Continued) | | Shares | | | Value | |
| Energy - 7.0% (Continued) | | | | | | |
| Oil, Gas & Consumable Fuels - 5.9% (Continued) | | | | | | |
| Cross Timbers Royalty Trust | | | 200 | | | $ | 3,594 | |
| Delek US Holdings, Inc. | | | 175 | | | | 4,212 | |
| Devon Energy Corp. | | | 4,066 | | | | 185,694 | |
Diamondback Energy, Inc. (a) | | | 535 | | | | 54,067 | |
Enbridge Energy Management, LLC (a) | | | 861 | | | | 22,300 | |
Energen Corp. (a) | | | 490 | | | | 28,258 | |
EnLink Midstream, LLC (b) | | | 1,550 | | | | 29,528 | |
| EOG Resources, Inc. | | | 4,171 | | | | 421,688 | |
| EQT Corp. | | | 1,260 | | | | 82,404 | |
| Exxon Mobil Corp. | | | 32,562 | | | | 2,939,045 | |
Green Plains, Inc. (b) | | | 300 | | | | 8,355 | |
Gulfport Energy Corp. (a) | | | 900 | | | | 19,476 | |
| Hess Corp. | | | 2,324 | | | | 144,762 | |
HollyFrontier Corp. (b) | | | 1,158 | | | | 37,936 | |
| Kinder Morgan, Inc. | | | 10,135 | | | | 209,896 | |
Laredo Petroleum, Inc. (a) | | | 800 | | | | 11,312 | |
| Marathon Oil Corp. | | | 6,297 | | | | 109,001 | |
| Marathon Petroleum Corp. | | | 4,006 | | | | 201,702 | |
Matador Resources Co. (a) (b) | | | 375 | | | | 9,660 | |
Murphy Oil Corp. (b) | | | 1,025 | | | | 31,908 | |
Newfield Exploration Co. (a) | | | 1,525 | | | | 61,763 | |
| Noble Energy, Inc. | | | 2,812 | | | | 107,025 | |
Oasis Petroleum, Inc. (a) | | | 1,375 | | | | 20,818 | |
| Occidental Petroleum Corp. | | | 6,000 | | | | 427,380 | |
| ONEOK, Inc. | | | 1,525 | | | | 87,550 | |
Pacific Ethanol, Inc. (a) (b) | | | 1 | | | | 10 | |
Parsley Energy, Inc. - Class A (a) | | | 950 | | | | 33,478 | |
PBF Energy, Inc. - Class A (b) | | | 625 | | | | 17,425 | |
PDC Energy, Inc. (a) | | | 375 | | | | 27,218 | |
| Phillips 66 | | | 3,474 | | | | 300,188 | |
| Pioneer Natural Resources Co. | | | 1,321 | | | | 237,872 | |
QEP Resources, Inc. (a) | | | 1,750 | | | | 32,218 | |
| Range Resources Corp. | | | 1,339 | | | | 46,008 | |
Renewable Energy Group, Inc. (a) (b) | | | 109 | | | | 1,057 | |
Rice Energy, Inc. (a) | | | 1,425 | | | | 30,424 | |
| WILSHIRE 5000 INDEX FUND | |
| SCHEDULE OF INVESTMENTS (Continued) | |
| | |
| COMMON STOCKS - 99.9% (Continued) | | Shares | | | Value | |
| Energy - 7.0% (Continued) | | | | | | |
| Oil, Gas & Consumable Fuels - 5.9% (Continued) | | | | | | |
RSP Permian, Inc. (a) | | | 600 | | | $ | 26,772 | |
Sanchez Energy Corp. (a) (b) | | | 325 | | | | 2,935 | |
| SemGroup Corp. - Class A | | | 450 | | | | 18,788 | |
Ship Finance International Ltd. (b) | | | 1,000 | | | | 14,850 | |
| SM Energy Co. | | | 450 | | | | 15,516 | |
Southwestern Energy Co. (a) | | | 3,325 | | | | 35,977 | |
| Spectra Energy Corp. | | | 5,441 | | | | 223,571 | |
Synergy Resources Corp. (a) (b) | | | 1,175 | | | | 10,469 | |
| Targa Resources Corp. | | | 1,255 | | | | 70,368 | |
Teekay Corp. (b) | | | 775 | | | | 6,223 | |
| Tesoro Corp. | | | 944 | | | | 82,553 | |
| Valero Energy Corp. | | | 3,514 | | | | 240,076 | |
| Western Refining, Inc. | | | 540 | | | | 20,439 | |
Westmoreland Coal Co. (a) | | | 300 | | | | 5,301 | |
Whiting Petroleum Corp. (a) | | | 1,922 | | | | 23,102 | |
| Williams Cos., Inc. (The) | | | 5,250 | | | | 163,485 | |
| World Fuel Services Corp. | | | 475 | | | | 21,807 | |
WPX Energy, Inc. (a) | | | 2,675 | | | | 38,975 | |
| | | | | | | | 10,317,533 | |
| Financials - 15.8% | | | | | | | | |
| Banks - 7.1% | | | | | | | | |
| Ameris Bancorp | | | 300 | | | | 13,080 | |
| Associated Banc-Corp | | | 1,200 | | | | 29,640 | |
Bancorp, Inc. (The) (a) | | | 50 | | | | 393 | |
| BancorpSouth, Inc. | | | 675 | | | | 20,959 | |
| Bank of America Corp. | | | 80,198 | | | | 1,772,375 | |
Bank of Hawaii Corp. (b) | | | 303 | | | | 26,873 | |
Bank of the Ozarks, Inc. (b) | | | 765 | | | | 40,231 | |
| BankUnited, Inc. | | | 375 | | | | 14,134 | |
| Banner Corp. | | | 300 | | | | 16,743 | |
| BB&T Corp. | | | 6,440 | | | | 302,809 | |
| BNC Bancorp | | | 400 | | | | 12,760 | |
BOK Financial Corp. (b) | | | 169 | | | | 14,034 | |
| Boston Private Financial Holdings, Inc. | | | 1,000 | | | | 16,550 | |
Bridge Bancorp, Inc. (b) | | | 300 | | | | 11,370 | |
| WILSHIRE 5000 INDEX FUND | |
| SCHEDULE OF INVESTMENTS (Continued) | |
| | |
| COMMON STOCKS - 99.9% (Continued) | | Shares | | | Value | |
| Financials - 15.8% (Continued) | | | | | | |
| Banks - 7.1% (Continued) | | | | | | |
| Camden National Corp. | | | 150 | | | $ | 6,668 | |
| Capital Bank Financial Corp. - Class A | | | 30 | | | | 1,178 | |
Capital City Bank Group, Inc. (b) | | | 350 | | | | 7,168 | |
| Cardinal Financial Corp. | | | 100 | | | | 3,279 | |
| Cathay General Bancorp | | | 463 | | | | 17,608 | |
| Central Pacific Financial Corp. | | | 300 | | | | 9,426 | |
| Chemical Financial Corp. | | | 500 | | | | 27,085 | |
| CIT Group, Inc. | | | 1,650 | | | | 70,422 | |
| Citigroup, Inc. | | | 22,615 | | | | 1,344,008 | |
| Citizens Financial Group, Inc. | | | 1,675 | | | | 59,680 | |
| CoBiz Financial, Inc. | | | 750 | | | | 12,668 | |
| Columbia Banking System, Inc. | | | 576 | | | | 25,736 | |
| Comerica, Inc. | | | 1,083 | | | | 73,763 | |
| Commerce Bancshares, Inc. | | | 689 | | | | 39,820 | |
| Community Bank System, Inc. | | | 200 | | | | 12,358 | |
| Community Trust Bancorp, Inc. | | | 110 | | | | 5,456 | |
Cullen/Frost Bankers, Inc. (b) | | | 432 | | | | 38,115 | |
| CVB Financial Corp. | | | 1,000 | | | | 22,930 | |
Eagle Bancorp, Inc. (a) | | | 300 | | | | 18,285 | |
| East West Bancorp, Inc. | | | 1,025 | | | | 52,101 | |
| Enterprise Financial Services Corp. | | | 50 | | | | 2,150 | |
| F.N.B. Corp. | | | 1,650 | | | | 26,450 | |
| Fifth Third Bancorp | | | 5,776 | | | | 155,779 | |
| Financial Institutions, Inc. | | | 1,200 | | | | 41,040 | |
First BanCorp. (a) | | | 2,516 | | | | 16,631 | |
| First Bancorp/NC | | | 300 | | | | 8,142 | |
| First Busey Corp. | | | 325 | | | | 10,004 | |
| First Citizens BancShares, Inc. - Class A | | | 50 | | | | 17,750 | |
| First Commonwealth Financial Corp. | | | 800 | | | | 11,344 | |
| First Community Bancshares, Inc. | | | 425 | | | | 12,810 | |
| First Financial Bancorp | | | 575 | | | | 16,359 | |
First Financial Bankshares, Inc. (b) | | | 300 | | | | 13,560 | |
| First Financial Corp. | | | 100 | | | | 5,280 | |
First Hawaiian, Inc. (b) | | | 300 | | | | 10,446 | |
First Horizon National Corp. (b) | | | 1,583 | | | | 31,676 | |
| WILSHIRE 5000 INDEX FUND | |
| SCHEDULE OF INVESTMENTS (Continued) | |
| | |
| COMMON STOCKS - 99.9% (Continued) | | Shares | | | Value | |
| Financials - 15.8% (Continued) | | | | | | |
| Banks - 7.1% (Continued) | | | | | | |
| First Interstate BancSystem, Inc. - Class A | | | 300 | | | $ | 12,765 | |
| First Merchants Corp. | | | 425 | | | | 16,001 | |
| First Midwest Bancorp, Inc. | | | 800 | | | | 20,184 | |
| First Republic Bank | | | 150 | | | | 13,821 | |
| Fulton Financial Corp. | | | 1,250 | | | | 23,500 | |
| Glacier Bancorp, Inc. | | | 550 | | | | 19,927 | |
| Great Western Bancorp, Inc. | | | 300 | | | | 13,077 | |
| Guaranty Bancorp | | | 200 | | | | 4,840 | |
| Hancock Holding Co. | | | 500 | | | | 21,550 | |
| Hanmi Financial Corp. | | | 369 | | | | 12,878 | |
| Heartland Financial USA, Inc. | | | 300 | | | | 14,400 | |
| Heritage Commerce Corp. | | | 50 | | | | 722 | |
| Hilltop Holdings, Inc. | | | 550 | | | | 16,390 | |
| Home BancShares, Inc. | | | 1,250 | | | | 34,713 | |
| Hope Bancorp, Inc. | | | 1,092 | | | | 23,904 | |
| Huntington Bancshares, Inc. | | | 7,772 | | | | 102,746 | |
| IBERIABANK Corp. | | | 375 | | | | 31,406 | |
| Independent Bank Corp. | | | 300 | | | | 21,135 | |
| International Bancshares Corp. | | | 400 | | | | 16,320 | |
| Investors Bancorp, Inc. | | | 1,325 | | | | 18,484 | |
| JPMorgan Chase & Co. | | | 28,098 | | | | 2,424,575 | |
| KeyCorp | | | 8,801 | | | | 160,794 | |
| Lakeland Financial Corp. | | | 300 | | | | 14,208 | |
| LegacyTexas Financial Group, Inc. | | | 375 | | | | 16,148 | |
| M&T Bank Corp. | | | 1,067 | | | | 166,911 | |
| MainSource Financial Group, Inc. | | | 300 | | | | 10,320 | |
| MB Financial, Inc. | | | 540 | | | | 25,504 | |
| NBT Bancorp, Inc. | | | 200 | | | | 8,376 | |
OFG Bancorp (b) | | | 432 | | | | 5,659 | |
| Old National Bancorp | | | 950 | | | | 17,243 | |
| Old Second Bancorp, Inc. | | | 400 | | | | 4,420 | |
Pacific Premier Bancorp, Inc. (a) | | | 300 | | | | 10,605 | |
| PacWest Bancorp | | | 817 | | | | 44,477 | |
| Park National Corp. | | | 87 | | | | 10,410 | |
People's United Financial, Inc. (b) | | | 2,322 | | | | 44,954 | |
| WILSHIRE 5000 INDEX FUND | |
| SCHEDULE OF INVESTMENTS (Continued) | |
| | |
| COMMON STOCKS - 99.9% (Continued) | | Shares | | | Value | |
| Financials - 15.8% (Continued) | | | | | | |
| Banks - 7.1% (Continued) | | | | | | |
| Pinnacle Financial Partners, Inc. | | | 350 | | | $ | 24,255 | |
| PNC Financial Services Group, Inc. (The) | | | 3,820 | | | | 446,787 | |
| Popular, Inc. | | | 782 | | | | 34,267 | |
| Preferred Bank | | | 200 | | | | 10,484 | |
| PrivateBancorp, Inc. | | | 697 | | | | 37,770 | |
| Prosperity Bancshares, Inc. | | | 500 | | | | 35,890 | |
| Regions Financial Corp. | | | 9,081 | | | | 130,403 | |
| Renasant Corp. | | | 400 | | | | 16,888 | |
| Republic Bancorp, Inc. - Class A | | | 315 | | | | 12,455 | |
| S&T Bancorp, Inc. | | | 350 | | | | 13,664 | |
| Sandy Spring Bancorp, Inc. | | | 300 | | | | 11,997 | |
Seacoast Banking Corp. of Florida (a) | | | 150 | | | | 3,309 | |
Signature Bank (a) | | | 387 | | | | 58,127 | |
| Simmons First National Corp. - Class A | | | 200 | | | | 12,430 | |
| South State Corp. | | | 180 | | | | 15,732 | |
| Southside Bancshares, Inc. | | | 331 | | | | 12,459 | |
| Southwest Bancorp, Inc. | | | 50 | | | | 1,450 | |
| Sterling Bancorp | | | 1,113 | | | | 26,044 | |
| Stock Yards Bancorp, Inc. | | | 300 | | | | 14,085 | |
| Suffolk Bancorp | | | 50 | | | | 2,141 | |
| Sun Bancorp, Inc. | | | 164 | | | | 4,264 | |
| SunTrust Banks, Inc. | | | 3,330 | | | | 182,651 | |
SVB Financial Group (a) | | | 367 | | | | 62,999 | |
| Synovus Financial Corp. | | | 947 | | | | 38,903 | |
| TCF Financial Corp. | | | 1,500 | | | | 29,385 | |
Texas Capital Bancshares, Inc. (a) | | | 384 | | | | 30,106 | |
| Tompkins Financial Corp. | | | 105 | | | | 9,927 | |
| TowneBank | | | 553 | | | | 18,387 | |
| TriCo Bancshares | | | 109 | | | | 3,726 | |
| Trustmark Corp. | | | 425 | | | | 15,151 | |
| U.S. Bancorp | | | 12,784 | | | | 656,713 | |
| UMB Financial Corp. | | | 243 | | | | 18,740 | |
| Umpqua Holdings Corp. | | | 1,500 | | | | 28,170 | |
| Union Bankshares Corp. | | | 275 | | | | 9,829 | |
United Bankshares, Inc. (b) | | | 482 | | | | 22,293 | |
| WILSHIRE 5000 INDEX FUND | |
| SCHEDULE OF INVESTMENTS (Continued) | |
| | |
| COMMON STOCKS - 99.9% (Continued) | | Shares | | | Value | |
| Financials - 15.8% (Continued) | | | | | | |
| Banks - 7.1% (Continued) | | | | | | |
| United Community Banks, Inc. | | | 474 | | | $ | 14,040 | |
| United Community Financial Corp. | | | 317 | | | | 2,834 | |
United Security Bancshares (a) | | | 403 | | | | 3,123 | |
| Valley National Bancorp | | | 2,225 | | | | 25,899 | |
| Washington Trust Bancorp, Inc. | | | 100 | | | | 5,605 | |
| Webster Financial Corp. | | | 675 | | | | 36,639 | |
| Wells Fargo & Co. | | | 36,042 | | | | 1,986,274 | |
| WesBanco, Inc. | | | 350 | | | | 15,071 | |
Westamerica Bancorp. (b) | | | 83 | | | | 5,223 | |
Western Alliance Bancorp (a) | | | 850 | | | | 41,404 | |
| Wintrust Financial Corp. | | | 425 | | | | 30,842 | |
| Yadkin Financial Corp. | | | 375 | | | | 12,848 | |
| Zions Bancorp. | | | 1,480 | | | | 63,699 | |
| | | | | | | | 12,217,875 | |
| Capital Markets - 2.5% | | | | | | | | |
Actua Corp. (a) | | | 100 | | | | 1,400 | |
Affiliated Managers Group, Inc. (a) | | | 428 | | | | 62,188 | |
American Capital Ltd. (a) (b) | | | 1,875 | | | | 33,600 | |
| Ameriprise Financial, Inc. | | | 1,275 | | | | 141,449 | |
| Apollo Investment Corp. | | | 2,675 | | | | 15,676 | |
Ares Capital Corp. (b) | | | 2,750 | | | | 45,348 | |
Arlington Asset Investment Corp. - Class A (b) | | | 4 | | | | 59 | |
| Artisan Partners Asset Management, Inc. - Class A | | | 300 | | | | 8,925 | |
Ashford, Inc. (a) | | | 6 | | | | 265 | |
| Bank of New York Mellon Corp. (The) | | | 8,488 | | | | 402,160 | |
| BGC Partners, Inc. - Class A | | | 2,300 | | | | 23,529 | |
| BlackRock, Inc. | | | 1,042 | | | | 396,522 | |
| Charles Schwab Corp. (The) | | | 9,189 | | | | 362,690 | |
Cohen & Steers, Inc. (b) | | | 50 | | | | 1,680 | |
Donnelley Financial Solutions, Inc. (a) | | | 159 | | | | 3,654 | |
E*TRADE Financial Corp. (a) | | | 2,078 | | | | 72,003 | |
| Eaton Vance Corp. | | | 850 | | | | 35,598 | |
| Ellington Financial, LLC | | | 425 | | | | 6,596 | |
| Evercore Partners, Inc. - Class A | | | 350 | | | | 24,045 | |
| Federated Investors, Inc. - Class B | | | 700 | | | | 19,796 | |
| WILSHIRE 5000 INDEX FUND | |
| SCHEDULE OF INVESTMENTS (Continued) | |
| | |
| COMMON STOCKS - 99.9% (Continued) | | Shares | | | Value | |
| Financials - 15.8% (Continued) | | | | | | |
| Capital Markets - 2.5% (Continued) | | | | | | |
| Fifth Street Finance Corp. | | | 1,750 | | | $ | 9,398 | |
| Financial Engines, Inc. | | | 225 | | | | 8,269 | |
| Franklin Resources, Inc. | | | 3,221 | | | | 127,487 | |
FS Investment Corp. (b) | | | 2,700 | | | | 27,810 | |
| Goldman Sachs Group, Inc. (The) | | | 2,988 | | | | 715,476 | |
| Golub Capital BDC, Inc. | | | 475 | | | | 8,735 | |
| Greenhill & Co., Inc. | | | 300 | | | | 8,310 | |
| Hercules Capital, Inc. | | | 775 | | | | 10,935 | |
| HFF, Inc. - Class A | | | 375 | | | | 11,344 | |
Interactive Brokers Group, Inc. - Class A (b) | | | 500 | | | | 18,255 | |
INTL FCStone, Inc. (a) | | | 500 | | | | 19,800 | |
| Invesco Ltd. | | | 3,400 | | | | 103,156 | |
| Investment Technology Group, Inc. | | | 1,000 | | | | 19,740 | |
Janus Capital Group, Inc. (b) | | | 1,425 | | | | 18,910 | |
| Legg Mason, Inc. | | | 750 | | | | 22,433 | |
| LPL Financial Holdings, Inc. | | | 200 | | | | 7,042 | |
| Main Street Capital Corp. | | | 475 | | | | 17,466 | |
| Moody's Corp. | | | 1,359 | | | | 128,113 | |
| Morgan Stanley | | | 12,175 | | | | 514,393 | |
| Morningstar, Inc. | | | 207 | | | | 15,227 | |
New Mountain Finance Corp. (b) | | | 650 | | | | 9,165 | |
| Northern Trust Corp. | | | 1,875 | | | | 166,969 | |
| NorthStar Asset Management Group, Inc. | | | 1,428 | | | | 21,306 | |
| Oaktree Capital Group, LLC | | | 1,100 | | | | 41,250 | |
Prospect Capital Corp. (b) | | | 3,375 | | | | 28,181 | |
| Pzena Investment Management, Inc. - Class A | | | 2,077 | | | | 23,075 | |
| Raymond James Financial, Inc. | | | 925 | | | | 64,075 | |
| SEI Investments Co. | | | 975 | | | | 48,126 | |
| Solar Capital Ltd. | | | 500 | | | | 10,410 | |
| State Street Corp. | | | 3,029 | | | | 235,414 | |
Stifel Financial Corp. (a) | | | 340 | | | | 16,983 | |
| T. Rowe Price Group, Inc. | | | 2,028 | | | | 152,627 | |
| TD Ameritrade Holding Corp. | | | 2,353 | | | | 102,591 | |
Triangle Capital Corp. (b) | | | 350 | | | | 6,419 | |
| Virtus Investment Partners, Inc. | | | 48 | | | | 5,666 | |
| WILSHIRE 5000 INDEX FUND | |
| SCHEDULE OF INVESTMENTS (Continued) | |
| | |
| COMMON STOCKS - 99.9% (Continued) | | Shares | | | Value | |
| Financials - 15.8% (Continued) | | | | | | |
| Capital Markets - 2.5% (Continued) | | | | | | |
Waddell & Reed Financial, Inc. - Class A (b) | | | 525 | | | $ | 10,243 | |
WisdomTree Investments, Inc. (b) | | | 750 | | | | 8,355 | |
| | | | | | | | 4,420,337 | |
| Consumer Finance - 0.9% | | | | | | | | |
| Ally Financial, Inc. | | | 4,200 | | | | 79,884 | |
| American Express Co. | | | 6,028 | | | | 446,553 | |
| Capital One Financial Corp. | | | 3,584 | | | | 312,668 | |
Credit Acceptance Corp. (a) (b) | | | 112 | | | | 24,361 | |
| Discover Financial Services | | | 3,075 | | | | 221,677 | |
Encore Capital Group, Inc. (a) | | | 200 | | | | 5,730 | |
Enova International, Inc. (a) | | | 297 | | | | 3,727 | |
EZCORP, Inc. - Class A (a) | | | 1,000 | | | | 10,650 | |
First Data Corp. - Class A (a) (b) | | | 1,825 | | | | 25,897 | |
| FirstCash, Inc. | | | 221 | | | | 10,387 | |
Green Dot Corp. - Class A (a) | | | 550 | | | | 12,953 | |
| Navient Corp. | | | 2,050 | | | | 33,682 | |
| Nelnet, Inc. - Class A | | | 325 | | | | 16,494 | |
OneMain Holdings, Inc. (a) (b) | | | 300 | | | | 6,642 | |
PRA Group, Inc. (a) | | | 300 | | | | 11,730 | |
SLM Corp. (a) | | | 2,500 | | | | 27,550 | |
| Synchrony Financial | | | 6,475 | | | | 234,848 | |
World Acceptance Corp. (a) (b) | | | 100 | | | | 6,428 | |
| | | | | | | | 1,491,861 | |
| Diversified Financial Services - 2.1% | | | | | | | | |
Berkshire Hathaway, Inc. - Class B (a) | | | 15,617 | | | | 2,545,258 | |
CBOE Holdings, Inc. (b) | | | 100 | | | | 7,389 | |
| CME Group, Inc. | | | 2,338 | | | | 269,688 | |
IHS Markit Ltd. (a) | | | 2,468 | | | | 87,392 | |
| Intercontinental Exchange, Inc. | | | 4,700 | | | | 265,174 | |
| Leucadia National Corp. | | | 2,732 | | | | 63,519 | |
| MarketAxess Holdings, Inc. | | | 250 | | | | 36,730 | |
| MSCI, Inc. | | | 641 | | | | 50,498 | |
| Nasdaq, Inc. | | | 1,025 | | | | 68,798 | |
PHH Corp. (a) | | | 573 | | | | 8,687 | |
| S&p Global, Inc. | | | 2,012 | | | | 216,370 | |
| WILSHIRE 5000 INDEX FUND | |
| SCHEDULE OF INVESTMENTS (Continued) | |
| | |
| COMMON STOCKS - 99.9% (Continued) | | Shares | | | Value | |
| Financials - 15.8% (Continued) | | | | | | |
| Diversified Financial Services - 2.1% (Continued) | | | | | | |
| Voya Financial, Inc. | | | 1,575 | | | $ | 61,772 | |
| | | | | | | | 3,681,275 | |
| Insurance - 2.7% | | | | | | | | |
| Aflac, Inc. | | | 3,100 | | | | 215,760 | |
Alleghany Corp. (a) | | | 127 | | | | 77,231 | |
| Allstate Corp. (The) | | | 2,775 | | | | 205,683 | |
| American Equity Investment Life Holding Co. | | | 625 | | | | 14,088 | |
| American Financial Group, Inc. | | | 546 | | | | 48,114 | |
| American International Group, Inc. | | | 7,550 | | | | 493,090 | |
| American National Insurance Co. | | | 181 | | | | 22,554 | |
| AmTrust Financial Services, Inc. | | | 664 | | | | 18,180 | |
Arch Capital Group Ltd. (a) | | | 619 | | | | 53,414 | |
| Argo Group International Holdings Ltd. | | | 63 | | | | 4,152 | |
| Arthur J. Gallagher & Co. | | | 1,225 | | | | 63,651 | |
| Aspen Insurance Holdings Ltd. | | | 350 | | | | 19,250 | |
| Assurant, Inc. | | | 444 | | | | 41,230 | |
| Assured Guaranty Ltd. | | | 1,075 | | | | 40,603 | |
| Axis Capital Holdings Ltd. | | | 475 | | | | 31,003 | |
| Berkley (W.R.) Corp. | | | 687 | | | | 45,692 | |
| Brown & Brown, Inc. | | | 900 | | | | 40,374 | |
| Chubb Ltd. | | | 1,487 | | | | 196,462 | |
| Cincinnati Financial Corp. | | | 1,135 | | | | 85,976 | |
| CNA Financial Corp. | | | 300 | | | | 12,450 | |
| CNO Financial Group, Inc. | | | 1,100 | | | | 21,065 | |
Crawford & Co. - Class B (b) | | | 200 | | | | 2,512 | |
| Donegal Group, Inc. - Class A | | | 1,100 | | | | 19,228 | |
eHealth, Inc. (a) | | | 175 | | | | 1,864 | |
| Employers Holdings, Inc. | | | 375 | | | | 14,850 | |
| Endurance Specialty Holdings Ltd. | | | 474 | | | | 43,798 | |
Enstar Group Ltd. (a) | | | 120 | | | | 23,724 | |
| Erie Indemnity Co. - Class A | | | 174 | | | | 19,566 | |
| Everest Re Group Ltd. | | | 226 | | | | 48,906 | |
| FBL Financial Group, Inc. - Class A | | | 300 | | | | 23,445 | |
| Federated National Holding Co. | | | 200 | | | | 3,738 | |
| First American Financial Corp. | | | 827 | | | | 30,293 | |
| WILSHIRE 5000 INDEX FUND | |
| SCHEDULE OF INVESTMENTS (Continued) | |
| | |
| COMMON STOCKS - 99.9% (Continued) | | Shares | | | Value | |
| Financials - 15.8% (Continued) | | | | | | |
| Insurance - 2.7% (Continued) | | | | | | |
| FNF Group | | | 2,259 | | | $ | 76,716 | |
Genworth Financial, Inc. - Class A (a) | | | 3,550 | | | | 13,526 | |
Hallmark Financial Services, Inc. (a) | | | 100 | | | | 1,163 | |
| Hanover Insurance Group, Inc. (The) | | | 300 | | | | 27,303 | |
| Hartford Financial Services Group, Inc. (The) | | | 2,675 | | | | 127,464 | |
| Horace Mann Educators Corp. | | | 375 | | | | 16,050 | |
| Kemper Corp. | | | 300 | | | | 13,290 | |
| Lincoln National Corp. | | | 1,600 | | | | 106,032 | |
| Loews Corp. | | | 2,625 | | | | 122,929 | |
| Maiden Holdings Ltd. | | | 675 | | | | 11,779 | |
Markel Corp. (a) | | | 138 | | | | 124,821 | |
| Marsh & McLennan Cos., Inc. | | | 3,995 | | | | 270,022 | |
MBIA, Inc. (a) | | | 925 | | | | 9,898 | |
| Mercury General Corp. | | | 300 | | | | 18,063 | |
| MetLife, Inc. | | | 7,321 | | | | 394,528 | |
| National General Holdings Corp. | | | 525 | | | | 13,120 | |
| Navigators Group, Inc. (The) | | | 100 | | | | 11,775 | |
| Old Republic International Corp. | | | 2,161 | | | | 41,059 | |
| OneBeacon Insurance Group Ltd. - Class A | | | 600 | | | | 9,630 | |
| Primerica, Inc. | | | 300 | | | | 20,745 | |
| Principal Financial Group, Inc. | | | 2,150 | | | | 124,399 | |
| ProAssurance Corp. | | | 230 | | | | 12,926 | |
| Progressive Corp. (The) | | | 4,475 | | | | 158,863 | |
| Prudential Financial, Inc. | | | 3,377 | | | | 351,410 | |
| Reinsurance Group of America, Inc. | | | 454 | | | | 57,127 | |
| RenaissanceRe Holdings Ltd. | | | 290 | | | | 39,504 | |
| RLI Corp. | | | 425 | | | | 26,830 | |
| Selective Insurance Group, Inc. | | | 300 | | | | 12,915 | |
| State Auto Financial Corp. | | | 400 | | | | 10,724 | |
| Stewart Information Services Corp. | | | 300 | | | | 13,824 | |
| Torchmark Corp. | | | 900 | | | | 66,384 | |
| Travelers Cos., Inc. (The) | | | 2,231 | | | | 273,118 | |
| United Fire Group, Inc. | | | 300 | | | | 14,751 | |
| Unum Group | | | 1,707 | | | | 74,989 | |
| Validus Holdings Ltd. | | | 483 | | | | 26,570 | |
| WILSHIRE 5000 INDEX FUND | |
| SCHEDULE OF INVESTMENTS (Continued) | |
| | |
| COMMON STOCKS - 99.9% (Continued) | | Shares | | | Value | |
| Financials - 15.8% (Continued) | | | | | | |
| Insurance - 2.7% (Continued) | | | | | | |
| Willis Towers Watson plc | | | 500 | | | $ | 61,140 | |
| | | | | | | | 4,737,333 | |
| Mortgage Real Estate Investment Trusts (REITs) - 0.3% | | | | | | | | |
AGNC Investment Corp. (b) | | | 2,500 | | | | 45,324 | |
| Altisource Residential Corp. | | | 33 | | | | 364 | |
Annaly Capital Management, Inc. (b) | | | 6,939 | | | | 69,181 | |
| Anworth Mortgage Asset Corp. | | | 1,500 | | | | 7,755 | |
Apollo Commercial Real Estate Finance, Inc. (b) | | | 600 | | | | 9,972 | |
| Arbor Realty Trust, Inc. | | | 200 | | | | 1,492 | |
| Blackstone Mortgage Trust, Inc. - Class A | | | 900 | | | | 27,063 | |
| Brixmor Property Group, Inc. | | | 2,575 | | | | 62,881 | |
| Capstead Mortgage Corp. | | | 700 | | | | 7,133 | |
| Chimera Investment Corp. | | | 1,455 | | | | 24,764 | |
Colony Capital, Inc. - Class A (b) | | | 825 | | | | 16,706 | |
| CYS Investments, Inc. | | | 1,575 | | | | 12,175 | |
Drive Shack, Inc. (b) | | | 695 | | | | 2,613 | |
Education Realty Trust, Inc. (b) | | | 633 | | | | 26,776 | |
| Four Corners Property Trust, Inc. | | | 444 | | | | 9,111 | |
| Healthcare Trust of America, Inc. - Class A | | | 1,025 | | | | 29,838 | |
| Invesco Mortgage Capital, Inc. | | | 1,000 | | | | 14,600 | |
| MFA Financial, Inc. | | | 2,250 | | | | 17,168 | |
| MTGE Investment Corp. | | | 575 | | | | 9,028 | |
| New Residential Investment Corp. | | | 1,400 | | | | 22,008 | |
| New York REIT, Inc. | | | 2,000 | | | | 20,240 | |
| PennyMac Mortgage Investment Trust | | | 775 | | | | 12,687 | |
| Physicians Realty Trust | | | 900 | | | | 17,064 | |
| Redwood Trust, Inc. | | | 450 | | | | 6,845 | |
Resource Capital Corp. (b) | | | 50 | | | | 417 | |
| Starwood Property Trust, Inc. | | | 1,825 | | | | 40,059 | |
| Two Harbors Investment Corp. | | | 2,425 | | | | 21,146 | |
| | | | | | | | 534,410 | |
| Thrifts & Mortgage Finance - 0.2% | | | | | | | | |
| Astoria Financial Corp. | | | 700 | | | | 13,055 | |
BankFinancial Corp. (b) | | | 700 | | | | 10,374 | |
| Beneficial Bancorp, Inc. | | | 549 | | | | 10,102 | |
| WILSHIRE 5000 INDEX FUND | |
| SCHEDULE OF INVESTMENTS (Continued) | |
| | |
| COMMON STOCKS - 99.9% (Continued) | | Shares | | | Value | |
| Financials - 15.8% (Continued) | | | | | | |
| Thrifts & Mortgage Finance - 0.2% (Continued) | | | | | | |
| Berkshire Hills Bancorp, Inc. | | | 300 | | | $ | 11,055 | |
| BFC Financial Corp. - Class A | | | 22 | | | | 105 | |
BofI Holding, Inc. (a) (b) | | | 672 | | | | 19,186 | |
| Brookline Bancorp, Inc. | | | 500 | | | | 8,200 | |
| Capitol Federal Financial, Inc. | | | 1,000 | | | | 16,460 | |
| Charter Financial Corp. | | | 498 | | | | 8,302 | |
Federal Home Loan Mortgage Corp. (a) | | | 5,800 | | | | 21,692 | |
Federal National Mortgage Association (a) | | | 10,325 | | | | 40,267 | |
HomeStreet, Inc. (a) | | | 300 | | | | 9,480 | |
Impac Mortgage Holdings, Inc. (a) (b) | | | 85 | | | | 1,192 | |
Kearny Financial Corp. (b) | | | 828 | | | | 12,875 | |
LendingTree, Inc. (a) (b) | | | 90 | | | | 9,122 | |
| Meta Financial Group, Inc. | | | 100 | | | | 10,290 | |
MGIC Investment Corp. (a) | | | 1,500 | | | | 15,285 | |
| New York Community Bancorp, Inc. | | | 3,662 | | | | 58,261 | |
| Northwest Bancshares, Inc. | | | 875 | | | | 15,776 | |
| Oritani Financial Corp. | | | 400 | | | | 7,500 | |
| Provident Financial Services, Inc. | | | 600 | | | | 16,980 | |
| Radian Group, Inc. | | | 1,445 | | | | 25,981 | |
| TFS Financial Corp. | | | 525 | | | | 9,996 | |
| TrustCo Bank Corp. | | | 1,208 | | | | 10,570 | |
| United Financial Bancorp, Inc. | | | 542 | | | | 9,843 | |
| Washington Federal, Inc. | | | 733 | | | | 25,179 | |
| Western New England Bancorp, Inc. | | | 200 | | | | 1,870 | |
| WSFS Financial Corp. | | | 300 | | | | 13,905 | |
| | | | | | | | 412,903 | |
| Health Care - 12.5% | | | | | | | | |
| Biotechnology - 2.7% | | | | | | | | |
| AbbVie, Inc. | | | 11,400 | | | | 713,868 | |
ACADIA Pharmaceuticals, Inc. (a) (b) | | | 625 | | | | 18,025 | |
Acorda Therapeutics, Inc. (a) (b) | | | 375 | | | | 7,050 | |
Agios Pharmaceuticals, Inc. (a) (b) | | | 300 | | | | 12,519 | |
Alder Biopharmaceuticals, Inc. (a) (b) | | | 300 | | | | 6,240 | |
Alexion Pharmaceuticals, Inc. (a) | | | 1,449 | | | | 177,285 | |
Alkermes plc (a) | | | 1,000 | | | | 55,580 | |
| WILSHIRE 5000 INDEX FUND | |
| SCHEDULE OF INVESTMENTS (Continued) | |
| | |
| COMMON STOCKS - 99.9% (Continued) | | Shares | | | Value | |
| Health Care - 12.5% (Continued) | | | | | | |
| Biotechnology - 2.7% (Continued) | | | | | | |
Alnylam Pharmaceuticals, Inc. (a) (b) | | | 413 | | | $ | 15,463 | |
AMAG Pharmaceuticals, Inc. (a) (b) | | | 100 | | | | 3,480 | |
| Amgen, Inc. | | | 5,213 | | | | 762,192 | |
Amicus Therapeutics, Inc. (a) (b) | | | 1,225 | | | | 6,088 | |
ARIAD Pharmaceuticals, Inc. (a) (b) | | | 1,775 | | | | 22,081 | |
Array BioPharma, Inc. (a) (b) | | | 1,175 | | | | 10,328 | |
Biogen, Inc. (a) | | | 1,532 | | | | 434,445 | |
BioMarin Pharmaceutical, Inc. (a) | | | 1,096 | | | | 90,793 | |
Bluebird Bio, Inc. (a) (b) | | | 286 | | | | 17,646 | |
Celgene Corp. (a) | | | 6,153 | | | | 712,210 | |
Chimerix, Inc. (a) | | | 300 | | | | 1,380 | |
Clovis Oncology, Inc. (a) (b) | | | 300 | | | | 13,326 | |
Dynavax Technologies Corp. (a) (b) | | | 425 | | | | 1,679 | |
Emergent BioSolutions, Inc. (a) | | | 293 | | | | 9,622 | |
Exact Sciences Corp. (a) (b) | | | 775 | | | | 10,354 | |
Exelixis, Inc. (a) | | | 1,875 | | | | 27,956 | |
Genomic Health, Inc. (a) | | | 200 | | | | 5,878 | |
| Gilead Sciences, Inc. | | | 10,467 | | | | 749,541 | |
Halozyme Therapeutics, Inc. (a) (b) | | | 750 | | | | 7,410 | |
Incyte Corp. (a) | | | 1,443 | | | | 144,690 | |
Intercept Pharmaceuticals, Inc. (a) (b) | | | 137 | | | | 14,885 | |
Intrexon Corp. (a) (b) | | | 400 | | | | 9,720 | |
Ionis Pharmaceuticals, Inc. (a) (b) | | | 700 | | | | 33,481 | |
Ironwood Pharmaceuticals, Inc. (a) (b) | | | 1,000 | | | | 15,290 | |
Keryx Biopharmaceuticals, Inc. (a) (b) | | | 975 | | | | 5,714 | |
Kite Pharma, Inc. (a) (b) | | | 300 | | | | 13,452 | |
Ligand Pharmaceuticals, Inc. (a) (b) | | | 164 | | | | 16,664 | |
Momenta Pharmaceuticals, Inc. (a) | | | 200 | | | | 3,010 | |
Myriad Genetics, Inc. (a) (b) | | | 450 | | | | 7,502 | |
Neurocrine Biosciences, Inc. (a) | | | 500 | | | | 19,350 | |
NewLink Genetics Corp. (a) (b) | | | 300 | | | | 3,084 | |
Ophthotech Corp. (a) (b) | | | 300 | | | | 1,449 | |
OPKO Health, Inc. (a) (b) | | | 3,000 | | | | 27,900 | |
Portola Pharmaceuticals, Inc. (a) (b) | | | 300 | | | | 6,732 | |
Progenics Pharmaceuticals, Inc. (a) (b) | | | 800 | | | | 6,912 | |
| WILSHIRE 5000 INDEX FUND | |
| SCHEDULE OF INVESTMENTS (Continued) | |
| | |
| COMMON STOCKS - 99.9% (Continued) | | Shares | | | Value | |
| Health Care - 12.5% (Continued) | | | | | | |
| Biotechnology - 2.7% (Continued) | | | | | | |
Puma Biotechnology, Inc. (a) | | | 254 | | | $ | 7,798 | |
Regeneron Pharmaceuticals, Inc. (a) | | | 569 | | | | 208,874 | |
Repligen Corp. (a) | | | 300 | | | | 9,246 | |
Sage Therapeutics, Inc. (a) | | | 300 | | | | 15,318 | |
Sarepta Therapeutics, Inc. (a) | | | 400 | | | | 10,972 | |
Seattle Genetics, Inc. (a) (b) | | | 625 | | | | 32,981 | |
TESARO, Inc. (a) | | | 174 | | | | 23,400 | |
Ultragenyx Pharmaceutical, Inc. (a) (b) | | | 207 | | | | 14,554 | |
United Therapeutics Corp. (a) (b) | | | 288 | | | | 41,308 | |
Vertex Pharmaceuticals, Inc. (a) | | | 1,608 | | | | 118,461 | |
ZIOPHARM Oncology, Inc. (a) (b) | | | 64 | | | | 342 | |
| | | | | | | | 4,705,528 | |
| Health Care Equipment & Supplies - 2.1% | | | | | | | | |
| Abbott Laboratories | | | 12,175 | | | | 467,641 | |
ABIOMED, Inc. (a) | | | 250 | | | | 28,170 | |
Alere, Inc. (a) | | | 550 | | | | 21,434 | |
Align Technology, Inc. (a) | | | 554 | | | | 53,256 | |
| Analogic Corp. | | | 130 | | | | 10,784 | |
Anika Therapeutics, Inc. (a) | | | 500 | | | | 24,480 | |
| Baxter International, Inc. | | | 4,563 | | | | 202,323 | |
| Becton, Dickinson and Co. | | | 1,625 | | | | 269,019 | |
Boston Scientific Corp. (a) | | | 8,664 | | | | 187,402 | |
| C.R. Bard, Inc. | | | 545 | | | | 122,440 | |
| Cantel Medical Corp. | | | 200 | | | | 15,750 | |
Cardiovascular Systems, Inc. (a) | | | 325 | | | | 7,868 | |
| CONMED Corp. | | | 300 | | | | 13,251 | |
| Cooper Cos., Inc. (The) | | | 300 | | | | 52,479 | |
Cynosure, Inc. - Class A (a) | | | 91 | | | | 4,150 | |
| Danaher Corp. | | | 4,700 | | | | 365,847 | |
| DENTSPLY SIRONA, Inc. | | | 1,852 | | | | 106,916 | |
DexCom, Inc. (a) | | | 598 | | | | 35,701 | |
Edwards Lifesciences Corp. (a) | | | 1,573 | | | | 147,390 | |
Endologix, Inc. (a) (b) | | | 700 | | | | 4,004 | |
Haemonetics Corp. (a) | | | 250 | | | | 10,050 | |
Halyard Health, Inc. (a) | | | 297 | | | | 10,983 | |
| WILSHIRE 5000 INDEX FUND | |
| SCHEDULE OF INVESTMENTS (Continued) | |
| | |
| COMMON STOCKS - 99.9% (Continued) | | Shares | | | Value | |
| Health Care - 12.5% (Continued) | | | | | | |
| Health Care Equipment & Supplies - 2.1% (Continued) | | | | | | |
| Hill-Rom Holdings, Inc. | | | 300 | | | $ | 16,842 | |
Hologic, Inc. (a) | | | 2,077 | | | | 83,329 | |
ICU Medical, Inc. (a) | | | 100 | | | | 14,735 | |
IDEXX Laboratories, Inc. (a) | | | 710 | | | | 83,262 | |
Insulet Corp. (a) (b) | | | 175 | | | | 6,594 | |
Integer Holdings Corp. (a) | | | 300 | | | | 8,835 | |
Integra LifeSciences Holdings Corp. (a) (b) | | | 189 | | | | 16,214 | |
Intuitive Surgical, Inc. (a) | | | 265 | | | | 168,055 | |
LivaNova plc (a) (b) | | | 300 | | | | 13,491 | |
Masimo Corp. (a) | | | 300 | | | | 20,220 | |
| Meridian Bioscience, Inc. | | | 375 | | | | 6,638 | |
MGC Diagnostics Corp. (a) | | | 600 | | | | 4,500 | |
Natus Medical, Inc. (a) | | | 375 | | | | 13,050 | |
Neogen Corp. (a) | | | 350 | | | | 23,100 | |
Nevro Corp. (a) (b) | | | 300 | | | | 21,798 | |
NuVasive, Inc. (a) | | | 400 | | | | 26,944 | |
Nuvectra Corp. (a) | | | 100 | | | | 503 | |
NxStage Medical, Inc. (a) | | | 450 | | | | 11,795 | |
Quidel Corp. (a) | | | 300 | | | | 6,426 | |
ResMed, Inc. (b) | | | 800 | | | | 49,640 | |
SeaSpine Holdings Corp. (a) | | | 100 | | | | 790 | |
Spectranetics Corp. (The) (a) (b) | | | 475 | | | | 11,638 | |
| St. Jude Medical, Inc. | | | 2,137 | | | | 171,366 | |
| STERIS plc | | | 350 | | | | 23,587 | |
| Stryker Corp. | | | 2,529 | | | | 302,999 | |
| Teleflex, Inc. | | | 300 | | | | 48,345 | |
Varian Medical Systems, Inc. (a) | | | 707 | | | | 63,474 | |
| West Pharmaceutical Services, Inc. | | | 505 | | | | 42,839 | |
Wright Medical Group N.V. (a) (b) | | | 773 | | | | 17,764 | |
| Zimmer Biomet Holdings, Inc. | | | 1,675 | | | | 172,860 | |
| | | | | | | | 3,612,971 | |
| Health Care Providers & Services - 2.4% | | | | | | | | |
Acadia Healthcare Co., Inc. (a) (b) | | | 775 | | | | 25,653 | |
| Aetna, Inc. | | | 2,939 | | | | 364,464 | |
Air Methods Corp. (a) (b) | | | 300 | | | | 9,555 | |
| WILSHIRE 5000 INDEX FUND | |
| SCHEDULE OF INVESTMENTS (Continued) | |
| | |
| COMMON STOCKS - 99.9% (Continued) | | Shares | | | Value | |
| Health Care - 12.5% (Continued) | | | | | | |
| Health Care Providers & Services - 2.4% (Continued) | | | | | | |
Alliance HealthCare Services, Inc. (a) | | | 140 | | | $ | 1,344 | |
Amedisys, Inc. (a) | | | 201 | | | | 8,569 | |
| AmerisourceBergen Corp. | | | 1,245 | | | | 97,347 | |
AMN Healthcare Services, Inc. (a) | | | 250 | | | | 9,613 | |
| Anthem, Inc. | | | 2,160 | | | | 310,543 | |
Brookdale Senior Living, Inc. (a) | | | 1,294 | | | | 16,071 | |
Capital Senior Living Corp. (a) | | | 100 | | | | 1,605 | |
| Cardinal Health, Inc. | | | 2,348 | | | | 168,986 | |
Centene Corp. (a) | | | 1,333 | | | | 75,328 | |
| Chemed Corp. | | | 136 | | | | 21,816 | |
| Cigna Corp. | | | 2,108 | | | | 281,186 | |
Community Health Systems, Inc. (a) | | | 832 | | | | 4,651 | |
DaVita, Inc. (a) | | | 1,333 | | | | 85,579 | |
| Ensign Group, Inc. (The) | | | 600 | | | | 13,326 | |
Express Scripts Holding Co. (a) | | | 4,536 | | | | 312,030 | |
Hanger, Inc. (a) (b) | | | 350 | | | | 4,025 | |
HCA Holdings, Inc. (a) | | | 200 | | | | 14,804 | |
| HealthSouth Corp. | | | 650 | | | | 26,806 | |
Henry Schein, Inc. (a) | | | 545 | | | | 82,682 | |
HMS Holdings Corp. (a) | | | 925 | | | | 16,798 | |
| Humana, Inc. | | | 1,094 | | | | 223,209 | |
| Kindred Healthcare, Inc. | | | 587 | | | | 4,608 | |
Laboratory Corp. of America Holdings (a) | | | 770 | | | | 98,853 | |
LHC Group, Inc. (a) | | | 600 | | | | 27,420 | |
LifePoint Hospitals, Inc. (a) | | | 265 | | | | 15,052 | |
Magellan Health, Inc. (a) | | | 100 | | | | 7,525 | |
| McKesson Corp. | | | 1,699 | | | | 238,625 | |
MEDNAX, Inc. (a) (b) | | | 600 | | | | 39,996 | |
Molina Healthcare, Inc. (a) | | | 300 | | | | 16,278 | |
| Owens & Minor, Inc. | | | 575 | | | | 20,292 | |
Patterson Cos., Inc. (b) | | | 575 | | | | 23,592 | |
PharMerica Corp. (a) | | | 381 | | | | 9,582 | |
Premier, Inc. - Class A (a) | | | 350 | | | | 10,626 | |
Providence Service Corp. (The) (a) | | | 200 | | | | 7,610 | |
| Quest Diagnostics, Inc. | | | 977 | | | | 89,786 | |
| WILSHIRE 5000 INDEX FUND | |
| SCHEDULE OF INVESTMENTS (Continued) | |
| | |
| COMMON STOCKS - 99.9% (Continued) | | Shares | | | Value | |
| Health Care - 12.5% (Continued) | | | | | | |
| Health Care Providers & Services - 2.4% (Continued) | | | | | | |
Quorum Health Corp. (a) | | | 208 | | | $ | 1,512 | |
Select Medical Holdings Corp. (a) | | | 1,250 | | | | 16,563 | |
Surgical Care Affiliates, Inc. (a) | | | 300 | | | | 13,881 | |
Team Health Holdings, Inc. (a) | | | 375 | | | | 16,294 | |
Tenet Healthcare Corp. (a) | | | 631 | | | | 9,364 | |
| UnitedHealth Group, Inc. | | | 7,072 | | | | 1,131,802 | |
Universal American Corp. (a) (b) | | | 500 | | | | 4,975 | |
| Universal Health Services, Inc. - Class B | | | 662 | | | | 70,424 | |
VCA, Inc. (a) | | | 525 | | | | 36,041 | |
WellCare Health Plans, Inc. (a) | | | 329 | | | | 45,099 | |
| | | | | | | | 4,131,790 | |
Health Care Services - 0.0% (c) | | | | | | | | |
Envision Healthcare Corp. (a) (b) | | | 575 | | | | 36,417 | |
| | | | | | | | | |
| Health Care Technology - 0.1% | | | | | | | | |
Allscripts Healthcare Solutions, Inc. (a) | | | 1,825 | | | | 18,633 | |
athenahealth, Inc. (a) (b) | | | 192 | | | | 20,193 | |
Cerner Corp. (a) | | | 2,500 | | | | 118,424 | |
Computer Programs & Systems, Inc. (b) | | | 100 | | | | 2,360 | |
Cotiviti Holdings, Inc. (a) (b) | | | 300 | | | | 10,320 | |
Medidata Solutions, Inc. (a) | | | 425 | | | | 21,110 | |
Omnicell, Inc. (a) | | | 375 | | | | 12,713 | |
| Quality Systems, Inc. | | | 575 | | | | 7,561 | |
| Simulations Plus, Inc. | | | 600 | | | | 5,790 | |
Veeva Systems, Inc. - Class A (a) | | | 725 | | | | 29,508 | |
| | | | | | | | 246,612 | |
| Life Sciences Tools & Services - 0.7% | | | | | | | | |
| Agilent Technologies, Inc. | | | 2,496 | | | | 113,717 | |
Albany Molecular Research, Inc. (a) (b) | | | 700 | | | | 13,132 | |
Bio-Rad Laboratories, Inc. - Class A (a) | | | 199 | | | | 36,274 | |
| Bio-Techne Corp. | | | 232 | | | | 23,857 | |
| Bruker Corp. | | | 725 | | | | 15,356 | |
Cambrex Corp. (a) | | | 350 | | | | 18,883 | |
Charles River Laboratories International, Inc. (a) | | | 346 | | | | 26,362 | |
Illumina, Inc. (a) | | | 852 | | | | 109,089 | |
| WILSHIRE 5000 INDEX FUND | |
| SCHEDULE OF INVESTMENTS (Continued) | |
| | |
| COMMON STOCKS - 99.9% (Continued) | | Shares | | | Value | |
| Health Care - 12.5% (Continued) | | | | | | |
| Life Sciences Tools & Services - 0.7% (Continued) | | | | | | |
Mettler-Toledo International, Inc. (a) | | | 200 | | | $ | 83,712 | |
PAREXEL International Corp. (a) (b) | | | 300 | | | | 19,716 | |
| PerkinElmer, Inc. | | | 792 | | | | 41,303 | |
PRA Health Sciences, Inc. (a) | | | 300 | | | | 16,536 | |
Quintiles IMS Holdings, Inc. (a) | | | 1,067 | | | | 81,130 | |
| Thermo Fisher Scientific, Inc. | | | 3,135 | | | | 442,348 | |
VWR Corp. (a) | | | 625 | | | | 15,644 | |
Waters Corp. (a) | | | 644 | | | | 86,547 | |
| | | | | | | | 1,143,606 | |
| Pharmaceuticals - 4.5% | | | | | | | | |
Akorn, Inc. (a) (b) | | | 600 | | | | 13,098 | |
Allergan plc (a) | | | 2,945 | | | | 618,479 | |
| Bristol-Myers Squibb Co. | | | 13,125 | | | | 767,025 | |
Catalent, Inc. (a) | | | 550 | | | | 14,828 | |
Depomed, Inc. (a) (b) | | | 675 | | | | 12,164 | |
Dermira, Inc. (a) | | | 300 | | | | 9,099 | |
| Eli Lilly & Co. | | | 7,676 | | | | 564,570 | |
Endo International plc (a) (b) | | | 922 | | | | 15,185 | |
Horizon Pharma plc (a) | | | 1,125 | | | | 18,203 | |
Impax Laboratories, Inc. (a) | | | 650 | | | | 8,613 | |
Innoviva, Inc. (a) (b) | | | 1,000 | | | | 10,700 | |
| Johnson & Johnson | | | 21,363 | | | | 2,461,230 | |
Lannett Co., Inc. (a) (b) | | | 300 | | | | 6,615 | |
Medicines Co. (The) (a) (b) | | | 350 | | | | 11,879 | |
| Merck & Co., Inc. | | | 21,655 | | | | 1,274,830 | |
Mylan N.V. (a) | | | 3,675 | | | | 140,201 | |
Nektar Therapeutics (a) | | | 950 | | | | 11,657 | |
Pacira Pharmaceuticals, Inc. (a) | | | 375 | | | | 12,113 | |
Paratek Pharmaceuticals, Inc. (a) | | | 6 | | | | 92 | |
| Pfizer, Inc. | | | 48,162 | | | | 1,564,301 | |
Prestige Brands Holdings, Inc. (a) | | | 350 | | | | 18,235 | |
Shire plc - ADR (b) | | | 920 | | | | 156,750 | |
Tetraphase Pharmaceuticals, Inc. (a) | | | 300 | | | | 1,209 | |
TherapeuticsMD, Inc. (a) (b) | | | 1,275 | | | | 7,357 | |
| WILSHIRE 5000 INDEX FUND | |
| SCHEDULE OF INVESTMENTS (Continued) | |
| | |
| COMMON STOCKS - 99.9% (Continued) | | Shares | | | Value | |
| Health Care - 12.5% (Continued) | | | | | | |
| Pharmaceuticals - 4.5% (Continued) | | | | | | |
| Zoetis, Inc. | | | 950 | | | $ | 50,854 | |
| | | | | | | | 7,769,287 | |
| Industrials - 10.7% | | | | | | | | |
| Aerospace & Defense - 2.2% | | | | | | | | |
| AAR Corp. | | | 300 | | | | 9,915 | |
AdvanSix, Inc. (a) | | | 250 | | | | 5,535 | |
Aerojet Rocketdyne Holdings, Inc. (a) | | | 500 | | | | 8,975 | |
| Arconic, Inc. | | | 3,490 | | | | 64,705 | |
Astronics Corp. (a) | | | 300 | | | | 10,152 | |
Astronics Corp. - Class B (a) | | | 96 | | | | 3,235 | |
| B/E Aerospace, Inc. | | | 834 | | | | 50,198 | |
| Boeing Co. (The) | | | 4,481 | | | | 697,602 | |
| BWX Technologies, Inc. | | | 912 | | | | 36,206 | |
| Cubic Corp. | | | 300 | | | | 14,385 | |
| Curtiss-Wright Corp. | | | 300 | | | | 29,508 | |
DigitalGlobe, Inc. (a) | | | 450 | | | | 12,893 | |
Engility Holdings, Inc. (a) | | | 179 | | | | 6,032 | |
Esterline Technologies Corp. (a) | | | 190 | | | | 16,948 | |
| General Dynamics Corp. | | | 1,870 | | | | 322,874 | |
| HEICO Corp. - Class A | | | 350 | | | | 23,765 | |
| Hexcel Corp. | | | 750 | | | | 38,580 | |
| Huntington Ingalls Industries, Inc. | | | 319 | | | | 58,757 | |
KLX, Inc. (a) | | | 317 | | | | 14,300 | |
Kratos Defense & Security Solutions, Inc. (a) (b) | | | 10 | | | | 74 | |
| L-3 Technologies, Inc. | | | 612 | | | | 93,091 | |
LMI Aerospace, Inc. (a) (b) | | | 100 | | | | 862 | |
| Lockheed Martin Corp. | | | 2,103 | | | | 525,624 | |
Moog, Inc. - Class A (a) | | | 300 | | | | 19,704 | |
| Northrop Grumman Corp. | | | 1,367 | | | | 317,937 | |
| Orbital ATK, Inc. | | | 423 | | | | 37,110 | |
| Raytheon Co. | | | 2,306 | | | | 327,452 | |
Rockwell Collins, Inc. (b) | | | 924 | | | | 85,710 | |
| Spirit AeroSystems Holdings, Inc. - Class A | | | 1,000 | | | | 58,350 | |
TASER International, Inc. (a) (b) | | | 325 | | | | 7,878 | |
Teledyne Technologies, Inc. (a) | | | 211 | | | | 25,953 | |
| WILSHIRE 5000 INDEX FUND | |
| SCHEDULE OF INVESTMENTS (Continued) | |
| | |
| COMMON STOCKS - 99.9% (Continued) | | Shares | | | Value | |
| Industrials - 10.7% (Continued) | | | | | | |
| Aerospace & Defense - 2.2% (Continued) | | | | | | |
| Textron, Inc. | | | 1,850 | | | $ | 89,836 | |
| TransDigm Group, Inc. | | | 398 | | | | 99,086 | |
| Triumph Group, Inc. | | | 256 | | | | 6,784 | |
| United Technologies Corp. | | | 6,535 | | | | 716,367 | |
Vectrus, Inc. (a) | | | 122 | | | | 2,910 | |
| | | | | | | | 3,839,293 | |
| Air Freight & Logistics - 0.6% | | | | | | | | |
C.H. Robinson Worldwide, Inc. (b) | | | 900 | | | | 65,934 | |
| Expeditors International of Washington, Inc. | | | 1,250 | | | | 66,200 | |
| FedEx Corp. | | | 1,817 | | | | 338,325 | |
| Forward Air Corp. | | | 300 | | | | 14,214 | |
Hub Group, Inc. - Class A (a) | | | 350 | | | | 15,313 | |
| United Parcel Service, Inc. - Class B | | | 4,200 | | | | 481,488 | |
XPO Logistics, Inc. (a) (b) | | | 655 | | | | 28,270 | |
| | | | | | | | 1,009,744 | |
| Airlines - 0.6% | | | | | | | | |
| Alaska Air Group, Inc. | | | 834 | | | | 74,001 | |
| Allegiant Travel Co. | | | 53 | | | | 8,819 | |
| American Airlines Group, Inc. | | | 3,711 | | | | 173,267 | |
| Delta Air Lines, Inc. | | | 5,950 | | | | 292,680 | |
Hawaiian Holdings, Inc. (a) | | | 325 | | | | 18,525 | |
JetBlue Airways Corp. (a) | | | 1,750 | | | | 39,235 | |
| SkyWest, Inc. | | | 375 | | | | 13,669 | |
| Southwest Airlines Co. | | | 3,824 | | | | 190,588 | |
United Continental Holdings, Inc. (a) | | | 2,331 | | | | 169,883 | |
| | | | | | | | 980,667 | |
| Building Products - 0.3% | | | | | | | | |
| A.O. Smith Corp. | | | 1,040 | | | | 49,244 | |
| AAON, Inc. | | | 225 | | | | 7,436 | |
American Woodmark Corp. (a) | | | 130 | | | | 9,783 | |
| Apogee Enterprises, Inc. | | | 200 | | | | 10,712 | |
Armstrong Flooring, Inc. (a) (b) | | | 100 | | | | 1,991 | |
Armstrong World Industries, Inc. (a) (b) | | | 200 | | | | 8,360 | |
Builders FirstSource, Inc. (a) | | | 450 | | | | 4,937 | |
| Fortune Brands Home & Security, Inc. | | | 1,000 | | | | 53,460 | |
| WILSHIRE 5000 INDEX FUND | |
| SCHEDULE OF INVESTMENTS (Continued) | |
| | |
| COMMON STOCKS - 99.9% (Continued) | | Shares | | | Value | |
| Industrials - 10.7% (Continued) | | | | | | |
| Building Products - 0.3% (Continued) | | | | | | |
Gibraltar Industries, Inc. (a) | | | 300 | | | $ | 12,495 | |
| Griffon Corp. | | | 350 | | | | 9,170 | |
| Insteel Industries, Inc. | | | 300 | | | | 10,692 | |
| Johnson Controls International plc | | | 3,750 | | | | 154,462 | |
| Lennox International, Inc. | | | 257 | | | | 39,365 | |
| Masco Corp. | | | 2,475 | | | | 78,259 | |
NCI Building Systems, Inc. (a) | | | 500 | | | | 7,825 | |
| Owens Corning, Inc. | | | 800 | | | | 41,248 | |
| Quanex Building Products Corp. | | | 1,000 | | | | 20,300 | |
| Simpson Manufacturing Co., Inc. | | | 400 | | | | 17,500 | |
TopBuild Corp. (a) | | | 325 | | | | 11,570 | |
Trex Co., Inc. (a) | | | 225 | | | | 14,490 | |
| Universal Forest Products, Inc. | | | 133 | | | | 13,590 | |
USG Corp. (a) (b) | | | 775 | | | | 22,382 | |
| | | | | | | | 599,271 | |
| Commercial Services & Supplies - 0.6% | | | | | | | | |
| ABM Industries, Inc. | | | 500 | | | | 20,420 | |
ACCO Brands Corp. (a) | | | 825 | | | | 10,766 | |
| Brady Corp. - Class A | | | 145 | | | | 5,445 | |
| Brink's Co. (The) | | | 450 | | | | 18,563 | |
Casella Waste Systems, Inc. - Class A (a) | | | 100 | | | | 1,241 | |
| CECO Environmental Corp. | | | 400 | | | | 5,580 | |
| Cintas Corp. | | | 701 | | | | 81,008 | |
Clean Harbors, Inc. (a) | | | 400 | | | | 22,260 | |
Copart, Inc. (a) | | | 700 | | | | 38,787 | |
Covanta Holding Corp. (b) | | | 850 | | | | 13,260 | |
| Deluxe Corp. | | | 200 | | | | 14,322 | |
| Ennis, Inc. | | | 50 | | | | 868 | |
G&K Services, Inc. - Class A (b) | | | 143 | | | | 13,792 | |
| Healthcare Services Group, Inc. | | | 675 | | | | 26,440 | |
| Herman Miller, Inc. | | | 300 | | | | 10,260 | |
| HNI Corp. | | | 400 | | | | 22,368 | |
InnerWorkings, Inc. (a) | | | 500 | | | | 4,925 | |
| Interface, Inc. | | | 500 | | | | 9,275 | |
| KAR Auction Services, Inc. | | | 400 | | | | 17,048 | |
| WILSHIRE 5000 INDEX FUND | |
| SCHEDULE OF INVESTMENTS (Continued) | |
| | |
| COMMON STOCKS - 99.9% (Continued) | | Shares | | | Value | |
| Industrials - 10.7% (Continued) | | | | | | |
| Commercial Services & Supplies - 0.6% (Continued) | | | | | | |
| Kimball International, Inc. - Class B | | | 700 | | | $ | 12,292 | |
| Knoll, Inc. | | | 500 | | | | 13,965 | |
| LSC Communications, Inc. | | | 159 | | | | 4,719 | |
| McGrath RentCorp | | | 300 | | | | 11,757 | |
Mobile Mini, Inc. (b) | | | 406 | | | | 12,282 | |
| MSA Safety, Inc. | | | 350 | | | | 24,266 | |
| Pitney Bowes, Inc. | | | 1,375 | | | | 20,886 | |
| R.R. Donnelley & Sons Co. | | | 425 | | | | 6,936 | |
| Republic Services, Inc. | | | 1,743 | | | | 99,437 | |
Rollins, Inc. (b) | | | 900 | | | | 30,402 | |
| Steelcase, Inc. - Class A | | | 875 | | | | 15,663 | |
Stericycle, Inc. (a) | | | 675 | | | | 52,002 | |
Team, Inc. (a) | | | 164 | | | | 6,437 | |
| Tetra Tech, Inc. | | | 418 | | | | 18,037 | |
TRC Cos., Inc. (a) | | | 100 | | | | 1,060 | |
| UniFirst Corp. | | | 86 | | | | 12,354 | |
| US Ecology, Inc. | | | 200 | | | | 9,830 | |
| Viad Corp. | | | 100 | | | | 4,410 | |
| Waste Connections, Inc. | | | 1,137 | | | | 89,356 | |
| Waste Management, Inc. | | | 3,375 | | | | 239,320 | |
| West Corp. | | | 425 | | | | 10,523 | |
| | | | | | | | 1,032,562 | |
| Construction & Engineering - 0.2% | | | | | | | | |
AECOM (a) | | | 977 | | | | 35,524 | |
| Comfort Systems USA, Inc. | | | 300 | | | | 9,990 | |
Dycom Industries, Inc. (a) (b) | | | 211 | | | | 16,941 | |
| EMCOR Group, Inc. | | | 500 | | | | 35,380 | |
| Fluor Corp. | | | 1,086 | | | | 57,036 | |
| Granite Construction, Inc. | | | 400 | | | | 22,000 | |
Great Lakes Dredge & Dock Corp. (a) | | | 1,500 | | | | 6,300 | |
IES Holdings, Inc. (a) | | | 500 | | | | 9,575 | |
Jacobs Engineering Group, Inc. (a) | | | 850 | | | | 48,450 | |
| KBR, Inc. | | | 925 | | | | 15,438 | |
Layne Christensen Co. (a) (b) | | | 600 | | | | 6,522 | |
MasTec, Inc. (a) | | | 500 | | | | 19,125 | |
| WILSHIRE 5000 INDEX FUND | |
| SCHEDULE OF INVESTMENTS (Continued) | |
| | |
| COMMON STOCKS - 99.9% (Continued) | | Shares | | | Value | |
| Industrials - 10.7% (Continued) | | | | | | |
| Construction & Engineering - 0.2% (Continued) | | | | | | |
| Primoris Services Corp. | | | 475 | | | $ | 10,821 | |
Quanta Services, Inc. (a) | | | 1,050 | | | | 36,593 | |
Tutor Perini Corp. (a) (b) | | | 500 | | | | 14,000 | |
| | | | | | | | 343,695 | |
| Electrical Equipment - 0.6% | | | | | | | | |
| Acuity Brands, Inc. | | | 275 | | | | 63,487 | |
| AMETEK, Inc. | | | 1,637 | | | | 79,558 | |
| AZZ, Inc. | | | 225 | | | | 14,378 | |
Babcock & Wilcox Enterprises, Inc. (a) | | | 718 | | | | 11,912 | |
| Belden, Inc. | | | 400 | | | | 29,908 | |
| Eaton Corp. plc | | | 3,471 | | | | 232,868 | |
| Emerson Electric Co. | | | 4,978 | | | | 277,523 | |
Encore Wire Corp. (b) | | | 200 | | | | 8,670 | |
| EnerSys | | | 375 | | | | 29,288 | |
| Franklin Electric Co., Inc. | | | 275 | | | | 10,698 | |
| General Cable Corp. | | | 625 | | | | 11,906 | |
| Hubbell, Inc. | | | 338 | | | | 39,445 | |
| LSI Industries, Inc. | | | 700 | | | | 6,818 | |
| Regal Beloit Corp. | | | 100 | | | | 6,925 | |
| Rockwell Automation, Inc. | | | 1,070 | | | | 143,808 | |
Ultralife Corp. (a) | | | 200 | | | | 990 | |
Vicor Corp. (a) (b) | | | 300 | | | | 4,530 | |
| | | | | | | | 972,712 | |
| Industrial Conglomerates - 2.3% | | | | | | | | |
| 3M Co. | | | 4,723 | | | | 843,386 | |
| Carlisle Cos., Inc. | | | 423 | | | | 46,653 | |
| General Electric Co. | | | 69,471 | | | | 2,195,283 | |
| Honeywell International, Inc. | | | 6,049 | | | | 700,777 | |
| Raven Industries, Inc. | | | 275 | | | | 6,930 | |
| Roper Technologies, Inc. | | | 734 | | | | 134,381 | |
| | | | | | | | 3,927,410 | |
| Machinery - 1.8% | | | | | | | | |
| Actuant Corp. - Class A | | | 590 | | | | 15,311 | |
| AGCO Corp. | | | 400 | | | | 23,144 | |
| Albany International Corp. - Class A | | | 100 | | | | 4,630 | |
| WILSHIRE 5000 INDEX FUND | |
| SCHEDULE OF INVESTMENTS (Continued) | |
| | |
| COMMON STOCKS - 99.9% (Continued) | | Shares | | | Value | |
| Industrials - 10.7% (Continued) | | | | | | |
| Machinery - 1.8% (Continued) | | | | | | |
| Allison Transmission Holdings, Inc. | | | 300 | | | $ | 10,107 | |
| Altra Industrial Motion Corp. | | | 300 | | | | 11,070 | |
American Railcar Industries, Inc. (b) | | | 300 | | | | 13,587 | |
| Astec Industries, Inc. | | | 200 | | | | 13,492 | |
| Barnes Group, Inc. | | | 300 | | | | 14,226 | |
| Briggs & Stratton Corp. | | | 450 | | | | 10,017 | |
| Caterpillar, Inc. | | | 4,644 | | | | 430,684 | |
Chart Industries, Inc. (a) | | | 300 | | | | 10,806 | |
| CIRCOR International, Inc. | | | 184 | | | | 11,938 | |
| CLARCOR, Inc. | | | 400 | | | | 32,988 | |
Colfax Corp. (a) | | | 625 | | | | 22,456 | |
| Columbus McKinnon Corp. | | | 400 | | | | 10,816 | |
Commercial Vehicle Group, Inc. (a) | | | 300 | | | | 1,659 | |
| Crane Co. | | | 325 | | | | 23,439 | |
| Cummins, Inc. | | | 1,281 | | | | 175,073 | |
| Deere & Co. | | | 2,071 | | | | 213,395 | |
| DMC Global, Inc. | | | 400 | | | | 6,340 | |
Donaldson Co., Inc. (b) | | | 925 | | | | 38,924 | |
| Dover Corp. | | | 1,259 | | | | 94,337 | |
Energy Recovery, Inc. (a) (b) | | | 500 | | | | 5,175 | |
| EnPro Industries, Inc. | | | 178 | | | | 11,990 | |
| ESCO Technologies, Inc. | | | 200 | | | | 11,330 | |
| Federal Signal Corp. | | | 475 | | | | 7,415 | |
Flowserve Corp. (b) | | | 1,115 | | | | 53,576 | |
| Fortive Corp. | | | 2,210 | | | | 118,522 | |
| FreightCar America, Inc. | | | 500 | | | | 7,465 | |
| Gorman-Rupp Co. (The) | | | 182 | | | | 5,633 | |
| Graco, Inc. | | | 362 | | | | 30,079 | |
Greenbrier Cos., Inc. (The) (b) | | | 200 | | | | 8,310 | |
| Hardinge, Inc. | | | 850 | | | | 9,418 | |
| Hillenbrand, Inc. | | | 325 | | | | 12,464 | |
Hurco Cos., Inc. (b) | | | 400 | | | | 13,240 | |
| Hyster-Yale Materials Handling, Inc. | | | 118 | | | | 7,525 | |
| IDEX Corp. | | | 537 | | | | 48,362 | |
| Illinois Tool Works, Inc. | | | 2,312 | | | | 283,127 | |
| WILSHIRE 5000 INDEX FUND | |
| SCHEDULE OF INVESTMENTS (Continued) | |
| | |
| COMMON STOCKS - 99.9% (Continued) | | Shares | | | Value | |
| Industrials - 10.7% (Continued) | | | | | | |
| Machinery - 1.8% (Continued) | | | | | | |
| ITT, Inc. | | | 600 | | | $ | 23,142 | |
| John Bean Technologies Corp. | | | 251 | | | | 21,573 | |
| Joy Global, Inc. | | | 525 | | | | 14,700 | |
| Kennametal, Inc. | | | 475 | | | | 14,849 | |
| Lincoln Electric Holdings, Inc. | | | 432 | | | | 33,121 | |
Lindsay Corp. (b) | | | 200 | | | | 14,922 | |
| Manitowoc Co., Inc. (The) | | | 1,075 | | | | 6,429 | |
Manitowoc Foodservice, Inc. (a) (b) | | | 1,075 | | | | 20,780 | |
Meritor, Inc. (a) | | | 550 | | | | 6,831 | |
MFRI, Inc. (a) | | | 300 | | | | 2,430 | |
Middleby Corp. (The) (a) | | | 468 | | | | 60,283 | |
| Mueller Industries, Inc. | | | 300 | | | | 11,988 | |
| Mueller Water Products, Inc. - Series A | | | 1,600 | | | | 21,296 | |
| NACCO Industries, Inc. - Class A | | | 200 | | | | 18,110 | |
Navistar International Corp. (a) (b) | | | 625 | | | | 19,606 | |
| Nordson Corp. | | | 318 | | | | 35,632 | |
| Oshkosh Corp. | | | 350 | | | | 22,614 | |
| PACCAR, Inc. | | | 2,505 | | | | 160,069 | |
| Parker-Hannifin Corp. | | | 1,077 | | | | 150,779 | |
| Pentair plc | | | 1,425 | | | | 79,900 | |
RBC Bearings, Inc. (a) | | | 165 | | | | 15,314 | |
Rexnord Corp. (a) | | | 325 | | | | 6,367 | |
| Snap-on, Inc. | | | 462 | | | | 79,127 | |
SPX Corp. (a) | | | 312 | | | | 7,401 | |
SPX FLOW, Inc. (a) | | | 312 | | | | 10,003 | |
| Standex International Corp. | | | 50 | | | | 4,393 | |
| Stanley Black & Decker, Inc. | | | 1,120 | | | | 128,453 | |
| Sun Hydraulics Corp. | | | 300 | | | | 11,991 | |
| Terex Corp. | | | 825 | | | | 26,012 | |
| Timken Co. (The) | | | 375 | | | | 14,888 | |
Titan International, Inc. (b) | | | 312 | | | | 3,498 | |
| Toro Co. (The) | | | 828 | | | | 46,327 | |
| Trinity Industries, Inc. | | | 1,050 | | | | 29,148 | |
Twin Disc, Inc. (a) | | | 400 | | | | 5,840 | |
| Valmont Industries, Inc. | | | 159 | | | | 22,403 | |
| WILSHIRE 5000 INDEX FUND | |
| SCHEDULE OF INVESTMENTS (Continued) | |
| | |
| COMMON STOCKS - 99.9% (Continued) | | Shares | | | Value | |
| Industrials - 10.7% (Continued) | | | | | | |
| Machinery - 1.8% (Continued) | | | | | | |
Wabash National Corp. (a) | | | 50 | | | $ | 791 | |
WABCO Holdings, Inc. (a) | | | 403 | | | | 42,778 | |
Wabtec Corp. (b) | | | 559 | | | | 46,408 | |
| Watts Water Technologies, Inc. - Class A | | | 300 | | | | 19,560 | |
| Woodward, Inc. | | | 500 | | | | 34,525 | |
| Xylem, Inc. | | | 1,300 | | | | 64,376 | |
| | | | | | | | 3,180,727 | |
Marine - 0.0% (c) | | | | | | | | |
Kirby Corp. (a) | | | 300 | | | | 19,950 | |
| Matson, Inc. | | | 325 | | | | 11,502 | |
| | | | | | | | 31,452 | |
| Professional Services - 0.3% | | | | | | | | |
| Acacia Research Corp. | | | 300 | | | | 1,950 | |
Advisory Board Co. (The) (a) (b) | | | 100 | | | | 3,325 | |
CBIZ, Inc. (a) | | | 1,300 | | | | 17,810 | |
| CDI Corp. | | | 400 | | | | 2,960 | |
| CEB, Inc. | | | 300 | | | | 18,180 | |
| Dun & Bradstreet Corp. (The) | | | 213 | | | | 25,841 | |
| Equifax, Inc. | | | 895 | | | | 105,815 | |
| Exponent, Inc. | | | 270 | | | | 16,281 | |
FTI Consulting, Inc. (a) | | | 250 | | | | 11,270 | |
| Heidrick & Struggles International, Inc. | | | 200 | | | | 4,830 | |
Hill International, Inc. (a) (b) | | | 300 | | | | 1,305 | |
Huron Consulting Group, Inc. (a) | | | 200 | | | | 10,130 | |
| Insperity, Inc. | | | 36 | | | | 2,554 | |
| Kelly Services, Inc. - Class A | | | 400 | | | | 9,168 | |
| Kforce, Inc. | | | 150 | | | | 3,465 | |
| Korn/Ferry International | | | 525 | | | | 15,451 | |
| ManpowerGroup, Inc. | | | 513 | | | | 45,590 | |
Navigant Consulting, Inc. (a) | | | 400 | | | | 10,472 | |
On Assignment, Inc. (a) | | | 250 | | | | 11,040 | |
Paylocity Holding Corp. (a) | | | 300 | | | | 9,003 | |
| Resources Connection, Inc. | | | 200 | | | | 3,850 | |
| Robert Half International, Inc. | | | 1,000 | | | | 48,780 | |
RPX Corp. (a) | | | 1,000 | | | | 10,800 | |
| WILSHIRE 5000 INDEX FUND | |
| SCHEDULE OF INVESTMENTS (Continued) | |
| | |
| COMMON STOCKS - 99.9% (Continued) | | Shares | | | Value | |
| Industrials - 10.7% (Continued) | | | | | | |
| Professional Services - 0.3% (Continued) | | | | | | |
TransUnion (a) | | | 650 | | | $ | 20,105 | |
TrueBlue, Inc. (a) | | | 300 | | | | 7,395 | |
Verisk Analytics, Inc. (a) | | | 1,264 | | | | 102,599 | |
Volt Information Sciences, Inc. (a) (b) | | | 750 | | | | 5,138 | |
| | | | | | | | 525,107 | |
| Road & Rail - 0.9% | | | | | | | | |
| AMERCO | | | 100 | | | | 36,959 | |
| ArcBest Corp. | | | 300 | | | | 8,295 | |
Avis Budget Group, Inc. (a) (b) | | | 692 | | | | 25,383 | |
Celadon Group, Inc. (b) | | | 300 | | | | 2,145 | |
Covenant Transportation Group, Inc. - Class A (a) | | | 100 | | | | 1,934 | |
| CSX Corp. | | | 6,875 | | | | 247,018 | |
Genesee & Wyoming, Inc. - Class A (a) | | | 285 | | | | 19,782 | |
Heartland Express, Inc. (b) | | | 625 | | | | 12,725 | |
Herc Holdings, Inc. (a) | | | 143 | | | | 5,743 | |
Hertz Global Holdings, Inc. (a) (b) | | | 430 | | | | 9,271 | |
| J.B. Hunt Transport Services, Inc. | | | 670 | | | | 65,037 | |
| Kansas City Southern | | | 859 | | | | 72,886 | |
| Knight Transportation, Inc. | | | 650 | | | | 21,483 | |
| Landstar System, Inc. | | | 300 | | | | 25,590 | |
| Marten Transport Ltd. | | | 150 | | | | 3,495 | |
| Norfolk Southern Corp. | | | 2,292 | | | | 247,695 | |
Old Dominion Freight Line, Inc. (a) | | | 500 | | | | 42,895 | |
Roadrunner Transportation Systems, Inc. (a) | | | 350 | | | | 3,637 | |
| Ryder System, Inc. | | | 405 | | | | 30,148 | |
Saia, Inc. (a) | | | 225 | | | | 9,934 | |
Swift Transportation Co. (a) (b) | | | 400 | | | | 9,744 | |
| Union Pacific Corp. | | | 6,123 | | | | 634,832 | |
Werner Enterprises, Inc. (b) | | | 250 | | | | 6,738 | |
| | | | | | | | 1,543,369 | |
| Trading Companies & Distributors - 0.3% | | | | | | | | |
| Air Lease Corp. | | | 600 | | | | 20,598 | |
| Aircastle Ltd. | | | 500 | | | | 10,425 | |
| Applied Industrial Technologies, Inc. | | | 375 | | | | 22,275 | |
Beacon Roofing Supply, Inc. (a) | | | 500 | | | | 23,035 | |
| WILSHIRE 5000 INDEX FUND | |
| SCHEDULE OF INVESTMENTS (Continued) | |
| | |
| COMMON STOCKS - 99.9% (Continued) | | Shares | | | Value | |
| Industrials - 10.7% (Continued) | | | | | | |
| Trading Companies & Distributors - 0.3% (Continued) | | | | | | |
DXP Enterprises, Inc. (a) | | | 100 | | | $ | 3,474 | |
Empire Resources Inc. (b) | | | 700 | | | | 4,753 | |
Fastenal Co. (b) | | | 2,125 | | | | 99,832 | |
GATX Corp. (b) | | | 325 | | | | 20,014 | |
Grainger (W.W.), Inc. (b) | | | 423 | | | | 98,241 | |
| H&E Equipment Services, Inc. | | | 325 | | | | 7,556 | |
HD Supply Holdings, Inc. (a) | | | 625 | | | | 26,569 | |
Kaman Corp. (b) | | | 300 | | | | 14,679 | |
MSC Industrial Direct Co., Inc. - Class A (b) | | | 345 | | | | 31,875 | |
NOW, Inc. (a) | | | 649 | | | | 13,285 | |
Rush Enterprises, Inc. - Class A (a) | | | 375 | | | | 11,963 | |
| Textainer Group Holdings Ltd. | | | 700 | | | | 5,215 | |
| Triton International Ltd. | | | 500 | | | | 7,900 | |
United Rentals, Inc. (a) | | | 642 | | | | 67,781 | |
Univar, Inc. (a) | | | 575 | | | | 16,313 | |
Veritiv Corp. (a) (b) | | | 97 | | | | 5,214 | |
| Watsco, Inc. | | | 214 | | | | 31,698 | |
WESCO International, Inc. (a) | | | 300 | | | | 19,965 | |
| | | | | | | | 562,660 | |
| Information Technology - 19.2% | | | | | | | | |
| Communications Equipment - 1.1% | | | | | | | | |
ARRIS International plc (a) | | | 1,229 | | | | 37,030 | |
| Bel Fuse, Inc. - Class B | | | 300 | | | | 9,270 | |
| Black Box Corp. | | | 298 | | | | 4,545 | |
| Brocade Communications Systems, Inc. | | | 2,700 | | | | 33,723 | |
CalAmp Corp. (a) | | | 400 | | | | 5,800 | |
Calix, Inc. (a) | | | 175 | | | | 1,348 | |
Ciena Corp. (a) (b) | | | 997 | | | | 24,337 | |
| Cisco Systems, Inc. | | | 39,423 | | | | 1,191,362 | |
CommScope Holding Co., Inc. (a) | | | 1,150 | | | | 42,780 | |
| Comtech Telecommunications Corp. | | | 100 | | | | 1,185 | |
EchoStar Corp. - Class A (a) | | | 400 | | | | 20,556 | |
| EMCORE Corp. | | | 125 | | | | 1,088 | |
F5 Networks, Inc. (a) | | | 533 | | | | 77,136 | |
Finisar Corp. (a) | | | 775 | | | | 23,459 | |
| WILSHIRE 5000 INDEX FUND | |
| SCHEDULE OF INVESTMENTS (Continued) | |
| | |
| COMMON STOCKS - 99.9% (Continued) | | Shares | | | Value | |
| Information Technology - 19.2% (Continued) | | | | | | |
| Communications Equipment - 1.1% (Continued) | | | | | | |
| Harris Corp. | | | 992 | | | $ | 101,650 | |
Infinera Corp. (a) (b) | | | 600 | | | | 5,094 | |
| InterDigital, Inc. | | | 246 | | | | 22,472 | |
Ixia (a) | | | 450 | | | | 7,245 | |
| Juniper Networks, Inc. | | | 2,490 | | | | 70,367 | |
Lumentum Holdings, Inc. (a) | | | 340 | | | | 13,141 | |
| Motorola Solutions, Inc. | | | 1,251 | | | | 103,695 | |
Napco Security Technologies, Inc. (a) (b) | | | 900 | | | | 7,650 | |
NETGEAR, Inc. (a) | | | 50 | | | | 2,718 | |
Oclaro, Inc. (a) | | | 1,321 | | | | 11,823 | |
Palo Alto Networks, Inc. (a) (b) | | | 100 | | | | 12,505 | |
| Plantronics, Inc. | | | 300 | | | | 16,428 | |
ShoreTel, Inc. (a) | | | 300 | | | | 2,145 | |
| TESSCO Technologies, Inc. | | | 100 | | | | 1,300 | |
Ubiquiti Networks, Inc. (a) (b) | | | 300 | | | | 17,340 | |
ViaSat, Inc. (a) | | | 350 | | | | 23,177 | |
Viavi Solutions, Inc. (a) | | | 1,328 | | | | 10,863 | |
| | | | | | | | 1,903,232 | |
| Electronic Equipment, Instruments & Components - 0.6% | | | | | | | | |
Agilysys, Inc. (a) | | | 500 | | | | 5,180 | |
| Amphenol Corp. - Class A | | | 1,900 | | | | 127,680 | |
Anixter International, Inc. (a) | | | 278 | | | | 22,532 | |
Arrow Electronics, Inc. (a) | | | 500 | | | | 35,650 | |
| Avnet, Inc. | | | 900 | | | | 42,849 | |
| AVX Corp. | | | 375 | | | | 5,861 | |
| Badger Meter, Inc. | | | 300 | | | | 11,085 | |
Benchmark Electronics, Inc. (a) | | | 475 | | | | 14,488 | |
| CDW Corp. | | | 300 | | | | 15,627 | |
| Cognex Corp. | | | 575 | | | | 36,582 | |
Coherent, Inc. (a) | | | 200 | | | | 27,477 | |
| Corning, Inc. | | | 7,469 | | | | 181,272 | |
| CTS Corp. | | | 100 | | | | 2,240 | |
| Daktronics, Inc. | | | 800 | | | | 8,560 | |
Digital Ally, Inc. (a) | | | 51 | | | | 214 | |
| Dolby Laboratories, Inc. - Class A | | | 300 | | | | 13,557 | |
| WILSHIRE 5000 INDEX FUND | |
| SCHEDULE OF INVESTMENTS (Continued) | |
| | |
| COMMON STOCKS - 99.9% (Continued) | | Shares | | | Value | |
| Information Technology - 19.2% (Continued) | | | | | | |
| Electronic Equipment, Instruments & Components - 0.6% (Continued) | | | | | | |
Electro Scientific Industries, Inc. (a) | | | 100 | | | $ | 592 | |
FARO Technologies, Inc. (a) | | | 200 | | | | 7,200 | |
Fitbit, Inc. - Class A (a) (b) | | | 425 | | | | 3,111 | |
| FLIR Systems, Inc. | | | 1,025 | | | | 37,095 | |
I.D. Systems, Inc. (a) | | | 100 | | | | 542 | |
II-VI, Inc. (a) | | | 375 | | | | 11,119 | |
Insight Enterprises, Inc. (a) | | | 200 | | | | 8,088 | |
IPG Photonics Corp. (a) | | | 281 | | | | 27,738 | |
Itron, Inc. (a) | | | 200 | | | | 12,570 | |
| Jabil Circuit, Inc. | | | 1,550 | | | | 36,689 | |
Key Tronic Corp. (a) (b) | | | 600 | | | | 4,692 | |
Keysight Technologies, Inc. (a) | | | 1,298 | | | | 47,468 | |
Kimball Electronics, Inc. (a) | | | 525 | | | | 9,555 | |
Knowles Corp. (a) | | | 983 | | | | 16,426 | |
| Littelfuse, Inc. | | | 118 | | | | 17,909 | |
Mercury Systems, Inc. (a) | | | 400 | | | | 12,088 | |
| Methode Electronics, Inc. | | | 400 | | | | 16,540 | |
| National Instruments Corp. | | | 812 | | | | 25,026 | |
OSI Systems, Inc. (a) | | | 200 | | | | 15,224 | |
PAR Technology Corp. (a) | | | 100 | | | | 558 | |
| Park Electrochemical Corp. | | | 600 | | | | 11,190 | |
PCM, Inc. (a) | | | 400 | | | | 9,000 | |
Plexus Corp. (a) | | | 300 | | | | 16,212 | |
Sanmina Corp. (a) | | | 633 | | | | 23,199 | |
ScanSource, Inc. (a) | | | 300 | | | | 12,105 | |
| SYNNEX Corp. | | | 163 | | | | 19,726 | |
Tech Data Corp. (a) | | | 211 | | | | 17,867 | |
Trimble, Inc. (a) | | | 1,334 | | | | 40,220 | |
TTM Technologies, Inc. (a) | | | 488 | | | | 6,651 | |
Universal Display Corp. (a) | | | 400 | | | | 22,520 | |
Vishay Intertechnology, Inc. (b) | | | 806 | | | | 13,057 | |
Vishay Precision Group, Inc. (a) | | | 129 | | | | 2,438 | |
Zebra Technologies Corp. - Class A (a) | | | 225 | | | | 19,296 | |
| | | | | | | | 1,074,565 | |
| WILSHIRE 5000 INDEX FUND | |
| SCHEDULE OF INVESTMENTS (Continued) | |
| | |
| COMMON STOCKS - 99.9% (Continued) | | Shares | | | Value | |
| Information Technology - 19.2% (Continued) | | | | | | |
| Internet Software & Services - 3.7% | | | | | | |
Akamai Technologies, Inc. (a) | | | 1,284 | | | $ | 85,617 | |
Alphabet, Inc. - Class C (a) | | | 4,481 | | | | 3,458,524 | |
Blucora, Inc. (a) | | | 250 | | | | 3,688 | |
comScore, Inc. (a) (b) | | | 400 | | | | 12,632 | |
Cornerstone OnDemand, Inc. (a) | | | 500 | | | | 21,155 | |
CoStar Group, Inc. (a) | | | 225 | | | | 42,410 | |
DHI Group, Inc. (a) | | | 388 | | | | 2,425 | |
| EarthLink Holdings Corp. | | | 1,421 | | | | 8,014 | |
eBay, Inc. (a) | | | 8,300 | | | | 246,427 | |
Envestnet, Inc. (a) | | | 375 | | | | 13,219 | |
Facebook, Inc. - Class A (a) | | | 17,278 | | | | 1,987,833 | |
| IAC/InterActiveCorp | | | 550 | | | | 35,635 | |
| j2 Global, Inc. | | | 325 | | | | 26,585 | |
Leaf Group Ltd. (a) | | | 200 | | | | 1,310 | |
| LogMeIn, Inc. | | | 144 | | | | 13,903 | |
Match Group, Inc. (a) (b) | | | 1,175 | | | | 20,093 | |
| NIC, Inc. | | | 375 | | | | 8,963 | |
Pandora Media, Inc. (a) (b) | | | 425 | | | | 5,542 | |
| QAD, Inc. - Class B | | | 40 | | | | 1,022 | |
RealNetworks, Inc. (a) (b) | | | 681 | | | | 3,310 | |
Shutterstock, Inc. (a) (b) | | | 122 | | | | 5,797 | |
Stamps.com, Inc. (a) (b) | | | 129 | | | | 14,790 | |
TechTarget, Inc. (a) | | | 800 | | | | 6,824 | |
Travelzoo, Inc. (a) (b) | | | 100 | | | | 940 | |
Twitter, Inc. (a) (b) | | | 1,100 | | | | 17,930 | |
VeriSign, Inc. (a) (b) | | | 616 | | | | 46,859 | |
Web.com Group, Inc. (a) | | | 500 | | | | 10,575 | |
WebMD Health Corp. (a) (b) | | | 158 | | | | 7,832 | |
XO Group, Inc. (a) | | | 800 | | | | 15,560 | |
Yahoo!, Inc. (a) | | | 7,375 | | | | 285,191 | |
Yelp, Inc. (a) | | | 566 | | | | 21,582 | |
Zillow Group, Inc. - Class A (a) (b) | | | 524 | | | | 19,100 | |
Zillow Group, Inc. - Class C (a) (b) | | | 748 | | | | 27,280 | |
| | | | | | | | 6,478,567 | |
| WILSHIRE 5000 INDEX FUND | |
| SCHEDULE OF INVESTMENTS (Continued) | |
| | |
| COMMON STOCKS - 99.9% (Continued) | | Shares | | | Value | |
| Information Technology - 19.2% (Continued) | | | | | | |
| IT Services - 3.2% | | | | | | |
Acxiom Corp. (a) | | | 475 | | | $ | 12,730 | |
Alliance Data Systems Corp. (b) | | | 408 | | | | 93,228 | |
| Automatic Data Processing, Inc. | | | 3,543 | | | | 364,150 | |
| Booz Allen Hamilton Holding Corp. | | | 1,000 | | | | 36,070 | |
| Broadridge Financial Solutions, Inc. | | | 875 | | | | 58,013 | |
CACI International, Inc. - Class A (a) | | | 99 | | | | 12,306 | |
Cardtronics plc - Class A (a) | | | 175 | | | | 9,550 | |
Cognizant Technology Solutions Corp. - Class A (a) | | | 4,673 | | | | 261,828 | |
| Computer Sciences Corp. | | | 955 | | | | 56,746 | |
| Convergys Corp. | | | 825 | | | | 20,262 | |
CoreLogic, Inc. (a) | | | 677 | | | | 24,934 | |
| CSG Systems International, Inc. | | | 378 | | | | 18,295 | |
| CSRA, Inc. | | | 1,255 | | | | 39,959 | |
Datalink Corp. (a) | | | 600 | | | | 6,756 | |
| DST Systems, Inc. | | | 184 | | | | 19,716 | |
EPAM Systems, Inc. (a) (b) | | | 300 | | | | 19,293 | |
Euronet Worldwide, Inc. (a) | | | 450 | | | | 32,594 | |
ExlService Holdings, Inc. (a) | | | 300 | | | | 15,132 | |
| Fidelity National Information Services, Inc. | | | 2,625 | | | | 198,555 | |
Fiserv, Inc. (a) | | | 1,650 | | | | 175,362 | |
FleetCor Technologies, Inc. (a) | | | 178 | | | | 25,191 | |
| Forrester Research, Inc. | | | 255 | | | | 10,952 | |
Gartner, Inc. (a) | | | 613 | | | | 61,956 | |
Genpact Ltd. (a) | | | 1,125 | | | | 27,383 | |
| Global Payments, Inc. | | | 1,050 | | | | 72,881 | |
| International Business Machines Corp. | | | 6,905 | | | | 1,146,160 | |
| Jack Henry & Associates, Inc. | | | 586 | | | | 52,025 | |
| Leidos Holdings, Inc. | | | 1,231 | | | | 62,953 | |
| ManTech International Corp. - Class A | | | 300 | | | | 12,675 | |
| Mastercard, Inc. - Class A | | | 7,452 | | | | 769,418 | |
| MAXIMUS, Inc. | | | 425 | | | | 23,711 | |
MoneyGram International, Inc. (a) | | | 662 | | | | 7,818 | |
NeuStar, Inc. - Class A (a) (b) | | | 350 | | | | 11,690 | |
| Paychex, Inc. | | | 2,450 | | | | 149,156 | |
PayPal Holdings, Inc. (a) | | | 8,975 | | | | 354,243 | |
| WILSHIRE 5000 INDEX FUND | |
| SCHEDULE OF INVESTMENTS (Continued) | |
| | |
| COMMON STOCKS - 99.9% (Continued) | | Shares | | | Value | |
| Information Technology - 19.2% (Continued) | | | | | | |
| IT Services - 3.2% (Continued) | | | | | | |
PFSweb, Inc. (a) | | | 8 | | | $ | 68 | |
PRGX Global, Inc. (a) | | | 220 | | | | 1,298 | |
Rightside Group Ltd. (a) | | | 200 | | | | 1,654 | |
Sabre Corp. (b) | | | 1,400 | | | | 34,930 | |
| Science Applications International Corp. | | | 260 | | | | 22,048 | |
Sykes Enterprises, Inc. (a) | | | 102 | | | | 2,944 | |
Syntel, Inc. (b) | | | 300 | | | | 5,937 | |
Teradata Corp. (a) | | | 1,025 | | | | 27,849 | |
| Total System Services, Inc. | | | 1,337 | | | | 65,553 | |
Unisys Corp. (a) (b) | | | 427 | | | | 6,384 | |
Vantiv, Inc. - Class A (a) | | | 525 | | | | 31,301 | |
VeriFone Systems, Inc. (a) (b) | | | 965 | | | | 17,109 | |
Virtusa Corp. (a) | | | 400 | | | | 10,048 | |
Visa, Inc. - Class A (b) | | | 12,229 | | | | 954,106 | |
Western Union Co. (The) (b) | | | 2,929 | | | | 63,618 | |
WEX, Inc. (a) | | | 314 | | | | 35,042 | |
| Xerox Corp. | | | 6,995 | | | | 61,066 | |
| | | | | | | | 5,604,646 | |
| Semiconductors & Semiconductor Equipment - 2.9% | | | | | | | | |
Advanced Energy Industries, Inc. (a) | | | 300 | | | | 16,425 | |
Advanced Micro Devices, Inc. (a) (b) | | | 4,575 | | | | 51,881 | |
Amkor Technology, Inc. (a) | | | 1,050 | | | | 11,078 | |
Amtech Systems, Inc. (a) | | | 32 | | | | 136 | |
| Analog Devices, Inc. | | | 2,275 | | | | 165,211 | |
| Applied Materials, Inc. | | | 8,583 | | | | 276,972 | |
Applied Micro Circuits Corp. (a) | | | 1,500 | | | | 12,375 | |
| Broadcom Ltd. | | | 128 | | | | 22,627 | |
| Brooks Automation, Inc. | | | 106 | | | | 1,809 | |
| Cabot Microelectronics Corp. | | | 100 | | | | 6,317 | |
Cavium, Inc. (a) (b) | | | 558 | | | | 34,842 | |
Cirrus Logic, Inc. (a) | | | 400 | | | | 22,616 | |
Cree, Inc. (a) (b) | | | 625 | | | | 16,494 | |
Cypress Semiconductor Corp. (b) | | | 1,625 | | | | 18,590 | |
Diodes, Inc. (a) | | | 300 | | | | 7,701 | |
Entegris, Inc. (a) | | | 1,011 | | | | 18,097 | |
| WILSHIRE 5000 INDEX FUND | |
| SCHEDULE OF INVESTMENTS (Continued) | |
| | |
| COMMON STOCKS - 99.9% (Continued) | | Shares | | | Value | |
| Information Technology - 19.2% (Continued) | | | | | | |
| Semiconductors & Semiconductor Equipment - 2.9% (Continued) | | | | | | |
Exar Corp. (a) | | | 500 | | | $ | 5,390 | |
First Solar, Inc. (a) (b) | | | 700 | | | | 22,463 | |
FormFactor, Inc. (a) | | | 480 | | | | 5,376 | |
Inphi Corp. (a) (b) | | | 300 | | | | 13,386 | |
Integrated Device Technology, Inc. (a) | | | 985 | | | | 23,207 | |
| Intel Corp. | | | 37,618 | | | | 1,364,404 | |
| Intersil Corp. - Class A | | | 850 | | | | 18,955 | |
| IXYS Corp. | | | 800 | | | | 9,520 | |
| KLA-Tencor Corp. | | | 1,056 | | | | 83,086 | |
Kulicke & Soffa Industries, Inc. (a) | | | 400 | | | | 6,380 | |
| Lam Research Corp. | | | 1,116 | | | | 117,995 | |
Lattice Semiconductor Corp. (a) | | | 200 | | | | 1,472 | |
| Linear Technology Corp. | | | 1,725 | | | | 107,554 | |
MACOM Technology Solutions Holdings, Inc. (a) (b) | | | 300 | | | | 13,884 | |
| Marvell Technology Group Ltd. | | | 3,175 | | | | 44,037 | |
| Maxim Integrated Products, Inc. | | | 2,075 | | | | 80,033 | |
MaxLinear, Inc. - Class A (a) | | | 475 | | | | 10,355 | |
Microchip Technology, Inc. (b) | | | 1,711 | | | | 109,761 | |
Micron Technology, Inc. (a) | | | 7,877 | | | | 172,664 | |
Microsemi Corp. (a) | | | 650 | | | | 35,081 | |
| MKS Instruments, Inc. | | | 300 | | | | 17,820 | |
| Monolithic Power Systems, Inc. | | | 200 | | | | 16,386 | |
Nanometrics, Inc. (a) | | | 200 | | | | 5,012 | |
| NVE Corp. | | | 100 | | | | 7,143 | |
NVIDIA Corp. (b) | | | 3,385 | | | | 361,314 | |
NXP Semiconductors N.V. (a) | | | 299 | | | | 29,305 | |
ON Semiconductor Corp. (a) | | | 3,155 | | | | 40,258 | |
| Power Integrations, Inc. | | | 300 | | | | 20,355 | |
| QUALCOMM, Inc. | | | 11,605 | | | | 756,645 | |
Rambus, Inc. (a) | | | 1,000 | | | | 13,770 | |
Rudolph Technologies, Inc. (a) | | | 340 | | | | 7,939 | |
Semtech Corp. (a) | | | 300 | | | | 9,465 | |
Silicon Laboratories, Inc. (a) | | | 200 | | | | 13,000 | |
| Skyworks Solutions, Inc. | | | 1,357 | | | | 101,314 | |
SunPower Corp. (a) (b) | | | 1,300 | | | | 8,593 | |
| WILSHIRE 5000 INDEX FUND | |
| SCHEDULE OF INVESTMENTS (Continued) | |
| | |
| COMMON STOCKS - 99.9% (Continued) | | Shares | | | Value | |
| Information Technology - 19.2% (Continued) | | | | | | |
| Semiconductors & Semiconductor Equipment - 2.9% (Continued) | | | | | | |
Synaptics, Inc. (a) | | | 333 | | | $ | 17,842 | |
| Teradyne, Inc. | | | 1,375 | | | | 34,925 | |
| Tessera Holding Corp. | | | 400 | | | | 17,680 | |
| Texas Instruments, Inc. | | | 6,660 | | | | 485,979 | |
Veeco Instruments, Inc. (a) | | | 400 | | | | 11,660 | |
| Xilinx, Inc. | | | 1,875 | | | | 113,194 | |
| | | | | | | | 5,017,773 | |
| Software - 4.4% | | | | | | | | |
ACI Worldwide, Inc. (a) | | | 560 | | | | 10,164 | |
| Activision Blizzard, Inc. | | | 5,363 | | | | 193,658 | |
Adobe Systems, Inc. (a) | | | 3,552 | | | | 365,677 | |
ANSYS, Inc. (a) | | | 600 | | | | 55,494 | |
Aspen Technology, Inc. (a) | | | 625 | | | | 34,175 | |
Autodesk, Inc. (a) | | | 1,650 | | | | 122,117 | |
| Blackbaud, Inc. | | | 300 | | | | 19,200 | |
Bottomline Technologies (de), Inc. (a) | | | 375 | | | | 9,383 | |
BroadSoft, Inc. (a) | | | 300 | | | | 12,375 | |
| CA, Inc. | | | 2,247 | | | | 71,387 | |
Cadence Design Systems, Inc. (a) | | | 2,252 | | | | 56,795 | |
Callidus Software, Inc. (a) | | | 200 | | | | 3,360 | |
Citrix Systems, Inc. (a) | | | 1,234 | | | | 110,209 | |
CommerceHub, Inc. - Series A (a) | | | 125 | | | | 1,876 | |
CommerceHub, Inc. - Series C (a) | | | 250 | | | | 3,758 | |
CommVault Systems, Inc. (a) | | | 375 | | | | 19,275 | |
Dell Technologies, Inc. - Class V (a) | | | 1,789 | | | | 98,362 | |
Ebix, Inc. (b) | | | 31 | | | | 1,769 | |
Electronic Arts, Inc. (a) | | | 2,188 | | | | 172,327 | |
Ellie Mae, Inc. (a) (b) | | | 219 | | | | 18,326 | |
EnerNOC, Inc. (a) (b) | | | 300 | | | | 1,800 | |
| FactSet Research Systems, Inc. | | | 250 | | | | 40,858 | |
| Fair Isaac Corp. | | | 246 | | | | 29,328 | |
FireEye, Inc. (a) (b) | | | 600 | | | | 7,140 | |
Fortinet, Inc. (a) | | | 1,075 | | | | 32,379 | |
Guidance Software, Inc. (a) | | | 200 | | | | 1,416 | |
Guidewire Software, Inc. (a) | | | 300 | | | | 14,799 | |
| WILSHIRE 5000 INDEX FUND | |
| SCHEDULE OF INVESTMENTS (Continued) | |
| | |
| COMMON STOCKS - 99.9% (Continued) | | Shares | | | Value | |
| Information Technology - 19.2% (Continued) | | | | | | |
| Software - 4.4% (Continued) | | | | | | |
| Intuit, Inc. | | | 1,789 | | | $ | 205,036 | |
Manhattan Associates, Inc. (a) | | | 350 | | | | 18,561 | |
Mentor Graphics Corp. (b) | | | 800 | | | | 29,512 | |
| Microsoft Corp. | | | 61,062 | | | | 3,794,392 | |
MicroStrategy, Inc. - Class A (a) | | | 100 | | | | 19,740 | |
| Monotype Imaging Holdings, Inc. | | | 350 | | | | 6,948 | |
NetScout Systems, Inc. (a) | | | 700 | | | | 22,050 | |
Nuance Communications, Inc. (a) | | | 2,175 | | | | 32,408 | |
| Oracle Corp. | | | 25,305 | | | | 972,976 | |
Paycom Software, Inc. (a) (b) | | | 300 | | | | 13,647 | |
| Pegasystems, Inc. | | | 300 | | | | 10,800 | |
| Progress Software Corp. | | | 500 | | | | 15,965 | |
PROS Holdings, Inc. (a) | | | 300 | | | | 6,456 | |
PTC, Inc. (a) | | | 865 | | | | 40,024 | |
Qualys, Inc. (a) | | | 300 | | | | 9,495 | |
RealPage, Inc. (a) | | | 325 | | | | 9,750 | |
Red Hat, Inc. (a) | | | 1,372 | | | | 95,628 | |
Rosetta Stone, Inc. (a) | | | 300 | | | | 2,673 | |
salesforce.com, Inc. (a) | | | 4,441 | | | | 304,030 | |
ServiceNow, Inc. (a) | | | 147 | | | | 10,928 | |
Splunk, Inc. (a) (b) | | | 193 | | | | 9,872 | |
| SS&C Technologies Holdings, Inc. | | | 450 | | | | 12,870 | |
| Symantec Corp. | | | 4,933 | | | | 117,849 | |
Synchronoss Technologies, Inc. (a) | | | 325 | | | | 12,448 | |
Synopsys, Inc. (a) | | | 1,117 | | | | 65,747 | |
Take-Two Interactive Software, Inc. (a) | | | 625 | | | | 30,806 | |
TiVo Corp. (a) | | | 878 | | | | 18,355 | |
Tyler Technologies, Inc. (a) (b) | | | 292 | | | | 41,689 | |
Ultimate Software Group, Inc. (The) (a) | | | 165 | | | | 30,088 | |
VASCO Data Security International, Inc. (a) (b) | | | 450 | | | | 6,143 | |
Verint Systems, Inc. (a) | | | 375 | | | | 13,219 | |
VMware, Inc. - Class A (a) (b) | | | 704 | | | | 55,426 | |
Workday, Inc. - Class A (a) (b) | | | 195 | | | | 12,888 | |
Zedge, Inc. - Class B (a) | | | 1 | | | | 1 | |
| WILSHIRE 5000 INDEX FUND | |
| SCHEDULE OF INVESTMENTS (Continued) | |
| | |
| COMMON STOCKS - 99.9% (Continued) | | Shares | | | Value | |
| Information Technology - 19.2% (Continued) | | | | | | |
| Software - 4.4% (Continued) | | | | | | |
Zynga, Inc. - Class A (a) (b) | | | 5,350 | | | $ | 13,750 | |
| | | | | | | | 7,569,577 | |
| Technology Hardware, Storage & Peripherals - 3.3% | | | | | | | | |
3D Systems Corp. (a) (b) | | | 848 | | | | 11,270 | |
| Apple, Inc. | | | 42,322 | | | | 4,901,733 | |
Cray, Inc. (a) | | | 425 | | | | 8,798 | |
Diebold Nixdorf, Inc. (b) | | | 650 | | | | 16,348 | |
Electronics For Imaging, Inc. (a) | | | 404 | | | | 17,719 | |
| Hewlett Packard Enterprise Co. | | | 13,627 | | | | 315,329 | |
| HP, Inc. | | | 14,052 | | | | 208,532 | |
NCR Corp. (a) | | | 925 | | | | 37,518 | |
| NetApp, Inc. | | | 1,775 | | | | 62,604 | |
Super Micro Computer, Inc. (a) | | | 375 | | | | 10,519 | |
| Western Digital Corp. | | | 2,120 | | | | 144,054 | |
| | | | | | | | 5,734,424 | |
| Materials - 3.2% | | | | | | | | |
| Chemicals - 2.0% | | | | | | | | |
| A. Schulman, Inc. | | | 81 | | | | 2,709 | |
| Air Products & Chemicals, Inc. | | | 1,560 | | | | 224,359 | |
| Albemarle Corp. | | | 745 | | | | 64,130 | |
| American Vanguard Corp. | | | 400 | | | | 7,660 | |
| Ashland Global Holdings, Inc. | | | 467 | | | | 51,038 | |
Axalta Coating Systems Ltd. (a) | | | 675 | | | | 18,360 | |
| Balchem Corp. | | | 201 | | | | 16,868 | |
| Cabot Corp. | | | 400 | | | | 20,216 | |
| Calgon Carbon Corp. | | | 500 | | | | 8,500 | |
| Celanese Corp. - Series A | | | 1,075 | | | | 84,646 | |
CF Industries Holdings, Inc. (b) | | | 1,670 | | | | 52,572 | |
| Chemours Co. (The) | | | 1,289 | | | | 28,474 | |
Chemtura Corp. (a) | | | 475 | | | | 15,770 | |
Codexis, Inc. (a) | | | 37 | | | | 170 | |
Core Molding Technologies, Inc. (a) | | | 1,800 | | | | 30,798 | |
| Dow Chemical Co. (The) | | | 8,811 | | | | 504,166 | |
| E.I. du Pont de Nemours and Co. | | | 6,046 | | | | 443,776 | |
| Eastman Chemical Co. | | | 1,115 | | | | 83,859 | |
| WILSHIRE 5000 INDEX FUND | |
| SCHEDULE OF INVESTMENTS (Continued) | |
| | |
| COMMON STOCKS - 99.9% (Continued) | | Shares | | | Value | |
| Materials - 3.2% (Continued) | | | | | | |
| Chemicals - 2.0% (Continued) | | | | | | |
| Ecolab, Inc. | | | 2,183 | | | $ | 255,891 | |
Ferro Corp. (a) | | | 1,000 | | | | 14,330 | |
Flotek Industries, Inc. (a) (b) | | | 550 | | | | 5,165 | |
| FMC Corp. | | | 875 | | | | 49,490 | |
GCP Applied Technologies, Inc. (a) | | | 427 | | | | 11,422 | |
| H.B. Fuller Co. | | | 450 | | | | 21,740 | |
| Huntsman Corp. | | | 1,575 | | | | 30,051 | |
| International Flavors & Fragrances, Inc. | | | 571 | | | | 67,281 | |
Koppers Holdings, Inc. (a) | | | 300 | | | | 12,090 | |
Kraton Corp. (a) | | | 300 | | | | 8,544 | |
LSB Industries, Inc. (a) (b) | | | 300 | | | | 2,526 | |
| Minerals Technologies, Inc. | | | 250 | | | | 19,313 | |
| Monsanto Co. | | | 3,284 | | | | 345,510 | |
| Mosaic Co. (The) | | | 2,625 | | | | 76,991 | |
| Olin Corp. | | | 1,595 | | | | 40,848 | |
| PolyOne Corp. | | | 483 | | | | 15,475 | |
| PPG Industries, Inc. | | | 2,023 | | | | 191,699 | |
| Praxair, Inc. | | | 2,069 | | | | 242,466 | |
| Quaker Chemical Corp. | | | 100 | | | | 12,794 | |
Rayonier Advanced Materials, Inc. (b) | | | 500 | | | | 7,730 | |
| RPM International, Inc. | | | 1,000 | | | | 53,830 | |
| Scotts Miracle-Gro Co. (The) - Class A | | | 400 | | | | 38,220 | |
| Sensient Technologies Corp. | | | 335 | | | | 26,324 | |
| Sherwin-Williams Co. (The) | | | 623 | | | | 167,425 | |
| Stepan Co. | | | 148 | | | | 12,059 | |
| Tredegar Corp. | | | 671 | | | | 16,104 | |
Trinseo S.A. (b) | | | 300 | | | | 17,790 | |
| Valspar Corp. (The) | | | 527 | | | | 54,602 | |
Versum Materials, Inc. (a) | | | 821 | | | | 23,045 | |
| W.R. Grace & Co. | | | 427 | | | | 28,882 | |
Westlake Chemical Corp. (b) | | | 202 | | | | 11,310 | |
| | | | | | | | 3,539,018 | |
| Construction Materials - 0.2% | | | | | | | | |
| Eagle Materials, Inc. | | | 333 | | | | 32,810 | |
Headwaters, Inc. (a) | | | 750 | | | | 17,640 | |
| WILSHIRE 5000 INDEX FUND | |
| SCHEDULE OF INVESTMENTS (Continued) | |
| | |
| COMMON STOCKS - 99.9% (Continued) | | Shares | | | Value | |
| Materials - 3.2% (Continued) | | | | | | |
| Construction Materials - 0.2% (Continued) | | | | | | |
| Martin Marietta Materials, Inc. | | | 444 | | | $ | 98,359 | |
Summit Materials, Inc. - Class A (a) | | | 565 | | | | 13,434 | |
| United States Lime & Minerals, Inc. | | | 50 | | | | 3,788 | |
| Vulcan Materials Co. | | | 955 | | | | 119,519 | |
| | | | | | | | 285,550 | |
| Containers & Packaging - 0.5% | | | | | | | | |
| AptarGroup, Inc. | | | 386 | | | | 28,352 | |
| Avery Dennison Corp. | | | 700 | | | | 49,154 | |
| Ball Corp. | | | 1,255 | | | | 94,212 | |
| Bemis Co., Inc. | | | 850 | | | | 40,647 | |
Berry Plastics Group, Inc. (a) | | | 350 | | | | 17,056 | |
Crown Holdings, Inc. (a) | | | 900 | | | | 47,313 | |
| Graphic Packaging Holding Co. | | | 1,325 | | | | 16,536 | |
| Greif, Inc. - Class A | | | 300 | | | | 15,393 | |
Ingevity Corp. (a) | | | 393 | | | | 21,560 | |
International Paper Co. (b) | | | 3,167 | | | | 168,040 | |
| Myers Industries, Inc. | | | 200 | | | | 2,860 | |
Owens-Illinois, Inc. (a) | | | 1,300 | | | | 22,633 | |
| Packaging Corp. of America | | | 675 | | | | 57,254 | |
| Sealed Air Corp. | | | 1,550 | | | | 70,277 | |
| Silgan Holdings, Inc. | | | 75 | | | | 3,839 | |
| Sonoco Products Co. | | | 725 | | | | 38,208 | |
UFP Technologies, Inc. (a) (b) | | | 500 | | | | 12,725 | |
| WestRock Co. | | | 1,534 | | | | 77,881 | |
| | | | | | | | 783,940 | |
| Metals & Mining - 0.5% | | | | | | | | |
AK Steel Holding Corp. (a) (b) | | | 1,875 | | | | 19,144 | |
| Alcoa Corp. | | | 1,163 | | | | 32,663 | |
Allegheny Technologies, Inc. (b) | | | 775 | | | | 12,346 | |
| Carpenter Technology Corp. | | | 200 | | | | 7,234 | |
Century Aluminum Co. (a) | | | 600 | | | | 5,136 | |
Cliffs Natural Resources, Inc. (a) (b) | | | 1,400 | | | | 11,774 | |
Coeur Mining, Inc. (a) | | | 1,110 | | | | 10,090 | |
| Commercial Metals Co. | | | 775 | | | | 16,880 | |
Compass Minerals International, Inc. (b) | | | 100 | | | | 7,835 | |
| WILSHIRE 5000 INDEX FUND | |
| SCHEDULE OF INVESTMENTS (Continued) | |
| | |
| COMMON STOCKS - 99.9% (Continued) | | Shares | | | Value | |
| Materials - 3.2% (Continued) | | | | | | |
| Metals & Mining - 0.5% (Continued) | | | | | | |
| Ferroglobe plc | | | 500 | | | $ | 5,415 | |
Freeport-McMoRan, Inc. (a) | | | 9,519 | | | | 125,556 | |
Hecla Mining Co. (b) | | | 3,150 | | | | 16,506 | |
| Kaiser Aluminum Corp. | | | 138 | | | | 10,721 | |
| Newmont Mining Corp. | | | 3,950 | | | | 134,577 | |
| Nucor Corp. | | | 2,345 | | | | 139,573 | |
| Reliance Steel & Aluminum Co. | | | 549 | | | | 43,667 | |
| Royal Gold, Inc. | | | 491 | | | | 31,105 | |
Southern Copper Corp. (b) | | | 747 | | | | 23,859 | |
| Steel Dynamics, Inc. | | | 1,850 | | | | 65,823 | |
Stillwater Mining Co. (a) | | | 825 | | | | 13,291 | |
SunCoke Energy, Inc. (a) | | | 564 | | | | 6,396 | |
Tahoe Resources, Inc. (b) | | | 1,250 | | | | 11,775 | |
TimkenSteel Corp. (a) | | | 400 | | | | 6,192 | |
United States Steel Corp. (b) | | | 1,350 | | | | 44,564 | |
| Worthington Industries, Inc. | | | 225 | | | | 10,674 | |
| | | | | | | | 812,796 | |
Paper & Forest Products - 0.0% (c) | | | | | | | | |
Deltic Timber Corp. (b) | | | 100 | | | | 7,707 | |
KapStone Paper and Packaging Corp. (b) | | | 950 | | | | 20,948 | |
Louisiana-Pacific Corp. (a) | | | 825 | | | | 15,617 | |
| Neenah Paper, Inc. | | | 120 | | | | 10,224 | |
| P.H. Glatfelter Co. | | | 325 | | | | 7,764 | |
| Schweitzer-Mauduit International, Inc. | | | 300 | | | | 13,659 | |
| | | | | | | | 75,919 | |
| Real Estate - 4.4% | | | | | | | | |
| Equity Real Estate Investment Trusts (REITs) - 4.2% | | | | | | | | |
| Acadia Realty Trust | | | 676 | | | | 22,092 | |
| Agree Realty Corp. | | | 300 | | | | 13,815 | |
| Alexandria Real Estate Equities, Inc. | | | 601 | | | | 66,789 | |
| American Assets Trust, Inc. | | | 425 | | | | 18,309 | |
| American Campus Communities, Inc. | | | 982 | | | | 48,874 | |
| American Homes 4 Rent - Class A | | | 1,700 | | | | 35,666 | |
| American Tower Corp. | | | 3,375 | | | | 356,669 | |
Apartment Investment & Management Co. - Class A (b) | | | 1,381 | | | | 62,766 | |
| WILSHIRE 5000 INDEX FUND | |
| SCHEDULE OF INVESTMENTS (Continued) | |
| | |
| COMMON STOCKS - 99.9% (Continued) | | Shares | | | Value | |
| Real Estate - 4.4% (Continued) | | | | | | |
| Equity Real Estate Investment Trusts (REITs) - 4.2% (Continued) | | | | | | |
| Apple Hospitality REIT, Inc. | | | 1,975 | | | $ | 39,461 | |
| Ashford Hospitality Prime, Inc. | | | 130 | | | | 1,775 | |
| Ashford Hospitality Trust, Inc. | | | 544 | | | | 4,221 | |
| AvalonBay Communities, Inc. | | | 1,199 | | | | 212,402 | |
| Boston Properties, Inc. | | | 1,343 | | | | 168,923 | |
| Brandywine Realty Trust | | | 1,988 | | | | 32,822 | |
| Camden Property Trust | | | 725 | | | | 60,951 | |
Care Capital Properties, Inc. (b) | | | 678 | | | | 16,950 | |
| CareTrust REIT, Inc. | | | 403 | | | | 6,174 | |
| CBL & Associates Properties, Inc. | | | 1,205 | | | | 13,858 | |
| Cedar Realty Trust, Inc. | | | 650 | | | | 4,245 | |
| Chatham Lodging Trust | | | 425 | | | | 8,734 | |
| Chesapeake Lodging Trust | | | 625 | | | | 16,163 | |
| Colony Starwood Homes | | | 840 | | | | 24,200 | |
| Columbia Property Trust, Inc. | | | 1,075 | | | | 23,220 | |
| Communications Sales & Leasing, Inc. | | | 1,228 | | | | 31,203 | |
| CoreCivic, Inc. | | | 799 | | | | 19,544 | |
| CoreSite Realty Corp. | | | 300 | | | | 23,811 | |
| Corporate Office Properties Trust | | | 850 | | | | 26,537 | |
Cousins Properties, Inc. (b) | | | 3,356 | | | | 28,560 | |
| Crown Castle International Corp. | | | 2,360 | | | | 204,776 | |
| CubeSmart | | | 1,737 | | | | 46,499 | |
| CyrusOne, Inc. | | | 725 | | | | 32,429 | |
DCT Industrial Trust, Inc. (b) | | | 887 | | | | 42,470 | |
| DDR Corp. | | | 2,820 | | | | 43,061 | |
| DiamondRock Hospitality Co. | | | 1,727 | | | | 19,912 | |
Digital Realty Trust, Inc. (b) | | | 1,350 | | | | 132,651 | |
| Douglas Emmett, Inc. | | | 1,300 | | | | 47,528 | |
| Duke Realty Corp. | | | 3,026 | | | | 80,371 | |
| DuPont Fabros Technology, Inc. | | | 700 | | | | 30,751 | |
| EastGroup Properties, Inc. | | | 375 | | | | 27,690 | |
| Empire State Realty Trust, Inc. - Class A | | | 1,100 | | | | 22,209 | |
| EPR Properties | | | 422 | | | | 30,287 | |
| Equinix, Inc. | | | 630 | | | | 225,167 | |
Equity Commonwealth (a) | | | 993 | | | | 30,028 | |
| WILSHIRE 5000 INDEX FUND | |
| SCHEDULE OF INVESTMENTS (Continued) | |
| | |
| COMMON STOCKS - 99.9% (Continued) | | Shares | | | Value | |
| Real Estate - 4.4% (Continued) | | | | | | |
| Equity Real Estate Investment Trusts (REITs) - 4.2% (Continued) | | | | | | |
| Equity LifeStyle Properties, Inc. | | | 739 | | | $ | 53,282 | |
| Equity One, Inc. | | | 825 | | | | 25,319 | |
| Equity Residential | | | 3,204 | | | | 206,208 | |
| Essex Property Trust, Inc. | | | 572 | | | | 132,990 | |
Extra Space Storage, Inc. (b) | | | 1,094 | | | | 84,501 | |
| Federal Realty Investment Trust | | | 620 | | | | 88,108 | |
| FelCor Lodging Trust, Inc. | | | 1,475 | | | | 11,815 | |
| First Industrial Realty Trust, Inc. | | | 1,025 | | | | 28,751 | |
| First Potomac Realty Trust | | | 800 | | | | 8,776 | |
| Forest City Realty Trust, Inc. - Class A | | | 2,100 | | | | 43,764 | |
| Franklin Street Properties Corp. | | | 950 | | | | 12,312 | |
| Gaming and Leisure Properties, Inc. | | | 1,517 | | | | 46,451 | |
| General Growth Properties, Inc. | | | 4,415 | | | | 110,287 | |
| Getty Realty Corp. | | | 402 | | | | 10,247 | |
Government Properties Income Trust (b) | | | 550 | | | | 10,486 | |
| Gramercy Property Trust | | | 2,738 | | | | 25,135 | |
| HCP, Inc. | | | 4,075 | | | | 121,109 | |
| Healthcare Realty Trust, Inc. | | | 875 | | | | 26,530 | |
| Hersha Hospitality Trust | | | 550 | | | | 11,825 | |
| Highwoods Properties, Inc. | | | 800 | | | | 40,808 | |
| Hospitality Properties Trust | | | 1,325 | | | | 42,056 | |
| Host Hotels & Resorts, Inc. | | | 6,524 | | | | 122,912 | |
| Hudson Pacific Properties, Inc. | | | 1,225 | | | | 42,606 | |
Investors Real Estate Trust (b) | | | 1,800 | | | | 12,834 | |
| Iron Mountain, Inc. | | | 1,672 | | | | 54,307 | |
| Kilroy Realty Corp. | | | 700 | | | | 51,254 | |
| Kimco Realty Corp. | | | 3,675 | | | | 92,463 | |
| Kite Realty Group Trust | | | 725 | | | | 17,023 | |
Lamar Advertising Co. - Class A (b) | | | 400 | | | | 26,896 | |
| LaSalle Hotel Properties | | | 1,000 | | | | 30,470 | |
| Lexington Realty Trust | | | 1,875 | | | | 20,250 | |
| Liberty Property Trust | | | 1,225 | | | | 48,388 | |
| Life Storage, Inc. | | | 450 | | | | 38,367 | |
| LTC Properties, Inc. | | | 350 | | | | 16,443 | |
| Macerich Co. (The) | | | 1,103 | | | | 78,137 | |
| WILSHIRE 5000 INDEX FUND | |
| SCHEDULE OF INVESTMENTS (Continued) | |
| | |
| COMMON STOCKS - 99.9% (Continued) | | Shares | | | Value | |
| Real Estate - 4.4% (Continued) | | | | | | |
| Equity Real Estate Investment Trusts (REITs) - 4.2% (Continued) | | | | | | |
| Mack-Cali Realty Corp. | | | 725 | | | $ | 21,040 | |
| Medical Properties Trust, Inc. | | | 1,500 | | | | 18,450 | |
| Mid-America Apartment Communities, Inc. | | | 959 | | | | 93,905 | |
| Monogram Residential Trust, Inc. | | | 1,450 | | | | 15,689 | |
| National Health Investors, Inc. | | | 325 | | | | 24,105 | |
| National Retail Properties, Inc. | | | 900 | | | | 39,780 | |
| New Senior Investment Group, Inc. | | | 695 | | | | 6,804 | |
| NorthStar Realty Europe Corp. | | | 542 | | | | 6,813 | |
| NorthStar Realty Finance Corp. | | | 1,626 | | | | 24,634 | |
| Omega Healthcare Investors, Inc. | | | 1,200 | | | | 37,512 | |
| Outfront Media, Inc. | | | 336 | | | | 8,356 | |
| Paramount Group, Inc. | | | 1,800 | | | | 28,782 | |
Parkway, Inc. (a) | | | 550 | | | | 12,238 | |
| Pebblebrook Hotel Trust | | | 625 | | | | 18,594 | |
Pennsylvania Real Estate Investment Trust (b) | | | 775 | | | | 14,694 | |
| Piedmont Office Realty Trust, Inc. - Class A | | | 1,275 | | | | 26,660 | |
| Potlatch Corp. | | | 400 | | | | 16,660 | |
| Prologis, Inc. | | | 4,585 | | | | 242,041 | |
| PS Business Parks, Inc. | | | 200 | | | | 23,304 | |
| Public Storage | | | 1,349 | | | | 301,501 | |
Quality Care Properties, Inc. (a) | | | 815 | | | | 12,633 | |
| Ramco-Gershenson Properties Trust | | | 1,000 | | | | 16,580 | |
| Rayonier, Inc. | | | 826 | | | | 21,972 | |
Realty Income Corp. (b) | | | 1,700 | | | | 97,716 | |
| Regency Centers Corp. | | | 811 | | | | 55,918 | |
| Retail Opportunity Investments Corp. | | | 725 | | | | 15,319 | |
| Retail Properties of America, Inc. - Class A | | | 2,075 | | | | 31,810 | |
| RLJ Lodging Trust | | | 1,100 | | | | 26,939 | |
Ryman Hospitality Properties, Inc. (b) | | | 525 | | | | 33,080 | |
| Sabra Health Care REIT, Inc. | | | 675 | | | | 16,484 | |
Saul Centers, Inc. (b) | | | 200 | | | | 13,322 | |
| Select Income REIT | | | 350 | | | | 8,820 | |
| Senior Housing Properties Trust | | | 2,075 | | | | 39,280 | |
Seritage Growth Properties - Class A (b) | | | 300 | | | | 12,813 | |
| Silver Bay Realty Trust Corp. | | | 152 | | | | 2,605 | |
| WILSHIRE 5000 INDEX FUND | |
| SCHEDULE OF INVESTMENTS (Continued) | |
| | |
| COMMON STOCKS - 99.9% (Continued) | | Shares | | | Value | |
| Real Estate - 4.4% (Continued) | | | | | | |
| Equity Real Estate Investment Trusts (REITs) - 4.2% (Continued) | | | | | | |
| Simon Property Group, Inc. | | | 2,653 | | | $ | 471,358 | |
| SL Green Realty Corp. | | | 876 | | | | 94,214 | |
| Spirit Realty Capital, Inc. | | | 4,000 | | | | 43,440 | |
| STAG Industrial, Inc. | | | 450 | | | | 10,742 | |
| STORE Capital Corp. | | | 675 | | | | 16,679 | |
| Summit Hotel Properties, Inc. | | | 975 | | | | 15,629 | |
| Sun Communities, Inc. | | | 500 | | | | 38,305 | |
| Sunstone Hotel Investors, Inc. | | | 1,840 | | | | 28,060 | |
| Tanger Factory Outlet Centers, Inc. | | | 775 | | | | 27,730 | |
| Taubman Centers, Inc. | | | 500 | | | | 36,965 | |
| Terreno Realty Corp. | | | 575 | | | | 16,382 | |
| UDR, Inc. | | | 2,328 | | | | 84,925 | |
| Universal Health Realty Income Trust | | | 200 | | | | 13,118 | |
| Urban Edge Properties | | | 811 | | | | 22,311 | |
| Urstadt Biddle Properties, Inc. - Class A | | | 500 | | | | 12,055 | |
| Ventas, Inc. | | | 2,965 | | | | 185,371 | |
| VEREIT, Inc. | | | 6,175 | | | | 52,241 | |
| Vornado Realty Trust | | | 1,650 | | | | 172,211 | |
| Washington Prime Group, Inc. | | | 1,617 | | | | 16,833 | |
| Washington Real Estate Investment Trust | | | 750 | | | | 24,518 | |
| Weingarten Realty Investors | | | 1,050 | | | | 37,580 | |
| Welltower, Inc. | | | 3,120 | | | | 208,821 | |
| Weyerhaeuser Co. | | | 6,127 | | | | 184,361 | |
| | | | | | | | 7,398,375 | |
| Real Estate Management & Development - 0.2% | | | | | | | | |
| Alexander & Baldwin, Inc. | | | 450 | | | | 20,192 | |
AV Homes, Inc. (a) (b) | | | 600 | | | | 9,480 | |
| Brookfield Property Partners, L.P. | | | 3,075 | | | | 67,619 | |
CBRE Group, Inc. - Class A (a) | | | 2,725 | | | | 85,809 | |
Howard Hughes Corp. (The) (a) | | | 321 | | | | 36,626 | |
| Jones Lang LaSalle, Inc. | | | 284 | | | | 28,695 | |
| Kennedy-Wilson Holdings, Inc. | | | 925 | | | | 18,963 | |
| RMR Group, Inc. (The) - Class A | | | 71 | | | | 2,805 | |
St. Joe Co. (The) (a) (b) | | | 500 | | | | 9,500 | |
| WILSHIRE 5000 INDEX FUND | |
| SCHEDULE OF INVESTMENTS (Continued) | |
| | |
| COMMON STOCKS - 99.9% (Continued) | | Shares | | | Value | |
| Real Estate - 4.4% (Continued) | | | | | | |
| Real Estate Management & Development - 0.2% (Continued) | | | | | | |
Tejon Ranch Co. (a) | | | 50 | | | $ | 1,272 | |
| | | | | | | | 280,961 | |
| Telecommunication Services - 2.6% | | | | | | | | |
| Diversified Telecommunication Services - 2.4% | | | | | | | | |
8x8, Inc. (a) | | | 1,000 | | | | 14,300 | |
| AT&T, Inc. | | | 48,750 | | | | 2,073,338 | |
| CenturyLink, Inc. | | | 3,735 | | | | 88,818 | |
| Cogent Communications Holdings, Inc. | | | 200 | | | | 8,270 | |
Consolidated Communications Holdings, Inc. (b) | | | 501 | | | | 13,452 | |
General Communication, Inc. - Class A (a) | | | 600 | | | | 11,670 | |
| IDT Corp. - Class B | | | 16 | | | | 297 | |
| Inteliquent, Inc. | | | 500 | | | | 11,460 | |
Level 3 Communications, Inc. (a) | | | 2,211 | | | | 124,612 | |
Straight Path Communications, Inc. - Class B (a) (b) | | | 8 | | | | 271 | |
| Verizon Communications, Inc. | | | 32,363 | | | | 1,727,537 | |
Vonage Holdings Corp. (a) | | | 1,425 | | | | 9,761 | |
Windstream Holdings, Inc. (b) | | | 731 | | | | 5,358 | |
Zayo Group Holdings, Inc. (a) | | | 300 | | | | 9,858 | |
| | | | | | | | 4,099,002 | |
| Wireless Telecommunication Services - 0.2% | | | | | | | | |
SBA Communications Corp. - Class A (a) | | | 1,020 | | | | 105,325 | |
| Shenandoah Telecommunications Co. | | | 300 | | | | 8,190 | |
| Spok Holdings, Inc. | | | 400 | | | | 8,300 | |
Sprint Corp. (a) (b) | | | 5,547 | | | | 46,706 | |
| Telephone and Data Systems, Inc. | | | 700 | | | | 20,209 | |
T-Mobile US, Inc. (a) (b) | | | 2,425 | | | | 139,462 | |
United States Cellular Corp. (a) | | | 300 | | | | 13,116 | |
| | | | | | | | 341,308 | |
| Utilities - 3.2% | | | | | | | | |
| Electric Utilities - 1.7% | | | | | | | | |
ALLETE, Inc. (b) | | | 425 | | | | 27,281 | |
| American Electric Power Co., Inc. | | | 3,655 | | | | 230,119 | |
| Avangrid, Inc. | | | 550 | | | | 20,834 | |
| Duke Energy Corp. | | | 5,410 | | | | 419,923 | |
| Edison International | | | 2,506 | | | | 180,407 | |
| WILSHIRE 5000 INDEX FUND | |
| SCHEDULE OF INVESTMENTS (Continued) | |
| | |
| COMMON STOCKS - 99.9% (Continued) | | Shares | | | Value | |
| Utilities - 3.2% (Continued) | | | | | | |
| Electric Utilities - 1.7% (Continued) | | | | | | |
| El Paso Electric Co. | | | 400 | | | $ | 18,600 | |
| Empire District Electric Co. (The) | | | 175 | | | | 5,966 | |
| Entergy Corp. | | | 1,250 | | | | 91,838 | |
| Eversource Energy | | | 2,392 | | | | 132,110 | |
| Exelon Corp. | | | 6,741 | | | | 239,238 | |
| FirstEnergy Corp. | | | 3,380 | | | | 104,679 | |
Fortis, Inc. (b) | | | 902 | | | | 27,854 | |
| Great Plains Energy, Inc. | | | 1,405 | | | | 38,427 | |
| Hawaiian Electric Industries, Inc. | | | 800 | | | | 26,456 | |
| IDACORP, Inc. | | | 313 | | | | 25,212 | |
| MGE Energy, Inc. | | | 150 | | | | 9,795 | |
| NextEra Energy, Inc. | | | 3,669 | | | | 438,298 | |
NRG Yield, Inc. - Class A (b) | | | 300 | | | | 4,608 | |
NRG Yield, Inc. - Class C (b) | | | 300 | | | | 4,740 | |
| OGE Energy Corp. | | | 1,475 | | | | 49,339 | |
| Otter Tail Corp. | | | 350 | | | | 14,280 | |
| Pinnacle West Capital Corp. | | | 816 | | | | 63,672 | |
| PNM Resources, Inc. | | | 700 | | | | 24,010 | |
| Portland General Electric Co. | | | 800 | | | | 34,664 | |
| PPL Corp. | | | 5,400 | | | | 183,870 | |
| Southern Co. (The) | | | 7,700 | | | | 378,763 | |
| Westar Energy, Inc. | | | 875 | | | | 49,306 | |
| Xcel Energy, Inc. | | | 3,600 | | | | 146,520 | |
| | | | | | | | 2,990,809 | |
| Gas Utilities - 0.3% | | | | | | | | |
| Atmos Energy Corp. | | | 760 | | | | 56,354 | |
National Fuel Gas Co. (b) | | | 650 | | | | 36,816 | |
| New Jersey Resources Corp. | | | 500 | | | | 17,750 | |
| Northwest Natural Gas Co. | | | 300 | | | | 17,940 | |
| ONE Gas, Inc. | | | 287 | | | | 18,357 | |
| Sempra Energy | | | 1,959 | | | | 197,153 | |
| South Jersey Industries, Inc. | | | 650 | | | | 21,899 | |
| Southwest Gas Holdings, Inc. | | | 475 | | | | 36,395 | |
| Spire, Inc. | | | 350 | | | | 22,593 | |
| UGI Corp. | | | 1,275 | | | | 58,751 | |
| WILSHIRE 5000 INDEX FUND | |
| SCHEDULE OF INVESTMENTS (Continued) | |
| | |
| COMMON STOCKS - 99.9% (Continued) | | Shares | | | Value | |
| Utilities - 3.2% (Continued) | | | | | | |
| Gas Utilities - 0.3% (Continued) | | | | | | |
| WGL Holdings, Inc. | | | 350 | | | $ | 26,698 | |
| | | | | | | | 510,706 | |
| Independent Power and Renewable Electricity Producers - 0.1% | | | | | | | | |
| AES Corp. | | | 5,235 | | | | 60,830 | |
Calpine Corp. (a) | | | 2,575 | | | | 29,432 | |
Dynegy, Inc. (a) | | | 11 | | | | 93 | |
Genie Energy Ltd. - Class B (b) | | | 16 | | | | 92 | |
| NRG Energy, Inc. | | | 2,252 | | | | 27,610 | |
| Ormat Technologies, Inc. | | | 175 | | | | 9,384 | |
| | | | | | | | 127,441 | |
| Multi-Utilities - 1.0% | | | | | | | | |
| Alliant Energy Corp. | | | 1,675 | | | | 63,466 | |
| Ameren Corp. | | | 1,925 | | | | 100,986 | |
Avista Corp. (b) | | | 550 | | | | 21,995 | |
Black Hills Corp. (b) | | | 300 | | | | 18,402 | |
| CenterPoint Energy, Inc. | | | 2,900 | | | | 71,456 | |
| CMS Energy Corp. | | | 1,800 | | | | 74,916 | |
| Consolidated Edison, Inc. | | | 2,329 | | | | 171,601 | |
| Dominion Resources, Inc. | | | 4,392 | | | | 336,382 | |
| DTE Energy Co. | | | 1,333 | | | | 131,314 | |
| MDU Resources Group, Inc. | | | 1,375 | | | | 39,559 | |
| NiSource, Inc. | | | 2,565 | | | | 56,789 | |
| NorthWestern Corp. | | | 400 | | | | 22,748 | |
| PG&E Corp. | | | 4,075 | | | | 247,638 | |
| Public Service Enterprise Group, Inc. | | | 3,900 | | | | 171,132 | |
| SCANA Corp. | | | 779 | | | | 57,085 | |
| Vectren Corp. | | | 508 | | | | 26,492 | |
| WEC Energy Group, Inc. | | | 2,339 | | | | 137,182 | |
| | | | | | | | 1,749,143 | |
| WILSHIRE 5000 INDEX FUND | |
| SCHEDULE OF INVESTMENTS (Continued) | |
| | |
| COMMON STOCKS - 99.9% (Continued) | Shares | | Value | |
| Utilities - 3.2% (Continued) | | | | |
| Water Utilities - 0.1% | | | | |
| American States Water Co. | | | 400 | | | | 18,224 | |
| American Water Works Co., Inc. | | | 1,320 | | | | 95,515 | |
| Aqua America, Inc. | | | 1,326 | | | | 39,833 | |
| California Water Service Group | | | 225 | | | | 7,628 | |
| | | | | | | | 161,200 | |
| | | | | | | | | |
Total Common Stocks (Cost $64,138,598) | | | $ | 173,307,064 | |
RIGHTS - 0.0% (c) | | Shares | | | Value | |
| AMR Corp., Escrow | | | 3,275 | | | $ | 6,321 | |
| Asterias Biotherapeutics, Inc. | | | 9 | | | | 5 | |
Dyax Corporation (b) | | | 1,200 | | | | 0 | |
| Leap Wireless CVR | | | 1,500 | | | | 3,780 | |
| Overstock.com, Inc. | | | 31 | | | | 0 | |
| Safeway CVR - Casa Ley | | | 2,075 | | | | 2,106 | |
| Safeway CVR - PDC | | | 2,075 | | | | 101 | |
Total Rights (Cost $0) | | | $ | 12,313 | |
| WILSHIRE 5000 INDEX FUND | |
| SCHEDULE OF INVESTMENTS (Continued) | |
| | |
| MONEY MARKET FUNDS - 2.7% | | Shares | | | Value | |
Northern Trust Institutional Government Select Portfolio - Institutional Class, 0.39% (d) | | | 140,499 | | | $ | 140,499 | |
Northern Trust Institutional Liquid Asset Portfolio - Institutional Class, 0.01% (d) (e) | | | 4,582,659 | | | | 4,582,659 | |
Total Money Market Funds (Cost $4,723,158) | | | $ | 4,723,158 | |
| | | | | | | | | |
Total Investments at Value - 102.6% (Cost $68,861,756) | | | $ | 178,042,535 | |
| | | | | | | | | |
| Liabilities in Excess of Other Assets - (2.6%) | | | | (4,513,156 | ) |
| | | | | | | | | |
| Net Assets - 100.0% | | | $ | 173,529,379 | |
| ADR - | American Depositary Receipt. |
| CVR - | Contingent Value Right. |
(a) | Non-income producing security. |
(b) | This security or a partial position of this security is on loan at December 31, 2016. The total market value of securities on loan at December 31, 2016 was $10,033,391. |
(c) | Percentage rounds to less than 0.1%. |
(d) | The rate shown is the 7-day effective yield as of December 31, 2016. |
(e) | This security was purchased with cash collateral held from securities on loan. The total value of such securities as of December 31, 2016 was $4,582,659. Securities on loan are also collateralized by various U.S. Treasury obligations in the amount of $5,762,862. |
| See accompanying notes to financial statements. |
WILSHIRE INTERNATIONAL EQUITY FUND
SCHEDULE OF INVESTMENTS
December 31, 2016 (Unaudited)
| COMMON STOCKS - 97.4% | | Shares | | | Value | |
| Australia - 3.4% | |
Australia & New Zealand Banking Group Ltd. (a) | | | 14,288 | | | $ | 312,761 | |
BHP Billiton Ltd. (a) | | | 41,168 | | | | 737,471 | |
BHP Billiton plc (a) | | | 116,395 | | | | 1,853,235 | |
Boral Ltd. (a) | | | 44,728 | | | | 174,119 | |
Coca-Cola Amatil Ltd. (a) | | | 30,815 | | | | 224,719 | |
Crown Resorts Ltd. (a) | | | 1,267 | | | | 10,559 | |
CSL Ltd. (a) | | | 51,905 | | | | 3,753,524 | |
Medibank Private Ltd. (a) | | | 86,055 | | | | 174,824 | |
Oil Search Ltd. (a) | | | 46,612 | | | | 239,886 | |
QBE Insurance Group Ltd. (a) | | | 118,700 | | | | 1,060,488 | |
Santos Ltd. (a) (b) | | | 87,163 | | | | 251,069 | |
TPG Telecom Ltd. (a) (c) | | | 31,186 | | | | 153,088 | |
Vocus Communications Ltd. (a) (c) | | | 40,247 | | | | 112,070 | |
Westpac Banking Corp. (a) | | | 3,118 | | | | 73,187 | |
| | | | | | | | 9,131,000 | |
| Austria - 0.1% | |
Erste Group Bank AG (a) | | | 286 | | | | 8,361 | |
OMV AG (a) | | | 6,610 | | | | 232,998 | |
| | | | | | | | 241,359 | |
| Belgium - 0.2% | |
Colruyt S.A. (a) | | | 6,752 | | | | 333,676 | |
UCB S.A. (a) (b) | | | 3,942 | | | | 252,182 | |
| | | | | | | | 585,858 | |
| Brazil - 2.1% | |
| Ambev S.A. - ADR | | | 722,901 | | | | 3,549,444 | |
Banco Santander Brasil S.A. (a) (b) | | | 29,900 | | | | 270,783 | |
BM&F Bovespa S.A. (a) | | | 45,100 | | | | 228,237 | |
Cia de Saneamento Basico do Estado de Sao Paulo (a) | | | 7,900 | | | | 69,744 | |
Cia Energetica de Minas Gerais (a) | | | 75,700 | | | | 178,848 | |
Cia Paranaense de Energia (a) | | | 8,900 | | | | 74,583 | |
Cia Siderurgica Nacional S.A. (a) (b) | | | 13,400 | | | | 44,304 | |
Cosan S.A. Indústria e Comércio (a) | | | 650 | | | | 7,605 | |
EDP - Energias do Brasil S.A. (a) | | | 26,950 | | | | 110,774 | |
Gerdau S.A. (a) | | | 78,300 | | | | 258,195 | |
WILSHIRE INTERNATIONAL EQUITY FUND
SCHEDULE OF INVESTMENTS (Continued)
| COMMON STOCKS - 97.4% (Continued) | | Shares | | | Value | |
| Brazil - 2.1% (Continued) | |
Petroleo Brasileiro S.A. (a) (b) | | | 38,200 | | | $ | 173,727 | |
Sul America S.A. (a) | | | 12,200 | | | | 67,423 | |
Vale S.A. (a) (b) (c) | | | 36,100 | | | | 257,416 | |
Vale S.A. (a) | | | 30,300 | | | | 237,853 | |
| | | | | | | | 5,528,936 | |
| Canada- 5.1% | |
| AltGas Ltd. | | | 9,700 | | | | 244,880 | |
| Atco Ltd. - Class I | | | 2,600 | | | | 86,472 | |
Bank of Montreal (c) | | | 8,100 | | | | 582,518 | |
| Barrick Gold Corp. | | | 18,200 | | | | 291,135 | |
BlackBerry Ltd. (b) (c) | | | 3,000 | | | | 20,643 | |
| Brookfield Asset Management, Inc. - Class A | | | 2,200 | | | | 72,579 | |
| CAE, Inc. | | | 400 | | | | 5,594 | |
| Cameco Corp. | | | 1,600 | | | | 16,729 | |
Canadian Imperial Bank of Commerce (c) | | | 7,700 | | | | 628,238 | |
| Canadian Pacific Railway Ltd. | | | 26,853 | | | | 3,833,804 | |
| Canadian Utilities Ltd. - Series A | | | 4,100 | | | | 110,498 | |
| Cenovus Energy, Inc. | | | 7,000 | | | | 105,822 | |
CI Financial Corp. (c) | | | 14,000 | | | | 300,994 | |
| Constellation Software, Inc. | | | 6,035 | | | | 2,742,046 | |
| Crescent Point Energy Corp. | | | 23,600 | | | | 320,742 | |
| Eldorado Gold Corp. | | | 25,500 | | | | 82,036 | |
| Element Fleet Management Corp. | | | 17,600 | | | | 163,310 | |
| Empire Co. Ltd. - Class A | | | 2,800 | | | | 32,779 | |
Enbridge, Inc. (c) | | | 1,600 | | | | 67,321 | |
| First Capital Realty, Inc. | | | 13,000 | | | | 200,108 | |
First Quantum Minerals Ltd. (c) | | | 2,800 | | | | 27,837 | |
| Goldcorp, Inc. | | | 8,300 | | | | 112,989 | |
| H&R Real Estate Investment Trust | | | 6,800 | | | | 113,281 | |
Husky Energy, Inc. (b) | | | 25,634 | | | | 310,971 | |
| IGM Financial, Inc. | | | 10,200 | | | | 290,165 | |
| Industrial Alliance Insurance & Financial Services, Inc. | | | 1,400 | | | | 55,663 | |
| Intact Financial Corp. | | | 100 | | | | 7,157 | |
Inter Pipeline Ltd. (c) | | | 1,600 | | | | 35,317 | |
Kinross Gold Corp. (b) | | | 11,600 | | | | 36,195 | |
WILSHIRE INTERNATIONAL EQUITY FUND
SCHEDULE OF INVESTMENTS (Continued)
| COMMON STOCKS - 97.4% (Continued) | | Shares | | | Value | |
| Canada - 5.1% (Continued) | |
| Linamar Corp. | | | 4,650 | | | $ | 199,772 | |
| Manulife Financial Corp. | | | 30,400 | | | | 541,297 | |
| National Bank of Canada | | | 3,100 | | | | 125,887 | |
| Potash Corp. of Saskatchewan, Inc. | | | 29,900 | | | | 540,855 | |
| Power Corp. of Canada | | | 3,200 | | | | 71,610 | |
| RioCan Real Estate Investment Trust | | | 5,600 | | | | 111,056 | |
| Royal Bank of Canada | | | 7,400 | | | | 500,766 | |
| Shaw Communications, Inc. - Class B | | | 10,700 | | | | 214,666 | |
SNC-Lavalin Group, Inc. (c) | | | 2,000 | | | | 86,073 | |
| Suncor Energy, Inc. | | | 9,400 | | | | 307,309 | |
Tourmaline Oil Corp. (b) | | | 1,800 | | | | 48,136 | |
Turquoise Hill Rsources Ltd. (b) | | | 20,800 | | | | 66,761 | |
Veresen, Inc. (c) | | | 2,100 | | | | 20,502 | |
| West Fraser Timber Company Ltd. | | | 200 | | | | 7,151 | |
Yamana Gold, Inc. (c) | | | 16,600 | | | | 46,605 | |
| | | | | | | | 13,786,269 | |
| Chile - 0.1% | |
Banco de Chile (b) | | | 45,163 | | | | 5,291 | |
Latam Airlines Group S.A. (b) | | | 18,574 | | | | 156,447 | |
| | | | | | | | 161,738 | |
| China - 4.7% | |
Agricultural Bank of China Ltd. - H Shares (a) | | | 91,000 | | | | 37,139 | |
Aluminum Corp. of China Ltd. (a) | | | 226,000 | | | | 92,569 | |
Belle International Holdings Ltd. (a) | | | 97,000 | | | | 54,337 | |
China Coal Energy Co. Ltd. - H Shares (a) (b) | | | 309,000 | | | | 145,795 | |
China Communications Services Corp. Ltd. - H Shares (a) | | | 164,000 | | | | 104,202 | |
China Construction Bank Corp. - H Shares (a) | | | 1,122,000 | | | | 859,269 | |
China Everbright Ltd. (a) | | | 78,000 | | | | 147,732 | |
China Longyuan Power Group Corp. Ltd. - H Shares (a) | | | 222,000 | | | | 172,507 | |
China Mobile Ltd. - ADR (c) | | | 47,000 | | | | 2,464,210 | |
China National Building Material Co. Ltd. - H Shares (a) | | | 334,000 | | | | 161,753 | |
China Railway Construction Corp. Ltd. - H Shares (a) | | | 26,500 | | | | 33,959 | |
China Resources Land Ltd. (a) | | | 120,000 | | | | 268,523 | |
WILSHIRE INTERNATIONAL EQUITY FUND
SCHEDULE OF INVESTMENTS (Continued)
| COMMON STOCKS - 97.4% (Continued) | | Shares | | | Value | |
| China- 4.7% (Continued) | |
China Shenhua Energy Co. Ltd. - H Shares (a) | | | 45,000 | | | $ | 84,115 | |
CITIC Ltd. (a) | | | 207,000 | | | | 294,802 | |
CNOOC Ltd. (a) | | | 445,000 | | | | 553,022 | |
Ctrip.com International Ltd. - ADR (b) (c) | | | 67,397 | | | | 2,695,880 | |
Great Wall Motor Co. Ltd. - H Shares (a) (b) | | | 300,500 | | | | 278,756 | |
Guangdong Investment Ltd. (a) | | | 78,000 | | | | 102,717 | |
Huaneng Renewables Corp. Ltd. - H Shares (a) | | | 418,000 | | | | 135,135 | |
Hutchison Port Holdings Trust (a) | | | 231,100 | | | | 100,279 | |
Kunlun Energy Co. Ltd. (a) | | | 374,000 | | | | 278,648 | |
| NetEase, Inc. - ADR | | | 219 | | | | 47,159 | |
PetroChina Co. Ltd. - H Shares (a) | | | 4,000 | | | | 2,971 | |
Shandong Weigao Group Medical Polymer Co. Ltd. (a) | | | 68,000 | | | | 45,288 | |
Shanghi Industrial Holdings Ltd. (a) | | | 19,000 | | | | 51,226 | |
Tencent Holdings Ltd. (a) | | | 129,855 | | | | 3,148,638 | |
Weichai Power Co Ltd. - H Shares (a) | | | 89,000 | | | | 136,486 | |
Yanzhou Coal Mining Co. Ltd. - H Shares (a) | | | 174,000 | | | | 117,973 | |
YY, Inc. - ADR (b) (c) | | | 2,800 | | | | 110,377 | |
| | | | | | | | 12,725,467 | |
Colombia - 0.0% (d) | |
| Grupo Aval Acciones y Valores S.A. | | | 316,284 | | | | 128,031 | |
| | | | | | | | | |
Czech Republic - 0.0% (d) | |
CEZ A/S (a) | | | 1,440 | | | | 24,100 | |
| | | | | | | | | |
| Denmark - 3.6% | |
Carlsberg A/S - Series B (a) | | | 24,511 | | | | 2,110,825 | |
Chr. Hansen Holding A/S (a) | | | 43,850 | | | | 2,424,812 | |
Coloplast A/S - Series B (a) | | | 40,404 | | | | 2,721,188 | |
ISS A/S (a) | | | 2,393 | | | | 80,640 | |
Novo Nordisk A/S - Class B (a) | | | 1,142 | | | | 40,960 | |
Novozymes A/S (a) | | | 65,724 | | | | 2,261,382 | |
William Demant Holding A/S (a) (b) | | | 5,321 | | | | 92,410 | |
| | | | | | | | 9,732,217 | |
| Finland - 0.4% | |
Nokian Renkaat OYJ (a) | | | 8,925 | | | | 331,772 | |
WILSHIRE INTERNATIONAL EQUITY FUND
SCHEDULE OF INVESTMENTS (Continued)
| COMMON STOCKS - 97.4% (Continued) | | Shares | | | Value | |
| Finland - 0.4% (Continued) | |
Sampo OYJ - A Shares (a) | | | 1,790 | | | $ | 80,008 | |
Stora Enso OYJ (a) | | | 7,262 | | | | 77,672 | |
UPM-Kymmene OYJ (a) | | | 25,817 | | | | 631,291 | |
| | | | | | | | 1,120,743 | |
| France - 11.1% | |
Alstom S.A. (a) (b) | | | 5,244 | | | | 144,185 | |
Atos SE (a) | | | 4,592 | | | | 483,926 | |
AXA S.A. (a) | | | 123,063 | | | | 3,101,889 | |
Bureau Veritas S.A. (a) | | | 172 | | | | 3,329 | |
Carrefour S.A. (a) | | | 73,230 | | | | 1,762,866 | |
Casino Guichard Perrachon S.A. (a) (c) | | | 2,970 | | | | 142,289 | |
Cie Generale des Etablissements Michelin (a) | | | 928 | | | | 103,143 | |
EADS N.V. (a) | | | 51,910 | | | | 3,428,166 | |
Engie S.A. (a) | | | 150,780 | | | | 1,919,035 | |
Essilor International S.A. (a) | | | 21,887 | | | | 2,469,168 | |
Eutelsat Communications S.A. (a) | | | 7,530 | | | | 145,595 | |
Groupe Bruxelle Lambert S.A. (a) | | | 317 | | | | 26,556 | |
Hermes International (a) | | | 6,085 | | | | 2,495,868 | |
Iliad S.A. (a) (c) | | | 310 | | | | 59,527 | |
LVMH Moet Hennessy Louis Vuitton SE (a) | | | 14,975 | | | | 2,854,956 | |
Orange S.A. (a) | | | 127,000 | | | | 1,925,588 | |
Remy Cointreau S.A. (a) | | | 433 | | | | 36,903 | |
SCOR SE (a) | | | 5,758 | | | | 198,689 | |
Société Générale S.A. (a) | | | 43,960 | | | | 2,161,987 | |
Sodexo S.A. (a) (b) | | | 1,820 | | | | 208,935 | |
Technip S.A. (a) | | | 10,354 | | | | 737,443 | |
Total S.A. - ADR (c) | | | 59,970 | | | | 3,056,671 | |
Unibail-Rodamco SE (a) | | | 1,397 | | | | 332,871 | |
Veolia Environnement S.A. (a) (c) | | | 2,640 | | | | 44,853 | |
Vinci S.A. (a) | | | 772 | | | | 52,509 | |
Vivendi S.A. (a) | | | 96,585 | | | | 1,831,694 | |
| | | | | | | | 29,728,641 | |
| Germany - 5.1% | |
adidas AG (a) | | | 13,208 | | | | 2,082,886 | |
Allianz SE (a) | | | 5,009 | | | | 826,573 | |
BASF SE (a) | | | 1,384 | | | | 128,248 | |
WILSHIRE INTERNATIONAL EQUITY FUND
SCHEDULE OF INVESTMENTS (Continued)
| COMMON STOCKS - 97.4% (Continued) | | Shares | | | Value | |
| Germany - 5.1% (Continued) | |
Bayer AG (a) | | | 4,854 | | | $ | 505,644 | |
Brenntag AG (a) | | | 4,157 | | | | 230,389 | |
Continental AG (a) | | | 561 | | | | 108,067 | |
Deutsche Bank AG (a) (b) | | | 11,705 | | | | 212,295 | |
Deutsche Lufthansa AG (a) (c) | | | 14,517 | | | | 187,112 | |
Deutsche Post AG (a) | | | 57,750 | | | | 1,893,680 | |
E.ON SE (a) (b) | | | 288,760 | | | | 2,031,161 | |
Evonik Industries AG (a) | | | 16,192 | | | | 482,605 | |
Fresenius Medical Care AG & Co. KGaA (a) | | | 21,485 | | | | 1,815,708 | |
Hannover Rueck SE (a) | | | 2,360 | | | | 254,913 | |
HeidelbergCement AG (a) | | | 98 | | | | 9,121 | |
K+S AG (a) | | | 2,734 | | | | 65,119 | |
LANXESS AG (a) | | | 4,791 | | | | 313,692 | |
Linde AG (a) | | | 964 | | | | 158,113 | |
METRO AG (a) (b) | | | 5,257 | | | | 174,706 | |
OSRAM Licht AG (a) (b) | | | 7,978 | | | | 417,720 | |
RWE AG (a) | | | 21,795 | | | | 270,413 | |
SAP SE (a) | | | 9,422 | | | | 814,950 | |
Siemens AG (a) | | | 931 | | | | 113,978 | |
thyssenkrupp AG (a) (b) | | | 4,111 | | | | 97,646 | |
Volkswagon AG (a) | | | 3,470 | | | | 485,453 | |
Volkswagon AG (a) | | | 371 | | | | 53,241 | |
| | | | | | | | 13,733,433 | |
Greece - 0.0% (d) | |
FF Group (a) (b) | | | 3,196 | | | | 64,627 | |
| | | | | | | | | |
| Hong Kong - 1.7% | |
AIA Group Ltd. (a) | | | 53,482 | | | | 299,600 | |
Bank of East Asia Ltd. (The) (a) | | | 2,200 | | | | 8,399 | |
Cathay Pacific Airways Ltd. (a) | | | 62,000 | | | | 81,366 | |
Cheung Kong Property Holdings Ltd. (a) (b) | | | 37,500 | | | | 229,014 | |
CK Hutchison Holdings Ltd. (a) | | | 170,625 | | | | 1,926,112 | |
First Pacific Co. Ltd. (a) | | | 194,000 | | | | 135,336 | |
Hang Lung Group Ltd. (a) | | | 38,000 | | | | 131,857 | |
Hang Seng Bank Ltd. (a) | | | 7,200 | | | | 133,522 | |
Hongkong Land Holdings Ltd. (a) | | | 15,500 | | | | 97,646 | |
WILSHIRE INTERNATIONAL EQUITY FUND
SCHEDULE OF INVESTMENTS (Continued)
| COMMON STOCKS - 97.4% (Continued) | | Shares | | | Value | |
| Hong Kong - 1.7% (Continued) | |
Hysan Development Co. Ltd. (a) | | | 54,000 | | | $ | 222,700 | |
Kerry Properties Ltd. (a) | | | 61,500 | | | | 166,311 | |
Li & Fung Ltd. (a) | | | 550,000 | | | | 241,044 | |
Nine Dragons Paper Holdings Ltd. (a) | | | 150,000 | | | | 135,450 | |
Shangri-La Asia Ltd. (a) | | | 120,000 | | | | 126,368 | |
Sino Land Co. Ltd. (a) | | | 12,000 | | | | 17,893 | |
Swire Properties Ltd. (a) | | | 105,400 | | | | 290,158 | |
Wheelock & Co. Ltd. (a) | | | 36,000 | | | | 202,043 | |
Yue Yuen Industrial Holdings Ltd. (a) | | | 7,500 | | | | 27,186 | |
| | | | | | | | 4,472,005 | |
Hungary - 0.0% (d) | |
| MOL Hungarian Oil & Gas plc | | | 121 | | | | 8,498 | |
| | | | | | | | | |
| India - 1.0% | |
| HDFC Bank Ltd. - ADR | | | 45,016 | | | | 2,731,571 | |
| | | | | | | | | |
Indonesia - 0.0% (d) | |
Bank CIMB Niaga Tbk PT (a) (b) | | | 6,009 | | | | 376 | |
Bank Danamon Indonesia Tbk PT (a) | | | 234,000 | | | | 64,350 | |
| | | | | | | | 64,726 | |
| Ireland - 2.2% | |
AerCap Holdings N.V. (b) | | | 53,485 | | | | 2,225,511 | |
Experian plc (a) | | | 186,151 | | | | 3,603,943 | |
| | | | | | | | 5,829,454 | |
| Israel - 0.1% | |
Nice Ltd. (a) | | | 3,374 | | | | 231,453 | |
| | | | | | | | | |
| Italy - 2.1% | |
Assicurazioni Generali SpA (a) | | | 11,254 | | | | 166,790 | |
Eni SpA (a) | | | 9,045 | | | | 146,611 | |
Intesa Sanpaolo SpA (a) | | | 1,025,035 | | | | 2,596,240 | |
Luxottica Group SpA (a) | | | 38,825 | | | | 2,086,450 | |
Saipem SpA (a) (b) (c) | | | 481,002 | | | | 268,998 | |
Snam SpA (a) | | | 46,472 | | | | 191,109 | |
Terna Rete Elettrica Nazionale SpA (a) (c) | | | 59,389 | | | | 271,573 | |
| | | | | | | | 5,727,771 | |
WILSHIRE INTERNATIONAL EQUITY FUND
SCHEDULE OF INVESTMENTS (Continued)
| COMMON STOCKS - 97.4% (Continued) | | Shares | | | Value | |
| Japan - 14.7% | |
AEON Financial Service Co. Ltd. (a) | | | 10,400 | | | $ | 184,190 | |
Alfresa Holdings Corp. (a) (b) | | | 3,400 | | | | 56,153 | |
Amada Holdings Co. Ltd. (a) | | | 24,600 | | | | 274,035 | |
Asics Corp. (a) (b) | | | 900 | | | | 17,934 | |
Astellas Pharma, Inc. (a) | | | 140,058 | | | | 1,942,908 | |
Bank of Kyoto Ltd. (The) (a) | | | 25,000 | | | | 185,298 | |
Bridgestone Corp. (a) | | | 11,100 | | | | 399,353 | |
Canon, Inc. (a) | | | 29,000 | | | | 816,633 | |
Casio Computer Co. Ltd. (a) | | | 9,400 | | | | 132,464 | |
Daicel Corp. (a) (b) | | | 14,300 | | | | 157,201 | |
Dai-ichi Life Insurance Holdings, Inc. (a) (b) | | | 26,200 | | | | 435,577 | |
Dentsu, Inc. (a) | | | 4,300 | | | | 202,183 | |
Electric Power Development Co. Ltd. (a) | | | 13,800 | | | | 316,704 | |
Fuji Heavy Industries Ltd. (a) | | | 9,800 | | | | 399,261 | |
Hachijuni Bank Ltd. (The) (a) | | | 8,400 | | | | 48,601 | |
Hino Motors Ltd. (a) | | | 10,600 | | | | 107,687 | |
Hokuriku Electric Power Co. (a) | | | 16,100 | | | | 180,064 | |
Iida Group Holdings Co. Ltd. (a) | | | 10,700 | | | | 202,825 | |
INPEX Corp. (a) | | | 43,400 | | | | 433,781 | |
Japan Airlines Co. Ltd. (a) (b) | | | 11,200 | | | | 326,797 | |
Japan Post Bank Co. Ltd. (a) | | | 11,600 | | | | 138,997 | |
JFE Holdings, Inc. (a) | | | 15,100 | | | | 228,329 | |
JGC Corp. (a) | | | 12,400 | | | | 224,623 | |
JTEKT Corp. (a) (b) | | | 500 | | | | 7,972 | |
JX Holdings, Inc. (a) | | | 127,000 | | | | 536,583 | |
Kamigumi Co. Ltd. (a) | | | 6,000 | | | | 57,141 | |
Kawasaki Heavy Industries Ltd. (a) | | | 47,000 | | | | 147,105 | |
KDDI Corp. (a) | | | 300 | | | | 7,575 | |
Keyence Corp. (a) | | | 4,730 | | | | 3,236,223 | |
Kobe Steel Ltd. (a) (b) | | | 16,600 | | | | 157,822 | |
Komatsu Ltd. (a) (b) | | | 80,000 | | | | 1,811,858 | |
Kurita Water Industries Ltd. (a) | | | 7,000 | | | | 153,992 | |
Kyocera Corp. (a) | | | 10,000 | | | | 495,763 | |
Lawson, Inc. (a) | | | 2,100 | | | | 147,390 | |
Marubeni Corp. (a) | | | 26,400 | | | | 149,308 | |
Mazda Motor Corp. (a) | | | 159,400 | | | | 2,595,443 | |
WILSHIRE INTERNATIONAL EQUITY FUND
SCHEDULE OF INVESTMENTS (Continued)
| COMMON STOCKS - 97.4% (Continued) | | Shares | | | Value | |
| Japan - 14.7% (Continued) | |
Medipal Holdings Corp. (a) (b) | | | 16,000 | | | $ | 252,012 | |
Mitsubishi Estate Company Ltd. (a) | | | 104,000 | | | | 2,065,749 | |
Mitsubishi Heavy Industries Ltd. (a) | | | 75,000 | | | | 340,924 | |
Mitsubishi Materials Corp. (a) | | | 8,300 | | | | 253,853 | |
Mitsubishi UFJ Financial Group, Inc. (a) | | | 34,700 | | | | 213,988 | |
Mitsubishi UFJ Lease & Finance Co. Ltd. (a) | | | 14,400 | | | | 74,265 | |
Mitsui OSK Lines Ltd. (a) | | | 55,000 | | | | 151,790 | |
Mixi, Inc. (a) | | | 4,400 | | | | 160,314 | |
Mizuho Financial Group, Inc. (a) | | | 90,100 | | | | 161,674 | |
MS&AD Insurance Group Holdings, Inc. (a) | | | 17,500 | | | | 541,885 | |
Murata Manufacturing Co. Ltd. (a) | | | 13,900 | | | | 1,856,001 | |
NGK Spark Plug Co. Ltd. (a) | | | 5,400 | | | | 119,679 | |
Nikon Corp. (a) | | | 13,000 | | | | 201,879 | |
Nippon Electric Glass Co. Ltd. (a) | | | 35,000 | | | | 188,825 | |
Nippon Yusen KK (a) | | | 9,000 | | | | 16,666 | |
Nissan Motor Co. Ltd. (a) | | | 16,100 | | | | 161,488 | |
Nomura Real Estate Holdings, Inc. (a) | | | 5,100 | | | | 86,539 | |
Nomura Research Institute Ltd. (a) | | | 3,267 | | | | 99,281 | |
NSK Ltd. (a) | | | 41,600 | | | | 480,417 | |
Oji Holdings Corp. (a) | | | 42,000 | | | | 170,783 | |
Otsuka Holdings Co. Ltd. (a) | | | 45,600 | | | | 1,986,185 | |
Panasonic Corp. (a) | | | 183,448 | | | | 1,860,399 | |
Rakuten, Inc. (a) | | | 52,400 | | | | 513,363 | |
Resona Holdings, Inc. (a) | | | 42,700 | | | | 218,820 | |
Ricoh Co. Ltd. (a) | | | 30,100 | | | | 254,257 | |
Sankyo Co. Ltd. (a) | | | 2,700 | | | | 87,045 | |
Secom Co. Ltd. (a) | | | 23,700 | | | | 1,731,471 | |
Sega Sammy Holdings, Inc. (a) | | | 17,500 | | | | 260,029 | |
Seiko Epson Corp. (a) | | | 91,130 | | | | 1,923,824 | |
Seven & i Holdings Co. Ltd. (a) | | | 2,300 | | | | 87,460 | |
Shimamura Co. Ltd. (a) (b) | | | 200 | | | | 24,934 | |
Sompo Holdings, Inc. (a) | | | 4,300 | | | | 145,204 | |
Sony Financial Holdings, Inc. (a) (b) | | | 11,400 | | | | 177,693 | |
Sumitomo Heavy Industries Ltd. (a) | | | 2,000 | | | | 12,841 | |
Sumitomo Mitsui Financial Group, Inc. (a) | | | 300 | | | | 11,424 | |
Sumitomo Mitsui Trust Holdings, Inc. (a) | | | 3,200 | | | | 114,482 | |
WILSHIRE INTERNATIONAL EQUITY FUND
SCHEDULE OF INVESTMENTS (Continued)
| COMMON STOCKS - 97.4% (Continued) | | Shares | | | Value | |
| Japan - 14.7% (Continued) | |
Sundrug Co. Ltd. (a) | | | 2,200 | | | $ | 152,098 | |
Suntory Beverage & Food Ltd. (a) | | | 39,100 | | | | 1,619,447 | |
Suzuken Co. Ltd. (a) | | | 3,900 | | | | 127,373 | |
Sysmex Corp. (a) | | | 34,675 | | | | 2,003,332 | |
T&D Holdings, Inc. (a) | | | 17,600 | | | | 232,255 | |
Takeda Pharmaceutical Co. Ltd. (a) | | | 1,100 | | | | 45,631 | |
Tokio Marine Holdings, Inc. (a) | | | 5,500 | | | | 225,168 | |
Tokyo Tatemono Co. Ltd. (a) | | | 5,100 | | | | 68,082 | |
Tokyu Fudosan Holdings Corp. (a) | | | 30,000 | | | | 176,672 | |
Toyo Suisan Kaisha Ltd. (a) | | | 400 | | | | 14,471 | |
Toyoda Gosei Co. Ltd. (a) | | | 1,200 | | | | 28,005 | |
Toyota Motor Corp. (a) | | | 14,600 | | | | 855,902 | |
| | | | | | | | 39,471,652 | |
| Jersey - 0.1% | |
Glencore plc (a) | | | 66,323 | | | | 224,083 | |
Randgold Resources Ltd. (a) | | | 1,663 | | | | 127,755 | |
| | | | | | | | 351,838 | |
| Luxembourg - 0.2% | |
ArcelorMittal (a) (b) | | | 79,214 | | | | 581,954 | |
| | | | | | | | | |
| Malaysia - 0.2% | |
AirAsia BHD (a) | | | 122,000 | | | | 62,181 | |
Public Bank BHD (a) | | | 33,800 | | | | 148,477 | |
Tenaga Nasional BHD (a) | | | 91,900 | | | | 284,476 | |
| | | | | | | | 495,134 | |
| Mexico - 0.5% | |
| Grupo Mexico SAB de CV - Series B | | | 6,900 | | | | 18,738 | |
| OHL Mexico SAB de CV | | | 90,300 | | | | 88,825 | |
| Wal-Mart de Mexico SAB de CV | | | 686,645 | | | | 1,228,961 | |
| | | | | | | | 1,336,524 | |
| Netherlands - 5.4% | |
Aegon N.V. (a) | | | 419,376 | | | | 2,303,622 | |
Akzo Nobel N.V. (a) | | | 4,507 | | | | 281,593 | |
Boskalis Westminster (a) | | | 4,804 | | | | 166,640 | |
Gemalto N.V. (a) (c) | | | 31,450 | | | | 1,816,059 | |
Heineken N.V. (a) | | | 1,266 | | | | 94,860 | |
WILSHIRE INTERNATIONAL EQUITY FUND
SCHEDULE OF INVESTMENTS (Continued)
| COMMON STOCKS - 97.4% (Continued) | | Shares | | | Value | |
| Netherlands - 5.4% (Continued) | |
Koninklijke Ahold Delhaize N.V. (a) | | | 17,875 | | | $ | 376,455 | |
Koninklijke DSM N.V. (a) | | | 28,408 | | | | 1,702,205 | |
Koninklijke KPN N.V. (a) | | | 647,128 | | | | 1,913,402 | |
Koninklijke Philips N.V. (a) | | | 63,723 | | | | 1,947,895 | |
Koninklijke Vopak N.V. (a) | | | 6,628 | | | | 312,671 | |
NN Group N.V. (a) | | | 15,652 | | | | 529,795 | |
Randstad Holding N.V. (a) | | | 3,212 | | | | 173,965 | |
Royal Dutch Shell plc (a) | | | 5,982 | | | | 165,113 | |
Royal Dutch Shell plc - Class A - ADR (c) | | | 52,125 | | | | 2,834,557 | |
| | | | | | | | 14,618,832 | |
| Norway - 0.9% | |
DNB ASA (a) (b) | | | 140,441 | | | | 2,084,747 | |
Norsk Hydro ASA (a) | | | 2,266 | | | | 10,814 | |
Orkla ASA (a) (b) | | | 12,145 | | | | 109,889 | |
Yara International ASA (a) | | | 6,215 | | | | 244,476 | |
| | | | | | | | 2,449,926 | |
Poland - 0.0% (d) | |
Tauron Polska Energia S.A. (a) (b) | | | 88,088 | | | | 59,955 | |
| | | | | | | | | |
| Portugal - 0.1% | |
Jeronimo Martins SGPS S.A. (a) | | | 9,378 | | | | 145,432 | |
| | | | | | | | | |
| Russia - 1.2% | |
| Alrosa PJSC | | | 90,700 | | | | 143,623 | |
Magnit PJSC - GDR (a) (b) | | | 2,074 | | | | 91,295 | |
| RusHydro PJSC | | | 10,602,000 | | | | 159,030 | |
Sistema PJSC - GDR (a) | | | 19,560 | | | | 176,047 | |
| Tatneft PJSC | | | 69,260 | | | | 480,644 | |
Yandex N.V. - Class A (b) | | | 104,818 | | | | 2,109,987 | |
| | | | | | | | 3,160,626 | |
| Singapore - 0.8% | |
DBS Group Holdings Ltd. (a) | | | 168,310 | | | | 2,008,122 | |
Genting Singapore plc (a) | | | 353,100 | | | | 219,774 | |
StarHub Ltd. (a) (c) | | | 9,400 | | | | 18,197 | |
Yangzijiang Shipbulidngs Holdings Ltd. (a) | | | 61,500 | | | | 34,484 | |
| | | | | | | | 2,280,577 | |
WILSHIRE INTERNATIONAL EQUITY FUND
SCHEDULE OF INVESTMENTS (Continued)
| COMMON STOCKS - 97.4% (Continued) | | Shares | | | Value | |
| South Africa - 0.9% | |
Brait SE (a) (b) | | | 9,264 | | | $ | 58,919 | |
Exxaro Resources Ltd. (a) | | | 13,401 | | | | 86,521 | |
Growthpoint Properties Ltd. (a) | | | 5,230 | | | | 9,846 | |
Mondi plc (a) | | | 1,131 | | | | 23,096 | |
Sasol Ltd. (a) | | | 5,875 | | | | 168,591 | |
Shoprite Holdings Ltd. (a) | | | 172,093 | | | | 2,150,630 | |
| | | | | | | | 2,497,603 | |
| South Korea - 1.7% | |
BNK Financial Group, Inc. (a) | | | 18,131 | | | | 130,162 | |
DGB Financial Group, Inc. (a) | | | 19,378 | | | | 156,699 | |
Hana Financial Group, Inc. (a) | | | 27,964 | | | | 722,302 | |
Hankook Tire Co. Ltd. (a) | | | 3,323 | | | | 159,877 | |
Hanwha Chemical Corp. (a) | | | 1,609 | | | | 32,825 | |
Hanwha Corp. (a) | | | 4,378 | | | | 126,938 | |
Hanwha Life Insurance Co. Ltd. (a) | | | 1,859 | | | | 10,051 | |
Hyundai Dept. Store Co. Ltd. (a) | | | 1,208 | | | | 109,136 | |
Hyundai Marine & Fire Insurance Co. Ltd. (a) | | | 3,506 | | | | 91,330 | |
KB Financial Group, Inc. (a) | | | 5,981 | | | | 211,527 | |
Korea Gas Corp. (a) | | | 2,507 | | | | 100,689 | |
Korean Air Lines Co. Ltd. (a) (b) | | | 3,475 | | | | 78,477 | |
KT Corp. (a) | | | 1,089 | | | | 26,516 | |
KT&G Corp. (a) | | | 1,985 | | | | 166,171 | |
LG Display Co. Ltd. (a) | | | 1,628 | | | | 42,272 | |
Samsung Electronics Co. Ltd. (a) | | | 852 | | | | 1,269,009 | |
Samsung Heavy Industries Co. Ltd. (a) (b) | | | 6,453 | | | | 49,314 | |
Shinhan Financial Group Co. Ltd. (a) | | | 8,051 | | | | 302,152 | |
SK Innovation Co. Ltd. (a) | | | 2,253 | | | | 272,862 | |
Woori Bank (a) | | | 39,148 | | | | 412,888 | |
| | | | | | | | 4,471,197 | |
| Spain - 3.1% | |
Abertis Infraestructuras S.A. (a) | | | 31,533 | | | | 440,509 | |
ACS Actividades de Construccion y Servicios S.A. (a) | | | 64,641 | | | | 2,039,663 | |
Amadeus IT Group S.A. (a) | | | 11,114 | | | | 504,004 | |
Banco Bilbao Vizcaya Argentaria S.A. - ADR (c) | | | 280,330 | | | | 1,897,834 | |
Banco Bilbao Vizcaya Argentaria S.A. (a) | | | 13,051 | | | | 87,939 | |
Banco Popular Espanol S.A. (a) (b) (c) | | | 134,715 | | | | 129,782 | |
WILSHIRE INTERNATIONAL EQUITY FUND
SCHEDULE OF INVESTMENTS (Continued)
| COMMON STOCKS - 97.4% (Continued) | | Shares | | | Value | |
| Spain - 3.1% (Continued) | |
Banco Santander S.A. (a) | | | 139,752 | | | $ | 726,938 | |
Enagas S.A. (a) | | | 21,434 | | | | 543,140 | |
Grifols S.A. (a) | | | 1,309 | | | | 25,982 | |
Iberdrola S.A. (a) | | | 51,733 | | | | 338,700 | |
Industria de Diseno Textil S.A. (a) | | | 42,888 | | | | 1,460,842 | |
Repsol S.A. (a) | | | 9,549 | | | | 134,177 | |
Zardoya Otis S.A. (a) | | | 15,080 | | | | 127,242 | |
| | | | | | | | 8,456,752 | |
| Sweden - 1.1% | |
Alfa Laval AB (a) | | | 14,872 | | | | 245,384 | |
Boliden AB (a) | | | 2,521 | | | | 65,500 | |
Electrolux AB - Series B (a) | | | 5,313 | | | | 131,590 | |
Getinge AB - B Shares (a) | | | 14,796 | | | | 237,139 | |
Husqvarna AB - B Shares (a) | | | 23,228 | | | | 180,276 | |
Kinnevik AB - Series B (a) | | | 7,375 | | | | 176,200 | |
Millicom International Cellular S.A. (a) | | | 433 | | | | 18,457 | |
Skandinaviska Enskilda Banken AB (a) | | | 4,085 | | | | 42,700 | |
SKF AB - B Shares (a) (b) | | | 33,900 | | | | 621,762 | |
Svenska Handelsbanken AB (a) | | | 6,218 | | | | 86,145 | |
Swedbank AB - A Shares (a) | | | 15,020 | | | | 361,995 | |
Swedish Match AB (a) | | | 10,902 | | | | 345,990 | |
Telefonaktiebolaget LM Ericsson - B Shares (a) | | | 29,311 | | | | 171,836 | |
Telia Co. AB (a) | | | 54,077 | | | | 217,295 | |
| | | | | | | | 2,902,269 | |
| Switzerland - 6.5% | |
Adecco Group AG (a) | | | 29,125 | | | | 1,901,112 | |
Aryzta AG (a) (b) (c) | | | 3,634 | | | | 159,803 | |
Credit Suisse Group AG (a) | | | 12,969 | | | | 185,333 | |
Givaudan S.A. (a) | | | 71 | | | | 129,938 | |
Julius Baer Group Ltd. (a) | | | 46,577 | | | | 2,063,361 | |
Nestlé S.A. (a) | | | 67,167 | | | | 4,811,492 | |
Novartis AG (a) | | | 11,028 | | | | 801,963 | |
Pargesa Holding S.A. (a) | | | 3,207 | | | | 208,444 | |
Roche Holdings AG (a) (b) | | | 15,636 | | | | 3,564,127 | |
SGS S.A. (a) | | | 1,326 | | | | 2,694,013 | |
Sika AG (a) | | | 17 | | | | 81,560 | |
WILSHIRE INTERNATIONAL EQUITY FUND
SCHEDULE OF INVESTMENTS (Continued)
| COMMON STOCKS - 97.4% (Continued) | | Shares | | | Value | |
| Switzerland - 6.5% (Continued) | |
Sonova Holding AG (a) | | | 726 | | | $ | 87,835 | |
STMicroelectronics N.V. (a) | | | 12,415 | | | | 140,700 | |
Swiss Re AG (a) | | | 6,262 | | | | 592,443 | |
| | | | | | | | 17,422,124 | |
| Taiwan - 2.7% | |
Asia Cement Corp. (a) | | | 202,000 | | | | 163,126 | |
Au Optronics Corp. (a) | | | 907,000 | | | | 326,993 | |
Casetek Holdings Ltd. (a) | | | 7,000 | | | | 18,392 | |
Chang Hwa Commercial Bank Ltd. (a) | | | 200,000 | | | | 105,390 | |
Cheng Shin Rubber Industry Co. Ltd. (a) | | | 161,000 | | | | 300,035 | |
Chunghwa Telecom Co. Ltd. (a) | | | 84,000 | | | | 261,865 | |
Formosa Petrochemical Corp. (a) | | | 12,000 | | | | 41,227 | |
Foxconn Technology Co. Ltd. (a) | | | 15,302 | | | | 39,969 | |
Inventec Corp. (a) | | | 17,000 | | | | 11,513 | |
Lite-On Technology Corp. (a) | | | 169,568 | | | | 253,166 | |
MediaTek, Inc. (a) | | | 115,000 | | | | 762,747 | |
Nanya Technology Corp. (a) | | | 67,000 | | | | 98,939 | |
Pegatron Corp. (a) | | | 3,000 | | | | 7,086 | |
Taiwan Business Bank (a) | | | 448,191 | | | | 112,311 | |
Taiwan Cooperative Financial Holding Co. Ltd. (a) | | | 75,274 | | | | 32,518 | |
Taiwan Fertilizer Co. Ltd. (a) | | | 66,000 | | | | 81,515 | |
Taiwan Semiconductor Manufacturing Co. Ltd. - ADR (c) | | | 152,213 | | | | 4,376,125 | |
Transcend Information, Inc. (a) | | | 15,000 | | | | 39,338 | |
Wistron Corp. (a) | | | 250,268 | | | | 191,480 | |
WPG Holdings Ltd. (a) | | | 51,000 | | | | 59,503 | |
| | | | | | | | 7,283,238 | |
| Thailand - 0.1% | |
PTT Exploration & Production PCL N.V. (a) | | | 99,400 | | | | 265,949 | |
Siam Commercial Bank PCL N.V. (The) (a) | | | 7,400 | | | | 31,348 | |
TMB Bank plc (a) | | | 672,100 | | | | 39,263 | |
| | | | | | | | 336,560 | |
| Turkey - 0.1% | |
Emlak Konut Gayrimenkul Yatirim Ortakligi AS (a) | | | 122,903 | | | | 104,075 | |
Turkiye Garanti Bankasi AS (a) | | | 35,305 | | | | 76,129 | |
Turkiye Halk Bankasi AS (a) | | | 44,558 | | | | 117,725 | |
WILSHIRE INTERNATIONAL EQUITY FUND
SCHEDULE OF INVESTMENTS (Continued)
| COMMON STOCKS - 97.4% (Continued) | | Shares | | | Value | |
| Turkey - 0.1% (Continued) | |
Turkiye Vakiflar Bankasi TAO (a) | | | 15,758 | | | $ | 19,392 | |
Yapi ve Kredi Bankasi AS (a) (b) | | | 14,278 | | | | 13,851 | |
| | | | | | | | 331,172 | |
| United Kingdom - 7.1% | |
3i Group plc (a) | | | 5,163 | | | | 44,659 | |
Aberdeen Asset Management plc (a) | | | 10,377 | | | | 32,808 | |
Admiral Group plc (a) | | | 21,182 | | | | 476,331 | |
AstraZeneca plc (a) | | | 7,470 | | | | 407,892 | |
BAE Systems plc (a) | | | 44,566 | | | | 324,130 | |
Barclays plc (a) | | | 32,790 | | | | 89,981 | |
BP plc (a) | | | 36,630 | | | | 229,414 | |
British American Tobacco plc (a) | | | 8,132 | | | | 460,853 | |
BT Group plc (a) | | | 115,613 | | | | 521,877 | |
Burberry Group plc (a) | | | 1,766 | | | | 32,543 | |
Capita plc (a) | | | 3,273 | | | | 21,399 | |
Centrica plc (a) | | | 81,282 | | | | 234,080 | |
Cobham plc (a) | | | 131,872 | | | | 265,499 | |
Compass Group plc (a) | | | 181,338 | | | | 3,351,181 | |
Croda International plc (a) | | | 10,052 | | | | 395,314 | |
Diageo plc (a) | | | 18,610 | | | | 482,894 | |
easyJet plc (a) (b) | | | 12,412 | | | | 153,519 | |
G4S plc (a) | | | 83,685 | | | | 241,865 | |
GlaxoSmithKline plc (a) | | | 13,565 | | | | 260,546 | |
HSBC Holdings plc (a) | | | 16,932 | | | | 136,609 | |
| HSBC Holdings plc - ADR | | | 73,235 | | | | 2,942,582 | |
Johnson Matthey plc (a) | | | 1,586 | | | | 62,052 | |
Prudential plc (a) | | | 9,643 | | | | 192,437 | |
Reckitt Benckiser Group plc (a) | | | 55,665 | | | | 4,714,950 | |
Rolls-Royce Holdings plc (a) | | | 33,378 | | | | 274,132 | |
Sky plc (a) | | | 30,245 | | | | 368,690 | |
Smith & Nephew plc (a) | | | 14,089 | | | | 211,451 | |
| Smith & Nephew plc - ADR | | | 56,780 | | | | 1,707,942 | |
Standard Chartered plc (a) (b) | | | 32,612 | | | | 265,930 | |
Standard Life plc (a) | | | 904 | | | | 4,139 | |
Tesco plc (a) (b) | | | 81,194 | | | | 207,014 | |
WILSHIRE INTERNATIONAL EQUITY FUND
SCHEDULE OF INVESTMENTS (Continued)
| COMMON STOCKS - 97.4% (Continued) | | Shares | | | Value | |
| United Kingdom- 7.1% (Continued) | |
Travis Perkins plc (a) | | | 4,540 | | | $ | 81,152 | |
| | | | | | | | 19,195,865 | |
| United States - 7.0% | |
| Accenture plc - Class A | | | 33,629 | | | $ | 3,938,965 | |
| Chubb Ltd. | | | 34,198 | | | | 4,518,240 | |
Core Laboratories N.V. (c) | | | 27,367 | | | | 3,285,134 | |
ICON plc (b) | | | 27,115 | | | | 2,039,048 | |
| Lazard Ltd. - Class A | | | 51,566 | | | | 2,118,847 | |
| Schlumberger Ltd. | | | 35,360 | | | | 2,968,472 | |
| | | | | | | | 18,868,706 | |
| | | | | | | | | |
Total Common Stocks (Cost $248,747,665) | | | $ | 262,475,833 | |
| RIGHTS - 0.0% | | Shares | | | Value | |
| Latam Airlines Group S.A. (Cost $0) | | | 2,087 | | | $ | 0 | |
| EXCHANGE-TRADED FUNDS - 0.4% | | Shares | | | Value | |
| iShares MSCI India ETF | | | 33,018 | | | $ | 885,213 | |
Vanguard FTSE All-World ex-US ETF (c) | | | 5,173 | | | | 228,543 | |
Total Exchange-Traded Funds (Cost $1,238,009) | | | $ | 1,113,756 | |
WILSHIRE INTERNATIONAL EQUITY FUND
SCHEDULE OF INVESTMENTS (Continued)
| Money Market Funds - 5.8% | | Shares | | | Value | |
Northern Trust Institutional Government Select Portfolio - Institutional Class, 0.39% (e) | | | 6,874,936 | | | $ | 6,874,936 | |
Northern Trust Institutional Liquid Asset Portfolio - Institutional Class, 0.01% (e) (f) | | | 8,828,715 | | | | 8,828,715 | |
Total Money Market Funds (Cost $15,703,651) | | | $ | 15,703,651 | |
| | | | | | | | | |
Total Investments at Value - 103.6% (Cost $265,689,325) | | | $ | 279,293,240 | |
| | | | | | | | | |
| Liabilities in Excess of Other Assets - (3.6%) | | | | (9,692,727 | ) |
| | | | | | | | | |
| Net Assets - 100.0% | | | $ | 269,600,513 | |
ADR - American Depositary Receipt.
GDR - Global Depositary Receipt.
(a) | Security value has been determined in good faith in accordance with procedures approved by the Board of Directors. The total value of such securities is $194,652,920 at December 31, 2016, representing 72.2% of net assets (Note 2). |
(b) | Non-income producing security. |
(c) | This security or a partial position of this security is on loan at December 31, 2016. The total market value of securities on loan at December 31, 2016 was $19,967,056. |
(d) | Percentage rounds to less than 0.1%. |
(e) | The rate shown is the 7-day effective yield as of December 31, 2016. |
(f) | This security was purchased with cash collateral held from securities on loan. The total value of such securities as of December 31, 2016 was $8,828,715. Securities on loan are also collateralized by various U.S. Treasury obligations in the amount of $11,735,202. |
See accompanying notes to financial statements.
Report of Independent Registered Public Accounting Firm
To the Board of Directors of Wilshire Mutual Funds, Inc. and the Shareholders of
Large Company Growth Portfolio, Large Company Value Portfolio, Small Company Growth Portfolio,
Small Company Value Portfolio, Wilshire 5000 IndexSM Fund, and Wilshire International Equity Fund:
In our opinion, the accompanying statements of assets and liabilities, including the condensed schedules of investments, and the related statements of operations and of changes in net assets and the financial highlights (included in Item 1 of this Form N-CSR) and the schedules of investments (included in Item 6 of this Form N-CSR) present fairly, in all material respects, the financial position of the Large Company Growth Portfolio, Large Company Value Portfolio, Small Company Growth Portfolio, Small Company Value Portfolio, Wilshire 5000 IndexSM Fund, and Wilshire International Equity Fund (six portfolios or funds constituting the Wilshire Mutual Funds, Inc., hereafter referred to as the "Portfolios") as of December 31, 2016, the results of each of their operations for the year then ended, the changes in each of their net assets for each of the two years in the period then ended and the financial highlights for each of the five years in the period then ended, in conformity with accounting principles generally accepted in the United States of America. These financial statements, financial highlights, and schedule of investments (hereafter referred to as "financial statements") are the responsibility of the Portfolios' management. Our responsibility is to express an opinion on these financial statements based on our audits. We conducted our audits of these financial statements in accordance with the standards of the Public Company Accounting Oversight Board (United States). Those standards require that we plan and perform the audit to obtain reasonable assurance about whether the financial statements are free of material misstatement. An audit includes examining, on a test basis, evidence supporting the amounts and disclosures in the financial statements, assessing the accounting principles used and significant estimates made by management, and evaluating the overall financial statement presentation. We believe that our audits, which included confirmation of securities as of December 31, 2016 by correspondence with the custodian and brokers, provide a reasonable basis for our opinion.

February 28, 2017
PricewaterhouseCooopers LLP, Two Commerce Square, Suite 1800, 2001 Market Street, Philadelphia, PA 19103-7042
T: (267) 330 3000, F:(267) 330 3300, www.pwc.com/us
| Item 7. | Disclosure of Proxy Voting Policies and Procedures for Closed-End Management Investment Companies. |
Not applicable
| Item 8. | Portfolio Managers of Closed-End Management Investment Companies. |
Not applicable
| Item 9. | Purchases of Equity Securities by Closed-End Management Investment Company and Affiliated Purchasers. |
Not applicable
| Item 10. | Submission of Matters to a Vote of Security Holders. |
There have been no changes to the procedures by which shareholders may recommend nominees to the Registrant’s Board of Directors since the Registrant last disclosed such procedures in the definitive proxy statement filed with the SEC on March 29, 2011.
| Item 11. | Controls and Procedures. |
(a) Based on their evaluation of the registrant’s disclosure controls and procedures (as defined in Rule 30a-3(c) under the Investment Company Act of 1940) as of a date within 90 days of the filing date of this report, the registrant’s principal executive officer and principal financial officer have concluded that such disclosure controls and procedures are reasonably designed and are operating effectively to ensure that material information relating to the registrant, including its consolidated subsidiaries, is made known to them by others within those entities, particularly during the period in which this report is being prepared, and that the information required in filings on Form N-CSR is recorded, processed, summarized, and reported on a timely basis.
(b) There were no changes in the registrant’s internal control over financial reporting (as defined in Rule 30a-3(d) under the Investment Company Act of 1940) that occurred during the second fiscal quarter of the period covered by this report that have materially affected, or are reasonably likely to materially affect, the registrant’s internal control over financial reporting.
File the exhibits listed below as part of this Form. Letter or number the exhibits in the sequence indicated.
(a)(1) Any code of ethics, or amendment thereto, that is the subject of the disclosure required by Item 2, to the extent that the registrant intends to satisfy the Item 2 requirements through filing of an exhibit: Attached hereto
(a)(2) A separate certification for each principal executive officer and principal financial officer of the registrant as required by Rule 30a-2(a) under the Act (17 CFR 270.30a-2(a)): Attached hereto
(a)(3) Any written solicitation to purchase securities under Rule 23c-1 under the Act (17 CFR 270.23c-1) sent or given during the period covered by the report by or on behalf of the registrant to 10 or more persons: Not applicable
(b) Certifications required by Rule 30a-2(b) under the Act (17 CFR 270.30a-2(b)): Attached hereto
| Exhibit 99.CODE ETH | Code of Ethics |
| Exhibit 99.CERT | Certifications required by Rule 30a-2(a) under the Act |
| Exhibit 99.906CERT | Certifications required by Rule 30a-2(b) under the Act |
SIGNATURES
Pursuant to the requirements of the Securities Exchange Act of 1934 and the Investment Company Act of 1940, the registrant has duly caused this report to be signed on its behalf by the undersigned, thereunto duly authorized.
| (Registrant) | Wilshire Mutual Funds, Inc. | | |
| | | | |
| By (Signature and Title)* | /s/ Jason A. Schwarz | |
| | | Jason A. Schwarz, President and Principal Executive Officer |
| | | | |
| Date | March 10, 2017 | | |
| | | | |
| Pursuant to the requirements of the Securities Exchange Act of 1934 and the Investment Company Act of 1940, this report has been signed below by the following persons on behalf of the registrant and in the capacities and on the dates indicated. |
| | | | |
| By (Signature and Title)* | /s/ Jason A. Schwarz | |
| | | Jason A. Schwarz, President and Principal Executive Officer |
| | | | |
| Date | March 10, 2017 | | |
| | | | |
| By (Signature and Title)* | /s/ Michael Wauters | |
| | | Michael Wauters, Treasurer, Principal Financial Officer and Principal Accounting Officer |
| | | | |
| Date | March 10, 2017 | | |
* | Print the name and title of each signing officer under his or her signature. |