Washington, D.C. 20549
Wilshire Mutual Funds, Inc.
Jason A. Schwarz, President
The Report to Shareholders is attached herewith.

Wilshire Mutual Funds |
ANNUAL REPORT Large Company Growth Portfolio Large Company Value Portfolio Small Company Growth Portfolio Small Company Value Portfolio Wilshire 5000 Indexsm Fund Wilshire International Equity Fund |
December 31, 2015
http://advisor.wilshire.com |
Wilshire Mutual Funds Table of Contents | 
|
Shareholder Letter | 1 |
Commentary: | |
Large Company Growth Portfolio | 4 |
Large Company Value Portfolio | 8 |
Small Company Growth Portfolio | 12 |
Small Company Value Portfolio | 16 |
Wilshire 5000 IndexSM Fund | 20 |
Wilshire International Equity Fund | 26 |
Disclosure of Fund Expenses | 32 |
Condensed Schedules of Investments: | |
Large Company Growth Portfolio | 35 |
Large Company Value Portfolio | 37 |
Small Company Growth Portfolio | 39 |
Small Company Value Portfolio | 41 |
Wilshire 5000 IndexSM Fund | 43 |
Wilshire International Equity Fund | 45 |
Statements of Assets and Liabilities | 49 |
Statements of Operations | 52 |
Statements of Changes in Net Assets | 54 |
Financial Highlights: | |
Large Company Growth Portfolio | 60 |
Large Company Value Portfolio | 62 |
Small Company Growth Portfolio | 64 |
Small Company Value Portfolio | 66 |
Wilshire 5000 IndexSM Fund | 68 |
Wilshire International Equity Fund | 72 |
Notes to Financial Statements | 74 |
Report of Independent Registered Public Accounting Firm | 86 |
Additional Fund Information | 87 |
Tax Information | 90 |
Board Approval of Advisory and Subadvisory Agreements | 92 |
This report is for the general information of the shareholders of Large Company Growth Portfolio, Large Company Value Portfolio, Small Company Growth Portfolio, Small Company Value Portfolio, Wilshire 5000 IndexSM Fund and Wilshire International Equity Fund. Its use in connection with any offering of a Portfolio’s shares is authorized only if accompanied or preceded by the Portfolio’s current prospectus.
Wilshire Mutual Funds, Inc. are distributed by SEI Investments Distribution Co.
Wilshire Mutual Funds Letter to Shareholders - (Unaudited) |
|
Dear Wilshire Mutual Fund Shareholder:
We are pleased to present this annual report to all shareholders of the Wilshire Mutual Funds. This report covers the period from January 1, 2015 to December 31, 2015, for all share classes of the Large Company Growth Portfolio, Large Company Value Portfolio, Small Company Growth Portfolio, Small Company Value Portfolio, Wilshire 5000 Index Fund, and Wilshire International Equity Fund.
Market Environment
U.S. Equity Market
The U.S. stock market, as represented by the Wilshire 5000 Total Market IndexSM, returned 0.68% during 2015 marking the Index’s seventh consecutive annual gain. After posting its 12th consecutive quarterly gain during the second quarter, markets were shaken in the third quarter in August as China surprised investors by devaluing its currency and then again in September after the Federal Reserve announced that it would not raise the Fed Funds rate at that time. Markets rebounded strongly in October and were positive overall for the fourth quarter as most major developed economies continued to strengthen on supportive central bank policies, lower fuel prices and strong consumer spending.
During the year, large-cap stocks outpaced small-cap stocks, with the Wilshire U.S. Large-Cap IndexSM and the Wilshire U.S. Small-Cap IndexSM returning 1.27% and -4.86%, respectively, while growth oriented stocks handily outpaced value stocks within large-cap stocks and value oriented stocks outpaced growth stocks within smaller capitalization securities. The relatively flat return for the Wilshire 5000 Total Market IndexSM hid the wide performance dispersion among industries for the year. Commodity-influenced and interest rate sensitive sectors trailed while Health Care and Consumer Discretionary had strong performance. For the year, Health Care, Consumer Discretionary, and Consumer Staples were the top performing sectors returning 8.4%, 7.5%, and 5.9%, respectively, while Energy, Materials, Utilities, and Industrials lagged, returning -22.1%, -10.7%, -4.2%, and -3.1%, respectively.
International Equity Market
After leading domestic equities during the first half of the year, international developed equities trailed during the second half of the year, and ended the year in negative territory with the MSCI EAFE Index returning -0.81% for 2015. Emerging markets trailed foreign developed markets with the MSCI Emerging Markets Index returning -14.92% for the year.
Global equity markets started 2015 with European stocks leading the charge as quantitative easing bond-buying programs propelled equity markets higher. Investors worldwide were shaken in the third quarter by fears regarding the impact of China’s economic slowdown on global commerce. Markets rebounded strongly in October as European Central (ECB) Bank President Mario Draghi indicated that he was prepared to ramp up the ECB’s stimulus program and the People’s Bank of China raised liquidity in its economy by reducing its benchmark interest rate and lowering banks’ reserve requirement ratios. Emerging markets suffered throughout the year both from China’s weakness and the worldwide collapse in commodities. The strong U.S. dollar has also impacted emerging market companies, since much of their debt financing is transacted in dollars and therefore has become much more expensive.
Bond Market
The U.S. fixed income market, as measured by the Barclays U.S. Aggregate Bond Index, fell -0.57% for the 4th quarter, reversing gains from the prior quarter, but ending the year in positive territory at 0.55%. The Federal Reserve’s decision on December 16th to raise the key federal-funds rate to a 0.25-0.50% target range had little real impact on Treasury markets. The pressure of rising yields on bond prices was tempered by the special status Treasuries enjoy as a global safe-haven asset, resulting in relatively little movement in this market sector. Credit spreads, which had tightened as investors sought out higher yields, widened during 2015, especially at year-end. Non-investment grade corporate bonds, as measured by the Barclays U.S. Corporate High Yield index, continued their slide and finished the year down -4.47%.
1
Wilshire Mutual Funds Letter to Shareholders (Unaudited) - (Continued) |
|
Continued weakness in the energy and materials sectors weighed on high yield, but other sectors also contributed to losses as investors became more concerned about the future availability of credit to leveraged companies and the liquidity of those issues.
Fund Performance Review
The Large Company Growth Portfolio Institutional Class shares returned 6.52%, outperforming the Russell 1000 Growth Index by 0.85%. The Large Company Value Portfolio Institutional Class shares returned -5.07%, underperforming the Russell 1000 Value Index by 1.24%. The Small Company Growth Portfolio Institutional Class shares returned 2.53%, outperforming the Russell 2000 Growth Index by 3.91%. The Small Company Value Portfolio Institutional Class shares returned -3.52%, outperforming the Russell 2000 Value Index by 3.95%. The Wilshire 5000 Index Fund Institutional Class shares returned 0.36%, underperforming the Wilshire 5000 Total Market IndexSM by 0.32%. The Wilshire International Equity Fund Institutional Class shares returned -1.37%, outperforming the MSCI All Country World ex-U.S. Index by 4.29%. We are pleased with the Funds’ performance for 2015 and we are confident that each Fund is well positioned for future growth.
As always, we sincerely appreciate your continued support and confidence in Wilshire Associates.
Sincerely,

Jason Schwarz
President, Wilshire Mutual Funds
The performance data quoted represents past performance and does not guarantee future results. Current performance may be lower or higher. The investment return and principal value of an investment will fluctuate so that shares, when redeemed, may be worth more or less than their original cost. Returns assume reinvestment of all distributions.
Index returns are for illustrative purposes only and do not represent actual Fund performance. Index performance returns do not reflect any management fees, transactions costs or expenses. Indexes are unmanaged and one cannot invest directly in an index. Past performance does not guarantee future results.
In addition to the normal risks associated with investing, international investments may involves risk of capital loss from unfavorable fluctuation in currency values, from differences in generally accepted accounting principles or from social, economic or political instability in other nations. Investments in smaller companies typically exhibit higher volatility.
Investing involves risk including loss of principal. This report identifies the Portfolio’s investments on December 31, 2015. These holdings are subject to change. Not all investments in each Portfolio performed the same, nor is there any guarantee that these investments will perform as well in the future. Market forecasts provided in this report may not occur.
The MSCI EAFE Index is an equity index which captures large and mid-cap representation across Developed Markets countries around the world, excluding the US and Canada.
MSCI Emerging Markets Index is a free float-adjusted market capitalization index that is designed to measure equity market performance of emerging markets.
2
Wilshire Mutual Funds Letter to Shareholders (Unaudited) - (Continued) |
|
Barclays U.S. Aggregate Bond Index is made up of the Barclays U.S. Government/Corporate Bond Index, Mortgage-Backed Securities Index, and Asset-Backed Securities Index, including securities that are of investment grade quality or better, have at least one year to maturity, and have an outstanding par value of at least $100 million.
Barclays U.S. Corporate High Yield Index is composed of fixed-rate, publicly issued, non-investment grade debt.
The Wilshire 5000 Total Market IndexSM is widely accepted as the definitive benchmark for the U.S. equity market, and measures performance of all U.S. equity securities with readily available price data.
The Wilshire U.S. Large-Cap IndexSM is a benchmark of the large-sized (based on capitalization) companies in the U.S. equity market and is a float-adjusted, market capitalization-weighted index of the issues ranked above 750 market capitalization of the Wilshire 5000®.
The Wilshire U.S. Small-Cap IndexSM is a benchmark of the small-sized (based on capitalization) companies in the U.S. equity market and is a float-adjusted, market capitalization-weighted index of the issues ranked between 750 and 2,500 by market capitalization of the Wilshire 5000®.
3
Large Company Growth Portfolio Commentary (Unaudited) |
|
INVESTMENT CLASS SHARES
Average Annual Total Return*
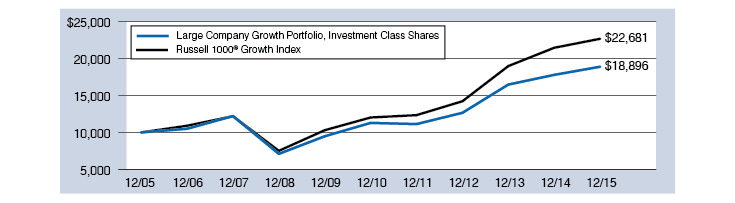
One Year Ended 12/31/15 | 6.18% |
Five Years Ended 12/31/15 | 10.85% |
Ten Years Ended 12/31/15 | 6.57% |
RUSSELL 1000® GROWTH INDEX(1)
Average Annual Total Return
One Year Ended 12/31/15 | 5.67% |
Five Years Ended 12/31/15 | 13.53% |
Ten Years Ended 12/31/15 | 8.53% |
COMPARATIVE PERFORMANCE
Comparison of Change in Value of $10,000 Investment in Shares of Large Company Growth
Portfolio, Investment Class Shares and the Russell 1000 Growth Index through 12/31/15.
The performance data quoted represents past performance and does not guarantee future results. Current performance may be lower or higher. Performance data current to the most recent month end may be obtained at http://advisor.wilshire.com. The investment return and principal value of an investment will fluctuate so that shares, when redeemed, may be worth more or less than their original cost. The table above does not reflect the deduction of taxes that a shareholder would pay on Portfolio distributions or the redemption of Portfolio shares.
* | Assumes reinvestment of all distributions. |
(1) | The Russell 1000® Growth Index is an unmanaged index that measures the performance of the largest 1,000 U.S. companies with higher price-to-book ratios and higher forecasted growth values. Index performance is presented for general comparative purposes. Unlike a mutual fund, the performance of an index assumes no transaction costs, management fees or other expenses. An individual cannot directly invest in any index. |
4
Large Company Growth Portfolio Commentary (Unaudited) - (Continued) |
|
INSTITUTIONAL CLASS SHARES
Average Annual Total Return*
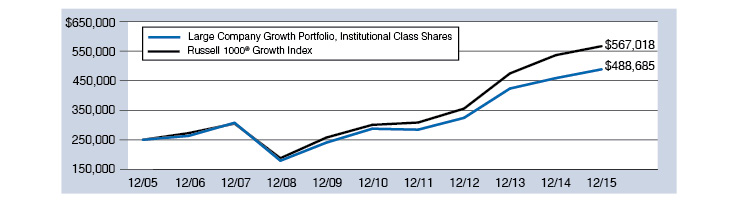
One Year Ended 12/31/15 | 6.52% |
Five Years Ended 12/31/15 | 11.19% |
Ten Years Ended 12/31/15 | 6.93% |
RUSSELL 1000® GROWTH INDEX(1)
Average Annual Total Return
One Year Ended 12/31/15 | 5.67% |
Five Years Ended 12/31/15 | 13.53% |
Ten Years Ended 12/31/15 | 8.53% |
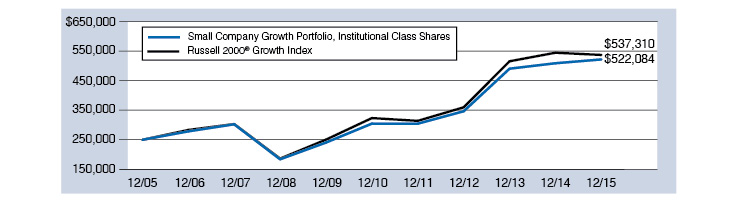
COMPARATIVE PERFORMANCE
Comparison of Change in Value of $250,000 Investment in Shares of Large Company Growth
Portfolio, Institutional Class Shares and the Russell 1000 Growth Index through 12/31/15.
The performance data quoted represents past performance and does not guarantee future results. Current performance may be lower or higher. Performance data current to the most recent month end may be obtained at http://advisor.wilshire.com. The investment return and principal value of an investment will fluctuate so that shares, when redeemed, may be worth more or less than their original cost. The table above does not reflect the deduction of taxes that a shareholder would pay on Portfolio distributions or the redemption of Portfolio shares.
* | Assumes reinvestment of all distributions. |
(1) | The Russell 1000® Growth Index is an unmanaged index that measures the performance of the largest 1,000 U.S. companies with higher price-to-book ratios and higher forecasted growth values. Index performance is presented for general comparative purposes. Unlike a mutual fund, the performance of an index assumes no transaction costs, management fees or other expenses. An individual cannot directly invest in any index. |
5
Large Company Growth Portfolio Commentary (Unaudited) - (Continued) |
|
The U.S. stock market, as represented by the Wilshire 5000 Total Market IndexSM, returned 0.68% during 2015. The year started with a loss as increased market volatility triggered by the continued sell off in oil, quantitative easing in the Eurozone, and the Swiss National Bank’s decision to remove its currency cap with the euro spooked investors. However, domestic investors rallied around the Federal Reserve’s patience with raising interest rates and the Wilshire 5000 Total Market IndexSM hit an all-time high in mid-June. Worldwide, equities experienced a sharp sell-off during the third quarter, marking the first negative quarter in three years. The first major sell-off of the third quarter occurred in August after China devalued its currency, which had been strengthening versus both the euro and yen at a time when China’s economic growth was failing to meet its official growth target. Another minor sell-off occurred in September after the Federal Open Market Committee announced it would not raise the Fed Funds rate at that time. Stocks recorded gains in the final quarter of the year, driven by a strong October rally that outweighed losses in November and December, and pushed large-cap benchmarks back into positive territory for 2015. Following positive economic news, including accelerating job growth in October and November and weekly jobless claims remaining near multi-decade lows, on December 16th the Federal Reserve raised its target for short-term interest rates—the first increase in nearly a decade.
Sector performance for the Wilshire 5000 Total Market IndexSM was mixed for the year as defensive stocks outpaced economically sensitive sectors. Health Care and Consumer stocks rallied, while Energy and Materials stocks plummeted amid falling commodities prices. Health Care continued its first half of the year dominance and was the top performing sector for the year, returning 8.4%. Consumer Discretionary and Consumer Staples retuned 7.5% and 5.9%, respectively, while Energy and Materials returned -22.1% and -10.7%, respectively.
The Wilshire Large Company Growth Portfolio Institutional Class shares returned 6.52% for 2015, outperforming the Russell 1000 Growth Index return of 5.67% by 0.85%. The Fund benefited from strong stock selection and sector allocation positioning. Strong stock selection in the Consumer Discretionary and Health Care sectors as well as an underweight allocation to the Industrials sector drove performance. Weak stock selection in the Industrials and Information Technology sectors weighed on relative performance.
We are pleased with the Fund’s outperformance for 2015 and believe the Fund is well positioned going into 2016 as the market deals with ongoing macroeconomic and geopolitical uncertainties.
6
Large Company Growth Portfolio Commentary (Unaudited) - (Continued) |
|
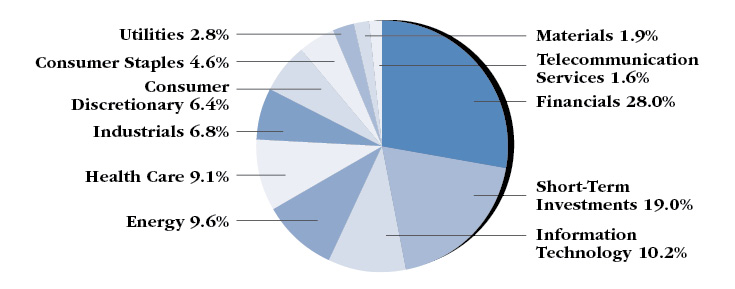
PORTFOLIO SECTOR WEIGHTING†
(As of December 31, 2015)

† | Based on percent of the Portfolio’s total investments in securities, at value. Includes investments held as collateral for securities on loan (see Note 6 in Notes to Financial Statements). |
7
Large Company Value Portfolio Commentary (Unaudited) |
|
INVESTMENT CLASS SHARES
Average Annual Total Return*
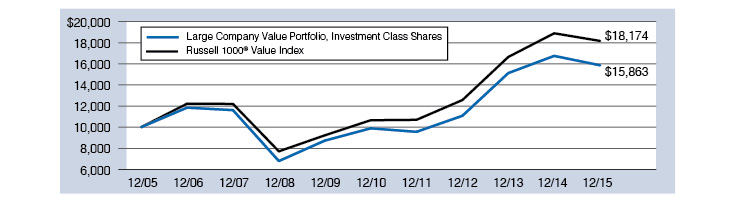
One Year Ended 12/31/15 | -5.33% |
Five Years Ended 12/31/15 | 9.91% |
Ten Years Ended 12/31/15 | 4.72% |
RUSSELL 1000® VALUE INDEX(1)
Average Annual Total Return
One Year Ended 12/31/15 | -3.83% |
Five Years Ended 12/31/15 | 11.27% |
Ten Years Ended 12/31/15 | 6.16% |
COMPARATIVE PERFORMANCE
Comparison of Change in Value of $10,000 Investment in Shares of Large Company Value
Portfolio, Investment Class Shares and the Russell 1000 Value Index through 12/31/15.
The performance data quoted represents past performance and does not guarantee future results. Current performance may be lower or higher. Performance data current to the most recent month end may be obtained at http://advisor.wilshire.com. The investment return and principal value of an investment will fluctuate so that shares, when redeemed, may be worth more or less than their original cost. The table above does not reflect the deduction of taxes that a shareholder would pay on Portfolio distributions or the redemption of Portfolio shares.
* | Assumes reinvestment of all distributions. |
(1) | The Russell 1000® Value Index is an unmanaged index that measures the performance of the largest 1,000 U.S. companies with lower price-to-book ratios and lower forecasted growth values. Index performance is presented for general comparative purposes. Unlike a mutual fund, the performance of an index assumes no transaction costs, management fees or other expenses. An individual cannot directly invest in any index. |
8
Large Company Value Portfolio Commentary (Unaudited) - (Continued) |
|
INSTITUTIONAL CLASS SHARES
Average Annual Total Return*
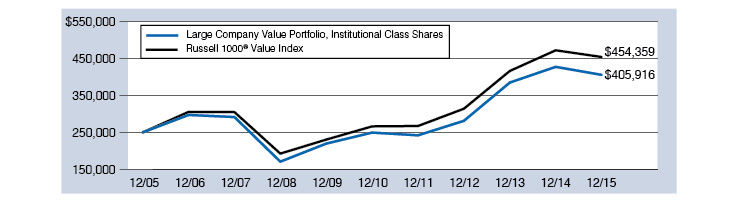
One Year Ended 12/31/15 | -5.07% |
Five Years Ended 12/31/15 | 10.22% |
Ten Years Ended 12/31/15 | 4.97% |
RUSSELL 1000® VALUE INDEX(1)
Average Annual Total Return
One Year Ended 12/31/15 | -3.83% |
Five Years Ended 12/31/15 | 11.27% |
Ten Years Ended 12/31/15 | 6.16% |
COMPARATIVE PERFORMANCE
Comparison of Change in Value of $250,000 Investment in Shares of Large Company Value
Portfolio, Institutional Class Shares and the Russell 1000 Value Index through 12/31/15.
The performance data quoted represents past performance and does not guarantee future results. Current performance may be lower or higher. Performance data current to the most recent month end may be obtained at http://advisor.wilshire.com. The investment return and principal value of an investment will fluctuate so that shares, when redeemed, may be worth more or less than their original cost. The table above does not reflect the deduction of taxes that a shareholder would pay on Portfolio distributions or the redemption of Portfolio shares.
* | Assumes reinvestment of all distributions. |
(1) | The Russell 1000® Value Index is an unmanaged index that measures the performance of the largest 1,000 U.S. companies with lower price-to-book ratios and lower forecasted growth values. Index performance is presented for general comparative purposes. Unlike a mutual fund, the performance of an index assumes no transaction costs, management fees or other expenses. An individual cannot directly invest in any index. |
9
Large Company Value Portfolio Commentary (Unaudited) - (Continued) |
|
The U.S. stock market, as represented by the Wilshire 5000 Total Market IndexSM, returned 0.68% during 2015. The year started with a loss as increased market volatility triggered by the continued sell off in oil, quantitative easing in the Eurozone, and the Swiss National Bank’s decision to remove its currency cap with the euro spooked investors. However, domestic investors rallied around the Federal Reserve’s patience with raising interest rates and the Wilshire 5000 Total Market IndexSM hit an all-time high in mid-June. Worldwide, equities experienced a sharp sell-off during the third quarter, marking the first negative quarter in three years. The first major sell-off of the third quarter occurred in August after China devalued its currency, which had been strengthening versus both the euro and yen at a time when China’s economic growth was failing to meet its official growth target. Another minor sell-off occurred in September after the Federal Open Market Committee announced it would not raise the Fed Funds rate at that time. Stocks recorded gains in the final quarter of the year, driven by a strong October rally that outweighed losses in November and December, and pushed large-cap benchmarks back into positive territory for 2015. Following positive economic news, including accelerating job growth in October and November and weekly jobless claims remaining near multi-decade lows, on December 16th the Federal Reserve raised its target for short-term interest rates—the first increase in nearly a decade.
Sector performance for the Wilshire 5000 Total Market IndexSM was mixed for the year as defensive stocks outpaced economically sensitive sectors. Health Care and Consumer stocks rallied, while Energy and Materials stocks plummeted amid falling commodities prices. Health Care continued its first half of the year dominance and was the top performing sector for the year, returning 8.4%. Consumer Discretionary and Consumer Staples retuned 7.5% and 5.9%, respectively, while Energy and Materials returned -22.1% and -10.7%, respectively.
The Wilshire Large Company Value Portfolio Institutional Class shares returned -5.07% for 2015, underperforming the Russell 1000 Value Index return of -3.83% by 1.24%. The Fund was hindered by weak stock selection in the Information Technology, Consumer Discretionary, and Financials sectors. Strong stock selection in the Health Care and Energy sectors helped mitigate relative underperformance.
Despite the Fund’s underperformance versus its benchmark, we believe the Fund is well positioned going into 2016 as the market deals with ongoing macroeconomic and geopolitical issues.
10
Large Company Value Portfolio Commentary (Unaudited) - (Continued) |
|
PORTFOLIO SECTOR WEIGHTING†
(As of December 31, 2015)
† | Based on percent of the Portfolio’s total investments in securities, at value. Includes investments held as collateral for securities on loan (see Note 6 in Notes to Financial Statements). |
11
Small Company Growth Portfolio Commentary (Unaudited) |
|
INVESTMENT CLASS SHARES
Average Annual Total Return*
One Year Ended 12/31/15 | 2.29% |
Five Years Ended 12/31/15 | 11.09% |
Ten Years Ended 12/31/15 | 7.39% |
RUSSELL 2000® GROWTH INDEX(1)
Average Annual Total Return
One Year Ended 12/31/15 | -1.38% |
Five Years Ended 12/31/15 | 10.67% |
Ten Years Ended 12/31/15 | 7.95% |
COMPARATIVE PERFORMANCE
Comparison of Change in Value of $10,000 Investment in Shares of Small Company Growth
Portfolio, Investment Class Shares and the Russell 2000 Growth Index through 12/31/15.

The performance data quoted represents past performance and does not guarantee future results. Current performance may be lower or higher. Performance data current to the most recent month end may be obtained at http://advisor.wilshire.com. The investment return and principal value of an investment will fluctuate so that shares, when redeemed, may be worth more or less than their original cost. The table above does not reflect the deduction of taxes that a shareholder would pay on Portfolio distributions or the redemption of Portfolio shares.
* | Assumes reinvestment of all distributions. During the ten years ended December 31, 2015, certain fees and expenses were waived or reimbursed. Without waivers and reimbursements (excluding fees paid indirectly), historical total returns would have been lower. For the year ended December 31, 2015, 0.17% of average net assets was waived or reimbursed through other expenses in the Investment Class Shares. |
(1) | The Russell 2000® Growth Index is an unmanaged index that measures the performance of the 2,000 smallest U.S. companies with higher price-to-book ratios and higher forecasted growth values. Index performance is presented for general comparative purposes. Unlike a mutual fund, the performance of an index assumes no transaction costs, management fees or other expenses. An individual cannot directly invest in any index. |
12
Small Company Growth Portfolio Commentary (Unaudited) - (Continued) |
|
INSTITUTIONAL CLASS SHARES
Average Annual Total Return*
One Year Ended 12/31/15 | 2.53% |
Five Years Ended 12/31/15 | 11.36% |
Ten Years Ended 12/31/15 | 7.64% |
RUSSELL 2000® GROWTH INDEX(1)
Average Annual Total Return
One Year Ended 12/31/15 | -1.38% |
Five Years Ended 12/31/15 | 10.67% |
Ten Years Ended 12/31/15 | 7.95% |
COMPARATIVE PERFORMANCE
Comparison of Change in Value of $250,000 Investment in Shares of Small Company Growth
Portfolio, Institutional Class Shares and the Russell 2000 Growth Index through 12/31/15.
The performance data quoted represents past performance and does not guarantee future results. Current performance may be lower or higher. Performance data current to the most recent month end may be obtained at http://advisor.wilshire.com. The investment return and principal value of an investment will fluctuate so that shares, when redeemed, may be worth more or less than their original cost. The table above does not reflect the deduction of taxes that a shareholder would pay on Portfolio distributions or the redemption of Portfolio shares.
* | Assumes reinvestment of all distributions. During the ten years ended December 31, 2015, certain fees and expenses were waived or reimbursed. Without waivers and reimbursements (excluding fees paid indirectly), historical total returns would have been lower. For the year ended December 31, 2015, 0.17% of average net assets was waived or reimbursed through other expenses in the Institutional Class Shares. |
(1) | The Russell 2000® Growth Index is an unmanaged index that measures the performance of the 2,000 smallest U.S. companies with higher price-to-book ratios and higher forecasted growth values. Index performance is presented for general comparative purposes. Unlike a mutual fund, the performance of an index assumes no transaction costs, management fees or other expenses. An individual cannot directly invest in any index. |
13
Small Company Growth Portfolio Commentary (Unaudited) - (Continued) |
|
The U.S. stock market, as represented by the Wilshire 5000 Total Market IndexSM, returned 0.68% during 2015. The year started with a loss as increased market volatility triggered by the continued sell off in oil, quantitative easing in the Eurozone, and the Swiss National Bank’s decision to remove its currency cap with the euro spooked investors. However, domestic investors rallied around the Federal Reserve’s patience with raising interest rates and the Wilshire 5000 Total Market IndexSM hit an all-time high in mid-June. Worldwide, equities experienced a sharp sell-off during the third quarter, marking the first negative quarter in three years. The first major sell-off of the third quarter occurred in August after China devalued its currency, which had been strengthening versus both the euro and yen at a time when China’s economic growth was failing to meet its official growth target. Another minor sell-off occurred in September after the Federal Open Market Committee announced it would not raise the Fed Funds rate at that time. Stocks recorded gains in the final quarter of the year, driven by a strong October rally that outweighed losses in November and December, and pushed large-cap benchmarks back into positive territory for 2015. Following positive economic news, including accelerating job growth in October and November and weekly jobless claims remaining near multi-decade lows, on December 16th the Federal Reserve raised its target for short-term interest rates—the first increase in nearly a decade.
Sector performance for the Wilshire 5000 Total Market IndexSM was mixed for the year as defensive stocks outpaced economically sensitive sectors. Health Care and Consumer stocks rallied, while Energy and Materials stocks plummeted amid falling commodities prices. Health Care continued its first half of the year dominance and was the top performing sector for the year, returning 8.4%. Consumer Discretionary and Consumer Staples retuned 7.5% and 5.9%, respectively, while Energy and Materials returned -22.1% and -10.7%, respectively.
The Wilshire Small Company Growth Portfolio Institutional Class shares returned 2.53%, outperforming the Russell 2000 Growth Index return of -1.38% by 3.91%. The Fund benefited from strong stock selection in the Health Care and Financials sectors as well as an underweight allocation to the Materials sector. Weak stock selection in the Industrials sector weighed on relative performance.
We are pleased with the Fund’s outperformance for 2015 and believe the Fund is well positioned going into 2016 as the market deals with ongoing macroeconomic and geopolitical uncertainties.
14
Small Company Growth Portfolio Commentary (Unaudited) - (Continued) |
|
PORTFOLIO SECTOR WEIGHTING†
(As of December 31, 2015)

† | Based on percent of the Portfolio’s total investments in securities, at value. Includes investments held as collateral for securities on loan (see Note 6 in Notes to Financial Statements). |
15
Small Company Value Portfolio Commentary (Unaudited) |
|
INVESTMENT CLASS SHARES
Average Annual Total Return*
One Year Ended 12/31/15 | -3.83% |
Five Years Ended 12/31/15 | 9.73% |
Ten Years Ended 12/31/15 | 6.48% |
RUSSELL 2000® VALUE INDEX(1)
Average Annual Total Return
One Year Ended 12/31/15 | -7.47% |
Five Years Ended 12/31/15 | 7.67% |
Ten Years Ended 12/31/15 | 5.57% |
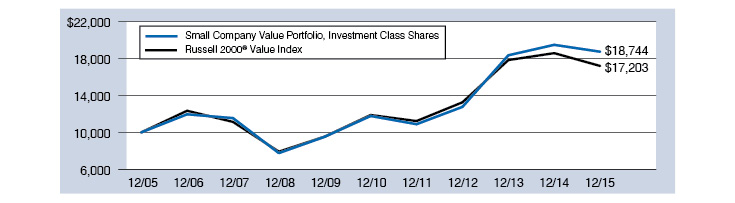
COMPARATIVE PERFORMANCE
Comparison of Change in Value of $10,000 Investment in Shares of Small Company Value
Portfolio, Investment Class Shares and the Russell 2000 Value Index through 12/31/15.
The performance data quoted represents past performance and does not guarantee future results. Current performance may be lower or higher. Performance data current to the most recent month end may be obtained at http://advisor.wilshire.com. The investment return and principal value of an investment will fluctuate so that shares, when redeemed, may be worth more or less than their original cost. The table above does not reflect the deduction of taxes that a shareholder would pay on Portfolio distributions or the redemption of Portfolio shares.
* | Assumes reinvestment of all distributions. During the ten years ended December 31, 2015, certain fees and expenses were waived or reimbursed. Without waivers and reimbursements (excluding fees paid indirectly), historical total returns would have been lower. For the year ended December 31, 2015, 0.06% of average net assets was waived or reimbursed through other expenses in the Investment Class Shares. |
(1) | The Russell 2000® Value Index is an unmanaged index that measures the performance of the 2,000 smallest U.S. companies with lower price-to-book ratios and lower forecasted growth values. Index performance is presented for general comparative purposes. Unlike a mutual fund, the performance of an index assumes no transaction costs, management fees or other expenses. An individual cannot directly invest in any index. |
16
Small Company Value Portfolio Commentary (Unaudited) - (Continued) |
|
INSTITUTIONAL CLASS SHARES
Average Annual Total Return*
One Year Ended 12/31/15 | -3.52% |
Five Years Ended 12/31/15 | 10.10% |
Ten Years Ended 12/31/15 | 6.84% |
RUSSELL 2000® VALUE INDEX(1)
Average Annual Total Return
One Year Ended 12/31/15 | -7.47% |
Five Years Ended 12/31/15 | 7.67% |
Ten Years Ended 12/31/15 | 5.57% |
COMPARATIVE PERFORMANCE
Comparison of Change in Value of $250,000 Investment in Shares of Small Company Value
Portfolio, Institutional Class Shares and the Russell 2000 Value Index through 12/31/15.

The performance data quoted represents past performance and does not guarantee future results. Current performance may be lower or higher. Performance data current to the most recent month end may be obtained at http://advisor.wilshire.com. The investment return and principal value of an investment will fluctuate so that shares, when redeemed, may be worth more or less than their original cost. The table above does not reflect the deduction of taxes that a shareholder would pay on Portfolio distributions or the redemption of Portfolio shares.
* | Assumes reinvestment of all distributions. During the ten years ended December 31, 2015, certain fees and expenses were waived or reimbursed. Without waivers and reimbursements (excluding fees paid indirectly), historical total returns would have been lower. For the year ended December 31, 2015, 0.04% of average net assets was waived or reimbursed through other expenses in the Institutional Class Shares. |
(1) | The Russell 2000® Value Index is an unmanaged index that measures the performance of the 2,000 smallest U.S. companies with lower price-to-book ratios and lower forecasted growth values. Index performance is presented for general comparative purposes. Unlike a mutual fund, the performance of an index assumes no transaction costs, management fees or other expenses. An individual cannot directly invest in any index. |
17
Small Company Value Portfolio Commentary (Unaudited) - (Continued) |
|
The U.S. stock market, as represented by the Wilshire 5000 Total Market IndexSM, returned 0.68% during 2015. The year started with a loss as increased market volatility triggered by the continued sell off in oil, quantitative easing in the Eurozone, and the Swiss National Bank’s decision to remove its currency cap with the euro spooked investors. However, domestic investors rallied around the Federal Reserve’s patience with raising interest rates and the Wilshire 5000 Total Market IndexSM hit an all-time high in mid-June. Worldwide, equities experienced a sharp sell-off during the third quarter, marking the first negative quarter in three years. The first major sell-off of the third quarter occurred in August after China devalued its currency, which had been strengthening versus both the euro and yen at a time when China’s economic growth was failing to meet its official growth target. Another minor sell-off occurred in September after the Federal Open Market Committee announced it would not raise the Fed Funds rate at that time. Stocks recorded gains in the final quarter of the year, driven by a strong October rally that outweighed losses in November and December, and pushed large-cap benchmarks back into positive territory for 2015. Following positive economic news, including accelerating job growth in October and November and weekly jobless claims remaining near multi-decade lows, on December 16th the Federal Reserve raised its target for short-term interest rates—the first increase in nearly a decade.
Sector performance for the Wilshire 5000 Total Market IndexSM was mixed for the year as defensive stocks outpaced economically sensitive sectors. Health Care and Consumer stocks rallied, while Energy and Materials stocks plummeted amid falling commodities prices. Health Care continued its first half of the year dominance and was the top performing sector for the year, returning 8.4%. Consumer Discretionary and Consumer Staples retuned 7.5% and 5.9%, respectively, while Energy and Materials returned -22.1% and -10.7%, respectively.
The Wilshire Small Company Value Portfolio Institutional Class shares returned -3.52% for 2015, outperforming the Russell 2000 Value Index return of -7.47% by 3.95%. The Fund benefited from strong stock selection and sector allocation positioning. Strong stock selection in the Consumer Discretionary, Materials and Financials sectors and an underweight allocation to the Energy sector drove performance. Weak stock selection in the Consumer Staples sector weighed on relative performance.
We are pleased with the Fund’s outperformance for 2015 and believe the Fund is well positioned going into 2016 as the market deals with ongoing macroeconomic and geopolitical uncertainties.
18
Small Company Value Portfolio Commentary (Unaudited) - (Continued) |
|
PORTFOLIO SECTOR WEIGHTING†
(As of December 31, 2015)

† | Based on percent of the Portfolio’s total investments in securities, at value. Includes investments held as collateral for securities on loan (see Note 6 in Notes to Financial Statements). |
19
Wilshire 5000 Indexsm Fund Commentary (Unaudited) |
|
INVESTMENT CLASS SHARES
Average Annual Total Return*
One Year Ended 12/31/15 | 0.08% |
Five Years Ended 12/31/15 | 11.43% |
Ten Years Ended 12/31/15 | 6.71% |
WILSHIRE 5000 INDEXSM(1)
Average Annual Total Return
One Year Ended 12/31/15 | 0.68% |
Five Years Ended 12/31/15 | 12.11% |
Ten Years Ended 12/31/15 | 7.40% |
COMPARATIVE PERFORMANCE
Comparison of Change in Value of $10,000 Investment in Shares of Wilshire 5000 IndexSM
Fund, Investment Class Shares and the Wilshire 5000 IndexSM through 12/31/15.

The performance data quoted represents past performance and does not guarantee future results. Current performance may be lower or higher. Performance data current to the most recent month end may be obtained at http://advisor.wilshire.com. The investment return and principal value of an investment will fluctuate so that shares, when redeemed, may be worth more or less than their original cost. The table above does not reflect the deduction of taxes that a shareholder would pay on Fund distributions or the redemption of Fund shares.
* | Assumes reinvestment of all distributions. |
(1) | The Wilshire 5000 IndexSM is an unmanaged index that measures the performance of all U.S. headquartered equity securities with readily available price data. Index performance is presented for general comparative purposes. Unlike a mutual fund, the performance of an index assumes no transaction costs, management fees or other expenses. An individual cannot directly invest in any index. |
20
Wilshire 5000 Indexsm Fund Commentary (Unaudited) - (Continued) |
|
INSTITUTIONAL CLASS SHARES
Average Annual Total Return*
One Year Ended 12/31/15 | 0.36% |
Five Years Ended 12/31/15 | 11.68% |
Ten Years Ended 12/31/15 | 6.94% |
WILSHIRE 5000 INDEXSM(1)
Average Annual Total Return
One Year Ended 12/31/15 | 0.68% |
Five Years Ended 12/31/15 | 12.11% |
Ten Years Ended 12/31/15 | 7.40% |
COMPARATIVE PERFORMANCE
Comparison of Change in Value of $250,000 Investment in Shares of Wilshire 5000 IndexSM
Fund, Institutional Class Shares and the Wilshire 5000 IndexSM through 12/31/15.

The performance data quoted represents past performance and does not guarantee future results. Current performance may be lower or higher. Performance data current to the most recent month end may be obtained at http://advisor.wilshire.com. The investment return and principal value of an investment will fluctuate so that shares, when redeemed, may be worth more or less than their original cost. The table above does not reflect the deduction of taxes that a shareholder would pay on Fund distributions or the redemption of Fund shares.
* | Assumes reinvestment of all distributions. |
(1) | The Wilshire 5000 IndexSM is an unmanaged index that measures the performance of all U.S. headquartered equity securities with readily available price data. Index performance is presented for general comparative purposes. Unlike a mutual fund, the performance of an index assumes no transaction costs, management fees or other expenses. An individual cannot directly invest in any index. |
21
Wilshire 5000 Indexsm Fund Commentary (Unaudited) - (Continued) |
|
QUALIFIED CLASS SHARES
Average Annual Total Return*
One Year Ended 12/31/15 | 0.34% |
Five Years Ended 12/31/15 | 12.02% |
Ten Years Ended 12/31/15 | 6.97% |
WILSHIRE 5000 INDEXSM(1)
Average Annual Total Return
One Year Ended 12/31/15 | 0.68% |
Five Years Ended 12/31/15 | 12.11% |
Ten Years Ended 12/31/15 | 7.40% |
COMPARATIVE PERFORMANCE
Comparison of Change in Value of $10,000 Investment in Shares of Wilshire 5000 IndexSM
Fund, Qualified Class Shares and the Wilshire 5000 IndexSM through 12/31/15.

The performance data quoted represents past performance and does not guarantee future results. Current performance may be lower or higher. Performance data current to the most recent month end may be obtained at http://advisor.wilshire.com. The investment return and principal value of an investment will fluctuate so that shares, when redeemed, may be worth more or less than their original cost. The table above does not reflect the deduction of taxes that a shareholder would pay on Fund distributions or the redemption of Fund shares.
* | Assumes reinvestment of all distributions. |
(1) | The Wilshire 5000 IndexSM is an unmanaged index that measures the performance of all U.S. headquartered equity securities with readily available price data. Index performance is presented for general comparative purposes. Unlike a mutual fund, the performance of an index assumes no transaction costs, management fees or other expenses. An individual cannot directly invest in any index. |
22
Wilshire 5000 Indexsm Fund Commentary (Unaudited) - (Continued) |
|
HORACE MANN CLASS SHARES
Average Annual Total Return*
One Year Ended 12/31/15 | 0.08% |
Five Years Ended 12/31/15 | 11.42% |
Ten Years Ended 12/31/15 | 6.67% |
WILSHIRE 5000 INDEXSM(1)
Average Annual Total Return
One Year Ended 12/31/15 | 0.68% |
Five Years Ended 12/31/15 | 12.11% |
Ten Years Ended 12/31/15 | 7.40% |
COMPARATIVE PERFORMANCE
Comparison of Change in Value of $10,000 Investment in Shares of Wilshire 5000 IndexSM
Fund, Horace Mann Class Shares and the Wilshire 5000 IndexSM through 12/31/15.

The performance data quoted represents past performance and does not guarantee future results. Current performance may be lower or higher. Performance data current to the most recent month end may be obtained at http://advisor.wilshire.com. The investment return and principal value of an investment will fluctuate so that shares, when redeemed, may be worth more or less than their original cost. The table above does not reflect the deduction of taxes that a shareholder would pay on Fund distributions or the redemption of Fund shares.
* | Assumes reinvestment of all distributions. |
(1) | The Wilshire 5000 IndexSM is an unmanaged index that measures the performance of all U.S. headquartered equity securities with readily available price data. Index performance is presented for general comparative purposes. Unlike a mutual fund, the performance of an index assumes no transaction costs, management fees or other expenses. An individual cannot directly invest in any index. |
23
Wilshire 5000 Indexsm Fund Commentary (Unaudited) - (Continued) |
|
The U.S. stock market, as represented by the Wilshire 5000 Total Market IndexSM, returned 0.68% during 2015. The year started with a loss as increased market volatility triggered by the continued sell off in oil, quantitative easing in the Eurozone, and the Swiss National Bank’s decision to remove its currency cap with the euro spooked investors. However, domestic investors rallied around the Federal Reserve’s patience with raising interest rates and the Wilshire 5000 Total Market IndexSM hit an all-time high in mid-June. Worldwide, equities experienced a sharp sell-off during the third quarter, marking the first negative quarter in three years. The first major sell-off of the third quarter occurred in August after China devalued its currency, which had been strengthening versus both the euro and yen at a time when China’s economic growth was failing to meet its official growth target. Another minor sell-off occurred in September after the Federal Open Market Committee announced it would not raise the Fed Funds rate at that time. Stocks recorded gains in the final quarter of the year, driven by a strong October rally that outweighed losses in November and December, and pushed large-cap benchmarks back into positive territory for 2015. Following positive economic news, including accelerating job growth in October and November and weekly jobless claims remaining near multi-decade lows, on December 16th the Federal Reserve raised its target for short-term interest rates—the first increase in nearly a decade.
Sector performance for the Wilshire 5000 Total Market IndexSM was mixed for the year as defensive stocks outpaced economically sensitive sectors. Health Care and Consumer stocks rallied, while Energy and Materials stocks plummeted amid falling commodities prices. Health Care continued its first half of the year dominance and was the top performing sector for the year, returning 8.4%. Consumer Discretionary and Consumer Staples retuned 7.5% and 5.9%, respectively, while Energy and Materials returned -22.1% and -10.7%, respectively.
The Wilshire 5000 IndexSM Fund Institutional Class shares returned 0.36% for 2015, underperforming the Fund’s benchmark (the Wilshire 5000 IndexSM) return of 0.68% by 0.32%. Underperformance is attributable to Fund expenses and is well within the range of historical experiences.
24
Wilshire 5000 Indexsm Fund Commentary (Unaudited) - (Continued) |
|
PORTFOLIO SECTOR WEIGHTING†
(As of December 31, 2015)

† | Based on percent of the Fund’s total investments in securities, at value. Includes investments held as collateral for securities on loan (see Note 6 in Notes to Financial Statements). |
25
Wilshire International Equity Fund Commentary (Unaudited) |
|
INVESTMENT CLASS SHARES
Average Annual Total Return*
One Year Ended 12/31/15 | -1.55% |
Five Years Ended 12/31/15 | 3.96% |
Inception (11/16/07) through 12/31/15 | 0.04% |
MSCI ALL COUNTRY WORLD INDEX EX-U.S.(1)
Average Annual Total Return
One Year Ended 12/31/15 | -5.66% |
Five Years Ended 12/31/15 | 1.06% |
Inception (11/16/07) through 12/31/15 | -1.21% |
On April 2, 2013, the Wilshire International Equity Fund’s investment strategy was changed. Consequently, prior period performance may have been different if the new investment strategy had been in effect during these periods. Effective May 28, 2014, the MSCI All Country World Index Ex-U.S. replaced the MSCI EAFE Index as the Wilshire International Equity Fund’s primary benchmark index. The adviser believes the MSCI All Country World Index Ex-U.S. is a more appropriate index given the Wilshire International Equity Fund’s investment strategy.
The performance data quoted represents past performance and does not guarantee future results. Current performance may be lower or higher. Performance data current to the most recent month end may be obtained at http://advisor.wilshire.com. The investment return and principal value of an investment will fluctuate so that shares, when redeemed, may be worth more or less than their original cost. The table above does not reflect the deduction of taxes that a shareholder would pay on Fund distributions or the redemption of Fund shares.
* | Assumes reinvestment of all distributions. During certain periods since inception, certain fees and expenses were waived or reimbursed. Without waivers and reimbursements, historical total returns would have been lower. For the year ended December 31, 2015, 0.25% of average net assets was waived or reimbursed through other expenses in the Investment Class Shares. |
(1) | The MSCI All Country World Ex-U.S. Index is an unmanaged capitalization-weighted measure of stock markets of developed and emerging markets, with the exception of U.S.-based companies. Unlike a mutual fund, the performance of an index assumes no transaction costs, management fees or other expenses. An individual cannot invest directly in an index. Index performance is presented for general comparative purposes. |
26
Wilshire International Equity Fund Commentary (Unaudited) - (Continued) |
|
COMPARATIVE PERFORMANCE
Comparison of Change in Value of $10,000 Investment in Shares of Wilshire International Equity
Fund, Investment Class Shares and the MSCI ACWI ex-US Index through 12/31/15.

The performance data quoted represents past performance and does not guarantee future results. Current performance may be lower or higher. Performance data current to the most recent month end may be obtained at http://advisor.wilshire.com. The investment return and principal value of an investment will fluctuate so that shares, when redeemed, may be worth more or less than their original cost. The table above does not reflect the deduction of taxes that a shareholder would pay on Fund distributions or the redemption of Fund shares.
27
Wilshire International Equity Fund Commentary (Unaudited) - (Continued) |
|
INSTITUTIONAL CLASS SHARES
Average Annual Total Return*
One Year Ended 12/31/15 | -1.37% |
Five Years Ended 12/31/15 | 4.16% |
Inception (11/16/07) through 12/31/15 | 0.29% |
MSCI ALL COUNTRY WORLD INDEX EX-U.S.(1)
Average Annual Total Return
One Year Ended 12/31/15 | -5.66% |
Five Years Ended 12/31/15 | 1.06% |
Inception (11/16/07) through 12/31/15 | -1.21% |
On April 2, 2013, the Wilshire International Equity Fund’s investment strategy was changed. Consequently, prior period performance may have been different if the new investment strategy had been in effect during these periods. Effective May 28, 2014, the MSCI All Country World Index Ex-U.S. replaced the MSCI EAFE Index as the Wilshire International Equity Fund’s primary benchmark index. The adviser believes the MSCI All Country World Index Ex-U.S. is a more appropriate index given the Wilshire International Equity Fund’s investment strategy.
The performance data quoted represents past performance and does not guarantee future results. Current performance may be lower or higher. Performance data current to the most recent month end may be obtained at http://advisor.wilshire.com. The investment return and principal value of an investment will fluctuate so that shares, when redeemed, may be worth more or less than their original cost. The table above does not reflect the deduction of taxes that a shareholder would pay on Fund distributions or the redemption of Fund shares.
* | Assumes reinvestment of all distributions. During certain periods since inception, certain fees and expenses were waived or reimbursed. Without waivers and reimbursements, historical total returns would have been lower. For the year ended December 31, 2015, 0.04% of average net assets was waived or reimbursed through other expenses in the Institutional Class Shares. |
(1) | The MSCI All Country World Ex-U.S. Index is an unmanaged capitalization-weighted measure of stock markets of developed and emerging markets, with the exception of U.S.-based companies. Unlike a mutual fund, the performance of an index assumes no transaction costs, management fees or other expenses. An individual cannot invest directly in an index. Index performance is presented for general comparative purposes. |
28
Wilshire International Equity Fund Commentary (Unaudited) - (Continued) |
|
COMPARATIVE PERFORMANCE
Comparison of Change in Value of $250,000 Investment in Shares of Wilshire International Equity
Fund, Institutional Class Shares and the MSCI ACWI ex-US Index through 12/31/15.

The performance data quoted represents past performance and does not guarantee future results. Current performance may be lower or higher. Performance data current to the most recent month end may be obtained at http://advisor.wilshire.com. The investment return and principal value of an investment will fluctuate so that shares, when redeemed, may be worth more or less than their original cost. The table above does not reflect the deduction of taxes that a shareholder would pay on Fund distributions or the redemption of Fund shares.
29
Wilshire International Equity Fund Commentary (Unaudited) - (Continued) |
|
International stock markets underperformed the U.S. for 2015 as the MSCI All Country World ex-U.S. Index returned -5.66%. Foreign developed securities fared far better emerging economy stocks with the MSCI EAFE Index and the MSCI Emerging Markets Index returning -0.81% and -14.92%, respectively, for the year. Global equity markets started 2015 with strong gains, with European stocks leading the charge. Despite Greece’s ongoing fiscal woes, the Eurozone began to show signs of economic recovery as moves by European central banks to relax monetary policy sent stock prices soaring. The European stock market rally was brought to an abrupt end by the late-June breakdown in negotiations between the European Central Bank and beleaguered Greece. Pacific region stocks also lost ground in June, but returned positive performance for the second quarter, adding to strong first quarter returns. Stock markets worldwide were rocked in the third quarter by fears regarding the impact of China’s economic slowdown on global commerce. European equities experienced somewhat smaller losses than Asia-Pacific region stocks, as the Eurozone’s economy in the second quarter grew at a higher rate than analysts had expected. International markets experienced a modest recovery in the fourth quarter as investors were cheered by Europe’s nascent economic recovery, the European Central Bank’s accommodative monetary policy, and overall resilience in the Asia-Pacific region outside of China. Emerging markets continue to suffer from China’s weakness and the worldwide collapse in commodities. The strong U.S. dollar also impacted emerging market companies, since much of their debt financing is transacted in dollars and therefore has become much more expensive.
Sector performance for the MSCI All Country World ex-U.S. Index was mixed for 2015. Only Health Care and Consumer Staples had positive performance for the year, returning 6.5% and 5.6%, respectively. Similar to domestic securities, in foreign markets Energy and Materials stocks plummeted amid falling commodities prices. The Energy and Materials sectors returned -21.3% and -19.4%, respectively.
The Wilshire International Equity Fund Institutional Class shares returned -1.37% for 2015, outperforming the MSCI All Country World ex U.S. Index return of -5.66% by 4.29%. The Fund benefited from strong stock selection in the Materials, Health Care, and Consumer Discretionary sectors. Weak stock selection in the Industrials and Financials sectors weighed on relative performance. Regionally, the Fund benefited from strong stock selection in the United Kingdom, Canada and Hong Kong as well as an overweight allocation to Denmark and Canada. Weak stock selection in South Korea weighed on relative performance.
We are pleased with the Fund’s outperformance for 2015 and believe the Fund is well positioned going into 2016 as the market deals with ongoing macroeconomic and geopolitical uncertainties.
30
Wilshire International Equity Fund Commentary (Unaudited) - (Continued) |
|
PORTFOLIO SECTOR WEIGHTING†
(As of December 31, 2015)

† | Based on percent of the Fund’s total investments in securities, at value. Includes investments held as collateral for securities on loan (see Note 6 in Notes to Financial Statements). |
31
Wilshire Mutual Funds, Inc. Disclosure of Fund Expenses For the Six Months Ended December 31, 2015 (Unaudited) |
|
All mutual funds have operating expenses. As a shareholder of a portfolio (or a “fund”), you incur ongoing costs, which include costs for investment advisory, administrative services, distribution and/or shareholder services and shareholder reports (like this one), among others. Operating expenses, which are deducted from a fund’s gross income, directly reduce the investment return of the fund. A fund’s expenses are expressed as a percentage of its average net assets. This figure is known as the expense ratio. The following examples are intended to help you understand the ongoing fees (in dollars) of investing in your fund and to compare these costs with those of other mutual funds. The examples are based on an investment of $1,000 made at the beginning of the period and held for the entire period from July 1, 2015 to December 31, 2015.
The table on the next page illustrates your Portfolio’s costs in two ways:
Actual Fund Return: This section helps you to estimate the actual expenses, after any applicable fee waivers, that you paid over the period. The “Ending Account Value” shown is derived from the Portfolio’s actual return for the period. The “Expense Ratio” column shows the period’s annualized expense ratio and the “Expenses Paid During Period” column shows the dollar amount that would have been paid by an investor who started with $1,000 in the Portfolio at the beginning of the period.
You may use the information here, together with your account value, to estimate the expenses that you paid over the period. To do so, simply divide your account value by $1,000 (for example, an $8,600 account value divided by $1,000 = 8.6), then multiply the result by the number given for your Portfolio in the first line under the heading entitled “Expenses Paid During Period.”
Hypothetical 5% Return: This section is intended to help you compare your Portfolio’s costs with those of other mutual funds. The “Ending Account Value” shown is derived from hypothetical account values and hypothetical expenses based on the Portfolio’s actual expense ratio and assumed rate of return. It assumes that the Portfolio had an annual return of 5% before expenses, but that the expense ratio is unchanged. In this case, because the return used is not the Portfolio’s actual return, the results do not apply to your investment. This example is useful in making comparisons to other mutual funds because the Securities and Exchange Commission (“SEC”) requires all mutual funds to calculate expenses based on an assumed 5% annual return. You can assess your Portfolio’s ongoing costs by comparing this hypothetical example with the hypothetical examples that appear in shareholder reports of other funds.
Please note that the expenses shown in the table are meant to highlight and help you compare your ongoing costs only and do not reflect any transactional costs such as sales charges (loads), redemption fees, or exchange fees. Wilshire Mutual Funds, Inc. has no such charges, but these may be present in other funds to which you compare this data. Therefore, the hypothetical portions of the table are useful in comparing ongoing costs only, and will not help you determine the relative total costs of owning different funds.
32
Wilshire Mutual Funds, Inc. Disclosure of Fund Expenses - (Continued) For the Six Months Ended December 31, 2015 (Unaudited) |
|
| | Beginning
Account
Value
07/01/2015 | Ending
Account
Value
12/31/2015 | Expense
Ratio(1) | Expenses Paid
During Period
07/01/15-12/31/15(2) |
Large Company Growth Portfolio |
Actual Fund Return | | | | |
Investment Class | $1,000.00 | $1,018.10 | 1.33% | $6.75 |
Institutional Class | $1,000.00 | $1,019.80 | 1.00% | $5.09 |
Hypothetical 5% Return | | | | |
Investment Class | $1,000.00 | $1,018.51 | 1.33% | $6.76 |
Institutional Class | $1,000.00 | $1,020.16 | 1.00% | $5.09 |
Large Company Value Portfolio |
Actual Fund Return | | | | |
Investment Class | $1,000.00 | $948.90 | 1.30% | $6.37 |
Institutional Class | $1,000.00 | $950.20 | 1.04% | $5.10 |
Hypothetical 5% Return | | | | |
Investment Class | $1,000.00 | $1,018.67 | 1.30% | $6.60 |
Institutional Class | $1,000.00 | $1,019.97 | 1.04% | $5.28 |
Small Company Growth Portfolio |
Actual Fund Return | | | | |
Investment Class | $1,000.00 | $941.00 | 1.47% | $7.21 |
Institutional Class | $1,000.00 | $941.90 | 1.21% | $5.95 |
Hypothetical 5% Return | | | | |
Investment Class | $1,000.00 | $1,017.78 | 1.47% | $7.49 |
Institutional Class | $1,000.00 | $1,019.08 | 1.21% | $6.18 |
Small Company Value Portfolio |
Actual Fund Return | | | | |
Investment Class | $1,000.00 | $945.60 | 1.49% | $7.32 |
Institutional Class | $1,000.00 | $946.90 | 1.19% | $5.86 |
Hypothetical 5% Return | | | | |
Investment Class | $1,000.00 | $1,017.68 | 1.49% | $7.59 |
Institutional Class | $1,000.00 | $1,019.19 | 1.19% | $6.07 |
33
Wilshire Mutual Funds, Inc. Disclosure of Fund Expenses - (Concluded) For the Six Months Ended December 31, 2015 (Unaudited) |
|
| | Beginning
Account
Value
07/01/2015 | Ending
Account
Value
12/31/2015 | Expense
Ratio(1) | Expenses Paid
During Period
07/01/15-12/31/15(2) |
Wilshire 5000 IndexSM Fund |
Actual Fund Return | | | | |
Investment Class | $1,000.00 | $989.20 | 0.63% | $3.16 |
Institutional Class | $1,000.00 | $990.40 | 0.38% | $1.92 |
Qualified Class | $1,000.00 | $992.30 | 0.36% | $1.81 |
Horace Mann Class | $1,000.00 | $989.20 | 0.59% | $2.96 |
Hypothetical 5% Return | | | | |
Investment Class | $1,000.00 | $1,022.03 | 0.63% | $3.21 |
Institutional Class | $1,000.00 | $1,023.28 | 0.38% | $1.95 |
Qualified Class | $1,000.00 | $1,023.39 | 0.36% | $1.84 |
Horace Mann Class | $1,000.00 | $1,022.23 | 0.59% | $3.01 |
Wilshire International Equity Fund |
Actual Fund Return | | | | |
Investment Class | $1,000.00 | $942.90 | 1.50% | $7.35 |
Institutional Class | $1,000.00 | $943.30 | 1.25% | $6.12 |
Hypothetical 5% Return | | | | |
Investment Class | $1,000.00 | $1,017.64 | 1.50% | $7.63 |
Institutional Class | $1,000.00 | $1,018.90 | 1.25% | $6.36 |
(1) | Annualized, based on the Portfolio’s most recent fiscal half-year expenses. |
(2) | Expenses are equal to the Portfolio’s annualized expense ratio multiplied by the average account value over the period, multiplied by 184/365 (to reflect one-half year period). |
34
Wilshire Mutual Funds, Inc. Large Company Growth Portfolio Condensed Schedule of Investments | December 31, 2015 |
|
Shares | | | Percentage of
Net Assets (%) | | | Value | |
COMMON STOCK — 99.2%†† | | | | | | |
Consumer Discretionary — 19.6% | | | | | | |
17,616 | | Amazon.com, Inc.† | | | 5.2 | | | $ | 11,906,478 | |
25,900 | | Delphi Automotive PLC | | | 1.0 | | | | 2,220,407 | |
30,183 | | Lowe's Cos., Inc. | | | 1.0 | | | | 2,295,115 | |
39,308 | | NIKE, Inc., Class B | | | 1.1 | | | | 2,456,750 | |
9,725 | | O'Reilly Automotive, Inc.† | | | 1.1 | | | | 2,464,509 | |
1,950 | | Priceline Group, Inc.† | | | 1.1 | | | | 2,486,152 | |
66,075 | | Starbucks Corp. | | | 1.7 | | | | 3,966,482 | |
27,675 | | Tractor Supply Co. | | | 1.0 | | | | 2,366,213 | |
16,395 | | Ulta Salon Cosmetics & Fragrance, Inc.† | | | 1.3 | | | | 3,033,075 | |
30,433 | | Yum! Brands, Inc. | | | 1.0 | | | | 2,223,131 | |
126,949 | | Other Securities | | | 4.1 | | | | 9,674,553 | |
| | | | | | | | | | 45,092,865 | |
Consumer Staples — 12.8% | | | | | | | | |
93,841 | | Coca-Cola Co. (The) | | | 1.8 | | | | 4,031,409 | |
16,770 | | Costco Wholesale Corp. | | | 1.2 | | | | 2,708,355 | |
217,694 | | Danone SA ADR | | | 1.3 | | | | 2,962,815 | |
46,566 | | Monster Beverage Corp.† (a) | | | 3.0 | | | | 6,936,472 | |
36,249 | | Procter & Gamble Co. (The) | | | 1.3 | | | | 2,878,533 | |
36,087 | | SABMiller PLC ADR | | | 0.9 | | | | 2,162,694 | |
121,389 | | Other Securities | | | 3.3 | | | | 7,707,127 | |
| | | | | | | | | | 29,387,405 | |
Energy — 1.0% | | | | | | | | |
29,568 | | Schlumberger, Ltd. | | | 0.9 | | | | 2,062,368 | |
2,936 | | Other Securities | | | 0.1 | | | | 242,668 | |
| | | | | | | | | | 2,305,036 | |
Financials — 4.8% | | | | | | | | |
70,625 | | Charles Schwab Corp. (The) | | | 1.0 | | | | 2,325,681 | |
112,439 | | Other Securities | | | 3.8 | | | | 8,745,077 | |
| | | | | | | | | | 11,070,758 | |
Health Care — 16.7% | | | | | | | | |
12,925 | | Alexion Pharmaceuticals, Inc.† (a) | | | 1.1 | | | | 2,465,444 | |
19,182 | | Amgen, Inc. | | | 1.3 | | | | 3,113,814 | |
33,678 | | Celgene Corp.† | | | 1.8 | | | | 4,033,277 | |
33,625 | | Centene Corp.† (a) | | | 1.0 | | | | 2,212,861 | |
56,099 | | Cerner Corp.† (a) | | | 1.5 | | | | 3,375,477 | |
23,300 | | Edwards Lifesciences Corp.† | | | 0.8 | | | | 1,840,234 | |
39,475 | | Gilead Sciences, Inc. | | | 1.7 | | | | 3,994,475 | |
24,175 | | IDEXX Laboratories, Inc.† (a) | | | 0.8 | | | | 1,762,841 | |
23,822 | | Novartis AG ADR(a) | | | 0.9 | | | | 2,049,645 | |
49,860 | | Novo Nordisk ADR(a) | | | 1.3 | | | | 2,895,869 | |
25,148 | | Varian Medical Systems, Inc.† (a) | | | 0.9 | | | | 2,031,958 | |
116,027 | | Other Securities | | | 3.6 | | | | 8,572,087 | |
| | | | | | | | | | 38,347,982 | |
Industrials — 5.8% | | | | | | | | |
16,725 | | Canadian Pacific Railway, Ltd. | | | 0.9 | | | | 2,134,110 | |
53,909 | | Expeditors International of Washington, Inc.(a) | | | 1.1 | | | | 2,431,296 | |
25,021 | | United Parcel Service, Inc., Class B | | | 1.0 | | | | 2,407,771 | |
73,962 | | Other Securities | | | 2.8 | | | | 6,267,631 | |
| | | | | | | | | | 13,240,808 | |
Information Technology — 35.7% | | | | | | | | |
36,500 | | Adobe Systems, Inc.† | | | 1.5 | | | | 3,428,810 | |
41,628 | | Alibaba Group Holding, Ltd. ADR† (a) | | | 1.5 | | | | 3,383,107 | |
6,196 | | Alphabet, Inc., Class A† | | | 2.1 | | | | 4,820,550 | |
9,497 | | Alphabet, Inc., Class C† | | | 3.1 | | | | 7,207,083 | |
68,122 | | Apple, Inc. | | | 3.1 | | | | 7,170,522 | |
39,256 | | Autodesk, Inc.† (a) | | | 1.1 | | | | 2,391,868 | |
147,937 | | Cisco Systems, Inc. | | | 1.7 | | | | 4,017,229 | |
40,620 | | Electronic Arts, Inc.† | | | 1.2 | | | | 2,791,406 | |
103,304 | | Facebook, Inc., Class A† (a) | | | 4.7 | | | | 10,811,797 | |
64,911 | | Microsoft Corp. | | | 1.6 | | | | 3,601,262 | |
24,653 | | NXP Semiconductor NV† | | | 0.9 | | | | 2,077,028 | |
96,707 | | Oracle Corp. | | | 1.5 | | | | 3,532,707 | |
57,934 | | QUALCOMM, Inc. | | | 1.3 | | | | 2,895,831 | |
22,975 | | Salesforce.com, Inc.† | | | 0.8 | | | | 1,801,240 | |
22,410 | | Skyworks Solutions, Inc.(a) | | | 0.8 | | | | 1,721,760 | |
122,880 | | Visa, Inc., Class A(a) | | | 4.1 | | | | 9,529,344 | |
245,878 | | Other Securities | | | 4.7 | | | | 10,819,492 | |
| | | | | | | | | | 82,001,036 | |
Materials — 2.2% | | | | | | | | |
10,965 | | Sherwin-Williams Co. (The) | | | 1.2 | | | | 2,846,514 | |
23,250 | | Other Securities | | | 1.0 | | | | 2,162,240 | |
| | | | | | | | | | 5,008,754 | |
Telecommunication Services — 0.6% | | | | | | | | |
32,129 | | Other Securities | | | 0.6 | | | | 1,365,887 | |
| | | | | | | | | | | |
Total Common Stock | | | | | | | | |
(Cost $167,122,168) | | | | | | | 227,820,531 | |
See Notes to Financial Statements.
35
Wilshire Mutual Funds, Inc. Large Company Growth Portfolio Condensed Schedule of Investments - (Continued) | December 31, 2015 |
|
Shares | | | Percentage of
Net Assets (%) | | | Value | |
SHORT-TERM INVESTMENTS (b) — 21.9% | |
827,993 | | Northern Trust Institutional Government Select Portfolio, Institutional Class, 0.010% | | | 0.4 | | | $ | 827,993 | |
49,384,840 | | Northern Trust Institutional Liquid Asset Portfolio, Institutional Class, 0.010%(c) | | | 21.5 | | | | 49,384,840 | |
| | | | | | | | | | | |
Total Short-Term Investments | | | | | | | | |
(Cost $50,212,833) | | | | | | | 50,212,833 | |
| | | | | | | | | | | |
Total Investments — 121.1% | | | | | | | | |
(Cost $217,335,001) | | | | | | | 278,033,364 | |
Other Assets & Liabilities, Net — (21.1)% | | | | | | | (48,433,432 | ) |
| | | | | | | | | | | |
NET ASSETS — 100.0% | | | | | | $ | 229,599,932 | |
†† | More narrow industries are utilized for compliance purposes, whereas broad sectors are utilized for reporting purposes. |
† | Non-income producing security. |
(a) | This security or a partial position of this security is on loan at December 31, 2015. The total market value of securities on loan at December 31, 2015 was $48,141,410 (Note 6). |
(b) | Rate shown in the 7-day effective yield as of December 31, 2015. |
(c) | This security was purchased with cash collateral held from securities on loan. The total value of such securities as of December 31, 2015 was $49,384,840. Securities on loan are also collateralized by various U.S. Treasury obligations in the amount of $391,320 (Note 6). |
ADR — American Depository Receipt
Ltd. — Limited
PLC — Public Limited Company
The Condensed Schedule of Investments does not reflect the complete portfolio holdings. It includes the Portfolio’s 50 largest holdings and each investment of any issuer that exceeds 1% of the Portfolio’s net assets. “Other Securities” represent all issues not required to be disclosed under the rules adopted by the U.S. Securities and Exchange Commission (“SEC”). The complete schedule of portfolio holdings is available (i) without charge, upon request, by calling (800) 607-2200; (ii) on the SEC’s website at http://www.sec.gov; and (iii) on our website at http://advisor.wilshire.com.
As of December 31, 2015, all of the Portfolio’s investments were considered Level 1. For the year ended December 31, 2015, there have been no transfers between Level 1 and Level 2 assets and liabilities. For the year ended December 31, 2015, there have been no transfers between Level 2 and Level 3 assets and liabilities. Please see Note 2 in Notes to Financial Statements for further information regarding fair value measurements.
See Notes to Financial Statements.
36
Wilshire Mutual Funds, Inc. Large Company Value Portfolio Condensed Schedule of Investments | December 31, 2015 |
|
Shares | | | Percentage of
Net Assets (%) | | | Value | |
COMMON STOCK — 99.1%†† | |
Consumer Discretionary — 7.9% | |
64,311 | | Ford Motor Co. | | | 0.8 | | | $ | 906,142 | |
53,975 | | News Corp., Class A | | | 0.7 | | | | 721,106 | |
10,275 | | Omnicom Group, Inc.(a) | | | 0.7 | | | | 777,406 | |
64,813 | | Staples, Inc. | | | 0.6 | | | | 613,779 | |
141,549 | | Other Securities | | | 5.1 | | | | 5,328,164 | |
| | | | | | | | | | 8,346,597 | |
Consumer Staples — 5.6% | |
7,448 | | CVS Health Corp. | | | 0.7 | | | | 728,191 | |
8,660 | | Kellogg Co.(a) | | | 0.6 | | | | 625,858 | |
6,945 | | Philip Morris International, Inc. | | | 0.6 | | | | 610,535 | |
8,749 | | Procter & Gamble Co. (The) | | | 0.6 | | | | 694,758 | |
13,875 | | Wal-Mart Stores, Inc. | | | 0.8 | | | | 850,537 | |
42,224 | | Other Securities | | | 2.3 | | | | 2,441,089 | |
| | | | | | | | | | 5,950,968 | |
Energy — 11.7% | |
17,115 | | Apache Corp. | | | 0.7 | | | | 761,104 | |
35,503 | | BP PLC ADR(a) | | | 1.1 | | | | 1,109,824 | |
8,104 | | Chevron Corp. | | | 0.7 | | | | 729,036 | |
32,653 | | Exxon Mobil Corp. | | | 2.4 | | | | 2,545,301 | |
13,315 | | Hess Corp.(a) | | | 0.6 | | | | 645,511 | |
35,810 | | Royal Dutch Shell PLC ADR, Class A(a) | | | 1.5 | | | | 1,639,718 | |
19,385 | | Valero Energy Corp. | | | 1.3 | | | | 1,370,713 | |
113,612 | | Other Securities | | | 3.4 | | | | 3,675,143 | |
| | | | | | | | | | 12,476,350 | |
Financials — 34.2% | |
14,715 | | Allstate Corp. (The) | | | 0.9 | | | | 913,654 | |
16,080 | | American International Group, Inc. | | | 0.9 | | | | 996,478 | |
11,000 | | Axis Capital Holdings, Ltd. | | | 0.6 | | | | 618,420 | |
171,843 | | Bank of America Corp. | | | 2.7 | | | | 2,892,118 | |
6,367 | | Berkshire Hathaway, Inc., Class B† | | | 0.8 | | | | 840,699 | |
49,612 | | Citigroup, Inc. | | | 2.4 | | | | 2,567,421 | |
6,112 | | Goldman Sachs Group, Inc. (The) | | | 1.0 | | | | 1,101,566 | |
48,301 | | JPMorgan Chase & Co. | | | 3.0 | | | | 3,189,315 | |
62,275 | | KeyCorp | | | 0.8 | | | | 821,407 | |
32,400 | | MetLife, Inc. | | | 1.5 | | | | 1,562,004 | |
24,225 | | Morgan Stanley | | | 0.7 | | | | 770,597 | |
15,854 | | PNC Financial Services Group, Inc. | | | 1.4 | | | | 1,511,045 | |
8,985 | | State Street Corp. | | | 0.6 | | | | 596,245 | |
40,275 | | UBS Group AG(a) | | | 0.7 | | | | 780,127 | |
26,600 | | Voya Financial, Inc. | | | 0.9 | | | | 981,806 | |
37,968 | | Wells Fargo & Co. | | | 2.0 | | | | 2,063,940 | |
17,450 | | XL Group PLC, Class A(a) | | | 0.7 | | | | 683,691 | |
468,419 | | Other Securities | | | 12.6 | | | | 13,466,488 | |
| | | | | | | | | | 36,357,021 | |
Health Care — 11.1% | | | | | |
9,720 | | Aetna, Inc. | | | 1.0 | | | | 1,050,926 | |
5,844 | | Cigna Corp. | | | 0.8 | | | | 855,153 | |
17,574 | | Johnson & Johnson | | | 1.7 | | | | 1,805,201 | |
17,242 | | Merck & Co., Inc. | | | 0.9 | | | | 910,723 | |
60,212 | | Pfizer, Inc.(a) | | | 1.8 | | | | 1,943,643 | |
86,460 | | Other Securities | | | 4.9 | | | | 5,204,512 | |
| | | | | | | | | | 11,770,158 | |
Industrials — 8.3% | |
12,725 | | Dover Corp.(a) | | | 0.7 | | | | 780,170 | |
44,166 | | General Electric Co.(a) | | | 1.3 | | | | 1,375,771 | |
9,950 | | Parker-Hannifin Corp.(a) | | | 0.9 | | | | 964,951 | |
12,534 | | Stanley Black & Decker, Inc.(a) | | | 1.2 | | | | 1,337,754 | |
77,633 | | Other Securities | | | 4.2 | | | | 4,359,987 | |
| | | | | | | | | | 8,818,633 | |
Information Technology — 12.4% | | | | | | | | |
62,841 | | Cisco Systems, Inc.(a) | | | 1.6 | | | | 1,706,447 | |
46,471 | | Hewlett Packard Enterprise Co. | | | 0.7 | | | | 706,359 | |
67,551 | | HP, Inc. | | | 0.7 | | | | 799,804 | |
42,975 | | Intel Corp. | | | 1.4 | | | | 1,480,489 | |
38,988 | | Microsoft Corp. | | | 2.0 | | | | 2,163,054 | |
24,850 | | Oracle Corp. | | | 0.9 | | | | 907,771 | |
134,875 | | Other Securities | | | 5.1 | | | | 5,463,155 | |
| | | | | | | | | | 13,227,079 | |
Materials — 2.4% | |
38,750 | | Other Securities | | | 2.4 | | | | 2,520,504 | |
| | | | | |
Telecommunication Services — 2.0% | | | | | |
34,623 | | AT&T, Inc. | | | 1.1 | | | | 1,191,378 | |
21,253 | | Other Securities | | | 0.9 | | | | 937,815 | |
| | | | | | | | | | 2,129,193 | |
See Notes to Financial Statements.
37
Wilshire Mutual Funds, Inc. Large Company Value Portfolio Condensed Schedule of Investments - (Continued) | December 31, 2015 |
|
Shares | | | Percentage of
Net Assets (%) | | | Value | |
Utilities — 3.5% | | | | | | |
93,248 | | Other Securities | | | 3.5 | | | $ | 3,682,324 | |
| | | | | | | | | | | |
Total Common Stock | | | | | | | | |
(Cost $93,886,959) | | | | | | | 105,278,827 | |
| | | | | | | | | | | |
SHORT-TERM INVESTMENTS (b) — 23.2% | |
174,295 | | Northern Trust Institutional Government Select Portfolio, Institutional Class, 0.010% | | | 0.2 | | | | 174,295 | |
24,469,794 | | Northern Trust Institutional Liquid Asset Portfolio, Institutional Class, 0.010%(c) | | | 23.0 | | | | 24,469,794 | |
| | | | | | | | | | | |
Total Short-Term Investments | | | | | | | | |
(Cost $24,644,089) | | | | | | | 24,644,089 | |
| | | | | | | | | | | |
RIGHTS — 0.0% | | | | | | | | |
Number
Of Rights | | | | | | | | |
United States — 0.0% | | | | | | |
2,236 | | Other Securities | | | 0.0 | | | | 1,189 | |
Total Rights (Cost $—) | | | | | | | 1,189 | |
| | | | | | | | | | | |
Total Investments — 122.3% | | | | | | | | |
(Cost $118,531,048) | | | | | | | 129,924,105 | |
Other Assets & Liabilities, Net — (22.3)% | | | | | | | (23,717,096 | ) |
| | | | | | | | | | | |
NET ASSETS — 100.0% | | | | | | $ | 106,207,009 | |
†† | More narrow industries are utilized for compliance purposes, whereas broad sectors are utilized for reporting purposes. |
† | Non-income producing security. |
(a) | Rate shown is the 7-day effective yield as of December 31, 2015. |
(b) | This security or a partial position of this security is on loan at December 31, 2015. The total market value of securities on loan at December 31, 2015 was $24,291,508 (Note 6). |
(c) | This security was purchased with cash collateral held from securities on loan. The total value of such securities as of December 31, 2015 was $24,469,794. Securities on loan are also collateralized by various U.S. Treasury obligations in the amount of $664,691 (Note 6). |
ADR — American Depositary Receipt
Ltd. — Limited
PLC — Public Limited Company
Amounts designated as “—“ are either $0, or have been rounded to $0.
The Condensed Schedule of Investments does not reflect the complete portfolio holdings. It includes the Portfolio’s 50 largest holdings and each investment of any issuer that exceeds 1% of the Portfolio’s net assets. “Other Securities” represent all issues not required to be disclosed under the rules adopted by the U.S. Securities and Exchange Commission (“SEC”). The complete schedule of portfolio holdings is available (i) without charge, upon request, by calling (800) 607-2200; (ii) on the SEC’s website at http://www.sec.gov; and (iii) on our website at http://advisor.wilshire.com.
As of December 31, 2015, all of the Portfolio’s investments were considered Level 1 except for Safeway Contingent Value Rights - PDC and Safeway Contingent Value Rights – Casa Ley which are Level 3. At December 31, 2015, the value of these Level 3 investments was $1,189. A reconciliation of Level 3 investments, including certain disclosures related to significant inputs used in valuing Level 3 investments is only presented when the Fund has over 1% of Level 3 investments at the beginning and/or end of the period in relation to net assets. For the year ended December 31, 2015, there have been no transfers between Level 2 and Level 3 assets and liabilities. Please see Note 2 in Notes to Financial Statements for further information regarding fair value measurements.
See Notes to Financial Statements.
38
Wilshire Mutual Funds, Inc. Small Company Growth Portfolio Condensed Schedule of Investments | December 31, 2015 |
|
Shares | | | Percentage of
Net Assets (%) | | | Value | |
COMMON STOCK — 98.3%†† | | | | |
Consumer Discretionary — 16.7% | | | | | | |
4,660 | | Asbury Automotive Group, Inc.† | | | 1.2 | | | $ | 314,270 | |
9,130 | | G-III Apparel Group, Ltd.† (a) | | | 1.5 | | | | 404,094 | |
5,630 | | Monro Muffler Brake, Inc.(a) | | | 1.4 | | | | 372,819 | |
8,845 | | Popeyes Louisiana
Kitchen, Inc.† (a) | | | 1.9 | | | | 517,432 | |
15,015 | | Sonic Corp.(a) | | | 1.8 | | | | 485,135 | |
12,460 | | Steven Madden, Ltd.† (a) | | | 1.4 | | | | 376,541 | |
66,612 | | Other Securities | | | 7.5 | | | | 2,044,938 | |
| | | | | | | | | | 4,515,229 | |
Consumer Staples — 4.8% | | | | | | | | |
3,380 | | Calavo Growers, Inc.(a) | | | 0.6 | | | | 165,620 | |
3,390 | | J&J Snack Foods Corp.(a) | | | 1.5 | | | | 395,511 | |
3,410 | | TreeHouse Foods, Inc.† | | | 1.0 | | | | 267,549 | |
10,424 | | Other Securities | | | 1.7 | | | | 460,685 | |
| | | | | | | | | | 1,289,365 | |
Energy — 2.8% | | | | | | | | |
19,594 | | Callon Petroleum Co.† (a) | | | 0.6 | | | | 163,414 | |
9,890 | | Matador Resources Co.† (a) | | | 0.7 | | | | 195,525 | |
6,010 | | PDC Energy, Inc.† (a) | | | 1.2 | | | | 320,814 | |
2,195 | | Other Securities | | | 0.3 | | | | 65,616 | |
| | | | | | | | | | 745,369 | |
Financials — 12.3% | | | | | | | | |
7,160 | | BancorpSouth, Inc.(a) | | | 0.6 | | | | 171,768 | |
5,900 | | MarketAxess Holdings, Inc.(a) | | | 2.4 | | | | 658,381 | |
7,032 | | Pinnacle Financial Partners, Inc.(a) | | | 1.3 | | | | 361,164 | |
15,080 | | PrivateBancorp, Inc., Class A(a) | | | 2.3 | | | | 618,582 | |
5,340 | | South State Corp.(a) | | | 1.4 | | | | 384,213 | |
47,788 | | Other Securities | | | 4.3 | | | | 1,129,529 | |
| | | | | | | | | | 3,323,637 | |
Health Care — 26.2% | | | | | | | | |
11,821 | | Aceto Corp.(a) | | | 1.2 | | | | 318,931 | |
10,739 | | Cambrex Corp.† (a) | | | 1.9 | | | | 505,699 | |
5,995 | | Cantel Medical Corp. | | | 1.4 | | | | 372,529 | |
4,150 | | Eagle Pharmaceuticals, Inc.† (a) | | | 1.4 | | | | 367,980 | |
6,310 | | ICON PLC† (a) | | | 1.8 | | | | 490,287 | |
7,990 | | Medidata Solutions, Inc.† (a) | | | 1.5 | | | | 393,827 | |
5,636 | | Neogen Corp.† (a) | | | 1.2 | | | | 318,547 | |
8,022 | | PRA Health Sciences, Inc.† (a) | | | 1.3 | | | | 363,156 | |
10,669 | | Prestige Brands Holdings, Inc.† (a) | | | 2.0 | | | | 549,240 | |
5,030 | | Providence Service Corp. (The)† (a) | | | 0.9 | | | | 236,008 | |
7,235 | | Repligen Corp.† (a) | | | 0.8 | | | | 204,678 | |
20,821 | | Supernus Pharmaceuticals, Inc.† (a) | | | 1.0 | | | | 279,834 | |
21,947 | | Teligent, Inc.† (a) | | | 0.7 | | | | 195,328 | |
87,134 | | Other Securities | | | 9.1 | | | | 2,482,996 | |
| | | | | | | | | | 7,079,040 | |
Industrials — 11.8% | | | | | | | | |
7,210 | | AAON, Inc.(a) | | | 0.6 | | | | 167,416 | |
11,340 | | Advanced Drainage Systems, Inc.(a) | | | 1.0 | | | | 272,500 | |
4,191 | | EnerSys, Inc. | | | 0.9 | | | | 234,403 | |
10,157 | | Knight Transportation, Inc.(a) | | | 0.9 | | | | 246,104 | |
4,000 | | Proto Labs, Inc.† (a) | | | 0.9 | | | | 254,760 | |
7,770 | | Saia, Inc.† (a) | | | 0.7 | | | | 172,883 | |
4,630 | | Trex Co., Inc.† (a) | | | 0.7 | | | | 176,125 | |
13,010 | | WageWorks, Inc.† | | | 2.2 | | | | 590,264 | |
30,952 | | Other Securities | | | 3.9 | | | | 1,087,353 | |
| | | | | | | | | | 3,201,808 | |
Information Technology — 21.0% | | | | | | | | |
9,456 | | Callidus Software, Inc.† | | | 0.6 | | | | 175,598 | |
8,863 | | Ellie Mae, Inc.† (a) | | | 2.0 | | | | 533,818 | |
4,910 | | LogMeIn, Inc.† (a) | | | 1.2 | | | | 329,461 | |
2,718 | | Luxoft Holding, Inc., Class A† (a) | | | 0.8 | | | | 209,639 | |
11,033 | | MAXIMUS, Inc.(a) | | | 2.3 | | | | 620,606 | |
7,070 | | Qualys, Inc.† (a) | | | 0.9 | | | | 233,946 | |
20,450 | | Ruckus Wireless, Inc.† | | | 0.8 | | | | 219,020 | |
7,290 | | Silicon Laboratories, Inc.† (a) | | | 1.3 | | | | 353,857 | |
3,270 | | SPS Commerce, Inc.† (a) | | | 0.9 | | | | 229,587 | |
96,233 | | Other Securities | | | 10.2 | | | | 2,790,941 | |
| | | | | | | | | | 5,696,473 | |
Materials — 0.8% | | | | | | | | |
9,879 | | Other Securities | | | 0.8 | | | | 224,443 | |
| | | | | | | | | | | |
Telecommunication Services — 1.8% | | | | | | | | |
10,800 | | Cogent Communications Holdings, Inc.(a) | | | 1.4 | | | | 374,652 | |
See Notes to Financial Statements.
39
Wilshire Mutual Funds, Inc. Small Company Growth Portfolio Condensed Schedule of Investments - (Continued) | December 31, 2015 |
|
Shares | | | Percentage of
Net Assets (%) | | | Value | |
8,693 | | Other Securities | | | 0.4 | | | $ | 121,954 | |
| | | | | | | | | | 496,606 | |
Utilities — 0.1% | | | | | | | | |
590 | | Other Securities | | | 0.1 | | | | 24,070 | |
| | | | | | | | | | | |
Total Common Stock | | | | | | | | |
(Cost $21,771,811) | | | | | | | 26,596,040 | |
| | | | | | | | | | | |
SHORT-TERM INVESTMENTS (b) — 52.4% | |
227,408 | | Northern Trust Institutional Government Select Portfolio, Institutional Class, 0.010% | | | 0.9 | | | | 227,408 | |
13,939,124 | | Northern Trust Institutional Liquid Asset Portfolio, Institutional Class, 0.010% (c) | | | 51.5 | | | | 13,939,124 | |
| | | | | | | | | | | |
Total Short-Term Investments | | | | | | | | |
(Cost $14,166,532) | | | | | | | 14,166,532 | |
| | | | | | | | | | | |
RIGHT — 0.0% | | | | | | | | |
Number
Of Rights | | | | | | | | |
United States — 0.0% | | | | | | |
180 | | Other Securities | | | 0.0 | | | | 360 | |
Total Right (Cost $—) | | | | | | | 360 | |
| | | | | | | | | | | |
Total Investments — 150.7% | | | | | | | | |
(Cost $35,938,343) | | | | | | | 40,762,932 | |
Other Assets & Liabilities, Net — (50.7)% | | | | | | | (13,706,392 | ) |
| | | | | | | | | | | |
NET ASSETS — 100.0% | | | | | | $ | 27,056,540 | |
†† | More narrow industries are utilized for compliance purposes, whereas broad sectors are utilized for reporting purposes. |
† | Non-income producing security. |
(a) | This security or a partial position of this security is on loan at December 31, 2015. The total market value of securities on loan at December 31, 2015 was $13,573,570 (Note 6). |
(b) | Rate shown is the 7-day effective yield as of December 31, 2015. |
(c) | This security was purchased with cash collateral held from securities on loan. The total value of such securities as of December 31, 2015 was $13,939,124. Securities on loan are also collateralized by various U.S. Treasury obligations in the amount of $196,213 (Note 6). |
Ltd. — Limited
PLC — Public Limited Company
Amounts designated as “—“ are either $0, or have been rounded to $0.
The Condensed Schedule of Investments does not reflect the complete portfolio holdings. It includes the Portfolio’s 50 largest holdings and each investment of any issuer that exceeds 1% of the Portfolio’s net assets. “Other Securities” represent all issues not required to be disclosed under the rules adopted by the U.S. Securities and Exchange Commission (“SEC”). The complete schedule of portfolio holdings is available (i) without charge, upon request, by calling (800) 607-2200; (ii) on the SEC’s website at http://www.sec.gov; and (iii) on our website at http://advisor.wilshire.com.
As of December 31, 2015, all of the Portfolio’s investments were considered Level 1 except for Trius Contingent Value Rights, which was Level 3. At December 31, 2015, the investment was valued at $360. A reconciliation of Level 3 investments, including certain disclosures related to significant inputs used in valuing Level 3 investments is only presented when the Fund has over 1% of Level 3 investments at the beginning and/or end of the period in relation to net assets. For the year ended December 31, 2015, there have been no transfers between Level 1 and Level 2 assets and liabilities. For the year ended December 31, 2015, there have been no transfers between Level 2 and Level 3 assets and liabilities. Please see Note 2 in Notes to Financial Statements for further information regarding fair value measurements.
See Notes to Financial Statements.
40
Wilshire Mutual Funds, Inc. Small Company Value Portfolio Condensed Schedule of Investments | December 31, 2015 |
|
Shares | | | Percentage of
Net Assets (%) | | | Value | |
COMMON STOCK — 98.0%†† | |
Consumer Discretionary — 11.2% | |
17,940 | | Fred's, Inc., Class A(a) | | | 1.0 | | | $ | 293,678 | |
16,101 | | Hooker Furniture Corp. | | | 1.5 | | | | 406,389 | |
32,860 | | Stoneridge, Inc.† (a) | | | 1.7 | | | | 486,328 | |
21,580 | | Taylor Morrison Home Corp., Class A† (a) | | | 1.2 | | | | 345,280 | |
28,100 | | TRI Pointe Group, Inc.† (a) | | | 1.3 | | | | 356,027 | |
57,732 | | Other Securities | | | 4.5 | | | | 1,240,397 | |
| | | | | | | | | | 3,128,099 | |
Consumer Staples — 8.6% | | | | | | | | |
12,140 | | Aryzta AG ADR | | | 1.1 | | | | 311,877 | |
5,855 | | Britvic PLC ADR(a) | | | 0.5 | | | | 125,562 | |
29,775 | | Elizabeth Arden, Inc.† (a) | | | 1.1 | | | | 294,772 | |
8,238 | | Inter Parfums, Inc.(a) | | | 0.7 | | | | 196,229 | |
4,950 | | John B. Sanfilippo & Son, Inc.(a) | | | 0.9 | | | | 265,017 | |
24,195 | | Landec Corp.† (a) | | | 1.0 | | | | 286,227 | |
5,693 | | TreeHouse Foods, Inc.† (a) | | | 1.6 | | | | 446,673 | |
13,042 | | Other Securities | | | 1.7 | | | | 478,136 | |
| | | | | | | | | | 2,404,493 | |
Energy — 1.1% | | | | | | | | |
33,362 | | Other Securities | | | 1.1 | | | | 316,957 | |
| | | | | | | | | | | |
Financials — 37.0% | | | | | | | | |
10,670 | | Apollo Residential Mortgage, Inc.‡ (a) | | | 0.5 | | | | 127,506 | |
27,495 | | Brandywine Realty Trust‡ (a) | | | 1.3 | | | | 375,582 | |
18,870 | | Capital Bank Financial Corp., Class A(a) | | | 2.2 | | | | 603,463 | |
10,680 | | Capitol Federal Financial, Inc.(a) | | | 0.5 | | | | 134,141 | |
30,625 | | Forestar Group, Inc.† (a) | | | 1.2 | | | | 335,037 | |
9,955 | | Heritage Financial Corp.(a) | | | 0.7 | | | | 187,552 | |
9,985 | | HomeStreet, Inc.† (a) | | | 0.8 | | | | 216,774 | |
15,990 | | Investors Bancorp, Inc.(a) | | | 0.7 | | | | 198,916 | |
4,425 | | MB Financial, Inc.(a) | | | 0.5 | | | | 143,237 | |
12,064 | | National Penn Bancshares, Inc.(a) | | | 0.5 | | | | 148,749 | |
9,464 | | PacWest Bancorp(a) | | | 1.5 | | | | 407,898 | |
11,505 | | PrivateBancorp, Inc., Class A(a) | | | 1.7 | | | | 471,935 | |
21,975 | | Ramco-Gershenson Properties Trust‡ | | | 1.3 | | | | 365,005 | |
16,578 | | Western Alliance Bancorp† | | | 2.1 | | | | 594,487 | |
315,157 | | Other Securities | | | 21.5 | | | | 6,055,893 | |
| | | | | | | | | | 10,366,175 | |
Health Care — 4.1% | | | | | | | | |
5,285 | | Analogic Corp.(a) | | | 1.6 | | | | 436,541 | |
29,074 | | Other Securities | | | 2.5 | | | | 701,997 | |
| | | | | | | | | | 1,138,538 | |
Industrials — 8.8% | | | | | | | | |
6,325 | | Albany International Corp., Class A(a) | | | 0.8 | | | | 231,179 | |
2,320 | | Curtiss-Wright Corp. | | | 0.6 | | | | 158,920 | |
6,365 | | EnerSys, Inc.(a) | | | 1.3 | | | | 355,994 | |
8,035 | | GP Strategies Corp.† (a) | | | 0.7 | | | | 201,759 | |
17,430 | | Marten Transport, Ltd.(a) | | | 1.1 | | | | 308,511 | |
2,539 | | Orbital ATK, Inc.(a) | | | 0.8 | | | | 226,834 | |
54,352 | | Other Securities | | | 3.5 | | | | 994,924 | |
| | | | | | | | | | 2,478,121 | |
Information Technology — 15.6% | | | | | | | | |
9,615 | | Coherent, Inc.† (a) | | | 2.2 | | | | 626,033 | |
25,725 | | Entegris, Inc.† | | | 1.2 | | | | 341,371 | |
1,785 | | Euronet Worldwide, Inc.† (a) | | | 0.4 | | | | 129,288 | |
28,565 | | GSI Group, Inc.† (a) | | | 1.4 | | | | 389,055 | |
10,575 | | Integrated Device Technology, Inc.† | | | 1.0 | | | | 278,651 | |
79,125 | | Lattice Semiconductor Corp.† (a) | | | 1.8 | | | | 511,939 | |
62,800 | | Mitel Networks Corp.† (a) | | | 1.7 | | | | 482,932 | |
5,630 | | Tessera Technologies, Inc. | | | 0.6 | | | | 168,956 | |
72,531 | | Other Securities | | | 5.3 | | | | 1,434,201 | |
| | | | | | | | | | 4,362,426 | |
Materials — 6.2% | | | | | | | | |
9,825 | | Boise Cascade Co.† (a) | | | 0.9 | | | | 250,832 | |
11,410 | | Louisiana-Pacific Corp.† (a) | | | 0.7 | | | | 205,494 | |
11,205 | | Materion Corp.(a) | | | 1.1 | | | | 313,740 | |
6,059 | | Neenah Paper, Inc.(a) | | | 1.4 | | | | 378,264 | |
16,705 | | PH Glatfelter Co.(a) | | | 1.1 | | | | 308,040 | |
10,589 | | Other Securities | | | 1.0 | | | | 274,918 | |
| | | | | | | | | | 1,731,288 | |
Telecommunication Services — 0.3% | | | | | | | | |
16,300 | | Other Securities | | | 0.3 | | | | 95,202 | |
| | | | | | | | | | | |
Utilities — 5.1% | | | | | | | | |
4,624 | | Cleco Corp.(a) | | | 0.9 | | | | 241,419 | |
5,935 | | Laclede Group, Inc.(a) | | | 1.3 | | | | 352,598 | |
See Notes to Financial Statements.
41
Wilshire Mutual Funds, Inc. Small Company Value Portfolio Condensed Schedule of Investments - (Continued) | December 31, 2015 |
|
Shares | | | Percentage of
Net Assets (%) | | | Value | |
26,173 | | Other Securities | | | 2.9 | | | $ | 847,793 | |
| | | | | | | | | | 1,441,810 | |
Total Common Stock | | | | | | | | |
(Cost $24,789,077) | | | | | | | 27,463,109 | |
| | | | | | | | | | | |
SHORT-TERM INVESTMENTS (b) — 50.1% | |
487,637 | | Northern Trust Institutional Government Select Portfolio, Institutional Class, 0.010% | | | 1.7 | | | | 487,637 | |
13,551,010 | | Northern Trust Institutional Liquid Asset Portfolio, Institutional Class, 0.010%(c) | | | 48.4 | | | | 13,551,010 | |
| | | | | | | | | | | |
Total Short-Term Investments | | | | | | | | |
(Cost $14,038,647) | | | | | | | 14,038,647 | |
| | | | | | | | | | | |
Total Investments — 148.1% | | | | | | | | |
(Cost $38,827,724) | | | | | | | 41,501,756 | |
Other Assets & Liabilities, Net — (48.1)% | | | | | | | (13,488,128 | ) |
| | | | | | | | | | | |
NET ASSETS — 100.0% | | | | | | $ | 28,013,628 | |
†† | More narrow industries are utilized for compliance purposes, whereas broad sectors are utilized for reporting purposes. |
† | Non-income producing security. |
‡ | Real Estate Investment Trust |
(a) | This security or a partial position of this security is on loan at December 31, 2015. The total market value of securities on loan at December 31, 2015 was $13,897,363 (Note 6). |
(b) | Rate shown in the 7-day effective yield as of December 31, 2015. |
(c) | This security was purchased with cash collateral held from securities on loan. The total value of such securities as of December 31, 2015 was $13,551,010. Securities on loan are also collateralized by various U.S. Treasury obligations in the amount of $1,002,947 (Note 6). |
ADR — American Depositary Receipt
Ltd. — Limited
PLC — Public Limited Company
The Condensed Schedule of Investments does not reflect the complete portfolio holdings. It includes the Portfolio’s 50 largest holdings and each investment of any issuer that exceeds 1% of the Portfolio’s net assets. “Other Securities” represent all issues not required to be disclosed under the rules adopted by the U.S. Securities and Exchange Commission (“SEC”). The complete schedule of portfolio holdings is available (i) without charge, upon request, by calling (800) 607-2200; (ii) on the SEC’s website at http://www.sec.gov; and (iii) on our website at http://advisor.wilshire.com.
As of December 31, 2015, all of the Portfolio’s investments were considered Level 1. For the year ended December 31, 2015, there have been no transfers between Level 1 and Level 2 assets and liabilities. For the year ended December 31, 2015, there have been no transfers between Level 2 and Level 3 assets and liabilities. Please see Note 2 in Notes to Financial Statements for further information regarding fair value measurements
See Notes to Financial Statements.
42
Wilshire Mutual Funds, Inc. Wilshire 5000 Indexsm Fund Condensed Schedule of Investments | December 31, 2015 |
|
Shares | | | Percentage of
Net Assets (%) | | | Value | |
COMMON STOCK — 99.6% | | | | | | |
Consumer Discretionary — 13.1% | | | | | | |
3,997 | | Amazon.com, Inc.† | | | 1.2 | | | $ | 2,701,532 | |
21,346 | | Comcast Corp., Class A | | | 0.5 | | | | 1,204,555 | |
13,012 | | Home Depot, Inc. (The) | | | 0.8 | | | | 1,720,837 | |
10,374 | | McDonald's Corp.(a) | | | 0.6 | | | | 1,225,584 | |
14,873 | | Starbucks Corp. | | | 0.4 | | | | 892,826 | |
17,745 | | Walt Disney Co. (The) | | | 0.8 | | | | 1,864,645 | |
467,040 | | Other Securities | | | 8.8 | | | | 19,392,999 | |
| | | | | | | | | | 29,002,978 | |
Consumer Staples — 9.3% | | | | | | | | |
19,575 | | Altria Group, Inc. | | | 0.5 | | | | 1,139,461 | |
42,115 | | Coca-Cola Co. (The) | | | 0.8 | | | | 1,809,260 | |
11,902 | | CVS Health Corp. | | | 0.5 | | | | 1,163,659 | |
15,814 | | PepsiCo, Inc. | | | 0.7 | | | | 1,580,135 | |
15,625 | | Philip Morris International, Inc. | | | 0.7 | | | | 1,373,594 | |
29,116 | | Procter & Gamble Co. (The) | | | 1.0 | | | | 2,312,102 | |
10,472 | | Walgreens Boots Alliance, Inc. | | | 0.4 | | | | 891,743 | |
17,779 | | Wal-Mart Stores, Inc. | | | 0.5 | | | | 1,089,853 | |
164,857 | | Other Securities | | | 4.2 | | | | 9,196,304 | |
| | | | | | | | | | 20,556,111 | |
Energy — 6.1% | | | | | | | | |
20,271 | | Chevron Corp. | | | 0.8 | | | | 1,823,579 | |
44,750 | | Exxon Mobil Corp. | | | 1.6 | | | | 3,488,262 | |
13,660 | | Schlumberger, Ltd. | | | 0.5 | | | | 952,785 | |
233,977 | | Other Securities | | | 3.2 | | | | 7,155,980 | |
| | | | | | | | | | 13,420,606 | |
Financials — 18.6% | | | | | | | | |
119,398 | | Bank of America Corp. | | | 0.9 | | | | 2,009,468 | |
20,982 | | Berkshire Hathaway, Inc., Class B† | | | 1.3 | | | | 2,770,463 | |
34,440 | | Citigroup, Inc. | | | 0.8 | | | | 1,782,270 | |
40,209 | | JPMorgan Chase & Co. | | | 1.2 | | | | 2,655,000 | |
2,650 | | Northern Trust Corp. | | | 0.1 | | | | 191,039 | |
50,292 | | Wells Fargo & Co. | | | 1.3 | | | | 2,733,873 | |
767,623 | | Other Securities | | | 13.0 | | | | 28,825,555 | |
| | | | | | | | | | 40,967,668 | |
Health Care — 13.5% | | | | | | | | |
3,782 | | Allergan PLC† | | | 0.6 | | | | 1,181,875 | |
7,187 | | Amgen, Inc. | | | 0.5 | | | | 1,166,666 | |
17,775 | | Bristol-Myers Squibb Co. | | | 0.6 | | | | 1,222,742 | |
8,658 | | Celgene Corp.† | | | 0.5 | | | | 1,036,882 | |
10,377 | | Eli Lilly & Co. | | | 0.4 | | | | 874,366 | |
13,692 | | Gilead Sciences, Inc. | | | 0.6 | | | | 1,385,493 | |
29,663 | | Johnson & Johnson | | | 1.4 | | | | 3,046,983 | |
28,405 | | Merck & Co., Inc. | | | 0.7 | | | | 1,500,352 | |
65,512 | | Pfizer, Inc. | | | 1.0 | | | | 2,114,727 | |
9,651 | | UnitedHealth Group, Inc. | | | 0.5 | | | | 1,135,344 | |
240,699 | | Other Securities | | | 6.7 | | | | 15,170,927 | |
| | | | | | | | | | 29,836,357 | |
Industrials — 10.8% | | | | | | | | |
6,814 | | 3M Co. | | | 0.5 | | | | 1,026,461 | |
7,313 | | Boeing Co. (The) | | | 0.5 | | | | 1,057,387 | |
107,596 | | General Electric Co. | | | 1.5 | | | | 3,351,615 | |
8,807 | | Honeywell International, Inc. | | | 0.4 | | | | 912,141 | |
9,697 | | United Technologies Corp. | | | 0.4 | | | | 931,591 | |
309,222 | | Other Securities | | | 7.5 | | | | 16,514,360 | |
| | | | | | | | | | 23,793,555 | |
Information Technology — 19.7% | | | | | | | | |
6,040 | | Alphabet, Inc., Class C† | | | 2.1 | | | | 4,583,635 | |
62,139 | | Apple, Inc. | | | 3.0 | | | | 6,540,751 | |
55,048 | | Cisco Systems, Inc. | | | 0.7 | | | | 1,494,828 | |
23,983 | | Facebook, Inc., Class A† | | | 1.2 | | | | 2,510,061 | |
51,068 | | Intel Corp. | | | 0.8 | | | | 1,759,293 | |
9,776 | | International Business Machines Corp. | | | 0.6 | | | | 1,345,373 | |
10,955 | | MasterCard, Inc., Class A | | | 0.5 | | | | 1,066,579 | |
88,462 | | Microsoft Corp. | | | 2.3 | | | | 4,907,872 | |
37,730 | | Oracle Corp. | | | 0.6 | | | | 1,378,277 | |
17,279 | | Visa, Inc., Class A(a) | | | 0.6 | | | | 1,339,986 | |
500,032 | | Other Securities | | | 7.3 | | | | 16,412,849 | |
| | | | | | | | | | 43,339,504 | |
Materials — 3.0% | | | | | | | | |
157,051 | | Other Securities | | | 3.0 | | | | 6,638,330 | |
| | | | | | | | | | | |
Telecommunication Services — 2.4% | | | | | | | | |
65,525 | | AT&T, Inc.(a) | | | 1.0 | | | | 2,254,715 | |
44,813 | | Verizon Communications, Inc. | | | 0.9 | | | | 2,071,257 | |
44,446 | | Other Securities | | | 0.5 | | | | 934,880 | |
| | | | | | | | | | 5,260,852 | |
Utilities — 3.1% | | | | | | | | |
153,337 | | Other Securities | | | 3.1 | | | | 6,755,999 | |
| | | | | | | | | | | |
Total Common Stock | | | | | | | | |
(Cost $98,060,162) | | | | | | | 219,571,960 | |
See Notes to Financial Statements.
43
Wilshire Mutual Funds, Inc. Wilshire 5000 Indexsm Fund Condensed Schedule of Investments - (Continued) | December 31, 2015 |
|
Shares | | | Percentage of
Net Assets (%) | | | Value | |
SHORT-TERM INVESTMENTS (b) — 13.8% | |
577,126 | | Northern Trust Institutional Government Select Portfolio, Institutional Class, 0.010% | | | 0.3 | | | $ | 577,126 | |
298,293,980 | | Northern Trust Institutional Liquid Asset Portfolio, Institutional Class, 0.010%(c) | | | 13.5 | | | | 29,829,398 | |
| | | | | | | | | | | |
Total Short-Term Investments | | | | | | | | |
(Cost $30,406,524) | | | | | | | 30,406,524 | |
| | | | | | | | | | | |
RIGHTS — 0.0% | | | | | | | | |
Number
Of Rights | | | | | | | | |
United States — 0.0% | | | | | | |
5,650 | | Other Securities | | | 0.0 | | | | 5,987 | |
Total Rights (Cost $—) | | | | | | | 5,987 | |
| | | | | | | | | | | |
Total Investments — 113.4% | | | | | | | | |
(Cost $128,466,686) | | | | | | | 249,984,471 | |
Other Assets & Liabilities, Net — (13.4)% | | | | | | | (29,584,624 | ) |
| | | | | | | | | | | |
NET ASSETS — 100.0% | | | | | | $ | 220,399,847 | |
† | Non-income producing security. |
(a) | This security or a partial position of this security is on loan at December 31, 2015. The total market value of securities on loan at December 31, 2015 was $30,239,547 (Note 6). |
(b) | Rate shown is the 7-day effective yield as of December 31, 2015. |
(c) | This security was purchased with cash collateral held from securities on loan. The total value of such securities as of December 31, 2015 was $29,829,398. Securities on loan are also collateralized by various U.S. Treasury obligations in the amount of $1,445,392 (Note 6). |
Ltd. — Limited
PLC — Public Limited Company
Amounts designated as “—“ are either $0, or have been rounded to $0.
The Condensed Schedule of Investments does not reflect the complete portfolio holdings. It includes the Fund’s 50 largest holdings and each investment of any issuer that exceeds 1% of the Fund’s net assets. “Other Securities” represent all issues not required to be disclosed under the rules adopted by the U.S. Securities and Exchange Commission (“SEC”). The complete schedule of portfolio holdings is available (i) without charge, upon request, by calling (800) 607-2200; (ii) on the SEC’s website at http://www.sec.gov; and (iii) on our website at http://advisor.wilshire.com.
As of December 31, 2015, all of the Fund’s investments were considered Level 1, except for Leap Wireless Contingent Value Rights, Orleans Homebuilders, Inc., Safeway Contingent Value Rights – CASA Ley, Safeway Contingent Value Rights – PDC and Trico Marine Services, Inc. which were Level 3. At December 31, 2015, the value of these Level 3 investments was $5,987. A reconciliation of Level 3 investments, including certain disclosures related to significant inputs used in valuing Level 3 investments is only presented when the Fund has over 1% of Level 3 investments at the beginning and/or end of the period in relation to net assets. For the year ended December 31, 2015, there have been no transfers between Level 1 and Level 2 assets and liabilities. For the year ended December 31, 2015, there have been no transfers between Level 2 and Level 3 assets and liabilities. Please see Note 2 in Notes to Financial Statements for further information regarding fair value measurements.
See Notes to Financial Statements.
44
Wilshire Mutual Funds, Inc. Wilshire International Equity Fund Condensed Schedule of Investments | December 31, 2015 |
|
Shares | | | Percentage of
Net Assets (%) | | | Value | |
COMMON STOCK — 96.5% | | | | | | |
Australia — 2.9% | | | | | | |
29,725 | | CSL, Ltd. | | | 1.3 | | | $ | 2,266,220 | |
558,547 | | Other Securities | | | 1.6 | | | | 3,037,238 | |
| | | | | | | | | | 5,303,458 | |
Austria — 0.1% | | | | | | | | |
6,007 | | Other Securities | | | 0.1 | | | | 132,527 | |
| | | | | | | | | | | |
Belgium — 0.7% | | | | | | | | |
19,390 | | Other Securities | | | 0.7 | | | | 1,255,041 | |
| | | | | | | | | | | |
Bermuda — 0.9% | | | | | | | | |
37,920 | | Lazard, Ltd., Class A (d) | | | 0.9 | | | | 1,706,779 | |
| | | | | | | | | | | |
Brazil — 1.0% | | | | | | | | |
219,185 | | Other Securities | | | 1.0 | | | | 1,887,474 | |
| | | | | | | | | | | |
Canada — 3.6% | | | | | | | | |
860 | | Canadian Pacific Railway, Ltd*. | | | 0.1 | | | | 109,841 | |
14,475 | | Canadian Pacific Railway, Ltd.(a) | | | 1.0 | | | | 1,847,010 | |
4,500 | | Constellation Software, Inc. | | | 1.1 | | | | 1,876,100 | |
73,226 | | Other Securities | | | 1.4 | | | | 2,648,042 | |
| | | | | | | | | | 6,480,993 | |
China — 2.1% | | | | | | | | |
123,900 | | Tencent Holdings, Ltd. | | | 1.4 | | | | 2,425,960 | |
1,653,000 | | Other Securities | | | 0.7 | | | | 1,353,665 | |
| | | | | | | | | | 3,779,625 | |
Denmark — 6.5% | | | | | | | | |
40,828 | | Chr Hansen Holding A | | | 1.4 | | | | 2,553,808 | |
30,185 | | Coloplast A, Class B | | | 1.3 | | | | 2,437,051 | |
53,430 | | Novo Nordisk ADR | | | 1.7 | | | | 3,103,214 | |
13,500 | | Novo Nordisk A, Class B | | | 0.5 | | | | 781,626 | |
46,738 | | Novozymes A, Class B | | | 1.2 | | | | 2,237,763 | |
40,518 | | Other Securities | | | 0.4 | | | | 668,619 | |
| | | | | | | | | | 11,782,081 | |
Finland — 0.4% | | | | | | | | |
41,824 | | Other Securities | | | 0.4 | | | | 767,475 | |
| | | | | | | | | | | |
France — 5.4% | | | | | | | | |
18,970 | | Atos SE | | | 0.9 | | | | 1,592,587 | |
11,189 | | LVMH Moet Hennessy Louis Vuitton SE | | | 1.0 | | | | 1,757,468 | |
5,094 | | Unibail-Rodamco SE‡ | | | 0.7 | | | | 1,293,532 | |
129,844 | | Other Securities | | | 2.8 | | | | 5,131,416 | |
| | | | | | | | | | 9,775,003 | |
Germany — 3.6% | | | | | | | | |
170,387 | | Other Securities | | | 3.6 | | | | 6,476,084 | |
| | | | | | | | | | | |
Hong Kong — 1.5% | | | | | | | | |
1,154,100 | | Other Securities | | | 1.5 | | | | 2,617,954 | |
| | | | | | | | | | | |
Ireland — 2.6% | | | | | | | | |
130,700 | | Experian PLC | | | 1.3 | | | | 2,310,059 | |
30,325 | | ICON PLC† | | | 1.3 | | | | 2,356,252 | |
| | | | | | | | | | 4,666,311 | |
Israel — 0.2% | | | | | | | | |
92,237 | | Other Securities | | | 0.2 | | | | 306,701 | |
| | | | | | | | | | | |
Italy — 1.1% | | | | | | | | |
214,368 | | Other Securities | | | 1.1 | | | | 2,047,804 | |
| | | | | | | | | | | |
Japan — 15.5% | | | | | | | | |
23,600 | | Denso Corp. | | | 0.6 | | | | 1,127,738 | |
3,600 | | Keyence Corp. | | | 1.1 | | | | 1,978,579 | |
54,540 | | LIXIL Group Corp. | | | 0.7 | | | | 1,211,317 | |
16,800 | | Secom Co., Ltd. | | | 0.6 | | | | 1,138,532 | |
76,600 | | Seiko Epson Corp. | | | 0.7 | | | | 1,179,576 | |
26,800 | | Seven & I Holdings Co., Ltd. | | | 0.7 | | | | 1,227,026 | |
208,300 | | Sumitomo Mitsui Financial Group, Inc. ADR | | | 0.9 | | | | 1,580,997 | |
46,200 | | Sysmex Corp. | | | 1.6 | | | | 2,963,484 | |
122,000 | | Toray Industries, Inc. | | | 0.6 | | | | 1,133,688 | |
63,400 | | Unicharm Corp. | | | 0.7 | | | | 1,294,734 | |
1,189,625 | | Other Securities | | | 7.3 | | | | 13,097,479 | |
| | | | | | | | | | 27,933,150 | |
Jersey — 0.0% | | | | | | | | |
493 | | Other Securities | | | 0.0 | | | | 32,809 | |
| | | | | | | | | | | |
Luxembourg — 0.0% | | | | | | | | |
13,485 | | Other Securities | | | 0.0 | | | | 56,896 | |
| | | | | | | | | | | |
Macau — 0.0% | | | | | | | | |
11,200 | | Other Securities | | | 0.0 | | | | 13,012 | |
| | | | | | | | | | | |
Mexico — 1.3% | | | | | | | | |
505,000 | | Wal-Mart de Mexico SAB de CV | | | 0.7 | | | | 1,274,330 | |
See Notes to Financial Statements.
45
Wilshire Mutual Funds, Inc. Wilshire International Equity Fund Condensed Schedule of Investments - (Continued) | December 31, 2015 |
|
Shares | | | Percentage of
Net Assets (%) | | | Value | |
244,300 | | Other Securities | | | 0.6 | | | $ | 1,060,635 | |
| | | | | | | | | | 2,334,965 | |
Netherlands — 3.2% | | | | | | | | |
566,125 | | Other Securities | | | 3.2 | | | | 5,821,627 | |
| | | | | | | | | | | |
New Zealand — 0.1% | | | | | | | | |
32,658 | | Other Securities | | | 0.1 | | | | 126,260 | |
| | | | | | | | | | | |
Norway — 0.2% | | | | | | | | |
25,936 | | Other Securities | | | 0.2 | | | | 285,360 | |
| | | | | | | | | | | |
Portugal — 0.1% | | | | | | | | |
8,823 | | Other Securities | | | 0.1 | | | | 114,809 | |
| | | | | | | | | | | |
Russia — 0.9% | | | | | | | | |
77,085 | | Yandex NV, Class A† | | | 0.7 | | | | 1,211,776 | |
6,608,830 | | Other Securities | | | 0.2 | | | | 372,662 | |
| | | | | | | | | | 1,584,438 | |
Singapore — 0.8% | | | | | | | | |
942,700 | | Other Securities | | | 0.8 | | | | 1,437,225 | |
| | | | | | | | | | | |
South Africa — 1.1% | | | | | | | | |
8,899 | | Vodacom Group, Ltd. | | | 0.1 | | | | 87,706 | |
348,306 | | Other Securities | | | 1.0 | | | | 1,978,004 | |
| | | | | | | | | | 2,065,710 | |
South Korea — 1.2% | | | | | | | | |
54,013 | | Other Securities | | | 1.2 | | | | 2,070,117 | |
| | | | | | | | | | | |
Spain — 2.2% | | | | | | | | |
239,781 | | Other Securities | | | 2.2 | | | | 3,878,904 | |
| | | | | | | | | | | |
Sweden — 0.9% | | | | | | | | |
102,893 | | Other Securities | | | 0.9 | | | | 1,543,360 | |
| | | | | | | | | | | |
Switzerland — 8.9% | | | | | | | | |
49,372 | | Nestle SA | | | 2.1 | | | | 3,665,143 | |
11,474 | | Novartis AG | | | 0.5 | | | | 986,985 | |
12,500 | | Novartis AG ADR(a) | | | 0.6 | | | | 1,075,500 | |
8,445 | | Roche Holding AG | | | 1.3 | | | | 2,340,181 | |
992 | | SGS SA | | | 1.0 | | | | 1,885,297 | |
4,771 | | Syngenta AG | | | 1.0 | | | | 1,867,384 | |
60,034 | | Other Securities | | | 2.4 | | | | 4,310,251 | |
| | | | | | | | | | 16,130,741 | |
| | | | | | | | | | | |
Taiwan — 3.6% | | | | | | | | |
165,195 | | Taiwan Semiconductor Manufacturing Co., Ltd. ADR(a) | | | 2.1 | | | | 3,758,186 | |
2,814,564 | | Other Securities | | | 1.5 | | | | 2,727,152 | |
| | | | | | | | | | 6,485,338 | |
United Kingdom — 13.5% | | | | | | | | |
45,990 | | ARM Holdings PLC ADR(a) | | | 1.1 | | | | 2,080,588 | |
8,071 | | ARM Holdings PLC | | | 0.1 | | | | 123,019 | |
33,162 | | AstraZeneca PLC | | | 1.3 | | | | 2,240,019 | |
120,875 | | Compass Group PLC | | | 1.2 | | | | 2,094,561 | |
82,148 | | National Grid PLC | | | 0.6 | | | | 1,132,958 | |
33,727 | | Reckitt Benckiser Group PLC | | | 1.7 | | | | 3,120,655 | |
30,220 | | Royal Dutch Shell PLC ADR, Class A | | | 0.8 | | | | 1,383,774 | |
120,663 | | Sky PLC | | | 1.1 | | | | 1,978,010 | |
31,500 | | Smith & Nephew PLC ADR(a) | | | 0.6 | | | | 1,121,400 | |
3,279 | | Vodafone Group PLC | | | 0.0 | | | | 10,633 | |
51,576 | | WPP PLC | | | 0.7 | | | | 1,186,347 | |
1,248,783 | | Other Securities | | | 4.3 | | | | 7,917,461 | |
| | | | | | | | | | 24,389,425 | |
United States — 10.4% | | | | | | | | |
25,150 | | ACE, Ltd.(a) | | | 1.6 | | | | 2,938,778 | |
20,125 | | Core Laboratories NV(a) | | | 1.2 | | | | 2,188,393 | |
49,565 | | Ctrip.com International, Ltd. ADR† (a) | | | 1.3 | | | | 2,296,346 | |
22,150 | | HDFC Bank, Ltd. ADR(a) | | | 0.7 | | | | 1,364,440 | |
37,900 | | Markit, Ltd.† (a) | | | 0.6 | | | | 1,143,443 | |
12,650 | | Perrigo Co. PLC(a) | | | 1.0 | | | | 1,830,455 | |
47,040 | | Sensata Technologies Holding NV† (a) | | | 1.2 | | | | 2,166,662 | |
51,145 | | Vodafone Group PLC ADR(a) | | | 0.9 | | | | 1,649,938 | |
277,755 | | Other Securities | | | 1.9 | | | | 3,186,366 | |
| | | | | | | | | | 18,764,821 | |
Total Common Stock | | | | | | | | |
(Cost $173,796,043) | | | | | | | 174,054,277 | |
| | | | | | | | | | | |
SHORT-TERM INVESTMENTS (b) — 19.7% | |
3,817,340 | | Northern Trust Institutional Government Select Portfolio, Institutional Class, 0.010% | | | 2.1 | | | | 3,817,340 | |
31,675,900 | | Northern Trust Institutional Liquid Asset Portfolio, Institutional Class, 0.010% (c) | | | 17.6 | | | | 31,675,900 | |
See Notes to Financial Statements.
46
Wilshire Mutual Funds, Inc. Wilshire International Equity Fund Condensed Schedule of Investments - (Continued) | December 31, 2015 |
|
Shares | | | Percentage of
Net Assets (%) | | | Value | |
| | | | | | |
Total Short-Term Investments | | | | | | |
(Cost $35,493,240) | | | | | $ | 35,493,240 | |
| | | | | | | |
EXCHANGE TRADED FUNDS — 0.6% | | | | | | | |
United States — 0.6% | | | | | | | |
33,018 | | iShares MSCI India ETF(a) | | | 0.5 | | | | 909,316 | |
5,173 | | Vanguard FTSE All-World ex-US ETF(a) | | | 0.1 | | | | 224,560 | |
| | | | | | | | | | | |
Total Exchange Traded Funds (Cost $1,238,009) | | | | | | | 1,133,876 | |
| | | | | | | | | | | |
PREFERRED STOCK — 0.2% | | | | | | | | |
Brazil — 0.0% | | | | | | | | |
17,580 | | Other Securities | | | 0.0 | | | | 89,740 | |
| | | | | | | | | | | |
Germany — 0.0% | | | | | | | | |
565 | | Other Securities | | | 0.0 | | | | 30,407 | |
| | | | | | | | | | | |
Russia — 0.1% | | | | | | | | |
39 | | Other Securities | | | 0.1 | | | | 103,570 | |
| | | | | | | | | | | |
South Korea — 0.1% | | | | | | | | |
196 | | Other Securities | | | 0.1 | | | | 181,180 | |
| | | | | | | | | | | |
Total Preferred Stock | | | | | | | | |
(Cost $501,245) | | | | | | | 404,897 | |
| | | | | | | | | | | |
RIGHTS — 0.0% | | | | | | | | |
Number
Of Rights | | | | | | | | |
Singapore — 0.0% | | | | | | |
5,149 | | Other Securities | | | 0.0 | | | | 225 | |
Total Rights (Cost $—) | | | | | | | 225 | |
| | | | | | | | | | | |
Total Investments — 117.0% | | | | | | | | |
(Cost $211,028,537) | | | | | | | 211,086,515 | |
Other Assets & Liabilities, Net — (17.0)% | | | | | | | (30,711,850 | ) |
| | | | | | | | | | | |
NET ASSETS — 100.0% | | | | | | $ | 180,374,665 | |
* | Security traded on the Toronto Stock Exchange. |
‡ | Real Estate Investment Trust. |
† | Non-income producing security. |
(a) | This security or a partial position of this security is on loan at December 31, 2015. The total market value of securities on loan at December 31, 2015 was $32,987,952 (Note 6). |
(b) | Rate shown in the 7-day effective yield as of December 31, 2015. |
(c) | This security was purchased with cash collateral held from securities on loan. The total value of such securities as of December 31, 2015 was $31,675,900. Securities on loan are also collateralized by various U.S. Treasury obligations in the amount of $2,408,489 (Note 6). |
(d) | Security considered Master Limited Partnership. At December 31,2015, this security amounted to $1,706,779 or 0.9% of Net Assets. |
ADR — American Depositary Receipt
ETF — Exchange Traded Fund
FTSE — Financial Times Stock Exchange
Ltd. — Limited
MSCI — Morgan Stanley Capital International
PLC — Public Limited Company
Amounts designated as “—“ are either $0, or have been rounded to $0.
The Condensed Schedule of Investments does not reflect the complete portfolio holdings. It includes the Fund’s 50 largest holdings and each investment of any issuer that exceeds 1% of the Fund’s net assets. “Other Securities” represent all issues not required to be disclosed under the rules adopted by the U.S. Securities and Exchange Commission (“SEC”). The complete schedule of portfolio holdings is available (i) without charge, upon request, by calling (800) 607-2200; (ii) on the SEC’s website at http://www.sec.gov; and (iii) on our website at http://advisor.wilshire.com.
See Notes to Financial Statements.
47
Wilshire Mutual Funds, Inc. Wilshire International Equity Fund Condensed Schedule of Investments - (Continued) | December 31, 2015 |
|
The following is a summary of the levels of inputs used as of December 31, 2015 in valuing the Fund’s investments carried at value:
Investments in Securities | | Level 1 | | | Level 2 | | | Level 3^ | | | Total | |
Common Stock | | | | | | | | | | | | |
Australia | | $ | — | | | $ | 5,303,458 | * | | $ | — | | | $ | 5,303,458 | |
Austria | | | — | | | | 132,527 | * | | | — | | | | 132,527 | |
Belgium | | | — | | | | 1,255,041 | * | | | — | | | | 1,255,041 | |
Bermuda | | | 1,706,779 | | | | — | | | | — | | | | 1,706,779 | |
Brazil | | | 1,887,474 | | | | — | | | | — | | | | 1,887,474 | |
Canada | | | 6,480,993 | | | | — | | | | — | | | | 6,480,993 | |
China | | | — | | | | 3,701,819 | * | | | 77,806 | | | | 3,779,625 | |
Denmark | | | 3,103,214 | | | | 8,678,867 | * | | | — | | | | 11,782,081 | |
Finland | | | — | | | | 767,475 | * | | | — | | | | 767,475 | |
France | | | — | | | | 9,775,003 | * | | | — | | | | 9,775,003 | |
Germany | | | — | | | | 6,476,084 | * | | | — | | | | 6,476,084 | |
Hong Kong | | | 1,053,371 | | | | 1,564,583 | * | | | — | | | | 2,617,954 | |
Ireland | | | 2,356,252 | | | | 2,310,059 | * | | | — | | | | 4,666,311 | |
Israel | | | — | | | | 306,701 | * | | | — | | | | 306,701 | |
Italy | | | — | | | | 2,047,804 | * | | | — | | | | 2,047,804 | |
Japan | | | 1,580,997 | | | | 26,352,153 | * | | | — | | | | 27,933,150 | |
Jersey | | | — | | | | 32,809 | * | | | — | | | | 32,809 | |
Luxembourg | | | — | | | | 56,896 | * | | | — | | | | 56,896 | |
Macau | | | — | | | | 13,012 | * | | | — | | | | 13,012 | |
Mexico | | | 2,334,965 | | | | — | | | | — | | | | 2,334,965 | |
Netherlands | | | 69,437 | | | | 5,752,190 | * | | | — | | | | 5,821,627 | |
New Zealand | | | — | | | | 126,260 | * | | | — | | | | 126,260 | |
Norway | | | — | | | | 285,360 | * | | | — | | | | 285,360 | |
Portugal | | | — | | | | 114,809 | * | | | — | | | | 114,809 | |
Russia | | | 1,211,776 | | | | 372,662 | * | | | — | | | | 1,584,438 | |
Singapore | | | — | | | | 1,437,225 | * | | | — | | | | 1,437,225 | |
South Africa | | | 33,621 | | | | 2,032,089 | * | | | — | | | | 2,065,710 | |
South Korea | | | — | | | | 2,070,117 | * | | | — | | | | 2,070,117 | |
Spain | | | — | | | | 3,878,904 | * | | | — | | | | 3,878,904 | |
Sweden | | | — | | | | 1,543,360 | * | | | — | | | | 1,543,360 | |
Switzerland | | | 1,075,500 | | | | 15,055,241 | * | | | — | | | | 16,130,741 | |
Taiwan | | | 3,758,186 | | | | 2,727,152 | * | | | — | | | | 6,485,338 | |
United Kingdom | | | 5,675,134 | | | | 18,714,291 | * | | | — | | | | 24,389,425 | |
United States | | | 18,764,821 | | | | — | | | | — | | | | 18,764,821 | |
Total Common Stock | | | 51,092,520 | | | | 122,883,951 | | | | 77,806 | | | | 174,054,277 | |
Short-Term Investments | | | 35,493,240 | | | | — | | | | — | | | | 35,493,240 | |
Exchange Traded Funds | | $ | 1,133,876 | | | $ | — | | | $ | — | | | $ | 1,133,876 | |
Preferred Stock | | | 89,740 | | | | 315,157 | * | | | — | | | | 404,897 | |
Rights | | | — | | | | 225 | | | | — | | | | 225 | |
Total Investments in Securities | | $ | 87,809,376 | | | $ | 123,199,333 | | | $ | 77,806 | | | $ | 211,086,515 | |
^ | A reconciliation of Level 3 investments, including certain disclosures related to significant inputs used in valuing Level 3 investments is only presented when the Fund has over 1% of Level 3 investments at the beginning and/or end of the period in relation to net assets. |
* | For the year ended December 31, 2015, the transfers out of Level 1 and into Level 2 were $123,199,108 and the transfers out of Level 2 into Level 1 were $0. The transfers into Level 2 were due to securities trading primarily outside the United States, the value of which were adjusted as a result of local trading through the application of a thirdparty vendor (Note 2). For the year ended December 31, 2015, there were transfers in the amount of $77,806 between Level 2 and Level 3 assets and liabilities due to changes in the availability of observable inputs used to determine fair value. All transfers, if any, are recognized by the Fund at the end of each period. |
Amounts designated as “—“ are either $0 or have been rounded to $0.
See Notes to Financial Statements.
48
Wilshire Mutual Funds, Inc. Statements of Assets and Liabilities December 31, 2015 |
|
| | | LARGE
COMPANY
GROWTH PORTFOLIO | | | LARGE
COMPANY
VALUE
PORTFOLIO | | | SMALL
COMPANY
GROWTH
PORTFOLIO | | | SMALL
COMPANY
VALUE
PORTFOLIO | | | WILSHIRE
5000
INDEXSM
FUND | | | WILSHIRE INTERNATIONAL EQUITY
FUND | |
ASSETS: | | | | | | | | | | | | | | | | | | |
Investments in securities, at value (Note 2) | | $ | 278,033,364 | * | | $ | 129,924,105 | * | | $ | 40,762,932 | * | | $ | 41,501,756 | * | | $ | 249,984,471 | * | | $ | 211,086,515 | * |
Foreign currency, at value | | | — | | | | — | | | | — | | | | — | | | | — | | | | 11,021 | |
Cash | | | — | | | | — | | | | — | | | | — | | | | — | | | | 210 | |
Receivable for investment securities sold | | | 1,611,128 | | | | 1,229,618 | | | | 402,026 | | | | 181,389 | | | | — | | | | 490,659 | |
Dividends and interest receivable | | | 98,896 | | | | 155,708 | | | | 6,928 | | | | 54,582 | | | | 301,784 | | | | 206,736 | |
Receivable for Portfolio shares sold | | | 70,004 | | | | 36,055 | | | | 14,912 | | | | 9,634 | | | | 193,748 | | | | 257,632 | |
Dividend reclaim receivable | | | 125 | | | | 938 | | | | — | | | | — | | | | 1 | | | | 236,766 | |
Receivable from Adviser (Note 3) | | | — | | | | — | | | | 5,569 | | | | 6,791 | | | | — | | | | — | |
Prepaid expenses and other assets | | | 16,021 | | | | 13,674 | | | | 10,413 | | | | 10,693 | | | | 30,220 | | | | 24,114 | |
Total Assets | | | 279,829,538 | | | | 131,360,098 | | | | 41,202,780 | | | | 41,764,845 | | | | 250,510,224 | | | | 212,313,653 | |
| | | | | | | | | | | | | | | | | | | | | | | | | |
LIABILITIES: | | | | | | | | | | | | | | | | | | | | | | | | |
Payable upon return on securities loaned (Note 6) | | | 49,384,840 | | | | 24,469,794 | | | | 13,939,124 | | | | 13,551,010 | | | | 29,829,398 | | | | 31,675,900 | |
Payable for investment securities purchased | | | — | | | | — | | | | 72,343 | | | | 14,163 | | | | — | | | | — | |
Cash overdraft | | | 388,697 | | | | 490,862 | | | | 82,800 | | | | 124,260 | | | | — | | | | — | |
Payable for Portfolio shares redeemed | | | 155,714 | | | | 49,641 | | | | 6,186 | | | | 15,266 | | | | 95,179 | | | | 5,475 | |
Investment advisory fees payable (Note 3) | | | 149,008 | | | | 69,246 | | | | 20,031 | | | | 20,822 | | | | 18,843 | | | | 150,830 | |
Distribution fees payable (Note 4) | | | 23,866 | | | | 8,438 | | | | 4,880 | | | | 4,108 | | | | 42,822 | | | | — | |
Shareholder Service fees payable (Note 4) | | | 19,684 | | | | 1,481 | | | | 741 | | | | 1,287 | | | | 20,048 | | | | 741 | |
Administration fees payable | | | 13,907 | | | | 6,463 | | | | 1,650 | | | | 1,715 | | | | 13,190 | | | | 10,757 | |
Directors’ fees payable | | | 7,975 | | | | 3,709 | | | | 950 | | | | 989 | | | | 7,493 | | | | 6,132 | |
Chief compliance officer expenses payable | | | 753 | | | | 347 | | | | 87 | | | | 92 | | | | 705 | | | | 574 | |
Accrued expenses and other payables | | | 85,162 | | | | 53,108 | | | | 17,448 | | | | 17,505 | | | | 82,699 | | | | 88,579 | |
Total Liabilities | | | 50,229,606 | | | | 25,153,089 | | | | 14,146,240 | | | | 13,751,217 | | | | 30,110,377 | | | | 31,938,988 | |
| | | | | | | | | | | | | | | | | | | | | | | | | |
NET ASSETS | | $ | 229,599,932 | | | $ | 106,207,009 | | | $ | 27,056,540 | | | $ | 28,013,628 | | | $ | 220,399,847 | | | $ | 180,374,665 | |
| | | | | | | | | | | | | | | | | | | | | | | | | |
* Includes Market Value of Securities on Loan | | $ | 48,141,410 | | | $ | 24,291,508 | | | $ | 13,573,570 | | | $ | 13,897,363 | | | $ | 30,239,547 | | | $ | 32,987,952 | |
Amounts designated as “—” are either $0, or have been rounded to $0. |
See Notes to Financial Statements.
49
Wilshire Mutual Funds, Inc. Statements of Assets and Liabilities - (Continued) December 31, 2015 |
|
| | | LARGE
COMPANY
GROWTH PORTFOLIO | | | LARGE
COMPANY
VALUE
PORTFOLIO | | | SMALL
COMPANY
GROWTH
PORTFOLIO | | | SMALL
COMPANY
VALUE
PORTFOLIO | | | WILSHIRE
5000
INDEXSM
FUND | | | WILSHIRE INTERNATIONAL EQUITY
FUND | |
NET ASSETS consist of: | | | | | | | | | | | | | | | | | | |
Paid-in capital | | $ | 168,326,010 | | | $ | 94,309,224 | | | $ | 22,244,298 | | | $ | 24,593,836 | | | $ | 123,717,822 | | | $ | 197,734,162 | |
Undistributed net investment income (accumulated net investment loss) | | | (10 | ) | | | (13 | ) | | | (3 | ) | | | 34,817 | | | | 540,069 | | | | 81,733 | |
Accumulated net realized gain (loss) on investments sold and foreign currency transactions | | | 575,569 | | | | 504,741 | | | | (12,344 | ) | | | 710,943 | | | | (25,375,829 | ) | | | (17,487,475 | ) |
Net unrealized appreciation on investments | | | 60,698,363 | | | | 11,393,057 | | | | 4,824,589 | | | | 2,674,032 | | | | 121,517,785 | | | | 57,978 | |
Net unrealized depreciation on other assets and liabilities denominated in foreign currencies | | | — | | | | — | | | | — | | | | — | | | | — | | | | (11,733 | ) |
| | | | | | | | | | | | | | | | | | | | | | | | | |
NET ASSETS | | $ | 229,599,932 | | | $ | 106,207,009 | | | $ | 27,056,540 | | | $ | 28,013,628 | | | $ | 220,399,847 | | | $ | 180,374,665 | |
| | | | | | | | | | | | | | | | | | | | | | | | | |
Investments in securities, at cost (Note 2) | | | 167,950,161 | | | | 94,061,254 | | | | 21,999,219 | | | | 25,276,714 | | | | 98,637,288 | | | | 179,352,637 | |
Cash collateral for securities on loan, at cost | | | 49,384,840 | | | | 24,469,794 | | | | 13,939,124 | | | | 13,551,010 | | | | 29,829,398 | | | | 31,675,900 | |
Foreign currency, at cost | | | — | | | | — | | | | — | | | | — | | | | — | | | | 11,039 | |
| | | | | | | | | | | | | | | | | | | | | | | | | |
NET ASSETS: | | | | | | | | | | | | | | | | | | | | | | | | |
Investment Class shares | | $ | 107,380,741 | | | $ | 52,864,367 | | | $ | 12,642,285 | | | $ | 14,286,807 | | | $ | 159,708,952 | | | $ | 3,437,913 | |
(50,000,000 shares authorized, per class, per Portfolio, par value $.001 per share)† | | | | | | | | | | | | | | | | | | | | | | | | |
Institutional Class shares | | $ | 122,219,191 | | | $ | 53,342,642 | | | $ | 14,414,255 | | | $ | 13,726,821 | | | $ | 59,064,860 | | | $ | 176,936,752 | |
(50,000,000 shares authorized, per class, per Portfolio, par value $.001 per share)† | | | | | | | | | | | | | | | | | | | | | | | | |
Qualified Class shares | | | N/A | | | | N/A | | | | N/A | | | | N/A | | | $ | 192 | | | | N/A | |
(50,000,000 shares authorized, per class, per Portfolio, par value $.001 per share) | | | | | | | | | | | | | | | | | | | | | | | | |
Horace Mann Class shares | | | N/A | | | | N/A | | | | N/A | | | | N/A | | | $ | 1,625,843 | | | | N/A | |
(50,000,000 shares authorized, per class, per Portfolio, par value $.001 per share) | | | | | | | | | | | | | | | | | | | | | | | | |
† | For the Wilshire International Equity Fund, (40,000,000 shares authorized, per class, par value $.001 per share). |
N/A — Not Applicable. Share classes currently not offered. |
See Notes to Financial Statements.
50
Wilshire Mutual Funds, Inc. Statements of Assets and Liabilities - (Continued) December 31, 2015 |
|
| | | LARGE
COMPANY
GROWTH PORTFOLIO | | | LARGE
COMPANY
VALUE
PORTFOLIO | | | SMALL
COMPANY
GROWTH
PORTFOLIO | | | SMALL
COMPANY
VALUE
PORTFOLIO | | | WILSHIRE
5000
INDEXSM
FUND | | | WILSHIRE INTERNATIONAL EQUITY
FUND | |
SHARES OUTSTANDING: | | | | | | | | | | | | | | | | | | |
Investment Class shares | | | 2,916,663 | | | | 2,839,284 | | | | 558,501 | | | | 688,917 | | | | 8,982,638 | | | | 386,435 | |
Institutional Class shares | | | 3,130,779 | | | | 2,857,504 | | | | 599,570 | | | | 651,131 | | | | 3,322,813 | | | | 20,146,724 | |
Qualified Class shares | | | N/A | | | | N/A | | | | N/A | | | | N/A | | | | 12 | | | | N/A | |
Horace Mann Class shares | | | N/A | | | | N/A | | | | N/A | | | | N/A | | | | 91,641 | | | | N/A | |
| | | | | | | | | | | | | | | | | | | | | | | | | |
INVESTMENT CLASS SHARES: | | | | | | | | | | | | | | | | | | | | | | | | |
Net asset value, offering and redemption price per share | | $ | 36.82 | | | $ | 18.62 | | | $ | 22.64 | | | $ | 20.74 | | | $ | 17.78 | | | $ | 8.90 | |
| | | | | | | | | | | | | | | | | | | | | | | | | |
INSTITUTIONAL CLASS SHARES: | | | | | | | | | | | | | | | | | | | | | | | | |
Net asset value, offering and redemption price per share | | $ | 39.04 | | | $ | 18.67 | | | $ | 24.04 | | | $ | 21.08 | | | $ | 17.78 | | | $ | 8.78 | |
| | | | | | | | | | | | | | | | | | | | | | | | | |
QUALIFIED CLASS SHARES: | | | | | | | | | | | | | | | | | | | | | | | | |
Net asset value, offering and redemption price per share | | | N/A | | | | N/A | | | | N/A | | | | N/A | | | $ | 18.06 | * | | | N/A | |
| | | | | | | | | | | | | | | | | | | | | | | | | |
HORACE MANN CLASS SHARES: | | | | | | | | | | | | | | | | | | | | | | | | |
Net asset value, offering and redemption price per share | | | N/A | | | | N/A | | | | N/A | | | | N/A | | | $ | 17.74 | | | | N/A | |
* | Difference in net asset value recalculation and net asset value stated is caused by rounding differences. |
N/A — Not Applicable. Share classes currently not offered. |
See Notes to Financial Statements.
51
Wilshire Mutual Funds, Inc. Statements of Operations For the Year Ended December 31, 2015 |
|
| | | LARGE
COMPANY
GROWTH PORTFOLIO | | | LARGE
COMPANY
VALUE
PORTFOLIO | | | SMALL
COMPANY
GROWTH
PORTFOLIO | | | SMALL
COMPANY
VALUE
PORTFOLIO | | | WILSHIRE
5000
INDEXSM
FUND | | | WILSHIRE INTERNATIONAL EQUITY
FUND | |
INVESTMENT INCOME: | | | | | | | | | | | | | | | | | | |
Dividends | | $ | 2,268,357 | | | $ | 2,598,215 | | | $ | 216,510 | | | $ | 441,203 | | | $ | 4,490,356 | | | $ | 4,564,372 | |
Dividends from investment companies | | | — | | | | — | | | | — | | | | — | | | | — | | | | 22,217 | |
Interest | | | 308 | | | | 126 | | | | — | | | | 277 | | | | 222 | | | | — | |
Income from Security Lending | | | 95,612 | | | | 43,779 | | | | 40,758 | | | | 33,248 | | | | 89,336 | | | | 56,386 | |
Foreign taxes withheld | | | (2,790 | ) | | | (17,806 | ) | | | — | | | | (438 | ) | | | (797 | ) | | | (455,167 | ) |
Total income | | | 2,361,487 | | | | 2,624,314 | | | | 257,268 | | | | 474,290 | | | | 4,579,117 | | | | 4,187,808 | |
| | | | | | | | | | | | | | | | | | | | | | | | | |
EXPENSES: | | | | | | | | | | | | | | | | | | | | | | | | |
Investment advisory fee (Note 3) | | | 1,786,041 | | | | 881,233 | | | | 245,733 | | | | 260,766 | | | | 229,712 | | | | 1,857,591 | |
Distribution (12b-1) fees (Note 4) | | | | | | | | | | | | | | | | | | | | | | | | |
Investment Class | | | 269,335 | | | | 144,097 | | | | 29,033 | | | | 39,297 | | | | 378,827 | | | | 14,990 | |
Horace Mann Class | | | N/A | | | | N/A | | | | N/A | | | | N/A | | | | 4,675 | | | | N/A | |
Shareholder Service fees (Note 4) | | | | | | | | | | | | | | | | | | | | | | | | |
Investment Class | | | 94,282 | | | | 10,574 | | | | 7,153 | | | | 9,771 | | | | 83,889 | | | | 13,569 | |
Institutional Class | | | 22,398 | | | | 585 | | | | 10 | | | | 75 | | | | 38,169 | | | | 389 | |
Administration and accounting fees (Note 3) | | | 166,697 | | | | 82,249 | | | | 20,237 | | | | 21,475 | | | | 160,799 | | | | 130,033 | |
Directors' fees and expenses (Note 3) | | | 37,061 | | | | 18,253 | | | | 4,469 | | | | 4,743 | | | | 36,119 | | | | 29,017 | |
Chief compliance officer expenses | | | 1,552 | | | | 728 | | | | 189 | | | | 195 | | | | 1,463 | | | | 1,202 | |
Transfer agent fees (Note 3) | | | 107,218 | | | | 35,387 | | | | 22,922 | | | | 26,394 | | | | 98,809 | | | | 71,527 | |
Professional fees | | | 74,728 | | | | 61,449 | | | | 42,327 | | | | 42,716 | | | | 64,234 | | | | 59,934 | |
Printing fees | | | 53,995 | | | | 23,156 | | | | 9,373 | | | | 9,946 | | | | 39,140 | | | | 36,369 | |
Registration and filing fees | | | 51,458 | | | | 40,511 | | | | 30,537 | | | | 31,483 | | | | 58,544 | | | | 39,836 | |
Custodian fees (Note 3) | | | 65,947 | | | | 35,988 | | | | 10,602 | | | | 11,388 | | | | 79,665 | | | | 111,380 | |
Other | | | 33,565 | | | | 19,675 | | | | 8,095 | | | | 8,212 | | | | 47,252 | | | | 52,757 | |
Total expenses | | | 2,764,277 | | | | 1,353,885 | | | | 430,680 | | | | 466,461 | | | | 1,321,297 | | | | 2,418,594 | |
Fees waived and/or reimbursed by Investment Adviser (Note 3) | | | — | | | | — | | | | (48,753 | ) | | | (52,909 | ) | | | — | | | | (81,678 | ) |
Fees paid indirectly (Note 4) | | | (4,680 | ) | | | (12,902 | ) | | | (1,972 | ) | | | (2,327 | ) | | | (1,687 | ) | | | — | |
Net expenses | | | 2,759,597 | | | | 1,340,983 | | | | 379,955 | | | | 411,225 | | | | 1,319,610 | | | | 2,336,916 | |
| | | | | | | | | | | | | | | | | | | | | | | | | |
Net investment income (loss) | | | (398,110 | ) | | | 1,283,331 | | | | (122,687 | ) | | | 63,065 | | | | 3,259,507 | | | | 1,850,892 | |
Amounts designated as “—” are either $0, or have been rounded to $0. |
N/A – Not Applicable. Share classes currently not offered. |
See Notes to Financial Statements.
52
Wilshire Mutual Funds, Inc. Statements of Operations - (Continued) For the Year Ended December 31, 2015 |
|
| | | LARGE
COMPANY
GROWTH PORTFOLIO | | | LARGE
COMPANY
VALUE
PORTFOLIO | | | SMALL
COMPANY
GROWTH
PORTFOLIO | | | SMALL
COMPANY
VALUE
PORTFOLIO | | | WILSHIRE
5000
INDEXSM
FUND | | | WILSHIRE INTERNATIONAL EQUITY
FUND | |
NET REALIZED AND UNREALIZED GAIN (LOSS) ON INVESTMENTS AND FOREIGN CURRENCY TRANSACTIONS (NOTES 2 and 5): | | | | | | | | | | | | | | | | | | |
Net realized gain (loss) from: | | | | | | | | | | | | | | | | | | |
Investments | | $ | 21,237,633 | | | $ | 6,431,264 | | | $ | 1,568,318 | | | $ | 1,708,145 | | | $ | 12,858,128 | | | $ | (9,022,347 | ) |
Foreign currency transactions | | | — | | | | — | | | | — | | | | — | | | | — | | | | (39,790 | ) |
Net change in unrealized appreciation (depreciation) on: | | | | | | | | | | | | | | | | | | | | | | | | |
Investments | | | (6,083,070 | ) | | | (13,725,637 | ) | | | (751,209 | ) | | | (2,915,605 | ) | | | (15,900,180 | ) | | | 3,654,592 | |
Other assets and liabilities denominated in foreign currencies | | | — | | | | — | | | | — | | | | — | | | | — | | | | (4,129 | ) |
| | | | | | | | | | | | | | | | | | | | | | | | | |
Net realized and unrealized gain (loss) on investments and foreign currencies | | | 15,154,563 | | | | (7,294,373 | ) | | | 817,109 | | | | (1,207,460 | ) | | | (3,042,052 | ) | | | (5,411,674 | ) |
| | | | | | | | | | | | | | | | | | | | | | | | | |
NET INCREASE (DECREASE) IN NET ASSETS RESULTING FROM OPERATIONS | | $ | 14,756,453 | | | $ | (6,011,042 | ) | | $ | 694,422 | | | $ | (1,144,395 | ) | | $ | 217,455 | | | $ | (3,560,782 | ) |
Amounts designated as “—” are either $0, or have been rounded to $0. |
See Notes to Financial Statements.
53
Wilshire Mutual Funds, Inc. Statements of Changes in Net Assets For the Year Ended December 31, 2015 |
|
| | | LARGE
COMPANY
GROWTH PORTFOLIO | | | LARGE
COMPANY
VALUE
PORTFOLIO | | | SMALL
COMPANY
GROWTH
PORTFOLIO | | | SMALL
COMPANY
VALUE
PORTFOLIO | | | WILSHIRE
5000
INDEXSM
FUND | | | WILSHIRE INTERNATIONAL EQUITY
FUND | |
OPERATIONS: | | | | | | | | | | | | | | | | | | |
Net investment income (loss) | | $ | (398,110 | ) | | $ | 1,283,331 | | | $ | (122,687 | ) | | $ | 63,065 | | | $ | 3,259,507 | | | $ | 1,850,892 | |
Net realized gain (loss) on investments and foreign currency transactions | | | 21,237,633 | | | | 6,431,264 | | | | 1,568,318 | | | | 1,708,145 | | | | 12,858,128 | | | | (9,062,137 | ) |
Net change in unrealized appreciation (depreciation) on investments and other assets and liabilities denominated in foreign currencies | | | (6,083,070 | ) | | | (13,725,637 | ) | | | (751,209 | ) | | | (2,915,605 | ) | | | (15,900,180 | ) | | | 3,650,463 | |
Net increase (decrease) in net assets resulting from operations | | | 14,756,453 | | | | (6,011,042 | ) | | | 694,422 | | | | (1,144,395 | ) | | | 217,455 | | | | (3,560,782 | ) |
| | | | | | | | | | | | | | | | | | | | | | | | | |
DISTRIBUTIONS TO SHAREHOLDERS FROM: | | | | | | | | | | | | | | | | | | | | | | | | |
Net Investment Income: | | | | | | | | | | | | | | | | | | | | | | | | |
Investment Class shares | | | — | | | | (559,437 | ) | | | — | | | | (1,177 | ) | | | (2,187,317 | ) | | | (8,401 | ) |
Institutional Class shares | | | — | | | | (692,061 | ) | | | — | | | | (45,631 | ) | | | (944,890 | ) | | | (1,748,013 | ) |
Qualified Class shares | | | N/A | | | | N/A | | | | N/A | | | | N/A | | | | (3 | ) | | | N/A | |
Horace Mann Class shares | | | N/A | | | | N/A | | | | N/A | | | | N/A | | | | (22,310 | ) | | | N/A | |
Net Realized Capital Gains: | | | | | | | | | | | | | | | | | | | | | | | | |
Investment Class shares | | | (11,355,053 | ) | | | (3,397,914 | ) | | | (720,384 | ) | | | (828,980 | ) | | | — | | | | — | |
Institutional Class shares | | | (12,134,652 | ) | | | (3,309,669 | ) | | | (766,658 | ) | | | (762,106 | ) | | | — | | | | — | |
Total Distributions to Shareholders | | | (23,489,705 | ) | | | (7,959,081 | ) | | | (1,487,042 | ) | | | (1,637,894 | ) | | | (3,154,520 | ) | | | (1,756,414 | ) |
| | | | | | | | | | | | | | | | | | | | | | | | | |
CAPITAL STOCK TRANSACTIONS (DOLLARS): | | | | | | | | | | | | | | | | | | | | | | | | |
Investment Class shares: | | | | | | | | | | | | | | | | | | | | | | | | |
Shares sold | | | 14,431,823 | | | | 9,017,150 | | | | 5,078,365 | | | | 5,800,048 | | | | 28,001,013 | | | | 4,067,254 | |
Shares issued as reinvestment of distributions | | | 11,150,215 | | | | 3,910,990 | | | | 712,109 | | | | 819,947 | | | | 2,059,887 | | | | 6,973 | |
Redemption fees (Note 2) | | | — | | | | — | | | | — | | | | — | | | | — | | | | 220 | |
Shares redeemed | | | (17,010,216 | ) | | | (14,667,095 | ) | | | (4,087,152 | ) | | | (4,997,495 | ) | | | (72,677,521 | ) | | | (12,701,044 | ) |
Net increase (decrease) in net assets from Investment Class share transactions | | | 8,571,822 | | | | (1,738,955 | ) | | | 1,703,322 | | | | 1,622,500 | | | | (42,616,621 | ) | | | (8,626,597 | ) |
| | | | | | | | | | | | | | | | | | | | | | | | | |
Institutional Class shares: | | | | | | | | | | | | | | | | | | | | | | | | |
Shares sold | | | 5,361,481 | | | | 9,153 | | | | 20,061 | | | | 154,125 | | | | 5,224,542 | | | | 40,029,720 | |
Shares issued as reinvestment of distributions | | | 10,859,881 | | | | 3,996,628 | | | | 766,653 | | | | 807,423 | | | | 459,540 | | | | 1,746,693 | |
Redemption fees (Note 2) | | | — | | | | — | | | | — | | | | — | | | | — | | | | 341 | |
Shares redeemed | | | (24,726,424 | ) | | | (7,155,243 | ) | | | (1,522,249 | ) | | | (1,563,847 | ) | | | (13,339,955 | ) | | | (23,877,118 | ) |
Net increase (decrease) in net assets from Institutional Class share transactions | | | (8,505,062 | ) | | | (3,149,462 | ) | | | (735,535 | ) | | | (602,299 | ) | | | (7,655,873 | ) | | | 17,899,636 | |
N/A — Not Applicable. Share classes currently not offered. |
Amounts designated as “—” are either $0, or have been rounded to $0. |
See Notes to Financial Statements.
54
Wilshire Mutual Funds, Inc. Statements of Changes in Net Assets - (Continued) For the Year Ended December 31, 2015 |
|
| | | LARGE
COMPANY
GROWTH PORTFOLIO | | | LARGE
COMPANY
VALUE
PORTFOLIO | | | SMALL
COMPANY
GROWTH
PORTFOLIO | | | SMALL
COMPANY
VALUE
PORTFOLIO | | | WILSHIRE
5000
INDEXSM
FUND | | | WILSHIRE INTERNATIONAL EQUITY
FUND | |
CAPITAL STOCK TRANSACTIONS (DOLLARS) (Continued): | | | | | | | | | | | | | | | | | | |
Qualified Class shares: | | | | | | | | | | | | | | | | | | |
Shares sold | | | N/A | | | | N/A | | | | N/A | | | | N/A | | | | 1 | | | | N/A | |
Shares issued as reinvestment of distributions | | | N/A | | | | N/A | | | | N/A | | | | N/A | | | | 2 | | | | N/A | |
Shares redeemed | | | N/A | | | | N/A | | | | N/A | | | | N/A | | | | — | | | | N/A | |
Net increase in net assets from Qualified Class share transactions | | | N/A | | | | N/A | | | | N/A | | | | N/A | | | | 3 | | | | N/A | |
| | | | | | | | | | | | | | | | | | | | | | | | | |
Horace Mann Class shares: | | | | | | | | | | | | | | | | | | | | | | | | |
Shares sold | | | N/A | | | | N/A | | | | N/A | | | | N/A | | | | 30,775 | | | | N/A | |
Shares issued as reinvestment of distributions | | | N/A | | | | N/A | | | | N/A | | | | N/A | | | | 22,309 | | | | N/A | |
Shares redeemed | | | N/A | | | | N/A | | | | N/A | | | | N/A | | | | (124,088 | ) | | | N/A | |
Net decrease in net assets from Horace Mann Class share transactions | | | N/A | | | | N/A | | | | N/A | | | | N/A | | | | (71,004 | ) | | | N/A | |
Net increase (decrease) in net assets from capital stock transactions | | | 66,760 | | | | (4,888,417 | ) | | | 967,787 | | | | 1,020,201 | | | | (50,343,495 | ) | | | 9,273,039 | |
Net increase (decrease) in net assets | | | (8,666,492 | ) | | | (18,858,540 | ) | | | 175,167 | | | | (1,762,088 | ) | | | (53,280,560 | ) | | | 3,955,843 | |
| | | | | | | | | | | | | | | | | | | | | | | | | |
NET ASSETS: | | | | | | | | | | | | | | | | | | | | | | | | |
Beginning of year | | | 238,266,424 | | | | 125,065,549 | | | | 26,881,373 | | | | 29,775,716 | | | | 273,680,407 | | | | 176,418,822 | |
End of year | | $ | 229,599,932 | | | $ | 106,207,009 | | | $ | 27,056,540 | | | $ | 28,013,628 | | | $ | 220,399,847 | | | $ | 180,374,665 | |
Undistributed net investment income (accumulated net investment loss) at end of year | | $ | (10 | ) | | $ | (13 | ) | | $ | (3 | ) | | $ | 34,817 | | | $ | 540,069 | | | $ | 81,733 | |
N/A — Not Applicable. Share classes currently not offered. |
Amounts designated as “—” are either $0, or have been rounded to $0 |
See Notes to Financial Statements.
55
Wilshire Mutual Funds, Inc. Statements of Changes in Net Assets - (Continued) For the Year Ended December 31, 2015 |
|
| | | LARGE
COMPANY
GROWTH PORTFOLIO | | | LARGE
COMPANY
VALUE
PORTFOLIO | | | SMALL
COMPANY
GROWTH
PORTFOLIO | | | SMALL
COMPANY
VALUE
PORTFOLIO | | | WILSHIRE
5000
INDEXSM
FUND | | | WILSHIRE INTERNATIONAL EQUITY
FUND | |
CAPITAL SHARE TRANSACTIONS: | | | | | | | | | | | | | | | | | | |
Investment Class shares: | | | | | | | | | | | | | | | | | | |
Shares sold | | | 362,130 | | | | 438,642 | | | | 207,103 | | | | 255,692 | | | | 1,545,688 | | | | 450,088 | |
Shares issued as reinvestment of distributions | | | 302,995 | | | | 208,652 | | | | 31,233 | | | | 39,706 | | | | 114,741 | | | | 778 | |
Shares redeemed | | | (431,846 | ) | | | (713,809 | ) | | | (166,035 | ) | | | (224,213 | ) | | | (4,033,525 | ) | | | (1,319,953 | ) |
Net increase (decrease) in Investment Class shares outstanding | | | 233,279 | | | | (66,515 | ) | | | 72,301 | | | | 71,185 | | | | (2,373,096 | ) | | | (869,087 | ) |
| | | | | | | | | | | | | | | | | | | | | | | | | |
Institutional Class shares: | | | | | | | | | | | | | | | | | | | | | | | | |
Shares sold | | | 128,974 | | | | 431 | | | | 761 | | | | 6,769 | | | | 287,221 | | | | 4,200,644 | |
Shares issued as reinvestment of distributions | | | 278,388 | | | | 212,174 | | | | 31,653 | | | | 38,323 | | | | 25,615 | | | | 197,366 | |
Shares redeemed | | | (588,546 | ) | | | (344,881 | ) | | | (58,468 | ) | | | (68,327 | ) | | | (740,212 | ) | | | (2,615,097 | ) |
Net increase (decrease) in Institutional Class shares outstanding | | | (181,184 | ) | | | (132,276 | ) | | | (26,054 | ) | | | (23,235 | ) | | | (427,376 | ) | | | 1,782,913 | |
| | | | | | | | | | | | | | | | | | | | | | | | | |
Qualified Class shares: | | | | | | | | | | | | | | | | | | | | | | | | |
Shares sold | | | N/A | | | | N/A | | | | N/A | | | | N/A | | | | 1 | | | | N/A | |
Shares issued as reinvestment of distributions | | | N/A | | | | N/A | | | | N/A | | | | N/A | | | | 1 | | | | N/A | |
Shares redeemed | | | N/A | | | | N/A | | | | N/A | | | | N/A | | | | — | | | | N/A | |
Net increase (decrease) in Qualified Class shares outstanding | | | N/A | | | | N/A | | | | N/A | | | | N/A | | | | 2 | | | | N/A | |
| | | | | | | | | | | | | | | | | | | | | | | | | |
Horace Mann Class shares: | | | | | | | | | | | | | | | | | | | | | | | | |
Shares sold | | | N/A | | | | N/A | | | | N/A | | | | N/A | | | | 1,699 | | | | N/A | |
Shares issued as reinvestment of distributions | | | N/A | | | | N/A | | | | N/A | | | | N/A | | | | 1,246 | | | | N/A | |
Shares redeemed | | | N/A | | | | N/A | | | | N/A | | | | N/A | | | | (6,773 | ) | | | N/A | |
Net decrease in Horace Mann Class shares outstanding | | | N/A | | | | N/A | | | | N/A | | | | N/A | | | | (3,828 | ) | | | N/A | |
N/A — Not Applicable. Share classes currently not offered. |
Amounts designated as “—” are either $0, or have been rounded to $0. |
See Notes to Financial Statements.
56
Wilshire Mutual Funds, Inc. Statements of Changes in Net Assets For the Year Ended December 31, 2014 |
|
| | | LARGE
COMPANY
GROWTH PORTFOLIO | | | LARGE
COMPANY
VALUE
PORTFOLIO | | | SMALL
COMPANY
GROWTH
PORTFOLIO | | | SMALL
COMPANY
VALUE
PORTFOLIO | | | WILSHIRE
5000
INDEXSM
FUND | | | WILSHIRE INTERNATIONAL EQUITY
FUND | |
OPERATIONS: | | | | | | | | | | | | | | | | | | |
Net investment income (loss) | | $ | (1,138,272 | ) | | $ | 1,454,381 | | | $ | (242,375 | ) | | $ | (60,598 | ) | | $ | 3,371,001 | | | $ | 1,055,132 | |
Net realized gain (loss) on investments and foreign currency transactions1 | | | 37,612,925 | | | | 19,795,935 | | | | 2,488,960 | | | | 4,154,913 | | | | 2,714,435 | | | | (6,599,153 | ) |
Net change in unrealized appreciation (depreciation) on investments and other assets and liabilities denominated in foreign currencies | | | (15,391,639 | ) | | | (5,478,728 | ) | | | (1,322,416 | ) | | | (2,249,172 | ) | | | 23,346,934 | | | | (5,785,252 | ) |
Net increase (decrease) in net assets resulting from operations | | | 21,083,014 | | | | 15,771,588 | | | | 924,169 | | | | 1,845,143 | | | | 29,432,370 | | | | (11,329,273 | ) |
| | | | | | | | | | | | | | | | | | | | | | | | | |
DISTRIBUTIONS TO SHAREHOLDERS FROM: | | | | | | | | | | | | | | | | | | | | | | | | |
Net Investment Income: | | | | | | | | | | | | | | | | | | | | | | | | |
Investment Class shares | | | — | | | | (651,594 | ) | | | — | | | | — | | | | (2,481,169 | ) | | | (26,717 | ) |
Institutional Class shares | | | (12,208 | ) | | | (833,097 | ) | | | — | | | | — | | | | (949,278 | ) | | | (1,039,566 | ) |
Qualified Class shares | | | N/A | | | | N/A | | | | N/A | | | | N/A | | | | (3 | ) | | | N/A | |
Horace Mann Class shares | | | N/A | | | | N/A | | | | N/A | | | | N/A | | | | (20,294 | ) | | | N/A | |
Net Realized Capital Gains: | | | | | | | | | | | | | | | | | | | | | | | | |
Investment Class shares | | | (14,643,447 | ) | | | (6,065,315 | ) | | | (1,040,728 | ) | | | (1,598,464 | ) | | | — | | | | — | |
Institutional Class shares | | | (17,516,210 | ) | | | (6,025,428 | ) | | | (1,342,084 | ) | | | (1,746,140 | ) | | | — | | | | — | |
Total Distributions to Shareholders | | | (32,171,865 | ) | | | (13,575,434 | ) | | | (2,382,812 | ) | | | (3,344,604 | ) | | | (3,450,744 | ) | | | (1,066,283 | ) |
| | | | | | | | | | | | | | | | | | | | | | | | | |
CAPITAL STOCK TRANSACTIONS (DOLLARS)2: | | | | | | | | | | | | | | | | | | | | | | | | |
Investment Class shares: | | | | | | | | | | | | | | | | | | | | | | | | |
Shares sold | | | 5,921,915 | | | | 7,924,035 | | | | 3,606,707 | | | | 2,374,779 | | | | 67,507,638 | | | | 14,389,483 | |
Shares issued as reinvestment of distributions | | | 14,284,315 | | | | 6,608,197 | | | | 1,018,961 | | | | 1,578,890 | | | | 2,410,271 | | | | 24,739 | |
Shares redeemed | | | (23,319,294 | ) | | | (14,252,531 | ) | | | (2,171,469 | ) | | | (2,738,445 | ) | | | (24,247,283 | ) | | | (4,803,477 | ) |
Net increase (decrease) in net assets from Investment Class share transactions | | | (3,113,064 | ) | | | 279,701 | | | | 2,454,199 | | | | 1,215,224 | | | | 45,670,626 | | | | 9,610,745 | |
| | | | | | | | | | | | | | | | | | | | | | | | | |
Institutional Class shares: | | | | | | | | | | | | | | | | | | | | | | | | |
Shares sold | | | 59,395,731 | | | | 46,114,964 | | | | 10,505,619 | | | | 10,564,201 | | | | 8,566,723 | | | | 189,140,359 | |
Shares issued as reinvestment of distributions | | | 14,806,421 | | | | 6,848,930 | | | | 1,342,076 | | | | 1,745,522 | | | | 499,120 | | | | 1,039,565 | |
Shares redeemed | | | (178,850,572 | ) | | | (103,724,127 | ) | | | (19,556,780 | ) | | | (20,871,705 | ) | | | (7,502,183 | ) | | | (59,283,107 | ) |
Net increase (decrease) in net assets from Institutional Class share transactions | | | (104,648,420 | ) | | | (50,760,233 | ) | | | (7,709,085 | ) | | | (8,561,982 | ) | | | 1,563,660 | | | | 130,896,817 | |
1 | Includes realized gain/(loss) as a result of in-kind transactions. See Note 10 in Notes to Financial Statements. |
2 | Includes shares sold/shares redeemed as a result of in-kind transactions. See Note 10 in Notes to Financial Statements. |
N/A — Not Applicable. Share classes currently not offered. |
Amounts designated as “—” are either $0, or have been rounded to $0. |
See Notes to Financial Statements.
57
Wilshire Mutual Funds, Inc. Statements of Changes in Net Assets - (Continued) For the Year Ended December 31, 2014 |
|
| | | LARGE
COMPANY
GROWTH PORTFOLIO | | | LARGE
COMPANY
VALUE
PORTFOLIO | | | SMALL
COMPANY
GROWTH
PORTFOLIO | | | SMALL
COMPANY
VALUE
PORTFOLIO | | | WILSHIRE
5000
INDEXSM
FUND | | | WILSHIRE INTERNATIONAL EQUITY
FUND | |
CAPITAL STOCK TRANSACTIONS (DOLLARS) (Continued): | | | | | | | | | | | | | | | | | | |
Qualified Class shares: | | | | | | | | | | | | | | | | | | |
Shares sold | | | N/A | | | | N/A | | | | N/A | | | | N/A | | | | 1 | | | | N/A | |
Shares issued as reinvestment of distributions | | | N/A | | | | N/A | | | | N/A | | | | N/A | | | | 1 | | | | N/A | |
Shares redeemed | | | N/A | | | | N/A | | | | N/A | | | | N/A | | | | — | | | | N/A | |
Net increase in net assets from Qualified Class share transactions | | | N/A | | | | N/A | | | | N/A | | | | N/A | | | | 2 | | | | N/A | |
| | | | | | | | | | | | | | | | | | | | | | | | | |
Horace Mann Class shares: | | | | | | | | | | | | | | | | | | | | | | | | |
Shares sold | | | N/A | | | | N/A | | | | N/A | | | | N/A | | | | 31,450 | | | | N/A | |
Shares issued as reinvestment of distributions | | | N/A | | | | N/A | | | | N/A | | | | N/A | | | | 20,294 | | | | N/A | |
Shares redeemed | | | N/A | | | | N/A | | | | N/A | | | | N/A | | | | (66,118 | ) | | | N/A | |
Net decrease in net assets from Horace Mann Class share transactions | | | N/A | | | | N/A | | | | N/A | | | | N/A | | | | (14,374 | ) | | | N/A | |
Net increase (decrease) in net assets from capital stock transactions | | | (107,761,484 | ) | | | (50,480,532 | ) | | | (5,254,886 | ) | | | (7,346,758 | ) | | | 47,219,914 | | | | 140,507,562 | |
Net increase (decrease) in net assets | | | (118,850,335 | ) | | | (48,284,378 | ) | | | (6,713,529 | ) | | | (8,846,219 | ) | | | 73,201,540 | | | | 128,112,006 | |
| | | | | | | | | | | | | | | | | | | | | | | | | |
NET ASSETS: | | | | | | | | | | | | | | | | | | | | | | | | |
Beginning of year | | | 357,116,759 | | | | 173,349,927 | | | | 33,594,902 | | | | 38,621,935 | | | | 200,478,867 | | | | 48,306,816 | |
End of year | | $ | 238,266,424 | | | $ | 125,065,549 | | | $ | 26,881,373 | | | $ | 29,775,716 | | | $ | 273,680,407 | | | $ | 176,418,822 | |
Undistributed net investment income (accumulated net investment loss) end of year | | $ | (6 | ) | | $ | (8 | ) | | $ | (1 | ) | | $ | (7 | ) | | $ | 404,516 | | | $ | (6,930 | ) |
N/A — Not Applicable. Share classes currently not offered. |
Amounts designated as “—” are either $0, or have been rounded to $0. |
See Notes to Financial Statements.
58
Wilshire Mutual Funds, Inc. Statements of Changes in Net Assets - (Continued) For the Year Ended December 31, 2014 |
|
| | | LARGE
COMPANY
GROWTH PORTFOLIO | | | LARGE
COMPANY
VALUE
PORTFOLIO | | | SMALL
COMPANY
GROWTH
PORTFOLIO | | | SMALL
COMPANY
VALUE
PORTFOLIO | | | WILSHIRE
5000
INDEXSM
FUND | | | WILSHIRE INTERNATIONAL EQUITY
FUND | |
CAPITAL SHARE TRANSACTIONS: | | | | | | | | | | | | | | | | | | |
Investment Class shares: | | | | | | | | | | | | | | | | | | |
Shares sold | | | 141,322 | | | | 355,455 | | | | 147,053 | | | | 98,245 | | | | 4,049,034 | | | | 1,508,963 | |
Shares issued as reinvestment of distributions | | | 367,584 | | | | 308,029 | | | | 43,808 | | | | 70,204 | | | | 132,505 | | | | 2,719 | |
Shares redeemed | | | (553,806 | ) | | | (639,727 | ) | | | (88,741 | ) | | | (113,434 | ) | | | (1,417,005 | ) | | | (504,565 | ) |
Net increase (decrease) in Investment Class shares outstanding | | | (44,900 | ) | | | 23,757 | | | | 102,120 | | | | 55,015 | | | | 2,764,534 | | | | 1,007,117 | |
| | | | | | | | | | | | | | | | | | | | | | | | | |
Institutional Class shares: | | | | | | | | | | | | | | | | | | | | | | | | |
Shares sold | | | 1,333,936 | | | | 1,972,639 | | | | 407,529 | | | | 425,268 | | | | 488,663 | | | | 19,755,735 | |
Shares issued as reinvestment of distributions | | | 362,636 | | | | 317,755 | | | | 54,667 | | | | 76,424 | | | | 27,454 | | | | 115,124 | |
Shares redeemed | | | (4,013,075 | ) | | | (4,493,655 | ) | | | (755,317 | ) | | | (841,471 | ) | | | (440,459 | ) | | | (6,266,104 | ) |
Net increase (decrease) in Institutional Class shares outstanding | | | (2,316,503 | ) | | | (2,203,261 | ) | | | (293,121 | ) | | | (339,779 | ) | | | 75,658 | | | | 13,604,755 | |
| | | | | | | | | | | | | | | | | | | | | | | | | |
Qualified Class shares: | | | | | | | | | | | | | | | | | | | | | | | | |
Shares sold | | | N/A | | | | N/A | | | | N/A | | | | N/A | | | | — | | | | N/A | |
Shares issued as reinvestment of distributions | | | N/A | | | | N/A | | | | N/A | | | | N/A | | | | — | | | | N/A | |
Shares redeemed | | | N/A | | | | N/A | | | | N/A | | | | N/A | | | | — | | | | N/A | |
Net increase (decrease) in Qualified Class shares outstanding | | | N/A | | | | N/A | | | | N/A | | | | N/A | | | | — | | | | N/A | |
| | | | | | | | | | | | | | | | | | | | | | | | | |
Horace Mann Class shares: | | | | | | | | | | | | | | | | | | | | | | | | |
Shares sold | | | N/A | | | | N/A | | | | N/A | | | | N/A | | | | 1,857 | | | | N/A | |
Shares issued as reinvestment of distributions | | | N/A | | | | N/A | | | | N/A | | | | N/A | | | | 1,118 | | | | N/A | |
Shares redeemed | | | N/A | | | | N/A | | | | N/A | | | | N/A | | | | (3,917 | ) | | | N/A | |
Net decrease in Horace Mann Class shares outstanding | | | N/A | | | | N/A | | | | N/A | | | | N/A | | | | (942 | ) | | | N/A | |
N/A — Not Applicable. Share classes currently not offered. |
Amounts designated as “—” are either $0, or have been rounded to $0. |
See Notes to Financial Statements.
59
Wilshire Mutual Funds, Inc. Large Company Growth Portfolio Financial Highlights |
|
For a Fund Share Outstanding Throughout Each Year. | |
| | | Investment Class Shares | |
| | | Year
Ended
12/31/2015 | | | Year
Ended
12/31/2014 | | | Year
Ended
12/31/2013 | | | Year
Ended 12/31/2012 | | | Year
Ended
12/31/2011 | |
Net asset value, beginning of year | | $ | 38.66 | | | $ | 41.60 | | | $ | 34.70 | | | $ | 31.54 | | | $ | 32.00 | |
| | | | | | | | | | | | | | | | | | | | | |
Income (loss) from investment operations: | | | | | | | | | | | | | | | | | | | | |
Net investment income (loss)1 | | | (0.14 | ) | | | (0.26 | ) | | | (0.02 | ) | | | 0.07 | | | | (0.09 | ) |
Net realized and unrealized gain (loss) on investments | | | 2.53 | | | | 3.61 | | | | 10.38 | | | | 4.24 | | | | (0.37 | ) |
Total from investment operations | | | 2.39 | | | | 3.35 | | | | 10.36 | | | | 4.31 | | | | (0.46 | ) |
| | | | | | | | | | | | | | | | | | | | | |
Less distributions: | | | | | | | | | | | | | | | | | | | | |
From net investment income | | | 0.00 | | | | 0.00 | | | | 0.00 | | | | (0.07 | ) | | | 0.00 | |
From capital gains | | | (4.23 | ) | | | (6.29 | ) | | | (3.46 | ) | | | (1.08 | ) | | | 0.00 | |
Total distributions | | | (4.23 | ) | | | (6.29 | ) | | | (3.46 | ) | | | (1.15 | ) | | | 0.00 | |
| | | | | | | | | | | | | | | | | | | | | |
Net asset value, end of year | | $ | 36.82 | | | $ | 38.66 | | | $ | 41.60 | | | $ | 34.70 | | | $ | 31.54 | |
| | | | | | | | | | | | | | | | | | | | | |
Total return | | | 6.18 | % | | | 7.97 | % | | | 30.22 | % | | | 13.72 | % | | | (1.44 | )% |
| | | | | | | | | | | | | | | | | | | | | |
Ratios to average net assets/supplemental data: | | | | | | | | | | | | | | | | | | | | |
Net assets, end of year (in 000’s) | | $ | 107,381 | | | $ | 103,733 | | | $ | 113,495 | | | $ | 100,853 | | | $ | 94,872 | |
Operating expenses including reimbursement/waiver and fees paid indirectly | | | 1.33 | % | | | 1.38 | % | | | 1.36 | % | | | 1.39 | % | | | 1.41 | % |
Operating expenses excluding reimbursement/waiver and fees paid indirectly | | | 1.33 | %2 | | | 1.38 | %2 | | | 1.36 | %2 | | | 1.39 | %2 | | | 1.41 | % |
Net investment income (loss) | | | (0.34 | )% | | | (0.61 | )% | | | (0.05 | )% | | | 0.20 | % | | | (0.27 | )% |
Portfolio turnover rate | | | 104 | % | | | 62 | % | | | 136 | % | | | 71 | % | | | 104 | % |
1 | The selected per share data was calculated using the average shares outstanding method for the period. |
2 | The ratio of operating expenses excluding reimbursement/waiver excludes the effect of fees paid indirectly. If this expense offset was included, the ratio would have been 1.34%, 1.38%, 1.36% and 1.39% for 2015, 2014, 2013 and 2012, respectively. |
See Notes to Financial Statements.
60
Wilshire Mutual Funds, Inc. Large Company Growth Portfolio Financial Highlights - (Continued) |
|
For a Fund Share Outstanding Throughout Each Year. | |
| | | Institutional Class Shares | |
| | | Year
Ended
12/31/2015 | | | Year
Ended
12/31/2014 | | | Year
Ended
12/31/2013 | | | Year
Ended 12/31/2012 | | | Year
Ended
12/31/2011 | |
Net asset value, beginning of year | | $ | 40.62 | | | $ | 43.28 | | | $ | 35.94 | | | $ | 32.63 | | | $ | 32.99 | |
| | | | | | | | | | | | | | | | | | | | | |
Income (loss) from investment operations: | | | | | | | | | | | | | | | | | | | | |
Net investment income (loss)1 | | | (0.01 | ) | | | (0.13 | ) | | | 0.10 | | | | 0.18 | | | | 0.03 | |
Net realized and unrealized gain (loss) on investments | | | 2.66 | | | | 3.76 | | | | 10.77 | | | | 4.38 | | | | (0.39 | ) |
Total from investment operations | | | 2.65 | | | | 3.63 | | | | 10.87 | | | | 4.56 | | | | (0.36 | ) |
| | | | | | | | | | | | | | | | | | | | | |
Less distributions: | | | | | | | | | | | | | | | | | | | | |
From net investment income | | | 0.00 | | | | (0.00 | )2 | | | (0.07 | ) | | | (0.17 | ) | | | 0.00 | |
From capital gains | | | (4.23 | ) | | | (6.29 | ) | | | (3.46 | ) | | | (1.08 | ) | | | 0.00 | |
Total distributions | | | (4.23 | ) | | | (6.29 | ) | | | (3.53 | ) | | | (1.25 | ) | | | 0.00 | |
| | | | | | | | | | | | | | | | | | | | | |
Net asset value, end of year | | $ | 39.04 | | | $ | 40.62 | | | $ | 43.28 | | | $ | 35.94 | | | $ | 32.63 | |
| | | | | | | | | | | | | | | | | | | | | |
Total return | | | 6.52 | % | | | 8.32 | % | | | 30.60 | % | | | 14.04 | % | | | (1.09 | )% |
| | | | | | | | | | | | | | | | | | | | | |
Ratios to average net assets/supplemental data: | | | | | | | | | | | | | | | | | | | | |
Net assets, end of year (in 000’s) | | $ | 122,219 | | | $ | 134,534 | | | $ | 243,622 | | | $ | 85,740 | | | $ | 74,201 | |
Operating expenses including reimbursement/waiver and fees paid indirectly | | | 1.01 | % | | | 1.06 | % | | | 1.05 | % | | | 1.11 | % | | | 1.05 | % |
Operating expenses excluding reimbursement/waiver and fees paid indirectly | | | 1.01 | %3 | | | 1.06 | %3 | | | 1.06 | %3 | | | 1.11 | %3 | | | 1.05 | % |
Net investment income (loss) | | | (0.02 | )% | | | (0.29 | )% | | | 0.23 | % | | | 0.50 | % | | | 0.09 | % |
Portfolio turnover rate | | | 104 | % | | | 62 | % | | | 136 | % | | | 71 | % | | | 104 | % |
1 | The selected per share data was calculated using the average shares outstanding method for the period. |
2 | Amount is less than $0.01 per share. |
3 | The ratio of operating expenses excluding reimbursement/waiver excludes the effect of fees paid indirectly. If this expense offset was included, the ratio would have been 1.02%, 1.06%, 1.05% and 1.11% for 2015, 2014, 2013 and 2012, respectively. |
See Notes to Financial Statements.
61
Wilshire Mutual Funds, Inc. Large Company Value Portfolio Financial Highlights |
|
For a Fund Share Outstanding Throughout Each Year. | |
| | | Investment Class Shares | |
| | | Year
Ended
12/31/2015 | | | Year
Ended
12/31/2014 | | | Year
Ended
12/31/2013 | | | Year
Ended 12/31/2012 | | | Year
Ended
12/31/2011 | |
Net asset value, beginning of year | | $ | 21.19 | | | $ | 21.44 | | | $ | 15.86 | | | $ | 13.82 | | | $ | 14.42 | |
| | | | | | | | | | | | | | | | | | | | | |
Income (loss) from investment operations: | | | | | | | | | | | | | | | | | | | | |
Net investment income1 | | | 0.20 | | | | 0.18 | | | | 0.16 | | | | 0.17 | | | | 0.11 | |
Net realized and unrealized gain (loss) on investments | | | (1.33 | ) | | | 2.14 | | | | 5.64 | | | | 2.03 | | | | (0.59 | ) |
Total from investment operations | | | (1.13 | ) | | | 2.32 | | | | 5.80 | | | | 2.20 | | | | (0.48 | ) |
| | | | | | | | | | | | | | | | | | | | | |
Less distributions: | | | | | | | | | | | | | | | | | | | | |
From net investment income | | | (0.19 | ) | | | (0.23 | ) | | | (0.14 | ) | | | (0.16 | ) | | | (0.12 | ) |
From capital gains | | | (1.25 | ) | | | (2.34 | ) | | | (0.08 | ) | | | 0.00 | | | | 0.00 | |
Total distributions | | | (1.44 | ) | | | (2.57 | ) | | | (0.22 | ) | | | (0.16 | ) | | | (0.12 | ) |
| | | | | | | | | | | | | | | | | | | | | |
Net asset value, end of year | | $ | 18.62 | | | $ | 21.19 | | | $ | 21.44 | | | $ | 15.86 | | | $ | 13.82 | |
| | | | | | | | | | | | | | | | | | | | | |
Total return | | | (5.33 | )% | | | 10.77 | % | | | 36.54 | % | | | 15.92 | % | | | (3.36 | )% |
| | | | | | | | | | | | | | | | | | | | | |
Ratios to average net assets/supplemental data: | | | | | | | | | | | | | | | | | | | | |
Net assets, end of year (in 000’s) | | $ | 52,864 | | | $ | 61,566 | | | $ | 61,800 | | | $ | 44,220 | | | $ | 30,968 | |
Operating expenses including reimbursement/waiver and fees paid indirectly | | | 1.27 | % | | | 1.29 | % | | | 1.24 | % | | | 1.35 | % | | | 1.39 | % |
Operating expenses excluding reimbursement/waiver and fees paid indirectly | | | 1.29 | %2 | | | 1.30 | %2 | | | 1.25 | %2 | | | 1.36 | %2 | | | 1.39 | % |
Net investment income | | | 0.96 | % | | | 0.80 | % | | | 0.87 | % | | | 1.12 | % | | | 0.77 | % |
Portfolio turnover rate | | | 55 | % | | | 57 | % | | | 101 | % | | | 97 | % | | | 140 | % |
1 | The selected per share data was calculated using the average shares outstanding method for the period. |
2 | The ratio of operating expenses excluding reimbursement/waiver excludes the effect of fees paid indirectly. If this expense offset was included, the ratio would have been 1.27%, 1.29%, 1.24% and 1.35% for 2015, 2014, 2013 and 2012, respectively. |
See Notes to Financial Statements.
62
Wilshire Mutual Funds, Inc. Large Company Value Portfolio Financial Highlights - (Continued) |
|
For a Fund Share Outstanding Throughout Each Year. | |
| | | Institutional Class Shares | |
| | | Year
Ended
12/31/2015 | | | Year
Ended
12/31/2014 | | | Year
Ended
12/31/2013 | | | Year
Ended 12/31/2012 | | | Year
Ended
12/31/2011 | |
Net asset value, beginning of year | | $ | 21.24 | | | $ | 21.48 | | | $ | 15.89 | | | $ | 13.84 | | | $ | 14.44 | |
| | | | | | | | | | | | | | | | | | | | | |
Income (loss) from investment operations: | | | | | | | | | | | | | | | | | | | | |
Net investment income1 | | | 0.26 | | | | 0.24 | | | | 0.22 | | | | 0.20 | | | | 0.16 | |
Net realized and unrealized gain (loss) on investments | | | (1.33 | ) | | | 2.14 | | | | 5.63 | | | | 2.04 | | | | (0.58 | ) |
Total from investment operations | | | (1.07 | ) | | | 2.38 | | | | 5.85 | | | | 2.24 | | | | (0.42 | ) |
| | | | | | | | | | | | | | | | | | | | | |
Less distributions: | | | | | | | | | | | | | | | | | | | | |
From net investment income | | | (0.25 | ) | | | (0.28 | ) | | | (0.18 | ) | | | (0.19 | ) | | | (0.18 | ) |
From capital gains | | | (1.25 | ) | | | (2.34 | ) | | | (0.08 | ) | | | 0.00 | | | | 0.00 | |
Total distributions | | | (1.50 | ) | | | (2.62 | ) | | | (0.26 | ) | | | (0.19 | ) | | | (0.18 | ) |
| | | | | | | | | | | | | | | | | | | | | |
Net asset value, end of year | | $ | 18.67 | | | $ | 21.24 | | | $ | 21.48 | | | $ | 15.89 | | | $ | 13.84 | |
| | | | | | | | | | | | | | | | | | | | | |
Total return | | | (5.07 | )% | | | 11.05 | % | | | 36.85 | % | | | 16.18 | % | | | (2.95 | )% |
| | | | | | | | | | | | | | | | | | | | | |
Ratios to average net assets/supplemental data: | | | | | | | | | | | | | | | | | | | | |
Net assets, end of year (in 000’s) | | $ | 53,343 | | | $ | 63,499 | | | $ | 111,550 | | | $ | 800 | | | $ | 773 | |
Operating expenses including reimbursement/waiver and fees paid indirectly | | | 1.01 | % | | | 1.00 | % | | | 0.95 | % | | | 1.14 | % | | | 1.00 | % |
Operating expenses excluding reimbursement/waiver and fees paid indirectly | | | 1.02 | %2 | | | 1.01 | %2 | | | 0.97 | %2 | | | 1.15 | %2 | | | 1.16 | % |
Net investment income | | | 1.23 | % | | | 1.09 | % | | | 1.13 | % | | | 1.32 | % | | | 1.13 | % |
Portfolio turnover rate | | | 55 | % | | | 57 | % | | | 101 | % | | | 97 | % | | | 140 | % |
1 | The selected per share data was calculated using the average shares outstanding method for the period. |
2 | The ratio of operating expenses excluding reimbursement/waiver excludes the effect of fees paid indirectly. If this expense offset was included, the ratio would have been 1.01%, 1.00%, 0.95% and 1.14% for 2015, 2014, 2013 and 2012, respectively. |
See Notes to Financial Statements.
63
Wilshire Mutual Funds, Inc. Small Company Growth Portfolio Financial Highlights |
|
For a Fund Share Outstanding Throughout Each Year. | |
| | | Investment Class Shares | |
| | | Year
Ended
12/31/2015 | | | Year
Ended
12/31/2014 | | | Year
Ended
12/31/2013 | | | Year
Ended 12/31/2012 | | | Year
Ended
12/31/2011 | |
Net asset value, beginning of year | | $ | 23.44 | | | $ | 24.95 | | | $ | 18.06 | | | $ | 15.90 | | | $ | 15.95 | |
| | | | | | | | | | | | | | | | | | | | | |
Income (loss) from investment operations: | | | | | | | | | | | | | | | | | | | | |
Net investment income (loss)1 | | | (0.15 | ) | | | (0.25 | ) | | | (0.16 | ) | | | 0.09 | | | | (0.14 | ) |
Net realized and unrealized gain on investments | | | 0.70 | | | | 1.09 | | | | 7.59 | | | | 2.07 | | | | 0.09 | 2 |
Total from investment operations | | | 0.55 | | | | 0.84 | | | | 7.43 | | | | 2.16 | | | | (0.05 | ) |
| | | | | | | | | | | | | | | | | | | | | |
Less distributions: | | | | | | | | | | | | | | | | | | | | |
From capital gains | | | (1.35 | ) | | | (2.35 | ) | | | (0.54 | ) | | | 0.00 | | | | 0.00 | |
Total distributions | | | (1.35 | ) | | | (2.35 | ) | | | (0.54 | ) | | | 0.00 | | | | 0.00 | |
| | | | | | | | | | | | | | | | | | | | | |
Net asset value, end of year | | $ | 22.64 | | | $ | 23.44 | | | $ | 24.95 | | | $ | 18.06 | | | $ | 15.90 | |
| | | | | | | | | | | | | | | | | | | | | |
Total return | | | 2.29 | % | | | 3.44 | % | | | 41.25 | % | | | 13.58 | % | | | (0.31 | )% |
| | | | | | | | | | | | | | | | | | | | | |
Ratios to average net assets/supplemental data: | | | | | | | | | | | | | | | | | | | | |
Net assets, end of year (in 000’s) | | $ | 12,642 | | | $ | 11,398 | | | $ | 9,582 | | | $ | 7,225 | | | $ | 6,813 | |
Operating expenses including reimbursement/waiver and fees paid indirectly | | | 1.46 | % | | | 1.50 | % | | | 1.47 | % | | | 1.47 | % | | | 1.50 | % |
Operating expenses excluding reimbursement/waiver and fees paid indirectly | | | 1.64 | %3 | | | 1.55 | %3 | | | 1.62 | %3 | | | 1.97 | %3 | | | 2.02 | % |
Net investment income (loss) | | | (0.59 | )% | | | (1.00 | )% | | | (0.75 | )% | | | 0.55 | % | | | (0.85 | )% |
Portfolio turnover rate | | | 63 | % | | | 77 | % | | | 88 | % | | | 99 | % | | | 177 | % |
1 | The selected per share data was calculated using the average shares outstanding method for the period. |
2 | The amount shown for a share outstanding throughout the year ended December 31, 2011, does not accord with the aggregate net gains on investments for the year because of the sales and repurchases of Portfolio shares in relation to fluctuating market value of the investments of the Portfolio. |
3 | The ratio of operating expenses excluding reimbursement/waiver excludes the effect of fees paid indirectly. If this expense offset was included, the ratio would have been 1.64%, 1.54%, 1.61% and 1.95% for 2015, 2014, 2013 and 2012, respectively. |
See Notes to Financial Statements.
64
Wilshire Mutual Funds, Inc. Small Company Growth Portfolio Financial Highlights - (Continued) | 
|
For a Fund Share Outstanding Throughout Each Year. | |
| | | Institutional Class Shares | |
| | | Year
Ended
12/31/2015 | | | Year
Ended
12/31/2014 | | | Year
Ended
12/31/2013 | | | Year
Ended 12/31/2012 | | | Year
Ended
12/31/2011 | |
Net asset value, beginning of year | | $ | 24.75 | | | $ | 26.14 | | | $ | 18.89 | | | $ | 16.60 | | | $ | 16.61 | |
| | | | | | | | | | | | | | | | | | | | | |
Income (loss) from investment operations: | | | | | | | | | | | | | | | | | | | | |
Net investment income (loss)1 | | | (0.07 | ) | | | (0.18 | ) | | | (0.15 | ) | | | 0.11 | | | | (0.12 | ) |
Net realized and unrealized gain on investments | | | 0.71 | | | | 1.14 | | | | 7.99 | | | | 2.18 | | | | 0.11 | 2 |
Total from investment operations | | | 0.64 | | | | 0.96 | | | | 7.84 | | | | 2.29 | | | | (0.01 | ) |
| | | | | | | | | | | | | | | | | | | | | |
Less distributions: | | | | | | | | | | | | | | | | | | | | |
From net investment income | | | 0.00 | | | | 0.00 | | | | (0.05 | ) | | | 0.00 | | | | 0.00 | |
From capital gains | | | (1.35 | ) | | | (2.35 | ) | | | (0.54 | ) | | | 0.00 | | | | 0.00 | |
Total distributions | | | (1.35 | ) | | | (2.35 | ) | | | (0.59 | ) | | | 0.00 | | | | 0.00 | |
| | | | | | | | | | | | | | | | | | | | | |
Net asset value, end of year | | $ | 24.04 | | | $ | 24.75 | | | $ | 26.14 | | | $ | 18.89 | | | $ | 16.60 | |
| | | | | | | | | | | | | | | | | | | | | |
Total return | | | 2.53 | % | | | 3.75 | % | | | 41.58 | % | | | 13.80 | % | | | (0.06 | )% |
| | | | | | | | | | | | | | | | | | | | | |
Ratios to average net assets/supplemental data: | | | | | | | | | | | | | | | | | | | | |
Net assets, end of year (in 000’s) | | $ | 14,414 | | | $ | 15,483 | | | $ | 24,013 | | | $ | 15 | | | $ | 13 | |
Operating expenses including reimbursement/waiver and fees paid indirectly | | | 1.19 | % | | | 1.20 | % | | | 1.19 | % | | | 1.28 | % | | | 1.23 | % |
Operating expenses excluding reimbursement/waiver and fees paid indirectly | | | 1.36 | %3 | | | 1.24 | %3 | | | 1.20 | %3 | | | 1.79 | %3 | | | 1.69 | % |
Net investment income (loss) | | | (0.28 | )% | | | (0.70 | )% | | | (0.54 | )% | | | 0.60 | % | | | (0.68 | )% |
Portfolio turnover rate | | | 63 | % | | | 77 | % | | | 88 | % | | | 99 | % | | | 177 | % |
1 | The selected per share data was calculated using the average shares outstanding method for the period. |
2 | The amount shown for a share outstanding throughout the year ended December 31, 2011, does not accord with the aggregate net gains on investments for the year because of the sales and repurchases of Portfolio shares in relation to fluctuating market value of the investments of the Portfolio. |
3 | The ratio of operating expenses excluding reimbursement/waiver excludes the effect of fees paid indirectly. If this expense offset was included, the ratio would have been 1.35%, 1.19%, 1.18% and 1.78% for 2015, 2014, 2013 and 2012, respectively. |
See Notes to Financial Statements.
65
Wilshire Mutual Funds, Inc. Small Company Value Portfolio Financial Highlights |
|
For a Fund Share Outstanding Throughout Each Year. | |
| | | Investment Class Shares | |
| | | Year
Ended
12/31/2015 | | | Year
Ended
12/31/2014 | | | Year
Ended
12/31/2013 | | | Year
Ended 12/31/2012 | | | Year
Ended
12/31/2011 | |
Net asset value, beginning of year | | $ | 22.86 | | | $ | 24.33 | | | $ | 17.40 | | | $ | 15.04 | | | $ | 16.34 | |
| | | | | | | | | | | | | | | | | | | | | |
Income (loss) from investment operations: | | | | | | | | | | | | | | | | | | | | |
Net investment income (loss)1 | | | 0.01 | | | | (0.08 | ) | | | (0.03 | ) | | | 0.20 | | | | 0.00 | |
Net realized and unrealized gain (loss) on investments | | | (0.89 | ) | | | 1.53 | | | | 7.62 | | | | 2.38 | | | | (1.23 | ) |
Total from investment operations | | | (0.88 | ) | | | 1.45 | | | | 7.59 | | | | 2.58 | | | | (1.23 | ) |
| | | | | | | | | | | | | | | | | | | | | |
Less distributions: | | | | | | | | | | | | | | | | | | | | |
From net investment income | | | 0.00 | 2 | | | 0.00 | | | | 0.00 | 2 | | | (0.22 | ) | | | (0.07 | ) |
From capital gains | | | (1.24 | ) | | | (2.92 | ) | | | (0.66 | ) | | | 0.00 | | | | 0.00 | |
Total distributions | | | (1.24 | ) | | | (2.92 | ) | | | (0.66 | ) | | | (0.22 | ) | | | (0.07 | ) |
| | | | | | | | | | | | | | | | | | | | | |
Net asset value, end of year | | $ | 20.74 | | | $ | 22.86 | | | $ | 24.33 | | | $ | 17.40 | | | $ | 15.04 | |
| | | | | | | | | | | | | | | | | | | | | |
Total return | | | (3.83 | )% | | | 6.17 | % | | | 43.79 | % | | | 17.20 | % | | | (7.54 | )% |
| | | | | | | | | | | | | | | | | | | | | |
Ratios to average net assets/supplemental data: | | | | | | | | | | | | | | | | | | | | |
Net assets, end of year (in 000’s) | | $ | 14,287 | | | $ | 14,120 | | | $ | 13,688 | | | $ | 9,641 | | | $ | 8,795 | |
Operating expenses including reimbursement/waiver and fees paid indirectly | | | 1.49 | % | | | 1.49 | % | | | 1.49 | % | | | 1.49 | % | | | 1.50 | % |
Operating expenses excluding reimbursement/waiver and fees paid indirectly | | | 1.67 | %3 | | | 1.56 | %3 | | | 1.58 | %3 | | | 1.84 | %3 | | | 1.90 | % |
Net investment income (loss) | | | 0.06 | % | | | (0.35 | )% | | | (0.13 | )% | | | 1.24 | % | | | (0.02 | )% |
Portfolio turnover rate | | | 49 | % | | | 53 | % | | | 60 | % | | | 68 | % | | | 118 | % |
1 | The selected per share data was calculated using the average shares outstanding method for the period. |
2 | Amount is less than $0.01 per share. |
3 | The ratio of operating expenses excluding reimbursement/waiver excludes the effect of fees paid indirectly. If this expense offset was included, the ratio would have been 1.67%, 1.55%, 1.57% and 1.83% for 2015, 2014, 2013 and 2012, respectively. |
See Notes to Financial Statements.
66
Wilshire Mutual Funds, Inc. Small Company Value Portfolio Financial Highlights - (Continued) |
|
For a Fund Share Outstanding Throughout Each Year. | |
| | | Institutional Class Shares | |
| | | Year
Ended
12/31/2015 | | | Year
Ended
12/31/2014 | | | Year
Ended
12/31/2013 | | | Year
Ended 12/31/2012 | | | Year
Ended
12/31/2011 | |
Net asset value, beginning of year | | $ | 23.21 | | | $ | 24.59 | | | $ | 17.58 | | | $ | 15.19 | | | $ | 16.51 | |
| | | | | | | | | | | | | | | | | | | | | |
Income (loss) from investment operations: | | | | | | | | | | | | | | | | | | | | |
Net investment income (loss)1 | | | 0.08 | | | | (0.02 | ) | | | 0.00 | | | | 0.22 | | | | 0.09 | |
Net realized and unrealized gain (loss) on investments | | | (0.90 | ) | | | 1.56 | | | | 7.74 | | | | 2.42 | | | | (1.24 | ) |
Total from investment operations | | | (0.82 | ) | | | 1.54 | | | | 7.74 | | | | 2.64 | | | | (1.15 | ) |
| | | | | | | | | | | | | | | | | | | | | |
Less distributions: | | | | | | | | | | | | | | | | | | | | |
From net investment income | | | (0.07 | ) | | | 0.00 | | | | (0.07 | ) | | | (0.25 | ) | | | (0.17 | ) |
From capital gains | | | (1.24 | ) | | | (2.92 | ) | | | (0.66 | ) | | | 0.00 | | | | 0.00 | |
Total distributions | | | (1.31 | ) | | | (2.92 | ) | | | (0.73 | ) | | | (0.25 | ) | | | (0.17 | ) |
| | | | | | | | | | | | | | | | | | | | | |
Net asset value, end of year | | $ | 21.08 | | | $ | 23.21 | | | $ | 24.59 | | | $ | 17.58 | | | $ | 15.19 | |
| | | | | | | | | | | | | | | | | | | | | |
Total return | | | (3.52 | )% | | | 6.47 | % | | | 44.16 | % | | | 17.41 | % | | | (6.95 | )% |
| | | | | | | | | | | | | | | | | | | | | |
Ratios to average net assets/supplemental data: | | | | | | | | | | | | | | | | | | | | |
Net assets, end of year (in 000’s) | | $ | 13,727 | | | $ | 15,655 | | | $ | 24,934 | | | $ | 54 | | | $ | 82 | |
Operating expenses including reimbursement/waiver and fees paid indirectly | | | 1.18 | % | | | 1.17 | % | | | 1.20 | % | | | 1.31 | % | | | 0.94 | % |
Operating expenses excluding reimbursement/waiver and fees paid indirectly | | | 1.36 | %2 | | | 1.23 | %2 | | | 1.19 | %2 | | | 1.66 | %2 | | | 1.64 | % |
Net investment income (loss) | | | 0.36 | % | | | (0.07 | )% | | | (0.01 | )% | | | 1.33 | % | | | 0.53 | % |
Portfolio turnover rate | | | 49 | % | | | 53 | % | | | 60 | % | | | 68 | % | | | 118 | % |
1 | The selected per share data was calculated using the average shares outstanding method for the period. |
2 | The ratio of operating expenses excluding reimbursement/waiver excludes the effect of fees paid indirectly. If this expense offset was included, the ratio would have been 1.35%, 1.21%, 1.18% and 1.65% for 2015, 2014, 2013 and 2012, respectively. |
See Notes to Financial Statements.
67
Wilshire Mutual Funds, Inc. Wilshire 5000 Indexsm Fund Financial Highlights |
|
For a Fund Share Outstanding Throughout Each Year. | |
| | | Investment Class Shares | |
| | | Year
Ended
12/31/2015 | | | Year
Ended
12/31/2014 | | | Year
Ended
12/31/2013 | | | Year
Ended 12/31/2012 | | | Year
Ended
12/31/2011 | |
Net asset value, beginning of year | | $ | 18.01 | | | $ | 16.22 | | | $ | 12.43 | | | $ | 10.93 | | | $ | 11.05 | |
| | | | | | | | | | | | | | | | | | | | | |
Income (loss) from investment operations: | | | | | | | | | | | | | | | | | | | | |
Net investment income1 | | | 0.24 | | | | 0.23 | | | | 0.19 | | | | 0.19 | | | | 0.14 | |
Net realized and unrealized gain (loss) on investments | | | (0.22 | ) | | | 1.78 | | | | 3.80 | | | | 1.49 | | | | (0.12 | ) |
Total from investment operations | | | 0.02 | | | | 2.01 | | | | 3.99 | | | | 1.68 | | | | 0.02 | |
| | | | | | | | | | | | | | | | | | | | | |
Less distributions: | | | | | | | | | | | | | | | | | | | | |
From net investment income | | | (0.25 | ) | | | (0.22 | ) | | | (0.20 | ) | | | (0.18 | ) | | | (0.14 | ) |
Total distributions | | | (0.25 | ) | | | (0.22 | ) | | | (0.20 | ) | | | (0.18 | ) | | | (0.14 | ) |
| | | | | | | | | | | | | | | | | | | | | |
Net asset value, end of year | | $ | 17.78 | | | $ | 18.01 | | | $ | 16.22 | | | $ | 12.43 | | | $ | 10.93 | |
| | | | | | | | | | | | | | | | | | | | | |
Total return | | | 0.08 | % | | | 12.38 | % | | | 32.10 | % | | | 15.36 | % | | | 0.21 | % |
| | | | | | | | | | | | | | | | | | | | | |
Ratios to average net assets/supplemental data: | | | | | | | | | | | | | | | | | | | | |
Net assets, end of year (in 000’s) | | $ | 159,709 | | | $ | 204,465 | | | $ | 139,354 | | | $ | 107,888 | | | $ | 99,545 | |
Operating expenses including reimbursement/fees paid indirectly | | | 0.64 | % | | | 0.65 | % | | | 0.68 | % | | | 0.70 | % | | | 0.74 | % |
Operating expenses excluding reimbursement/fees paid indirectly | | | 0.64 | %2 | | | 0.65 | % | | | 0.68 | % | | | 0.70 | % | | | 0.74 | % |
Net investment income | | | 1.35 | % | | | 1.32 | % | | | 1.33 | % | | | 1.61 | % | | | 1.22 | % |
Portfolio turnover rate | | | 6 | % | | | 3 | % | | | 2 | % | | | 2 | % | | | 9 | % |
1 | The selected per share data was calculated using the average shares outstanding method for the period. |
2 | The ratio of operating expenses excluding reimbursement/waiver excludes the effect of fees paid indirectly. If this expense offset was included, the ratio would have been 0.64%. |
See Notes to Financial Statements.
68
Wilshire Mutual Funds, Inc. Wilshire 5000 Indexsm Fund Financial Highlights - (Continued) |
|
For a Fund Share Outstanding Throughout Each Year. | |
| | | Institutional Class Shares | |
| | | Year
Ended
12/31/2015 | | | Year
Ended
12/31/2014 | | | Year
Ended
12/31/2013 | | | Year
Ended 12/31/2012 | | | Year
Ended
12/31/2011 | |
Net asset value, beginning of year | | $ | 18.00 | | | $ | 16.21 | | | $ | 12.41 | | | $ | 10.92 | | | $ | 11.04 | |
| | | | | | | | | | | | | | | | | | | | | |
Income (loss) from investment operations: | | | | | | | | | | | | | | | | | | | | |
Net investment income1 | | | 0.29 | | | | 0.26 | | | | 0.22 | | | | 0.22 | | | | 0.16 | |
Net realized and unrealized gain (loss) on investments | | | (0.22 | ) | | | 1.79 | | | | 3.81 | | | | 1.47 | | | | (0.11 | ) |
Total from investment operations | | | 0.07 | | | | 2.05 | | | | 4.03 | | | | 1.69 | | | | 0.05 | |
| | | | | | | | | | | | | | | | | | | | | |
Less distributions: | | | | | | | | | | | | | | | | | | | | |
From net investment income | | | (0.29 | ) | | | (0.26 | ) | | | (0.23 | ) | | | (0.20 | ) | | | (0.17 | ) |
Total distributions | | | (0.29 | ) | | | (0.26 | ) | | | (0.23 | ) | | | (0.20 | ) | | | (0.17 | ) |
| | | | | | | | | | | | | | | | | | | | | |
Net asset value, end of year | | $ | 17.78 | | | $ | 18.00 | | | $ | 16.21 | | | $ | 12.41 | | | $ | 10.92 | |
| | | | | | | | | | | | | | | | | | | | | |
Total return | | | 0.36 | % | | | 12.60 | % | | | 32.48 | % | | | 15.54 | % | | | 0.43 | % |
| | | | | | | | | | | | | | | | | | | | | |
Ratios to average net assets/supplemental data: | | | | | | | | | | | | | | | | | | | | |
Net assets, end of year (in 000’s) | | $ | 59,065 | | | $ | 67,500 | | | $ | 59,565 | | | $ | 50,633 | | | $ | 50,252 | |
Operating expenses including reimbursement/fees paid indirectly | | | 0.41 | % | | | 0.44 | % | | | 0.46 | % | | | 0.47 | % | | | 0.53 | % |
Operating expenses excluding reimbursement/fees paid indirectly | | | 0.41 | %2 | | | 0.44 | % | | | 0.46 | % | | | 0.47 | % | | | 0.53 | % |
Net investment income | | | 1.59 | % | | | 1.53 | % | | | 1.55 | % | | | 1.84 | % | | | 1.43 | % |
Portfolio turnover rate | | | 6 | % | | | 3 | % | | | 2 | % | | | 2 | % | | | 9 | % |
1 | The selected per share data was calculated using the average shares outstanding method for the period. |
2 | The ratio of operating expenses excluding reimbursement/waiver excludes the effect of fees paid indirectly. If this expense offset was included, the ratio would have been 0.41%. |
See Notes to Financial Statements.
69
Wilshire Mutual Funds, Inc. Wilshire 5000 Indexsm Fund Financial Highlights - (Continued) |
|
For a Fund Share Outstanding Throughout Each Year. | |
| | | Qualified Class Shares | |
| | | Year
Ended
12/31/2015 | | | Year
Ended
12/31/2014 | | | Year
Ended
12/31/2013 | | | Year
Ended 12/31/2012 | | | Year
Ended
12/31/2011 | |
Net asset value, beginning of year | | $ | 18.29 | | | $ | 16.46 | 3 | | $ | 12.59 | 3 | | $ | 11.09 | | | $ | 11.03 | |
| | | | | | | | | | | | | | | | | | | | | |
Income (loss) from investment operations: | | | | | | | | | | | | | | | | | | | | |
Net investment income1 | | | 0.30 | | | | 0.27 | 3 | | | 0.23 | 3 | | | 0.21 | 3 | | | 0.14 | |
Net realized and unrealized gain (loss) on investments | | | (0.23 | ) | | | 1.83 | | | | 3.88 | | | | 1.50 | | | | (0.08 | ) |
Total from investment operations | | | 0.07 | | | | 2.10 | 3 | | | 4.11 | 3 | | | 1.71 | 3 | | | 0.06 | |
| | | | | | | | | | | | | | | | | | | | | |
Less distributions: | | | | | | | | | | | | | | | | | | | | |
From net investment income | | | (0.30 | ) | | | (0.27 | ) | | | (0.24 | ) | | | (0.21 | ) | | | 0.00 | |
Total distributions | | | (0.30 | ) | | | (0.27 | ) | | | (0.24 | ) | | | (0.21 | ) | | | 0.00 | |
| | | | | | | | | | | | | | | | | | | | | |
Net asset value, end of year | | $ | 18.06 | | | $ | 18.29 | 3 | | $ | 16.46 | 3 | | $ | 12.59 | 3 | | $ | 11.09 | |
| | | | | | | | | | | | | | | | | | | | | |
Total return | | | 0.34 | % | | | 12.71 | %3 | | | 32.67 | %3 | | | 15.47 | %3 | | | 0.54 | % |
| | | | | | | | | | | | | | | | | | | | | |
Ratios to average net assets/supplemental data: | | | | | | | | | | | | | | | | | | | | |
Net assets, end of year (in 000’s) | | $ | — | 2 | | $ | — | 2 | | $ | — | 2 | | $ | — | 2 | | $ | — | 2 |
Operating expenses including reimbursement/fees paid indirectly | | | 0.36 | % | | | 0.36 | %3 | | | 0.38 | %3 | | | 0.40 | %3 | | | 0.65 | % |
Operating expenses excluding reimbursement/fees paid indirectly | | | 0.36 | % | | | 0.36 | %3 | | | 0.38 | %3 | | | 0.40 | %3 | | | 0.65 | % |
Net investment income | | | 1.59 | % | | | 1.52 | %3 | | | 1.54 | %3 | | | 1.76 | %3 | | | 1.21 | % |
Portfolio turnover rate | | | 6 | % | | | 3 | % | | | 2 | % | | | 2 | % | | | 9 | % |
1 | The selected per share data was calculated using the average shares outstanding method for the period. |
2 | Amounts designated as "—" have been rounded to $0. |
3 | Amounts have been revised to reflect estimation of expenses based on Institutional Class shares due to low asset levels in the Qualified Class shares. |
See Notes to Financial Statements.
70
Wilshire Mutual Funds, Inc. Wilshire 5000 Indexsm Fund Financial Highlights - (Continued) |
|
For a Fund Share Outstanding Throughout Each Year. | |
| | | Horace Mann Class Shares | |
| | | Year
Ended
12/31/2015 | | | Year
Ended
12/31/2014 | | | Year
Ended
12/31/2013 | | | Year
Ended 12/31/2012 | | | Year
Ended
12/31/2011 | |
Net asset value, beginning of year | | $ | 17.97 | | | $ | 16.18 | | | $ | 12.40 | | | $ | 10.91 | | | $ | 11.02 | |
| | | | | | | | | | | | | | | | | | | | | |
Income (loss) from investment operations: | | | | | | | | | | | | | | | | | | | | |
Net investment income1 | | | 0.25 | | | | 0.22 | | | | 0.19 | | | | 0.19 | | | | 0.13 | |
Net realized and unrealized gain (loss) on investments | | | (0.23 | ) | | | 1.79 | | | | 3.79 | | | | 1.48 | | | | (0.10 | ) |
Total from investment operations | | | 0.02 | | | | 2.01 | | | | 3.98 | | | | 1.67 | | | | 0.03 | |
| | | | | | | | | | | | | | | | | | | | | |
Less distributions: | | | | | | | | | | | | | | | | | | | | |
From net investment income | | | (0.25 | ) | | | (0.22 | ) | | | (0.20 | ) | | | (0.18 | ) | | | (0.14 | ) |
Total distributions | | | (0.25 | ) | | | (0.22 | ) | | | (0.20 | ) | | | (0.18 | ) | | | (0.14 | ) |
| | | | | | | | | | | | | | | | | | | | | |
Net asset value, end of year | | $ | 17.74 | | | $ | 17.97 | | | $ | 16.18 | | | $ | 12.40 | | | $ | 10.91 | |
| | | | | | | | | | | | | | | | | | | | | |
Total return | | | 0.08 | % | | | 12.38 | % | | | 32.07 | % | | | 15.31 | % | | | 0.25 | % |
| | | | | | | | | | | | | | | | | | | | | |
Ratios to average net assets/supplemental data: | | | | | | | | | | | | | | | | | | | | |
Net assets, end of year (in 000’s) | | $ | 1,626 | | | $ | 1,715 | | | $ | 1,560 | | | $ | 1,243 | | | $ | 1,108 | |
Operating expenses including reimbursement/fees paid indirectly | | | 0.63 | % | | | 0.67 | % | | | 0.70 | % | | | 0.69 | % | | | 0.78 | % |
Operating expenses excluding reimbursement/fees paid indirectly | | | 0.63 | %2 | | | 0.67 | % | | | 0.70 | % | | | 0.69 | % | | | 0.78 | % |
Net investment income | | | 1.37 | % | | | 1.30 | % | | | 1.31 | % | | | 1.62 | % | | | 1.17 | % |
Portfolio turnover rate | | | 6 | % | | | 3 | % | | | 2 | % | | | 2 | % | | | 9 | % |
1 | The selected per share data was calculated using the average shares outstanding method for the period. |
2 | The ratio of operating expenses excluding reimbursement/waiver excludes the effect of fees paid indirectly. If this expense offset was included, the ratio would have been 0.63%. |
See Notes to Financial Statements.
71
Wilshire Mutual Funds, Inc. Wilshire International Equity Fund Financial Highlights |
|
For a Fund Share Outstanding Throughout Each Year. | |
| | | Investment Class Shares | |
| | | Year
Ended
12/31/2015 | | | Year
Ended
12/31/2014 | | | Year
Ended
12/31/2013 | | | Year
Ended 12/31/2012 | | | Year
Ended
12/31/2011 | |
Net asset value, beginning of year | | $ | 9.06 | | | $ | 9.70 | | | $ | 8.34 | | | $ | 7.63 | | | $ | 8.09 | |
Income (loss) from investment operations: | | | | | | | | | | | | | | | | | | | | |
Net investment income1 | | | 0.09 | | | | 0.09 | | | | 0.03 | | | | 0.06 | | | | 0.00 | 2 |
Net realized and unrealized gain (loss) on investments and foreign currency transactions | | | (0.23 | ) | | | (0.71 | ) | | | 1.54 | | | | 0.96 | | | | (0.19 | ) |
Total from investment operations | | | (0.14 | ) | | | (0.62 | ) | | | 1.57 | | | | 1.02 | | | | (0.19 | ) |
Less distributions: | | | | | | | | | | | | | | | | | | | | |
From net investment income | | | (0.02 | ) | | | (0.02 | ) | | | 0.00 | | | | (0.09 | ) | | | (0.06 | ) |
From capital gains | | | 0.00 | | | | 0.00 | | | | (0.21 | ) | | | (0.22 | ) | | | (0.21 | ) |
Redemption fee (Note 2) | | | 0.00 | 2 | | | — | | | | — | | | | — | | | | — | |
Total distributions | | | (0.02 | ) | | | (0.02 | ) | | | (0.21 | ) | | | (0.31 | ) | | | (0.27 | ) |
Net asset value, end of year | | $ | 8.90 | | | $ | 9.06 | | | $ | 9.70 | | | $ | 8.34 | | | $ | 7.63 | |
Total return | | | (1.55 | )% | | | (6.38 | )% | | | 18.95 | % | | | 13.36 | % | | | (2.28 | )% |
Ratios to average net assets/supplemental data: | | | | | | | | | | | | | | | | | | | | |
Net assets, end of year (in 000’s) | | $ | 3,438 | | | $ | 11,371 | | | $ | 2,410 | | | $ | 74,999 | | | $ | 80,004 | |
Operating expenses including dividends and rebates on securities sold short and interest expense, after expense reimbursement/waiver and fees paid indirectly4 | | | 1.50 | % | | | 1.50 | % | | | 1.85 | %3 | | | 2.24 | %3 | | | 2.27 | %3 |
Operating expenses including dividends and rebates on securities sold short and interest expense, before expense reimbursement/waiver and fees paid indirectly4 | | | 1.75 | % | | | 1.71 | % | | | 1.93 | %5 | | | 2.29 | %5 | | | 2.33 | % |
Net investment income | | | 0.99 | % | | | 0.97 | % | | | 0.38 | % | | | 0.77 | % | | | 0.06 | % |
Portfolio turnover rate | | | 84 | % | | | 176 | % | | | 368 | % | | | 45 | % | | | 134 | % |
1 | The selected per share data was calculated using the average shares outstanding method for the period. |
2 | Amount is less than $0.01 per share. |
3 | The operating expense ratios reflect the expenses related to investing in securities sold short. Had these expenses been excluded, the expense ratio (after waiver and fees paid indirectly) would have been 1.50% for 2013, 2012, 2011 and 2010, respectively. |
4 | Effective April 2, 2013, the Wilshire International Equity Fund no longer engages in short selling. |
5 | The ratio of operating expenses including dividends and rebates on securities sold short and interest expense, before reimbursement/waiver excludes the effect of fees paid indirectly. If this expense offset was included, the ratio would have been 1.71%, 1.93% and 2.28% for 2014, 2013 and 2012, respectively. |
See Notes to Financial Statements.
72
Wilshire Mutual Funds, Inc. Wilshire International Equity Fund Financial Highlights - (Continued) |
|
For a Fund Share Outstanding Throughout Each Year. | |
| | | Institutional Class Shares | |
| | | Year
Ended
12/31/2015 | | | Year
Ended
12/31/2014 | | | Year
Ended
12/31/2013 | | | Year
Ended 12/31/2012 | | | Year
Ended
12/31/2011 | |
Net asset value, beginning of year | | $ | 8.99 | | | $ | 9.64 | | | $ | 8.38 | | | $ | 7.67 | | | $ | 8.14 | |
Income (loss) from investment operations: | | | | | | | | | | | | | | | | | | | | |
Net investment income1 | | | 0.09 | | | | 0.09 | | | | 0.08 | | | | 0.09 | | | | 0.02 | |
Net realized and unrealized gain (loss) on investments and foreign currency transactions | | | (0.21 | ) | | | (0.68 | ) | | | 1.51 | | | | 0.95 | | | | (0.20 | ) |
Total from investment operations | | | (0.12 | ) | | | (0.59 | ) | | | 1.59 | | | | 1.04 | | | | (0.18 | ) |
Less distributions: | | | | | | | | | | | | | | | | | | | | |
From net investment income | | | (0.09 | ) | | | (0.06 | ) | | | (0.12 | ) | | | (0.11 | ) | | | (0.08 | ) |
From capital gains | | | 0.00 | | | | 0.00 | | | | (0.21 | ) | | | (0.22 | ) | | | (0.21 | ) |
Redemption fee (Note 2) | | | 0.00 | 2 | | | — | | | | — | | | | — | | | | — | |
Total distributions | | | (0.09 | ) | | | (0.06 | ) | | | (0.33 | ) | | | (0.33 | ) | | | (0.29 | ) |
Net asset value, end of year | | $ | 8.78 | | | $ | 8.99 | | | $ | 9.64 | | | $ | 8.38 | | | $ | 7.67 | |
Total return | | | (1.37 | )% | | | (6.16 | )% | | | 19.10 | % | | | 13.63 | % | | | (2.11 | )% |
Ratios to average net assets/supplemental data2: | | | | | | | | | | | | | | | | | | | | |
Net assets, end of year (in 000’s) | | $ | 176,937 | | | $ | 165,048 | | | $ | 45,897 | | | $ | 99,106 | | | $ | 93,132 | |
Operating expenses including dividends and rebates on securities sold short and interest expense, after expense reimbursement/waiver and fees paid indirectly3 | | | 1.25 | % | | | 1.25 | % | | | 1.61 | %2 | | | 1.99 | %2 | | | 2.02 | %2 |
Operating expenses including dividends and rebates on securities sold short and interest expense, before expense reimbursement/ waiver and fees paid indirectly3 | | | 1.29 | % | | | 1.31 | % | | | 1.87 | %4 | | | 2.01 | %4 | | | 2.05 | % |
Net investment income | | | 1.00 | % | | | 0.96 | % | | | 0.88 | % | | | 1.03 | % | | | 0.32 | % |
Portfolio turnover rate | | | 84 | % | | | 176 | % | | | 368 | % | | | 45 | % | | | 134 | % |
1 | The selected per share data was calculated using the average shares outstanding method for the period. |
2 | The operating expense ratios reflect the expenses related to investing in securities sold short. Had these expenses been excluded, the expense ratio (after waiver and fees paid indirectly) would have been 1.25% for 2013, 2012, 2011 and 2010, respectively. |
3 | Effective April 2, 2013, the Wilshire International Equity Fund no longer engages in short selling. |
4 | The ratio of operating expenses including dividends and rebates on securities sold short and interest expense, before reimbursement/waiver excludes the effect of fees paid indirectly. If this expense offset was included, the ratio would have been 1.31%, 1.87% and 2.00% for 2014, 2013 and 2012, respectively. |
See Notes to Financial Statements.
73
Wilshire Mutual Funds, Inc. Notes to Financial Statements December 31, 2015 |
|
1. Organization.
Wilshire Mutual Funds, Inc. (the “Company”) is registered under the Investment Company Act of 1940, as amended (the “1940 Act”), as an open-end diversified investment company, which was incorporated under Maryland law on July 30, 1992. The Company operates as a series company and presently offers six series, all of which had operations during the period: Large Company Growth Portfolio, Large Company Value Portfolio, Small Company Growth Portfolio, Small Company Value Portfolio, Wilshire 5000 IndexSM Fund and Wilshire International Equity Fund (each a “Portfolio” and collectively the “Portfolios”). The Company accounts separately for the assets, liabilities and operations of each series.
Each of the Portfolios offers Investment and Institutional Class shares, each of which has equal rights as to voting privileges. The Wilshire 5000 IndexSM Fund also offers Qualified Class Shares and Horace Mann Class Shares. Each of the Investment Class, Qualified Class and Horace Mann Class has exclusive voting rights with respect to its particular service and distribution plan. Investment income, realized and unrealized capital gains and losses and the common expenses of each Portfolio are allocated on a pro-rata basis to each class based on the relative net assets of each class to the total net assets of each Portfolio. Each class of shares differs in its respective service and distribution expenses.
2. Significant Accounting Policies.
Use of estimates – Each Portfolio is an investment company in conformity with U.S. generally accepted accounting principles (“U.S. GAAP”). Therefore, each Portfolio follows the accounting and reporting guidelines for investment companies. The preparation of financial statements in accordance with U.S. GAAP requires management to make estimates and assumptions that affect the reported amounts of assets and liabilities and disclosure of contingent assets and liabilities at the date of the financial statements and the reported amounts of revenues and expenses during the reporting period. Actual results could differ from those estimates and those differences could be material. The following is a summary of significant accounting policies consistently followed by the Portfolios in the preparation of their financial statements.
Security valuation – A security listed or traded on U.S. exchanges is valued at its last sales price on the exchange where it is principally traded. In the absence of a current quotation, the security is valued at the mean between the last bid and asked prices on that exchange. Securities quoted on the National Association of Securities Dealers Automatic Quotation (NASDAQ) System, for which there have been sales, are valued at the NASDAQ official closing price. If there are no such sales, the most recent bid quotation is used. Securities traded over-the-counter (other than on NASDAQ) are valued at the last current sale price; and if there are no such sales, the most recent bid quotation is used. Equity securities primarily traded on a foreign exchange or market are valued daily at the price, which is an estimate of the fair value price, as provided by an independent pricing service. In the event market quotations are not readily available, such securities are valued at fair value according to procedures adopted by the Board of Directors or as determined in good faith by the Pricing Committee, whose members include at least two representatives of Wilshire Associates Incorporated (“Wilshire” or the “Adviser”), one of whom is an officer of the Company, or by the Company’s Valuation Committee. Fair value is defined as the amount the owner of a security might reasonably expect to receive upon a current sale. Securities whose value does not reflect fair value because a significant valuation event has occurred may be valued at fair value by the Pricing Committee or the
74
Wilshire Mutual Funds, Inc. Notes to Financial Statements - (Continued) December 31, 2015 |
|
Valuation Committee in accordance with the Company’s valuation procedures. Significant events may include, but are not limited to, the following: significant fluctuations in domestic markets, foreign markets or foreign currencies; occurrences not directly tied to the securities markets such as natural disasters, armed conflicts or significant governmental actions; and major announcements affecting a single issuer or an entire market or market sector.
The Wilshire International Equity Fund uses Interactive Data Pricing and Reference Data, Inc. (“Interactive Data”) as a third party fair valuation vendor daily. Interactive Data provides a fair value for foreign securities in the Wilshire International Equity Fund based on certain factors and methodologies (involving, generally, tracking valuation correlations between the U.S. market and each non-U.S. security) applied by Interactive Data. These factors are used to value the Wilshire International Equity Fund without holding a Pricing Committee meeting. In the event that the Adviser believes that the fair values provided by Interactive Data are not reliable, the Adviser contacts the Wilshire International Equity Fund’s administrator and may request that a meeting of the Pricing Committee be held.
In accordance with the authoritative guidance on fair value measurements and disclosures under U.S. GAAP, the Portfolios disclose fair value of their investments in a hierarchy that prioritizes the inputs to valuation techniques used to measure the fair value. The objective of a fair value measurement is to determine the price that would be received to sell an asset or paid to transfer a liability in an orderly transaction between market participants at the measurement date (an exit price). Accordingly, the fair value hierarchy gives the highest priority to quoted prices (unadjusted) in active markets for identical assets or liabilities (Level 1) and the lowest priority to unobservable inputs (Level 3). The guidance establishes three levels of the fair value hierarchy as follows:
| | ● | Level 1 – Unadjusted quoted prices in active markets for identical, unrestricted assets or liabilities that the Portfolios have the ability to access at the measurement date; |
| | ● | Level 2 – Other significant observable inputs (including quoted prices for similar securities, interest rates, prepayment speeds, credit risk, referenced indices, quoted prices in inactive markets, adjusted quoted prices in active markets, etc.); and |
| | ● | Level 3 – Prices, inputs or exotic modeling techniques which are both significant to the fair value measurement and unobservable (supported by little or no market activity). |
The inputs or methodology used for valuing securities are not necessarily an indication of the risk associated with investing in those securities. For the year ended December 31, 2015, there have been no significant changes to the Portfolios’ fair value methodologies.
Fair value measurement classifications are summarized in each Portfolio’s Condensed Schedule of Investments, as applicable.
Securities transactions and investment income – Securities transactions are recorded on a trade date basis. Realized gains and losses from securities transactions are recorded on the identified cost basis. Dividend income is recognized on the ex-dividend date and interest income, including, where applicable, accretion of discount and amortization of premium on investments, is recognized on the accrual basis from settlement date. Distributions received on securities that represent a return of capital or capital gain are reclassed as a reduction of
75
Wilshire Mutual Funds, Inc. Notes to Financial Statements - (Continued) December 31, 2015 |
|
cost of investments and/or as a realized gain. The actual character of income, realized gain and return of capital distributions received from Real Estate Investment Trusts (“REITs”) is not known until after the end of the fiscal year, at which time such distribution estimates are appropriately adjusted.
Foreign currency transactions – The books and records of the Funds are maintained in U.S. dollars. Foreign currency transactions are translated into U.S. dollars on the following basis:
| | ● | market value of investment securities, other assets and other liabilities at the daily rates of exchange and |
| | ● | purchases and sales of investment securities, dividend and interest income and certain expenses at the rates of exchange prevailing on the respective dates of such transactions. |
Net realized and unrealized gain (loss) from foreign currency related transactions includes gains and losses between trade and settlement dates on securities transactions, gains and losses arising from the sales of foreign currency and gains and losses between the ex-dividend and payment dates on dividends, interest and foreign withholding taxes. The effect of changes in foreign exchange rates on realized and unrealized gains or losses is reflected as a component of such gains or losses.
Expense policy – Distribution and Service fees directly attributable to a class of shares are charged to that class’ operations. Expenses of the Portfolios other than Distribution and Service fees are prorated among the classes to which the expense relates based on the relative net assets of each class of shares. Expenses directly attributable to a Portfolio are charged to that Portfolio. Expenses not directly attributable to a Portfolio are allocated proportionately among all Portfolios daily in relation to the net assets of each Portfolio or another reasonable basis. Expenses which are attributable to the Company and the Wilshire Variable Insurance Trust are allocated across the Company and the Wilshire Variable Insurance Trust based upon relative net assets or another reasonable basis. Expenses and fees, including the advisory fees, are accrued daily and taken into account for the purpose of determining the net asset value of each Portfolio’s shares.
Investments in REITs – With respect to the Portfolios, dividend income is recorded based on the income included in distributions received from the REIT investments using published REIT reclassifications including some management estimates when actual amounts are not available. Distributions received in excess of these estimated amounts are recorded as a reduction of the cost of investments or reclassified to capital gains. The actual amounts of income, return of capital, and capital gains are only determined by each REIT after its fiscal year end, and may differ from the estimated amounts.
Distributions to shareholders – Distributions to shareholders are recorded on the ex-dividend date. Distributions from net investment income, if any, are declared and paid annually. The Portfolios’ net realized capital gains, unless offset by any available capital loss carryforward, are distributed to shareholders annually. Additional distributions of net investment income and capital gains may be made at the discretion of the Board of Directors in order to avoid the application of a 4% non-deductible Federal excise tax.
Master Limited Partnerships – The Portfolios may invest in master limited partnerships (“MLPs”). MLPs are limited partnerships or limited liability companies, whose partnership units or limited liability interests are listed and traded on a U.S. securities exchange, and are treated as publicly traded partnerships for federal income tax
76
Wilshire Mutual Funds, Inc. Notes to Financial Statements - (Continued) December 31, 2015 |
|
purposes. To qualify to be treated as a partnership for tax purposes, an MLP must receive at least 90% of its income from qualifying sources as set forth in Section 7704(d) of the Internal Revenue Code of 1986, as amended (the “Code”). These qualifying sources include activities such as the exploration, development, mining, production, processing, refining, transportation, storage and marketing of mineral or natural resources. MLPs generally have two classes of owners, the general partner and limited partners. MLPs that are formed as limited liability companies generally have two analogous classes of owners, the managing member and the members. For purposes of this section, references to general partners also apply to managing members and references to limited partners also apply to members. The general partner is typically owned by a major energy company, an investment fund, the direct management of the MLP or is an entity owned by one or more of such parties. The general partner may be structured as a private or publicly traded corporation or other entity. The general partner typically controls the operations and management of the MLP through an equity interest of as much as 2% in the MLP plus, in many cases, ownership of common units and subordinated units. Limited partners own the remainder of the MLP through ownership of common units and have a limited role in the MLP’s operations and management.
Redemption fees – The Wilshire International Equity Fund charges a redemption fee of 1% on redemption of capital shares held for sixty days or less, subject to certain exceptions. For the year ended December 31, 2015, the Wilshire International Equity Fund charged $561 in redemption fees.
3. Investment Advisory Fee and Other Transactions.
Pursuant to the Advisory Agreement (the “Agreement”) between the Company and the Adviser, Wilshire charges annual fees of 0.75% of average daily net assets for the first $1 billion and 0.65% thereafter for the Large Company Growth Portfolio and Large Company Value Portfolio, 0.85% of average daily net assets for the first $1 billion and 0.75% thereafter for the Small Company Growth Portfolio and Small Company Value Portfolio, 0.10% of the average daily net assets for the first $1 billion and 0.07% thereafter for the Wilshire 5000 IndexSM Fund and 1.00% of the average daily net assets for the first $1 billion and 0.90% thereafter for the Wilshire International Equity Fund. Wilshire has entered into contractual expense limitation agreements with the Small Company Growth Portfolio, the Small Company Value Portfolio and the Wilshire International Equity Fund to waive a portion of its management fees or reimburse expenses to limit expenses of such Portfolios (excluding taxes, brokerage expenses, dividend expenses on short securities, and extraordinary expenses) to 1.50% and 1.25% of average daily net assets for Investment Class Shares and Institutional Class Shares, respectively. These agreements to limit expenses continue through at least April 30, 2016. Wilshire may recoup the amount of any management fee waived or expenses reimbursed within three years after the year in which Wilshire waived fees or reimbursed the expenses if the recoupment does not exceed the expense limitation that was in place at the time of the waiver/expense reimbursement. At December 31, 2015, the amounts of waivers/reimbursements subject to recoupment for Wilshire Small Company Growth Portfolio were $48,753 expiring in 2018 and $16,159 expiring in 2017. At December 31, 2015, the amounts of waivers/reimbursements subject to recoupment for Wilshire Small Company Value Portfolio were $52,909 expiring in 2018 and $17,655 expiring in 2017. At December 31, 2015, the amounts of waivers/reimbursements subject to recoupment for Wilshire International Equity Fund were $81,678 expiring in 2018, $78,351 expiring in 2017 and $152,161, expiring in 2016.
77
Wilshire Mutual Funds, Inc. Notes to Financial Statements - (Continued) December 31, 2015 |
|
For the year ended December 31, 2015, Wilshire waived advisory fees or reimbursed expenses as follows:
Portfolio | | Fees Waived/ Reimbursed | | | Fees Recouped | |
Small Company Growth Portfolio | | $ | 48,753 | | | | N/A | |
Small Company Value Portfolio | | | 52,909 | | | | N/A | |
Wilshire International Equity Fund | | | 81,678 | | | | N/A | |
The Board of Directors of the Company has approved Los Angeles Capital Management and Equity Research, Inc. (“L.A. Capital”), Victory Capital Management Inc. (“Victory”), Pzena Investment Management, LLC (“Pzena”), Systematic Financial Management, L.P. (“Systematic”), Ranger Investment Management, LLC (“Ranger”), NWQ Investment Management Company, LP (“NWQ”), Cambiar Investors, LLC (“Cambiar”), Loomis, Sayles & Company, L.P. (“Loomis Sayles”) and WCM Investment Management (“WCM”) (collectively the “Sub-Advisers”) to provide sub-advisory services with respect to the Portfolios. L.A. Capital, Loomis Sayles and Victory each manage a portion of the Large Company Growth Portfolio. L.A. Capital, Pzena and Systematic each manage a portion of the Large Company Value Portfolio. L.A. Capital and Ranger each manage a portion of the Small Company Growth Portfolio. L.A. Capital and NWQ each manage a portion of the Small Company Value Portfolio. L.A. Capital is the sole sub-adviser for the Wilshire 5000 IndexSM Fund. L.A. Capital, Cambiar and WCM each manage a portion of the Wilshire International Equity Fund.
The Sub-Advisers are subject to Wilshire oversight. The fees of the Sub-Advisers are paid by Wilshire.
SEI Investments Global Funds Services (“SEI”) serves as the Company’s administrator and accounting agent pursuant to an administration agreement dated May 31, 2008, as amended. DST Systems, Inc. serves as the Company’s transfer agent and dividend disbursing agent. The Northern Trust Company (“NTC”) serves as the Company’s custodian for all Portfolios. SEI Investments Distribution Co. serves as the Company’s distributor.
Officers’ and Directors’ Expenses – Certain officers of the Company are affiliated with and receive remuneration from the Adviser. The Company does not pay any remuneration to its officers. The Company and the Wilshire Variable Insurance Trust together pay each independent director an annual retainer of $18,000, an annual additional Board chair retainer of $12,000, a Board in-person meeting fee of $2,000, a Board telephonic meeting fee of $1,000, an annual Committee Member retainer of $8,000 and a Committee telephonic meeting fee of $500.
4. Distribution Plan, Shareholder Services Plan and Fees Paid Indirectly.
The Directors of the Company have adopted shareholder services and/or distribution plans (the “Plans”) pursuant to Rule 12b-1 under the 1940 Act, with respect to the Investment Class Shares of each Portfolio and the Qualified Class Shares of the Wilshire 5000 IndexSM Fund. Under the Plans, each such Portfolio reimburses SEI Investments Distribution Co. (the “Distributor”), at an annual rate of up to 0.25% of the value of the average daily net assets attributable to the Investment Class Shares and Qualified Class Shares of each Portfolio for certain services provided by securities dealers or other financial intermediaries or for certain distribution expenses for the purpose of financing any activity intended to result in the sale of Investment Class Shares or Qualified Class Shares. For the
78
Wilshire Mutual Funds, Inc. Notes to Financial Statements - (Continued) December 31, 2015 |
|
year ended December 31, 2015, the distribution and service fee expenses incurred for the Investment Class of the Large Company Growth Portfolio, Large Company Value Portfolio, Small Company Value Portfolio, Wilshire 5000 IndexSM Fund and Wilshire International Equity was 0.25% of the respective average net assets of each Portfolio.
For the year ended December 31, 2015, the distribution and services fee expenses incurred for Investment Class Shares of the Small Company Growth Portfolio was 0.22% of its average net assets. For the year ended December 31, 2015, there were no distribution and service fee expenses incurred for Qualified Class Shares of the Wilshire 5000 IndexSM Fund.
The Directors of the Company have adopted a shareholder services and distribution plan pursuant to Rule 12b-1 with respect to the Horace Mann Class Shares of the Wilshire 5000 IndexSM Fund. Under such Plan, the Company reimburses the Distributor for its shareholder service and distribution payments at an annual rate of up to 0.35% of the value of the average daily net assets of the Wilshire 5000 IndexSM Fund attributable to the Horace Mann Class Shares. For the year ended December 31, 2015, the shareholder services and distribution fees for the Horace Mann Class Shares were 0.28% of average net assets.
In addition, Investment Class Shares and Institutional Class Shares pay the expenses associated with certain shareholder servicing arrangements with third parties, provided that payment of such fees does not exceed in any year 0.20% and 0.15% for the Investment and Institutional Class Shares, respectively, of the average net assets of each class. For the year ended December 31, 2015, the net shareholder service provider fees were as follows (as a percent of average net assets of each class):
Portfolio | Investment Class | Institutional Class |
Large Company Growth Portfolio | 0.09% | 0.02% |
Large Company Value Portfolio | 0.02% | 0.00% |
Small Company Growth Portfolio | 0.05% | 0.00% |
Small Company Value Portfolio | 0.06% | 0.00% |
Wilshire 5000 IndexSM Fund | 0.05% | 0.06% |
Wilshire International Equity Fund | 0.20% | 0.00% |
The Directors of the Company have adopted a shareholder services plan with respect to the Qualified Class Shares of the Wilshire 5000 IndexSM Fund which authorizes payments by the Qualified Class Shares of up to 0.15% of the average daily net assets attributable to the Portfolio’s Qualified Class Shares for certain shareholder services provided by insurers or other financial intermediaries. For the year ended December 31, 2015, there were no shareholder service provider fees for the Qualified Class Shares.
Fees paid indirectly – The Company has entered into a brokerage commission recapture program with the Distributor, pursuant to which a portion of the Portfolios’ commissions generated from transactions directed to the Distributor are used to reduce the Portfolios’ expenses. Under such program, the Distributor, as introducing broker, retains a portion of the Portfolios’ commissions.
79
Wilshire Mutual Funds, Inc. Notes to Financial Statements - (Continued) December 31, 2015 |
|
Such commissions rebated to the Portfolios for the year ended December 31, 2015 were as follows:
Large Company Growth Portfolio | | $ | 4,680 | |
Large Company Value Portfolio | | | 12,902 | |
Small Company Growth Portfolio | | | 1,972 | |
Small Company Value Portfolio | | | 2,327 | |
Wilshire 5000 IndexSM Fund | | | 1,687 | |
Wilshire International Equity Fund | | | — | |
For the year ended December 31, 2015, the Distributor retained the following commissions:
Large Company Growth Portfolio | | $ | 2,434 | |
Large Company Value Portfolio | | | 5,663 | |
Small Company Growth Portfolio | | | 1,584 | |
Small Company Value Portfolio | | | 2,195 | |
Wilshire 5000 IndexSM Fund | | | 1,416 | |
Wilshire International Equity Fund | | | — | |
5. Securities Transactions.
For the year ended December 31, 2015, aggregate cost of purchases and proceeds from sales of securities, other than short-term investments, short sales and purchases to cover, were as follows:
Portfolio | | Purchases | | | Sales | |
Large Company Growth Portfolio | | $ | 242,609,721 | | | $ | 264,520,879 | |
Large Company Value Portfolio | | | 63,385,964 | | | | 72,610,386 | |
Small Company Growth Portfolio | | | 17,611,487 | | | | 18,388,403 | |
Small Company Value Portfolio | | | 14,343,011 | | | | 14,529,276 | |
Wilshire 5000 IndexSM Fund | | | 12,811,701 | | | | 63,153,228 | |
Wilshire International Equity Fund | | | 158,424,648 | | | | 151,313,559 | |
6. Securities Lending.
The Portfolios may seek additional income by lending their securities on a short-term basis to banks, brokers and dealers in return for cash collateral, which is invested in short-term securities. A Portfolio may return a portion of the interest earned to the borrower or a third party which is unaffiliated with the Company and acting as a “placing broker.” A Portfolio receives compensation for lending securities in the form of fees. A Portfolio also continues to receive dividends on the securities loaned. Security loans are secured at all times by collateral. It is the Company’s policy that the collateral be equal to at least 102% of the market value of the securities loaned (105% if the collateral and securities loaned are denominated in different currencies) plus accrued interest when the transaction is entered into, and that the collateral supporting loans be valued daily. However, due to market fluctuations during the day, the value of securities loaned on a particular day may, during the course of the day, exceed the value of
80
Wilshire Mutual Funds, Inc. Notes to Financial Statements - (Continued) December 31, 2015 |
|
collateral. On each business day, the amount of collateral is adjusted based on the prior day’s market fluctuations and the current day’s lending activity. Gain or loss in the market price of the securities loaned that may occur during the term of the loan are reflected in the value of the Portfolio. The risks from securities lending are that the borrower may not provide additional collateral when required or return the securities when due or when called for by the Portfolio. Lending securities entails a risk of loss to the Portfolio if and to the extent that the market value of securities loans were to increase and the borrower did not increase the collateral accordingly, and the borrower fails to return the securities. NTC, the Portfolios’ custodian, acts as the securities lending agent for the Portfolios. The value of the securities on loan and the value of the related collateral at December 31, 2015 are shown on the Statement of Assets and Liabilities. The Northern Trust Institutional Liquid Asset Portfolio was purchased with proceeds from collateral received from securities on loan. At December 31, 2015, $49,384,840, $24,469,794, $13,939,124, $13,551,010, $29,829,398 and $31,675,900 of this cash equivalent represents the collateral received, net of any fees retained by the securities lending agent for securities on loan in the Large Company Growth Portfolio, Large Company Value Portfolio, Small Company Growth Portfolio, Small Company Value Portfolio, Wilshire 5000 IndexSM Fund, and the Wilshire International Equity Fund, respectively. Securities on loan are also collateralized by various U.S. Treasury obligations. At December 31, 2015, $391,320, $664,691, $196,213, $1,002,947, $1,445,392 and $2,408,489 represent the collateral received for securities on loan in the Large Company Growth Portfolio, Large Company Value Portfolio, Small Company Growth Portfolio, Small Company Value Portfolio, Wilshire 5000 IndexSM Fund and the Wilshire International Equity Fund, respectively.
7. Significant Shareholder Activity.
On December 31, 2015, the Portfolios had the following concentrations of shareholders holding 10% or more of the outstanding shares of the Portfolios. These represent omnibus shareholder accounts comprised of many individual shareholders.
Portfolio | |
Large Company Growth Portfolio (3 omnibus shareholders) | 75% |
Large Company Value Portfolio (2 omnibus shareholder) | 85% |
Small Company Growth Portfolio (2 omnibus shareholders) | 66% |
Small Company Value Portfolio (2 omnibus shareholders) | 70% |
Wilshire 5000 IndexSM Fund (3 omnibus shareholders) | 60% |
Wilshire International Equity Fund (1 omnibus shareholders) | 80% |
8. Tax Information.
No provision for federal income taxes is required because each Portfolio has qualified and intends to continue to qualify, as a regulated investment company under Subchapter M of the Internal Revenue Code of 1986, as amended, and distributes to shareholders all of its taxable income and gains. Federal income tax regulations differ from accounting principles generally accepted in the United States of America; therefore, distributions determined in accordance with tax regulations may differ in amount or character from net investment income and realized gains for financial reporting purposes. Financial reporting records are adjusted for permanent book/tax differences to reflect tax character. Financial records are not adjusted for temporary differences.
81
Wilshire Mutual Funds, Inc. Notes to Financial Statements - (Continued) December 31, 2015 |
|
The Portfolios evaluate tax positions taken or expected to be taken in the course of preparing the Portfolios’ tax returns to determine whether it is “more-likely than-not” (i.e., greater than 50 percent) that each tax position will be sustained upon examination by a taxing authority based on the technical merits of the position. Tax positions not deemed to meet the more-likely-than-not threshold are recorded as a tax benefit or expense in the current year. The Portfolios did not record any tax provision in the current period. However, management’s conclusions regarding tax positions taken may be subject to review and adjustment at a later date based on factors including, but not limited to, examination by tax authorities (i.e., the last 3 tax year ends, as applicable), on-going analysis of and changes to tax laws, regulations and interpretations thereof.
The federal tax cost, unrealized appreciation and depreciation at December 31, 2015 for each Portfolio are as follows:
Portfolio | | Tax Cost | | | Aggregate
Gross
Unrealized Appreciation | | | Aggregate
Gross
Unrealized Depreciation | | | Net
Unrealized Appreciation
(Depreciation) | |
Large Company Growth Portfolio | | $ | 218,016,540 | | | $ | 63,370,441 | | | $ | (3,353,617 | ) | | $ | 60,016,824 | |
Large Company Value Portfolio | | | 119,360,838 | | | | 17,295,040 | | | | (6,731,773 | ) | | | 10,563,267 | |
Small Company Growth Portfolio | | | 35,976,722 | | | | 5,687,056 | | | | (900,846 | ) | | | 4,786,210 | |
Small Company Value Portfolio | | | 38,924,741 | | | | 4,747,548 | | | | (2,170,533 | ) | | | 2,577,015 | |
Wilshire 5000 IndexSM Fund | | | 132,131,371 | | | | 125,883,933 | | | | (8,030,833 | ) | | | 117,853,100 | |
Wilshire International Equity Fund | | | 211,374,095 | | | | 11,151,607 | | | | (11,439,187 | ) | | | (287,580 | ) |
The differences between book and tax-basis unrealized appreciation (depreciation) are attributable primarily to the tax deferral of losses on wash sales, investment in passive foreign investment companies, investments in Master Limited Partnerships and investment in Grantor Trusts.
Under the Regulated Investment Company Modernization Act of 2010 (“RIC Modernization”), the Portfolios are permitted to carry forward capital losses incurred in taxable years beginning after December 22, 2010 for an unlimited period. However, any losses incurred during those future taxable years will be required to be utilized prior to the losses incurred in pre-enactment taxable years. As a result of this ordering rule, pre-enactment capital loss carryforwards may be more likely to expire unused. Additionally, post-enactment capital losses that are carried forward will retain their character as either short-term or long-term capital losses rather than being considered all short-term as under previous law.
The Portfolios intend to retain realized gains to the extent of available capital loss carryforwards. At December 31, 2015, the following Portfolios had available for federal income tax purposes unused capital losses as follows:
| | | Expiring December 31 | |
Portfolio | | 2017 | | | 2018 | |
Wilshire 5000 IndexSM Fund | | $ | 21,728,203 | | | $ | 2,464 | |
82
Wilshire Mutual Funds, Inc. Notes to Financial Statements - (Continued) December 31, 2015 |
|
Losses carried forward under these new provisions are as follows:
Portfolio | | Short-Term Loss | | | Long-Term Loss | | | Total | |
Wilshire International Equity Fund | | $ | 15,338,079 | | | $ | 1,414,850 | | | $ | 16,752,929 | |
During the year ended December 31, 2015, the Wilshire 5000 IndexSM Fund utilized capital loss carryforwards of $12,161,775, to offset capital gains.
The tax character of distributions declared during the years ended December 31, 2015 and 2014 were as follows:
Portfolio | | 2015 Ordinary Income | | | 2015
Capital Gains | | | 2015
Return of Capital | | | 2014 Ordinary Income | | | 2014 Capital Gains | | | 2014
Return of Capital | |
Large Company Growth Portfolio | | $ | 73,052 | | | $ | 23,416,653 | | | $ | — | | | $ | 10,600,458 | | | $ | 21,571,407 | | | $ | — | |
Large Company Value Portfolio | | | 1,572,836 | | | | 6,386,245 | | | | — | | | | 6,224,189 | | | | 7,351,245 | | | | — | |
Small Company Growth Portfolio | | | — | | | | 1,487,042 | | | | — | | | | 747,668 | | | | 1,635,144 | | | | — | |
Small Company Value Portfolio | | | 456,140 | | | | 1,181,754 | | | | — | | | | 538,712 | | | | 2,805,892 | | | | — | |
Wilshire 5000 IndexSM Fund | | | 3,154,520 | | | | — | | | | — | | | | 3,450,744 | | | | — | | | | — | |
Wilshire International Equity Fund | | | 1,756,414 | | | | — | | | | — | | | | 1,062,512 | | | | — | | | | 3,771 | |
At December 31, 2015, the components of distributable earnings (accumulated losses) on a tax basis were as follows:
| | | Large Company Growth Portfolio | | | Large Company Value Portfolio | | | Small Company Growth Portfolio | | | Small Company Value Portfolio | | | Wilshire 5000 IndexSM Fund | | | Wilshire International Equity Fund | |
Undistributed ordinary income | | $ | — | | | $ | — | | | $ | — | | | $ | 34,826 | | | $ | 559,575 | | | $ | 91,938 | |
Undistributed long-term capital gain | | | 1,257,103 | | | | 1,334,528 | | | | 26,034 | | | | 807,953 | | | | — | | | | — | |
Capital loss carryforwards | | | — | | | | — | | | | — | | | | — | | | | (21,730,667 | ) | | | (16,752,929 | ) |
Post October losses | | | — | | | | — | | | | — | | | | — | | | | — | | | | (399,186 | ) |
Unrealized appreciation (depreciation) | | | 60,016,824 | | | | 10,563,267 | | | | 4,786,210 | | | | 2,577,015 | | | | 117,853,098 | | | | (299,313 | ) |
Other temporary differences | | | (5 | ) | | | (10 | ) | | | (2 | ) | | | (2 | ) | | | 19 | | | | (7 | ) |
Total distributable earnings/ (accumulated losses) | | $ | 61,273,922 | | | $ | 11,897,785 | | | $ | 4,812,242 | | | $ | 3,419,792 | | | $ | 96,682,025 | | | $ | (17,359,497 | ) |
83
Wilshire Mutual Funds, Inc. Notes to Financial Statements - (Continued) December 31, 2015 |
|
9. Reclassifications.
Accounting principles generally accepted in the United States of America require that certain components of net assets be reclassified between financial and tax reporting. The reclassifications primarily include investments in real estate investment trusts, sales of passive foreign investment companies, investments in Master Limited Partnerships, investment in Grantor Trusts, net operating losses and reclass of distribution. These reclassifications have no effect on net assets or net asset values per share. As of December 31, 2015, the reclassifications were as follows:
Portfolio | | Increase (Decrease) Paid in Capital | | | Increase (Decrease) Undistributed Investment Income | | | Increase (Decrease) Net Realized Capital Gains (Losses) | |
Large Company Growth Portfolio | | $ | (392,934 | ) | | $ | 398,106 | | | $ | (5,172 | ) |
Large Company Value Portfolio | | | — | | | | (31,838 | ) | | | 31,838 | |
Small Company Growth Portfolio | | | (121,963 | ) | | | 122,685 | | | | (722 | ) |
Small Company Value Portfolio | | | — | | | | 18,567 | | | | (18,567 | ) |
Wilshire 5000 IndexSM Fund | | | (13 | ) | | | 30,566 | | | | (30,553 | ) |
Wilshire International Equity Fund | | | (207 | ) | | | (5,815 | ) | | | 6,022 | |
10. Indemnifications.
In the normal course of business, the Company, on behalf of the Portfolios, enters into contracts that provide general indemnifications. The Portfolios’ maximum exposure under these arrangements is dependent on claims that may be made against the Portfolios in the future and, therefore, cannot be estimated; however, based on experience, the risk of material loss from such claims is considered remote.
11. Risks.
Foreign security risk – The Wilshire International Equity Fund invests in securities of foreign issuers in various countries. These investments may involve certain considerations and risks not typically associated with investments in the United States, as a result of, among other factors, the possibility of future political and economic developments and the level of governmental supervision and regulation of securities markets in the respective countries.
12. Contingencies.
The Wilshire 5000 IndexSM Fund was named as a defendant and a putative member of a proposed defendant class of shareholders in a lawsuit filed on December 7, 2010, in the U.S. Bankruptcy Court for the District of Delaware and on March 6, 2012, in the District Court for the Southern District of New York, in connection with Tribune Company’s Chapter 11 bankruptcy proceeding. The 2010 lawsuit was brought by the official Committee of Unsecured Creditors of the Tribune Company and the 2012 lawsuit was brought by Deutsche Bank, as trustee for senior noteholders of Tribune Company. Both lawsuits relate to a leveraged buyout transaction by which Tribune Company converted to a privately-held company in 2007 less than a year prior to Tribune Company’s bankruptcy filing. The putative defendant class is comprised of beneficial owners of shares of Tribune Company who meet certain jurisdictional requirements and received proceeds of the leveraged buyout. The plaintiffs seek
84
Wilshire Mutual Funds, Inc. Notes to Financial Statements - (Continued) December 31, 2015 |
|
to recover those proceeds, together with interest and attorneys’ fees and expenses, as fraudulent transfers under the Bankruptcy Act or various state laws, respectively. On September 2013, the District Court dismissed the 2012 lawsuit and this decision is on appeal to the Second Circuit Court of Appeals. The 2010 lawsuit continues in the District Court. The Adviser does not expect the Portfolio to be materially impacted by the lawsuits.
13. Subsequent Event Evaluation.
The Portfolios have evaluated the need for additional disclosures and/or adjustments resulting from subsequent events through the date the financial statements were issued. Based on this evaluation, no additional disclosures and/or adjustments were required to the financial statements.
85
Wilshire Mutual Funds, Inc. Report of Independent Registered Public Accounting Firm |
|
To the Board of Directors of Wilshire Mutual Funds, Inc. and the Shareholders of
Large Company Growth Portfolio, Large Company Value Portfolio, Small Company Growth Portfolio,
Small Company Value Portfolio, Wilshire 5000 IndexSM Fund, and Wilshire International Equity Fund:
In our opinion, the accompanying statements of assets and liabilities, including the condensed schedules of investments, and the related statements of operations and of changes in net assets and the financial highlights present fairly, in all material respects, the financial position of the Large Company Growth Portfolio, Large Company Value Portfolio, Small Company Growth Portfolio, Small Company Value Portfolio, Wilshire 5000 IndexSM Fund, and Wilshire International Equity Fund (six portfolios/funds constituting the Wilshire Mutual Funds, Inc., hereafter referred to as the “Portfolios”) at December 31, 2015, the results of each of their operations for the year then ended, the changes in each of their net assets for the two years in the period then ended and the financial highlights for each of the five years in the period then ended, in conformity with accounting principles generally accepted in the United States of America. These financial statements and financial highlights (hereafter referred to as “financial statements”) are the responsibility of the Portfolios’ management. Our responsibility is to express an opinion on these financial statements based on our audits. We conducted our audits of these financial statements in accordance with the standards of the Public Company Accounting Oversight Board (United States). Those standards require that we plan and perform the audit to obtain reasonable assurance about whether the financial statements are free of material misstatement. An audit includes examining, on a test basis, evidence supporting the amounts and disclosures in the financial statements, assessing the accounting principles used and significant estimates made by management, and evaluating the overall financial statement presentation. We believe that our audits, which included confirmation of securities at December 31, 2015 by correspondence with the custodian and brokers, provide a reasonable basis for our opinion.
PricewaterhouseCoopers LLP
Philadelphia, Pennsylvania
February 26, 2016
86
Wilshire Mutual Funds, Inc. Additional Fund Information (Unaudited) |
|
The Board of Directors has responsibility for the overall management and operations of the Company. The Board establishes the Company’s policies and meets regularly to review the activities of the officers, who are responsible for the day-to-day operations of the Company.
Set forth below are the names of the Directors and executive officers of the Company, their ages, positions and terms of office, their principal occupations during the past five years, and other directorships held by them. The address of each Director and Officer is 1299 Ocean Avenue, Suite 700, Santa Monica, California 90401.
Name and Age | Position Held with the Company | Term of
Office(1) and
Length of
Time
Served | Principal
Occupations
During the Past
Five Years | Number of
Funds/
Funds in
Complex
Overseen
by Director | Other
Directorships
Held by
Director |
INTERESTED DIRECTOR |
John C. Hindman, 45 | Director | Since 2014 | President, Wilshire Associates; formerly, Executive Vice President, Allianz Global Investors of America | 10 | Wilshire Associates; Wilshire Variable Insurance Trust (4 Funds) |
NON-INTERESTED DIRECTORS |
Roger A. Formisano, 66 | Director | Since 2006 | Vice President, University Medical Foundation, 2006- Present; formerly Director, The Center for Leadership and Applied Business, UW-Madison School of Business; Principal, R.A. Formisano & Company, LLC | 10 | Integrity Mutual Insurance Company, Wilshire Variable Insurance Trust (4 Funds) |
Edward Gubman, 64 | Director | Since 2011 | Founder and Principal, Strategic Talent Solutions | 10 | Wilshire Variable Insurance Trust (4 Funds) |
Suanne K. Luhn, 61 | Director | Since 2008 | Retired; formerly Chief Compliance Officer, Bahl & Gaynor (investment adviser) (1990 to 2006) | 10 | Wilshire Variable Insurance Trust (4 Funds) |
George J. Zock, 64 | Director, Chairman of the Board | Since 2006 | Independent Consultant; Consultant, Horace Mann Service Corporation (2004 to 2005); Executive Vice President, Horace Mann Life Insurance Company and Horace Mann Service Corporation (1997 to 2003). | 10 | Wilshire Variable Insurance Trust (4 Funds), Armed Forces Insurance Exchange |
87
Wilshire Mutual Funds, Inc. Additional Fund Information (Unaudited) - (Continued) |
|
Name and Age | Position
Held
with the
Company | Term of
Office(1) and
Length of
Time
Served | Principal
Occupations
During the Past
Five Years |
OFFICERS |
Jason Schwarz, 41 | President | Since 2012 | President, Wilshire Funds Management Group (Since 2005). |
Reena S. Lalji, 44 | Secretary | Since 2009 | Managing Director and General Counsel, Wilshire Associates Incorporated |
Benkai Boucy, 45 | Chief Compliance Officer | Since 2015 | Chief Compliance Officer, Wilshire Associates Incorporated. (Since 2012); Attorney, Benkai Bouey, Attorney at Law (2010-2013); Client Relationship Manager, Horizon Asset Management, Inc. (2008 to 2010) |
Michael Wauters, 50 | Treasurer | Since 2009 | Chief Financial Officer, Wilshire Associates Incorporated (Since 2009) |
Nathan R. Palmer, 40 | Vice President | Since 2011 | Managing Director, Wilshire Associates Incorporated; Senior Investment Management Associate, Convergent Wealth Advisors (2009 to 2010) |
(1) | Each director serves until the next shareholders’ meeting (and until the election and qualification of a successor), or until death, resignation, removal or retirement which takes effect no later than May 1 following his or her 70th birthday. Officers are elected by the board on an annual basis to serve until their successors have been elected and qualified. |
The Company’s Statement of Additional Information includes additional information about the Directors of the Company and is available, without charge, upon request, by calling 1-888-200-6796.
88
Wilshire Mutual Funds, Inc. Additional Fund Information (Unaudited) - (Continued) |
|
Information on Proxy Voting
The Securities and Exchange Commission (“SEC”) has adopted the requirement that all funds file their complete proxy voting records with the SEC on an annual basis on Form N-PX. Such filing, for the 12-month period ended June 30, must be made no later than August 31 of each year.
A description of policies and procedures that the Portfolios use to determine how to vote proxies relating to portfolio securities, along with each Portfolio’s proxy voting record relating to portfolio securities held during most recent 12-month period ended June 30 is available at no charge, upon request by calling 1-888-200-6796, by e-mailing us at http://advisor.wilshire.com or on the SEC’s website at http://www.sec.gov.
Information on Form N-Q
The Company files its complete schedule of portfolio holdings with the SEC for the first and third quarters of each fiscal year on Form N-Q within sixty days after the end of period. The Company’s Forms N-Q are available on the SEC’s website at http://www.sec.gov, and may be reviewed and copied at the SEC’s Public Reference Room in Washington, DC. Information on the operation of the Public Reference Room may be obtained by calling 1-202-551-8090.
Householding Policy
In order to reduce printing and mailing expenses, only one copy of each prospectus, annual and semi-annual report will be sent to all related accounts at a common address, unless you have indicated otherwise on your Account Application. Shareholders may revoke their consent to householding at any time by calling 1-888-200-6796. Upon receipt of a shareholder’s revocation, the Company will begin mailing individual copies of the above-referenced documents to the shareholder’s attention within 30 days.
89
Wilshire Mutual Funds, Inc. Tax Information - (Unaudited) |
|
Of the distributions made by the following Portfolios, the corresponding percentage represents the amount of each distribution which will qualify for the dividends received deduction available to corporate shareholders:
Portfolio | Percentage |
Large Company Growth Portfolio | 26.12% |
Large Company Value Portfolio | 90.16% |
Small Company Growth Portfolio | 0.00% |
Small Company Value Portfolio | 62.82% |
Wilshire 5000 IndexSM Fund | 13.33% |
Wilshire International Equity Fund | 0.00% |
Pursuant to the Jobs and Growth Tax Relief Reconciliation Act of 2003, and as extended by Tax Relief, Unemployment Insurance Reauthorization and Jobs Creation Act of 2010, the Portfolios listed below designate the following percentages of their income dividends distributed in 2013 as qualified dividend income as defined in Section 1(h)(II) of the Internal Revenue Code.
Portfolio | Percentage |
Large Company Growth Portfolio | 26.12% |
Large Company Value Portfolio | 90.97% |
Small Company Growth Portfolio | 0.00% |
Small Company Value Portfolio | 62.60% |
Wilshire 5000 IndexSM Fund | 100.00% |
Wilshire International Equity Fund | 0.00% |
Pursuant to the American Jobs Creation Act of 2004, and as extended by Tax Relief, Unemployment Insurance Reauthorization and Jobs Creation Act of 2010, the Funds listed below designate the following percentages of income distributions as qualified interest income that is exempt from U.S. withholding tax when paid to foreign investors.
Portfolio | Percentage |
Large Company Growth Portfolio | 0.00% |
Large Company Value Portfolio | 0.00% |
Small Company Growth Portfolio | 0.00% |
Small Company Value Portfolio | 0.00% |
Wilshire 5000 IndexSM Fund | 0.00% |
Wilshire International Equity Fund | 0.00% |
90
Wilshire Mutual Funds, Inc. Tax Information - (Unaudited) (Continued) |
|
Pursuant to the American Jobs Creation Act of 2004, and as extended by Tax Relief, Unemployment Insurance Reauthorization and Jobs Creation Act of 2010, the Funds listed below designate the following percentages of short-term capital gain distributions as qualified short-term capital gain that is exempt from U.S. withholding tax when paid to foreign investors.
Portfolio | Percentage |
Large Company Growth Portfolio | 100.00% |
Large Company Value Portfolio | 100.00% |
Small Company Growth Portfolio | 0.00% |
Small Company Value Portfolio | 100.00% |
Wilshire 5000 IndexSM Fund | 0.00% |
Wilshire International Equity Fund | 0.00% |
Wilshire International Equity Fund intends to pass through a foreign tax credit to shareholders. For the fiscal year ended December 31, 2015, the total amount of foreign tax paid is $406,892.
91
Wilshire Mutual Funds, Inc. Board Approval of Advisory and Subadvisory Agreements (Unaudited) |
|
During the six months ended December 31, 2015, the Board of Directors (the “Board”) of Wilshire Mutual Funds, Inc. (the “Company”) approved the renewal for an additional one-year term of the Company’s advisory agreement (the “Advisory Agreement”) with Wilshire Associates Incorporated (“Wilshire” or the “Adviser”) with respect to each of the Large Company Growth Portfolio, Large Company Value Portfolio, Small Company Growth Portfolio, Small Company Value Portfolio, Wilshire 5000 Index Fund and Wilshire International Equity Fund (the “Funds”). The Funds also approved new subadvisory agreements between Wilshire and each of the following subadvisers: Cambiar Investors, LLC (“Cambiar”) with respect to the Wilshire International Equity Fund and Loomis, Sayles & Company, L.P. (“Loomis Sayles”) with respect to the Large Company Growth Portfolio and approved the renewal for additional one-year terms of Wilshire’s subadvisory agreements with each of the following subadvisers: Los Angeles Capital Management and Equity Research, Inc. (“LA Capital”) with respect to each of the Small Company Value Portfolio, Small Company Growth Portfolio, Large Company Value Portfolio, Large Company Growth Portfolio, Wilshire International Equity Fund and Wilshire 5000 Index Fund, NWQ Investment Management Company, LLC (“NWQ”) with respect to the Small Company Value Portfolio, Pzena Investment Management, LLC (“Pzena”) with respect to the Large Company Value Portfolio, Ranger Investment Management, L.P. (“Ranger”) with respect to the Small Company Growth Portfolio, Systematic Financial Management, L.P. (“Systematic”) with respect to the Large Company Value Portfolio, Victory Capital Management, Inc. (“Victory”) with respect to the Large Company Growth Portfolio, and WCM Investment Management (“WCM”) with respect to the Wilshire International Equity Fund. In the following text, the subadvisers are referred to as “Subadvisers” and the subadvisory agreements between Wilshire and each Subadviser are referred to as “Subadvisory Agreements.”
The information in this summary outlines the Board’s considerations associated with its approval of the Advisory Agreement and the Subadvisory Agreements. In connection with its deliberations regarding these relationships, the Board considered such information and factors as it believed to be relevant. As described below, the Board considered the nature, extent and quality of the services performed or to be performed by Wilshire and the Subadvisers under the advisory arrangements; with respect to Wilshire, comparative fees and expense ratios; the profits to be realized by Wilshire and the Subadivsers; the extent to which Wilshire and the Subadvisers realize or may realize economies of scale; and whether any fall-out benefits are being or would be realized by Wilshire and the Subadvisers. In considering these matters, the Board was advised with respect to relevant legal standards by independent legal counsel. In addition, the Directors who are not “interested persons” of the Company as defined in the Investment Company Act of 1940 (the “Independent Directors”) discussed the renewal of the Advisory Agreement with management and in private sessions with independent legal counsel at which no representatives of Wilshire were present and discussed the approval of the Subadvisory Agreements with management and in private sessions with counsel at which no representatives of the Subadvisers were present.
As required by the Investment Company Act of 1940, each approval was confirmed by a vote of the Independent Directors. In deciding to approve the Advisory Agreement and the Subadvisory Agreements, the Board did not identify any single factor as controlling and this summary does not describe all of the matters considered. However, the Board concluded that each of the various factors referred to below favored such approval.
Information Requested and Received
The Board, including all the Independent Directors, considered the approval of the Subadvisory Agreements with Cambiar and Loomis Sayles at the Board’s July 17, 2015 meeting, the renewal of the existing Subadvisory Agreements pursuant to a process that concluded at the Board’s August 18-19, 2015 meeting and the renewal of the Advisory Agreement pursuant to a process that concluded at the Board’s November 17-18, 2015 meeting, in each case following an extensive process. At the direction of the Independent Directors, independent legal counsel sent memoranda to the Adviser requesting information regarding the existing Subadvisory Agreements and the Advisory Agreement to be provided to the Directors in advance of meetings of the Independent Directors held prior to the Board meetings on August 18-19, 2015 and
92
Wilshire Mutual Funds, Inc. Board Approval of Advisory and Subadvisory Agreements (Unaudited) - (continued) |
|
November 17-18, 2015, respectively. With respect to Cambiar and Loomis Sayles, the Adviser sent a memorandum to each Subadviser requesting information regarding the Subadvisory Agreement to be provided to the Directors in advance of the July 17, 2015 meeting.
In response to the requests for information, the Directors received information from the Adviser as to each of the Funds describing: (i) the nature, extent and quality of services provided; (ii) the investment performance of each Fund as provided by Wilshire based upon data gathered from the Morningstar Direct database (“Morningstar”), along with the comparison to its benchmark index; (iii) the costs of services provided and estimated profits realized by the Adviser; (iv) the extent to which economies of scale are realized; (v) whether fee levels reflect any economies of scale realized by the Adviser and any sharing of such for the benefit of Fund shareholders; (vi) comparisons of services rendered and amounts paid by other registered investment companies as provided by Wilshire based upon data gathered from Morningstar; and (vii) benefits realized by the Adviser from its relationship with each Fund. The Directors received information from the Adviser regarding the factors underlying its recommendations to approve each Subadvisory Agreement. The Directors also received information from each Subadviser as to each Fund it managed or would manage describing: (i) the nature, extent and quality of services provided or to be provided, (ii) the investment performance of the Subadviser in connection with the Fund, and for Cambiar and Loomis Sayles, investment performance for managing investment products similar to the Fund; (iii) the financial condition of the Subadviser, (iv) the extent to which economies of scale are or will be realized as a Fund grows, (v) whether fee levels reflect any possible economies of scale for the benefit of Fund shareholders, (vi) where applicable, comparisons of services rendered and amounts paid by other registered investment companies and any comparable advisory clients, and (vii) benefits realized or to be realized by the Subadviser from its relationship with the Fund. At each meeting, the Independent Directors also received a memorandum from independent legal counsel describing their duties in connection with contract approvals, and they were assisted in their review by such counsel.
As a part of its evaluation of the existing Subadvisory Agreements and the Advisory Agreement, the Board considered the assessment of performance made by the Investment Committee (which is comprised solely of Independent Directors), which met on August 28, 2015 and November 17, 2015 to review data on the Subadviser’s performance and the data Wilshire had prepared on performance, respectively. With respect to Wilshire, the Board noted that although it was currently reviewing potential alternative structures and arrangements for providing administrative services for the Funds, it also evaluated the administrative services currently being provided by Wilshire and Wilshire’s ability to continue to provide such services. Based upon its evaluation of all materials provided, the Board concluded that it was in the best interests of each Fund to approve the Advisory Agreement and the Subadvisory Agreements.
Nature, Extent and Quality of Services – Wilshire
With respect to the nature, extent and quality of services provided by the Adviser, the Board reviewed the functions currently performed by the Adviser. The Board considered the experience and skills of the senior management leading fund operations, the experience and skills of the personnel performing the functions under the Advisory Agreement and the resources made available to such personnel. The Board determined that the current personnel had the requisite skill sets. The Board also considered the compliance program established by the Adviser and the level of compliance maintained for the Funds. The Board reviewed the processes used by the Adviser to select, monitor and replace subadvisers. The Board concluded that the Adviser was successful in negotiating favorable subadvisory agreements on behalf of the Funds and that the Adviser had a robust system in place for selecting, monitoring and terminating subadvisers, which system appeared to be reasonable. The Board also reviewed the Adviser’s financial condition, and considered the financial support provided by the Adviser to the Small Company Growth Portfolio, the Small Company Value Portfolio and the Wilshire International Equity Fund through expense limitation agreements. Based upon all relevant factors, the Board concluded that the nature, quality and extent of the services provided by the Adviser to each Fund support renewal of the contract.
93
Wilshire Mutual Funds, Inc. Board Approval of Advisory and Subadvisory Agreements (Unaudited) - (continued) |
|
The Board reviewed information on the performance of each Fund for the annualized one-, three-, five- and ten-year periods ended September 30, 2015, as applicable, along with performance information of a peer group of funds determined by Wilshire based upon the Morningstar database and in comparison to its benchmark for the same periods.
For the Large Company Growth Portfolio, the Board noted that although the Fund underperformed the median of its peer group and its benchmark for the three-, five- and ten-year periods, the Fund outperformed the median of its peer group for the one-year period, was competitive relative to its benchmark for the one-year period and ranked in the fourth quintile relative to its peers for the five- and ten-year periods (the first quintile being the best performers and the fifth quintile being the worst performers).
For the Large Company Value Portfolio, the Board noted that the Fund underperformed the median of its peer group and benchmark for the one-, five- and ten-year periods but outperformed the median of its peer group for the three-year period, ranked in the third or fourth quintile relative to its peers for the other periods and was competitive relative to its benchmark for the three-year period. The Board took into consideration the Adviser’s explanation for the recent underperformance and the response by the Adviser.
For the Small Company Growth Portfolio, the Board noted that the Fund outperformed the median of its peer group for all periods reviewed, outperformed its benchmark for the one-, three- and five-year periods and was competitive relative to its benchmark for the ten-year period.
For the Small Company Value Portfolio, the Board noted that the Fund outperformed the median of its peer group for the one-, three- and five-year periods, was in the third quintile of its peer group for the ten-year period and outperformed its benchmark for the one-, three- five- and ten-year periods.
For the Wilshire 5000 Index Fund, the Board noted that, although the Fund underperformed its benchmark for the one-, three-, five- and ten-year periods and the Fund’s tracking error to the Wilshire 5000 Index was higher than the median of its peer group, underperformance relative to the benchmark was primarily due to the Fund’s expenses.
For the Wilshire International Equity Fund, the Board noted that the Fund changed its investment mandate from a domestic large cap core fund to an international large cap fund in April 2013 and changed its benchmark to the MSCI ACW-ex U.S. Index at the same time so annualized peer returns and performance relative to the Index are not comparable for the three- and five-year periods. The Board also noted that, although the Wilshire International Equity Fund underperformed the median of its peer group for the one-year period, it was in the third quintile of the peer group and outperformed its benchmark for the same period. The Board took into consideration the Adviser’s explanation for the underperformance relative to the peer group and the response by the Adviser, including recent steps taken by the Adviser designed to improve performance.
Based upon the above performance, the Board determined that it was in the best interests of the Funds to continue the Advisory Agreement.
Advisory Fees
The Board reviewed each Fund’s advisory fee and total expense ratio and reviewed information comparing the advisory fee and total expense ratio to those of the peer group of funds. For each Fund other than the Large Company Value Portfolio, the Small Company Value Portfolio and the Wilshire International Equity Fund, the advisory fee was at or below the median. With respect to each of the Small Company Value Portfolio and the Wilshire International Equity Fund, the Board concluded that the actual advisory fee, which was below the median of its peer group, was competitive. With respect to the Large Company Value Portfolio, the Board concluded that the advisory fee, which was in the fourth quintile of its peer group, was competitive. As to total expenses, the Board noted that total expenses for each Fund are influenced by the small size of the complex. The Board also noted that the Adviser waives advisory fees and reimburses
94
Wilshire Mutual Funds, Inc. Board Approval of Advisory and Subadvisory Agreements (Unaudited) - (continued) |
|
expenses for the Small Company Growth Portfolio, the Small Company Value Portfolio and the Wilshire International Equity Fund pursuant to expense imitation agreements. The Board compared contractual fees charged by the Adviser to the Funds with similar investment styles. The Board was advised that there were no other registered investment companies advised by the Adviser with similar investment strategies. The Board concluded that the advisory fee for each Fund was reasonable.
Profitability to Wilshire and Economies of Scale
With respect to the profitability of the Advisory Agreement, the Board primarily considered the fee structure of the Advisory Agreement, including the costs of the services provided and the profits realized by the Adviser from its relationship with the Funds. The Board concluded that the profits realized by the Adviser were not unreasonable in comparison with the costs of providing investment advisory services to the Funds. In addition, the Board considered the extent to which economies of scale are realized and whether fee levels reasonably reflect economies of scale for the benefit of shareholders. The Board reviewed each Fund’s asset size, each Fund’s expense ratio, the expense limitation agreements in place for the Small Company Growth Portfolio, Small Company Value Portfolio and Wilshire International Equity Fund and whether the investment process produced economies of scale. The Board noted that the advisory fee for all Funds includes a breakpoint. The Board concluded that each Fund’s advisory fee reasonably reflected appropriate recognition of any economies of scale.
Fall-Out Benefits – Wilshire
The Board considered the nature and amount of any benefits derived by the Adviser from its relationship with the Funds. The Board determined that the advisory fees were reasonable in light of any fall-out benefits.
Nature, Extent and Quality of Services – Subadvisers
As to each Subadvisory Agreement, the Board considered the nature, extent and quality of services provided or to be provided. The Board considered the reputation, qualifications and background of the Subadviser, investment approach of the Subadviser, the experience and skills of investment personnel responsible, or to be responsible, for the day-to-day management of each Fund, and the resources made available to such personnel. For each existing Subadviser, the Board also considered the Subadviser’s compliance with investment policies and general legal compliance. In addition, the Board considered the analysis provided by the Adviser, which concluded that each Subadviser was providing or would provide reasonable services and, for each existing Subadviser, had reasonable compliance policies and procedures in place, and that the Adviser recommended that each Subadvisory Agreement for each Fund be approved.
The Board reviewed information comparing each existing Subadviser’s gross investment performance to a relevant benchmark (except for LA Capital with respect to the Wilshire 5000 Index Fund for which the Subadviser’s net performance was compared to the benchmark). Based upon all relevant factors, the Board determined to approve the Subadvisory Agreement with LA Capital, with respect to the Large Company Growth Portfolio, noting LA Capital’s outperformance for all periods reviewed, which resulted in a conclusion that performance was satisfactory. With respect to Victory’s performance for the Large Company Growth Portfolio, the Board determined to approve the continuation of Victory’s Subadvisory Agreement given outperformance for the one-year period ended June 30, 2015 and the since inspection period (January 31, 2007) to June 30, 2015, although the Board noted Victory’s underperformance for the three- and five-year periods ended June 30, 2015. The Board considered the Adviser’s recommendation for renewal and the Adviser’s commitment to monitor closely Victory’s performance.
With respect to Systematic’s performance for the Large Company Value Portfolio, the Board noted underperformance for the annualized one- and five-year periods ended June 30, 2015, but outperformance for the three-year period ended, quarter ended, year-to-date period ended and since inception (September 30, 2007) period ended June 30, 2015, which resulted in a conclusion that performance was satisfactory. With respect to LA Capital’s performance for the Large
95
Wilshire Mutual Funds, Inc. Board Approval of Advisory and Subadvisory Agreements (Unaudited) - (continued) |
|
Company Value Portfolio, the Fund noted LA Capital’s outperformance for the since inception (April 30, 2013) period ended June 30, 2015, which resulted in a conclusion that performance was satisfactory. The Board also noted that LA Capital’s performance for the one-year period ended was the same as that of the benchmark. The Board noted that Pzena, with respect to the Large Company Value Portfolio, had outperformed for the one-, three- and five-year periods ended June 30, 2015, which resulted in a conclusion that performance was satisfactory.
The Board considered that Ranger, with respect to the Small Company Growth Portfolio, underperformed for the one-year and since inception (April 30, 2013) periods ended June 30, 2015, but noted that Ranger outperformed for the year-to-date period ended June 30, 2015 and determined to approve the Subadvisory Agreement given the Adviser’s commitment to monitor closely Ranger’s performance. With respect to LA Capital’s performance for the Small Company Growth Portfolio and Small Company Value Portfolio, the Board noted LA Capital’s outperformance for the one-, three-, five- and ten-year periods ended June 30, 2015, which resulted in a conclusion that performance was satisfactory. With respect to NWQ’s performance for the Small Company Value Portfolio, the Board noted that outperformance for the one-year and since inception (April 30, 2013) periods ended June 30, 2015 resulted in a conclusion that performance was satisfactory.
With respect to the Wilshire 5000 Index Fund, the Board noted LA Capital’s underperformance for all periods reviewed, but considered that the Adviser is satisfied with the level of services provided and that underperformance was primarily due to Fund expenses.
The Board considered that WCM and LA Capital, with respect to the Wilshire International Equity Fund, outperformed for the one-year period ended June 30, 2015 and WCM outperformed since inception (October 31, 2013), which resulted in a conclusion that performance was satisfactory.
For Cambiar and Loomis Sayles, the Board reviewed information comparing each Subadviser’s gross investment performance for managing investment products similar to the respective Fund to a relevant benchmark. The Board noted that Cambiar outperformed the Wilshire International Equity Fund’s benchmark for the year to date, one-, three- and five-year periods ended May 31, 2015. The Board also noted that, although Loomis Sayles underperformed the Large Company Growth Portfolio’s benchmark for the year to date and one-year periods ended May 31, 2015, Loomis Sayles outperformed the benchmark for the three- and five-year periods ended May 31, 2015.
Subadvisory Fees
The Board considered each Fund’s subadvisory fees. The Board evaluated the competitiveness of the subadvisory fees based upon data supplied by each Subadviser about the fees charged to other clients. The Board also considered that the subadvisory fee rates were negotiated at arm’s length between the Adviser and each Subadviser, that the Adviser compensates the Subadviser from its fees and that the aggregate advisory fee had been deemed reasonable by the Board.
For the Subadvisers that reported fees for “Other Clients” with comparable investment policies and services, the Board noted that most Subadvisers did not charge higher fees to the Adviser for the Funds than were charged to their Other Clients. For the Subadvisers where the fees charged to the Adviser were higher than that charged to Other Clients, the Board determined that the fees charged to the Adviser were competitive.
The Board noted that Cambiar reported that it would not charge higher fees to the Adviser for the Wilshire International Equity Fund than were charged to its Other Clients.
Based upon all of the above, the Board determined that the subadvisory fees for each Fund were reasonable.
96
Wilshire Mutual Funds, Inc. Board Approval of Advisory and Subadvisory Agreements (Unaudited) - (continued) |
|
Profitability to the Subadvisers
The Board noted that the Adviser compensates each Subadviser from its own advisory fees and that the fees were negotiated at arm’s length between the Adviser and each Subadviser. In addition, the Board noted that the revenues to the various Subadvisers were or would be limited due to the size of the Funds. The Board took these factors into consideration in concluding that the subadvisory fees were reasonable.
Economies of Scale – Subadvisers
The Board considered whether there are economies of scale with respect to the subadvisory services provided to each Fund and whether the subadvisory fees reflect such economies of scale through breakpoints in fees. The Board also considered whether the effective subadvisory fee rate for each Fund under the Subadvisory Agreement is reasonable in relation to the asset size of such Fund. The Board concluded that the fee schedule for each Fund reflects an appropriate recognition of any economies of scale.
Fall-Out Benefits – Subadvisers
The Board also considered the character and amount of other incidental benefits received by each Subadviser. The Board considered each Subadviser’s soft dollar practices. The Board concluded that, taking into account the benefits arising from these practices, the fees charged under each Subadvisory Agreement were reasonable.
Conclusion
Based upon all of the information considered and the conclusions reached, the Board determined that the terms of the Advisory Agreement and each Subadvisory Agreement are fair and reasonable and that the approval of the Advisory Agreement and each Subadvisory Agreement is in the best interests of each Fund.
97

Wilshire Mutual Funds
Wilshire Associates Incorporated 1299 Ocean Avenue Santa Monica, CA 90401 1-888-200-6796 http://advisor.wilshire.com | WIL-AR-001-0900 |
The Registrant’s Board of Directors has determined that the Registrant has at least one “audit committee financial expert” (as defined by Item 3 of Form N-CSR) serving on its audit committee. Mr. Roger A. Formisano, the Registrant’s audit committee financial expert, is “independent,” for purposes of Item 3 of Form N-CSR.
An “audit committee financial expert” is not an “expert” for any purpose, including for purposes of Section 11 of the Securities Act of 1933, as a result of being designated as an “audit committee financial expert.” Further, the designation of a person as an “audit committee financial expert” does not mean that the person has any greater duties, obligations, or liability than those imposed on the person without the “audit committee financial expert” designation. Similarly, the designation of a person as an “audit committee financial expert” does not affect the duties, obligations, or liability of any other member of the audit committee or Board of Directors.
Pursuant to Registrant’s Audit Committee Charter (the “Charter”), the Audit Committee is responsible for pre-approving any engagement of the principal accountant to provide non-prohibited services to the Registrant, including the fees and other compensation to be paid to the principal accountant, to the extent required by Rule 2-01(c)(7) of Regulation S-X. The Chairman of the Audit Committee may grant pre-approval for engagements of less than $5,000. All such delegated pre-approvals will be presented to the Audit Committee no later than the next Audit Committee meeting.
Pursuant to the Charter, the Audit Committee is also responsible for pre-approving any engagement of the principal accountant, including the fees and other compensation to be paid to the principal accountant, to provide non-audit services to the Registrant’s investment adviser (or any entity controlling, controlled by, or under common control with the adviser that provides ongoing services to the Registrant), if the engagement relates directly to the operations and financial reporting of the Registrant, to the extent required by Rule 2-01(c)(7) of Regulation S-X. The Chairman of the Audit Committee may grant pre-approval for engagements of less than $5,000. All such delegated pre-approvals will be presented to the Audit Committee no later than the next Audit Committee meeting.
Not applicable.
Not applicable.
Not applicable.
Not applicable.
There have been no changes to the procedures by which shareholders may recommend nominees to the Registrant’s Board of Directors since the Registrant last disclosed such procedures in the definitive proxy statement filed with the SEC on March 29, 2011.
Pursuant to the requirements of the Securities Exchange Act of 1934 and the Investment Company Act of 1940, the Registrant has duly caused this report to be signed on its behalf by the undersigned, thereunto duly authorized.
Pursuant to the requirements of the Securities Exchange Act of 1934 and the Investment Company Act of 1940, this report has been signed below by the following persons on behalf of the Registrant and in the capacities and on the dates indicated.