FORM 6-K
SECURITIES AND EXCHANGE COMMISSION
Washington, D.C. 20549
Report of Foreign Issuer
Pursuant to Rule 13a-16 or 15d-16 of
the Securities Exchange Act of 1934
For the month of February, 2023
Commission File Number: 001-12518
Banco Santander, S.A.
(Exact name of registrant as specified in its charter)
Ciudad Grupo Santander
28660 Boadilla del Monte (Madrid) Spain
(Address of principal executive office)
Indicate by check mark whether the registrant files or will file annual reports under cover of Form 20-F or Form 40-F:
| Form 20-F | X | Form 40-F |
Indicate by check mark if the registrant is submitting the Form 6-K in paper as permitted by Regulation S-T Rule 101(b)(1):
| Yes | No | X |
Indicate by check mark if the registrant is submitting the Form 6-K in paper as permitted by Regulation S-T Rule 101(b)(7):
| Yes | No | X |
Banco Santander, S.A.
TABLE OF CONTENTS
Item | |
| 1 | Investor Day Presentation – Héctor Grisi, Group CEO |
Item 1

1 Héctor Grisi Group CEO
Important information Forward - looking statements Santander hereby warns that this document contains “forward - looking statements” as per the meaning of the U . S . Private Securities Litigation Reform Act of 1995 . Such statements can be understood through words and expressions like “expect”, “project”, “anticipate”, “should”, “intend”, “probability”, “risk”, “VaR”, “RoRAC”, “RoRWA”, “CoE”, “RoTE”, “TNAV”, “efficiency ratio”, “target”, “goal”, “objective”, “estimate”, “future”, “commitment”, “commit”, “focus”, “pledge” and similar expressions . They include (but are not limited to) statements on future business development, shareholder remuneration policy and NFI . However, risks, uncertainties and other important factors may lead to developments and results to differ materially from those anticipated, expected, projected or assumed in forward - looking statements . In particular, references in this document to any metric, data or plan relating to the periods 2023 to 2025 are stated as forward - looking statements and should be understood as targets or goals . The following important factors (and others described elsewhere in this document and other risk factors, uncertainties or contingencies detailed in our most recent Form 20 - F and subsequent 6 - Ks filed with, or furnished to, the SEC), as well as other unknown or unpredictable factors, could affect our future development and results and could lead to outcomes materially different from what our forward - looking statements anticipate, expect, project or assume : ( 1 ) general economic or industry conditions (e . g . , an economic downturn ; higher volatility in the capital markets ; inflation ; deflation ; changes in demographics, consumer spending, investment or saving habits ; and the effects of the war in Ukraine or the COVID - 19 pandemic in the global economy) in areas where we have significant operations or investments ; ( 2 ) climate - related conditions, regulations, targets and weather events ; ( 3 ) exposure to various market risks (e . g . , risks from interest rates, foreign exchange rates, equity prices and new benchmark indices) ; ( 4 ) potential losses from early loan repayment, collateral depreciation or counterparty risk ; ( 5 ) political instability in Spain, the UK, other European countries, Latin America and the US ; ( 6 ) legislative, regulatory or tax changes (including regulatory capital and liquidity requirements), especially in view of the UK s exit from the European Union and increased regulation prompted by financial crises ; ( 7 ) acquisition integration challenges arising from deviating management’s resources and attention from other strategic opportunities and operational matters ; and ( 8 ) uncertainty over the scope of actions that may be required by us, governments and others to achieve goals relating to climate, environmental and social matters, as well as the evolving nature of underlying science and industry and governmental standards and regulations ; and ( 9 ) changes affecting our access to liquidity and funding on acceptable terms, especially due to credit spread shifts or credit rating downgrades for the entire group or core subsidiaries . Forward looking statements are based on current expectations and future estimates about Santander’s and third - parties’ operations and businesses and address matters that are uncertain to varying degrees, including, but not limited to developing standards that may change in the future ; plans, projections, expectations, targets, objectives, strategies and goals relating to environmental, social, safety and governance performance, including expectations regarding future execution of Santander’s and third - parties’ energy and climate strategies, and the underlying assumptions and estimated impacts on Santander’s and third - parties’ businesses related thereto ; Santander’s and third - parties’ approach, plans and expectations in relation to carbon use and targeted reductions of emissions ; changes in operations or investments under existing or future environmental laws and regulations ; and changes in government regulations and regulatory requirements, including those related to climate - related initiatives . Forward - looking statements are aspirational, should be regarded as indicative, preliminary and for illustrative purposes only, speak only as of the date of this document, are informed by the knowledge, information and views available on such date and are subject to change without notice . Santander is not required to update or revise any forward - looking statements, regardless of new information, future events or otherwise, except as required by applicable law . Non - IFRS and alternative performance measures This document contains financial information prepared according to International Financial Reporting Standards (IFRS) and taken from our consolidated financial statements, as well as alternative performance measures (APMs) as defined in the Guidelines on Alternative Performance Measures issued by the European Securities and Markets Authority (ESMA) on 5 October 2015 , and other non - IFRS measures . The APMs and non - IFRS measures were calculated with information from Grupo Santander ; however, they are neither defined or detailed in the applicable financial reporting framework nor audited or reviewed by our auditors . We use these APMs and non - IFRS measures when planning, monitoring and evaluating our performance . We consider them to be useful metrics for our management and investors to compare operating performance between periods . 2
Nonetheless, the APMs and non - IFRS measures are supplemental information ; their purpose is not to substitute IFRS measures . Furthermore, companies in our industry and others may calculate or use APMs and non - IFRS measures differently, thus making them less useful for comparison purposes . For further details on APMs and Non - IFRS Measures, including their definition or a reconciliation between any applicable management indicators and the financial data presented in the consolidated financial statements prepared under IFRS, please see the 2021 Annual Report on Form 20 - F filed with the U . S . Securities and Exchange Commission (the SEC) on 1 March 2022 , as updated by the Form 6 - K filed with the SEC on 8 April 2022 in order to reflect our new organizational and reporting structure, as well as the section “Alternative performance measures” of the annex to the Banco Santander, S . A . (Santander) 2022 Annual Report, published as Inside Information on 28 February 2023 . These documents are available on Santander’s website (www . santander . com) . Underlying measures, which are included in this document, are non - IFRS measures . The businesses included in each of our geographic segments and the accounting principles under which their results are presented here may differ from the businesses included and local applicable accounting principles of our public subsidiaries in such geographies . Accordingly, the results of operations and trends shown for our geographic segments may differ materially from those of such subsidiaries . Non - financial information This document contains, in addition to financial information, non - financial information (NFI), including environmental, social and governance - related metrics, statements, goals, commitments and opinions . NFI is included to comply with Spanish Act 11 / 2018 on non - financial information and diversity and to provide a broader view of our impact . NFI is not audited nor, save as expressly indicated under ‘Auditors’ review’ of the 2022 Annual Report, reviewed by an external auditor . NFI is prepared following various external and internal frameworks, reporting guidelines and measurement, collection and verification methods and practices, which are materially different from those applicable to financial information and are in many cases emerging and evolving . NFI is based on various materiality thresholds, estimates, assumptions, judgments and underlying data derived internally and from third parties . NFI is thus subject to significant measurement uncertainties, may not be comparable to NFI of other companies or over time or across periods and its inclusion is not meant to imply that the information is fit for any particular purpose or that it is material to us under mandatory reporting standards . NFI is for informational purposes only and without any liability being accepted in connection with it except where such liability cannot be limited under overriding provisions of applicable law . Not a securities offer This document and the information it contains does not constitute an offer to sell nor the solicitation of an offer to buy any securities . Past performance does not indicate future outcomes Statements about historical performance or growth rates must not be construed as suggesting that future performance, share price or results (including earnings per share) will necessarily be the same or higher than in a previous period . Nothing in this document should be taken as a profit and loss forecast . Third party information In this document, Santander relies on and refers to certain information and statistics obtained from publicly - available information and third - party sources, which it believes to be reliable . Neither Santander nor its directors, officers and employees have independently verified the accuracy or completeness of any such publicly - available and third - party information, make any representation or warranty as to the quality, fitness for a particular purpose, non - infringement, accuracy or completeness of such information or undertake any obligation to update such information after the date of this report . In no event shall Santander be liable for any use by any party of, for any decision made or action taken by any party in reliance upon, or for inaccuracies or errors in, or omission from, such publicly - available and third - party information contained herein . Any sources of publicly - available information and third - party information referred or contained herein retain all rights with respect to such information and use of such information herein shall not be deemed to grant a license to any third party . 3 Important information
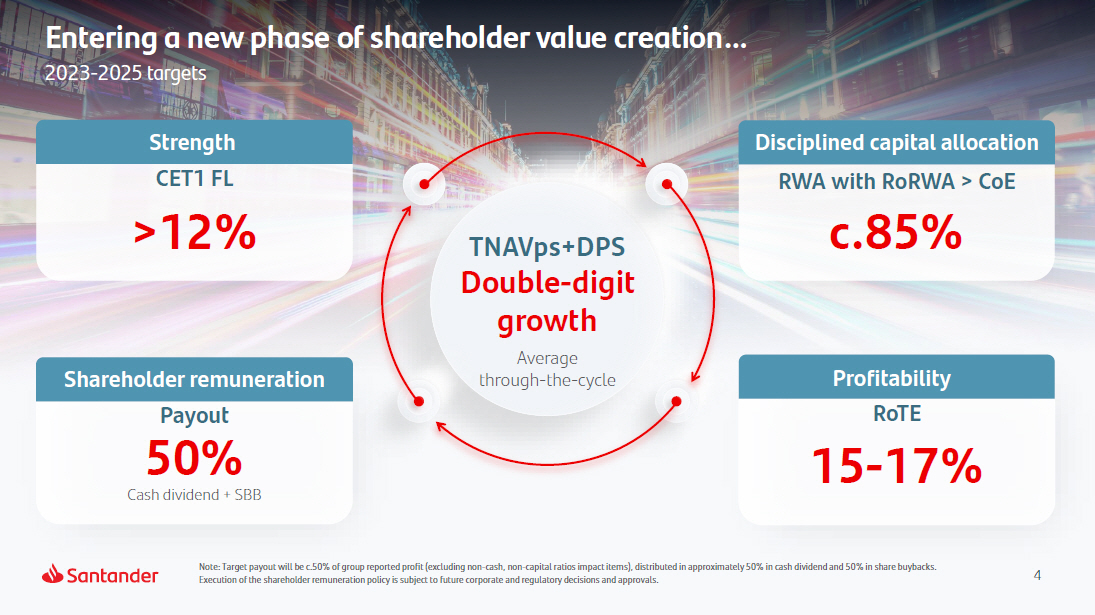
4 P r ofi t ab ili ty RoTE 15 - 17 % >12% St r ength CET1 FL c.85% Disciplined capital allocation RWA with RoRWA > CoE P a y out Cash dividend + SBB 50% Shareholder remuneration Note: Target payout will be c.50% of group reported profit (excluding non - cash, non - capital ratios impact items), distributed in approximately 50% in cash dividend and 50% in share buybacks. Execution of the shareholder remuneration policy is subject to future corporate and regulatory decisions and approvals. Entering a new phase of shareholder value creation… 2023 - 2025 targets TNAVps+DPS Double - digit growth Average through - the - cycle
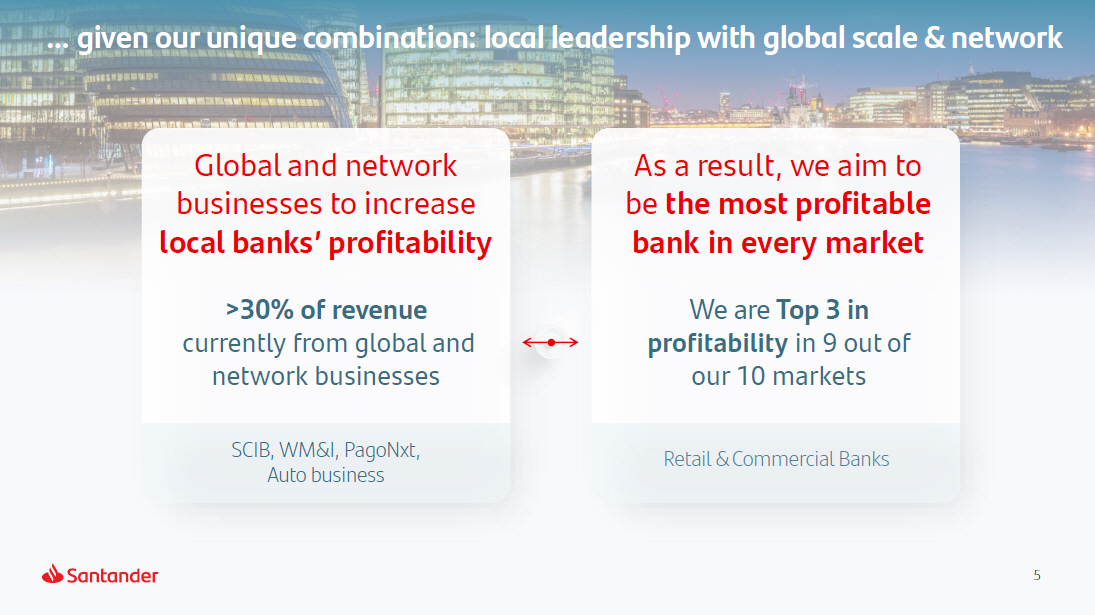
5 Global and network businesses to increase local banks’ profitability >30% of revenue currently from global and network businesses SCIB, WM&I, PagoNxt, Auto business As a result, we aim to be the most profitable bank in every market We are Top 3 in profitability in 9 out of our 10 markets Retail & Commercial Banks … given our unique combination: local leadership with global scale & network
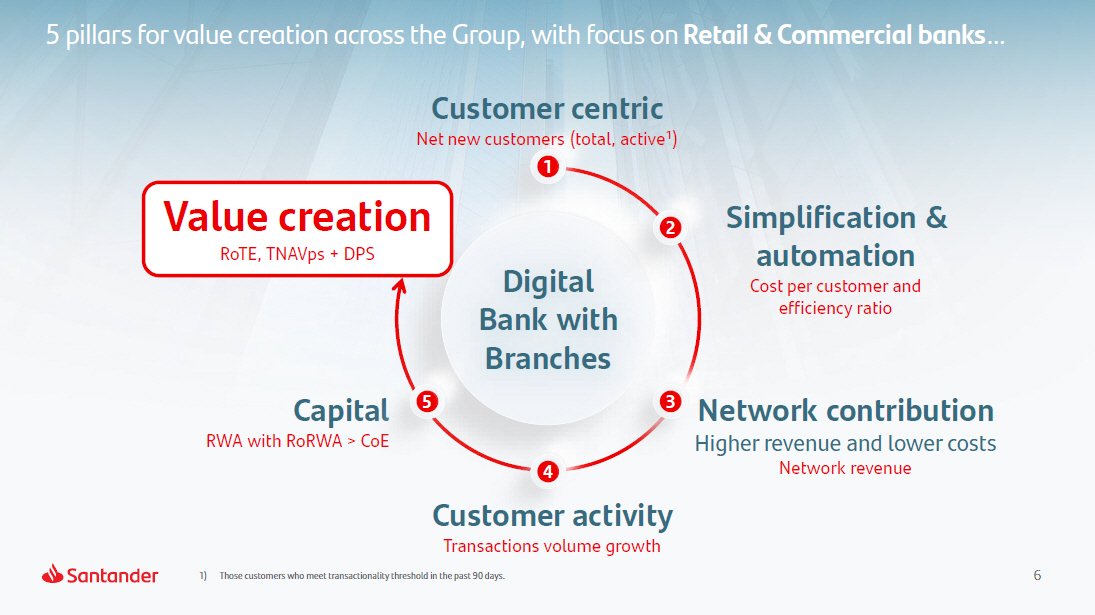
6 5 pillars for value creation across the Group, with focus on Retail & Commercial banks … Cap i t al RWA with RoRWA > CoE Dig i tal Bank with Branches 2 3 5 4 Customer activity Transactions volume growth 1) Those customers who meet transactionality threshold in the past 90 days. Customer centric Net new customers (total, active 1 ) 1 Network contribution Higher revenue and lower costs Network revenue Simplification & automation Cost per customer and efficiency ratio Value creation RoTE, TNAVps + DPS
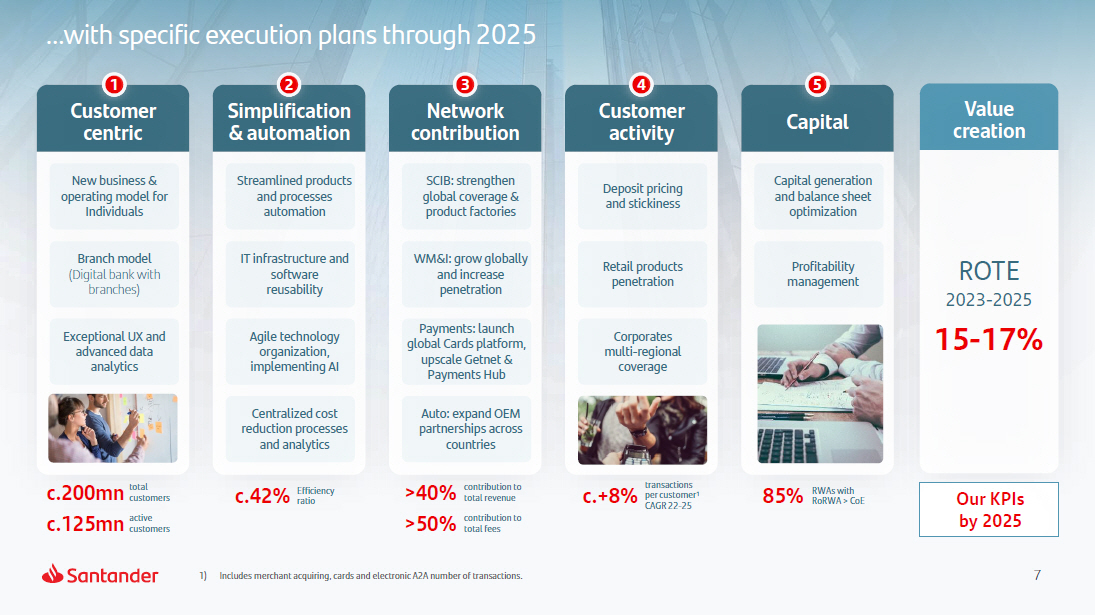
7 1) Includes merchant acquiring, cards and electronic A2A number of transactions. …with specific execution plans through 2025 Branch model (Digital bank with branches) Exceptional UX and advanced data analytics total cu s t o me r s active cu s t o me r s c . 2 00 mn c . 125 mn IT infrastructure and software reusability Agile technology organization, implementing AI c . 42 % E f f ic iency ratio Centralized cost reduction processes and analytics WM&I: grow globally and increase penetration Payments: launch global Cards platform, upscale Getnet & Payments Hub Auto: expand OEM partnerships across countries contribution to total revenue contribution to total fees >40% >50% Deposit pricing and stickiness Retail products penetration Corporates mu l t i - regio nal coverage Capital generation and balance sheet optimization Profitability manage me nt 85% RWAs with RoRWA > CoE Value creation c . + 8 % transactions 1 per customer CAGR 22 - 25 R O TE 2023 - 2025 15 - 17 % 1 C u s t omer centric New business & operating model for Individuals 2 Simp l i fi c ation & automation Streamlined products and processes automation 3 Network c on t ribution SCIB: strengthen global coverage & product factories 4 C u s t omer activity 5 C api t al Our KPIs by 2025
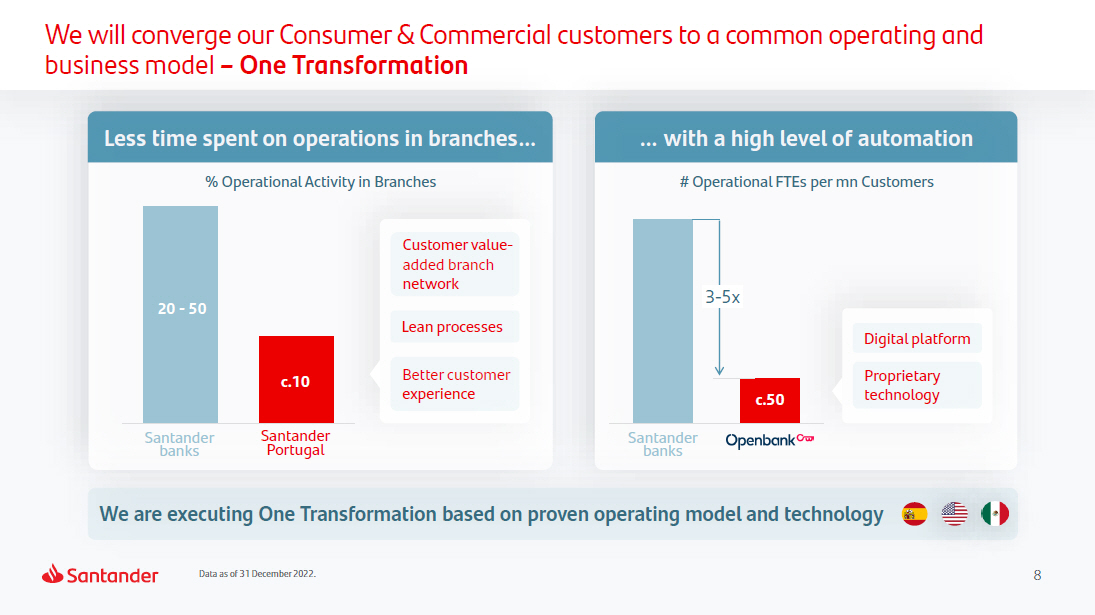
8 Data as of 31 December 2022. We will converge our Consumer & Commercial customers to a common operating and business model – One Transformation Santander b a n k s Less time spent on operations in branches… % Operational Activity in Branches Santander Portugal Santander b a n k s … with a high level of automation # Operational FTEs per mn Customers Customer value - added branch network Lean processes Better customer experience Digital platform P r opri e t a ry t e c h n o l ogy 3 - 5 x We are executing One Transformation based on proven operating model and technology 20 - 50 c.10 c.50
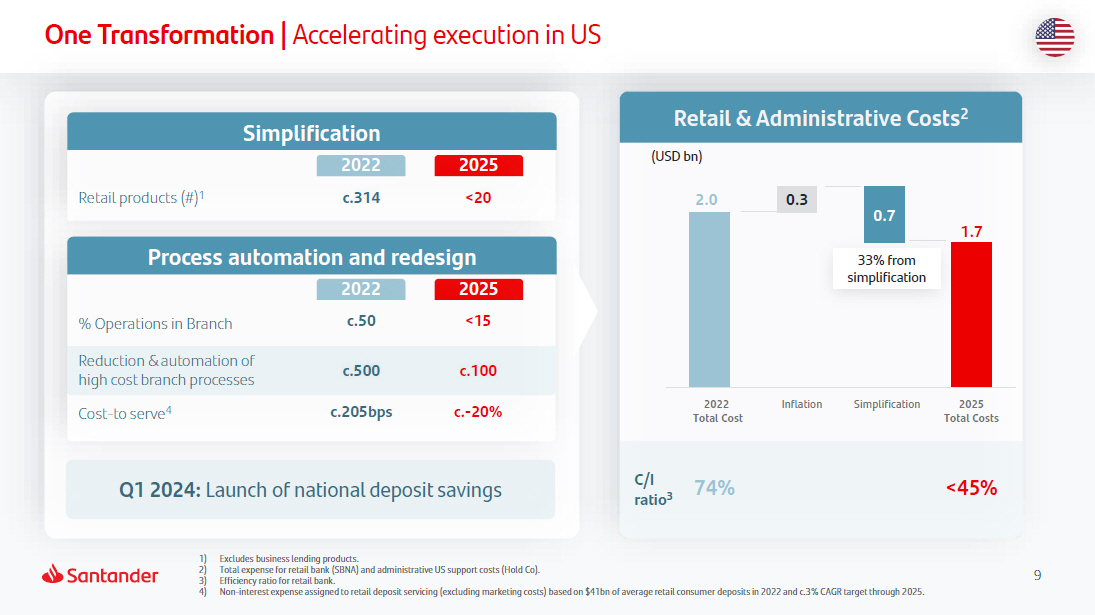
9 One Transformation | Accelerating execution in US 1) Excludes business lending products. 2) Total expense for retail bank (SBNA) and administrative US support costs (Hold Co). 3) Efficiency ratio for retail bank. 4) Non - interest expense assigned to retail deposit servicing (excluding marketing costs) based on $41bn of average retail consumer deposits in 2022 and c.3% CAGR target through 2025. 1 .7 2.0 0.3 0.7 Retail & Administrative Costs 2 (USD bn) 2022 Total Cost Inf la t ion Simplification 2025 Total Costs 33% from s i m pli f ication C/I r at io 3 74% <45% Q1 2024: Launch of national deposit savings Retail products (#) 1 Simplification 2022 c.314 2025 <20 Process automation and redesign 202 2 2025 % Operations in Branch c.50 <15 Reduction & automation of high cost branch processes c.500 c.100 Cost - to serve 4 c.205bps c. - 20%
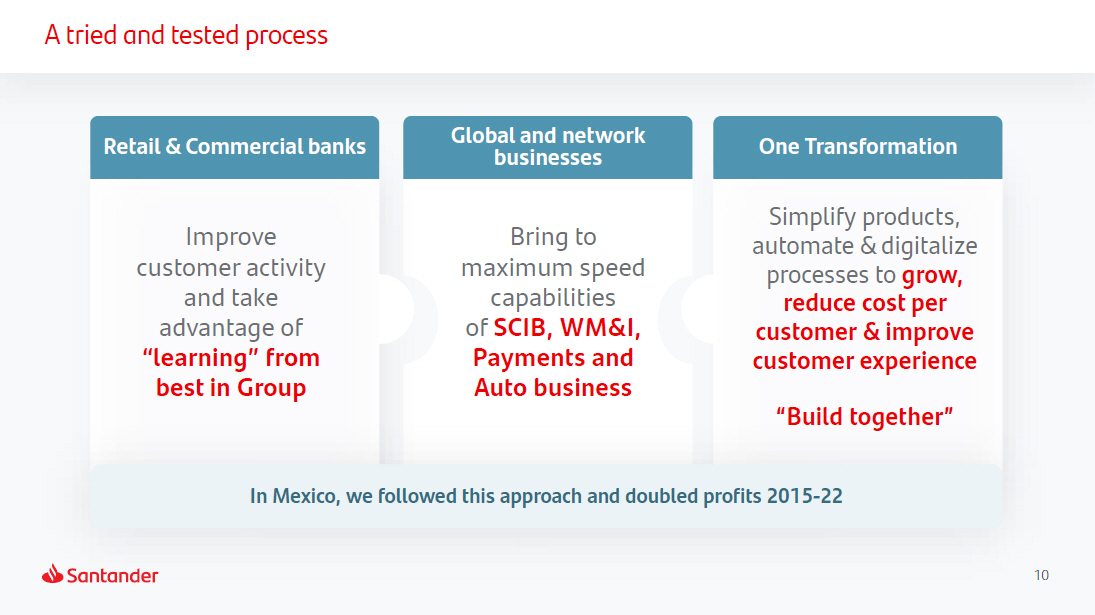
10 A tried and tested process Retail & Commercial banks Global and network bus i n e ss e s One Transformation Improve customer activity and take advantage of “learning” from best in Group Bring to maximum speed capabilities of SCIB, WM&I, Payments and Auto business Simplify products, automate & digitalize processes to grow, reduce cost per customer & improve customer experience “Build together” In Mexico, we followed this approach and doubled profits 2015 - 22
11 Aiming to be the most profitable bank in each
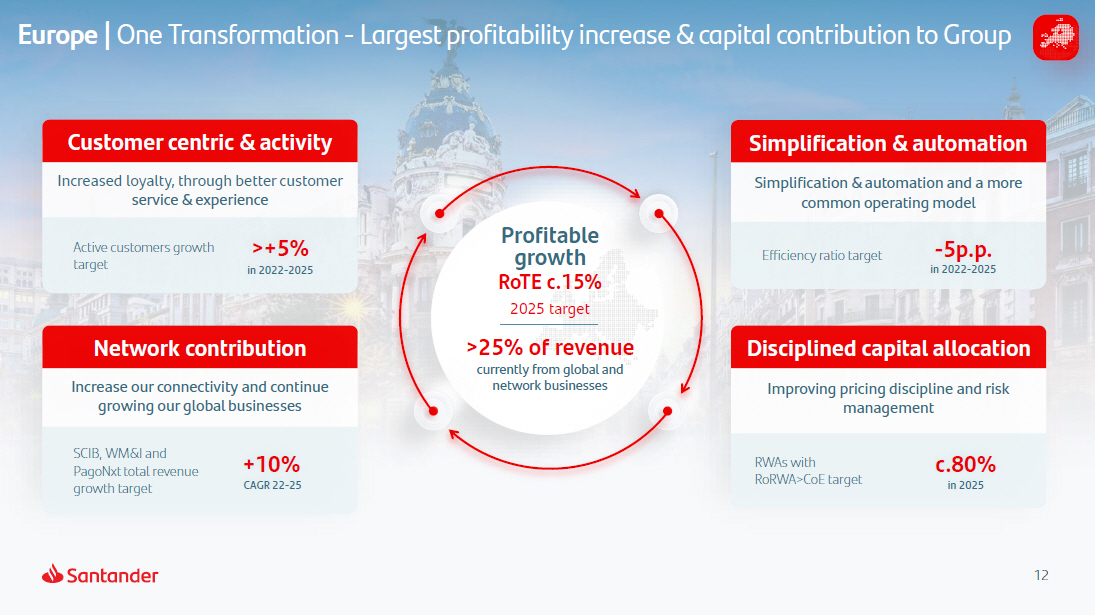
12 Europe | One Transformation - Largest profitability increase & capital contribution to Group Customer centric & activity Increased loyalty, through better customer service & experience Active customers growth target >+5% in 2022 - 2025 Simplification & automation Simplification & automation and a more common operating model Efficiency ratio target - 5p.p. in 2022 - 2025 Network contribution Increase our connectivity and continue growing our global businesses SCIB, WM&I and PagoNxt total revenue growth target +10% CAGR 22 - 25 Disciplined capital allocation Improving pricing discipline and risk management RWAs with RoRWA>CoE target c.80% in 2025 Profitable growth RoTE c.15% 2025 target >25% of revenue currently from global and network businesses
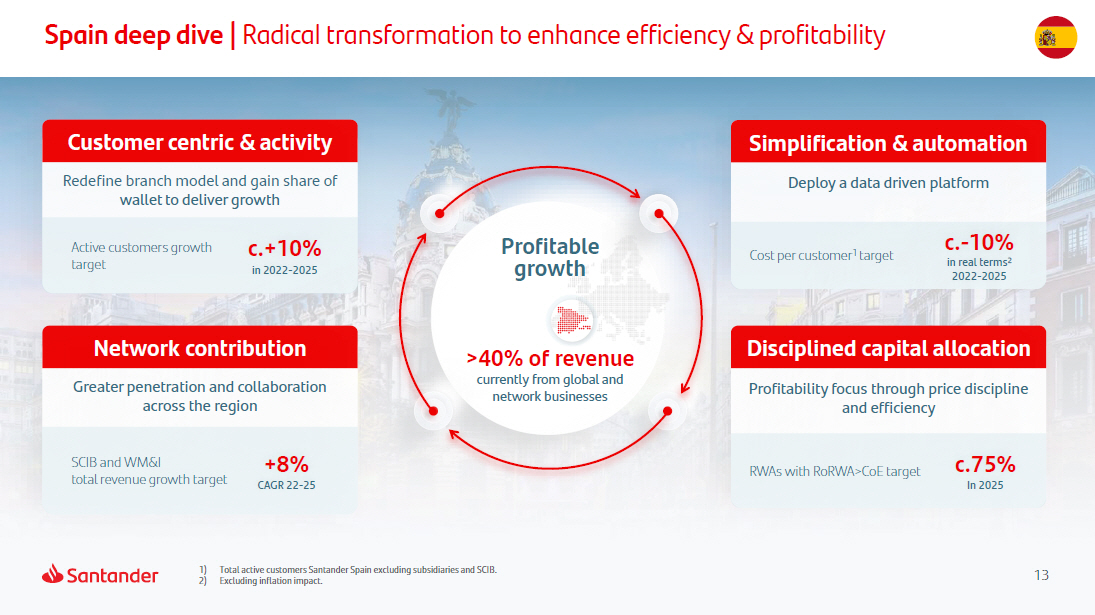
13 1) Total active customers Santander Spain excluding subsidiaries and SCIB. 2) Excluding inflation impact. Spain deep dive | Radical transformation to enhance efficiency & profitability Customer centric & activity Redefine branch model and gain share of wallet to deliver growth Simplification & automation Deploy a data driven platform Network contribution Greater penetration and collaboration across the region Disciplined capital allocation Profitability focus through price discipline and efficiency Active customers growth target c.+10% in 2022 - 2025 SCIB and WM&I total revenue growth target +8% CAGR 22 - 25 Cost per customer 1 target c. - 10% in real terms 2 2022 - 2025 RWAs with RoRWA>CoE target c.75% In 2025 Profitable g r o wth >40% of revenue currently from global and network businesses
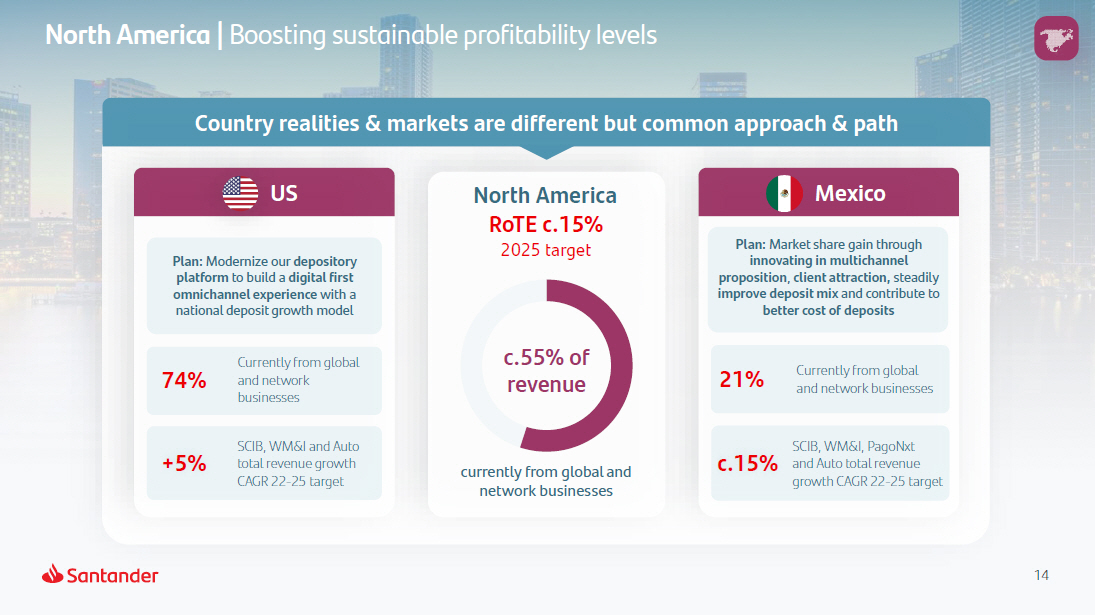
14 North America | Boosting sustainable profitability levels US c.55% of revenue currently from global and network businesses +5% SCIB, WM&I and Auto total revenue growth CAGR 22 - 25 target 74% Currently from global and network businesses Plan : Modernize our depository platform to build a digital first omnichannel experience with a national deposit growth model c.15% SCIB, WM&I, PagoNxt and Auto total revenue growth CAGR 22 - 25 target Mexico Plan: Market share gain through innovating in multichannel proposition , client attraction, steadily improve deposit mix and contribute to better cost of deposits North America RoTE c.15% 2025 target 21% Currently from global and network businesses Country realities & markets are different but common approach & path
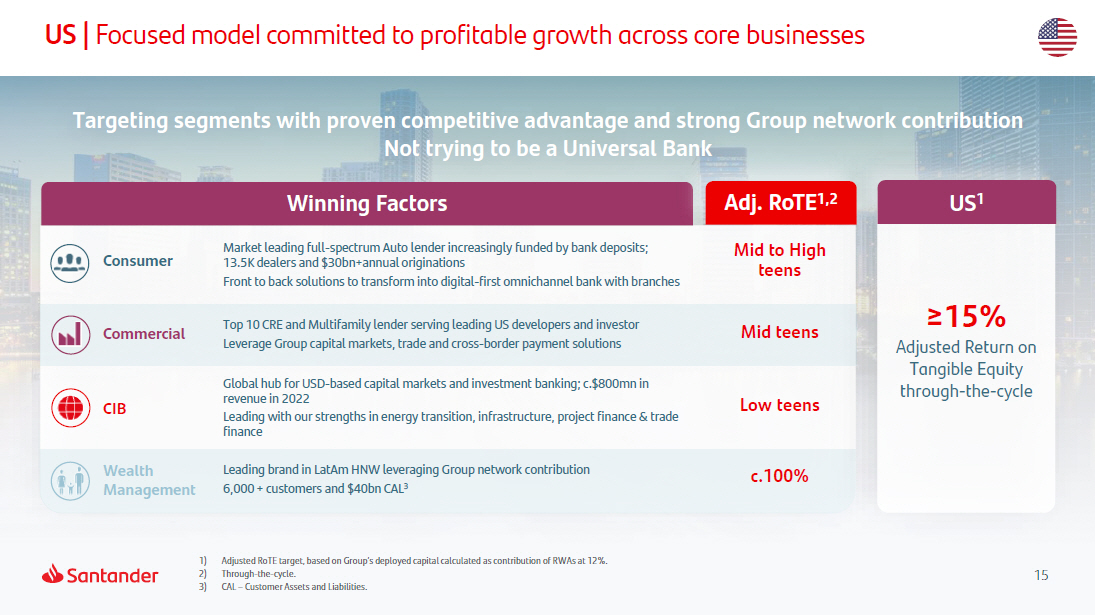
15 US | Focused model committed to profitable growth across core businesses 1) Adjusted RoTE target, based on Group’s deployed capital calculated as contribution of RWAs at 12%. 2) Through - the - cycle. 3) CAL – Customer Assets and Liabilities. Targeting segments with proven competitive advantage and strong Group network contribution Not trying to be a Universal Bank Winning Factors US 1 ≥15% Adjusted Return on Tangible Equity t hroug h - t h e - cyc l e Adj. RoTE 1,2 Mid to High teens Mid teens Low teens c. 1 0 0% Market leading full - spectrum Auto lender increasingly funded by bank deposits; 13.5K dealers and $30bn+annual originations Front to back solutions to transform into digital - first omnichannel bank with branches Top 10 CRE and Multifamily lender serving leading US developers and investor Leverage Group capital markets, trade and cross - border payment solutions Global hub for USD - based capital markets and investment banking; c.$800mn in revenue in 2022 Leading with our strengths in energy transition, infrastructure, project finance & trade finance Leading brand in LatAm HNW leveraging Group network contribution 6,000 + customers and $40bn CAL 3 C om m e r c ial CIB Wealth Mana g e m e n t Consumer
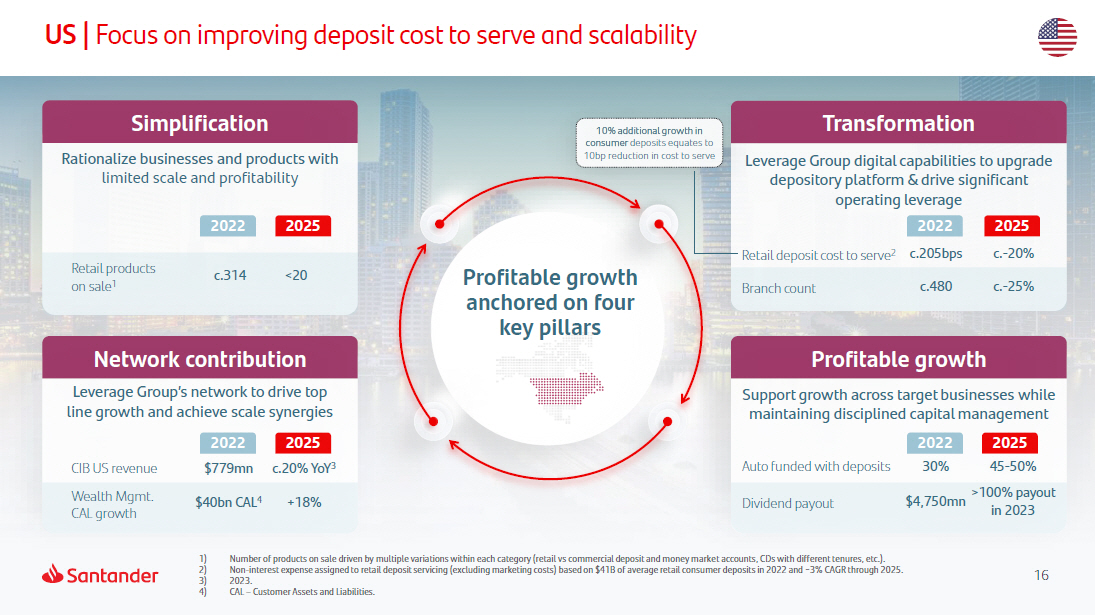
16 1) 2) 3) 4) Number of products on sale driven by multiple variations within each category (retail vs commercial deposit and money market accounts, CDs with different tenures, etc.). Non - interest expense assigned to retail deposit servicing (excluding marketing costs) based on $41B of average retail consumer deposits in 2022 and ~3% CAGR through 2025. 2023. CAL – Customer Assets and Liabilities. US | Focus on improving deposit cost to serve and scalability Network contribution Profitable growth Profitable growth anchored on four key pillars Retail products on sale 1 c.314 <20 CIB US revenue $779mn c.20% YoY 3 Wealth Mgmt. CAL growth $40bn CAL 4 +18% Leverage Group’s network to drive top line growth and achieve scale synergies 2022 2025 Simplification Rationalize businesses and products with limited scale and profitability 2022 2025 Support growth across target businesses while maintaining disciplined capital management 2022 2025 Auto funded with deposits 30% 45 - 50% Dividend payout $4,750mn >100% payout in 2023 Transformation Leverage Group digital capabilities to upgrade depository platform & drive significant operating leverage 2022 2025 Retail deposit cost to serve 2 c.205bps c. - 20% Branch count c.480 c. - 25% 10% additional growth in consumer deposits equates to 10bp reduction in cost to serve
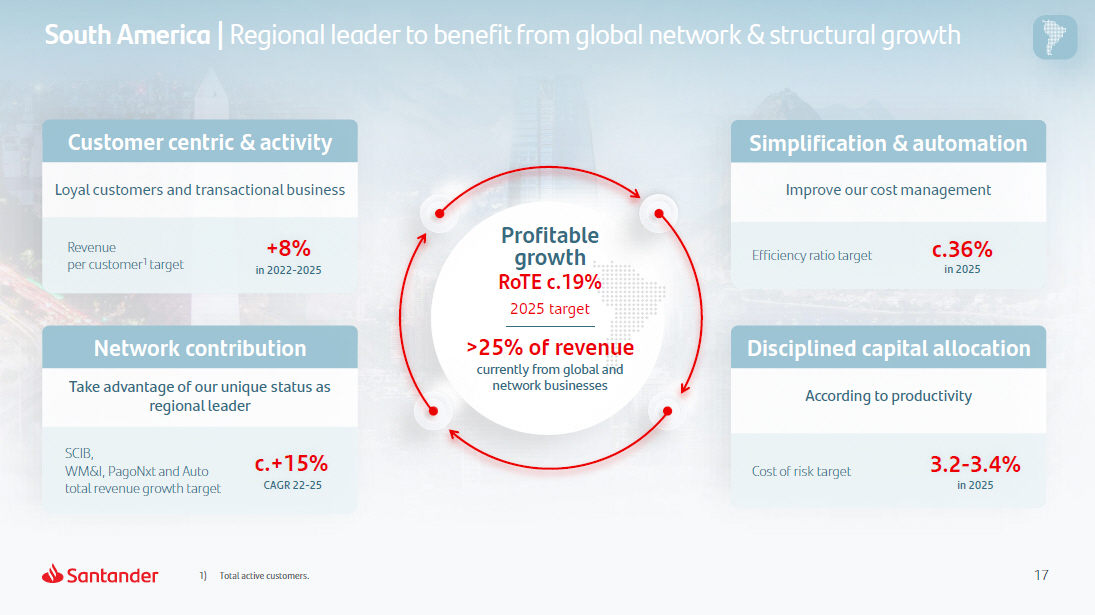
17 1) Total active customers. South America | Regional leader to benefit from global network & structural growth Customer centric & activity Loyal customers and transactional business Simplification & automation Improve our cost management Network contribution Take advantage of our unique status as regional leader Disciplined capital allocation According to productivity Revenue per customer 1 target +8% in 2022 - 2025 SCIB, WM&I, PagoNxt and Auto total revenue growth target c.+15% CAGR 22 - 25 Efficiency ratio target c.36% in 2025 Cost of risk target 3.2 - 3.4% in 2025 Profitable growth RoTE c.19% 2025 target >25% of revenue currently from global and network businesses
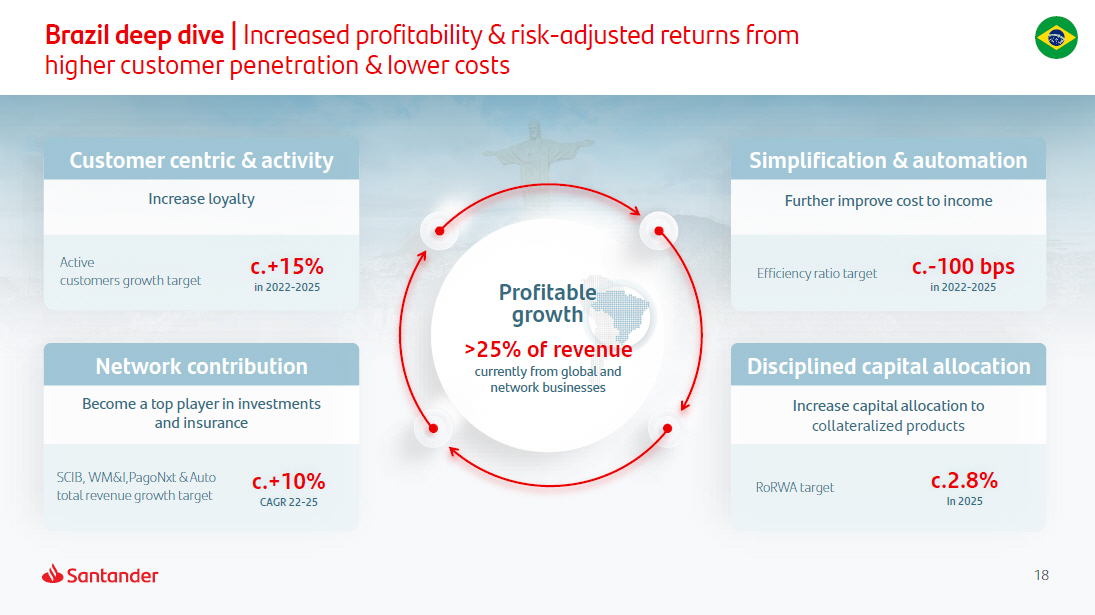
18 Brazil deep dive | Increased profitability & risk - adjusted returns from higher customer penetration & lower costs Customer centric & activity Increase loyalty Simplification & automation Further improve cost to income Network contribution Become a top player in investments and insurance Disciplined capital allocation Increase capital allocation to collateralized products Profitable growth >25% of revenue currently from global and network businesses SCIB, WM&I,PagoNxt & Auto total revenue growth target c. + 1 0% CAGR 22 - 25 RoRWA target c.2.8% In 2025 Active customers growth target c.+15% in 2022 - 2025 Efficiency ratio target c. - 100 bps in 2022 - 2025
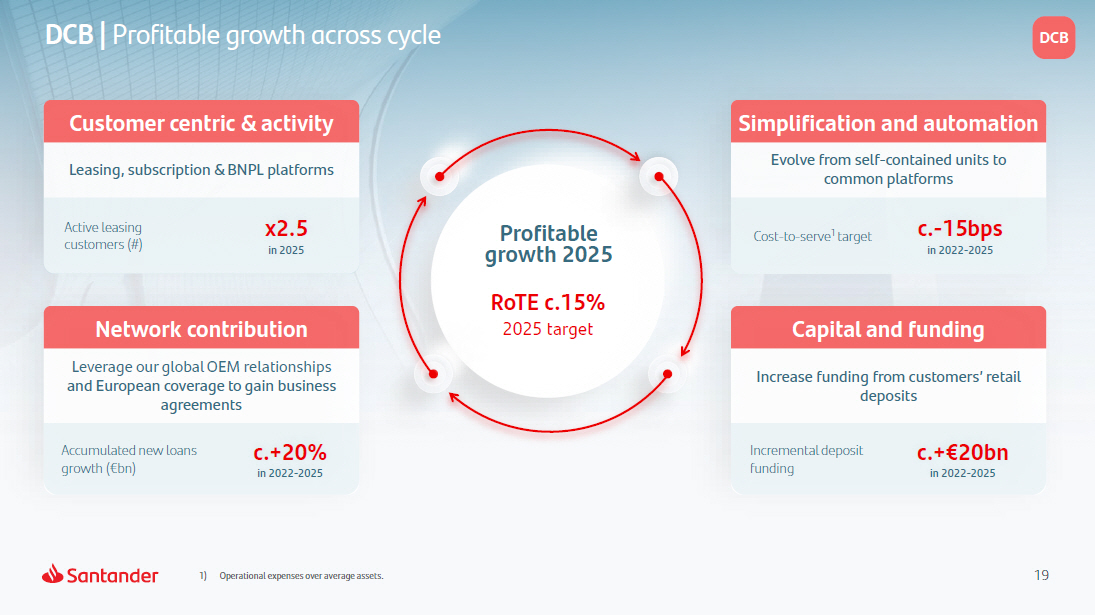
19 1) Operational expenses over average assets. DCB | Profitable growth across cycle DCB Profitable growth 2025 Customer centric & activity Leasing, subscription & BNPL platforms Simplification and automation Evolve from self - contained units to common platforms Network contribution Leverage our global OEM relationships and European coverage to gain business agreements Capital and funding Increase funding from customers’ retail deposits Active leasing customers (#) x2.5 in 2025 Cost - to - serve 1 target c. - 15bps in 2022 - 2025 Accumulated new loans growth (€bn) c.+20% in 2022 - 2025 Incremental deposit funding c.+€20bn in 2022 - 2025 RoTE c.15% 2025 target
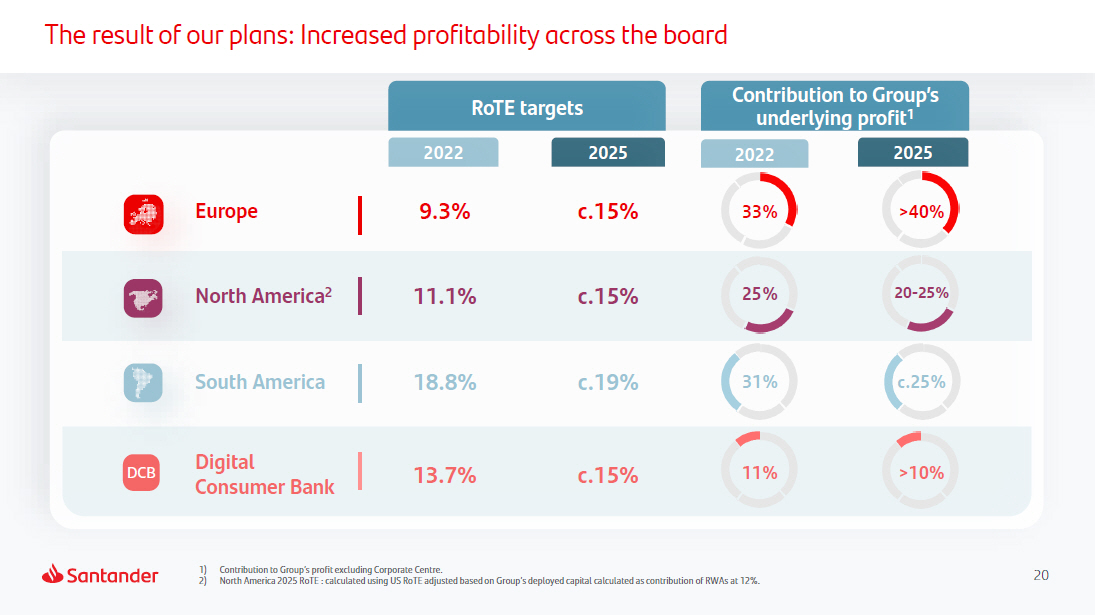
20 1) Contribution to Group’s profit excluding Corporate Centre. 2) North America 2025 RoTE : calculated using US RoTE adjusted based on Group’s deployed capital calculated as contribution of RWAs at 12%. The result of our plans: Increased profitability across the board RoTE targets Contribution to Group’s underlying profit 1 2022 2025 2022 2025 Europe 9.3% c.15% 33% >40% North America 2 11.1% c.15% 25% 20 - 25% South America 18.8% c.19% 31% c.25% DCB Digital Consumer Bank 13.7% c.15% 11% >10%
S CIB Santander Corporate and Investment Banking WM&I Wealth Management and Insurance A u t o 21 P P a a y g m oN e x n t ts
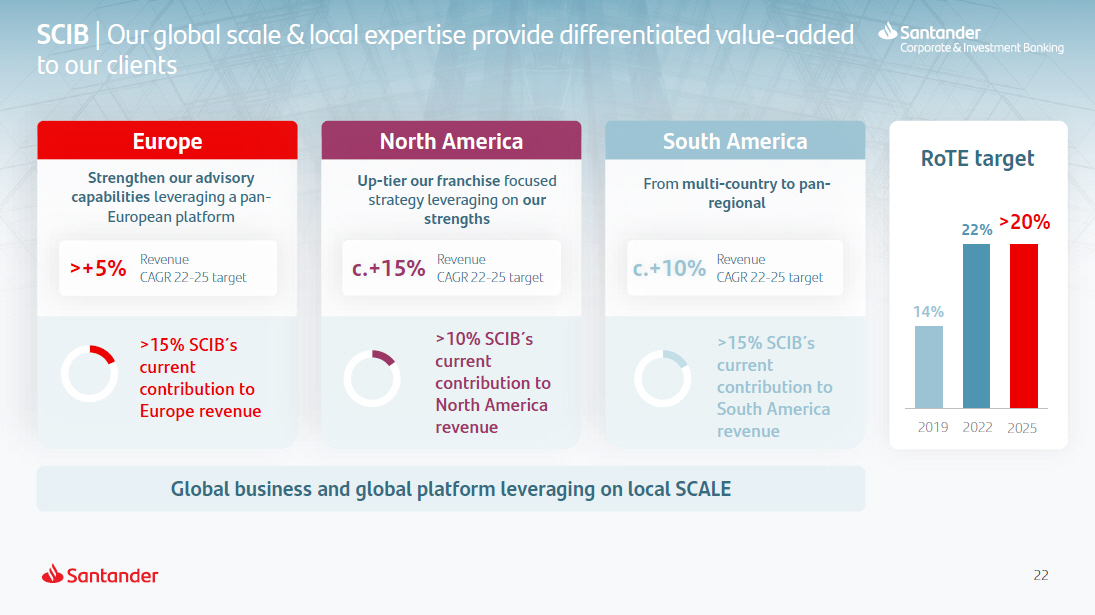
22 SCIB | Our global scale & local expertise provide differentiated value - added to our clients RoTE target 2019 2022 2025 >15% SCIB Dz s current contribution to Europe revenue Europe Strengthen our advisory capabilities leveraging a pan - European platform >10% SCIB Dz s current contribution to North America re ven u e North America Up - tier our franchise focused strategy leveraging on our strengths >15% SCIB Dz s current contribution to South America reven u e South America From multi - country to pan - regional 14% 22% >20% Global business and global platform leveraging on local SCALE >+5% Revenue CAGR 22 - 25 target c.+15% Revenue CAGR 22 - 25 target c.+10% Revenue CAGR 22 - 25 target
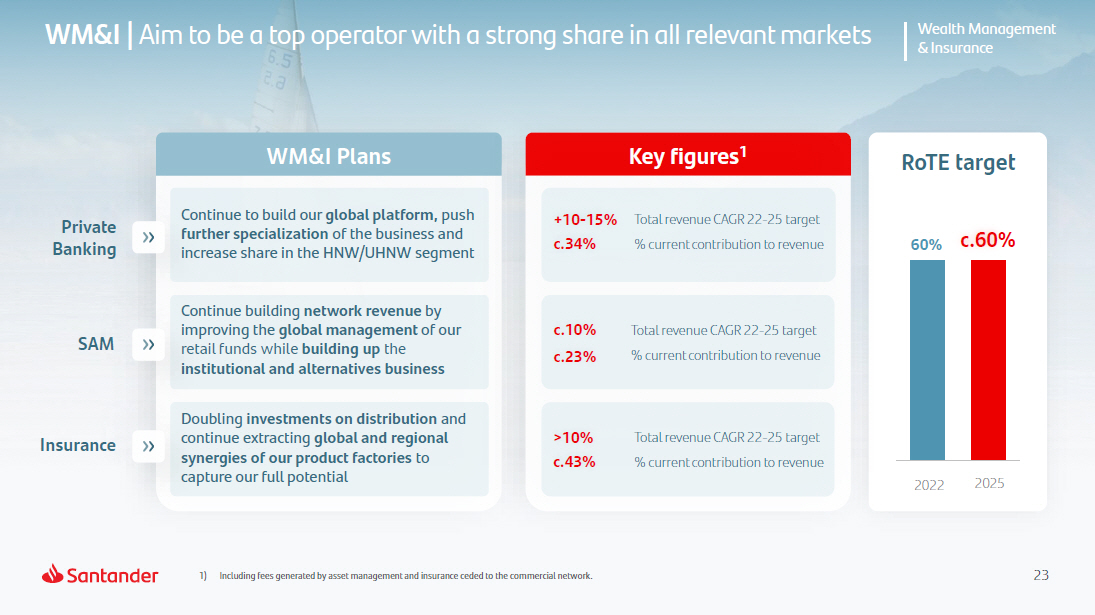
23 1) Including fees generated by asset management and insurance ceded to the commercial network. WM&I | Aim to be a top operator with a strong share in all relevant markets RoTE target WM&I Plans c . 6 0 % 2022 2025 60% Continue to build our global platform, push further specialization of the business and increase share in the HNW/UHNW segment Pr i v a t e B a nking SAM Insurance Continue building network revenue by improving the global management of our retail funds while building up the institutional and alternatives business Doubling investments on distribution and continue extracting global and regional synergies of our product factories to capture our full potential Key figures 1 +10 - 15% c.34% Total revenue CAGR 22 - 25 target % current contribution to revenue c .1 0% c .2 3 % Total revenue CAGR 22 - 25 target % current contribution to revenue >10% c .4 3 % Total revenue CAGR 22 - 25 target % current contribution to revenue Wealth Management & Insurance
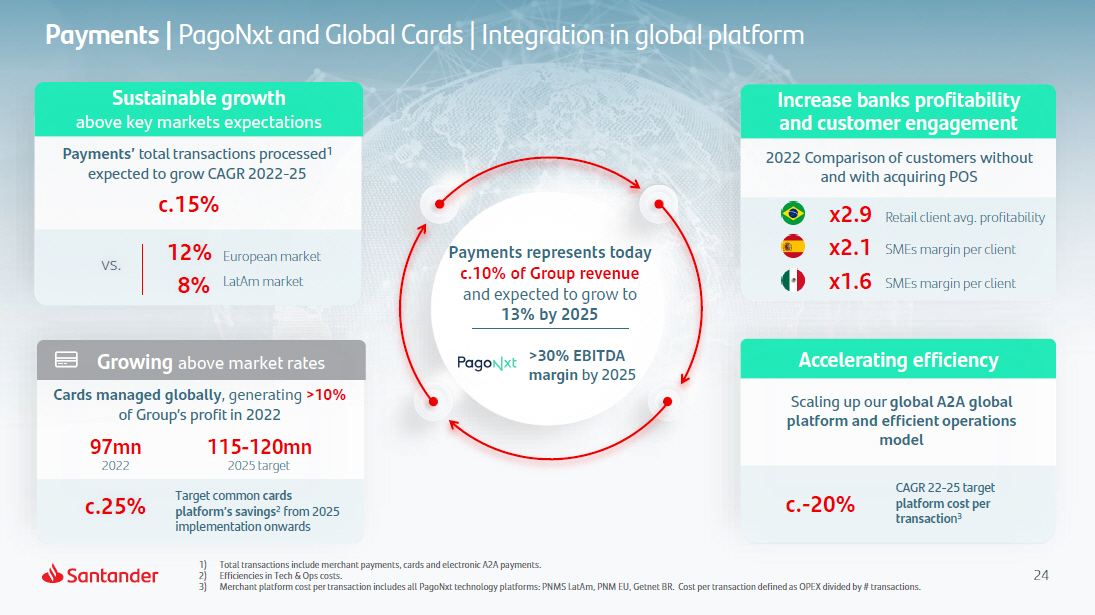
24 1) Total transactions include merchant payments, cards and electronic A2A payments. 2) Efficiencies in Tech & Ops costs. 3) Merchant platform cost per transaction includes all PagoNxt technology platforms: PNMS LatAm, PNM EU, Getnet BR. Cost per transaction defined as OPEX divided by # transactions. Payments | PagoNxt and Global Cards | Integration in global platform v s . Sustainable growth above key markets expectations Payments’ total transactions processed 1 expected to grow CAGR 2022 - 25 c.15% Increase banks profitability and customer engagement 2022 Comparison of customers without and with acquiring POS x 2 . 9 x 2 . 1 x 1 . 6 Retail client avg. profitability SMEs margin per client SMEs margin per client Accelerating efficiency Scaling up our global A2A global platform and efficient operations model Growing above market rates Cards managed globally , generating >10% of Group’s profit in 2022 8% 12% European market LatAm market Payments represents today c.10% of Group revenue and expected to grow to 13% by 2025 >30% EBITDA margin by 2025 c. - 20% CAGR 22 - 25 target platform cost per transactio n 3 97mn 2022 c.25% 115 - 120mn 2025 target Target common cards platform’s savings 2 from 2025 implementation onwards

25 1) Adjusted based on Group’s deployed capital calculated as contribution of RWAs at 12%. Leverage our global OEM relationships to expand the business across our global footprint Profitable growth Adj. RoTE 1 target >15% Sustainable growth above the market average Continue to grow above the market leveraging our OEM relationships Global OEM relationships in Europe and the Americas Strengthen our global OEM relationships Build a leadership position in leasing Leasing & subscription business Capture the value of our digital proprietary mobility platforms Auto loans & leases growth globally (€bn) target >20% in 2022 - 25 >60 0 K Auto fleet Top 5 in Europe Activity related to global OEMs 2025 40 - 45 % 2022 >40% 2025 Target

O u r
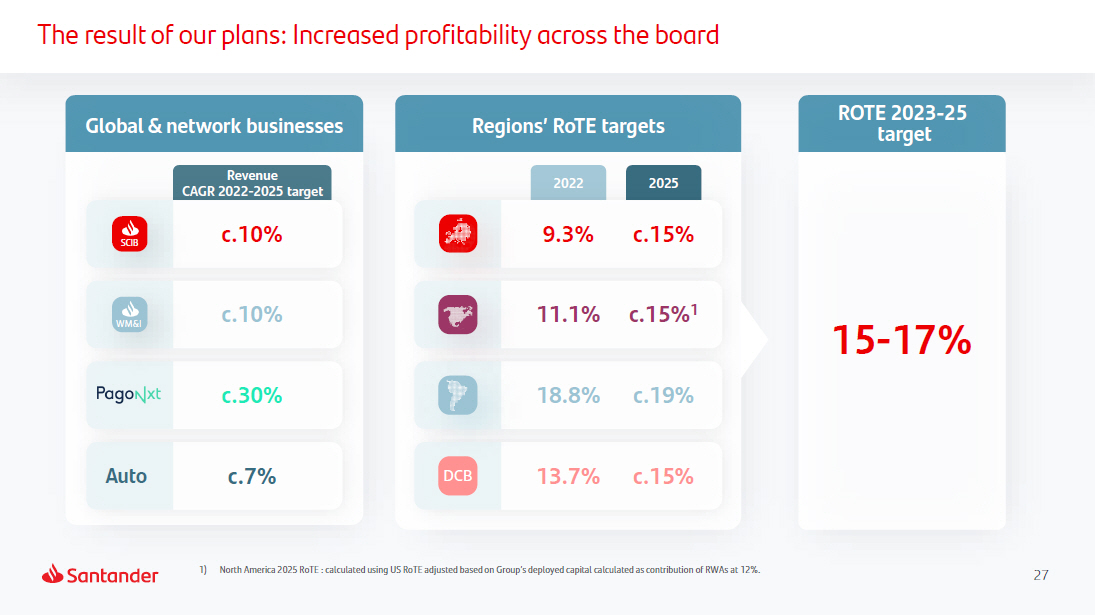
27 1) North America 2025 RoTE : calculated using US RoTE adjusted based on Group’s deployed capital calculated as contribution of RWAs at 12%. Global & network businesses Regions’ RoTE targets 15 - 17 % ROTE 2023 - 25 target Revenue CAGR 2022 - 2025 target S CIB c.10% A u t o c.7% c.30% W M &I c.10% 2022 2025 9.3% c.15% 13.7% c.15% D CB 18.8% c.19% 11.1% c.15% 1 The result of our plans: Increased profitability across the board

28 P r ofi t ab ili ty RoTE 15 - 17 % >12% St r ength CET1 FL c.85% Disciplined capital allocation RWA with RoRWA > CoE P a y out Cash dividend + SBB 50% Shareholder remuneration Note: Target payout will be c.50% of group reported profit (excluding non - cash, non - capital ratios impact items), distributed in approximately 50% in cash dividend and 50% in share buybacks. Execution of the shareholder remuneration policy is subject to future corporate and regulatory decisions and approvals. Entering a new phase of shareholder value creation 2023 - 2025 targets TNAVps+DPS Double - digit growth Average through - the - cycle

2 9 Our purpose is to help people and business prosper. Our culture is based on believing that everything we do should be: Thank You.
SIGNATURE
Pursuant to the requirements of the Securities Exchange Act of 1934, the registrant has duly caused this report to be signed on its behalf by the undersigned, thereunto duly authorized.
| Banco Santander, S.A. | |||||
| Date: | February 28, 2023 | By: | /s/ Pedro de Mingo Kaminouchi | ||
| Name: | Pedro de Mingo Kaminouchi | ||||
| Title: | Head of Regulatory Compliance | ||||