UNITED STATES
SECURITIES AND EXCHANGE COMMISSION
Washington, D.C. 20549
FORM N-CSR
CERTIFIED SHAREHOLDER REPORT OF REGISTERED
MANAGEMENT INVESTMENT COMPANIES
Investment Company Act file number: 811-7170
TCW Funds, Inc.
(Exact name of registrant as specified in charter)
865 South Figueroa Street, Suite 1800, Los Angeles, CA 90017
(Address of principal executive offices)
Patrick W. Dennis, Esq.
Assistant Secretary
865 South Figueroa Street, Suite 1800
Los Angeles, CA 90017
(Name and address of agent for service)
Registrant’s telephone number, including area code: (213) 244-0000
Date of fiscal year end: October 31
Date of reporting period: October 31, 2016
| Item 1. | Report to Shareholders. |
OCTOBER 31
2016
ANNUAL REPORT
TCW EQUITY FUNDS
TCW Focused Equities Fund TCW Global Real Estate Fund TCW Growth Equities Fund TCW High Dividend Equities Fund
TCW New America Premier Equities Fund TCW Relative Value Dividend Appreciation Fund TCW Relative Value Large Cap Fund TCW Relative Value Mid Cap Fund TCW Select Equities Fund TCW Small Cap Growth Fund
ASSET ALLOCATION FUND
TCW Conservative Allocation Fund
TCW Funds, Inc.
| 1 | ||||
| 4 | ||||
| 30 | ||||
| 30 | ||||
| 32 | ||||
| 36 | ||||
| 39 | ||||
| 43 | ||||
| 47 | ||||
| 51 | ||||
| 55 | ||||
| 59 | ||||
| 63 | ||||
| 66 | ||||
| 71 | ||||
| 74 | ||||
| 77 | ||||
| 83 | ||||
| 102 | ||||
| 124 | ||||
| 125 | ||||
| 128 | ||||
| 130 | ||||
Proxy Voting Guidelines and Availability of Quarterly Portfolio Schedule | 133 | |||
| 134 | ||||
| 135 | ||||
| The Letter to Shareholders and/or Management Discussions contained in this Annual Report are the opinions of each Fund’s portfolio managers and are not the opinions of TCW Funds, Inc. or its Board of Directors. Various matters discussed in the Letter to Shareholders and/or Management Discussions constitute forward-looking statements within the meaning of the federal securities laws. Actual results and the timing of certain events could differ materially from those projected or contemplated by these forward-looking statements due to a number of factors, including general economic conditions, overall availability of securities for investment by a Fund, the level of volatility in the securities markets and in the share price of a Fund, and other risk factors discussed in the SEC filings of TCW Funds, Inc. The data presented in the Letter to Shareholders and/or Management Discussions represents past performance and cannot be used to predict future results. |
|
| David S. DeVito President, Chief Executive Officer and Director |

Dear Valued Investors,
It is my pleasure to present the 2016 annual report for the TCW Funds, Inc. covering the 12-month period ended October 31, 2016. I would like to express our appreciation for your continued investment in the TCW Funds as well as welcome new shareholders to our fund family. As of October 31, 2016, the TCW Funds held total net assets of approximately $19.2 billion.
This report contains information and portfolio management discussions of our TCW Equity Funds and our TCW Allocation Fund.
The U.S. Stock Market
U.S. stocks (S&P 500 Index) posted a 4.50% total return for the year ended October 31, 2016. Equities ended the year in very much the same mode as they began the year, grappling in each case with the prospect of a Fed interest rate hike at its December meeting. Indeed, the macroeconomic narrative for much of the year centered around the Fed’s attempts to proceed with the normalization of interest rates after over seven years of extraordinary monetary accommodation and near-zero rates. Yet, concerns about anemic U.S. GDP growth, the growth slowdown in China, mixed results from Abenomics in Japan, and renewed concerns about the health of the Eurozone’s banking sector forced the Fed to relent on its original intentions to raise interest rates multiple times over the course of the year. Also, the uncertainty associated with the surprise Brexit vote result in the UK at the end of June led to an additional bout of financial market volatility, as did the run-up to the recent U.S. presidential election.
Despite the challenging macroeconomic backdrop, stocks were able to advance as the Fed’s accommodative stance provided continued support to risk assets including equities, and stock market leadership was squarely focused on bond proxies such as utility stocks. Given the defensive tone of the market, our equity funds struggled to
keep pace with their respective benchmarks during the period. Our growth-oriented funds were generally hurt by the substantial multiple compression experienced by growth names in the technology and healthcare sectors, especially given the pre-election headline risk associated with the latter, while many names in our value-oriented funds were hurt by global growth fears and the impact of a weaker U.S. dollar. Stocks finished the year appearing fairly valued, trading at roughly 16 times forward earnings, which is just slightly above the average over the past three decades.
Looking Ahead
On the positive side, earnings growth expectations may have troughed at the mid-single digit level for calendar year 2016, but admittedly the U.S. economy’s economic growth prospects will have to show improvement in order for consensus estimates for double-digit earnings growth in 2017 to materialize. The election victory of President-elect Trump represents a tectonic shift in the U.S. political landscape and portends major realignments in the policy priorities of the country with broad implications for the economy and financial markets. While the uncertainty associated with this dramatic shift in the political backdrop is likely to result in heightened volatility in the near term — particularly with respect to specific industries as proposed policy details become known — corporate America is well-positioned to avail itself of opportunities that may develop in the coming months and years, which bodes well for stocks over the medium and longer term.
An Update on the TCW Equity Funds
There were a few updates to our fund family over the past twelve months that we would like to note for our investors:
| • | Effective February 1, 2016, TCW launched the TCW New America Premier Equities Fund (TGUSX/TGUNX). The Fund seeks long-term capital appreciation by investing |
1
Letter to Shareholders (Continued) |
in a portfolio of companies the portfolio manager believes are enduring, cash generating businesses whose leaders prudently manage their environmental, social and financial resources and whose shares are attractively valued relative to the free cash flow generated by the businesses. The Fund is managed by Joseph Shaposhnik, Senior Vice President. |
| • | Effective September 30, 2016 the TCW Concentrated Value Fund (TGFFX/ TGFVX) changed its name to the TCW Focused Equities Fund. |
We know that you have many choices when it comes to the management of your financial assets. On behalf of everyone at TCW, I would like to thank you for making the TCW Funds part of your long-term investment plan. We
truly value our relationship with you. If you have any questions or require further information, I invite you to visit our website at www.tcw.com, or call our shareholder services department at 800-386-3829.
I wish you all the best in the coming year and look forward to further correspondence with you through our semi-annual report in 2017.
Sincerely,
David S. DeVito
President, Chief Executive Officer and Director
2
(THIS PAGE INTENTIONALLY LEFT BLANK)
3
TCW Conservative Allocation Fund
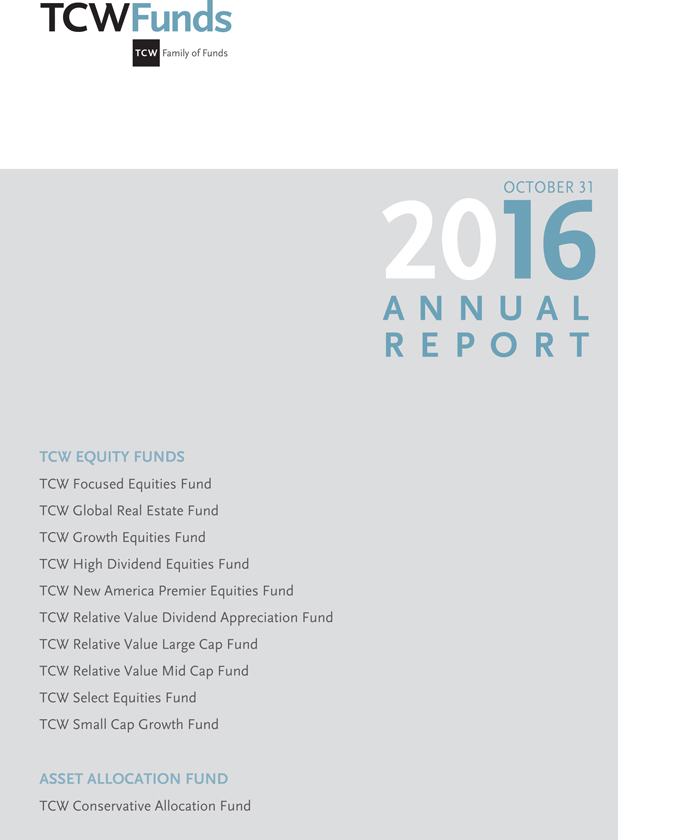
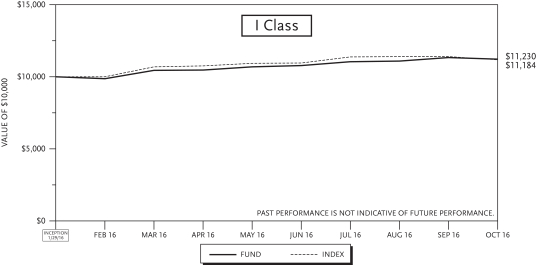
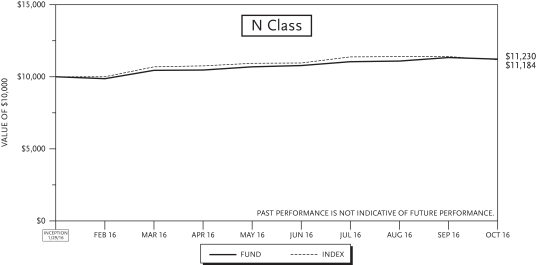
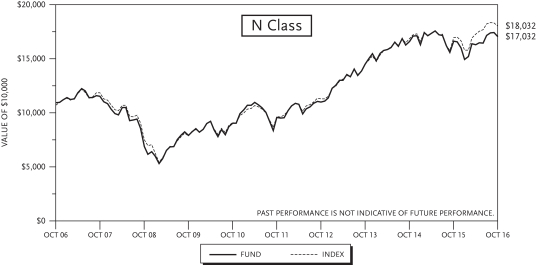
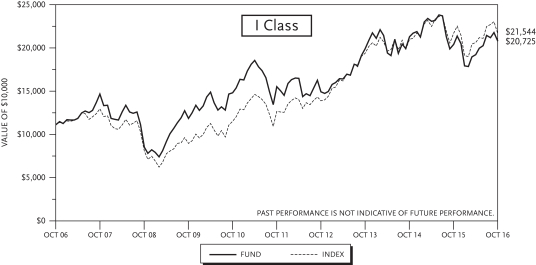
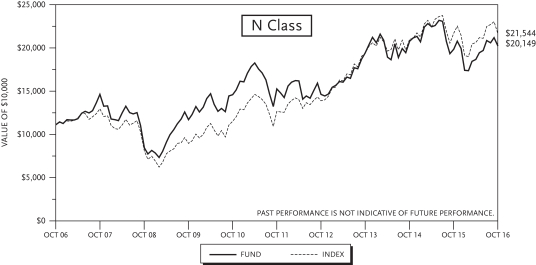
For the year ended October 31, 2016, the TCW Conservative Allocation Fund (the “Fund”) gained 0.78% and 0.31% on its I Class and N Class shares, respectively. The performance of the Fund’s classes varies because of differing expenses. The Fund’s blended benchmark of 40% S&P 500 Index and 60% Bloomberg Barclay U.S. Aggregate Bond Index returned 4.54% over the same period.
The Fund posted positive returns over the past year with a majority of the returns coming from both U.S. equities and U.S. fixed income. The strongest returns came from TCW I Gargoyle Hedged Value and MetWest Total Return Bond Funds. At the asset allocation level, the decision to overweight U.S. fixed income helped relative performance.
As of October, the allocation for the Fund was 39% in equities and 61% in fixed income, giving the Fund a slight underweight to equities and overweight in fixed income relative to its blended index. Over the past 12 months, the Fund has gradually reduced the allocation to U.S. equities, especially the allocations to mid-cap funds, as we feel that some profit taking is best. For the fixed income allocations we remain concentrated within high grade debt favoring mortgage-backed securities. The Fund had small allocations to both high yield and emerging market debt over the past year. Within fixed income allocation, the Fund has recently decreased the duration of its fixed income holdings; for example, an allocation to MetWest Low Duration Fund was added in the third quarter, as we anticipate higher interest rates in the near term.
Over the past year, U.S. equity markets continue to climb reaching all-time highs. The key drivers for these higher returns have been stronger than expected economic data along with strong corporate earnings growth. In addition, central banks are globally maintaining accommodative monetary policies, which are keeping global interest rates low. With the employment landscape improving, the housing sector continuing to show strength, consumer confidence rebounding, low interest rates globally, and expanding GDP growth, we feel confident the recovery will continue to expand and lead to a favorable backdrop for the equity markets. The fixed income markets continue to benefit from a globally low interest rate environment and easy monetary policies worldwide. We do however anticipate the Federal Reserve to increase interest rate in the near term.
4
TCW Conservative Allocation Fund
Management Discussions (Continued)
| Annualized Return(1) | ||||||||||||||||
| 1 Yr Return | 3 Yr Return | 5 Yr Return | Inception | |||||||||||||
TCW Conservative Allocation Fund | ||||||||||||||||
Class I – 11/16/2006 | 0.78 | % | 3.74 | % | 5.77 | % | 5.03 | % | ||||||||
Class N – 11/16/2006 | 0.31 | % | 3.20 | % | 5.30 | % | 4.79 | % | ||||||||
40% S&P 500 Index/60% Bloomberg Barclays U.S. Aggregate Bond Index | 4.54 | % | 5.75 | % | 7.20 | % | 5.71 | % | ||||||||

| (1) | The total returns do not reflect taxes that a shareholder would pay on fund distributions or on the redemption of fund shares. |
5
TCW Focused Equities Fund
Management Discussions
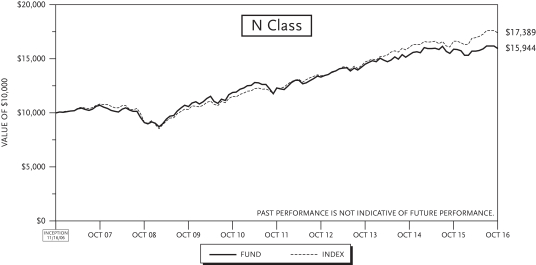
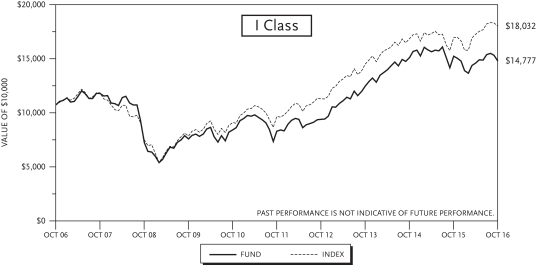
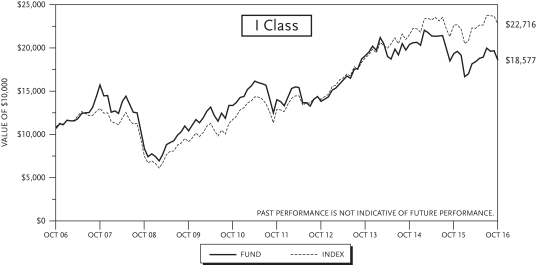
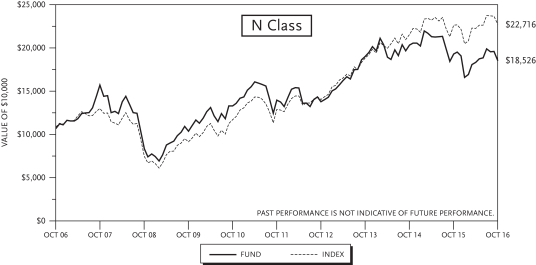
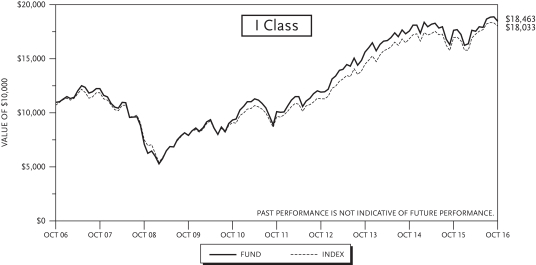
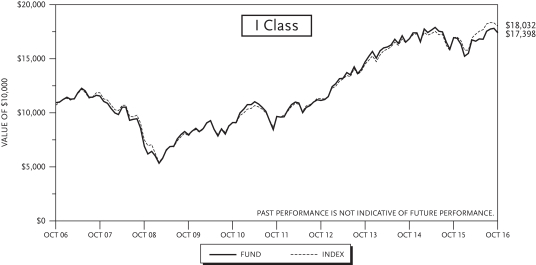
For the year ended October 31, 2016, the TCW Focused Equities Fund (formerly TCW Concentrated Value Fund) (“the Fund”) declined 3.04% and 3.08% for its I Class and N Class Shares, respectively. The performance of the Fund’s classes varies because of differing expenses. During the same period, the Russell 1000 Value Index rose 6.37%.
During the year, nearly all of the negative attribution was a result of poor stock selection. This stock selection was partially offset by favorable sector allocation. Healthcare was the worst performing sector in the portfolio and generated nearly half of the underperformance for the year. The underperformance of healthcare started in September 2015 and accelerated during 2016 as a result of the controversy over increasing drug prices. There were companies in the sector that were guilty of increasing prices too quickly but our companies were not involved. Yet no company escaped unscathed and Allergan was the worst performing stock, down 32% for the year followed by McKesson, which was down 28%. Allergan’s negative performance also occurred when the regulators stepped in and called off the merger between Pfizer and Allergan. McKesson, a drug distribution company, does not set prices for drugs but as pricing gets called into question their margins are impacted. Although Celgene and Amgen did not perform as badly as the two companies above, they were negatively impacted by this situation nonetheless. Consumer staples were the second worst performing sector in the portfolio and it also had a healthcare theme to the negative attribution with our investment in CVS. Although CVS is a drug store, they generate substantial profits from their pharmacy benefit manager business. This business also was impacted by the drug pricing issue and the company lowered guidance for 2016 and 2017 due to their forecast of lower prices. Lastly on the negative side of the ledger was the materials sector. The bulk of the underperformance in this sector occurred due to the underperformance of Sealed Air. In last year’s Fund write up we noted that Sealed Air was the best performing stock in the portfolio as they executed flawlessly. However, this year they surprised investors by reducing their cash flow guidance as a result of market conditions and a sluggish economy. We still have faith in management as they are taking actions to create further shareholder value. The best performing sector in the portfolio was the consumer discretion sector, which was the worst performing sector last year. Our patience paid off in the gaming and retail stocks this year as they generated a nearly 20% return. We believe our patience with the underperforming healthcare stocks will be rewarded in 2017.
There were three themes that dominated the markets for most of 2016. First was the drug pricing issue talked about above as healthcare was a substantial underperformer in 2016. Second was the timing of the 2nd rate hike by the Federal Reserve. When the year began the consensus view was that the Fed would raise the Fed Funds rate 2 or 3 times during the year, but as of 10/31 they hadn’t raised rates yet. A rise in the Fed Funds rate is fully expected in December with a probability of over 90% as of this writing. Third was the search for yield. As the 10 year bond yield remained very low throughout the year, investors were searching for yield and found that yield in the utilities, telecom and staples sectors as those were the three best performing sectors in the market during the year ended 10/31/16. Since the election, yields have risen considerably due to the perceived policies of the new President-elect and the 10 year yield now stands at 2.33%, which is the highest yield this year.
6
TCW Focused Equities Fund
Management Discussions (Continued)
We believe that the portfolio owns high quality stocks and it is prudent to be patient. The objective is to create a portfolio that has a good risk/reward profile and to remain balanced so as to be poised to do well in both up markets as well as down markets. We remain confident that investing in attractively valued companies with strong management teams that are expected to increase their return on invested capital and free cash flow generation will yield favorable long-term results.
| Annualized Return(1) | ||||||||||||||||||||||||
| 1 Yr Return | 3 Yr Return | 5 Yr Return | 10 Yr Return | Inception Fund | Inception Index | |||||||||||||||||||
TCW Focused Equities Fund (formerly TCW Concentrated Value Fund) | ||||||||||||||||||||||||
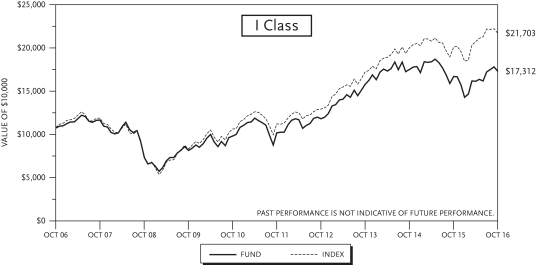
Class I – 10/29/2004 | (3.04 | )% | 5.88 | % | 12.21 | % | 3.26 | % | 5.02 | % | 7.14 | % | ||||||||||||
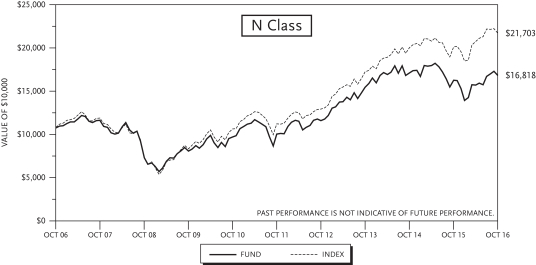
Class N – 07/20/1998 | (3.08 | )% | 5.88 | % | 12.22 | % | 3.07 | % | 5.12 | %(2) | 6.06 | % | ||||||||||||
Russell 1000 Value Index | 6.37 | % | 7.59 | % | 13.31 | % | 5.35 | % | ||||||||||||||||
| (1) | The total returns do not reflect taxes that a shareholder would pay on fund distributions or on the redemption of fund shares. |
| (2) | Performance data includes the performance of the predecessor entity for periods before the Fund’s registration became effective. The predecessor entity was not registered under the 1940 Act and, therefore, was not subject to certain investment restrictions that are imposed by the 1940 Act. If the predecessor entity had been registered under the 1940 Act, the predecessor entity’s performance may have been lower. |
7
TCW Global Real Estate Fund
Management Discussions
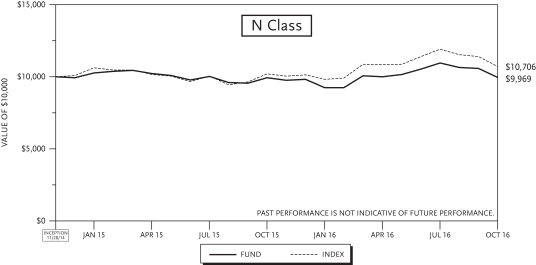
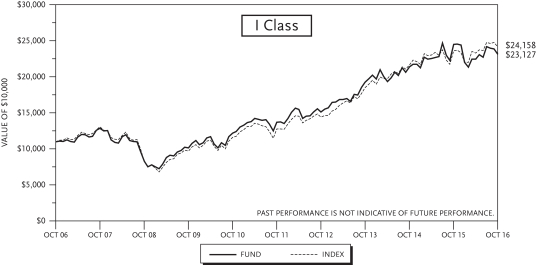
For the year ended October 31, 2016, the TCW Global Real Estate Fund (the “Fund”) gained 0.31% and 0.41% on its I Class and N Class shares, respectively. The performance of the Fund’s classes varies because of differing expenses. The Fund’s benchmark, the S&P Global REIT Index, had a return of 5.00% over the same period.
The year for global real estate equities was volatile. The beginning of the period was particularly tumultuous, as the lead-up to and fallout from the Fed’s December 2015 rate hike and the prospect of a major slowdown in global growth loomed large over the space. For the period ranging from 10/31/2015 to mid-February, the index was down 7.1%. However, with 4Q15 earnings reconfirming the strength of REIT fundamentals and with the Fed backing off the previously communicated pace of its tightening campaign, REITs reflated massively – the sector posted total returns of 20.13% from March through the end of the period. Finally, uncertainty with regard to the U.S. elections and renewed concerns over rising rates weighed on the sector, with the index posting returns of -10.17% for the final 3 months of the reporting period.
On an attribution basis, the Fund’s underperformance relative to its benchmark during the period was both a result of negative stock selection and sector allocation. Allocation was impeded by the 40-Act rule, which imposes a sub-sector maximum of 25%, resulting in an underweight of retail REITs (24.54% vs. 29.10% for the S&P Global REIT Index). From a relative standpoint, the Fund’s largest sector overweight was in Mortgage REITs (up 17.71%), which benefitted performance. The Fund’s largest sector underweight was in Diversified REITs (down 1.16% vs. up 5.95% for the index), which hurt performance. From a stock selection perspective, notable detractors included Toll Brothers Inc., British Land Plc, and Lennar Corporation, which accounted for over half of the Fund’s underperformance relative to its benchmark. Conversely, positive contributors to the Fund’s performance included Nippon Prologis REIT, Chimera Investment Corporation, and Northstar Realty Finance.
With regard to outlook, we remain cautious on REITs despite the recent selloff in the space. History has demonstrated that it pays to heed cues and warnings from the credit markets, as credit tends to lead stocks, especially at inflections. Fixed income markets are suggestive that the credit cycle is nearing an end. Debt growth (particularly in the commodity and pro-cyclical sectors) has been high, and the reach for yield has lowered underwriting standards. Typically what follows is a widening of spreads, which portends defaults are ahead. This, in turn, causes banks and other financial institutions to tighten conditions and scale back lending activity, further fueling a cycle of retraction.
While today’s equity multiples may make sense in a world where low interest rates over the long-term are a given, investors have already begun to view that premise with skepticism. In addition, the global political climate and rise of nationalism/protectionism — previously a largely ignored factor — is likely to impede economic growth and weigh on the markets.
However, there could be some positive offsets as well. The supply/demand picture remains balanced, and REITs could benefit from a “flight to quality” if investors were to shun riskier asset classes. The U.S. housing market seems to be sustaining its growth, which could add to employment and GDP and lengthen the cycle. Also, it appears that central banks across the globe will continue to take the required steps to provide ample liquidity for the proper functioning of financial markets. Thus, a disaster-type crash scenario is fairly unlikely. In a yield-starved world, the REIT sector’s current 4.3% dividend yield could provide some degree of valuation support not too far below current levels.
8
TCW Global Real Estate Fund
Management Discussions (Continued)
Overall, we believe that the net impact of all of these factors skews risk-reward ratios to the downside. As a result, we have adopted a defensive stance in our portfolios, and thus look for companies and REIT sub-sectors with low demand elasticity (which translates into pricing power), lower cyclicality, high earnings or cash flow visibility, and some form of valuation support. We value your support and thank you for your trust.
| Annualized Return(1) | ||||||||
| 1 Yr Return | Inception | |||||||
TCW Global Real Estate Fund | ||||||||
Class I – 11/28/2014 | 0.31 | % | (0.16 | )% | ||||
Class N – 11/28/2014 | 0.41 | % | (0.16 | )% | ||||
S&P Global REIT Index | 5.00 | % | 3.62 | % | ||||

| (1) | The total returns do not reflect taxes that a shareholder would pay on fund distributions or on the redemption of fund shares. |
9
TCW Growth Equities Fund
Management Discussions
For the year ended October 31, 2016, the TCW Growth Equities Fund (the “Fund”) had a negative return of 3.93% on both I Class and N Class shares. The Fund’s benchmark, the Russell Midcap Growth Index, returned a positive 0.40% over the same period.
U.S. equities started 2016 in decline and have mostly been on the upswing since mid-February. Following the Federal Reserve’s first interest rate hike in nearly a decade in December, equity markets pushed to record highs on better U.S. economic data and a rebound from record low oil prices. The markets seemed to shrug off the political uncertainty surrounding the U.S. presidential election and Britain’s vote to leave the European Union. Underlying the seemingly bullish market, however, investor sentiment remained bearish as money managers continued to rest on high cash levels and as funds extended their flow out of equities into bonds. IPO activity did pick up modestly in the latter portion of the year, but volume is still down year-over-year. Uncertainty around interest rates, the regulatory environment, and political outcomes in Europe and in the U.S. have kept IPO activity relatively slow. On the other hand, healthy balance sheets and low interest rates funded considerable M&A activity, especially among small- and mid-cap companies.
On an attribution basis, the Fund’s underperformance during the period was primarily a result of negative stock selection in the healthcare, consumer discretionary and financials sectors. Negative stock selection in the consumer staples sector was offset by positive allocation in the sector. Stock selection was positive in the industrials sector. At the end of the period, the Fund’s largest sector weighting was information technology, followed by consumer discretionary. Notable detractors included athenahealth, Valeant Pharmaceuticals and Alkermes in healthcare; Skechers, The Habit Restaurants and Under Armour in consumer discretionary; Boston Beer Company in consumer staples; FireEye and Twitter in information technology; and WisdomTree Investments in financials. On the other hand, contributors of note were names such as Wynn Resorts and Dick’s Sporting Goods in consumer discretionary; Keurig Green Mountain in consumer staples; MarketAxess in financials; Demandware, Proofpoint, Cornerstone OnDemand and ServiceNow in information technology; and HEICO Corporation in industrials. Demandware was acquired by Salesforce.com and Keurig Green Mountain was acquired by an investor group led by JAB Holding Company. ARM Holdings was acquired by Softbank.
At a macroeconomic level, while conditions in China and emerging markets are still the primary headwinds to a global recovery, we are optimistic on the overall strength of the U.S. economy compared to the rest of the world. The U.S. consumer remains relatively resilient as evidenced by new home sales, personal income, and personal consumption expenditures, which are all up year-over-year. In aggregate, despite a few volatile monthly data points, we believe the latest economic data supports that the wider U.S. economy is advancing, albeit at a modest pace. With respect to our investments, we believe “quality,” growth over value, and domestically focused names should outperform in a volatile environment. We seek to invest in companies with highly innovative and differentiated products and services, along with strong balance sheets, positive earnings, and sustainable business models. We continue to anticipate healthy M&A activity and believe there is a robust pipeline of M&A-ready companies. M&A activity in 2015 was largely financially motivated, i.e., large companies buying other large companies through inexpensive financing. As we have
10
TCW Growth Equities Fund
Management Discussions (Continued)
already seen so far this year, we think small- and mid-cap companies with differentiated businesses will be attractive to larger companies looking for strategic assets to drive top-line growth.
| Annualized Return(1) | ||||||||||||||||||||
| 1 Yr Return | 3 Yr Return | 5 Yr Return | 10 Yr Return | Inception | ||||||||||||||||
TCW Growth Equities Fund | ||||||||||||||||||||
Class I – 02/27/2004 | (3.93 | )% | (0.86 | )% | 5.79 | % | 5.70 | % | 6.10 | % | ||||||||||
Class N – 02/27/2004 | (3.93 | )% | (0.83 | )% | 5.80 | % | 5.67 | % | 6.07 | % | ||||||||||
Russell Midcap Growth Index | 0.40 | % | 6.48 | % | 12.02 | % | 7.65 | % | 8.36 | % | ||||||||||
| (1) | The total returns do not reflect taxes that a shareholder would pay on fund distributions or on the redemption of fund shares. |
11
TCW High Dividend Equities Fund
Management Discussions
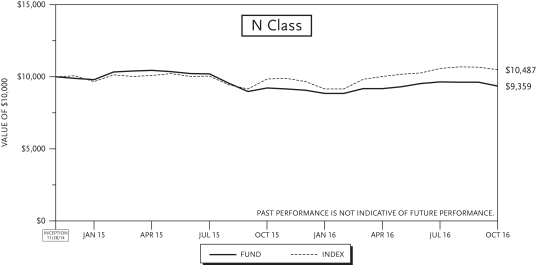
For the year ended October 31, 2016, the TCW High Dividend Equities Fund (the “Fund”) gained 1.35% and 1.46% on its I Class and N Class shares, respectively. The performance of the Fund’s classes varies because of differing expenses. The Fund’s benchmark, the Russell 3000 Value Index, had a return of 6.55% over the same period.
The year for dividend equities was volatile. The beginning of the period was particularly tumultuous, as the lead-up to and fallout from the Fed’s December 2015 rate hike and the prospect of a major slowdown in global growth loomed large over the space. For the period ranging from 10/31/2015 to mid-February, the index was down 10.46%. However, with 4Q15 earnings surpassing expectations and the Fed backing off the previously communicated pace of its tightening campaign, equities reflated – the index posted total returns of 14.57% from March through the end of the period.
On an attribution basis, the Fund’s underperformance relative to its benchmark during the period was both a result of negative stock selection and sector allocation. From a relative standpoint, the Fund’s largest sector overweight was in Consumer Staples (up 11.63% vs. 12.92% for the index), which benefitted performance. The Fund’s largest sector underweight was in Energy (down 8.96% vs. up 1.91% for the index), which hurt performance. From a stock selection perspective, notable detractors included CVS Health Corporation, Qualcomm Inc., and Cardinal Health Inc. Conversely, positive contributors to the Fund’s performance included Altria Group Inc., Republic Services Inc., and Chubb Limited.
With regard to outlook, we remain cautious despite the recent selloff in our investment universe. History has demonstrated that it pays to heed cues and warnings from the credit markets, as credit tends to lead stocks, especially at inflections. Fixed income markets are suggestive that the credit cycle is nearing an end. Debt growth (particularly in the commodity and pro-cyclical sectors) has been high, and the reach for yield has lowered underwriting standards. Typically what follows is a widening of spreads, which portends defaults are ahead. This, in turn, causes banks and other financial institutions to tighten conditions and scale back lending activity, further fueling a cycle of retraction.
While today’s equity multiples may make sense in a world where low interest rates over the long-term are a given, investors have already begun to view that premise with skepticism (as can be seen by the recent performance of yield sensitive sectors such as REITs and Utilities). In addition, the global political climate and rise of nationalism/protectionism — previously a largely ignored factor — is likely to impede economic growth and weigh on the markets.
However, there could be some positive offsets as well. The U.S. could benefit from a “flight to quality” if investors were to shun riskier markets. The housing market seems to be sustaining its growth, which could add to employment and GDP and lengthen the cycle. Also, it appears that central banks across the globe will continue to take the required steps to provide ample liquidity for the proper functioning of financial markets. Thus, a disaster-type crash scenario is fairly unlikely.
Overall, we believe that the net impact of all of these factors skews risk-reward ratios to the downside. As a result, we have adopted a defensive stance in our portfolios, and thus look for companies with low demand
12
TCW High Dividend Equities Fund
Management Discussions (Continued)
elasticity (which translates into pricing power), lower cyclicality, high earnings or cash flow visibility, and some form of valuation support. We value your support and thank you for your trust.
| Annualized Return(1) | ||||||||
| 1 Yr Return | Inception | |||||||
TCW High Dividend Equities Fund | ||||||||
Class I – 11/28/2014 | 1.35 | % | (3.40 | )% | ||||
Class N – 11/28/2014 | 1.46 | % | (3.40 | )% | ||||
Russell 3000 Value Index | 6.55 | % | 2.51 | % | ||||

| (1) | The total returns do not reflect taxes that a shareholder would pay on fund distributions or on the redemption of fund shares. |
13
TCW New America Premier Equities Fund
Management Discussions
For the period January 29, 2016 (inception date of the Fund) through October 31, 2016, the TCW New America Premier Equities Fund (the “Fund”) increased by 12.30% on both its I Class and N Class shares. The Fund’s benchmark, the Russell 1000 Index, returned 11.84% over the same period.
The Fund benefitted from owning Illinois Tool Works, Comcast, and Air Products. These three high free cash flow yielding businesses were top contributors to the Fund’s outperformance, while Dr. Pepper Snapple Group, Inc., Roper Technologies, and Sealed Air Corporation were negative contributors. The Fund continued to own these six securities at the close of trading on October 31, 2016.
We believe that controlling risk, not generating returns, is our primary objective. Since inception our returns have been generated while exposing our clients to lower volatility, downside risk and tracking error relative to the benchmark. It is our goal to continue to generate strong returns while taking on lower than market volatility and risk.
Investment Philosophy
The Fund seeks to outperform the broad U.S. indices in both rising and falling markets with less risk and volatility. We seek to accomplish this objective by investing in a concentrated portfolio of businesses that carefully manage their environmental and social resources and that employ best in class corporate governance practices. We invest in businesses that have high barriers to entry, are stable, generate substantial free cash flow and are managed by prudent leaders.
Risk control. Our primary objective, as stewards of your capital, is to control risk while seeking attractive returns. We control risk in a unique manner; initially we apply our proprietary ESG quantitative framework to identify better managed businesses that have lower quantifiable and unquantifiable risks. Subsequently, we hone our efforts on those businesses that we believe operate in stable industries with attractive industry structures, businesses that produce products that are critical to their customers, and businesses that we believe are led by proven, appropriately incentivized leaders. We endeavor to further control valuation risk by purchasing securities at attractive prices relative to the current free cash flow generation of the businesses. We believe that businesses that fit our profile produce fairly stable cash flow streams and are less prone to macroeconomic fluctuations, competitive pressures and valuation risks.
Consistency. It is also our objective to deliver a consistently positive outcome. We would view outsized outperformance in one year and poor performance in the subsequent year as a poor outcome for our clients. Our bottoms up investment process is focused on selecting undervalued businesses that we believe should perform well in most market environments and hold up well in negative periods. We believe consistency in approach and consistency in outcome gives us the best chance of minimizing a left tail outcome in any given year. It is our view that if we can consistently deliver above average risk adjusted performance over a long period of time the outcome likely would be outperformance relative to our peers over the full period. That is our goal.
Environmental, Social, Governance Analysis: Traditional fundamental analysis does not capture risks associated with managing environmental resources nor does it assess the performance of businesses from the perspective of resource efficiency. Traditional analysis does not typically assess the risks associated with a heterogeneous workforce nor does it assess the competence, quality and engagement level of the Board of Directors. Our investment framework not only pays close attention to these issues, we also quantify, score, and rank companies and exclude businesses based on these risk factors.
14
TCW New America Premier Equities Fund
Management Discussions (Continued)
While those risks are not quantified through traditional financial analysis, we have found a significant correlation between companies that manage their resources prudently and businesses that sport strong financial metrics. Based on our research and investment criteria, businesses that meet our rigorous ESG performance requirements typically have higher free cash flow yields, higher total yields, higher margins and lower levels of financial leverage.
Focus on Dominant, Predictable Businesses with High Barriers to Entry: In the long run the investment performance of a portfolio is inextricably linked to the underlying performance of the earnings and cash flows of the businesses comprising the portfolio. We believe one of the greatest risks in investing is valuing a business based on an erroneous view of the future free cash flows of the business. Such a circumstance results in an investor typically overpaying for a business and therefore generating a poor return on the investment.
In fast growing businesses or in industries that are undergoing rapid changes it is extraordinarily difficult and often dangerous to make an investment in a business when the long-term cash generation potential of the enterprise has a wide spectrum of outcomes. We seek to avoid companies and industries that are undergoing rapid changes.
What we do seek, however, are stable businesses that have dominant market positions, and whose long- term cash flows we believe can be predicted reasonably well. The qualitative characteristics that we seek, including attractive industry structures, pricing power and dominant market positions, make us confident in our forecast of the future cash flows of the businesses and therefore provide greater confidence that our valuation of the business is reasonably accurate.
The famed value investor Benjamin Graham once said, “In the short run, the market is a voting machine but in the long run, it is a weighing machine.” Our view is that the market weighs cash flows and in order to consistently purchase a security for less than what it is worth, one should have high confidence in the future free cash flows of a business.
15
TCW New America Premier Equities Fund
Management Discussions (Continued)
Cumulative Inception(1) | ||||
TCW New America Premier Equities Fund | ||||
Class I – 1/29/2016 | 12.30 | % | ||
Class N – 1/29/2016 | 12.30 | % | ||
Russell 1000 Index | 11.84 | % | ||
| (1) | The total returns do not reflect taxes that a shareholder would pay on fund distributions or on the redemption of fund shares. |
16
TCW Relative Value Dividend Appreciation Fund
Management Discussions
For the year ended October 31, 2016, the TCW Relative Value Dividend Appreciation Fund (the “Fund”) gained 4.66% and 4.43% on its I Class and N Class shares, respectively. The performance of the Fund’s classes varies because of differing expenses. The Fund’s benchmark, the Russell 1000 Value Index, returned 6.37% over the same period.
Market Outlook
After dipping to 49.4 in August, the Institute of Supply Management’s Purchasing Managers Index “ISM PMI” bounced back in September and further in October to 51.9, and the new orders and production components also climbed back above 50 after their respective dips in August; a level of 50 or greater connotes expansion. Similarly, after a slowdown in August, auto sales have showed some resurgence with October’s number coming in at a 17.9 million seasonally adjusted annual rate (SAAR). While housing data softened in September, the housing market is showing signs of strength as new home purchases by millennials scarred by the Great Financial Crisis appear to have picked up. Buyers have purchased new single-family houses at an annualized rate of nearly 600,000, near its highest rate since the winter of 2008 (July 2016 registered 629,000), and housing starts have been running at a one million annual pace every month since April 2015, a marked improvement from the 478,000 rate in the spring of 2009. According to Realtor.com, first-time buyers now comprise one-half of those looking to purchase a home in 2017, up from 33% last year. New home buyers should provide a significant boost to sales which would then translate to a bounce in household spending.
With the relatively strong 3Q GDP figure, solid monthly jobs gains, and continuing rise in year-over-year wage growth there is a stronger likelihood for a rate hike in December. The consensus is for one to two modest hikes in 2017. After tepid growth in the first half of the year, the first estimate for 3Q U.S. economic activity came in at a robust 2.9% annualized rate quarter-over-quarter as a build up in inventory and a soybean-related spike in exports offset softer household spending, which grew at a slower pace after the prior quarter’s healthy 4.3% pace. Inventories accounted for 0.6 percentage points to GDP growth as stockpiles were rebuilt ending a streak in which negative changes in inventories weighed on growth for five consecutive quarters. Job growth thus far this year, while not as robust as in 2015, has been solid running at a 180,000 monthly average pace and the unemployment rate now stands at 4.9%. Average hourly earnings have risen to 2.8% year-over-year, the four-week moving average for jobless claims is at lows not seen since the early 1970s, and temporary employment figures (a harbinger for future full-time hires) remain solid.
The S&P 500 earnings recession may have come to an end with year-over-year earnings coming in at flat to low single-digits on the positive side; previous estimates had called for negative low single-digits. The Conference Board Consumer Confidence Index softened to 98.6 in October from 103.5 in September potentially due to acrimony surrounding the FBI and the election; a level of 100 or higher connotes an expansionary economy. Household incomes rose for the first time in eight years. According to the Census Bureau, in 2015 middle-class Americans and the poor enjoyed their best year of economic improvement in decades, a spike that broke a years-long streak of disappointment for American workers. Real median household income increased 5.2% to $56,500 in 2015 from $53,700 in 2014. This increase was the largest, in percentage terms, since the Bureau began tracking median income statistics in the 1960s.
The U.S. remains in a slow to low 1-3% GDP growth rate, even with a potential Brexit global growth hair cut of 0.25% to 0.50% over the next year. The U.S. continues to be an attractive market and safe haven for investors given uncertainty in Europe and Japan as well as decelerating growth in China. These and other
17
TCW Relative Value Dividend Appreciation Fund
Management Discussions (Continued)
factors are important supports for U.S. growth, making the odds of a near-term recession remain less than 40% in our view. Generally, recessions do not occur with an accommodative Fed or when oil prices are low. Historically, since the end of World War II, the market has rebounded post presidential elections into year-end by nearly two percentage points, regardless of the party victor, 70% of the time. With the election decided, by the end of the year stronger U.S. earnings growth will be more evident. This, along with an accommodative Federal Reserve policy slowly moving to interest rate normalization, should be positive for the market.
Fund Review
Over the course of the year ended October 31, the Fund’s top ten conviction-weighted holdings outperformed the portfolio and both benchmarks over the period returning +9.1%, on average, led by Chevron, Microsoft, Royal Philips, Merck, and JP Morgan Chase. The Fund’s Energy names were the best relative performers led by Chevron, Baker Hughes, and Nabors Industries, while its Consumer Staples stocks performed admirably led by Sysco and Campbell Soup. DuPont, recent initiation WestRock, and Avery Dennison were the stalwarts among the portfolio’s Materials stocks leading to the relative outperformance in the sector. Other positive performers included ADT, Microchip Technology, Quest Diagnostics, Johnson Controls (acquirer of Tyco), Corning, and Regal Entertainment. Avery Dennison was completely sold as it reached its valuation target while ADT was eliminated after news it was being acquired by a private equity firm at a significant premium. On the downside, the portfolio’s Telecommunication Services names underperformed due in large part to Deutsche Telekom, while Ameriprise Financial was largely responsible for the loss suffered in Financials and was completely sold post fiscal year end. Gap, Time, and Lennar were the biggest laggards in the Consumer Discretionary Care space, as was Seagate Technology in Information Technology. Other notable detractors included Gilead Sciences, Citigroup, New York Community Bancorp, Textron, and MetLife.
18
TCW Relative Value Dividend Appreciation Fund
Management Discussions (Continued)
| Annualized Return(1) | ||||||||||||||||||||||||
| 1 Yr Return | 3 Yr Return | 5 Yr Return | 10 Yr Return | Inception Fund | Inception Index | |||||||||||||||||||
TCW Relative Value Dividend Appreciation Fund | ||||||||||||||||||||||||
Class I – 10/29/2004 | 4.66 | % | 5.73 | % | 12.83 | % | 5.35 | % | 6.79 | % | 7.14 | % | ||||||||||||
Class N – 09/19/1986 | 4.43 | % | 5.45 | % | 12.52 | % | 5.05 | % | 9.05 | % | 10.11 | % | ||||||||||||
Russell 1000 Value Index | 6.37 | % | 7.59 | % | 13.31 | % | 5.35 | % | ||||||||||||||||

| (1) | The total returns do not reflect taxes that a shareholder would pay on fund distributions or on the redemption of fund shares. |
19
TCW Relative Value Large Cap Fund
Management Discussions
For the year ended October 31, 2016, the TCW Relative Value Large Cap Fund (the “Fund”) gained 2.61% and 2.42% on its I Class and N Class shares, respectively. The performance of the Fund’s classes varies because of differing expenses. The Fund’s benchmark, the Russell 1000 Value Index, returned 6.37% over the same period.
Market Outlook
After dipping to 49.4 in August, the Institute of Supply Management’s Purchasing Managers Index “ISM PMI” bounced back in September and further in October to 51.9, and the new orders and production components also climbed back above 50 after their respective dips in August; a level of 50 or greater connotes expansion. Similarly, after a slowdown in August, auto sales have showed some resurgence with October’s number coming in at a 17.9 million seasonally adjusted annual rate (SAAR). While housing data softened in September, the housing market is showing signs of strength as new home purchases by millennials scarred by the Great Financial Crisis appear to have picked up. Buyers have purchased new single-family houses at an annualized rate of nearly 600,000, near its highest rate since the winter of 2008 (July 2016 registered 629,000), and housing starts have been running at a one million annual pace every month since April 2015, a marked improvement from the 478,000 rate in the spring of 2009. According to Realtor.com, first-time buyers now comprise one-half of those looking to purchase a home in 2017, up from 33% last year. New home buyers should provide a significant boost to sales which would then translate to a bounce in household spending.
With the relatively strong 3Q GDP figure, solid monthly jobs gains, and continuing rise in year-over-year wage growth there is a stronger likelihood for a rate hike in December. The consensus is for one to two modest hikes in 2017. After tepid growth in the first half of the year, the first estimate for 3Q U.S. economic activity came in at a robust 2.9% annualized rate quarter-over-quarter as a build up in inventory and a soybean-related spike in exports offset softer household spending, which grew at a slower pace after the prior quarter’s healthy 4.3% pace. Inventories accounted for 0.6 percentage points to GDP growth as stockpiles were rebuilt ending a streak in which negative changes in inventories weighed on growth for five consecutive quarters. Job growth thus far this year, while not as robust as in 2015, has been solid running at a 180,000 monthly average pace and the unemployment rate now stands at 4.9%. Average hourly earnings have risen to 2.8% year-over-year, the four-week moving average for jobless claims is at lows not seen since the early 1970s, and temporary employment figures (a harbinger for future full-time hires) remain solid.
The S&P 500 earnings recession may have come to an end with year-over-year earnings coming in at flat to low single-digits on the positive side; previous estimates had called for negative low single-digits. The Conference Board Consumer Confidence Index softened to 98.6 in October from 103.5 in September potentially due to acrimony surrounding the FBI and the election; a level of 100 or higher connotes an expansionary economy. Household incomes rose for the first time in eight years. According to the Census Bureau, in 2015 middle-class Americans and the poor enjoyed their best year of economic improvement in decades, a spike that broke a years-long streak of disappointment for American workers. Real median household income increased 5.2% to $56,500 in 2015 from $53,700 in 2014. This increase was the largest, in percentage terms, since the Bureau began tracking median income statistics in the 1960s.
The U.S. remains in a slow to low 1-3% GDP growth rate, even with a potential Brexit global growth hair cut of 0.25% to 0.50% over the next year. The U.S. continues to be an attractive market and safe haven for investors given uncertainty in Europe and Japan as well as decelerating growth in China. These and other
20
TCW Relative Value Large Cap Fund
Management Discussions (Continued)
factors are important supports for U.S. growth, making the odds of a near-term recession remain less than 40% in our view. Generally, recessions do not occur with an accommodative Fed or when oil prices are low. Historically, since the end of World War II, the market has rebounded post presidential elections into year-end by nearly two percentage points, regardless of the party victor, 70% of the time. With the election decided, by the end of the year stronger U.S. earnings growth will be more evident. This, along with an accommodative Federal Reserve policy slowly moving to interest rate normalization, should be positive for the market.
Fund Review
Over the course of the year ended October 31, the Fund’s top ten conviction-weighted holdings outperformed the portfolio and both benchmarks over the period returning +5.3%, on average, led by Chevron, Microsoft, JP Morgan Chase, and Cisco Systems. The Fund’s Information Technology names were the best relative performers led by Applied Materials, Corning, Micron Technology, and Microsoft, while its Energy stocks performed admirably led by Chevron, Baker Hughes, and Newfield Exploration. Sysco was the stalwart among the portfolio’s Consumer Staples stocks leading to the relative outperformance in the sector. The portfolio was well positioned for either outcome of the U.S. presidential election and went to a natural underweight in Health Care at the end of September, which was positive, given the two candidates’ polemic positions. Other positive performers included ADT, Johnson Controls (acquirer of Tyco), and Terex in Industrials, Utility company American Electric Power, and Zions Bancorporation in Financials. American Electric Power was completely sold as it appreciated to the point of meeting its valuation target, while ADT was eliminated after news it was being acquired by a private equity firm at a significant premium. On the downside, the portfolio’s Consumer Discretionary names underperformed due in large part to Gap, Lennar, and Dana. Ameriprise Financial was largely responsible for the loss suffered in Financials and was completely sold while Gilead Sciences and Anthem were the biggest laggards in the Health Care space. Other notable detractors include Sealed Air in Materials, Textron in Industrials, and Chesapeake Energy, which was completely sold after a fundamental review in February.
21
TCW Relative Value Large Cap Fund
Management Discussions (Continued)
| Annualized Return(1) | ||||||||||||||||||||||||
| 1 Yr Return | 3 Yr Return | 5 Yr Return | 10 Yr Return | Inception Fund | Inception Index | |||||||||||||||||||
TCW Relative Value Large Cap Fund | ||||||||||||||||||||||||
Class I – 12/31/2003 | 2.61 | % | 5.79 | % | 12.50 | % | 4.74 | % | 7.00 | % | 7.24 | % | ||||||||||||
Class N – 12/31/1997 | 2.42 | % | 5.53 | % | 12.23 | % | 4.52 | % | 5.93 | % | 6.68 | % | ||||||||||||
Russell 1000 Value Index | 6.37 | % | 7.59 | % | 13.31 | % | 5.35 | % | ||||||||||||||||
| (1) | The total returns do not reflect taxes that a shareholder would pay on fund distributions or on the redemption of fund shares. |
22
TCW Relative Value Mid Cap Fund
Management Discussions
For the year ended October 31, 2016, the TCW Relative Value Mid Cap Fund (the “Fund”) posted a return of 3.53% and 3.30% on its I Class and N Class shares, respectively. The performance of the Fund’s classes varies because of differing expenses. The Fund’s benchmark, the Russell Midcap Value Index, returned 7.84% over the same period.
Market Outlook
After dipping to 49.4 in August, the Institute of Supply Management’s Purchasing Managers Index “ISM PMI” bounced back in September and further in October to 51.9, and the new orders and production components also climbed back above 50 after their respective dips in August; a level of 50 or greater connotes expansion. Similarly, after a slowdown in August, auto sales have showed some resurgence with October’s number coming in at a 17.9 million seasonally adjusted annual rate (SAAR). While housing data softened in September, the housing market is showing signs of strength as new home purchases by millennials scarred by the Great Financial Crisis appear to have picked up. Buyers have purchased new single-family houses at an annualized rate of nearly 600,000, near its highest rate since the winter of 2008 (July 2016 registered 629,000), and housing starts have been running at a one million annual pace every month since April 2015, a marked improvement from the 478,000 rate in the spring of 2009. According to Realtor.com, first-time buyers now comprise one-half of those looking to purchase a home in 2017, up from 33% last year. New home buyers should provide a significant boost to sales which would then translate to a bounce in household spending.
With the relatively strong 3Q GDP figure, solid monthly jobs gains, and continuing rise in year-over-year wage growth there is a stronger likelihood for a rate hike in December. The consensus is for one to two modest hikes in 2017. After tepid growth in the first half of the year, the first estimate for 3Q U.S. economic activity came in at a robust 2.9% annualized rate quarter-over-quarter as a build up in inventory and a soybean-related spike in exports offset softer household spending, which grew at a slower pace after the prior quarter’s healthy 4.3% pace. Inventories accounted for 0.6 percentage points to GDP growth as stockpiles were rebuilt ending a streak in which negative changes in inventories weighed on growth for five consecutive quarters. Job growth thus far this year, while not as robust as in 2015, has been solid running at a 180,000 monthly average pace and the unemployment rate now stands at 4.9%. Average hourly earnings have risen to 2.8% year-over-year, the four-week moving average for jobless claims is at lows not seen since the early 1970s, and temporary employment figures (a harbinger for future full-time hires) remain solid.
The Russell Midcap earnings recession may have come to an end with year-over-year earnings coming in at flat to low single-digits on the positive side; previous estimates had called for negative low single-digits. The Conference Board Consumer Confidence Index softened to 98.6 in October from 103.5 in September potentially due to acrimony surrounding the FBI and the election; a level of 100 or higher connotes an expansionary economy. Household incomes rose for the first time in eight years. According to the Census Bureau, in 2015 middle-class Americans and the poor enjoyed their best year of economic improvement in decades, a spike that broke a years-long streak of disappointment for American workers. Real median household income increased 5.2% to $56,500 in 2015 from $53,700 in 2014. This increase was the largest, in percentage terms, since the Bureau began tracking median income statistics in the 1960s.
The U.S. remains in a slow to low 1-3% GDP growth rate, even with a potential Brexit global growth hair cut of 0.25% to 0.50% over the next year. The U.S. continues to be an attractive market and safe haven for investors given uncertainty in Europe and Japan as well as decelerating growth in China. These and other
23
TCW Relative Value Mid Cap Fund
Management Discussions (Continued)
factors are important supports for U.S. growth, making the odds of a near-term recession remain less than 40% in our view. Generally, recessions do not occur with an accommodative Fed or when oil prices are low. Historically, since the end of World War II, the market has rebounded post presidential elections into year-end by nearly two percentage points, regardless of the party victor, 70% of the time. With the election decided, by the end of the year stronger U.S. earnings growth will be more evident. This along with an accommodative Federal Reserve policy slowly moving to interest rate normalization should be positive for the market.
Fund Review
Over the course of the year ended October 31, the Fund’s top ten conviction-weighted holdings was accretive to the Fund’s performance returning +12.4%, on average, led by Worthington Industries, Popular, Quest Diagnostics, Coach, and KeyCorp. The Fund’s Materials stocks also contributed positive return, led by Worthington Industries and Axiall, as well as Campbell Soup and Sysco in Consumer Staples. Quest Diagnostics was a bright spot in Health Care aiding in the portfolio’s outperformance in the sector, one that struggled during the one year period, while Windstream’s robust return along with aid from the recently initiated Zayo Group were the primary drivers in Telecommunication Services. On the downside, the portfolio’s Information Technology names were the worst relative performers due in large part to Seagate Technology, Polycom, Western Digital, and NetApp. Toll Brothers, Gap, Beazer Homes, and Lennar were the largest detractors among the portfolio’s Consumer Discretionary names while Jones Lang LaSalle (now reassigned to the newly carved out Real Estate sector), Invesco, and GEO Group struggled in Financials. Other notable detractors include Chesapeake Energy, which was completely sold after a fundamental review in February, and SPX Flow.
24
TCW Relative Value Mid Cap Fund
Management Discussions (Continued)
| Annualized Return(1) | ||||||||||||||||||||||||
| 1 Yr Return | 3 Yr Return | 5 Yr Return | 10 Yr Return | Inception Fund | Inception Index | |||||||||||||||||||
TCW Relative Value Mid Cap Fund | ||||||||||||||||||||||||
Class I – 11/1/1996 | 3.53 | % | 3.15 | % | 11.16 | % | 4.89 | % | 9.95 | %(2) | 10.45 | % | ||||||||||||
Class N – 10/31/2000 | 3.30 | % | 2.91 | % | 10.89 | % | 4.59 | % | 7.17 | % | 9.72 | % | ||||||||||||
Russell Midcap Value Index | 7.84 | % | 7.97 | % | 14.07 | % | 7.19 | % | ||||||||||||||||
| (1) | The total returns do not reflect taxes that a shareholder would pay on fund distributions or on the redemption of fund shares. |
| (2) | Performance data includes the performance of the predecessor entity for periods before the Fund’s registration became effective. The predecessor entity was not registered under the 1940 Act and, therefore, was not subject to certain investment restrictions that are imposed by the 1940 Act. If the predecessor entity had been registered under the 1940 Act, the predecessor entity’s performance may have been lower. |
25
TCW Select Equities Fund
Management Discussions
For the year ended October 31, 2016, the TCW Select Equities Fund (the “Fund”) had a negative return of 5.56% and 5.81% on its I Class and N Class shares, respectively. The performance of the Fund’s classes varies because of differing expenses. The Fund’s benchmark, Russell 1000 Growth Index, returned 2.28% over the same period.
Fiscal 2016 began with the S&P 500 rallying +8.4% in October, marking the best monthly gain in five years. Economic data remained mixed in November and December 2015 but the key event was the Fed’s decision in December to finally move off the zero-bound and raise the target range for the federal funds rate by 25 basis points, the first rate tightening since June 2006. Stock market volatility ensued and the first six weeks of calendar 2016 marked the worst stock market start to a calendar year in U.S. history. The Bank of Japan surprised the market by introducing negative interest rates, potentially opening up Pandora’s Box as to the technical limits of QE. By the end of February, ~1/3 of global sovereign debt traded with a negative interest rate. In Europe, the ECB delivered a package of policy measures that included cutting its benchmark rate to 0.0%, announced a larger-than-expected €20B increase in its monthly asset purchases to €80B, and amended the composition of its QE program to include investment grade euro-denominated bonds. In April the yen hit a 17-month high despite NIRP (negative interest rate policy). Meanwhile in the U.S., the FOMC remained dovish as Fed Chair Yellen noted that global economic and financial developments continue to pose risks for the economy and the inflation outlook had become more uncertain and 1Q16 GDP increased only +0.8%. Increased volatility returned to the markets in June when the British voted to exit the EU (“Brexit”) but the S&P 500 finished June in modestly positive territory. Economic data remained mixed through the summer and fall and although U.S. GDP of +2.9% in 3Q16 represented a sequential improvement, U.S. GDP remained stubbornly low post the Great Recession. As the fiscal year ended, focus turned to the U.S. Presidential election.
Net of expenses, the Fund underperformed for the year primarily as a result of negative security selection results, particularly in the health care, consumer discretionary and information technology sectors. Athenahealth, Inc. underperformed as the company failed to announce a large enterprise deal in 2016 and bookings growth moderated due to a more challenging end market landscape. Chipotle Mexican Grill, Inc. retreated due to a handful of E. coli outbreaks, which severely negatively impacted traffic and sales. Our biggest stock detractor during the year came from the information technology sector: LinkedIn Corporation dropped after the company issued weak FY2016 guidance and noted a meaningfully slowing in its Marketing and Subscriptions segments.
Our biggest stock contributors during the year came from the information technology and financials sectors. Facebook Inc. rallied as the company posted robust broad-based growth across several advertiser segments and verticals. ARM Holdings plc jumped when it was announced that SoftBank Group intended to acquire the company in an all-cash transaction for a 43% premium to its last closing price. Equinix, Inc., the largest network neutral co-location data center provider in the world, rallied due to strong revenues per cabinet, decreasing customer churn and solid higher-margin interconnection revenues. In the financials sector, Chubb moved higher as its announced deal with ACE in 2015 created a global P&C industry leader
26
TCW Select Equities Fund
Management Discussions (Continued)
and provided revenue and expense synergy opportunities that offset a weakening pricing environment in its end market.
| Annualized Return(1) | ||||||||||||||||||||||||
| 1 Yr Return | 3 Yr Return | 5 Yr Return | 10 Yr Return | Inception Fund | Inception Index | |||||||||||||||||||
TCW Select Equities Fund | ||||||||||||||||||||||||
Class I – 07/01/1991 | (5.56 | )% | 6.29 | % | 11.07 | % | 7.73 | % | 9.49 | %(2) | 8.70 | % | ||||||||||||
Class N – 2/26/1999 | (5.81 | )% | 6.01 | % | 10.76 | % | 7.43 | % | 5.09 | % | 4.00 | % | ||||||||||||
Russell 1000 Growth Index | 2.28 | % | 9.36 | % | 13.65 | % | 8.22 | % | ||||||||||||||||

| (1) | The total returns do not reflect taxes that a shareholder would pay on fund distributions or on the redemption of fund shares. |
| (2) | Performance data includes the performance of the predecessor entity for periods before the Fund’s registration became effective. The predecessor entity was not registered under the 1940 Act and, therefore, was not subject to certain investment restrictions that are imposed by the 1940 Act. If the predecessor entity had been registered under the 1940 Act, the predecessor entity’s performance may have been lower. |
27
TCW Small Cap Growth Fund
Management Discussions
For the year ended October 31, 2016, the TCW Small Cap Growth Fund (the “Fund”) gained 1.94% and 1.92% on its I Class and N Class shares, respectively. The performance of the Fund’s classes varies because of differing expenses. The Fund’s benchmark, the Russell 2000 Growth Index, declined 0.49% over the same period.
U.S. equities started 2016 in decline and have mostly been on the upswing since mid-February. Following the Federal Reserve’s first interest rate hike in nearly a decade in December, equity markets pushed to record highs on better U.S. economic data and a rebound from record low oil prices. The markets seemed to shrug off the political uncertainty surrounding the U.S. presidential election and Britain’s vote to leave the European Union. Underlying the seemingly bullish market, however, investor sentiment remains bearish as money managers continue to rest on high cash levels and as funds extended their flow out of equities into bonds. IPO activity did pick up modestly in the latter portion of the year, but volume is still down year-over-year. Uncertainty around interest rates, the regulatory environment, and political outcomes in Europe and in the U.S. have kept IPO activity relatively slow. On the other hand, healthy balance sheets and low interest rates funded considerable M&A activity, especially among small- and mid-cap companies.
On an attribution basis, the Fund’s outperformance was primarily a result of positive stock selection in the healthcare and industrials sectors. Stock selection also helped in information technology and energy. Partially offsetting this was negative stock selection in consumer discretionary, consumer staples and financials. At the end of the period, the Fund’s largest sector weighting was the information technology sector, followed by healthcare. Contributors of note included Cepheid and LDR Holding Corporation in healthcare, John Bean Technologies, HEICO Corporation and B/E Aerospace in industrials, Demandware and Cornerstone OnDemand in information technology and MarketAxess in financials. LDR Holding was acquired by Zimmer Biomet and B/E Aerospace agreed to be acquired by Rockwell Collins. Demandware was acquired by Salesforce.com and Marketo was acquired by Vista Equity Partners. On the other hand, notable detractors were names such as Skechers, The Habit Restaurants and Gentherm in consumer discretionary, Boston Beer Company in consumer staples, WisdomTree Investments in financials, Eagle Pharmaceuticals, Valeant Pharmaceuticals and athenahealth in healthcare, and FireEye in information technology.
At a macroeconomic level, while conditions in China and emerging markets are still the primary headwinds to a global recovery, we are optimistic on the overall strength of the U.S. economy compared to the rest of the world. The U.S. consumer remains relatively resilient as evidenced by new home sales, personal income, and personal consumption expenditures, which are all up year-over-year. In aggregate, despite a few volatile monthly data points, we believe the latest economic data support that the wider U.S. economy is advancing, albeit at a modest pace. With respect to our investments, we believe “quality,” growth over value, and domestically focused names should outperform in a volatile environment. We seek to invest in companies with highly innovative and differentiated products and services, along with strong balance sheets, positive earnings, and sustainable business models. We continue to anticipate healthy M&A activity and believe there is a robust pipeline of M&A-ready companies. M&A activity in 2015 was largely financially motivated, i.e., large companies buying other large companies through inexpensive financing. As we have
28
TCW Small Cap Growth Fund
Management Discussions (Continued)
already seen so far this year, we think small- and mid-cap companies with differentiated businesses will be attractive to larger companies looking for strategic assets to drive top-line growth.
| Annualized Return(1) | ||||||||||||||||||||||||
| 1 Yr Return | 3 Yr Return | 5 Yr Return | 10 Yr Return | Inception Fund | Inception Index | |||||||||||||||||||
TCW Small Cap Growth Fund | ||||||||||||||||||||||||
Class I – 12/01/1989 | 1.94 | % | 1.52 | % | 6.03 | % | 6.50 | % | 8.63 | %(2) | 7.30 | % | ||||||||||||
Class N – 2/26/1999 | 1.92 | % | 1.36 | % | 5.79 | % | 6.21 | % | 3.56 | % | 6.07 | % | ||||||||||||
Russell 2000 Growth Index | (0.49 | )% | 3.70 | % | 11.34 | % | 6.92 | % | ||||||||||||||||
| (1) | The total returns do not reflect taxes that a shareholder would pay on fund distributions or on the redemption of fund shares. |
| (2) | Performance data includes the performance of the predecessor entity for periods before the Fund’s registration became effective. The predecessor entity was not registered under the 1940 Act and, therefore, was not subject to certain investment restrictions that are imposed by the 1940 Act. If the predecessor entity had been registered under the 1940 Act, the predecessor entity’s performance may have been lower. |
29
TCW Conservative Allocation Fund
| Number of Shares | Investment Companies | Value | ||||||
Diversified Equity Funds (39.0% of Net Assets) | ||||||||
| 195,801 | TCW / Gargoyle Hedged Value Fund — I Class (1) | $ | 1,707,381 | |||||
| 120,731 | TCW Global Real Estate Fund — I Class (1) | 1,137,284 | ||||||
| 351,990 | TCW High Dividend Equities Fund — I Class (1) | 3,136,227 | ||||||
| 77,502 | TCW International Growth Fund — I Class (1) | 758,743 | ||||||
| 124,211 | TCW Relative Value Large Cap Fund — I Class (1) | 2,655,623 | ||||||
| 96,331 | TCW Select Equities Fund — I Class (1) | 2,510,378 | ||||||
|
| |||||||
Total Diversified Equity Funds | 11,905,636 | |||||||
|
| |||||||
Diversified Fixed Income Funds (60.2%) | ||||||||
| 354,750 | Metropolitan West Low Duration Bond Fund — I Class (1) | 3,104,061 | ||||||
| 391,564 | Metropolitan West Total Return Bond Fund — I Class (1) | 4,279,794 | ||||||
| 75,764 | TCW Global Bond Fund — I Class (1) | 748,545 | ||||||
| 995,444 | TCW Total Return Bond Fund — I Class (1) | 10,282,941 | ||||||
|
| |||||||
Total Diversified Fixed Income Funds | 18,415,341 | |||||||
|
| |||||||
Total Investment Companies (Cost: $28,113,725) (99.2%) | 30,320,977 | |||||||
|
| |||||||
Total Investments (Cost: $28,113,725) (99.2%) | 30,320,977 | |||||||
Excess of Other Assets over Liabilities (0.8%) | 257,982 | |||||||
|
| |||||||
Net Assets (100.0%) | $ | 30,578,959 | ||||||
|
| |||||||
Notes to the Schedule of Investments:
| (1) | Affiliated issuer. |
See accompanying notes to financial statements.
30
TCW Conservative Allocation Fund
Investments by Industry | October 31, 2016 |
| Industry | Percentage of Net Assets | |||
Diversified Fixed Income Funds | 60.2 | % | ||
Diversified Equity Funds | 39.0 | |||
|
| |||
Total | 99.2 | % | ||
|
| |||
See accompanying notes to financial statements.
31
Schedule of Investments
| Number of Shares | Common Stock | Value | ||||||
Aerospace & Defense (4.5% of Net Assets) | ||||||||
| 1,930 | Honeywell International, Inc. | $ | 211,683 | |||||
| 855 | TransDigm Group, Inc. (1) | 232,953 | ||||||
|
| |||||||
Total Aerospace & Defense | 444,636 | |||||||
|
| |||||||
Banks (13.6%) | ||||||||
| 3,535 | JPMorgan Chase & Co. | 244,834 | ||||||
| 3,150 | M&T Bank Corp. | 386,599 | ||||||
| 6,520 | US Bancorp | 291,835 | ||||||
| 9,065 | Wells Fargo & Co. | 417,081 | ||||||
|
| |||||||
Total Banks | 1,340,349 | |||||||
|
| |||||||
Beverages (2.7%) | ||||||||
| 2,315 | Anheuser-Busch InBev NV (Belgium) (SP ADR) | 267,359 | ||||||
|
| |||||||
Biotechnology (5.6%) | ||||||||
| 1,780 | Amgen, Inc. | 251,265 | ||||||
| 2,900 | Celgene Corp. (1) | 296,322 | ||||||
|
| |||||||
Total Biotechnology | 547,587 | |||||||
|
| |||||||
Capital Markets (2.9%) | ||||||||
| 1,585 | Goldman Sachs Group, Inc. (The) | 282,510 | ||||||
|
| |||||||
Chemicals (5.9%) | ||||||||
| 2,415 | Air Products & Chemicals, Inc. | 322,209 | ||||||
| 2,280 | Ecolab, Inc. | 260,308 | ||||||
|
| |||||||
Total Chemicals | 582,517 | |||||||
|
| |||||||
Containers & Packaging (2.8%) | ||||||||
| 6,090 | Sealed Air Corp. | 277,887 | ||||||
|
| |||||||
Energy Equipment & Services (1.0%) | ||||||||
| 1,235 | Schlumberger, Ltd. | 96,614 | ||||||
|
| |||||||
Food & Staples Retailing (2.6%) | ||||||||
| 3,060 | CVS Health Corp. | 257,346 | ||||||
|
| |||||||
Food Products (3.5%) | ||||||||
| 1,285 | Mead Johnson Nutrition Co. | 96,079 | ||||||
| 5,425 | Mondelez International, Inc. | 243,800 | ||||||
|
| |||||||
Total Food Products | 339,879 | |||||||
|
| |||||||
Health Care Providers & Services (2.4%) | ||||||||
| 1,840 | McKesson Corp. | 233,993 | ||||||
|
| |||||||
Hotels, Restaurants & Leisure (4.9%) | ||||||||
| 4,975 | Las Vegas Sands Corp. | 287,953 | ||||||
| 3,740 | Starbucks Corp. | 198,482 | ||||||
|
| |||||||
Total Hotels, Restaurants & Leisure | 486,435 | |||||||
|
| |||||||
See accompanying notes to financial statements.
32
TCW Focused Equities Fund
October 31, 2016 |
| Number of Shares | Common Stock | Value | ||||||
Industrial Conglomerates (5.0%) | ||||||||
| 4,230 | Danaher Corp. | $ | 332,266 | |||||
| 950 | Roper Technologies, Inc. | 164,645 | ||||||
|
| |||||||
Total Industrial Conglomerates | 496,911 | |||||||
|
| |||||||
Insurance (3.4%) | ||||||||
| 2,640 | Chubb, Ltd. (Switzerland) | 335,280 | ||||||
|
| |||||||
Internet Software & Services (3.1%) | ||||||||
| 395 | Alphabet, Inc. — Class C (1) | 309,893 | ||||||
|
| |||||||
Machinery (2.5%) | ||||||||
| 2,885 | IDEX Corp. | 249,379 | ||||||
|
| |||||||
Multiline Retail (3.0%) | ||||||||
| 3,870 | Dollar Tree, Inc. (1) | 292,378 | ||||||
|
| |||||||
Oil, Gas & Consumable Fuels (10.9%) | ||||||||
| 4,710 | Devon Energy Corp. | 178,462 | ||||||
| 4,805 | EOG Resources, Inc. | 434,468 | ||||||
| 3,925 | Occidental Petroleum Corp. | 286,172 | ||||||
| 6,140 | Williams Cos., Inc. (The) | 179,288 | ||||||
|
| |||||||
Total Oil, Gas & Consumable Fuels | 1,078,390 | |||||||
|
| |||||||
Pharmaceuticals (6.2%) | ||||||||
| 5,285 | AbbVie, Inc. | 294,797 | ||||||
| 1,517 | Allergan plc (Ireland) (1) | 316,962 | ||||||
|
| |||||||
Total Pharmaceuticals | 611,759 | |||||||
|
| |||||||
Road & Rail (3.5%) | ||||||||
| 3,890 | Union Pacific Corp. | 343,020 | ||||||
|
| |||||||
Software (3.6%) | ||||||||
| 3,335 | Adobe Systems, Inc. (1) | 358,546 | ||||||
|
| |||||||
Specialty Retail (1.7%) | ||||||||
| 1,220 | Advance Auto Parts, Inc. | 170,898 | ||||||
|
| |||||||
Textiles, Apparel & Luxury Goods (1.8%) | ||||||||
| 1,660 | PVH Corp. | 177,587 | ||||||
|
| |||||||
Total Common Stock (Cost: $8,835,161) (97.1%) | 9,581,153 | |||||||
|
| |||||||
| Master Limited Partnership | ||||||||
Oil, Gas & Consumable Fuels (2.0%) | ||||||||
| 2,586 | EQT Midstream Partners LP | 193,614 | ||||||
|
| |||||||
Total Master Limited Partnership (Cost: $182,391) (2.0%) | 193,614 | |||||||
|
| |||||||
See accompanying notes to financial statements.
33
TCW Focused Equities Fund
Schedule of Investments (Continued)
| Number of Shares | Money Market Investments | Value | ||||||
| 65,451 | State Street Institutional U.S. Government Money Market Fund — Premier Class, 0.25% (2) | $ | 65,451 | |||||
|
| |||||||
Total Money Market Investments (Cost: $65,451) (0.7%) | 65,451 | |||||||
|
| |||||||
Total Investments (Cost: $9,083,003) (99.8%) | 9,840,218 | |||||||
Excess of Other Assets over Liabilities (0.2%) | 21,104 | |||||||
|
| |||||||
Net Assets (100.0%) | $ | 9,861,322 | ||||||
|
| |||||||
Notes to the Schedule of Investments:
| (1) | Non-income producing security. |
| (2) | Rate disclosed is the 7-day net yield as of October 31, 2016. |
| SP ADR - Sponsored | American Depositary Receipt. Shares of a foreign based corporation held in U.S. banks that are issued with the cooperation of the company whose stock underlies the ADR and entitles the shareholder to all dividends, capital gains and voting rights. |
See accompanying notes to financial statements.
34
TCW Focused Equities Fund
Investments by Industry | October 31, 2016 |
| Industry | Percentage of Net Assets | |||
Aerospace & Defense | 4.5 | % | ||
Banks | 13.6 | |||
Beverages | 2.7 | |||
Biotechnology | 5.6 | |||
Capital Markets | 2.9 | |||
Chemicals | 5.9 | |||
Containers & Packaging | 2.8 | |||
Energy Equipment & Services | 1.0 | |||
Food & Staples Retailing | 2.6 | |||
Food Products | 3.5 | |||
Health Care Providers & Services | 2.4 | |||
Hotels, Restaurants & Leisure | 4.9 | |||
Industrial Conglomerates | 5.0 | |||
Insurance | 3.4 | |||
Internet Software & Services | 3.1 | |||
Machinery | 2.5 | |||
Multiline Retail | 3.0 | |||
Oil, Gas & Consumable Fuels | 12.9 | |||
Pharmaceuticals | 6.2 | |||
Road & Rail | 3.5 | |||
Software | 3.6 | |||
Specialty Retail | 1.7 | |||
Textiles, Apparel & Luxury Goods | 1.8 | |||
Money Market Investments | 0.7 | |||
|
| |||
Total | 99.8 | % | ||
|
| |||
See accompanying notes to financial statements.
35
Schedule of Investments
| Number of Shares | Common Stock | Value | ||||||
Australia (4.7% of Net Assets) |
| |||||||
| 33,873 | Scentre Group | $ | 108,447 | |||||
| 12,134 | Westfield Corp. | 82,027 | ||||||
|
| |||||||
Total Australia (Cost: $195,383) | 190,474 | |||||||
|
| |||||||
China (4.4%) |
| |||||||
| 31,000 | China Overseas Land & Investment, Ltd. | 95,175 | ||||||
| 11,332 | Link REIT (The) | 80,623 | ||||||
|
| |||||||
Total China (Cost: $161,726) | 175,798 | |||||||
|
| |||||||
France (4.7%) |
| |||||||
| 1,720 | Klepierre | 70,193 | ||||||
| 492 | Unibail — Rodamco SE | 116,619 | ||||||
|
| |||||||
Total France (Cost: $208,530) | 186,812 | |||||||
|
| |||||||
Germany (Cost: $84,644) (2.5%) |
| |||||||
| 3,119 | Deutsche Wohnen AG | 101,759 | ||||||
|
| |||||||
Japan (11.2%) |
| |||||||
| 6,000 | Mitsubishi Estate Co., Ltd. | 119,005 | ||||||
| 5,000 | Mitsui Fudosan Co., Ltd. | 113,636 | ||||||
| 72 | Mori Hills REIT Investment Corp. | 101,312 | ||||||
| 52 | Nippon Prologis REIT, Inc. | 117,444 | ||||||
|
| |||||||
Total Japan (Cost: $445,228) | 451,397 | |||||||
|
| |||||||
Singapore (Cost: $83,507) (1.8%) |
| |||||||
| 56,443 | Global Logistic Properties, Ltd. | 71,788 | ||||||
|
| |||||||
United Kingdom (Cost: $77,670) (1.3%) |
| |||||||
| 7,302 | British Land Co. PLC (The) | 52,145 | ||||||
|
| |||||||
United States (67.1%) |
| |||||||
| 3,563 | AGNC Investment Corp. | 71,474 | ||||||
| 662 | AvalonBay Communities, Inc. | 113,321 | ||||||
| 630 | Boston Properties, Inc. | 75,902 | ||||||
| 6,291 | Chimera Investment Corp. | 98,580 | ||||||
| 7,680 | Colony Capital, Inc. | 145,997 | ||||||
| 3,811 | Colony Starwood Homes | 110,557 | ||||||
| 1,322 | Digital Realty Trust, Inc. | 123,515 | ||||||
| 300 | Equinix, Inc. | 107,184 | ||||||
| 1,600 | Equity Residential | 98,800 | ||||||
| 1,071 | Extra Space Storage, Inc. | 78,344 | ||||||
| 2,986 | Gaming and Leisure Properties, Inc. | 98,030 | ||||||
| 2,444 | General Growth Properties, Inc. | 60,978 | ||||||
| 2,607 | HCP, Inc. | 89,290 | ||||||
| 2,520 | Hospitality Properties Trust | 68,947 | ||||||
| 5,964 | Host Hotels & Resorts, Inc. | 92,323 | ||||||
| 861 | Macerich Co. (The) | 60,942 | ||||||
| 3,470 | MDC Holdings, Inc. | 82,274 | ||||||
See accompanying notes to financial statements.
36
TCW Global Real Estate Fund
October 31, 2016 |
| Number of Shares | Common Stock | Value | ||||||
United States (Continued) |
| |||||||
| 6,372 | MFA Financial, Inc. | $ | 46,579 | |||||
| 2,887 | Prologis, Inc. | 150,586 | ||||||
| 623 | Public Storage | 133,148 | ||||||
| 2,944 | Seritage Growth Properties | 134,099 | ||||||
| 1,000 | Simon Property Group, Inc. | 185,960 | ||||||
| 1,779 | Ventas, Inc. | 120,527 | ||||||
| 14,813 | VEREIT, Inc. | 139,242 | ||||||
| 1,040 | Vornado Realty Trust | 96,491 | ||||||
| 1,642 | Welltower, Inc. | 112,526 | ||||||
|
| |||||||
Total United States (Cost: $2,642,628) | 2,695,616 | |||||||
|
| |||||||
Total Common Stock (Cost: $3,899,316) (97.7%) | 3,925,789 | |||||||
|
| |||||||
| Preferred Stock | ||||||||
United States (Cost: $39,488) (1.0%) |
| |||||||
| 1,493 | Public Storage, 6% | 40,236 | ||||||
|
| |||||||
Total Preferred Stock (Cost: $39,488) (1.0%) | 40,236 | |||||||
|
| |||||||
| Money Market Investments | ||||||||
| 66,011 | State Street Institutional U.S. Government Money Market Fund — Premier Class, 0.25% (1) | 66,011 | ||||||
|
| |||||||
Total Money Market Investments (Cost: $66,011) (1.7%) | 66,011 | |||||||
|
| |||||||
Total Investments (Cost: $4,004,815) (100.4%) | 4,032,036 | |||||||
Liabilities in Excess of Other Assets (-0.4%) | (15,566 | ) | ||||||
|
| |||||||
Total Net Assets (100.0%) | $ | 4,016,470 | ||||||
|
| |||||||
Notes to the Schedule of Investments:
| REIT - Real | Estate Investment Trust. |
| (1) | Rate disclosed is the 7-day net yield as of October 31, 2016. |
See accompanying notes to financial statements.
37
TCW Global Real Estate Fund
Investments by Industry | October 31, 2016 |
| Industry | Percentage of Net Assets | |||
Building-Residential/Commercial | 2.0 | % | ||
Casino Services | 2.4 | |||
REITS-Apartments | 8.1 | |||
REITS-Diversified | 14.0 | |||
REITS-Health Care | 8.0 | |||
REITS-Hotels | 4.0 | |||
REITS-Mortgage | 9.1 | |||
REITS-Office Property | 5.4 | |||
REITS-Regional Malls | 7.6 | |||
REITS-Shopping Centers | 10.0 | |||
REITS-Storage | 6.3 | |||
REITS-Warehouse/Industrial | 6.6 | |||
Real Estate Management/Services | 5.5 | |||
Real Estate Operations/Development | 7.0 | |||
Web Hosting/Design | 2.7 | |||
Money Market Investments | 1.7 | |||
|
| |||
Total | 100.4 | % | ||
|
| |||
Fair Valuation Summary
The following is a summary of the fair valuations according to the inputs used as of October 31, 2016 in valuing the Fund’s investments:
| Description | Quoted Prices in Active Markets for Identical Assets (Level 1) | Other Significant Observable Inputs (Level 2) | Significant Unobservable Inputs (Level 3) | Total | ||||||||||||
Common Stock | ||||||||||||||||
Household Durables | $ | 82,274 | $ | — | $ | — | $ | 82,274 | ||||||||
Internet Software & Services | 107,184 | — | — | 107,184 | ||||||||||||
REIT | 2,506,159 | 728,809 | — | 3,234,968 | ||||||||||||
Real Estate Management & Development | — | 501,363 | — | 501,363 | ||||||||||||
|
|
|
|
|
|
|
| |||||||||
Total Common Stock | 2,695,617 | 1,230,172 | — | 3,925,789 | ||||||||||||
|
|
|
|
|
|
|
| |||||||||
Preferred Stock | ||||||||||||||||
REIT | 40,236 | — | — | 40,236 | ||||||||||||
|
|
|
|
|
|
|
| |||||||||
Total Preferred Stock | 40,236 | — | — | 40,236 | ||||||||||||
|
|
|
|
|
|
|
| |||||||||
Money Market Investments | 66,011 | — | — | 66,011 | ||||||||||||
|
|
|
|
|
|
|
| |||||||||
Total Investments | $ | 2,801,864 | $ | 1,230,172 | $ | — | $ | 4,032,036 | ||||||||
|
|
|
|
|
|
|
| |||||||||
See accompanying notes to financial statements.
38
Schedule of Investments | October 31, 2016 |
| Number of Shares | Common Stock | Value | ||||||
Aerospace & Defense (3.0% of Net Assets) | ||||||||
| 2,990 | BE Aerospace, Inc. | $ | 177,965 | |||||
| 1,463 | HEICO Corp. | 98,840 | ||||||
|
| |||||||
Total Aerospace & Defense | 276,805 | |||||||
|
| |||||||
Beverages (5.6%) | ||||||||
| 1,360 | Boston Beer Co., Inc. (The) (1) | 211,140 | ||||||
| 1,225 | Constellation Brands, Inc. | 204,722 | ||||||
| 640 | Monster Beverage Corp. (1) | 92,378 | ||||||
|
| |||||||
Total Beverages | 508,240 | |||||||
|
| |||||||
Biotechnology (3.2%) | ||||||||
| 1,705 | BioMarin Pharmaceutical, Inc. (1) | 137,286 | ||||||
| 1,775 | Incyte Corp. (1) | 154,372 | ||||||
|
| |||||||
Total Biotechnology | 291,658 | |||||||
|
| |||||||
Capital Markets (1.5%) | ||||||||
| 15,590 | WisdomTree Investments, Inc. | 133,762 | ||||||
|
| |||||||
Diversified Consumer Services (3.1%) | ||||||||
| 1,840 | MarketAxess Holdings, Inc. | 277,398 | ||||||
|
| |||||||
Electrical Equipment (2.3%) | ||||||||
| 1,755 | Rockwell Automation, Inc. | 210,109 | ||||||
|
| |||||||
Energy Equipment & Services (0.9%) | ||||||||
| 810 | Core Laboratories NV (Netherlands) | 78,546 | ||||||
|
| |||||||
Food & Staples Retailing (6.0%) | ||||||||
| 1,791 | Pricesmart, Inc. | 162,891 | ||||||
| 9,035 | United Natural Foods, Inc. (1) | 377,121 | ||||||
|
| |||||||
Total Food & Staples Retailing | 540,012 | |||||||
|
| |||||||
Food Products (3.9%) | ||||||||
| 9,615 | Hain Celestial Group, Inc. (The) (1) | 349,697 | ||||||
|
| |||||||
Health Care Equipment & Supplies (2.3%) | ||||||||
| 305 | Intuitive Surgical, Inc. (1) | 204,984 | ||||||
|
| |||||||
Health Care Providers & Services (2.4%) | ||||||||
| 9,265 | Diplomat Pharmacy, Inc. (1) | 214,670 | ||||||
|
| |||||||
Health Care Technology (3.1%) | ||||||||
| 1,690 | athenahealth, Inc. (1) | 174,611 | ||||||
| 1,805 | Cerner Corp. (1) | 105,737 | ||||||
|
| |||||||
Total Health Care Technology | 280,348 | |||||||
|
| |||||||
Hotels, Restaurants & Leisure (3.8%) | ||||||||
| 7,815 | Habit Restaurants, Inc. (The) (1) | 110,582 | ||||||
| 2,520 | Wynn Resorts, Ltd. | 238,266 | ||||||
|
| |||||||
Total Hotels, Restaurants & Leisure | 348,848 | |||||||
|
| |||||||
See accompanying notes to financial statements.
39
TCW Growth Equities Fund
Schedule of Investments (Continued)
| Number of Shares | Common Stock | Value | ||||||
Household Durables (2.7%) | ||||||||
| 3,110 | Harman International Industries, Inc. (1) | $ | 247,898 | |||||
|
| |||||||
Internet & Catalog Retail (2.0%) | ||||||||
| 2,820 | TripAdvisor, Inc. (1) | 181,834 | ||||||
|
| |||||||
Internet Software & Services (5.7%) | ||||||||
| 6,115 | Cornerstone OnDemand, Inc. (1) | 252,549 | ||||||
| 6,230 | Twitter, Inc. (1) | 111,829 | ||||||
| 4,650 | Yelp, Inc. (1) | 151,869 | ||||||
|
| |||||||
Total Internet Software & Services | 516,247 | |||||||
|
| |||||||
Life Sciences Tools & Services (4.3%) | ||||||||
| 551 | Illumina, Inc. (1) | 75,013 | ||||||
| 6,980 | INC Research Holdings, Inc. (1) | 318,986 | ||||||
|
| |||||||
Total Life Sciences Tools & Services | 393,999 | |||||||
|
| |||||||
Machinery (5.7%) | ||||||||
| 1,695 | Graco, Inc. | 126,955 | ||||||
| 1,805 | Middleby Corp. (The) (1) | 202,359 | ||||||
| 2,405 | Wabtec Corp. | 185,931 | ||||||
|
| |||||||
Total Machinery | 515,245 | |||||||
|
| |||||||
Media (1.1%) | ||||||||
| 4,785 | Lions Gate Entertainment Corp. | 97,423 | ||||||
|
| |||||||
Pharmaceuticals (1.5%) | ||||||||
| 8,085 | Horizon Pharma PLC (Ireland) (1) | 135,181 | ||||||
|
| |||||||
Semiconductors & Semiconductor Equipment (1.3%) | ||||||||
| 2,765 | Mellanox Technologies, Ltd. (Israel) (1) | 120,001 | ||||||
|
| |||||||
Software (16.4%) | ||||||||
| 1,055 | ANSYS, Inc. (1) | 96,374 | ||||||
| 120 | Blackline, Inc. (1) | 2,730 | ||||||
| 8,240 | FireEye, Inc. (1) | 95,749 | ||||||
| 2,700 | Imperva, Inc. (1) | 99,630 | ||||||
| 1,865 | Proofpoint, Inc. (1) | 146,179 | ||||||
| 1,345 | Red Hat, Inc. (1) | 104,170 | ||||||
| 3,020 | ServiceNow, Inc. (1) | 265,488 | ||||||
| 4,070 | Splunk, Inc. (1) | 244,973 | ||||||
| 2,170 | Tableau Software, Inc. (1) | 104,269 | ||||||
| 600 | Tyler Technologies, Inc. (1) | 96,240 | ||||||
| 2,630 | Workday, Inc. (1) | 227,968 | ||||||
|
| |||||||
Total Software | 1,483,770 | |||||||
|
| |||||||
Specialty Retail (7.2%) | ||||||||
| 3,680 | CarMax, Inc. (1) | 183,779 | ||||||
| 5,860 | Dick’s Sporting Goods, Inc. | 326,109 | ||||||
| 4,850 | Restoration Hardware Holdings, Inc. (1) | 140,505 | ||||||
|
| |||||||
Total Specialty Retail | 650,393 | |||||||
|
| |||||||
See accompanying notes to financial statements.
40
TCW Growth Equities Fund
October 31, 2016 |
| Number of Shares | Common Stock | Value | ||||||
Textiles, Apparel & Luxury Goods (5.5%) | ||||||||
| 15,195 | Skechers U.S.A., Inc. (1) | $ | 319,551 | |||||
| 3,190 | Under Armour, Inc. (1) | 99,209 | ||||||
| 3,212 | Under Armour, Inc. — Class C (1) | 83,062 | ||||||
|
| |||||||
Total Textiles, Apparel & Luxury Goods | 501,822 | |||||||
|
| |||||||
Total Common Stock (Cost: $7,054,288) (94.5%) | 8,558,890 | |||||||
|
| |||||||
| Money Market Investments | ||||||||
| 516,630 | State Street Institutional U.S. Government Money Market Fund — Premier Class, 0.25% (2) | 516,630 | ||||||
|
| |||||||
Total Money Market Investments (Cost: $516,630) (5.7%) | 516,630 | |||||||
|
| |||||||
Total Investments (Cost: $7,570,918) (100.2%) | 9,075,520 | |||||||
Liabilities in Excess of Other Assets (-0.2%) | (16,347 | ) | ||||||
|
| |||||||
Net Assets (100.0%) | $ | 9,059,173 | ||||||
|
| |||||||
Notes to the Schedule of Investments:
| (1) | Non-income producing security. |
| (2) | Rate disclosed is the 7-day net yield as of October 31, 2016. |
See accompanying notes to financial statements.
41
TCW Growth Equities Fund
Investments by Industry | October 31, 2016 |
| Industry | Percentage of Net Assets | |||
Aerospace & Defense | 3.0 | % | ||
Beverages | 5.6 | |||
Biotechnology | 3.2 | |||
Capital Markets | 1.5 | |||
Diversified Consumer Services | 3.1 | |||
Electrical Equipment | 2.3 | |||
Energy Equipment & Services | 0.9 | |||
Food & Staples Retailing | 6.0 | |||
Food Products | 3.9 | |||
Health Care Equipment & Supplies | 2.3 | |||
Health Care Providers & Services | 2.4 | |||
Health Care Technology | 3.1 | |||
Hotels, Restaurants & Leisure | 3.8 | |||
Household Durables | 2.7 | |||
Internet & Catalog Retail | 2.0 | |||
Internet Software & Services | 5.7 | |||
Life Sciences Tools & Services | 4.3 | |||
Machinery | 5.7 | |||
Media | 1.1 | |||
Pharmaceuticals | 1.5 | |||
Semiconductors & Semiconductor Equipment | 1.3 | |||
Software | 16.4 | |||
Specialty Retail | 7.2 | |||
Textiles, Apparel & Luxury Goods | 5.5 | |||
Money Market Investments | 5.7 | |||
|
| |||
Total | 100.2 | % | ||
|
| |||
See accompanying notes to financial statements.
42
TCW High Dividend Equities Fund
Schedule of Investments | October 31, 2016 |
| Number of Shares | Common Stock | Value | ||||||
Banks (3.8% of Net Assets) | ||||||||
| 5,880 | US Bancorp | $ | 263,188 | |||||
| 4,280 | Wells Fargo & Co. | 196,923 | ||||||
|
| |||||||
Total Banks | 460,111 | |||||||
|
| |||||||
Beverages (4.6%) | ||||||||
| 5,945 | Coca-Cola Co. (The) | 252,068 | ||||||
| 2,780 | PepsiCo, Inc. | 298,016 | ||||||
|
| |||||||
Total Beverages | 550,084 | |||||||
|
| |||||||
Biotechnology (1.9%) | ||||||||
| 1,580 | Amgen, Inc. | 223,033 | ||||||
|
| |||||||
Capital Markets (6.4%) | ||||||||
| 27,570 | Ares Capital Corp. | 421,821 | ||||||
| 6,277 | Golub Capital BDC, Inc. | 111,103 | ||||||
| 22,330 | TriplePoint Venture Growth BDC Corp. | 239,154 | ||||||
|
| |||||||
Total Capital Markets | 772,078 | |||||||
|
| |||||||
Commercial Services & Supplies (4.9%) | ||||||||
| 6,165 | Republic Services, Inc. | 324,464 | ||||||
| 3,955 | Waste Management, Inc. | 259,685 | ||||||
|
| |||||||
Total Commercial Services & Supplies | 584,149 | |||||||
|
| |||||||
Diversified Telecommunication Services (4.1%) | ||||||||
| 4,095 | Cogent Communications Group, Inc. | 151,106 | ||||||
| 7,155 | Verizon Communications, Inc. | 344,155 | ||||||
|
| |||||||
Total Diversified Telecommunication Services | 495,261 | |||||||
|
| |||||||
Electric Utilities (3.1%) | ||||||||
| 1,895 | Edison International | 139,245 | ||||||
| 1,815 | NextEra Energy, Inc. | 232,320 | ||||||
|
| |||||||
Total Electric Utilities | 371,565 | |||||||
|
| |||||||
Food & Staples Retailing (5.7%) | ||||||||
| 6,090 | CVS Health Corp. | 512,169 | ||||||
| 2,485 | Wal-Mart Stores, Inc. | 174,000 | ||||||
|
| |||||||
Total Food & Staples Retailing | 686,169 | |||||||
|
| |||||||
Food Products (4.8%) | ||||||||
| 11,985 | ConAgra Foods, Inc. | 577,437 | ||||||
|
| |||||||
Health Care Providers & Services (3.3%) | ||||||||
| 5,745 | Cardinal Health, Inc. | 394,624 | ||||||
|
| |||||||
Household Durables (1.8%) | ||||||||
| 9,205 | MDC Holdings, Inc. | 218,251 | ||||||
|
| |||||||
See accompanying notes to financial statements.
43
TCW High Dividend Equities Fund
Schedule of Investments (Continued)
| Number of Shares | Common Stock | Value | ||||||
Insurance (4.9%) | ||||||||
| 2,005 | Chubb, Ltd. (Switzerland) | $ | 254,635 | |||||
| 10,490 | Progressive Corp. (The) | 330,540 | ||||||
|
| |||||||
Total Insurance | 585,175 | |||||||
|
| |||||||
Internet Software & Services (1.6%) | ||||||||
| 535 | Equinix, Inc. | 191,145 | ||||||
|
| |||||||
IT Services (2.4%) | ||||||||
| 1,845 | International Business Machines Corp. | 283,558 | ||||||
|
| |||||||
Machinery (4.0%) | ||||||||
| 8,925 | EnPro Industries, Inc. | 483,021 | ||||||
|
| |||||||
Media (1.1%) | ||||||||
| 5,265 | Sinclair Broadcast Group, Inc. | 132,151 | ||||||
|
| |||||||
Oil, Gas & Consumable Fuels (8.3%) | ||||||||
| 8,190 | ConocoPhillips | 355,855 | ||||||
| 2,740 | Hess Corp. | 131,438 | ||||||
| 12,105 | Kinder Morgan, Inc. | 247,305 | ||||||
| 3,625 | Occidental Petroleum Corp. | 264,299 | ||||||
|
| |||||||
Total Oil, Gas & Consumable Fuels | 998,897 | |||||||
|
| |||||||
Professional Services (2.0%) | ||||||||
| 5,165 | Nielsen Holdings PLC (United Kingdom) | 232,528 | ||||||
|
| |||||||
REIT (12.3%) | ||||||||
| 27,125 | Colony Capital, Inc. | 515,646 | ||||||
| 5,825 | Colony Starwood Homes | 168,983 | ||||||
| 12,045 | Seritage Growth Properties | 548,650 | ||||||
| 1,280 | Simon Property Group, Inc. | 238,029 | ||||||
|
| |||||||
Total REIT | 1,471,308 | |||||||
|
| |||||||
| �� | Technology Hardware, Storage & Peripherals (1.0%) | |||||||
| 1,085 | Apple, Inc. | 123,191 | ||||||
|
| |||||||
Tobacco (3.0%) | ||||||||
| 5,375 | Altria Group, Inc. | 355,395 | ||||||
|
| |||||||
Total Common Stock (Cost: $10,083,925) (85.0%) | 10,189,131 | |||||||
|
| |||||||
| Preferred Stock | ||||||||
Banks (2.6%) | ||||||||
| 11,560 | Bank of America Corp., 6.5% | 310,849 | ||||||
|
| |||||||
REIT (2.5%) | ||||||||
| 11,835 | Public Storage, 5.75% | 300,727 | ||||||
|
| |||||||
Total Preferred Stock (Cost: $611,555) (5.1%) | 611,576 | |||||||
|
| |||||||
See accompanying notes to financial statements.
44
TCW High Dividend Equities Fund
October 31, 2016 |
| Number of Shares | Master Limited Partnership | Value | ||||||
Oil, Gas & Consumable Fuels (1.7%) | ||||||||
| 2,790 | EQT Midstream Partners LP | $ | 208,887 | |||||
|
| |||||||
Total Master Limited Partnership (Cost: $212,445) (1.7%) | 208,887 | |||||||
|
| |||||||
| Number of Contracts | Purchased Options | |||||||
| 10 | BlackRock, Inc., Put, Strike Price $360, Expires 01/20/2017 | 24,550 | ||||||
| 76 | Greenhill & Co., Inc., Call, Strike Price $20, Expires 12/16/2016 | 28,500 | ||||||
| 73 | Industrial Select Sector SPDR, Put, Strike Price $58, Expires 12/16/2016 | 12,994 | ||||||
| 115 | Industrial Select Sector SPDR, Put, Strike Price $58, Expires 01/20/2017 | 24,438 | ||||||
| 176 | Pfizer, Inc., Call, Strike Price $37, Expires 01/20/2017 | 1,056 | ||||||
| 41 | Sanderson Farms, Inc., Put, Strike Price $79, Expires 02/17/2017 | 9,840 | ||||||
| 53 | SPDR S&P 500 ETF Trust, Put, Strike Price $217, Expires 01/20/2017 | 43,195 | ||||||
|
| |||||||
Total Purchased Options (Cost: $165,472) (1.2%) | 144,573 | |||||||
|
| |||||||
| Number of Shares | Money Market Investments | |||||||
| 887,614 | State Street Institutional U.S. Government Money Market Fund — Premier Class, 0.25% (1) | 887,614 | ||||||
|
| |||||||
Total Money Market Investments (Cost: $887,614) (7.4%) | 887,614 | |||||||
|
| |||||||
Total Investments (Cost: $11,961,011) (100.4%) | 12,041,781 | |||||||
Liabilities in Excess of Other Assets (-0.4%) | (46,872 | ) | ||||||
|
| |||||||
Net Assets (100.0%) | $ | 11,994,909 | ||||||
|
| |||||||
| Written Options — Exchange Traded | ||||||||||||
| Number of Contracts | Description | Premiums (Received) | Value | |||||||||
| 16 | Chubb, Ltd., Call, Strike Price $120.00, Expires 02/17/2017 | $ | (9,423 | ) | $ | (15,760 | ) | |||||
|
|
|
| |||||||||
Notes to the Schedule of Investments:
BDC -��Business Development Company.
| ETF - Exchange | Traded Fund. |
| REIT - Real | Estate Investment Trust. |
| (1) | Rate disclosed is the 7-day net yield as of October 31, 2016. |
See accompanying notes to financial statements.
45
TCW High Dividend Equities Fund
Investments by Industry | October 31, 2016 |
| Industry | Percentage of Net Assets | |||
Banks | 6.4 | % | ||
Beverages | 4.6 | |||
Biotechnology | 1.9 | |||
Capital Markets | 6.4 | |||
Commercial Services & Supplies | 4.9 | |||
Diversified Telecommunication Services | 4.1 | |||
Electric Utilities | 3.1 | |||
Food & Staples Retailing | 5.7 | |||
Food Products | 4.8 | |||
Health Care Providers & Services | 3.3 | |||
Household Durables | 1.8 | |||
Insurance | 4.9 | |||
Internet Software & Services | 1.6 | |||
IT Services | 2.4 | |||
Machinery | 4.0 | |||
Media | 1.1 | |||
Oil, Gas & Consumable Fuels | 10.0 | |||
Professional Services | 2.0 | |||
Purchased Options | 1.2 | |||
REIT | 14.8 | |||
Technology Hardware, Storage & Peripherals | 1.0 | |||
Tobacco | 3.0 | |||
Money Market Investments | 7.4 | |||
|
| |||
Total | 100.4 | % | ||
|
| |||
See accompanying notes to financial statements.
46
TCW New America Premier Equities Fund
Schedule of Investments | October 31, 2016 |
| Number of Shares | Common Stock | Value | ||||||
Aerospace & Defense (7.7% of Net Assets) | ||||||||
| 873 | Honeywell International, Inc. | $ | 95,751 | |||||
| 1,298 | Safran S.A. (France) | 89,191 | ||||||
| 524 | TransDigm Group, Inc. (1) | 142,769 | ||||||
|
| |||||||
Total Aerospace & Defense | 327,711 | |||||||
|
| |||||||
Beverages (8.7%) | ||||||||
| 2,140 | Dr Pepper Snapple Group, Inc. | 187,871 | ||||||
| 1,732 | PepsiCo, Inc. | 185,670 | ||||||
|
| |||||||
Total Beverages | 373,541 | |||||||
|
| |||||||
Chemicals (8.9%) | ||||||||
| 38 | AdvanSix, Inc. (1) | 607 | ||||||
| 1,863 | Air Products & Chemicals, Inc. | 248,561 | ||||||
| 1,193 | Celanese Corp. — Series A | 86,994 | ||||||
| 326 | International Flavors & Fragrances, Inc. | 42,634 | ||||||
|
| |||||||
Total Chemicals | 378,796 | |||||||
|
| |||||||
Communications Equipment (1.2%) | ||||||||
| 608 | Motorola Solutions, Inc. | 44,129 | ||||||
| 390 | Quantenna Communications, Inc. (1) | 5,842 | ||||||
|
| |||||||
Total Communications Equipment | 49,971 | |||||||
|
| |||||||
Containers & Packaging (3.9%) | ||||||||
| 3,682 | Sealed Air Corp. | 168,010 | ||||||
|
| |||||||
Diversified Financial Services (1.6%) | ||||||||
| 467 | Berkshire Hathaway, Inc. — Class B (1) | 67,388 | ||||||
|
| |||||||
Electrical Equipment (0.9%) | ||||||||
| 881 | AMETEK, Inc. | 38,852 | ||||||
|
| |||||||
Electronic Equipment, Instruments & Components (3.3%) | ||||||||
| 3,239 | Agilent Technologies, Inc. | 141,123 | ||||||
|
| |||||||
Food Products (4.3%) | ||||||||
| 3,402 | ConAgra Foods, Inc. | 163,908 | ||||||
| 245 | Mead Johnson Nutrition Co. | 18,319 | ||||||
|
| |||||||
Total Food Products | 182,227 | |||||||
|
| |||||||
Health Care Equipment & Supplies (1.5%) | ||||||||
| 1,314 | Baxter International, Inc. | 62,533 | ||||||
|
| |||||||
Household Products (1.6%) | ||||||||
| 812 | Procter & Gamble Co. (The) | 70,481 | ||||||
|
| |||||||
Industrial Conglomerates (9.6%) | ||||||||
| 371 | 3M Co. | 61,327 | ||||||
| 2,915 | Danaher Corp. | 228,973 | ||||||
| 691 | Roper Technologies, Inc. | 119,757 | ||||||
|
| |||||||
Total Industrial Conglomerates | 410,057 | |||||||
|
| |||||||
See accompanying notes to financial statements.
47
TCW New America Premier Equities Fund
Schedule of Investments (Continued)
| Number of Shares | Common Stock | Value | ||||||
Internet Software & Services (3.1%) | ||||||||
| 1,780 | Trade Desk, Inc. (The) (1) | $ | 44,821 | |||||
| 2,106 | Yahoo!, Inc. (1) | 87,504 | ||||||
|
| |||||||
Total Internet Software & Services | 132,325 | |||||||
|
| |||||||
Machinery (4.1%) | ||||||||
| 963 | IDEX Corp. | 83,242 | ||||||
| 827 | Illinois Tool Works, Inc. | 93,922 | ||||||
|
| |||||||
Total Machinery | 177,164 | |||||||
|
| |||||||
Media (3.3%) | ||||||||
| 2,255 | Comcast Corp. | 139,404 | ||||||
|
| |||||||
Pharmaceuticals (3.0%) | ||||||||
| 1,113 | Johnson & Johnson | 129,097 | ||||||
|
| |||||||
Professional Services (4.1%) | ||||||||
| 2,145 | IHS Markit, Ltd. (1) | 78,914 | ||||||
| 3,095 | TransUnion (1) | 96,688 | ||||||
|
| |||||||
Total Professional Services | 175,602 | |||||||
|
| |||||||
Semiconductors & Semiconductor Equipment (1.0%) | ||||||||
| 3,269 | Marvell Technology Group, Ltd. | 42,595 | ||||||
|
| |||||||
Software (13.6%) | ||||||||
| 5,407 | Activision Blizzard, Inc. | 233,420 | ||||||
| 57 | Blackline, Inc. (1) | 1,297 | ||||||
| 623 | Dell Technologies, Inc. — VMware, Inc. — Class V (1) | 30,583 | ||||||
| 3,186 | Microsoft Corp. | 190,905 | ||||||
| 3,275 | Oracle Corp. | 125,826 | ||||||
|
| |||||||
Total Software | 582,031 | |||||||
|
| |||||||
Specialty Retail (1.5%) | ||||||||
| 849 | TJX Cos., Inc. (The) | 62,614 | ||||||
|
| |||||||
Total Common Stock (Cost: $3,491,900) (86.9%) | 3,711,522 | |||||||
|
| |||||||
| Money Market Investments | ||||||||
| 365,598 | State Street Institutional U.S. Government Money Market Fund — Premier Class, 0.25% (2) | 365,598 | ||||||
|
| |||||||
Total Money Market Investments (Cost: $365,598) (8.5%) | 365,598 | |||||||
|
| |||||||
Total Investments (Cost: $3,857,498) (95.4%) | 4,077,120 | |||||||
Excess of Other Assets over Liabilities (4.6%) | 194,359 | |||||||
|
| |||||||
Net Assets (100.0%) | $ | 4,271,479 | ||||||
|
| |||||||
Notes to the Schedule of Investments:
| (1) | Non-income producing security. |
| (2) | Rate disclosed is the 7-day net yield as of October 31, 2016. |
See accompanying notes to financial statements.
48
TCW New America Premier Equities Fund
Investments by Industry | October 31, 2016 |
| Industry | Percentage of Net Assets | |||
Aerospace & Defense | 7.7 | % | ||
Beverages | 8.7 | |||
Chemicals | 8.9 | |||
Communications Equipment | 1.2 | |||
Containers & Packaging | 3.9 | |||
Diversified Financial Services | 1.6 | |||
Electrical Equipment | 0.9 | |||
Electronic Equipment, Instruments & Components | 3.3 | |||
Food Products | 4.3 | |||
Health Care Equipment & Supplies | 1.5 | |||
Household Products | 1.6 | |||
Industrial Conglomerates | 9.6 | |||
Internet Software & Services | 3.1 | |||
Machinery | 4.1 | |||
Media | 3.3 | |||
Pharmaceuticals | 3.0 | |||
Professional Services | 4.1 | |||
Semiconductors & Semiconductor Equipment | 1.0 | |||
Software | 13.6 | |||
Specialty Retail | 1.5 | |||
Money Market Investments | 8.5 | |||
|
| |||
Total | 95.4 | % | ||
|
| |||
See accompanying notes to financial statements.
49
TCW New America Premier Equities Fund
Fair Valuation Summary | October 31, 2016 |
The following is a summary of the fair valuations according to the inputs used as of October 31, 2016 in valuing the Fund’s investments:
| Description | Quoted Prices in Active Markets for Identical Assets (Level 1) | Other Significant Observable Inputs (Level 2) | Significant Unobservable Inputs (Level 3) | Total | ||||||||||||
Common Stock | ||||||||||||||||
Aerospace & Defense | $ | 238,520 | $ | 89,191 | $ | — | $ | 327,711 | ||||||||
Beverages | 373,541 | — | — | 373,541 | ||||||||||||
Chemicals | 378,796 | — | — | 378,796 | ||||||||||||
Communications Equipment | 49,971 | — | — | 49,971 | ||||||||||||
Containers & Packaging | 168,010 | — | — | 168,010 | ||||||||||||
Diversified Financial Services | 67,388 | — | — | 67,388 | ||||||||||||
Electrical Equipment | 38,852 | — | — | 38,852 | ||||||||||||
Electronic Equipment, Instruments & Components | 141,123 | — | — | 141,123 | ||||||||||||
Food Products | 182,227 | — | — | 182,227 | ||||||||||||
Health Care Equipment & Supplies | 62,533 | — | — | 62,533 | ||||||||||||
Household Products | 70,481 | — | — | 70,481 | ||||||||||||
Industrial Conglomerates | 410,057 | — | — | 410,057 | ||||||||||||
Internet Software & Services | 132,325 | — | — | 132,325 | ||||||||||||
Machinery | 177,164 | — | — | 177,164 | ||||||||||||
Media | 139,404 | — | — | 139,404 | ||||||||||||
Pharmaceuticals | 129,097 | — | — | 129,097 | ||||||||||||
Professional Services | 175,602 | — | — | 175,602 | ||||||||||||
Semiconductors & Semiconductor Equipment | 42,595 | — | — | 42,595 | ||||||||||||
Software | 582,031 | — | — | 582,031 | ||||||||||||
Specialty Retail | 62,614 | — | — | 62,614 | ||||||||||||
|
|
|
|
|
|
|
| |||||||||
Total Common Stock | 3,622,331 | 89,191 | — | 3,711,522 | ||||||||||||
|
|
|
|
|
|
|
| |||||||||
Money Market Investments | 365,598 | — | — | 365,598 | ||||||||||||
Total Investments | $ | 3,987,929 | $ | 89,191 | $ | — | $ | 4,077,120 | ||||||||
|
|
|
|
|
|
|
| |||||||||
See accompanying notes to financial statements.
50
TCW Relative Value Dividend Appreciation Fund
Schedule of Investments | October 31, 2016 |
| Number of Shares | Common Stock | Value | ||||||
Aerospace & Defense (2.0% of Net Assets) | ||||||||
| 524,085 | Textron, Inc. | $ | 21,005,327 | |||||
|
| |||||||
Air Freight & Logistics (2.0%) | ||||||||
| 117,580 | FedEx Corp. | 20,496,546 | ||||||
|
| |||||||
Auto Components (2.1%) | ||||||||
| 48,721 | Adient PLC (Ireland) (1) | 2,217,293 | ||||||
| 487,212 | Johnson Controls International PLC (Ireland) | 19,644,388 | ||||||
|
| |||||||
Total Auto Components | 21,861,681 | |||||||
|
| |||||||
Banks (8.5%) | ||||||||
| 657,100 | Citigroup, Inc. | 32,296,465 | ||||||
| 588,204 | JPMorgan Chase & Co. | 40,739,009 | ||||||
| 486,800 | Zions Bancorp. | 15,679,828 | ||||||
|
| |||||||
Total Banks | 88,715,302 | |||||||
|
| |||||||
Beverages (2.6%) | ||||||||
| 256,745 | PepsiCo, Inc. | 27,523,064 | ||||||
|
| |||||||
Biotechnology (2.2%) | ||||||||
| 314,500 | Gilead Sciences, Inc. | 23,156,635 | ||||||
|
| |||||||
Capital Markets (3.3%) | ||||||||
| 45,171 | Ameriprise Financial, Inc. | 3,992,665 | ||||||
| 162,800 | Invesco, Ltd. | 4,573,052 | ||||||
| 369,900 | State Street Corp. | 25,970,679 | ||||||
|
| |||||||
Total Capital Markets | 34,536,396 | |||||||
|
| |||||||
Chemicals (2.3%) | ||||||||
| 354,765 | Du Pont (E.I.) de Nemours & Co. | 24,404,284 | ||||||
|
| |||||||
Communications Equipment (3.2%) | ||||||||
| 1,079,985 | Cisco Systems, Inc. | 33,133,940 | ||||||
|
| |||||||
Consumer Finance (1.2%) | ||||||||
| 419,237 | Synchrony Financial | 11,985,986 | ||||||
|
| |||||||
Containers & Packaging (1.1%) | ||||||||
| 252,600 | WestRock Co. | 11,667,594 | ||||||
|
| |||||||
Diversified Financial Services (2.0%) | ||||||||
| 75,102 | Intercontinental Exchange, Inc. | 20,306,830 | ||||||
|
| |||||||
Diversified Telecommunication Services (3.3%) | ||||||||
| 443,060 | AT&T, Inc. | 16,300,177 | ||||||
| 1,136,700 | Deutsche Telekom AG (Germany) (SP ADR) | 18,550,944 | ||||||
|
| |||||||
Total Diversified Telecommunication Services | 34,851,121 | |||||||
|
| |||||||
Electronic Equipment, Instruments & Components (2.0%) | ||||||||
| 936,495 | Corning, Inc. | 21,267,801 | ||||||
|
| |||||||
See accompanying notes to financial statements.
51
TCW Relative Value Dividend Appreciation Fund
Schedule of Investments (Continued)
| Number of Shares | Common Stock | Value | ||||||
Energy Equipment & Services (5.2%) | ||||||||
| 383,256 | Baker Hughes, Inc. | $ | 21,232,382 | |||||
| 871,972 | Nabors Industries, Ltd. | 10,376,467 | ||||||
| 282,100 | Schlumberger, Ltd. | 22,068,683 | ||||||
|
| |||||||
Total Energy Equipment & Services | 53,677,532 | |||||||
|
| |||||||
Food & Staples Retailing (1.6%) | ||||||||
| 340,300 | Sysco Corp. | 16,375,236 | ||||||
|
| |||||||
Food Products (1.0%) | ||||||||
| 208,600 | ConAgra Foods, Inc. | 10,050,348 | ||||||
|
| |||||||
Health Care Providers & Services (2.0%) | ||||||||
| 249,750 | Quest Diagnostics, Inc | 20,339,640 | ||||||
|
| |||||||
Household Durables (1.4%) | ||||||||
| 343,471 | Lennar Corp. | 14,319,306 | ||||||
|
| |||||||
Independent Power and Renewable Electricity Producers (1.4%) | ||||||||
| 1,230,071 | AES Corp. (The) | 14,477,936 | ||||||
|
| |||||||
Industrial Conglomerates (6.6%) | ||||||||
| 1,387,496 | General Electric Co. | 40,376,133 | ||||||
| 941,091 | Koninklijke Philips Electronics NV (Netherlands) (NYRS) | 28,260,963 | ||||||
|
| |||||||
Total Industrial Conglomerates | 68,637,096 | |||||||
|
| |||||||
Insurance (4.7%) | ||||||||
| 292,800 | Allstate Corp. (The) | 19,881,120 | ||||||
| 426,080 | MetLife, Inc. | 20,008,717 | ||||||
| 86,600 | Travelers Cos., Inc. (The) | 9,368,388 | ||||||
|
| |||||||
Total Insurance | 49,258,225 | |||||||
|
| |||||||
Leisure Products (0.4%) | ||||||||
| 137,200 | Mattel, Inc. | 4,325,916 | ||||||
|
| |||||||
Machinery (1.4%) | ||||||||
| 263,032 | Pentair PLC (United Kingdom) | 14,500,954 | ||||||
|
| |||||||
Media (5.2%) | ||||||||
| 458,462 | Comcast Corp. | 28,342,121 | ||||||
| 629,398 | Regal Entertainment Group | 13,538,351 | ||||||
| 912,636 | Time, Inc. | 11,864,268 | ||||||
|
| |||||||
Total Media | 53,744,740 | |||||||
|
| |||||||
Multiline Retail (1.5%) | ||||||||
| 1,875,084 | J.C. Penney Co., Inc. (1) | 16,106,972 | ||||||
|
| |||||||
Oil, Gas & Consumable Fuels (4.8%) | ||||||||
| 372,160 | Chevron Corp. | 38,983,760 | ||||||
| 228,637 | Royal Dutch Shell PLC (United Kingdom) (SP ADR) | 11,388,409 | ||||||
|
| |||||||
Total Oil, Gas & Consumable Fuels | 50,372,169 | |||||||
|
| |||||||
See accompanying notes to financial statements.
52
TCW Relative Value Dividend Appreciation Fund
October 31, 2016 |
| Number of Shares | Common Stock | Value | ||||||
Pharmaceuticals (5.6%) | ||||||||
| 82,100 | Johnson & Johnson | $ | 9,522,779 | |||||
| 451,370 | Merck & Co., Inc. | 26,504,446 | ||||||
| 711,400 | Pfizer, Inc. | 22,558,494 | ||||||
|
| |||||||
Total Pharmaceuticals | 58,585,719 | |||||||
|
| |||||||
REIT (0.9%) | ||||||||
| 337,200 | Kimco Realty Corp. | 8,972,892 | ||||||
|
| |||||||
Semiconductors & Semiconductor Equipment (8.3%) | ||||||||
| 1,643,400 | Cypress Semiconductor Corp. | 16,384,698 | ||||||
| 714,736 | Intel Corp. | 24,922,844 | ||||||
| 649,860 | Maxim Integrated Products, Inc. | 25,753,952 | ||||||
| 326,200 | Microchip Technology, Inc. | 19,751,410 | ||||||
|
| |||||||
Total Semiconductors & Semiconductor Equipment | 86,812,904 | |||||||
|
| |||||||
Software (3.4%) | ||||||||
| 590,175 | Microsoft Corp. | 35,363,286 | ||||||
|
| |||||||
Specialty Retail (0.8%) | ||||||||
| 66,514 | Home Depot, Inc. (The) | 8,115,373 | ||||||
|
| |||||||
Technology Hardware, Storage & Peripherals (1.7%) | ||||||||
| 517,465 | Seagate Technology PLC (Netherlands) | 17,754,224 | ||||||
|
| |||||||
Textiles, Apparel & Luxury Goods (2.2%) | ||||||||
| 640,809 | Coach, Inc. | 22,998,635 | ||||||
|
| |||||||
Thrifts & Mortgage Finance (1.9%) | ||||||||
| 1,413,700 | New York Community Bancorp, Inc. | 20,300,732 | ||||||
|
| |||||||
Total Common Stock (Cost: $853,397,179) (99.8%) | 1,040,002,342 | |||||||
|
| |||||||
| Money Market Investments | ||||||||
| 3,285,906 | State Street Institutional U.S. Government Money Market Fund — Premier Class, 0.25% (2) | 3,285,906 | ||||||
|
| |||||||
Total Money Market Investments (Cost: $3,285,906) (0.3%) | 3,285,906 | |||||||
|
| |||||||
Total Investments (Cost: $856,683,085) (100.1%) | 1,043,288,248 | |||||||
Liabilities in Excess of Other Assets (-0.1%) | (1,536,728 | ) | ||||||
|
| |||||||
Net Assets (100.0%) | $ | 1,041,751,520 | ||||||
|
| |||||||
Notes to the Schedule of Investments:
NYRS - New York Registry Shares.
SP ADR - Sponsored American Depositary Receipt. Shares of a foreign based corporation held in U.S. banks that are issued with the cooperation of the company whose stock underlies the ADR and entitles the shareholder to all dividends, capital gains and voting rights.
| (1) | Non-income producing security. |
| (2) | Rate disclosed is the 7-day net yield as of October 31, 2016. |
See accompanying notes to financial statements.
53
TCW Relative Value Dividend Appreciation Fund
Investments by Industry | October 31, 2016 |
| Industry | Percentage of Net Assets | |||
Aerospace & Defense | 2.0 | % | ||
Air Freight & Logistics | 2.0 | |||
Auto Components | 2.1 | |||
Banks | 8.5 | |||
Beverages | 2.6 | |||
Biotechnology | 2.2 | |||
Capital Markets | 3.3 | |||
Chemicals | 2.3 | |||
Communications Equipment | 3.2 | |||
Consumer Finance | 1.2 | |||
Containers & Packaging | 1.1 | |||
Diversified Financial Services | 2.0 | |||
Diversified Telecommunication Services | 3.3 | |||
Electronic Equipment, Instruments & Components | 2.0 | |||
Energy Equipment & Services | 5.2 | |||
Food & Staples Retailing | 1.6 | |||
Food Products | 1.0 | |||
Health Care Providers & Services | 2.0 | |||
Household Durables | 1.4 | |||
Independent Power and Renewable Electricity Producers | 1.4 | |||
Industrial Conglomerates | 6.6 | |||
Insurance | 4.7 | |||
Leisure Products | 0.4 | |||
Machinery | 1.4 | |||
Media | 5.2 | |||
Multiline Retail | 1.5 | |||
Oil, Gas & Consumable Fuels | 4.8 | |||
Pharmaceuticals | 5.6 | |||
REIT | 0.9 | |||
Semiconductors & Semiconductor Equipment | 8.3 | |||
Software | 3.4 | |||
Specialty Retail | 0.8 | |||
Technology Hardware, Storage & Peripherals | 1.7 | |||
Textiles, Apparel & Luxury Goods | 2.2 | |||
Thrifts & Mortgage Finance | 1.9 | |||
Money Market Investments | 0.3 | |||
|
| |||
Total | 100.1 | % | ||
|
| |||
See accompanying notes to financial statements.
54
TCW Relative Value Large Cap Fund
Schedule of Investments | October 31, 2016 |
| Number of Shares | Common Stock | Value | ||||||
Aerospace & Defense (3.3% of Net Assets) | ||||||||
| 416,210 | Textron, Inc. | $ | 16,681,697 | |||||
|
| |||||||
Auto Components (3.3%) | ||||||||
| 28,536 | Adient PLC (Ireland) (1) | 1,298,673 | ||||||
| 242,770 | Dana, Inc. | 3,758,080 | ||||||
| 285,368 | Johnson Controls International PLC (Ireland) | 11,506,038 | ||||||
|
| |||||||
Total Auto Components | 16,562,791 | |||||||
|
| |||||||
Banks (9.5%) | ||||||||
| 341,100 | Citigroup, Inc. | 16,765,065 | ||||||
| 279,758 | JPMorgan Chase & Co. | 19,376,039 | ||||||
| 348,200 | Zions Bancorp. | 11,215,522 | ||||||
|
| |||||||
Total Banks | 47,356,626 | |||||||
|
| |||||||
Beverages (2.5%) | ||||||||
| 117,600 | PepsiCo, Inc. | 12,606,720 | ||||||
|
| |||||||
Biotechnology (1.4%) | ||||||||
| 95,554 | Gilead Sciences, Inc. | 7,035,641 | ||||||
|
| |||||||
Capital Markets (2.3%) | ||||||||
| 163,900 | State Street Corp. | 11,507,419 | ||||||
|
| |||||||
Chemicals (1.8%) | ||||||||
| 163,686 | Dow Chemical Co. (The) | 8,807,944 | ||||||
|
| |||||||
Communications Equipment (3.4%) | ||||||||
| 547,890 | Cisco Systems, Inc. | 16,809,265 | ||||||
|
| |||||||
Consumer Finance (1.3%) | ||||||||
| 221,792 | Synchrony Financial | 6,341,033 | ||||||
|
| |||||||
Containers & Packaging (3.2%) | ||||||||
| 229,153 | Sealed Air Corp. | 10,456,251 | ||||||
| 115,700 | WestRock Co. | 5,344,183 | ||||||
|
| |||||||
Total Containers & Packaging | 15,800,434 | |||||||
|
| |||||||
Diversified Financial Services (2.5%) | ||||||||
| 45,921 | Intercontinental Exchange, Inc. | 12,416,579 | ||||||
|
| |||||||
Diversified Telecommunication Services (1.4%) | ||||||||
| 195,300 | AT&T, Inc. | 7,185,087 | ||||||
|
| |||||||
Electronic Equipment, Instruments & Components (2.5%) | ||||||||
| 541,190 | Corning, Inc. | 12,290,425 | ||||||
|
| |||||||
Energy Equipment & Services (4.0%) | ||||||||
| 295,150 | Baker Hughes, Inc. | 16,351,310 | ||||||
| 291,231 | Nabors Industries, Ltd. | 3,465,649 | ||||||
|
| |||||||
Total Energy Equipment & Services | 19,816,959 | |||||||
| �� |
|
| ||||||
See accompanying notes to financial statements.
55
TCW Relative Value Large Cap Fund
Schedule of Investments (Continued)
| Number of Shares | Common Stock | Value | ||||||
Food & Staples Retailing (1.5%) | ||||||||
| 156,100 | Sysco Corp. | $ | 7,511,532 | |||||
|
| |||||||
Food Products (1.1%) | ||||||||
| 119,000 | ConAgra Foods, Inc. | 5,733,420 | ||||||
|
| |||||||
Health Care Providers & Services (3.3%) | ||||||||
| 100,084 | Anthem, Inc. | 12,196,236 | ||||||
| 35,806 | Cigna Corp. | 4,254,827 | ||||||
|
| |||||||
Total Health Care Providers & Services | 16,451,063 | |||||||
|
| |||||||
Household Durables (2.6%) | ||||||||
| 311,363 | Lennar Corp. | 12,980,723 | ||||||
|
| |||||||
Independent Power and Renewable Electricity Producers (1.9%) | ||||||||
| 830,500 | AES Corp. (The) | 9,774,985 | ||||||
|
| |||||||
Industrial Conglomerates (3.9%) | ||||||||
| 667,336 | General Electric Co. | 19,419,478 | ||||||
|
| |||||||
Insurance (4.2%) | ||||||||
| 305,084 | Hartford Financial Services Group, Inc. | 13,457,255 | ||||||
| 69,270 | Travelers Cos., Inc. (The) | 7,493,629 | ||||||
|
| |||||||
Total Insurance | 20,950,884 | |||||||
|
| |||||||
Machinery (2.9%) | ||||||||
| 134,767 | Pentair PLC (United Kingdom) | 7,429,705 | ||||||
| 292,430 | Terex Corp. | 6,983,228 | ||||||
|
| |||||||
Total Machinery | 14,412,933 | |||||||
|
| |||||||
Media (3.9%) | ||||||||
| 315,255 | Comcast Corp. | 19,489,064 | ||||||
|
| |||||||
Metals & Mining (0.4%) | ||||||||
| 153,800 | Allegheny Technologies, Inc. | 2,097,832 | ||||||
|
| |||||||
Multiline Retail (3.0%) | ||||||||
| 1,732,034 | J.C. Penney Co., Inc. (1) | 14,878,172 | ||||||
|
| |||||||
Oil, Gas & Consumable Fuels (5.1%) | ||||||||
| 182,600 | Chevron Corp. | 19,127,350 | ||||||
| 161,400 | Newfield Exploration Co. (1) | 6,551,226 | ||||||
|
| |||||||
Total Oil, Gas & Consumable Fuels | 25,678,576 | |||||||
|
| |||||||
Pharmaceuticals (5.0%) | ||||||||
| 35,950 | Johnson & Johnson | 4,169,841 | ||||||
| 199,650 | Merck & Co., Inc. | 11,723,448 | ||||||
| 290,350 | Pfizer, Inc. | 9,206,998 | ||||||
|
| |||||||
Total Pharmaceuticals | 25,100,287 | |||||||
|
| |||||||
See accompanying notes to financial statements.
56
TCW Relative Value Large Cap Fund
October 31, 2016 |
| Number of Shares | Common Stock | Value | ||||||
Real Estate Management & Development (1.4%) | ||||||||
| 71,200 | Jones Lang LaSalle, Inc. | $ | 6,895,720 | |||||
|
| |||||||
Semiconductors & Semiconductor Equipment (7.7%) | ||||||||
| 484,575 | Applied Materials, Inc. | 14,091,441 | ||||||
| 824,400 | Cypress Semiconductor Corp. (1) | 8,219,268 | ||||||
| 286,639 | Intel Corp. | 9,995,102 | ||||||
| 373,100 | Micron Technology, Inc. (1) | 6,402,396 | ||||||
|
| |||||||
Total Semiconductors & Semiconductor Equipment | 38,708,207 | |||||||
|
| |||||||
Software (4.1%) | ||||||||
| 338,390 | Microsoft Corp. | 20,276,329 | ||||||
|
| |||||||
Specialty Retail (1.9%) | ||||||||
| 76,900 | Home Depot, Inc. (The) | 9,382,569 | ||||||
|
| |||||||
Technology Hardware, Storage & Peripherals (2.2%) | ||||||||
| 190,040 | Western Digital Corp. | 11,105,938 | ||||||
|
| |||||||
Textiles, Apparel & Luxury Goods (1.4%) | ||||||||
| 195,442 | Coach, Inc. | 7,014,413 | ||||||
|
| |||||||
Total Common Stock (Cost: $335,477,246) (99.9%) | 499,080,745 | |||||||
|
| |||||||
| Money Market Investments | ||||||||
| 934,272 | State Street Institutional U.S. Government Money Market Fund — Premier Class, 0.25% (2) | 934,272 | ||||||
|
| |||||||
Total Money Market Investments (Cost: $934,272) (0.2%) | 934,272 | |||||||
|
| |||||||
Total Investments (Cost: $336,411,518) (100.1%) | 500,015,017 | |||||||
Liabilities in Excess of Other Assets (-0.1%) | (310,910 | ) | ||||||
|
| |||||||
Net Assets (100.0%) | $ | 499,704,107 | ||||||
|
| |||||||
Notes to the Schedule of Investments:
| (1) | Non-income producing security. |
| (2) | Rate disclosed is the 7-day net yield as of October 31, 2016. |
See accompanying notes to financial statements.
57
TCW Relative Value Large Cap Fund
Investments by Industry | October 31, 2016 |
| Industry | Percentage of Net Assets | |||
Aerospace & Defense | 3.3 | % | ||
Auto Components | 3.3 | |||
Banks | 9.5 | |||
Beverages | 2.5 | |||
Biotechnology | 1.4 | |||
Capital Markets | 2.3 | |||
Chemicals | 1.8 | |||
Communications Equipment | 3.4 | |||
Consumer Finance | 1.3 | |||
Containers & Packaging | 3.2 | |||
Diversified Financial Services | 2.5 | |||
Diversified Telecommunication Services | 1.4 | |||
Electronic Equipment, Instruments & Components | 2.5 | |||
Energy Equipment & Services | 4.0 | |||
Food & Staples Retailing | 1.5 | |||
Food Products | 1.1 | |||
Health Care Providers & Services | 3.3 | |||
Household Durables | 2.6 | |||
Independent Power and Renewable Electricity Producers | 1.9 | |||
Industrial Conglomerates | 3.9 | |||
Insurance | 4.2 | |||
Machinery | 2.9 | |||
Media | 3.9 | |||
Metals & Mining | 0.4 | |||
Multiline Retail | 3.0 | |||
Oil, Gas & Consumable Fuels | 5.1 | |||
Pharmaceuticals | 5.0 | |||
Real Estate Management & Development | 1.4 | |||
Semiconductors & Semiconductor Equipment | 7.7 | |||
Software | 4.1 | |||
Specialty Retail | 1.9 | |||
Technology Hardware, Storage & Peripherals | 2.2 | |||
Textiles, Apparel & Luxury Goods | 1.4 | |||
Money Market Investments | 0.2 | |||
|
| |||
Total | 100.1 | % | ||
|
| |||
See accompanying notes to financial statements.
58
TCW Relative Value Mid Cap Fund
Schedule of Investments | October 31, 2016 |
| Number of Shares | Common Stock | Value | ||||||
Aerospace & Defense (2.5% of Net Assets) | ||||||||
| 58,245 | Textron, Inc. | $ | 2,334,460 | |||||
|
| |||||||
Auto Components (3.0%) | ||||||||
| 93,150 | Dana, Inc. | 1,441,962 | ||||||
| 24,515 | Tenneco, Inc. (1) | 1,350,041 | ||||||
|
| |||||||
Total Auto Components | 2,792,003 | |||||||
|
| |||||||
Banks (13.4%) | ||||||||
| 25,966 | Comerica, Inc. | 1,352,569 | ||||||
| 260,742 | KeyCorp | 3,681,677 | ||||||
| 67,065 | Popular, Inc. | 2,434,460 | ||||||
| 66,829 | Synovus Financial Corp. | 2,210,035 | ||||||
| 61,200 | Umpqua Holdings Corp. | 935,136 | ||||||
| 50,400 | Zions Bancorp. | 1,623,384 | ||||||
|
| |||||||
Total Banks | 12,237,261 | |||||||
|
| |||||||
Capital Markets (5.4%) | ||||||||
| 66,300 | E*TRADE Financial Corp. (1) | 1,867,008 | ||||||
| 32,000 | Evercore Partners, Inc. | 1,720,000 | ||||||
| 47,688 | Invesco, Ltd. | 1,339,556 | ||||||
|
| |||||||
Total Capital Markets | 4,926,564 | |||||||
|
| |||||||
Chemicals (0.4%) | ||||||||
| 5,442 | Celanese Corp. — Series A | 396,831 | ||||||
|
| |||||||
Communications Equipment (1.7%) | ||||||||
| 147,500 | Brocade Communications Systems, Inc. | 1,563,500 | ||||||
|
| |||||||
Construction & Engineering (2.3%) | ||||||||
| 40,933 | Jacobs Engineering Group, Inc. (1) | 2,111,324 | ||||||
|
| |||||||
Consumer Finance (0.5%) | ||||||||
| 69,547 | SLM Corp. (1) | 490,306 | ||||||
|
| |||||||
Containers & Packaging (3.2%) | ||||||||
| 43,732 | Sealed Air Corp. | 1,995,491 | ||||||
| 21,200 | WestRock Co. | 979,228 | ||||||
|
| |||||||
Total Containers & Packaging | 2,974,719 | |||||||
|
| |||||||
Diversified Telecommunication Services (0.9%) | ||||||||
| 25,100 | Zayo Group Holdings, Inc. (1) | 807,718 | ||||||
|
| |||||||
Energy Equipment & Services (3.7%) | ||||||||
| 26,800 | Forum Energy Technologies, Inc. (1) | 482,400 | ||||||
| 124,940 | Nabors Industries, Ltd. | 1,486,786 | ||||||
| 222,972 | Newpark Resources, Inc. (1) | 1,404,724 | ||||||
|
| |||||||
Total Energy Equipment & Services | 3,373,910 | |||||||
|
| |||||||
Food & Staples Retailing (1.0%) | ||||||||
| 19,100 | Sysco Corp. | 919,092 | ||||||
|
| |||||||
Food Products (1.3%) | ||||||||
| 25,600 | ConAgra Foods, Inc. | 1,233,408 | ||||||
|
| |||||||
See accompanying notes to financial statements.
59
TCW Relative Value Mid Cap Fund
Schedule of Investments (Continued)
| Number of Shares | Common Stock | Value | ||||||
Health Care Providers & Services (4.9%) | ||||||||
| 10,000 | Cigna Corp. | $ | 1,188,300 | |||||
| 40,700 | Quest Diagnostics, Inc. | 3,314,608 | ||||||
|
| |||||||
Total Health Care Providers & Services | 4,502,908 | |||||||
|
| |||||||
Hotels, Restaurants & Leisure (0.4%) | ||||||||
| 19,400 | Bloomin’ Brands, Inc. | 335,620 | ||||||
|
| |||||||
Household Durables (7.0%) | ||||||||
| 104,755 | Beazer Homes USA, Inc. (1) | 1,071,644 | ||||||
| 7,700 | DR Horton, Inc. | 221,991 | ||||||
| 113,760 | KB Home | 1,654,070 | ||||||
| 38,200 | Lennar Corp. | 1,592,558 | ||||||
| 67,400 | Toll Brothers, Inc. (1) | 1,849,456 | ||||||
|
| |||||||
Total Household Durables | 6,389,719 | |||||||
|
| |||||||
Independent Power and Renewable Electricity Producers (2.2%) | ||||||||
| 172,000 | AES Corp. (The) | 2,024,440 | ||||||
|
| |||||||
Insurance (3.3%) | ||||||||
| 17,886 | Arch Capital Group, Ltd. (1) | 1,394,571 | ||||||
| 53,805 | Assured Guaranty, Ltd. | 1,608,232 | ||||||
|
| |||||||
Total Insurance | 3,002,803 | |||||||
|
| |||||||
Machinery (7.1%) | ||||||||
| 21,509 | Dover Corp. | 1,438,737 | ||||||
| 14,200 | Joy Global, Inc. | 395,186 | ||||||
| 35,500 | Kennametal, Inc. | 1,005,005 | ||||||
| 272,900 | Manitowoc Co., Inc. (The) | 1,102,516 | ||||||
| 36,355 | SPX FLOW, Inc. (1) | 912,147 | ||||||
| 68,798 | Terex Corp. | 1,642,896 | ||||||
|
| |||||||
Total Machinery | 6,496,487 | |||||||
|
| |||||||
Marine (0.6%) | ||||||||
| 9,300 | Kirby Corp. (1) | 548,235 | ||||||
|
| |||||||
Metals & Mining (5.4%) | ||||||||
| 50,971 | Allegheny Technologies, Inc. | 695,244 | ||||||
| 85,607 | Commercial Metals Co. | 1,344,886 | ||||||
| 62,640 | Worthington Industries, Inc. | 2,944,080 | ||||||
|
| |||||||
Total Metals & Mining | 4,984,210 | |||||||
|
| |||||||
Multi-Utilities (1.2%) | ||||||||
| 25,400 | Avista Corp. | 1,051,560 | ||||||
|
| |||||||
Multiline Retail (3.0%) | ||||||||
| 315,300 | J.C. Penney Co., Inc. (1) | 2,708,427 | ||||||
|
| |||||||
Oil, Gas & Consumable Fuels (2.4%) | ||||||||
| 46,400 | Newfield Exploration Co. (1) | 1,883,376 | ||||||
| 52,500 | Synergy Resources Corp. (1) | 359,100 | ||||||
|
| |||||||
Total Oil, Gas & Consumable Fuels | 2,242,476 | |||||||
|
| |||||||
See accompanying notes to financial statements.
60
TCW Relative Value Mid Cap Fund
October 31, 2016 |
| Number of Shares | Common Stock | Value | ||||||
Real Estate Management & Development (1.4%) | ||||||||
| 12,875 | Jones Lang LaSalle, Inc. | $ | 1,246,944 | |||||
|
| |||||||
REIT (3.1%) | ||||||||
| 27,900 | Kimco Realty Corp. | 742,419 | ||||||
| 20,265 | Liberty Property Trust | 819,314 | ||||||
| 5,100 | Life Storage, Inc. | 411,315 | ||||||
| 12,675 | Welltower, Inc. | 868,618 | ||||||
|
| |||||||
Total REIT | 2,841,666 | |||||||
|
| |||||||
Road & Rail (0.6%) | ||||||||
| 8,300 | Genesee & Wyoming, Inc. (1) | 563,902 | ||||||
|
| |||||||
Semiconductors & Semiconductor Equipment (9.7%) | ||||||||
| 128,300 | Cypress Semiconductor Corp. (1) | 1,279,151 | ||||||
| 14,510 | Lam Research Corp. | 1,405,438 | ||||||
| 60,646 | Maxim Integrated Products, Inc. | 2,403,401 | ||||||
| 58,500 | Micron Technology, Inc. (1) | 1,003,860 | ||||||
| 17,028 | NXP Semiconductors NV (Netherlands) (1) | 1,702,800 | ||||||
| 46,548 | Teradyne, Inc. | 1,084,103 | ||||||
|
| |||||||
Total Semiconductors & Semiconductor Equipment | 8,878,753 | |||||||
|
| |||||||
Technology Hardware, Storage & Peripherals (3.1%) | ||||||||
| 48,280 | Western Digital Corp. | 2,821,483 | ||||||
|
| |||||||
Textiles, Apparel & Luxury Goods (2.7%) | ||||||||
| 69,643 | Coach, Inc. | 2,499,487 | ||||||
|
| |||||||
Thrifts & Mortgage Finance (2.3%) | ||||||||
| 71,900 | EverBank Financial Corp. | 1,388,389 | ||||||
| 51,500 | New York Community Bancorp, Inc. | 739,540 | ||||||
|
| |||||||
Total Thrifts & Mortgage Finance | 2,127,929 | |||||||
|
| |||||||
Total Common Stock (Cost: $74,775,333) (99.7%) | 91,428,145 | |||||||
|
| |||||||
| Money Market Investments | ||||||||
| 218,096 | State Street Institutional U.S. Government Money Market Fund — Premier Class, 0.25% (2) | 218,096 | ||||||
|
| |||||||
Total Money Market Investments (Cost: $218,096) (0.3%) | 218,096 | |||||||
|
| |||||||
Total Investments (Cost: $74,993,429) (100.0%) | 91,646,241 | |||||||
Excess of Other Assets over Liabilities (0.0%) | 33,205 | |||||||
|
| |||||||
Net Assets (100.0%) | $ | 91,679,446 | ||||||
|
| |||||||
Notes to the Schedule of Investments:
| (1) | Non-income producing security. |
| (2) | Rate disclosed is the 7-day net yield as of October 31, 2016. |
See accompanying notes to financial statements.
61
TCW Relative Value Mid Cap Fund
Investments by Industry October 31, 2016 |
| Industry | Percentage of Net Assets | |||
Aerospace & Defense | 2.5 | % | ||
Auto Components | 3.0 | |||
Banks | 13.4 | |||
Capital Markets | 5.4 | |||
Chemicals | 0.4 | |||
Communications Equipment | 1.7 | |||
Construction & Engineering | 2.3 | |||
Consumer Finance | 0.5 | |||
Containers & Packaging | 3.2 | |||
Diversified Telecommunication Services | 0.9 | |||
Energy Equipment & Services | 3.7 | |||
Food & Staples Retailing | 1.0 | |||
Food Products | 1.3 | |||
Health Care Providers & Services | 4.9 | |||
Hotels, Restaurants & Leisure | 0.4 | |||
Household Durables | 7.0 | |||
Independent Power and Renewable Electricity Producers | 2.2 | |||
Insurance | 3.3 | |||
Machinery | 7.1 | |||
Marine | 0.6 | |||
Metals & Mining | 5.4 | |||
Multi-Utilities | 1.2 | |||
Multiline Retail | 3.0 | |||
Oil, Gas & Consumable Fuels | 2.4 | |||
REIT | 3.1 | |||
Real Estate Management & Development | 1.4 | |||
Road & Rail | 0.6 | |||
Semiconductors & Semiconductor Equipment | 9.7 | |||
Technology Hardware, Storage & Peripherals | 3.1 | |||
Textiles, Apparel & Luxury Goods | 2.7 | |||
Thrifts & Mortgage Finance | 2.3 | |||
Money Market Investments | 0.3 | |||
|
| |||
Total | 100.0 | % | ||
|
| |||
See accompanying notes to financial statements.
62
Schedule of Investments | October 31, 2016 |
| Number of Shares | Common Stock | Value | ||||||
Beverages (2.6% of Net Assets) | ||||||||
| 255,800 | Monster Beverage Corp. (1) | $ | 36,922,172 | |||||
|
| |||||||
Biotechnology (9.4%) | ||||||||
| 322,072 | Alexion Pharmaceuticals, Inc. (1) | 42,030,396 | ||||||
| 330,913 | BioMarin Pharmaceutical, Inc. (1) | 26,645,115 | ||||||
| 635,880 | Celgene Corp. (1) | 64,974,218 | ||||||
|
| |||||||
Total Biotechnology | 133,649,729 | |||||||
|
| |||||||
Capital Markets (2.3%) | ||||||||
| 1,030,270 | Charles Schwab Corp. (The) | 32,659,559 | ||||||
|
| |||||||
Food & Staples Retailing (6.6%) | ||||||||
| 265,544 | Costco Wholesale Corp. | 39,265,991 | ||||||
| 641,530 | CVS Health Corp. | 53,952,673 | ||||||
|
| |||||||
Total Food & Staples Retailing | 93,218,664 | |||||||
|
| |||||||
Health Care Providers & Services (1.7%) | ||||||||
| 674,863 | Acadia Healthcare Co., Inc. (1) | 24,268,074 | ||||||
|
| |||||||
Health Care Technology (5.1%) | ||||||||
| 341,998 | athenahealth, Inc. (1) | 35,335,233 | ||||||
| 632,767 | Cerner Corp. (1) | 37,067,491 | ||||||
|
| |||||||
Total Health Care Technology | 72,402,724 | |||||||
|
| |||||||
Hotels, Restaurants & Leisure (5.3%) | ||||||||
| 59,553 | Chipotle Mexican Grill, Inc. (1) | 21,484,340 | ||||||
| 1,011,230 | Starbucks Corp. | 53,665,976 | ||||||
|
| |||||||
Total Hotels, Restaurants & Leisure | 75,150,316 | |||||||
|
| |||||||
Insurance (4.1%) | ||||||||
| 459,890 | Chubb, Ltd. (Switzerland) | 58,406,030 | ||||||
|
| |||||||
Internet & Catalog Retail (8.3%) | ||||||||
| 73,814 | Amazon.com, Inc. (1) | 58,299,774 | ||||||
| 40,114 | Priceline Group, Inc. (The) (1) | 59,137,262 | ||||||
|
| |||||||
Total Internet & Catalog Retail | 117,437,036 | |||||||
|
| |||||||
Internet Software & Services (16.9%) | ||||||||
| 128,329 | Alphabet, Inc. — Class C (1) | 100,679,234 | ||||||
| 130,055 | Equinix, Inc. | 46,466,050 | ||||||
| 699,602 | Facebook, Inc. (1) | 91,640,866 | ||||||
|
| |||||||
Total Internet Software & Services | 238,786,150 | |||||||
|
| |||||||
IT Services (6.9%) | ||||||||
| 427,410 | PayPal Holdings, Inc. (1) | 17,805,901 | ||||||
| 970,504 | Visa, Inc. | 80,076,285 | ||||||
|
| |||||||
Total IT Services | 97,882,186 | |||||||
|
| |||||||
See accompanying notes to financial statements.
63
TCW Select Equities Fund
Schedule of Investments (Continued)
| Number of Shares | Common Stock | Value | ||||||
Life Sciences Tools & Services (1.8%) | ||||||||
| 187,935 | Illumina, Inc. (1) | $ | 25,585,471 | |||||
|
| |||||||
Pharmaceuticals (3.2%) | ||||||||
| 215,778 | Allergan PLC (Ireland) (1) | 45,084,655 | ||||||
|
| |||||||
REIT (5.6%) | ||||||||
| 673,072 | American Tower Corp. | 78,877,308 | ||||||
|
| |||||||
Software (16.9%) | ||||||||
| 473,157 | Adobe Systems, Inc. (1) | 50,869,109 | ||||||
| 1,003,830 | Mobileye NV (Netherlands) (1) | 37,322,399 | ||||||
| 865,648 | Salesforce.com, Inc. (1) | 65,062,104 | ||||||
| 489,143 | ServiceNow, Inc. (1) | 43,000,561 | ||||||
| 719,202 | Splunk, Inc. (1) | 43,288,768 | ||||||
|
| |||||||
Total Software | 239,542,941 | |||||||
|
| |||||||
Textiles, Apparel & Luxury Goods (1.0%) | ||||||||
| 353,100 | Under Armour, Inc. (1) | 10,981,410 | ||||||
| 118,355 | Under Armour, Inc. — Class C (1) | 3,060,660 | ||||||
|
| |||||||
Total Textiles, Apparel & Luxury Goods | 14,042,070 | |||||||
|
| |||||||
Total Common Stock (Cost: $861,691,420) (97.7%) | 1,383,915,085 | |||||||
|
| |||||||
| Money Market Investments | ||||||||
| 31,989,148 | State Street Institutional U.S. Government Money Market Fund — Premier Class, 0.25% (2) | 31,989,148 | ||||||
|
| |||||||
Total Money Market Investments (Cost: $31,989,148) (2.3%) | 31,989,148 | |||||||
|
| |||||||
Total Investments (Cost: $893,680,568) (100.0%) | 1,415,904,233 | |||||||
Liabilities in Excess of Other Assets (-0.0%) | (108,284 | ) | ||||||
|
| |||||||
Net Assets (100.0%) | $ | 1,415,795,949 | ||||||
|
| |||||||
Notes to the Schedule of Investments:
| (1) | Non-income producing security. |
| (2) | Rate disclosed is the 7-day net yield as of October 31, 2016. |
See accompanying notes to financial statements.
64
TCW Select Equities Fund
Investments by Industry | October 31, 2016 |
| Industry | Percentage of Net Assets | |||
Beverages | 2.6 | % | ||
Biotechnology | 9.4 | |||
Capital Markets | 2.3 | |||
Food & Staples Retailing | 6.6 | |||
Health Care Providers & Services | 1.7 | |||
Health Care Technology | 5.1 | |||
Hotels, Restaurants & Leisure | 5.3 | |||
Insurance | 4.1 | |||
Internet & Catalog Retail | 8.3 | |||
Internet Software & Services | 16.9 | |||
IT Services | 6.9 | |||
Life Sciences Tools & Services | 1.8 | |||
Pharmaceuticals | 3.2 | |||
REIT | 5.6 | |||
Software | 16.9 | |||
Textiles, Apparel & Luxury Goods | 1.0 | |||
Money Market Investments | 2.3 | |||
|
| |||
Total | 100.0 | % | ||
|
| |||
See accompanying notes to financial statements.
65
Schedule of Investments
| Number of Shares | Common Stock | Value | ||||||
Aerospace & Defense (4.3% of Net Assets) | ||||||||
| 26,800 | BE Aerospace, Inc. | $ | 1,595,136 | |||||
| 8,010 | HEICO Corp. | 541,156 | ||||||
|
| |||||||
Total Aerospace & Defense | 2,136,292 | |||||||
|
| |||||||
Auto Components (1.9%) | ||||||||
| 13,200 | Dorman Products, Inc. (1) | 847,968 | ||||||
| 4,500 | Gentherm, Inc. (1) | 126,675 | ||||||
|
| |||||||
Total Auto Components | 974,643 | |||||||
|
| |||||||
Beverages (1.9%) | ||||||||
| 6,000 | Boston Beer Co., Inc. (The) (1) | 931,500 | ||||||
|
| |||||||
Biotechnology (7.7%) | ||||||||
| 11,500 | Alkermes PLC (Ireland) (1) | 579,715 | ||||||
| 9,200 | BeiGene, Ltd. (China) (ADR)(1) | 305,808 | ||||||
| 5,600 | BioMarin Pharmaceutical, Inc. (1) | 450,912 | ||||||
| 29,590 | Cepheid, Inc. (1) | 1,565,311 | ||||||
| 5,700 | Incyte Corp. (1) | 495,729 | ||||||
| 5,600 | Ophthotech Corp. (1) | 200,592 | ||||||
| 4,025 | Ultragenyx Pharmaceutical, Inc. (1) | 237,435 | ||||||
|
| |||||||
Total Biotechnology | 3,835,502 | |||||||
|
| |||||||
Capital Markets (1.5%) | ||||||||
| 27,500 | Financial Engines, Inc. | 760,375 | ||||||
|
| |||||||
Chemicals (3.0%) | ||||||||
| 12,700 | Ingevity Corp. (1) | 525,780 | ||||||
| 18,300 | Trinseo SA (Luxembourg) | 959,835 | ||||||
|
| |||||||
Total Chemicals | 1,485,615 | |||||||
|
| |||||||
Commercial Services & Supplies (5.6%) | ||||||||
| 13,600 | Advisory Board Co. (The) (1) | 541,280 | ||||||
| 23,500 | Healthcare Services Group, Inc. | 868,795 | ||||||
| 8,800 | UniFirst Corp. | 1,078,000 | ||||||
| 7,600 | US Ecology, Inc. | 321,100 | ||||||
|
| |||||||
Total Commercial Services & Supplies | 2,809,175 | |||||||
|
| |||||||
Communications Equipment (0.6%) | ||||||||
| 19,300 | CalAmp Corp. (1) | 249,356 | ||||||
| 4,610 | Quantenna Communications, Inc. (1) | 69,058 | ||||||
|
| |||||||
Total Communications Equipment | 318,414 | |||||||
|
| |||||||
Distributors (0.6%) | ||||||||
| 8,200 | Core-Mark Holding Co., Inc. | 289,870 | ||||||
|
| |||||||
Diversified Consumer Services (1.0%) | ||||||||
| 3,415 | MarketAxess Holdings, Inc. | 514,845 | ||||||
|
| |||||||
See accompanying notes to financial statements.
66
TCW Small Cap Growth Fund
October 31, 2016 |
| Number of Shares | Common Stock | Value | ||||||
Electronic Equipment, Instruments & Components (2.6%) | ||||||||
| 4,745 | Cognex Corp. | $ | 244,842 | |||||
| 23,389 | FARO Technologies, Inc. (1) | 784,701 | ||||||
| 36,300 | InvenSense, Inc. (1) | 277,695 | ||||||
|
| |||||||
Total Electronic Equipment, Instruments & Components | 1,307,238 | |||||||
|
| |||||||
Food & Staples Retailing (3.6%) | ||||||||
| 8,090 | Pricesmart, Inc. | 735,785 | ||||||
| 25,000 | United Natural Foods, Inc. (1) | 1,043,500 | ||||||
|
| |||||||
Total Food & Staples Retailing | 1,779,285 | |||||||
|
| |||||||
Food Products (2.1%) | ||||||||
| 29,100 | Hain Celestial Group, Inc. (The) (1) | 1,058,367 | ||||||
|
| |||||||
Health Care Providers & Services (6.3%) | ||||||||
| 6,600 | Acadia Healthcare Co., Inc. (1) | 237,336 | ||||||
| 2,000 | Chemed Corp. | 282,840 | ||||||
| 41,800 | Diplomat Pharmacy, Inc. (1) | 968,506 | ||||||
| 7,200 | HealthEquity, Inc. (1) | 239,256 | ||||||
| 20,300 | LHC Group, Inc. (1) | 695,681 | ||||||
| 16,600 | Surgical Care Affiliates, Inc. (1) | 710,314 | ||||||
|
| |||||||
Total Health Care Providers & Services | 3,133,933 | |||||||
|
| |||||||
Health Care Technology (0.9%) | ||||||||
| 4,500 | athenahealth, Inc. (1) | 464,940 | ||||||
|
| |||||||
Hotels, Restaurants & Leisure (0.9%) | ||||||||
| 38,500 | Eldorado Resorts, Inc. (1) | 465,850 | ||||||
|
| |||||||
Household Products (0.6%) | ||||||||
| 11,900 | Central Garden & Pet Co. (1) | 289,408 | ||||||
|
| |||||||
Internet & Catalog Retail (2.5%) | ||||||||
| 59,300 | Etsy, Inc. (1) | 769,714 | ||||||
| 14,800 | Wayfair, Inc. (1) | 493,284 | ||||||
|
| |||||||
Total Internet & Catalog Retail | 1,262,998 | |||||||
|
| |||||||
Internet Software & Services (9.1%) | ||||||||
| 27,435 | Apptio, Inc. (1) | 541,293 | ||||||
| 51,340 | Cornerstone OnDemand, Inc. (1) | 2,120,342 | ||||||
| 15,600 | New Relic, Inc. (1) | 568,620 | ||||||
| 7,290 | SPS Commerce, Inc. (1) | 454,750 | ||||||
| 25,900 | Yelp, Inc. (1) | 845,894 | ||||||
|
| |||||||
Total Internet Software & Services | 4,530,899 | |||||||
|
| |||||||
IT Services (1.6%) | ||||||||
| 12,600 | EPAM Systems, Inc. (1) | 811,062 | ||||||
|
| |||||||
See accompanying notes to financial statements.
67
TCW Small Cap Growth Fund
Schedule of Investments (Continued)
| Number of Shares | Common Stock | Value | ||||||
Life Sciences Tools & Services (4.2%) | ||||||||
| 28,300 | INC Research Holdings, Inc. (1) | $ | 1,293,310 | |||||
| 16,700 | NanoString Technologies, Inc. (1) | 324,815 | ||||||
| 18,200 | Patheon NV (Netherlands) (1) | 462,098 | ||||||
|
| |||||||
Total Life Sciences Tools & Services | 2,080,223 | |||||||
|
| |||||||
Machinery (5.0%) | ||||||||
| 12,700 | CLARCOR, Inc. | 790,067 | ||||||
| 4,550 | John Bean Technologies Corp. | 363,317 | ||||||
| 11,600 | RBC Bearings, Inc. (1) | 827,660 | ||||||
| 6,600 | Wabtec Corp. | 510,246 | ||||||
|
| |||||||
Total Machinery | 2,491,290 | |||||||
|
| |||||||
Media (1.6%) | ||||||||
| 39,500 | Lions Gate Entertainment Corp. | 804,220 | ||||||
|
| |||||||
Oil, Gas & Consumable Fuels (1.8%) | ||||||||
| 22,200 | Matador Resources Co. (1) | 484,182 | ||||||
| 11,950 | RSP Permian, Inc. (1) | 431,395 | ||||||
|
| |||||||
Total Oil, Gas & Consumable Fuels | 915,577 | |||||||
|
| |||||||
Personal Products (1.1%) | ||||||||
| 21,250 | elf Beauty, Inc. (1) | 549,525 | ||||||
|
| |||||||
Pharmaceuticals (3.0%) | ||||||||
| 43,000 | Depomed, Inc. (1) | 961,480 | ||||||
| 32,100 | Horizon Pharma PLC (Ireland) (1) | 536,712 | ||||||
|
| |||||||
Total Pharmaceuticals | 1,498,192 | |||||||
|
| |||||||
Professional Services (1.8%) | ||||||||
| 5,700 | Exponent, Inc. | 326,325 | ||||||
| 10,000 | WageWorks, Inc. (1) | 589,500 | ||||||
|
| |||||||
Total Professional Services | 915,825 | |||||||
|
| |||||||
Real Estate Management & Development (1.6%) | ||||||||
| 18,475 | RE/MAX Holdings, Inc. | 802,739 | ||||||
|
| |||||||
Semiconductors & Semiconductor Equipment (1.1%) | ||||||||
| 12,388 | Mellanox Technologies, Ltd. (Israel) (1) | 537,639 | ||||||
|
| |||||||
Software (10.1%) | ||||||||
| 670 | Blackline, Inc. (1) | 15,243 | ||||||
| 14,900 | Callidus Software, Inc. (1) | 271,925 | ||||||
| 5,500 | Imperva, Inc. (1) | 202,950 | ||||||
| 10,950 | Proofpoint, Inc. (1) | 858,261 | ||||||
| 14,250 | Qualys, Inc. (1) | 530,813 | ||||||
| 5,800 | ServiceNow, Inc. (1) | 509,878 | ||||||
| 9,250 | Splunk, Inc. (1) | 556,757 | ||||||
| 10,600 | Tableau Software, Inc. (1) | 509,330 | ||||||
See accompanying notes to financial statements.
68
TCW Small Cap Growth Fund
October 31, 2016 |
| Number of Shares | Common Stock | Value | ||||||
Software (Continued) | ||||||||
| 23,000 | Take-Two Interactive Software, Inc. (1) | $ | 1,020,970 | |||||
| 2,670 | Ultimate Software Group, Inc. (The) (1) | 563,343 | ||||||
|
| |||||||
Total Software | 5,039,470 | |||||||
|
| |||||||
Specialty Retail (2.4%) | ||||||||
| 2,400 | Asbury Automotive Group, Inc. (1) | 122,280 | ||||||
| 14,250 | Dick’s Sporting Goods, Inc. | 793,012 | ||||||
| 9,500 | Restoration Hardware Holdings, Inc. (1) | 275,215 | ||||||
|
| |||||||
Total Specialty Retail | 1,190,507 | |||||||
|
| |||||||
Textiles, Apparel & Luxury Goods (0.8%) | ||||||||
| 6,800 | Skechers U.S.A., Inc. (1) | 143,004 | ||||||
| 8,000 | Under Armour, Inc. (1) | 248,800 | ||||||
|
| |||||||
Total Textiles, Apparel & Luxury Goods | 391,804 | |||||||
|
| |||||||
Trading Companies & Distributors (2.6%) | ||||||||
| 26,500 | NOW, Inc. (1) | 571,340 | ||||||
| 14,700 | SiteOne Landscape Supply, Inc. (1) | 458,346 | ||||||
| 5,200 | WESCO International, Inc. (1) | 281,840 | ||||||
|
| |||||||
Total Trading Companies & Distributors | 1,311,526 | |||||||
|
| |||||||
Total Common Stock (Cost: $38,488,512) (95.4%) | 47,688,748 | |||||||
|
| |||||||
| Money Market Investments | ||||||||
| 2,341,083 | State Street Institutional U.S. Government Money Market Fund — Premier Class, 0.25% (2) | 2,341,083 | ||||||
|
| |||||||
Total Money Market Investments (Cost: $2,341,083) (4.7%) | 2,341,083 | |||||||
|
| |||||||
Total Investments (Cost: $40,829,595) (100.1%) | 50,029,831 | |||||||
Liabilities in Excess of Other Assets (-0.1%) | (70,208 | ) | ||||||
|
| |||||||
Net Assets (100.0%) | $ | 49,959,623 | ||||||
|
| |||||||
Notes to the Schedule of Investments:
| ADR - | American Depositary Receipt. Shares of a foreign based corporation held in U.S. banks entitling the shareholder to all dividends and capital gains. |
| (1) | Non-income producing security. |
| (2) | Rate disclosed is the 7-day net yield as of October 31, 2016. |
See accompanying notes to financial statements.
69
TCW Small Cap Growth Fund
Investments by Industry | October 31, 2016 |
| Industry | Percentage of Net Assets | |||
Aerospace & Defense | 4.3 | % | ||
Auto Components | 1.9 | |||
Beverages | 1.9 | |||
Biotechnology | 7.7 | |||
Capital Markets | 1.5 | |||
Chemicals | 3.0 | |||
Commercial Services & Supplies | 5.6 | |||
Communications Equipment | 0.6 | |||
Distributors | 0.6 | |||
Diversified Consumer Services | 1.0 | |||
Electronic Equipment, Instruments & Components | 2.6 | |||
Food & Staples Retailing | 3.6 | |||
Food Products | 2.1 | |||
Health Care Providers & Services | 6.3 | |||
Health Care Technology | 0.9 | |||
Hotels, Restaurants & Leisure | 0.9 | |||
Household Products | 0.6 | |||
Internet & Catalog Retail | 2.5 | |||
Internet Software & Services | 9.1 | |||
IT Services | 1.6 | |||
Life Sciences Tools & Services | 4.2 | |||
Machinery | 5.0 | |||
Media | 1.6 | |||
Oil, Gas & Consumable Fuels | 1.8 | |||
Personal Products | 1.1 | |||
Pharmaceuticals | 3.0 | |||
Professional Services | 1.8 | |||
Real Estate Management & Development | 1.6 | |||
Semiconductors & Semiconductor Equipment | 1.1 | |||
Software | 10.1 | |||
Specialty Retail | 2.4 | |||
Textiles, Apparel & Luxury Goods | 0.8 | |||
Trading Companies & Distributors | 2.6 | |||
Money Market Investments | 4.7 | |||
|
| |||
Total | 100.1 | % | ||
|
| |||
See accompanying notes to financial statements.
70
TCW Funds, Inc.
October 31, 2016 |
| TCW Conservative Allocation Fund | TCW Focused Equities Fund (1) | TCW Global Real Estate Fund | TCW Growth Equities Fund | |||||||||||||
| Dollar Amounts in Thousands (Except per Share Amounts) | ||||||||||||||||
ASSETS | ||||||||||||||||
Investments, at Value | $ | — | $ | 9,840 | (2) | $ | 4,032 | (2) | $ | 9,076 | (2) | |||||
Investment in Affiliated Issuers, at Value | 30,321 | (3) | — | — | — | |||||||||||
Receivable for Securities Sold | 258 | — | — | — | ||||||||||||
Receivable for Fund Shares Sold | — | (4) | — | (4) | — | — | (4) | |||||||||
Dividends Receivable | 35 | 27 | 4 | 1 | ||||||||||||
Foreign Tax Reclaims Receivable | — | 2 | — | — | ||||||||||||
Receivable from Investment Advisor | 1 | 4 | 6 | 6 | ||||||||||||
Prepaid Expenses | 21 | 17 | 4 | 12 | ||||||||||||
|
|
|
|
|
|
|
| |||||||||
Total Assets | 30,636 | 9,890 | 4,046 | 9,095 | ||||||||||||
|
|
|
|
|
|
|
| |||||||||
LIABILITIES | ||||||||||||||||
Payable for Securities Purchased | 10 | — | — | 2 | ||||||||||||
Payable for Fund Shares Redeemed | — | — | 10 | — | ||||||||||||
Disbursements in Excess of Available Cash | 29 | — | — | — | ||||||||||||
Accrued Directors’ Fees and Expenses | 2 | 2 | 2 | 2 | ||||||||||||
Accrued Management Fees | — | 6 | 3 | 8 | ||||||||||||
Accrued Distribution Fees | — | (4) | — | (4) | — | (4) | 1 | |||||||||
Other Accrued Expenses | 16 | 21 | 15 | 23 | ||||||||||||
|
|
|
|
|
|
|
| |||||||||
Total Liabilities | 57 | 29 | 30 | 36 | ||||||||||||
|
|
|
|
|
|
|
| |||||||||
NET ASSETS | $ | 30,579 | $ | 9,861 | $ | 4,016 | $ | 9,059 | ||||||||
|
|
|
|
|
|
|
| |||||||||
NET ASSETS CONSIST OF: | ||||||||||||||||
Paid-in Capital | $ | 26,900 | $ | 15,613 | $ | 4,499 | $ | 7,324 | ||||||||
Accumulated Net Realized Gain (Loss) on Investments, Options Written and Foreign Currency | 1,132 | (6,609 | ) | (509 | ) | 292 | ||||||||||
Unrealized Appreciation of Investments | 2,207 | 757 | 27 | 1,505 | ||||||||||||
Undistributed Net Investment Income (Loss) | 340 | 100 | (1 | ) | (62 | ) | ||||||||||
|
|
|
|
|
|
|
| |||||||||
NET ASSETS | $ | 30,579 | $ | 9,861 | $ | 4,016 | $ | 9,059 | ||||||||
|
|
|
|
|
|
|
| |||||||||
NET ASSETS ATTRIBUTABLE TO: | ||||||||||||||||
I Class Share | $ | 28,982 | $ | 8,903 | $ | 3,499 | $ | 6,247 | ||||||||
|
|
|
|
|
|
|
| |||||||||
N Class Share | $ | 1,597 | $ | 958 | $ | 517 | $ | 2,812 | ||||||||
|
|
|
|
|
|
|
| |||||||||
CAPITAL SHARES OUTSTANDING: (5) | ||||||||||||||||
I Class Share | 2,390,122 | 476,970 | 371,650 | 755,232 | ||||||||||||
|
|
|
|
|
|
|
| |||||||||
N Class Share | 132,292 | 51,862 | 54,952 | 343,136 | ||||||||||||
|
|
|
|
|
|
|
| |||||||||
NET ASSET VALUE PER SHARE: (6) | ||||||||||||||||
I Class Share | $ | 12.13 | $ | 18.67 | $ | 9.42 | $ | 8.27 | ||||||||
|
|
|
|
|
|
|
| |||||||||
N Class Share | $ | 12.07 | $ | 18.47 | $ | 9.42 | $ | 8.20 | ||||||||
|
|
|
|
|
|
|
| |||||||||
| (1) | Formerly TCW Concentrated Value Fund. |
| (2) | The identified cost for the TCW Focused Equities Fund, the TCW Global Real Estate Fund and the TCW Growth Equities Fund at October 31, 2016 was $9,083, $4,005 and $7,571, respectively. |
| (3) | The identified cost for investments in affiliated issuers of the TCW Conservative Allocation Fund was $28,114. |
| (4) | Amount rounds to less than $1. |
| (5) | The number of authorized shares, with a par value of $0.001 per share, is 4,000,000,000 for each of the I Class and N Class shares. |
| (6) | Represents offering price and redemption price per share. |
See accompanying notes to financial statements.
71
TCW Funds, Inc.
Statements of Assets and Liabilities | October 31, 2016 |
| TCW High Dividend Equities Fund | TCW New America Premier Equities Fund | TCW Relative Value Dividend Appreciation Fund | TCW Relative Value Large Cap Fund | |||||||||||||
| Dollar Amounts in Thousands (Except per Share Amounts) | ||||||||||||||||
ASSETS | ||||||||||||||||
Investments, at Value (1) | $ | 12,042 | $ | 4,077 | $ | 1,043,288 | $ | 500,015 | ||||||||
Foreign Currency, at Value | — | 125 | (2) | — | — | |||||||||||
Receivable for Securities Sold | — | 238 | 1,355 | 491 | ||||||||||||
Receivable for Fund Shares Sold | — | — | 414 | 227 | ||||||||||||
Dividends Receivable | 14 | 15 | 2,777 | 1,601 | ||||||||||||
Receivable from Investment Advisor | 1 | 12 | 125 | 5 | ||||||||||||
Prepaid Expenses | 5 | 16 | 30 | 21 | ||||||||||||
|
|
|
|
|
|
|
| |||||||||
Total Assets | 12,062 | 4,483 | 1,047,989 | 502,360 | ||||||||||||
|
|
|
|
|
|
|
| |||||||||
LIABILITIES | ||||||||||||||||
Payable for Securities Purchased | — | 201 | 3,870 | 1,781 | ||||||||||||
Payable for Fund Shares Redeemed | 27 | — | 1,258 | 388 | ||||||||||||
Accrued Directors’ Fees and Expenses | 2 | 3 | 2 | 3 | ||||||||||||
Accrued Management Fees | 7 | 3 | 670 | 322 | ||||||||||||
Accrued Distribution Fees | — | (3) | — | (3) | 188 | 4 | ||||||||||
Options Written, at Value | 16 | (4) | — | — | — | |||||||||||
Other Accrued Expenses | 15 | 5 | 249 | 158 | ||||||||||||
|
|
|
|
|
|
|
| |||||||||
Total Liabilities | 67 | 212 | 6,237 | 2,656 | ||||||||||||
|
|
|
|
|
|
|
| |||||||||
NET ASSETS | $ | 11,995 | $ | 4,271 | $ | 1,041,752 | $ | 499,704 | ||||||||
|
|
|
|
|
|
|
| |||||||||
NET ASSETS CONSIST OF: | ||||||||||||||||
Paid-in Capital | $ | 12,583 | $ | 3,894 | $ | 899,124 | $ | 304,862 | ||||||||
Accumulated Net Realized Gain (Loss) on Investments, Options Written and Foreign Currency | (663 | ) | 131 | (45,638 | ) | 23,648 | ||||||||||
Unrealized Appreciation of Investments and Options Written | 75 | 220 | 186,605 | 163,603 | ||||||||||||
Undistributed Net Investment Income | — | 26 | 1,661 | 7,591 | ||||||||||||
|
|
|
|
|
|
|
| |||||||||
NET ASSETS | $ | 11,995 | $ | 4,271 | $ | 1,041,752 | $ | 499,704 | ||||||||
|
|
|
|
|
|
|
| |||||||||
NET ASSETS ATTRIBUTABLE TO: | ||||||||||||||||
I Class Share | $ | 11,527 | $ | 3,143 | $ | 165,331 | $ | 480,174 | ||||||||
|
|
|
|
|
|
|
| |||||||||
N Class Share | $ | 468 | $ | 1,128 | $ | 876,421 | $ | 19,530 | ||||||||
|
|
|
|
|
|
|
| |||||||||
CAPITAL SHARES OUTSTANDING: (5) | ||||||||||||||||
I Class Share | 1,293,383 | 279,930 | 9,752,448 | 22,459,688 | ||||||||||||
|
|
|
|
|
|
|
| |||||||||
N Class Share | 52,517 | 100,450 | 50,862,131 | 916,592 | ||||||||||||
|
|
|
|
|
|
|
| |||||||||
NET ASSET VALUE PER SHARE: (6) | ||||||||||||||||
I Class Share | $ | 8.91 | $ | 11.23 | $ | 16.95 | $ | 21.38 | ||||||||
|
|
|
|
|
|
|
| |||||||||
N Class Share | $ | 8.91 | $ | 11.23 | $ | 17.23 | $ | 21.31 | ||||||||
|
|
|
|
|
|
|
| |||||||||
| (1) | The identified cost for the TCW High Dividend Equities Fund, the TCW New America Premier Equities Fund, the TCW Relative Value Dividend Appreciation Fund and the TCW Relative Value Large Cap Fund at October 31, 2016 was $11,961, $3,857, $856,683 and $336,412, respectively. |
| (2) | The identified cost for the TCW New America Premier Equities Fund at October 31, 2016 was $125. |
| (3) | Amount rounds to less than $1. |
| (4) | Premium received $10. |
| (5) | The number of authorized shares, with a par value of $0.001 per share, is 4,000,000,000 for each of the I Class and N Class shares. |
| (6) | Represents offering price and redemption price per share. |
See accompanying notes to financial statements.
72
TCW Funds, Inc.
Statements of Assets and Liabilities | October 31, 2016 |
| TCW Relative Value Mid Cap Fund | TCW Select Equities Fund | TCW Small Cap Growth Fund | ||||||||||
| Dollar Amounts in Thousands (Except per Share Amounts) | ||||||||||||
ASSETS | ||||||||||||
Investments, at Value (1) | $ | 91,646 | $ | 1,415,905 | $ | 50,030 | ||||||
Receivable for Securities Sold | 303 | — | 166 | |||||||||
Receivable for Fund Shares Sold | 7 | 4,896 | 4 | |||||||||
Dividends Receivable | 27 | 277 | 4 | |||||||||
Receivable from Investment Advisor | 1 | — | 1 | |||||||||
Prepaid Expenses | 21 | 35 | 10 | |||||||||
|
|
|
|
|
| |||||||
Total Assets | 92,005 | 1,421,113 | 50,215 | |||||||||
|
|
|
|
|
| |||||||
LIABILITIES | ||||||||||||
Payable for Securities Purchased | 175 | 2,753 | 85 | |||||||||
Payable for Fund Shares Redeemed | 45 | 1,211 | 81 | |||||||||
Accrued Directors’ Fees and Expenses | 2 | 2 | 2 | |||||||||
Accrued Management Fees | 63 | 919 | 44 | |||||||||
Accrued Distribution Fees | 4 | 33 | 4 | |||||||||
Other Accrued Expenses | 37 | 399 | 39 | |||||||||
|
|
|
|
|
| |||||||
Total Liabilities | 326 | 5,317 | 255 | |||||||||
|
|
|
|
|
| |||||||
NET ASSETS | $ | 91,679 | $ | 1,415,796 | $ | 49,960 | ||||||
|
|
|
|
|
| |||||||
NET ASSETS CONSIST OF: | ||||||||||||
Paid-in Capital | $ | 77,295 | $ | 811,267 | $ | 41,440 | ||||||
Accumulated Net Realized Gain (Loss) on Investments | (2,311 | ) | 82,306 | (679 | ) | |||||||
Unrealized Appreciation of Investments | 16,653 | 522,224 | 9,200 | |||||||||
Undistributed Net Investment Income (Loss) | 42 | (1 | ) | (1 | ) | |||||||
|
|
|
|
|
| |||||||
NET ASSETS | $ | 91,679 | $ | 1,415,796 | $ | 49,960 | ||||||
|
|
|
|
|
| |||||||
NET ASSETS ATTRIBUTABLE TO: | ||||||||||||
I Class Share | $ | 74,840 | $ | 1,264,622 | $ | 33,424 | ||||||
|
|
|
|
|
| |||||||
N Class Share | $ | 16,839 | $ | 151,174 | $ | 16,536 | ||||||
|
|
|
|
|
| |||||||
CAPITAL SHARES OUTSTANDING: (2) | ||||||||||||
I Class Share | 3,738,821 | 48,525,880 | 1,591,029 | |||||||||
|
|
|
|
|
| |||||||
N Class Share | 863,740 | 6,207,175 | 863,038 | |||||||||
|
|
|
|
|
| |||||||
NET ASSET VALUE PER SHARE: (3) | ||||||||||||
I Class Share | $ | 20.02 | $ | 26.06 | $ | 21.01 | ||||||
|
|
|
|
|
| |||||||
N Class Share | $ | 19.50 | $ | 24.35 | $ | 19.16 | ||||||
|
|
|
|
|
| |||||||
| (1) | The identified cost for the TCW Relative Value Mid Cap Fund, the TCW Select Equities Fund and the TCW Small Cap Growth Fund at October 31, 2016 was $74,993, $893,681 and $40,830, respectively. |
| (2) | The number of authorized shares, with a par value of $0.001 per share, is 4,000,000,000 for each of the I Class and N Class shares. |
| (3) | Represents offering price and redemption price per share. |
See accompanying notes to financial statements.
73
TCW Funds, Inc.
Year Ended October 31, 2016 |
| TCW Conservative Allocation Fund | TCW Focused Equities Fund (1) | TCW Global Real Estate Fund | TCW Growth Equities Fund | |||||||||||||
| Dollar Amounts in Thousands | ||||||||||||||||
INVESTMENT INCOME | ||||||||||||||||
Income: | ||||||||||||||||
Dividends | $ | — | (2) | $ | 198 | (3) | $ | 177 | (3) | $ | 48 | (3) | ||||
Dividends from Investments in Affiliated Issuers | 540 | — | — | — | ||||||||||||
Other | 10 | 14 | — | 9 | ||||||||||||
|
|
|
|
|
|
|
| |||||||||
Total | 550 | 212 | 177 | 57 | ||||||||||||
|
|
|
|
|
|
|
| |||||||||
Expenses: | ||||||||||||||||
Management Fees | — | 64 | 31 | 107 | ||||||||||||
Accounting Services Fees | 6 | 3 | 3 | 3 | ||||||||||||
Administration Fees | 3 | 2 | 2 | 2 | ||||||||||||
Transfer Agent Fees: | ||||||||||||||||
I Class | 5 | 3 | — | (2) | 4 | |||||||||||
N Class | 2 | 1 | — | (2) | 4 | |||||||||||
Custodian Fees | 2 | 2 | 8 | 6 | ||||||||||||
Professional Fees | 17 | 23 | 24 | 23 | ||||||||||||
Directors’ Fees and Expenses | 32 | 32 | 32 | 32 | ||||||||||||
Registration Fees: | ||||||||||||||||
I Class | 17 | 18 | 18 | 16 | ||||||||||||
N Class | 16 | 16 | 18 | 16 | ||||||||||||
Distribution Fees: | ||||||||||||||||
N Class | 4 | 3 | 1 | 8 | ||||||||||||
Compliance Expense | — | (2) | — | (2) | — | (2) | — | (2) | ||||||||
Shareholder Reporting Expense | 2 | 1 | 1 | 3 | ||||||||||||
Other | 11 | 8 | 7 | 11 | ||||||||||||
|
|
|
|
|
|
|
| |||||||||
Total | 117 | 176 | 145 | 235 | ||||||||||||
|
|
|
|
|
|
|
| |||||||||
Less Expenses Borne by Investment Advisor: | ||||||||||||||||
I Class | — | 46 | 64 | 61 | ||||||||||||
N Class | 13 | 24 | 27 | 45 | ||||||||||||
|
|
|
|
|
|
|
| |||||||||
Net Expenses | 104 | 106 | 54 | 129 | ||||||||||||
|
|
|
|
|
|
|
| |||||||||
Net Investment Income (Loss) | 446 | 106 | 123 | (72 | ) | |||||||||||
|
|
|
|
|
|
|
| |||||||||
NET REALIZED AND UNREALIZED GAIN (LOSS) ON INVESTMENTS | ||||||||||||||||
Net Realized Gain (Loss) on: | ||||||||||||||||
Investments | 22 | (230 | ) | (532 | ) | 561 | ||||||||||
Investments in Affiliated Issuers | 390 | — | — | — | ||||||||||||
Realized Gain Distributed from Affiliated Issuers | 1,039 | — | — | — | ||||||||||||
Foreign Currency | — | — | (1 | ) | — | |||||||||||
Options Written | — | — | 15 | — | ||||||||||||
Change in Unrealized Appreciation (Depreciation) on: | ||||||||||||||||
Investments | 143 | 214 | 70 | (1,404 | ) | |||||||||||
Foreign Currency | — | — | — | — | ||||||||||||
Investments in Affiliated Issuers | (1,801 | ) | — | — | — | |||||||||||
Options Written | — | — | (1 | ) | — | |||||||||||
|
|
|
|
|
|
|
| |||||||||
Net Realized and Unrealized Gain (Loss) on Investments | (207 | ) | (16 | ) | (449 | ) | (843 | ) | ||||||||
|
|
|
|
|
|
|
| |||||||||
INCREASE (DECREASE) IN NET ASSETS RESULTING FROM OPERATIONS | $ | 239 | $ | 90 | $ | (326 | ) | $ | (915 | ) | ||||||
|
|
|
|
|
|
|
| |||||||||
| (1) | Formerly TCW Concentrated Value Fund. |
| (2) | Amount rounds to less than $1. |
| (3) | Net of foreign taxes withheld of $2, $4 and $0 for the TCW Focused Equities Fund, the TCW Global Real Estate Fund and the TCW Growth Equities Fund, respectively. |
See accompanying notes to financial statements.
74
TCW Funds, Inc.
Statements of Operations | Year Ended October 31, 2016 |
| TCW High Dividend Equities Fund | TCW New America Premier Equities Fund (1) | TCW Relative Value Dividend Appreciation Fund | TCW Relative Value Large Cap Fund | |||||||||||||
| Dollar Amounts in Thousands | ||||||||||||||||
INVESTMENT INCOME | ||||||||||||||||
Income: | ||||||||||||||||
Dividends | $ | 259 | (2) | $ | 51 | (2) | $ | 30,906 | (2) | $ | 14,790 | |||||
Other | — | — | 106 | 89 | ||||||||||||
|
|
|
|
|
|
|
| |||||||||
Total | 259 | 51 | 31,012 | 14,879 | ||||||||||||
|
|
|
|
|
|
|
| |||||||||
Expenses: | ||||||||||||||||
Management Fees | 52 | 20 | 7,831 | 4,550 | ||||||||||||
Accounting Services Fees | 3 | 2 | 100 | 61 | ||||||||||||
Administration Fees | 2 | 1 | 60 | 36 | ||||||||||||
Transfer Agent Fees: | ||||||||||||||||
I Class | — | (3) | — | (3) | 108 | 491 | ||||||||||
N Class | — | (3) | — | (3) | 878 | 22 | ||||||||||
Custodian Fees | 5 | 6 | 3 | 4 | ||||||||||||
Professional Fees | 24 | 37 | 55 | 29 | ||||||||||||
Directors’ Fees and Expenses | 32 | 25 | 32 | 32 | ||||||||||||
Registration Fees: | ||||||||||||||||
I Class | 18 | 10 | 20 | 26 | ||||||||||||
N Class | 18 | 10 | 36 | 20 | ||||||||||||
Distribution Fees: | ||||||||||||||||
N Class | 1 | 2 | 2,198 | 56 | ||||||||||||
Compliance Expense | — | (3) | — | (3) | 10 | 6 | ||||||||||
Shareholder Reporting Expense | 1 | 13 | 14 | 9 | ||||||||||||
Other | 8 | 3 | 155 | 98 | ||||||||||||
|
|
|
|
|
|
|
| |||||||||
Total | 164 | 129 | 11,500 | 5,440 | ||||||||||||
|
|
|
|
|
|
|
| |||||||||
Less Expenses Borne by Investment Advisor: | ||||||||||||||||
I Class | 49 | 63 | — | — | ||||||||||||
N Class | 22 | 40 | 345 | 29 | ||||||||||||
|
|
|
|
|
|
|
| |||||||||
Net Expenses | 93 | 26 | 11,155 | 5,411 | ||||||||||||
|
|
|
|
|
|
|
| |||||||||
Net Investment Income | 166 | 25 | 19,857 | 9,468 | ||||||||||||
|
|
|
|
|
|
|
| |||||||||
NET REALIZED AND UNREALIZED GAIN (LOSS) ON INVESTMENTS | ||||||||||||||||
Net Realized Gain (Loss) on: | ||||||||||||||||
Investments | (459 | ) | 131 | 46,231 | 33,789 | |||||||||||
Foreign Currency | — | (1 | ) | — | — | |||||||||||
Options Written | 17 | — | — | — | ||||||||||||
Change in Unrealized Appreciation (Depreciation) on: | ||||||||||||||||
Investments | 418 | 220 | (19,557 | ) | (30,718 | ) | ||||||||||
Foreign Currency | — | — | (3) | — | — | |||||||||||
Options Written | (6 | ) | — | — | — | |||||||||||
|
|
|
|
|
|
|
| |||||||||
Net Realized and Unrealized Gain (Loss) on Investments | (30 | ) | 350 | 26,674 | 3,071 | |||||||||||
|
|
|
|
|
|
|
| |||||||||
INCREASE IN NET ASSETS RESULTING FROM OPERATIONS | $ | 136 | $ | 375 | $ | 46,531 | $ | 12,539 | ||||||||
|
|
|
|
|
|
|
| |||||||||
| (1) | For the period January 29, 2016 (commencement of operations) through October 31, 2016. |
| (2) | Net of foreign taxes withheld of $0, $0 and $132 for the TCW High Dividend Equities Fund, the TCW New America Premier Equities Fund and the TCW Relative Value Dividend Appreciation Fund, respectively. |
| (3) | Amount rounds to less than $1. |
See accompanying notes to financial statements.
75
TCW Funds, Inc.
Statements of Operations | Year Ended October 31, 2016 |
| TCW Relative Value Mid Cap Fund | TCW Select Equities Fund | TCW Small Cap Growth Fund | ||||||||||
| Dollar Amounts in Thousands | ||||||||||||
INVESTMENT INCOME | ||||||||||||
Income: | ||||||||||||
Dividends | $ | 1,813 | (1) | $ | 8,106 | $ | 304 | (1) | ||||
Other | 42 | 127 | 60 | |||||||||
|
|
|
|
|
| |||||||
Total | 1,855 | 8,233 | 364 | |||||||||
|
|
|
|
|
| |||||||
Expenses: | ||||||||||||
Management Fees | 766 | 12,183 | 685 | |||||||||
Accounting Services Fees | 11 | 163 | 8 | |||||||||
Administration Fees | 6 | 98 | 5 | |||||||||
Transfer Agent Fees: | ||||||||||||
I Class | 40 | 1,342 | 39 | |||||||||
N Class | 15 | 211 | 21 | |||||||||
Custodian Fees | 5 | 6 | 9 | |||||||||
Professional Fees | 22 | 43 | 22 | |||||||||
Directors’ Fees and Expenses | 32 | 32 | 32 | |||||||||
Registration Fees: | ||||||||||||
I Class | 18 | 36 | 18 | |||||||||
N Class | 17 | 39 | 16 | |||||||||
Distribution Fees: | ||||||||||||
N Class | 43 | 516 | 49 | |||||||||
Compliance Expense | 1 | 17 | — | (2) | ||||||||
Shareholder Reporting Expense | 4 | 12 | 4 | |||||||||
Other | 24 | 263 | 31 | |||||||||
|
|
|
|
|
| |||||||
Total | 1,004 | 14,961 | 939 | |||||||||
|
|
|
|
|
| |||||||
Less Expenses Borne by Investment Advisor: | ||||||||||||
N Class | 26 | 32 | 50 | |||||||||
|
|
|
|
|
| |||||||
Net Expenses | 978 | 14,929 | 889 | |||||||||
|
|
|
|
|
| |||||||
Net Investment Income (Loss) | 877 | (6,696 | ) | (525 | ) | |||||||
|
|
|
|
|
| |||||||
NET REALIZED AND UNREALIZED GAIN (LOSS) ON INVESTMENTS | ||||||||||||
Net Realized Gain (Loss) on: | ||||||||||||
Investments | (1,293 | ) | 100,802 | 172 | ||||||||
Change in Unrealized Appreciation (Depreciation) on: | ||||||||||||
Investments | 2,273 | (206,536 | ) | (3,853 | ) | |||||||
|
|
|
|
|
| |||||||
Net Realized and Unrealized Gain (Loss) on Investments | 980 | (105,734 | ) | (3,681 | ) | |||||||
|
|
|
|
|
| |||||||
INCREASE (DECREASE) IN NET ASSETS RESULTING FROM OPERATIONS | $ | 1,857 | $ | (112,430 | ) | $ | (4,206 | ) | ||||
|
|
|
|
|
| |||||||
| (1) | Net of foreign taxes withheld of $4 and $1 for the TCW Relative Value Mid Cap Fund and the TCW Small Cap Growth Fund, respectively. |
| (2) | Amount rounds to less than $1. |
See accompanying notes to financial statements.
76
TCW Funds, Inc.
Statements of Changes in Net Assets
| TCW Conservative Allocation Fund | TCW Focused Equities Fund (1) | |||||||||||||||
| Year Ended October 31, 2016 | Year Ended October 31, 2015 | Year Ended October 31, 2016 | Year Ended October 31, 2015 | |||||||||||||
| Dollar Amounts in Thousands | ||||||||||||||||
OPERATIONS | ||||||||||||||||
Net Investment Income | $ | 446 | $ | 325 | $ | 106 | $ | 81 | ||||||||
Net Realized Gain (Loss) on Investments | 1,451 | 859 | (230 | ) | 2,083 | |||||||||||
Change in Unrealized Appreciation (Depreciation) on Investments | (1,658 | ) | (6 | ) | 214 | (1,946 | ) | |||||||||
|
|
|
|
|
|
|
| |||||||||
Increase in Net Assets Resulting from Operations | 239 | 1,178 | 90 | 218 | ||||||||||||
|
|
|
|
|
|
|
| |||||||||
DISTRIBUTIONS TO SHAREHOLDERS | ||||||||||||||||
Distributions from Net Investment Income: | ||||||||||||||||
I Class | (465 | ) | (332 | ) | (64 | ) | (42 | ) | ||||||||
N Class | (18 | ) | (4 | ) | (13 | ) | (9 | ) | ||||||||
Distributions from Net Realized Gain: | ||||||||||||||||
I Class | (689 | ) | (158 | ) | — | — | ||||||||||
N Class | (40 | ) | (4 | ) | — | — | ||||||||||
|
|
|
|
|
|
|
| |||||||||
Total Distributions to Shareholders | (1,212 | ) | (498 | ) | (77 | ) | (51 | ) | ||||||||
|
|
|
|
|
|
|
| |||||||||
NET CAPITAL SHARE TRANSACTIONS | ||||||||||||||||
I Class | (4,003 | ) | 2,508 | (559 | ) | (720 | ) | |||||||||
N Class | (230 | ) | 1,044 | (433 | ) | (381 | ) | |||||||||
|
|
|
|
|
|
|
| |||||||||
Increase (Decrease) in Net Assets Resulting from Net Capital Shares Transactions | (4,233 | ) | 3,552 | (992 | ) | (1,101 | ) | |||||||||
|
|
|
|
|
|
|
| |||||||||
Increase (Decrease) in Net Assets | (5,206 | ) | 4,232 | (979 | ) | (934 | ) | |||||||||
NET ASSETS | ||||||||||||||||
Beginning of Year | 35,785 | 31,553 | 10,840 | 11,774 | ||||||||||||
|
|
|
|
|
|
|
| |||||||||
End of Year | $ | 30,579 | $ | 35,785 | $ | 9,861 | $ | 10,840 | ||||||||
|
|
|
|
|
|
|
| |||||||||
Undistributed Net Investment Income | $ | 340 | $ | 237 | $ | 100 | $ | 66 | ||||||||
| (1) | Formerly TCW Concentrated Value Fund. |
See accompanying notes to financial statements.
77
TCW Funds, Inc.
Statements of Changes in Net Assets
| TCW Global Real Estate Fund | TCW Growth Equities Fund | |||||||||||||||
| Year Ended October 31, 2016 | November 28, 2014 (Commencement of Operations) through October 31, 2015 | Year Ended October 31, 2016 | Year Ended October 31, 2015 | |||||||||||||
| Dollar Amounts in Thousands | ||||||||||||||||
OPERATIONS | ||||||||||||||||
Net Investment Income (Loss) | $ | 123 | $ | 48 | $ | (72 | ) | $ | (139 | ) | ||||||
Net Realized Gain (Loss) on Investments, Options Written and Foreign Currency Transactions | (518 | ) | 3 | 561 | 4,059 | |||||||||||
Change in Unrealized Appreciation (Depreciation) on Investments and Options Written | 69 | (42 | ) | (1,404 | ) | (4,755 | ) | |||||||||
|
|
|
|
|
|
|
| |||||||||
Increase (Decrease) in Net Assets Resulting from Operations | (326 | ) | 9 | (915 | ) | (835 | ) | |||||||||
|
|
|
|
|
|
|
| |||||||||
DISTRIBUTIONS TO SHAREHOLDERS | ||||||||||||||||
Distributions from Net Investment Income: | ||||||||||||||||
I Class | (98 | ) | (35 | ) | — | — | ||||||||||
N Class | (15 | ) | (12 | ) | — | — | ||||||||||
Distributions from Net Realized Gain: | ||||||||||||||||
I Class | (5 | ) | — | (2,459 | ) | (2,007 | ) | |||||||||
N Class | (1 | ) | — | (742 | ) | (502 | ) | |||||||||
Distributions from Return of Capital: | ||||||||||||||||
I Class | (10 | ) | — | — | — | |||||||||||
N Class | (2 | ) | — | — | — | |||||||||||
|
|
|
|
|
|
|
| |||||||||
Total Distributions to Shareholders | (131 | ) | (47 | ) | (3,201 | ) | (2,509 | ) | ||||||||
|
|
|
|
|
|
|
| |||||||||
NET CAPITAL SHARE TRANSACTIONS | ||||||||||||||||
I Class | (380 | ) | 4,343 | (2,662 | ) | (7,005 | ) | |||||||||
N Class | 23 | 525 | 157 | (1,169 | ) | |||||||||||
|
|
|
|
|
|
|
| |||||||||
Increase (Decrease) in Net Assets Resulting from Net Capital Shares Transactions | (357 | ) | 4,868 | (2,505 | ) | (8,174 | ) | |||||||||
|
|
|
|
|
|
|
| |||||||||
Increase (Decrease) in Net Assets | (814 | ) | 4,830 | (6,621 | ) | (11,518 | ) | |||||||||
NET ASSETS | ||||||||||||||||
Beginning of Year | 4,830 | — | 15,680 | 27,198 | ||||||||||||
|
|
|
|
|
|
|
| |||||||||
End of Year | $ | 4,016 | $ | 4,830 | $ | 9,059 | $ | 15,680 | ||||||||
|
|
|
|
|
|
|
| |||||||||
Undistributed Net Investment Income (Loss) | $ | (1 | ) | $ | (1 | ) | $ | (62 | ) | $ | (139 | ) | ||||
See accompanying notes to financial statements.
78
TCW Funds, Inc.
Statements of Changes in Net Assets
| TCW High Dividend Equities Fund | TCW New America Premier Equities Fund | |||||||||||
| Year Ended October 31, 2016 | November 28, 2014 (Commencement of Operations) through October 31, 2015 | January 29, 2016 (Commencement of Operations) through October 31, 2016 | ||||||||||
| Dollar Amounts in Thousands | ||||||||||||
OPERATIONS | ||||||||||||
Net Investment Income | $ | 166 | $ | 100 | $ | 25 | ||||||
Net Realized Gain (Loss) on Investments, Options Written and Foreign Currency Transactions | (442 | ) | (237 | ) | 130 | |||||||
Change in Unrealized Appreciation (Depreciation) on Investments and Options Written | 412 | (337 | ) | 220 | ||||||||
|
|
|
|
|
| |||||||
Increase (Decrease) in Net Assets Resulting from Operations | 136 | (474 | ) | 375 | ||||||||
|
|
|
|
|
| |||||||
DISTRIBUTIONS TO SHAREHOLDERS | ||||||||||||
Distributions from Net Investment Income: | ||||||||||||
I Class | (143 | ) | (83 | ) | — | |||||||
N Class | (10 | ) | (14 | ) | — | |||||||
Distributions from Return of Capital: | ||||||||||||
I Class | (15 | ) | — | — | ||||||||
N Class | (1 | ) | — | — | ||||||||
|
|
|
|
|
| |||||||
Total Distributions to Shareholders | (169 | ) | (97 | ) | — | |||||||
|
|
|
|
|
| |||||||
NET CAPITAL SHARE TRANSACTIONS | ||||||||||||
I Class | 7,588 | 4,479 | 2,891 | |||||||||
N Class | (38 | ) | 570 | 1,005 | ||||||||
|
|
|
|
|
| |||||||
Increase in Net Assets Resulting from Net Capital Shares Transactions | 7,550 | 5,049 | 3,896 | |||||||||
|
|
|
|
|
| |||||||
Increase in Net Assets | 7,517 | 4,478 | 4,271 | |||||||||
NET ASSETS | ||||||||||||
Beginning of Year | 4,478 | — | — | |||||||||
|
|
|
|
|
| |||||||
End of Year | $ | 11,995 | $ | 4,478 | $ | 4,271 | ||||||
|
|
|
|
|
| |||||||
Undistributed Net Investment Income | $ | — | $ | 3 | $ | 26 | ||||||
See accompanying notes to financial statements.
79
TCW Funds, Inc.
Statements of Changes in Net Assets
| TCW Relative Value Dividend Appreciation Fund | TCW Relative Value Large Cap Fund | |||||||||||||||
| Year Ended October 31, 2016 | Year Ended October 31, 2015 | Year Ended October 31, 2016 | Year Ended October 31, 2015 | |||||||||||||
| Dollar Amounts in Thousands | ||||||||||||||||
OPERATIONS | ||||||||||||||||
Net Investment Income | $ | 19,857 | $ | 17,592 | $ | 9,468 | $ | 8,062 | ||||||||
Net Realized Gain on Investments | 46,231 | 64,155 | 33,789 | 53,805 | ||||||||||||
Change in Unrealized Appreciation (Depreciation) on Investments | (19,557 | ) | (78,953 | ) | (30,718 | ) | (57,453 | ) | ||||||||
|
|
|
|
|
|
|
| |||||||||
Increase in Net Assets Resulting from Operations | 46,531 | 2,794 | 12,539 | 4,414 | ||||||||||||
|
|
|
|
|
|
|
| |||||||||
DISTRIBUTIONS TO SHAREHOLDERS | ||||||||||||||||
Distributions from Net Investment Income: | ||||||||||||||||
I Class | (3,005 | ) | (3,223 | ) | (7,528 | ) | (6,775 | ) | ||||||||
N Class | (14,089 | ) | (13,035 | ) | (227 | ) | (214 | ) | ||||||||
Distributions from Net Realized Gain: | ||||||||||||||||
I Class | — | — | (25,919 | ) | — | |||||||||||
N Class | — | — | (975 | ) | — | |||||||||||
|
|
|
|
|
|
|
| |||||||||
Total Distributions to Shareholders | (17,094 | ) | (16,258 | ) | (34,649 | ) | (6,989 | ) | ||||||||
|
|
|
|
|
|
|
| |||||||||
NET CAPITAL SHARE TRANSACTIONS | ||||||||||||||||
I Class | (14,631 | ) | (17,193 | ) | (166,273 | ) | (30,072 | ) | ||||||||
N Class | (27,292 | ) | (80,902 | ) | (4,954 | ) | (4,385 | ) | ||||||||
|
|
|
|
|
|
|
| |||||||||
Decrease in Net Assets Resulting from Net Capital Shares Transactions | (41,923 | ) | (98,095 | ) | (171,227 | ) | (34,457 | ) | ||||||||
|
|
|
|
|
|
|
| |||||||||
Decrease in Net Assets | (12,486 | ) | (111,559 | ) | (193,337 | ) | (37,032 | ) | ||||||||
NET ASSETS | ||||||||||||||||
Beginning of Year | 1,054,238 | 1,165,797 | 693,041 | 730,073 | ||||||||||||
|
|
|
|
|
|
|
| |||||||||
End of Year | $ | 1,041,752 | $ | 1,054,238 | $ | 499,704 | $ | 693,041 | ||||||||
|
|
|
|
|
|
|
| |||||||||
Undistributed Net Investment Income | $ | 1,661 | $ | — | $ | 7,591 | $ | 6,334 | ||||||||
See accompanying notes to financial statements.
80
TCW Funds, Inc.
Statements of Changes in Net Assets
| TCW Relative Value Mid Cap Fund | TCW Select Equities Fund | |||||||||||||||
| Year Ended October 31, 2016 | Year Ended October 31, 2015 | Year Ended October 31, 2016 | Year Ended October 31, 2015 | |||||||||||||
| Dollar Amounts in Thousands | ||||||||||||||||
OPERATIONS | ||||||||||||||||
Net Investment Income (Loss) | $ | 877 | $ | 854 | $ | (6,696 | ) | $ | (1,930 | ) | ||||||
Net Realized Gain (Loss) on Investments | (1,293 | ) | 15,816 | 100,802 | 162,929 | |||||||||||
Change in Unrealized Appreciation (Depreciation) on Investments | 2,273 | (22,175 | ) | (206,536 | ) | 82,304 | ||||||||||
|
|
|
|
|
|
|
| |||||||||
Increase (Decrease) in Net Assets Resulting from Operations | 1,857 | (5,505 | ) | (112,430 | ) | 243,303 | ||||||||||
|
|
|
|
|
|
|
| |||||||||
DISTRIBUTIONS TO SHAREHOLDERS | ||||||||||||||||
Distributions from Net Investment Income: | ||||||||||||||||
I Class | (644 | ) | (506 | ) | — | — | ||||||||||
N Class | (81 | ) | (90 | ) | — | — | ||||||||||
Distributions from Net Realized Gain: | ||||||||||||||||
I Class | (11,118 | ) | (13,135 | ) | (115,798 | ) | (50,376 | ) | ||||||||
N Class | (2,394 | ) | (3,290 | ) | (21,972 | ) | (7,121 | ) | ||||||||
|
|
|
|
|
|
|
| |||||||||
Total Distributions to Shareholders | (14,237 | ) | (17,021 | ) | (137,770 | ) | (57,497 | ) | ||||||||
|
|
|
|
|
|
|
| |||||||||
NET CAPITAL SHARE TRANSACTIONS | ||||||||||||||||
I Class | (8,116 | ) | (3,473 | ) | (158,555 | ) | (144,323 | ) | ||||||||
N Class | (740 | ) | (4,367 | ) | (78,565 | ) | 23,002 | |||||||||
|
|
|
|
|
|
|
| |||||||||
Decrease in Net Assets Resulting from Net Capital Shares Transactions | (8,856 | ) | (7,840 | ) | (237,120 | ) | (121,321 | ) | ||||||||
|
|
|
|
|
|
|
| |||||||||
Increase (Decrease) in Net Assets | (21,236 | ) | (30,366 | ) | (487,320 | ) | 64,485 | |||||||||
NET ASSETS | ||||||||||||||||
Beginning of Year | 112,915 | 143,281 | 1,903,116 | 1,838,631 | ||||||||||||
|
|
|
|
|
|
|
| |||||||||
End of Year | $ | 91,679 | $ | 112,915 | $ | 1,415,796 | $ | 1,903,116 | ||||||||
|
|
|
|
|
|
|
| |||||||||
Undistributed Net Investment Income (Loss) | $ | 42 | $ | 80 | $ | (1 | ) | $ | (1 | ) | ||||||
See accompanying notes to financial statements.
81
TCW Funds, Inc.
Statements of Changes in Net Assets
| TCW Small Cap Growth Fund | ||||||||
| Year Ended October 31, 2016 | Year Ended October 31, 2015 | |||||||
| Dollar Amounts in Thousands | ||||||||
OPERATIONS | ||||||||
Net Investment Loss | $ | (525 | ) | $ | (1,365 | ) | ||
Net Realized Gain on Investments | 172 | 29,359 | ||||||
Change in Unrealized Appreciation (Depreciation) on Investments | (3,853 | ) | (30,338 | ) | ||||
|
|
|
| |||||
Decrease in Net Assets Resulting from Operations | (4,206 | ) | (2,344 | ) | ||||
|
|
|
| |||||
DISTRIBUTIONS TO SHAREHOLDERS | ||||||||
Distributions from Net Realized Gain: | ||||||||
I Class | (18,761 | ) | (22,038 | ) | ||||
N Class | (5,616 | ) | (5,353 | ) | ||||
|
|
|
| |||||
Total Distributions to Shareholders | (24,377 | ) | (27,391 | ) | ||||
|
|
|
| |||||
NET CAPITAL SHARE TRANSACTIONS | ||||||||
I Class | (35,928 | ) | (24,331 | ) | ||||
N Class | (1,965 | ) | (2,591 | ) | ||||
|
|
|
| |||||
Decrease in Net Assets Resulting from Net Capital Shares Transactions | (37,893 | ) | (26,922 | ) | ||||
|
|
|
| |||||
Decrease in Net Assets | (66,476 | ) | (56,657 | ) | ||||
NET ASSETS | ||||||||
Beginning of Year | 116,436 | 173,093 | ||||||
|
|
|
| |||||
End of Year | $ | 49,960 | $ | 116,436 | ||||
|
|
|
| |||||
Undistributed Net Investment Income (Loss) | $ | (1 | ) | $ | — | |||
See accompanying notes to financial statements.
82
TCW Funds, Inc.
Note 1 — Organization
TCW Funds, Inc., a Maryland corporation (the “Company”), is an open-end management investment company registered under the Investment Company Act of 1940, as amended (the “1940 Act”), that currently offers 23 no-load mutual funds (each series, a “Fund” and collectively, the “Funds”). TCW Investment Management Company LLC (the “Advisor”) is the investment advisor to and an affiliate of the Funds and is registered under the Investment Advisers Act of 1940, as amended. Each Fund has distinct investment objectives. The following are the objectives for the 11 U.S. Equity Funds that are covered in this report:
TCW Fund | Investment Objective | |
| Diversified U.S. Equity Funds | ||
TCW Focused Equities Fund (formerly TCW Concentrated Value Fund) | Seeks to provide long-term capital appreciation by investing at least 80% of the value of its net assets in publicly traded equity securities of companies with market capitalizations of greater than $3 billion dollars at the time of acquisition. | |
| TCW Global Real Estate Fund | Seeks to maximize total return from current income and long-term capital growth by investing at least 80% of its net assets in equity securities of real estate investment trusts (“REITs”) and real estate companies. | |
| TCW Growth Equities Fund | Seeks long-term capital appreciation by investing at least 80% of the value of its net assets in equity securities issued by companies with market capitalizations, at the time of acquisition, within the capitalization range of the companies comprising Russell Mid Cap Growth Index. | |
| TCW High Dividend Equities Fund | Seeks high total return from current income and capital appreciation by investing at least 80% of the value of its net assets equity securities of U.S. issuers with history of paying high dividends. | |
| TCW New America Premier Equities Fund | Seeks to provide long-term capital appreciation by investing at least 80% under normal circumstances of the value of its net assets in companies with enduring, cash generating businesses whose leaders prudently manage their environmental, social, and financial resources and whose shares are attractively valued relative to free cash flow generated by the businesses. | |
| TCW Relative Value Dividend Appreciation Fund | Seeks to realize a high level of dividend income along with capital appreciation by investing at least 80% of the value of its net assets in equity securities of companies that have a record of paying dividends. | |
| TCW Relative Value Large Cap Fund | Seeks capital appreciation, with a secondary goal of current income, by investing at least 80% of the value of its net assets in equity securities of companies with a market capitalization of greater than $1 billion at the time of purchase. | |
83
TCW Funds, Inc.
Notes to Financial Statements (Continued)
Note 1 — Organization (Continued)
TCW Fund | Investment Objective | |
| TCW Relative Value Mid Cap Fund | Seeks to provide long-term capital appreciation by investing at least 65% of the value of its net assets in equity securities issued by companies with market capitalizations at the time of acquisition, within the capitalization ranges of the companies comprising the Russell Mid Cap Index. | |
| TCW Select Equities Fund | Seeks to provide long-term capital appreciation by investing primarily in equity securities that the portfolio manager believes to have strong and enduring business models and inherent advantages over their competitors. | |
| TCW Small Cap Growth Fund | Seeks to provide long-term capital appreciation by investing at least 80% of the value of its net assets in equity securities issued by companies with market capitalizations, at the time of acquisition, within the capitalization range of the companies comprising the Russell 2000 Growth Index. | |
| Fund of Funds | ||
| TCW Conservative Allocation Fund | Seeks to provide current income, and secondarily, long-term capital appreciation by investing in a combination of fixed income funds and equity funds that utilize diverse investment styles such as growth and/or value investing. The Fund invests between 20% and 60% of its net assets in equity funds and between 40% and 80% in fixed income funds. The Fund may also invests in ETFs. | |
All Funds offer two classes of shares: I Class and N Class. The Classes are substantially the same except that the N Class shares are subject to a distribution fee.
The TCW Conservative Allocation Fund is a “fund of funds” that invests in affiliated funds which are identified on the Schedule of Investments.
Note 2 — Significant Accounting Policies
The following is a summary of significant accounting policies which are in conformity with accounting principles generally accepted in the United States of America (“GAAP”) and which are consistently followed by the Funds in the preparation of their financial statements. Each Fund is considered an investment company under the Financial Accounting Standards Board (FASB) Accounting Standards Codification (ASC) No. 946, Financial Services — Investment Companies.
Principles of Accounting: The Funds use the accrual method of accounting for financial reporting purposes.
Net Asset Value: The net asset value (“NAV”) per share of each class of a Fund is determined by dividing the Fund’s net assets attributable to each class by the number of shares issued and outstanding of that class on each day the New York Stock Exchange (“NYSE”) is open for trading.
84
TCW Funds, Inc.
October 31, 2016 |
Note 2 — Significant Accounting Policies (Continued)
Security Valuations: Equity Securities listed or traded on the NYSE and other stock exchanges are valued at the latest sale price on that exchange. Securities traded on the NASDAQ stock market (“NASDAQ”) are valued using official closing prices as reported by NASDAQ. Options on equity securities and options on indexes are valued using mid prices (average of bid and ask prices) as reported by the exchange or pricing service. Investments in open-end mutual funds are valued based on the NAV per share as reported by the fund companies. All other securities for which over-the-counter (“OTC”) market quotations are readily available, including short-term securities, are valued with prices furnished by independent pricing services or by broker dealers.
The Company has adopted, after the approval by the Company’s Board of Directors (the “Board” and each member thereof a “Director”), a fair valuation methodology for foreign equity securities (exclusive of certain Latin American and Canadian equity securities). This methodology is designed to address the effect of movements in the U.S. market on the securities traded on foreign exchanges that have been closed for a period of time due to time zone difference. The utilization of the fair value model may result in the adjustment of prices taking into account fluctuations in the U.S. market. The fair value model is utilized each trading day and not dependent on certain thresholds or triggers.
Securities for which market quotations are not readily available, including circumstances under which the prices received are not reflective of a security’s market value, are valued by the Advisor in good faith under procedures established by and under the general supervision of the Board.
Fair value is defined as the price that a Fund would receive upon selling an investment in a timely transaction to an independent buyer in the principal or most advantageous market for the investment. In accordance with the authoritative guidance on fair value measurements and disclosures under GAAP, the Funds disclose investments in a three-tier hierarchy. This hierarchy is utilized to establish classification of fair value based on inputs. Inputs that go into fair value measurement refer broadly to the assumptions that market participants would use in pricing the asset or liability, including assumptions about risk. Inputs may be observable or unobservable. Observable inputs are inputs that reflect the assumptions market participants would use in pricing the asset or liability developed based on market data obtained from sources independent of the reporting entity. Unobservable inputs are inputs that reflect the reporting entity’s own assumptions about the assumptions market participants would use in pricing the asset or liability developed based on the best information available in the circumstances.
The three-tier hierarchy of inputs is summarized in the three broad levels listed below.
| Level 1 — | quoted prices in active markets for identical investments | |
| Level 2 — | other significant observable inputs (including quoted prices for similar investments, interest rates, prepayment speeds, credit risk, etc.) | |
| Level 3 — | significant unobservable inputs (including the Funds’ own assumptions in determining the fair value of investments) |
Changes in valuation techniques may result in transfers in or out of an investment’s assigned level within the hierarchy. The inputs or methodologies used for valuing investments are not necessarily an indication of the risk associated with investing in those investments and the determination of the significance of a particular input to the fair value measurement in its entirety requires judgment and consideration of factors specific to each security.
85
TCW Funds, Inc.
Notes to Financial Statements (Continued)
Note 2 — Significant Accounting Policies (Continued)
The availability of observable inputs can vary from security to security and is affected by a wide variety of factors, including, for example, the type of security, whether the security is new and not yet established in the marketplace, the liquidity of markets, and other characteristics particular to the security. To the extent that valuation is based on models or inputs that are less observable or unobservable in the market, the determination of fair value requires more judgment. Accordingly, the degree of judgment exercised in determining fair value is greatest for instruments categorized in Level 3.
In periods of market dislocation, the observability of prices and inputs may be reduced for many instruments. This condition, as well as changes related to liquidity of investments, could cause a security to be reclassified between Level 1, Level 2, or Level 3.
In certain cases, the inputs used to measure fair value may fall into different levels of the fair value hierarchy. In such cases, for disclosure purposes the level in the fair value hierarchy within which the fair value measurement falls in its entirety is determined based on the lowest level input that is significant to the fair value measurement.
Fair Value Measurements: A description of the valuation techniques applied to the Funds’ major categories of assets and liabilities measured at fair value on a recurring basis is as follows:
Equity securities. Securities are generally valued based on quoted prices from the applicable exchange. To the extent these securities are actively traded and valuation adjustments are not applied, they are generally categorized in Level 1 of the fair value hierarchy. Restricted securities issued by publicly held companies are categorized in Level 2 or 3 of the fair value hierarchy depending on whether a discount is applied and significant. Restricted securities held in non-public entities are included in Level 3 of the fair value hierarchy because they trade infrequently, and therefore, the inputs are unobservable. Certain foreign securities that are fair valued using a pricing service that considers the correlation of the trading patterns of the foreign security to the intraday trading in the U.S. markets and are categorized in Level 2 of the fair value hierarchy.
Master Limited Partnerships. Master Limited Partnerships are generally valued based on quoted prices from the applicable exchange. They are categorized in Level 1 of the fair value hierarchy.
Mutual funds. Open-end mutual funds are valued using the NAV as reported by the fund companies. As such, they are categorized in Level 1.
Options contracts. Option contracts traded on exchanges are fair valued using market mid prices; as such, they are categorized in Level 1. Option contracts traded OTC are fair valued based on pricing models and incorporate various inputs such as interest rate, credit spreads, currency exchange rates and volatility measurements for in-the-money, at-the-money, and out-of-money contracts on a given strike price. To the extent that these inputs are observable and timely, the fair value of OTC option contracts would be categorized in Level 2; otherwise, the fair values would be categorized in Level 3.
Restricted securities. Restricted securities, including illiquid Rule 144A securities, held in non-public entities are included in Level 3 of the fair value hierarchy because they trade infrequently, and therefore, the inputs are unobservable. Any other restricted securities valued similar to publicly traded securities may be categorized in Level 2 or 3 of the fair value hierarchy depending on whether a discount is applied and significant to the fair value.
As of October 31, 2016, the Funds, with the exception of the TCW Global Real Estate Fund and the TCW New America Premier Equities Fund, categorized their investments at Level 1, with the corresponding
86
TCW Funds, Inc.
October 31, 2016 |
Note 2 — Significant Accounting Policies (Continued)
industries as represented in the Schedules of Investments. The summary of the inputs used as of October 31, 2016 for the TCW Global Real Estate Fund and the TCW New America Premier Equities Fund are listed after the Schedule of Investments for each fund.
The Funds did not have any transfers in and out of Level 1 and Level 2 of the fair value hierarchy during the year ended October 31, 2016.
Security Transactions and Related Investment Income: Security transactions are recorded as of the trade date. Dividend income is recorded on the ex-dividend date. Interest income is recognized on an accrual basis. Realized gains and losses on investments are recorded on the basis of specific identification.
Foreign Currency Translation: The books and records of each Fund are maintained in U.S. dollars as follows: (1) the market value of foreign securities, and other assets and liabilities stated in foreign currencies, are translated using the daily spot rate; and (2) purchases, sales, income and expenses are translated at the rate of exchange prevailing on the respective dates of such transactions. The resultant exchange gains and losses are included in net realized or net unrealized gain (loss) in the Statements of Operations. Pursuant to U.S. federal income tax regulations, certain foreign exchange gains and losses included in realized and unrealized gains and losses are included in, or are a reduction of, ordinary income for federal income tax purposes.
Foreign Taxes: The Funds may be subject to withholding taxes on income and capital gains imposed by certain countries in which they invest. The withholding tax on income is netted against the income accrued or received. Any reclaimable taxes are recorded as income. The withholding tax on realized or unrealized gain is recorded as a liability.
Derivative Instruments: Derivatives are financial instruments which are valued based on the values of one or more indicators, such as a security, asset, currency, interest rate, or index. Derivative transactions can create investment leverage and may be highly volatile. It is possible that a derivative transaction will result in a loss greater than the principal amount invested. The Funds may not be able to close out a derivative transaction at a favorable time or price.
For the year ended October 31, 2016, the TCW Global Real Estate Fund and the TCW High Dividend Equities Fund had the following derivatives and transactions in derivatives, grouped in the following risk categories (amounts in thousands except Number of Contracts):
| Equity Risk | Total | |||||||
| TCW Global Real Estate Fund | ||||||||
Statement of Operations: | ||||||||
Realized Gain | ||||||||
Written Options | $ | 15 | $ | 15 | ||||
|
|
|
| |||||
Total Realized Gain | $ | 15 | $ | 15 | ||||
|
|
|
| |||||
Change in Unrealized (Depreciation): | ||||||||
Written Options | $ | (1 | ) | $ | (1 | ) | ||
|
|
|
| |||||
Total Change in Unrealized (Depreciation) | $ | (1 | ) | $ | (1 | ) | ||
|
|
|
| |||||
Number of Contracts (1) | 31 | 31 | ||||||
| (1) | Amount disclosed represents average number of contracts, which are representative of the volume traded for the year ended October 31, 2016. |
87
TCW Funds, Inc.
Notes to Financial Statements (Continued)
Note 2 — Significant Accounting Policies (Continued)
| Equity Risk | Total | |||||||
| TCW High Dividend Equities Fund | ||||||||
Statement of Asset and Liabilities | ||||||||
Asset Derivatives | ||||||||
Investments (1) | $ | 145 | $ | 145 | ||||
|
|
|
| |||||
Total Value | $ | 145 | $ | 145 | ||||
|
|
|
| |||||
Liability Derivatives | ||||||||
Written Options | $ | (16 | ) | $ | (16 | ) | ||
|
|
|
| |||||
Total Value | $ | (16 | ) | $ | (16 | ) | ||
|
|
|
| |||||
Statement of Operations: | ||||||||
Realized Gain | ||||||||
Investments (1) | $ | 7 | $ | 7 | ||||
Written Options | 17 | 17 | ||||||
|
|
|
| |||||
Total Realized Gain (Loss) | $ | 24 | $ | 24 | ||||
|
|
|
| |||||
Change in Appreciation (Depreciation) | ||||||||
Investments | $ | (21 | ) | $ | (21 | ) | ||
Options Written | (6 | ) | (6 | ) | ||||
|
|
|
| |||||
Total Change in Appreciation (Depreciation) | $ | (27 | ) | $ | (27 | ) | ||
|
|
|
| |||||
Number of Contracts (2) | ||||||||
Purchased Options | 208 | 208 | ||||||
Written Options | 86 | 86 | ||||||
| (1) | Represents purchased options, at value. |
| (2) | Amount disclosed represents average number of contracts, which are representative of the volume traded for the year ended October 31, 2016. |
Options: The Funds may purchase and sell put and call options on a security or an index of securities to enhance investment performance and to protect against changes in market prices. The Funds may also enter into currency options to hedge against currency fluctuations.
A call option gives the holder the right to purchase, and obligates the writer to sell, a security at the strike price at any time before the expiration date. A put option gives the holder the right to sell, and obligates the writer to buy, a security at the exercise price at any time before the expiration date. A Fund may purchase put options to protect portfolio holdings against a decline in market value of a security or securities held by it. A Fund may also purchase a put option hoping to profit from an anticipated decline in the value of the underlying security. If a Fund holds the security underlying the option, the option premium and any transaction costs will reduce any profit the Fund might have realized had it sold the underlying security instead of buying the put option. A Fund may purchase call options to hedge against an increase in the price of securities that the Fund ultimately wants to buy. A Fund may also purchase a call option as a long directional investment hoping to profit from an anticipated increase in the value of the underlying security. In order for a call option to be profitable, the market price of the underlying security must rise sufficiently above the exercise price to cover the premium and transaction costs. These costs will reduce any profit a Fund might have realized had it bought the underlying security at the time it purchased the call option.
When a Fund purchases an option, it runs the risk that it will lose its entire investment in the option in a relatively short period of time, unless the Fund exercises the option or enters into a closing sale transaction before the option’s expiration. If the price of the underlying security does not rise (in the case of a call) or fall (in the case of a put) to an extent sufficient to cover the option premium and transaction costs, the Fund will lose part or all of its investment in the option. This contrasts with an investment by a Fund in the
88
TCW Funds, Inc.
October 31, 2016 |
Note 2 — Significant Accounting Policies (Continued)
underlying security, since the Fund will not realize a loss if the security’s price does not change. Premiums paid for purchasing options that expire are treated as realized losses.
Options traded on a securities or options exchange typically have minimal exposure to counterparty risk. However, an exchange or market may at times find it necessary to impose restrictions on particular types of options transactions, such as opening transactions. If an underlying security ceases to meet qualifications imposed by an exchange or the Options Clearing Corporation, new series of options on that security will no longer be opened to replace expiring series, and opening transactions in existing series may be prohibited.
OTC options are options not traded on exchanges or backed by clearinghouses. Rather, they are entered into directly between a Fund and the counterparty to the option. In the case of an OTC option purchased by a Fund, the value of the option to the Fund will depend on the willingness and ability of the option writer to perform its obligations to the Fund. In addition, OTC options may not be transferable and there may be little or no secondary market for them, so they may be considered illiquid. It may not be possible to enter into closing transactions with respect to OTC options or otherwise to terminate such options, and as a result a Fund may be required to remain obligated on an unfavorable OTC option until its expiration.
TCW Global Real Estate Fund and TCW High Dividend Equities Fund entered into option contracts during the fiscal year to increase the yield of the Funds and/or to hedge the Funds’ investments from market volatility. Transactions in written option contracts for the year ended October 31, 2016 were as follows:
| TCW Global Real Estate Fund | Call Contracts | Call Premiums | ||||||
Options outstanding at October 31, 2015 | 40 | $ | 4,164 | |||||
Options written | 175 | 14,036 | ||||||
Options exercised | (15 | ) | (3,615 | ) | ||||
Options expired | (200 | ) | (14,585 | ) | ||||
|
|
|
| |||||
Options outstanding at October 31, 2016 | — | $ | — | |||||
|
|
|
| |||||
| TCW High Dividend Equities Fund | Call Contracts | Call Premiums | ||||||
Options outstanding at October 31, 2015 | 26 | $ | 5,353 | |||||
Options written | 449 | 48,327 | ||||||
Options terminated in closing purchase transactions | (158 | ) | (18,224 | ) | ||||
Options exercised | (159 | ) | (19,214 | ) | ||||
Options expired | (142 | ) | (6,819 | ) | ||||
|
|
|
| |||||
Options outstanding at October 31, 2016 | 16 | $ | 9,423 | |||||
|
|
|
| |||||
When-Issued, Delayed-Delivery and Forward Commitment Transactions: The Funds, with the exception of the TCW Conservative Allocation Fund, may enter into when-issued, delayed-delivery, or forward commitment transactions in order to lock in the purchase price of the underlying security. In when-issued, delayed-delivery, or forward commitment transactions, a Fund commits to purchase or sell particular securities, with payment and delivery to take place at a future date. Although the Fund does not pay for the securities until they are delivered, it immediately assumes the risks of ownership, including the risk of price fluctuation. If the Fund’s counterparty fails to deliver a security purchased on a when-issued, delayed-delivery or forward commitment basis, there may be a loss, and the Fund may have missed an opportunity to make an alternative investment.
Prior to settlement of these transactions, the value of the subject securities will fluctuate with market conditions. In addition, because a Fund is not required to pay for when-issued, delayed-delivery or forward
89
TCW Funds, Inc.
Notes to Financial Statements (Continued)
Note 2 — Significant Accounting Policies (Continued)
commitment securities until the delivery date, they may result in a form of leverage to the extent the Fund does not maintain liquid assets equal to the face amount of the contract. To guard against the deemed leverage, the Fund monitors the obligations under these transactions and ensures that the Fund has sufficient liquid assets to cover them.
Repurchase Agreements: The Funds may enter into Repurchase Agreements, under the terms of a Master Repurchase Agreement (“MRA”). The MRA permits each Fund, under certain circumstances including an event of default (such as bankruptcy or insolvency), to offset payables and/or receivables under the MRA with collateral held and/or posted to the counterparty and create one single net payment due to or from each Fund. However, bankruptcy or insolvency laws of a particular jurisdiction may impose restrictions on or prohibitions against such a right of offset in the event of a MRA counterparty’s bankruptcy or insolvency. Pursuant to the terms of the MRA, the Funds receive securities as collateral with a market value in excess of the repurchase price to be received by the Fund upon the maturity of the repurchase transaction. Upon a bankruptcy or insolvency of the MRA counterparty, the Fund recognizes a liability with respect to such excess collateral to reflect the Fund’s obligation under bankruptcy law to return the excess to the counterparty. There were no repurchase agreements outstanding as of October 31, 2016.
Security Lending: The Funds may lend their securities to qualified brokers. The loans must be collateralized at all times primarily with cash although the Funds can accept money market instruments or U.S. government securities with a market value at least equal to the market value of the securities on loan. As with any extensions of credit, the Funds may bear the risk of delay in recovery or even loss of rights in the collateral if the borrowers of the securities fail financially. The Funds earn additional income for lending their securities by investing the cash collateral in short-term investments. The Funds did not lend any securities during the year ended October 31, 2016.
Allocation of Operating Activity for Multiple Classes: Investment income, common expenses and realized and unrealized gains and losses are allocated among the share classes of the Funds based on the relative net assets of each class. Distribution fees, which are directly attributable to a class of shares, are charged to the operations of the class. All other expenses are charged to each Fund or class as incurred on a specific identification basis. Differences in class specific fees and expenses will result in differences in net investment income for each class, and in turn differences in dividends paid by each class.
Dividends and Distributions: Dividends and distributions to shareholders are recorded on the ex-dividend date. The TCW Global Real Estate Fund, the TCW High Dividend Equities Fund and the TCW Relative Value Dividend Appreciation Fund declare and pay, or reinvest, dividends from net investment income quarterly. The other Equity Funds and TCW Conservative Allocation Fund declare and pay, or reinvest, dividends from net investment income annually. Capital gains realized by a Fund will be distributed at least annually.
Income and capital gain distributions are determined in accordance with income tax regulations which may differ from GAAP. These differences are primarily due to differing treatments for foreign currency transactions, market discount and premium, losses deferred due to wash sales, excise tax regulations and employing equalization in determining amounts to be distributed to fund shareholders. Permanent book and tax basis differences relating to shareholder distributions will result in reclassifications between paid-in capital, undistributed net investment income (loss), and/or undistributed accumulated realized gain (loss). Undistributed net investment income or loss may include temporary book and tax differences which will reverse in subsequent periods. Any taxable income or capital gain remaining at fiscal year-end is distributed in the following year. Distributions received from real estate investment trusts may include return of capital
90
TCW Funds, Inc.
October 31, 2016 |
Note 2 — Significant Accounting Policies (Continued)
which is treated as a reduction in the cost basis of those investments. Distributions received, if any, in excess of the cost basis of a security is recognized as capital gain.
Use of Estimates: The preparation of the accompanying financial statements requires management to make estimates and assumptions that affect the reported amount of assets and liabilities at the date of the financial statements and the reported amounts of income and expenses during the reporting period. Actual results could differ from these estimates.
Note 3 — Risk Considerations
Market Risk: The Funds’ investments will fluctuate with market conditions, so will the value of your investment in the Funds. You could lose money on your investment in the Funds or the Funds could underperform other investments.
Liquidity Risk: The Funds’ investments in illiquid securities may reduce the returns of the Funds because they may not be able to sell the illiquid securities at an advantageous time or price. Investments in high yield securities, foreign securities, derivatives or other securities with substantial market and/or credit risk tend to have the greatest exposure to liquidity risk. Certain investments in private placements and Rule 144A securities may be considered illiquid investments. The Funds may invest in private placements and Rule 144A securities.
Counterparty Risk: The Funds may be exposed to counterparty risk, or the risk that an entity with which the Funds have unsettled or open transactions may default. Financial assets, which potentially expose the Funds to credit and counterparty risks, consist principally of investments and cash due from counterparties.
Investment Style Risk: Certain Funds may also be subject to investment style risk. The Advisor’s investment styles may be out of favor at times or may not produce the best results over short or longer time periods and may increase the volatility of a Fund’s share price.
Equity Risk: Equity securities may include common stock, preferred stock or other securities representing an ownership interest of the right to acquire an ownership interest in an issuer. Equity risk is the risk that stocks and other equity securities generally fluctuate in value more than bonds and can decline in value over short or extended periods. The value of stocks and other equity securities will be affected by changes in a company’s financial condition and in overall market, economic and political conditions.
The exposure to credit and counterparty risks with respect to these financial assets is reflected in fair value recorded in the Funds’ Statements of Assets and Liabilities.
For complete information on the various risks involved, please refer to the Funds’ prospectus and the Statement of Additional Information which can be obtained on the Funds’ website (www.tcw.com) or by calling the customer service.
Note 4 — Federal Income Taxes
It is the policy of each Fund to comply with the requirements under Subchapter M of the Internal Revenue Code (the “Code”) applicable to regulated investment companies and to distribute all of its net taxable income, including any net realized gains on investments, to its shareholders. Therefore, no federal income tax provision is required.
91
TCW Funds, Inc.
Notes to Financial Statements (Continued)
Note 4 — Federal Income Taxes (Continued)
At October 31, 2016, the components of distributable earnings on a tax basis were as follows (amounts in thousands):
| Undistributed Ordinary Income | Undistributed Long-Term Gain | Total Distributable Earnings | ||||||||||
TCW Conservative Allocation Fund | $ | 341 | $ | 1,185 | $ | 1,526 | ||||||
TCW Focused Equities Fund | 109 | — | 109 | |||||||||
TCW Growth Equities Fund | — | 513 | 513 | |||||||||
TCW New America Premier Equities Fund | 160 | — | 160 | |||||||||
TCW Relative Value Dividend Appreciation Fund | 1,661 | — | 1,661 | |||||||||
TCW Relative Value Large Cap Fund | 7,592 | 24,779 | 32,371 | |||||||||
TCW Relative Value Mid Cap Fund | 42 | — | 42 | |||||||||
TCW Select Equities Fund | — | 83,783 | 83,783 | |||||||||
For the prior fiscal year ended October 31, 2015, the components of distributable earnings on a tax basis were as follows (amounts in thousands):
| Undistributed Ordinary Income | Undistributed Long-Term Gain | Total Distributable Earnings | ||||||||||
TCW Conservative Allocation Fund | $ | 238 | $ | 729 | $ | 967 | ||||||
TCW Focused Equities Fund | 59 | — | 59 | |||||||||
TCW Global Real Estate Fund | 6 | 1 | 7 | |||||||||
TCW Growth Equities Fund | — | 3,201 | 3,201 | |||||||||
TCW High Dividend Equities Fund | 3 | — | 3 | |||||||||
TCW Relative Value Large Cap Fund | 6,336 | 26,895 | 33,231 | |||||||||
TCW Relative Value Mid Cap Fund | 80 | 13,512 | 13,592 | |||||||||
TCW Select Equities Fund | 12,885 | 124,880 | 137,765 | |||||||||
TCW Small Cap Growth Fund | — | 21,447 | 21,447 | |||||||||
Permanent differences incurred during the year ended October 31, 2016, resulting from differences in book and tax accounting, have been reclassified at year-end between undistributed net investment income (loss), undistributed (accumulated) net realized gain (loss) and paid-in capital as follows, with no impact to the net asset value per share (amounts in thousands):
| Undistributed Net Investment Income (Loss) | Undistributed (Accumulated) Net Realized Gain (Loss) | Paid-in Capital | ||||||||||
TCW Conservative Allocation Fund | $ | 140 | $ | (261 | ) | $ | 121 | |||||
TCW Focused Equities Fund | 5 | (5 | ) | — | (1) | |||||||
TCW Global Real Estate Fund | (10 | ) | 10 | — | ||||||||
TCW Growth Equities Fund | 149 | (66 | ) | (83 | ) | |||||||
TCW High Dividend Equities Fund | (16 | ) | 16 | — | ||||||||
TCW New America Premier Equities Fund | 1 | 1 | (2 | ) | ||||||||
TCW Relative Value Dividend Appreciation Fund | (1,102 | ) | 1,102 | — | (1) | |||||||
TCW Relative Value Large Cap Fund | (456 | ) | (8,010 | ) | 8,466 | |||||||
TCW Relative Value Mid Cap Fund | (190 | ) | 6,265 | (6,075 | ) | |||||||
TCW Select Equities Fund | 6,696 | (17,887 | ) | 11,191 | ||||||||
TCW Small Cap Growth Fund | 524 | 2,912 | (3,436 | ) | ||||||||
| (1) | Amount rounds to less than $1 |
92
TCW Funds, Inc.
October 31, 2016 |
Note 4 — Federal Income Taxes (Continued)
During the year ended October 31, 2016, the tax character of distributions paid was as follows (amounts in thousands):
| Ordinary Income | Long-Term Capital Gain | Return of Capital | Total Distributions | |||||||||||||
TCW Conservative Allocation Fund | $ | 483 | $ | 729 | $ | — | $ | 1,212 | ||||||||
TCW Focused Equities Fund | 77 | — | — | 77 | ||||||||||||
TCW Global Real Estate Fund | 113 | 6 | 12 | 131 | ||||||||||||
TCW Growth Equities Fund | — | 3,201 | — | 3,201 | ||||||||||||
TCW High Dividend Equities Fund | 153 | — | 16 | 169 | ||||||||||||
TCW Relative Value Dividend Appreciation Fund | 17,094 | — | — | 17,094 | ||||||||||||
TCW Relative Value Large Cap Fund | 7,755 | 26,894 | — | 34,649 | ||||||||||||
TCW Relative Value Mid Cap Fund | 725 | 13,512 | — | 14,237 | ||||||||||||
TCW Select Equities Fund | 12,885 | 124,885 | — | 137,770 | ||||||||||||
TCW Small Cap Growth Fund | 2,883 | 21,494 | — | 24,377 | ||||||||||||
During the prior fiscal year ended October 31, 2015, the tax character of distributions paid was as follows (amounts in thousands):
| Ordinary Income | Long-Term Capital Gain | Total Distributions | ||||||||||
TCW Conservative Allocation Fund | $ | 336 | $ | 162 | $ | 498 | ||||||
TCW Focused Equities Fund | 51 | — | 51 | |||||||||
TCW Global Real Estate Fund | 47 | — | 47 | |||||||||
TCW Growth Equities Fund | 499 | 2,010 | 2,509 | |||||||||
TCW High Dividend Equities Fund | 97 | — | 97 | |||||||||
TCW Relative Value Dividend Appreciation Fund | 16,258 | — | 16,258 | |||||||||
TCW Relative Value Large Cap Fund | 6,989 | — | 6,989 | |||||||||
TCW Relative Value Mid Cap Fund | 596 | 16,425 | 17,021 | |||||||||
TCW Select Equities Fund | 3,370 | 54,127 | 57,497 | |||||||||
TCW Small Cap Growth Fund | 8,498 | 18,893 | 27,391 | |||||||||
At October 31, 2016, net unrealized appreciation (depreciation) on investments for federal income tax purposes was as follows (amounts in thousands):
| Unrealized Appreciation | Unrealized (Depreciation) | Net Unrealized Appreciation (Depreciation) | Cost of Investments for Federal Income Tax Purposes | |||||||||||||
TCW Conservative Allocation Fund | $ | 2,452 | $ | (298 | ) | $ | 2,154 | $ | 28,167 | |||||||
TCW Focused Equities Fund | 976 | (271 | ) | 705 | 9,135 | |||||||||||
TCW Global Real Estate Fund | 178 | (157 | ) | 21 | 4,011 | |||||||||||
TCW Growth Equities Fund | 1,993 | (708 | ) | 1,285 | 7,790 | |||||||||||
TCW High Dividend Equities Fund | 401 | (338 | ) | 63 | 11,979 | |||||||||||
TCW New America Premier Equities Fund | 246 | (27 | ) | 219 | 3,858 | |||||||||||
TCW Relative Value Dividend Appreciation Fund | 216,391 | (27,283 | ) | 189,108 | 854,180 | |||||||||||
TCW Relative Value Large Cap Fund | 166,192 | (3,721 | ) | 162,471 | 337,544 | |||||||||||
TCW Relative Value Mid Cap Fund | 19,959 | (4,520 | ) | 15,439 | 76,207 | |||||||||||
TCW Select Equities Fund | 583,278 | (62,530 | ) | 520,748 | 895,157 | |||||||||||
TCW Small Cap Growth Fund | 9,737 | (1,215 | ) | 8,522 | 41,508 | |||||||||||
93
TCW Funds, Inc.
Notes to Financial Statements (Continued)
Note 4 — Federal Income Taxes (Continued)
Under the Regulated Investment Company Modernization Act of 2010, the Funds will be permitted to carry forward capital losses incurred in taxable years beginning after December 22, 2010 for an unlimited period. However, any losses incurred during those future taxable years will be required to be utilized prior to the losses incurred in the pre-enactment taxable years. Additionally, post-enactment capital losses that are carried forward will retain their character as either short-term or long-term capital losses rather than being considered all short-term as under previous law.
At October 31, 2016, the following Funds had net realized loss carryforwards for federal income tax purposes (Amounts in thousands):
| No Expiration (2) | ||||||||||||||||
| Expiring in 2017(1) | Short-Term Capital Losses | Long-Term Capital Losses | Total | |||||||||||||
TCW Focused Equities Fund | $ | 6,357 | $ | 88 | $ | 121 | $ | 6,566 | ||||||||
TCW Global Real Estate Fund | — | 397 | 106 | 503 | ||||||||||||
TCW High Dividend Equities Fund | — | 590 | 54 | 644 | ||||||||||||
TCW Relative Value Dividend Appreciation Fund | 48,142 | — | — | 48,142 | ||||||||||||
TCW Relative Value Mid Cap Fund | — | 530 | 565 | 1,095 | ||||||||||||
| (1) | Losses incurred prior to December 22, 2010. |
| (2) | Losses incurred after December 22, 2010. |
The Funds did not have any unrecognized tax benefits at October 31, 2016, nor were there any increases or decreases in unrecognized tax benefits for the year ended October 31, 2016. The Funds are subject to examination by the U.S. Federal and state tax authorities for returns filed for the prior three and four fiscal years, respectively.
Note 5 — Fund Management Fees and Other Expenses
The Funds pay to the Advisor, as compensation for services rendered, facilities furnished and expenses borne by it, the following annual management fees as a percentage of daily NAV:
TCW Focused Equities Fund | 0.65 | % | ||
TCW Global Real Estate Fund | 0.80 | % | ||
TCW Growth Equities Fund | 1.00 | % | ||
TCW High Dividend Equities Fund | 0.65 | % | ||
TCW New America Premier Equities Fund | 0.80 | % | ||
TCW Relative Value Dividend Appreciation Fund (1) | 0.75 | % | ||
TCW Relative Value Large Cap Fund (1) | 0.75 | % | ||
TCW Relative Value Mid Cap Fund | 0.80 | % | ||
TCW Select Equities Fund | 0.75 | % | ||
TCW Small Cap Growth Fund | 1.00 | % |
| (1) | Effective November 1, 2016 the management fees changed from 0.75% to 0.65%. |
The TCW Conservative Allocation Fund does not pay management fees to the Advisor; however, the Fund pays management fees to the Advisor indirectly, as a shareholder in the affiliated funds.
In addition to the management fee, the Company’s Board has approved an annual amount for the Funds to reimburse the Advisor for a portion of its costs associated with implementing the Funds’ Rule 38a-1 compliance program. The amount is accrued on a daily basis and included in the Statement of Operations. However, the Advisor has waived its reimbursement request since April 2016.
94
TCW Funds, Inc.
October 31, 2016 |
Note 5 — Fund Management Fees and Other Expenses (Continued)
The Advisor limits the operating expenses of the Funds not to exceed the following expense ratios relative to the Funds’ average daily net assets:
TCW Conservative Allocation Fund | ||||
I Class | 0.85 | % (1) | ||
N Class | 0.85 | % (1) | ||
TCW Focused Equities Fund | ||||
I Class | 1.09 | % (1) | ||
N Class | 1.09 | % (1) | ||
TCW Global Real Estate Fund | ||||
I Class | 1.46 | % (1) | ||
N Class | 1.46 | % (1) | ||
TCW Growth Equities Fund | ||||
I Class | 1.20 | % (1) | ||
N Class | 1.20 | % (1) | ||
TCW High Dividend Equities Fund | ||||
I Class | 1.18 | % (1) | ||
N Class | 1.18 | % (1) | ||
TCW New America Premier Equities Fund | ||||
I Class | 1.04 | % (1) | ||
N Class | 1.04 | % (1) | ||
TCW Relative Value Dividend Appreciation Fund | ||||
I Class | 1.00 | % (1) | ||
N Class | 1.00 | % (1) | ||
TCW Relative Value Large Cap Fund | ||||
I Class | 1.00 | % (1) | ||
N Class | 1.00 | % (1) | ||
TCW Relative Value Mid Cap Fund | ||||
I Class | 1.21 | % (1) | ||
N Class | 1.21 | % (1) | ||
TCW Select Equities Fund | ||||
I Class | 1.12 | % (2) | ||
N Class | 1.12 | % (2) | ||
TCW Small Cap Growth Fund | ||||
I Class | 1.33 | % (2) | ||
N Class | 1.33 | % (2) |
| (1) | These limitations are based on an agreement between the Advisor and the Company. |
| (2) | Limitations based on average expense ratio as reported by Lipper, Inc., which is subject to change on a monthly basis. This ratio was in effect as of October 31, 2016. These limitations are voluntary and terminable in a six month notice. |
The amount borne by the Advisor during a fiscal year when the operating expenses of a Fund are in excess of the expense limitation cannot be recaptured in the subsequent fiscal years should the expenses drop below the expense limitation in the subsequent years. The Advisor can only recapture expenses within a given fiscal year for that year’s operating expenses.
Directors’ Fees: Directors who are not affiliated with the Advisor receive compensation from the Funds which are shown on the Statement of Operations. Directors may elect to defer receipt of their fees in accordance with the terms of a Non-Qualified Deferred Compensation Plan. Total accrued and deferred amounts are recorded on the Funds’ books as other liabilities.
95
TCW Funds, Inc.
Notes to Financial Statements (Continued)
Note 6 — Distribution Plan
TCW Funds Distributors (“Distributor”), an affiliate of the Advisor and the Funds, serves as the nonexclusive distributor of each class of the Funds’ shares. The Funds have a distribution plan pursuant to Rule 12b-1 under the 1940 Act with respect to the N Class shares of each Fund. Under the terms of the plan, each Fund compensates the Distributor at a rate equal to 0.25% of the average daily net assets of the Fund attributable to its N Class shares for distribution and related services.
Note 7 — Transactions with Affiliates
The summary of the TCW Conservative Allocation Fund transactions in the affiliated funds for the year ended October 31, 2016 is as follows:
Name of | Number of Shares Held Beginning of Year | Gross Additions | Gross Reductions | Number of Shares Held End of Year | Value at End of Year (In Thousands) | Dividends and Interest Income Received (In Thousands) | Distributions Received as Net Realized Gain (In thousands) | |||||||||||||||||||||
Metropolitan West Low Duration Fund—I Class |
| |||||||||||||||||||||||||||
| — | 361,087 | (6,337 | ) | 354,750 | $ | 3,104 | $ | 12 | $ | — | ||||||||||||||||||
Metropolitan West Total Return Bond Fund—I Class |
| |||||||||||||||||||||||||||
| 688,594 | 32,794 | (329,824 | ) | 391,564 | 4,280 | 120 | 81 | |||||||||||||||||||||
TCW / Gargoyle Hedged Value Fund—I Class |
| |||||||||||||||||||||||||||
| — | 210,685 | (14,884 | ) | 195,801 | 1,707 | — | — | |||||||||||||||||||||
TCW Global Bond Fund—I Class |
| |||||||||||||||||||||||||||
| — | 79,557 | (3,793 | ) | 75,764 | 749 | 10 | — | |||||||||||||||||||||
TCW Global Real Estate Fund—I Class |
| |||||||||||||||||||||||||||
| 134,167 | 6,938 | (20,374 | ) | 120,731 | 1,137 | 39 | 2 | |||||||||||||||||||||
TCW Growth Equities Fund—I Class |
| |||||||||||||||||||||||||||
| 66,589 | 19,168 | (85,757 | ) | — | — | — | 164 | |||||||||||||||||||||
TCW High Dividend Equities Fund—I Class |
| |||||||||||||||||||||||||||
| 166,698 | 218,383 | (33,091 | ) | 351,990 | 3,136 | 46 | — | |||||||||||||||||||||
TCW International Growth Fund—I Class |
| |||||||||||||||||||||||||||
| — | 81,400 | (3,898 | ) | 77,502 | 759 | — | — | |||||||||||||||||||||
TCW Relative Value Large Cap Fund—I Class |
| |||||||||||||||||||||||||||
| 185,015 | 13,209 | (74,013 | ) | 124,211 | 2,656 | 45 | 157 | |||||||||||||||||||||
TCW Relative Value Mid Cap Fund—I Class |
| |||||||||||||||||||||||||||
| 24,980 | 3,892 | (28,872 | ) | — | — | 4 | 67 | |||||||||||||||||||||
TCW Select Equities Fund—I Class |
| |||||||||||||||||||||||||||
| 244,346 | 22,513 | (170,528 | ) | 96,331 | 2,510 | — | 493 | |||||||||||||||||||||
TCW Total Return Bond Fund—I Class |
| |||||||||||||||||||||||||||
| 1,079,823 | 193,668 | (278,047 | ) | 995,444 | 10,283 | 264 | 75 | |||||||||||||||||||||
|
|
|
|
|
| |||||||||||||||||||||||
Total | $ | 30,321 | $ | 540 | $ | 1,039 | ||||||||||||||||||||||
|
|
|
|
|
| |||||||||||||||||||||||
The ownership percentage of the TCW Conservative Allocation Fund in each of the affiliated underlying funds at October 31, 2016 is as follows:
Name of Affiliated Fund | Ownership Percentage (1) | |||
Metropolitan West Low Duration Bond Fund | 0.10 | % | ||
Metropolitan West Total Return Bond Fund | 0.01 | % | ||
TCW / Gargoyle Hedged Value Fund | 3.70 | % | ||
TCW Global Bond Fund | 4.61 | % | ||
TCW Global Real Estate Fund | 28.32 | % | ||
TCW High Dividend Equities Fund | 26.15 | % | ||
TCW International Growth Fund | 23.62 | % | ||
96
TCW Funds, Inc.
October 31, 2016 |
Note 7 — Transactions with Affiliates (Continued)
Name of Affiliated Fund | Ownership Percentage (1) | |||
TCW Relative Value Large Cap Fund | 0.53 | % | ||
TCW Select Equities Fund | 0.18 | % | ||
TCW Total Return Bond Fund | 0.10 | % | ||
| (1) | Percentage ownership based on total net assets of the underlying fund. |
The financial statements of the Funds not contained in this report are available by calling 800-FUND-TCW (800-386-3829) or by going to the SEC website at www.sec.gov.
Note 8 — Purchases and Sales of Securities
Investment transactions (excluding short-term investments) for the year ended October 31, 2016 were as follows (amounts in thousands):
| Purchases at Cost | Sales or Maturity Proceeds | U.S. Government Purchases at Cost | U.S. Government Sales or Maturity Proceeds | |||||||||||||
TCW Conservative Allocation Fund | $ | 11,962 | $ | 15,116 | $ | — | $ | — | ||||||||
TCW Focused Equities Fund | 4,660 | 5,636 | — | — | ||||||||||||
TCW Global Real Estate Fund | 2,551 | 2,783 | — | — | ||||||||||||
TCW Growth Equities Fund | 6,085 | 11,729 | — | — | ||||||||||||
TCW High Dividend Equities Fund | 13,464 | 6,565 | — | — | ||||||||||||
TCW New America Premier Equities Fund (1) | 5,271 | 2,269 | — | — | ||||||||||||
TCW Relative Value Dividend Appreciation Fund | 198,876 | 240,899 | — | — | ||||||||||||
TCW Relative Value Large Cap Fund | 88,995 | 270,963 | — | — | ||||||||||||
TCW Relative Value Mid Cap Fund | 17,176 | 38,880 | — | — | ||||||||||||
TCW Select Equities Fund | 223,985 | 549,266 | — | — | ||||||||||||
TCW Small Cap Growth Fund | 51,674 | 114,039 | — | — | ||||||||||||
| (1) | The Fund received securities as in-kind subscriptions in exchange for shares issued by the Fund which amounted to $494 (amount in thousands). Securities were received from affiliates of the Advisor at fair value on the date of transfer. |
Transactions in each Fund’s shares were as follows:
Note 9 — Capital Share Transactions
| TCW Conservative Allocation Fund | Year Ended October 31, 2016 | Year Ended October 31, 2015 | ||||||||||||||
| I Class | Shares | Amount (in thousands) | Shares | Amount (in thousands) | ||||||||||||
Shares Sold | 266,269 | $ | 3,156 | 458,599 | $ | 5,727 | ||||||||||
Shares Issued upon Reinvestment of Dividends | 94,762 | 1,131 | 39,547 | 484 | ||||||||||||
Shares Redeemed | (683,727 | ) | (8,290 | ) | (297,993 | ) | (3,703 | ) | ||||||||
|
|
|
|
|
|
|
| |||||||||
Net Increase (Decrease) | (322,696 | ) | $ | (4,003 | ) | 200,153 | $ | 2,508 | ||||||||
|
|
|
|
|
|
|
| |||||||||
| N Class | Shares | Amount (in thousands) | Shares | Amount (in thousands) | ||||||||||||
Shares Sold | 40,211 | $ | 479 | 359,303 | $ | 4,480 | ||||||||||
Shares Issued upon Reinvestment of Dividends | 4,787 | 57 | 632 | 8 | ||||||||||||
Shares Redeemed | (63,507 | ) | (766 | ) | (275,435 | ) | (3,444 | ) | ||||||||
|
|
|
|
|
|
|
| |||||||||
Net Increase (Decrease) | (18,509 | ) | $ | (230 | ) | 84,500 | $ | 1,044 | ||||||||
|
|
|
|
|
|
|
| |||||||||
| TCW Focused Equities Fund | Year Ended October 31, 2016 | Year Ended October 31, 2015 | ||||||||||||||
| I Class | Shares | Amount (in thousands) | Shares | Amount (in thousands) | ||||||||||||
Shares Sold | 205,905 | $ | 3,451 | 248,452 | $ | 4,959 | ||||||||||
Shares Issued upon Reinvestment of Dividends | 2,922 | 55 | 1,992 | 41 | ||||||||||||
Shares Redeemed | (214,385 | ) | (4,065 | ) | (282,615 | ) | (5,720 | ) | ||||||||
|
|
|
|
|
|
|
| |||||||||
Net Decrease | (5,558 | ) | $ | (559 | ) | (32,171 | ) | $ | (720 | ) | ||||||
|
|
|
|
|
|
|
| |||||||||
97
TCW Funds, Inc.
Notes to Financial Statements (Continued)
Note 9 — Capital Share Transactions (Continued)
| N Class | Shares | Amount (in thousands) | Shares | Amount (in thousands) | ||||||||||||
Shares Sold | 1,638 | $ | 29 | 123,883 | $ | 2,456 | ||||||||||
Shares Issued upon Reinvestment of Dividends | 688 | 13 | 453 | 9 | ||||||||||||
Shares Redeemed | (25,999 | ) | (475 | ) | (142,926 | ) | (2,846 | ) | ||||||||
|
|
|
|
|
|
|
| |||||||||
Net Decrease | (23,673 | ) | $ | (433 | ) | (18,590 | ) | $ | (381 | ) | ||||||
|
|
|
|
|
|
|
| |||||||||
| TCW Global Real Estate Fund | Year Ended October 31, 2016 | November 28, 2014 (Commencement of Operations) through October 31, 2015 | ||||||||||||||
| I Class | Shares | Amount (in thousands) | Shares | Amount (in thousands) | ||||||||||||
Shares Sold | 184,189 | $ | 1,795 | 458,267 | $ | 4,477 | ||||||||||
Shares Issued upon Reinvestment of Dividends | 11,410 | 112 | 3,584 | 35 | ||||||||||||
Shares Redeemed | (269,042 | ) | (2,287 | ) | (16,758 | ) | (169 | ) | ||||||||
|
|
|
|
|
|
|
| |||||||||
Net Increase (Decrease) | (73,443 | ) | $ | (380 | ) | 445,093 | $ | 4,343 | ||||||||
|
|
|
|
|
|
|
| |||||||||
| N Class | Shares | Amount (in thousands) | Shares | Amount (in thousands) | ||||||||||||
Shares Sold | 568 | $ | 5 | 51,405 | $ | 514 | ||||||||||
Shares Issued upon Reinvestment of Dividends | 1,801 | 18 | 1,188 | 11 | ||||||||||||
Shares Redeemed | (10 | ) | — | — | — | |||||||||||
|
|
|
|
|
|
|
| |||||||||
Net Increase | 2,359 | $ | 23 | 52,593 | $ | 525 | ||||||||||
|
|
|
|
|
|
|
| |||||||||
| TCW Growth Equities Fund | Year Ended October 31, 2016 | Year Ended October 31, 2015 | ||||||||||||||
| I Class | Shares | Amount (in thousands) | Shares | Amount (in thousands) | ||||||||||||
Shares Sold | 19,082 | $ | 169 | 96,539 | $ | 1,198 | ||||||||||
Shares Issued upon Reinvestment of Dividends | 271,061 | 2,326 | 160,008 | 1,920 | ||||||||||||
Shares Redeemed | (626,712 | ) | (5,157 | ) | (834,043 | ) | (10,123 | ) | ||||||||
|
|
|
|
|
|
|
| |||||||||
Net Decrease | (336,569 | ) | $ | (2,662 | ) | (577,496 | ) | $ | (7,005 | ) | ||||||
|
|
|
|
|
|
|
| |||||||||
| N Class | Shares | Amount (in thousands) | Shares | Amount (in thousands) | ||||||||||||
Shares Sold | 32,630 | $ | 263 | 29,125 | $ | 353 | ||||||||||
Shares Issued upon Reinvestment of Dividends | 85,332 | 726 | 41,507 | 494 | ||||||||||||
Shares Redeemed | (91,208 | ) | (832 | ) | (164,135 | ) | (2,016 | ) | ||||||||
|
|
|
|
|
|
|
| |||||||||
Net Increase (Decrease) | 26,754 | $ | 157 | (93,503 | ) | $ | (1,169 | ) | ||||||||
|
|
|
|
|
|
|
| |||||||||
| TCW High Dividend Equities Fund | Year Ended October 31, 2016 | November 28, 2014 (Commencement of Operations) through October 31, 2015 | ||||||||||||||
| I Class | Shares | Amount (in thousands) | Shares | Amount (in thousands) | ||||||||||||
Shares Sold | 912,708 | $ | 8,121 | 452,841 | $ | 4,598 | ||||||||||
Shares Issued upon Reinvestment of Dividends | 15,211 | 138 | 6,033 | 57 | ||||||||||||
Shares Redeemed | (76,372 | ) | (671 | ) | (17,038 | ) | (176 | ) | ||||||||
|
|
|
|
|
|
|
| |||||||||
Net Increase | 851,547 | $ | 7,588 | 441,836 | $ | 4,479 | ||||||||||
|
|
|
|
|
|
|
| |||||||||
| N Class | Shares | Amount (in thousands) | Shares | Amount (in thousands) | ||||||||||||
Shares Sold | 1,406 | $ | 12 | 59,709 | $ | 598 | ||||||||||
Shares Issued upon Reinvestment of Dividends | 1,234 | 11 | 1,477 | 14 | ||||||||||||
Shares Redeemed | (6,727 | ) | (61 | ) | (4,582 | ) | (42 | ) | ||||||||
|
|
|
|
|
|
|
| |||||||||
Net Increase (Decrease) | (4,087 | ) | $ | (38 | ) | 56,604 | $ | 570 | ||||||||
|
|
|
|
|
|
|
| |||||||||
98
TCW Funds, Inc.
October 31, 2016 |
Note 9 — Capital Share Transactions (Continued)
| TCW New America Premier Equities Fund | January 29, 2016 (Commencement of Operations) through April 30, 2016 | |||||||||||||||
| I Class | Shares | Amount (in thousands) | ||||||||||||||
Shares Sold | 279,930 | $ | 2,891 | |||||||||||||
Shares Issued upon Reinvestment of Dividends | — | — | ||||||||||||||
Shares Redeemed | — | — | ||||||||||||||
|
|
|
| |||||||||||||
Net Increase | 279,930 | $ | 2,891 | |||||||||||||
|
|
|
| |||||||||||||
| N Class | Shares | Amount (in thousands) | ||||||||||||||
Shares Sold | 100,450 | $ | 1,005 | |||||||||||||
Shares Issued upon Reinvestment of Dividends | — | — | ||||||||||||||
Shares Redeemed | — | — | ||||||||||||||
|
|
|
| |||||||||||||
Net Increase | 100,450 | $ | 1,005 | |||||||||||||
|
|
|
| |||||||||||||
| TCW Relative Value Dividend Appreciation Fund | Year Ended October 31, 2016 | Year Ended October 31, 2015 | ||||||||||||||
| I Class | Shares | Amount (in thousands) | Shares | Amount (in thousands) | ||||||||||||
Shares Sold | 948,410 | $ | 15,498 | 1,575,298 | $ | 26,538 | ||||||||||
Shares Issued upon Reinvestment of Dividends | 170,136 | 2,833 | 183,083 | 3,014 | ||||||||||||
Shares Redeemed | (2,020,794 | ) | (32,962 | ) | (2,794,008 | ) | (46,745 | ) | ||||||||
|
|
|
|
|
|
|
| |||||||||
Net Decrease | (902,248 | ) | $ | (14,631 | ) | (1,035,627 | ) | $ | (17,193 | ) | ||||||
|
|
|
|
|
|
|
| |||||||||
| N Class | Shares | Amount (in thousands) | Shares | Amount (in thousands) | ||||||||||||
Shares Sold | 9,410,205 | $ | 155,007 | 8,160,662 | $ | 139,279 | ||||||||||
Shares Issued upon Reinvestment of Dividends | 827,154 | 14,023 | 769,641 | 12,885 | ||||||||||||
Shares Redeemed | (11,784,787 | ) | (196,322 | ) | (13,622,511 | ) | (233,066 | ) | ||||||||
|
|
|
|
|
|
|
| |||||||||
Net Decrease | (1,547,428 | ) | $ | (27,292 | ) | (4,692,208 | ) | $ | (80,902 | ) | ||||||
|
|
|
|
|
|
|
| |||||||||
| TCW Relative Value Large Cap Fund | Year Ended October 31, 2016 | Year Ended October 31, 2015 | ||||||||||||||
| I Class | Shares | Amount (in thousands) | Shares | Amount (in thousands) | ||||||||||||
Shares Sold | 3,071,355 | $ | 61,967 | 5,555,127 | $ | 125,156 | ||||||||||
Shares Issued upon Reinvestment of Dividends | 1,619,808 | 32,801 | 290,398 | 6,627 | ||||||||||||
Shares Redeemed | (12,606,029 | ) | (261,041 | ) | (7,174,838 | ) | (161,855 | ) | ||||||||
|
|
|
|
|
|
|
| |||||||||
Net Decrease | (7,914,866 | ) | $ | (166,273 | ) | (1,329,313 | ) | $ | (30,072 | ) | ||||||
|
|
|
|
|
|
|
| |||||||||
| N Class | Shares | Amount (in thousands) | Shares | Amount (in thousands) | ||||||||||||
Shares Sold | 288,193 | $ | 5,723 | 189,992 | $ | 4,291 | ||||||||||
Shares Issued upon Reinvestment of Dividends | 58,635 | 1,186 | 9,147 | 208 | ||||||||||||
Shares Redeemed | (574,905 | ) | (11,863 | ) | (396,847 | ) | (8,884 | ) | ||||||||
|
|
|
|
|
|
|
| |||||||||
Net Decrease | (228,077 | ) | $ | (4,954 | ) | (197,708 | ) | $ | (4,385 | ) | ||||||
|
|
|
|
|
|
|
| |||||||||
| TCW Relative Value Mid Cap Fund | Year Ended October 31, 2016 | Year Ended October 31, 2015 | ||||||||||||||
| I Class | Shares | Amount (in thousands) | Shares | Amount (in thousands) | ||||||||||||
Shares Sold | 485,901 | $ | 9,717 | 338,696 | $ | 8,340 | ||||||||||
Shares Issued upon Reinvestment of Dividends | 618,869 | 11,338 | 547,757 | 13,217 | ||||||||||||
Shares Redeemed | (1,527,336 | ) | (29,171 | ) | (1,038,994 | ) | (25,030 | ) | ||||||||
|
|
|
|
|
|
|
| |||||||||
Net Decrease | (422,566 | ) | $ | (8,116 | ) | (152,541 | ) | $ | (3,473 | ) | ||||||
|
|
|
|
|
|
|
| |||||||||
99
TCW Funds, Inc.
Notes to Financial Statements (Continued)
Note 9 — Capital Share Transactions (Continued)
| N Class | Shares | Amount (in thousands) | Shares | Amount (in thousands) | ||||||||||||
Shares Sold | 71,949 | $ | 1,214 | 53,145 | $ | 1,279 | ||||||||||
Shares Issued upon Reinvestment of Dividends | 132,387 | 2,366 | 136,665 | 3,227 | ||||||||||||
Shares Redeemed | (233,700 | ) | (4,320 | ) | (387,910 | ) | (8,873 | ) | ||||||||
|
|
|
|
|
|
|
| |||||||||
Net Decrease | (29,364 | ) | $ | (740 | ) | (198,100 | ) | $ | (4,367 | ) | ||||||
|
|
|
|
|
|
|
| |||||||||
| TCW Select Equities Fund | Year Ended October 31, 2016 | Year Ended October 31, 2015 | ||||||||||||||
| I Class | Shares | Amount (in thousands) | Shares | Amount (in thousands) | ||||||||||||
Shares Sold | 14,358,052 | $ | 377,427 | 15,387,856 | $ | 425,189 | ||||||||||
Shares Issued upon Reinvestment of Dividends | 1,713,253 | 47,526 | 749,179 | 19,883 | ||||||||||||
Shares Redeemed | (22,491,120 | ) | (583,508 | ) | (21,518,847 | ) | (589,395 | ) | ||||||||
|
|
|
|
|
|
|
| |||||||||
Net Decrease | (6,419,815 | ) | $ | (158,555 | ) | (5,381,812 | ) | $ | (144,323 | ) | ||||||
|
|
|
|
|
|
|
| |||||||||
| N Class | Shares | Amount (in thousands) | Shares | Amount (in thousands) | ||||||||||||
Shares Sold | 2,068,585 | $ | 54,054 | 3,438,725 | $ | 90,685 | ||||||||||
Shares Issued upon Reinvestment of Dividends | 832,078 | 21,617 | 273,878 | 6,858 | ||||||||||||
Shares Redeemed | (6,511,018 | ) | (154,236 | ) | (2,890,875 | ) | (74,541 | ) | ||||||||
|
|
|
|
|
|
|
| |||||||||
Net Increase (Decrease) | (3,610,355 | ) | $ | (78,565 | ) | 821,728 | $ | 23,002 | ||||||||
|
|
|
|
|
|
|
| |||||||||
| TCW Small Cap Growth Fund | Year Ended October 31, 2016 | Year Ended October 31, 2015 | ||||||||||||||
| I Class | Shares | Amount (in thousands) | Shares | Amount (in thousands) | ||||||||||||
Shares Sold | 382,044 | $ | 8,005 | 400,913 | $ | 11,955 | ||||||||||
Shares Issued upon Reinvestment of Dividends | 870,355 | 18,234 | 741,101 | 21,432 | ||||||||||||
Shares Redeemed | (3,120,875 | ) | (62,167 | ) | (1,918,943 | ) | (57,718 | ) | ||||||||
|
|
|
|
|
|
|
| |||||||||
Net Decrease | (1,868,476 | ) | $ | (35,928 | ) | (776,929 | ) | $ | (24,331 | ) | ||||||
|
|
|
|
|
|
|
| |||||||||
| N Class | Shares | Amount (in thousands) | Shares | Amount (in thousands) | ||||||||||||
Shares Sold | 80,353 | $ | 1,478 | 109,577 | $ | 3,096 | ||||||||||
Shares Issued upon Reinvestment of Dividends | 288,336 | 5,510 | 190,980 | 5,160 | ||||||||||||
Shares Redeemed | (460,449 | ) | (8,953 | ) | (388,399 | ) | (10,847 | ) | ||||||||
|
|
|
|
|
|
|
| |||||||||
Net Decrease | (91,760 | ) | $ | (1,965 | ) | (87,842 | ) | $ | (2,591 | ) | ||||||
|
|
|
|
|
|
|
| |||||||||
Note 10 — Restricted Securities
The Funds are permitted to invest in securities that have legal or contractual restrictions on resale. These securities may be sold privately, but are required to be registered or exempted from such registration before being sold to the public. Private placement securities are generally considered to be restricted except for those securities traded between qualified institutional investors under the provisions of Rule 144A of the Securities Act of 1933, as amended (the “Securities Act”). However, the Company considers 144A securities to be restricted if those securities have been deemed illiquid. Disposal of these securities may involve time consuming negotiations and expense, and prompt sale at an acceptable price may be difficult. There were no restricted securities at October 31, 2016.
Note 11 — Indemnifications
Under the Company’s organizational documents, its Officers and Directors may be indemnified against certain liabilities and expenses arising out of the performance of their duties to the Company. In addition,
100
TCW Funds, Inc.
October 31, 2016 |
Note 11 — Indemnifications (Continued)
the Company entered into an agreement with each of the Directors which provides that the Company will indemnify and hold harmless each Director against any expenses actually and reasonably incurred by any Director in any proceeding arising out of or in connection with the Director’s services to the Company, to the fullest extent permitted by the Company’s Articles of Incorporation and By-Laws, the Maryland General Corporation Law, the Securities Act and the 1940 Act, each as now or hereinafter in force. Additionally, in the normal course of business, the Company enters into agreements with service providers that may contain indemnification clauses. The Company’s maximum exposure under these arrangements is unknown as this would involve future claims that may be made against the Company that have not yet occurred. However, based on experience, the Company expects the risk of loss to be remote. The Company has not accrued any liability in connection with such indemnification.
Note 12 — Recently Issued Accounting Pronouncements
In October 2016, the U.S. Securities and Exchange Commission adopted new rules and amended existing rules (together, “final rules”) intended to modernize the reporting and disclosure of information by registered investment companies. In part, the final rules amend Regulation S-X and require standardized, enhanced disclosure about derivatives in investment company financial statements, as well as other amendments. The compliance date for the amendments to Regulation S-X is August 1, 2017. Management is currently evaluating the impact that the adoption of the amendments to Regulation S-X will have on the Funds’ financial statements and related disclosures.
101
TCW Conservative Allocation Fund
Financial Highlights — I Class
| Year Ended October 31, | ||||||||||||||||||||
| 2016 | 2015 | 2014 | 2013 | 2012 | ||||||||||||||||
Net Asset Value per Share, Beginning of Year | $ | 12.50 | $ | 12.24 | $ | 11.66 | $ | 10.91 | $ | 10.51 | ||||||||||
|
|
|
|
|
|
|
|
|
| |||||||||||
Income (Loss) from Investment Operations: | ||||||||||||||||||||
Net Investment Income (1) | 0.17 | 0.13 | 0.11 | 0.22 | 0.32 | |||||||||||||||
Net Realized and Unrealized Gain (Loss) on Investments | (0.07 | ) | 0.33 | 0.67 | 0.79 | 0.51 | ||||||||||||||
|
|
|
|
|
|
|
|
|
| |||||||||||
Total from Investment Operations | 0.10 | 0.46 | 0.78 | 1.01 | 0.83 | |||||||||||||||
|
|
|
|
|
|
|
|
|
| |||||||||||
Less Distributions: | ||||||||||||||||||||
Distributions from Net Investment Income | (0.19 | ) | (0.14 | ) | (0.20 | ) | (0.26 | ) | (0.20 | ) | ||||||||||
Distributions from Net Realized Gain | (0.28 | ) | (0.06 | ) | — | — | (0.23 | ) | ||||||||||||
|
|
|
|
|
|
|
|
|
| |||||||||||
Total Distributions | (0.47 | ) | (0.20 | ) | (0.20 | ) | (0.26 | ) | (0.43 | ) | ||||||||||
|
|
|
|
|
|
|
|
|
| |||||||||||
Net Asset Value per Share, End of Year | $ | 12.13 | $ | 12.50 | $ | 12.24 | $ | 11.66 | $ | 10.91 | ||||||||||
|
|
|
|
|
|
|
|
|
| |||||||||||
Total Return | 0.78 | % | 3.88 | % | 6.66 | % | 9.42 | % | 8.35 | % | ||||||||||
Ratios/Supplemental Data: | ||||||||||||||||||||
Net Assets, End of Year (in thousands) | $ | 28,982 | $ | 33,909 | $ | 30,746 | $ | 27,121 | $ | 14,705 | ||||||||||
Ratio of Expenses to Average Net Assets: (2) | ||||||||||||||||||||
Before Expense Reimbursement | 0.30 | % | 0.25 | % | 0.29 | % | 0.40 | % | 0.67 | % | ||||||||||
Ratio of Net Investment Income to Average Net Assets | 1.41 | % | 1.01 | % | 0.94 | % | 1.96 | % | 2.98 | % | ||||||||||
Portfolio Turnover Rate | 37.62 | % | 30.24 | % | 40.56 | % | 57.98 | % | 59.12 | % | ||||||||||
| (1) | Computed using average shares outstanding throughout the period. |
| (2) | Does not include expenses of the underlying affiliated funds. |
See accompanying notes to financial statements.
102
TCW Conservative Allocation Fund
Financial Highlights — N Class
| Year Ended October 31, | ||||||||||||||||||||
| 2016 | 2015 | 2014 | 2013 | 2012 | ||||||||||||||||
Net Asset Value per Share, Beginning of Year | $ | 12.44 | $ | 12.17 | $ | 11.61 | $ | 10.89 | $ | 10.51 | ||||||||||
|
|
|
|
|
|
|
|
|
| |||||||||||
Income (Loss) from Investment Operations: | ||||||||||||||||||||
Net Investment Income (1) | 0.11 | 0.04 | 0.05 | 0.18 | 0.29 | |||||||||||||||
Net Realized and Unrealized Gain (Loss) on Investments | (0.08 | ) | 0.35 | 0.66 | 0.78 | 0.52 | ||||||||||||||
|
|
|
|
|
|
|
|
|
| |||||||||||
Total from Investment Operations | 0.03 | 0.39 | 0.71 | 0.96 | 0.81 | |||||||||||||||
|
|
|
|
|
|
|
|
|
| |||||||||||
Less Distributions: | ||||||||||||||||||||
Distributions from Net Investment Income | (0.12 | ) | (0.06 | ) | (0.15 | ) | (0.24 | ) | (0.20 | ) | ||||||||||
Distributions from Net Realized Gain | (0.28 | ) | (0.06 | ) | — | — | (0.23 | ) | ||||||||||||
|
|
|
|
|
|
|
|
|
| |||||||||||
Total Distributions | (0.40 | ) | (0.12 | ) | (0.15 | ) | (0.24 | ) | (0.43 | ) | ||||||||||
|
|
|
|
|
|
|
|
|
| |||||||||||
Net Asset Value per Share, End of Year | $ | 12.07 | $ | 12.44 | $ | 12.17 | $ | 11.61 | $ | 10.89 | ||||||||||
|
|
|
|
|
|
|
|
|
| |||||||||||
Total Return | 0.31 | % | 3.31 | % | 6.07 | % | 8.97 | % | 8.09 | % | ||||||||||
Ratios/Supplemental Data: | ||||||||||||||||||||
Net Assets, End of Year (in thousands) | $ | 1,597 | $ | 1,876 | $ | 807 | $ | 1,047 | $ | 815 | ||||||||||
Ratio of Expenses to Average Net Assets: (2) | ||||||||||||||||||||
Before Expense Reimbursement | 1.54 | % | 1.61 | % | 3.20 | % | 2.84 | % | 2.70 | % | ||||||||||
After Expense Reimbursement | 0.82 | % | 0.84 | % | 0.85 | % | 0.85 | % | 0.85 | % | ||||||||||
Ratio of Net Investment Income to Average Net Assets | 0.89 | % | 0.36 | % | 0.41 | % | 1.58 | % | 2.72 | % | ||||||||||
Portfolio Turnover Rate | 37.62 | % | 30.24 | % | 40.56 | % | 57.98 | % | 59.12 | % | ||||||||||
| (1) | Computed using average shares outstanding throughout the period. |
| (2) | Does not include expenses of the underlying affiliated funds. |
See accompanying notes to financial statements.
103
TCW Focused Equities Fund(1)
Financial Highlights — I Class
| Year Ended October 31, | ||||||||||||||||||||
| 2016 | 2015 | 2014 | 2013 | 2012 | ||||||||||||||||
Net Asset Value per Share, Beginning of Year | $ | 19.45 | $ | 19.37 | $ | 16.02 | $ | 12.20 | $ | 10.83 | ||||||||||
|
|
|
|
|
|
|
|
|
| |||||||||||
Income (Loss) from Investment Operations: | ||||||||||||||||||||
Net Investment Income (2) | 0.20 | 0.12 | 0.09 | 0.08 | 0.05 | |||||||||||||||
Net Realized and Unrealized Gain (Loss) on Investments | (0.79 | ) | 0.04 | 3.34 | 3.86 | 1.36 | ||||||||||||||
|
|
|
|
|
|
|
|
|
| |||||||||||
Total from Investment Operations | (0.59 | ) | 0.16 | 3.43 | 3.94 | 1.41 | ||||||||||||||
|
|
|
|
|
|
|
|
|
| |||||||||||
Less Distributions: | ||||||||||||||||||||
Distributions from Net Investment Income | (0.19 | ) | (0.08 | ) | (0.08 | ) | (0.12 | ) | (0.04 | ) | ||||||||||
|
|
|
|
|
|
|
|
|
| |||||||||||
Net Asset Value per Share, End of Year | $ | 18.67 | $ | 19.45 | $ | 19.37 | $ | 16.02 | $ | 12.20 | ||||||||||
|
|
|
|
|
|
|
|
|
| |||||||||||
Total Return | (3.04 | )% | 0.79 | % | 21.46 | % | 32.67 | % | 12.94 | % | ||||||||||
Ratios/Supplemental Data: | ||||||||||||||||||||
Net Assets, End of Year (in thousands) | $ | 8,903 | $ | 9,386 | $ | 9,970 | $ | 7,628 | $ | 7,007 | ||||||||||
Ratio of Expenses to Average Net Assets: | ||||||||||||||||||||
Before Expense Reimbursement | 1.60 | % | 1.46 | % | 1.60 | % | 1.95 | % | 1.19 | % | ||||||||||
After Expense Reimbursement | 1.08 | % | 1.09 | % | 1.11 | % | 1.14 | % | 1.19 | % | ||||||||||
Ratio of Net Investment Income to Average Net Assets | 1.08 | % | 0.62 | % | 0.52 | % | 0.56 | % | 0.43 | % | ||||||||||
Portfolio Turnover Rate | 47.89 | % | 83.02 | % | 39.65 | % | 39.65 | % | 24.99 | % | ||||||||||
| (1) | Formerly TCW Concentrated Value Fund. |
| (2) | Computed using average shares outstanding throughout the period. |
See accompanying notes to financial statements.
104
TCW Focused Equities Fund(1)
Financial Highlights — N Class
| Year Ended October 31, | ||||||||||||||||||||
| 2016 | 2015 | 2014 | 2013 | 2012 | ||||||||||||||||
Net Asset Value per Share, Beginning of Year | $ | 19.25 | $ | 19.17 | $ | 15.85 | $ | 12.11 | $ | 10.71 | ||||||||||
|
|
|
|
|
|
|
|
|
| |||||||||||
Income (Loss) from Investment Operations: | ||||||||||||||||||||
Net Investment Income (2) | 0.19 | 0.12 | 0.09 | 0.08 | 0.05 | |||||||||||||||
Net Realized and Unrealized Gain (Loss) on Investments | (0.78 | ) | 0.04 | 3.31 | 3.82 | 1.35 | ||||||||||||||
|
|
|
|
|
|
|
|
|
| |||||||||||
Total from Investment Operations | (0.59 | ) | 0.16 | 3.40 | 3.90 | 1.40 | ||||||||||||||
|
|
|
|
|
|
|
|
|
| |||||||||||
Less Distributions: | ||||||||||||||||||||
Distributions from Net Investment Income | (0.19 | ) | (0.08 | ) | (0.08 | ) | (0.16 | ) | — | |||||||||||
|
|
|
|
|
|
|
|
|
| |||||||||||
Net Asset Value per Share, End of Year | $ | 18.47 | $ | 19.25 | $ | 19.17 | $ | 15.85 | $ | 12.11 | ||||||||||
|
|
|
|
|
|
|
|
|
| |||||||||||
Total Return | (3.08 | )% | 0.80 | % | 21.50 | % | 32.61 | % | 13.07 | % | ||||||||||
Ratios/Supplemental Data: | ||||||||||||||||||||
Net Assets, End of Year (in thousands) | $ | 958 | $ | 1,454 | $ | 1,804 | $ | 921 | $ | 861 | ||||||||||
Ratio of Expenses to Average Net Assets: | ||||||||||||||||||||
Before Expense Reimbursement | 3.19 | % | 2.39 | % | 3.66 | % | 4.15 | % | 3.29 | % | ||||||||||
After Expense Reimbursement | 1.08 | % | 1.09 | % | 1.11 | % | 1.14 | % | 1.18 | % | ||||||||||
Ratio of Net Investment Income to Average Net Assets | 1.05 | % | 0.63 | % | 0.50 | % | 0.58 | % | 0.45 | % | ||||||||||
Portfolio Turnover Rate | 47.89 | % | 83.02 | % | 39.65 | % | 39.65 | % | 24.99 | % | ||||||||||
| (1) | Formerly TCW Concentrated Value Fund. |
| (2) | Computed using average shares outstanding throughout the period. |
See accompanying notes to financial statements.
105
TCW Global Real Estate Fund
Financial Highlights — I Class
| Year Ended October 31, 2016 | November 28, 2014 (Commencement of Operations) through October 31, 2015 | |||||||
Net Asset Value per Share, Beginning of Year | $ | 9.71 | $ | 10.00 | ||||
|
|
|
| |||||
Income (Loss) from Investment Operations: | ||||||||
Net Investment Income (1) | 0.30 | 0.21 | ||||||
Net Realized and Unrealized Loss on Investments | (0.26 | ) | (0.27 | ) | ||||
|
|
|
| |||||
Total from Investment Operations | 0.04 | (0.06 | ) | |||||
|
|
|
| |||||
Less Distributions: | ||||||||
Distributions from Net Investment Income | (0.29 | ) | (0.23 | ) | ||||
Distributions from Net Realized Gain | (0.01 | ) | — | |||||
Distributions from Return of Capital | (0.03 | ) | — | |||||
|
|
|
| |||||
Total Distributions | (0.33 | ) | (0.23 | ) | ||||
|
|
|
| |||||
Net Asset Value per Share, End of Year | $ | 9.42 | $ | 9.71 | ||||
|
|
|
| |||||
Total Return | 0.31 | % | (0.62 | )% (2) | ||||
Ratios/Supplemental Data: | ||||||||
Net Assets, End of Year (in thousands) | $ | 3,499 | $ | 4,320 | ||||
Ratio of Expenses to Average Net Assets: | ||||||||
Before Expense Reimbursement | 3.29 | % | 5.28 | % (3) | ||||
After Expense Reimbursement | 1.40 | % | 1.43 | % (3) | ||||
Ratio of Net Investment Income to Average Net Assets | 3.14 | % | 2.27 | % (3) | ||||
Portfolio Turnover Rate | 68.69 | % | 23.58 | % (2) | ||||
| (1) | Computed using average shares outstanding throughout the period. |
| (2) | For the period November 28, 2014 (Commencement of Operations) through October 31, 2015 and is not indicative of a full year’s operating results. |
| (3) | Annualized. |
See accompanying notes to financial statements.
106
TCW Global Real Estate Fund
Financial Highlights — N Class
| Year Ended October 31, 2016 | November 28, 2014 (Commencement of Operations) through October 31, 2015 | |||||||
Net Asset Value per Share, Beginning of Year | $ | 9.70 | $ | 10.00 | ||||
|
|
|
| |||||
Income (Loss) from Investment Operations: | ||||||||
Net Investment Income (1) | 0.32 | 0.24 | ||||||
Net Realized and Unrealized Loss on Investments | (0.27 | ) | (0.31 | ) | ||||
|
|
|
| |||||
Total from Investment Operations | 0.05 | (0.07 | ) | |||||
|
|
|
| |||||
Less Distributions: | ||||||||
Distributions from Net Investment Income | (0.29 | ) | (0.23 | ) | ||||
Distributions from Net Realized Gain | (0.01 | ) | — | |||||
Distributions from Return of Capital | (0.03 | ) | — | |||||
|
|
|
| |||||
Total Distributions | (0.33 | ) | (0.23 | ) | ||||
|
|
|
| |||||
Net Asset Value per Share, End of Year | $ | 9.42 | $ | 9.70 | ||||
|
|
|
| |||||
Total Return | 0.41 | % | (0.72 | )% (2) | ||||
Ratios/Supplemental Data: | ||||||||
Net Assets, End of Year (in thousands) | $ | 517 | $ | 510 | ||||
Ratio of Expenses to Average Net Assets: | ||||||||
Before Expense Reimbursement | 6.66 | % | 9.21 | % (3) | ||||
After Expense Reimbursement | 1.40 | % | 1.43 | % (3) | ||||
Ratio of Net Investment Income to Average Net Assets | 3.34 | % | 2.58 | % (3) | ||||
Portfolio Turnover Rate | 68.69 | % | 23.58 | % (2) | ||||
| (1) | Computed using average shares outstanding throughout the period. |
| (2) | For the period November 28, 2014 (Commencement of Operations) through October 31, 2015 and is not indicative of a full year’s operating results. |
| (3) | Annualized. |
See accompanying notes to financial statements.
107
TCW Growth Equities Fund
Financial Highlights — I Class
| Year Ended October 31, | ||||||||||||||||||||
| 2016 | 2015 | 2014 | 2013 | 2012 | ||||||||||||||||
Net Asset Value per Share, Beginning of Year | $ | 11.15 | $ | 13.10 | $ | 18.86 | $ | 13.87 | $ | 14.66 | ||||||||||
|
|
|
|
|
|
|
|
|
| |||||||||||
Income (Loss) from Investment Operations: | ||||||||||||||||||||
Net Investment Loss (1) | (0.06 | ) | (0.08 | ) | (0.08 | ) | (0.05 | ) | (0.08 | ) | ||||||||||
Net Realized and Unrealized Gain (Loss) on Investments | (0.29 | ) | (0.51 | ) | 1.32 | 5.24 | (0.15 | ) | ||||||||||||
|
|
|
|
|
|
|
|
|
| |||||||||||
Total from Investment Operations | (0.35 | ) | (0.59 | ) | 1.24 | 5.19 | (0.23 | ) | ||||||||||||
|
|
|
|
|
|
|
|
|
| |||||||||||
Less Distributions: | ||||||||||||||||||||
Distributions from Net Investment Income | — | — | — | (0.02 | ) | — | ||||||||||||||
Distributions from Net Realized Gain | (2.53 | ) | (1.36 | ) | (7.00 | ) | (0.18 | ) | (0.56 | ) | ||||||||||
|
|
|
|
|
|
|
|
|
| |||||||||||
Total Distributions | (2.53 | ) | (1.36 | ) | (7.00 | ) | (0.20 | ) | (0.56 | ) | ||||||||||
|
|
|
|
|
|
|
|
|
| |||||||||||
Net Asset Value per Share, End of Year | $ | 8.27 | $ | 11.15 | $ | 13.10 | $ | 18.86 | $ | 13.87 | ||||||||||
|
|
|
|
|
|
|
|
|
| |||||||||||
Total Return | (3.93 | )% | (5.26 | )% | 7.06 | % | 37.96 | % | (1.43 | )% | ||||||||||
Ratios/Supplemental Data: | ||||||||||||||||||||
Net Assets, End of Year (in thousands) | $ | 6,247 | $ | 12,176 | $ | 21,863 | $ | 23,891 | $ | 66,951 | ||||||||||
Ratio of Expenses to Average Net Assets: | ||||||||||||||||||||
Before Expense Reimbursement | 1.99 | % | 1.47 | % | 1.42 | % | 1.32 | % | 1.21 | % | ||||||||||
After Expense Reimbursement | 1.20 | % | 1.20 | % | 1.20 | % | 1.20 | % | 1.20 | % | ||||||||||
Ratio of Net Investment Loss to Average Net Assets | (0.67 | )% | (0.61 | )% | (0.61 | )% | (0.35 | )% | (0.54 | )% | ||||||||||
Portfolio Turnover Rate | 57.41 | % | 58.06 | % | 49.03 | % | 78.65 | % | 48.75 | % | ||||||||||
| (1) | Computed using average shares outstanding throughout the period. |
See accompanying notes to financial statements.
108
TCW Growth Equities Fund
Financial Highlights — N Class
| Year Ended October 31, | ||||||||||||||||||||
| 2016 | 2015 | 2014 | 2013 | 2012 | ||||||||||||||||
Net Asset Value per Share, Beginning of Year | $ | 11.08 | $ | 13.01 | $ | 18.79 | $ | 13.82 | $ | 14.61 | ||||||||||
|
|
|
|
|
|
|
|
|
| |||||||||||
Income (Loss) from Investment Operations: | ||||||||||||||||||||
Net Investment Loss (1) | (0.06 | ) | (0.08 | ) | (0.08 | ) | (0.06 | ) | (0.08 | ) | ||||||||||
Net Realized and Unrealized Gain (Loss) on Investments | (0.29 | ) | (0.49 | ) | 1.30 | 5.23 | (0.15 | ) | ||||||||||||
|
|
|
|
|
|
|
|
|
| |||||||||||
Total from Investment Operations | (0.35 | ) | (0.57 | ) | 1.22 | 5.17 | (0.23 | ) | ||||||||||||
|
|
|
|
|
|
|
|
|
| |||||||||||
Less Distributions: | ||||||||||||||||||||
Distributions from Net Investment Income | — | — | — | (0.02 | ) | — | ||||||||||||||
Distributions from Net Realized Gain | (2.53 | ) | (1.36 | ) | (7.00 | ) | (0.18 | ) | (0.56 | ) | ||||||||||
|
|
|
|
|
|
|
|
|
| |||||||||||
Total Distributions | (2.53 | ) | (1.36 | ) | (7.00 | ) | (0.20 | ) | (0.56 | ) | ||||||||||
|
|
|
|
|
|
|
|
|
| |||||||||||
Net Asset Value per Share, End of Year | $ | 8.20 | $ | 11.08 | $ | 13.01 | $ | 18.79 | $ | 13.82 | ||||||||||
|
|
|
|
|
|
|
|
|
| |||||||||||
Total Return | (3.93 | )% | (5.13 | )% | 7.02 | % | 37.93 | % | (1.44 | )% | ||||||||||
Ratios/Supplemental Data: | ||||||||||||||||||||
Net Assets, End of Year (in thousands) | $ | 2,812 | $ | 3,504 | $ | 5,335 | $ | 6,366 | $ | 9,865 | ||||||||||
Ratio of Expenses to Average Net Assets: | ||||||||||||||||||||
Before Expense Reimbursement | 2.67 | % | 2.09 | % | 2.01 | % | 1.93 | % | 1.73 | % | ||||||||||
After Expense Reimbursement | 1.20 | % | 1.20 | % | 1.20 | % | 1.20 | % | 1.20 | % | ||||||||||
Ratio of Net Investment Loss to Average Net Assets | (0.68 | )% | (0.62 | )% | (0.61 | )% | (0.36 | )% | (0.53 | )% | ||||||||||
Portfolio Turnover Rate | 57.41 | % | 58.06 | % | 49.03 | % | 78.65 | % | 48.75 | % | ||||||||||
| (1) | Computed using average shares outstanding throughout the period. |
See accompanying notes to financial statements.
109
TCW High Dividend Equities Fund
Financial Highlights — I Class
| Year Ended October 31, 2016 | November 28, 2014 (Commencement of Operations) through October 31, 2015 | |||||||
Net Asset Value per Share, Beginning of Year | $ | 8.98 | $ | 10.00 | ||||
|
|
|
| |||||
Income (Loss) from Investment Operations: | ||||||||
Net Investment Income (1) | 0.19 | 0.27 | ||||||
Net Realized and Unrealized Loss on Investments | (0.06 | ) | (1.03 | ) | ||||
|
|
|
| |||||
Total from Investment Operations | 0.13 | (0.76 | ) | |||||
|
|
|
| |||||
Less Distributions: | ||||||||
Distributions from Net Investment Income | (0.18 | ) | (0.26 | ) | ||||
Distributions from Return of Capital | (0.02 | ) | — | |||||
|
|
|
| |||||
Total Distributions | (0.20 | ) | (0.26 | ) | ||||
|
|
|
| |||||
Net Asset Value per Share, End of Year | $ | 8.91 | $ | 8.98 | ||||
|
|
|
| |||||
Total Return | 1.35 | % | (7.66 | )% (2) | ||||
Ratios/Supplemental Data: | ||||||||
Net Assets, End of Year (in thousands) | $ | 11,527 | $ | 3,969 | ||||
Ratio of Expenses to Average Net Assets: | ||||||||
Before Expense Reimbursement | 1.82 | % | 3.28 | % (3) | ||||
After Expense Reimbursement | 1.16 | % | 1.17 | % (3) | ||||
Ratio of Net Investment Income to Average Net Assets | 2.08 | % | 2.94 | % (3) | ||||
Portfolio Turnover Rate | 92.66 | % | 89.39 | % (2) | ||||
| (1) | Computed using average shares outstanding throughout the period. |
| (2) | For the period November 28, 2014 (Commencement of Operations) through October 31, 2015 and is not indicative of a full year’s operating results. |
| (3) | Annualized. |
See accompanying notes to financial statements.
110
TCW High Dividend Equities Fund
Financial Highlights — N Class
| Year Ended October 31, 2016 | November 28, 2014 (Commencement of Operations) through October 31, 2015 | |||||||
Net Asset Value per Share, Beginning of Year | $ | 8.98 | $ | 10.00 | ||||
|
|
|
| |||||
Income (Loss) from Investment Operations: | ||||||||
Net Investment Income (1) | 0.19 | 0.28 | ||||||
Net Realized and Unrealized Loss on Investments | (0.06 | ) | (1.04 | ) | ||||
|
|
|
| |||||
Total from Investment Operations | 0.13 | (0.76 | ) | |||||
|
|
|
| |||||
Less Distributions: | ||||||||
Distributions from Net Investment Income | (0.18 | ) | (0.26 | ) | ||||
Distributions from Return of Capital | (0.02 | ) | — | |||||
|
|
|
| |||||
Total Distributions | (0.20 | ) | (0.26 | ) | ||||
|
|
|
| |||||
Net Asset Value per Share, End of Year | $ | 8.91 | $ | 8.98 | ||||
|
|
|
| |||||
Total Return | 1.46 | % | (7.76 | )% (2) | ||||
Ratios/Supplemental Data: | ||||||||
Net Assets, End of Year (in thousands) | $ | 468 | $ | 509 | ||||
Ratio of Expenses to Average Net Assets: | ||||||||
Before Expense Reimbursement | 5.59 | % | 7.30 | % (3) | ||||
After Expense Reimbursement | 1.16 | % | 1.17 | % (3) | ||||
Ratio of Net Investment Income to Average Net Assets | 2.13 | % | 3.05 | % (3) | ||||
Portfolio Turnover Rate | 92.66 | % | 89.39 | % (2) | ||||
| (1) | Computed using average shares outstanding throughout the period. |
| (2) | For the period November 28, 2014 (Commencement of Operations) through October 31, 2015 and is not indicative of a full year’s operating results. |
| (3) | Annualized. |
See accompanying notes to financial statements.
111
TCW New America Premier Equities Fund
Financial Highlights — I Class
January 29, 2016 (Commencement of operations) through October 31, 2016 | ||||
Net Asset Value per Share, Beginning of Year | $ | 10.00 | ||
|
| |||
Income (Loss) from Investment Operations: | ||||
Net Investment Income (1) | 0.08 | |||
Net Realized and Unrealized Gain on Investments | 1.15 | |||
|
| |||
Total from Investment Operations | 1.23 | |||
|
| |||
Net Asset Value per Share, End of Year | $ | 11.23 | ||
|
| |||
Total Return | 12.30 | % (2) | ||
Ratios/Supplemental Data: | ||||
Net Assets, End of Year (in thousands) | $ | 3,143 | ||
Ratio of Expenses to Average Net Assets: | ||||
Before Expense Reimbursement | 4.72 | % (3) | ||
After Expense Reimbursement | 1.05 | % (3) | ||
Ratio of Net Investment Income to Average Net Assets | 1.03 | % (3) | ||
Portfolio Turnover Rate (2) | 73.83 | % (2) | ||
| (1) | Computed using average shares outstanding throughout the period. |
| (2) | For the period January 29, 2016 (Commencement of operations) through October 31, 2016. |
| (3) | Annualized. |
See accompanying notes to financial statements.
112
TCW New America Premier Equities Fund
Financial Highlights — N Class
January 29, 2016 (Commencement of operations) through October 31, 2016 | ||||
Net Asset Value per Share, Beginning of Year | $ | 10.00 | ||
|
| |||
Income (Loss) from Investment Operations: | ||||
Net Investment Income (1) | 0.08 | |||
Net Realized and Unrealized Gain on Investments | 1.15 | |||
|
| |||
Total from Investment Operations | 1.23 | |||
|
| |||
Net Asset Value per Share, End of Year | $ | 11.23 | ||
|
| |||
Total Return | 12.30 | % (2) | ||
Ratios/Supplemental Data: | ||||
Net Assets, End of Year (in thousands) | $ | 1,128 | ||
Ratio of Expenses to Average Net Assets: | ||||
Before Expense Reimbursement | 6.08 | % (3) | ||
After Expense Reimbursement | 1.05 | % (3) | ||
Ratio of Net Investment Income to Average Net Assets | 0.98 | % (3) | ||
Portfolio Turnover Rate | 73.83 | % (2) | ||
| (1) | Computed using average shares outstanding throughout the period. |
| (2) | For the period January 29, 2016 (Commencement of operations) through October 31, 2016. |
| (3) | Annualized. |
See accompanying notes to financial statements.
113
TCW Relative Value Dividend Appreciation Fund
Financial Highlights — I Class
| Year Ended October 31, | ||||||||||||||||||||
| 2016 | 2015 | 2014 | 2013 | 2012 | ||||||||||||||||
Net Asset Value per Share, Beginning of Year | $ | 16.49 | $ | 16.71 | $ | 15.11 | $ | 11.77 | $ | 10.18 | ||||||||||
|
|
|
|
|
|
|
|
|
| |||||||||||
Income (Loss) from Investment Operations: | ||||||||||||||||||||
Net Investment Income (1) | 0.35 | 0.30 | 0.27 | 0.25 | 0.22 | |||||||||||||||
Net Realized and Unrealized Gain (Loss) on Investments | 0.41 | (0.24 | ) | 1.61 | 3.36 | 1.60 | ||||||||||||||
|
|
|
|
|
|
|
|
|
| |||||||||||
Total from Investment Operations | 0.76 | 0.06 | 1.88 | 3.61 | 1.82 | |||||||||||||||
|
|
|
|
|
|
|
|
|
| |||||||||||
Less Distributions: | ||||||||||||||||||||
Distributions from Net Investment Income | (0.30 | ) | (0.28 | ) | (0.28 | ) | (0.27 | ) | (0.23 | ) | ||||||||||
|
|
|
|
|
|
|
|
|
| |||||||||||
Net Asset Value per Share, End of Year | $ | 16.95 | $ | 16.49 | $ | 16.71 | $ | 15.11 | $ | 11.77 | ||||||||||
|
|
|
|
|
|
|
|
|
| |||||||||||
Total Return | 4.66 | % | 0.40 | % | 12.49 | % | 31.06 | % | 18.03 | % | ||||||||||
Ratios/Supplemental Data: | ||||||||||||||||||||
Net Assets, End of Year (in thousands) | $ | 165,331 | $ | 175,694 | $ | 195,400 | $ | 176,226 | $ | 99,787 | ||||||||||
Ratio of Expenses to Average Net Assets | 0.87 | % | 0.86 | % | 0.86 | % | 0.82 | % | 0.85 | % | ||||||||||
Ratio of Net Investment Income to Average Net Assets | 2.11 | % | 1.81 | % | 1.67 | % | 1.86 | % | 1.95 | % | ||||||||||
Portfolio Turnover Rate | 19.13 | % | 17.95 | % | 17.33 | % | 18.37 | % | 23.15 | % | ||||||||||
| (1) | Computed using average shares outstanding throughout the period. |
See accompanying notes to financial statements.
114
TCW Relative Value Dividend Appreciation Fund
Financial Highlights — N Class
| Year Ended October 31, | ||||||||||||||||||||
| 2016 | 2015 | 2014 | 2013 | 2012 | ||||||||||||||||
Net Asset Value per Share, Beginning of Year | $ | 16.76 | $ | 16.99 | $ | 15.34 | $ | 11.92 | $ | 10.29 | ||||||||||
|
|
|
|
|
|
|
|
|
| |||||||||||
Income (Loss) from Investment Operations: | ||||||||||||||||||||
Net Investment Income (1) | 0.31 | 0.26 | 0.23 | 0.22 | 0.19 | |||||||||||||||
Net Realized and Unrealized Gain (Loss) on Investments | 0.43 | (0.25 | ) | 1.63 | 3.41 | 1.62 | ||||||||||||||
|
|
|
|
|
|
|
|
|
| |||||||||||
Total from Investment Operations | 0.74 | 0.01 | 1.86 | 3.63 | 1.81 | |||||||||||||||
|
|
|
|
|
|
|
|
|
| |||||||||||
Less Distributions: | ||||||||||||||||||||
Distributions from Net Investment Income | (0.27 | ) | (0.24 | ) | (0.21 | ) | (0.21 | ) | (0.18 | ) | ||||||||||
|
|
|
|
|
|
|
|
|
| |||||||||||
Net Asset Value per Share, End of Year | $ | 17.23 | $ | 16.76 | $ | 16.99 | $ | 15.34 | $ | 11.92 | ||||||||||
|
|
|
|
|
|
|
|
|
| |||||||||||
Total Return | 4.43 | % | 0.10 | % | 12.19 | % | 30.71 | % | 17.68 | % | ||||||||||
Ratios/Supplemental Data: | ||||||||||||||||||||
Net Assets, End of Year (in thousands) | $ | 876,421 | $ | 878,544 | $ | 970,397 | $ | 887,435 | $ | 601,397 | ||||||||||
Ratio of Expenses to Average Net Assets: | ||||||||||||||||||||
Before Expense Reimbursement | 1.15 | % | 1.14 | % | 1.14 | % | 1.11 | % | 1.14 | % | ||||||||||
After Expense Reimbursement | 1.11 | % | N/A | N/A | N/A | N/A | ||||||||||||||
Ratio of Net Investment Income to Average Net Assets | 1.86 | % | 1.53 | % | 1.40 | % | 1.60 | % | 1.70 | % | ||||||||||
Portfolio Turnover Rate | 19.13 | % | 17.95 | % | 17.33 | % | 18.37 | % | 23.15 | % | ||||||||||
| (1) | Computed using average shares outstanding throughout the period. |
See accompanying notes to financial statements.
115
TCW Relative Value Large Cap Fund
Financial Highlights — I Class
| Year Ended October 31, | ||||||||||||||||||||
| 2016 | 2015 | 2014 | 2013 | 2012 | ||||||||||||||||
Net Asset Value per Share, Beginning of Year | $ | 21.99 | $ | 22.09 | $ | 19.47 | $ | 14.91 | $ | 13.05 | ||||||||||
|
|
|
|
|
|
|
|
|
| |||||||||||
Income (Loss) from Investment Operations: | ||||||||||||||||||||
Net Investment Income (1) | 0.32 | 0.26 | 0.21 | 0.19 | 0.16 | |||||||||||||||
Net Realized and Unrealized Gain (Loss) on Investments | 0.19 | (0.14 | ) | 2.65 | 4.53 | 1.82 | ||||||||||||||
|
|
|
|
|
|
|
|
|
| |||||||||||
Total from Investment Operations | 0.51 | 0.12 | 2.86 | 4.72 | 1.98 | |||||||||||||||
|
|
|
|
|
|
|
|
|
| |||||||||||
Less Distributions: | ||||||||||||||||||||
Distributions from Net Investment Income | (0.25 | ) | (0.22 | ) | (0.24 | ) | (0.16 | ) | (0.12 | ) | ||||||||||
Distributions from Net Realized Gain | (0.87 | ) | — | — | — | — | ||||||||||||||
|
|
|
|
|
|
|
|
|
| |||||||||||
Total Distributions | (1.12 | ) | (0.22 | ) | (0.24 | ) | (0.16 | ) | (0.12 | ) | ||||||||||
|
|
|
|
|
|
|
|
|
| |||||||||||
Net Asset Value per Share, End of Year | $ | 21.38 | $ | 21.99 | $ | 22.09 | $ | 19.47 | $ | 14.91 | ||||||||||
|
|
|
|
|
|
|
|
|
| |||||||||||
Total Return | 2.61 | % | 0.50 | % | 14.79 | % | 31.99 | % | 15.33 | % | ||||||||||
Ratios/Supplemental Data: | ||||||||||||||||||||
Net Assets, End of Year (in thousands) | $ | 480,174 | $ | 667,957 | $ | 700,484 | $ | 543,669 | $ | 741,996 | ||||||||||
Ratio of Expenses to Average Net Assets | 0.88 | % | 0.88 | % | 0.88 | % | 0.87 | % | 0.89 | % | ||||||||||
Ratio of Net Investment Income to Average Net Assets | 1.57 | % | 1.14 | % | 1.02 | % | 1.13 | % | 1.14 | % | ||||||||||
Portfolio Turnover Rate | 14.71 | % | 21.60 | % | 18.77 | % | 37.33 | % | 19.71 | % | ||||||||||
| (1) | Computed using average shares outstanding throughout the period. |
See accompanying notes to financial statements.
116
TCW Relative Value Large Cap Fund
Financial Highlights — N Class
| Year Ended October 31, | ||||||||||||||||||||
| 2016 | 2015 | 2014 | 2013 | 2012 | ||||||||||||||||
Net Asset Value per Share, Beginning of Year | $ | 21.91 | $ | 22.04 | $ | 19.44 | $ | 14.89 | $ | 13.00 | ||||||||||
|
|
|
|
|
|
|
|
|
| |||||||||||
Income (Loss) from Investment Operations: | ||||||||||||||||||||
Net Investment Income (1) | 0.28 | 0.19 | 0.16 | 0.15 | 0.13 | |||||||||||||||
Net Realized and Unrealized Gain (Loss) on Investments | 0.19 | (0.14 | ) | 2.65 | 4.52 | 1.83 | ||||||||||||||
|
|
|
|
|
|
|
|
|
| |||||||||||
Total from Investment Operations | 0.47 | 0.05 | 2.81 | 4.67 | 1.96 | |||||||||||||||
|
|
|
|
|
|
|
|
|
| |||||||||||
Less Distributions: | ||||||||||||||||||||
Distributions from Net Investment Income | (0.20 | ) | (0.18 | ) | (0.21 | ) | (0.12 | ) | (0.07 | ) | ||||||||||
Distributions from Net Realized Gain | (0.87 | ) | — | — | — | — | ||||||||||||||
|
|
|
|
|
|
|
|
|
| |||||||||||
Total Distributions | (1.07 | ) | (0.18 | ) | (0.21 | ) | (0.12 | ) | (0.07 | ) | ||||||||||
|
|
|
|
|
|
|
|
|
| |||||||||||
Net Asset Value per Share, End of Year | $ | 21.31 | $ | 21.91 | $ | 22.04 | $ | 19.44 | $ | 14.89 | ||||||||||
|
|
|
|
|
|
|
|
|
| |||||||||||
Total Return | 2.42 | % | 0.20 | % | 14.52 | % | 31.64 | % | 15.11 | % | ||||||||||
Ratios/Supplemental Data: | ||||||||||||||||||||
Net Assets, End of Year (in thousands) | $ | 19,530 | $ | 25,084 | $ | 29,589 | $ | 75,450 | $ | 50,212 | ||||||||||
Ratio of Expenses to Average Net Assets: | ||||||||||||||||||||
Before Expense Reimbursement | 1.23 | % | 1.20 | % | 1.12 | % | 1.13 | % | 1.14 | % | ||||||||||
After Expense Reimbursement | 1.10 | % | 1.16 | % | N/A | N/A | N/A | |||||||||||||
Ratio of Net Investment Income to Average Net Assets | 1.35 | % | 0.86 | % | 0.77 | % | 0.83 | % | 0.92 | % | ||||||||||
Portfolio Turnover Rate | 14.71 | % | 21.60 | % | 18.77 | % | 37.33 | % | 19.71 | % | ||||||||||
| (1) | Computed using average shares outstanding throughout the period. |
See accompanying notes to financial statements.
117
TCW Relative Value Mid Cap Fund
Financial Highlights — I Class
| Year Ended October 31, | ||||||||||||||||||||
| 2016 | 2015 | 2014 | 2013 | 2012 | ||||||||||||||||
Net Asset Value per Share, Beginning of Year | $ | 22.43 | $ | 26.62 | $ | 26.56 | $ | 20.10 | $ | 17.43 | ||||||||||
|
|
|
|
|
|
|
|
|
| |||||||||||
Income (Loss) from Investment Operations: | ||||||||||||||||||||
Net Investment Income (1) | 0.18 | 0.17 | 0.13 | 0.16 | 0.15 | |||||||||||||||
Net Realized and Unrealized Gain (Loss) on Investments | 0.34 | (1.16 | ) | 2.70 | 6.48 | 2.63 | ||||||||||||||
|
|
|
|
|
|
|
|
|
| |||||||||||
Total from Investment Operations | 0.52 | (0.99 | ) | 2.83 | 6.64 | 2.78 | ||||||||||||||
|
|
|
|
|
|
|
|
|
| |||||||||||
Less Distributions: | ||||||||||||||||||||
Distributions from Net Investment Income | (0.16 | ) | (0.12 | ) | (0.14 | ) | (0.17 | ) | (0.11 | ) | ||||||||||
Distributions from Net Realized Gain | (2.77 | ) | (3.08 | ) | (2.63 | ) | (0.01 | ) | — | |||||||||||
|
|
|
|
|
|
|
|
|
| |||||||||||
Total Distributions | (2.93 | ) | (3.20 | ) | (2.77 | ) | (0.18 | ) | (0.11 | ) | ||||||||||
|
|
|
|
|
|
|
|
|
| |||||||||||
Net Asset Value per Share, End of Year | $ | 20.02 | $ | 22.43 | $ | 26.62 | $ | 26.56 | $ | 20.10 | ||||||||||
|
|
|
|
|
|
|
|
|
| |||||||||||
Total Return | 3.53 | % | (4.58 | )% | 11.09 | % | 33.30 | % | 16.04 | % | ||||||||||
Ratios/Supplemental Data: | ||||||||||||||||||||
Net Assets, End of Year (in thousands) | $ | 74,840 | $ | 93,356 | $ | 114,823 | $ | 118,138 | $ | 95,698 | ||||||||||
Ratio of Expenses to Average Net Assets | 0.98 | % | 0.96 | % | 0.95 | % | 0.94 | % | 1.01 | % | ||||||||||
Ratio of Net Investment Income to Average Net Assets | 0.96 | % | 0.68 | % | 0.49 | % | 0.68 | % | 0.79 | % | ||||||||||
Portfolio Turnover Rate | 17.81 | % | 23.15 | % | 21.67 | % | 28.91 | % | 32.87 | % | ||||||||||
| (1) | Computed using average shares outstanding throughout the period. |
See accompanying notes to financial statements.
118
TCW Relative Value Mid Cap Fund
Financial Highlights — N Class
| Year Ended October 31, | ||||||||||||||||||||
| 2016 | 2015 | 2014 | 2013 | 2012 | ||||||||||||||||
Net Asset Value per Share, Beginning of Year | $ | 21.90 | $ | 26.08 | $ | 26.07 | $ | 19.74 | $ | 17.06 | ||||||||||
|
|
|
|
|
|
|
|
|
| |||||||||||
Income (Loss) from Investment Operations: | ||||||||||||||||||||
Net Investment Income (1) | 0.14 | 0.10 | 0.06 | 0.09 | 0.10 | |||||||||||||||
Net Realized and Unrealized Gain (Loss) on Investments | 0.32 | (1.12 | ) | 2.65 | 6.37 | 2.59 | ||||||||||||||
|
|
|
|
|
|
|
|
|
| |||||||||||
Total from Investment Operations | 0.46 | (1.02 | ) | 2.71 | 6.46 | 2.69 | ||||||||||||||
|
|
|
|
|
|
|
|
|
| |||||||||||
Less Distributions: | ||||||||||||||||||||
Distributions from Net Investment Income | (0.09 | ) | (0.08 | ) | (0.07 | ) | (0.12 | ) | (0.01 | ) | ||||||||||
Distributions from Net Realized Gain | (2.77 | ) | (3.08 | ) | (2.63 | ) | (0.01 | ) | — | |||||||||||
|
|
|
|
|
|
|
|
|
| |||||||||||
Total Distributions | (2.86 | ) | (3.16 | ) | (2.70 | ) | (0.13 | ) | (0.01 | ) | ||||||||||
|
|
|
|
|
|
|
|
|
| |||||||||||
Net Asset Value per Share, End of Year | $ | 19.50 | $ | 21.90 | $ | 26.08 | $ | 26.07 | $ | 19.74 | ||||||||||
|
|
|
|
|
|
|
|
|
| |||||||||||
Total Return | 3.30 | % | (4.78 | )% | 10.80 | % | 32.90 | % | 15.75 | % | ||||||||||
Ratios/Supplemental Data: | ||||||||||||||||||||
Net Assets, End of Year (in thousands) | $ | 16,839 | $ | 19,559 | $ | 28,458 | $ | 36,875 | $ | 32,292 | ||||||||||
Ratio of Expenses to Average Net Assets: | ||||||||||||||||||||
Before Expense Reimbursement | 1.35 | % | 1.30 | % | 1.27 | % | 1.32 | % | 1.40 | % | ||||||||||
After Expense Reimbursement | 1.20 | % | 1.21 | % | 1.20 | % | 1.23 | % | 1.27 | % | ||||||||||
Ratio of Net Investment Income to Average Net Assets | 0.74 | % | 0.44 | % | 0.23 | % | 0.40 | % | 0.53 | % | ||||||||||
Portfolio Turnover Rate | 17.81 | % | 23.15 | % | 21.67 | % | 28.91 | % | 32.87 | % | ||||||||||
| (1) | Computed using average shares outstanding throughout the period. |
See accompanying notes to financial statements.
119
TCW Select Equities Fund
Financial Highlights — I Class
| Year Ended October 31, | ||||||||||||||||||||
| 2016 | 2015 | 2014 | 2013 | 2012 | ||||||||||||||||
Net Asset Value per Share, Beginning of Year | $ | 29.65 | $ | 26.71 | $ | 24.84 | $ | 19.81 | $ | 18.17 | ||||||||||
|
|
|
|
|
|
|
|
|
| |||||||||||
Income (Loss) from Investment Operations: | ||||||||||||||||||||
Net Investment Income | (0.10 | ) | (0.02 | ) | (0.03 | ) | 0.03 | (0.00 | )(2) | |||||||||||
Net Realized and Unrealized Gain (Loss) on Investments | (1.42 | ) | 3.80 | 2.71 | 5.34 | 1.86 | ||||||||||||||
|
|
|
|
|
|
|
|
|
| |||||||||||
Total from Investment Operations | (1.52 | ) | 3.78 | 2.68 | 5.37 | 1.86 | ||||||||||||||
|
|
|
|
|
|
|
|
|
| |||||||||||
Less Distributions: | ||||||||||||||||||||
Distributions from Net Investment Income | — | — | (0.00 | )(2) | (0.05 | ) | — | |||||||||||||
Distributions from Net Realized Gain | (2.07 | ) | (0.84 | ) | (0.81 | ) | (0.29 | ) | (0.22 | ) | ||||||||||
|
|
|
|
|
|
|
|
|
| |||||||||||
Total Distributions | (2.07 | ) | (0.84 | ) | (0.81 | ) | (0.34 | ) | (0.22 | ) | ||||||||||
|
|
|
|
|
|
|
|
|
| |||||||||||
Net Asset Value per Share, End of Year | $ | 26.06 | $ | 29.65 | $ | 26.71 | $ | 24.84 | $ | 19.81 | ||||||||||
|
|
|
|
|
|
|
|
|
| |||||||||||
Total Return | (5.56 | )% | 14.54 | % | 11.01 | % | 27.53 | % | 10.37 | % | ||||||||||
Ratios/Supplemental Data: | ||||||||||||||||||||
Net Assets, End of Year (in thousands) | $ | 1,264,622 | $ | 1,629,090 | $ | 1,611,400 | $ | 1,325,609 | $ | 802,524 | ||||||||||
Ratio of Expenses to Average Net Assets | 0.89 | % | 0.88 | % | 0.86 | % | 0.83 | % | 0.86 | % | ||||||||||
Ratio of Net Investment Income (Loss) to Average Net Assets | (0.38 | )% | (0.08 | )% | (0.11 | )% | 0.15 | % | (0.01 | )% | ||||||||||
Portfolio Turnover Rate | 14.05 | % | 27.19 | % | 25.79 | % | 24.55 | % | 19.74 | % | ||||||||||
| (1) | Computed using average shares outstanding throughout the period. |
| (2) | Amount rounds to less than $0.01 per share. |
See accompanying notes to financial statements.
120
TCW Select Equities Fund
Financial Highlights — N Class
| Year Ended October 31, | ||||||||||||||||||||
| 2016 | 2015 | 2014 | 2013 | 2012 | ||||||||||||||||
Net Asset Value per Share, Beginning of Year | $ | 27.91 | $ | 25.26 | $ | 23.59 | $ | 18.84 | $ | 17.34 | ||||||||||
|
|
|
|
|
|
|
|
|
| |||||||||||
Income (Loss) from Investment Operations: | ||||||||||||||||||||
Net Investment Loss (1) | (0.16 | ) | (0.09 | ) | (0.10 | ) | (0.02 | ) | (0.06 | ) | ||||||||||
Net Realized and Unrealized Gain (Loss) on Investments | (1.33 | ) | 3.58 | 2.58 | 5.06 | 1.78 | ||||||||||||||
|
|
|
|
|
|
|
|
|
| |||||||||||
Total from Investment Operations | (1.49 | ) | 3.49 | 2.48 | 5.04 | 1.72 | ||||||||||||||
|
|
|
|
|
|
|
|
|
| |||||||||||
Less Distributions: | ||||||||||||||||||||
Distributions from Net Realized Gain | (2.07 | ) | (0.84 | ) | (0.81 | ) | (0.29 | ) | (0.22 | ) | ||||||||||
|
|
|
|
|
|
|
|
|
| |||||||||||
Net Asset Value per Share, End of Year | $ | 24.35 | $ | 27.91 | $ | 25.26 | $ | 23.59 | $ | 18.84 | ||||||||||
|
|
|
|
|
|
|
|
|
| |||||||||||
Total Return | (5.81 | )% | 14.22 | % | 10.73 | % | 27.14 | % | 10.06 | % | ||||||||||
Ratios/Supplemental Data: | ||||||||||||||||||||
Net Assets, End of Year (in thousands) | $ | 151,174 | $ | 274,026 | $ | 227,231 | $ | 378,026 | $ | 292,448 | ||||||||||
Ratio of Expenses to Average Net Assets: | ||||||||||||||||||||
Before Expense Reimbursement | 1.16 | % | 1.14 | % | 1.13 | % | 1.10 | % | 1.14 | % | ||||||||||
After Expense Reimbursement | 1.14 | % | N/A | N/A | N/A | N/A | ||||||||||||||
Ratio of Net Investment Loss to Average Net Assets | (0.64 | )% | (0.33 | )% | (0.40 | )% | (0.10 | )% | (0.31 | )% | ||||||||||
Portfolio Turnover Rate | 14.05 | % | 27.19 | % | 25.79 | % | 24.55 | % | 19.74 | % | ||||||||||
| (1) | Computed using average shares outstanding throughout the period. |
See accompanying notes to financial statements.
121
TCW Small Cap Growth Fund
Financial Highlights — I Class
| Year Ended October 31, | ||||||||||||||||||||
| 2016 | 2015 | 2014 | 2013 | 2012 | ||||||||||||||||
Net Asset Value per Share, Beginning of Year | $ | 26.77 | $ | 33.15 | $ | 35.69 | $ | 26.74 | $ | 27.84 | ||||||||||
|
|
|
|
|
|
|
|
|
| |||||||||||
Income (Loss) from Investment Operations: | ||||||||||||||||||||
Net Investment Loss (1) | (0.16 | ) | (0.27 | ) | (0.32 | ) | (0.20 | ) | (0.24 | ) | ||||||||||
Net Realized and Unrealized Gain (Loss) on Investments | 0.66 | (0.74 | ) | 2.93 | 9.15 | (0.86 | ) | |||||||||||||
|
|
|
|
|
|
|
|
|
| |||||||||||
Total from Investment Operations | 0.50 | (1.01 | ) | 2.61 | 8.95 | (1.10 | ) | |||||||||||||
|
|
|
|
|
|
|
|
|
| |||||||||||
Less Distributions: | ||||||||||||||||||||
Distributions from Net Realized Gain | (6.26 | ) | (5.37 | ) | (5.15 | ) | — | — | ||||||||||||
|
|
|
|
|
|
|
|
|
| |||||||||||
Net Asset Value per Share, End of Year | $ | 21.01 | $ | 26.77 | $ | 33.15 | $ | 35.69 | $ | 26.74 | ||||||||||
|
|
|
|
|
|
|
|
|
| |||||||||||
Total Return | 1.94 | % | (4.26 | )% | 7.22 | % | 33.32 | % | (3.95 | )% | ||||||||||
Ratios/Supplemental Data: | ||||||||||||||||||||
Net Assets, End of Year (in thousands) | $ | 33,424 | $ | 92,601 | $ | 140,438 | $ | 165,248 | $ | 828,435 | ||||||||||
Ratio of Expenses to Average Net Assets | 1.28 | % | 1.17 | % | 1.20 | % | 1.18 | % | 1.16 | % | ||||||||||
Ratio of Net Investment Loss to Average Net Assets | (0.75 | )% | (0.88 | )% | (0.97 | )% | (0.71 | )% | (0.89 | )% | ||||||||||
Portfolio Turnover Rate | 76.94 | % | 81.19 | % | 75.51 | % | 84.46 | % | 79.27 | % | ||||||||||
| (1) | Computed using average shares outstanding throughout the period. |
See accompanying notes to financial statements.
122
TCW Small Cap Growth Fund
Financial Highlights — N Class
| Year Ended October 31, | ||||||||||||||||||||
| 2016 | 2015 | 2014 | 2013 | 2012 | ||||||||||||||||
Net Asset Value per Share, Beginning of Year | $ | 24.96 | $ | 31.32 | $ | 34.05 | $ | 25.60 | $ | 26.73 | ||||||||||
|
|
|
|
|
|
|
|
|
| |||||||||||
Income (Loss) from Investment Operations: | ||||||||||||||||||||
Net Investment Loss (1) | (0.16 | ) | (0.31 | ) | (0.37 | ) | (0.29 | ) | (0.31 | ) | ||||||||||
Net Realized and Unrealized Gain (Loss) on Investments | 0.62 | (0.68 | ) | 2.79 | 8.74 | (0.82 | ) | |||||||||||||
|
|
|
|
|
|
|
|
|
| |||||||||||
Total from Investment Operations | 0.46 | (0.99 | ) | 2.42 | 8.45 | (1.13 | ) | |||||||||||||
|
|
|
|
|
|
|
|
|
| |||||||||||
Less Distributions: | ||||||||||||||||||||
Distributions from Net Realized Gain | (6.26 | ) | (5.37 | ) | (5.15 | ) | — | — | ||||||||||||
|
|
|
|
|
|
|
|
|
| |||||||||||
Net Asset Value per Share, End of Year | $ | 19.16 | $ | 24.96 | $ | 31.32 | $ | 34.05 | $ | 25.60 | ||||||||||
|
|
|
|
|
|
|
|
|
| |||||||||||
Total Return | 1.92 | % | (4.48 | )% | 6.98 | % | 32.85 | % | (4.23 | )% | ||||||||||
Ratios/Supplemental Data: | ||||||||||||||||||||
Net Assets, End of Year (in thousands) | $ | 16,536 | $ | 23,835 | $ | 32,655 | $ | 121,038 | $ | 186,245 | ||||||||||
Ratio of Expenses to Average Net Assets: | ||||||||||||||||||||
Before Expense Reimbursement | 1.60 | % | 1.50 | % | 1.46 | % | 1.47 | % | 1.44 | % | ||||||||||
After Expense Reimbursement | 1.35 | % | 1.37 | % | 1.41 | % | 1.46 | % | N/A | |||||||||||
Ratio of Net Investment Loss to Average Net Assets | (0.81 | )% | (1.08 | )% | (1.17 | )% | (1.02 | )% | (1.16 | )% | ||||||||||
Portfolio Turnover Rate | 76.94 | % | 81.19 | % | 75.51 | % | 84.46 | % | 79.27 | % | ||||||||||
| (1) | Computed using average shares outstanding throughout the period. |
See accompanying notes to financial statements.
123
TCW Funds, Inc.
Report of Independent Registered Public Accounting Firm
To the Board of Directors and Shareholders of
TCW Funds, Inc.
Los Angeles, California
We have audited the accompanying statements of assets and liabilities, including the schedules of investments, of TCW Conservative Allocation Fund, TCW Focused Equities Fund (formerly Concentrated Value Fund), TCW Global Real Estate Fund, TCW Growth Equities Fund, TCW High Dividend Equities Fund, TCW New America Premier Equities Fund, TCW Relative Value Dividend Appreciation Fund, TCW Relative Value Large Cap Fund, TCW Relative Value Mid Cap Fund, TCW Select Equities Fund, and TCW Small Cap Growth Fund (collectively, the “TCW Equity and Allocation Funds”) (eleven of twenty-three funds comprising TCW Funds, Inc.) as of October 31, 2016, and the related statements of operations for the periods then ended, the statements of changes in net assets for each of the respective stated periods then ended, and the financial highlights for each of the respective stated periods then ended. These financial statements and financial highlights are the responsibility of the TCW Equity and Allocation Funds’ management. Our responsibility is to express an opinion on these financial statements and financial highlights based on our audits.
We conducted our audits in accordance with the standards of the Public Accounting Oversight Board (United States). Those standards require that we plan and perform the audits to obtain reasonable assurance about whether the financial statements and financial highlights are free of material misstatement. The TCW Equity and Allocation Funds are not required to have, nor were we engaged to perform, an audit of their internal control over financial reporting. Our audits included consideration of internal control over financial reporting as a basis for designing audit procedures that are appropriate in the circumstances, but not for the purpose of expressing an opinion on the effectiveness of the TCW Equity and Allocation Funds’ internal control over financial reporting. Accordingly, we express no such opinion. An audit also includes examining on a test basis, evidence supporting the amounts and disclosures in the financial statements, assessing the accounting principle used and significant estimates made by management, as well as evaluating the overall financial statement presentation. Our procedures included confirmation of securities owned as of October 31, 2016, by correspondence with the custodian and brokers; where replies were not received from brokers, we performed other auditing procedures. We believe that our audits provide a reasonable basis for our opinion.
In our opinion, the financial statements and financial highlights referred to above present fairly, in all material aspects, the financial position of each of the respective TCW Equity and Allocation Funds as of October 31, 2016, the results of their operations for the periods then ended, the changes in their net assets for each of the respective stated periods then ended, and the financial highlights for each of the respective stated periods then ended, in conformity with accounting principles generally accepted in the United States of America.

Los Angeles, California
December 21, 2016
124
TCW Funds, Inc.
Shareholder Expenses (Unaudited)
As a shareholder of a Fund, you incur ongoing operational costs of the Fund, including management fees and other fund expenses. The following example is intended to help you understand your ongoing costs (in dollars and cents) of investing in a Fund and to compare these costs with the ongoing costs of investing in other funds.
The example is based on an investment of $1,000 invested at the beginning of the period and held for the entire period from May 1, 2016 to October 31, 2016 (184 days).
Actual Expenses The first line under each Fund in the table below provides information about the actual account values and actual expenses. You may use the information in this line, together with the amount you invested, to estimate the expenses that you paid over the period. Simply divide your account value by $1,000 (for example, an $8,600 account value divided by $1,000 = 8.6), then multiply the result by the number in the first line for your Fund under the heading entitled “Expenses Paid During Period” to estimate the expenses you paid on your account during this period.
Hypothetical Example for Comparison Purposes The second line under each Fund in the table below provides information about the hypothetical expenses based on each Fund’s actual expense ratio and an assumed rate of return of 5% per year before expenses, which is not the Fund’s actual return. The hypothetical account value and expenses may not be used to estimate the actual ending account balance or expenses you paid for the period. You may use this information to compare the ongoing costs of investing in your Fund and other funds. To do so, compare this 5% hypothetical example with the 5% hypothetical examples that appear in the shareholder reports of the other funds.
TCW Funds, Inc. | Beginning Account Value May 1, 2016 | Ending Account Value October 31, 2016 | Annualized Expense Ratio | Expenses Paid During Period (May 1, 2016 to October 31, 2016) | ||||||||||||
| TCW Conservative Allocation Fund | ||||||||||||||||
I Class Shares | ||||||||||||||||
Actual | $ | 1,000.00 | $ | 1,016.80 | 0.30 | % (1) | $ | 1.52 | (1) | |||||||
Hypothetical (5% return before expenses) | 1,000.00 | 1,023.63 | 0.30 | % (1) | 1.53 | (1) | ||||||||||
N Class Shares | ||||||||||||||||
Actual | $ | 1,000.00 | $ | 1,015.10 | 0.81 | % (1) | $ | 4.10 | (1) | |||||||
Hypothetical (5% return before expenses) | 1,000.00 | 1,021.06 | 0.81 | % (1) | 4.12 | (1) | ||||||||||
| TCW Focused Equities Fund | ||||||||||||||||
I Class Shares | ||||||||||||||||
Actual | $ | 1,000.00 | $ | 1,010.80 | 1.07 | % | $ | 5.41 | ||||||||
Hypothetical (5% return before expenses) | 1,000.00 | 1,019.76 | 1.07 | % | 5.43 | |||||||||||
N Class Shares | ||||||||||||||||
Actual | $ | 1,000.00 | $ | 1,010.40 | 1.07 | % | $ | 5.41 | ||||||||
Hypothetical (5% return before expenses) | 1,000.00 | 1,019.76 | 1.07 | % | 5.43 | |||||||||||
| TCW Global Real Estate Fund | ||||||||||||||||
I Class Shares | ||||||||||||||||
Actual | $ | 1,000.00 | $ | 996.40 | 1.38 | % | $ | 6.93 | ||||||||
Hypothetical (5% return before expenses) | 1,000.00 | 1,018.20 | 1.38 | % | 7.00 | |||||||||||
N Class Shares | ||||||||||||||||
Actual | $ | 1,000.00 | $ | 996.40 | 1.39 | % | $ | 6.98 | ||||||||
Hypothetical (5% return before expenses) | 1,000.00 | 1,018.15 | 1.39 | % | 7.05 | |||||||||||
125
TCW Funds, Inc.
Shareholder Expenses (Unaudited) (Continued)
TCW Funds, Inc. | Beginning Account Value May 1, 2016 | Ending Account Value October 31, 2016 | Annualized Expense Ratio | Expenses Paid During Period (May 1, 2016 to October 31, 2016) | ||||||||||||
| TCW Growth Equities Fund | ||||||||||||||||
I Class Shares | ||||||||||||||||
Actual | $ | 1,000.00 | $ | 1,008.50 | 1.20 | % | $ | 6.06 | ||||||||
Hypothetical (5% return before expenses) | 1,000.00 | 1,019.10 | 1.20 | % | 6.09 | |||||||||||
N Class Shares | ||||||||||||||||
Actual | $ | 1,000.00 | $ | 1,009.90 | 1.20 | % | $ | 6.06 | ||||||||
Hypothetical (5% return before expenses) | 1,000.00 | 1,019.10 | 1.20 | % | 6.09 | |||||||||||
| TCW High Dividend Equities Fund | ||||||||||||||||
I Class Shares | ||||||||||||||||
Actual | $ | 1,000.00 | $ | 1,019.30 | 1.16 | % | $ | 5.89 | ||||||||
Hypothetical (5% return before expenses) | 1,000.00 | 1,019.31 | 1.16 | % | 5.89 | |||||||||||
N Class Shares | ||||||||||||||||
Actual | $ | 1,000.00 | $ | 1,019.30 | 1.16 | % | $ | 5.89 | ||||||||
Hypothetical (5% return before expenses) | 1,000.00 | 1,019.31 | 1.16 | % | 5.89 | |||||||||||
| TCW New America Premier Equities Fund | ||||||||||||||||
I Class Shares | ||||||||||||||||
Actual | $ | 1,000.00 | $ | 1,071.60 | 1.05 | % | $ | 5.47 | ||||||||
Hypothetical (5% return before expenses) | 1,000.00 | 1,019.86 | 1.05 | % | 5.33 | |||||||||||
N Class Shares | ||||||||||||||||
Actual | $ | 1,000.00 | $ | 1,071.60 | 1.05 | % | $ | 5.47 | ||||||||
Hypothetical (5% return before expenses) | 1,000.00 | 1,019.86 | 1.05 | % | 5.33 | |||||||||||
| TCW Relative Value Dividend Appreciation Fund | ||||||||||||||||
I Class Shares | ||||||||||||||||
Actual | $ | 1,000.00 | $ | 1,051.60 | 0.86 | % | $ | 4.44 | ||||||||
Hypothetical (5% return before expenses) | 1,000.00 | 1,020.81 | 0.86 | % | 4.37 | |||||||||||
N Class Shares | ||||||||||||||||
Actual | $ | 1,000.00 | $ | 1,050.60 | 1.07 | % | $ | 5.52 | ||||||||
Hypothetical (5% return before expenses) | 1,000.00 | 1,019.76 | 1.07 | % | 5.43 | |||||||||||
| TCW Relative Value Large Cap Fund | ||||||||||||||||
I Class Shares | ||||||||||||||||
Actual | $ | 1,000.00 | $ | 1,046.00 | 0.88 | % | $ | 4.53 | ||||||||
Hypothetical (5% return before expenses) | 1,000.00 | 1,020.71 | 0.88 | % | 4.47 | |||||||||||
N Class Shares | ||||||||||||||||
Actual | $ | 1,000.00 | $ | 1,045.10 | 1.07 | % | $ | 5.50 | ||||||||
Hypothetical (5% return before expenses) | 1,000.00 | 1,019.76 | 1.07 | % | 5.43 | |||||||||||
| TCW Relative Value Mid Cap Fund | ||||||||||||||||
I Class Shares | ||||||||||||||||
Actual | $ | 1,000.00 | $ | 1,071.20 | 0.95 | % | $ | 4.95 | ||||||||
Hypothetical (5% return before expenses) | 1,000.00 | 1,020.36 | 0.95 | % | 4.82 | |||||||||||
N Class Shares | ||||||||||||||||
Actual | $ | 1,000.00 | $ | 1,070.20 | 1.19 | % | $ | 6.19 | ||||||||
Hypothetical (5% return before expenses) | 1,000.00 | 1,019.15 | 1.19 | % | 6.04 | |||||||||||
126
TCW Funds, Inc.
TCW Funds, Inc. | Beginning Account Value May 1, 2016 | Ending Account Value October 31, 2016 | Annualized Expense Ratio | Expenses Paid During Period (May 1, 2016 to October 31, 2016) | ||||||||||||
| TCW Select Equities Fund | ||||||||||||||||
I Class Shares | ||||||||||||||||
Actual | $ | 1,000.00 | $ | 1,030.40 | 0.89 | % | $ | 4.54 | ||||||||
Hypothetical (5% return before expenses) | 1,000.00 | 1,020.66 | 0.89 | % | 4.52 | |||||||||||
N Class Shares | ||||||||||||||||
Actual | $ | 1,000.00 | $ | 1,028.70 | 1.13 | % | $ | 5.76 | ||||||||
Hypothetical (5% return before expenses) | 1,000.00 | 1,019.46 | 1.13 | % | 5.74 | |||||||||||
| TCW Small Cap Growth Fund | ||||||||||||||||
I Class Shares | ||||||||||||||||
Actual | $ | 1,000.00 | $ | 1,083.00 | 1.24 | % | $ | 6.49 | ||||||||
Hypothetical (5% return before expenses) | 1,000.00 | 1,018.90 | 1.24 | % | 6.29 | |||||||||||
N Class Shares | ||||||||||||||||
Actual | $ | 1,000.00 | $ | 1,082.50 | 1.34 | % | $ | 7.01 | ||||||||
Hypothetical (5% return before expenses) | 1,000.00 | 1,018.40 | 1.34 | % | 6.80 | |||||||||||
| (1) | Does not included Expenses of the underlying affiliated investments. |
127
TCW Funds, Inc.
Our Privacy Policy
We, The TCW Group, Inc. and its subsidiaries, the TCW Funds, Inc., TCW Alternative Funds, TCW Strategic Income Fund, Inc. and the Metropolitan West Funds (collectively, “TCW”) are committed to protecting the nonpublic personal and financial information of our customers and consumers who obtain or seek to obtain financial products or services primarily for personal, family or household purposes. We fulfill our commitment by establishing and implementing policies and systems to protect the security and confidentiality of this information.
In our offices, we limit access to nonpublic personal and financial information about you to those TCW personnel who need to know the information in order to provide products or services to you. We maintain physical, electronic and procedural safeguards to protect your nonpublic personal and financial information.
What You Should Know
At TCW, we recognize the importance of keeping information about you secure and confidential. We do not sell or share your nonpublic personal and financial information with marketers or others outside our affiliated group of companies.
We carefully manage information among our affiliated group of companies to safeguard your privacy and to provide you with consistently excellent service.
We are providing this notice to you to comply with the requirements of Regulation S-P, “Privacy of Consumer Financial Information,” issued by the United States Securities and Exchange Commission.
Categories of Information We Collect
We may collect the following types of nonpublic personal and financial information about you from the following sources:
| • | Your name, address and identifying numbers, and other personal and financial information, from you and from identification cards and papers you submit to us, on applications, subscription agreements or other forms or communications. |
| • | Information about your account balances and financial transactions with us, our affiliated entities, or nonaffiliated third parties, from our internal sources, from affiliated entities and from nonaffiliated third parties. |
| • | Information about your account balances and financial transactions and other personal and financial information, from consumer credit reporting agencies or other nonaffiliated third parties, to verify information received from you or others. |
Categories of Information We Disclose to Nonaffiliated Third Parties
| • | We may disclose your name, address and account and other identifying numbers, as well as information about your pending or past transactions and other personal financial information, to nonaffiliated third parties, for our everyday business purposes such as necessary to execute, process, service and confirm your securities transactions and mutual fund transactions, to administer and service your account and commingled investment vehicles in which you are invested, to market our products and services through joint marketing arrangements or to respond to court orders and legal investigations. |
128
TCW Funds, Inc.
| • | We may disclose nonpublic personal and financial information concerning you to law enforcement agencies, federal regulatory agencies, self-regulatory organizations or other nonaffiliated third parties, if required or requested to do so by a court order, judicial subpoena or regulatory inquiry. |
We do not otherwise disclose your nonpublic personal and financial information to nonaffiliated third parties, except where we believe in good faith that disclosure is required or permitted by law. Because we do not disclose your nonpublic personal and financial information to nonaffiliated third parties, our Customer Privacy Policy does not contain opt-out provisions.
Categories of Information We Disclose to Our Affiliated Entities
| • | We may disclose your name, address and account and other identifying numbers, account balances, information about your pending or past transactions and other personal financial information to our affiliated entities for any purpose. |
| • | We regularly disclose your name, address and account and other identifying numbers, account balances and information about your pending or past transactions to our affiliates to execute, process and confirm securities transactions or mutual fund transactions for you, to administer and service your account and commingled investment vehicles in which you are invested, or to market our products and services to you. |
Information About Former Customers
We do not disclose nonpublic personal and financial information about former customers to nonaffiliated third parties unless required or requested to do so by a court order, judicial subpoena or regulatory inquiry, or otherwise where we believe in good faith that disclosure is required or permitted by law.
Questions
Should you have any questions about our Customer Privacy Policy, please contact us by email or by regular mail at the address at the end of this policy.
Reminder About TCW’s Financial Products
Financial products offered by The TCW Group, Inc. and its subsidiaries, the TCW Funds, Inc., TWC Alternative Funds, TCW Strategic Income Fund, Inc. and the Metropolitan West Funds:
| • | Are not guaranteed by a bank; |
| • | Are not obligations of The TCW Group, Inc. or of its subsidiaries; |
| • | Are not insured by the Federal Deposit Insurance Corporation; and |
| • | Are subject to investment risks, including possible loss of the principal amount committed or invested, and earnings thereon. |
THE TCW GROUP, INC.
TCW FUNDS, INC.
TCW ALTERNATIVE FUNDS
TCW STRATEGIC INCOME FUND, INC.
METROPOLITAN WEST FUNDS
Attention: Privacy Officer | 865 South Figueroa St. Suite 1800 | Los Angeles, CA 90017 |
email: privacy@tcw.com
129
TCW Funds, Inc.
Investment Management and Advisory Agreement
TCW Funds, Inc. (the “Corporation”) and TCW Investment Management Company LLC (the “Advisor”) are parties to an Investment Advisory and Management Agreement (“Current Agreement”), pursuant to which the Advisor is responsible for managing the investments of each separate investment series (each, a “Fund” and collectively, the “Funds”) of the Corporation. The Current Agreement continues in effect from year to year provided that such continuance is specifically approved at least annually by the Board of Directors of the Corporation (the “Board”), including the directors who are not “interested persons” of either the Corporation or the Advisor (the “Independent Directors”). The Current Agreement terminates automatically in the event of its assignment.
At a meeting held on September 26, 2016, the Board, including the Independent Directors, approved the continuation of the Current Agreement with respect to each Fund for an additional one-year term from when it otherwise would expire.
Continuation of the Current Agreement
The Advisor provided materials to the Board in advance of meetings held on September 7, 2016 and September 26, 2016 (the “Current Agreement Materials”) for their evaluation of the Current Agreement in response to information requested by the Independent Directors, who were advised by counsel to the Independent Directors with respect to these and other relevant matters. In addition, the Independent Directors met separately with counsel to the Independent Directors to consider the information provided. As a result of those meetings and their other meetings, the Board (including a majority of the Independent Directors voting separately) approved the continuation of the Current Agreement based on the recommendation of the Independent Directors. In deciding to recommend the renewal of the Current Agreement with respect to each Fund, the Independent Directors did not identify any single or particular piece of information that, in isolation, was the controlling factor. Each Independent Director may also have weighed factors differently. This summary describes the most important, but not all, of the factors considered by the Board.
Nature, Extent, and Quality of Services The Independent Directors considered the general nature, extent, and quality of services provided and expected to be provided by the Advisor. The Independent Directors evaluated the Advisor’s experience in serving as manager of the Funds, and considered the benefits to shareholders of investing in a fund complex that is served by a large investment management organization where the Advisor and its affiliates also serve a variety of other investment advisory clients, including separate accounts, other pooled investment vehicles, registered investment companies and commingled funds. The Independent Directors also considered the ability of the Advisor to provide appropriate levels of support and resources to the Funds. The Independent Directors noted the Advisor’s responsibility to supervise the activities of the Funds’ various service providers, as well as to support the Independent Directors and their meetings, prepare regulatory filings, and provide various operational personnel.
In addition, the Independent Directors took note of the background and experience of the senior management and portfolio management personnel of the Advisor and that the Advisor provides and is expected to continue to provide substantial expertise and attention to the Funds as well as resources and infrastructure, noting also the Advisor’s description of its stable team and deep bench of personnel. The Independent Directors considered the ability of the Advisor to attract and retain qualified business professionals and its compensation program, noting in particular the Advisor’s recent hiring of professionals in various areas over the past several years, including additional analysts on the equity research team and emerging markets team, a new Chief Data Officer, upgrading resources in the middle
130
TCW Funds, Inc.
office and back office operations and other areas, as well as its continuing and extensive program of infrastructure and systems enhancements. The Independent Directors also considered the breadth of the compliance programs of the Advisor, as well as the compliance operations of the Advisor with respect to the Funds. The Independent Directors concluded that they were satisfied with the nature, extent and quality of the services provided and anticipated to be provided to the Funds by the Advisor under the Current Agreement.
Investment Performance The Independent Directors reviewed information about each Fund’s historical performance, including materials prepared by the Advisor and a Report prepared by Broadridge, an independent third party consultant, which provided a comparative analysis of each Fund with the performance of similar funds over one-, three-, five- and ten-year periods, as applicable. The Independent Directors noted that investment performance of most of the Funds was generally consistent with or above the median performance of the applicable Lipper peer group during most periods covered in the Report. They noted, however, that the investment performance of each of the TCW Select Equities Fund, TCW Relative Value Large Cap Fund, TCW Relative Value Mid Cap Fund, TCW Small Cap Growth Fund, TCW Growth Equities Fund, TCW Short Term Bond Fund, TCW International Small Cap Fund, TCW High Dividend Equities Fund, TCW Global Real Estate Fund, TCW Relative Value Dividend Appreciation Fund, TCW International Growth Fund and TCW Focused Equities Fund (formerly known as TCW Concentrated Value Fund) was in the fourth or fifth quintile of the applicable Lipper peer group for one or more periods covered in the Report. The Independent Directors noted the recent underperformance of these Funds and reviewed the actions taken by the Advisor to address such underperformance. The Independent Directors concluded that the Advisor should continue to provide investment advisory and management services to the Funds. The Independent Directors indicated that they would continue to monitor portfolio investment performance on a regular basis and discuss with the Advisor from time to time any instances of long-term underperformance as appropriate.
Advisory Fees and Profitability The Independent Directors considered information in the materials prepared by Lipper and the Advisor regarding the advisory fees charged to the Funds, advisory fees paid by other funds in the Funds’ respective peer groups, and advisory fees paid to the Advisor under advisory contracts with respect to other institutional clients. The Independent Directors noted that the investment advisory fees charged by the Advisor to many of the Funds were near or below the medians of their respective Lipper peer groups. They also noted, however, that the investment advisory fees of the TCW Select Equities Fund, TCW Small Cap Growth Fund, TCW SMID Cap Growth Fund, TCW Relative Value Dividend Appreciation Fund, TCW Relative Value Large Cap Fund, TCW Emerging Markets Income Fund, TCW Emerging Markets Multi-Asset Opportunities Fund and TCW Emerging Markets Local Currency Income Fund were above the medians of their respective Lipper peer groups. The Independent Directors reviewed related materials prepared the Advisor. The Independent Directors also noted that the advisory fees charged by the Advisor to many of the Funds are higher than the advisory fees charged by the Advisor to certain institutional separate accounts with similar strategies managed by the Advisor, but that the services provided the Funds are more extensive than the services provided to institutional separate accounts. The Independent Directors reviewed and discussed with the Advisor those additional services.
The Independent Directors noted that the total expenses of the Funds are near or below median expenses of the other funds in their respective peer groups. They considered that the Advisor has agreed to reduce its investment advisory fee or pay the operating expenses of each Fund in order to maintain the overall expense ratios of the Funds at competitive levels, and the amounts paid or waived by the Advisor pursuant
131
TCW Funds, Inc.
Investment Management and Advisory Agreement (Continued)
to expense limitations. The Independent Directors also considered the costs of services provided to the Funds by the Advisor and profits realized by the Advisor and its affiliates from their relationship with the Funds. Recognizing the difficulty in evaluating a manager’s profitability with respect to the funds it manages in the context of a manager with multiple lines of business, and noting that other profitability evaluation methodologies might also be reasonable, the Independent Directors concluded that the profits of the Advisor from its relationship with the Funds was reasonable. Based on these various considerations, the Independent Directors concluded that the contractual management fees of the Funds under the Investment Advisory and Management Agreement are fair and bear a reasonable relationship to the services rendered by the Advisor.
Expenses and Economies of Scale The Independent Directors considered the potential of the Advisor and the Funds to achieve economies of scale as the Funds grow in size. The Independent Directors noted that the Advisor has agreed to contractual expense limitation agreements, which are designed to maintain the overall expense ratio of each of the Fund at a competitive level. The Independent Directors were satisfied with the explanation for Funds with total expense ratios exceeding their peer group medians, such as the small size of the Fund or an expense ratio relatively near the median level. The Independent Directors also received information about the extent to which the Advisor has shared economies of scale through the reinvestment of profits into the advisory business of the Advisor and its affiliates, which benefits the Funds. The Independent Directors also considered the relative advantages and disadvantages of an advisory fee with breakpoints compared to a flat advisory fee supplemented by advisory fee waivers and/or expense reimbursements. The Independent Directors concluded that the current fee arrangements were appropriate given the current size and structure of the Funds and adequately reflected any economies of scale.
Ancillary Benefits The Independent Directors considered ancillary benefits to be received by the Advisor and its affiliates as a result of the relationship of the Advisor with the Funds, including compensation for certain compliance support services. The Independent Directors noted that, in addition to the fees the Advisor receives under the Current Agreement, the Advisor receives additional benefits in connection with management of the Funds in the form of reports, research and other services from brokers and their affiliates in return for brokerage commissions paid to such brokers. The Independent Directors concluded that any potential benefits to be derived by the Advisor from its relationships with the Funds are reasonably related to the services provided by the Advisor to the Funds.
Conclusions Based on their overall review, including their consideration of each of the factors referred to above (and others), the Board and the Independent Directors concluded that the Current Agreement is fair and reasonable to each Fund and its shareholders, that the Fund’s shareholders received reasonable value in return for the advisory fees and other amounts paid to the Advisor by each Fund, and that the renewal of the Current Agreement was in the best interests of each Fund and its shareholders.
132
TCW Funds, Inc.
Supplemental Information
The policies and procedures that the Company uses to determine how to vote proxies are available without charge. The Board of the Company has delegated the Company’s proxy voting authority to the Advisor.
Disclosure of Proxy Voting Guidelines
The proxy voting guidelines of the Advisor are available:
| 1. | By calling 800-FUND-TCW (800-386-3829) to obtain a hard copy; or |
| 2. | By going to the SEC website at http://www.sec.gov. |
When the Company receives a request for a description of the Advisor’s proxy voting guidelines, it will deliver the description that is disclosed in the Company’s Statement of Additional Information. This information will be sent out via first class mail (or other means designed to ensure equally prompt delivery) within three business days of receiving the request.
The Advisor, on behalf of the Company, prepares and files Form N-PX with the SEC not later than August 31 of each year, which includes the Company’s proxy voting record for the most recent twelve-month period ended June 30 of that year. The Company’s proxy voting record for the most recent twelve-month period ended June 30 is available:
| 1. | By calling 800-FUND-TCW (800-386-3829) to obtain a hard copy; or |
| 2. | By going to the SEC website at http://www.sec.gov. |
When the Company receives a request for the Company’s proxy voting record, it will send the information disclosed in the Company’s most recently filed report on Form N-PX via first class mail (or other means designed to ensure equally prompt delivery) within three business days of receiving the request.
The Company also discloses its proxy voting record on its website as soon as is reasonably practicable after its report on Form N-PX is filed with the SEC.
Availability of Quarterly Portfolio Schedule
The Company files a complete schedule of its portfolio holdings with the SEC for the first and third quarters of its fiscal year on Form N-Q. The Form N-Q is available by calling 800-FUND-TCW (800-386-3829) to obtain a hard copy. You may also obtain the Company’s Form N-Q:
| 1. | By going to the SEC website at http://www.sec.gov.; or |
| 2. | By visiting the SEC’s Public Reference Room in Washington, D.C. and photocopying it (Phone 1-800-SEC-0330 for information on the operation of the SEC’s Public Reference Room). |
133
TCW Funds, Inc.
Tax Information Notice (Unaudited)
On account of the year ended October 31, 2016, the following Funds paid a capital gain distribution within the meaning 852 (b) (3) (c) of the Code. Each Fund also designates as a capital gain distribution a portion of earnings and profits paid to shareholders in redemption of their shares.
Fund | Amounts per Share | |||
TCW Conservative Allocation Fund | $ | 0.34 | ||
TCW Global Real Estate Fund | $ | 0.00 | (1) | |
TCW Growth Equities Fund | $ | 2.98 | ||
TCW Relative Value Large Cap Fund | $ | 1.51 | ||
TCW Relative Value Mid Cap Fund | $ | 2.94 | ||
TCW Select Equities Fund | $ | 2.62 | ||
TCW Small Cap Growth Fund | $ | 8.74 | ||
| (1) | Amount rounds to less than $0.01. |
Under Section 854 (b) (2) of the Code, the Funds hereby designate the following maximum amounts as qualified dividends for purposes of the maximum rate under Section 1 (h) (11) of the Code for the fiscal year ended October 31, 2016:
Fund | Qualified Dividend Income | |||
TCW Conservative Allocation Fund | $ | 135 | ||
TCW Focused Equities Fund | $ | 18 | ||
TCW Global Real Estate Fund | $ | 39 | ||
TCW High Dividend Equities Fund | $ | 153 | ||
TCW Relative Value Dividend Appreciation Fund | $ | 17,094 | ||
TCW Relative Value Large Cap Fund | $ | 7,755 | ||
TCW Relative Value Mid Cap Fund | $ | 725 | ||
TCW Select Equities Fund | $ | 5,828 | ||
The following are dividend received deduction percentages for the Funds’ corporate shareholders:
Fund | Dividends Received Deductions | |||
TCW Conservative Allocation Fund | 10.08% | |||
TCW Focused Equities Fund | 23.09% | |||
TCW Global Real Estate Fund | 1.95% | |||
TCW High Dividend Equities Fund | 99.79% | |||
TCW Relative Value Dividend Appreciation Fund | 100% | |||
TCW Relative Value Large Cap Fund | 100% | |||
TCW Relative Value Mid Cap Fund | 100% | |||
TCW Select Equities Fund | 43.64% | |||
This information is given to meet certain requirements of the Code and should not be used by shareholders for preparing their income tax returns. In February 2017, shareholders will receive Form 1099-DIV which will show the actual distribution received and include their share of qualified dividends during the calendar year of 2016. Shareholders are advised to check with their tax advisors for information on the treatment of these amounts on their individual tax returns.
134
TCW Funds, Inc.
Directors and Officers of the Company
A board of nine directors is responsible for overseeing the operations of the Company, which consists of 23 Funds at October 31, 2016. The directors of the Company, and their business addresses and their principal occupation for the last five years are set forth below.
Independent Directors
Name, and Year of Birth (1) | Term of Office and Length of Time Served | Principal Occupation(s) During Past 5 Years | Other Directorships held by Director | |||
| Samuel P. Bell (1936) | Indefinite term; Mr. Bell has served as a director of TCW Funds, Inc. since October 2002. | Private Investor. | Point 360 (post production services); TCW Strategic Income Fund, Inc. (closed-end fund). | |||
| John A. Gavin (1931) | Indefinite term; Mr. Gavin has served as a director of TCW Funds, Inc. since May 2001. | Founder and Chairman of Gamma Holdings (international capital consulting firm). | TCW Strategic Income Fund, Inc. (closed-end fund); Hotchkis and Wiley Funds (mutual fund). | |||
Patrick C. Haden (1953) Chairman of the Board | Indefinite term; Mr. Haden has served as a director of TCW Funds, Inc. since May 2001. | Senior Advisor to President (since July 2016). and Athletic Director (2010-June 2016), University of Southern California. | Tetra Tech, Inc. (environmental consulting); The Rose Hills Foundation (charitable foundation); Unihealth Foundation (charitable foundation); Fletcher Jones Foundation (charitable foundation); Mayr Foundation (charitable foundation); First Beverage (beverage consulting); Auto Club (affiliate of AAA); Metropolitan West Funds (mutual fund); TCW Alternative Funds (mutual fund); TCW Strategic Income Fund, Inc. (closed-end fund). | |||
| Peter McMillan (1957) | Indefinite term; Mr. McMillan has served as a director of TCW Funds, Inc. since August 2010. | Co-founder, Managing Partner and Chief Investment Officer (since May 2013), Temescal Canyon Partners (investment advisory firm); Co-founder and Managing Partner (since 2000) Willowbrook Capital Group, LLC (investment advisory firm); Co-founder and Executive Vice President (since 2005), KBS Capital Advisors (a manager of real estate investment trusts). | KBS Real Estate Investment Trusts (real estate investments); KBS Strategic Opportunity REITs (real estate investments); Metropolitan West Funds (mutual funds); TCW Strategic Income Fund, Inc. (closed-end fund);TCW Alternative Funds (mutual fund). | |||
| Charles A. Parker (1934) | Indefinite term; Mr. Parker has served as a director of the TCW Funds, Inc. since April 2003. | Private Investor. | Burridge Center for Research in Security Prices (University of Colorado); TCW Strategic Income Fund, Inc. (closed-end fund). | |||
| Victoria B. Rogers (1961) | Indefinite term; Ms. Rogers has served as a director of the TCW Funds, Inc. since October 2011. | President, The Rose Hills Foundation. (charitable foundation) | Causeway Capital Management Trust (mutual fund); TCW Strategic Income Fund, Inc. (closed-end fund). | |||
| Andrew Tarica (1959) | Indefinite term; Mr. Tarica has served as a director of the TCW Funds, Inc. since March 2012. | Chief Executive Officer, Meadowbrook Capital Management (asset management company); Employee, Cowen & Co. (broker-dealer). | Metropolitan West Funds (mutual fund); TCW Strategic Income Fund, Inc. (closed-end fund); TCW Alternative Funds (mutual fund). |
| (1) | The address of each Independent Director is c/o Morgan Lewis, & Bockius LLP, Counsel to the Independent Directors, 300 South Grand Avenue, 22nd floor, Los Angeles, CA 90071. |
135
TCW Funds, Inc.
Directors and Officers of the Company (Continued)
Interested Directors
Each of these directors are “interested persons” of the Company as defined in the 1940 Act because they are directors and officers of the Advisor, and shareholders and directors of The TCW Group, Inc., the parent company of the Advisor.
Name and Year of Birth | Term of Office and Length of Time Served | Principal Occupation(s) During Past 5 Years | Other Directorships held by Director | |||
| Marc I. Stern (1944) | Indefinite term; Mr. Stern has served as a director since inception of TCW Funds, Inc. in September 1992. | Chairman (since January 2016), TCW LLC; Chairman (since February 2013), The TCW Group, Inc., TCW Investment Management Company LLC, TCW Asset Management Company LLC and Metropolitan West Asset Management, LLC; Chief Executive Officer and Chairman (December 2009 to February 2013), TCW Investment Management Company LLC; Vice Chairman and Chief Executive Officer (December 2009 to August 2012), The TCW Group, Inc. (December 2009 to February 2013 and December 2009 to February 2013) TCW Asset Management Company LLC; Vice Chairman and President (November 2010 to February 2013); Vice Chairman (November 2010 to December 2014) and Chairman (since December 2014), Trust Company of the West. | Qualcomm Incorporated (wireless communications) | |||
| David S. DeVito (1962) | Indefinite term; Mr. DeVito has served as a director since January 2014. | Executive Vice President and Chief Operating Officer (since January 2016), TCW LLC; President and Chief Executive Officer (since 2015), TCW Alternative Funds; Executive Vice President and Chief Operating Officer (since October 2013), TCW Investment Management Company LLC, The TCW Group, Inc., Trust Company of the West, Metropolitan West Asset Management, LLC and TCW Asset Management Company LLC; President and Chief Executive Officer (since January 2014), TCW Strategic Income Fund, Inc. ; Executive Vice President and Chief Financial Officer (since 2010), Metropolitan West Funds. | TCW Strategic Income Fund, Inc. (closed-end fund) |
136
TCW Funds, Inc.
The officers of the Company who are not directors of the Company are:
| Name and Year of Birth | Position(s) Held with Company | Principal Occupation(s) During Past 5 Years (1) | ||
| Peter A. Brown (1955) | Senior Vice President | Managing Director (since January 2016), TCW LLC; Managing Director (since February 1998), TCW Investment Management Company LLC, The TCW Group Inc., Trust Company of the West and TCW Asset Management Company LLC; Senior Vice President (since August 2007), TCW Strategic Income Fund, Inc. | ||
| Meredith S. Jackson (1959) | Senior Vice President, General Counsel and Secretary | Executive Vice President, General Counsel and Secretary (since January 2016), TCW LLC; Senior Vice President, General Counsel and Secretary (since 2015), TCW Alternative Funds; Executive Vice President, General Counsel and Secretary (since February 2013), TCW Investment Management Company LLC, The TCW Group Inc., Trust Company of the West, TCW Asset Management Company LLC and Metropolitan West Asset Management, LLC; Senior Vice President, General Counsel and Secretary (since February 2013), TCW Strategic Income Fund, Inc. and Metropolitan West Funds; Partner and Chair of the Debt Finance Practice Group (1999 – January 2013), Irell & Manella (law firm). | ||
| Jeffrey Engelsman (1967) | Chief Compliance Officer | Global Chief Compliance Officer (since January 2016), TCW LLC; Chief Compliance Officer (since 2015), TCW Alternative Funds; Managing Director, Global Chief Compliance Officer (since August 2014), TCW Investment Management Company LLC, The TCW Group Inc., Trust Company of the West and TCW Asset Management Company LLC, Metropolitan West Asset Management, LLC – Global Chief Compliance Officer (December 2014); Chief Compliance Officer (since September 2014), TCW Strategic Income Fund, Inc.; Chief Compliance Officer (2009 – August 2014), MainStay Funds (mutual fund); Managing Director (2009 – July 2014), New York Life Investments (investment management). |
137
TCW Funds, Inc.
Directors and Officers of the Company (Continued)
| Name and Year of Birth | Position(s) Held with Company | Principal Occupation(s) During Past 5 Years (1) | ||
| Richard Villa (1964) | Treasurer and Chief Financial Officer | Managing Director, Chief Financial Officer and Assistant Secretary (since January 2016), TCW LLC; Treasurer (since 2015), TCW Alternative Funds; Treasurer and Chief Financial Officer (since January 2014), TCW Strategic Income Fund, Inc.; Managing Director and Chief Financial Officer (since July 2008), TCW Investment Management Company LLC, the TCW Group, Inc., Trust Company of the West, TCW Asset Management Company LLC, and Metropolitan West Asset Management, LLC. |
| (1) | Positions with The TCW Group, Inc. and its affiliates may have changed over time. |
| * | Address is 865 South Figueroa Street, 18th Floor, Los Angeles, California 90017 |
In addition, George N. Winn, Senior Vice President of Trust Company of the West, TCW Asset Management Company LLC, Metropolitan West Asset Management, LLC, TCW LLC and the Advisor, is Assistant Treasurer of TCW Alternative Funds and the Corporation; and Patrick W. Dennis, Senior Vice President and Associate General Counsel of Trust Company of the West, TCW Asset Management Company LLC, Metropolitan West Asset Management, LLC, TCW LLC and the Advisor, is Assistant Secretary of TCW Alternative Funds and the Corporation.
The SAI (Statement of Additional Information) has additional information regarding the Board of Directors. A copy is available without charge by calling 1-800-FUND-TCW (1-800-386-3829) to obtain a hard copy or by going to the SEC website at http://www.sec.gov.
138

TCW Funds, Inc.
865 South Figueroa Street
Los Angeles, California 90017
800 FUND TCW
(800 386 3829)
www.TCW.com
INVESTMENT ADVISOR
TCW Investment Management Company LLC 865 South Figueroa Street Los Angeles, California 90017
TRANSFER AGENT
U.S. Bancorp Fund Services, LLC 615 E. Michigan Street Milwaukee, Wisconsin 53202
INDEPENDENT REGISTERED PUBLIC ACCOUNTING FIRM
Deloitte & Touche LLP 555 West 5th Street Los Angeles, California 90013
CUSTODIAN & ADMINISTRATOR
State Street Bank & Trust Company One Lincoln Street Boston, Massachusetts 02111
DISTRIBUTOR
TCW Funds Distributors LLC 865 South Figueroa Street Los Angeles, California 90017 | DIRECTORS
Patrick C. Haden Director and Chairman of the Board
Samuel P. Bell Director
David S. DeVito Director
John A. Gavin Director
Peter McMillan Director
Charles A. Parker Director
Victoria B. Rogers Director
Marc I. Stern Director
Andrew Tarica Director
OFFICERS
David S. DeVito President and Chief Executive Officer
Meredith S. Jackson Senior Vice President, General Counsel and Secretary
Richard M. Villa Treasurer and Chief Financial Officer
Jeffrey A. Engelsman Chief Compliance Office
Peter A. Brown Senior Vice President
Patrick W. Dennis Assistant Secretary
George N. Winn Assistant Treasurer | TCW FAMILY OF FUNDS
EQUITY FUNDS TCW Focused Equities Fund TCW Global Real Estate Fund TCW Growth Equities Fund TCW High Dividend Equities Fund TCW New America Premier Equities Fund TCW Relative Value Dividend Appreciation Fund TCW Relative Value Large Cap Fund TCW Relative Value Mid Cap Fund TCW Select Equities Fund TCW Small Cap Growth Fund
TCW ALLOCATION FUND TCW Conservative Allocation Fund
FIXED INCOME FUNDS TCW Core Fixed Income Fund TCW Enhanced Commodity Strategy Fund TCW Global Bond Fund TCW High Yield Bond Fund TCW Short Term Bond Fund TCW Total Return Bond Fund
INTERNATIONAL FUNDS TCW Developing Markets Equity Fund TCW Emerging Markets Income Fund TCW Emerging Markets Local Currency Income Fund TCW Emerging Markets Multi-Asset Opportunities Fund TCW International Growth Fund TCW International Small Cap Fund |
FUNDarEQ1016

OCTOBER 31
2016
ANNUAL REPORT
U.S. FIXED INCOME FUNDS
TCW Core Fixed Income Fund
TCW Enhanced Commodity Strategy Fund TCW Global Bond Fund TCW High Yield Bond Fund TCW Short Term Bond Fund TCW Total Return Bond Fund
TCW Funds, Inc.
| 1 | ||||
| 4 | ||||
| 16 | ||||
| 16 | ||||
| 33 | ||||
| 37 | ||||
| 47 | ||||
| 57 | ||||
| 63 | ||||
| 84 | ||||
| 86 | ||||
| 88 | ||||
| 91 | ||||
| 116 | ||||
| 127 | ||||
| 128 | ||||
| 130 | ||||
| 132 | ||||
Proxy Voting Guidelines and Availability of Quarterly Portfolio Schedule | 135 | |||
| 136 | ||||
| 137 | ||||
| 141 | ||||
| The Letter to Shareholders and/or Management Discussions contained in this Annual Report are the opinions of each Fund’s portfolio managers and are not the opinions of TCW Funds, Inc. or its Board of Directors. Various matters discussed in the Letter to Shareholders and/or Management Discussions constitute forward-looking statements within the meaning of the federal securities laws. Actual results and the timing of certain events could differ materially from those projected or contemplated by these forward-looking statements due to a number of factors, including general economic conditions, overall availability of securities for investment by a Fund, the level of volatility in the securities markets and in the share price of a Fund, and other risk factors discussed in the SEC filings of TCW Funds, Inc. The data presented in the Letter to Shareholders and/or Management Discussions represents past performance and cannot be used to predict future results. |
|
| David S. DeVito President, Chief Executive Officer and Director |

Dear Valued Investors,
It is my pleasure to present the 2016 annual report for the TCW Funds, Inc. covering the 12-month period ended October 31, 2016. I would like to express our appreciation for your continued investment in the TCW Funds as well as welcome new shareholders to our fund family. As of October 31, 2016, the TCW Funds held total net assets of approximately $19.2 billion.
This report contains information and portfolio management discussions of our TCW Fixed Income Funds.
Economic Review and Market Environment
Turbulent market action dominated the latter half of 2015, primarily driven by three developments: 1) the highly anticipated end to the Federal Reserve’s (Fed) zero interest rate policy, which finally came to fruition in December when the Fed raised the benchmark Federal Funds rate by 25 basis points (bps); 2) the continued deterioration of commodity prices and the prospect of defaults by overleveraged producers as the benchmark West Texas Intermediate Crude oil price fell below $35 a barrel, a seven year low; and 3) disappointing economic data from China, which rattled investors who questioned the ability of Chinese policy makers to manage the economic downturn and transition to a more open economy. Uncertainty spilled into 2016 with markets selling off dramatically over the first six weeks before giving way to a vigorous rally that continued over the next several months, interrupted only briefly by June’s “Brexit” referendum deciding the United Kingdom’s future in the European Union. However, this rally continues to be unsupported by the weak fundamental backdrop and thus, risks to the downside appear heightened as volatility is fueled by sluggish growth, stunted productivity, sagging commodity demand, declining corporate profitability, and disappointing wage gains. Instead, accommodative policies of global central banks and investors’ appetite for yield have supported markets and overshadowed worsening fundamentals.
In this environment characterized by investor complacency regarding lower-for-longer interest rates and the effectiveness of central bank policies, the reach for yield intensified, resulting in a 4.4% return for the Bloomberg Barclays Aggregate Index over the 12-month period ended October 31, 2016. Lower quality cohorts, as well as energy and commodity-related sectors, which were some of the most challenged sectors in the credit markets at the end of 2015 and first several weeks of 2016, completely reversed losses in the following months to claim a spot among the top performers year-over-year. High yield corporate bonds, which lagged comparable Treasuries by almost 600 bps in 2015, generated over 740 bps of excess return for the past year, with speculative CCC-rated bonds up over 16% and yields of sub-investment grade energy bonds touching a multi-year low of 7.1%. Impressive returns have not been confined to lower quality areas of the market, with broad-based gains realized across the credit markets. Corporate issuance sustained a record-breaking pace to meet robust demand for higher yielding U.S. assets. As a result, investment grade corporates returned 7.2% for the year, with industrials performing the best on a duration-adjusted basis, benefitting from the stabilization in oil prices and the resultant demand for commodity-related sectors. Among securitized products, non-agency mortgage-backed securities (MBS) continued to profit from steady sponsorship and strengthening fundamentals as home prices edged higher and borrower profiles of the underlying collateral improved. Commercial MBS (CMBS) gained 4.6% and saw excess returns over Treasuries of more than 140 bps, led by non-agency issues as private label issuance remained well below year-ago levels, while significantly higher year-over-year issuance in the agency CMBS space resulted in the sector’s relative underperformance. Agency MBS remained well supported by foreign investors and continued reinvestment in the asset class by the Fed, delivering a positive return of 3.3% for the year. Consumer asset-backed securities (ABS) were up a modest 2.4%, while government-guaranteed student
1
Letter to Shareholders (Continued) |
loan ABS outperformed as downgrade uncertainty dissipated once rating actions by Moody’s and Fitch began to materialize and were less negative than anticipated.
The Economy and Market Ahead
Despite several years of Fed accommodation, economic outcomes continue to fall short of expectations, with GDP growth tracking at an annualized 1.5% over the period. While failing to deliver anticipated growth, these policies have nonetheless suppressed market volatility and delayed re-pricing based on fundamentals. Dampened returns and muted risks have also encouraged investors to reach for performance, overlooking some of the downside perils. The growing misalignment between outcomes and valuations is unsustainable, with it unlikely that sufficient growth can take place, absent a highly improbable surge in productivity, to justify current price levels in many markets.
So, with valuations pushing higher across credit markets and the most vulnerable sectors of the market defying fundamentals, investors may be overestimating the ability of strong technical factors, such as foreign demand and massive yield-seeking investor behavior, to continue supporting markets. Further, mounting evidence that markets are late in the credit cycle warrants an elevated degree of caution and a strict focus on fundamentals. Consequently, we believe the Funds remain defensively positioned and prepared for better risk-adjusted return opportunities as the credit cycle extends. Duration profiles generally remain shorter than the Funds’ respective benchmark indexes, while the allocation among non-government fixed income sectors is conservative. Corporate credit remains a relative underweight and favors financials over industrials. In the multi-sector Funds, small allocations to high yield focus on higher quality holdings that will likely have the credit resilience to withstand late cycle volatility. Securitized products continue to offer
opportunities for attractive risk-adjusted returns, and positioning favors high quality, more senior positions. Non-agency MBS remains attractive as fundamentals continue to improve. However, security selection is increasingly important as prices rise and more favorable assumptions are built into pricing. Agency MBS positioning is largely in line with the Bloomberg Barclays Aggregate Bond Index and represents a good liquid alternative to Treasuries and defensive coverage. CMBS holdings favor agency issues given relatively good risk-adjusted returns and muted credit risk. Finally, the ABS overweight is focused on student loan receivables backed by the Federal Family Educational Loan Program (FFELP), which provide government guaranteed credit at a significant yield premium versus comparable Treasuries.
Data sources for the discussion above include Bloomberg and Barclays.
We know that you have many choices when it comes to the management of your financial assets. On behalf of everyone at TCW, I would like to thank you for making the TCW Funds part of your long-term investment plan. We truly value our relationship with you. If you have any questions or require further information, I invite you to visit our website at www.tcw.com, or call our shareholder services department at 800-386-3829.
I wish you all the best in the coming year and look forward to further correspondence with you through our semi-annual report in 2017.
Sincerely,

David S. DeVito
President, Chief Executive Officer and Director
2
[THIS PAGE INTENTIONALLY LEFT BLANK]
3
Management Discussions
The TCW Core Fixed Income Fund (the “Fund”) returned 3.97% and 3.66% on its I Class and N Class shares, respectively, for the year ended October 31, 2016. The performance of the Fund’s classes varies because of differing expenses. The Bloomberg Barclays Aggregate Bond Index, the Fund’s benchmark, returned 4.37% for the same period.
Given the Fund’s defensive duration position, the decline in intermediate and long U.S. Treasury rates over the year was a drag on performance. Returns were also held back by the Fund’s underweight to corporate and non-corporate credit. However, the underperformance was partially offset by contributions from the allocation to structured products, particularly the off-Index allocation to Federal Family Educational Loan Program “FFELP” student loan asset-backed securities “ABS”, which tightened as uncertainty dissipated once rating actions by Moody’s and Fitch began to materialize and proved less negative than markets expected. Non-agency MBS also contributed as the sector benefitted from strong technicals and improving fundamentals, as well as from the recent Countrywide settlement, which provided an influx of cash and better bids from dealers as settlement paydowns and subsequent write-ups helped improve capital levels. Finally, the overweight to commercial mortgage-backed securities “CMBS” benefitted the Fund, as the sector rallied along with credit markets over the course of the year and benefited from a favorable technical landscape characterized by a lack of issuance.
With spreads tightening across credit markets and the most vulnerable sectors of the market defying fundamentals, investors may be overestimating the ability of strong technical factors, such as foreign demand and massive yield-seeking investor behavior, to continue supporting markets. Mounting evidence that markets are late in the credit cycle warrants an elevated degree of caution and a strict focus on fundamentals. Consequently, we believe the Fund remains defensively positioned and prepared for better risk-adjusted return opportunities as the credit cycle extends. The duration profile remains shorter than the Index, while the allocation among non-government fixed income sectors is conservative. Corporate credit remains a relative underweight and slightly favors financials over industrials. Securitized products continue to offer opportunities for attractive risk-adjusted returns, and positioning favors high quality, more senior positions. Non-agency MBS remains attractive as fundamentals continue to improve; however, security selection is increasingly important as prices rise and more favorable assumptions are built into pricing. Agency MBS positioning is moderately underweight compared to the Index but represents a good liquid alternative to Treasuries and defensive coverage. CMBS holdings favor agency issues given relatively good risk-adjusted returns and muted credit risk. Finally, the ABS overweight is focused on bonds backed by FFELP student loans, which provide government guaranteed credit at a significant yield premium versus comparable Treasuries.
4
TCW Core Fixed Income Fund
Management Discussions (Continued)
| Annualized Return(1) | ||||||||||||||||||||||||
| 1 Yr Return | 3 Yr Return | 5 Yr Return | 10 Yr Return | Inception Fund | Inception Index | |||||||||||||||||||
TCW Core Fixed Income Fund | ||||||||||||||||||||||||
Class I – 01/01/1990 | 3.97 | % | 3.11 | % | 3.25 | % | 5.92 | % | 6.27 | %(2) | 6.25 | % | ||||||||||||
Class N – 02/26/1999 | 3.66 | % | 2.77 | % | 2.93 | % | 5.60 | % | 5.39 | % | 5.15 | % | ||||||||||||
Bloomberg Barclays Aggregate Bond Index | 4.37 | % | 3.48 | % | 2.90 | % | 4.64 | % | ||||||||||||||||
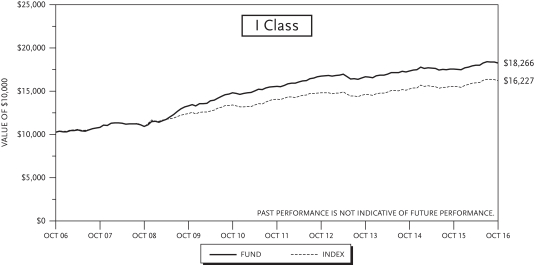

| (1) | The total returns do not reflect taxes that a shareholder would pay on fund distributions or on the redemption of fund shares. |
| (2) | Performance data includes the performance of the predecessor entity for periods before the Fund’s registration became effective. The predecessor entity was not registered under the 1940 Act and, therefore, was not subject to certain investment restrictions that are imposed by the 1940 Act. If the predecessor entity had been registered under the 1940 Act, the predecessor entity’s performance may have been lower. |
5
TCW Enhanced Commodity Strategy Fund
Management Discussions
The TCW Enhanced Commodity Strategy Fund (the “Fund”) had a negative return of 1.83% and 2.03% on its I Class and N Class shares, respectively, for the year ended October 31, 2016. The performance of the Fund’s classes varies because of differing expenses. The Bloomberg Commodity Total Return Index, the Fund’s benchmark, also had a negative return of 2.62% for the same period.
The Fund outperformed the Index by 79 bps due to having broad sector exposure. Specifically, outperformance was driven by the allocation to corporate credit and the Fund’s emphasis on securitized products, particularly non-agency MBS. In addition to strong technicals and improving fundamentals, the non-agency mortgage-backed securities (“MBS”) sector benefitted from the recent Countrywide settlement, which provided an influx of cash and better bids from dealers as settlement paydowns and subsequent write-ups helped improve capital levels. Returns also benefitted from a small allocation to commercial MBS (“CMBS”) and asset-backed securities (“ABS”), which both outpaced duration matched Treasuries over the year by 140 and 102 bps, respectively. However, the Fund and the Index’s overall negative performance was driven primarily by the exposure to the commodity complex, which suffered substantial losses this year due to a combination of oversupply and dwindling global demand. While there has been a strong recovery in commodity prices and commodity-related sectors since mid-February, these gains have not fully made up for Index losses that reached as high as 25% in December 2015.
With spreads tightening across credit markets and the most vulnerable sectors of the market defying fundamentals, investors may be overestimating the ability of strong technical factors, such as foreign demand and massive yield-seeking investor behavior, to continue supporting markets. Mounting evidence that markets are late in the credit cycle warrants an elevated degree of caution and a strict focus on fundamentals. Consequently, we believe the Fund remains defensively positioned and prepared for better risk-adjusted return opportunities as the credit cycle extends. The duration profile remains short, while the allocation among non-government fixed income sectors is conservative. Corporate credit remains a relative underweight and favors financials over industrials. Securitized products continue to offer opportunities for attractive risk-adjusted returns, and positioning favors high quality, more senior positions. Non-agency MBS remains attractive as fundamentals continue to improve; however, security selection is increasingly important as prices rise and more favorable assumptions are built into pricing. CMBS holdings favor agency issues given relatively good risk-adjusted returns and muted credit risk. Finally, the ABS overweight is focused on bonds backed by Federal Family Education Loan Program (“FFELP”) student loans, which provide government guaranteed credit at a significant yield premium versus comparable Treasuries.
6
TCW Enhanced Commodity Strategy Fund
Management Discussions (Continued)
| Annualized Return(1) | ||||||||||||||||
| 1 Yr Return | 3 Yr Return | 5 Yr Return | Inception | |||||||||||||
TCW Enhanced Commodity Strategy Fund | ||||||||||||||||
Class I – 03/31/2011 | (1.83 | )% | (11.08 | )% | (8.45 | )% | (9.65 | )% | ||||||||
Class N – 03/31/2011 | (2.03 | )% | (11.10 | )% | (8.47 | )% | (9.66 | )% | ||||||||
Bloomberg Commodity Total Return Index | (2.62 | )% | (12.05 | )% | (10.61 | )% | (11.55 | )% | ||||||||
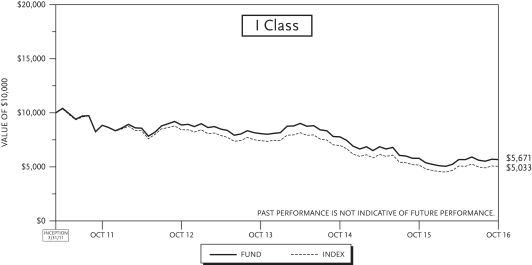

| (1) | The total returns do not reflect taxes that a shareholder would pay on fund distributions or on the redemption of fund shares. |
7
TCW Global Bond Fund
Management Discussions
The TCW Global Bond Fund (the “Fund”) returned 4.03% for the year ended October 31, 2016. The Bloomberg Barclays Global Aggregate Index, the Fund’s benchmark, returned 5.59% for the same period.
The Fund’s defensive duration position weighed on relative performance as sovereign and U.S. rates declined over the year. Performance was held back by the Fund’s large exposure to the U.S., which underperformed global credit markets on a total-return basis and only slightly outperformed global markets on a duration-neutral basis as spreads in the U.S. tightened on the surge in demand for higher-yielding U.S. assets. At the same time, performance was supported by an emphasis on Spain and high quality emerging markets such as Romania. In terms of sector exposure, the relative underweight to industrial credit and non-U.S. sovereign debt weighed on performance as both outpaced duration-matched Treasuries as the demand for yield and recovery in oil prices drove a sustained rally in those sectors that were most affected by the January sell-off. The underperformance was partially offset by the Fund’s emphasis on U.S. securitized products, particularly the emphasis on FFELP student loan ABS, which tightened throughout the year as uncertainty dissipated once rating actions by Moody’s and Fitch began to materialize and proved less negative than markets anticipated. Finally, the Fund’s small allocation to U.S. high yield also contributed to returns as the sector significantly outpaced the Index.
With spreads tightening across credit markets and the most vulnerable sectors of the market defying fundamentals, investors may be overestimating the ability of strong technical factors, such as foreign demand and massive yield-seeking investor behavior, to continue supporting markets. Mounting evidence that markets are late in the credit cycle warrants an elevated degree of caution and a strict focus on fundamentals. Consequently, we believe the Fund remains defensively positioned and prepared for better risk-adjusted return opportunities as the credit cycle extends. Exposure primarily to the U.S. remains appropriate given the challenged growth outlook in other developed markets and the risks to emerging markets from a normalization of monetary policy in the U.S. Global currency and country exposure will remain focused on high quality developed market sovereigns and on select emerging markets where the macroeconomic fundamentals are strong. The duration profile remains shorter than the Index, while the allocation among non-government fixed income sectors is conservative. Corporate credit remains a relative underweight and favors financials over industrials. The Fund’s small allocation to high yield focuses on higher quality holdings that will likely have the credit resilience to withstand late cycle volatility. Securitized products continue to offer opportunities for attractive risk-adjusted returns and positioning favors high quality, more senior positions. Non-agency MBS remains attractive as fundamentals continue to improve, however, security selection is increasingly important as prices rise and more favorable assumptions are built into pricing. Agency MBS positioning is largely in line with the Index and represents a good liquid alternative to Treasuries and defensive coverage. CMBS holdings favor agency issues given relatively good risk-adjusted returns and muted credit risk. The ABS overweight is focused on bonds backed by FFELP student loans, which provide government guaranteed credit at a significant yield premium versus comparable Treasuries.
8
TCW Global Bond Fund
Management Discussions (Continued)
| Annualized Return(1) | ||||||||||||
| 1 Yr Return | 3 Yr Return | Inception | ||||||||||
TCW Global Bond Fund | ||||||||||||
Class I – 11/30/2011 | 4.03 | % | 0.39 | % | 2.61 | % | ||||||
Class N – 11/30/2011 | 4.03 | % | 0.39 | % | 2.61 | % | ||||||
Bloomberg Barclays Global Aggregate Index | 5.59 | % | 0.85 | % | 1.27 | % | ||||||
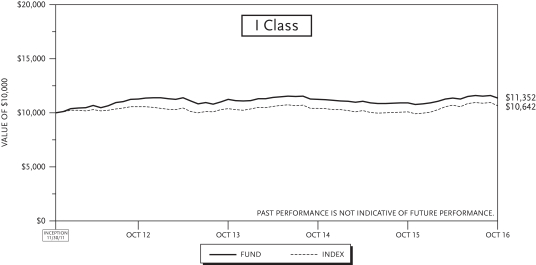
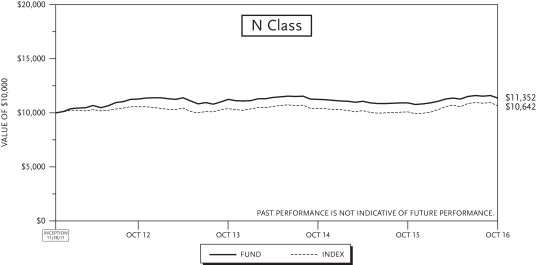
| (1) | The total returns do not reflect taxes that a shareholder would pay on fund distributions or on the redemption of fund shares. |
9
TCW High Yield Bond Fund
Management Discussions
The TCW High Yield Bond Fund (the “Fund”) returned 5.06% and 4.82% for its I Class and N Class shares, respectively, for the year ended October 31, 2016. The performance of the Fund’s classes varies because of differing expenses. The Citigroup High Yield Cash Pay Custom Index, the Fund’s benchmark, returned 9.54% over the same period.
Despite the positive absolute returns, performance relative to the Index has disappointed, with a lag of 448 bps largely due to the highly defensive orientation as accommodative central bank policy and late cycle appetite for risk sustained a vigorous rally that weighed on nearly all the strategies deployed in Fund construction. Hindering performance in particular was the relative underweight to the basic industry sector, specifically the minimal exposure to energy and metals & mining (EMM), as these sectors posted exceptional returns. The overall higher quality emphasis was also a drag as lower rated cohorts outperformed. Meanwhile, the Fund’s defensive duration position weighed on returns as intermediate and long U.S. Treasury rates were lower over the year, with the 10-Year U.S. Treasury yield down by over 31 bps. From an issuer perspective, former GE affiliate Homer City proceeded with its restructuring, with prices easing and detracting from performance over the past twelve months.
With spreads tightening across credit markets and the most vulnerable sectors defying fundamentals, investors may be overestimating the ability of strong technical factors, such as foreign demand and massive yield-seeking investor behavior, to continue supporting markets longer term. Mounting evidence that we are late in the credit cycle warrants an elevated degree of caution and a strict focus on fundamentals. Consequently, we believe the Fund remains defensively positioned and prepared for better risk-adjusted return opportunities as the credit cycle extends. The Fund’s duration profile remains shorter than that of the Index, while sector allocation is conservative, favoring higher quality, asset heavy, and lower beta holdings that will likely have the credit resilience to withstand late cycle volatility. While the recent underperformance to the benchmark is disappointing, confidence remains that the current defensive posture of the Fund has positioned it to capture value as the cycle eventually turns.
10
TCW High Yield Bond Fund
Management Discussions (Continued)
| Annualized Return(1) | ||||||||||||||||||||||||
| 1 Yr Return | 3 Yr Return | 5 Yr Return | 10 Yr Return | Inception Fund | Inception Index | |||||||||||||||||||
TCW High Yield Bond Fund | ||||||||||||||||||||||||
Class I – 02/01/1989 | 5.06 | % | 4.00 | % | 6.05 | % | 5.95 | % | 7.26 | %(2) | 8.04 | % | ||||||||||||
Class N – 02/26/1999 | 4.82 | % | 3.79 | % | 5.87 | % | 5.74 | % | 5.27 | % | 6.74 | % | ||||||||||||
Citigroup High Yield Cash Pay Custom Index | 9.54 | % | 3.95 | % | 6.58 | % | 7.08 | % | ||||||||||||||||

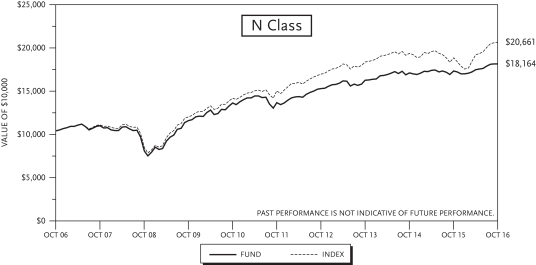
| (1) | The total returns do not reflect taxes that a shareholder would pay on fund distributions or on the redemption of fund shares. |
| (2) | Performance data includes the performance of the predecessor entity for periods before the Fund’s registration became effective. The predecessor entity was not registered under the 1940 Act and, therefore, was not subject to certain investment restrictions that are imposed by the 1940 Act. If the predecessor entity had been registered under the 1940 Act, the predecessor entity’s performance may have been lower. |
11
TCW Short Term Bond Fund
Management Discussions
The TCW Short Term Bond Fund (the “Fund”) returned 0.84% for the year ended October 31, 2016. The Citigroup 1-Year Treasury Index, the Fund’s benchmark, returned 0.61% for the same period.
Returns benefitted from the broad sector exposure in the Fund. Specifically, outperformance was driven by the allocation to corporate credit, with REITs and banking contributing the most. Returns also benefitted from the emphasis on structured products, particularly commercial MBS, which outperformed duration-matched Treasuries by 140 bps. Also additive to performance was the Fund’s exposure to non-agency MBS. In addition to strong technicals and improving fundamentals, the non-agency MBS sector benefitted from the recent Countrywide settlement, which provided an influx of cash and better bids from dealers as settlement paydowns and subsequent write-ups helped improve capital levels. Finally, the defensive duration profile of the Fund was rewarded by the modest increase in short Treasury rates throughout the quarter, adding to relative performance.
With spreads tightening across credit markets and the most vulnerable sectors of the market defying fundamentals, investors may be overestimating the ability of strong technical factors, such as foreign demand and massive yield-seeking investor behavior, to continue supporting markets. Mounting evidence that markets are late in the credit cycle warrants an elevated degree of caution and a strict focus on fundamentals. Consequently, we believe the Fund remains defensively positioned and prepared for better risk-adjusted return opportunities as the credit cycle extends. The duration profile remains shorter than the Index, while the allocation among non-government fixed income sectors is conservative. Corporate credit positioning maintains a preference for financials over industrials, while securitized products continue to offer opportunities for attractive risk-adjusted returns, with a focus on high quality, more senior positions. Non-agency MBS remains attractive as fundamentals continue to improve, however, security selection is increasingly important as prices rise and more favorable assumptions are built into pricing. Agency MBS holdings are focused in short, well-structured CMOs given relatively stable duration profiles, while CMBS positioning favors agency issues given relatively good risk-adjusted returns and muted credit risk.
12
TCW Short Term Bond Fund
Management Discussions (Continued)
| Annualized Return(1) | ||||||||||||||||||||
| 1 Yr Return | 3 Yr Return | 5 Yr Return | 10 Yr Return | Inception | ||||||||||||||||
TCW Short Term Bond Fund | ||||||||||||||||||||
Class I – 02/01/1990 | 0.84 | % | 0.58 | % | 1.03 | % | 1.92 | % | 4.09 | %(2) | ||||||||||
Citigroup 1 Year Treasury Index | 0.61 | % | 0.39 | % | 0.35 | % | 1.50 | % | 3.67 | % | ||||||||||

| (1) | The total returns do not reflect taxes that a shareholder would pay on fund distributions or on the redemption of fund shares. |
| (2) | Performance data includes the performance of the predecessor entity for periods before the Fund’s registration became effective. The predecessor entity was not registered under the 1940 Act and, therefore, was not subject to certain investment restrictions that are imposed by the 1940 Act. If the predecessor entity had been registered under the 1940 Act, the predecessor entity’s performance may have been lower. |
13
TCW Total Return Bond Fund
Management Discussions
The TCW Total Return Bond Fund (the “Fund”) returned 3.63% and 3.35% on its I Class and N Class shares, respectively, for the year ended October 31, 2016. The performance of the Fund’s classes varies because of differing expenses. The Bloomberg Barclays Aggregate Bond Index, the Fund’s benchmark, returned 4.37% for the same period.
The decline in intermediate and long Treasury rates over the year cost relative performance against the benchmark as the Fund continued with its short duration profile. Also detracting from performance was the lack of exposure to corporate and non-corporate credit in the Fund, which significantly outperformed over the year as demand for higher-yielding U.S. assets pushed investors out of the risk spectrum and drove impressive returns for the sector. Outside of the corporate space, underperformance was partially offset by the off-Index allocation to non-agency MBS. In addition to strong technicals and improving fundamentals, the sector benefitted from the recent Countrywide settlement, which provided an influx of cash and better bids from dealers as settlement paydowns and subsequent write-ups helped improve capital levels. Also additive to performance was the allocation to FFELP student loan ABS, which tightened as uncertainty dissipated once rating actions by Moody’s and Fitch began to materialize and proved less negative than markets expected. The overweight to CMBS also benefitted the Fund, as the sector rallied along with credit markets over the course of the year and benefited from a favorable technical landscape characterized by a lack of issuance.
With spreads tightening across credit markets and the most vulnerable sectors of the market defying fundamentals, investors may be overestimating the ability of strong technical factors, such as foreign demand and massive yield-seeking investor behavior, to continue supporting markets. Mounting evidence that markets are late in the credit cycle warrants an elevated degree of caution and a strict focus on fundamentals. Consequently, we believe the Fund remains defensively positioned and prepared for better risk-adjusted return opportunities as the credit cycle extends. The duration profile remains shorter than the Index, while the allocation among non-government fixed income sectors is conservative. Corporate credit remains absent in the Fund given the mortgage focus, while securitized products continue to offer opportunities for attractive risk-adjusted returns, and positioning favors high quality, more senior positions. Non-agency MBS remains attractive as fundamentals continue to improve, however, security selection is increasingly important as prices rise and more favorable assumptions are built into pricing. Agency MBS continues to represent a core position in the Fund, with positioning focused on new production specified pools that offer better carry, and liquidity benefits. Additionally, the Fund maintains an allocation to collateralized mortgage obligations (CMOs), including floating rate issues, which help protect against rising interest rates. CMBS holdings favor agency issues given relatively good risk-adjusted returns and muted credit risk. Finally, the ABS overweight is focused on bonds backed by FFELP student loans, which provide government guaranteed credit at a significant yield premium versus comparable Treasuries.
14
TCW Total Return Bond Fund
Management Discussions (Continued)
| Annualized Return(1) | ||||||||||||||||||||||||
| 1 Yr Return | 3 Yr Return | 5 Yr Return | 10 Yr Return | Inception Fund | Inception Index | |||||||||||||||||||
TCW Total Return Bond Fund | ||||||||||||||||||||||||
Class I – 06/17/1993 | 3.63 | % | 3.45 | % | 5.13 | % | 6.78 | % | 6.72 | % | 5.54 | % | ||||||||||||
Class N – 02/26/1999 | 3.35 | % | 3.13 | % | 4.82 | % | 6.46 | % | 6.28 | % | 5.15 | % | ||||||||||||
Bloomberg Barclays Aggregate Bond Index | 4.37 | % | 3.48 | % | 2.90 | % | 4.64 | % | ||||||||||||||||
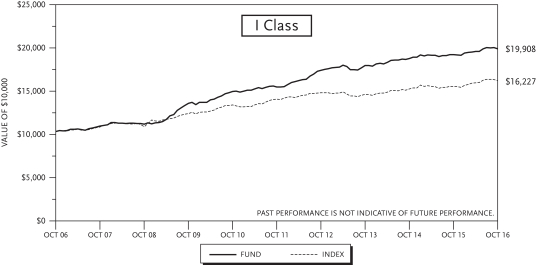
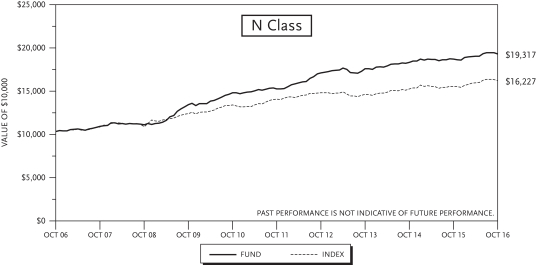
| (1) | The total returns do not reflect taxes that a shareholder would pay on fund distributions or on the redemption of fund shares. |
15
| Principal Amount | Fixed Income Securities | Value | ||||||||||
Corporate Bonds (23.6% of Net Assets) | ||||||||||||
Airlines (0.5%) | ||||||||||||
| $ | 1,866,844 | America West Airlines, Inc. Pass-Through Certificates, (01-1), | $ | 2,044,194 | ||||||||
| 36,866 | Continental Airlines, Inc. Pass-Through Certificates, (00-2-A1), | 40,161 | ||||||||||
| 980,784 | Continental Airlines, Inc. Pass-Through Certificates, (07-1-A), | 1,107,059 | ||||||||||
| 692,376 | Continental Airlines, Inc. Pass-Through Certificates, (09-2-A1), | 781,520 | ||||||||||
| 687,351 | Continental Airlines, Inc. Pass-Through Certificates, (99-1-A), | 727,321 | ||||||||||
| 494,900 | Northwest Airlines LLC Pass-Through Certificates, (01-1-A1), | 569,432 | ||||||||||
| 483,694 | US Airways Group, Inc. Pass-Through Certificates, (10-1A), | 548,993 | ||||||||||
| 1,973,144 | US Airways Group, Inc. Pass-Through Certificates, (12-1A), | 2,271,583 | ||||||||||
| 796,263 | US Airways Group, Inc. Pass-Through Certificates, (12-2-A), | 868,922 | ||||||||||
|
| |||||||||||
Total Airlines | 8,959,185 | |||||||||||
|
| |||||||||||
Auto Manufacturers (0.6%) | ||||||||||||
| 3,000,000 | Ford Motor Credit Co. LLC, 1.461%, due 03/27/17 | 3,002,274 | ||||||||||
| 3,000,000 | Ford Motor Credit Co. LLC, 1.816%, due 01/09/18 (1) | 3,012,723 | ||||||||||
| 450,000 | Ford Motor Credit Co. LLC, 8%, due 12/15/16 | 453,776 | ||||||||||
| 1,680,000 | General Motors Co., 6.6%, due 04/01/36 | 1,982,736 | ||||||||||
| 2,500,000 | General Motors Financial Co., Inc., 3.1%, due 01/15/19 | 2,546,750 | ||||||||||
|
| |||||||||||
Total Auto Manufacturers | 10,998,259 | |||||||||||
|
| |||||||||||
Banks (6.5%) | ||||||||||||
| 1,500,000 | Bank of America Corp., 1.716%, due 04/01/19 (1) | 1,505,949 | ||||||||||
| 3,000,000 | Bank of America Corp., 3.3%, due 01/11/23 | 3,090,156 | ||||||||||
| 2,675,000 | Bank of America Corp., 4.125%, due 01/22/24 | 2,875,309 | ||||||||||
| 1,910,000 | Bank of America Corp., 5%, due 05/13/21 | 2,119,674 | ||||||||||
| 1,100,000 | Bank of America Corp., 5.65%, due 05/01/18 | 1,163,389 | ||||||||||
| 8,200,000 | Bank of America Corp., 6.875%, due 04/25/18 | 8,828,276 | ||||||||||
| 1,000,000 | Bank of America N.A., 1.15%, due 06/15/17 (1) | 999,768 | ||||||||||
| 1,250,000 | Bank of America N.A., 5.3%, due 03/15/17 | 1,268,229 | ||||||||||
| 5,300,000 | Bank of America N.A., 6.1%, due 06/15/17 | 5,447,046 | ||||||||||
| 2,450,000 | Capital One N.A., 2.35%, due 08/17/18 | 2,479,334 | ||||||||||
| 1,000,000 | Chase Capital VI, 1.381%, due 08/01/28 (1) | 903,750 | ||||||||||
| 4,000,000 | Citigroup, Inc., 1.55%, due 08/14/17 | 4,008,248 | ||||||||||
| 5,000,000 | Citigroup, Inc., 1.8%, due 02/05/18 | 5,010,975 | ||||||||||
| 1,000,000 | Citigroup, Inc., 6.125%, due 11/21/17 | 1,048,350 | ||||||||||
| 2,666,000 | Discover Bank/Greenwood DE, 3.1%, due 06/04/20 | 2,742,448 | ||||||||||
| 1,500,000 | Discover Bank/Greenwood DE, 4.2%, due 08/08/23 | 1,601,340 | ||||||||||
See accompanying notes to financial statements.
16
TCW Core Fixed Income Fund
October 31, 2016 |
| Principal Amount | Fixed Income Securities | Value | ||||||||||
Banks (Continued) | ||||||||||||
| $ | 1,495,000 | Discover Bank/Greenwood DE, 7%, due 04/15/20 | $ | 1,694,686 | ||||||||
| 475,000 | First Chicago NBD Institutional Capital I, 1.31%, due 02/01/27 (1) | 436,250 | ||||||||||
| 2,435,000 | Goldman Sachs Group, Inc. (The), 3.85%, due 07/08/24 | 2,576,078 | ||||||||||
| 1,000,000 | Goldman Sachs Group, Inc. (The), 5.25%, due 07/27/21 | 1,124,730 | ||||||||||
| 2,000,000 | Goldman Sachs Group, Inc. (The), 5.95%, due 01/18/18 | 2,104,892 | ||||||||||
| 50,000 | Goldman Sachs Group, Inc. (The), 6%, due 06/15/20 | 56,639 | ||||||||||
| 4,050,000 | Goldman Sachs Group, Inc. (The), 6.15%, due 04/01/18 | 4,300,719 | ||||||||||
| 4,000,000 | HBOS PLC (United Kingdom), (144A), 6.75%, due 05/21/18 (2) | 4,256,952 | ||||||||||
| 3,600,000 | JPMorgan Chase & Co., 2.7%, due 05/18/23 | 3,614,566 | ||||||||||
| 4,100,000 | JPMorgan Chase & Co., 6%, due 01/15/18 | 4,317,279 | ||||||||||
| 2,475,000 | JPMorgan Chase & Co., 7.25%, due 02/01/18 | 2,647,404 | ||||||||||
| 8,875,000 | JPMorgan Chase Bank N.A., 6%, due 10/01/17 | 9,245,434 | ||||||||||
| 730,000 | JPMorgan Chase Capital XIII, 1.788%, due 09/30/34 (1) | 636,925 | ||||||||||
| 3,250,000 | JPMorgan Chase Capital XXI, 1.709%, due 01/15/87 (1) | 2,746,250 | ||||||||||
| 2,000,000 | JPMorgan Chase Capital XXIII, 1.817%, due 05/15/77 (1) | 1,600,000 | ||||||||||
| 850,000 | Lloyds TSB Bank PLC (United Kingdom), (144A), 5.8%, due 01/13/20 (2) | 946,390 | ||||||||||
| 1,500,000 | Morgan Stanley, 4.75%, due 03/22/17 | 1,521,612 | ||||||||||
| 575,000 | Morgan Stanley, 5.45%, due 01/09/17 | 579,755 | ||||||||||
| 600,000 | Morgan Stanley, 5.5%, due 07/24/20 | 668,623 | ||||||||||
| 1,750,000 | Morgan Stanley, 5.625%, due 09/23/19 | 1,929,369 | ||||||||||
| 975,000 | Morgan Stanley, 6.625%, due 04/01/18 | 1,041,354 | ||||||||||
| 5,870,000 | Morgan Stanley, 7.3%, due 05/13/19 | 6,641,289 | ||||||||||
| 3,100,000 | Santander UK PLC (United Kingdom), 1.65%, due 09/29/17 | 3,112,271 | ||||||||||
| 3,305,000 | UBS AG (Switzerland), 1.8%, due 03/26/18 | 3,315,341 | ||||||||||
| 5,000,000 | Wachovia Corp., 5.75%, due 02/01/18 | 5,258,343 | ||||||||||
| 1,790,000 | Wells Fargo & Co., 2.5%, due 03/04/21 | 1,811,093 | ||||||||||
| 2,355,000 | Wells Fargo & Co., 2.6%, due 07/22/20 | 2,400,729 | ||||||||||
| 7,765,000 | Wells Fargo & Co., 3%, due 04/22/26 | 7,752,646 | ||||||||||
|
| |||||||||||
Total Banks | 123,429,860 | |||||||||||
|
| |||||||||||
Beverages (0.4%) | ||||||||||||
| 5,698,000 | Anheuser-Busch InBev Finance, Inc., 3.65%, due 02/01/26 | 6,018,780 | ||||||||||
| 1,180,000 | Molson Coors Brewing Co., 3%, due 07/15/26 | 1,172,143 | ||||||||||
|
| |||||||||||
Total Beverages | 7,190,923 | |||||||||||
|
| |||||||||||
Biotechnology (0.6%) | ||||||||||||
| 620,000 | Amgen, Inc., 4.4%, due 05/01/45 | 632,958 | ||||||||||
| 1,402,000 | Amgen, Inc., (144A), 4.663%, due 06/15/51 (2) | 1,450,912 | ||||||||||
| 2,450,000 | Biogen, Inc., 5.2%, due 09/15/45 | 2,771,860 | ||||||||||
| 2,200,000 | Celgene Corp., 5%, due 08/15/45 | 2,386,766 | ||||||||||
| 3,000,000 | Gilead Sciences, Inc., 3.25%, due 09/01/22 | 3,153,828 | ||||||||||
| 1,905,000 | Gilead Sciences, Inc., 4.15%, due 03/01/47 | 1,895,843 | ||||||||||
|
| |||||||||||
Total Biotechnology | 12,292,167 | |||||||||||
|
| |||||||||||
Chemicals (0.0%) | ||||||||||||
| 101,000 | Rohm and Haas Co., 6%, due 09/15/17 | 104,926 | ||||||||||
|
| |||||||||||
See accompanying notes to financial statements.
17
TCW Core Fixed Income Fund
Schedule of Investments (Continued)
| Principal Amount | Fixed Income Securities | Value | ||||||||||
Computers (0.2%) | ||||||||||||
| $ | 4,045,000 | Apple, Inc., 4.65%, due 02/23/46 | $ | 4,475,772 | ||||||||
|
| |||||||||||
Diversified Financial Services (0.9%) | ||||||||||||
| 3,000,000 | American Express Co., 7%, due 03/19/18 | 3,224,643 | ||||||||||
| 425,000 | GE Capital International Funding Co. Unlimited Co. (Ireland), | 464,484 | ||||||||||
| 4,000,000 | International Lease Finance Corp., (144A), 7.125%, due 09/01/18 (2) | 4,357,500 | ||||||||||
| 2,875,000 | Protective Life Global Funding, (144A), 1.391%, due 06/08/18 (1)(2) | 2,881,955 | ||||||||||
| 4,000,000 | Protective Life Global Funding, (144A), 1.722%, due 04/15/19 (2) | 4,004,312 | ||||||||||
| 2,270,000 | Visa, Inc., 3.15%, due 12/14/25 | 2,368,934 | ||||||||||
|
| |||||||||||
Total Diversified Financial Services | 17,301,828 | |||||||||||
|
| |||||||||||
Electric (2.6%) | ||||||||||||
| 1,500,000 | Appalachian Power Co., 4.45%, due 06/01/45 | 1,629,833 | ||||||||||
| 1,800,000 | Berkshire Hathaway Energy Co., 5.95%, due 05/15/37 | 2,317,351 | ||||||||||
| 2,400,000 | Black Hills Corp., 3.15%, due 01/15/27 | 2,410,532 | ||||||||||
| 3,910,000 | Commonwealth Edison Co., 3.65%, due 06/15/46 | 3,911,779 | ||||||||||
| 2,000,000 | Dominion Resources, Inc., 4.104%, due 04/01/21 | 2,143,838 | ||||||||||
| 2,800,000 | Duke Energy Progress LLC, 3.7%, due 10/15/46 | 2,806,213 | ||||||||||
| 2,250,000 | El Paso Electric Co., 3.3%, due 12/15/22 | 2,266,733 | ||||||||||
| 3,684,000 | Emera US Finance LP, (144A), 2.15%, due 06/15/19 (2) | 3,716,684 | ||||||||||
| 2,000,000 | Entergy Corp., 4.7%, due 01/15/17 | 2,008,288 | ||||||||||
| 3,000,000 | Entergy Mississippi, Inc., 3.1%, due 07/01/23 | 3,061,724 | ||||||||||
| 1,585,000 | FirstEnergy Transmission LLC, (144A), 4.35%, due 01/15/25 (2) | 1,685,733 | ||||||||||
| 1,000,000 | Indiana Michigan Power Co., 4.55%, due 03/15/46 | 1,101,422 | ||||||||||
| 4,000,000 | ITC Holdings Corp., 3.25%, due 06/30/26 | 4,039,856 | ||||||||||
| 4,000,000 | Kansas City Power & Light Co., 3.15%, due 03/15/23 | 4,099,152 | ||||||||||
| 1,100,000 | KCP&L Greater Missouri Operations Co., 8.27%, due 11/15/21 | 1,327,426 | ||||||||||
| 3,300,000 | Metropolitan Edison Co., (144A), 3.5%, due 03/15/23 (2) | 3,382,531 | ||||||||||
| 1,000,000 | Niagara Mohawk Power Corp., (144A), 2.721%, due 11/28/22 (2) | 1,016,515 | ||||||||||
| 150,000 | Oncor Electric Delivery Co. LLC, 5.25%, due 09/30/40 | 186,738 | ||||||||||
| 2,545,000 | Public Service Co. of New Mexico, 7.949%, due 05/15/18 | 2,791,623 | ||||||||||
| 1,980,000 | Puget Energy, Inc., 6%, due 09/01/21 | 2,284,001 | ||||||||||
| 1,000,000 | Southwestern Electric Power Co., 6.45%, due 01/15/19 | 1,096,752 | ||||||||||
| 1,000,000 | Tucson Electric Power Co., 5.15%, due 11/15/21 | 1,109,926 | ||||||||||
|
| |||||||||||
Total Electric | 50,394,650 | |||||||||||
|
| |||||||||||
Energy-Alternate Sources (0.1%) | ||||||||||||
| 1,138,487 | Alta Wind Holdings LLC, (144A), 7%, due 06/30/35 (2)(3) | 1,180,023 | ||||||||||
|
| |||||||||||
Environmental Control (0.1%) | ||||||||||||
| 2,075,000 | Republic Services, Inc., 2.9%, due 07/01/26 | 2,076,614 | ||||||||||
|
| |||||||||||
Food (0.6%) | ||||||||||||
| 2,467,000 | Kraft Heinz Foods Co., 1.6%, due 06/30/17 | 2,472,181 | ||||||||||
| 1,500,000 | Kraft Heinz Foods Co., 3%, due 06/01/26 | 1,486,200 | ||||||||||
| 1,250,000 | Kraft Heinz Foods Co., 3.95%, due 07/15/25 | 1,338,805 | ||||||||||
| 1,700,000 | Kraft Heinz Foods Co., 4.375%, due 06/01/46 | 1,734,871 | ||||||||||
See accompanying notes to financial statements.
18
TCW Core Fixed Income Fund
October 31, 2016 |
| Principal Amount | Fixed Income Securities | Value | ||||||||||
Food (Continued) | ||||||||||||
| $ | 143,000 | Kraft Heinz Foods Co., 5.375%, due 02/10/20 | $ | 158,261 | ||||||||
| 3,000,000 | Kraft Heinz Foods Co., 6.125%, due 08/23/18 | 3,240,688 | ||||||||||
|
| |||||||||||
Total Food | 10,431,006 | |||||||||||
|
| |||||||||||
Gas (0.4%) | ||||||||||||
| 1,750,000 | CenterPoint Energy Resources Corp., 6.25%, due 02/01/37 | 2,072,494 | ||||||||||
| 3,265,000 | KeySpan Gas East Corp., (144A), 5.819%, due 04/01/41 (2) | 4,071,386 | ||||||||||
| 400,000 | NiSource Finance Corp., 6.8%, due 01/15/19 | 443,447 | ||||||||||
|
| |||||||||||
Total Gas | 6,587,327 | |||||||||||
|
| |||||||||||
Healthcare-Products (0.0%) | ||||||||||||
| 250,000 | Covidien International Finance S.A. (Ireland), 6%, due 10/15/17 | 261,008 | ||||||||||
|
| |||||||||||
Healthcare-Services (1.8%) | ||||||||||||
| 4,300,000 | Aetna, Inc., 1.7%, due 06/07/18 | 4,320,837 | ||||||||||
| 2,450,000 | Anthem, Inc., 1.875%, due 01/15/18 | 2,461,211 | ||||||||||
| 175,000 | Anthem, Inc., 5.875%, due 06/15/17 | 179,932 | ||||||||||
| 2,545,000 | Hartford HealthCare Corp., 5.746%, due 04/01/44 | 3,142,789 | ||||||||||
| 4,105,000 | New York and Presbyterian Hospital (The), 3.563%, due 08/01/36 | 4,192,164 | ||||||||||
| 3,000,000 | North Shore Long Island Jewish Health Care, Inc., 4.8%, due 11/01/42 | 3,200,460 | ||||||||||
| 1,305,000 | North Shore Long Island Jewish Health Care, Inc., 6.15%, due 11/01/43 | 1,705,402 | ||||||||||
| 3,000,000 | NYU Hospitals Center, 4.428%, due 07/01/42 | 3,098,502 | ||||||||||
| 60,000 | NYU Hospitals Center, 5.75%, due 07/01/43 | 75,770 | ||||||||||
| 3,860,000 | Providence Health & Services Obligated Group, 1.796%, due 10/01/17 (1) | 3,868,630 | ||||||||||
| 3,290,000 | Saint Barnabas Health Care System, 4%, due 07/01/28 | 3,536,750 | ||||||||||
| 2,270,000 | Sutter Health, 2.286%, due 08/15/53 | 2,292,700 | ||||||||||
| 2,460,000 | UnitedHealth Group, Inc., 4.625%, due 07/15/35 | 2,809,918 | ||||||||||
|
| |||||||||||
Total Healthcare-Services | 34,885,065 | |||||||||||
|
| |||||||||||
Insurance (1.0%) | ||||||||||||
| 2,500,000 | Berkshire Hathaway Finance Corp., 4.4%, due 05/15/42 | 2,785,236 | ||||||||||
| 2,500,000 | Berkshire Hathaway, Inc., 3.125%, due 03/15/26 | 2,598,015 | ||||||||||
| 1,625,000 | Farmers Exchange Capital, (144A), 7.2%, due 07/15/48 (2) | 1,893,646 | ||||||||||
| 2,250,000 | Farmers Exchange Capital II, (144A), 6.151%, due 11/01/53 (1)(2) | 2,360,756 | ||||||||||
| 800,000 | MetLife, Inc., 4.368%, due 09/15/23 | 887,916 | ||||||||||
| 300,000 | MetLife, Inc., 5.7%, due 06/15/35 | 367,387 | ||||||||||
| 3,460,000 | Metropolitan Life Global Funding I, (144A), 3.875%, due 04/11/22 (2) | 3,745,287 | ||||||||||
| 4,000,000 | Pricoa Global Funding I, (144A), 1.6%, due 05/29/18 (2) | 4,016,906 | ||||||||||
| 1,000,000 | Prudential Financial, Inc., 4.5%, due 11/15/20 | 1,094,466 | ||||||||||
|
| |||||||||||
Total Insurance | 19,749,615 | |||||||||||
|
| |||||||||||
Media (0.3%) | ||||||||||||
| 4,130,000 | Charter Communications Operating LLC / Charter Communications Operating Capital, (144A), 4.908%, due 07/23/25 (2) | 4,465,975 | ||||||||||
| 200,000 | NBCUniversal Media LLC, 5.15%, due 04/30/20 | 222,744 | ||||||||||
|
| |||||||||||
Total Media | 4,688,719 | |||||||||||
|
| |||||||||||
See accompanying notes to financial statements.
19
TCW Core Fixed Income Fund
Schedule of Investments (Continued)
| Principal Amount | Fixed Income Securities | Value | ||||||||||
Mining (0.0%) | ||||||||||||
| $ | 300,000 | Southern Copper Corp. (Peru), 7.5%, due 07/27/35 | $ | 354,872 | ||||||||
|
| |||||||||||
Miscellaneous Manufacturers (0.3%) | ||||||||||||
| 565,000 | General Electric Capital Corp., 1.158%, due 05/05/26 (1) | 548,108 | ||||||||||
| 3,315,000 | General Electric Capital Corp., 1.297%, due 08/15/36 (1) | 2,896,700 | ||||||||||
| 287,000 | General Electric Capital Corp., 3.15%, due 09/07/22 | 303,884 | ||||||||||
| 2,865,000 | Siemens Financieringsmaatschappij NV (Netherlands), (144A), | 2,799,971 | ||||||||||
|
| |||||||||||
Total Miscellaneous Manufacturers | 6,548,663 | |||||||||||
|
| |||||||||||
Oil & Gas (0.1%) | ||||||||||||
| 1,000,000 | Noble Energy, Inc., 5.05%, due 11/15/44 | 1,012,874 | ||||||||||
| 1,250,000 | Shell International Finance BV (Netherlands), 4.375%, due 05/11/45 | 1,304,107 | ||||||||||
|
| |||||||||||
Total Oil & Gas | 2,316,981 | |||||||||||
|
| |||||||||||
Packaging & Containers (0.1%) | ||||||||||||
| 1,500,000 | Amcor Finance USA, Inc., (144A), 3.625%, due 04/28/26 (2) | 1,530,908 | ||||||||||
|
| |||||||||||
Pharmaceuticals (1.3%) | ||||||||||||
| 3,212,000 | AbbVie, Inc., 1.75%, due 11/06/17 | 3,223,608 | ||||||||||
| 1,500,000 | AbbVie, Inc., 1.8%, due 05/14/18 | 1,505,283 | ||||||||||
| 1,700,000 | AbbVie, Inc., 3.2%, due 05/14/26 | 1,678,637 | ||||||||||
| 2,000,000 | AbbVie, Inc., 4.7%, due 05/14/45 | 2,070,156 | ||||||||||
| 1,865,000 | Actavis Funding SCS (Luxembourg), 3.45%, due 03/15/22 | 1,938,546 | ||||||||||
| 2,600,000 | Actavis Funding SCS (Luxembourg), 3.8%, due 03/15/25 | 2,703,025 | ||||||||||
| 3,400,000 | Actavis Funding SCS (Luxembourg), 4.55%, due 03/15/35 | 3,521,302 | ||||||||||
| 2,000,000 | Baxalta, Inc., 2.875%, due 06/23/20 | 2,042,782 | ||||||||||
| 3,000,000 | Express Scripts Holding Co., 3.4%, due 03/01/27 | 2,951,610 | ||||||||||
| 3,835,000 | Shire Acquisitions Investments Ireland DAC (Ireland), 1.9%, due 09/23/19 | 3,830,486 | ||||||||||
|
| |||||||||||
Total Pharmaceuticals | 25,465,435 | |||||||||||
|
| |||||||||||
Pipelines (1.2%) | ||||||||||||
| 2,000,000 | Enbridge Energy Partners LP, 5.875%, due 10/15/25 | 2,305,867 | ||||||||||
| 1,500,000 | Energy Transfer Partners LP, 5.95%, due 10/01/43 | 1,548,928 | ||||||||||
| 2,000,000 | Florida Gas Transmission Co. LLC, (144A), 3.875%, due 07/15/22 (2) | 2,092,134 | ||||||||||
| 250,000 | Florida Gas Transmission Co. LLC, (144A), 7.9%, due 05/15/19 (2) | 282,808 | ||||||||||
| 675,000 | Panhandle Eastern Pipe Line Co. LP, 7%, due 06/15/18 | 717,111 | ||||||||||
| 825,000 | Panhandle Eastern Pipe Line Co. LP, 8.125%, due 06/01/19 | 918,902 | ||||||||||
| 2,350,000 | Ruby Pipeline LLC, (144A), 6%, due 04/01/22 (2) | 2,487,240 | ||||||||||
| 2,590,000 | Southern Natural Gas Co. LLC, 7.35%, due 02/15/31 | 2,966,667 | ||||||||||
| 2,000,000 | TC PipeLines LP, 4.375%, due 03/13/25 | 2,070,879 | ||||||||||
| 2,090,000 | Tennessee Gas Pipeline Co., 8.375%, due 06/15/32 | 2,643,152 | ||||||||||
| 1,000,000 | Texas Eastern Transmission LP, (144A), 2.8%, due 10/15/22 (2) | 998,546 | ||||||||||
| 375,000 | TransCanada PipeLines, Ltd. (Canada), 6.1%, due 06/01/40 | 481,448 | ||||||||||
| 1,350,000 | Williams Partners LP, 3.6%, due 03/15/22 | 1,375,692 | ||||||||||
| 2,000,000 | Williams Partners LP, 6.3%, due 04/15/40 | 2,142,787 | ||||||||||
|
| |||||||||||
Total Pipelines | 23,032,161 | |||||||||||
|
| |||||||||||
See accompanying notes to financial statements.
20
TCW Core Fixed Income Fund
October 31, 2016 |
| Principal Amount | Fixed Income Securities | Value | ||||||||||
Real Estate (0.1%) | ||||||||||||
| $ | 850,000 | Post Apartment Homes LP, 4.75%, due 10/15/17 | $ | 868,086 | ||||||||
|
| |||||||||||
REIT (2.4%) | ||||||||||||
| 2,250,000 | Alexandria Real Estate Equities, Inc., 4.6%, due 04/01/22 | 2,434,622 | ||||||||||
| 3,000,000 | AvalonBay Communities, Inc., 2.95%, due 09/15/22 | 3,081,606 | ||||||||||
| 1,000,000 | AvalonBay Communities, Inc., 3.95%, due 01/15/21 | 1,070,372 | ||||||||||
| 2,200,000 | Boston Properties LP, 5.875%, due 10/15/19 | 2,437,761 | ||||||||||
| 3,052,000 | Duke Realty LP, 6.5%, due 01/15/18 | 3,229,033 | ||||||||||
| 2,295,000 | HCP, Inc., 3.875%, due 08/15/24 | 2,354,776 | ||||||||||
| 1,500,000 | HCP, Inc., 5.625%, due 05/01/17 | 1,532,318 | ||||||||||
| 2,900,000 | Healthcare Realty Trust, Inc., 5.75%, due 01/15/21 | 3,280,052 | ||||||||||
| 1,459,000 | Highwoods Realty LP, 7.5%, due 04/15/18 | 1,576,077 | ||||||||||
| 2,300,000 | Kimco Realty Corp., 4.3%, due 02/01/18 | 2,362,693 | ||||||||||
| 2,150,000 | Realty Income Corp., 2%, due 01/31/18 | 2,161,608 | ||||||||||
| 2,900,000 | Realty Income Corp., 5.375%, due 09/15/17 | 2,998,824 | ||||||||||
| 2,440,000 | SL Green Realty Corp., 5%, due 08/15/18 | 2,551,856 | ||||||||||
| 1,000,000 | SL Green Realty Corp., 7.75%, due 03/15/20 | 1,158,401 | ||||||||||
| 1,500,000 | Ventas Realty LP / Ventas Capital Corp., 2.7%, due 04/01/20 | 1,531,479 | ||||||||||
| 7,340,000 | WEA Finance LLC / Westfield UK & Europe Finance PLC (Australia), (144A), | 7,361,737 | ||||||||||
| 605,000 | Welltower, Inc., 3.75%, due 03/15/23 | 631,584 | ||||||||||
| 545,000 | Welltower, Inc., 4.95%, due 01/15/21 | 600,499 | ||||||||||
| 3,400,000 | Welltower, Inc., 6.125%, due 04/15/20 | 3,848,365 | ||||||||||
|
| |||||||||||
Total REIT | 46,203,663 | |||||||||||
|
| |||||||||||
Retail (0.4%) | ||||||||||||
| 1,960,000 | CVS Health Corp., 5.125%, due 07/20/45 | 2,292,570 | ||||||||||
| 2,100,000 | Wal-Mart Stores, Inc., 4.75%, due 10/02/43 | 2,506,935 | ||||||||||
| 3,500,000 | Walgreens Boots Alliance, Inc., 3.1%, due 06/01/23 | 3,546,721 | ||||||||||
|
| |||||||||||
Total Retail | 8,346,226 | |||||||||||
|
| |||||||||||
Software (0.2%) | ||||||||||||
| 2,000,000 | Microsoft Corp., 3.75%, due 02/12/45 | 1,998,496 | ||||||||||
| 1,580,000 | Oracle Corp., 2.4%, due 09/15/23 | 1,578,035 | ||||||||||
|
| |||||||||||
Total Software | 3,576,531 | |||||||||||
|
| |||||||||||
Telecommunications (0.9%) | ||||||||||||
| 2,400,000 | AT&T, Inc., 4.125%, due 02/17/26 | 2,517,362 | ||||||||||
| 1,500,000 | AT&T, Inc., 4.45%, due 04/01/24 | 1,624,284 | ||||||||||
| 1,500,000 | AT&T, Inc., 4.75%, due 05/15/46 | 1,473,618 | ||||||||||
| 1,500,000 | AT&T, Inc., 5.35%, due 09/01/40 | 1,582,412 | ||||||||||
| 970,000 | AT&T, Inc., (144A), 4.5%, due 03/09/48 (2) | 913,696 | ||||||||||
| 1,000,000 | Qwest Corp., 7.25%, due 09/15/25 | 1,092,219 | ||||||||||
| 2,000,000 | Verizon Communications, Inc., 2.606%, due 09/14/18 (1) | 2,052,682 | ||||||||||
| 1,526,000 | Verizon Communications, Inc., 3%, due 11/01/21 | 1,573,393 | ||||||||||
| 1,439,000 | Verizon Communications, Inc., 4.272%, due 01/15/36 | 1,448,355 | ||||||||||
| 600,000 | Verizon Communications, Inc., 4.522%, due 09/15/48 | 599,165 | ||||||||||
See accompanying notes to financial statements.
21
TCW Core Fixed Income Fund
Schedule of Investments (Continued)
| Principal Amount | Fixed Income Securities | Value | ||||||||||
Telecommunications (Continued) | ||||||||||||
| $ | 2,000,000 | Verizon Communications, Inc., 4.862%, due 08/21/46 | $ | 2,134,370 | ||||||||
| 125,000 | Verizon Communications, Inc., 6.25%, due 04/01/37 | 157,453 | ||||||||||
|
| |||||||||||
Total Telecommunications | 17,169,009 | |||||||||||
|
| |||||||||||
Transportation (0.0%) | ||||||||||||
| 650,000 | Burlington Northern Santa Fe LLC, 4.15%, due 04/01/45 | 689,037 | ||||||||||
|
| |||||||||||
Total Corporate Bonds (Cost: $436,713,977) | 451,108,519 | |||||||||||
|
| |||||||||||
Municipal Bonds (0.6%) | ||||||||||||
| 1,500,000 | City of New York, General Obligation Unlimited, 5.047%, due 10/01/24 | 1,753,575 | ||||||||||
| 1,250,000 | City of New York, General Obligation Unlimited, 5.517%, due 10/01/37 | 1,601,525 | ||||||||||
| 700,000 | Fiscal Year 2005 Securitization Corp., Special Obligation Bond for the City of New York, 4.93%, due 04/01/20 | 747,712 | ||||||||||
| 3,000,000 | New York City Transitional Finance Authority, Future Tax Secured Revenue Bond, 5.572%, due 11/01/38 | 3,843,900 | ||||||||||
| 2,000,000 | New York City Water & Sewer System, Revenue Bond, 5.882%, due 06/15/44 | 2,772,440 | ||||||||||
| 730,000 | New York State, Build America Bonds, General Obligation Unlimited, | 830,908 | ||||||||||
|
| |||||||||||
Total Municipal Bonds (Cost: $10,838,549) | 11,550,060 | |||||||||||
|
| |||||||||||
Foreign Government Bonds (Cost: $198,163) (0.0%) | ||||||||||||
| 200,000 | Province of Manitoba (Canada), 4.9%, due 12/06/16 | 200,810 | ||||||||||
|
| |||||||||||
Asset-Backed Securities (7.4%) |
| |||||||||||
| 1,813,067 | 321 Henderson Receivables I LLC (13-3A-A), (144A), 4.08%, due 01/17/73 (2) | 1,872,924 | ||||||||||
| 2,133,551 | 321 Henderson Receivables I LLC (14-2A-A), (144A), 3.61%, due 01/17/73 (2) | 2,128,654 | ||||||||||
| 2,800,000 | Academic Loan Funding Trust (12-1A-A2), (144A), 1.634%, due 12/27/44 (1)(2) | 2,698,686 | ||||||||||
| 2,925,000 | BA Credit Card Trust (14-A3-A), 0.825%, due 01/15/20 (1) | 2,929,199 | ||||||||||
| 1,900,000 | BA Credit Card Trust (15-A1-A), 0.865%, due 06/15/20 (1) | 1,902,582 | ||||||||||
| 1,000,000 | Babson CLO, Ltd. (14-IIA-A), (144A), 2.27%, due 10/17/26 (1)(2) | 996,868 | ||||||||||
| 1,000,000 | Babson CLO, Ltd. (15-IA-A), (144A), 2.311%, due 04/20/27 (1)(2) | 1,000,125 | ||||||||||
| 1,600,000 | Ballyrock CLO, Ltd. (14-1A-A1), (144A), 2.361%, due 10/20/26 (1)(2) | 1,602,394 | ||||||||||
| 1,665,137 | Bayview Commercial Asset Trust (06-4A-A1), (144A), 0.764%, due 12/25/36 (1)(2) | 1,428,031 | ||||||||||
| 1,357,226 | Brazos Education Loan Authority, Inc. (12-1-A1), 1.234%, due 12/26/35 (1) | 1,331,750 | ||||||||||
| 646,320 | Brazos Higher Education Authority, Inc. (06-2-A9), 0.866%, due 12/26/24 (1) | 618,104 | ||||||||||
| 675,000 | Brazos Higher Education Authority, Inc. (10-1-A2), 2.025%, due 02/25/35 (1) | 667,974 | ||||||||||
| 1,695,000 | Brazos Higher Education Authority, Inc. (11-1-A3), 1.875%, due 11/25/33 (1) | 1,667,162 | ||||||||||
| 4,160,000 | Chase Issuance Trust (15-A6-A6), 0.785%, due 05/15/19 (1) | 4,162,680 | ||||||||||
| 4,915,000 | Citibank Credit Card Issuance Trust (08-A2-A2), 1.674%, due 01/23/20 (1) | 4,978,622 | ||||||||||
| 3,960,000 | Dryden Senior Loan Fund (15-37A-A), (144A), 2.38%, due 04/15/27 (1)(2) | 3,965,136 | ||||||||||
| 2,319,188 | Educational Funding of the South, Inc. (11-1-A2), 1.532%, due 04/25/35 (1) | 2,286,582 | ||||||||||
| 1,105,377 | Educational Services of America, Inc. (12-2-A), (144A), 1.264%, due 04/25/39 (1)(2) | 1,061,432 | ||||||||||
| 2,907,079 | GCO Education Loan Funding Master Trust (06-2AR-A1RN), (144A), | 2,632,186 | ||||||||||
| 2,390,875 | Global SC Finance SRL (14-1A-A2), (144A), 3.09%, due 07/17/29 (2) | 2,288,717 | ||||||||||
| 2,695,551 | Higher Education Funding I (14-1-A), (144A), 1.875%, due 05/25/34 (1)(2) | 2,598,215 | ||||||||||
| 2,862,945 | Honda Auto Receivables Owner Trust (15-4-A2), 0.82%, due 07/23/18 | 2,861,152 | ||||||||||
| 4,800,000 | Honda Auto Receivables Owner Trust (16-4-A2), 1.04%, due 04/18/19 | 4,797,528 | ||||||||||
See accompanying notes to financial statements.
22
TCW Core Fixed Income Fund
October 31, 2016 |
| Principal Amount | Fixed Income Securities | Value | ||||||||||
Asset-Backed Securities (Continued) | ||||||||||||
| $ | 3,400,000 | Magnetite XI, Ltd. (14-11A-A1), (144A), 2.129%, due 01/18/27 (1)(2) | $ | 3,400,375 | ||||||||
| 3,260,000 | Magnetite XII, Ltd. (15-12A-A), (144A), 2.38%, due 04/15/27 (1)(2) | 3,262,277 | ||||||||||
| 2,400,000 | Montana Higher Education Student Assistance Corp. (12-1-A3), 1.576%, due 07/20/43 (1) | 2,314,841 | ||||||||||
| 4,796,464 | Navient Student Loan Trust (14-2-A), 1.174%, due 03/25/83 (1) | 4,646,754 | ||||||||||
| 4,828,001 | Navient Student Loan Trust (14-3-A), 1.154%, due 03/25/83 (1) | 4,676,165 | ||||||||||
| 2,351,733 | Navient Student Loan Trust (14-4-A), 1.154%, due 03/25/83 (1) | 2,277,714 | ||||||||||
| 5,004,402 | Navient Student Loan Trust (16-1A-A), (144A), 1.234%, due 02/25/70 (1)(2) | 4,876,548 | ||||||||||
| 3,578,810 | Nelnet Student Loan Trust (11-1A-A), (144A), 1.384%, due 02/25/48 (1)(2) | 3,580,824 | ||||||||||
| 2,965,000 | Nelnet Student Loan Trust (14-4A-A2), (144A), 1.484%, due 11/25/48 (1)(2) | 2,745,675 | ||||||||||
| 6,733,117 | Nelnet Student Loan Trust (15-2A-A2), (144A), 1.134%, due 09/25/47 (1)(2) | 6,618,612 | ||||||||||
| 2,815,532 | Nissan Auto Receivables Owner Trust (15-C-A2A), 0.87%, due 11/15/18 | 2,813,985 | ||||||||||
| 2,763,180 | PHEAA Student Loan Trust (15-1A-A), (144A), 1.125%, due 10/25/41 (1)(2) | 2,657,822 | ||||||||||
| 2,081,074 | SLC Student Loan Trust (05-3-B), 1.1%, due 06/15/40 (1) | 1,748,329 | ||||||||||
| 58,530 | SLM Student Loan Trust (04-10-A5B), (144A), 1.282%, due 04/25/23 (1)(2) | 58,525 | ||||||||||
| 1,001,451 | SLM Student Loan Trust (05-6-B), 1.172%, due 01/25/44 (1) | 884,724 | ||||||||||
| 1,024,670 | SLM Student Loan Trust (06-10-B), 0.934%, due 03/25/44 (1) | 845,145 | ||||||||||
| 3,400,000 | SLM Student Loan Trust (06-2-A6), 1.052%, due 01/25/41 (1) | 3,142,462 | ||||||||||
| 3,400,000 | SLM Student Loan Trust (06-8-A6), 1.042%, due 01/25/41 (1) | 3,030,010 | ||||||||||
| 1,033,750 | SLM Student Loan Trust (07-1-B), 1.102%, due 01/27/42 (1) | 863,093 | ||||||||||
| 549,851 | SLM Student Loan Trust (07-6-B), 1.732%, due 04/27/43 (1) | 480,253 | ||||||||||
| 710,000 | SLM Student Loan Trust (08-2-B), 2.082%, due 01/25/83 (1) | 618,705 | ||||||||||
| 710,000 | SLM Student Loan Trust (08-3-B), 2.082%, due 04/26/83 (1) | 629,767 | ||||||||||
| 7,938,057 | SLM Student Loan Trust (08-4-A4), 2.532%, due 07/25/22 (1) | 7,993,457 | ||||||||||
| 710,000 | SLM Student Loan Trust (08-4-B), 2.732%, due 04/25/29 (1) | 657,173 | ||||||||||
| 710,000 | SLM Student Loan Trust (08-5-B), 2.732%, due 07/25/29 (1) | 662,307 | ||||||||||
| 3,641,427 | SLM Student Loan Trust (08-6-A3), 1.632%, due 01/25/19 (1) | 3,646,089 | ||||||||||
| 710,000 | SLM Student Loan Trust (08-6-B), 2.732%, due 07/26/83 (1) | 653,632 | ||||||||||
| 710,000 | SLM Student Loan Trust (08-7-B), 2.732%, due 07/26/83 (1) | 652,619 | ||||||||||
| 710,000 | SLM Student Loan Trust (08-8-B), 3.132%, due 10/25/29 (1) | 681,901 | ||||||||||
| 4,895,243 | SLM Student Loan Trust (08-9-A), 2.382%, due 04/25/23 (1) | 4,905,722 | ||||||||||
| 710,000 | SLM Student Loan Trust (08-9-B), 3.132%, due 10/25/83 (1) | 686,532 | ||||||||||
| 4,445,757 | SLM Student Loan Trust (09-3-A), (144A), 1.284%, due 01/25/45 (1)(2) | 4,265,531 | ||||||||||
| 2,000,000 | SLM Student Loan Trust (11-2-A2), 1.734%, due 10/25/34 (1) | 1,984,398 | ||||||||||
| 2,600,000 | SLM Student Loan Trust (12-7-A3), 1.184%, due 05/26/26 (1) | 2,486,953 | ||||||||||
| 1,862,203 | SLM Student Loan Trust (13-4-A), 1.084%, due 06/25/27 (1) | 1,798,112 | ||||||||||
| 1,269,011 | Toyota Auto Receivables Owner Trust (15-A-A3), 1.12%, due 02/15/19 | 1,269,814 | ||||||||||
|
| |||||||||||
Total Asset-Backed Securities (Cost: $142,468,393) | 140,993,548 | |||||||||||
|
| |||||||||||
Commercial Mortgage-Backed Securities — Agency (4.6%) | ||||||||||||
| 3,380,000 | Federal Home Loan Mortgage Corp. Multifamily Structured Pass-Through Certificates (K151-A3), 3.511%, due 04/25/30 | 3,633,350 | ||||||||||
| 1,495,876 | Federal Home Loan Mortgage Corp. Multifamily Structured Pass-Through Certificates (KF02-A3), 1.155%, due 07/25/20 (1) | 1,502,166 | ||||||||||
| 8,230,657 | Federal Home Loan Mortgage Corp. Multifamily Structured Pass-Through Certificates (KJ05-A1), 1.418%, due 05/25/21 | 8,228,251 | ||||||||||
| 1,163,217 | Federal National Mortgage Association, Pool #464959, 4.12%, due 04/01/20 | 1,254,273 | ||||||||||
| 3,045,000 | Federal National Mortgage Association, Pool #467944, 4.25%, due 04/01/21 | 3,358,581 | ||||||||||
See accompanying notes to financial statements.
23
TCW Core Fixed Income Fund
Schedule of Investments (Continued)
| Principal Amount | Fixed Income Securities | Value | ||||||||||
Commercial Mortgage-Backed Securities — Agency (Continued) | ||||||||||||
| $ | 1,775,632 | Federal National Mortgage Association, Pool #468048, 4.41%, due 05/01/21 | $ | 1,963,470 | ||||||||
| 2,305,000 | Federal National Mortgage Association, Pool #AE0134, 4.4%, due 02/01/20 | 2,499,298 | ||||||||||
| 3,416,076 | Federal National Mortgage Association, Pool #AE0918, 3.666%, due 10/01/20 | 3,657,400 | ||||||||||
| 1,874,134 | Federal National Mortgage Association, Pool #Al0151, 4.382%, due 04/01/21 | 2,057,997 | ||||||||||
| 5,483,614 | Federal National Mortgage Association, Pool #AL6829, 2.965%, due 05/01/27 | 5,712,401 | ||||||||||
| 2,305,000 | Federal National Mortgage Association, Pool #AM1551, 2.44%, due 12/01/23 | 2,370,177 | ||||||||||
| 3,560,300 | Federal National Mortgage Association, Pool #AM3058, 3.41%, due 04/01/28 | 3,830,389 | ||||||||||
| 3,300,000 | Federal National Mortgage Association, Pool #AM4125, 3.74%, due 08/01/23 | 3,631,265 | ||||||||||
| 3,555,816 | Federal National Mortgage Association, Pool #AM4198, 3.55%, due 03/01/24 | 3,857,771 | ||||||||||
| 3,175,000 | Federal National Mortgage Association, Pool #AM7516, 3.55%, due 02/01/30 | 3,409,232 | ||||||||||
| 3,580,000 | Federal National Mortgage Association, Pool #AM9343, 3.38%, due 09/01/30 | 3,851,262 | ||||||||||
| 2,177,124 | Federal National Mortgage Association, Pool #FN0000, 3.585%, due 09/01/20 | 2,323,198 | ||||||||||
| 3,109,073 | Federal National Mortgage Association, Pool #FN0001, 3.762%, due 12/01/20 | 3,338,070 | ||||||||||
| 2,272,669 | Federal National Mortgage Association, Pool #FN0003, 4.284%, due 01/01/21 | 2,478,230 | ||||||||||
| 3,080,100 | Federal National Mortgage Association, Pool#AM9536, 3.34%, due 08/01/30 | 3,262,280 | ||||||||||
| 3,265,000 | Federal National Mortgage Association, Pool#AM9793, 3.12%, due 10/01/27 | 3,436,480 | ||||||||||
| 2,386,711 | Federal National Mortgage Association, Pool#AN0245, 3.42%, due 11/01/35 | 2,502,091 | ||||||||||
| 3,270,000 | Federal National Mortgage Association, Pool#AN0564, 3.2%, due 03/01/31 | 3,409,303 | ||||||||||
| 2,385,000 | Federal National Mortgage Association, Pool#AN1032, 2.86%, due 03/01/26 | 2,478,677 | ||||||||||
| 3,512,000 | Federal National Mortgage Association, Pool#AN1282, 3.01%, due 04/01/28 | 3,691,911 | ||||||||||
| 3,143,276 | Federal National Mortgage Association (14-M12 FA), | 3,132,290 | ||||||||||
| 2,372,287 | NCUA Guaranteed Notes (11-C1-1A), 0.866%, due 02/28/20 (1) | 2,366,064 | ||||||||||
| 1,224,773 | NCUA Guaranteed Notes (11-C1-2A), 1.049%, due 03/09/21 (1) | 1,224,236 | ||||||||||
|
| |||||||||||
Total Commercial Mortgage-Backed Securities — Agency (Cost: $88,162,024) | 88,460,113 | |||||||||||
|
| |||||||||||
Commercial Mortgage-Backed Securities — Non-Agency (2.3%) | ||||||||||||
| 3,728,000 | Citigroup Commercial Mortgage Trust (07-C6-A4), 5.711%, due 12/10/49 (1) | 3,778,653 | ||||||||||
| 1,515,000 | COMM Mortgage Trust (13-300P-A1), (144A), 4.353%, due 08/10/30 (2) | 1,694,565 | ||||||||||
| 400,000 | COMM Mortgage Trust (14-277P-A), (144A), 3.611%, due 08/10/49 (1)(2) | 429,570 | ||||||||||
| 1,635,000 | COMM Mortgage Trust (16-787S-A), (144A), 3.545%, due 02/10/36 (2) | 1,740,416 | ||||||||||
| 4,580,287 | Commercial Mortgage Asset Trust (99-C2-G), 6%, due 11/17/32 | 4,744,315 | ||||||||||
| 1,899,648 | GE Capital Commercial Mortgage Corp. (07-C1-A4), 5.543%, due 12/10/49 | 1,911,287 | ||||||||||
| 4,569,606 | JPMorgan Chase Commercial Mortgage Securities Trust (11-C3-A3), (144A), 4.388%, due 02/15/46 (2) | 4,727,170 | ||||||||||
| 1,635,000 | Liberty Street Trust (16-225L-A), (144A), 3.597%, due 02/10/36 (2) | 1,747,380 | ||||||||||
| 1,505,000 | OBP Depositor LLC Trust (10-OBP-A), (144A), 4.646%, due 07/15/45 (2) | 1,639,594 | ||||||||||
| 1,555,000 | RBS Commercial Funding, Inc. (13-GSP-A), (144A), 3.834%, due 01/13/32 (1)(2) | 1,685,612 | ||||||||||
| 1,710,000 | SFAVE Commercial Mortgage Securities Trust (15-5AVE-A1), (144A), | 1,738,499 | ||||||||||
| 1,250,000 | VNDO Mortgage Trust (12-6AVE-A), (144A), 2.996%, due 11/15/30 (2) | 1,300,011 | ||||||||||
| 9,895,000 | Wachovia Bank Commercial Mortgage Trust (07-C32-A3), 5.703%, due 06/15/49 (1) | 10,021,692 | ||||||||||
| 2,679,878 | Wachovia Bank Commercial Mortgage Trust (07-C33-A4), 5.959%, due 02/15/51 (1) | 2,703,836 | ||||||||||
| 3,177,193 | WF-RBS Commercial Mortgage Trust (11-C4-A3), (144A), 4.394%, due 06/15/44 (2) | 3,318,134 | ||||||||||
| 668,016 | WTC Depositor LLC Trust (12-7WTC-A), (144A), 4.082%, due 03/13/31 (2) | 677,646 | ||||||||||
|
| |||||||||||
Total Commercial Mortgage-Backed Securities — Non-Agency (Cost: $44,366,189) | 43,858,380 | |||||||||||
|
| |||||||||||
See accompanying notes to financial statements.
24
TCW Core Fixed Income Fund
October 31, 2016 |
| Principal Amount | Fixed Income Securities | Value | ||||||||||
Residential Mortgage-Backed Securities — Agency (24.6%) | ||||||||||||
| $ | 222,993 | Federal Home Loan Mortgage Corp. (2439-KZ), 6.5%, due 04/15/32 | $ | 252,517 | ||||||||
| 532,534 | Federal Home Loan Mortgage Corp. (2575-FD), 0.985%, due 02/15/33 (PAC) (1) | 534,654 | ||||||||||
| 312,393 | Federal Home Loan Mortgage Corp. (2662-MT), 4.5%, due 08/15/33 (TAC) | 332,359 | ||||||||||
| 6,543,758 | Federal Home Loan Mortgage Corp. (277-30), 3%, due 09/15/42 | 6,700,193 | ||||||||||
| 112,017 | Federal Home Loan Mortgage Corp. (3315-S), 5.875%, due 05/15/37 (I/O) (I/F) (1) | 17,430 | ||||||||||
| 735,923 | Federal Home Loan Mortgage Corp. (3339-JS), 39.36%, due 07/15/37 (I/F) (1) | 1,522,940 | ||||||||||
| 628,316 | Federal Home Loan Mortgage Corp. (3351-ZC), 5.5%, due 07/15/37 | 714,818 | ||||||||||
| 930,815 | Federal Home Loan Mortgage Corp. (3380-SM), | 163,823 | ||||||||||
| 609,471 | Federal Home Loan Mortgage Corp. (3382-FL), 1.235%, due 11/15/37 (1) | 612,954 | ||||||||||
| 3,086,163 | Federal Home Loan Mortgage Corp. (3439-SC), | 529,821 | ||||||||||
| 1,351,842 | Federal Home Loan Mortgage Corp. (3578-DI), | 249,442 | ||||||||||
| 4,137,625 | Federal Home Loan Mortgage Corp. (4139-PA), 2.5%, due 11/15/41 (PAC) | 4,230,538 | ||||||||||
| 3,147,452 | Federal Home Loan Mortgage Corp., Pool #A97179, 4.5%, due 03/01/41 | 3,529,059 | ||||||||||
| 11,183 | Federal Home Loan Mortgage Corp., Pool #B15026, 5%, due 06/01/19 | 11,517 | ||||||||||
| 7,330 | Federal Home Loan Mortgage Corp., Pool #B15591, 5%, due 07/01/19 | 7,579 | ||||||||||
| 19,121 | Federal Home Loan Mortgage Corp., Pool #C90526, 5.5%, due 02/01/22 | 21,483 | ||||||||||
| 3,467,851 | Federal Home Loan Mortgage Corp., Pool #G06360, 4%, due 03/01/41 | 3,808,813 | ||||||||||
| 2,715,241 | Federal Home Loan Mortgage Corp., Pool #G06498, 4%, due 04/01/41 | 2,973,402 | ||||||||||
| 1,870,864 | Federal Home Loan Mortgage Corp., Pool #G06499, 4%, due 03/01/41 | 2,042,603 | ||||||||||
| 856,665 | Federal Home Loan Mortgage Corp., Pool #G06620, 4.5%, due 07/01/41 | 942,699 | ||||||||||
| 2,057,490 | Federal Home Loan Mortgage Corp., Pool #G07849, 3.5%, due 05/01/44 | 2,183,643 | ||||||||||
| 13,256,459 | Federal Home Loan Mortgage Corp., Pool #G07924, 3.5%, due 01/01/45 | 14,053,837 | ||||||||||
| 8,258,498 | Federal Home Loan Mortgage Corp., Pool #G08676, 3.5%, due 11/01/45 | 8,668,104 | ||||||||||
| 6,405,137 | Federal Home Loan Mortgage Corp., Pool #G08677, 4%, due 11/01/45 | 6,851,489 | ||||||||||
| 9,907,567 | Federal Home Loan Mortgage Corp., Pool #G08698, 3.5%, due 03/01/46 | 10,402,976 | ||||||||||
| 14,115,417 | Federal Home Loan Mortgage Corp., Pool #G08702, 3.5%, due 04/01/46 | 14,818,967 | ||||||||||
| 5,025,557 | Federal Home Loan Mortgage Corp., Pool #G08703, 4%, due 04/01/46 | 5,386,144 | ||||||||||
| 3,990,275 | Federal Home Loan Mortgage Corp., Pool #G08706, 3.5%, due 05/01/46 | 4,192,034 | ||||||||||
| 5,809,096 | Federal Home Loan Mortgage Corp., Pool #G08710, 3%, due 06/01/46 | 5,984,183 | ||||||||||
| 12,457,892 | Federal Home Loan Mortgage Corp., Pool #G08711, 3.5%, due 06/01/46 | 13,090,924 | ||||||||||
| 10,742,710 | Federal Home Loan Mortgage Corp., Pool #G08715, 3%, due 08/01/46 | 11,066,679 | ||||||||||
| 15,115,157 | Federal Home Loan Mortgage Corp., Pool #G08716, 3.5%, due 08/01/46 | 15,869,144 | ||||||||||
| 8,665,993 | Federal Home Loan Mortgage Corp., Pool #G08721, 3%, due 09/01/46 | 8,927,017 | ||||||||||
| 5,093,089 | Federal Home Loan Mortgage Corp., Pool #G08722, 3.5%, due 09/01/46 | 5,353,539 | ||||||||||
| 8,285,266 | Federal Home Loan Mortgage Corp., Pool #G08726, 3%, due 10/01/46 | 8,536,414 | ||||||||||
| 7,955,000 | Federal Home Loan Mortgage Corp., Pool #G08732, 3%, due 10/01/46 | 8,194,583 | ||||||||||
| 3,032,390 | Federal Home Loan Mortgage Corp., Pool #G18592, 3%, due 03/01/31 | 3,178,087 | ||||||||||
| 14,113,355 | Federal Home Loan Mortgage Corp., Pool #G60080, 3.5%, due 06/01/45 | 14,980,003 | ||||||||||
| 4,977,865 | Federal Home Loan Mortgage Corp., Pool #G60238, 3.5%, due 10/01/45 | 5,283,537 | ||||||||||
| 1,932,900 | Federal Home Loan Mortgage Corp., Pool #G60344, 4%, due 12/01/45 | 2,102,651 | ||||||||||
| 3,032,149 | Federal Home Loan Mortgage Corp., Pool #Q05261, 3.5%, due 12/01/41 | 3,228,291 | ||||||||||
| 4,910,180 | Federal Home Loan Mortgage Corp., Pool #Q20178, 3.5%, due 07/01/43 | 5,247,593 | ||||||||||
| 231,163 | Federal National Mortgage Association (01-14-SH), 10.797%, due 03/25/30 (I/F) (1) | 379,879 | ||||||||||
| 300,248 | Federal National Mortgage Association (01-34-FV), 1.034%, due 08/25/31 (1) | 301,647 | ||||||||||
| 2,000,000 | Federal National Mortgage Association (04-W10-A6), 5.75%, due 08/25/34 (PAC) | 2,298,712 | ||||||||||
See accompanying notes to financial statements.
25
TCW Core Fixed Income Fund
Schedule of Investments (Continued)
| Principal Amount | Fixed Income Securities | Value | ||||||||||
Residential Mortgage-Backed Securities — Agency (Continued) | ||||||||||||
| $ | 1,195,927 | Federal National Mortgage Association (07-89-GF), 1.054%, due 09/25/37 (1) | $ | 1,203,305 | ||||||||
| 236,059 | Federal National Mortgage Association (08-30-SA), | 45,871 | ||||||||||
| 279,426 | Federal National Mortgage Association (08-62-SN), | 53,972 | ||||||||||
| 2,787,775 | Federal National Mortgage Association (09-64-TB), 4%, due 08/25/29 | 2,977,899 | ||||||||||
| 151,941 | Federal National Mortgage Association (09-68-SA), | 27,907 | ||||||||||
| 2,279,947 | Federal National Mortgage Association (10-26-AS), | 405,901 | ||||||||||
| 4,000,000 | Federal National Mortgage Association (11-111-DB), 4%, due 11/25/41 | 4,356,930 | ||||||||||
| 21,796 | Federal National Mortgage Association, Pool #254634, 5.5%, due 02/01/23 | 24,283 | ||||||||||
| 19,786 | Federal National Mortgage Association, Pool #596686, 6.5%, due 11/01/31 | 22,441 | ||||||||||
| 28,525 | Federal National Mortgage Association, Pool #679263, 4.5%, due 11/01/24 | 31,156 | ||||||||||
| 41,569 | Federal National Mortgage Association, Pool #725275, 4%, due 03/01/19 | 43,040 | ||||||||||
| 71,583 | Federal National Mortgage Association, Pool #727575, 5%, due 06/01/33 | 77,149 | ||||||||||
| 104,146 | Federal National Mortgage Association, Pool #748751, 5.5%, due 10/01/33 | 113,726 | ||||||||||
| 17,509 | Federal National Mortgage Association, Pool #782593, 4.5%, due 06/01/34 | 19,227 | ||||||||||
| 1,560,221 | Federal National Mortgage Association, Pool #AB2127, 3.5%, due 01/01/26 | 1,652,780 | ||||||||||
| 1,576,386 | Federal National Mortgage Association, Pool #AB3679, 3.5%, due 10/01/41 | 1,676,634 | ||||||||||
| 2,728,305 | Federal National Mortgage Association, Pool #AB3685, 4%, due 10/01/41 | 2,977,857 | ||||||||||
| 2,285,347 | Federal National Mortgage Association, Pool #AB3864, 3.5%, due 11/01/41 | 2,438,458 | ||||||||||
| 4,731,524 | Federal National Mortgage Association, Pool #AB4045, 3.5%, due 12/01/41 | 5,061,164 | ||||||||||
| 3,513,590 | Federal National Mortgage Association, Pool #AC1604, 4%, due 08/01/39 | 3,863,713 | ||||||||||
| 954,492 | Federal National Mortgage Association, Pool #AL0209, 4.5%, due 05/01/41 | 1,070,560 | ||||||||||
| 1,205,686 | Federal National Mortgage Association, Pool #AL0851, 6%, due 10/01/40 | 1,384,423 | ||||||||||
| 9,644,618 | Federal National Mortgage Association, Pool #AL9105, 4.5%, due 10/01/46 | 10,545,425 | ||||||||||
| 6,778,144 | Federal National Mortgage Association, Pool #AL9106, 4.5%, due 02/01/46 | 7,440,754 | ||||||||||
| 7,259,255 | Federal National Mortgage Association, Pool #AL9107, 4.5%, due 03/01/46 | 7,942,796 | ||||||||||
| 1,269,095 | Federal National Mortgage Association, Pool #AL9108, 4.5%, due 12/01/34 | 1,398,037 | ||||||||||
| 1,481,794 | Federal National Mortgage Association, Pool #BC1158, 3.5%, due 02/01/46 | 1,555,738 | ||||||||||
| 4,371,511 | Federal National Mortgage Association, Pool #MA1561, 3%, due 09/01/33 | 4,554,568 | ||||||||||
| 7,332,832 | Federal National Mortgage Association, Pool #MA1584, 3.5%, due 09/01/33 | 7,785,405 | ||||||||||
| 9,214,156 | Federal National Mortgage Association, Pool #MA2776, 2.5%, due 10/01/26 (4)(5) | 9,493,455 | ||||||||||
| 30,875,000 | Federal National Mortgage Association TBA, 2.5% (4) | 31,772,306 | ||||||||||
| 8,110,000 | Federal National Mortgage Association TBA, 3% (4) | 8,488,889 | ||||||||||
| 30,615,000 | Federal National Mortgage Association TBA, 3% (4) | 31,521,491 | ||||||||||
| 22,180,000 | Federal National Mortgage Association TBA, 4% (4) | 23,753,394 | ||||||||||
| 651,697 | Government National Mortgage Association (04-30-UC), | 677,652 | ||||||||||
| 564,256 | Government National Mortgage Association (08-27-SI), | 104,408 | ||||||||||
| 2,205,476 | Government National Mortgage Association (08-81-S), | 403,032 | ||||||||||
| 916,584 | Government National Mortgage Association (09-66-UF), 1.535%, due 08/16/39 (1) | 928,566 | ||||||||||
| 3,468,899 | Government National Mortgage Association (10-1-S), | 553,029 | ||||||||||
See accompanying notes to financial statements.
26
TCW Core Fixed Income Fund
October 31, 2016 |
| Principal Amount | Fixed Income Securities | Value | ||||||||||
Residential Mortgage-Backed Securities — Agency (Continued) | ||||||||||||
| $ | 79,429 | Government National Mortgage Association, Pool #608259, 4.5%, due 08/15/33 | $ | 87,820 | ||||||||
| 216,775 | Government National Mortgage Association, Pool #782114, 5%, due 09/15/36 | 243,198 | ||||||||||
| 5,956,058 | Government National Mortgage Association II, Pool #MA3521, | 6,312,025 | ||||||||||
| 5,585,081 | Government National Mortgage Association II, Pool #MA3597, | 5,919,313 | ||||||||||
| 7,725,420 | Government National Mortgage Association II, Pool #MA3663, | 8,191,078 | ||||||||||
| 6,437,195 | Government National Mortgage Association II, Pool #MA3736, | 6,826,669 | ||||||||||
| 10,402,264 | Government National Mortgage Association II, Pool #MA3873, 3%, due 08/20/46 | 10,845,812 | ||||||||||
| 17,057,616 | Government National Mortgage Association II, Pool #MA3936, 3%, due 09/20/46 | 17,787,896 | ||||||||||
| 17,780,000 | Government National Mortgage Association II TBA, 3% (4) | 18,523,149 | ||||||||||
| 1,658,993 | NCUA Guaranteed Notes (10-R1-1A), 0.969%, due 10/07/20 (1) | 1,662,472 | ||||||||||
| 866,775 | NCUA Guaranteed Notes (10-R2-1A), 0.898%, due 11/06/17 (1) | 866,997 | ||||||||||
| 853,622 | NCUA Guaranteed Notes (10-R3-1A), 1.079%, due 12/08/20 (1) | 855,171 | ||||||||||
| 762,329 | NCUA Guaranteed Notes (10-R3-2A), 1.087%, due 12/08/20 (1) | 766,303 | ||||||||||
| 960,071 | NCUA Guaranteed Notes (11-R1-1A), 0.976%, due 01/08/20 (1) | 961,675 | ||||||||||
| 958,627 | NCUA Guaranteed Notes (11-R2-1A), 0.927%, due 02/06/20 (1) | 957,916 | ||||||||||
|
| |||||||||||
Total Residential Mortgage-Backed Securities — Agency (Cost: $463,401,395) | 469,033,556 | |||||||||||
|
| |||||||||||
Residential Mortgage-Backed Securities — Non-Agency (6.0%) | ||||||||||||
| 9,146,431 | Aegis Asset Backed Securities Trust (05-5-2A), 0.784%, due 12/25/35 (1) | 9,016,331 | ||||||||||
| 804,760 | Asset-Backed Securities Corp. Home Equity (05-HE6-M2), 1.299%, due 07/25/35 (1) | 807,453 | ||||||||||
| 5,497,693 | Banc of America Funding Trust (15-R2-9A1), (144A), 0.74%, due 03/27/36 (1)(2) | 5,338,996 | ||||||||||
| 3,224,467 | Bear Stearns Asset-Backed Securities Trust (06-HE1-1M1), | 3,208,183 | ||||||||||
| 282,523 | Centex Home Equity (02-C-AF6), 4.5%, due 09/25/32 (1) | 284,333 | ||||||||||
| 699,702 | Centex Home Equity (03-B-AF6), 3.173%, due 06/25/33 (1) | 698,210 | ||||||||||
| 6,961,217 | Centex Home Equity (05-C-M1), 0.964%, due 06/25/35 (1) | 6,907,113 | ||||||||||
| 477,198 | Citigroup Mortgage Loan Trust, Inc. (05-5-2A2), 5.75%, due 08/25/35 (6) | 377,809 | ||||||||||
| 1,260,092 | Conseco Financial Corp. (98-6-A8), 6.66%, due 06/01/30 | 1,351,714 | ||||||||||
| 16,604 | Credit Suisse First Boston Mortgage Securities Corp. (03-8-4PPA), | 16,974 | ||||||||||
| 5,941,669 | Credit Suisse Mortgage Capital Certificates (15-5R-1A1), (144A), | 5,807,234 | ||||||||||
| 5,460,479 | CSMC Trust (14-7R-8A1), (144A), 2.739%, due 07/27/37 (1)(2) | 5,454,449 | ||||||||||
| 488,121 | GSAMP Trust (05-HE5-M1), 0.954%, due 11/25/35 (1) | 485,047 | ||||||||||
| 694,687 | HSBC Home Equity Loan Trust USA (07-1-AM), 0.766%, due 03/20/36 (1) | 694,948 | ||||||||||
| 213,981 | HSBC Home Equity Loan Trust USA (07-2-AM), 0.766%, due 07/20/36 (1) | 212,018 | ||||||||||
| 1,077,971 | HSBC Home Equity Loan Trust USA (07-3-APT), 1.726%, due 11/20/36 (1) | 1,078,456 | ||||||||||
| 559,258 | HSI Asset Securitization Corp. Trust (06-OPT1-2A3), 0.724%, due 12/25/35 (1) | 556,493 | ||||||||||
| 1,331,411 | Indymac Index Mortgage Loan Trust (05-AR6-2A1), 0.774%, due 04/25/35 (1) | 1,164,427 | ||||||||||
| 2,603,301 | JPMorgan Mortgage Acquisition Corp. (05-OPT1-M1), 0.984%, due 06/25/35 (1) | 2,602,625 | ||||||||||
| 5,198,596 | Merrill Lynch Mortgage Investors Trust (05-2-2A), 2.71%, due 10/25/35 (1) | 5,260,533 | ||||||||||
| 1,638,305 | Mid-State Trust (04-1-B), 8.9%, due 08/15/37 | 1,877,407 | ||||||||||
See accompanying notes to financial statements.
27
TCW Core Fixed Income Fund
Schedule of Investments (Continued)
| Principal Amount | Fixed Income Securities | Value | ||||||||||
Residential Mortgage-Backed Securities — Non-Agency (Continued) | ||||||||||||
| $ | 1,005,786 | Morgan Stanley ABS Capital I, Inc. Trust (05-WMC6-M2), | $ | 1,021,395 | ||||||||
| 1,650,507 | Morgan Stanley Capital, Inc. (04-WMC2-M1), 1.449%, due 07/25/34 (1) | 1,593,036 | ||||||||||
| 6,041,246 | Morgan Stanley Home Equity Loan Trust (05-1-M3), 1.314%, due 12/25/34 (1) | 5,964,968 | ||||||||||
| 325,600 | Morgan Stanley Mortgage Loan Trust (04-3-4A), 5.672%, due 04/25/34 (1) | 342,822 | ||||||||||
| 2,248,995 | New Century Home Equity Loan Trust (05-1-A2C), 1.234%, due 03/25/35 (1) | 2,258,704 | ||||||||||
| 1,185,652 | New Century Home Equity Loan Trust (05-2-M1), 1.179%, due 06/25/35 (1) | 1,191,116 | ||||||||||
| 79,343 | New Century Home Equity Loan Trust (05-3-M1), 1.014%, due 07/25/35 (1) | 79,506 | ||||||||||
| 7,107,984 | New Century Home Equity Loan Trust (05-3-M2), 1.024%, due 07/25/35 (1) | 7,025,404 | ||||||||||
| 9,610,503 | New Century Home Equity Loan Trust (05-D-A1), 0.754%, due 02/25/36 (1) | 9,269,919 | ||||||||||
| 2,948,648 | Nomura Resecuritization Trust (14-5R-3A1), (144A), 0.765%, due 05/26/37 (1)(2) | 2,862,225 | ||||||||||
| 4,233,113 | Nomura Resecuritization Trust (15-1R-6A1), (144A), 1%, due 05/26/47 (1)(2) | 4,179,400 | ||||||||||
| 3,352,671 | Nomura Resecuritization Trust (15-4R-3A1), (144A), 2.946%, due 02/26/36 (1)(2)(6) | 3,404,736 | ||||||||||
| 5,264,626 | Nomura Resecuritization Trust (15-5R-2A1), (144A), 3.022%, due 03/26/35 (1)(2) | 5,328,335 | ||||||||||
| 907,322 | Park Place Securities, Inc. (05-WCH1-M2), 1.314%, due 01/25/36 (1) | 905,947 | ||||||||||
| 2,075,980 | Park Place Securities, Inc. (05-WHQ4-A2D), 0.904%, due 09/25/35 (1) | 2,065,447 | ||||||||||
| 1,648,996 | RAMP Trust (06-RZ3-A2), 0.694%, due 08/25/36 (1) | 1,649,637 | ||||||||||
| 699,228 | Structured Asset Securities Corp. (03-34A-5A4), 2.617%, due 11/25/33 (1) | 705,730 | ||||||||||
| 2,905,708 | WaMu Mortgage Pass-Through Certificates (05-AR3-A2), | 2,929,371 | ||||||||||
| 232,860 | Wells Fargo Alternative Loan Trust (07-PA3-2A1), 6%, due 07/25/37 (6) | 218,239 | ||||||||||
| 8,215,342 | Wells Fargo Home Equity Trust (04-2-A33), 1.534%, due 10/25/34 (1) | 8,071,649 | ||||||||||
|
| |||||||||||
Total Residential Mortgage-Backed Securities — Non-Agency | 114,268,339 | |||||||||||
|
| |||||||||||
U.S. Government Agency Obligations (Cost: $8,305,024) (0.4%) | ||||||||||||
| 8,320,000 | Federal Home Loan Bank, 1.25%, due 06/28/30 | 8,327,351 | ||||||||||
|
| |||||||||||
U.S. Treasury Securities (29.1%) | ||||||||||||
| 67,085,000 | U.S. Treasury Bond, 2.25%, due 08/15/46 | 62,394,350 | ||||||||||
| 4,619,740 | U.S. Treasury Inflation Indexed Bond, 0.625%, due 02/15/43 (7) | 4,521,492 | ||||||||||
| 11,705,717 | U.S. Treasury Inflation Indexed Bond, 0.75%, due 02/15/45 (7) | 11,769,820 | ||||||||||
| 11,491,519 | U.S. Treasury Inflation Indexed Bond, 1.375%, due 02/15/44 (7) | 13,334,651 | ||||||||||
| 26,395,704 | U.S. Treasury Inflation Indexed Note, 0.375%, due 07/15/25 (7) | 27,094,397 | ||||||||||
| 34,000,000 | U.S. Treasury Note, 0.612%, due 01/31/18 (1) | 34,082,423 | ||||||||||
| 73,698,000 | U.S. Treasury Note, 0.75%, due 10/31/17 | 73,733,983 | ||||||||||
| 42,320,000 | U.S. Treasury Note, 0.75%, due 07/31/18 | 42,264,148 | ||||||||||
| 43,660,000 | U.S. Treasury Note, 1.125%, due 07/31/21 | 43,274,563 | ||||||||||
| 34,060,000 | U.S. Treasury Note, 1.125%, due 08/31/21 | 33,763,307 | ||||||||||
| 28,415,000 | U.S. Treasury Note, 1.125%, due 09/30/21 | 28,151,960 | ||||||||||
| 120,065,000 | U.S. Treasury Note, 1.125%, due 10/31/21 | 119,723,008 | ||||||||||
| 14,035,000 | U.S. Treasury Note, 1.5%, due 12/31/18 | 14,211,532 | ||||||||||
| 47,335,000 | U.S. Treasury Note, 1.5%, due 08/15/26 | 45,924,228 | ||||||||||
|
| |||||||||||
Total U.S. Treasury Securities (Cost: $556,460,312) | 554,243,862 | |||||||||||
|
| |||||||||||
Total Fixed Income Securities (Cost: $1,862,875,435) (98.6%) | 1,882,044,538 | |||||||||||
|
| |||||||||||
See accompanying notes to financial statements.
28
TCW Core Fixed Income Fund
October 31, 2016 |
| Number of Shares | Money Market Investments | Value | ||||||||||
| 20,053,000 | JPMorgan Prime Money Market Fund — Institutional Class, 0.66% (8) | $ | 20,053,000 | |||||||||
| 311,028 | State Street Institutional U.S. Government Money Market Fund — Premier Class, 0.25% (8) | 311,028 | ||||||||||
|
| |||||||||||
Total Money Market Investments (Cost: $20,364,028) (1.1%) | 20,364,028 | |||||||||||
|
| |||||||||||
| Principal Amount | Short-Term Investments | |||||||||||
U.S. Treasury Securities (6.6%) | ||||||||||||
| $ | 920,000 | U.S. Treasury Bill, 0.16%, due 12/08/16 (9)(10) | 919,845 | |||||||||
| 35,000,000 | U.S. Treasury Bill, 0.26%, due 01/12/17 (9) | 34,981,870 | ||||||||||
| 15,000,000 | U.S. Treasury Bill, 0.28%, due 01/19/17 (9) | 14,990,775 | ||||||||||
| 75,000,000 | U.S. Treasury Bill, 0.32%, due 02/23/17 (9) | 74,923,425 | ||||||||||
|
| |||||||||||
Total U.S. Treasury Securities (Cost: $125,786,563) (6.6%) | 125,815,915 | |||||||||||
|
| |||||||||||
Total Short-Term Investments (Cost: $125,786,563) (6.6%) | 125,815,915 | |||||||||||
|
| |||||||||||
Total Investments (Cost: $2,009,026,026) (106.3%) | 2,028,224,481 | |||||||||||
Liabilities in Excess of Other Assets (-6.3%) | (119,734,979 | ) | ||||||||||
|
| |||||||||||
Net Assets (100.0%) | $ | 1,908,489,502 | ||||||||||
|
| |||||||||||
| Futures Contracts | ||||||||||||||||
| Number of Contracts | Type | Expiration Date | Notional Contract Value | Net Unrealized (Depreciation) | ||||||||||||
| BUY | ||||||||||||||||
| 307 | 2-Year U.S. Treasury Note Futures | 12/30/16 | $ | 66,969,172 | $ | (71,691 | ) | |||||||||
| 874 | 5-Year U.S. Treasury Note Futures | 12/30/16 | 105,576,469 | (712,933 | ) | |||||||||||
|
|
|
| |||||||||||||
| $ | 172,545,641 | $ | (784,624 | ) | ||||||||||||
|
|
|
| |||||||||||||
See accompanying notes to financial statements.
29
TCW Core Fixed Income Fund
Schedule of Investments (Continued)
Notes to the Schedule of Investments:
| ABS - | Asset-Backed Securities. |
| ACES - | Alternative Credit Enhancement Securities. |
| CLO - | Collateralized Loan Obligation. |
| EETC - | Enhanced Equipment Trust Certificate. |
| I/F - | Inverse Floating rate security whose interest rate moves in the opposite direction of prevailing interest rates. |
| I/O - Interest | Only Security. |
| PAC - | Planned Amortization Class. |
| REIT - | Real Estate Investment Trust. |
| TAC - | Target Amortization Class. |
| TBA - | To be Announced. |
| (1) | Floating or variable rate security. The interest shown reflects the rate in effect at October 31, 2016. |
| (2) | Security exempt from registration under Rule 144A of the Securities Act of 1933, as amended. These securities may be resold, normally only to qualified institutional buyers. At October 31, 2016, the value of these securities amounted to $176,714,032 or 9.3% of net assets. These securities are determined to be liquid by the Advisor, unless otherwise noted, under procedures established by and under the general supervision of the Company’s Board of Directors. |
| (3) | Restricted security (Note 10). |
| (4) | Security purchased on a forward commitment with an approximate principal amount. The actual principal amount and maturity date will be determined upon settlement when the security is delivered. |
| (5) | This security is purchased on a when-issued, delayed-delivery or forward commitment basis. |
| (6) | A portion of the principal balance has been written-off during the period due to defaults in the underlying loans. |
| (7) | Interest rate for this security is a stated rate. Interest payments are determined based on the inflation-adjusted principal. |
| (8) | Rate disclosed is the 7-day net yield as of October 31, 2016. |
| (9) | Rate shown represents yield-to-maturity. |
| (10) | All or a portion of this security is held as collateral for open futures contracts. |
See accompanying notes to financial statements.
30
TCW Core Fixed Income Fund
Investments by Industry | October 31, 2016 |
| Industry | Percentage of Net Assets | |||
Airlines | 0.5 | % | ||
Asset-Backed Securities | 7.4 | |||
Auto Manufacturers | 0.6 | |||
Banks | 6.5 | |||
Beverages | 0.4 | |||
Biotechnology | 0.6 | |||
Chemicals | 0.0 | * | ||
Commercial Mortgage-Backed Securities — Agency | 4.6 | |||
Commercial Mortgage-Backed Securities — Non-Agency | 2.3 | |||
Computers | 0.2 | |||
Diversified Financial Services | 0.9 | |||
Electric | 2.6 | |||
Energy-Alternate Sources | 0.1 | |||
Environmental Control | 0.1 | |||
Food | 0.6 | |||
Foreign Government Bonds | 0.0 | * | ||
Gas | 0.4 | |||
Healthcare-Products | 0.0 | * | ||
Healthcare-Services | 1.8 | |||
Insurance | 1.0 | |||
Media | 0.3 | |||
Mining | 0.0 | * | ||
Miscellaneous Manufacturers | 0.3 | |||
Municipal Bonds | 0.6 | |||
Oil & Gas | 0.1 | |||
Packaging & Containers | 0.1 | |||
Pharmaceuticals | 1.3 | |||
Pipelines | 1.2 | |||
REIT | 2.4 | |||
Real Estate | 0.1 | |||
Residential Mortgage-Backed Securities — Agency | 24.6 | |||
Residential Mortgage-Backed Securities — Non-Agency | 6.0 | |||
Retail | 0.4 | |||
Short Term Investments | 6.6 | |||
Software | 0.2 | |||
Telecommunications | 0.9 | |||
Transportation | 0.0 | |||
U.S. Government Agency Obligations | 0.4 | |||
U.S. Treasury Securities | 29.1 | |||
Money Market Investments | 1.1 | |||
|
| |||
Total | 106.3 | % | ||
|
| |||
| * | Value rounds to less than 0.1% of net assets. |
See accompanying notes to financial statements.
31
TCW Core Fixed Income Fund
Fair Valuation Summary | October 31, 2016 |
The following is a summary of the fair valuations according to the inputs used as of October 31, 2016 in valuing the Fund’s investments:
| Description | Quoted Prices (Level 1) | Other Significant Observable Inputs (Level 2) | Significant (Level 3) | Total | ||||||||||||
Fixed Income Securities | ||||||||||||||||
Corporate Bonds* | $ | — | $ | 449,928,496 | $ | 1,180,023 | $ | 451,108,519 | ||||||||
Municipal Bonds | — | 11,550,060 | — | 11,550,060 | ||||||||||||
Foreign Government Bonds | — | 200,810 | — | 200,810 | ||||||||||||
Asset-Backed Securities | — | 140,993,548 | — | 140,993,548 | ||||||||||||
Commercial Mortgage-Backed Securities — Agency | — | 88,460,113 | — | 88,460,113 | ||||||||||||
Commercial Mortgage-Backed Securities — Non-Agency | — | 43,858,380 | — | 43,858,380 | ||||||||||||
Residential Mortgage-Backed Securities — Agency | — | 469,033,556 | — | 469,033,556 | ||||||||||||
Residential Mortgage-Backed Securities — Non-Agency | — | 114,268,339 | — | 114,268,339 | ||||||||||||
U.S. Government Agency Obligations | — | 8,327,351 | — | 8,327,351 | ||||||||||||
U.S. Treasury Securities | 497,523,502 | 56,720,360 | — | 554,243,862 | ||||||||||||
|
|
|
|
|
|
|
| |||||||||
Total Fixed Income Securities | 497,523,502 | 1,383,341,013 | 1,180,023 | 1,882,044,538 | ||||||||||||
|
|
|
|
|
|
|
| |||||||||
Money Market Investments | 20,364,028 | — | — | 20,364,028 | ||||||||||||
Short-Term Investments* | 125,815,915 | — | — | 125,815,915 | ||||||||||||
|
|
|
|
|
|
|
| |||||||||
Total Investments | $ | 643,703,445 | $ | 1,383,341,013 | $ | 1,180,023 | $ | 2,028,224,481 | ||||||||
|
|
|
|
|
|
|
| |||||||||
Liability Derivatives | ||||||||||||||||
Futures | ||||||||||||||||
Interest Rate Risk | $ | (784,624 | ) | $ | — | $ | — | $ | (784,624 | ) | ||||||
|
|
|
|
|
|
|
| |||||||||
Total | $ | (784,624 | ) | $ | — | $ | — | $ | (784,624 | ) | ||||||
|
|
|
|
|
|
|
| |||||||||
| * | See Schedule of Investments for corresponding industries. |
See accompanying notes to financial statements.
32
TCW Enhanced Commodity Strategy Fund
Consolidated Schedule of Investments | October 31, 2016 |
| Principal Amount | Fixed Income Securities | Value | ||||||||||
Asset-Backed Securities (1.7% of Net Assets) |
| |||||||||||
| $ | 11,054 | Educational Services of America, Inc. (12-2-A), (144A), 1.264%, due 04/25/39 (1)(2) | $ | 10,614 | ||||||||
| 5,780 | Nelnet Student Loan Trust (12-5A-A), (144A), 1.134%, due 10/27/36 (1)(2) | 5,622 | ||||||||||
| 4,939 | Scholar Funding Trust (11-A-A), (144A), 1.79%, due 10/28/43 (1)(2) | 4,766 | ||||||||||
|
| |||||||||||
Total Asset-Backed Securities (Cost: $21,857) | 21,002 | |||||||||||
|
| |||||||||||
Commercial Mortgage-Backed Securities — Agency (2.0%) |
| |||||||||||
| 14,378 | Federal Home Loan Mortgage Corp. Multifamily Structured Pass-Through Certificates (KF05-A), 0.884%, due 09/25/21 (2) | 14,362 | ||||||||||
| 10,420 | Federal National Mortgage Association (13-M4-ASQ2), 1.451%, due 02/25/18 | 10,439 | ||||||||||
|
| |||||||||||
Total Commercial Mortgage-Backed Securities — Agency (Cost: $24,825) | 24,801 | |||||||||||
|
| |||||||||||
Commercial Mortgage-Backed Securities — Non-Agency (Cost: $3,197) (0.1%) |
| |||||||||||
| 1,705,385 | LB-UBS Commercial Mortgage Trust (06-C6 XCL), (144A), | 817 | ||||||||||
|
| |||||||||||
Residential Mortgage-Backed Securities — Agency (Cost: $18,826) (1.6%) |
| |||||||||||
| 19,309 | Federal National Mortgage Association (05-W3-2AF), 0.754%, due 03/25/45 (2) | 18,805 | ||||||||||
|
| |||||||||||
Residential Mortgage-Backed Securities — Non-Agency (22.1%) |
| |||||||||||
| 6,483 | Bear Stearns Alt-A Trust (04-13-A1), 1.274%, due 11/25/34 (2) | 6,363 | ||||||||||
| 2,815 | Bear Stearns Asset-Backed Securities Trust (05-SD1-1A3), 0.934%, due 08/25/43 (2) | 2,794 | ||||||||||
| 10,529 | Bombardier Capital Mortgage Securitization Corp. (01-A-A), | 10,756 | ||||||||||
| 56,358 | Centex Home Equity Loan Trust (05-A-AF5), 5.78%, due 01/25/35 | 58,527 | ||||||||||
| 7,304 | Conseco Financial Corp. (97-7-A9), 7.37%, due 07/15/28 (2) | 7,440 | ||||||||||
| 12,031 | Credit-Based Asset Servicing and Securitization LLC (03-CB5-M1), | 11,566 | ||||||||||
| 14,794 | First Franklin Mortgage Loan Asset-Backed Certificates (04-FF5-A3C), | 14,088 | ||||||||||
| 5,366 | Homestar Mortgage Acceptance Corp. (04-5-A1), 0.984%, due 10/25/34 (2) | 5,326 | ||||||||||
| 39,598 | JPMorgan Mortgage Trust (05-A6-7A1), 3.165%, due 08/25/35 (2)(4) | 37,991 | ||||||||||
| 30,114 | MASTR Seasoned Securitization Trust (05-1-4A1), 2.856%, due 10/25/32 (2) | 30,160 | ||||||||||
| 30,216 | Mid-State Trust (04-1-M1), 6.497%, due 08/15/37 | 32,264 | ||||||||||
| 9,821 | Morgan Stanley Mortgage Loan Trust (04-6AR-1A), 1.434%, due 07/25/34 (2) | 9,524 | ||||||||||
| 21,332 | Origen Manufactured Housing (05-A-M1), 5.46%, due 06/15/36 (2) | 22,435 | ||||||||||
| 2,264 | Residential Asset Mortgage Products, Inc. (03-RZ3-A6), 3.9%, due 03/25/33 | 2,275 | ||||||||||
| 17,838 | Residential Asset Mortgage Products, Inc. (04-SL3-A2), 6.5%, due 12/25/31 | 18,141 | ||||||||||
|
| |||||||||||
Total Residential Mortgage-Backed Securities — Non-Agency (Cost: $242,637) | 269,650 | |||||||||||
|
| |||||||||||
Corporate Bonds (18.2%) |
| |||||||||||
Airlines (Cost: $53,226) (4.7%) | ||||||||||||
| 51,020 | Continental Airlines, Inc. Pass-Through Certificates (00-1-A1), | 57,270 | ||||||||||
|
| |||||||||||
Banks (6.7%) | ||||||||||||
| 7,000 | Citigroup, Inc., 1.375%, due 08/25/36 (2) | 5,059 | ||||||||||
| 75,000 | Citigroup, Inc., 2.517%, due 05/15/18 (2) | 76,323 | ||||||||||
|
| |||||||||||
Total Banks (Cost: $80,635) | 81,382 | |||||||||||
|
| |||||||||||
See accompanying notes to financial statements.
33
TCW Enhanced Commodity Strategy Fund
Consolidated Schedule of Investments (Continued)
| Principal Amount | Fixed Income Securities | Value | ||||||||||
Insurance (Cost: $67,941) (5.6%) |
| |||||||||||
| $ | 70,000 | Nationwide Mutual Insurance Co., (144A), 3.14%, due 12/15/24 (1)(2) | $ | 68,775 | ||||||||
|
| |||||||||||
REIT (Cost: $14,817) (1.2%) |
| |||||||||||
| 15,000 | HCP, Inc., 3.15%, due 08/01/22 | 15,144 | ||||||||||
|
| |||||||||||
Total Corporate Bonds (Cost: $216,619) | 222,571 | |||||||||||
|
| |||||||||||
Total Fixed Income Securities (Cost: $527,961) (45.7%) | 557,646 | |||||||||||
|
| |||||||||||
| Number of Shares | Money Market Investments | |||||||||||
| 22,118 | State Street Institutional U.S. Government Money Market Fund — Premier Class, 0.25% (5)(6) | 22,118 | ||||||||||
|
| |||||||||||
Total Money Market Investments (Cost: $22,118) (1.8%) | 22,118 | |||||||||||
|
| |||||||||||
| Principal Amount | Short-Term Investments | |||||||||||
U.S. Treasury Securities (47.9%) |
| |||||||||||
| $ | 135,000 | U.S. Treasury Bill, 0.17%, due 12/15/16 (7) | 134,971 | |||||||||
| 190,000 | U.S. Treasury Bill, 0.26%, due 01/12/17 (7) | 189,902 | ||||||||||
| 50,000 | U.S. Treasury Bill, 0.27%, due 01/05/17 (7) | 49,976 | ||||||||||
| 90,000 | U.S. Treasury Bill, 0.28%, due 01/19/17 (7) | 89,945 | ||||||||||
| 10,000 | U.S. Treasury Bill, 0.32%, due 02/23/17 (7) | 9,990 | ||||||||||
| 20,000 | U.S. Treasury Bill, 0.43%, due 04/06/17 (7) | 19,964 | ||||||||||
| 50,000 | U.S. Treasury Bill, 0.45%, due 04/13/17 (7) | 49,900 | ||||||||||
| 40,000 | U.S. Treasury Bill, 0.46%, due 04/20/17 (7) | 39,914 | ||||||||||
|
| |||||||||||
Total U.S. Treasury Securities (Cost: $584,505) | 584,562 | |||||||||||
|
| |||||||||||
Total Short-Term Investments (Cost: $584,505) (47.9%) | 584,562 | |||||||||||
|
| |||||||||||
Total Investments (Cost: $1,134,584) (95.4%) | 1,164,326 | |||||||||||
Excess of Other Assets over Liabilities (4.6%) | 56,266 | |||||||||||
|
| |||||||||||
Net Assets (100.0%) | $ | 1,220,592 | ||||||||||
|
| |||||||||||
See accompanying notes to financial statements.
34
TCW Enhanced Commodity Strategy Fund
October 31, 2016 |
| Total Return Swaps (6) | ||||||||||||||||||||||||||||
| Notional Amount | Expiration Date | Counterparty | Payment Made by Fund | Payment Received by Fund | Unrealized Depreciation | Premium Paid | Value | |||||||||||||||||||||
OTC Swaps | ||||||||||||||||||||||||||||
$1,238,530 | 11/22/16 | | Credit Suisse First Boston Corp. | | 3-Month U.S. Treasury Bills plus 0.2% | Credit Suisse Custom 24 Total Return Index (8) | $ (17,747) | $ | — | $ (17,747) | ||||||||||||||||||
|
|
|
|
|
| |||||||||||||||||||||||
Notes to the Schedule of Investments:
| EETC - | Enhanced Equipment Trust Certificate. |
| OTC - | Over the Counter. |
| REIT - | Real Estate Investment Trust. |
| (1) | Security exempt from registration under Rule 144A of the Securities Act of 1933, as amended. These securities may be resold, normally only to qualified institutional buyers. At October 31, 2016, the value of these securities amounted to $90,594 or 7.4% of net assets. These securities are determined to be liquid by the Advisor, unless otherwise noted, under procedures established by and under the general supervision of the Company’s Board of Directors. |
| (2) | Floating or variable rate security. The interest shown reflects the rate in effect at October 31, 2016. |
| (3) | Restricted security (Note 10). |
| (4) | A portion of the principal balance has been written-off during the period due to defaults in the underlying loans. |
| (5) | Rate disclosed is the 7-day net yield as of October 31, 2016. |
| (6) | All or a portion of this security is owned by TCW Cayman Enhanced Commodity Fund, Ltd. |
| (7) | Rate shown represents yield-to-maturity. |
| (8) | Custom Index has exposure to the following commodities: HRW Wheat, Cotton, Lean Hogs, Soybean Meal, Nickel Primary, Soybean Oil, Zinc High Grade, RBOB Gasoline, SRW Wheat, Heating Oil, Silver, Coffee ‘C’ Arabica, Sugar #11, Live Cattle, Soybeans, Brent Crude Oil, Aluminum Primary, Corn, Copper High Grade, WTI Crude Oil, Natural Gas, and Gold. |
See accompanying notes to financial statements.
35
TCW Enhanced Commodity Strategy Fund
Consolidated Investments by Industry | October 31, 2016 |
| Industry | Percentage of Net Assets | |||
Airlines | 4.7 | % | ||
Asset-Backed Securities | 1.7 | |||
Banks | 6.7 | |||
Commercial Mortgage-Backed Securities — Agency | 2.0 | |||
Commercial Mortgage-Backed Securities — Non-Agency | 0.1 | |||
Insurance | 5.6 | |||
REIT | 1.2 | |||
Residential Mortgage-Backed Securities — Agency | 1.6 | |||
Residential Mortgage-Backed Securities — Non-Agency | 22.1 | |||
Money Market Investments | 1.8 | |||
U.S. Treasury Securities | 47.9 | |||
|
| |||
Total | 95.4 | % | ||
|
| |||
Fair Valuation Summary
The following is a summary of the fair valuations according to the inputs used as of October 31, 2016 in valuing the Fund’s investments:
| Description | Quoted Prices (Level 1) | Other (Level 2) | Significant (Level 3) | Total | ||||||||||||
Fixed Income Securities | ||||||||||||||||
Asset-Backed Securities | $ | — | $ | 21,002 | $ | — | $ | 21,002 | ||||||||
Commercial Mortgage-Backed Securities — Agency | — | 24,801 | — | 24,801 | ||||||||||||
Commercial Mortgage-Backed Securities — Non-Agency | — | — | 817 | 817 | ||||||||||||
Residential Mortgage-Backed Securities — Agency | — | 18,805 | — | 18,805 | ||||||||||||
Residential Mortgage-Backed Securities — Non-Agency | — | 269,650 | — | 269,650 | ||||||||||||
Corporate Bonds* | — | 222,571 | — | 222,571 | ||||||||||||
|
|
|
|
|
|
|
| |||||||||
Total Fixed Income Securities | — | 556,829 | 817 | 557,646 | ||||||||||||
|
|
|
|
|
|
|
| |||||||||
Money Market Investments | 22,118 | — | — | 22,118 | ||||||||||||
Short-Term Investments* | 584,562 | — | — | 584,562 | ||||||||||||
|
|
|
|
|
|
|
| |||||||||
Total Investments | $ | 606,680 | $ | 556,829 | $ | 817 | $ | 1,164,326 | ||||||||
|
|
|
|
|
|
|
| |||||||||
Liability Derivatives | ||||||||||||||||
Total Return Swaps | ||||||||||||||||
Commodity Risk | $ | — | $ | (17,747 | ) | $ | — | $ | (17,747 | ) | ||||||
|
|
|
|
|
|
|
| |||||||||
Total | $ | — | $ | (17,747 | ) | $ | — | $ | (17,747 | ) | ||||||
|
|
|
|
|
|
|
| |||||||||
| * | See Schedule of Investments for corresponding industries. |
See accompanying notes to financial statements.
36
Schedule of Investments | October 31, 2016 |
| Principal Amount | Fixed Income Securities | Value | ||||||||||
Corporate Bonds (21.4% of Net Assets) |
| |||||||||||
Airlines (2.3%) | ||||||||||||
| $ | 159,823 | American Airlines, Inc. Pass-Through Trust, (13-2A), 4.95%, due 07/15/24 (EETC) | $ | 173,807 | ||||||||
| 37,239 | Continental Airlines, Inc. Pass-Through Trust, (01-1A-1), | 39,333 | ||||||||||
| 77,478 | Delta Air Lines, Inc. Pass-Through Certificates, (02-1G1), | 89,100 | ||||||||||
| 16,123 | US Airways Group, Inc. Pass-Through Certificates, (10-1A), | 18,300 | ||||||||||
| 46,427 | US Airways Group, Inc. Pass-Through Certificates, (12-1A), | 53,449 | ||||||||||
|
| |||||||||||
Total Airlines | 373,989 | |||||||||||
|
| |||||||||||
Auto Manufacturers (0.6%) | ||||||||||||
| 100,000 | Ford Motor Credit Co. LLC, 8%, due 12/15/16 | 100,839 | ||||||||||
|
| |||||||||||
Banks (7.4%) | ||||||||||||
| 45,000 | Abbey National Treasury Services PLC (United Kingdom), (Reg. S), | 50,342 | ||||||||||
| 250,000 | Bank of America N.A., 6.1%, due 06/15/17 | 256,936 | ||||||||||
| 200,000 | BBVA Bancomer S.A. (Mexico), (144A), 6.75%, due 09/30/22 (2) | 224,560 | ||||||||||
| 300,000 | Chase Capital VI, 1.381%, due 08/01/28 (3) | 271,125 | ||||||||||
| 70,000 | Citigroup, Inc., 1.375%, due 08/25/36 (3) | 50,594 | ||||||||||
| 110,000 | Goldman Sachs Group, Inc. (The), 5.95%, due 01/18/18 | 115,769 | ||||||||||
| 40,000 | HBOS PLC (United Kingdom), (144A), 6.75%, due 05/21/18 (2) | 42,570 | ||||||||||
| 100,000 | Rabobank Nederland Utrecht (Netherlands), 3.375%, due 01/19/17 | 100,515 | ||||||||||
| 85,000 | Wells Fargo & Co., 3%, due 04/22/26 | 84,865 | ||||||||||
|
| |||||||||||
Total Banks | 1,197,276 | |||||||||||
|
| |||||||||||
Beverages (0.3%) | ||||||||||||
| 14,000 | Anheuser-Busch InBev Finance, Inc., 3.65%, due 02/01/26 | 14,788 | ||||||||||
| 24,000 | Anheuser-Busch InBev Finance, Inc., 4.9%, due 02/01/46 | 27,602 | ||||||||||
|
| |||||||||||
Total Beverages | 42,390 | |||||||||||
|
| |||||||||||
Biotechnology (0.5%) | ||||||||||||
| 22,000 | Amgen, Inc., (144A), 4.663%, due 06/15/51 (2) | 22,768 | ||||||||||
| 20,000 | Celgene Corp., 3.875%, due 08/15/25 | 20,990 | ||||||||||
| 40,000 | Gilead Sciences, Inc., 2.95%, due 03/01/27 | 39,602 | ||||||||||
|
| |||||||||||
Total Biotechnology | 83,360 | |||||||||||
|
| |||||||||||
Computers (0.2%) | ||||||||||||
| 35,000 | Apple, Inc., 4.65%, due 02/23/46 | 38,727 | ||||||||||
|
| |||||||||||
Electric (1.8%) | ||||||||||||
| 50,000 | AEP Texas Central Co., (144A), 3.85%, due 10/01/25 (2) | 53,749 | ||||||||||
| 50,000 | FirstEnergy Transmission LLC, (144A), 4.35%, due 01/15/25 (2) | 53,178 | ||||||||||
| 75,000 | IPALCO Enterprises, Inc., 5%, due 05/01/18 | 78,528 | ||||||||||
| 40,000 | ITC Holdings Corp., 3.65%, due 06/15/24 | 42,045 | ||||||||||
See accompanying notes to financial statements.
37
TCW Global Bond Fund
Schedule of Investments (Continued)
| Principal Amount | Fixed Income Securities | Value | ||||||||||
Electric (Continued) | ||||||||||||
| $ | 60,000 | NextEra Energy Capital Holdings, Inc., 1.586%, due 06/01/17 | $ | 60,173 | ||||||||
|
| |||||||||||
Total Electric | 287,673 | |||||||||||
|
| |||||||||||
Food (0.2%) | ||||||||||||
| 35,000 | Kraft Heinz Foods Co., 3.95%, due 07/15/25 | 37,486 | ||||||||||
|
| |||||||||||
Insurance (0.8%) | ||||||||||||
| 100,000 | Farmers Exchange Capital II, (144A), 6.151%, due 11/01/53 (2)(3) | 104,923 | ||||||||||
| 26,000 | Jackson National Life Global Funding, (144A), 3.05%, due 04/29/26 (2) | 25,948 | ||||||||||
|
| |||||||||||
Total Insurance | 130,871 | |||||||||||
|
| |||||||||||
Media (0.5%) | ||||||||||||
| 20,000 | 21st Century Fox America, Inc., 4.95%, due 10/15/45 | 22,062 | ||||||||||
| 22,000 | CCO Holdings LLC / CCO Holdings Capital Corp., 5.75%, due 09/01/23 | 23,238 | ||||||||||
| 30,000 | Charter Communications Operating LLC / Charter Communications Operating Capital, (144A), 6.484%, due 10/23/45 (2) | 35,347 | ||||||||||
|
| |||||||||||
Total Media | 80,647 | |||||||||||
|
| |||||||||||
Miscellaneous Manufacturers (1.1%) | ||||||||||||
| 200,000 | General Electric Capital Corp., 1.297%, due 08/15/36 (3) | 174,763 | ||||||||||
|
| |||||||||||
Oil & Gas (0.1%) | ||||||||||||
| 9,000 | Devon Energy Corp., 5.85%, due 12/15/25 | 10,335 | ||||||||||
|
| |||||||||||
Pharmaceuticals (1.0%) | ||||||||||||
| 50,000 | AbbVie, Inc., 4.5%, due 05/14/35 | 51,160 | ||||||||||
| 20,000 | Actavis Funding SCS (Luxembourg), 3.8%, due 03/15/25 | 20,792 | ||||||||||
| 20,000 | Actavis Funding SCS (Luxembourg), 4.75%, due 03/15/45 | 21,061 | ||||||||||
| 25,000 | AstraZeneca PLC (United Kingdom), 3.375%, due 11/16/25 | 26,081 | ||||||||||
| 20,000 | Baxalta, Inc., 2.875%, due 06/23/20 | 20,428 | ||||||||||
| 20,000 | Valeant Pharmaceuticals International, Inc. (Canada), (144A), | 15,900 | ||||||||||
| 6,000 | Valeant Pharmaceuticals International, Inc. (Canada), (144A), | 4,770 | ||||||||||
|
| |||||||||||
Total Pharmaceuticals | 160,192 | |||||||||||
|
| |||||||||||
Pipelines (0.5%) | ||||||||||||
| 40,000 | Boardwalk Pipelines LP, 5.875%, due 11/15/16 | 40,061 | ||||||||||
| 50,000 | Energy Transfer Partners LP, 5.15%, due 03/15/45 | 46,750 | ||||||||||
|
| |||||||||||
Total Pipelines | 86,811 | |||||||||||
|
| |||||||||||
REIT (2.5%) | ||||||||||||
| 50,000 | HCP, Inc., 3.15%, due 08/01/22 | 50,480 | ||||||||||
| 50,000 | Highwoods Realty LP, 5.85%, due 03/15/17 | 50,790 | ||||||||||
| 100,000 | SL Green Realty Corp., 5%, due 08/15/18 | 104,584 | ||||||||||
| 200,000 | WEA Finance LLC / Westfield UK & Europe Finance PLC, (144A), | 200,592 | ||||||||||
|
| |||||||||||
Total REIT | 406,446 | |||||||||||
|
| |||||||||||
See accompanying notes to financial statements.
38
TCW Global Bond Fund
October 31, 2016 |
| Principal Amount | Fixed Income Securities | Value | ||||||||||
Retail (0.4%) | ||||||||||||
| $ | 60,000 | Walgreens Boots Alliance, Inc., 3.45%, due 06/01/26 | $ | 61,280 | ||||||||
|
| |||||||||||
Software (0.3%) | ||||||||||||
| 25,000 | Microsoft Corp., 2.4%, due 08/08/26 | 24,556 | ||||||||||
| 25,000 | Microsoft Corp., 4.45%, due 11/03/45 | 27,503 | ||||||||||
|
| |||||||||||
Total Software | 52,059 | |||||||||||
|
| |||||||||||
Telecommunications (0.9%) | ||||||||||||
| 45,000 | AT&T, Inc., 1.768%, due 06/30/20 (3) | 45,222 | ||||||||||
| 25,000 | AT&T, Inc., 4.125%, due 02/17/26 | 26,223 | ||||||||||
| 75,000 | Verizon Communications, Inc., 4.862%, due 08/21/46 | 80,039 | ||||||||||
|
| |||||||||||
Total Telecommunications | 151,484 | |||||||||||
|
| |||||||||||
Total Corporate Bonds (Cost: $3,217,638) | 3,476,628 | |||||||||||
|
| |||||||||||
Foreign Government Bonds (37.9%) | ||||||||||||
| AUD | 186,000 | Australia Government Bond, (Reg. S), 2.75%, due 04/21/24 (1) | 147,053 | |||||||||
| EUR | 360,000 | Bundesrepublik Deutschland (Germany), (Reg. S), 2.25%, due 09/04/21 (1) | 446,509 | |||||||||
| EUR | 38,000 | Bundesrepublik Deutschland (Germany), (Reg. S), 0.01%, due 08/15/26 (1) | 41,003 | |||||||||
| CAD | 430,000 | Canada Housing Trust No. 1, (144A), 3.35%, due 12/15/20 (2) | 351,235 | |||||||||
| DKK | 900,000 | Denmark Government Bond, 1.75%, due 11/15/25 | 150,342 | |||||||||
| EUR | 65,000 | France Government Bond OAT, (Reg. S), 3.25%, due 10/25/21 (1) | 83,773 | |||||||||
| EUR | 278,000 | France Government Bond OAT, (Reg. S), 2.5%, due 05/25/30 (1) | 376,700 | |||||||||
| EUR | 55,000 | Ireland Government Bond, (Reg. S), 3.4%, due 03/18/24 (1) | 73,965 | |||||||||
| ILS | 280,000 | Israel Government Bond, 5.5%, due 01/31/22 | 89,519 | |||||||||
| EUR | 482,000 | Italy Buoni Poliennali Del Tesoro, 4.5%, due 03/01/24 | 649,576 | |||||||||
| JPY | 95,800,000 | Japan Government Ten-Year Bond, 1%, due 09/20/21 | 964,609 | |||||||||
| JPY | 45,000,000 | Japan Government Thirty-Year Bond, 2%, due 03/20/42 | 586,077 | |||||||||
| KRW | 144,000,000 | Korea Treasury Bond, 1.875%, due 06/10/26 | 127,092 | |||||||||
| MYR | 525,000 | Malaysia Government Bond, 3.955%, due 09/15/25 | 127,092 | |||||||||
| NOK | 1,350,000 | Norway Government Bond, (Reg. S), 3.75%, due 05/25/21 (1) | 183,828 | |||||||||
| PLN | 265,000 | Poland Government Bond, 3.25%, due 07/25/25 | 68,518 | |||||||||
| $ | 250,000 | Romanian Government International Bond, (Reg. S), 4.875%, due 01/22/24 (1) | 280,836 | |||||||||
| EUR | 515,000 | Spain Government Bond, (Reg. S), 2.75%, due 10/31/24 (1) | 645,612 | |||||||||
| SEK | 500,000 | Sweden Government Bond, 3.5%, due 06/01/22 | 67,472 | |||||||||
| GBP | 500,000 | United Kingdom Gilt, (Reg. S), 2.75%, due 09/07/24 (1) | 690,443 | |||||||||
|
| |||||||||||
Total Foreign Government Bonds (Cost: $6,693,820) | 6,151,254 | |||||||||||
|
| |||||||||||
Asset-Backed Securities (4.7%) | ||||||||||||
| 40,000 | Dryden Senior Loan Fund, (144A), 2.38%, due 04/15/27 (2)(3) | 40,052 | ||||||||||
| 36,444 | Educational Funding of the South, Inc. (11-1-A2), 1.532%, due 04/25/35 (3) | 35,932 | ||||||||||
| 20,000 | Magnetite XI, Ltd. (14-11A-A1), (144A), 2.129%, due 01/18/27 (2)(3) | 20,002 | ||||||||||
| 40,000 | Magnetite XII, Ltd. (15-12A-A), (144A), 2.38%, due 04/15/27 (2)(3) | 40,028 | ||||||||||
| 80,000 | Navient Student Loan Trust (14-8-A3), 1.134%, due 05/27/31 (3) | 77,089 | ||||||||||
| 50,000 | Navient Student Loan Trust (16-2-A3), (144A), 2.034%, due 06/25/65 (2)(3) | 51,538 | ||||||||||
| 115,000 | Nelnet Education Loan Corp. (04-1A-B1), (144A), 1.5%, due 02/25/36 (2)(3) | 99,063 | ||||||||||
| 71,657 | SLC Student Loan Trust (08-1-A4A), 2.45%, due 12/15/32 (3) | 72,817 | ||||||||||
See accompanying notes to financial statements.
39
TCW Global Bond Fund
Schedule of Investments (Continued)
| Principal Amount | Fixed Income Securities | Value | ||||||||||
Asset-Backed Securities (Continued) | ||||||||||||
| $ | 50,000 | SLM Student Loan Trust (07-3-A4), 0.942%, due 01/25/22 (3) | $ | 46,988 | ||||||||
| 73,719 | SLM Student Loan Trust (07-6-A4), 1.262%, due 10/25/24 (3) | 72,470 | ||||||||||
| 16,251 | SLM Student Loan Trust (08-9-A), 2.382%, due 04/25/23 (3) | 16,286 | ||||||||||
| 50,000 | SLM Student Loan Trust (11-2-A2), 1.734%, due 10/25/34 (3) | 49,610 | ||||||||||
| 59,052 | Spirit Master Funding LLC (14-1A-A1), (144A), 5.05%, due 07/20/40 (2) | 60,505 | ||||||||||
| 50,000 | Student Loan Consolidation Center (02-2-B2), (144A), 0%, due 07/01/42 (2)(3) | 38,786 | ||||||||||
| 40,000 | Voya CLO, Ltd. (14-4A-A1), (144A), 2.381%, due 10/14/26 (2)(3) | 40,011 | ||||||||||
|
| |||||||||||
Total Asset-Backed Securities (Cost: $743,601) | 761,177 | |||||||||||
|
| |||||||||||
Commercial Mortgage-Backed Securities — Agency (1.6%) | ||||||||||||
| 344,008 | Federal Home Loan Mortgage Corp. Multifamily Structured Pass-Through Certificates(KSCT-AX), 1.232%, due 01/25/20 (3) (I/O) | 10,239 | ||||||||||
| 71,791 | Federal National Mortgage Association, Pool #467731, 4.62%, due 04/01/21 | 79,954 | ||||||||||
| 27,500 | Federal National Mortgage Association, Pool #460605, 6.09%, due 01/01/17 | 27,591 | ||||||||||
| 120,156 | Federal National Mortgage Association (12-M10-AFL), 0.984%, due 09/25/22 (3) | 119,674 | ||||||||||
| 25,096 | Federal National Mortgage Association (14-M12-FA), 0.814%, due 10/25/21 (3) | 25,008 | ||||||||||
|
| |||||||||||
Total Commercial Mortgage-Backed Securities — Agency (Cost: $292,422) | 262,466 | |||||||||||
|
| |||||||||||
Commercial Mortgage-Backed Securities — Non-Agency (0.3%) | ||||||||||||
| 1,834,784 | Bank of America-First Union NB Commercial Mortgage (01-3-XC), (144A), | 284 | ||||||||||
| 1,420,543 | Morgan Stanley Capital I Trust (99-RM1-X), (144A), 0. | 4,923 | ||||||||||
| 48,027 | WF-RBS Commercial Mortgage Trust (11-C4-A3), (144A), 4.394%, due 06/15/44 (2) | 50,158 | ||||||||||
|
| |||||||||||
Total Commercial Mortgage-Backed Securities — Non-Agency (Cost: $69,097) | 55,365 | |||||||||||
|
| |||||||||||
Residential Mortgage-Backed Securities — Agency (10.8%) | ||||||||||||
| 12,832 | Federal Home Loan Mortgage Corp. (2990-ND), | 15,019 | ||||||||||
| 117,849 | Federal Home Loan Mortgage Corp. (3439-SC), | 20,232 | ||||||||||
| 101,051 | Federal Home Loan Mortgage Corp., Pool #G08698, 3.5%, due 03/01/46 | 106,104 | ||||||||||
| 28,468 | Federal Home Loan Mortgage Corp., Pool #G08702, 3.5%, due 04/01/46 | 29,887 | ||||||||||
| 98,727 | Federal Home Loan Mortgage Corp., Pool #G08716, 3.5%, due 08/01/46 | 103,652 | ||||||||||
| 14,890 | Federal Home Loan Mortgage Corp., Pool #G08721, 3%, due 09/01/46 | 15,339 | ||||||||||
| 9,918 | Federal Home Loan Mortgage Corp., Pool #G08722, 3.5%, due 09/01/46 | 10,426 | ||||||||||
| 174,584 | Federal Home Loan Mortgage Corp., Pool #G08726, 3%, due 10/01/46 | 179,876 | ||||||||||
| 20,000 | Federal Home Loan Mortgage Corp., Pool #G08732, 3%, due 10/01/46 | 20,602 | ||||||||||
| 13,742 | Federal Home Loan Mortgage Corp., Pool #G18592, 3%, due 03/01/31 | 14,402 | ||||||||||
| 77,498 | Federal Home Loan Mortgage Corp., Pool #G60344, 4%, due 12/01/45 | 84,304 | ||||||||||
| 133,561 | Federal National Mortgage Association (07-52-LS), | 21,606 | ||||||||||
| 123,151 | Federal National Mortgage Association (08-18-SM), | 20,891 | ||||||||||
| 86,544 | Federal National Mortgage Association (09-115-SB), | 15,793 | ||||||||||
See accompanying notes to financial statements.
40
TCW Global Bond Fund
October 31, 2016 |
| Principal Amount | Fixed Income Securities | Value | ||||||||||
Residential Mortgage-Backed Securities — Agency (Continued) | ||||||||||||
| $ | 182,181 | Federal National Mortgage Association (10-116-SE), | $ | 33,724 | ||||||||
| 157,639 | Federal National Mortgage Association, Pool #AB3679, 3.5%, due 10/01/41 | 167,663 | ||||||||||
| 180,219 | Federal National Mortgage Association, Pool #AB4045, 3.5%, due 12/01/41 | 192,775 | ||||||||||
| 69,410 | Federal National Mortgage Association, Pool #AT5914, 3.5%, due 06/01/43 | 73,681 | ||||||||||
| 89,343 | Federal National Mortgage Association, Pool #MA1527, 3%, due 08/01/33 | 93,084 | ||||||||||
| 72,485 | Federal National Mortgage Association, Pool #MA1652, 3.5%, due 11/01/33 | 76,958 | ||||||||||
| 78,100 | Federal National Mortgage Association, Pool #MA2740, 2.5%, due 09/01/26 (5) | 80,465 | ||||||||||
| 5,000 | Federal National Mortgage Association TBA, 2.5% (6) | 5,145 | ||||||||||
| 165,000 | Federal National Mortgage Association TBA, 4% (6) | 176,705 | ||||||||||
| 116,581 | Government National Mortgage Association (11-146-EI), | 25,464 | ||||||||||
| 269,943 | Government National Mortgage Association (11-69-GI), | 26,527 | ||||||||||
| 234,209 | Government National Mortgage Association (12-7-PI), | 9,350 | ||||||||||
| 65,707 | Government National Mortgage Association II, Pool #MA3597, | 69,639 | ||||||||||
| 9,555 | Government National Mortgage Association II, Pool #MA3663, | 10,131 | ||||||||||
| 44,303 | Government National Mortgage Association II, Pool #MA3803, | 46,973 | ||||||||||
|
| |||||||||||
Total Residential Mortgage-Backed Securities — Agency (Cost: $1,733,468) | 1,746,417 | |||||||||||
|
| |||||||||||
Residential Mortgage-Backed Securities — Non-Agency (4.1%) | ||||||||||||
| 96,181 | First Horizon Mortgage Pass-Through Trust (05-AR4-2A1), | 80,341 | ||||||||||
| 43,203 | Green Tree Financial Corp. (98-6-A8), 6.66%, due 06/01/30 | 46,344 | ||||||||||
| 130,195 | Lehman XS Trust (06-9-A1B), 0.694%, due 05/25/46 (3)(7) | 113,379 | ||||||||||
| 1,251,739 | Merrill Lynch Alternative Note Asset Trust (07-A3-A2D), | 161,703 | ||||||||||
| 110,390 | Structured Adjustable Rate Mortgage Loan Trust (04-18-4A1), | 108,795 | ||||||||||
| 237,912 | Structured Asset Mortgage Investments, Inc. (06-AR3-22A1), | 148,853 | ||||||||||
|
| |||||||||||
Total Residential Mortgage-Backed Securities — Non-Agency (Cost: $518,110) | 659,415 | |||||||||||
|
| |||||||||||
U.S. Treasury Securities (17.0%) | ||||||||||||
| 675,000 | U.S. Treasury Bond, 2.25%, due 08/15/46 | 627,803 | ||||||||||
| 500,000 | U.S. Treasury Note, 0.625%, due 08/31/17 | 499,864 | ||||||||||
| 160,000 | U.S. Treasury Note, 0.75%, due 10/31/17 | 160,078 | ||||||||||
| 180,000 | U.S. Treasury Note, 0.75%, due 07/31/18 | 179,763 | ||||||||||
| 400,000 | U.S. Treasury Note, 1.125%, due 07/31/21 | 396,469 | ||||||||||
| 75,000 | U.S. Treasury Note, 1.125%, due 09/30/21 | 74,306 | ||||||||||
| 855,000 | U.S. Treasury Note, 1.5%, due 08/15/26 | 829,518 | ||||||||||
|
| |||||||||||
Total U.S. Treasury Securities (Cost: $2,805,601) | 2,767,801 | |||||||||||
|
| |||||||||||
Total Fixed Income Securities (Cost: $16,073,757) (97.8%) | 15,880,523 | |||||||||||
|
| |||||||||||
See accompanying notes to financial statements.
41
TCW Global Bond Fund
Schedule of Investments (Continued)
| Number of Shares | Money Market Investments | Value | ||||||||||
| 20,443 | State Street Institutional U.S. Government Money Market Fund — Premier Class, 0.25% (8) | $ | 20,443 | |||||||||
|
| |||||||||||
Total Money Market Investments (Cost: $20,443) (0.1%) | 20,443 | |||||||||||
|
| |||||||||||
| Principal Amount | Short-Term Investments | |||||||||||
U.S. Treasury Securities (3.3%) | ||||||||||||
| $ | 100,000 | U.S. Treasury Bill, 0.259%, due 01/12/17(9) | 99,948 | |||||||||
| 180,000 | U.S. Treasury Bill, 0.324%, due 02/23/17(9) | 179,816 | ||||||||||
| 100,000 | U.S. Treasury Bill, 0.444%, due 04/13/17(9) | 99,801 | ||||||||||
| 150,000 | U.S. Treasury Bill, 0.462%, due 04/20/17(9) | 149,676 | ||||||||||
|
| |||||||||||
Total U.S. Treasury Securities (Cost: $529,208) | 529,241 | |||||||||||
|
| |||||||||||
Total Short-Term Investments (Cost: $529,208) (3.3%) | 529,241 | |||||||||||
|
| |||||||||||
Total Investments (Cost: $16,623,408) (101.2%) | 16,430,207 | |||||||||||
Liabilities in Excess of Other Assets (-1.2%) | (195,854 | ) | ||||||||||
|
| |||||||||||
Total Net Assets (100.0%) | $ | 16,234,353 | ||||||||||
|
| |||||||||||
| Forward Currency Contracts | ||||||||||||||||||||||||
| Counterparty | Contracts to Deliver | Units of Currency | Settlement Date | In Exchange for U.S. Dollars | Contracts at Value | Unrealized Appreciation (Depreciation) | ||||||||||||||||||
BUY (10) | ||||||||||||||||||||||||
Barclays Capital | EUR | 510,000 | 01/11/17 | $ | 571,922 | $ | 560,912 | $ | (11,010 | ) | ||||||||||||||
Barclays Capital | JPY | 34,700,000 | 01/11/17 | 334,977 | 331,209 | (3,768 | ) | |||||||||||||||||
|
|
|
|
|
| |||||||||||||||||||
| $ | 906,899 | $ | 892,121 | $ | (14,778 | ) | ||||||||||||||||||
|
|
|
|
|
| |||||||||||||||||||
SELL (11) | ||||||||||||||||||||||||
Barclays Capital | GBP | 175,000 | 01/11/17 | $ | 221,735 | $ | 214,028 | $ | 7,707 | |||||||||||||||
Barclays Capital | ILS | 360,000 | 01/11/17 | 95,172 | 93,894 | 1,278 | ||||||||||||||||||
Barclays Capital | KRW | 148,000,000 | 01/11/17 | 132,270 | 129,312 | 2,958 | ||||||||||||||||||
Barclays Capital | MYR | 537,000 | 01/11/17 | 128,607 | 127,580 | 1,027 | ||||||||||||||||||
|
|
|
|
|
| |||||||||||||||||||
| $ | 577,784 | $ | 564,814 | $ | 12,970 | |||||||||||||||||||
|
|
|
|
|
| |||||||||||||||||||
See accompanying notes to financial statements.
42
TCW Global Bond Fund
October 31, 2016 |
Notes to the Schedule of Investments:
| AUD | - Australian Dollar. |
| CAD | - Canadian Dollar. |
| DKK | - Danish Krone. |
| EUR | - Euro Currency. |
| GBP | - British Pound Sterling. |
| ILS | - Israeli Shekel. |
| JPY | - Japanese Yen. |
| KRW | - South Korean Won. |
| MYR | - Malaysian Ringgit. |
| NOK | - Norwegian Krona. |
| PLN | - Polish Zloty. |
| SEK | - Swedish Krona. |
| ABS | - Asset-Backed Securities. |
| CLO | - Collateralized Loan Obligation. |
| EETC | - Enhanced Equipment Trust Certificate. |
| I/F | - Inverse Floating rate security whose interest rate moves in the opposite direction of prevailing interest rates. |
| I/O | - Interest Only Security. |
| PAC | - Planned Amortization Class. |
| TBA | - To be Announced. |
| (1) | Investments issued under Regulation S of the Securities Act of 1933, may not be offered, sold, or delivered within the United States except under special exemptions. At October 31, 2016, the value of these securities amounted to $3,020,064 or 18.6% of net assets. |
| (2) | Security exempt from registration under Rule 144A of the Securities Act of 1933, as amended. These securities may be resold, normally only to qualified institutional buyers. At October 31, 2016, the value of these securities amounted to $1,580,890 or 9.7% of net assets. These securities are determined to be liquid by the Advisor, unless otherwise noted, under procedures established by and under the general supervision of the Company’s Board of Directors. |
| (3) | Floating or variable rate security. The interest shown reflects the rate in effect at October 31, 2016. |
| (4) | Restricted security (Note 10). |
| (5) | This security is purchased on a when-issued, delayed-delivery or forward commitment basis. |
| (6) | Security purchased on a forward commitment with an approximate principal amount. The actual principal amount and maturity date will be determined upon settlement when the security is delivered. |
| (7) | A portion of the principal balance has been written-off during the period due to defaults in the underlying loans. Cost basis has been adjusted as a result. |
| (8) | Rate disclosed is the 7-day net yield as of October 31, 2016. |
| (9) | Rate shown represents yield-to-maturity. |
| (10) | Fund buys foreign currency, sells U.S. Dollar. |
| (11) | Fund sells foreign currency, buys U.S. Dollar. |
See accompanying notes to financial statements.
43
TCW Global Bond Fund
Investments by Industry | October 31, 2016 |
| Industry | Percentage of Net Assets | |||
Airlines | 2.3 | % | ||
Asset-Backed Securities | 4.7 | |||
Auto Manufacturers | 0.6 | |||
Banks | 7.4 | |||
Beverages | 0.3 | |||
Biotechnology | 0.5 | |||
Commercial Mortgage-Backed Securities — Agency | 1.6 | |||
Commercial Mortgage-Backed Securities — Non-Agency | 0.3 | |||
Computers | 0.2 | |||
Electric | 1.8 | |||
Food | 0.2 | |||
Foreign Government Bonds | 37.9 | |||
Insurance | 0.8 | |||
Media | 0.5 | |||
Miscellaneous Manufacturers | 1.1 | |||
Oil & Gas | 0.1 | |||
Pharmaceuticals | 1.0 | |||
Pipelines | 0.5 | |||
REIT | 2.5 | |||
Residential Mortgage-Backed Securities — Agency | 10.8 | |||
Residential Mortgage-Backed Securities — Non-Agency | 4.1 | |||
Retail | 0.4 | |||
Short Term Investments | 3.3 | |||
Software | 0.3 | |||
Telecommunications | 0.9 | |||
U.S. Treasury Securities | 17.0 | |||
Money Market Investments | 0.1 | |||
|
| |||
Total | 101.2 | % | ||
|
| |||
See accompanying notes to financial statements.
44
TCW Global Bond Fund
Investments by Country | October 31, 2016 |
| Country | Percentage of Net Assets | |||
Australia | 0.9 | % | ||
Canada | 2.3 | |||
Cayman Islands | 0.9 | |||
Denmark | 0.9 | |||
France | 2.8 | |||
Germany | 3.0 | |||
Great Britain | 4.5 | |||
Ireland | 0.5 | |||
Israel | 0.6 | |||
Italy | 4.0 | |||
Japan | 9.5 | |||
Luxembourg | 0.3 | |||
Malaysia | 0.8 | |||
Mexico | 1.4 | |||
Netherlands | 0.6 | |||
Norway | 1.1 | |||
Poland | 0.4 | |||
Romania | 1.7 | |||
South Korea | 0.8 | |||
Spain | 4.0 | |||
Sweden | 0.4 | |||
United Kingdom | 0.6 | |||
United States | 59.2 | |||
|
| |||
Total | 101.2 | % | ||
|
| |||
See accompanying notes to financial statements.
45
TCW Global Bond Fund
Fair Valuation Summary | October 31, 2016 |
The following is a summary of the fair valuations according to the inputs used as of October 31, 2016 in valuing the Fund’s investments:
| Description | Quoted Prices (Level 1) | Other (Level 2) | Significant (Level 3) | Total | ||||||||||||
Fixed Income Securities | ||||||||||||||||
Corporate Bonds* | $ | — | $ | 3,476,628 | $ | — | $ | 3,476,628 | ||||||||
Foreign Government Bonds | — | 6,151,254 | — | 6,151,254 | ||||||||||||
Asset-Backed Securities | — | 761,177 | — | 761,177 | ||||||||||||
Commercial Mortgage-Backed Securities — Agency | — | 262,466 | — | 262,466 | ||||||||||||
Commercial Mortgage-Backed Securities — Non-Agency | — | 50,158 | 5,207 | 55,365 | ||||||||||||
Residential Mortgage-Backed Securities — Agency | — | 1,746,417 | — | 1,746,417 | ||||||||||||
Residential Mortgage-Backed Securities — Non-Agency | — | 497,712 | 161,703 | 659,415 | ||||||||||||
U.S. Treasury Securities | 2,767,801 | — | — | 2,767,801 | ||||||||||||
|
|
|
|
|
|
|
| |||||||||
Total Fixed Income Securities | 2,767,801 | 12,945,812 | 166,910 | 15,880,523 | ||||||||||||
|
|
|
|
|
|
|
| |||||||||
Money Market Investments | 20,443 | — | — | 20,443 | ||||||||||||
Short-Term Investments* | 529,241 | — | — | 529,241 | ||||||||||||
|
|
|
|
|
|
|
| |||||||||
Total Investments | 3,317,485 | 12,945,812 | 166,910 | 16,430,207 | ||||||||||||
|
|
|
|
|
|
|
| |||||||||
Asset Derivatives | ||||||||||||||||
Forward Currency Contracts | ||||||||||||||||
Foreign Currency Risk | — | 12,970 | — | 12,970 | ||||||||||||
|
|
|
|
|
|
|
| |||||||||
Total Investments | $ | 3,317,485 | $ | 12,958,782 | $ | 166,910 | $ | 16,443,177 | ||||||||
|
|
|
|
|
|
|
| |||||||||
Liability Derivatives | ||||||||||||||||
Forward Currency Contracts | ||||||||||||||||
Foreign Currency Risk | $ | — | $ | (14,778 | ) | $ | — | $ | (14,778 | ) | ||||||
|
|
|
|
|
|
|
| |||||||||
Total | $ | — | $ | (14,778 | ) | $ | — | $ | (14,778 | ) | ||||||
|
|
|
|
|
|
|
| |||||||||
| * | See Schedule of Investments for corresponding industries. |
See accompanying notes to financial statements.
46
Schedule of Investments | October 31, 2016 |
| Principal Amount | Fixed Income Securities | Value | ||||||
Bank Loans (6.1% of Net Assets) | ||||||||
Aerospace/Defense (0.8%) | ||||||||
| $ | 49,880 | TransDigm, Inc., 2015 Term Loan E, 4.316%, due 05/14/22 (1) | $ | 49,784 | ||||
| 175,000 | TransDigm, Inc., 2016 Extended Term Loan F, 4.414%, due 06/09/23 (1) | 174,535 | ||||||
|
| |||||||
Total Aerospace/Defense | 224,319 | |||||||
|
| |||||||
Electric (1.0%) | ||||||||
| 70,000 | Dynegy, Inc., Term Loan B, 5.565%, due 06/27/23 (1) | 70,312 | ||||||
| 154,360 | Lonestar Generation LLC, Term Loan B, 9.416%, due 02/22/21 (1) | 135,065 | ||||||
| 61,071 | TEX Operations Co. LLC, Exit Term Loan B, 5.487%, due 08/04/23 (1) | 61,704 | ||||||
| 13,929 | TEX Operations Co. LLC, Exit Term Loan C, 5.482%, due 08/04/23 (1) | 14,073 | ||||||
|
| |||||||
Total Electric | 281,154 | |||||||
|
| |||||||
Entertainment (0.5%) | ||||||||
| 141,638 | NEP/NCP Holdco, Inc., Incremental Term Loan, 4.584%, due 01/22/20 (1) | 141,527 | ||||||
|
| |||||||
Healthcare-Services (0.6%) | ||||||||
| 174,307 | Community Health Systems, Inc., Term Loan G, 5.916%, due 12/31/19 (1) | 165,402 | ||||||
|
| |||||||
Lodging (0.7%) | ||||||||
| 188,783 | CityCenter Holdings LLC, Term Loan B, 4.622%, due 10/16/20 (1) | 190,179 | ||||||
|
| |||||||
Media (1.6%) | ||||||||
| 309,201 | Charter Communications Operating LLC, Term Loan E, 3.362%, due 07/01/20 (1) | 310,226 | ||||||
| 135,255 | Nexstar Broadcasting, Inc., Bridge Term Loan, 8.417%, due 03/28/17 (1) | 135,255 | ||||||
|
| |||||||
Total Media | 445,481 | |||||||
|
| |||||||
Packaging & Containers (0.7%) | ||||||||
| 123,750 | Peacock Engineering Co., LLC, 2015 Term Loan B, 5.713%, due 07/27/22 (1) | 124,008 | ||||||
| 65,000 | Reynolds Group Holdings, Inc., 2016 Term Loan, 4.625%, due 02/05/23 (1) | 65,258 | ||||||
|
| |||||||
Total Packaging & Containers | 189,266 | |||||||
|
| |||||||
Pharmaceuticals (0.2%) | ||||||||
| 49,875 | NBTY, Inc., Term Loan B, 5.568%, due 05/05/23 (1) | 50,122 | ||||||
|
| |||||||
Total Bank Loans (Cost: $1,627,104) | 1,687,450 | |||||||
|
| |||||||
Corporate Bonds (83.5%) | ||||||||
Advertising (0.6%) | ||||||||
| 100,000 | Lamar Media Corp., 5.75%, due 02/01/26 | 107,320 | ||||||
| 46,000 | Outfront Media Capital LLC / Outfront Media Capital Corp., 5.25%, due 02/15/22 | 47,783 | ||||||
|
| |||||||
Total Advertising | 155,103 | |||||||
|
| |||||||
Aerospace/Defense (0.7%) | ||||||||
| 43,000 | KLX, Inc., (144A), 5.875%, due 12/01/22 (2) | 43,815 | ||||||
| 90,000 | Orbital ATK, Inc., 5.5%, due 10/01/23 | 94,050 | ||||||
| 50,000 | TransDigm, Inc., 5.5%, due 10/15/20 | 51,406 | ||||||
| 10,000 | TransDigm, Inc., (144A), 6.375%, due 06/15/26 (2) | 10,276 | ||||||
|
| |||||||
Total Aerospace/Defense | 199,547 | |||||||
|
| |||||||
See accompanying notes to financial statements.
47
TCW High Yield Bond Fund
Schedule of Investments (Continued)
| Principal Amount | Fixed Income Securities | Value | ||||||
Airlines (2.8%) | ||||||||
| $ | 295,720 | American Airlines, Inc. Pass-Through Trust (13-2-B), (144A), | $ | 309,028 | ||||
| 158,091 | Continental Airlines, Inc. Pass-Through Certificates (99-1-A), | 167,284 | ||||||
| 264,129 | Delta Air Lines, Inc. Pass-Through Certificates (02-1-G-1), | 303,748 | ||||||
|
| |||||||
Total Airlines | 780,060 | |||||||
|
| |||||||
Auto Parts & Equipment (1.5%) | ||||||||
| 260,000 | Goodyear Tire & Rubber Co. (The), 7%, due 05/15/22 | 276,900 | ||||||
| 95,000 | Tenneco, Inc., 5%, due 07/15/26 | 95,712 | ||||||
| 50,000 | Tenneco, Inc., 5.375%, due 12/15/24 | 52,438 | ||||||
|
| |||||||
Total Auto Parts & Equipment | 425,050 | |||||||
|
| |||||||
Banks (1.3%) | ||||||||
| 500,000 | Citigroup, Inc., 1.375%, due 08/25/36 (3) | 361,389 | ||||||
|
| |||||||
Beverages (2.0%) | ||||||||
| 175,000 | Constellation Brands, Inc., 6%, due 05/01/22 | 203,875 | ||||||
| 110,000 | Cott Beverages, Inc., 6.75%, due 01/01/20 | 114,543 | ||||||
| 225,000 | DS Services of America, Inc., (144A), 10%, due 09/01/21 (2) | 250,875 | ||||||
|
| |||||||
Total Beverages | 569,293 | |||||||
|
| |||||||
Biotechnology (0.2%) | ||||||||
| 60,000 | Concordia International Corp. (Canada), (144A), 9%, due 04/01/22(2) | 58,500 | ||||||
|
| |||||||
Building Materials (0.3%) | ||||||||
| 75,000 | RSI Home Products, Inc., (144A), 6.5%, due 03/15/23 (2) | 79,875 | ||||||
| 13,000 | Standard Industries, Inc., (144A), 5.125%, due 02/15/21 (2) | 13,707 | ||||||
|
| |||||||
Total Building Materials | 93,582 | |||||||
|
| |||||||
Chemicals (1.9%) | ||||||||
| 180,000 | Axalta Coating Systems LLC, (144A), 4.875%, due 08/15/24 (2) | 184,275 | ||||||
| 75,000 | MPM Escrow LLC, 8.875%, due 10/15/20 (4) | — | ||||||
| 325,000 | Valvoline, Inc., (144A), 5.5%, due 07/15/24 (2) | 343,687 | ||||||
|
| |||||||
Total Chemicals | 527,962 | |||||||
|
| |||||||
Coal (0.0%) | ||||||||
| 66,950 | Walter Energy, Inc., (144A), 11%, due 04/01/20 (2)(4) | 90 | ||||||
|
| |||||||
Commercial Services (1.4%) | ||||||||
| 138,000 | IHS Markit, Ltd., (144A), 5%, due 11/01/22 (2) | 146,625 | ||||||
| 26,000 | Midas Intermediate Holdco II LLC / Midas Intermediate Holdco II Finance, Inc., (144A), 7.875%, due 10/01/22 (2) | 26,585 | ||||||
| 165,000 | Nielsen Co. Luxembourg SARL (The) (Luxembourg), (144A), 5.5%, due 10/01/21 (2) | 172,837 | ||||||
| 45,000 | United Rentals North America, Inc., 4.625%, due 07/15/23 | 46,688 | ||||||
|
| |||||||
Total Commercial Services | 392,735 | |||||||
|
| |||||||
See accompanying notes to financial statements.
48
TCW High Yield Bond Fund
October 31, 2016 |
| Principal Amount | Fixed Income Securities | Value | ||||||
Diversified Financial Services (3.1%) | ||||||||
| $ | 250,000 | Ally Financial, Inc., 3.25%, due 11/05/18 | $ | 250,625 | ||||
| 100,000 | CIT Group, Inc., 3.875%, due 02/19/19 | 101,781 | ||||||
| 350,000 | CIT Group, Inc., (144A), 5.5%, due 02/15/19 (2) | 369,250 | ||||||
| 130,000 | Double Eagle Acquisition Sub, Inc., (144A), 7.5%, due 10/01/24 (2) | 134,550 | ||||||
|
| |||||||
Total Diversified Financial Services | 856,206 | |||||||
|
| |||||||
Electric (0.5%) | ||||||||
| 320,180 | Homer City Generation LP, 8.734%, due 10/01/26 | 126,471 | ||||||
|
| |||||||
Engineering & Construction (1.2%) | ||||||||
| 335,000 | SBA Communications Corp., (144A), 4.875%, due 09/01/24 (2) | 337,094 | ||||||
|
| |||||||
Entertainment (4.2%) | ||||||||
| 200,000 | AMC Entertainment Holdings., (144A), 5.875%, due 11/15/26 (2)(5) | 202,000 | ||||||
| 200,000 | Carmike Cinemas, Inc., (144A), 6%, due 06/15/23 (2) | 213,500 | ||||||
| 415,000 | Churchill Downs, Inc., (144A), 5.375%, due 12/15/21 (2) | 433,675 | ||||||
| 125,000 | Isle of Capri Casinos, Inc., 5.875%, due 03/15/21 | 130,625 | ||||||
| 175,000 | Rivers Pittsburgh Borrower LP / Rivers Pittsburgh Finance Corp., (144A), 6.125%, due 08/15/21 (2) | 181,125 | ||||||
|
| |||||||
Total Entertainment | 1,160,925 | |||||||
|
| |||||||
Environmental Control (1.1%) | ||||||||
| 305,000 | Clean Harbors, Inc., 5.125%, due 06/01/21 | 312,625 | ||||||
|
| |||||||
Food (0.5%) | ||||||||
| 20,000 | B&G Foods, Inc., 4.625%, due 06/01/21 | 20,650 | ||||||
| 60,000 | Kraft Heinz Foods Co., (144A), 4.875%, due 02/15/25 (2) | 65,973 | ||||||
| 10,000 | Pinnacle Foods Finance LLC / Pinnacle Foods Finance Corp., 5.875%, due 01/15/24 | 10,775 | ||||||
| 26,000 | TreeHouse Foods, Inc., (144A), 6%, due 02/15/24 (2) | 28,054 | ||||||
|
| |||||||
Total Food | 125,452 | |||||||
|
| |||||||
Food Service (0.9%) | ||||||||
| 40,000 | Aramark Services, Inc., (144A), 4.75%, due 06/01/26 (2) | 40,150 | ||||||
| 100,000 | Aramark Services, Inc., (144A), 5.125%, due 01/15/24 (2) | 105,000 | ||||||
| 105,000 | Aramark Services, Inc., 5.75%, due 03/15/20 | 108,281 | ||||||
|
| |||||||
Total Food Service | 253,431 | |||||||
|
| |||||||
Healthcare-Products (0.5%) | ||||||||
| 70,000 | Hill-Rom Holdings, Inc., (144A), 5.75%, due 09/01/23 (2) | 74,200 | ||||||
| 30,000 | Hologic, Inc., (144A), 5.25%, due 07/15/22 (2) | 31,841 | ||||||
| 24,000 | Teleflex, Inc., 4.875%, due 06/01/26 | 24,735 | ||||||
|
| |||||||
Total Healthcare-Products | 130,776 | |||||||
|
| |||||||
Healthcare-Services (10.3%) | ||||||||
| 76,000 | Acadia Healthcare Co., Inc., 6.5%, due 03/01/24 | 77,710 | ||||||
| 420,000 | Centene Corp., 4.75%, due 01/15/25 (5) | 419,212 | ||||||
| 15,000 | Centene Corp., 5.625%, due 02/15/21 | 15,773 | ||||||
| 165,000 | DaVita HealthCare Partners, Inc., 5.125%, due 07/15/24 | 161,287 | ||||||
See accompanying notes to financial statements.
49
TCW High Yield Bond Fund
Schedule of Investments (Continued)
| Principal Amount | Fixed Income Securities | Value | ||||||
Healthcare-Services (Continued) | ||||||||
| $ | 30,000 | DaVita HealthCare Partners, Inc., 5.75%, due 08/15/22 | $ | 30,863 | ||||
| 90,000 | Fresenius Medical Care US Finance II, Inc., (144A), 4.125%, due 10/15/20 (2) | 94,163 | ||||||
| 100,000 | Fresenius Medical Care US Finance, Inc., 6.875%, due 07/15/17 | 103,625 | ||||||
| 125,000 | HCA, Inc., 4.75%, due 05/01/23 | 130,586 | ||||||
| 15,000 | HCA, Inc., 5.25%, due 04/15/25 | 15,750 | ||||||
| 600,000 | HCA, Inc., 6.5%, due 02/15/20 | 666,750 | ||||||
| 135,000 | HealthSouth Corp., 5.75%, due 11/01/24 | 139,894 | ||||||
| 155,000 | Molina Healthcare, Inc., 5.375%, due 11/15/22 | 161,587 | ||||||
| 45,000 | MPH Acquisition Holdings LLC, (144A), 7.125%, due 06/01/24 (2) | 48,375 | ||||||
| 42,000 | RegionalCare Hospital Partners Holdings, Inc., (144A), 8.25%, due 05/01/23 (2) | 42,788 | ||||||
| 348,000 | Tenet Healthcare Corp., 4.35%, due 06/15/20 (3) | 352,350 | ||||||
| 150,000 | Tenet Healthcare Corp., 4.5%, due 04/01/21 | 150,750 | ||||||
| 240,000 | WellCare Health Plans, Inc., 5.75%, due 11/15/20 | 247,350 | ||||||
|
| |||||||
Total Healthcare-Services | 2,858,813 | |||||||
|
| |||||||
Home Builders (0.2%) | ||||||||
| 50,000 | Shea Homes LP / Shea Homes Funding Corp., (144A), 6.125%, due 04/01/25 (2) | 49,375 | ||||||
|
| |||||||
Household Products/Wares (0.9%) | ||||||||
| 100,000 | Central Garden & Pet Co., 6.125%, due 11/15/23 | 106,999 | ||||||
| 135,000 | Spectrum Brands, Inc., 6.625%, due 11/15/22 | 145,379 | ||||||
|
| |||||||
Total Household Products/Wares | 252,378 | |||||||
|
| |||||||
Leisure Time (0.9%) | ||||||||
| 245,000 | NCL Corp., Ltd., Class C, (144A), 5.25%, due 11/15/19 (2) | 249,900 | ||||||
|
| |||||||
Lodging (1.6%) | ||||||||
| 70,000 | Boyd Gaming Corp., 6.875%, due 05/15/23 | 75,250 | ||||||
| 275,000 | Hilton Worldwide Finance LLC / Hilton Worldwide Finance Corp., | 283,274 | ||||||
| 70,000 | MGM Resorts International, 8.625%, due 02/01/19 | 78,881 | ||||||
|
| |||||||
Total Lodging | 437,405 | |||||||
|
| |||||||
Media (12.6%) | ||||||||
| 200,000 | Altice US Finance I Corp. (Luxembourg), (144A), 5.375%, due 07/15/23 (2) | 205,360 | ||||||
| 190,000 | Cable One, Inc., (144A), 5.75%, due 06/15/22 (2) | 200,925 | ||||||
| 100,000 | CCO Holdings LLC / CCO Holdings Capital Corp., (144A), 5.5%, due 05/01/26 (2) | 102,688 | ||||||
| 300,000 | CCO Holdings LLC / CCO Holdings Capital Corp., 6.625%, due 01/31/22 | 313,125 | ||||||
| 165,000 | Cequel Communications Holdings I LLC / Cequel Capital Corp., (144A), 5.125%, due 12/15/21 (2) | 161,287 | ||||||
| 30,000 | Cequel Communications Holdings I LLC / Cequel Capital Corp., (144A), 6.375%, due 09/15/20 (2) | 30,975 | ||||||
| 200,000 | CSC Holdings LLC, (144A), 5.5%, due 04/15/27 (2) | 203,500 | ||||||
| 40,000 | DISH DBS Corp., 4.625%, due 07/15/17 | 40,750 | ||||||
| 300,000 | DISH DBS Corp., 7.875%, due 09/01/19 | 333,000 | ||||||
| 254,000 | LIN Television Corp., 5.875%, due 11/15/22 | 267,017 | ||||||
| 60,000 | Midcontinent Communications & Finance Co., (144A), 6.875%, due 08/15/23 (2) | 64,275 | ||||||
| 200,000 | Neptune Finco Corp., (144A), 6.625%, due 10/15/25 (2) | 217,500 | ||||||
See accompanying notes to financial statements.
50
TCW High Yield Bond Fund
October 31, 2016 |
| Principal Amount | Fixed Income Securities | Value | ||||||
Media (Continued) | ||||||||
| $ | 80,000 | Nexstar Escrow Corp., (144A), 5.625%, due 08/01/24 (2) | $ | 79,800 | ||||
| 10,000 | Nielsen Finance LLC / Nielsen Finance Co., (144A), 5%, due 04/15/22 (2) | 10,191 | ||||||
| 195,000 | Sinclair Television Group, Inc., 6.125%, due 10/01/22 | 205,735 | ||||||
| 50,000 | Sirius XM Radio, Inc., (144A), 4.25%, due 05/15/20 (2) | 51,163 | ||||||
| 495,000 | Sirius XM Radio, Inc., (144A), 5.75%, due 08/01/21 (2) | 517,449 | ||||||
| 28,000 | TEGNA, Inc., 5.125%, due 10/15/19 | 28,805 | ||||||
| 77,000 | Univision Communications, Inc., (144A), 5.125%, due 02/15/25 (2) | 77,481 | ||||||
| 180,000 | Virgin Media Secured Finance PLC (United Kingdom), (144A), 5.375%, due 04/15/21 (2) | 186,525 | ||||||
| 200,000 | Virgin Media Secured Finance PLC (United Kingdom), (144A), 5.5%, due 08/15/26 (2) | 204,750 | ||||||
|
| |||||||
Total Media | 3,502,301 | |||||||
|
| |||||||
Oil & Gas (2.3%) | ||||||||
| 70,000 | Concho Resources, Inc., 5.5%, due 04/01/23 | 71,960 | ||||||
| 150,000 | Gulfport Energy Corp., (144A), 6%, due 10/15/24 (2) | 153,000 | ||||||
| 60,000 | Gulfport Energy Corp., 6.625%, due 05/01/23 | 63,300 | ||||||
| 75,000 | Parsley Energy LLC / Parsley Finance Corp., (144A), 6.25%, due 06/01/24 (2) | 79,125 | ||||||
| 65,000 | PDC Energy, Inc., (144A), 6.125%, due 09/15/24 (2) | 67,763 | ||||||
| 45,000 | Range Resources Corp., 4.875%, due 05/15/25 | 43,223 | ||||||
| 150,000 | Sunoco LP / Sunoco Finance Corp., 5.5%, due 08/01/20 | 152,812 | ||||||
|
| |||||||
Total Oil & Gas | 631,183 | |||||||
|
| |||||||
Packaging & Containers (6.8%) | ||||||||
| 285,000 | Ardagh Packaging Finance PLC / Ardagh Holdings USA, Inc. (Ireland), (144A), 3.85%, due 12/15/19 (2)(3) | 290,344 | ||||||
| 345,000 | Ardagh Packaging Finance PLC / Ardagh Holdings USA, Inc. (Ireland), (144A), 4.067%, due 05/15/21 (2)(3) | 354,056 | ||||||
| 15,000 | Ball Corp., 4%, due 11/15/23 | 15,206 | ||||||
| 75,000 | Ball Corp., 4.375%, due 12/15/20 | 80,156 | ||||||
| 40,000 | Berry Plastics Corp., 5.125%, due 07/15/23 | 40,850 | ||||||
| 128,000 | Graphic Packaging International, Inc., 4.125%, due 08/15/24 | 127,680 | ||||||
| 170,000 | Reynolds Group Issuer, Inc. / Reynolds Group Issuer LLC / Reynolds Group Issuer (Luxembourg), (144A), 4.38%, due 07/15/21 (2)(3) | 173,825 | ||||||
| 360,000 | Reynolds Group Issuer, Inc. / Reynolds Group Issuer LLC / Reynolds Group Issuer (Luxembourg), 5.75%, due 10/15/20 | 371,250 | ||||||
| 295,000 | Sealed Air Corp., (144A), 5.125%, due 12/01/24 (2) | 313,438 | ||||||
| 130,000 | Sealed Air Corp., (144A), 5.25%, due 04/01/23 (2) | 137,150 | ||||||
|
| |||||||
Total Packaging & Containers | 1,903,955 | |||||||
|
| |||||||
Pharmaceuticals (3.1%) | ||||||||
| 200,000 | Grifols Worldwide Operations, Ltd. (Ireland), 5.25%, due 04/01/22 | 210,000 | ||||||
| 120,000 | NBTY, Inc., (144A), 7.625%, due 05/15/21 (2) | 118,050 | ||||||
| 85,000 | Valeant Pharmaceuticals International, Inc. (Canada), (144A), 5.625%, due 12/01/21 (2) | 70,125 | ||||||
| 315,000 | Valeant Pharmaceuticals International, Inc. (Canada), (144A), 5.875%, due 05/15/23 (2) | 250,425 | ||||||
| 270,000 | Valeant Pharmaceuticals International, Inc. (Canada), (144A), 6.125%, due 04/15/25 (2) | 214,650 | ||||||
|
| |||||||
Total Pharmaceuticals | 863,250 | |||||||
|
| |||||||
See accompanying notes to financial statements.
51
TCW High Yield Bond Fund
Schedule of Investments (Continued)
| Principal Amount | Fixed Income Securities | Value | ||||||
Pipelines (2.0%) | ||||||||
| $ | 272,000 | Energy Transfer Partners LP, 3.774%, due 11/01/66 (3) | $ | 189,550 | ||||
| 290,000 | Sabine Pass LNG LP, 7.5%, due 11/30/16 | 291,138 | ||||||
| 70,000 | Summit Midstream Holdings LLC / Summit Midstream Finance Corp., 7.5%, due 07/01/21 | 73,150 | ||||||
|
| |||||||
Total Pipelines | 553,838 | |||||||
|
| |||||||
REIT (2.1%) | ||||||||
| 145,000 | DuPont Fabros Technology LP, 5.875%, due 09/15/21 | 152,612 | ||||||
| 325,000 | VEREIT Operating Partnership LP, 3%, due 02/06/19 | 329,469 | ||||||
| 85,000 | VEREIT Operating Partnership LP, 4.125%, due 06/01/21 | 88,825 | ||||||
|
| |||||||
Total REIT | 570,906 | |||||||
|
| |||||||
Retail (1.1%) | ||||||||
| 190,000 | Dollar Tree, Inc., 5.75%, due 03/01/23 | 203,300 | ||||||
| 110,000 | KFC Holding Co. / Pizza Hut Holdings LLC / Taco Bell of America LLC, (144A), 5%, due 06/01/24 (2) | 114,675 | ||||||
|
| |||||||
Total Retail | 317,975 | |||||||
|
| |||||||
Semiconductors (0.7%) | ||||||||
| 200,000 | NXP BV / NXP Funding LLC (Netherlands), (144A), 3.75%, due 06/01/18 (2) | 206,250 | ||||||
|
| |||||||
Software (4.4%) | ||||||||
| 153,000 | First Data Corp., (144A), 5%, due 01/15/24 (2) | 155,869 | ||||||
| 450,000 | First Data Corp., (144A), 6.75%, due 11/01/20 (2) | 466,312 | ||||||
| 200,000 | IMS Health, Inc., (144A), 5%, due 10/15/26 (2) | 207,260 | ||||||
| 90,000 | MSCI, Inc., (144A), 4.75%, due 08/01/26 (2) | 91,350 | ||||||
| 60,000 | Open Text Corp. (Canada), (144A), 5.875%, due 06/01/26 (2) | 64,050 | ||||||
| 94,000 | PTC, Inc., 6%, due 05/15/24 | 100,580 | ||||||
| 92,000 | Quintiles Transnational Corp., (144A), 4.875%, due 05/15/23 (2) | 95,225 | ||||||
| 41,000 | SS&C Technologies Holdings, Inc., 5.875%, due 07/15/23 | 43,152 | ||||||
|
| |||||||
Total Software | 1,223,798 | |||||||
|
| |||||||
Telecommunications (9.8%) | ||||||||
| 125,000 | Frontier Communications Corp., 8.875%, due 09/15/20 | 132,969 | ||||||
| 145,000 | Intelsat Jackson Holdings S.A. (Luxembourg), 5.5%, due 08/01/23 | 96,788 | ||||||
| 350,000 | Qwest Corp., 6.5%, due 06/01/17 | 360,062 | ||||||
| 75,000 | Qwest Corp., 6.75%, due 12/01/21 | 83,156 | ||||||
| 200,000 | SoftBank Group Corp. (Japan), (144A), 4.5%, due 04/15/20 (2) | 206,750 | ||||||
| 505,000 | Sprint Communications, Inc., (144A), 9%, due 11/15/18 (2) | 554,237 | ||||||
| 130,000 | Sprint Nextel Corp., 9.25%, due 04/15/22 | 144,950 | ||||||
| 280,000 | Sprint Spectrum Co. LLC / Sprint Spectrum Co. II LLC / Sprint Spectrum Co. III LLC, (144A), 3.36%, due 03/20/23 (2) | 282,100 | ||||||
| 620,000 | T-Mobile USA, Inc., 6.625%, due 11/15/20 | 640,150 | ||||||
| 200,000 | T-Mobile USA, Inc., 6.731%, due 04/28/22 | 210,250 | ||||||
| 15,000 | Windstream Services LLC, 6.375%, due 08/01/23 | 13,350 | ||||||
|
| |||||||
Total Telecommunications | 2,724,762 | |||||||
|
| |||||||
Total Corporate Bonds (Cost: $23,107,101) | 23,212,380 | |||||||
|
| |||||||
See accompanying notes to financial statements.
52
TCW High Yield Bond Fund
October 31, 2016 |
| Principal Amount | Fixed Income Securities | Value | ||||||
Residential Mortgage-Backed Securities — Non-Agency (0.2%) | ||||||||
| $ | 85,000 | Soundview Home Loan Trust (06-EQ1-A4), 0.784%, due 10/25/36 (3) | $ | 63,004 | ||||
|
| |||||||
Total Residential Mortgage-Backed Securities — Non-Agency (Cost: $59,713) | 63,004 | |||||||
|
| |||||||
Total Fixed Income Securities (Cost: $24,793,918) (89.8%) | 24,962,834 | |||||||
|
| |||||||
| Short-Term Investments | ||||||||
U.S. Treasury Securities | ||||||||
| 1,950,000 | U.S. Treasury Bill, 0.26%, due 01/05/17 (6) | 1,949,085 | ||||||
| 300,000 | U.S. Treasury Bill, 0.279%, due 01/19/17 (6) | 299,816 | ||||||
| 820,000 | U.S. Treasury Bill, 0.324%, due 02/23/17 (6) | 819,163 | ||||||
| 250,000 | U.S. Treasury Bill, 0.444%, due 04/13/17 (6) | 249,502 | ||||||
|
| |||||||
Total U.S. Treasury Securities (Cost: $3,317,229) (12.0%) | 3,317,566 | |||||||
|
| |||||||
Total Short-Term Investments (Cost: $3,317,229) (12.0%) | 3,317,566 | |||||||
|
| |||||||
Total Investments (Cost: $28,111,147) (101.8%) | 28,280,400 | |||||||
Liabilities in Excess of Other Assets (-1.8%) | (489,188 | ) | ||||||
|
| |||||||
Net Assets (100.0%) | $ | 27,791,212 | ||||||
|
| |||||||
| Credit Default Swaps — Buy Protection | ||||||||||||||||||||||||||||
| Notional Amount (7) | Implied Credit Spread (8) | Expiration Date | Counterparty | Fixed Deal Receive Rate | Reference Entity | Unrealized Appreciation | Premium (Received) | Value (9) | ||||||||||||||||||||
| OTC Swaps | ||||||||||||||||||||||||||||
| $250,000 | 1.37 | % | 3/20/19 | Goldman Sachs International | 1% | ALCOA, Inc. | $ | (4,574 | ) | $ 3,995 | $ | (579 | ) | |||||||||||||||
|
|
|
|
|
| |||||||||||||||||||||||
See accompanying notes to financial statements.
53
TCW High Yield Bond Fund
Schedule of Investments (Continued)
Notes to the Schedule of Investments:
| ABS - | Asset-Backed Securities. |
| EETC - | Enhanced Equipment Trust Certificate. |
| REIT | - Real Estate Investment Trust. |
| (1) | Rate stated is the effective yield. |
| (2) | Security exempt from registration under Rule 144A of the Securities Act of 1933, as amended. These securities may be resold, normally only to qualified institutional buyers. At October 31, 2016, the value of these securities amounted to $11,321,086 or 40.7% of net assets. These securities are determined to be liquid by the Advisor, unless otherwise noted, under procedures established by and under the general supervision of the Company’s Board of Directors. |
| (3) | Floating or variable rate security. The interest shown reflects the rate in effect at October 31, 2016. |
| (4) | Security is currently in default due to bankruptcy or failure to make payment of principal or interest of the issuer. Income is not being accrued. |
| (5) | This security is purchased on a when-issued, delayed-delivery or forward commitment basis. |
| (6) | Rate shown represents yield-to-maturity. |
| (7) | The maximum potential amount the Fund could receive as buyer or pay as seller of protection if a credit event occurred as defined under the terms of that particular swap agreement. |
| (8) | An implied credit spread is the spread in yield between a U.S. Treasury security and the referenced obligation. Implied credit spreads, represented in the absolute terms, utilized in determining the value of credit default swap agreements serve as an indicator of the current status of the payment/performance risk and represent the likelihood of risk of default for the credit derivative. The implied credit spread of a particular referenced entity reflects the cost of buying protection and may include upfront payments required to be made to enter into the agreement. Wider credit spreads, in comparison to narrower credit spreads, represent a deterioration of the referenced entity’s credit soundness and a greater likelihood of risk of default or other credit event occurring as defined under the terms of the agreement. |
| (9) | The value of a credit default swap agreement serves as an indicator of the current status of the payments/performance risk and represents the likelihood of an expected liability (or profit) for the credit derivative should the notional amount of the swap agreement be closed/sold as of the period end. Increasing values, in absolute terms, when compared to the notional amount of the swap, represent a deterioration of the reference entity’s credit worthiness and a greater likelihood or risk of default or other credit event occurring as defined under the terms of the agreements. |
See accompanying notes to financial statements.
54
TCW High Yield Bond Fund
Investments by Industry | October 31, 2016 |
| Industry | Percentage of Net Assets | |||
Advertising | 0.6 | % | ||
Aerospace/Defense | 1.5 | |||
Airlines | 2.8 | |||
Auto Parts & Equipment | 1.5 | |||
Banks | 1.3 | |||
Beverages | 2.0 | |||
Biotechnology | 0.2 | |||
Building Materials | 0.3 | |||
Chemicals | 1.9 | |||
Coal | 0.0 | |||
Commercial Services | 1.4 | |||
Diversified Financial Services | 3.1 | |||
Electric | 1.5 | |||
Engineering & Construction | 1.2 | |||
Entertainment | 4.7 | |||
Environmental Control | 1.1 | |||
Food | 0.5 | |||
Food Service | 0.9 | |||
Healthcare-Products | 0.5 | |||
Healthcare-Services | 10.9 | |||
Home Builders | 0.2 | |||
Household Products/Wares | 0.9 | |||
Leisure Time | 0.9 | |||
Lodging | 2.3 | |||
Media | 14.2 | |||
Oil & Gas | 2.3 | |||
Packaging & Containers | 7.5 | |||
Pharmaceuticals | 3.3 | |||
Pipelines | 2.0 | |||
REIT | 2.1 | |||
Residential Mortgage-Backed Securities — Non-Agency | 0.2 | |||
Retail | 1.1 | |||
Semiconductors | 0.7 | |||
Short Term Investments | 12.0 | |||
Software | 4.4 | |||
Telecommunications | 9.8 | |||
|
| |||
Total | 101.8 | % | ||
|
| |||
See accompanying notes to financial statements.
55
TCW High Yield Bond Fund
Fair Valuation Summary | October 31, 2016 |
The following is a summary of the fair valuations according to the inputs used as of October 31, 2016 in valuing the Fund’s investments:
| Description | Quoted Prices (Level 1) | Other (Level 2) | Significant (Level 3) | Total | ||||||||||||
Fixed Income Securities | ||||||||||||||||
Bank Loans* | $ | — | $ | 1,417,131 | $ | 270,319 | $ | 1,687,450 | ||||||||
Corporate Bonds* | — | 23,085,909 | 126,471 | 23,212,380 | ||||||||||||
Residential Mortgage-Backed Securities — Non-Agency | — | 63,004 | — | 63,004 | ||||||||||||
|
|
|
|
|
|
|
| |||||||||
Total Fixed Income Securities | — | 24,566,044 | 396,790 | 24,962,834 | ||||||||||||
|
|
|
|
|
|
|
| |||||||||
Short-Term Investments* | 3,317,566 | — | — | 3,317,566 | ||||||||||||
|
|
|
|
|
|
|
| |||||||||
Total Investments | $ | 3,317,566 | $ | 24,566,044 | $ | 396,790 | $ | 28,280,400 | ||||||||
|
|
|
|
|
|
|
| |||||||||
Liability Derivatives | ||||||||||||||||
Swap Agreements | ||||||||||||||||
Credit Risk | $ | — | $ | (579 | ) | $ | — | $ | (579 | ) | ||||||
|
|
|
|
|
|
|
| |||||||||
Total | $ | — | $ | (579 | ) | $ | — | $ | (579 | ) | ||||||
|
|
|
|
|
|
|
| |||||||||
| * | See Schedule of Investments for corresponding industries. |
See accompanying notes to financial statements.
56
Schedule of Investments | October 31, 2016 |
| Principal Amount | Fixed Income Securities | Value | ||||||||||
Commercial Mortgage-Backed Securities — Agency (3.6% of Net Assets) | ||||||||||||
| $ | 53,145 | Federal Home Loan Mortgage Corp. Multifamily Structured Pass-Through Certificates (KIR1-A1), 2.446%, due 03/25/26 | $ | 54,792 | ||||||||
| 97,323 | Federal National Mortgage Association, Pool #467288, 2.8%, due 03/01/18 | 98,526 | ||||||||||
| 46,127 | Federal National Mortgage Association, Pool #FN0002, 3.189%, due 12/01/17 | 46,560 | ||||||||||
| 33,103 | Federal National Mortgage Association (15-M10-FA), 0.757%, due 03/25/19 (1) | 33,132 | ||||||||||
| 46,567 | Federal National Mortgage Association (15-M12-FA), 0.854%, due 04/25/20 (1) | 46,477 | ||||||||||
|
| |||||||||||
Total Commercial Mortgage-Backed Securities — Agency (Cost: $284,244) | 279,487 | |||||||||||
|
| |||||||||||
Commercial Mortgage-Backed Securities — Non-Agency (0.7%) | ||||||||||||
| 24,984 | Bear Stearns Commercial Mortgage Securities Trust (99-CLF1-A4), 7%, due 05/20/30 (1) | 25,751 | ||||||||||
| 20,655 | JPMorgan Chase Commercial Mortgage Securities Trust (06-LDP9-A3S), (144A), 5.24%, due 05/15/47 (2) | 20,628 | ||||||||||
| 5,887 | Wachovia Bank Commercial Mortgage Trust (07-C32-APB), 5.702%, due 06/15/49 (1) | 5,878 | ||||||||||
|
| |||||||||||
Total Commercial Mortgage-Backed Securities — Non-Agency (Cost: $54,607) | 52,257 | |||||||||||
|
| |||||||||||
Residential Mortgage-Backed Securities — Agency (23.5%) | ||||||||||||
| 9,728 | Federal Home Loan Mortgage Corp. (2550-FI), 0.884%, due 11/15/32 (TAC) (1) | 9,747 | ||||||||||
| 43,035 | Federal Home Loan Mortgage Corp. (2591-EF), 1.034%, due 03/15/32 (1) | 43,035 | ||||||||||
| 72,402 | Federal Home Loan Mortgage Corp. (263-F5), 1.034%, due 06/15/42 (1) | 72,232 | ||||||||||
| 70,777 | Federal Home Loan Mortgage Corp. (2990-DE), 0.914%, due 11/15/34 (1) | 71,085 | ||||||||||
| 7,198 | Federal Home Loan Mortgage Corp. (3001-HS), 15.413%, due 02/15/35 (I/F) (PAC) (1) | 7,529 | ||||||||||
| 77,619 | Federal Home Loan Mortgage Corp. (3139-FL), 0.834%, due 01/15/36 (PAC) (1) | 77,624 | ||||||||||
| 39,286 | Federal Home Loan Mortgage Corp. (3172-FK), 0.984%, due 08/15/33 (1) | 39,320 | ||||||||||
| 70,326 | Federal Home Loan Mortgage Corp. (3300-FA), 0.834%, due 08/15/35 (1) | 70,128 | ||||||||||
| 86,362 | Federal Home Loan Mortgage Corp. (3318-F), 0.784%, due 05/15/37 (1) | 85,928 | ||||||||||
| 71,367 | Federal Home Loan Mortgage Corp. (3335-FT), 0.684%, due 08/15/19 (1) | 71,243 | ||||||||||
| 7,784 | Federal Home Loan Mortgage Corp. (3346-FA), 0.764%, due 02/15/19 (1) | 7,789 | ||||||||||
| 18,019 | Federal Home Loan Mortgage Corp. (3347-PF), 0.884%, due 01/15/36 (PAC) (1) | 18,028 | ||||||||||
| 101,144 | Federal Home Loan Mortgage Corp. (3767-JF), 0.834%, due 02/15/39 (PAC) (1) | 101,166 | ||||||||||
| 45,947 | Federal Home Loan Mortgage Corp. (3780-LF), 0.934%, due 03/15/29 (1) | 45,972 | ||||||||||
| 12,680 | Federal Home Loan Mortgage Corp. (3798-BF), 0.834%, due 06/15/24 (1) | 12,680 | ||||||||||
| 44,186 | Federal Home Loan Mortgage Corp. (3803-DF), 0.934%, due 11/15/35 (PAC) (1) | 44,216 | ||||||||||
| 50,551 | Federal Home Loan Mortgage Corp. (3824-FA), 0.684%, due 03/15/26 (1) | 50,520 | ||||||||||
| 46,835 | Federal Home Loan Mortgage Corp. (3946-FG), 0.884%, due 10/15/39 (PAC) (1) | 46,925 | ||||||||||
| 26,656 | Federal National Mortgage Association (03-11-FA), 1.534%, due 09/25/32 (1) | 27,269 | ||||||||||
| 13,692 | Federal National Mortgage Association (03-64-KS), 8.964%, due 07/25/18 (I/F) (1) | 14,244 | ||||||||||
| 70,910 | Federal National Mortgage Association (05-114-PF), 0.9%, due 08/25/35 (PAC) (1) | 70,928 | ||||||||||
| 66,701 | Federal National Mortgage Association (06-60-DF), 0.964%, due 04/25/35 (1) | 67,064 | ||||||||||
| 24,969 | Federal National Mortgage Association (06-84-WF), 0.834%, due 02/25/36 (PAC) (1) | 25,021 | ||||||||||
| 68,828 | Federal National Mortgage Association (07-64-FA), 1.004%, due 07/25/37 (1) | 69,481 | ||||||||||
| 77,616 | Federal National Mortgage Association (07-67-FA), 0.784%, due 04/25/37 (1) | 77,567 | ||||||||||
| 10,758 | Federal National Mortgage Association (08-47-PF), 1.034%, due 06/25/38 (PAC) (1) | 10,802 | ||||||||||
| 40,168 | Federal National Mortgage Association (09-33-FB), 1.354%, due 03/25/37 (1) | 40,787 | ||||||||||
| 83,246 | Federal National Mortgage Association (11-75-HP), 2.5%, due 07/25/40 (PAC) | 84,808 | ||||||||||
| 21,997 | Federal National Mortgage Association, Pool #254548, 5.5%, due 12/01/32 | 25,031 | ||||||||||
| 46,081 | Federal National Mortgage Association, Pool #600187, 7%, due 07/01/31 | 51,781 | ||||||||||
See accompanying notes to financial statements.
57
TCW Short Term Bond Fund
Schedule of Investments (Continued)
| Principal Amount | Fixed Income Securities | Value | ||||||||||
Residential Mortgage-Backed Securities — Agency (Continued) | ||||||||||||
| $ | 32,031 | Federal National Mortgage Association, Pool #995364, 6%, due 10/01/38 | $ | 37,093 | ||||||||
| 13,675 | Federal National Mortgage Association, Pool #AL0851, 6%, due 10/01/40 | 15,702 | ||||||||||
| 36,292 | Government National Mortgage Association (10-108-PF), 0.925%, due 02/20/38 (PAC) (1) | 36,362 | ||||||||||
| 13,438 | Government National Mortgage Association (10-2-FA), 1.025%, due 05/20/37 (1) | 13,444 | ||||||||||
| 87,762 | Government National Mortgage Association (12-13-KF), 0.825%, due 07/20/38 (1) | 87,768 | ||||||||||
| 22,556 | Government National Mortgage Association II, Pool #80022, 2%, due 12/20/26 (1) | 23,314 | ||||||||||
| 16,151 | Government National Mortgage Association II, Pool #80636, 1.875%, due 09/20/32 (1) | 16,747 | ||||||||||
| 10,033 | Government National Mortgage Association II, Pool #80757, 1.875%, due 10/20/33 (1) | 10,173 | ||||||||||
| 85,219 | Government National Mortgage Association II, Pool #80797, 2%, due 01/20/34 (1) | 88,488 | ||||||||||
| 35,544 | Government National Mortgage Association II, Pool #80937, 2.125%, due 06/20/34 (1) | 36,969 | ||||||||||
|
| |||||||||||
Total Residential Mortgage-Backed Securities — Agency (Cost: $1,795,922) | 1,806,010 | |||||||||||
|
| |||||||||||
Residential Mortgage-Backed Securities — Non-Agency (2.7%) | ||||||||||||
| 5,631 | Bear Stearns Asset-Backed Securities Trust (05-SD1-1A3), 0.925%, due 08/25/43 (1) | 5,588 | ||||||||||
| 131,441 | Credit Suisse First Boston Mortgage Securities Corp. (02-AR31-6A1), 2.779%, due 11/25/32 (1) | 131,607 | ||||||||||
| 29,588 | First Franklin Mortgage Loan Asset-Backed Certificates (04-FF5-A3C), 1.534%, due 08/25/34 (1) | 28,176 | ||||||||||
| 10,590 | Homestar Mortgage Acceptance Corp. (04-5-A1), 0.975%, due 10/25/34 (1) | 10,511 | ||||||||||
| 8,467 | JPMorgan Mortgage Acquisition Corp. (05-WMC1-M1), 1.164%, due 09/25/35 (1) | 8,446 | ||||||||||
| 19,643 | Morgan Stanley Mortgage Loan Trust (04-6AR-1A), 1.434%, due 07/25/34 (1) | 19,047 | ||||||||||
| 2,906 | Residential Accredit Loans, Inc. (02-QS16-A2), 1.084%, due 10/25/17 (1) | 2,908 | ||||||||||
|
| |||||||||||
Total Residential Mortgage-Backed Securities — Non-Agency (Cost: $202,161) | 206,283 | |||||||||||
|
| |||||||||||
Corporate Bonds (26.9%) | ||||||||||||
Airlines (2.3%) | ||||||||||||
| 85,232 | Continental Airlines, Inc. Pass-Through Certificates (99-1-A), | 90,188 | ||||||||||
| 50,000 | JetBlue Airways Corp. Pass-Through Trust, (04-2-G2), 1.267%, due 05/15/18 (1) (EETC) | 49,937 | ||||||||||
| 35,078 | United Airlines, Inc. Pass-Through Trust, (09-2A), 9.75%, due 07/15/18 (EETC) | 35,713 | ||||||||||
|
| |||||||||||
Total Airlines | 175,838 | |||||||||||
|
| |||||||||||
Banks (5.6%) | ||||||||||||
| 75,000 | Bank of America Corp., 5.75%, due 12/01/17 | 78,384 | ||||||||||
| 30,000 | Bank of America N.A., 6.1%, due 06/15/17 | 30,832 | ||||||||||
| 25,000 | Capital One N.A., 2.35%, due 08/17/18 | 25,299 | ||||||||||
| 35,000 | Citigroup, Inc., 1.55%, due 08/14/17 | 35,072 | ||||||||||
| 50,000 | Goldman Sachs Group, Inc. (The), 7.5%, due 02/15/19 | 56,244 | ||||||||||
| 20,000 | Goldman Sachs Group, Inc. (The), 2.875%, due 02/25/21 | 20,438 | ||||||||||
| 15,000 | Macquarie Bank, Ltd. (Australia), (144A), 1.515%, due 10/27/17 (1)(2) | 15,002 | ||||||||||
| 65,000 | Morgan Stanley, 1.597%, due 01/05/18 (1) | 65,108 | ||||||||||
| 30,000 | Santander UK PLC (Great Britain), 1.65%, due 09/29/17 | 30,119 | ||||||||||
| 70,000 | Wachovia Corp., 5.75%, due 02/01/18 | 73,617 | ||||||||||
|
| |||||||||||
Total Banks | 430,115 | |||||||||||
|
| |||||||||||
See accompanying notes to financial statements.
58
TCW Short Term Bond Fund
October 31, 2016 |
| Principal Amount | Fixed Income Securities | Value | ||||||||||
Beverages (0.8%) | ||||||||||||
| $ | 35,000 | Anheuser-Busch InBev Finance, Inc., 1.9%, due 02/01/19 | $ | 35,293 | ||||||||
| 25,000 | Pernod Ricard S.A. (France), (144A), 2.95%, due 01/15/17 (2) | 25,071 | ||||||||||
|
| |||||||||||
Total Beverages | 60,364 | |||||||||||
|
| |||||||||||
Computers (0.4%) | ||||||||||||
| 30,000 | Apple, Inc., 1.7%, due 02/22/19 | 30,275 | ||||||||||
|
| |||||||||||
Diversified Financial Services (1.0%) | ||||||||||||
| 70,000 | Bear Stearns Cos. LLC (The), 7.25%, due 02/01/18 | 74,876 | ||||||||||
|
| |||||||||||
Electric (2.4%) | ||||||||||||
| 30,000 | Duke Energy Progress LLC, 1.035%, due 03/06/17 (1) | 30,023 | ||||||||||
| 20,000 | Entergy Gulf States Louisiana LLC, 6%, due 05/01/18 | 21,324 | ||||||||||
| 35,000 | Exelon Corp., 1.55%, due 06/09/17 | 35,035 | ||||||||||
| 50,000 | Oncor Electric Delivery Co. LLC, 6.8%, due 09/01/18 | 54,780 | ||||||||||
| 40,000 | Southern Co. (The), 1.3%, due 08/15/17 | 40,028 | ||||||||||
|
| |||||||||||
Total Electric | 181,190 | |||||||||||
|
| |||||||||||
Food (0.5%) | ||||||||||||
| 35,000 | Kraft Heinz Foods Co., 6.125%, due 08/23/18 | 37,808 | �� | |||||||||
|
| |||||||||||
Healthcare-Services (2.1%) | ||||||||||||
| 35,000 | Anthem, Inc., 1.875%, due 01/15/18 | 35,160 | ||||||||||
| 85,000 | Providence Health & Services Obligated Group, 1.795%, due 10/01/17 (1) | 85,190 | ||||||||||
| 45,000 | UnitedHealth Group, Inc., 1.33%, due 01/17/17 (1) | 45,052 | ||||||||||
|
| |||||||||||
Total Healthcare-Services | 165,402 | |||||||||||
|
| |||||||||||
Pharmaceuticals (0.7%) | ||||||||||||
| 30,000 | Actavis Funding SCS (Luxembourg), 2.35%, due 03/12/18 | 30,305 | ||||||||||
| 25,000 | Express Scripts Holding Co., 1.25%, due 06/02/17 | 25,013 | ||||||||||
|
| |||||||||||
Total Pharmaceuticals | 55,318 | |||||||||||
|
| |||||||||||
Real Estate (1.1%) | ||||||||||||
| 50,000 | Post Apartment Homes, LP, 4.75%, due 10/15/17 | 51,064 | ||||||||||
| 35,000 | Prologis LP, 4%, due 01/15/18 | 35,807 | ||||||||||
|
| |||||||||||
Total Real Estate | 86,871 | |||||||||||
|
| |||||||||||
REIT (9.5%) | ||||||||||||
| 25,000 | Camden Property Trust, 5.7%, due 05/15/17 | 25,580 | ||||||||||
| 20,000 | DDR Corp., 7.5%, due 07/15/18 | 21,839 | ||||||||||
| 40,000 | Duke Realty LP, 6.5%, due 01/15/18 | 42,320 | ||||||||||
| 50,000 | Essex Portfolio LP, 5.5%, due 03/15/17 | 50,740 | ||||||||||
| 75,000 | HCP, Inc., 6%, due 01/30/17 | 75,836 | ||||||||||
| 70,000 | Highwoods Realty LP, 5.85%, due 03/15/17 | 71,106 | ||||||||||
| 35,000 | Kimco Realty Corp., 4.3%, due 02/01/18 | 35,954 | ||||||||||
| 25,000 | Liberty Property LP, 6.625%, due 10/01/17 | 26,159 | ||||||||||
| 35,000 | National Retail Properties, Inc., 6.875%, due 10/15/17 | 36,766 | ||||||||||
| 30,000 | Realty Income Corp., 2%, due 01/31/18 | 30,162 | ||||||||||
See accompanying notes to financial statements.
59
TCW Short Term Bond Fund
Schedule of Investments (Continued)
| Principal Amount | Fixed Income Securities | Value | ||||||||||
REIT (Continued) | ||||||||||||
| $ | 50,000 | SL Green Realty Corp., 5%, due 08/15/18 | $ | 52,292 | ||||||||
| 30,000 | Ventas Realty LP / Ventas Capital Corp., 2%, due 02/15/18 | 30,150 | ||||||||||
| 200,000 | WEA Finance LLC / Westfield UK & Europe Finance PLC, (144A), 1.75%, due 09/15/17 (2) | 200,592 | ||||||||||
| 35,000 | Welltower, Inc., 2.25%, due 03/15/18 | 35,298 | ||||||||||
|
| |||||||||||
Total REIT | 734,794 | |||||||||||
|
| |||||||||||
Retail (0.5%) | ||||||||||||
| 40,000 | Walgreens Boots Alliance, Inc., 1.75%, due 05/30/18 | 40,174 | ||||||||||
|
| |||||||||||
Total Corporate Bonds (Cost: $2,104,408) | 2,073,025 | |||||||||||
|
| |||||||||||
U.S. Treasury Securities (15.6%) | ||||||||||||
| 200,000 | U.S. Treasury Note, 0.5%, due 01/31/17 | 200,065 | ||||||||||
| 200,000 | U.S. Treasury Note, 0.508%, due 10/31/17 (1) | 200,303 | ||||||||||
| 395,000 | U.S. Treasury Note, 0.625%, due 08/31/17 | 394,893 | ||||||||||
| 409,000 | U.S. Treasury Note, 0.875%, due 07/15/17 | 409,743 | ||||||||||
|
| |||||||||||
Total U.S. Treasury Securities (Cost: $1,202,871) | 1,205,004 | |||||||||||
|
| |||||||||||
Total Fixed Income Securities (Cost: $5,644,213) (73.0%) | 5,622,066 | |||||||||||
|
| |||||||||||
| Number of Shares | Money Market Investments | |||||||||||
| 4,687 | State Street Institutional U.S. Government Money Market Fund — Premier Class, 0.25% (3) | 4,687 | ||||||||||
|
| |||||||||||
Total Money Market Investments (Cost: $4,687) (0.1%) | 4,687 | |||||||||||
|
| |||||||||||
| Principal Amount | Short-Term Investments | |||||||||||
U.S. Treasury Securities (27.5%) | ||||||||||||
| $ | 280,000 | U.S. Treasury Bill, 0.26%, due 01/05/17 (4) | 279,869 | |||||||||
| 350,000 | U.S. Treasury Bill, 0.28%, due 01/19/17 (4) | 349,785 | ||||||||||
| 810,000 | U.S. Treasury Bill, 0.32%, due 02/23/17 (4) | 809,173 | ||||||||||
| 680,000 | U.S. Treasury Bill, 0.42%, due 04/06/17 (4) | 678,761 | ||||||||||
|
| |||||||||||
Total U.S. Treasury Securities (Cost: $2,066,877) | 2,117,588 | |||||||||||
|
| |||||||||||
Total Short-Term Investments (Cost: $2,066,877) (27.5%) | 2,117,588 | |||||||||||
|
| |||||||||||
Total Investments (Cost: $7,715,777) (100.6%) | 7,744,341 | |||||||||||
Liabilities in Excess of Other Assets (-0.6%) | (46,536 | ) | ||||||||||
|
| |||||||||||
Net Assets (100.0%) | $ | 7,697,805 | ||||||||||
|
| |||||||||||
See accompanying notes to financial statements.
60
TCW Short Term Bond Fund
October 31, 2016 |
Notes to the Schedule of Investments:
| EETC - | Enhanced Equipment Trust Certificate. |
| I/F - | Inverse Floating rate security whose interest rate moves in the opposite direction of prevailing interest rates. |
| PAC - | Planned Amortization Class. |
| REIT - | Real Estate Investment Trust. |
| TAC | - Target Amortization Class. |
| (1) | Floating or variable rate security. The interest shown reflects the rate in effect at October 31, 2016. |
| (2) | Security exempt from registration under Rule 144A of the Securities Act of 1933, as amended. These securities may be resold, normally only to qualified institutional buyers. At October 31, 2016, the value of these securities amounted to $261,293 or 3.4% of net assets. These securities are determined to be liquid by the Advisor, unless otherwise noted, under procedures established by and under the general supervision of the Company’s Board of Directors. |
| (3) | Rate disclosed is the 7-day net yield as of October 31, 2016. |
| (4) | Rate shown represents yield-to-maturity. |
See accompanying notes to financial statements.
61
TCW Short Term Bond Fund
Investments by Industry | October 31, 2016 |
| Industry | Percentage of Net Assets | |||
Airlines | 2.3 | % | ||
Banks | 5.6 | |||
Beverages | 0.8 | |||
Commercial Mortgage-Backed Securities — Agency | 3.6 | |||
Commercial Mortgage-Backed Securities — Non-Agency | 0.7 | |||
Computers | 0.4 | |||
Diversified Financial Services | 1.0 | |||
Electric | 2.4 | |||
Food | 0.5 | |||
Healthcare-Services | 2.1 | |||
Pharmaceuticals | 0.7 | |||
REIT | 9.5 | |||
Real Estate | 1.1 | |||
Residential Mortgage-Backed Securities — Agency | 23.5 | |||
Residential Mortgage-Backed Securities — Non-Agency | 2.7 | |||
Retail | 0.5 | |||
U.S. Treasury Securities | 15.6 | |||
Money Market Investments | 0.1 | |||
U.S. Treasury Bills | 27.5 | |||
|
| |||
Total | 100.6 | % | ||
|
| |||
Fair Valuation Summary
The following is a summary of the fair valuations according to the inputs used as of October 31, 2016 in valuing the Fund’s investments:
| Description | Quoted Prices (Level 1) | Other (Level 2) | Significant (Level 3) | Total | ||||||||||||
Fixed Income Securities | ||||||||||||||||
Commercial Mortgage-Backed Securities — Agency | $ | — | $ | 279,487 | $ | — | $ | 279,487 | ||||||||
Commercial Mortgage-Backed Securities — Non-Agency | — | 52,257 | — | 52,257 | ||||||||||||
Residential Mortgage-Backed Securities — Agency | — | 1,806,010 | — | 1,806,010 | ||||||||||||
Residential Mortgage-Backed Securities — Non-Agency | — | 206,283 | — | 206,283 | ||||||||||||
Corporate Bonds* | — | 2,073,025 | — | 2,073,025 | ||||||||||||
U.S. Treasury Securities | 1,205,004 | — | — | 1,205,004 | ||||||||||||
|
|
|
|
|
|
|
| |||||||||
Total Fixed Income Securities | 1,205,004 | 4,417,062 | — | 5,622,066 | ||||||||||||
|
|
|
|
|
|
|
| |||||||||
Money Market Investments | — | 4,687 | — | 4,687 | ||||||||||||
Short-Term Investments* | 2,117,588 | — | — | 2,117,588 | ||||||||||||
|
|
|
|
|
|
|
| |||||||||
Total Investments | $ | 3,322,592 | $ | 4,421,749 | $ | — | $ | 7,744,341 | ||||||||
|
|
|
|
|
|
|
| |||||||||
| * | See Schedule of Investments for corresponding industries. |
See accompanying notes to financial statements.
62
Schedule of Investments | October 31, 2016 |
| Principal Amount | Fixed Income Securities | Value | ||||||||||
Asset-Backed Securities (3.5% of Net Assets) | ||||||||||||
| $ | 8,840,262 | 321 Henderson Receivables I LLC (13-3A-A), (144A), 4.08%, due 01/17/73 (1) | $ | 9,132,118 | ||||||||
| 20,000,000 | Academic Loan Funding Trust (12-1A-A2), (144A), 1.634%, due 12/27/44 (1)(2) | 19,276,331 | ||||||||||
| 5,318,211 | ACE Securities Corp. Home Equity Loan Trust (05-HE7-A2D), | 5,318,414 | ||||||||||
| 12,712,698 | Ameriquest Mortgage Securities Trust (06-R2-A1), 0.709%, due 04/25/36 (2) | 12,688,077 | ||||||||||
| 18,835,000 | Brazos Higher Education Authority, Inc. (11-1-A3), 1.875%, due 11/25/33 (2) | 18,525,665 | ||||||||||
| 11,775,000 | Brazos Higher Education Authority, Inc. (11-2-A3), 1.882%, due 10/27/36 (2) | 11,239,259 | ||||||||||
| 7,225,000 | EFS Volunteer No 2 LLC (12-1-A2), (144A), 1.875%, due 03/25/36 (1)(2) | 7,153,536 | ||||||||||
| 17,750,000 | EFS Volunteer No 3 LLC (12-1-A3), (144A), 1.524%, due 04/25/33 (1)(2) | 17,354,996 | ||||||||||
| 11,020,000 | Flagship CLO (14-8A-A), (144A), 2.44%, due 01/16/26 (1)(2) | 11,056,476 | ||||||||||
| 12,682,875 | Global SC Finance SRL (14-1A-A2), (144A), 3.09%, due 07/17/29 (1) | 12,140,960 | ||||||||||
| 18,182 | Higher Education Funding I (14-1-A), (144A), 1.875%, due 05/25/34 (1)(2) | 17,526 | ||||||||||
| 17,225,000 | Montana Higher Education Student Assistance Corp. (12-1-A3), | 16,613,804 | ||||||||||
| 433,717 | National Collegiate Student Loan Trust (06-3-A3), 0.684%, due 10/25/27 (2) | 433,350 | ||||||||||
| 32,208,861 | Navient Student Loan Trust (14-2-A), 1.174%, due 03/25/83 (2) | 31,203,542 | ||||||||||
| 32,420,635 | Navient Student Loan Trust (14-3-A), 1.154%, due 03/25/83 (2) | 31,401,036 | ||||||||||
| 18,319,799 | Navient Student Loan Trust (14-4-A), 1.154%, due 03/25/83 (2) | 17,743,201 | ||||||||||
| 30,195,000 | Nelnet Student Loan Trust (14-4A-A2), (144A), 1.484%, due 11/25/48 (1)(2) | 27,961,440 | ||||||||||
| 3,350,375 | SLM Student Loan Trust (04-8-B), 1.342%, due 01/25/40 (2) | 2,908,873 | ||||||||||
| 22,211 | SLM Student Loan Trust (04-8A-A5), (144A), 1.382%, due 04/25/24 (1)(2)(3) | 22,230 | ||||||||||
| 7,534,000 | SLM Student Loan Trust (05-5-A5), 1.632%, due 10/25/40 (2) | 6,937,656 | ||||||||||
| 5,583,696 | SLM Student Loan Trust (07-6-B), 1.732%, due 04/27/43 (2) | 4,876,934 | ||||||||||
| 4,092,159 | SLM Student Loan Trust (07-8-B), 1.882%, due 04/27/43 (2) | 3,534,235 | ||||||||||
| 7,405,000 | SLM Student Loan Trust (08-2-B), 2.082%, due 01/25/83 (2) | 6,452,830 | ||||||||||
| 6,559,000 | SLM Student Loan Trust (08-3-B), 2.082%, due 04/26/83 (2) | 5,817,805 | ||||||||||
| 3,280,000 | SLM Student Loan Trust (08-4-B), 2.732%, due 04/25/29 (2) | 3,035,953 | ||||||||||
| 16,210,000 | SLM Student Loan Trust (08-5-B), 2.732%, due 07/25/29 (2) | 15,121,119 | ||||||||||
| 6,515,000 | SLM Student Loan Trust (08-6-B), 2.732%, due 07/26/83 (2) | 5,997,762 | ||||||||||
| 6,390,000 | SLM Student Loan Trust (08-7-B), 2.732%, due 07/26/83 (2) | 5,873,569 | ||||||||||
| 5,706,000 | SLM Student Loan Trust (08-8-B), 3.132%, due 10/25/29 (2) | 5,480,178 | ||||||||||
| 15,950,000 | SLM Student Loan Trust (08-9-B), 3.132%, due 10/25/83 (2) | 15,422,794 | ||||||||||
| 11,840,000 | SLM Student Loan Trust (11-1-A2), 1.684%, due 10/25/34 (2) | 11,863,502 | ||||||||||
| 17,730,000 | SLM Student Loan Trust (11-2-A2), 1.734%, due 10/25/34 (2) | 17,591,690 | ||||||||||
| 18,780,000 | Voya CLO, Ltd. (14-2A-A1), (144A), 2.33%, due 07/17/26 (1)(2) | 18,782,019 | ||||||||||
|
| |||||||||||
Total Asset-Backed Securities (Cost: $432,650,805) | 378,978,880 | |||||||||||
|
| |||||||||||
Commercial Mortgage-Backed Securities — Agency (3.0%) | ||||||||||||
| 45,330,000 | Federal Home Loan Mortgage Corp. Multifamily Structured Pass-Through Certificates (K005-A2), 4.317%, due 11/25/19 | 49,007,460 | ||||||||||
| 24,280,000 | Federal Home Loan Mortgage Corp. Multifamily Structured Pass-Through Certificates (K007-A2), 4.224%, due 03/25/20 | 26,333,554 | ||||||||||
| 42,420,000 | Federal Home Loan Mortgage Corp. Multifamily Structured Pass-Through Certificates (K151-A3), 3.511%, due 04/25/30 | 45,599,616 | ||||||||||
| 2,554,915 | Federal National Mortgage Association, Pool #AE0918, | 2,735,403 | ||||||||||
See accompanying notes to financial statements.
63
TCW Total Return Bond Fund
Schedule of Investments (Continued)
| Principal Amount | Fixed Income Securities | Value | ||||||||||
Commercial Mortgage-Backed Securities — Agency (Continued) | ||||||||||||
| $ | 18,672,083 | Federal National Mortgage Association, Pool #AL0290, | $ | 20,662,591 | ||||||||
| 20,060,252 | Federal National Mortgage Association, Pool #AL0600, | 22,067,984 | ||||||||||
| 15,569,887 | Federal National Mortgage Association, Pool #AL2660, | 16,185,823 | ||||||||||
| 42,694,771 | Federal National Mortgage Association, Pool #AL3366, | 44,007,696 | ||||||||||
| 10,632,169 | Federal National Mortgage Association, Pool #FN0003, | 11,593,843 | ||||||||||
| 47,165,377 | Federal National Mortgage Association (12-M12-1A), | 49,527,250 | ||||||||||
| 32,725,809 | Federal National Mortgage Association (12-M15-A), | 33,720,978 | ||||||||||
|
| |||||||||||
Total Commercial Mortgage-Backed Securities — Agency | 321,442,198 | |||||||||||
|
| |||||||||||
Commercial Mortgage-Backed Securities — Non-Agency (0.5%) | ||||||||||||
| 3,000,000 | Americold LLC Trust (10-ARTA-A2FX), (144A), 4.954%, due 01/14/29 (1) | 3,294,258 | ||||||||||
| 10,301,320 | DBRR Trust (11-LC2-A4A), (144A), 4.537%, due 07/12/44 (1)(2) | 11,182,427 | ||||||||||
| 15,750,000 | GRACE Mortgage Trust (14-GRCE-A), (144A), 3.369%, due 06/10/28 (1) | 16,670,328 | ||||||||||
| 6,105,000 | GS Mortgage Securities Corp. (12-ALOH-A), (144A), 3.551%, due 04/10/34 (1) | 6,555,199 | ||||||||||
| 17,835,000 | WF-RBS Commercial Mortgage Trust (11-C5-A4), 3.667%, due 11/15/44 | 19,261,513 | ||||||||||
|
| |||||||||||
Total Commercial Mortgage-Backed Securities — Non-Agency | 56,963,725 | |||||||||||
|
| |||||||||||
Residential Mortgage-Backed Securities — Agency (51.5%) | ||||||||||||
| 193,162 | Federal Home Loan Mortgage Corp. (1829-ZB), 6.5%, due 03/15/26 | 212,164 | ||||||||||
| 285,551 | Federal Home Loan Mortgage Corp. (2367-ZK), 6%, due 10/15/31 | 321,804 | ||||||||||
| 3,598,773 | Federal Home Loan Mortgage Corp. (2514-PZ), 5.5%, due 10/15/32 (PAC) | 4,009,088 | ||||||||||
| 9,016,232 | Federal Home Loan Mortgage Corp. (2571-PZ), 5.5%, due 02/15/33 (PAC) | 10,006,374 | ||||||||||
| 874,206 | Federal Home Loan Mortgage Corp. (2642-AR), 4.5%, due 07/15/23 | 922,400 | ||||||||||
| 651,850 | Federal Home Loan Mortgage Corp. (2647-OV), 0%, due 07/15/33 (P/O) (4) | 634,823 | ||||||||||
| 3,446,174 | Federal Home Loan Mortgage Corp. (2662-MT), 4.5%, due 08/15/33 (TAC) | 3,666,429 | ||||||||||
| 1,984,536 | Federal Home Loan Mortgage Corp. (2666-BD), 4.5%, due 08/15/23 | 2,094,313 | ||||||||||
| 2,869,386 | Federal Home Loan Mortgage Corp. (2700-B), 4.5%, due 11/15/23 | 3,058,218 | ||||||||||
| 34,129,463 | Federal Home Loan Mortgage Corp. (2752-GZ), 5%, due 02/15/34 (PAC) | 37,316,312 | ||||||||||
| 48,640,112 | Federal Home Loan Mortgage Corp. (277-30), 3%, due 09/15/42 | 49,802,899 | ||||||||||
| 711,640 | Federal Home Loan Mortgage Corp. (2882-JH), 4.5%, due 10/15/34 (PAC) | 727,619 | ||||||||||
| 555,401 | Federal Home Loan Mortgage Corp. (2903-PO), 0%, due 11/15/23 (P/O) (4) | 520,450 | ||||||||||
| 3,261,911 | Federal Home Loan Mortgage Corp. (3045-HZ), 4.5%, due 10/15/35 | 3,514,165 | ||||||||||
| 40,939,513 | Federal Home Loan Mortgage Corp. (3063-YG), 5.5%, due 11/15/35 (PAC) | 46,389,560 | ||||||||||
| 32,350,106 | Federal Home Loan Mortgage Corp. (3114-KZ), 5%, due 02/15/36 | 35,338,512 | ||||||||||
| 8,579,243 | Federal Home Loan Mortgage Corp. (3146-GE), 5.5%, due 04/15/26 | 9,517,157 | ||||||||||
| 8,320,884 | Federal Home Loan Mortgage Corp. (3149-OD), | 7,184,349 | ||||||||||
See accompanying notes to financial statements.
64
TCW Total Return Bond Fund
October 31, 2016 |
| Principal Amount | Fixed Income Securities | Value | ||||||||||
Residential Mortgage-Backed Securities — Agency (Continued) | ||||||||||||
| $ | 5,498,830 | Federal Home Loan Mortgage Corp. (3315-S), | $ | 855,643 | ||||||||
| 5,268,003 | Federal Home Loan Mortgage Corp. (3376-SX), | 946,539 | ||||||||||
| 7,474,099 | Federal Home Loan Mortgage Corp. (3410-IS), | 1,034,679 | ||||||||||
| 7,136,435 | Federal Home Loan Mortgage Corp. (3424-BI), | 1,514,787 | ||||||||||
| 7,964,490 | Federal Home Loan Mortgage Corp. (3512-AY), | 8,179,969 | ||||||||||
| 1,912,534 | Federal Home Loan Mortgage Corp. (3519-SH), | 235,385 | ||||||||||
| 11,687,790 | Federal Home Loan Mortgage Corp. (3531-SC), | 1,347,649 | ||||||||||
| 2,860,828 | Federal Home Loan Mortgage Corp. (3541-SA), | 524,011 | ||||||||||
| 11,247,751 | Federal Home Loan Mortgage Corp. (3550-GS), | 2,378,995 | ||||||||||
| 4,598,980 | Federal Home Loan Mortgage Corp. (3551-VZ), 5.5%, due 12/15/32 | 5,139,765 | ||||||||||
| 9,601,080 | Federal Home Loan Mortgage Corp. (3557-KB), 4.5%, due 07/15/29 | 10,312,216 | ||||||||||
| 21,848,617 | Federal Home Loan Mortgage Corp. (3557-NB), 4.5%, due 07/15/29 | 23,564,103 | ||||||||||
| 10,942,722 | Federal Home Loan Mortgage Corp. (3558-KB), 4%, due 08/15/29 | 11,685,818 | ||||||||||
| 16,338,568 | Federal Home Loan Mortgage Corp. (3565-XB), 4%, due 08/15/24 | 17,291,957 | ||||||||||
| 1,310,077 | Federal Home Loan Mortgage Corp. (3575-D), 4.5%, due 03/15/37 | 1,409,031 | ||||||||||
| 20,115,000 | Federal Home Loan Mortgage Corp. (3626-MD), 5%, due 01/15/38 (PAC) | 21,852,448 | ||||||||||
| 20,025,406 | Federal Home Loan Mortgage Corp. (3719-PJ), 4.5%, due 09/15/40 (PAC) | 22,489,660 | ||||||||||
| 14,269,682 | Federal Home Loan Mortgage Corp. (3788-SB), | 2,760,184 | ||||||||||
| 3,646,200 | Federal Home Loan Mortgage Corp. (3885-PO), | 3,218,216 | ||||||||||
| 10,470,000 | Federal Home Loan Mortgage Corp. (3930-KE), 4%, due 09/15/41 (PAC) | 11,668,479 | ||||||||||
| 6,046,127 | Federal Home Loan Mortgage Corp. (4030-HS), | 1,172,349 | ||||||||||
| 8,022,201 | Federal Home Loan Mortgage Corp. (R002-ZA), 5.5%, due 06/15/35 | 8,927,200 | ||||||||||
| 5,806,448 | Federal Home Loan Mortgage Corp., Pool #A88591, 5%, due 09/01/39 | 6,474,152 | ||||||||||
| 32,292,177 | Federal Home Loan Mortgage Corp., Pool #A91162, 5%, due 02/01/40 | 36,633,566 | ||||||||||
| 9,595,624 | Federal Home Loan Mortgage Corp., Pool #A92195, 5%, due 05/01/40 | 10,829,028 | ||||||||||
| 21,603,809 | Federal Home Loan Mortgage Corp., Pool #A97038, 4%, due 02/01/41 | 23,493,607 | ||||||||||
| 3,801 | Federal Home Loan Mortgage Corp., Pool #B15322, 5%, due 07/01/19 | 3,906 | ||||||||||
| 5,864 | Federal Home Loan Mortgage Corp., Pool #B15490, 5%, due 07/01/19 | 6,026 | ||||||||||
| 29,494 | Federal Home Loan Mortgage Corp., Pool #B15557, 5%, due 07/01/19 | 30,387 | ||||||||||
| 57,333 | Federal Home Loan Mortgage Corp., Pool #C90552, 6%, due 06/01/22 | 64,670 | ||||||||||
| 213,521 | Federal Home Loan Mortgage Corp., Pool #G01959, 5%, due 12/01/35 | 238,114 | ||||||||||
| 37,406,230 | Federal Home Loan Mortgage Corp., Pool #G06173, 4%, due 11/01/40 | 41,162,021 | ||||||||||
| 11,417,784 | Federal Home Loan Mortgage Corp., Pool #G07556, 4%, due 11/01/43 | 12,539,830 | ||||||||||
| 42,265,231 | Federal Home Loan Mortgage Corp., Pool #G07786, 4%, due 08/01/44 | 46,291,528 | ||||||||||
| 88,494,563 | Federal Home Loan Mortgage Corp., Pool #G07848, 3.5%, due 04/01/44 | 94,477,004 | ||||||||||
See accompanying notes to financial statements.
65
TCW Total Return Bond Fund
Schedule of Investments (Continued)
| Principal Amount | Fixed Income Securities | Value | ||||||||||
Residential Mortgage-Backed Securities — Agency (Continued) | ||||||||||||
| $ | 70,429,073 | Federal Home Loan Mortgage Corp., Pool #G07924, 3.5%, due 01/01/45 | $ | 74,665,393 | ||||||||
| 52,650,312 | Federal Home Loan Mortgage Corp., Pool #G08677, 4%, due 11/01/45 | 56,319,334 | ||||||||||
| 66,736,289 | Federal Home Loan Mortgage Corp., Pool #G08681, 3.5%, due 12/01/45 | 70,049,891 | ||||||||||
| 135,237,536 | Federal Home Loan Mortgage Corp., Pool #G08687, 3.5%, due 01/01/46 | 141,972,685 | ||||||||||
| 11,822,938 | Federal Home Loan Mortgage Corp., Pool #G08698, 3.5%, due 03/01/46 | 12,414,121 | ||||||||||
| 42,025,689 | Federal Home Loan Mortgage Corp., Pool #G08699, 4%, due 03/01/46 | 44,997,035 | ||||||||||
| 126,910,648 | Federal Home Loan Mortgage Corp., Pool #G08702, 3.5%, due 04/01/46 | 133,236,210 | ||||||||||
| 68,338,952 | Federal Home Loan Mortgage Corp., Pool #G08706, 3.5%, due 05/01/46 | 71,794,355 | ||||||||||
| 4,765,859 | Federal Home Loan Mortgage Corp., Pool #G08710, 3%, due 06/01/46 | 4,909,502 | ||||||||||
| 24,446,413 | Federal Home Loan Mortgage Corp., Pool #G08711, 3.5%, due 06/01/46 | 25,688,627 | ||||||||||
| 90,641,002 | Federal Home Loan Mortgage Corp., Pool #G08715, 3%, due 08/01/46 | 93,374,470 | ||||||||||
| 155,831,195 | Federal Home Loan Mortgage Corp., Pool #G08716, 3.5%, due 08/01/46 | 163,604,492 | ||||||||||
| 100,661,512 | Federal Home Loan Mortgage Corp., Pool #G08721, 3%, due 09/01/46 | 103,693,493 | ||||||||||
| 59,845,375 | Federal Home Loan Mortgage Corp., Pool #G08722, 3.5%, due 09/01/46 | 62,905,746 | ||||||||||
| 33,850,000 | Federal Home Loan Mortgage Corp., Pool #G08732, 3%, due 10/01/46 | 34,869,471 | ||||||||||
| 263,661 | Federal Home Loan Mortgage Corp., Pool #G11678, 4.5%, due 04/01/20 | 274,442 | ||||||||||
| 804,012 | Federal Home Loan Mortgage Corp., Pool #G12635, 5.5%, due 03/01/22 | 827,099 | ||||||||||
| 781,445 | Federal Home Loan Mortgage Corp., Pool #G12702, 4.5%, due 09/01/20 | 803,730 | ||||||||||
| 1,219,968 | Federal Home Loan Mortgage Corp., Pool #G13390, 6%, due 01/01/24 | 1,316,874 | ||||||||||
| 54,540,465 | Federal Home Loan Mortgage Corp., Pool #G18592, 3%, due 03/01/31 | 57,160,965 | ||||||||||
| 16,386 | Federal Home Loan Mortgage Corp., Pool #G30194, 6.5%, due 04/01/21 | 18,209 | ||||||||||
| 2,574,222 | Federal Home Loan Mortgage Corp., Pool #G30450, 6%, due 01/01/29 | 2,952,380 | ||||||||||
| 2,778,418 | Federal Home Loan Mortgage Corp., Pool #G30452, 6%, due 10/01/28 | 3,187,184 | ||||||||||
| 4,053,468 | Federal Home Loan Mortgage Corp., Pool #G30454, 5%, due 05/01/29 | 4,499,981 | ||||||||||
| 74,605,431 | Federal Home Loan Mortgage Corp., Pool #G60080, 3.5%, due 06/01/45 | 79,186,675 | ||||||||||
| 139,317,398 | Federal Home Loan Mortgage Corp., Pool #G60238, 3.5%, due 10/01/45 | 147,872,364 | ||||||||||
| 84,597,551 | Federal Home Loan Mortgage Corp., Pool #G60440, 3.5%, due 03/01/46 | 89,750,801 | ||||||||||
| 32,772,958 | Federal Home Loan Mortgage Corp., Pool #G67700, 3.5%, due 08/01/46 | 34,816,146 | ||||||||||
| 633,938 | Federal Home Loan Mortgage Corp., Pool #H82001, 5.5%, due 07/01/37 | 703,200 | ||||||||||
| 5,318,864 | Federal Home Loan Mortgage Corp., Pool #N70081, 5.5%, due 07/01/38 | 6,031,803 | ||||||||||
| 5,950,478 | Federal Home Loan Mortgage Corp., Pool #P51350, 5%, due 03/01/36 | 6,602,535 | ||||||||||
| 31,885,584 | Federal Home Loan Mortgage Corp., Pool #V80284, 3.5%, due 08/01/43 | 34,039,642 | ||||||||||
| 42,353,324 | Federal Home Loan Mortgage Corp., Pool #V80353, 3%, due 08/01/43 | 43,820,801 | ||||||||||
| 324,489 | Federal National Mortgage Association (01-40-Z), 6%, due 08/25/31 | 370,931 | ||||||||||
| 733,118 | Federal National Mortgage Association (03-117-TG), | 791,607 | ||||||||||
| 929,307 | Federal National Mortgage Association (04-52-SW), | 210,330 | ||||||||||
| 2,147,587 | Federal National Mortgage Association (04-65-LT), 4.5%, due 08/25/24 | 2,293,213 | ||||||||||
| 2,337,097 | Federal National Mortgage Association (04-68-LC), 5%, due 09/25/29 | 2,569,548 | ||||||||||
| 8,208,249 | Federal National Mortgage Association (05-117-LC), | 8,820,284 | ||||||||||
| 454,667 | Federal National Mortgage Association (05-74-CP), | 681,263 | ||||||||||
| 3,176,559 | Federal National Mortgage Association (07-20-SI), | 502,541 | ||||||||||
See accompanying notes to financial statements.
66
TCW Total Return Bond Fund
October 31, 2016 |
| Principal Amount | Fixed Income Securities | Value | ||||||||||
Residential Mortgage-Backed Securities — Agency (Continued) | ||||||||||||
| $ | 2,797,159 | Federal National Mortgage Association (07-21-SE), | $ | 403,747 | ||||||||
| 3,387,452 | Federal National Mortgage Association (07-56-SG), | 486,844 | ||||||||||
| 9,184,243 | Federal National Mortgage Association (07-58-SV), | 1,502,153 | ||||||||||
| 2,174,060 | Federal National Mortgage Association (07-65-S), | 325,513 | ||||||||||
| 1,183,966 | Federal National Mortgage Association (07-88-FY), 0.994%, due 09/25/37 (2) | 1,189,209 | ||||||||||
| 10,233,047 | Federal National Mortgage Association (07-103-AI), | 1,275,596 | ||||||||||
| 23,096,774 | Federal National Mortgage Association (07-B2-ZA), 5.5%, due 06/25/37 | 26,183,117 | ||||||||||
| 9,255,421 | Federal National Mortgage Association (08-1-AI), | 1,703,414 | ||||||||||
| 6,997,596 | Federal National Mortgage Association (08-13-SB), | 1,479,165 | ||||||||||
| 13,334,025 | Federal National Mortgage Association (08-23-SB), | 2,608,407 | ||||||||||
| 1,186,911 | Federal National Mortgage Association (08-35-SD), | 182,773 | ||||||||||
| 19,654,856 | Federal National Mortgage Association (08-66-SG), | 3,491,508 | ||||||||||
| 7,164,283 | Federal National Mortgage Association (08-68-SA), | 1,071,590 | ||||||||||
| 4,095,764 | Federal National Mortgage Association (09-3-SH), | 511,412 | ||||||||||
| 1,786,393 | Federal National Mortgage Association (09-47-SV), | 322,994 | ||||||||||
| 7,439,672 | Federal National Mortgage Association (09-51-SA), | 1,456,762 | ||||||||||
| 3,919,903 | Federal National Mortgage Association (09-6-SD), | 708,205 | ||||||||||
| 8,963,451 | Federal National Mortgage Association (09-68-KB), 4%, due 09/25/24 | 9,351,845 | ||||||||||
| 21,158,485 | Federal National Mortgage Association (09-71-LB), 4%, due 09/25/29 | 22,579,920 | ||||||||||
| 27,552,291 | Federal National Mortgage Association (09-72-AC), 4%, due 09/25/29 | 29,301,017 | ||||||||||
| 2,007,245 | Federal National Mortgage Association (09-72-JS), | 431,344 | ||||||||||
| 20,937,000 | Federal National Mortgage Association (10-136-CX), 4%, due 08/25/39 (PAC) | 22,765,942 | ||||||||||
| 50,000,000 | Federal National Mortgage Association (11-111-DB), 4%, due 11/25/41 | 54,461,620 | ||||||||||
| 11,738,000 | Federal National Mortgage Association (12-128-UY), | 11,213,727 | ||||||||||
| 40,208,614 | Federal National Mortgage Association (12-133-GC), | 41,183,987 | ||||||||||
| 14,724,826 | Federal National Mortgage Association (12-153-PC), 2%, due 05/25/42 (PAC) | 14,504,325 | ||||||||||
| 10,011,464 | Federal National Mortgage Association (13-101-BO), | 8,200,596 | ||||||||||
See accompanying notes to financial statements.
67
TCW Total Return Bond Fund
Schedule of Investments (Continued)
| Principal Amount | Fixed Income Securities | Value | ||||||||||
Residential Mortgage-Backed Securities — Agency (Continued) | ||||||||||||
| $ | 23,396,613 | Federal National Mortgage Association (13-101-CO), | $ | 19,201,532 | ||||||||
| 22,129,913 | Federal National Mortgage Association (13-21-EC), 2%, due 12/25/38 (I/O) | 22,248,221 | ||||||||||
| 21,400,000 | Federal National Mortgage Association (13-95-PN), 3%, due 01/25/43 (PAC) | 21,951,946 | ||||||||||
| 94,272 | Federal National Mortgage Association (93-202-SZ), | 105,692 | ||||||||||
| 534,112 | Federal National Mortgage Association (95-21-C), 0%, due 05/25/24 (P/O) (4) | 502,508 | ||||||||||
| 40,375 | Federal National Mortgage Association (G92-29-J), 8%, due 07/25/22 | 45,171 | ||||||||||
| 15,978 | Federal National Mortgage Association, Pool #254442, 5.5%, due 09/01/17 | 16,188 | ||||||||||
| 174,372 | Federal National Mortgage Association, Pool #254634, 5.5%, due 02/01/23 | 194,268 | ||||||||||
| 2,372,661 | Federal National Mortgage Association, Pool #257536, 5%, due 01/01/29 | 2,627,149 | ||||||||||
| 1,140,709 | Federal National Mortgage Association, Pool #310033, 6%, due 07/01/47 | 1,262,993 | ||||||||||
| 5,591,395 | Federal National Mortgage Association, Pool #555424, 5.5%, due 05/01/33 | 6,352,289 | ||||||||||
| 281,016 | Federal National Mortgage Association, Pool #555811, 4%, due 10/01/18 | 290,963 | ||||||||||
| 47,301 | Federal National Mortgage Association, Pool #661856, | 47,142 | ||||||||||
| 86,268 | Federal National Mortgage Association, Pool #671133, | 89,179 | ||||||||||
| 52,815 | Federal National Mortgage Association, Pool #672272, | 55,382 | ||||||||||
| 156,618 | Federal National Mortgage Association, Pool #687847, | 165,330 | ||||||||||
| 821,060 | Federal National Mortgage Association, Pool #692104, | 849,213 | ||||||||||
| 360,191 | Federal National Mortgage Association, Pool #699866, | 375,690 | ||||||||||
| 141,862 | Federal National Mortgage Association, Pool #704454, | 145,093 | ||||||||||
| 224,988 | Federal National Mortgage Association, Pool #708820, | 224,984 | ||||||||||
| 145,490 | Federal National Mortgage Association, Pool #725275, 4%, due 03/01/19 | 150,640 | ||||||||||
| 205,631 | Federal National Mortgage Association, Pool #728824, | 218,494 | ||||||||||
| 659,193 | Federal National Mortgage Association, Pool #734384, 5.5%, due 07/01/33 | 726,997 | ||||||||||
| 13,723 | Federal National Mortgage Association, Pool #785677, 5%, due 07/01/19 | 14,153 | ||||||||||
| 701,149 | Federal National Mortgage Association, Pool #888593, 7%, due 06/01/37 | 826,959 | ||||||||||
| 576,727 | Federal National Mortgage Association, Pool #934103, 5%, due 07/01/38 | 620,810 | ||||||||||
| 1,511,345 | Federal National Mortgage Association, Pool #979563, 5%, due 04/01/28 | 1,673,622 | ||||||||||
| 811,040 | Federal National Mortgage Association, Pool #995040, 5%, due 06/01/23 | 870,154 | ||||||||||
| 4,107,829 | Federal National Mortgage Association, Pool #995425, 6%, due 01/01/24 | 4,500,333 | ||||||||||
| 2,073,664 | Federal National Mortgage Association, Pool #995573, 6%, due 01/01/49 | 2,308,693 | ||||||||||
| 6,848,151 | Federal National Mortgage Association, Pool #995953, 6%, due 11/01/28 | 7,843,690 | ||||||||||
| 3,775,326 | Federal National Mortgage Association, Pool #995954, 6%, due 03/01/29 | 4,324,158 | ||||||||||
| 3,931,735 | Federal National Mortgage Association, Pool #AA3303, 5.5%, due 06/01/38 | 4,434,912 | ||||||||||
| 48,076,313 | Federal National Mortgage Association, Pool #AB1617, 4%, due 10/01/40 | 52,882,065 | ||||||||||
| 40,499,071 | Federal National Mortgage Association, Pool #AB6210, 3%, due 09/01/42 | 41,840,603 | ||||||||||
See accompanying notes to financial statements.
68
TCW Total Return Bond Fund
October 31, 2016 |
| Principal Amount | Fixed Income Securities | Value | ||||||||||
Residential Mortgage-Backed Securities — Agency (Continued) | ||||||||||||
| $ | 11,319,724 | Federal National Mortgage Association, Pool #AE0588, 6%, due 08/01/37 | $ | 13,053,914 | ||||||||
| 8,622,136 | Federal National Mortgage Association, Pool #AL0851, 6%, due 10/01/40 | 9,900,323 | ||||||||||
| 6,263,770 | Federal National Mortgage Association, Pool #AL1594, 6%, due 07/01/40 | 7,203,892 | ||||||||||
| 56,607,489 | Federal National Mortgage Association, Pool #AL4597, 4%, due 01/01/44 | 62,109,030 | ||||||||||
| 74,926,746 | Federal National Mortgage Association, Pool #AL9105, 4.5%, due 10/01/46 | 81,924,904 | ||||||||||
| 52,644,073 | Federal National Mortgage Association, Pool #AL9106, 4.5%, due 02/01/46 | 57,790,395 | ||||||||||
| 56,386,517 | Federal National Mortgage Association, Pool #AL9107, 4.5%, due 03/01/46 | 61,695,949 | ||||||||||
| 9,865,878 | Federal National Mortgage Association, Pool #AL9108, 4.5%, due 12/01/34 | 10,868,267 | ||||||||||
| 67,027,223 | Federal National Mortgage Association, Pool #BC1158, 3.5%, due 02/01/46 | 70,372,015 | ||||||||||
| 60,126,495 | Federal National Mortgage Association, Pool #MA1561, 3%, due 09/01/33 | 62,644,292 | ||||||||||
| 43,992,857 | Federal National Mortgage Association, Pool #MA1584, 3.5%, due 09/01/33 | 46,708,043 | ||||||||||
| 15,754,088 | Federal National Mortgage Association, Pool #MA2740, | 16,231,253 | ||||||||||
| 4,047,621 | Federal National Mortgage Association, Pool #MA2776, | 4,170,312 | ||||||||||
| 32,960,000 | Federal National Mortgage Association, Pool #MA2801, | 33,969,400 | ||||||||||
| 291,880,000 | Federal National Mortgage Association TBA, 3% (6) | 300,522,386 | ||||||||||
| 54,520,000 | Federal National Mortgage Association TBA, 3% (6) | 57,067,106 | ||||||||||
| 538,240,000 | Federal National Mortgage Association TBA, 2.5% (6) | 553,882,616 | ||||||||||
| 266,285,000 | Federal National Mortgage Association TBA, 4% (6) | 285,174,592 | ||||||||||
| 226,035,000 | Federal National Mortgage Association TBA, 3% (6) | 232,180,327 | ||||||||||
| 1,102,455 | Government National Mortgage Association (03-42-SH), | 235,577 | ||||||||||
| 15,214,700 | Government National Mortgage Association (11-70-BO), | 13,355,903 | ||||||||||
| 16,729,593 | Government National Mortgage Association (15-42-ZB), 3%, due 03/20/45 | 16,807,795 | ||||||||||
| 37,325,347 | Government National Mortgage Association (15-43-DM), 2.5%, due 03/20/45 | 34,862,875 | ||||||||||
| 11,321,064 | Government National Mortgage Association (15-44-Z), 3%, due 03/20/45 | 10,731,890 | ||||||||||
| 9,991,369 | Government National Mortgage Association (15-52-EZ), 3%, due 04/16/45 | 9,884,136 | ||||||||||
| 368,061 | Government National Mortgage Association II, Pool #80963, | 380,573 | ||||||||||
| 124,737,514 | Government National Mortgage Association II, Pool #MA3521, | 132,192,527 | ||||||||||
| 58,320,471 | Government National Mortgage Association II, Pool #MA3663, | 61,835,803 | ||||||||||
| 71,900,601 | Government National Mortgage Association II, Pool #MA3736, | 76,250,856 | ||||||||||
| 16,333,034 | Government National Mortgage Association II, Pool #MA3803, | 17,317,263 | ||||||||||
| 51,107,206 | Government National Mortgage Association II, Pool #MA3873, | 53,286,397 | ||||||||||
| 222,427,525 | Government National Mortgage Association II, Pool #MA3936, | 231,950,203 | ||||||||||
| 196,835,000 | Government National Mortgage Association II TBA, 3% (6) | 205,062,097 | ||||||||||
|
| |||||||||||
Total Residential Mortgage-Backed Securities — Agency | 5,561,095,790 | |||||||||||
|
| |||||||||||
See accompanying notes to financial statements.
69
TCW Total Return Bond Fund
Schedule of Investments (Continued)
| Principal Amount | Fixed Income Securities | Value | ||||||||||
Residential Mortgage-Backed Securities — Non-Agency (16.9%) | ||||||||||||
| $ | 13,720,313 | ACE Securities Corp. (06-ASP1-A2D), 1.154%, due 12/25/35 (2) | $ | 13,763,344 | ||||||||
| 17,513,477 | ACE Securities Corp. (07-ASP1-A2C), 0.794%, due 03/25/37 (2) | 10,841,660 | ||||||||||
| 9,413,308 | ACE Securities Corp. (07-ASP1-A2D), 0.914%, due 03/25/37 (2) | 5,920,122 | ||||||||||
| 1,363,713 | Adjustable Rate Mortgage Trust (04-5-3A1), 3.035%, due 04/25/35 (2) | 1,370,677 | ||||||||||
| 16,286,588 | Ameriquest Mortgage Securities, Inc. (05-R10-A2C), 0.864%, due 01/25/36 (2) | 16,143,105 | ||||||||||
| 3,375,928 | Asset-Backed Funding Certificates (05-HE2-M2), 1.284%, due 06/25/35 (2) | 3,360,652 | ||||||||||
| 8,747,000 | Asset-Backed Funding Certificates (07-NC1-A2), (144A), | 6,854,416 | ||||||||||
| 18,559,392 | Asset-Backed Funding Certificates (07-WMC1-A2A), 1.284%, due 06/25/37 (2) | 14,057,646 | ||||||||||
| 339,536 | Asset-Backed Securities Corp. Home Equity (05-HE5-M2), | 339,702 | ||||||||||
| 789,412 | Banc of America Funding Corp. (04-B-3A1), 3.123%, due 12/20/34 (2) | 409,590 | ||||||||||
| 97,836 | Banc of America Funding Corp. (06-D-2A1), 4.686%, due 05/20/36 (2)(3) | 88,267 | ||||||||||
| 5,317,500 | Banc of America Funding Corp. (06-D-3A1), 3.243%, due 05/20/36 (2)(3) | 4,698,041 | ||||||||||
| 11,353,197 | Banc of America Funding Corp. (06-G-2A1), 0.746%, due 07/20/36 (2) | 10,748,344 | ||||||||||
| 8,644,800 | Banc of America Funding Corp. (15-R8-1A1), (144A), | 8,261,122 | ||||||||||
| 1,449,451 | Banc of America Funding Trust (06-3-4A14), 6%, due 03/25/36 | 1,470,828 | ||||||||||
| 5,979,590 | Banc of America Funding Trust (06-3-5A3), 5.5%, due 03/25/36 (3) | 5,608,311 | ||||||||||
| 1,584,458 | BCAP LLC Trust (07-AA1-1A2), 0.694%, due 02/25/47 (2)(3) | 1,536,916 | ||||||||||
| 22,825,850 | BCAP LLC Trust (08-IND2-A1), 2.184%, due 04/25/38 (2) | 22,556,485 | ||||||||||
| 106,182 | BCAP LLC Trust (09-RR1-21A1), (144A), 3.028%, due 11/26/34 (1)(2) | 106,532 | ||||||||||
| 650,418 | BCAP LLC Trust (09-RR1-22A1), (144A), 2.98%, due 05/26/35 (1)(2) | 649,643 | ||||||||||
| 420,066 | BCAP LLC Trust (09-RR1-23A1), (144A), 2.958%, due 05/26/35 (1)(2) | 420,769 | ||||||||||
| 737,055 | BCAP LLC Trust (11-RR3-1A5), (144A), 3.198%, due 05/27/37 (1)(2) | 735,329 | ||||||||||
| 1,309,624 | BCAP LLC Trust (11-RR3-5A3), (144A), 5.094%, due 11/27/37 (1)(2) | 1,280,360 | ||||||||||
| 5,097,380 | BCAP LLC Trust (11-RR4-2A3), (144A), 1%, due 06/26/47 (1)(2) | 5,083,015 | ||||||||||
| 5,127,115 | BCAP LLC Trust (11-RR4-3A3), (144A), 3.016%, due 07/26/36 (1)(2) | 5,070,097 | ||||||||||
| 5,774,128 | BCAP LLC Trust (11-RR5-1A3), (144A), 2.689%, due 03/26/37 (1)(2) | 5,783,531 | ||||||||||
| 12,581,637 | BCAP LLC Trust (11-RR9-7A1), (144A), 2.319%, due 04/26/37 (1)(2) | 12,508,802 | ||||||||||
| 3,808,363 | BCAP LLC Trust (12-RR2-9A3), (144A), 2.889%, due 03/26/35 (1)(2) | 3,785,004 | ||||||||||
| 5,936,892 | BCAP LLC Trust (12-RR8-3A1), (144A), 3.082%, due 08/26/36 (1)(2)(3) | 5,923,289 | ||||||||||
| 1,603,554 | BCAP LLC Trust (12-RR9-1A1), (144A), 0.705%, due 07/26/35 (1)(2)(3) | 1,588,577 | ||||||||||
| 4,843,969 | BCAP LLC Trust (13-RR2-6A1), (144A), 3%, due 06/26/37 (1)(2) | 4,829,425 | ||||||||||
| 1,668,261 | Bear Stearns Alt-A Trust (04-13-A1), 1.274%, due 11/25/34 (2) | 1,637,435 | ||||||||||
| 6,994 | Bear Stearns Alt-A Trust (05-2-2A4), 2.882%, due 04/25/35 (2) | 6,742 | ||||||||||
| 8,693,099 | Bear Stearns Alt-A Trust (05-4-23A1), 2.986%, due 05/25/35 (2) | 8,407,926 | ||||||||||
| 705,079 | Bear Stearns Alt-A Trust (06-4-32A1), 3.243%, due 07/25/36 (2)(3) | 557,745 | ||||||||||
| 1,362,619 | Bear Stearns ARM Trust (04-12-1A1), 2.92%, due 02/25/35 (2) | 1,243,244 | ||||||||||
| 10,879,675 | Bear Stearns ARM Trust (05-10-A3), 3.071%, due 10/25/35 (2) | 11,035,644 | ||||||||||
| 3,074,293 | Bear Stearns ARM Trust (06-2-2A1), 3.218%, due 07/25/36 (2)(3) | 2,699,315 | ||||||||||
| 414,950 | Bear Stearns ARM Trust (07-1-2A1), 2.951%, due 02/25/47 (2)(3) | 346,490 | ||||||||||
| 1,935,438 | Bear Stearns ARM Trust (07-5-3A1), 4.78%, due 08/25/47 (2)(3) | 1,831,226 | ||||||||||
| 2,425,723 | Bear Stearns Asset-Backed Securities I Trust (05-AC6-1A3), | 2,467,101 | ||||||||||
See accompanying notes to financial statements.
70
TCW Total Return Bond Fund
October 31, 2016 |
| Principal Amount | Fixed Income Securities | Value | ||||||||||
Residential Mortgage-Backed Securities — Non-Agency (Continued) | ||||||||||||
| $ | 5,186,609 | Bear Stearns Asset-Backed Securities I Trust (05-AC6-1A4), | $ | 5,275,105 | ||||||||
| 7,462,868 | Bear Stearns Asset-Backed Securities I Trust (06-HE9-1A2), | 6,460,478 | ||||||||||
| 869,176 | Bear Stearns Mortgage Funding Trust (06-AR3-1A1), 0.714%, due 10/25/36 (2) | 719,296 | ||||||||||
| 188,798 | BNC Mortgage Loan Trust (07-3-A2), 0.594%, due 07/25/37 (2) | 188,747 | ||||||||||
| 10,662,336 | Carrington Mortgage Loan Trust (05-NC5-A3), 0.954%, due 10/25/35 (2)(3) | 10,483,398 | ||||||||||
| 1,247,179 | Chase Mortgage Finance Corp. (06-A1-2A1), 3.079%, due 09/25/36 (2)(3) | 1,131,049 | ||||||||||
| 6,840,547 | Chase Mortgage Finance Corp. (07-A1-8A1), 3.168%, due 02/25/37 (2) | 6,925,827 | ||||||||||
| 4,604,837 | Chaseflex Trust (05-1-1A5), 6.5%, due 02/25/35 | 4,548,022 | ||||||||||
| 20,863,553 | Chaseflex Trust (06-1-A3), 6.295%, due 06/25/36 (2)(3) | 20,759,146 | ||||||||||
| 27,676,746 | CIM Trust (15-3AG-A1), (144A), 2.277%, due 10/25/57 (1)(2) | 27,350,017 | ||||||||||
| 37,216,477 | CIM Trust (15-4AG-A1), (144A), 2.527%, due 10/25/57 (1)(2) | 36,559,961 | ||||||||||
| 55,000,000 | CIM Trust (16-4-A1), (144A), 1%, due 10/25/57 (1)(2) | 54,725,000 | ||||||||||
| 1,034,938 | Citicorp Mortgage Securities Trust, Inc. (07-4-3A1), 5.5%, due 05/25/37 | 1,021,780 | ||||||||||
| 3,876,050 | Citicorp Residential Mortgage Trust, Inc. (06-2-A4), 5.775%, due 09/25/36 | 4,024,622 | ||||||||||
| 7,357,216 | Citigroup Mortgage Loan Trust, Inc. (06-AR5-1A1A), | 6,397,874 | ||||||||||
| 9,633,854 | Citigroup Mortgage Loan Trust, Inc. (06-WFH2-A2A), | 9,469,690 | ||||||||||
| 4,571,144 | Citigroup Mortgage Loan Trust, Inc. (07-12-2A1), (144A), | 3,405,614 | ||||||||||
| 2,589,295 | Citigroup Mortgage Loan Trust, Inc. (08-AR4-1A1A), (144A), | 2,607,475 | ||||||||||
| 725,147 | Citigroup Mortgage Loan Trust, Inc. (09-5-7A1), (144A), | 720,666 | ||||||||||
| 1,194,674 | Citigroup Mortgage Loan Trust, Inc. (10-4-4A5), (144A), | 1,222,238 | ||||||||||
| 5,864,313 | Citigroup Mortgage Loan Trust, Inc. (14-10-2A1), (144A), | 5,701,212 | ||||||||||
| 844,918 | CitiMortgage Alternative Loan Trust (05-A1-2A1), 5%, due 07/25/20 | 853,718 | ||||||||||
| 4,481,647 | Conseco Financial Corp. (99-2-A7), 6.44%, due 12/01/30 | 4,685,097 | ||||||||||
| 849,644 | Countrywide Alternative Loan Trust (05-20CB-4A1), 5.25%, due 07/25/20 (3) | 832,713 | ||||||||||
| 397,200 | Countrywide Alternative Loan Trust (05-84-1A1), 2.833%, due 02/25/36 (2)(3) | 276,606 | ||||||||||
| 1,379,114 | Countrywide Alternative Loan Trust (05-J1-2A1), 5.5%, due 02/25/25 | 1,400,676 | ||||||||||
| 18,227,057 | Countrywide Alternative Loan Trust (06-HY12-A5), 2.957%, due 08/25/36 (2) | 17,372,963 | ||||||||||
| 893,451 | Countrywide Alternative Loan Trust (06-J3-3A1), 5.5%, due 04/25/21 | 878,744 | ||||||||||
| 11,757,276 | Countrywide Home Loans Mortgage Pass-Through Trust (04-13-1A3), | 12,310,818 | ||||||||||
| 15,813,827 | Countrywide Home Loans Mortgage Pass-Through Trust (05-9-1A1), 1.125%, due 05/25/35 (2) | 12,691,162 | ||||||||||
| 49,578 | Countrywide Home Loans Mortgage Pass-Through Trust (05-HYB5-4A1), 3.063%, due 09/20/35 (2)(3) | 41,107 | ||||||||||
| 15,841 | Countrywide Home Loans Mortgage Pass-Through Trust (07-HY5-1A1), 3.295%, due 09/25/47 (2)(3) | 14,453 | ||||||||||
See accompanying notes to financial statements.
71
TCW Total Return Bond Fund
Schedule of Investments (Continued)
| Principal Amount | Fixed Income Securities | Value | ||||||||||
Residential Mortgage-Backed Securities — Non-Agency (Continued) | ||||||||||||
| $ | 65,390 | Countrywide Home Loans Mortgage Pass-Through Trust (07-HYB1-1A1), 2.867%, due 03/25/37 (2)(3) | $ | 50,449 | ||||||||
| 66,417 | Credit Suisse First Boston Mortgage Securities Corp. (03-8-4PPA), | 67,898 | ||||||||||
| 2,946,916 | Credit Suisse First Boston Mortgage Securities Corp. (05-11-1A1), | 2,259,109 | ||||||||||
| 10,685,105 | Credit Suisse First Boston Mortgage Securities Corp. (05-12-1A1), | 7,787,322 | ||||||||||
| 12,850,732 | Credit Suisse Mortgage Capital Certificates (15-5R-2A1), (144A), | 12,375,717 | ||||||||||
| 5,123,934 | Credit Suisse Mortgage Trust (13-7R-4A1), (144A), 0.685%, due 07/26/36 (1)(2) | 4,786,215 | ||||||||||
| 4,868,425 | Credit-Based Asset Servicing and Securitization LLC (06-CB1-AF2), | 3,602,399 | ||||||||||
| 34,843,959 | Credit-Based Asset Servicing and Securitization LLC (06-CB7-A4), | 23,548,196 | ||||||||||
| 19,341,467 | Credit-Based Asset Servicing and Securitization LLC (06-CB9-A4), | 12,486,304 | ||||||||||
| 4,524,170 | Credit-Based Asset Servicing and Securitization LLC (07-CB2-A2B), | 3,356,775 | ||||||||||
| 15,562,275 | Credit-Based Asset Servicing and Securitization LLC (07-CB2-A2C), | 11,545,129 | ||||||||||
| 7,581,951 | CSMC Mortgage-Backed Trust (06-8-3A1), 6%, due 10/25/21 (3) | 7,281,439 | ||||||||||
| 4,245,995 | CSMC Mortgage-Backed Trust (06-9-5A1), 5.5%, due 11/25/36 (3) | 4,087,571 | ||||||||||
| 13,064,876 | CSMC Mortgage-Backed Trust (07-2-3A4), 5.5%, due 03/25/37 (3) | 11,908,936 | ||||||||||
| 9,604,051 | CSMC Mortgage-Backed Trust (14-11R-11A1), (144A), | 9,815,922 | ||||||||||
| 616,515 | Deutsche Alt-A Securities, Inc. Mortgage Loan Trust (06-AR6-A6), | 498,716 | ||||||||||
| 4,179,695 | DSLA Mortgage Loan Trust (05-AR6-2A1A), 0.818%, due 10/19/45 (2) | 3,582,156 | ||||||||||
| 37,464,194 | DSLA Mortgage Loan Trust (06-AR2-2A1A), 0.728%, due 10/19/36 (2) | 31,876,193 | ||||||||||
| 11,224,290 | DSLA Mortgage Loan Trust (07-AR1-2A1A), 0.668%, due 04/19/47 (2) | 9,057,113 | ||||||||||
| 5,226,794 | Fieldstone Mortgage Investment Corp. (07-1-2A2), 0.804%, due 04/25/47 (2) | 3,833,876 | ||||||||||
| 32,647,558 | First Franklin Mortgage Loan Asset-Backed Certificates (06-FF18-A2C), 0.694%, due 12/25/37 (2) | 20,631,131 | ||||||||||
| 19,158,375 | First Franklin Mortgage Loan Asset-Backed Certificates (06-FF18-A2D), 0.744%, due 12/25/37 (2) | 12,218,616 | ||||||||||
| 6,547,603 | First Franklin Mortgage Loan Asset-Backed Certificates (07-FF1-A2C), 0.665%, due 01/25/38 (2) | 4,290,617 | ||||||||||
| 27,459,957 | First Franklin Mortgage Loan Asset-Backed Certificates (07-FF1-A2D), 0.745%, due 01/25/38 (2) | 18,647,162 | ||||||||||
| 5,068,000 | First Franklin Mortgage Loan Trust (06-FF9-2A4), 0.784%, due 06/25/36 (2) | 3,192,256 | ||||||||||
| 7,016,492 | First Horizon Alternative Mortgage Securities Trust (05-AA3-3A1), | 6,709,666 | ||||||||||
| 5,225,803 | First Horizon Alternative Mortgage Securities Trust (05-AA7-1A1), | 4,579,754 | ||||||||||
See accompanying notes to financial statements.
72
TCW Total Return Bond Fund
October 31, 2016 |
| Principal Amount | Fixed Income Securities | Value | ||||||||||
Residential Mortgage-Backed Securities — Non-Agency (Continued) | ||||||||||||
| $ | 5,041,279 | First Horizon Alternative Mortgage Securities Trust (05-AA7-2A1), | $ | 4,610,410 | ||||||||
| 17,997,268 | First Horizon Alternative Mortgage Securities Trust (06-AA7-A1), | 15,280,359 | ||||||||||
| 17,099,999 | Fremont Home Loan Trust (05-E-2A4), 0.864%, due 01/25/36 (2) | 15,351,068 | ||||||||||
| 4,718,532 | Fremont Home Loan Trust (06-1-2A3), 0.714%, due 04/25/36 (2) | 4,375,255 | ||||||||||
| 4,251,465 | GMAC Mortgage Loan Trust (05-AR5-2A1), 3.558%, due 09/19/35 (2) | 3,855,896 | ||||||||||
| 734,757 | GreenPoint Mortgage Funding Trust (05-AR3-1A1), 0.774%, due 08/25/45 (2) | 608,617 | ||||||||||
| 10,036,548 | GreenPoint Mortgage Funding Trust (06-AR5-A2A2), | 9,905,781 | ||||||||||
| 998,355 | GS Mortgage Securities Corp. (09-1R-3A1), (144A), | 1,002,129 | ||||||||||
| 2,542,108 | GSAA Home Equity Trust (05-7-AF5), 4.611%, due 05/25/35 | 2,571,005 | ||||||||||
| 1,467,360 | GSAA Home Equity Trust (05-9-2A3), 0.904%, due 08/25/35 (2) | 1,441,374 | ||||||||||
| 4,354,187 | GSR Mortgage Loan Trust (04-9-3A1), 3.151%, due 08/25/34 (2) | 4,417,659 | ||||||||||
| 494,963 | GSR Mortgage Loan Trust (05-4F-4A3), 5.5%, due 05/25/35 | 497,762 | ||||||||||
| 19,083,161 | GSR Mortgage Loan Trust (07-3F-3A7), 6%, due 05/25/37 | 18,187,873 | ||||||||||
| 1,713,805 | GSR Mortgage Loan Trust (07-AR2-2A1), 2.781%, due 05/25/37 (2)(3) | 1,539,747 | ||||||||||
| 2,900,486 | GSR Mortgage Loan Trust (07-AR2-5A1A), 5.191%, due 05/25/37 (2)(3) | 2,559,909 | ||||||||||
| 3,550,577 | Harborview Mortgage Loan Trust (05-9-2A1A), 0.866%, due 06/20/35 (2) | 3,263,467 | ||||||||||
| 23,287,217 | Harborview Mortgage Loan Trust (06-8-2A1A), 0.715%, due 07/21/36 (2) | 18,930,612 | ||||||||||
| 3,766,822 | Home Equity Asset Trust (05-8-2A4), 0.894%, due 02/25/36 (2) | 3,778,925 | ||||||||||
| 2,852,505 | Homestar Mortgage Acceptance Corp. (04-3-AV2C), 1.114%, due 07/25/34 (2) | 2,834,479 | ||||||||||
| 688,485 | Homestar Mortgage Acceptance Corp. (04-5-A1), 0.984%, due 10/25/34 (2) | 683,367 | ||||||||||
| 1,211,174 | HSI Asset Loan Obligation Trust (07-2-2A12), 6%, due 09/25/37 (3) | 1,115,970 | ||||||||||
| 10,305 | Impac CMB Trust (04-5-1A1), 1.254%, due 10/25/34 (2) | 9,907 | ||||||||||
| 1,675,232 | Impac CMB Trust (05-1-1A1), 1.054%, due 04/25/35 (2) | 1,557,158 | ||||||||||
| 8,614,840 | Impac CMB Trust (05-5-A2), 0.974%, due 08/25/35 (2) | 7,525,093 | ||||||||||
| 9,888,883 | Indymac Index Mortgage Loan Trust (04-AR4-2A), 2.963%, due 08/25/34 (2) | 9,829,709 | ||||||||||
| 1,449,127 | Indymac Index Mortgage Loan Trust (04-AR9-4A), 2.553%, due 11/25/34 (2) | 1,325,093 | ||||||||||
| 6,659,700 | Indymac Index Mortgage Loan Trust (05-AR17-3A1), | 5,659,639 | ||||||||||
| 5,223,051 | Indymac Index Mortgage Loan Trust (05-AR23-2A1), | 4,590,823 | ||||||||||
| 6,503,799 | Indymac Index Mortgage Loan Trust (05-AR23-6A1), | 5,419,611 | ||||||||||
| 3,361,590 | Indymac Index Mortgage Loan Trust (05-AR25-2A1), | 2,983,510 | ||||||||||
| 4,662,738 | Indymac Index Mortgage Loan Trust (05-AR7-2A1), 2.786%, due 06/25/35 (2) | 3,901,307 | ||||||||||
| 5,952,412 | Indymac Index Mortgage Loan Trust (06-AR19-4A1), | 4,547,015 | ||||||||||
| 12,506,160 | Indymac Index Mortgage Loan Trust (06-AR39-A1), | 10,950,496 | ||||||||||
| 30,694 | Indymac Index Mortgage Loan Trust (07-AR11-1A1), | 23,234 | ||||||||||
See accompanying notes to financial statements.
73
TCW Total Return Bond Fund
Schedule of Investments (Continued)
| Principal Amount | Fixed Income Securities | Value | ||||||||||
Residential Mortgage-Backed Securities — Non-Agency (Continued) | ||||||||||||
| $ | 23,233,677 | Indymac Index Mortgage Loan Trust (07-AR5-2A1), | $ | 18,735,449 | ||||||||
| 5,716,849 | Indymac Index Mortgage Loan Trust (07-AR7-1A1), 3.278%, due 11/25/37 (2) | 5,346,862 | ||||||||||
| 12,762,620 | Indymac Index Mortgage Loan Trust (07-FLX1-A2), 0.714%, due 02/25/37 (2) | 12,602,680 | ||||||||||
| 404,125 | Jefferies & Co., Inc. (09-R3-1A1), (144A), 2.823%, due 12/26/35 (1)(2) | 406,397 | ||||||||||
| 9,748,725 | JPMorgan Alternative Loan Trust (06-A2-5A1), 2.952%, due 05/25/36 (2)(3) | 6,749,692 | ||||||||||
| 6,990,922 | JPMorgan Alternative Loan Trust (06-A4-A8), 3.072%, due 09/25/36 (2)(3) | 7,194,057 | ||||||||||
| 8,740,025 | JPMorgan Mortgage Acquisition Corp. (06-CH2-AF4), 5.763%, due 10/25/36 | 7,108,181 | ||||||||||
| 29,015,000 | JPMorgan Mortgage Acquisition Corp. (07-CH4-A4), 0.694%, due 01/25/36 (2) | 27,350,851 | ||||||||||
| 693,728 | JPMorgan Mortgage Trust (05-A6-7A1), 3.165%, due 08/25/35 (2)(3) | 665,574 | ||||||||||
| 4,533,819 | JPMorgan Mortgage Trust (06-A2-5A3), 2.971%, due 11/25/33 (2) | 4,575,985 | ||||||||||
| 815,454 | JPMorgan Mortgage Trust (06-A4-1A4), 3.211%, due 06/25/36 (2)(3) | 735,106 | ||||||||||
| 39,053 | JPMorgan Mortgage Trust (06-A7-2A4R), 3.064%, due 01/25/37 (2)(3) | 36,695 | ||||||||||
| 1,463,713 | JPMorgan Mortgage Trust (06-S2-2A2), 5.875%, due 06/25/21 (3) | 1,424,553 | ||||||||||
| 332,700 | JPMorgan Resecuritization Trust Series (10-5-3A1), (144A), | 332,812 | ||||||||||
| 4,308,530 | JPMorgan Resecuritization Trust Series (12-3-A3), (144A), | 4,229,500 | ||||||||||
| 8,503,980 | JPMorgan Resecuritization Trust Series (14-6-3A1), (144A), | 8,003,475 | ||||||||||
| 1,084,059 | Lehman Mortgage Trust (05-1-6A1), 5%, due 11/25/20 | 823,863 | ||||||||||
| 3,090,554 | Lehman Mortgage Trust (06-4-4A1), 6%, due 08/25/21 (3) | 3,033,520 | ||||||||||
| 1,568,440 | Lehman Mortgage Trust (07-10-4A1), 6%, due 01/25/27 (3) | 1,162,170 | ||||||||||
| 22,383,842 | Lehman XS Trust (06-10N-1A3A), 0.744%, due 07/25/46 (2)(3) | 17,998,881 | ||||||||||
| 491 | Lehman XS Trust (06-12N-A2A1), 0.675%, due 08/25/46 (2)(3) | 492 | ||||||||||
| 7,649,299 | Lehman XS Trust (06-12N-A31A), 0.734%, due 08/25/46 (2)(3) | 5,938,657 | ||||||||||
| 6,867,268 | Lehman XS Trust (06-13-1A2), 0.704%, due 09/25/36 (2)(3) | 6,247,830 | ||||||||||
| 15,022,507 | Lehman XS Trust (06-9-A1B), 0.694%, due 05/25/46 (2)(3) | 13,082,172 | ||||||||||
| 1,905,076 | Lehman XS Trust (06-GP4-3A2A), 0.694%, due 08/25/46 (2)(3) | 1,893,400 | ||||||||||
| 30 | Lehman XS Trust (07-4N-1A1), 0.655%, due 03/25/47 (2)(3) | 30 | ||||||||||
| 12,591,242 | Long Beach Mortgage Loan Trust (06-WL1-1A3), 0.864%, due 01/25/46 (2) | 12,214,377 | ||||||||||
| 14,950,000 | Long Beach Mortgage Loan Trust (06-WL1-2A4), 0.874%, due 01/25/46 (2) | 12,591,697 | ||||||||||
| 3,563,015 | Luminent Mortgage Trust (07-2-1A3), 0.754%, due 05/25/37 (2)(3) | 3,424,495 | ||||||||||
| 7,622,503 | Madison Avenue Manufactured Housing Contract (02-A-B1), | 7,743,726 | ||||||||||
| 8,547,417 | MASTR Adjustable Rate Mortgages Trust (04-9-M1), 1.114%, due 11/25/34 (2) | 8,497,381 | ||||||||||
| 106,715 | MASTR Adjustable Rate Mortgages Trust (07-2-A2), 0.644%, due 03/25/47 (2) | 106,085 | ||||||||||
| 7,272,031 | MASTR Alternative Loans Trust (05-4-1A1), 6.5%, due 05/25/35 | 7,143,510 | ||||||||||
| 75,539 | MASTR Alternative Loans Trust (06-2-2A1), 0.934%, due 03/25/36 (2)(3) | 15,078 | ||||||||||
| 130,911 | MASTR Asset Securitization Trust (03-8-1A1), 5.5%, due 09/25/33 | 131,608 | ||||||||||
| 65,273 | MASTR Asset Securitization Trust (06-3-2A1), 0.984%, due 10/25/36 (2)(3) | 37,884 | ||||||||||
| 691,131 | MASTR Asset-Backed Securities Trust (06-AB1-A2), 0.764%, due 02/25/36 (2) | 690,987 | ||||||||||
| 2,358,732 | MASTR Asset-Backed Securities Trust (06-AB1-A4), 5.719%, due 02/25/36 | 2,329,545 | ||||||||||
| 5,418,856 | MASTR Asset-Backed Securities Trust (06-HE1-A4), 0.824%, due 01/25/36 (2) | 5,272,204 | ||||||||||
| 24,426,592 | MASTR Asset-Backed Securities Trust (06-HE5-A3), 0.694%, due 11/25/36 (2) | 15,168,093 | ||||||||||
| 12,737 | MASTR Seasoned Securitization Trust (04-1-4A1), 3.051%, due 10/25/32 (2) | 12,898 | ||||||||||
See accompanying notes to financial statements.
74
TCW Total Return Bond Fund
October 31, 2016 |
| Principal Amount | Fixed Income Securities | Value | ||||||||||
Residential Mortgage-Backed Securities — Non-Agency (Continued) | ||||||||||||
| $ | 2,374,428 | Merrill Lynch Alternative Note Asset Trust (07-A1-A2C), | $ | 1,105,593 | ||||||||
| 1,221,405 | Merrill Lynch Alternative Note Asset Trust (07-A1-A3), | 559,220 | ||||||||||
| 9,332,937 | Merrill Lynch First Franklin Mortgage Loan Trust (07-1-A2B), | 5,470,009 | ||||||||||
| 32,661,339 | Merrill Lynch First Franklin Mortgage Loan Trust (07-1-A2C), | 19,423,395 | ||||||||||
| 8,049,573 | Merrill Lynch First Franklin Mortgage Loan Trust (07-1-A2D), | 4,864,826 | ||||||||||
| 7,276,824 | Merrill Lynch First Franklin Mortgage Loan Trust (07-2-A2C), | 3,693,588 | ||||||||||
| 3,552,087 | Merrill Lynch First Franklin Mortgage Loan Trust (07-3-A2B), | 2,554,313 | ||||||||||
| 43,895,986 | Merrill Lynch First Franklin Mortgage Loan Trust (07-4-2A3), | 28,305,133 | ||||||||||
| 2,865,401 | Merrill Lynch Mortgage-Backed Securities Trust (07-2-1A1), | 2,649,324 | ||||||||||
| 4,103,385 | Mid-State Trust (05-1-A), 5.745%, due 01/15/40 | 4,426,392 | ||||||||||
| 1,003,122 | Morgan Stanley ABS Capital I, Inc. Trust (04-NC8-M2), | 971,664 | ||||||||||
| 5,074,324 | Morgan Stanley ABS Capital I, Inc. Trust (05-HE3-M3), | 5,001,739 | ||||||||||
| 2,027,988 | Morgan Stanley Home Equity Loan Trust (05-2-M3), 1.209%, due 05/25/35 (2) | 2,034,689 | ||||||||||
| 4,404,190 | Morgan Stanley Home Equity Loan Trust (06-2-A4), 0.814%, due 02/25/36 (2) | 4,217,541 | ||||||||||
| 3,804,070 | Morgan Stanley Mortgage Loan Trust (05-6AR-1A1), 0.814%, due 11/25/35 (2) | 3,734,074 | ||||||||||
| 1,197,679 | Morgan Stanley Mortgage Loan Trust (07-3XS-2A6), | 681,175 | ||||||||||
| 4,397,980 | Morgan Stanley Mortgage Loan Trust (07-7AX-2A1), 0.654%, due 04/25/37 (2) | 2,127,192 | ||||||||||
| 12,530,794 | Morgan Stanley REREMIC Trust (13-R2-1A), (144A), 2.38%, due 10/26/36 (1)(2) | 12,514,455 | ||||||||||
| 2,847,690 | Morgan Stanley REREMIC Trust (13-R3-12A), (144A), | 2,846,430 | ||||||||||
| 12,544,824 | Morgan Stanley Resecuritization Trust (14-R2-2A), (144A), | 12,630,086 | ||||||||||
| 9,829,279 | MortgageIT Trust (05-3-A1), 0.834%, due 08/25/35 (2) | 9,324,152 | ||||||||||
| 5,053,985 | MortgageIT Trust (05-4-A1), 0.814%, due 10/25/35 (2) | 4,608,963 | ||||||||||
| 10,000,000 | Nationstar Home Equity Loan Trust (07-B-2AV3), 0.784%, due 04/25/37 (2) | 9,433,632 | ||||||||||
| 7,490,800 | New Century Home Equity Loan Trust (05-1-A1SS), 1.054%, due 03/25/35 (2) | 7,500,106 | ||||||||||
| 3,959,087 | Nomura Resecuritization Trust (12-3R-1A1), (144A), | 3,872,146 | ||||||||||
| 12,000,371 | Nomura Resecuritization Trust (15-1R-2A1), (144A), | 11,956,794 | ||||||||||
| 8,894,907 | Nomura Resecuritization Trust (15-2R-1A1), (144A), | 8,858,420 | ||||||||||
| 14,396,863 | Nomura Resecuritization Trust (15-4R-2A1), (144A), | 13,916,320 | ||||||||||
See accompanying notes to financial statements.
75
TCW Total Return Bond Fund
Schedule of Investments (Continued)
| Principal Amount | Fixed Income Securities | Value | ||||||||||
Residential Mortgage-Backed Securities — Non-Agency (Continued) | ||||||||||||
| $ | 6,022,654 | Nomura Resecuritization Trust (15-4R-3A1), (144A), | $ | 6,116,183 | ||||||||
| 16,050,793 | Nomura Resecuritization Trust (15-5R-2A1), (144A), | 16,245,027 | ||||||||||
| 6,524,063 | Nomura Resecuritization Trust (15-7R-2A1), (144A), | 6,756,337 | ||||||||||
| �� | 3,834,876 | Oakwood Mortgage Investors, Inc. (02-A-A4), 6.97%, due 03/15/32 (2) | 4,124,438 | |||||||||
| 5,850,548 | Oakwood Mortgage Investors, Inc. (99-E-A1), 7.608%, due 03/15/30 (2) | 5,175,705 | ||||||||||
| 10,364,959 | Opteum Mortgage Acceptance Corp. (06-1-2A1), 5.75%, due 04/25/36 (2) | 10,548,511 | ||||||||||
| 871,075 | Origen Manufactured Housing Contract Trust (05-A-B), | 936,688 | ||||||||||
| 711,082 | Origen Manufactured Housing Contract Trust (05-A-M2), | 762,917 | ||||||||||
| 19,300,000 | Ownit Mortgage Loan Asset-Backed Certificates (06-3-A2D), | 16,137,593 | ||||||||||
| 20,777,149 | Ownit Mortgage Loan Asset-Backed Certificates (06-6-A2C), | 13,355,385 | ||||||||||
| 3,251,085 | Park Place Securities, Inc. (05-WCH1-M2), 1.314%, due 01/25/36 (2) | 3,246,160 | ||||||||||
| 4,453,295 | Prime Mortgage Trust (06-1-1A1), 5.5%, due 06/25/36 (3) | 4,207,334 | ||||||||||
| 5,803,073 | RAAC Series Trust (05-SP1-4A1), 7%, due 09/25/34 | 6,261,788 | ||||||||||
| 2,595,144 | RAAC Series Trust (07-SP1-A3), 1.014%, due 03/25/37 (2) | 2,533,294 | ||||||||||
| 1,187,809 | RALI Trust (05-QA13-2A1), 3.905%, due 12/25/35 (2)(3) | 1,040,766 | ||||||||||
| 5,044,107 | RALI Trust (05-QA7-A21), 3.423%, due 07/25/35 (2)(3) | 4,547,291 | ||||||||||
| 9,414,521 | RALI Trust (06-QA3-A1), 0.734%, due 04/25/36 (2)(3) | 8,839,498 | ||||||||||
| 8,752,070 | Residential Accredit Loans, Inc. (05-QA8-CB21), 3.692%, due 07/25/35 (2)(3) | 7,189,749 | ||||||||||
| 1,651,245 | Residential Accredit Loans, Inc. (05-QS7-A1), 5.5%, due 06/25/35 (3) | 1,478,928 | ||||||||||
| 28,750 | Residential Accredit Loans, Inc. (06-QA1-A21), 4.064%, due 01/25/36 (2)(3) | 23,438 | ||||||||||
| 24,395,311 | Residential Accredit Loans, Inc. (06-QA10-A2), 0.714%, due 12/25/36 (2)(3) | 20,742,581 | ||||||||||
| 34,321 | Residential Accredit Loans, Inc. (06-QA2-1A1), 0.784%, due 02/25/36 (2)(3) | 23,199 | ||||||||||
| 62,993,573 | Residential Accredit Loans, Inc. (06-QS10-AV), 0.573%, due 08/25/36 (I/O) (2) | 1,534,996 | ||||||||||
| 62,270,310 | Residential Accredit Loans, Inc. (06-QS11-AV), 0.348%, due 08/25/36 (I/O) (2) | 926,140 | ||||||||||
| 8,309,445 | Residential Accredit Loans, Inc. (06-QS5-A5), 6%, due 05/25/36 (3) | 7,207,577 | ||||||||||
| 83,153,298 | Residential Accredit Loans, Inc. (06-QS6-1AV), 0.756%, due 06/25/36 (I/O) (2) | 2,507,721 | ||||||||||
| 18,864,883 | Residential Accredit Loans, Inc. (06-QS7-AV), 0.659%, due 06/25/36 (I/O) (2) | 461,013 | ||||||||||
| 4,274,422 | Residential Accredit Loans, Inc. (07-QS1-2AV), 0.167%, due 01/25/37 (I/O) (2) | 31,422 | ||||||||||
| 32,208,513 | Residential Accredit Loans, Inc. (07-QS2-AV), 0.331%, due 01/25/37 (I/O) (2) | 445,803 | ||||||||||
| 124,732,709 | Residential Accredit Loans, Inc. (07-QS3-AV), 0.342%, due 02/25/37 (I/O) (2) | 1,914,323 | ||||||||||
| 14,268,711 | Residential Accredit Loans, Inc. (07-QS4-3AV), 0.38%, due 03/25/37 (I/O) (2) | 196,153 | ||||||||||
| 20,582,441 | Residential Accredit Loans, Inc. (07-QS5-AV), 0.251%, due 03/25/37 (I/O) (2) | 257,624 | ||||||||||
| 4,630,309 | Residential Accredit Loans, Inc. (07-QS6-A45), 5.75%, due 04/25/37 (3) | 3,750,225 | ||||||||||
| 29,536,791 | Residential Accredit Loans, Inc. (07-QS8-AV), 0.389%, due 06/25/37 (I/O) (2) | 431,813 | ||||||||||
| 42,430 | Residential Funding Mortgage Securities I (05-SA5-2A), | 38,536 | ||||||||||
| 2,898,731 | Residential Funding Mortgage Securities I (06-S10-1A1), 6%, due 10/25/36 (3) | 2,758,833 | ||||||||||
| 1,011,024 | Residential Funding Mortgage Securities I (06-S9-A3), | 939,195 | ||||||||||
See accompanying notes to financial statements.
76
TCW Total Return Bond Fund
October 31, 2016 |
| Principal Amount | Fixed Income Securities | Value | ||||||||||
Residential Mortgage-Backed Securities — Non-Agency (Continued) | ||||||||||||
| $ | 11,238,468 | Residential Funding Mortgage Securities I (07-S2-A9), | $ | 10,607,676 | ||||||||
| 39,035 | Residential Funding Mortgage Securities I (07-SA2-2A2), | 33,468 | ||||||||||
| 12,770,650 | Saxon Asset Securities Trust (06-2-A2), 0.664%, due 09/25/36 (2)(3) | 12,369,730 | ||||||||||
| 16,814,860 | Saxon Asset Securities Trust (06-3-A3), 0.704%, due 10/25/46 (2) | 14,260,044 | ||||||||||
| 22,895,844 | Saxon Asset Securities Trust (07-2-A2D), 0.834%, due 05/25/47 (2) | 16,780,842 | ||||||||||
| 3,566,436 | Securitized Asset-Backed Receivables LLC Trust (07-BR1-A2C), | 2,019,765 | ||||||||||
| 46,897,530 | Securitized Asset-Backed Receivables LLC Trust (07-BR2-A2), | 31,768,429 | ||||||||||
| 21,372,114 | Securitized Asset-Backed Receivables LLC Trust (07-NC2-A2B), | 14,264,733 | ||||||||||
| 1,209,305 | Sequoia Mortgage Trust (03-8-A1), 1.166%, due 01/20/34 (2) | 1,134,384 | ||||||||||
| 2,482,149 | SG Mortgage Securities Trust (05-OPT1-A3), 0.884%, due 10/25/35 (2) | 2,473,173 | ||||||||||
| 25,457,094 | SG Mortgage Securities Trust (07-NC1-A2), (144A), | 15,866,735 | ||||||||||
| 7,999,299 | Soundview Home Equity Loan Trust (06-2-A4), 0.804%, due 03/25/36 (2) | 7,960,627 | ||||||||||
| 10,400,000 | Soundview Home Equity Loan Trust (06-OPT4-2A4), 0.764%, due 06/25/36 (2) | 7,791,426 | ||||||||||
| 4,000,000 | Soundview Home Equity Loan Trust (07-OPT3-2A4), 0.784%, due 08/25/37 (2) | 2,765,215 | ||||||||||
| 729,460 | Specialty Underwriting & Residential Finance (05-BC4-A2C), | 729,571 | ||||||||||
| 23,406 | Specialty Underwriting & Residential Finance (06-AB3-A2B), | 14,316 | ||||||||||
| 3,638,387 | Structured Adjustable Rate Mortgage Loan Trust (04-12-2A), | 3,591,764 | ||||||||||
| 5,814,162 | Structured Adjustable Rate Mortgage Loan Trust (04-14-2A), | 5,931,630 | ||||||||||
| 8,449,744 | Structured Adjustable Rate Mortgage Loan Trust (05-16XS-A2A), | 8,254,405 | ||||||||||
| 684,994 | Structured Adjustable Rate Mortgage Loan Trust (06-2-5A1), | 560,937 | ||||||||||
| 2,846,463 | Structured Adjustable Rate Mortgage Loan Trust (06-4-5A1), | 2,399,687 | ||||||||||
| 7,449,376 | Structured Adjustable Rate Mortgage Loan Trust (06-5-1A1), | 6,586,066 | ||||||||||
| 5,553,142 | Structured Adjustable Rate Mortgage Loan Trust (07-1-1A1), | 4,838,275 | ||||||||||
| 211,654 | Structured Asset Mortgage Investments, Inc. (06-AR3-24A1), | 117,974 | ||||||||||
| 456,168 | Structured Asset Securities Corp. (05-2XS-1A5B), 4.65%, due 02/25/35 | 463,540 | ||||||||||
| 13,777,256 | Structured Asset Securities Corp. (06-EQ1A-A4), (144A), | 13,564,335 | ||||||||||
| 11,203,518 | Structured Asset Securities Corp. (06-WF2-A4), 0.844%, due 07/25/36 (2) | 10,828,274 | ||||||||||
| 387,547 | Suntrust Adjustable Rate Mortgage Loan Trust (07-2-2A1), | 322,681 | ||||||||||
See accompanying notes to financial statements.
77
TCW Total Return Bond Fund
Schedule of Investments (Continued)
| Principal Amount | Fixed Income Securities | Value | ||||||||||
Residential Mortgage-Backed Securities — Non-Agency (Continued) | ||||||||||||
| $ | 17,168 | Suntrust Adjustable Rate Mortgage Loan Trust (07-3-1A1), | $ | 15,323 | ||||||||
| 1,342,898 | Suntrust Adjustable Rate Mortgage Loan Trust (07-S1-2A1), | 1,332,769 | ||||||||||
| 11,079,984 | Wachovia Mortgage Loan Trust LLC (06-AMN1-A3), 0.774%, due 08/25/36 (2) | 7,071,700 | ||||||||||
| 10,237,358 | WaMu Mortgage Pass-Through Certificates (04-AR14-A1), | 10,255,497 | ||||||||||
| 11,890,993 | WaMu Mortgage Pass-Through Certificates (05-AR13-A1A1), | 11,401,278 | ||||||||||
| 958,261 | WaMu Mortgage Pass-Through Certificates (05-AR13-A1A2), | 954,591 | ||||||||||
| 2,449,180 | WaMu Mortgage Pass-Through Certificates (05-AR14-2A1), | 2,248,734 | ||||||||||
| 3,825,108 | WaMu Mortgage Pass-Through Certificates (05-AR18-1A1), | 3,544,697 | ||||||||||
| 358,679 | WaMu Mortgage Pass-Through Certificates (05-AR2-2A1A), | 335,501 | ||||||||||
| 8,950,623 | WaMu Mortgage Pass-Through Certificates (05-AR9-A1A), | 8,562,216 | ||||||||||
| 25,413,876 | WaMu Mortgage Pass-Through Certificates (06-AR1-2A1A), | 24,636,346 | ||||||||||
| 6,529,279 | WaMu Mortgage Pass-Through Certificates (06-AR11-1A), | 5,412,069 | ||||||||||
| 7,156,142 | WaMu Mortgage Pass-Through Certificates (06-AR17-1A1A), | 6,343,678 | ||||||||||
| 138,663 | Washington Mutual Alternative Mortgage Pass-Through Certificates | 138,654 | ||||||||||
| 1,678,649 | Washington Mutual Alternative Mortgage Pass-Through Certificates | 1,585,267 | ||||||||||
| 3,147,115 | Washington Mutual Alternative Mortgage Pass-Through Certificates | 1,893,012 | ||||||||||
| 5,661,375 | Washington Mutual Alternative Mortgage Pass-Through Certificates | 4,614,177 | ||||||||||
| 2,342,505 | Washington Mutual Alternative Mortgage Pass-Through Certificates | 1,801,610 | ||||||||||
| 6,930,141 | Washington Mutual Alternative Mortgage Pass-Through Certificates | 5,610,372 | ||||||||||
| 11,691,000 | Washington Mutual Asset-Backed Certificates (06-HE1-2A4), | 10,706,896 | ||||||||||
| 13,080,901 | Wells Fargo Home Equity Asset-Backed Securities (06-3-A2), | 12,564,496 | ||||||||||
| 5,521,000 | Wells Fargo Home Equity Asset-Backed Securities (07-1-A3), | 4,179,078 | ||||||||||
| 6,311,751 | Wells Fargo Mortgage Loan Trust (11-RR3-A1), (144A), | 6,228,330 | ||||||||||
See accompanying notes to financial statements.
78
TCW Total Return Bond Fund
October 31, 2016 |
| Principal Amount | Fixed Income Securities | Value | ||||||||||
Residential Mortgage-Backed Securities — Non-Agency (Continued) | ||||||||||||
| $ | 4,898,619 | Wells Fargo Mortgage Loan Trust (12-RR2-1A1), (144A), | $ | 4,808,744 | ||||||||
| 4,177,092 | Wells Fargo Mortgage-Backed Securities Trust (04-DD-2A6), | 4,157,357 | ||||||||||
| 7,922,658 | Wells Fargo Mortgage-Backed Securities Trust (06-AR11-A6), | 7,495,974 | ||||||||||
| 5,113,023 | Wells Fargo Mortgage-Backed Securities Trust (06-AR6-4A1), | 5,079,375 | ||||||||||
| 3,321,519 | Wells Fargo Mortgage-Backed Securities Trust (06-AR7-2A4), | 3,148,699 | ||||||||||
| 6,192,074 | Wells Fargo Mortgage-Backed Securities Trust (07-10-1A32), | 6,144,338 | ||||||||||
| 630,317 | Wells Fargo Mortgage-Backed Securities Trust (07-AR4-A1), | 578,664 | ||||||||||
| 2,918,380 | Wells Fargo Mortgage-Backed Securities Trust (08-1-4A1), | 3,069,511 | ||||||||||
|
| |||||||||||
Total Residential Mortgage-Backed Securities — Non-Agency | 1,824,545,301 | |||||||||||
|
| |||||||||||
U.S. Government Agency Obligation (Cost: $44,320,080) (0.4%) | ||||||||||||
| 44,400,000 | Federal Home Loan Bank, 1.25%, due 06/28/30 | 44,439,227 | ||||||||||
|
| |||||||||||
U.S. Treasury Securities (20.2%) | ||||||||||||
| 804,200,000 | U.S. Treasury Bond, 2.25%, due 08/15/46 | 747,969,532 | ||||||||||
| 238,510,000 | U.S. Treasury Note, 1.125%, due 07/31/21 | 236,404,398 | ||||||||||
| 320,815,000 | U.S. Treasury Note, 1.125%, due 08/31/21 | 318,020,413 | ||||||||||
| 88,735,000 | U.S. Treasury Note, 1.125%, due 09/30/21 | 87,913,573 | ||||||||||
| 321,285,000 | U.S. Treasury Note, 1.125%, due 10/31/21 | 320,369,855 | ||||||||||
| 399,790,000 | U.S. Treasury Note, 1.5%, due 08/15/26 | 387,874,659 | ||||||||||
| 80,935,000 | U.S. Treasury Note, 2.625%, due 08/15/20 | 85,277,324 | ||||||||||
|
| |||||||||||
Total U.S. Treasury Securities (Cost: $2,222,262,321) | 2,183,829,754 | |||||||||||
|
| |||||||||||
Total Fixed Income Securities (Cost: $10,072,606,686) (96.0%) | 10,371,294,875 | |||||||||||
|
| |||||||||||
| Number of Shares | Money Market Investments | |||||||||||
| 10,909,000 | JPMorgan U.S. Government Money Market Fund — Institutional, 0.66% (7) | 10,909,000 | ||||||||||
| 200,139 | State Street Institutional U.S. Government Money Market Fund — Premier Class, 0.25% (7) | 200,139 | ||||||||||
|
| |||||||||||
Total Money Market Investments (Cost: $11,109,139) (0.1%) | 11,109,139 | |||||||||||
|
| |||||||||||
See accompanying notes to financial statements.
79
TCW Total Return Bond Fund
Schedule of Investments (Continued)
| Principal Amount | Short-Term Investments | Value | ||||||||||
Foreign Government Bonds (Cost: $416,128,576) (3.8%) | ||||||||||||
| JPY | 43,000,000,000 | Japan Treasury Bill, 0%, due 01/23/17 (8) | $ | 409,432,345 | ||||||||
|
| |||||||||||
U.S. Treasury Securities (14.9%) | ||||||||||||
| $ | 215,000,000 | U.S. Treasury Bill, 0.16%, due 11/17/16 (8) | 214,983,660 | |||||||||
| 11,405,000 | U.S. Treasury Bill, 0.16%, due 12/08/16 (8)(9) | 11,403,084 | ||||||||||
| 441,000,000 | U.S. Treasury Bill, 0.26%, due 01/05/17 (8) | 440,793,171 | ||||||||||
| 259,950,000 | U.S. Treasury Bill, 0.26%, due 01/12/17 (8) | 259,815,346 | ||||||||||
| 258,300,000 | U.S. Treasury Bill, 0.28%, due 01/19/17 (8) | 258,141,145 | ||||||||||
| 211,135,000 | U.S. Treasury Bill, 0.32%, due 02/23/17 (8) | 210,919,431 | ||||||||||
| 220,000,000 | U.S. Treasury Bill, 0.44%, due 04/13/17 (8) | 219,561,760 | ||||||||||
|
| |||||||||||
Total U.S. Treasury Securities (Cost: $1,615,458,032) | 1,615,617,597 | |||||||||||
|
| |||||||||||
Total Short-Term Investments (Cost: $2,031,586,608) (18.7%) | 2,025,049,942 | |||||||||||
|
| |||||||||||
Total Investments (Cost: $12,115,302,433) (114.8%) | 12,407,453,956 | |||||||||||
Liabilities in Excess of Other Assets (-14.8%) | (1,602,457,148 | ) | ||||||||||
|
| |||||||||||
Net Assets (100.0%) | $ | 10,804,996,808 | ||||||||||
|
| |||||||||||
| Futures Contracts | ||||||||||||||||
| Number of Contracts | Type | Expiration Date | Notional Contract Value | Net Unrealized Appreciation (Depreciation) | ||||||||||||
| BUY | ||||||||||||||||
| 5,829 | 2-Year U.S. Treasury Note Futures | 12/30/16 | $ | 1,271,541,709 | $ | (2,008,645 | ) | |||||||||
| 5,261 | 5-Year U.S. Treasury Note Futures | 12/30/16 | 635,512,359 | (3,058,070 | ) | |||||||||||
| 1,893 | 10-Year U.S. Treasury Note Futures | 12/20/16 | 245,380,125 | (2,907,969 | ) | |||||||||||
| 2,450 | 90-Day Eurodollar Futures | 12/19/16 | 606,711,875 | 789,856 | ||||||||||||
|
|
|
| |||||||||||||
| $ | 2,759,146,068 | $ | (7,184,828 | ) | ||||||||||||
|
|
|
| |||||||||||||
| Forward Currency Exchange Contracts | ||||||||||||||||||||||
| Counterparty | Contracts to Deliver | Units of Currency | Settlement Date | In Exchange for U.S. Dollars | Contracts at Value | Unrealized Appreciation | ||||||||||||||||
SELL (10) | ||||||||||||||||||||||
| Bank of America | JPY | 43,000,000,000 | 01/23/17 | $ | 416,255,252 | $ | 410,622,133 | $ | 5,633,119 | |||||||||||||
|
|
|
|
|
| |||||||||||||||||
See accompanying notes to financial statements.
80
TCW Total Return Bond Fund
October 31, 2016 |
Notes to the Schedule of Investments:
| JPY - | Japanese Yen |
| ABS - | Asset-Backed Securities. |
| ACES - | Alternative Credit Enhancement Securities. |
| ARM - | Adjustable Rate Mortgage. |
| CLO - | Collateralized Loan Obligation. |
| I/F - | Inverse Floating rate security whose interest rate moves in the opposite direction of prevailing interest rates. |
| I/O - Interest | Only Security. |
| PAC - | Planned Amortization Class. |
| P/O - | Principal Only Security. |
| TAC - | Target Amortization Class. |
| TBA - | To be Announced. |
| (1) | Security exempt from registration under Rule 144A of the Securities Act of 1933, as amended. These securities may be resold, normally only to qualified institutional buyers. At October 31, 2016, the value of these securities amounted to $532,904,447 or 4.9% of net assets. These securities are determined to be liquid by the Advisor, unless otherwise noted, under procedures established by and under the general supervision of the Company’s Board of Directors. |
| (2) | Floating or variable rate security. The interest shown reflects the rate in effect at October 31, 2016. |
| (3) | A portion of the principal balance has been written-off during the period due to defaults in the underlying loans. |
| (4) | As of October 31, 2016, security is not accruing interest. |
| (5) | This security is purchased on a when-issued, delayed-delivery or forward commitment basis. |
| (6) | Security purchased on a forward commitment with an approximate principal amount. The actual principal amount and maturity date will be determined upon settlement when the security is delivered. |
| (7) | Rate disclosed is the 7-day net yield as of October 31, 2016. |
| (8) | Rate shown represents yield-to-maturity. |
| (9) | All or a portion of this security is held as collateral for open futures contracts. |
| (10) | Fund sells foreign currency, buys U.S. Dollar. |
See accompanying notes to financial statements.
81
TCW Total Return Bond Fund
Investments by Industry | October 31, 2016 |
| Industry | Percentage of Net Assets | |||
Asset-Backed Securities | 3.5 | % | ||
Commercial Mortgage-Backed Securities — Agency | 3.0 | |||
Commercial Mortgage-Backed Securities — Non-Agency | 0.5 | |||
Residential Mortgage-Backed Securities — Agency | 51.5 | |||
Residential Mortgage-Backed Securities — Non-Agency | 16.9 | |||
Short Term Investments | 18.7 | |||
U.S. Government Agency Obligations | 0.4 | |||
U.S. Treasury Securities | 20.2 | |||
Money Market Investments | 0.1 | |||
|
| |||
Total | 114.8 | % | ||
|
| |||
See accompanying notes to financial statements.
82
TCW Total Return Bond Fund
Fair Valuation Summary | October 31, 2016 |
The following is a summary of the fair valuations according to the inputs used as of October 31, 2016 in valuing the Fund’s investments:
| Description | Quoted Prices in (Level 1) | Other (Level 2) | Significant (Level 3) | Total | ||||||||||||
Fixed Income Securities | ||||||||||||||||
Asset-Backed Securities | $ | — | $ | 378,978,880 | $ | — | $ | 378,978,880 | ||||||||
Commercial Mortgage-Backed Securities — Agency | — | 321,442,198 | — | 321,442,198 | ||||||||||||
Commercial Mortgage-Backed Securities — Non-Agency | — | 56,963,725 | — | 56,963,725 | ||||||||||||
Residential Mortgage-Backed Securities — Agency | — | 5,561,095,790 | — | 5,561,095,790 | ||||||||||||
Residential Mortgage-Backed Securities — Non-Agency | — | 1,815,823,215 | 8,722,086 | 1,824,545,301 | ||||||||||||
U.S. Government Agency Obligations | — | 44,439,227 | — | 44,439,227 | ||||||||||||
U.S. Treasury Securities | 2,183,829,754 | — | — | 2,183,829,754 | ||||||||||||
|
|
|
|
|
|
|
| |||||||||
Total Fixed Income Securities | 2,183,829,754 | 8,178,743,035 | 8,722,086 | 10,371,294,875 | ||||||||||||
|
|
|
|
|
|
|
| |||||||||
Money Market Investments | 11,109,139 | — | — | 11,109,139 | ||||||||||||
Short-Term Investments* | 1,615,617,597 | 409,432,345 | — | 2,025,049,942 | ||||||||||||
|
|
|
|
|
|
|
| |||||||||
Total Investments | 3,810,556,490 | 8,588,175,380 | 8,722,086 | 12,407,453,956 | ||||||||||||
|
|
|
|
|
|
|
| |||||||||
Asset Derivatives | ||||||||||||||||
Futures | ||||||||||||||||
Interest Rate Risk | 789,856 | — | — | 789,856 | ||||||||||||
Forward Currency Contracts | ||||||||||||||||
Foreign Currency Risk | — | 5,633,119 | — | 5,633,119 | ||||||||||||
|
|
|
|
|
|
|
| |||||||||
Total | $ | 3,811,346,346 | $ | 8,593,808,499 | $ | 8,722,086 | $ | 12,413,876,931 | ||||||||
|
|
|
|
|
|
|
| |||||||||
Liability Derivatives | ||||||||||||||||
Futures | ||||||||||||||||
Interest Rate Risk | $ | (7,974,684 | ) | $ | — | $ | — | $ | (7,974,684 | ) | ||||||
|
|
|
|
|
|
|
| |||||||||
Total | $ | (7,974,684 | ) | $ | — | $ | — | $ | (7,974,684 | ) | ||||||
|
|
|
|
|
|
|
| |||||||||
| * | See Schedule of Investments for corresponding industries. |
See accompanying notes to financial statements.
83
TCW Funds, Inc.
October 31, 2016 |
| TCW Core Fixed Income Fund | TCW Enhanced Commodity Strategy Fund (1) | TCW Global Bond Fund | ||||||||||
| Dollar Amounts in Thousands (Except per Share Amounts) | ||||||||||||
ASSETS | ||||||||||||
Investments, at Value (2) | $ | 2,028,224 | $ | 1,165 | $ | 16,430 | ||||||
Foreign Currency, at Value | — | — | 15 | (3) | ||||||||
Receivable for Securities Sold | 6,071 | — | (4) | 80 | ||||||||
Receivable for Sale of When-Issued Securities | 69,811 | — | 131 | |||||||||
Receivable for Fund Shares Sold | 2,141 | — | — | |||||||||
Interest and Dividends Receivable | 6,970 | 4 | 93 | |||||||||
Receivable from Investment Advisor | 64 | 18 | 8 | |||||||||
Unrealized Appreciation on Open Forward Foreign Currency Contracts | — | — | 13 | |||||||||
Receivable for Daily Variation Margin on Open Financial Futures Contracts | 69 | — | — | |||||||||
Cash Collateral on Deposit | — | 110 | — | |||||||||
Prepaid Expenses | 72 | 7 | 5 | |||||||||
|
|
|
|
|
| |||||||
Total Assets | 2,113,422 | 1,304 | 16,775 | |||||||||
|
|
|
|
|
| |||||||
LIABILITIES | ||||||||||||
Distributions Payable | 2,454 | — | 37 | |||||||||
Payable for Securities Purchased | 1,791 | — | 80 | |||||||||
Payable for Purchase of When-Issued Securities | 197,017 | — | 366 | |||||||||
Payable for Fund Shares Redeemed | 2,463 | — | 6 | |||||||||
Accrued Directors’ Fees and Expenses | 2 | 2 | 2 | |||||||||
Accrued Management Fees | 650 | 1 | 8 | |||||||||
Accrued Distribution Fees | 104 | — | (4) | 1 | ||||||||
Interest Payable on Swap Agreements | — | — | (4) | — | ||||||||
Open Swap Agreements, at Value | — | 18 | — | |||||||||
Unrealized Depreciation on Open Forward Foreign Currency Contracts | — | — | 15 | |||||||||
Other Accrued Expenses | 451 | 62 | 26 | |||||||||
|
|
|
|
|
| |||||||
Total Liabilities | 204,932 | 83 | 541 | |||||||||
|
|
|
|
|
| |||||||
NET ASSETS | $ | 1,908,490 | $ | 1,221 | $ | 16,234 | ||||||
|
|
|
|
|
| |||||||
NET ASSETS CONSIST OF: | ||||||||||||
Paid-in Capital | $ | 1,869,604 | $ | 2,898 | $ | 16,278 | ||||||
Accumulated Net Realized Gain (Loss) on Investments, Futures Contracts, Swap Contracts and Foreign Currency | 20,965 | (1,652 | ) | 141 | ||||||||
Unrealized Appreciation (Depreciation) of Investments, Futures Contracts, Swap Contracts and Foreign Currency | 18,413 | 12 | (195 | ) | ||||||||
Undistributed (Overdistributed) Net Investment Income | (492 | ) | (37 | ) | 10 | |||||||
|
|
|
|
|
| |||||||
NET ASSETS | $ | 1,908,490 | $ | 1,221 | $ | 16,234 | ||||||
|
|
|
|
|
| |||||||
NET ASSETS ATTRIBUTABLE TO: | ||||||||||||
I Class Share | $ | 1,421,267 | $ | 725 | $ | 8,648 | ||||||
|
|
|
|
|
| |||||||
N Class Share | $ | 487,223 | $ | 496 | $ | 7,586 | ||||||
|
|
|
|
|
| |||||||
CAPITAL SHARES OUTSTANDING: (5) | ||||||||||||
I Class Share | 126,006,666 | 140,880 | 875,708 | |||||||||
|
|
|
|
|
| |||||||
N Class Share | 43,307,226 | 96,154 | 768,202 | |||||||||
|
|
|
|
|
| |||||||
NET ASSET VALUE PER SHARE: (6) | ||||||||||||
I Class Share | $ | 11.28 | $ | 5.15 | $ | 9.88 | ||||||
|
|
|
|
|
| |||||||
N Class Share | $ | 11.25 | $ | 5.15 | $ | 9.88 | ||||||
|
|
|
|
|
| |||||||
| (1) | Consolidated Statement of Asset and Liabilities (See Note 2). |
| (2) | The identified cost for the TCW Core Fixed Income Fund, the TCW Enhanced Commodity Strategy Fund and the TCW Global Bond Fund at October 31, 2016 was $2,009,026, $1,135 and $16,623, respectively. |
| (3) | The identified cost for the TCW Global Bond Fund at October 31, 2016 was $15. |
| (4) | Amount rounds to less than $1. |
| (5) | The number of authorized shares, with a par value of $0.001 per share is 4,000,000,000 for each of the I Class and N Class shares. |
| (6) | Represents offering price and redemption price per share. |
See accompanying notes to financial statements.
84
TCW Funds, Inc.
Statements of Assets and Liabilities | October 31, 2016 |
| TCW High Yield Bond Fund | TCW Short Term Bond Fund | TCW Total Return Bond Fund | ||||||||||
| Dollar Amounts in Thousands (Except per Share Amounts) | ||||||||||||
ASSETS | ||||||||||||
Investments, at Value (1) | $ | 28,280 | $ | 7,745 | $ | 12,407,454 | ||||||
Cash | 57 | — | — | |||||||||
Receivable for Securities Sold | 450 | — | — | |||||||||
Receivable for Sale of When-Issued Securities | — | — | 421,509 | |||||||||
Receivable for Fund Shares Sold | 4 | 21 | 22,725 | |||||||||
Interest and Dividends Receivable | 360 | 22 | 22,939 | |||||||||
Receivable from Investment Advisor | 12 | 12 | 1,128 | |||||||||
Unrealized Appreciation on Open Forward Foreign Currency Contracts | — | — | 5,633 | |||||||||
Receivable for Daily Variation Margin on Open Financial Futures Contracts | — | — | 781 | |||||||||
Cash Collateral Held for Brokers | — | — | 5,500 | |||||||||
Prepaid Expenses | 12 | 9 | 269 | |||||||||
|
|
|
|
|
| |||||||
Total Assets | 29,175 | 7,809 | 12,887,938 | |||||||||
|
|
|
|
|
| |||||||
LIABILITIES | ||||||||||||
Distributions Payable | 111 | 8 | 23,484 | |||||||||
Payable for Securities Purchased | 539 | 21 | 11 | |||||||||
Payable for Purchase of When-Issued Securities | 620 | — | 2,032,983 | |||||||||
Payable for Fund Shares Redeemed | 58 | 15 | 13,557 | |||||||||
Accrued Directors’ Fees and Expenses | 2 | 2 | 2 | |||||||||
Accrued Management Fees | 11 | 2 | 4,611 | |||||||||
Accrued Distribution Fees | 2 | — | 592 | |||||||||
Open Swap Agreements, at Value | 1 | — | — | |||||||||
Collateral Received from Brokers | — | — | 5,500 | |||||||||
Other Accrued Expenses | 40 | 63 | 2,201 | |||||||||
|
|
|
|
|
| |||||||
Total Liabilities | 1,384 | 111 | 2,082,941 | |||||||||
|
|
|
|
|
| |||||||
NET ASSETS | $ | 27,791 | $ | 7,698 | $ | 10,804,997 | ||||||
|
|
|
|
|
| |||||||
NET ASSETS CONSIST OF: | ||||||||||||
Paid-in Capital | $ | 28,780 | $ | 15,038 | $ | 10,291,197 | ||||||
Accumulated Net Realized Gain (Loss) on Investments, Futures Contracts, Swap Contracts and Foreign Currency | (1,232 | ) | (7,378 | ) | 162,501 | |||||||
Unrealized Appreciation of Investments, Futures Contracts, Swap Contracts and Foreign Currency | 164 | 29 | 290,600 | |||||||||
Undistributed Net Investment Income | 79 | 9 | 60,699 | |||||||||
|
|
|
|
|
| |||||||
NET ASSETS | $ | 27,791 | $ | 7,698 | $ | 10,804,997 | ||||||
|
|
|
|
|
| |||||||
NET ASSETS ATTRIBUTABLE TO: | ||||||||||||
I Class Share | $ | 20,265 | $ | 7,698 | $ | 8,042,194 | ||||||
|
|
|
|
|
| |||||||
N Class Share | $ | 7,526 | $ | 2,762,803 | ||||||||
|
|
|
| |||||||||
CAPITAL SHARES OUTSTANDING: (2) | ||||||||||||
I Class Share | 3,251,571 | 884,613 | 778,634,198 | |||||||||
|
|
|
|
|
| |||||||
N Class Share | 1,198,476 | 259,390,191 | ||||||||||
|
|
|
| |||||||||
NET ASSET VALUE PER SHARE: (3) | ||||||||||||
I Class Share | $ | 6.23 | $ | 8.70 | $ | 10.33 | ||||||
|
|
|
|
|
| |||||||
N Class Share | $ | 6.28 | $ | 10.65 | ||||||||
|
|
|
| |||||||||
| (1) | The identified cost for the TCW High Yield Bond Fund, the TCW Short Term Bond Fund and the TCW Total Return Bond Fund at October 31, 2016 was $28,111, $7,716 and $12,115,302, respectively. |
| (2) | The number of authorized shares, with a par value of $0.001 per share is 4,000,000,000 for each of the I Class and N Class shares. |
| (3) | Represents offering price and redemption price per share. |
See accompanying notes to financial statements.
85
TCW Funds, Inc.
Year Ended October 31, 2016 |
| TCW Core Fixed Income Fund | TCW Enhanced Commodity Strategy Fund (1) | TCW Global Bond Fund | ||||||||||
| Dollar Amounts in Thousands | ||||||||||||
INVESTMENT INCOME | ||||||||||||
Income: | ||||||||||||
Interest | $ | 39,082 | $ | 36 | $ | 496 | ||||||
Other | 9 | — | — | |||||||||
|
|
|
|
|
| |||||||
Total | 39,091 | 36 | 496 | |||||||||
|
|
|
|
|
| |||||||
Expenses: | ||||||||||||
Management Fees | 7,139 | 13 | 89 | |||||||||
Accounting Services Fees | 167 | 26 | 3 | |||||||||
Administration Fees | 102 | 38 | 2 | |||||||||
Transfer Agent Fees: | ||||||||||||
I Class | 861 | 3 | — | (2) | ||||||||
N Class | 530 | 2 | 1 | |||||||||
Custodian Fees | 35 | 10 | 15 | |||||||||
Professional Fees | 111 | 61 | 49 | |||||||||
Directors’ Fees and Expenses | 32 | 32 | 32 | |||||||||
Registration Fees: | ||||||||||||
I Class | 55 | 15 | 17 | |||||||||
N Class | 25 | 15 | 17 | |||||||||
Distribution Fees: | ||||||||||||
N Class | 1,306 | 3 | 19 | |||||||||
Compliance Expense | 9 | — | (2) | — | (2) | |||||||
Shareholder Reporting Expense | 6 | 2 | 1 | |||||||||
Other | 140 | 9 | 15 | |||||||||
|
|
|
|
|
| |||||||
Total | 10,518 | 229 | 260 | |||||||||
|
|
|
|
|
| |||||||
Less Expenses Borne by Investment Advisor: | ||||||||||||
I Class | 195 | 114 | 36 | |||||||||
N Class | 105 | 98 | 54 | |||||||||
|
|
|
|
|
| |||||||
Net Expenses | 10,218 | 17 | 170 | |||||||||
|
|
|
|
|
| |||||||
Net Investment Income | 28,873 | 19 | 326 | |||||||||
|
|
|
|
|
| |||||||
NET REALIZED AND UNREALIZED GAIN (LOSS) ON INVESTMENTS | ||||||||||||
Net Realized Gain (Loss) on: | ||||||||||||
Investments | 22,993 | 13 | 94 | |||||||||
Foreign Currency | — | — | 44 | |||||||||
Futures Contracts | 2,172 | — | — | |||||||||
Swap Agreements | — | (99 | ) | — | ||||||||
Change in Unrealized Appreciation (Depreciation) on: | ||||||||||||
Investments | 13,702 | (25 | ) | 120 | ||||||||
Foreign Currency | — | — | 30 | |||||||||
Futures Contracts | (785 | ) | — | — | ||||||||
Swap Agreements | — | 52 | — | |||||||||
|
|
|
|
|
| |||||||
Net Realized and Unrealized Gain (Loss) on Investments | 38,082 | (59 | ) | 288 | ||||||||
|
|
|
|
|
| |||||||
INCREASE (DECREASE) IN NET ASSETS RESULTING FROM OPERATIONS | $ | 66,955 | $ | (40 | ) | $ | 614 | |||||
|
|
|
|
|
| |||||||
| (1) | Consolidated Statement of Operations (See Note 2). |
| (2) | Amount rounds to less than $1. |
See accompanying notes to financial statements.
86
TCW Funds, Inc.
Statements of Operations | Year Ended October 31, 2016 |
| TCW High Yield Bond Fund | TCW Short Term Bond Fund | TCW Total Return Bond Fund | ||||||||||
| Dollar Amounts in Thousands | ||||||||||||
INVESTMENT INCOME | ||||||||||||
Income: | ||||||||||||
Interest | $ | 1,285 | $ | 85 | $ | 303,679 | ||||||
Dividends | 14 | — | — | |||||||||
Other | 15 | — | — | |||||||||
|
|
|
|
|
| |||||||
Total | 1,314 | 85 | 303,679 | |||||||||
|
|
|
|
|
| |||||||
Expenses: | ||||||||||||
Management Fees | 133 | 29 | 49,910 | |||||||||
Accounting Services Fees | 26 | 1 | 935 | |||||||||
Administration Fees | 3 | 1 | 571 | |||||||||
Transfer Agent Fees: | ||||||||||||
I Class | 12 | 5 | 4,996 | |||||||||
N Class | 10 | — | 2,337 | |||||||||
Custodian Fees | 15 | 8 | 56 | |||||||||
Professional Fees | 33 | 97 | 376 | |||||||||
Directors’ Fees and Expenses | 32 | 32 | 32 | |||||||||
Registration Fees: | ||||||||||||
I Class | 22 | 21 | 181 | |||||||||
N Class | 16 | — | 146 | |||||||||
Distribution Fees: | ||||||||||||
N Class | 23 | — | 6,601 | |||||||||
Compliance Expense | — | (1) | — | (1) | 60 | |||||||
Shareholder Reporting Expense | 3 | — | (1) | 18 | ||||||||
Other | 10 | 9 | 872 | |||||||||
|
|
|
|
|
| |||||||
Total | 338 | 203 | 67,091 | |||||||||
|
|
|
|
|
| |||||||
Less Expenses Borne by Investment Advisor: | ||||||||||||
I Class | 99 | 167 | 8,039 | |||||||||
N Class | 54 | — | 2,218 | |||||||||
|
|
|
|
|
| |||||||
Net Expenses | 185 | 36 | 56,834 | |||||||||
|
|
|
|
|
| |||||||
Net Investment Income | 1,129 | 49 | 246,845 | |||||||||
|
|
|
|
|
| |||||||
NET REALIZED AND UNREALIZED GAIN (LOSS) ON INVESTMENTS | ||||||||||||
Net Realized Gain on: | ||||||||||||
Investments | 65 | 18 | 195,735 | |||||||||
Foreign Currency | — | — | 1,224 | |||||||||
Futures Contracts | — | — | 1,487 | |||||||||
Swap Agreements | 30 | — | — | |||||||||
Change in Unrealized Appreciation (Depreciation) on: | ||||||||||||
Investments | 359 | 1 | (99,656 | ) | ||||||||
Foreign Currency | — | — | 5,633 | |||||||||
Futures Contracts | — | — | (7,185 | ) | ||||||||
Swap Agreements | (15 | ) | — | — | ||||||||
|
|
|
|
|
| |||||||
Net Realized and Unrealized Gain (Loss) on Investments | 439 | 19 | 97,238 | |||||||||
|
|
|
|
|
| |||||||
INCREASE IN NET ASSETS RESULTING FROM OPERATIONS | $ | 1,568 | $ | 68 | $ | 344,083 | ||||||
|
|
|
|
|
| |||||||
| (1) | Amount rounds to less than $1. |
See accompanying notes to financial statements.
87
TCW Funds, Inc.
Statements of Changes in Net Assets
| TCW Core Fixed Income Fund | TCW Enhanced Commodity Strategy Fund (1) | |||||||||||||||
| Year Ended October 31, 2016 | Year Ended October 31, 2015 | Year Ended October 31, 2016 | Year Ended October 31, 2015 | |||||||||||||
| Dollar Amounts in Thousands | ||||||||||||||||
OPERATIONS | ||||||||||||||||
Net Investment Income | $ | 28,873 | $ | 23,235 | $ | 19 | $ | 26 | ||||||||
Net Realized Gain (Loss) on Investments, Futures Contracts and Swap Contracts | 25,165 | 16,934 | (86 | ) | (811 | ) | ||||||||||
Change in Unrealized Appreciation (Depreciation) on Investments and Futures Contracts | 12,917 | (23,857 | ) | 27 | (102 | ) | ||||||||||
|
|
|
|
|
|
|
| |||||||||
Increase (Decrease) in Net Assets Resulting from Operations | 66,955 | 16,312 | (40 | ) | (887 | ) | ||||||||||
|
|
|
|
|
|
|
| |||||||||
DISTRIBUTIONS TO SHAREHOLDERS | ||||||||||||||||
Distributions from Net Investment Income: | ||||||||||||||||
I Class | (21,736 | ) | (17,232 | ) | (13 | ) | (15 | ) | ||||||||
N Class | (7,802 | ) | (8,343 | ) | (11 | ) | (12 | ) | ||||||||
Distributions from Net Realized Gain: | ||||||||||||||||
I Class | (9,987 | ) | (2,547 | ) | — | — | ||||||||||
N Class | (5,013 | ) | (1,706 | ) | — | — | ||||||||||
|
|
|
|
|
|
|
| |||||||||
Total Distributions to Shareholders | (44,538 | ) | (29,828 | ) | (24 | ) | (27 | ) | ||||||||
|
|
|
|
|
|
|
| |||||||||
NET CAPITAL SHARE TRANSACTIONS | ||||||||||||||||
I Class | 295,328 | 472,774 | (682 | ) | 18 | |||||||||||
N Class | (60,988 | ) | (62,026 | ) | (629 | ) | 12 | |||||||||
|
|
|
|
|
|
|
| |||||||||
Increase (Decrease) in Net Assets Resulting from Net Capital Shares Transactions | 234,340 | 410,748 | (1,311 | ) | 30 | |||||||||||
|
|
|
|
|
|
|
| |||||||||
Increase (Decrease) in Net Assets | 256,757 | 397,232 | (1,375 | ) | (884 | ) | ||||||||||
NET ASSETS | ||||||||||||||||
Beginning of Year | 1,651,733 | 1,254,501 | 2,596 | 3,480 | ||||||||||||
|
|
|
|
|
|
|
| |||||||||
End of Year | $ | 1,908,490 | $ | 1,651,733 | $ | 1,221 | $ | 2,596 | ||||||||
|
|
|
|
|
|
|
| |||||||||
Undistributed (Overdistributed) Net Investment Income | $ | (492 | ) | $ | 635 | $ | (37 | ) | $ | (34 | ) | |||||
| (1) | Consolidated Statement of Changes in Net Assets (See Note 2). |
See accompanying notes to financial statements.
88
TCW Funds, Inc.
Statements of Changes in Net Assets
| TCW Global Bond Fund | TCW High Yield Bond Fund | |||||||||||||||
| Year Ended October 31, 2016 | Year Ended October 31, 2015 | Year Ended October 31, 2016 | Year Ended October 31, 2015 | |||||||||||||
| Dollar Amounts in Thousands | ||||||||||||||||
OPERATIONS | ||||||||||||||||
Net Investment Income | $ | 326 | $ | 296 | $ | 1,129 | $ | 1,171 | ||||||||
Net Realized Gain (Loss) on Investments, Swap Contracts and Foreign Currency Transactions | 138 | 44 | 95 | (495 | ) | |||||||||||
Change in Unrealized Appreciation (Depreciation) on Investments and Foreign Currency Transactions | 150 | (794 | ) | 344 | (174 | ) | ||||||||||
|
|
|
|
|
|
|
| |||||||||
Increase (Decrease) in Net Assets Resulting from Operations | 614 | (454 | ) | 1,568 | 502 | |||||||||||
|
|
|
|
|
|
|
| |||||||||
DISTRIBUTIONS TO SHAREHOLDERS | ||||||||||||||||
Distributions from Net Investment Income: | ||||||||||||||||
I Class | (191 | ) | (74 | ) | (852 | ) | (867 | ) | ||||||||
N Class | (170 | ) | (69 | ) | (337 | ) | (422 | ) | ||||||||
Distributions from Net Realized Gain: | ||||||||||||||||
I Class | (110 | ) | (13 | ) | — | — | ||||||||||
N Class | (103 | ) | (12 | ) | — | — | ||||||||||
|
|
|
|
|
|
|
| |||||||||
Total Distributions to Shareholders | (574 | ) | (168 | ) | (1,189 | ) | (1,289 | ) | ||||||||
|
|
|
|
|
|
|
| |||||||||
NET CAPITAL SHARE TRANSACTIONS | ||||||||||||||||
I Class | 757 | 62 | (918 | ) | 662 | |||||||||||
N Class | 201 | 93 | (8,371 | ) | 3,622 | |||||||||||
|
|
|
|
|
|
|
| |||||||||
Increase (Decrease) in Net Assets Resulting from Net Capital Shares Transactions | 958 | 155 | (9,289 | ) | 4,284 | |||||||||||
|
|
|
|
|
|
|
| |||||||||
Increase (Decrease) in Net Assets | 998 | (467 | ) | (8,910 | ) | 3,497 | ||||||||||
NET ASSETS | ||||||||||||||||
Beginning of Year | 15,236 | 15,703 | 36,701 | 33,204 | ||||||||||||
|
|
|
|
|
|
|
| |||||||||
End of Year | $ | 16,234 | $ | 15,236 | $ | 27,791 | $ | 36,701 | ||||||||
|
|
|
|
|
|
|
| |||||||||
Undistributed Net Investment Income | $ | 10 | $ | 42 | $ | 79 | $ | 32 | ||||||||
See accompanying notes to financial statements.
89
TCW Funds, Inc.
Statements of Changes in Net Assets
| TCW Short Term Bond Fund | TCW Total Return Bond Fund | |||||||||||||||
| Year Ended October 31, 2016 | Year Ended October 31, 2015 | Year Ended October 31, 2016 | Year Ended October 31, 2015 | |||||||||||||
| Dollar Amounts in Thousands | ||||||||||||||||
OPERATIONS | ||||||||||||||||
Net Investment Income | $ | 49 | $ | 77 | $ | 246,845 | $ | 208,247 | ||||||||
Net Realized Gain (Loss) on Investments, Futures Contracts and Foreign Currency Transactions | 18 | (15 | ) | 198,446 | 75,966 | |||||||||||
Change in Unrealized Appreciation on Investments, Futures Contracts and Foreign Currency Transactions | 1 | (20 | ) | (101,208 | ) | (105,944 | ) | |||||||||
|
|
|
|
|
|
|
| |||||||||
Increase in Net Assets Resulting from Operations | 68 | 42 | 344,083 | 178,269 | ||||||||||||
|
|
|
|
|
|
|
| |||||||||
DISTRIBUTIONS TO SHAREHOLDERS | ||||||||||||||||
Distributions from Net Investment Income: | ||||||||||||||||
I Class | (58 | ) | (139 | ) | (177,095 | ) | (135,970 | ) | ||||||||
N Class | — | — | (57,056 | ) | (42,556 | ) | ||||||||||
Distributions from Net Realized Gain: | ||||||||||||||||
I Class | — | — | (44,612 | ) | (25,108 | ) | ||||||||||
N Class | — | — | (16,251 | ) | (8,273 | ) | ||||||||||
|
|
|
|
|
|
|
| |||||||||
Total Distributions to Shareholders | (58 | ) | (139 | ) | (295,014 | ) | (211,907 | ) | ||||||||
|
|
|
|
|
|
|
| |||||||||
NET CAPITAL SHARE TRANSACTIONS | ||||||||||||||||
I Class | (1,926 | ) | (11,369 | ) | 1,644,991 | 254,924 | ||||||||||
N Class | — | — | 350,792 | 232,273 | ||||||||||||
|
|
|
|
|
|
|
| |||||||||
Increase (Decrease) in Net Assets Resulting from Net Capital Shares Transactions | (1,926 | ) | (11,369 | ) | 1,995,783 | 487,197 | ||||||||||
|
|
|
|
|
|
|
| |||||||||
Increase (Decrease) in Net Assets | (1,916 | ) | (11,466 | ) | 2,044,852 | 453,559 | ||||||||||
NET ASSETS | ||||||||||||||||
Beginning of Year | 9,614 | 21,080 | 8,760,145 | 8,306,586 | ||||||||||||
|
|
|
|
|
|
|
| |||||||||
End of Year | $ | 7,698 | $ | 9,614 | $ | 10,804,997 | $ | 8,760,145 | ||||||||
|
|
|
|
|
|
|
| |||||||||
Undistributed (Overdistributed) Net Investment Income | $ | 9 | $ | (7 | ) | $ | 60,699 | $ | 46,701 | |||||||
See accompanying notes to financial statements.
90
TCW Funds, Inc.
October 31, 2016 |
Note 1 — Organization
TCW Funds, Inc., a Maryland corporation (the “Company”), is an open-end management investment company registered under the Investment Company Act of 1940, as amended (the “1940 Act”), that currently offers 23 no-load mutual funds (each series, a “Fund” and collectively, the “Funds”). TCW Investment Management Company LLC (the “Advisor”) is the investment advisor to and an affiliate of the Funds and is registered under the Investment Advisers Act of 1940, as amended. Each Fund has distinct investment objectives. The following are the objectives for the 6 Fixed Income Funds that are covered in this report:
TCW Fund | Investment Objective | |
| Diversified Fixed Income Funds | ||
| TCW Core Fixed Income Fund | Seeks to maximize current income and achieve above average total return consistent with prudent investment management over a full market cycle by investing at least 80% of the value of its net assets in debt securities. | |
| TCW Enhanced Commodity Strategy Fund | Seeks total return which exceeds that of its commodity benchmark by investing in commodity linked derivative instruments backed by a portfolio of fixed income instruments. | |
| TCW Global Bond Fund | Seeks total return by investing at least 80% of its net assets in debt securities of government and corporate issuers in at least three countries, and will invest at least 30% of its net assets in securities of issuers located outside the United States. | |
| TCW High Yield Bond Fund | Seeks to maximize income and achieve above average total return consistent with reasonable risk over a full market cycle by investing at least 80% of the value of its net assets in high yield/below investment grade bonds, commonly known as “junk” bonds. | |
| TCW Short Term Bond Fund | Seeks to maximize current income by investing at least 80% of the value of its net assets in a diversified portfolio of debt securities of varying maturities including bonds, notes and other similar fixed income instruments issued by governmental or private sector issuers. | |
| TCW Total Return Bond Fund | Seeks to maximize current income and achieve above average total return consistent with prudent investment management over a full market cycle by investing at least 80% of the value of its net assets in debt securities and at least 50% of the value in securitized obligations. | |
91
TCW Funds, Inc.
Notes to Financial Statements (Continued)
Note 2 — Significant Accounting Policies
All Funds, except for the TCW Short Term Bond Fund, offer two classes of shares: I Class and N Class. The TCW Short Term Bond Fund offers only the I Class shares. The classes are substantially the same except that the N Class shares are subject to a distribution fee (see Note 6).
The following is a summary of significant accounting policies, which are in conformity with accounting principles generally accepted in the United States of America (“GAAP”) and which are consistently followed by the Funds in the preparation of their financial statements. Each Fund is considered an investment company under the Financial Accounting Standards Board (FASB) Accounting Standards Codification (ASC) No. 946, Financial Services — Investment Companies.
Principles of Accounting: The Funds use the accrual method of accounting for financial reporting purposes.
Principles of Consolidation: The TCW Cayman Enhanced Commodity Fund, Ltd. (the “Subsidiary”), a Cayman Islands exempted company, was incorporated as a wholly owned subsidiary acting as an investment vehicle for the TCW Enhanced Commodity Strategy Fund (the “Parent”) in order to effect certain investments for the Parent consistent with the Parent’s investment objectives and policies as specified in its prospectus and statement of additional information. The accompanying financial statements are consolidated and include the accounts of the Subsidiary. The Parent may invest up to 25% of its total assets in the Subsidiary. The net assets of the Subsidiary at October 31, 2016 were $65,828 or 5.39% of the Parent’s consolidated net assets. Intercompany balances and transactions have been eliminated in consolidation.
Net Asset Value: The net asset value (“NAV”) per share of each class of a Fund is determined by dividing the Fund’s net assets attributable to each class by the number of shares issued and outstanding of that class on each day the New York Stock Exchange (“NYSE”) is open for trading.
Security Valuations: Securities listed or traded on the NYSE and other stock exchanges are valued at the latest sale price on that exchange. Securities traded on the NASDAQ stock market (“NASDAQ”) are valued using official closing prices as reported by NASDAQ. All other securities including short-term securities traded over the counter (“OTC”) for which market quotations are readily available are valued with prices furnished by independent pricing services or by broker dealers.
Securities for which market quotations are not readily available, including circumstances under which it is determined by the Advisor that prices received are not reflective of a security’s market value, are valued by the Advisor in good faith under procedures established by and under the general supervision of Company’s Board of Directors (the “Board”).
Fair value is defined as the price that a Fund would receive upon selling an investment in a timely transaction to an independent buyer in the principal or most advantageous market for the investment. In accordance with the authoritative guidance on fair value measurements and disclosures under GAAP, the Funds disclose investments in their financial statements in a three-tier hierarchy. This hierarchy is utilized to establish classification of fair value measurements based on inputs. Inputs that go into fair value measurement refer broadly to the assumptions that market participants would use in pricing the asset or liability, including assumptions about risk. Inputs may be observable or unobservable. Observable inputs are inputs that reflect the assumptions market participants would use in pricing the asset or liability developed based on market data obtained from sources independent of the reporting entity. Unobservable
92
TCW Funds, Inc.
October 31, 2016 |
Note 2 — Significant Accounting Policies (Continued)
inputs are inputs that reflect the reporting entity’s own assumptions about the inputs market participants would use in pricing the asset or liability developed based on the best information available in the circumstances.
The three-tier hierarchy of inputs is summarized in three broad levels listed below.
| Level 1 — | quoted prices in active markets for identical investments | |
| Level 2 — | other significant observable inputs (including quoted prices for similar investments, interest rates, prepayment speeds, credit risk, etc.) | |
| Level 3 — | significant unobservable inputs (including the Funds’ own assumptions in determining the fair value of investments) |
Changes in valuation techniques may result in transfers in or out of an investment’s assigned Level within the hierarchy. The inputs or methodology used for valuing investments are not necessarily an indication of the risk associated with investing in those investments and the determination of the significance of a particular input to the fair value measurement in its entirety requires judgment and consideration of factors specific to each security.
The availability of observable inputs can vary from security to security and is affected by a wide variety of factors, including, for example, the type of security, whether the security is new and not yet established in the marketplace, the liquidity of markets, and other characteristics particular to the security. To the extent that valuation is based on models or inputs that are less observable or unobservable in the market, the determination of fair value requires more judgment. Accordingly, the degree of judgment exercised in determining fair value is greatest for instruments categorized in Level 3.
In periods of market dislocation, the observability of prices and inputs may be reduced for many instruments. This condition, as well as changes related to liquidity of investments, could cause a security to be reclassified between Level 1, Level 2, or Level 3.
In certain cases, the inputs used to measure fair value may fall into different levels of the fair value hierarchy. In such cases, for disclosure purposes the level in the fair value hierarchy within which the fair value measurement falls in its entirety is determined based on the lowest level input that is significant to the fair value measurement.
Fair Value Measurements: A description of the valuation techniques applied to the Funds’ major categories of assets and liabilities measured at fair value on a recurring basis is as follows:
Asset-backed securities (“ABS”) and mortgage-backed securities (“MBS”). The fair value of ABS and MBS is estimated based on models that consider the estimated cash flows of each debt tranche of the issuer, establish a benchmark yield, and develop an estimated tranche specific spread to the benchmark yield based on the unique attributes of the tranche including, but not limited to, the prepayment speed assumptions and attributes of the collateral. To the extent the inputs are observable and timely, the values would be categorized in Level 2 of the fair value hierarchy; otherwise, they would be categorized in Level 3.
Bank loans. The fair value of bank loans is estimated using recently executed transactions, market price quotations, credit/market events, and cross-asset pricing. Inputs are generally observable and are obtained from independent sources. Bank loans are generally categorized in Level 2 of the fair value hierarchy.
93
TCW Funds, Inc.
Notes to Financial Statements (Continued)
Note 2 — Significant Accounting Policies (Continued)
Corporate bonds. The fair value of corporate bonds is estimated using recently executed transactions, market price quotations (where observable), bond spreads, or credit default swap spreads adjusted for any basis difference between cash and derivative instruments. Corporate bonds are generally categorized in Level 2 of the fair value hierarchy.
Credit default swaps. Credit default swaps are fair valued using pricing models that take into account among other factors, index spread curves, nominal values, modified duration values and cash flows. To the extent that these inputs are observable and timely, the fair values of credit default swaps would be categorized as Level 2; otherwise, the fair values would be categorized in Level 3.
Foreign currency contracts. The fair value of foreign currency contracts are derived from indices, reference rates, and other inputs or a combination of these factors. To the extent that these factors can be observed, foreign currency contracts are categorized in Level 2 of the fair value hierarchy.
Futures contracts. Futures contracts are generally valued at the settlement price established at the close of business each day by the exchange on which they are traded. As such, they are categorized in Level 1.
Government and agency securities. Government and agency securities are normally valued using a model that incorporates market observable data such as reported sales of similar securities, broker quotes, yields, bids, offers, quoted market prices, and reference data. Accordingly, government and agency securities are normally categorized in Level 1 or 2 of the fair value hierarchy depending on the liquidity and transparency of the market.
Money market funds. Money market funds are open-ended mutual funds that invest in short-term debt securities. To the extent that these funds are valued based upon the reported NAV, they are categorized in Level 1 of the fair value hierarchy.
Municipal bonds. Municipal bonds are fair valued based on pricing models that take into account, among other factors, information received from market makers and broker-dealers, current trades, bid wants lists, offerings, market movements, the callability of the bond, state of issuance, benchmark yield curves, and bond insurance. To the extent that these inputs are observable and timely, the fair values of municipal bonds would be categorized in Level 2; otherwise, the fair values would be categorized in Level 3.
Restricted securities. Restricted securities, including illiquid Rule 144A securities, issued by non-public entities are included in Level 3 of the fair value hierarchy because they trade infrequently, and therefore, the inputs are unobservable. Any other restricted securities valued similar to publicly traded securities may be categorized in Level 2 or 3 of the fair value hierarchy depending on whether a discount is applied and significant to the fair value.
Short-term investments. Short-term investments are valued using market price quotations, and are reflected in Level 2 of the fair value hierarchy.
Total return swaps. Total return swaps are fair valued using pricing models that take into account, among other factors, index spread curves, nominal values, modified duration values and cash flows. To the extent that these inputs are observable and timely, the fair values of the total return swaps would be categorized in Level 2; otherwise, the fair values would be categorized in Level 3.
The summary of the inputs used as of October 31, 2016 is listed after the Schedule of Investments for each Fund.
94
TCW Funds, Inc.
October 31, 2016 |
Note 2 — Significant Accounting Policies (Continued)
The Funds did not have any transfers in and out of Level 1 and Level 2 of the fair value hierarchy during the year ended October 31, 2016.
Following is a reconciliation of investments in which significant unobservable inputs (Level 3) were used in determining value:
| TCW Core Fixed Income Fund | TCW Enhanced Commodity Strategy Fund | TCW Global Bond Fund | TCW High Yield Bond Fund | TCW Total Return Bond Fund | ||||||||||||||||
Balance as of October 31, 2015 | $ | — | $ | — | $ | 198,523 | $ | 186,140 | $ | 10,674,961 | ||||||||||
Accrued Discounts (Premiums) | (1,567 | ) | (8,549 | ) | 10,710 | — | (1,484,150 | ) | ||||||||||||
Realized Gain (Loss) | (4,531 | ) | — | — | (13,739 | ) | 1,764 | |||||||||||||
Change in Unrealized Appreciation | (53,052 | ) | (2,381 | ) | (42,323 | ) | (164,729 | ) | (466,767 | ) | ||||||||||
Purchases | — | 11,747 | — | 135,254 | 9 | |||||||||||||||
Sales | (92,979 | ) | — | — | (72,620 | ) | (3,731 | ) | ||||||||||||
Transfers in to Level 3 (1) | 1,332,152 | — | — | 326,484 | — | |||||||||||||||
Transfers out of Level 3 (1) | — | — | — | — | — | |||||||||||||||
|
|
|
|
|
|
|
|
|
| |||||||||||
Balance as of October 31, 2016 | $ | 1,180,023 | $ | 817 | $ | 166,910 | $ | 396,790 | $ | 8,722,086 | ||||||||||
|
|
|
|
|
|
|
|
|
| |||||||||||
Change in Unrealized Appreciation from Investments Still Held at October 31, 2016 | $ | (53,052 | ) | $ | (2,381 | ) | $ | (42,323 | ) | $ | (181,941 | ) | $ | (466,767 | ) | |||||
|
|
|
|
|
|
|
|
|
| |||||||||||
| (1) | The Funds recognize transfers in and out at the beginning of the period. |
Significant unobservable valuations inputs for Level 3 investments as of October 31, 2016 are as follows:
Description | Fair Value at 10/31/2016 | Valuation Techniques* | Unobservable Input | Price or Price Range | ||||||
| TCW Core Fixed Income Fund | ||||||||||
Corporate Bonds | $1,180,023 | Third-party Vendor | Vendor Prices | $103.648 | ||||||
| TCW Enhanced Commodity Strategy Fund | ||||||||||
Commercial Mortgage-Backed Securities — Non-Agency | $817 | Third-party Vendor | Vendor Prices | $0.048 | ||||||
| TCW Global Bond Fund | ||||||||||
Commercial Mortgage-Backed Securities — Non-Agency | $5,207 | Third-party Vendor | Vendor Prices | $0.016–$0.347 | ||||||
Residential Mortgage-Backed Securities — Non-Agency | $161,703 | Third-party Vendor | Vendor Prices | $12.918 | ||||||
| TCW High Yield Bond Fund | ||||||||||
Bank Loans | $270,319 | Third-party Vendor | Vendor Prices | $87.50–$100 | ||||||
Corporate Bonds | $126,471 | Third-party Vendor | Vendor Prices | $39.50 | ||||||
| TCW Total Return Bond Fund | ||||||||||
Residential Mortgage-Backed Securities — Non-Agency | $15,078 | Third-party Vendor | Vendor Prices | $19.961 | ||||||
Residential Mortgage-Backed Securities — Non-Agency (Interest Only, Collateral Strip Rate Securities) | $8,707,008 | Third-party Vendor | Vendor Prices | $0.735–$3.016 | ||||||
| * | The valuation technique employed on the Level 3 securities involves the use of the vendor prices. The Advisor monitors the effectiveness of vendor pricing using the valuation process described below. |
95
TCW Funds, Inc.
Notes to Financial Statements (Continued)
Note 2 — Significant Accounting Policies (Continued)
Level 3 Valuation Process: Investments classified within Level 3 of the fair value hierarchy may be fair valued by the Advisor with consent by the Company’s Pricing Committee in accordance with the guidelines established by the Board, and under the general oversight of the Board. The Company’s Pricing Committee employs various methods to determine fair valuations, including a regular review of key inputs and assumptions and review of any related market activity. The Company’s Pricing Committee reports to the Board at their regularly scheduled meetings. It is possible that fair value prices will be used by the Funds to a significant extent. The value determined for an investment using the Company’s fair value procedures may differ from recent market prices for the investment and may be significantly different from the value realized upon the sale of such investment. The Advisor, as part of the daily process, conducts back-testing of prices based on daily trade activities.
The Pricing Committee consists of the Company’s President, General Counsel, Chief Compliance Officer, Treasurer, Assistant Treasurer, Secretary, and a representative from the portfolio management team, as well as alternate members as the Board may from time to time designate. The Pricing Committee reviews and makes recommendations concerning the fair valuation of portfolio securities and the Funds’ pricing procedures in general.
Security Transactions and Related Investment Income: Security transactions are recorded as of the trade date. Dividend income is recorded on the ex-dividend date. Interest income is recognized on an accrual basis. Realized gains and losses on investments are recorded on the basis of specific identification.
Foreign Currency Translation: The books and records of each Fund are maintained in U.S. dollars as follows: (1) the foreign currency denominated securities and other assets and liabilities stated in foreign currencies are translated using the daily spot rate; and (2) purchases, sales, income and expenses are translated at the rate of exchange prevailing on the respective dates of such transactions. The resultant exchange gains and losses are included in net realized or net unrealized gain (loss) in the Statements of Operations. Pursuant to U.S. federal income tax regulations, certain foreign exchange gains and losses included in realized and unrealized gains and losses are included in, or are a reduction of, ordinary income for federal income tax purposes.
Foreign Taxes: The Funds may be subject to withholding taxes on income and capital gains imposed by certain countries in which they invest. The withholding tax on income is netted against the income accrued or received. Any reclaimable taxes are recorded as income. The withholding tax on realized or unrealized gain is recorded as a liability.
Derivative Instruments: Derivatives are financial instruments whose values are based on the values of one or more indicators, such as a security, asset, currency, interest rate, or index. Derivative transactions can create investment leverage and may be highly volatile. A derivative contract may result in a mark to market loss if the value of the contract decreases due to an unfavorable change in the market rates or values of the underlying instrument. It is possible that a derivative transaction will result in a loss greater than the principal amount invested. The Funds may not be able to close out a derivative transaction at a favorable time or price.
96
TCW Funds, Inc.
October 31, 2016 |
Note 2 — Significant Accounting Policies (Continued)
For the year ended October 31, 2016 , the Funds had the following derivatives and transactions in derivatives, grouped in the following risk categories (amounts in thousands except Notional Amounts or Shares/Units):
| Commodity Risk | Foreign Currency Risk | Interest Rate Risk | Total | |||||||||||||||||
| TCW Core Fixed Income Fund | ||||||||||||||||||||
Statement of Asset and Liabilities | ||||||||||||||||||||
Liability Derivatives | ||||||||||||||||||||
Futures Contracts (1) | $ | (785 | ) | $ | (785 | ) | ||||||||||||||
|
|
|
| |||||||||||||||||
Total Value | $ | (785 | ) | $ | (785 | ) | ||||||||||||||
|
|
|
| |||||||||||||||||
Statement of Operations: | ||||||||||||||||||||
Realized Gain | ||||||||||||||||||||
Futures Contracts | $ | 2,172 | $ | 2,172 | ||||||||||||||||
|
|
|
| |||||||||||||||||
Total Realized Gain | $ | 2,172 | $ | 2,172 | ||||||||||||||||
|
|
|
| |||||||||||||||||
Change in (Depreciation) | ||||||||||||||||||||
Futures Contracts | (785 | ) | (785 | ) | ||||||||||||||||
|
|
|
| |||||||||||||||||
Total Change in (Depreciation) | $ | (785 | ) | $ | (785 | ) | ||||||||||||||
|
|
|
| |||||||||||||||||
Number of Contracts (2) | ||||||||||||||||||||
Futures Contracts | 785 | 785 | ||||||||||||||||||
| TCW Enhanced Commodity Strategy Fund | ||||||||||||||||||||
Statement of Asset and Liabilities |
| |||||||||||||||||||
Liability Derivatives | ||||||||||||||||||||
Open Swaps Agreements, at Value | $ | (18 | ) | $ | (18 | ) | ||||||||||||||
|
|
|
| |||||||||||||||||
Total Value | $ | (18 | ) | $ | (18 | ) | ||||||||||||||
|
|
|
| |||||||||||||||||
Statement of Operations: | ||||||||||||||||||||
Realized (Loss) | ||||||||||||||||||||
Swaps Agreements | $ | (99 | ) | $ | (99 | ) | ||||||||||||||
|
|
|
| |||||||||||||||||
Total Realized (Loss) | $ | (99 | ) | $ | (99 | ) | ||||||||||||||
|
|
|
| |||||||||||||||||
Change in Appreciation | ||||||||||||||||||||
Swaps Agreements | $ | 52 | $ | 52 | ||||||||||||||||
|
|
|
| |||||||||||||||||
Total Change in Appreciation | $ | 52 | $ | 52 | ||||||||||||||||
|
|
|
| |||||||||||||||||
Notional Amounts | ||||||||||||||||||||
Swaps Contracts | $ | 2,291,237 | $ | 2,291,237 | ||||||||||||||||
| TCW Global Bond Fund | ||||||||||||||||||||
Statement of Asset and Liabilities |
| |||||||||||||||||||
Asset Derivatives | ||||||||||||||||||||
Forward Contracts | $ | 13 | $ | 13 | ||||||||||||||||
|
|
|
| |||||||||||||||||
Total Value | $ | 13 | $ | 13 | ||||||||||||||||
|
|
|
| |||||||||||||||||
Liability Derivatives | ||||||||||||||||||||
Forward Contracts | $ | (15 | ) | $ | (15 | ) | ||||||||||||||
|
|
|
| |||||||||||||||||
Total Value | $ | (15 | ) | $ | (15 | ) | ||||||||||||||
|
|
|
| |||||||||||||||||
Statement of Operations: | ||||||||||||||||||||
Realized Gain | ||||||||||||||||||||
Forward Contracts | $ | 44 | $ | 44 | ||||||||||||||||
|
|
|
| |||||||||||||||||
Total Realized Gain | $ | 44 | $ | 44 | ||||||||||||||||
|
|
|
| |||||||||||||||||
Change in Appreciation | ||||||||||||||||||||
Forward Contracts | $ | 29 | $ | 29 | ||||||||||||||||
|
|
|
| |||||||||||||||||
Total Change in Appreciation | $ | 29 | $ | 29 | ||||||||||||||||
|
|
|
| |||||||||||||||||
Notional Amounts (2) | ||||||||||||||||||||
Forward Currency Contracts | $ | 1,666,254 | $ | 1,666,254 | ||||||||||||||||
97
TCW Funds, Inc.
Notes to Financial Statements (Continued)
Note 2 — Significant Accounting Policies (Continued)
| Credit Risk | Foreign Currency Risk | Interest Rate Risk | Total | |||||||||||||
| TCW High Yield Bond Fund | ||||||||||||||||
Statement of Asset and Liabilities |
| |||||||||||||||
Liability Derivatives | ||||||||||||||||
Open Swaps Agreements, at Value | $ | (1 | ) | $ | (1 | ) | ||||||||||
|
|
|
| |||||||||||||
Total Value | $ | (1 | ) | $ | (1 | ) | ||||||||||
|
|
|
| |||||||||||||
Statement of Operations: | ||||||||||||||||
Realized Gain | ||||||||||||||||
Swaps Agreements | $ | 30 | $ | 30 | ||||||||||||
|
|
|
| |||||||||||||
Total Realized Gain | $ | 30 | $ | 30 | ||||||||||||
|
|
|
| |||||||||||||
Change in (Depreciation) | ||||||||||||||||
Swaps Agreements | $ | (15 | ) | $ | (15 | ) | ||||||||||
|
|
|
| |||||||||||||
Total Change in (Depreciation) | $ | (15 | ) | $ | (15 | ) | ||||||||||
|
|
|
| |||||||||||||
Notional Amounts (2) | ||||||||||||||||
Swaps Agreements | $ | 262,500 | $ | 262,500 | ||||||||||||
| TCW Total Return Bond Fund | ||||||||||||||||
Statement of Asset and Liabilities |
| |||||||||||||||
Asset Derivatives | ||||||||||||||||
Futures Contracts (1) | $ | — | $ | 790 | $ | 790 | ||||||||||
Forward Contracts | 5,633 | — | 5,633 | |||||||||||||
|
|
|
|
|
| |||||||||||
Total Value | $ | 5,633 | $ | 790 | $ | 6,423 | ||||||||||
|
|
|
|
|
| |||||||||||
Liability Derivatives | ||||||||||||||||
Futures Contracts (1) | $ | — | $ | (7,975 | ) | $ | (7,975 | ) | ||||||||
|
|
|
|
|
| |||||||||||
Total Value | $ | — | $ | (7,975 | ) | $ | (7,975 | ) | ||||||||
|
|
|
|
|
| |||||||||||
Statement of Operations: | ||||||||||||||||
Realized Gain (Loss) | ||||||||||||||||
Forward Contracts | $ | (1,177 | ) | $ | — | $ | (1,177 | ) | ||||||||
Futures Contracts | — | 1,487 | 1,487 | |||||||||||||
|
|
|
|
|
| |||||||||||
Total Realized Gain (Loss) | $ | (1,177 | ) | $ | 1,487 | $ | 310 | |||||||||
|
|
|
|
|
| |||||||||||
Change in Appreciation (Depreciation) | ||||||||||||||||
Forward Contracts | $ | 5,633 | $ | — | $ | 5,633 | ||||||||||
Futures Contracts | — | (7,185 | ) | (7,185 | ) | |||||||||||
|
|
|
|
|
| |||||||||||
Total Change in Appreciation (Depreciation) | $ | 5,633 | $ | (7,185 | ) | $ | (1,552 | ) | ||||||||
|
|
|
|
|
| |||||||||||
Number of Contracts or Notional Amounts (2) | ||||||||||||||||
Forward Currency Contracts | $ | 416,255,252 | — | $ | 416,255,252 | |||||||||||
Futures Contracts | — | 8,500 | 8,500 | |||||||||||||
| (1) | Includes cumulative appreciation (depreciation) of futures contracts as reported in the Schedule of Investments. Only variation margin on October 31, 2016 is reported within the Statement of Assets and Liabilities. |
| (2) | Amount disclosed represents average number of contracts or notional amounts, which are representative of the volume traded for the year ended October 31, 2016. |
98
TCW Funds, Inc.
October 31, 2016 |
Note 2 — Significant Accounting Policies (Continued)
Counterparty Credit Risk: Derivative contracts may be exposed to counterparty risk. Losses can occur if the counterparty does not perform under the contract.
The Funds’ risk of loss from counterparty credit risk on OTC derivatives is generally limited to the aggregate unrealized gain netted against any collateral held by the Funds.
With exchange traded futures and centrally cleared swaps, there is less counterparty credit risk to the Funds since the exchange or clearinghouse, as counterparty to such instruments, guarantees against a possible default. The clearinghouse stands between the buyer and the seller of the contract; therefore, the credit risk is limited to failure of the clearinghouse. While offset rights may exist under applicable law, the Funds do not have a contractual right of offset against a clearing broker or clearinghouse in the event of a default (including the bankruptcy or insolvency) of the clearing broker or clearinghouse. Additionally, credit risk exists in exchange traded futures and centrally cleared swaps with respect to initial and variation margin that is held in a clearing broker’s customer accounts. While clearing brokers are required to segregate customer margin from their own assets, in the event that a clearing broker becomes insolvent or goes into bankruptcy and at that time there is a shortfall in the aggregate amount of margin held by the clearing broker for all its clients, typically the shortfall would be allocated on a pro rata basis across all the clearing broker’s customers, potentially resulting in losses to the Funds. In order to better define its contractual rights and to secure rights that will help the Funds mitigate their counterparty risk, the Funds may enter into an International Swaps and Derivatives Association, Inc. Master Agreement (“ISDA Master Agreement”) or similar agreement with their derivative contract counterparties. An ISDA Master Agreement is a bilateral agreement between the Funds and a counterparty that governs OTC derivatives and typically contains, among other things, collateral posting terms and netting provisions in the event of a default and/or termination event. Under an ISDA Master Agreement, the Funds may, under certain circumstances, offset with the counterparty certain derivative financial instruments’ payables and/or receivables with collateral held and/or posted and create one single net payment. The provisions of the ISDA Master Agreement typically permit a single net payment in the event of default including the bankruptcy or insolvency of the counterparty. However, bankruptcy or insolvency laws of a particular jurisdiction may impose restrictions on or prohibitions against the right of offset in bankruptcy, insolvency or other events. In addition, certain ISDA Master Agreements allow counterparties to OTC derivatives to terminate derivative contracts prior to maturity in the event a Fund’s net assets declines by a stated percentage or a Fund fails to meet the terms of its ISDA Master Agreements, which would cause the Fund to accelerate payment of any net liability owed to the counterparty.
Collateral requirements: For derivatives traded under an ISDA Master Agreement, the collateral requirements are typically calculated by netting the mark to market amount for each transaction under such agreement and comparing that amount to the value of any collateral pledged or received by a Fund.
Cash collateral that has been pledged to cover obligations of a Fund is reported separately on the Statement of Assets and Liabilities. Non-cash collateral pledged by a Fund, if any, is noted in the Schedule of Investments. Generally, the amount of collateral due from or to a party has to exceed a minimum transfer amount threshold typically $250,000 or $500,000, before a transfer is required, which is determined at the close of each business day and the collateral is transferred on the next business day. To the extent amounts due to a Fund from its counterparties are not fully collateralized, contractually or otherwise, the Fund bears the risk of loss from counterparty non-performance. The Funds attempt to mitigate counterparty risk by entering into agreements only with counterparties that the Advisor believes
99
TCW Funds, Inc.
Notes to Financial Statements (Continued)
Note 2 — Significant Accounting Policies (Continued)
have the financial resources to honor their obligations and by monitoring the financial stability of those counterparties. For financial reporting purposes, the Funds do not offset derivative assets and derivative liabilities that are subject to netting arrangements in the Statement of Assets and Liabilities. The Funds have implemented the disclosure requirements pursuant to FASB ASU No. 2013-01, Disclosures about Offsetting Assets and Liabilities that requires disclosures to make financial statements that are prepared under GAAP more comparable to those prepared under International Financial Reporting Standards.
The following table presents the Funds’ OTC derivatives assets and liabilities by counterparty net of amounts available for offset under an ISDA Master Agreement or Master Repurchase Agreement (“MRA”) and net of the related collateral received by the Funds as of October 31, 2016 (in thousands):
TCW Enhanced Commodity Strategy Fund
Counterparty | Gross Assets Subject to Master Agreements | Gross Liabilities Subject to Master Agreements | Net Assets (Liabilities) Subject to Master Agreements | Collateral Pledged (Received) | Net Amount (1) | |||||||||||||||
Credit Suisse First Boston Corp. (Derivatives) | $ | — | $ | (18 | ) | $ | (18 | ) | $ | 18 | (2) | $ | — | |||||||
|
|
|
|
|
|
|
|
|
| |||||||||||
Total | $ | — | $ | (18 | ) | $ | (18 | ) | $ | 18 | (2) | $ | — | |||||||
|
|
|
|
|
|
|
|
|
| |||||||||||
| (1) | Represents the net amount receivable (payable) from (to) the counterparty in the event of default. |
| (2) | Amount does not include excess collateral pledged or received. |
TCW Global Bond Fund
Counterparty | Gross Assets Subject to Master Agreements | Gross Liabilities Subject to Master Agreements | Net Assets (Liabilities) Subject to Master Agreements | Collateral Pledged (Received) | Net Amount (1) | |||||||||||||||
Barclays Capital (Derivatives) | $ | 13 | $ | (15 | ) | $ | (2 | ) | $ | — | $ | (2 | ) | |||||||
|
|
|
|
|
|
|
|
|
| |||||||||||
Total | $ | 13 | $ | (15 | ) | $ | (2 | ) | $ | — | $ | (2 | ) | |||||||
|
|
|
|
|
|
|
|
|
| |||||||||||
| (1) | Represents the net amount receivable (payable) from (to) the counterparty in the event of default. |
TCW High Yield Bond Fund
Counterparty | Gross Assets Subject to Master Agreements | Gross Liabilities Subject to Master Agreements | Net Assets (Liabilities) Subject to Master Agreements | Collateral Pledged (Received) | Net Amount (1) | |||||||||||||||
Goldman Sachs International (Derivatives) | $ | — | $ | (1 | ) | $ | (1 | ) | $ | — | $ | (1 | ) | |||||||
|
|
|
|
|
|
|
|
|
| |||||||||||
Total | $ | — | $ | (1 | ) | $ | (1 | ) | $ | — | $ | (1 | ) | |||||||
|
|
|
|
|
|
|
|
|
| |||||||||||
| (1) | Represents the net amount receivable (payable) from (to) the counterparty in the event of default. |
TCW Total Return Bond Fund
Counterparty | Gross Assets Subject to Master Agreements | Gross Liabilities Subject to Master Agreements | Net Assets (Liabilities) Subject to Master Agreements | Collateral Pledged (Received) | Net Amount (1) | |||||||||||||||
Bank of America (Derivatives) | $ | 5,633 | $ | — | $ | 5,633 | $ | (5,500 | ) | $ | 133 | |||||||||
|
|
|
|
|
|
|
|
|
| |||||||||||
Total | $ | 5,633 | $ | — | $ | 5,633 | $ | (5,500 | ) | $ | 133 | |||||||||
|
|
|
|
|
|
|
|
|
| |||||||||||
| (1) | Represents the net amount receivable (payable) from (to) the counterparty in the event of default. |
100
TCW Funds, Inc.
October 31, 2016 |
Note 2 — Significant Accounting Policies (Continued)
Forward Foreign Currency Contracts: The Funds may enter into forward foreign currency contracts as a hedge against fluctuations in foreign exchange rates. Forward foreign currency contracts are marked to market daily and the change in market value is recorded by each Fund, as unrealized gains or losses in the Statements of Assets and Liabilities. When a contract is closed or delivery is taken, a Fund records a realized gain or loss equal to the difference between the value of the contract at the time it was opened and the value at the time it was closed. Risks may arise upon entering into these contracts from the potential inability of counterparties to meet the terms of their contracts and from unanticipated movements in the value of the foreign currency relative to the U.S. dollar. TCW Global Bond Fund and TCW Total Return Bond Fund entered into forward foreign currency contracts during the fiscal year to hedge against the foreign currency exposure within the Funds’ holdings. Outstanding foreign currency forward contracts at October 31, 2016 are disclosed in the Schedules of Investments.
Futures Contracts: The Funds may enter into futures contracts. A Fund may seek to manage a variety of different risks through the use of futures contracts, such as interest rate risk, equity price risk, and currency risk. A Fund may use index futures to hedge against broad market risks to its portfolio or to gain broad market exposure. Securities index futures contracts are contracts to buy or sell units of a securities index at a specified future date at a price agreed upon when the contract is made and are settled in cash. Positions in futures may be closed out only on an exchange or board of trade which provides a secondary market for such futures. Because futures contracts are exchange-traded, they typically have minimal exposure to counterparty risk. Parties to a futures contract are not required to post the entire notional amount of the contract, but rather a small percentage of that amount (by way of margin), both at the time they enter into futures transactions, and then on a daily basis if their positions decline in value; as a result, futures contracts are highly leveraged. Such payments are known as variation margin and are recorded by a Fund as unrealized gains or losses. Because futures markets are highly leveraged, they can be extremely volatile, and there can be no assurance that the pricing of a futures contract will correlate precisely with the pricing of the asset or index underlying it or the asset or liability of a Fund that is the subject of the hedge. It may not always be possible for a Fund to enter into a closing transaction with respect to a futures contract it has entered into at a favorable time or price. When a Fund enters into a futures transaction, it is subject to the risk that the value of the futures contract will move in a direction unfavorable to it.
When a Fund uses futures contracts for hedging purposes, it is likely that the Fund will have an asset or liability that will offset any loss (or gain) on the transactions, at least in part. When a futures contract is closed, the Fund records a realized gain or loss equal to the difference between the value of the contract at the time it was opened and the value at the time it was closed. The TCW Core Fixed Income Fund and the TCW Total Return Bond Fund utilized futures during the fiscal year to help manage interest rate duration of those Funds. Futures contracts outstanding at October 31, 2016 are listed on the Schedules of Investments.
Options: The Funds may purchase and sell put and call options on an index of securities to enhance investment performance and to protect against changes in market prices. The Funds may also enter into currency options to hedge against currency fluctuations.
A call option gives the holder the right to purchase, and obligates the writer to sell, a security at the strike price at any time before the expiration date. A put option gives the holder the right to sell, and obligates the writer to buy, a security at the exercise price at any time before the expiration date. A Fund may purchase put options to protect portfolio holdings against a decline in market value of a security or securities held by it. A Fund may also purchase a put option hoping to profit from an anticipated decline in the value of the underlying security. If a Fund holds the security underlying the option, the option premium and any transaction costs will reduce any profit the Fund might have realized had it sold the underlying security
101
TCW Funds, Inc.
Notes to Financial Statements (Continued)
Note 2 — Significant Accounting Policies (Continued)
instead of buying the put option. A Fund may purchase call options to hedge against an increase in the price of securities that the Fund ultimately wants to buy. A Fund may also purchase a call option as a long directional investment hoping to profit from an anticipated increase in the value of the underlying security. In order for a call option to be profitable, the market price of the underlying security must rise sufficiently above the exercise price to cover the premium and transaction costs. These costs will reduce any profit a Fund might have realized had it bought the underlying security at the time it purchased the call option.
When a Fund purchases an option, it runs the risk that it will lose its entire investment in the option in a relatively short period of time, unless the Fund exercises the option or enters into a closing sale transaction before the option’s expiration. If the price of the underlying security does not rise (in the case of a call) or fall (in the case of a put) to an extent sufficient to cover the option premium and transaction costs, the Fund will lose part or all of its investment in the option. This contrasts with an investment by a Fund in the underlying security, since the Fund will not realize a loss if the security’s price does not change. Premiums paid for purchasing options that expire are treated as realized losses.
Options purchased or sold by a Fund may be traded on a securities or options exchange. Such options typically have minimal exposure to counterparty risk. However, an exchange or market may at times find it necessary to impose restrictions on particular types of options transactions, such as opening transactions. If an underlying security ceases to meet qualifications imposed by an exchange or the Options Clearing Corporation, new series of options on that security will no longer be opened to replace the expiring series, and opening transactions in existing series may be prohibited.
The Funds may purchase or write (sell) put and call swaptions. Swaption contracts give the purchaser the right (or option), but not the obligation, to enter into a new swap agreement, or to shorten, extend, cancel or modify an existing swap agreement, on a future date on specified terms. Depending on the terms of the particular option agreement, a Fund will generally incur a greater degree of risk when it writes a swaption than it will incur when it purchases a swaption. When a Fund purchases a swaption, it risks losing only the amount of the premium it has paid should it decide to let the option expire unexercised. However, when a Fund writes a swaption, upon exercise of the option the Fund will become obligated according to the terms of the underlying agreement.
OTC options are options not traded on exchanges or backed by clearinghouses. Rather, they are entered into directly between a Fund and the counterparty to the option. In the case of an OTC option purchased by a Fund, the value of the option to the Fund will depend on the willingness and ability of the option writer to perform its obligations to the Fund. In addition, OTC options may not be transferable and there may be little or no secondary market for them, so they may be considered illiquid. It may not be possible to enter into closing transactions with respect to OTC options or otherwise to terminate such options, and as a result a Fund may be required to remain obligated on an unfavorable OTC option until its expiration. During the year ended October 31, 2016, the Funds have not purchased or written any options.
Swap Agreements. The Funds may enter into swap agreements. Swap agreements are typically two-party contracts entered into primarily by institutional investors. In a standard “swap” transaction, two parties agree to exchange the returns (or differentials in rates of return) earned or realized on particular predetermined investments or instruments, which may be adjusted for an interest factor. The gross returns to be exchanged or “swapped” between the parties are generally calculated with respect to a “notional amount” (i.e., the return on or increase in value of a particular dollar amount invested at a particular interest rate or in a “basket” of securities representing a particular index).
102
TCW Funds, Inc.
October 31, 2016 |
Note 2 — Significant Accounting Policies (Continued)
In a total return swap, one party typically agrees to pay to the other a short-term interest rate in return for a payment at one or more times in the future based on the increase in the value of an underlying security or other asset, or index of securities or assets; if the underlying security, asset, or index declines in value, the party that pays the short-term interest rate must also pay to its counterparty a payment based on the amount of the decline. A Fund may take either side of such a swap, and so may take a long or short position in the underlying security, asset, or index. A Fund may enter into a total return swap to hedge against an exposure in its portfolio — such as interest rate risk (including to adjust the duration or credit quality of a Fund’s bond portfolio), equity risk, or credit risk — or generally to put cash to work efficiently in the markets in anticipation of, or as a replacement for, cash investments. A Fund may also enter into a total return swap to gain exposure to securities or markets in which it might not be able to invest directly (in so called market access transactions).
Interest rate swaps are agreements in which one party pays a floating rate of interest on a notional principal amount and receives a fixed rate of interest on the same notional principal amount for a specified period of time. Alternatively, a party may pay a fixed rate and receive a floating rate. In more complex swaps, the notional principal amount may decline (or amortize) over time. A Fund’s maximum risk of loss from counterparty default is the discounted NAV of the cash flows paid to the counterparty over the interest rate swap’s remaining life.
A Fund may enter into credit default swap transactions as a “buyer” or “seller” of credit protection. In a credit default swap, one party provides what is in effect insurance against a default or other adverse credit event affecting an issuer of debt securities (typically referred to as a “reference entity”). In general, the buyer of credit protection is obligated to pay the protection seller an upfront amount or a periodic stream of payments over the term of the swap. If a “credit event” occurs, the buyer has the right to deliver to the seller bonds (or other obligations of the reference entity with a value up to the full notional value of the swap), and to receive a payment equal to the par value of the bonds or other obligations. Credit events that would trigger a request that the seller make payment are specific to each credit default swap agreement, but generally include bankruptcy, failure to pay, restructuring, obligation acceleration, obligation default, or repudiation/moratorium. When a Fund buys protection, it may or may not own securities of the reference entity. When a Fund sells protection under a credit default swap, the position may have the effect of creating leverage in the Fund’s portfolio through the Fund’s indirect long exposure to the issuer or securities on which the swap is written. When a Fund sells protection, it may do so either to earn additional income or to create such a “synthetic” long position.
Whenever a Fund enters into a swap agreement, it takes on counterparty risk — the risk that its counterparty will be unable or unwilling to meet its obligations under the swap agreement. A Fund also takes the risk that the market will move against its position in the swap agreement. In the case of a total return swap, the swap will change in value depending on the change in value of the asset or index on which the swap is written. When a Fund enters into any type of swap for hedging purposes, it is likely that the Fund will have an asset or liability that will offset any loss (or gain) on the swap, at least in part. Swap agreements may be non-transferable or otherwise highly illiquid, and a Fund may not be able to terminate or transfer a swap agreement at any particular time or at an acceptable price.
During the term of a swap transaction, changes in the value of the swap are recognized as unrealized gains or losses by marking to market to reflect the market value of the swap. When the swap is terminated, a Fund will record a realized gain or loss equal to the difference, if any, between the proceeds from the
103
TCW Funds, Inc.
Notes to Financial Statements (Continued)
Note 2 — Significant Accounting Policies (Continued)
closing transaction and the Fund’s basis in the agreement. Upfront swap premium payments paid or received by a Fund, if any, are recorded within the value of the open swap agreement on the Fund’s Statement of Assets and Liabilities and represent payments paid or received upon entering into the swap agreement to compensate for differences between stated terms of the swap agreement and prevailing market conditions (credit spreads, currency exchange rates, and other relevant factors). These upfront payments are recorded as realized gains or losses on the Fund’s Statement of Operations upon termination or maturity of the swap agreement.
During the term of a swap transaction, the periodic net payments can be made for a set period of time or may be triggered by a predetermined credit event. The net periodic payments may be based on a fixed or variable interest rate, the change in market value of a specified security, basket of securities or index, or the return generated by a security. These periodic payments received or made by the Funds are recorded as realized gains and losses, respectively. During the year ended October 31, 2016, the TCW High Yield Bond Fund utilized credit default swaps to manage credit market exposure; and the TCW Enhanced Commodity Strategy Fund used total return swap agreements to gain exposure to the commodity market.
Mortgage-Backed Securities: The Funds may invest in MBS which represent interests in pools of mortgages in which payments of both principal and interest on the securities are generally made monthly, in effect “passing through” monthly payments made by borrowers on the residential or commercial mortgage loans which underlie the securities (net of any fees paid to the issuer or guarantor of the securities). MBS differ from other forms of debt securities which normally provide for periodic payment of interest in fixed amounts with principal payments at maturity or specified call dates. These Funds may also invest in Collateralized Mortgage Obligations (“CMOs”). CMOs are debt obligations collateralized by residential or commercial mortgage loans or residential or commercial mortgage pass-through securities. Interest and principal are generally paid monthly. CMOs may be collateralized by whole mortgage loans or private mortgage pass-through securities but are more typically collateralized by portfolios of mortgage pass-through securities guaranteed by Ginnie Mae, Freddie Mac or Fannie Mae. The issuer of a series of CMOs may elect to be treated for tax purposes as a Real Estate Mortgage Investment Conduit. CMOs are structured into multiple classes, each bearing a different stated maturity. Monthly payment of principal received from the pool of underlying mortgages, including prepayments, is first returned to investors holding the shortest maturity class. Investors holding the longer maturity classes usually receive principal only after shorter classes have been retired. An investor may be partially protected against a sooner than desired return of principal because of the sequential payments. These Funds may invest in stripped MBS. Stripped MBS are usually structured with two classes that receive different proportions of the interest and principal distributions on a pool of mortgage assets. In certain cases, one class will receive all of the interest (the interest-only or “IO” class), while the other class will receive all of the principal (the principal-only or “PO” class). The yield to maturity on IOs is sensitive to the rate of principal repayments (including prepayments) on the related underlying mortgage assets, and principal payments may have a material effect on yield to maturity. If the underlying mortgage assets experience greater than anticipated prepayments of principal, a Fund may not fully recoup its initial investment in IOs.
Inflation-Indexed Bonds: The Funds may invest in inflation-indexed bonds, which are fixed income securities whose principal value or coupon is periodically adjusted according to the rate of inflation. Any increase or decrease in the principal amount of an inflation-indexed bond will be included as interest income.
104
TCW Funds, Inc.
October 31, 2016 |
Note 2 — Significant Accounting Policies (Continued)
Inflation-indexed securities issued by the U.S. Treasury have maturities of five, ten, twenty, or thirty years, although it is possible that securities with other maturities will be issued in the future. The U.S. Treasury securities pay interest on a semi-annual basis, equal to a fixed percentage of the inflation-adjusted principal amount.
If the periodic adjustment rate measuring inflation falls, the principal value of inflation-indexed bonds will be adjusted downward, and consequently the interest payable on these securities (calculated with respect to a smaller principal amount) will be reduced. Repayment of the original bond principal upon maturity (as adjusted for inflation) is guaranteed in the case of U.S. Treasury inflation-indexed bonds, even during a period of deflation. However, the current market value of the bonds is not guaranteed, and will fluctuate. The Funds may also invest in other inflation related bonds which may or may not provide a similar guarantee. If a guarantee of principal is not provided, the adjusted principal value of the bond repaid at maturity may be less than the original principal.
The value of inflation-indexed bonds is expected to change in response to changes in real interest rates. Real interest rates in turn are tied to the relationship between nominal interest rates and the rate of inflation. Therefore, if inflation were to rise at a faster rate than nominal interest rates, real interest rates might decline, leading to an increase in value of inflation-indexed bonds. In contrast, if nominal interest rates increased at a faster rate than inflation, real interest rates might rise, leading to a decrease in value of inflation-indexed bonds.
While the values of these securities are expected to be protected from long-term inflationary trends, short term increases in inflation may lead to declines in values. If interest rates rise due to reasons other than inflation (for example, due to changes in currency exchange rates), investors in these securities may not be protected to the extent that the increase is not reflected in the bond’s inflation measure.
When-Issued, Delayed-Delivery, To be Announced (“TBA”) and Forward Commitment Transactions: The Funds may enter into when-issued, delayed-delivery, TBA or forward commitment transactions in order to lock in the purchase price of the underlying security or to adjust the interest rate exposure of the Funds’ existing portfolios. In when-issued, delayed-delivery, or forward commitment transactions, a Fund commits to purchase securities, with payment and delivery to take place at a future date. Although the Fund does not pay for the securities or start earning interest on them until they are delivered, it immediately assumes the risks of ownership, including the risk of price fluctuation. If a Fund’s counterparty fails to deliver a security purchased on a when-issued, delayed-delivery, TBA or forward commitment basis, there may be a loss, and that Fund may have missed an opportunity to make an alternative investment.
Prior to settlement of these transactions, the value of the subject securities will fluctuate, with market. In addition, because a Fund is not required to pay for when-issued, delayed-delivery, TBA or forward commitment securities until the delivery date, they may result in a form of leverage to the extent a Fund does not maintain liquid assets equal to the face amount of the contract. To guard against the deemed leverage, the Fund monitors the obligations under these transactions and ensures that the Fund has sufficient liquid assets to cover them.
Dollar Roll Transactions: The Funds may enter into dollar roll transactions with financial institutions to take advantage of opportunities in the MBS market. A dollar roll transaction involves a simultaneous sale of securities by a Fund with an agreement to repurchase substantially similar securities at an agreed upon price and date, but generally will be collateralized at time of delivery by different pools of mortgages with
105
TCW Funds, Inc.
Notes to Financial Statements (Continued)
Note 2 — Significant Accounting Policies (Continued)
different prepayment histories than those securities sold. These transactions are accounted for as financing transactions as opposed to sales and purchases. The differential between the sale price and the repurchase price is recorded as deferred income and recognized between the settlement dates of the sale and repurchase. During the period between the sale and repurchase, a Fund will not be entitled to receive interest and principal payments on the securities sold. Dollar roll transactions involve risk that the market value of the security sold by a Fund may decline below the repurchase price of the security and the potential inability of counter parties to complete the transaction. There were no such transactions by the Funds for the year ended October 31, 2016.
Repurchase Agreements: The Funds may enter into repurchase agreements, under the terms of a MRA. The MRA permits a Fund, under certain circumstances including an event of default (such as bankruptcy or insolvency), to offset payables and/or receivables under the MRA with collateral held and/or posted to the counterparty and create one single net payment due to or from the Fund. However, bankruptcy or insolvency laws of a particular jurisdiction may impose restrictions on or prohibitions against such a right of offset in the event of a MRA counterparty’s bankruptcy or insolvency. Pursuant to the terms of the MRA, a Fund receives securities as collateral with a market value in excess of the repurchase price to be received by the Funds upon the maturity of the repurchase transaction. Upon a bankruptcy or insolvency of the MRA counterparty, a Fund recognizes a liability with respect to such excess collateral to reflect the Fund’s obligation under bankruptcy law to return the excess to the counterparty. There were no repurchase agreements outstanding as of October 31, 2016.
Reverse Repurchase Agreements: The Funds may enter into reverse repurchase agreements. Under a reverse repurchase agreement, a Fund sells portfolio assets subject to an agreement by the Fund to repurchase the same assets at an agreed upon price and date. The Funds may utilize reverse repurchase agreements when it is anticipated that the interest income to be earned from the investment of the proceeds of the transaction is greater than the interest expense of the transaction. During the term of the reverse repurchase agreement, the Funds continue to receive the principal and interest payments on the securities sold. There were no reverse repurchase agreements outstanding during the year ended October 31, 2016.
Security Lending: The Funds may lend their securities to qualified brokers. The loans must be collateralized at all times primarily with cash although the Funds can accept money market instruments or U.S. Government securities with a market value at least equal to the market value of the securities on loan. As with any extensions of credit, the Funds may bear the risk of delay in recovery or even loss of rights in the collateral if the borrowers of the securities fail financially. The Funds earn additional income for lending their securities by investing the cash collateral in short-term investments. The Funds did not lend any securities during the year ended October 31, 2016.
Allocation of Operating Activity for Multiple Classes: Investment income, common expenses and realized and unrealized gains and losses are allocated among the classes of shares of a Fund based on the relative net assets of each class. Distribution fees, which are directly attributable to a class of shares, are charged to the operations of that class. All other expenses are charged to each Fund or class as incurred on a specific identification basis. Differences in class specific fees and expenses will result in differences in net investment income, and in turn differences in dividends paid by each class.
Dividends and Distributions: Dividends and distributions to shareholders are recorded on the ex-dividend date. The TCW Enhanced Commodity Strategy Fund declares and pays, or reinvests,
106
TCW Funds, Inc.
October 31, 2016 |
Note 2 — Significant Accounting Policies (Continued)
dividends from net investment income quarterly. The other Fixed Income Funds declare and pay, or reinvest, dividends from net investment income monthly. Distribution of any net long-term and net short-term capital gains earned by a Fund will be distributed at least annually.
Income and capital gain distributions are determined in accordance with income tax regulations which may differ from GAAP. These differences are primarily due to differing treatments for foreign currency transactions, market discount and premium, losses deferred due to wash sales, excise tax regulations and employing equalization in determining amounts to be distributed to fund shareholders. Permanent book and tax basis differences relating to shareholder distributions will result in reclassifications between paid-in capital, undistributed net investment income (loss), and/or undistributed accumulated realized gain (loss). Undistributed net investment income or loss may include temporary book and tax basis differences which will reverse in subsequent periods. Any taxable income or capital gain remaining at fiscal year-end is distributed in the following year.
Use of Estimates: The preparation of the accompanying financial statements requires management to make estimates and assumptions that affect the reported amount of assets and liabilities at the date of the financial statements and the reported amounts of income and expenses during the reporting period. Actual results could differ from these estimates.
Note 3 — Risk Considerations
Market Risk: The Funds’ investments will fluctuate with market conditions, so will the value of your investment in the Funds. You could lose money on your investment in the Funds or the Funds could underperform other investments.
Liquidity Risk: The Funds’ investments in illiquid securities may reduce the returns of the Funds because they may not be able to sell the illiquid securities at an advantageous time or price. Investments in high yield securities, foreign securities, derivatives or other securities with substantial market and/or credit risk tend to have the greatest exposure to liquidity risk. Certain investments in private placements and Rule 144A securities may be considered illiquid investments. The Funds may invest in private placements and Rule 144A securities.
Interest Rate Risk: The values of the Funds’ investments fluctuate in response to movements in interest rates. If rates rise, the values of debt securities generally fall. The longer the average duration of a Fund’s investment portfolio, the greater the change in value.
Mortgage-Backed and Other Asset-Backed Securities Risk: Each Fund may invest in mortgage-backed or other asset-backed securities. The values of some mortgage-backed or other asset-backed securities may expose a Fund to a lower rate of return upon reinvestment of principal. When interest rates rise, the value of mortgage-related securities generally will decline; however, when interest rates are declining, the value of mortgage related-securities with prepayment features may not increase as much as other fixed-income securities. The rate of prepayments on underlying mortgages will affect the price and volatility of a mortgage-related security, and may shorten or extend the effective maturity of the security beyond what was anticipated at the time of purchase. If unanticipated rate of prepayment on underlying mortgages increase the effective maturity of a mortgage-related security, the volatility of the security can be expected to increase. The value of these securities may fluctuate in response to the market’s perception of the creditworthiness of the issuers. Additionally, although mortgages and mortgage-related securities are generally supported by some form of government or private guarantee and/or insurance, there is no assurance that private guarantors or insurers will meet their obligations.
107
TCW Funds, Inc.
Notes to Financial Statements (Continued)
Note 3 — Risk Considerations (Continued)
Derivatives Risk: Use of derivatives, which at times is an important part of the Funds’ investment strategies, involves risks different from, or possibly greater than, the risks associated with investing directly in securities and other traditional investments. Investments in derivatives could cause the Funds to lose more than the principal amount invested. Also, suitable derivative transactions may not be available in all circumstances and there can be no assurance that the Funds will engage in these transactions to reduce exposure to other risks when that would be beneficial.
Credit Risk: The values of any of the Funds’ investments may also decline in response to events affecting the issuer or its credit rating. The lower rated debt securities in which a Fund may invest are considered speculative and are subject to greater volatility and risk of loss than investment-grade securities, particularly in deteriorating economic conditions. The value of some mortgage-related securities in which the Funds invest also may fall because of unanticipated levels of principal prepayments that can occur when interest rates decline. Certain Funds invest a material portion of their assets in securities of issuers that hold mortgage- and asset-backed securities and direct investments in securities backed by commercial and residential mortgage loans and other financial assets. The value and related income of these securities are sensitive to changes in economic conditions, including delinquencies and/or defaults. Continuing shifts in the market’s perception of credit quality on securities backed by commercial and residential mortgage loans and other financial assets may result in increased volatility of market price and periods of illiquidity that can negatively impact the valuation of certain issuers held by the Funds.
MBS and ABS are characterized and classified in a variety of different ways. These classifications include a view of the securities’ cash flow structure (pass through, sequential pay, prepayment-protected, interest only, principal-only, etc.), the security of the claim on the underlying assets, (senior, mezzanine and subordinated), as well as types of underlying collateral (prime conforming loans, prime non-conforming loans, Alt-A loans, subprime loans, commercial loans, etc.) In many cases, the classification incorporates a degree of subjectivity: a particular loan might be categorized as “prime” by the underwriting standards of one mortgage issuer while another might classify the loan as “subprime.” In addition to other functions, the risk associated with an investment in a mortgage loan must take into account the nature of the collateral, the form and the level of credit enhancement, the vintage of the loan, the geography of the loan, the purpose of the loan (refinance versus purchase versus equity takeout), the borrower’s credit quality (e.g., FICO score), and whether the loan is a first trust deed or a second lien.
Counterparty Risk: The Funds may be exposed to counterparty risk, or the risk that an entity with which the Funds have unsettled or open transactions may default. Financial assets, which potentially expose the Funds to credit and counterparty risks, consist principally of investments and cash due from counterparties. The exposure to credit and counterparty risks with respect to these financial assets is reflected in fair value recorded in the Funds’ Statements of Assets and Liabilities.
For complete information on the various risks involved, please refer to the Funds’ prospectus and the Statement of Additional Information which can be obtained on the Funds’ website (www.tcw.com) or by calling the customer service.
Note 4 — Federal Income Taxes
It is the policy of each Fund to comply with the requirements under Subchapter M of the Internal Revenue Code applicable to regulated investment companies and to distribute all of its net taxable income, including any net realized gains on investments, to its shareholders. Therefore, no federal income tax provision is required.
108
TCW Funds, Inc.
October 31, 2016 |
Note 4 — Federal Income Taxes (Continued)
At October 31, 2016 the components of distributable earnings on a tax basis were as follows (amounts in thousands):
| Undistributed Ordinary Income | Undistributed Long-Term Gain | Total Distributable Earnings | ||||||||||
TCW Core Fixed Income Fund | $ | 20,035 | $ | 3,498 | $ | 23,533 | ||||||
TCW Enhanced Commodity Strategy Fund | 1 | 12 | 13 | |||||||||
TCW Global Bond Fund | 149 | 3 | 152 | |||||||||
TCW High Yield Bond Fund | 187 | — | 187 | |||||||||
TCW Short Term Bond Fund | 35 | — | 35 | |||||||||
TCW Total Return Bond Fund | 167,057 | 31,547 | 198,604 | |||||||||
At the end of the previous fiscal year ended October 31, 2015, the components of distributable earnings on a tax basis were as follows (amounts in thousands):
| Undistributed Ordinary Income | Undistributed Long-Term Gain | Total Distributable Earnings | ||||||||||
TCW Core Fixed Income Fund | $ | 18,009 | $ | 1,054 | $ | 19,063 | ||||||
TCW Enhanced Commodity Strategy Fund | 4 | — | 4 | |||||||||
TCW Global Bond Fund | 67 | 146 | 213 | |||||||||
TCW High Yield Bond Fund | 167 | — | 167 | |||||||||
TCW Total Return Bond Fund | 66,932 | 23,089 | 90,021 | |||||||||
Permanent differences incurred during the year ended October 31, 2016, resulting from differences in book and tax accounting, have been reclassified at year-end between undistributed net investment income (loss), undistributed (accumulated) net realized gain (loss) and paid-in capital as follows, with no impact to the NAV per share (amounts in thousands):
| Undistributed Net Investment Income (Loss) | Undistributed Accumulated Net Realized Gain (Loss) | Paid-in Capital | ||||||||||
TCW Core Fixed Income Fund | $ | (462 | ) | $ | (3,665 | ) | $ | 4,127 | ||||
TCW Enhanced Commodity Strategy Fund | 2 | (2 | ) | — | (1) | |||||||
TCW Global Bond Fund | 3 | (3 | ) | — | (1) | |||||||
TCW High Yield Bond Fund | 107 | (107 | ) | — | ||||||||
TCW Short Term Bond Fund | 25 | 203 | (228 | ) | ||||||||
TCW Total Return Bond Fund | 1,304 | (36,104) | 34,800 | |||||||||
| (1) | Amounts rounds to less than $1. |
During the year ended October 31, 2016, the tax character of distributions paid was as follows (amounts in thousands):
| Ordinary Income | Long-Term Capital Gain | Total Distributions | ||||||||||
TCW Core Fixed Income Fund | $ | 43,487 | $ | 1,051 | $ | 44,538 | ||||||
TCW Enhanced Commodity Strategy Fund | 24 | — | 24 | |||||||||
TCW Global Bond Fund | 428 | 146 | 574 | |||||||||
TCW High Yield Bond Fund | 1,189 | — | 1,189 | |||||||||
TCW Short Term Bond Fund | 58 | — | 58 | |||||||||
TCW Total Return Bond Fund | 271,922 | 23,092 | 295,014 | |||||||||
109
TCW Funds, Inc.
Notes to Financial Statements (Continued)
Note 4 — Federal Income Taxes (Continued)
During the previous fiscal year ended October 31, 2015, the tax character of distributions paid was as follows (amounts in thousands):
| Ordinary Income | Long-Term Capital Gain | Total Distributions | ||||||||||
TCW Core Fixed Income Fund | $ | 29,209 | $ | 619 | $ | 29,828 | ||||||
TCW Enhanced Commodity Strategy Fund | 27 | — | 27 | |||||||||
TCW Global Bond Fund | 142 | 26 | 168 | |||||||||
TCW High Yield Bond Fund | 1,289 | — | 1,289 | |||||||||
TCW Short Term Bond Fund | 139 | — | 139 | |||||||||
TCW Total Return Bond Fund | 186,037 | 25,870 | 211,907 | |||||||||
At October 31, 2016, net unrealized appreciation (depreciation) on investments for federal income tax purposes was as follows (amounts in thousands):
| Unrealized Appreciation | Unrealized (Depreciation) | Net Unrealized Appreciation (Depreciation) | Cost of Investments for Federal Income Tax Purposes | |||||||||||||
TCW Core Fixed Income Fund | $ | 27,522 | $ | (9,713 | ) | $ | 17,809 | $ | 2,010,415 | |||||||
TCW Enhanced Commodity Strategy Fund | 13 | (4 | ) | 9 | 1,156 | |||||||||||
TCW Global Bond Fund | 559 | (718 | ) | (159 | ) | 16,589 | ||||||||||
TCW High Yield Bond Fund | 639 | (385 | ) | 254 | 28,026 | |||||||||||
TCW Short Term Bond Fund | 23 | (47 | ) | (24 | ) | 7,769 | ||||||||||
TCW Total Return Bond Fund | 419,339 | (80,659 | ) | 338,680 | 12,068,774 | |||||||||||
At October 31, 2016, the following Funds had net realized loss carryforwards for federal income tax purposes (amounts in thousands):
| Expiring In 2018 (1) | Expiring In 2019 (1) | No Expiration (2) | Total | |||||||||||||||||
| Short-Term Capital Losses | Long-Term Capital Losses | |||||||||||||||||||
TCW High Yield Bond Fund | $ | — | $ | — | $ | 766 | $ | 551 | $ | 1,317 | ||||||||||
TCW Short Term Bond Fund | 7,023 | 111 | 93 | 116 | 7,343 | |||||||||||||||
| (1) | Losses incurred prior to December 22, 2010. |
| (2) | Losses incurred after December 22, 2010. |
The Funds did not have any unrecognized tax benefits at October 31, 2016, nor were there any increases or decreases in unrecognized tax benefits for the year ended October 31, 2016. The Funds are subject to examination by U.S. federal and state tax authorities for returns filed for the prior three and four fiscal years, respectively.
Note 5 — Fund Management Fees and Other Expenses
The Funds pay to the Advisor, as compensation for services rendered, facilities furnished and expenses borne by it, the following annual management fees as a percentage of daily NAV:
TCW Core Fixed Income Fund | 0.40 | % | ||
TCW Enhanced Commodity Strategy Fund | 0.50 | % | ||
TCW Global Bond Fund | 0.55 | % | ||
TCW High Yield Bond Fund | 0.45 | % | ||
TCW Short Term Bond Fund | 0.35 | % | ||
TCW Total Return Bond Fund | 0.50 | % |
110
TCW Funds, Inc.
October 31, 2016 |
Note 5 — Fund Management Fees and Other Expenses (Continued)
In addition to the management fee, the Company’s Board has approved an annual amount for the Funds to reimburse the Advisor for a portion of its costs associated with implementing the Funds’ Rule 38a-1 compliance program. The amount is accrued on a daily basis and included in the Statement of Operations. However, the Advisor has waived its reimbursement request since April 2016.
The Advisor limits the operating expenses of the Funds not to exceed the following expense ratios relative to the Funds’ average daily net assets. Limitation is set to the lower of average expense ratio as reported by Lipper, Inc. (which is subject to change on a monthly basis) or the expense limitation agreement between the Advisor and Company.
TCW Core Fixed Income Fund | ||||
I Class | 0.49 | % (1) | ||
N Class | 0.77 | % (2) | ||
TCW Enhanced Commodity Strategy Fund | ||||
I Class | 0.70 | % (1) | ||
N Class | 0.75 | % (1) | ||
TCW Global Bond Fund | ||||
I Class | 1.04 | % (2) | ||
N Class | 1.04 | % (2) | ||
TCW High Yield Bond Fund | ||||
I Class | 0.55 | % (1) | ||
N Class | 0.80 | % (1) | ||
TCW Short Term Bond Fund | ||||
I Class | 0.44 | % (1) | ||
TCW Total Return Bond Fund | ||||
I Class | 0.49 | % (1) | ||
N Class | 0.79 | % (1) |
| (1) | These limitations are based on an agreement between the Advisor and Company. |
| (2) | Limitation based on average expense ratio as reported by Lipper, Inc. |
The amount borne by the Advisor during the fiscal year when the operating expenses of a Fund are in excess of the expense limitation cannot be recaptured in the subsequent fiscal years should the expenses drop below the expense limitation in the subsequent years. The Advisor can recapture expenses only within a given fiscal year for that year’s operating expenses.
Directors’ Fees: Directors who are not affiliated with the Advisor receive compensation from the Funds which are shown on the Statement of Operations. Directors may elect to defer receipt of their fees in accordance with the terms of a Non-Qualified Deferred Compensation Plan. Total accrued and deferred amounts are recorded on the Funds’ books as other liabilities.
Note 6 — Distribution Plan
TCW Funds Distributors (“Distributor”), an affiliate of the Advisor and the Funds, serves as the nonexclusive distributor of each class of the Funds’ shares. The Funds have a distribution plan pursuant to Rule 12b-1 under the 1940 Act with respect to the N Class shares of each Fund. Under the terms of the plan, each Fund compensates the Distributor at a rate equal to 0.25% of the average daily net assets of the Fund attributable to its N Class shares for distribution and related services.
111
TCW Funds, Inc.
Notes to Financial Statements (Continued)
Note 7 — Purchases and Sales of Securities
Investment transactions (excluding short-term investments) for the year ended October 31, 2016, were as follows (amounts in thousands):
| Purchases at Cost | Sales or Maturity Proceeds | U.S. Government Purchases at Cost | U.S. Government Sales or Maturity Proceeds | |||||||||||||
TCW Core Fixed Income Fund | $ | 395,755 | $ | 332,006 | $ | 4,711,226 | $ | 4,574,133 | ||||||||
TCW Enhanced Commodity Strategy Fund | 12 | 498 | 12 | 166 | ||||||||||||
TCW Global Bond Fund | 2,879 | 1,882 | 16,593 | 16,092 | ||||||||||||
TCW High Yield Bond Fund | 58,370 | 61,179 | — | — | ||||||||||||
TCW Short Term Bond Fund | 1,017 | 1,515 | 1,595 | 1,785 | ||||||||||||
TCW Total Return Bond Fund (1) | 118,825 | 947,739 | 32,539,400 | 30,642,482 | ||||||||||||
| (1) | Purchases include the Fund’s purchase of certain securities from affiliated investment accounts for a total of $700 (amount in thousands) in accordance with the provisions set forth in Section 17(a)-7 of the 1940 Act. |
Note 8 — Capital Share Transactions
Transactions in each Fund’s shares were as follows:
| TCW Core Fixed Income Fund | Year Ended October 31, 2016 | Year Ended October 31, 2015 | ||||||||||||||
| I Class | Shares | Amount (in thousands) | Shares | Amount (in thousands) | ||||||||||||
Shares Sold | 57,678,268 | $ | 646,593 | 60,112,141 | $ | 676,421 | ||||||||||
Shares Issued upon Reinvestment of Dividends | 2,643,314 | 29,401 | 1,612,372 | 18,111 | ||||||||||||
Shares Redeemed | (33,895,565 | ) | (380,666 | ) | (19,758,909 | ) | (221,758 | ) | ||||||||
|
|
|
|
|
|
|
| |||||||||
Net Increase | 26,426,017 | $ | 295,328 | 41,965,604 | $ | 472,774 | ||||||||||
|
|
|
|
|
|
|
| |||||||||
| N Class | Shares | Amount (in thousands) | Shares | Amount (in thousands) | ||||||||||||
Shares Sold | 8,762,584 | $ | 97,810 | 9,500,132 | $ | 106,708 | ||||||||||
Shares Issued upon Reinvestment of Dividends | 890,126 | 9,853 | 724,638 | 8,131 | ||||||||||||
Shares Redeemed | (15,083,249 | ) | (168,651 | ) | (15,762,483 | ) | (176,865 | ) | ||||||||
|
|
|
|
|
|
|
| |||||||||
Net Decrease | (5,430,539 | ) | $ | (60,988 | ) | (5,537,713 | ) | $ | (62,026 | ) | ||||||
|
|
|
|
|
|
|
| |||||||||
| TCW Enhanced Commodity Strategy Fund | Year Ended October 31, 2016 | Year Ended October 31, 2015 | ||||||||||||||
| I Class | Shares | Amount (in thousands) | Shares | Amount (in thousands) | ||||||||||||
Shares Sold | 96,339 | $ | 500 | 397 | $ | 2 | ||||||||||
Shares Issued upon Reinvestment of Dividends | 2,698 | 13 | 2,590 | 16 | ||||||||||||
Shares Redeemed | (230,448 | ) | (1,195 | ) | — | — | ||||||||||
|
|
|
|
|
|
|
| |||||||||
Net Decrease | (131,411 | ) | $ | (682 | ) | 2,987 | $ | 18 | ||||||||
|
|
|
|
|
|
|
| |||||||||
| N Class | Shares | Amount (in thousands) | Shares | Amount (in thousands) | ||||||||||||
Shares Sold | 96,154 | $ | 500 | — | $ | — | ||||||||||
Shares Issued upon Reinvestment of Dividends | 2,192 | 11 | 1,995 | 12 | ||||||||||||
Shares Redeemed | (219,349 | ) | (1,140 | ) | — | — | ||||||||||
|
|
|
|
|
|
|
| |||||||||
Net Decrease | (121,003 | ) | $ | (629 | ) | 1,995 | $ | 12 | ||||||||
|
|
|
|
|
|
|
| |||||||||
112
TCW Funds, Inc.
October 31, 2016 |
Note 8 — Capital Share Transactions (Continued)
| TCW Global Bond Fund | Year Ended October 31, 2016 | Year Ended October 31, 2015 | ||||||||||||||
| I Class | Shares | Amount (in thousands) | Shares | Amount (in thousands) | ||||||||||||
Shares Sold | 876,674 | $ | 8,801 | 793 | $ | 8 | ||||||||||
Shares Issued upon Reinvestment of Dividends | 30,509 | 299 | 6,806 | 69 | ||||||||||||
Shares Redeemed | (830,998 | ) | (8,343 | ) | (1,496 | ) | (15 | ) | ||||||||
|
|
|
|
|
|
|
| |||||||||
Net Increase | 76,185 | $ | 757 | 6,103 | $ | 62 | ||||||||||
|
|
|
|
|
|
|
| |||||||||
| N Class | Shares | Amount (in thousands) | Shares | Amount (in thousands) | ||||||||||||
Shares Sold | 21,917 | $ | 215 | 3,420 | $ | 34 | ||||||||||
Shares Issued upon Reinvestment of Dividends | 27,807 | 272 | 6,333 | 64 | ||||||||||||
Shares Redeemed | (28,373 | ) | (286 | ) | (485 | ) | (5 | ) | ||||||||
|
|
|
|
|
|
|
| |||||||||
Net Increase | 21,351 | $ | 201 | 9,268 | $ | 93 | ||||||||||
|
|
|
|
|
|
|
| |||||||||
| TCW High Yield Bond Fund | Year Ended October 31, 2016 | Year Ended October 31, 2015 | ||||||||||||||
| I Class | Shares | Amount (in thousands) | Shares | Amount (in thousands) | ||||||||||||
Shares Sold | 4,266,185 | $ | 25,648 | 5,065,713 | $ | 31,742 | ||||||||||
Shares Issued upon Reinvestment of Dividends | 104,658 | 642 | 102,211 | 641 | ||||||||||||
Shares Redeemed | (4,485,794 | ) | (27,208 | ) | (5,051,287 | ) | (31,721 | ) | ||||||||
|
|
|
|
|
|
|
| |||||||||
Net Decrease | (114,951 | ) | $ | (918 | ) | 116,637 | $ | 662 | ||||||||
|
|
|
|
|
|
|
| |||||||||
| N Class | Shares | Amount (in thousands) | Shares | Amount (in thousands) | ||||||||||||
Shares Sold | 3,341,838 | $ | 20,346 | 4,744,408 | $ | 29,937 | ||||||||||
Shares Issued upon Reinvestment of Dividends | 46,466 | 287 | 56,020 | 355 | ||||||||||||
Shares Redeemed | (4,744,767 | ) | (29,004 | ) | (4,205,055 | ) | (26,670 | ) | ||||||||
|
|
|
|
|
|
|
| |||||||||
Net Decrease | (1,356,463 | ) | $ | (8,371 | ) | 595,373 | $ | 3,622 | ||||||||
|
|
|
|
|
|
|
| |||||||||
| TCW Short Term Bond Fund | Year Ended October 31, 2016 | Year Ended October 31, 2015 | ||||||||||||||
| I Class | Shares | Amount (in thousands) | Shares | Amount (in thousands) | ||||||||||||
Shares Sold | 274,893 | $ | 2,390 | 443,509 | $ | 3,863 | ||||||||||
Shares Issued upon Reinvestment of Dividends | 5,124 | 45 | 14,688 | 128 | ||||||||||||
Shares Redeemed | (501,979 | ) | (4,361 | ) | (1,760,685 | ) | (15,360 | ) | ||||||||
|
|
|
|
|
|
|
| |||||||||
Net Decrease | (221,962 | ) | $ | (1,926 | ) | (1,302,488 | ) | $ | (11,369 | ) | ||||||
|
|
|
|
|
|
|
| |||||||||
| TCW Total Return Bond Fund | Year Ended October 31, 2016 | Year Ended October 31, 2015 | ||||||||||||||
| I Class | Shares | Amount (in thousands) | Shares | Amount (in thousands) | ||||||||||||
Shares Sold | 357,901,258 | $ | 3,692,928 | 225,857,764 | $ | 2,334,444 | ||||||||||
Shares Issued upon Reinvestment of Dividends | 13,961,930 | 143,503 | 10,694,643 | 110,417 | ||||||||||||
Shares Redeemed | (212,039,701 | ) | (2,191,440 | ) | (211,973,390 | ) | (2,189,937 | ) | ||||||||
|
|
|
|
|
|
|
| |||||||||
Net Increase | 159,823,487 | $ | 1,644,991 | 24,579,017 | $ | 254,924 | ||||||||||
|
|
|
|
|
|
|
| |||||||||
| N Class | Shares | Amount (in thousands) | Shares | Amount (in thousands) | ||||||||||||
Shares Sold | 99,640,430 | $ | 1,060,476 | 84,931,354 | $ | 905,877 | ||||||||||
Shares Issued upon Reinvestment of Dividends | 6,253,093 | 66,269 | 4,340,686 | 46,242 | ||||||||||||
Shares Redeemed | (72,842,852 | ) | (775,953 | ) | (67,581,644 | ) | (719,846 | ) | ||||||||
|
|
|
|
|
|
|
| |||||||||
Net Increase | 33,050,671 | $ | 350,792 | 21,690,396 | $ | 232,273 | ||||||||||
|
|
|
|
|
|
|
| |||||||||
113
TCW Funds, Inc.
Notes to Financial Statements (Continued)
Note 9 — Affiliate Ownership
As of October 31, 2016, affiliates of the Funds and Advisor own 99.8% and 97.3% of the NAV of TCW Enhanced Commodity Strategy Fund and TCW Global Bond Fund, respectively.
Note 10 — Restricted Securities
The Funds are permitted to invest in securities that have legal or contractual restrictions on resale. These securities may be sold privately, but are required to be registered before being sold to the public (exemption rules apply). Private placement securities are generally considered to be restricted except for those securities traded between qualified institutional investors under the provisions of Rule 144A of the Securities Act of 1933, as amended (the “Securities Act”). However, the Company considers 144A securities to be restricted if those securities have been deemed illiquid. Disposal of these securities may involve time consuming negotiations and expense, and prompt sale at an acceptable price may be difficult. Restricted securities outstanding at October 31, 2016 are listed below:
Issuer Description | Acquisition Date | Acquisition Cost | Aggregate Value | Percentage of Net Assets | ||||||||||||
| TCW Core Fixed Income Fund | ||||||||||||||||
Alta Wind Holdings LLC, (144A), 7%, due 06/30/35 | 7/14/10 | $ | 1,193,584 | $ | 1,180,023 | 0.06 | % | |||||||||
| TCW Enhanced Commodity Strategy Fund | ||||||||||||||||
LB-UBS Commercial Mortgage Trust (06-C6 XCL), (144A), | 7/15/16 | $ | 3,198 | $ | 817 | 0.07 | % | |||||||||
| TCW Global Bond Fund | ||||||||||||||||
Bank of America-First Union NB Commercial Mortgage (01-3-XC), (144A), 1.438%, due 04/11/37 | 3/26/15 | $ | 8,003 | $ | 284 | 0.00 | % (1) | |||||||||
Morgan Stanley Capital I Trust (99-RM1-X), (144A), | 3/26/15 | 8,598 | 4,923 | 0.03 | % | |||||||||||
|
|
|
|
|
| |||||||||||
| $ | 16,601 | $ | 5,207 | 0.03 | % | |||||||||||
|
|
|
|
|
| |||||||||||
| (1) | Amount rounds to less than 0.01%. |
Note 11 — Indemnifications
Under the Company’s organizational documents, its Officers and Directors may be indemnified against certain liabilities and expenses arising out of the performance of their duties to the Company. In addition, the Company entered into an agreement with each of the Directors which provides that the Company will indemnify and hold harmless each Director against any expenses actually and reasonably incurred by any Director in any proceeding arising out of or in connection with the Director’s services to the Company, to the fullest extent permitted by the Company’s Articles of Incorporation and By-Laws, the Maryland General Corporation Law, the Securities Act, and the 1940 Act, each as now or hereinafter in force. Additionally, in the normal course of business, the Company enters into agreements with service providers that may contain indemnification clauses. The Company’s maximum exposure under these arrangements is unknown as this would involve future claims that may be made against the Company that have not yet occurred. However, based on experience, the Company expects the risk of loss to be remote. The Company has not accrued any liability in connection with such indemnification.
114
TCW Funds, Inc.
October 31, 2016 |
Note 12 — Recently Issued Accounting Pronouncements
In October 2016, the U.S. Securities and Exchange Commission adopted new rules and amended existing rules (together, “final rules”) intended to modernize the reporting and disclosure of information by registered investment companies. In part, the final rules amend Regulation S-X and require standardized, enhanced disclosure about derivatives in investment company financial statements, as well as other amendments. The compliance date for the amendments to Regulation S-X is August 1, 2017. Management is currently evaluating the impact that the adoption of the amendments to Regulation S-X will have on the Funds’ financial statements and related disclosures.
115
TCW Core Fixed Income Fund
Financial Highlights — I Class
| Year Ended October 31, | ||||||||||||||||||||
| 2016 | 2015 | 2014 | 2013 | 2012 | ||||||||||||||||
Net Asset Value per Share, Beginning of Year | $ | 11.14 | $ | 11.22 | $ | 10.97 | $ | 11.34 | $ | 10.90 | ||||||||||
|
|
|
|
|
|
|
|
|
| |||||||||||
Income (Loss) from Investment Operations: | ||||||||||||||||||||
Net Investment Income (1) | 0.19 | 0.18 | 0.21 | 0.21 | 0.24 | |||||||||||||||
Net Realized and Unrealized Gain (Loss) on Investments | 0.24 | (0.04 | ) | 0.24 | (0.27 | ) | 0.57 | |||||||||||||
|
|
|
|
|
|
|
|
|
| |||||||||||
Total from Investment Operations | 0.43 | 0.14 | 0.45 | (0.06 | ) | 0.81 | ||||||||||||||
|
|
|
|
|
|
|
|
|
| |||||||||||
Less Distributions: | ||||||||||||||||||||
Distributions from Net Investment Income | (0.19 | ) | (0.19 | ) | (0.20 | ) | (0.20 | ) | (0.28 | ) | ||||||||||
Distributions from Net Realized Gain | (0.10 | ) | (0.03 | ) | — | (0.11 | ) | (0.09 | ) | |||||||||||
|
|
|
|
|
|
|
|
|
| |||||||||||
Total Distributions | (0.29 | ) | (0.22 | ) | (0.20 | ) | (0.31 | ) | (0.37 | ) | ||||||||||
|
|
|
|
|
|
|
|
|
| |||||||||||
Net Asset Value per Share, End of Year | $ | 11.28 | $ | 11.14 | $ | 11.22 | $ | 10.97 | $ | 11.34 | ||||||||||
|
|
|
|
|
|
|
|
|
| |||||||||||
Total Return | 3.97 | % | 1.25 | % | 4.14 | % | (0.49 | )% | 7.57 | % | ||||||||||
Ratios/Supplemental Data: | ||||||||||||||||||||
Net Assets, End of Year (in thousands) | $ | 1,421,267 | $ | 1,109,630 | $ | 646,372 | $ | 589,911 | $ | 501,448 | ||||||||||
Ratio of Expenses to Average Net Assets: | ||||||||||||||||||||
Before Expense Reimbursement | 0.51 | % | 0.50 | % | 0.49 | % | 0.48 | % | 0.49 | % | ||||||||||
After Expense Reimbursement | 0.49 | % | 0.49 | % | 0.47 | % | 0.44 | % | 0.44 | % | ||||||||||
Ratio of Net Investment Income to Average Net Assets | 1.70 | % | 1.57 | % | 1.92 | % | 1.89 | % | 2.20 | % | ||||||||||
Portfolio Turnover Rate | 283.38 | % | 332.85 | % | 249.94 | % | 197.42 | % | 213.82 | % | ||||||||||
| (1) | Computed using average shares outstanding throughout the period. |
See accompanying notes to financial statements.
116
TCW Core Fixed Income Fund
Financial Highlights — N Class
| Year Ended October 31, | ||||||||||||||||||||
| 2016 | 2015 | 2014 | 2013 | 2012 | ||||||||||||||||
Net Asset Value per Share, Beginning of Year | $ | 11.12 | $ | 11.20 | $ | 10.97 | $ | 11.34 | $ | 10.91 | ||||||||||
|
|
|
|
|
|
|
|
|
| |||||||||||
Income (Loss) from Investment Operations: | ||||||||||||||||||||
Net Investment Income (1) | 0.16 | 0.14 | 0.18 | 0.17 | 0.21 | |||||||||||||||
Net Realized and Unrealized Gain (Loss) on Investments | 0.24 | (0.03 | ) | 0.22 | (0.25 | ) | 0.56 | |||||||||||||
|
|
|
|
|
|
|
|
|
| |||||||||||
Total from Investment Operations | 0.40 | 0.11 | 0.40 | (0.08 | ) | 0.77 | ||||||||||||||
|
|
|
|
|
|
|
|
|
| |||||||||||
Less Distributions: | ||||||||||||||||||||
Distributions from Net Investment Income | (0.17 | ) | (0.16 | ) | (0.17 | ) | (0.18 | ) | (0.25 | ) | ||||||||||
Distributions from Net Realized Gain | (0.10 | ) | (0.03 | ) | — | (0.11 | ) | (0.09 | ) | |||||||||||
|
|
|
|
|
|
|
|
|
| |||||||||||
Total Distributions | (0.27 | ) | (0.19 | ) | (0.17 | ) | (0.29 | ) | (0.34 | ) | ||||||||||
|
|
|
|
|
|
|
|
|
| |||||||||||
Net Asset Value per Share, End of Year | $ | 11.25 | $ | 11.12 | $ | 11.20 | $ | 10.97 | $ | 11.34 | ||||||||||
|
|
|
|
|
|
|
|
|
| |||||||||||
Total Return | 3.66 | % | 1.00 | % | 3.68 | % | (0.74 | )% | 7.21 | % | ||||||||||
Ratios/Supplemental Data: | ||||||||||||||||||||
Net Assets, End of Year (in thousands) | $ | 487,223 | $ | 542,103 | $ | 608,129 | $ | 698,223 | $ | 530,935 | ||||||||||
Ratio of Expenses to Average Net Assets: | ||||||||||||||||||||
Before Expense Reimbursement | 0.79 | % | 0.79 | % | 0.80 | % | 0.77 | % | 0.79 | % | ||||||||||
After Expense Reimbursement | 0.77 | % | 0.79 | %(2) | N/A | 0.77 | % (2) | 0.78 | % | |||||||||||
Ratio of Net Investment Income to Average Net Assets | 1.41 | % | 1.25 | % | 1.59 | % | 1.56 | % | 1.86 | % | ||||||||||
Portfolio Turnover Rate | 283.38 | % | 332.85 | % | 249.94 | % | 197.42 | % | 213.82 | % | ||||||||||
| (1) | Computed using average shares outstanding throughout the period. |
| (2) | Reimbursement is less than 0.01%. |
See accompanying notes to financial statements.
117
TCW Enhanced Commodity Strategy Fund
Financial Highlights — I Class
| Year Ended October 31, | ||||||||||||||||||||
| 2016 | 2015 | 2014 | 2013 | 2012 | ||||||||||||||||
Net Asset Value per Share, Beginning of Year | $ | 5.30 | $ | 7.18 | $ | 7.61 | $ | 8.58 | $ | 8.73 | ||||||||||
|
|
|
|
|
|
|
|
|
| |||||||||||
Income (Loss) from Investment Operations: | ||||||||||||||||||||
Net Investment Income (1) | 0.04 | 0.05 | 0.10 | 0.16 | 0.16 | |||||||||||||||
Net Realized and Unrealized Loss on Investments | (0.14 | ) | (1.87 | ) | (0.39 | ) | (0.92 | ) | (0.11 | ) | ||||||||||
|
|
|
|
|
|
|
|
|
| |||||||||||
Total from Investment Operations | (0.10 | ) | (1.82 | ) | (0.29 | ) | (0.76 | ) | 0.05 | |||||||||||
|
|
|
|
|
|
|
|
|
| |||||||||||
Less Distributions: | ||||||||||||||||||||
Distributions from Net Investment Income | (0.05 | ) | (0.06 | ) | (0.11 | ) | (0.16 | ) | (0.18 | ) | ||||||||||
Distributions from Net Realized Gain | — | — | (0.03 | ) | (0.05 | ) | (0.02 | ) | ||||||||||||
|
|
|
|
|
|
|
|
|
| |||||||||||
Total Distributions | (0.05 | ) | (0.06 | ) | (0.14 | ) | (0.21 | ) | (0.20 | ) | ||||||||||
|
|
|
|
|
|
|
|
|
| |||||||||||
Net Asset Value per Share, End of Year | $ | 5.15 | $ | 5.30 | $ | 7.18 | $ | 7.61 | $ | 8.58 | ||||||||||
|
|
|
|
|
|
|
|
|
| |||||||||||
Total Return | (1.83 | )% | (25.47 | )% | (3.90 | )% | (9.05 | )% | 0.55 | % | ||||||||||
Ratios/Supplemental Data: | ||||||||||||||||||||
Net Assets, End of Year (in thousands) | $ | 725 | $ | 1,443 | $ | 1,934 | $ | 2,013 | $ | 2,218 | ||||||||||
Ratio of Expenses to Average Net Assets: | ||||||||||||||||||||
Before Expense Reimbursement | 9.74 | % | 7.82 | % | 5.90 | % | 5.67 | % | 5.94 | % | ||||||||||
After Expense Reimbursement | 0.70 | % | 0.70 | % | 0.70 | % | 0.70 | % | 0.70 | % | ||||||||||
Ratio of Net Investment Income to Average Net Assets | 0.88 | % | 0.88 | % | 1.30 | % | 2.01 | % | 1.95 | % | ||||||||||
Portfolio Turnover Rate | 2.44 | % | 10.68 | % | 4.13 | % | 54.20 | % | 9.39 | % | ||||||||||
| (1) | Computed using average shares outstanding throughout the period. |
See accompanying notes to financial statements.
118
TCW Enhanced Commodity Strategy Fund
Financial Highlights — N Class
| Year Ended October 31, | ||||||||||||||||||||
| 2016 | 2015 | 2014 | 2013 | 2012 | ||||||||||||||||
Net Asset Value per Share, Beginning of Year | $ | 5.31 | $ | 7.18 | $ | 7.61 | $ | 8.58 | $ | 8.73 | ||||||||||
|
|
|
|
|
|
|
|
|
| |||||||||||
Income (Loss) from Investment Operations: | ||||||||||||||||||||
Net Investment Income (1) | 0.04 | 0.05 | 0.10 | 0.16 | 0.16 | |||||||||||||||
Net Realized and Unrealized Loss on Investments | (0.15 | ) | (1.86 | ) | (0.39 | ) | (0.92 | ) | (0.11 | ) | ||||||||||
|
|
|
|
|
|
|
|
|
| |||||||||||
Total from Investment Operations | (0.11 | ) | (1.81 | ) | (0.29 | ) | (0.76 | ) | 0.05 | |||||||||||
|
|
|
|
|
|
|
|
|
| |||||||||||
Less Distributions: | ||||||||||||||||||||
Distributions from Net Investment Income | (0.05 | ) | (0.06 | ) | (0.11 | ) | (0.16 | ) | (0.18 | ) | ||||||||||
Distributions from Net Realized Gain | — | — | (0.03 | ) | (0.05 | ) | (0.02 | ) | ||||||||||||
|
|
|
|
|
|
|
|
|
| |||||||||||
Total Distributions | (0.05 | ) | (0.06 | ) | (0.14 | ) | (0.21 | ) | (0.20 | ) | ||||||||||
|
|
|
|
|
|
|
|
|
| |||||||||||
Net Asset Value per Share, End of Year | $ | 5.15 | $ | 5.31 | $ | 7.18 | $ | 7.61 | $ | 8.58 | ||||||||||
|
|
|
|
|
|
|
|
|
| |||||||||||
Total Return | (2.03 | )% | (25.36 | )% | (3.92 | )% | (9.05 | )% | 0.55 | % | ||||||||||
Ratios/Supplemental Data: | ||||||||||||||||||||
Net Assets, End of Year (in thousands) | $ | 496 | $ | 1,153 | $ | 1,546 | $ | 1,609 | $ | 1,773 | ||||||||||
Ratio of Expenses to Average Net Assets: | ||||||||||||||||||||
Before Expense Reimbursement | 10.21 | % | 8.32 | % | 6.45 | % | 6.14 | % | 6.30 | % | ||||||||||
After Expense Reimbursement | 0.75 | % | 0.75 | % | 0.73 | % | 0.70 | % | 0.70 | % | ||||||||||
Ratio of Net Investment Income to Average Net Assets | 0.83 | % | 0.83 | % | 1.27 | % | 2.01 | % | 1.94 | % | ||||||||||
Portfolio Turnover Rate | 2.44 | % | 10.68 | % | 4.13 | % | 54.20 | % | 9.39 | % | ||||||||||
| (1) | Computed using average shares outstanding throughout the period. |
See accompanying notes to financial statements.
119
TCW Global Bond Fund
Financial Highlights — I Class
| Year Ended October 31, | November 30, 2011 (Commencement of Operations) through October 31, 2012 | |||||||||||||||||||
| 2016 | 2015 | 2014 | 2013 | |||||||||||||||||
Net Asset Value per Share, Beginning of Year | $ | 9.85 | $ | 10.26 | $ | 10.45 | $ | 10.97 | $ | 10.00 | ||||||||||
|
|
|
|
|
|
|
|
|
| |||||||||||
Income (Loss) from Investment Operations: | ||||||||||||||||||||
Net Investment Income (1) | 0.20 | 0.19 | 0.22 | 0.35 | 0.27 | |||||||||||||||
Net Realized and Unrealized Gain (Loss) on Investments | 0.19 | (0.49 | ) | (0.20 | ) | (0.40 | ) | 0.99 | ||||||||||||
|
|
|
|
|
|
|
|
|
| |||||||||||
Total from Investment Operations | 0.39 | (0.30 | ) | 0.02 | (0.05 | ) | 1.26 | |||||||||||||
|
|
|
|
|
|
|
|
|
| |||||||||||
Less Distributions: | ||||||||||||||||||||
Distributions from Net Investment Income | (0.22 | ) | (0.09 | ) | (0.13 | ) | (0.16 | ) | (0.29 | ) | ||||||||||
Distributions from Net Realized Gain | (0.14 | ) | (0.02 | ) | (0.08 | ) | (0.31 | ) | — | |||||||||||
|
|
|
|
|
|
|
|
|
| |||||||||||
Total Distributions | (0.36 | ) | (0.11 | ) | (0.21 | ) | (0.47 | ) | (0.29 | ) | ||||||||||
|
|
|
|
|
|
|
|
|
| |||||||||||
Net Asset Value per Share, End of Year | $ | 9.88 | $ | 9.85 | $ | 10.26 | $ | 10.45 | $ | 10.97 | ||||||||||
|
|
|
|
|
|
|
|
|
| |||||||||||
Total Return | 4.03 | % | (2.96 | )% | 0.21 | % | (0.46 | )% | 12.74 | % (2) | ||||||||||
Ratios/Supplemental Data: | ||||||||||||||||||||
Net Assets, End of Year (in thousands) | $ | 8,648 | $ | 7,878 | $ | 8,138 | $ | 11,170 | $ | 11,253 | ||||||||||
Ratio of Expenses to Average Net Assets: | ||||||||||||||||||||
Before Expense Reimbursement | 1.48 | % | 1.37 | % | 1.39 | % | 1.38 | % | 1.42 | % (3) | ||||||||||
After Expense Reimbursement | 1.05 | % | 1.08 | % | 1.12 | % | 1.14 | % | 1.15 | % (3) | ||||||||||
Ratio of Net Investment Income to Average Net Assets | 2.02 | % | 1.92 | % | 2.11 | % | 3.31 | % | 2.80 | % (3) | ||||||||||
Portfolio Turnover Rate | 116.87 | % | 147.16 | % | 125.54 | % | 135.67 | % | 165.46 | % (2) | ||||||||||
| (1) | Computed using average shares outstanding throughout the period. |
| (2) | For the period November 30, 2011 (Commencement of Operations) through October 31, 2012 and is not indicative of a full year’s operating results. |
| (3) | Annualized. |
See accompanying notes to financial statements.
120
TCW Global Bond Fund
Financial Highlights — N Class
| Year Ended October 31, | November 30, 2011 (Commencement of Operations) through October 31, 2012 | |||||||||||||||||||
| 2016 | 2015 | 2014 | 2013 | |||||||||||||||||
Net Asset Value per Share, Beginning of Year | $ | 9.85 | $ | 10.26 | $ | 10.45 | $ | 10.97 | $ | 10.00 | ||||||||||
|
|
|
|
|
|
|
|
|
| |||||||||||
Income (Loss) from Investment Operations: | ||||||||||||||||||||
Net Investment Income (1) | 0.20 | 0.19 | 0.22 | 0.35 | 0.27 | |||||||||||||||
Net Realized and Unrealized Gain (Loss) on Investments | 0.19 | (0.49 | ) | (0.20 | ) | (0.40 | ) | 0.99 | ||||||||||||
|
|
|
|
|
|
|
|
|
| |||||||||||
Total from Investment Operations | 0.39 | (0.30 | ) | 0.02 | (0.05 | ) | 1.26 | |||||||||||||
|
|
|
|
|
|
|
|
|
| |||||||||||
Less Distributions: | ||||||||||||||||||||
Distributions from Net Investment Income | (0.22 | ) | (0.09 | ) | (0.13 | ) | (0.16 | ) | (0.29 | ) | ||||||||||
Distributions from Net Realized Gain | (0.14 | ) | (0.02 | ) | (0.08 | ) | (0.31 | ) | — | |||||||||||
|
|
|
|
|
|
|
|
|
| |||||||||||
Total Distributions | (0.36 | ) | (0.11 | ) | (0.21 | ) | (0.47 | ) | (0.29 | ) | ||||||||||
|
|
|
|
|
|
|
|
|
| |||||||||||
Net Asset Value per Share, End of Year | $ | 9.88 | $ | 9.85 | $ | 10.26 | $ | 10.45 | $ | 10.97 | ||||||||||
|
|
|
|
|
|
|
|
|
| |||||||||||
Total Return | 4.03 | % | (2.96 | )% | 0.21 | % | (0.46 | )% | 12.74 | % (2) | ||||||||||
Ratios/Supplemental Data: | ||||||||||||||||||||
Net Assets, End of Year (in thousands) | $ | 7,586 | $ | 7,358 | $ | 7,565 | $ | 11,746 | $ | 11,602 | ||||||||||
Ratio of Expenses to Average Net Assets: | ||||||||||||||||||||
Before Expense Reimbursement | 1.76 | % | 1.64 | % | 1.67 | % | 1.62 | % | 1.68 | % (3) | ||||||||||
After Expense Reimbursement | 1.05 | % | 1.08 | % | 1.12 | % | 1.14 | % | 1.15 | % (3) | ||||||||||
Ratio of Net Investment Income to Average Net Assets | 2.02 | % | 1.92 | % | 2.12 | % | 3.30 | % | 2.79 | % (3) | ||||||||||
Portfolio Turnover Rate | 116.87 | % | 147.16 | % | 125.54 | % | 135.67 | % | 165.46 | % (2) | ||||||||||
| (1) | Computed using average shares outstanding throughout the period. |
| (2) | For the period November 30, 2011 (Commencement of Operations) through October 31, 2012 and is not indicative of a full year’s operating results. |
| (3) | Annualized. |
See accompanying notes to financial statements.
121
TCW High Yield Bond Fund
Financial Highlights — I Class
| Year Ended October 31, | ||||||||||||||||||||
| 2016 | 2015 | 2014 | 2013 | 2012 | ||||||||||||||||
Net Asset Value per Share, Beginning of Year | $ | 6.18 | $ | 6.35 | $ | 6.33 | $ | 6.30 | $ | 5.99 | ||||||||||
|
|
|
|
|
|
|
|
|
| |||||||||||
Income (Loss) from Investment Operations: | ||||||||||||||||||||
Net Investment Income (1) | 0.24 | 0.26 | 0.29 | 0.33 | 0.33 | |||||||||||||||
Net Realized and Unrealized Gain (Loss) on Investments | 0.06 | (0.15 | ) | 0.04 | 0.06 | 0.37 | ||||||||||||||
|
|
|
|
|
|
|
|
|
| |||||||||||
Total from Investment Operations | 0.30 | 0.11 | 0.33 | 0.39 | 0.70 | |||||||||||||||
|
|
|
|
|
|
|
|
|
| |||||||||||
Less Distributions: | ||||||||||||||||||||
Distributions from Net Investment Income | (0.25 | ) | (0.28 | ) | (0.31 | ) | (0.36 | ) | (0.37 | ) | ||||||||||
Distributions from Net Realized Gain | — | — | — | — | (0.02 | ) | ||||||||||||||
|
|
|
|
|
|
|
|
|
| |||||||||||
Total Distributions | (0.25 | ) | (0.28 | ) | (0.31 | ) | (0.36 | ) | (0.39 | ) | ||||||||||
|
|
|
|
|
|
|
|
|
| |||||||||||
Net Asset Value per Share, End of Year | $ | 6.23 | $ | 6.18 | $ | 6.35 | $ | 6.33 | $ | 6.30 | ||||||||||
|
|
|
|
|
|
|
|
|
| |||||||||||
Total Return | 5.06 | % | 1.74 | % | 5.25 | % | 6.44 | % | 12.03 | % | ||||||||||
Ratios/Supplemental Data: | ||||||||||||||||||||
Net Assets, End of Year (in thousands) | $ | 20,265 | $ | 20,791 | $ | 20,649 | $ | 26,102 | $ | 35,006 | ||||||||||
Ratio of Expenses to Average Net Assets: | ||||||||||||||||||||
Before Expense Reimbursement | 1.03 | % | 1.03 | % | 0.90 | % | 1.00 | % | 1.14 | % | ||||||||||
After Expense Reimbursement | 0.55 | % | 0.55 | % | 0.53 | % | 0.63 | % | N/A | |||||||||||
Ratio of Net Investment Income to Average Net Assets | 3.88 | % | 4.11 | % | 4.60 | % | 5.14 | % | 5.39 | % | ||||||||||
Portfolio Turnover Rate | 244.36 | % | 195.97 | % | 145.14 | % | 114.95 | % | 111.02 | % | ||||||||||
| (1) | Computed using average shares outstanding throughout the period. |
See accompanying notes to financial statements.
122
TCW High Yield Bond Fund
Financial Highlights — N Class
| Year Ended October 31, | ||||||||||||||||||||
| 2016 | 2015 | 2014 | 2013 | 2012 | ||||||||||||||||
Net Asset Value per Share, Beginning of Year | $ | 6.23 | $ | 6.41 | $ | 6.37 | $ | 6.35 | $ | 6.02 | ||||||||||
|
|
|
|
|
|
|
|
|
| |||||||||||
Income (Loss) from Investment Operations: | ||||||||||||||||||||
Net Investment Income (1) | 0.22 | 0.25 | 0.28 | 0.32 | 0.33 | |||||||||||||||
Net Realized and Unrealized Gain (Loss) on Investments | 0.07 | (0.17 | ) | 0.05 | 0.06 | 0.38 | ||||||||||||||
|
|
|
|
|
|
|
|
|
| |||||||||||
Total from Investment Operations | 0.29 | 0.08 | 0.33 | 0.38 | 0.71 | |||||||||||||||
|
|
|
|
|
|
|
|
|
| |||||||||||
Less Distributions: | ||||||||||||||||||||
Distributions from Net Investment Income | (0.24 | ) | (0.26 | ) | (0.29 | ) | (0.36 | ) | (0.36 | ) | ||||||||||
Distributions from Net Realized Gain | — | — | — | — | (0.02 | ) | ||||||||||||||
|
|
|
|
|
|
|
|
|
| |||||||||||
Total Distributions | (0.24 | ) | (0.26 | ) | (0.29 | ) | (0.36 | ) | (0.38 | ) | ||||||||||
|
|
|
|
|
|
|
|
|
| |||||||||||
Net Asset Value per Share, End of Year | $ | 6.28 | $ | 6.23 | $ | 6.41 | $ | 6.37 | $ | 6.35 | ||||||||||
|
|
|
|
|
|
|
|
|
| |||||||||||
Total Return | 4.82 | % | 1.34 | % | 5.24 | % | 6.12 | % | 12.11 | % | ||||||||||
Ratios/Supplemental Data: | ||||||||||||||||||||
Net Assets, End of Year (in thousands) | $ | 7,526 | $ | 15,910 | $ | 12,555 | $ | 14,620 | $ | 20,498 | ||||||||||
Ratio of Expenses to Average Net Assets: | ||||||||||||||||||||
Before Expense Reimbursement | 1.40 | % | 1.38 | % | 1.39 | % | 1.34 | % | 1.51 | % | ||||||||||
After Expense Reimbursement | 0.80 | % | 0.80 | % | 0.78 | % | 0.83 | % | 1.17 | % | ||||||||||
Ratio of Net Investment Income to Average Net Assets | 3.64 | % | 3.87 | % | 4.30 | % | 4.96 | % | 5.34 | % | ||||||||||
Portfolio Turnover Rate | 244.36 | % | 195.97 | % | 145.14 | % | 114.95 | % | 111.02 | % | ||||||||||
| (1) | Computed using average shares outstanding throughout the period. |
See accompanying notes to financial statements.
123
TCW Short Term Bond Fund
Financial Highlights — I Class
| Year Ended October 31, | ||||||||||||||||||||
| 2016 | 2015 | 2014 | 2013 | 2012 | ||||||||||||||||
Net Asset Value per Share, Beginning of Year | $ | 8.69 | $ | 8.75 | $ | 8.80 | $ | 8.85 | $ | 8.77 | ||||||||||
|
|
|
|
|
|
|
|
|
| |||||||||||
Income (Loss) from Investment Operations: | ||||||||||||||||||||
Net Investment Income (1) | 0.05 | 0.05 | 0.06 | 0.09 | 0.11 | |||||||||||||||
Net Realized and Unrealized Gain (Loss) on Investments | 0.02 | (0.03 | ) | 0.00 | (2) | (0.03 | ) | 0.13 | ||||||||||||
|
|
|
|
|
|
|
|
|
| |||||||||||
Total from Investment Operations | 0.07 | 0.02 | 0.06 | 0.06 | 0.24 | |||||||||||||||
|
|
|
|
|
|
|
|
|
| |||||||||||
Less Distributions: | ||||||||||||||||||||
Distributions from Net Investment Income | (0.06 | ) | (0.08 | ) | (0.11 | ) | (0.11 | ) | (0.15 | ) | ||||||||||
Distributions from Return of Capital | — | — | — | — | (0.01 | ) | ||||||||||||||
|
|
|
|
|
|
|
|
|
| |||||||||||
Total Distributions | (0.06 | ) | (0.08 | ) | (0.11 | ) | (0.11 | ) | (0.16 | ) | ||||||||||
|
|
|
|
|
|
|
|
|
| |||||||||||
Net Asset Value per Share, End of Year | $ | 8.70 | $ | 8.69 | $ | 8.75 | $ | 8.80 | $ | 8.85 | ||||||||||
|
|
|
|
|
|
|
|
|
| |||||||||||
Total Return | 0.84 | % | 0.25 | % | 0.65 | % | 0.67 | % | 2.74 | % | ||||||||||
Ratios/Supplemental Data: | ||||||||||||||||||||
Net Assets, End of Year (in thousands) | $ | 7,698 | $ | 9,614 | $ | 21,080 | $ | 15,202 | $ | 12,814 | ||||||||||
Ratio of Expenses to Average Net Assets: | ||||||||||||||||||||
Before Expense Reimbursement | 2.46 | % | 1.57 | % | 1.23 | % | 1.33 | % | 1.63 | % | ||||||||||
After Expense Reimbursement | 0.44 | % | 0.44 | % | 0.44 | % | 0.44 | % | 0.44 | % | ||||||||||
Ratio of Net Investment Income to Average Net Assets | 0.58 | % | 0.53 | % | 0.70 | % | 1.01 | % | 1.21 | % | ||||||||||
Portfolio Turnover Rate | 46.36 | % | 8.51 | % | 67.27 | % | 71.48 | % | 81.91 | % | ||||||||||
| (1) | Computed using average shares outstanding throughout the period. |
| (2) | Amount rounds to less than $0.01 per share. |
See accompanying notes to financial statements.
124
TCW Total Return Bond Fund
Financial Highlights — I Class
| Year Ended October 31, | ||||||||||||||||||||
| 2016 | 2015 | 2014 | 2013 | 2012 | ||||||||||||||||
Net Asset Value per Share, Beginning of Year | $ | 10.28 | $ | 10.31 | $ | 10.13 | $ | 10.27 | $ | 9.76 | ||||||||||
|
|
|
|
|
|
|
|
|
| |||||||||||
Income (Loss) from Investment Operations: | ||||||||||||||||||||
Net Investment Income (1) | 0.26 | 0.25 | 0.27 | 0.27 | 0.52 | |||||||||||||||
Net Realized and Unrealized Gain (Loss) on Investments | 0.11 | (0.02 | ) | 0.18 | 0.06 | 0.64 | ||||||||||||||
|
|
|
|
|
|
|
|
|
| |||||||||||
Total from Investment Operations | 0.37 | 0.23 | 0.45 | 0.33 | 1.16 | |||||||||||||||
|
|
|
|
|
|
|
|
|
| |||||||||||
Less Distributions: | ||||||||||||||||||||
Distributions from Net Investment Income | (0.25 | ) | (0.22 | ) | (0.27 | ) | (0.33 | ) | (0.63 | ) | ||||||||||
Distributions from Net Realized Gain | (0.07 | ) | (0.04 | ) | — | — | (0.02 | ) | ||||||||||||
Distributions from Return of Capital | — | — | — | (0.14 | ) | — | ||||||||||||||
|
|
|
|
|
|
|
|
|
| |||||||||||
Total Distributions | (0.32 | ) | (0.26 | ) | (0.27 | ) | (0.47 | ) | (0.65 | ) | ||||||||||
|
|
|
|
|
|
|
|
|
| |||||||||||
Net Asset Value per Share, End of Year | $ | 10.33 | $ | 10.28 | $ | 10.31 | $ | 10.13 | $ | 10.27 | ||||||||||
|
|
|
|
|
|
|
|
|
| |||||||||||
Total Return | 3.63 | % | 2.24 | % | 4.49 | % | 3.26 | % | 12.35 | % | ||||||||||
Ratios/Supplemental Data: | ||||||||||||||||||||
Net Assets, End of Year (in thousands) | $ | 8,042,194 | $ | 6,360,295 | $ | 6,129,426 | $ | 5,085,781 | $ | 5,837,581 | ||||||||||
Ratio of Expenses to Average Net Assets: | ||||||||||||||||||||
Before Expense Reimbursement | 0.60 | % | 0.60 | % | 0.59 | % | 0.57 | % | 0.57 | % | ||||||||||
After Expense Reimbursement | 0.49 | % | 0.49 | % | 0.47 | % | 0.44 | % | 0.44 | % | ||||||||||
Ratio of Net Investment Income to Average Net Assets | 2.55 | % | 2.46 | % | 2.65 | % | 2.60 | % | 5.21 | % | ||||||||||
Portfolio Turnover Rate | 318.48 | % | 287.85 | % | 201.30 | % | 190.79 | % | 123.43 | % | ||||||||||
| (1) | Computed using average shares outstanding throughout the period. |
See accompanying notes to financial statements.
125
TCW Total Return Bond Fund
Financial Highlights — N Class
| Year Ended October 31, | ||||||||||||||||||||
| 2016 | 2015 | 2014 | 2013 | 2012 | ||||||||||||||||
Net Asset Value per Share, Beginning of Year | $ | 10.60 | $ | 10.64 | $ | 10.45 | $ | 10.61 | $ | 10.09 | ||||||||||
|
|
|
|
|
|
|
|
|
| |||||||||||
Income (Loss) from Investment Operations: | ||||||||||||||||||||
Net Investment Income (1) | 0.24 | 0.23 | 0.25 | 0.24 | 0.52 | |||||||||||||||
Net Realized and Unrealized Gain (Loss) on Investments | 0.11 | (0.04 | ) | 0.19 | 0.07 | 0.65 | ||||||||||||||
|
|
|
|
|
|
|
|
|
| |||||||||||
Total from Investment Operations | 0.35 | 0.19 | 0.44 | 0.31 | 1.17 | |||||||||||||||
|
|
|
|
|
|
|
|
|
| |||||||||||
Less Distributions: | ||||||||||||||||||||
Distributions from Net Investment Income | (0.23 | ) | (0.19 | ) | (0.25 | ) | (0.33 | ) | (0.63 | ) | ||||||||||
Distributions from Net Realized Gain | (0.07 | ) | (0.04 | ) | — | — | (0.02 | ) | ||||||||||||
Distributions from Return of Capital | — | — | — | (0.14 | ) | — | ||||||||||||||
|
|
|
|
|
|
|
|
|
| |||||||||||
Total Distributions | (0.30 | ) | (0.23 | ) | (0.25 | ) | (0.47 | ) | (0.65 | ) | ||||||||||
|
|
|
|
|
|
|
|
|
| |||||||||||
Net Asset Value per Share, End of Year | $ | 10.65 | $ | 10.60 | $ | 10.64 | $ | 10.45 | $ | 10.61 | ||||||||||
|
|
|
|
|
|
|
|
|
| |||||||||||
Total Return | 3.35 | % | 1.83 | % | 4.24 | % | 2.96 | % | 12.03 | % | ||||||||||
Ratios/Supplemental Data: | ||||||||||||||||||||
Net Assets, End of Year (in thousands) | $ | 2,762,803 | $ | 2,399,850 | $ | 2,177,160 | $ | 2,492,073 | $ | 2,342,406 | ||||||||||
Ratio of Expenses to Average Net Assets: | ||||||||||||||||||||
Before Expense Reimbursement | 0.87 | % | 0.88 | % | 0.87 | % | 0.83 | % | 0.83 | % | ||||||||||
After Expense Reimbursement | 0.79 | % | 0.79 | % | 0.77 | % | 0.73 | % | 0.73 | % | ||||||||||
Ratio of Net Investment Income to Average Net Assets | 2.25 | % | 2.17 | % | 2.36 | % | 2.31 | % | 5.02 | % | ||||||||||
Portfolio Turnover Rate | 318.48 | % | 287.85 | % | 201.30 | % | 190.79 | % | 123.43 | % | ||||||||||
| (1) | Computed using average shares outstanding throughout the period. |
See accompanying notes to financial statements.
126
TCW Funds, Inc.
Report of Independent Registered Public Accounting Firm
To the Board of Directors and Shareholders of
TCW Funds, Inc.
Los Angeles, California
We have audited the accompanying statements of assets and liabilities, including the schedules of investments, of TCW Core Fixed Income Fund, TCW Global Bond Fund, TCW High Yield Bond Fund, TCW Short Term Bond Fund, and TCW Total Return Bond Fund and the consolidated statement of assets and liabilities, including the consolidated schedule of investments of TCW Enhanced Commodity Strategy Fund (collectively, the “TCW Fixed Income Funds”) (six of twenty-three funds comprising the TCW Funds, Inc.) as of October 31, 2016, and the related statements of operations for TCW Core Fixed Income Fund, TCW Global Bond Fund, TCW High Yield Bond Fund, TCW Short Term Bond Fund, and TCW Total Return Bond Fund and the related consolidated statement of operations for TCW Enhanced Commodity Strategy Fund for the year then ended, the statements of changes in net assets for TCW Core Fixed Income Fund, TCW Global Bond Fund, TCW High Yield Bond Fund, TCW Short Term Bond Fund, and TCW Total Return Bond Fund and the consolidated statement of changes in net assets for TCW Enhanced Commodity Strategy Fund for each of the two years in the period then ended, and the financial highlights for TCW Core Fixed Income Fund, TCW Global Bond Fund, TCW High Yield Bond Fund, TCW Short Term Bond Fund, and TCW Total Return Bond Fund and the consolidated financial highlights for TCW Enhanced Commodity Strategy Fund for each of the respective stated periods then ended. These financial statements and financial highlights are the responsibility of the TCW Fixed Income Funds’ management. Our responsibility is to express an opinion on these financial statements and financial highlights based on our audits.
We conducted our audits in accordance with the standards of the Public Company Accounting Oversight Board (United States). Those standards require that we plan and perform the audits to obtain reasonable assurance about whether the financial statements and financial highlights are free of material misstatement. The TCW Fixed Income Funds are not required to have, nor were we engaged to perform, an audit of their internal control over financial reporting. Our audits included consideration of internal control over financial reporting as a basis for designing audit procedures that are appropriate in the circumstances, but not for the purpose of expressing an opinion on the effectiveness of the TCW Fixed Income Funds’ internal control over financial reporting . Accordingly, we express no such opinion. An audit also includes examining, on a test basis, evidence supporting the amounts and disclosures in the financial statements, assessing the accounting principles used and significant estimates made by management, as well as evaluating the overall financial statement presentation. Our procedures included confirmation of securities owned as of October 31, 2016, by correspondence with custodian and brokers; where replies were not received from brokers, we performed other auditing procedures. We believe that our audits provide a reasonable basis for our opinion.
In our opinion, the financial statements and financial highlights for TCW Core Fixed Income Fund, TCW Global Bond Fund, TCW High Yield Bond Fund, TCW Short Term Bond Fund, and TCW Total Return Bond Fund and the consolidated financial statements and consolidated financial highlights for TCW Enhanced Commodity Strategy Fund referred to above present fairly, in all material respects, the financial position of each of the respective TCW Fixed Income Funds as of October 31, 2016, the results of their operations for the year then ended, and the changes in their net assets for each of the two years in the period then ended and the financial highlights for each of the respective stated periods then ended, in conformity with accounting principles generally accepted in the United States of America.

Los Angeles, California
December 21, 2016
127
TCW Funds, Inc.
Shareholder Expenses (Unaudited)
As a shareholder of a Fund, you incur ongoing operational costs of the Fund, including management fees and other fund expenses. The following example is intended to help you understand your ongoing costs (in dollars and cents) of investing in a Fund and to compare these costs with the ongoing costs of investing in other funds.
The example is based on an investment of $1,000 invested at the beginning of the period and held for the entire period from May 1, 2016 to October 31, 2016 (184 days).
Actual Expenses The first line under each Fund in the table below provides information about the actual account values and actual expenses. You may use the information in this line, together with the amount you invested, to estimate the expenses that you paid over the period. Simply divide your account value by $1,000 (for example, an $8,600 account value divided by $1,000 = 8.6), then multiply the result by the number in the first line for your Fund under the heading entitled “Expenses Paid During Period” to estimate the expenses you paid on your account during this period.
Hypothetical Example for Comparison Purposes The second line under each Fund in the table below provides information about the hypothetical expenses based on each Fund’s actual expense ratio and an assumed rate of return of 5% per year before expenses, which is not the Fund’s actual return. The hypothetical account value and expenses may not be used to estimate the actual ending account balance or expenses you paid for the period. You may use this information to compare the ongoing costs of investing in your Fund and other funds. To do so, compare this 5% hypothetical example with the 5% hypothetical examples that appear in the shareholder reports of the other funds.
TCW Funds, Inc. | Beginning Account Value May 1, 2016 | Ending Account Value October 31, 2016 | Annualized Expense Ratio | Expenses Paid During Period (May 1, 2016 to October 31, 2016) | ||||||||||||
| TCW Core Fixed Income Fund | ||||||||||||||||
I Class Shares | ||||||||||||||||
Actual | $ | 1,000.00 | $ | 1,015.10 | 0.49 | % | $ | 2.48 | ||||||||
Hypothetical (5% return before expenses) | 1,000.00 | 1,022.67 | 0.49 | % | 2.49 | |||||||||||
N Class Shares | ||||||||||||||||
Actual | $ | 1,000.00 | $ | 1,014.00 | 0.77 | % | $ | 3.90 | ||||||||
Hypothetical (5% return before expenses) | 1,000.00 | 1,021.27 | 0.77 | % | 3.91 | |||||||||||
| TCW Enhanced Commodity Strategy Fund | ||||||||||||||||
I Class Shares | ||||||||||||||||
Actual | $ | 1,000.00 | $ | 1,000.60 | 0.70 | % | $ | 3.52 | ||||||||
Hypothetical (5% return before expenses) | 1,000.00 | 1,021.62 | 0.70 | % | 3.56 | |||||||||||
N Class Shares | ||||||||||||||||
Actual | $ | 1,000.00 | $ | 998.70 | 0.75 | % | $ | 3.77 | ||||||||
Hypothetical (5% return before expenses) | 1,000.00 | 1,021.37 | 0.75 | % | 3.81 | |||||||||||
| TCW Global Bond Fund | ||||||||||||||||
I Class Shares | ||||||||||||||||
Actual | $ | 1,000.00 | $ | 999.00 | 1.04 | % | $ | 5.23 | ||||||||
Hypothetical (5% return before expenses) | 1,000.00 | 1,019.91 | 1.04 | % | 5.28 | |||||||||||
N Class Shares | ||||||||||||||||
Actual | $ | 1,000.00 | $ | 999.00 | 1.04 | % | $ | 5.23 | ||||||||
Hypothetical (5% return before expenses) | 1,000.00 | 1,019.91 | 1.04 | % | 5.28 | |||||||||||
128
TCW Funds, Inc.
TCW Funds, Inc. | Beginning Account Value May 1, 2016 | Ending Account Value October 31, 2016 | Annualized Expense Ratio | Expenses Paid During Period (May 1, 2016 to October 31, 2016) | ||||||||||||
| TCW High Yield Bond Fund | ||||||||||||||||
I Class Shares | ||||||||||||||||
Actual | $ | 1,000.00 | $ | 1,039.00 | 0.55 | % | $ | 2.82 | ||||||||
Hypothetical (5% return before expenses) | 1,000.00 | 1,022.37 | 0.55 | % | 2.80 | |||||||||||
N Class Shares | ||||||||||||||||
Actual | $ | 1,000.00 | $ | 1,038.00 | 0.80 | % | $ | 4.10 | ||||||||
Hypothetical (5% return before expenses) | 1,000.00 | 1,021.12 | 0.80 | % | 4.06 | |||||||||||
| TCW Short Term Bond Fund | ||||||||||||||||
I Class Shares | ||||||||||||||||
Actual | $ | 1,000.00 | $ | 1,004.70 | 0.44 | % | $ | 2.22 | ||||||||
Hypothetical (5% return before expenses) | 1,000.00 | 1,022.93 | 0.44 | % | 2.24 | |||||||||||
| TCW Total Return Bond Fund | ||||||||||||||||
I Class Shares | ||||||||||||||||
Actual | $ | 1,000.00 | $ | 1,016.50 | 0.49 | % | $ | 2.48 | ||||||||
Hypothetical (5% return before expenses) | 1,000.00 | 1,022.67 | 0.49 | % | 2.49 | |||||||||||
N Class Shares | ||||||||||||||||
Actual | $ | 1,000.00 | $ | 1,015.10 | 0.79 | % | $ | 4.00 | ||||||||
Hypothetical (5% return before expenses) | 1,000.00 | 1,021.17 | 0.79 | % | 4.01 | |||||||||||
129
TCW Funds, Inc.
Our Privacy Policy
We, The TCW Group, Inc. and its subsidiaries, the TCW Funds, Inc., TCW Alternative Funds, TCW Strategic Income Fund, Inc. and the Metropolitan West Funds (collectively, “TCW”) are committed to protecting the nonpublic personal and financial information of our customers and consumers who obtain or seek to obtain financial products or services primarily for personal, family or household purposes. We fulfill our commitment by establishing and implementing policies and systems to protect the security and confidentiality of this information.
In our offices, we limit access to nonpublic personal and financial information about you to those TCW personnel who need to know the information in order to provide products or services to you. We maintain physical, electronic and procedural safeguards to protect your nonpublic personal and financial information.
What You Should Know
At TCW, we recognize the importance of keeping information about you secure and confidential. We do not sell or share your nonpublic personal and financial information with marketers or others outside our affiliated group of companies.
We carefully manage information among our affiliated group of companies to safeguard your privacy and to provide you with consistently excellent service.
We are providing this notice to you to comply with the requirements of Regulation S-P, “Privacy of Consumer Financial Information,” issued by the United States Securities and Exchange Commission.
Categories of Information We Collect
We may collect the following types of nonpublic personal and financial information about you from the following sources:
| • | Your name, address and identifying numbers, and other personal and financial information, from you and from identification cards and papers you submit to us, on applications, subscription agreements or other forms or communications. |
| • | Information about your account balances and financial transactions with us, our affiliated entities, or nonaffiliated third parties, from our internal sources, from affiliated entities and from nonaffiliated third parties. |
| • | Information about your account balances and financial transactions and other personal and financial information, from consumer credit reporting agencies or other nonaffiliated third parties, to verify information received from you or others. |
Categories of Information We Disclose to Nonaffiliated Third Parties
| • | We may disclose your name, address and account and other identifying numbers, as well as information about your pending or past transactions and other personal financial information, to nonaffiliated third parties, for our everyday business purposes such as necessary to execute, process, service and confirm your securities transactions and mutual fund transactions, to administer and service your account and commingled investment vehicles in which you are invested, to market our products and services through joint marketing arrangements or to respond to court orders and legal investigations. |
130
TCW Funds, Inc.
| • | We may disclose nonpublic personal and financial information concerning you to law enforcement agencies, federal regulatory agencies, self-regulatory organizations or other nonaffiliated third parties, if required or requested to do so by a court order, judicial subpoena or regulatory inquiry. |
We do not otherwise disclose your nonpublic personal and financial information to nonaffiliated third parties, except where we believe in good faith that disclosure is required or permitted by law. Because we do not disclose your nonpublic personal and financial information to nonaffiliated third parties, our Customer Privacy Policy does not contain opt-out provisions.
Categories of Information We Disclose to Our Affiliated Entities
| • | We may disclose your name, address and account and other identifying numbers, account balances, information about your pending or past transactions and other personal financial information to our affiliated entities for any purpose. |
| • | We regularly disclose your name, address and account and other identifying numbers, account balances and information about your pending or past transactions to our affiliates to execute, process and confirm securities transactions or mutual fund transactions for you, to administer and service your account and commingled investment vehicles in which you are invested, or to market our products and services to you. |
Information About Former Customers
We do not disclose nonpublic personal and financial information about former customers to nonaffiliated third parties unless required or requested to do so by a court order, judicial subpoena or regulatory inquiry, or otherwise where we believe in good faith that disclosure is required or permitted by law.
Questions
Should you have any questions about our Customer Privacy Policy, please contact us by email or by regular mail at the address at the end of this policy.
Reminder About TCW’s Financial Products
Financial products offered by The TCW Group, Inc. and its subsidiaries, the TCW Funds, Inc., TCW Alternative Funds, TCW Strategic Income Fund, Inc. and the Metropolitan West Funds:
| • | Are not guaranteed by a bank; |
| • | Are not obligations of The TCW Group, Inc. or of its subsidiaries; |
| • | Are not insured by the Federal Deposit Insurance Corporation; and |
| • | Are subject to investment risks, including possible loss of the principal amount committed or invested, and earnings thereon. |
THE TCW GROUP, INC
TCW FUNDS, INC.
TCW ALTERNATIVE FUNDS
TCW STRATEGIC INCOME FUND, INC.
METROPOLITAN WEST FUNDS
Attention: Privacy Officer | 865 South Figueroa St. Suite 1800 | Los Angeles, CA 90017 |
email: privacy@tcw.com
131
TCW Funds, Inc.
Approval of Investment Management and Advisory Agreement
TCW Funds, Inc. (the “Corporation”) and TCW Investment Management Company LLC (the “Advisor”) are parties to an Investment Advisory and Management Agreement (“Current Agreement”), pursuant to which the Advisor is responsible for managing the investments of each separate investment series (each, a “Fund” and collectively, the “Funds”) of the Corporation. The Current Agreement continues in effect from year to year provided that such continuance is specifically approved at least annually by the Board of Directors of the Corporation (the “Board”), including the directors who are not “interested persons” of either the Corporation or the Advisor (the “Independent Directors”). The Current Agreement terminates automatically in the event of its assignment.
At a meeting held on September 26, 2016, the Board, including the Independent Directors, approved the continuation of the Current Agreement with respect to each Fund for an additional one-year term from when it otherwise would expire.
Continuation of the Current Agreement
The Advisor provided materials to the Board in advance of meetings held on September 7, 2016 and September 26, 2016 (the “Current Agreement Materials”) for their evaluation of the Current Agreement in response to information requested by the Independent Directors, who were advised by counsel to the Independent Directors with respect to these and other relevant matters. In addition, the Independent Directors met separately with counsel to the Independent Directors to consider the information provided. As a result of those meetings and their other meetings, the Board (including a majority of the Independent Directors voting separately) approved the continuation of the Current Agreement based on the recommendation of the Independent Directors. In deciding to recommend the renewal of the Current Agreement with respect to each Fund, the Independent Directors did not identify any single or particular piece of information that, in isolation, was the controlling factor. Each Independent Director may also have weighed factors differently. This summary describes the most important, but not all, of the factors considered by the Board.
Nature, Extent, and Quality of Services The Independent Directors considered the general nature, extent, and quality of services provided and expected to be provided by the Advisor. The Independent Directors evaluated the Advisor’s experience in serving as manager of the Funds, and considered the benefits to shareholders of investing in a fund complex that is served by a large investment management organization where the Advisor and its affiliates also serve a variety of other investment advisory clients, including separate accounts, other pooled investment vehicles, registered investment companies and commingled funds. The Independent Directors also considered the ability of the Advisor to provide appropriate levels of support and resources to the Funds. The Independent Directors noted the Advisor’s responsibility to supervise the activities of the Funds’ various service providers, as well as to support the Independent Directors and their meetings, prepare regulatory filings, and provide various operational personnel.
In addition, the Independent Directors took note of the background and experience of the senior management and portfolio management personnel of the Advisor and that the Advisor provides and is expected to continue to provide substantial expertise and attention to the Funds as well as resources and infrastructure, noting also the Advisor’s description of its stable team and deep bench of personnel. The Independent Directors considered the ability of the Advisor to attract and retain qualified business professionals and its compensation program, noting in particular the Advisor’s recent hiring of professionals in various areas over the past several years, including additional analysts on the equity research team and emerging markets team, a new Chief Data Officer, upgrading resources in the middle
132
TCW Funds, Inc.
office and back office operations and other areas, as well as its continuing and extensive program of infrastructure and systems enhancements. The Independent Directors also considered the breadth of the compliance programs of the Advisor, as well as the compliance operations of the Advisor with respect to the Funds. The Independent Directors concluded that they were satisfied with the nature, extent and quality of the services provided and anticipated to be provided to the Funds by the Advisor under the Current Agreement.
Investment Performance The Independent Directors reviewed information about each Fund’s historical performance, including materials prepared by the Advisor and a Report prepared by Broadridge, an independent third party consultant, which provided a comparative analysis of each Fund with the performance of similar funds over one-, three-, five- and ten-year periods, as applicable. The Independent Directors noted that investment performance of most of the Funds was generally consistent with or above the median performance of the applicable Lipper peer group during most periods covered in the Report. They noted, however, that the investment performance of each of the TCW Select Equities Fund, TCW Relative Value Large Cap Fund, TCW Relative Value Mid Cap Fund, TCW Small Cap Growth Fund, TCW Growth Equities Fund, TCW Short Term Bond Fund, TCW International Small Cap Fund, TCW High Dividend Equities Fund, TCW Global Real Estate Fund, TCW Relative Value Dividend Appreciation Fund, TCW International Growth Fund and TCW Focused Equities Fund (formerly known as TCW Concentrated Value Fund) was in the fourth or fifth quintile of the applicable Lipper peer group for one or more periods covered in the Report. The Independent Directors noted the recent underperformance of these Funds and reviewed the actions taken by the Advisor to address such underperformance. The Independent Directors concluded that the Advisor should continue to provide investment advisory and management services to the Funds. The Independent Directors indicated that they would continue to monitor portfolio investment performance on a regular basis and discuss with the Advisor from time to time any instances of long-term underperformance as appropriate.
Advisory Fees and Profitability The Independent Directors considered information in the materials prepared by Lipper and the Advisor regarding the advisory fees charged to the Funds, advisory fees paid by other funds in the Funds’ respective peer groups, and advisory fees paid to the Advisor under advisory contracts with respect to other institutional clients. The Independent Directors noted that the investment advisory fees charged by the Advisor to many of the Funds were near or below the medians of their respective Lipper peer groups. They also noted, however, that the investment advisory fees of the TCW Select Equities Fund, TCW Small Cap Growth Fund, TCW SMID Cap Growth Fund, TCW Relative Value Dividend Appreciation Fund, TCW Relative Value Large Cap Fund, TCW Emerging Markets Income Fund, TCW Emerging Markets Multi-Asset Opportunities Fund and TCW Emerging Markets Local Currency Income Fund were above the medians of their respective Lipper peer groups. The Independent Directors reviewed related materials prepared the Advisor. The Independent Directors also noted that the advisory fees charged by the Advisor to many of the Funds are higher than the advisory fees charged by the Advisor to certain institutional separate accounts with similar strategies managed by the Advisor, but that the services provided the Funds are more extensive than the services provided to institutional separate accounts. The Independent Directors reviewed and discussed with the Advisor those additional services.
The Independent Directors noted that the total expenses of the Funds are near or below median expenses of the other funds in their respective peer groups. They considered that the Advisor has agreed to reduce its investment advisory fee or pay the operating expenses of each Fund in order to maintain the overall expense ratios of the Funds at competitive levels, and the amounts paid or waived by the Advisor pursuant
133
TCW Funds, Inc.
Approval of Investment Management and Advisory Agreement (Continued)
to expense limitations. The Independent Directors also considered the costs of services provided to the Funds by the Advisor and profits realized by the Advisor and its affiliates from their relationship with the Funds. Recognizing the difficulty in evaluating a manager’s profitability with respect to the funds it manages in the context of a manager with multiple lines of business, and noting that other profitability evaluation methodologies might also be reasonable, the Independent Directors concluded that the profits of the Advisor from its relationship with the Funds was reasonable. Based on these various considerations, the Independent Directors concluded that the contractual management fees of the Funds under the Investment Advisory and Management Agreement are fair and bear a reasonable relationship to the services rendered by the Advisor.
Expenses and Economies of Scale The Independent Directors considered the potential of the Advisor and the Funds to achieve economies of scale as the Funds grow in size. The Independent Directors noted that the Advisor has agreed to contractual expense limitation agreements, which are designed to maintain the overall expense ratio of each of the Fund at a competitive level. The Independent Directors were satisfied with the explanation for Funds with total expense ratios exceeding their peer group medians, such as the small size of the Fund or an expense ratio relatively near the median level. The Independent Directors also received information about the extent to which the Advisor has shared economies of scale through the reinvestment of profits into the advisory business of the Advisor and its affiliates, which benefits the Funds. The Independent Directors also considered the relative advantages and disadvantages of an advisory fee with breakpoints compared to a flat advisory fee supplemented by advisory fee waivers and/or expense reimbursements. The Independent Directors concluded that the current fee arrangements were appropriate given the current size and structure of the Funds and adequately reflected any economies of scale.
Ancillary Benefits The Independent Directors considered ancillary benefits to be received by the Advisor and its affiliates as a result of the relationship of the Advisor with the Funds, including compensation for certain compliance support services. The Independent Directors noted that, in addition to the fees the Advisor receives under the Current Agreement, the Advisor receives additional benefits in connection with management of the Funds in the form of reports, research and other services from brokers and their affiliates in return for brokerage commissions paid to such brokers. The Independent Directors concluded that any potential benefits to be derived by the Advisor from its relationships with the Funds are reasonably related to the services provided by the Advisor to the Funds.
Conclusions Based on their overall review, including their consideration of each of the factors referred to above (and others), the Board and the Independent Directors concluded that the Current Agreement is fair and reasonable to each Fund and its shareholders, that the Fund’s shareholders received reasonable value in return for the advisory fees and other amounts paid to the Advisor by each Fund, and that the renewal of the Current Agreement was in the best interests of each Fund and its shareholders.
134
TCW Funds, Inc.
Proxy Voting Guidelines
The policies and procedures that the Company uses to determine how to vote proxies are available without charge. The Board has delegated the Company’s proxy voting authority to the Advisor.
Disclosure of Proxy Voting Guidelines
The proxy voting guidelines of the Advisor are available:
| 1. | By calling 800-FUND-TCW (800-386-3829) to obtain a hard copy; or |
| 2. | By going to the SEC website at http://www.sec.gov. |
When the Company receives a request for a description of the Advisor’s proxy voting guidelines, it will deliver the description that is disclosed in the Company’s Statement of Additional Information. This information will be sent out via first class mail (or other means designed to ensure equally prompt delivery) within three business days of receiving the request.
The Advisor, on behalf of the Company, prepares and files Form N-PX with the SEC not later than August 31 of each year, which includes the Company’s proxy voting record for the most recent twelve-month period ended June 30 of that year. The Company’s proxy voting record for the most recent twelve-month period ended June 30 is available:
| 1. | By calling 800-FUND-TCW (800-386-3829) to obtain a hard copy; or |
| 2. | By going to the SEC website at http://www.sec.gov. |
When the Company receives a request for the Company’s proxy voting record, it will send the information disclosed in the Company’s most recently filed report on Form N-PX via first class mail (or other means designed to ensure equally prompt delivery) within three business days of receiving the request.
The Company also discloses its proxy voting record on its website as soon as is reasonably practicable after its report on Form N-PX is filed with the SEC.
Availability of Quarterly Portfolio Schedule
The Company files a complete schedule of its portfolio holdings with the SEC for the first and third quarters of its fiscal year on Form N-Q. The Form N-Q is available by calling 800-FUND-TCW (800-386-3829) to obtain a hard copy. You may also obtain the Company’s Form N-Q:
| 1. | By going to the SEC website at http://www.sec.gov.; or |
| 2. | By visiting the SEC’s Public Reference Room in Washington, D.C. and photocopying it (Phone 1-800-SEC-0330 for information on the operation of the SEC’s Public Reference Room). |
135
TCW Funds, Inc.
Tax Information Notice (Unaudited)
On account of the year ended October 31, 2016, the following Funds paid a capital gain distribution within the meaning 852 (b) (3) (c) of the Code. Each Fund also designates as a capital gain distribution a portion of earnings and profits paid to shareholders in redemption of their shares.
Fund | Amounts per Share | |||
TCW Core Fixed Income Fund | $ | 0.01 | ||
TCW Global Bond Fund | $ | 0.09 | ||
TCW Total Return Bond Fund | $ | 0.03 | ||
This information is given to meet certain requirements of the Code and should not be used by shareholders for preparing their income tax returns. In February 2017, shareholders will receive Form 1099-DIV which will show the actual distribution received and include their share of qualified dividends during the calendar year of 2016. Shareholders are advised to check with their tax advisors for information on the treatment of these amounts on their individual tax returns.
136
TCW Funds, Inc.
Directors and Officers of the Company
A board of nine directors is responsible for overseeing the operations of the Company, which consists of 23 Funds at October 31, 2016. The directors of the Company, and their business addresses and their principal occupation for the last five years are set forth below.
Independent Directors
Name, and Year of Birth (1) | Term of Office and Length of Time Served | Principal Occupation(s) During Past 5 Years | Other Directorships held by Director | |||
| Samuel P. Bell (1936) | Indefinite term; Mr. Bell has served as a director of TCW Funds, Inc. since October 2002. | Private Investor. | Point 360 (post production services); TCW Strategic Income Fund, Inc. (closed-end fund). | |||
| John A. Gavin (1931) | Indefinite term; Mr. Gavin has served as a director of TCW Funds, Inc. since May 2001. | Founder and Chairman of Gamma Holdings (international capital consulting firm). | TCW Strategic Income Fund, Inc. (closed-end fund); Hotchkis and Wiley Funds (mutual fund). | |||
Patrick C. Haden (1953) Chairman of the Board | Indefinite term; Mr. Haden has served as a director of TCW Funds, Inc. since May 2001. | Senior Advisor to President (since July 2016). and Athletic Director (2010-June 2016), University of Southern California. | Tetra Tech, Inc. (environmental consulting); The Rose Hills Foundation (charitable foundation); Unihealth Foundation (charitable foundation); Fletcher Jones Foundation (charitable foundation); Mayr Foundation (charitable foundation); First Beverage (beverage consulting); Auto Club (affiliate of AAA); Metropolitan West Funds (mutual fund); TCW Alternative Funds (mutual fund); TCW Strategic Income Fund, Inc. (closed-end fund). | |||
| Peter McMillan (1957) | Indefinite term; Mr. McMillan has served as a director of TCW Funds, Inc. since August 2010. | Co-founder, Managing Partner and Chief Investment Officer (since May 2013), Temescal Canyon Partners (investment advisory firm); Co-founder and Managing Partner (since 2000) Willowbrook Capital Group, LLC (investment advisory firm); Co-founder and Executive Vice President (since 2005), KBS Capital Advisors (a manager of real estate investment trusts). | KBS Real Estate Investment Trusts (real estate investments); KBS Strategic Opportunity REITs (real estate investments); Metropolitan West Funds (mutual funds); TCW Strategic Income Fund, Inc. (closed-end fund); TCW Alternative Funds (mutual fund). | |||
| Charles A. Parker (1934) | Indefinite term; Mr. Parker has served as a director of the TCW Funds, Inc. since April 2003. | Private Investor. | Burridge Center for Research in Security Prices (University of Colorado); TCW Strategic Income Fund, Inc. (closed-end fund). | |||
| Victoria B. Rogers (1961) | Indefinite term; Ms. Rogers has served as a director of the TCW Funds, Inc. since October 2011. | President, The Rose Hills Foundation. (charitable foundation) | Causeway Capital Management Trust (mutual fund); TCW Strategic Income Fund, Inc. (closed-end fund). | |||
| Andrew Tarica (1959) | Indefinite term; Mr. Tarica has served as a director of the TCW Funds, Inc. since March 2012. | Chief Executive Officer, Meadowbrook Capital Management (asset management company); Employee, Cowen & Co. (broker-dealer). | Metropolitan West Funds (mutual fund); TCW Strategic Income Fund, Inc. (closed-end fund); TCW Alternative Funds (mutual fund). |
| (1) | The address of each Independent Director is c/o Morgan Lewis, & Bockius LLP, Counsel to the Independent Directors, 300 South Grand Avenue, 22nd floor, Los Angeles, CA 90071. |
137
TCW Funds, Inc.
Interested Directors
Each of these directors are “interested persons” of the Company as defined in the 1940 Act because they are directors and officers of the Advisor, and shareholders and directors of The TCW Group, Inc., the parent company of the Advisor.
Name and Year of Birth | Term of Office and Length of Time Served | Principal Occupation(s) During Past 5 Years | Other Directorships held by Director | |||
| Marc I. Stern (1944) | Indefinite term; Mr. Stern has served as a director since inception of TCW Funds, Inc. in September 1992. | Chairman (since January 2016), TCW LLC; Chairman (since February 2013), The TCW Group, Inc., TCW Investment Management Company LLC, TCW Asset Management Company LLC and Metropolitan West Asset Management, LLC; Chief Executive Officer and Chairman (December 2009 to February 2013), TCW Investment Management Company LLC; Vice Chairman and Chief Executive Officer (December 2009 to August 2012), The TCW Group, Inc. (December 2009 to February 2013 and December 2009 to February 2013) TCW Asset Management Company LLC; Vice Chairman and President (November 2010 to February 2013); Vice Chairman (November 2010 to December 2014) and Chairman (since December 2014), Trust Company of the West. | Qualcomm Incorporated (wireless communications) | |||
| David S. DeVito (1962) | Indefinite term; Mr. DeVito has served as a director since January 2014. | Executive Vice President and Chief Operating Officer (since January 2016), TCW LLC; President and Chief Executive Officer (since 2015), TCW Alternative Funds; Executive Vice President and Chief Operating Officer (since October 2013), TCW Investment Management Company LLC, The TCW Group, Inc., Trust Company of the West, Metropolitan West Asset Management, LLC and TCW Asset Management Company LLC; President and Chief Executive Officer (since January 2014), TCW Strategic Income Fund, Inc. ; Executive Vice President and Chief Financial Officer (since 2010), Metropolitan West Funds. | TCW Strategic Income Fund, Inc. (closed-end fund) |
138
TCW Funds, Inc.
Directors and Officers of the Company (Continued)
The officers of the Company who are not directors of the Company are:
| Name and Year of Birth | Position(s) Held with Company | Principal Occupation(s) During Past 5 Years (1) | ||
| Peter A. Brown (1955) | Senior Vice President | Managing Director (since January 2016), TCW LLC; Managing Director (since February 1998), TCW Investment Management Company LLC, The TCW Group Inc., Trust Company of the West and TCW Asset Management Company LLC; Senior Vice President (since August 2007), TCW Strategic Income Fund, Inc. | ||
| Meredith S. Jackson (1959) | Senior Vice President, General Counsel and Secretary | Executive Vice President, General Counsel and Secretary (since January 2016), TCW LLC; Senior Vice President, General Counsel and Secretary (since 2015), TCW Alternative Funds; Executive Vice President, General Counsel and Secretary (since February 2013), TCW Investment Management Company LLC, The TCW Group Inc., Trust Company of the West, TCW Asset Management Company LLC and Metropolitan West Asset Management, LLC; Senior Vice President, General Counsel and Secretary (since February 2013), TCW Strategic Income Fund, Inc. and Metropolitan West Funds; Partner and Chair of the Debt Finance Practice Group (1999 – January 2013), Irell & Manella (law firm). | ||
| Jeffrey Engelsman (1967) | Chief Compliance Officer | Global Chief Compliance Officer (since January 2016), TCW LLC; Chief Compliance Officer (since 2015), TCW Alternative Funds; Managing Director, Global Chief Compliance Officer (since August 2014), TCW Investment Management Company LLC, The TCW Group Inc., Trust Company of the West and TCW Asset Management Company LLC, Metropolitan West Asset Management, LLC – Global Chief Compliance Officer (December 2014); Chief Compliance Officer (since September 2014), TCW Strategic Income Fund, Inc.; Chief Compliance Officer (2009 – August 2014), MainStay Funds (mutual fund); Managing Director (2009 – July 2014), New York Life Investments (investment management). |
139
TCW Funds, Inc.
| Name and Year of Birth | Position(s) Held with Company | Principal Occupation(s) During Past 5 Years (1) | ||
| Richard Villa (1964) | Treasurer and Chief Financial Officer | Managing Director, Chief Financial Officer and Assistant Secretary (since January 2016), TCW LLC; Treasurer (since 2015), TCW Alternative Funds; Treasurer and Chief Financial Officer (since January 2014), TCW Strategic Income Fund, Inc.; Managing Director and Chief Financial Officer (since July 2008),TCW Investment Management Company LLC, the TCW Group, Inc., Trust Company of the West, TCW Asset Management Company LLC, and Metropolitan West Asset Management, LLC. |
| (1) | Positions with The TCW Group, Inc. and its affiliates may have changed over time. |
| * | Address is 865 South Figueroa Street, 18th Floor, Los Angeles, California 90017 |
In addition, George N. Winn, Senior Vice President of Trust Company of the West, TCW Asset Management Company LLC, Metropolitan West Asset Management, LLC, TCW LLC and the Advisor, is Assistant Treasurer of TCW Alternative Funds and the Corporation; and Patrick W. Dennis, Senior Vice President and Associate General Counsel of Trust Company of the West, TCW Asset Management Company LLC, Metropolitan West Asset Management, LLC, TCW LLC and the Advisor, is Assistant Secretary of TCW Alternative Funds and the Corporation.
The SAI (Statement of Additional Information) has additional information regarding the Board of Directors. A copy is available without charge by calling 1-800-FUND-TCW (1-800-386-3829) to obtain a hard copy or by going to the SEC website at http://www.sec.gov.
140
TCW Funds, Inc.
Disclaimers for Use of Bloomberg Barclays Indexes
BARCLAYS is a trademark and service mark of Barclays Bank Plc, used under license. Barclays Capital Inc. and its affiliates (“Barclays”) is not the issuer or producer of TCW Funds, Inc. and Barclays has no responsibilities, obligations or duties to investors in TCW Funds, Inc. (the “Funds”). Barclays’ only relationship with the Funds is the licensing of the BARCLAYS mark as part of the name of the respective Barclays Indexes, which Barclays does not determine, compose or calculate. Additionally, the Funds may for itself execute transaction(s) with Barclays in or relating to the Indexes used in connection with the Funds. Investors who acquire the Funds neither acquire any interest in the Indexes nor enter into any relationship of any kind whatsoever with Barclays upon making an investment in the Funds. The Funds are not sponsored, endorsed, sold or promoted by Barclays. Barclays does not make any representation or warranty, express or implied regarding the advisability of investing in the Funds or the advisability of investing in securities generally or the ability of the Indexes to track corresponding or relative market performance. Barclays has not passed on the legality or suitability of the Funds with respect to any person or entity. Barclays is not responsible for and has not participated in the determination of the timing of, prices at, or quantities of the Funds to be issued. Barclays has no obligation or liability in connection with administration, marketing or trading of the Funds.
The licensing agreement between Bloomberg and Barclays is solely for the benefit of Bloomberg and Barclays and not for the benefit of the owners of the Funds’ investors or other third parties.
BARCLAYS SHALL HAVE NO LIABILITY TO THE ISSUER, INVESTORS OR TO OTHER THIRD PARTIES FOR THE QUALITY, ACCURACY AND/OR COMPLETENESS OF THE INDEXES OR ANY DATA INCLUDED THEREIN OR FOR INTERRUPTIONS IN THE DELIVERY OF THE INDEXES. BARCLAYS MAKES NO WARRANTY, EXPRESS OR IMPLIED, AS TO RESULTS TO BE OBTAINED BY THE ISSUER, THE INVESTORS OR ANY OTHER PERSON OR ENTITY FROM THE USE OF THE INDEXES OR ANY DATA INCLUDED THEREIN. BARCLAYS MAKES NO EXPRESS OR IMPLIED WARRANTIES, AND HEREBY EXPRESSLY DISCLAIMS ALL WARRANTIES OF MERCHANTABILITY OR FITNESS FOR A PARTICULAR PURPOSE OR USE WITH RESPECT TO THE INDEXES OR ANY DATA INCLUDED THEREIN. BARCLAYS DOES NOT CALCULATE OR PUBLISH THE BLOOMBERG BARCLAYS INDEXES AND SHALL NOT BE LIABLE FOR ANY MISCALCULATION OF OR ANY INCORRECT, DELAYED OR INTERRUPTED PUBLICATION WITH RESPECT TO ANY OF THE BLOOMBERG BARCLAYS INDEXES. BARCLAYS SHALL NOT BE LIABLE FOR ANY DAMAGES, INCLUDING, WITHOUT LIMITATION, ANY SPECIAL, INDIRECT OR CONSEQUENTIAL DAMAGES, OR ANY LOST PROFITS AND EVEN IF ADVISED OF THE POSSIBILITY OF SUCH, RESULTING FROM THE USE OF THE INDEXES OR ANY DATA INCLUDED THEREIN OR WITH RESPECT TO THE FUNDS.
None of the information supplied by Barclays and used in this publication may be reproduced in any manner without the prior written permission of Barclays Capital, the investment banking division of Barclays Bank Plc. Barclays Bank Plc is registered in England No. 1026167. Registered office 1 Churchill Place London E14 5HP.
BLOOMBERG is a trademark and service mark of Bloomberg Finance L.P. Bloomberg Finance L.P. and its affiliates (collectively, “Bloomberg”) or Bloomberg’s licensors own all proprietary right in the Barclays Indexes. Bloomberg does not guarantee the timeliness, accuracy or completeness of any data or information relating to the Indexes. Bloomberg makes no warranty, express or implied, as to the Indexes or any data or values relating thereto or results to be obtained therefrom, and expressly disclaims all warranties of merchantability and fitness for a particular purpose with respect thereto. It is not possible to
141
TCW Funds, Inc.
Disclaimers for Use of Bloomberg Barclays Indexes (Continued)
invest directly in an index. Back-tested performance is not actual performance. To the maximum extent allowed by law, Bloomberg, its licensors, and its and their respective employees, contractors, agents, suppliers and vendors shall have no liability or responsibility whatsoever for any injury or damages — whether direct, indirect, consequential, incidental, punitive or otherwise — arising in connection with Indexes or any data or values relating thereto — whether arising from their negligence or otherwise. Nothing in the Indexes shall constitute or be construed as an offering of financial instruments or as investment advice or investment recommendations (i.e., recommendations as to whether or not to “buy”, “sell”, “hold”, or to enter or not to enter into any other transaction involving any specific interest or interests) by Bloomberg or its affiliates or a recommendation as to an investment or other strategy by Bloomberg or its affiliates. Data and other information available via the Indexes should not be considered as information sufficient upon which to base an investment decision. All information provided by the Indexes is impersonal and not tailored to the needs of any person, entity or group of persons. Bloomberg and its affiliates do not express an opinion on the future or expected value of any security or other interest and do not explicitly or implicitly recommend or suggest an investment strategy of any kind.
The only relationship of Bloomberg or any of its subsidiaries or affiliates to the Funds is the licensing of certain trademarks, trade names and service marks and of the Indexes, which is determined, composed and calculated by Bloomberg without regard to the Funds. Bloomberg has no obligation to take the needs of the Funds or the owners of the Funds into consideration in determining, composing or calculating the Indexes. The Funds are not sponsored, endorsed, sold or promoted by Bloomberg or any of its subsidiaries or affiliates.
142

TCW Funds, Inc.
865 South Figueroa Street
Los Angeles, California 90017
800 FUND TCW
(800 386 3829)
www.TCW.com
INVESTMENT ADVISOR
TCW Investment Management Company LLC 865 South Figueroa Street Los Angeles, California 90017
TRANSFER AGENT
U.S. Bancorp Fund Services, LLC 615 E. Michigan Street Milwaukee, Wisconsin 53202
INDEPENDENT REGISTERED PUBLIC ACCOUNTING FIRM
Deloitte & Touche LLP 555 West 5th Street Los Angeles, California 90013
CUSTODIAN & ADMINISTRATOR
State Street Bank & Trust Company One Lincoln Street Boston, Massachusetts 02111
DISTRIBUTOR
TCW Funds Distributors LLC 865 South Figueroa Street Los Angeles, California 90017 | DIRECTORS
Patrick C. Haden Director and Chairman of the Board
Samuel P. Bell Director
David S. DeVito Director
John A. Gavin Director
Peter McMillan Director
Charles A. Parker Director
Victoria B. Rogers Director
Marc I. Stern Director
Andrew Tarica Director
OFFICERS
David S. DeVito President and Chief Executive Officer
Meredith S. Jackson Senior Vice President, General Counsel and Secretary
Richard M. Villa Treasurer and Chief Financial Officer
Jeffrey A. Engelsman Chief Compliance Office
Peter A. Brown Senior Vice President
Patrick W. Dennis Assistant Secretary
George N. Winn Assistant Treasurer | TCW FAMILY OF FUNDS
EQUITY FUNDS TCW Focused Equities Fund TCW Global Real Estate Fund TCW Growth Equities Fund TCW High Dividend Equities Fund TCW New America Premier Equities Fund TCW Relative Value Dividend Appreciation Fund TCW Relative Value Large Cap Fund TCW Relative Value Mid Cap Fund TCW Select Equities Fund TCW Small Cap Growth Fund
TCW ALLOCATION FUND TCW Conservative Allocation Fund
FIXED INCOME FUNDS TCW Core Fixed Income Fund TCW Enhanced Commodity Strategy Fund TCW Global Bond Fund TCW High Yield Bond Fund TCW Short Term Bond Fund TCW Total Return Bond Fund
INTERNATIONAL FUNDS TCW Developing Markets Equity Fund TCW Emerging Markets Income Fund TCW Emerging Markets Local Currency Income Fund TCW Emerging Markets Multi-Asset Opportunities Fund TCW International Growth Fund TCW International Small Cap Fund |
FUNDarFI1016
OCTOBER 31
2016
ANNUAL REPORT
INTERNATIONAL FUNDS
TCW Developing Markets Equity Fund
TCW Emerging Markets Income Fund
TCW Emerging Markets Local Currency Income Fund TCW Emerging Markets Multi-Asset Opportunities Fund TCW International Growth Fund TCW International Small Cap Fund
TCW Funds, Inc.
| 1 | ||||
| 2 | ||||
| 14 | ||||
| 14 | ||||
| 20 | ||||
| 31 | ||||
| 37 | ||||
| 50 | ||||
| 59 | ||||
| 68 | ||||
| 70 | ||||
| 72 | ||||
| 75 | ||||
| 101 | ||||
| 113 | ||||
| 114 | ||||
| 116 | ||||
| 118 | ||||
Proxy Voting Guidelines and Availability of Quarterly Portfolio Schedule | 121 | |||
| 122 | ||||
| 123 | ||||
| The Letter to Shareholders and/or Management Discussions contained in this Annual Report are the opinions of each Fund’s portfolio managers and are not the opinions of TCW Funds, Inc. or its Board of Directors. Various matters discussed in the Letter to Shareholders and/or Management Discussions constitute forward-looking statements within the meaning of the federal securities laws. Actual results and the timing of certain events could differ materially from those projected or contemplated by these forward-looking statements due to a number of factors, including general economic conditions, overall availability of securities for investment by a Fund, the level of volatility in the securities markets and in the share price of a Fund, and other risk factors discussed in the SEC filings of TCW Funds, Inc. The data presented in the Letter to Shareholders and/or Management Discussions represents past performance and cannot be used to predict future results. |
|
| David S. DeVito President, Chief Executive Officer and Director |

Dear Valued Investors,
It is my pleasure to present the 2016 annual report for the TCW Funds, Inc. covering the 12-month period ended October 31, 2016. I would like to express our appreciation for your continued investment in the TCW Funds as well as welcome new shareholders to our fund family. As of October 31, 2016, the TCW Funds held total net assets of approximately $19.2 billion.
This report contains information and portfolio management discussions of our TCW International Funds.
The International Markets
International developed market central banks have continued to be accommodative over the past year, which has helped support asset prices during periods when investors seek less risky assets, notably Brexit. Improved sentiment around China on the back of a more aggressive government stimulus, rising commodity prices and improving emerging market growth resulted in better performance from both emerging market equities and debt. Throughout the period our international funds have been steadily increasing emerging market exposure at the expense of developed markets. Similarly, improving economic data in the U.S. and Europe as well as in emerging markets spurred our more pro-cyclical stance relative to prior periods. Emerging market valuations remain supportive, with debt yields in the 6-7% area and P/E’s still at a discount to developed markets.
We do expect elevated volatility until the U.S. policy path is formalized, which has implications for global trade,
U.S. dollar, inflation, and global growth. Therefore, differentiation will remain key to outperformance. Country and security selection will be crucial to performance, driven by factors such as reform momentum, terms of trade, and the central bank reaction function. In our view, there will be significant opportunities for an actively managed portfolio to capture attractive returns in countries and sectors best positioned to perform well in the current environment.
We know that you have many choices when it comes to the management of your financial assets. On behalf of everyone at TCW, I would like to thank you for making the TCW Funds part of your long-term investment plan. We truly value our relationship with you. If you have any questions or require further information, I invite you to visit our website at www.tcw.com, or call our shareholder services department at 800-386-3829.
I wish you all the best in the coming year and look forward to further correspondence with you through our semi-annual report in 2017.
Sincerely,

David S. DeVito
President, Chief Executive Officer and Director
1
TCW Developing Markets Equity Fund
Management Discussions
For the year ended October 31, 2016, the TCW Developing Markets Equity Fund (the “Fund”) returned 5.63%. The Fund’s benchmark, the MSCI Emerging Markets Net Total Return Index, returned 9.27% over the same period.
The bulk of the underperformance occurred during the first quarter of 2016, as we were more defensively positioned heading into February’s swift market rally. Specifically, underweight positioning in commodities and Brazil hurt performance. During the year, we neutralized our commodities exposure and shifted to an overweight position in Brazil, which helped make back some of the underperformance.
Our key overweights from a country perspective are in Brazil, Russia, and Argentina as they are all experiencing a growth recovery. We remain significantly underweight in Asia complex, primarily through China, South Korea and Taiwan. We see this region in particular as susceptible to shifts in U.S. trade policy. From a sector perspective, we are overweight in Information Technology and Healthcare against underweights in the Industrial, Telecom and Real Estate sectors.
The Fund’s forward P/E ratio is slightly above the Index, but, consistent with our bias for quality growth, has a substantially better earnings growth outlook and earnings revisions dynamic, and higher return on equity and free cash flow yields. Our portfolio dividend yield is in line with the Index.
Looking ahead, we expect volatility in the near-term as details have yet to come out on the U.S. policy path, which has implications for global trade, the US dollar, inflation, growth and U.S. interest rate policy. Heightened protectionism would impact Mexico and various Asian countries the most, given closer trading relationships with the U.S. and also has the potential to lower global growth expectations. However, if growth in infrastructure spending in the U.S. generates increased commodity demand, that would be beneficial to emerging markets (EM).
We continue to focus on idiosyncratic long-term growth stories at attractive valuations, and believe that differentiating between companies will continue to be key in emerging markets. Country and security selection will be crucial to performance, driven by factors such as reform momentum, terms of trade, and the central bank reaction function. In our view, there will be significant dispersion in returns going forward, allowing for an actively managed portfolio to capture attractive returns in those securities best positioned for the current evolving environment.
2
TCW Developing Markets Equity Fund
Management Discussions (Continued)
| Annualized Return(1) | ||||||||
| 1 Yr Return | Inception | |||||||
TCW Developing Markets Equity Fund | ||||||||
Class I – 6/30/2015 | 5.63 | % | (6.77 | )% | ||||
Class N – 6/30/2015 | 5.63 | % | (6.77 | )% | ||||
MSCI Emerging Markets Net Total Return Index | 9.27 | % | (2.92 | )% | ||||
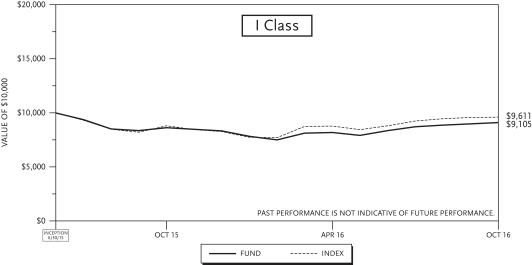
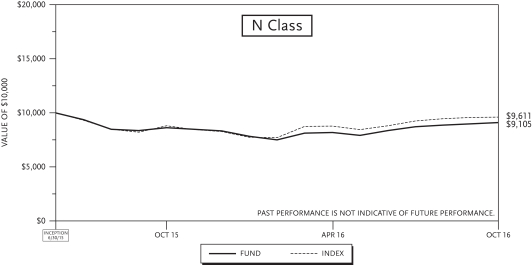
| (1) | The total returns do not reflect taxes that a shareholder would pay on fund distributions or on the redemption of fund shares. |
3
TCW Emerging Markets Income Fund
Management Discussions
For the year ended October 31, 2016, the TCW Emerging Markets Income Fund (the “Fund”) returned 14.29% and 13.98% on its I Class and N Class shares, respectively. The performance of the Fund’s classes varies because of differing expenses. The Fund’s benchmark, the JP Morgan EMBI Global Diversified Index, gained 11.70% over the same period.
Outperformance was driven by security selection and country allocation decisions in sovereign dollar-denominated debt, as well as off-index allocations to local currency and corporate debt. From a regional perspective, overweight positioning to Latin America (Argentina, Brazil and Venezuela, in particular) against underweights in tighter-trading Eastern European and Asian sovereigns also contributed to relative outperformance.
The improved emerging markets (EM) fundamental backdrop, combined with attractive carry, stabilization in commodity prices and healthy technicals, has generated renewed interest in the asset class. The asset class is much more resilient to shocks given improving growth and declining fears of a hard landing in China. Current account balances have also improved following notable currency adjustments. Real rates have increased, which has provided room for EM central banks to ease and stimulate growth. In addition, valuations remain attractive, especially when considering that close to 70% of global fixed income yields are below 2%.
Our sovereign portfolio is focused on countries undergoing reform/political change (Argentina and Brazil), constructive growth stories (Indonesia), and those where growth appears to be bottoming out (Russia, as well as Brazil). As for local currency, we continue to see this as one of the most interesting opportunities in emerging markets debt and selectively added exposure this year. We will continue to look to add exposure to this segment of the market opportunistically. As for corporates, we believe we are approaching the end of the credit cycle. There are signs that corporate credit fundamentals are improving, as issuers have cut capital expenditure significantly and focused on debt repurchases and asset sales. We see potential for corporates to outperform in 2017 as the benefits from rising economic growth spread and deleveraging becomes more broad-based, and may look to more meaningfully increase our corporate allocation in 2017.
We are closely monitoring the policy path of the U.S. as it has implications for global trade, inflation and growth. EM economies have been adjusting to slower China and developed market growth for several years, with domestic demand taking the place of exports. That said, heightened protectionism would impact Mexico and various Asian countries the most, given closer trading relationships with the U.S., and also has the potential to lower global growth expectations. However, if growth in infrastructure spending in the U.S. generates increased commodity demand, that would be beneficial to EM.
As such, differentiating between credits will continue to be key in emerging markets. Country and security selection will be crucial to performance, driven by factors such as reform momentum, terms of trade, and the central bank reaction function. In our view, there will be significant opportunities for an actively managed portfolio to capture attractive returns in those countries and sectors best positioned to perform well in the current environment.
4
TCW Emerging Markets Income Fund
Management Discussions (Continued)
| Annualized Return(1) | ||||||||||||||||||||||||
| 1 Yr Return | 3 Yr Return | 5 Yr Return | 10 Yr Return | Inception Fund | Inception Index | |||||||||||||||||||
TCW Emerging Markets Income Fund | ||||||||||||||||||||||||
Class I – 09/01/1996 | 14.29 | % | 4.36 | % | 5.72 | % | 8.32 | % | 9.72 | %(2) | 9.69 | % | ||||||||||||
Class N – 2/27/2004 | 13.98 | % | 4.06 | % | 5.43 | % | 8.06 | % | 8.30 | % | 8.07 | % | ||||||||||||
JPM EMBI Global Diversified Index | 11.70 | % | 6.77 | % | 6.56 | % | 7.38 | % | ||||||||||||||||
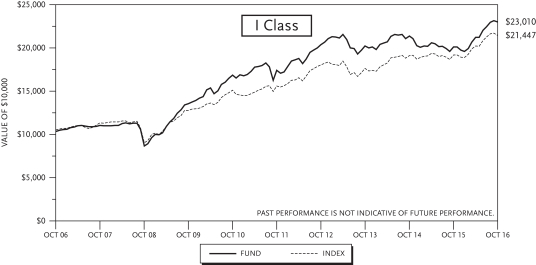
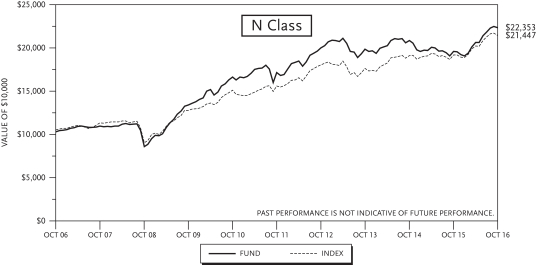
| (1) | The total returns do not reflect taxes that a shareholder would pay on fund distributions or on the redemption of fund shares. |
| (2) | Performance data includes the performance of the predecessor entity for periods before the Fund’s registration became effective. The predecessor entity was not registered under the 1940 Act and, therefore, was not subject to certain investment restrictions that are imposed by the 1940 Act. If the predecessor entity had been registered under the 1940 Act, the predecessor entity’s performance may have been lower. |
5
TCW Emerging Markets Local Currency Income Fund
Management Discussions
For the year ended October 31, 2016, the TCW Emerging Markets Local Currency Income Fund (the “Fund”) returned 11.61% and 11.63% on its I Class and N Class shares, respectively. The performance of the Fund’s classes varies because of differing expenses. The Fund’s benchmark, the JP Morgan GBI-EM Global Diversified Index, returned 11.04% over the same period.
Outperformance during the period was driven by 1) overweight positioning and security selection in Brazil, which underwent a significant political change and started to implement important structural reforms, 2) underweight positioning in tighter-trading sovereigns, such as Poland and Thailand, and 3) overweight positioning in Colombia, which benefited from the rebound in oil. Off-index allocations to India and Argentina further contributed to outperformance.
We continue to focus on countries undergoing reform/political change (Brazil and Argentina), constructive growth stories (Indonesia and India), and those where growth appears to be bottoming out (Russia as well as Brazil). Our larger underweights are in tighter trading sovereigns and in Turkey, where we are concerned with the politics and fundamentals.
This year, we have seen a reversal in sentiment for emerging markets (EM) local currency debt, driven by improved fundamentals, attractive carry, stabilization in commodity prices and healthy technicals. Even with the rally this year, we continue to believe that the rates story is attractive, with ~7% yields for an investment-grade rated asset class when close to 70% of global fixed income yields are below 2%.
In addition, EM economies have been adjusting to slower China and developed market growth for several years, with domestic demand taking the place of exports. Furthermore, the asset class is much more resilient to shocks given improving growth and declining fears of a hard landing in China. Current account balances have also improved following notable currency adjustments. Real rates have increased, which has provided room for EM central banks to ease and stimulate growth.
That said, we expect volatility in the near-term as details have yet to come out on the U.S. policy path, which has implications for global trade, the U.S. dollar, inflation and growth. Heightened protectionism would impact Mexico and various Asian countries the most, given closer trading relationships with the U.S., and also has the potential to lower global growth expectations. However, if growth in infrastructure spending in the U.S. generates increased commodity demand, that would be beneficial to EM.
As such, differentiating between credits will continue to be key in emerging markets. Country and security selection will be crucial to performance, driven by factors such as reform momentum, terms of trade, and the central bank reaction function. In our view, there will be significant opportunities for an actively managed portfolio to capture attractive returns in those countries and sectors best positioned to perform well in the current environment.
6
TCW Emerging Markets Local Currency Income Fund
Management Discussions (Continued)
| Annualized Return(1) | ||||||||||||||||
| 1 Yr Return | 3 Yr Return | 5 Yr Return | Inception | |||||||||||||
TCW Emerging Markets Local Currency Income Fund | ||||||||||||||||
Class I – 12/14/2010 | 11.61 | % | (2.97 | )% | (0.26 | )% | 0.49 | % | ||||||||
Class N – 12/14/2010 | 11.63 | % | (2.99 | )% | (0.30 | )% | 0.46 | % | ||||||||
JPM GBI-EM Global Diversified Index | 11.04 | % | (3.72 | )% | (1.19 | )% | (0.27 | )% | ||||||||
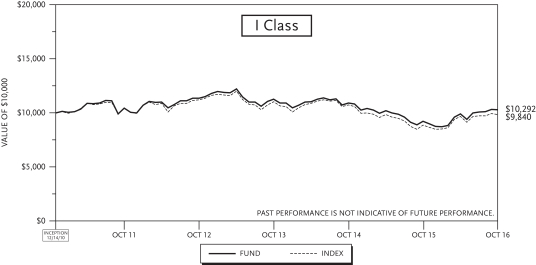
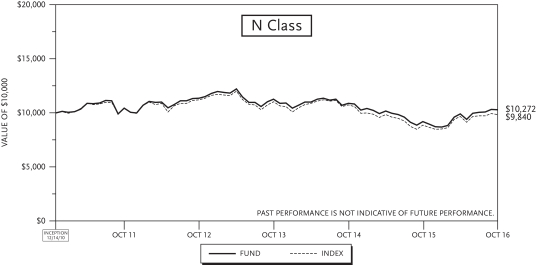
| (1) | The total returns do not reflect taxes that a shareholder would pay on fund distributions or on the redemption of fund shares. |
7
TCW Emerging Markets Multi-Asset Opportunities Fund
Management Discussions
For the year ended October 31, 2016, the TCW Emerging Markets Multi-Asset Opportunities Fund (the “Fund”) returned 10.75% and 10.78% on its I Class and N Class shares, respectively. The performance of the Fund’s classes varies because of differing expenses. The Fund’s blended benchmark, 50% JP Morgan EMBI Global Diversified Index and 50% MSCI Daily Total Return Net Emerging Markets Index returned 10.72% over the same period.
Outperformance was driven by security selection and country allocation decisions in sovereign dollar-denominated debt, as well as off-index allocations to local currency and corporate debt. This was partially offset by security selection in equities, as underweight positioning in commodities into a swift market rally in the earlier part of 2016 weighed on performance.
During the initial part of the period, we steadily increased our exposure to fixed income in light of attractive valuations. As we started to see signs of corporate earnings recovering and currency stabilization, we increased equities exposure, ending the period with approximately 60% equities and 39% fixed income, with the balance in cash.
The improved emerging markets (EM) fundamental backdrop, combined with attractive carry, stabilization in commodity prices and healthy technicals, has generated renewed interest in the asset class. The asset class is much more resilient to shocks given improving growth and declining fears of a hard landing in China. Current account balances have also improved following notable currency adjustments. Real rates have increased, which has provided room for EM central banks to ease and stimulate growth. In addition, with yields in the 6-7% area, valuations remain attractive, especially when considering that close to 70% of global fixed income yields are below 2% and P/E ratios in EM equities remain below developed markets.
That said, we expect volatility in the near-term as details have yet to come out on the U.S. policy path, which has implications for global trade, the U.S. dollar, inflation and growth. Heightened protectionism would impact Mexico and various Asian countries the most, given closer trading relationships with the U.S., and also has the potential to lower global growth expectations. However, if growth in infrastructure spending in the U.S. generates increased commodity demand, that would be beneficial to EM.
As such, differentiating between credits will continue to be key in emerging markets. Country and security selection will be crucial to performance, driven by factors such as reform momentum, terms of trade, and the central bank reaction function. In our view, there will be significant opportunities for an actively managed portfolio to capture attractive returns in those countries and sectors best positioned to perform well in the current environment.
8
TCW Emerging Markets Multi-Asset Opportunities Fund
Management Discussions (Continued)
| Annualized Return(1) | ||||||||||||
| 1 Yr Return | 3 Yr Return | Inception | ||||||||||
TCW Emerging Markets Multi-Asset Opportunities Fund | ||||||||||||
Class I – 06/28/2013 | 10.75 | % | 0.82 | % | 2.74 | % | ||||||
Class N – 06/28/2013 | 10.78 | % | 0.88 | % | 2.62 | % | ||||||
50% JPM EMBI Global Diversified Index / 50% MSCI Daily Total Return | 10.72 | % | 2.47 | % | 4.42 | % | ||||||

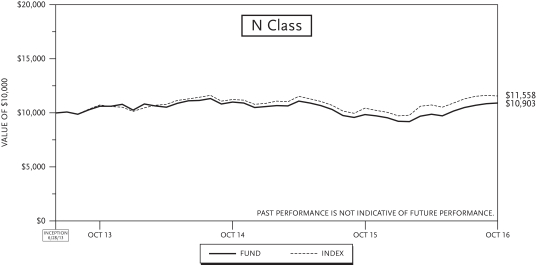
| (1) | The total returns do not reflect taxes that a shareholder would pay on fund distributions or on the redemption of fund shares. |
9
TCW International Growth Fund
Management Discussions
For the year ended October 31, 2016, the TCW International Growth Fund (the “Fund”) returned a negative 1.45% and 1.77% on its I Class and N Class shares, respectively. The performance of the Fund’s classes varies because of differing expenses. The Fund’s benchmark, the MSCI All Country World ex U.S. Index, returned 0.72% over the same time period.
Underperformance during the period has been driven by underweight positioning to deep cyclicals and commodities earlier in 2016, as well as more defensive positioning (lack of high beta stocks and higher cash levels) heading into the post-Brexit rally. This has been partially offset by security selection in the Healthcare and Consumer Staples sectors.
The global investment environment remains challenging with continued uncertainty around the U.S. policy path. We see Europe, Japan and China as having to continue to work through high leverage levels and as a result, remain underweight relative to the benchmark. We are monitoring the Bank of Japan (BOJ) recent shift towards targeting nominal rates. We remain skeptical of its efficacy but are open to the fact that the policy is flexible enough that it may be successful, particularly as the BOJ controls more than half of the Japanese bond market. On the other hand, we are overweight in select emerging markets (EM) countries where growth is starting to recover: Brazil, Russia and Argentina (off-index), for example.
On a sector basis, we are overweight in the Information Technology (IT), Materials, and Energy sectors against underweights in Consumer Staples, Financials, and Industrial sectors. We continue to focus on companies with higher growth visibility and earnings momentum.
Looking ahead, we expect volatility in the near-term as details have yet to come out on the U.S. policy path, which has implications for global trade, the U.S. dollar, inflation, growth and U.S. interest rate policy. Heightened protectionism would impact Mexico and various Asian countries the most, given closer trading relationships with the U.S., and also has the potential to lower global growth expectations. However, if growth in infrastructure spending in the U.S. generates increased commodity demand, that would be beneficial to EM in particular.
We continue to focus on idiosyncratic long-term growth stories at attractive valuations, and believe that differentiating between companies will continue to be key. Country and security selection will be crucial to performance, driven by factors such as reform momentum, terms of trade, and the central bank reaction function. In our view, there will be significant dispersion in returns going forward, allowing for an actively managed portfolio to capture attractive returns in those securities best positioned to perform well in the current evolving environment.
10
TCW International Growth Fund
Management Discussions (Continued)
| Annualized Return(1) | ||||||||||||
| 1 Yr Return | 3 Yr Return | Inception | ||||||||||
TCW International Growth Fund | ||||||||||||
Class I – 10/31/2012 | (1.45 | )% | (1.03 | )% | 3.94 | % | ||||||
Class N – 10/31/2012 | (1.77 | )% | (1.35 | )% | 3.63 | % | ||||||
MSCI All Country World ex U.S. Index | 0.72 | % | (1.04 | )% | 4.01 | % | ||||||
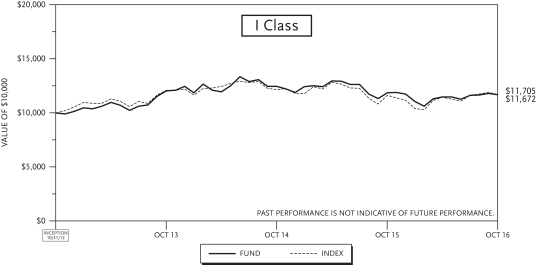

| (1) | The total returns do not reflect taxes that a shareholder would pay on fund distributions or on the redemption of fund shares. |
11
TCW International Small Cap Fund
Management Discussions
For the year ended October 31, 2016, the TCW International Small Cap Fund (the “Fund”) returned a negative 0.49% and 0.60% on its I Class and N Class shares, respectively. The performance of the Fund’s classes varies because of differing expenses. The Fund’s benchmark, the MSCI All Country World (ex USA) Small Cap Net Index, gained 4.22% over the same time period.
Underperformance during the period has been driven by underweight positioning to commodities earlier in 2016, as well as more defensive positioning (lack of high beta stocks and higher cash levels) heading into the post-Brexit rally. This has been partially offset by security selection in the Industrial and Healthcare sectors.
The global investment environment remains challenging with continued uncertainty around the U.S. policy path. We see Europe, Japan and China as having to continue to work through high leverage levels. We are moderately overweight in Europe, and remain underweight Japan, the United Kingdom and China. We are monitoring the Bank of Japan (BOJ) recent shift towards targeting nominal rates. We remain skeptical of its efficacy but are open to the fact that the policy is flexible enough that it may be successful, particularly as the BOJ controls more than half of the Japanese bond market. On the other hand, we are overweight in select emerging markets (EM) countries where growth is starting to recover: Brazil, Russia and Argentina (off-index), for example.
On a sector basis, we are overweight in the Materials and Healthcare sectors against underweights in the Real Estate, Consumer Staples and Industrial sectors. We continue to focus on companies with higher growth visibility and earnings momentum.
Looking ahead, we expect volatility in the near-term as details have yet to come out on the U.S. policy path, which has implications for global trade, the U.S. dollar, inflation, growth and U.S. interest rate policy. Heightened protectionism would impact Mexico and various Asian countries the most, given closer trading relationships with the U.S. and also has the potential to lower global growth expectations. However, if growth in infrastructure spending in the U.S. generates increased commodity demand, that would be beneficial to EM in particular.
We continue to focus on idiosyncratic long-term growth stories at attractive valuations, and believe that differentiating between companies will continue to be key. Country and security selection will be crucial to performance, driven by factors such as reform momentum, terms of trade, and the central bank reaction function. In our view, there will be significant dispersion in returns going forward, allowing for an actively managed portfolio to capture attractive returns in those securities best positioned for the current evolving environment.
12
TCW International Small Cap Fund
Management Discussions (Continued)
| Annualized Return(1) | ||||||||||||||||
| 1 Yr Return | 3 Yr Return | 5 Yr Return | Inception | |||||||||||||
TCW International Small Cap Fund | ||||||||||||||||
Class I – 02/28/2011 | (0.49 | )% | (0.98 | )% | 3.83 | % | (1.33 | )% | ||||||||
Class N – 02/28/2011 | (0.60 | )% | (1.05 | )% | 3.75 | % | (1.40 | )% | ||||||||
MSCI All Country World (ex USA) Small Cap Net Index | 4.22 | % | 1.57 | % | 6.28 | % | 3.00 | % | ||||||||
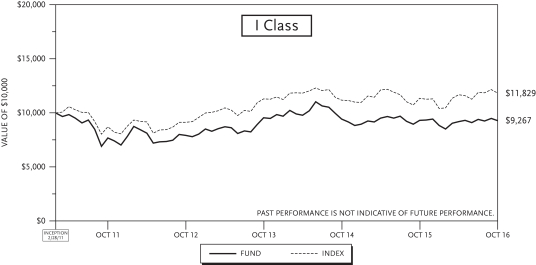

| (1) | The total returns do not reflect taxes that a shareholder would pay on fund distributions or on the redemption of fund shares. |
13
TCW Developing Markets Equity Fund
| Number of Shares | Common Stock | Value | ||||||
Argentina (3.9% of Net Assets) | ||||||||
| 4,000 | Adecoagro S.A. (1) | $ | 44,000 | |||||
| 1,775 | Grupo Financiero Galicia S.A. (ADR) | 55,273 | ||||||
| 270 | MercadoLibre, Inc. | 45,363 | ||||||
| 1,700 | Tenaris S.A. (ADR) | 47,940 | ||||||
|
| |||||||
Total Argentina (Cost: $182,409) | 192,576 | |||||||
|
| |||||||
Brazil (7.6%) | ||||||||
| 5,900 | Banco do Brasil S.A. | 54,586 | ||||||
| 10,600 | Banco Santander Brasil S.A. | 88,058 | ||||||
| 4,200 | Cia Paranaense de Energia (SP ADR) | 47,922 | ||||||
| 13,800 | Petroleo Brasileiro S.A. (SP ADR) (1) | 161,046 | ||||||
| 3,580 | Vale S.A. (SP ADR) | 24,774 | ||||||
|
| |||||||
Total Brazil (Cost: $310,208) | 376,386 | |||||||
|
| |||||||
China (18.9%) | ||||||||
| 1,719 | Alibaba Group Holding, Ltd. (SP ADR) (1) | 174,805 | ||||||
| 600 | CNOOC, Ltd. (SP ADR) | 75,288 | ||||||
| 1,325 | Ctrip.com International, Ltd. (ADR) (1) | 58,499 | ||||||
| 100,500 | Great Wall Motor Co., Ltd. — Class H | 98,091 | ||||||
| 236 | NetEase, Inc. (ADR) | 60,650 | ||||||
| 18,150 | Ping An Insurance Group Co. of China, Ltd. — Class H | 95,541 | ||||||
| 96,144 | Q Technology Group Co., Ltd. (1) | 48,230 | ||||||
| 54,000 | Shenzhen Investment, Ltd. | 23,539 | ||||||
| 11,300 | Tencent Holdings, Ltd. | 299,503 | ||||||
|
| |||||||
Total China (Cost: $835,489) | 934,146 | |||||||
|
| |||||||
Egypt (Cost: $37,269) (0.7%) | ||||||||
| 1,420 | Eastern Tobacco | 33,574 | ||||||
|
| |||||||
India (7.1%) | ||||||||
| 10,040 | Crompton Greaves Consumer Electricals, Ltd. (1) | 27,796 | ||||||
| 621 | HDFC Bank, Ltd. (ADR) | 43,954 | ||||||
| 20,233 | ITC, Ltd. | 73,200 | ||||||
| 4,650 | Mahindra & Mahindra Financial Services, Ltd. | 25,148 | ||||||
| 11,685 | Punjab National Bank (1) | 25,424 | ||||||
| 725 | Shriram City Union Finance, Ltd. | 28,279 | ||||||
| 1,200 | Tata Motors, Ltd. (SP ADR) | 47,292 | ||||||
| 13,450 | Tata Steel, Ltd. | 81,556 | ||||||
|
| |||||||
Total India (Cost: $337,111) | 352,649 | |||||||
|
| |||||||
Indonesia (2.1%) | ||||||||
| 40,200 | Bank Central Asia Tbk PT | 47,796 | ||||||
| 26,300 | Matahari Department Store Tbk PT | 36,269 | ||||||
| 573,200 | Sumber Alfaria Trijaya Tbk PT | 21,877 | ||||||
|
| |||||||
Total Indonesia (Cost: $106,794) | 105,942 | |||||||
|
| |||||||
See accompanying notes to financial statements.
14
TCW Developing Markets Equity Fund
October 31, 2016
| Number of Shares | Common Stock | Value | ||||||
Italy (Cost: $48,057) (1.0%) | ||||||||
| 13,940 | PRADA SpA | $ | 48,841 | |||||
|
| |||||||
Kenya (Cost: $97,335) (2.3%) | ||||||||
| 577,700 | Safari.com, Ltd. | 113,319 | ||||||
|
| |||||||
Malaysia (Cost: $52,585) (1.5%) | ||||||||
| 129,700 | My EG Services BHD | 75,303 | ||||||
|
| |||||||
Mexico (4.8%) | ||||||||
| 74,274 | Genomma Lab Internacional S.A.B. de C.V. (1) | 89,567 | ||||||
| 24,800 | Grupo Financiero Banorte S.A.B. de C.V. — Class O | 147,027 | ||||||
|
| |||||||
Total Mexico (Cost: $218,637) | 236,594 | |||||||
|
| |||||||
Pakistan (Cost: $52,059) (1.0%) | ||||||||
| 22,550 | Habib Bank, Ltd. | 47,964 | ||||||
|
| |||||||
Russia (9.3%) | ||||||||
| 14,200 | Aeroflot PJSC (1) | 29,149 | ||||||
| 38,400 | Alrosa PJSC | 53,820 | ||||||
| 945,000 | Inter RAO UES PJSC | 49,967 | ||||||
| 508 | Lukoil PJSC (SP ADR) | 24,694 | ||||||
| 23,930 | Rosneft PJSC | 131,980 | ||||||
| 53,880 | Sberbank of Russia | 125,857 | ||||||
| 2,125 | Yandex N.V. (1) | 41,841 | ||||||
|
| |||||||
Total Russia (Cost: $401,004) | 457,308 | |||||||
|
| |||||||
Singapore (Cost: $68,441) (1.4%) | ||||||||
| 418 | Broadcom, Ltd. | 71,177 | ||||||
|
| |||||||
South Africa (4.4%) | ||||||||
| 14,920 | FirstRand, Ltd. | 53,505 | ||||||
| 335 | Naspers, Ltd. — N Shares | 56,111 | ||||||
| 10,950 | Sanlam, Ltd. | 53,043 | ||||||
| 5,004 | Standard Bank Group, Ltd. | 53,124 | ||||||
|
| |||||||
Total South Africa (Cost: $199,071) | 215,783 | |||||||
|
| |||||||
South Korea (8.8%) | ||||||||
| 115 | Hyundai Mobis Co., Ltd. | 27,428 | ||||||
| 1,075 | KB Financial Group, Inc. | 39,793 | ||||||
| 330 | Mando Corp. | 77,157 | ||||||
| 202 | Samsung Electronics Co., Ltd. | 288,926 | ||||||
|
| |||||||
Total South Korea (Cost: $377,775) | 433,304 | |||||||
|
| |||||||
See accompanying notes to financial statements.
15
TCW Developing Markets Equity Fund
Schedule of Investments (Continued)
| Number of Shares | Common Stock | Value | ||||||
Taiwan (8.7%) | ||||||||
| 27,000 | Powertech Technology, Inc. | $ | 77,036 | |||||
| 3,873 | Silergy Corp. | 56,429 | ||||||
| 7,970 | Taiwan Semiconductor Manufacturing Co., Ltd. (SP ADR) | 247,867 | ||||||
| 3,270 | Tung Thih Electronic Co., Ltd. | 47,710 | ||||||
|
| |||||||
Total Taiwan (Cost: $348,489) | 429,042 | |||||||
|
| |||||||
Thailand (2.6%) | ||||||||
| 31,400 | KCE Electronics PCL (NVDR) | 100,509 | ||||||
| 6,600 | Krungthai Card PCL Class N (NVDR) | 28,269 | ||||||
|
| |||||||
Total Thailand (Cost: $113,900) | 128,778 | |||||||
|
| |||||||
Turkey (Cost: $98,869) (2.0%) | ||||||||
| 36,244 | Turkiye Garanti Bankasi A.S. | 98,552 | ||||||
|
| |||||||
United Arab Emirates (Cost: $73,499) (1.7%) | ||||||||
| 4,755 | NMC Health PLC | 84,817 | ||||||
|
| |||||||
United Kingdom (Cost: $24,747) (0.5%) | ||||||||
| 1,850 | Anglo American PLC (1) | 25,611 | ||||||
|
| |||||||
Total Common Stock (Cost: $3,983,748) (90.3%) | 4,461,666 | |||||||
|
| |||||||
| Preferred Stock | ||||||||
Brazil (6.7%) | ||||||||
| 4,500 | Cia Brasileira de Distribuicao, 0.28% (ADR) | 85,725 | ||||||
| 40,600 | Gerdau S.A., 0.58% | 141,325 | ||||||
| 8,910 | Itau Unibanco Holding S.A., 3.46% (ADR) | 106,296 | ||||||
|
| |||||||
Total Brazil (Cost: $263,593) | 333,346 | |||||||
|
| |||||||
Total Preferred Stock (Cost: $263,593) (6.7%) | 333,346 | |||||||
|
| |||||||
| Participation Notes | ||||||||
Saudi Arabia (2.7%) | ||||||||
| 6,200 | Al Hammadi Development and Investment Co. (HSBC as Counterparty) | 52,950 | ||||||
| 3,490 | Al Rajhi Bank (HSBC as Counterparty) | 52,611 | ||||||
| 4,880 | Samba Financial Group (HSBC as Counterparty) | 25,524 | ||||||
|
| |||||||
Total Saudi Arabia (Cost: $129,941) | 131,085 | |||||||
|
| |||||||
Total Participation Notes (Cost: $129,941) (2.7%) | 131,085 | |||||||
|
| |||||||
See accompanying notes to financial statements.
16
TCW Developing Markets Equity Fund
October 31, 2016
| Number of Shares | Money Market Investments (1.6%) | Value | ||||||
| 80,038 | State Street Institutional U.S. Government Money Market Fund — Premier Class, 0.25% (2) | $ | 80,038 | |||||
|
| |||||||
Total Money Market Investments (Cost: $80,038) (1.6%) | 80,038 | |||||||
|
| |||||||
Total Investments (Cost: $4,457,320) (101.3%) | 5,006,135 | |||||||
Liabilities in Excess of Other Assets (-1.3%) | (65,632 | ) | ||||||
|
| |||||||
Total Net Assets (100.0%) | $ | 4,940,503 | ||||||
|
| |||||||
Notes to the Schedule of Investments:
| ADR - American | Depositary Receipt. Shares of a foreign based corporation held in U.S. banks entitling the shareholder to all dividends and capital gains. |
| NVDR - Non-Voting | Depositary Receipt. |
| PJSC - Private | Joint-Stock Company. |
| SP ADR - Sponsored | American Depositary Receipt. Shares of a foreign based corporation held in U.S. banks that are issued with the cooperation of the company whose stock underlies the ADR and entitles the shareholder to all dividends, capital gains and voting rights. |
| (1) | Non-income producing security. |
| (2) | Rate disclosed is the 7-day net yield as of October 31, 2016. |
See accompanying notes to financial statements.
17
TCW Developing Markets Equity Fund
Investments by Industry | October 31, 2016 |
| Industry | Percentage of Net Assets | |||
Airlines | 0.6 | % | ||
Auto Components | 3.2 | |||
Automobiles | 2.9 | |||
Banking | 0.5 | |||
Banks | 20.1 | |||
Consumer Finance | 1.7 | |||
Diversified Financial Services | 1.1 | |||
Electric | 1.0 | |||
Electric Utilities | 1.0 | |||
Electronics | 2.0 | |||
Energy Equipment & Services | 1.0 | |||
Food & Staples Retailing | 2.1 | |||
Food Products | 0.9 | |||
Health Care Providers & Services | 2.8 | |||
Household Durables | 1.6 | |||
Insurance | 3.0 | |||
Internet & Catalog Retail | 1.2 | |||
Internet Software & Services | 12.5 | |||
IT Services | 1.5 | |||
Media | 1.1 | |||
Metals & Mining | 6.6 | |||
Multiline Retail | 0.7 | |||
Oil, Gas & Consumable Fuels | 7.9 | |||
Pharmaceuticals | 1.8 | |||
Real Estate Management & Development | 0.5 | |||
Semiconductors & Semiconductor Equipment | 9.1 | |||
Technology Hardware, Storage & Peripherals | 5.8 | |||
Textiles, Apparel & Luxury Goods | 1.0 | |||
Tobacco | 2.2 | |||
Wireless Telecommunication Services | 2.3 | |||
Money Market Investments | 1.6 | |||
|
| |||
Total | 101.3 | % | ||
|
| |||
See accompanying notes to financial statements.
18
TCW Developing Markets Equity Fund
Fair Valuation Summary | October 31, 2016 |
The following is a summary of the fair valuations according to the inputs used as of October 31, 2016 in valuing the Fund’s investments:
| Description | Quoted Prices (Level 1) | Other (Level 2) | Significant (Level 3) | Total | ||||||||||||
Common Stock | ||||||||||||||||
Airlines | $ | — | $ | 29,149 | $ | — | $ | 29,149 | ||||||||
Auto Components | — | 152,295 | — | 152,295 | ||||||||||||
Automobiles | 47,292 | 98,092 | — | 145,384 | ||||||||||||
Banks | 388,898 | 438,510 | — | 827,408 | ||||||||||||
Consumer Finance | 28,278 | 53,417 | — | 81,695 | ||||||||||||
Diversified Financial Services | — | 53,505 | — | 53,505 | ||||||||||||
Electric Utilities | — | 49,967 | — | 49,967 | ||||||||||||
Electric | 47,922 | — | — | 47,922 | ||||||||||||
Electronics | — | 100,509 | — | 100,509 | ||||||||||||
Energy Equipment & Services | 47,940 | — | — | 47,940 | ||||||||||||
Food & Staples Retailing | 21,877 | — | — | 21,877 | ||||||||||||
Food Products | 44,000 | — | — | 44,000 | ||||||||||||
Health Care Providers & Services | 84,817 | — | — | 84,817 | ||||||||||||
Household Durables | 27,796 | 48,230 | — | 76,026 | ||||||||||||
Insurance | — | 148,585 | — | 148,585 | ||||||||||||
Internet & Catalog Retail | 58,499 | — | — | 58,499 | ||||||||||||
Internet Software & Services | 322,659 | 299,503 | — | 622,162 | ||||||||||||
IT Services | — | 75,303 | — | 75,303 | ||||||||||||
Media | — | 56,111 | — | 56,111 | ||||||||||||
Metals & Mining | 24,774 | 160,987 | — | 185,761 | ||||||||||||
Multiline Retail | — | 36,269 | — | 36,269 | ||||||||||||
Oil, Gas & Consumable Fuels | 261,028 | 131,979 | — | 393,007 | ||||||||||||
Pharmaceuticals | 89,567 | — | — | 89,567 | ||||||||||||
Real Estate Management & Development | — | 23,539 | — | 23,539 | ||||||||||||
Semiconductors & Semiconductor Equipment | 319,044 | 133,465 | — | 452,509 | ||||||||||||
Technology Hardware, Storage & Peripherals | — | 288,926 | — | 288,926 | ||||||||||||
Textiles, Apparel & Luxury Goods | — | 48,841 | — | 48,841 | ||||||||||||
Tobacco | — | 106,774 | — | 106,774 | ||||||||||||
Wireless Telecommunication Services | 113,319 | — | — | 113,319 | ||||||||||||
|
|
|
|
|
|
|
| |||||||||
Total Common Stock | 1,927,710 | 2,533,956 | — | 4,461,666 | ||||||||||||
|
|
|
|
|
|
|
| |||||||||
Preferred Stock | ||||||||||||||||
Banks | 106,296 | — | — | 106,296 | ||||||||||||
Food & Staples Retailing | 85,725 | — | — | 85,725 | ||||||||||||
Metals & Mining | 141,325 | — | — | 141,325 | ||||||||||||
|
|
|
|
|
|
|
| |||||||||
Total Preferred Stock | 333,346 | — | — | 333,346 | ||||||||||||
|
|
|
|
|
|
|
| |||||||||
Participation Notes | ||||||||||||||||
Banks | — | 78,135 | — | 78,135 | ||||||||||||
Health Care Providers & Services | — | 52,950 | — | 52,950 | ||||||||||||
|
|
|
|
|
|
|
| |||||||||
Total Participation Notes | — | 131,085 | — | 131,085 | ||||||||||||
|
|
|
|
|
|
|
| |||||||||
Money Market Investments | 80,038 | — | — | 80,038 | ||||||||||||
|
|
|
|
|
|
|
| |||||||||
Total Investments | $ | 2,341,094 | $ | 2,665,041 | $ | — | $ | 5,006,135 | ||||||||
|
|
|
|
|
|
|
| |||||||||
See accompanying notes to financial statements.
19
TCW Emerging Markets Income Fund
Schedule of Investments
| Principal Amount | Fixed Income Securities | Value | ||||||||||
Angola (Cost: $11,726,222) (0.4% of Net Assets) | ||||||||||||
| $ | 13,480,000 | Angolan Government International Bond, (144A), 9.5%, due 11/12/25 (1) | $ | 13,252,053 | ||||||||
|
| |||||||||||
Argentina (8.8%) | ||||||||||||
| ARS | 181,475,000 | Argentina Treasury Bond BONCER, 2.5%, due 07/22/21 | 12,875,606 | |||||||||
| ARS | 213,551,600 | Argentine Bonos del Tesoro, 15.5%, due 10/17/26 | 14,317,684 | |||||||||
| ARS | 227,000,000 | Argentine Bonos del Tesoro, 22.75%, due 03/05/18 | 15,320,947 | |||||||||
| $ | 74,060,000 | Argentine Republic Government International Bond, 2.5%, due 12/31/38 | 50,805,160 | |||||||||
| 55,590,000 | Argentine Republic Government International Bond, (144A), | 57,452,265 | ||||||||||
| 37,880,000 | Argentine Republic Government International Bond, (144A), | 41,478,600 | ||||||||||
| EUR | 21,136,953 | Argentine Republic Government International Bond, 7.82%, due 12/31/33 | 24,838,599 | |||||||||
| $ | 28,645,000 | Argentine Republic Government International Bond, (Reg. S), | 29,532,995 | |||||||||
| ARS | 286,917,000 | Banco Hipotecario S.A., (144A), 24.729%, due 01/12/20 (1)(3) | 19,087,668 | |||||||||
| $ | 5,860,000 | YPF S.A., (144A), 31.354%, due 07/07/20 (1)(3) | 6,491,034 | |||||||||
|
| |||||||||||
Total Argentina (Cost: $269,035,319) | 272,200,558 | |||||||||||
|
| |||||||||||
Azerbaijan (Cost: $9,973,695) (0.3%) | ||||||||||||
| 10,100,000 | State Oil Co. of the Azerbaijan Republic, (Reg. S), 4.75%, due 03/13/23 (2) | 10,112,625 | ||||||||||
|
| |||||||||||
Bahrain (1.5%) | ||||||||||||
| 22,105,000 | Bahrain Government International Bond, (144A), 7%, due 10/12/28 (1) | 22,823,413 | ||||||||||
| 13,740,000 | Bahrain Government International Bond, (Reg. S), 6%, due 09/19/44 (2) | 11,679,000 | ||||||||||
| 11,400,000 | CBB International Sukuk Co. SPC, (144A), 5.624%, due 02/12/24 (1) | 11,742,000 | ||||||||||
|
| |||||||||||
Total Bahrain (Cost: $45,344,912) | 46,244,413 | |||||||||||
|
| |||||||||||
Brazil (14.2%) | ||||||||||||
| 16,650,000 | Banco do Brasil S.A., (Reg. S), 9%, due 06/29/49 (2)(3) | 15,501,150 | ||||||||||
| 4,485,000 | Brazil Minas SPE via State of Minas Gerais, (Reg. S), 5.333%, due 02/15/28 (2) | 4,406,513 | ||||||||||
| BRL | 13,000,000 | Brazil Notas do Tesouro Nacional, Series B, 6%, due 08/15/50 | 12,606,690 | |||||||||
| BRL | 29,075,000 | Brazil Notas do Tesouro Nacional, Series F, 10%, due 01/01/21 | 8,850,533 | |||||||||
| BRL | 152,500,000 | Brazil Notas do Tesouro Nacional, Series F, 10%, due 01/01/27 | 44,444,535 | |||||||||
| $ | 48,010,000 | Brazilian Government International Bond, 4.25%, due 01/07/25 | 47,577,910 | |||||||||
| 14,675,000 | Brazilian Government International Bond, 5%, due 01/27/45 | 13,005,719 | ||||||||||
| 23,835,000 | Brazilian Government International Bond, 5.625%, due 01/07/41 | 23,060,363 | ||||||||||
| 22,520,000 | Brazilian Government International Bond, 5.625%, due 02/21/47 | 21,619,200 | ||||||||||
| 14,288,000 | Centrais Eletricas Brasileiras S.A., (Reg. S), 5.75%, due 10/27/21 (2) | 14,341,580 | ||||||||||
| 16,375,000 | GTL Trade Finance, Inc., (Reg. S), 5.893%, due 04/29/24 (2) | 16,170,313 | ||||||||||
| 6,035,000 | Marfrig Holdings Europe BV, (144A), 8%, due 06/08/23 (1) | 6,246,225 | ||||||||||
| 8,600,000 | Minerva Luxembourg S.A., (144A), 6.5%, due 09/20/26 (1) | 8,404,350 | ||||||||||
| 42,690,000 | Petrobras Global Finance BV, 4.375%, due 05/20/23 | 38,794,537 | ||||||||||
| 37,230,000 | Petrobras Global Finance BV, 5.625%, due 05/20/43 | 29,429,384 | ||||||||||
| 36,295,000 | Petrobras Global Finance BV, 6.75%, due 01/27/41 | 32,157,370 | ||||||||||
| 43,875,000 | Petrobras Global Finance BV, 8.75%, due 05/23/26 | 49,319,887 | ||||||||||
| 25,650,000 | Vale Overseas, Ltd., 6.25%, due 08/10/26 | 27,514,755 | ||||||||||
| 27,925,000 | Vale Overseas, Ltd., 6.875%, due 11/10/39 | 27,595,485 | ||||||||||
|
| |||||||||||
Total Brazil (Cost: $412,830,245) | 441,046,499 | |||||||||||
|
| |||||||||||
See accompanying notes to financial statements.
20
TCW Emerging Markets Income Fund
October 31, 2016 |
| Principal Amount | Fixed Income Securities | Value | ||||||||||
Chile (Cost: $15,915,474) (0.5%) | ||||||||||||
| $ | 16,454,000 | Empresa Electrica Guacolda S.A., (Reg. S), 4.56%, due 04/30/25 (2) | $ | 15,619,782 | ||||||||
|
| |||||||||||
China (Cost: $10,343,160) (0.3%) | ||||||||||||
| 10,882,464 | Kaisa Group Holdings, Ltd., 6.56%, due 12/31/19 (2) | 10,183,810 | ||||||||||
|
| |||||||||||
Colombia (3.5%) | ||||||||||||
| 8,500,000 | Avianca Holdings S.A. / Avianca Leasing LLC / Grupo Taca Holdings, Ltd., (Reg. S), 8.375%, due 05/10/20 (2) | 8,415,000 | ||||||||||
| 16,350,000 | Banco de Bogota S.A., (144A), 6.25%, due 05/12/26 (1) | 16,840,500 | ||||||||||
| 4,500,000 | Banco de Bogota S.A., (144A), 6.25%, due 05/12/26 (1) | 4,657,500 | ||||||||||
| 21,775,000 | Colombia Government International Bond, 2.625%, due 03/15/23 | 21,121,750 | ||||||||||
| 29,080,000 | Colombia Government International Bond, 4%, due 02/26/24 | 30,315,900 | ||||||||||
| 12,645,000 | Colombia Government International Bond, 4.5%, due 01/28/26 | 13,577,569 | ||||||||||
| 9,310,000 | Colombia Government International Bond, 5%, due 06/15/45 | 9,496,200 | ||||||||||
| 4,199,000 | Ecopetrol S.A., 4.125%, due 01/16/25 | 4,010,045 | ||||||||||
|
| |||||||||||
Total Colombia (Cost: $105,003,601) | 108,434,464 | |||||||||||
|
| |||||||||||
Costa Rica (2.4%) | ||||||||||||
| 20,555,000 | Banco Nacional de Costa Rica, (144A), 5.875%, due 04/25/21 (1) | 21,428,587 | ||||||||||
| 7,250,000 | Banco Nacional de Costa Rica, (Reg. S), 6.25%, due 11/01/23 (2) | 7,567,188 | ||||||||||
| 30,365,000 | Costa Rica Government International Bond, (Reg. S), 7%, due 04/04/44 (2) | 31,541,644 | ||||||||||
| 12,130,000 | Costa Rica Government International Bond, (Reg. S), | 12,797,150 | ||||||||||
|
| |||||||||||
Total Costa Rica (Cost: $68,092,224) | 73,334,569 | |||||||||||
|
| |||||||||||
Croatia (1.9%) | ||||||||||||
| 21,025,000 | Croatia Government International Bond, (Reg. S), 5.5%, due 04/04/23 (2) | 22,996,094 | ||||||||||
| 18,990,000 | Croatia Government International Bond, (Reg. S), 6%, due 01/26/24 (2) | 21,474,367 | ||||||||||
| 13,521,000 | Hrvatska Elektroprivreda, (144A), 5.875%, due 10/23/22 (1) | 14,783,658 | ||||||||||
|
| |||||||||||
Total Croatia (Cost: $56,531,216) | 59,254,119 | |||||||||||
|
| |||||||||||
Dominican Republic (2.5%) | ||||||||||||
| 15,255,000 | AES Andres B.V. / Dominican Power Partners / Empresa Generadora de Electricidad Itabo, S.A., (144A), 7.95%, due 05/11/26 (1) | 16,284,712 | ||||||||||
| 17,621,000 | Dominican Republic International Bond, (144A), 6.875%, due 01/29/26 (1) | 19,416,580 | ||||||||||
| 14,250,000 | Dominican Republic International Bond, (Reg. S), 5.5%, due 01/27/25 (2) | 14,570,625 | ||||||||||
| 13,980,000 | Dominican Republic International Bond, (Reg. S), | 14,540,878 | ||||||||||
| 12,801,000 | Dominican Republic International Bond, (Reg. S), 6.85%, due 01/27/45 (2) | 13,377,045 | ||||||||||
|
| |||||||||||
Total Dominican Republic (Cost: $74,573,880) | 78,189,840 | |||||||||||
|
| |||||||||||
Ecuador (2.0%) | ||||||||||||
| 19,385,000 | Ecuador Government International Bond, (144A), | 20,596,563 | ||||||||||
| 45,165,000 | Ecuador Government International Bond, (Reg. S), | 42,793,837 | ||||||||||
|
| |||||||||||
Total Ecuador (Cost: $59,129,410) | 63,390,400 | |||||||||||
|
| |||||||||||
See accompanying notes to financial statements.
21
TCW Emerging Markets Income Fund
Schedule of Investments (Continued)
| Principal Amount | Fixed Income Securities | Value | ||||||||||
Egypt (Cost: $24,572,837) (0.8%) | ||||||||||||
| $ | 26,235,000 | Egypt Government International Bond, (Reg. S), 5.875%, due 06/11/25 (2) | $ | 24,389,630 | ||||||||
|
| |||||||||||
El Salvador (1.7%) | ||||||||||||
| 9,000,000 | El Salvador Government International Bond, (Reg. S), | 9,486,900 | ||||||||||
| 18,028,000 | El Salvador Government International Bond, (Reg. S), | 18,596,783 | ||||||||||
| 24,710,000 | El Salvador Government International Bond, (Reg. S), | 25,760,175 | ||||||||||
|
| |||||||||||
Total El Salvador (Cost: $53,720,623) | 53,843,858 | |||||||||||
|
| |||||||||||
Ghana (Cost: $14,421,939) (0.5%) |
| |||||||||||
| 15,565,000 | Ghana Government International Bond, (Reg. S), 7.875%, due 08/07/23 (2) | 14,959,599 | ||||||||||
|
| |||||||||||
Greece (Cost: $55,807,595) (1.9%) | ||||||||||||
| EUR | 57,872,000 | Hellenic Republic Government Bond, (144A), 4.75%, due 04/17/19 (1) | 58,497,385 | |||||||||
|
| |||||||||||
Guatemala (0.9%) | ||||||||||||
| $ | 14,654,000 | Comcel Trust via Comunicaciones Celulares S.A., (Reg. S), | 15,056,985 | |||||||||
| 12,450,000 | Industrial Senior Trust, (144A), 5.5%, due 11/01/22 (1) | 12,458,217 | ||||||||||
|
| |||||||||||
Total Guatemala (Cost: $28,084,528) | 27,515,202 | |||||||||||
|
| |||||||||||
Hungary (1.9%) | ||||||||||||
| 17,654,000 | Hungary Government International Bond, 5.375%, due 02/21/23 | 20,081,425 | ||||||||||
| 33,795,000 | �� | Hungary Government International Bond, 5.375%, due 03/25/24 | 38,948,737 | |||||||||
|
| |||||||||||
Total Hungary (Cost: $58,212,509) | 59,030,162 | |||||||||||
|
| |||||||||||
India (0.8%) | ||||||||||||
| 10,300,000 | Delhi International Airport Pvt, Ltd., (144A), 6.125%, due 10/31/26 (1) | 10,580,799 | ||||||||||
| 13,675,000 | Vedanta Resources PLC, (Reg. S), 8.25%, due 06/07/21 (2) | 14,068,840 | ||||||||||
|
| |||||||||||
Total India (Cost: $24,290,138) | 24,649,639 | |||||||||||
|
| |||||||||||
Indonesia (2.9%) | ||||||||||||
| IDR | 135,619,000,000 | Indonesia Treasury Bond, 9%, due 03/15/29 | 11,568,099 | |||||||||
| $ | 16,250,000 | Pertamina Persero PT, (Reg. S), 6%, due 05/03/42 (2) | 17,194,548 | |||||||||
| 20,750,000 | Perusahaan Penerbit SBSN Indonesia III, (144A), 4.35%, due 09/10/24 (1) | 21,910,340 | ||||||||||
| 17,875,000 | Perusahaan Penerbit SBSN Indonesia III, (144A), 4.55%, due 03/29/26 (1) | 18,833,100 | ||||||||||
| 19,780,000 | Perusahaan Penerbit SBSN Indonesia III, (Reg. S), | 20,695,814 | ||||||||||
|
| |||||||||||
Total Indonesia (Cost: $85,637,737) | 90,201,901 | |||||||||||
|
| |||||||||||
Ivory Coast (Cost: $7,131,831) (0.3%) | ||||||||||||
| 7,620,000 | Ivory Coast Government International Bond, (144A), | 7,979,093 | ||||||||||
|
| |||||||||||
Jamaica (Cost: $10,694,288) (0.3%) | ||||||||||||
| 11,850,000 | Digicel, Ltd. (Reg. S), 6%, due 04/15/21 (2) | 10,661,445 | ||||||||||
|
| |||||||||||
See accompanying notes to financial statements.
22
TCW Emerging Markets Income Fund
October 31, 2016 |
| Principal Amount | Fixed Income Securities | Value | ||||||||||
Kazakhstan (Cost: $32,482,212) (1.0%) | ||||||||||||
| $ | 32,625,000 | Tengizchevroil Finance Co. International, Ltd., (144A), | $ | 31,545,863 | ||||||||
|
| |||||||||||
Kenya (Cost: $17,079,798) (0.6%) | ||||||||||||
| 17,459,000 | Kenya Government International Bond, (Reg. S), 6.875%, due 06/24/24 (2) | 17,448,088 | ||||||||||
|
| |||||||||||
Lebanon (3.4%) | ||||||||||||
| 19,710,000 | Lebanon Government International Bond, 6.15%, due 06/19/20 | 19,783,912 | ||||||||||
| 26,655,000 | Lebanon Government International Bond, 6.375%, due 03/09/20 | 26,921,550 | ||||||||||
| 14,250,000 | Lebanon Government International Bond, (Reg. S), 6%, due 01/27/23 (2) | 13,840,313 | ||||||||||
| 44,825,000 | Lebanon Government International Bond, (Reg. S), 6.6%, due 11/27/26 (2) | 43,760,406 | ||||||||||
|
| |||||||||||
Total Lebanon (Cost: $105,113,187) | 104,306,181 | |||||||||||
|
| |||||||||||
Mexico (8.5%) | ||||||||||||
| 20,830,000 | Banco Mercantil del Norte S.A., (144A), 5.75%, due 10/04/31 (1)(3) | 20,205,100 | ||||||||||
| 12,891,000 | BBVA Bancomer S.A., (Reg. S), 6.008%, due 05/17/22 (2)(3) | 12,852,327 | ||||||||||
| 10,803,000 | Cemex Finance LLC, (Reg. S), 6%, due 04/01/24 (2) | 11,194,609 | ||||||||||
| 17,325,000 | Cemex SAB de C.V., (Reg. S), 5.7%, due 01/11/25 (2) | 17,671,500 | ||||||||||
| 5,625,000 | Comision Federal de Electricidad, (144A), 4.75%, due 02/23/27 (1) | 5,737,500 | ||||||||||
| 12,395,000 | Credito Real S.A.B. de C.V. SOFOM ER, (144A), 7.25%, due 07/20/23 (1) | 12,797,838 | ||||||||||
| 15,719,000 | Metalsa S.A. de C.V., (Reg. S), 4.9%, due 04/24/23 (2) | 15,522,512 | ||||||||||
| 23,075,000 | Mexico City Airport Trust, (144A), 5.5%, due 10/31/46 (1) | 22,584,656 | ||||||||||
| 18,995,000 | Mexico Government International Bond, 3.6%, due 01/30/25 | 19,422,387 | ||||||||||
| 9,280,000 | Mexico Government International Bond, 4%, due 10/02/23 | 9,776,480 | ||||||||||
| 17,415,000 | Mexico Government International Bond, 4.125%, due 01/21/26 | 18,451,192 | ||||||||||
| 8,750,000 | Mexico Government International Bond, 4.35%, due 01/15/47 | 8,310,313 | ||||||||||
| 7,150,000 | Mexico Government International Bond, 4.75%, due 03/08/44 | 7,150,000 | ||||||||||
| 20,870,000 | Petroleos Mexicanos, 4.5%, due 01/23/26 | 20,212,595 | ||||||||||
| 42,335,000 | Petroleos Mexicanos, (144A), 4.625%, due 09/21/23 (1) | 42,273,614 | ||||||||||
| 14,835,000 | Petroleos Mexicanos, 5.625%, due 01/23/46 | 12,884,198 | ||||||||||
| 7,045,000 | Trust F/1401, (144A), 6.95%, due 01/30/44 (1) | 7,309,188 | ||||||||||
|
| |||||||||||
Total Mexico (Cost: $262,572,038) | 264,356,009 | |||||||||||
|
| |||||||||||
Mongolia (Cost: $14,521,210) (0.5%) | ||||||||||||
| 15,616,000 | Mongolia Government International Bond, (Reg. S), | 15,069,440 | ||||||||||
|
| |||||||||||
Panama (1.5%) | ||||||||||||
| 31,410,000 | AES Panama SRL, (144A), 6%, due 06/25/22 (1) | 32,688,387 | ||||||||||
| 14,900,000 | Global Bank Corp., (144A), 4.5%, due 10/20/21 (1) | 14,868,338 | ||||||||||
|
| |||||||||||
Total Panama (Cost: $46,625,593) | 47,556,725 | |||||||||||
|
| |||||||||||
Paraguay (1.0%) | ||||||||||||
| 15,850,000 | Banco Regional SAECA, (144A), 8.125%, due 01/24/19 (1) | 17,200,420 | ||||||||||
| 12,800,000 | Telefonica Celular del Paraguay S.A., (Reg. S), 6.75%, due 12/13/22 (2) | 13,408,000 | ||||||||||
|
| |||||||||||
Total Paraguay (Cost: $29,377,866) | 30,608,420 | |||||||||||
|
| |||||||||||
See accompanying notes to financial statements.
23
TCW Emerging Markets Income Fund
Schedule of Investments (Continued)
| Principal Amount | Fixed Income Securities | Value | ||||||||||
Peru (3.2%) | ||||||||||||
| $ | 17,373,000 | Banco Internacional del Peru SAA Interbank, (Reg. S), | $ | 19,148,521 | ||||||||
| 18,014,000 | Corp. Financiera de Desarrollo S.A., (144A), 5.25%, due 07/15/29 (1)(3) | 19,365,050 | ||||||||||
| 10,953,000 | Inkia Energy, Ltd., (Reg. S), 8.375%, due 04/04/21 (2) | 11,445,885 | ||||||||||
| PEN | 103,600,000 | Peruvian Government International Bond, (144A), 6.35%, due 08/12/28 (1) | 31,959,382 | |||||||||
| PEN | 50,475,000 | Peruvian Government International Bond, (Reg. S), | 16,366,338 | |||||||||
|
| |||||||||||
Total Peru (Cost: $95,558,677) | 98,285,176 | |||||||||||
|
| |||||||||||
Russia (3.9%) | ||||||||||||
| $ | 14,610,000 | Evraz Group S.A., 8.25%, due 01/28/21 (2) | 15,924,900 | |||||||||
| 22,250,000 | Gazprom OAO via Gaz Capital S.A., (Reg. S), 4.95%, due 02/06/28 (2) | 21,888,437 | ||||||||||
| 14,226,000 | GTH Finance BV, (144A), 7.25%, due 04/26/23 (1) | 15,164,916 | ||||||||||
| 10,315,000 | Sberbank of Russia via SB Capital S.A., (Reg. S), 5.25%, due 05/23/23 (2) | 10,147,949 | ||||||||||
| 59,680,000 | Sberbank of Russia via SB Capital S.A., (Reg. S), 5.5%, due 02/26/24 (2)(3) | 59,307,000 | ||||||||||
|
| |||||||||||
Total Russia (Cost: $120,777,886) | 122,433,202 | |||||||||||
|
| |||||||||||
Saudi Arabia (1.2%) | ||||||||||||
| 20,910,000 | Saudi Government International Bond, (144A), 3.25%, due 10/26/26 (1) | 20,643,397 | ||||||||||
| 16,815,000 | Saudi Government International Bond, (144A), 4.5%, due 10/26/46 (1) | 16,571,183 | ||||||||||
|
| |||||||||||
Total Saudi Arabia (Cost: $37,150,838) | 37,214,580 | |||||||||||
|
| |||||||||||
South Africa (1.6%) | ||||||||||||
| 16,100,000 | MTN Mauritius Investment, Ltd., (144A), 6.5%, due 10/13/26 (1) | 16,401,875 | ||||||||||
| 35,965,000 | Republic of South Africa Government International Bond, | 34,975,962 | ||||||||||
|
| |||||||||||
Total South Africa (Cost: $51,874,575) | 51,377,837 | |||||||||||
|
| |||||||||||
Sri Lanka (3.0%) | ||||||||||||
| 17,650,000 | Sri Lanka Government International Bond, (144A), | 18,617,220 | ||||||||||
| 34,850,000 | Sri Lanka Government International Bond, (Reg. S), | 35,715,151 | ||||||||||
| 29,850,000 | Sri Lanka Government International Bond, (Reg. S), | 31,233,995 | ||||||||||
| 7,350,000 | Sri Lanka Government International Bond, (Reg. S), | 7,764,107 | ||||||||||
|
| |||||||||||
Total Sri Lanka (Cost: $89,016,325) | 93,330,473 | |||||||||||
|
| |||||||||||
Trinidad And Tobago (Cost: $10,490,744) (0.3%) | ||||||||||||
| 10,670,000 | Trinidad Generation UnLtd, (144A), 5.25%, due 11/04/27 (1) | 10,643,325 | ||||||||||
|
| |||||||||||
Turkey (3.1%) | ||||||||||||
| 27,725,000 | Hazine Mustesarligi Varlik Kiralama AS, (Reg. S), | 27,447,750 | ||||||||||
| 35,680,000 | Turkey Government International Bond, 3.25%, due 03/23/23 | 33,316,200 | ||||||||||
| 31,525,000 | Turkey Government International Bond, 4.25%, due 04/14/26 | 30,274,561 | ||||||||||
See accompanying notes to financial statements.
24
TCW Emerging Markets Income Fund
October 31, 2016 |
| Principal Amount | Fixed Income Securities | Value | ||||||||||
| Turkey (continued) | ||||||||||||
| $ | 5,850,000 | Turkey Government International Bond, 5.125%, due 03/25/22 | $ | 6,054,253 | ||||||||
|
| |||||||||||
Total Turkey (Cost: $99,643,217) | 97,092,764 | |||||||||||
|
| |||||||||||
Ukraine (2.7%) | ||||||||||||
| 20,773,000 | Ukraine Government International Bond, (144A), 0%,due 05/31/40 (1)(3)(4) | 6,656,604 | ||||||||||
| 33,315,000 | Ukraine Government International Bond, (Reg. S), 7.75%, due 09/01/19 (2) | 33,398,287 | ||||||||||
| 44,208,000 | Ukraine Government International Bond, (Reg. S), 7.75%, due 09/01/20 (2) | 43,655,400 | ||||||||||
|
| |||||||||||
Total Ukraine (Cost: $86,498,612) | 83,710,291 | |||||||||||
|
| |||||||||||
Venezuela (3.3%) | ||||||||||||
| 134,685,000 | Petroleos de Venezuela S.A., 5.375%, due 04/12/27 (2) | 49,496,737 | ||||||||||
| 12,180,000 | Petroleos de Venezuela S.A., (Reg. S), 9.75%, due 05/17/35 (2) | 5,423,145 | ||||||||||
| 41,000,000 | Venezuela Government International Bond, 9.25%, due 09/15/27 | 20,746,000 | ||||||||||
| 62,300,000 | Venezuela Government International Bond, (Reg. S), 8.25%, due 10/13/24 (2) | 27,785,800 | ||||||||||
|
| |||||||||||
Total Venezuela (Cost: $96,883,395) | 103,451,682 | |||||||||||
|
| |||||||||||
Total Fixed Income Securities (Cost: $2,696,739,556) (89.1%) | 2,771,421,102 | |||||||||||
|
| |||||||||||
| Number of Shares | Equity Securities | |||||||||||
Mexico (0.0%) | ||||||||||||
| 2,707,350 | Corp. GEO S.A.B. de C.V. (5) | — | ||||||||||
| 240,079 | Hipotecaria Su Casita S.A. de C.V., SOFOM E.N.R. (5) | — | ||||||||||
|
| |||||||||||
Total Mexico (Cost: $—) | — | |||||||||||
|
| |||||||||||
| Exchange Traded Funds | ||||||||||||
United States (Cost: $55,156,988) (1.8%) | ||||||||||||
| 1,457,650 | Vanguard Emerging Markets Stock Index Fund — FTSE Emerging Markets ETF Shares | 55,026,287 | ||||||||||
|
| |||||||||||
Total Equity Securities (Cost: $55,156,988) (1.8%) | 55,026,287 | |||||||||||
|
| |||||||||||
| Notional Amount | Currency Options | |||||||||||
| $ | 30,700,000 | USD Call / MXN Put, Strike Price MXN 19.50, Expires 11/23/16 (6) | 468,513 | |||||||||
| 26,025,000 | USD Call / TRY Put, Strike Price TRY 3.08, Expires 11/16/16 (6) | 350,531 | ||||||||||
| 30,600,000 | USD Put / MXN Call, Strike Price MXN 18, Expires 12/19/2016 (7) | 205,968 | ||||||||||
|
| |||||||||||
Total Currency Options (Cost: $2,132,333) (0%) | 1,025,012 | |||||||||||
|
| |||||||||||
See accompanying notes to financial statements.
25
TCW Emerging Markets Income Fund
Schedule of Investments (Continued)
| Notional Amount | Money Market Investments | Value | ||||||||||
| $ | 219,745,353 | State Street Institutional U.S. Government Money Market Fund — Premier Class, 0.25% (8) | $ | 219,745,353 | ||||||||
|
| |||||||||||
Total Money Market Investments (Cost: $219,745,353) (7.1%) | 219,745,353 | |||||||||||
|
| |||||||||||
Total Investments (Cost: $2,973,774,230) (98.0%) | 3,047,217,754 | |||||||||||
Excess of Other Assets over Liabilities (2.0%) | 61,731,534 | |||||||||||
|
| |||||||||||
Total Net Assets (100.0%) | $ | 3,108,949,288 | ||||||||||
|
| |||||||||||
| Forward Currency Contracts | ||||||||||||||||||||||||
| Counterparty | Contracts to Deliver | Units of Currency | Settlement Date | In Exchange for U.S. Dollars | Contracts at Value | Unrealized Appreciation (Depreciation) | ||||||||||||||||||
BUY (9) | ||||||||||||||||||||||||
Bank of America | EUR | 25,490,000 | 12/08/16 | $ | 28,357,625 | $ | 27,984,909 | $ | (372,716 | ) | ||||||||||||||
Citibank N.A. | EUR | 60,283,586 | 12/08/16 | 67,978,434 | 66,184,022 | (1,794,412 | ) | |||||||||||||||||
Goldman Sachs International | EUR | 13,825,000 | 12/08/16 | 15,763,956 | 15,178,163 | (585,793 | ) | |||||||||||||||||
Morgan Stanley & Co. | EUR | 14,700,000 | 12/08/16 | 16,885,890 | 16,138,806 | (747,084 | ) | |||||||||||||||||
|
|
|
|
|
| |||||||||||||||||||
| $ | 128,985,905 | $ | 125,485,900 | $ | (3,500,005 | ) | ||||||||||||||||||
|
|
|
|
|
| |||||||||||||||||||
SELL (10) | ||||||||||||||||||||||||
Citibank N.A. | BRL | 102,845,000 | 12/22/16 | $ | 30,700,000 | $ | 32,009,352 | $ | (1,309,352 | ) | ||||||||||||||
Citibank N.A. | EUR | 88,998,586 | 12/08/16 | 99,043,586 | 97,709,587 | 1,333,999 | ||||||||||||||||||
Morgan Stanley & Co. | EUR | 25,300,000 | 12/08/16 | 28,664,900 | 27,776,313 | 888,587 | ||||||||||||||||||
|
|
|
|
|
| |||||||||||||||||||
| $ | 158,408,486 | $ | 157,495,252 | $ | 913,234 | |||||||||||||||||||
|
|
|
|
|
| |||||||||||||||||||
| Written Options — OTC | ||||||||||||||||||
| Notional Amount | Description | Premiums (Received) | Value | |||||||||||||||
| $ 30,700,000 | USD Call / MXN Put, Strike Price MXN 21.00, Expires 11/23/16 (6) | $ | (193,410 | ) | $ | (126,576 | ) | |||||||||||
| 26,025,000 | USD Call / TRY Put, Strike Price TRY 3.33, Expires 11/16/16 (6) | (713,423 | ) | (4,320 | ) | |||||||||||||
|
|
|
| |||||||||||||||
| $ | (906,833 | ) | $ | (130,896 | ) | |||||||||||||
|
|
|
| |||||||||||||||
See accompanying notes to financial statements.
26
TCW Emerging Markets Income Fund
October 31, 2016 |
| Credit Default Swaps — Buy Protection | ||||||||||||||||||||||||||
| Notional Amount (11) | Implied Credit Spread (12) | Expiration Date | Counterparty and Reference Entity | Fixed Deal Pay Rate | Unrealized (Depreciation) | Premium Paid (Received) | Value (13) | |||||||||||||||||||
| OTC Swaps | ||||||||||||||||||||||||||
| $ 15,900,000 | 1.108 | % | 12/20/21 | Bank of America, China Government Bond, 7.5%, due 10/28/27 | 1% | $ | 24 | $ | 70,386 | $ | 70,410 | |||||||||||||||
| 16,000,000 | 1.80 | % | 12/20/21 | Citibank N.A., Colombia Government Bond, 10.375%, due 01/28/23 | 1% | (95,285) | 665,330 | 570,045 | ||||||||||||||||||
| 16,350,000 | 1.55 | % | 12/20/21 | Citibank N.A., Mexico Government Bond, 5.95%, due 03/19/19 | 1% | (112,389) | 540,913 | 428,524 | ||||||||||||||||||
| 15,800,000 | 1.55 | % | 12/20/21 | Bank of America, Mexico Government Bond, 5.95%, due 03/19/19 | 1% | (127,362) | 541,471 | 414,109 | ||||||||||||||||||
| 6,310,000 | 1.57 | % | 12/20/21 | Bank of America, Indonesia Government Bond, 5.875%, due 03/13/20 | 1% | 5,322 | 158,436 | 163,758 | ||||||||||||||||||
| 15,850,000 | 1.55 | % | 12/20/21 | Bank of America, Mexico Government Bond, 5.95%, due 03/19/19 | 1% | (40,560) | 455,979 | 415,419 | ||||||||||||||||||
| 15,900,000 | 1.80 | % | 12/20/21 | Citibank N.A., Colombia Government Bond, 10.375%, due 01/28/23 | 1% | 3,256 | 563,226 | 566,482 | ||||||||||||||||||
| 4,375,000 | 1.57 | % | 12/20/21 | Bank of America, Indonesia Government Bond, 5.875%, due 03/13/20 | 1% | (2,273) | 115,814 | 113,541 | ||||||||||||||||||
| 60,300,000 | 0.425 | % | 12/20/21 | Citibank N.A., Korea Government Bond, 7.125%, due 04/16/19 | 1% | (12,779) | (1,720,436 | ) | (1,733,215) | |||||||||||||||||
| 19,700,000 | 1.108 | % | 12/20/21 | Deutsche Bank AG, China Government Bond, 7.5%, due 10/28/27 | 1% | 9,841 | 77,397 | 87,238 | ||||||||||||||||||
| 11,400,000 | 1.57 | % | 12/20/21 | Deutsche Bank AG, Indonesia Government Bond, 5.875%, due 03/13/20 | 1% | (5,921) | 301,777 | 295,856 | ||||||||||||||||||
| 32,000,000 | 1.55 | % | 12/20/21 | Barclays Bank PLC, Mexico Government Bond, 5.95%, due 03/19/19 | 1% | (285,156) | 1,123,857 | 838,701 | ||||||||||||||||||
|
|
|
|
|
| |||||||||||||||||||||
| $ | (663,282 | ) | $ | 2,894,150 | $ | 2,230,868 | ||||||||||||||||||||
|
|
|
|
|
| |||||||||||||||||||||
See accompanying notes to financial statements.
27
TCW Emerging Markets Income Fund
Schedule of Investments (Continued)
Notes to the Schedule of Investments:
| ARS - Argentine | Peso. |
| BRL - Brazilian | Real. |
| EUR - Euro | Currency. |
| IDR - Indonesian | Rupiah. |
| MXN - Mexican | Peso. |
| PEN - Peruvian | Nouveau Sol. |
| TRY - New | Turkish Lira. |
| ETF - Exchange | Traded Fund. |
| OTC - Over | the Counter. |
| (1) | Security exempt from registration under Rule 144A of the Securities Act of 1933, as amended. These securities may be resold, normally only to qualified institutional buyers. At October 31, 2016, the value of these securities amounted to $794,478,498 or 25.6% of net assets. These securities are determined to be liquid by the Advisor, unless otherwise noted, under procedures established by and under the general supervision of the Company’s Board of Directors. |
| (2) | Investments issued under Regulation S of the Securities Act of 1933, may not be offered, sold, or delivered within the United States except under special exemptions. At October 31, 2016, the value of these securities amounted to $1,065,408,912 or 34.3% of net assets. |
| (3) | Floating or variable rate security. The interest shown reflects the rate in effect at October 31, 2016. |
| (4) | Security not accruing interest. |
| (5) | Non-income producing security. |
| (6) | Over-the-counter traded option; Counterparty — Bank of America. |
| (7) | Over-the-counter traded option; Counterparty — Citigroup Global Market, Inc. |
| (8) | Rate disclosed is the 7-day net yield as of October 31, 2016. |
| (9) | Fund buys foreign currency, sells U.S. Dollar. |
| (10) | Fund sells foreign currency, buys U.S. Dollar. |
| (11) | The maximum potential amount the Fund could be required to make as seller of credit protection or receive as buyer of protection if a credit event occurred as defined under the terms of that particular swap agreement. |
| (12) | An implied credit spread is the spread in yield between a U.S. Treasury security and the referenced obligation. Implied credit spreads, represented in the absolute terms, utilized in determining the value of credit default swap agreements serve as an indicator of the current status of the payment/performance risk and represent the likelihood of risk of default for the credit derivative. The implied credit spread of a particular referenced entity reflects the cost of buying/selling protection and may include upfront payments required to be made to enter into the agreement. Wider credit spreads, in comparison to narrower credit spreads, represent a deterioration of the referenced entity’s credit soundness and a greater likelihood of risk of default or other credit event occurring as defined under the terms of the agreement. |
| (13) | The value of a credit default swap agreement serves as an indicator of the current status of the payments/performance risk and represents the likelihood of an expected liability (or profit) for the credit derivative should the notional amount of the swap agreement closed/sold as of the period end. Increasing values, in absolute terms when compared to the notional amount of the swap, represent a deterioration of the reference entity’s credit soundness and a greater likelihood or risk of default or other credit event occurring as defined under the terms of the agreement. |
See accompanying notes to financial statements.
28
TCW Emerging Markets Income Fund
Investments by Industry | October 31, 2016 |
| Industry | Percentage of Net Assets | |||
Airlines | 0.3 | |||
Auto Parts & Equipment | 0.5 | |||
Banks | 8.5 | |||
Building Materials | 1.0 | |||
Currency Options | 0.0 | * | ||
Diversified Financial Services | 0.4 | |||
Electric | 3.9 | |||
Engineering & Construction | 1.0 | |||
Exchange-Traded Fund (ETF) | 1.8 | |||
Food | 0.5 | |||
Foreign Government Bonds | 55.0 | |||
Government Regional/Local | 0.1 | |||
Iron & Steel | 2.8 | |||
Mining | 0.5 | |||
Oil & Gas | 11.7 | |||
REIT | 0.2 | |||
Real Estate | 0.3 | |||
Telecommunications | 2.4 | |||
Money Market Investments | 7.1 | |||
|
| |||
Total | 98.0 | % | ||
|
| |||
| * | Value rounds to less than 0.1% of net assets. |
See accompanying notes to financial statements.
29
TCW Emerging Markets Income Fund
Fair Valuation Summary | October 31, 2016 |
The following is a summary of the fair valuations according to the inputs used as of October 31, 2016 in valuing the Fund’s investments:
| Description | Quoted Prices (Level 1) | Other (Level 2) | Significant (Level 3) | Total | ||||||||||||
Fixed Income Securities | ||||||||||||||||
Government Regional/Local | $ | — | $ | 4,406,513 | $ | — | $ | 4,406,513 | ||||||||
Airlines | — | 8,415,000 | — | 8,415,000 | ||||||||||||
Auto Parts & Equipment | — | 15,522,512 | — | 15,522,512 | ||||||||||||
Banks | — | 270,635,514 | — | 270,635,514 | ||||||||||||
Building Materials | — | 28,866,109 | — | 28,866,109 | ||||||||||||
Diversified Financial Services | — | 12,797,838 | — | 12,797,838 | ||||||||||||
Electric | — | 121,544,830 | — | 121,544,830 | ||||||||||||
Engineering & Construction | — | 33,165,455 | — | 33,165,455 | ||||||||||||
Food | — | 14,650,575 | — | 14,650,575 | ||||||||||||
Foreign Government Bonds | — | 1,710,834,850 | — | 1,710,834,850 | ||||||||||||
Iron & Steel | — | 87,205,452 | — | 87,205,452 | ||||||||||||
Mining | — | 14,068,840 | — | 14,068,840 | ||||||||||||
Oil & Gas | — | 361,121,395 | — | 361,121,395 | ||||||||||||
REIT | — | 7,309,188 | — | 7,309,188 | ||||||||||||
Real Estate | — | 10,183,810 | — | 10,183,810 | ||||||||||||
Telecommunications | — | 70,693,221 | — | 70,693,221 | ||||||||||||
|
|
|
|
|
|
|
| |||||||||
Total Fixed Income Securities | — | 2,771,421,102 | — | 2,771,421,102 | ||||||||||||
|
|
|
|
|
|
|
| |||||||||
Equity Securities | ||||||||||||||||
Miscellaneous Manufacturers | — | * | — | — | — | * | ||||||||||
|
|
|
|
|
|
|
| |||||||||
Total Equity Securities | — | — | — | — | ||||||||||||
|
|
|
|
|
|
|
| |||||||||
Exchange-Traded Funds | 55,026,287 | — | — | 55,026,287 | ||||||||||||
Currency Options | — | 1,025,012 | — | 1,025,012 | ||||||||||||
Money Market Investments | 219,745,353 | — | — | 219,745,353 | ||||||||||||
|
|
|
|
|
|
|
| |||||||||
Total Investments | 274,771,640 | 2,772,446,114 | — | 3,047,217,754 | ||||||||||||
|
|
|
|
|
|
|
| |||||||||
Asset Derivatives | ||||||||||||||||
Forward Currency Contracts | ||||||||||||||||
Foreign Currency Risk | — | 2,222,586 | — | 2,222,586 | ||||||||||||
Swap Agreements | ||||||||||||||||
Credit Risk | — | 3,964,083 | — | 3,964,083 | ||||||||||||
|
|
|
|
|
|
|
| |||||||||
Total | $ | 274,771,640 | $ | 2,778,632,783 | $ | — | $ | 3,053,404,423 | ||||||||
|
|
|
|
|
|
|
| |||||||||
Liability Derivatives | ||||||||||||||||
Forward Currency Contracts | ||||||||||||||||
Foreign Currency Risk | $ | — | $ | (4,809,357 | ) | $ | — | $ | (4,809,357 | ) | ||||||
Written Options | ||||||||||||||||
Foreign Currency Risk | — | (130,896 | ) | — | (130,896 | ) | ||||||||||
Swap Agreements | ||||||||||||||||
Credit Risk | — | (1,733,215 | ) | — | (1,733,215 | ) | ||||||||||
|
|
|
|
|
|
|
| |||||||||
Total | $ | — | $ | (6,673,468 | ) | $ | — | $ | (6,673,468 | ) | ||||||
|
|
|
|
|
|
|
| |||||||||
| * | Amount rounds to less than $1. |
See accompanying notes to financial statements.
30
TCW Emerging Markets Local Currency Income Fund
Schedule of Investments | October 31, 2016 |
| Principal Amount | Fixed Income Securities | Value | ||||||||||
Argentina (3.4% of Net Assets) |
| |||||||||||
| ARS | 9,380,000 | Argentine Bonos del Tesoro, 15.5%, due 10/17/26 | $ | 628,887 | ||||||||
| ARS | 10,000,000 | Argentine Bonos del Tesoro, 22.75%, due 03/05/18 | 674,932 | |||||||||
| ARS | 2,566,000 | Argentine Republic Government International Bond, 5.83%, due 12/31/33 (1) | 1,187,787 | |||||||||
| ARS | 11,780,000 | Banco Hipotecario S.A., (144A), 24.729%, due 01/12/20 (1)(2) | 783,686 | |||||||||
| ARS | 560,000 | YPF S.A., (144A), 31.354%, due 07/07/20 (1)(2) | 620,303 | |||||||||
|
| |||||||||||
Total Argentina (Cost: $3,731,538) | 3,895,595 | |||||||||||
|
| |||||||||||
Brazil (17.5%) | ||||||||||||
| BRL | 2,740,000 | Brazil Notas do Tesouro Nacional, Series B, 6%, due 08/15/50 | 2,657,102 | |||||||||
| BRL | 7,823,000 | Brazil Notas do Tesouro Nacional, Series F, 10%, due 01/01/19 | 2,409,880 | |||||||||
| BRL | 14,305,000 | Brazil Notas do Tesouro Nacional, Series F, 10%, due 01/01/21 | 4,354,493 | |||||||||
| BRL | 16,700,000 | Brazil Notas do Tesouro Nacional, Series F, 10%, due 01/01/25 | 4,939,061 | |||||||||
| BRL | 18,410,000 | Brazil Notas do Tesouro Nacional, Series F, 10%, due 01/01/27 | 5,365,403 | |||||||||
|
| |||||||||||
Total Brazil (Cost: $15,310,162) | 19,725,939 | |||||||||||
|
| |||||||||||
Colombia (6.7%) | ||||||||||||
| COP | 11,831,900,000 | Colombian TES (Treasury) Bond, 7%, due 05/04/22 | 3,975,039 | |||||||||
| COP | 3,500,000,000 | Colombian TES (Treasury) Bond, 7.5%, due 08/26/26 | 1,181,314 | |||||||||
| COP | 6,082,000,000 | Colombian TES (Treasury) Bond, 10%, due 07/24/24 | 2,385,823 | |||||||||
|
| |||||||||||
Total Colombia (Cost: $7,098,354) | 7,542,176 | |||||||||||
|
| |||||||||||
Greece (Cost: $2,128,168) (2.0%) | ||||||||||||
| EUR | 2,205,000 | Hellenic Republic Government Bond, (Reg. S), 4.75%, due 04/17/19 (3) | 2,228,828 | |||||||||
|
| |||||||||||
India (3.5%) | ||||||||||||
| INR | 80,000,000 | NTPC Ltd., (Reg. S), 7.375%, due 08/10/21 (3) | 1,214,617 | |||||||||
| INR | 180,000,000 | Rural Electrification Corp., Ltd., 8.37%, due 08/14/20 | 2,787,243 | |||||||||
|
| |||||||||||
Total India (Cost: $3,983,424) | 4,001,860 | |||||||||||
|
| |||||||||||
Indonesia (13.8%) | ||||||||||||
| IDR | 25,827,000,000 | Indonesia Treasury Bond, 7.875%, due 04/15/19 | 2,028,245 | |||||||||
| IDR | 30,000,000,000 | Indonesia Treasury Bond, 8.25%, due 07/15/21 | 2,419,118 | |||||||||
| IDR | 72,688,000,000 | Indonesia Treasury Bond, 8.375%, due 03/15/24 | 5,932,918 | |||||||||
| IDR | 12,000,000,000 | Indonesia Treasury Bond, 8.75%, due 05/15/31 | 1,011,649 | |||||||||
| IDR | 49,341,000,000 | Indonesia Treasury Bond, 9%, due 03/15/29 | 4,208,714 | |||||||||
|
| |||||||||||
Total Indonesia (Cost: $14,189,814) | 15,600,644 | |||||||||||
|
| |||||||||||
Malaysia (6.5%) | ||||||||||||
| MYR | 11,178,000 | Malaysia Government Bond, 3.659%, due 10/15/20 | 2,697,852 | |||||||||
| MYR | 6,600,000 | Malaysia Government Bond, 3.955%, due 09/15/25 | 1,597,723 | |||||||||
| MYR | 7,660,000 | Malaysia Government Bond, 4.254%, due 05/31/35 | 1,816,214 | |||||||||
| MYR | 5,037,000 | Malaysia Government Bond, 4.378%, due 11/29/19 | 1,242,615 | |||||||||
|
| |||||||||||
Total Malaysia (Cost: $7,434,386) | 7,354,404 | |||||||||||
|
| |||||||||||
Mexico (9.8%) | ||||||||||||
| MXN | 51,640,470 | Mexican UDIBONOS Government Bond, 4.5%, due 12/04/25 | 3,097,995 | |||||||||
| MXN | 60,550,000 | Mexican BONOS Government Bond, 6.5%, due 06/10/21 | 3,290,376 | |||||||||
See accompanying notes to financial statements.
31
TCW Emerging Markets Local Currency Income Fund
Schedule of Investments (Continued)
| Principal Amount | Fixed Income Securities | Value | ||||||||||
Mexico (Continued) | ||||||||||||
| MXN | 25,420,000 | Mexican BONOS Government Bond, 7.75%, due 05/29/31 | $ | 1,495,330 | ||||||||
| MXN | 21,890,000 | Mexican BONOS Government Bond, 8.5%, due 12/13/18 | 1,232,584 | |||||||||
| MXN | 32,000,000 | Mexican BONOS Government Bond, 8.5%, due 05/31/29 | 1,985,547 | |||||||||
|
| |||||||||||
Total Mexico (Cost: $11,400,998) | 11,101,832 | |||||||||||
|
| |||||||||||
Peru (5.4%) | ||||||||||||
| PEN | 3,300,000 | Peruvian Government International Bond, (Reg. S), 6.35%, due 08/12/28 (3) | 1,018,011 | |||||||||
| PEN | 15,631,000 | Peruvian Government International Bond, (Reg. S), 6.95%, due 08/12/31 (3) | 5,068,296 | |||||||||
|
| |||||||||||
Total Peru (Cost: $5,777,863) | 6,086,307 | |||||||||||
|
| |||||||||||
Romania (1.1%) | ||||||||||||
| RON | 2,750,000 | Romania Government Bond, 4.75%, due 02/24/25 | 749,195 | |||||||||
| RON | 1,730,000 | Romania Government Bond, 5.85%, due 04/26/23 | 496,606 | |||||||||
|
| |||||||||||
Total Romania (Cost: $1,251,493) | 1,245,801 | |||||||||||
|
| |||||||||||
Russia (5.6%) | ||||||||||||
| RUB | 103,214,000 | Russian Federal Bond — OFZ, 6.4%, due 05/27/20 | 1,519,930 | |||||||||
| RUB | 142,200,000 | Russian Federal Bond — OFZ, 7%, due 01/25/23 | 2,083,343 | |||||||||
| RUB | 47,000,000 | Russian Federal Bond — OFZ, 7%, due 08/16/23 | 686,552 | |||||||||
| RUB | 134,165,000 | Russian Federal Bond — OFZ, 7.5%, due 08/18/21 | 2,029,771 | |||||||||
|
| |||||||||||
Total Russia (Cost: $5,861,873) | 6,319,596 | |||||||||||
|
| |||||||||||
Serbia (Cost: $1,968,538) (1.9%) | ||||||||||||
| RSD | 198,900,000 | Serbia Treasury Bond, 10%, due 02/05/22 | 2,125,775 | |||||||||
|
| |||||||||||
South Africa (9.6%) | ||||||||||||
| ZAR | 8,800,000 | South Africa Government Bond, 7.75%, due 02/28/23 | 632,923 | |||||||||
| ZAR | 38,300,000 | South Africa Government Bond, 8%, due 01/31/30 | 2,601,815 | |||||||||
| ZAR | 27,980,000 | South Africa Government Bond, 8.25%, due 03/31/32 | 1,914,199 | |||||||||
| ZAR | 29,180,000 | South Africa Government Bond, 8.5%, due 01/31/37 | 1,998,489 | |||||||||
| ZAR | 45,194,062 | South Africa Government Bond, 10.5%, due 12/21/26 | 3,715,852 | |||||||||
|
| |||||||||||
Total South Africa (Cost: $10,326,193) | 10,863,278 | |||||||||||
|
| |||||||||||
Sri Lanka (Cost: $1,459,735) (1.2%) | ||||||||||||
| LKR | 215,000,000 | Sri Lanka Government Bond, 10.75%, due 03/01/21 | 1,408,294 | |||||||||
|
| |||||||||||
Turkey (7.3%) | ||||||||||||
| TRY | 9,991,148 | Turkey Government Bond, 8.3%, due 06/20/18 | 3,192,341 | |||||||||
| TRY | 8,645,708 | Turkey Government Bond, 9.4%, due 07/08/20 | 2,780,877 | |||||||||
| TRY | 2,700,000 | Turkey Government Bond, 10.6%, due 02/11/26 | 914,227 | |||||||||
| TRY | 3,900,000 | Turkey Government Bond, 10.7%, due 02/17/21 | 1,309,832 | |||||||||
|
| |||||||||||
Total Turkey (Cost: $8,557,452) | 8,197,277 | |||||||||||
|
| |||||||||||
Total Fixed Income Securities (Cost: $100,479,991) (95.3%) | 107,697,606 | |||||||||||
|
| |||||||||||
See accompanying notes to financial statements.
32
TCW Emerging Markets Local Currency Income Fund
October 31, 2016 |
| Notional Amount | Currency Options | Value | ||||||||||
| $ | 2,930,000 | USD Call / MXN Put, Strike Price MXN 19.50, Expires 11/23/16 (4) | $ | 44,715 | ||||||||
| 6,700,000 | USD Put / MXN Call, Strike Price MXN 18, Expires 12/19/16 (5) | 45,097 | ||||||||||
|
| |||||||||||
Total Currency Options (Cost: $96,161) (0.1%) | 89,812 | |||||||||||
|
| |||||||||||
| Principal Amount | Short-Term Investments | |||||||||||
Argentina (1.5%) | ||||||||||||
| ARS | 26,500,000 | Letras del Banco Central de la Republica Argentina, 0%, due 12/07/16 (6) | 1,705,639 | |||||||||
|
| |||||||||||
Total Short-Term Investments (Cost: $1,844,698) (1.5%) | 1,705,639 | |||||||||||
|
| |||||||||||
| Number of Shares | Money Market Investments | |||||||||||
| 25,163,561 | State Street Institutional U.S. Government Money Market Fund — Premier Class, 0.25% (7) | 25,163,561 | ||||||||||
|
| |||||||||||
Total Money Market Investments (Cost: $25,163,561) (22.3%) | 25,163,561 | |||||||||||
|
| |||||||||||
Total Investments (Cost: $127,584,411) (119.2%) | 134,656,618 | |||||||||||
|
| |||||||||||
Liabilities in Excess of Other Assets (-19.2%) | (21,681,490 | ) | ||||||||||
|
| |||||||||||
Total Net Assets (100.0%) | $ | 112,975,128 | ||||||||||
|
| |||||||||||
| Written Options — OTC | ||||||||||||
| Notional Amount | Description | Premiums (Received) | Value | |||||||||
| $ | 3,050,000 | USD Call / CNH Put, Strike Price CNH 7.72, Expires 02/14/17 (5) | $ | (47,443 | ) | $ | (210 | ) | ||||
| 2,930,000 | USD Call / MXN Put, Strike Price MXN 21.00, Expires 11/23/16 (4) | (18,459 | ) | (12,081 | ) | |||||||
|
|
|
| |||||||||
| $ | (65,902 | ) | $ | (12,291 | ) | |||||||
|
|
|
| |||||||||
| Forward Currency Contracts | ||||||||||||||||||||||||
| Counterparty | Contracts to Deliver | Units of Currency | Settlement Date | In Exchange for U.S. Dollars | Contracts at Value | Unrealized Appreciation (Depreciation) | ||||||||||||||||||
BUY (8) | ||||||||||||||||||||||||
Bank of America | BRL | 8,703,961 | 11/01/16 | $ | 2,760,000 | $ | 2,749,328 | $ | (10,672 | ) | ||||||||||||||
Bank of America | COP | 4,085,490,000 | 11/01/16 | 1,380,000 | 1,363,600 | (16,400 | ) | |||||||||||||||||
Bank of America | EUR | 1,440,000 | 12/08/16 | 1,602,000 | 1,580,945 | (21,055 | ) | |||||||||||||||||
Bank of America | MYR | 12,127,270 | 01/12/17 | 2,930,000 | 2,881,076 | (48,924 | ) | |||||||||||||||||
Bank of America | PLN | 37,774,991 | 12/09/16 | 9,815,000 | 9,589,844 | (225,156 | ) | |||||||||||||||||
Bank of America | THB | 269,600,100 | 11/07/16 | 7,700,000 | 7,702,388 | 2,388 | ||||||||||||||||||
Bank of America | ZAR | 38,288,583 | 11/02/16 | 2,760,000 | 2,839,873 | 79,873 | ||||||||||||||||||
Bank of America | ZAR | 19,416,600 | 01/11/17 | 1,373,994 | 1,419,918 | 45,924 | ||||||||||||||||||
Barclays Bank PLC | CLP | 3,198,890,000 | 11/14/16 | 4,731,422 | 4,892,456 | 161,034 | ||||||||||||||||||
Barclays Bank PLC | MXN | 38,948,913 | 11/03/16 | 2,070,000 | 2,070,925 | 925 | ||||||||||||||||||
Barclays Bank PLC | MXN | 51,560,660 | 11/14/16 | 2,780,000 | 2,738,171 | (41,829 | ) | |||||||||||||||||
BNP Paribas S.A. | HUF | 1,989,081,900 | 01/19/17 | 7,020,000 | 7,086,813 | 66,813 | ||||||||||||||||||
See accompanying notes to financial statements.
33
TCW Emerging Markets Local Currency Income Fund
Schedule of Investments (Continued)
| Forward Currency Contracts (Continued) | ||||||||||||||||||||||||
| Counterparty | Contracts to Deliver | Units of Currency | Settlement Date | In Exchange for U.S. Dollars | Contracts at Value | Unrealized Appreciation (Depreciation) | ||||||||||||||||||
BUY (8) (Continued) | ||||||||||||||||||||||||
Citibank N.A. | COP | 4,163,600,000 | 11/28/16 | $ | 1,371,862 | $ | 1,383,643 | $ | 11,781 | |||||||||||||||
Citibank N.A. | EUR | 1,815,002 | 12/08/16 | 2,013,200 | 1,992,650 | (20,550 | ) | |||||||||||||||||
Citibank N.A. | HUF | 765,600,000 | 01/19/17 | 2,750,000 | 2,727,723 | (22,277 | ) | |||||||||||||||||
Citibank N.A. | MXN | 38,621,100 | 11/14/16 | 2,100,000 | 2,051,005 | (48,995 | ) | |||||||||||||||||
Citibank N.A. | RUB | 86,739,900 | 11/01/16 | 1,380,000 | 1,370,528 | (9,472 | ) | |||||||||||||||||
Citibank N.A. | RUB | 52,887,600 | 01/09/17 | 830,000 | 821,524 | (8,476 | ) | |||||||||||||||||
Citibank N.A. | THB | 95,691,960 | 11/07/16 | 2,760,000 | 2,733,889 | (26,111 | ) | |||||||||||||||||
Citibank N.A. | ZAR | 19,915,000 | 11/25/16 | 1,359,850 | 1,470,366 | 110,516 | ||||||||||||||||||
Goldman Sachs International | EUR | 1,242,000 | 12/08/16 | 1,425,071 | 1,363,564 | (61,507 | ) | |||||||||||||||||
Goldman Sachs International | MXN | 25,612,845 | 11/14/16 | 1,350,000 | 1,360,191 | 10,191 | ||||||||||||||||||
Morgan Stanley & Co. | EUR | 500,000 | 12/08/16 | 564,937 | 548,939 | (15,998 | ) | |||||||||||||||||
Standard Chartered PLC | INR | 91,691,200 | 12/27/16 | 1,360,000 | 1,361,844 | 1,844 | ||||||||||||||||||
Standard Chartered PLC | PHP | 67,608,750 | 01/17/17 | 1,375,000 | 1,394,958 | 19,958 | ||||||||||||||||||
|
|
|
|
|
| |||||||||||||||||||
| $ | 67,562,336 | $ | 67,496,161 | $ | (66,175 | ) | ||||||||||||||||||
|
|
|
|
|
| |||||||||||||||||||
SELL (9) | ||||||||||||||||||||||||
Bank of America | BRL | 8,703,961 | 11/01/16 | $ | 2,735,804 | $ | 2,749,328 | $ | (13,524 | ) | ||||||||||||||
Bank of America | CNH | 20,596,650 | 02/13/17 | 3,050,000 | 3,014,201 | 35,799 | ||||||||||||||||||
Bank of America | COP | 4,085,490,000 | 11/01/16 | 1,376,670 | 1,363,600 | 13,070 | ||||||||||||||||||
Bank of America | EUR | 930,000 | 12/08/16 | 1,049,056 | 1,021,027 | 28,029 | ||||||||||||||||||
Bank of America | IDR | 18,109,740,000 | 01/11/17 | 1,380,000 | 1,373,407 | 6,593 | ||||||||||||||||||
Bank of America | MXN | 25,796,130 | 11/14/16 | 1,363,000 | 1,369,925 | (6,925 | ) | |||||||||||||||||
Bank of America | RUB | 52,887,600 | 01/09/17 | 828,440 | 821,524 | 6,916 | ||||||||||||||||||
Bank of America | THB | 89,964,600 | 11/07/16 | 2,580,000 | 2,570,260 | 9,740 | ||||||||||||||||||
Bank of America | ZAR | 38,288,583 | 11/02/16 | 2,766,938 | 2,839,872 | (72,934 | ) | |||||||||||||||||
Barclays Bank PLC | BRL | 4,534,680 | 01/13/17 | 1,380,000 | 1,401,699 | (21,699 | ) | |||||||||||||||||
Barclays Bank PLC | CLP | 1,825,070,000 | 11/14/16 | 2,780,000 | 2,791,304 | (11,304 | ) | |||||||||||||||||
Barclays Bank PLC | MXN | 38,948,913 | 11/03/16 | 2,053,795 | 2,070,924 | (17,129 | ) | |||||||||||||||||
Citibank N.A. | CNH | 9,974,358 | 02/13/17 | 1,490,000 | 1,459,690 | 30,310 | ||||||||||||||||||
Citibank N.A. | BRL | 6,817,250 | 12/22/16 | 2,035,000 | 2,121,793 | (86,793 | ) | |||||||||||||||||
Citibank N.A. | CLP | 1,373,820,000 | 11/14/16 | 2,100,000 | 2,101,152 | (1,152 | ) | |||||||||||||||||
Citibank N.A. | COP | 4,163,600,000 | 11/28/16 | 1,400,000 | 1,383,642 | 16,358 | ||||||||||||||||||
Citibank N.A. | EUR | 1,902,002 | 12/08/16 | 2,100,000 | 2,088,166 | 11,834 | ||||||||||||||||||
Citibank N.A. | PLN | 10,832,250 | 01/19/17 | 2,750,000 | 2,748,156 | 1,844 | ||||||||||||||||||
Citibank N.A. | RUB | 86,739,900 | 11/01/16 | 1,373,606 | 1,370,528 | 3,078 | ||||||||||||||||||
Citibank N.A. | SGD | 4,527,600 | 11/14/16 | 3,300,000 | 3,253,184 | 46,816 | ||||||||||||||||||
Citibank N.A. | ZAR | 19,915,000 | 11/25/16 | 1,400,000 | 1,470,366 | (70,366 | ) | |||||||||||||||||
Citibank N.A. | ZAR | 19,416,600 | 01/11/17 | 1,380,000 | 1,419,918 | (39,918 | ) | |||||||||||||||||
Goldman Sachs International | MXN | 25,421,675 | 11/14/16 | 1,385,000 | 1,350,039 | 34,961 | ||||||||||||||||||
Morgan Stanley & Co. | EUR | 2,165,000 | 12/08/16 | 2,456,270 | 2,376,906 | 79,364 | ||||||||||||||||||
Morgan Stanley & Co. | MXN | 25,612,800 | 11/14/16 | 1,380,000 | 1,360,188 | 19,812 | ||||||||||||||||||
Natixis | MXN | 38,964,000 | 11/14/16 | 2,000,000 | 2,069,215 | (69,215 | ) | |||||||||||||||||
Standard Chartered PLC | INR | 91,691,200 | 12/27/16 | 1,357,785 | 1,361,845 | (4,060 | ) | |||||||||||||||||
Standard Chartered PLC | THB | 48,374,700 | 11/07/16 | 1,370,000 | 1,382,050 | (12,050 | ) | |||||||||||||||||
|
|
|
|
|
| |||||||||||||||||||
| $ | 52,621,364 | $ | 52,703,909 | $ | (82,545 | ) | ||||||||||||||||||
|
|
|
|
|
| |||||||||||||||||||
See accompanying notes to financial statements.
34
TCW Emerging Markets Local Currency Income Fund
October 31, 2016 |
Notes to the Schedule of Investments:
| ARS - | Argentine Peso. |
| BRL - | Brazilian Real. |
| CLP - | Chilean Peso. |
| CNH - | Chinese Yuan Renminbi. |
| COP - | Colombian Peso. |
| EUR - | Euro Currency. |
| HUF - | Hungarian Forint. |
| IDR - | Indonesian Rupiah. |
| INR - | Indian Rupee. |
| LKR - | Sri Lankan Rupee. |
| MXN - | Mexican Peso. |
| MYR - | Malaysian Ringgit. |
| PEN - | Peruvian Nouveau Sol. |
| PHP - | Philippines Peso. |
| PLN - | Polish Zloty. |
| RON - | New Romanian Leu. |
| RSD - | Serbian Dinar. |
| RUB - | Russian Ruble. |
| SGD - | Singapore Dollar. |
| THB - | Thai Baht. |
| TRY - | New Turkish Lira. |
| ZAR - | South African Rand. |
| (1) | Floating or variable rate security. The interest shown reflects the rate in effect at October 31, 2016. |
| (2) | Security exempt from registration under Rule 144A of the Securities Act of 1933, as amended. These securities may be resold, normally only to qualified institutional buyers. At October 31, 2016, the value of these securities amounted to $1,403,989 or 1.2% of net assets. These securities are determined to be liquid by the Advisor, unless otherwise noted, under procedures established by and under the general supervision of the Company’s Board of Directors. |
| (3) | Investments issued under Regulation S of the Securities Act of 1933, may not be offered, sold, or delivered within the United States except under special exemptions. At October 31, 2016, the value of these securities amounted to $9,529,752 or 8.4% of net assets. |
| (4) | Over-the-counter traded option; Counterparty — Bank of America. |
| (5) | Over-the-counter traded option; Counterparty — Citigroup Global Market, Inc. |
| (6) | As of October 31, 2016 security is not accuring interest. |
| (7) | Rate disclosed is the 7-day net yield as of October 31, 2016. |
| (8) | Fund buys foreign currency, sells U.S. Dollar. |
| (9) | Fund sells foreign currency, buys U.S. Dollar. |
See accompanying notes to financial statements.
35
TCW Emerging Markets Local Currency Income Fund
Investments by Industry | October 31, 2016 |
| Industry | Percentage of Net Assets | |||
Diversified Financial Services | 2.4 | % | ||
Currency Options | 0.1 | |||
Electric | 1.1 | |||
Foreign Government Bonds | 91.8 | |||
Short Term Investments | 1.5 | |||
Money Market Investments | 22.3 | |||
|
| |||
Total | 119.2 | % | ||
|
| |||
Fair Valuation Summary
The following is a summary of the fair valuations according to the inputs used as of October 31, 2016 in valuing the Fund’s investments:
| Description | Quoted Prices (Level 1) | Other (Level 2) | Significant (Level 3) | Total | ||||||||||||
Fixed Income Securities | ||||||||||||||||
Diversified Financial Services | $ | — | $ | 2,787,243 | $ | — | $ | 2,787,243 | ||||||||
Electric | — | 1,214,617 | — | 1,214,617 | ||||||||||||
Foreign Government Bonds | — | 103,695,746 | — | 103,695,746 | ||||||||||||
|
|
|
|
|
|
|
| |||||||||
Total Fixed Income Securities | — | 107,697,606 | — | 107,697,606 | ||||||||||||
|
|
|
|
|
|
|
| |||||||||
Currency Options | — | 89,812 | — | 89,812 | ||||||||||||
Short-Term Investments | — | 1,705,639 | — | 1,705,639 | ||||||||||||
Money Market Investments | 25,163,561 | — | — | 25,163,561 | ||||||||||||
|
|
|
|
|
|
|
| |||||||||
Total Investments | 25,163,561 | 109,493,057 | — | 134,656,618 | ||||||||||||
|
|
|
|
|
|
|
| |||||||||
Asset Derivatives | ||||||||||||||||
Forward Currency Contracts | ||||||||||||||||
Foreign Currency Risk | — | 855,771 | — | 855,771 | ||||||||||||
|
|
|
|
|
|
|
| |||||||||
Total | $ | 25,163,561 | $ | 110,348,828 | $ | — | $ | 135,512,389 | ||||||||
|
|
|
|
|
|
|
| |||||||||
Liability Derivatives | ||||||||||||||||
Forward Currency Contracts | ||||||||||||||||
Foreign Currency Risk | $ | — | $ | (1,004,491 | ) | $ | — | $ | (1,004,491 | ) | ||||||
Written Options | ||||||||||||||||
Foreign Currency Risk | — | (12,291 | ) | — | (12,291 | ) | ||||||||||
|
|
|
|
|
|
|
| |||||||||
Total | $ | — | $ | (1,016,782 | ) | $ | — | $ | (1,016,782 | ) | ||||||
|
|
|
|
|
|
|
| |||||||||
See accompanying notes to financial statements.
36
TCW Emerging Markets Multi-Asset Opportunities Fund
Schedule of Investments | October 31, 2016 |
| Principal Amount | Fixed Income Securities | Value | ||||||||||
Argentina (3.6% of Net Assets) | ||||||||||||
| ARS | 1,325,000 | Argentina Treasury Bond BONCER, 2.5%, due 07/22/21 | $ | 94,008 | ||||||||
| ARS | 1,190,000 | Argentine Bonos del Tesoro, 15.5%, due 10/17/26 | 79,784 | |||||||||
| ARS | 1,400,000 | Argentine Bonos del Tesoro, 22.75%, due 03/05/18 | 94,491 | |||||||||
| $ | 455,000 | Argentine Republic Government International Bond, 2.5%, due 12/31/38 (1) | 312,130 | |||||||||
| 400,000 | Argentine Republic Government International Bond, (144A), | 413,400 | ||||||||||
| 150,000 | Argentine Republic Government International Bond, (144A), | 164,250 | ||||||||||
| EUR | 68,805 | Argentine Republic Government International Bond, 7.82%, due 12/31/33 | 80,856 | |||||||||
| $ | 150,000 | Argentine Republic Government International Bond, (Reg. S), | 154,650 | |||||||||
| ARS | 1,575,000 | Banco Hipotecario S.A., (144A), 24.729%, due 01/12/20 (1)(2) | 104,780 | |||||||||
| ARS | 40,000 | YPF S.A., (144A), 31.354%, due 07/07/20 (1)(2) | 44,307 | |||||||||
|
| |||||||||||
Total Argentina (Cost: $1,527,351) | 1,542,656 | |||||||||||
|
| |||||||||||
Bahrain (1.0%) | ||||||||||||
| $ | 200,000 | Bahrain Government International Bond, (144A), 7%, due 10/12/28 (2) | 206,500 | |||||||||
| 200,000 | CBB International Sukuk Co. SPC, (144A), 5.624%, due 02/12/24 (2) | 206,000 | ||||||||||
|
| |||||||||||
Total Bahrain (Cost: $403,493) | 412,500 | |||||||||||
|
| |||||||||||
Brazil (5.6%) | ||||||||||||
| 200,000 | Banco do Brasil S.A., (Reg. S), 9%, due 06/29/49 (1)(3) | 186,200 | ||||||||||
| BRL | 90,000 | Brazil Notas do Tesouro Nacional, Series B, 6%, due 08/15/50 | 87,277 | |||||||||
| BRL | 1,045,000 | Brazil Notas do Tesouro Nacional, Series F, 10%, due 01/01/27 | 304,554 | |||||||||
| BRL | 225,000 | Brazil Notas do Tesouro Nacional, Series F, 10%, due 01/01/21 | 68,491 | |||||||||
| $ | 225,000 | Brazilian Government International Bond, 4.25%, due 01/07/25 | 222,975 | |||||||||
| 200,000 | Minerva Luxembourg S.A., (144A), 6.5%, due 09/20/26 (2) | 195,450 | ||||||||||
| 310,000 | Petrobras Global Finance BV, 4.375%, due 05/20/23 | 281,713 | ||||||||||
| 125,000 | Petrobras Global Finance BV, 5.625%, due 05/20/43 | 98,809 | ||||||||||
| 150,000 | Petrobras Global Finance BV, 6.75%, due 01/27/41 | 132,900 | ||||||||||
| 400,000 | Petrobras Global Finance BV, 8.75%, due 05/23/26 | 449,640 | ||||||||||
| 165,000 | Vale Overseas, Ltd., 6.25%, due 08/10/26 | 176,996 | ||||||||||
| 185,000 | Vale Overseas, Ltd., 6.875%, due 11/10/39 | 182,817 | ||||||||||
|
| |||||||||||
Total Brazil (Cost: $2,265,913) | 2,387,822 | |||||||||||
|
| |||||||||||
China (Cost: $46,440) (0.1%) | ||||||||||||
| 49,000 | Kaisa Group Holdings, Ltd., 6.56%, due 12/31/19 | 45,854 | ||||||||||
|
| |||||||||||
Colombia (1.5%) | ||||||||||||
| 200,000 | Avianca Holdings S.A. / Avianca Leasing LLC / Grupo Taca Holdings, Ltd., (Reg. S), 8.375%, due 05/10/20 (3) | 198,000 | ||||||||||
| 200,000 | Banco de Bogota S.A., (144A), 6.25%, due 05/12/26 (2) | 206,000 | ||||||||||
| 200,000 | Colombia Government International Bond, 4%, due 02/26/24 | 208,500 | ||||||||||
| 24,000 | Ecopetrol S.A., 4.125%, due 01/16/25 | 22,920 | ||||||||||
|
| |||||||||||
Total Colombia (Cost: $624,464) | 635,420 | |||||||||||
|
| |||||||||||
See accompanying notes to financial statements.
37
TCW Emerging Markets Multi-Asset Opportunities Fund
Schedule of Investments (Continued)
| Principal Amount | Fixed Income Securities | Value | ||||||||||
Costa Rica (0.8%) | ||||||||||||
| $ | 200,000 | Banco Nacional de Cost Rica, (144A), 5.875%, due 04/25/21 (2) | $ | 208,500 | ||||||||
| 125,000 | Costa Rica Government International Bond, (Reg. S), 7%, due 04/04/44 (3) | 129,844 | ||||||||||
|
| |||||||||||
Total Costa Rica (Cost: $312,039) | 338,344 | |||||||||||
|
| |||||||||||
Croatia (Cost: $220,061) (0.5%) | ||||||||||||
| 200,000 | Croatia Government International Bond, (Reg. S), 6%, due 01/26/24 (3) | 226,165 | ||||||||||
|
| |||||||||||
Dominican Republic (1.0%) | ||||||||||||
| 200,000 | AES Andres B.V. / Dominican Power Partners / Empresa Generadora de Electricidad Itabo, S.A. (144A), 7.95%, due 05/11/26 (2) | 213,500 | ||||||||||
| 40,000 | Dominican Republic International Bond, (144A), 6.875%, due 01/29/26 (2) | 44,076 | ||||||||||
| 100,000 | Dominican Republic International Bond, (Reg. S), 5.5%, due 01/27/25 (3) | 102,250 | ||||||||||
| 50,000 | Dominican Republic International Bond, (Reg. S), 6.85%, due 01/27/45 (3) | 52,250 | ||||||||||
|
| |||||||||||
Total Dominican Republic (Cost: $388,961) | 412,076 | |||||||||||
|
| |||||||||||
Ecuador (1.0%) | ||||||||||||
| 200,000 | Ecuador Government International Bond, (144A), 10.75%, due 03/28/22 (2) | 212,500 | ||||||||||
| 200,000 | Ecuador Government International Bond, (Reg. S), 7.95%, due 06/20/24 (3) | 189,500 | ||||||||||
|
| |||||||||||
Total Ecuador (Cost: $377,559) | 402,000 | |||||||||||
|
| |||||||||||
Egypt (Cost: $182,767) (0.4%) | ||||||||||||
| 200,000 | Egypt Government International Bond, (Reg. S), 5.875%, due 06/11/25 (3) | 185,932 | ||||||||||
|
| |||||||||||
El Salvador (0.9%) | ||||||||||||
| 45,000 | El Salvador Government International Bond, (Reg. S), 5.875%, due 01/30/25 (3) | 44,831 | ||||||||||
| 50,000 | El Salvador Government International Bond, (Reg. S), 6.375%, due 01/18/27 (3) | 50,188 | ||||||||||
| 150,000 | El Salvador Government International Bond, (Reg. S), 7.625%, due 02/01/41 (3) | 154,732 | ||||||||||
| 140,000 | El Salvador Government International Bond, (Reg. S), 7.65%, due 06/15/35 (3) | 145,950 | ||||||||||
|
| |||||||||||
Total El Salvador (Cost: $390,881) | 395,701 | |||||||||||
|
| |||||||||||
Ghana (Cost: $205,017) (0.5%) | ||||||||||||
| 220,000 | Ghana Government International Bond, (Reg. S), 7.875%, due 08/07/23 (3) | 211,443 | ||||||||||
|
| |||||||||||
Greece (Cost: $347,725) (0.8%) | ||||||||||||
| EUR | 354,000 | Hellenic Republic Government Bond, (Reg. S), 4.75%, due 04/17/19 (3) | 357,826 | |||||||||
|
| |||||||||||
Guatemala (0.8%) | ||||||||||||
| $ | 250,000 | Comcel Trust via Comunicaciones Celulares S.A., (Reg. S), | 256,875 | |||||||||
| 80,000 | Industrial Senior Trust, (144A), 5.5%, due 11/01/22 (2) | 80,053 | ||||||||||
|
| |||||||||||
Total Guatemala (Cost: $340,927) | 336,928 | |||||||||||
|
| |||||||||||
Hungary (0.9%) | ||||||||||||
| 200,000 | Hungary Government International Bond, 5.375%, due 02/21/23 | 227,500 | ||||||||||
| 134,000 | Hungary Government International Bond, 5.375%, due 03/25/24 | 154,435 | ||||||||||
|
| |||||||||||
Total Hungary (Cost: $372,549) | 381,935 | |||||||||||
|
| |||||||||||
India (Cost: $200,000) (0.5%) | ||||||||||||
| 200,000 | Delhi International Airport Pvt., Ltd., (144A), 6.125%, due 10/31/26 (2) | 205,452 | ||||||||||
|
| |||||||||||
See accompanying notes to financial statements.
38
TCW Emerging Markets Multi-Asset Opportunities Fund
October 31, 2016 |
| Principal Amount | Fixed Income Securities | Value | ||||||||||
Indonesia (0.7%) | ||||||||||||
| IDR | 975,000,000 | Indonesia Treasury Bond, 9%, due 03/15/29 | $ | 83,166 | ||||||||
| $ | 200,000 | Pertamina Persero PT, (Reg. S), 6%, due 05/03/42 (3) | 211,625 | |||||||||
|
| |||||||||||
Total Indonesia (Cost: $277,319) | 294,791 | |||||||||||
|
| |||||||||||
Ivory Coast (Cost: $195,910) (0.5%) | ||||||||||||
| 200,000 | Ivory Coast Government International Bond, (144A), 6.375%, due 03/03/28 (2) | 209,425 | ||||||||||
|
| |||||||||||
Kazakhstan (Cost: $196,800) (0.5%) | ||||||||||||
| 200,000 | Tengizchevroil Finance Co. International, Ltd., (144A), 4%, due 08/15/26 (2) | 193,385 | ||||||||||
|
| |||||||||||
Lebanon (1.6%) | ||||||||||||
| 80,000 | Lebanon Government International Bond, 6%, due 01/27/23 | 77,700 | ||||||||||
| 130,000 | Lebanon Government International Bond, 6.15%, due 06/19/20 | 130,487 | ||||||||||
| 165,000 | Lebanon Government International Bond, 6.375%, due 03/09/20 | 166,650 | ||||||||||
| 295,000 | Lebanon Government International Bond, 6.6%, due 11/27/26 | 287,994 | ||||||||||
|
| |||||||||||
Total Lebanon (Cost: $667,959) | 662,831 | |||||||||||
|
| |||||||||||
Mexico (4.1%) | ||||||||||||
| 200,000 | Banco Mercantil del Norte S.A., (144A), 5.75%, due 10/04/31 (1)(2) | 194,000 | ||||||||||
| 200,000 | Comision Federal de Electricidad, (144A), 4.75%, due 02/23/27 (2) | 204,000 | ||||||||||
| 200,000 | Credito Real S.A.B. de C.V. SOFOM ER, (144A), 7.25%, due 07/20/23 (2) | 206,500 | ||||||||||
| 200,000 | Mexico City Airport Trust, (144A), 5.5%, due 10/31/46 (2) | 195,750 | ||||||||||
| 405,000 | Mexico Government International Bond, 3.6%, due 01/30/25 | 414,112 | ||||||||||
| 210,000 | Mexico Government International Bond, 4.35%, due 01/15/47 | 199,448 | ||||||||||
| 325,000 | Petroleos Mexicanos, (144A), 4.625%, due 09/21/23 (2) | 324,529 | ||||||||||
|
| |||||||||||
Total Mexico (Cost: $1,748,509) | 1,738,339 | |||||||||||
|
| |||||||||||
Mongolia (Cost: $191,298) (0.5%) | ||||||||||||
| 200,000 | Mongolia Government International Bond, (Reg. S), 4.125%, due 01/05/18 (3) | 193,000 | ||||||||||
|
| |||||||||||
Panama (Cost: $207,368) (0.5%) | ||||||||||||
| 200,000 | AES Panama SRL, (144A), 6%, due 06/25/22 (2) | 208,140 | ||||||||||
|
| |||||||||||
Paraguay (Cost: $149,244) (0.4%) | ||||||||||||
| 150,000 | Banco Regional SAECA, (144A), 8.125%, due 01/24/19 (2) | 162,780 | ||||||||||
|
| |||||||||||
Peru (1.0%) | ||||||||||||
| 145,000 | Banco Internacional del Peru SAA Interbank, (Reg. S), 6.625%, due 03/19/29 (1)(3) | 159,819 | ||||||||||
| PEN | 700,000 | Peruvian Government International Bond, (144A), 6.35%, due 08/12/28 (2) | 215,942 | |||||||||
| PEN | 200,000 | Peruvian Government International Bond, (Reg. S), 6.95%, due 08/12/31 (3) | 64,849 | |||||||||
|
| |||||||||||
Total Peru (Cost: $425,823) | 440,610 | |||||||||||
|
| |||||||||||
Russia (1.5%) | ||||||||||||
| $ | 200,000 | Evraz Group S.A., 8.25%, due 01/28/21 | 218,000 | |||||||||
| 200,000 | GTH Finance BV, (144A), 7.25%, due 04/26/23 (2) | 213,200 | ||||||||||
| 200,000 | Sberbank of Russia via SB Capital S.A., (Reg. S), 5.5%, due 02/26/24 (1)(3) | 198,750 | ||||||||||
|
| |||||||||||
Total Russia (Cost: $615,437) | 629,950 | |||||||||||
|
| |||||||||||
Saudi Arabia (Cost: $197,358) (0.5%) | ||||||||||||
| 200,000 | Saudi Government International Bond, (144A), 3.25%, due 10/26/26 (2) | 197,450 | ||||||||||
|
| |||||||||||
See accompanying notes to financial statements.
39
TCW Emerging Markets Multi-Asset Opportunities Fund
Schedule of Investments (Continued)
| Principal Amount | Fixed Income Securities | Value | ||||||||||
South Africa (0.9%) | ||||||||||||
| $ | 200,000 | MTN Mauritius Investment, Ltd., (144A), 6.5%, due 10/13/26 (2) | $ | 203,750 | ||||||||
| 200,000 | South Africa Government International Bond, 4.3%, due 10/12/28 | 194,500 | ||||||||||
|
| |||||||||||
Total South Africa (Cost: $400,000) | 398,250 | |||||||||||
|
| |||||||||||
Sri Lanka (1.2%) | ||||||||||||
| 200,000 | Sri Lanka Government International Bond, (144A), 6.825%, due 07/18/26 (2) | 210,960 | ||||||||||
| 90,000 | Sri Lanka Government International Bond, (Reg. S), 5.875%, due 07/25/22 (3) | 92,234 | ||||||||||
| 200,000 | Sri Lanka Government International Bond, (Reg. S), 6.25%, due 07/27/21 (3) | 209,273 | ||||||||||
|
| |||||||||||
Total Sri Lanka (Cost: $499,060) | 512,467 | |||||||||||
|
| |||||||||||
Trinidad And Tobago (Cost: $196,640) (0.5%) |
| |||||||||||
| 200,000 | Trinidad Generation Unlimited, (144A), 5.25%, due 11/04/27 (2) | 199,500 | ||||||||||
|
| |||||||||||
Turkey (1.3%) |
| |||||||||||
| 200,000 | Hazine Mustesarligi Varlik Kiralama AS, (Reg. S), 4.489%, due 11/25/24 (3) | 198,000 | ||||||||||
| 350,000 | Turkey Government International Bond, 4.25%, due 04/14/26 | 336,117 | ||||||||||
|
| |||||||||||
Total Turkey (Cost: $554,815) | 534,117 | |||||||||||
|
| |||||||||||
Ukraine (1.3%) |
| |||||||||||
| 115,000 | Ukraine Government International Bond, (144A), 0%, due 05/31/40 (1)(2)(4) | 36,851 | ||||||||||
| 185,000 | Ukraine Government International Bond, (Reg. S), 7.75%, due 09/01/19 (3) | 185,463 | ||||||||||
| 325,000 | Ukraine Government International Bond, (Reg. S), 7.75%, due 09/01/20 (3) | 320,937 | ||||||||||
|
| |||||||||||
Total Ukraine (Cost: $557,273) | 543,251 | |||||||||||
|
| |||||||||||
Venezuela (1.5%) |
| |||||||||||
| 1,020,000 | Petroleos de Venezuela S.A., 5.375%, due 04/12/27 | 374,850 | ||||||||||
| 20,000 | Petroleos de Venezuela S.A., (Reg. S), 9.75%, due 05/17/35 (3) | 8,905 | ||||||||||
| 265,000 | Venezuela Government International Bond, 9.25%, due 09/15/27 | 134,090 | ||||||||||
| 250,000 | Venezuela Government International Bond, (Reg. S), 8.25%, due 10/13/24 (3) | 111,500 | ||||||||||
|
| |||||||||||
Total Venezuela (Cost: $559,529) | 629,345 | |||||||||||
|
| |||||||||||
Total Fixed Income Securities (Cost: $15,846,489) (38.4%) | 16,225,685 | |||||||||||
|
| |||||||||||
| Number of Shares | Preferred Stock | |||||||||||
Brazil (3.7%) |
| |||||||||||
| 216,700 | Gerdau S.A., 0.55% | 754,311 | ||||||||||
| 37,070 | Itau Unibanco Holding S.A., 3.27% (ADR) | 442,245 | ||||||||||
| 19,100 | Cia Brasileira de Distribuicao, 1.08% (ADR) | 363,855 | ||||||||||
|
| |||||||||||
Total Brazil (Cost: $1,236,064) | 1,560,411 | |||||||||||
|
| |||||||||||
Total Preferred Stock (Cost: $1,236,064) (3.7%) | 1,560,411 | |||||||||||
|
| |||||||||||
See accompanying notes to financial statements.
40
TCW Emerging Markets Multi-Asset Opportunities Fund
October 31, 2016 |
| Number of Shares | Common Stock | Value | ||||||||||
Argentina (3.1%) |
| |||||||||||
| 14,800 | Adecoagro S.A. (5) | $ | 162,800 | |||||||||
| 12,440 | Grupo Financiero Galicia S.A. (ADR) | 387,381 | ||||||||||
| 1,580 | MercadoLibre, Inc. | 265,456 | ||||||||||
| 10,700 | Tenaris S.A. (ADR) | 301,740 | ||||||||||
| 27,550 | Vale S.A. (SP ADR) (5) | 190,646 | ||||||||||
|
| |||||||||||
Total Argentina (Cost: $1,260,185) | 1,308,023 | |||||||||||
|
| |||||||||||
Brazil (4.8%) |
| |||||||||||
| 42,000 | Banco do Brasil S.A. | 388,578 | ||||||||||
| 45,500 | Banco Santander Brasil S.A. | 377,987 | ||||||||||
| 20,400 | Cia Hering | 124,752 | ||||||||||
| 21,100 | Cia Paranaense de Energia (SP ADR) | 240,751 | ||||||||||
| 13,600 | CVC Brasil Operadora e Agencia de Viagens S.A. | 105,248 | ||||||||||
| 67,700 | Petroleo Brasileiro S.A. (SP ADR) (5) | 790,059 | ||||||||||
|
| |||||||||||
Total Brazil (Cost: $1,703,942) | 2,027,375 | |||||||||||
|
| |||||||||||
China (10.5%) |
| |||||||||||
| 7,122 | Alibaba Group Holding, Ltd. (SP ADR) (5) | 724,236 | ||||||||||
| 3,536 | CNOOC, Ltd. (SP ADR) | 443,697 | ||||||||||
| 5,705 | Ctrip.com International, Ltd. (ADR) (5) | 251,876 | ||||||||||
| 502,000 | Great Wall Motor Co., Ltd. — Class H | 489,970 | ||||||||||
| 1,126 | NetEase, Inc. (ADR) | 289,371 | ||||||||||
| 106,150 | Ping An Insurance Group Co. of China, Ltd. — Class H | 558,773 | ||||||||||
| 692,131 | Q Technology Group Co., Ltd. (5) | 347,200 | ||||||||||
| 236,000 | Shenzhen Investment, Ltd. | 102,873 | ||||||||||
| 45,912 | Tencent Holdings, Ltd. | 1,216,884 | ||||||||||
|
| |||||||||||
Total China (Cost: $3,760,083) | 4,424,880 | |||||||||||
|
| |||||||||||
Egypt (1.4%) |
| |||||||||||
| 71,421 | Commercial International Bank Egypt SAE | 412,381 | ||||||||||
| 8,350 | Eastern Tobacco | 197,423 | ||||||||||
|
| |||||||||||
Total Egypt (Cost: $552,608) | 609,804 | |||||||||||
|
| |||||||||||
India (4.6%) |
| |||||||||||
| 6,880 | Cholamandalam Investment and Finance Co., Ltd. | 121,248 | ||||||||||
| 45,850 | Crompton Greaves Consumer Electricals, Ltd. | 126,937 | ||||||||||
| 10,969 | Housing Development Finance Corp., Ltd. | 226,449 | ||||||||||
| 78,447 | ITC, Ltd. | 283,811 | ||||||||||
| 21,475 | Mahindra & Mahindra Financial Services, Ltd. | 116,139 | ||||||||||
| 58,240 | Punjab National Bank (5) | 126,719 | ||||||||||
| 3,470 | Shriram City Union Finance, Ltd. | 135,347 | ||||||||||
| 31,750 | State Bank of India | 122,363 | ||||||||||
| 7,000 | Tata Motors, Ltd. (SP ADR) | 275,870 | ||||||||||
| 66,950 | Tata Steel, Ltd. | 405,962 | ||||||||||
|
| |||||||||||
Total India (Cost: $1,909,165) | 1,940,845 | |||||||||||
|
| |||||||||||
See accompanying notes to financial statements.
41
TCW Emerging Markets Multi-Asset Opportunities Fund
Schedule of Investments (Continued)
| Number of Shares | Common Stock | Value | ||||||||||
Indonesia (0.8%) |
| |||||||||||
| 183,600 | Bank Central Asia Tbk PT | $ | 218,290 | |||||||||
| 84,700 | Matahari Department Store Tbk PT | 116,807 | ||||||||||
|
| |||||||||||
Total Indonesia (Cost: $329,649) | 335,097 | |||||||||||
|
| |||||||||||
Italy (Cost: $310,785) (0.7%) |
| |||||||||||
| 89,565 | PRADA SpA | 313,802 | ||||||||||
|
| |||||||||||
Kenya (Cost: $260,821) (1.1%) |
| |||||||||||
| 2,287,700 | Safari.com, Ltd. | 448,745 | ||||||||||
|
| |||||||||||
Malaysia (Cost: $206,296) (0.7%) |
| |||||||||||
| 524,208 | My EG Services BHD | 304,352 | ||||||||||
|
| |||||||||||
Mexico (2.9%) |
| |||||||||||
| 348,643 | Genomma Lab Internacional S.A.B. de C.V. Class B (5) | 420,429 | ||||||||||
| 137,050 | Grupo Financiero Banorte S.A.B. de C.V. | 812,499 | ||||||||||
|
| |||||||||||
Total Mexico (Cost: $1,171,785) | 1,232,928 | |||||||||||
|
| |||||||||||
Pakistan (Cost: $142,272) (0.4%) |
| |||||||||||
| 85,799 | Habib Bank, Ltd. | 182,495 | ||||||||||
|
| |||||||||||
Russia (5.4%) |
| |||||||||||
| 59,000 | Aeroflot PJSC (5) | 121,114 | ||||||||||
| 211,800 | Alrosa PJSC | 296,850 | ||||||||||
| 4,700,000 | Inter RAO UES PJSC | 248,515 | ||||||||||
| 2,528 | Lukoil PJSC (SP ADR) | 122,886 | ||||||||||
| 107,450 | Rosneft PJSC | 592,612 | ||||||||||
| 221,145 | Sberbank of Russia PJSC | 516,567 | ||||||||||
| 18,570 | Yandex N.V. (5) | 365,643 | ||||||||||
|
| |||||||||||
Total Russia (Cost: $2,078,351) | 2,264,187 | |||||||||||
|
| |||||||||||
Singapore (Cost: $293,566) (0.7%) |
| |||||||||||
| 1,775 | Broadcom, Ltd. | 302,247 | ||||||||||
|
| |||||||||||
South Africa (3.3%) |
| |||||||||||
| 114,125 | FirstRand, Ltd. | 409,263 | ||||||||||
| 2,650 | Naspers, Ltd. — N Shares | 443,864 | ||||||||||
| 63,400 | Sanlam, Ltd. | 307,119 | ||||||||||
| 21,271 | Standard Bank Group, Ltd. | 225,819 | ||||||||||
|
| |||||||||||
Total South Africa (Cost: $1,225,729) | 1,386,065 | |||||||||||
|
| |||||||||||
South Korea (5.3%) |
| |||||||||||
| 2,730 | Hyundai Engineering & Construction Co., Ltd. | 98,609 | ||||||||||
| 410 | Hyundai Mobis | 97,789 | ||||||||||
| 870 | Hyundai Motor Co. (5) | 106,218 | ||||||||||
| 7,080 | KB Financial Group, Inc. | 262,079 | ||||||||||
| 1,510 | Mando Corp. | 353,049 | ||||||||||
| 927 | Samsung Electronics Co., Ltd. | 1,325,914 | ||||||||||
|
| |||||||||||
Total South Korea (Cost: $2,087,655) | 2,243,658 | |||||||||||
|
| |||||||||||
See accompanying notes to financial statements.
42
TCW Emerging Markets Multi-Asset Opportunities Fund
October 31, 2016 |
| Number of Shares | Common Stock | Value | ||||||||||
| �� | Taiwan (4.5%) |
| ||||||||||
| 127,000 | Powertech Technology, Inc. | $ | 362,357 | |||||||||
| 198,612 | Taiwan Semiconductor Manufacturing Co., Ltd. | 1,191,940 | ||||||||||
| 13,930 | Tung Thih Electronic Co., Ltd. | 203,243 | ||||||||||
| 67,000 | Vanguard International Semiconductor Corp. | 136,404 | ||||||||||
|
| |||||||||||
Total Taiwan (Cost: $1,413,884) | 1,893,944 | |||||||||||
|
| |||||||||||
Thailand (2.1%) |
| |||||||||||
| 156,600 | KCE Electronics PCL (NVDR) | 501,263 | ||||||||||
| 30,700 | Krungthai Card PCL (NVDR) | 131,494 | ||||||||||
| 16,500 | Silergy Corp. | 240,401 | ||||||||||
|
| |||||||||||
Total Thailand (Cost: $728,621) | 873,158 | |||||||||||
|
| |||||||||||
Turkey (Cost: $586,655) (1.5%) |
| |||||||||||
| 234,191 | Turkiye Garanti Bankasi A.S. | 636,793 | ||||||||||
|
| |||||||||||
United Arab Emirates (Cost: $294,553) (0.8%) |
| |||||||||||
| 19,000 | NMC Health PLC | 338,910 | ||||||||||
|
| |||||||||||
United Kingdom (Cost: $125,069) (0.3%) |
| |||||||||||
| 9,350 | Anglo American PLC | 129,442 | ||||||||||
|
| |||||||||||
Total Common Stocks (Cost: $20,441,674) (54.9%) | 23,196,750 | |||||||||||
|
| |||||||||||
| Participation Notes | ||||||||||||
Saudi Arabia (1.6%) |
| |||||||||||
| 17,590 | Al Rajhi Bank (HSBC as Counterparty) | 265,164 | ||||||||||
| 8,150 | Al Mouwasat Medical Services (HSBC as Counterparty) | 280,354 | ||||||||||
| 25,040 | Samba Financial Group (HSBC as Counterparty) | 130,970 | ||||||||||
|
| |||||||||||
Total Saudi Arabia (Cost: $638,089) | 676,488 | |||||||||||
|
| |||||||||||
Total Participation Notes (Cost: $638,089) (1.6%) | 676,488 | |||||||||||
|
| |||||||||||
| Notional Amount | Currency Options | |||||||||||
| $ | 210,000 | USD Call / TRY Put, Strike Price TRY 3.08, Expires 11/16/16 (6) | 2,829 | |||||||||
| 185,000 | USD Put / MXN Call, Strike Price MXN 18.00, Expires 12/19/16 (7) | 1,245 | ||||||||||
| 230,000 | USD Put / MXN Call, Strike Price MXN 19.50, Expires 11/23/16 (6) | 3,510 | ||||||||||
|
| |||||||||||
Total Currency Options (Cost: $16,507) (0%) | 7,584 | |||||||||||
|
| |||||||||||
| Number of Shares | Money Market Investments | |||||||||||
| 104,446 | State Street Institutional U.S. Government Money Market Fund — Premier Class, 0.25% (8) | 104,446 | ||||||||||
|
| |||||||||||
Total Money Market Investments (Cost: $104,446) (0.2%) | 104,446 | |||||||||||
|
| |||||||||||
Total Investments (Cost: $38,283,269) (98.8%) | 41,771,364 | |||||||||||
Excess of Other Assets over Liabilities (1.2%) | 489,889 | |||||||||||
|
| |||||||||||
Total Net Assets (100.0%) | $ | 42,261,253 | ||||||||||
|
| |||||||||||
See accompanying notes to financial statements.
43
TCW Emerging Markets Multi-Asset Opportunities Fund
Schedule of Investments (Continued)
| Forward Currency Contracts | ||||||||||||||||||||||||
| Counterparty | Contracts to Deliver | Units of Currency | Settlement Date | In Exchange for U.S. Dollars | Contracts at Value | Unrealized Appreciation (Depreciation) | ||||||||||||||||||
BUY (9) | ||||||||||||||||||||||||
Bank of America | EUR | 200,000 | 12/08/16 | $ | 222,500 | $ | 219,576 | $ | (2,924 | ) | ||||||||||||||
Citibank N.A. | EUR | 589,641 | 12/08/16 | 665,117 | 647,353 | (17,764 | ) | |||||||||||||||||
Morgan Stanley & Co. | EUR | 300,000 | 12/08/16 | 344,610 | 329,363 | (15,247 | ) | |||||||||||||||||
|
|
|
|
|
| |||||||||||||||||||
| $ | 1,232,227 | $ | 1,196,292 | $ | (35,935 | ) | ||||||||||||||||||
|
|
|
|
|
| |||||||||||||||||||
SELL (10) | ||||||||||||||||||||||||
Citibank N.A. | BRL | 619,750 | 12/22/16 | $ | 185,000 | $ | 192,891 | $ | (7,891 | ) | ||||||||||||||
Citibank N.A. | EUR | 997,641 | 12/08/16 | 1,117,473 | 1,095,287 | 22,186 | ||||||||||||||||||
Morgan Stanley & Co. | EUR | 92,000 | 12/08/16 | 104,236 | 101,005 | 3,231 | ||||||||||||||||||
|
|
|
|
|
| |||||||||||||||||||
| $ | 1,406,709 | $ | 1,389,183 | $ | 17,526 | |||||||||||||||||||
|
|
|
|
|
| |||||||||||||||||||
| Written Options — OTC | ||||||||||||
| Notional Amount | Description | Premiums (Received) | Value | |||||||||
| $ 210,000 | USD Call / TRY Put, Strike Price TRY 3.33, Expires 11/16/16 (6) | $ | (5,757 | ) | $ | (35 | ) | |||||
| 230,000 | USD Put / MXN Call, Strike Price MXN 21.00, Expires 11/23/16 (6) | (1,449 | ) | (948 | ) | |||||||
|
|
|
| |||||||||
| $ | (7,206 | ) | $ | (983 | ) | |||||||
|
|
|
| |||||||||
| Credit Default Swaps — Buy Protection | ||||||||||||||||||||||||||
| Notional Amount (11) | Implied Credit Spread (12) | Expiration Date | Counterparty and Reference Entity | Fixed Deal Pay Rate | Unrealized Appreciation | Premium (Paid) | Value (13) | |||||||||||||||||||
| OTC Swaps |
| ||||||||||||||||||||||||
| $ 100,000 | 1.55 | % | 12/20/21 | Citibank N.A., Mexico Government Bond, 5.95%, due 03/19/19 | 1% | $ | (620) | $ | 3,241 | $ | 2,621 | |||||||||||||||
| 100,000 | 1.80 | % | 12/20/21 | Citibank N.A., Colombia Government Bond, 10.375%, due 01/28/23 | 1% | (511) | 4,074 | 3,563 | ||||||||||||||||||
| 100,000 | 1.108 | % | 12/20/21 | Bank of America, China Government Bond, 7.5%, due 10/28/27 | 1% | 9 | 434 | 443 | ||||||||||||||||||
| 100,000 | 1.55 | % | 12/20/21 | Bank of America, Mexico Government Bond, 5.95%, due 03/19/19 | 1% | (736) | 3,357 | 2,621 | ||||||||||||||||||
| 40,000 | 1.57 | % | 12/20/21 | Bank of America, Indonesia Government Bond, 5.875%, due 03/13/20 | 1% | 54 | 984 | 1,038 | ||||||||||||||||||
| 100,000 | 1.55 | % | 12/20/21 | Bank of America, Mexico Government Bond, 5.95%, due 03/19/19 | 1% | (203) | 2,824 | 2,621 | ||||||||||||||||||
| 100,000 | 1.80 | % | 12/20/21 | Citibank N.A., Colombia Government Bond, 10.375%, due 01/28/23 | 1% | 83 | 3,479 | 3,562 | ||||||||||||||||||
| 350,000 | 0.425 | % | 12/20/21 | Citibank N.A., Korea Government Bond, 7.125%, due 04/16/19 | 1% | (247) | (9,813 | ) | (10,060) | |||||||||||||||||
| 100,000 | 1.108 | % | 12/20/21 | Deutsche Bank AG, China Government Bond, 7.5%, due 10/28/27 | 1% | 57 | 386 | 443 | ||||||||||||||||||
| 40,000 | 1.57 | % | 12/20/21 | Bank of America, Indonesia Government Bond, 5.875%, due 03/13/20 | 1% | (2) | 1,040 | 1,038 | ||||||||||||||||||
| 75,000 | 1.57 | % | 12/20/21 | Deutsche Bank AG, Indonesia Government Bond, 5.875%, due 03/13/20 | 1% | (5) | 1,951 | 1,946 | ||||||||||||||||||
| 175,000 | 1.55 | % | 12/20/21 | Barclays Bank PLC, Mexico Government Bond, 5.95%, due 03/19/19 | 1% | (1,469) | 6,056 | 4,587 | ||||||||||||||||||
|
|
|
|
|
| |||||||||||||||||||||
| $ (3,590) | $ | 18,013 | $ 14,423 | |||||||||||||||||||||||
|
|
|
|
|
| |||||||||||||||||||||
See accompanying notes to financial statements.
44
TCW Emerging Markets Multi-Asset Opportunities Fund
October 31, 2016 |
Notes to the Schedule of Investments:
| ARS - | Argentine Peso. |
| BRL - | Brazilian Real. |
| EUR - | Euro Currency. |
| IDR - | Indonesian Rupiah. |
| MXN - | Mexican Peso. |
| PEN - | Peruvian Nouveau Sol. |
| TRY - | New Turkish Lira. |
| USD - | U.S. Dollar. |
| ADR - | American Depositary Receipt. Shares of a foreign based corporation held in U.S. banks entitling the shareholder to all dividends and capital gains. |
| GDR - | Global Depositary Receipt. A negotiable certificate held in the bank of one country representing a specific number of shares of a stock traded on an exchange of another country. |
| MTN - | Medium Term Note. |
| NVDR - | Non-Voting Depositary Receipt. |
| OTC - | Over the Counter. |
| PJSC - | Private Joint-Stock Company. |
| SP ADR | - Sponsored American Depositary Receipt. Shares of a foreign based corporation held in U.S. banks that are issued with the cooperation of the company whose stock underlies the ADR and entitles the shareholder to all dividends, capital gains and voting rights. |
| (1) | Floating or variable rate security. The interest shown reflects the rate in effect at October 31, 2016. |
| (2) | Security exempt from registration under Rule 144A of the Securities Act of 1933, as amended. These securities may be resold, normally only to qualified institutional buyers. At October 31, 2016, the value of these securities amounted to $5,680,930 or 13.4% of net assets. These securities are determined to be liquid by the Advisor, unless otherwise noted, under procedures established by and under the general supervision of the Company’s Board of Directors. |
| (3) | Investments issued under Regulation S of the Securities Act of 1933, may not be offered, sold, or delivered within the United States except under special exemptions. At October 31, 2016, the value of these securities amounted to $4,600,991 or 10.9% of net assets. |
| (4) | Security not a accruing interest. |
| (5) | Non-income producing security. |
| (6) | Over-the-counter traded option; Counterparty — Bank of America. |
| (7) | Over-the-counter traded option; Counterparty — Citigroup Global Market, Inc. |
| (8) | Rate disclosed is the 7-day net yield as of October 31, 2016. |
| (9) | Fund buys foreign currency, sells U.S. Dollar. |
| (10) | Fund sells foreign currency, buys U.S. Dollar. |
| (11) | The maximum potential amount the Fund could be required to make as seller of credit protection or receive as buyer of protection if a credit event occurred as defined under the terms of that particular swap agreement. |
| (12) | An implied credit spread is the spread in yield between a U.S. Treasury security and the referenced obligation. Implied credit spreads, represented in the absolute terms, utilized in determining the value of credit default swap agreements serve as an indicator of the current status of the payment/performance risk and represent the likelihood of risk of default for the credit derivative. The implied credit spread of a particular referenced entity reflects the cost of buying/selling protection and may include upfront payments required to be made to enter into the agreement. Wider credit spreads, in comparison to narrower credit spreads, represent a deterioration of the referenced entity’s credit soundness and a greater likelihood of risk of default or other credit event occurring as defined under the terms of the agreement. |
| (13) | The value of a credit default swap agreement serves as an indicator of the current status of the payments/performance risk and represents the likelihood of an expected liability (or profit) for the credit derivative should the notional amount of the swap agreement be closed/sold as of the period end. Increasing values, in absolute terms when compared to the notional amount of the swap, represent a deterioration of the reference entity’s credit soundness and a greater likelihood or risk of default or other credit event occurring as defined under the terms of the agreement. |
See accompanying notes to financial statements.
45
TCW Emerging Markets Multi-Asset Opportunities Fund
Investments by Industry | October 31, 2016 |
| Industry | Percentage of Net Assets | |||
Agriculture | 1.5 | % | ||
Airlines | 0.7 | |||
Apparel | 0.7 | |||
Auto Manufacturers | 2.4 | |||
Auto Parts & Equipment | 1.5 | |||
Banks | 16.3 | |||
Diversified Financial Services | 2.5 | |||
Electric | 3.2 | |||
Electronics | 2.6 | |||
Engineering & Construction | 1.1 | |||
Food | 1.4 | |||
Foreign Government Bonds | 22.4 | |||
Healthcare-Services | 1.5 | |||
Household Products/Wares | 0.3 | |||
Insurance | 2.0 | |||
Internet | 7.4 | |||
Iron & Steel | 4.6 | |||
Leisure Time | 0.2 | |||
Media | 1.1 | |||
Metal Fabricate & Hardware | 0.7 | |||
Mining | 1.0 | |||
Miscellaneous Manufacturers | 0.6 | |||
Oil & Gas | 9.7 | |||
Pharmaceuticals | 1.0 | |||
Real Estate | 0.3 | |||
Retail | 0.3 | |||
Semiconductors | 7.9 | |||
Software | 0.7 | |||
Telecommunications | 2.7 | |||
Textiles | 0.3 | |||
Money Market Investments | 0.2 | |||
|
| |||
Total | 98.8 | % | ||
|
| |||
See accompanying notes to financial statements.
46
TCW Emerging Markets Multi-Asset Opportunities Fund
Investments by Country | October 31, 2016 |
| Country | Percentage of Net Assets | |||
Argentina | 6.7 | % | ||
Bahrain | 1.0 | |||
Brazil | 14.1 | |||
China | 10.6 | |||
Colombia | 1.5 | |||
Costa Rica | 0.8 | |||
Croatia | 0.5 | |||
Dominican Republic | 1.0 | |||
Ecuador | 1.0 | |||
Egypt | 1.8 | |||
El Salvador | 0.9 | |||
Ghana | 0.5 | |||
Greece | 0.8 | |||
Guatemala | 0.8 | |||
Hungary | 0.9 | |||
India | 5.1 | |||
Indonesia | 1.5 | |||
Italy | 0.7 | |||
Ivory Coast | 0.5 | |||
Kazakhstan | 0.5 | |||
Kenya | 1.1 | |||
Lebanon | 1.6 | |||
Malaysia | 0.7 | |||
Mexico | 7.0 | |||
Mongolia | 0.5 | |||
Pakistan | 0.4 | |||
Panama | 0.5 | |||
Paraguay | 0.4 | |||
Peru | 1.0 | |||
Russia | 6.9 | |||
Saudi Arabia | 2.1 | |||
Singapore | 0.7 | |||
South Africa | 4.2 | |||
South Korea | 5.3 | |||
Sri Lanka | 1.2 | |||
Taiwan | 4.5 | |||
Thailand | 2.1 | |||
Trinidad And Tobago | 0.5 | |||
Turkey | 2.8 | |||
Ukraine | 1.3 | |||
United Arab Emirates | 0.8 | |||
United Kingdom | 0.3 | |||
United States | 0.2 | |||
Venezuela | 1.5 | |||
|
| |||
Total | 98.8 | % | ||
|
| |||
See accompanying notes to financial statements.
47
TCW Emerging Markets Multi-Asset Opportunities Fund
Fair Valuation Summary | October 31, 2016 |
The following is a summary of the fair valuations according to the inputs used as of October 31, 2016 in valuing the Fund’s investments:
| Description | Quoted Prices (Level 1) | Other (Level 2) | Significant (Level 3) | Total | ||||||||||||
Fixed Income Securities | ||||||||||||||||
Airlines | $ | — | $ | 198,000 | $ | — | $ | 198,000 | ||||||||
Banks | — | 1,500,881 | — | 1,500,881 | ||||||||||||
Diversified Financial Services | — | 206,500 | — | 206,500 | ||||||||||||
Electric | — | 825,140 | — | 825,140 | ||||||||||||
Engineering & Construction | — | 401,202 | — | 401,202 | ||||||||||||
Food | — | 195,450 | — | 195,450 | ||||||||||||
Foreign Government Bonds | — | 9,457,438 | — | 9,457,438 | ||||||||||||
Iron & Steel | — | 577,812 | — | 577,812 | ||||||||||||
Oil & Gas | — | 2,143,583 | — | 2,143,583 | ||||||||||||
Real Estate | — | 45,854 | — | 45,854 | ||||||||||||
Telecommunications | — | 673,825 | — | 673,825 | ||||||||||||
|
|
|
|
|
|
|
| |||||||||
Total Fixed Income Securities | — | 16,225,685 | — | 16,225,685 | ||||||||||||
|
|
|
|
|
|
|
| |||||||||
Preferred Stock | ||||||||||||||||
Banks | 442,245 | — | — | 442,245 | ||||||||||||
Food | 363,855 | — | — | 363,855 | ||||||||||||
Iron & Steel | 754,311 | — | — | 754,311 | ||||||||||||
|
|
|
|
|
|
|
| |||||||||
Total Preferred Stock | 1,560,411 | — | — | 1,560,411 | ||||||||||||
|
|
|
|
|
|
|
| |||||||||
Common Stocks | ||||||||||||||||
Agriculture | 162,800 | 481,234 | — | 644,034 | ||||||||||||
Airlines | — | 121,114 | — | 121,114 | ||||||||||||
Apparel | — | 313,802 | — | 313,802 | ||||||||||||
Auto Manufacturers | 275,870 | 1,065,376 | — | 1,341,246 | ||||||||||||
Auto Parts & Equipment | — | 301,031 | — | 301,031 | ||||||||||||
Banks | 1,966,446 | 2,850,689 | — | 4,817,135 | ||||||||||||
Diversified Financial Services | 256,596 | 868,537 | — | 1,125,133 | ||||||||||||
Electric | 240,751 | — | — | 240,751 | ||||||||||||
Electronics | — | 1,088,864 | — | 1,088,864 | ||||||||||||
Engineering & Construction | — | 98,609 | — | 98,609 | ||||||||||||
Healthcare-Services | 338,910 | — | — | 338,910 | ||||||||||||
Household Products/Wares | 126,937 | — | — | 126,937 | ||||||||||||
Insurance | — | 865,892 | — | 865,892 | ||||||||||||
Internet | 1,607,211 | 1,521,237 | — | 3,128,448 | ||||||||||||
Iron & Steel | 190,646 | 405,962 | — | 596,608 | ||||||||||||
Leisure Time | 105,248 | — | — | 105,248 | ||||||||||||
Media | — | 443,864 | — | 443,864 | ||||||||||||
Metal Fabricate & Hardware | 301,740 | — | — | 301,740 | ||||||||||||
Mining | — | 426,291 | — | 426,291 | ||||||||||||
Oil & Gas | 1,356,642 | 592,612 | — | 1,949,254 | ||||||||||||
Pharmaceuticals | 420,429 | — | — | 420,429 | ||||||||||||
See accompanying notes to financial statements.
48
TCW Emerging Markets Multi-Asset Opportunities Fund
Fair Valuation Summary (Continued) | October 31, 2016 |
| Description | Quoted Prices (Level 1) | Other (Level 2) | Significant (Level 3) | Total | ||||||||||||
Real Estate | $ | — | $ | 102,873 | $ | — | $ | 102,873 | ||||||||
Retail | — | 116,807 | — | 116,807 | ||||||||||||
Semiconductors | 302,247 | 3,016,616 | — | 3,318,863 | ||||||||||||
Software | 289,371 | — | — | 289,371 | ||||||||||||
Telecommunications | 448,745 | — | — | 448,745 | ||||||||||||
Textiles | 124,751 | — | — | 124,751 | ||||||||||||
|
|
|
|
|
|
|
| |||||||||
Total Common Stocks | 8,515,340 | 14,681,410 | — | 23,196,750 | ||||||||||||
|
|
|
|
|
|
|
| |||||||||
Participation Notes | ||||||||||||||||
Banks | — | 130,970 | — | 130,970 | ||||||||||||
Healthcare-Services | — | 280,354 | — | 280,354 | ||||||||||||
Miscellaneous Manufacturers | — | 265,164 | — | 265,164 | ||||||||||||
|
|
|
|
|
|
|
| |||||||||
Total Participation Notes | — | 676,488 | — | 676,488 | ||||||||||||
|
|
|
|
|
|
|
| |||||||||
Currency Options | — | 7,584 | — | 7,584 | ||||||||||||
|
|
|
|
|
|
|
| |||||||||
Total Currency Options | — | 7,584 | — | 7,584 | ||||||||||||
|
|
|
|
|
|
|
| |||||||||
Money Market Investments | 104,446 | — | — | 104,446 | ||||||||||||
|
|
|
|
|
|
|
| |||||||||
Total Investments | 10,180,197 | 31,591,167 | — | 41,771,364 | ||||||||||||
|
|
|
|
|
|
|
| |||||||||
Asset Derivatives | ||||||||||||||||
Forward Currency Contracts | ||||||||||||||||
Foreign Currency Risk | — | 25,417 | — | 25,417 | ||||||||||||
Swap Agreements | ||||||||||||||||
Credit Risk | — | 24,483 | — | 24,483 | ||||||||||||
|
|
|
|
|
|
|
| |||||||||
Total | $ | 10,180,197 | $ | 31,641,067 | $ | — | $ | 41,821,264 | ||||||||
|
|
|
|
|
|
|
| |||||||||
Liability Derivatives | ||||||||||||||||
Written Options | ||||||||||||||||
Foreign Currency Risk | $ | — | $ | (983 | ) | $ | — | $ | (983 | ) | ||||||
Forward Currency Contracts | ||||||||||||||||
Foreign Currency Risk | — | (43,826 | ) | — | (43,826 | ) | ||||||||||
Swap Agreements | ||||||||||||||||
Credit Risk | — | (10,060 | ) | — | (10,060 | ) | ||||||||||
|
|
|
|
|
|
|
| |||||||||
Total | $ | — | $ | (54,869 | ) | $ | — | $ | (54,869 | ) | ||||||
|
|
|
|
|
|
|
| |||||||||
See accompanying notes to financial statements.
49
Schedule of Investments
| Number of Shares | Common Stock | Value | ||||||
Argentina (3.2% of Net Assets) | ||||||||
| 1,060 | Grupo Financiero Galicia S.A. (ADR) | $ | 33,009 | |||||
| 210 | MercadoLibre, Inc. | 35,282 | ||||||
| 1,200 | Tenaris S.A. (ADR) | 33,840 | ||||||
|
| |||||||
Total Argentina (Cost: $94,692) | 102,131 | |||||||
|
| |||||||
Australia (Cost: $32,052) (1.0%) | ||||||||
| 7,860 | Fortescue Metals Group, Ltd. | 32,996 | ||||||
|
| |||||||
Belgium (Cost: $30,999) (1.0%) | ||||||||
| 545 | KBC Groep N.V. (1) | 33,177 | ||||||
|
| |||||||
Brazil (2.9%) | ||||||||
| 4,200 | CVC Brasil Operadora e Agencia de Viagens SA | 32,503 | ||||||
| 5,300 | Petroleo Brasileiro S.A. (SP ADR) (1) | 61,851 | ||||||
|
| |||||||
Total Brazil (Cost: $79,186) | 94,354 | |||||||
|
| |||||||
Canada (3.3%) | ||||||||
| 310 | Alimentation Couche-Tard, Inc. — Class B | 15,585 | ||||||
| 300 | Bank of Nova Scotia (The) | 16,134 | ||||||
| 215 | Dollarama, Inc. | 16,079 | ||||||
| 3,400 | Encana Corp. | 32,436 | ||||||
| 250 | Loblaw Cos., Ltd. | 12,345 | ||||||
| 300 | Toronto-Dominion Bank (The) | 13,614 | ||||||
|
| |||||||
Total Canada (Cost: $87,211) | 106,193 | |||||||
|
| |||||||
China (6.8%) | ||||||||
| 320 | Alibaba Group Holding, Ltd. (SP ADR)(1) | 32,541 | ||||||
| 40,000 | China Animal Healthcare, Ltd. (1) | — | ||||||
| 10,000 | CNOOC, Ltd. | 12,584 | ||||||
| 110 | CNOOC, Ltd. (SP ADR) | 13,803 | ||||||
| 350 | Ctrip.com International, Ltd. (ADR) (1) | 15,452 | ||||||
| 44,000 | Great Wall Motor Co., Ltd. — Class H | 42,946 | ||||||
| 6,000 | Ping An Insurance Group Co. of China, Ltd. — Class H | 31,584 | ||||||
| 63,315 | Q Technology Group Co., Ltd. (1) | 31,761 | ||||||
| 1,373 | Tencent Holdings, Ltd. | 36,391 | ||||||
|
| |||||||
Total China (Cost: $247,444) | 217,062 | |||||||
|
| |||||||
Denmark (2.5%) | ||||||||
| 865 | Ambu A/S | 44,760 | ||||||
| 23 | AP Moeller-Maersk A/S — B Shares | 35,226 | ||||||
|
| |||||||
Total Denmark (Cost: $72,407) | 79,986 | |||||||
|
| |||||||
Egypt (Cost: $14,958) (0.4%) | ||||||||
| 500 | Eastern Tobacco | 11,822 | ||||||
|
| |||||||
Finland (Cost: $13,099) (0.5%) | ||||||||
| 731 | UPM-Kymmene OYJ | 16,980 | ||||||
|
| |||||||
See accompanying notes to financial statements.
50
TCW International Growth Fund
October 31, 2016
| Number of Shares | Common Stock | Value | ||||||
France (2.8%) | ||||||||
| 185 | Arkema S.A. | $ | 17,518 | |||||
| 500 | AXA S.A. | 11,265 | ||||||
| 605 | BNP Paribas S.A. | 35,030 | ||||||
| 776 | SCOR SE | 25,094 | ||||||
|
| |||||||
Total France (Cost: $87,604) | 88,907 | |||||||
|
| |||||||
Germany (1.9%) | ||||||||
| 160 | BASF SE | 14,105 | ||||||
| 547 | Covestro AG | 32,346 | ||||||
| 500 | METRO AG | 14,956 | ||||||
|
| |||||||
Total Germany (Cost: $57,938) | 61,407 | |||||||
|
| |||||||
India (3.6%) | ||||||||
| 900 | Cholamandalam Investment & Finance Co., Ltd. | 15,861 | ||||||
| 1,800 | ICICI Bank, Ltd. (SP ADR) | 14,922 | ||||||
| 6,090 | Mahindra & Mahindra Financial Services, Ltd. | 32,935 | ||||||
| 800 | Tata Motors, Ltd. (SP ADR) | 31,528 | ||||||
| 3,515 | Tata Steel, Ltd. | 21,314 | ||||||
|
| |||||||
Total India (Cost: $115,543) | 116,560 | |||||||
|
| |||||||
Indonesia (Cost: $30,180) (1.0%) | ||||||||
| 101,100 | Telekomunikasi Indonesia Persero Tbk PT | 32,643 | ||||||
|
| |||||||
Ireland (1.9%) | ||||||||
| 450 | CRH PLC (SP ADR) | 14,535 | ||||||
| 850 | Experian PLC | 16,300 | ||||||
| 3,920 | UDG Healthcare PLC | 31,248 | ||||||
|
| |||||||
Total Ireland (Cost: $61,147) | 62,083 | |||||||
|
| |||||||
Italy (2.4%) | ||||||||
| 274 | Brembo SpA | 16,940 | ||||||
| 5,150 | Intesa Sanpaolo SpA | 11,924 | ||||||
| 1,500 | Leonardo-Finmeccanica SpA (1) | 18,239 | ||||||
| 9,040 | PRADA SpA | 31,673 | ||||||
|
| |||||||
Total Italy (Cost: $84,545) | 78,776 | |||||||
|
| |||||||
Japan (15.3%) | ||||||||
| 2,325 | Dai-ichi Life Holdings, Inc. | 34,017 | ||||||
| 200 | Daikin Industries, Ltd. | 19,127 | ||||||
| 459 | Dentsu, Inc. | 22,834 | ||||||
| 1,000 | Dip Corp. | 26,435 | ||||||
| 700 | Iida Group Holdings Co., Ltd. | 13,503 | ||||||
| 920 | M3, Inc. | 27,939 | ||||||
| 300 | Makita Corp. | 20,700 | ||||||
| 2,212 | Mitsubishi Electric Corp. | 29,865 | ||||||
| 6,000 | Mitsui Chemicals, Inc. | 29,488 | ||||||
See accompanying notes to financial statements.
51
TCW International Growth Fund
Schedule of Investments (Continued)
| Number of Shares | Common Stock | Value | ||||||
Japan (Continued) | ||||||||
| 1,250 | Nippon Telegraph & Telephone Corp. | $ | 55,308 | |||||
| 800 | ORIX Corp. | 12,651 | ||||||
| 400 | Sanyo Chemical Industries, Ltd. | 18,049 | ||||||
| 6,181 | Sanyo Special Steel Co., Ltd. | 31,621 | ||||||
| 200 | Shin-Etsu Chemical Co., Ltd. | 15,133 | ||||||
| 400 | Sony Corp. | 12,582 | ||||||
| 600 | Sumitomo Mitsui Trust Holdings, Inc. | 20,204 | ||||||
| 2,000 | Taisei Corp. | 14,959 | ||||||
| 800 | Tokai Rika Co., Ltd. | 14,971 | ||||||
| 370 | Tokyo Electron, Ltd. | 33,308 | ||||||
| 2,000 | Toray Industries, Inc. | 18,576 | ||||||
| 3,000 | Tosoh Corp. | 19,551 | ||||||
|
| |||||||
Total Japan (Cost: $441,978) | 490,821 | |||||||
|
| |||||||
Kenya (Cost: $16,587) (0.6%) | ||||||||
| 93,200 | Safari.com, Ltd. | 18,282 | ||||||
|
| |||||||
Luxembourg (Cost: $31,939) (1.0%) | ||||||||
| 4,835 | ArcelorMittal (1) | 32,624 | ||||||
|
| |||||||
Malaysia (Cost: $23,984) (0.9%) | ||||||||
| 47,400 | My EG Services BHD | 27,520 | ||||||
|
| |||||||
Mexico (1.2%) | ||||||||
| 12,415 | Genomma Lab Internacional SAB de C.V. — Class B (1) | 14,971 | ||||||
| 4,100 | Grupo Financiero Banorte SAB de C.V. — Class O | 24,307 | ||||||
|
| |||||||
Total Mexico (Cost: $37,801) | 39,278 | |||||||
|
| |||||||
Netherlands (1.9%) | ||||||||
| 370 | IMCD Group NV | 15,982 | ||||||
| 696 | Koninklijke Ahold Delhaize NV | 15,855 | ||||||
| 580 | Royal Dutch Shell PLC — B Shares | 14,922 | ||||||
| 400 | Wolters Kluwer NV | 15,446 | ||||||
|
| |||||||
Total Netherlands (Cost: $56,102) | 62,205 | |||||||
|
| |||||||
Russia (5.0%) | ||||||||
| 8,500 | Aeroflot PJSC (1) | 17,449 | ||||||
| 13,200 | Alrosa PJSC | 18,500 | ||||||
| 715 | Lukoil PJSC (SP ADR) | 34,756 | ||||||
| 9,760 | Rosneft PJSC | 53,829 | ||||||
| 15,840 | Sberbank of Russia PJSC | 37,000 | ||||||
|
| |||||||
Total Russia (Cost: $147,953) | 161,534 | |||||||
|
| |||||||
Singapore (Cost: $28,541) (1.0%) | ||||||||
| 180 | Broadcom, Ltd. | 30,650 | ||||||
|
| |||||||
South Africa (Cost: $32,782) (1.1%) | ||||||||
| 9,670 | FirstRand, Ltd. | 34,678 | ||||||
|
| |||||||
See accompanying notes to financial statements.
52
TCW International Growth Fund
October 31, 2016
| Number of Shares | Common Stock | Value | ||||||
South Korea (4.7%) | ||||||||
| 220 | Mando Corp. | $ | 51,438 | |||||
| 60 | Samsung Electronics Co., Ltd. | 85,820 | ||||||
| 117 | SK Energy Co., Ltd. | 15,401 | ||||||
|
| |||||||
Total South Korea (Cost: $155,701) | 152,659 | |||||||
|
| |||||||
Spain (3.2%) | ||||||||
| 217 | Aena S.A. (1) | 31,753 | ||||||
| 450 | Amadeus IT Group S.A. | 21,149 | ||||||
| 4,600 | Banco Bilbao Vizcaya Argentaria S.A. (SP ADR) | 33,166 | ||||||
| 5,313 | Tubacex S.A. | 15,776 | ||||||
|
| |||||||
Total Spain (Cost: $86,273) | 101,844 | |||||||
|
| |||||||
Switzerland (4.8%) | ||||||||
| 370 | BKW AG | 17,230 | ||||||
| 400 | Gategroup Holding AG (1) | 21,054 | ||||||
| 5,300 | Glencore PLC (1) | 16,183 | ||||||
| 305 | LafargeHolcim Ltd. | 16,279 | ||||||
| 341 | Lonza Group AG | 64,389 | ||||||
| 230 | VAT Group AG (1) | 18,746 | ||||||
|
| |||||||
Total Switzerland (Cost: $133,704) | 153,881 | |||||||
|
| |||||||
Taiwan (3.2%) | ||||||||
| 18,000 | Powertech Technology, Inc. | 51,358 | ||||||
| 1,605 | Taiwan Semiconductor Manufacturing Co., Ltd. (SP ADR) | 49,915 | ||||||
|
| |||||||
Total Taiwan (Cost: $94,319) | 101,273 | |||||||
|
| |||||||
Thailand (Cost: $22,215) (1.0%) | ||||||||
| 10,300 | KCE Electronics PCL (NVDR) | 32,969 | ||||||
|
| |||||||
United Arab Emirates (Cost: $49,379) (1.8%) | ||||||||
| 3,195 | NMC Health PLC | 56,990 | ||||||
|
| |||||||
United Kingdom (6.5%) | ||||||||
| 2,635 | Ashtead Group PLC | 40,953 | ||||||
| 2,420 | BP PLC | 14,270 | ||||||
| 1,035 | Imperial Tobacco Group PLC | 49,938 | ||||||
| 2,750 | National Express Group PLC | 12,322 | ||||||
| 500 | Persimmon PLC | 10,324 | ||||||
| 5,820 | Standard Chartered PLC (1) | 50,482 | ||||||
| 385 | Unilever PLC | 16,033 | ||||||
| 690 | WPP PLC | 14,944 | ||||||
|
| |||||||
Total United Kingdom (Cost: $214,365) | 209,266 | |||||||
|
| |||||||
United States (3.7%) | ||||||||
| 2,700 | Advanced Micro Devices, Inc. (1) | 19,521 | ||||||
| 256 | Facebook, Inc. (1) | 33,533 | ||||||
| 2,855 | Micron Technology, Inc. (1) | 48,992 | ||||||
See accompanying notes to financial statements.
53
TCW International Growth Fund
Schedule of Investments (Continued)
| Number of Shares | Common Stock | Value | ||||||
United States (Continued) | ||||||||
| 230 | Quintiles IMS Holdings, Inc. (1) | $ | 16,500 | |||||
|
| |||||||
Total United States (Cost: $113,735) | 118,546 | |||||||
|
| |||||||
Total Common Stock (Cost: $2,796,363) (92.1%) | 2,960,097 | |||||||
|
| |||||||
| Participation Notes | ||||||||
Saudi Arabia (2.1%) | ||||||||
| 2,020 | Al Hammadi Development and Investment Co. (HSBC as Counterparty) | 17,251 | ||||||
| 2,265 | Al Rajhi Bank (HSBC as Counterparty) | 34,144 | ||||||
| 3,185 | Samba Financial Group (HSBC as Counterparty) | 16,659 | ||||||
|
| |||||||
Total Saudi Arabia (Cost: $67,212) | 68,054 | |||||||
|
| |||||||
Total Participation Notes (Cost: $67,212) (2.1%) | 68,054 | |||||||
|
| |||||||
| Preferred Stock | ||||||||
Brazil (4.6%) | ||||||||
| 2,000 | Cia Brasileira de Distribuicao, 0.27% (ADR) | 38,100 | ||||||
| 20,400 | Gerdau S.A., 0.56% | 71,010 | ||||||
| 3,080 | Itau Unibanco Holding S.A., 3.42% (SP ADR) | 36,745 | ||||||
|
| |||||||
Total Brazil (Cost: $120,754) | 145,855 | |||||||
|
| |||||||
Total Preferred Stock (Cost: $120,754) (4.6%) | 145,855 | |||||||
|
| |||||||
| Money Market Investments | ||||||||
| 12,787 | State Street Institutional U.S. Government Money Market Fund — Premier Class, 0.25% (2) | 12,787 | ||||||
|
| |||||||
Total Money Market Investments (Cost: $12,787) (0.4%) | 12,787 | |||||||
|
| |||||||
Total Investments (Cost: $2,997,116) (99.2%) | 3,186,793 | |||||||
Excess of Other Assets over Liabilities (0.8%) | 25,870 | |||||||
|
| |||||||
Total Net Assets (100.0%) | $ | 3,212,663 | ||||||
|
| |||||||
See accompanying notes to financial statements.
54
TCW International Growth Fund
October 31, 2016
| Forward Currency Contracts | ||||||||||||||||||||||||
| Counterparty | Contracts to Deliver | Units of Currency | Settlement Date | In Exchange for U.S. Dollars | Contracts at Value | Unrealized Appreciation (Depreciation) | ||||||||||||||||||
BUY (3) | ||||||||||||||||||||||||
Bank of America | JPY | 15,209,262 | 11/07/16 | $ | 130,002 | $ | 144,756 | $ | 14,754 | |||||||||||||||
Bank of America | JPY | 43,087,191 | 11/17/16 | 372,295 | 410,224 | 37,929 | ||||||||||||||||||
|
|
|
|
|
| |||||||||||||||||||
| $ | 502,297 | $ | 554,980 | $ | 52,683 | |||||||||||||||||||
|
|
|
|
|
| |||||||||||||||||||
SELL (4) | ||||||||||||||||||||||||
Bank of America | JPY | 15,209,262 | 11/07/16 | $ | 130,000 | $ | 144,757 | $ | (14,757 | ) | ||||||||||||||
Bank of America | JPY | 43,087,191 | 11/17/16 | 365,000 | 410,223 | (45,223 | ) | |||||||||||||||||
|
|
|
|
|
| |||||||||||||||||||
| $ | 495,000 | $ | 554,980 | $ | (59,980 | ) | ||||||||||||||||||
|
|
|
|
|
| |||||||||||||||||||
Notes to the Schedule of Investments:
| JPY - | Japanese Yen. |
| ADR - | American Depositary Receipt. Shares of a foreign based corporation held in U.S. banks entitling the shareholder to all dividends and capital gains. |
| PJSC - | Private Joint-Stock Company. |
| SP ADR - Sponsored | American Depositary Receipt. Shares of a foreign based corporation held in U.S. banks that are issued with the cooperation of the company whose stock underlies the ADR and entitles the shareholder to all dividends, capital gains and voting rights. |
| (1) | Non-income producing security. |
| (2) | Rate disclosed is the 7-day net yield as of October 31, 2016. |
| (3) | Fund buys foreign currency, sells U.S. Dollar. |
| (4) | Fund sells foreign currency, buys U.S. Dollar. |
See accompanying notes to financial statements.
55
TCW International Growth Fund
Investments by Industry | October 31, 2016 |
| Industry | Percentage of Net Assets | |||
Basic Materials | 15.0 | % | ||
Communications | 12.4 | |||
Consumer, Cyclical | 10.6 | |||
Consumer, Non-cyclical | 12.0 | |||
Diversified | 1.6 | |||
Energy | 7.8 | |||
Financial | 16.9 | |||
Industrial | 11.4 | |||
Technology | 10.6 | |||
Utilities | 0.5 | |||
Money Market Investments | 0.4 | |||
|
| |||
Total | 99.2 | % | ||
|
| |||
See accompanying notes to financial statements.
56
TCW International Growth Fund
Fair Valuation Summary | October 31, 2016 |
The following is a summary of the fair valuations according to the inputs used as of October 31, 2016 in valuing the Fund’s investments:
| Description | Quoted Prices (Level 1) | Other (Level 2) | Significant (Level 3) | Total | ||||||||||||
Common Stock | ||||||||||||||||
Aerospace & Defense | $ | — | $ | 18,239 | $ | — | $ | 18,239 | ||||||||
Airlines | — | 17,449 | — | 17,449 | ||||||||||||
Auto Components | — | 83,349 | — | 83,349 | ||||||||||||
Automobiles | 31,528 | 42,945 | — | 74,473 | ||||||||||||
Banks | 135,152 | 187,817 | — | 322,969 | ||||||||||||
Building Products | — | 19,127 | — | 19,127 | ||||||||||||
Chemicals | — | 164,765 | — | 164,765 | ||||||||||||
Construction & Engineering | — | 14,959 | — | 14,959 | ||||||||||||
Construction Materials | 14,535 | 16,280 | — | 30,815 | ||||||||||||
Consumer Finance | 15,861 | 45,587 | — | 61,448 | ||||||||||||
Diversified Financial Services | — | 34,678 | — | 34,678 | ||||||||||||
Diversified Telecommunication Services | — | 87,950 | — | 87,950 | ||||||||||||
Electric Utilities | 17,230 | — | — | 17,230 | ||||||||||||
Electrical Equipment | — | 29,865 | — | 29,865 | ||||||||||||
Energy Equipment & Services | 33,840 | — | — | 33,840 | ||||||||||||
Food & Staples Retailing | 27,930 | 30,811 | — | 58,741 | ||||||||||||
Health Care Equipment & Supplies | — | 44,760 | — | 44,760 | ||||||||||||
Health Care Providers & Services | 56,991 | 31,248 | — | 88,239 | ||||||||||||
Health Care Technology | — | 27,939 | — | 27,939 | ||||||||||||
Hotels, Restaurants & Leisure | 47,956 | — | — | 47,956 | ||||||||||||
Household Durables | — | 88,869 | — | 88,869 | ||||||||||||
Insurance | — | 101,960 | — | 101,960 | ||||||||||||
Internet Software & Services | 101,356 | 62,827 | — | 164,183 | ||||||||||||
IT Services | — | 48,669 | — | 48,669 | ||||||||||||
Life Sciences Tools & Services | 16,500 | 64,390 | — | 80,890 | ||||||||||||
Machinery | 18,746 | — | — | 18,746 | ||||||||||||
Marine | — | 35,225 | — | 35,225 | ||||||||||||
Media | — | 53,224 | — | 53,224 | ||||||||||||
Metals & Mining | — | 169,014 | — | 169,014 | ||||||||||||
Miscellaneous | — | 32,969 | — | 32,969 | ||||||||||||
Multiline Retail | 16,079 | — | — | 16,079 | ||||||||||||
Oil, Gas & Consumable Fuels | 142,846 | 111,005 | — | 253,851 | ||||||||||||
Paper & Forest Products | — | 16,980 | — | 16,980 | ||||||||||||
Personal Products | — | 16,033 | — | 16,033 | ||||||||||||
Pharmaceuticals | 14,971 | — | — | 14,971 | ||||||||||||
Professional Services | — | 16,299 | — | 16,299 | ||||||||||||
Road & Rail | — | 12,322 | — | 12,322 | ||||||||||||
Semiconductors & Semiconductor Equipment | 149,078 | 84,666 | — | 233,744 | ||||||||||||
Technology Hardware, Storage & Peripherals | — | 85,820 | — | 85,820 | ||||||||||||
Textiles, Apparel & Luxury Goods | — | 31,673 | — | 31,673 | ||||||||||||
See accompanying notes to financial statements.
57
TCW International Growth Fund
Fair Valuation Summary (Continued) | October 31, 2016 |
| Description | Quoted Prices (Level 1) | Other (Level 2) | Significant (Level 3) | Total | ||||||||||||
Tobacco | $ | — | $ | 61,760 | $ | — | $ | 61,760 | ||||||||
Trading Companies & Distributors | 15,983 | 40,953 | — | 56,936 | ||||||||||||
Transportation Infrastructure | — | 31,753 | — | 31,753 | ||||||||||||
Transportation | 21,054 | — | — | 21,054 | ||||||||||||
Wireless Telecommunication Services | 18,282 | — | — | 18,282 | ||||||||||||
|
|
|
|
|
|
|
| |||||||||
Total Common Stock | 895,918 | 2,064,179 | — | 2,960,097 | ||||||||||||
|
|
|
|
|
|
|
| |||||||||
Participation Notes | ||||||||||||||||
Automobiles | — | 17,251 | — | 17,251 | ||||||||||||
Banks | — | 50,803 | — | 50,803 | ||||||||||||
|
|
|
|
|
|
|
| |||||||||
Total Participation Notes | — | 68,054 | — | 68,054 | ||||||||||||
|
|
|
|
|
|
|
| |||||||||
Preferred Stock | ||||||||||||||||
Banks | 36,745 | — | — | 36,745 | ||||||||||||
Food & Staples Retailing | 38,100 | — | — | 38,100 | ||||||||||||
Metals & Mining | 71,010 | — | — | 71,010 | ||||||||||||
|
|
|
|
|
|
|
| |||||||||
Total Preferred Stock | 145,855 | — | — | 145,855 | ||||||||||||
|
|
|
|
|
|
|
| |||||||||
Money Market Investments | 12,787 | — | — | 12,787 | ||||||||||||
|
|
|
|
|
|
|
| |||||||||
Total Investments | 1,054,560 | 2,132,233 | 3,186,793 | |||||||||||||
|
|
|
|
|
|
|
| |||||||||
Asset Derivatives | ||||||||||||||||
Forward Currency Contracts | ||||||||||||||||
Foreign Currency Risk | — | 52,683 | — | 52,683 | ||||||||||||
|
|
|
|
|
|
|
| |||||||||
Total Investments | $ | 1,054,560 | $ | 2,184,916 | $ | — | $ | 3,239,476 | ||||||||
|
|
|
|
|
|
|
| |||||||||
Liability Derivatives | ||||||||||||||||
Forward Currency Contracts | ||||||||||||||||
Foreign Currency Risk | $ | — | $ | (59,980 | ) | $ | — | $ | (59,980 | ) | ||||||
|
|
|
|
|
|
|
| |||||||||
Total | $ | — | $ | (59,980 | ) | $ | — | $ | (59,980 | ) | ||||||
|
|
|
|
|
|
|
| |||||||||
See accompanying notes to financial statements.
58
TCW International Small Cap Fund
Schedule of Investments | October 31, 2016 |
| Number of Shares | Common Stock | Value | ||||||
Argentina (Cost: $45,718) (0.5% of Net Assets) | ||||||||
| 1,400 | Grupo Financiero Galicia S.A. (ADR) | $ | 43,596 | |||||
|
| |||||||
Australia (2.8%) | ||||||||
| 12,950 | Cedar Woods Properties, Ltd. | 44,245 | ||||||
| 3,280 | Credit Corp. Group, Ltd. | 44,153 | ||||||
| 26,530 | Metcash, Ltd. (1) | 40,051 | ||||||
| 22,750 | Orora, Ltd. | 50,148 | ||||||
| 33,800 | St Barbara, Ltd. (1) | 69,009 | ||||||
|
| |||||||
Total Australia (Cost: $236,545) | 247,606 | |||||||
|
| |||||||
Austria (Cost: $44,452) (0.5%) | ||||||||
| 1,268 | Porr AG | 45,510 | ||||||
|
| |||||||
Brazil (2.7%) | ||||||||
| 3,200 | CETIP S.A. — Mercados Organizados | 45,354 | ||||||
| 15,800 | Cia Hering | 96,621 | ||||||
| 5,800 | CVC Brasil Operadora e Agencia de Viagens S.A. | 44,885 | ||||||
| 2,600 | Smiles S.A. | 47,847 | ||||||
|
| |||||||
Total Brazil (Cost: $204,137) | 234,707 | |||||||
|
| |||||||
Canada (4.5%) | ||||||||
| 2,000 | Brookfield Canada Office Properties | 39,604 | ||||||
| 9,800 | Encana Corp. | 93,492 | ||||||
| 2,625 | MTY Food Group, Inc. | 94,796 | ||||||
| 30,700 | Pengrowth Energy Corp. | 47,416 | ||||||
| 9,200 | Precision Drilling Corp. | 41,049 | ||||||
| 2,710 | Torex Gold Resources, Inc. (1) | 50,449 | ||||||
| 8,650 | Yamana Gold, Inc. | 30,915 | ||||||
|
| |||||||
Total Canada (Cost: $342,873) | 397,721 | |||||||
|
| |||||||
China (4.4%) |
| |||||||
| 338,522 | China Animal Healthcare, Ltd. (1) | — | ||||||
| 92,000 | Fufeng Group, Ltd. | 38,824 | ||||||
| 91,000 | Great Wall Motor Co., Ltd. — Class H | 88,819 | ||||||
| 53,200 | Man Wah Holdings, Ltd. | 35,312 | ||||||
| 172,739 | Q Technology Group Co., Ltd. (1) | 86,653 | ||||||
| 92,400 | Shenzhen Expressway Co., Ltd. — Class H | 92,605 | ||||||
| 10,000 | Sunny Optical Technology Group Co., Ltd. | 48,773 | ||||||
|
| |||||||
Total China (Cost: $671,941) | 390,986 | |||||||
|
| |||||||
Denmark (2.2%) |
| |||||||
| 2,084 | Ambu A/S | 107,838 | ||||||
| 833 | DFDS A/S | 40,188 | ||||||
| 1,406 | Sydbank A/S | 43,837 | ||||||
|
| |||||||
Total Denmark (Cost: $180,408) | 191,863 | |||||||
|
| |||||||
Finland (Cost: $43,268) (0.5%) |
| |||||||
| 6,515 | Outokumpu OYJ (1) | 45,356 | ||||||
|
| |||||||
See accompanying notes to financial statements.
59
TCW International Small Cap Fund
Schedule of Investments (Continued)
| Number of Shares | Common Stock | Value | ||||||
France (2.0%) |
| |||||||
| 750 | ORPEA | $ | 62,333 | |||||
| 780 | Teleperformance | 82,296 | ||||||
| 1,075 | Ubisoft Entertainment S.A. (1) | 36,526 | ||||||
|
| |||||||
Total France (Cost: $157,795) | 181,155 | |||||||
|
| |||||||
Germany (4.3%) |
| |||||||
| 1,222 | Carl Zeiss Meditec AG | 43,927 | ||||||
| 995 | CompuGroup Medical AG | 44,028 | ||||||
| 9,000 | Deutz AG | 44,454 | ||||||
| 8,500 | DIC Asset AG | 81,441 | ||||||
| 705 | Grammer AG | 40,302 | ||||||
| 1,042 | Indus Holding AG | 61,416 | ||||||
| 2,250 | VTG AG | 68,566 | ||||||
|
| |||||||
Total Germany (Cost: $338,391) | 384,134 | |||||||
|
| |||||||
India (4.3%) |
| |||||||
| 12,540 | Berger Paints India, Ltd. | 48,625 | ||||||
| 2,475 | Cholamandalam Investment and Finance Co., Ltd. | 43,618 | ||||||
| 18,276 | Crompton Greaves Consumer Electricals, Ltd. (1) | 50,598 | ||||||
| 10,020 | Dewan Housing Finance Corp., Ltd. | 49,449 | ||||||
| 29,500 | Jain Irrigation Systems, Ltd. | 47,305 | ||||||
| 32,475 | Manappuram Finance, Ltd. | 49,957 | ||||||
| 20,275 | Punjab National Bank (1) | 44,114 | ||||||
| 1,270 | Shriram City Union Finance, Ltd. | 49,536 | ||||||
|
| |||||||
Total India (Cost: $357,091) | 383,202 | |||||||
|
| |||||||
Italy (5.4%) |
| |||||||
| 9,100 | Amplifon SpA | 96,017 | ||||||
| 770 | Brembo SpA | 47,606 | ||||||
| 3,300 | Buzzi Unicem SpA | 64,087 | ||||||
| 8,870 | Davide Campari-Milano SpA | 89,208 | ||||||
| 684 | DiaSorin SpA | 41,978 | ||||||
| 34,050 | Iren SpA | 61,015 | ||||||
| 2,730 | Recordati SpA | 77,092 | ||||||
|
| |||||||
Total Italy (Cost: $400,173) | 477,003 | |||||||
|
| |||||||
Japan (16.4%) |
| |||||||
| 2,833 | Benefit One, Inc. | 81,772 | ||||||
| 2,528 | Dip Corp. | 66,829 | ||||||
| 6,000 | Dowa Holdings Co., Ltd. | 44,470 | ||||||
| 2,600 | Fuso Chemical Co., Ltd. | 55,341 | ||||||
| 2,400 | Godo Steel, Ltd. | 41,800 | ||||||
| 1,200 | Kyudenko Corp. | 38,581 | ||||||
| 8,975 | Mitsui Chemicals, Inc. | 44,108 | ||||||
| 19,000 | Mitsui Mining & Smelting Co., Ltd. | 42,245 | ||||||
| 8,996 | Nichias Corp. | 79,877 | ||||||
See accompanying notes to financial statements.
60
TCW International Small Cap Fund
October 31, 2016
| Number of Shares | Common Stock | Value | ||||||
Japan (Continued) |
| |||||||
| 4,600 | Nichiha Corp. | $ | 113,379 | |||||
| 2,000 | Nichirei Corp. | 43,644 | ||||||
| 1,600 | Nifco, Inc. | 91,958 | ||||||
| 5,200 | Okabe Co., Ltd. | 44,286 | ||||||
| 7,790 | Sanyo Special Steel Co., Ltd. | 39,852 | ||||||
| 1,400 | SCREEN Holdings Co., Ltd. | 95,577 | ||||||
| 32,300 | Taiheiyo Cement Corp. | 92,315 | ||||||
| 3,900 | Temp Holdings Co., Ltd. | 66,008 | ||||||
| 20,600 | Tokuyama Corp. (1) | 87,901 | ||||||
| 14,000 | Tosoh Corp. | 91,240 | ||||||
| 15,000 | UACJ Corp. | 48,649 | ||||||
| 1,100 | Zenkoku Hosho Co., Ltd. | 47,198 | ||||||
| 10,000 | Zeon Corp. | 91,164 | ||||||
|
| |||||||
Total Japan (Cost: $1,155,083) | 1,448,194 | |||||||
|
| |||||||
Luxembourg (1.7%) |
| |||||||
| 210 | Eurofins Scientific SE | 95,299 | ||||||
| 1,300 | Globant S.A. (1) | 56,550 | ||||||
|
| |||||||
Total Luxembourg (Cost: $100,428) | 151,849 | |||||||
|
| |||||||
Malaysia (2.2%) |
| |||||||
| 62,000 | AirAsia BHD | 40,933 | ||||||
| 59,700 | Excel Force MSC BHD | 21,781 | ||||||
| 78,500 | My EG Services BHD | 45,577 | ||||||
| 60,700 | Padini Holdings BHD | 40,949 | ||||||
| 43,300 | Press Metal BHD | 44,990 | ||||||
|
| |||||||
Total Malaysia (Cost: $195,690) | 194,230 | |||||||
|
| |||||||
Malta (Cost: $43,325) (0.4%) |
| |||||||
| 3,780 | Unibet Group PLC (ADR) | 33,423 | ||||||
|
| |||||||
Mexico (Cost: $64,034) (0.8%) |
| |||||||
| 56,293 | Genomma Lab Internacional S.A.B. de C.V. — Class B (1) | 67,884 | ||||||
|
| |||||||
Netherlands (1.2%) |
| |||||||
| 1,601 | Euronext NV (1) | 64,022 | ||||||
| 1,030 | IMCD Group NV | 44,492 | ||||||
|
| |||||||
Total Netherlands (Cost: $111,288) | 108,514 | |||||||
|
| |||||||
New Zealand (Cost: $45,068) (0.6%) |
| |||||||
| 7,191 | Fletcher Building, Ltd. | 53,294 | ||||||
|
| |||||||
Norway (2.3%) |
| |||||||
| 2,854 | Aker ASA | 105,460 | ||||||
| 5,321 | Austevoll Seafood ASA | 48,038 | ||||||
| 2,317 | TGS Nopec Geophysical Co. ASA | 46,928 | ||||||
|
| |||||||
Total Norway (Cost: $164,708) | 200,426 | |||||||
|
| |||||||
Pakistan (Cost: $42,261) (0.5%) |
| |||||||
| 41,600 | Hub Power Co., Ltd. (The) | 42,473 | ||||||
|
| |||||||
See accompanying notes to financial statements.
61
TCW International Small Cap Fund
Schedule of Investments (Continued)
| Number of Shares | Common Stock | Value | ||||||
Peru (Cost: $44,745) (0.5%) |
| |||||||
| 3,300 | Cia de Minas Buenaventura S.A. (ADR) (1) | $ | 43,857 | |||||
|
| |||||||
Russia (4.3%) |
| |||||||
| 56,200 | Aeroflot PJSC (1) | 115,366 | ||||||
| 1,741,000 | Inter RAO UES PJSC | 92,056 | ||||||
| 15,775 | M.Video PJSC | 84,675 | ||||||
| 22,610 | Moscow Exchange MICEX-RTS PJSC | 41,933 | ||||||
| 11,000 | TMK PJSC (GDR) | 46,420 | ||||||
|
| |||||||
Total Russia (Cost: $338,065) | 380,450 | |||||||
|
| |||||||
Singapore (Cost: $41,353) (0.5%) |
| |||||||
| 43,000 | Frasers Commercial Trust | 42,144 | ||||||
|
| |||||||
South Korea (2.1%) |
| |||||||
| 706 | Dongbu Insurance Co., Ltd. | 43,796 | ||||||
| 366 | Mando Corp. | 85,573 | ||||||
| 402 | SK Materials Co., Ltd. | 54,680 | ||||||
|
| |||||||
Total South Korea (Cost: $172,293) | 184,049 | |||||||
|
| |||||||
Spain (Cost: $45,071) (0.5%) |
| |||||||
| 14,666 | Tubacex S.A. | 43,547 | ||||||
|
| |||||||
Sweden (1.9%) |
| |||||||
| 4,704 | NetEnt AB | 37,111 | ||||||
| 4,968 | Scandic Hotels Group AB, (144A) (1) | 43,386 | ||||||
| 27,975 | SSAB AB (1) | 88,833 | ||||||
|
| |||||||
Total Sweden (Cost: $156,663) | 169,330 | |||||||
|
| |||||||
Switzerland (3.6%) |
| |||||||
| 1,877 | BKW AG | 87,406 | ||||||
| 635 | Cembra Money Bank AG | 48,567 | ||||||
| 355 | Flughafen Zuerich AG | 65,300 | ||||||
| 175 | Straumann Holding AG | 65,701 | ||||||
| 740 | Temenos Group AG | 47,822 | ||||||
|
| |||||||
Total Switzerland (Cost: $273,594) | 314,796 | |||||||
|
| |||||||
Taiwan (5.3%) |
| |||||||
| 13,000 | Basso Industry Corp. | 34,961 | ||||||
| 8,000 | Chaun-Choung Technology Corp. | 35,270 | ||||||
| 26,000 | Everlight Electronics Co., Ltd. | 39,216 | ||||||
| 52,000 | Inventec Corp. | 40,598 | ||||||
| 25,000 | Kinik Co. | 41,295 | ||||||
| 35,000 | Powertech Technology, Inc. | 99,862 | ||||||
| 32,000 | Primax Electronics, Ltd. | 50,609 | ||||||
| 6,065 | Tung Thih Electronic Co., Ltd. | 88,490 | ||||||
| 8,000 | Zeng Hsing Industrial Co., Ltd. | 38,609 | ||||||
|
| |||||||
Total Taiwan (Cost: $474,929) | 468,910 | |||||||
|
| |||||||
See accompanying notes to financial statements.
62
TCW International Small Cap Fund
October 31, 2016
| Number of Shares | Common Stock | Value | ||||||
Thailand (2.6%) |
| |||||||
| 42,400 | KCE Electronics PCL (NVDR) | $ | 135,719 | |||||
| 21,400 | Krungthai Card PCL (NVDR) | 91,660 | ||||||
|
| |||||||
Total Thailand (Cost: $175,996) | 227,379 | |||||||
|
| |||||||
Turkey (Cost: $45,090) (0.5%) |
| |||||||
| 31,125 | Eregli Demir ve Celik Fabrikalari TAS | 42,289 | ||||||
|
| |||||||
United Arab Emirates (Cost: $135,980) (1.8%) |
| |||||||
| 8,795 | NMC Health PLC | 156,880 | ||||||
|
| |||||||
United Kingdom (7.9%) |
| |||||||
| 6,050 | Abcam PLC | 64,264 | ||||||
| 8,200 | Beazley PLC | 36,419 | ||||||
| 2,540 | Berendsen PLC | 29,899 | ||||||
| 7,960 | Bovis Homes Group PLC | 73,513 | ||||||
| 33,100 | Fenner PLC | 88,481 | ||||||
| 6,070 | GVC Holdings PLC | 51,616 | ||||||
| 5,080 | John Wood Group PLC | 47,627 | ||||||
| 19,327 | National Express Group PLC | 86,603 | ||||||
| 41,000 | Premier Oil PLC (1) | 32,931 | ||||||
| 8,520 | Redrow PLC | 39,474 | ||||||
| 18,645 | Rentokil Initial PLC | 51,875 | ||||||
| 3,635 | RPC Group PLC | 42,047 | ||||||
| 28,191 | Taylor Wimpey PLC | 48,696 | ||||||
|
| |||||||
Total United Kingdom (Cost: $721,836) | 693,445 | |||||||
|
| |||||||
Total Common Stock (Cost: $7,570,292) (91.7%) | 8,090,202 | |||||||
|
| |||||||
| Total Participation Notes | ||||||||
Saudi Arabia (Cost: $91,056) (1.0%) |
| |||||||
| 10,655 | Al Hammadi Development and Investment Co. (HSBC as Counterparty) | 90,996 | ||||||
|
| |||||||
Total Participation Notes (Cost: $91,056) (1.0%) | 90,996 | |||||||
|
| |||||||
| Preferred Stock | ||||||||
Brazil (3.0%) |
| |||||||
| 12,900 | Banco do Estado do Rio Grande do Sul S.A., 7.13% | 55,416 | ||||||
| 2,800 | Cia Brasileira de Distribuicao, 0.28% (SP ADR) | 53,340 | ||||||
| 45,500 | Gerdau S.A., 0.53% | 158,381 | ||||||
|
| |||||||
Total Brazil (Cost: $223,076) | 267,137 | |||||||
|
| |||||||
Germany (1.4%) |
| |||||||
| 1,386 | Jungheinrich AG, 1.55% | 43,697 | ||||||
| 1,040 | Sartorius AG, 0.57% | 81,750 | ||||||
|
| |||||||
Total Germany (Cost: $99,173) | 125,447 | |||||||
|
| |||||||
Total Preferred Stock (Cost: $322,249) (4.4%) | 392,584 | |||||||
|
| |||||||
See accompanying notes to financial statements.
63
TCW International Small Cap Fund
Schedule of Investments (Continued)
| Number of Shares | Money Market Investments | Value | ||||||
| 131,682 | State Street Institutional U.S. Government Money Market Fund — Premier Class, 0.25% (2) | $ | 131,682 | |||||
|
| |||||||
Total Money Market Investments (Cost: $131,682) (1.5%) | 131,682 | |||||||
|
| |||||||
Total Investments (Cost: $8,115,279) (98.6%) | 8,705,464 | |||||||
|
| |||||||
Excess of Other Assets over Liabilities (1.4%) | 121,723 | |||||||
|
| |||||||
Total Net Assets (100.0%) | $ | 8,827,187 | ||||||
|
| |||||||
| Forward Currency Contracts | ||||||||||||||||||||||||
| Counterparty | Contracts to Deliver | Units of Currency | Settlement Date | In Exchange for U.S. Dollars | Contracts at Value | Unrealized Appreciation (Depreciation) | ||||||||||||||||||
BUY (3) | ||||||||||||||||||||||||
Bank of America | JPY | 240,122,484 | 11/07/16 | $ | 2,067,939 | $ | 2,285,408 | $ | 217,469 | |||||||||||||||
|
|
|
|
|
| |||||||||||||||||||
| $ | 2,067,939 | $ | 2,285,408 | $ | 217,469 | |||||||||||||||||||
|
|
|
|
|
| |||||||||||||||||||
SELL (4) | ||||||||||||||||||||||||
Bank of America | JPY | 240,122,484 | 11/07/16 | $ | 2,120,000 | $ | 2,285,408 | $ | (165,408 | ) | ||||||||||||||
|
|
|
|
|
| |||||||||||||||||||
| $ | 2,120,000 | $ | 2,285,408 | $ | (165,408 | ) | ||||||||||||||||||
|
|
|
|
|
| |||||||||||||||||||
Notes to the Schedule of Investments:
| JPY - Japanese | Yen. |
| ADR - American | Depositary Receipt. Shares of a foreign based corporation held in U.S. banks entitling the shareholder to all dividends and capital gains. |
| NVDR - Non-Voting | Depositary Receipt. |
| PJSC - Private | Joint-Stock Company. |
| (1) | Non-income producing security. |
| (2) | Rate disclosed is the 7-day net yield as of October 31, 2016. |
| (3) | Fund buys foreign currency, sells U.S. Dollar. |
| (4) | Fund sells foreign currency, buys U.S. Dollar. |
See accompanying notes to financial statements.
64
TCW International Small Cap Fund
Investments by Industry | October 31, 2016 |
| Industry | Percentage of Net Assets | |||
Basic Materials | 14.0 | % | ||
Communications | 2.8 | |||
Consumer, Cyclical | 16.1 | |||
Consumer, Non-cyclical | 16.8 | |||
Diversified | 1.0 | |||
Energy | 3.5 | |||
Financial | 12.7 | |||
Industrial | 21.8 | |||
Technology | 5.2 | |||
Utilities | 3.2 | |||
Money Market Investments | 1.5 | |||
|
| |||
Total | 98.6 | % | ||
|
| |||
See accompanying notes to financial statements.
65
TCW International Small Cap Fund
Fair Valuation Summary | October 31, 2016 |
The following is a summary of the fair valuations according to the inputs used as of October 31, 2016 in valuing the Fund’s investments:
| Description | Quoted Prices (Level 1) | Other (Level 2) | Significant (Level 3) | Total | ||||||||||||
Common Stock | ||||||||||||||||
Airlines | $ | — | $ | 156,300 | $ | — | $ | 156,300 | ||||||||
Auto Components | — | 353,930 | — | 353,930 | ||||||||||||
Automobiles | — | 88,819 | — | 88,819 | ||||||||||||
Banks | 43,596 | 87,952 | — | 131,548 | ||||||||||||
Beverages | — | 89,208 | — | 89,208 | ||||||||||||
Biotechnology | — | 64,265 | — | 64,265 | ||||||||||||
Building Products | — | 237,543 | — | 237,543 | ||||||||||||
Capital Markets | 45,354 | — | — | 45,354 | ||||||||||||
Chemicals | — | 511,883 | — | 511,883 | ||||||||||||
Commercial Services & Supplies | — | 81,774 | — | 81,774 | ||||||||||||
Construction & Engineering | — | 84,091 | — | 84,091 | ||||||||||||
Construction Materials | — | 209,695 | — | 209,695 | ||||||||||||
Consumer Finance | 93,154 | 234,337 | — | 327,491 | ||||||||||||
Containers & Packaging | — | 92,195 | — | 92,195 | ||||||||||||
Diversified Financial Services | — | 258,612 | — | 258,612 | ||||||||||||
Electric Utilities | 87,406 | 92,056 | — | 179,462 | ||||||||||||
Electronic Equipment, Instruments & Components | — | 84,042 | — | 84,042 | ||||||||||||
Electronics | — | 135,719 | — | 135,719 | ||||||||||||
Energy Equipment & Services | 87,469 | 94,555 | — | 182,024 | ||||||||||||
Food & Staples Retailing | — | 40,051 | — | 40,051 | ||||||||||||
Food Products | — | 91,681 | — | 91,681 | ||||||||||||
Health Care Equipment & Supplies | — | 259,444 | — | 259,444 | ||||||||||||
Health Care Providers & Services | 156,880 | 158,350 | — | 315,230 | ||||||||||||
Health Care Technology | — | 44,028 | — | 44,028 | ||||||||||||
Hotels, Restaurants & Leisure | 191,298 | 76,808 | — | 268,106 | ||||||||||||
Household Durables | 50,597 | 357,218 | — | 407,815 | ||||||||||||
Independent Power and Renewable Electricity Producers | 42,473 | — | — | 42,473 | ||||||||||||
Industrial Conglomerates | — | 61,416 | — | 61,416 | ||||||||||||
Insurance | — | 80,214 | — | 80,214 | ||||||||||||
Internet Software & Services | — | 103,939 | — | 103,939 | ||||||||||||
IT Services | — | 45,577 | — | 45,577 | ||||||||||||
Life Sciences Tools & Services | — | 95,299 | — | 95,299 | ||||||||||||
Machinery | — | 221,535 | — | 221,535 | ||||||||||||
Marine | — | 40,188 | — | 40,188 | ||||||||||||
Media | 47,847 | — | — | 47,847 | ||||||||||||
Metals & Mining | 125,221 | 551,040 | — | 676,261 | ||||||||||||
Multi-Utilities | — | 61,015 | — | 61,015 | ||||||||||||
Oil, Gas & Consumable Fuels | 140,908 | 32,931 | — | 173,839 | ||||||||||||
Pharmaceuticals | 67,884 | 77,092 | — | 144,976 | ||||||||||||
See accompanying notes to financial statements.
66
TCW International Small Cap Fund
Fair Valuation Summary (Continued) | October 31, 2016 |
| Description | Quoted Prices (Level 1) | Other (Level 2) | Significant (Level 3) | Total | ||||||||||||
Professional Services | $ | — | $ | 230,076 | $ | — | $ | 230,076 | ||||||||
REIT | 39,604 | 42,144 | — | 81,748 | ||||||||||||
Real Estate Management & Development | — | 81,441 | — | 81,441 | ||||||||||||
Real Estate | — | 44,245 | — | 44,245 | ||||||||||||
Road & Rail | — | 155,169 | — | 155,169 | ||||||||||||
Semiconductors & Semiconductor Equipment | — | 234,655 | — | 234,655 | ||||||||||||
Software | 56,550 | 106,129 | — | 162,679 | ||||||||||||
Specialty Retail | 137,570 | 84,676 | — | 222,246 | ||||||||||||
Technology Hardware, Storage & Peripherals | — | 91,207 | — | 91,207 | ||||||||||||
Thrifts & Mortgage Finance | — | 49,449 | — | 49,449 | ||||||||||||
Trading Companies & Distributors | 44,492 | — | — | 44,492 | ||||||||||||
Transportation Infrastructure | — | 157,906 | — | 157,906 | ||||||||||||
|
|
|
|
|
|
|
| |||||||||
Total Common Stock | 1,458,303 | 6,631,899 | — | 8,090,202 | ||||||||||||
|
|
|
|
|
|
|
| |||||||||
Participation Notes | ||||||||||||||||
Health Care Providers & Services | — | 90,996 | — | 90,996 | ||||||||||||
|
|
|
|
|
|
|
| |||||||||
Total Participation Notes | — | 90,996 | — | 90,996 | ||||||||||||
|
|
|
|
|
|
|
| |||||||||
Preferred Stock | ||||||||||||||||
Automobiles | 108,756 | — | — | 108,756 | ||||||||||||
Health Care Equipment & Supplies | — | 81,750 | — | 81,750 | ||||||||||||
Machinery | — | 43,697 | — | 43,697 | ||||||||||||
Metals & Mining | 158,381 | — | — | 158,381 | ||||||||||||
|
|
|
|
|
|
|
| |||||||||
Total Preferred Stock | 267,137 | 125,447 | — | 392,584 | ||||||||||||
|
|
|
|
|
|
|
| |||||||||
Money Market Investments | 131,682 | — | — | 131,682 | ||||||||||||
|
|
|
|
|
|
|
| |||||||||
Total Investments | 1,857,122 | 6,848,342 | — | 8,705,464 | ||||||||||||
|
|
|
|
|
|
|
| |||||||||
Asset Derivatives | ||||||||||||||||
Forward Currency Contracts | ||||||||||||||||
Foreign Currency Risk | — | 217,469 | — | 217,469 | ||||||||||||
|
|
|
|
|
|
|
| |||||||||
Total Investments | $ | 1,857,122 | $ | 7,065,811 | $ | — | $ | 8,922,933 | ||||||||
|
|
|
|
|
|
|
| |||||||||
Liability Derivatives | ||||||||||||||||
Forward Currency Contracts | ||||||||||||||||
Foreign Currency Risk | $ | — | $ | (165,408 | ) | $ | — | $ | (165,408 | ) | ||||||
|
|
|
|
|
|
|
| |||||||||
Total | $ | — | $ | (165,408 | ) | $ | — | $ | (165,408 | ) | ||||||
|
|
|
|
|
|
|
| |||||||||
See accompanying notes to financial statements.
67
TCW Funds, Inc.
October 31, 2016 |
| TCW Developing Markets Equity Fund | TCW Emerging Markets Income Fund | TCW Emerging Markets Local Currency Income Fund | ||||||||||
Dollar Amounts in Thousands (Except per Share Amounts) | ||||||||||||
ASSETS | ||||||||||||
Investments, at Value (1) | $ | 5,006 | $ | 3,047,218 | $ | 134,656 | ||||||
Foreign Currency, at Value | — | 24,867 | (2) | 951 | (2) | |||||||
Cash | — | — | 185 | |||||||||
Receivable for Securities Sold | 23 | 21,966 | — | |||||||||
Receivable for Fund Shares Sold | — | 10,603 | 25 | |||||||||
Interest and Dividends Receivable | 9 | 42,170 | 2,489 | |||||||||
Receivable from Investment Advisor | 5 | — | — | |||||||||
Unrealized Appreciation on Open Forward Foreign Currency Contracts | — | 2,223 | 856 | |||||||||
Cash Collateral Held for Brokers | — | 4,430 | 280 | |||||||||
Open Swap Agreements, at Value | — | 3,964 | — | |||||||||
Prepaid Expenses | 13 | 87 | 30 | |||||||||
|
|
|
|
|
| |||||||
Total Assets | 5,056 | 3,157,528 | 139,472 | |||||||||
|
|
|
|
|
| |||||||
LIABILITIES | ||||||||||||
Distributions Payable | — | 14,015 | — | |||||||||
Payable for Securities Purchased | 77 | 19,196 | — | |||||||||
Payable for Fund Shares Redeemed | — | 3,946 | 25,150 | |||||||||
Accrued Capital Gain Withholding Taxes | — | 96 | 105 | |||||||||
Accrued Directors’ Fees and Expenses | 2 | 2 | 2 | |||||||||
Accrued Management Fees | 3 | 1,990 | 106 | |||||||||
Accrued Distribution Fees | — | 115 | 3 | |||||||||
Interest Payable on Swap Agreements | — | 268 | — | |||||||||
Options Written, at Value | — | 131 | (3) | 12 | (3) | |||||||
Open Swap Agreements, at Value | — | 1,733 | — | |||||||||
Collateral Pledged by Brokers | — | 1,530 | — | |||||||||
Unrealized Depreciation on Open Forward Foreign Currency Contracts | — | 4,809 | 1,004 | |||||||||
Other Accrued Expenses | 33 | 748 | 115 | |||||||||
|
|
|
|
|
| |||||||
Total Liabilities | 115 | 48,579 | 26,497 | |||||||||
|
|
|
|
|
| |||||||
NET ASSETS | $ | 4,941 | $ | 3,108,949 | $ | 112,975 | ||||||
|
|
|
|
|
| |||||||
NET ASSETS CONSIST OF: | ||||||||||||
Paid-in Capital | $ | 5,417 | $ | 3,737,463 | $ | 134,669 | ||||||
Accumulated Net Realized Loss on Investments, Futures Contracts, Options Written, Swap Contracts and Foreign Currency | (1,071 | ) | (707,190 | ) | (27,720 | ) | ||||||
Unrealized Appreciation of Investments, Options Written, Swap Contracts and Foreign Currency | 549 | 70,958 | 6,911 | |||||||||
Undistributed Net Investment Income | 46 | 7,718 | (885 | ) | ||||||||
|
|
|
|
|
| |||||||
NET ASSETS | $ | 4,941 | $ | 3,108,949 | $ | 112,975 | ||||||
|
|
|
|
|
| |||||||
NET ASSETS ATTRIBUTABLE TO: | ||||||||||||
I Class Share | $ | 3,577 | $ | 2,574,798 | $ | 97,650 | ||||||
|
|
|
|
|
| |||||||
N Class Share | $ | 1,364 | $ | 534,151 | $ | 15,325 | ||||||
|
|
|
|
|
| |||||||
CAPITAL SHARES OUTSTANDING: (4) | ||||||||||||
I Class Share | 392,996 | 308,642,007 | 10,701,334 | |||||||||
|
|
|
|
|
| |||||||
N Class Share | 149,795 | 49,698,102 | 1,680,522 | |||||||||
|
|
|
|
|
| |||||||
NET ASSET VALUE PER SHARE: (5) | ||||||||||||
I Class Share | $ | 9.10 | $ | 8.34 | $ | 9.13 | ||||||
|
|
|
|
|
| |||||||
N Class Share | $ | 9.10 | $ | 10.75 | $ | 9.12 | ||||||
|
|
|
|
|
| |||||||
| (1) | The identified cost for the TCW Developing Markets Equity Fund, the TCW Emerging Markets Income Fund and the TCW Emerging Markets Local Currency Income Fund at October 31, 2016 was $4,457, $2,973,774 and $127,584, respectively. |
| (2) | The identified cost for the TCW Emerging Markets Income Fund and the TCW Emerging Markets Local Currency Income Fund at October 31, 2016 was $24,828 and $950, respectively. |
| (3) | Premium received $907 and $66 for the TCW Emerging Markets Income Fund and the TCW Emerging Markets Local Currency Income Fund, respectively. |
| (4) | The number of authorized shares, with a par value of $0.001 per share is 4,000,000,000 for each of the I Class and N Class shares. |
| (5) | Represents offering price and redemption price per share. |
See accompanying notes to financial statements.
68
TCW Funds, Inc.
Statements of Assets and Liabilities | October 31, 2016 |
| TCW Emerging Markets Multi-Asset Opportunities Fund | TCW International Growth Fund | TCW International Small Cap Fund | ||||||||||
Dollar Amounts in Thousands (Except per Share Amounts) | ||||||||||||
ASSETS | ||||||||||||
Investments, at Value (1) | $ | 41,771 | $ | 3,187 | $ | 8,705 | ||||||
Foreign Currency, at Value | 26 | (2) | 1 | (2) | — | |||||||
Cash | 650 | — | — | |||||||||
Receivable for Securities Sold | 418 | 100 | 75 | |||||||||
Receivable for Fund Shares Sold | 28 | — | 29 | |||||||||
Interest and Dividends Receivable | 297 | 6 | 13 | |||||||||
Foreign Tax Reclaims Receivable | 4 | — | (3) | 1 | ||||||||
Receivable from Investment Advisor | 5 | 14 | 6 | |||||||||
Unrealized Appreciation on Open Forward Foreign Currency Contracts | 25 | 53 | 217 | |||||||||
Cash Collateral Held for Brokers | — | — | 100 | |||||||||
Open Swap Agreements, at Value | 24 | — | — | |||||||||
Prepaid Expenses | 13 | 15 | 8 | |||||||||
|
|
|
|
|
| |||||||
Total Assets | 43,261 | 3,376 | 9,154 | |||||||||
|
|
|
|
|
| |||||||
LIABILITIES | ||||||||||||
Payable for Securities Purchased | 828 | 67 | 21 | |||||||||
Payable for Fund Shares Redeemed | — | 6 | — | |||||||||
Accrued Capital Gain Withholding Taxes | 18 | — | 1 | |||||||||
Accrued Directors’ Fees and Expenses | 2 | 2 | 2 | |||||||||
Accrued Management Fees | 34 | 2 | 6 | |||||||||
Accrued Distribution Fees | 1 | — | (3) | 1 | ||||||||
Interest Payable on Swap Agreements | 2 | — | — | |||||||||
Options Written, at Value | 1 | (4) | — | — | ||||||||
Open Swap Agreements, at Value | 10 | — | — | |||||||||
Collateral Pledged by Brokers | — | — | 100 | |||||||||
Unrealized Depreciation on Open Forward Foreign Currency Contracts | 44 | 60 | 165 | |||||||||
Other Accrued Expenses | 60 | 26 | 31 | |||||||||
|
|
|
|
|
| |||||||
Total Liabilities | 1,000 | 163 | 327 | |||||||||
|
|
|
|
|
| |||||||
NET ASSETS | $ | 42,261 | $ | 3,213 | $ | 8,827 | ||||||
|
|
|
|
|
| |||||||
NET ASSETS CONSIST OF: | ||||||||||||
Paid-in Capital | $ | 42,503 | $ | 3,275 | $ | 11,700 | ||||||
Accumulated Net Realized Loss on Investments, Swap Contracts and Foreign Currency | (4,892 | ) | (267 | ) | (3,423 | ) | ||||||
Unrealized Appreciation of Investments, Options Written, Swap Contracts and Foreign Currency | 3,450 | 183 | 642 | |||||||||
Undistributed (Overdistributed) Net Investment Income | 1,200 | 22 | (92 | ) | ||||||||
|
|
|
|
|
| |||||||
NET ASSETS | $ | 42,261 | $ | 3,213 | $ | 8,827 | ||||||
|
|
|
|
|
| |||||||
NET ASSETS ATTRIBUTABLE TO: | ||||||||||||
I Class Share | $ | 37,173 | $ | 2,055 | $ | 5,684 | ||||||
|
|
|
|
|
| |||||||
N Class Share | $ | 5,088 | $ | 1,158 | $ | 3,143 | ||||||
|
|
|
|
|
| |||||||
CAPITAL SHARES OUTSTANDING: (5) | ||||||||||||
I Class Share | 3,578,524 | 209,938 | 696,109 | |||||||||
|
|
|
|
|
| |||||||
N Class Share | 491,653 | 118,902 | 384,565 | |||||||||
|
|
|
|
|
| |||||||
NET ASSET VALUE PER SHARE: (6) | ||||||||||||
I Class Share | $ | 10.39 | $ | 9.79 | $ | 8.17 | ||||||
|
|
|
|
|
| |||||||
N Class Share | $ | 10.35 | $ | 9.74 | $ | 8.17 | ||||||
|
|
|
|
|
| |||||||
| (1) | The identified cost for the TCW Emerging Markets Multi-Asset Opportunities Fund, the TCW International Growth Fund and the TCW International Small Cap Fund at October 31, 2016 was $38,283, $2,997 and $8,115, respectively. |
| (2) | The identified cost for the TCW Emerging Markets Multi-Asset Opportunities Fund and the TCW International Growth Fund at October 31, 2016 was $27 and $1, respectively. |
| (3) | Amount rounds to less than $1. |
| (4) | Premium received $7. |
| (5) | The number of authorized shares, with a par value of $0.001 per share is 4,000,000,000 for each of the I Class and N Class shares. |
| (6) | Represents offering price and redemption price per share. |
See accompanying notes to financial statements.
69
TCW Funds, Inc.
Year Ended October 31, 2016 |
| TCW Developing Markets Equity Fund | TCW Emerging Markets Income Fund | TCW Emerging Markets Local Currency Income Fund | ||||||||||
| Dollar Amounts in Thousands | ||||||||||||
INVESTMENT INCOME | ||||||||||||
Income: | ||||||||||||
Dividends | $ | 108 | (1) | $ | 374 | $ | — | |||||
Interest | — | 225,861 | (2) | 12,082 | (2) | |||||||
Other | — | 229 | 13 | |||||||||
|
|
|
|
|
| |||||||
Total | 108 | 226,464 | 12,095 | |||||||||
|
|
|
|
|
| |||||||
Expenses: | ||||||||||||
Management Fees | 36 | 21,694 | 1,280 | |||||||||
Accounting Services Fees | 2 | 240 | 9 | |||||||||
Administration Fees | 1 | 147 | 6 | |||||||||
Transfer Agent Fees: | ||||||||||||
I Class | — | (3) | 1,789 | 56 | ||||||||
N Class | — | (3) | 481 | 42 | ||||||||
Custodian Fees | 32 | 204 | 184 | |||||||||
Professional Fees | 16 | 83 | 36 | |||||||||
Directors’ Fees and Expenses | 32 | 32 | 32 | |||||||||
Registration Fees: | ||||||||||||
I Class | 22 | 50 | 22 | |||||||||
N Class | 22 | 58 | 20 | |||||||||
Distribution Fees: | ||||||||||||
N Class | 3 | 1,268 | 134 | |||||||||
Compliance Expense | — | (3) | 26 | 2 | ||||||||
Shareholder Reporting Expense | — | (3) | 16 | 4 | ||||||||
Other | 9 | 519 | 41 | |||||||||
|
|
|
|
|
| |||||||
Total | 175 | 26,607 | 1,868 | |||||||||
|
|
|
|
|
| |||||||
Less Expenses Borne by Investment Advisor: | ||||||||||||
I Class | 75 | — | 7 | |||||||||
N Class | 44 | — | 171 | |||||||||
|
|
|
|
|
| |||||||
Net Expenses | 56 | 26,607 | 1,690 | |||||||||
|
|
|
|
|
| |||||||
Net Investment Income | 52 | 199,857 | 10,405 | |||||||||
|
|
|
|
|
| |||||||
NET REALIZED AND UNREALIZED GAIN (LOSS) ON INVESTMENTS | ||||||||||||
Net Realized Gain (Loss) on: | ||||||||||||
Investments | (740 | ) | (65,525 | ) (4) | (30,595 | ) (4) | ||||||
Foreign Currency | (9 | ) | (11,106 | ) | (1,044 | ) | ||||||
Futures Contracts | — | 1,701 | — | |||||||||
Options Written | — | 36 | 207 | |||||||||
Swap Agreements | — | (281 | ) | — | ||||||||
Change in Unrealized Appreciation (Depreciation) on: | ||||||||||||
Investments | 963 | 245,547 | (5) | 30,826 | (5) | |||||||
Foreign Currency | — | (932 | ) | 828 | ||||||||
Futures Contracts | — | (191 | ) | — | ||||||||
Options Written | — | 776 | 54 | |||||||||
Swap Agreements | — | (663 | ) | — | ||||||||
|
|
|
|
|
| |||||||
Net Realized and Unrealized Gain (Loss) on Investments and Foreign Currency Transactions | 214 | 169,362 | 276 | |||||||||
|
|
|
|
|
| |||||||
INCREASE IN NET ASSETS RESULTING FROM OPERATIONS | $ | 266 | $ | 369,219 | $ | 10,681 | ||||||
|
|
|
|
|
| |||||||
| (1) | Net of foreign taxes withheld of $13 for the TCW Developing Markets Equity Fund. |
| (2) | Net of foreign taxes withheld of $37 and $170 for the TCW Emerging Markets Income Fund and the TCW Emerging Markets Local Currency Income Fund, respectively. |
| (3) | Amount rounds to less than $1. |
| (4) | Net of capital gain withholding taxes of $492 and $327 for the TCW Emerging Markets Income Fund and the TCW Emerging Markets Local Currency Income Fund, respectively. |
| (5) | Net of capital gain withholding taxes of $4 and $110 for the TCW Emerging Markets Income Fund and the TCW Emerging Markets Local Currency Income Fund, respectively. |
See accompanying notes to financial statements.
70
TCW Funds, Inc.
Statements of Operations | Year Ended October 31, 2016 |
| TCW Emerging Markets Multi-Asset Opportunities Fund | TCW International Growth Fund | TCW International Small Cap Fund | ||||||||||
| Dollar Amounts in Thousands | ||||||||||||
INVESTMENT INCOME | ||||||||||||
Income: | ||||||||||||
Dividends | $ | 475 | (1) | $ | 62 | (1) | $ | 153 | (1) | |||
Interest | 1,503 | (2) | — | — | ||||||||
Other | — | — | 1 | |||||||||
|
|
|
|
|
| |||||||
Total | 1,978 | 62 | 154 | |||||||||
|
|
|
|
|
| |||||||
Expenses: | ||||||||||||
Management Fees | 378 | 24 | 66 | |||||||||
Accounting Services Fees | 3 | 2 | 3 | |||||||||
Administration Fees | 2 | 1 | 2 | |||||||||
Transfer Agent Fees: | ||||||||||||
I Class | 4 | — | (3) | 2 | ||||||||
N Class | 1 | — | (3) | 1 | ||||||||
Custodian Fees | 110 | 39 | 33 | |||||||||
Professional Fees | 45 | 21 | 20 | |||||||||
Directors’ Fees and Expenses | 32 | 32 | 32 | |||||||||
Registration Fees: | ||||||||||||
I Class | 16 | 11 | 16 | |||||||||
N Class | 16 | 10 | 16 | |||||||||
Distribution Fees: | ||||||||||||
N Class | 11 | 3 | 8 | |||||||||
Shareholder Reporting Expense | 2 | 1 | 4 | |||||||||
Other | 30 | 20 | 25 | |||||||||
|
|
|
|
|
| |||||||
Total | 650 | 164 | 228 | |||||||||
|
|
|
|
|
| |||||||
Less Expenses Borne by Investment Advisor: | ||||||||||||
I Class | 120 | 76 | 54 | |||||||||
N Class | 40 | 56 | 46 | |||||||||
|
|
|
|
|
| |||||||
Net Expenses | 490 | 32 | 128 | |||||||||
|
|
|
|
|
| |||||||
Net Investment Income | 1,488 | 30 | 26 | |||||||||
|
|
|
|
|
| |||||||
NET REALIZED AND UNREALIZED GAIN (LOSS) ON INVESTMENTS | ||||||||||||
Net Realized (Loss) on: | ||||||||||||
Investments | (1,756 | ) (4) | (215 | ) (4) | (84 | ) | ||||||
Foreign Currency | (122 | ) | — | (3) | (2 | ) | ||||||
Options Written | — | (3) | — | — | ||||||||
Swap Agreements | (2 | ) | — | — | ||||||||
Change in Unrealized Appreciation (Depreciation) on: | ||||||||||||
Investments | 4,315 | (5) | 166 | 70 | ||||||||
Foreign Currency | (14 | ) | (15 | ) | (60 | ) | ||||||
Options Written | 6 | — | — | |||||||||
Swap Agreements | (4 | ) | — | — | ||||||||
|
|
|
|
|
| |||||||
Net Realized and Unrealized Gain (Loss) on Investments and Foreign Currency Transactions | 2,423 | (64 | ) | (76 | ) | |||||||
|
|
|
|
|
| |||||||
INCREASE (DECREASE) IN NET ASSETS RESULTING FROM OPERATIONS | $ | 3,911 | $ | (34 | ) | $ | (50 | ) | ||||
|
|
|
|
|
| |||||||
| (1) | Net of foreign taxes withheld of $63, $7 and $19 for the TCW Emerging Markets Multi-Asset Opportunities Fund, the TCW International Growth Fund and the TCW International Small Cap Fund, respectively. |
| (2) | Net of foreign taxes withheld of $0 (amount rounds to less than $1) for the TCW Emerging Markets Multi-Asset Opportunities Fund. |
| (3) | Amount rounds to less than $1. |
| (4) | Net of capital gain withholding taxes of $23 and $0 (amount rounds to less than $1) for the TCW Emerging Markets Multi-Asset Opportunities Fund and the TCW International Growth Fund, respectively. |
| (5) | Net of capital gain withholding tax of $18 for the TCW Emerging Markets Multi-Asset Opportunities Fund. |
See accompanying notes to financial statements.
71
TCW Funds, Inc.
Statements of Changes in Net Assets
| TCW Developing Markets Equity Fund | TCW Emerging Markets Income Fund | |||||||||||||||
| Year Ended October 31, 2016 | June 30, 2015 (1) through October 31, 2015 | Year Ended October 31, 2016 | Year Ended October 31, 2015 | |||||||||||||
OPERATIONS | ||||||||||||||||
Net Investment Income | $ | 52 | $ | 4 | $ | 199,857 | $ | 206,848 | ||||||||
Net Realized Loss on Investments, Futures Contracts, Options Written, Swap Contracts and Foreign Currency Transactions | (749 | ) | (331 | ) | (75,175 | ) | (374,459 | ) | ||||||||
Change in Unrealized Appreciation (Depreciation) on Investments, Futures Contracts, Options Written and Foreign Currency Transactions | 963 | (414 | ) | 244,537 | (153,869 | ) | ||||||||||
|
|
|
|
|
|
|
| |||||||||
Increase (Decrease) in Net Assets Resulting from Operations | 266 | (741 | ) | 369,219 | (321,480 | ) | ||||||||||
|
|
|
|
|
|
|
| |||||||||
DISTRIBUTIONS TO SHAREHOLDERS | ||||||||||||||||
Distributions from Net Investment Income: | ||||||||||||||||
I Class | (1 | ) | — | (119,349 | ) | (180,472 | ) | |||||||||
N Class | (1 | ) | — | (24,182 | ) | (29,061 | ) | |||||||||
Distributions from Return of Capital: | ||||||||||||||||
I Class | — | — | — | (9,011 | ) | |||||||||||
N Class | — | — | — | (1,462 | ) | |||||||||||
|
|
|
|
|
|
|
| |||||||||
Total Distributions to Shareholders | (2 | ) | — | (143,531 | ) | (220,006 | ) | |||||||||
|
|
|
|
|
|
|
| |||||||||
NET CAPITAL SHARE TRANSACTIONS | ||||||||||||||||
I Class | (5 | ) | 3,930 | (343,324 | ) | (1,404,328 | ) | |||||||||
N Class | (7 | ) | 1,500 | (28,507 | ) | (183,685 | ) | |||||||||
|
|
|
|
|
|
|
| |||||||||
Increase (Decrease) in Net Assets Resulting from Net Capital Shares Transactions | (12 | ) | 5,430 | (371,831 | ) | (1,588,013 | ) | |||||||||
|
|
|
|
|
|
|
| |||||||||
Increase (Decrease) in Net Assets | 252 | 4,689 | (146,143 | ) | (2,129,499 | ) | ||||||||||
NET ASSETS | ||||||||||||||||
Beginning of Year | 4,689 | — | 3,255,092 | 5,384,591 | ||||||||||||
|
|
|
|
|
|
|
| |||||||||
End of Year | $ | 4,941 | $ | 4,689 | $ | 3,108,949 | $ | 3,255,092 | ||||||||
|
|
|
|
|
|
|
| |||||||||
Undistributed Net Investment Income (Loss) | $ | 46 | $ | 1 | $ | 7,718 | $ | (11,211 | ) | |||||||
| (1) | Commencement of Operations. |
See accompanying notes to financial statements.
72
TCW Funds, Inc.
Statements of Changes in Net Assets
| TCW Emerging Markets Local Currency Income Fund | TCW Emerging Markets Multi-Asset Opportunities Fund | |||||||||||||||
| Year Ended October 31, 2016 | Year Ended October 31, 2015 | Year Ended October 31, 2016 | Year Ended October 31, 2015 | |||||||||||||
OPERATIONS | ||||||||||||||||
Net Investment Income | $ | 10,405 | $ | 13,674 | $ | 1,488 | $ | 1,184 | ||||||||
Net Realized Loss on Investments, Options Written, Swap Contracts and Foreign Currency Transactions | (31,432 | ) | (40,928 | ) | (1,880 | ) | (2,899 | ) | ||||||||
Change in Unrealized Appreciation (Depreciation) on Investments, Options Written and Foreign Currency Transactions | 31,708 | (14,135 | ) | 4,303 | (3,907 | ) | ||||||||||
|
|
|
|
|
|
|
| |||||||||
Increase (Decrease) in Net Assets Resulting from Operations | 10,681 | (41,389 | ) | 3,911 | (5,622 | ) | ||||||||||
|
|
|
|
|
|
|
| |||||||||
DISTRIBUTIONS TO SHAREHOLDERS | ||||||||||||||||
Distributions from Net Investment Income: | ||||||||||||||||
I Class | — | — | (931 | ) | (937 | ) | ||||||||||
N Class | — | — | (103 | ) | (77 | ) | ||||||||||
Distributions from Return of Capital: | ||||||||||||||||
I Class | — | (450 | ) | — | — | |||||||||||
N Class | — | (335 | ) | — | — | |||||||||||
|
|
|
|
|
|
|
| |||||||||
Total Distributions to Shareholders | — | (785 | ) | (1,034 | ) | (1,014 | ) | |||||||||
|
|
|
|
|
|
|
| |||||||||
NET CAPITAL SHARE TRANSACTIONS | ||||||||||||||||
I Class | (19,368 | ) | (51,829 | ) | (5,065 | ) | (7,610 | ) | ||||||||
N Class | (133,642 | ) | 115,451 | 603 | 4,351 | |||||||||||
|
|
|
|
|
|
|
| |||||||||
Increase (Decrease) in Net Assets Resulting from Net Capital Shares Transactions | (153,010 | ) | 63,622 | (4,462 | ) | (3,259 | ) | |||||||||
|
|
|
|
|
|
|
| |||||||||
Increase (Decrease) in Net Assets | (142,329 | ) | 21,448 | (1,585 | ) | (9,895 | ) | |||||||||
NET ASSETS | ||||||||||||||||
Beginning of Year | 255,304 | 233,856 | 43,846 | 53,741 | ||||||||||||
|
|
|
|
|
|
|
| |||||||||
End of Year | $ | 112,975 | $ | 255,304 | $ | 42,261 | $ | 43,846 | ||||||||
|
|
|
|
|
|
|
| |||||||||
Undistributed Net Investment Income (Loss) | $ | (885 | ) | $ | 952 | $ | 1,200 | $ | 895 | |||||||
See accompanying notes to financial statements.
73
TCW Funds, Inc.
Statements of Changes in Net Assets
| TCW International Growth Fund | TCW International Small Cap Fund | |||||||||||||||
| Year Ended October 31, 2016 | Year Ended October 31, 2015 | Year Ended October 31, 2016 | Year Ended October 31, 2015 | |||||||||||||
OPERATIONS | ||||||||||||||||
Net Investment Income | $ | 30 | $ | 12 | $ | 26 | $ | 47 | ||||||||
Net Realized Gain (Loss) on Investments and Foreign Currency Transactions | (215 | ) | 34 | (86 | ) | (641 | ) | |||||||||
Change in Unrealized Appreciation (Depreciation) on Investments and Foreign Currency Transactions | 151 | (172 | ) | 10 | 385 | |||||||||||
|
|
|
|
|
|
|
| |||||||||
Decrease in Net Assets Resulting from Operations | (34 | ) | (126 | ) | (50 | ) | (209 | ) | ||||||||
|
|
|
|
|
|
|
| |||||||||
DISTRIBUTIONS TO SHAREHOLDERS | ||||||||||||||||
Distributions from Net Investment Income: | ||||||||||||||||
I Class | (27 | ) | (22 | ) | (245 | ) | (118 | ) | ||||||||
N Class | (21 | ) | (17 | ) | (145 | ) | (50 | ) | ||||||||
Distributions from Net Realized Gain: | ||||||||||||||||
I Class | — | (155 | ) | — | — | |||||||||||
N Class | — | (140 | ) | — | — | |||||||||||
|
|
|
|
|
|
|
| |||||||||
Total Distributions to Shareholders | (48 | ) | (334 | ) | (390 | ) | (168 | ) | ||||||||
|
|
|
|
|
|
|
| |||||||||
NET CAPITAL SHARE TRANSACTIONS | ||||||||||||||||
I Class | 779 | 175 | (1,322 | ) | (12,156 | ) | ||||||||||
N Class | 27 | 157 | (125 | ) | (5,976 | ) | ||||||||||
|
|
|
|
|
|
|
| |||||||||
Increase (Decrease) in Net Assets Resulting from Net Capital Shares Transactions | 806 | 332 | (1,447 | ) | (18,132 | ) | ||||||||||
|
|
|
|
|
|
|
| |||||||||
Increase (Decrease) in Net Assets | 724 | (128 | ) | (1,887 | ) | (18,509 | ) | |||||||||
NET ASSETS | ||||||||||||||||
Beginning of Year | 2,489 | 2,617 | 10,714 | 29,223 | ||||||||||||
|
|
|
|
|
|
|
| |||||||||
End of Year | $ | 3,213 | $ | 2,489 | $ | 8,827 | $ | 10,714 | ||||||||
|
|
|
|
|
|
|
| |||||||||
Undistributed Net Investment Income (Loss) | $ | 22 | $ | 37 | $ | (92 | ) | $ | 258 | |||||||
See accompanying notes to financial statements.
74
TCW Funds, Inc.
October 31, 2016 |
Note 1 — Organization
TCW Funds, Inc., a Maryland corporation (the “Company”), is an open-end management investment company registered under the Investment Company Act of 1940, as amended (the “1940 Act”), that currently offers 23 no-load mutual funds (each series, a “Fund” and collectively, the “Funds”). TCW Investment Management Company LLC (the “Advisor”) is the investment advisor to and an affiliate of the Funds and is registered under the Investment Advisers Act of 1940, as amended. Each Fund has distinct investment objectives. The following are the objectives for the 6 International Funds that are covered in this report:
TCW Fund | Investment Objective | |
| Diversified Fixed Income Fund | ||
| TCW Emerging Markets Income Fund | Seeks high total return from current income and capital appreciation by investing at least 80% of the value of its net assets in debt securities issued or guaranteed by companies, financial institutions and government entities in emerging market countries. | |
| Non-Diversified Fixed Income Fund | ||
| TCW Emerging Markets Local Currency Income Fund | Seeks to provide high total return from current income and capital appreciation by investing at least 80% of the value of its net assets in debt securities issued or guaranteed by non-financial companies, financial institutions and government entities in emerging market countries denominated in the local currencies of the issuer and in derivative instruments that provide investment exposure to such securities. | |
| Diversified International Equity Fund | ||
| TCW International Growth Fund | Seeks long-term capital appreciation by investing primarily in equity securities of companies across all market capitalizations that are domiciled outside the United States or whose primary business operations are outside the United States. | |
| TCW International Small Cap Fund | Seeks long-term capital appreciation by investing at least 80% of its net assets in equity securities of small capitalization companies that are generally outside the United States or whose primary business operations are outside the United States. | |
| Non-Diversified International Equity Funds | ||
| TCW Developing Markets Equity Fund | Seeks long-term capital appreciation by investing primarily in equity securities of companies and financial institutions domiciled or with primary business operations in, or with the majority of their net assets in or revenues or net income deriving from, developing market countries. | |
75
TCW Funds, Inc.
Notes to Financial Statements (Continued)
Note 1 — Organization (Continued)
TCW Fund | Investment Objective | |
| Non-Diversified Balanced Fund | ||
| TCW Emerging Markets Multi-Asset Opportunities Fund | Seeks current income and long term capital appreciation by investing at least 80% of the value of its net assets in debt and equity securities issued or guaranteed by companies, financial institutions and government entities in emerging market countries. | |
All Funds offer two classes of shares: I Class and N Class. The classes are substantially the same except that the N Class shares are subject to a distribution fee (see Note 6).
Note 2 — Significant Accounting Policies
The following is a summary of significant accounting policies, which are in conformity with accounting principles generally accepted in the United States of America (“GAAP”) and which are consistently followed by the Funds in the preparation of their financial statements. Each Fund is considered an investment company under the Financial Accounting Standards Board (FASB) Accounting Standards Codification (ASC) No. 946, Financial Services — Investment Companies.
Principles of Accounting: The Funds use the accrual method of accounting for financial reporting purposes.
Net Asset Value: The net asset value (“NAV”) per share of each class of a Fund is determined by dividing the Fund’s net assets attributable to each class by the number of shares issued and outstanding of that class on each day the New York Stock Exchange (“NYSE”) is open for trading.
Security Valuations: Securities listed or traded on the NYSE and other stock exchanges are valued at the latest sale price on that exchange. Securities traded on the NASDAQ stock market (“NASDAQ”) are valued using official closing prices as reported by NASDAQ. All other securities traded over-the-counter (“OTC”) for which market quotations are readily available, including short-term securities, are valued with prices furnished by independent pricing services or by broker dealers.
The Company has adopted, after the approval by the Company’s Board of Directors (the “Board” and each member thereof a “Director”), a fair valuation methodology for foreign equity securities (exclusive of certain Latin American and Canadian equity securities). This methodology is designed to address the effect of movements in the U.S. market on the securities traded on foreign exchanges that have been closed for a period of time due to time zone difference. The utilization of the fair value model may result in the adjustment of prices taking into account fluctuations in the U.S. market. The fair value model is utilized each trading day and not dependent on certain thresholds or triggers.
Securities for which market quotations are not readily available, including circumstances under which the prices received are not reflective of a security’s market value, are valued by the Advisor in good faith under procedures established by and under the general supervision of the Company’s Board.
Fair value is defined as the price that a Fund would receive upon selling an investment in a timely transaction to an independent buyer in the principal or most advantageous market for the investment. In accordance with the authoritative guidance on fair value measurements and disclosures GAAP, the Funds disclose investments in a three-tier hierarchy. This hierarchy is utilized to establish classification of fair value measurements based on inputs. Inputs that go into fair value measurement refer broadly to the
76
TCW Funds, Inc.
October 31, 2016 |
Note 2 — Significant Accounting Policies (Continued)
assumptions that market participants would use in pricing the asset or liability, including assumptions about risk. Inputs may be observable or unobservable. Observable inputs are inputs that reflect the assumptions market participants would use in pricing the asset or liability developed based on market data obtained from sources independent of the reporting entity. Unobservable inputs are inputs that reflect the reporting entity’s own assumptions about the inputs market participants would use in pricing the asset or liability developed based on the best information available in the circumstances.
The three-tier hierarchy of inputs is summarized in the three broad levels listed below.
| Level 1 — | quoted prices in active markets for identical investments | |
| Level 2 — | other significant observable inputs (including quoted prices for similar investments, interest rates, prepayment speeds, credit risk, etc.) | |
| Level 3 — | significant unobservable inputs (including the Funds’ own assumptions in determining the fair value of investments) |
Changes in valuation techniques may result in transfers in or out of an investment’s assigned level within the hierarchy. The inputs or methodology used for valuing investments are not necessarily an indication of the risk associated with investing in those investments and the determination of the significance of a particular input to the fair value measurement in its entirety requires judgment and consideration of factors specific to each security.
The availability of observable inputs can vary from security to security and is affected by a wide variety of factors, including, for example, the type of security, whether the security is new and not yet established in the marketplace, the liquidity of markets, and other characteristics particular to the security. To the extent that valuation is based on models or inputs that are less observable or unobservable in the market, the determination of fair value requires more judgment. Accordingly, the degree of judgment exercised in determining fair value is greatest for instruments categorized in Level 3.
In periods of market dislocation, the observability of prices and inputs may be reduced for many instruments. This condition, as well as changes related to liquidity of investments, could cause a security to be reclassified between Level 1, Level 2, or Level 3.
In certain cases, the inputs used to measure fair value may fall into different levels of the fair value hierarchy. In such cases, for disclosure purposes the level in the fair value hierarchy within which the fair value measurement falls in its entirety is determined based on the lowest level input that is significant to the fair value measurement.
Fair Value Measurements: A description of the valuation techniques applied to the Funds’ major categories of assets and liabilities measured at fair value on a recurring basis is as follows:
Corporate bonds. The fair value of corporate bonds is estimated using recently executed transactions, market price quotations (where observable), bond spreads, or credit default swap spreads adjusted for any basis difference between cash and derivative instruments. Corporate bonds are generally categorized in Level 2 of the fair value hierarchy; in instances where prices, spreads, or any of the other aforementioned key inputs are unobservable, they are categorized in Level 3 of the hierarchy.
Equity securities. Securities are generally valued based on quoted prices from the applicable exchange. To the extent these securities are actively traded and valuation adjustments are not applied, they are generally categorized in Level 1 of the fair value hierarchy. Restricted securities issued by publicly held companies are
77
TCW Funds, Inc.
Notes to Financial Statements (Continued)
Note 2 — Significant Accounting Policies (Continued)
generally categorized in Level 2 of the fair value hierarchy; if a discount is applied and insignificant, they are categorized as Level 3. Restricted securities held in non-public entities are included in Level 3 of the fair value hierarchy because they trade infrequently, and therefore, the inputs are unobservable. Certain foreign securities may be fair valued using a pricing service that considers the correlation of the trading patterns of the foreign security to the intraday trading in the U.S. markets and are categorized in Level 2 of the fair value hierarchy.
Exchange-traded funds. Exchange-traded funds are generally valued based on quoted prices from the applicable exchange. They are categorized in Level 1 of the fair value hierarchy.
Foreign currency contracts. The fair value of foreign currency contracts are derived from indices, reference rates, and other inputs or a combination of these factors. To the extent that these factors can be observed, foreign currency contracts are categorized in Level 2 of the fair value hierarchy.
Money market funds. Money market funds are open-ended mutual funds that invest in short-term debt securities. To the extent that these funds are valued based upon the reported NAV, they are categorized in Level 1 of the fair value hierarchy.
Options contracts. Options contracts traded on exchanges are valued using market mid prices; as such, they are categorized in Level 1. Option contracts traded OTC are fair valued based on pricing models and incorporate various inputs such as interest rate, credit spreads, currency exchange rates and volatility measurements for in-the-money, at-the-money, and out-of-money contracts on a given strike price. To the extent that these inputs are observable and timely, the fair value of OTC option contracts would be categorized in Level 2; otherwise, the fair values would be categorized in Level 3.
Participation notes. Participation notes are fair valued based on underlying equity security valuations. Valuation of underlying equity securities is derived from the market exchange or quotations from dealers. Participation notes are generally categorized in Level 2 of the fair value hierarchy.
Restricted securities. Restricted securities, including illiquid Rule 144A securities, held in non-public entities are included in Level 3 of the fair value hierarchy because they trade infrequently, and therefore, the inputs are unobservable. Any other restricted securities valued similar to publicly traded securities may be categorized in Level 2 or 3 of the fair value hierarchy depending on whether a discount is applied and significant to the fair value.
Short-term investments. Short-term investments are valued using market price quotations, and are reflected in Level 2 of the fair value hierarchy.
U.S. and foreign government and agency securities. Government and agency securities are normally valued using a model that incorporates market observable data such as reported sales of similar securities, broker quotes, yields, bids, offers, quoted market prices, and reference data. Accordingly, U.S. and foreign government and agency securities are normally categorized in Level 1 or 2 of the fair value hierarchy depending on the liquidity and transparency of the market.
The summary of the inputs used as of October 31, 2016 in valuing the Funds’ investments is listed after each Fund’s Schedule of Investments.
78
TCW Funds, Inc.
October 31, 2016 |
Note 2 — Significant Accounting Policies (Continued)
The following table shows transfers between Level 1 and Level 2 of the fair value hierarchy:
Fund | Transfer out of Level 1* and Transfer into Level 2 | Transfer out of Level 2* and Transfer into Level 1 | ||||||
TCW Developing Markets Equity Fund | $ | 124,312 | $ | 80,794 | ||||
TCW Emerging Markets Multi-Asset Opportunities Fund | 687,604 | 415,789 | ||||||
TCW International Growth Fund | 25,480 | — | ||||||
TCW International Small Cap Fund | 148,474 | — | ||||||
| * | The Funds recognized transfers between the Levels as of the beginning of the period. |
The transfers between Level 1 and Level 2 of the fair value hierarchy during the year ended October 31, 2016 were due to changes in valuation to/from the exchange closing price from/to the fair value price.
Following is a reconciliation of investments in which significant unobservable inputs (Level 3) were used in determining value:
| TCW Emerging Markets Income Fund | TCW Emerging Markets Multi-Asset Opportunities Fund | TCW International Growth Fund | TCW International Small Cap Fund | |||||||||||||
Balance as of October 31, 2015 | $ | 1,275,000 | $ | 40,527 | $ | 2,374 | $ | 20,088 | ||||||||
Accrued Discounts (Premiums) | — | — | — | — | ||||||||||||
Realized Gain (Loss) | — | (118,637 | ) | — | — | |||||||||||
Change in Unrealized Appreciation | 62,524,375 | 136,136 | (2,374 | ) | (20,088 | ) | ||||||||||
Purchases | — | — | — | — | ||||||||||||
Sales | (63,799,375 | ) | (58,026 | ) | — | — | ||||||||||
Transfers in to Level 3 (1) | — | — | — | — | ||||||||||||
Transfers out of Level 3 (1) | — | — | — | — | ||||||||||||
|
|
|
|
|
|
|
| |||||||||
Balance as of October 31, 2016 | $ | — | $ | — | $ | — | $ | — | ||||||||
|
|
|
|
|
|
|
| |||||||||
Change in Unrealized Appreciation from Investments Still Held at October 31, 2016 | $ | — | $ | — | $ | (2,374 | ) | $ | (20,088 | ) | ||||||
|
|
|
|
|
|
|
| |||||||||
| (1) | The Funds recognize transfers in and out at the beginning of the period. |
Significant unobservable valuations inputs for Level 3 investments as of October 31, 2016 are as follows:
| Fair Value at 10/31/2016 | Valuation Techniques | Unobservable Input | Input | |||||||||||||
TCW International Growth Fund | ||||||||||||||||
Common Stock | $ | 0 | Internal Model | Discount Applied | 100 | % | ||||||||||
| TCW International Small Cap Fund | ||||||||||||||||
Common Stock | $ | 0 | Internal Model | Discount Applied | 100 | % | ||||||||||
Level 3 Valuation Process: Investments classified within Level 3 of the fair value hierarchy may be fair valued by the Advisor with consent by the Company’s Pricing Committee in accordance with the guidelines established by the Board, and under the general oversight of the Board. The Company’s Pricing Committee employs various methods to determine fair valuations including a regular review of key inputs and assumptions and review of any related market activity. The Company’s Pricing Committee reports to the Board at their regularly scheduled meetings. It is possible that fair value prices will be used by the Funds to a significant extent. The value determined for an investment using the Company’s fair value procedures may differ from recent market prices for the investment and may be significantly different from the value realized upon the sale of such investment. The Advisor, as part of the daily process, conducts back-testing of prices based on daily trade activities.
79
TCW Funds, Inc.
Notes to Financial Statements (Continued)
Note 2 — Significant Accounting Policies (Continued)
The Pricing Committee consists of the Company’s President, General Counsel, Chief Compliance Officer, Treasurer, Assistant Treasurer, Secretary, and a representative from the portfolio management team, as well as alternate members as the Board may from time to time designate. The Pricing Committee reviews and makes recommendations concerning the fair valuation of portfolio securities and the Funds’ pricing procedures in general.
Security Transactions and Related Investment Income: Security transactions are recorded as of the trade date. Dividend income is recorded on the ex-dividend date. Interest income is recognized on an accrual basis. Realized gains and losses on investments are recorded on the basis of specific identification.
Foreign Currency Translation: The books and records of each Fund are maintained in U.S. dollars as follows: (1) the foreign currency denominated securities and other assets and liabilities stated in foreign currencies are translated using the daily spot rate; and (2) purchases, sales, income and expenses are translated at the rate of exchange prevailing on the respective dates of such transactions. The resultant exchange gains and losses are included in net realized or net unrealized gain (loss) in the Statements of Operations. Pursuant to U.S. federal income tax regulations, certain foreign exchange gains and losses included in realized and unrealized gains and losses are included in, or are a reduction of, ordinary income for federal income tax purposes.
Foreign Taxes: The Funds may be subject to withholding taxes on income and capital gains imposed by certain countries in which they invest. The withholding tax on income is netted against the income accrued or received. Any reclaimable taxes are recorded as income. The withholding tax on realized or unrealized gain is recorded as a liability.
Derivative Instruments: Derivatives are financial instruments whose values are based on the values of one or more indicators, such as a security, asset, currency, interest rate, or index. Derivative transactions can create investment leverage and may be highly volatile. A derivative contract may result in a mark to market loss if the value of the contract decreases due to an unfavorable change in the market rates or values of the underlying instrument. It is possible that a derivative transaction will result in a loss greater than the principal amount invested. The Funds may not be able to close out a derivative transaction at a favorable time or price.
80
TCW Funds, Inc.
October 31, 2016 |
Note 2 — Significant Accounting Policies (Continued)
For the year ended October 31, 2016, the Funds had the following derivatives and transactions in derivatives, grouped in the following risk categories (amounts in thousands except Notional Amounts):
| Credit Risk | Foreign Currency Risk | Interest Rate Risk | Total | |||||||||||||
| TCW Emerging Markets Income Fund | ||||||||||||||||
Statement of Asset and Liabilities | ||||||||||||||||
Asset Derivatives | ||||||||||||||||
Investments (1) | $ | — | $ | 1,025 | $ | 1,025 | ||||||||||
Swaps Contracts | 3,964 | — | 3,964 | |||||||||||||
Forward Contracts | — | 2,223 | 2,223 | |||||||||||||
|
|
|
|
|
| |||||||||||
Total Value | $ | 3,964 | $ | 3,248 | $ | 7,212 | ||||||||||
|
|
|
|
|
| |||||||||||
Liability Derivatives | ||||||||||||||||
Forward Contracts | $ | — | $ | (4,809 | ) | $ | (4,809 | ) | ||||||||
Swaps Contracts | (1,733 | ) | — | (1,733 | ) | |||||||||||
Written Options | — | (131 | ) | (131 | ) | |||||||||||
|
|
|
|
|
| |||||||||||
Total Value | $ | (1,733 | ) | $ | (4,940 | ) | $ | (6,673 | ) | |||||||
|
|
|
|
|
| |||||||||||
Statement of Operations: | ||||||||||||||||
Realized Gain (Loss) | ||||||||||||||||
Forward Contracts | $ | — | $ | (10,020 | ) | $ | — | $ | (10,020 | ) | ||||||
Futures Contracts | — | — | 1,701 | 1,701 | ||||||||||||
Investments (2) | — | (2,491 | ) | — | (2,491 | ) | ||||||||||
Options Written | — | 36 | — | 36 | ||||||||||||
Swaps Contracts | (281 | ) | — | — | (281 | ) | ||||||||||
|
|
|
|
|
|
|
| |||||||||
Total Realized Gain (Loss) | $ | (281 | ) | $ | (12,475 | ) | $ | 1,701 | $ | (11,055 | ) | |||||
|
|
|
|
|
|
|
| |||||||||
Change in Appreciation (Depreciation) | ||||||||||||||||
Forward Contracts | $ | — | $ | (978 | ) | $ | — | $ | (978 | ) | ||||||
Futures Contracts | — | — | (191 | ) | (191 | ) | ||||||||||
Investments (3) | — | (792 | ) | — | (792 | ) | ||||||||||
Options Written | — | 776 | — | 776 | ||||||||||||
Swaps Contracts | (663 | ) | — | — | (663 | ) | ||||||||||
|
|
|
|
|
|
|
| |||||||||
Total Change in Appreciation (Depreciation) | $ | (663 | ) | $ | (994 | ) | $ | (191 | ) | $ | (1,848 | ) | ||||
|
|
|
|
|
|
|
| |||||||||
Notional Amounts (5) | ||||||||||||||||
Forward Currency Contracts | — | $ | 267,864,375 | $ | 267,864,375 | |||||||||||
Options Purchased | — | $ | 55,388,182 | $ | 55,388,182 | |||||||||||
Options Written | — | $ | 38,277,778 | $ | 38,277,778 | |||||||||||
Swaps Contracts | $ | 229,885,000 | — | $ | 229,885,000 | |||||||||||
81
TCW Funds, Inc.
Notes to Financial Statements (Continued)
Note 2 — Significant Accounting Policies (Continued)
| Foreign Currency Risk | Total | |||||||
| TCW Emerging Markets Local Currency Income Fund | ||||||||
Statement of Asset and Liabilities | ||||||||
Asset Derivatives | ||||||||
Investments (1) | $ | 90 | $ | 90 | ||||
Forward Contracts | 856 | 856 | ||||||
|
|
|
| |||||
Total Value | $ | 946 | $ | 946 | ||||
|
|
|
| |||||
Liability Derivatives | ||||||||
Forward Contracts | $ | (1,004 | ) | $ | (1,004 | ) | ||
Written Options | (12 | ) | (12 | ) | ||||
|
|
|
| |||||
Total Value | $ | (1,016 | ) | $ | (1,016 | ) | ||
|
|
|
| |||||
Statement of Operations: | ||||||||
Realized Gain (Loss) | ||||||||
Forward Contracts | $ | (371 | ) | $ | (371 | ) | ||
Investments (2) | (616 | ) | (616 | ) | ||||
Options Written | 207 | 207 | ||||||
|
|
|
| |||||
Total Realized Gain (Loss) | $ | (780 | ) | $ | (780 | ) | ||
|
|
|
| |||||
Change in Appreciation (Depreciation) | ||||||||
Forward Contracts | $ | 715 | $ | 715 | ||||
Investments (3) | 59 | 59 | ||||||
Options Written | 54 | 54 | ||||||
|
|
|
| |||||
Total Change in Appreciation (Depreciation) | $ | 828 | $ | 828 | ||||
|
|
|
| |||||
Notional Amounts (5) | ||||||||
Forward Currency Contracts | $ | 131,536,038 | $ | 131,536,038 | ||||
Options Purchased | $ | 7,369,400 | $ | 7,369,400 | ||||
Options Written | $ | 8,774,400 | $ | 8,774,400 | ||||
82
TCW Funds, Inc.
October 31, 2016 |
Note 2 — Significant Accounting Policies (Continued)
| Credit Risk | Foreign Currency Risk | Total | ||||||||||
| TCW Emerging Markets Multi-Asset Opportunities Fund | ||||||||||||
Statement of Asset and Liabilities | ||||||||||||
Asset Derivatives | ||||||||||||
Investments (1) | $ | — | $ | 8 | $ | 8 | ||||||
Swaps Contracts | 24 | — | 24 | |||||||||
Forward Contracts | — | 25 | 25 | |||||||||
|
|
|
|
|
| |||||||
Total Value | $ | 24 | $ | 33 | $ | 57 | ||||||
|
|
|
|
|
| |||||||
Liability Derivatives | ||||||||||||
Forward Contracts | $ | — | $ | (44 | ) | $ | (44 | ) | ||||
Swaps Contracts | (10 | ) | — | (10 | ) | |||||||
Written Options | — | (1 | ) | (1 | ) | |||||||
|
|
|
|
|
| |||||||
Total Value | $ | (10 | ) | $ | (45 | ) | $ | (55 | ) | |||
|
|
|
|
|
| |||||||
Statement of Operations: | ||||||||||||
Realized Gain (Loss) | ||||||||||||
Forward Contracts | $ | — | $ | (55 | ) | $ | (55 | ) | ||||
Investments (2) | — | (16 | ) | (16 | ) | |||||||
Options Written | — | — | (4) | — | ||||||||
Swaps Contracts | (2 | ) | — | (2 | ) | |||||||
|
|
|
|
|
| |||||||
Total Realized Gain (Loss) | $ | (2 | ) | $ | (71 | ) | $ | (73 | ) | |||
|
|
|
|
|
| |||||||
Change in Appreciation (Depreciation) | ||||||||||||
Forward Contracts | $ | — | $ | (10 | ) | $ | (10 | ) | ||||
Investments (3) | — | (7 | ) | (7 | ) | |||||||
Options Written | — | 6 | 6 | |||||||||
Swaps Contracts | (4 | ) | — | (4 | ) | |||||||
|
|
|
|
|
| |||||||
Total Change in Appreciation (Depreciation) | $ | (4 | ) | $ | (11 | ) | $ | (15 | ) | |||
|
|
|
|
|
| |||||||
Notional Amounts (5) | ||||||||||||
Forward Currency Contracts | — | $ | 2,186,643 | $ | 2,186,643 | |||||||
Options Purchased | — | $ | 393,636 | $ | 393,636 | |||||||
Options Written | — | $ | 298,889 | $ | 298,889 | |||||||
Swaps Contracts | $ | 1,380,000 | — | $ | 1,380,000 | |||||||
| TCW International Growth Fund | ||||||||||||
Statement of Asset and Liabilities | ||||||||||||
Asset Derivatives | ||||||||||||
Forward Contracts | $ | 53 | $ | 53 | ||||||||
|
|
|
| |||||||||
Total Value | $ | 53 | $ | 53 | ||||||||
|
|
|
| |||||||||
Liability Derivatives | ||||||||||||
Forward Contracts | $ | (60 | ) | $ | (60 | ) | ||||||
|
|
|
| |||||||||
Total Value | $ | (60 | ) | $ | (60 | ) | ||||||
|
|
|
| |||||||||
Statement of Operations: | ||||||||||||
Realized Gain (Loss) | ||||||||||||
Forward Contracts | $ | 2 | $ | 2 | ||||||||
|
|
|
| |||||||||
Total Realized Gain (Loss) | $ | 2 | $ | 2 | ||||||||
|
|
|
| |||||||||
Change in Appreciation (Depreciation) | ||||||||||||
Forward Contracts | $ | (15 | ) | $ | (15 | ) | ||||||
|
|
|
| |||||||||
Total Change in Appreciation (Depreciation) | $ | (15 | ) | $ | (15 | ) | ||||||
|
|
|
| |||||||||
Notional Amounts (5) | ||||||||||||
Forward Currency Contracts | $ | 972,785 | $ | 972,785 | ||||||||
83
TCW Funds, Inc.
Notes to Financial Statements (Continued)
Note 2 — Significant Accounting Policies (Continued)
| Foreign Currency Risk | Total | |||||||
| TCW International Small Cap Fund | ||||||||
Statement of Asset and Liabilities | ||||||||
Asset Derivatives | ||||||||
Forward Contracts | $ | 217 | $ | 217 | ||||
|
|
|
| |||||
Total Value | $ | 217 | $ | 217 | ||||
|
|
|
| |||||
Liability Derivatives | ||||||||
Forward Contracts | $ | (165 | ) | $ | (165 | ) | ||
|
|
|
| |||||
Total Value | $ | (165 | ) | $ | (165 | ) | ||
|
|
|
| |||||
Statement of Operations: | ||||||||
Realized Gain (Loss) | ||||||||
Forward Contracts | $ | 5 | $ | 5 | ||||
|
|
|
| |||||
Total Realized Gain (Loss) | $ | 5 | $ | 5 | ||||
|
|
|
| |||||
Change in Appreciation (Depreciation) | ||||||||
Forward Contracts | $ | (61 | ) | $ | (61 | ) | ||
|
|
|
| |||||
Total Change in Appreciation (Depreciation) | $ | (61 | ) | $ | (61 | ) | ||
|
|
|
| |||||
Notional Amounts (5) | ||||||||
Forward Currency Contracts | $ | 4,079,112 | $ | 4,079,112 | ||||
| (1) | Represents purchased options, at value. |
| (2) | Represents realized gain (loss) for purchased options. |
| (3) | Represents change in unrealized appreciation (depreciation) for purchased options during the period. |
| (4) | Amount less than $1. |
| (5) | Amount disclosed represents average number of contracts or notional amounts, which are representative of the volume traded for the period ended October 31, 2016. |
Counterparty Credit Risk: Derivative contracts may be exposed to counterparty risk. Losses can occur if the counterparty does not perform under the contract.
The Funds’ risk of loss from counterparty credit risk on OTC derivatives is generally limited to the aggregate unrealized gain netted against any collateral held by the Funds.
With exchange traded futures and centrally cleared swaps, there is less counterparty credit risk to the Funds since the exchange or clearinghouse, as counterparty to such instruments, guarantees against a possible default. The clearinghouse stands between the buyer and the seller of the contract; therefore, the credit risk is limited to failure of the clearinghouse. While offset rights may exist under applicable law, the Funds do not have a contractual right of offset against a clearing broker or clearinghouse in the event of a default (including the bankruptcy or insolvency) of the clearing broker or clearinghouse. Additionally, credit risk exists in exchange traded futures and centrally cleared swaps with respect to initial and variation margin that is held in a clearing broker’s customer accounts. While clearing brokers are required to segregate customer margin from their own assets, in the event that a clearing broker becomes insolvent or goes into bankruptcy and at that time there is a shortfall in the aggregate amount of margin held by the clearing broker for all its clients, typically the shortfall would be allocated on a pro rata basis across all the clearing broker’s customers, potentially resulting in losses to the Funds. In order to better define its contractual rights and to secure rights that will help the Funds mitigate their counterparty risk, the Funds may enter into an International Swaps and Derivatives Association, Inc. Master Agreement (“ISDA Master
84
TCW Funds, Inc.
October 31, 2016 |
Note 2 — Significant Accounting Policies (Continued)
Agreement”) or similar agreement with their derivative contract counterparties. An ISDA Master Agreement is a bilateral agreement between the Funds and a counterparty that governs OTC derivatives and typically contains, among other things, collateral posting terms and netting provisions in the event of a default and/or termination event. Under an ISDA Master Agreement, a Fund may, under certain circumstances, offset with the counterparty certain derivative financial instruments’ payables and/or receivables with collateral held and/or posted and create one single net payment. The provisions of the ISDA Master Agreement typically permit a single net payment in the event of default including the bankruptcy or insolvency of the counterparty. However, bankruptcy or insolvency laws of a particular jurisdiction may impose restrictions on or prohibitions against the right of offset in bankruptcy, insolvency or other events. In addition, certain ISDA Master Agreements allow counterparties to OTC derivatives to terminate derivative contracts prior to maturity in the event a Fund’s net assets decline by a stated percentage or fail to meet the terms of its ISDA Master Agreements, which would cause the Fund to accelerate payment of any net liability owed to the counterparty.
Collateral requirements: For derivatives traded under an ISDA Master Agreement, the collateral requirements are typically calculated by netting the mark to market amount for each transaction under such agreement and comparing that amount to the value of any collateral pledged or received by a Fund.
Cash collateral that has been pledged to cover obligations of a Fund is reported separately on the Statement of Assets and Liabilities. Non-cash collateral pledged by a Fund, if any, is noted in the Schedule of Investments. Generally, the amount of collateral due from or to a party has to exceed a minimum transfer amount threshold typically $250,000 or $500,000, before a transfer is required, which is determined at the close of each business day and the collateral is transferred on the next business day. To the extent amounts due to a Fund from its counterparties are not fully collateralized, contractually or otherwise, the Fund bears the risk of loss from counterparty non-performance. The Funds attempt to mitigate counterparty risk by entering into agreements only with counterparties that Advisor believes have the financial resources to honor their obligations and by monitoring the financial stability of those counterparties. For financial reporting purposes, the Funds do not offset derivative assets and derivative liabilities that are subject to netting arrangements in the Statements of Assets and Liabilities. The Funds have implemented the disclosure requirements pursuant to FASB ASU No. 2011-11, Disclosures about Offsetting Assets and Liabilities that requires disclosures to make financial statements that are prepared under GAAP more comparable to those prepared under International Financial Reporting Standards.
85
TCW Funds, Inc.
Notes to Financial Statements (Continued)
Note 2 — Significant Accounting Policies (Continued)
The following table presents the Funds’ OTC derivative assets and liabilities by counterparty net of amounts available for offset under ISDA Master Agreement or Master Repurchase Agreement (“MRA”) and net of the related collateral received by the Funds as of October 31, 2016 (in thousands):
TCW Emerging Markets Income Fund
Counterparty | Gross Assets Subject to Master Agreements | Gross Liabilities Subject to Master Agreements | Net Assets (Liabilities) Subject to Master Agreements | Collateral Pledged (Received) | Net Amount (1) | |||||||||||||||
Bank of America (Derivatives) | $ | 1,996 | $ | (504 | ) | $ | 1,492 | $ | (1,180 | ) | $ | 312 | ||||||||
Barclays Bank PLC (Derivatives) | 839 | — | 839 | (729 | ) | 110 | ||||||||||||||
Citibank N.A. (Derivatives) | 3,105 | (4,836 | ) | (1,731 | ) | 1,731 | (2) | — | ||||||||||||
Deutsche Bank AG (Derivatives) | 383 | — | 383 | (350 | ) | 33 | ||||||||||||||
Goldman Sachs International (Derivatives) | — | (586 | ) | (586 | ) | 586 | (2) | — | ||||||||||||
Morgan Stanley & Co. (Derivatives) | 889 | (747 | ) | 142 | — | 142 | ||||||||||||||
|
|
|
|
|
|
|
|
|
| |||||||||||
Total | $ | 7,212 | $ | (6,673 | ) | $ | 539 | $ | 58 | $ | 597 | |||||||||
|
|
|
|
|
|
|
|
|
| |||||||||||
| (1) | Represents the net amount receivable (payable) from (to) the counterparty in the event of default. |
| (2) | Amount does not include excess collateral pledged or received. |
TCW Emerging Markets Local Currency Income Fund
Counterparty | Gross Assets Subject to Master Agreements | Gross Liabilities Subject to Master Agreements | Net Assets (Liabilities) Subject to Master Agreements | Collateral Pledged (Received) | Net Amount (1) | |||||||||||||||
Bank of America (Derivatives) | $ | 273 | $ | (428 | ) | $ | (155 | ) | $ | 155 | (2) | $ | — | |||||||
Barclays Bank PLC (Derivatives) | 162 | (92 | ) | 70 | — | 70 | ||||||||||||||
BNP Paribas S.A. (Derivatives) | 67 | — | 67 | — | 67 | |||||||||||||||
Citibank N.A. (Derivatives) | 277 | (333 | ) | (56 | ) | — | (56 | ) | ||||||||||||
Goldman Sachs International (Derivatives) | 46 | (62 | ) | (16 | ) | — | (16 | ) | ||||||||||||
Morgan Stanley & Co. (Derivatives) | 99 | (16 | ) | 83 | — | 83 | ||||||||||||||
Natixis (Derivatives) | — | (69 | ) | (69 | ) | — | (69 | ) | ||||||||||||
Standard Chartered PLC (Derivatives) | 22 | (16 | ) | 6 | — | 6 | ||||||||||||||
|
|
|
|
|
|
|
|
|
| |||||||||||
Total | $ | 946 | $ | (1,016 | ) | $ | (70 | ) | $ | 155 | $ | 85 | ||||||||
|
|
|
|
|
|
|
|
|
| |||||||||||
| (1) | Represents the net amount receivable (payable) from (to) the counterparty in the event of default. |
| (2) | Amount does not include excess collateral pledged or received. |
TCW Emerging Markets Multi-Asset Opportunities Fund
Counterparty | Gross Assets Subject to Master Agreements | Gross Liabilities Subject to Master Agreements | Net Assets (Liabilities) Subject to Master Agreements | Collateral Pledged (Received) | Net Amount (1) | |||||||||||||||
Bank of America (Derivatives) | $ | 14 | $ | (4 | ) | $ | 10 | $ | — | $ | 10 | |||||||||
Barclays Bank PLC (Derivatives) | 5 | — | 5 | — | 5 | |||||||||||||||
Citibank N.A. (Derivatives) | 33 | (36 | ) | (3 | ) | — | (3 | ) | ||||||||||||
Deutsche Bank AG (Derivatives) | 2 | — | 2 | — | 2 | |||||||||||||||
Morgan Stanley & Co. (Derivatives) | 3 | (15 | ) | (12 | ) | — | (12 | ) | ||||||||||||
|
|
|
|
|
|
|
|
|
| |||||||||||
Total | $ | 57 | $ | (55 | ) | $ | 2 | $ | — | $ | 2 | |||||||||
|
|
|
|
|
|
|
|
|
| |||||||||||
| (1) | Represents the net amount receivable (payable) from (to) the counterparty in the event of default. |
86
TCW Funds, Inc.
October 31, 2016 |
Note 2 — Significant Accounting Policies (Continued)
TCW International Growth Fund
Counterparty | Gross Assets Subject to Master Agreements | Gross Liabilities Subject to Master Agreements | Net Assets (Liabilities) Subject to Master Agreements | Collateral Pledged (Received) | Net Amount (1) | |||||||||||||||
Bank of America (Derivatives) | $ | 53 | $ | (60 | ) | $ | (7 | ) | $ | — | $ | (7 | ) | |||||||
|
|
|
|
|
|
|
|
|
| |||||||||||
Total | $ | 53 | $ | (60 | ) | $ | (7 | ) | $ | — | $ | (7 | ) | |||||||
|
|
|
|
|
|
|
|
|
| |||||||||||
| (1) | Represents the net amount receivable (payable) from (to) the counterparty in the event of default. |
TCW International Small Cap Fund
Counterparty | Gross Assets Subject to Master Agreements | Gross Liabilities Subject to Master Agreements | Net Assets (Liabilities) Subject to Master Agreements | Collateral Pledged (Received) | Net Amount (1) | |||||||||||||||
Bank of America (Derivatives) | $ | 217 | $ | (165 | ) | $ | 52 | $ | (52 | ) (2) | $ | — | ||||||||
|
|
|
|
|
|
|
|
|
| |||||||||||
Total | $ | 217 | $ | (165 | ) | $ | 52 | $ | (52 | ) | $ | — | ||||||||
|
|
|
|
|
|
|
|
|
| |||||||||||
| (1) | Represents the net amount receivable (payable) from (to) the counterparty in the event of default. |
| (2) | Amount does not include excess collateral pledged or received. |
Forward Foreign Currency Contracts: The Funds may enter into forward foreign currency contracts as a hedge against fluctuations in foreign exchange rates. Forward foreign currency contracts are marked-to market daily and the change in market value is recorded by each Fund as unrealized gains or losses in the Statement of Assets and Liabilities. Risks may arise upon entering into these contracts from the potential inability of counterparties to meet the terms of their contracts and from unanticipated movements in the value of the foreign currency relative to the U.S. dollar. Outstanding foreign currency forward contracts at October 31, 2016 are disclosed in the Schedules of Investments.
Futures Contracts: The Funds may enter into futures contracts. A Fund may seek to manage a variety of different risks through the use of futures contracts, such as interest rate risk, equity price risk, and currency risk. A Fund may use index futures to hedge against broad market risks to its portfolio or to gain broad market exposure. Securities index futures contracts are contracts to buy or sell units of a securities index at a specified future date at a price agreed upon when the contract is made and are settled in cash. Positions in futures may be closed out only on an exchange or board of trade which provides a secondary market for such futures. Because futures contracts are exchange-traded, they typically have minimal exposure to counterparty risk. Parties to a futures contract are not required to post the entire notional amount of the contract, but rather a small percentage of that amount (by way of margin), both at the time they enter into futures transactions, and then on a daily basis if their positions decline in value; as a result, futures contracts are highly leveraged. Such payments are known as variation margin and are recorded by each Fund as unrealized gains or losses. Because futures markets are highly leveraged, they can be extremely volatile, and there can be no assurance that the pricing of a futures contract will correlate precisely with the pricing of the asset or index underlying it or the asset or liability of a Fund that is the subject of the hedge. It may not always be possible for a Fund to enter into a closing transaction with respect to a futures contract it has entered into, at a favorable time or price. When a Fund enters into a futures transaction, it is subject to the risk that the value of the futures contract will move in a direction unfavorable to it.
When a Fund uses futures contracts for hedging purposes, it is likely that the Fund will have an asset or liability that will offset any loss (or gain) on the transactions, at least in part. When a futures contract is
87
TCW Funds, Inc.
Notes to Financial Statements (Continued)
Note 2 — Significant Accounting Policies (Continued)
closed, the Fund records a realized gain or loss equal to the difference between the value of the contract at the time it was opened and the value at the time it was closed. The TCW Emerging Markets Income Fund utilized futures to help manage interest rate duration and credit market exposure. However, there are no futures contracts outstanding at October 31, 2016 for any of the Funds.
Options: The Funds may purchase and sell put and call options to enhance investment performance and to protect against changes in market prices. The Funds may also enter into currency options to hedge against currency fluctuations.
A call option gives the holder the right to purchase, and obligates the writer to sell, a security at the strike price at any time before the expiration date. A put option gives the holder the right to sell, and obligates the writer to buy, a security at the exercise price at any time before the expiration date. A Fund may purchase put options to protect portfolio holdings against a decline in market value of a security or securities held by it. A Fund may also purchase a put option hoping to profit from an anticipated decline in the value of the underlying security. If a Fund holds the security underlying the option, the option premium and any transaction costs will reduce any profit the Fund might have realized had it sold the underlying security instead of buying the put option. A Fund may purchase call options to hedge against an increase in the price of securities that the Fund ultimately wants to buy. A Fund may also purchase a call option as a long directional investment hoping to profit from an anticipated increase in the value of the underlying security. In order for a call option to be profitable, the market price of the underlying security must rise sufficiently above the exercise price to cover the premium and transaction costs. These costs will reduce any profit a Fund might have realized had it bought the underlying security at the time it purchased the call option.
When a Fund purchases an option, it runs the risk that it will lose its entire investment in the option in a relatively short period of time, unless the Fund exercises the option or enters into a closing sale transaction before the option’s expiration. If the price of the underlying security does not rise (in the case of a call) or fall (in the case of a put) to an extent sufficient to cover the option premium and transaction costs, the Fund will lose part or all of its investment in the option. This contrasts with an investment by a Fund in the underlying security, since the Fund will not realize a loss if the security’s price does not change. Premiums paid for purchasing options that expire are treated as realized losses.
Options purchased or sold by a Fund may be traded on a securities or options exchange. Such options typically have minimal exposure to counterparty risk. However, an exchange or market may at times find it necessary to impose restrictions on particular types of options transactions, such as opening transactions. If an underlying security ceases to meet qualifications imposed by an exchange or the Options Clearing Corporation, new series of options on that security will no longer be opened to replace the expiring series, and opening transactions in existing series may be prohibited.
OTC options are options not traded on exchanges or backed by clearinghouses. Rather, they are entered into directly between a Fund and the counterparty to the option. In the case of an OTC option purchased by a Fund, the value of the option to the Fund will depend on the willingness and ability of the option writer to perform its obligations to the Fund. In addition, OTC options may not be transferable and there may be little or no secondary market for them, so they may be considered illiquid. It may not be possible to enter into closing transactions with respect to OTC options or otherwise to terminate such options, and as a result a Fund may be required to remain obligated on an unfavorable OTC option until its expiration. During the year ended October 31, 2016, the TCW Emerging Markets Income Fund, TCW Emerging Markets Local Currency Income Fund, and TCW Emerging Markets Multi-Asset Opportunities Fund had written options.
88
TCW Funds, Inc.
October 31, 2016 |
Note 2 — Significant Accounting Policies (Continued)
Transactions in written option contracts during the year ended October 31, 2016 were as follows:
| TCW Emerging Markets Income Fund | Call Contracts | Call Premiums | ||||||
Options outstanding at October 31, 2015 | — | $ | — | |||||
Options written | 70,225,000 | 943,283 | ||||||
Options terminated in closing purchase transactions | — | — | ||||||
Options exercised | — | — | ||||||
Options expired | (13,500,000 | ) | (36,450 | ) | ||||
|
|
|
| |||||
Options outstanding at October 31, 2016 | 56,725,000 | $ | 906,833 | |||||
|
|
|
| |||||
| TCW Emerging Markets Local Currency Income Fund | Call Contracts | Call Premiums | ||||||
Options outstanding at October 31, 2015 | — | $ | — | |||||
Options written | 25,603,000 | 286,259 | ||||||
Options terminated in closing purchase transactions | (1,490,000 | ) | (24,996 | ) | ||||
Options exercised | — | — | ||||||
Options expired | (18,133,000 | ) | (195,361 | ) | ||||
|
|
|
| |||||
Options outstanding at October 31, 2016 | 5,980,000 | $ | 65,902 | |||||
|
|
|
| |||||
| TCW Emerging Markets Multi-Asset Opportunities Fund | Call Contracts | Call Premiums | ||||||
Options outstanding at October 31, 2015 | — | $ | — | |||||
Options written | 530,000 | 7,449 | ||||||
Options terminated in closing purchase transactions | — | — | ||||||
Options exercised | — | — | ||||||
Options expired | (90,000 | ) | (243 | ) | ||||
|
|
|
| |||||
Options outstanding at October 31, 2016 | 440,000 | $ | 7,206 | |||||
|
|
|
| |||||
Swap Agreements. The Funds may enter into swap agreements. Swap agreements are typically two-party contracts entered into primarily by institutional investors. In a standard “swap” transaction, two parties agree to exchange the returns (or differentials in rates of return) earned or realized on particular predetermined investments or instruments, which may be adjusted for an interest factor. The gross returns to be exchanged or “swapped” between the parties are generally calculated with respect to a “notional amount” (i.e., the return on or increase in value of a particular dollar amount invested at a particular interest rate or in a “basket” of securities representing a particular index).
A Fund may enter into total return swaps. In a total return swap, one party typically agrees to pay to the other a short-term interest rate in return for a payment at one or more times in the future based on the increase in the value of an underlying security or other asset, or index of securities or assets; if the underlying security, asset, or index declines in value, the party that pays the short-term interest rate must also pay to its counterparty a payment based on the amount of the decline. A Fund may take either side of such a swap, and so may take a long or short position in the underlying security, asset, or index. A Fund may enter into a total return swap to hedge against an exposure in its portfolio — such as interest rate risk (including to adjust the duration or credit quality of a Fund’s bond portfolio), equity risk, or credit risk — or generally to put cash to work efficiently in the markets in anticipation of, or as a replacement for, cash investments. A Fund may also enter into a total return swap to gain exposure to securities or markets in which it might not be able to invest directly (in so-called market access transactions).
89
TCW Funds, Inc.
Notes to Financial Statements (Continued)
Note 2 — Significant Accounting Policies (Continued)
A Fund may enter into enter into an interest rate swap agreement. Interest rate swaps are agreements in which one party pays a floating rate of interest on a notional principal amount and receives a fixed rate of interest on the same notional principal amount for a specified period of time. Alternatively, a party may pay a fixed rate and receive a floating rate. In more complex swaps, the notional principal amount may decline (or amortize) over time. The Fund’s maximum risk of loss due to counterparty default is the discounted NAV of the cash flows paid to/received from the counterparty over the interest rate swap’s remaining life.
A Fund may enter into credit default swap transactions as a “buyer” or “seller” of credit protection. In a credit default swap, one party provides what is in effect insurance against a default or other adverse credit event affecting an issuer of debt securities (typically referred to as a “reference entity”). In general, the buyer of credit protection is obligated to pay the protection seller an upfront amount or a periodic stream of payments over the term of the swap. If a “credit event” occurs, the buyer has the right to deliver to the seller bonds or other obligations of the reference entity (with a value up to the full notional value of the swap), and to receive a payment equal to the par value of the bonds or other obligations. Credit events that would trigger a request that the seller make payment are specific to each credit default swap agreement, but generally include bankruptcy, failure to pay, restructuring, obligation acceleration, obligation default, or repudiation/moratorium. When a Fund buys protection, it may or may not own securities of the reference entity. When a Fund sells protection under a credit default swap, the position may have the effect of creating leverage in the Fund’s portfolio through the Fund’s indirect long exposure to the issuer or securities on which the swap is written. When a Fund sells protection, it may do so either to earn additional income or to create such a “synthetic” long position.
Whenever a Fund enters into a swap agreement, it takes on counterparty risk — the risk that its counterparty will be unable or unwilling to meet its obligations under the swap agreement. A Fund also takes the risk that the market will move against its position in the swap agreement. In the case of a total return swap, the swap will change in value depending on the change in value of the asset or index on which the swap is written. When a Fund enters into any type of swap for hedging purposes, it is likely that the Fund will have an asset or liability that will offset any loss (or gain) on the swap, at least in part. Swap agreements may be non-transferable or otherwise highly illiquid, and a Fund may not be able to terminate or transfer a swap agreement at any particular time or at an acceptable price.
During the term of a swap transaction, changes in the value of the swap are recognized as unrealized gains or losses by marking to market to reflect the market value of the swap. When the swap is terminated, a Fund will record a realized gain or loss equal to the difference, if any, between the proceeds from (or cost of) the closing transaction and the Fund’s basis in the agreement. Upfront swap premium payments paid or received by a Fund, if any, are recorded within the value of the open swap agreement on the Fund’s Statement of Assets and Liabilities and represent payments paid or received upon entering into the swap agreement to compensate for differences between stated terms of the swap agreement and prevailing market conditions (credit spreads, currency exchange rates, and other relevant factors). These upfront payments are recorded as realized gains or losses on the Fund’s Statement of Operations upon termination or maturity of the swap agreement.
During the term of a swap transaction, the periodic net payments can be made for a set period of time or may be triggered by a predetermined credit event. The net periodic payments may be based on a fixed or variable interest rate, the change in market value of a specified security, basket of securities or index, or the return generated by a security. These periodic payments received or made by the Funds are recorded as
90
TCW Funds, Inc.
October 31, 2016 |
Note 2 — Significant Accounting Policies (Continued)
realized gains and losses, respectively. At the year ended October 31, 2016, the TCW Emerging Markets Income Fund and TCW Emerging Markets Multi-Asset Opportunities Fund held swap agreements listed on the Schedules of investments.
When-Issued, Delayed-Delivery, and Forward Commitment Transactions: The Funds may enter into when-issued, delayed-delivery, or forward commitment transactions in order to lock in the purchase price of the underlying security or to adjust the interest rate exposure of each Fund’s existing portfolio. In when issued, delayed-delivery, or forward commitment transactions, a Fund commits to purchase securities, with payment and delivery to take place at a future date. Although the Fund does not pay for the securities or start earning interest on them until they are delivered, it immediately assumes the risks of ownership, including the risk of price fluctuation. If a Fund’s counterparty fails to deliver a security purchased on a when-issued, delayed-delivery, or forward commitment basis, there may be a loss, and that Fund may have missed an opportunity to make an alternative investment.
Prior to settlement of these transactions, the value of the subject securities will fluctuate, with market. In addition, because the Fund is not required to pay for when-issued, delayed-delivery, or forward commitment securities until the delivery date, they may result in a form of leverage to the extent the Fund does not maintain liquid assets equal to the face amount of the contract. To guard against this deemed leverage, the Fund monitors the obligations under these transactions and ensures that the Fund has sufficient liquid assets to cover them.
Repurchase Agreements: The Funds may enter into repurchase agreements, under the terms of MRA. The MRA permits a Fund, under certain circumstances, including an event of default (such as bankruptcy or insolvency), to offset payables and/or receivables under the MRA with collateral held and/or posted to the counterparty and create one single net payment due to or from each Fund. However, bankruptcy or insolvency laws of a particular jurisdiction may impose restrictions on or prohibitions against such a right of offset in the event of a MRA counterparty’s bankruptcy or insolvency. Pursuant to the terms of the MRA, the Funds receive securities as collateral with a market value in excess of the repurchase price to be received by the Funds upon the maturity of the repurchase transaction. Upon a bankruptcy or insolvency of the MRA counterparty, the Funds recognize a liability with respect to such excess collateral to reflect the Funds obligation under bankruptcy law to return the excess to the counterparty. There were no repurchase agreements outstanding as of October 31, 2016.
Participation Notes: The Funds may invest in participation notes of equity-linked instruments (collectively, participation notes), through which a counterparty provides exposure to common stock, in the form of an unsecured interest, in markets where direct investment by a Fund is not possible. Participation notes provide the economic benefit of common stock ownership to a Fund, while legal ownership and voting rights are retained by the counterparty. Although participation notes are usually structured with a defined maturity or termination date, early redemption may be possible. Risks associated with participation notes include possible failure of the counterparty to perform in accordance with the terms of the agreement, inability to transfer or liquidate the notes, potential delays or an inability to redeem before maturity under certain market conditions, and limited legal recourse against the issuer of the underlying common stock. The TCW Developing Markets Equity Fund, TCW Emerging Markets Multi-Asset Opportunities Fund, TCW International Growth Fund and TCW International Small Cap Fund held participation notes as of October 31, 2016, which are listed on the Schedules of Investments.
91
TCW Funds, Inc.
Notes to Financial Statements (Continued)
Note 2 — Significant Accounting Policies (Continued)
Security Lending: The Funds may lend their securities to qualified brokers. The loans must be collateralized at all times primarily with cash although the Funds can accept money market instruments or U.S. government securities with a market value at least equal to the market value of the securities on loan. As with any extensions of credit, the Funds may bear the risk of delay in recovery or even loss of rights in the collateral if the borrowers of the securities fail financially. The Funds earn additional income for lending their securities by investing the cash collateral in short-term investments. The Funds did not lend any securities during the year ended October 31, 2016.
Allocation of Operating Activity for Multiple Classes: Investment income, common expenses and realized and unrealized gains and losses are allocated among the share classes of the Funds based on the relative net assets of each class. Distribution fees, which are directly attributable to a class of shares, are charged to the operations of the class. All other expenses are charged to each Fund or class as incurred on a specific identification basis. Differences in class specific fees and expenses will result in differences in net investment income for each class, and in turn differences in dividends paid by each class.
Dividends and Distributions: Dividends and distributions to shareholders are recorded on the ex-dividend date. The TCW Emerging Markets Income Fund and the TCW Emerging Markets Local Currency Income Fund declare and pay, or reinvest, dividends from net investment income monthly. The other Funds declare and pay, or reinvest, dividends from net investment income annually. Distribution of any net long term and net short-term capital gains earned by a fund will be distributed at least annually.
Income and capital gain distributions are determined in accordance with income tax regulations which may differ from GAAP. These differences are primarily due to differing treatments for foreign currency transactions, market discount and premium, losses deferred due to wash sales, excise tax regulations and employing equalization in determining amounts to be distributed to fund shareholders. Permanent book and tax basis differences relating to shareholder distributions will result in reclassifications between paid-in capital, undistributed net investment income (loss), and/or undistributed accumulated realized gain (loss). Undistributed net investment income or loss may include temporary book and tax basis differences which will reverse in a subsequent period. Any taxable income or capital gain remaining at fiscal year end is distributed in the following year.
Use of Estimates: The preparation of the accompanying financial statements requires management to make estimates and assumptions that affect the reported amount of assets and liabilities at the date of the financial statements and the reported amounts of income and expenses during the reporting period. Actual results could differ from these estimates.
Note 3 — Risk Considerations
Market Risk: The Funds’ investments will fluctuate with market conditions, so will the value of your investment in the Funds. You could lose money on your investment in the Funds or the Funds could underperform other investments.
Liquidity Risk: The Funds’ investments in illiquid securities may reduce the returns of the Funds because they may not be able to sell the illiquid securities at an advantageous time or price. Investments in high yield securities, foreign securities, derivatives or other securities with substantial market and/or credit risk tend to have the greatest exposure to liquidity risk. Certain investments in private placements and Rule 144A securities may be considered illiquid investments. The Funds may invest in private placements and Rule 144A securities.
92
TCW Funds, Inc.
October 31, 2016 |
Note 3 — Risk Considerations (Continued)
Interest Rate Risk: The values of the Funds’ investments fluctuate in response to movements in interest rates. If rates rise, the values of debt securities generally fall. The longer the average duration of a Fund’s investment portfolio, the greater the change in value.
Derivatives Risk: Use of derivatives, which at times is an important part of the Funds’ investment strategy, involves risks different from, or possibly greater than, the risks associated with investing directly in securities and other traditional investments. Investments in derivatives could cause the Funds to lose more than the principal amount invested. Also, suitable derivative transactions may not be available in all circumstances and there can be no assurance that the Funds will engage in these transactions to reduce exposure to other risks when that would be beneficial.
Credit Risk: The values of any of the Funds’ investments may also decline in response to events affecting the issuer or its credit rating. The lower rated debt securities in which a Fund may invest are considered speculative and are subject to greater volatility and risk of loss than investment-grade securities, particularly in deteriorating economic conditions.
Counterparty Risk: The Funds may be exposed to counterparty risk, or the risk that an entity with which the Funds have unsettled or open transactions may default. Financial assets, which potentially expose the Funds to credit and counterparty risks, consist principally of investments and cash due from counterparties. The exposure to credit and counterparty risks with respect to these financial assets is reflected in fair value recorded in the Funds’ Statements of Assets and Liabilities.
Foreign Currency Risk: The Funds may be exposed to the risk that the value of the Funds’ investments denominated in foreign currencies will decline in value because the foreign currency has declined in value relative to the U.S. dollar.
Foreign Investing Risk: The Funds may be exposed to the risk that the Funds’ share prices will fluctuate with market conditions, currency exchange rates and the economic and political climates in countries where the Funds invest.
For complete information on the various risks involved, please refer to the Funds’ prospectus and the Statement of Additional Information which can be obtained on the Funds’ website (www.tcw.com) or by calling the customer service.
Note 4 — Federal Income Taxes
It is the policy of each Fund to comply with the requirements under Subchapter M of the Internal Revenue Code applicable to regulated investment companies and to distribute all of its net taxable income, including any net realized gains on investments, to its shareholders. Therefore, no federal income tax provision is required.
At October 31, 2016, the components of distributable earnings on a tax basis were as follows (amounts in thousands):
| Undistributed Ordinary Income | Undistributed Long-Term Gain | Total Distributable Earnings | ||||||||||
TCW Developing Markets Equity Fund | $ | 47 | $ | — | $ | 47 | ||||||
TCW Emerging Markets Income Fund | 20,368 | — | 20,368 | |||||||||
TCW Emerging Markets Multi-Asset Opportunity Fund | 1,277 | — | 1,277 | |||||||||
TCW International Growth Fund | 19 | — | 19 | |||||||||
TCW International Small Cap Fund | 29 | — | 29 | |||||||||
93
TCW Funds, Inc.
Notes to Financial Statements (Continued)
Note 4 — Federal Income Taxes (Continued)
At the end of the previous fiscal year, October 31, 2015, the components of distributable earnings on a tax basis were as follows (amounts in thousands):
| Undistributed Ordinary Income | Undistributed Long-Term Gain | Total Distributable Earnings | ||||||||||
TCW Developing Markets Equity Fund | $ | 3 | $ | — | $ | 3 | ||||||
TCW Emerging Markets Multi-Asset Opportunity Fund | 891 | — | 891 | |||||||||
TCW International Growth Fund | 49 | — | 49 | |||||||||
TCW International Small Cap Fund | 389 | — | 389 | |||||||||
Permanent differences incurred during the year ended October 31, 2016 resulting from differences in book and tax accounting, have been reclassified at year-end between undistributed net investment income (loss), undistributed (accumulated) net realized gain (loss) and paid-in capital as follows, with no impact to the NAV per share (amounts in thousands):
| Undistributed Net Investment Income (Loss) | Undistributed Accumulated Net Realized Gain (Loss) | Paid-in Capital | ||||||||||
TCW Developing Markets Equity Fund | $ | (5 | ) | $ | 5 | $ | — | |||||
TCW Emerging Markets Income Fund | (37,397 | ) | 37,397 | — | ||||||||
TCW Emerging Markets Income Local Currency Income Fund | (12,242 | ) | 34,640 | (22,398 | ) | |||||||
TCW Emerging Markets Multi-Asset Opportunity Fund | (149 | ) | 149 | — | (1) | |||||||
TCW International Growth Fund | 3 | (3 | ) | — | ||||||||
TCW International Small Cap Fund | 14 | (14 | ) | — | (1) | |||||||
| (1) | Amount rounds less than $1. |
During the year ended October 31, 2016, the tax character of distributions paid was as follows (amounts in thousands):
| Ordinary Income | Long-Term Capital Gain | Total Distributions | ||||||||||
TCW Developing Markets Equity Fund | $ | 2 | $ | — | $ | 2 | ||||||
TCW Emerging Markets Income Fund | 143,531 | — | 143,531 | |||||||||
TCW Emerging Markets Multi-Asset Opportunity Fund | 1,034 | — | 1,034 | |||||||||
TCW International Growth Fund | 48 | — | 48 | |||||||||
TCW International Small Cap Fund | 390 | — | 390 | |||||||||
For the previous fiscal year ended October 31, 2015 the tax character of distributions paid was as follows (amounts in thousands):
| Ordinary Income | Long-Term Capital Gain | Return of Capital | Total Distributions | |||||||||||||
TCW Emerging Markets Income Fund | $ | 209,533 | $ | — | $ | 10,473 | $ | 220,006 | ||||||||
TCW Emerging Markets Income Local Currency Income Fund | — | — | 785 | 785 | ||||||||||||
TCW Emerging Markets Multi-Asset Opportunity Fund | 1,014 | — | — | 1,014 | ||||||||||||
TCW International Growth Fund | 201 | 133 | — | 334 | ||||||||||||
TCW International Small Cap Fund | 168 | — | — | 168 | ||||||||||||
94
TCW Funds, Inc.
October 31, 2016 |
Note 4 — Federal Income Taxes (Continued)
At October 31, 2016, net unrealized appreciation (depreciation) on investments for federal income tax purposes was as follows (amounts in thousands):
| Unrealized Appreciation | Unrealized (Depreciation) | Net Unrealized Appreciation (Depreciation) | Cost of Investments for Federal Income Tax Purposes | |||||||||||||
TCW Developing Markets Equity Fund | $ | 583 | $ | (36 | ) | $ | 547 | $ | 4,459 | |||||||
TCW Emerging Markets Income Fund | 86,291 | (19,560 | ) | 66,731 | 2,980,487 | |||||||||||
TCW Emerging Markets Income Local Currency Income Fund | 4,208 | (1,316 | ) | 2,892 | 131,764 | |||||||||||
TCW Emerging Markets Multi-Asset Opportunity Fund | 3,675 | (308 | ) | 3,367 | 38,404 | |||||||||||
TCW International Growth Fund | 277 | (89 | ) | 188 | 2,999 | |||||||||||
TCW International Small Cap Fund | 1,013 | (492 | ) | 521 | 8,185 | |||||||||||
Under the Regulated Investment Company Modernization Act of 2010, the Funds will be permitted to carry forward capital losses incurred in taxable years beginning after December 22, 2010 for an unlimited period. However, any losses incurred during those future taxable years will be required to be utilized prior to the losses incurred in the pre-enactment taxable years. Additionally, post-enactment capital losses that are carried forward will retain their character as either short-term or long-term capital losses rather than being considered all short-term as under previous law.
The following Funds had net realized losses that will be carried forward indefinitely for federal income tax purposes (amounts in thousands):
| Short-Term Capital Losses | Long-Term Capital Losses | Total | ||||||||||
TCW Developing Markets Equity Fund | $ | 1,026 | $ | 43 | $ | 1,069 | ||||||
TCW Emerging Markets Income Fund | 386,977 | 313,501 | 700,478 | |||||||||
TCW Emerging Markets Income Local Currency Income Fund | 12,837 | 10,703 | 23,540 | |||||||||
TCW Emerging Markets Multi-Asset Opportunity Fund | 4,110 | 746 | 4,856 | |||||||||
TCW International Growth Fund | 264 | 4 | 268 | |||||||||
TCW International Small Cap Fund | 2,997 | 425 | 3,422 | |||||||||
The Funds did not have any unrecognized tax benefits at October 31, 2016, nor were there any increases or decreases in unrecognized tax benefits for the year ended October 31, 2016. The Funds are subject to examination by the U.S. federal and state tax authorities for returns filed for the prior three and four fiscal years, respectively.
Note 5 — Fund Management Fees and Other Expenses
The Funds pay to the Advisor, as compensation for services rendered, facilities furnished and expenses borne by it, the following annual management fees as a percentage of daily NAV:
TCW Developing Markets Equity Fund | 0.80% | |||
TCW Emerging Markets Income Fund | 0.75% | |||
TCW Emerging Markets Local Currency Income Fund | 0.75% | |||
TCW Emerging Markets Multi-Asset Opportunities Fund | 0.95% | |||
TCW International Growth Fund | 0.85% | |||
TCW International Small Cap Fund | 0.75% |
In addition to the management fee, the Company’s Board has approved an annual amount for the Funds to reimburse the Advisor for a portion of its costs associated with implementing the Funds’ Rule 38a-1
95
TCW Funds, Inc.
Notes to Financial Statements (Continued)
Note 5 — Fund Management Fees and Other Expenses (Continued)
compliance program. The amount is accrued on a daily basis and included in the Statements of Operations. However, the Advisor has waived its reimbursement request since April 2016.
The Advisor limits the operating expenses of the Funds not to exceed the following expense ratios relative to the Funds’ average daily net assets:
TCW Developing Markets Equity Fund | ||||
I Class | 1.25% | (1) | ||
N Class | 1.25% | (1) | ||
TCW Emerging Markets Income Fund | ||||
I Class | 1.15% | (2) | ||
N Class | 1.15% | (2) | ||
TCW Emerging Markets Local Currency Income Fund | ||||
I Class | 0.99% | (1) | ||
N Class | 0.99% | (1) | ||
TCW Emerging Markets Multi-Asset Opportunities Fund | ||||
I Class | 1.23% | (1) | ||
N Class | 1.23% | (1) | ||
TCW International Growth Fund | ||||
I Class | 1.04% | (1) | ||
N Class | 1.28% | (1) | ||
TCW International Small Cap Fund | ||||
I Class | 1.44% | (1) | ||
N Class | 1.44% | (1) |
| (1) | These limitations are based on an agreement between the Advisor and Company. |
| (2) | Limitation based on average expense ratio as reported by Lipper, Inc., which is subject to change on a monthly basis. This ratio was in effect as of October 31, 2016. These limitations are voluntary and terminable in a six months notice. |
The amount borne by the Advisor during a fiscal year when the operating expenses of a fund are in excess of the expense limitation cannot be recaptured in the subsequent fiscal years should the expenses drop below the expense limitation in the subsequent years. The Advisor can recapture expenses only within a given fiscal year for that year’s operating expenses.
Directors’ Fees: Directors who are not affiliated with the Advisor receive compensation from the Funds which are shown on the Statements of Operations. Directors may elect to defer receipt of their fees in accordance with the terms of a Non-Qualified Deferred Compensation Plan. Total accrued and deferred amounts are recorded on the Funds’ books as other liabilities.
Note 6 — Distribution Plan
TCW Funds Distributors (“Distributor”), an affiliate of the Advisor and the Funds, serves as the nonexclusive distributor of each class of the Funds’ shares. The Funds have a distribution plan pursuant to Rule 12b-1 under the 1940 Act with respect to the N Class shares of each Fund. Under the terms of the plan, each Fund compensates the Distributor at a rate equal to 0.25% of the average daily net assets of the Fund attributable to its N Class shares for distribution and related services.
96
TCW Funds, Inc.
October 31, 2016 |
Note 7 — Purchases and Sales of Securities
Investment transactions (excluding short-term investments) for the year ended October 31, 2016 were as follows (amounts in thousands):
| Purchases at Cost | Sales or Maturity Proceeds | U.S. Government Purchases at Cost | U.S. Government Sales or Maturity Proceeds | |||||||||||||
TCW Developing Markets Equity Fund | $ | 7,143 | $ | 6,768 | $ | — | $ | — | ||||||||
TCW Emerging Markets Income Fund | 5,907,088 | 6,373,899 | — | — | ||||||||||||
TCW Emerging Markets Local Currency Income Fund | 329,566 | 460,862 | — | — | ||||||||||||
TCW Emerging Markets Multi-Asset Opportunities Fund | 88,357 | 90,301 | — | — | ||||||||||||
TCW International Growth Fund | 4,589 | 3,728 | — | — | ||||||||||||
TCW International Small Cap Fund | 10,964 | 12,219 | — | — | ||||||||||||
Note 8 — Capital Share Transactions
Transactions in each Fund’s shares were as follows:
| TCW Developing Markets Equity Fund | Year Ended October 31, 2016 | June 30, 2015 (Commencement of Operations) through October 31, 2015 | ||||||||||||||
| I Class | Shares | Amount (in thousands) | Shares | Amount (in thousands) | ||||||||||||
Shares Sold | 76,815 | $ | 700 | 470,559 | $ | 4,680 | ||||||||||
Shares Issued upon Reinvestment of Dividends | 228 | 1 | — | — | ||||||||||||
Shares Redeemed | (77,604 | ) | (706 | ) | (77,002 | ) | (750 | ) | ||||||||
|
|
|
|
|
|
|
| |||||||||
Net Increase (Decrease) | (561 | ) | $ | (5 | ) | 393,557 | $ | 3,930 | ||||||||
|
|
|
|
|
|
|
| |||||||||
| N Class | Shares | Amount (in thousands) | Shares | Amount (in thousands) | ||||||||||||
Shares Sold | 76,755 | $ | 700 | 227,559 | $ | 2,250 | ||||||||||
Shares Issued upon Reinvestment of Dividends | 87 | 1 | — | — | ||||||||||||
Shares Redeemed | (77,604 | ) | (708 | ) | (77,002 | ) | (750 | ) | ||||||||
|
|
|
|
|
|
|
| |||||||||
Net Increase (Decrease) | (762 | ) | $ | (7 | ) | 150,557 | $ | 1,500 | ||||||||
|
|
|
|
|
|
|
| |||||||||
| TCW Emerging Markets Income Fund | Year Ended October 31, 2016 | Year Ended October 31, 2015 | ||||||||||||||
| I Class | Shares | Amount (in thousands) | Shares | Amount (in thousands) | ||||||||||||
Shares Sold | 112,184,967 | $ | 889,712 | 154,075,797 | $ | 1,236,388 | ||||||||||
Shares Issued upon Reinvestment of Dividends | 12,105,774 | 95,420 | 18,882,517 | 150,848 | ||||||||||||
Shares Redeemed | (171,946,398 | ) | (1,328,456 | ) | (353,578,949 | ) | (2,791,564 | ) | ||||||||
|
|
|
|
|
|
|
| |||||||||
Net Decrease | (47,655,657 | ) | $ | (343,324 | ) | (180,620,635 | ) | $ | (1,404,328 | ) | ||||||
|
|
|
|
|
|
|
| |||||||||
| N Class | Shares | Amount (in thousands) | Shares | Amount (in thousands) | ||||||||||||
Shares Sold | 16,214,832 | $ | 165,419 | 20,642,802 | $ | 211,811 | ||||||||||
Shares Issued upon Reinvestment of Dividends | 2,279,008 | 23,145 | 2,901,700 | 29,898 | ||||||||||||
Shares Redeemed | (21,517,525 | ) | (217,071 | ) | (41,598,472 | ) | (425,394 | ) | ||||||||
|
|
|
|
|
|
|
| |||||||||
Net Decrease | (3,023,685 | ) | $ | (28,507 | ) | (18,053,970 | ) | $ | (183,685 | ) | ||||||
|
|
|
|
|
|
|
| |||||||||
97
TCW Funds, Inc.
Notes to Financial Statements (Continued)
Note 8 — Capital Share Transactions (Continued)
| TCW Emerging Markets Local Currency Income Fund | Year Ended October 31, 2016 | Year Ended October 31, 2015 | ||||||||||||||
| I Class | Shares | Amount (in thousands) | Shares | Amount (in thousands) | ||||||||||||
Shares Sold | 9,424,813 | $ | 75,249 | 5,444,329 | $ | 48,888 | ||||||||||
Shares Issued upon Reinvestment of Dividends | — | — | 45,913 | 424 | ||||||||||||
Shares Redeemed | (11,201,554 | ) | (94,617 | ) | (11,459,346 | ) | (101,141 | ) | ||||||||
|
|
|
|
|
|
|
| |||||||||
Net Decrease | (1,776,741 | ) | $ | (19,368 | ) | (5,969,104 | ) | $ | (51,829 | ) | ||||||
|
|
|
|
|
|
|
| |||||||||
| N Class | Shares | Amount (in thousands) | Shares | Amount (in thousands) | ||||||||||||
Shares Sold | 5,376,036 | $ | 42,691 | 21,800,094 | $ | 189,022 | ||||||||||
Shares Issued upon Reinvestment of Dividends | — | — | 36,326 | 335 | ||||||||||||
Shares Redeemed | (22,458,546 | ) | (176,333 | ) | (8,754,907 | ) | (73,906 | ) | ||||||||
|
|
|
|
|
|
|
| |||||||||
Net Increase (Decrease) | (17,082,510 | ) | $ | (133,642 | ) | 13,081,513 | $ | 115,451 | ||||||||
|
|
|
|
|
|
|
| |||||||||
| TCW Emerging Markets Multi-Asset Opportunities Fund | Year Ended October 31, 2016 | Year Ended October 31, 2015 | ||||||||||||||
| I Class | Shares | Amount (in thousands) | Shares | Amount (in thousands) | ||||||||||||
Shares Sold | 124,090 | $ | 1,220 | 247,559 | $ | 2,570 | ||||||||||
Shares Issued upon Reinvestment of Dividends | 97,656 | 886 | 77,170 | 793 | ||||||||||||
Shares Redeemed | (770,874 | ) | (7,171 | ) | (1,089,497 | ) | (10,973 | ) | ||||||||
|
|
|
|
|
|
|
| |||||||||
Net (Decrease) | (549,128 | ) | $ | (5,065 | ) | (764,768 | ) | $ | (7,610 | ) | ||||||
|
|
|
|
|
|
|
| |||||||||
| N Class | Shares | Amount (in thousands) | Shares | Amount (in thousands) | ||||||||||||
Shares Sold | 94,620 | $ | 927 | 418,378 | $ | 4,335 | ||||||||||
Shares Issued upon Reinvestment of Dividends | 11,379 | 103 | 7,546 | 77 | ||||||||||||
Shares Redeemed | (42,552 | ) | (427 | ) | (5,893 | ) | (61 | ) | ||||||||
|
|
|
|
|
|
|
| |||||||||
Net Increase | 63,447 | $ | 603 | 420,031 | $ | 4,351 | ||||||||||
|
|
|
|
|
|
|
| |||||||||
| TCW International Growth Fund | Year Ended October 31, 2016 | Year Ended October 31, 2015 | ||||||||||||||
| I Class | Shares | Amount (in thousands) | Shares | Amount (in thousands) | ||||||||||||
Shares Sold | 200,713 | $ | 1,970 | 2,370 | $ | 25 | ||||||||||
Shares Issued upon Reinvestment of Dividends | 2,740 | 27 | 17,271 | 175 | ||||||||||||
Shares Redeemed | (123,164 | ) | (1,218 | ) | (2,289 | ) | (25 | ) | ||||||||
|
|
|
|
|
|
|
| |||||||||
Net Increase | 80,289 | $ | 779 | 17,352 | $ | 175 | ||||||||||
|
|
|
|
|
|
|
| |||||||||
| N Class | Shares | Amount (in thousands) | Shares | Amount (in thousands) | ||||||||||||
Shares Sold | 118,902 | $ | 1,170 | — | $ | — | ||||||||||
Shares Issued upon Reinvestment of Dividends | 2,162 | 21 | 15,472 | 157 | ||||||||||||
Shares Redeemed | (118,265 | ) | (1,164 | ) | — | — | ||||||||||
|
|
|
|
|
|
|
| |||||||||
Net Increase | 2,799 | $ | 27 | 15,472 | $ | 157 | ||||||||||
|
|
|
|
|
|
|
| |||||||||
98
TCW Funds, Inc.
October 31, 2016 |
Note 8 — Capital Share Transactions (Continued)
| TCW International Small Cap Fund | Year Ended October 31, 2016 | Year Ended October 31, 2015 | ||||||||||||||
| I Class | Shares | Amount (in thousands) | Shares | Amount (in thousands) | ||||||||||||
Shares Sold | 337,420 | $ | 2,784 | 154,931 | $ | 1,322 | ||||||||||
Shares Issued upon Reinvestment of Dividends | 29,232 | 245 | 14,610 | 118 | ||||||||||||
Shares Redeemed | (519,196 | ) | (4,351 | ) | (1,590,440 | ) | (13,596 | ) | ||||||||
|
|
|
|
|
|
|
| |||||||||
Net (Decrease) | (152,544 | ) | $ | (1,322 | ) | (1,420,899 | ) | $ | (12,156 | ) | ||||||
|
|
|
|
|
|
|
| |||||||||
| N Class | Shares | Amount (in thousands) | Shares | Amount (in thousands) | ||||||||||||
Shares Sold | 279,590 | $ | 2,318 | 72,940 | $ | 624 | ||||||||||
Shares Issued upon Reinvestment of Dividends | 17,179 | 144 | 6,103 | 49 | ||||||||||||
Shares Redeemed | (313,208 | ) | (2,587 | ) | (760,336 | ) | (6,649 | ) | ||||||||
|
|
|
|
|
|
|
| |||||||||
Net (Decrease) | (16,439 | ) | $ | (125 | ) | (681,293 | ) | $ | (5,976 | ) | ||||||
|
|
|
|
|
|
|
| |||||||||
Note 9 — Affiliate Ownership
As of October 31, 2016, affiliates of the Funds and Advisor own 100%, 98.2%, and 64.1% of the NAV of TCW Developing Markets Equity Fund, TCW International Growth Fund, and TCW International Small Cap Fund, respectively.
Note 10 — Restricted Securities
The Funds are permitted to invest in securities that have legal or contractual restrictions on resale. These securities may be sold privately, but are required to be registered or exempted from such registration before being sold to the public. Private placement securities are generally considered to be restricted except for those securities traded between qualified institutional investors under the provisions of Rule 144A of the Securities Act of 1933, as amended (the “Securities Act”). However, the Company considers 144A securities to be restricted if those securities have been deemed illiquid. Disposal of these securities may involve time consuming negotiations and expense, and prompt sale at an acceptable price may be difficult. There were no restricted securities at October 31, 2016.
Note 11 — Indemnifications
Under the Company’s organizational documents, its Officers and Directors may be indemnified against certain liabilities and expenses arising out of the performance of their duties to the Company. In addition, the Company entered into an agreement with each of the Directors which provides that the Company will indemnify and hold harmless each Director against any expenses actually and reasonably incurred by any Director in any proceeding arising out of or in connection with the Director’s services to the Company, to the fullest extent permitted by the Company’s Articles of Incorporation and By-Laws, the Maryland General Corporation Law, the Securities Act, and the 1940 Act, each as now or hereinafter in force. Additionally, in the normal course of business, the Company enters into agreements with service providers that may contain indemnification clauses. The Company’s maximum exposure under these arrangements is unknown as this would involve future claims that may be made against the Company that have not yet occurred. However, based on experience, the Company expects the risk of loss to be remote. The Company has not accrued any liability in connection with such indemnification.
99
TCW Funds, Inc.
Notes to Financial Statements (Continued)
Note 12 — Recently Issued Accounting Pronouncements
In October 2016, the U.S. Securities and Exchange Commission adopted new rules and amended existing rules (together, “final rules”) intended to modernize the reporting and disclosure of information by registered investment companies. In part, the final rules amend Regulation S-X and require standardized, enhanced disclosure about derivatives in investment company financial statements, as well as other amendments. The compliance date for the amendments to Regulation S-X is August 1, 2017. Management is currently evaluating the impact that the adoption of the amendments to Regulation S-X will have on the Funds’ financial statements and related disclosures.
100
TCW Developing Markets Equity Fund
Financial Highlights — I Class
| Year Ended October 31, 2016 | June 30, 2015 (Commencement of Operations) through October 31, 2015 | |||||||
Net Asset Value per Share, Beginning of Year | $ | 8.62 | $ | 10.00 | ||||
|
|
|
| |||||
Income (Loss) from Investment Operations: | ||||||||
Net Investment Income (1) | 0.10 | 0.01 | ||||||
Net Realized and Unrealized Gain (Loss) on Investments | 0.38 | (1.39 | ) | |||||
|
|
|
| |||||
Total from Investment Operations | 0.48 | (1.38 | ) | |||||
|
|
|
| |||||
Less Distributions: | ||||||||
Distributions from Net Investment Income | (0.00 | ) (4) | — | |||||
|
|
|
| |||||
Net Asset Value per Share, End of Year | $ | 9.10 | $ | 8.62 | ||||
|
|
|
| |||||
Total Return | 5.63 | % | (13.80 | )% (2) | ||||
Ratios/Supplemental Data: | ||||||||
Net Assets, End of Year (in thousands) | $ | 3,577 | $ | 3,392 | ||||
Ratio of Expenses to Average Net Assets: | ||||||||
Before Expense Reimbursement | 3.56 | % | 7.09 | % (3) | ||||
After Expense Reimbursement | 1.25 | % | 1.25 | % (3) | ||||
Ratio of Net Investment Income to Average Net Assets | 1.15 | % | 0.30 | % (3) | ||||
Portfolio Turnover Rate | 154.70 | % | 54.34 | % (2) | ||||
| (1) | Computed using average shares outstanding throughout the period. |
| (2) | For the period June 30, 2015 (Commencement of Operations) through October 31, 2015 and is not indicative of a full year’s operating results. |
| (3) | Annualized. |
| (4) | Amount is less than $0.005. |
See accompanying notes to financial statements.
101
TCW Developing Markets Equity Fund
Financial Highlights — N Class
| Year Ended October 31, 2016 | June 30, 2015 (Commencement of Operations) through October 31, 2015 | |||||||
Net Asset Value per Share, Beginning of Year | $ | 8.62 | $ | 10.00 | ||||
|
|
|
| |||||
Income (Loss) from Investment Operations: | ||||||||
Net Investment Income (1) | 0.10 | 0.01 | ||||||
Net Realized and Unrealized Gain (Loss) on Investments | 0.38 | (1.39 | ) | |||||
|
|
|
| |||||
Total from Investment Operations | 0.48 | (1.38 | ) | |||||
|
|
|
| |||||
Less Distributions: | ||||||||
Distributions from Net Investment Income | (0.00 | ) (4) | — | |||||
|
|
|
| |||||
Net Asset Value per Share, End of Year | $ | 9.10 | $ | 8.62 | ||||
|
|
|
| |||||
Total Return | 5.63 | % | (13.80 | )% (2) | ||||
Ratios/Supplemental Data: | ||||||||
Net Assets, End of Year (in thousands) | $ | 1,364 | $ | 1,297 | ||||
Ratio of Expenses to Average Net Assets: | ||||||||
Before Expense Reimbursement | 4.80 | % | 8.39 | % (3) | ||||
After Expense Reimbursement | 1.25 | % | 1.25 | % (3) | ||||
Ratio of Net Investment Income to Average Net Assets | 1.15 | % | 0.29 | % (3) | ||||
Portfolio Turnover Rate | 154.70 | % | 54.34 | % (2) | ||||
| (1) | Computed using average shares outstanding throughout the period. |
| (2) | For the period June 30, 2015 (Commencement of Operations) through October 31, 2015 and is not indicative of a full year’s operating results. |
| (3) | Annualized. |
| (4) | Amount is less than $0.005. |
See accompanying notes to financial statements.
102
TCW Emerging Markets Income Fund
Financial Highlights — I Class
| Year Ended October 31, | ||||||||||||||||||||
| 2016 | 2015 | 2014 | 2013 | 2012 | ||||||||||||||||
Net Asset Value per Share, Beginning of Year | $ | 7.67 | $ | 8.57 | $ | 8.53 | $ | 9.30 | $ | 8.43 | ||||||||||
|
|
|
|
|
|
|
|
|
| |||||||||||
Income (Loss) from Investment Operations: | ||||||||||||||||||||
Net Investment Income (1) | 0.55 | 0.38 | 0.47 | 0.55 | 0.64 | |||||||||||||||
Net Realized and Unrealized Gain (Loss) on Investments | 0.52 | (0.87 | ) | (0.01 | ) | (0.59 | ) | 0.75 | ||||||||||||
|
|
|
|
|
|
|
|
|
| |||||||||||
Total from Investment Operations | 1.07 | (0.49 | ) | 0.46 | (0.04 | ) | 1.39 | |||||||||||||
|
|
|
|
|
|
|
|
|
| |||||||||||
Less Distributions: | ||||||||||||||||||||
Distributions from Net Investment Income | (0.40 | ) | (0.39 | ) | (0.42 | ) | (0.44 | ) | (0.52 | ) | ||||||||||
Distributions from Net Realized Gain | — | — | — | (0.22 | ) | — | ||||||||||||||
Distributions from Return of Capital | — | (0.02 | ) | — | (0.07 | ) | — | |||||||||||||
|
|
|
|
|
|
|
|
|
| |||||||||||
Total Distributions | (0.40 | ) | (0.41 | ) | (0.42 | ) | (0.73 | ) | (0.52 | ) | ||||||||||
|
|
|
|
|
|
|
|
|
| |||||||||||
Net Asset Value per Share, End of Year | $ | 8.34 | $ | 7.67 | $ | 8.57 | $ | 8.53 | $ | 9.30 | ||||||||||
|
|
|
|
|
|
|
|
|
| |||||||||||
Total Return | 14.29 | % | (5.75 | )% | 5.52 | % | (0.68 | )% | 16.99 | % | ||||||||||
Ratios/Supplemental Data: | ||||||||||||||||||||
Net Assets, End of Year (in thousands) | $ | 2,574,798 | $ | 2,733,679 | $ | 4,602,207 | $ | 4,260,067 | $ | 4,223,485 | ||||||||||
Ratio of Expenses to Average Net Assets | 0.87 | % | 0.88 | % | 0.85 | % | 0.83 | % | 0.84 | % | ||||||||||
Ratio of Net Investment Income to Average Net Assets | 6.95 | % | 4.79 | % | 5.44 | % | 6.09 | % | 7.24 | % | ||||||||||
Portfolio Turnover Rate | 214.73 | % | 172.93 | % | 165.55 | % | 150.21 | % | 174.98 | % | ||||||||||
| (1) | Computed using average shares outstanding throughout the period. |
See accompanying notes to financial statements.
103
TCW Emerging Markets Income Fund
Financial Highlights — N Class
| Year Ended October 31, | ||||||||||||||||||||
| 2016 | 2015 | 2014 | 2013 | 2012 | ||||||||||||||||
Net Asset Value per Share, Beginning of Year | $ | 9.89 | $ | 11.05 | $ | 11.01 | $ | 11.93 | $ | 10.81 | ||||||||||
|
|
|
|
|
|
|
|
|
| |||||||||||
Income (Loss) from Investment Operations: | ||||||||||||||||||||
Net Investment Income (1) | 0.68 | 0.46 | 0.57 | 0.68 | 0.81 | |||||||||||||||
Net Realized and Unrealized Gain (Loss) on Investments | 0.67 | (1.11 | ) | (0.02 | ) | (0.76 | ) | 0.93 | ||||||||||||
|
|
|
|
|
|
|
|
|
| |||||||||||
Total from Investment Operations | 1.35 | (0.65 | ) | 0.55 | (0.08 | ) | 1.74 | |||||||||||||
|
|
|
|
|
|
|
|
|
| |||||||||||
Less Distributions: | ||||||||||||||||||||
Distributions from Net Investment Income | (0.49 | ) | (0.48 | ) | (0.51 | ) | (0.53 | ) | (0.62 | ) | ||||||||||
Distributions from Net Realized Gain | — | — | — | (0.22 | ) | — | ||||||||||||||
Distributions from Return of Capital | — | (0.03 | ) | — | (0.09 | ) | — | |||||||||||||
|
|
|
|
|
|
|
|
|
| |||||||||||
Total Distributions | (0.49 | ) | (0.51 | ) | (0.51 | ) | (0.84 | ) | (0.62 | ) | ||||||||||
|
|
|
|
|
|
|
|
|
| |||||||||||
Net Asset Value per Share, End of Year | $ | 10.75 | $ | 9.89 | $ | 11.05 | $ | 11.01 | $ | 11.93 | ||||||||||
|
|
|
|
|
|
|
|
|
| |||||||||||
Total Return | 13.98 | % | (5.96 | )% | 5.11 | % | (0.86 | )% | 16.64 | % | ||||||||||
Ratios/Supplemental Data: | ||||||||||||||||||||
Net Assets, End of Year (in thousands) | $ | 534,151 | $ | 521,413 | $ | 782,384 | $ | 1,419,298 | $ | 1,286,033 | ||||||||||
Ratio of Expenses to Average Net Assets: | 1.15 | % | 1.16 | % | 1.13 | % | 1.10 | % | 1.11 | % | ||||||||||
Ratio of Net Investment Income to Average Net Assets | 6.71 | % | 4.50 | % | 5.21 | % | 5.83 | % | 7.23 | % | ||||||||||
Portfolio Turnover Rate | 214.73 | % | 172.93 | % | 165.55 | % | 150.21 | % | 174.98 | % | ||||||||||
| (1) | Computed using average shares outstanding throughout the period. |
See accompanying notes to financial statements.
104
TCW Emerging Markets Local Currency Income Fund
Financial Highlights — I Class
| Year Ended October 31, | ||||||||||||||||||||
| 2016 | 2015 | 2014 | 2013 | 2012 | ||||||||||||||||
Net Asset Value per Share, Beginning of Year | $ | 8.18 | $ | 9.69 | $ | 10.14 | $ | 10.52 | $ | 9.89 | ||||||||||
|
|
|
|
|
|
|
|
|
| |||||||||||
Income (Loss) from Investment Operations: | ||||||||||||||||||||
Net Investment Income (1) | 0.52 | 0.46 | 0.55 | 0.54 | 0.64 | |||||||||||||||
Net Realized and Unrealized Gain (Loss) on Investments | 0.43 | (1.94 | ) | (0.88 | ) | (0.62 | ) | 0.23 | ||||||||||||
|
|
|
|
|
|
|
|
|
| |||||||||||
Total from Investment Operations | 0.95 | (1.48 | ) | (0.33 | ) | (0.08 | ) | 0.87 | ||||||||||||
|
|
|
|
|
|
|
|
|
| |||||||||||
Less Distributions: | ||||||||||||||||||||
Distributions from Net Investment Income | — | — | — | (0.06 | ) | (0.18 | ) | |||||||||||||
Distributions from Return of Capital | — | (0.03 | ) | (0.12 | ) | (0.24 | ) | (0.06 | ) | |||||||||||
|
|
|
|
|
|
|
|
|
| |||||||||||
Total Distributions | — | (0.03 | ) | (0.12 | ) | (0.30 | ) | (0.24 | ) | |||||||||||
|
|
|
|
|
|
|
|
|
| |||||||||||
Net Asset Value per Share, End of Year | $ | 9.13 | $ | 8.18 | $ | 9.69 | $ | 10.14 | $ | 10.52 | ||||||||||
|
|
|
|
|
|
|
|
|
| |||||||||||
Total Return | 11.61 | % | (15.35 | )% | (3.29 | )% | (0.89 | )% | 9.02 | % | ||||||||||
Ratios/Supplemental Data: | ||||||||||||||||||||
Net Assets, End of Year (in thousands) | $ | 97,650 | $ | 102,034 | $ | 178,828 | $ | 237,695 | $ | 122,196 | ||||||||||
Ratio of Expenses to Average Net Assets: | ||||||||||||||||||||
Before Expense Reimbursement | 1.00 | % | 1.00 | % | 0.95 | % | 0.90 | % | 0.96 | % | ||||||||||
After Expense Reimbursement | 0.99 | % | 0.99 | % | N/A | % | N/A | % | N/A | % | ||||||||||
Ratio of Net Investment Income to Average Net Assets | 6.12 | % | 5.20 | % | 5.61 | % | 5.19 | % | 6.39 | % | ||||||||||
Portfolio Turnover Rate | 209.07 | % | 250.10 | % | 223.55 | % | 290.24 | % | 252.93 | % | ||||||||||
| (1) | Computed using average shares outstanding throughout the period. |
See accompanying notes to financial statements.
105
TCW Emerging Markets Local Currency Income Fund
Financial Highlights — N Class
| Year Ended October 31, | ||||||||||||||||||||
| 2016 | 2015 | 2014 | 2013 | 2012 | ||||||||||||||||
Net Asset Value per Share, Beginning of Year | $ | 8.17 | $ | 9.69 | $ | 10.13 | $ | 10.52 | $ | 9.89 | ||||||||||
|
|
|
|
|
|
|
|
|
| |||||||||||
Income (Loss) from Investment Operations: | ||||||||||||||||||||
Net Investment Income (1) | 0.48 | 0.46 | 0.58 | 0.54 | 0.62 | |||||||||||||||
Net Realized and Unrealized Gain (Loss) on Investments | 0.47 | (1.95 | ) | (0.91 | ) | (0.64 | ) | 0.25 | ||||||||||||
|
|
|
|
|
|
|
|
|
| |||||||||||
Total from Investment Operations | 0.95 | (1.49 | ) | (0.33 | ) | (0.10 | ) | 0.87 | ||||||||||||
|
|
|
|
|
|
|
|
|
| |||||||||||
Less Distributions: | ||||||||||||||||||||
Distributions from Net Investment Income | — | — | — | (0.05 | ) | (0.18 | ) | |||||||||||||
Distributions from Return of Capital | — | (0.03 | ) | (0.11 | ) | (0.24 | ) | (0.06 | ) | |||||||||||
|
|
|
|
|
|
|
|
|
| |||||||||||
Total Distributions | — | (0.03 | ) | (0.11 | ) | (0.29 | ) | (0.24 | ) | |||||||||||
|
|
|
|
|
|
|
|
|
| |||||||||||
Net Asset Value per Share, End of Year | $ | 9.12 | $ | 8.17 | $ | 9.69 | $ | 10.13 | $ | 10.52 | ||||||||||
|
|
|
|
|
|
|
|
|
| |||||||||||
Total Return | 11.63 | % | (15.37 | )% | (3.37 | )% | (0.91 | )% | 8.92 | % | ||||||||||
Ratios/Supplemental Data: | ||||||||||||||||||||
Net Assets, End of Year (in thousands) | $ | 15,325 | $ | 153,270 | $ | 55,028 | $ | 113,380 | $ | 89,410 | ||||||||||
Ratio of Expenses to Average Net Assets: | ||||||||||||||||||||
Before Expense Reimbursement | 1.31 | % | 1.25 | % | 1.24 | % | 1.15 | % | 1.25 | % | ||||||||||
After Expense Reimbursement | 0.99 | % | 0.99 | % | 0.99 | % | 0.99 | % | 0.99 | % | ||||||||||
Ratio of Net Investment Income to Average Net Assets | 6.05 | % | 5.29 | % | 5.87 | % | 5.15 | % | 6.20 | % | ||||||||||
Portfolio Turnover Rate | 209.07 | % | 250.10 | % | 223.55 | % | 290.24 | % | 252.93 | % | ||||||||||
| (1) | Computed using average shares outstanding throughout the period. |
See accompanying notes to financial statements.
106
TCW Emerging Markets Multi-Asset Opportunities Fund
Financial Highlights — I Class
| Year Ended October 31, | June 28, 2013 (Commencement of Operations) through October 31, 2013 | |||||||||||||||
| 2016 | 2015 | 2014 | ||||||||||||||
Net Asset Value per Share, Beginning of Year | $ | 9.63 | $ | 10.97 | $ | 10.68 | $ | 10.00 | ||||||||
|
|
|
|
|
|
|
| |||||||||
Income (Loss) from Investment Operations: | ||||||||||||||||
Net Investment Income (1) | 0.35 | 0.24 | 0.22 | 0.07 | ||||||||||||
Net Realized and Unrealized Gain (Loss) on Investments | 0.65 | (1.38 | ) | 0.14 | 0.61 | |||||||||||
|
|
|
|
|
|
|
| |||||||||
Total from Investment Operations | 1.00 | (1.14 | ) | 0.36 | 0.68 | |||||||||||
|
|
|
|
|
|
|
| |||||||||
Less Distributions: | ||||||||||||||||
Distributions from Net Investment Income | (0.24 | ) | (0.20 | ) | (0.07 | ) | — | |||||||||
|
|
|
|
|
|
|
| |||||||||
Net Asset Value per Share, End of Year | $ | 10.39 | $ | 9.63 | $ | 10.97 | $ | 10.68 | ||||||||
|
|
|
|
|
|
|
| |||||||||
Total Return | 10.75 | % | (10.53 | )% | 3.43 | % | 6.80 | % (2) | ||||||||
Ratios/Supplemental Data: | ||||||||||||||||
Net Assets, End of Year (in thousands) | $ | 37,173 | $ | 39,739 | $ | 53,652 | $ | 40,903 | ||||||||
Ratio of Expenses to Average Net Assets: | ||||||||||||||||
Before Expense Reimbursement | 1.57 | % | 1.47 | % | 1.43 | % | 1.72 | % (3) | ||||||||
After Expense Reimbursement | 1.23 | % | 1.23 | % | 1.21 | % | 1.26 | % (3) | ||||||||
Ratio of Net Investment Income to Average Net Assets | 3.74 | % | 2.31 | % | 2.04 | % | 2.06 | % (3) | ||||||||
Portfolio Turnover Rate | 227.75 | % | 145.86 | % | 151.61 | % | 52.53 | % (2) | ||||||||
| (1) | Computed using average shares outstanding throughout the period. |
| (2) | For the period June 28, 2013 (Commencement of Operations) through October 31, 2013 and is not indicative of a full year’s operating results. |
| (3) | Annualized. |
See accompanying notes to financial statements.
107
TCW Emerging Markets Multi-Asset Opportunities Fund
Financial Highlights — N Class
| Year Ended October 31, | June 28, 2013 (Commencement of Operations) through October 31, 2013 | |||||||||||||||
| 2016 | 2015 | 2014 | ||||||||||||||
Net Asset Value per Share, Beginning of Year | $ | 9.59 | $ | 10.92 | $ | 10.62 | $ | 10.00 | ||||||||
|
|
|
|
|
|
|
| |||||||||
Income (Loss) from Investment Operations: | ||||||||||||||||
Net Investment Income (1) | 0.36 | 0.24 | 0.22 | 0.06 | ||||||||||||
Net Realized and Unrealized Gain (Loss) on Investments | 0.64 | (1.37 | ) | 0.15 | 0.56 | |||||||||||
|
|
|
|
|
|
|
| |||||||||
Total from Investment Operations | 1.00 | (1.13 | ) | 0.37 | 0.62 | |||||||||||
|
|
|
|
|
|
|
| |||||||||
Less Distributions: | ||||||||||||||||
Distributions from Net Investment Income | (0.24 | ) | (0.20 | ) | (0.07 | ) | — | |||||||||
|
|
|
|
|
|
|
| |||||||||
Net Asset Value per Share, End of Year | $ | 10.35 | $ | 9.59 | $ | 10.92 | $ | 10.62 | ||||||||
|
|
|
|
|
|
|
| |||||||||
Total Return | 10.78 | % | (10.50 | )% | 3.54 | % | 6.20 | % (2) | ||||||||
Ratios/Supplemental Data: | ||||||||||||||||
Net Assets, End of Year (in thousands) | $ | 5,088 | $ | 4,107 | $ | 89 | $ | 31 | ||||||||
Ratio of Expenses to Average Net Assets: | ||||||||||||||||
Before Expense Reimbursement | 2.15 | % | 2.15 | % | 48.38 | % | 480.73 | % (3) | ||||||||
After Expense Reimbursement | 1.23 | % | 1.23 | % | 1.21 | % | 1.26 | % (3) | ||||||||
Ratio of Net Investment Income to Average Net Assets | 3.79 | % | 2.38 | % | 2.01 | % | 1.72 | % (3) | ||||||||
Portfolio Turnover Rate | 227.75 | % | 145.86 | % | 151.61 | % | 52.53 | % (2) | ||||||||
| (1) | Computed using average shares outstanding throughout the period. |
| (2) | For the period June 28, 2013 (Commencement of Operations) through October 31, 2013 and is not indicative of a full year’s operating results. |
| (3) | Annualized. |
See accompanying notes to financial statements.
108
TCW International Growth Fund
Financial Highlights — I Class
| Year Ended October 31, | October 31, 2012 (Commencement of Operations) through October 31, 2013 | |||||||||||||||
| 2016 | 2015 | 2014 | ||||||||||||||
Net Asset Value per Share, Beginning of Year | $ | 10.15 | $ | 12.31 | $ | 12.04 | $ | 10.00 | ||||||||
|
|
|
|
|
|
|
| |||||||||
Income (Loss) from Investment Operations: | ||||||||||||||||
Net Investment Income (1) | 0.12 | 0.07 | 0.10 | 0.05 | ||||||||||||
Net Realized and Unrealized Gain (Loss) on Investments | (0.26 | ) | (0.65 | ) | 0.30 | 1.99 | ||||||||||
|
|
|
|
|
|
|
| |||||||||
Total from Investment Operations | (0.14 | ) | (0.58 | ) | 0.40 | 2.04 | ||||||||||
|
|
|
|
|
|
|
| |||||||||
Less Distributions: | ||||||||||||||||
Distributions from Net Investment Income | (0.22 | ) | (0.19 | ) | (0.09 | ) | — | |||||||||
Distributions from Net Realized Gain | — | (1.39 | ) | (0.04 | ) | — | ||||||||||
|
|
|
|
|
|
|
| |||||||||
Total Distributions | (0.22 | ) | (1.58 | ) | (0.13 | ) | — | |||||||||
|
|
|
|
|
|
|
| |||||||||
Net Asset Value per Share, End of Year | $ | 9.79 | $ | 10.15 | $ | 12.31 | $ | 12.04 | ||||||||
|
|
|
|
|
|
|
| |||||||||
Total Return | (1.45 | )% | (4.74 | )% | 3.27 | % | 20.40 | % | ||||||||
Ratios/Supplemental Data: | ||||||||||||||||
Net Assets, End of Year (in thousands) | $ | 2,055 | $ | 1,316 | $ | 1,383 | $ | 1,341 | ||||||||
Ratio of Expenses to Average Net Assets: | ||||||||||||||||
Before Expense Reimbursement | 5.64 | % | 5.05 | % | 4.95 | % | 7.74 | % | ||||||||
After Expense Reimbursement | 1.04 | % | 1.04 | % | 1.04 | % | 1.04 | % | ||||||||
Ratio of Net Investment Income to Average Net Assets | 1.23 | % | 0.63 | % | 0.82 | % | 0.46 | % | ||||||||
Portfolio Turnover Rate | 140.02 | % | 223.01 | % | 318.07 | % | 309.74 | % | ||||||||
| (1) | Computed using average shares outstanding throughout the period. |
See accompanying notes to financial statements.
109
TCW International Growth Fund
Financial Highlights — N Class
| Year Ended October 31, | October 31, 2012 (Commencement of Operations) through October 31, 2013 | |||||||||||||||
| 2016 | 2015 | 2014 | ||||||||||||||
Net Asset Value per Share, Beginning of Year | $ | 10.10 | $ | 12.27 | $ | 12.01 | $ | 10.00 | ||||||||
|
|
|
|
|
|
|
| |||||||||
Income (Loss) from Investment Operations: | ||||||||||||||||
Net Investment Income (1) | 0.09 | 0.03 | 0.06 | 0.02 | ||||||||||||
Net Realized and Unrealized Gain (Loss) on Investments | (0.27 | ) | (0.64 | ) | 0.30 | 1.99 | ||||||||||
|
|
|
|
|
|
|
| |||||||||
Total from Investment Operations | (0.18 | ) | (0.61 | ) | 0.36 | 2.01 | ||||||||||
|
|
|
|
|
|
|
| |||||||||
Less Distributions: | ||||||||||||||||
Distributions from Net Investment Income | (0.18 | ) | (0.17 | ) | (0.06 | ) | — | |||||||||
Distributions from Net Realized Gain | — | (1.39 | ) | (0.04 | ) | — | ||||||||||
|
|
|
|
|
|
|
| |||||||||
Total Distributions | (0.18 | ) | (1.56 | ) | (0.10 | ) | — | |||||||||
|
|
|
|
|
|
|
| |||||||||
Net Asset Value per Share, End of Year | $ | 9.74 | $ | 10.10 | $ | 12.27 | $ | 12.01 | ||||||||
|
|
|
|
|
|
|
| |||||||||
Total Return | (1.77 | )% | (5.03 | )% | 2.92 | % | 20.10 | % | ||||||||
Ratios/Supplemental Data: | ||||||||||||||||
Net Assets, End of Year (in thousands) | $ | 1,158 | $ | 1,173 | $ | 1,234 | $ | 1,201 | ||||||||
Ratio of Expenses to Average Net Assets: | ||||||||||||||||
Before Expense Reimbursement | 6.27 | % | 5.18 | % | 5.23 | % | 7.99 | % | ||||||||
After Expense Reimbursement | 1.31 | % | 1.34 | % | 1.34 | % | 1.34 | % | ||||||||
Ratio of Net Investment Income to Average Net Assets | 0.90 | % | 0.32 | % | 0.52 | % | 0.15 | % | ||||||||
Portfolio Turnover Rate | 140.02 | % | 223.01 | % | 318.07 | % | 309.74 | % | ||||||||
| (1) | Computed using average shares outstanding throughout the period. |
See accompanying notes to financial statements.
110
TCW International Small Cap Fund
Financial Highlights — I Class
| Year Ended October 31, | ||||||||||||||||||||
| 2016 | 2015 | 2014 | 2013 | 2012 | ||||||||||||||||
Net Asset Value per Share, Beginning of Year | $ | 8.57 | $ | 8.72 | $ | 8.92 | $ | 7.83 | $ | 7.68 | ||||||||||
|
|
|
|
|
|
|
|
|
| |||||||||||
Income (Loss) from Investment Operations: | ||||||||||||||||||||
Net Investment Income (Loss) (1) | 0.02 | 0.01 | 0.01 | (0.01 | ) | 0.09 | ||||||||||||||
Net Realized and Unrealized Gain (Loss) on Investments | (0.05 | ) | (0.11 | ) | (0.13 | ) | 1.55 | 0.13 | ||||||||||||
|
|
|
|
|
|
|
|
|
| |||||||||||
Total from Investment Operations | (0.03 | ) | (0.10 | ) | (0.12 | ) | 1.54 | 0.22 | ||||||||||||
|
|
|
|
|
|
|
|
|
| |||||||||||
Less Distributions: | ||||||||||||||||||||
Distributions from Net Investment Income | (0.37 | ) | (0.05 | ) | (0.08 | ) | (0.45 | ) | (0.07 | ) | ||||||||||
|
|
|
|
|
|
|
|
|
| |||||||||||
Net Asset Value per Share, End of Year | $ | 8.17 | $ | 8.57 | $ | 8.72 | $ | 8.92 | $ | 7.83 | ||||||||||
|
|
|
|
|
|
|
|
|
| |||||||||||
Total Return | (0.49 | )% | (1.07 | )% | (1.39 | )% | 20.77 | % | 2.92 | % | ||||||||||
Ratios/Supplemental Data: | ||||||||||||||||||||
Net Assets, End of Year (in thousands) | $ | 5,684 | $ | 7,274 | $ | 19,786 | $ | 24,266 | $ | 18,354 | ||||||||||
Ratio of Expenses to Average Net Assets: | ||||||||||||||||||||
Before Expense Reimbursement | 2.40 | % | 1.67 | % | 1.37 | % | 1.36 | % | 1.32 | % | ||||||||||
After Expense Reimbursement | 1.44 | % | 1.44 | % | N/A | N/A | N/A | |||||||||||||
Ratio of Net Investment Income (Loss) to Average Net Assets | 0.29 | % | 0.17 | % | 0.12 | % | (0.17 | )% | 1.16 | % | ||||||||||
Portfolio Turnover Rate | 128.62 | % | 243.88 | % | 259.88 | % | 301.86 | % | 139.84 | % | ||||||||||
| (1) | Computed using average shares outstanding throughout the period. |
See accompanying notes to financial statements.
111
TCW International Small Cap Fund
Financial Highlights — N Class
| Year Ended October 31, | ||||||||||||||||||||
| 2016 | 2015 | 2014 | 2013 | 2012 | ||||||||||||||||
Net Asset Value per Share, Beginning of Year | $ | 8.58 | $ | 8.72 | $ | 8.92 | $ | 7.82 | $ | 7.68 | ||||||||||
|
|
|
|
|
|
|
|
|
| |||||||||||
Income (Loss) from Investment Operations: | ||||||||||||||||||||
Net Investment Income (Loss) (1) | 0.03 | 0.03 | 0.00 | (2) | (0.02 | ) | 0.08 | |||||||||||||
Net Realized and Unrealized Gain (Loss) on Investments | (0.07 | ) | (0.12 | ) | (0.13 | ) | 1.56 | 0.12 | ||||||||||||
|
|
|
|
|
|
|
|
|
| |||||||||||
Total from Investment Operations | (0.04 | ) | (0.09 | ) | (0.13 | ) | 1.54 | 0.20 | ||||||||||||
|
|
|
|
|
|
|
|
|
| |||||||||||
Less Distributions: | ||||||||||||||||||||
Distributions from Net Investment Income | (0.37 | ) | (0.05 | ) | (0.07 | ) | (0.44 | ) | (0.06 | ) | ||||||||||
|
|
|
|
|
|
|
|
|
| |||||||||||
Net Asset Value per Share, End of Year | $ | 8.17 | $ | 8.58 | $ | 8.72 | $ | 8.92 | $ | 7.82 | ||||||||||
|
|
|
|
|
|
|
|
|
| |||||||||||
Total Return | (0.60 | )% | (1.03 | )% | (1.52 | )% | 20.77 | % | 2.75 | % | ||||||||||
Ratios/Supplemental Data: | ||||||||||||||||||||
Net Assets, End of Year (in thousands) | $ | 3,143 | $ | 3,440 | $ | 9,437 | $ | 11,847 | $ | 11,715 | ||||||||||
Ratio of Expenses to Average Net Assets: | ||||||||||||||||||||
Before Expense Reimbursement | 2.88 | % | 2.09 | % | 1.75 | % | 1.67 | % | 1.64 | % | ||||||||||
After Expense Reimbursement | 1.44 | % | 1.44 | % | 1.44 | % | 1.44 | % | 1.44 | % | ||||||||||
Ratio of Net Investment Income (Loss) to Average Net Assets | 0.33 | % | 0.40 | % | 0.04 | % | (0.23 | )% | 1.00 | % | ||||||||||
Portfolio Turnover Rate | 128.62 | % | 243.88 | % | 259.88 | % | 301.86 | % | 139.84 | % | ||||||||||
| (1) | Computed using average shares outstanding throughout the period. |
| (2) | Amount rounds to less than $0.01 per share. |
See accompanying notes to financial statements.
112
TCW Funds, Inc.
|
To the Board of Directors and Shareholders of
TCW Funds, Inc.
Los Angeles, California
We have audited the accompanying statements of assets and liabilities, including the schedules of investments, of TCW Developing Markets Equity Fund, TCW Emerging Markets Income Fund, TCW Emerging Markets Local Currency Income Fund, TCW Emerging Markets Multi-Asset Opportunities Fund, TCW International Growth Fund, and TCW International Small Cap Fund (collectively, the “TCW International Funds”) (six of twenty-three funds comprising TCW Funds, Inc.) as of October 31, 2016, and the related statements of operations for the year then ended, the statements of changes in net assets for each of the respective stated periods then ended, and the financial highlights for each of the respective stated periods then ended. These financial statements and financial highlights are the responsibility of the TCW International Funds’ management. Our responsibility is to express an opinion on these financial statements and financial highlights based on our audits.
We conducted our audits in accordance with the standards of the Public Company Accounting Oversight Board (United States). Those standards require that we plan and perform the audits to obtain reasonable assurance about whether the financial statements and financial highlights are free of material misstatement. The TCW International Funds are not required to have, nor were we engaged to perform, an audit of their internal control over financial reporting. Our audits included consideration of internal control over financial reporting as a basis for designing audit procedures that are appropriate in the circumstances, but not for the purpose of expressing an opinion on the effectiveness of the TCW International Funds’ internal control over financial reporting . Accordingly, we express no such opinion. An audit also includes examining, on a test basis, evidence supporting the amounts and disclosures in the financial statements, assessing the accounting principles used and significant estimates made by management, as well as evaluating the overall financial statement presentation. Our procedures included confirmation of securities owned as of October 31, 2016, by correspondence with custodian and brokers; where replies were not received from brokers, we performed other auditing procedures. We believe that our audits provide a reasonable basis for our opinion.
In our opinion, the financial statements and financial highlights referred to above present fairly, in all material respects, the financial position of each of the respective TCW International Funds as of October 31, 2016, the results of their operations for the year then ended, and the changes in their net assets, and the financial highlights for each of the respective stated periods then ended, in conformity with accounting principles generally accepted in the United States of America.

Los Angeles, California
December 21, 2016
113
TCW Funds, Inc.
Shareholder Expenses (Unaudited)
As a shareholder of a Fund, you incur ongoing operational costs of the Fund, including management fees and other fund expenses. The following example is intended to help you understand your ongoing costs (in dollars and cents) of investing in a Fund and to compare these costs with the ongoing costs of investing in other funds.
The example is based on an investment of $1,000 invested at the beginning of the period and held for the entire period from May 1, 2016 to October 31, 2016 (184 days).
Actual Expenses The first line under each Fund in the table below provides information about the actual account values and actual expenses. You may use the information in this line, together with the amount you invested, to estimate the expenses that you paid over the period. Simply divide your account value by $1,000 (for example, an $8,600 account value divided by $1,000 = 8.6), then multiply the result by the number in the first line for your Fund under the heading entitled “Expenses Paid During Period” to estimate the expenses you paid on your account during this period.
Hypothetical Example for Comparison Purposes The second line under each Fund in the table below provides information about the hypothetical expenses based on each Fund’s actual expense ratio and an assumed rate of return of 5% per year before expenses, which is not the Fund’s actual return. The hypothetical account value and expenses may not be used to estimate the actual ending account balance or expenses you paid for the period. You may use this information to compare the ongoing costs of investing in your Fund and other funds. To do so, compare this 5% hypothetical example with the 5% hypothetical examples that appear in the shareholder reports of the other funds.
TCW Funds, Inc. | Beginning Account Value May 1, 2016 | Ending Account Value October 31, 2016 | Annualized Expense Ratio | Expenses Paid During Period (May 1, 2016 to October 31, 2016) | ||||||||||||
| TCW Developing Markets Equity Fund | ||||||||||||||||
I Class Shares | ||||||||||||||||
Actual | $ | 1,000.00 | $ | 1,111.10 | 1.25 | % | $ | 6.63 | ||||||||
Hypothetical (5% return before expenses) | 1,000.00 | 1,018.85 | 1.25 | % | 6.34 | |||||||||||
N Class Shares | ||||||||||||||||
Actual | $ | 1,000.00 | $ | 1,111.10 | 1.25 | % | $ | 6.63 | ||||||||
Hypothetical (5% return before expenses) | 1,000.00 | 1,018.85 | 1.25 | % | 6.34 | |||||||||||
| TCW Emerging Markets Income Fund | ||||||||||||||||
I Class Shares | ||||||||||||||||
Actual | $ | 1,000.00 | $ | 1,083.90 | 0.83 | % | $ | 4.35 | ||||||||
Hypothetical (5% return before expenses) | 1,000.00 | 1,020.96 | 0.83 | % | 4.22 | |||||||||||
N Class Shares | ||||||||||||||||
Actual | $ | 1,000.00 | $ | 1,082.70 | 1.14 | % | $ | 5.97 | ||||||||
Hypothetical (5% return before expenses) | 1,000.00 | 1,019.41 | 1.14 | % | 5.79 | |||||||||||
| TCW Emerging Markets Local Currency Income Fund | ||||||||||||||||
I Class Shares | ||||||||||||||||
Actual | $ | 1,000.00 | $ | 1,038.70 | 0.99 | % | $ | 5.07 | ||||||||
Hypothetical (5% return before expenses) | 1,000.00 | 1,020.16 | 0.99 | % | 5.03 | |||||||||||
N Class Shares | ||||||||||||||||
Actual | $ | 1,000.00 | $ | 1,038.70 | 0.99 | % | $ | 5.07 | ||||||||
Hypothetical (5% return before expenses) | 1,000.00 | 1,020.16 | 0.99 | % | 5.03 | |||||||||||
114
TCW Funds, Inc.
Shareholder Expenses (Unaudited) (Continued)
TCW Funds, Inc. | Beginning Account Value May 1, 2016 | Ending Account Value October 31, 2016 | Annualized Expense Ratio | Expenses Paid During Period (May 1, 2016 to October 31, 2016) | ||||||||||||
| TCW Emerging Markets Multi-Asset Opportunities Fund | ||||||||||||||||
I Class Shares | ||||||||||||||||
Actual | $ | 1,000.00 | $ | 1,104.10 | 1.23 | % | $ | 6.51 | ||||||||
Hypothetical (5% return before expenses) | 1,000.00 | 1,018.95 | 1.23 | % | 6.24 | |||||||||||
N Class Shares | ||||||||||||||||
Actual | $ | 1,000.00 | $ | 1,104.60 | 1.23 | % | $ | 6.51 | ||||||||
Hypothetical (5% return before expenses) | 1,000.00 | 1,018.95 | 1.23 | % | 6.24 | |||||||||||
| TCW International Growth Fund | ||||||||||||||||
I Class Shares | ||||||||||||||||
Actual | $ | 1,000.00 | $ | 1,016.60 | 1.04 | % | $ | 5.27 | ||||||||
Hypothetical (5% return before expenses) | 1,000.00 | 1,019.91 | 1.04 | % | 5.28 | |||||||||||
N Class Shares | ||||||||||||||||
Actual | $ | 1,000.00 | $ | 1,014.60 | 1.29 | % | $ | 6.53 | ||||||||
Hypothetical (5% return before expenses) | 1,000.00 | 1,018.65 | 1.29 | % | 6.55 | |||||||||||
| TCW International Small Cap Fund | ||||||||||||||||
I Class Shares | ||||||||||||||||
Actual | $ | 1,000.00 | $ | 1,008.60 | 1.44 | % | $ | 7.27 | ||||||||
Hypothetical (5% return before expenses) | 1,000.00 | 1,017.90 | 1.44 | % | 7.30 | |||||||||||
N Class Shares | ||||||||||||||||
Actual | $ | 1,000.00 | $ | 1,008.60 | 1.44 | % | $ | 7.27 | ||||||||
Hypothetical (5% return before expenses) | 1,000.00 | 1,017.90 | 1.44 | % | 7.30 | |||||||||||
115
TCW Funds, Inc.
Our Privacy Policy
We, The TCW Group, Inc. and its subsidiaries, the TCW Funds, Inc., TCW Alternative Funds, TCW Strategic Income Fund, Inc. and the Metropolitan West Funds (collectively, “TCW”) are committed to protecting the nonpublic personal and financial information of our customers and consumers who obtain or seek to obtain financial products or services primarily for personal, family or household purposes. We fulfill our commitment by establishing and implementing policies and systems to protect the security and confidentiality of this information.
In our offices, we limit access to nonpublic personal and financial information about you to those TCW personnel who need to know the information in order to provide products or services to you. We maintain physical, electronic and procedural safeguards to protect your nonpublic personal and financial information.
What You Should Know
At TCW, we recognize the importance of keeping information about you secure and confidential. We do not sell or share your nonpublic personal and financial information with marketers or others outside our affiliated group of companies.
We carefully manage information among our affiliated group of companies to safeguard your privacy and to provide you with consistently excellent service.
We are providing this notice to you to comply with the requirements of Regulation S-P, “Privacy of Consumer Financial Information,” issued by the United States Securities and Exchange Commission.
Categories of Information We Collect
We may collect the following types of nonpublic personal and financial information about you from the following sources:
| • | Your name, address and identifying numbers, and other personal and financial information, from you and from identification cards and papers you submit to us, on applications, subscription agreements or other forms or communications. |
| • | Information about your account balances and financial transactions with us, our affiliated entities, or nonaffiliated third parties, from our internal sources, from affiliated entities and from nonaffiliated third parties. |
| • | Information about your account balances and financial transactions and other personal and financial information, from consumer credit reporting agencies or other nonaffiliated third parties, to verify information received from you or others. |
Categories of Information We Disclose to Nonaffiliated Third Parties
| • | We may disclose your name, address and account and other identifying numbers, as well as information about your pending or past transactions and other personal financial information, to nonaffiliated third parties, for our everyday business purposes such as necessary to execute, process, service and confirm your securities transactions and mutual fund transactions, to administer and service your account and commingled investment vehicles in which you are invested, to market our products and services through joint marketing arrangements or to respond to court orders and legal investigations. |
116
TCW Funds, Inc.
Privacy Policy (Continued)
| • | We may disclose nonpublic personal and financial information concerning you to law enforcement agencies, federal regulatory agencies, self-regulatory organizations or other nonaffiliated third parties, if required or requested to do so by a court order, judicial subpoena or regulatory inquiry. |
We do not otherwise disclose your nonpublic personal and financial information to nonaffiliated third parties, except where we believe in good faith that disclosure is required or permitted by law. Because we do not disclose your nonpublic personal and financial information to nonaffiliated third parties, our Customer Privacy Policy does not contain opt-out provisions.
Categories of Information We Disclose to Our Affiliated Entities
| • | We may disclose your name, address and account and other identifying numbers, account balances, information about your pending or past transactions and other personal financial information to our affiliated entities for any purpose. |
| • | We regularly disclose your name, address and account and other identifying numbers, account balances and information about your pending or past transactions to our affiliates to execute, process and confirm securities transactions or mutual fund transactions for you, to administer and service your account and commingled investment vehicles in which you are invested, or to market our products and services to you. |
Information About Former Customers
We do not disclose nonpublic personal and financial information about former customers to nonaffiliated third parties unless required or requested to do so by a court order, judicial subpoena or regulatory inquiry, or otherwise where we believe in good faith that disclosure is required or permitted by law.
Questions
Should you have any questions about our Customer Privacy Policy, please contact us by email or by regular mail at the address at the end of this policy.
Reminder About TCW’s Financial Products
Financial products offered by The TCW Group, Inc. and its subsidiaries, the TCW Funds, Inc., TWC Alternative Funds, TCW Strategic Income Fund, Inc. and the Metropolitan West Funds:
| • | Are not guaranteed by a bank; |
| • | Are not obligations of The TCW Group, Inc. or of its subsidiaries; |
| • | Are not insured by the Federal Deposit Insurance Corporation; and |
| • | Are subject to investment risks, including possible loss of the principal amount committed or invested, and earnings thereon. |
THE TCW GROUP, INC.
TCW FUNDS, INC.
TCW ALTERNATIVE FUNDS
TCW STRATEGIC INCOME FUND, INC.
METROPOLITAN WEST FUNDS
Attention: Privacy Officer | 865 South Figueroa St. Suite 1800 | Los Angeles, CA 90017 |
email: privacy@tcw.com
117
TCW Funds, Inc.
Approval of Investment Management and Advisory Agreement
TCW Funds, Inc. (the “Corporation”) and TCW Investment Management Company LLC (the “Advisor”) are parties to an Investment Advisory and Management Agreement (“Current Agreement”), pursuant to which the Advisor is responsible for managing the investments of each separate investment series (each, a “Fund” and collectively, the “Funds”) of the Corporation. The Current Agreement continues in effect from year to year provided that such continuance is specifically approved at least annually by the Board of Directors of the Corporation (the “Board”), including the directors who are not “interested persons” of either the Corporation or the Advisor (the “Independent Directors”). The Current Agreement terminates automatically in the event of its assignment.
At a meeting held on September 26, 2016, the Board, including the Independent Directors, approved the continuation of the Current Agreement with respect to each Fund for an additional one-year term from when it otherwise would expire.
Continuation of the Current Agreement
The Advisor provided materials to the Board in advance of meetings held on September 7, 2016 and September 26, 2016 (the “Current Agreement Materials”) for their evaluation of the Current Agreement in response to information requested by the Independent Directors, who were advised by counsel to the Independent Directors with respect to these and other relevant matters. In addition, the Independent Directors met separately with counsel to the Independent Directors to consider the information provided. As a result of those meetings and their other meetings, the Board (including a majority of the Independent Directors voting separately) approved the continuation of the Current Agreement based on the recommendation of the Independent Directors. In deciding to recommend the renewal of the Current Agreement with respect to each Fund, the Independent Directors did not identify any single or particular piece of information that, in isolation, was the controlling factor. Each Independent Director may also have weighed factors differently. This summary describes the most important, but not all, of the factors considered by the Board.
Nature, Extent, and Quality of Services The Independent Directors considered the general nature, extent, and quality of services provided and expected to be provided by the Advisor. The Independent Directors evaluated the Advisor’s experience in serving as manager of the Funds, and considered the benefits to shareholders of investing in a fund complex that is served by a large investment management organization where the Advisor and its affiliates also serve a variety of other investment advisory clients, including separate accounts, other pooled investment vehicles, registered investment companies and commingled funds. The Independent Directors also considered the ability of the Advisor to provide appropriate levels of support and resources to the Funds. The Independent Directors noted the Advisor’s responsibility to supervise the activities of the Funds’ various service providers, as well as to support the Independent Directors and their meetings, prepare regulatory filings, and provide various operational personnel.
In addition, the Independent Directors took note of the background and experience of the senior management and portfolio management personnel of the Advisor and that the Advisor provides and is expected to continue to provide substantial expertise and attention to the Funds as well as resources and infrastructure, noting also the Advisor’s description of its stable team and deep bench of personnel. The Independent Directors considered the ability of the Advisor to attract and retain qualified business professionals and its compensation program, noting in particular the Advisor’s recent hiring of professionals in various areas over the past several years, including additional analysts on the equity research team and emerging markets team, a new Chief Data Officer, upgrading resources in the middle
118
TCW Funds, Inc.
Approval of Investment Management and Advisory Agreement (Continued)
office and back office operations and other areas, as well as its continuing and extensive program of infrastructure and systems enhancements. The Independent Directors also considered the breadth of the compliance programs of the Advisor, as well as the compliance operations of the Advisor with respect to the Funds. The Independent Directors concluded that they were satisfied with the nature, extent and quality of the services provided and anticipated to be provided to the Funds by the Advisor under the Current Agreement.
Investment Performance The Independent Directors reviewed information about each Fund’s historical performance, including materials prepared by the Advisor and a Report prepared by Broadridge, an independent third party consultant, which provided a comparative analysis of each Fund with the performance of similar funds over one-, three-, five- and ten-year periods, as applicable. The Independent Directors noted that investment performance of most of the Funds was generally consistent with or above the median performance of the applicable Lipper peer group during most periods covered in the Report. They noted, however, that the investment performance of each of the TCW Select Equities Fund, TCW Relative Value Large Cap Fund, TCW Relative Value Mid Cap Fund, TCW Small Cap Growth Fund, TCW Growth Equities Fund, TCW Short Term Bond Fund, TCW International Small Cap Fund, TCW High Dividend Equities Fund, TCW Global Real Estate Fund, TCW Relative Value Dividend Appreciation Fund, TCW International Growth Fund and TCW Focused Equities Fund (formerly known as TCW Concentrated Value Fund) was in the fourth or fifth quintile of the applicable Lipper peer group for one or more periods covered in the Report. The Independent Directors noted the recent underperformance of these Funds and reviewed the actions taken by the Advisor to address such underperformance. The Independent Directors concluded that the Advisor should continue to provide investment advisory and management services to the Funds. The Independent Directors indicated that they would continue to monitor portfolio investment performance on a regular basis and discuss with the Advisor from time to time any instances of long-term underperformance as appropriate.
Advisory Fees and Profitability The Independent Directors considered information in the materials prepared by Lipper and the Advisor regarding the advisory fees charged to the Funds, advisory fees paid by other funds in the Funds’ respective peer groups, and advisory fees paid to the Advisor under advisory contracts with respect to other institutional clients. The Independent Directors noted that the investment advisory fees charged by the Advisor to many of the Funds were near or below the medians of their respective Lipper peer groups. They also noted, however, that the investment advisory fees of the TCW Select Equities Fund, TCW Small Cap Growth Fund, TCW SMID Cap Growth Fund, TCW Relative Value Dividend Appreciation Fund, TCW Relative Value Large Cap Fund, TCW Emerging Markets Income Fund, TCW Emerging Markets Multi-Asset Opportunities Fund and TCW Emerging Markets Local Currency Income Fund were above the medians of their respective Lipper peer groups. The Independent Directors reviewed related materials prepared the Advisor. The Independent Directors also noted that the advisory fees charged by the Advisor to many of the Funds are higher than the advisory fees charged by the Advisor to certain institutional separate accounts with similar strategies managed by the Advisor, but that the services provided the Funds are more extensive than the services provided to institutional separate accounts. The Independent Directors reviewed and discussed with the Advisor those additional services.
The Independent Directors noted that the total expenses of the Funds are near or below median expenses of the other funds in their respective peer groups. They considered that the Advisor has agreed to reduce its investment advisory fee or pay the operating expenses of each Fund in order to maintain the overall expense ratios of the Funds at competitive levels, and the amounts paid or waived by the Advisor pursuant
119
TCW Funds, Inc.
to expense limitations. The Independent Directors also considered the costs of services provided to the Funds by the Advisor and profits realized by the Advisor and its affiliates from their relationship with the Funds. Recognizing the difficulty in evaluating a manager’s profitability with respect to the funds it manages in the context of a manager with multiple lines of business, and noting that other profitability evaluation methodologies might also be reasonable, the Independent Directors concluded that the profits of the Advisor from its relationship with the Funds was reasonable. Based on these various considerations, the Independent Directors concluded that the contractual management fees of the Funds under the Investment Advisory and Management Agreement are fair and bear a reasonable relationship to the services rendered by the Advisor.
Expenses and Economies of Scale The Independent Directors considered the potential of the Advisor and the Funds to achieve economies of scale as the Funds grow in size. The Independent Directors noted that the Advisor has agreed to contractual expense limitation agreements, which are designed to maintain the overall expense ratio of each of the Fund at a competitive level. The Independent Directors were satisfied with the explanation for Funds with total expense ratios exceeding their peer group medians, such as the small size of the Fund or an expense ratio relatively near the median level. The Independent Directors also received information about the extent to which the Advisor has shared economies of scale through the reinvestment of profits into the advisory business of the Advisor and its affiliates, which benefits the Funds. The Independent Directors also considered the relative advantages and disadvantages of an advisory fee with breakpoints compared to a flat advisory fee supplemented by advisory fee waivers and/or expense reimbursements. The Independent Directors concluded that the current fee arrangements were appropriate given the current size and structure of the Funds and adequately reflected any economies of scale.
Ancillary Benefits The Independent Directors considered ancillary benefits to be received by the Advisor and its affiliates as a result of the relationship of the Advisor with the Funds, including compensation for certain compliance support services. The Independent Directors noted that, in addition to the fees the Advisor receives under the Current Agreement, the Advisor receives additional benefits in connection with management of the Funds in the form of reports, research and other services from brokers and their affiliates in return for brokerage commissions paid to such brokers. The Independent Directors concluded that any potential benefits to be derived by the Advisor from its relationships with the Funds are reasonably related to the services provided by the Advisor to the Funds.
Conclusions Based on their overall review, including their consideration of each of the factors referred to above (and others), the Board and the Independent Directors concluded that the Current Agreement is fair and reasonable to each Fund and its shareholders, that the Fund’s shareholders received reasonable value in return for the advisory fees and other amounts paid to the Advisor by each Fund, and that the renewal of the Current Agreement was in the best interests of each Fund and its shareholders.
120
TCW Funds, Inc.
Proxy Voting Guidelines
The policies and procedures that the Company uses to determine how to vote proxies are available without charge. The Board of the Company has delegated the Company’s proxy voting authority to the Advisor.
Disclosure of Proxy Voting Guidelines
The proxy voting guidelines of the Advisor are available:
| 1. | By calling 800-FUND-TCW (800-386-3829) to obtain a hard copy; or |
| 2. | By going to the SEC website at http://www.sec.gov. |
When the Company receives a request for a description of the Advisor’s proxy voting guidelines, it will deliver the description that is disclosed in the Company’s Statement of Additional Information. This information will be sent out via first class mail (or other means designed to ensure equally prompt delivery) within three business days of receiving the request.
The Advisor, on behalf of the Company, prepares and files Form N-PX with the SEC not later than August 31 of each year, which includes the Company’s proxy voting record for the most recent twelve-month period ended June 30 of that year. The Company’s proxy voting record for the most recent twelve-month period ended June 30 is available:
| 1. | By calling 800-FUND-TCW (800-386-3829) to obtain a hard copy; or |
| 2. | By going to the SEC website at http://www.sec.gov. |
When the Company receives a request for the Company’s proxy voting record, it will send the information disclosed in the Company’s most recently filed report on Form N-PX via first class mail (or other means designed to ensure equally prompt delivery) within three business days of receiving the request.
The Company also discloses its proxy voting record on its website as soon as is reasonably practicable after its report on Form N-PX is filed with the SEC.
Availability of Quarterly Portfolio Schedule
The Company files a complete schedule of its portfolio holdings with the SEC for the first and third quarters of its fiscal year on Form N-Q. The Form N-Q is available by calling 800-FUND-TCW (800-386-3829) to obtain a hard copy. You may also obtain the Company’s Form N-Q:
| 1. | By going to the SEC website at http://www.sec.gov.; or |
| 2. | By visiting the SEC’s Public Reference Room in Washington, D.C. and photocopying it (Phone 1-800-SEC-0330 for information on the operation of the SEC’s Public Reference Room). |
121
TCW Funds, Inc.
Tax Information Notice (Unaudited)
Under Section 854(b)(2) of the Code, the Funds hereby designate the following maximum amounts as qualified dividends for purposes of the maximum rate under Section 1(h)(11) of the Code for the fiscal year ended October 31, 2016 (amounts in thousands):
Fund | Qualified Dividend Income | |||
TCW Developing Markets Equity Fund | $ | 10 | ||
TCW Emerging Markets Multi-Asset Opportunities Fund | 353 | |||
TCW International Growth Fund | 40 | |||
TCW International Small Cap Fund | 239 | |||
The following is the dividend received deduction percentage for the Funds’ corporate shareholders:
Fund | Qualified Received Deductions | |||
TCW Developing Markets Equity Fund | 0.21% | |||
TCW Emerging Markets Multi-Asset Opportunities Fund | 0.01% | |||
TCW International Growth Fund | 2.14% | |||
TCW International Small Cap Fund | 0.30% | |||
The following Funds paid foreign taxes during the year ended October 31, 2016 that are available as income tax credits (amounts in thousands):
Fund | Foreign Tax Credit | |||
TCW Developing Markets Equity Fund | $ | 10 | ||
TCW Emerging Markets Income Fund | 62 | |||
TCW Emerging Markets Multi-Asset Opportunities Fund | 64 | |||
TCW International Growth Fund | 6 | |||
TCW International Small Cap Fund | 16 | |||
This information is given to meet certain requirements of the Code and should not be used by shareholders for preparing their income tax returns. In February 2017, shareholders will receive Form 1099-DIV which will show the actual distribution received and include their share of qualified dividends during the calendar year of 2016. Shareholders are advised to check with their tax advisors for information on the treatment of these amounts on their individual tax returns.
122
TCW Funds, Inc.
Directors and Officers of the Company
A board of nine directors is responsible for overseeing the operations of the Company, which consists of 23 Funds at October 31, 2016. The directors of the Company, and their business addresses and their principal occupation for the last five years are set forth below.
Independent Directors
Name, and Year of Birth (1) | Term of Office and Length of Time Served | Principal Occupation(s) During Past 5 Years | Other Directorships held by Director | |||
| Samuel P. Bell (1936) | Indefinite term; Mr. Bell has served as a director of TCW Funds, Inc. since October 2002. | Private Investor. | Point 360 (post production services); TCW Strategic Income Fund, Inc. (closed-end fund). | |||
| John A. Gavin (1931) | Indefinite term; Mr. Gavin has served as a director of TCW Funds, Inc. since May 2001. | Founder and Chairman of Gamma Holdings (international capital consulting firm). | TCW Strategic Income Fund, Inc. (closed-end fund); Hotchkis and Wiley Funds (mutual fund). | |||
Patrick C. Haden (1953) Chairman of the Board | Indefinite term; Mr. Haden has served as a director of TCW Funds, Inc. since May 2001. | Senior Advisor to President (since July 2016). and Athletic Director (2010-June 2016), University of Southern California. | Tetra Tech, Inc. (environmental consulting); The Rose Hills Foundation (charitable foundation); Unihealth Foundation (charitable foundation); Fletcher Jones Foundation (charitable foundation); Mayr Foundation (charitable foundation); First Beverage (beverage consulting); Auto Club (affiliate of AAA); Metropolitan West Funds (mutual fund); TCW Alternative Funds (mutual fund); TCW Strategic Income Fund, Inc. (closed-end fund). | |||
| Peter McMillan (1957) | Indefinite term; Mr. McMillan has served as a director of TCW Funds, Inc. since August 2010. | Co-founder, Managing Partner and Chief Investment Officer (since May 2013), Temescal Canyon Partners (investment advisory firm); Co-founder and Managing Partner (since 2000) Willowbrook Capital Group, LLC (investment advisory firm); Co-founder and Executive Vice President (since 2005), KBS Capital Advisors (a manager of real estate investment trusts). | KBS Real Estate Investment Trusts (real estate investments); KBS Strategic Opportunity REITs (real estate investments); Metropolitan West Funds (mutual funds); TCW Strategic Income Fund, Inc. (closed-end fund); TCW Alternative Funds (mutual fund). | |||
| Charles A. Parker (1934) | Indefinite term; Mr. Parker has served as a director of the TCW Funds, Inc. since April 2003. | Private Investor. | Burridge Center for Research in Security Prices (University of Colorado); TCW Strategic Income Fund, Inc. (closed-end fund). | |||
| Victoria B. Rogers (1961) | Indefinite term; Ms. Rogers has served as a director of the TCW Funds, Inc. since October 2011. | President, The Rose Hills Foundation. (charitable foundation) | Causeway Capital Management Trust (mutual fund); TCW Strategic Income Fund, Inc. (closed-end fund). | |||
| Andrew Tarica (1959) | Indefinite term; Mr. Tarica has served as a director of the TCW Funds, Inc. since March 2012. | Chief Executive Officer, Meadowbrook Capital Management (asset management company); Employee, Cowen & Co. (broker-dealer). | Metropolitan West Funds (mutual fund); TCW Strategic Income Fund, Inc. (closed-end fund); TCW Alternative Funds (mutual fund). |
| (1) | The address of each Independent Director is c/o Morgan Lewis, & Bockius LLP, Counsel to the Independent Directors, 300 South Grand Avenue, 22nd floor, Los Angeles, CA 90071. |
123
TCW Funds, Inc.
Interested Directors
Each of these directors are “interested persons” of the Company as defined in the 1940 Act because they are directors and officers of the Advisor, and shareholders and directors of The TCW Group, Inc., the parent company of the Advisor.
Name and Year of Birth | Term of Office and Length of Time Served | Principal Occupation(s) During Past 5 Years | Other Directorships held by Director | |||
| Marc I. Stern (1944) | Indefinite term; Mr. Stern has served as a director since inception of TCW Funds, Inc. in September 1992. | Chairman (since January 2016), TCW LLC; Chairman (since February 2013), The TCW Group, Inc., TCW Investment Management Company LLC, TCW Asset Management Company LLC and Metropolitan West Asset Management, LLC; Chief Executive Officer and Chairman (December 2009 to February 2013), TCW Investment Management Company LLC; Vice Chairman and Chief Executive Officer (December 2009 to August 2012), The TCW Group, Inc. (December 2009 to February 2013 and December 2009 to February 2013) TCW Asset Management Company LLC; Vice Chairman and President (November 2010 to February 2013); Vice Chairman (November 2010 to December 2014) and Chairman (since December 2014), Trust Company of the West. | Qualcomm Incorporated (wireless communications) | |||
| David S. DeVito (1962) | Indefinite term; Mr. DeVito has served as a director since January 2014. | Executive Vice President and Chief Operating Officer (since January 2016), TCW LLC; President and Chief Executive Officer (since 2015), TCW Alternative Funds; Executive Vice President and Chief Operating Officer (since October 2013), TCW Investment Management Company LLC, The TCW Group, Inc., Trust Company of the West, Metropolitan West Asset Management, LLC and TCW Asset Management Company LLC; President and Chief Executive Officer (since January 2014), TCW Strategic Income Fund, Inc. ; Executive Vice President and Chief Financial Officer (since 2010), Metropolitan West Funds. | TCW Strategic Income Fund, Inc. (closed-end fund) |
124
TCW Funds, Inc.
Directors and Officers of the Company (Continued)
The officers of the Company who are not directors of the Company are:
| Name and Year of Birth | Position(s) Held with Company | Principal Occupation(s) During Past 5 Years (1) | ||
| Peter A. Brown (1955) | Senior Vice President | Managing Director (since January 2016), TCW LLC; Managing Director (since February 1998), TCW Investment Management Company LLC, The TCW Group Inc., Trust Company of the West and TCW Asset Management Company LLC; Senior Vice President (since August 2007), TCW Strategic Income Fund, Inc. | ||
| Meredith S. Jackson (1959) | Senior Vice President, General Counsel and Secretary | Executive Vice President, General Counsel and Secretary (since January 2016), TCW LLC; Senior Vice President, General Counsel and Secretary (since 2015), TCW Alternative Funds; Executive Vice President, General Counsel and Secretary (since February 2013), TCW Investment Management Company LLC, The TCW Group Inc., Trust Company of the West, TCW Asset Management Company LLC and Metropolitan West Asset Management, LLC; Senior Vice President, General Counsel and Secretary (since February 2013), TCW Strategic Income Fund, Inc. and Metropolitan West Funds; Partner and Chair of the Debt Finance Practice Group (1999 – January 2013), Irell & Manella (law firm). | ||
| Jeffrey Engelsman (1967) | Chief Compliance Officer | Global Chief Compliance Officer (since January 2016), TCW LLC; Chief Compliance Officer (since 2015), TCW Alternative Funds; Managing Director, Global Chief Compliance Officer (since August 2014), TCW Investment Management Company LLC, The TCW Group Inc., Trust Company of the West and TCW Asset Management Company LLC, Metropolitan West Asset Management, LLC – Global Chief Compliance Officer (December 2014); Chief Compliance Officer (since September 2014), TCW Strategic Income Fund, Inc.; Chief Compliance Officer (2009 – August 2014), MainStay Funds (mutual fund); Managing Director (2009 – July 2014), New York Life Investments (investment management). |
125
TCW Funds, Inc.
| Name and Year of Birth | Position(s) Held with Company | Principal Occupation(s) During Past 5 Years (1) | ||
| Richard Villa (1964) | Treasurer and Chief Financial Officer | Managing Director, Chief Financial Officer and Assistant Secretary (since January 2016), TCW LLC; Treasurer (since 2015), TCW Alternative Funds; Treasurer and Chief Financial Officer (since January 2014), TCW Strategic Income Fund, Inc.; Managing Director and Chief Financial Officer (since July 2008), TCW Investment Management Company LLC, the TCW Group, Inc., Trust Company of the West, TCW Asset Management Company LLC, and Metropolitan West Asset Management, LLC. |
| (1) | Positions with The TCW Group, Inc. and its affiliates may have changed over time. |
| * | Address is 865 South Figueroa Street, 18th Floor, Los Angeles, California 90017 |
In addition, George N. Winn, Senior Vice President of Trust Company of the West, TCW Asset Management Company LLC, Metropolitan West Asset Management, LLC, TCW LLC and the Advisor, is Assistant Treasurer of TCW Alternative Funds and the Corporation; and Patrick W. Dennis, Senior Vice President and Associate General Counsel of Trust Company of the West, TCW Asset Management Company LLC, Metropolitan West Asset Management, LLC, TCW LLC and the Advisor, is Assistant Secretary of TCW Alternative Funds and the Corporation.
The SAI (Statement of Additional Information) has additional information regarding the Board of Directors. A copy is available without charge by calling 1-800-FUND-TCW (1-800-386-3829) to obtain a hard copy or by going to the SEC website at http://www.sec.gov.
126

TCW Funds, Inc.
865 South Figueroa Street
Los Angeles, California 90017
800 FUND TCW
(800 386 3829)
www.TCW.com
INVESTMENT ADVISOR
TCW Investment Management Company LLC 865 South Figueroa Street Los Angeles, California 90017
TRANSFER AGENT
U.S. Bancorp Fund Services, LLC 615 E. Michigan Street Milwaukee, Wisconsin 53202
INDEPENDENT REGISTERED PUBLIC ACCOUNTING FIRM
Deloitte & Touche LLP 555 West 5th Street Los Angeles, California 90013
CUSTODIAN & ADMINISTRATOR
State Street Bank & Trust Company One Lincoln Street Boston, Massachusetts 02111
DISTRIBUTOR
TCW Funds Distributors LLC 865 South Figueroa Street Los Angeles, California 90017 | DIRECTORS
Patrick C. Haden Director and Chairman of the Board
Samuel P. Bell Director
David S. DeVito Director
John A. Gavin Director
Peter McMillan Director
Charles A. Parker Director
Victoria B. Rogers Director
Marc I. Stern Director
Andrew Tarica Director
OFFICERS
David S. DeVito President and Chief Executive Officer
Meredith S. Jackson Senior Vice President, General Counsel and Secretary
Richard M. Villa Treasurer and Chief Financial Officer
Jeffrey A. Engelsman Chief Compliance Office
Peter A. Brown Senior Vice President
Patrick W. Dennis Assistant Secretary
George N. Winn Assistant Treasurer | TCW FAMILY OF FUNDS
EQUITY FUNDS TCW Focused Equities Fund TCW Global Real Estate Fund TCW Growth Equities Fund TCW High Dividend Equities Fund TCW New America Premier Equities Fund TCW Relative Value Dividend Appreciation Fund TCW Relative Value Large Cap Fund TCW Relative Value Mid Cap Fund TCW Select Equities Fund TCW Small Cap Growth Fund
TCW ALLOCATION FUND TCW Conservative Allocation Fund
FIXED INCOME FUNDS TCW Core Fixed Income Fund TCW Enhanced Commodity Strategy Fund TCW Global Bond Fund TCW High Yield Bond Fund TCW Short Term Bond Fund TCW Total Return Bond Fund
INTERNATIONAL FUNDS TCW Developing Markets Equity Fund TCW Emerging Markets Income Fund TCW Emerging Markets Local Currency Income Fund TCW Emerging Markets Multi-Asset Opportunities Fund TCW International Growth Fund TCW International Small Cap Fund |
FUNDarINT1016
| Item 2. | Code of Ethics. |
| (a) | The Registrant has adopted a code of ethics that applies to its principal executive officer and principal financial officer or persons performing similar functions. |
| (c) | The Registrant has made no material changes to its code of ethics. |
| (d) | The Registrant has not granted any waivers from any provisions of its code of ethics during the period covered by this Form N-CSR. |
| (e) | Not applicable. |
| (f) | A copy of the Registrant’s code of ethics is filed as Exhibit 12(a)(1) to this Form N-CSR. |
| Item 3. | Audit Committee Financial Expert. |
| (a)(1) | The Registrant’s Board of Directors (the “Board”) has determined that the Registrant has three members serving on the Registrant’s Audit Committee that possess the attributes identified in Form N-CSR to qualify as an “audit committee financial expert.” |
| (a)(2) | The audit committee financial experts are Samuel P. Bell, Charles A. Parker and Victoria B. Rogers. Each has been deemed to be “independent” as that term is defined in Form N-CSR. |
| Item 4. | Principal Accountant Fees and Services. |
The firm of Deloitte & Touche LLP (“Deloitte”) serves as the independent registered public accounting firm for the Registrant.
(a) Audit Fees
For the fiscal years ended October 31, 2016 and October 31, 2015, the aggregate fees billed for professional services rendered by Deloitte for the audit of the Registrant’s annual financial statements or for services that are normally provided by Deloitte in connection with statutory and regulatory filings or engagements were:
2016 | 2015 | |
| $623,195 | $625,175 |
(b) Audit-Related Fees
For the fiscal years October 31, 2016 and October 31, 2015, the aggregate fees billed for assurance and related services rendered by Deloitte that are reasonably related to the performance of the audit or review of the Registrant’s financial statements and that are not reported under Audit Fees above were:
2016 | 2015 | |
| $0 | $0 |
(c) Tax Fees
For the fiscal years ended October 31, 2016 and October 31, 2015, the aggregate fees billed for tax compliance, tax advice and tax planning by Deloitte were:
2016 | 2015 | |
| $126,200 | $127,400 |
Fees were for the preparation and filing of the Registrant’s corporate returns.
(d) All Other Fees
For the fiscal years ended October 31, 2016 and October 31, 2015, the aggregate fees billed by Deloitte to the Registrant for all services other than services reported under Audit Fees, Audit-Related Fees, and Tax Fees were:
2016 | 2015 | |
| $0 | $0 |
(e) (1) The Registrant’s Audit Committee approves each specific service the auditor will perform for the Registrant. Accordingly, the Audit Committee has not established pre-approval policies or procedures for services that the auditor may perform for the Registrant.
(e) (2) None of the services described in each of paragraphs (b) through (d) of this Item were approved by the Registrant’s Audit Committee pursuant to paragraph (c)(7)(i)(C) of Rule 2-01 of Regulation S-X.
(f) Not applicable.
(g) For the fiscal years ended October 31, 2016 and October 31, 2015, aggregate non-audit fees billed by Deloitte for services rendered to the Registrant were:
2016 | 2015 | |
| $126,200 | $127,400 |
For the twelve month periods ended October 31, 2016 and October 31, 2015, aggregate non-audit fees billed by Deloitte for services rendered to the Registrant’s investment adviser and any entity controlling, controlled by or under common control with the investment adviser that provides ongoing services to the Registrant were $0 and $0, respectively.
| (h) | Not applicable. |
| Item 5. | Audit Committees of Listed Registrants. |
Not applicable.
| Item 6. | Investments. |
| (a) | The Schedule of Investments is included as part of the Report to Shareholders filed under Item 1 of this Form N-CSR. |
| (b) | Not applicable. |
| Item 7. | Disclosure of Proxy Voting Policies and Procedures for Closed-End Management Investment Companies. |
Not applicable.
| Item 8. | Portfolio Managers of Closed-End Management Investment Companies. |
Not applicable.
| Item 9. | Purchases of Equity Securities by Closed-End Management Investment Company and Affiliated Purchasers. |
Not applicable.
| Item 10. | Submission of Matters to a Vote of Security Holders. |
There have been no material changes to the procedures by which shareholders may recommend nominees to the Registrant’s Board of Directors.
| Item 11. | Controls and Procedures. |
| (a) | The Chief Executive Officer and Chief Financial Officer have concluded that the Registrant’s disclosure controls and procedures (as defined in Rule 30a-3(c) under the Investment Company Act of 1940, as amended (the “1940 Act”)) provide reasonable assurances that material information relating to the Registrant is made known to them by the appropriate persons as of a date within 90 days of the filing date of this report, based on their evaluation of these controls and procedures required by Rule 30a-3(b) under the 1940 Act and 15d-15(b) under the Securities Exchange Act of 1934, as amended. |
| (b) | There were no changes in the Registrant’s internal control over financial reporting (as defined in Rule 30a-3(d) under the 1940 Act) that occurred during the Registrant’s second fiscal quarter of the period covered by this report that have materially affected, or are reasonably likely to materially affect, the Registrant’s internal control over financial reporting. |
| Item 12. | Exhibits. |
(a)(1) Code of Ethics referred to in Item 2 is filed herewith.
(a)(2) The certifications required by Rule 30a-2(a) of the 1940 Act and Section 302 of the Sarbanes-Oxley Act of 2002 (“Sarbanes-Oxley Act”) are filed herewith.
(a)(3) Not applicable.
(b) The certifications required by Rule 30a-2(b) of the 1940 Act and Section 906 of the Sarbanes-Oxley Act are filed herewith.
SIGNATURES
Pursuant to the requirements of the Securities Exchange Act of 1934 and the Investment Company Act of 1940, the Registrant has duly caused this report to be signed on its behalf by the undersigned, thereunto duly authorized.
| (Registrant) | TCW Funds, Inc. | |
| By (Signature and Title) | ||
| /s/ David S. DeVito | ||
| David S. DeVito | ||
| Chief Executive Officer | ||
| Date | December 29, 2016 | |
Pursuant to the requirements of the Securities Exchange Act of 1934 and the Investment Company Act of 1940, this report has been signed below by the following persons on behalf of the Registrant and in the capacities and on the dates indicated.
| By (Signature and Title) | ||
| /s/ David S. DeVito | ||
| David S. DeVito | ||
| Chief Executive Officer | ||
| Date | December 29, 2016 | |
| By (Signature and Title) | ||
| /s/ Richard M. Villa | ||
| Richard M. Villa | ||
| Chief Financial Officer | ||
| Date | December 29, 2016 | |