Table of Contents
UNITED STATES
SECURITIES AND EXCHANGE COMMISSION
Washington, D.C. 20549
FORM N-CSR
CERTIFIED SHAREHOLDER REPORT OF REGISTERED
MANAGEMENT INVESTMENT COMPANIES
Investment Company Act file number: 811-07170
TCW Funds, Inc.
(Exact name of registrant as specified in charter)
865 South Figueroa Street, Suite 1800, Los Angeles, CA 90017
(Address of principal executive offices)
Patrick W. Dennis, Esq.
Vice President and Assistant Secretary
865 South Figueroa Street, Suite 1800
Los Angeles, CA 90017
(Name and address of agent for service)
Registrant’s telephone number, including area code: (213) 244-0000
Date of fiscal year end: October 31
Date of reporting period: October 31, 2018
Table of Contents
| Item 1. | Reports to Shareholders. |
2
Table of Contents

OCTOBER 31

A N N U A L
R E P O R T
EQUITY FUNDS
TCW Artificial Intelligence Equity Fund
TCW Global Real Estate Fund
TCW New America Premier Equities Fund
TCW Relative Value Dividend Appreciation Fund
TCW Relative Value Large Cap Fund
TCW Relative Value Mid Cap Fund
TCW Select Equities Fund
ASSET ALLOCATION FUND
TCW Conservative Allocation Fund
Table of Contents
TCW Funds, Inc.
| 1 | ||||
| 3 | ||||
| 24 | ||||
| 24 | ||||
| 28 | ||||
| 31 | ||||
| 33 | ||||
| 36 | ||||
| 40 | ||||
| 44 | ||||
| 48 | ||||
| 51 | ||||
| 53 | ||||
| 55 | ||||
| 59 | ||||
| 75 | ||||
| 91 | ||||
| 93 | ||||
| 95 | ||||
| 98 | ||||
Proxy Voting Guidelines and Availability of Quarterly Portfolio Schedule | 104 | |||
| 105 | ||||
| 106 | ||||
Table of Contents
| The Letter to Shareholders and/or Management Discussions contained in this Annual Report are the opinions of each Fund’s portfolio managers and are not the opinions of TCW Funds, Inc. or its Board of Directors. Various matters discussed in the Letter to Shareholders and/or Management Discussions constitute forward-looking statements within the meaning of the federal securities laws. Actual results and the timing of certain events could differ materially from those projected or contemplated by these forward-looking statements due to a number of factors, including general economic conditions, overall availability of securities for investment by a Fund, the level of volatility in the securities markets and in the share price of a Fund, and other risk factors discussed in the SEC filings of TCW Funds, Inc. The data presented in the Letter to Shareholders and/or Management Discussions represents past performance and cannot be used to predict future results. |
Table of Contents
|
| David S. DeVito President, Chief Executive Officer and Director |

Dear Valued Investors,
I am pleased to present the annual report for the TCW Funds, Inc. covering the 12-month period ended October 31, 2018. I would like to express our appreciation for your continued investment in the TCW Funds as well as welcome new shareholders to our fund family. As of October 31, 2018, the TCW Funds held total net assets of approximately $15 billion.
This report contains information and portfolio management discussions of our Equity Funds and the TCW Conservative Allocation Fund.
The U.S. Stock Market
U.S. stocks advanced 7.3% (S&P 500 total return index) during the one-year period ended 10/31/18, fueled by strong corporate earnings results that were boosted by a strengthening macroeconomic backdrop and the positive impact of the Tax Cuts and Jobs Act of 2017. The U.S. GDP quarterly growth rate accelerated to the three-to-four percent range in the second and third quarters of the year, with the unemployment rate dipping to a near 50-year low of 3.8%. At the same time, corporate profits jumped over 20% on a year-over-year basis, including a roughly 6-9% gain attributable to the cut in the statutory federal corporate tax rate from 35% to 21%. Yet, after achieving a record high close in late September (S&P 500 price index), the equity market suffered a 9.9% correction during the following month, as Fed Chairman Powell made it clear that the Fed would steadily pursue its agenda of removing the easy liquidity that had characterized monetary policy for nearly a decade. Indeed, the most consequential development for the equity market — and the financial markets more broadly — has been the unequivocal upward drift in interest rates, with the yield on the 10-year US Treasury note climbing from 2.38% at the beginning of the period to 3.14% at the end of October. In addition to the rising cost of capital, stocks have faced a substantial headwind stemming from the U.S. / China trade dispute, which has begun to cut into corporate profits by boosting input costs and creating uncertainty for supply chains.
Looking Ahead
Looking forward, equity investors are focused on whether corporate America has achieved “peak earnings” and the extent to which earnings momentum slows. To be sure, asset prices can no longer rely upon Fed-induced liquidity to propel valuation levels higher, and with interest rates on the rise, stock multiples are likely to face downward pressure. On the other hand, we note that stock market valuations do not appear demanding, as they are presently in line with the average level of the last several decades (forward P/E ratio is presently about 15.5 versus an average of 15.7), and the potential for mid-to-high single digit earnings growth in 2019 is supportive of equity prices. Our view, then, is for greater volatility in the equity market to persist in the near term given the rising interest rate environment coupled with the China trade issue, even if the medium-to-long term prospects for stocks remain compelling. We would also contend that it is likely for there to be ever broader dispersion between winners and losers, largely dictated by the ability of individual companies to achieve recurring cash earnings growth. As such, we believe that bottom-up stock picking is likely to reassert itself in this new era, as the equity market becomes more of a “show-me” story in terms of earnings.
An Update on the TCW Funds Equity Funds
We note the following funds were closed and liquidated within the past 12 months:
| • | TCW High Dividend Equities Fund (TGHDX/TGDEX) was liquidated effective January 25, 2018; |
| • | TCW Focused Equities Fund (TGFFX/TGFVX) was liquidated effective May 31, 2018. |
We know that you have many choices when it comes to the management of your financial assets. On behalf of everyone at TCW, I would like to thank you for making the TCW Funds part of your long-term investment plan. We truly value our relationship with you. If you have any
1
Table of Contents
Letter to Shareholders (Continued) |
questions or require further information, I invite you to visit our website at www.tcw.com, or call our shareholder services department at 800-386-3829.
I look forward to further correspondence with you through our semi-annual report next year.
Sincerely,

David S. DeVito
President, Chief Executive Officer and Director
2
Table of Contents
TCW Artificial Intelligence Equity Fund
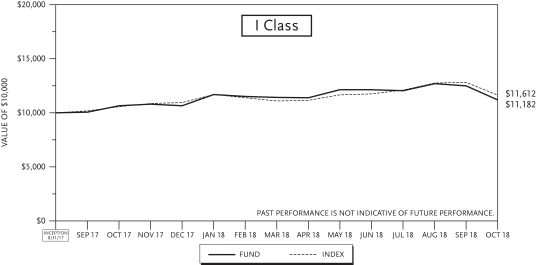
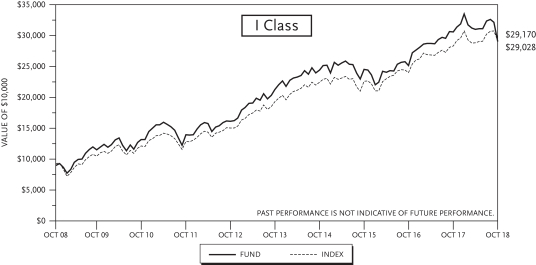
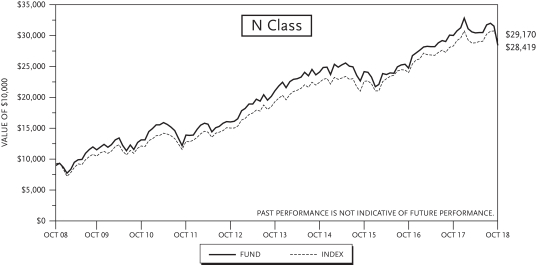
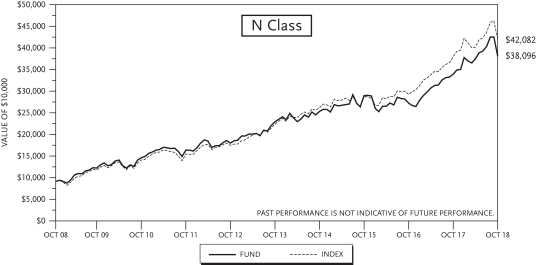
For the year ended October 31, 2018, the TCW Artificial Intelligence Equity Fund (the “Fund”) returned +5.09% and +5.00% on its I Class and N Class shares, respectively. The performance of the Fund’s classes varies because of differing expenses. The Fund’s benchmark, Russell 3000 Growth Index, returned +10.20% over the same period.
The fiscal year of 2018 started with the S&P 500 posting an 11% gain for the year, though volatility shook the markets in October as the market entered “correction” territory and registered a 10% decline from its late-September peak. The catalysts for the recent leg down include, among other things:
| • | Fears that the U.S. Fed will provoke a recession by continuing to raise interest rates — President Trump has been vocal in his explicit criticism of Fed Chair Powell, thereby stoking concerns about whether U.S. GDP can sustain a 3%+ growth rate as we head into 2019; |
| • | Concerns that the U.S. / China trade war is cutting into corporate profits by boosting input costs — we are in the midst of 3Q earnings season, and many companies are referencing the potential damaging impact of tariffs given the uncertainty for supply chains and potentially higher input costs; |
| • | Fears that U.S. corporate profit margins have peaked — if the pace of U.S. GDP growth decelerates from its current rate, it may be difficult for companies to sustain the generally strong top-line growth we have witnessed this year and to achieve the market’s consensus 10% earnings growth assumption for 2019; and, |
| • | Concern that global growth will continue to slow due to trade issues, the Brexit impasse, the Italian budget dispute, and dislocations in emerging markets — there is already evidence of slower global growth ranging from a slowdown in China to weak Purchasing Managers’ Index (PMIs) out of the Eurozone. |
Given the considerable uncertainty inherent in the above headwinds for the equity market, stock volatility (as measured by the CBOE Volatility Index (VIX)) at one point roughly doubled in the month of October, from around 12 to 25. Because there is no assurance that the above-stated cross-currents are likely to be resolved in the near-term, it is difficult to anticipate the duration of this period of heightened volatility.
Our two biggest stock contributors during the year were Amazon.com and Netflix, both of which are on the forefront of artificial intelligence technology. Amazon uses machine learning and artificial intelligence in all aspects of its businesses, both retail and Amazon Web Services. On its retail side, algorithmic pricing changes the list price of items, sometimes thousands of times per day, tens of thousands of Kiva robots help assist human workers in fulfilling orders, and drones just recently started delivering orders in the UK and US. Amazon has the leading position in the next frontier of AI — voice — through its Echo devices and the Alexa platform. In cloud computing, Amazon offers a family of AI services that provide cloud-native machine and deep learning, including natural language understanding and automatic speech recognition (Lex), visual search and image recognition (Rekognition), and text-to-speech (Polly).
Amazon showcased encouraging profitability performance during both its second and third quarters. The company exceeded expectations on operating profit behind a sizable margin improvement in the North American Retail segment. Management provided commentary that they are finding and driving efficiencies in the business that should result in sustainable margins. The company also saw continued acceleration of AWS at scale ($24.5B in annualized revenue growing at 49% with margin expansion). Building upon its strong earnings results, we hypothesize that strong results from Walmart and Target may have led to positive read-throughs to Amazon, as the retailers’ performances could be further evidence of a strong U.S. consumer. This positive momentum continued to support Amazon shares during the period.
3
Table of Contents
TCW Artificial Intelligence Equity Fund
Management Discussions (Continued)
Netflix is a high-growth subscription based content company that applies sophisticated data analysis to its vast amount of generated data in order to determine how much to acquire its content for and how much to invest in its own internally produced content. Furthermore, Netflix’s neural network uses deep learning technology to provide more accurate content recommendations for its users.
Netflix posted stellar subscriber growth during the period. Netflix continues to focus on developing wholesale partnerships and growing its content library which should drive substantial sub growth going forward. The sub strength in the face of price increases suggests that churn has improved and pricing power continues to exist. We believe that the bidding work for 21st Century Fox’s assets during the year gave investors some insight on how much global distribution at scale could be worth, and more specifically, how much value Netflix holds as a company that is already a more developed international platform than Fox. For company-specific news, Netflix announced a few additional distribution partnerships with Comcast, Telefonica, and KDDI, which should help drive incremental subscriber growth or reduce churn through bundled payment offerings.
Our biggest detractor in the period was Western Digital Corp. Western Digital traded down during the period due to weak NAND pricing concerns that negatively impacted the company’s performance. Flash pricing is expected to decline at a faster rate than in prior quarters due to an influx of flash supply amidst a softer demand environment. Partially offsetting this, however, is flash costs that are declining at 15% to 20% annual rates. In response to the difficult price environment, various suppliers of NAND have announced that they will cut production going into next year, which we believe should result in improved supply-demand dynamics in 2019.
4
Table of Contents
TCW Artificial Intelligence Equity Fund
Management Discussions (Continued)
| Annualized Returns(1) | ||||||||
| 1 Yr Return | Inception to Date | |||||||
TCW Artificial Intelligence Equity Fund | ||||||||
Class I (Inception: 8/31/2017) | 5.09 | % | 10.05 | % | ||||
Class N (Inception: 8/31/2017) | 5.00 | % | 9.96 | % | ||||
Russell 3000 Growth Index | 10.20 | % | 13.66 | % | ||||

| (1) | The total returns do not reflect taxes that a shareholder would pay on fund distribution or on the redemption of fund shares. |
5
Table of Contents
TCW Conservative Allocation Fund
Management Discussions
For the year ended October 31, 2018, the TCW Conservative Allocation Fund (the “Fund”) returned +0.04% for the I Class and -0.35% for the N Class shares. The performance of the Fund’s classes varies because of differing expenses. The Fund’s blended benchmark of 40% S&P 500 Index and 60% Bloomberg Barclay U.S. Aggregate Bond Index returned +1.77% over the same period.
The Fund benefited from its allocation in the U.S. equities sector. The strongest returns came from TCW Select Equities Fund (9.3% allocation) and TCW New American Premier Equities Fund (11.4% allocation), both Funds up over 10% over the past year. At the asset allocation level, the decision to overweight large cap U.S. equities helped relative performance.
As of October, the allocation for the Fund was 37% equities, 60% fixed income and 3% cash. This gives the Fund slight underweight to equities and equal weight to fixed income relative to its blended benchmark. Over the past twelve months, the Fund has slightly increased the allocation to Fixed Income. Within Fixed Income, the allocation has been weighted towards lower duration and higher credit quality fixed income. The Fund increased its allocation to Metropolitan West Low Duration Fund over the past year. Within equites, the Fund focused on less volatile and defensive equities. The allocation to TCW Select Equities Fund was slightly increased. Allocations to TCW/Gargoyle Dynamic 500 Fund and TCW/Gargoyle Hedged Value Fund were eliminated this year. The Fund also increased the allocation to cash over the past few months.
Over the past year, U.S. stocks have been volatile. During the month of October, the U.S. equity market at one point registered a 10% price decline from its late-September record high, thereby entering “correction” territory. The catalysts for the recent downturn include, among other things, i) fears that the U.S. Fed will provoke a recession by continuing to raise interest rates, ii) concerns that the U.S. / China trade war is cutting into corporate profits by boosting input costs (many companies have referenced the potential damaging impact of tariffs given the uncertainty for supply chains and potentially higher input costs), and iii) fears that U.S. corporate profit margins have peaked.
The fixed income markets have struggled over the past year with the Bloomberg Barclays U.S. Aggregate Bond Index down 2%. With the 10-year Treasury yields climbing nearly 80 bps in the past year, nearly all sectors in fixed income have struggled. With the Federal Reserve on a path for higher interest rates and unwinding their balance sheets, we think the path for higher interest rates in the short term is likely.
6
Table of Contents
TCW Conservative Allocation Fund
Management Discussions (Continued)
| Annualized Returns(1) | ||||||||||||||||||||
1 Yr | 3 Yr | 5 Yr | 10 Yr | Inception to Date | ||||||||||||||||
TCW Conservative Allocation Fund | ||||||||||||||||||||
Class I (Inception: 11/16/2006) | 0.04 | % | 2.65 | % | 3.68 | % | 6.74 | % | 4.79 | % | ||||||||||
Class N (Inception: 11/16/2006) | (0.35 | )% | 2.18 | % | 3.18 | % | 6.41 | % | 4.52 | % | ||||||||||
40% S&P 500 Index/60% Bloomberg Barclays U.S. Aggregate Bond Index | 1.77 | % | 5.23 | % | 5.68 | % | 7.82 | % | 5.69 | % | ||||||||||
| (1) | The total returns do not reflect taxes that a shareholder would pay on fund distribution or on the redemption of fund shares. |
7
Table of Contents
TCW Global Real Estate Fund
Management Discussions
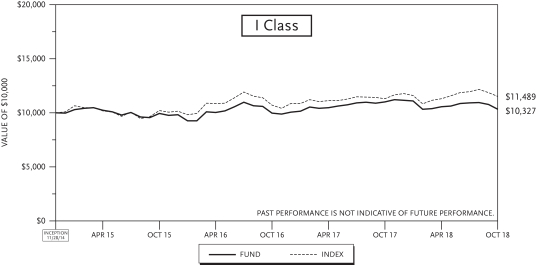
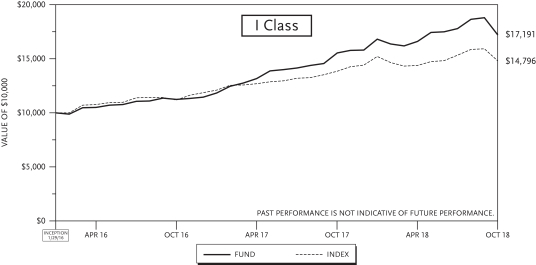
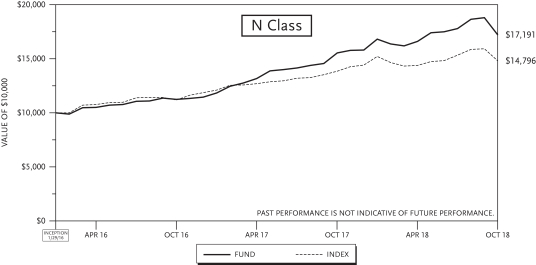
For the year ended October 31, 2018, the TCW Global Real Estate Fund (the “Fund”) generated returns of -6.06% and -6.14% on its I Class and N Class shares, respectively. The performance of the Fund’s classes varies because of differing expenses. The Fund’s benchmark, the S&P Global REIT Index, had a positive return of 1.74% over the same period.
On an attribution basis, the Fund’s underperformance relative to its benchmark during the period was both a result of poor stock selection and sector allocation. From a relative standpoint, the Fund’s largest sector overweight was in Industrial REITs (average weight of 17.27% and up 8.3% for the Fund vs. average weight of 9.86% and up 5.32% for the index), which benefitted performance. The Fund’s largest sector underweight was in Diversified REITs (average weight of 5.11% and down 34.04% for the Fund vs. average weight of 15.20% and down 3.71% for the index), which hurt performance. From a stock selection perspective, positive contributors included NextPoint Residential (NXRT) and Ichigo Office REIT (8975 JP). Conversely, notable detractors from performance included Colony Capital (CLNY) and D.R. Horton (DHI).
After a volatile start to 2018, U.S. stocks resumed the upward march of the past several quarters and peaked in September at around 11% gain for the year. However, volatility again reemerged in October, and the S&P 500 at one point registered a 10% price decline from its late-September record high, thereby entering “correction” territory. The catalysts for the most recent leg down include: (i) Fears that the U.S. Federal Reserve will provoke a recession by continuing to raise interest rates, (ii) Concerns that the U.S. / China trade war is cutting into corporate profits by boosting input costs, (ii) Fears that U.S. corporate profit margins have peaked, and (iv) Concern that global growth will continue to slow due to trade issues, the Brexit impasse, the Italian budget dispute, and dislocations in emerging markets. Given the considerable uncertainty inherent in the above headwinds for the equity market, stock volatility (as measured by the VIX) at one point roughly doubled in the month of October, from around 12 to 25.
While REIT indices generally outperformed during the recent period of heightened volatility, they have considerably underperformed the broader markets over the past several quarters. The primary drivers of the performance disparity in recent years have been robust economic growth and the exceptionally strong performance of the technology space. As an illustration, consider that the technology-heavy Nasdaq Composite Index was up 6.7% year-to-date through October 2018, and was up as much as 18% for the year prior to the recent sell-off. To be sure, many of the megacap technology companies have proven that they have dominant business models and can grow share even at massive scale. Furthermore, unlike during the dot-com era, valuation levels do not yet appear excessively stretched. Accordingly, technology has been an area that many investors have overweight. In contrast, the real estate sector has been entirely out of favor. In a booming economy, most REITs are unable to post high revenue growth due to the contractual nature of leases. Additionally, viewed as a hybrid between fixed income instruments and equity, REITs suffer during periods of rising interest rates. Finally, REITs lack the potential upside capture or “homerun” nature of technology companies that are more levered to innovation. The market is not interested in owning land or hard assets as capital-light business models tend to compound capital faster over time.
We take a differentiated view to the space. Rent growth, while potentially delayed, will still come through in a strong economy. Interest rate concerns are not a REIT-specific phenomenon; in the event that rates rise sharply, all asset classes will be affected. Unlike other sectors, REITs just happen to be pricing in rate increases already. With regard to upside capture, the REIT space is evolving and the value of high quality real estate can provide considerable leverage to innovation, but without the risks. As technology hubs form in certain areas, REITs with outsized exposure to these geographies will perform very well and with less
8
Table of Contents
TCW Global Real Estate Fund
Management Discussions (Continued)
downside from the next competitor’s disruptive technology. Finally, Real Estate will serve as a good inflation hedge as land tends to appreciate in inflationary environments. For these reasons, we believe it is beneficial to own high quality real estate assets at a time when the market is not interested.
| Annualized Returns(1) | ||||||||||||
1 Yr | 3 Yr | Inception to Date | ||||||||||
TCW Global Real Estate Fund | ||||||||||||
Class I (Inception: 11/28/2014) | (6.06 | )% | 1.29 | % | 0.82 | % | ||||||
Class N (Inception: 11/28/2014) | (6.14 | )% | 1.29 | % | 0.80 | % | ||||||
S&P Global REIT Index | 1.74 | % | 4.06 | % | 3.61 | % | ||||||

| (1) | The total returns do not reflect taxes that a shareholder would pay on fund distribution or on the redemption of fund shares. |
9
Table of Contents
TCW New America Premier Equities Fund
Management Discussions
For the year ended October 31, 2018, the TCW New America Premier Equities Fund (the “Fund”) returned 10.60% on both I Class and N Class shares. The Fund’s benchmark, the Russell 1000 Index, returned 6.98% over the same period.
The Fund’s performance benefited from concentrated investments in Transunion, Heico Corporation, The Trade Desk Inc. and Constellation Software. The Fund’s performance was negatively impacted by investments in Conagra Brands Inc, Oracle Corporation and Celanese Corporation. Security selection was the primary driver of the Fund’s performance during the year.
As we have indicated in the past we eschew a reliance on macroeconomic forecasts and projections of the future direction of markets — our view is that these factors are unknowable. We therefore focus on what we think is knowable. We believe that a careful assessment of investment opportunities at the security level will provide us, in some cases, with a high probability view of the future free cash flows of a business. Risk adjusted cash flow stream is a key determinant of the future returns of an investment and therefore a key determinant of the portfolio’s future returns. We believe that we have made good decisions in this respect and that the portfolio of companies is built to weather most market environments.
Investment Philosophy
The Fund seeks to outperform the broad U.S. indices in both rising and falling markets with less risk and volatility. We seek to accomplish this objective by investing in a concentrated portfolio of businesses that carefully manage their environmental and social resources and that employ best in class corporate governance practices. We invest in businesses that have high barriers to entry, are stable, generate substantial free cash flow and are managed by prudent leaders.
Risk control. Our primary objective, as stewards of your capital, is to control risk while seeking attractive returns. We control risk in a unique manner; initially we apply our proprietary environmental, social and governance (ESG) quantitative framework to identify better managed businesses that have lower quantifiable and unquantifiable risks. Subsequently we hone our efforts on those businesses that we believe operate in stable industries with attractive industry structures, businesses that produce products that are critical to their customers, and businesses that we believe are led by proven, appropriately incentivized leaders. We endeavor to further control valuation risk by purchasing securities at attractive prices relative to the current free cash flow generation of the businesses. We believe that businesses that fit our profile produce fairly stable cash flow streams and are less prone to macroeconomic fluctuations, competitive pressures and valuation risks.
Consistency. It is also our objective to deliver a consistently positive outcome. We would view outsized outperformance in one year and poor performance in the subsequent year as a poor outcome for our clients. Our bottoms up investment process is focused on selecting undervalued businesses that we believe should perform well in most market environments and hold up well in negative periods. We believe consistency in approach and consistency in outcome gives us the best chance of minimizing a left tail outcome in any given year. It is our view that if we can consistently deliver above average risk adjusted performance over a long period of time the outcome likely would be outperformance relative to our peers over the full period. That is our goal.
Environmental, Social, Governance Analysis: Traditional fundamental analysis does not capture risks associated with managing environmental resources nor does it assess the performance of businesses from
10
Table of Contents
TCW New America Premier Equities Fund
Management Discussions (Continued)
the perspective of resource efficiency. Traditional analysis does not typically assess the risks associated with a heterogeneous workforce nor does it assess the competence, quality and engagement level of the Board of Directors. Our investment framework not only pays close attention to these issues, but also we quantify, score, and rank companies and exclude businesses based on these risk factors.
While those risks are not quantified through traditional financial analysis, we have found a significant correlation between companies that manage their resources prudently and businesses that sport strong financial metrics. Businesses that meet our rigorous ESG performance requirements typically have higher free cash flow yields, higher total yields, higher margins and lower levels of financial leverage.
Focus on Dominant, Predictable Businesses with High Barriers to Entry: In the long run the investment performance of a portfolio is inextricably linked to the underlying performance of the earnings and cash flows of the businesses comprising the portfolio. We believe one of the greatest risks in investing is valuing a business based on an erroneous view of the future free cash flows of the business. Such a circumstance results in an investor typically overpaying for a business and therefore generating a poor return on the investment.
In fast growing businesses or in industries that are undergoing rapid changes it is extraordinarily difficult and often dangerous to make an investment in a business when the long-term cash generation potential of the enterprise has a wide spectrum of outcomes. We seek to avoid companies and industries that are undergoing rapid changes.
What we do seek, however, are stable businesses that have dominant market positions, and whose long term cash flows we believe can be predicted reasonably well. The qualitative characteristics that we seek, including attractive industry structures, pricing power and dominant market positions, make us confident in our forecast of the future cash flows of the businesses and therefore provide greater confidence that our valuation of the business is reasonably accurate.
The famed value investor Benjamin Graham once said, “In the short run, the market is a voting machine but in the long run, it is a weighing machine.” Our view is that the market weighs cash flows and in order to consistently purchase a security for less than what it is worth, one should have high confidence in the future free cash flows of a business.
11
Table of Contents
TCW New America Premier Equities Fund
Management Discussions (Continued)
| Annualized Returns(1) | ||||||||
1 Yr | Inception to Date | |||||||
TCW New America Premier Equities Fund | ||||||||
Class I (Inception: 1/29/2016) | 10.60 | % | 21.77 | % | ||||
Class N (Inception: 1/29/2016) | 10.60 | % | 21.77 | % | ||||
Russell 1000 Index | 6.98 | % | 15.32 | % | ||||
| (1) | The total returns do not reflect taxes that a shareholder would pay on fund distribution or on the redemption of fund shares. |
12
Table of Contents
TCW Relative Value Dividend Appreciation Fund
Management Discussions
For the year ended October 31, 2018, the TCW Relative Value Dividend Appreciation Fund (the “Fund”) posted a return of -3.28% and -3.52% on its I Class and N Class shares, respectively. The performance of the Fund’s classes varies because of differing expenses. The Fund’s benchmark, the Russell 1000 Value Index, returned +3.03% over the same period.
Market Outlook
With the midterm elections in the rear view mirror, investors can now refocus their attention to the health of the U.S. economy and corporate earnings. The advance release for 3Q 2018 GDP came in at a solid 3.5%. Over the course of 2018, the economy has added over 210,000 jobs, on average, per month, a pace not seen since 2015. The unemployment rate has dipped to 3.7%, the underemployment rate slid to 7.4%, and wage growth has risen to 3.1% year-over-year. Current year-over-year 3Q18 revenue run rates are 8-10% with earnings per share (EPS) approximately 25% (17-19% excluding taxes). This marks the third consecutive quarter of 20%+ EPS growth. Corporate profits have room to grow as the U.S. is firmly in the second, positive phase of an equity cycle where margins continue to increase based on top-line revenue growth.
While the U.S. and most of its partners have arrived at overarching agreements on trade, or are at least in negotiations, the situation with China remains tense. Across the Atlantic, with less than six months to go before Britain is to leave the European Union (EU), there is still uncertainty as to how this will play out. Prime Minister Theresa May suffered another setback after the EU rejected parts of the so-called Chequers Plan. Italian politicians are playing with fire over upcoming budget proposals to the EU. Brussels is likely to take relatively hard stances with both countries. Also of concern is Chancellor Angela Merkel’s announcement she will step down as leader of her Christian Democratic Union party in December and not seek re-election when her term expires in 2021. Her announcement came shortly after her party suffered the worst election results over fifty years in the western state of Hesse.
Historically, when election results are finalized, regardless of which party wins, there have been significant late fourth quarter rallies as investors reposition their portfolios for the new Congress. Since 1926, the S&P 500 has returned 7.4%, on average, in the fourth quarter of mid-term election years versus 3.8% for all fourth quarters. Secondly, the third year of Republican presidential terms (since the Eisenhower administration) have proven to be the strongest for stocks with the S&P 500 returning 17.2% on average, or nearly 2.5x the average yearly return of 7.1%. Finally, the combination of a Republican president and a split Congress has resulted in an average return of 15.7% for the S&P 500 since 1950, the second-best among all permutations.
It is typical for there to be much political “noise” during mid-term election years and this one was no exception, albeit exacerbated by the trade strife between the U.S and China and the specter of higher interest rates. The Democrats taking the House of Representatives has led to a divided government, and a “gridlock” environment has historically been supportive for stocks. Infrastructure legislation represents the most likely common ground opportunity which could provide support for industrials and materials stocks. Even though the risk of recession is still low, acrimonious trade talks with China, Washington strife, a tightening Fed, and the narrowing spread between the 2- and 10-Year Treasury yields are all being continuously monitored.
13
Table of Contents
TCW Relative Value Dividend Appreciation Fund
Management Discussions (Continued)
Fund Review
Over the course of the one-year period ended October 31, 2018, the Fund’s top ten conviction-weighted holdings outperformed the portfolio and the benchmark over the period returning +14.2%, on average, led by AES, Cisco Systems, and Merck. The Fund’s Utilities names were the best relative performers led by AES while its Consumer Staples and Consumer Discretionary names outperformed with solid returns from PepsiCo, Procter & Gamble, and Regal Entertainment. Other notable performers included Intercontinental Exchange and Microsoft, with the latter having been completely sold early in 2018 after appreciating past all five valuation factors. On the downside, the Fund’s Financials names were the biggest detractors due in large part to State Street, MetLife, Invesco, and Citigroup. Schlumberger and Baker Hughes were largely responsible for the loss in Energy while General Electric and to a lesser degree Johnson Controls were mostly to blame for the underperformance in Industrials. The Fund also lost ground in Health Care and Materials due to Gilead, Royal Philips, DowDuPont, and Freeport-McMoRan.
The Fund’s strategy tends to outperform one or more of the benchmarks in most market environments, especially those that favor relative value and growth at a reasonable price (GARP). On the other hand, the Fund’s strategy tends to underperform in deep value environments such as 2002 (when only REITs were positive) and 2011 and 2014 (when Utilities was the best performing sector) as well as in momentum markets such as 2008, 2011 and 2015 when correlations were historically high. While performance for the one-year period ending October 31, 2018 is disappointing, it becomes more understandable as to why the Fund’s strategy has underperformed with both deep value and momentum outperforming. Analysis has shown the strategy has a strong record of rebounding after periods of underperformance, and on a three-year rolling period basis (ending October 31, 2018), has outperformed the Russell 1000 Value Index in 10 out of the 14 periods, over 70% of the time.
14
Table of Contents
TCW Relative Value Dividend Appreciation Fund
Management Discussions (Continued)
| Annualized Returns(1) | ||||||||||||||||||||||||
1 Yr | 3 Yr | 5 Yr | 10 Yr | Inception Fund | Inception Index | |||||||||||||||||||
TCW Relative Value Dividend Appreciation Fund | ||||||||||||||||||||||||
Class I (Inception: 10/29/2004) | (3.28 | )% | 5.41 | % | 5.75 | % | 11.29 | % | 6.65 | % | 7.56 | % | ||||||||||||
Class N (Inception: 09/19/1986) | (3.52 | )% | 5.17 | % | 5.49 | % | 10.99 | % | 8.83 | % | 10.11 | % | ||||||||||||
Russell 1000 Value Index | 3.03 | % | 8.88 | % | 8.61 | % | 11.30 | % | ||||||||||||||||
| (1) | The total returns do not reflect taxes that a shareholder would pay on fund distribution or on the redemption of fund shares. |
15
Table of Contents
TCW Relative Value Large Cap Fund
Management Discussions
For the year ended October 31, 2018, the TCW Relative Value Large Cap Fund (the “Fund”) posted a return of -5.11% and -5.35% on its I Class and N Class shares, respectively. The performance of the Fund’s classes varies because of differing expenses. The Fund’s benchmark, the Russell 1000 Value Index, returned +3.03% over the same period.
Market Outlook
With the midterm elections in the rear view mirror, investors can now refocus their attention to the health of the U.S. economy and corporate earnings. The advance release for 3Q 2018 GDP came in at a solid 3.5%. Over the course of 2018, the economy has added over 210,000 jobs, on average, per month, a pace not seen since 2015. The unemployment rate has dipped to 3.7%, the underemployment rate slid to 7.4%, and wage growth has risen to 3.1% year-over-year. Current year-over-year 3Q18 revenue run rates are 8-10% with earnings per share (EPS) approximately 25% (17-19% excluding taxes). This marks the third consecutive quarter of 20%+ EPS growth. Corporate profits have room to grow as the U.S. is firmly in the second, positive phase of an equity cycle where margins continue to increase based on top-line revenue growth.
While the U.S. and most of its partners have arrived at overarching agreements on trade, or are at least in negotiations, the situation with China remains tense. Across the Atlantic, with less than six months to go before Britain is to leave the European Union (EU), there is still uncertainty as to how this will play out. Prime Minister Theresa May suffered another setback after the EU rejected parts of the so-called Chequers Plan. Italian politicians are playing with fire over upcoming budget proposals to the EU. Brussels is likely to take relatively hard stances with both countries. Also of concern is Chancellor Angela Merkel’s announcement she will step down as leader of her Christian Democratic Union party in December and not seek re-election when her term expires in 2021. Her announcement came shortly after her party suffered the worst election results over fifty years in the western state of Hesse.
Historically, when election results are finalized, regardless of which party wins, there have been significant late fourth quarter rallies as investors reposition their portfolios for the new Congress. Since 1926, the S&P 500 has returned 7.4%, on average, in the fourth quarter of mid-term election years versus 3.8% for all fourth quarters. Secondly, the third year of Republican presidential terms (since the Eisenhower administration) have proven to be the strongest for stocks with the S&P 500 returning 17.2% on average, or nearly 2.5x the average yearly return of 7.1%. Finally, the combination of a Republican president and a split Congress has resulted in an average return of 15.7% for the S&P 500 since 1950, the second-best among all permutations.
It is typical for there to be much political “noise” during mid-term election years and this one was no exception, albeit exacerbated by the trade strife between the U.S and China and the specter of higher interest rates. The Democrats taking the House of Representatives has led to a divided government, and a “gridlock” environment has historically been supportive for stocks. Infrastructure legislation represents the most likely common ground opportunity which could provide support for industrials and materials stocks. Even though the risk of recession is still low, acrimonious trade talks with China, Washington strife, a tightening Fed, and the narrowing spread between the 2- and 10-Year Treasury yields are all being continuously monitored.
16
Table of Contents
TCW Relative Value Large Cap Fund
Management Discussions (Continued)
Fund Review
Usually a long-term positive, the Fund’s diversified portfolio structure has hampered returns since mid-May as economically sensitive companies and industries have been negatively impacted by President Trump’s trade war rhetoric and the rotation to U.S. domestic, high dividend oriented sectors. Over the course of the one-year period ended October 31, 2018, the Fund’s top ten conviction-weighted holdings outperformed the portfolio and the benchmark returning +14.5%, on average, led by AES, Cisco Systems, and Merck. The Fund’s Utilities names were the best relative performers led by AES while the strong gains by Molina Healthcare, Merck, and Centene propelled the outperformance in Health Care. The Fund also benefited from stock selection in Consumer Staples and Real Estate led by Procter & Gamble, PepsiCo, and Jones Lang LaSalle. Other positive performers included Intercontinental Exchange and Microsoft, with the latter having been completely sold early in 2018 after appreciating past all five valuation factors. On the downside, the Fund’s Information Technology names were the biggest detractors due in large part to Western Digital and to a lesser degree Cypress Semiconductor and ON Semiconductor. Dana was largely responsible for the loss experienced in Consumer Discretionary while State Street, Hartford Financial, and Invesco detracted in Financials. The Fund also underperformed with its Industrials and Energy names from Terex, General Electric, and Baker Hughes.
The Fund’s strategy tends to outperform one or more of the benchmarks in most market environments, especially those that favor relative value and growth at a reasonable price (GARP). On the other hand, the Fund’s strategy tends to underperform in deep value environments such as 2002 (when only REITs were positive) and 2011 and 2014 (when Utilities was the best performing sector) as well as in momentum markets such as 2008, 2011 and 2015 when correlations were historically high. While performance for the one-year period ending October 31, 2018 is disappointing, it becomes more understandable as to why the Fund’s strategy has underperformed with both deep value and momentum outperforming. Analysis has shown the strategy has a strong record of rebounding after periods of underperformance, and on a three-year rolling period basis (ending October 31, 2018), has outperformed the Russell 1000 Value Index in 15 out of the 21 periods, over 70% of the time.
17
Table of Contents
TCW Relative Value Large Cap Fund
Management Discussions (Continued)
| Annualized Returns(1) | ||||||||||||||||||||||||
1 Yr | 3 Yr | 5 Yr | 10 Yr | Inception Fund | Inception Index | |||||||||||||||||||
TCW Relative Value Large Cap Fund | ||||||||||||||||||||||||
Class I (Inception: 12/31/2003) | (5.11 | )% | 5.78 | % | 6.43 | % | 11.25 | % | 7.05 | % | 7.63 | % | ||||||||||||
Class N (Inception: 12/31/1997) | (5.35 | )% | 5.54 | % | 6.17 | % | 11.01 | % | 6.05 | % | 7.01 | % | ||||||||||||
Russell 1000 Value Index | 3.03 | % | 8.88 | % | 8.61 | % | 11.30 | % | ||||||||||||||||
| (1) | The total returns do not reflect taxes that a shareholder would pay on fund distribution or on the redemption of fund shares. |
18
Table of Contents
TCW Relative Value Mid Cap Fund
Management Discussions
For the year ended October 31, 2018, the TCW Relative Value Mid Cap Fund (the “Fund”) posted a return of -6.48% and -6.61% on its I Class and N Class shares, respectively. The performance of the Fund’s classes varies because of differing expenses. The Fund’s benchmark, the Russell Midcap Value Index, returned +0.16% over the same period.
Market Outlook
With the midterm elections in the rear view mirror, investors can now refocus their attention to the health of the U.S. economy and corporate earnings. The advance release for 3Q 2018 GDP came in at a solid 3.5%. Over the course of 2018, the economy has added over 210,000 jobs, on average, per month, a pace not seen since 2015. The unemployment rate has dipped to 3.7%, the underemployment rate slid to 7.4%, and wage growth has risen to 3.1% year-over-year. For the Russell Midcap, current year-over-year 3Q18 revenue run rates are 8-10% with earnings per share (EPS) approximately 25-30% (20-22% excluding taxes). This marks the fourth consecutive quarter of 20%+ EPS growth. Corporate profits have room to grow as the U.S. is firmly in the second, positive phase of an equity cycle where margins continue to increase based on top-line revenue growth.
While the U.S. and most of its partners have arrived at overarching agreements on trade, or are at least in negotiations, the situation with China remains tense. Across the Atlantic, with less than six months to go before Britain is to leave the European Union (EU), there is still uncertainty as to how this will play out. Prime Minister Theresa May suffered another setback after the EU rejected parts of the so-called Chequers Plan. Italian politicians are playing with fire over upcoming budget proposals to the EU. Brussels is likely to take relatively hard stances with both countries. Also of concern is Chancellor Angela Merkel’s announcement she will step down as leader of her Christian Democratic Union party in December and not seek re-election when her term expires in 2021. Her announcement came shortly after her party suffered the worst election results over fifty years in the western state of Hesse.
Historically, when election results are finalized, regardless of which party wins, there have been significant late fourth quarter rallies as investors reposition their portfolios for the new Congress. Since 1926, the S&P 500 has returned 7.4%, on average, in the fourth quarter of mid-term election years versus 3.8% for all fourth quarters. Secondly, the third year of Republican presidential terms (since the Eisenhower administration) have proven to be the strongest for stocks with the S&P 500 returning 17.2% on average, or nearly 2.5x the average yearly return of 7.1%. Finally, the combination of a Republican president and a split Congress has resulted in an average return of 15.7% for the S&P 500 since 1950, the second-best among all permutations.
It is typical for there to be much political “noise” during mid-term election years and this one was no exception, albeit exacerbated by the trade strife between the U.S and China and the specter of higher interest rates. The Democrats taking the House of Representatives has led to a divided government, and a “gridlock” environment has historically been supportive for stocks. Infrastructure legislation represents the most likely common ground opportunity which could provide support for industrials and materials stocks. Even though the risk of recession is still low, acrimonious trade talks with China, Washington strife, a tightening Fed, and the narrowing spread between the 2- and 10-Year Treasury yields are all being continuously monitored.
19
Table of Contents
TCW Relative Value Mid Cap Fund
Management Discussions (Continued)
Fund Review
Usually a long-term positive, the Fund diversified portfolio structure has hampered returns since mid-May as economically sensitive companies and industries have been negatively impacted by President Trump’s trade war rhetoric and the rotation to U.S. domestic, high dividend oriented sectors. Over the course of the one-year period ended October 31, 2018, the Fund’s top ten conviction-weighted holdings outperformed the portfolio and the benchmark returning +11.4%, on average, led by Popular, AES, and Centene. The Fund’s benefited significantly from its Health Care names led by the strong returns from Molina Healthcare and Centene while achieving nearly similar results with its Financials holdings led by Popular and E*Trade. AES’s strong showing propelled the outperformance in Utilities. On the downside, the Fund’s Information Technology names were the most deleterious largely due to Western Digital and to a lesser degree Cypress Semiconductor and ON Semiconductor. The Fund also lost value with its Consumer Discretionary holdings due to Dana and homebuilders Toll Brothers, KB Home, Beazer Homes, and Lennar which have struggled as a group due to the specter of rising interest rates, supply, and affordability. After a robust rise in 2017, Manitowoc has struggled in 2018 and was most responsible for the loss experienced in Industrials.
The Fund’s strategy tends to outperform one or more of the benchmarks in most market environments, especially those that favor relative value and growth at a reasonable price (GARP). On the other hand, the Fund’s strategy tends to underperform in deep value environments such as 2002 (when only REITs were positive) and 2011 and 2014 (when Utilities was the best performing sector) as well as in momentum markets such as 2008, 2011 and 2015 when correlations were historically high. While performance for the one-year period ending October 31, 2018 is disappointing, it becomes more understandable as to why the Fund’s strategy has underperformed with both deep value and momentum outperforming. It is worth noting that the Fund achieved the Wall Street Category Kings designation in seven of the twelve months during the fiscal year with the most recent reward being for outstanding one-year performance ended June 30, 2018.
20
Table of Contents
TCW Relative Value Mid Cap Fund
Management Discussions (Continued)
| Annualized Returns(1) | ||||||||||||||||||||||||
1 Yr | 3 Yr | 5 Yr | 10 Yr | Inception Fund | Inception Index | |||||||||||||||||||
TCW Relative Value Mid Cap | ||||||||||||||||||||||||
Class I (Inception: 11/01/1996) | (6.48 | )% | 8.08 | % | 6.00 | % | 11.13 | % | 10.00 | % (2) | 10.25 | % | ||||||||||||
Class N (Inception: 10/31/2000) | (6.61 | )% | 7.88 | % | 5.79 | % | 10.84 | % | 7.51 | % | 9.56 | % | ||||||||||||
Russell Midcap Value Index | 0.16 | % | 8.15 | % | 8.11 | % | 13.35 | % | ||||||||||||||||
| (1) | The total returns do not reflect taxes that a shareholder would pay on fund distribution or on the redemption of fund shares. |
| (2) | Performance data includes the performance of the predecessor entity for periods before the Fund’s registration became effective. The predecessor entity was not registered under the 1940 Act and, therefore, was not subject to certain investment restrictions that are imposed by the 1940 Act. If the predecessor entity had been registered under the 1940 Act, the predecessor entity’s performance may have been lower. |
21
Table of Contents
TCW Select Equities Fund
Management Discussions
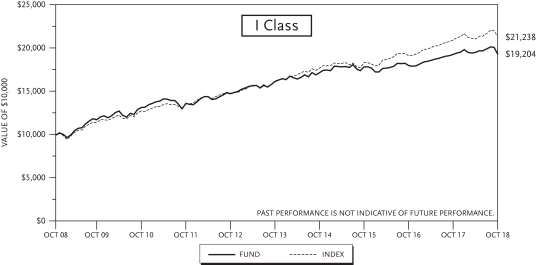
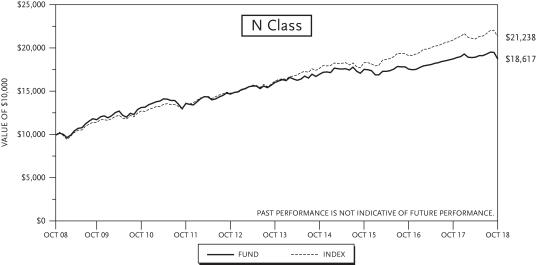
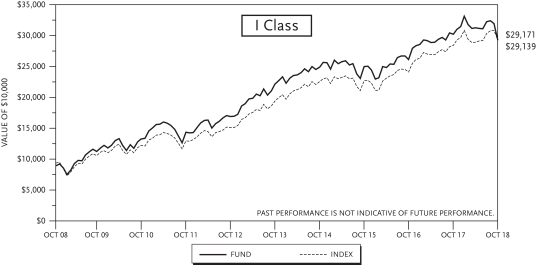
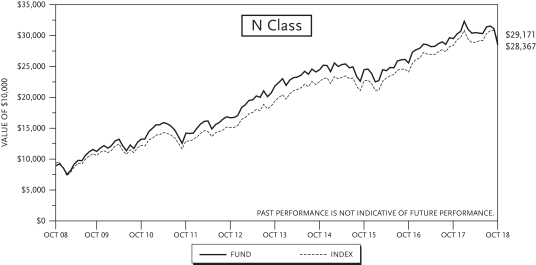
For the year ended October 31, 2018, the TCW Select Equities Fund (the “Fund”) returned +12.59% and +12.36% on its I Class and N Class shares, respectively. The performance of the Fund’s classes varies because of differing expenses. The Fund’s benchmark, Russell 1000 Growth Index, returned +10.71% over the same period.
Solid economic data led the market higher in 2018. Early in the year, real GDP for 3Q17 was revised higher to +3.3% quarter-on-quarter (QoQ), ISM Manufacturing Index ticked up to a 161 month high and volatility remained subdued. In fact, calendar year 2017 was the only year besides 1995 when we did not have a single trading day with a 5% or greater pullback (vs. the historical average of three times per year since 1928). President Trump signed the Tax Cuts and Jobs Act of 2017, billed as the most sweeping tax reform since 1986. Alas, volatility finally returned in February 2018 and the S&P 500 Index logged its worst month in two years. In Washington, a bipartisan budget deal was passed, which will increase spending by $500 billion over the next two years and the debt ceiling was suspended. In March, fears of a potential trade war emerged when President Trump announced 25% tariffs on aluminum and 10% on steel (while excluding Canada and Mexico) as well as tariffs to ~$50B of Chinese goods but the U.S. economy remained solid as U.S. GDP grew +4.1% QoQ annualized rate in 2Q18. In September, the S&P 500 Index touched an all-time high and the Federal Reserve (“Fed”) hiked rates another 25bps, its eighth tightening since December 2015. Trade war concerns remained center stage as President Trump announced plans for additional tariffs on ~$200B of imports from China. In October, the S&P 500 Index finished with its worst monthly return (-7%) in seven years. Bond yields spiked up, the VIX jumped above 20 for the first time since April and the spread between 2-year Treasuries and 10-year Treasuries finished October at 28bps, essentially one Fed tightening from yield curve inversion. As the fiscal year ended, focus turned to midterm elections and ponderance of whether a Fed policy error may be imminent.
Net of expenses, the Fund outperformed the benchmark for the year primarily as a result of security selection, particularly in the information technology sector. Our biggest stock contributor during the year was Adobe Systems Incorporated (ADBE). The stock rallied due to a string of solid earnings reports and the news that it had entered the e-commerce market with the acquisition of privately-held Magento Commerce for ~$1.7B. We believe Magento will expand Adobe’s TAM (Total Addressable Market) by $13B; and by adding Magento’s e-Commerce and Order Management assets to its portfolio, ADBE will be able to manage the entire digital customer lifecycle. Also in the information technology sector, shares of ServiceNow, Inc. (NOW) moved higher after several strong earnings reports that included both operating margin as well as TAM expansion.
Our two biggest stock detractors during the year came from the financials and real estate sectors. Shares of Chubb Limited (CB) pulled back after the company announced preliminary fourth quarter loss estimates of $320 million from California’s wildfires and other natural catastrophes, net of reinsurance recoveries. Shares of Equinix, Inc. (EQIX) declined after reporting mixed quarterly results that missed consensus EBITDA estimates largely due to accelerating investments. While near-term investments and rising interest rates create a modest headwind for the stock, we remain constructive on the company as we believe long-term demand trends remain favorable and EQIX has an enviable competitive position in the rapidly growing data center industry.
22
Table of Contents
TCW Select Equities Fund
Management Discussions (Continued)
| Annualized Returns(1) | ||||||||||||||||||||||||
| 1 Yr Return | 3 Yr Return | 5 Yr Return | 10 Yr Return | Inception Fund | Inception Index | |||||||||||||||||||
TCW Select Equities Fund | ||||||||||||||||||||||||
Class I (Inception: 07/01/1991) | 12.59 | % | 9.80 | % | 10.97 | % | 14.62 | % | 10.12 | % (2) | 9.47 | % | ||||||||||||
Class N (Inception: 2/26/1999) | 12.36 | % | 9.54 | % | 10.70 | % | 14.31 | % | 6.35 | % | 5.51 | % | ||||||||||||
Russell 1000 Growth Index | 10.71 | % | 13.67 | % | 13.43 | % | 15.45 | % | ||||||||||||||||

| (1) | The total returns do not reflect taxes that a shareholder would pay on fund distribution or on the redemption of fund shares. |
| (2) | Performance data includes the performance of the predecessor entity for periods before the Fund’s registration became effective. The predecessor entity was not registered under the 1940 Act and, therefore, was not subject to certain investment restrictions that are imposed by the 1940 Act. If the predecessor entity had been registered under the 1940 Act, the predecessor entity’s performance may have been lower. |
23
Table of Contents
TCW Artificial Intelligence Equity Fund
| Issues | Shares | Value | ||||||
COMMON STOCK — 98.4% of Net Assets |
| |||||||
| Application Software — 16.2% | ||||||||
Adobe, Inc. (1) | 297 | $ | 72,991 | |||||
Autodesk, Inc. (1) | 303 | 39,163 | ||||||
Ceridian HCM Holding, Inc. (1) | 607 | 23,048 | ||||||
Domo, Inc. (1) | 175 | 2,840 | ||||||
Nuance Communications, Inc. (1) | 1,363 | 23,702 | ||||||
Salesforce.com, Inc. (1) | 532 | 73,012 | ||||||
Splunk, Inc. (1) | 583 | 58,207 | ||||||
Workday, Inc. (1) | 305 | 40,571 | ||||||
|
| |||||||
| 333,534 | ||||||||
|
| |||||||
| Auto Parts & Equipment — 1.5% | ||||||||
Aptiv PLC | 413 | 31,718 | ||||||
|
| |||||||
| Automobile Manufacturers — 3.9% | ||||||||
General Motors Co. | 815 | 29,821 | ||||||
Tesla Inc. (1) | 151 | 50,935 | ||||||
|
| |||||||
| 80,756 | ||||||||
|
| |||||||
| Data Processing & Outsourced Services — 3.6% | ||||||||
Mastercard, Inc. | 197 | 38,941 | ||||||
Visa, Inc. | 254 | 35,014 | ||||||
|
| |||||||
| 73,955 | ||||||||
|
| |||||||
| Diversified Support Services — 0.9% | ||||||||
KAR Auction Services, Inc. | 322 | 18,335 | ||||||
|
| |||||||
| Health Care Equipment — 3.3% | ||||||||
IDEXX Laboratories, Inc. (1) | 138 | 29,272 | ||||||
Intuitive Surgical, Inc. (1) | 76 | 39,610 | ||||||
|
| |||||||
| 68,882 | ||||||||
|
| |||||||
| Health Care Supplies — 1.0% | ||||||||
Align Technology, Inc. (1) | 94 | 20,793 | ||||||
|
| |||||||
| Home Entertainment Software — 3.9% | ||||||||
Activision Blizzard, Inc. | 474 | 32,730 | ||||||
Electronic Arts, Inc. (1) | 260 | 23,655 | ||||||
Take-Two Interactive Software, Inc. (1) | 181 | 23,325 | ||||||
|
| |||||||
| 79,710 | ||||||||
|
| |||||||
| Internet Retail — 4.6% | ||||||||
Amazon.com, Inc. (1) | 46 | 73,509 | ||||||
Netflix, Inc. (1) | 68 | 20,521 | ||||||
|
| |||||||
| 94,030 | ||||||||
|
| |||||||
| Internet Services & Infrastructure — 14.0% | ||||||||
Alibaba Group Holding, Ltd. (SP ADR) (China) (1) | 254 | 36,139 | ||||||
Alphabet, Inc. (1) | 64 | 69,797 | ||||||
Baidu, Inc. (SP ADR) (China) (1) | 147 | 27,939 | ||||||
Facebook, Inc. (1) | 533 | 80,904 | ||||||
Hortonworks, Inc. (1) | 979 | 17,485 | ||||||
Tencent Holdings, Ltd. (China) | 829 | 28,460 | ||||||
| Issues | Shares | Value | ||||||
| Internet Services & Infrastructure (Continued) | ||||||||
Twitter, Inc. (1) | 790 | $ | 27,452 | |||||
|
| |||||||
| 288,176 | ||||||||
|
| |||||||
| IT Consulting & Other Services — 5.5% | ||||||||
Accenture PLC | 267 | 42,085 | ||||||
EPAM Systems, Inc. (1) | 288 | 34,407 | ||||||
Gartner, Inc. (1) | 245 | 36,143 | ||||||
Switch, Inc. | 128 | 1,135 | ||||||
|
| |||||||
| 113,770 | ||||||||
|
| |||||||
| Life Sciences Tools & Services — 2.1% | ||||||||
Illumina, Inc. (1) | 136 | 42,316 | ||||||
|
| |||||||
| Managed Health Care — 1.7% | ||||||||
UnitedHealth Group, Inc. | 132 | 34,498 | ||||||
|
| |||||||
| Restaurants — 1.9% | ||||||||
Domino’s Pizza, Inc. | 144 | 38,706 | ||||||
|
| |||||||
| Semiconductor Equipment — 3.4% | ||||||||
ASML Holding NV (Netherlands) | 275 | 47,399 | ||||||
Lam Research Corp. | 152 | 21,543 | ||||||
|
| |||||||
| 68,942 | ||||||||
|
| |||||||
| Semiconductors — 13.0% | ||||||||
Broadcom, Inc. | 155 | 34,641 | ||||||
Cypress Semiconductor Corp. | 804 | 10,404 | ||||||
Intel Corp. | 1,191 | 55,834 | ||||||
Micron Technology, Inc. (1) | 881 | 33,231 | ||||||
NVIDIA Corp. | 337 | 71,050 | ||||||
QUALCOMM, Inc. | 387 | 24,338 | ||||||
Silicon Laboratories, Inc. (1) | 143 | 11,659 | ||||||
Taiwan Semiconductor Manufacturing Co., Ltd. (SP ADR) (Taiwan) | 692 | 26,365 | ||||||
|
| |||||||
| 267,522 | ||||||||
|
| |||||||
| Specialized REITs — 3.6% | ||||||||
American Tower Corp. | 339 | 52,819 | ||||||
Equinix, Inc. | 55 | 20,831 | ||||||
|
| |||||||
| 73,650 | ||||||||
|
| |||||||
| Systems Software — 9.0% | ||||||||
Microsoft Corp. | 776 | 82,884 | ||||||
ServiceNow, Inc. (1) | 440 | 79,658 | ||||||
Tableau Software, Inc. (1) | 220 | 23,470 | ||||||
|
| |||||||
| 186,012 | ||||||||
|
| |||||||
| Technology Hardware, Storage & Peripherals — 5.3% | ||||||||
Apple, Inc. | 207 | 45,304 | ||||||
NetApp, Inc. | 540 | 42,385 | ||||||
Western Digital Corp. | 492 | 21,190 | ||||||
|
| |||||||
| 108,879 | ||||||||
|
| |||||||
Total Common Stock |
| |||||||
(Cost: $1,951,936) |
| 2,024,184 | ||||||
|
| |||||||
See accompanying notes to financial statements.
24
Table of Contents
TCW Artificial Intelligence Equity Fund
October 31, 2018
| Issues | Shares | Value | ||||||
| MONEY MARKET INVESTMENTS — 3.2% | ||||||||
State Street Institutional U.S. Government Money Market Fund — Premier Class, 2.09% (2) | 65,193 | $ | 65,193 | |||||
|
| |||||||
Total Money Market Investments |
| |||||||
(Cost: $65,193) |
| 65,193 | ||||||
|
| |||||||
Total Investments (101.6%) |
| |||||||
(Cost: $2,017,129) |
| 2,089,377 | ||||||
Liabilities in Excess of Other Assets (-1.6%) |
| (31,933 | ) | |||||
|
| |||||||
Net Assets (100.0%) |
| $ | 2,057,444 | |||||
|
| |||||||
Notes to the Schedule of Investments
| (1) | Non-income producing security. |
| (2) | Rate disclosed is the 7-day net yield as of October 31, 2018. |
| REIT- | Real Estate Investment Trust. |
| SP ADR - | Sponsored American Depositary Receipt. ADRs are receipts, typically issued by a U.S. bank or trust company, evidencing ownership of underlying securities issued by a foreign corporation. Sponsored ADRs are ADRs issued with the cooperation of the foreign corporation. |
See accompanying notes to financial statements.
25
Table of Contents
TCW Artificial Intelligence Equity Fund
Investments by Industry | October 31, 2018 |
| Industry | Percentage of Net Assets | |||
Application Software | 16.2 | % | ||
Auto Parts & Equipment | 1.5 | |||
Automobile Manufacturers | 3.9 | |||
Data Processing & Outsourced Services | 3.6 | |||
Diversified Support Services | 0.9 | |||
Health Care Equipment | 3.3 | |||
Health Care Supplies | 1.0 | |||
Home Entertainment Software | 3.9 | |||
Internet Retail | 4.6 | |||
Internet Services & Infrastructure | 14.0 | |||
IT Consulting & Other Services | 5.5 | |||
Life Sciences Tools & Services | 2.1 | |||
Managed Health Care | 1.7 | |||
Restaurants | 1.9 | |||
Semiconductor Equipment | 3.4 | |||
Semiconductors | 13.0 | |||
Specialized REITs | 3.6 | |||
Systems Software | 9.0 | |||
Technology Hardware, Storage & Peripherals | 5.3 | |||
Money Market Investments | 3.2 | |||
|
| |||
Total | 101.6 | % | ||
|
| |||
See accompanying notes to financial statements.
26
Table of Contents
TCW Artificial Intelligence Equity Fund
Fair Valuation Summary October 31, 2018 |
The following is a summary of the fair valuations according to the inputs used as of October 31, 2018 in valuing the Fund’s investments:
Description | Quoted Prices in Active Markets for Identical Assets (Level 1) | Other Significant Observable Inputs (Level 2) | Significant Unobservable Inputs (Level 3) | Total | ||||||||||||
Common Stock | ||||||||||||||||
Application Software | $ | 333,534 | $ | — | $ | — | $ | 333,534 | ||||||||
Auto Parts & Equipment | 31,718 | — | — | 31,718 | ||||||||||||
Automobile Manufacturers | 80,756 | — | — | 80,756 | ||||||||||||
Data Processing & Outsourced Services | 73,955 | — | — | 73,955 | ||||||||||||
Diversified Support Services | 18,335 | — | — | 18,335 | ||||||||||||
Health Care Equipment | 68,882 | — | — | 68,882 | ||||||||||||
Health Care Supplies | 20,793 | — | — | 20,793 | ||||||||||||
Home Entertainment Software | 79,710 | — | — | 79,710 | ||||||||||||
Internet Retail | 94,030 | — | — | 94,030 | ||||||||||||
Internet Services & Infrastructure | 288,176 | — | — | 288,176 | ||||||||||||
IT Consulting & Other Services | 113,770 | — | — | 113,770 | ||||||||||||
Life Sciences Tools & Services | 42,316 | — | — | 42,316 | ||||||||||||
Managed Health Care | 34,498 | — | — | 34,498 | ||||||||||||
Restaurants | 38,706 | — | — | 38,706 | ||||||||||||
Semiconductor Equipment | 68,942 | — | — | 68,942 | ||||||||||||
Semiconductors | 267,522 | — | — | 267,522 | ||||||||||||
Specialized REITs | 73,650 | — | — | 73,650 | ||||||||||||
Systems Software | 186,012 | — | — | 186,012 | ||||||||||||
Technology Hardware, Storage & Peripherals | 108,879 | — | — | 108,879 | ||||||||||||
|
|
|
|
|
|
|
| |||||||||
Total Common Stock | 2,024,184 | — | — | 2,024,184 | ||||||||||||
|
|
|
|
|
|
|
| |||||||||
Money Market Investments | 65,193 | — | — | 65,193 | ||||||||||||
|
|
|
|
|
|
|
| |||||||||
Total Investments | $ | 2,089,377 | $ | — | $ | — | $ | 2,089,377 | ||||||||
|
|
|
|
|
|
|
| |||||||||
See accompanying notes to financial statements.
27
Table of Contents
TCW Conservative Allocation Fund
Schedule of Investments
| Issues | Shares | Value | ||||||
EXCHANGE-TRADED FUNDS — 2.5% of Net Assets |
| |||||||
iShares MSCI EAFE Index Fund | 11,160 | $ | 697,054 | |||||
|
| |||||||
Total Exchange-traded Funds | ||||||||
(Cost: $725,446) |
| 697,054 | ||||||
|
| |||||||
INVESTMENT COMPANIES — 91.9% |
| |||||||
| Diversified Equity Funds — 33.6% | ||||||||
TCW New America Premier Equities Fund — I Class (1) | 174,047 | 2,831,744 | ||||||
TCW Relative Value Large Cap Fund — I Class (1) | 166,434 | 3,298,723 | ||||||
TCW Relative Value Mid Cap Fund — I Class (1) | 32,594 | 731,412 | ||||||
TCW Select Equities Fund — I Class (1) | 99,039 | 2,686,941 | ||||||
|
| |||||||
| 9,548,820 | ||||||||
|
| |||||||
| Diversified Fixed Income Funds — 58.3% | ||||||||
Metropolitan West Low Duration Bond Fund — I Class (1) | 410,574 | 3,514,514 | ||||||
Metropolitan West Total Return Bond Fund — I Class (1) | 352,026 | 3,594,186 | ||||||
Metropolitan West Unconstrained Bond Fund — I Class (1) | 464,670 | 5,431,996 | ||||||
TCW Global Bond Fund — I Class (1) | 75,074 | 708,696 | ||||||
| Issues | Shares | Value | ||||||
| Diversified Fixed Income Funds (Continued) | ||||||||
TCW Total Return Bond Fund — I Class (1) | 352,295 | $ | 3,336,230 | |||||
|
| |||||||
| 16,585,622 | ||||||||
|
| |||||||
Total Investment Companies | ||||||||
(Cost: $25,075,978) |
| 26,134,442 | ||||||
|
| |||||||
MONEY MARKET INVESTMENTS — 5.6% |
| |||||||
State Street Institutional U.S. Government Money Market Fund — Premier Class, 2.09% (2) | 423,906 | 423,906 | ||||||
Fidelity Institutional Government Portfolio — Select Class, 2.01% (2) | 1,182,006 | 1,182,006 | ||||||
|
| |||||||
Total Money Market Investments | ||||||||
(Cost: $1,605,912) |
| 1,605,912 | ||||||
|
| |||||||
Total Investments (100.0%) | ||||||||
(Cost: $27,407,336) |
| 28,437,408 | ||||||
Excess of Other Assets over Liabilities (0.0%) |
| 5,627 | ||||||
|
| |||||||
Net Assets (100.0%) |
| $ | 28,443,035 | |||||
|
| |||||||
Notes to the Schedule of Investments
| (1) | Affiliated issuer. |
| (2) | Rate disclosed is the 7-day net yield as of October 31, 2018. |
See accompanying notes to financial statements.
28
Table of Contents
TCW Conservative Allocation Fund
October 31, 2018
The summary of the TCW Conservative Allocation Fund transactions in the affiliated funds for the year ended October 31, 2018 is as follows:
Name of | Value at October 31, 2017 (In Thousands) | Purchases at Cost (In Thousands) | Proceeds from Sales (In Thousands) | Number of Shares Held October 31, 2018 | Value at October 31, 2018 (In Thousands) | Dividends and Interest Income Received (In Thousands) | Distributions Received from Net Realized Gain (In thousands) | Net Realized Gain/(Loss) on Investments (In thousands) | Net change in Unrealized Gain/(Loss) on Investments (In thousands) | |||||||||||||||||||||||||||
Metropolitan West Low Duration Bond Fund—I Class |
| |||||||||||||||||||||||||||||||||||
| $ | 2,924 | $ | 934 | $ | (288 | ) | 410,574 | $ | 3,515 | $ | 69 | $ | — | $ | (4 | ) | $ | (52 | ) | |||||||||||||||||
Metropolitan West Total Return Bond Fund—I Class |
| |||||||||||||||||||||||||||||||||||
| $ | 4,019 | $ | 98 | $ | (357 | ) | 352,026 | 3,594 | 98 | — | (15 | ) | (150 | ) | ||||||||||||||||||||||
Metropolitan West Unconstrained Bond Fund—I Class |
| |||||||||||||||||||||||||||||||||||
| $ | 5,898 | $ | 205 | $ | (533 | ) | 464,670 | 5,432 | 195 | 11 | (2 | ) | (137 | ) | ||||||||||||||||||||||
TCW / Gargoyle Dynamic 500 Fund—I Class |
| |||||||||||||||||||||||||||||||||||
| $ | 2,556 | $ | 23 | $ | (2,703 | ) | — | — | 23 | — | 368 | (244 | ) | |||||||||||||||||||||||
TCW / Gargoyle Hedged Value Fund—I Class |
| |||||||||||||||||||||||||||||||||||
| $ | 858 | $ | — | $ | (929 | ) | — | — | — | — | 196 | (125 | ) | |||||||||||||||||||||||
TCW Global Bond Fund—I Class |
| |||||||||||||||||||||||||||||||||||
| $ | 704 | $ | 98 | $ | (69 | ) | 75,074 | 708 | 4 | 1 | (2 | ) | (22 | ) | ||||||||||||||||||||||
TCW New America Premier Equities Fund—I Class |
| |||||||||||||||||||||||||||||||||||
| $ | 2,835 | $ | 537 | $ | (690 | ) | 174,047 | 2,832 | — | 100 | (16 | ) | 165 | |||||||||||||||||||||||
TCW Relative Value Large Cap Fund—I Class |
| |||||||||||||||||||||||||||||||||||
| $ | 3,188 | $ | 1,078 | $ | (296 | ) | 166,434 | 3,299 | 62 | 404 | (19 | ) | (652 | ) | ||||||||||||||||||||||
TCW Relative Value Mid Cap Fund—I Class |
| |||||||||||||||||||||||||||||||||||
| $ | — | $ | 939 | $ | (75 | ) | 32,594 | 731 | — | — | (3 | ) | (130 | ) | ||||||||||||||||||||||
TCW Select Equities Fund—I Class |
| |||||||||||||||||||||||||||||||||||
| $ | 1,690 | $ | 1,418 | $ | (168 | ) | 99,039 | 2,687 | — | 362 | (14 | ) | (239 | ) | ||||||||||||||||||||||
TCW Total Return Bond Fund—I Class |
| |||||||||||||||||||||||||||||||||||
| $ | 3,733 | $ | 122 | $ | (333 | ) | 352,295 | 3,336 | 124 | — | (5 | ) | (180 | ) | ||||||||||||||||||||||
|
|
|
|
|
|
|
|
|
| |||||||||||||||||||||||||||
Total | $ | 26,134 | $ | 575 | $ | 878 | $ | 484 | $ | (1,766 | ) | |||||||||||||||||||||||||
|
|
|
|
|
|
|
|
|
| |||||||||||||||||||||||||||
See accompanying notes to financial statements.
29
Table of Contents
TCW Conservative Allocation Fund
Investments by Industry October 31, 2018 |
| Industry | Percentage of Net Assets | |||
Diversified Fixed Income Funds | 58.3 | % | ||
Diversified Equity Funds | 33.6 | |||
Money Market Investments | 5.6 | |||
Exchange-Traded Funds | 2.5 | |||
|
| |||
Total | 100.0 | % | ||
|
| |||
Fair Valuation Summary
The following is a summary of the fair valuations according to the inputs used as of October 31, 2018 in valuing the Fund’s investments:
Description | Quoted Prices in Active Markets for Identical Assets (Level 1) | Other Significant Observable Inputs (Level 2) | Significant Unobservable Inputs (Level 3) | Total | ||||||||||||
Exchange-Traded Funds | $ | 697,054 | $ | — | $ | — | $ | 697,054 | ||||||||
Investment Companies | 26,134,442 | — | — | 26,134,442 | ||||||||||||
Money Market Investments | 1,605,912 | — | — | 1,605,912 | ||||||||||||
|
|
|
|
|
|
|
| |||||||||
Total Investments | $ | 28,437,408 | $ | — | $ | — | $ | 28,437,408 | ||||||||
|
|
|
|
|
|
|
| |||||||||
See accompanying notes to financial statements.
30
Table of Contents
Schedule of Investments October 31, 2018 |
| Issues | Shares | Value | ||||||
COMMON STOCK — 92.5% of Net Assets |
| |||||||
| Australia — 7.4% | ||||||||
Goodman Group | 19,764 | $ | 145,378 | |||||
Scentre Group | 37,780 | 106,526 | ||||||
|
| |||||||
| 251,904 | ||||||||
|
| |||||||
| China — 3.5% | ||||||||
Link REIT (The) | 13,332 | 118,521 | ||||||
|
| |||||||
| 118,521 | ||||||||
|
| |||||||
| France — 3.7% | ||||||||
Klepierre | 1,162 | 39,391 | ||||||
Unibail — Rodamco — Westfield | 484 | 87,615 | ||||||
|
| |||||||
| 127,006 | ||||||||
|
| |||||||
| Germany — 3.9% | ||||||||
Deutsche Wohnen SE | 2,907 | 133,013 | ||||||
|
| |||||||
| Japan — 9.5% | ||||||||
Ichigo Office REIT Investment | 168 | 137,877 | ||||||
Mitsui Fudosan Co., Ltd. | 5,300 | 119,346 | ||||||
Nippon Prologis REIT, Inc. | 34 | 68,427 | ||||||
|
| |||||||
| 325,650 | ||||||||
|
| |||||||
| United Kingdom — 3.5% | ||||||||
British Land Co. PLC (The) | 5,146 | 38,851 | ||||||
Segro PLC | 10,384 | 81,380 | ||||||
|
| |||||||
| 120,231 | ||||||||
|
| |||||||
| United States — 61.0% | ||||||||
American Tower Corp. | 1,000 | 155,810 | ||||||
Braemar Hotels & Resorts, Inc. | 22,248 | 236,719 | ||||||
Colony Capital, Inc. | 14,476 | 84,974 | ||||||
DR Horton, Inc. | 1,690 | 60,772 | ||||||
| Issues | Shares | Value | ||||||
| United States (Continued) | ||||||||
Industrial Logistics Properties Trust | 21,768 | $ | 469,971 | |||||
Invitation Homes, Inc. | 3,077 | 67,325 | ||||||
JBG SMITH Properties | 2,932 | 109,891 | ||||||
Kennedy-Wilson Holdings, Inc. | 4,574 | 86,815 | ||||||
NexPoint Residential Trust, Inc. | 3,059 | 109,023 | ||||||
Prologis, Inc. | 1,304 | 84,069 | ||||||
Ramco-Gershenson Properties Trust | 5,225 | 69,388 | ||||||
Retail Properties of America, Inc. | 5,724 | 70,233 | ||||||
SBA Communications Corp.(1) | 448 | 72,652 | ||||||
Select Income REIT | 8,200 | 155,062 | ||||||
Simon Property Group, Inc. | 763 | 140,026 | ||||||
Tier REIT, Inc. | 3,481 | 75,433 | ||||||
Walker & Dunlop, Inc. | 962 | 40,366 | ||||||
|
| |||||||
| 2,088,529 | ||||||||
|
| |||||||
Total Common Stock | ||||||||
(Cost: $3,019,466) | 3,164,854 | |||||||
|
| |||||||
PURCHASED OPTIONS (2) (0.3%) |
| |||||||
(Cost: $15,003) |
| 8,800 | ||||||
|
| |||||||
| MONEY MARKET INVESTMENTS — 7.4% | ||||||||
State Street Institutional U.S. Government Money Market Fund — Premier Class, 2.09% (3) | 252,603 | 252,603 | ||||||
|
| |||||||
Total Money Market Investments | ||||||||
(Cost: $252,603) | 252,603 | |||||||
|
| |||||||
Total Investments (100.1%) | ||||||||
(Cost: $3,287,072) | 3,426,257 | |||||||
Liabilities in Excess of Other Assets (-0.1%) |
| (4,231 | ) | |||||
|
| |||||||
Net Assets (100.0%) |
| $ | 3,422,026 | |||||
|
| |||||||
| Purchased Options — Exchange Traded | ||||||||||||||||||||||||||
| Description | Exercise Price | Expiration Date | Number of Contracts | Notional Amount (000) | Market Value | Premiums Paid by Fund | Unrealized Appreciation/ (Depreciation) | |||||||||||||||||||
PUT |
| |||||||||||||||||||||||||
Vanguard Real Estate ETF | $75 | 12/21/18 | 80 | $ | 627 | $ | 8,800 | $ | 15,003 | $ | (6,203 | ) | ||||||||||||||
|
|
|
|
|
| |||||||||||||||||||||
Notes to the Schedule of Investments
| (1) | Non-income producing security. |
| (2) | See options table for description of purchased options. |
| (3) | Rate disclosed is the 7-day net yield as of October 31, 2018. |
| ETF | Exchange Traded Fund. |
| REIT | Real Estate Investment Trust. |
See accompanying notes to financial statements.
31
Table of Contents
TCW Global Real Estate Fund
Investments by Industry | October 31, 2018 |
| Industry | Percentage of Net Assets | |||
Diversified REITs | 16.2 | % | ||
Diversified Real Estate Activities | 3.5 | |||
Homebuilding | 1.8 | |||
Hotel & Resort REITs | 6.9 | |||
Industrial REITs | 11.1 | |||
Office REITs | 13.9 | |||
Purchased Options | 0.3 | |||
Real Estate Operating Companies | 6.4 | |||
Residential REITs | 5.2 | |||
Retail REITs | 19.5 | |||
Specialized REITs | 6.7 | |||
Thrifts & Mortgage Finance | 1.2 | |||
Money Market Investments | 7.4 | |||
|
| |||
Total | 100.1 | % | ||
|
| |||
Fair Valuation Summary
The following is a summary of the fair valuations according to the inputs used as of October 31, 2018 in valuing the Fund’s investments:
Description | Quoted Prices in Active Markets for Identical Assets (Level 1) | Other Significant Observable Inputs (Level 2) | Significant Unobservable Inputs (Level 3) | Total | ||||||||||||
Common Stock | ||||||||||||||||
Diversified REITs | $ | 554,945 | $ | — | $ | — | $ | 554,945 | ||||||||
Diversified Real Estate Activities | — | 119,346 | — | 119,346 | ||||||||||||
Homebuilding | 60,772 | — | — | 60,772 | ||||||||||||
Hotel & Resort REITs | 236,719 | — | — | 236,719 | ||||||||||||
Industrial REITs | 84,069 | 295,185 | — | 379,254 | ||||||||||||
Office REITs | 340,386 | 137,877 | — | 478,263 | ||||||||||||
Real Estate Operating Companies | 86,815 | 133,013 | — | 219,828 | ||||||||||||
Residential REITs | 176,348 | — | — | 176,348 | ||||||||||||
Retail REITs | 279,647 | 390,904 | — | 670,551 | ||||||||||||
Specialized REITs | 228,462 | — | — | 228,462 | ||||||||||||
Thrifts & Mortgage Finance | 40,366 | — | — | 40,366 | ||||||||||||
|
|
|
|
|
|
|
| |||||||||
Total Common Stock | 2,088,529 | 1,076,325 | — | 3,164,854 | ||||||||||||
|
|
|
|
|
|
|
| |||||||||
Purchased Options | 8,800 | — | — | 8,800 | ||||||||||||
|
|
|
|
|
|
|
| |||||||||
Money Market Investments | 252,603 | — | — | 252,603 | ||||||||||||
|
|
|
|
|
|
|
| |||||||||
Total Investments | $ | 2,349,932 | $ | 1,076,325 | $ | — | $ | 3,426,257 | ||||||||
|
|
|
|
|
|
|
| |||||||||
See accompanying notes to financial statements.
32
Table of Contents
TCW New America Premier Equities Fund
Schedule of Investments October 31, 2018 |
| Issues | Shares | Value | ||||||
COMMON STOCK — 90.8% of Net Assets |
| |||||||
| Aerospace & Defense — 6.4% | ||||||||
HEICO Corp. | 13,117 | $ | 1,099,598 | |||||
Honeywell International, Inc. | 3,812 | 552,054 | ||||||
TransDigm Group, Inc. (1) | 1,501 | 495,705 | ||||||
|
| |||||||
| 2,147,357 | ||||||||
|
| |||||||
| Auto Components — 0.0% | ||||||||
Garrett Motion, Inc. (1) | 374 | 5,674 | ||||||
|
| |||||||
| Building Products — 0.0% | ||||||||
Resideo Technologies, Inc. (1) | 635 | 13,374 | ||||||
|
| |||||||
| Capital Markets — 1.5% | ||||||||
S&P Global, Inc. | 2,784 | 507,579 | ||||||
|
| |||||||
| Chemicals — 8.1% | ||||||||
Air Products & Chemicals, Inc. | 8,669 | 1,338,060 | ||||||
Celanese Corp. — Series A | 8,571 | 830,873 | ||||||
Chase Corp. | 4,792 | 516,769 | ||||||
|
| |||||||
| 2,685,702 | ||||||||
|
| |||||||
| Commercial Services & Supplies — 1.0% | ||||||||
Cintas Corp. | 1,889 | 343,552 | ||||||
|
| |||||||
| Communications Equipment — 1.2% | ||||||||
Motorola Solutions, Inc. | 3,232 | 396,114 | ||||||
|
| |||||||
| Diversified Financial Services — 4.4% | ||||||||
Berkshire Hathaway, Inc. — Class B (1) | 6,344 | 1,302,296 | ||||||
GS Acquisition Holdings Corp. (1) | 16,156 | 167,215 | ||||||
|
| |||||||
| 1,469,511 | ||||||||
|
| |||||||
| Entertainment — 1.4% | ||||||||
Activision Blizzard, Inc. | 6,869 | 474,304 | ||||||
|
| |||||||
| Food Products — 1.4% | ||||||||
Conagra Brands, Inc. | 12,657 | 450,589 | ||||||
|
| |||||||
| Health Care Equipment & Supplies — 7.0% | ||||||||
Baxter International, Inc. | 22,729 | 1,420,790 | ||||||
Danaher Corp. | 9,316 | 926,010 | ||||||
|
| |||||||
| 2,346,800 | ||||||||
|
| |||||||
| Industrial Conglomerates — 5.0% | ||||||||
Roper Technologies, Inc. | 5,880 | 1,663,452 | ||||||
|
| |||||||
| IT Services — 9.2% | ||||||||
EVO Payments, Inc. (1) | 6,468 | 153,550 | ||||||
Fiserv, Inc. (1) | 20,253 | 1,606,063 | ||||||
Mastercard, Inc. | 2,872 | 567,708 | ||||||
Visa, Inc. | 5,297 | 730,192 | ||||||
|
| |||||||
| 3,057,513 | ||||||||
|
| |||||||
| Life Sciences Tools & Services — 4.5% | ||||||||
Agilent Technologies, Inc. | 12,664 | 820,501 | ||||||
Thermo Fisher Scientific, Inc. | 2,845 | 664,734 | ||||||
|
| |||||||
| 1,485,235 | ||||||||
|
| |||||||
| Issues | Shares | Value | ||||||
| Machinery — 4.6% | ||||||||
Caterpillar, Inc. | 2,213 | $ | 268,481 | |||||
IDEX Corp. | 10,042 | 1,273,527 | ||||||
|
| |||||||
| 1,542,008 | ||||||||
|
| |||||||
| Professional Services — 14.1% | ||||||||
IHS Markit, Ltd. (1) | 13,943 | 732,426 | ||||||
TransUnion | 60,259 | 3,962,029 | ||||||
|
| |||||||
| 4,694,455 | ||||||||
|
| |||||||
| Software — 20.6% | ||||||||
Constellation Software, Inc. | 5,923 | 4,086,272 | ||||||
Microsoft Corp. | 15,370 | 1,641,670 | ||||||
Trade Desk, Inc. (The) (1) | 9,185 | 1,134,807 | ||||||
|
| |||||||
| 6,862,749 | ||||||||
|
| |||||||
| Specialty Retail — 0.4% | ||||||||
National Vision Holdings, Inc. (1) | 3,577 | 148,195 | ||||||
|
| |||||||
Total Common Stock | ||||||||
(Cost: $25,662,255) | 30,294,163 | |||||||
|
| |||||||
| EXCHANGE-TRADED FUNDS — 1.6% | ||||||||
SPDR S&P 500 ETF Trust | 2,000 | 541,260 | ||||||
|
| |||||||
Total Exchange-traded Funds | ||||||||
(Cost: $538,316) | 541,260 | |||||||
|
| |||||||
| MONEY MARKET INVESTMENTS — 6.8% | ||||||||
State Street Institutional U.S. Government Money Market Fund — Premier Class, 2.09% (2) | 2,258,980 | 2,258,980 | ||||||
|
| |||||||
Total Money Market Investments | ||||||||
(Cost: $2,258,980) | 2,258,980 | |||||||
|
| |||||||
Total Investments (99.2%) | ||||||||
(Cost: $28,459,551) | 33,094,403 | |||||||
|
| |||||||
Excess of Other Assets over Liabilities (0.8%) |
| 270,308 | ||||||
|
| |||||||
Net Assets (100.0%) |
| $ | 33,364,711 | |||||
|
| |||||||
Notes to the Schedule of Investments
| ETF | Exchange Traded Fund. |
| (1) | Non-income producing security. |
| (2) | Rate disclosed is the 7-day net yield as of October 31, 2018. |
See accompanying notes to financial statements.
33
Table of Contents
TCW New America Premier Equities Fund
Investments by Industry | October 31, 2018 |
| Industry | Percentage of Net Assets | |||
Aerospace & Defense | 6.4 | % | ||
Auto Components | 0.0 | * | ||
Building Products | 0.0 | * | ||
Capital Markets | 1.5 | |||
Chemicals | 8.1 | |||
Commercial Services & Supplies | 1.0 | |||
Communications Equipment | 1.2 | |||
Diversified Financial Services | 4.4 | |||
Entertainment | 1.4 | |||
Exchange-traded Funds | 1.6 | |||
Food Products | 1.4 | |||
Health Care Equipment & Supplies | 7.0 | |||
IT Services | 9.2 | |||
Industrial Conglomerates | 5.0 | |||
Life Sciences Tools & Services | 4.5 | |||
Machinery | 4.6 | |||
Professional Services | 14.1 | |||
Software | 20.6 | |||
Specialty Retail | 0.4 | |||
Money Market Investments | 6.8 | |||
|
| |||
Total | 99.2 | % | ||
|
| |||
| * | Value rounds to less than 0.1% of net assets. |
See accompanying notes to financial statements.
34
Table of Contents
TCW New America Premier Equities Fund
Fair Valuation Summary | October 31, 2018 |
The following is a summary of the fair valuations according to the inputs used as of October 31, 2018 in valuing the Fund’s investments:
Description | Quoted Prices in Active Markets for Identical Assets (Level 1) | Other Significant Observable Inputs (Level 2) | Significant Unobservable Inputs (Level 3) | Total | ||||||||||||
Common Stock | ||||||||||||||||
Aerospace & Defense | $ | 2,147,357 | $ | — | $ | — | $ | 2,147,357 | ||||||||
Auto Components | 5,674 | — | — | 5,674 | ||||||||||||
Building Products | 13,374 | — | — | 13,374 | ||||||||||||
Capital Markets | 507,579 | — | — | 507,579 | ||||||||||||
Chemicals | 2,685,702 | — | — | 2,685,702 | ||||||||||||
Commercial Services & Supplies | 343,552 | — | — | 343,552 | ||||||||||||
Communications Equipment | 396,114 | — | — | 396,114 | ||||||||||||
Diversified Financial Services | 1,469,511 | — | — | 1,469,511 | ||||||||||||
Entertainment | 474,304 | — | — | 474,304 | ||||||||||||
Food Products | 450,589 | — | — | 450,589 | ||||||||||||
Health Care Equipment & Supplies | 2,346,800 | — | — | 2,346,800 | ||||||||||||
Industrial Conglomerates | 1,663,452 | — | — | 1,663,452 | ||||||||||||
IT Services | 3,057,513 | — | — | 3,057,513 | ||||||||||||
Life Sciences Tools & Services | 1,485,235 | — | — | 1,485,235 | ||||||||||||
Machinery | 1,542,008 | — | — | 1,542,008 | ||||||||||||
Professional Services | 4,694,455 | — | — | 4,694,455 | ||||||||||||
Software | 6,862,749 | — | — | 6,862,749 | ||||||||||||
Specialty Retail | 148,195 | — | — | 148,195 | ||||||||||||
|
|
|
|
|
|
|
| |||||||||
Total Common Stock | 30,294,163 | — | — | 30,294,163 | ||||||||||||
|
|
|
|
|
|
|
| |||||||||
Exchange-Traded Funds | 541,260 | 541,260 | ||||||||||||||
|
|
|
|
|
|
|
| |||||||||
Money Markets Investments | 2,258,980 | — | — | 2,258,980 | ||||||||||||
|
|
|
|
|
|
|
| |||||||||
Total Investments | $ | 33,094,403 | $ | — | $ | — | $ | 33,094,403 | ||||||||
|
|
|
|
|
|
|
| |||||||||
See accompanying notes to financial statements.
35
Table of Contents
TCW Relative Value Dividend Appreciation Fund
Schedule of Investments
| Issues | Shares | Value | ||||||
COMMON STOCK — 99.8% of Net Assets |
| |||||||
| Aerospace & Defense — 2.9% | ||||||||
Textron, Inc. | 274,606 | $ | 14,727,120 | |||||
|
| |||||||
| Air Freight & Logistics — 1.6% | ||||||||
United Parcel Service, Inc. — Class B | 76,000 | 8,097,040 | ||||||
|
| |||||||
| Auto Components — 2.1% | ||||||||
Johnson Controls International PLC (Ireland) | 326,589 | 10,441,050 | ||||||
|
| |||||||
| Banks — 11.9% | ||||||||
Citigroup, Inc. | 335,304 | 21,949,000 | ||||||
JPMorgan Chase & Co. | 217,186 | 23,677,618 | ||||||
PacWest Bancorp | 66,300 | 2,693,106 | ||||||
Zions Bancorp | 252,770 | 11,892,828 | ||||||
|
| |||||||
| 60,212,552 | ||||||||
|
| |||||||
| Beverages — 2.6% | ||||||||
PepsiCo, Inc. | 116,473 | 13,089,236 | ||||||
|
| |||||||
| Biotechnology — 3.5% | ||||||||
Gilead Sciences, Inc. | 256,165 | 17,465,330 | ||||||
|
| |||||||
| Capital Markets — 7.3% | ||||||||
Goldman Sachs Group, Inc. (The) | 23,821 | 5,368,539 | ||||||
Intercontinental Exchange, Inc. | 255,870 | 19,712,225 | ||||||
State Street Corp. | 174,919 | 12,025,681 | ||||||
|
| |||||||
| 37,106,445 | ||||||||
|
| |||||||
| Chemicals — 2.6% | ||||||||
DowDuPont, Inc. | 247,911 | 13,367,361 | ||||||
|
| |||||||
| Communications Equipment — 5.1% | ||||||||
Cisco Systems, Inc. | 563,081 | 25,760,956 | ||||||
|
| |||||||
| Consumer Finance — 2.0% | ||||||||
Synchrony Financial | 342,955 | 9,904,540 | ||||||
|
| |||||||
| Diversified Telecommunication Services — 1.7% | ||||||||
AT&T, Inc. | 279,532 | 8,576,042 | ||||||
|
| |||||||
| Electrical Equipment — 1.3% | ||||||||
nVent Electric PLC | 267,682 | 6,536,794 | ||||||
|
| |||||||
| Electronic Equipment, Instruments & Components — 3.0% | ||||||||
Corning, Inc. | 482,464 | 15,414,725 | ||||||
|
| |||||||
| Energy Equipment & Services — 5.0% | ||||||||
Baker Hughes, a GE Co. | 408,785 | 10,910,472 | ||||||
Schlumberger, Ltd. | 283,756 | 14,559,520 | ||||||
|
| |||||||
| 25,469,992 | ||||||||
|
| |||||||
| Health Care Equipment & Supplies — 1.7% | ||||||||
Medtronic PLC (Ireland) | 94,005 | 8,443,529 | ||||||
|
| |||||||
| Household Durables — 1.8% | ||||||||
Lennar Corp. | 212,882 | 9,149,668 | ||||||
Lennar Corp. — Class B | 4,211 | 150,628 | ||||||
|
| |||||||
| 9,300,296 | ||||||||
|
| |||||||
| Issues | Shares | Value | ||||||
| Household Products — 2.8% | ||||||||
Procter & Gamble Co. (The) | 158,500 | $ | 14,055,780 | |||||
|
| |||||||
| Independent Power and Renewable Electricity Producers — 3.3% | ||||||||
AES Corp. (The) | 1,135,665 | 16,557,996 | ||||||
|
| |||||||
| Industrial Conglomerates — 4.2% | ||||||||
General Electric Co. | 795,855 | 8,038,136 | ||||||
Koninklijke Philips Electronics NV (NYRS) (Netherlands) | 359,467 | 13,382,956 | ||||||
|
| |||||||
| 21,421,092 | ||||||||
|
| |||||||
| Insurance — 3.2% | ||||||||
American International Group, Inc. | 85,400 | 3,526,166 | ||||||
MetLife, Inc. | 309,278 | 12,739,161 | ||||||
|
| |||||||
| 16,265,327 | ||||||||
|
| |||||||
| IT Services — 0.9% | ||||||||
International Business Machines Corp. | 41,419 | 4,780,995 | ||||||
|
| |||||||
| Machinery — 1.3% | ||||||||
Pentair PLC (United Kingdom) | 163,282 | 6,555,772 | ||||||
|
| |||||||
| Media — 2.8% | ||||||||
Comcast Corp. | 378,094 | 14,420,505 | ||||||
|
| |||||||
| Metals & Mining — 1.0% | ||||||||
Freeport-McMoRan, Inc. | 419,700 | 4,889,505 | ||||||
|
| |||||||
| Multiline Retail — 1.3% | ||||||||
Target Corp. | 77,700 | 6,498,051 | ||||||
|
| |||||||
| Oil, Gas & Consumable Fuels — 6.9% | ||||||||
Chevron Corp. | 196,525 | 21,942,016 | ||||||
Royal Dutch Shell PLC (SP ADR) (United Kingdom) | 206,620 | 13,056,318 | ||||||
|
| |||||||
| 34,998,334 | ||||||||
|
| |||||||
| Pharmaceuticals — 5.7% | ||||||||
Merck & Co., Inc. | 278,045 | 20,466,892 | ||||||
Novartis AG (SP ADR) (Switzerland) | 95,200 | 8,326,192 | ||||||
|
| |||||||
| 28,793,084 | ||||||||
|
| |||||||
| Real Estate Management & Development — 0.6% | ||||||||
Jones Lang LaSalle, Inc. | 23,812 | 3,149,375 | ||||||
|
| |||||||
| REIT — 0.5% | ||||||||
Cousins Properties, Inc. | 280,700 | 2,332,617 | ||||||
|
| |||||||
| Semiconductors & Semiconductor Equipment — 5.4% | ||||||||
Cypress Semiconductor Corp. | 1,120,714 | 14,502,039 | ||||||
Maxim Integrated Products, Inc. | 251,748 | 12,592,435 | ||||||
|
| |||||||
| 27,094,474 | ||||||||
|
| |||||||
| Technology Hardware, Storage & Peripherals — 0.8% | ||||||||
Seagate Technology PLC (Netherlands) | 96,338 | 3,875,678 | ||||||
|
| |||||||
See accompanying notes to financial statements.
36
Table of Contents
TCW Relative Value Dividend Appreciation Fund
October 31, 2018
| Issues | Shares | Value | ||||||
| Textiles, Apparel & Luxury Goods — 3.0% | ||||||||
Tapestry, Inc. | 364,854 | $ | 15,436,973 | |||||
|
| |||||||
Total Common Stock | ||||||||
(Cost: $441,148,292) | 505,038,566 | |||||||
|
| |||||||
| MONEY MARKET INVESTMENTS — 0.2% | ||||||||
State Street Institutional U.S. Government Money Market Fund — Premier Class, 2.09% (1) | 1,120,541 | 1,120,541 | ||||||
|
| |||||||
Total Money Market Investments | ||||||||
(Cost: $1,120,541) | 1,120,541 | |||||||
|
| |||||||
Total Investments (100.0%) | ||||||||
(Cost: $442,268,833) | 506,159,107 | |||||||
Excess of Other Assets over Liabilities (0.0%) |
| 72,260 | ||||||
|
| |||||||
Net Assets (100.0%) |
| $ | 506,231,367 | |||||
|
| |||||||
Notes to the Schedule of Investments
| NYRS - | New York Registry Shares. |
| SP ADR - | Sponsored American Depositary Receipt. ADRs are receipts, typically issued by a U.S. bank or trust company, evidencing ownership of underlying securities issued by a foreign corporation. Sponsored ADRs are ADRs issued with the cooperation of the foreign corporation. |
| (1) | Rate disclosed is the 7-day net yield as of October 31, 2018. |
See accompanying notes to financial statements.
37
Table of Contents
TCW Relative Value Dividend Appreciation Fund
Investments by Industry October 31, 2018 |
| Industry | Percentage of Net Assets | |||
Aerospace & Defense | 2.9 | % | ||
Air Freight & Logistics | 1.6 | |||
Auto Components | 2.1 | |||
Banks | 11.9 | |||
Beverages | 2.6 | |||
Biotechnology | 3.5 | |||
Capital Markets | 7.3 | |||
Chemicals | 2.6 | |||
Communications Equipment | 5.1 | |||
Consumer Finance | 2.0 | |||
Diversified Telecommunication Services | 1.7 | |||
Electrical Equipment | 1.3 | |||
Electronic Equipment, Instruments & Components | 3.0 | |||
Energy Equipment & Services | 5.0 | |||
Health Care Equipment & Supplies | 1.7 | |||
Household Durables | 1.8 | |||
Household Products | 2.8 | |||
Independent Power and Renewable Electricity Producers | 3.3 | |||
Industrial Conglomerates | 4.2 | |||
Insurance | 3.2 | |||
IT Services | 0.9 | |||
Machinery | 1.3 | |||
Media | 2.8 | |||
Metals & Mining | 1.0 | |||
Multiline Retail | 1.3 | |||
Oil, Gas & Consumable Fuels | 6.9 | |||
Pharmaceuticals | 5.7 | |||
REIT | 0.5 | |||
Real Estate Management & Development | 0.6 | |||
Semiconductors & Semiconductor Equipment | 5.4 | |||
Technology Hardware, Storage & Peripherals | 0.8 | |||
Textiles, Apparel & Luxury Goods | 3.0 | |||
Money Market Investments | 0.2 | |||
|
| |||
Total | 100.0 | % | ||
|
| |||
See accompanying notes to financial statements.
38
Table of Contents
TCW Relative Value Dividend Appreciation Fund
Fair Valuation Summary | October 31, 2018 |
The following is a summary of the fair valuations according to the inputs used as of October 31, 2018 in valuing the Fund’s investments:
Description | Quoted Prices in Active Markets for Identical Assets (Level 1) | Other Significant Observable Inputs (Level 2) | Significant Unobservable Inputs (Level 3) | Total | ||||||||||||
Common Stock | ||||||||||||||||
Aerospace & Defense | $ | 14,727,120 | $ | — | $ | — | $ | 14,727,120 | ||||||||
Air Freight & Logistics | 8,097,040 | — | — | 8,097,040 | ||||||||||||
Auto Components | 10,441,050 | — | — | 10,441,050 | ||||||||||||
Banks | 60,212,552 | — | — | 60,212,552 | ||||||||||||
Beverages | 13,089,236 | — | — | 13,089,236 | ||||||||||||
Biotechnology | 17,465,330 | — | — | 17,465,330 | ||||||||||||
Capital Markets | 37,106,445 | — | — | 37,106,445 | ||||||||||||
Chemicals | 13,367,361 | — | — | 13,367,361 | ||||||||||||
Communications Equipment | 25,760,956 | — | — | 25,760,956 | ||||||||||||
Consumer Finance | 9,904,540 | — | — | 9,904,540 | ||||||||||||
Diversified Telecommunication Services | 8,576,042 | — | — | 8,576,042 | ||||||||||||
Electrical Equipment | 6,536,794 | — | — | 6,536,794 | ||||||||||||
Electronic Equipment, Instruments & Components | 15,414,725 | — | — | 15,414,725 | ||||||||||||
Energy Equipment & Services | 25,469,992 | — | — | 25,469,992 | ||||||||||||
Health Care Equipment & Supplies | 8,443,529 | — | — | 8,443,529 | ||||||||||||
Household Durables | 9,300,296 | — | — | 9,300,296 | ||||||||||||
Household Products | 14,055,780 | — | — | 14,055,780 | ||||||||||||
Independent Power and Renewable Electricity Producers | 16,557,996 | — | — | 16,557,996 | ||||||||||||
Industrial Conglomerates | 21,421,092 | — | — | 21,421,092 | ||||||||||||
Insurance | 16,265,327 | — | — | 16,265,327 | ||||||||||||
IT Services | 4,780,995 | — | — | 4,780,995 | ||||||||||||
Machinery | 6,555,772 | — | — | 6,555,772 | ||||||||||||
Media | 14,420,505 | — | — | 14,420,505 | ||||||||||||
Metals & Mining | 4,889,505 | — | — | 4,889,505 | ||||||||||||
Multiline Retail | 6,498,051 | — | — | 6,498,051 | ||||||||||||
Oil, Gas & Consumable Fuels | 34,998,334 | — | — | 34,998,334 | ||||||||||||
Pharmaceuticals | 28,793,084 | — | — | 28,793,084 | ||||||||||||
Real Estate Management & Development | 3,149,375 | — | — | 3,149,375 | ||||||||||||
REIT | 2,332,617 | — | — | 2,332,617 | ||||||||||||
Semiconductors & Semiconductor Equipment | 27,094,474 | — | — | 27,094,474 | ||||||||||||
Technology Hardware, Storage & Peripherals | 3,875,678 | — | — | 3,875,678 | ||||||||||||
Textiles, Apparel & Luxury Goods | 15,436,973 | — | — | 15,436,973 | ||||||||||||
|
|
|
|
|
|
|
| |||||||||
Total Common Stock | 505,038,566 | — | — | 505,038,566 | ||||||||||||
|
|
|
|
|
|
|
| |||||||||
Money Market Investments | 1,120,541 | — | — | 1,120,541 | ||||||||||||
|
|
|
|
|
|
|
| |||||||||
Total Investments | $ | 506,159,107 | $ | — | $ | — | $ | 506,159,107 | ||||||||
|
|
|
|
|
|
|
| |||||||||
See accompanying notes to financial statements.
39
Table of Contents
TCW Relative Value Large Cap Fund
Schedule of Investments
| Issues | Shares | Value | ||||||
COMMON STOCK — 99.2% of Net Assets |
| |||||||
| Aerospace & Defense — 4.0% | ||||||||
Textron, Inc. | 312,310 | $ | 16,749,185 | |||||
|
| |||||||
| Air Freight & Logistics — 1.5% | ||||||||
United Parcel Service, Inc. — Class B | 58,045 | 6,184,114 | ||||||
|
| |||||||
| Auto Components — 3.3% | ||||||||
Dana, Inc. | 341,298 | 5,314,010 | ||||||
Johnson Controls International PLC (Ireland) | 260,868 | 8,339,950 | ||||||
|
| |||||||
| 13,653,960 | ||||||||
|
| |||||||
| Banks — 11.5% | ||||||||
Citigroup, Inc. | 281,500 | 18,426,990 | ||||||
JPMorgan Chase & Co. | 175,658 | 19,150,235 | ||||||
Zions Bancorp | 219,700 | 10,336,885 | ||||||
|
| |||||||
| 47,914,110 | ||||||||
|
| |||||||
| Beverages — 2.4% | ||||||||
PepsiCo, Inc. | 86,800 | 9,754,584 | ||||||
|
| |||||||
| Biotechnology — 2.9% | ||||||||
Gilead Sciences, Inc. | 173,429 | 11,824,389 | ||||||
|
| |||||||
| Capital Markets — 6.7% | ||||||||
Goldman Sachs Group, Inc. (The) | 21,562 | 4,859,428 | ||||||
Intercontinental Exchange, Inc. | 198,005 | 15,254,305 | ||||||
State Street Corp. | 114,100 | 7,844,375 | ||||||
|
| |||||||
| 27,958,108 | ||||||||
|
| |||||||
| Chemicals — 1.9% | ||||||||
DowDuPont, Inc. | 149,486 | 8,060,285 | ||||||
|
| |||||||
| Communications Equipment — 4.7% | ||||||||
Cisco Systems, Inc. | 428,390 | 19,598,842 | ||||||
|
| |||||||
| Construction & Engineering — 1.0% | ||||||||
Fluor Corp. | 96,100 | 4,214,946 | ||||||
|
| |||||||
| Consumer Finance — 1.6% | ||||||||
Synchrony Financial | 234,692 | 6,777,905 | ||||||
|
| |||||||
| Diversified Telecommunication Services — 1.5% | ||||||||
AT&T, Inc. | 197,497 | 6,059,208 | ||||||
|
| |||||||
| Electrical Equipment — 1.0% | ||||||||
nVent Electric PLC | 161,267 | 3,938,140 | ||||||
|
| |||||||
| Electronic Equipment, Instruments & Components — 3.3% | ||||||||
Corning, Inc. | 423,150 | 13,519,642 | ||||||
|
| |||||||
| Energy Equipment & Services — 4.1% | ||||||||
Baker Hughes, a GE Co. | 394,910 | 10,540,148 | ||||||
TechnipFMC PLC (United Kingdom) | 238,500 | 6,272,550 | ||||||
|
| |||||||
| 16,812,698 | ||||||||
|
| |||||||
| Food Products — 0.3% | ||||||||
Conagra Brands, Inc. | 39,900 | 1,420,440 | ||||||
|
| |||||||
| Issues | Shares | Value | ||||||
| Health Care Equipment & Supplies — 1.6% | ||||||||
Medtronic PLC (Ireland) | 75,496 | $ | 6,781,051 | |||||
|
| |||||||
| Health Care Providers & Services — 4.1% | ||||||||
Centene Corp. (1) | 74,289 | 9,681,342 | ||||||
Molina Healthcare, Inc. (1) | 58,258 | 7,385,367 | ||||||
|
| |||||||
| 17,066,709 | ||||||||
|
| |||||||
| Household Durables — 2.3% | ||||||||
Lennar Corp. | 221,863 | 9,535,672 | ||||||
Lennar Corp. — Class B | 5,357 | 191,620 | ||||||
|
| |||||||
| 9,727,292 | ||||||||
|
| |||||||
| Household Products — 2.7% | ||||||||
Procter & Gamble Co. (The) | 125,700 | 11,147,076 | ||||||
|
| |||||||
| Independent Power and Renewable Electricity Producers — 2.9% | ||||||||
AES Corp. (The) | 810,600 | 11,818,548 | ||||||
|
| |||||||
| Industrial Conglomerates — 1.1% | ||||||||
General Electric Co. | 441,536 | 4,459,514 | ||||||
|
| |||||||
| Insurance — 3.6% | ||||||||
American International Group, Inc. | 97,400 | 4,021,646 | ||||||
Hartford Financial Services Group, Inc. | 136,284 | 6,190,019 | ||||||
MetLife, Inc. | 117,900 | 4,856,301 | ||||||
|
| |||||||
| 15,067,966 | ||||||||
|
| |||||||
| IT Services — 2.9% | ||||||||
First Data Corp. (1) | 478,500 | 8,967,090 | ||||||
International Business Machines Corp. | 26,602 | 3,070,669 | ||||||
|
| |||||||
| 12,037,759 | ||||||||
|
| |||||||
| Machinery — 2.5% | ||||||||
Pentair PLC (Ireland) | 98,567 | 3,957,465 | ||||||
Terex Corp. | 193,830 | 6,471,984 | ||||||
|
| |||||||
| 10,429,449 | ||||||||
|
| |||||||
| Media — 4.2% | ||||||||
Comcast Corp. | 455,010 | 17,354,081 | ||||||
|
| |||||||
| Metals & Mining — 1.6% | ||||||||
Freeport-McMoRan, Inc. | 585,159 | 6,817,102 | ||||||
|
| |||||||
| Oil, Gas & Consumable Fuels — 4.4% | ||||||||
Chevron Corp. | 119,000 | 13,286,350 | ||||||
Marathon Petroleum Corp. | 69,344 | 4,885,285 | ||||||
|
| |||||||
| 18,171,635 | ||||||||
|
| |||||||
| Pharmaceuticals — 6.0% | ||||||||
Allergan PLC (Ireland) | 21,305 | 3,366,403 | ||||||
Amneal Pharmaceuticals, Inc. (1) | 254,000 | 4,686,300 | ||||||
Merck & Co., Inc. | 230,450 | 16,963,425 | ||||||
|
| |||||||
| 25,016,128 | ||||||||
|
| |||||||
| Real Estate Management & Development — 1.9% | ||||||||
Jones Lang LaSalle, Inc. | 58,138 | 7,689,332 | ||||||
|
| |||||||
See accompanying notes to financial statements.
40
Table of Contents
TCW Relative Value Large Cap Fund
October 31, 2018
| Issues | Shares | Value | ||||||
| Semiconductors & Semiconductor Equipment — 2.7% | ||||||||
Cypress Semiconductor Corp. | 868,900 | $ | 11,243,566 | |||||
|
| |||||||
| Technology Hardware, Storage & Peripherals — 1.0% | ||||||||
Western Digital Corp. | 93,440 | 4,024,461 | ||||||
|
| |||||||
| Textiles, Apparel & Luxury Goods — 2.0% | ||||||||
Tapestry, Inc. | 199,742 | 8,451,084 | ||||||
|
| |||||||
Total Common Stock | ||||||||
(Cost: $299,566,393) |
| 411,743,309 | ||||||
|
| |||||||
| MONEY MARKET INVESTMENTS — 0.5% | ||||||||
State Street Institutional U.S. Government Money Market Fund — Premier Class, 2.09% (2) | 1,998,231 | 1,998,231 | ||||||
|
| |||||||
Total Money Market Investments | ||||||||
(Cost: $1,998,231) |
| 1,998,231 | ||||||
|
| |||||||
Total Investments (99.7%) | ||||||||
(Cost: $301,564,624) |
| 413,741,540 | ||||||
Excess of Other Assets over Liabilities (0.3%) |
| 1,296,940 | ||||||
|
| |||||||
Net Assets (100.0%) |
| $ | 415,038,480 | |||||
|
| |||||||
Notes to the Schedule of Investments
| (1) | Non-income producing security. |
| (2) | Rate disclosed is the 7-day net yield as of October 31, 2018. |
See accompanying notes to financial statements.
41
Table of Contents
TCW Relative Value Large Cap Fund
Investments by Industry | October 31, 2018 |
| Industry | Percentage of Net Assets | |||
Aerospace & Defense | 4.0 | % | ||
Air Freight & Logistics | 1.5 | |||
Auto Components | 3.3 | |||
Banks | 11.5 | |||
Beverages | 2.4 | |||
Biotechnology | 2.9 | |||
Capital Markets | 6.7 | |||
Chemicals | 1.9 | |||
Communications Equipment | 4.7 | |||
Construction & Engineering | 1.0 | |||
Consumer Finance | 1.6 | |||
Diversified Telecommunication Services | 1.5 | |||
Electrical Equipment | 1.0 | |||
Electronic Equipment, Instruments & Components | 3.3 | |||
Energy Equipment & Services | 4.1 | |||
Food Products | 0.3 | |||
Health Care Equipment & Supplies | 1.6 | |||
Health Care Providers & Services | 4.1 | |||
Household Durables | 2.3 | |||
Household Products | 2.7 | |||
Independent Power and Renewable Electricity Producers | 2.9 | |||
Industrial Conglomerates | 1.1 | |||
Insurance | 3.6 | |||
IT Services | 2.9 | |||
Machinery | 2.5 | |||
Media | 4.2 | |||
Metals & Mining | 1.6 | |||
Oil, Gas & Consumable Fuels | 4.4 | |||
Pharmaceuticals | 6.0 | |||
Real Estate Management & Development | 1.9 | |||
Semiconductors & Semiconductor Equipment | 2.7 | |||
Technology Hardware, Storage & Peripherals | 1.0 | |||
Textiles, Apparel & Luxury Goods | 2.0 | |||
Money Market Investments | 0.5 | |||
|
| |||
Total | 99.7 | % | ||
|
| |||
See accompanying notes to financial statements.
42
Table of Contents
TCW Relative Value Large Cap Fund
Fair Valuation Summary October 31, 2018 |
The following is a summary of the fair valuations according to the inputs used as of October 31, 2018 in valuing the Fund’s investments:
Description | Quoted Prices in Active Markets for Identical Assets (Level 1) | Other Significant Observable Inputs (Level 2) | Significant Unobservable Inputs (Level 3) | Total | ||||||||||||
Common Stock | ||||||||||||||||
Aerospace & Defense | $ | 16,749,185 | $ | — | $ | — | $ | 16,749,185 | ||||||||
Air Freight & Logistics | 6,184,114 | — | — | 6,184,114 | ||||||||||||
Auto Components | 13,653,960 | — | — | 13,653,960 | ||||||||||||
Banks | 47,914,110 | — | — | 47,914,110 | ||||||||||||
Beverages | 9,754,584 | — | — | 9,754,584 | ||||||||||||
Biotechnology | 11,824,389 | — | — | 11,824,389 | ||||||||||||
Capital Markets | 27,958,108 | — | — | 27,958,108 | ||||||||||||
Chemicals | 8,060,285 | — | — | 8,060,285 | ||||||||||||
Communications Equipment | 19,598,842 | — | — | 19,598,842 | ||||||||||||
Construction & Engineering | 4,214,946 | — | — | 4,214,946 | ||||||||||||
Consumer Finance | 6,777,905 | — | — | 6,777,905 | ||||||||||||
Diversified Telecommunication Services | 6,059,208 | — | — | 6,059,208 | ||||||||||||
Electrical Equipment | 3,938,140 | — | — | 3,938,140 | ||||||||||||
Electronic Equipment, Instruments & Components | 13,519,642 | — | — | 13,519,642 | ||||||||||||
Energy Equipment & Services | 16,812,698 | — | — | 16,812,698 | ||||||||||||
Food Products | 1,420,440 | — | — | 1,420,440 | ||||||||||||
Health Care Equipment & Supplies | 6,781,051 | — | — | 6,781,051 | ||||||||||||
Health Care Providers & Services | 17,066,709 | — | — | 17,066,709 | ||||||||||||
Household Durables | 9,727,292 | — | — | 9,727,292 | ||||||||||||
Household Products | 11,147,076 | — | — | 11,147,076 | ||||||||||||
Independent Power and Renewable Electricity Producers | 11,818,548 | — | — | 11,818,548 | ||||||||||||
Industrial Conglomerates | 4,459,514 | — | — | 4,459,514 | ||||||||||||
Insurance | 15,067,966 | — | — | 15,067,966 | ||||||||||||
IT Services | 12,037,759 | — | — | 12,037,759 | ||||||||||||
Machinery | 10,429,449 | — | — | 10,429,449 | ||||||||||||
Media | 17,354,081 | — | — | 17,354,081 | ||||||||||||
Metals & Mining | 6,817,102 | — | — | 6,817,102 | ||||||||||||
Oil, Gas & Consumable Fuels | 18,171,635 | — | — | 18,171,635 | ||||||||||||
Pharmaceuticals | 25,016,128 | — | — | 25,016,128 | ||||||||||||
Real Estate Management & Development | 7,689,332 | — | — | 7,689,332 | ||||||||||||
Semiconductors & Semiconductor Equipment | 11,243,566 | — | — | 11,243,566 | ||||||||||||
Technology Hardware, Storage & Peripherals | 4,024,461 | — | — | 4,024,461 | ||||||||||||
Textiles, Apparel & Luxury Goods | 8,451,084 | — | — | 8,451,084 | ||||||||||||
|
|
|
|
|
|
|
| |||||||||
Total Common Stock | 411,743,309 | — | — | 411,743,309 | ||||||||||||
|
|
|
|
|
|
|
| |||||||||
Money Market Investments | 1,998,231 | — | — | 1,998,231 | ||||||||||||
|
|
|
|
|
|
|
| |||||||||
Total Investments | $ | 413,741,540 | $ | — | $ | — | $ | 413,741,540 | ||||||||
|
|
|
|
|
|
|
| |||||||||
See accompanying notes to financial statements.
43
Table of Contents
TCW Relative Value Mid Cap Fund
Schedule of Investments
| Issues | Shares | Value | ||||||
COMMON STOCK — 96.9% of Net Assets |
| |||||||
| Aerospace & Defense — 3.2% | ||||||||
Textron, Inc. | 54,345 | $ | 2,914,522 | |||||
|
| |||||||
| Auto Components — 1.5% | ||||||||
Aptiv PLC | 5,700 | 437,760 | ||||||
Dana, Inc. | 60,796 | 946,594 | ||||||
|
| |||||||
| 1,384,354 | ||||||||
|
| |||||||
| Banks — 15.6% | ||||||||
Comerica, Inc. | 21,566 | 1,758,923 | ||||||
KeyCorp | 159,442 | 2,895,467 | ||||||
PacWest Bancorp | 9,900 | 402,138 | ||||||
Popular, Inc. | 63,065 | 3,280,011 | ||||||
Synovus Financial Corp. | 52,529 | 1,972,989 | ||||||
Umpqua Holdings Corp. | 95,100 | 1,825,920 | ||||||
Zions Bancorp | 42,910 | 2,018,915 | ||||||
|
| |||||||
| 14,154,363 | ||||||||
|
| |||||||
| Capital Markets — 3.3% | ||||||||
E*TRADE Financial Corp. (1) | 21,400 | 1,057,588 | ||||||
Evercore Partners, Inc. | 18,495 | 1,510,857 | ||||||
Invesco, Ltd. | 17,188 | 373,151 | ||||||
|
| |||||||
| 2,941,596 | ||||||||
|
| |||||||
| Communications Equipment — 0.4% | ||||||||
Finisar Corp. (1) | 21,100 | 352,159 | ||||||
|
| |||||||
| Construction & Engineering — 3.1% | ||||||||
Fluor Corp. | 19,800 | 868,428 | ||||||
Jacobs Engineering Group, Inc. | 26,233 | 1,969,836 | ||||||
|
| |||||||
| 2,838,264 | ||||||||
|
| |||||||
| Consumer Finance — 1.9% | ||||||||
Santander Consumer USA Holdings, Inc. | 57,900 | 1,085,625 | ||||||
Synchrony Financial | 21,500 | 620,920 | ||||||
|
| |||||||
| 1,706,545 | ||||||||
|
| |||||||
| Diversified Telecommunication Services — 0.6% | ||||||||
CenturyLink, Inc. | 7,800 | 160,992 | ||||||
Zayo Group Holdings, Inc. (1) | 13,700 | 409,356 | ||||||
|
| |||||||
| 570,348 | ||||||||
|
| |||||||
| Energy Equipment & Services — 5.2% | ||||||||
Ensco PLC (United Kingdom) | 34,800 | 248,472 | ||||||
Forum Energy Technologies, Inc. (1) | 64,600 | 578,816 | ||||||
Newpark Resources, Inc. (1) | 298,972 | 2,454,560 | ||||||
TechnipFMC PLC (United Kingdom) | 53,600 | 1,409,680 | ||||||
|
| |||||||
| 4,691,528 | ||||||||
|
| |||||||
| Entertainment — 0.6% | ||||||||
Viacom, Inc. — Class B | 17,500 | 559,650 | ||||||
|
| |||||||
| Food Products — 2.8% | ||||||||
Conagra Brands, Inc. | 50,900 | 1,812,040 | ||||||
| Issues | Shares | Value | ||||||
| Food Products (Continued) | ||||||||
Hain Celestial Group, Inc. (The) (1) | 17,600 | $ | 437,888 | |||||
TreeHouse Foods, Inc. (1) | 4,700 | 214,132 | ||||||
Tyson Foods, Inc. | 1,100 | 65,912 | ||||||
|
| |||||||
| 2,529,972 | ||||||||
|
| |||||||
| Health Care Equipment & Supplies — 0.5% | ||||||||
Zimmer Biomet Holdings, Inc. | 4,300 | 488,437 | ||||||
|
| |||||||
| Health Care Providers & Services — 6.8% | ||||||||
Acadia Healthcare Co., Inc. (1) | 22,800 | 946,200 | ||||||
Centene Corp. (1) | 24,796 | 3,231,415 | ||||||
Magellan Health, Inc. (1) | 3,500 | 227,710 | ||||||
Molina Healthcare, Inc. (1) | 13,430 | 1,702,521 | ||||||
|
| |||||||
| 6,107,846 | ||||||||
|
| |||||||
| Household Durables — 6.6% | ||||||||
Beazer Homes USA, Inc. (1) | 23,479 | 206,850 | ||||||
DR Horton, Inc. | 22,000 | 791,120 | ||||||
KB Home | 79,060 | 1,578,828 | ||||||
Lennar Corp. | 36,100 | 1,551,578 | ||||||
Lennar Corp. — Class B | 734 | 26,255 | ||||||
Toll Brothers, Inc. | 55,328 | 1,862,341 | ||||||
|
| |||||||
| 6,016,972 | ||||||||
|
| |||||||
| Independent Power and Renewable Electricity Producers — 4.0% | ||||||||
AES Corp. (The) | 245,200 | 3,575,016 | ||||||
|
| |||||||
| Insurance — 1.5% | ||||||||
Assured Guaranty, Ltd. | 34,102 | 1,363,398 | ||||||
|
| |||||||
| IT Services — 1.8% | ||||||||
First Data Corp. (1) | 86,944 | 1,629,331 | ||||||
|
| |||||||
| Machinery — 7.8% | ||||||||
Dover Corp. | 17,909 | 1,483,582 | ||||||
Kennametal, Inc. | 23,800 | 843,710 | ||||||
Manitowoc Co., Inc. (The) (1) | 105,100 | 1,921,228 | ||||||
SPX FLOW, Inc. (1) | 24,405 | 835,383 | ||||||
Terex Corp. | 36,098 | 1,205,312 | ||||||
Trinity Industries, Inc. | 28,500 | 813,675 | ||||||
|
| |||||||
| 7,102,890 | ||||||||
|
| |||||||
| Marine — 2.5% | ||||||||
Kirby Corp. (1) | 25,400 | 1,827,276 | ||||||
Matson, Inc. | 13,200 | 463,056 | ||||||
|
| |||||||
| 2,290,332 | ||||||||
|
| |||||||
| Media — 0.6% | ||||||||
Discovery Communications, Inc. (1) | 17,600 | 570,064 | ||||||
|
| |||||||
| Metals & Mining — 3.1% | ||||||||
Commercial Metals Co. | 14,707 | 280,315 | ||||||
Freeport-McMoRan, Inc. | 134,704 | 1,569,302 | ||||||
Worthington Industries, Inc. | 22,540 | 943,975 | ||||||
|
| |||||||
| 2,793,592 | ||||||||
|
| |||||||
See accompanying notes to financial statements.
44
Table of Contents
TCW Relative Value Mid Cap Fund
October 31, 2018
| Issues | Shares | Value | ||||||
| Multi-Utilities — 0.7% | ||||||||
SCANA Corp. | 15,561 | $ | 623,218 | |||||
|
| |||||||
| Oil, Gas & Consumable Fuels — 3.6% | ||||||||
Marathon Petroleum Corp. | 15,530 | 1,094,089 | ||||||
SRC Energy, Inc. (1) | 196,603 | 1,391,949 | ||||||
Whiting Petroleum Corp. (1) | 21,600 | 805,680 | ||||||
|
| |||||||
| 3,291,718 | ||||||||
|
| |||||||
| Pharmaceuticals — 1.5% | ||||||||
Amneal Pharmaceuticals, Inc. (1) | 72,700 | 1,341,315 | ||||||
|
| |||||||
| Real Estate Management & Development — 2.8% | ||||||||
Jones Lang LaSalle, Inc. | 19,316 | 2,554,734 | ||||||
|
| |||||||
| REIT — 2.5% | ||||||||
Cousins Properties, Inc. | 111,900 | 929,889 | ||||||
Mid-America Apartment Communities, Inc. | 13,800 | 1,348,398 | ||||||
|
| |||||||
| 2,278,287 | ||||||||
|
| |||||||
| Road & Rail — 1.3% | ||||||||
Genesee & Wyoming, Inc. (1) | 14,900 | 1,180,527 | ||||||
|
| |||||||
| Semiconductors & Semiconductor Equipment — 5.1% | ||||||||
Cypress Semiconductor Corp. | 161,700 | 2,092,398 | ||||||
Maxim Integrated Products, Inc. | 50,646 | 2,533,313 | ||||||
|
| |||||||
| 4,625,711 | ||||||||
|
| |||||||
| Software — 1.2% | ||||||||
Nuance Communications, Inc. (1) | 59,716 | 1,038,461 | ||||||
|
| |||||||
| Issues | Shares | Value | ||||||
| Technology Hardware, Storage & Peripherals — 1.0% | ||||||||
Western Digital Corp. | 20,380 | $ | 877,767 | |||||
|
| |||||||
| Textiles, Apparel & Luxury Goods — 3.1% | ||||||||
Tapestry, Inc. | 67,043 | 2,836,589 | ||||||
|
| |||||||
| Trading Companies & Distributors — 0.7% | ||||||||
Univar, Inc. (1) | 23,900 | 588,418 | ||||||
|
| |||||||
Total Common Stock |
| |||||||
(Cost: $68,479,282) |
| 87,817,924 | ||||||
|
| |||||||
| MONEY MARKET INVESTMENTS — 3.3% | ||||||||
State Street Institutional U.S. Government Money Market Fund — Premier Class, 2.09% (2) | 2,974,323 | 2,974,323 | ||||||
|
| |||||||
Total Money Market Investments | ||||||||
(Cost: $2,974,323) |
| 2,974,323 | ||||||
|
| |||||||
Total Investments (100.2%) |
| |||||||
(Cost: $71,453,605) |
| 90,792,247 | ||||||
Liabilities in Excess of Other Assets (-0.2%) |
| (225,412 | ) | |||||
|
| |||||||
Net Assets (100.0%) |
| $ | 90,566,835 | |||||
|
| |||||||
Notes to the Schedule of Investments
| (1) | Non-income producing security. |
| (2) | Rate disclosed is the 7-day net yield as of October 31, 2018. |
See accompanying notes to financial statements.
45
Table of Contents
TCW Relative Value Mid Cap Fund
Investments by Industry | October 31, 2018 |
| Industry | Percentage of Net Assets | |||
Aerospace & Defense | 3.2 | % | ||
Auto Components | 1.5 | |||
Banks | 15.6 | |||
Capital Markets | 3.3 | |||
Communications Equipment | 0.4 | |||
Construction & Engineering | 3.1 | |||
Consumer Finance | 1.9 | |||
Diversified Telecommunication Services | 0.6 | |||
Energy Equipment & Services | 5.2 | |||
Entertainment | 0.6 | |||
Food Products | 2.8 | |||
Health Care Equipment & Supplies | 0.5 | |||
Health Care Providers & Services | 6.8 | |||
Household Durables | 6.6 | |||
Independent Power and Renewable Electricity Producers | 4.0 | |||
Insurance | 1.5 | |||
IT Services | 1.8 | |||
Machinery | 7.8 | |||
Marine | 2.5 | |||
Media | 0.6 | |||
Metals & Mining | 3.1 | |||
Multi-Utilities | 0.7 | |||
Oil, Gas & Consumable Fuels | 3.6 | |||
Pharmaceuticals | 1.5 | |||
Real Estate Management & Development | 2.8 | |||
REIT | 2.5 | |||
Road & Rail | 1.3 | |||
Semiconductors & Semiconductor Equipment | 5.1 | |||
Software | 1.2 | |||
Technology Hardware, Storage & Peripherals | 1.0 | |||
Textiles, Apparel & Luxury Goods | 3.1 | |||
Trading Companies & Distributors | 0.7 | |||
Money Market Investments | 3.3 | |||
|
| |||
Total | 100.2 | % | ||
|
| |||
See accompanying notes to financial statements.
46
Table of Contents
TCW Relative Value Mid Cap Fund
Fair Valuation Summary | October 31, 2018 |
The following is a summary of the fair valuations according to the inputs used as of October 31, 2018 in valuing the Fund’s investments:
Description | Quoted Prices in Active Markets for Identical Assets (Level 1) | Other Significant Observable Inputs (Level 2) | Significant Unobservable Inputs (Level 3) | Total | ||||||||||||
Common Stock | ||||||||||||||||
Aerospace & Defense | $ | 2,914,522 | $ | — | $ | — | $ | 2,914,522 | ||||||||
Auto Components | 1,384,354 | — | — | 1,384,354 | ||||||||||||
Banks | 14,154,363 | — | — | 14,154,363 | ||||||||||||
Capital Markets | 2,941,596 | — | — | 2,941,596 | ||||||||||||
Communications Equipment | 352,159 | — | — | 352,159 | ||||||||||||
Construction & Engineering | 2,838,264 | — | — | 2,838,264 | ||||||||||||
Consumer Finance | 1,706,545 | — | — | 1,706,545 | ||||||||||||
Diversified Telecommunication Services | 570,348 | — | — | 570,348 | ||||||||||||
Energy Equipment & Services | 4,691,528 | — | — | 4,691,528 | ||||||||||||
Entertainment | 559,650 | — | — | 559,650 | ||||||||||||
Food Products | 2,529,972 | — | — | 2,529,972 | ||||||||||||
Health Care Equipment & Supplies | 488,437 | — | — | 488,437 | ||||||||||||
Health Care Providers & Services | 6,107,846 | — | — | 6,107,846 | ||||||||||||
Household Durables | 6,016,972 | — | — | 6,016,972 | ||||||||||||
Independent Power and Renewable Electricity Producers | 3,575,016 | — | — | 3,575,016 | ||||||||||||
Insurance | 1,363,398 | — | — | 1,363,398 | ||||||||||||
IT Services | 1,629,331 | — | — | 1,629,331 | ||||||||||||
Machinery | 7,102,890 | — | — | 7,102,890 | ||||||||||||
Marine | 2,290,332 | — | — | 2,290,332 | ||||||||||||
Media | 570,064 | — | — | 570,064 | ||||||||||||
Metals & Mining | 2,793,592 | — | — | 2,793,592 | ||||||||||||
Multi-Utilities | 623,218 | — | — | 623,218 | ||||||||||||
Oil, Gas & Consumable Fuels | 3,291,718 | — | — | 3,291,718 | ||||||||||||
Pharmaceuticals | 1,341,315 | — | — | 1,341,315 | ||||||||||||
Real Estate Management & Development | 2,554,734 | — | — | 2,554,734 | ||||||||||||
REIT | 2,278,287 | — | — | 2,278,287 | ||||||||||||
Road & Rail | 1,180,527 | — | — | 1,180,527 | ||||||||||||
Semiconductors & Semiconductor Equipment | 4,625,711 | — | — | 4,625,711 | ||||||||||||
Software | 1,038,461 | — | — | 1,038,461 | ||||||||||||
Technology Hardware, Storage & Peripherals | 877,767 | — | — | 877,767 | ||||||||||||
Textiles, Apparel & Luxury Goods | 2,836,589 | — | — | 2,836,589 | ||||||||||||
Trading Companies & Distributors | 588,418 | — | — | 588,418 | ||||||||||||
|
|
|
|
|
|
|
| |||||||||
Total Common Stock | 87,817,924 | — | — | 87,817,924 | ||||||||||||
|
|
|
|
|
|
|
| |||||||||
Money Market Investments | 2,974,323 | — | — | 2,974,323 | ||||||||||||
|
|
|
|
|
|
|
| |||||||||
Total Investments | $ | 90,792,247 | $ | — | $ | — | $ | 90,792,247 | ||||||||
|
|
|
|
|
|
|
| |||||||||
See accompanying notes to financial statements.
47
Table of Contents
Schedule of Investments
| Issues | Shares | Value | ||||||
COMMON STOCK —100.0% of Net Assets |
| |||||||
| Beverages — 2.3% | ||||||||
Monster Beverage Corp. (1) | 376,000 | $ | 19,871,600 | |||||
|
| |||||||
| Biotechnology — 4.7% | ||||||||
Alexion Pharmaceuticals, Inc. (1) | 122,172 | 13,691,816 | ||||||
BioMarin Pharmaceutical, Inc. (1) | 186,313 | 17,172,469 | ||||||
Celgene Corp. (1) | 137,980 | 9,879,368 | ||||||
|
| |||||||
| 40,743,653 | ||||||||
|
| |||||||
| Capital Markets — 4.2% | ||||||||
Charles Schwab Corp. (The) | 462,370 | 21,379,989 | ||||||
S&P Global, Inc. | 82,101 | 14,968,654 | ||||||
|
| |||||||
| 36,348,643 | ||||||||
|
| |||||||
| Commercial Services & Supplies — 2.2% | ||||||||
Waste Connections, Inc. (Canada) | 251,145 | 19,197,524 | ||||||
|
| |||||||
| Equity Real Estate — 2.5% | ||||||||
Equinix, Inc. | 57,455 | 21,760,507 | ||||||
|
| |||||||
| Food & Staples Retailing — 2.6% | ||||||||
Costco Wholesale Corp. | 100,544 | 22,987,375 | ||||||
|
| |||||||
| Health Care Equipment & Supplies — 3.5% | ||||||||
Align Technology, Inc. (1) | 73,570 | 16,273,684 | ||||||
West Pharmaceutical Services, Inc. | 138,336 | 14,652,549 | ||||||
|
| |||||||
| 30,926,233 | ||||||||
|
| |||||||
| Insurance — 2.6% | ||||||||
Chubb, Ltd. (Switzerland) | 181,304 | 22,646,683 | ||||||
|
| |||||||
| Interactive Media & Services — 10.8% | ||||||||
Alphabet, Inc. — Class C (1) | 48,342 | 52,053,215 | ||||||
Facebook, Inc. (1) | 279,177 | 42,376,277 | ||||||
|
| |||||||
| 94,429,492 | ||||||||
|
| |||||||
| Internet & Direct Marketing Retail — 9.0% | ||||||||
Amazon.com, Inc. (1) | 36,044 | 57,598,673 | ||||||
Booking Holdings, Inc. (1) | 11,157 | 20,914,689 | ||||||
|
| |||||||
| 78,513,362 | ||||||||
|
| |||||||
| IT Services — 13.4% | ||||||||
Mastercard, Inc. | 135,117 | 26,708,577 | ||||||
PayPal Holdings, Inc. (1) | 393,751 | 33,149,897 | ||||||
Visa, Inc. | 416,904 | 57,470,216 | ||||||
|
| |||||||
| 117,328,690 | ||||||||
|
| |||||||
| Life Sciences Tools & Services — 2.3% | ||||||||
Illumina, Inc. (1) | 63,606 | 19,791,007 | ||||||
|
| |||||||
| Machinery — 1.8% | ||||||||
Xylem, Inc. | 237,800 | 15,594,924 | ||||||
|
| |||||||
| Oil, Gas & Consumable Fuels — 1.3% | ||||||||
Concho Resources, Inc. (1) | 83,940 | 11,675,215 | ||||||
|
| |||||||
| Issues | Shares | Value | ||||||
| Pharmaceuticals — 2.8% | ||||||||
Zoetis, Inc. | 265,900 | $ | 23,970,885 | |||||
|
| |||||||
| Professional Services — 4.1% | ||||||||
IHS Markit, Ltd. (1) | 271,800 | 14,277,654 | ||||||
TransUnion | 330,399 | 21,723,734 | ||||||
|
| |||||||
| 36,001,388 | ||||||||
|
| |||||||
| REIT — 4.7% | ||||||||
American Tower Corp. | 263,772 | 41,098,315 | ||||||
|
| |||||||
| Semiconductors & Semiconductor Equipment — 2.6% | ||||||||
NVIDIA Corp. | 106,380 | 22,428,095 | ||||||
|
| |||||||
| Software — 17.2% | ||||||||
Adobe, Inc. (1) | 205,886 | 50,598,543 | ||||||
Salesforce.com, Inc. (1) | 331,709 | 45,523,743 | ||||||
ServiceNow, Inc. (1) | 198,912 | 36,011,029 | ||||||
Splunk, Inc. (1) | 184,776 | 18,448,036 | ||||||
|
| |||||||
| 150,581,351 | ||||||||
|
| |||||||
| Specialty Retail — 5.4% | ||||||||
Home Depot, Inc. (The) | 143,649 | 25,264,986 | ||||||
Ulta Beauty, Inc. (1) | 80,895 | 22,207,296 | ||||||
|
| |||||||
| 47,472,282 | ||||||||
|
| |||||||
Total Common Stock | ||||||||
(Cost: $407,377,096) |
| 873,367,224 | ||||||
|
| |||||||
| MONEY MARKET INVESTMENTS — 0.4% | ||||||||
State Street Institutional U.S. Government Money Market Fund — Premier Class, 2.09% (2) | 3,898,790 | 3,898,790 | ||||||
|
| |||||||
Total Money Market Investments | ||||||||
(Cost: $3,898,790) |
| 3,898,790 | ||||||
|
| |||||||
Total Investments (100.4%) | ||||||||
(Cost: $411,275,886) |
| 877,266,014 | ||||||
Liabilities in Excess of Other Assets (-0.4%) |
| (3,529,339 | ) | |||||
|
| |||||||
Net Assets (100.0%) |
| $ | 873,736,675 | |||||
|
| |||||||
Notes to the Schedule of Investments
| (1) | Non-income producing security. |
| (2) | Rate disclosed is the 7-day net yield as of October 31, 2018. |
| REIT - | Real Estate Investment Trust. |
See accompanying notes to financial statements.
48
Table of Contents
TCW Select Equities Fund
Investments by Industry October 31, 2018 |
| Industry | Percentage of Net Assets | |||
Beverages | 2.3 | % | ||
Biotechnology | 4.7 | |||
Capital Markets | 4.2 | |||
Commercial Services & Supplies | 2.2 | |||
Equity Real Estate | 2.5 | |||
Food & Staples Retailing | 2.6 | |||
Health Care Equipment & Supplies | 3.5 | |||
IT Services | 13.4 | |||
Insurance | 2.6 | |||
Interactive Media & Services | 10.8 | |||
Internet & Direct Marketing Retail | 9.0 | |||
Life Sciences Tools & Services | 2.3 | |||
Machinery | 1.8 | |||
Oil, Gas & Consumable Fuels | 1.3 | |||
Pharmaceuticals | 2.8 | |||
Professional Services | 4.1 | |||
REIT | 4.7 | |||
Semiconductors & Semiconductor Equipment | 2.6 | |||
Software | 17.2 | |||
Specialty Retail | 5.4 | |||
Money Market Investments | 0.4 | |||
|
| |||
Total | 100.4 | % | ||
|
| |||
See accompanying notes to financial statements.
49
Table of Contents
TCW Select Equities Fund
Fair Valuation Summary | October 31, 2018 |
The following is a summary of the fair valuations according to the inputs used as of October 31, 2018 in valuing the Fund’s investments:
Description | Quoted Prices in Active Markets for Identical Assets (Level 1) | Other Significant Observable Inputs (Level 2) | Significant Unobservable Inputs (Level 3) | Total | ||||||||||||
Common Stock | ||||||||||||||||
Beverages | $ | 19,871,600 | $ | — | $ | — | $ | 19,871,600 | ||||||||
Biotechnology | 40,743,653 | — | — | 40,743,653 | ||||||||||||
Capital Markets | 36,348,643 | — | — | 36,348,643 | ||||||||||||
Commercial Services & Supplies | 19,197,524 | — | — | 19,197,524 | ||||||||||||
Equity Real Estate | 21,760,507 | — | — | 21,760,507 | ||||||||||||
Food & Staples Retailing | 22,987,375 | — | — | 22,987,375 | ||||||||||||
Health Care Equipment & Supplies | 30,926,233 | — | — | 30,926,233 | ||||||||||||
Insurance | 22,646,683 | — | — | 22,646,683 | ||||||||||||
Interactive Media & Services | 94,429,492 | — | — | 94,429,492 | ||||||||||||
Internet & Direct Marketing Retail | 78,513,362 | — | — | 78,513,362 | ||||||||||||
IT Services | 117,328,690 | — | — | 117,328,690 | ||||||||||||
Life Sciences Tools & Services | 19,791,007 | — | — | 19,791,007 | ||||||||||||
Machinery | 15,594,924 | — | — | 15,594,924 | ||||||||||||
Oil, Gas & Consumable Fuels | 11,675,215 | — | — | 11,675,215 | ||||||||||||
Pharmaceuticals | 23,970,885 | — | — | 23,970,885 | ||||||||||||
Professional Services | 36,001,388 | — | — | 36,001,388 | ||||||||||||
REIT | 41,098,315 | — | — | 41,098,315 | ||||||||||||
Semiconductors & Semiconductor Equipment | 22,428,095 | — | — | 22,428,095 | ||||||||||||
Software | 150,581,351 | — | — | 150,581,351 | ||||||||||||
Specialty Retail | 47,472,282 | — | — | 47,472,282 | ||||||||||||
|
|
|
|
|
|
|
| |||||||||
Total Common Stock | 873,367,224 | — | — | 873,367,224 | ||||||||||||
|
|
|
|
|
|
|
| |||||||||
Money Market Investments | 3,898,790 | — | — | 3,898,790 | ||||||||||||
|
|
|
|
|
|
|
| |||||||||
Total Investments | $ | 877,266,014 | $ | — | $ | — | $ | 877,266,014 | ||||||||
|
|
|
|
|
|
|
| |||||||||
See accompanying notes to financial statements.
50
Table of Contents
TCW Funds, Inc.
October 31, 2018 |
| TCW Artificial Intelligence Equity Fund | TCW Conservative Allocation Fund | TCW Global Real Estate Fund | TCW New America Premier Equities Fund | |||||||||||||
Dollar Amounts in Thousands (Except per Share Amounts) | ||||||||||||||||
ASSETS |
| |||||||||||||||
Investments, at Value (1) | $ | 2,089 | $ | 2,303 | (1) | $ | 3,426 | $ | 33,095 | |||||||
Investment in Affiliated Issuers, at Value | — | 26,134 | (2) | — | — | |||||||||||
Foreign Currency, at Value | — | — | — | (3)(4) | — | |||||||||||
Receivable for Securities Sold | — | — | — | 1,293 | ||||||||||||
Receivable for Fund Shares Sold | — | — | — | 467 | ||||||||||||
Dividends Receivable | 1 | 1 | 15 | 26 | ||||||||||||
Affiliated Dividends Receivable | — | 10 | — | — | ||||||||||||
Receivable from Investment Advisor | 12 | 2 | 13 | 10 | ||||||||||||
Prepaid Expenses | 15 | 22 | 5 | 9 | ||||||||||||
|
|
|
|
|
|
|
| |||||||||
Total Assets | 2,117 | 28,472 | 3,459 | 34,900 | ||||||||||||
|
|
|
|
|
|
|
| |||||||||
LIABILITIES |
| |||||||||||||||
Payable for Securities Purchased | 21 | — | — | 1,212 | ||||||||||||
Payable for Fund Shares Redeemed | — | — | — | 261 | ||||||||||||
Accrued Directors’ Fees and Expenses | 11 | 11 | 11 | 11 | ||||||||||||
Accrued Management Fees | 2 | — | 2 | 25 | ||||||||||||
Accrued Distribution Fees | — | (4) | — | (4) | — | (4) | 1 | |||||||||
Other Accrued Expenses | 26 | 18 | 24 | 25 | ||||||||||||
|
|
|
|
|
|
|
| |||||||||
Total Liabilities | 60 | 29 | 37 | 1,535 | ||||||||||||
|
|
|
|
|
|
|
| |||||||||
NET ASSETS | $ | 2,057 | $ | 28,443 | $ | 3,422 | $ | 33,365 | ||||||||
|
|
|
|
|
|
|
| |||||||||
NET ASSETS CONSIST OF: |
| |||||||||||||||
Paid-in Capital | $ | 1,998 | $ | 25,878 | $ | 4,007 | $ | 28,298 | ||||||||
Accumulated Earnings (Loss) | 59 | 2,565 | (585 | ) | 5,067 | |||||||||||
|
|
|
|
|
|
|
| |||||||||
NET ASSETS | $ | 2,057 | $ | 28,443 | $ | 3,422 | $ | 33,365 | ||||||||
|
|
|
|
|
|
|
| |||||||||
NET ASSETS ATTRIBUTABLE TO: |
| |||||||||||||||
I Class Share | $ | 1,364 | $ | 27,925 | $ | 2,886 | $ | 28,486 | ||||||||
|
|
|
|
|
|
|
| |||||||||
N Class Share | $ | 693 | $ | 518 | $ | 536 | $ | 4,879 | ||||||||
|
|
|
|
|
|
|
| |||||||||
CAPITAL SHARES OUTSTANDING: (5) |
| |||||||||||||||
I Class Share | 122,092 | 2,391,772 | 310,310 | 1,750,905 | ||||||||||||
|
|
|
|
|
|
|
| |||||||||
N Class Share | 62,020 | 44,370 | 57,603 | 299,901 | ||||||||||||
|
|
|
|
|
|
|
| |||||||||
NET ASSET VALUE PER SHARE: (6) |
| |||||||||||||||
I Class Share | $ | 11.18 | $ | 11.68 | $ | 9.30 | $ | 16.27 | ||||||||
|
|
|
|
|
|
|
| |||||||||
N Class Share | $ | 11.17 | $ | 11.67 | $ | 9.30 | $ | 16.27 | ||||||||
|
|
|
|
|
|
|
| |||||||||
| (1) | The identified cost for the TCW Artificial Intelligence Equity Fund, the TCW Conservative Allocation Fund, the TCW Global Real Estate Fund and the TCW New America Premier Equities Fund at October 31, 2018 was $2,017, $2,331, $3,287 and $28,460, respectively. |
| (2) | The identified cost for investments in affiliated issuers of the TCW Conservative Allocation Fund was $ 25,076. |
| (3) | The identified cost for the TCW Global Real Estate Fund at October 31, 2018 was $0. |
| (4) | Amount rounds to less than $1. |
| (5) | The number of authorized shares, with a par value of $0.001 per share, is 4,000,000,000 for each of the I Class and N Class shares. |
| (6) | Represents offering price and redemption price per share. |
See accompanying notes to financial statements.
51
Table of Contents
TCW Funds, Inc.
Statements of Assets and Liabilities | October 31, 2018 |
| TCW Relative Value Dividend Appreciation Fund | TCW Relative Value Large Cap Fund | TCW Relative Value Mid Cap Fund | TCW Select Equities Fund | |||||||||||||
Dollar Amounts in Thousands (Except per Share Amounts) | ||||||||||||||||
ASSETS |
| |||||||||||||||
Investments, at Value (1) | $ | 506,159 | $ | 413,742 | $ | 90,793 | $ | 877,266 | ||||||||
Receivable for Securities Sold | 642 | 1,964 | — | — | ||||||||||||
Receivable for Fund Shares Sold | 36 | 240 | 25 | 478 | ||||||||||||
Dividends Receivable | 490 | 382 | 57 | 142 | ||||||||||||
Foreign Tax Reclaims Receivable | 35 | — | — | — | ||||||||||||
Receivable from Investment Advisor | 17 | 3 | 6 | 13 | ||||||||||||
Prepaid Expenses | 7 | 8 | 19 | 5 | ||||||||||||
|
|
|
|
|
|
|
| |||||||||
Total Assets | 507,386 | 416,339 | 90,900 | 877,904 | ||||||||||||
|
|
|
|
|
|
|
| |||||||||
LIABILITIES |
| |||||||||||||||
Payable for Securities Purchased | 207 | 612 | 194 | 966 | ||||||||||||
Payable for Fund Shares Redeemed | 343 | 283 | 18 | 2,281 | ||||||||||||
Accrued Directors’ Fees and Expenses | 11 | 11 | 11 | 11 | ||||||||||||
Accrued Management Fees | 313 | 258 | 61 | 623 | ||||||||||||
Accrued Distribution Fees | 98 | 3 | 5 | 32 | ||||||||||||
Other Accrued Expenses | 183 | 134 | 44 | 254 | ||||||||||||
|
|
|
|
|
|
|
| |||||||||
Total Liabilities | 1,155 | 1,301 | 333 | 4,167 | ||||||||||||
|
|
|
|
|
|
|
| |||||||||
NET ASSETS | $ | 506,231 | $ | 415,038 | $ | 90,567 | $ | 873,737 | ||||||||
|
|
|
|
|
|
|
| |||||||||
NET ASSETS CONSIST OF: |
| |||||||||||||||
Paid-in Capital | $ | 418,228 | $ | 259,438 | $ | 65,752 | $ | 290,243 | ||||||||
Accumulated Earnings (Loss) | 88,003 | 155,600 | 24,815 | 583,494 | ||||||||||||
|
|
|
|
|
|
|
| |||||||||
NET ASSETS | $ | 506,231 | $ | 415,038 | $ | 90,567 | $ | 873,737 | ||||||||
|
|
|
|
|
|
|
| |||||||||
NET ASSETS ATTRIBUTABLE TO: |
| |||||||||||||||
I Class Share | $ | 95,108 | $ | 402,035 | $ | 72,527 | $ | 740,485 | ||||||||
|
|
|
|
|
|
|
| |||||||||
N Class Share | $ | 411,123 | $ | 13,003 | $ | 18,040 | $ | 133,252 | ||||||||
|
|
|
|
|
|
|
| |||||||||
CAPITAL SHARES OUTSTANDING: (2) |
| |||||||||||||||
I Class Share | 5,444,434 | 20,285,191 | 3,232,497 | 27,296,021 | ||||||||||||
|
|
|
|
|
|
|
| |||||||||
N Class Share | 23,135,945 | 658,677 | 826,591 | 5,414,508 | ||||||||||||
|
|
|
|
|
|
|
| |||||||||
NET ASSET VALUE PER SHARE: (3) |
| |||||||||||||||
I Class Share | $ | 17.47 | $ | 19.82 | $ | 22.44 | $ | 27.13 | ||||||||
|
|
|
|
|
|
|
| |||||||||
N Class Share | $ | 17.77 | $ | 19.74 | $ | 21.82 | $ | 24.61 | ||||||||
|
|
|
|
|
|
|
| |||||||||
| (1) | The identified cost for the TCW Relative Value Dividend Appreciation Fund, the TCW Relative Value Large Cap Fund, the TCW Relative Value Mid Cap Fund and the TCW Select Equities Fund at October 31, 2018 was $442,269, $301,565, $71,454 and $411,276, respectively. |
| (2) | The number of authorized shares, with a par value of $0.001 per share, is 4,000,000,000 for each of the I Class and N Class shares. |
| (3) | Represents offering price and redemption price per share. |
See accompanying notes to financial statements.
52
Table of Contents
TCW Funds, Inc.
Year Ended October 31, 2018 |
| TCW Artificial Intelligence Equity Fund | TCW Conservative Allocation Fund | TCW Global Real Estate Fund | TCW New America Premier Equities Fund | |||||||||||||
| Dollar Amounts in Thousands | ||||||||||||||||
INVESTMENT INCOME | ||||||||||||||||
Income: | ||||||||||||||||
Dividends | $ | 13 | (1) | $ | 38 | $ | 147 | (1) | $ | 212 | (1) | |||||
Dividends from Investment in Affiliated Issuers | — | 575 | — | — | ||||||||||||
Non-cash Dividend Income | — | — | — | 20 | ||||||||||||
|
|
|
|
|
|
|
| |||||||||
Total | 13 | 613 | 147 | 232 | ||||||||||||
|
|
|
|
|
|
|
| |||||||||
Expenses: | ||||||||||||||||
Management Fees | 14 | — | 32 | 204 | ||||||||||||
Accounting Services Fees | 2 | 6 | 3 | 5 | ||||||||||||
Administration Fees | 1 | 3 | 2 | 3 | ||||||||||||
Transfer Agent Fees: | ||||||||||||||||
I Class | 2 | 10 | 6 | 11 | ||||||||||||
N Class | 1 | 7 | 6 | 8 | ||||||||||||
Custodian Fees | 15 | 2 | 9 | 3 | ||||||||||||
Professional Fees | 40 | 17 | 26 | 25 | ||||||||||||
Directors’ Fees and Expenses | 42 | 44 | 44 | 44 | ||||||||||||
Registration Fees: | ||||||||||||||||
I Class | 13 | 19 | 18 | 18 | ||||||||||||
N Class | 13 | 19 | 18 | 18 | ||||||||||||
Distribution Fees: | ||||||||||||||||
N Class | 2 | 1 | 1 | 9 | ||||||||||||
Shareholder Reporting Expense | 6 | 2 | 1 | 2 | ||||||||||||
Other | 7 | 6 | 6 | 6 | ||||||||||||
|
|
|
|
|
|
|
| |||||||||
Total | 158 | 136 | 172 | 356 | ||||||||||||
|
|
|
|
|
|
|
| |||||||||
Less Expenses Borne by Investment Advisor: | ||||||||||||||||
I Class | 83 | — | 91 | 52 | ||||||||||||
N Class | 56 | 24 | 36 | 39 | ||||||||||||
|
|
|
|
|
|
|
| |||||||||
Net Expenses | 19 | 112 | 45 | 265 | ||||||||||||
|
|
|
|
|
|
|
| |||||||||
Net Investment Income (Loss) | (6 | ) | 501 | 102 | (33 | ) | ||||||||||
|
|
|
|
|
|
|
| |||||||||
NET REALIZED AND UNREALIZED GAIN (LOSS) ON INVESTMENTS | ||||||||||||||||
Net Realized Gain (Loss) on: | ||||||||||||||||
Investments | (2 | ) | 27 | (191 | ) | 542 | ||||||||||
Investments in Affiliated Issuers | — | 484 | — | — | ||||||||||||
Realized Gain Received as Distribution from Affiliated Issuers | — | 878 | — | — | ||||||||||||
Foreign Currency | — | — | (2 | ) | (1 | ) | ||||||||||
Securities sold short | — | — | — | (29 | ) | |||||||||||
Change in Unrealized Appreciation (Depreciation) on: | ||||||||||||||||
Investments | (11 | ) | (84 | ) | (161 | ) | 1,181 | |||||||||
Foreign Currency | — | — | — | (2) | — | (2) | ||||||||||
Investments in Affiliated Issuers | — | (1,766 | ) | — | — | |||||||||||
Securities sold short | — | — | — | 40 | ||||||||||||
|
|
|
|
|
|
|
| |||||||||
Net Realized and Unrealized Gain (Loss) on Investments | (13 | ) | (461 | ) | (354 | ) | 1,733 | |||||||||
|
|
|
|
|
|
|
| |||||||||
INCREASE (DECREASE) IN NET ASSETS RESULTING FROM OPERATIONS | $ | (19 | ) | $ | 40 | $ | (252 | ) | $ | 1,700 | ||||||
|
|
|
|
|
|
|
| |||||||||
| (1) | Net of foreign taxes withheld of $0, $5 and $3 for the TCW Artificial Intelligence Equity Fund, the TCW Global Real Estate Fund and the TCW New America Premier Equities Fund, respectively. |
| (2) | Amount rounds to less than $1. |
See accompanying notes to financial statements.
53
Table of Contents
TCW Funds, Inc.
Statements of Operations | Year Ended October 31, 2018 |
| TCW Relative Value Dividend Appreciation Fund | TCW Relative Value Large Cap Fund | TCW Relative Value Mid Cap Fund | TCW Select Equities Fund | |||||||||||||
| Dollar Amounts in Thousands | ||||||||||||||||
INVESTMENT INCOME | ||||||||||||||||
Income: | ||||||||||||||||
Dividends | $ | 15,460 | (1) | $ | 9,722 | $ | 1,452 | (1) | $ | 5,415 | (1) | |||||
|
|
|
|
|
|
|
| |||||||||
Total | 15,460 | 9,722 | 1,452 | 5,415 | ||||||||||||
|
|
|
|
|
|
|
| |||||||||
Expenses: | ||||||||||||||||
Management Fees | 3,834 | 3,095 | 757 | 7,024 | ||||||||||||
Accounting Services Fees | 59 | 51 | 12 | 92 | ||||||||||||
Administration Fees | 31 | 30 | 7 | 57 | ||||||||||||
Transfer Agent Fees: | ||||||||||||||||
I Class | 80 | 291 | 47 | 657 | ||||||||||||
N Class | 493 | 21 | 23 | 145 | ||||||||||||
Custodian Fees | 5 | 4 | 4 | 3 | ||||||||||||
Professional Fees | 48 | 36 | 28 | 48 | ||||||||||||
Directors’ Fees and Expenses | 45 | 44 | 44 | 45 | ||||||||||||
Registration Fees: | ||||||||||||||||
I Class | 21 | 30 | 19 | 26 | ||||||||||||
N Class | 30 | 20 | 19 | 19 | ||||||||||||
Distribution Fees: | ||||||||||||||||
N Class | 1,195 | 39 | 50 | 353 | ||||||||||||
Shareholder Reporting Expense | 5 | 4 | 4 | 5 | ||||||||||||
Other | 61 | 47 | 16 | 83 | ||||||||||||
|
|
|
|
|
|
|
| |||||||||
Total | 5,907 | 3,712 | 1,030 | 8,557 | ||||||||||||
|
|
|
|
|
|
|
| |||||||||
Less Expenses Borne by Investment Advisor: | ||||||||||||||||
N Class | 253 | 33 | 54 | 110 | ||||||||||||
|
|
|
|
|
|
|
| |||||||||
Net Expenses | 5,654 | 3,679 | 976 | 8,447 | ||||||||||||
|
|
|
|
|
|
|
| |||||||||
Net Investment Income (Loss) | 9,806 | 6,043 | 476 | (3,032 | ) | |||||||||||
|
|
|
|
|
|
|
| |||||||||
NET REALIZED AND UNREALIZED GAIN (LOSS) ON INVESTMENTS | ||||||||||||||||
Net Realized Gain (Loss) on: | ||||||||||||||||
Investments | 26,207 | 43,418 | 6,667 | 134,658 | ||||||||||||
Foreign Currency | — | — | — | — | (2) | |||||||||||
Change in Unrealized Appreciation (Depreciation) on: | ||||||||||||||||
Investments | (48,642 | ) | (69,355 | ) | (13,168 | ) | (20,639 | ) | ||||||||
|
|
|
|
|
|
|
| |||||||||
Net Realized and Unrealized Gain (Loss) on Investments | (22,435 | ) | (25,937 | ) | (6,501 | ) | 114,019 | |||||||||
|
|
|
|
|
|
|
| |||||||||
INCREASE (DECREASE) IN NET ASSETS RESULTING FROM OPERATIONS | $ | (12,629 | ) | $ | (19,894 | ) | $ | (6,025 | ) | $ | 110,987 | |||||
|
|
|
|
|
|
|
| |||||||||
| (1) | Net of foreign taxes withheld of $174, $6 and $21 for the TCW Relative Value Dividend Appreciation Fund, the TCW Relative Value Mid Cap Fund and the TCW Select Equities Fund, respectively. |
| (2) | Amount rounds to less than $1. |
See accompanying notes to financial statements.
54
Table of Contents
TCW Funds, Inc.
Statements of Changes in Net Assets
| TCW Artificial Intelligence Equity Fund | TCW Conservative Allocation Fund | |||||||||||||||
| Year Ended October 31, 2018 | For the period August 31, 2017 (commencement of operations) through October 31, 2017 | Year Ended October 31, 2018 | Year Ended October 31, 2017 | |||||||||||||
| Dollar Amounts in Thousands | ||||||||||||||||
OPERATIONS |
| |||||||||||||||
Net Investment Income (Loss) | $ | (6 | ) | $ | — | $ | 501 | $ | 375 | |||||||
Net Realized Gain (Loss) on Investments | (2 | ) | (9 | ) | 1,389 | 1,035 | ||||||||||
Change in Unrealized Appreciation (Depreciation) on Investments | (11 | ) | 83 | (1,850 | ) | 673 | ||||||||||
|
|
|
|
|
|
|
| |||||||||
Increase (Decrease) in Net Assets Resulting from Operations | (19 | ) | 74 | 40 | 2,083 | |||||||||||
|
|
|
|
|
|
|
| |||||||||
DISTRIBUTIONS TO SHAREHOLDERS (1) |
| |||||||||||||||
Distributions to Shareholders | — | (2) | — | (1,259 | ) | (1,871 | ) | |||||||||
|
|
|
|
|
|
|
| |||||||||
NET CAPITAL SHARE TRANSACTIONS |
| |||||||||||||||
I Class | 695 | 653 | (1,021 | ) | 930 | |||||||||||
N Class | 154 | 500 | 7 | (1,045 | ) | |||||||||||
|
|
|
|
|
|
|
| |||||||||
Increase (Decrease) in Net Assets Resulting from Net Capital Shares Transactions | 849 | 1,153 | (1,014 | ) | (115 | ) | ||||||||||
|
|
|
|
|
|
|
| |||||||||
Increase (Decrease) in Net Assets | 830 | 1,227 | (2,233 | ) | 97 | |||||||||||
NET ASSETS |
| |||||||||||||||
Beginning of Year | 1,227 | — | 30,676 | 30,579 | ||||||||||||
|
|
|
|
|
|
|
| |||||||||
End of Year | $ | 2,057 | $ | 1,227 | $ | 28,443 | $ | 30,676 | ||||||||
|
|
|
|
|
|
|
| |||||||||
| (1) | For the year ended October 31, 2017, the TCW Conservative Allocation Fund distributed to shareholders $666 and $20 for the I Class and N Class shares, respectively, from net investment income and $1,136 and $49 for the I Class and N Class shares, respectively, from net realized gains. The Securities Exchange Commission eliminated the requirement to disclose distributions to shareholders from each component in 2018. See Note 13. |
| (2) | Amount rounds to less than $1. |
See accompanying notes to financial statements.
55
Table of Contents
TCW Funds, Inc.
Statements of Changes in Net Assets
| TCW Global Real Estate Fund | TCW New America Premier Equities Fund | |||||||||||||||
| Year Ended October 31, 2018 | Year Ended October 31, 2017 | Year Ended October 31, 2018 | Year Ended October 31, 2017 | |||||||||||||
| Dollar Amounts in Thousands | ||||||||||||||||
OPERATIONS |
| |||||||||||||||
Net Investment Income (Loss) | $ | 102 | $ | 81 | $ | (33 | ) | $ | 12 | |||||||
Net Realized Gain (Loss) on Investments, Short Sales and Foreign Currency Transactions | (193 | ) | (69 | ) | 512 | 696 | ||||||||||
Change in Unrealized Appreciation (Depreciation) on Investments and Short Sales | (161 | ) | 273 | 1,221 | 3,194 | |||||||||||
|
|
|
|
|
|
|
| |||||||||
Increase (Decrease) in Net Assets Resulting from Operations | (252 | ) | 285 | 1,700 | 3,902 | |||||||||||
|
|
|
|
|
|
|
| |||||||||
DISTRIBUTIONS TO SHAREHOLDERS (1) |
| |||||||||||||||
Distributions to Shareholders | (82 | ) | (85 | ) | (677 | ) | (173 | ) | ||||||||
|
|
|
|
|
|
|
| |||||||||
NET CAPITAL SHARE TRANSACTIONS |
| |||||||||||||||
I Class | 356 | (842 | ) | 11,097 | 10,113 | |||||||||||
N Class | 1 | 25 | 2,405 | 727 | ||||||||||||
|
|
|
|
|
|
|
| |||||||||
Increase (Decrease) in Net Assets Resulting from Net Capital Shares Transactions | 357 | (817 | ) | 13,502 | 10,840 | |||||||||||
|
|
|
|
|
|
|
| |||||||||
Increase (Decrease) in Net Assets | 23 | (617 | ) | 14,525 | 14,569 | |||||||||||
NET ASSETS |
| |||||||||||||||
Beginning of Year | 3,399 | 4,016 | 18,840 | 4,271 | ||||||||||||
|
|
|
|
|
|
|
| |||||||||
End of Year | $ | 3,422 | $ | 3,399 | $ | 33,365 | $ | 18,840 | ||||||||
|
|
|
|
|
|
|
| |||||||||
| (1) | For the year ended October 31, 2017, the TCW Global Real Estate Fund distributed to shareholders $70 and $15 for the I Class and N Class shares, respectively, from net investment income; the TCW New America Premier Equities Fund distributed to shareholders $36 and $5 for the I Class and N Class shares, respectively, from net investment income and $115 and $17 for the I Class and N Class shares, respectively, from net realized gains. The Securities Exchange Commission eliminated the requirement to disclose distributions to shareholders from each component in 2018. See Note 13. |
See accompanying notes to financial statements.
56
Table of Contents
TCW Funds, Inc.
Statements of Changes in Net Assets
| TCW Relative Value Dividend Appreciation Fund | TCW Relative Value Large Cap Fund | |||||||||||||||
| Year Ended October 31, 2018 | Year Ended October 31, 2017 | Year Ended October 31, 2018 | Year Ended October 31, 2017 | |||||||||||||
| Dollar Amounts in Thousands | ||||||||||||||||
OPERATIONS |
| |||||||||||||||
Net Investment Income | $ | 9,806 | $ | 20,083 | $ | 6,043 | $ | 10,236 | ||||||||
Net Realized Gain on Investments | 26,207 | 196,680 | 43,418 | 69,143 | ||||||||||||
Change in Unrealized Appreciation (Depreciation) on Investments | (48,642 | ) | (74,073 | ) | (69,355 | ) | 17,929 | |||||||||
|
|
|
|
|
|
|
| |||||||||
Increase (Decrease) in Net Assets Resulting from Operations | (12,629 | ) | 142,690 | (19,894 | ) | 97,308 | ||||||||||
|
|
|
|
|
|
|
| |||||||||
DISTRIBUTIONS TO SHAREHOLDERS (1) |
| |||||||||||||||
Distributions to Shareholders | (33,737 | ) | (18,463 | ) | (71,597 | ) | (33,823 | ) | ||||||||
|
|
|
|
|
|
|
| |||||||||
NET CAPITAL SHARE TRANSACTIONS |
| |||||||||||||||
I Class | (24,898 | ) | (58,271 | ) | 18,450 | (69,061 | ) | |||||||||
N Class | (44,769 | ) | (485,444 | ) | (372 | ) | (5,677 | ) | ||||||||
|
|
|
|
|
|
|
| |||||||||
Increase (Decrease) in Net Assets Resulting from Net Capital Shares Transactions | (69,667 | ) | (543,715 | ) | 18,078 | (74,738 | ) | |||||||||
|
|
|
|
|
|
|
| |||||||||
Decrease in Net Assets | (116,033 | ) | (419,488 | ) | (73,413 | ) | (11,253 | ) | ||||||||
NET ASSETS |
| |||||||||||||||
Beginning of Year | 622,264 | 1,041,752 | 488,451 | 499,704 | ||||||||||||
|
|
|
|
|
|
|
| |||||||||
End of Year | $ | 506,231 | $ | 622,264 | $ | 415,038 | $ | 488,451 | ||||||||
|
|
|
|
|
|
|
| |||||||||
| (1) | For the year ended October 31, 2017, the TCW Relative Value Dividend Appreciation Fund distributed to shareholders $3,591 and $14,872 for the I Class and N Class shares, respectively, from net investment income; and the TCW Relative Value Large Cap Fund distributed to shareholders $8,711 and $328 for the I Class and N Class shares, respectively, from net investment income and $23,770 and $1,014 for the I Class and N Class shares, respectively, for net realized gains. The Securities Exchange Commission eliminated the requirement to disclose distributions to shareholders from each component in 2018. See Note 13. |
See accompanying notes to financial statements.
57
Table of Contents
TCW Funds, Inc.
Statements of Changes in Net Assets
| TCW Relative Value Mid Cap Fund | TCW Select Equities Fund | |||||||||||||||
| Year Ended October 31, 2018 | Year Ended October 31, 2017 | Year Ended October 31, 2018 | Year Ended October 31, 2017 | |||||||||||||
| Dollar Amounts in Thousands | ||||||||||||||||
OPERATIONS |
| |||||||||||||||
Net Investment Income (Loss) | $ | 476 | $ | 432 | $ | (3,032 | ) | $ | (2,097 | ) | ||||||
Net Realized Gain on Investments | 6,667 | 10,180 | 134,658 | 244,140 | ||||||||||||
Change in Unrealized Appreciation (Depreciation) on Investments | (13,168 | ) | 15,854 | �� | (20,639 | ) | (35,595 | ) | ||||||||
|
|
|
|
|
|
|
| |||||||||
Increase (Decrease) in Net Assets Resulting from Operations | (6,025 | ) | 26,466 | 110,987 | 206,448 | |||||||||||
|
|
|
|
|
|
|
| |||||||||
DISTRIBUTIONS TO SHAREHOLDERS (1) |
| |||||||||||||||
Distributions to Shareholders | (8,260 | ) | (558 | ) | (201,824 | ) | (83,785 | ) | ||||||||
|
|
|
|
|
|
|
| |||||||||
NET CAPITAL SHARE TRANSACTIONS |
| |||||||||||||||
I Class | (213 | ) | (11,805 | ) | 48,042 | (597,986 | ) | |||||||||
N Class | 1,834 | (2,551 | ) | 9,190 | (33,131 | ) | ||||||||||
|
|
|
|
|
|
|
| |||||||||
Increase (Decrease) in Net Assets Resulting from Net Capital Shares Transactions | 1,621 | (14,356 | ) | 57,232 | (631,117 | ) | ||||||||||
|
|
|
|
|
|
|
| |||||||||
Increase (Decrease) in Net Assets | (12,664 | ) | 11,552 | (33,605 | ) | (508,454 | ) | |||||||||
NET ASSETS |
| |||||||||||||||
Beginning of Year | 103,231 | 91,679 | 907,342 | 1,415,796 | ||||||||||||
|
|
|
|
|
|
|
| |||||||||
End of Year | $ | 90,567 | $ | 103,231 | $ | 873,737 | $ | 907,342 | ||||||||
|
|
|
|
|
|
|
| |||||||||
| (1) | For the year ended October 31, 2017, the TCW Relative Value Mid Cap Fund distributed to shareholders $479 and $79 for the I Class and N Class shares, respectively, from net investment income; and the TCW Select Equities Fund distributed to shareholders $74,719 and $9,066 for the I Class and N Class shares, respectively, from net realized gains. The Securities Exchange Commission eliminated the requirement to disclose distributions to shareholders from each component in 2018. See Note 13. |
See accompanying notes to financial statements.
58
Table of Contents
TCW Funds, Inc.
October 31, 2018 |
Note 1 — Organization
TCW Funds, Inc., a Maryland corporation (the “Company”), is an open-end management investment company registered under the Investment Company Act of 1940, as amended (the “1940 Act”), that currently offers 19 no-load mutual funds (each series, a “Fund” and collectively, the “Funds”). TCW Investment Management Company LLC (the “Advisor”) is the investment advisor to and an affiliate of the Funds and is registered under the Investment Advisers Act of 1940. Each Fund has distinct investment objectives. The following is a brief description of the investment objectives and principal investment strategies for the Funds that are covered in this report:
TCW Fund | Investment Objective | |
| Non-Diversified U.S. Equity Fund | ||
| TCW Artificial Intelligence Equity Fund | Seeks long term capital appreciation by investing at least 80% of the value of its net assets in publicly traded equity securities of businesses that the portfolio managers believe are benefitting from or have the potential to benefit from advances in the use of artificial intelligence. | |
| Diversified U.S. Equity Funds | ||
| TCW Global Real Estate Fund | Seeks to maximize total return from current income and long-term capital growth by investing at least 80% of its net assets in equity securities of real estate investment trusts (“REITs”) and real estate companies. | |
| TCW New America Premier Equities Fund | Seeks to provide long-term capital appreciation by investing at least 80% of the value of its net assets in equity securities of U.S. companies; intends to achieve its objective by investing in a portfolio of companies the portfolio manager believes are enduring, cash generating business whose leaders prudently manage their environmental, social, and financial resources and whose shares are attractively valued relative to free cash flow generating by the businesses. | |
| TCW Relative Value Dividend Appreciation Fund | Seeks to realize a high level of dividend income consistent with prudent investment management, with secondary objective of capital appreciation, by investing at least 80% of the value of its net assets in equity securities of companies that have a record of paying dividends. | |
| TCW Relative Value Large Cap Fund | Seeks capital appreciation, with a secondary goal of current income, by investing at least 80% of the value of its net assets in equity securities of companies with a market capitalization of greater than $1 billion at the time of purchase. | |
| TCW Relative Value Mid Cap Fund | Seeks to provide long-term capital appreciation by investing at least 65% of the value of its net assets in equity securities issued by companies with market capitalizations, at the time of acquisition, within the capitalization ranges of the companies comprising the Russell Mid Cap Index. | |
59
Table of Contents
TCW Funds, Inc.
Notes to Financial Statements (Continued)
Note 1 — Organization (Continued)
TCW Fund | Investment Objective | |
| TCW Select Equities Fund | Seeks to provide long-term capital appreciation by investing at least 80% of its net assets in equity securities; uses a highly focused approach to seek to achieve superior long-term returns over a full market cycle by owning shares of companies that the portfolio manager believes to have strong and enduring business models and inherent advantages over their competitors. | |
| Fund of Funds | ||
| TCW Conservative Allocation Fund | Seeks to provide current income, and secondarily, long-term capital appreciation by investing in a combination of fixed income funds and equity funds that utilize diverse investment styles such as growth and/or value investing. The Fund invests between 20% and 60% of its net assets in equity funds and between 40% and 80% in fixed income funds. | |
All Funds offer two classes of shares: I Class and N Class. The two Classes of a Fund are substantially the same except that the N Class shares are subject to a distribution fee (see Note 6).
The TCW Conservative Allocation Fund is a “fund of funds” that invests in affiliated and unaffiliated funds which are identified on the Schedule of Investments.
Note 2 — Significant Accounting Policies
The following is a summary of significant accounting policies which are in conformity with accounting principles generally accepted in the United States of America (“GAAP”) and which are consistently followed by the Funds in the preparation of their financial statements. Each Fund is considered an investment company under the Financial Accounting Standards Board (FASB) Accounting Standards Codification (ASC) No. 946, Financial Services — Investment Companies.
Principles of Accounting: The Funds use the accrual method of accounting for financial reporting purposes.
Net Asset Value: The net asset value (“NAV”) per share of each class of a Fund is determined by dividing the Fund’s net assets attributable to each class by the number of shares issued and outstanding of that class on each day the New York Stock Exchange (“NYSE”) is open for trading.
Security Valuations: Equity securities listed or traded on the NYSE and other stock exchanges are valued at the latest sale price on the exchange. Securities traded on the NASDAQ stock market (“NASDAQ”) are valued using official closing prices as reported by NASDAQ, which may not be the last sale price. Options on equity securities and options on indexes are valued using mid prices (average of bid and ask prices) as reported by the exchange or pricing service. Investments in open-end mutual funds, including money market funds, are valued based on the NAV per share as reported by the fund companies. All other securities for which over-the-counter (“OTC”) market quotations are readily available, including short-term securities, are valued with prices furnished by independent pricing services or by broker dealers.
The Company has adopted, after the approval by the Company’s Board of Directors (the “Board” and each member thereof a “Director”), a fair valuation methodology for foreign equity securities (exclusive of
60
Table of Contents
TCW Funds, Inc.
October 31, 2018
Note 2 — Significant Accounting Policies (Continued)
certain Latin American and Canadian equity securities). This methodology is designed to address the effect of movements in the U.S. market on the securities traded on foreign exchanges that have been closed for a period of time due to time zones differences. The utilization of the fair value model may result in the adjustment of prices taking into account fluctuations in the U.S. market. The fair value model is utilized each trading day and not dependent on certain thresholds or triggers.
Securities for which market quotations are not readily available, including circumstances under which the prices received are not reflective of a security’s market value, are valued by the Advisor’s Pricing Committee in accordance with the guidelines established by the Board’s Valuation Committee and under the general oversight of the Board.
Fair value is defined as the price that a fund would receive upon selling an investment in a timely transaction to an independent buyer in the principal or most advantageous market for the investment. In accordance with the authoritative guidance on fair value measurements and disclosures under GAAP, the Funds disclose investments in their financial statements in a three-tier hierarchy. This hierarchy is utilized to establish classification of fair value based on inputs. Inputs that go into fair value measurement refer broadly to the assumptions that market participants would use in pricing the asset or liability, including assumptions about risk. Inputs may be observable or unobservable. Observable inputs are inputs that reflect the assumptions market participants would use in pricing the asset or liability developed based on market data obtained from sources independent of the reporting entity. Unobservable inputs are inputs that reflect the reporting entity’s own assumptions in pricing the asset or liability developed based on the best information available in the circumstances.
The three-tier hierarchy of inputs is summarized in the three broad levels listed below.
| Level 1 — | quoted prices in active markets for identical investments. | |
| Level 2 — | other significant observable inputs (including quoted prices for similar investments, interest rates, prepayment speeds, credit risk, etc.). | |
| Level 3 — | significant unobservable inputs (including the Funds’ own assumptions in determining the fair value of investments). |
Changes in valuation techniques may result in transfers in or out of an investment’s assigned level within the hierarchy. The inputs or methodologies used for valuing investments are not necessarily an indication of the risk associated with investing in those investments and the determination of the significance of a particular input to the fair value measurement in its entirety requires judgment and consideration of factors specific to each security.
The availability of observable inputs can vary from security to security and is affected by a wide variety of factors, including, for example, the type of security, whether the security is new and not yet established in the marketplace, the liquidity of markets, and other characteristics particular to the security. To the extent that valuation is based on models or inputs that are less observable or unobservable in the market, the determination of fair value requires more judgment. Accordingly, the degree of judgment exercised in determining fair value is greatest for instruments categorized in Level 3.
In periods of market dislocation, the observability of prices and inputs may be reduced for many instruments. This condition, as well as changes related to liquidity of investments, could cause a security to be reclassified between Level 1, Level 2, or Level 3.
61
Table of Contents
TCW Funds, Inc.
Notes to Financial Statements (Continued)
Note 2 — Significant Accounting Policies (Continued)
In certain cases, the inputs used to measure fair value may fall into different levels of the fair value hierarchy. In such cases, for disclosure purposes the level in the fair value hierarchy within which the fair value measurement falls in its entirety is determined based on the lowest level input that is significant to the fair value measurement.
Fair Value Measurements: A description of the valuation techniques applied to the Funds’ major categories of assets and liabilities measured at fair value on a recurring basis is as follows:
Equity securities. Securities are generally valued based on quoted prices from the applicable exchange. To the extent these securities are actively traded and valuation adjustments are not applied, they are generally categorized in Level 1 of the fair value hierarchy. Restricted securities issued by publicly held companies are categorized in Level 2 or 3 of the fair value hierarchy depending on whether a discount is applied and significant. Restricted securities held in non-public entities are included in Level 3 of the fair value hierarchy because they trade infrequently, and therefore, the inputs are unobservable. Certain foreign securities that are fair valued using a pricing service that considers the correlation of the trading patterns of the foreign security to the intraday trading in the U.S. markets are categorized in Level 2 of the fair value hierarchy.
Mutual funds. Open-end mutual funds, including money market funds, are valued using the NAV as reported by the fund companies. As such, they are categorized in Level 1.
Options contracts. Option contracts traded on securities exchanges are fair valued using market mid prices; as such, they are categorized in Level 1. Option contracts traded OTC are fair valued based on pricing models and incorporate various inputs such as interest rate, credit spreads, currency exchange rates and volatility measurements for in-the-money, at-the-money, and out-of-money contracts on a given strike price. To the extent that these inputs are observable and timely, the fair value of OTC option contracts would be categorized in Level 2; otherwise, the fair values would be categorized in Level 3.
Restricted securities. Restricted securities, including illiquid Rule 144A securities, held in non-public entities are included in Level 3 of the fair value hierarchy because they trade infrequently, and therefore, the inputs are unobservable. Any other restricted securities valued similar to publicly traded securities may be categorized in Level 2 or 3 of the fair value hierarchy depending on whether a discount is applied and significant to the fair value.
The summary of the inputs used as of October 31, 2018 in valuing the Funds’ investments is listed after each Fund’s Schedule of Investments.
The Funds held no investments or other financial instruments at October 31, 2018 for which fair value was calculated using Level 3 inputs.
The Funds did not have any transfers in and out of Level 1 and Level 2 of the fair value hierarchy for the year ended October 31, 2018.
Security Transactions and Related Investment Income: Security transactions are recorded as of the trade date. Dividend income is recorded on the ex-dividend date. Interest income is recognized on an accrual basis. Realized gains and losses on investments are recorded on the basis of specific identification.
Foreign Currency Translation: The books and records of each Fund are maintained in U.S. dollars as follows: (1) the market value of foreign securities, and other assets and liabilities stated in foreign currencies, are translated using the daily spot rate; and (2) purchases, sales, income and expenses are translated at the rate of exchange prevailing on the respective dates of such transactions. The resultant
62
Table of Contents
TCW Funds, Inc.
October 31, 2018
Note 2 — Significant Accounting Policies (Continued)
exchange gains and losses are included in net realized or net unrealized gain (loss) in the Statements of Operations. Pursuant to U.S. federal income tax regulations, certain foreign exchange gains and losses included in realized and unrealized gains and losses are included in, or are a reduction of, ordinary income for federal income tax purposes.
Foreign Taxes: The Funds may be subject to withholding taxes on income and capital gains imposed by certain countries in which they invest. The withholding tax on income is netted against the income accrued or received. Any reclaimable taxes are recorded as income. The withholding tax on realized or unrealized gain is recorded as a liability.
Derivative Instruments: Derivatives are financial instruments which are valued based on the values of one or more indicators, such as a security, asset, currency, interest rate, or index. Derivative transactions can create investment leverage and may be highly volatile. It is possible that a derivative transaction will result in a loss greater than the principal amount invested. The Funds may not be able to close out a derivative transaction at a favorable time or price.
For the year ended October 31, 2018, the TCW Global Real Estate Fund had the following derivatives and transactions in derivatives, grouped in the following risk categories (amounts in thousands except Numbers of Contracts):
TCW Global Real Estate Fund
| Equity Risk | Total | |||||||
Statement of Asset and Liabilities |
| |||||||
Asset Derivatives | ||||||||
Investments (1) | $ | 9 | $ | 9 | ||||
|
|
|
| |||||
Total Value | $ | 9 | $ | 9 | ||||
|
|
|
| |||||
Statement of Operations |
| |||||||
Change in (Depreciation) |
| |||||||
Investments (2) | $ | (6 | ) | $ | (6 | ) | ||
|
|
|
| |||||
Total Change in (Depreciation) | $ | (6 | ) | $ | (6 | ) | ||
|
|
|
| |||||
Number of Contracts (3) |
| |||||||
Purchased Options | 80 | 80 | ||||||
| (1) | Represents purchased options, at value. |
| (2) | Represents change in unrealized depreciation for purchased options during the year. |
| (3) | Amount disclosed represents average number of contracts which are representative of the volume traded for the year ended October 31, 2018. |
Options: The Funds may purchase and sell put and call options on a security or an index of securities to enhance investment performance or to protect against changes in market prices. The Funds may also enter into currency options to hedge against or take advantage of changes in currency fluctuations.
A call option gives the holder the right to purchase, and obligates the writer to sell, a security at the strike price at any time before the expiration date. A put option gives the holder the right to sell, and obligates the writer to buy, a security at the exercise price at any time before the expiration date. A Fund may purchase put options to protect portfolio holdings against a decline in market value of a security or securities held by it. A Fund may also purchase a put option hoping to profit from an anticipated decline in the value of the underlying security. If a Fund holds the security underlying the option, the option premium and any transaction costs will reduce any profit the Fund might have realized had it sold the underlying security
63
Table of Contents
TCW Funds, Inc.
Notes to Financial Statements (Continued)
Note 2 — Significant Accounting Policies (Continued)
instead of buying the put option. A Fund may purchase call options to hedge against an increase in the price of securities that the Fund ultimately wants to buy. A Fund may also purchase a call option as a long directional investment hoping to profit from an anticipated increase in the value of the underlying security. In order for a call option to be profitable, the market price of the underlying security must rise sufficiently above the exercise price to cover the premium and transaction costs. These costs will reduce any profit a Fund might have realized had it bought the underlying security at the time it purchased the call option.
When a Fund purchases an option, it runs the risk that it will lose its entire investment in the option in a relatively short period of time, unless the Fund exercises the option or enters into a closing sale transaction before the option’s expiration. If the price of the underlying security does not rise (in the case of a call) or fall (in the case of a put) to an extent sufficient to cover the option premium and transaction costs, the Fund will lose part or all of its investment in the option. Premiums paid for purchasing options that expire are treated as realized losses.
Options traded on a securities or options exchange typically have minimal exposure to counterparty risk. However, an exchange or market may at times find it necessary to impose restrictions on particular types of options transactions, such as opening transactions. If an underlying security ceases to meet qualifications imposed by an exchange or the Options Clearing Corporation, new series of options on that security will no longer be opened to replace expiring series, and opening transactions in existing series may be prohibited.
OTC options are options not traded on exchanges or backed by clearinghouses. Rather, they are entered into directly between a Fund and the counterparty to the option. In the case of an OTC option purchased by a Fund, the value of the option to the Fund will depend on the willingness and ability of the option writer to perform its obligations to the Fund. In addition, OTC options may not be transferable and there may be little or no secondary market for them, so they may be considered illiquid. It may not be possible to enter into closing transactions with respect to OTC options or otherwise to terminate such options, and as a result a Fund may be required to remain obligated on an unfavorable OTC option until its expiration.
During the year ended October 31, 2018, TCW Global Real Estate Fund entered into option contracts to hedge the Fund’s investments from market volatility in the real estate sector.
When-Issued, Delayed-Delivery and Forward Commitment Transactions: The Funds, with the exception of the TCW Conservative Allocation Fund, may enter into when-issued, delayed-delivery, or forward commitment transactions in order to lock in the purchase price of the underlying security. In when-issued, delayed-delivery, or forward commitment transactions, a Fund commits to purchase or sell particular securities, with payment and delivery to take place at a future date. Although the Fund does not pay for the securities until they are delivered, it immediately assumes the risks of ownership, including the risk of price fluctuation. If the Fund’s counterparty fails to deliver a security purchased on a when issued, delayed delivery or forward commitment basis, there may be a loss, and the Fund may have missed an opportunity to make an alternative investment.
Prior to settlement of these transactions, the values of the subject securities will fluctuate with market conditions. In addition, because a Fund is not required to pay for when-issued, delayed-delivery or forward commitment securities until the delivery date, they may result in a form of leverage to the extent the Fund does not set aside liquid assets to cover the commitment. To guard against the deemed leverage, the Fund monitors the obligations under these transactions on a daily basis and ensures that the Fund has sufficient liquid assets to cover them.
64
Table of Contents
TCW Funds, Inc.
October 31, 2018
Note 2 — Significant Accounting Policies (Continued)
Repurchase Agreements: The Funds may enter into Repurchase Agreements, under the terms of a Master Repurchase Agreement (“MRA”). The MRA permits each Fund, under certain circumstances including an event of default (such as bankruptcy or insolvency), to offset payables and/or receivables under the MRA with collateral held and/or posted to the counterparty and create one single net payment due to or from each Fund. However, bankruptcy or insolvency laws of a particular jurisdiction may impose restrictions on or prohibitions against such a right of offset in the event of a MRA counterparty’s bankruptcy or insolvency. Pursuant to the terms of the MRA, each Fund receives securities as collateral with a market value in excess of the repurchase price. Upon a bankruptcy or insolvency of the MRA counterparty, the Fund recognizes a liability with respect to such excess collateral to reflect the Fund’s obligation under bankruptcy law to return the excess to the counterparty. There were no repurchase agreements outstanding as of October 31, 2018.
Security Lending: The Funds may lend their securities to qualified brokers. The loans must be collateralized at all times primarily with cash although the Funds can accept money market instruments or U.S. government securities with a market value at least equal to the market value of the securities on loan. As with any extensions of credit, the Funds may bear the risk of delay in recovery or even loss of rights in the collateral if the borrowers of the securities fail financially. The Funds earn additional income for lending their securities by investing the cash collateral in short-term investments. The Funds did not lend any securities during the year ended October 31, 2018.
Allocation of Operating Activity for Multiple Classes: Investment income, common expenses and realized and unrealized gains and losses are allocated among the share classes of the Funds based on the relative net assets of each class. Distribution fees, which are directly attributable to a class of shares, are charged to the operations of that class. All other expenses are charged to each Fund or class as incurred on a specific identification basis. Differences in class specific fees and expenses will result in differences in net investment income for each class, and in turn differences in dividends paid by each class.
Dividends and Distributions: Dividends and distributions to shareholders are recorded on the ex-dividend date. The TCW Global Real Estate Fund and the TCW Relative Value Dividend Appreciation Fund declare and pay, or reinvest, dividends from net investment income quarterly. The other Equity Funds and TCW Conservative Allocation Fund declare and pay, or reinvest, dividends from net investment income annually. Capital gains realized by a Fund will be distributed at least annually.
Income and capital gain distributions are determined in accordance with income tax regulations which may differ from GAAP. These differences are primarily due to differing treatments for foreign currency transactions, market discount and premium, losses deferred due to wash sales, excise tax regulations and employing equalization in determining amounts to be distributed to fund shareholders. Permanent book and tax basis differences relating to shareholder distributions will result in reclassifications between paid-in capital, undistributed net investment income (loss), and/or undistributed accumulated realized gain (loss). Undistributed net investment income or loss may include temporary book and tax differences which will reverse in subsequent periods. Any taxable income or capital gain remaining at fiscal year-end is distributed in the following year. Distributions received from real estate investment trusts may include return of capital which is treated as a reduction in the cost basis of those investments. Distributions received, if any, in excess of the cost basis of a security is recognized as capital gain.
Use of Estimates: The preparation of the accompanying financial statements requires management to make estimates and assumptions that affect the reported amount of assets and liabilities at the date of the financial statements and the reported amounts of income and expenses during the reporting period. Actual results could differ from these estimates.
65
Table of Contents
TCW Funds, Inc.
Notes to Financial Statements (Continued)
Note 3 — Risk Considerations
Market Risk: As the Funds’ investments will fluctuate with market conditions, and so will the value of your investment in the Funds. You could lose money on your investment in the Funds or the Funds could underperform other investments.
Liquidity Risk: The Funds’ investments in illiquid securities may reduce the returns of the Funds because they may not be able to sell the illiquid securities at an advantageous time or price. Investments in high yield securities, foreign securities, derivatives or other securities with substantial market and/or credit risk tend to have the greatest exposure to liquidity risk. Certain investments in private placements and Rule 144A securities may be considered illiquid investments. The Funds may invest in private placements and Rule 144A securities.
Counterparty Risk: The Funds may be exposed to counterparty risk, the risk that an entity with which the Funds have unsettled or open transactions may not fulfill its obligations.
Investment Style Risk: Certain Funds may also be subject to investment style risk. The Advisor’s investment styles may be out of favor at times or may not produce the best results over short or longer time periods and may increase the volatility of a Fund’s share price.
Equity Risk: Equity securities may include common stock, preferred stock or other securities representing an ownership interest or the right to acquire an ownership interest in an issuer. Equity risk is the risk that stocks and other equity securities generally fluctuate in value more than bonds and can decline in value over short or extended periods. The value of stocks and other equity securities will be affected by changes in a company’s financial condition and in overall market, economic and political conditions.
For complete information on the various risks involved, please refer to the Funds’ prospectus and the Statement of Additional Information which can be obtained on the Funds’ website (www.tcw.com) or by calling the customer service.
Note 4 — Federal Income Taxes
It is the policy of each Fund to comply with the requirements under Subchapter M of the Internal Revenue Code (the “Code”) applicable to regulated investment companies and to distribute all of its net taxable income, including any net realized gains on investments, to its shareholders. Therefore, no federal income tax provision is required.
At October 31, 2018, the components of distributable earnings on a tax basis were as follows (amounts in thousands):
| Undistributed Ordinary Income | Undistributed Long-Term Gain | Total Distributable Earnings | ||||||||||
TCW Conservative Allocation Fund | $ | 341 | $ | 1,228 | $ | 1,569 | ||||||
TCW New America Premier Equities Fund | 166 | 297 | 463 | |||||||||
TCW Global Real Estate Fund | 33 | — | 33 | |||||||||
TCW Relative Value Dividend Appreciation Fund | 506 | 25,420 | 25,926 | |||||||||
TCW Relative Value Large Cap Fund | 4,923 | 39,750 | 44,673 | |||||||||
TCW Relative Value Mid Cap Fund | — | 6,240 | 6,240 | |||||||||
TCW Select Equities Fund | — | 117,726 | 117,726 | |||||||||
66
Table of Contents
TCW Funds, Inc.
October 31, 2018
Note 4 — Federal Income Taxes (Continued)
For the prior fiscal year ended October 31, 2017, the components of distributable earnings on a tax basis were as follows (amounts in thousands):
| Undistributed Ordinary Income | Undistributed Long-Term Gain | Total Distributable Earnings | ||||||||||
TCW Artificial Intelligence Equity Fund | $ | — | (1) | $ | — | $ | — | (1) | ||||
TCW Conservative Allocation Fund | 242 | 749 | 991 | |||||||||
TCW Global Real Estate Fund | 14 | — | 14 | |||||||||
TCW New America Premier Equities Fund | 669 | 8 | 677 | |||||||||
TCW Relative Value Dividend Appreciation Fund | 2,044 | 22,669 | 24,713 | |||||||||
TCW Relative Value Large Cap Fund | 9,182 | 61,294 | 70,476 | |||||||||
TCW Relative Value Mid Cap Fund | 366 | 7,415 | 7,781 | |||||||||
TCW Select Equities Fund | — | 201,823 | 201,823 | |||||||||
| (1) | Amounts rounds to less than $1. |
Permanent differences incurred during the year ended October 31, 2018 resulting from differences in book and tax accounting, have been reclassified at year-end between undistributed net investment income (loss), undistributed (accumulated) net realized gain (loss) and paid-in capital as follows, with no impact to the net asset value per share (amounts in thousands):
| Undistributed Net Investment Income (Loss) | Undistributed Accumulated Net Realized Gain (Loss) | Paid-in Capital | ||||||||||
TCW Artificial Intelligence Equity Fund | $ | 4 | $ | — | (1) | $ | (4 | ) | ||||
TCW Conservative Allocation Fund | 107 | (166 | ) | 59 | ||||||||
TCW Global Real Estate Fund | (21 | ) | 23 | (2 | ) | |||||||
TCW New America Premier Equities Fund | 32 | (57 | ) | 25 | ||||||||
TCW Relative Value Dividend Appreciation Fund | (278 | ) | (2,969 | ) | 3,247 | |||||||
TCW Relative Value Large Cap Fund | (1 | ) | (4,261 | ) | 4,262 | |||||||
TCW Relative Value Mid Cap Fund | 1 | (348 | ) | 347 | ||||||||
TCW Select Equities Fund | 3,031 | (16,681 | ) | 13,650 | ||||||||
| (1) | Amounts rounds to less than $1. |
During the year ended October 31, 2018, the tax character of distributions paid was as follows (amounts in thousands):
| Ordinary Income | Long-Term Capital Gain | Total Distributions | ||||||||||
TCW Artificial Intelligence Equity Fund | $ | — | (1) | $ | — | $ | — | (1) | ||||
TCW Conservative Allocation Fund | 510 | 749 | 1,259 | |||||||||
TCW Global Real Estate Fund | 82 | — | 82 | |||||||||
TCW New America Premier Equities Fund | 669 | 8 | 677 | |||||||||
TCW Relative Value Dividend Appreciation Fund | 11,067 | 22,670 | 33,737 | |||||||||
TCW Relative Value Large Cap Fund | 10,302 | 61,295 | 71,597 | |||||||||
TCW Relative Value Mid Cap Fund | 823 | 7,437 | 8,260 | |||||||||
TCW Select Equities Fund | — | 201,824 | 201,824 | |||||||||
| (1) | Amounts rounds to less than $1. |
67
Table of Contents
TCW Funds, Inc.
Notes to Financial Statements (Continued)
Note 4 — Federal Income Taxes (Continued)
During the prior fiscal year ended October 31, 2017, the tax character of distributions paid was as follows (amounts in thousands):
| Ordinary Income | Long-Term Capital Gain | Total Distributions | ||||||||||
TCW Conservative Allocation Fund | $ | 686 | $ | 1,185 | $ | 1,871 | ||||||
TCW Global Real Estate Fund | 85 | — | 85 | |||||||||
TCW New America Premier Equities Fund | 173 | — | 173 | |||||||||
TCW Relative Value Dividend Appreciation Fund | 18,463 | — | 18,463 | |||||||||
TCW Relative Value Large Cap Fund | 9,039 | 24,784 | 33,823 | |||||||||
TCW Relative Value Mid Cap Fund | 558 | — | 558 | |||||||||
TCW Select Equities Fund | — | 83,785 | 83,785 | |||||||||
At October 31, 2018, net unrealized appreciation (depreciation) on investments for federal income tax purposes was as follows (amounts in thousands):
| Unrealized Appreciation | Unrealized (Depreciation) | Net Unrealized Appreciation (Depreciation) | Cost of Investments for Federal Income Tax Purposes | |||||||||||||
TCW Artificial Intelligence Equity Fund | $ | 194 | $ | (130 | ) | $ | 64 | $ | 2,025 | |||||||
TCW Conservative Allocation Fund | 1,640 | (643 | ) | 997 | 27,440 | |||||||||||
TCW Global Real Estate Fund | 201 | (157 | ) | 44 | 3,382 | |||||||||||
TCW New America Premier Equities Fund | 4,748 | (143 | ) | 4,605 | 28,490 | |||||||||||
TCW Relative Value Dividend Appreciation Fund | 104,373 | (42,295 | ) | 62,078 | 444,081 | |||||||||||
TCW Relative Value Large Cap Fund | 129,161 | (18,232 | ) | 110,929 | 302,813 | |||||||||||
TCW Relative Value Mid Cap Fund | 21,205 | (2,627 | ) | 18,578 | 72,215 | |||||||||||
TCW Select Equities Fund | 478,062 | (12,292 | ) | 465,770 | 411,496 | |||||||||||
At October 31, 2018, the following Funds had net realized loss carryforwards for federal income tax purposes (amounts in thousands):
| Short-Term Capital losses | Long-Term Capital Losses | Total | ||||||||||
TCW Artificial Intelligence Equity Fund | $ | 2 | $ | — | $ | 2 | ||||||
TCW Global Real Estate Fund | 581 | 80 | 661 | |||||||||
The Funds did not have any unrecognized tax benefits at October 31, 2018, nor were there any increases or decreases in unrecognized tax benefits for the year ended October 31, 2018. The Funds are subject to examination by the U.S. Federal and state tax authorities for returns filed for the prior three and four fiscal years, respectively.
Note 5 — Fund Management Fees and Other Expenses
The Funds pay to the Advisor, as compensation for services rendered, facilities furnished and expenses borne by it, the following annual management fees as a percentage of daily net assets:
TCW Artificial Intelligence Equity Fund | 0.80 | % | ||
TCW Global Real Estate Fund | 0.80 | % | ||
TCW New America Premier Equities Fund | 0.80 | % | ||
TCW Relative Value Dividend Appreciation Fund | 0.65 | % | ||
TCW Relative Value Large Cap Fund | 0.65 | % | ||
TCW Relative Value Mid Cap Fund | 0.70 | % (1) | ||
TCW Select Equities Fund | 0.75 | % |
| (1) | Effective March 1, 2018. From November 1, 2017 through February 28, 2018, the management fee was 0.80%. |
68
Table of Contents
TCW Funds, Inc.
October 31, 2018
Note 5 — Fund Management Fees and Other Expenses (Continued)
The TCW Conservative Allocation Fund does not pay management fees to the Advisor; however, the Fund pays management fees to the Advisor indirectly as a shareholder in the underlying affiliated funds.
The Advisor limits the operating expenses of the Funds not to exceed the following expense ratios relative to the Funds’ average daily net assets.
TCW Artificial Intelligence Equity Fund | ||||
I Class | 1.05 | % (1) | ||
N Class | 1.05 | % (1) | ||
TCW Conservative Allocation Fund | ||||
I Class | 0.85 | % (1) | ||
N Class | 0.85 | % (1) | ||
TCW Global Real Estate Fund | ||||
I Class | 1.00 | % (1) | ||
N Class | 1.15 | % (1) | ||
TCW New America Premier Equities Fund | ||||
I Class | 1.04 | % (1) | ||
N Class | 1.04 | % (1) | ||
TCW Relative Value Dividend Appreciation Fund | ||||
I Class | 0.80 | % (1) | ||
N Class | 1.00 | % (1) | ||
TCW Relative Value Large Cap Fund | ||||
I Class | 0.80 | % (1) | ||
N Class | 1.00 | % (1) | ||
TCW Relative Value Mid Cap Fund | ||||
I Class | 0.90 | % (1) | ||
N Class | 1.00 | % (1) | ||
TCW Select Equities Fund | ||||
I Class | 1.05 | % (2) | ||
N Class | 1.05 | % (2) |
| (1) | These limitations are based on an agreement between the Advisor and the Company. |
| (2) | Limitations based on average expense ratio as reported by Lipper, Inc., which is subject to change on a monthly basis. This ratio was in effect as of October 31, 2018. These limitations are voluntary and terminable in a six month notice. |
The amount borne by the Advisor during a fiscal year when the operating expenses of a Fund are in excess of the expense limitation cannot be recaptured in the subsequent fiscal years should the expenses drop below the expense limitation in the subsequent years. The Advisor can only recapture expenses within a given fiscal year for that year’s operating expenses.
Directors’ Fees: Directors who are not affiliated with the Advisor receive compensation from the Funds which are shown on the Statement of Operations. Directors may elect to defer receipt of their fees in accordance with the terms of a Non-Qualified Deferred Compensation Plan. Total accrued and deferred amounts are recorded on the Fund’s books as other liabilities.
Note 6 — Distribution Plan
TCW Funds Distributors LLC (“Distributor”), an affiliate of the Advisor and the Funds, serves as the nonexclusive distributor of each class of the Funds’ shares. The Funds have a distribution plan pursuant to Rule 12b-1 under the 1940 Act with respect to the N Class shares of each Fund. Under the terms of the plan, each Fund compensates the Distributor at a rate equal to 0.25% of the average daily net assets of the Fund attributable to its N Class shares for distribution and related services.
69
Table of Contents
TCW Funds, Inc.
Notes to Financial Statements (Continued)
Note 7 — Transactions with Affiliates
The ownership percentage of the TCW Conservative Allocation Fund in each of the affiliated underlying Funds at October 31, 2018 is as follows:
Name of Affiliated Fund | Ownership Percentage (1) | |||
Metropolitan West Low Duration Bond Fund | 0.16 | % | ||
Metropolitan West Total Return Bond Fund | 0.01 | % | ||
Metropolitan West Unconstrained Bond Fund | 0.17 | % | ||
TCW Global Bond Fund | 4.43 | % | ||
TCW New America Premier Equities Fund | 8.49 | % | ||
TCW Relative Value Large Cap Fund | 0.79 | % | ||
TCW Relative Value Mid Cap Fund | 0.81 | % | ||
TCW Select Equities Fund | 0.31 | % | ||
TCW Total Return Bond Fund | 0.05 | % | ||
| (1) | Percentage ownership based on total net assets of the underlying fund. |
The financial statements of the Funds not contained in this report are available by calling 800-FUND-TCW (800-386-3829) or by going to the SEC website at www.sec.gov.
Note 8 — Purchases and Sales of Securities
Investment transactions (excluding short-term investments) for the year ended October 31, 2018, were as follows (amounts in thousands):
| Purchases at Cost | Sales or Maturity Proceeds | U.S. Government Purchases at Cost | U.S. Government Sales or Maturity Proceeds | |||||||||||||
TCW Artificial Intelligence Equity Fund | $ | 2,128 | $ | 1,283 | $ | — | $ | — | ||||||||
TCW Conservative Allocation Fund | 5,880 | 7,152 | — | — | ||||||||||||
TCW Global Real Estate Fund | 4,853 | 4,658 | — | — | ||||||||||||
TCW New America Premier Equities Fund | 23,760 | 11,670 | — | — | ||||||||||||
TCW Relative Value Dividend Appreciation Fund | 107,633 | 200,116 | — | — | ||||||||||||
TCW Relative Value Large Cap Fund | 95,758 | 142,612 | — | — | ||||||||||||
TCW Relative Value Mid Cap Fund | 22,735 | 30,112 | — | — | ||||||||||||
TCW Select Equities Fund | 140,475 | 276,800 | — | — | ||||||||||||
70
Table of Contents
TCW Funds, Inc.
October 31, 2018
Note 9 — Capital Share Transactions
Transactions in each Fund’s shares were as follows:
| TCW Artificial Intelligence Equity Fund | Year Ended October 31, 2018 | August 31, 2017 (Commencement of Operations) through October 31, 2017 | ||||||||||||||
| I Class | Shares | Amount (in thousands) | Shares | Amount (in thousands) | ||||||||||||
Shares Sold | 87,472 | $ | 1,068 | 65,264 | $ | 653 | ||||||||||
Shares Issued upon Reinvestment of Dividends | 12 | — | (1) | — | — | |||||||||||
Shares Redeemed | (30,656 | ) | (373 | ) | — | — | ||||||||||
|
|
|
|
|
|
|
| |||||||||
Net Increase | 56,828 | $ | 695 | 65,264 | $ | 653 | ||||||||||
|
|
|
|
|
|
|
| |||||||||
| N Class | Shares | Amount (in thousands) | Shares | Amount (in thousands) | ||||||||||||
Shares Sold | 20,017 | $ | 250 | 50,000 | $ | 500 | ||||||||||
Shares Issued upon Reinvestment of Dividends | 9 | — | (1) | — | — | |||||||||||
Shares Redeemed | (8,006 | ) | (96 | ) | — | — | ||||||||||
|
|
|
|
|
|
|
| |||||||||
Net Increase | 12,020 | $ | 154 | 50,000 | $ | 500 | ||||||||||
|
|
|
|
|
|
|
| |||||||||
| (1) | Amount rounds to less than $1. |
| TCW Conservative Allocation Fund | Year Ended October 31, 2018 | Year Ended October 31, 2017 | ||||||||||||||
| I Class | Shares | Amount (in thousands) | Shares | Amount (in thousands) | ||||||||||||
Shares Sold | 91,379 | $ | 1,110 | 186,502 | $ | 2,188 | ||||||||||
Shares Issued upon Reinvestment of Dividends | 102,921 | 1,217 | 155,467 | 1,761 | ||||||||||||
Shares Redeemed | (280,133 | ) | (3,348 | ) | (254,486 | ) | (3,019 | ) | ||||||||
|
|
|
|
|
|
|
| |||||||||
Net Increase (Decrease) | (85,833 | ) | $ | (1,021 | ) | 87,483 | $ | 930 | ||||||||
|
|
|
|
|
|
|
| |||||||||
| N Class | Shares | Amount (in thousands) | Shares | Amount (in thousands) | ||||||||||||
Shares Sold | 8,674 | $ | 103 | 26,148 | $ | 313 | ||||||||||
Shares Issued upon Reinvestment of Dividends | 1,528 | 18 | 5,978 | 68 | ||||||||||||
Shares Redeemed | (9,614 | ) | (114 | ) | (120,636 | ) | (1,426 | ) | ||||||||
|
|
|
|
|
|
|
| |||||||||
Net Increase (Decrease) | 588 | $ | 7 | (88,510 | ) | $ | (1,045 | ) | ||||||||
|
|
|
|
|
|
|
| |||||||||
| TCW Global Real Estate Fund | Year Ended October 31, 2018 | Year Ended October 31, 2017 | ||||||||||||||
| I Class | Shares | Amount (in thousands) | Shares | Amount (in thousands) | ||||||||||||
Shares Sold | 125,773 | $ | 1,281 | 33,764 | $ | 329 | ||||||||||
Shares Issued upon Reinvestment of Dividends | 6,968 | 68 | 6,976 | 67 | ||||||||||||
Shares Redeemed | (101,561 | ) | (993 | ) | (133,260 | ) | (1,238 | ) | ||||||||
|
|
|
|
|
|
|
| |||||||||
Net Increase (Decrease) | 31,180 | $ | 356 | (92,520 | ) | $ | (842 | ) | ||||||||
|
|
|
|
|
|
|
| |||||||||
| N Class | Shares | Amount (in thousands) | Shares | Amount (in thousands) | ||||||||||||
Shares Sold | 107 | $ | 1 | 2,031 | $ | 20 | ||||||||||
Shares Issued upon Reinvestment of Dividends | 1,110 | 11 | 1,581 | 15 | ||||||||||||
Shares Redeemed | (1,137 | ) | (11 | ) | (1,041 | ) | (10 | ) | ||||||||
|
|
|
|
|
|
|
| |||||||||
Net Increase | 80 | $ | 1 | 2,571 | $ | 25 | ||||||||||
|
|
|
|
|
|
|
| |||||||||
71
Table of Contents
TCW Funds, Inc.
Notes to Financial Statements (Continued)
Note 9 — Capital Share Transactions (Continued)
| TCW New America Premier Equities Fund | Year Ended October 31, 2018 | Year Ended October 31, 2017 | ||||||||||||||
| I Class | Shares | Amount (in thousands) | Shares | Amount (in thousands) | ||||||||||||
Shares Sold | 788,224 | $ | 13,092 | 889,822 | $ | 11,268 | ||||||||||
Shares Issued upon Reinvestment of Dividends | 38,162 | 572 | 12,994 | 146 | ||||||||||||
Shares Redeemed | (160,059 | ) | (2,567 | ) | (98,168 | ) | (1,301 | ) | ||||||||
|
|
|
|
|
|
|
| |||||||||
Net Increase | 666,327 | $ | 11,097 | 804,648 | $ | 10,113 | ||||||||||
|
|
|
|
|
|
|
| |||||||||
| N Class | Shares | Amount (in thousands) | Shares | Amount (in thousands) | ||||||||||||
Shares Sold | 152,798 | $ | 2,489 | 51,050 | $ | 726 | ||||||||||
Shares Issued upon Reinvestment of Dividends | 5,974 | 90 | 2,001 | 23 | ||||||||||||
Shares Redeemed | (10,648 | ) | (174 | ) | (1,724 | ) | (22 | ) | ||||||||
|
|
|
|
|
|
|
| |||||||||
Net Increase | 148,124 | $ | 2,405 | 51,327 | $ | 727 | ||||||||||
|
|
|
|
|
|
|
| |||||||||
| TCW Relative Value Dividend Appreciation Fund | Year Ended October 31, 2018 | Year Ended October 31, 2017 | ||||||||||||||
| I Class | Shares | Amount (in thousands) | Shares | Amount (in thousands) | ||||||||||||
Shares Sold | 1,170,743 | $ | 22,458 | 1,571,327 | $ | 29,392 | ||||||||||
Shares Issued upon Reinvestment of Dividends | 349,698 | 6,687 | 174,490 | 3,283 | ||||||||||||
Shares Redeemed | (2,788,916 | ) | (54,043 | ) | (4,785,356 | ) | (90,946 | ) | ||||||||
|
|
|
|
|
|
|
| |||||||||
Net Decrease | (1,268,475 | ) | $ | (24,898 | ) | (3,039,539 | ) | $ | (58,271 | ) | ||||||
|
|
|
|
|
|
|
| |||||||||
| N Class | Shares | Amount (in thousands) | Shares | Amount (in thousands) | ||||||||||||
Shares Sold | 1,992,134 | $ | 38,575 | 24,813,876 | $ | 468,038 | ||||||||||
Shares Issued upon Reinvestment of Dividends | 1,359,169 | 26,431 | 773,578 | 14,787 | ||||||||||||
Shares Redeemed | (5,592,917 | ) | (109,775 | ) | (31,373,199 | ) | (594,714 | ) | ||||||||
Shares Redeemed through in-kind Redemptions | — | — | (19,698,827 | ) | (373,555 | ) | ||||||||||
|
|
|
|
|
|
|
| |||||||||
Net Decrease | (2,241,614 | ) | $ | (44,769 | ) | (25,484,572 | ) | $ | (485,444 | ) | ||||||
|
|
|
|
|
|
|
| |||||||||
| TCW Relative Value Large Cap Fund | Year Ended October 31, 2018 | Year Ended October 31, 2017 | ||||||||||||||
| I Class | Shares | Amount (in thousands) | Shares | Amount (in thousands) | ||||||||||||
Shares Sold | 2,750,555 | $ | 60,616 | 2,241,430 | $ | 51,607 | ||||||||||
Shares Issued upon Reinvestment of Dividends | 3,059,339 | 66,999 | 1,432,234 | 31,595 | ||||||||||||
Shares Redeemed | (4,954,321 | ) | (109,165 | ) | (6,703,734 | ) | (152,263 | ) | ||||||||
|
|
|
|
|
|
|
| |||||||||
Net Increase (Decrease) | 855,573 | $ | 18,450 | (3,030,070 | ) | $ | (69,061 | ) | ||||||||
|
|
|
|
|
|
|
| |||||||||
| N Class | Shares | Amount (in thousands) | Shares | Amount (in thousands) | ||||||||||||
Shares Sold | 48,027 | $ | 1,057 | 99,985 | $ | 2,299 | ||||||||||
Shares Issued upon Reinvestment of Dividends | 105,507 | 2,305 | 60,256 | 1,327 | ||||||||||||
Shares Redeemed | (171,260 | ) | (3,734 | ) | (400,430 | ) | (9,303 | ) | ||||||||
|
|
|
|
|
|
|
| |||||||||
Net Decrease | (17,726 | ) | $ | (372 | ) | (240,189 | ) | $ | (5,677 | ) | ||||||
|
|
|
|
|
|
|
| |||||||||
72
Table of Contents
TCW Funds, Inc.
October 31, 2018
Note 9 — Capital Share Transactions (Continued)
| TCW Relative Value Mid Cap Fund | Year Ended October 31, 2018 | Year Ended October 31, 2017 | ||||||||||||||
| I Class | Shares | Amount (in thousands) | Shares | Amount (in thousands) | ||||||||||||
Shares Sold | 396,213 | $ | 10,205 | 365,523 | $ | 8,619 | ||||||||||
Shares Issued upon Reinvestment of Dividends | 260,385 | 6,601 | 20,199 | 461 | ||||||||||||
Shares Redeemed | (665,570 | ) | (17,019 | ) | (883,074 | ) | (20,885 | ) | ||||||||
|
|
|
|
|
|
|
| |||||||||
Net Decrease | (8,972 | ) | $ | (213 | ) | (497,352 | ) | $ | (11,805 | ) | ||||||
|
|
|
|
|
|
|
| |||||||||
| N Class | Shares | Amount (in thousands) | Shares | Amount (in thousands) | ||||||||||||
Shares Sold | 114,082 | $ | 2,889 | 133,705 | $ | 3,025 | ||||||||||
Shares Issued upon Reinvestment of Dividends | 58,853 | 1,452 | 3,399 | 76 | ||||||||||||
Shares Redeemed | (101,633 | ) | (2,507 | ) | (245,555 | ) | (5,652 | ) | ||||||||
|
|
|
|
|
|
|
| |||||||||
Net Increase (Decrease) | 71,302 | $ | 1,834 | (108,451 | ) | $ | (2,551 | ) | ||||||||
|
|
|
|
|
|
|
| |||||||||
| TCW Select Equities Fund | Year Ended October 31, 2018 | Year Ended October 31, 2017 | ||||||||||||||
| I Class | Shares | Amount (in thousands) | Shares | Amount (in thousands) | ||||||||||||
Shares Sold | 5,631,218 | $ | 160,868 | 4,737,934 | $ | 124,547 | ||||||||||
Shares Issued upon Reinvestment of Dividends | 4,718,127 | 118,189 | 1,164,576 | 27,822 | ||||||||||||
Shares Redeemed | (8,316,559 | ) | (231,015 | ) | (29,165,155 | ) | (750,355 | ) | ||||||||
|
|
|
|
|
|
|
| |||||||||
Net Increase (Decrease) | 2,032,786 | $ | 48,042 | (23,262,645 | ) | $ | (597,986 | ) | ||||||||
|
|
|
|
|
|
|
| |||||||||
| N Class | Shares | Amount (in thousands) | Shares | Amount (in thousands) | ||||||||||||
Shares Sold | 513,203 | $ | 13,228 | 229,950 | $ | 5,748 | ||||||||||
Shares Issued upon Reinvestment of Dividends | 1,337,789 | 30,448 | 396,802 | 8,817 | ||||||||||||
Shares Redeemed | (1,353,097 | ) | (34,486 | ) | (1,917,314 | ) | (47,696 | ) | ||||||||
|
|
|
|
|
|
|
| |||||||||
Net Increase (Decrease) | 497,895 | $ | 9,190 | (1,290,562 | ) | $ | (33,131 | ) | ||||||||
|
|
|
|
|
|
|
| |||||||||
Note 10 — Restricted Securities
The Funds are permitted to invest in securities that have legal or contractual restrictions on resale. These securities may be sold privately, but are required to be registered before being sold to the public (exemption rules apply). Private placement securities are generally considered to be restricted except for those securities traded between qualified institutional investors under the provisions of Rule 144A of the Securities Act of 1933 (the “Securities Act”). However, the Company considers 144A securities to be restricted if those securities have been deemed illiquid. Disposal of these securities may involve time consuming negotiations and expense, and prompt sale at an acceptable price may be difficult. The Funds held no restricted securities at October 31, 2018.
Note 11 — Committed Line Of Credit
The Company has entered into a $100,000,000 committed revolving line of credit agreement renewed annually with the State Street Bank and Trust Company (the “Bank”) for temporary borrowing purposes. The interest rate on borrowing is the higher of the Federal Funds rate or the overnight LIBOR rate, plus 1.25%. There were no borrowings from the line of credit as of or during the year ended October 31, 2018. The Funds pay the Bank a commitment fee equal to 0.25% per annum on the daily unused portion of the committed line amount. The commitment fees incurred by the Funds are presented in the Statements of Operations. The commitment fees are allocated to each applicable portfolio in proportion to its relative average daily net assets and the interest expenses are charged directly to the applicable portfolio.
73
Table of Contents
TCW Funds, Inc.
Notes to Financial Statements (Continued)
Note 12 — Indemnifications
Under the Company’s organizational documents, its Officers and Directors may be indemnified against certain liabilities and expenses arising out of the performance of their duties to the Company. In addition, the Company entered into an agreement with each of the Directors which provides that the Company will indemnify and hold harmless each Director against any expenses actually and reasonably incurred by any Director in any proceeding arising out of or in connection with the Director’s services to the Company, to the fullest extent permitted by the Company’s Articles of Incorporation and By-Laws, the Maryland General Corporation Law, the Securities Act, and the 1940 Act, each as now or hereinafter in force. Additionally, in the normal course of business, the Company enters into agreements with service providers that may contain indemnification clauses. The Company’s maximum exposure under these arrangements is unknown as this would involve future claims that may be made against the Company that have not yet occurred. However, based on experience, the Company expects the risk of loss to be remote. The Company has not accrued any liability in connection with such indemnification.
Note 13 — SEC Simplification
In August 2018, the Securities and Exchange Commission adopted the Disclosure Update and Simplification rule, which amends certain disclosure requirements. The amendment requires presentation of the total, rather than the components, of accumulated or undistributed earnings on the Statements of Assets and Liabilities; the amendment also provides the presentation of the distributions on the Statements of Changes in Net Assets at the total level rather than components and to remove the requirement for disclosure of undistributed net investment income on a book basis. This amendment facilitates compliance of the disclosure of information without significantly altering the information provided to investors.
Note 14 — New Accounting Pronouncement
In August 2018, the FASB released Accounting Standards Update (ASU) 2018-13, which changes the fair value measurement disclosure requirements of Topic 820. The amendments in this ASU are the result of a broader disclosure project called FASB Concept Statement, Conceptual Framework for Financial Reporting — Chapter 8: Notes to Financial Statements. The objective and primary focus of the project are to improve the effectiveness of disclosures in the notes to the financial statements by facilitating clear communication of the information required by GAAP that is most important to users of the financial statements. The ASU is effective for all entities for fiscal years beginning after December 15, 2019, including interim periods therein. Early adoption is permitted for any eliminated or modified disclosures upon issuance of the ASU. Management is currently evaluating the impact of the ASU to the financial statements.
74
Table of Contents
TCW Artificial Intelligence Equity Fund
Financial Highlights — I Class
| Year Ended October 31, 2018 | August 31, 2017 (Commencement of Operations) through October 31, 2017 | |||||||
Net Asset Value per Share, Beginning of Year | $ | 10.64 | $ | 10.00 | ||||
|
|
|
| |||||
Income (Loss) from Investment Operations: | ||||||||
Net Investment Loss | (0.04 | ) | �� | (0.00 | ) (1) | |||
Net Realized and Unrealized Gain on Investments (2) | 0.58 | 0.64 | ||||||
|
|
|
| |||||
Total from Investment Operations | 0.54 | 0.64 | ||||||
|
|
|
| |||||
Less Distributions: | ||||||||
Distributions from Net Investment Income | (0.00 | ) (1) | — | |||||
|
|
|
| |||||
Net Asset Value per Share, End of Year | $ | 11.18 | $ | 10.64 | ||||
|
|
|
| |||||
Total Return | 5.09 | % | 6.40 | % (3) | ||||
Ratios/Supplemental Data: | ||||||||
Net Assets, End of Year (in thousands) | $ | 1,364 | $ | 695 | ||||
Ratio of Expenses to Average Net Assets: | ||||||||
Before Expense Reimbursement | 8.32 | % | 23.66 | % (4) | ||||
After Expense Reimbursement | 1.05 | % | 1.05 | % (4) | ||||
Ratio of Net Investment Income (Loss) to Average Net Assets | (0.34 | )% | 0.23 | % (4) | ||||
Portfolio Turnover Rate | 74.22 | % | 13.05 | % (3) | ||||
| (1) | Amount rounds to less than $0.01 per share. |
| (2) | Computed using average shares outstanding throughout the period. |
| (3) | For the period August 31, 2017 (commencement of operations) through October 31, 2017. |
| (4) | Annualized. |
See accompanying notes to financial statements.
75
Table of Contents
TCW Artificial Intelligence Equity Fund
Financial Highlights — N Class
| Year Ended October 31, 2018 | August 31, 2017 (Commencement of Operations) through October 31, 2017 | |||||||
Net Asset Value per Share, Beginning of Year | $ | 10.64 | $ | 10.00 | ||||
|
|
|
| |||||
Income (Loss) from Investment Operations: | ||||||||
Net Investment Loss | (0.04 | ) | (0.00 | ) (1) | ||||
Net Realized and Unrealized Gain on Investments (2) | 0.57 | 0.64 | ||||||
|
|
|
| |||||
Total from Investment Operations | 0.53 | 0.64 | ||||||
|
|
|
| |||||
Less Distributions: | ||||||||
Distributions from Net Investment Income | (0.00 | ) (1) | — | |||||
|
|
|
| |||||
Net Asset Value per Share, End of Year | $ | 11.17 | $ | 10.64 | ||||
|
|
|
| |||||
Total Return | 5.00 | % | 6.40 | % (3) | ||||
Ratios/Supplemental Data: | ||||||||
Net Assets, End of Year (in thousands) | $ | 693 | $ | 532 | ||||
Ratio of Expenses to Average Net Assets: | ||||||||
Before Expense Reimbursement | 9.60 | % | 26.07 | % (4) | ||||
After Expense Reimbursement | 1.05 | % | 1.05 | % (4) | ||||
Ratio of Net Investment Income (Loss) to Average Net Assets | (0.33 | )% | 0.25 | % (4) | ||||
Portfolio Turnover Rate | 74.22 | % | 13.05 | % (3) | ||||
| (1) | Amount rounds to less than $0.01 per share. |
| (2) | Computed using average shares outstanding throughout the period. |
| (3) | For the period August 31, 2017 (commencement of operations) through October 31, 2017. |
| (4) | Annualized. |
See accompanying notes to financial statements.
76
Table of Contents
TCW Conservative Allocation Fund
Financial Highlights — I Class
| Year Ended October 31, | ||||||||||||||||||||
| 2018 | 2017 | 2016 | 2015 | 2014 | ||||||||||||||||
Net Asset Value per Share, Beginning of Year | $ | 12.17 | $ | 12.13 | $ | 12.50 | $ | 12.24 | $ | 11.66 | ||||||||||
|
|
|
|
|
|
|
|
|
| |||||||||||
Income (Loss) from Investment Operations: |
| |||||||||||||||||||
Net Investment Income (1) | 0.20 | 0.15 | 0.17 | 0.13 | 0.11 | |||||||||||||||
Net Realized and Unrealized Gain (Loss) on Investments | (0.19 | ) | 0.67 | (0.07 | ) | 0.33 | 0.67 | |||||||||||||
|
|
|
|
|
|
|
|
|
| |||||||||||
Total from Investment Operations | 0.01 | 0.82 | 0.10 | 0.46 | 0.78 | |||||||||||||||
|
|
|
|
|
|
|
|
|
| |||||||||||
Less Distributions: |
| |||||||||||||||||||
Distributions from Net Investment Income | (0.20 | ) | (0.29 | ) | (0.19 | ) | (0.14 | ) | (0.20 | ) | ||||||||||
Distributions from Net Realized Gain | (0.30 | ) | (0.49 | ) | (0.28 | ) | (0.06 | ) | — | |||||||||||
|
|
|
|
|
|
|
|
|
| |||||||||||
Total Distributions | (0.50 | ) | (0.78 | ) | (0.47 | ) | (0.20 | ) | (0.20 | ) | ||||||||||
|
|
|
|
|
|
|
|
|
| |||||||||||
Net Asset Value per Share, End of Year | $ | 11.68 | $ | 12.17 | $ | 12.13 | $ | 12.50 | $ | 12.24 | ||||||||||
|
|
|
|
|
|
|
|
|
| |||||||||||
Total Return | 0.04 | % | 7.28 | % | 0.78 | % | 3.88 | % | 6.66 | % | ||||||||||
Ratios/Supplemental Data: |
| |||||||||||||||||||
Net Assets, End of Year (in thousands) | $ | 27,925 | $ | 30,144 | $ | 28,982 | $ | 33,909 | $ | 30,746 | ||||||||||
Ratio of Expenses to Average Net Assets (2) | 0.37 | % | 0.36 | % | 0.30 | % | 0.25 | % | 0.29 | % | ||||||||||
Ratio of Net Investment Income to Average Net Assets | 1.68 | % | 1.26 | % | 1.41 | % | 1.01 | % | 0.94 | % | ||||||||||
Portfolio Turnover Rate | 19.79 | % | 55.53 | % | 37.62 | % | 30.24 | % | 40.56 | % | ||||||||||
| (1) | Computed using average shares outstanding throughout the period. |
| (2) | Does not include expenses of the underlying affiliated funds. |
See accompanying notes to financial statements.
77
Table of Contents
TCW Conservative Allocation Fund
Financial Highlights — N Class
| Year Ended October 31, | ||||||||||||||||||||
| 2018 | 2017 | 2016 | 2015 | 2014 | ||||||||||||||||
Net Asset Value per Share, Beginning of Year | $ | 12.15 | $ | 12.07 | $ | 12.44 | $ | 12.17 | $ | 11.61 | ||||||||||
|
|
|
|
|
|
|
|
|
| |||||||||||
Income (Loss) from Investment Operations: |
| |||||||||||||||||||
Net Investment Income (1) | 0.15 | 0.11 | 0.11 | 0.04 | 0.05 | |||||||||||||||
Net Realized and Unrealized Gain (Loss) on Investments | (0.18 | ) | 0.66 | (0.08 | ) | 0.35 | 0.66 | |||||||||||||
|
|
|
|
|
|
|
|
|
| |||||||||||
Total from Investment Operations | (0.03 | ) | 0.77 | 0.03 | 0.39 | 0.71 | ||||||||||||||
|
|
|
|
|
|
|
|
|
| |||||||||||
Less Distributions: |
| |||||||||||||||||||
Distributions from Net Investment Income | (0.15 | ) | (0.20 | ) | (0.12 | ) | (0.06 | ) | (0.15 | ) | ||||||||||
Distributions from Net Realized Gain | (0.30 | ) | (0.49 | ) | (0.28 | ) | (0.06 | ) | — | |||||||||||
|
|
|
|
|
|
|
|
|
| |||||||||||
Total Distributions | (0.45 | ) | (0.69 | ) | (0.40 | ) | (0.12 | ) | (0.15 | ) | ||||||||||
|
|
|
|
|
|
|
|
|
| |||||||||||
Net Asset Value per Share, End of Year | $ | 11.67 | $ | 12.15 | $ | 12.07 | $ | 12.44 | $ | 12.17 | ||||||||||
|
|
|
|
|
|
|
|
|
| |||||||||||
Total Return | (0.35 | )% | 6.74 | % | 0.31 | % | 3.31 | % | 6.07 | % | ||||||||||
Ratios/Supplemental Data: |
| |||||||||||||||||||
Net Assets, End of Year (in thousands) | $ | 518 | $ | 532 | $ | 1,597 | $ | 1,876 | $ | 807 | ||||||||||
Ratio of Expenses to Average Net Assets: (2) |
| |||||||||||||||||||
Before Expense Reimbursement | 5.14 | % | 3.30 | % | 1.54 | % | 1.61 | % | 3.20 | % | ||||||||||
After Expense Reimbursement | 0.76 | % | 0.81 | % | 0.82 | % | 0.84 | % | 0.85 | % | ||||||||||
Ratio of Net Investment Income to Average Net Assets | 1.28 | % | 0.89 | % | 0.89 | % | 0.36 | % | 0.41 | % | ||||||||||
Portfolio Turnover Rate | 19.79 | % | 55.53 | % | 37.62 | % | 30.24 | % | 40.56 | % | ||||||||||
| (1) | Computed using average shares outstanding throughout the period. |
| (2) | Does not include expenses of the underlying affiliated funds. |
See accompanying notes to financial statements.
78
Table of Contents
TCW Global Real Estate Fund
Financial Highlights — I Class
| Year Ended October 31, | November 28, 2014 (Commencement of Operations) through October 31, 2015 | |||||||||||||||
| 2018 | 2017 | 2016 | ||||||||||||||
Net Asset Value per Share, Beginning of Year | $ | 10.10 | $ | 9.42 | $ | 9.71 | $ | 10.00 | ||||||||
|
|
|
|
|
|
|
| |||||||||
Income (Loss) from Investment Operations: |
| |||||||||||||||
Net Investment Income (1) | 0.25 | 0.25 | 0.30 | 0.21 | ||||||||||||
Net Realized and Unrealized Gain (Loss) on Investments | (0.85 | ) | 0.70 | (0.26 | ) | (0.27 | ) | |||||||||
|
|
|
|
|
|
|
| |||||||||
Total from Investment Operations | (0.60 | ) | 0.95 | 0.04 | (0.06 | ) | ||||||||||
|
|
|
|
|
|
|
| |||||||||
Less Distributions: | ||||||||||||||||
Distributions from Net Investment Income | (0.20 | ) | (0.27 | ) | (0.29 | ) | (0.23 | ) | ||||||||
Distributions from Net Realized Gain | — | — | (0.01 | ) | — | |||||||||||
Distributions from Return of Capital | — | — | (0.03 | ) | — | |||||||||||
|
|
|
|
|
|
|
| |||||||||
Total Distributions | (0.20 | ) | (0.27 | ) | (0.33 | ) | (0.23 | ) | ||||||||
|
|
|
|
|
|
|
| |||||||||
Net Asset Value per Share, End of Year | $ | 9.30 | $ | 10.10 | $ | 9.42 | $ | 9.71 | ||||||||
|
|
|
|
|
|
|
| |||||||||
Total Return | (6.06 | )% | 10.28 | % | 0.31 | % | (0.62 | )% (2) | ||||||||
Ratios/Supplemental Data: |
| |||||||||||||||
Net Assets, End of Year (in thousands) | $ | 2,886 | $ | 2,818 | $ | 3,499 | $ | 4,320 | ||||||||
Ratio of Expenses to Average Net Assets: |
| |||||||||||||||
Before Expense Reimbursement | 3.78 | % | 4.38 | % | 3.29 | % | 5.28 | % (3) | ||||||||
After Expense Reimbursement | 1.12 | % | 1.37 | % | 1.40 | % | 1.43 | % (3) | ||||||||
Ratio of Net Investment Income to Average Net Assets | 2.55 | % | 2.57 | % | 3.14 | % | 2.27 | % (3) | ||||||||
Portfolio Turnover Rate | 121.67 | % | 74.51 | % | 68.69 | % | 23.58 | % (2) | ||||||||
| (1) | Computed using average shares outstanding throughout the period. |
| (2) | For the period November 28, 2014 (Commencement of Operations) through October 31, 2015. |
| (3) | Annualized. |
See accompanying notes to financial statements.
79
Table of Contents
TCW Global Real Estate Fund
Financial Highlights — N Class
| Year Ended October 31, | November 28, 2014 (Commencement of Operations) through October 31, 2015 | |||||||||||||||
| 2018 | 2017 | 2016 | ||||||||||||||
Net Asset Value per Share, Beginning of Year | $ | 10.10 | $ | 9.42 | $ | 9.70 | $ | 10.00 | ||||||||
|
|
|
|
|
|
|
| |||||||||
Income (Loss) from Investment Operations: | ||||||||||||||||
Net Investment Income (1) | 0.24 | 0.25 | 0.32 | 0.24 | ||||||||||||
Net Realized and Unrealized Gain (Loss) on Investments | (0.85 | ) | 0.70 | (0.27 | ) | (0.31 | ) | |||||||||
|
|
|
|
|
|
|
| |||||||||
Total from Investment Operations | (0.61 | ) | 0.95 | 0.05 | (0.07 | ) | ||||||||||
|
|
|
|
|
|
|
| |||||||||
Less Distributions: | ||||||||||||||||
Distributions from Net Investment Income | (0.19 | ) | (0.27 | ) | (0.29 | ) | (0.23 | ) | ||||||||
Distributions from Net Realized Gain | — | — | (0.01 | ) | — | |||||||||||
Distributions from Return of Capital | — | — | (0.03 | ) | — | |||||||||||
|
|
|
|
|
|
|
| |||||||||
Total Distributions | (0.19 | ) | (0.27 | ) | (0.33 | ) | (0.23 | ) | ||||||||
|
|
|
|
|
|
|
| |||||||||
Net Asset Value per Share, End of Year | $ | 9.30 | $ | 10.10 | $ | 9.42 | $ | 9.70 | ||||||||
|
|
|
|
|
|
|
| |||||||||
Total Return | (6.14 | )% | 10.28 | % | 0.41 | % | (0.72 | )% (2) | ||||||||
Ratios/Supplemental Data: |
| |||||||||||||||
Net Assets, End of Year (in thousands) | $ | 536 | $ | 581 | $ | 517 | $ | 510 | ||||||||
Ratio of Expenses to Average Net Assets: |
| |||||||||||||||
Before Expense Reimbursement | 7.65 | % | 7.92 | % | 6.66 | % | 9.21 | % (3) | ||||||||
After Expense Reimbursement | 1.22 | % | 1.37 | % | 1.40 | % | 1.43 | % (3) | ||||||||
Ratio of Net Investment Income to Average Net Assets | 2.46 | % | 2.51 | % | 3.34 | % | 2.58 | % (3) | ||||||||
Portfolio Turnover Rate | 121.67 | % | 74.51 | % | 68.69 | % | 23.58 | % (2) | ||||||||
| (1) | Computed using average shares outstanding throughout the period. |
| (2) | For the period November 28, 2014 (Commencement of Operations) through October 31, 2015. |
| (3) | Annualized. |
See accompanying notes to financial statements.
80
Table of Contents
TCW New America Premier Equities Fund
Financial Highlights — I Class
| Year Ended October 31, | January 29, 2016 (Commencement of Operations) through October 31, 2016 | |||||||||||
| 2018 | 2017 | |||||||||||
Net Asset Value per Share, Beginning of Year | $ | 15.24 | $ | 11.23 | $ | 10.00 | ||||||
|
|
|
|
|
| |||||||
Income (Loss) from Investment Operations: | ||||||||||||
Net Investment Income (Loss) (1) | (0.02 | ) | 0.01 | 0.08 | ||||||||
Net Realized and Unrealized Gain on Investments | 1.59 | 4.22 | 1.15 | |||||||||
|
|
|
|
|
| |||||||
Total from Investment Operations | 1.57 | 4.23 | 1.23 | |||||||||
|
|
|
|
|
| |||||||
Less Distributions: | ||||||||||||
Distributions from Net Investment Income | — | (0.05 | ) | — | ||||||||
Distributions from Net Realized Gain | (0.54 | ) | (0.17 | ) | — | |||||||
|
|
|
|
|
| |||||||
Total Distributions | (0.54 | ) | (0.22 | ) | — | |||||||
|
|
|
|
|
| |||||||
Net Asset Value per Share, End of Year | $ | 16.27 | $ | 15.24 | $ | 11.23 | ||||||
|
|
|
|
|
| |||||||
Total Return | 10.60 | % | 38.41 | % | 12.30 | % (2) | ||||||
Ratios/Supplemental Data: | ||||||||||||
Net Assets, End of Year (in thousands) | $ | 28,486 | $ | 16,527 | $ | 3,143 | ||||||
Ratio of Expenses to Average Net Assets: | ||||||||||||
Before Expense Reimbursement | 1.28 | % | 1.79 | % | 4.72 | % (3) | ||||||
After Expense Reimbursement | 1.04 | % | 1.04 | % | 1.05 | % (3) | ||||||
Ratio of Net Investment Income (Loss) to Average Net Assets | (0.13 | )% | 0.11 | % | 1.03 | % (3) | ||||||
Portfolio Turnover Rate | 49.68 | % | 114.48 | % | 73.83 | % (2) | ||||||
| (1) | Computed using average shares outstanding throughout the period. |
| (2) | For the period January 29, 2016 (commencement of operations) through October 31, 2016. |
| (3) | Annualized. |
See accompanying notes to financial statements.
81
Table of Contents
TCW New America Premier Equities Fund
Financial Highlights — N Class
| Year Ended October 31, | January 29, 2016 (Commencement of Operations) through October 31, 2016 | |||||||||||
| 2018 | 2017 | |||||||||||
Net Asset Value per Share, Beginning of Year | $ | 15.24 | $ | 11.23 | $ | 10.00 | ||||||
|
|
|
|
|
| |||||||
Income (Loss) from Investment Operations: | ||||||||||||
Net Investment Income (Loss) (1) | (0.02 | ) | 0.01 | 0.08 | ||||||||
Net Realized and Unrealized Gain on Investments | 1.59 | 4.22 | 1.15 | |||||||||
|
|
|
|
|
| |||||||
Total from Investment Operations | 1.57 | 4.23 | 1.23 | |||||||||
|
|
|
|
|
| |||||||
Less Distributions: | ||||||||||||
Distributions from Net Investment Income | — | (0.05 | ) | — | ||||||||
Distributions from Net Realized Gain | (0.54 | ) | (0.17 | ) | — | |||||||
|
|
|
|
|
| |||||||
Total Distributions | (0.54 | ) | (0.22 | ) | — | |||||||
|
|
|
|
|
| |||||||
Net Asset Value per Share, End of Year | $ | 16.27 | $ | 15.24 | $ | 11.23 | ||||||
|
|
|
|
|
| |||||||
Total Return | 10.60 | % | 38.41 | % | 12.30 | % (2) | ||||||
Ratios/Supplemental Data: | ||||||||||||
Net Assets, End of Year (in thousands) | $ | 4,879 | $ | 2,313 | $ | 1,128 | ||||||
Ratio of Expenses to Average Net Assets: | ||||||||||||
Before Expense Reimbursement | 2.14 | % | 3.64 | % | 6.08 | % (3) | ||||||
After Expense Reimbursement | 1.04 | % | 1.04 | % | 1.05 | % (3) | ||||||
Ratio of Net Investment Income (Loss) to Average Net Assets | (0.13 | )% | 0.11 | % | 0.98 | % (3) | ||||||
Portfolio Turnover Rate | 49.68 | % | 114.48 | % | 73.83 | % (2) | ||||||
| (1) | Computed using average shares outstanding throughout the period. |
| (2) | For the period January 29, 2016 (commencement of operations) through October 31, 2016. |
| (3) | Annualized. |
See accompanying notes to financial statements.
82
Table of Contents
TCW Relative Value Dividend Appreciation Fund
Financial Highlights — I Class
| Year Ended October 31, | ||||||||||||||||||||
| 2018 | 2017 | 2016 | 2015 | 2014 | ||||||||||||||||
Net Asset Value per Share, Beginning of Year | $ | 19.14 | $ | 16.95 | $ | 16.49 | $ | 16.71 | $ | 15.11 | ||||||||||
|
|
|
|
|
|
|
|
|
| |||||||||||
Income (Loss) from Investment Operations: |
| |||||||||||||||||||
Net Investment Income (1) | 0.35 | 0.48 | 0.35 | 0.30 | 0.27 | |||||||||||||||
Net Realized and Unrealized Gain (Loss) on Investments | (0.90 | ) | 2.17 | 0.41 | (0.24 | ) | 1.61 | |||||||||||||
|
|
|
|
|
|
|
|
|
| |||||||||||
Total from Investment Operations | (0.55 | ) | 2.65 | 0.76 | 0.06 | 1.88 | ||||||||||||||
|
|
|
|
|
|
|
|
|
| |||||||||||
Less Distributions: |
| |||||||||||||||||||
Distributions from Net Investment Income | (0.40 | ) | (0.46 | ) | (0.30 | ) | (0.28 | ) | (0.28 | ) | ||||||||||
Distributions from Net Realized Gain | (0.72 | ) | — | — | — | — | ||||||||||||||
|
|
|
|
|
|
|
|
|
| |||||||||||
Total Distributions | (1.12 | ) | (0.46 | ) | (0.30 | ) | (0.28 | ) | (0.28 | ) | ||||||||||
|
|
|
|
|
|
|
|
|
| |||||||||||
Net Asset Value per Share, End of Year | $ | 17.47 | $ | 19.14 | $ | 16.95 | $ | 16.49 | $ | 16.71 | ||||||||||
|
|
|
|
|
|
|
|
|
| |||||||||||
Total Return | (3.28 | )% | 15.69 | % | 4.66 | % | 0.40 | % | 12.49 | % | ||||||||||
Ratios/Supplemental Data: |
| |||||||||||||||||||
Net Assets, End of Year (in thousands) | $ | 95,108 | $ | 128,498 | $ | 165,331 | $ | 175,694 | $ | 195,400 | ||||||||||
Ratio of Expenses to Average Net Assets | 0.78 | % | 0.78 | % | 0.87 | % | 0.86 | % | 0.86 | % | ||||||||||
Ratio of Net Investment Income to Average Net Assets | 1.84 | % | 2.60 | % | 2.11 | % | 1.81 | % | 1.67 | % | ||||||||||
Portfolio Turnover Rate | 18.48 | % | 23.45 | % | 19.13 | % | 17.95 | % | 17.33 | % | ||||||||||
| (1) | Computed using average shares outstanding throughout the period. |
See accompanying notes to financial statements.
83
Table of Contents
TCW Relative Value Dividend Appreciation Fund
Financial Highlights — N Class
| Year Ended October 31, | ||||||||||||||||||||
| 2018 | 2017 | 2016 | 2015 | 2014 | ||||||||||||||||
Net Asset Value per Share, Beginning of Year | $ | 19.46 | $ | 17.23 | $ | 16.76 | $ | 16.99 | $ | 15.34 | ||||||||||
|
|
|
|
|
|
|
|
|
| |||||||||||
Income (Loss) from Investment Operations: |
| |||||||||||||||||||
Net Investment Income (1) | 0.32 | 0.43 | 0.31 | 0.26 | 0.23 | |||||||||||||||
Net Realized and Unrealized Gain (Loss) on Investments | (0.93 | ) | 2.23 | 0.43 | (0.25 | ) | 1.63 | |||||||||||||
|
|
|
|
|
|
|
|
|
| |||||||||||
Total from Investment Operations | (0.61 | ) | 2.66 | 0.74 | 0.01 | 1.86 | ||||||||||||||
|
|
|
|
|
|
|
|
|
| |||||||||||
Less Distributions: |
| |||||||||||||||||||
Distributions from Net Investment Income | (0.36 | ) | (0.43 | ) | (0.27 | ) | (0.24 | ) | (0.21 | ) | ||||||||||
Distributions from Net Realized Gain | (0.72 | ) | — | — | — | — | ||||||||||||||
|
|
|
|
|
|
|
|
|
| |||||||||||
Total Distributions | (1.08 | ) | (0.43 | ) | (0.27 | ) | (0.24 | ) | (0.21 | ) | ||||||||||
|
|
|
|
|
|
|
|
|
| |||||||||||
Net Asset Value per Share, End of Year | $ | 17.77 | $ | 19.46 | $ | 17.23 | $ | 16.76 | $ | 16.99 | ||||||||||
|
|
|
|
|
|
|
|
|
| |||||||||||
Total Return | (3.52 | )% | 15.46 | % | 4.43 | % | 0.10 | % | 12.19 | % | ||||||||||
Ratios/Supplemental Data: |
| |||||||||||||||||||
Net Assets, End of Year (in thousands) | $ | 411,123 | $ | 493,766 | $ | 876,421 | $ | 878,544 | $ | 970,397 | ||||||||||
Ratio of Expenses to Average Net Assets: |
| |||||||||||||||||||
Before Expense Reimbursement | 1.05 | % | 1.05 | % | 1.15 | % | 1.14 | % | 1.14 | % | ||||||||||
After Expense Reimbursement | 1.00 | % | 1.00 | % | 1.11 | % | N/A | N/A | ||||||||||||
Ratio of Net Investment Income to Average Net Assets | 1.62 | % | 2.24 | % | 1.86 | % | 1.53 | % | 1.40 | % | ||||||||||
Portfolio Turnover Rate | 18.48 | % | 23.45 | % | 19.13 | % | 17.95 | % | 17.33 | % | ||||||||||
| (1) | Computed using average shares outstanding throughout the period. |
See accompanying notes to financial statements.
84
Table of Contents
TCW Relative Value Large Cap Fund
Financial Highlights — I Class
| Year Ended October 31, | ||||||||||||||||||||
| 2018 | 2017 | 2016 | 2015 | 2014 | ||||||||||||||||
Net Asset Value per Share, Beginning of Year | $ | 24.30 | $ | 21.38 | $ | 21.99 | $ | 22.09 | $ | 19.47 | ||||||||||
|
|
|
|
|
|
|
|
|
| |||||||||||
Income (Loss) from Investment Operations: |
| |||||||||||||||||||
Net Investment Income (1) | 0.28 | 0.49 | 0.32 | 0.26 | 0.21 | |||||||||||||||
Net Realized and Unrealized Gain (Loss) on Investments | (1.18 | ) | 3.96 | 0.19 | (0.14 | ) | 2.65 | |||||||||||||
|
|
|
|
|
|
|
|
|
| |||||||||||
Total from Investment Operations | (0.90 | ) | 4.45 | 0.51 | 0.12 | 2.86 | ||||||||||||||
|
|
|
|
|
|
|
|
|
| |||||||||||
Less Distributions: |
| |||||||||||||||||||
Distributions from Net Investment Income | (0.47 | ) | (0.41 | ) | (0.25 | ) | (0.22 | ) | (0.24 | ) | ||||||||||
Distributions from Net Realized Gain | (3.11 | ) | (1.12 | ) | (0.87 | ) | — | — | ||||||||||||
|
|
|
|
|
|
|
|
|
| |||||||||||
Total Distributions | (3.58 | ) | (1.53 | ) | (1.12 | ) | (0.22 | ) | (0.24 | ) | ||||||||||
|
|
|
|
|
|
|
|
|
| |||||||||||
Net Asset Value per Share, End of Year | $ | 19.82 | $ | 24.30 | $ | 21.38 | $ | 21.99 | $ | 22.09 | ||||||||||
|
|
|
|
|
|
|
|
|
| |||||||||||
Total Return | (5.11 | )% | 21.55 | % | 2.61 | % | 0.50 | % | 14.79 | % | ||||||||||
Ratios/Supplemental Data: |
| |||||||||||||||||||
Net Assets, End of Year (in thousands) | $ | 402,035 | $ | 472,078 | $ | 480,174 | $ | 667,957 | $ | 700,484 | ||||||||||
Ratio of Expenses to Average Net Assets | 0.77 | % | 0.77 | % | 0.88 | % | 0.88 | % | 0.88 | % | ||||||||||
Ratio of Net Investment Income to Average Net Assets | 1.28 | % | 2.11 | % | 1.57 | % | 1.14 | % | 1.02 | % | ||||||||||
Portfolio Turnover Rate | 20.47 | % | 24.44 | % | 14.71 | % | 21.60 | % | 18.77 | % | ||||||||||
| (1) | Computed using average shares outstanding throughout the period. |
See accompanying notes to financial statements.
85
Table of Contents
TCW Relative Value Large Cap Fund
Financial Highlights — N Class
| Year Ended October 31, | ||||||||||||||||||||
| 2018 | 2017 | 2016 | 2015 | 2014 | ||||||||||||||||
Net Asset Value per Share, Beginning of Year | $ | 24.21 | $ | 21.31 | $ | 21.91 | $ | 22.04 | $ | 19.44 | ||||||||||
|
|
|
|
|
|
|
|
|
| |||||||||||
Income (Loss) from Investment Operations: |
| |||||||||||||||||||
Net Investment Income (1) | 0.23 | 0.44 | 0.28 | 0.19 | 0.16 | |||||||||||||||
Net Realized and Unrealized Gain (Loss) on Investments | (1.18 | ) | 3.94 | 0.19 | (0.14 | ) | 2.65 | |||||||||||||
|
|
|
|
|
|
|
|
|
| |||||||||||
Total from Investment Operations | (0.95 | ) | 4.38 | 0.47 | 0.05 | 2.81 | ||||||||||||||
|
|
|
|
|
|
|
|
|
| |||||||||||
Less Distributions: |
| |||||||||||||||||||
Distributions from Net Investment Income | (0.41 | ) | (0.36 | ) | (0.20 | ) | (0.18 | ) | (0.21 | ) | ||||||||||
Distributions from Net Realized Gain | (3.11 | ) | (1.12 | ) | (0.87 | ) | — | — | ||||||||||||
|
|
|
|
|
|
|
|
|
| |||||||||||
Total Distributions | (3.52 | ) | (1.48 | ) | (1.07 | ) | (0.18 | ) | (0.21 | ) | ||||||||||
|
|
|
|
|
|
|
|
|
| |||||||||||
Net Asset Value per Share, End of Year | $ | 19.74 | $ | 24.21 | $ | 21.31 | $ | 21.91 | $ | 22.04 | ||||||||||
|
|
|
|
|
|
|
|
|
| |||||||||||
Total Return | (5.35 | )% | 21.27 | % | 2.42 | % | 0.20 | % | 14.52 | % | ||||||||||
Ratios/Supplemental Data: |
| |||||||||||||||||||
Net Assets, End of Year (in thousands) | $ | 13,003 | $ | 16,373 | $ | 19,530 | $ | 25,084 | $ | 29,589 | ||||||||||
Ratio of Expenses to Average Net Assets: |
| |||||||||||||||||||
Before Expense Reimbursement | 1.21 | % | 1.16 | % | 1.23 | % | 1.20 | % | 1.12 | % | ||||||||||
After Expense Reimbursement | 0.99 | % | 1.00 | % | 1.10 | % | 1.16 | % | N/A | |||||||||||
Ratio of Net Investment Income to Average Net Assets | 1.05 | % | 1.93 | % | 1.35 | % | 0.86 | % | 0.77 | % | ||||||||||
Portfolio Turnover Rate | 20.47 | % | 24.44 | % | 14.71 | % | 21.60 | % | 18.77 | % | ||||||||||
| (1) | Computed using average shares outstanding throughout the period. |
See accompanying notes to financial statements.
86
Table of Contents
TCW Relative Value Mid Cap Fund
Financial Highlights — I Class
| Year Ended October 31, | ||||||||||||||||||||
| 2018 | 2017 | 2016 | 2015 | 2014 | ||||||||||||||||
Net Asset Value per Share, Beginning of Year | $ | 25.96 | $ | 20.02 | $ | 22.43 | $ | 26.62 | $ | 26.56 | ||||||||||
|
|
|
|
|
|
|
|
|
| |||||||||||
Income (Loss) from Investment Operations: | ||||||||||||||||||||
Net Investment Income (1) | 0.12 | 0.11 | 0.18 | 0.17 | 0.13 | |||||||||||||||
Net Realized and Unrealized Gain (Loss) on Investments | (1.56 | ) | 5.96 | 0.34 | (1.16 | ) | 2.70 | |||||||||||||
|
|
|
|
|
|
|
|
|
| |||||||||||
Total from Investment Operations | (1.44 | ) | 6.07 | 0.52 | (0.99 | ) | 2.83 | |||||||||||||
|
|
|
|
|
|
|
|
|
| |||||||||||
Less Distributions: | ||||||||||||||||||||
Distributions from Net Investment Income | (0.13 | ) | (0.13 | ) | (0.16 | ) | (0.12 | ) | (0.14 | ) | ||||||||||
Distributions from Net Realized Gain | (1.95 | ) | — | (2.77 | ) | (3.08 | ) | (2.63 | ) | |||||||||||
|
|
|
|
|
|
|
|
|
| |||||||||||
Total Distributions | (2.08 | ) | (0.13 | ) | (2.93 | ) | (3.20 | ) | (2.77 | ) | ||||||||||
|
|
|
|
|
|
|
|
|
| |||||||||||
Net Asset Value per Share, End of Year | $ | 22.44 | $ | 25.96 | $ | 20.02 | $ | 22.43 | $ | 26.62 | ||||||||||
|
|
|
|
|
|
|
|
|
| |||||||||||
Total Return | (6.48 | )% | 30.40 | % | 3.53 | % | (4.58 | )% | 11.09 | % | ||||||||||
Ratios/Supplemental Data: | ||||||||||||||||||||
Net Assets, End of Year (in thousands) | $ | 72,527 | $ | 84,136 | $ | 74,840 | $ | 93,356 | $ | 114,823 | ||||||||||
Ratio of Expenses to Average Net Assets | 0.92 | % | 0.99 | % | 0.98 | % | 0.96 | % | 0.95 | % | ||||||||||
Ratio of Net Investment Income to Average Net Assets | 0.48 | % | 0.45 | % | 0.96 | % | 0.68 | % | 0.49 | % | ||||||||||
Portfolio Turnover Rate | 22.60 | % | 31.93 | % | 17.81 | % | 23.15 | % | 21.67 | % | ||||||||||
| (1) | Computed using average shares outstanding throughout the period. |
See accompanying notes to financial statements.
87
Table of Contents
TCW Relative Value Mid Cap Fund
Financial Highlights — N Class
| Year Ended October 31, | ||||||||||||||||||||
| 2018 | 2017 | 2016 | 2015 | 2014 | ||||||||||||||||
Net Asset Value per Share, Beginning of Year | $ | 25.28 | $ | 19.50 | $ | 21.90 | $ | 26.08 | $ | 26.07 | ||||||||||
|
|
|
|
|
|
|
|
|
| |||||||||||
Income (Loss) from Investment Operations: | ||||||||||||||||||||
Net Investment Income (1) | 0.09 | 0.07 | 0.14 | 0.10 | 0.06 | |||||||||||||||
Net Realized and Unrealized Gain (Loss) on Investments | (1.52 | ) | 5.80 | 0.32 | (1.12 | ) | 2.65 | |||||||||||||
|
|
|
|
|
|
|
|
|
| |||||||||||
Total from Investment Operations | (1.43 | ) | 5.87 | 0.46 | (1.02 | ) | 2.71 | |||||||||||||
|
|
|
|
|
|
|
|
|
| |||||||||||
Less Distributions: | ||||||||||||||||||||
Distributions from Net Investment Income | (0.08 | ) | (0.09 | ) | (0.09 | ) | (0.08 | ) | (0.07 | ) | ||||||||||
Distributions from Net Realized Gain | (1.95 | ) | — | (2.77 | ) | (3.08 | ) | (2.63 | ) | |||||||||||
|
|
|
|
|
|
|
|
|
| |||||||||||
Total Distributions | (2.03 | ) | (0.09 | ) | (2.86 | ) | (3.16 | ) | (2.70 | ) | ||||||||||
|
|
|
|
|
|
|
|
|
| |||||||||||
Net Asset Value per Share, End of Year | $ | 21.82 | $ | 25.28 | $ | 19.50 | $ | 21.90 | $ | 26.08 | ||||||||||
|
|
|
|
|
|
|
|
|
| |||||||||||
Total Return | (6.61 | )% | 30.15 | % | 3.30 | % | (4.78 | )% | 10.80 | % | ||||||||||
Ratios/Supplemental Data: | ||||||||||||||||||||
Net Assets, End of Year (in thousands) | $ | 18,040 | $ | 19,095 | $ | 16,839 | $ | 19,559 | $ | 28,458 | ||||||||||
Ratio of Expenses to Average Net Assets: | ||||||||||||||||||||
Before Expense Reimbursement | 1.31 | % | 1.37 | % | 1.35 | % | 1.30 | % | 1.27 | % | ||||||||||
After Expense Reimbursement | 1.04 | % | 1.16 | % | 1.20 | % | 1.21 | % | 1.20 | % | ||||||||||
Ratio of Net Investment Income to Average Net Assets | 0.36 | % | 0.29 | % | 0.74 | % | 0.44 | % | 0.23 | % | ||||||||||
Portfolio Turnover Rate | 22.60 | % | 31.93 | % | 17.81 | % | 23.15 | % | 21.67 | % | ||||||||||
| (1) | Computed using average shares outstanding throughout the period. |
See accompanying notes to financial statements.
88
Table of Contents
TCW Select Equities Fund
Financial Highlights — I Class
| Year Ended October 31, | ||||||||||||||||||||
| 2018 | 2017 | 2016 | 2015 | 2014 | ||||||||||||||||
Net Asset Value per Share, Beginning of Year | $ | 30.42 | $ | 26.06 | $ | 29.65 | $ | 26.71 | $ | 24.84 | ||||||||||
|
|
|
|
|
|
|
|
|
| |||||||||||
Income (Loss) from Investment Operations: | ||||||||||||||||||||
Net Investment Loss (1) | (0.08 | ) | (0.05 | ) | (0.10 | ) | (0.02 | ) | (0.03 | ) | ||||||||||
Net Realized and Unrealized Gain (Loss) on Investments | 3.37 | 5.99 | (1.42 | ) | 3.80 | 2.71 | ||||||||||||||
|
|
|
|
|
|
|
|
|
| |||||||||||
Total from Investment Operations | 3.29 | 5.94 | (1.52 | ) | 3.78 | 2.68 | ||||||||||||||
|
|
|
|
|
|
|
|
|
| |||||||||||
Less Distributions: | ||||||||||||||||||||
Distributions from Net Investment Income | — | — | — | — | (0.00 | ) (2) | ||||||||||||||
Distributions from Net Realized Gain | (6.58 | ) | (1.58 | ) | (2.07 | ) | (0.84 | ) | (0.81 | ) | ||||||||||
|
|
|
|
|
|
|
|
|
| |||||||||||
Total Distributions | (6.58 | ) | (1.58 | ) | (2.07 | ) | (0.84 | ) | (0.81 | ) | ||||||||||
|
|
|
|
|
|
|
|
|
| |||||||||||
Net Asset Value per Share, End of Year | $ | 27.13 | $ | 30.42 | $ | 26.06 | $ | 29.65 | $ | 26.71 | ||||||||||
|
|
|
|
|
|
|
|
|
| |||||||||||
Total Return | 12.59 | % | 24.47 | % | (5.56 | )% | 14.54 | % | 11.01 | % | ||||||||||
Ratios/Supplemental Data: | ||||||||||||||||||||
Net Assets, End of Year (in thousands) | $ | 740,485 | $ | 768,535 | $ | 1,264,622 | $ | 1,629,090 | $ | 1,611,400 | ||||||||||
Ratio of Expenses to Average Net Assets | 0.87 | % | 0.88 | % | 0.89 | % | 0.88 | % | 0.86 | % | ||||||||||
Ratio of Net Investment Loss to Average Net Assets | (0.29 | )% | (0.18 | )% | (0.38 | )% | (0.08 | )% | (0.11 | )% | ||||||||||
Portfolio Turnover Rate | 15.43 | % | 17.95 | % | 14.05 | % | 27.19 | % | 25.79 | % | ||||||||||
| (1) | Computed using average shares outstanding throughout the period. |
| (2) | Amount rounds to less than $0.01 per share. |
See accompanying notes to financial statements.
89
Table of Contents
TCW Select Equities Fund
Financial Highlights — N Class
| Year Ended October 31, | ||||||||||||||||||||
| 2018 | 2017 | 2016 | 2015 | 2014 | ||||||||||||||||
Net Asset Value per Share, Beginning of Year | $ | 28.23 | $ | 24.35 | $ | 27.91 | $ | 25.26 | $ | 23.59 | ||||||||||
|
|
|
|
|
|
|
|
|
| |||||||||||
Income (Loss) from Investment Operations: | ||||||||||||||||||||
Net Investment Loss (1) | (0.13 | ) | (0.10 | ) | (0.16 | ) | (0.09 | ) | (0.10 | ) | ||||||||||
Net Realized and Unrealized Gain (Loss) on Investments | 3.09 | 5.56 | (1.33 | ) | 3.58 | 2.58 | ||||||||||||||
|
|
|
|
|
|
|
|
|
| |||||||||||
Total from Investment Operations | 2.96 | 5.46 | (1.49 | ) | 3.49 | 2.48 | ||||||||||||||
|
|
|
|
|
|
|
|
|
| |||||||||||
Less Distributions: | ||||||||||||||||||||
Distributions from Net Realized Gain | (6.58 | ) | (1.58 | ) | (2.07 | ) | (0.84 | ) | (0.81 | ) | ||||||||||
|
|
|
|
|
|
|
|
|
| |||||||||||
Net Asset Value per Share, End of Year | $ | 24.61 | $ | 28.23 | $ | 24.35 | $ | 27.91 | $ | 25.26 | ||||||||||
|
|
|
|
|
|
|
|
|
| |||||||||||
Total Return | 12.36 | % | 24.20 | % | (5.81 | )% | 14.22 | % | 10.73 | % | ||||||||||
Ratios/Supplemental Data: | ||||||||||||||||||||
Net Assets, End of Year (in thousands) | $ | 133,252 | $ | 138,807 | $ | 151,174 | $ | 274,026 | $ | 227,231 | ||||||||||
Ratio of Expenses to Average Net Assets: | ||||||||||||||||||||
Before Expense Reimbursement | 1.15 | % | 1.16 | % | 1.16 | % | 1.14 | % | 1.13 | % | ||||||||||
After Expense Reimbursement | 1.08 | % | 1.11 | % | 1.14 | % | N/A | N/A | ||||||||||||
Ratio of Net Investment Loss to Average Net Assets | (0.50 | )% | (0.39 | )% | (0.64 | )% | (0.33 | )% | (0.40 | )% | ||||||||||
Portfolio Turnover Rate | 15.43 | % | 17.95 | % | 14.05 | % | 27.19 | % | 25.79 | % | ||||||||||
| (1) | Computed using average shares outstanding throughout the period. |
See accompanying notes to financial statements.
90
Table of Contents
TCW Funds, Inc.
Report of Independent Registered Public Accounting Firm
To the Board of Directors and Shareholders of TCW Funds, Inc.:
We have audited the accompanying statements of assets and liabilities of TCW Artificial Intelligence Equity Fund, TCW Conservative Allocation Fund, TCW Global Real Estate Fund, TCW New America Premier Equities Fund, TCW Relative Value Dividend Appreciation Fund, TCW Relative Value Large Cap Fund, TCW Relative Value Mid Cap Fund, and TCW Select Equities Fund (collectively, the “TCW Equity and Asset Allocation Funds”) (eight of nineteen funds comprising TCW Funds, Inc.), including the schedules of investments, as of October 31, 2018, the related statements of operations for the year then ended, the statements of changes in net assets for each of the two years in the period then ended, the financial highlights for each of the five years in the period then ended for the TCW Equity and Asset Allocation Funds, except TCW Artificial Intelligence Equity Fund which is for the one year in the period then ended and for the period August 31, 2017 (commencement of operations) to October 31, 2017, TCW Global Real Estate Fund which is for each of the three years in the period then ended and for the period November 28, 2014 (commencement of operations) to October 31, 2015, and TCW New America Premier Equities Fund which is for each of the two years in the period then ended and for the period January 29, 2016 (commencement of operations) to October 31, 2016, and the related notes. In our opinion, the financial statements and financial highlights present fairly, in all material respects, the financial position of each of the respective TCW Equity and Asset Allocation Funds as of October 31, 2018, and the results of their operations for the year then ended, the changes in their net assets for each of the two years in the period then ended, and the financial highlights for each of the five years in the period then ended for the TCW Equity and Asset Allocation Funds, except TCW Artificial Intelligence Equity Fund which is for the one year in the period then ended and for the period August 31, 2017 (commencement of operations) to October 31, 2017, and TCW Global Real Estate Fund which is for each of the three years in the period then ended and for the period November 28, 2014 (commencement of operations) to October 31, 2015, and TCW New America Premier Equities Fund which is for each of the two years in the period then ended and for the period January 29, 2016 (commencement of operations) to October 31, 2016, in conformity with accounting principles generally accepted in the United States of America.
Basis for Opinion
These financial statements and financial highlights are the responsibility of the TCW Equity and Asset Allocation Funds’ management. Our responsibility is to express an opinion on the TCW Equity and Asset Allocation Funds’ financial statements and financial highlights based on our audits. We are a public accounting firm registered with the Public Company Accounting Oversight Board (United States) (PCAOB) and are required to be independent with respect to the Funds in accordance with the U.S. federal securities laws and the applicable rules and regulations of the Securities and Exchange Commission and the PCAOB.
We conducted our audits in accordance with the standards of the PCAOB. Those standards require that we plan and perform the audits to obtain reasonable assurance about whether the financial statements and financial highlights are free of material misstatement, whether due to error or fraud. The TCW Equity and Asset Allocation Funds are not required to have, nor were we engaged to perform, an audit of their internal control over financial reporting. As part of our audits we are required to obtain an understanding of internal control over financial reporting but not for the purpose of expressing an opinion on the effectiveness of the TCW Equity and Asset Allocation Funds’ internal control over financial reporting. Accordingly, we express no such opinion.
91
Table of Contents
TCW Funds, Inc.
Report of Independent Registered Public Accounting Firm (Continued)
Our audits included performing procedures to assess the risks of material misstatement of the financial statements and financial highlights, whether due to error or fraud, and performing procedures that respond to those risks. Such procedures included examining, on a test basis, evidence regarding the amounts and disclosures in the financial statements and financial highlights. Our audits also included evaluating the accounting principles used and significant estimates made by management, as well as evaluating the overall presentation of the financial statements and financial highlights. Our procedures included confirmation of securities owned as of October 31, 2018, by correspondence with the custodian and brokers; when replies were not received from brokers, we performed other auditing procedures. We believe that our audits provide a reasonable basis for our opinion.

Los Angeles, California
December 19, 2018
We have served as the auditor of one or more TCW/Metropolitan West Funds investment companies since 1990.
92
Table of Contents
TCW Funds, Inc.
Shareholder Expenses (Unaudited)
As a shareholder of a Fund, you incur ongoing operational costs of the Fund, including management fees and other fund expenses. The following example is intended to help you understand your ongoing costs (in dollars and cents) of investing in a Fund and to compare these costs with the ongoing costs of investing in other funds.
The example is based on an investment of $1,000 invested at the beginning of the period and held for the entire period from May 1, 2018 to October 31, 2018 (184 days).
Actual Expenses The first line under each Fund in the table below provides information about the actual account values and actual expenses. You may use the information in this line, together with the amount you invested, to estimate the expenses that you paid over the period. Simply divide your account value by $1,000 (for example, an $8,600 account value divided by $1,000 = 8.6), then multiply the result by the number in the first line for your Fund under the heading entitled “Expenses Paid During Period” to estimate the expenses you paid on your account during this period.
Hypothetical Example for Comparison Purposes The second line under each Fund in the table below provides information about the hypothetical expenses based on each Fund’s actual expense ratio and an assumed rate of return of 5% per year before expenses, which is not the Fund’s actual return. The hypothetical account value and expenses may not be used to estimate the actual ending account balance or expenses you paid for the period. You may use this information to compare the ongoing costs of investing in your Fund and other funds. To do so, compare this 5% hypothetical example with the 5% hypothetical examples that appear in the shareholder reports of the other funds.
TCW Funds, Inc. | Beginning Account Value May 1, 2018 | Ending Account Value October 31, 2018 | Annualized Expense Ratio | Expenses Paid During Period (May 1, 2018 to October 31, 2018) | ||||||||||||
| TCW Artificial Intelligence Equity Fund | ||||||||||||||||
I Class Shares | ||||||||||||||||
Actual | $ | 1,000.00 | $ | 983.30 | 1.05 | % | $ | 5.25 | ||||||||
Hypothetical (5% return before expenses) | 1,000.00 | 1,019.91 | 1.05 | % | 5.35 | |||||||||||
N Class Shares | ||||||||||||||||
Actual | $ | 1,000.00 | $ | 982.40 | 1.05 | % | $ | 5.25 | ||||||||
Hypothetical (5% return before expenses) | 1,000.00 | 1,019.91 | 1.05 | % | 5.35 | |||||||||||
| TCW Conservative Allocation Fund | ||||||||||||||||
I Class Shares | ||||||||||||||||
Actual | $ | 1,000.00 | $ | 989.80 | 0.36 | % (1) | $ | 1.81 | (1) | |||||||
Hypothetical (5% return before expenses) | 1,000.00 | 1,023.39 | 0.36 | % (1) | 1.84 | (1) | ||||||||||
N Class Shares | ||||||||||||||||
Actual | $ | 1,000.00 | $ | 988.10 | 0.75 | % (1) | $ | 3.76 | (1) | |||||||
Hypothetical (5% return before expenses) | 1,000.00 | 1,021.43 | 0.75 | % (1) | 3.82 | (1) | ||||||||||
| TCW Global Real Estate Fund | ||||||||||||||||
I Class Shares | ||||||||||||||||
Actual | $ | 1,000.00 | $ | 978.40 | 1.00 | % | $ | 4.99 | ||||||||
Hypothetical (5% return before expenses) | 1,000.00 | 1,020.16 | 1.00 | % | 5.09 | |||||||||||
N Class Shares | ||||||||||||||||
Actual | $ | 1,000.00 | $ | 977.60 | 1.15 | % | $ | 5.73 | ||||||||
Hypothetical (5% return before expenses) | 1,000.00 | 1,019.41 | 1.15 | % | 5.85 | |||||||||||
93
Table of Contents
TCW Funds, Inc.
Shareholder Expenses (Unaudited) (Continued)
TCW Funds, Inc. | Beginning Account Value May 1, 2018 | Ending Account Value October 31, 2018 | Annualized Expense Ratio | Expenses Paid During Period (May 1, 2018 to October 31, 2018) | ||||||||||||
| TCW New America Premier Equities Fund | ||||||||||||||||
I Class Shares | ||||||||||||||||
Actual | $ | 1,000.00 | $ | 1,035.00 | 1.04 | % | $ | 5.33 | ||||||||
Hypothetical (5% return before expenses) | 1,000.00 | 1,019.96 | 1.04 | % | 5.30 | |||||||||||
N Class Shares | ||||||||||||||||
Actual | $ | 1,000.00 | $ | 1,035.00 | 1.04 | % | $ | 5.33 | ||||||||
Hypothetical (5% return before expenses) | 1,000.00 | 1,019.96 | 1.04 | % | 5.30 | |||||||||||
| TCW Relative Value Dividend Appreciation Fund | ||||||||||||||||
I Class Shares | ||||||||||||||||
Actual | $ | 1,000.00 | $ | 935.30 | 0.76 | % | $ | 3.71 | ||||||||
Hypothetical (5% return before expenses) | 1,000.00 | 1,021.37 | 0.76 | % | 3.87 | |||||||||||
N Class Shares | ||||||||||||||||
Actual | $ | 1,000.00 | $ | 933.90 | 1.00 | % | $ | 4.87 | ||||||||
Hypothetical (5% return before expenses) | 1,000.00 | 1,020.16 | 1.00 | % | 5.09 | |||||||||||
| TCW Relative Value Large Cap Fund | ||||||||||||||||
I Class Shares | ||||||||||||||||
Actual | $ | 1,000.00 | $ | 935.30 | 0.77 | % | $ | 3.76 | ||||||||
Hypothetical (5% return before expenses) | 1,000.00 | 1,021.32 | 0.77 | % | 3.92 | |||||||||||
N Class Shares | ||||||||||||||||
Actual | $ | 1,000.00 | $ | 934.20 | 0.99 | % | $ | 4.83 | ||||||||
Hypothetical (5% return before expenses) | 1,000.00 | 1,020.22 | 0.99 | % | 5.04 | |||||||||||
| TCW Relative Value Mid Cap Fund | ||||||||||||||||
I Class Shares | ||||||||||||||||
Actual | $ | 1,000.00 | $ | 895.80 | 0.89 | % | $ | 4.25 | ||||||||
Hypothetical (5% return before expenses) | 1,000.00 | 1,020.72 | 0.89 | % | 4.53 | |||||||||||
N Class Shares | ||||||||||||||||
Actual | $ | 1,000.00 | $ | 895.00 | 1.00 | % | $ | 4.78 | ||||||||
Hypothetical (5% return before expenses) | 1,000.00 | 1,020.16 | 1.00 | % | 5.09 | |||||||||||
| TCW Select Equities Fund | ||||||||||||||||
I Class Shares | ||||||||||||||||
Actual | $ | 1,000.00 | $ | 1,018.40 | 0.86 | % | $ | 4.38 | ||||||||
Hypothetical (5% return before expenses) | 1,000.00 | 1,020.87 | 0.86 | % | 4.38 | |||||||||||
N Class Shares | ||||||||||||||||
Actual | $ | 1,000.00 | $ | 1,016.90 | 1.07 | % | $ | 5.44 | ||||||||
Hypothetical (5% return before expenses) | 1,000.00 | 1,019.81 | 1.07 | % | 5.45 | |||||||||||
| (1) | Does not included Expenses of the underlying affiliated investments. |
94
Table of Contents
TCW Funds, Inc.
The TCW Group, Inc. and Subsidiaries
TCW Investment Management Company LLC
TCW Asset Management Company LLC
Metropolitan West Asset Management, LLC
| TCW Funds, Inc. | Sepulveda Management LLC | |
| TCW Strategic Income Fund, Inc. | TCW Direct Lending LLC | |
| Metropolitan West Funds | TCW Direct Lending VII LLC |
What You Should Know
At TCW, we recognize the importance of keeping information about you secure and confidential. We do not sell or share your nonpublic personal and financial information with marketers or others outside our affiliated group of companies.
We carefully manage information among our affiliated group of companies to safeguard your privacy and to provide you with consistently excellent service.
We are providing this notice to you to comply with the requirements of Regulation S-P, “Privacy of Consumer Financial Information,” issued by the United States Securities and Exchange Commission.
Our Privacy Policy
We, The TCW Group, Inc. and its subsidiaries, the TCW Funds, Inc., TCW Strategic Income Fund, Inc., the Metropolitan West Funds, Sepulveda Management LLC and TCW Direct Lending (collectively, “TCW”) are committed to protecting the nonpublic personal and financial information of our customers and consumers who obtain or seek to obtain financial products or services primarily for personal, family or household purposes. We fulfill our commitment by establishing and implementing policies and systems to protect the security and confidentiality of this information.
In our offices, we limit access to nonpublic personal and financial information about you to those TCW personnel who need to know the information in order to provide products or services to you. We maintain physical, electronic and procedural safeguards to protect your nonpublic personal and financial information.
Categories of Information We Collect
We may collect the following types of nonpublic personal and financial information about you from the following sources:
| • | Your name, address and identifying numbers, and other personal and financial information, from you and from identification cards and papers you submit to us, on applications, subscription agreements or other forms or communications. |
| • | Information about your account balances and financial transactions with us, our affiliated entities, or nonaffiliated third parties, from our internal sources, from affiliated entities and from nonaffiliated third parties. |
| • | Information about your account balances and financial transactions and other personal and financial information, from consumer credit reporting agencies or other nonaffiliated third parties, to verify information received from you or others. |
95
Table of Contents
TCW Funds, Inc.
Privacy Policy (Continued)
Categories of Information We Disclose to Nonaffiliated Third Parties
| • | We may disclose your name, address and account and other identifying numbers, as well as information about your pending or past transactions and other personal financial information, to nonaffiliated third parties, for our everyday business purposes such as necessary to execute, process, service and confirm your securities transactions and mutual fund transactions, to administer and service your account and commingled investment vehicles in which you are invested, to market our products and services through joint marketing arrangements or to respond to court orders and legal investigations. |
| • | We may disclose nonpublic personal and financial information concerning you to law enforcement agencies, federal regulatory agencies, self-regulatory organizations or other nonaffiliated third parties, if required or requested to do so by a court order, judicial subpoena or regulatory inquiry. |
We do not otherwise disclose your nonpublic personal and financial information to nonaffiliated third parties, except where we believe in good faith that disclosure is required or permitted by law. Because we do not disclose your nonpublic personal and financial information to nonaffiliated third parties, our Customer Privacy Policy does not contain opt-out provisions.
Categories of Information We Disclose to Our Affiliated Entities
| • | We may disclose your name, address and account and other identifying numbers, account balances, information about your pending or past transactions and other personal financial information to our affiliated entities for any purpose. |
| • | We regularly disclose your name, address and account and other identifying numbers, account balances and information about your pending or past transactions to our affiliates to execute, process and con- firm securities transactions or mutual fund transactions for you, to administer and service your account and commingled investment vehicles in which you are invested, or to market our products and services to you. |
Information About Former Customers
We do not disclose nonpublic personal and financial information about former customers to nonaffiliated third parties unless required or requested to do so by a court order, judicial subpoena or regulatory inquiry, or otherwise where we believe in good faith that disclosure is required or permitted by law.
Questions
Should you have any questions about our Customer Privacy Policy, please contact us by email or by regular mail at the address at the end of this policy.
Reminder About TCW’s Financial Products
Financial products offered by The TCW Group, Inc. and its subsidiaries, the TCW Funds, Inc., TCW Strategic Income Fund, Inc., the Metropolitan West Funds, Sepulveda Management LLC and TCW Direct Lending.
| • | Are not guaranteed by a bank; |
96
Table of Contents
TCW Funds, Inc.
| • | Are not obligations of The TCW Group, Inc. or of its subsidiaries; |
| • | Are not insured by the Federal Deposit Insurance Corporation; and |
| • | Are subject to investment risks, including possible loss of the principal amount committed or invested, and earnings thereon. |
THE TCW GROUP, INC.
TCW FUNDS, INC.
TCW STRATEGIC INCOME FUND, INC.
METROPOLITAN WEST FUNDS
SEPULVEDA MANAGEMENT LLC
TCW DIRECT LENDING LLC
TCW DIRECT LENDING VII LLC
Attention: Privacy Officer | 865 South Figueroa St. Suite 1800 | Los Angeles, CA 90017 |
email: privacy@tcw.com
97
Table of Contents
TCW Funds, Inc.
Renewal of Investment Advisory and Management Agreement (Unaudited)
TCW Funds, Inc. (the “Corporation”) and TCW Investment Management Company LLC (the “Advisor”) are parties to an Investment Advisory and Management Agreement (“Agreement”), pursuant to which the Advisor is responsible for managing the investments of each separate investment series (each, a “Fund” and collectively, the “Funds”) of the Corporation. Unless terminated by either party, the Agreement continues in effect from year to year provided that the continuance is specifically approved at least annually by the vote of the holders of at least a majority of the outstanding shares of the Funds, or by the Board of Directors of the Corporation (the “Board”), and, in either event, by a majority of the Directors who are not “interested persons” of the Corporation, as such term is defined in Section 2(a)(19) of the Investment Company Act of 1940, as amended (the “Independent Directors”), casting votes in person at a meeting called for that purpose.
On September 24, 2018, the Board approved the renewal of the Agreement for an additional one-year term from February 6, 2019 through February 5, 2020. The renewal of the Agreement was approved by the Board (including by a majority of the Independent Directors) upon the recommendation of the Independent Directors. The Independent Directors met separately by telephone on August 28, 2018, and in person on September 24, 2018, with their independent legal counsel to review and discuss the information that had been requested on their behalf by their independent legal counsel and presented by the Advisor for their consideration. The information, material facts, and conclusions that formed the basis for the Independent Directors’ recommendation and the Board’s subsequent approval are described below.
1. Information received
Materials reviewed — During the course of each year, the Directors receive a wide variety of materials relating to the services provided by the Advisor, including reports on the Advisor’s investment processes, as well as on each Fund’s investment results, portfolio composition, portfolio trading practices, compliance monitoring, shareholder services, and other information relating to the nature, extent, and quality of services provided by the Advisor to the Funds. In addition, the Board reviewed information furnished to the Independent Directors in response to a detailed request sent to the Advisor on their behalf. The information in the Advisor’s responses included extensive materials regarding each Fund’s investment results, advisory fee comparisons to advisory fees charged by the Advisor to its institutional clients, financial and profitability information regarding the Advisor, descriptions of various services provided to the Funds and to other advisory and sub-advisory clients, descriptions of functions such as compliance monitoring and portfolio trading practices, and information about the personnel providing investment management services to each Fund. The Directors also considered information provided by an independent data provider, Broadridge, comparing the investment performance and the fee and expense levels of each Fund to those of appropriate peer groups of mutual funds selected by Broadridge. After reviewing this information, the Directors requested additional financial, profitability and service information from the Advisor, which the Advisor provided and the Directors considered.
Review process — The Directors’ determinations were made on the basis of each Director’s business judgment after consideration of all the information presented. The Independent Directors were advised by their independent legal counsel throughout the renewal process and received and reviewed advice from their independent legal counsel regarding legal and industry standards applicable to the renewal of the Agreement, including a legal memorandum from their independent legal counsel discussing their fiduciary duties related to their approval of the continuation of the Agreement. The Independent Directors also discussed the renewal of the Agreement with the Advisor’s representatives and in private sessions at which no representatives of the Advisor were present. In deciding to recommend the renewal of the Agreement
98
Table of Contents
TCW Funds, Inc.
with respect to each Fund, the Independent Directors did not identify any single piece of information or particular factor that, in isolation, was the controlling factor. Each Independent Director may also have weighed factors differently. This summary describes the most important, but not all, of the factors considered by the Board and the Independent Directors.
2. Nature, extent, and quality of services provided by the Advisor
The Board and the Independent Directors considered the depth and quality of the Advisor’s investment management process, including its research and strong analytical capabilities; the experience, capability, and integrity of its senior management and other personnel; the relatively low turnover rates of its key personnel; the overall resources available to the Advisor; and the ability of its organizational structure to address the growth in assets over the past several years and withstand the recent decline in assets. The Board and the Independent Directors considered the ability of the Advisor to attract and retain well-qualified investment professionals, noting in particular the Advisor’s hiring of professionals in various areas over the past several years, continued upgrading of resources in its middle office and back office operations and other areas, as well as a continuing and extensive program of infrastructure and systems enhancements. The Board and the Independent Directors also considered that the Advisor made available to its investment professionals a variety of resources and systems relating to investment management, compliance, trading, operations, administration, research, portfolio accounting, and legal matters. They noted the substantial additional resources made available by The TCW Group, Inc., the parent company of the Advisor. The Board and the Independent Directors examined and discussed a detailed description of the extensive additional services provided to the Funds to support their operations and compliance, as compared to the much narrower range of services provided to the Advisor’s institutional and sub-advised clients, as well as the Advisor’s oversight and coordination of numerous outside service providers to the Funds. They further noted the high level of regular communication between the Advisor and the Independent Directors. The Advisor explained its responsibility to supervise the activities of the Funds’ various service providers, as well as supporting the Independent Directors and their meetings, regulatory filings, and various operational personnel, and the related costs.
The Board and the Independent Directors concluded that the nature, extent, and quality of the services provided by the Advisor are of a high quality and have benefited and should continue to benefit the Funds and their shareholders.
3. Investment results
The Board and the Independent Directors considered the investment results of each Fund in light of its investment objective(s) and principal investment strategies. They compared each Fund’s total returns with the total returns of other mutual funds in peer group reports prepared by Broadridge with respect to various longer and more recent periods all ended May 31, 2018. The Board and the Independent Directors reviewed information as to peer group selections presented by Broadridge and discussed the methodology for those selections with Broadridge. In reviewing each Fund’s relative performance, the Board and the Independent Directors took into account each Fund’s investment strategies, distinct characteristics, asset size and diversification.
The Board and the Independent Directors noted that most Funds’ performance was satisfactory over the relevant periods. The Board and the Independent Directors noted that investment performance of most of the Funds was generally close to or above the median performance of the applicable peer group during the three-year period emphasized by Broadridge in the supplemental materials, but seven Funds ranked in the
99
Table of Contents
TCW Funds, Inc.
Renewal of Investment Advisory and Management Agreement (Unaudited) (Continued)
fourth or fifth quintile of their peer groups for that three-year period. For those Funds that lagged peer group averages, they noted that the Advisor had discussed with the Board the reasons for the underperformance and the actions taken or to be taken by the Advisor to address the underperformance, and they indicated that they would continue to monitor portfolio investment performance on a regular basis and discuss with the Advisor from time to time any instances of long-term underperformance as appropriate. The Board and the Independent Directors noted that the performance of some Funds for periods when they lagged their peer group averages remained satisfactory when assessed on a risk-adjusted basis because performance quintiles do not necessarily reflect the degree of risk employed by peer funds to achieve their returns.
With respect to the fixed income Funds, the Board and the Independent Directors recognized the Advisor’s deliberate strategy to manage risk in light of its critical view of the fixed-income securities markets and overall investment market conditions at present and in the near term. For that reason, the Board and the Independent Directors believed that relative performance also should be considered in light of future market conditions expected by the Advisor. The Board and the Independent Directors noted the Advisor’s view that longer term performance can be more meaningful for active fixed income funds than shorter term performance because fixed income market cycles are generally longer than three years.
For the U.S. fixed income Funds, the Board and the Independent Directors noted the conservative profile of these Funds, which generally experienced less volatility compared to various other funds in the applicable peer group (except for the relative volatility of Total Return Bond Fund, which is a mortgage focused Fund). They also noted the Advisor’s conservative posture for these Funds with respect to credit and interest rate risks.
For the Total Return Bond Fund, the Board and the Independent Directors noted that the Fund’s performance was in the first quintile for the ten-year period and the second quintile for the five-, three- and one-year periods.
For the Core Fixed Income Fund, the Board and the Independent Directors noted that the Fund’s performance was in the first quintile for the ten-year period, the third quintile for the five-year period, the fourth quintile for the three-year period and the second quintile for the one-year period.
For the High Yield Bond Fund, the Board and the Independent Directors noted that the Fund’s performance was in the third quintile for the ten-year period and the second quintile for the five-, three- and one-year periods.
For the Global Bond Fund, the Board and the Independent Directors noted that the Fund’s performance was in the fourth quintile for the five- and three-year periods and the third quintile for the one-year period.
For the Short Term Bond Fund, the Board and the Independent Directors noted that the Fund’s performance was in the fourth quintile for the ten-, five- and three-year periods and the first quintile for the one-year period.
For the Enhanced Commodity Strategy Fund, the Board and the Independent Directors noted that the Fund’s performance was in the second quintile for the five-year period and the third quintile for the three- and one-year periods.
With respect to the U.S. equity Funds, the Board and the Independent Directors noted that the performance of most Funds for the various periods reviewed ranked in the first, second or third quintiles.
100
Table of Contents
TCW Funds, Inc.
The Select Equities Fund ranked in the fourth quintile for the five-year period.
The Relative Value Dividend Appreciation Fund ranked in the fourth quintile for the one-, three- and five-year periods. The Relative Value Large Cap Fund ranked in the fourth quintile for the one- and three-year periods. The Relative Value Mid Cap Fund ranked in the fourth quintile for the ten-year period. The Board and the Independent Directors noted the Advisor’s explanation that the diversification tool used to mitigate risk of the Relative Value Dividend Appreciation Fund and the Relative Value Large Cap Fund weighed on their near-term performance in a momentum-driven market and its opinion that each of the Relative Value Funds is well-positioned to excel in a strengthening economic environment.
The Global Real Estate Fund ranked in the fifth quintile for the one- and three-year periods, and while it ranked in the third quintile during the quarter ended June 30, 2018, the Board and the Independent Directors determined to continue to closely monitor its performance and did not believe any other immediate action was needed.
With respect to the international and emerging markets Funds, the Board and the Independent Directors noted that the performance of a majority of these Funds ranked in the first, second or third quintiles. The Developing Markets Equity Fund ranked in the fourth quintile for the period since inception, but ranked in the first quintile for the one-year period.
For the asset allocation Fund, the Board the Independent Directors noted that the Conservative Allocation Fund’s performance was in the first quintile for the ten-year period, the second quintile for the five-year period, the third quintile for the three-year period and the first quintile for the one-year period.
The Board and the Independent Directors concluded that the Advisor was implementing each Fund’s investment objective(s) and that the Advisor’s record in managing the Funds indicated that its continued management should benefit each Fund and its shareholders over the long term.
4. Advisory fees and total expenses
The Board and the Independent Directors compared the management fees (which Broadridge defines to include the advisory fee and the administrative fee) and total expenses of each Fund (each as a percentage of average net assets) with the median management fee and operating expense level of the other mutual funds in the relevant Broadridge peer groups. These comparisons assisted the Board and the Independent Directors by providing a reasonable statistical measure to assess each Fund’s fees relative to its relevant peers. The Board and the Independent Directors observed that each Fund’s management fee, after giving effect to applicable waivers and/or reimbursements, was below or near the median of the peer group funds on a current basis, with the exception of the Select Equities Fund, the Emerging Markets Income Fund and the Emerging Markets Local Currency Income Fund. They also observed that each Fund’s total expenses, after giving effect to applicable waivers and/or reimbursements, were below or near the median of the peer group funds, with the exception of the Global Bond Fund primarily due to its smaller size relative to most of the other funds in the peer group. The Board and the Independent Directors also noted the contractual expense limitations to which the Advisor has agreed with respect to each Fund and that the Advisor historically has absorbed any expenses in excess of these limits. The Board and the Independent Directors noted that for several Funds, their below-median management fee and total expenses were in part due to substantial waiver and/or reimbursement pursuant to the contractual expense limitations. The Board and the Independent Directors concluded that the competitive fees charged by the Advisor, and competitive expense ratios, should continue to benefit each Fund and its shareholders.
101
Table of Contents
TCW Funds, Inc.
Renewal of Investment Advisory and Management Agreement (Unaudited) (Continued)
The Board and the Independent Directors also reviewed information regarding the advisory fees charged by the Advisor to its institutional and sub-advisory clients with similar investment mandates. The Board and the Independent Directors concluded that, although the fees paid by those clients generally were lower than advisory fees paid by the Funds, the differences appropriately reflected the more extensive services provided by the Advisor to the Funds and the Advisor’s significantly greater responsibilities and expenses with respect to the Funds, including the additional time spent by portfolio managers for reasons such as managing the more active cash flows from purchases and redemptions by shareholders, the additional risks of managing a pool of assets for public investors, administrative burdens, daily pricing, valuation and liquidity responsibilities, the supervision of vendors and service providers, and the costs of additional infrastructure and operational resources and personnel and of complying with and supporting the more comprehensive regulatory and governance regime applicable to mutual funds.
5. The Advisor’s costs, level of profits, and economies of scale
The Board and the Independent Directors reviewed information regarding the Advisor’s costs of providing services to the Funds, as well as the resulting level of profits to the Advisor. They reviewed the Advisor’s stated assumptions and methods of allocating certain costs, such as personnel costs, which constitute the Advisor’s largest operating cost. The Board and the Independent Directors recognized that the Advisor should be entitled to earn a reasonable level of profits for the services that it provides to each Fund. The Board and the Independent Directors also reviewed a comparison of the Advisor’s profitability with respect to the Funds to the profitability of certain unaffiliated publicly traded asset managers, which the Advisor believed supported its view that the Advisor’s profitability was reasonable. Based on their review, the Board and the Independent Directors concluded that they were satisfied that the Advisor’s level of profitability from its relationship with each Fund was not unreasonable or excessive.
The Board and the Independent Directors considered the extent to which potential economies of scale could be realized as the Funds grow and whether the advisory fees reflect those potential economies of scale. They recognized that the advisory fees for the Funds do not have breakpoints, which would otherwise result in lower advisory fee rates as the Funds grow larger. They also recognized the Advisor’s view that the advisory fees compare favorably to peer group fees and expenses and remain competitive even at higher asset levels and that the relatively low advisory fees reflect the potential economies of scale. The Board and the Independent Directors recognized the benefits of the Advisor’s substantial past and on-going investment in the advisory business, such as successfully recruiting and retaining key professional talent, systems and technology upgrades, added resources dedicated to legal and compliance programs, and improvements to the overall firm infrastructure, as well as the financial pressures of competing against much larger firms and passive investment products. The Board and the Independent Directors further noted the Advisor’s past and continuing subsidies of the Funds’ operating expenses when they were newer and smaller and the Advisor’s commitment to maintain reasonable overall operating expenses for each Fund. The Board and the Independent Directors also recognized that the Funds benefit from receiving investment advice from an organization with other types of advisory clients in addition to mutual funds. The Board and the Independent Directors concluded that the Advisor was satisfactorily sharing potential economies of scale with the Funds through low fees and expenses, and through reinvesting in its capabilities for serving the Funds and their shareholders.
102
Table of Contents
TCW Funds, Inc.
6. Ancillary benefits
The Board and the Independent Directors also considered ancillary benefits received or to be received by the Advisor and its affiliates as a result of the relationship of the Advisor with the Funds, including compensation for certain compliance support services. The Board and the Independent Directors noted that, in addition to the fees the Advisor receives under the Agreement, the Advisor receives additional benefits in connection with management of the Funds in the form of reports, research and other services from brokers and their affiliates in return for brokerage commissions paid to such brokers. The Board and the Independent Directors concluded that any potential benefits received or to be derived by the Advisor from its relationships with the Funds are reasonably related to the services provided by the Advisor to the Funds.
7. Conclusions
Based on their overall review, including their consideration of each of the factors referred to above (and others), the Board and the Independent Directors concluded that the Agreement is fair and reasonable to each Fund and its shareholders, that each Fund’s shareholders received reasonable value in return for the advisory fees and other amounts paid to the Advisor by each Fund, and that the renewal of the Agreement was in the best interests of each Fund and its shareholders.
103
Table of Contents
TCW Funds, Inc.
Supplemental Information
The policies and procedures that the Company uses to determine how to vote proxies are available without charge. The Board has delegated the Company’s proxy voting authority to the Advisor.
Disclosure of Proxy Voting Guidelines
The proxy voting guidelines of the Advisor are available:
| 1. | By calling 800-FUND-TCW (800-386-3829) to obtain a hard copy; or |
| 2. | By going to the SEC website at http://www.sec.gov. |
When the Company receives a request for a description of the Advisor’s proxy voting guidelines, it will deliver the description that is disclosed in the Company’s Statement of Additional Information. This information will be sent out via first class mail (or other means designed to ensure equally prompt delivery) within three business days of receiving the request.
The Advisor, on behalf of the Company, prepares and files Form N-PX with the SEC not later than August 31 of each year, which includes the Company’s proxy voting record for the most recent twelve-month period ended June 30 of that year. The Company’s proxy voting record for the most recent twelve-month period ended June 30 is available:
| 1. | By calling 800-FUND-TCW (800-386-3829) to obtain a hard copy; or |
| 2. | By going to the SEC website at http://www.sec.gov. |
When the Company receives a request for the Company’s proxy voting record, it will send the information disclosed in the Company’s most recently filed report on Form N-PX via first class mail (or other means designed to ensure equally prompt delivery) within three business days of receiving the request.
The Company also discloses its proxy voting record on its website as soon as is reasonably practicable after its report on Form N-PX is filed with the SEC.
Filing of Quarterly Portfolio Schedule
The Company files a complete schedule of its portfolio holdings with the SEC for the first and third quarters of its fiscal year on Form N-Q.
104
Table of Contents
TCW Funds, Inc.
Tax Information Notice (Unaudited)
On account of the year ended October 31, 2018, the following Funds paid a capital gain distribution within the meaning 852 (b) (3) (c) of the Code. Each fund also designates as a capital gain distribution a portion of earnings and profits paid to shareholders in redemption of their shares.
Fund | Amounts per Share | |||
TCW Conservative Allocation Fund | $ | 0.31 | ||
TCW New America Premier Equities Fund | $ | 0.00 | (1) | |
TCW Relative Value Dividend Appreciation Fund | $ | 0.79 | ||
TCW Relative Value Large Cap Fund | $ | 2.93 | ||
TCW Relative Value Mid Cap Fund | $ | 1.83 | ||
TCW Select Equities Fund | $ | 6.17 | ||
| (1) | Amount rounds to less than $0.00. |
Under Section 854 (b) (2) of the Code, the Funds hereby designate the following maximum amounts as qualified dividends for purposes of the maximum rate under Section 1 (h) (11) of the Code for the fiscal year ended October 31, 2018 (amounts in thousands):
Fund | Qualified Dividend Income | |||
TCW Artificial Intelligence Equity Fund | $ | 9 | ||
TCW Global Real Estate Fund | $ | 10 | ||
TCW New America Premier Equities Fund | $ | 201 | ||
TCW Relative Value Dividend Appreciation Fund | $ | 14,072 | ||
TCW Relative Value Large Cap Fund | $ | 9,148 | ||
TCW Relative Value Mid Cap Fund | $ | 1,237 | ||
TCW Select Equities Fund | $ | 3,047 | ||
The following are dividend received deduction percentages for the Funds’ corporate shareholders:
Fund | Dividends Received Deductions | |||
TCW Conservative Allocation Fund | 4.64% | |||
TCW Global Real Estate Fund | 5.47% | |||
TCW New America Premier Equities Fund | 17.63% | |||
TCW Relative Value Dividend Appreciation Fund | 100.00% | |||
TCW Relative Value Large Cap Fund | 100.00% | |||
TCW Relative Value Mid Cap Fund | 100.00% | |||
This information is given to meet certain requirements of the Code and should not be used by shareholders for preparing their income tax returns. In February 2019, shareholders will receive Form 1099-DIV which will show the actual distribution received and include their share of qualified dividends during the calendar year of 2018. Shareholders are advised to check with their tax advisors for information on the treatment of these amounts on their individual tax returns.
105
Table of Contents
TCW Funds, Inc.
Directors and Officers of the Company
A board of eight directors is responsible for overseeing the operations of the Company, which consists of 19 Funds at October 31, 2018. The directors of the Company, and their business addresses and their principal occupation for the last five years are set forth below.
Independent Directors
Name, and Year of Birth (1) | Term of Office and Length of Time Served | Principal Occupation(s) During Past 5 Years | Other Directorships held by Director | |||
| Samuel P. Bell (1936) | Indefinite term; Mr. Bell has served as a director of TCW Funds, Inc. since October 2002. | Private Investor. | Point 360 (post production services); TCW Strategic Income Fund, Inc. (closed-end fund). | |||
Patrick C. Haden (1953) Chairman of the Board | Indefinite term; Mr. Haden has served as a director of TCW Funds, Inc. since May 2001. | President (since 2003), Wilson Ave. Consulting (business consulting firm); Senior Advisor to President (July 2016 – June 2017) and Athletic Director (August 2010-June 2016), University of Southern California. | Tetra Tech, Inc. (environmental consulting); Auto Club (affiliate of AAA); Metropolitan West Funds (mutual fund); TCW Strategic Income Fund, Inc. (closed end fund). | |||
| Peter McMillan (1957) | Indefinite term; Mr. McMillan has served as a director of TCW Funds, Inc. since August 2010. | Co-founder, Managing Partner and Chief Investment Officer (since May 2013), Temescal Canyon Partners (investment advisory firm); Co-founder and Managing Partner (since 2000), Willowbrook Capital Group, LLC (investment advisory firm); Co-founder and Executive Vice President (since 2005), KBS Capital Advisors (a manager of real estate investment trusts). | KBS Real Estate Investment Trusts (real estate investments); KBS Strategic Opportunity REITS (real estate investments); Metropolitan West Funds (mutual funds); TCW Strategic Income Fund, Inc. (closed-end fund). | |||
| Charles A. Parker (1934) | Indefinite term; Mr. Parker has served as a director of the TCW Funds, Inc. since April 2003. | Private Investor. | Burridge Center for Research in Security Prices (University of Colorado); TCW Strategic Income Fund, Inc. (closed-end fund). | |||
| Victoria B. Rogers (1961) | Indefinite term; Ms. Rogers has served as a director of the TCW Funds, Inc. since October 2011. | President, The Rose Hills Foundation (charitable foundation). | Causeway Capital Management Trust (mutual fund); TCW Strategic Income Fund, Inc. (closed-end fund). | |||
| Andrew Tarica (1959) | Indefinite term; Mr. Tarica has served as a director of the TCW Funds, Inc. since March 2012. | Chief Executive Officer, Meadowbrook Capital Management (asset management company); Employee, Cowen & Co. (broker-dealer). | Metropolitan West Funds (mutual fund); TCW Strategic Income Fund, Inc. (closed-end fund); TCW Direct Lending VII, LLC (business development company). |
| (1) | The address of each Independent Director is c/o Morgan Lewis, & Bockius LLP, Counsel to the Independent Directors, 300 South Grand Avenue 22nd Floor, Los Angeles, CA 90071. |
106
Table of Contents
TCW Funds, Inc.
Interested Directors
These directors are “interested persons” of the Company as defined in the 1940 Act because they are directors and officers of the Advisor, and shareholders and directors of The TCW Group, Inc., the parent company of the Advisor.
Name and Year of Birth | Term of Office and Length of Time Served | Principal Occupation(s) During Past 5 Years (1) | Other Directorships held by Director | |||
| Marc I. Stern (1944) | Indefinite term; Mr. Stern has served as a director since inception of TCW Funds, Inc. in September 1992. | Chairman (since January 2016), TCW LLC; Chairman (since February 2013), The TCW Group, Inc., TCW Investment Management Company, TCW Asset Management Company and Metropolitan West Asset Management. | Qualcomm Incorporated (wireless communications) | |||
| David S. DeVito (1962) | Indefinite term; Mr. DeVito has served as a director since January 2014. | Executive Vice President and Chief Operating Officer (since January 2016), TCW LLC; Executive Vice President and Chief Operating Officer (since October 2013), TCW Investment Management Company LLC, The TCW Group, Inc., Metropolitan West Asset Management, LLC and TCW Asset Management Company LLC; President and Chief Executive Officer (since January 2014), TCW Strategic Income Fund, Inc.; Treasurer, Principal Financial Officer and Principal Accounting Officer (since 2010), Metropolitan West Funds. | TCW Strategic Income Fund, Inc. (closed-end fund) |
| (1) | Positions with The TCW Group, Inc. and its affiliates may have changed over time. |
The officers of the Company who are not directors of the Company are:
| Name and Year of Birth | Position(s) Held with Company | Principal Occupation(s) During Past 5 Years (1) | ||
| Lisa Eisen (1963) | Tax Officer | Tax Officer (since December 2016), Metropolitan West Funds and TCW Strategic Income Fund, Inc.; Managing Director and Director of Tax (since August 2016), TCW, LLC; Vice President of Corporate Tax and Payroll for Health Net, Inc. (1998 – July 2016). |
107
Table of Contents
TCW Funds, Inc.
Directors and Officers of the Company (Continued)
| Name and Year of Birth | Position(s) Held with Company | Principal Occupation(s) During Past 5 Years (1) | ||
| Meredith S. Jackson (1959) | Senior Vice President, General Counsel and Secretary | Executive Vice President, General Counsel and Secretary (since January 2016), TCW LLC; Executive Vice President, General Counsel and Secretary (since February 2013), TCW Investment Management Company, The TCW Group Inc., TCW Asset Management Company and Metropolitan West Asset Management; Senior Vice President, General Counsel and Secretary (since February 2013), TCW Strategic Income Fund, Inc.; Vice President and Secretary (since February 2013), Metropolitan West Funds; Partner and Chair of the Debt Finance Practice Group (1999 – January 2013), Irell & Manella (law firm). | ||
| Jeffrey Engelsman (1967) | Chief Compliance Officer since September 2014 and AML Officer since December 2016 | AML Officer (since December 2016), Metropolitan West Funds, and TCW Strategic Income Fund, Inc.; Global Chief Compliance Officer (since January 2016), TCW LLC; Chief Compliance Officer (since 2014), Metropolitan West Funds and TCW Strategic Income Fund, Inc.; Managing Director, Global Chief Compliance Officer (since August 2014), TCW Investment Management Company LLC, TCW Asset Management, LLC and Metropolitan West Asset Management, LLC; Global Chief Compliance Officer (since September 2014), The TCW Group, Inc.; Chief Compliance Officer (2009 – August 2014), MainStay Funds (mutual fund); Managing Director (2009 – July 2014), New York Life Investments (investment management). | ||
| Richard Villa (1964) | Treasurer and Principal Financial and Accounting Officer | Managing Director, Chief Financial Officer and Assistant Secretary (since January 2016), TCW LLC; Treasurer and Chief Financial Officer (since January 2014), TCW Strategic Income Fund, Inc.; Managing Director and Chief Financial Officer (since July 2008), TCW Investment Management Company, the TCW Group, Inc., TCW Asset Management Company LLC, and Metropolitan West Asset Management LLC. |
| (1) | Positions with The TCW Group, Inc. and its affiliates may have changed over time. |
| * | Address is 865 South Figueroa Street, 18th Floor, Los Angeles, California 90017 |
108
Table of Contents
TCW Funds, Inc.
In addition, George N. Winn, Senior Vice President of TCW Asset Management Company LLC, Metropolitan West Asset Management, LLC, TCW LLC and the Advisor, is Assistant Treasurer of the Company; and Patrick W. Dennis, Senior Vice President, Associate General Counsel and Assistant Secretary of TCW Asset Management Company LLC, Metropolitan West Asset Management, LLC, TCW LLC and the Advisor, is Vice President and Assistant Secretary of the Company.
The SAI (Statement of Additional Information) has additional information regarding the Board of Directors. A copy is available without charge by calling 1-800-FUND-TCW (1-800-386-3829) to obtain a hard copy or by going to the SEC website at http://www.sec.gov.
109
Table of Contents
TCW Funds, Inc.
865 South Figueroa Street
Los Angeles, California 90017
800 FUND TCW
(800 386 3829)
www.TCW.com
INVESTMENT ADVISOR
TCW Investment Management Company LLC
865 South Figueroa Street
Los Angeles, California 90017
TRANSFER AGENT
U.S. Bancorp Fund Services, LLC
615 E. Michigan Street
Milwaukee, Wisconsin 53202
INDEPENDENT REGISTERED PUBLIC ACCOUNTING FIRM
Deloitte & Touche LLP
555 West 5th Street
Los Angeles, California 90013
CUSTODIAN & ADMINISTRATOR
State Street Bank & Trust Company
One Lincoln Street
Boston, Massachusetts 02111
DISTRIBUTOR
TCW Funds Distributors LLC
865 South Figueroa Street
Los Angeles, California 90017
DIRECTORS
Patrick C. Haden
Director and Chairman of the Board
Samuel P. Bell
Director
David S. DeVito
Director
Peter McMillan
Director
Charles A. Parker
Director
Victoria B. Rogers
Director
Marc I. Stern
Director
Andrew Tarica
Director
OFFICERS
David S. DeVito
President and Chief Executive Officer
Meredith S. Jackson
Senior Vice President,
General Counsel and Secretary
Richard M. Villa
Treasurer and Principal Financial and Accounting Officer
Jeffrey A. Engelsman
Chief Compliance Officer and Anti-Money Laundering Officer
Patrick W. Dennis
Vice President and Assistant Secretary
Lisa Eisen
Tax Officer
George N. Winn
Assistant Treasurer
TCW FAMILY OF FUNDS
EQUITY FUNDS
TCW Artificial Intelligence Equity Fund
TCW Global Real Estate Fund
TCW New America Premier Equities Fund
TCW Relative Value Dividend Appreciation Fund
TCW Relative Value Large Cap Fund
TCW Relative Value Mid Cap Fund
TCW Select Equities Fund
ALLOCATION FUND
TCW Conservative Allocation Fund
FIXED INCOME FUNDS
TCW Core Fixed Income Fund
TCW Enhanced Commodity Strategy Fund
TCW Global Bond Fund
TCW High Yield Bond Fund
TCW Short Term Bond Fund
TCW Total Return Bond Fund
INTERNATIONAL FUNDS
TCW Developing Markets Equity Fund
TCW Emerging Markets Income Fund
TCW Emerging Markets Local Currency Income Fund
TCW Emerging Markets Multi-Asset Opportunities Fund
TCW International Small Cap Fund
FUNDarEQ1018
Table of Contents

OCTOBER 31

A N N U A L
R E P O R T
FIXED INCOME FUNDS
TCW Core Fixed Income Fund
TCW Enhanced Commodity Strategy Fund
TCW Global Bond Fund
TCW High Yield Bond Fund
TCW Short Term Bond Fund
TCW Total Return Bond Fund
Table of Contents
TCW Funds, Inc.
| 1 | ||||
| 16 | ||||
| 16 | ||||
| 30 | ||||
| 35 | ||||
| 47 | ||||
| 56 | ||||
| 64 | ||||
| 80 | ||||
| 82 | ||||
| 84 | ||||
| 87 | ||||
| 112 | ||||
| 123 | ||||
| 124 | ||||
| 126 | ||||
| 129 | ||||
Proxy Voting Guidelines and Availability of Quarterly Portfolio Schedule | 135 | |||
| 136 | ||||
| 139 | ||||
Table of Contents
| The Letter to Shareholders and/or Management Discussions contained in this Annual Report are the opinions of each Fund’s portfolio managers and are not the opinions of TCW Funds, Inc. or its Board of Directors. Various matters discussed in the Letter to Shareholders and/or Management Discussions constitute forward-looking statements within the meaning of the federal securities laws. Actual results and the timing of certain events could differ materially from those projected or contemplated by these forward-looking statements due to a number of factors, including general economic conditions, overall availability of securities for investment by a Fund, the level of volatility in the securities markets and in the share price of a Fund, and other risk factors discussed in the SEC filings of TCW Funds, Inc. The data presented in the Letter to Shareholders and/or Management Discussions represents past performance and cannot be used to predict future results. |
Table of Contents
|
| David S. DeVito President, Chief Executive Officer and Director |

Dear Valued Investors,
I am pleased to present the 2018 annual report for the TCW Funds, Inc. covering the 12-month period ended October 31, 2018. I would like to express our appreciation for your continued investment in the TCW Funds as well as welcome new shareholders to our fund family. As of October 31, 2018, the TCW Funds held total net assets of approximately $15 billion.
This report contains information and portfolio management discussions of our TCW Fixed Income Funds.
Economic Review and Market Environment
Encouraging signs continued to appear across the macroeconomic spectrum over the annual reporting period, as the labor market remained strong to bring unemployment to historic lows while GDP growth prints reflected one of the best six-month stretches for the U.S. economy in recent history. While much of the macroeconomic data had a positive tilt, these backward-looking statistics do not necessarily signal a sustainable story going forward as a spate of coincident or leading indicators skew toward tighter financial conditions ready to choke off faster growth. Thematically, there is less accommodative Fed policy (at eight hikes and counting since December 2015, along with balance sheet reduction), resulting in higher short-term rates and a recession-hinting flatness to the US Treasury curve. The beginning signs of weakness have started to show in the housing sector – the segment of the economy that has thus far been an engine for growth — as new home sales, housing starts, and building permits have disappointed given decreasing affordability, particularly for the new homebuyer segment, as mortgage rates have climbed significantly over the past twelve months. Next up thematically is increased volatility, the incidence of which has picked up considerably in 2018, following a near-absence of it in 2017, especially late in the year. Both February and October saw bouts of volatility that weighed on confidence and reset risk premiums
higher, reflected perhaps most readily by investment grade yield spreads. Ironically, higher quality debt has incurred more generalized widening than the speculative grade market, owing to voluminous issuance, increased leverage and limited covenant protection. Further, in typical late-cycle fashion, the rating agencies seem most lenient to even the most outrageous debt incurrence, with susceptibility, particularly in mergers and acquisitions (M&A) and leveraged buyout (LBO) activity, to claims for post-transaction deleveraging to forestall downgrades. The array of factors lined up continues to suggest that optimistic pricing prevails, with markets prone to downward adjustment.
As the Fed continued on its path of policy normalization, rates moved considerably higher over the past year, led by the front end of the curve, which was higher by roughly 120 basis points (bps). Meanwhile, the 10-Year U.S. Treasury yield was over 76 bps higher. The rising rate environment was a considerable headwind for fixed income market performance, and the Bloomberg Barclays Aggregate Index posted a loss of 2.1% for the period. Investment grade corporate credit was weighed down by sizeable new issuance levels and bouts of spread volatility, declining 3.0% and trailing duration-matched Treasuries by nearly 50 bps. In contrast, high yield credit was an outlier and gained 1.0%, as supportive technicals from fairly stable fund flows and continued underwhelming primary issuance buoyed high yield bond prices in the face of rising interest rates. Securitized products were also generally in negative territory, though they outpaced corporates. Asset-backed securities (ABS) gained 0.5%, with spreads only modestly wider, and non-agency mortgage-backed securities (MBS) continued to post consistent, positive returns, particularly issues backed by subprime and alt-A collateral. Commercial MBS (CMBS) bested corporates, though non-agency backed CMBS securities outpaced their agency CMBS counterparts. Meanwhile, agency MBS trailed as rate increases and unwinding of the Fed balance sheet weighed on the sector.
1
Table of Contents
Letter to Shareholders (Continued) |
The Economy and Market Ahead
At over nine years, this span of recovery and expansion is the second longest in history, extending well beyond the typical timeframe. Notwithstanding its considerable length, this cycle shares many characteristics (namely high debt levels and limited excess capacity) with those of the past, suggesting that we are much closer to the end than the beginning. While the specific catalyst that will bring on the end of the cycle is always difficult to predict, as noted above, there is no shortage of candidates that alone or more likely in combination will be the culprit. History suggests, however, that the usual prologue to a turn is tighter monetary policy, leading to the observation that “cycles don’t die of old age; it’s the Fed that kills them!” When markets are flooded with liquidity, as has been the case for the past ten years given unprecedented central bank support, investors have gotten away with overlooking the growing weakness in underlying fundamentals. In a new, liquidity-constrained environment with brewing risks under the surface, we believe that prevailing asset prices reflect a degree of misplaced optimism, with markets prone to downward adjustment. As a result, investors should be cautious overall as markets get closer to a deleveraging.
On February 28, 2018, two fixed income funds from the TCW Funds family were honored in the 2018 Thomson Reuters Lipper Fund Awards:
| • | The TCW Total Return Bond Fund (TGLMX) was named best U.S. mortgage fund for the ten-year period ended 12/31/17. |
| • | The TCW Emerging Markets Income Fund (TGEIX) was named best emerging markets hard currency debt fund for the ten-year period ended 12/31/17. |
The Thomson Reuters Lipper Fund Awards, granted annually, highlight funds and fund companies that have excelled in delivering consistently strong risk-adjusted performance relative to their peers.
We know that you have many choices when it comes to the management of your financial assets. On behalf of everyone at TCW, I would like to thank you for making the TCW Funds part of your long-term investment plan. We truly value our relationship with you. If you have any questions or require further information, I invite you to visit our website at www.tcw.com, or call our shareholder services department at 800-386-3829.
I look forward to further correspondence with you through our semi-annual report next year.
Sincerely,

David S. DeVito
President, Chief Executive Officer and Director
2
Table of Contents
[THIS PAGE INTENTIONALLY LEFT BLANK]
3
Table of Contents
TCW Core Fixed Income Bond Fund
Management Discussions
The TCW Core Fixed Income Fund (the “Fund”) returned a negative 1.87% and negative 2.10% on its I Class and N Class shares, respectively, for the year ended October 31, 2018. The performance of the Fund’s classes varies because of differing expenses. The Bloomberg Barclays U.S. Aggregate Bond Index, the Fund’s benchmark, returned a negative 2.05% over the same period.
The Fund’s outperformance was driven by the conservative positioning among corporate credit, particularly the underweight to lagging industrial sectors such as basic industries, capital goods, tobacco, and transportation, and the overweight to leading sectors like communications, healthcare, airlines, and real estate investment trusts (REITs). The overweight to securitized products such as government guaranteed student loans, non-agency MBS, and commercial MBS also benefitted returns as these sectors generally outperformed corporate credit and the broader Bloomberg Barclays U.S. Aggregate Bond Index. However, issue selection among agency MBS weighed on relative performance, namely the allocation to 3% through 4.5% coupon issues, which underperformed on concerns about Fed balance sheet reduction and duration extension with rates moving higher. Finally, the Fund continued to see contributions from the position in Japanese Government issued T-bills, with the Yen exposure fully hedged out using a Dollar-Yen cross currency swap.
With leverage near record highs, issuance ever more aggressive, and yield compensation skinny, the signs that we are nearing the end of this credit cycle continue to grow. When markets are flooded with liquidity, as has been the case for the past ten years given unprecedented central bank support, investors have gotten away with overlooking the growing weakness in underlying fundamentals. Moreover, fiscal stimulus has bolstered headline figures of macroeconomic data and corporate earnings, which has provided justification for continued bullish sentiment even in the face of growing headwinds. In a new, liquidity-constrained environment with brewing risks under the surface, we believe that prevailing asset prices reflect a degree of misplaced optimism, with markets prone to downward adjustment. As a result, investors should be cautious overall as markets get closer to a deleveraging.
Given the above dynamics, overall positioning remains defensive with respect to credit and emphasizes high quality, non-cyclical sectors that would be resilient in the face of a deleveraging event. Within this conservative context, however, we continue to actively manage the Fund with an eye toward attractive relative value opportunities. Securitized products remain a focus and favor higher quality, more senior issues. Legacy non-agency MBS remains attractive, though allocations will likely edge lower as prices rise, consistent with our dedicated dollar cost averaging approach to positioning. Agency MBS provides better liquidity characteristics and is high quality, but uncertainty remains as the Fed begins to shrink its position. Opportunities for reasonably safe yields can still be found in the higher quality segments of ABS and CMBS, though investors must remain vigilant as underwriting standards continue to deteriorate. Among CMBS, exposure is skewed towards agency-backed as well as seasoned non-agency issues at the top of the capital structure and single asset single borrower deals to avoid the underwriting challenges faced by current vintage non-agency CMBS. Consistent with this defensive posture, the Fund’s ABS allocation favors more robust structures such as federally guaranteed student loans and AAA-rated collateralized loan obligations (CLOs) that offer value. Finally, the Fund continues to hold fully currency-hedged Japanese T-bills as a higher yielding cash substitute, though the position has drifted lower as the relative value proposition has declined.
4
Table of Contents
TCW Core Fixed Income Bond Fund
Management Discussions (Continued)
| Annualized Return(1) | ||||||||||||||||||||||||
| 1 Yr Return | 3 Yr Return | 5 Yr Return | 10 Yr Return | Inception Fund | Inception Index | |||||||||||||||||||
TCW Core Fixed Income Fund | ||||||||||||||||||||||||
Class I (Inception: 1/1/1990) | (1.87 | )% | 0.90 | % | 1.61 | % | 5.13 | % | 5.78 | %(2) | 5.76 | % | ||||||||||||
Class N (Inception: 2/26/1999) | (2.10 | )% | 0.63 | % | 1.31 | % | 4.81 | % | 4.74 | % | 4.55 | % | ||||||||||||
Bloomberg Barclays U.S. Aggregate Bond Index | (2.05 | )% | 1.04 | % | 1.83 | % | 3.94 | % | ||||||||||||||||
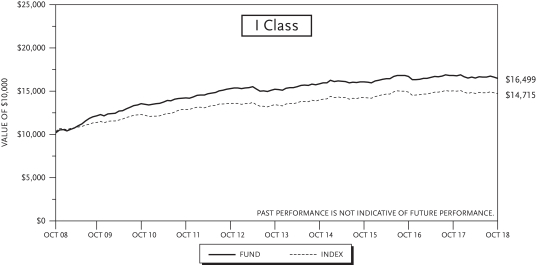

| (1) | The total returns do not reflect taxes that a shareholder would pay on fund distributions or on the redemption of fund shares. |
| (2) | Performance data includes the performance of the predecessor entity for periods before the Fund’s registration became effective. The predecessor entity was not registered under the 1940 Act and, therefore, was not subject to certain investment restrictions that are imposed by the 1940 Act. If the predecessor entity had been registered under the 1940 Act, the predecessor entity’s performance may have been lower. |
5
Table of Contents
TCW Enhanced Commodity Strategy Fund
Management Discussions
The TCW Enhanced Commodity Strategy Fund (the “Fund”) declined by 1.96% on both I Class and N Class shares for the year ended October 31, 2018. The Bloomberg Commodity Index, the Fund’s benchmark, also declined by 1.73% for the same period.
Returns were weighed down by softness across the short fixed income sectors that are used to generate excess returns in the strategy. Of particular note during the period was the corporate sector where yield spreads widened by more than 20 basis points (bps). Securitized products also generally widened, but outpaced corporate credit. The Fund benefitted from exposure to non-agency mortgage-backed securities (MBS), which led among securitized products, and the allocation to floating rate agency collateralized mortgage obligations (CMO) and asset-backed securities (ABS) backed by government guaranteed student loan receivables.
With leverage near record highs, issuance ever more aggressive, and yield compensation skinny, the signs that we are nearing the end of this credit cycle continue to grow. When markets are flooded with liquidity, as has been the case for the past ten years given unprecedented central bank support, investors have gotten away with overlooking the growing weakness in underlying fundamentals. Moreover, fiscal stimulus has bolstered headline figures of macroeconomic data and corporate earnings, which has provided justification for continued bullish sentiment even in the face of growing headwinds. In a new, liquidity-constrained environment with brewing risks under the surface, we believe that prevailing asset prices reflect a degree of misplaced optimism, with markets prone to downward adjustment. As a result, investors should be cautious overall as markets get closer to a deleveraging.
Given the above dynamics, overall positioning remains defensive with respect to credit and emphasizes high quality, non-cyclical sectors that would be resilient in the face of a deleveraging event. Within this conservative context, however, we continue to actively manage the Fund with an eye toward attractive relative value opportunities, while maintaining a relatively short duration profile and relatively high cash levels to retain liquidity. Securitized products favors higher quality, more senior issues. Legacy non-agency MBS remains attractive, though allocations will likely edge lower as prices rise, consistent with our dedicated dollar cost averaging approach to positioning. Opportunities for reasonably safe yields can still be found in the higher quality segments of ABS and CMBS, though investors must remain vigilant as underwriting standards continue to deteriorate. Consistent with this defensive posture, the Fund’s ABS allocation favors more robust structures such as federally guaranteed student loans that offer value.
6
Table of Contents
TCW Enhanced Commodity Strategy Fund
Management Discussions (Continued)
| Annualized Return(1) | ||||||||||||||||
| 1 Yr Return | 3 Yr Return | 5 Yr Return | Inception to Date | |||||||||||||
TCW Enhanced Commodity Strategy Fund | ||||||||||||||||
Class I (Inception: 3/31/2011) | (1.96 | )% | 0.21 | % | (6.34 | )% | (6.90 | )% | ||||||||
Class N (Inception: 3/31/2011) | (1.96 | )% | 0.14 | % | (6.36 | )% | (6.91 | )% | ||||||||
Bloomberg Commodity Index | (1.73 | )% | (0.69 | )% | (7.31 | )% | (8.58 | )% | ||||||||
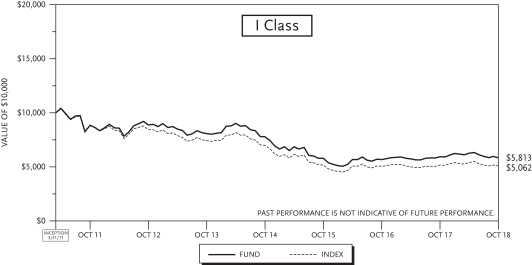
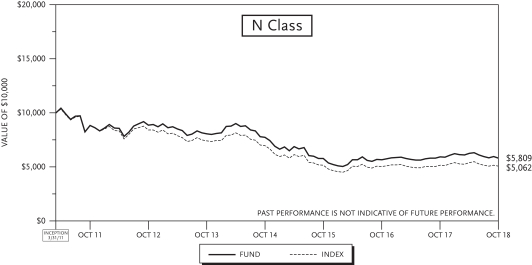
| (1) | The total returns do not reflect taxes that a shareholder would pay on fund distributions or on the redemption of fund shares. |
7
Table of Contents
TCW Global Bond Fund
Management Discussions
For the year ended October 31, 2018, the TCW Global Bond Fund (the “Fund”) had a negative return of 2.54% on both I Class and N Class shares. The Bloomberg Barclays Global Aggregate Bond Index, the Fund’s benchmark, also experienced a negative return of 2.05% over the same period.
From the country perspective, the Fund’s emphasis on the U.S. was additive as the U.S. outpaced the benchmark though returns were still negative largely due to rising global rates. While the emphasis on non-Euro countries such as Norway also supported returns, the focus on Mexico detracted from performance as did the underweight to Brazil, the UK, Canada, and Qatar. Currency performance was mixed as the continued emphasis on U.S. dollar assets and the underweight to the Euro contributed while yen and pound exposures weighed on performance. Looking at sector allocation, the Fund remained underweight to corporate credit, particularly industrials, which supported relative performance as the sector struggled as rates rose over this period. The underweight to non-U.S. sovereigns and emerging market credit, however, was a drag, though the recent volatility in Q3 provided an opportunity to add to our emerging market exposure. Structured product performance was mixed, though non-agency, commercial mortgage-backed securities (CMBS), and asset-backed securities (ABS) backed by government guaranteed student loan cash flows continued to support performance.
The Fund remains true to its disciplined, value-based approach, with a focus on higher quality, more defensive areas of the market and a relatively short duration profile. As accommodative global monetary policy by the Fed and the European Central Bank (ECB) are coming closer to the end, rates have risen significantly along with increased market volatility, which will continue as financial conditions tighten. These factors, combined with the relatively better U.S. growth prospects, inform a continued underweight to most of Europe and Asia, particularly continental Europe and Japan, and an overweight to the U.S. Similarly, currency exposure remains significantly underweight the euro, in favor of the U.S. dollar and select high quality emerging markets. Concerns about the aging credit cycle also inform our cautious sector exposures. Tight valuations and historically high leverage in the corporate sector inform our credit positioning, which favors regulated sectors like U.S. financials and real estate investment trusts (REITs), along with significant exposure to U.S. securitized products, which continue to provide protection from excesses in credit markets and offer opportunities for attractive risk-adjusted returns. Among securitized products, positioning favors non-agency MBS, CMBS, and government guaranteed student loan ABS.
8
Table of Contents
TCW Global Bond Fund
Management Discussions (Continued)
| Annualized Return(1) | ||||||||||||||||
| 1 Yr Return | 3 Yr Return | 5 Yr Return | Inception to Date | |||||||||||||
TCW Global Bond Fund | ||||||||||||||||
Class I (Inception: 11/30/2011) | (2.54 | )% | 0.82 | % | (0.07 | )% | 1.63 | % | ||||||||
Class N (Inception: 11/30/2011) | (2.54 | )% | 0.82 | % | (0.07 | )% | 1.63 | % | ||||||||
Bloomberg Barclays Global Aggregate Bond Index | (2.05 | )% | 1.52 | % | 0.33 | % | 0.77 | % | ||||||||
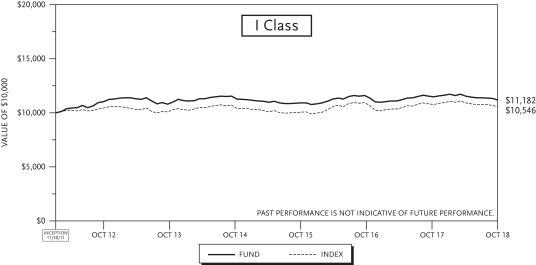

| (1) | The total returns do not reflect taxes that a shareholder would pay on fund distributions or on the redemption of fund shares. |
9
Table of Contents
TCW High Yield Bond Fund
Management Discussions
The TCW High Yield Bond Fund (the “Fund”) gained 1.40% and 1.04% for its I Class and N Class shares, respectively, for the year ended October 31, 2018. The performance of the Fund’s classes varies because of differing expenses. The FTSE High Yield Cash Pay Custom Index, the Fund’s benchmark, returned 1.10% over the same period.
The Fund’s performance was driven by the emphasis on communications (particularly wireless) and consumer non-cyclicals, with gains driven by strong healthcare and pharmaceutical credits. Meanwhile, the underweight to higher beta basic industry was beneficial, as commodity price weakness late in the period weighed on the sector. Further contributions came from the underweight to consumer cyclicals, which substantially lagged the overall high yield universe. From an issuer perspective, the largest drag came from Homer City, which experienced price weakness over the course of the year, though this was offset by solid security selection among strong bank loan holdings. Finally, performance benefitted from the Fund’s duration profile, which was extended from approximately 1.5 years short versus the index to 0.4 years short versus the index as rates moved closer to what we believed to be fair value.
With leverage near record highs, issuance ever more aggressive, and yield compensation skinny, the signs that we are nearing the end of this credit cycle continue to grow. When markets are flooded with liquidity, as has been the case for the past ten years given unprecedented central bank support, investors have gotten away with overlooking the growing weakness in underlying fundamentals. Moreover, fiscal stimulus has bolstered headline figures of macroeconomic data and corporate earnings, which has provided justification for continued bullish sentiment even in the face of growing headwinds. In a new, liquidity-constrained environment with brewing risks under the surface, we believe that prevailing asset prices reflect a degree of misplaced optimism, with markets prone to downward adjustment. This risk is particularly notable in the high yield space, where spreads have thus far remained insulated from macroeconomic volatility and year-to-date outflows. Notwithstanding the supportive technical backdrop, high yield investors should be cautious overall as markets get closer to a deleveraging. A credit-intensive, bottoms-up investment approach remains the key to value uncovering opportunities and, most importantly, avoiding credit accidents. This disciplined approach to portfolio construction is reflected in the Fund’s focus on higher quality, better-collateralized areas of the market, while the introduction of risk into the portfolio is done in an extremely measured and selective way. The industrial allocation emphasizes non-cyclical sectors that have less economically sensitive business drivers, with a focus on select companies with solid asset coverage and stable cash flows within lower beta packaging, transportation, communication, food & beverage, and midstream energy sectors. Finally, the cash position remains elevated to preserve ample capacity to deploy capital as opportunities emerge.
10
Table of Contents
TCW High Yield Bond Fund
Management Discussions (Continued)
| Annualized Return(1) | ||||||||||||||||||||||||
| 1 Yr Return | 3 Yr Return | 5 Yr Return | 10 Yr Return | Inception Fund | Inception Index | |||||||||||||||||||
TCW High Yield Bond Fund | ||||||||||||||||||||||||
Class I (Inception: 02/01/1989) | 1.40 | % | 4.40 | % | 4.03 | % | 9.46 | % | 7.05 | %(2) | 7.82 | % | ||||||||||||
Class N (Inception: 02/26/1999) | 1.04 | % | 4.12 | % | 3.78 | % | 9.24 | % | 5.12 | % | 6.53 | % | ||||||||||||
FTSE High Yield Cash Pay Custom Index | 1.10 | % | 6.30 | % | 4.26 | % | 10.30 | % | ||||||||||||||||

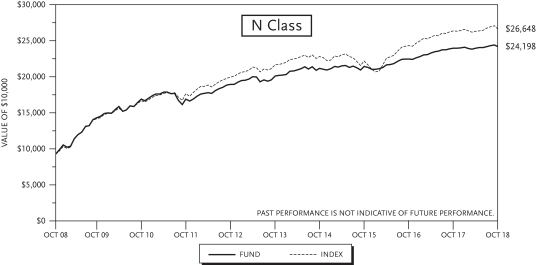
| (1) | The total returns do not reflect taxes that a shareholder would pay on fund distributions or on the redemption of fund shares. |
| (2) | Performance data includes the performance of the predecessor entity for periods before the Fund’s registration became effective. The predecessor entity was not registered under the 1940 Act and, therefore, was not subject to certain investment restrictions that are imposed by the 1940 Act. If the predecessor entity had been registered under the 1940 Act, the predecessor entity’s performance may have been lower. |
11
Table of Contents
TCW Short Term Bond Fund
Management Discussions
The TCW Short Term Bond Fund (the “Fund”) returned 1.26% for the year ended October 31, 2018. The FTSE 1-Year Treasury Index, the Fund’s benchmark, returned 1.33% for the same period.
The duration of the Fund was extended from approximately 0.4 year short versus the index to 0.5 year long versus the index as rates moved closer to what we believed to be fair value, detracting somewhat from performance, while an additional drag came from yield curve positioning with a slight preference for 2-Year maturities where rates rose the most. Meanwhile, returns benefitted from the allocation to short corporate credit, which led Treasuries by over 30 bps on a duration-adjusted basis, and from issue selection among corporate credit, namely the emphasis on short financials, which marginally outpaced industrials and utilities. Outside of the corporate space, floating rate agency collateralized mortgage obligations (CMO) added to returns, along with the allocation to commercial mortgage-backed securities (CMBS), which outpaced Treasuries on a duration-adjusted basis.
With leverage near record highs, issuance ever more aggressive, and yield compensation skinny, the signs that we are nearing the end of this credit cycle continue to grow. When markets are flooded with liquidity, as has been the case for the past ten years given unprecedented central bank support, investors have gotten away with overlooking the growing weakness in underlying fundamentals. Moreover, fiscal stimulus has bolstered headline figures of macroeconomic data and corporate earnings, which has provided justification for continued bullish sentiment even in the face of growing headwinds. In a new, liquidity-constrained environment with brewing risks under the surface, we believe that prevailing asset prices reflect a degree of misplaced optimism, with markets prone to downward adjustment. As a result, investors should be cautious overall as markets get closer to a deleveraging.
Given the above dynamics, overall positioning remains defensive with respect to credit and emphasizes high quality, non-cyclical sectors that would be resilient in the face of a deleveraging event. Within this conservative context, however, we continue to actively manage the Fund with an eye toward attractive relative value opportunities. Securitized products favors higher quality, more senior issues including a small allocation to legacy non-agency MBS, while the larger allocation to agency MBS is focused on floating rate CMOs given relatively stable duration profiles. Opportunities for reasonably safe yields can still be found in the higher quality segments of the CMBS market, though investors must remain vigilant as underwriting standards continue to deteriorate. Among CMBS, exposure is skewed towards agency-backed issues, with a very small allocation to seasoned non-agency issues at the top of the capital structure and single asset single borrower deals to avoid the underwriting challenges faced by current vintage non-agency CMBS.
12
Table of Contents
TCW Short Term Bond Fund
Management Discussions (Continued)
| Annualized Return(1) | ||||||||||||||||||||
| 1 Yr Return | 3 Yr Return | 5 Yr Return | 10 Yr Return | Inception to Date | ||||||||||||||||
TCW Short Term Bond Fund | ||||||||||||||||||||
Class I (Inception: 2/1/1990) | 1.26 | % | 0.95 | % | 0.75 | % | 1.73 | % | 3.87 | %(2) | ||||||||||
FTSE 1-Year Treasury Index | 1.33 | % | 0.84 | % | 0.62 | % | 0.68 | % | 3.48 | % | ||||||||||
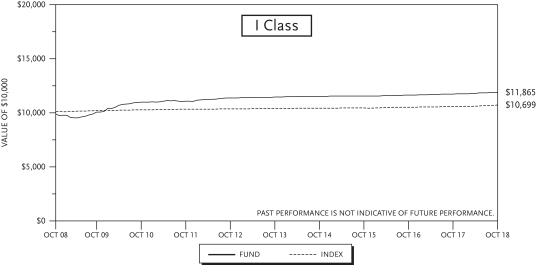
| (1) | The total returns do not reflect taxes that a shareholder would pay on fund distributions or on the redemption of fund shares. |
| (2) | Performance data includes the performance of the predecessor entity for periods before the Fund’s registration became effective. The predecessor entity was not registered under the 1940 Act and, therefore, was not subject to certain investment restrictions that are imposed by the 1940 Act. If the predecessor entity had been registered under the 1940 Act, the predecessor entity’s performance may have been lower. |
13
Table of Contents
TCW Total Return Bond Fund
Management Discussions
The TCW Total Return Bond Fund (the “Fund”) returned a negative 1.67% and negative 1.96% on its I Class and N Class shares, respectively, for the year ended October 31, 2018. The performance of the Fund’s classes varies because of differing expenses. The Bloomberg Barclays U.S. Aggregate Bond Index, the Fund’s benchmark, returned a negative 2.05% over the same period.
The Fund’s outperformance was driven by the off benchmark allocation to non-agency mortgage-backed securities (MBS) (particularly bonds backed by alt-A and subprime), which have benefitted from solid demand and continued improvements in fundamentals such as higher home prices and lower loan-to-value ratios and delinquency rates. Other securitized products such as commercial mortgage-backed securities (CMBS) and asset-backed securities (ABS) contributed as both sectors outpaced the benchmark, with an additional small boost coming from the Fund’s emphasis on ABS backed by floating rate government guaranteed student loans. Additionally, the Fund benefitted from the lack of exposure to corporate credit, which weighed on benchmark returns as spreads widened over the period. Finally, the Fund continued to see contributions from the position in Japanese Government issued T-bills, with the Yen exposure fully hedged out using a Dollar-Yen cross currency swap.
With leverage near record highs, issuance ever more aggressive, and yield compensation skinny, the signs that we are nearing the end of this credit cycle continue to grow. When markets are flooded with liquidity, as has been the case for the past ten years given unprecedented central bank support, investors have gotten away with overlooking the growing weakness in underlying fundamentals. Moreover, fiscal stimulus has bolstered headline figures of macroeconomic data and corporate earnings, which has provided justification for continued bullish sentiment even in the face of growing headwinds. In a new, liquidity-constrained environment with brewing risks under the surface, we believe that prevailing asset prices reflect a degree of misplaced optimism, with markets prone to downward adjustment. As a result, investors should be cautious overall as markets get closer to a deleveraging.
Given the above dynamics, overall positioning remains defensive and emphasizes high quality, non-cyclical sectors that would be resilient in the face of a deleveraging event. Within this conservative context, however, we continue to actively manage the Fund with an eye toward attractive relative value opportunities. Corporate credit remains absent in the Fund given the mortgage focus while securitized products remain an emphasis and positioning favors higher quality, more senior issues. Legacy non-agency MBS remains attractive, though allocations will likely edge lower as prices rise, consistent with our dedicated dollar cost averaging approach to positioning. Agency MBS provides better liquidity characteristics and is high quality, but uncertainty remains as the Fed begins to shrink its position. Opportunities for reasonably safe yields can still be found in the higher quality segments of ABS and CMBS, though investors must remain vigilant as underwriting standards continue to deteriorate. Among CMBS, exposure is skewed towards agency-backed as well as seasoned non-agency issues at the top of the capital structure and single asset single borrower deals to avoid the underwriting challenges faced by current vintage non-agency CMBS. Consistent with this defensive posture, the Fund’s ABS allocation favors more robust structures such as federally guaranteed student loans that offer value. Finally, the Fund continues to hold fully currency-hedged Japanese T-bills as a higher yielding cash substitute, though the position has drifted lower as the relative value proposition has declined.
14
Table of Contents
TCW Total Return Bond Fund
Management Discussions (Continued)
| Annualized Return(1) | ||||||||||||||||||||||||
| 1 Yr Return | 3 Yr Return | 5 Yr Return | 10 Yr Return | Inception Fund | Inception Index | |||||||||||||||||||
TCW Total Return Bond Fund | ||||||||||||||||||||||||
Class I (Inception: 06/17/1993) | (1.67 | )% | 0.87 | % | 1.86 | % | 5.83 | % | 6.14 | % | 5.04 | % | ||||||||||||
Class N (Inception: 02/26/1999) | (1.96 | )% | 0.58 | % | 1.55 | % | 5.51 | % | 5.54 | % | 4.55 | % | ||||||||||||
Bloomberg Barclays U.S. Aggregate Bond Index | (2.05 | )% | 1.04 | % | 1.83 | % | 3.94 | % | ||||||||||||||||
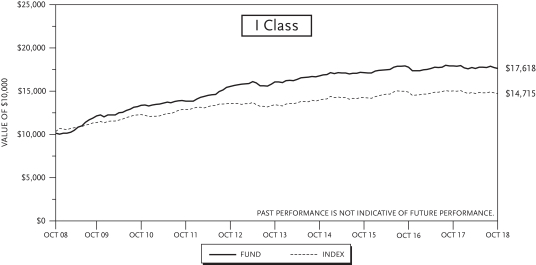
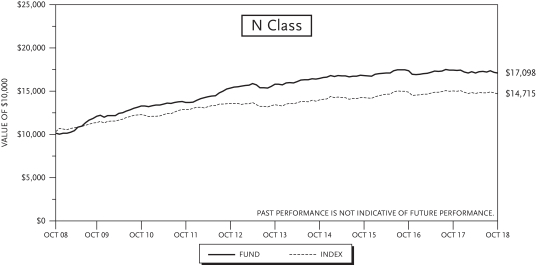
| (1) | The total returns do not reflect taxes that a shareholder would pay on fund distributions or on the redemption of fund shares. |
15
Table of Contents
| Issues | Maturity Date | Principal Amount | Value | |||||||||
FIXED INCOME SECURITIES — 102.8% of Net Assets |
| |||||||||||
CORPORATE BONDS — 35.5% |
| |||||||||||
| Aerospace/Defense — 0.4% | ||||||||||||
L3 Technologies, Inc. |
| |||||||||||
4.40% | 06/15/28 | $ | 2,470,000 | $ | 2,472,763 | |||||||
Northrop Grumman Corp. |
| |||||||||||
3.25% | 01/15/28 | 2,395,000 | 2,216,898 | |||||||||
|
| |||||||||||
| 4,689,661 | ||||||||||||
|
| |||||||||||
| Airlines — 0.5% | ||||||||||||
America West Airlines, Inc. Pass-Through Certificates, (01-1) (EETC) |
| |||||||||||
7.10% | 10/02/22 | 1,401,930 | 1,479,316 | |||||||||
Continental Airlines, Inc. Pass-Through Certificates, (00-2-A1) (EETC) |
| |||||||||||
7.71% | 10/02/22 | 15,121 | 15,860 | |||||||||
Continental Airlines, Inc. Pass-Through Certificates, (07-1-A) (EETC) |
| |||||||||||
5.98% | 10/19/23 | 817,227 | 855,555 | |||||||||
Continental Airlines, Inc. Pass-Through Certificates, (09-2-A1) (EETC) |
| |||||||||||
7.25% | 05/10/21 | 560,580 | 580,200 | |||||||||
Continental Airlines, Inc. Pass-Through Certificates, (99-1-A) (EETC) |
| |||||||||||
6.55% | 08/02/20 | 235,938 | 237,910 | |||||||||
Northwest Airlines LLC Pass-Through Certificates, (01-1-A1) (EETC) |
| |||||||||||
7.04% | 10/01/23 | 453,334 | 493,136 | |||||||||
US Airways Group, Inc. Pass-Through Certificates, (10-1A) (EETC) |
| |||||||||||
6.25% | 10/22/24 | 355,907 | 380,128 | |||||||||
US Airways Group, Inc. Pass-Through Certificates, (12-1A) (EETC) |
| |||||||||||
5.90% | 04/01/26 | 1,536,032 | 1,636,457 | |||||||||
US Airways Group, Inc. Pass-Through Certificates, (12-2-A) (EETC) |
| |||||||||||
4.63% | 12/03/26 | 630,795 | 641,457 | |||||||||
|
| |||||||||||
| 6,320,019 | ||||||||||||
|
| |||||||||||
| Auto Manufacturers — 1.0% | ||||||||||||
Ford Motor Credit Co. LLC |
| |||||||||||
2.34% | 11/02/20 | 1,500,000 | 1,444,872 | |||||||||
2.43% | 06/12/20 | 650,000 | 634,117 | |||||||||
3.31% (1) | 10/12/21 | 2,265,000 | 2,220,658 | |||||||||
3.43% (3 mo. USD LIBOR + 1.080%) (2) | 08/03/22 | 1,000,000 | 974,644 | |||||||||
8.13% | 01/15/20 | 1,265,000 | 1,326,445 | |||||||||
General Motors Co. |
| |||||||||||
6.60% | 04/01/36 | 1,545,000 | 1,587,372 | |||||||||
General Motors Financial Co., Inc. |
| |||||||||||
2.40% | 05/09/19 | 555,000 | 553,780 | |||||||||
3.10% | 01/15/19 | 3,215,000 | 3,214,720 | |||||||||
|
| |||||||||||
| 11,956,608 | ||||||||||||
|
| |||||||||||
| Issues | Maturity Date | Principal Amount | Value | |||||||||
| Banks — 11.7% | ||||||||||||
Bank of America Corp. |
| |||||||||||
2.37% (3 mo. USD LIBOR + 0.660%) (2) | 07/21/21 | $ | 945,000 | $ | 927,348 | |||||||
2.60% | 01/15/19 | 217,000 | 216,900 | |||||||||
2.74% (2.738% to 01/23/21 then 3 mo. USD LIBOR +0.37%) (2) | 01/23/22 | 4,045,000 | 3,965,901 | |||||||||
3.00% (3.004% to 02/20/22 then 3 mo. USD LIBOR +0.79%) (2) | 12/20/23 | 4,161,000 | 4,006,015 | |||||||||
3.09% (3.093% to 10/01/24 then 3 Mo. USD LIBOR + 1.09%) (2) | 10/01/25 | 2,350,000 | 2,228,858 | |||||||||
3.71% (3 mo. USD LIBOR + 1.512%) (2) | 04/24/28 | 6,340,000 | 6,020,752 | |||||||||
Bank of New York Mellon Corp. (The) |
| |||||||||||
2.30% | 09/11/19 | 4,595,000 | 4,567,207 | |||||||||
Citibank N.A. |
| |||||||||||
3.05% | 05/01/20 | 4,055,000 | 4,040,167 | |||||||||
Citigroup, Inc. |
| |||||||||||
2.05% | 12/07/18 | 8,730,000 | 8,725,434 | |||||||||
2.50% | 07/29/19 | 3,400,000 | 3,389,603 | |||||||||
8.50% | 05/22/19 | 1,485,000 | 1,529,726 | |||||||||
Discover Bank |
| |||||||||||
2.60% | 11/13/18 | 1,840,000 | 1,839,710 | |||||||||
4.20% | 08/08/23 | 1,380,000 | 1,377,999 | |||||||||
7.00% | 04/15/20 | 1,375,000 | 1,436,342 | |||||||||
Goldman Sachs Group, Inc. (The) |
| |||||||||||
2.55% | 10/23/19 | 2,755,000 | 2,738,787 | |||||||||
2.63% | 04/25/21 | 920,000 | 900,175 | |||||||||
3.81% (3.814% to 04/23/28 then 3 mo. USD LIBOR + 1.158%) (2) | 04/23/29 | 1,615,000 | 1,518,826 | |||||||||
3.85% | 07/08/24 | 2,235,000 | 2,200,259 | |||||||||
6.00% | 06/15/20 | 50,000 | 52,060 | |||||||||
JPMorgan Chase & Co. |
| |||||||||||
2.70% | 05/18/23 | 1,930,000 | 1,845,325 | |||||||||
3.22% (3 mo. USD LIBOR + 1.155%) (2) | 03/01/25 | 2,985,000 | 2,873,315 | |||||||||
3.51% (3.509% to 01/23/28 then 3 mo. USD LIBOR + 0.945%) (2) | 01/23/29 | 3,215,000 | 3,008,639 | |||||||||
3.90% | 07/15/25 | 2,195,000 | 2,167,669 | |||||||||
JPMorgan Chase Bank NA |
| |||||||||||
2.59% (1) | 02/13/20 | 6,470,000 | 6,472,316 | |||||||||
See accompanying notes to financial statements.
16
Table of Contents
TCW Core Fixed Income Fund
October 31, 2018 |
| Issues | Maturity Date | Principal Amount | Value | |||||||||
| Banks (Continued) | ||||||||||||
2.60% (2.604% to 02/01/20 then 3 mo. USD LIBOR + 0.28%) (2) | 02/01/21 | $ | 6,435,000 | $ | 6,379,182 | |||||||
3.09% (3.086% to 04/26/20 then 3 mo. USD LIBOR +0.35%) (2) | 04/26/21 | 2,075,000 | 2,066,742 | |||||||||
Lloyds Banking Group PLC (United Kingdom) |
| |||||||||||
2.91% (2.907% to 11/07/22 then 3 mo. USD LIBOR + 0.81%) (2) | 11/07/23 | 1,600,000 | 1,521,358 | |||||||||
Lloyds TSB Bank PLC (United Kingdom) |
| |||||||||||
5.80% (3) | 01/13/20 | 780,000 | 802,383 | |||||||||
Macquarie Bank, Ltd. (Australia) |
| |||||||||||
2.35% (3) | 01/15/19 | 2,985,000 | 2,981,867 | |||||||||
Morgan Stanley |
| |||||||||||
3.12% (3 mo. USD LIBOR + 0.800%) (2) | 02/14/20 | 2,755,000 | 2,758,389 | |||||||||
3.40% (3 mo. USD LIBOR + 0.930%) (2) | 07/22/22 | 4,595,000 | 4,616,874 | |||||||||
3.77% (3.772% to 01/24/28 then 3 mo. USD LIBOR + 1.14%) (2) | 01/24/29 | 1,615,000 | 1,532,059 | |||||||||
5.63% | 09/23/19 | 2,525,000 | 2,579,169 | |||||||||
7.30% | 05/13/19 | 9,620,000 | 9,833,309 | |||||||||
PNC Bank NA |
| |||||||||||
2.25% | 07/02/19 | 1,840,000 | 1,830,891 | |||||||||
3.80% | 07/25/23 | 3,215,000 | 3,197,779 | |||||||||
Santander UK Group Holdings PLC (United Kingdom) |
| |||||||||||
3.37% (3.373% to 01/05/23 then 3 mo. USD LIBOR + 1.08%) (2) | 01/05/24 | 2,460,000 | 2,351,769 | |||||||||
Santander UK PLC (United Kingdom) |
| |||||||||||
2.50% | 03/14/19 | 2,985,000 | 2,981,593 | |||||||||
3.40% | 06/01/21 | 2,050,000 | 2,036,240 | |||||||||
UBS AG (Switzerland) |
| |||||||||||
2.63% (1)(3) | 05/28/19 | 3,035,000 | 3,040,316 | |||||||||
US Bank NA/Cincinnati OH |
| |||||||||||
3.40% | 07/24/23 | 2,420,000 | 2,404,341 | |||||||||
Wells Fargo & Co. |
| |||||||||||
2.60% | 07/22/20 | 2,165,000 | 2,145,382 | |||||||||
2.63% | 07/22/22 | 1,840,000 | 1,766,855 | |||||||||
3.00% | 04/22/26 | 7,100,000 | 6,543,868 | |||||||||
3.55% | 09/29/25 | 850,000 | 815,676 | |||||||||
Wells Fargo Bank N.A. |
| |||||||||||
2.40% | 01/15/20 | 13,780,000 | 13,666,301 | |||||||||
|
| |||||||||||
| 145,901,676 | ||||||||||||
|
| |||||||||||
| Issues | Maturity Date | Principal Amount | Value | |||||||||
| Beverages — 0.4% | ||||||||||||
Anheuser-Busch InBev Finance, Inc. |
| |||||||||||
3.65% | 02/01/26 | $ | 920,000 | $ | 874,586 | |||||||
4.90% | 02/01/46 | 2,285,000 | 2,162,216 | |||||||||
Constellation Brands, Inc. |
| |||||||||||
3.88% | 11/15/19 | 1,840,000 | 1,851,982 | |||||||||
|
| |||||||||||
| 4,888,784 | ||||||||||||
|
| |||||||||||
| Biotechnology — 0.7% | ||||||||||||
Amgen, Inc. |
| |||||||||||
4.40% | 05/01/45 | 3,150,000 | 2,876,647 | |||||||||
Baxalta, Inc. |
| |||||||||||
2.88% | 06/23/20 | 548,000 | 542,154 | |||||||||
Biogen, Inc. |
| |||||||||||
5.20% | 09/15/45 | 1,073,000 | 1,081,732 | |||||||||
Celgene Corp. |
| |||||||||||
3.90% | 02/20/28 | 2,295,000 | 2,158,779 | |||||||||
5.00% | 08/15/45 | 2,020,000 | 1,864,963 | |||||||||
|
| |||||||||||
| 8,524,275 | ||||||||||||
|
| |||||||||||
| Chemicals — 0.1% | ||||||||||||
Dow Chemical Co. (The) |
| |||||||||||
8.55% | 05/15/19 | 920,000 | 947,035 | |||||||||
|
| |||||||||||
| Commercial Services — 0.2% | ||||||||||||
IHS Markit, Ltd. |
| |||||||||||
4.75% (3) | 02/15/25 | 750,000 | 744,360 | |||||||||
4.75% | 08/01/28 | 1,750,000 | 1,717,852 | |||||||||
|
| |||||||||||
| 2,462,212 | ||||||||||||
|
| |||||||||||
| Computers — 0.3% | ||||||||||||
Dell International LLC / EMC Corp. |
| |||||||||||
3.48% (3) | 06/01/19 | 3,215,000 | 3,219,485 | |||||||||
|
| |||||||||||
| Diversified Financial Services — 0.8% | ||||||||||||
AerCap Ireland Capital DAC / AerCap Global Aviation Trust (Ireland) |
| |||||||||||
4.50% | 05/15/21 | 1,690,000 | 1,713,237 | |||||||||
AerCap Ireland Capital, Ltd. / AerCap Global Aviation Trust (Netherlands) |
| |||||||||||
5.00% | 10/01/21 | 590,000 | 606,225 | |||||||||
Air Lease Corp. |
| |||||||||||
4.75% | 03/01/20 | 3,120,000 | 3,166,620 | |||||||||
American Express Credit Corp. |
| |||||||||||
2.20% | 03/03/20 | 2,435,000 | 2,403,416 | |||||||||
GE Capital International Funding Co. Unlimited Co. (Ireland) |
| |||||||||||
2.34% | 11/15/20 | 1,000,000 | 971,493 | |||||||||
4.42% | 11/15/35 | 425,000 | 375,001 | |||||||||
International Lease Finance Corp. |
| |||||||||||
6.25% | 05/15/19 | 1,380,000 | 1,402,195 | |||||||||
|
| |||||||||||
| 10,638,187 | ||||||||||||
|
| |||||||||||
See accompanying notes to financial statements.
17
Table of Contents
TCW Core Fixed Income Fund
Schedule of Investments (Continued)
| Issues | Maturity Date | Principal Amount | Value | |||||||||
| Electric — 3.0% | ||||||||||||
Appalachian Power Co. |
| |||||||||||
3.30% | 06/01/27 | $ | 690,000 | $ | 649,887 | |||||||
4.45% | 06/01/45 | 690,000 | 668,047 | |||||||||
Black Hills Corp. |
| |||||||||||
2.50% | 01/11/19 | 1,745,000 | 1,744,124 | |||||||||
Dominion Energy, Inc. |
| |||||||||||
2.72% (1)(3) | 12/01/20 | 4,595,000 | 4,587,832 | |||||||||
Duke Energy Florida LLC |
| |||||||||||
2.10% | 12/15/19 | 1,493,750 | 1,484,069 | |||||||||
Duke Energy Progress LLC |
| |||||||||||
3.70% | 10/15/46 | 2,575,000 | 2,254,777 | |||||||||
El Paso Electric Co. |
| |||||||||||
3.30% | 12/15/22 | 2,065,000 | 1,985,216 | |||||||||
Emera US Finance LP |
| |||||||||||
2.15% | 06/15/19 | 3,384,000 | 3,363,556 | |||||||||
Entergy Mississippi, Inc. |
| |||||||||||
3.10% | 07/01/23 | 2,755,000 | 2,668,402 | |||||||||
Indiana Michigan Power Co. |
| |||||||||||
4.55% | 03/15/46 | 920,000 | 911,455 | |||||||||
Kansas City Power & Light Co. |
| |||||||||||
3.15% | 03/15/23 | 3,675,000 | 3,576,680 | |||||||||
KCP&L Greater Missouri Operations Co. |
| |||||||||||
8.27% | 11/15/21 | 1,100,000 | 1,224,180 | |||||||||
Metropolitan Edison Co. |
| |||||||||||
3.50% (3) | 03/15/23 | 3,030,000 | 2,973,983 | |||||||||
MidAmerican Energy Co. |
| |||||||||||
5.80% | 10/15/36 | 1,655,000 | 1,936,830 | |||||||||
NextEra Energy Capital Holdings, Inc. |
| |||||||||||
2.86% (1) | 08/28/21 | 2,000,000 | 2,002,262 | |||||||||
Niagara Mohawk Power Corp. |
| |||||||||||
2.72% (3) | 11/28/22 | 920,000 | 890,904 | |||||||||
Public Service Co. of Oklahoma |
| |||||||||||
4.40% | 02/01/21 | 1,840,000 | 1,874,120 | |||||||||
Puget Energy, Inc. |
| |||||||||||
6.00% | 09/01/21 | 1,820,000 | 1,926,840 | |||||||||
Tucson Electric Power Co. |
| |||||||||||
5.15% | 11/15/21 | 1,000,000 | 1,033,283 | |||||||||
|
| |||||||||||
| 37,756,447 | ||||||||||||
|
| |||||||||||
| Energy-Alternate Sources — 0.1% | ||||||||||||
Alta Wind Holdings LLC |
| |||||||||||
7.00% (3)(4)(5) | 06/30/35 | 963,994 | 1,036,315 | |||||||||
|
| |||||||||||
| Environmental Control — 0.1% | ||||||||||||
Republic Services, Inc. |
| |||||||||||
2.90% | 07/01/26 | 1,905,000 | 1,762,173 | |||||||||
|
| |||||||||||
| Food — 0.7% | ||||||||||||
General Mills, Inc. |
| |||||||||||
4.20% | 04/17/28 | 1,500,000 | 1,450,742 | |||||||||
| Issues | Maturity Date | Principal Amount | Value | |||||||||
| Food (Continued) | ||||||||||||
Kraft Heinz Foods Co. |
| |||||||||||
3.00% | 06/01/26 | $ | 805,000 | $ | 719,610 | |||||||
3.95% | 07/15/25 | 1,700,000 | 1,646,074 | |||||||||
4.38% | 06/01/46 | 1,560,000 | 1,298,162 | |||||||||
4.63% | 01/30/29 | 685,000 | 669,452 | |||||||||
5.38% | 02/10/20 | 143,000 | 146,786 | |||||||||
Mondelez International Holdings Netherlands BV (Netherlands) |
| |||||||||||
2.00% (3) | 10/28/21 | 920,000 | 877,167 | |||||||||
3.12% (3 mo. USD LIBOR + 0.610%) (2)(3) | 10/28/19 | 2,205,000 | 2,212,706 | |||||||||
|
| |||||||||||
| 9,020,699 | ||||||||||||
|
| |||||||||||
| Forest Products & Paper — 0.3% | ||||||||||||
Georgia-Pacific LLC |
| |||||||||||
2.54% (3) | 11/15/19 | 3,675,000 | 3,650,412 | |||||||||
|
| |||||||||||
| Gas — 0.3% | ||||||||||||
CenterPoint Energy Resources Corp. |
| |||||||||||
6.25% | 02/01/37 | 1,610,000 | 1,843,063 | |||||||||
KeySpan Gas East Corp. |
| |||||||||||
5.82% (3) | 04/01/41 | 1,551,000 | 1,788,120 | |||||||||
|
| |||||||||||
| 3,631,183 | ||||||||||||
|
| |||||||||||
| Healthcare-Products — 0.3% | ||||||||||||
Becton Dickinson and Co. |
| |||||||||||
3.26% (1) | 12/29/20 | 3,675,000 | 3,678,117 | |||||||||
|
| |||||||||||
| Healthcare-Services — 2.5% | ||||||||||||
Anthem, Inc. |
| |||||||||||
2.50% | 11/21/20 | 1,380,000 | 1,352,615 | |||||||||
3.65% | 12/01/27 | 2,405,000 | 2,256,726 | |||||||||
Cigna Corp. |
| |||||||||||
3.05% | 10/15/27 | 2,370,000 | 2,120,050 | |||||||||
Fresenius Medical Care US Finance II, Inc. |
| |||||||||||
5.63% (3) | 07/31/19 | 4,700,000 | 4,774,197 | |||||||||
Halfmoon Parent, Inc. |
| |||||||||||
4.13% (3) | 11/15/25 | 6,000,000 | 5,939,340 | |||||||||
Hartford HealthCare Corp. |
| |||||||||||
5.75% | 04/01/44 | 2,545,000 | 2,855,450 | |||||||||
Humana, Inc. |
| |||||||||||
2.63% | 10/01/19 | 1,840,000 | 1,830,998 | |||||||||
Kaiser Foundation Hospitals |
| |||||||||||
4.15% | 05/01/47 | 675,000 | 643,752 | |||||||||
NYU Hospitals Center |
| |||||||||||
4.43% | 07/01/42 | 2,755,000 | 2,709,954 | |||||||||
Saint Barnabas Health Care System |
| |||||||||||
4.00% | 07/01/28 | 3,290,000 | 3,253,344 | |||||||||
Sutter Health |
| |||||||||||
2.29% | 08/15/53 | 2,270,000 | 2,211,892 | |||||||||
UnitedHealth Group, Inc. |
| |||||||||||
4.63% | 07/15/35 | 1,200,000 | 1,239,778 | |||||||||
|
| |||||||||||
| 31,188,096 | ||||||||||||
|
| |||||||||||
See accompanying notes to financial statements.
18
Table of Contents
TCW Core Fixed Income Fund
October 31, 2018 |
| Issues | Maturity Date | Principal Amount | Value | |||||||||
| Insurance — 0.7% | ||||||||||||
Berkshire Hathaway Finance Corp. |
| |||||||||||
4.40% | 05/15/42 | $ | 500,000 | $ | 493,255 | |||||||
Farmers Exchange Capital |
| |||||||||||
7.20% (3) | 07/15/48 | 1,495,000 | 1,676,217 | |||||||||
Farmers Exchange Capital II |
| |||||||||||
6.15% (3 mo. USD LIBOR + 3.744%) (2)(3) | 11/01/53 | 2,065,000 | 2,162,875 | |||||||||
MetLife, Inc. |
| |||||||||||
5.70% | 06/15/35 | 300,000 | 334,384 | |||||||||
Protective Life Global Funding |
| |||||||||||
1.72% (3) | 04/15/19 | 3,675,000 | 3,655,020 | |||||||||
Prudential Financial, Inc. |
| |||||||||||
4.50% | 11/15/20 | 920,000 | 941,741 | |||||||||
|
| |||||||||||
| 9,263,492 | ||||||||||||
|
| |||||||||||
| Media — 0.7% | ||||||||||||
CBS Corp. |
| |||||||||||
3.70% (3) | 06/01/28 | 2,395,000 | 2,211,246 | |||||||||
Charter Communications Operating LLC / Charter Communications Operating Capital |
| |||||||||||
3.75% | 02/15/28 | 3,189,000 | 2,893,471 | |||||||||
Comcast Corp. |
| |||||||||||
4.60% | 10/15/38 | 3,820,000 | 3,744,949 | |||||||||
NBCUniversal Media LLC |
| |||||||||||
5.15% | 04/30/20 | 200,000 | 205,706 | |||||||||
|
| |||||||||||
| 9,055,372 | ||||||||||||
|
| |||||||||||
| Miscellaneous Manufacturers — 0.7% | ||||||||||||
General Electric Capital Corp. |
| |||||||||||
2.79% (3 mo. USD LIBOR + 0.480%) (2) | 08/15/36 | 3,045,000 | 2,586,718 | |||||||||
3.15% | 09/07/22 | 287,000 | 277,387 | |||||||||
General Electric Co. |
| |||||||||||
4.63% | 01/07/21 | 2,080,000 | 2,113,124 | |||||||||
4.65% | 10/17/21 | 1,205,000 | 1,232,528 | |||||||||
Siemens Financieringsmaatschappij NV (Netherlands) |
| |||||||||||
1.70% (3) | 09/15/21 | 2,633,000 | 2,511,112 | |||||||||
|
| |||||||||||
| 8,720,869 | ||||||||||||
|
| |||||||||||
| Oil & Gas — 0.1% | ||||||||||||
Petroleos Mexicanos |
| |||||||||||
6.50% (3) | 01/23/29 | 1,265,000 | 1,212,819 | |||||||||
|
| |||||||||||
| Packaging & Containers — 0.3% | ||||||||||||
Amcor Finance USA, Inc. |
| |||||||||||
3.63% (3) | 04/28/26 | 1,380,000 | 1,291,096 | |||||||||
WestRock MWV LLC |
| |||||||||||
7.38% | 09/01/19 | 1,840,000 | 1,900,029 | |||||||||
|
| |||||||||||
| 3,191,125 | ||||||||||||
|
| |||||||||||
| Issues | Maturity Date | Principal Amount | Value | |||||||||
| Pharmaceuticals — 1.5% | ||||||||||||
AbbVie, Inc. |
| |||||||||||
3.60% | 05/14/25 | $ | 953,000 | $ | 911,575 | |||||||
4.70% | 05/14/45 | 50,000 | 45,283 | |||||||||
Actavis, Inc. |
| |||||||||||
3.25% | 10/01/22 | 936,000 | 909,814 | |||||||||
Bayer US Finance II LLC |
| |||||||||||
4.38% (3) | 12/15/28 | 2,840,000 | 2,747,380 | |||||||||
Bayer US Finance LLC |
| |||||||||||
2.38% (3) | 10/08/19 | 3,215,000 | 3,182,323 | |||||||||
CVS Health Corp. |
| |||||||||||
3.88% | 07/20/25 | 3,600,000 | 3,507,315 | |||||||||
5.05% | 03/25/48 | 3,870,000 | 3,787,726 | |||||||||
Shire Acquisitions Investments Ireland DAC (Ireland) |
| |||||||||||
1.90% | 09/23/19 | 3,525,000 | 3,482,172 | |||||||||
|
| |||||||||||
| 18,573,588 | ||||||||||||
|
| |||||||||||
| Pipelines — 1.8% | ||||||||||||
Enbridge Energy Partners LP |
| |||||||||||
5.88% | 10/15/25 | 333,000 | 358,758 | |||||||||
Energy Transfer Partners LP |
| |||||||||||
5.95% | 10/01/43 | 1,380,000 | 1,338,929 | |||||||||
Florida Gas Transmission Co. LLC |
| |||||||||||
7.90% (3) | 05/15/19 | 1,150,000 | 1,178,854 | |||||||||
Kinder Morgan Energy Partners LP |
| |||||||||||
5.80% | 03/15/35 | 780,000 | 811,824 | |||||||||
Panhandle Eastern Pipe Line Co. LP |
| |||||||||||
8.13% | 06/01/19 | 760,000 | 778,752 | |||||||||
Plains All American Pipeline LP / PAA Finance Corp. |
| |||||||||||
4.65% | 10/15/25 | 2,115,000 | 2,090,317 | |||||||||
Ruby Pipeline LLC |
| |||||||||||
6.00% (3) | 04/01/22 | 1,976,136 | 2,025,705 | |||||||||
Sabine Pass Liquefaction LLC |
| |||||||||||
5.63% | 03/01/25 | 1,840,000 | 1,924,525 | |||||||||
Southern Natural Gas Co. LLC |
| |||||||||||
7.35% | 02/15/31 | 2,380,000 | 2,834,076 | |||||||||
Sunoco Logistics Partners Operations LP |
| |||||||||||
5.40% | 10/01/47 | 1,500,000 | 1,360,614 | |||||||||
TC PipeLines LP |
| |||||||||||
4.38% | 03/13/25 | 1,840,000 | 1,808,080 | |||||||||
Tennessee Gas Pipeline Co. |
| |||||||||||
8.38% | 06/15/32 | 1,920,000 | 2,408,089 | |||||||||
Texas Eastern Transmission LP |
| |||||||||||
2.80% (3) | 10/15/22 | 920,000 | 882,211 | |||||||||
TransCanada PipeLines, Ltd. (Canada) |
| |||||||||||
6.10% | 06/01/40 | 375,000 | 415,992 | |||||||||
Williams Partners LP |
| |||||||||||
3.90% | 01/15/25 | 920,000 | 883,923 | |||||||||
6.30% | 04/15/40 | 1,150,000 | 1,245,080 | |||||||||
|
| |||||||||||
| 22,345,729 | ||||||||||||
|
| |||||||||||
See accompanying notes to financial statements.
19
Table of Contents
TCW Core Fixed Income Fund
Schedule of Investments (Continued)
| Issues | Maturity Date | Principal Amount | Value | |||||||||
| REIT — 3.5% | ||||||||||||
Alexandria Real Estate Equities, Inc. |
| |||||||||||
4.60% | 04/01/22 | $ | 2,065,000 | $ | 2,121,123 | |||||||
American Campus Communities Operating Partnership LP |
| |||||||||||
3.35% | 10/01/20 | 1,840,000 | 1,829,511 | |||||||||
American Tower Corp. |
| |||||||||||
3.00% | 06/15/23 | 1,605,000 | 1,539,108 | |||||||||
3.40% | 02/15/19 | 2,400,000 | 2,402,332 | |||||||||
AvalonBay Communities, Inc. |
| |||||||||||
3.95% | 01/15/21 | 920,000 | 927,590 | |||||||||
Boston Properties LP |
| |||||||||||
3.20% | 01/15/25 | 1,605,000 | 1,526,221 | |||||||||
5.88% | 10/15/19 | 2,020,000 | 2,059,943 | |||||||||
CC Holdings GS V LLC / Crown Castle GS III Corp. |
| |||||||||||
3.85% | 04/15/23 | 1,895,000 | 1,877,170 | |||||||||
GLP Capital LP / GLP Financing II, Inc. |
| |||||||||||
5.30% | 01/15/29 | 1,280,000 | 1,262,464 | |||||||||
5.38% | 04/15/26 | 1,308,000 | 1,303,095 | |||||||||
5.75% | 06/01/28 | 1,600,000 | 1,623,000 | |||||||||
HCP, Inc. |
| |||||||||||
3.75% | 02/01/19 | 3,150,000 | 3,150,299 | |||||||||
3.88% | 08/15/24 | 2,110,000 | 2,057,863 | |||||||||
Healthcare Realty Trust, Inc. |
| |||||||||||
3.75% | 04/15/23 | 1,840,000 | 1,804,392 | |||||||||
Host Hotels & Resorts LP |
| |||||||||||
5.25% | 03/15/22 | 1,840,000 | 1,902,952 | |||||||||
SL Green Operating Partnership LP |
| |||||||||||
3.25% | 10/15/22 | 2,380,000 | 2,299,092 | |||||||||
SL Green Realty Corp. |
| |||||||||||
7.75% | 03/15/20 | 920,000 | 966,347 | |||||||||
Ventas Realty LP |
| |||||||||||
3.85% | 04/01/27 | 690,000 | 657,040 | |||||||||
Ventas Realty LP / Ventas Capital Corp. |
| |||||||||||
2.70% | 04/01/20 | 2,620,000 | 2,593,590 | |||||||||
VEREIT Operating Partnership LP |
| |||||||||||
3.00% | 02/06/19 | 763,000 | 762,778 | |||||||||
WEA Finance LLC / Westfield UK & Europe Finance PLC |
| |||||||||||
3.25% (3) | 10/05/20 | 4,595,000 | 4,574,109 | |||||||||
Welltower, Inc. |
| |||||||||||
3.75% | 03/15/23 | 555,000 | 549,307 | |||||||||
4.95% | 01/15/21 | 545,000 | 557,685 | |||||||||
6.13% | 04/15/20 | 3,125,000 | 3,238,730 | |||||||||
|
| |||||||||||
| 43,585,741 | ||||||||||||
|
| |||||||||||
| Retail — 0.7% | ||||||||||||
Alimentation Couche-Tard, Inc. (Canada) |
| |||||||||||
3.55% (3) | 07/26/27 | 3,250,000 | 3,010,007 | |||||||||
Walgreens Boots Alliance, Inc. |
| |||||||||||
2.70% | 11/18/19 | 2,755,000 | 2,740,551 | |||||||||
| Issues | Maturity Date | Principal Amount | Value | |||||||||
| Retail (Continued) | ||||||||||||
Walmart, Inc. |
| |||||||||||
3.55% | 06/26/25 | $ | 3,115,000 | $ | 3,106,198 | |||||||
|
| |||||||||||
| 8,856,756 | ||||||||||||
|
| |||||||||||
| Semiconductors — 0.3% | ||||||||||||
Broadcom Corp. / Broadcom Cayman Finance, Ltd. |
| |||||||||||
2.38% | 01/15/20 | 3,675,000 | 3,633,017 | |||||||||
|
| |||||||||||
| Software — 0.1% | ||||||||||||
Oracle Corp. |
| |||||||||||
3.25% | 11/15/27 | 1,605,000 | 1,515,775 | |||||||||
|
| |||||||||||
| Telecommunications — 1.6% | ||||||||||||
AT&T, Inc. |
| |||||||||||
3.40% | 05/15/25 | 1,220,000 | 1,146,460 | |||||||||
4.35% | 06/15/45 | 1,780,000 | 1,465,562 | |||||||||
4.75% | 05/15/46 | 2,995,000 | 2,595,476 | |||||||||
4.80% | 06/15/44 | 890,000 | 779,363 | |||||||||
5.25% | 03/01/37 | 3,155,000 | 3,014,475 | |||||||||
Qwest Corp. |
| |||||||||||
7.25% | 09/15/25 | 920,000 | 981,931 | |||||||||
Sprint Spectrum Co. LLC / Sprint Spectrum Co. II LLC / Sprint Spectrum Co. III LLC |
| |||||||||||
3.36% (3) | 03/20/23 | 750,000 | 742,537 | |||||||||
4.74% (3) | 09/20/29 | 3,240,000 | 3,244,050 | |||||||||
Verizon Communications, Inc. |
| |||||||||||
4.27% | 01/15/36 | 1,324,000 | 1,224,050 | |||||||||
4.81% | 03/15/39 | 905,000 | 878,731 | |||||||||
4.86% | 08/21/46 | 715,000 | 687,007 | |||||||||
5.01% | 04/15/49 | 150,000 | 146,542 | |||||||||
5.25% | 03/16/37 | 1,380,000 | 1,416,493 | |||||||||
Vodafone Group PLC (United Kingdom) |
| |||||||||||
4.38% | 05/30/28 | 1,470,000 | 1,419,039 | |||||||||
|
| |||||||||||
| 19,741,716 | ||||||||||||
|
| |||||||||||
| Transportation — 0.1% | ||||||||||||
Union Pacific Corp. |
| |||||||||||
3.95% | 09/10/28 | 1,250,000 | 1,227,602 | |||||||||
|
| |||||||||||
Total Corporate Bonds |
| |||||||||||
(Cost: $448,604,759) |
| 442,194,985 | ||||||||||
|
| |||||||||||
| MUNICIPAL BONDS — 0.9% | ||||||||||||
City of New York, General Obligation |
| |||||||||||
5.05% | 10/01/24 | 1,500,000 | 1,603,770 | |||||||||
Fiscal Year 2005 Securitization Corp., Special Obligation Bond for the City of New York |
| |||||||||||
4.93% | 04/01/20 | 350,000 | 353,944 | |||||||||
Los Angeles Unified School District/CA, General Obligation |
| |||||||||||
5.76% | 07/01/29 | 2,500,000 | 2,844,900 | |||||||||
New York State Dormitory Authority, Revenue Bond |
| |||||||||||
5.50% | 03/15/30 | 2,480,000 | 2,758,033 | |||||||||
See accompanying notes to financial statements.
20
Table of Contents
TCW Core Fixed Income Fund
October 31, 2018 |
| Issues | Maturity Date | Principal Amount | Value | |||||||||
| MUNICIPAL BONDS (Continued) | ||||||||||||
New York State, Build America Bonds, General Obligation |
| |||||||||||
5.82% | 10/01/31 | $ | 730,000 | $ | 760,784 | |||||||
State of California, General Obligation |
| |||||||||||
7.95% | 03/01/36 | 3,000,000 | 3,179,040 | |||||||||
|
| |||||||||||
Total Municipal Bonds |
| |||||||||||
(Cost: $12,082,241) |
| 11,500,471 | ||||||||||
|
| |||||||||||
| ASSET-BACKED SECURITIES — 7.6% | ||||||||||||
321 Henderson Receivables I LLC (13-3A-A) |
| |||||||||||
4.08% (3) | 01/17/73 | 1,571,225 | 1,571,453 | |||||||||
321 Henderson Receivables I LLC (14-2A-A) |
| |||||||||||
3.61% (3) | 01/17/73 | 1,835,422 | 1,746,844 | |||||||||
Academic Loan Funding Trust (12-1A-A2) |
| |||||||||||
3.38% (1 mo. USD LIBOR + 1.100%) (2)(3) | 12/27/44 | 2,537,928 | 2,553,408 | |||||||||
Babson CLO, Ltd. (14-IIA-AR) |
| |||||||||||
3.60% (3 mo. USD LIBOR + 1.150%) (2)(3) | 10/17/26 | 427,443 | 427,576 | |||||||||
Brazos Education Loan Authority, Inc. (12-1-A1) |
| |||||||||||
2.98% (1 mo. USD LIBOR + 0.700%) (2) | 12/26/35 | 967,691 | 966,787 | |||||||||
Brazos Higher Education Authority, Inc. (10-1-A2) |
| |||||||||||
3.51% (3 mo. USD LIBOR + 1.200%) (2) | 02/25/35 | 675,000 | 693,303 | |||||||||
Brazos Higher Education Authority, Inc. (11-1-A3) |
| |||||||||||
3.36% (3 mo. USD LIBOR + 1.050%) (2) | 11/25/33 | 1,695,000 | 1,732,955 | |||||||||
Dryden XXVI Senior Loan Fund (13-26A-AR) |
| |||||||||||
3.34% (1)(3) | 04/15/29 | 800,000 | 797,457 | |||||||||
Educational Funding of the South, Inc. (11-1-A2) |
| |||||||||||
2.99% (3 mo. USD LIBOR + 0.650%) (2) | 04/25/35 | 1,470,385 | 1,473,005 | |||||||||
Educational Services of America, Inc. (12-2-A) |
| |||||||||||
3.01% (1 mo. USD LIBOR + 0.730%) (2)(3) | 04/25/39 | 713,696 | 716,098 | |||||||||
GCO Education Loan Funding Master Trust (06-2AR-A1RN) |
| |||||||||||
2.93% (1 mo. USD LIBOR + 0.650%) (2)(3) | 08/27/46 | 2,637,556 | 2,602,522 | |||||||||
Global SC Finance SRL (14-1A-A2) |
| |||||||||||
3.09% (3) | 07/17/29 | 1,773,875 | 1,716,734 | |||||||||
GoldenTree Loan Opportunities IX, Ltd. (14-9A-AR2) |
| |||||||||||
3.62% (1)(3) | 10/29/29 | 3,100,000 | 3,100,000 | |||||||||
Higher Education Funding I (14-1-A) |
| |||||||||||
3.36% (3 mo. USD LIBOR + 1.050%) (2)(3) | 05/25/34 | 2,695,551 | 2,721,060 | |||||||||
Magnetite XI, Ltd. (14-11A-A1R) |
| |||||||||||
3.56% (3 mo. USD LIBOR + 1.120%) (2)(3) | 01/18/27 | 2,000,000 | 2,000,936 | |||||||||
| Issues | Maturity Date | Principal Amount | Value | |||||||||
| ASSET-BACKED SECURITIES (Continued) | ||||||||||||
Navient Student Loan Trust (14-2-A) |
| |||||||||||
2.93% (1 mo. USD LIBOR + 0.640%) (2) | 03/25/83 | $ | 3,935,704 | $ | 3,918,051 | |||||||
Navient Student Loan Trust (14-3-A) |
| |||||||||||
2.90% (1 mo. USD LIBOR + 0.620%) (2) | 03/25/83 | 4,013,069 | 3,999,995 | |||||||||
Navient Student Loan Trust (14-4-A) |
| |||||||||||
2.91% (1 mo. USD LIBOR + 0.620%) (2) | 03/25/83 | 1,936,470 | 1,929,269 | |||||||||
Navient Student Loan Trust (16-1A-A) |
| |||||||||||
2.99% (1 mo. USD LIBOR + 0.700%) (2)(3) | 02/25/70 | 3,948,705 | 3,966,167 | |||||||||
Navient Student Loan Trust (17-3A-A3) |
| |||||||||||
3.33% (1 mo. USD LIBOR + 1.050%) (2)(3) | 07/26/66 | 4,400,000 | 4,510,471 | |||||||||
Nelnet Student Loan Trust (11-1A-A) |
| |||||||||||
3.13% (1 mo. USD LIBOR + 0.850%) (2)(3) | 02/25/48 | 2,437,578 | 2,460,381 | |||||||||
Nelnet Student Loan Trust (14-4A-A2) |
| |||||||||||
3.23% (1 mo. USD LIBOR + 0.950%) (2)(3) | 11/25/48 | 2,965,000 | 2,986,768 | |||||||||
Nelnet Student Loan Trust (15-2A-A2) |
| |||||||||||
2.88% (1 mo. USD LIBOR + 0.600%) (2)(3) | 09/25/47 | 4,447,977 | 4,445,458 | |||||||||
Octagon Investment Partners 25, Ltd. (15-1A-AR) |
| |||||||||||
3.27% (1)(3) | 10/20/26 | 4,500,000 | 4,479,570 | |||||||||
PHEAA Student Loan Trust (15-1A-A) |
| |||||||||||
2.88% (1 mo. USD LIBOR + 0.600%) (2)(3) | 10/25/41 | 2,001,313 | 1,981,868 | |||||||||
SLM Student Loan Trust (03-7A-A5A) |
| |||||||||||
3.53% (3 mo. USD LIBOR + 1.200%) (2)(3) | 12/15/33 | 3,089,023 | 3,132,252 | |||||||||
SLM Student Loan Trust (06-2-A6) |
| |||||||||||
2.66% (3 mo. USD LIBOR + 0.170%) (2) | 01/25/41 | 3,300,939 | 3,230,538 | |||||||||
SLM Student Loan Trust (06-8-A6) |
| |||||||||||
2.65% (3 mo. USD LIBOR + 0.160%) (2) | 01/25/41 | 3,400,000 | 3,307,222 | |||||||||
SLM Student Loan Trust (07-6-A4) |
| |||||||||||
2.87% (3 mo. USD LIBOR + 0.380%) (2) | 10/25/24 | 2,345,301 | 2,350,415 | |||||||||
SLM Student Loan Trust (08-2-B) |
| |||||||||||
3.69% (3 mo. USD LIBOR + 1.200%) (2) | 01/25/83 | 710,000 | 685,680 | |||||||||
SLM Student Loan Trust (08-3-B) |
| |||||||||||
3.69% (3 mo. USD LIBOR + 1.200%) (2) | 04/26/83 | 710,000 | 695,634 | |||||||||
SLM Student Loan Trust (08-4-A4) |
| |||||||||||
4.14% (3 mo. USD LIBOR + 1.650%) (2) | 07/25/22 | 5,557,868 | 5,675,009 | |||||||||
See accompanying notes to financial statements.
21
Table of Contents
TCW Core Fixed Income Fund
Schedule of Investments (Continued)
| Issues | Maturity Date | Principal Amount | Value | |||||||||
| ASSET-BACKED SECURITIES (Continued) | ||||||||||||
SLM Student Loan Trust (08-4-B) |
| |||||||||||
4.34% (3 mo. USD LIBOR + 1.850%) (2) | 04/25/73 | $ | 710,000 | $ | 731,467 | |||||||
SLM Student Loan Trust (08-5-B) |
| |||||||||||
4.34% (3 mo. USD LIBOR + 1.850%) (2) | 07/25/73 | 710,000 | 728,529 | |||||||||
SLM Student Loan Trust (08-6-A4) |
| |||||||||||
3.59% (3 mo. USD LIBOR + 1.100%) (2) | 07/25/23 | 4,478,845 | 4,526,709 | |||||||||
SLM Student Loan Trust (08-6-B) |
| |||||||||||
4.34% (3 mo. USD LIBOR + 1.850%) (2) | 07/26/83 | 710,000 | 727,123 | |||||||||
SLM Student Loan Trust (08-7-B) |
| |||||||||||
4.34% (3 mo. USD LIBOR + 1.850%) (2) | 07/26/83 | 710,000 | 725,064 | |||||||||
SLM Student Loan Trust (08-8-B) |
| |||||||||||
4.74% (3 mo. USD LIBOR + 2.250%) (2) | 10/25/75 | 710,000 | 747,075 | |||||||||
SLM Student Loan Trust (08-9-A) |
| |||||||||||
3.99% (3 mo. USD LIBOR + 1.500%) (2) | 04/25/23 | 3,025,878 | 3,079,674 | |||||||||
SLM Student Loan Trust (08-9-B) |
| |||||||||||
4.74% (3 mo. USD LIBOR + 2.250%) (2) | 10/25/83 | 710,000 | 738,444 | |||||||||
SLM Student Loan Trust (11-2-A2) |
| |||||||||||
3.48% (1 mo. USD LIBOR + 1.200%) (2) | 10/25/34 | 2,000,000 | 2,061,363 | |||||||||
SLM Student Loan Trust (12-7-A3) |
| |||||||||||
2.93% (1 mo. USD LIBOR + 0.650%) (2) | 05/26/26 | 2,346,546 | 2,326,819 | |||||||||
|
| |||||||||||
Total Asset-backed Securities |
| |||||||||||
(Cost: $93,357,859) |
| 94,967,153 | ||||||||||
|
| |||||||||||
| COMMERCIAL MORTGAGE-BACKED SECURITIES — AGENCY — 4.5% | ||||||||||||
Fannie Mae (14-M12-FA) (ACES) |
| |||||||||||
2.46% (1 mo. USD LIBOR + 0.300%) (2) | 10/25/21 | 809,904 | 810,556 | |||||||||
Fannie Mae, Pool #467944 |
| |||||||||||
4.25% | 04/01/21 | 3,045,000 | 3,107,776 | |||||||||
Fannie Mae, Pool #468048 |
| |||||||||||
4.41% | 05/01/21 | 1,710,335 | 1,744,725 | |||||||||
Fannie Mae, Pool #AE0134 |
| |||||||||||
4.40% | 02/01/20 | 254,242 | 257,326 | |||||||||
Fannie Mae, Pool #AE0918 |
| |||||||||||
3.67% | 10/01/20 | 2,004,557 | 2,019,989 | |||||||||
Fannie Mae, Pool #AM1551 |
| |||||||||||
2.44% | 12/01/23 | 2,225,597 | 2,141,035 | |||||||||
Fannie Mae, Pool #AM3058 |
| |||||||||||
3.41% | 04/01/28 | 3,429,149 | 3,379,860 | |||||||||
| Issues | Maturity Date | Principal Amount | Value | |||||||||
| COMMERCIAL MORTGAGE-BACKED SECURITIES — AGENCY (Continued) | ||||||||||||
Fannie Mae, Pool #AM4198 |
| |||||||||||
3.55% | 03/01/24 | $ | 3,441,729 | $ | 3,485,553 | |||||||
Fannie Mae, Pool #AM9536 |
| |||||||||||
3.34% | 08/01/30 | 2,977,852 | 2,874,372 | |||||||||
Fannie Mae, Pool #AN0245 |
| |||||||||||
3.42% | 11/01/35 | 2,226,795 | 2,145,189 | |||||||||
Fannie Mae, Pool #AN5742 |
| |||||||||||
3.19% | 05/01/30 | 3,405,185 | 3,213,296 | |||||||||
Fannie Mae, Pool #AN5977 |
| |||||||||||
3.49% | 02/01/33 | 3,000,000 | 2,842,318 | |||||||||
Fannie Mae, Pool #AN9655 |
| |||||||||||
3.71% | 06/01/30 | 4,480,000 | 4,421,154 | |||||||||
Fannie Mae, Pool #FN0000 |
| |||||||||||
3.59% | 09/01/20 | 1,398,031 | 1,407,045 | |||||||||
Fannie Mae, Pool #FN0003 |
| |||||||||||
4.28% | 01/01/21 | 1,991,565 | 2,032,563 | |||||||||
Freddie Mac Multifamily Structured Pass-Through Certificates (K155-A3) |
| |||||||||||
3.75% | 04/25/33 | 4,045,000 | 3,999,886 | |||||||||
Freddie Mac Multifamily Structured Pass-Through Certificates (KJ05-A1) |
| |||||||||||
1.42% | 05/25/21 | 3,178,497 | 3,122,578 | |||||||||
Freddie Mac Multifamily Structured Pass-Through Certificates (Q004-A2H) |
| |||||||||||
2.80% (1) | 01/25/21 | 7,148,681 | 7,136,602 | |||||||||
Freddie Mac Multifamily Structured Pass-Through Certificates (Q006-A-PT2) |
| |||||||||||
2.48% (1) | 09/25/26 | 4,956,380 | 4,990,455 | |||||||||
NCUA Guaranteed Notes (11-C1-2A) |
| |||||||||||
2.75% (1 mo. USD LIBOR + 0.530%) (2) | 03/09/21 | 731,924 | 732,336 | |||||||||
|
| |||||||||||
Total Commercial Mortgage-backed Securities — Agency |
| |||||||||||
(Cost: $58,463,998) |
| 55,864,614 | ||||||||||
|
| |||||||||||
| COMMERCIAL MORTGAGE-BACKED SECURITIES — NON-AGENCY — 1.7% | ||||||||||||
BAMLL Commercial Mortgage Securities Trust (18-PARK-A) |
| |||||||||||
4.09% (1)(3) | 08/10/38 | 1,930,000 | 1,947,025 | |||||||||
BBCMS Trust (13-TYSN-A2) |
| |||||||||||
3.76% (3) | 09/05/32 | 1,740,000 | 1,750,434 | |||||||||
CGRBS Commercial Mortgage Trust (13-VN05-A) |
| |||||||||||
3.37% (3) | 03/13/35 | 1,700,000 | 1,682,842 | |||||||||
CityLine Commercial Mortgage Trust (16-CLNE-A) |
| |||||||||||
2.78% (1)(3) | 11/10/31 | 1,815,000 | 1,746,513 | |||||||||
COMM Mortgage Trust (13-300P-A1) |
| |||||||||||
4.35% (3) | 08/10/30 | 1,515,000 | 1,566,393 | |||||||||
COMM Mortgage Trust (14-277P-A) |
| |||||||||||
3.61% (1)(3) | 08/10/49 | 400,000 | 399,310 | |||||||||
See accompanying notes to financial statements.
22
Table of Contents
TCW Core Fixed Income Fund
October 31, 2018 |
| Issues | Maturity Date | Principal Amount | Value | |||||||||
| COMMERCIAL MORTGAGE-BACKED SECURITIES — NON-AGENCY (Continued) | ||||||||||||
COMM Mortgage Trust (16-787S-A) |
| |||||||||||
3.55% (3) | 02/10/36 | $ | 1,635,000 | $ | 1,597,546 | |||||||
Core Industrial Trust (15-CALW-A) |
| |||||||||||
3.04% (3) | 02/10/34 | 1,375,573 | 1,361,137 | |||||||||
OBP Depositor LLC Trust (10-OBP-A) |
| |||||||||||
4.65% (3) | 07/15/45 | 2,055,000 | 2,089,370 | |||||||||
SFAVE Commercial Mortgage Securities Trust (15-5AVE-A1) |
| |||||||||||
3.87% (1)(3) | 01/05/43 | 1,710,000 | 1,589,358 | |||||||||
VNDO Mortgage Trust (12-6AVE-A) |
| |||||||||||
3.00% (3) | 11/15/30 | 1,550,000 | 1,517,066 | |||||||||
VNDO Mortgage Trust (13-PENN-A) |
| |||||||||||
3.81% (3) | 12/13/29 | 1,675,000 | 1,685,798 | |||||||||
Wells Fargo Commercial Mortgage Trust (13-120B-A) (P/O) |
| |||||||||||
2.71% (1)(3) | 03/18/28 | 1,695,000 | 1,681,652 | |||||||||
WF-RBS Commercial Mortgage Trust (11-C4-A3) |
| |||||||||||
4.39% (3) | 06/15/44 | 342,413 | 343,583 | |||||||||
|
| |||||||||||
Total Commercial Mortgage-backed Securities — Non-agency |
| |||||||||||
(Cost: $21,706,965) |
| 20,958,027 | ||||||||||
|
| |||||||||||
| RESIDENTIAL MORTGAGE-BACKED SECURITIES — AGENCY — 27.5% | ||||||||||||
Fannie Mae (01-14-SH) (I/F) |
| |||||||||||
19.84% (-3.50 x 1 mo. USD LIBOR + 27.825%) (2) | 03/25/30 | 154,838 | 212,268 | |||||||||
Fannie Mae (01-34-FV) |
| |||||||||||
2.78% (1 mo. USD LIBOR + 0.500%) (2) | 08/25/31 | 191,588 | 192,434 | |||||||||
Fannie Mae (04-W10-A6) (PAC) |
| |||||||||||
5.75% | 08/25/34 | 2,000,000 | 2,090,193 | |||||||||
Fannie Mae (07-89-GF) |
| |||||||||||
2.80% (1 mo. USD LIBOR + 0.520%) (2) | 09/25/37 | 755,527 | 763,005 | |||||||||
Fannie Mae (08-30-SA) (I/O) (I/F) |
| |||||||||||
4.57% (-1.00 x 1 mo. USD LIBOR + 6.850%) (2) | 04/25/38 | 118,600 | 17,611 | |||||||||
Fannie Mae (08-62-SN) (I/O) (I/F) |
| |||||||||||
3.92% (-1.00 x 1 mo. USD LIBOR + 6.200%) (2) | 07/25/38 | 186,832 | 24,572 | |||||||||
Fannie Mae (09-64-TB) |
| |||||||||||
4.00% | 08/25/29 | 1,816,272 | 1,856,072 | |||||||||
Fannie Mae (09-68-SA) (I/O) (I/F) |
| |||||||||||
4.47% (-1.00 x 1 mo. USD LIBOR + 6.750%) (2) | 09/25/39 | 88,122 | 13,112 | |||||||||
Fannie Mae (10-26-AS) (I/O) (I/F) |
| |||||||||||
4.05% (-1.00 x 1 mo. USD LIBOR + 6.330%) (2) | 03/25/40 | 1,432,927 | 154,966 | |||||||||
| Issues | Maturity Date | Principal Amount | Value | |||||||||
| RESIDENTIAL MORTGAGE-BACKED SECURITIES — AGENCY (Continued) | ||||||||||||
Fannie Mae (11-111-DB) |
| |||||||||||
4.00% | 11/25/41 | $ | 4,000,000 | $ | 4,037,166 | |||||||
Fannie Mae, Pool #254634 |
| |||||||||||
5.50% | 02/01/23 | 11,046 | 11,712 | |||||||||
Fannie Mae, Pool #596686 |
| |||||||||||
6.50% | 11/01/31 | 12,323 | 13,225 | |||||||||
Fannie Mae, Pool #679263 |
| |||||||||||
4.50% | 11/01/24 | 21,390 | 21,916 | |||||||||
Fannie Mae, Pool #725275 |
| |||||||||||
4.00% | 03/01/19 | 250 | 250 | |||||||||
Fannie Mae, Pool #727575 |
| |||||||||||
5.00% | 06/01/33 | 40,184 | 41,383 | |||||||||
Fannie Mae, Pool #748751 |
| |||||||||||
5.50% | 10/01/33 | 96,034 | 99,943 | |||||||||
Fannie Mae, Pool #AB2127 |
| |||||||||||
3.50% | 01/01/26 | 978,092 | 981,239 | |||||||||
Fannie Mae, Pool #AL0209 |
| |||||||||||
4.50% | 05/01/41 | 713,485 | 741,129 | |||||||||
Fannie Mae, Pool #AL0851 |
| |||||||||||
6.00% | 10/01/40 | 732,061 | 791,252 | |||||||||
Fannie Mae, Pool #AS9830 |
| |||||||||||
4.00% | 06/01/47 | 4,869,423 | 4,877,459 | |||||||||
Fannie Mae, Pool #CA1710 |
| |||||||||||
4.50% | 05/01/48 | 8,037,120 | 8,236,792 | |||||||||
Fannie Mae, Pool #CA1711 |
| |||||||||||
4.50% | 05/01/48 | 5,722,685 | 5,864,886 | |||||||||
Fannie Mae, Pool #CA2208 |
| |||||||||||
4.50% | 08/01/48 | 5,091,424 | 5,217,914 | |||||||||
Fannie Mae, Pool #MA1561 |
| |||||||||||
3.00% | 09/01/33 | 3,235,087 | 3,153,704 | |||||||||
Fannie Mae, Pool #MA1584 |
| |||||||||||
3.50% | 09/01/33 | 5,139,845 | 5,088,347 | |||||||||
Fannie Mae, Pool #MA2995 |
| |||||||||||
4.00% | 05/01/47 | 5,639,477 | 5,642,208 | |||||||||
Fannie Mae, Pool #MA3027 |
| |||||||||||
4.00% | 06/01/47 | 4,832,198 | 4,834,547 | |||||||||
Fannie Mae, Pool #MA3182 |
| |||||||||||
3.50% | 11/01/47 | 1,658,932 | 1,615,875 | |||||||||
Fannie Mae, Pool #MA3210 |
| |||||||||||
3.50% | 12/01/47 | 10,632,551 | 10,356,588 | |||||||||
Fannie Mae, Pool #MA3332 |
| |||||||||||
3.50% (6) | 04/01/48 | 10,371,492 | 10,100,955 | |||||||||
Fannie Mae, Pool #MA3333 |
| |||||||||||
4.00% | 04/01/48 | 2,238,943 | 2,240,323 | |||||||||
Fannie Mae, Pool #MA3415 |
| |||||||||||
4.00% | 07/01/48 | 1,768,698 | 1,769,569 | |||||||||
Fannie Mae TBA, 15 Year |
| |||||||||||
3.00% (7) | 03/01/33 | 730,000 | 716,428 | |||||||||
See accompanying notes to financial statements.
23
Table of Contents
TCW Core Fixed Income Fund
Schedule of Investments (Continued)
| Issues | Maturity Date | Principal Amount | Value | |||||||||
| RESIDENTIAL MORTGAGE-BACKED SECURITIES — AGENCY (Continued) | ||||||||||||
Fannie Mae TBA, 30 Year |
| |||||||||||
4.00% (7) | 05/01/48 | $ | 8,420,000 | $ | 8,420,658 | |||||||
4.50% (7) | 05/01/48 | 6,185,000 | 6,332,377 | |||||||||
Freddie Mac (2439-KZ) |
| |||||||||||
6.50% | 04/15/32 | 148,340 | 162,128 | |||||||||
Freddie Mac (2575-FD) (PAC) |
| |||||||||||
2.73% (1 mo. USD LIBOR + 0.450%)(2) | 02/15/33 | 357,224 | 360,261 | |||||||||
Freddie Mac (2662-MT) (TAC) |
| |||||||||||
4.50% | 08/15/33 | 220,490 | 225,992 | |||||||||
Freddie Mac (3315-S) (I/O) (I/F) |
| |||||||||||
4.13% (-1.00 x 1 mo. USD LIBOR + 6.410%) (2) | 05/15/37 | 40,831 | 4,235 | |||||||||
Freddie Mac (3339-JS) (I/F) |
| |||||||||||
28.02% (-6.50 x 1 mo. USD LIBOR + 42.835%) (2) | 07/15/37 | 488,862 | 831,472 | |||||||||
Freddie Mac (3351-ZC) |
| |||||||||||
5.50% | 07/15/37 | 379,607 | 408,771 | |||||||||
Freddie Mac (3380-SM) (I/O) (I/F) |
| |||||||||||
4.13% (-1.00 x 1 mo. USD LIBOR + 6.410%) (2) | 10/15/37 | 582,845 | 73,888 | |||||||||
Freddie Mac (3382-FL) |
| |||||||||||
2.98% (1 mo. USD LIBOR + 0.700%) (2) | 11/15/37 | 209,595 | 211,615 | |||||||||
Freddie Mac (3439-SC) (I/O) (I/F) |
| |||||||||||
3.62% (-1.00 x 1 mo. USD LIBOR + 5.900%) (2) | 04/15/38 | 2,111,266 | 251,926 | |||||||||
Freddie Mac (3578-DI) (I/O) (I/F) |
| |||||||||||
4.37% (-1.00 x 1 mo. USD LIBOR + 6.650%) (2) | 04/15/36 | 863,681 | 109,305 | |||||||||
Freddie Mac (4818-CA) |
| |||||||||||
3.00% | 04/15/48 | 3,252,856 | 3,071,535 | |||||||||
Freddie Mac, Pool #A97179 |
| |||||||||||
4.50% | 03/01/41 | 2,243,223 | 2,325,416 | |||||||||
Freddie Mac, Pool #B15026 |
| |||||||||||
5.00% | 06/01/19 | 1,122 | 1,128 | |||||||||
Freddie Mac, Pool #B15591 |
| |||||||||||
5.00% | 07/01/19 | 1,088 | 1,094 | |||||||||
Freddie Mac, Pool #C90526 |
| |||||||||||
5.50% | 02/01/22 | 8,207 | 8,407 | |||||||||
Freddie Mac, Pool #G06360 |
| |||||||||||
4.00% | 03/01/41 | 2,662,512 | 2,684,682 | |||||||||
Freddie Mac, Pool #G06498 |
| |||||||||||
4.00% | 04/01/41 | 1,938,652 | 1,958,714 | |||||||||
Freddie Mac, Pool #G06499 |
| |||||||||||
4.00% | 03/01/41 | 1,413,670 | 1,428,299 | |||||||||
Freddie Mac, Pool #G07849 |
| |||||||||||
3.50% | 05/01/44 | 1,560,145 | 1,532,168 | |||||||||
| Issues | Maturity Date | Principal Amount | Value | |||||||||
| RESIDENTIAL MORTGAGE-BACKED SECURITIES — AGENCY (Continued) | ||||||||||||
Freddie Mac, Pool #G07924 |
| |||||||||||
3.50% | 01/01/45 | $ | 3,088,003 | $ | 3,025,449 | |||||||
Freddie Mac, Pool #G08710 |
| |||||||||||
3.00% | 06/01/46 | 4,834,472 | 4,579,667 | |||||||||
Freddie Mac, Pool #G08711 |
| |||||||||||
3.50% | 06/01/46 | 9,421,028 | 9,198,837 | |||||||||
Freddie Mac, Pool #G08715 |
| |||||||||||
3.00% | 08/01/46 | 9,051,561 | 8,574,491 | |||||||||
Freddie Mac, Pool #G08716 |
| |||||||||||
3.50% | 08/01/46 | 6,286,812 | 6,136,297 | |||||||||
Freddie Mac, Pool #G08721 |
| |||||||||||
3.00% | 09/01/46 | 7,324,707 | 6,938,652 | |||||||||
Freddie Mac, Pool #G08722 |
| |||||||||||
3.50% | 09/01/46 | 2,487,158 | 2,429,780 | |||||||||
Freddie Mac, Pool #G08726 |
| |||||||||||
3.00% | 10/01/46 | 7,024,969 | 6,654,712 | |||||||||
Freddie Mac, Pool #G08732 |
| |||||||||||
3.00% | 11/01/46 | 6,811,298 | 6,452,303 | |||||||||
Freddie Mac, Pool #G08795 |
| |||||||||||
3.00% | 01/01/48 | 1,376,719 | 1,302,897 | |||||||||
Freddie Mac, Pool #G08816 |
| |||||||||||
3.50% | 06/01/48 | 2,184,685 | 2,128,218 | |||||||||
Freddie Mac, Pool #G08826 |
| |||||||||||
5.00% | 06/01/48 | 1,803,860 | 1,885,065 | |||||||||
Freddie Mac, Pool #G18592 |
| |||||||||||
3.00% | 03/01/31 | 2,145,284 | 2,105,719 | |||||||||
Freddie Mac, Pool #G18670 |
| |||||||||||
3.00% | 12/01/32 | 1,598,988 | 1,567,049 | |||||||||
Freddie Mac, Pool #G60344 |
| |||||||||||
4.00% | 12/01/45 | 1,421,626 | 1,431,554 | |||||||||
Freddie Mac, Pool #G67700 |
| |||||||||||
3.50% | 08/01/46 | 2,093,010 | 2,048,937 | |||||||||
Freddie Mac, Pool #G67703 |
| |||||||||||
3.50% | 04/01/47 | 12,411,183 | 12,142,078 | |||||||||
Freddie Mac, Pool #G67706 |
| |||||||||||
3.50% | 12/01/47 | 8,241,228 | 8,048,138 | |||||||||
Freddie Mac, Pool #G67707 |
| |||||||||||
3.50% | 01/01/48 | 14,435,522 | 14,108,250 | |||||||||
Freddie Mac, Pool #G67708 |
| |||||||||||
3.50% | 03/01/48 | 16,048,275 | 15,667,565 | |||||||||
Freddie Mac, Pool #G67710 |
| |||||||||||
3.50% | 03/01/48 | 14,010,849 | 13,660,393 | |||||||||
Freddie Mac, Pool #G67711 |
| |||||||||||
4.00% | 03/01/48 | 4,621,250 | 4,650,345 | |||||||||
Freddie Mac, Pool #Q05261 |
| |||||||||||
3.50% | 12/01/41 | 2,220,333 | 2,185,721 | |||||||||
Freddie Mac, Pool #Q20178 |
| |||||||||||
3.50% | 07/01/43 | 3,784,863 | 3,712,297 | |||||||||
See accompanying notes to financial statements.
24
Table of Contents
TCW Core Fixed Income Fund
October 31, 2018 |
| Issues | Maturity Date | Principal Amount | Value | |||||||||
| RESIDENTIAL MORTGAGE-BACKED SECURITIES — AGENCY (Continued) | ||||||||||||
Freddie Mac TBA, 15 Year |
| |||||||||||
3.50% (7) | 03/01/33 | $ | 11,370,000 | $ | 11,365,120 | |||||||
Freddie Mac TBA, 30 Year |
| |||||||||||
3.50% (7) | 03/04/48 | 7,510,000 | 7,311,103 | |||||||||
Ginnie Mae (04-30-UC) (PAC) |
| |||||||||||
5.50% | 02/20/34 | 73,136 | 73,380 | |||||||||
Ginnie Mae (08-27-SI) (I/O) (I/F) |
| |||||||||||
4.19% (-1.00 x 1 mo. USD LIBOR + 6.470%) (2) | 03/20/38 | 366,309 | 49,912 | |||||||||
Ginnie Mae (08-81-S) (I/O) (I/F) |
| |||||||||||
3.92% (-1.00 x 1 mo. USD LIBOR + 6.200%) (2) | 09/20/38 | 1,401,140 | 184,458 | |||||||||
Ginnie Mae (09-66-UF) |
| |||||||||||
3.28% (1 mo. USD LIBOR + 1.000%) (2) | 08/16/39 | 554,771 | 568,724 | |||||||||
Ginnie Mae (10-1-S) (I/O) (I/F) |
| |||||||||||
3.47% (-1.00 x 1 mo. USD LIBOR + 5.750%) (2) | 01/20/40 | 2,211,751 | 208,579 | |||||||||
Ginnie Mae (18-124-NW) |
| |||||||||||
3.50% | 09/20/48 | 2,591,382 | 2,548,118 | |||||||||
Ginnie Mae, Pool #608259 |
| |||||||||||
4.50% | 08/15/33 | 46,910 | 48,460 | |||||||||
Ginnie Mae, Pool #782114 |
| |||||||||||
5.00% | 09/15/36 | 149,731 | 158,595 | |||||||||
Ginnie Mae, Pool #MA4127 |
| |||||||||||
3.50% | 12/20/46 | 4,962,789 | 4,888,218 | |||||||||
Ginnie Mae II, Pool #MA3521 |
| |||||||||||
3.50% | 03/20/46 | 3,947,801 | 3,887,836 | |||||||||
Ginnie Mae II, Pool #MA3597 |
| |||||||||||
3.50% | 04/20/46 | 3,810,247 | 3,751,196 | |||||||||
Ginnie Mae II, Pool #MA3663 |
| |||||||||||
3.50% | 05/20/46 | 3,853,827 | 3,793,506 | |||||||||
Ginnie Mae II, Pool #MA4126 |
| |||||||||||
3.00% | 12/20/46 | 9,814,275 | 9,405,017 | |||||||||
Ginnie Mae II, Pool #MA4196 |
| |||||||||||
3.50% | 01/20/47 | 3,226,173 | 3,175,193 | |||||||||
Ginnie Mae II, Pool #MA4454 |
| |||||||||||
5.00% | 05/20/47 | 1,365,987 | 1,422,694 | |||||||||
Ginnie Mae II, Pool #MA4510 |
| |||||||||||
3.50% | 06/20/47 | 1,834,848 | 1,803,939 | |||||||||
Ginnie Mae II, Pool #MA4589 |
| |||||||||||
5.00% | 07/20/47 | 3,686,451 | 3,838,295 | |||||||||
Ginnie Mae II, Pool #MA4722 |
| |||||||||||
5.00% | 09/20/47 | 1,337,141 | 1,392,008 | |||||||||
Ginnie Mae II, Pool #MA4777 |
| |||||||||||
3.00% | 10/20/47 | 1,356,855 | 1,297,565 | |||||||||
Ginnie Mae II, Pool #MA4836 |
| |||||||||||
3.00% | 11/20/47 | 5,342,174 | 5,113,338 | |||||||||
| Issues | Maturity Date | Principal Amount | Value | |||||||||
| RESIDENTIAL MORTGAGE-BACKED SECURITIES — AGENCY (Continued) | ||||||||||||
Ginnie Mae II, Pool #MA4838 |
| |||||||||||
4.00% | 11/20/47 | $ | 3,873,952 | $ | 3,902,329 | |||||||
Ginnie Mae II TBA, 30 Year |
| |||||||||||
3.50% (7) | 12/01/47 | 1,080,000 | 1,060,805 | |||||||||
4.00% (7) | 05/01/48 | 4,045,000 | 4,071,229 | |||||||||
4.50% (7) | 05/01/48 | 14,170,000 | 14,535,320 | |||||||||
|
| |||||||||||
Total Residential Mortgage-backed Securities — Agency |
| |||||||||||
(Cost: $354,777,114) |
| 342,672,465 | ||||||||||
|
| |||||||||||
| RESIDENTIAL MORTGAGE-BACKED SECURITIES — NON-AGENCY — 6.0% | ||||||||||||
Aegis Asset Backed Securities Trust (05-5-2A) |
| |||||||||||
2.53% (1 mo. USD LIBOR + 0.250%)(2) | 12/25/35 | 4,717,618 | 4,719,754 | |||||||||
Banc of America Funding Trust (15-R2-9A1) |
| |||||||||||
2.50% (1 mo. USD LIBOR + 0.215%) (2)(3) | 03/27/36 | 2,776,476 | 2,738,700 | |||||||||
Bear Stearns Asset-Backed Securities Trust (06-HE1-1M1) |
| |||||||||||
2.69% (1 mo. USD LIBOR + 0.410%) (2) | 12/25/35 | 783,913 | 789,288 | |||||||||
Centex Home Equity (02-C-AF6) |
| |||||||||||
4.50% (1) | 09/25/32 | 31,411 | 31,556 | |||||||||
CIM Trust (17-7-A) |
| |||||||||||
3.00% (1)(3) | 04/25/57 | 7,337,196 | 7,255,313 | |||||||||
Citigroup Mortgage Loan Trust, Inc. (05-5-2A2) |
| |||||||||||
5.75% (8) | 08/25/35 | 332,971 | 261,201 | |||||||||
COLT Mortgage Loan Trust (17-2-A1A) |
| |||||||||||
2.42% (1)(3) | 10/25/47 | 4,201,076 | 4,183,213 | |||||||||
Conseco Financial Corp. (98-6-A8) |
| |||||||||||
6.66% (1) | 06/01/30 | 659,865 | 691,860 | |||||||||
Credit Suisse First Boston Mortgage Securities Corp. (03-8-4PPA) |
| |||||||||||
5.75% | 04/22/33 | 7,605 | 7,901 | |||||||||
Credit Suisse Mortgage Capital Certificates (15-5R-1A1) |
| |||||||||||
2.76% (1)(3) | 09/27/46 | 4,016,762 | 3,906,846 | |||||||||
CSMC Series, Ltd. (10-3R-2A3) |
| |||||||||||
4.50% (1)(3) | 12/26/36 | 3,601,000 | 3,650,677 | |||||||||
CSMC Trust (14-7R-8A1) |
| |||||||||||
3.74% (1)(3) | 07/27/37 | 2,976,061 | 2,971,309 | |||||||||
CSMC Trust (18-RPL9-A) |
| |||||||||||
3.85% (1)(3) | 09/25/57 | 5,983,156 | 5,967,886 | |||||||||
GSAA Home Equity Trust (05-11-2A2) |
| |||||||||||
2.60% (1 mo. USD LIBOR + 0.320%) (2) | 10/25/35 | 1,520,813 | 1,497,687 | |||||||||
Home Equity Asset Trust (06-3-1A1) |
| |||||||||||
2.48% (1 mo. USD LIBOR + 0.200%) (2) | 07/25/36 | 3,910,512 | 3,916,757 | |||||||||
See accompanying notes to financial statements.
25
Table of Contents
TCW Core Fixed Income Fund
Schedule of Investments (Continued)
| Issues | Maturity Date | Principal Amount | Value | |||||||||
| RESIDENTIAL MORTGAGE-BACKED SECURITIES — NON-AGENCY (Continued) | ||||||||||||
Indymac Index Mortgage Loan Trust (05-AR6-2A1) |
| |||||||||||
2.76% (1 mo. USD LIBOR + 0.480%) (2) | 04/25/35 | $ | 902,367 | $ | 873,777 | |||||||
Mid-State Trust (04-1-B) |
| |||||||||||
8.90% | 08/15/37 | 1,240,399 | 1,404,757 | |||||||||
Morgan Stanley Capital, Inc. (04-WMC2-M1) |
| |||||||||||
3.20% (1 mo. USD LIBOR + 0.915%) (2) | 07/25/34 | 1,274,137 | 1,300,460 | |||||||||
Morgan Stanley Home Equity Loan Trust (05-1-M3) |
| |||||||||||
3.06% (1 mo. USD LIBOR + 0.780%) (2) | 12/25/34 | 2,522,027 | 2,537,139 | |||||||||
Morgan Stanley Mortgage Loan Trust (04-3-4A) |
| |||||||||||
5.64% (1) | 04/25/34 | 209,547 | 221,758 | |||||||||
New Century Home Equity Loan Trust (05-3-M2) |
| |||||||||||
3.02% (1 mo. USD LIBOR + 0.735%) (2) | 07/25/35 | 1,193,877 | 1,198,061 | |||||||||
New Century Home Equity Loan Trust (05-D-A1) |
| |||||||||||
2.50% (1 mo. USD LIBOR + 0.220%) (2) | 02/25/36 | 5,981,889 | 5,949,250 | |||||||||
Nomura Resecuritization Trust (14-5R-3A1) |
| |||||||||||
2.46% (1 mo. USD LIBOR + 0.240%) (2)(3) | 05/26/37 | 943,131 | 938,724 | |||||||||
Nomura Resecuritization Trust (15-1R-6A1) |
| |||||||||||
2.53% (1 mo. USD LIBOR + 0.210%) (2)(3) | 05/26/47 | 872,928 | 873,451 | |||||||||
Nomura Resecuritization Trust (15-5R-2A1) |
| |||||||||||
4.11% (1)(3) | 03/26/35 | 2,246,481 | 2,271,271 | |||||||||
Structured Asset Securities Corp. (03-34A-5A4) |
| |||||||||||
4.33% (1) | 11/25/33 | 402,640 | 410,626 | |||||||||
WaMu Mortgage Pass-Through Certificates (05-AR15-A1A1) |
| |||||||||||
2.54% (1 mo. USD LIBOR + 0.260%) (2) | 11/25/45 | 5,492,440 | 5,466,914 | |||||||||
WaMu Mortgage Pass-Through Certificates (05-AR3-A2) |
| |||||||||||
3.66% (1) | 03/25/35 | 1,701,275 | 1,724,869 | |||||||||
Wells Fargo Alternative Loan Trust (07-PA3-2A1) |
| |||||||||||
6.00% | 07/25/37 | 126,033 | 123,829 | |||||||||
Wells Fargo Home Equity Trust (04-2-A33) |
| |||||||||||
3.28% (1 mo. USD LIBOR + 1.000%) (2) | 10/25/34 | 6,654,879 | 6,685,865 | |||||||||
|
| |||||||||||
Total Residential Mortgage-backed Securities — Non-agency |
| |||||||||||
(Cost: $73,010,401) |
| 74,570,699 | ||||||||||
|
| |||||||||||
| U.S. TREASURY SECURITIES — 19.1% | ||||||||||||
U.S. Treasury Bond |
| |||||||||||
3.00% | 08/15/48 | 88,208,000 | 81,578,618 | |||||||||
U.S. Treasury Note |
| |||||||||||
0.75% (9) | 07/15/28 | 3,239,448 | 3,139,270 | |||||||||
1.00% (9) | 02/15/48 | 3,854,787 | 3,564,387 | |||||||||
2.75% | 09/30/20 | 3,105,000 | 3,098,087 | |||||||||
| Issues | Maturity Date | Principal Amount | Value | |||||||||
| U.S. TREASURY SECURITIES (Continued) | ||||||||||||
2.75% | 07/31/23 | $ 10,985,000 | $ | 10,872,146 | ||||||||
2.88% | 09/30/23 | 53,015,000 | 52,747,638 | |||||||||
2.88% | 10/31/23 | 33,345,000 | 33,176,898 | |||||||||
2.88% | 08/15/28 | 51,843,000 | 50,622,423 | |||||||||
|
| |||||||||||
Total U.S. Treasury Securities |
| |||||||||||
(Cost: $241,706,852) | 238,799,467 | |||||||||||
|
| |||||||||||
Total Fixed Income Securities |
| |||||||||||
(Cost: $1,303,710,189) | 1,281,527,881 | |||||||||||
|
| |||||||||||
| Shares | ||||||||||||
MONEY MARKET INVESTMENTS — 0.4% |
| |||||||||||
Dreyfus Government Cash Management Fund — Institutional Shares, 2.05% (9) |
| 944,000 | 944,000 | |||||||||
State Street Institutional U.S. Government Money Market Fund — Premier Class, 2.09% (10) |
| 3,643,808 | 3,643,808 | |||||||||
|
| |||||||||||
Total Money Market Investments |
| |||||||||||
(Cost: $4,587,808) | 4,587,808 | |||||||||||
|
| |||||||||||
| Principal Amount | ||||||||||||
SHORT TERM INVESTMENTS — 1.3% |
| |||||||||||
| FOREIGN GOVERNMENT BONDS — 1.0% | ||||||||||||
Japan Treasury Bill |
| |||||||||||
0.00% (11) | 01/28/19 | JPY | 710,000,000 | 6,296,040 | ||||||||
0.00% (11) | 01/09/19 | JPY | 720,000,000 | 6,383,664 | ||||||||
|
| |||||||||||
Total Foreign Government Bonds |
| |||||||||||
(Cost: $12,658,285) |
| 12,679,704 | ||||||||||
|
| |||||||||||
| U.S. TREASURY SECURITIES — 0.1% | ||||||||||||
U.S. Treasury Bill |
| |||||||||||
2.12% (12)(13) | 12/13/18 | 61,000 | 60,848 | |||||||||
2.12% (12) | 12/13/18 | 1,131,000 | 1,128,176 | |||||||||
|
| |||||||||||
Total U.S. Treasury Securities |
| |||||||||||
(Cost: $1,189,074) |
| 1,189,024 | ||||||||||
|
| |||||||||||
| COMMERCIAL PAPER — 0.2% (Cost: $2,501,491) | ||||||||||||
| Auto Manufacturers — 0.2% | ||||||||||||
Ford Motor Credit Co. |
| |||||||||||
3.18% | 04/04/19 | 2,535,000 | 2,500,586 | |||||||||
|
| |||||||||||
Total Short Term Investments |
| |||||||||||
(Cost: $16,348,850) |
| 16,369,314 | ||||||||||
|
| |||||||||||
Total Investments (104.5%) |
| |||||||||||
(Cost: $1,324,646,847) |
| 1,302,485,003 | ||||||||||
Liabilities In Excess Of Other Assets (-4.5%) |
| (56,267,061 | ) | |||||||||
|
| |||||||||||
Net Assets (100.0%) |
| $ | 1,246,217,942 | |||||||||
|
| |||||||||||
See accompanying notes to financial statements.
26
Table of Contents
TCW Core Fixed Income Fund
October 31, 2018 |
| Futures | ||||||||||||||||||
| Number of Contracts | Type | Expiration Date | Notional Value | Market Value | Net Unrealized Appreciation/ Depreciation | |||||||||||||
Long Futures | ||||||||||||||||||
| 453 | 2-Year U.S. Treasury Note Futures | 12/31/18 | $ | 95,723,626 | $ | 95,427,281 | $ | (296,345 | ) | |||||||||
| 1,394 | 5-Year U.S. Treasury Note Futures | 12/31/18 | 157,937,503 | 156,661,641 | (1,275,862 | ) | ||||||||||||
|
|
|
|
|
| |||||||||||||
| $ | 253,661,129 | $ | 252,088,922 | $ | (1,572,207 | ) | ||||||||||||
|
|
|
|
|
| |||||||||||||
| Forward Currency Exchange Contracts | ||||||||||||||||||||||||
| Counterparty | Contracts to Deliver | Units of Currency | Settlement Date | In Exchange for U.S. Dollars | Contracts at Value | Unrealized Appreciation (Depreciation) | ||||||||||||||||||
SELL (14) | ||||||||||||||||||||||||
Goldman Sachs & Co. | JPY | 710,000,000 | 01/28/19 | $ | 6,367,713 | $ | 6,339,477 | $ | 28,236 | |||||||||||||||
Goldman Sachs & Co. | JPY | 720,000,000 | 01/09/19 | 6,397,640 | 6,418,961 | (21,321 | ) | |||||||||||||||||
|
|
|
|
|
| |||||||||||||||||||
| $ | 12,765,353 | $ | 12,758,438 | $ | 6,915 | |||||||||||||||||||
|
|
|
|
|
| |||||||||||||||||||
Notes to Schedule of Investments:
| JPY - | Japanese Yen. |
| ACES - | Alternative Credit Enhancement Securities. |
| CLO - | Collateralized Loan Obligation. |
| EETC - | Enhanced Equipment Trust Certificate. |
| I/F - | Inverse Floating rate security whose interest rate moves in the opposite direction of prevailing interest rates. |
| I/O - | Interest Only Security. |
| OTC - | Over the Counter. |
| PAC - | Planned Amortization Class. |
| P/O - | Principal Only Security. |
| REIT - | Real Estate Investment Trust. |
| TAC - | Target Amortization Class. |
| TBA - | To be Announced. |
| (1) | Variable rate security. Interest rate disclosed is as of the most recent information available. Certain variable rate securities are not based on a published reference rate and spread but are determined by the issuer or agent and are based on current market conditions. These securities do not indicate a reference rate and spread in their description above. |
| (2) | Floating or variable rate security. The interest shown reflects the rate in effect at October 31, 2018. |
| (3) | Security exempt from registration under Rule 144A of the Securities Act of 1933, as amended. These securities may be resold, normally only to qualified institutional buyers. At October 31, 2018, the value of these securities amounted to $179,459,388 or 14.4% of net assets. These securities are determined to be liquid by the Advisor, unless otherwise noted, under procedures established by and under the general supervision of the Company’s Board of Directors. |
| (4) | Restricted security (Note 10). |
| (5) | For fair value measurement disclosure purposes, security is categorized as Level 3. |
| (6) | This security is purchased on a when-issued, delayed delivery or forward commitment basis. |
| (7) | Security purchased on a forward commitment with an approximate principal amount. The actual principal amount and maturity date will be determined upon settlement when the security is delivered. |
| (8) | A portion of the principal balance has been written-off during the period due to defaults in the underlying loans. Cost basis has been adjusted. |
| (9) | Interest rate for this security is a stated rate. Interest payments are determined based on the inflation-adjusted principal. |
| (10) | Rate disclosed is the 7-day net yield as of October 31, 2018. |
| (11) | Security is not accruing interest. |
| (12) | Rate shown represents yield-to-maturity. |
| (13) | All or a portion of this security is held as collateral for open futures contracts. |
| (14) | Fund sells foreign currency, buys U.S. Dollar. |
See accompanying notes to financial statements.
27
Table of Contents
TCW Core Fixed Income Fund
Investments by Industry
| Industry | Percentage of Net Assets | |||
Aerospace/Defense | 0.4 | % | ||
Airlines | 0.5 | |||
Asset-Backed Securities | 7.6 | |||
Auto Manufacturers | 1.0 | |||
Banks | 11.7 | |||
Beverages | 0.4 | |||
Biotechnology | 0.7 | |||
Chemicals | 0.1 | |||
Commercial Mortgage-Backed Securities — Agency | 4.5 | |||
Commercial Mortgage-Backed Securities — Non-Agency | 1.7 | |||
Commercial Services | 0.2 | |||
Computers | 0.3 | |||
Diversified Financial Services | 0.8 | |||
Electric | 3.0 | |||
Energy-Alternate Sources | 0.1 | |||
Environmental Control | 0.1 | |||
Food | 0.7 | |||
Forest Products & Paper | 0.3 | |||
Gas | 0.3 | |||
Healthcare-Products | 0.3 | |||
Healthcare-Services | 2.5 | |||
Insurance | 0.7 | |||
Media | 0.7 | |||
Miscellaneous Manufacturers | 0.7 | |||
Municipal Bonds | 0.9 | |||
Oil & Gas | 0.1 | |||
Packaging & Containers | 0.3 | |||
Pharmaceuticals | 1.5 | |||
Pipelines | 1.8 | |||
REIT | 3.5 | |||
Residential Mortgage-Backed Securities — Agency | 27.5 | |||
Residential Mortgage-Backed Securities — Non-Agency | 6.0 | |||
Retail | 0.7 | |||
Semiconductors | 0.3 | |||
Short Term Investments | 1.3 | |||
Software | 0.1 | |||
Telecommunications | 1.6 | |||
Transportation | 0.1 | |||
U.S. Treasury Securities | 19.1 | |||
Money Market Investments | 0.4 | |||
|
| |||
Total | 104.5 | % | ||
|
| |||
See accompanying notes to financial statements.
28
Table of Contents
TCW Core Fixed Income Fund
Fair Valuation Summary | October 31, 2018 |
The following is a summary of the fair valuations according to the inputs used as of October 31, 2018 in valuing the Fund’s investments:
Description | Quoted Prices in Active Markets for Identical Assets (Level 1) | Other Significant Observable Inputs (Level 2) | Significant Unobservable Inputs (Level 3) | Total | ||||||||||||
Fixed Income Securities | ||||||||||||||||
Corporate Bonds* | $ | — | $ | 441,158,670 | $ | 1,036,315 | $ | 442,194,985 | ||||||||
Municipal Bonds | — | 11,500,471 | — | 11,500,471 | ||||||||||||
Asset-Backed Securities | — | 94,967,153 | — | 94,967,153 | ||||||||||||
Commercial Mortgage-Backed Securities — Agency | — | 55,864,614 | — | 55,864,614 | ||||||||||||
Commercial Mortgage-Backed Securities — Non-Agency | — | 20,958,027 | — | 20,958,027 | ||||||||||||
Residential Mortgage-Backed Securities — Agency | — | 342,672,465 | — | 342,672,465 | ||||||||||||
Residential Mortgage-Backed Securities — Non-Agency | — | 74,570,699 | — | 74,570,699 | ||||||||||||
U.S. Treasury Securities | 232,095,810 | 6,703,657 | — | 238,799,467 | ||||||||||||
|
|
|
|
|
|
|
| |||||||||
Total Fixed Income Securities | 232,095,810 | 1,048,395,756 | 1,036,315 | 1,281,527,881 | ||||||||||||
|
|
|
|
|
|
|
| |||||||||
Money Market Investments | 4,587,808 | — | — | 4,587,808 | ||||||||||||
Short-Term Investments* | 3,689,610 | 12,679,704 | — | 16,369,314 | ||||||||||||
|
|
|
|
|
|
|
| |||||||||
Total Investments | 240,373,228 | 1,061,075,460 | 1,036,315 | 1,302,485,003 | ||||||||||||
|
|
|
|
|
|
|
| |||||||||
Asset Derivatives | ||||||||||||||||
Forward Currency Contracts | ||||||||||||||||
Foreign Currency Risk | — | 28,236 | — | 28,236 | ||||||||||||
|
|
|
|
|
|
|
| |||||||||
Total Investments | $ | 240,373,228 | $ | 1,061,103,696 | $ | 1,036,315 | $ | 1,302,513,239 | ||||||||
|
|
|
|
|
|
|
| |||||||||
Liability Derivatives | ||||||||||||||||
Futures | ||||||||||||||||
Interest Rate Risk | $ | (1,572,207 | ) | $ | — | $ | — | $ | (1,572,207 | ) | ||||||
Forward Currency Contracts | ||||||||||||||||
Foreign Currency Risk | — | (21,321 | ) | — | (21,321 | ) | ||||||||||
|
|
|
|
|
|
|
| |||||||||
Total | $ | (1,572,207 | ) | $ | (21,321 | ) | $ | — | $ | (1,593,528 | ) | |||||
|
|
|
|
|
|
|
| |||||||||
| * | See Schedule of Investments for corresponding industries. |
See accompanying notes to financial statements.
29
Table of Contents
TCW Enhanced Commodity Strategy Fund
Consolidated Schedule of Investments
| Issues | Maturity Date | Principal Amount | Value | |||||||||
FIXED INCOME SECURITIES — 27.6% of Net Assets |
| |||||||||||
| ASSET-BACKED SECURITIES — 0.9% | ||||||||||||
Educational Services of America, Inc. (12-2-A) |
| |||||||||||
3.01% (1 mo. USD LIBOR + 0.730%) (1)(2) | 04/25/39 | $ | 7,137 | $ | 7,161 | |||||||
Nelnet Student Loan Trust (12-5A-A) |
| |||||||||||
2.88% (1 mo. USD LIBOR + 0.600%) (1)(2) | 10/27/36 | 4,255 | 4,253 | |||||||||
Scholar Funding Trust (11-A-A) |
| |||||||||||
3.41% (3 mo. USD LIBOR + 0.900%) (1)(2) | 10/28/43 | 3,588 | 3,599 | |||||||||
|
| |||||||||||
Total Asset-backed Securities | ||||||||||||
(Cost: $15,131) | 15,013 | |||||||||||
|
| |||||||||||
| COMMERCIAL MORTGAGE-BACKED SECURITIES — AGENCY — 0.1% (Cost: $1,816) | ||||||||||||
Freddie Mac Multifamily Structured Pass-Through Certificates (KF05-A) |
| |||||||||||
2.61% (1 mo. USD LIBOR + 0.350%) (2) | 09/25/21 | 1,816 | 1,816 | |||||||||
|
| |||||||||||
| COMMERCIAL MORTGAGE-BACKED SECURITIES — NON-AGENCY — 0.4% (Cost: $1,013) | ||||||||||||
LB-UBS Commercial Mortgage Trust (06-C6-XCL) (I/O) |
| |||||||||||
0.68% (1)(3)(4) | 09/15/39 | 540,160 | 7,861 | |||||||||
|
| |||||||||||
| RESIDENTIAL MORTGAGE-BACKED SECURITIES — AGENCY — 0.7% (Cost: $12,586) | ||||||||||||
Fannie Mae (05-W3-2AF) |
| |||||||||||
2.50% (1 mo. USD LIBOR + 0.220%) (2) | 03/25/45 | 12,908 | 12,856 | |||||||||
|
| |||||||||||
| RESIDENTIAL MORTGAGE-BACKED SECURITIES — NON-AGENCY — 9.0% | ||||||||||||
Bear Stearns Alt-A Trust (04-13-A1) |
| |||||||||||
3.02% (1 mo. USD LIBOR + 0.740%) (2) | 11/25/34 | 1,374 | 1,377 | |||||||||
Bombardier Capital Mortgage Securitization Corp. (01-A-A) |
| |||||||||||
6.81% (4) | 12/15/30 | 1,295 | 1,299 | |||||||||
Centex Home Equity Loan Trust (05-A-AF5) |
| |||||||||||
5.78% (4) | 01/25/35 | 56,358 | 57,140 | |||||||||
Credit-Based Asset Servicing and Securitization LLC (03-CB5-M1) |
| |||||||||||
3.30% (1 mo. USD LIBOR + 1.020%) (2) | 11/25/33 | 9,750 | 9,559 | |||||||||
First Franklin Mortgage Loan Asset-Backed Certificates (04-FF5-A3C) |
| |||||||||||
3.28% (1 mo. USD LIBOR + 1.000%) (2) | 08/25/34 | 9,804 | 9,590 | |||||||||
JPMorgan Mortgage Trust (05-A6-7A1) |
| |||||||||||
4.37% (4) | 08/25/35 | 23,071 | 22,675 | |||||||||
MASTR Seasoned Securitization Trust (05-1-4A1) |
| |||||||||||
4.52% (4) | 10/25/32 | 21,096 | 21,385 | |||||||||
| Issues | Maturity Date | Principal Amount | Value | |||||||||
| RESIDENTIAL MORTGAGE-BACKED SECURITIES — NON-AGENCY (Continued) | ||||||||||||
Mid-State Trust (04-1-M1) |
| |||||||||||
6.50% | 08/15/37 | $ | 22,878 | $ | 24,298 | |||||||
Morgan Stanley Mortgage Loan Trust (04-6AR-1A) |
| |||||||||||
3.18% (1 mo. USD LIBOR + 0.900%) (2) | 07/25/34 | 3,593 | 3,598 | |||||||||
Residential Asset Mortgage Products, Inc. (04-SL3-A2) |
| |||||||||||
6.50% | 12/25/31 | 2,814 | 2,776 | |||||||||
|
| |||||||||||
Total Residential Mortgage-backed Securities — Non-agency | ||||||||||||
(Cost: $137,348) | 153,697 | |||||||||||
|
| |||||||||||
CORPORATE BONDS — 6.9% |
| |||||||||||
| Airlines — 2.0% | ||||||||||||
Continental Airlines, Inc. Pass-Through Certificates (00-1-A1) (EETC) |
| |||||||||||
8.05% | 05/01/22 | 32,360 | 33,632 | |||||||||
|
| |||||||||||
| Insurance — 4.1% | ||||||||||||
Nationwide Mutual Insurance Co. | ||||||||||||
4.62% (3 mo. USD LIBOR + 2.290%) (1)(2) | 12/15/24 | 70,000 | 70,175 | |||||||||
|
| |||||||||||
| REIT — 0.8% | ||||||||||||
HCP, Inc. | ||||||||||||
3.15% | 08/01/22 | 15,000 | 14,544 | |||||||||
|
| |||||||||||
Total Corporate Bonds | ||||||||||||
(Cost: $116,485) | 118,351 | |||||||||||
|
| |||||||||||
| U.S. TREASURY SECURITY — 9.6% (Cost: $164,786) | ||||||||||||
U.S. Treasury Note |
| |||||||||||
2.75% | 09/30/20 | 165,000 | 164,633 | |||||||||
|
| |||||||||||
Total Fixed Income Securities | ||||||||||||
(Cost: $449,165) | 474,227 | |||||||||||
|
| |||||||||||
| Security | Shares | |||||||||||
Money Market Investments — 10.4% |
| |||||||||||
State Street Institutional U.S. Government Money Market Fund — Premier Class, 2.09% (5)(6) | 178,631 | 178,631 | ||||||||||
|
| |||||||||||
Total Money Market Investments | ||||||||||||
(Cost: $178,631) | 178,631 | |||||||||||
|
| |||||||||||
See accompanying notes to financial statements.
30
Table of Contents
TCW Enhanced Commodity Strategy Fund
October 31, 2018 |
| Issues | Maturity Date | Principal Amount | Value | |||||||||
SHORT TERM INVESTMENTS — 57.5% |
| |||||||||||
| U.S. TREASURY SECURITIES — 57.5% | ||||||||||||
U.S. Treasury Bill | ||||||||||||
2.21% (7) | 01/03/19 | $ | 575,000 | $ | 572,776 | |||||||
2.22% (7) | 01/10/19 | 204,000 | 203,121 | |||||||||
2.41% (7) | 04/04/19 | 212,000 | 209,853 | |||||||||
|
| |||||||||||
Total U.S. Treasury Securities | ||||||||||||
(Cost: $985,965) | 985,750 | |||||||||||
|
| |||||||||||
Total Short Term Investments | ||||||||||||
(Cost: $985,965) | 985,750 | |||||||||||
|
| |||||||||||
Total Investments (95.5%) | ||||||||||||
(Cost: $1,613,761) | 1,638,608 | |||||||||||
Excess Of Other Assets Over Liabilities (4.5%) |
| 76,806 | ||||||||||
|
| |||||||||||
Net Assets (100.0%) | $ | 1,715,414 | ||||||||||
|
| |||||||||||
| Total Return Swaps (6) | ||||||||||||||||||||||||||||
| Notional Amount | Expiration Date | Counterparty | Payment Made by Fund | Payment Received by Fund | Payment Frequency | Unrealized Appreciation (Depreciation) | Premium Paid | Value | ||||||||||||||||||||
| OTC Swaps | ||||||||||||||||||||||||||||
| $ | 1,778,356 | 11/20/18 | Credit Suisse International | 3-Month U.S. Treasury Bills plus 0.2% | Credit Suisse Custom 24 Total Return Index (8) | Monthly | $ (56,058) | $ | — | $ | (56,058 | ) | ||||||||||||||||
|
|
|
|
|
| |||||||||||||||||||||||
Notes to Schedule of Investments:
| EETC - | Enhanced Equipment Trust Certificate. |
| I/O - | Interest Only Security. |
| OTC - | Over the Counter. |
| REIT - | Real Estate Investment Trust. |
| (1) | Security exempt from registration under Rule 144A of the Securities Act of 1933, as amended. These securities may be resold, normally only to qualified institutional buyers. At October 31, 2018, the value of these securities amounted to $93,049 or 5.4% of net assets. These securities are determined to be liquid by the Advisor, unless otherwise noted, under procedures established by and under the general supervision of the Company’s Board of Directors. |
| (2) | Floating or variable rate security. The interest shown reflects the rate in effect at October 31, 2018. |
| (3) | Restricted security (Note 10). |
| (4) | Variable rate security. Interest rate disclosed is as of the most recent information available. Certain variable rate securities are not based on a published reference rate and spread but are determined by the issuer or agent and are based on current market conditions. These securities do not indicate a reference rate and spread in their description above. |
| (5) | Rate disclosed is the 7-day net yield as of October 31, 2018. |
| (6) | All or a portion of this security is owned by TCW Cayman Enhanced Commodity Fund, Ltd. |
| (7) | Rate shown represents yield-to-maturity. |
| (8) | This index has exposure to the commodities as shown on the next page. |
See accompanying notes to financial statements.
31
Table of Contents
TCW Enhanced Commodity Strategy Fund
Components of Total Return Swap
| Description(1) | Notional Amount | Weight % | Unrealized Appreciation (Depreciation) | |||||||||
Gold | $ | 199,887 | 11.24 | % | $ | (2,205 | ) | |||||
Natural Gas | 174,635 | 9.82 | % | (4,286 | ) | |||||||
Brent Crude Oil | 154,539 | 8.69 | % | (8,218 | ) | |||||||
WTI Crude Oil | 141,379 | 7.95 | % | (8,217 | ) | |||||||
Corn | 118,794 | 6.68 | % | (1,085 | ) | |||||||
Copper High Grade | 107,591 | 6.05 | % | (4,695 | ) | |||||||
Soybeans | 94,786 | 5.33 | % | (2,027 | ) | |||||||
Live Cattle | 80,026 | 4.50 | % | 372 | ||||||||
Heating Oil | 73,090 | 4.11 | % | (1,761 | ) | |||||||
Aluminium Primary | 72,201 | 4.06 | % | (1,974 | ) | |||||||
SRW Wheat | 70,779 | 3.98 | % | (2,508 | ) | |||||||
RBOB Gasoline | 65,799 | 3.70 | % | (5,922 | ) | |||||||
Sugar#11 | 56,018 | 3.15 | % | (2,881 | ) | |||||||
Silver | 55,485 | 3.12 | % | (1,387 | ) | |||||||
Soybean Meal | 52,639 | 2.96 | % | (1,156 | ) | |||||||
Nickel Primary | 45,882 | 2.58 | % | (3,717 | ) | |||||||
Coffee ‘C’ Arabica | 42,858 | 2.41 | % | (3,361 | ) | |||||||
Zinc High Grade | 41,614 | 2.34 | % | (2,152 | ) | |||||||
Soybean Oil | 41,614 | 2.34 | % | (1,636 | ) | |||||||
Lean Hogs | 34,322 | 1.93 | % | 3,087 | ||||||||
HRW Wheat | 27,920 | 1.57 | % | (1,281 | ) | |||||||
Cotton | 26,498 | 1.49 | % | (373 | ) | |||||||
United States Treasury Bill | — | — | 1,325 | |||||||||
|
|
|
|
|
| |||||||
| $ | 1,778,356 | 100.00 | % | $ | (56,058 | ) | ||||||
|
|
|
|
|
| |||||||
| (1) | Commodity Exposures of the Credit Suisse Custom 24 Total Return Index. |
See accompanying notes to financial statements.
32
Table of Contents
TCW Enhanced Commodity Strategy Fund
Consolidated Investments by Industry | October 31, 2018 |
| Industry | Percentage of Net Assets | |||
Airlines | 2.0 | % | ||
Asset-Backed Securities | 0.9 | |||
Commercial Mortgage-Backed Securities — Agency | 0.1 | |||
Commercial Mortgage-Backed Securities — Non-Agency | 0.4 | |||
Insurance | 4.1 | |||
REIT | 0.8 | |||
Residential Mortgage-Backed Securities — Agency | 0.7 | |||
Residential Mortgage-Backed Securities — Non-Agency | 9.0 | |||
U.S. Treasury Bills | 57.5 | |||
U.S. Treasury Securities | 9.6 | |||
Money Market Investments | 10.4 | |||
|
| |||
Total | 95.5 | % | ||
|
| |||
See accompanying notes to financial statements.
33
Table of Contents
TCW Enhanced Commodity Strategy Fund
Fair Valuation Summary | October 31, 2018 |
The following is a summary of the fair valuations according to the inputs used as of October 31, 2018 in valuing the Fund’s investments:
Description | Quoted Prices in Active Markets for Identical Assets (Level 1) | Other Significant Observable Inputs (Level 2) | Significant Unobservable Inputs (Level 3) | Total | ||||||||||||
Fixed Income Securities | ||||||||||||||||
Asset-Backed Securities | $ | — | $ | 15,013 | $ | — | $ | 15,013 | ||||||||
Commercial Mortgage-Backed Securities — Agency | — | 1,816 | — | 1,816 | ||||||||||||
Commercial Mortgage-Backed Securities — Non-Agency | — | 7,861 | — | 7,861 | ||||||||||||
Residential Mortgage-Backed Securities — Agency | — | 12,856 | — | 12,856 | ||||||||||||
Residential Mortgage-Backed Securities — Non-Agency | — | 153,697 | — | 153,697 | ||||||||||||
Corporate Bonds* | — | 118,351 | — | 118,351 | ||||||||||||
U.S. Treasury Securities | 164,633 | — | — | 164,633 | ||||||||||||
|
|
|
|
|
|
|
| |||||||||
Total Fixed Income Securities | 164,633 | 309,594 | — | 474,227 | ||||||||||||
|
|
|
|
|
|
|
| |||||||||
Money Market Investments | 178,631 | — | — | 178,631 | ||||||||||||
Short-Term Investments | 985,750 | — | — | 985,750 | ||||||||||||
|
|
|
|
|
|
|
| |||||||||
Total Investments | $ | 1,329,014 | $ | 309,594 | $ | — | $ | 1,638,608 | ||||||||
|
|
|
|
|
|
|
| |||||||||
Liability Derivatives | ||||||||||||||||
Swap Agreements | ||||||||||||||||
Commodity Risk | $ | — | $ | (56,058 | ) | $ | — | $ | (56,058 | ) | ||||||
|
|
|
|
|
|
|
| |||||||||
Total | $ | — | $ | (56,058 | ) | $ | — | $ | (56,058 | ) | ||||||
|
|
|
|
|
|
|
| |||||||||
| * | See Schedule of Investments for corresponding industries. |
See accompanying notes to financial statements.
34
Table of Contents
Schedule of Investments | October 31, 2018 |
| Issues | Maturity Date | Principal Amount | Value | |||||||||
FIXED INCOME SECURITIES — 93.7% of Net Assets |
| |||||||||||
CORPORATE BONDS — 20.7% |
| |||||||||||
| Advertising — 0.0% | ||||||||||||
Clear Channel International BV |
| |||||||||||
8.75% (1) | 12/15/20 | $ | 3,000 | $ | 3,069 | |||||||
|
| |||||||||||
| Aerospace/Defense — 0.4% | ||||||||||||
BAE Systems Holdings, Inc. |
| |||||||||||
6.38% (1) | 06/01/19 | 35,000 | 35,662 | |||||||||
L3 Technologies, Inc. |
| |||||||||||
4.40% | 06/15/28 | 25,000 | 25,028 | |||||||||
|
| |||||||||||
| 60,690 | ||||||||||||
|
| |||||||||||
| Airlines — 0.9% | ||||||||||||
Continental Airlines, Inc. Pass-Through Trust (01-1A-1) (EETC) |
| |||||||||||
6.70% | 12/15/22 | 14,021 | 14,844 | |||||||||
Delta Air Lines, Inc. Pass-Through Certificates (02-1G1) (EETC) |
| |||||||||||
6.72% | 07/02/24 | 69,463 | 73,560 | |||||||||
US Airways Group, Inc. Pass-Through Certificates (10-1A) (10-1A) (EETC) |
| |||||||||||
6.25% | 10/22/24 | 12,895 | 13,773 | |||||||||
US Airways Group, Inc. Pass-Through Certificates, (12-1A) (EETC) |
| |||||||||||
5.90% | 04/01/26 | 39,301 | 41,871 | |||||||||
|
| |||||||||||
| 144,048 | ||||||||||||
|
| |||||||||||
| Auto Manufacturers — 1.0% | ||||||||||||
Ford Motor Credit Co. LLC |
| |||||||||||
2.34% | 11/02/20 | 25,000 | 24,081 | |||||||||
3.20% | 01/15/21 | 15,000 | 14,644 | |||||||||
3.43% (3 mo. USD LIBOR + 1.080%) (2) | 08/03/22 | 25,000 | 24,366 | |||||||||
3.66% (3 mo. USD LIBOR + 1.270%) (2) | 03/28/22 | 20,000 | 19,766 | |||||||||
8.13% | 01/15/20 | 65,000 | 68,157 | |||||||||
|
| |||||||||||
| 151,014 | ||||||||||||
|
| |||||||||||
| Banks — 5.6% | ||||||||||||
Citigroup, Inc. |
| |||||||||||
2.05% | 12/07/18 | 125,000 | 124,935 | |||||||||
3.14% (3) | 01/24/23 | 75,000 | 73,272 | |||||||||
Goldman Sachs Group, Inc. (The) |
| |||||||||||
2.88% (2.876% to 10/31/17 then 3 mo. USD LIBOR +0.821%)) (2) | 10/31/22 | 100,000 | 97,283 | |||||||||
JPMorgan Chase & Co. |
| |||||||||||
2.25% | 01/23/20 | 75,000 | 74,157 | |||||||||
3.00% (3 mo. USD LIBOR + 0.680%) (2) | 06/01/21 | 50,000 | 50,219 | |||||||||
3.90% | 07/15/25 | 100,000 | 98,755 | |||||||||
| Issues | Maturity Date | Principal Amount | Value | |||||||||
| Banks (Continued) | ||||||||||||
Morgan Stanley |
| |||||||||||
3.92% (3 mo. USD LIBOR + 1.375%) (2) | 02/01/19 | $ | 50,000 | $ | 50,138 | |||||||
Wells Fargo & Co. |
| |||||||||||
3.00% | 04/22/26 | 85,000 | 78,342 | |||||||||
Wells Fargo Bank N.A. |
| |||||||||||
2.40% | 01/15/20 | 250,000 | 247,937 | |||||||||
|
| |||||||||||
| 895,038 | ||||||||||||
|
| |||||||||||
| Beverages — 0.5% | ||||||||||||
Anheuser-Busch InBev Finance, Inc. |
| |||||||||||
4.90% | 02/01/46 | 29,000 | 27,442 | |||||||||
Constellation Brands, Inc. |
| |||||||||||
2.00% | 11/07/19 | 50,000 | 49,460 | |||||||||
|
| |||||||||||
| 76,902 | ||||||||||||
|
| |||||||||||
| Biotechnology — 0.5% | ||||||||||||
Amgen, Inc. |
| |||||||||||
4.40% | 05/01/45 | 25,000 | 22,830 | |||||||||
Baxalta, Inc. |
| |||||||||||
2.88% | 06/23/20 | 6,000 | 5,936 | |||||||||
Celgene Corp. |
| |||||||||||
3.88% | 08/15/25 | 20,000 | 19,280 | |||||||||
Gilead Sciences, Inc. |
| |||||||||||
3.65% | 03/01/26 | 40,000 | 38,786 | |||||||||
|
| |||||||||||
| 86,832 | ||||||||||||
|
| |||||||||||
| Chemicals — 0.3% | ||||||||||||
Dow Chemical Co. (The) |
| |||||||||||
8.55% | 05/15/19 | 40,000 | 41,175 | |||||||||
|
| |||||||||||
| Commercial Services — 0.2% | ||||||||||||
IHS Markit, Ltd. |
| |||||||||||
4.75% | 08/01/28 | 30,000 | 29,449 | |||||||||
|
| |||||||||||
| Cosmetics/Personal Care — 0.0% | ||||||||||||
First Quality Finance Co., Inc. |
| |||||||||||
5.00% (1) | 07/01/25 | 3,000 | 2,768 | |||||||||
|
| |||||||||||
| Diversified Financial Services — 0.2% | ||||||||||||
Air Lease Corp. |
| |||||||||||
2.13% | 01/15/20 | 35,000 | 34,464 | |||||||||
|
| |||||||||||
| Electric — 1.1% | ||||||||||||
AEP Texas Central Co. |
| |||||||||||
3.85% (1) | 10/01/25 | 50,000 | 49,331 | |||||||||
ITC Holdings Corp. |
| |||||||||||
3.65% | 06/15/24 | 40,000 | 39,287 | |||||||||
MidAmerican Energy Co. |
| |||||||||||
3.10% | 05/01/27 | 40,000 | 37,930 | |||||||||
Pennsylvania Electric Co. |
| |||||||||||
3.25% (1) | 03/15/28 | 50,000 | 45,967 | |||||||||
|
| |||||||||||
| 172,515 | ||||||||||||
|
| |||||||||||
See accompanying notes to financial statements.
35
Table of Contents
TCW Global Bond Fund
Schedule of Investments (Continued)
| Issues | Maturity Date | Principal Amount | Value | |||||||||
| Electronics — 0.0% | ||||||||||||
Itron, Inc. |
| |||||||||||
5.00% (1) | 01/15/26 | $ | 4,000 | $ | 3,735 | |||||||
|
| |||||||||||
| Environmental Control — 0.0% | ||||||||||||
Clean Harbors, Inc. |
| |||||||||||
5.13% | 06/01/21 | 5,000 | 5,013 | |||||||||
|
| |||||||||||
| Food — 0.2% | ||||||||||||
Kraft Heinz Foods Co. |
| |||||||||||
3.95% | 07/15/25 | 35,000 | 33,890 | |||||||||
|
| |||||||||||
| Forest Products & Paper — 0.3% | ||||||||||||
Georgia-Pacific LLC |
| |||||||||||
2.54% (1) | 11/15/19 | 50,000 | 49,666 | |||||||||
|
| |||||||||||
| Healthcare-Products — 0.3% | ||||||||||||
Abbott Laboratories |
| |||||||||||
3.75% | 11/30/26 | 23,000 | 22,616 | |||||||||
Becton Dickinson and Co. |
| |||||||||||
2.89% | 06/06/22 | 30,000 | 29,156 | |||||||||
|
| |||||||||||
| 51,772 | ||||||||||||
|
| |||||||||||
| Healthcare-Services — 1.2% | ||||||||||||
Anthem, Inc. |
| |||||||||||
3.50% | 08/15/24 | 50,000 | 48,571 | |||||||||
Centene Corp. |
| |||||||||||
4.75% | 05/15/22 | 3,000 | 3,019 | |||||||||
5.63% | 02/15/21 | 16,000 | 16,280 | |||||||||
Fresenius Medical Care US Finance II, Inc. |
| |||||||||||
5.63% (1) | 07/31/19 | 50,000 | 50,789 | |||||||||
HCA, Inc. |
| |||||||||||
5.00% | 03/15/24 | 8,000 | 8,115 | |||||||||
5.25% | 04/15/25 | 2,000 | 2,048 | |||||||||
6.50% | 02/15/20 | 6,000 | 6,210 | |||||||||
Humana, Inc. |
| |||||||||||
2.63% | 10/01/19 | 40,000 | 39,804 | |||||||||
Molina Healthcare, Inc. |
| |||||||||||
5.38% | 11/15/22 | 3,000 | 3,007 | |||||||||
Tenet Healthcare Corp. |
| |||||||||||
4.38% | 10/01/21 | 5,000 | 4,937 | |||||||||
4.75% | 06/01/20 | 5,000 | 5,019 | |||||||||
|
| |||||||||||
| 187,799 | ||||||||||||
|
| |||||||||||
| Household Products/Wares — 0.0% | ||||||||||||
Central Garden & Pet Co. |
| |||||||||||
5.13% | 02/01/28 | 3,000 | 2,775 | |||||||||
|
| |||||||||||
| Insurance — 0.5% | ||||||||||||
Farmers Exchange Capital II |
| |||||||||||
6.15% (3 mo. USD LIBOR + 3.744%) (1)(2) | 11/01/53 | 80,000 | 83,792 | |||||||||
|
| |||||||||||
| Issues | Maturity Date | Principal Amount | Value | |||||||||
| Internet — 0.0% | ||||||||||||
Zayo Group LLC / Zayo Capital, Inc. |
| |||||||||||
5.75% (1) | 01/15/27 | $ | 3,000 | $ | 2,948 | |||||||
|
| |||||||||||
| Media — 0.6% | ||||||||||||
21st Century Fox America, Inc. |
| |||||||||||
4.95% | 10/15/45 | 20,000 | 21,424 | |||||||||
CCO Holdings LLC / CCO Holdings Capital Corp. |
| |||||||||||
5.00% (1) | 02/01/28 | 6,000 | 5,610 | |||||||||
5.13% (1) | 05/01/27 | 8,000 | 7,540 | |||||||||
Charter Communications Operating LLC / Charter Communications Operating Capital |
| |||||||||||
6.48% | 10/23/45 | 30,000 | 30,731 | |||||||||
Sirius XM Radio, Inc. |
| |||||||||||
3.88% (1) | 08/01/22 | 5,000 | 4,825 | |||||||||
Warner Media LLC |
| |||||||||||
3.88% | 01/15/26 | 25,000 | 23,987 | |||||||||
|
| |||||||||||
| 94,117 | ||||||||||||
|
| |||||||||||
| Miscellaneous Manufacturers — 1.1% | ||||||||||||
General Electric Capital Corp. |
| |||||||||||
2.79% (3 mo. USD LIBOR + 0.480%) (2) | 08/15/36 | 200,000 | 169,899 | |||||||||
|
| |||||||||||
| Oil & Gas — 0.8% | ||||||||||||
Parsley Energy LLC / Parsley Finance Corp. |
| |||||||||||
5.38% (1) | 01/15/25 | 3,000 | 2,947 | |||||||||
Petroleos Mexicanos |
| |||||||||||
3.13% (4) | 11/27/20 | 100,000 | 117,588 | |||||||||
|
| |||||||||||
| 120,535 | ||||||||||||
|
| |||||||||||
| Packaging & Containers — 0.1% | ||||||||||||
Berry Global, Inc. |
| |||||||||||
4.50% (1) | 02/15/26 | 4,000 | 3,750 | |||||||||
Crown Americas LLC / Crown Americas Capital Corp. V |
| |||||||||||
4.25% | 09/30/26 | 2,000 | 1,820 | |||||||||
Graphic Packaging International, Inc. |
| |||||||||||
4.88% | 11/15/22 | 8,000 | 8,000 | |||||||||
Reynolds Group Issuer, Inc. / Reynolds Group Issuer LLC / Reynolds Group Issuer (Luxembourg) |
| |||||||||||
5.94% (3 mo. USD LIBOR + 3.500%) (1)(2) | 07/15/21 | 5,000 | 5,063 | |||||||||
|
| |||||||||||
| 18,633 | ||||||||||||
|
| |||||||||||
| Pharmaceuticals — 0.6% | ||||||||||||
AbbVie, Inc. |
| |||||||||||
4.50% | 05/14/35 | 25,000 | 23,123 | |||||||||
AstraZeneca PLC (United Kingdom) |
| |||||||||||
3.38% | 11/16/25 | 25,000 | 23,822 | |||||||||
Bausch Health Cos, Inc. (Canada) |
| |||||||||||
5.50% (1) | 11/01/25 | 2,000 | 1,967 | |||||||||
5.88% (1) | 05/15/23 | 8,000 | 7,670 | |||||||||
See accompanying notes to financial statements.
36
Table of Contents
TCW Global Bond Fund
October 31, 2018 |
Issues | Maturity Date | Principal Amount | Value | |||||||||
| Pharmaceuticals (Continued) | ||||||||||||
CVS Health Corp. |
| |||||||||||
5.05% | 03/25/48 | $ | 40,000 | $ | 39,150 | |||||||
|
| |||||||||||
| 95,732 | ||||||||||||
|
| |||||||||||
| Pipelines — 0.4% | ||||||||||||
Energy Transfer Partners LP |
| |||||||||||
5.15% | 03/15/45 | 50,000 | 44,279 | |||||||||
Rockies Express Pipeline LLC |
| |||||||||||
5.63% (1) | 04/15/20 | 24,000 | 24,641 | |||||||||
|
| |||||||||||
| 68,920 | ||||||||||||
|
| |||||||||||
| REIT — 2.3% | ||||||||||||
Alexandria Real Estate Equities, Inc. |
| |||||||||||
3.45% | 04/30/25 | 25,000 | 23,775 | |||||||||
American Campus Communities Operating Partnership LP |
| |||||||||||
3.35% | 10/01/20 | 50,000 | 49,715 | |||||||||
AvalonBay Communities, Inc. |
| |||||||||||
2.87% (2)(3) | 01/15/21 | 40,000 | 40,000 | |||||||||
GLP Capital LP / GLP Financing II, Inc. |
| |||||||||||
5.30% | 01/15/29 | 15,000 | 14,794 | |||||||||
5.38% | 04/15/26 | 25,000 | 24,906 | |||||||||
HCP, Inc. |
| |||||||||||
3.15% | 08/01/22 | 50,000 | 48,479 | |||||||||
Host Hotels & Resorts LP |
| |||||||||||
5.25% | 03/15/22 | 40,000 | 41,369 | |||||||||
SBA Communications Corp. |
| |||||||||||
4.00% | 10/01/22 | 8,000 | 7,700 | |||||||||
SL Green Operating Partnership LP |
| |||||||||||
3.32% (3) | 08/16/21 | 50,000 | 50,031 | |||||||||
Welltower, Inc. |
| |||||||||||
4.13% | 04/01/19 | 70,000 | 70,145 | |||||||||
|
| |||||||||||
| 370,914 | ||||||||||||
|
| |||||||||||
| Retail — 0.4% | ||||||||||||
KFC Holding Co. / Pizza Hut Holdings LLC / Taco Bell of America LLC |
| |||||||||||
5.25% (1) | 06/01/26 | 4,000 | 3,935 | |||||||||
Walgreens Boots Alliance, Inc. |
| |||||||||||
3.45% | 06/01/26 | 60,000 | 55,585 | |||||||||
|
| |||||||||||
| 59,520 | ||||||||||||
|
| |||||||||||
| Software — 0.0% | ||||||||||||
Change Healthcare Holdings LLC / Change Healthcare Finance, Inc. |
| |||||||||||
5.75% (1) | 03/01/25 | 3,000 | 2,944 | |||||||||
|
| |||||||||||
| Telecommunications — 1.2% | ||||||||||||
AT&T, Inc. |
| |||||||||||
3.40% | 05/15/25 | 45,000 | 42,287 | |||||||||
4.80% | 06/15/44 | 44,000 | 38,530 | |||||||||
| Issues | Maturity Date | Principal Amount | Value | |||||||||
| Telecommunications (Continued) | ||||||||||||
Intelsat Jackson Holdings S.A. (Luxembourg) |
| |||||||||||
9.75% (1) | 07/15/25 | $ 9,000 | $ | 9,450 | ||||||||
Intelsat Jackson Holdings SA |
| |||||||||||
8.50% (1) | 10/15/24 | 6,000 | 5,974 | |||||||||
Sprint Capital Corp. |
| |||||||||||
6.88% | 11/15/28 | 3,000 | 2,959 | |||||||||
Sprint Communications, Inc. |
| |||||||||||
7.00% (1) | 03/01/20 | 6,000 | 6,233 | |||||||||
Sprint Communications, Inc. |
| |||||||||||
9.00% (1) | 11/15/18 | 8,000 | 8,036 | |||||||||
Sprint Corp. |
| |||||||||||
7.63% | 03/01/26 | 2,000 | 2,085 | |||||||||
Verizon Communications, Inc. |
| |||||||||||
5.25% | 03/16/37 | 75,000 | 76,983 | |||||||||
|
| |||||||||||
| 192,537 | ||||||||||||
|
| |||||||||||
Total Corporate Bonds | ||||||||||||
(Cost: $3,269,081) | 3,313,105 | |||||||||||
|
| |||||||||||
MUNICIPAL BOND — 0.3% (Cost: $40,000) |
| |||||||||||
Alabama Economic Settlement Authority, Revenue Bond |
| |||||||||||
4.26% | 09/15/32 | 40,000 | 40,032 | |||||||||
|
| |||||||||||
FOREIGN GOVERNMENT BONDS — 44.2% |
| |||||||||||
Australia Government Bond |
| |||||||||||
2.75% (4) | 04/21/24 | AUD | 99,000 | 71,796 | ||||||||
Brazil Notas do Tesouro Nacional, Series F |
| |||||||||||
10.00% | 01/01/23 | BRL | 265,000 | 72,949 | ||||||||
Bundesrepublik Deutschland (Germany) |
| |||||||||||
1.25% (4) | 08/15/48 | EUR | 33,000 | 39,621 | ||||||||
2.25% (4) | 09/04/21 | EUR | 90,000 | 110,095 | ||||||||
Canadian Government Bond |
| |||||||||||
0.50% | 03/01/22 | CAD | 215,000 | 153,891 | ||||||||
0.75% | 03/01/21 | CAD | 416,000 | 305,437 | ||||||||
Czech Republic Government Bond |
| |||||||||||
0.45% (4) | 10/25/23 | CZK | 3,680,000 | 150,441 | ||||||||
France Government Bond OAT |
| |||||||||||
2.50% (4) | 05/25/30 | EUR | 154,000 | 205,877 | ||||||||
3.25% (4) | 10/25/21 | EUR | 170,000 | 213,516 | ||||||||
French Republic Government Bond OAT |
| |||||||||||
2.00% (4) | 05/25/48 | EUR | 132,000 | 163,479 | ||||||||
Indonesia Government International Bond |
| |||||||||||
2.63% (4) | 06/14/23 | EUR | 120,000 | 141,163 | ||||||||
Indonesia Treasury Bond |
| |||||||||||
8.38% | 03/15/24 | IDR | 1,550,000,000 | 101,192 | ||||||||
Ireland Government Bond |
| |||||||||||
0.90% (4) | 05/15/28 | EUR | 186,000 | 209,740 | ||||||||
1.30% (4) | 05/15/33 | EUR | 65,000 | 72,390 | ||||||||
Italy Buoni Ordinari del Tesoro BOT |
| |||||||||||
0.00% (4) | 02/14/19 | EUR | 140,000 | 158,714 | ||||||||
See accompanying notes to financial statements.
37
Table of Contents
TCW Global Bond Fund
Schedule of Investments (Continued)
| Issues | Maturity Date | Principal Amount | Value | |||||||||
| FOREIGN GOVERNMENT BONDS (Continued) | ||||||||||||
Italy Buoni Poliennali Del Tesoro |
| |||||||||||
0.20% | 10/15/20 | EUR | 235,000 | $ | 260,651 | |||||||
4.50% | 03/01/24 | EUR | 142,000 | 174,157 | ||||||||
Japan Government Ten-Year Bond |
| |||||||||||
1.00% | 09/20/21 | JPY | 95,800,000 | 876,336 | ||||||||
Japan Government Thirty-Year Bond |
| |||||||||||
2.00% | 03/20/42 | JPY | 54,900,000 | 616,351 | ||||||||
Japan Government Twenty Year Bond |
| |||||||||||
0.50% | 09/20/36 | JPY | 8,700,000 | 76,373 | ||||||||
Korea Treasury Bond |
| |||||||||||
1.88% | 06/10/26 | KRW | 144,000,000 | 123,444 | ||||||||
2.38% | 12/10/27 | KRW | 94,000,000 | 83,365 | ||||||||
Mexico Government Bond (BONOS) |
| |||||||||||
8.00% | 06/11/20 | MXN | 3,000,000 | 147,138 | ||||||||
Norway Government Bond |
| |||||||||||
1.75% (4) | 02/17/27 | NOK | 650,000 | 76,649 | ||||||||
2.00% (4) | 05/24/23 | NOK | 1,020,000 | 123,827 | ||||||||
Peruvian Government International Bond |
| |||||||||||
6.35% (4) | 08/12/28 | PEN | 435,000 | 133,465 | ||||||||
Poland Government Bond |
| |||||||||||
3.25% | 07/25/25 | PLN | 265,000 | 70,765 | ||||||||
Portugal Obrigacoes do Tesouro OT |
| |||||||||||
2.13% (4) | 10/17/28 | EUR | 140,000 | 162,329 | ||||||||
4.75% (4) | 06/14/19 | EUR | 172,000 | 200,979 | ||||||||
Slovenia Government Bond |
| |||||||||||
1.00% (4) | 03/06/28 | EUR | 83,000 | 92,985 | ||||||||
South Africa Government Bond |
| |||||||||||
7.75% | 02/28/23 | ZAR | 1,165,000 | 76,364 | ||||||||
Spain Government Bond |
| |||||||||||
0.05% | 01/31/21 | EUR | 100,000 | 113,611 | ||||||||
1.40% | 01/31/20 | EUR | 131,000 | 151,655 | ||||||||
2.75% (4) | 10/31/24 | EUR | 192,000 | 242,041 | ||||||||
2.90% (4) | 10/31/46 | EUR | 128,000 | 153,839 | ||||||||
United Kingdom Gilt |
| |||||||||||
1.25% (4) | 07/22/27 | GBP | 90,000 | 114,168 | ||||||||
1.63% (4) | 10/22/28 | GBP | 130,000 | 168,984 | ||||||||
1.75% (4) | 07/22/19 | GBP | 146,000 | 187,897 | ||||||||
1.75% (4) | 09/07/37 | GBP | 94,000 | 118,961 | ||||||||
2.00% (4) | 07/22/20 | GBP | 90,000 | 117,464 | ||||||||
2.75% (4) | 09/07/24 | GBP | 170,000 | 237,679 | ||||||||
|
| |||||||||||
Total Foreign Government Bonds |
| |||||||||||
(Cost: $7,674,137) | 7,071,778 | |||||||||||
|
| |||||||||||
| ASSET-BACKED SECURITIES — 2.0% | ||||||||||||
Babson CLO, Ltd. (13-IA-AR) |
| |||||||||||
3.27% (1)(2)(3) | 01/20/28 | $ 40,000 | 39,951 | |||||||||
Educational Funding of the South, Inc. (11-1-A2) |
| |||||||||||
2.99% (3 mo. USD LIBOR + 0.650%) (2) | 04/25/35 | 23,106 | 23,147 | |||||||||
| Issues | Maturity Date | Principal Amount | Value | |||||||||
| ASSET-BACKED SECURITIES (Continued) | ||||||||||||
Magnetite XI, Ltd. (14-11A-A1R) |
| |||||||||||
3.56% (3 mo. USD LIBOR + 1.120%) (1)(2) | 01/18/27 | $ | 20,000 | $ | 20,009 | |||||||
SLC Student Loan Trust (08-1-A4A) |
| |||||||||||
3.93% (3 mo. USD LIBOR + 1.600%) (2) | 12/15/32 | 52,353 | 53,965 | |||||||||
SLM Student Loan Trust (07-3-A4) |
| |||||||||||
2.55% (3 mo. USD LIBOR + 0.060%) (2) | 01/25/22 | 50,000 | 48,837 | |||||||||
SLM Student Loan Trust (11-2-A2) |
| |||||||||||
3.48% (1 mo. USD LIBOR + 1.200%) (2) | 10/25/34 | 50,000 | 51,534 | |||||||||
Student Loan Consolidation Center (02-2-B2) |
| |||||||||||
0.00% (28-Day Auction Rate) (1)(2)(5) | 07/01/42 | 50,000 | 39,961 | |||||||||
Voya CLO, Ltd. (15-2A-AR) |
| |||||||||||
3.45% (1)(2)(3) | 07/23/27 | 45,000 | 44,997 | |||||||||
|
| |||||||||||
Total Asset-backed Securities |
| |||||||||||
(Cost: $318,071) | 322,401 | |||||||||||
|
| |||||||||||
| COMMERCIAL MORTGAGE-BACKED SECURITIES — AGENCY — 3.2% | ||||||||||||
Fannie Mae (14-M12-FA) |
| |||||||||||
2.46% (1 mo. USD LIBOR + 0.300%) (2) | 10/25/21 | 6,466 | 6,472 | |||||||||
Fannie Mae (16-M2-X3) (I/O) |
| |||||||||||
2.00% (3) | 04/25/36 | 2,257,930 | 103,292 | |||||||||
Fannie Mae (16-M4-X2) (I/O) |
| |||||||||||
2.63% (3) | 01/25/39 | 1,642,945 | 150,445 | |||||||||
Freddie Mac Multifamily Structured Pass Through Certificates (K019-X1) (I/O) |
| |||||||||||
1.63% (3) | 03/25/22 | 3,415,992 | 156,578 | |||||||||
FREMF Mortgage Trust (10-K6-AX2) (I/O) |
| |||||||||||
0.10% (1)(3) | 12/25/46 | 96,625,801 | 90,021 | |||||||||
|
| |||||||||||
Total Commercial Mortgage-backed Securities — Agency |
| |||||||||||
(Cost: $496,790) | 506,808 | |||||||||||
|
| |||||||||||
| COMMERCIAL MORTGAGE-BACKED SECURITIES — NON-AGENCY — 9.2% | ||||||||||||
Bank of America-First Union NB Commercial Mortgage (01-3-XC) (I/O) |
| |||||||||||
1.19% (1)(3)(6) | 04/11/37 | 1,720,144 | 2,749 | |||||||||
Citigroup Commercial Mortgage Trust (14-GC23-XA) (I/O) |
| |||||||||||
1.04% (3) | 07/10/47 | 1,126,740 | 49,889 | |||||||||
COMM Mortgage Trust (14-CR18-XA) (I/O) |
| |||||||||||
1.15% (3) | 07/15/47 | 4,532,922 | 170,117 | |||||||||
COMM Mortgage Trust (15-CR22-XA) (I/O) |
| |||||||||||
0.97% (3) | 03/10/48 | 1,836,911 | 72,950 | |||||||||
COMM Mortgage Trust (15-LC19-XA) (I/O) |
| |||||||||||
1.18% (3) | 02/10/48 | 2,706,064 | 153,681 | |||||||||
See accompanying notes to financial statements.
38
Table of Contents
TCW Global Bond Fund
October 31, 2018 |
| Issues | Maturity Date | Principal Amount | Value | |||||||||
| COMMERCIAL MORTGAGE-BACKED SECURITIES — NON-AGENCY (Continued) | ||||||||||||
GS Mortgage Securities Trust (13-GC12-XA) (I/O) |
| |||||||||||
1.44% (3) | 06/10/46 | $ | 5,297,063 | $ | 254,058 | |||||||
GS Mortgage Securities Trust (14-GC26-XA) (I/O) |
| |||||||||||
1.03% (3) | 11/10/47 | 3,133,304 | 140,663 | |||||||||
JP Morgan Chase Commercial Mortgage Securities Trust (11-C3-XB) (I/O) |
| |||||||||||
0.53% (1)(3) | 02/15/46 | 6,837,378 | 85,350 | |||||||||
JP Morgan Chase Commercial Mortgage Securities Trust (14-C19-XA) (I/O) |
| |||||||||||
1.12% (3) | 04/15/47 | 5,496,494 | 98,009 | |||||||||
Morgan Stanley Capital I Trust (15-420-A) |
| |||||||||||
3.73% (1) | 10/12/50 | 15,000 | 14,806 | |||||||||
Morgan Stanley Capital I Trust (99-RM1-X) (I/O) |
| |||||||||||
0.73% (1)(3)(6) | 12/15/31 | 517,515 | 138 | |||||||||
Wells Fargo Commercial Mortgage Trust (15-C26-XA) (I/O) |
| |||||||||||
1.24% (3) | 02/15/48 | 3,685,577 | 213,949 | |||||||||
Wells Fargo Commercial Mortgage Trust (15-NXS1-XA) (I/O) |
| |||||||||||
1.16% (3) | 05/15/48 | 3,413,558 | 162,468 | |||||||||
WF-RBS Commercial Mortgage Trust (11-C4-A3) |
| |||||||||||
4.39% (1) | 06/15/44 | 5,176 | 5,194 | |||||||||
WFRBS Commercial Mortgage Trust (14-LC14-XA) (I/O) |
| |||||||||||
1.29% (3) | 03/15/47 | 1,025,893 | 43,821 | |||||||||
|
| |||||||||||
Total Commercial Mortgage-backed Securities — Non-agency |
| |||||||||||
(Cost: $1,441,318) | 1,467,842 | |||||||||||
|
| |||||||||||
| RESIDENTIAL MORTGAGE-BACKED SECURITIES — AGENCY — 8.8% | ||||||||||||
Fannie Mae (07-52-LS) (I/O) (I/F) |
| |||||||||||
3.77% (-1.00 X 1 mo. USD LIBOR + 6.050%) (2) | 06/25/37 | 82,139 | 7,226 | |||||||||
Fannie Mae (08-18-SM) (I/O) (I/F) |
| |||||||||||
4.72% (-1.00 X 1 mo. USD LIBOR + 7.000%) (2) | 03/25/38 | 71,789 | 7,791 | |||||||||
Fannie Mae (09-115-SB) (I/O) (I/F) |
| |||||||||||
3.97% (-1.00 X 1 mo. USD LIBOR + 6.250%) (2) | 01/25/40 | 58,075 | 7,319 | |||||||||
Fannie Mae (10-116-SE) (I/O) (I/F) |
| |||||||||||
4.32% (-1.00 X 1 mo. USD LIBOR + 6.600%) (2) | 10/25/40 | 117,041 | 15,586 | |||||||||
Fannie Mae, Pool #AB3679 |
| |||||||||||
3.50% | 10/01/41 | 103,532 | 101,102 | |||||||||
Fannie Mae, Pool #AB4045 |
| |||||||||||
3.50% | 12/01/41 | 137,114 | 134,762 | |||||||||
Fannie Mae, Pool #AT5914 |
| |||||||||||
3.50% | 06/01/43 | 50,776 | 49,743 | |||||||||
Fannie Mae, Pool #BD7081 |
| |||||||||||
4.00% | 03/01/47 | 87,604 | 87,748 | |||||||||
Fannie Mae, Pool #CA2208 |
| |||||||||||
4.50% | 08/01/48 | 9,886 | 10,132 | |||||||||
| Issues | Maturity Date | Principal Amount | Value | |||||||||
| RESIDENTIAL MORTGAGE-BACKED SECURITIES — AGENCY (Continued) | ||||||||||||
Fannie Mae, Pool #MA1527 |
| |||||||||||
3.00% | 08/01/33 | $ | 31,532 | $ | 30,739 | |||||||
Fannie Mae, Pool #MA1652 |
| |||||||||||
3.50% | 11/01/33 | 51,259 | 51,056 | |||||||||
Freddie Mac (2990-ND) (I/F) (PAC) |
| |||||||||||
11.10% (-2.54 X 1 mo. USD LIBOR + 16.891%) (2) | 12/15/34 | 3,312 | 3,439 | |||||||||
Freddie Mac (3439-SC) (I/O) (I/F) |
| |||||||||||
3.62% (-1.00 X 1 mo. USD LIBOR + 5.900%) (2) | 04/15/38 | 80,621 | 9,620 | |||||||||
Freddie Mac, Pool #G08681 |
| |||||||||||
3.50% | 12/01/45 | 76,088 | 74,319 | |||||||||
Freddie Mac, Pool #G08698 |
| |||||||||||
3.50% | 03/01/46 | 75,785 | 74,023 | |||||||||
Freddie Mac, Pool #G08716 |
| |||||||||||
3.50% | 08/01/46 | 75,654 | 73,842 | |||||||||
Freddie Mac, Pool #G08721 |
| |||||||||||
3.00% | 09/01/46 | 12,585 | 11,922 | |||||||||
Freddie Mac, Pool #G08722 |
| |||||||||||
3.50% | 09/01/46 | 7,653 | 7,476 | |||||||||
Freddie Mac, Pool #G08726 |
| |||||||||||
3.00% | 10/01/46 | 148,028 | 140,226 | |||||||||
Freddie Mac, Pool #G08732 |
| |||||||||||
3.00% | 11/01/46 | 17,125 | 16,222 | |||||||||
Freddie Mac, Pool #G08762 |
| |||||||||||
4.00% | 05/01/47 | 86,319 | 86,464 | |||||||||
Freddie Mac, Pool #G08833 |
| |||||||||||
5.00% | 07/01/48 | 14,488 | 15,140 | |||||||||
Freddie Mac, Pool #G18592 |
| |||||||||||
3.00% | 03/01/31 | 9,722 | 9,543 | |||||||||
Freddie Mac TBA, 15 Year |
| |||||||||||
3.50% (7) | 03/01/33 | 25,000 | 24,989 | |||||||||
Ginnie Mae (11-146-EI) (I/O) (PAC) |
| |||||||||||
5.00% | 11/16/41 | 81,898 | 17,093 | |||||||||
Ginnie Mae (11-69-GI) (I/O) |
| |||||||||||
5.00% | 05/16/40 | 132,026 | 10,265 | |||||||||
Ginnie Mae (12-7-PI) (I/O) (PAC) |
| |||||||||||
3.50% | 01/20/38 | 68,578 | 2,049 | |||||||||
Ginnie Mae II, Pool #MA3597 |
| |||||||||||
3.50% | 04/20/46 | 44,826 | 44,132 | |||||||||
Ginnie Mae II, Pool #MA3663 |
| |||||||||||
3.50% | 05/20/46 | 6,668 | 6,563 | |||||||||
Ginnie Mae II, Pool #MA3803 |
| |||||||||||
3.50% | 07/20/46 | 31,874 | 31,360 | |||||||||
Ginnie Mae II, Pool #MA3873 |
| |||||||||||
3.00% | 08/20/46 | 58,787 | 56,340 | |||||||||
Ginnie Mae II, Pool #MA4454 |
| |||||||||||
5.00% | 05/20/47 | 33,659 | 35,056 | |||||||||
See accompanying notes to financial statements.
39
Table of Contents
TCW Global Bond Fund
Schedule of Investments (Continued)
| Issues | Maturity Date | Principal Amount | Value | |||||||||
| RESIDENTIAL MORTGAGE-BACKED SECURITIES — AGENCY (Continued) | ||||||||||||
Ginnie Mae II TBA, 30 Year |
| |||||||||||
5.00% (7) | 06/01/47 | $ | 25,000 | $ | 25,994 | |||||||
4.50% (7) | 05/01/48 | 120,000 | 123,094 | |||||||||
|
| |||||||||||
Total Residential Mortgage-backed |
| |||||||||||
(Cost: $1,487,734) | 1,402,375 | |||||||||||
|
| |||||||||||
| RESIDENTIAL MORTGAGE-BACKED SECURITIES — NON-AGENCY — 5.3% | ||||||||||||
ACE Securities Corp. Home Equity Loan Trust (05-HE3-M2) |
| |||||||||||
2.96% (1 mo. USD LIBOR + 0.675%) (2) | 05/25/35 | 53,013 | 53,473 | |||||||||
Banc of America Funding Trust (05-C-A3) |
| |||||||||||
2.58% (1 mo. USD LIBOR + 0.300%) (2) | 05/20/35 | 55,445 | 54,730 | |||||||||
BCMSC Trust (00-A-A4) |
| |||||||||||
8.29% (3) | 06/15/30 | 189,525 | 74,806 | |||||||||
Bear Stearns ALT-A Trust (05-8-11A1) |
| |||||||||||
2.82% (1 mo. USD LIBOR + 0.540%) (2) | 10/25/35 | 68,767 | 67,613 | |||||||||
First Horizon Mortgage Pass-Through Trust (05-AR4-2A1) |
| |||||||||||
4.11% (3) | 10/25/35 | 67,296 | 65,030 | |||||||||
Green Tree Financial Corp. (98-6-A8) |
| |||||||||||
6.66% (3) | 06/01/30 | 22,624 | 23,721 | |||||||||
JPMorgan Mortgage Trust (05-A6-7A1) |
| |||||||||||
4.37% (3) | 08/25/35 | 40,906 | 40,204 | |||||||||
Lehman XS Trust (06-9-A1B) |
| |||||||||||
2.44% (1 mo. USD LIBOR + 0.160%) (2) | 05/25/46 | 31,043 | 43,753 | |||||||||
Merrill Lynch Alternative Note Asset Trust (07-A3-A2D) |
| |||||||||||
2.61% (1 mo. USD LIBOR + 0.330%) (2)(8) | 04/25/37 | 1,251,739 | 127,112 | |||||||||
MortgageIT Trust (05-1-1A1) |
| |||||||||||
2.92% (1 mo. USD LIBOR + 0.640%) (2) | 02/25/35 | 57,556 | 57,693 | |||||||||
Structured Adjustable Rate Mortgage Loan Trust (04-18-4A1) |
| |||||||||||
4.21% (3) | 12/25/34 | 46,264 | 45,838 | |||||||||
Structured Asset Mortgage Investments II Trust (05-AR6-2A1) |
| |||||||||||
2.90% (1 mo. USD LIBOR + 0.310%) (2) | 09/25/45 | 59,350 | 58,788 | |||||||||
| Issues | Maturity Date | Principal Amount | Value | |||||||||
| RESIDENTIAL MORTGAGE-BACKED SECURITIES — NON-AGENCY (Continued) | ||||||||||||
Structured Asset Mortgage Investments, Inc. (06-AR3-22A1) |
| |||||||||||
3.82% (3) | 05/25/36 | $ 192,106 | $ | 135,119 | ||||||||
|
| |||||||||||
Total Residential Mortgage-backed Securities — Non-agency |
| |||||||||||
(Cost: $791,476) | 847,880 | |||||||||||
|
| |||||||||||
Total Fixed Income Securities |
| |||||||||||
(Cost: $15,518,607) | 14,972,221 | |||||||||||
|
| |||||||||||
| Security | Shares | |||||||||||
INVESTMENT COMPANIES — 2.2% |
| |||||||||||
TCW Emerging Markets Income Fund — I Class (9) |
| 45,767 | 355,611 | |||||||||
|
| |||||||||||
Total Investment Companies |
| |||||||||||
(Cost: $367,936) | 355,611 | |||||||||||
|
| |||||||||||
MONEY MARKET INVESTMENTS — 0.7% |
| |||||||||||
State Street Institutional U.S. Government Money Market Fund — Premier Class, 2.09% (10) |
| 118,577 | 118,577 | |||||||||
|
| |||||||||||
Total Money Market Investments |
| |||||||||||
(Cost: $118,577) | 118,577 | |||||||||||
|
| |||||||||||
| Principal Amount | ||||||||||||
SHORT TERM INVESTMENTS — 4.5% |
| |||||||||||
FOREIGN GOVERNMENT BONDS — 3.9% |
| |||||||||||
Japan Treasury Bill |
| |||||||||||
0.00% (5) | 12/03/18 | JPY | 45,000,000 | 398,793 | ||||||||
0.00% (5) | 11/19/18 | JPY | 24,900,000 | 220,650 | ||||||||
|
| |||||||||||
Total Foreign Government Bonds |
| |||||||||||
(Cost: $627,281) | 619,443 | |||||||||||
|
| |||||||||||
U.S. TREASURY SECURITY — 0.6% (Cost: $92,772) |
| |||||||||||
U.S. Treasury Bill |
| |||||||||||
2.12% (11)(12) | 12/13/18 | 93,000 | 92,768 | |||||||||
|
| |||||||||||
Total Short Term Investments |
| |||||||||||
(Cost: $720,053) |
| 712,211 | ||||||||||
|
| |||||||||||
Total Investments (101.1%) |
| |||||||||||
(Cost: $16,725,173) |
| 16,158,620 | ||||||||||
Liabilities In Excess Of Other Assets (-1.1%) |
| (177,257 | ) | |||||||||
|
| |||||||||||
Net Assets (100.0%) |
| $ | 15,981,363 | |||||||||
|
| |||||||||||
See accompanying notes to financial statements.
40
Table of Contents
TCW Global Bond Fund
October 31, 2018 |
| Forward Currency Exchange Contracts | ||||||||||||||||||||||||
| Counterparty | Contracts to Deliver | Units of Currency | Settlement Date | In Exchange for U.S. Dollars | Contracts at Value | Unrealized Appreciation (Depreciation) | ||||||||||||||||||
BUY (13) | ||||||||||||||||||||||||
Goldman Sachs & Co. | EUR | 365,000 | 01/31/19 | $ | 418,187 | $ | 417,022 | $ | (1,165 | ) | ||||||||||||||
Bank of America | NOK | 3,005,000 | 01/31/19 | 361,791 | 359,047 | (2,744 | ) | |||||||||||||||||
Bank of America | PLN | 360,000 | 01/31/19 | 95,258 | 94,219 | (1,039 | ) | |||||||||||||||||
Goldman Sachs & Co. | SEK | 635,000 | 01/31/19 | 70,207 | 70,087 | (120 | ) | |||||||||||||||||
|
|
|
|
|
| |||||||||||||||||||
| $ | 945,443 | $ | 940,375 | $ | (5,068 | ) | ||||||||||||||||||
|
|
|
|
|
| |||||||||||||||||||
SELL (14) | ||||||||||||||||||||||||
Citibank N.A. | BRL | 265,000 | 08/28/19 | $ | 62,097 | $ | 69,461 | $ | (7,364 | ) | ||||||||||||||
Goldman Sachs & Co. | EUR | 140,000 | 02/14/19 | 164,639 | 160,152 | 4,487 | ||||||||||||||||||
|
|
|
|
|
| |||||||||||||||||||
| $ | 226,736 | $ | 229,613 | $ | (2,877 | ) | ||||||||||||||||||
|
|
|
|
|
| |||||||||||||||||||
| Futures Contracts | ||||||||||||||||||
| Number of Contracts | Type | Expiration Date | Notional Value | Market Value | Net Unrealized Appreciation (Depreciation) | |||||||||||||
BUY |
| |||||||||||||||||
| 8 | 2-Year U.S. Treasury Note Futures | 12/31/18 | $ | 1,689,700 | $ | 1,685,250 | $ | (4,450 | ) | |||||||||
| 17 | 5-Year U.S. Treasury Note Futures | 12/31/18 | 1,922,081 | 1,910,508 | (11,573 | ) | ||||||||||||
| 3 | U.S. Ultra Long Bond Futures | 12/19/18 | 476,561 | 447,655 | (28,906 | ) | ||||||||||||
|
|
|
|
|
| |||||||||||||
| $ | 4,088,342 | $ | 4,043,413 | $ | (44,929 | ) | ||||||||||||
|
|
|
|
|
| |||||||||||||
SELL |
| |||||||||||||||||
| 7 | 10-Year U.S. Treasury Note Futures | 12/19/18 | $ | 891,796 | $ | 875,766 | $ | (16,030 | ) | |||||||||
|
|
|
|
|
| |||||||||||||
See accompanying notes to financial statements.
41
Table of Contents
TCW Global Bond Fund
Schedule of Investments (Continued)
Notes to Schedule of Investments:
| CLO - | Collateralized Loan Obligation. |
| EETC - | Enhanced Equipment Trust Certificate. |
| I/F - | Inverse Floating rate security whose interest rate moves in the opposite direction of prevailing interest rates. |
| I/O - | Interest Only Security. |
| PAC - | Planned Amortization Class. |
| REIT - | Real Estate Investment Trust. |
| TBA - | To be Announced. |
| AUD - | Australian Dollar. |
| BRL - | Brazilian Real. |
| CAD - | Canadian Dollar. |
| CZK - | Czech Koruna. |
| EUR - | Euro Currency. |
| GBP - | British Pound Sterling. |
| IDR - | Indonesian Rupiah. |
| JPY - | Japanese Yen. |
| MXN - | Mexican Peso. |
| NOK - | Norwegian Krone. |
| PEN - | Peruvian Nuevo Sol. |
| PLN - | Polish Zloty. |
| SEK - | Swedish Krona. |
| ZAR - | South African Rand. |
| (1) | Security exempt from registration under Rule 144A of the Securities Act of 1933, as amended. These securities may be resold, normally only to qualified institutional buyers. At October 31, 2018, the value of these securities amounted to $771,488 or 4.8% of net assets. These securities are determined to be liquid by the Advisor, unless otherwise noted, under procedures established by and under the general supervision of the Company’s Board of Directors. |
| (2) | Floating or variable rate security. The interest shown reflects the rate in effect at October 31, 2018. |
| (3) | Variable rate security. Interest rate disclosed is as of the most recent information available. Certain variable rate securities are not based on a published reference rate and spread but are determined by the issuer or agent and are based on current market conditions. These securities do not indicate a reference rate and spread in their description above. |
| (4) | Investments issued under Regulation S of the Securities Act of 1933, as amended, may not be offered, sold, or delivered within the United States except under special exemptions. At October 31, 2018, the value of these securities amounted to $3,785,687 or 23.7% of net assets. |
| (5) | Security is not accruing interest. |
| (6) | Restricted security (Note 10). |
| (7) | Security purchased on a forward commitment with an approximate principal amount. The actual principal amount and maturity date will be determined upon settlement when the security is delivered. |
| (8) | For fair value measurement disclosure purposes, security is categorized as Level 3. |
| (9) | Affiliated issuer. |
| (10) | Rate disclosed is the 7-day net yield as of October 31, 2018. |
| (11) | Rate shown represents yield-to-maturity. |
| (12) | All or a portion of this security is held as collateral for open futures contracts. |
| (13) | Fund buys foreign currency, sells U.S. Dollar. |
| (14) | Fund sells foreign currency, buys U.S. Dollar. |
See accompanying notes to financial statements.
42
Table of Contents
TCW Global Bond Fund
October 31, 2018 |
The summary of the TCW Global Bond Fund transactions in the affiliated fund for the year ended October 31, 2018 is as follows:
Name of | Value at October 31, 2017 (In Thousands) | Purchases at Cost (In Thousands) | Proceeds from Sales (In Thousands) | Number of Shares Held October 31, 2018 | Value at October 31, 2018 (In Thousands) | Dividends and Interest Income Received (In Thousands) | Distributions Received from Net Realized Gain (In thousands) | Net Realized Gain/(Loss) on Investments (In thousands) | Net change in Unrealized Gain/(Loss) on Investments (In thousands) | |||||||||||||||||||||||||||
TCW Emerging Markets Income Fund—I Class |
| |||||||||||||||||||||||||||||||||||
| $ | — | $ | 368 | $ | — | 45,767 | $ | 356 | $ | 4 | $ | — | $ | — | $ | (12 | ) | |||||||||||||||||||
|
|
|
|
|
|
|
|
|
| |||||||||||||||||||||||||||
Total | $ | 356 | $ | 4 | $ | — | $ | — | $ | (12 | ) | |||||||||||||||||||||||||
|
|
|
|
|
|
|
|
|
| |||||||||||||||||||||||||||
See accompanying notes to financial statements.
43
Table of Contents
TCW Global Bond Fund
Investments by Industry
| Industry | Percentage of Net Assets | |||
Advertising | 0.0 | %* | ||
Aerospace/Defense | 0.4 | |||
Airlines | 0.9 | |||
Asset-Backed Securities | 2.0 | |||
Auto Manufacturers | 1.0 | |||
Banks | 5.6 | |||
Beverages | 0.5 | |||
Biotechnology | 0.5 | |||
Chemicals | 0.3 | |||
Commercial Mortgage-Backed Securities — Agency | 3.2 | |||
Commercial Mortgage-Backed Securities — Non-Agency | 9.2 | |||
Commercial Services | 0.2 | |||
Cosmetics/Personal Care | 0.0 | * | ||
Diversified Financial Services | 0.2 | |||
Electric | 1.1 | |||
Electronics | 0.0 | * | ||
Environmental Control | 0.0 | * | ||
Food | 0.2 | |||
Foreign Government Bonds | 44.2 | |||
Forest Products & Paper | 0.3 | |||
Healthcare-Products | 0.3 | |||
Healthcare-Services | 1.2 | |||
Household Products/Wares | 0.0 | * | ||
Insurance | 0.5 | |||
Internet | 0.0 | * | ||
Investment Companies | 2.2 | |||
Media | 0.6 | |||
Miscellaneous Manufacturers | 1.1 | |||
Municipal Bonds | 0.3 | |||
Oil & Gas | 0.8 | |||
Packaging & Containers | 0.1 | |||
Pharmaceuticals | 0.6 | |||
Pipelines | 0.4 | |||
REIT | 2.3 | |||
Residential Mortgage-Backed Securities — Agency | 8.8 | |||
Residential Mortgage-Backed Securities — Non-Agency | 5.3 | |||
Retail | 0.4 | |||
Short Term Investments | 4.5 | |||
Software | 0.0 | * | ||
Telecommunications | 1.2 | |||
Money Market Investments | 0.7 | |||
|
| |||
Total | 101.1 | % | ||
|
| |||
| * | Amount rounds to less than 0.1% |
See accompanying notes to financial statements.
44
Table of Contents
TCW Global Bond Fund
Investments by Country | October 31, 2018 |
| Country | Percentage of Net Assets | |||
Australia | 0.4 | % | ||
Bermuda | 0.2 | |||
Brazil | 0.5 | |||
Canada | 2.9 | |||
Cayman Islands | 0.7 | |||
Czech Republic | 0.9 | |||
France | 3.6 | |||
Germany | 0.9 | |||
Great Britain | 6.1 | |||
Indonesia | 1.5 | |||
Ireland | 1.8 | |||
Italy | 3.7 | |||
Japan | 13.7 | |||
Luxembourg | 0.1 | |||
Mexico | 1.7 | |||
Netherlands | 0.0 | * | ||
Norway | 1.3 | |||
Peru | 0.8 | |||
Poland | 0.4 | |||
Portugal | 2.3 | |||
Slovenia | 0.6 | |||
South Africa | 0.5 | |||
South Korea | 1.3 | |||
Spain | 4.1 | |||
United States | 51.1 | |||
|
| |||
Total | 101.1 | % | ||
|
| |||
| * | Amount rounds to less than 0.1% |
See accompanying notes to financial statements.
45
Table of Contents
TCW Global Bond Fund
Fair Valuation Summary | October 31, 2018 |
The following is a summary of the fair valuations according to the inputs used as of October 31, 2018 in valuing the Fund’s investments:
Description | Quoted Prices in Active Markets for Identical Assets (Level 1) | Other Significant Observable Inputs (Level 2) | Significant Unobservable Inputs (Level 3) | Total | ||||||||||||
Fixed Income Securities | ||||||||||||||||
Corporate Bonds* | $ | — | $ | 3,313,105 | $ | — | $ | 3,313,105 | ||||||||
Municipal Bonds | — | 40,032 | — | 40,032 | ||||||||||||
Foreign Government Bonds | — | 7,071,778 | — | 7,071,778 | ||||||||||||
Asset-Backed Securities | — | 322,401 | — | 322,401 | ||||||||||||
Commercial Mortgage-Backed Securities — Agency | — | 506,808 | — | 506,808 | ||||||||||||
Commercial Mortgage-Backed Securities — Non-Agency | — | 1,467,842 | — | 1,467,842 | ||||||||||||
Residential Mortgage-Backed Securities — Agency | — | 1,402,375 | — | 1,402,375 | ||||||||||||
Residential Mortgage-Backed Securities — Non-Agency | — | 720,768 | 127,112 | 847,880 | ||||||||||||
|
|
|
|
|
|
|
| |||||||||
Total Fixed Income Securities | — | 14,845,109 | 127,112 | 14,972,221 | ||||||||||||
|
|
|
|
|
|
|
| |||||||||
Investment Companies | 355,611 | — | — | 355,611 | ||||||||||||
Money Market Investments | 118,577 | — | — | 118,577 | ||||||||||||
Short-Term Investments | 92,768 | 619,443 | — | 712,211 | ||||||||||||
|
|
|
|
|
|
|
| |||||||||
Total Investments | 566,956 | 15,464,552 | 127,112 | 16,158,620 | ||||||||||||
|
|
|
|
|
|
|
| |||||||||
Asset Derivatives | ||||||||||||||||
Forward Currency Contracts | ||||||||||||||||
Foreign Currency Risk | — | 4,487 | — | 4,487 | ||||||||||||
|
|
|
|
|
|
|
| |||||||||
Total Investments | $ | 566,956 | $ | 15,469,039 | $ | 127,112 | $ | 16,163,107 | ||||||||
|
|
|
|
|
|
|
| |||||||||
Liability Derivatives | ||||||||||||||||
Forward Currency Contracts | ||||||||||||||||
Foreign Currency Risk | $ | — | $ | (12,432 | ) | $ | — | $ | (12,432 | ) | ||||||
Futures | ||||||||||||||||
Interest Rate Risk | (60,959 | ) | — | — | (60,959 | ) | ||||||||||
|
|
|
|
|
|
|
| |||||||||
Total | $ | (60,959 | ) | $ | (12,432 | ) | $ | — | $ | (73,391 | ) | |||||
|
|
|
|
|
|
|
| |||||||||
| * | See Schedule of Investments for corresponding industries. |
See accompanying notes to financial statements.
46
Table of Contents
Schedule of Investments | October 31, 2018 |
| Issues | Maturity Date | Principal Amount | Value | |||||||||
FIXED INCOME SECURITIES — 88.1% of Net Assets |
| |||||||||||
BANK LOANS — 6.8% |
| |||||||||||
| Commercial Services — 1.8% | ||||||||||||
Mister Car Wash, Inc., Term Loan B |
| |||||||||||
5.54% (3 mo. USD LIBOR + 3.250%) (1) | 08/20/21 | $ | 32,339 | $ | 32,514 | |||||||
SBA Senior Finance II LLC 2018 Term Loan B |
| |||||||||||
4.31% (3 mo. USD LIBOR + 2.000%) (1) | 04/11/25 | 74,813 | 74,749 | |||||||||
Scientific Games International, Inc., 2018 Term Loan B5 |
| |||||||||||
5.04% (3 mo. USD LIBOR + 2.750%) (1) | 08/14/24 | 32,798 | 32,525 | |||||||||
SS&C Technologies Holdings Europe S.A.R.L. 2018 Term Loan B4 |
| |||||||||||
4.55% (3 mo. USD LIBOR + 2.500%) (1) | 04/16/25 | 24,292 | 24,199 | |||||||||
SS&C Technologies, Inc. 2018 Term Loan B3 |
| |||||||||||
4.55% (3 mo. USD LIBOR + 2.500%) (1) | 04/16/25 | 62,672 | 62,433 | |||||||||
|
| |||||||||||
| 226,420 | ||||||||||||
|
| |||||||||||
| Electric — 0.8% | ||||||||||||
TEX Operations Co. LLC, Exit Term Loan B |
| |||||||||||
4.30% (3 mo. USD LIBOR + 2.000%) (1) | 08/04/23 | 36,002 | 35,964 | |||||||||
Vistra Energy Corp. 1st Lien Term Loan B3 |
| |||||||||||
4.29% (3 mo. USD LIBOR + 2.000%) (1) | 12/31/25 | 62,843 | 62,728 | |||||||||
|
| |||||||||||
| 98,692 | ||||||||||||
|
| |||||||||||
| Entertainment — 0.4% | ||||||||||||
Churchill Downs, Inc. 2017 Term Loan B |
| |||||||||||
4.31% (3 mo. USD LIBOR + 2.000%) (1) | 12/27/24 | 56,573 | 56,749 | |||||||||
|
| |||||||||||
| Food — 0.1% | ||||||||||||
Dhanani Group, Inc. 2018 Term Loan B |
| |||||||||||
6.05% (3 mo. USD LIBOR +3.75%) (1) | 07/20/25 | 14,962 | 14,935 | |||||||||
|
| |||||||||||
| Healthcare-Products — 0.1% | ||||||||||||
Auris Luxembourg III S.A.R.L. 2018 USD Term Loan B |
| |||||||||||
3.75% (3 mo. USD LIBOR + 3.750%) (1) | 07/20/25 | 16,500 | 16,641 | |||||||||
|
| |||||||||||
| Healthcare-Services — 0.6% | ||||||||||||
BCPE Eagle Buyer LLC, 2017 1st Lien Term Loan |
| |||||||||||
6.55% (3 mo. USD LIBOR + 4.250%) (1) | 03/18/24 | 12,805 | 12,645 | |||||||||
BCPE Eagle Buyer LLC, 2017 2nd Lien Term Loan |
| |||||||||||
10.30% (3 mo. USD LIBOR + 8.000%) (1) | 03/17/25 | 13,000 | 12,826 | |||||||||
| Issues | Maturity Date | Principal Amount | Value | |||||||||
| Healthcare-Services (Continued) | ||||||||||||
Gentiva Health Services, Inc. 2018 1st Lien Term Loan |
| |||||||||||
6.06% (3 mo. USD LIBOR + 3.750%) (1) | 07/02/25 | $ | 48,869 | $ | 49,144 | |||||||
|
| |||||||||||
| 74,615 | ||||||||||||
|
| |||||||||||
| Lodging — 0.3% | ||||||||||||
CityCenter Holdings, LLC, 2017 Term Loan B |
| |||||||||||
4.55% (3 mo. USD LIBOR + 2.500%) (1) | 04/18/24 | 32,439 | 32,413 | |||||||||
|
| |||||||||||
| Pharmaceuticals — 0.4% | ||||||||||||
Alphabet Holding Co., Inc., 2017 1st Lien Term Loan |
| |||||||||||
5.80% (3 mo. USD LIBOR + 3.500%) (1) | 09/26/24 | 32,446 | 31,160 | |||||||||
PharMerica Corp., 2nd Lien Term Loan |
| |||||||||||
10.03% (3 mo. USD LIBOR + 8.750%) (1) | 12/07/25 | 26,000 | 25,870 | |||||||||
|
| |||||||||||
| 57,030 | ||||||||||||
|
| |||||||||||
| Retail — 0.7% | ||||||||||||
1011778 B.C. Unlimited Liability Co., Term Loan B3 |
| |||||||||||
4.55% (3 mo. USD LIBOR + 2.250%) (1) | 02/16/24 | 88,647 | 88,415 | |||||||||
|
| |||||||||||
| Software — 1.5% | ||||||||||||
First Data Corp., 2017 Term Loan |
| |||||||||||
4.29% (3 mo. USD LIBOR + 2.000%) (1) | 07/08/22 | 34,174 | 34,100 | |||||||||
First Data Corp., 2024 Term Loan |
| |||||||||||
4.29% (3 mo. USD LIBOR + 2.000%) (1) | 04/26/24 | 127,364 | 126,820 | |||||||||
TierPoint LLC, 2017 1st Lien Term Loan |
| |||||||||||
6.05% (3 mo. USD LIBOR + 3.750%) (1) | 05/06/24 | 35,296 | 34,767 | |||||||||
|
| |||||||||||
| 195,687 | ||||||||||||
|
| |||||||||||
| Telecommunications — 0.1% | ||||||||||||
Intelsat Jackson Holdings S.A., 2017 Term Loan B5 |
| |||||||||||
6.63% (3 mo. USD LIBOR + 6.625%) (1) | 01/02/24 | 14,000 | 14,405 | |||||||||
|
| |||||||||||
Total Bank Loans | ||||||||||||
(Cost: $875,994) | 876,002 | |||||||||||
|
| |||||||||||
| CORPORATE BONDS — 81.3% | ||||||||||||
| Advertising — 0.7% | ||||||||||||
Clear Channel International BV |
| |||||||||||
8.75% (2) | 12/15/20 | 68,000 | 69,573 | |||||||||
Lamar Media Corp. |
| |||||||||||
5.75% | 02/01/26 | 21,000 | 21,236 | |||||||||
|
| |||||||||||
| 90,809 | ||||||||||||
|
| |||||||||||
| Aerospace/Defense — 0.7% | ||||||||||||
Bombardier, Inc. (Canada) |
| |||||||||||
6.13% (2) | 01/15/23 | 27,000 | 26,798 | |||||||||
See accompanying notes to financial statements.
47
Table of Contents
TCW High Yield Bond Fund
Schedule of Investments (Continued)
| Issues | Maturity Date | Principal Amount | Value | |||||||||
| Aerospace/Defense (Continued) | ||||||||||||
KLX, Inc. |
| |||||||||||
5.88% (2) | 12/01/22 | $ | 64,000 | $ | 65,923 | |||||||
|
| |||||||||||
| 92,721 | ||||||||||||
|
| |||||||||||
| Airlines — 4.3% | ||||||||||||
American Airlines, Inc. Pass-Through Trust (13-2-B) (EETC) |
| |||||||||||
5.60% (2) | 01/15/22 | 236,833 | 240,693 | |||||||||
Continental Airlines, Inc. Pass-Through Certificates (99-1-A) (EETC) |
| |||||||||||
6.55% | 08/02/20 | 59,113 | 59,607 | |||||||||
Delta Air Lines, Inc. Pass-Through Certificates (02-1-G-1) (EETC) |
| |||||||||||
6.72% | 07/02/24 | 236,805 | 250,774 | |||||||||
|
| |||||||||||
| 551,074 | ||||||||||||
|
| |||||||||||
| Chemicals — 1.5% | ||||||||||||
Axalta Coating Systems LLC |
| |||||||||||
4.88% (2) | 08/15/24 | 160,000 | 151,800 | |||||||||
Kissner Holdings LP / Kissner Milling Co., Ltd. / BSC Holding, Inc. / Kissner USA (Canada) |
| |||||||||||
8.38% (2) | 12/01/22 | 11,000 | 11,261 | |||||||||
Valvoline, Inc. |
| |||||||||||
4.38% | 08/15/25 | 34,000 | 31,408 | |||||||||
|
| |||||||||||
| 194,469 | ||||||||||||
|
| |||||||||||
| Coal — 0.1% | ||||||||||||
SunCoke Energy Partners LP / SunCoke Energy Partners Finance Corp. |
| |||||||||||
7.50% (2) | 06/15/25 | 18,000 | 18,292 | |||||||||
|
| |||||||||||
| Commercial Services — 2.2% | ||||||||||||
Gartner, Inc. |
| |||||||||||
5.13% (2) | 04/01/25 | 8,000 | 7,960 | |||||||||
IHS Markit, Ltd. | ||||||||||||
4.00% (2) | 03/01/26 | 85,000 | 80,210 | |||||||||
4.75% (2) | 02/15/25 | 11,000 | 10,917 | |||||||||
Matthews International Corp. |
| |||||||||||
5.25% (2) | 12/01/25 | 53,000 | 49,889 | |||||||||
Service Corp. International | ||||||||||||
4.50% | 11/15/20 | 92,000 | 92,058 | |||||||||
4.63% | 12/15/27 | 42,000 | 39,480 | |||||||||
|
| |||||||||||
| 280,514 | ||||||||||||
|
| |||||||||||
| Computers — 0.8% | ||||||||||||
EMC Corp. |
| |||||||||||
2.65% | 06/01/20 | 100,000 | 97,625 | |||||||||
|
| |||||||||||
| Diversified Financial Services — 1.6% | ||||||||||||
Ally Financial, Inc. |
| |||||||||||
3.25% | 11/05/18 | 208,000 | 207,470 | |||||||||
|
| |||||||||||
| Issues | Maturity Date | Principal Amount | Value | |||||||||
| Electric — 0.6% | ||||||||||||
NextEra Energy Operating Partners LP |
| |||||||||||
4.25% (2) | 09/15/24 | $ | 3,000 | $ | 2,865 | |||||||
4.50% (2) | 09/15/27 | 74,000 | 68,635 | |||||||||
|
| |||||||||||
| 71,500 | ||||||||||||
|
| |||||||||||
| Electrical Components & Equipment — 0.3% | ||||||||||||
Energizer Gamma Acquisition, Inc. |
| |||||||||||
6.38% (2) | 07/15/26 | 34,000 | 34,085 | |||||||||
|
| |||||||||||
| Electronics — 0.4% | ||||||||||||
Itron, Inc. |
| |||||||||||
5.00% (2) | 01/15/26 | 61,000 | 56,959 | |||||||||
|
| |||||||||||
| Entertainment — 1.0% | ||||||||||||
Caesars Resort Collection LLC / CRC Finco, Inc. |
| |||||||||||
5.25% (2) | 10/15/25 | 23,000 | 21,505 | |||||||||
Delta Merger Sub, Inc. |
| |||||||||||
6.00% (2) | 09/15/26 | 45,000 | 44,241 | |||||||||
Rivers Pittsburgh Borrower LP / Rivers Pittsburgh Finance Corp. |
| |||||||||||
6.13% (2) | 08/15/21 | 42,000 | 41,895 | |||||||||
WMG Acquisition Corp. |
| |||||||||||
5.50% (2) | 04/15/26 | 27,000 | 26,359 | |||||||||
|
| |||||||||||
| 134,000 | ||||||||||||
|
| |||||||||||
| Environmental Control — 1.9% | ||||||||||||
Clean Harbors, Inc. |
| |||||||||||
5.13% | 06/01/21 | 138,000 | 138,345 | |||||||||
Covanta Holding Corp. |
| |||||||||||
5.88% | 07/01/25 | 14,000 | 13,615 | |||||||||
GFL Environmental, Inc. |
| |||||||||||
5.38% (2) | 03/01/23 | 47,000 | 43,240 | |||||||||
Waste Pro USA, Inc. |
| |||||||||||
5.50% (2) | 02/15/26 | 45,000 | 42,750 | |||||||||
|
| |||||||||||
| 237,950 | ||||||||||||
|
| |||||||||||
| Food — 3.1% | ||||||||||||
B&G Foods, Inc. |
| |||||||||||
4.63% | 06/01/21 | 72,000 | 71,820 | |||||||||
Chobani LLC / Chobani Finance Corp., Inc. |
| |||||||||||
7.50% (2) | 04/15/25 | 39,000 | 33,491 | |||||||||
Kraft Heinz Foods Co. |
| |||||||||||
4.88% (2) | 02/15/25 | 50,000 | 50,766 | |||||||||
Nathan’s Famous, Inc. |
| |||||||||||
6.63% (2) | 11/01/25 | 15,000 | 14,972 | |||||||||
Pilgrim’s Pride Corp. | ||||||||||||
5.75% (2) | 03/15/25 | 43,000 | 40,313 | |||||||||
5.88% (2) | 09/30/27 | 48,000 | 43,680 | |||||||||
Post Holdings, Inc. | ||||||||||||
5.50% (2) | 03/01/25 | 50,000 | 48,500 | |||||||||
5.63% (2) | 01/15/28 | 103,000 | 97,108 | |||||||||
|
| |||||||||||
| 400,650 | ||||||||||||
|
| |||||||||||
See accompanying notes to financial statements.
48
Table of Contents
TCW High Yield Bond Fund
October 31, 2018 |
| Issues | Maturity Date | Principal Amount | Value | |||||||||
| Healthcare-Products — 1.5% | ||||||||||||
Hill-Rom Holdings, Inc. |
| |||||||||||
5.75% (2) | 09/01/23 | $ | 58,000 | $ | 58,870 | |||||||
Hologic, Inc. |
| |||||||||||
4.63% (2) | 02/01/28 | 60,000 | 54,903 | |||||||||
Teleflex, Inc. | ||||||||||||
4.63% | 11/15/27 | 80,000 | 74,300 | |||||||||
4.88% | 06/01/26 | 3,000 | 2,929 | |||||||||
|
| |||||||||||
| 191,002 | ||||||||||||
|
| |||||||||||
| Healthcare-Services — 8.1% | ||||||||||||
Acadia Healthcare Co., Inc. | ||||||||||||
6.50% | 03/01/24 | 62,000 | 63,333 | |||||||||
Centene Corp. | ||||||||||||
4.75% | 05/15/22 | 71,000 | 71,444 | |||||||||
5.63% | 02/15/21 | 96,000 | 97,680 | |||||||||
CHS / Community Health Systems, Inc. |
| |||||||||||
5.13% | 08/01/21 | 8,000 | 7,620 | |||||||||
6.25% | 03/31/23 | 47,000 | 43,402 | |||||||||
HCA, Inc. | ||||||||||||
5.25% | 04/15/25 | 238,000 | 243,653 | |||||||||
6.50% | 02/15/20 | 92,000 | 95,220 | |||||||||
Polaris Intermediate Corp. | ||||||||||||
8.50% (2) | 12/01/22 | 6,000 | 6,165 | |||||||||
Tenet Healthcare Corp. | ||||||||||||
4.50% | 04/01/21 | 93,000 | 92,651 | |||||||||
4.63% | 07/15/24 | 123,000 | 118,861 | |||||||||
4.75% | 06/01/20 | 119,000 | 119,446 | |||||||||
WellCare Health Plans, Inc. | ||||||||||||
5.25% | 04/01/25 | 80,000 | 80,000 | |||||||||
|
| |||||||||||
| 1,039,475 | ||||||||||||
|
| |||||||||||
| Holding Companies-Diversified — 0.2% | ||||||||||||
Trident Merger Sub, Inc. |
| |||||||||||
6.63% (2) | 11/01/25 | 30,000 | 28,125 | |||||||||
|
| |||||||||||
| Household Products/Wares — 0.7% | ||||||||||||
Central Garden & Pet Co. |
| |||||||||||
5.13% | 02/01/28 | 39,000 | 36,075 | |||||||||
Spectrum Brands, Inc. | ||||||||||||
6.13% | 12/15/24 | 16,000 | 16,080 | |||||||||
6.63% | 11/15/22 | 37,000 | 37,879 | |||||||||
|
| |||||||||||
| 90,034 | ||||||||||||
|
| |||||||||||
| Internet — 0.6% | ||||||||||||
Zayo Group LLC / Zayo Capital, Inc. |
| |||||||||||
5.75% (2) | 01/15/27 | 75,000 | 73,702 | |||||||||
|
| |||||||||||
| Iron & Steel — 0.2% | ||||||||||||
Big River Steel LLC / BRS Finance Corp. |
| |||||||||||
7.25% (2) | 09/01/25 | 19,000 | 19,855 | |||||||||
|
| |||||||||||
| Issues | Maturity Date | Principal Amount | Value | |||||||||
| Lodging — 1.0% | ||||||||||||
Boyd Gaming Corp. |
| |||||||||||
6.00% | 08/15/26 | $ | 48,000 | $ | 46,560 | |||||||
Sugarhouse HSP Gaming Prop Mezz LP / Sugarhouse HSP Gaming Finance Corp. |
| |||||||||||
5.88% (2) | 05/15/25 | 32,000 | 30,280 | |||||||||
Wynn Las Vegas LLC / Wynn Las Vegas Capital Corp. |
| |||||||||||
5.25% (2) | 05/15/27 | 24,000 | 21,810 | |||||||||
5.50% (2) | 03/01/25 | 24,000 | 22,890 | |||||||||
|
| |||||||||||
| 121,540 | ||||||||||||
|
| |||||||||||
| Machinery-Diversified — 0.1% | ||||||||||||
Titan Acquisition, Ltd. / Titan Co-Borrower LLC |
| |||||||||||
7.75% (2) | 04/15/26 | 16,000 | 13,321 | |||||||||
|
| |||||||||||
| Media — 11.2% | ||||||||||||
Altice US Finance I Corp. (Luxembourg) |
| |||||||||||
5.38% (2) | 07/15/23 | 200,000 | 200,462 | |||||||||
AMC Networks, Inc. |
| |||||||||||
4.75% | 08/01/25 | 37,000 | 34,547 | |||||||||
Cable One, Inc. |
| |||||||||||
5.75% (2) | 06/15/22 | 97,000 | 98,697 | |||||||||
CCO Holdings LLC / CCO Holdings Capital Corp. |
| |||||||||||
5.13% (2) | 05/01/27 | 278,000 | 262,013 | |||||||||
CSC Holdings LLC |
| |||||||||||
5.38% (2) | 02/01/28 | 200,000 | 189,000 | |||||||||
8.63% | 02/15/19 | 108,000 | 109,350 | |||||||||
DISH DBS Corp. |
| |||||||||||
5.88% | 11/15/24 | 10,000 | 8,525 | |||||||||
7.75% | 07/01/26 | 10,000 | 8,887 | |||||||||
DISH Network Corp. |
| |||||||||||
3.38% | 08/15/26 | 44,000 | 39,312 | |||||||||
EW Scripps Co. (The) |
| |||||||||||
5.13% (2) | 05/15/25 | 32,000 | 30,162 | |||||||||
Midcontinent Communications & Finance Co. |
| |||||||||||
6.88% (2) | 08/15/23 | 45,000 | 47,081 | |||||||||
Radiate Holdco LLC / Radiate Finance, Inc. |
| |||||||||||
6.88% (2) | 02/15/23 | 14,000 | 13,510 | |||||||||
Sinclair Television Group, Inc. |
| |||||||||||
6.13% | 10/01/22 | 82,000 | 83,640 | |||||||||
Sirius XM Radio, Inc. |
| |||||||||||
3.88% (2) | 08/01/22 | 208,000 | 200,730 | |||||||||
TEGNA, Inc. |
| |||||||||||
5.13% | 10/15/19 | 75,000 | 74,906 | |||||||||
Univision Communications, Inc. |
| |||||||||||
5.13% (2) | 02/15/25 | 33,000 | 30,278 | |||||||||
|
| |||||||||||
| 1,431,100 | ||||||||||||
|
| |||||||||||
| Oil & Gas — 5.4% | ||||||||||||
Centennial Resource Production LLC |
| |||||||||||
5.38% (2) | 01/15/26 | 22,000 | 21,560 | |||||||||
See accompanying notes to financial statements.
49
Table of Contents
TCW High Yield Bond Fund
Schedule of Investments (Continued)
| Issues | Maturity Date | Principal Amount | Value | |||||||||
| Oil & Gas (Continued) | ||||||||||||
CrownRock LP / CrownRock Finance, Inc. |
| |||||||||||
5.63% (2) | 10/15/25 | $ | 13,000 | $ | 12,383 | |||||||
Diamondback Energy, Inc. |
| |||||||||||
5.38% | 05/31/25 | 42,000 | 42,000 | |||||||||
Endeavor Energy Resources LP / EER Finance, Inc. |
| |||||||||||
5.75% (2) | 01/30/28 | 23,000 | 23,863 | |||||||||
Ensco PLC (United Kingdom) |
| |||||||||||
7.75% | 02/01/26 | 35,000 | 32,769 | |||||||||
EQT Corp. |
| |||||||||||
3.90% | 10/01/27 | 65,000 | 59,255 | |||||||||
Gulfport Energy Corp. |
| |||||||||||
6.38% | 05/15/25 | 4,000 | 3,815 | |||||||||
Matador Resources Co. |
| |||||||||||
5.88% (2) | 09/15/26 | 42,000 | 41,265 | |||||||||
Newfield Exploration Co. |
| |||||||||||
5.75% | 01/30/22 | 114,000 | 118,132 | |||||||||
Parsley Energy LLC / Parsley Finance Corp. |
| |||||||||||
5.25% (2) | 08/15/25 | 48,000 | 46,620 | |||||||||
Range Resources Corp. |
| |||||||||||
4.88% | 05/15/25 | 29,000 | 26,970 | |||||||||
5.00% | 03/15/23 | 20,000 | 19,400 | |||||||||
Seven Generations Energy, Ltd. (Canada) |
| |||||||||||
5.38% (2) | 09/30/25 | 31,000 | 28,946 | |||||||||
Sunoco LP / Sunoco Finance Corp. |
| |||||||||||
4.88% (2) | 01/15/23 | 53,000 | 51,012 | |||||||||
5.88% (2) | 03/15/28 | 60,000 | 56,100 | |||||||||
Transocean Pontus, Ltd. |
| |||||||||||
6.13% (2) | 08/01/25 | 71,000 | 70,734 | |||||||||
WPX Energy, Inc. |
| |||||||||||
5.25% | 09/15/24 | 19,000 | 18,786 | |||||||||
5.75% | 06/01/26 | 13,000 | 13,000 | |||||||||
|
| |||||||||||
| 686,610 | ||||||||||||
|
| |||||||||||
| Oil & Gas Services — 1.4% | ||||||||||||
Transocean Proteus, Ltd. |
| |||||||||||
6.25% (2) | 12/01/24 | 147,050 | 147,050 | |||||||||
USA Compression Partners LP / USA Compression Finance Corp. |
| |||||||||||
6.88% (2) | 04/01/26 | 33,000 | 33,454 | |||||||||
|
| |||||||||||
| 180,504 | ||||||||||||
|
| |||||||||||
| Packaging & Containers — 6.3% | ||||||||||||
Ardagh Packaging Finance PLC / Ardagh Holdings USA, Inc. (Ireland) |
| |||||||||||
4.25% (2) | 09/15/22 | 200,000 | 194,260 | |||||||||
Ball Corp. |
| |||||||||||
4.00% | 11/15/23 | 92,000 | 89,700 | |||||||||
4.38% | 12/15/20 | 45,000 | 45,225 | |||||||||
Berry Global, Inc. |
| |||||||||||
4.50% (2) | 02/15/26 | 55,000 | 51,562 | |||||||||
| Issues | Maturity Date | Principal Amount | Value | |||||||||
| Packaging & Containers (Continued) | ||||||||||||
Berry Plastics Corp. |
| |||||||||||
5.13% | 07/15/23 | $ | 34,000 | $ | 33,873 | |||||||
Crown Americas LLC / Crown Americas Capital Corp. V |
| |||||||||||
4.25% | 09/30/26 | 53,000 | 48,230 | |||||||||
Graphic Packaging International, Inc. |
| |||||||||||
4.88% | 11/15/22 | 50,000 | 50,000 | |||||||||
Multi-Color Corp. |
| |||||||||||
4.88% (2) | 11/01/25 | 47,000 | 43,123 | |||||||||
Reynolds Group Issuer, Inc. / Reynolds Group Issuer LLC / Reynolds Group Issuer (Luxembourg) |
| |||||||||||
5.94% (3 mo. USD LIBOR + 3.500%) (1)(2) | 07/15/21 | 142,000 | 143,775 | |||||||||
Sealed Air Corp. |
| |||||||||||
5.25% (2) | 04/01/23 | 62,000 | 61,767 | |||||||||
5.50% (2) | 09/15/25 | 13,000 | 12,870 | |||||||||
Silgan Holdings, Inc. |
| |||||||||||
4.75% | 03/15/25 | 27,000 | 25,751 | |||||||||
|
| |||||||||||
| 800,136 | ||||||||||||
|
| |||||||||||
| Pharmaceuticals — 3.1% | ||||||||||||
Bausch Health Cos, Inc. (Canada) |
| |||||||||||
5.50% (2) | 11/01/25 | 149,000 | 146,579 | |||||||||
5.88% (2) | 05/15/23 | 121,000 | 116,009 | |||||||||
9.25% (2) | 04/01/26 | 29,000 | 30,559 | |||||||||
Elanco Animal Health, Inc. |
| |||||||||||
3.91% (2) | 08/27/21 | 66,000 | 66,043 | |||||||||
4.90% (2) | 08/28/28 | 42,000 | 41,571 | |||||||||
|
| |||||||||||
| 400,761 | ||||||||||||
|
| |||||||||||
| Pipelines — 5.8% | ||||||||||||
Cheniere Corpus Christi Holdings LLC |
| |||||||||||
5.13% | 06/30/27 | 11,000 | 10,808 | |||||||||
Cheniere Energy Partners LP |
| |||||||||||
5.63% (2) | 10/01/26 | 58,000 | 57,275 | |||||||||
Energy Transfer LP | ||||||||||||
5.50% | 06/01/27 | 95,000 | 96,810 | |||||||||
5.88% | 01/15/24 | 13,000 | 13,666 | |||||||||
Kinder Morgan Energy Partners LP |
| |||||||||||
2.65% | 02/01/19 | 113,000 | 112,885 | |||||||||
NGPL PipeCo LLC |
| |||||||||||
4.38% (2) | 08/15/22 | 79,000 | 78,407 | |||||||||
Rockies Express Pipeline LLC | ||||||||||||
5.63% (2) | 04/15/20 | 129,000 | 132,444 | |||||||||
6.00% (2) | 01/15/19 | 71,000 | 71,195 | |||||||||
6.88% (2) | 04/15/40 | 6,000 | 6,555 | |||||||||
Targa Resources Partners LP / Targa Resources Partners Finance Corp. |
| |||||||||||
5.88% (2) | 04/15/26 | 27,000 | 27,236 | |||||||||
See accompanying notes to financial statements.
50
Table of Contents
TCW High Yield Bond Fund
October 31, 2018 |
| Issues | Maturity Date | Principal Amount | Value | |||||||||
| Pipelines (Continued) | ||||||||||||
TransMontaigne Partners LP / TLP Finance Corp. |
| |||||||||||
6.13% | 02/15/26 | $ | 55,000 | $ | 51,838 | |||||||
Williams Cos., Inc. (The) | ||||||||||||
3.70% | 01/15/23 | 37,000 | 36,360 | |||||||||
4.55% | 06/24/24 | 42,000 | 42,429 | |||||||||
|
| |||||||||||
| 737,908 | ||||||||||||
|
| |||||||||||
| REIT — 1.2% | ||||||||||||
GLP Capital LP / GLP Financing II, Inc. |
| |||||||||||
4.88% | 11/01/20 | 63,000 | 63,945 | |||||||||
5.75% | 06/01/28 | 35,000 | 35,503 | |||||||||
MGM Growth Properties Operating Partnership LP / MGP Finance Co-Issuer, Inc. |
| |||||||||||
4.50% | 01/15/28 | 40,000 | 35,750 | |||||||||
5.63% | 05/01/24 | 17,000 | 17,085 | |||||||||
|
| |||||||||||
| 152,283 | ||||||||||||
|
| |||||||||||
| Retail — 3.1% | ||||||||||||
1011778 BC ULC / New Red Finance, Inc. (Canada) |
| |||||||||||
4.25% (2) | 05/15/24 | 47,000 | 44,297 | |||||||||
Cumberland Farms, Inc. | ||||||||||||
6.75% (2) | 05/01/25 | 22,000 | 22,605 | |||||||||
IRB Holding Corp. | ||||||||||||
6.75% (2) | 02/15/26 | 16,000 | 15,360 | |||||||||
KFC Holding Co. / Pizza Hut Holdings LLC / Taco Bell of America LLC |
| |||||||||||
4.75% (2) | 06/01/27 | 24,000 | 22,620 | |||||||||
5.00% (2) | 06/01/24 | 60,000 | 59,325 | |||||||||
5.25% (2) | 06/01/26 | 97,000 | 95,424 | |||||||||
Party City Holdings, Inc. | ||||||||||||
6.63% (2) | 08/01/26 | 25,000 | 24,375 | |||||||||
Rite Aid Corp. | ||||||||||||
6.13% (2) | 04/01/23 | 130,000 | 111,069 | |||||||||
|
| |||||||||||
| 395,075 | ||||||||||||
|
| |||||||||||
| Software — 0.8% | ||||||||||||
CDK Global, Inc. |
| |||||||||||
3.80% | 10/15/19 | 69,000 | 69,048 | |||||||||
Change Healthcare Holdings LLC / Change Healthcare Finance, Inc. |
| |||||||||||
5.75% (2) | 03/01/25 | 32,000 | 31,401 | |||||||||
|
| |||||||||||
| 100,449 | ||||||||||||
|
| |||||||||||
| Telecommunications — 11.1% | ||||||||||||
Frontier Communications Corp. |
| |||||||||||
7.13% | 01/15/23 | 122,000 | 82,472 | |||||||||
8.50% (2) | 04/01/26 | 23,000 | 21,448 | |||||||||
Intelsat Jackson Holdings S.A. (Luxembourg) |
| |||||||||||
5.50% | 08/01/23 | 226,000 | 202,835 | |||||||||
9.75% (2) | 07/15/25 | 37,000 | 38,850 | |||||||||
| Issues | Maturity Date | Principal Amount | Value | |||||||||
| Telecommunications (Continued) | ||||||||||||
Level 3 Financing, Inc. | ||||||||||||
5.25% | 03/15/26 | $ | 49,000 | $ | 47,163 | |||||||
6.13% | 01/15/21 | 37,000 | 37,141 | |||||||||
Qwest Corp. | ||||||||||||
6.75% | 12/01/21 | 118,000 | 123,457 | |||||||||
Sprint Capital Corp. | ||||||||||||
8.75% | 03/15/32 | 136,000 | 148,920 | |||||||||
Sprint Communications, Inc. | ||||||||||||
7.00% (2) | 03/01/20 | 119,000 | 123,611 | |||||||||
Sprint Corp. | ||||||||||||
7.13% | 06/15/24 | 60,000 | 61,500 | |||||||||
Sprint Spectrum Co. LLC / Sprint Spectrum Co. II LLC / Sprint Spectrum Co. III LLC |
| |||||||||||
4.74% (2) | 09/20/29 | 166,000 | 166,207 | |||||||||
T-Mobile USA, Inc. | ||||||||||||
4.75% | 02/01/28 | 191,000 | 176,914 | |||||||||
6.50% | 01/15/24 | 176,000 | 182,600 | |||||||||
Windstream Services LLC / Windstream Finance Corp. |
| |||||||||||
9.00% (2) | 06/30/25 | 6,000 | 4,348 | |||||||||
|
| |||||||||||
| 1,417,466 | ||||||||||||
|
| |||||||||||
| Trucking & Leasing — 0.3% | ||||||||||||
Avolon Holdings Funding, Ltd. |
| |||||||||||
5.13% (2) | 10/01/23 | 45,000 | 44,269 | |||||||||
|
| |||||||||||
Total Corporate Bonds | ||||||||||||
(Cost: $10,532,018) | 10,391,733 | |||||||||||
|
| |||||||||||
Total Fixed Income Securities | ||||||||||||
(Cost: $11,408,012) | 11,267,735 | |||||||||||
|
| |||||||||||
| Shares | ||||||||||||
COMMON STOCK — 0.4% (Cost: $327,224) |
| |||||||||||
| Electric — 0.4% | ||||||||||||
Homer City Holdings LLC — Series A (3)(4) | 5,610 | 47,685 | ||||||||||
|
| |||||||||||
Total Common Stock | ||||||||||||
(Cost: $327,224) | 47,685 | |||||||||||
|
| |||||||||||
| MONEY MARKET INVESTMENTS — 1.8% | ||||||||||||
State Street Institutional U.S. Government Money Market Fund — Premier Class, 2.09% (5) | 231,613 | 231,613 | ||||||||||
|
| |||||||||||
Total Money Market Investments | ||||||||||||
(Cost: $231,613) | 231,613 | |||||||||||
|
| |||||||||||
See accompanying notes to financial statements.
51
Table of Contents
TCW High Yield Bond Fund
Schedule of Investments (Continued)
| Issues | Maturity Date | Principal Amount | Value | |||||||||
SHORT TERM INVESTMENTS — 7.9% |
| |||||||||||
| U.S. Treasury Securities — 7.9% | ||||||||||||
U.S. Treasury Bill | ||||||||||||
2.12% (6)(7) | 12/13/18 | $ | 31,000 | $ | 30,923 | |||||||
2.30% (6) | 01/31/19 | 179,000 | 177,967 | |||||||||
2.40% (6) | 04/04/19 | 505,000 | 499,886 | |||||||||
2.43% (6) | 04/11/19 | 302,000 | 298,770 | |||||||||
|
| |||||||||||
Total U.S. Treasury Securities | ||||||||||||
(Cost: $1,007,579) | 1,007,546 | |||||||||||
|
| |||||||||||
Total Short Term Investments | ||||||||||||
(Cost: $1,007,579) | 1,007,546 | |||||||||||
|
| |||||||||||
Total Investments (98.2%) | ||||||||||||
(Cost: $12,974,428) | 12,554,579 | |||||||||||
Excess Of Other Assets Over Liabilities (1.8%) |
| 235,319 | ||||||||||
|
| |||||||||||
Net Assets (100.0%) | $ | 12,789,898 | ||||||||||
|
| |||||||||||
| Credit Default Swaps — Buy Protection | ||||||||||||||||||||||||||||||||
| Notional Amount (8) | Implied Credit Spread (9) | Expiration Date | Counterparty | Reference Entity | Fixed Deal Pay Rate | Payment Frequency | Unrealized Appreciation (Depreciation) | Premium Paid | Value (10) | |||||||||||||||||||||||
OTC Swaps | ||||||||||||||||||||||||||||||||
| $ | 250,000 | 0.499% | 3/20/19 | Goldman Sachs International | Arconic, Inc. | 1.0% | Quarterly | $ | (1,257 | ) | $ | 639 | $ | (618 | ) | |||||||||||||||||
|
|
|
|
|
| |||||||||||||||||||||||||||
| Futures Contracts | ||||||||||||||||||
| Number of Contracts | Type | Expiration Date | Notional Value | Market Value | Net Unrealized Appreciation (Depreciation) | |||||||||||||
Long Futures |
| |||||||||||||||||
| 9 | 2-Year U.S. Treasury Note Futures | 12/31/18 | $ | 1,900,696 | $ | 1,895,906 | $ | (4,790 | ) | |||||||||
| 14 | 5-Year U.S. Treasury Note Futures | 12/31/18 | 1,572,872 | 1,573,359 | 487 | |||||||||||||
|
|
|
|
|
| |||||||||||||
| $ | 3,473,568 | $ | 3,469,265 | $ | (4,303 | ) | ||||||||||||
|
|
|
|
|
| |||||||||||||
Short Futures |
| |||||||||||||||||
| 1 | 10-Year U.S. Treasury Note Futures | 12/19/18 | $ | (128,310 | ) | $ | (125,109 | ) | $ | 3,201 | ||||||||
|
|
|
|
|
| |||||||||||||
See accompanying notes to financial statements.
52
Table of Contents
TCW High Yield Bond Fund
October 31, 2018 |
Notes to Schedule of Investments:
| EETC - | Enhanced Equipment Trust Certificate. |
| OTC - | Over the Counter. |
| REIT - | Real Estate Investment Trust. |
| (1) | Floating or variable rate security. The interest shown reflects the rate in effect at October 31, 2018. |
| (2) | Security exempt from registration under Rule 144A of the Securities Act of 1933, as amended. These securities may be resold, normally only to qualified institutional buyers. At October 31, 2018, the value of these securities amounted to $5,485,960 or 42.9% of net assets. These securities are determined to be liquid by the Advisor, unless otherwise noted, under procedures established by and under the general supervision of the Company’s Board of Directors. |
| (3) | For fair value measurement disclosure purposes, security is categorized as Level 3. |
| (4) | Non-income producing security. |
| (5) | Rate disclosed is the 7-day net yield as of October 31, 2018. |
| (6) | Rate shown represents yield-to-maturity. |
| (7) | All or a portion of this security is held as collateral for open futures contracts. |
| (8) | The maximum potential amount the Fund could receive as buyer of protection if a credit event occurred as defined under the terms of that particular swap agreement. |
| (9) | An implied credit spread is the spread in yield between a U.S. Treasury security and the referenced obligation. Implied credit spreads, represented in the absolute terms, utilized in determining the value of credit default swap agreements serve as an indicator of the current status of the payment/performance risk and represent the likelihood of risk of default for the credit derivative. The implied credit spread of a particular referenced entity reflects the cost of buying protection and may include upfront payments required to be made to enter into the agreement. Wider credit spreads, in comparison to narrower credit spreads, represent a deterioration of the referenced entity’s credit soundness and a greater likelihood of risk of default or other credit event occurring as defined under the terms of the agreement. |
| (10) | The value of a credit default swap agreement serves as an indicator of the current status of the payments/performance risk and represents the likelihood of an expected liability (or profit) for the credit derivative should the notional amount of the swap agreement be closed/sold as of the period end. Increasing market values, in absolute terms, when compared to the notional amount of the swap, represent a deterioration of the reference entity’s credit worthiness and a greater likelihood or risk of default or other credit event occurring as defined under the terms of the agreements. |
See accompanying notes to financial statements.
53
Table of Contents
TCW High Yield Bond Fund
Investments by Industry
| Industry | Percentage of Net Assets | |||
Advertising | 0.7 | % | ||
Aerospace/Defense | 0.7 | |||
Airlines | 4.3 | |||
Chemicals | 1.5 | |||
Coal | 0.1 | |||
Commercial Services | 4.0 | |||
Computers | 0.8 | |||
Diversified Financial Services | 1.6 | |||
Electric | 1.8 | |||
Electrical Components & Equipment | 0.3 | |||
Electronics | 0.4 | |||
Entertainment | 1.4 | |||
Environmental Control | 1.9 | |||
Food | 3.2 | |||
Healthcare-Products | 1.6 | |||
Healthcare-Services | 8.7 | |||
Holding Companies-Diversified | 0.2 | |||
Household Products/Wares | 0.7 | |||
Internet | 0.6 | |||
Iron & Steel | 0.2 | |||
Lodging | 1.3 | |||
Machinery-Diversified | 0.1 | |||
Media | 11.2 | |||
Oil & Gas | 5.4 | |||
Oil & Gas Services | 1.4 | |||
Packaging & Containers | 6.3 | |||
Pharmaceuticals | 3.5 | |||
Pipelines | 5.8 | |||
REIT | 1.2 | |||
Retail | 3.8 | |||
Short Term Investments | 7.9 | |||
Software | 2.3 | |||
Telecommunications | 11.2 | |||
Trucking & Leasing | 0.3 | |||
Money Market Investments | 1.8 | |||
|
| |||
Total | 98.2 | % | ||
|
| |||
See accompanying notes to financial statements.
54
Table of Contents
TCW High Yield Bond Fund
Fair Valuation Summary | October 31, 2018 |
The following is a summary of the fair valuations according to the inputs used as of October 31, 2018 in valuing the Fund’s investments:
Description | Quoted Prices in Active Markets for Identical Assets (Level 1) | Other Significant Observable Inputs (Level 2) | Significant Unobservable Inputs (Level 3) | Total | ||||||||||||
Fixed Income Securities | ||||||||||||||||
Bank Loans* | $ | — | $ | 876,002 | $ | — | $ | 876,002 | ||||||||
Corporate Bonds* | — | 10,391,733 | — | 10,391,733 | ||||||||||||
|
|
|
|
|
|
|
| |||||||||
Total Fixed Income Securities | — | 11,267,735 | — | 11,267,735 | ||||||||||||
|
|
|
|
|
|
|
| |||||||||
Equity Securities | ||||||||||||||||
Common Stock* | — | — | 47,685 | 47,685 | ||||||||||||
Money Market Investments | 231,613 | — | — | 231,613 | ||||||||||||
Short-Term Investments* | 1,007,546 | — | — | 1,007,546 | ||||||||||||
|
|
|
|
|
|
|
| |||||||||
Total Investments | 1,239,159 | 11,267,735 | 47,685 | 12,554,579 | ||||||||||||
|
|
|
|
|
|
|
| |||||||||
Asset Derivatives | ||||||||||||||||
Futures | ||||||||||||||||
Interest Rate Risk | 3,688 | — | — | 3,688 | ||||||||||||
|
|
|
|
|
|
|
| |||||||||
Total Investments | $ | 1,242,847 | $ | 11,267,735 | $ | 47,685 | $ | 12,558,267 | ||||||||
|
|
|
|
|
|
|
| |||||||||
Liability Derivatives | ||||||||||||||||
Swap Agreements | ||||||||||||||||
Credit Risk | $ | — | $ | (618 | ) | $ | — | $ | (618 | ) | ||||||
Futures | ||||||||||||||||
Interest Rate Risk | (4,790 | ) | — | — | (4,790 | ) | ||||||||||
|
|
|
|
|
|
|
| |||||||||
Total | $ | (4,790 | ) | $ | (618 | ) | $ | — | $ | (5,408 | ) | |||||
|
|
|
|
|
|
|
| |||||||||
| * | See Schedule of Investments for corresponding industries. |
See accompanying notes to financial statements.
55
Table of Contents
Schedule of Investments
| Issues | Maturity Date | Principal Amount | Value | |||||||||
FIXED INCOME SECURITIES — 92.3% of Net Assets |
| |||||||||||
| COMMERCIAL MORTGAGE-BACKED SECURITIES — AGENCY — 6.8% | ||||||||||||
Fannie Mae, Pool #AM6161 |
| |||||||||||
2.28% | 08/01/19 | $ | 59,484 | $ | 59,221 | |||||||
Fannie Mae, Pool #AM7028 |
| |||||||||||
2.35% (1 mo. USD LIBOR + 0.240%) (1) | 10/01/19 | 65,000 | 64,949 | |||||||||
Fannie Mae, Pool #464321 |
| |||||||||||
4.36% | 01/01/20 | 43,709 | 44,105 | |||||||||
Fannie Mae (15-M10-FA) |
| |||||||||||
2.41% (1 mo. USD LIBOR + 0.250%) (1) | 03/25/19 | 888 | 886 | |||||||||
Freddie Mac Multifamily Structured Pass-Through Certificates (J15F-A1) |
| |||||||||||
2.36% | 07/25/20 | 23,043 | 22,935 | |||||||||
Freddie Mac Multifamily Structured Pass-Through Certificates (K004-A1) |
| |||||||||||
3.41% | 05/25/19 | 73,574 | 73,591 | |||||||||
Freddie Mac Multifamily Structured Pass-Through Certificates (K707-A2) |
| |||||||||||
2.22% | 12/25/18 | 23,824 | 23,782 | |||||||||
Freddie Mac Multifamily Structured Pass-Through Certificates (KF04-A) |
| |||||||||||
2.57% (1 mo. USD LIBOR + 0.310%) (1) | 06/25/21 | 8,968 | 8,964 | |||||||||
Freddie Mac Multifamily Structured Pass-Through Certificates (KF14-A) |
| |||||||||||
2.91% (1 mo. USD LIBOR + 0.650%) (1) | 01/25/23 | 15,104 | 15,134 | |||||||||
Freddie Mac Multifamily Structured Pass-Through Certificates (KJ02-A2) |
| |||||||||||
2.60% | 09/25/20 | 139,359 | 138,255 | |||||||||
Freddie Mac Multifamily Structured Pass-Through Certificates (KP02-A2) |
| |||||||||||
2.36% (2) | 04/25/21 | 40,680 | 40,460 | |||||||||
|
| |||||||||||
Total Commercial Mortgage-backed Securities — Agency |
| |||||||||||
(Cost: $494,276) |
| 492,282 | ||||||||||
|
| |||||||||||
COMMERCIAL MORTGAGE-BACKED SECURITIES — NON-AGENCY — 0.5% |
| |||||||||||
JPMorgan Chase Commercial Mortgage Securities Trust (06-LDP9-A3S) |
| |||||||||||
5.24% (3) | 05/15/47 | 15,073 | 15,015 | |||||||||
JPMorgan Chase Commercial Mortgage Securities Trust (12-HSBC-A) |
| |||||||||||
3.09% (3) | 07/05/32 | 9,712 | 9,619 | |||||||||
OBP Depositor LLC Trust (10-OBP-A) |
| |||||||||||
4.65% (3) | 07/15/45 | 10,000 | 10,167 | |||||||||
|
| |||||||||||
Total Commercial Mortgage-backed Securities — Non-agency |
| |||||||||||
(Cost: $35,809) |
| 34,801 | ||||||||||
|
| |||||||||||
| Issues | Maturity Date | Principal Amount | Value | |||||||||
RESIDENTIAL MORTGAGE-BACKED SECURITIES — AGENCY —16.2% |
| |||||||||||
Fannie Mae (03-11-FA) |
| |||||||||||
3.28% (1 mo. USD LIBOR + 1.000%) (1) | 09/25/32 | $ | 17,128 | $ | 17,464 | |||||||
Fannie Mae (03-52-NF) |
| |||||||||||
2.68% (1 mo. USD LIBOR + 0.400%) (1) | 06/25/23 | 18,682 | 18,720 | |||||||||
Fannie Mae (05-114-PF) (PAC) |
| |||||||||||
2.66% (1 mo. USD LIBOR + 0.375%) (1) | 08/25/35 | 32,653 | 32,692 | |||||||||
Fannie Mae (06-60-DF) |
| |||||||||||
2.71% (1 mo. USD LIBOR + 0.430%) (1) | 04/25/35 | 26,942 | 27,045 | |||||||||
Fannie Mae (06-84-WF) (PAC) |
| |||||||||||
2.58% (1 mo. USD LIBOR + 0.300%) (1) | 02/25/36 | 8,376 | 8,379 | |||||||||
Fannie Mae (07-64-FA) |
| |||||||||||
2.75% (1 mo. USD LIBOR + 0.470%) (1) | 07/25/37 | 35,706 | 36,013 | |||||||||
Fannie Mae (07-67-FA) |
| |||||||||||
2.53% (1 mo. USD LIBOR + 0.250%) (1) | 04/25/37 | 20,435 | 20,438 | |||||||||
Fannie Mae (08-15-JN) |
| |||||||||||
4.50% | 02/25/23 | 13,884 | 13,943 | |||||||||
Fannie Mae (08-24-PF) (PAC) |
| |||||||||||
2.93% (1 mo. USD LIBOR + 0.650%) (1) | 02/25/38 | 24,774 | 24,915 | |||||||||
Fannie Mae (08-47-PF) (PAC) |
| |||||||||||
2.78% (1 mo. USD LIBOR + 0.500%) (1) | 06/25/38 | 1,203 | 1,203 | |||||||||
Fannie Mae (09-33-FB) |
| |||||||||||
3.10% (1 mo. USD LIBOR + 0.820%) (1) | 03/25/37 | 26,200 | 26,768 | |||||||||
Fannie Mae (10-83-AK) |
| |||||||||||
3.00% | 11/25/18 | 21 | 21 | |||||||||
Fannie Mae (11-124-DF) |
| |||||||||||
2.73% (1 mo. USD LIBOR + 0.450%) (1) | 08/25/40 | 15,184 | 15,249 | |||||||||
Fannie Mae (11-75-HP) (PAC) |
| |||||||||||
2.50% | 07/25/40 | 35,476 | 34,975 | |||||||||
Fannie Mae, Pool #254548 |
| |||||||||||
5.50% | 12/01/32 | 14,011 | 14,999 | |||||||||
Fannie Mae, Pool #600187 |
| |||||||||||
7.00% | 07/01/31 | 32,968 | 35,739 | |||||||||
Fannie Mae, Pool #995364 |
| |||||||||||
6.00% | 10/01/38 | 16,922 | 18,397 | |||||||||
Fannie Mae, Pool #AL0851 |
| |||||||||||
6.00% | 10/01/40 | 8,303 | 8,974 | |||||||||
Freddie Mac (2550-FI) (TAC) |
| |||||||||||
2.63% (1 mo. USD LIBOR + 0.350%) (1) | 11/15/32 | 3,846 | 3,901 | |||||||||
See accompanying notes to financial statements.
56
Table of Contents
TCW Short Term Bond Fund
October 31, 2018
| Issues | Maturity Date | Principal Amount | Value | |||||||||
RESIDENTIAL MORTGAGE-BACKED SECURITIES — AGENCY (Continued) |
| |||||||||||
Freddie Mac (2763-FC) |
| |||||||||||
2.63% (1 mo. USD LIBOR + 0.350%) (1) | 04/15/32 | $ | 6,466 | $ | 6,472 | |||||||
Freddie Mac (2764-OE) (PAC) |
| |||||||||||
4.50% | 03/15/19 | 619 | 619 | |||||||||
Freddie Mac (2990-DE) |
| |||||||||||
2.66% (1 mo. USD LIBOR + 0.380%) (1) | 11/15/34 | 26,745 | 26,816 | |||||||||
Freddie Mac (3071-TF) (PAC) |
| |||||||||||
2.58% (1 mo. USD LIBOR + 0.300%) (1) | 04/15/35 | 43,659 | 43,685 | |||||||||
Freddie Mac (3139-FL) (PAC) |
| |||||||||||
2.58% (1 mo. USD LIBOR + 0.300%) (1) | 01/15/36 | 25,753 | 25,763 | |||||||||
Freddie Mac (3172-FK) |
| |||||||||||
2.73% (1 mo. USD LIBOR + 0.450%) (1) | 08/15/33 | 12,843 | 12,854 | |||||||||
Freddie Mac (3196-FA) (PAC) |
| |||||||||||
2.63% (1 mo. USD LIBOR + 0.350%) (1) | 04/15/32 | 52,481 | 52,527 | |||||||||
Freddie Mac (3300-FA) |
| |||||||||||
2.58% (1 mo. USD LIBOR + 0.300%) (1) | 08/15/35 | 43,474 | 43,519 | |||||||||
Freddie Mac (3318-F) |
| |||||||||||
2.53% (1 mo. USD LIBOR + 0.250%) (1) | 05/15/37 | 50,686 | 50,564 | |||||||||
Freddie Mac (3335-FT) |
| |||||||||||
2.43% (1 mo. USD LIBOR + 0.150%) (1) | 08/15/19 | 63 | 63 | |||||||||
Freddie Mac (3645-EH) |
| |||||||||||
3.00% | 12/15/20 | 16,198 | 16,174 | |||||||||
Freddie Mac (3747-HG) (PAC) |
| |||||||||||
2.40% | 07/15/37 | 1,443 | 1,443 | |||||||||
Freddie Mac (3767-JF) (PAC) |
| |||||||||||
2.58% (1 mo. USD LIBOR + 0.300%) (1) | 02/15/39 | 45,710 | 45,852 | |||||||||
Freddie Mac (3804-FN) (PAC) |
| |||||||||||
2.73% (1 mo. USD LIBOR + 0.450%) (1) | 03/15/39 | 539 | 540 | |||||||||
Freddie Mac (3828-TF) |
| |||||||||||
2.68% (1 mo. USD LIBOR + 0.400%) (1) | 04/15/29 | 40,472 | 40,503 | |||||||||
Freddie Mac (3879-MF) |
| |||||||||||
2.63% (1 mo. USD LIBOR + 0.350%) (1) | 09/15/38 | 31,330 | 31,429 | |||||||||
Freddie Mac (3940-PF) (PAC) |
| |||||||||||
2.63% (1 mo. USD LIBOR + 0.350%) (1) | 05/15/40 | 60,724 | 60,812 | |||||||||
| Issues | Maturity Date | Principal Amount | Value | |||||||||
RESIDENTIAL MORTGAGE-BACKED SECURITIES — AGENCY (Continued) |
| |||||||||||
Freddie Mac (3946-FG) (PAC) |
| |||||||||||
2.63% (1 mo. USD LIBOR + 0.350%) (1) | �� | 10/15/39 | $ | 28,051 | $ | 28,105 | ||||||
Freddie Mac (4231-FD) |
| |||||||||||
2.63% (1 mo. USD LIBOR + 0.350%) (1) | 10/15/32 | 71,617 | 71,620 | |||||||||
Freddie Mac (263-F5) |
| |||||||||||
2.78% (1 mo. USD LIBOR + 0.500%) (1) | 06/15/42 | 52,407 | 52,834 | |||||||||
Ginnie Mae (04-5-PF) |
| |||||||||||
2.83% (1 mo. USD LIBOR + 0.550%) (1) | 02/20/33 | 5,793 | 5,816 | |||||||||
Ginnie Mae (12-13-KF) |
| |||||||||||
2.58% (1 mo. USD LIBOR + 0.300%) (1) | 07/20/38 | 32,077 | 32,138 | |||||||||
Ginnie Mae II, Pool #80022 |
| |||||||||||
3.13% (1 year Treasury Constant Maturity Rate + 1.500%) (1) | 12/20/26 | 15,126 | 15,525 | |||||||||
Ginnie Mae II, Pool #80636 |
| |||||||||||
2.75% (1 year Treasury Constant Maturity Rate + 1.500%) (1) | 09/20/32 | 10,802 | 11,125 | |||||||||
Ginnie Mae II, Pool #80757 |
| |||||||||||
2.75% (1 year Treasury Constant Maturity Rate + 1.500%) (1) | 10/20/33 | 7,869 | 7,904 | |||||||||
Ginnie Mae II, Pool #80797 |
| |||||||||||
3.38% (1 year Treasury Constant Maturity Rate + 1.500%) (1) | 01/20/34 | 54,112 | 56,037 | |||||||||
Ginnie Mae II, Pool #80937 |
| |||||||||||
3.63% (1 year Treasury Constant Maturity Rate + 1.500%) (1) | 06/20/34 | 21,319 | 22,025 | |||||||||
NCUA Guaranteed Notes (10-R1-1A) |
| |||||||||||
2.73% (1 mo. USD LIBOR + 0.450%) (1) | 10/07/20 | 59,066 | 59,158 | |||||||||
|
| |||||||||||
Total Residential Mortgage-backed Securities — Agency |
| |||||||||||
(Cost: $1,143,715) |
| 1,181,757 | ||||||||||
|
| |||||||||||
RESIDENTIAL MORTGAGE-BACKED SECURITIES — NON-AGENCY—1.2% |
| |||||||||||
Credit Suisse First Boston Mortgage Securities Corp. (02-AR31-6A1) |
| |||||||||||
4.25% (2) | 11/25/32 | 60,946 | 62,142 | |||||||||
First Franklin Mortgage Loan Asset-Backed Certificates (04-FF5-A3C) |
| |||||||||||
3.28% (1 mo. USD LIBOR + 1.000%) (1) | 08/25/34 | 19,609 | 19,180 | |||||||||
Morgan Stanley Mortgage Loan Trust (04-6AR-1A) |
| |||||||||||
3.18% (1 mo. USD LIBOR + 0.900%) (1) | 07/25/34 | 7,186 | 7,195 | |||||||||
See accompanying notes to financial statements.
57
Table of Contents
TCW Short Term Bond Fund
Schedule of Investments (Continued)
| Issues | Maturity Date | Principal Amount | Value | |||||||||
RESIDENTIAL MORTGAGE-BACKED SECURITIES — NON-AGENCY (Continued) |
| |||||||||||
Residential Accredit Loans, Inc. (02-QS16-A2) |
| |||||||||||
2.83% (1 mo. USD LIBOR + 0.55%) (1)(4) | 10/25/17 | $ | 83 | $ | 83 | |||||||
|
| |||||||||||
Total Residential Mortgage-backed Securities — Non-agency |
| |||||||||||
(Cost: $85,461) |
| 88,600 | ||||||||||
|
| |||||||||||
CORPORATE BONDS — 32.9% |
| |||||||||||
| Aerospace/Defense — 1.2% | ||||||||||||
BAE Systems Holdings, Inc. |
| |||||||||||
6.38% (3) | 06/01/19 | 20,000 | 20,378 | |||||||||
L3 Technologies, Inc. |
| |||||||||||
4.95% | 02/15/21 | 15,000 | 15,382 | |||||||||
Lockheed Martin Corp. |
| |||||||||||
1.85% | 11/23/18 | 25,000 | 24,989 | |||||||||
United Technologies Corp. |
| |||||||||||
2.97% (3 mo. USD LIBOR + 0.650%) (1) | 08/16/21 | 25,000 | 25,030 | |||||||||
|
| |||||||||||
| 85,779 | ||||||||||||
|
| |||||||||||
| Agriculture — 0.3% | ||||||||||||
Altria Group, Inc. |
| |||||||||||
9.70% | 11/10/18 | 20,000 | 20,030 | |||||||||
|
| |||||||||||
| Airlines — 0.4% | ||||||||||||
Continental Airlines, Inc. Pass-Through Certificates (99-1-A) (EETC) |
| |||||||||||
6.55% | 08/02/20 | 31,870 | 32,136 | |||||||||
|
| |||||||||||
| Auto Manufacturers — 0.7% | ||||||||||||
Ford Motor Credit Co. LLC |
| |||||||||||
2.46% | 03/27/20 | 25,000 | 24,497 | |||||||||
2.60% | 11/04/19 | 25,000 | 24,715 | |||||||||
|
| |||||||||||
| 49,212 | ||||||||||||
|
| |||||||||||
| Banks — 11.1% | ||||||||||||
Bank of America Corp. |
| |||||||||||
2.37% (3 mo. USD LIBOR + 0.66%) (1) | 07/21/21 | 100,000 | 98,132 | |||||||||
2.74% (1) | 01/23/22 | 25,000 | 24,511 | |||||||||
7.63% | 06/01/19 | 15,000 | 15,391 | |||||||||
Bank of New York Mellon Corp. (The) |
| |||||||||||
2.20% | 05/15/19 | 25,000 | 24,920 | |||||||||
Citigroup, Inc. |
| |||||||||||
2.05% | 12/07/18 | 25,000 | 24,987 | |||||||||
2.45% | 01/10/20 | 25,000 | 24,777 | |||||||||
2.50% | 07/29/19 | 25,000 | 24,923 | |||||||||
2.90% | 12/08/21 | 25,000 | 24,450 | |||||||||
Goldman Sachs Group, Inc. (The) |
| |||||||||||
2.55% | 10/23/19 | 40,000 | 39,765 | |||||||||
3.41% (3 mo. USD LIBOR + 1.100%) (1) | 11/15/18 | 25,000 | 25,011 | |||||||||
| Issues | Maturity Date | Principal Amount | Value | |||||||||
| Banks (Continued) | ||||||||||||
JPMorgan Chase & Co. |
| |||||||||||
3.00% (3 mo. USD LIBOR + 0.68%) (1) | 06/01/21 | $ | 75,000 | $ | 75,329 | |||||||
JPMorgan Chase Bank NA | ||||||||||||
3.09% (3.086% until 4/26/20 then 3 mo. USD LIBOR +0.35%) (1) | 04/26/21 | 50,000 | 49,801 | |||||||||
Macquarie Bank, Ltd. (Australia) |
| |||||||||||
2.35% (3) | 01/15/19 | 15,000 | 14,984 | |||||||||
Morgan Stanley | ||||||||||||
2.89% (3 mo. USD LIBOR + 0.55%) (1) | 02/10/21 | 30,000 | 30,021 | |||||||||
3.12% (3 mo. USD LIBOR + 0.800%) (1) | 02/14/20 | 30,000 | 30,037 | |||||||||
7.30% | 05/13/19 | 60,000 | 61,330 | |||||||||
PNC Bank NA | ||||||||||||
1.80% | 11/05/18 | 50,000 | 49,997 | |||||||||
Santander UK PLC (United Kingdom) |
| |||||||||||
2.50% | 03/14/19 | 30,000 | 29,966 | |||||||||
Wells Fargo & Co. | ||||||||||||
2.15% | 01/30/20 | 40,000 | 39,487 | |||||||||
Wells Fargo Bank N.A. | ||||||||||||
2.40% | 01/15/20 | 100,000 | 99,175 | |||||||||
|
| |||||||||||
| 806,994 | ||||||||||||
|
| |||||||||||
| Beverages — 0.9% | ||||||||||||
Anheuser-Busch InBev Worldwide, Inc. |
| |||||||||||
6.88% | 11/15/19 | 25,000 | 25,933 | |||||||||
Constellation Brands, Inc. |
| |||||||||||
2.00% | 11/07/19 | 25,000 | 24,730 | |||||||||
Molson Coors Brewing Co. |
| |||||||||||
2.25% | 03/15/20 | 15,000 | 14,774 | |||||||||
|
| |||||||||||
| 65,437 | ||||||||||||
|
| |||||||||||
| Chemicals — 0.3% | ||||||||||||
Dow Chemical Co. (The) |
| |||||||||||
8.55% | 05/15/19 | 20,000 | 20,588 | |||||||||
|
| |||||||||||
| Computers — 0.7% | ||||||||||||
Apple, Inc. |
| |||||||||||
1.70% | 02/22/19 | 30,000 | 29,927 | |||||||||
Dell International LLC / EMC Corp. |
| |||||||||||
3.48% (3) | 06/01/19 | 20,000 | 20,028 | |||||||||
|
| |||||||||||
| 49,955 | ||||||||||||
|
| |||||||||||
| Diversified Financial Services — 1.1% | ||||||||||||
AerCap Ireland Capital DAC / AerCap Global Aviation Trust (Ireland) |
| |||||||||||
3.75% | 05/15/19 | 25,000 | 25,052 | |||||||||
Air Lease Corp. |
| |||||||||||
3.50% | 01/15/22 | 30,000 | 29,685 | |||||||||
See accompanying notes to financial statements.
58
Table of Contents
TCW Short Term Bond Fund
October 31, 2018
| Issues | Maturity Date | Principal Amount | Value | |||||||||
| Diversified Financial Services (Continued) | ||||||||||||
American Express Credit Corp. |
| |||||||||||
2.25% | 08/15/19 | $ | 25,000 | $ | 24,872 | |||||||
|
| |||||||||||
| 79,609 | ||||||||||||
|
| |||||||||||
| Electric — 0.6% | ||||||||||||
Jersey Central Power & Light Co. |
| |||||||||||
7.35% | 02/01/19 | 40,000 | 40,429 | |||||||||
|
| |||||||||||
| Food — 1.4% | ||||||||||||
Campbell Soup Co. |
| |||||||||||
2.83% (3 mo. USD LIBOR + 0.500%) (1) | 03/16/20 | 15,000 | 14,976 | |||||||||
Conagra Brands, Inc. |
| |||||||||||
2.91% (3 mo. USD LIBOR + 0.500%) (1) | 10/09/20 | 25,000 | 24,936 | |||||||||
Danone SA |
| |||||||||||
1.69% (3) | 10/30/19 | 20,000 | 19,715 | |||||||||
Mondelez International Holdings Netherlands BV |
| |||||||||||
1.63% (3) | 10/28/19 | 25,000 | 24,651 | |||||||||
Tyson Foods, Inc. |
| |||||||||||
2.76% (3 mo. USD LIBOR + 0.45%) (1) | 08/21/20 | 15,000 | 14,989 | |||||||||
|
| |||||||||||
| 99,267 | ||||||||||||
|
| |||||||||||
| Forest Products & Paper — 0.3% | ||||||||||||
Georgia-Pacific LLC |
| |||||||||||
2.54% (3) | 11/15/19 | 20,000 | 19,866 | |||||||||
|
| |||||||||||
| Gas — 0.3% | ||||||||||||
ONE Gas, Inc. |
| |||||||||||
2.07% | 02/01/19 | 25,000 | 24,944 | |||||||||
|
| |||||||||||
| Healthcare-Products — 0.7% | ||||||||||||
Becton Dickinson and Co. |
| |||||||||||
3.26% (2) | 12/29/20 | 20,000 | 20,017 | |||||||||
Boston Scientific Corp. |
| |||||||||||
6.00% | 01/15/20 | 15,000 | 15,473 | |||||||||
Zimmer Biomet Holdings, Inc. |
| |||||||||||
3.09% (3 mo. USD LIBOR + 0.75%) (1) | 03/19/21 | 15,000 | 15,008 | |||||||||
|
| |||||||||||
| 50,498 | ||||||||||||
|
| |||||||||||
| Healthcare-Services — 1.5% | ||||||||||||
Anthem, Inc. |
| |||||||||||
2.25% | 08/15/19 | 25,000 | 24,852 | |||||||||
Fresenius Medical Care US Finance II, Inc. |
| |||||||||||
5.63% (3) | 07/31/19 | 25,000 | 25,395 | |||||||||
Humana, Inc. |
| |||||||||||
2.50% | 12/15/20 | 15,000 | 14,687 | |||||||||
Sutter Health |
| |||||||||||
2.29% | 08/15/53 | 25,000 | 24,360 | |||||||||
Universal Health Services, Inc. |
| |||||||||||
3.75% (3) | 08/01/19 | 20,000 | 20,030 | |||||||||
|
| |||||||||||
| 109,324 | ||||||||||||
|
| |||||||||||
| Issues | Maturity Date | Principal Amount | Value | |||||||||
| Housewares — 0.3% | ||||||||||||
Newell Brands, Inc. |
| |||||||||||
2.60% | 03/29/19 | $ | 20,000 | $ | 19,953 | |||||||
|
| |||||||||||
| Insurance — 0.7% | ||||||||||||
Allstate Corp. (The) |
| |||||||||||
2.82% (3 mo. USD LIBOR + 0.43%) (1) | 03/29/21 | 25,000 | 25,026 | |||||||||
Pricoa Global Funding I |
| |||||||||||
1.45% (3) | 09/13/19 | 25,000 | 24,595 | |||||||||
|
| |||||||||||
| 49,621 | ||||||||||||
|
| |||||||||||
| Media — 0.1% | ||||||||||||
Discovery Communications LLC |
| |||||||||||
2.80% (3) | 06/15/20 | 10,000 | 9,879 | |||||||||
|
| |||||||||||
| Miscellaneous Manufacturers — 0.8% | ||||||||||||
General Electric Co. |
| |||||||||||
2.20% | 01/09/20 | 45,000 | 44,202 | |||||||||
4.65% | 10/17/21 | 15,000 | 15,343 | |||||||||
|
| |||||||||||
| 59,545 | ||||||||||||
|
| |||||||||||
| Oil & Gas — 0.3% | ||||||||||||
Phillips 66 |
| |||||||||||
3.09% (3 mo. USD LIBOR + 0.65%) (1)(3) | 04/15/19 | 25,000 | 25,008 | |||||||||
|
| |||||||||||
| Packaging & Containers — 0.7% | ||||||||||||
Bemis Co., Inc. |
| |||||||||||
6.80% | 08/01/19 | 20,000 | 20,555 | |||||||||
WestRock RKT Co. |
| |||||||||||
4.45% | 03/01/19 | 30,000 | 30,143 | |||||||||
|
| |||||||||||
| 50,698 | ||||||||||||
|
| |||||||||||
| Pharmaceuticals — 1.2% | ||||||||||||
Bayer US Finance II LLC |
| |||||||||||
2.13% (3) | 07/15/19 | 20,000 | 19,851 | |||||||||
Bayer US Finance LLC |
| |||||||||||
2.38% (3) | 10/08/19 | 15,000 | 14,848 | |||||||||
CVS Health Corp. |
| |||||||||||
2.25% | 12/05/18 | 55,000 | 54,989 | |||||||||
|
| |||||||||||
| 89,688 | ||||||||||||
|
| |||||||||||
| REIT — 5.7% | ||||||||||||
Alexandria Real Estate Equities, Inc. |
| |||||||||||
2.75% | 01/15/20 | 25,000 | 24,802 | |||||||||
American Campus Communities Operating Partnership LP |
| |||||||||||
3.35% | 10/01/20 | 20,000 | 19,886 | |||||||||
American Tower Corp. |
| |||||||||||
3.40% | 02/15/19 | 25,000 | 25,024 | |||||||||
Boston Properties LP |
| |||||||||||
5.88% | 10/15/19 | 40,000 | 40,791 | |||||||||
See accompanying notes to financial statements.
59
Table of Contents
TCW Short Term Bond Fund
Schedule of Investments (Continued)
| Issues | Maturity Date | Principal Amount | Value | |||||||||
| REIT (Continued) | ||||||||||||
Digital Realty Trust LP |
| |||||||||||
5.88% | 02/01/20 | $ | 15,000 | $ | 15,359 | |||||||
GLP Capital LP / GLP Financing II, Inc. |
| |||||||||||
4.38% | 04/15/21 | 10,000 | 10,019 | |||||||||
4.88% | 11/01/20 | 15,000 | 15,225 | |||||||||
HCP, Inc. |
| |||||||||||
3.75% | 02/01/19 | 45,000 | 45,004 | |||||||||
Healthcare Trust of America Holdings LP (REIT) |
| |||||||||||
3.38% | 07/15/21 | 30,000 | 29,706 | |||||||||
Host Hotels & Resorts LP (REIT) |
| |||||||||||
6.00% | 10/01/21 | 15,000 | 15,756 | |||||||||
SL Green Operating Partnership LP (REIT) |
| |||||||||||
3.32% (3 mo. USD LIBOR + 0.98%) (1) | 08/16/21 | 40,000 | 40,025 | |||||||||
UDR, Inc. (REIT) |
| |||||||||||
3.70% | 10/01/20 | 35,000 | 35,112 | |||||||||
Ventas Realty LP / Ventas Capital Corp. |
| |||||||||||
2.70% | 04/01/20 | 25,000 | 24,748 | |||||||||
VEREIT Operating Partnership LP |
| |||||||||||
3.00% | 02/06/19 | 20,000 | 19,994 | |||||||||
WEA Finance LLC / Westfield UK & Europe Finance PLC |
| |||||||||||
2.70% (3) | 09/17/19 | 25,000 | 24,903 | |||||||||
Welltower, Inc. |
| |||||||||||
4.13% | 04/01/19 | 30,000 | 30,062 | |||||||||
|
| |||||||||||
| 416,416 | ||||||||||||
|
| |||||||||||
| Retail — 0.8% | ||||||||||||
Alimentation Couche-Tard, Inc. (Canada) |
| |||||||||||
2.35% (3) | 12/13/19 | 20,000 | 19,801 | |||||||||
Dollar Tree, Inc. |
| |||||||||||
3.15% (3 mo. USD LIBOR + 0.700%) (1) | 04/17/20 | 25,000 | 25,022 | |||||||||
Walgreens Boots Alliance, Inc. |
| |||||||||||
2.70% | 11/18/19 | 15,000 | 14,921 | |||||||||
|
| |||||||||||
| 59,744 | ||||||||||||
|
| |||||||||||
| Semiconductors — 0.3% | ||||||||||||
Analog Devices, Inc. |
| |||||||||||
2.85% | 03/12/20 | 10,000 | 9,944 | |||||||||
Broadcom Corp. / Broadcom Cayman Finance, Ltd. |
| |||||||||||
2.38% | 01/15/20 | 15,000 | 14,829 | |||||||||
|
| |||||||||||
| 24,773 | ||||||||||||
|
| |||||||||||
| Telecommunications — 0.5% | ||||||||||||
Sprint Spectrum Co. LLC / Sprint Spectrum Co. II LLC / Sprint Spectrum Co. III LLC |
| |||||||||||
3.36% (3) | 03/20/23 | 37,500 | 37,127 | |||||||||
|
| |||||||||||
Total Corporate Bonds | ||||||||||||
(Cost: $2,426,998) | 2,396,520 | |||||||||||
|
| |||||||||||
| Issues | Maturity Date | Principal Amount | Value | |||||||||
U.S. TREASURY SECURITIES — 34.7% |
| |||||||||||
U.S. Treasury Note |
| |||||||||||
2.63% | 07/31/20 | $ | 282,000 | $ | 280,882 | |||||||
2.75% | 09/30/20 | 1,845,000 | 1,840,892 | |||||||||
2.75% | 09/15/21 | 405,000 | 402,983 | |||||||||
|
| |||||||||||
Total U.S. Treasury Securities | ||||||||||||
(Cost: $2,527,634) | 2,524,757 | |||||||||||
|
| |||||||||||
Total Fixed Income Securities | ||||||||||||
(Cost: $6,713,893) | 6,718,717 | |||||||||||
|
| |||||||||||
| Shares | ||||||||||||
MONEY MARKET INVESTMENTS — 0.7% |
| |||||||||||
State Street Institutional U.S. Government Money Market Fund — Premier Class, 2.09% (5) | 54,201 | 54,201 | ||||||||||
|
| |||||||||||
Total Money Market Investments | ||||||||||||
(Cost: $54,201) | 54,201 | |||||||||||
|
| |||||||||||
| Principal Amount | ||||||||||||
SHORT TERM INVESTMENTS — 7.5% |
| |||||||||||
| U.S. Treasury Securities — 7.5% | ||||||||||||
U.S. Treasury Bill |
| |||||||||||
2.20% (6)(7) | 12/13/18 | $ | 17,000 | 16,957 | ||||||||
2.30% (6) | 01/31/19 | 533,000 | 529,925 | |||||||||
|
| |||||||||||
Total U.S. Treasury Securities | ||||||||||||
(Cost: $547,015) | 546,882 | |||||||||||
|
| |||||||||||
Total Short Term Investments | ||||||||||||
(Cost: $547,015) | 546,882 | |||||||||||
|
| |||||||||||
Total Investments (100.5%) | ||||||||||||
(Cost: $7,315,109) | 7,319,800 | |||||||||||
Liabilities In Excess Of Other Assets (-0.5%) |
| (39,713 | ) | |||||||||
|
| |||||||||||
Net Assets (100.0%) | $ | 7,280,087 | ||||||||||
|
| |||||||||||
See accompanying notes to financial statements.
60
Table of Contents
TCW Short Term Bond Fund
October 31, 2018 |
| Futures Contracts | ||||||||||||||||||
| Number of Contracts | Type | Expiration Date | Notional Contract Value | Market Value | Net Unrealized (Depreciation) | |||||||||||||
BUY | ||||||||||||||||||
| 7 | 2-Year U.S. Treasury Note Futures | 12/31/18 | $ | 1,479,599 | $ | 1,474,594 | $ | (5,005 | ) | |||||||||
|
|
|
|
|
| |||||||||||||
Notes to Schedule of Investments:
| EETC | Enhanced Equipment Trust Certificate. |
| I/F | Inverse Floating rate security whose interest rate moves in the opposite direction of prevailing interest rates. |
| PAC | Planned Amortization Class. |
| REIT | Real Estate Investment Trust. |
| TAC | Target Amortization Class. |
| (1) | Floating or variable rate security. The interest shown reflects the rate in effect at October 31, 2018. |
| (2) | Variable rate security. Interest rate disclosed is as of the most recent information available. Certain variable rate securities are not based on a published reference rate and spread but are determined by the issuer or agent and are based on current market conditions. These securities do not indicate a reference rate and spread in their description above. |
| (3) | Security exempt from registration under Rule 144A of the Securities Act of 1933, as amended. These securities may be resold, normally only to qualified institutional buyers. At October 31, 2018, the value of these securities amounted to $375,860 or 5.2% of net assets. These securities are determined to be liquid by the Advisor, unless otherwise noted, under procedures established by and under the general supervision of the Company’s Board of Directors. |
| (4) | The maturity date of the security has been extended past the date disclosed. The new maturity date is not known as of October 31, 2018. |
| (5) | Rate disclosed is the 7-day net yield as of October 31, 2018. |
| (6) | Rate shown represents yield-to-maturity. |
| (7) | All or a portion of this security is held as collateral for open futures contracts. |
See accompanying notes to financial statements.
61
Table of Contents
TCW Short Term Bond Fund
Investments by Industry | October 31, 2018 |
| Industry | Percentage of Net Assets | |||
Aerospace/Defense | 1.2 | % | ||
Agriculture | 0.3 | |||
Airlines | 0.4 | |||
Auto Manufacturers | 0.7 | |||
Banks | 11.1 | |||
Beverages | 0.9 | |||
Chemicals | 0.3 | |||
Commercial Mortgage-Backed Securities — Agency | 6.8 | |||
Commercial Mortgage-Backed Securities — Non-Agency | 0.5 | |||
Computers | 0.7 | |||
Diversified Financial Services | 1.1 | |||
Electric | 0.6 | |||
Food | 1.4 | |||
Forest Products & Paper | 0.3 | |||
Gas | 0.3 | |||
Healthcare-Products | 0.7 | |||
Healthcare-Services | 1.5 | |||
Housewares | 0.3 | |||
Insurance | 0.7 | |||
Media | 0.1 | |||
Miscellaneous Manufacturers | 0.8 | |||
Oil & Gas | 0.3 | |||
Packaging & Containers | 0.7 | |||
Pharmaceuticals | 1.2 | |||
REIT | 5.7 | |||
Residential Mortgage-Backed Securities — Agency | 16.2 | |||
Residential Mortgage-Backed Securities — Non-Agency | 1.2 | |||
Retail | 0.8 | |||
Semiconductors | 0.3 | |||
Short Term Investments | 7.5 | |||
Telecommunications | 0.5 | |||
U.S. Treasury Securities | 34.7 | |||
Money Market Investments | 0.7 | |||
|
| |||
Total | 100.5 | % | ||
|
| |||
See accompanying notes to financial statements.
62
Table of Contents
TCW Short Term Bond Fund
Fair Valuation Summary | October 31, 2018 |
The following is a summary of the fair valuations according to the inputs used as of October 31, 2018 in valuing the Fund’s investments:
Description | Quoted Prices in Active Markets for Identical Assets (Level 1) | Other Significant Observable Inputs (Level 2) | Significant Unobservable Inputs (Level 3) | Total | ||||||||||||
Fixed Income Securities | ||||||||||||||||
Commercial Mortgage-Backed Securities — Agency | $ | — | $ | 492,282 | $ | — | $ | 492,282 | ||||||||
Commercial Mortgage-Backed Securities — Non-Agency | — | 34,801 | — | 34,801 | ||||||||||||
Residential Mortgage-Backed Securities — Agency | — | 1,181,757 | — | 1,181,757 | ||||||||||||
Residential Mortgage-Backed Securities — Non-Agency | — | 88,600 | — | 88,600 | ||||||||||||
Corporate Bonds* | — | 2,396,520 | — | 2,396,520 | ||||||||||||
U.S. Treasury Securities | 2,524,757 | — | — | 2,524,757 | ||||||||||||
|
|
|
|
|
|
|
| |||||||||
Total Fixed Income Securities | 2,524,757 | 4,193,960 | — | 6,718,717 | ||||||||||||
|
|
|
|
|
|
|
| |||||||||
Money Market Investments | 54,201 | — | — | 54,201 | ||||||||||||
Short-Term Investments | 546,882 | — | — | 546,882 | ||||||||||||
|
|
|
|
|
|
|
| |||||||||
Total Investments | $ | 3,125,840 | $ | 4,193,960 | $ | — | $ | 7,319,800 | ||||||||
|
|
|
|
|
|
|
| |||||||||
Liability Derivatives | ||||||||||||||||
Futures | ||||||||||||||||
Interest Rate Risk | $ | (5,005 | ) | $ | — | $ | — | $ | (5,005 | ) | ||||||
|
|
|
|
|
|
|
| |||||||||
Total | $ | (5,005 | ) | $ | — | $ | — | $ | (5,005 | ) | ||||||
|
|
|
|
|
|
|
| |||||||||
| * | See Schedule of Investments for corresponding industries. |
See accompanying notes to financial statements.
63
Table of Contents
Schedule of Investments
| Issues | Maturity Date | Principal Amount | Value | |||||||||
FIXED INCOME SECURITIES — 98.5% of Net Assets |
| |||||||||||
| ASSET-BACKED SECURITIES — 1.7% | ||||||||||||
321 Henderson Receivables I LLC (13-3A-A) |
| |||||||||||
4.08% (1) | 01/17/73 | $ | 7,661,078 | $ | 7,662,188 | |||||||
EFS Volunteer No 2 LLC (12-1-A2) |
| |||||||||||
3.63% (1 mo. USD LIBOR + 1.350%) (1)(2) | 03/25/36 | 7,225,000 | 7,426,336 | |||||||||
EFS Volunteer No 3 LLC (12-1-A3) |
| |||||||||||
3.28% (1 mo. USD LIBOR + 1.000%) (1)(2) | 04/25/33 | 17,750,000 | 17,848,651 | |||||||||
Global SC Finance SRL (14-1A-A2) |
| |||||||||||
3.09% (1) | 07/17/29 | 9,409,875 | 9,106,762 | |||||||||
Higher Education Funding I (14-1-A) |
| |||||||||||
3.36% (3 mo. USD LIBOR + 1.050%) (1)(2) | 05/25/34 | 18,182 | 18,355 | |||||||||
Navient Student Loan Trust (14-2-A) |
| |||||||||||
2.93% (1 mo. USD LIBOR + 0.640%) (2) | 03/25/83 | 26,428,750 | 26,310,208 | |||||||||
Navient Student Loan Trust (14-3-A) |
| |||||||||||
2.90% (1 mo. USD LIBOR + 0.620%) (2) | 03/25/83 | 26,948,263 | 26,860,471 | |||||||||
Navient Student Loan Trust (14-4-A) |
| |||||||||||
2.91% (1 mo. USD LIBOR + 0.620%) (2) | 03/25/83 | 15,084,937 | 15,028,846 | |||||||||
SLM Student Loan Trust (08-8-B) |
| |||||||||||
4.74% (3 mo. USD LIBOR + 2.250%) (2) | 10/25/75 | 5,706,000 | 6,003,956 | |||||||||
|
| |||||||||||
Total Asset-backed Securities |
| |||||||||||
(Cost: $115,106,703) |
| 116,265,773 | ||||||||||
|
| |||||||||||
| COMMERCIAL MORTGAGE-BACKED SECURITIES — AGENCY — 1.8% | ||||||||||||
Fannie Mae (12-M12-1A) (ACES) |
| |||||||||||
2.84% (3) | 08/25/22 | 43,587,867 | 43,133,825 | |||||||||
Fannie Mae (12-M15-A) (ACES) |
| |||||||||||
2.69% (3) | 10/25/22 | 24,490,906 | 24,090,889 | |||||||||
Fannie Mae, Pool #AL2660 |
| |||||||||||
2.63% | 10/01/22 | 15,066,526 | 14,783,142 | |||||||||
Fannie Mae, Pool #AL3366 |
| |||||||||||
2.44% | 02/01/23 | 38,929,877 | 37,594,409 | |||||||||
|
| |||||||||||
Total Commercial Mortgage-backed Securities — Agency |
| |||||||||||
(Cost: $126,451,138) |
| 119,602,265 | ||||||||||
|
| |||||||||||
| COMMERCIAL MORTGAGE-BACKED SECURITIES — NON-AGENCY — 0.5% | ||||||||||||
DBRR Trust (11-LC2-A4A) |
| |||||||||||
4.54% (1)(3) | 07/12/44 | 10,300,241 | 10,457,474 | |||||||||
GRACE Mortgage Trust (14-GRCE-A) |
| |||||||||||
3.37% (1) | 06/10/28 | 15,750,000 | 15,729,922 | |||||||||
| Issues | Maturity Date | Principal Amount | Value | |||||||||
| COMMERCIAL MORTGAGE-BACKED SECURITIES — NON-AGENCY (Continued) | ||||||||||||
GS Mortgage Securities Corp. (12-ALOH-A) |
| |||||||||||
3.55% (1) | 04/10/34 | $ | 6,105,000 | $ | 6,108,771 | |||||||
|
| |||||||||||
Total Commercial Mortgage-backed Securities — Non-agency |
| |||||||||||
(Cost: $34,259,704) |
| 32,296,167 | ||||||||||
|
| |||||||||||
| RESIDENTIAL MORTGAGE-BACKED SECURITIES — AGENCY — 54.7% | ||||||||||||
Fannie Mae (01-40-Z) |
| |||||||||||
6.00% | 08/25/31 | 203,729 | 217,141 | |||||||||
Fannie Mae (03-117-TG) (PAC) |
| |||||||||||
4.75% | 08/25/33 | 418,159 | 430,682 | |||||||||
Fannie Mae (04-52-SW) (I/O) (I/F) |
| |||||||||||
4.82% (1 mo. USD LIBOR + 7.100%) (2) | 07/25/34 | 663,485 | 80,450 | |||||||||
Fannie Mae (04-65-LT) |
| |||||||||||
4.50% | 08/25/24 | 1,236,278 | 1,251,629 | |||||||||
Fannie Mae (04-68-LC) |
| |||||||||||
5.00% | 09/25/29 | 1,568,848 | 1,634,578 | |||||||||
Fannie Mae (05-117-LC) (PAC) |
| |||||||||||
5.50% | 11/25/35 | 4,470,627 | 4,618,111 | |||||||||
Fannie Mae (05-74-CP) (I/F) (PAC) |
| |||||||||||
16.38% (-3.67 X 1 mo. USD LIBOR + 24.750%) (2) | 05/25/35 | 271,537 | 335,422 | |||||||||
Fannie Mae (07-103-AI) (I/O) (I/F) |
| |||||||||||
4.22% (1 mo. USD LIBOR + 6.500%) (2) | 03/25/37 | 4,960,655 | 605,479 | |||||||||
Fannie Mae (07-20-SI) (I/O) (I/F) |
| |||||||||||
4.17% (-1.00 X 1 mo. USD LIBOR + 6.450%) (2) | 03/25/37 | 1,540,450 | 193,552 | |||||||||
Fannie Mae (07-21-SE) (I/O) (I/F) |
| |||||||||||
4.16% (-1.00 X 1 mo. USD LIBOR + 6.440%) (2) | 03/25/37 | 1,249,487 | 147,682 | |||||||||
Fannie Mae (07-56-SG) (I/O) (I/F) |
| |||||||||||
4.13% (-1.00 X 1 mo. USD LIBOR + 6.410%) (2) | 06/25/37 | 1,513,884 | 115,215 | |||||||||
Fannie Mae (07-58-SV) (I/O) (I/F) |
| |||||||||||
4.47% (-1.00 X 1 mo. USD LIBOR + 6.750%) (2) | 06/25/37 | 5,832,730 | 597,756 | |||||||||
Fannie Mae (07-65-S) (I/O) (I/F) |
| |||||||||||
4.32% (-1.00 X 1 mo. USD LIBOR + 6.600%) (2) | 07/25/37 | 1,165,378 | 152,724 | |||||||||
Fannie Mae (07-88-FY) |
| |||||||||||
2.74% (1 mo. USD LIBOR + 0.460%) (2) | 09/25/37 | 760,040 | 767,252 | |||||||||
See accompanying notes to financial statements.
64
Table of Contents
TCW Total Return Bond Fund
October 31, 2018 |
| Issues | Maturity Date | Principal Amount | Value | |||||||||
| RESIDENTIAL MORTGAGE-BACKED SECURITIES — AGENCY (Continued) | ||||||||||||
Fannie Mae (07-B2-ZA) |
| |||||||||||
5.50% | 06/25/37 | $ | 14,070,550 | $ | 15,166,710 | |||||||
Fannie Mae (08-1-AI) (I/O) (I/F) |
| |||||||||||
3.97% (-1.00 X 1 mo. USD LIBOR + 6.250%) (2) | 05/25/37 | 5,187,260 | 567,869 | |||||||||
Fannie Mae (08-13-SB) (I/O) (I/F) |
| |||||||||||
3.96% (-1.00 X 1 mo. USD LIBOR + 6.240%) (2) | 03/25/38 | 4,675,963 | 642,343 | |||||||||
Fannie Mae (08-23-SB) (I/O) (I/F) |
| |||||||||||
4.57% (-1.00 X 1 mo. USD LIBOR + 6.850%) (2) | 04/25/38 | 8,578,238 | 1,016,654 | |||||||||
Fannie Mae (08-35-SD) (I/O) (I/F) |
| |||||||||||
4.17% (-1.00 X 1 mo. USD LIBOR + 6.450%) (2) | 05/25/38 | 626,347 | 42,940 | |||||||||
Fannie Mae (08-66-SG) (I/O) (I/F) |
| |||||||||||
3.79% (-1.00 X 1 mo. USD LIBOR + 6.070%) (2) | 08/25/38 | 10,440,602 | 1,485,762 | |||||||||
Fannie Mae (08-68-SA) (I/O) (I/F) |
| |||||||||||
3.69% (-1.00 X 1 mo. USD LIBOR + 5.970%) (2) | 08/25/38 | 3,920,781 | 313,473 | |||||||||
Fannie Mae (09-3-SH) (I/O) (I/F) |
| |||||||||||
3.17% (-1.00 X 1 mo. USD LIBOR + 5.450%) (2) | 06/25/37 | 1,851,234 | 168,387 | |||||||||
Fannie Mae (09-47-SV) (I/O) (I/F) |
| |||||||||||
4.47% (-1.00 X 1 mo. USD LIBOR + 6.750%) (2) | 07/25/39 | 1,134,581 | 110,700 | |||||||||
Fannie Mae (09-51-SA) (I/O) (I/F) |
| |||||||||||
4.47% (-1.00 X 1 mo. USD LIBOR + 6.750%) (2) | 07/25/39 | 4,925,420 | 594,608 | |||||||||
Fannie Mae (09-6-SD) (I/O) (I/F) |
| |||||||||||
3.27% (-1.00 X 1 mo. USD LIBOR + 5.550%) (2) | 02/25/39 | 2,122,827 | 298,951 | |||||||||
Fannie Mae (09-68-KB) |
| |||||||||||
4.00% | 09/25/24 | 5,001,129 | 5,045,590 | |||||||||
Fannie Mae (09-71-LB) |
| |||||||||||
4.00% | 09/25/29 | 13,676,229 | 13,925,941 | |||||||||
Fannie Mae (09-72-AC) |
| |||||||||||
4.00% | 09/25/29 | 17,686,137 | 17,966,854 | |||||||||
Fannie Mae (09-72-JS) (I/O) (I/F) |
| |||||||||||
4.97% (-1.00 X 1 mo. USD LIBOR + 7.250%) (2) | 09/25/39 | 1,044,422 | 164,084 | |||||||||
| Issues | Maturity Date | Principal Amount | Value | |||||||||
| RESIDENTIAL MORTGAGE-BACKED SECURITIES — AGENCY (Continued) | ||||||||||||
Fannie Mae (10-136-CX) (PAC) |
| |||||||||||
4.00% | 08/25/39 | $ | 20,937,000 | $ | 21,285,174 | |||||||
Fannie Mae (11-111-DB) |
| |||||||||||
4.00% | 11/25/41 | 50,000,000 | 50,464,580 | |||||||||
Fannie Mae (11-123-ZP) (PAC) |
| |||||||||||
4.50% | 12/25/41 | 4,603,270 | 4,767,341 | |||||||||
Fannie Mae (12-128-UY) (PAC) |
| |||||||||||
2.50% | 11/25/42 | 11,738,000 | 10,056,623 | |||||||||
Fannie Mae (12-133-GC) (PAC) |
| |||||||||||
2.50% | 08/25/41 | 28,008,168 | 26,932,076 | |||||||||
Fannie Mae (12-153-PC) (PAC) |
| |||||||||||
2.00% | 05/25/42 | 8,924,382 | 8,098,356 | |||||||||
Fannie Mae (13-101-BO) (P/O) |
| |||||||||||
0.00% (4) | 10/25/43 | 7,839,233 | 5,996,053 | |||||||||
Fannie Mae (13-101-CO) (P/O) |
| |||||||||||
0.00% (4) | 10/25/43 | 18,252,152 | 14,263,653 | |||||||||
Fannie Mae (13-21-EC) (I/O) |
| |||||||||||
2.00% | 12/25/38 | 13,184,742 | 12,642,723 | |||||||||
Fannie Mae (13-95-PN) (PAC) |
| |||||||||||
3.00% | 01/25/43 | 21,400,000 | 20,442,016 | |||||||||
Fannie Mae (18-52 PZ) (PAC) |
| |||||||||||
4.00% | 07/25/48 | 2,865,896 | 2,811,146 | |||||||||
Fannie Mae (18-55 PA) (PAC) |
| |||||||||||
3.50% | 01/25/47 | 20,520,238 | 20,416,022 | |||||||||
Fannie Mae (93-202-SZ) (I/F) (PAC) |
| |||||||||||
10.00% | 11/25/23 | 52,200 | 56,696 | |||||||||
Fannie Mae (95-21-C) (P/O) |
| |||||||||||
0.00% (4) | 05/25/24 | 285,587 | 266,043 | |||||||||
Fannie Mae (G92-29-J) |
| |||||||||||
8.00% | 07/25/22 | 19,802 | 21,201 | |||||||||
Fannie Mae, Pool #254634 |
| |||||||||||
5.50% | 02/01/23 | 88,366 | 93,697 | |||||||||
Fannie Mae, Pool #257536 |
| |||||||||||
5.00% | 01/01/29 | 1,476,661 | 1,541,489 | |||||||||
Fannie Mae, Pool #310033 |
| |||||||||||
6.00% | 07/01/47 | 489,802 | 527,720 | |||||||||
Fannie Mae, Pool #555424 |
| |||||||||||
5.50% | 05/01/33 | 3,542,403 | 3,807,236 | |||||||||
Fannie Mae, Pool #661856 |
| |||||||||||
4.50% (12 mo. USD LIBOR + 1.623%) (2) | 10/01/32 | 35,721 | 35,585 | |||||||||
Fannie Mae, Pool #671133 |
| |||||||||||
3.91% (6 mo. USD LIBOR + 1.413%) (2) | 02/01/33 | 77,985 | 80,355 | |||||||||
Fannie Mae, Pool #672272 |
| |||||||||||
3.55% (12 mo. USD LIBOR + 1.579%) (2) | 12/01/32 | 29,862 | 30,909 | |||||||||
See accompanying notes to financial statements.
65
Table of Contents
TCW Total Return Bond Fund
Schedule of Investments (Continued)
| Issues | Maturity Date | Principal Amount | Value | |||||||||
| RESIDENTIAL MORTGAGE-BACKED SECURITIES — AGENCY (Continued) | ||||||||||||
Fannie Mae, Pool #687847 |
| |||||||||||
3.68% (12 mo. USD LIBOR + 1.590%) (2) | 02/01/33 | $ | 103,898 | $ | 108,821 | |||||||
Fannie Mae, Pool #692104 |
| |||||||||||
3.91% (6 mo. USD LIBOR + 1.413%) (2) | 02/01/33 | 498,602 | 514,049 | |||||||||
Fannie Mae, Pool #699866 |
| |||||||||||
3.97% (12 mo. USD LIBOR + 1.588%) (2) | 04/01/33 | 296,657 | 308,048 | |||||||||
Fannie Mae, Pool #704454 |
| |||||||||||
4.20% (12 mo. USD LIBOR + 1.695%) (2) | 05/01/33 | 78,148 | 79,517 | |||||||||
Fannie Mae, Pool #725275 |
| |||||||||||
4.00% | 03/01/19 | 876 | 876 | |||||||||
Fannie Mae, Pool #728824 |
| |||||||||||
4.40% (12 mo. USD LIBOR + 1.586%) (2) | 07/01/33 | 91,083 | 95,913 | |||||||||
Fannie Mae, Pool #734384 |
| |||||||||||
5.50% | 07/01/33 | 390,930 | 411,174 | |||||||||
Fannie Mae, Pool #785677 |
| |||||||||||
5.00% | 07/01/19 | 2,575 | 2,654 | |||||||||
Fannie Mae, Pool #888593 |
| |||||||||||
7.00% | 06/01/37 | 395,487 | 442,735 | |||||||||
Fannie Mae, Pool #934103 |
| |||||||||||
5.00% | 07/01/38 | �� | 294,926 | 305,607 | ||||||||
Fannie Mae, Pool #979563 |
| |||||||||||
5.00% | 04/01/28 | 806,323 | 841,722 | |||||||||
Fannie Mae, Pool #995040 |
| |||||||||||
5.00% | 06/01/23 | 410,932 | 425,853 | |||||||||
Fannie Mae, Pool #995425 |
| |||||||||||
6.00% | 01/01/24 | 2,006,747 | 2,084,562 | |||||||||
Fannie Mae, Pool #995573 |
| |||||||||||
6.00% | 01/01/49 | 1,347,531 | 1,405,322 | |||||||||
Fannie Mae, Pool #995953 |
| |||||||||||
6.00% | 11/01/28 | 4,332,875 | 4,656,430 | |||||||||
Fannie Mae, Pool #995954 |
| |||||||||||
6.00% | 03/01/29 | 2,356,685 | 2,533,916 | |||||||||
Fannie Mae, Pool #AA3303 |
| |||||||||||
5.50% | 06/01/38 | 3,057,758 | 3,277,936 | |||||||||
Fannie Mae, Pool #AB6210 |
| |||||||||||
3.00% | 09/01/42 | 34,678,571 | 33,096,361 | |||||||||
Fannie Mae, Pool #AE0588 |
| |||||||||||
6.00% | 08/01/37 | 7,452,373 | 8,138,636 | |||||||||
Fannie Mae, Pool #AL0851 |
| |||||||||||
6.00% | 10/01/40 | 5,235,138 | 5,658,423 | |||||||||
Fannie Mae, Pool #AL1594 |
| |||||||||||
6.00% | 07/01/40 | 3,862,002 | 4,248,150 | |||||||||
Fannie Mae, Pool #AL9106 |
| |||||||||||
4.50% | 02/01/46 | 31,255,911 | 32,170,230 | |||||||||
| Issues | Maturity Date | Principal Amount | Value | |||||||||
| RESIDENTIAL MORTGAGE-BACKED SECURITIES — AGENCY (Continued) | ||||||||||||
Fannie Mae, Pool #AS9749 |
| |||||||||||
4.00% | 06/01/47 | $ | 20,526,041 | $ | 20,559,915 | |||||||
Fannie Mae, Pool #AS9830 |
| |||||||||||
4.00% | 06/01/47 | 25,154,943 | 25,196,456 | |||||||||
Fannie Mae, Pool #AS9972 |
| |||||||||||
4.00% | 07/01/47 | 21,836,876 | 21,872,913 | |||||||||
Fannie Mae, Pool #CA1710 |
| |||||||||||
4.50% | 05/01/48 | 33,147,807 | 33,971,323 | |||||||||
Fannie Mae, Pool #CA1711 |
| |||||||||||
4.50% | 05/01/48 | 31,181,298 | 31,956,110 | |||||||||
Fannie Mae, Pool #CA2208 |
| |||||||||||
4.50% | 08/01/48 | 35,911,843 | 36,804,028 | |||||||||
Fannie Mae, Pool #MA1561 |
| |||||||||||
3.00% | 09/01/33 | 44,495,926 | 43,376,575 | |||||||||
Fannie Mae, Pool #MA1584 |
| |||||||||||
3.50% | 09/01/33 | 30,836,174 | 30,527,212 | |||||||||
Fannie Mae, Pool #MA2871 |
| |||||||||||
3.00% | 01/01/32 | 14,335,063 | 14,084,300 | |||||||||
Fannie Mae, Pool #MA2995 |
| |||||||||||
4.00% | 05/01/47 | 29,190,669 | 29,204,808 | |||||||||
Fannie Mae, Pool #MA3027 |
| |||||||||||
4.00% | 06/01/47 | 63,268,180 | 63,298,935 | |||||||||
Fannie Mae, Pool #MA3058 |
| |||||||||||
4.00% | 07/01/47 | 109,683,022 | 109,736,321 | |||||||||
Fannie Mae, Pool #MA3276 |
| |||||||||||
3.50% | 02/01/48 | 78,005,710 | 75,981,106 | |||||||||
Fannie Mae, Pool #MA3305 |
| |||||||||||
3.50% | 03/01/48 | 34,163,748 | 33,272,597 | |||||||||
Fannie Mae, Pool #MA3332 |
| |||||||||||
3.50% | 04/01/48 | 34,475,012 | 33,575,741 | |||||||||
Fannie Mae, Pool #MA3427 |
| |||||||||||
4.00% | 07/01/33 | 37,475,537 | 38,178,787 | |||||||||
Fannie Mae, Pool #MA3444 |
| |||||||||||
4.50% | 08/01/48 | 39,586,101 | 40,567,316 | |||||||||
Fannie Mae TBA, 15 Year |
| |||||||||||
3.00% (5) | 03/01/33 | 960,000 | 942,152 | |||||||||
Fannie Mae TBA, 30 Year |
| |||||||||||
3.50% (5) | 02/01/48 | 34,440,000 | 33,525,186 | |||||||||
4.00% (5) | 05/01/48 | 28,445,000 | 28,447,223 | |||||||||
4.50% (5) | 05/01/48 | 50,760,000 | 51,969,515 | |||||||||
Freddie Mac (1829-ZB) |
| |||||||||||
6.50% | 03/15/26 | 96,983 | 102,088 | |||||||||
Freddie Mac (2367-ZK) |
| |||||||||||
6.00% | 10/15/31 | 158,676 | 170,833 | |||||||||
Freddie Mac (2514-PZ) (PAC) |
| |||||||||||
5.50% | 10/15/32 | 2,239,485 | 2,398,583 | |||||||||
Freddie Mac (2571-PZ) (PAC) |
| |||||||||||
5.50% | 02/15/33 | 5,473,495 | 5,825,358 | |||||||||
See accompanying notes to financial statements.
66
Table of Contents
TCW Total Return Bond Fund
October 31, 2018 |
| Issues | Maturity Date | Principal Amount | Value | |||||||||
| RESIDENTIAL MORTGAGE-BACKED SECURITIES — AGENCY (Continued) | ||||||||||||
Freddie Mac (2642-AR) |
| |||||||||||
4.50% | 07/15/23 | $ | 465,720 | $ | 474,601 | |||||||
Freddie Mac (2647-OV) (P/O) |
| |||||||||||
0.00% (4) | 07/15/33 | 604,092 | 520,407 | |||||||||
Freddie Mac (2662-MT) (TAC) |
| |||||||||||
4.50% | 08/15/33 | 2,432,347 | 2,493,034 | |||||||||
Freddie Mac (2666-BD) |
| |||||||||||
4.50% | 08/15/23 | 1,045,386 | 1,065,399 | |||||||||
Freddie Mac (2700-B) |
| |||||||||||
4.50% | 11/15/23 | 1,621,227 | 1,664,964 | |||||||||
Freddie Mac (2752-GZ) (PAC) |
| |||||||||||
5.00% | 02/15/34 | 22,269,838 | 23,380,968 | |||||||||
Freddie Mac (277-30) |
| |||||||||||
3.00% | 09/15/42 | 32,565,848 | 31,281,312 | |||||||||
Freddie Mac (2882-JH) (PAC) |
| |||||||||||
4.50% | 10/15/34 | 279,005 | 282,417 | |||||||||
Freddie Mac (2903-PO) (P/O) |
| |||||||||||
0.00% (4) | 11/15/23 | 304,873 | 283,083 | |||||||||
Freddie Mac (3045-HZ) |
| |||||||||||
4.50% | 10/15/35 | 2,435,491 | 2,476,531 | |||||||||
Freddie Mac (3063-YG) (PAC) |
| |||||||||||
5.50% | 11/15/35 | 25,962,061 | 27,845,089 | |||||||||
Freddie Mac (3114-KZ) |
| |||||||||||
5.00% | 02/15/36 | 19,252,920 | 20,243,579 | |||||||||
Freddie Mac (3146-GE) |
| |||||||||||
5.50% | 04/15/26 | 5,221,442 | 5,539,132 | |||||||||
Freddie Mac (3149-OD) (P/O) (PAC) |
| |||||||||||
0.00% (4) | 05/15/36 | 5,771,509 | 4,832,905 | |||||||||
Freddie Mac (3315-S) (I/O) (I/F) |
| |||||||||||
4.13% (-1.00 X 1 mo. USD LIBOR + 6.410%) (2) | 05/15/37 | 2,004,380 | 207,913 | |||||||||
Freddie Mac (3376-SX) (I/O) (I/F) |
| |||||||||||
3.76% (-1.00 X 1 mo. USD LIBOR + 6.040%) (2) | 10/15/37 | 3,322,862 | 341,172 | |||||||||
Freddie Mac (3410-IS) (I/O) (I/F) |
| |||||||||||
3.99% (-1.00 X 1 mo. USD LIBOR + 6.270%) (2) | 02/15/38 | 4,341,402 | 524,638 | |||||||||
Freddie Mac (3424-BI) (I/O) (I/F) |
| |||||||||||
4.52% (-1.00 X 1 mo. USD LIBOR + 6.800%) (2) | 04/15/38 | 4,998,049 | 828,873 | |||||||||
Freddie Mac (3512-AY) |
| |||||||||||
4.00% | 02/15/24 | 1,579,438 | 1,580,793 | |||||||||
Freddie Mac (3519-SH) (I/O) (I/F) |
| |||||||||||
3.22% (-1.00 X 1 mo. USD LIBOR + 5.500%) (2) | 07/15/37 | 559,017 | 41,110 | |||||||||
Freddie Mac (3531-SC) (I/O) (I/F) |
| |||||||||||
4.02% (-1.00 X 1 mo. USD LIBOR + 6.300%) (2) | 05/15/39 | 7,161,244 | 353,008 | |||||||||
| Issues | Maturity Date | Principal Amount | Value | |||||||||
| RESIDENTIAL MORTGAGE-BACKED SECURITIES — AGENCY (Continued) | ||||||||||||
Freddie Mac (3541-SA) (I/O) (I/F) |
| |||||||||||
4.47% (-1.00 X 1 mo. USD LIBOR + 6.750%) (2) | 06/15/39 | $ | 2,013,168 | $ | 267,053 | |||||||
Freddie Mac (3550-GS) (I/O) (I/F) |
| |||||||||||
4.47% (-1.00 X 1 mo. USD LIBOR + 6.750%) (2) | 07/15/39 | 6,394,437 | 948,590 | |||||||||
Freddie Mac (3551-VZ) |
| |||||||||||
5.50% | 12/15/32 | 2,860,775 | 3,053,801 | |||||||||
Freddie Mac (3557-KB) |
| |||||||||||
4.50% | 07/15/29 | 6,220,479 | 6,404,373 | |||||||||
Freddie Mac (3557-NB) |
| |||||||||||
4.50% | 07/15/29 | 14,233,574 | 14,704,994 | |||||||||
Freddie Mac (3558-KB) |
| |||||||||||
4.00% | 08/15/29 | 7,160,562 | 7,323,392 | |||||||||
Freddie Mac (3565-XB) |
| |||||||||||
4.00% | 08/15/24 | 9,556,339 | 9,691,368 | |||||||||
Freddie Mac (3575-D) |
| |||||||||||
4.50% | 03/15/37 | 885,132 | 911,212 | |||||||||
Freddie Mac (3626-MD) (PAC) |
| |||||||||||
5.00% | 01/15/38 | 19,692,607 | 20,246,838 | |||||||||
Freddie Mac (3719-PJ) (PAC) |
| |||||||||||
4.50% | 09/15/40 | 20,025,406 | 20,796,697 | |||||||||
Freddie Mac (3788-SB) (I/O) (I/F) |
| |||||||||||
4.20% (-1.00 X 1 mo. USD LIBOR + 6.480%) (2) | 01/15/41 | 9,116,434 | 1,079,142 | |||||||||
Freddie Mac (3885-PO) (P/O) (PAC) |
| |||||||||||
0.00% (4) | 11/15/33 | 2,281,231 | 1,971,062 | |||||||||
Freddie Mac (3930-KE) (PAC) |
| |||||||||||
4.00% | 09/15/41 | 10,470,000 | 10,418,518 | |||||||||
Freddie Mac (4030-HS) (I/O) (I/F) |
| |||||||||||
4.33% (-1.00 X 1 mo. USD LIBOR + 6.610%) (2) | 04/15/42 | 3,953,587 | 533,271 | |||||||||
Freddie Mac (4604-PB) (PAC) |
| |||||||||||
3.00% | 01/15/46 | 2,201,517 | 2,029,722 | |||||||||
Freddie Mac (R002-ZA) |
| |||||||||||
5.50% | 06/15/35 | 5,012,892 | 5,390,207 | |||||||||
Freddie Mac, Pool #A91162 |
| |||||||||||
5.00% | 02/01/40 | 22,593,095 | 23,947,409 | |||||||||
Freddie Mac, Pool #A92195 |
| |||||||||||
5.00% | 05/01/40 | 6,766,190 | 7,171,902 | |||||||||
Freddie Mac, Pool #B15322 |
| |||||||||||
5.00% | 07/01/19 | 272 | 273 | |||||||||
Freddie Mac, Pool #B15490 |
| |||||||||||
5.00% | 07/01/19 | 1,643 | 1,651 | |||||||||
Freddie Mac, Pool #B15557 |
| |||||||||||
5.00% | 07/01/19 | 4,055 | 4,077 | |||||||||
Freddie Mac, Pool #C90552 |
| |||||||||||
6.00% | 06/01/22 | 28,868 | 31,162 | |||||||||
See accompanying notes to financial statements.
67
Table of Contents
TCW Total Return Bond Fund
Schedule of Investments (Continued)
| Issues | Maturity Date | Principal Amount | Value | |||||||||
| RESIDENTIAL MORTGAGE-BACKED SECURITIES — AGENCY (Continued) | ||||||||||||
Freddie Mac, Pool #G01959 |
| |||||||||||
5.00% | 12/01/35 | $ | 134,428 | $ | 142,367 | |||||||
Freddie Mac, Pool #G06173 |
| |||||||||||
4.00% | 11/01/40 | 27,690,179 | 27,976,724 | |||||||||
Freddie Mac, Pool #G07556 |
| |||||||||||
4.00% | 11/01/43 | 8,381,340 | 8,461,728 | |||||||||
Freddie Mac, Pool #G07786 |
| |||||||||||
4.00% | 08/01/44 | 31,069,004 | 31,330,841 | |||||||||
Freddie Mac, Pool #G07848 |
| |||||||||||
3.50% | 04/01/44 | 67,709,096 | 66,534,243 | |||||||||
Freddie Mac, Pool #G08687 |
| |||||||||||
3.50% | 01/01/46 | 83,318,190 | 81,381,459 | |||||||||
Freddie Mac, Pool #G08710 |
| |||||||||||
3.00% | 06/01/46 | 3,966,264 | 3,757,219 | |||||||||
Freddie Mac, Pool #G08715 |
| |||||||||||
3.00% | 08/01/46 | 76,372,024 | 72,346,775 | |||||||||
Freddie Mac, Pool #G08716 |
| |||||||||||
3.50% | 08/01/46 | 47,154,831 | 46,025,880 | |||||||||
Freddie Mac, Pool #G08721 |
| |||||||||||
3.00% | 09/01/46 | 85,081,548 | 80,597,256 | |||||||||
Freddie Mac, Pool #G08722 |
| |||||||||||
3.50% | 09/01/46 | 46,175,312 | 45,110,061 | |||||||||
Freddie Mac, Pool #G08737 |
| |||||||||||
3.00% | 12/01/46 | 141,740,784 | 134,270,221 | |||||||||
Freddie Mac, Pool #G08833 |
| |||||||||||
5.00% | 07/01/48 | 16,199,245 | 16,928,485 | |||||||||
Freddie Mac, Pool #G08840 |
| |||||||||||
5.00% | 08/01/48 | 3,544,709 | 3,706,621 | |||||||||
Freddie Mac, Pool #G11678 |
| |||||||||||
4.50% | 04/01/20 | 61,057 | 62,037 | |||||||||
Freddie Mac, Pool #G12635 |
| |||||||||||
5.50% | 03/01/22 | 291,938 | 299,480 | |||||||||
Freddie Mac, Pool #G12702 |
| |||||||||||
4.50% | 09/01/20 | 128,738 | 130,805 | |||||||||
Freddie Mac, Pool #G13390 |
| |||||||||||
6.00% | 01/01/24 | 558,538 | 577,141 | |||||||||
Freddie Mac, Pool #G16085 |
| |||||||||||
2.50% | 02/01/32 | 7,352,885 | 7,046,019 | |||||||||
Freddie Mac, Pool #G16258 |
| |||||||||||
2.50% | 06/01/32 | 34,295,870 | 32,855,825 | |||||||||
Freddie Mac, Pool #G18592 |
| |||||||||||
3.00% | 03/01/31 | 38,585,004 | 37,873,389 | |||||||||
Freddie Mac, Pool #G18627 |
| |||||||||||
3.00% | 01/01/32 | 22,758,978 | 22,327,644 | |||||||||
Freddie Mac, Pool #G30194 |
| |||||||||||
6.50% | 04/01/21 | 7,769 | 7,970 | |||||||||
Freddie Mac, Pool #G30450 |
| |||||||||||
6.00% | 01/01/29 | 1,560,428 | 1,686,466 | |||||||||
| Issues | Maturity Date | Principal Amount | Value | |||||||||
| RESIDENTIAL MORTGAGE-BACKED SECURITIES — AGENCY (Continued) | ||||||||||||
Freddie Mac, Pool #G30452 |
| |||||||||||
6.00% | 10/01/28 | $ | 1,645,136 | $ | 1,778,435 | |||||||
Freddie Mac, Pool #G30454 |
| |||||||||||
5.00% | 05/01/29 | 2,181,401 | 2,284,776 | |||||||||
Freddie Mac, Pool #G60238 |
| |||||||||||
3.50% | 10/01/45 | 107,641,318 | 105,408,299 | |||||||||
Freddie Mac, Pool #G60440 |
| |||||||||||
3.50% | 03/01/46 | 66,554,838 | 65,174,158 | |||||||||
Freddie Mac, Pool #G67700 |
| |||||||||||
3.50% | 08/01/46 | 59,236,013 | 57,988,651 | |||||||||
Freddie Mac, Pool #G67703 |
| |||||||||||
3.50% | 04/01/47 | 75,956,101 | 74,309,183 | |||||||||
Freddie Mac, Pool #G67705 |
| |||||||||||
4.00% | 10/01/47 | 9,518,381 | 9,574,351 | |||||||||
Freddie Mac, Pool #G67706 |
| |||||||||||
3.50% | 12/01/47 | 64,093,286 | 62,591,596 | |||||||||
Freddie Mac, Pool #G67707 |
| |||||||||||
3.50% | 01/01/48 | 30,452,634 | 29,762,233 | |||||||||
Freddie Mac, Pool #G67708 |
| |||||||||||
3.50% | 03/01/48 | 88,513,142 | 86,413,363 | |||||||||
Freddie Mac, Pool #G67709 |
| |||||||||||
3.50% | 03/01/48 | 50,373,568 | 49,192,694 | |||||||||
Freddie Mac, Pool #G67710 |
| |||||||||||
3.50% | 03/01/48 | 107,572,880 | 104,882,135 | |||||||||
Freddie Mac, Pool #G67711 |
| |||||||||||
4.00% | 03/01/48 | 144,616,529 | 145,527,020 | |||||||||
Freddie Mac, Pool #H82001 |
| |||||||||||
5.50% | 07/01/37 | 189,353 | 198,023 | |||||||||
Freddie Mac, Pool #N70081 |
| |||||||||||
5.50% | 07/01/38 | 3,933,778 | 4,260,947 | |||||||||
Freddie Mac, Pool #P51350 |
| |||||||||||
5.00% | 03/01/36 | 3,723,281 | 3,929,052 | |||||||||
Freddie Mac, Pool #Q56089 |
| |||||||||||
5.00% | 05/01/48 | 3,941,884 | 4,125,343 | |||||||||
Freddie Mac TBA, 15 Year |
| |||||||||||
3.50% (5) | 03/01/33 | 10,925,000 | 10,920,311 | |||||||||
Ginnie Mae (03-42-SH) (I/O) (I/F) |
| |||||||||||
4.27% (-1.00 X 1 mo. USD LIBOR + 6.550%) (2) | 05/20/33 | 837,450 | 104,973 | |||||||||
Ginnie Mae (11-70-BO) (P/O) |
| |||||||||||
0.00% (4) | 05/20/41 | 10,430,751 | 8,091,112 | |||||||||
Ginnie Mae (15-42-ZB) |
| |||||||||||
3.00% | 03/20/45 | 17,762,763 | 15,453,569 | |||||||||
Ginnie Mae (15-43-DM) |
| |||||||||||
2.50% | 03/20/45 | 37,325,347 | 31,885,386 | |||||||||
Ginnie Mae (15-44-Z) |
| |||||||||||
3.00% | 03/20/45 | 12,020,219 | 10,457,249 | |||||||||
See accompanying notes to financial statements.
68
Table of Contents
TCW Total Return Bond Fund
October 31, 2018 |
| Issues | Maturity Date | Principal Amount | Value | |||||||||
| RESIDENTIAL MORTGAGE-BACKED SECURITIES — AGENCY (Continued) | ||||||||||||
Ginnie Mae (15-52-EZ) |
| |||||||||||
3.00% | 04/16/45 | $ | 10,608,406 | $ | 9,128,749 | |||||||
Ginnie Mae II, Pool #80963 |
| |||||||||||
2.75% (1 year Treasury Constant Maturity Rate + 1.500%) (2) | 07/20/34 | 221,305 | 226,743 | |||||||||
Ginnie Mae II, Pool #MA2374 |
| |||||||||||
5.00% | 11/20/44 | 752,378 | 782,808 | |||||||||
Ginnie Mae II, Pool #MA2828 |
| |||||||||||
4.50% | 05/20/45 | 502,567 | 518,122 | |||||||||
Ginnie Mae II, Pool #MA3456 |
| |||||||||||
4.50% | 02/20/46 | 2,841,908 | 2,942,257 | |||||||||
Ginnie Mae II, Pool #MA3521 |
| |||||||||||
3.50% | 03/20/46 | 82,678,666 | 81,422,817 | |||||||||
Ginnie Mae II, Pool #MA3663 |
| |||||||||||
3.50% | 05/20/46 | 40,695,215 | 40,058,241 | |||||||||
Ginnie Mae II, Pool #MA3665 |
| |||||||||||
4.50% | 05/20/46 | 4,559,637 | 4,708,906 | |||||||||
Ginnie Mae II, Pool #MA3736 |
| |||||||||||
3.50% | 06/20/46 | 32,022,071 | 31,510,971 | |||||||||
Ginnie Mae II, Pool #MA3739 |
| |||||||||||
5.00% | 06/20/46 | 8,430,722 | 8,898,812 | |||||||||
Ginnie Mae II, Pool #MA3803 |
| |||||||||||
3.50% | 07/20/46 | 11,750,778 | 11,561,413 | |||||||||
Ginnie Mae II, Pool #MA3876 |
| |||||||||||
4.50% | 08/20/46 | 291,134 | 301,120 | |||||||||
Ginnie Mae II, Pool #MA3877 |
| |||||||||||
5.00% | 08/20/46 | 3,792,461 | 4,018,838 | |||||||||
Ginnie Mae II, Pool #MA4006 |
| |||||||||||
4.50% | 10/20/46 | 138,756 | 143,689 | |||||||||
Ginnie Mae II, Pool #MA4007 |
| |||||||||||
5.00% | 10/20/46 | 8,731,024 | 9,084,148 | |||||||||
Ginnie Mae II, Pool #MA4071 |
| |||||||||||
4.50% | 11/20/46 | 648,936 | 677,362 | |||||||||
Ginnie Mae II, Pool #MA4126 |
| |||||||||||
3.00% | 12/20/46 | 106,629,310 | 102,182,838 | |||||||||
Ginnie Mae II, Pool #MA4129 |
| |||||||||||
4.50% | 12/20/46 | 197,262 | 204,444 | |||||||||
Ginnie Mae II, Pool #MA4199 |
| |||||||||||
5.00% | 01/20/47 | 8,090,936 | 8,537,976 | |||||||||
Ginnie Mae II, Pool #MA4264 |
| |||||||||||
4.50% | 02/20/47 | 25,705,431 | 26,477,596 | |||||||||
Ginnie Mae II, Pool #MA4265 |
| |||||||||||
5.00% | 02/20/47 | 8,281,661 | 8,620,399 | |||||||||
Ginnie Mae II, Pool #MA4324 |
| |||||||||||
5.00% | 03/20/47 | 9,320,181 | 9,827,802 | |||||||||
Ginnie Mae II, Pool #MA4385 |
| |||||||||||
5.00% | 04/20/47 | 1,900,032 | 1,983,203 | |||||||||
| Issues | Maturity Date | Principal Amount | Value | |||||||||
| RESIDENTIAL MORTGAGE-BACKED SECURITIES — AGENCY (Continued) | ||||||||||||
Ginnie Mae II, Pool #MA4454 |
| |||||||||||
5.00% | 05/20/47 | $ | 1,522,555 | $ | 1,585,762 | |||||||
Ginnie Mae II, Pool #MA4512 |
| |||||||||||
4.50% | 06/20/47 | 70,203,006 | 72,094,176 | |||||||||
Ginnie Mae II, Pool #MA4513 |
| |||||||||||
5.00% | 06/20/47 | 6,008,420 | 6,268,581 | |||||||||
Ginnie Mae II, Pool #MA4781 |
| |||||||||||
5.00% | 10/20/47 | 7,865,923 | 8,242,634 | |||||||||
Ginnie Mae II, Pool #MA4836 |
| |||||||||||
3.00% | 11/20/47 | 35,999,348 | 34,457,284 | |||||||||
Ginnie Mae II, Pool #MA4838 |
| |||||||||||
4.00% | 11/20/47 | 41,709,910 | 42,015,433 | |||||||||
Ginnie Mae II TBA, 30 Year |
| |||||||||||
4.00% (5) | 05/01/48 | 19,875,000 | 20,003,876 | |||||||||
3.50% (5) | 12/01/47 | 63,440,000 | 62,312,451 | |||||||||
5.00% (5) | 06/01/47 | 11,490,000 | 11,946,818 | |||||||||
|
| |||||||||||
Total Residential Mortgage-backed Securities — Agency |
| |||||||||||
(Cost: $3,843,089,179) |
| 3,671,330,975 | ||||||||||
|
| |||||||||||
| RESIDENTIAL MORTGAGE-BACKED SECURITIES — NON-AGENCY — 17.8% | ||||||||||||
ACE Securities Corp. (06-ASP1-A2D) |
| |||||||||||
2.90% (1 mo. USD LIBOR + 0.620%) (2) | 12/25/35 | 5,097,337 | 5,084,329 | |||||||||
ACE Securities Corp. (07-ASP1-A2C) |
| |||||||||||
2.54% (1 mo. USD LIBOR + 0.260%) (2) | 03/25/37 | 14,856,791 | 9,120,156 | |||||||||
ACE Securities Corp. (07-ASP1-A2D) |
| |||||||||||
2.66% (1 mo. USD LIBOR + 0.380%) (2) | 03/25/37 | 7,985,367 | 4,906,145 | |||||||||
Adjustable Rate Mortgage Trust (04-5-3A1) |
| |||||||||||
3.97% (3) | 04/25/35 | 606,080 | 612,578 | |||||||||
Ameriquest Mortgage Securities Trust (06-R2-A1) |
| |||||||||||
2.46% (1 mo. USD LIBOR + 0.175%) (2) | 04/25/36 | 3,347,242 | 3,343,712 | |||||||||
Asset-Backed Funding Certificates (07-NC1-A2) |
| |||||||||||
2.58% (1 mo. USD LIBOR + 0.300%) (1)(2) | 05/25/37 | 8,393,273 | 8,210,965 | |||||||||
Asset-Backed Funding Certificates (07-WMC1-A2A) |
| |||||||||||
3.03% (1 mo. USD LIBOR + 0.750%) (2) | 06/25/37 | 15,200,037 | 13,084,706 | |||||||||
Banc of America Funding Corp. (04-B-3A1) |
| |||||||||||
3.68% (3)(6) | 12/20/34 | 335,175 | 259,570 | |||||||||
Banc of America Funding Corp. (06-D-2A1) |
| |||||||||||
3.51% (3)(6) | 05/20/36 | 59,770 | 54,552 | |||||||||
Banc of America Funding Corp. (06-D-3A1) |
| |||||||||||
3.92% (3) | 05/20/36 | 3,478,536 | 3,370,372 | |||||||||
See accompanying notes to financial statements.
69
Table of Contents
TCW Total Return Bond Fund
Schedule of Investments (Continued)
| Issues | Maturity Date | Principal Amount | Value | |||||||||
| RESIDENTIAL MORTGAGE-BACKED SECURITIES — NON-AGENCY (Continued) | ||||||||||||
Banc of America Funding Corp. (06-G-2A1) |
| |||||||||||
2.50% (1 mo. USD LIBOR + 0.220%) (2) | 07/20/36 | $ | 5,429,170 | $ | 5,423,501 | |||||||
Banc of America Funding Corp. (15-R8-1A1) |
| |||||||||||
2.68% (1)(3) | 11/26/46 | 6,096,864 | 6,059,376 | |||||||||
Banc of America Funding Trust (06-3-4A14) |
| |||||||||||
6.00% | 03/25/36 | 934,053 | 946,966 | |||||||||
Banc of America Funding Trust (06-3-5A3) |
| |||||||||||
5.50% | 03/25/36 | 3,417,578 | 3,245,580 | |||||||||
BCAP LLC Trust (08-IND2-A1) |
| |||||||||||
3.93% (1 mo. USD LIBOR + 1.650%) (2) | 04/25/38 | 9,455,203 | 9,522,290 | |||||||||
BCAP LLC Trust (11-RR3-5A3) |
| |||||||||||
3.68% (1)(3) | 11/27/37 | 369,031 | 368,959 | |||||||||
BCAP LLC Trust (11-RR4-2A3) |
| |||||||||||
3.96% (1)(3) | 06/26/47 | 953,463 | 957,544 | |||||||||
BCAP LLC Trust (11-RR4-3A3) |
| |||||||||||
3.63% (1)(3) | 07/26/36 | 1,489,479 | 1,495,752 | |||||||||
BCAP LLC Trust (11-RR9-7A1) |
| |||||||||||
3.17% (1)(3) | 04/26/37 | 3,703,432 | 3,687,192 | |||||||||
BCAP LLC Trust (12-RR2-9A3) |
| |||||||||||
4.00% (1)(3) | 03/26/35 | 276,078 | 275,493 | |||||||||
BCAP LLC Trust (12-RR8-3A1) |
| |||||||||||
3.79% (1)(3) | 08/26/36 | 1,143,186 | 1,146,184 | |||||||||
Bear Stearns Alt-A Trust (04-13-A1) |
| |||||||||||
3.02% (1 mo. USD LIBOR + 0.740%) (2) | 11/25/34 | 353,524 | 354,429 | |||||||||
Bear Stearns Alt-A Trust (05-2-2A4) |
| |||||||||||
3.86% (3) | 04/25/35 | 3,699 | 3,696 | |||||||||
Bear Stearns Alt-A Trust (05-4-23A1) |
| |||||||||||
4.02% (3) | 05/25/35 | 5,564,834 | 5,622,805 | |||||||||
Bear Stearns Alt-A Trust (06-4-32A1) |
| |||||||||||
4.00% (3) | 07/25/36 | 516,259 | 446,422 | |||||||||
Bear Stearns ARM Trust (04-12-1A1) |
| |||||||||||
3.88% (3) | 02/25/35 | 920,828 | 908,272 | |||||||||
Bear Stearns ARM Trust (05-10-A3) |
| |||||||||||
4.43% (3) | 10/25/35 | 5,693,100 | 5,904,501 | |||||||||
Bear Stearns ARM Trust (06-2-2A1) |
| |||||||||||
4.02% (3) | 07/25/36 | 1,914,045 | 1,848,774 | |||||||||
Bear Stearns ARM Trust (07-1-2A1) |
| |||||||||||
3.93% (3) | 02/25/47 | 256,535 | 264,327 | |||||||||
Bear Stearns ARM Trust (07-5-3A1) |
| |||||||||||
4.20% (3) | 08/25/47 | 1,245,042 | 1,111,815 | |||||||||
Bear Stearns Asset-Backed Securities I Trust (05-AC6-1A3) |
| |||||||||||
5.50% (3) | 09/25/35 | 1,588,338 | 1,582,549 | |||||||||
Bear Stearns Asset-Backed Securities I Trust (05-AC6-1A4) |
| |||||||||||
5.40% (3) | 09/25/35 | 3,396,137 | 3,382,752 | |||||||||
| Issues | Maturity Date | Principal Amount | Value | |||||||||
| RESIDENTIAL MORTGAGE-BACKED SECURITIES — NON-AGENCY (Continued) | ||||||||||||
Bear Stearns Mortgage Funding Trust (06-AR3-1A1) |
| |||||||||||
2.46% (1 mo. USD LIBOR + 0.180%) (2) | 10/25/36 | $ | 721,207 | $ | 676,411 | |||||||
Chase Mortgage Finance Corp. (06-A1-2A1) |
| |||||||||||
4.28% (3) | 09/25/36 | 902,027 | 866,332 | |||||||||
Chase Mortgage Finance Corp. (07-A1-8A1) |
| |||||||||||
4.51% (3) | 02/25/37 | 3,673,729 | 3,781,644 | |||||||||
Chaseflex Trust (05-1-1A5) |
| |||||||||||
6.50% | 02/25/35 | 3,772,187 | 3,872,361 | |||||||||
Chaseflex Trust (06-1-A3) |
| |||||||||||
6.30% (3) | 06/25/36 | 3,463,803 | 3,464,306 | |||||||||
CIM Trust (16-4-A1) |
| |||||||||||
4.26% (1 mo. USD LIBOR + 2.000%) (1)(2) | 10/25/57 | 37,622,918 | 38,876,297 | |||||||||
CIM Trust (17-7-A) |
| |||||||||||
3.00% (1)(3) | 12/25/65 | 35,119,890 | 34,527,364 | |||||||||
CIM Trust (18-R5-A1) |
| |||||||||||
3.75% (1)(3) | 07/25/58 | 33,300,034 | 33,059,422 | |||||||||
CIM Trust (18-R6-A1) |
| |||||||||||
0.00% (1)(3)(4) | 09/25/58 | 25,000,000 | 24,948,500 | |||||||||
Citicorp Mortgage Securities Trust, Inc. (07-4-3A1) |
| |||||||||||
5.50% | 05/25/37 | 505,187 | 501,644 | |||||||||
Citigroup Mortgage Loan Trust (06-HE3-A1) |
| |||||||||||
2.42% (1 mo. USD LIBOR + 0.140%) (1)(2) | 12/25/36 | 16,690,814 | 16,290,565 | |||||||||
Citigroup Mortgage Loan Trust, Inc. (06-AR5-1A1A) |
| |||||||||||
3.96% (3) | 07/25/36 | 4,134,473 | 3,491,649 | |||||||||
Citigroup Mortgage Loan Trust, Inc. (06-WFH2-A2A) |
| |||||||||||
2.43% (1 mo. USD LIBOR + 0.150%) (2) | 08/25/36 | 367,106 | 367,921 | |||||||||
Citigroup Mortgage Loan Trust, Inc. (07-12-2A1) |
| |||||||||||
6.50% (1) | 10/25/36 | 3,501,496 | 2,720,314 | |||||||||
Citigroup Mortgage Loan Trust, Inc. (14-10-2A1) |
| |||||||||||
2.47% (1 mo. USD LIBOR + 0.250%) (1)(2) | 07/25/37 | 2,486,278 | 2,470,534 | |||||||||
CitiMortgage Alternative Loan Trust (05-A1-2A1) |
| |||||||||||
5.00% | 07/25/20 | 141,663 | 141,929 | |||||||||
Conseco Financial Corp. (99-2-A7) |
| |||||||||||
6.44% | 12/01/30 | 3,258,130 | 3,544,256 | |||||||||
Countrywide Alternative Loan Trust (05-20CB-4A1) |
| |||||||||||
5.25% | 07/25/20 | 295,941 | 293,260 | |||||||||
Countrywide Alternative Loan Trust (05-84-1A1) |
| |||||||||||
3.41% (3) | 02/25/36 | 253,906 | 207,859 | |||||||||
Countrywide Alternative Loan Trust (05-J1-2A1) |
| |||||||||||
5.50% | 02/25/25 | 754,100 | 763,496 | |||||||||
Countrywide Alternative Loan Trust (06-HY12-A5) |
| |||||||||||
3.85% (3) | 08/25/36 | 12,903,632 | 13,287,620 | |||||||||
Countrywide Alternative Loan Trust (06-J3-3A1) |
| |||||||||||
5.50% | 04/25/21 | 286,748 | 285,040 | |||||||||
See accompanying notes to financial statements.
70
Table of Contents
TCW Total Return Bond Fund
October 31, 2018 |
| Issues | Maturity Date | Principal Amount | Value | |||||||||
| RESIDENTIAL MORTGAGE-BACKED SECURITIES — NON-AGENCY (Continued) | ||||||||||||
Countrywide Home Loans Mortgage Pass-Through Trust (04-13-1A3) |
| |||||||||||
5.50% | 08/25/34 | $ | 6,165,568 | $ | 6,528,779 | |||||||
Countrywide Home Loans Mortgage Pass-Through Trust (05-9-1A1) |
| |||||||||||
2.88% (1 mo. USD LIBOR + 0.600%) (2) | 05/25/35 | 11,556,092 | 10,900,615 | |||||||||
Countrywide Home Loans Mortgage Pass-Through Trust (05-HYB5-4A1) |
| |||||||||||
3.94% (3) | 09/20/35 | 28,369 | 24,102 | |||||||||
Countrywide Home Loans Mortgage Pass-Through Trust (07-HY5-1A1) |
| |||||||||||
4.51% (3) | 09/25/47 | 8,399 | 8,204 | |||||||||
Countrywide Home Loans Mortgage Pass-Through Trust (07-HYB1-1A1) |
| |||||||||||
3.31% (3) | 03/25/37 | 48,204 | 40,692 | |||||||||
Credit Suisse First Boston Mortgage Securities Corp. (03-8-4PPA) |
| |||||||||||
5.75% | 04/22/33 | 30,420 | 31,605 | |||||||||
Credit Suisse First Boston Mortgage Securities Corp. (05-11-1A1) |
| |||||||||||
6.50% (6) | 12/25/35 | 2,338,014 | 1,945,208 | |||||||||
Credit Suisse First Boston Mortgage Securities Corp. (05-12-1A1) |
| |||||||||||
6.50% | 01/25/36 | 8,402,881 | 5,386,874 | |||||||||
Credit Suisse Mortgage Capital Certificates (15-5R-2A1) |
| |||||||||||
2.50% (1 mo. USD LIBOR + 0.280%) (1)(2) | 04/27/47 | 5,978,788 | 5,919,232 | |||||||||
Credit Suisse Mortgage Trust (13-7R-4A1) |
| |||||||||||
2.38% (1 mo. USD LIBOR + 0.160%) (1)(2) | 07/26/36 | 2,763,928 | 2,653,807 | |||||||||
Credit-Based Asset Servicing and Securitization LLC (06-CB1-AF2) |
| |||||||||||
3.48% | 01/25/36 | 4,228,459 | 3,605,518 | |||||||||
Credit-Based Asset Servicing and Securitization LLC (06-CB7-A4) |
| |||||||||||
2.44% (1 mo. USD LIBOR + 0.160%) (2) | 10/25/36 | 28,999,567 | 22,553,172 | |||||||||
Credit-Based Asset Servicing and Securitization LLC (06-CB9-A4) |
| |||||||||||
2.51% (1 mo. USD LIBOR + 0.230%) (2) | 11/25/36 | 16,588,919 | 11,039,215 | |||||||||
Credit-Based Asset Servicing and Securitization LLC (07-CB2-A2B) |
| |||||||||||
4.10% | 02/25/37 | 3,638,022 | 2,886,737 | |||||||||
Credit-Based Asset Servicing and Securitization LLC (07-CB2-A2C) |
| |||||||||||
4.10% | 02/25/37 | 12,514,095 | 9,928,588 | |||||||||
CSMC Mortgage-Backed Trust (06-8-3A1) |
| |||||||||||
6.00% | 10/25/21 | 2,532,248 | 2,301,420 | |||||||||
| Issues | Maturity Date | Principal Amount | Value | |||||||||
| RESIDENTIAL MORTGAGE-BACKED SECURITIES — NON-AGENCY (Continued) | ||||||||||||
CSMC Mortgage-Backed Trust (06-9-5A1) |
| |||||||||||
5.50% | 11/25/36 | $ | 2,377,785 | $ | 2,305,412 | |||||||
CSMC Mortgage-Backed Trust (07-2-3A4) |
| |||||||||||
5.50% | 03/25/37 | 8,197,284 | 7,001,811 | |||||||||
Deutsche Alt-A Securities, Inc. Mortgage Loan Trust (06-AR6-A6) |
| |||||||||||
2.47% (1 mo. USD LIBOR + 0.190%) (2) | 02/25/37 | 399,357 | 363,560 | |||||||||
DSLA Mortgage Loan Trust (05-AR6-2A1A) |
| |||||||||||
2.57% (1 mo. USD LIBOR + 0.290%) (2) | 10/19/45 | 2,946,790 | 2,965,964 | |||||||||
DSLA Mortgage Loan Trust (06-AR2-2A1A) |
| |||||||||||
2.48% (1 mo. USD LIBOR + 0.200%) (2) | 10/19/36 | 29,769,886 | 26,964,381 | |||||||||
DSLA Mortgage Loan Trust (07-AR1-2A1A) |
| |||||||||||
2.42% (1 mo. USD LIBOR + 0.140%) (2) | 04/19/47 | 8,703,672 | 8,575,002 | |||||||||
Fieldstone Mortgage Investment Corp. (07-1-2A2) |
| |||||||||||
2.55% (1 mo. USD LIBOR + 0.270%) (2) | 04/25/47 | 4,157,703 | 3,194,734 | |||||||||
First Franklin Mortgage Loan Asset-Backed Certificates (06-FF18-A2C) |
| |||||||||||
2.44% (1 mo. USD LIBOR + 0.160%) (2) | 12/25/37 | 23,433,719 | 20,591,129 | |||||||||
First Franklin Mortgage Loan Asset-Backed Certificates (06-FF18-A2D) |
| |||||||||||
2.49% (1 mo. USD LIBOR + 0.210%) (2) | 12/25/37 | 13,751,705 | 12,144,262 | |||||||||
First Franklin Mortgage Loan Asset-Backed Certificates (07-FF1-A2C) |
| |||||||||||
2.42% (1 mo. USD LIBOR + 0.140%) (2) | 01/25/38 | 5,615,997 | 4,206,892 | |||||||||
First Franklin Mortgage Loan Asset-Backed Certificates (07-FF1-A2D) |
| |||||||||||
2.50% (1 mo. USD LIBOR + 0.220%) (2) | 01/25/38 | 23,552,900 | 17,826,853 | |||||||||
First Franklin Mortgage Loan Trust (06-FF9-2A4) |
| |||||||||||
2.53% (1 mo. USD LIBOR + 0.250%) (2) | 06/25/36 | 5,068,000 | 4,472,757 | |||||||||
First Horizon Alternative Mortgage Securities Trust (05-AA3-3A1) |
| |||||||||||
4.15% (3) | 05/25/35 | 3,980,703 | 4,062,263 | |||||||||
First Horizon Alternative Mortgage Securities Trust (05-AA7-1A1) |
| |||||||||||
3.89% (3) | 09/25/35 | 3,246,581 | 3,045,931 | |||||||||
First Horizon Alternative Mortgage Securities Trust (05-AA7-2A1) |
| |||||||||||
4.11% (3) | 09/25/35 | 2,732,331 | 2,652,050 | |||||||||
First Horizon Alternative Mortgage Securities Trust (06-AA7-A1) |
| |||||||||||
3.93% (3) | 01/25/37 | 10,811,929 | 9,869,032 | |||||||||
See accompanying notes to financial statements.
71
Table of Contents
TCW Total Return Bond Fund
Schedule of Investments (Continued)
| Issues | Maturity Date | Principal Amount | Value | |||||||||
| RESIDENTIAL MORTGAGE-BACKED SECURITIES — NON-AGENCY (Continued) | ||||||||||||
Fremont Home Loan Trust (05-E-2A4) |
| |||||||||||
2.61% (1 mo. USD LIBOR + 0.330%) (2) | 01/25/36 | $ | 15,482,783 | $ | 14,941,635 | |||||||
Fremont Home Loan Trust (06-1-2A3) |
| |||||||||||
2.46% (1 mo. USD LIBOR + 0.180%) (2) | 04/25/36 | 2,981,831 | 2,943,038 | |||||||||
GMAC Mortgage Loan Trust (05-AR5-2A1) |
| |||||||||||
4.62% (3) | 09/19/35 | 2,822,846 | 2,534,743 | |||||||||
GreenPoint Mortgage Funding Trust (05-AR3-1A1) |
| |||||||||||
2.52% (1 mo. USD LIBOR + 0.240%) (2) | 08/25/45 | 582,562 | 543,855 | |||||||||
GreenPoint Mortgage Funding Trust (06-AR5-A2A2) |
| |||||||||||
2.37% (1 mo. USD LIBOR + 0.150%) (2)(7) | 10/25/46 | 799 | — | |||||||||
GS Mortgage Securities Corp. (09-1R-3A1) |
| |||||||||||
3.93% (1)(3) | 11/25/35 | 126,630 | 127,324 | |||||||||
GSAA Home Equity Trust (05-7-AF5) |
| |||||||||||
4.61% | 05/25/35 | 838,125 | 845,396 | |||||||||
GSAA Home Equity Trust (05-9-2A3) |
| |||||||||||
2.65% (1 mo. USD LIBOR + 0.370%) (2) | 08/25/35 | 390,288 | 389,113 | |||||||||
GSR Mortgage Loan Trust (04-9-3A1) |
| |||||||||||
4.31% (3) | 08/25/34 | 2,923,713 | 3,038,505 | |||||||||
GSR Mortgage Loan Trust (07-3F-3A7) |
| |||||||||||
6.00% | 05/25/37 | 11,163,406 | 10,380,717 | |||||||||
GSR Mortgage Loan Trust (07-AR2-2A1) |
| |||||||||||
3.98% (3) | 05/25/37 | 3,628,850 | 3,273,289 | |||||||||
GSR Mortgage Loan Trust (07-AR2-5A1A) |
| |||||||||||
4.17% (3) | 05/25/37 | 1,875,575 | 1,692,511 | |||||||||
Harborview Mortgage Loan Trust (05-9-2A1A) |
| |||||||||||
2.62% (1 mo. USD LIBOR + 0.340%) (2) | 06/20/35 | 2,783,135 | 2,766,223 | |||||||||
Harborview Mortgage Loan Trust (06-8-2A1A) |
| |||||||||||
2.47% (1 mo. USD LIBOR + 0.190%) (2) | 07/21/36 | 12,051,092 | 11,039,091 | |||||||||
HSI Asset Loan Obligation Trust (07-2-2A12) |
| |||||||||||
6.00% | 09/25/37 | 880,974 | 802,451 | |||||||||
Impac CMB Trust (04-5-1A1) |
| |||||||||||
3.00% (1 mo. USD LIBOR + 0.720%) (2) | 10/25/34 | 5,951 | 5,915 | |||||||||
Impac CMB Trust (05-1-1A1) |
| |||||||||||
2.80% (1 mo. USD LIBOR + 0.520%) (2) | 04/25/35 | 1,223,513 | 1,180,446 | |||||||||
Impac CMB Trust (05-5-A2) |
| |||||||||||
2.72% (1 mo. USD LIBOR + 0.440%) (2) | 08/25/35 | 5,953,273 | 5,826,930 | |||||||||
Indymac Index Mortgage Loan Trust (04-AR4-2A) |
| |||||||||||
4.28% (3) | 08/25/34 | 6,308,360 | 6,426,659 | |||||||||
Indymac Index Mortgage Loan Trust (04-AR9-4A) |
| |||||||||||
4.39% (3) | 11/25/34 | 1,003,615 | 888,055 | |||||||||
| Issues | Maturity Date | Principal Amount | Value | |||||||||
| RESIDENTIAL MORTGAGE-BACKED SECURITIES — NON-AGENCY (Continued) | ||||||||||||
Indymac Index Mortgage Loan Trust (05-AR17-3A1) |
| |||||||||||
3.90% (3) | 09/25/35 | $ | 4,477,339 | $ | 4,127,353 | |||||||
Indymac Index Mortgage Loan Trust (05-AR23-2A1) |
| |||||||||||
4.02% (3) | 11/25/35 | 3,412,750 | 3,297,232 | |||||||||
Indymac Index Mortgage Loan Trust (05-AR23-6A1) |
| |||||||||||
3.77% (3) | 11/25/35 | 4,447,296 | 4,265,859 | |||||||||
Indymac Index Mortgage Loan Trust (05-AR25-2A1) |
| |||||||||||
3.71% (3) | 12/25/35 | 2,427,011 | 2,332,801 | |||||||||
Indymac Index Mortgage Loan Trust (05-AR7-2A1) |
| |||||||||||
3.83% (3) | 06/25/35 | 3,393,403 | 3,077,765 | |||||||||
Indymac Index Mortgage Loan Trust (06-AR39-A1) |
| |||||||||||
2.46% (1 mo. USD LIBOR + 0.180%) (2) | 02/25/37 | 8,831,706 | 8,498,731 | |||||||||
Indymac Index Mortgage Loan Trust (07-AR11-1A1) |
| |||||||||||
3.35% (3)(6) | 06/25/37 | 23,039 | 19,615 | |||||||||
Indymac Index Mortgage Loan Trust (07-AR5-2A1) |
| |||||||||||
3.59% (3) | 05/25/37 | 15,309,439 | 14,336,778 | |||||||||
Indymac Index Mortgage Loan Trust (07-AR7-1A1) |
| |||||||||||
4.10% (3) | 11/25/37 | 3,793,380 | 3,773,981 | |||||||||
JPMorgan Alternative Loan Trust (06-A2-5A1) |
| |||||||||||
3.78% (3) | 05/25/36 | 6,660,275 | 5,715,965 | |||||||||
JPMorgan Alternative Loan Trust (06-A4-A8) |
| |||||||||||
3.84% (3) | 09/25/36 | 2,247,551 | 2,191,278 | |||||||||
JPMorgan Mortgage Acquisition Corp. (06-CH2-AF4) |
| |||||||||||
5.76% | 10/25/36 | 6,769,612 | 5,535,737 | |||||||||
JPMorgan Mortgage Acquisition Corp. (07-CH4-A4) |
| |||||||||||
2.44% (1 mo. USD LIBOR + 0.160%) (2) | 01/25/36 | 13,058,033 | 13,028,849 | |||||||||
JPMorgan Mortgage Trust (05-A6-7A1) |
| |||||||||||
4.37% (3) | 08/25/35 | 404,184 | 397,241 | |||||||||
JPMorgan Mortgage Trust (06-A2-5A3) |
| |||||||||||
4.24% (3) | 11/25/33 | 2,218,398 | 2,295,303 | |||||||||
JPMorgan Mortgage Trust (06-A4-1A4) |
| |||||||||||
4.15% (3) | 06/25/36 | 532,054 | 512,155 | |||||||||
JPMorgan Mortgage Trust (06-A7-2A4R) |
| |||||||||||
3.92% (3) | 01/25/37 | 23,112 | 22,335 | |||||||||
JPMorgan Mortgage Trust (06-S2-2A2) |
| |||||||||||
5.88% | 06/25/21 | 557,966 | 531,522 | |||||||||
JPMorgan Resecuritization Trust Series (14-6-3A1) |
| |||||||||||
2.43% (1 mo. USD LIBOR + 0.210%) (1)(2) | 07/27/46 | 3,808,429 | 3,797,594 | |||||||||
Lehman Mortgage Trust (05-1-6A1) |
| |||||||||||
5.00% | 11/25/20 | 833,846 | 463,446 | |||||||||
Lehman Mortgage Trust (06-4-4A1) |
| |||||||||||
6.00% | 08/25/21 | 1,604,485 | 1,562,145 | |||||||||
Lehman Mortgage Trust (07-10-4A1) |
| |||||||||||
6.00% (6) | 01/25/27 | 71,437 | 64,809 | |||||||||
See accompanying notes to financial statements.
72
Table of Contents
TCW Total Return Bond Fund
October 31, 2018 |
| Issues | Maturity Date | Principal Amount | Value | |||||||||
| RESIDENTIAL MORTGAGE-BACKED SECURITIES — NON-AGENCY (Continued) | ||||||||||||
Lehman XS Trust (06-10N-1A3A) |
| |||||||||||
2.49% (1 mo. USD LIBOR + 0.210%) (2) | 07/25/46 | $ | 15,410,006 | $ | 15,057,126 | |||||||
Lehman XS Trust (06-12N-A2A1) |
| |||||||||||
2.43% (1 mo. USD LIBOR + 0.150%) (2)(6)(7) | 08/25/46 | 4,500 | — | |||||||||
Lehman XS Trust (06-12N-A31A) |
| |||||||||||
2.48% (1 mo. USD LIBOR + 0.200%) (2) | 08/25/46 | 5,376,987 | 5,024,425 | |||||||||
Lehman XS Trust (06-13-1A2) |
| |||||||||||
2.45% (1 mo. USD LIBOR + 0.170%) (2) | 09/25/36 | 2,110,255 | 2,070,478 | |||||||||
Lehman XS Trust (06-9-A1B) |
| |||||||||||
2.44% (1 mo. USD LIBOR + 0.160%) (2) | 05/25/46 | 3,581,882 | 5,048,474 | |||||||||
Lehman XS Trust (06-GP1-A2A) |
| |||||||||||
2.45% (1 mo. USD LIBOR + 0.170%) (2)(6)(7) | 05/25/46 | 8,343 | — | |||||||||
Lehman XS Trust (06-GP4-3A2A) |
| |||||||||||
2.44% (1 mo. USD LIBOR + 0.160%) (2)(7) | 08/25/46 | 77 | — | |||||||||
Long Beach Mortgage Loan Trust (06-WL1-1A3) |
| |||||||||||
2.94% (1 mo. USD LIBOR + 0.330%) (2) | 01/25/46 | 726,492 | 726,029 | |||||||||
Long Beach Mortgage Loan Trust (06-WL1-2A4) |
| |||||||||||
2.96% (1 mo. USD LIBOR + 0.340%) (2) | 01/25/46 | 14,950,000 | 14,860,584 | |||||||||
Madison Avenue Manufactured Housing Contract (02-A-B1) |
| |||||||||||
5.53% (1 mo. USD LIBOR + 3.250%) (2) | 03/25/32 | 1,491,103 | 1,502,897 | |||||||||
MASTR Alternative Loans Trust (05-4-1A1) |
| |||||||||||
6.50% | 05/25/35 | 5,801,582 | 5,660,702 | |||||||||
MASTR Alternative Loans Trust (06-2-2A1) |
| |||||||||||
2.68% (1 mo. USD LIBOR + 0.400%) (2)(7) | 03/25/36 | 67,852 | 13,879 | |||||||||
MASTR Asset Securitization Trust (06-3-2A1) |
| |||||||||||
2.73% (1 mo. USD LIBOR + 0.450%) (2)(6) | 10/25/36 | 45,500 | 24,276 | |||||||||
MASTR Asset-Backed Securities Trust (06-AB1-A4) |
| |||||||||||
5.72% | 02/25/36 | 1,010,793 | 980,886 | |||||||||
MASTR Asset-Backed Securities Trust (06-HE1-A4) |
| |||||||||||
2.57% (1 mo. USD LIBOR + 0.290%) (2) | 01/25/36 | 2,688,920 | 2,699,661 | |||||||||
MASTR Asset-Backed Securities Trust (06-HE5-A3) |
| |||||||||||
2.44% (1 mo. USD LIBOR + 0.160%) (2) | 11/25/36 | 20,491,636 | 14,307,645 | |||||||||
MASTR Seasoned Securitization Trust (04-1-4A1) |
| |||||||||||
4.63% (3) | 10/25/32 | 8,700 | 8,865 | |||||||||
| Issues | Maturity Date | Principal Amount | Value | |||||||||
| RESIDENTIAL MORTGAGE-BACKED SECURITIES — NON-AGENCY (Continued) | ||||||||||||
Merrill Lynch Alternative Note Asset Trust (07-A1-A2C) |
| |||||||||||
2.51% (1 mo. USD LIBOR + 0.230%) (2) | 01/25/37 | $ | 1,994,677 | $ | 906,628 | |||||||
Merrill Lynch Alternative Note Asset Trust (07-A1-A3) |
| |||||||||||
2.44% (1 mo. USD LIBOR + 0.160%) (2) | 01/25/37 | 1,026,062 | 463,554 | |||||||||
Merrill Lynch First Franklin Mortgage Loan Trust (07-1-A2B) |
| |||||||||||
2.45% (1 mo. USD LIBOR + 0.170%) (2) | 04/25/37 | 7,995,109 | 4,853,943 | |||||||||
Merrill Lynch First Franklin Mortgage Loan Trust (07-1-A2C) |
| |||||||||||
2.53% (1 mo. USD LIBOR + 0.250%) (2) | 04/25/37 | 27,979,504 | 17,152,855 | |||||||||
Merrill Lynch First Franklin Mortgage Loan Trust (07-1-A2D) |
| |||||||||||
2.62% (1 mo. USD LIBOR + 0.340%) (2) | 04/25/37 | 6,895,708 | 4,273,467 | |||||||||
Merrill Lynch First Franklin Mortgage Loan Trust (07-2-A2C) |
| |||||||||||
2.52% (1 mo. USD LIBOR + 0.240%) (2) | 05/25/37 | 6,165,584 | 4,319,990 | |||||||||
Merrill Lynch First Franklin Mortgage Loan Trust (07-3-A2B) |
| |||||||||||
2.41% (1 mo. USD LIBOR + 0.130%) (2) | 06/25/37 | 2,903,230 | 2,157,680 | |||||||||
Merrill Lynch First Franklin Mortgage Loan Trust (07-4-2A3) |
| |||||||||||
2.44% (1 mo. USD LIBOR + 0.160%) (2) | 07/25/37 | 37,062,785 | 26,634,040 | |||||||||
Merrill Lynch Mortgage-Backed Securities Trust (07-2-1A1) |
| |||||||||||
4.98% (1 year Treasury Constant Maturity Rate + 2.400%) (2) | 08/25/36 | 1,694,210 | 1,660,166 | |||||||||
Mid-State Trust (05-1-A) |
| |||||||||||
5.75% | 01/15/40 | 3,182,915 | 3,447,751 | |||||||||
Morgan Stanley ABS Capital I, Inc. Trust (04-NC8-M2) |
| |||||||||||
3.24% (1 mo. USD LIBOR + 0.960%) (2) | 09/25/34 | 790,893 | 789,385 | |||||||||
Morgan Stanley ABS Capital I, Inc. Trust (05-HE3-M3) |
| |||||||||||
3.08% (1 mo. USD LIBOR + 0.795%) (2) | 07/25/35 | 110,500 | 110,812 | |||||||||
Morgan Stanley Home Equity Loan Trust (06-2-A4) |
| |||||||||||
2.56% (1 mo. USD LIBOR + 0.280%) (2) | 02/25/36 | 3,012,159 | 3,000,317 | |||||||||
Morgan Stanley Mortgage Loan Trust (05-6AR-1A1) |
| |||||||||||
2.56% (1 mo. USD LIBOR + 0.280%) (2) | 11/25/35 | 1,087,679 | 1,094,364 | |||||||||
Morgan Stanley Mortgage Loan Trust (07-3XS-2A6) |
| |||||||||||
5.76% | 01/25/47 | 1,032,375 | 526,619 | |||||||||
See accompanying notes to financial statements.
73
Table of Contents
TCW Total Return Bond Fund
Schedule of Investments (Continued)
| Issues | Maturity Date | Principal Amount | Value | |||||||||
| RESIDENTIAL MORTGAGE-BACKED SECURITIES — NON-AGENCY (Continued) | ||||||||||||
Morgan Stanley Mortgage Loan Trust (07-7AX-2A1) |
| |||||||||||
2.40% (1 mo. USD LIBOR + 0.120%) (2) | 04/25/37 | $ | 3,744,424 | $ | 1,862,781 | |||||||
Morgan Stanley REREMIC Trust (13-R2-1A) |
| |||||||||||
3.55% (1)(3) | 10/26/36 | 4,071,370 | 4,054,552 | |||||||||
Morgan Stanley REREMIC Trust (13-R3-12A) |
| |||||||||||
3.61% (1)(3) | 01/26/47 | 114,865 | 115,183 | |||||||||
Morgan Stanley Resecuritization Trust (14-R2-2A) |
| |||||||||||
3.13% (1)(3) | 12/26/46 | 7,171,093 | 7,112,230 | |||||||||
MortgageIT Trust (05-3-A1) |
| |||||||||||
2.88% (1 mo. USD LIBOR + 0.600%) (2) | 08/25/35 | 5,712,868 | 5,620,987 | |||||||||
MortgageIT Trust (05-4-A1) |
| |||||||||||
2.56% (1 mo. USD LIBOR + 0.280%) (2) | 10/25/35 | 2,820,985 | 2,782,582 | |||||||||
Nationstar Home Equity Loan Trust (07-B-2AV3) |
| |||||||||||
2.53% (1 mo. USD LIBOR + 0.250%) (2) | 04/25/37 | 6,556,313 | 6,555,182 | |||||||||
Nomura Resecuritization Trust (15-2R-1A1) |
| |||||||||||
2.84% (12 mo. Monthly Treasury Average Index + 1.000%) (1)(2) | 08/26/46 | 4,474,965 | 4,417,996 | |||||||||
Nomura Resecuritization Trust (15-4R-2A1) |
| |||||||||||
2.36% (1 mo. USD LIBOR + 0.306%) (1)(2) | 10/26/36 | 5,968,305 | 5,940,705 | |||||||||
Nomura Resecuritization Trust (15-5R-2A1) |
| |||||||||||
4.11% (1)(3) | 03/26/35 | 6,849,072 | 6,924,652 | |||||||||
Nomura Resecuritization Trust (15-7R-2A1) |
| |||||||||||
3.64% (1)(3) | 08/26/36 | 2,949,108 | 2,934,634 | |||||||||
Oakwood Mortgage Investors, Inc. (02-A-A4) |
| |||||||||||
6.97% (3) | 03/15/32 | 2,523,446 | 2,686,237 | |||||||||
Oakwood Mortgage Investors, Inc. (99-E-A1) |
| |||||||||||
7.61% (3) | 03/15/30 | 4,670,102 | 4,250,838 | |||||||||
Opteum Mortgage Acceptance Corp. (06-1-2A1) |
| |||||||||||
5.75% (3) | 04/25/36 | 3,033,397 | 3,228,238 | |||||||||
Ownit Mortgage Loan Asset-Backed Certificates (06-3-A2D) |
| |||||||||||
2.55% (1 mo. USD LIBOR + 0.270%) (2) | 03/25/37 | 19,300,000 | 17,386,295 | |||||||||
Ownit Mortgage Loan Asset-Backed Certificates (06-6-A2C) |
| |||||||||||
2.44% (1 mo. USD LIBOR + 0.160%) (2) | 09/25/37 | 17,563,543 | 11,047,830 | |||||||||
Prime Mortgage Trust (06-1-1A1) |
| |||||||||||
5.50% | 06/25/36 | 1,986,696 | 1,977,649 | |||||||||
RAAC Series Trust (05-SP1-4A1) |
| |||||||||||
7.00% | 09/25/34 | 3,209,841 | 3,224,574 | |||||||||
RAAC Series Trust (07-SP1-A3) |
| |||||||||||
2.76% (1 mo. USD LIBOR + 0.480%) (2) | 03/25/37 | 1,139,377 | 1,142,850 | |||||||||
| Issues | Maturity Date | Principal Amount | Value | |||||||||
| RESIDENTIAL MORTGAGE-BACKED SECURITIES — NON-AGENCY (Continued) | ||||||||||||
RALI Trust (05-QA13-2A1) |
| |||||||||||
4.62% (3) | 12/25/35 | $ | 814,004 | $ | 744,273 | |||||||
RALI Trust (05-QA7-A21) |
| |||||||||||
4.39% (3) | 07/25/35 | 2,914,654 | 2,768,407 | |||||||||
RALI Trust (06-QA3-A1) |
| |||||||||||
2.48% (1 mo. USD LIBOR + 0.200%) (2) | 04/25/36 | 4,359,034 | 4,284,681 | |||||||||
Residential Accredit Loans, Inc. (05-QA8-CB21) |
| |||||||||||
4.58% (3) | 07/25/35 | 5,556,011 | 4,422,846 | |||||||||
Residential Accredit Loans, Inc. (05-QS7-A1) |
| |||||||||||
5.50% | 06/25/35 | 1,079,155 | 984,832 | |||||||||
Residential Accredit Loans, Inc. (06-QA1-A21) |
| |||||||||||
4.70% (3) | 01/25/36 | 20,585 | 18,141 | |||||||||
Residential Accredit Loans, Inc. (06-QA10-A2) |
| |||||||||||
2.46% (1 mo. USD LIBOR + 0.180%) (2) | 12/25/36 | 17,693,937 | 16,930,598 | |||||||||
Residential Accredit Loans, Inc. (06-QA2-1A1) |
| |||||||||||
2.53% (1 mo. USD LIBOR + 0.250%) (2) | 02/25/36 | 24,889 | 20,345 | |||||||||
Residential Accredit Loans, Inc. (06-QS10-AV) (I/O) |
| |||||||||||
0.57% (3)(7) | 08/25/36 | 45,051,950 | 1,043,065 | |||||||||
Residential Accredit Loans, Inc. (06-QS11-AV) (I/O) |
| |||||||||||
0.35% (3)(6)(7) | 08/25/36 | 43,624,400 | 635,967 | |||||||||
Residential Accredit Loans, Inc. (06-QS5-A5) |
| |||||||||||
6.00% | 05/25/36 | 5,647,822 | 5,233,658 | |||||||||
Residential Accredit Loans, Inc. (06-QS6-1AV) (I/O) |
| |||||||||||
0.76% (3)(7) | 06/25/36 | 56,143,067 | 1,436,892 | |||||||||
Residential Accredit Loans, Inc. (06-QS7-AV) (I/O) |
| |||||||||||
0.70% (3)(6)(7) | 06/25/36 | 12,953,963 | 332,574 | |||||||||
Residential Accredit Loans, Inc. (07-QS1-2AV) (I/O) |
| |||||||||||
0.17% (3)(7) | 01/25/37 | 2,926,935 | 22,645 | |||||||||
Residential Accredit Loans, Inc. (07-QS2-AV) (I/O) |
| |||||||||||
0.33% (3)(7) | 01/25/37 | 21,815,682 | 256,007 | |||||||||
Residential Accredit Loans, Inc. (07-QS3-AV) (I/O) |
| |||||||||||
0.37% (3)(7) | 02/25/37 | 89,289,439 | 1,200,809 | |||||||||
Residential Accredit Loans, Inc. (07-QS4-3AV) (I/O) |
| |||||||||||
0.37% (3)(7) | 03/25/37 | 10,386,688 | 148,057 | |||||||||
Residential Accredit Loans, Inc. (07-QS5-AV) (I/O) |
| |||||||||||
0.26% (3)(7) | 03/25/37 | 14,338,477 | 130,156 | |||||||||
Residential Accredit Loans, Inc. (07-QS6-A45) |
| |||||||||||
5.75% | 04/25/37 | 3,166,688 | 2,915,509 | |||||||||
Residential Accredit Loans, Inc. (07-QS8-AV) (I/O) |
| |||||||||||
0.40% (3)(7) | 06/25/37 | 21,355,643 | 390,107 | |||||||||
Residential Funding Mortgage Securities I (05-SA5-2A) |
| |||||||||||
4.55% (3) | 11/25/35 | 24,829 | 23,685 | |||||||||
Residential Funding Mortgage Securities I (06-S9-A3) (PAC) |
| |||||||||||
5.75% | 09/25/36 | 661,603 | 630,942 | |||||||||
See accompanying notes to financial statements.
74
Table of Contents
TCW Total Return Bond Fund
October 31, 2018 |
| Issues | Maturity Date | Principal Amount | Value | |||||||||
| RESIDENTIAL MORTGAGE-BACKED SECURITIES — NON-AGENCY (Continued) | ||||||||||||
Residential Funding Mortgage Securities I (07-S2-A9) |
| |||||||||||
6.00% | 02/25/37 | $ | 7,747,708 | $ | 7,306,863 | |||||||
Residential Funding Mortgage Securities I (07-SA2-2A2) |
| |||||||||||
4.27% (3) | 04/25/37 | 24,328 | 23,322 | |||||||||
Saxon Asset Securities Trust (06-2-A2) |
| |||||||||||
2.41% (1 mo. USD LIBOR + 0.130%) (2) | 09/25/36 | 5,786,735 | 5,784,680 | |||||||||
Saxon Asset Securities Trust (06-3-A3) |
| |||||||||||
2.45% (1 mo. USD LIBOR + 0.170%) (2) | 10/25/46 | 11,962,232 | 11,742,881 | |||||||||
Saxon Asset Securities Trust (07-2-A2D) |
| |||||||||||
2.58% (1 mo. USD LIBOR + 0.300%) (2) | 05/25/47 | 18,889,327 | 15,137,578 | |||||||||
Securitized Asset-Backed Receivables LLC Trust (07-BR1-A2C) |
| |||||||||||
2.62% (1 mo. USD LIBOR + 0.340%) (2) | 02/25/37 | 3,273,155 | 2,156,945 | |||||||||
Securitized Asset-Backed Receivables LLC Trust (07-BR2-A2) |
| |||||||||||
2.51% (1 mo. USD LIBOR + 0.230%) (2) | 02/25/37 | 42,072,433 | 21,662,330 | |||||||||
Securitized Asset-Backed Receivables LLC Trust (07-NC2-A2B) |
| |||||||||||
2.42% (1 mo. USD LIBOR + 0.140%) (2) | 01/25/37 | 18,246,484 | 13,544,460 | |||||||||
Sequoia Mortgage Trust (03-8-A1) |
| |||||||||||
2.92% (1 mo. USD LIBOR + 0.640%) (2) | 01/20/34 | 744,684 | 737,538 | |||||||||
SG Mortgage Securities Trust (07-NC1-A2) |
| |||||||||||
2.52% (1 mo. USD LIBOR + 0.240%) (1)(2) | 12/25/36 | 21,266,399 | 14,876,952 | |||||||||
Soundview Home Equity Loan Trust (06-OPT4-2A4) |
| |||||||||||
2.51% (1 mo. USD LIBOR + 0.230%) (2) | 06/25/36 | 10,400,000 | 9,952,463 | |||||||||
Soundview Home Equity Loan Trust (07-OPT3-2A4) |
| |||||||||||
2.53% (1 mo. USD LIBOR + 0.250%) (2) | 08/25/37 | 4,000,000 | 3,763,228 | |||||||||
Specialty Underwriting & Residential Finance (06-AB3-A2B) |
| |||||||||||
2.43% (1 mo. USD LIBOR + 0.150%) (2) | 09/25/37 | 20,088 | 12,380 | |||||||||
Structured Adjustable Rate Mortgage Loan Trust (04-12-2A) |
| |||||||||||
4.25% (3) | 09/25/34 | 2,099,329 | 2,080,059 | |||||||||
Structured Adjustable Rate Mortgage Loan Trust (04-14-2A) |
| |||||||||||
4.36% (3) | 10/25/34 | 3,300,829 | 3,366,172 | |||||||||
Structured Adjustable Rate Mortgage Loan Trust (05-16XS-A2A) |
| |||||||||||
3.23% (1 mo. USD LIBOR + 0.950%) (2) | 08/25/35 | 3,552,755 | 3,573,006 | |||||||||
| Issues | Maturity Date | Principal Amount | Value | |||||||||
| RESIDENTIAL MORTGAGE-BACKED SECURITIES — NON-AGENCY (Continued) | ||||||||||||
Structured Adjustable Rate Mortgage Loan Trust (06-2-5A1) |
| |||||||||||
4.10% (3) | 03/25/36 | $ | 511,894 | $ | 466,255 | |||||||
Structured Adjustable Rate Mortgage Loan Trust (06-4-5A1) |
| |||||||||||
4.01% (3) | 05/25/36 | 2,081,382 | 1,883,348 | |||||||||
Structured Adjustable Rate Mortgage Loan Trust (06-5-1A1) |
| |||||||||||
4.12% (3) | 06/25/36 | 4,469,155 | 4,404,913 | |||||||||
Structured Adjustable Rate Mortgage Loan Trust (07-1-1A1) |
| |||||||||||
3.87% (3) | 02/25/37 | 2,489,269 | 2,005,968 | |||||||||
Structured Asset Securities Corp. (05-2XS-1A5B) |
| |||||||||||
5.15% | 02/25/35 | 114,446 | 114,082 | |||||||||
Structured Asset Securities Corp. (06-EQ1A-A4) |
| |||||||||||
2.43% (1 mo. USD LIBOR + 0.150%) (1)(2) | 07/25/36 | 2,520,518 | 2,525,162 | |||||||||
Structured Asset Securities Corp. (06-WF2-A4) |
| |||||||||||
2.59% (1 mo. USD LIBOR + 0.310%) (2) | 07/25/36 | 3,511,835 | 3,521,883 | |||||||||
Suntrust Adjustable Rate Mortgage Loan Trust (07-2-2A1) |
| |||||||||||
3.82% (3) | 04/25/37 | 201,070 | 166,416 | |||||||||
Suntrust Adjustable Rate Mortgage Loan Trust (07-3-1A1) |
| |||||||||||
4.22% (3) | 06/25/37 | 6,774 | 6,331 | |||||||||
Suntrust Adjustable Rate Mortgage Loan Trust (07-S1-2A1) |
| |||||||||||
4.33% (3) | 01/25/37 | 733,643 | 739,960 | |||||||||
Towd Point Mortgage Trust (17-4-A1) |
| |||||||||||
2.75% (1)(3) | 06/25/57 | 20,496,646 | 19,917,851 | |||||||||
Wachovia Mortgage Loan Trust LLC (06-AMN1-A3) |
| |||||||||||
2.52% (1 mo. USD LIBOR + 0.240%) (2) | 08/25/36 | 8,570,295 | 5,176,944 | |||||||||
WaMu Mortgage Pass-Through Certificates (04-AR14-A1) |
| |||||||||||
3.51% (3) | 01/25/35 | 6,553,094 | 6,737,709 | |||||||||
WaMu Mortgage Pass-Through Certificates (05-AR13-A1A1) |
| |||||||||||
2.57% (1 mo. USD LIBOR + 0.290%) (2) | 10/25/45 | 7,965,752 | 7,954,300 | |||||||||
WaMu Mortgage Pass-Through Certificates |
| |||||||||||
3.40% (12 mo. Monthly Treasury Average Index + 1.450%) (2) | 10/25/45 | 641,937 | 660,274 | |||||||||
WaMu Mortgage Pass-Through Certificates (05-AR14-2A1) |
| |||||||||||
3.82% (3) | 12/25/35 | 1,358,338 | 1,322,682 | |||||||||
See accompanying notes to financial statements.
75
Table of Contents
TCW Total Return Bond Fund
Schedule of Investments (Continued)
| Issues | Maturity Date | Principal Amount | Value | |||||||||
| RESIDENTIAL MORTGAGE-BACKED SECURITIES — NON-AGENCY (Continued) | ||||||||||||
WaMu Mortgage Pass-Through Certificates (05-AR18-1A1) |
| |||||||||||
3.52% (3) | 01/25/36 | $ | 2,424,909 | $ | 2,381,990 | |||||||
WaMu Mortgage Pass-Through Certificates (05-AR2-2A1A) |
| |||||||||||
2.59% (1 mo. USD LIBOR + 0.310%) (2) | 01/25/45 | 248,873 | 250,254 | |||||||||
WaMu Mortgage Pass-Through Certificates (05-AR9-A1A) |
| |||||||||||
2.92% (1 mo. USD LIBOR + 0.640%) (2) | 07/25/45 | 5,688,169 | 5,738,491 | |||||||||
WaMu Mortgage Pass-Through Certificates (06-AR1-2A1A) |
| |||||||||||
3.02% (12 mo. Monthly Treasury Average Index + 1.070%) (2) | 01/25/46 | 17,685,401 | 18,427,668 | |||||||||
WaMu Mortgage Pass-Through Certificates (06-AR11-1A) |
| |||||||||||
2.91% (12 mo. Monthly Treasury Average Index + 0.960%) (2) | 09/25/46 | 4,665,479 | 4,308,476 | |||||||||
WaMu Mortgage Pass-Through Certificates (06-AR17-1A1A) |
| |||||||||||
2.65% (12 mo. Monthly Treasury Average Index + 0.810%) (2) | 12/25/46 | 5,388,837 | 5,297,433 | |||||||||
Washington Mutual Alternative Mortgage Pass-Through Certificates (02-AR1-1A1) |
| |||||||||||
3.60% (3) | 11/25/30 | 112,946 | 114,656 | |||||||||
Washington Mutual Alternative Mortgage Pass-Through Certificates (06-1-3A2) |
| |||||||||||
5.75% | 02/25/36 | 1,082,774 | 1,023,714 | |||||||||
Washington Mutual Alternative Mortgage Pass-Through Certificates (06-5-1A1) |
| |||||||||||
2.88% (1 mo. USD LIBOR + 0.600%) (2) | 07/25/36 | 2,319,017 | 1,704,871 | |||||||||
Washington Mutual Alternative Mortgage Pass-Through Certificates (06-AR10-A2A) |
| |||||||||||
2.45% (1 mo. USD LIBOR + 0.170%) (2) | 12/25/36 | 4,105,048 | 3,704,919 | |||||||||
Washington Mutual Alternative Mortgage Pass-Through Certificates (07-OA3-5A) |
| |||||||||||
2.27% (11th District Cost of Funds + 1.250%) (2) | 04/25/47 | 1,765,727 | 1,595,272 | |||||||||
Washington Mutual Alternative Mortgage Pass-Through Certificates (07-OC2-A3) |
| |||||||||||
2.59% (1 mo. USD LIBOR + 0.310%) (2) | 06/25/37 | 5,107,390 | 4,691,058 | |||||||||
Washington Mutual Asset-Backed Certificates (06-HE1-2A4) |
| |||||||||||
2.56% (1 mo. USD LIBOR + 0.280%) (2) | 04/25/36 | 10,740,233 | 10,409,640 | |||||||||
| Issues | Maturity Date | Principal Amount | Value | |||||||||
| RESIDENTIAL MORTGAGE-BACKED SECURITIES — NON-AGENCY (Continued) | ||||||||||||
Wells Fargo Home Equity Asset-Backed Securities (06-3-A2) |
| |||||||||||
2.43% (1 mo. USD LIBOR + 0.150%) (2) | 01/25/37 | $ | 6,473,350 | $ | 6,437,744 | |||||||
Wells Fargo Home Equity Asset-Backed Securities (07-1-A3) |
| |||||||||||
2.60% (1 mo. USD LIBOR + 0.320%) (2) | 03/25/37 | 5,521,000 | 4,524,574 | |||||||||
Wells Fargo Mortgage-Backed Securities Trust (04-DD-2A6) |
| |||||||||||
3.82% (3) | 01/25/35 | 1,820,100 | 1,889,508 | |||||||||
Wells Fargo Mortgage-Backed Securities Trust (06-AR11-A6) |
| |||||||||||
4.52% (3) | 08/25/36 | 3,683,896 | 3,725,668 | |||||||||
Wells Fargo Mortgage-Backed Securities Trust (06-AR6-4A1) |
| |||||||||||
4.40% (3) | 03/25/36 | 2,724,810 | 2,748,788 | |||||||||
Wells Fargo Mortgage-Backed Securities Trust (06-AR7-2A4) |
| |||||||||||
4.32% (3) | 05/25/36 | 1,674,411 | 1,702,108 | |||||||||
Wells Fargo Mortgage-Backed Securities Trust (07-10-1A32) |
| |||||||||||
6.00% | 07/25/37 | 3,309,995 | 3,293,461 | |||||||||
Wells Fargo Mortgage-Backed Securities Trust (07-AR4-A1) |
| |||||||||||
4.57% (3) | 08/25/37 | 275,803 | 273,171 | |||||||||
Wells Fargo Mortgage-Backed Securities Trust (08-1-4A1) |
| |||||||||||
5.75% | 02/25/38 | 1,299,215 | 1,364,337 | |||||||||
|
| |||||||||||
Total Residential Mortgage-backed Securities — Non-agency |
| |||||||||||
(Cost: $943,375,631) |
| 1,192,685,604 | ||||||||||
|
| |||||||||||
| U.S. GOVERNMENT AGENCY OBLIGATION — 0.3% (Cost: $18,170,166) | ||||||||||||
Federal Home Loan Banks 4.35%, due 09/28/38 |
| 18,210,000 | 18,071,240 | |||||||||
|
| |||||||||||
| U.S. TREASURY SECURITIES — 21.7% | ||||||||||||
U.S. Treasury Bond |
| |||||||||||
3.00% | 08/15/48 | 551,696,000 | 510,232,598 | |||||||||
U.S. Treasury Note |
| |||||||||||
2.75% | 07/31/23 | 159,833,000 | 158,190,964 | |||||||||
2.88% | 09/30/23 | 120,325,000 | 119,718,185 | |||||||||
2.88% | 10/31/23 | 431,206,000 | 429,032,157 | |||||||||
2.88% | 08/15/28 | 245,042,000 | 239,272,802 | |||||||||
|
| |||||||||||
Total U.S. Treasury Securities |
| |||||||||||
(Cost: $1,474,612,132) |
| 1,456,446,706 | ||||||||||
|
| |||||||||||
Total Fixed Income Securities |
| |||||||||||
(Cost: $6,555,064,653) |
| 6,606,698,730 | ||||||||||
|
| |||||||||||
See accompanying notes to financial statements.
76
Table of Contents
TCW Total Return Bond Fund
October 31, 2018 |
| Issues | Maturity Date | Shares | Value | |||||||||
MONEY MARKET INVESTMENTS — 0.1% |
| |||||||||||
State Street Institutional U.S. Government Money Market Fund — Premier Class, |
| |||||||||||
2.09% (8) | 9,109,170 | $ | 9,109,170 | |||||||||
|
| |||||||||||
Total Money Market Investments |
| |||||||||||
(Cost: $9,109,170) |
| 9,109,170 | ||||||||||
|
| |||||||||||
| Principal Amount | ||||||||||||
SHORT TERM INVESTMENTS — 4.8% |
| |||||||||||
| Foreign Government Bonds — 1.0% | ||||||||||||
Japan Treasury Bill |
| |||||||||||
0.00% (4) | 01/09/19 | JPY 3,930,000,000 | 34,844,166 | |||||||||
0.00% (4) | 01/28/19 | JPY 3,815,000,000 | 33,830,131 | |||||||||
|
| |||||||||||
Total Foreign Government Bonds |
| |||||||||||
(Cost: $68,555,687) |
| 68,674,297 | ||||||||||
|
| |||||||||||
| Issues | Maturity Date | Principal Amount | Value | |||||||||
| U.S. Treasury Securities — 3.2% | ||||||||||||
U.S. Treasury Bill |
| |||||||||||
2.12% (9)(10) | 12/13/18 | $ | 6,419,000 | $ | 6,402,974 | |||||||
2.22% (9) | 01/10/19 | 20,000,000 | 19,913,812 | |||||||||
2.30% (9) | 01/31/19 | 30,000,000 | 29,826,910 | |||||||||
2.41% (9) | 04/04/19 | 163,000,000 | 161,349,195 | |||||||||
|
| |||||||||||
Total U.S. Treasury Securities |
| |||||||||||
(Cost: $217,503,782) |
| 217,492,891 | ||||||||||
|
| |||||||||||
DISCOUNT NOTE — 0.6% (Cost: $37,916,627) |
| |||||||||||
Federal Home Loan Bank |
| |||||||||||
0.00% (4)(9) | 12/07/18 | 38,000,000 | 37,916,755 | |||||||||
|
| |||||||||||
Total Short Term Investments |
| |||||||||||
(Cost: $323,976,096) |
| 324,083,943 | ||||||||||
|
| |||||||||||
Total Investments (103.4%) |
| |||||||||||
(Cost: $6,888,149,919) |
| 6,939,891,843 | ||||||||||
Liabilities in Excess of Other Assets (-3.4%) |
| (230,483,184 | ) | |||||||||
|
| |||||||||||
Net Assets (100.0%) |
| $ | 6,709,408,659 | |||||||||
|
| |||||||||||
| Futures Contracts | ||||||||||||||||||
| Number of Contracts | Type | Expiration Date | Notional Contract Value | Market Value | Net Unrealized (Depreciation) | |||||||||||||
BUY | ||||||||||||||||||
| 3,730 | 5-Year U.S. Treasury Note Futures | 12/31/18 | $ | 422,850,814 | $ | 419,187,892 | $ | (3,662,922 | ) | |||||||||
| 1,121 | 10-Year U.S. Treasury Note Futures | 12/19/18 | 134,408,525 | 132,768,438 | (1,640,087 | ) | ||||||||||||
| 3,463 | 2-Year U.S. Treasury Note Futures | 12/31/18 | 731,770,250 | 729,502,594 | (2,267,656 | ) | ||||||||||||
|
|
|
|
|
| |||||||||||||
| $ | 1,289,029,589 | $ | 1,281,458,924 | $ | (7,570,665 | ) | ||||||||||||
|
|
|
|
|
| |||||||||||||
| Forward Currency Contracts | ||||||||||||||||||||||||
| Counterparty | Contracts to Deliver | Units of Currency | Settlement Date | In Exchange for U.S. Dollars | Contracts at Value | Unrealized Appreciation (Depreciation) | ||||||||||||||||||
SELL (11) | ||||||||||||||||||||||||
Goldman Sachs & Co. | JPY | 3,930,000,000 | 01/09/19 | $ | 34,920,451 | $ | 35,036,829 | $ | (116,378 | ) | ||||||||||||||
Goldman Sachs & Co. | JPY | 3,815,000,000 | 01/28/19 | 34,215,247 | 34,063,527 | 151,720 | ||||||||||||||||||
|
|
|
|
|
| |||||||||||||||||||
| $ | 69,135,698 | $ | 69,100,356 | $ | 35,342 | |||||||||||||||||||
|
|
|
|
|
| |||||||||||||||||||
See accompanying notes to financial statements.
77
Table of Contents
TCW Total Return Bond Fund
Schedule of Investments (Continued)
Notes to Schedule of Investments:
| JPY - | Japanese Yen. |
| ABS - | Asset-Backed Securities. |
| ACES - | Alternative Credit Enhancement Securities. |
| ARM - | Adjustable Rate Mortgage. |
| I/F - | Inverse Floating rate security whose interest rate moves in the opposite direction of prevailing interest rates. |
| I/O - | Interest Only Security. |
| PAC - | Planned Amortization Class. |
| P/O - | Principal Only Security. |
| TAC - | Target Amortization Class. |
| TBA - | To be Announced. |
| (1) | Security exempt from registration under Rule 144A of the Securities Act of 1933, as amended. These securities may be resold, normally only to qualified institutional buyers. At October 31, 2018, the value of these securities amounted to $330,770,794 or 4.9% of net assets. These securities are determined to be liquid by the Advisor, unless otherwise noted, under procedures established by and under the general supervision of the Company’s Board of Directors. |
| (2) | Floating or variable rate security. The interest shown reflects the rate in effect at October 31, 2018. |
| (3) | Variable rate security. Interest rate disclosed is as of the most recent information available. Certain variable rate securities are not based on a published reference rate and spread but are determined by the issuer or agent and are based on current market conditions. These securities do not indicate a reference rate and spread in their description above. |
| (4) | Security is not accruing interest. |
| (5) | Security purchased on a forward commitment with an approximate principal amount. The actual principal amount and maturity date will be determined upon settlement when the security is delivered. |
| (6) | A portion of the principal balance has been written-off during the period due to defaults in the underlying loans. Cost basis has been adjusted. |
| (7) | For fair value measurement disclosure purposes, security is categorized as Level 3. |
| (8) | Rate disclosed is the 7-day net yield as of October 31, 2018. |
| (9) | Rate shown represents yield-to-maturity. |
| (10) | All or a portion of this security is held as collateral for open futures contracts. |
| (11) | Fund sells foreign currency, buys U.S. Dollar. |
See accompanying notes to financial statements.
78
Table of Contents
TCW Total Return Bond Fund
Investments by Industry | October 31, 2018 |
| Industry | Percentage of Net Assets | |||
Asset-Backed Securities | 1.7 | % | ||
Commercial Mortgage-Backed Securities — Agency | 1.8 | |||
Commercial Mortgage-Backed Securities — Non-Agency | 0.5 | |||
Residential Mortgage-Backed Securities — Agency | 54.7 | |||
Residential Mortgage-Backed Securities — Non-Agency | 17.8 | |||
Short Term Investments | 4.8 | |||
U.S. Government Agency Obligations | 0.3 | |||
U.S. Treasury Securities | 21.7 | |||
Money Market Investments | 0.1 | |||
|
| |||
Total | 103.4 | % | ||
|
| |||
Fair Valuation Summary
The following is a summary of the fair valuations according to the inputs used as of October 31, 2018 in valuing the Fund’s investments:
Description | Quoted Prices in Active Markets for Identical Assets (Level 1) | Other Significant Observable Inputs (Level 2) | Significant Unobservable Inputs (Level 3) | Total | ||||||||||||
Fixed Income Securities | ||||||||||||||||
Asset-Backed Securities | $ | — | $ | 116,265,773 | $ | — | $ | 116,265,773 | ||||||||
Commercial Mortgage-Backed Securities — Agency | — | 119,602,265 | — | 119,602,265 | ||||||||||||
Commercial Mortgage-Backed Securities — Non-Agency | — | 32,296,167 | — | 32,296,167 | ||||||||||||
Residential Mortgage-Backed Securities — Agency | — | 3,671,330,975 | — | 3,671,330,975 | ||||||||||||
Residential Mortgage-Backed Securities — Non-Agency | — | 1,187,075,446 | 5,610,158 | 1,192,685,604 | ||||||||||||
U.S. Government Agency Obligations | — | 18,071,240 | — | 18,071,240 | ||||||||||||
U.S. Treasury Securities | 1,456,446,706 | — | — | 1,456,446,706 | ||||||||||||
|
|
|
|
|
|
|
| |||||||||
Total Fixed Income Securities | 1,456,446,706 | 5,144,641,866 | 5,610,158 | 6,606,698,730 | ||||||||||||
|
|
|
|
|
|
|
| |||||||||
Money Market Investments | 9,109,170 | — | — | 9,109,170 | ||||||||||||
Short-Term Investments | 217,492,891 | 106,591,052 | — | 324,083,943 | ||||||||||||
|
|
|
|
|
|
|
| |||||||||
Total Investments | 1,683,048,767 | 5,251,232,918 | 5,610,158 | 6,939,891,843 | ||||||||||||
|
|
|
|
|
|
|
| |||||||||
Asset Derivatives | ||||||||||||||||
Forward Currency Contracts | ||||||||||||||||
Foreign Currency Risk | — | 151,720 | — | 151,720 | ||||||||||||
|
|
|
|
|
|
|
| |||||||||
Total Investments | $ | 1,683,048,767 | $ | 5,251,384,638 | $ | 5,610,158 | $ | 6,940,043,563 | ||||||||
|
|
|
|
|
|
|
| |||||||||
Liability Derivatives | ||||||||||||||||
Futures | ||||||||||||||||
Interest Rate Risk | $ | (7,570,665 | ) | $ | — | $ | — | $ | (7,570,665 | ) | ||||||
Forward Currency Contracts | ||||||||||||||||
Foreign Currency Risk | — | (116,378 | ) | — | (116,378 | ) | ||||||||||
|
|
|
|
|
|
|
| |||||||||
Total | $ | (7,570,665 | ) | $ | (116,378 | ) | $ | — | $ | (7,687,043 | ) | |||||
|
|
|
|
|
|
|
| |||||||||
See accompanying notes to financial statements.
79
Table of Contents
TCW Funds, Inc.
October 31, 2018 |
| TCW Core Fixed Income Fund | TCW Enhanced Commodity Strategy Fund (1) | TCW Global Bond Fund | ||||||||||
| Dollar Amounts in Thousands (Except per Share Amounts) | ||||||||||||
ASSETS | ||||||||||||
Investments, at Value (2) | $ | 1,302,485 | $ | 1,639 | $ | 15,803 | ||||||
Investment in Affiliated Issuers, at Value | — | — | 356 | (3) | ||||||||
Foreign Currency, at Value | — | — | 10 | (4) | ||||||||
Cash | — | — | 2 | |||||||||
Receivable for Securities Sold | 7,836 | — | (5) | — | ||||||||
Receivable for Sale of When-Issued Securities | 12,904 | — | 25 | |||||||||
Receivable for Fund Shares Sold | 483 | — | — | |||||||||
Interest Receivable | 6,761 | 3 | 143 | |||||||||
Dividends Receivable from Affiliate | — | — | 1 | |||||||||
Receivable from Investment Advisor | 54 | 15 | 15 | |||||||||
Unrealized Appreciation on Open Forward Foreign Currency Contracts | 28 | — | 4 | |||||||||
Cash Collateral Held for Brokers | — | 230 | — | |||||||||
Prepaid Expenses | 5 | — | 4 | |||||||||
|
|
|
|
|
| |||||||
Total Assets | 1,330,556 | 1,887 | 16,363 | |||||||||
|
|
|
|
|
| |||||||
LIABILITIES | ||||||||||||
Distributions Payable | 2,805 | — | — | |||||||||
Payable for Securities Purchased | 7,550 | — | 97 | |||||||||
Payable for Purchase of When-Issued Securities | 66,744 | — | 199 | |||||||||
Payable for Fund Shares Redeemed | 5,880 | — | — | |||||||||
Accrued Directors’ Fees and Expenses | 11 | 11 | 11 | |||||||||
Accrued Management Fees | 458 | 1 | 8 | |||||||||
Accrued Distribution Fees | 63 | — | (5) | 2 | ||||||||
Interest Payable on Swap Agreements | — | 2 | — | |||||||||
Payable for Variation Margin on Open Futures Contracts to Broker | 361 | — | 12 | |||||||||
Open Swap Agreements, at Value | — | 56 | — | |||||||||
Unrealized Depreciation on Open Forward Foreign Currency Contracts | 21 | — | 12 | |||||||||
Other Accrued Expenses | 445 | 102 | 41 | |||||||||
|
|
|
|
|
| |||||||
Total Liabilities | 84,338 | 172 | 382 | |||||||||
|
|
|
|
|
| |||||||
NET ASSETS | $ | 1,246,218 | $ | 1,715 | $ | 15,981 | ||||||
|
|
|
|
|
| |||||||
NET ASSETS CONSIST OF: | ||||||||||||
Paid-in Capital | $ | 1,320,919 | $ | 1,720 | $ | 16,739 | ||||||
Accumulated Earnings (Loss) | (74,701 | ) | (5 | ) | (758 | ) | ||||||
|
|
|
|
|
| |||||||
NET ASSETS | $ | 1,246,218 | $ | 1,715 | $ | 15,981 | ||||||
|
|
|
|
|
| |||||||
NET ASSETS ATTRIBUTABLE TO: | ||||||||||||
I Class Share | $ | 975,741 | $ | 1,208 | $ | 8,505 | ||||||
|
|
|
|
|
| |||||||
N Class Share | $ | 270,477 | $ | 507 | $ | 7,476 | ||||||
|
|
|
|
|
| |||||||
CAPITAL SHARES OUTSTANDING: (6) | ||||||||||||
I Class Share | 92,774,988 | 241,199 | 900,479 | |||||||||
|
|
|
|
|
| |||||||
N Class Share | 25,785,106 | 101,312 | 791,519 | |||||||||
|
|
|
|
|
| |||||||
NET ASSET VALUE PER SHARE: (7) |
| |||||||||||
I Class Share | $ | 10.52 | $ | 5.01 | $ | 9.45 | ||||||
|
|
|
|
|
| |||||||
N Class Share | $ | 10.49 | $ | 5.01 | $ | 9.45 | ||||||
|
|
|
|
|
| |||||||
| (1) | Consolidated Statement of Asset and Liabilities (See Note 2). |
| (2) | The identified cost for the TCW Core Fixed Income Fund, the TCW Enhanced Commodity Strategy Fund and the TCW Global Bond Fund at October 31, 2018 was $1,324,647, $1,614 and $16,357, respectively. |
| (3) | The identified cost for investments in affiliated issuers of the TCW Global Bond Fund was $368. |
| (4) | The identified cost for the TCW Global Bond Fund at October 31, 2018 was $10. |
| (5) | Amount rounds to less than $1. |
| (6) | The number of authorized shares, with a par value of $0.001 per share is 4,000,000,000 for each of the I Class and N Class shares. |
| (7) | Represents offering price and redemption price per share. |
See accompanying notes to financial statements.
80
Table of Contents
TCW Funds, Inc.
Statements of Assets and Liabilities | October 31, 2018 |
| TCW High Yield Bond Fund | TCW Short Term Bond Fund | TCW Total Return Bond Fund | ||||||||||
| Dollar Amounts in Thousands (Except per Share Amounts) | ||||||||||||
ASSETS |
| |||||||||||
Investments, at Value (1) | $ | 12,554 | $ | 7,320 | $ | 6,939,892 | ||||||
Receivable for Securities Sold | 217 | — | 23,576 | |||||||||
Receivable for Sale of When-Issued Securities | — | — | 9,978 | |||||||||
Receivable for Fund Shares Sold | 53 | — | 6,321 | |||||||||
Interest Receivable | 159 | 31 | 20,331 | |||||||||
Receivable from Investment Advisor | 16 | 14 | 794 | |||||||||
Unrealized Appreciation on Open Forward Foreign Currency Contracts | — | — | 152 | |||||||||
Cash Collateral Held for Brokers | — | — | 334 | |||||||||
Prepaid Expenses | 12 | 10 | 22 | |||||||||
|
|
|
|
|
| |||||||
Total Assets | 13,011 | 7,375 | 7,001,400 | |||||||||
|
|
|
|
|
| |||||||
LIABILITIES |
| |||||||||||
Distributions Payable | 51 | 15 | 21,010 | |||||||||
Payable for Securities Purchased | 96 | 30 | 21,933 | |||||||||
Payable for Purchase of When-Issued Securities | — | — | 230,426 | |||||||||
Payable for Fund Shares Redeemed | 5 | 5 | 11,088 | |||||||||
Accrued Directors’ Fees and Expenses | 11 | 11 | 11 | |||||||||
Accrued Management Fees | 5 | 2 | 3,086 | |||||||||
Accrued Distribution Fees | 1 | — | 260 | |||||||||
Interest Payable on Swap Agreements | — | (2) | — | — | ||||||||
Payable for Variation Margin on Open Futures Contracts to Broker | 3 | 1 | 1,634 | |||||||||
Open Swap Agreements, at Value | 1 | — | — | |||||||||
Unrealized Depreciation on Open Forward Foreign Currency Contracts | — | — | 116 | |||||||||
Other Accrued Expenses | 48 | 31 | 2,427 | |||||||||
|
|
|
|
|
| |||||||
Total Liabilities | 221 | 95 | 291,991 | |||||||||
|
|
|
|
|
| |||||||
NET ASSETS | $ | 12,790 | $ | 7,280 | $ | 6,709,409 | ||||||
|
|
|
|
|
| |||||||
NET ASSETS CONSIST OF: |
| |||||||||||
Paid-in Capital | $ | 13,813 | $ | 7,750 | $ | 6,973,330 | ||||||
Accumulated Earnings (Loss) | (1,023 | ) | (470 | ) | (263,921 | ) | ||||||
|
|
|
|
|
| |||||||
NET ASSETS | $ | 12,790 | $ | 7,280 | $ | 6,709,409 | ||||||
|
|
|
|
|
| |||||||
NET ASSETS ATTRIBUTABLE TO: |
| |||||||||||
I Class Share | $ | 7,749 | $ | 7,280 | $ | 5,587,668 | ||||||
|
|
|
|
|
| |||||||
N Class Share | $ | 5,041 | $ | — | $ | 1,121,741 | ||||||
|
|
|
|
|
| |||||||
CAPITAL SHARES OUTSTANDING: (3) |
| |||||||||||
I Class Share | 1,259,640 | 852,668 | 590,351,267 | |||||||||
|
|
|
|
|
| |||||||
N Class Share | 814,030 | — | 114,981,300 | |||||||||
|
|
|
|
|
| |||||||
NET ASSET VALUE PER SHARE: (4) |
| |||||||||||
I Class Share | $ | 6.15 | $ | 8.54 | $ | 9.46 | ||||||
|
|
|
|
|
| |||||||
N Class Share | $ | 6.19 | $ | — | $ | 9.76 | ||||||
|
|
|
|
|
| |||||||
| (1) | The identified cost for the TCW High Yield Bond Fund, the TCW Short Term Bond Fund and the TCW Total Return Bond Fund at October 31, 2018 was $12,974, $7,315 and $6,888,150, respectively. |
| (2) | Amount rounds to less than $1. |
| (3) | The number of authorized shares, with a par value of $0.001 per share is 4,000,000,000 for each of the I Class and N Class shares. |
| (4) | Represents offering price and redemption price per share. |
See accompanying notes to financial statements.
81
Table of Contents
TCW Funds, Inc.
Year Ended October 31, 2018 |
| TCW Core Fixed Income Fund | TCW Enhanced Commodity Strategy Fund (1) | TCW Global Bond Fund | ||||||||||
| Dollar Amounts in Thousands | ||||||||||||
INVESTMENT INCOME |
| |||||||||||
Income: |
| |||||||||||
Dividends from Investment in Affiliated Issuers | $ | — | $ | — | $ | 4 | ||||||
Interest | 43,910 | 46 | 486 | (2) | ||||||||
|
|
|
|
|
| |||||||
Total | 43,910 | 46 | 490 | |||||||||
|
|
|
|
|
| |||||||
Expenses: |
| |||||||||||
Management Fees | 6,193 | 10 | 90 | |||||||||
Accounting Services Fees | 172 | 26 | 3 | |||||||||
Administration Fees | 102 | 20 | 2 | |||||||||
Transfer Agent Fees: |
| |||||||||||
I Class | 894 | 11 | 6 | |||||||||
N Class | 341 | 8 | 7 | |||||||||
Custodian Fees | 42 | 6 | 32 | |||||||||
Professional Fees | 106 | 64 | 39 | |||||||||
Directors’ Fees and Expenses | 44 | 44 | 44 | |||||||||
Registration Fees: |
| |||||||||||
I Class | 32 | — | (3) | 18 | ||||||||
N Class | 26 | — | (3) | 18 | ||||||||
Distribution Fees: |
| |||||||||||
N Class | 784 | 1 | 19 | |||||||||
Shareholder Reporting Expense | 9 | 2 | 2 | |||||||||
Other | 136 | 6 | 10 | |||||||||
|
|
|
|
|
| |||||||
Total | 8,881 | 198 | 290 | |||||||||
|
|
|
|
|
| |||||||
Less Expenses Borne by Investment Advisor: | ||||||||||||
I Class | 299 | 124 | 55 | |||||||||
N Class | 264 | 62 | 71 | |||||||||
|
|
|
|
|
| |||||||
Net Expenses | 8,318 | 12 | 164 | |||||||||
|
|
|
|
|
| |||||||
Net Investment Income | 35,592 | 34 | 326 | |||||||||
|
|
|
|
|
| |||||||
NET REALIZED AND UNREALIZED GAIN (LOSS) ON INVESTMENTS |
| |||||||||||
Net Realized Gain (Loss) on: |
| |||||||||||
Investments | (28,672 | ) | (1 | ) | (222 | ) | ||||||
Foreign Currency | 2,654 | — | (23 | ) | ||||||||
Foreign Currency Forward | ||||||||||||
Contracts | (1,578 | ) | — | (81 | ) | |||||||
Futures Contracts | (4,605 | ) | — | (53 | ) | |||||||
Swap Agreements | — | (15 | ) | — | ||||||||
Change in Unrealized (Depreciation) on: |
| |||||||||||
Investments | (32,091 | ) | (9 | ) | (284 | ) | ||||||
Investments in Affiliated Issuers | — | — | (12 | ) | ||||||||
Foreign Currency | — | — | (1 | ) | ||||||||
Foreign Currency Forward | ||||||||||||
Contracts | (1,407 | ) | — | (1 | ) | |||||||
Futures contracts | (334 | ) | — | (61 | ) | |||||||
Swap Agreements | — | (69 | ) | — | ||||||||
|
|
|
|
|
| |||||||
Net Realized and Unrealized Gain (Loss) on Investments and Foreign | (66,033 | ) | (94 | ) | (738 | ) | ||||||
|
|
|
|
|
| |||||||
DECREASE IN NET ASSETS RESULTING FROM OPERATIONS | $ | (30,441 | ) | $ | (60 | ) | $ | (412 | ) | |||
|
|
|
|
|
| |||||||
| (1) | Consolidated Statement of Operations (See Note 2). |
| (2) | Net of foreign taxes withheld of $2 for the TCW Global Bond Fund. |
| (3) | Amount rounds to less than $1. |
See accompanying notes to financial statements.
82
Table of Contents
TCW Funds, Inc.
Statements of Operations | Year Ended October 31, 2018 |
| TCW High Yield Bond Fund | TCW Short Term Bond Fund | TCW Total Return Bond Fund | ||||||||||
| Dollar Amounts in Thousands | ||||||||||||
INVESTMENT INCOME |
| |||||||||||
Income: |
| |||||||||||
Interest | $ | 801 | $ | 165 | $ | 293,844 | ||||||
|
|
|
|
|
| |||||||
Total | 801 | 165 | 293,844 | |||||||||
|
|
|
|
|
| |||||||
Expenses: |
| |||||||||||
Management Fees | 77 | 27 | 39,872 | |||||||||
Accounting Services Fees | 26 | 1 | 838 | |||||||||
Administration Fees | 2 | — | (1) | 493 | ||||||||
Transfer Agent Fees: |
| |||||||||||
I Class | 14 | 11 | 5,984 | |||||||||
N Class | 13 | — | 1,386 | |||||||||
Custodian Fees | 12 | 10 | 75 | |||||||||
Professional Fees | 36 | 56 | 348 | |||||||||
Directors’ Fees and Expenses | 44 | 44 | 44 | |||||||||
Registration Fees: |
| |||||||||||
I Class | 18 | 21 | 60 | |||||||||
N Class | 18 | — | 45 | |||||||||
Distribution Fees: |
| |||||||||||
N Class | 15 | — | 3,493 | |||||||||
Shareholder Reporting Expense | 3 | — | (1) | 23 | ||||||||
Other | 6 | 6 | 783 | |||||||||
|
|
|
|
|
| |||||||
Total | 284 | 176 | 53,444 | |||||||||
|
|
|
|
|
| |||||||
Less Expenses Borne by Investment Advisor: | ||||||||||||
I Class | 105 | 142 | 8,854 | |||||||||
N Class | 70 | — | 1,324 | |||||||||
|
|
|
|
|
| |||||||
Net Expenses | 109 | 34 | 43,266 | |||||||||
|
|
|
|
|
| |||||||
Net Investment Income | 692 | 131 | 250,578 | |||||||||
|
|
|
|
|
| |||||||
NET REALIZED AND UNREALIZED GAIN (LOSS) ON INVESTMENTS |
| |||||||||||
Net Realized Gain (Loss) on: |
| |||||||||||
Investments | 48 | (25 | ) | (159,733 | ) | |||||||
Foreign Currency | 1 | — | (1,568 | ) | ||||||||
Foreign Currency Forward | ||||||||||||
Contracts | (10 | ) | — | 1,876 | ||||||||
Futures Contracts | (1 | ) | 2 | (40,029 | ) | |||||||
Swap Agreements | (4 | ) | — | — | ||||||||
Change in Unrealized Appreciation (Depreciation) on: |
| |||||||||||
Investments | (518 | ) | (12 | ) | (188,781 | ) | ||||||
Foreign Currency Forward | ||||||||||||
Contracts | (2 | ) | — | (8,034 | ) | |||||||
Futures contracts | (1 | ) | (5 | ) | 3,716 | |||||||
Swap Agreements | 4 | — | — | |||||||||
|
|
|
|
|
| |||||||
Net Realized and Unrealized Gain (Loss) on Investments and Foreign Currency Transactions | (483 | ) | (40 | ) | (392,553 | ) | ||||||
|
|
|
|
|
| |||||||
INCREASE (DECREASE) IN NET ASSETS RESULTING FROM OPERATIONS | $ | 209 | $ | 91 | $ | (141,975 | ) | |||||
|
|
|
|
|
| |||||||
| (1) | Amount rounds to less than $1. |
See accompanying notes to financial statements.
83
Table of Contents
TCW Funds, Inc.
Statements of Changes in Net Assets
| TCW Core Fixed Income Fund | TCW Enhanced Commodity Strategy Fund (1) | |||||||||||||||
| Year Ended October 31, 2018 | Year Ended October 31, 2017 | Year Ended October 31, 2018 | Year Ended October 31, 2017 | |||||||||||||
| Dollar Amounts in Thousands | ||||||||||||||||
OPERATIONS | ||||||||||||||||
Net Investment Income | $ | 35,592 | $ | 33,163 | $ | 34 | $ | 27 | ||||||||
Net Realized Loss on Investments, Futures Contracts, Swap Contracts and Foreign Currency Transactions | (32,201 | ) | (16,204 | ) | (16 | ) | (9 | ) | ||||||||
Change in Unrealized Appreciation (Depreciation) on Investments, Futures Contracts, Swap Contracts and Foreign Currency Transactions | (33,832 | ) | (8,308 | ) | (78 | ) | 35 | |||||||||
|
|
|
|
|
|
|
| |||||||||
Increase (Decrease) in Net Assets Resulting from Operations | (30,441 | ) | 8,651 | (60 | ) | 53 | ||||||||||
|
|
|
|
|
|
|
| |||||||||
DISTRIBUTIONS TO SHAREHOLDERS (2) |
| |||||||||||||||
Distributions to Shareholders | (36,700 | ) | (55,097 | ) | (32 | ) | (40 | ) | ||||||||
|
|
|
|
|
|
|
| |||||||||
NET CAPITAL SHARE TRANSACTIONS |
| |||||||||||||||
I Class | (349,830 | ) | (8,123 | ) | 522 | 24 | ||||||||||
N Class | (72,937 | ) | (117,795 | ) | 10 | 17 | ||||||||||
|
|
|
|
|
|
|
| |||||||||
Increase (Decrease) in Net Assets Resulting from Net Capital Shares Transactions | (422,767 | ) | (125,918 | ) | 532 | 41 | ||||||||||
|
|
|
|
|
|
|
| |||||||||
Increase (Decrease) in Net Assets | (489,908 | ) | (172,364 | ) | 440 | 54 | ||||||||||
NET ASSETS |
| |||||||||||||||
Beginning of Year | 1,736,126 | 1,908,490 | 1,275 | 1,221 | ||||||||||||
|
|
|
|
|
|
|
| |||||||||
End of Year | $ | 1,246,218 | $ | 1,736,126 | $ | 1,715 | $ | 1,275 | ||||||||
|
|
|
|
|
|
|
| |||||||||
| (1) | Consolidated Statement of Changes in Net Assets (See Note 2). |
| (2) | For the year ended October 31, 2017, the TCW Core Fixed Income Fund distributed to shareholders $28,052 and $14,647 for the I Class and N Class shares, respectively, from net investment income and $7,220 and $5,178 for the I Class and N Class shares, respectively, from net realized gains; the TCW Enhanced Commodity Strategy Fund distributed to shareholders $16 and $11 for the I Class and N Class shares, respectively, from net investment income and $8 and $5 for the I Class and N Class shares, respectively, from net realized gains. The Securities Exchange Commission eliminated the requirement to disclose distributions to shareholders from each component in 2018. See Note 13. |
See accompanying notes to financial statements.
84
Table of Contents
TCW Funds, Inc.
Statements of Changes in Net Assets
| TCW Global Bond Fund | TCW High Yield Bond Fund | |||||||||||||||
| Year Ended October 31, 2018 | Year Ended October 31, 2017 | Year Ended October 31, 2018 | Year Ended October 31, 2017 | |||||||||||||
| Dollar Amounts in Thousands | ||||||||||||||||
OPERATIONS | ||||||||||||||||
Net Investment Income | $ | 326 | $ | 282 | $ | 692 | $ | 929 | ||||||||
Net Realized Gain (Loss) on Investments, Futures Contracts, Swap Contracts and Foreign Currency Transactions | (379 | ) | (15 | ) | 34 | 761 | ||||||||||
Change in Unrealized Depreciation on Investments, Investments in Affiliated Issuers, Futures Contracts, Swap Contracts and Foreign Currency Transactions | (359 | ) | (82 | ) | (517 | ) | (69 | ) | ||||||||
|
|
|
|
|
|
|
| |||||||||
Increase (Decrease) in Net Assets Resulting from Operations | (412 | ) | 185 | 209 | 1,621 | |||||||||||
|
|
|
|
|
|
|
| |||||||||
DISTRIBUTIONS TO SHAREHOLDERS (1) | ||||||||||||||||
Distributions to Shareholders | (109 | ) | (380 | ) | (799 | ) | (1,065 | ) | ||||||||
|
|
|
|
|
|
|
| |||||||||
NET CAPITAL SHARE TRANSACTIONS | ||||||||||||||||
I Class | 67 | 170 | (6,067 | ) | (6,449 | ) | ||||||||||
N Class | 42 | 184 | (1,682 | ) | (769 | ) | ||||||||||
|
|
|
|
|
|
|
| |||||||||
Increase (Decrease) in Net Assets Resulting from Net Capital Shares Transactions | 109 | 354 | (7,749 | ) | (7,218 | ) | ||||||||||
|
|
|
|
|
|
|
| |||||||||
Increase (Decrease) in Net Assets | (412 | ) | 159 | (8,339 | ) | (6,662 | ) | |||||||||
NET ASSETS | ||||||||||||||||
Beginning of Year | 16,393 | 16,234 | 21,129 | 27,791 | ||||||||||||
|
|
|
|
|
|
|
| |||||||||
End of Year | $ | 15,981 | $ | 16,393 | $ | 12,790 | $ | 21,129 | ||||||||
|
|
|
|
|
|
|
| |||||||||
| (1) | For the year ended October 31, 2017, the TCW Global Bond Fund distributed to shareholders $144 and $127 for the I Class and N Class shares, respectively, from net investment income and $58 and $51 for the I Class and N Class shares, respectively, from net realized gains; the TCW High Yield Bond Fund distributed to shareholders $726 and $339 for the I Class and N Class shares, respectively, from net investment income. The Securities Exchange Commission eliminated the requirement to disclose distributions to shareholders from each component in 2018. See Note 13. |
See accompanying notes to financial statements.
85
Table of Contents
TCW Funds, Inc.
Statements of Changes in Net Assets
| TCW Short Term Bond Fund | TCW Total Return Bond Fund | |||||||||||||||
| Year Ended October 31, 2018 | Year Ended October 31, 2017 | Year Ended October 31, 2018 | Year Ended October 31, 2017 | |||||||||||||
| Dollar Amounts in Thousands | ||||||||||||||||
OPERATIONS |
| |||||||||||||||
Net Investment Income | $ | 131 | $ | 83 | $ | 250,578 | $ | 250,522 | ||||||||
Net Realized Loss on Investments, Futures Contracts and Foreign Currency Transactions | (23 | ) | (5 | ) | (199,454 | ) | (170,461 | ) | ||||||||
Change in Unrealized Depreciation on Investments and Futures Contracts | (17 | ) | (12 | ) | (193,099 | ) | (53,295 | ) | ||||||||
|
|
|
|
|
|
|
| |||||||||
Increase (Decrease) in Net Assets Resulting from Operations | 91 | 66 | (141,975 | ) | 26,766 | |||||||||||
|
|
|
|
|
|
|
| |||||||||
DISTRIBUTIONS TO SHAREHOLDERS (1) |
| |||||||||||||||
Distributions to Shareholders | (167 | ) | (143 | ) | (275,920 | ) | (386,592 | ) | ||||||||
|
|
|
|
|
|
|
| |||||||||
NET CAPITAL SHARE TRANSACTIONS |
| |||||||||||||||
I Class | (595 | ) | 330 | (1,172,213 | ) | (671,642 | ) | |||||||||
N Class | — | — | (706,623 | ) | (767,389 | ) | ||||||||||
|
|
|
|
|
|
|
| |||||||||
Increase (Decrease) in Net Assets Resulting from Net Capital Shares Transactions | (595 | ) | 330 | (1,878,836 | ) | (1,439,031 | ) | |||||||||
|
|
|
|
|
|
|
| |||||||||
Increase (Decrease) in Net Assets | (671 | ) | 253 | (2,296,731 | ) | (1,798,857 | ) | |||||||||
NET ASSETS |
| |||||||||||||||
Beginning of Year | 7,951 | 7,698 | 9,006,140 | 10,804,997 | ||||||||||||
|
|
|
|
|
|
|
| |||||||||
End of Year | $ | 7,280 | $ | 7,951 | $ | 6,709,409 | $ | 9,006,140 | ||||||||
|
|
|
|
|
|
|
| |||||||||
| (1) | For the year ended October 31, 2017, the TCW Short Term Bond Fund distributed to shareholders $143 for the I Class shares from net investment income; the TCW Total Return Bond Fund distributed to shareholders $183,998 and $50,442 for the I Class and N Class shares, respectively, from net investment income, and $114,017 and $38,135 for the I Class and N Class shares, respectively, from net realized gains. The Securities Exchange Commission eliminated the requirement to disclose distributions to shareholders from each component in 2018. See Note 13. |
See accompanying notes to financial statements.
86
Table of Contents
TCW Funds, Inc.
October 31, 2018 |
Note 1 — Organization
TCW Funds, Inc., a Maryland corporation (the “Company”), is an open-end management investment company registered under the Investment Company Act of 1940, as amended, (the “1940 Act”), that currently offers 19 no-load mutual funds (each series a “Fund” and collectively the “Funds”). TCW Investment Management Company LLC (the “Advisor”) is the investment advisor to and an affiliate of the Funds and is registered under the Investment Advisers Act of 1940, as amended. Each Fund has distinct investment objectives. The following is a brief description of the investment objectives and principal investment strategies for the Funds that are covered in this report:
TCW Fund | Investment Objective | |
| Diversified Fixed Income Funds | ||
| TCW Core Fixed Income Fund | Seeks to maximize current income and achieve above average total return consistent with prudent investment management over a full market cycle by investing at least 80% of the value of its net assets in debt securities; uses a controlled risk approach and active asset allocation; monitors the duration of portfolio securities to seek to mitigate exposure to interest rate risk. | |
| TCW Enhanced Commodity Strategy Fund | Seeks total return which exceeds that of its commodity benchmark by investing in commodity linked derivative instruments backed by a portfolio of fixed income instruments. | |
| TCW Global Bond Fund | Seeks total return by investing at least 80% of its net assets in debt securities of government and corporate issuers; invests in securities of issuers located in at least three countries representing at least 30% of its net assets in securities of issuers located outside the United States. | |
| TCW High Yield Bond Fund | Seeks to maximize income and achieve above average total return consistent with reasonable risk over a full market cycle by investing at least 80% of the value of its net assets in high yield/below investment grade bonds, commonly known as “junk bonds”. | |
| TCW Short Term Bond Fund | Seeks to maximize current income by investing at least 80% of the value of its net assets in a diversified portfolio of debt securities of varying maturities including bonds, notes and other similar fixed income instruments issued by governmental or private sector issuers. | |
87
Table of Contents
TCW Funds, Inc.
Notes to Financial Statements (Continued)
Note 1 — Organization (Continued)
TCW Fund | Investment Objective | |
| TCW Total Return Bond Fund | Seeks to maximize current income and achieve above average total return consistent with prudent investment management over a full market cycle by investing at least 80% of the value of its net assets in debt securities; invests at least 50% of the value in securitized obligations guaranteed by the U.S. government or its agencies, instrumentalities or sponsored corporations, privately issued mortgage-backed and asset-backed securities rated at time of investment Aa3 or higher by Moody’s, AA- or higher by Standard & Poor’s or the equivalent by any other nationally recognized statistical organization, other obligations of the U.S. government or its agencies, instrumentalities or sponsored corporations, and money market instruments. | |
All Funds, except for the TCW Short Term Bond Fund, offer two classes of shares: I Class and N Class. The TCW Short Term Bond Fund offers only the I Class shares. The two classes of a Fund are substantially the same except that the N Class shares are subject to a distribution fee (see Note 6).
Note 2 — Significant Accounting Policies
The following is a summary of significant accounting policies, which are in conformity with accounting principles generally accepted in the United States of America (“GAAP”) and which are consistently followed by the Funds in the preparation of their financial statements. Each Fund is considered an investment company under the Financial Accounting Standards Board (FASB) Accounting Standards Codification (ASC) No. 946, Financial Services — Investment Companies.
Principles of Accounting: The Funds use the accrual method of accounting for financial reporting purposes.
Principles of Consolidation: The TCW Cayman Enhanced Commodity Fund, Ltd. (the “Subsidiary”), a Cayman Islands exempted company, was incorporated as a wholly owned subsidiary acting as an investment vehicle for the TCW Enhanced Commodity Strategy Fund (the “Parent”) in order to effect certain investments for the Parent consistent with the Parent’s investment objectives and policies as specified in its prospectus and statement of additional information. The accompanying financial statements are consolidated and include the accounts of the Subsidiary. The Parent may invest up to 25% of its total assets in the Subsidiary. The net assets of the Subsidiary at October 31, 2018 were $243,250 or 14.18% of the Parent’s consolidated net assets. Intercompany balances and transactions have been eliminated in consolidation.
Net Asset Value: The net asset value per share (“NAV”) of each class of a Fund is determined by dividing the Fund’s net assets attributable to each class by the number of shares issued and outstanding of that class on each day the New York Stock Exchange (“NYSE”) is open for trading.
Security Valuations: Securities listed or traded on the NYSE and other stock exchanges are valued at the latest sale price on that exchange. Securities traded on the NASDAQ stock market (“NASDAQ”) are valued
88
Table of Contents
TCW Funds, Inc.
October 31, 2018 |
Note 2 — Significant Accounting Policies (Continued)
using official closing prices as reported by NASDAQ, which may not be the last sale price. Investments in open-end mutual funds, including money market funds, are valued based on the NAV per share as reported by the investment companies. All other securities including short-term securities traded over the counter (“OTC”) for which market quotations are readily available are valued with prices furnished by independent pricing services or by broker dealers.
Securities for which market quotations are not readily available, including in circumstances under which it is determined by the Advisor that prices received are not reflective of their market values, are valued by the Advisor’s Pricing Committee in accordance with the guidelines established by the Valuation Committee of the Company’s Board of Directors (“Board”) and under the general oversight of the Board.
Fair value is defined as the price that a Fund would receive upon selling an investment in a timely transaction to an independent buyer in the principal or most advantageous market for the investment. In accordance with the authoritative guidance on fair value measurements and disclosures under GAAP, the Funds disclose investments in their financial statements in a three-tier hierarchy. This hierarchy is utilized to establish classification of fair value measurements based on inputs. Inputs that go into fair value measurement refer broadly to the assumptions that market participants would use in pricing the asset or liability, including assumptions about risk. Inputs may be observable or unobservable. Observable inputs are inputs that reflect the assumptions market participants would use in pricing the asset or liability developed based on market data obtained from sources independent of the reporting entity. Unobservable inputs are inputs that reflect the reporting entity’s own assumptions in pricing the asset or liability developed based on the best information available in the circumstances.
The three-tier hierarchy of inputs is summarized in three broad levels listed below.
| Level 1 — | quoted prices in active markets for identical investments. | |
| Level 2 — | other significant observable inputs (including quoted prices for similar investments, interest rates, prepayment speeds, credit risk, etc.). | |
| Level 3 — | significant unobservable inputs (including the Funds’ own assumptions in determining the fair value of investments). |
Changes in valuation techniques may result in transfers in or out of an investment’s assigned Level within the hierarchy. The inputs or methodologies used for valuing investments are not necessarily an indication of the risk associated with investing in those investments and the determination of the significance of a particular input to the fair value measurement in its entirety requires judgment and consideration of factors specific to each security.
The availability of observable inputs can vary from security to security and is affected by a wide variety of factors, including, for example, the type of security, whether the security is new and not yet established in the marketplace, the liquidity of markets, and other characteristics particular to the security. To the extent that valuation is based on models or inputs that are less observable or unobservable in the market, the determination of fair value requires more judgment. Accordingly, the degree of judgment exercised in determining fair value is greatest for instruments categorized in Level 3.
In periods of market dislocation, the observability of prices and inputs may be reduced for many instruments. This condition, as well as changes related to liquidity of investments, could cause a security to be reclassified between Level 1, Level 2, or Level 3.
89
Table of Contents
TCW Funds, Inc.
Notes to Financial Statements (Continued)
Note 2 — Significant Accounting Policies (Continued)
In certain cases, the inputs used to measure fair value may fall into different levels of the fair value hierarchy. In such cases, for disclosure purposes the level in the fair value hierarchy within which the fair value measurement falls in its entirety is determined based on the lowest level input that is significant to the fair value measurement.
Fair Value Measurements: Descriptions of the valuation techniques applied to the Funds’ major categories of assets and liabilities on a recurring basis are as follows:
Asset-backed securities (“ABS”) and mortgage-backed securities (“MBS”). The fair value of ABS and MBS is estimated based on pricing models that consider the estimated cash flows of each debt tranche of the issuer, establish a benchmark yield, and develop an estimated tranche specific spread to the benchmark yield based on the unique attributes of the tranche including, but not limited to, the prepayment speed assumptions and attributes of the collateral. To the extent the inputs are observable and timely, the values would be categorized in Level 2 of the fair value hierarchy; otherwise, they would be categorized in Level 3.
Bank loans. The fair value of bank loans is estimated using recently executed transactions, market price quotations, credit/market events, and cross-asset pricing. Inputs are generally observable and are obtained from independent sources. Bank loans are generally categorized in Level 2 of the fair value hierarchy.
Corporate bonds. The fair value of corporate bonds is estimated using recently executed transactions, market price quotations (where observable), bond spreads, or credit default swap spreads adjusted for any basis difference between cash and derivative instruments. Corporate bonds are generally categorized in Level 2 of the fair value hierarchy.
Credit default and total return swaps. Credit default and total return swaps are fair valued using pricing models that take into account among other factors, index spread curves, nominal values, modified duration values and cash flows. To the extent that these inputs are observable and timely, the fair values of credit default swaps would be categorized as Level 2; otherwise, the fair values would be categorized in Level 3.
Foreign currency contracts. The fair values of foreign currency contracts are derived from indices, reference rates, and other inputs or a combination of these factors. To the extent that these factors can be observed, foreign currency contracts are categorized in Level 2 of the fair value hierarchy.
Futures contracts. Futures contracts are generally valued at the settlement price established at the close of business each day by the exchange on which they are traded. As such, they are categorized in Level 1.
Government and agency securities. Government and agency securities are normally valued using a model that incorporates market observable data such as reported sales of similar securities, broker quotes, yields, bids, offers, quoted market prices, and reference data. Accordingly, government and agency securities are normally categorized in Level 1 or 2 of the fair value hierarchy depending on the liquidity and transparency of the market.
Money market funds. Money market funds are open-end mutual funds that invest in short-term debt securities. To the extent that these funds are valued based upon the reported NAV, they are categorized in Level 1 of the fair value hierarchy.
Municipal bonds. Municipal bonds are fair valued based on pricing models that take into account, among other factors, information received from market makers and broker-dealers, current trades, bid wants lists, offerings, market movements, the callability of the bond, state of issuance, benchmark yield curves, and
90
Table of Contents
TCW Funds, Inc.
October 31, 2018 |
Note 2 — Significant Accounting Policies (Continued)
bond insurance. To the extent that these inputs are observable and timely, the fair values of municipal bonds would be categorized in Level 2; otherwise, the fair values would be categorized in Level 3.
Restricted securities. Restricted securities, including illiquid Rule 144A securities, issued by non-public entities are included in Level 3 of the fair value hierarchy because they trade infrequently, and therefore, the inputs are unobservable. Any other restricted securities valued similar to publicly traded securities may be categorized in Level 2 or 3 of the fair value hierarchy depending on whether a discount is applied and significant to the fair value.
Short-term investments. Short-term investments are valued using market price quotations, and are reflected in Level 1 or Level 2 of the fair value hierarchy.
The summary of the inputs used as October 31, 2018 is listed after the Schedule of Investments for each Fund.
The Funds did not have any transfers in and out of Level 1 and Level 2 of the fair value hierarchy during the year ended October 31, 2018.
Following is a reconciliation of investments in which significant unobservable inputs (Level 3) were used in determining value:
| TCW Core Fixed Income Fund | TCW Enhanced Commodity Strategy Fund | TCW Global Bond Fund | TCW High Yield Bond Fund | TCW Total Return Bond Fund | ||||||||||||||||
Balance as of October 31, 2017 | $ | 1,229,012 | $ | 10,660 | $ | 146,477 | $ | 112,200 | $ | 6,981,408 | ||||||||||
Accrued Discounts (Premiums) | (1,514 | ) | (1,945 | ) | 7,884 | — | (1,031,159 | ) | ||||||||||||
Realized Gain (Loss) | (4,109 | ) | — | — | — | 10,899 | ||||||||||||||
Change in Unrealized Appreciation | (97,471 | ) | (854 | ) | (24,362 | ) | (64,515 | ) | (346,716 | ) | ||||||||||
Purchases | — | — | — | 70,258 | ||||||||||||||||
Sales | (89,603 | ) | — | — | — | (74,532 | ) | |||||||||||||
Transfers in to Level 3 (1) | — | — | — | — | — | |||||||||||||||
Transfers out of Level 3 (1) | — | (7,861 | ) (2) | (2,887 | ) (2) | — | — | |||||||||||||
|
|
|
|
|
|
|
|
|
| |||||||||||
Balance as of October 31, 2018 | $ | 1,036,315 | $ | — | $ | 127,112 | $ | 47,685 | $ | 5,610,158 | ||||||||||
|
|
|
|
|
|
|
|
|
| |||||||||||
Change in Unrealized Appreciation from Investments Still Held at October 31, 2018 | $ | (97,471 | ) | $ | — | $ | 25,422 | $ | (64,515 | ) | $ | (338,314 | ) | |||||||
|
|
|
|
|
|
|
|
|
| |||||||||||
| (1) | The Funds recognized transfers in and out at the beginning of the period. |
| (2) | Financial assets transferred between Level 2 and Level 3 were due to a change in observable and/or unobservable inputs. |
Significant unobservable valuations inputs for Level 3 investments as of October 31, 2018 are as follows:
Description | Fair Value at 10/31/2018 | Valuation Techniques* | Unobservable | Price or Price Range | Average Weighted Price | |||||||||
TCW Core Fixed Income Fund | ||||||||||||||
Corporate Bonds | $ 1,036,315 | Third-party Vendor | Vendor Prices | $107.502 | $107.502 | |||||||||
TCW Global Bond Fund | ||||||||||||||
Residential Mortgage-Backed Securities — Non-Agency | 127,112 | Third-party Vendor | Vendor Prices | $10.155 | $10.155 | |||||||||
TCW High Yield Bond Fund | ||||||||||||||
Equity | 47,685 | Third-party Vendor | Vendor Prices | $8.500 | $8.500 | |||||||||
91
Table of Contents
TCW Funds, Inc.
Notes to Financial Statements (Continued)
Note 2 — Significant Accounting Policies (Continued)
Description | Fair Value at 10/31/2018 | Valuation Techniques* | Unobservable | Price or Price Range | Average Weighted Price | |||||||
TCW Total Return Bond Fund | ||||||||||||
Residential Mortgage-Backed Securities — Non-Agency | 13,879 | Third-party Vendor | Vendor Prices | $20.455 | $20.455 | |||||||
Residential Mortgage-Backed Securities — Non-Agency (Interest Only, Collateral Strip Rate Securities) | 5,596,279 | Third-party Vendor | Vendor Prices | $0.774–2.567 | $1.760 | |||||||
| * | The valuation technique employed on the Level 3 securities involves the use of the vendor prices. The Advisor monitors the effectiveness of vendor pricing using the Advisor’s own model and inputs. |
Security Transactions and Related Investment Income: Security transactions are recorded as of the trade date. Dividend income is recorded on the ex-dividend date. Interest income is recognized on an accrual basis. Realized gains and losses on investments are recorded on the basis of specific identification.
Foreign Currency Translation: The books and records of each Fund are maintained in U.S. dollars as follows: (1) the foreign currency denominated securities and other assets and liabilities stated in foreign currencies are translated using the daily spot rate; and (2) purchases, sales, income and expenses are translated at the rate of exchange prevailing on the respective dates of such transactions. The resultant exchange gains and losses are included in net realized or net unrealized gain (loss) in the Statements of Operations. Pursuant to U.S. federal income tax regulations, certain foreign exchange gains and losses included in realized and unrealized gains and losses are included in, or are a reduction of, ordinary income for federal income tax purposes.
Foreign Taxes: The Funds may be subject to withholding taxes on income and capital gains imposed by certain countries in which they invest. The withholding tax on income is netted against the income accrued or received. Any reclaimable taxes are recorded as income. The withholding tax on realized or unrealized gain is recorded as a liability.
Derivative Instruments: Derivatives are financial instruments whose values are based on the values of one or more indicators, such as a security, asset, currency, interest rate, or index. Derivative transactions can create investment leverage and may be highly volatile. A derivative contract may result in a mark to market loss if the value of the contract decreases due to an unfavorable change in the market rates or values of the underlying instrument. It is possible that a derivative transaction will result in a loss greater than the principal amount invested. The Funds may not be able to close out a derivative transaction at a favorable time or price.
92
Table of Contents
TCW Funds, Inc.
October 31, 2018 |
Note 2 — Significant Accounting Policies (Continued)
For the year ended October 31, 2018 , the following Funds had derivatives and transactions in derivatives, grouped in the following risk categories (amounts in thousands except notional amounts or number of contracts):
| TCW Core Fixed Income Fund | Foreign Currency Risk | Interest Rate Risk | Total | |||||||||
Statement of Asset and Liabilities | ||||||||||||
Asset Derivatives | ||||||||||||
Statement of Asset and Liabilities | ||||||||||||
Forward Contracts | $ | 28 | $ | — | $ | 28 | ||||||
|
|
|
|
|
| |||||||
Total Value | $ | 28 | $ | — | $ | 28 | ||||||
|
|
|
|
|
| |||||||
Liability Derivatives | ||||||||||||
Forward Contracts | $ | (21 | ) | $ | — | $ | (21 | ) | ||||
Futures Contracts (1) | — | (1,572 | ) | (1,572 | ) | |||||||
|
|
|
|
|
| |||||||
Total Value | $ | (21 | ) | $ | (1,572 | ) | $ | (1,593 | ) | |||
|
|
|
|
|
| |||||||
Statement of Operations: | ||||||||||||
Realized Gain (Loss) | ||||||||||||
Forward Contracts | $ | (1,578 | ) | $ | — | $ | (1,578 | ) | ||||
Futures Contracts | — | (4,605 | ) | (4,605 | ) | |||||||
|
|
|
|
|
| |||||||
Total Realized Loss | $ | (1,578 | ) | $ | (4,605 | ) | $ | (6,183 | ) | |||
|
|
|
|
|
| |||||||
Change in (Depreciation) | ||||||||||||
Forward Contracts | $ | (1,407 | ) | $ | — | $ | (1,407 | ) | ||||
Futures Contracts | — | (334 | ) | (334 | ) | |||||||
|
|
|
|
|
| |||||||
Total Change in Appreciation (Depreciation) | $ | (1,407 | ) | $ | (334 | ) | $ | (1,741 | ) | |||
|
|
|
|
|
| |||||||
Number of Contracts or Notional Amounts (2) | ||||||||||||
Forward Currency Contracts | $43,602,049 | $ — | $43,602,049 | |||||||||
Futures Contracts | — | 1,557 | 1,557 | |||||||||
| TCW Enhanced Commodity Strategy Fund | Commodity Risk | Total | ||||||
Statement of Asset and Liabilities | ||||||||
Liability Derivatives | ||||||||
Swaps Contracts | $ | (56 | ) | $ | (56 | ) | ||
|
|
|
| |||||
Total Value | $ | (56 | ) | $ | (56 | ) | ||
|
|
|
| |||||
Statement of Operations: | ||||||||
Realized Gain (Loss) | ||||||||
Swaps Contracts | $ | (15 | ) | $ | (15 | ) | ||
|
|
|
| |||||
Total Realized Gain (Loss) | $ | (15 | ) | $ | (15 | ) | ||
|
|
|
| |||||
Change in Appreciation (Depreciation) | ||||||||
Swaps Contracts | $ | (69 | ) | $ | (69 | ) | ||
|
|
|
| |||||
Total Realized Gain (Loss) | $ | (69 | ) | $ | (69 | ) | ||
|
|
|
| |||||
Notional Amounts (2) | ||||||||
Swaps Contracts | $1,702,086 | $1,702,086 | ||||||
93
Table of Contents
TCW Funds, Inc.
Notes to Financial Statements (Continued)
Note 2 — Significant Accounting Policies (Continued)
| TCW Global Bond Fund | Foreign Currency Risk | Interest Rate Risk | Total | |||||||||
Statement of Asset and Liabilities | ||||||||||||
Asset Derivatives | ||||||||||||
Forward Contracts | $ | 4 | $ | — | $ | 4 | ||||||
|
|
|
|
|
| |||||||
Total Value | $ | 4 | $ | — | $ | 4 | ||||||
|
|
|
|
|
| |||||||
Liability Derivatives | ||||||||||||
Forward Contracts | $ | (12 | ) | $ | — | $ | (12 | ) | ||||
Futures Contracts (1) | — | (61 | ) | (61 | ) | |||||||
|
|
|
|
|
| |||||||
Total Value | $ | (12 | ) | $ | (61 | ) | $ | (73 | ) | |||
|
|
|
|
|
| |||||||
Statement of Operations: | ||||||||||||
Realized Gain (Loss) | ||||||||||||
Forward Contracts | $ | (81 | ) | $ | — | $ | (81 | ) | ||||
Futures Contracts | — | (53 | ) | (53 | ) | |||||||
|
|
|
|
|
| |||||||
Total Realized Gain (Loss) | $ | (81 | ) | $ | (53 | ) | $ | (134 | ) | |||
|
|
|
|
|
| |||||||
Change in Appreciation (Depreciation) | ||||||||||||
Forward Contracts | $ | (1 | ) | $ | — | $ | (1 | ) | ||||
Futures Contracts | — | (61 | ) | (61 | ) | |||||||
|
|
|
|
|
| |||||||
Total Change in Appreciation (Depreciation) | $ | (1 | ) | $ | (61 | ) | $ | (62 | ) | |||
|
|
|
|
|
| |||||||
Number of Contracts or Notional Amounts (2) | ||||||||||||
Forward Currency Contracts | $1,623,085 | $ — | $1,623,085 | |||||||||
Futures Contracts | — | 26 | 26 | |||||||||
| TCW High Yield Bond Fund | Credit Risk | Foreign Currency Risk | Interest Rate Risk | Total | ||||||||||||
Statement of Asset and Liabilities: | ||||||||||||||||
Asset Derivatives | ||||||||||||||||
Futures Contracts | $ | — | $ | — | $ | 4 | $ | 4 | ||||||||
|
|
|
|
|
|
|
| |||||||||
Total Value | $ | — | $ | — | $ | 4 | $ | 4 | ||||||||
|
|
|
|
|
|
|
| |||||||||
Liability Derivatives | ||||||||||||||||
Swaps Contracts | $ | (1 | ) | $ | — | $ | — | $ | (1 | ) | ||||||
Futures Contracts (1) | — | — | (5 | ) | (5 | ) | ||||||||||
|
|
|
|
|
|
|
| |||||||||
Total Value | $ | (1 | ) | $ | — | $ | (5 | ) | $ | (6 | ) | |||||
|
|
|
|
|
|
|
| |||||||||
Statement of Operations: | ||||||||||||||||
Realized Gain (Loss) | ||||||||||||||||
Forward Contracts | $ | — | $ | (10 | ) | $ | — | $ | (10 | ) | ||||||
Futures Contracts | — | — | (1 | ) | (1 | ) | ||||||||||
Swaps Contracts | (4 | ) | — | — | (4 | ) | ||||||||||
|
|
|
|
|
|
|
| |||||||||
Total Realized Gain (Loss) | $ | (4 | ) | $ | (10 | ) | $ | (1 | ) | $ | (15 | ) | ||||
|
|
|
|
|
|
|
| |||||||||
Change in Appreciation (Depreciation) | ||||||||||||||||
Forward Contracts | $ | — | $ | (2 | ) | $ | — | $ | (2 | ) | ||||||
Futures Contracts | — | — | (1 | ) | (1 | ) | ||||||||||
Swaps Contracts | 4 | — | — | 4 | ||||||||||||
|
|
|
|
|
|
|
| |||||||||
Total Change in Appreciation (Depreciation) | $ | 4 | $ | (2 | ) | $ | (1 | ) | $ | 1 | ||||||
|
|
|
|
|
|
|
| |||||||||
Number of Contracts or Notional Amounts (2) | ||||||||||||||||
Forward Currency Contracts | $ — | $299,726 | $ — | $299,726 | ||||||||||||
Futures Contracts | — | — | 26 | 26 | ||||||||||||
Swaps Contracts | $250,000 | $ — | $ — | $250,000 | ||||||||||||
94
Table of Contents
TCW Funds, Inc.
October 31, 2018 |
Note 2 — Significant Accounting Policies (Continued)
| TCW Short Term Bond Fund | Interest Rate Risk | Total | ||||||
Statement of Asset and Liabilities: |
| |||||||
Liability Derivatives |
| |||||||
Futures Contracts (1) | $ | (5 | ) | $ | (5 | ) | ||
|
|
|
| |||||
Total Value | $ | (5 | ) | $ | (5 | ) | ||
|
|
|
| |||||
Statement of Operations: |
| |||||||
Realized Gain (Loss) |
| |||||||
Futures Contracts | $ | 2 | $ | 2 | ||||
|
|
|
| |||||
Total Realized Gain (Loss) | $ | 2 | $ | 2 | ||||
|
|
|
| |||||
Change in Appreciation (Depreciation) |
| |||||||
Futures Contracts | $ | (5 | ) | $ | (5 | ) | ||
|
|
|
| |||||
Total Change in Appreciation (Depreciation) | $ | (5 | ) | $ | (5 | ) | ||
|
|
|
| |||||
Number of Contracts (2) |
| |||||||
Futures Contracts | 8 | 8 | ||||||
| TCW Total Return Bond Fund | Foreign Currency Risk | Interest Rate Risk | Total | |||||||||
Statement of Asset and Liabilities: | ||||||||||||
Asset Derivatives | ||||||||||||
Forward Contracts | $ | 152 | $ | — | $ | 152 | ||||||
|
|
|
|
|
| |||||||
Total Value | $ | 152 | $ | — | $ | 152 | ||||||
|
|
|
|
|
| |||||||
Liability Derivatives | ||||||||||||
Forward Contracts | $ | (116 | ) | $ | — | $ | (116 | ) | ||||
Futures Contracts (1) | — | (7,571 | ) | (7,571 | ) | |||||||
|
|
|
|
|
| |||||||
Total Value | $ | (116 | ) | $ | (7,571 | ) | $ | (7,687 | ) | |||
|
|
|
|
|
| |||||||
Statement of Operations: | ||||||||||||
Realized Gain (Loss) | ||||||||||||
Forward Contracts | $ | 1,876 | $ | — | $ | 1,876 | ||||||
Futures Contracts | — | (40,029 | ) | (40,029 | ) | |||||||
|
|
|
|
|
| |||||||
Total Realized Gain (Loss) | $ | 1,876 | $ | (40,029 | ) | $ | (38,153 | ) | ||||
|
|
|
|
|
| |||||||
Change in Appreciation (Depreciation) | ||||||||||||
Forward Contracts | $ | (8,034 | ) | $ | — | $ | (8,034 | ) | ||||
Futures Contracts | — | 3,716 | 3,716 | |||||||||
|
|
|
|
|
| |||||||
Total Change in Appreciation (Depreciation) | $ | (8,034 | ) | $ | 3,716 | $ | (4,318 | ) | ||||
|
|
|
|
|
| |||||||
Number of Contracts or Notional Amounts (2) | ||||||||||||
Forward Currency Contracts | $216,969,529 | $ — | $216,969,529 | |||||||||
Futures Contracts | — | 9,004 | 9,004 | |||||||||
| (1) | Includes cumulative appreciation (depreciation) of futures contracts as reported in the Schedule of Investments. Only variation margin on October 31, 2018 is reported within the Statement of Assets and Liabilities. |
| (2) | Amount disclosed represents average number of contracts or notional amounts, which are representative of the volume traded for the year ended October 31, 2018. |
Counterparty Credit Risk: Derivative contracts may be exposed to counterparty risk. Losses can occur if the counterparty does not perform under the contract.
The Funds’ risk of loss from counterparty credit risk on OTC derivatives is generally limited to the aggregate unrealized gain netted against any collateral held by the Funds.
95
Table of Contents
TCW Funds, Inc.
Notes to Financial Statements (Continued)
Note 2 — Significant Accounting Policies (Continued)
With exchange traded futures and centrally cleared swaps, there is less counterparty credit risk to the Funds since the exchange or clearinghouse, as counterparty to such instruments, guarantees against a possible default. The clearinghouse stands between the buyer and the seller of the contract; therefore, the credit risk is limited to failure of the clearinghouse. While offset rights may exist under applicable law, the Funds do not have a contractual right of offset against a clearing broker or clearinghouse in the event of a default (including the bankruptcy or insolvency) of the clearing broker or clearinghouse. Additionally, credit risk exists in exchange traded futures and centrally cleared swaps with respect to initial and variation margin that is held in a clearing broker’s customer accounts. While clearing brokers are required to segregate customer margin from their own assets, in the event that a clearing broker becomes insolvent or goes into bankruptcy and at that time there is a shortfall in the aggregate amount of margin held by the clearing broker for all its clients, typically the shortfall would be allocated on a pro rata basis across all the clearing broker’s customers, potentially resulting in losses to the Funds.
For OTC derivatives, the Funds entered into an International Swaps and Derivatives Association, Inc. Master Agreement (“ISDA Master Agreement”) with each counterparty. An ISDA Master Agreement is a bilateral agreement between the Funds and a counterparty that governs OTC derivatives and typically contains, among other things, collateral posting terms and netting provisions in the event of a default and/or termination event. Under an ISDA Master Agreement, the Funds may, under certain circumstances, offset with the counterparty certain derivative financial instruments’ payables and/or receivables with collateral held and/or posted and create one single net payment. The provisions of the ISDA Master Agreement typically permit a single net payment in the event of default including the bankruptcy or insolvency of the counterparty. However, bankruptcy or insolvency laws of a particular jurisdiction may impose restrictions on or prohibitions against the right of offset in bankruptcy, insolvency or other events. In addition, certain ISDA Master Agreements allow counterparties to OTC derivatives to terminate derivative contracts prior to maturity in the event a Fund’s net assets declines by a stated percentage or a Fund fails to meet the terms of its ISDA Master Agreements, which would cause the Fund to accelerate payment of any net liability owed to the counterparty.
Collateral requirements: For derivatives traded under an ISDA Master Agreement, the collateral requirements are typically calculated by netting the mark to market amount for each transaction under such agreement and comparing that amount to the value of any collateral pledged or received by a Fund.
Cash collateral that has been pledged to cover obligations of a Fund is reported separately on the Statement of Assets and Liabilities. Non-cash collateral pledged by a Fund, if any, is noted in the Schedule of Investments. Generally, the amount of collateral due from or to a party has to exceed a minimum transfer amount threshold, typically $250,000 or $500,000, before a transfer is required, which is determined at the close of each business day and the collateral is transferred on the next business day. To the extent amounts due to a Fund from its counterparties are not fully collateralized, contractually or otherwise, the Fund bears the risk of loss from counterparty non-performance. The Funds attempt to mitigate counterparty risk by entering into agreements only with counterparties that the Advisor believes have the financial resources to honor their obligations and by monitoring the financial stability of those counterparties. For financial reporting purposes, the Funds do not offset derivative assets and derivative liabilities that are subject to netting arrangements in the Statement of Assets and Liabilities. The Funds have implemented the disclosure requirements pursuant to FASB ASU No. 2013-01, Disclosures about Offsetting Assets and Liabilities that requires disclosures to make financial statements that are prepared under GAAP more comparable to those prepared under International Financial Reporting Standards.
96
Table of Contents
TCW Funds, Inc.
October 31, 2018 |
Note 2 — Significant Accounting Policies (Continued)
The following table presents the Funds’ OTC derivatives assets and liabilities by counterparty net of amounts available for offset under an ISDA Master Agreement and net of the related collateral received by the Funds as of October 31, 2018 (in thousands):
TCW Core Fixed Income Fund
Counterparty | Gross Assets Subject to Master Agreements | Gross Liabilities Subject to Master Agreements | Net Assets (Liabilities) Subject to Master Agreements | Collateral Pledged (Received) | Net Amount (1) | |||||||||||||||
Goldman Sachs & Co. | $ | 28 | $ | (21 | ) | $ | 7 | $ | — | $ | 7 | |||||||||
|
|
|
|
|
|
|
|
|
| |||||||||||
Total | $ | 28 | $ | (21 | ) | $ | 7 | $ | — | $ | 7 | |||||||||
|
|
|
|
|
|
|
|
|
| |||||||||||
| (1) | Represents the net amount receivable (payable) from (to) the counterparty in the event of default. |
TCW Enhanced Commodity Strategy Fund
Counterparty | Gross Assets Subject to Master Agreements | Gross Liabilities Subject to Master Agreements | Net Assets (Liabilities) Subject to Master Agreements | Collateral Pledged (Received) | Net Amount (1) | |||||||||||||||
Credit Suisse First Boston Corp. | $ | — | $ | (56 | ) | $ | (56 | ) | $ | 56 (2 | ) | $ | — | |||||||
|
|
|
|
|
|
|
|
|
| |||||||||||
Total | $ | — | $ | (56 | ) | $ | (56 | ) | $ | 56 (2 | ) | $ | — | |||||||
|
|
|
|
|
|
|
|
|
| |||||||||||
| (1) | Represents the net amount receivable (payable) from (to) the counterparty in the event of default. |
| (2) | Amount does not include excess collateral pledged or received. |
TCW Global Bond Fund
Counterparty | Gross Assets Subject to Master Agreements | Gross Liabilities Subject to Master Agreements | Net Assets (Liabilities) Subject to Master Agreements | Collateral Pledged (Received) | Net Amount (1) | |||||||||||||||
Bank of America | $ | — | $ | (4 | ) | $ | (4 | ) | $ | — | $ | (4 | ) | |||||||
Citibank N.A. | — | (7 | ) | (7 | ) | — | (7 | ) | ||||||||||||
Goldman Sachs & Co. | 4 | (1 | ) | 3 | — | 3 | ||||||||||||||
|
|
|
|
|
|
|
|
|
| |||||||||||
Total | $ | 4 | $ | (12 | ) | $ | (8 | ) | $ | — | $ | (8 | ) | |||||||
|
|
|
|
|
|
|
|
|
| |||||||||||
| (1) | Represents the net amount receivable (payable) from (to) the counterparty in the event of default. |
TCW High Yield Bond Fund
Counterparty | Gross Assets Subject to Master Agreements | Gross Liabilities Subject to Master Agreements | Net Assets (Liabilities) Subject to Master Agreements | Collateral Pledged (Received) | Net Amount (1) | |||||||||||||||
Goldman Sachs & Co. | $ | — | $ | (1 | ) | $ | (1 | ) | $ | — | $ | (1 | ) | |||||||
|
|
|
|
|
|
|
|
|
| |||||||||||
Total | $ | — | $ | (1 | ) | $ | (1 | ) | $ | — | $ | (1 | ) | |||||||
|
|
|
|
|
|
|
|
|
| |||||||||||
| (1) | Represents the net amount receivable (payable) from (to) the counterparty in the event of default. |
TCW Total Return Bond Fund
Counterparty | Gross Assets Subject to Master Agreements | Gross Liabilities Subject to Master Agreements | Net Assets (Liabilities) Subject to Master Agreements | Collateral Pledged (Received) | Net Amount (1) | |||||||||||||||
Goldman Sachs & Co. | $ | 152 | $ | (116 | ) | $ | 36 | $ | — | $ | 36 | |||||||||
|
|
|
|
|
|
|
|
|
| |||||||||||
Total | $ | 152 | $ | (116 | ) | $ | 36 | $ | — | $ | 36 | |||||||||
|
|
|
|
|
|
|
|
|
| |||||||||||
| (1) | Represents the net amount receivable (payable) from (to) the counterparty in the event of default. |
97
Table of Contents
TCW Funds, Inc.
Notes to Financial Statements (Continued)
Note 2 — Significant Accounting Policies (Continued)
Forward Foreign Currency Contracts: The Funds enter into forward foreign currency contracts as a hedge against fluctuations in foreign exchange rates. Forward foreign currency contracts are marked to market daily and the change in market value is recorded by the Funds as unrealized gains or losses in the Statement of Assets and Liabilities. When a contract is closed or delivery is taken, a Fund records a realized gain or loss equal to the difference between the value of the contract at the time it was opened and the value at the time it was closed. Risks may arise upon entering into these contracts from the potential inability of counterparties to meet the terms of their contracts and from unanticipated movements in the value of the foreign currency relative to the U.S. dollar. The TCW Core Fixed Income Fund, the TCW Global Bond Fund, the TCW High Yield Bond Fund and the TCW Total Return Bond Fund entered into forward foreign currency contracts during the year to hedge against the foreign currency exposure within the Funds. Outstanding foreign currency forward contracts at October 31, 2018 are disclosed in the Schedule of Investments.
Futures Contracts: The Funds may enter into futures contracts. A Fund may seek to manage a variety of different risks through the use of futures contracts, such as interest rate risk, equity price risk, and currency risk. A Fund may use index futures to hedge against broad market risks to its portfolio or to gain broad market exposure. Securities index futures contracts are contracts to buy or sell units of a securities index at a specified future date at a price agreed upon when the contract is made and are settled in cash. Positions in futures may be closed out only on an exchange or board of trade which provides a secondary market for such futures. Because futures contracts are exchange-traded, they typically have minimal exposure to counterparty risk. Parties to a futures contract are not required to post the entire notional amount of the contract, but rather a small percentage of that amount (by way of margin), both at the time they enter into futures transactions, and then on a daily basis if their positions decline in value; as a result, futures contracts are highly leveraged. Such payments are known as variation margin and are recorded by a Fund as unrealized gains or losses. Because futures markets are highly leveraged, they can be extremely volatile, and there can be no assurance that the pricing of a futures contract will correlate precisely with the pricing of the asset or index underlying it or the asset or liability of a Fund that is the subject of the hedge. It may not always be possible for a Fund to enter into a closing transaction with respect to a futures contract it has entered into at a favorable time or price. When a Fund enters into a futures transaction, it is subject to the risk that the value of the futures contract will move in a direction unfavorable to it.
When a Fund uses futures contracts for hedging purposes, it is likely that the Fund will have an asset or liability that will offset any loss (or gain) on the transactions, at least in part. When a futures contract is closed, the Fund records a realized gain or loss equal to the difference between the value of the contract at the time it was opened and the value at the time it was closed. The TCW Core Fixed Income Fund, the TCW Global Bond Fund, the TCW High Yield Bond Fund, the TCW Short Term Bond Fund and the TCW Total Return Bond Fund utilized futures during the year ended October 31, 2018 to help manage interest rate duration of those Funds. Futures contracts outstanding at October 31, 2018 are listed on the Schedule of Investments.
Swap Agreements. The Funds may enter into swap agreements. Swap agreements are typically two-party contracts entered into primarily by institutional investors. In a standard “swap” transaction, two parties agree to exchange the returns (or differentials in rates of return) earned or realized on particular predetermined investments or instruments, which may be adjusted for an interest factor. The gross returns to be exchanged or “swapped” between the parties are generally calculated with respect to a “notional
98
Table of Contents
TCW Funds, Inc.
October 31, 2018 |
Note 2 — Significant Accounting Policies (Continued)
amount” (i.e., the return on or increase in value of a particular dollar amount invested at a particular interest rate or in a “basket” of securities representing a particular index).
In a total return swap, one party typically agrees to pay to the other a short-term interest rate in return for a payment at one or more times in the future based on the increase in the value of an underlying security or other asset, or index of securities or assets; if the underlying security, asset, or index declines in value, the party that pays the short-term interest rate must also pay to its counterparty a payment based on the amount of the decline. A Fund may take either side of such a swap, and so may take a long or short position in the underlying security, asset, or index. A Fund may enter into a total return swap to hedge against an exposure in its portfolio — such as interest rate risk (including to adjust the duration or credit quality of a Fund’s bond portfolio), equity risk, or credit risk — or generally to put cash to work efficiently in the markets in anticipation of, or as a replacement for, cash investments. A Fund may also enter into a total return swap to gain exposure to securities or markets in which it might not be able to invest directly (in so called market access transactions).
Interest rate swaps are agreements in which one party pays a floating rate of interest on a notional principal amount and receives a fixed rate of interest on the same notional principal amount for a specified period of time. Alternatively, a party may pay a fixed rate and receive a floating rate. In more complex swaps, the notional principal amount may decline (or amortize) over time. A Fund’s maximum risk of loss from counterparty default is the discounted NAV of the cash flows paid to the counterparty over the interest rate swap’s remaining life.
A Fund may enter into credit default swap transactions as a “buyer” or “seller” of credit protection. In a credit default swap, one party provides what is in effect insurance against a default or other adverse credit event affecting an issuer of debt securities (typically referred to as a “reference entity”). In general, the buyer of credit protection is obligated to pay the protection seller an upfront amount or a periodic stream of payments over the term of the swap. If a “credit event” occurs, the buyer has the right to deliver to the seller bonds (or other obligations of the reference entity with a value up to the full notional value of the swap), and to receive a payment equal to the par value of the bonds or other obligations. Credit events that would trigger a request that the seller make payment are specific to each credit default swap agreement, but generally include bankruptcy, failure to pay, restructuring, obligation acceleration, obligation default, or repudiation/moratorium. When a Fund buys protection, it may or may not own securities of the reference entity. When a Fund sells protection under a credit default swap, the position may have the effect of creating leverage in the Fund’s portfolio through the Fund’s indirect long exposure to the issuer or securities on which the swap is written. When a Fund sells protection, it may do so either to earn additional income or to create such a “synthetic” long position.
Whenever a Fund enters into a swap agreement, it takes on counterparty risk — the risk that its counterparty will be unable or unwilling to meet its obligations under the swap agreement. A Fund also takes the risk that the market will move against its position in the swap agreement. In the case of a total return swap, the swap will change in value depending on the change in value of the asset or index on which the swap is written. When a Fund enters into any type of swap for hedging purposes, it is likely that the Fund will have an asset or liability that will offset any loss (or gain) on the swap, at least in part. Swap agreements may be non-transferable or otherwise highly illiquid, and a Fund may not be able to terminate or transfer a swap agreement at any particular time or at an acceptable price.
99
Table of Contents
TCW Funds, Inc.
Notes to Financial Statements (Continued)
Note 2 — Significant Accounting Policies (Continued)
During the term of a swap transaction, changes in the value of the swap are recognized as unrealized gains or losses by marking to market to reflect the market value of the swap. When the swap is terminated, a Fund will record a realized gain or loss equal to the difference, if any, between the proceeds from the closing transaction and the Fund’s basis in the agreement. Upfront swap premium payments paid or received by a Fund, if any, are recorded within the value of the open swap agreement on the Fund’s Statement of Assets and Liabilities and represent payments paid or received upon entering into the swap agreement to compensate for differences between stated terms of the swap agreement and prevailing market conditions (credit spreads, currency exchange rates, and other relevant factors). These upfront payments are recorded as realized gains or losses on each Fund’s Statement of Operations upon termination or maturity of the swap agreement.
During the term of a swap transaction, the periodic net payments can be made for a set period of time or may be triggered by a predetermined credit event. The net periodic payments may be based on a fixed or variable interest rate, the change in market value of a specified security, basket of securities or index, or the return generated by a security. These periodic payments received or made by the Funds are recorded as realized gains and losses, respectively. During the year ended October 31, 2018, the TCW High Yield Bond Fund utilized credit default swaps to manage credit market exposure; and the TCW Enhanced Commodity Strategy Fund used total return swap agreements to gain exposure to the commodity market.
Mortgage-Backed Securities: The Funds may invest in MBS which represent interests in pools of mortgages in which payments of both principal and interest on the securities are generally made monthly, in effect “passing through” monthly payments made by borrowers on the residential or commercial mortgage loans which underlie the securities (net of any fees paid to the issuer or guarantor of the securities). Mortgage pass-through securities differ from other forms of debt securities which normally provide for periodic payment of interest in fixed amounts with principal payments at maturity or specified call dates. The Funds may also invest in Collateralized Mortgage Obligations (“CMOs”). CMOs are debt obligations collateralized by residential or commercial mortgage loans or residential or commercial mortgage pass-through securities. Interest and principal are generally paid monthly. CMOs may be collateralized by whole mortgage loans or private mortgage pass-through securities but are more typically collateralized by portfolios of mortgage pass-through securities guaranteed by Ginnie Mae, Freddie Mac or Fannie Mae. The issuer of a series of CMOs may elect to be treated for tax purposes as a Real Estate Mortgage Investment Conduit. CMOs are structured into multiple classes, each bearing a different stated maturity. Monthly payment of principal received from the pool of underlying mortgages, including prepayments, is first returned to investors holding the shortest maturity class. Investors holding the longer maturity classes usually receive principal only after shorter classes have been retired. An investor may be partially protected against a sooner than desired return of principal because of the sequential payments. The Funds may invest in stripped MBS. Stripped MBS are usually structured with two classes that receive different proportions of the interest and principal distributions on a pool of mortgage assets. In certain cases, one class will receive all of the interest (the interest-only or “IO” class), while the other class will receive all of the principal (the principal-only or “PO” class). The yield to maturity on IOs is sensitive to the rate of principal repayments (including prepayments) on the related underlying mortgage assets, and principal payments may have a material effect on yield to maturity. If the underlying mortgage assets experience greater than anticipated prepayments of principal, a Fund may not fully recoup its initial investment in IOs.
100
Table of Contents
TCW Funds, Inc.
October 31, 2018 |
Note 2 — Significant Accounting Policies (Continued)
Inflation-Indexed Bonds: The Funds may invest in inflation-indexed bonds, which are fixed income securities whose principal value or coupon is periodically adjusted according to the rate of inflation. Any increase or decrease in the principal amount of an inflation-indexed bond will be included as interest income.
Inflation-indexed securities issued by the U.S. Treasury have maturities of five, ten, twenty, or thirty years, although it is possible that securities with other maturities will be issued in the future. The U.S. Treasury securities pay interest on a semi-annual basis, equal to a fixed percentage of the inflation-adjusted principal amount.
If the periodic adjustment rate measuring inflation falls, the principal value of inflation-indexed bonds will be adjusted downward, and consequently the interest payable on these securities (calculated with respect to a smaller principal amount) will be reduced. Repayment of the original bond principal upon maturity (as adjusted for inflation) is guaranteed in the case of U.S. Treasury inflation-indexed bonds, even during a period of deflation. However, the current market value of the bonds is not guaranteed, and will fluctuate. The Funds may also invest in other inflation related bonds which may or may not provide a similar guarantee. If a guarantee of principal is not provided, the adjusted principal value of the bond repaid at maturity may be less than the original principal.
The value of inflation-indexed bonds is expected to change in response to changes in real interest rates. Real interest rates in turn are tied to the relationship between nominal interest rates and the rate of inflation. Therefore, if inflation were to rise at a faster rate than nominal interest rates, real interest rates might decline, leading to an increase in value of inflation-indexed bonds. In contrast, if nominal interest rates increased at a faster rate than inflation, real interest rates might rise, leading to a decrease in value of inflation-indexed bonds.
While the values of these securities are expected to be protected from long-term inflationary trends, short term increases in inflation may lead to declines in values. If interest rates rise due to reasons other than inflation (for example, due to changes in currency exchange rates), investors in these securities may not be protected to the extent that the increase is not reflected in the bond’s inflation measure.
When-Issued, Delayed-Delivery, To be Announced (“TBA”) and Forward Commitment Transactions: The Funds may enter into when-issued, delayed-delivery, TBA or forward commitment transactions in order to lock in the purchase price of the underlying security or to adjust the interest rate exposure of the Funds’ existing portfolios. In when-issued, delayed-delivery, or forward commitment transactions, a Fund commits to purchase securities, with payment and delivery to take place at a future date. Although the Fund does not pay for the securities or start earning interest on them until they are delivered, it immediately assumes the risks of ownership, including the risk of price fluctuation. If a Fund’s counterparty fails to deliver a security purchased on a when-issued, delayed-delivery, TBA or forward commitment basis, there may be a loss, and that Fund may have missed an opportunity to make an alternative investment.
Prior to settlement of these transactions, the value of the subject securities will fluctuate with market movement. In addition, because a Fund is not required to pay for when-issued, delayed-delivery, TBA or forward commitment securities until the delivery date, they may result in a form of leverage to the extent a Fund does not set aside liquid assets to cover the commitment. To guard against the deemed leverage, the Fund monitors the obligations under these transactions and ensures that the Fund has sufficient liquid assets to cover them.
101
Table of Contents
TCW Funds, Inc.
Notes to Financial Statements (Continued)
Note 2 — Significant Accounting Policies (Continued)
Dollar Roll Transactions: The Funds may enter into dollar roll transactions with financial institutions to take advantage of opportunities in the MBS market. A dollar roll transaction involves a simultaneous sale of securities by a Fund with an agreement to repurchase substantially similar securities at an agreed upon price and date, but generally will be collateralized at time of delivery by different pools of mortgages with different prepayment histories than those securities sold. These transactions are accounted for as financing transactions as opposed to sales and purchases. The differential between the sale price and the repurchase price is recorded as deferred income and recognized between the settlement dates of the sale and repurchase. During the period between the sale and repurchase, a Fund will not be entitled to receive interest and principal payments on the securities sold. Dollar roll transactions involve risk that the market value of the security sold by a Fund may decline below the repurchase price of the security and the potential inability of counterparties to complete the transaction. There were no such transactions by the Funds for the year ended October 31, 2018.
Repurchase Agreements: The Funds may enter into repurchase agreements, under the terms of a Master Repurchase Agreement (“MRA”). In a repurchase agreement, the Funds purchase a security from a counterparty who agrees to repurchase the same security at a mutually agreed upon date and price. The MRA permits a Fund, under certain circumstances including an event of default (such as bankruptcy or insolvency), to offset payables and/or receivables under the MRA with collateral held and/or posted to the counterparty and create one single net payment due to or from the Fund. However, bankruptcy or insolvency laws of a particular jurisdiction may impose restrictions on or prohibitions against such a right of offset in the event of a MRA counterparty’s bankruptcy or insolvency. Pursuant to the terms of the MRA, each Fund receives securities as collateral with a market value in excess of the repurchase price. Upon a bankruptcy or insolvency of the MRA counterparty, a Fund recognizes a liability with respect to such excess collateral to reflect the Fund’s obligation under bankruptcy law to return the excess to the counterparty. There were no repurchase agreements outstanding as of October 31, 2018.
Reverse Repurchase Agreements: The Funds may enter into reverse repurchase agreements. Under a reverse repurchase agreement, a Fund sells portfolio assets subject to an agreement by the Fund to repurchase the same assets at an agreed upon price and date. The Funds may utilize reverse repurchase agreements when it is anticipated that the interest income to be earned from the investment of the proceeds of the transaction is greater than the interest expense of the transaction. During the term of the reverse repurchase agreement, the Funds continue to receive the principal and interest payments on the securities sold. There were no reverse repurchase agreements outstanding during the year ended October 31, 2018.
Security Lending: The Funds may lend their securities to qualified brokers. The loans must be collateralized at all times primarily with cash although the Funds can accept money market instruments or U.S. Government securities with a market value at least equal to the market value of the securities on loan. As with any extensions of credit, the Funds may bear the risk of delay in recovery or even loss of rights in the collateral if the borrowers of the securities fail financially. The Funds earn additional income for lending their securities by investing the cash collateral in short-term investments. The Funds did not lend any securities during the year ended October 31, 2018.
Allocation of Operating Activity for Multiple Classes: Investment income, common expenses and realized and unrealized gains and losses are allocated among the classes of shares of a Fund based on the relative net assets of each class. Distribution fees, which are directly attributable to a class of shares, are charged to
102
Table of Contents
TCW Funds, Inc.
October 31, 2018 |
Note 2 — Significant Accounting Policies (Continued)
the operations of that class. All other expenses are charged to each Fund or class as incurred on a specific identification basis. Differences in class specific fees and expenses will result in differences in net investment income, and in turn differences in dividends paid by each class.
Dividends and Distributions: Dividends and distributions to shareholders are recorded on the ex-dividend date. The TCW Enhanced Commodity Strategy Fund declares and pays, or reinvests, dividends from net investment income quarterly. The other Fixed Income Funds declare and pay, or reinvest, dividends from net investment income monthly. Any net long-term and net short-term capital gains earned by a Fund will be distributed at least annually.
Income and capital gain distributions are determined in accordance with income tax regulations which may differ from GAAP. These differences are primarily due to differing treatments for foreign currency transactions, market discount and premium, losses deferred due to wash sales, excise tax regulations and employing equalization in determining amounts to be distributed to Fund shareholders. Permanent book and tax basis differences relating to shareholder distributions will result in reclassifications between paid-in capital, undistributed net investment income (loss), and/or undistributed accumulated realized gain (loss). Undistributed net investment income or loss may include temporary book and tax basis differences which will reverse in subsequent periods. Any taxable income or capital gain remaining at fiscal year-end is distributed in the following year.
Use of Estimates: The preparation of the accompanying financial statements requires management to make estimates and assumptions that affect the reported amount of assets and liabilities at the date of the financial statements and the reported amounts of income and expenses during the reporting period. Actual results could differ from these estimates.
Note 3 — Risk Considerations
Market Risk: The Funds’ investments will fluctuate with market conditions, so will the value of your investment in the Funds. You could lose money on your investment in the Funds or the Funds could underperform other investments.
Liquidity Risk: The Funds’ investments in illiquid securities may reduce the returns of the Funds because they may not be able to sell the illiquid securities at an advantageous time or price. Investments in high yield securities, foreign securities, derivatives or other securities with substantial market and/or credit risk tend to have the greatest exposure to liquidity risk. Certain investments in private placements and Rule 144A securities may be considered illiquid investments. The Funds may invest in private placements and Rule 144A securities.
Interest Rate Risk: The values of the Funds’ investments fluctuate in response to movements in interest rates. If rates rise, the values of debt securities generally fall. The longer the average duration of a Fund’s investment portfolio, the greater the change in value.
Mortgage-Backed Securities Risk: Each Fund may invest in mortgage-backed securities. The values of some mortgage-backed securities may expose a Fund to a lower rate of return upon reinvestment of principal. When interest rates rise, the value of mortgage-related securities generally will decline; however, when interest rates are declining, the value of mortgage related-securities with prepayment features may not increase as much as other fixed-income securities. The rate of prepayments on underlying mortgages will affect the price and volatility of a mortgage-related security, and may shorten or extend the effective
103
Table of Contents
TCW Funds, Inc.
Notes to Financial Statements (Continued)
Note 3 — Risk Considerations (Continued)
maturity of the security beyond what was anticipated at the time of purchase. The value of these securities may fluctuate in response to the market’s perception of the creditworthiness of the issuers. Additionally, although mortgages and mortgage-related securities are generally supported by some form of government or private guarantee and/or insurance, there is no assurance that private guarantors or insurers will meet their obligations.
Derivatives Risk: Use of derivatives, which at times is an important part of the Funds’ investment strategies, involves risks different from, or possibly greater than, the risks associated with investing directly in securities and other traditional investments. Investments in derivatives could cause the Funds to lose more than the principal amount invested. Also, suitable derivative transactions may not be available in all circumstances and there can be no assurance that the Funds will achieve their objective through the use of the derivatives.
Credit Risk: The values of any of the Funds’ investments may also decline in response to events affecting the issuer or its credit rating. The lower rated debt securities in which a Fund may invest are considered speculative and are subject to greater volatility and risk of loss than investment-grade securities, particularly in deteriorating economic conditions. The value of some mortgage-related securities in which the Funds invest also may fall because of unanticipated levels of principal prepayments that can occur when interest rates decline. Certain Funds invest a material portion of their assets in securities of issuers that hold mortgage- and asset-backed securities and direct investments in securities backed by commercial and residential mortgage loans and other financial assets. The value and related income of these securities are sensitive to changes in economic conditions, including delinquencies and/or defaults. Continuing shifts in the market’s perception of credit quality on securities backed by commercial and residential mortgage loans and other financial assets may result in increased volatility of market price and periods of illiquidity that can negatively impact the valuation of certain issuers held by the Funds.
MBS and ABS are characterized and classified in a variety of different ways. These classifications include a view of the securities’ cash flow structure (pass through, sequential pay, prepayment-protected, interest only, principal-only, etc.), the security of the claim on the underlying assets (senior, mezzanine and subordinated), as well as types of underlying collateral (prime conforming loans, prime non-conforming loans, Alt-A loans, subprime loans, commercial loans, etc.). In many cases, the classification incorporates a degree of subjectivity: a particular loan might be categorized as “prime” by the underwriting standards of one mortgage issuer while another might classify the loan as “subprime.” In addition to other functions, the risk associated with an investment in a mortgage loan must take into account the nature of the collateral, the form and the level of credit enhancement, the vintage of the loan, the geography of the loan, the purpose of the loan (refinance versus purchase versus equity takeout), the borrower’s credit quality (e.g., FICO score), and whether the loan is a first trust deed or a second lien.
Counterparty Risk: The Funds may be exposed to counterparty risk, the risk that an entity with which the Funds have unsettled or open transactions may not fulfill its obligations.
Commodities Risk: The TCW Enhanced Commodity Strategy Fund has exposure to commodity markets through its investments in total return swap agreements. Therefore, the price of its shares is affected by factors particular to the commodity markets and may decline and fluctuate more than the price of shares of a fund with a broader range of investments. Commodity prices can be extremely volatile and are affected by many factors, including changes in overall market movements, real or perceived inflationary trends,
104
Table of Contents
TCW Funds, Inc.
October 31, 2018 |
Note 3 — Risk Considerations (Continued)
commodity index volatility, changes in interest rates or currency exchange rates, population growth and changing demographics, nationalization, expropriation, or other confiscation, international regulatory, political and economic developments (e.g., regime changes and changes in economic activity levels), and developments affecting a particular industry or commodity, such as drought, floods or other weather conditions, livestock disease, trade embargoes, competition from substitute products, transportation bottlenecks or shortages, fluctuations in supply and demand and tariffs.
Foreign Currency Risk: The Funds may be exposed to the risk that the value of the Funds’ investments denominated in foreign currencies will decline in value because the foreign currencies have declined in value relative to the U.S. dollar.
Foreign Investment Risk: The Funds may be exposed to the risk that the Funds’ share prices will fluctuate with market conditions, currency exchange rates and the economic and political climates in countries where the Funds invest.
For complete information on the various risks involved, please refer to the Funds’ prospectus and the Statement of Additional Information which can be obtained on the Funds’ website (www.tcw.com) or by calling the customer service.
Note 4 — Federal Income Taxes
It is the policy of each Fund to comply with the requirements under Subchapter M of the Internal Revenue Code applicable to regulated investment companies and to distribute all of its net taxable income, including any net realized gains on investments, to its shareholders. Therefore, no federal income tax provision is required.
At October 31, 2018, the components of distributable earnings on a tax basis were as follows (amounts in thousands):
| Undistributed Ordinary Income | Undistributed Long-Term Gain | Total Distributable Earnings | ||||||||||
TCW Core Fixed Income Fund | $ | 3,339 | $ | — | $ | 3,339 | ||||||
TCW Enhanced Commodity Strategy Fund | 5 | — | 5 | |||||||||
TCW High Yield Bond Fund | 80 | — | 80 | |||||||||
TCW Short Term Bond Fund | 49 | — | 49 | |||||||||
TCW Total Return Bond Fund | 49,461 | — | 49,461 | |||||||||
At the end of the previous fiscal year ended October 31, 2017, the components of distributable earnings on a tax basis were as follows (amounts in thousands):
| Undistributed Ordinary Income | Undistributed Long-Term Gain | Total Distributable Earnings | ||||||||||
TCW Core Fixed Income Fund | $ | 5,191 | $ | — | $ | 5,191 | ||||||
TCW Enhanced Commodity Strategy Fund | 2 | — | 2 | |||||||||
TCW Global Bond Fund | 65 | 17 | 82 | |||||||||
TCW High Yield Bond Fund | 139 | — | 139 | |||||||||
TCW Short Term Bond Fund | 47 | — | 47 | |||||||||
TCW Total Return Bond Fund | 66,234 | — | 66,234 | |||||||||
105
Table of Contents
TCW Funds, Inc.
Notes to Financial Statements (Continued)
Note 4 — Federal Income Taxes (Continued)
Permanent differences incurred during the year ended October 31, 2018, resulting from differences in book and tax accounting, have been reclassified at year-end between undistributed net investment income (loss), undistributed (accumulated) net realized gain (loss) and paid-in capital as follows, with no impact to the net asset value per share (amounts in thousands):
| Undistributed Net Investment Income (Loss) | Undistributed Accumulated Net Realized Gain (Loss) | Paid-in Capital | ||||||||||
TCW Core Fixed Income Fund | $ | 609 | $ | (609 | ) | $ | — | |||||
TCW Enhanced Commodity Strategy Fund | — | (1) | — | (1) | — | |||||||
TCW Global Bond Fund | (290 | ) | 292 | (2 | ) | |||||||
TCW High Yield Bond Fund | 69 | (69 | ) | — | ||||||||
TCW Short Term Bond Fund | 36 | 6,987 | (7,023 | ) | ||||||||
TCW Total Return Bond Fund | 5,566 | (5,566 | ) | — | ||||||||
| (1) | Amount rounds to less than $1. |
During the year ended October 31, 2018, the tax character of distributions paid was as follows (amounts in thousands):
| Ordinary Income | Long-Term Capital Gain | Total Distributions | ||||||||||
TCW Core Fixed Income Fund | $ | 36,700 | $ | — | $ | 36,700 | ||||||
TCW Enhanced Commodity Strategy Fund | 32 | — | 32 | |||||||||
TCW Global Bond Fund | 92 | 17 | 109 | |||||||||
TCW High Yield Bond Fund | 799 | — | 799 | |||||||||
TCW Short Term Bond Fund | 167 | — | 167 | |||||||||
TCW Total Return Bond Fund | 275,920 | — | 275,920 | |||||||||
During the previous fiscal year ended October 31, 2017, the tax character of distributions paid was as follows (amounts in thousands):
| Ordinary Income | Long-Term Capital Gain | Total Distributions | ||||||||||
TCW Core Fixed Income Fund | $ | 51,602 | $ | 3,495 | $ | 55,097 | ||||||
TCW Enhanced Commodity Strategy Fund | 28 | 12 | 40 | |||||||||
TCW Global Bond Fund | 377 | 3 | 380 | |||||||||
TCW High Yield Bond Fund | 1,065 | — | 1,065 | |||||||||
TCW Short Term Bond Fund | 143 | — | 143 | |||||||||
TCW Total Return Bond Fund | 355,061 | 31,531 | 386,592 | |||||||||
At October 31, 2018, net unrealized appreciation (depreciation) on investments for federal income tax purposes was as follows (amounts in thousands):
| Unrealized Appreciation | Unrealized (Depreciation) | Net Unrealized Appreciation (Depreciation) | Cost of Investments for Federal Income Tax Purposes | |||||||||||||
TCW Core Fixed Income Fund | $ | 8,441 | $ | (33,818 | ) | $ | (25,377 | ) | $ | 1,327,862 | ||||||
TCW Enhanced Commodity Strategy Fund | 26 | (57 | ) | (31 | ) | 1,614 | ||||||||||
TCW Global Bond Fund | 316 | (932 | ) | (616 | ) | 16,775 | ||||||||||
TCW High Yield Bond Fund | 100 | (368 | ) | (268 | ) | 12,822 | ||||||||||
TCW Short Term Bond Fund | — | (43 | ) | (43 | ) | 7,363 | ||||||||||
TCW Total Return Bond Fund | 311,546 | (230,067 | ) | 81,479 | 6,858,413 | |||||||||||
106
Table of Contents
TCW Funds, Inc.
October 31, 2018 |
Note 4 — Federal Income Taxes (Continued)
At October 31, 2018, the following Funds had net realized loss carryforwards for federal income tax purposes (amounts in thousands):
| No Expiration (2) | ||||||||||||||||
| Expiring in 2019 (1) | Short-Term Capital Losses | Long-Term Capital Losses | Total | |||||||||||||
TCW Core Fixed Income Fund | $ | — | $ | 44,342 | $ | 5,513 | $ | 49,855 | ||||||||
TCW Enhanced Commodity Strategy Fund | — | — | (3) | — | (3) | — | (3) | |||||||||
TCW Global Bond Fund | — | 103 | 36 | 139 | ||||||||||||
TCW High Yield Bond Fund | — | 279 | 504 | 783 | ||||||||||||
TCW Short Term Bond Fund | 111 | 143 | 206 | 460 | ||||||||||||
TCW Total Return Bond Fund | — | 339,535 | 34,314 | 373,849 | ||||||||||||
| (1) | Losses incurred prior to December 22, 2010. |
| (2) | Losses incurred after December 22, 2010. |
| (3) | Amount rounds to less than $1. |
The Funds did not have any unrecognized tax benefits at October 31, 2018, nor were there any increases or decreases in unrecognized tax benefits for the year ended October 31, 2018. The Funds are subject to examination by U.S. federal and state tax authorities for returns filed for the prior three and four fiscal years, respectively.
Note 5 — Fund Management Fees and Other Expenses
The Funds pay to the Advisor, as compensation for services rendered, facilities furnished and expenses borne by it, the following annual management fees as a percentage of daily NAV:
TCW Core Fixed Income Fund | 0.40 | % | ||
TCW Enhanced Commodity Strategy Fund | 0.50 | % | ||
TCW Global Bond Fund | 0.55 | % | ||
TCW High Yield Bond Fund | 0.45 | % | ||
TCW Short Term Bond Fund | 0.35 | % | ||
TCW Total Return Bond Fund | 0.50 | % |
The Advisor limits the operating expenses of the Funds not to exceed the following expense ratios relative to the Funds’ average daily net assets.
TCW Core Fixed Income Fund | ||||
I Class | 0.49 | % (1) | ||
N Class | 0.72 | % (2) | ||
TCW Enhanced Commodity Strategy Fund | ||||
I Class | 0.70 | % (1) | ||
N Class | 0.75 | % (1) | ||
TCW Global Bond Fund | ||||
I Class | 0.98 | % (2) | ||
N Class | 0.98 | % (2) | ||
TCW High Yield Bond Fund | ||||
I Class | 0.55 | % (1) | ||
N Class | 0.80 | % (1) | ||
TCW Short Term Bond Fund | ||||
I Class | 0.44 | % (1) | ||
TCW Total Return Bond Fund | ||||
I Class | 0.49 | % (1) | ||
N Class | 0.79 | % (1) |
| (1) | These limitations are based on an agreement between the Advisor and Company. |
| (2) | Limitation based on average expense ratio as reported by Lipper, Inc. which is subject to change on a monthly basis. This ratio was in effect as of October 31, 2018. This limitation is voluntary and terminable on a six months’ notice. |
107
Table of Contents
TCW Funds, Inc.
Notes to Financial Statements (Continued)
Note 5 — Fund Management Fees and Other Expenses (Continued)
The amount borne by the Advisor during the fiscal year when the operating expenses of a Fund are in excess of the expense limitation cannot be recaptured in the subsequent fiscal years should the expenses drop below the expense limitation in the subsequent years. The Advisor can recapture expenses only within a given fiscal year for that year’s operating expenses.
Directors’ Fees: Directors who are not affiliated with the Advisor receive compensation from the Funds which are shown on the Statement of Operations. Directors may elect to defer receipt of their fees in accordance with the terms of a Non-Qualified Deferred Compensation Plan. Deferred compensation is included within directors’ fees and expenses in the Statements of Assets and Liabilities.
Note 6 — Distribution Plan
TCW Funds Distributors LLC (“Distributor”), an affiliate of the Advisor and the Funds, serves as the nonexclusive distributor of each class of the Funds’ shares. The Funds have a distribution plan pursuant to Rule 12b-1 under the 1940 Act with respect to the N Class shares of each Fund. Under the terms of the plan, each Fund compensates the Distributor at a rate equal to 0.25% of the average daily net assets of the Fund attributable to its N Class shares for distribution and related services.
Note 7 — Purchases and Sales of Securities
Investment transactions (excluding short-term investments) for the year ended October 31, 2018 were as follows (amounts in thousands):
| Purchases at Cost | Sales or Maturity Proceeds | U.S. Government Purchases at Cost | U.S. Government Sales or Maturity Proceeds | |||||||||||||
TCW Core Fixed Income Fund | $ | 303,627 | $ | 368,028 | $ | 3,834,325 | $ | 4,124,979 | ||||||||
TCW Enhanced Commodity Strategy Fund | — | 124 | 339 | 185 | ||||||||||||
TCW Global Bond Fund | 10,348 | (1) | 7,464 | 5,342 | 7,883 | |||||||||||
TCW High Yield Bond Fund | 15,315 | 21,909 | — | — | ||||||||||||
TCW Short Term Bond Fund | 1,901 | 1,644 | 11,064 | 10,146 | ||||||||||||
TCW Total Return Bond Fund | 104,022 | 442,185 | 18,368,734 | 19,939,077 | ||||||||||||
| (1) | Purchases include the Fund’s purchase of a security from an affiliated investment account for a total of $1,506 (amount in thousands) in accordance with the provisions set forth in Section 17(a)-7 of the 1940 Act. |
Note 8 — Capital Share Transactions
Transactions in each Fund’s shares were as follows:
| TCW Core Fixed Income Fund | Year Ended October 31, 2018 | Year Ended October 31, 2017 | ||||||||||||||
| I Class | Shares | Amount (in thousands) | Shares | Amount (in thousands) | ||||||||||||
Shares Sold | 31,871,049 | $ | 344,924 | 52,501,918 | $ | 575,707 | ||||||||||
Shares Issued upon Reinvestment of Dividends | 2,461,509 | 26,542 | 3,503,848 | 38,366 | ||||||||||||
Shares Redeemed | (67,085,708 | ) | (721,296 | ) | (56,484,294 | ) | (622,196 | ) | ||||||||
|
|
|
|
|
|
|
| |||||||||
Net Decrease | (32,753,150 | ) | $ | (349,830 | ) | (478,528 | ) | $ | (8,123 | ) | ||||||
|
|
|
|
|
|
|
| |||||||||
| N Class | Shares | Amount (in thousands) | Shares | Amount (in thousands) | ||||||||||||
Shares Sold | 6,167,589 | $ | 66,350 | 4,750,936 | $ | 52,020 | ||||||||||
Shares Issued upon Reinvestment of Dividends | 493,732 | 5,307 | 862,922 | 9,415 | ||||||||||||
Shares Redeemed | (13,445,430 | ) | (144,594 | ) | (16,351,869 | ) | (179,230 | ) | ||||||||
|
|
|
|
|
|
|
| |||||||||
Net Decrease | (6,784,109 | ) | $ | (72,937 | ) | (10,738,011 | ) | $ | (117,795 | ) | ||||||
|
|
|
|
|
|
|
| |||||||||
108
Table of Contents
TCW Funds, Inc.
October 31, 2018 |
Note 8 — Capital Share Transactions (Continued)
| TCW Enhanced Commodity Strategy Fund | Year Ended October 31, 2018 | Year Ended October 31, 2017 | ||||||||||||||
| I Class | Shares | Amount (in thousands) | Shares | Amount (in thousands) | ||||||||||||
Shares Sold | 91,408 | $ | 500 | — | $ | — | ||||||||||
Shares Issued upon Reinvestment of Dividends | 4,198 | 22 | 4,713 | 24 | ||||||||||||
Shares Redeemed | — | — | — | — | ||||||||||||
|
|
|
|
|
|
|
| |||||||||
Net Increase | 95,606 | $ | 522 | 4,713 | $ | 24 | ||||||||||
|
|
|
|
|
|
|
| |||||||||
| N Class | Shares | Amount (in thousands) | Shares | Amount (in thousands) | ||||||||||||
Shares Sold | — | $ | — | — | $ | — | ||||||||||
Shares Issued upon Reinvestment of Dividends | 1,943 | 10 | 3,215 | 17 | ||||||||||||
Shares Redeemed | — | — | — | — | ||||||||||||
|
|
|
|
|
|
|
| |||||||||
Net Increase | 1,943 | $ | 10 | 3,215 | $ | 17 | ||||||||||
|
|
|
|
|
|
|
| |||||||||
| TCW Global Bond Fund | Year Ended October 31, 2018 | Year Ended October 31, 2017 | ||||||||||||||
| I Class | Shares | Amount (in thousands) | Shares | Amount (in thousands) | ||||||||||||
Shares Sold | 11,813 | $ | 115 | 3,718 | $ | 36 | ||||||||||
Shares Issued upon Reinvestment of Dividends | 7,300 | 71 | 21,732 | 208 | ||||||||||||
Shares Redeemed | (12,111 | ) | (119 | ) | (7,681 | ) | (74 | ) | ||||||||
|
|
|
|
|
|
|
| |||||||||
Net Increase | 7,002 | $ | 67 | 17,769 | $ | 170 | ||||||||||
|
|
|
|
|
|
|
| |||||||||
| N Class | Shares | Amount (in thousands) | Shares | Amount (in thousands) | ||||||||||||
Shares Sold | 68 | $ | 1 | 125 | $ | 1 | ||||||||||
Shares Issued upon Reinvestment of Dividends | 6,434 | 63 | 19,117 | 184 | ||||||||||||
Shares Redeemed | (2,263 | ) | (22 | ) | (164 | ) | (1 | ) | ||||||||
|
|
|
|
|
|
|
| |||||||||
Net Increase | 4,239 | $ | 42 | 19,078 | $ | 184 | ||||||||||
|
|
|
|
|
|
|
| |||||||||
| TCW High Yield Bond Fund | Year Ended October 31, 2018 | Year Ended October 31, 2017 | ||||||||||||||
| I Class | Shares | Amount (in thousands) | Shares | Amount (in thousands) | ||||||||||||
Shares Sold | 572,054 | $ | 3,575 | 658,272 | $ | 4,135 | ||||||||||
Shares Issued upon Reinvestment of Dividends | 67,107 | 421 | 92,725 | 584 | ||||||||||||
Shares Redeemed | (1,606,329 | ) | (10,063 | ) | (1,775,760 | ) | (11,168 | ) | ||||||||
|
|
|
|
|
|
|
| |||||||||
Net Decrease | (967,168 | ) | $ | (6,067 | ) | (1,024,763 | ) | $ | (6,449 | ) | ||||||
|
|
|
|
|
|
|
| |||||||||
| N Class | Shares | Amount (in thousands) | Shares | Amount (in thousands) | ||||||||||||
Shares Sold | 380,994 | $ | 2,407 | 1,291,908 | $ | 8,204 | ||||||||||
Shares Issued upon Reinvestment of Dividends | 37,265 | 235 | 42,606 | 270 | ||||||||||||
Shares Redeemed | (684,444 | ) | (4,324 | ) | (1,452,775 | ) | (9,243 | ) | ||||||||
|
|
|
|
|
|
|
| |||||||||
Net Decrease | (266,185 | ) | $ | (1,682 | ) | (118,261 | ) | $ | (769 | ) | ||||||
|
|
|
|
|
|
|
| |||||||||
| TCW Short Term Bond Fund | Year Ended October 31, 2018 | Year Ended October 31, 2017 | ||||||||||||||
| I Class | Shares | Amount (in thousands) | Shares | Amount (in thousands) | ||||||||||||
Shares Sold | 262,262 | $ | 2,251 | 375,030 | $ | 3,259 | ||||||||||
Shares Issued upon Reinvestment of Dividends | 17,601 | 151 | 14,015 | 121 | ||||||||||||
Shares Redeemed | (349,163 | ) | (2,997 | ) | (351,690 | ) | (3,050 | ) | ||||||||
|
|
|
|
|
|
|
| |||||||||
Net Increase (Decrease) | (69,300 | ) | $ | (595 | ) | 37,355 | $ | 330 | ||||||||
|
|
|
|
|
|
|
| |||||||||
109
Table of Contents
TCW Funds, Inc.
Notes to Financial Statements (Continued)
Note 8 — Capital Share Transactions (Continued)
| TCW Total Return Bond Fund | Year Ended October 31, 2018 | Year Ended October 31, 2017 | ||||||||||||||
| I Class | Shares | Amount (in thousands) | Shares | Amount (in thousands) | ||||||||||||
Shares Sold | 204,848,174 | $ | 2,002,728 | 273,529,025 | $ | 2,724,778 | ||||||||||
Shares Issued upon Reinvestment of Dividends | 12,103,452 | 118,065 | 18,402,930 | 182,908 | ||||||||||||
Shares Redeemed | (338,581,903 | ) | (3,293,006 | ) | (358,584,609 | ) | (3,579,328 | ) | ||||||||
|
|
|
|
|
|
|
| |||||||||
Net Decrease | (121,630,277 | ) | $ | (1,172,213 | ) | (66,652,654 | ) | $ | (671,642 | ) | ||||||
|
|
|
|
|
|
|
| |||||||||
| N Class | Shares | Amount (in thousands) | Shares | Amount (in thousands) | ||||||||||||
Shares Sold | 13,094,820 | $ | 131,597 | 36,575,671 | $ | 376,747 | ||||||||||
Shares Issued upon Reinvestment of Dividends | 4,256,561 | 42,830 | 8,106,956 | 83,082 | ||||||||||||
Shares Redeemed | (87,235,011 | ) | (881,050 | ) | (119,207,888 | ) | (1,227,218 | ) | ||||||||
|
|
|
|
|
|
|
| |||||||||
Net Decrease | (69,883,630 | ) | $ | (706,623 | ) | (74,525,261 | ) | $ | (767,389 | ) | ||||||
|
|
|
|
|
|
|
| |||||||||
Note 9 — Affiliate Ownership
As of October 31, 2018, affiliates of the Funds and Advisor owned 99.9%, and 97.3% of the NAV of TCW Enhanced Commodity Strategy Fund and the TCW Global Bond Fund, respectively.
Note 10 — Restricted Securities
The Funds are permitted to invest in securities that have legal or contractual restrictions on resale. These securities may be sold privately, but are required to be registered before being sold to the public (exemption rules apply). Private placement securities are generally considered to be restricted except for those securities traded between qualified institutional investors under the provisions of Rule 144A of the Securities Act of 1933, as amended (the “Securities Act”). However, the Company considers 144A securities to be restricted if those securities have been deemed illiquid. Disposal of these securities may involve time consuming negotiations and expense, and prompt sale at an acceptable price may be difficult. Restricted securities held by the Funds at October 31, 2018 are listed below:
TCW Core Fixed Income Fund
Issuer Description | Acquisition Date | Acquisition Cost | Aggregate Value | Percentage of Net Assets | ||||||||||
Alta Wind Holdings LLC, (144A), 7%, due 06/30/35 | 7/14/10 | $ | 1,007,506 | $ | 1,036,315 | 0.08 | % | |||||||
|
|
|
|
|
| |||||||||
TCW Enhanced Commodity Strategy Fund
Issuer Description | Acquisition Date | �� | Acquisition Cost | Aggregate Value | Percentage of Net Assets | |||||||||
LB-UBS Commercial Mortgage Trust (06-C6 XCL), (144A), 0.573%, due 09/15/39 | 7/15/16 | $ | 1,013 | $ | 7,861 | 0.46 | % | |||||||
|
|
|
|
|
| |||||||||
TCW Global Bond Fund
Issuer Description | Acquisition Date | Acquisition Cost | Aggregate Value | Percentage of Net Assets | ||||||||||
Bank of America-First Union NB Commercial Mortgage (01-3-XC), (144A), 1.438%, due 04/11/37 | 3/26/15 | $ | 0 | $ | 2,749 | 0.02 | % | |||||||
Morgan Stanley Capital I Trust (99-RM1-X), (144A), 0.896%, due 12/15/31 | 3/26/15 | 0 | 138 | 0.00 | % | |||||||||
|
|
|
|
|
| |||||||||
| $ | 0 | $ | 2,887 | 0.02 | % | |||||||||
|
|
|
|
|
| |||||||||
110
Table of Contents
TCW Funds, Inc.
October 31, 2018 |
Note 11 — Committed Line Of Credit
The Funds have entered into a $100,000,000 committed revolving line of credit agreement renewed annually with the State Street Bank and Trust Company (the “Bank”) for temporary borrowing purposes. The interest rate on borrowing is the higher of the federal funds rate or the overnight LIBOR rate, plus 1.25%. There were no borrowings from the line of credit as of or during the year ended October 31, 2018. The Funds pay the Bank a commitment fee equal to 0.25% per annum on the daily unused portion of the committed line amount. The commitment fees incurred by the Funds are presented in the Statements of Operations. The commitment fees are allocated to each applicable portfolio in proportion to its relative average daily net assets and the interest expenses are charged directly to the applicable portfolio.
Note 12 — Indemnifications
Under the Company’s organizational documents, its Officers and Directors may be indemnified against certain liabilities and expenses arising out of the performance of their duties to the Company. In addition, the Company entered into an agreement with each of the Directors which provides that the Company will indemnify and hold harmless each Director against any expenses actually and reasonably incurred by such Director in any proceeding arising out of or in connection with the Director’s services to the Company, to the fullest extent permitted by the Company’s Articles of Incorporation and By-Laws, the Maryland General Corporation Law, the Securities Act, and the 1940 Act, each as now or hereinafter in force. Additionally, in the normal course of business, the Company enters into agreements with service providers that may contain indemnification clauses. The Company’s maximum exposure under these arrangements is unknown as this would involve future claims that may be made against the Company that have not yet occurred. However, based on experience, the Company expects the risk of loss to be remote. The Company has not accrued any liability in connection with such indemnification.
Note 13 — SEC Simplification
In August 2018, the Securities and Exchange Commission adopted the Disclosure Update and Simplification rule, which amends certain disclosure requirements. The amendment requires presentation of the total, rather than the components, of accumulated or undistributed earnings on the Statements of Assets and Liabilities; the amendment also provides the presentation of the distributions on the Statements of Changes in Net Assets at the total level rather than components and to remove the requirement for disclosure of undistributed net investment income on a book basis. This amendment facilitates compliance of the disclosure of information without significantly altering the information provided to investors.
Note 14 — New Accounting Pronouncement
In August 2018, the FASB released Accounting Standards Update (ASU) 2018-13, which changes the fair value measurement disclosure requirements of Topic 820. The amendments in this ASU are the result of a broader disclosure project called FASB Concept Statement, Conceptual Framework for Financial Reporting — Chapter 8: Notes to Financial Statements. The objective and primary focus of the project are to improve the effectiveness of disclosures in the notes to the financial statements by facilitating clear communication of the information required by GAAP that is most important to users of the financial statements. The ASU is effective for all entities for fiscal years beginning after December 15, 2019, including interim periods therein. Early adoption is permitted for any eliminated or modified disclosures upon issuance of the ASU. Management is currently evaluating the impact of the ASU to the financial statements.
111
Table of Contents
TCW Core Fixed Income Fund
Financial Highlights — I Class
| Year Ended October 31, | ||||||||||||||||||||
| 2018 | 2017 | 2016 | 2015 | 2014 | ||||||||||||||||
Net Asset Value per Share, Beginning of Year | $ | 10.99 | $ | 11.28 | $ | 11.14 | $ | 11.22 | $ | 10.97 | ||||||||||
|
|
|
|
|
|
|
|
|
| |||||||||||
Income (Loss) from Investment Operations: | ||||||||||||||||||||
Net Investment Income (1) | 0.25 | 0.22 | 0.19 | 0.18 | 0.21 | |||||||||||||||
Net Realized and Unrealized Gain (Loss) on Investments | (0.45 | ) | (0.15 | ) | 0.24 | (0.04 | ) | 0.24 | ||||||||||||
|
|
|
|
|
|
|
|
|
| |||||||||||
Total from Investment Operations | (0.20 | ) | 0.07 | 0.43 | 0.14 | 0.45 | ||||||||||||||
|
|
|
|
|
|
|
|
|
| |||||||||||
Less Distributions: |
| |||||||||||||||||||
Distributions from Net Investment Income | (0.27 | ) | (0.23 | ) | (0.19 | ) | (0.19 | ) | (0.20 | ) | ||||||||||
Distributions from Net Realized Gain | — | (0.13 | ) | (0.10 | ) | (0.03 | ) | — | ||||||||||||
|
|
|
|
|
|
|
|
|
| |||||||||||
Total Distributions | (0.27 | ) | (0.36 | ) | (0.29 | ) | (0.22 | ) | (0.20 | ) | ||||||||||
|
|
|
|
|
|
|
|
|
| |||||||||||
Net Asset Value per Share, End of Year | $ | 10.52 | $ | 10.99 | $ | 11.28 | $ | 11.14 | $ | 11.22 | ||||||||||
|
|
|
|
|
|
|
|
|
| |||||||||||
Total Return | (1.87 | )% | 0.68 | % | 3.97 | % | 1.25 | % | 4.14 | % | ||||||||||
Ratios/Supplemental Data: | ||||||||||||||||||||
Net Assets, End of Year (in thousands) | $ | 975,741 | $ | 1,379,196 | $ | 1,421,267 | $ | 1,109,630 | $ | 646,372 | ||||||||||
Ratio of Expenses to Average Net Assets: |
| |||||||||||||||||||
Before Expense Reimbursement | 0.51 | % | 0.51 | % | 0.51 | % | 0.50 | % | 0.49 | % | ||||||||||
After Expense Reimbursement | 0.49 | % | 0.49 | % | 0.49 | % | 0.49 | % | 0.47 | % | ||||||||||
Ratio of Net Investment Income to Average Net Assets | 2.34 | % | 1.96 | % | 1.70 | % | 1.57 | % | 1.92 | % | ||||||||||
Portfolio Turnover Rate | 267.96 | % | 287.39 | % | 283.38 | % | 332.85 | % | 249.94 | % | ||||||||||
| (1) | Computed using average shares outstanding throughout the period. |
See accompanying notes to financial statements.
112
Table of Contents
TCW Core Fixed Income Fund
Financial Highlights — N Class
| Year Ended October 31, | ||||||||||||||||||||
| 2018 | 2017 | 2016 | 2015 | 2014 | ||||||||||||||||
Net Asset Value per Share, Beginning of Year | $ | 10.96 | $ | 11.25 | $ | 11.12 | $ | 11.20 | $ | 10.97 | ||||||||||
|
|
|
|
|
|
|
|
|
| |||||||||||
Income (Loss) from Investment Operations: | ||||||||||||||||||||
Net Investment Income (1) | 0.23 | 0.19 | 0.16 | 0.14 | 0.18 | |||||||||||||||
Net Realized and Unrealized Gain (Loss) on Investments | (0.46 | ) | (0.15 | ) | 0.24 | (0.03 | ) | 0.22 | ||||||||||||
|
|
|
|
|
|
|
|
|
| |||||||||||
Total from Investment Operations | (0.23 | ) | 0.04 | 0.40 | 0.11 | 0.40 | ||||||||||||||
|
|
|
|
|
|
|
|
|
| |||||||||||
Less Distributions: |
| |||||||||||||||||||
Distributions from Net Investment Income | (0.24 | ) | (0.20 | ) | (0.17 | ) | (0.16 | ) | (0.17 | ) | ||||||||||
Distributions from Net Realized Gain | — | (0.13 | ) | (0.10 | ) | (0.03 | ) | — | ||||||||||||
|
|
|
|
|
|
|
|
|
| |||||||||||
Total Distributions | (0.24 | ) | (0.33 | ) | (0.27 | ) | (0.19 | ) | (0.17 | ) | ||||||||||
|
|
|
|
|
|
|
|
|
| |||||||||||
Net Asset Value per Share, End of Year | $ | 10.49 | $ | 10.96 | $ | 11.25 | $ | 11.12 | $ | 11.20 | ||||||||||
|
|
|
|
|
|
|
|
|
| |||||||||||
Total Return | (2.10 | )% | 0.41 | % | 3.66 | % | 1.00 | % | 3.68 | % | ||||||||||
Ratios/Supplemental Data: | ||||||||||||||||||||
Net Assets, End of Year (in thousands) | $ | 270,477 | $ | 356,930 | $ | 487,223 | $ | 542,103 | $ | 608,129 | ||||||||||
Ratio of Expenses to Average Net Assets: |
| |||||||||||||||||||
Before Expense Reimbursement | 0.81 | % | 0.79 | % | 0.79 | % | 0.79 | % | 0.80 | % | ||||||||||
After Expense Reimbursement | 0.72 | % | 0.75 | % | 0.77 | % | 0.79 | % (2) | N/A | |||||||||||
Ratio of Net Investment Income to Average Net Assets | 2.12 | % | 1.69 | % | 1.41 | % | 1.25 | % | 1.59 | % | ||||||||||
Portfolio Turnover Rate | 267.96 | % | 287.39 | % | 283.38 | % | 332.85 | % | 249.94 | % | ||||||||||
| (1) | Computed using average shares outstanding throughout the period. |
| (2) | Reimbursement is less than 0.01%. |
See accompanying notes to financial statements.
113
Table of Contents
TCW Enhanced Commodity Strategy Fund
Financial Highlights — I Class
| Year Ended October 31, | ||||||||||||||||||||
| 2018 | 2017 | 2016 | 2015 | 2014 | ||||||||||||||||
Net Asset Value per Share, Beginning of Year | $ | 5.20 | $ | 5.15 | $ | 5.30 | $ | 7.18 | $ | 7.61 | ||||||||||
|
|
|
|
|
|
|
|
|
| |||||||||||
Income (Loss) from Investment Operations: | ||||||||||||||||||||
Net Investment Income (1) | 0.11 | 0.12 | 0.04 | 0.05 | 0.10 | |||||||||||||||
Net Realized and Unrealized Gain (Loss) on Investments | (0.20 | ) | 0.10 | (0.14 | ) | (1.87 | ) | (0.39 | ) | |||||||||||
|
|
|
|
|
|
|
|
|
| |||||||||||
Total from Investment Operations | (0.09 | ) | 0.22 | (0.10 | ) | (1.82 | ) | (0.29 | ) | |||||||||||
|
|
|
|
|
|
|
|
|
| |||||||||||
Less Distributions: |
| |||||||||||||||||||
Distributions from Net Investment Income | (0.10 | ) | (0.11 | ) | (0.05 | ) | (0.06 | ) | (0.11 | ) | ||||||||||
Distributions from Net Realized Gain | — | (0.06 | ) | — | — | (0.03 | ) | |||||||||||||
|
|
|
|
|
|
|
|
|
| |||||||||||
Total Distributions | (0.10 | ) | (0.17 | ) | (0.05 | ) | (0.06 | ) | (0.14 | ) | ||||||||||
|
|
|
|
|
|
|
|
|
| |||||||||||
Net Asset Value per Share, End of Year | $ | 5.01 | $ | 5.20 | $ | 5.15 | $ | 5.30 | $ | 7.18 | ||||||||||
|
|
|
|
|
|
|
|
|
| |||||||||||
Total Return | (1.96 | )% | 4.55 | % | (1.83 | )% | (25.47 | )% | (3.90 | )% | ||||||||||
Ratios/Supplemental Data: | ||||||||||||||||||||
Net Assets, End of Year (in thousands) | $ | 1,208 | $ | 758 | $ | 725 | $ | 1,443 | $ | 1,934 | ||||||||||
Ratio of Expenses to Average Net Assets: |
| |||||||||||||||||||
Before Expense Reimbursement | 11.53 | % | 16.65 | % | 9.74 | % | 7.82 | % | 5.90 | % | ||||||||||
After Expense Reimbursement | 0.70 | % | 0.70 | % | 0.70 | % | 0.70 | % | 0.70 | % | ||||||||||
Ratio of Net Investment Income to Average Net Assets | 2.06 | % | 2.31 | % | 0.88 | % | 0.88 | % | 1.30 | % | ||||||||||
Portfolio Turnover Rate | 75.52 | % | 0.00 | % | 2.44 | % | 10.68 | % | 4.13 | % | ||||||||||
| (1) | Computed using average shares outstanding throughout the period. |
See accompanying notes to financial statements.
114
Table of Contents
TCW Enhanced Commodity Strategy Fund
Financial Highlights — N Class
| Year Ended October 31, | ||||||||||||||||||||
| 2018 | 2017 | 2016 | 2015 | 2014 | ||||||||||||||||
Net Asset Value per Share, Beginning of Year | $ | 5.21 | $ | 5.15 | $ | 5.31 | $ | 7.18 | $ | 7.61 | ||||||||||
|
|
|
|
|
|
|
|
|
| |||||||||||
Income (Loss) from Investment Operations: | ||||||||||||||||||||
Net Investment Income (1) | 0.11 | 0.12 | 0.04 | 0.05 | 0.10 | |||||||||||||||
Net Realized and Unrealized Gain (Loss) on Investments | (0.21 | ) | 0.11 | (0.15 | ) | (1.86 | ) | (0.39 | ) | |||||||||||
|
|
|
|
|
|
|
|
|
| |||||||||||
Total from Investment Operations | (0.10 | ) | 0.23 | (0.11 | ) | (1.81 | ) | (0.29 | ) | |||||||||||
|
|
|
|
|
|
|
|
|
| |||||||||||
Less Distributions: |
| |||||||||||||||||||
Distributions from Net Investment Income | (0.10 | ) | (0.11 | ) | (0.05 | ) | (0.06 | ) | (0.11 | ) | ||||||||||
Distributions from Net Realized Gain | — | (0.06 | ) | — | — | (0.03 | ) | |||||||||||||
|
|
|
|
|
|
|
|
|
| |||||||||||
Total Distributions | (0.10 | ) | (0.17 | ) | (0.05 | ) | (0.06 | ) | (0.14 | ) | ||||||||||
|
|
|
|
|
|
|
|
|
| |||||||||||
Net Asset Value per Share, End of Year | $ | 5.01 | $ | 5.21 | $ | 5.15 | $ | 5.31 | $ | 7.18 | ||||||||||
|
|
|
|
|
|
|
|
|
| |||||||||||
Total Return | (1.96 | )% | 4.55 | % | (2.03 | )% | (25.36 | )% | (3.92 | )% | ||||||||||
Ratios/Supplemental Data: | ||||||||||||||||||||
Net Assets, End of Year (in thousands) | $ | 507 | $ | 517 | $ | 496 | $ | 1,153 | $ | 1,546 | ||||||||||
Ratio of Expenses to Average Net Assets: |
| |||||||||||||||||||
Before Expense Reimbursement | 12.59 | % | 18.01 | % | 10.21 | % | 8.32 | % | 6.45 | % | ||||||||||
After Expense Reimbursement | 0.75 | % | 0.75 | % | 0.75 | % | 0.75 | % | 0.73 | % | ||||||||||
Ratio of Net Investment Income to Average Net Assets | 2.02 | % | 2.26 | % | 0.83 | % | 0.83 | % | 1.27 | % | ||||||||||
Portfolio Turnover Rate | 75.52 | % | 0.00 | % | 2.44 | % | 10.68 | % | 4.13 | % | ||||||||||
| (1) | Computed using average shares outstanding throughout the period. |
See accompanying notes to financial statements.
115
Table of Contents
TCW Global Bond Fund
Financial Highlights — I Class
| Year Ended October 31, | ||||||||||||||||||||
| 2018 | 2017 | 2016 | 2015 | 2014 | ||||||||||||||||
Net Asset Value per Share, Beginning of Year | $ | 9.75 | $ | 9.88 | $ | 9.85 | $ | 10.26 | $ | 10.45 | ||||||||||
|
|
|
|
|
|
|
|
|
| |||||||||||
Income (Loss) from Investment Operations: | ||||||||||||||||||||
Net Investment Income (1) | 0.19 | 0.17 | 0.20 | 0.19 | 0.22 | |||||||||||||||
Net Realized and Unrealized Gain (Loss) on Investments | (0.43 | ) | (0.07 | ) | 0.19 | (0.49 | ) | (0.20 | ) | |||||||||||
|
|
|
|
|
|
|
|
|
| |||||||||||
Total from Investment Operations | (0.24 | ) | 0.10 | 0.39 | (0.30 | ) | 0.02 | |||||||||||||
|
|
|
|
|
|
|
|
|
| |||||||||||
Less Distributions: |
| |||||||||||||||||||
Distributions from Net Investment Income | (0.05 | ) | (0.16 | ) | (0.22 | ) | (0.09 | ) | (0.13 | ) | ||||||||||
Distributions from Net Realized Gain | (0.01 | ) | (0.07 | ) | (0.14 | ) | (0.02 | ) | (0.08 | ) | ||||||||||
|
|
|
|
|
|
|
|
|
| |||||||||||
Total Distributions | (0.06 | ) | (0.23 | ) | (0.36 | ) | (0.11 | ) | (0.21 | ) | ||||||||||
|
|
|
|
|
|
|
|
|
| |||||||||||
Net Asset Value per Share, End of Year | $ | 9.45 | $ | 9.75 | $ | 9.88 | $ | 9.85 | $ | 10.26 | ||||||||||
|
|
|
|
|
|
|
|
|
| |||||||||||
Total Return | (2.54 | )% | 1.07 | % | 4.03 | % | (2.96 | )% | 0.21 | % | ||||||||||
Ratios/Supplemental Data: | ||||||||||||||||||||
Net Assets, End of Year (in thousands) | $ | 8,505 | $ | 8,714 | $ | 8,648 | $ | 7,878 | $ | 8,138 | ||||||||||
Ratio of Expenses to Average Net Assets: |
| |||||||||||||||||||
Before Expense Reimbursement | 1.63 | % | 1.60 | % | 1.48 | % | 1.37 | % | 1.39 | % | ||||||||||
After Expense Reimbursement | 1.00 | % | 1.04 | % | 1.05 | % | 1.08 | % | 1.12 | % | ||||||||||
Ratio of Net Investment Income to Average Net Assets | 1.99 | % | 1.75 | % | 2.02 | % | 1.92 | % | 2.11 | % | ||||||||||
Portfolio Turnover Rate | 102.42 | % | 90.08 | % | 116.87 | % | 147.16 | % | 125.54 | % | ||||||||||
| (1) | Computed using average shares outstanding throughout the period. |
See accompanying notes to financial statements.
116
Table of Contents
TCW Global Bond Fund
Financial Highlights — N Class
| Year Ended October 31, | ||||||||||||||||||||
| 2018 | 2017 | 2016 | 2015 | 2014 | ||||||||||||||||
Net Asset Value per Share, Beginning of Year | $ | 9.75 | $ | 9.88 | $ | 9.85 | $ | 10.26 | $ | 10.45 | ||||||||||
|
|
|
|
|
|
|
|
|
| |||||||||||
Income (Loss) from Investment Operations: | ||||||||||||||||||||
Net Investment Income (1) | 0.19 | 0.17 | 0.20 | 0.19 | 0.22 | |||||||||||||||
Net Realized and Unrealized Gain (Loss) on Investments | (0.43 | ) | (0.07 | ) | 0.19 | (0.49 | ) | (0.20 | ) | |||||||||||
|
|
|
|
|
|
|
|
|
| |||||||||||
Total from Investment Operations | (0.24 | ) | 0.10 | 0.39 | (0.30 | ) | 0.02 | |||||||||||||
|
|
|
|
|
|
|
|
|
| |||||||||||
Less Distributions: |
| |||||||||||||||||||
Distributions from Net Investment Income | (0.05 | ) | (0.16 | ) | (0.22 | ) | (0.09 | ) | (0.13 | ) | ||||||||||
Distributions from Net Realized Gain | (0.01 | ) | (0.07 | ) | (0.14 | ) | (0.02 | ) | (0.08 | ) | ||||||||||
|
|
|
|
|
|
|
|
|
| |||||||||||
Total Distributions | (0.06 | ) | (0.23 | ) | (0.36 | ) | (0.11 | ) | (0.21 | ) | ||||||||||
|
|
|
|
|
|
|
|
|
| |||||||||||
Net Asset Value per Share, End of Year | $ | 9.45 | $ | 9.75 | $ | 9.88 | $ | 9.85 | $ | 10.26 | ||||||||||
|
|
|
|
|
|
|
|
|
| |||||||||||
Total Return | (2.54 | )% | 1.07 | % | 4.03 | % | (2.96 | )% | 0.21 | % | ||||||||||
Ratios/Supplemental Data: | ||||||||||||||||||||
Net Assets, End of Year (in thousands) | $ | 7,476 | $ | 7,679 | $ | 7,586 | $ | 7,358 | $ | 7,565 | ||||||||||
Ratio of Expenses to Average Net Assets: |
| |||||||||||||||||||
Before Expense Reimbursement | 1.92 | % | 1.89 | % | 1.76 | % | 1.64 | % | 1.67 | % | ||||||||||
After Expense Reimbursement | 1.00 | % | 1.04 | % | 1.05 | % | 1.08 | % | 1.12 | % | ||||||||||
Ratio of Net Investment Income to Average Net Assets | 1.99 | % | 1.75 | % | 2.02 | % | 1.92 | % | 2.12 | % | ||||||||||
Portfolio Turnover Rate | 102.42 | % | 90.08 | % | 116.87 | % | 147.16 | % | 125.54 | % | ||||||||||
| (1) | Computed using average shares outstanding throughout the period. |
See accompanying notes to financial statements.
117
Table of Contents
TCW High Yield Bond Fund
Financial Highlights — I Class
| Year Ended October 31, | ||||||||||||||||||||
| 2018 | 2017 | 2016 | 2015 | 2014 | ||||||||||||||||
Net Asset Value per Share, Beginning of Year | $ | 6.37 | $ | 6.23 | $ | 6.18 | $ | 6.35 | $ | 6.33 | ||||||||||
|
|
|
|
|
|
|
|
|
| |||||||||||
Income (Loss) from Investment Operations: | ||||||||||||||||||||
Net Investment Income (1) | 0.26 | 0.24 | 0.24 | 0.26 | 0.29 | |||||||||||||||
Net Realized and Unrealized Gain (Loss) on Investments | (0.17 | ) | 0.18 | 0.06 | (0.15 | ) | 0.04 | |||||||||||||
|
|
|
|
|
|
|
|
|
| |||||||||||
Total from Investment Operations | 0.09 | 0.42 | 0.30 | 0.11 | 0.33 | |||||||||||||||
|
|
|
|
|
|
|
|
|
| |||||||||||
Less Distributions: |
| |||||||||||||||||||
Distributions from Net Investment Income | (0.31 | ) | (0.28 | ) | (0.25 | ) | (0.28 | ) | (0.31 | ) | ||||||||||
|
|
|
|
|
|
|
|
|
| |||||||||||
Net Asset Value per Share, End of Year | $ | 6.15 | $ | 6.37 | $ | 6.23 | $ | 6.18 | $ | 6.35 | ||||||||||
|
|
|
|
|
|
|
|
|
| |||||||||||
Total Return | 1.40 | % | 6.80 | % | 5.06 | % | 1.74 | % | 5.25 | % | ||||||||||
Ratios/Supplemental Data: |
| |||||||||||||||||||
Net Assets, End of Year (in thousands) | $ | 7,749 | $ | 14,195 | $ | 20,265 | $ | 20,791 | $ | 20,649 | ||||||||||
Ratio of Expenses to Average Net Assets: |
| |||||||||||||||||||
Before Expense Reimbursement | 1.50 | % | 1.22 | % | 1.03 | % | 1.03 | % | 0.90 | % | ||||||||||
After Expense Reimbursement | 0.55 | % | 0.55 | % | 0.55 | % | 0.55 | % | 0.53 | % | ||||||||||
Ratio of Net Investment Income to Average Net Assets | 4.13 | % | 3.85 | % | 3.88 | % | 4.11 | % | 4.60 | % | ||||||||||
Portfolio Turnover Rate | 104.21 | % | 179.87 | % | 244.36 | % | 195.97 | % | 145.14 | % | ||||||||||
| (1) | Computed using average shares outstanding throughout the period. |
See accompanying notes to financial statements.
118
Table of Contents
TCW High Yield Bond Fund
Financial Highlights — N Class
| Year Ended October 31, | ||||||||||||||||||||
| 2018 | 2017 | 2016 | 2015 | 2014 | ||||||||||||||||
Net Asset Value per Share, Beginning of Year | $ | 6.42 | $ | 6.28 | $ | 6.23 | $ | 6.41 | $ | 6.37 | ||||||||||
|
|
|
|
|
|
|
|
|
| |||||||||||
Income (Loss) from Investment Operations: | ||||||||||||||||||||
Net Investment Income (1) | 0.25 | 0.23 | 0.22 | 0.25 | 0.28 | |||||||||||||||
Net Realized and Unrealized Gain (Loss) on Investments | (0.18 | ) | 0.18 | 0.07 | (0.17 | ) | 0.05 | |||||||||||||
|
|
|
|
|
|
|
|
|
| |||||||||||
Total from Investment Operations | 0.07 | 0.41 | 0.29 | 0.08 | 0.33 | |||||||||||||||
|
|
|
|
|
|
|
|
|
| |||||||||||
Less Distributions: |
| |||||||||||||||||||
Distributions from Net Investment Income | (0.30 | ) | (0.27 | ) | (0.24 | ) | (0.26 | ) | (0.29 | ) | ||||||||||
|
|
|
|
|
|
|
|
|
| |||||||||||
Net Asset Value per Share, End of Year | $ | 6.19 | $ | 6.42 | $ | 6.28 | $ | 6.23 | $ | 6.41 | ||||||||||
|
|
|
|
|
|
|
|
|
| |||||||||||
Total Return | 1.04 | % | 6.59 | % | 4.82 | % | 1.34 | % | 5.24 | % | ||||||||||
Ratios/Supplemental Data: |
| |||||||||||||||||||
Net Assets, End of Year (in thousands) | $ | 5,041 | $ | 6,934 | $ | 7,526 | $ | 15,910 | $ | 12,555 | ||||||||||
Ratio of Expenses to Average Net Assets: |
| |||||||||||||||||||
Before Expense Reimbursement | 1.98 | % | 1.65 | % | 1.40 | % | 1.38 | % | 1.39 | % | ||||||||||
After Expense Reimbursement | 0.80 | % | 0.80 | % | 0.80 | % | 0.80 | % | 0.78 | % | ||||||||||
Ratio of Net Investment Income to Average Net Assets | 3.90 | % | 3.60 | % | 3.64 | % | 3.87 | % | 4.30 | % | ||||||||||
Portfolio Turnover Rate | 104.21 | % | 179.87 | % | 244.36 | % | 195.97 | % | 145.14 | % | ||||||||||
| (1) | Computed using average shares outstanding throughout the period. |
See accompanying notes to financial statements.
119
Table of Contents
TCW Short Term Bond Fund
Financial Highlights — I Class
| Year Ended October 31, | ||||||||||||||||||||
| 2018 | 2017 | 2016 | 2015 | 2014 | ||||||||||||||||
Net Asset Value per Share, Beginning of Year | $ | 8.62 | $ | 8.70 | $ | 8.69 | $ | 8.75 | $ | 8.80 | ||||||||||
|
|
|
|
|
|
|
|
|
| |||||||||||
Income (Loss) from Investment Operations: |
| |||||||||||||||||||
Net Investment Income (1) | 0.15 | 0.08 | 0.05 | 0.05 | 0.06 | |||||||||||||||
Net Realized and Unrealized Gain (Loss) on Investments | (0.04 | ) | (0.01 | ) | 0.02 | (0.03 | ) | 0.00 | (2) | |||||||||||
|
|
|
|
|
|
|
|
|
| |||||||||||
Total from Investment Operations | 0.11 | 0.07 | 0.07 | 0.02 | 0.06 | |||||||||||||||
|
|
|
|
|
|
|
|
|
| |||||||||||
Less Distributions: |
| |||||||||||||||||||
Distributions from Net Investment Income | (0.19 | ) | (0.15 | ) | (0.06 | ) | (0.08 | ) | (0.11 | ) | ||||||||||
|
|
|
|
|
|
|
|
|
| |||||||||||
Net Asset Value per Share, End of Year | $ | 8.54 | $ | 8.62 | $ | 8.70 | $ | 8.69 | $ | 8.75 | ||||||||||
|
|
|
|
|
|
|
|
|
| |||||||||||
Total Return | 1.26 | % | 0.75 | % | 0.84 | % | 0.25 | % | 0.65 | % | ||||||||||
Ratios/Supplemental Data: |
| |||||||||||||||||||
Net Assets, End of Year (in thousands) | $ | 7,280 | $ | 7,951 | $ | 7,698 | $ | 9,614 | $ | 21,080 | ||||||||||
Ratio of Expenses to Average Net Assets: |
| |||||||||||||||||||
Before Expense Reimbursement | 2.28 | % | 1.65 | % | 2.46 | % | 1.57 | % | 1.23 | % | ||||||||||
After Expense Reimbursement | 0.44 | % | 0.44 | % | 0.44 | % | 0.44 | % | 0.44 | % | ||||||||||
Ratio of Net Investment Income to Average Net Assets | 1.70 | % | 0.96 | % | 0.58 | % | 0.53 | % | 0.70 | % | ||||||||||
Portfolio Turnover Rate | 199.55 | % | 131.31 | % | 46.36 | % | 8.51 | % | 67.27 | % | ||||||||||
| (1) | Computed using average shares outstanding throughout the period. |
| (2) | Amount rounds to less than $0.01 per share. |
See accompanying notes to financial statements.
120
Table of Contents
TCW Total Return Bond Fund
Financial Highlights — I Class
| Year Ended October 31, | ||||||||||||||||||||
| 2018 | 2017 | 2016 | 2015 | 2014 | ||||||||||||||||
Net Asset Value per Share, Beginning of Year | $ | 9.98 | $ | 10.33 | $ | 10.28 | $ | 10.31 | $ | 10.13 | ||||||||||
|
|
|
|
|
|
|
|
|
| |||||||||||
Income (Loss) from Investment Operations: | ||||||||||||||||||||
Net Investment Income (1) | 0.31 | 0.27 | 0.26 | 0.25 | 0.27 | |||||||||||||||
Net Realized and Unrealized Gain (Loss) on Investments | (0.48 | ) | (0.20 | ) | 0.11 | (0.02 | ) | 0.18 | ||||||||||||
|
|
|
|
|
|
|
|
|
| |||||||||||
Total from Investment Operations | (0.17 | ) | 0.07 | 0.37 | 0.23 | 0.45 | ||||||||||||||
|
|
|
|
|
|
|
|
|
| |||||||||||
Less Distributions: |
| |||||||||||||||||||
Distributions from Net Investment Income | (0.35 | ) | (0.26 | ) | (0.25 | ) | (0.22 | ) | (0.27 | ) | ||||||||||
Distributions from Net Realized Gain | — | (0.16 | ) | (0.07 | ) | (0.04 | ) | — | ||||||||||||
|
|
|
|
|
|
|
|
|
| |||||||||||
Total Distributions | (0.35 | ) | (0.42 | ) | (0.32 | ) | (0.26 | ) | (0.27 | ) | ||||||||||
|
|
|
|
|
|
|
|
|
| |||||||||||
Net Asset Value per Share, End of Year | $ | 9.46 | $ | 9.98 | $ | 10.33 | $ | 10.28 | $ | 10.31 | ||||||||||
|
|
|
|
|
|
|
|
|
| |||||||||||
Total Return | (1.67 | )% | 0.72 | % | 3.63 | % | 2.24 | % | 4.49 | % | ||||||||||
Ratios/Supplemental Data: | ||||||||||||||||||||
Net Assets, End of Year (in thousands) | $ | 5,587,668 | $ | 7,103,832 | $ | 8,042,194 | $ | 6,360,295 | $ | 6,129,426 | ||||||||||
Ratio of Expenses to Average Net Assets: |
| |||||||||||||||||||
Before Expense Reimbursement | 0.62 | % | 0.61 | % | 0.60 | % | 0.60 | % | 0.59 | % | ||||||||||
After Expense Reimbursement | 0.49 | % | 0.49 | % | 0.49 | % | 0.49 | % | 0.47 | % | ||||||||||
Ratio of Net Investment Income to Average Net Assets | 3.20 | % | 2.73 | % | 2.55 | % | 2.46 | % | 2.65 | % | ||||||||||
Portfolio Turnover Rate | 241.76 | % | 287.55 | % | 318.48 | % | 287.85 | % | 201.30 | % | ||||||||||
| (1) | Computed using average shares outstanding throughout the period. |
See accompanying notes to financial statements.
121
Table of Contents
TCW Total Return Bond Fund
Financial Highlights — N Class
| Year Ended October 31, | ||||||||||||||||||||
| 2018 | 2017 | 2016 | 2015 | 2014 | ||||||||||||||||
Net Asset Value per Share, Beginning of Year | $ | 10.29 | $ | 10.65 | $ | 10.60 | $ | 10.64 | $ | 10.45 | ||||||||||
|
|
|
|
|
|
|
|
|
| |||||||||||
Income (Loss) from Investment Operations: | ||||||||||||||||||||
Net Investment Income (1) | 0.29 | 0.25 | 0.24 | 0.23 | 0.25 | |||||||||||||||
Net Realized and Unrealized Gain (Loss) on Investments | (0.49 | ) | (0.21 | ) | 0.11 | (0.04 | ) | 0.19 | ||||||||||||
|
|
|
|
|
|
|
|
|
| |||||||||||
Total from Investment Operations | (0.20 | ) | 0.04 | 0.35 | 0.19 | 0.44 | ||||||||||||||
|
|
|
|
|
|
|
|
|
| |||||||||||
Less Distributions: |
| |||||||||||||||||||
Distributions from Net Investment Income | (0.33 | ) | (0.24 | ) | (0.23 | ) | (0.19 | ) | (0.25 | ) | ||||||||||
Distributions from Net Realized Gain | — | (0.16 | ) | (0.07 | ) | (0.04 | ) | — | ||||||||||||
|
|
|
|
|
|
|
|
|
| |||||||||||
Total Distributions | (0.33 | ) | (0.40 | ) | (0.30 | ) | (0.23 | ) | (0.25 | ) | ||||||||||
|
|
|
|
|
|
|
|
|
| |||||||||||
Net Asset Value per Share, End of Year | $ | 9.76 | $ | 10.29 | $ | 10.65 | $ | 10.60 | $ | 10.64 | ||||||||||
|
|
|
|
|
|
|
|
|
| |||||||||||
Total Return | (1.96 | )% | 0.41 | % | 3.35 | % | 1.83 | % | 4.24 | % | ||||||||||
Ratios/Supplemental Data: | ||||||||||||||||||||
Net Assets, End of Year (in thousands) | $ | 1,121,741 | $ | 1,902,308 | $ | 2,762,803 | $ | 2,399,850 | $ | 2,177,160 | ||||||||||
Ratio of Expenses to Average Net Assets: |
| |||||||||||||||||||
Before Expense Reimbursement | 0.88 | % | 0.88 | % | 0.87 | % | 0.88 | % | 0.87 | % | ||||||||||
After Expense Reimbursement | 0.79 | % | 0.79 | % | 0.79 | % | 0.79 | % | 0.77 | % | ||||||||||
Ratio of Net Investment Income to Average Net Assets | 2.89 | % | 2.42 | % | 2.25 | % | 2.17 | % | 2.36 | % | ||||||||||
Portfolio Turnover Rate | 241.76 | % | 287.55 | % | 318.48 | % | 287.85 | % | 201.30 | % | ||||||||||
| (1) | Computed using average shares outstanding throughout the period. |
See accompanying notes to financial statements.
122
Table of Contents
TCW Funds, Inc.
Report of Independent Registered Public Accounting Firm
To the Board of Directors and Shareholders of TCW Funds, Inc.
We have audited the accompanying statements of assets and liabilities of TCW Core Fixed Income Fund, TCW Global Bond Fund, TCW High Yield Bond Fund, TCW Short Term Bond Fund, and TCW Total Return Bond Fund and the consolidated statement of assets and liabilities of TCW Enhanced Commodity Strategy Fund (collectively, the “TCW Fixed Income Funds”) (six of nineteen funds comprising the TCW Funds, Inc.), including the schedules of investments of TCW Core Fixed Income Fund, TCW Global Bond Fund, TCW High Yield Bond Fund, TCW Short Term Bond Fund, and TCW Total Return Bond Fund and the consolidated schedule of investments of TCW Enhanced Commodity Strategy Fund, as of October 31, 2018, and the related statements of operations for TCW Core Fixed Income Fund, TCW Global Bond Fund, TCW High Yield Bond Fund, TCW Short Term Bond Fund, and TCW Total Return Bond Fund and the related consolidated statement of operations for TCW Enhanced Commodity Strategy Fund for the year then ended, the statements of changes in net assets for TCW Core Fixed Income Fund, TCW Global Bond Fund, TCW High Yield Bond Fund, TCW Short Term Bond Fund, and TCW Total Return Bond Fund and the consolidated statement of changes in net assets for TCW Enhanced Commodity Strategy Fund for each of the two years in the period then ended, the financial highlights for TCW Core Fixed Income Fund, TCW Global Bond Fund, TCW High Yield Bond Fund, TCW Short Term Bond Fund, and TCW Total Return Bond Fund and the consolidated financial highlights for TCW Enhanced Commodity Strategy Fund for each of the five years in the period then ended, and the related notes. In our opinion, the financial statements and financial highlights for TCW Core Fixed Income Fund, TCW Global Bond Fund, TCW High Yield Bond Fund, TCW Short Term Bond Fund, and TCW Total Return Bond Fund and the consolidated financial statements and consolidated financial highlights for TCW Enhanced Commodity Strategy Fund present fairly, in all material respects, the financial position of each of the respective TCW Fixed Income Funds as of October 31, 2018, the results of their operations for the year then ended, the changes in their net assets for each of the two years in the period then ended and the financial highlights for each of the five years in the period then ended, in conformity with accounting principles generally accepted in the United States of America.
Basis for Opinion
These financial statements and financial highlights are the responsibility of the TCW Fixed Income Funds’ management. Our responsibility is to express an opinion on the TCW Fixed Income Funds’ financial statements and financial highlights based on our audits. We are a public accounting firm registered with the Public Company Accounting Oversight Board (United States) (PCAOB) and are required to be independent with respect to the Funds in accordance with the U.S. federal securities laws and the applicable rules and regulations of the Securities and Exchange Commission and the PCAOB.
We conducted our audits in accordance with the standards of the PCAOB. Those standards require that we plan and perform the audits to obtain reasonable assurance about whether the financial statements and financial highlights are free of material misstatement, whether due to error or fraud. The TCW Fixed Income Funds are not required to have, nor were we engaged to perform, an audit of their internal control over financial reporting. As part of our audits we are required to obtain an understanding of internal control over financial reporting but not for the purpose of expressing an opinion on the effectiveness of the TCW Fixed Income Funds’ internal control over financial reporting. Accordingly, we express no such opinion.
Our audits included performing procedures to assess the risks of material misstatement of the financial statements and financial highlights, whether due to error or fraud, and performing procedures that respond to those risks. Such procedures included examining, on a test basis, evidence regarding the amounts and disclosures in the financial statements and financial highlights. Our audits also included evaluating the accounting principles used and significant estimates made by management, as well as evaluating the overall presentation of the financial statements and financial highlights. Our procedures included confirmation of securities owned as of October 31, 2018, by correspondence with the custodian and brokers; when replies were not received from brokers, we performed other auditing procedures. We believe that our audits provide a reasonable basis for our opinion.

Los Angeles, California
December 19, 2018
We have served as the auditor of one or more TCW/Metropolitan West Funds investment companies since 1990.
123
Table of Contents
TCW Funds, Inc.
Shareholder Expenses (Unaudited)
As a shareholder of a Fund, you incur ongoing operational costs of the Fund, including management fees and other fund expenses. The following example is intended to help you understand your ongoing costs (in dollars and cents) of investing in a Fund and to compare these costs with the ongoing costs of investing in other funds.
The example is based on an investment of $1,000 invested at the beginning of the period and held for the entire period from May 1, 2018 to October 31, 2018 (184 days).
Actual Expenses The first line under each Fund in the table below provides information about the actual account values and actual expenses. You may use the information in this line, together with the amount you invested, to estimate the expenses that you paid over the period. Simply divide your account value by $1,000 (for example, an $8,600 account value divided by $1,000 = 8.6), then multiply the result by the number in the first line for your Fund under the heading entitled “Expenses Paid During Period” to estimate the expenses you paid on your account during this period.
Hypothetical Example for Comparison Purposes The second line under each Fund in the table below provides information about the hypothetical expenses based on each Fund’s actual expense ratio and an assumed rate of return of 5% per year before expenses, which is not the Fund’s actual return. The hypothetical account value and expenses may not be used to estimate the actual ending account balance or expenses you paid for the period. You may use this information to compare the ongoing costs of investing in your Fund and other funds. To do so, compare this 5% hypothetical example with the 5% hypothetical examples that appear in the shareholder reports of the other funds.
TCW Funds, Inc. | Beginning Account Value May 1, 2018 | Ending Account Value October 31, 2018 | Annualized Expense Ratio | Expenses Paid During Period (May 1, 2018 to October 31, 2018) | ||||||||||||
| TCW Core Fixed Income Fund | ||||||||||||||||
I Class Shares | ||||||||||||||||
Actual | $ | 1,000.00 | $ | 998.60 | 0.49 | % | $ | 2.47 | ||||||||
Hypothetical (5% return before expenses) | 1,000.00 | 1,022.74 | 0.49 | % | 2.50 | |||||||||||
N Class Shares | ||||||||||||||||
Actual | $ | 1,000.00 | $ | 997.50 | 0.71 | % | $ | 3.57 | ||||||||
Hypothetical (5% return before expenses) | 1,000.00 | 1,021.63 | 0.71 | % | 3.62 | |||||||||||
| TCW Enhanced Commodity Strategy Fund | ||||||||||||||||
I Class Shares | ||||||||||||||||
Actual | $ | 1,000.00 | $ | 930.60 | 0.70 | % | $ | 3.41 | ||||||||
Hypothetical (5% return before expenses) | 1,000.00 | $ | 1,021.68 | 0.70 | % | 3.57 | ||||||||||
N Class Shares | ||||||||||||||||
Actual | $ | 1,000.00 | $ | 930.60 | 0.75 | % | $ | 3.65 | ||||||||
Hypothetical (5% return before expenses) | 1,000.00 | $ | 1,021.42 | 0.75 | % | 3.82 | ||||||||||
| TCW Global Bond Fund | ||||||||||||||||
I Class Shares | ||||||||||||||||
Actual | $ | 1,000.00 | $ | 970.20 | 0.99 | % (1) | $ | 4.92 (1 | ) | |||||||
Hypothetical (5% return before expenses) | 1,000.00 | 1,020.22 | 0.99 | % (1) | 5.04 (1 | ) | ||||||||||
N Class Shares | ||||||||||||||||
Actual | $ | 1,000.00 | $ | 970.20 | 0.99 | % (1) | $ | 4.92 (1 | ) | |||||||
Hypothetical (5% return before expenses) | 1,000.00 | 1,020.22 | 0.99 | % (1) | 5.04 (1 | ) | ||||||||||
124
Table of Contents
TCW Funds, Inc.
TCW Funds, Inc. | Beginning Account Value May 1, 2018 | Ending Account Value October 31, 2018 | Annualized Expense Ratio | Expenses Paid During Period (May 1, 2018 to October 31, 2018) | ||||||||||||
| TCW High Yield Bond Fund | ||||||||||||||||
I Class Shares | ||||||||||||||||
Actual | $ | 1,000.00 | $ | 1,010.30 | 0.55 | % | $ | 2.79 | ||||||||
Hypothetical (5% return before expenses) | 1,000.00 | 1,022.43 | 0.55 | % | 2.80 | |||||||||||
N Class Shares | ||||||||||||||||
Actual | $ | 1,000.00 | $ | 1,009.20 | 0.80 | % | $ | 4.05 | ||||||||
Hypothetical (5% return before expenses) | 1,000.00 | 1,021.17 | 0.80 | % | 4.08 | |||||||||||
| TCW Short Term Bond Fund | ||||||||||||||||
I Class Shares | ||||||||||||||||
Actual | $ | 1,000.00 | $ | 1,008.10 | 0.44 | % | $ | 2.23 | ||||||||
Hypothetical (5% return before expenses) | 1,000.00 | 1,022.99 | 0.44 | % | 2.24 | |||||||||||
| TCW Total Return Bond Fund | ||||||||||||||||
I Class Shares | ||||||||||||||||
Actual | $ | 1,000.00 | $ | 999.90 | 0.49 | % | $ | 2.47 | ||||||||
Hypothetical (5% return before expenses) | 1,000.00 | 1,022.74 | 0.49 | % | 2.50 | |||||||||||
N Class Shares | ||||||||||||||||
Actual | $ | 1,000.00 | $ | 997.90 | 0.79 | % | $ | 3.98 | ||||||||
Hypothetical (5% return before expenses) | 1,000.00 | 1,021.22 | 0.79 | % | 4.02 | |||||||||||
| (1) | Does not include expenses of the underlying affiliated investments. |
125
Table of Contents
TCW Funds, Inc.
The TCW Group, Inc. and Subsidiaries
TCW Investment Management Company LLC
TCW Asset Management Company LLC
Metropolitan West Asset Management, LLC
| TCW Funds, Inc. | Sepulveda Management LLC | |
| TCW Strategic Income Fund, Inc. | TCW Direct Lending LLC | |
| Metropolitan West Funds | TCW Direct Lending VII LLC |
What You Should Know
At TCW, we recognize the importance of keeping information about you secure and confidential. We do not sell or share your nonpublic personal and financial information with marketers or others outside our affiliated group of companies.
We carefully manage information among our affiliated group of companies to safeguard your privacy and to provide you with consistently excellent service.
We are providing this notice to you to comply with the requirements of Regulation S-P, “Privacy of Consumer Financial Information,” issued by the United States Securities and Exchange Commission.
Our Privacy Policy
We, The TCW Group, Inc. and its subsidiaries, the TCW Funds, Inc., TCW Strategic Income Fund, Inc., the Metropolitan West Funds, Sepulveda Management LLC and TCW Direct Lending (collectively, “TCW”) are committed to protecting the nonpublic personal and financial information of our customers and consumers who obtain or seek to obtain financial products or services primarily for personal, family or household purposes. We fulfill our commitment by establishing and implementing policies and systems to protect the security and confidentiality of this information.
In our offices, we limit access to nonpublic personal and financial information about you to those TCW personnel who need to know the information in order to provide products or services to you. We maintain physical, electronic and procedural safeguards to protect your nonpublic personal and financial information.
Categories of Information We Collect
We may collect the following types of nonpublic personal and financial information about you from the following sources:
| • | Your name, address and identifying numbers, and other personal and financial information, from you and from identification cards and papers you submit to us, on applications, subscription agreements or other forms or communications. |
| • | Information about your account balances and financial transactions with us, our affiliated entities, or nonaffiliated third parties, from our internal sources, from affiliated entities and from nonaffiliated third parties. |
| • | Information about your account balances and financial transactions and other personal and financial information, from consumer credit reporting agencies or other nonaffiliated third parties, to verify information received from you or others. |
126
Table of Contents
TCW Funds, Inc.
Categories of Information We Disclose to Nonaffiliated Third Parties
| • | We may disclose your name, address and account and other identifying numbers, as well as information about your pending or past transactions and other personal financial information, to nonaffiliated third parties, for our everyday business purposes such as necessary to execute, process, service and confirm your securities transactions and mutual fund transactions, to administer and service your account and commingled investment vehicles in which you are invested, to market our products and services through joint marketing arrangements or to respond to court orders and legal investigations. |
| • | We may disclose nonpublic personal and financial information concerning you to law enforcement agencies, federal regulatory agencies, self-regulatory organizations or other nonaffiliated third parties, if required or requested to do so by a court order, judicial subpoena or regulatory inquiry. |
We do not otherwise disclose your nonpublic personal and financial information to nonaffiliated third parties, except where we believe in good faith that disclosure is required or permitted by law. Because we do not disclose your nonpublic personal and financial information to nonaffiliated third parties, our Customer Privacy Policy does not contain opt-out provisions.
Categories of Information We Disclose to Our Affiliated Entities
| • | We may disclose your name, address and account and other identifying numbers, account balances, information about your pending or past transactions and other personal financial information to our affiliated entities for any purpose. |
| • | We regularly disclose your name, address and account and other identifying numbers, account balances and information about your pending or past transactions to our affiliates to execute, process and confirm securities transactions or mutual fund transactions for you, to administer and service your account and commingled investment vehicles in which you are invested, or to market our products and services to you. |
Information About Former Customers
We do not disclose nonpublic personal and financial information about former customers to nonaffiliated third parties unless required or requested to do so by a court order, judicial subpoena or regulatory inquiry, or otherwise where we believe in good faith that disclosure is required or permitted by law.
Questions
Should you have any questions about our Customer Privacy Policy, please contact us by email or by regular mail at the address at the end of this policy.
Reminder About TCW’s Financial Products
Financial products offered by The TCW Group, Inc. and its subsidiaries, the TCW Funds, Inc., TCW Strategic Income Fund, Inc., the Metropolitan West Funds, Sepulveda Management LLC and TCW Direct Lending.
| • | Are not guaranteed by a bank; |
127
Table of Contents
TCW Funds, Inc.
Privacy Policy (Continued)
| • | Are not obligations of The TCW Group, Inc. or of its subsidiaries; |
| • | Are not insured by the Federal Deposit Insurance Corporation; and |
| • | Are subject to investment risks, including possible loss of the principal amount committed or invested, and earnings thereon. |
THE TCW GROUP, INC.
TCW FUNDS, INC.
TCW STRATEGIC INCOME FUND, INC.
METROPOLITAN WEST FUNDS
SEPULVEDA MANAGEMENT LLC
TCW DIRECT LENDING LLC
TCW DIRECT LENDING VII LLC
Attention: Privacy Officer | 865 South Figueroa St. Suite 1800 | Los Angeles, CA 90017 |
email: privacy@tcw.com
128
Table of Contents
TCW Funds, Inc.
Renewal of Investment Advisory and Management Agreement (Unaudited)
TCW Funds, Inc. (the “Corporation”) and TCW Investment Management Company LLC (the “Advisor”) are parties to an Investment Advisory and Management Agreement (“Agreement”), pursuant to which the Advisor is responsible for managing the investments of each separate investment series (each, a “Fund” and collectively, the “Funds”) of the Corporation. Unless terminated by either party, the Agreement continues in effect from year to year provided that the continuance is specifically approved at least annually by the vote of the holders of at least a majority of the outstanding shares of the Funds, or by the Board of Directors of the Corporation (the “Board”), and, in either event, by a majority of the Directors who are not “interested persons” of the Corporation, as such term is defined in Section 2(a)(19) of the Investment Company Act of 1940, as amended (the “Independent Directors”), casting votes in person at a meeting called for that purpose.
On September 24, 2018, the Board approved the renewal of the Agreement for an additional one-year term from February 6, 2019 through February 5, 2020. The renewal of the Agreement was approved by the Board (including by a majority of the Independent Directors) upon the recommendation of the Independent Directors. The Independent Directors met separately by telephone on August 28, 2018, and in person on September 24, 2018, with their independent legal counsel to review and discuss the information that had been requested on their behalf by their independent legal counsel and presented by the Advisor for their consideration. The information, material facts, and conclusions that formed the basis for the Independent Directors’ recommendation and the Board’s subsequent approval are described below.
1. Information received
Materials reviewed — During the course of each year, the Directors receive a wide variety of materials relating to the services provided by the Advisor, including reports on the Advisor’s investment processes, as well as on each Fund’s investment results, portfolio composition, portfolio trading practices, compliance monitoring, shareholder services, and other information relating to the nature, extent, and quality of services provided by the Advisor to the Funds. In addition, the Board reviewed information furnished to the Independent Directors in response to a detailed request sent to the Advisor on their behalf. The information in the Advisor’s responses included extensive materials regarding each Fund’s investment results, advisory fee comparisons to advisory fees charged by the Advisor to its institutional clients, financial and profitability information regarding the Advisor, descriptions of various services provided to the Funds and to other advisory and sub-advisory clients, descriptions of functions such as compliance monitoring and portfolio trading practices, and information about the personnel providing investment management services to each Fund. The Directors also considered information provided by an independent data provider, Broadridge, comparing the investment performance and the fee and expense levels of each Fund to those of appropriate peer groups of mutual funds selected by Broadridge. After reviewing this information, the Directors requested additional financial, profitability and service information from the Advisor, which the Advisor provided and the Directors considered.
Review process — The Directors’ determinations were made on the basis of each Director’s business judgment after consideration of all the information presented. The Independent Directors were advised by their independent legal counsel throughout the renewal process and received and reviewed advice from their independent legal counsel regarding legal and industry standards applicable to the renewal of the Agreement, including a legal memorandum from their independent legal counsel discussing their fiduciary duties related to their approval of the continuation of the Agreement. The Independent Directors also discussed the renewal of the Agreement with the Advisor’s representatives and in private sessions at which
129
Table of Contents
TCW Funds, Inc.
Renewal of Investment Advisory and Management Agreement (Unaudited) (Continued)
no representatives of the Advisor were present. In deciding to recommend the renewal of the Agreement with respect to each Fund, the Independent Directors did not identify any single piece of information or particular factor that, in isolation, was the controlling factor. Each Independent Director may also have weighed factors differently. This summary describes the most important, but not all, of the factors considered by the Board and the Independent Directors.
2. Nature, extent, and quality of services provided by the Advisor
The Board and the Independent Directors considered the depth and quality of the Advisor’s investment management process, including its research and strong analytical capabilities; the experience, capability, and integrity of its senior management and other personnel; the relatively low turnover rates of its key personnel; the overall resources available to the Advisor; and the ability of its organizational structure to address the growth in assets over the past several years and withstand the recent decline in assets. The Board and the Independent Directors considered the ability of the Advisor to attract and retain well-qualified investment professionals, noting in particular the Advisor’s hiring of professionals in various areas over the past several years, continued upgrading of resources in its middle office and back office operations and other areas, as well as a continuing and extensive program of infrastructure and systems enhancements. The Board and the Independent Directors also considered that the Advisor made available to its investment professionals a variety of resources and systems relating to investment management, compliance, trading, operations, administration, research, portfolio accounting, and legal matters. They noted the substantial additional resources made available by The TCW Group, Inc., the parent company of the Advisor. The Board and the Independent Directors examined and discussed a detailed description of the extensive additional services provided to the Funds to support their operations and compliance, as compared to the much narrower range of services provided to the Advisor’s institutional and sub-advised clients, as well as the Advisor’s oversight and coordination of numerous outside service providers to the Funds. They further noted the high level of regular communication between the Advisor and the Independent Directors. The Advisor explained its responsibility to supervise the activities of the Funds’ various service providers, as well as supporting the Independent Directors and their meetings, regulatory filings, and various operational personnel, and the related costs.
The Board and the Independent Directors concluded that the nature, extent, and quality of the services provided by the Advisor are of a high quality and have benefited and should continue to benefit the Funds and their shareholders.
3. Investment results
The Board and the Independent Directors considered the investment results of each Fund in light of its investment objective(s) and principal investment strategies. They compared each Fund’s total returns with the total returns of other mutual funds in peer group reports prepared by Broadridge with respect to various longer and more recent periods all ended May 31, 2018. The Board and the Independent Directors reviewed information as to peer group selections presented by Broadridge and discussed the methodology for those selections with Broadridge. In reviewing each Fund’s relative performance, the Board and the Independent Directors took into account each Fund’s investment strategies, distinct characteristics, asset size and diversification.
The Board and the Independent Directors noted that most Funds’ performance was satisfactory over the relevant periods. The Board and the Independent Directors noted that investment performance of most of
130
Table of Contents
TCW Funds, Inc.
the Funds was generally close to or above the median performance of the applicable peer group during the three-year period emphasized by Broadridge in the supplemental materials, but seven Funds ranked in the fourth or fifth quintile of their peer groups for that three-year period. For those Funds that lagged peer group averages, they noted that the Advisor had discussed with the Board the reasons for the underperformance and the actions taken or to be taken by the Advisor to address the underperformance, and they indicated that they would continue to monitor portfolio investment performance on a regular basis and discuss with the Advisor from time to time any instances of long-term underperformance as appropriate. The Board and the Independent Directors noted that the performance of some Funds for periods when they lagged their peer group averages remained satisfactory when assessed on a risk-adjusted basis because performance quintiles do not necessarily reflect the degree of risk employed by peer funds to achieve their returns.
With respect to the fixed income Funds, the Board and the Independent Directors recognized the Advisor’s deliberate strategy to manage risk in light of its critical view of the fixed-income securities markets and overall investment market conditions at present and in the near term. For that reason, the Board and the Independent Directors believed that relative performance also should be considered in light of future market conditions expected by the Advisor. The Board and the Independent Directors noted the Advisor’s view that longer term performance can be more meaningful for active fixed income funds than shorter term performance because fixed income market cycles are generally longer than three years.
For the U.S. fixed income Funds, the Board and the Independent Directors noted the conservative profile of these Funds, which generally experienced less volatility compared to various other funds in the applicable peer group (except for the relative volatility of Total Return Bond Fund, which is a mortgage focused Fund). They also noted the Advisor’s conservative posture for these Funds with respect to credit and interest rate risks.
For the Total Return Bond Fund, the Board and the Independent Directors noted that the Fund’s performance was in the first quintile for the ten-year period and the second quintile for the five-, three- and one-year periods.
For the Core Fixed Income Fund, the Board and the Independent Directors noted that the Fund’s performance was in the first quintile for the ten-year period, the third quintile for the five-year period, the fourth quintile for the three-year period and the second quintile for the one-year period.
For the High Yield Bond Fund, the Board and the Independent Directors noted that the Fund’s performance was in the third quintile for the ten-year period and the second quintile for the five-, three- and one-year periods.
For the Global Bond Fund, the Board and the Independent Directors noted that the Fund’s performance was in the fourth quintile for the five- and three-year periods and the third quintile for the one-year period.
For the Short Term Bond Fund, the Board and the Independent Directors noted that the Fund’s performance was in the fourth quintile for the ten-, five- and three-year periods and the first quintile for the one-year period.
For the Enhanced Commodity Strategy Fund, the Board and the Independent Directors noted that the Fund’s performance was in the second quintile for the five-year period and the third quintile for the three- and one-year periods.
131
Table of Contents
TCW Funds, Inc.
Renewal of Investment Advisory and Management Agreement (Unaudited) (Continued)
With respect to the U.S. equity Funds, the Board and the Independent Directors noted that the performance of most Funds for the various periods reviewed ranked in the first, second or third quintiles.
The Select Equities Fund ranked in the fourth quintile for the five-year period.
The Relative Value Dividend Appreciation Fund ranked in the fourth quintile for the one-, three- and five-year periods. The Relative Value Large Cap Fund ranked in the fourth quintile for the one- and three-year periods. The Relative Value Mid Cap Fund ranked in the fourth quintile for the ten-year period. The Board and the Independent Directors noted the Advisor’s explanation that the diversification tool used to mitigate risk of the Relative Value Dividend Appreciation Fund and the Relative Value Large Cap Fund weighed on their near-term performance in a momentum-driven market and its opinion that each of the Relative Value Funds is well-positioned to excel in a strengthening economic environment.
The Global Real Estate Fund ranked in the fifth quintile for the one- and three-year periods, and while it ranked in the third quintile during the quarter ended June 30, 2018, the Board and the Independent Directors determined to continue to closely monitor its performance and did not believe any other immediate action was needed.
With respect to the international and emerging markets Funds, the Board and the Independent Directors noted that the performance of a majority of these Funds ranked in the first, second or third quintiles. The Developing Markets Equity Fund ranked in the fourth quintile for the period since inception, but ranked in the first quintile for the one-year period.
For the asset allocation Fund, the Board the Independent Directors noted that the Conservative Allocation Fund’s performance was in the first quintile for the ten-year period, the second quintile for the five-year period, the third quintile for the three-year period and the first quintile for the one-year period.
The Board and the Independent Directors concluded that the Advisor was implementing each Fund’s investment objective(s) and that the Advisor’s record in managing the Funds indicated that its continued management should benefit each Fund and its shareholders over the long term.
4. Advisory fees and total expenses
The Board and the Independent Directors compared the management fees (which Broadridge defines to include the advisory fee and the administrative fee) and total expenses of each Fund (each as a percentage of average net assets) with the median management fee and operating expense level of the other mutual funds in the relevant Broadridge peer groups. These comparisons assisted the Board and the Independent Directors by providing a reasonable statistical measure to assess each Fund’s fees relative to its relevant peers. The Board and the Independent Directors observed that each Fund’s management fee, after giving effect to applicable waivers and/or reimbursements, was below or near the median of the peer group funds on a current basis, with the exception of the Select Equities Fund, the Emerging Markets Income Fund and the Emerging Markets Local Currency Income Fund. They also observed that each Fund’s total expenses, after giving effect to applicable waivers and/or reimbursements, were below or near the median of the peer group funds, with the exception of the Global Bond Fund primarily due to its smaller size relative to most of the other funds in the peer group. The Board and the Independent Directors also noted the contractual expense limitations to which the Advisor has agreed with respect to each Fund and that the Advisor historically has absorbed any expenses in excess of these limits. The Board and the Independent Directors noted that for several Funds, their below-median management fee and total expenses were in part due to substantial waiver and/or reimbursement pursuant to the contractual expense limitations. The Board and
132
Table of Contents
TCW Funds, Inc.
the Independent Directors concluded that the competitive fees charged by the Advisor, and competitive expense ratios, should continue to benefit each Fund and its shareholders.
The Board and the Independent Directors also reviewed information regarding the advisory fees charged by the Advisor to its institutional and sub-advisory clients with similar investment mandates. The Board and the Independent Directors concluded that, although the fees paid by those clients generally were lower than advisory fees paid by the Funds, the differences appropriately reflected the more extensive services provided by the Advisor to the Funds and the Advisor’s significantly greater responsibilities and expenses with respect to the Funds, including the additional time spent by portfolio managers for reasons such as managing the more active cash flows from purchases and redemptions by shareholders, the additional risks of managing a pool of assets for public investors, administrative burdens, daily pricing, valuation and liquidity responsibilities, the supervision of vendors and service providers, and the costs of additional infrastructure and operational resources and personnel and of complying with and supporting the more comprehensive regulatory and governance regime applicable to mutual funds.
5. The Advisor’s costs, level of profits, and economies of scale
The Board and the Independent Directors reviewed information regarding the Advisor’s costs of providing services to the Funds, as well as the resulting level of profits to the Advisor. They reviewed the Advisor’s stated assumptions and methods of allocating certain costs, such as personnel costs, which constitute the Advisor’s largest operating cost. The Board and the Independent Directors recognized that the Advisor should be entitled to earn a reasonable level of profits for the services that it provides to each Fund. The Board and the Independent Directors also reviewed a comparison of the Advisor’s profitability with respect to the Funds to the profitability of certain unaffiliated publicly traded asset managers, which the Advisor believed supported its view that the Advisor’s profitability was reasonable. Based on their review, the Board and the Independent Directors concluded that they were satisfied that the Advisor’s level of profitability from its relationship with each Fund was not unreasonable or excessive.
The Board and the Independent Directors considered the extent to which potential economies of scale could be realized as the Funds grow and whether the advisory fees reflect those potential economies of scale. They recognized that the advisory fees for the Funds do not have breakpoints, which would otherwise result in lower advisory fee rates as the Funds grow larger. They also recognized the Advisor’s view that the advisory fees compare favorably to peer group fees and expenses and remain competitive even at higher asset levels and that the relatively low advisory fees reflect the potential economies of scale. The Board and the Independent Directors recognized the benefits of the Advisor’s substantial past and on-going investment in the advisory business, such as successfully recruiting and retaining key professional talent, systems and technology upgrades, added resources dedicated to legal and compliance programs, and improvements to the overall firm infrastructure, as well as the financial pressures of competing against much larger firms and passive investment products. The Board and the Independent Directors further noted the Advisor’s past and continuing subsidies of the Funds’ operating expenses when they were newer and smaller and the Advisor’s commitment to maintain reasonable overall operating expenses for each Fund. The Board and the Independent Directors also recognized that the Funds benefit from receiving investment advice from an organization with other types of advisory clients in addition to mutual funds. The Board and the Independent Directors concluded that the Advisor was satisfactorily sharing potential economies of scale with the Funds through low fees and expenses, and through reinvesting in its capabilities for serving the Funds and their shareholders.
133
Table of Contents
TCW Funds, Inc.
Renewal of Investment Advisory and Management Agreement (Unaudited) (Continued)
6. Ancillary benefits
The Board and the Independent Directors also considered ancillary benefits received or to be received by the Advisor and its affiliates as a result of the relationship of the Advisor with the Funds, including compensation for certain compliance support services. The Board and the Independent Directors noted that, in addition to the fees the Advisor receives under the Agreement, the Advisor receives additional benefits in connection with management of the Funds in the form of reports, research and other services from brokers and their affiliates in return for brokerage commissions paid to such brokers. The Board and the Independent Directors concluded that any potential benefits received or to be derived by the Advisor from its relationships with the Funds are reasonably related to the services provided by the Advisor to the Funds.
7. Conclusions
Based on their overall review, including their consideration of each of the factors referred to above (and others), the Board and the Independent Directors concluded that the Agreement is fair and reasonable to each Fund and its shareholders, that each Fund’s shareholders received reasonable value in return for the advisory fees and other amounts paid to the Advisor by each Fund, and that the renewal of the Agreement was in the best interests of each Fund and its shareholders.
134
Table of Contents
TCW Funds, Inc.
Supplemental Information
The policies and procedures that the Company uses to determine how to vote proxies are available without charge. The Board has delegated the Company’s proxy voting authority to the Advisor.
Disclosure of Proxy Voting Guidelines
The proxy voting guidelines of the Advisor are available:
| 1. | By calling 800-FUND-TCW (800-386-3829) to obtain a hard copy; or |
| 2. | By going to the SEC website at http://www.sec.gov. |
When the Company receives a request for a description of the Advisor’s proxy voting guidelines, it will deliver the description that is disclosed in the Company’s Statement of Additional Information. This information will be sent out via first class mail (or other means designed to ensure equally prompt delivery) within three business days of receiving the request.
The Advisor, on behalf of the Company, prepares and files Form N-PX with the SEC not later than August 31 of each year, which includes the Company’s proxy voting record for the most recent twelve-month period ended June 30 of that year. The Company’s proxy voting record for the most recent twelve-month period ended June 30 is available:
| 1. | By calling 800-FUND-TCW (800-386-3829) to obtain a hard copy; or |
| 2. | By going to the SEC website at http://www.sec.gov. |
When the Company receives a request for the Company’s proxy voting record, it will send the information disclosed in the Company’s most recently filed report on Form N-PX via first class mail (or other means designed to ensure equally prompt delivery) within three business days of receiving the request.
The Company also discloses its proxy voting record on its website as soon as is reasonably practicable after its report on Form N-PX is filed with the SEC.
Filing of Quarterly Portfolio Schedule
The Company files a complete schedule of its portfolio holdings with the SEC for the first and third quarters of its fiscal year on Form N-Q.
135
Table of Contents
TCW Funds, Inc.
Directors and Officers of the Company
A board of eight directors is responsible for overseeing the operations of the Company, which consists of 19 Funds at October 31, 2018. The directors of the Company, and their business addresses and their principal occupation for the last five years are set forth below.
Independent Directors
Name, and Year of Birth (1) | Term of Office and Length of Time Served | Principal Occupation(s) During Past 5 Years | Other Directorships held by Director | |||
| Samuel P. Bell (1936) | Indefinite term; Mr. Bell has served as a director of TCW Funds, Inc. since October 2002. | Private Investor. | Point 360 (post production services); TCW Strategic Income Fund, Inc. (closed-end fund). | |||
Patrick C. Haden (1953) Chairman of the Board | Indefinite term; Mr. Haden has served as a director of TCW Funds, Inc. since May 2001. | President (since 2003), Wilson Ave. Consulting (business consulting firm); Senior Advisor to President (July 2016-June 2017) and Athletic Director (August 2010-June 2016), University of Southern California. | Tetra Tech, Inc. (environmental consulting); Auto Club (affiliate of AAA); Metropolitan West Funds (mutual fund); TCW Strategic Income Fund, Inc. (closed end fund). | |||
| Peter McMillan (1957) | Indefinite term; Mr. McMillan has served as a director of TCW Funds, Inc. since August 2010. | Co-founder, Managing Partner and Chief Investment Officer (since May 2013), Temescal Canyon Partners (investment advisory firm); Co-founder and Managing Partner (since 2000), Willowbrook Capital Group, LLC (investment advisory firm); Co-founder and Executive Vice President (since 2005), KBS Capital Advisors (a manager of real estate investment trusts). | KBS Real Estate Investment Trusts (real estate investments); KBS Strategic Opportunity REITS (real estate investments); Metropolitan West Funds (mutual funds); TCW Strategic Income Fund, Inc. (closed-end fund). | |||
| Charles A. Parker (1934) | Indefinite term; Mr. Parker has served as a director of the TCW Funds, Inc. since April 2003. | Private Investor. | Burridge Center for Research in Security Prices (University of Colorado); TCW Strategic Income Fund, Inc. (closed-end fund). | |||
| Victoria B. Rogers (1961) | Indefinite term; Ms. Rogers has served as a director of the TCW Funds, Inc. since October 2011. | President (since 1996), The Rose Hills Foundation (charitable foundation). | Causeway Capital Management Trust (mutual fund); TCW Strategic Income Fund, Inc. (closed-end fund). | |||
| Andrew Tarica (1959) | Indefinite term; Mr. Tarica has served as a director of the TCW Funds, Inc. since March 2012. | Chief Executive Officer (since February 2001), Meadowbrook Capital Management (asset management company); Employee (since 2003), Cowen & Co. (broker-dealer). | Metropolitan West Funds (mutual fund); TCW Strategic Income Fund, Inc. (closed-end fund); TCW Direct Lending VII, LLC (business development company). |
| (1) | The address of each Independent Director is c/o Morgan Lewis, & Bockius LLP, Counsel to the Independent Directors, 300 South Grand Avenue 22nd Floor, Los Angeles, CA 90071. |
136
Table of Contents
TCW Funds, Inc.
Interested Directors
These directors are “interested persons” of the Company as defined in the 1940 Act because they are directors and officers of the Advisor, and shareholders and directors of The TCW Group, Inc., the parent company of the Advisor.
Name and Year of Birth | Term of Office and Length of Time Served | Principal Occupation(s) During Past 5 Years (1) | Other Directorships held by Director | |||
| Marc I. Stern (1944) | Indefinite term; Mr. Stern has served as a director since inception of TCW Funds, Inc. in September 1992. | Chairman (since January 2016), TCW LLC; Chairman (since February 2013), The TCW Group, Inc., TCW Investment Management Company, TCW Asset Management Company and Metropolitan West Asset Management. | Qualcomm Incorporated (wireless communications) | |||
| David S. DeVito (1962) | Indefinite term; Mr. DeVito has served as a director since January 2014. | Executive Vice President and Chief Operating Officer (since January 2016), TCW LLC; Executive Vice President and Chief Operating Officer (since October 2013), TCW Investment Management Company LLC, The TCW Group, Inc., Metropolitan West Asset Management, LLC and TCW Asset Management Company LLC; President and Chief Executive Officer (since January 2014), TCW Strategic Income Fund, Inc.; Treasurer, Principal Financial Officer and Principal Accounting Officer (since 2010), Metropolitan West Funds. | TCW Strategic Income Fund, Inc. (closed-end fund) |
| (1) | Positions with The TCW Group, Inc. and its affiliates may have changed over time. |
The officers of the Company who are not directors of the Company are:
| Name and Year of Birth | Position(s) Held with Company | Principal Occupation(s) During Past 5 Years (1) | ||
| Lisa Eisen (1963) | Tax Officer | Tax Officer (since December 2016), Metropolitan West Funds and TCW Strategic Income Fund, Inc.; Managing Director and Director of Tax (since August 2016), TCW, LLC; Vice President of Corporate Tax and Payroll for Health Net, Inc. (1998 – July 2016). |
137
Table of Contents
TCW Funds, Inc.
Directors and Officers of the Company (Continued)
| Name and Year of Birth | Position(s) Held with Company | Principal Occupation(s) During Past 5 Years (1) | ||
| Meredith S. Jackson (1959) | Senior Vice President, General Counsel and Secretary | Executive Vice President, General Counsel and Secretary (since January 2016), TCW LLC; Executive Vice President, General Counsel and Secretary (since February 2013), TCW Investment Management Company, The TCW Group Inc., TCW Asset Management Company and Metropolitan West Asset Management; Senior Vice President, General Counsel and Secretary (since February 2013), TCW Strategic Income Fund, Inc.; Vice President and Secretary (since February 2013), Metropolitan West Funds; Partner and Chair of the Debt Finance Practice Group (1999 – January 2013), Irell & Manella (law firm). | ||
| Jeffrey Engelsman (1967) | Chief Compliance Officer since September 2014 and AML Officer since December 2016 | AML Officer (since December 2016), Metropolitan West Funds, and TCW Strategic Income Fund, Inc.; Global Chief Compliance Officer (since January 2016), TCW LLC; Chief Compliance Officer (since 2014), Metropolitan West Funds and TCW Strategic Income Fund, Inc.; Managing Director, Global Chief Compliance Officer (since August 2014), TCW Investment Management Company LLC, TCW Asset Management, LLC and Metropolitan West Asset Management, LLC; Global Chief Compliance Officer (since September 2014), The TCW Group, Inc.; Chief Compliance Officer (2009 – August 2014), MainStay Funds (mutual fund); Managing Director (2009 – July 2014), New York Life Investments (investment management). | ||
| Richard Villa (1964) | Treasurer and Principal Financial and Accounting Officer | Managing Director, Chief Financial Officer and Assistant Secretary (since January 2016), TCW LLC; Treasurer and Chief Financial Officer (since January 2014), TCW Strategic Income Fund, Inc.; Managing Director and Chief Financial Officer (since July 2008), TCW Investment Management Company, the TCW Group, Inc., TCW Asset Management Company LLC, and Metropolitan West Asset Management LLC. |
| (1) | Positions with The TCW Group, Inc. and its affiliates may have changed over time. |
| * | Address is 865 South Figueroa Street, 18th Floor, Los Angeles, California 90017 |
In addition, George N. Winn, Senior Vice President of TCW Asset Management Company LLC, Metropolitan West Asset Management, LLC, TCW LLC and the Advisor, is Assistant Treasurer of the Company; and Patrick W. Dennis, Senior Vice President, Associate General Counsel and Assistant Secretary of TCW Asset Management Company LLC, Metropolitan West Asset Management, LLC, TCW LLC and the Advisor, is Vice President and Assistant Secretary of the Company.
The SAI (Statement of Additional Information) has additional information regarding the Board of Directors. A copy is available without charge by calling 1-800-FUND-TCW (1-800-386-3829) to obtain a hard copy or by going to the SEC website at http://www.sec.gov.
138
Table of Contents
TCW Funds, Inc.
Disclaimers for Use of Bloomberg Barclays Indexes
BARCLAYS is a trademark and service mark of Barclays Bank Plc, used under license. Barclays Capital Inc. and its affiliates (“Barclays”) is not the issuer or producer of TCW Funds, Inc. and Barclays has no responsibilities, obligations or duties to investors in TCW Funds, Inc. (the “Funds”). Barclays’ only relationship with the Funds is the licensing of the BARCLAYS mark as part of the name of the respective Barclays Indexes, which Barclays does not determine, compose or calculate. Additionally, the Funds may for itself execute transaction(s) with Barclays in or relating to the Indexes used in connection with the Funds. Investors who acquire the Funds neither acquire any interest in the Indexes nor enter into any relationship of any kind whatsoever with Barclays upon making an investment in the Funds. The Funds are not sponsored, endorsed, sold or promoted by Barclays. Barclays does not make any representation or warranty, express or implied regarding the advisability of investing in the Funds or the advisability of investing in securities generally or the ability of the Indexes to track corresponding or relative market performance. Barclays has not passed on the legality or suitability of the Funds with respect to any person or entity. Barclays is not responsible for and has not participated in the determination of the timing of, prices at, or quantities of the Funds to be issued. Barclays has no obligation or liability in connection with administration, marketing or trading of the Funds.
The licensing agreement between Bloomberg and Barclays is solely for the benefit of Bloomberg and Barclays and not for the benefit of the owners of the Funds’ investors or other third parties.
BARCLAYS SHALL HAVE NO LIABILITY TO THE ISSUER, INVESTORS OR TO OTHER THIRD PARTIES FOR THE QUALITY, ACCURACY AND/OR COMPLETENESS OF THE INDEXES OR ANY DATA INCLUDED THEREIN OR FOR INTERRUPTIONS IN THE DELIVERY OF THE INDEXES. BARCLAYS MAKES NO WARRANTY, EXPRESS OR IMPLIED, AS TO RESULTS TO BE OBTAINED BY THE ISSUER, THE INVESTORS OR ANY OTHER PERSON OR ENTITY FROM THE USE OF THE INDEXES OR ANY DATA INCLUDED THEREIN. BARCLAYS MAKES NO EXPRESS OR IMPLIED WARRANTIES, AND HEREBY EXPRESSLY DISCLAIMS ALL WARRANTIES OF MERCHANTABILITY OR FITNESS FOR A PARTICULAR PURPOSE OR USE WITH RESPECT TO THE INDEXES OR ANY DATA INCLUDED THEREIN. BARCLAYS DOES NOT CALCULATE OR PUBLISH THE BLOOMBERG BARCLAYS INDEXES AND SHALL NOT BE LIABLE FOR ANY MISCALCULATION OF OR ANY INCORRECT, DELAYED OR INTERRUPTED PUBLICATION WITH RESPECT TO ANY OF THE BLOOMBERG BARCLAYS INDEXES. BARCLAYS SHALL NOT BE LIABLE FOR ANY DAMAGES, INCLUDING, WITHOUT LIMITATION, ANY SPECIAL, INDIRECT OR CONSEQUENTIAL DAMAGES, OR ANY LOST PROFITS AND EVEN IF ADVISED OF THE POSSIBILITY OF SUCH, RESULTING FROM THE USE OF THE INDEXES OR ANY DATA INCLUDED THEREIN OR WITH RESPECT TO THE FUNDS.
None of the information supplied by Barclays and used in this publication may be reproduced in any manner without the prior written permission of Barclays Capital, the investment banking division of Barclays Bank Plc. Barclays Bank Plc is registered in England No. 1026167. Registered office 1 Churchill Place London E14 5HP.
BLOOMBERG is a trademark and service mark of Bloomberg Finance L.P. Bloomberg Finance L.P. and its affiliates (collectively, “Bloomberg”) or Bloomberg’s licensors own all proprietary right in the Barclays Indexes. Bloomberg does not guarantee the timeliness, accuracy or completeness of any data or information relating to the Indexes. Bloomberg makes no warranty, express or implied, as to the Indexes or any data or values relating thereto or results to be obtained therefrom, and expressly disclaims all warranties of merchantability and fitness for a particular purpose with respect thereto. It is not possible to
139
Table of Contents
TCW Funds, Inc.
Disclaimers for Use of Bloomberg Barclays Indexes (Continued)
invest directly in an index. Back-tested performance is not actual performance. To the maximum extent allowed by law, Bloomberg, its licensors, and its and their respective employees, contractors, agents, suppliers and vendors shall have no liability or responsibility whatsoever for any injury or damages — whether direct, indirect, consequential, incidental, punitive or otherwise — arising in connection with Indexes or any data or values relating thereto — whether arising from their negligence or otherwise. Nothing in the Indexes shall constitute or be construed as an offering of financial instruments or as investment advice or investment recommendations (i.e., recommendations as to whether or not to “buy”, “sell”, “hold”, or to enter or not to enter into any other transaction involving any specific interest or interests) by Bloomberg or its affiliates or a recommendation as to an investment or other strategy by Bloomberg or its affiliates. Data and other information available via the Indexes should not be considered as information sufficient upon which to base an investment decision. All information provided by the Indexes is impersonal and not tailored to the needs of any person, entity or group of persons. Bloomberg and its affiliates do not express an opinion on the future or expected value of any security or other interest and do not explicitly or implicitly recommend or suggest an investment strategy of any kind.
The only relationship of Bloomberg or any of its subsidiaries or affiliates to the Funds is the licensing of certain trademarks, trade names and service marks and of the Indexes, which is determined, composed and calculated by Bloomberg without regard to the Funds. Bloomberg has no obligation to take the needs of the Funds or the owners of the Funds into consideration in determining, composing or calculating the Indexes. The Funds are not sponsored, endorsed, sold or promoted by Bloomberg or any of its subsidiaries or affiliates.
140
Table of Contents
TCW Funds, Inc.
865 South Figueroa Street
Los Angeles, California 90017
800 FUND TCW
(800 386 3829)
www.TCW.com
INVESTMENT ADVISOR
TCW Investment Management Company LLC
865 South Figueroa Street
Los Angeles, California 90017
TRANSFER AGENT
U.S. Bancorp Fund Services, LLC
615 E. Michigan Street
Milwaukee, Wisconsin 53202
INDEPENDENT REGISTERED PUBLIC ACCOUNTING FIRM
Deloitte & Touche LLP
555 West 5th Street
Los Angeles, California 90013
CUSTODIAN & ADMINISTRATOR
State Street Bank & Trust Company
One Lincoln Street
Boston, Massachusetts 02111
DISTRIBUTOR
TCW Funds Distributors LLC
865 South Figueroa Street
Los Angeles, California 90017
DIRECTORS
Patrick C. Haden
Director and Chairman of the Board
Samuel P. Bell
Director
David S. DeVito
Director
Peter McMillan
Director
Charles A. Parker
Director
Victoria B. Rogers
Director
Marc I. Stern
Director
Andrew Tarica
Director
OFFICERS
David S. DeVito
President and Chief Executive Officer
Meredith S. Jackson
Senior Vice President,
General Counsel and Secretary
Richard M. Villa
Treasurer and Principal Financial and Accounting Officer
Jeffrey A. Engelsman
Chief Compliance Officer and Anti-Money Laundering Officer
Patrick W. Dennis
Vice President and Assistant Secretary
Lisa Eisen
Tax Officer
George N. Winn
Assistant Treasurer
TCW FAMILY OF FUNDS
EQUITY FUNDS
TCW Artificial Intelligence Equity Fund
TCW Global Real Estate Fund
TCW New America Premier Equities Fund
TCW Relative Value Dividend Appreciation Fund
TCW Relative Value Large Cap Fund
TCW Relative Value Mid Cap Fund
TCW Select Equities Fund
ASSET ALLOCATION FUND
TCW Conservative Allocation Fund
FIXED INCOME FUNDS
TCW Core Fixed Income Fund
TCW Enhanced Commodity Strategy Fund
TCW Global Bond Fund
TCW High Yield Bond Fund
TCW Short Term Bond Fund
TCW Total Return Bond Fund
INTERNATIONAL FUNDS
TCW Developing Markets Equity Fund
TCW Emerging Markets Income Fund
TCW Emerging Markets Local Currency Income Fund
TCW Emerging Markets Multi-Asset Opportunities Fund
TCW International Small Cap Fund
FUNDarFI1018
Table of Contents

OCTOBER 31

A N N U A L
R E P O R T
INTERNATIONAL FUNDS
TCW Developing Markets Equity Fund
TCW Emerging Markets Income Fund
TCW Emerging Markets Local Currency Income Fund
TCW Emerging Markets Multi-Asset Opportunities Fund
TCW International Small Cap Fund
Table of Contents
TCW Funds, Inc.
| 1 | ||||
| 2 | ||||
| 12 | ||||
| 12 | ||||
| 16 | ||||
| 24 | ||||
| 29 | ||||
| 41 | ||||
| 47 | ||||
| 48 | ||||
| 49 | ||||
| 52 | ||||
| 74 | ||||
| 84 | ||||
| 85 | ||||
| 87 | ||||
| 90 | ||||
Proxy Voting Guidelines and Availability of Quarterly Portfolio Schedule | 96 | |||
| 97 | ||||
| 98 | ||||
Table of Contents
| The Letter to Shareholders and/or Management Discussions contained in this Annual Report are the opinions of each Fund’s portfolio managers and are not the opinions of TCW Funds, Inc. or its Board of Directors. Various matters discussed in the Letter to Shareholders and/or Management Discussions constitute forward-looking statements within the meaning of the federal securities laws. Actual results and the timing of certain events could differ materially from those projected or contemplated by these forward-looking statements due to a number of factors, including general economic conditions, overall availability of securities for investment by a Fund, the level of volatility in the securities markets and in the share price of a Fund, and other risk factors discussed in the SEC filings of TCW Funds, Inc. The data presented in the Letter to Shareholders and/or Management Discussions represents past performance and cannot be used to predict future results. |
Table of Contents
|
| David S. DeVito President, Chief Executive Officer and Director |

Dear Valued Investors,
I am pleased to present the annual report for the TCW Funds, Inc. covering the 12-month period ended October 31, 2018. I would like to express our appreciation for your continued investment in the TCW Funds as well as welcome new shareholders to our fund family. As of October 31, 2018, the TCW Funds held total net assets of approximately $15 billion.
This report contains information and portfolio management discussions of our TCW International Funds.
The International Markets
Late 2017 and early 2018 were characterized by synchronous global growth, an environment that has historically benefitted international markets. However, as the year progressed, the synchronous growth story was called into question amidst weaker-than-expected growth data in Europe and several Emerging Markets countries against stronger US growth. The weaker international growth story helped drive a stronger dollar, and that, along with tighter financial conditions, trade fears and various idiosyncratic domestic challenges put pressure on international assets.
We believe that a recovery for International Markets is centered around 1) stabilization in China and Europe and 2) a weaker dollar environment. In our view, we will start to see the impact of various Chinese stimulus measures during the first half of 2019, and are starting to see more constructive rhetoric around both Brexit and the Italian budget. In addition, we see scope for dollar strength to wane as the spread between growth in the U.S. and the rest of the world begins to narrow and the market turns its attention away from cyclical factors and starts to focus more on structural issues.
As such, we are starting to see interesting opportunities within international markets, particularly within Emerging Markets, given the extent of the repricing in 2018. In
particular, Emerging Markets debt remains cheap relative to developed markets debt, but is also moderately cheap relative to its own history, one of very few asset classes about which this can be said.
Trade tensions and a broader slowdown in global growth remain risks that we are monitoring closely. As such, differentiating between credits will remain critical to alpha generation.
TCW Emerging Markets Income Fund Receives 2018 Thomson Reuters Lipper Fund Award
On February 28, 2018, the TCW Emerging Markets Income Fund (TGEIX) was honored in the 2018 Lipper Fund Awards and named best emerging markets hard currency debt fund for the ten-year period ended 12/31/17. The Thomson Reuters Lipper Fund Awards, granted annually, highlight funds and fund companies that have excelled in delivering consistently strong risk-adjusted performance relative to their peers.
We know that you have many choices when it comes to the management of your financial assets. On behalf of everyone at TCW, I would like to thank you for making the TCW Funds part of your long-term investment plan. We truly value our relationship with you. If you have any questions or require further information, I invite you to visit our website at www.tcw.com, or call our shareholder services department at 800-386-3829.
I look forward to further correspondence with you through our semi-annual report next year.
Sincerely,

David S. DeVito
President, Chief Executive Officer and Director
1
Table of Contents
TCW Developing Markets Equity Fund
Management Discussions
For the year ended October 31, 2018, the TCW Developing Markets Equity Fund (the “Fund”) returned negative 15.51% on both I Class and N Class shares. The Fund’s benchmark, the MSCI Emerging Markets Net Total Return Index, returned negative 12.52% over the same period.
Underperformance primarily occurred during the latter few months of the period, as a sharp growth to value rotation and an increase in trade tensions had a pronounced negative impact on the Fund’s China exposure, as well as some of the longer term structural growth holdings in the consumer, technology, media and telecom (TMT) and healthcare sectors. Our commodities exposure in Asia also underperformed on the back of fears of a China slowdown. We adjusted the portfolio to add value stocks, but missed part of this rotation.
Late 2017 and early 2018 were characterized by synchronous global growth, an environment that has historically benefitted Emerging Markets (EM). However, as the year progressed, the synchronous growth story was called into question amidst weaker-than-expected growth data in Europe and several EM countries against stronger US growth. The weaker international growth story helped drive a stronger dollar, and that, along with tighter financial conditions, trade fears and various EM domestic challenges put significant pressure on EM equities.
Looking ahead, the overall EM outlook appears to be less uniform than before with some large EM economies slowing into 2019 (e.g., China, Turkey and Argentina), others accelerating (e.g., Brazil and South Africa), and many looking to be relatively unchanged (e.g., India, Indonesia, and Russia). That will present differentiated opportunities, in our view.
We believe that a recovery for EM equities is centered around 1) stabilization in China and 2) a weaker dollar environment. While we have lowered our growth forecast for 2019, and expect a continuation of trade tensions in the near-term, we do not envision a hard landing in China. In our view, we will start to see the impact of various stimulus measures during the first half of 2019 with full year growth likely to be in the 5.75-6.25% range. Consolidating our forecasts for growth in individual EM countries, we expect overall EM growth in 2019 to be comparable to 2018. This compares with our expectation that developing markets (DM) growth in 2019 will come in slightly below the 2018 level as the impact of fiscal stimulus in the US begins to fade.
In addition, we believe that dollar strength will begin to wane as the spread between growth in the U.S. and the rest of the world begins to narrow and the market turns its attention away from cyclical factors and starts to focus more on structural issues (rising U.S. current account and fiscal deficits). Given the divide in Congress, we think there will be less of a chance of additional and broader US fiscal stimulus next year, and therefore a higher probability of our base case of US growth slowing next year, and less upward pressure on US interest rates and the US dollar.
We certainly see value at current levels and believe that 2019 will present opportunities to add risk. The Fund’s forward P/E ratio is above that of the benchmark, but consistent with our bias for quality growth, has a substantially better earnings growth outlook and earnings revisions dynamic, and higher return on equity (ROE) and free cash flow yields.
We continue to focus on idiosyncratic long-term growth stories at attractive valuations, and believe differentiating between companies will continue to be key in EM. Country and security selection will be crucial to performance, driven by factors such as reform momentum, terms of trade, and the central bank reaction function. In our view, there will be significant dispersion in returns going forward, allowing for an actively managed portfolio to capture attractive returns in those securities best positioned for the current evolving environment.
2
Table of Contents
TCW Developing Markets Equity Fund
Management Discussions (Continued)
| Annualized Return(1) | ||||||||||||
| Fund Name | 1 Yr Return | 3 Yr Return | Inception to Date | |||||||||
TCW Developing Markets Equity Fund | ||||||||||||
Class I (Inception: 06/30/2015) | (15.51 | )% | 3.42 | % | (1.41 | )% | ||||||
Class N (Inception: 06/30/2015) | (15.51 | )% | 3.42 | % | (1.41 | )% | ||||||
MSCI Emerging Markets Net Total Return Index | (12.52 | )% | 6.52 | % | 1.85 | % | ||||||
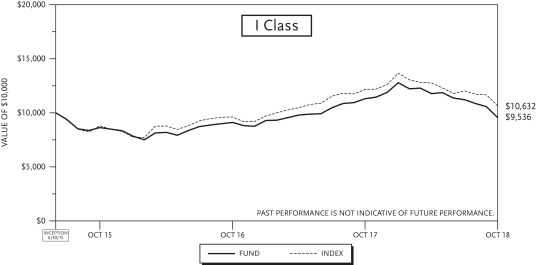
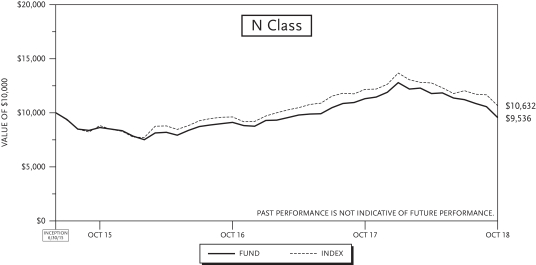
| (1) | The total returns do not reflect taxes that a shareholder would pay on fund distributions or on the redemption of fund shares. |
3
Table of Contents
TCW Emerging Markets Income Fund
Management Discussions
For the year ended October 31, 2018, the TCW Emerging Markets Income Fund (the “Fund”) returned negative 4.85% and negative 5.16% net on its I Class and N Class shares, respectively. The performance of the Fund’s classes varies because of differing expenses. The Fund’s benchmark, the JP Morgan EMBI Global Diversified Index, returned negative 4.39% over the same period.
Underperformance during the period was driven by overweight positioning and security selection in Argentina. We have maintained the overweight in light of its recent International Monetary Fund (IMF) agreement as well as the Argentine administration’s various measures to reduce fiscal imbalances. On the other hand, overweight positioning and an emphasis on corporates in Brazil, as well as opportunistic local currency positions in Nigeria and Egypt, contributed to relative outperformance versus the benchmark.
Late 2017 and early 2018 were characterized by synchronous global growth, an environment that has historically benefitted emerging markets (EM). However, as the year progressed, the synchronous growth story was called into question amidst weaker-than-expected growth data in Europe and several Emerging Markets countries against stronger US growth. The weaker growth story, along with tighter financial conditions, a stronger dollar, trade fears and various EM domestic challenges put further pressure on Emerging Markets debt.
Looking ahead, the overall EM outlook appears to be less uniform than before with some large EM economies slowing into 2019 (e.g., China, Turkey and Argentina), others accelerating (e.g., Brazil and South Africa), and many looking to be relatively unchanged (e.g., India, Indonesia, and Russia). That will present differentiated opportunities, in our view.
We believe that a recovery for Emerging Markets is centered around stabilization in China. While we have lowered our growth forecast for 2019, and expect a continuation of trade tensions in the near-term, we do not envision a hard landing in China. We believe we will start to see the impact of various stimulus measures during the first half of 2019 with full year growth likely to be in the 5.75-6.25% range. Consolidating our forecasts for growth in individual EM countries, we expect overall EM growth in 2019 to be comparable to 2018. This compares with our expectation that developing markets (DM) growth in 2019 will come in slightly below the 2018 level as the impact of fiscal stimulus in the US begins to fade.
We have had a significant repricing in both the dollar-denominated and local currency markets. Emerging Markets dollar-denominated debt spreads are over 110 bps wider from the tight spreads of late January 2018. At the beginning of the year, we felt that credit spreads globally were tight, and that there was more of a relative value story between EM and DM credit. Now, it appears that not only is EM debt still cheap relative to DM debt, but EM debt is also moderately cheap relative to its own history, one of very few asset classes about which this can be said.
In addition, EM local currency debt has borne the brunt of the weakness this year, as typically a pickup in U.S. growth relative to other parts of the world tends to benefit the US dollar. We certainly see value at current levels. What prevents us from adding local currency risk in a significant way at this point is the uncertainty around U.S. trade policy and the resulting volatility — this year, EM currency volatility hit its highest level since 2001. However, we believe that US dollar strength will begin to wane as the spread between growth in the U.S. and the rest of the world begins to narrow and the market turns its attention away from cyclical factors and starts to focus more on structural issues (rising U.S. current account and fiscal deficits). Given the divide in Congress, we think there will be less of a chance of additional and broader US fiscal stimulus next year, and therefore a higher probability of our base case of US growth slowing next year, and less upward pressure on US interest rates and the US dollar.
4
Table of Contents
TCW Emerging Markets Income Fund
Management Discussions (Continued)
Emerging Markets debt represents approximately 16% of global fixed income. Notably, throughout the year we continued to see investor interest to add exposure, taking advantage of the recent downtrade to reduce underweights to the asset class.
| Annualized Return(1) | ||||||||||||||||||||||||
| Fund Name | 1 Yr Return | 3 Yr Return | 5 Yr Return | 10 Yr Return | Inception to Date | Inception Index | ||||||||||||||||||
TCW Emerging Markets Income Fund | ||||||||||||||||||||||||
Class I (Inception: 09/01/1996 | (4.85 | )% | 5.49 | % | 3.15 | % | 10.54 | % | 8.94 | %(2) | 8.86 | % | ||||||||||||
Class N (Inception: 02/27/2004 | (5.16 | )% | 5.19 | % | 2.84 | % | 10.24 | % | 7.29 | % | 7.06 | % | ||||||||||||
JPMorgan EMBI Global Diversified Index | (4.39 | )% | 4.33 | % | 4.35 | % | 9.20 | % | ||||||||||||||||

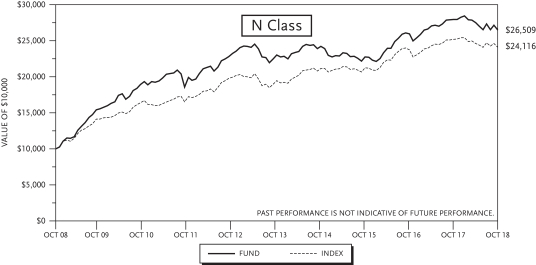
| (1) | The total returns do not reflect taxes that a shareholder would pay on fund distributions or on the redemption of fund shares. |
| (2) | Performance data includes the performance of the predecessor entity for periods before the Fund’s registration became effective. The predecessor entity was not registered under the 1940 Act, and therefore, was not subject to certain investment restrictions that we imposed by the 1940 Act. If the predecessor entity had been registered under the 1940 Act, the predecessor entity’s performance may have been lower. |
5
Table of Contents
TCW Emerging Markets Local Currency Income Fund
Management Discussions
For the year ended October 31, 2018, the TCW Emerging Markets Local Currency Income Fund (the “Fund”) returned negative 7.74% and negative 7.75% net on its I Class and N class shares, respectively. The performance of the Fund’s classes varies because of differing expenses. The Fund’s benchmark, the JP Morgan GBI-EM Global Diversified Index, returned negative 6.58% over the same period.
Underperformance during the period was primarily driven by overweight positioning to emerging markets foreign exchange (EMFX) earlier in 2018. We reduced the extent of the overweight as we started to see greater signs of growth divergence between the US and international economies. Off-index positioning in Egypt, Nigeria, and Serbia, along with an early overweight in Brazil leading into market-friendly elections, helped mitigate part of the underperformance.
Late 2017 and early 2018 were characterized by synchronous global growth, an environment that has historically benefitted Emerging Markets (EM). However, as the year progressed, the synchronous growth story was called into question amidst weaker-than-expected growth data in Europe and several Emerging Markets countries against stronger US growth. The weaker international growth story helped drive a stronger dollar, and that, along with tighter financial conditions, trade fears and various EM domestic challenges put significant pressure on Emerging Markets local currency debt.
Looking ahead, the overall EM outlook appears to be less uniform than before with some large EM economies slowing into 2019 (e.g., China, Turkey and Argentina), others accelerating (e.g., Brazil and South Africa), and many looking to be relatively unchanged (e.g., India, Indonesia, and Russia). That will present differentiated opportunities, in our view.
We believe that a recovery for Emerging Markets local currency debt is centered around 1) stabilization in China and 2) a weaker US dollar environment. While we have lowered our growth forecast for 2019, and expect a continuation of trade tensions in the near-term, we do not envision a hard landing in China. We believe we will start to see the impact of various stimulus measures during the first half of 2019 with full year growth likely to be in the 5.75-6.25% range. Consolidating our forecasts for growth in individual EM countries, we expect overall EM growth in 2019 to be comparable to 2018. This compares with our expectation that developing markets growth in 2019 will come in slightly below the 2018 level as the impact of fiscal stimulus in the US begins to fade.
In addition, we believe we believe that US dollar strength will begin to wane as the spread between growth in the U.S. and the rest of the world begins to narrow and the market turns its attention away from cyclical factors and starts to focus more on structural issues (rising U.S. current account and fiscal deficits). Given the divide in Congress, we think there will be less of a chance of additional and broader US fiscal stimulus next year, and therefore a higher probability of our base case of US growth slowing next year, and less upward pressure on US interest rates and the US dollar.
We certainly see value at current levels and believe that 2019 will present opportunities to add risk. This year, we continued to see investor interest to add exposure, taking advantage of the recent downtrade to reduce underweights to the asset class.
6
Table of Contents
TCW Emerging Markets Local Currency Income Fund
Management Discussions (Continued)
| Annualized Return(1) | ||||||||||||||||
| Fund Name | 1 Yr Return | 3 Yr Return | 5 Yr Return | Inception to Date | ||||||||||||
TCW Emerging Markets Local Currency Income Fund | ||||||||||||||||
Class I (Inception: 12/14/2010) | (7.74 | )% | 3.07 | % | (2.17 | )% | 0.12 | % | ||||||||
Class N (Inception: 12/14/2010) | (7.75 | )% | 3.07 | % | (2.19 | )% | 0.10 | % | ||||||||
JPMorgan GBI-EM Global Diversified Index | (6.58 | )% | 2.95 | % | (2.59 | )% | (0.44 | )% | ||||||||
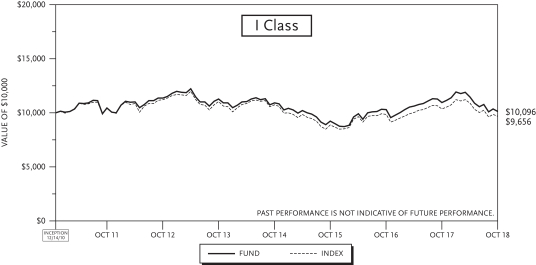
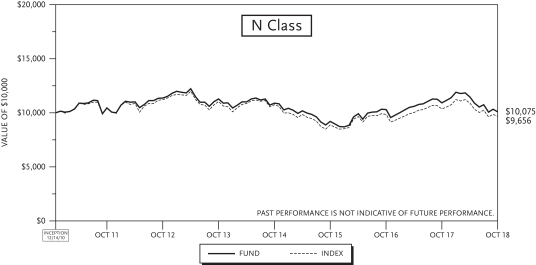
| (1) | The total returns do not reflect taxes that a shareholder would pay on fund distributions or on the redemption of fund shares. |
7
Table of Contents
TCW Emerging Markets Multi-Asset Opportunities Fund
Management Discussions
For the year ended October 31, 2017, the TCW Emerging Markets Multi-Asset Opportunities Fund (the “Fund”) returned negative 9.23% and negative 9.26% on its I Class and N Class shares, respectively. The performance of the Fund’s classes varies because of differing expenses. The Fund’s blended benchmark, 50% JP Morgan EMBI Global Diversified Index and 50% MSCI Daily Total Return Net Emerging Markets Index, returned negative 8.36% over the same period.
Underperformance was primarily driven by security selection in the equity sleeve, as a sharp growth to value rotation and an increase in trade tensions had a pronounced negative impact on the Fund’s China exposure, as well as some of the longer term structural growth holdings in the consumer, technology, media and telecommunication and healthcare sectors. We adjusted the portfolio to add value stocks, but missed part of this rotation. Security selection in the debt sleeve helped mitigate part of this underperformance, driven by an early Brazil overweight in anticipation of market-friendly elections, and an emphasis on higher quality Middle Eastern countries.
Late 2017 and early 2018 were characterized by synchronous global growth, an environment that has historically benefitted Emerging Markets (EM). However, as the year progressed, the synchronous growth story was called into question amidst weaker-than-expected growth data in Europe and several Emerging Markets countries against stronger US growth. The weaker international growth story helped drive a stronger US dollar, and that, along with tighter financial conditions, trade fears and various EM domestic challenges put significant pressure on Emerging Markets assets.
Looking ahead, the overall EM outlook appears to be less uniform than before with some large EM economies slowing into 2019 (e.g., China, Turkey and Argentina), others accelerating (e.g., Brazil and South Africa), and many looking to be relatively unchanged (e.g., India, Indonesia, and Russia). That will present differentiated opportunities, in our view.
We believe that a recovery for Emerging Markets equities is centered around 1) stabilization in China and 2) a weaker US dollar environment. While we have lowered our growth forecast for 2019, and expect a continuation of trade tensions in the near-term, we do not envision a hard landing in China. In our view, we will start to see the impact of various stimulus measures during the first half of 2019 with full year growth likely to be in the 5.75-6.25% range. Consolidating our forecasts for growth in individual EM countries, we expect overall EM growth in 2019 to be comparable to 2018. This compares with our expectation that developing markets growth in 2019 will come in slightly below the 2018 level as the impact of fiscal stimulus in the US begins to fade.
In addition, we believe that US dollar strength will begin to wane as the spread between growth in the U.S. and the rest of the world begins to narrow and the market turns its attention away from cyclical factors and starts to focus more on structural issues (rising U.S. current account and fiscal deficits). Given the divide in Congress, we think there will be less of a chance of additional and broader US fiscal stimulus next year, and therefore a higher probability of our base case of US growth slowing next year, and less upward pressure on US interest rates and the US dollar.
We are moderately underweight in equities, although we have been incrementally increasing the Fund’s exposure to equities taking advantage of the weakness in equity prices. We are neutral in debt, with the balance in cash. We certainly see value at current levels and believe that 2019 will present opportunities to add risk, with country and security selection being crucial to performance. In our view, there will be significant dispersion in returns going forward, allowing for an actively managed portfolio to capture attractive returns in those securities best positioned for the current evolving environment.
8
Table of Contents
TCW Emerging Markets Multi-Asset Opportunities Fund
Management Discussions (Continued)
| Annualized Return(1) | ||||||||||||||||
| Fund Name | 1 Yr Return | 3 Yr Return | 5 Yr Return | Inception to Date | ||||||||||||
TCW Emerging Markets Multi-Asset Opportunities Fund | ||||||||||||||||
Class I (Inception: 06/28/2013) | (9.23 | )% | 5.57 | % | 1.71 | % | 2.87 | % | ||||||||
Class N (Inception: 06/28/2013) | (9.26 | )% | 5.59 | % | 1.75 | % | 2.79 | % | ||||||||
50% JPM EMBI Global Diversified Index/50% MSCI Daily Total Return Net Emerging Markets Index | (8.36 | )% | 5.59 | % | 2.73 | % | 3.93 | % | ||||||||
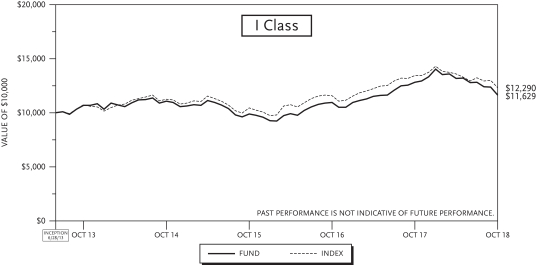
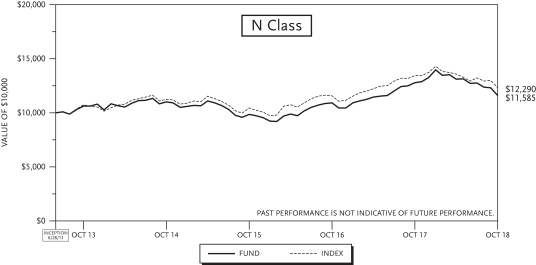
| (1) | The total returns do not reflect taxes that a shareholder would pay on fund distributions or on the redemption of fund shares. |
9
Table of Contents
TCW International Small Cap Fund
Management Discussions
For the year ended October 31, 2018, the TCW International Small Cap Fund (the “Fund”) returned negative 8.65% and negative 8.64% on its I Class and N Class shares, respectively. The performance of the Fund’s classes varies because of differing expenses. The Fund’s benchmark, the MSCI All Country World (ex USA) Small Cap Net Index, returned negative 9.73% over the same time period.
Outperformance was primarily driven by 1) security selection in information technology, particularly in semiconductor components and IT services in Taiwan and Japan, 2) underweight positioning in the materials sector, combined with an emphasis on specialty chemicals and base metals and 3) overweight positioning and security selection in healthcare, with a focus on medical device companies, specialty pharmaceuticals, biotech and hospitals.
Late 2017 and early 2018 were characterized by synchronous global growth, an environment that has historically benefitted international markets. However, as the year progressed, the synchronous growth story was called into question amidst weaker-than-expected growth data in Europe and several Emerging Markets (EM) countries against stronger US growth. The weaker international growth story helped drive a stronger US dollar, and that, along with tighter financial conditions, trade fears and various idiosyncratic domestic challenges put pressure on International Equities.
We believe that a recovery for International Markets is centered around 1) stabilization in China and Europe and 2) a weaker US dollar environment. While we have lowered our growth forecast for 2019, and expect a continuation of trade tensions in the near-term, we do not envision a hard landing in China. We believe we will start to see the impact of various stimulus measures during the first half of 2019 with full year growth likely to be in the 5.75-6.25% range, although it may not be until 2019 before we see this filter through to earnings. As for Europe, we believe that Purchasing Managers Index (PMI) momentum will also improve, and while Brexit and the Italian budget remain overhangs, we believe there will ultimately be positive solutions.
In addition, we believe that US dollar strength will begin to wane as the spread between growth in the U.S. and the rest of the world begins to narrow and the market turns its attention away from cyclical factors and starts to focus more on structural issues (rising U.S. current account and fiscal deficits). Given the divide in Congress, we think there will be less of a chance of additional and broader US fiscal stimulus next year, and therefore a higher probability of our base case of US growth slowing next year, and less upward pressure on US interest rates and the US dollar.
In the Fund, we are overweight Developed Markets (DM) and underweight Emerging Markets. Within DM, we are neutral in Japan, as earnings continue to disappoint in the technology sector. We remain overweight in Europe, while underweight in resource economies such as Australia and Canada. Style-wise, we remain quality growth oriented, but have been reducing this in favor of more defensive value exposure. We have also increased cash levels, as well as the number of names in the portfolio for diversification purposes, given the heightened volatility. In our view, valuations are becoming increasingly attractive, although the forward earnings picture remains cloudy.
We continue to focus on idiosyncratic long-term growth stories at attractive valuations, and believe differentiating between companies will continue to be key. In our view, there will be significant dispersion in returns going forward as pairwise stock correlations are beginning to decline, allowing for an actively managed portfolio to capture attractive returns in those securities best positioned for the evolving environment.
10
Table of Contents
TCW International Small Cap Fund
Management Discussions (Continued)
| Annualized Return(1) | ||||||||||||||||
| Fund Name | 1 Yr Return | 3 Yr Return | 5 Yr Return | Inception to Date | ||||||||||||
TCW International Small Cap Fund | ||||||||||||||||
Class I (Inception: 02/28/2011) | (8.65 | )% | 5.51 | % | 2.76 | % | 1.18 | % | ||||||||
Class N (Inception: 02/28/2011) | (8.64 | )% | 5.51 | % | 2.74 | % | 1.14 | % | ||||||||
MSCI All Country World (ex USA) Small Cap Net Index | (9.73 | )% | 5.47 | % | 3.36 | % | 3.80 | % | ||||||||
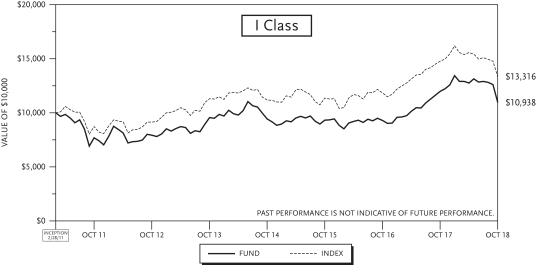
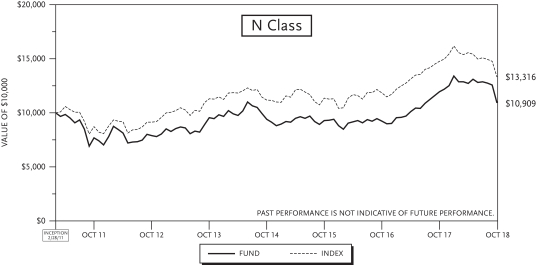
| (1) | The total returns do not reflect taxes that a shareholder would pay on fund distributions or on the redemption of fund shares. |
11
Table of Contents
TCW Developing Markets Equity Fund
| Issues | Shares | Value | ||||||
COMMON STOCK — 86.4% of Net Assets |
| |||||||
| Brazil — 8.2% | ||||||||
B3 S.A. — Brasil Bolsa Balcao | 4,000 | $ | 28,580 | |||||
Banco Bradesco S.A. (ADR) | 8,300 | 76,111 | ||||||
Banco Santander Brasil S.A. | 2,400 | 27,266 | ||||||
Braskem S.A. (ADR) | 1,000 | 27,860 | ||||||
BRF S.A. (ADR) (1) | 5,000 | 29,600 | ||||||
CCR S.A. | 9,000 | 26,580 | ||||||
Petroleo Brasileiro S.A. (SP ADR) | 7,100 | 115,375 | ||||||
Vale S.A. | 6,300 | 95,130 | ||||||
|
| |||||||
Total Brazil |
| |||||||
(Cost: $368,531) |
| 426,502 | ||||||
|
| |||||||
| China — 22.6% | ||||||||
58.Com, Inc. (ADR) (1) | 400 | 26,236 | ||||||
Agricultural Bank of China, Ltd. — Class H | 64,000 | 28,181 | ||||||
Alibaba Group Holding, Ltd. (SP ADR) (China) (1) | 1,384 | 196,916 | ||||||
Angang Steel Co., Ltd. — Class H | 30,000 | 25,663 | ||||||
Anhui Conch Cement Co., Ltd. — Class H | 7,000 | 36,294 | ||||||
China Communications Construction Co., Ltd. — Class H | 28,000 | 25,682 | ||||||
China Mobile, Ltd. | 5,500 | 51,540 | ||||||
China Overseas Land & Investment, Ltd. | 14,000 | 44,028 | ||||||
China Petroleum & Chemical Corp. (ADR) | 500 | 40,330 | ||||||
China Railway Construction Corp., Ltd. — Class H | 21,000 | 26,679 | ||||||
China Railway Group, Ltd. — Class H | 30,000 | 26,820 | ||||||
Guangdong Investment, Ltd. | 28,000 | 50,144 | ||||||
Guangzhou Automobile Group Co., Ltd. — Class H | 12,000 | 12,167 | ||||||
Hesteel Co., Ltd. — Class A | 94,900 | 43,297 | ||||||
HKT Trust & HKT, Ltd. — Class SS | 38,000 | 52,425 | ||||||
Industrial & Commercial Bank of China, Ltd. — Class H | 250,000 | 169,673 | ||||||
Ping An Insurance Group Co. of China, Ltd. — Class H | 12,650 | 119,632 | ||||||
Postal Savings Bank of China Co., Ltd. — Class H | 46,000 | 27,531 | ||||||
Tencent Holdings, Ltd. | 4,400 | 150,790 | ||||||
Wuxi Biologics, Inc. (1) | 3,500 | 25,050 | ||||||
|
| |||||||
Total China |
| |||||||
(Cost: $1,059,089) |
| 1,179,078 | ||||||
|
| |||||||
| Colombia — 0.5% (Cost: $27,109) | ||||||||
Ecopetrol S.A. (ADR) | 1,200 | 27,912 | ||||||
|
| |||||||
| Czech Republic — 0.9% (Cost: $49,266) | ||||||||
Komercni banka as | 1,183 | 44,900 | ||||||
|
| |||||||
| Egypt — 0.6% (Cost: $35,512) | ||||||||
Commercial International Bank Egypt SAE | 6,982 | 30,949 | ||||||
|
| |||||||
| Issues | Shares | Value | ||||||
| India — 8.1% | ||||||||
Aurobindo Pharma, Ltd. | 7,905 | $ | 85,246 | |||||
Axis Bank, Ltd. (1) | 5,610 | 43,945 | ||||||
Dr Reddy’s Laboratories, Ltd. (ADR) | 1,100 | 37,433 | ||||||
Federal Bank, Ltd. | 23,350 | 26,098 | ||||||
Havells India, Ltd. | 3,620 | 31,677 | ||||||
ITC, Ltd. | 13,495 | 50,921 | ||||||
LIC Housing Finance, Ltd. | 5,279 | 29,268 | ||||||
Maruti Suzuki India, Ltd. | 567 | 50,609 | ||||||
Tata Consultancy Services, Ltd. | 1,517 | 39,696 | ||||||
Wipro, Ltd. (ADR) | 4,900 | 25,333 | ||||||
|
| |||||||
Total India |
| |||||||
(Cost: $426,343) |
| 420,226 | ||||||
|
| |||||||
| Indonesia — 3.2% | ||||||||
Bank Central Asia Tbk PT | 40,200 | 62,594 | ||||||
Charoen Pokphand Indonesia Tbk PT | 40,400 | 14,633 | ||||||
Telekomunikasi Indonesia Persero Tbk PT | 244,800 | 62,014 | ||||||
United Tractors Tbk PT | 12,000 | 26,494 | ||||||
|
| |||||||
Total Indonesia |
| |||||||
(Cost: $160,638) |
| 165,735 | ||||||
|
| |||||||
| Jordan — 0.6% (Cost: $28,312) | ||||||||
Hikma Pharmaceuticals PLC | 1,188 | 28,805 | ||||||
|
| |||||||
| Kenya — 1.8% (Cost: $103,864) | ||||||||
Safari.com, Ltd. | 414,100 | 94,935 | ||||||
|
| |||||||
| Mexico — 1.4% | ||||||||
Alfa S.A.B. de C.V. — Class A | 22,400 | 23,760 | ||||||
Grupo Financiero Banorte S.A.B. de C.V. — Class O | 3,900 | 21,567 | ||||||
Nemak S.A.B. de C.V. | 35,900 | 26,006 | ||||||
|
| |||||||
Total Mexico |
| |||||||
(Cost: $87,112) |
| 71,333 | ||||||
|
| |||||||
| Poland — 1.0% | ||||||||
Powszechna Kasa Oszczednosci Bank Polski S.A. | 2,875 | 29,909 | ||||||
Santander Bank Polska S.A. | 278 | 24,675 | ||||||
|
| |||||||
Total Poland |
| |||||||
(Cost: $61,410) |
| 54,584 | ||||||
|
| |||||||
| Portugal — 0.2% (Cost: $13,557) | ||||||||
GS Retail Co., Ltd. | 380 | 12,003 | ||||||
|
| |||||||
| Qatar — 1.6% | ||||||||
Industries Qatar QSC | 820 | 31,549 | ||||||
Qatar National Bank QPSC | 1,005 | 53,786 | ||||||
|
| |||||||
Total Qatar |
| |||||||
(Cost: $81,496) |
| 85,335 | ||||||
|
| |||||||
| Russia — 4.8% | ||||||||
Evraz PLC | 3,795 | 26,285 | ||||||
LUKOIL PJSC (SP ADR) | 1,867 | 139,353 | ||||||
See accompanying notes to financial statements.
12
Table of Contents
TCW Developing Markets Equity Fund
October 31, 2018 |
| Issues | Shares | Value | ||||||
| Russia (Continued) | ||||||||
Magnitogorsk Iron & Steel Works PJSC | 18,600 | $ | 13,510 | |||||
Novolipetsk Steel PJSC | 5,500 | 13,406 | ||||||
Sberbank of Russia | 9,930 | 28,479 | ||||||
Tatneft PJSC (ADR) | 410 | 29,110 | ||||||
|
| |||||||
Total Russia |
| |||||||
(Cost: $221,282) |
| 250,143 | ||||||
|
| |||||||
| South Africa — 5.5% | ||||||||
Capitec Bank Holdings, Ltd. | 920 | 61,748 | ||||||
Clicks Group, Ltd. | 4,933 | 62,806 | ||||||
Exxaro Resources, Ltd. | 2,615 | 26,721 | ||||||
FirstRand, Ltd. | 6,145 | 26,814 | ||||||
Mr Price Group, Ltd. | 3,093 | 48,383 | ||||||
Sasol, Ltd. | 370 | 12,080 | ||||||
Truworths International, Ltd. | 8,809 | 48,208 | ||||||
|
| |||||||
Total South Africa |
| |||||||
(Cost: $283,183) |
| 286,760 | ||||||
|
| |||||||
| South Korea — 4.6% | ||||||||
BGF retail Co., Ltd. | 75 | 11,095 | ||||||
Handsome Co., Ltd. | 903 | 28,844 | ||||||
Hyundai Motor Co. | 240 | 22,479 | ||||||
S-Oil Corp. | 235 | 25,644 | ||||||
Samsung C&T Corp. | 285 | 27,277 | ||||||
Samsung Electronics Co., Ltd. | 2,675 | 100,141 | ||||||
SK Telecom Co., Ltd. | 110 | 25,845 | ||||||
|
| |||||||
Total South Korea |
| |||||||
(Cost: $250,767) |
| 241,325 | ||||||
|
| |||||||
| Taiwan — 15.2% | ||||||||
Accton Technology Corp. | 28,000 | 77,502 | ||||||
Cathay Financial Holding Co., Ltd. | 36,000 | 57,156 | ||||||
E.Sun Financial Holding Co., Ltd. | 72,165 | 47,915 | ||||||
Eclat Textile Co., Ltd. | 5,000 | 59,534 | ||||||
Formosa Chemicals & Fibre Corp. | 16,000 | 58,065 | ||||||
Formosa Petrochemical Corp. | 15,000 | 59,217 | ||||||
Formosa Plastics Corp. | 16,000 | 52,321 | ||||||
Mega Financial Holding Co., Ltd. | 31,000 | 26,251 | ||||||
President Chain Store Corp. | 8,000 | 90,497 | ||||||
Shin Kong Financial Holding Co., Ltd. | 45,000 | 14,837 | ||||||
Taiwan Semiconductor Manufacturing Co., Ltd. | 30,000 | 225,221 | ||||||
Uni-President Enterprises Corp. | 11,000 | 26,662 | ||||||
|
| |||||||
Total Taiwan |
| |||||||
(Cost: $826,257) |
| 795,178 | ||||||
|
| |||||||
| Thailand — 1.9% | ||||||||
Charoen Pokphand Foods PCL (NVDR) | 18,100 | 13,795 | ||||||
PTT Exploration & Production PCL (NVDR) | 20,500 | 85,862 | ||||||
|
| |||||||
Total Thailand |
| |||||||
(Cost: $96,895) |
| 99,657 | ||||||
|
| |||||||
| Issues | Shares | Value | ||||||
| United Arab Emirates — 2.5% (Cost: $50,799) | ||||||||
NMC Health PLC | 2,856 | $ | 128,730 | |||||
|
| |||||||
| United Kingdom — 0.4% (Cost: $29,872) | ||||||||
Premier Oil PLC (1) | 16,140 | 22,134 | ||||||
|
| |||||||
| United States — 0.8% (Cost: $38,294) | ||||||||
Xilinx, Inc. | 500 | 42,685 | ||||||
|
| |||||||
Total Common Stock |
| |||||||
(Cost: $4,299,588) |
| 4,508,909 | ||||||
|
| |||||||
| MONEY MARKET INVESTMENTS — 12.1% | ||||||||
State Street Institutional U.S. Government Money Market Fund — Premier Class, 2.09% (2) | 628,841 | 628,841 | ||||||
|
| |||||||
Total Money Market Investments |
| |||||||
(Cost: $628,841) |
| 628,841 | ||||||
|
| |||||||
Total Investments (98.5%) |
| |||||||
(Cost: $4,928,429) |
| 5,137,750 | ||||||
Excess of Other Assets over Liabilities (1.5%) |
| 79,860 | ||||||
|
| |||||||
Total Net Assets (100.0%) |
| $ | 5,217,610 | |||||
|
| |||||||
Notes to the Schedule of Investments:
| ADR | American Depositary Receipt. ADRs are receipts typically issued by a U.S. bank or trust company, evidencing ownership of underlying securities issued by a foreign corporation. |
| NVDR | Non-Voting Depositary Receipt. |
| OTC | Over the Counter. |
| PJSC | Private Joint-Stock Company. |
| SP ADR | Sponsored American Depositary Receipt. ADRs are receipts, typically issued by a U.S. bank or trust company, evidencing ownership of underlying securities issued by a foreign corporation. Sponsored ADRs are ADRs issued with the cooperation of the foreign corporation. |
| (1) | Non-income producing security. |
| (2) | Rate disclosed is the 7-day net yield as of October 31, 2018. |
See accompanying notes to financial statements.
13
Table of Contents
TCW Developing Markets Equity Fund
Investments by Industry | October 31, 2018 |
| Industry | Percentage of Net Assets | |||
Auto Components | 0.5 | % | ||
Automobiles | 1.6 | |||
Banks | 15.8 | |||
Capital Markets | 0.6 | |||
Chemicals | 2.9 | |||
Communications Equipment | 1.5 | |||
Construction & Engineering | 1.5 | |||
Construction Materials | 0.7 | |||
Diversified Financial Services | 0.5 | |||
Diversified Telecommunication Services | 2.2 | |||
Electrical Equipment | 0.6 | |||
Food & Staples Retailing | 3.3 | |||
Food Products | 1.7 | |||
Health Care Providers & Services | 2.5 | |||
Industrial Conglomerates | 1.6 | |||
Insurance | 3.7 | |||
Interactive Media & Services | 7.2 | |||
IT Services | 1.3 | |||
Life Sciences Tools & Services | 0.5 | |||
Metals & Mining | 4.1 | |||
Oil, Gas & Consumable Fuels | 11.4 | |||
Pharmaceuticals | 2.9 | |||
Real Estate Management & Development | 0.8 | |||
Semiconductors & Semiconductor Equipment | 5.1 | |||
Specialty Retail | 1.8 | |||
Technology Hardware, Storage & Peripherals | 1.9 | |||
Textiles, Apparel & Luxury Goods | 1.8 | |||
Thrifts & Mortgage Finance | 0.6 | |||
Tobacco | 1.0 | |||
Transportation Infrastructure | 0.5 | |||
Water Utilities | 1.0 | |||
Wireless Telecommunication Services | 3.3 | |||
Money Market Investments | 12.1 | |||
|
| |||
Total | 98.5 | % | ||
|
| |||
See accompanying notes to financial statements.
14
Table of Contents
TCW Developing Markets Equity Fund
Fair Valuation Summary | October 31, 2018 |
The following is a summary of the fair valuations according to the inputs used as of October 31, 2018 in valuing the Fund’s investments:
Description | Quoted Prices in Active Markets for Identical Assets (Level 1) | Other Significant Observable Inputs (Level 2) | Significant Unobservable Inputs (Level 3) | Total | ||||||||||||
Common Stock | ||||||||||||||||
Auto Components | $ | 26,006 | $ | — | $ | — | $ | 26,006 | ||||||||
Automobiles | — | 85,254 | — | 85,254 | ||||||||||||
Banks | 155,893 | 675,686 | — | 831,579 | ||||||||||||
Capital Markets | 28,580 | — | — | 28,580 | ||||||||||||
Chemicals | 27,860 | 122,467 | — | 150,327 | ||||||||||||
Communications Equipment | — | 77,502 | — | 77,502 | ||||||||||||
Construction & Engineering | — | 79,181 | — | 79,181 | ||||||||||||
Construction Materials | — | 36,294 | — | 36,294 | ||||||||||||
Diversified Financial Services | — | 26,814 | — | 26,814 | ||||||||||||
Diversified Telecommunication Services | — | 114,439 | — | 114,439 | ||||||||||||
Electrical Equipment | — | 31,677 | — | 31,677 | ||||||||||||
Food & Staples Retailing | 62,806 | 113,595 | — | 176,401 | ||||||||||||
Food Products | 29,600 | 55,091 | — | 84,691 | ||||||||||||
Health Care Providers & Services | — | 128,730 | — | 128,730 | ||||||||||||
IT Services | 25,333 | 39,696 | — | 65,029 | ||||||||||||
Industrial Conglomerates | 23,760 | 58,825 | — | 82,585 | ||||||||||||
Insurance | — | 191,625 | — | 191,625 | ||||||||||||
Interactive Media & Services | 223,151 | 150,790 | — | 373,941 | ||||||||||||
Life Sciences Tools & Services | — | 25,050 | — | 25,050 | ||||||||||||
Metals & Mining | 95,130 | 122,162 | — | 217,292 | ||||||||||||
Oil, Gas & Consumable Fuels | 352,080 | 246,071 | — | 598,151 | ||||||||||||
Pharmaceuticals | 37,433 | 114,050 | — | 151,483 | ||||||||||||
Real Estate Management & Development | — | 44,028 | — | 44,028 | ||||||||||||
Semiconductors & Semiconductor Equipment | 42,685 | 225,222 | — | 267,907 | ||||||||||||
Specialty Retail | — | 96,591 | — | 96,591 | ||||||||||||
Technology Hardware, Storage & Peripherals | — | 100,141 | — | 100,141 | ||||||||||||
Textiles, Apparel & Luxury Goods | 28,844 | 59,534 | — | 88,378 | ||||||||||||
Thrifts & Mortgage Finance | — | 29,268 | — | 29,268 | ||||||||||||
Tobacco | — | 50,921 | — | 50,921 | ||||||||||||
Transportation Infrastructure | 26,580 | — | — | 26,580 | ||||||||||||
Water Utilities | — | 50,144 | — | 50,144 | ||||||||||||
Wireless Telecommunication Services | — | 172,320 | — | 172,320 | ||||||||||||
|
|
|
|
|
|
|
| |||||||||
Total Common Stock | 1,185,741 | 3,323,168 | — | 4,508,909 | ||||||||||||
|
|
|
|
|
|
|
| |||||||||
Money Market Investments | 628,841 | — | — | 628,841 | ||||||||||||
|
|
|
|
|
|
|
| |||||||||
Total Investments | $ | 1,814,582 | $ | 3,323,168 | $ | — | $ | 5,137,750 | ||||||||
|
|
|
|
|
|
|
| |||||||||
See accompanying notes to financial statements.
15
Table of Contents
TCW Emerging Markets Income Fund
Schedule of Investments
| Issues | Maturity Date | Principal Amount | Value | |||||||||
FIXED INCOME SECURITIES — 94.5% of Net Assets |
| |||||||||||
| Angola — 2.6% | ||||||||||||
Angolan Government International Bond |
| |||||||||||
8.25% (1) | 05/09/28 | $ | 79,114,000 | $ | 79,373,890 | |||||||
9.38% (1) | 05/08/48 | 43,675,000 | 44,025,710 | |||||||||
|
| |||||||||||
Total Angola |
| |||||||||||
(Cost: $125,572,088) |
| 123,399,600 | ||||||||||
|
| |||||||||||
| Argentina — 6.0% | ||||||||||||
Argentine Republic Government International Bond |
| |||||||||||
4.63% | 01/11/23 | 40,750,000 | 34,561,094 | |||||||||
5.63% | 01/26/22 | 96,535,000 | 87,122,837 | |||||||||
6.88% | 04/22/21 | 65,630,000 | 63,021,208 | |||||||||
6.88% | 01/26/27 | 70,870,000 | 59,488,278 | |||||||||
7.50% | 04/22/26 | 42,530,000 | 37,392,376 | |||||||||
|
| |||||||||||
Total Argentina |
| |||||||||||
(Cost: $291,437,264) |
| 281,585,793 | ||||||||||
|
| |||||||||||
| Azerbaijan — 1.1% | ||||||||||||
Republic of Azerbaijan International Bond |
| |||||||||||
3.50% (2) | 09/01/32 | 11,825,000 | 9,729,208 | |||||||||
Southern Gas Corridor CJSC |
| |||||||||||
6.88% (2) | 03/24/26 | 40,510,000 | 43,426,720 | |||||||||
|
| |||||||||||
Total Azerbaijan |
| |||||||||||
(Cost: $54,131,316) |
| 53,155,928 | ||||||||||
|
| |||||||||||
| Bahrain — 3.2% | ||||||||||||
Bahrain Government International Bond |
| |||||||||||
6.75% (2) | 09/20/29 | 64,615,000 | 61,949,631 | |||||||||
7.00% (1) | 10/12/28 | 57,680,000 | 56,487,178 | |||||||||
Oil and Gas Holding Co. (The) |
| |||||||||||
7.50% (1) | 10/25/27 | 15,333,000 | 14,949,675 | |||||||||
7.63% (1) | 11/07/24 | 6,375,000 | 6,375,000 | |||||||||
8.38% (1) | 11/07/28 | 11,150,000 | 11,150,000 | |||||||||
|
| |||||||||||
Total Bahrain |
| |||||||||||
(Cost: $150,200,445) |
| 150,911,484 | ||||||||||
|
| |||||||||||
| Brazil — 8.4% | ||||||||||||
Aegea Finance S.a.r.l. |
| |||||||||||
5.75% (1) | 10/10/24 | 5,625,000 | 5,443,313 | |||||||||
Andrade Gutierrez International S.A. |
| |||||||||||
11.00% (1) | 08/20/21 | 8,028,000 | 6,502,760 | |||||||||
Banco do Brasil S.A. |
| |||||||||||
6.25% (10 year U.S Treasury Constant Maturity Rate + 4.398%) (2)(3)(4) | 10/29/49 | 18,545,000 | 15,996,453 | |||||||||
9.00% (10 year U.S. Treasury Constant Maturity Rate + 6.362%) (2)(3)(4) | 06/29/49 | 24,597,000 | 25,519,387 | |||||||||
| Issues | Maturity Date | Principal Amount | Value | |||||||||
| Brazil (Continued) | ||||||||||||
Brazil Minas SPE via State of Minas Gerais |
| |||||||||||
5.33% (2) | 02/15/28 | $ | 23,673,000 | $ | 23,007,789 | |||||||
Brazil Notas do Tesouro Nacional, Series F |
| |||||||||||
10.00% | 01/01/23 | BRL | 193,500,000 | 53,266,966 | ||||||||
Brazilian Government International Bond |
| |||||||||||
4.63% | 01/13/28 | $ | 22,150,000 | 20,843,150 | ||||||||
Cemig Geracao e Transmissao S.A. |
| |||||||||||
9.25% (2) | 12/05/24 | 16,615,000 | 17,802,142 | |||||||||
Light Servicos de Eletricidade SA/Light Energia SA |
| |||||||||||
7.25% (1) | 05/03/23 | 13,885,000 | 13,555,925 | |||||||||
MARB BondCo PLC |
| |||||||||||
6.88% (1) | 01/19/25 | 23,290,000 | 21,958,394 | |||||||||
Petrobras Global Finance BV |
| |||||||||||
5.75% | 02/01/29 | 115,692,000 | 107,130,792 | |||||||||
6.85% | 06/05/15 | 39,010,000 | 34,718,900 | |||||||||
Samarco Mineracao S.A. |
| |||||||||||
4.13% (2)(5) | 11/01/22 | 21,565,000 | 16,173,966 | |||||||||
5.38% (2)(5) | 09/26/24 | 2,765,000 | 2,134,304 | |||||||||
Suzano Austria GmbH |
| |||||||||||
6.00% (1) | 01/15/29 | 11,710,000 | 11,944,200 | |||||||||
Vale Overseas, Ltd. |
| |||||||||||
6.88% | 11/21/36 | 17,100,000 | 19,071,459 | |||||||||
|
| |||||||||||
Total Brazil |
| |||||||||||
(Cost: $384,863,535) |
| 395,069,900 | ||||||||||
|
| |||||||||||
| Chile — 0.4% | ||||||||||||
C&W Senior Financing Designated Activity Co. |
| |||||||||||
6.88% (1) | 09/15/27 | 11,785,000 | 11,284,138 | |||||||||
7.50% (1) | 10/15/26 | 9,275,000 | 9,321,375 | |||||||||
|
| |||||||||||
Total Chile |
| |||||||||||
(Cost: $20,985,000) |
| 20,605,513 | ||||||||||
|
| |||||||||||
| China — 1.1% | ||||||||||||
China SCE Group Holdings, Ltd. |
| |||||||||||
7.45% (2) | 04/17/21 | 13,575,000 | 12,679,966 | |||||||||
CIFI Holdings Group Co., Ltd. |
| |||||||||||
7.75% (2) | 06/05/20 | 13,350,000 | 13,231,145 | |||||||||
Kaisa Group Holdings, Ltd. |
| |||||||||||
8.50% (2) | 06/30/22 | 19,548,000 | 13,843,796 | |||||||||
New Metro Global, Ltd. |
| |||||||||||
6.50% (2) | 04/23/21 | 13,080,000 | 12,327,429 | |||||||||
|
| |||||||||||
Total China |
| |||||||||||
(Cost: $59,364,280) |
| 52,082,336 | ||||||||||
|
| |||||||||||
| Colombia — 3.7% | ||||||||||||
Banco GNB Sudameris S.A. |
| |||||||||||
6.50% (5 year U.S. Treasury Constant Maturity Rate + 4.561%) (1)(3) | 04/03/27 | 17,350,000 | 17,225,080 | |||||||||
See accompanying notes to financial statements.
16
Table of Contents
TCW Emerging Markets Income Fund
October 31, 2018 |
| Issues | Maturity Date | Principal Amount | Value | |||||||||
| Colombia (Continued) | ||||||||||||
Colombia Government International Bond |
| |||||||||||
3.88% | 04/25/27 | $ | 68,335,000 | $ | 65,212,090 | |||||||
4.50% | 03/15/29 | 19,480,000 | 19,281,304 | |||||||||
5.00% | 06/15/45 | 17,070,000 | 16,233,570 | |||||||||
Ecopetrol S.A. |
| |||||||||||
5.88% | 05/28/45 | 38,080,000 | 36,433,040 | |||||||||
Gilex Holding SARL |
| |||||||||||
8.50% (1) | 05/02/23 | 9,377,000 | 9,552,913 | |||||||||
Millicom International Cellular S.A. |
| |||||||||||
6.63% (1) | 10/15/26 | 11,875,000 | 12,053,125 | |||||||||
|
| |||||||||||
Total Colombia |
| |||||||||||
(Cost: $178,455,147) |
| 175,991,122 | ||||||||||
|
| |||||||||||
| Costa Rica — 0.5% (Cost: $23,859,349) | ||||||||||||
Autopistas del Sol S.A. |
| |||||||||||
7.38% (1) | 12/30/30 | 23,401,022 | 23,050,241 | |||||||||
|
| |||||||||||
| Dominican Republic — 3.9% | ||||||||||||
AES Andres B.V. / Dominican Power Partners / Empresa Generadora de Electricidad Itabo, S.A. |
| |||||||||||
7.95% (1) | 05/11/26 | 9,091,000 | 9,352,457 | |||||||||
Dominican Republic International Bond |
| |||||||||||
5.50% (2) | 01/27/25 | 33,820,000 | 33,447,980 | |||||||||
5.95% (1) | 01/25/27 | 59,008,000 | 58,854,579 | |||||||||
6.00% (1) | 07/19/28 | 36,470,000 | 36,242,063 | |||||||||
6.85% (2) | 01/27/45 | 44,606,000 | 44,076,304 | |||||||||
|
| |||||||||||
Total Dominican Republic |
| |||||||||||
(Cost: $185,911,518) |
| 181,973,383 | ||||||||||
|
| |||||||||||
| Ecuador — 2.3% | ||||||||||||
Ecuador Government International Bond |
| |||||||||||
7.88% (1) | 01/23/28 | 72,348,000 | 61,134,060 | |||||||||
7.95% (2) | 06/20/24 | 51,810,000 | 46,888,050 | |||||||||
|
| |||||||||||
Total Ecuador |
| |||||||||||
(Cost: $114,287,002) |
| 108,022,110 | ||||||||||
|
| |||||||||||
| Egypt — 3.6% | ||||||||||||
Egypt Government International Bond |
| |||||||||||
5.58% (1) | 02/21/23 | 63,947,000 | 61,548,987 | |||||||||
6.13% (1) | 01/31/22 | 20,618,000 | 20,436,562 | |||||||||
6.59% (1) | 02/21/28 | 45,553,000 | 41,849,086 | |||||||||
7.50% (1) | 01/31/27 | 32,850,000 | 32,234,063 | |||||||||
8.50% (2) | 01/31/47 | 13,775,000 | 13,044,773 | |||||||||
|
| |||||||||||
Total Egypt |
| |||||||||||
(Cost: $172,905,178) |
| 169,113,471 | ||||||||||
|
| |||||||||||
| El Salvador — 1.3% | ||||||||||||
AES El Salvador Trust III |
| |||||||||||
6.75% (2) | 03/28/23 | 12,800,000 | 11,943,680 | |||||||||
| Issues | Maturity Date | Principal Amount | Value | |||||||||
| El Salvador (Continued) | ||||||||||||
El Salvador Government International Bond |
| |||||||||||
7.63% (2) | 02/01/41 | $ | 38,725,000 | $ | 35,336,562 | |||||||
7.65% (2) | 06/15/35 | 12,675,000 | 11,716,770 | |||||||||
|
| |||||||||||
Total El Salvador |
| |||||||||||
(Cost: $64,955,688) |
| 58,997,012 | ||||||||||
|
| |||||||||||
| Ghana — 0.4% | ||||||||||||
Ghana Government International Bond |
| |||||||||||
7.88% (2) | 08/07/23 | 10,495,000 | 10,746,880 | |||||||||
8.13% (2) | 01/18/26 | 10,110,000 | 10,195,935 | |||||||||
|
| |||||||||||
Total Ghana |
| |||||||||||
(Cost: $21,014,960) |
| 20,942,815 | ||||||||||
|
| |||||||||||
| India — 1.6% | ||||||||||||
Azure Power Energy, Ltd. |
| |||||||||||
5.50% (1) | 11/03/22 | 14,667,000 | 13,815,214 | |||||||||
Neerg Energy, Ltd. |
| |||||||||||
6.00% (1) | 02/13/22 | 18,042,000 | 17,031,143 | |||||||||
Rec, Ltd. |
| |||||||||||
5.25% (6) | 11/13/23 | 17,800,000 | 17,699,786 | |||||||||
Vedanta Resources PLC |
| |||||||||||
6.13% (2) | 08/09/24 | 13,144,000 | 11,744,164 | |||||||||
6.38% (1) | 07/30/22 | 13,670,000 | 12,859,369 | |||||||||
|
| |||||||||||
Total India |
| |||||||||||
(Cost: $75,466,693) |
| 73,149,676 | ||||||||||
|
| |||||||||||
| Indonesia — 4.3% | ||||||||||||
Indika Energy Capital III Pte, Ltd. |
| |||||||||||
5.88% (2) | 11/09/24 | 7,119,000 | 6,395,087 | |||||||||
Indonesia Government International Bond |
| |||||||||||
3.50% | 01/11/28 | 30,570,000 | 27,570,961 | |||||||||
4.75% (2) | 01/08/26 | 24,550,000 | 24,341,325 | |||||||||
Minejesa Capital BV |
| |||||||||||
5.63% (1) | 08/10/37 | 47,335,000 | 42,068,981 | |||||||||
Perusahaan Listrik Negara PT |
| |||||||||||
6.15% (2) | 05/21/48 | 18,480,000 | 18,029,088 | |||||||||
Perusahaan Penerbit SBSN Indonesia III |
| |||||||||||
4.15% (2) | 03/29/27 | 53,315,000 | 50,116,100 | |||||||||
Saka Energi Indonesia PT |
| |||||||||||
4.45% (1) | 05/05/24 | 23,930,000 | 22,096,172 | |||||||||
Star Energy Geothermal Wayang Windu, Ltd. |
| |||||||||||
6.75% (1) | 04/24/33 | 14,474,675 | 13,051,814 | |||||||||
|
| |||||||||||
Total Indonesia |
| |||||||||||
(Cost: $221,107,515) |
| 203,669,528 | ||||||||||
|
| |||||||||||
| Iraq — 1.0% (Cost: $48,463,711) | ||||||||||||
Iraq International Bond |
| |||||||||||
5.80% (2) | 01/15/28 | 53,225,000 | 49,169,255 | |||||||||
|
| |||||||||||
See accompanying notes to financial statements.
17
Table of Contents
TCW Emerging Markets Income Fund
Schedule of Investments (Continued)
| Issues | Maturity Date | Principal Amount | Value | |||||||||
| Ivory Coast — 1.0% (Cost: $51,096,920) | ||||||||||||
Ivory Coast Government International Bond |
| |||||||||||
6.13% (1) | 06/15/33 | $ | 54,615,000 | $ | 47,446,781 | |||||||
|
| |||||||||||
| Kazakhstan — 3.7% | ||||||||||||
Kazakhstan Temir Zholy National Co. JSC |
| |||||||||||
4.85% (1) | 11/17/27 | 38,455,000 | 37,926,244 | |||||||||
KazMunayGas National Co. JSC |
| |||||||||||
4.75% (1) | 04/19/27 | 45,170,000 | 44,323,062 | |||||||||
5.38% (1) | 04/24/30 | 26,935,000 | 26,808,405 | |||||||||
5.75% (1) | 04/19/47 | 43,730,000 | 41,888,967 | |||||||||
6.38% (1) | 10/24/48 | 21,210,000 | 21,607,688 | |||||||||
|
| |||||||||||
Total Kazakhstan |
| |||||||||||
(Cost: $175,121,402) |
| 172,554,366 | ||||||||||
|
| |||||||||||
| Mexico — 5.3% | ||||||||||||
Axtel SAB de CV |
| |||||||||||
6.38% (1) | 11/14/24 | 21,300,000 | 20,475,690 | |||||||||
Banco Mercantil del Norte S.A. |
| |||||||||||
6.88% (5 year Treasury Constant Maturity Rate + 5.035%) (1)(3)(4) | 12/31/99 | 22,400,000 | 22,167,040 | |||||||||
Banco Mercantil del Norte S.A. |
| |||||||||||
7.63% (10 year Treasury Constant Maturity Rate + 5.353%) (1)(3)(4) | 12/31/99 | 21,930,000 | 21,546,444 | |||||||||
Cemex SAB de CV |
| |||||||||||
7.75% (2) | 04/16/26 | 11,100,000 | 11,738,250 | |||||||||
Cometa Energia SA de CV |
| |||||||||||
6.38% (1) | 04/24/35 | 11,567,640 | 11,218,297 | |||||||||
Controladora Mabe SA de CV |
| |||||||||||
5.60% (1) | 10/23/28 | 9,725,000 | 9,469,719 | |||||||||
Credito Real SAB de CV |
| |||||||||||
9.13% (U.S Ten year Treasury Constant Maturity Rate + 7.026%) (1)(3)(4) | 12/31/99 | 9,570,000 | 9,481,956 | |||||||||
Mexico Government Bond |
| |||||||||||
6.50% | 06/10/21 | MXN | 220,000,000 | 10,336,556 | ||||||||
Nemak SAB de CV |
| |||||||||||
4.75% (1) | 01/23/25 | $ | 11,511,000 | 10,978,616 | ||||||||
Petroleos Mexicanos |
| |||||||||||
5.35% (1) | 02/12/28 | 45,625,000 | 40,761,375 | |||||||||
6.50% | 03/13/27 | 28,765,000 | 27,916,433 | |||||||||
6.75% | 09/21/47 | 49,480,000 | 42,617,124 | |||||||||
Unifin Financiera S.A.B. de C.V. |
| |||||||||||
7.00% (1) | 01/15/25 | 11,270,000 | 10,479,973 | |||||||||
|
| |||||||||||
Total Mexico |
| |||||||||||
(Cost: $261,486,812) |
| 249,187,473 | ||||||||||
|
| |||||||||||
| Issues | Maturity Date | Principal Amount | Value | |||||||||
| Mongolia — 1.0% | ||||||||||||
Development Bank of Mongolia LLC |
| |||||||||||
7.25% (1) | 10/23/23 | $ | 14,315,000 | $ | 14,012,954 | |||||||
Mongolia Government International Bond |
| |||||||||||
5.13% (2) | 12/05/22 | 34,073,000 | 32,338,684 | |||||||||
|
| |||||||||||
Total Mongolia |
| |||||||||||
(Cost: $46,739,381) |
| 46,351,638 | ||||||||||
|
| |||||||||||
| Nigeria — 1.9% | ||||||||||||
IHS Netherlands Holdco BV |
| |||||||||||
9.50% (2) | 10/27/21 | 16,185,000 | 16,414,827 | |||||||||
Nigeria Government International Bond |
| |||||||||||
5.63% | 06/27/22 | 22,200,000 | 22,061,250 | |||||||||
6.50% (1) | 11/28/27 | 10,844,000 | 9,990,035 | |||||||||
7.14% (1) | 02/23/30 | 23,960,000 | 22,103,100 | |||||||||
7.70% (1) | 02/23/38 | 18,844,000 | 17,044,398 | |||||||||
|
| |||||||||||
Total Nigeria |
| |||||||||||
(Cost: $90,008,031) |
| 87,613,610 | ||||||||||
|
| |||||||||||
| Oman — 3.7% | ||||||||||||
Oman Government International Bond |
| |||||||||||
4.13% (2) | 01/17/23 | 15,005,000 | 14,404,800 | |||||||||
5.63% (1) | 01/17/28 | 72,425,000 | 69,256,406 | |||||||||
6.75% (1) | 01/17/48 | 78,995,000 | 72,304,124 | |||||||||
Oman Sovereign Sukuk SAOC |
| |||||||||||
5.93% (1) | 10/31/25 | 19,200,000 | 19,200,000 | |||||||||
|
| |||||||||||
Total Oman |
| |||||||||||
(Cost: $179,262,956) |
| 175,165,330 | ||||||||||
|
| |||||||||||
| Pakistan — 0.8% (Cost: $36,029,295) | ||||||||||||
Pakistan Government International Bond |
| |||||||||||
6.88% (2) | 12/05/27 | 39,420,000 | 36,477,888 | |||||||||
|
| |||||||||||
| Panama — 1.2% | ||||||||||||
AES Panama SRL |
| |||||||||||
6.00% (1) | 06/25/22 | 27,230,000 | 27,807,276 | |||||||||
Banistmo S.A. |
| |||||||||||
3.65% (1) | 09/19/22 | 9,140,000 | 8,674,774 | |||||||||
Global Bank Corp. |
| |||||||||||
4.50% (2) | 10/20/21 | 18,625,000 | 18,496,487 | |||||||||
|
| |||||||||||
Total Panama |
| |||||||||||
(Cost: $54,635,495) |
| 54,978,537 | ||||||||||
|
| |||||||||||
| Paraguay — 1.4% | ||||||||||||
Banco Regional SAECA |
| |||||||||||
8.13% (1) | 01/24/19 | 13,350,000 | 13,380,304 | |||||||||
Paraguay Government International Bond |
| |||||||||||
4.70% (2) | 03/27/27 | 21,828,000 | 21,306,311 | |||||||||
5.60% (2) | 03/13/48 | 32,542,000 | 31,077,610 | |||||||||
|
| |||||||||||
Total Paraguay |
| |||||||||||
(Cost: $67,364,120) |
| 65,764,225 | ||||||||||
|
| |||||||||||
See accompanying notes to financial statements.
18
Table of Contents
TCW Emerging Markets Income Fund
October 31, 2018 |
| Issues | Maturity Date | Principal Amount | Value | |||||||||
| Peru — 2.3% | ||||||||||||
Hunt Oil Co. of Peru LLC Sucursal Del Peru |
| |||||||||||
6.38% (1) | 06/01/28 | $ | 12,759,000 | $ | 13,014,180 | |||||||
Inkia Energy, Ltd. |
| |||||||||||
5.88% (1) | 11/09/27 | 13,830,000 | 13,155,787 | |||||||||
Nexa Resources S.A. |
| |||||||||||
5.38% (1) | 05/04/27 | 11,925,000 | 11,639,993 | |||||||||
Orazul Energy Egenor S en C por A |
| |||||||||||
5.63% (1) | 04/28/27 | 18,809,000 | 17,172,805 | |||||||||
Peru LNG SRL |
| |||||||||||
5.38% (1) | 03/22/30 | 15,905,000 | 15,775,772 | |||||||||
Petroleos del Peru S.A. |
| |||||||||||
5.63% (1) | 06/19/47 | 38,385,000 | 36,417,769 | |||||||||
|
| |||||||||||
Total Peru |
| |||||||||||
(Cost: $111,256,103) |
| 107,176,306 | ||||||||||
|
| |||||||||||
| Qatar — 2.8% | ||||||||||||
Qatar Government International Bond |
| |||||||||||
3.88% (1) | 04/23/23 | 27,850,000 | 27,971,844 | |||||||||
4.50% (1) | 04/23/28 | 51,550,000 | 52,709,875 | |||||||||
5.10% (1) | 04/23/48 | 49,875,000 | 50,837,587 | |||||||||
|
| |||||||||||
Total Qatar |
| |||||||||||
(Cost: $130,178,183) |
| 131,519,306 | ||||||||||
|
| |||||||||||
| Russia — 3.6% | ||||||||||||
Russian Federation Government Bond |
| |||||||||||
4.25% (2) | 06/23/27 | 51,200,000 | 48,580,608 | |||||||||
4.38% (1) | 03/21/29 | 33,800,000 | 32,059,300 | |||||||||
4.75% (2) | 05/27/26 | 64,600,000 | 63,870,020 | |||||||||
5.25% (2) | 06/23/47 | 28,800,000 | 26,706,240 | |||||||||
|
| |||||||||||
Total Russia |
| |||||||||||
(Cost: $173,674,460) |
| 171,216,168 | ||||||||||
|
| |||||||||||
| Saudi Arabia — 1.2% | ||||||||||||
Saudi Government International Bond |
| |||||||||||
4.50% (2) | 10/26/46 | 19,960,000 | 18,163,600 | |||||||||
5.00% (1) | 04/17/49 | 39,750,000 | 38,322,975 | |||||||||
|
| |||||||||||
Total Saudi Arabia |
| |||||||||||
(Cost: $56,993,108) |
| 56,486,575 | ||||||||||
|
| |||||||||||
| Senegal — 0.5% (Cost: $22,286,940) | ||||||||||||
Senegal Government International Bond |
| |||||||||||
6.25% (2) | 05/23/33 | 24,484,000 | 21,293,735 | |||||||||
|
| |||||||||||
| South Africa — 5.2% | ||||||||||||
Eskom Holdings SOC, Ltd. |
| |||||||||||
8.45% (2) | 08/10/28 | 13,350,000 | 12,928,140 | |||||||||
Petra Diamonds US Treasury PLC |
| |||||||||||
7.25% (2) | 05/01/22 | 11,650,000 | 11,169,438 | |||||||||
SASOL Financing USA LLC |
| |||||||||||
5.88% | 03/27/24 | 14,205,000 | 14,326,038 | |||||||||
6.50% | 09/27/28 | 16,505,000 | 16,663,448 | |||||||||
| Issues | Maturity Date | Principal Amount | Value | |||||||||
| South Africa (Continued) | ||||||||||||
South Africa Government Bond |
| |||||||||||
4.30% | 10/12/28 | $ | 43,165,000 | $ | 36,910,391 | |||||||
4.67% | 01/17/24 | 30,350,000 | 29,129,930 | |||||||||
4.88% | 04/14/26 | 55,275,000 | 51,336,656 | |||||||||
5.88% | 09/16/25 | 40,600,000 | 40,126,685 | |||||||||
5.88% | 06/22/30 | 33,850,000 | 31,981,480 | |||||||||
|
| |||||||||||
Total South Africa |
| |||||||||||
(Cost: $255,694,105) |
| 244,572,206 | ||||||||||
|
| |||||||||||
| Sri Lanka — 1.4% | ||||||||||||
Sri Lanka Government Bond |
| |||||||||||
5.75% (1) | 04/18/23 | 41,520,000 | 37,600,512 | |||||||||
6.20% (1) | 05/11/27 | 16,625,000 | 14,289,187 | |||||||||
6.83% (1) | 07/18/26 | 13,835,000 | 12,504,073 | |||||||||
|
| |||||||||||
Total Sri Lanka |
| |||||||||||
(Cost: $70,642,863) |
| 64,393,772 | ||||||||||
|
| |||||||||||
| Tanzania — 0.3% (Cost: $13,118,419) | ||||||||||||
HTA Group, Ltd. |
| |||||||||||
9.13% (2) | 03/08/22 | 12,829,000 | 13,149,725 | |||||||||
|
| |||||||||||
| Tunisia — 0.3% (Cost: $14,973,124) | ||||||||||||
Banque Centrale de Tunisie International Bond |
| |||||||||||
6.75% (1) | 10/31/23 | EUR | 13,275,000 | 14,834,415 | ||||||||
|
| |||||||||||
| Turkey — 3.5% | ||||||||||||
Petkim Petrokimya Holding AS |
| |||||||||||
5.88% (1) | 01/26/23 | $ | 10,600,000 | 9,752,000 | ||||||||
Turkcell Iletisim Hizmetleri AS |
| |||||||||||
5.80% (1) | 04/11/28 | 18,650,000 | 16,197,824 | |||||||||
Turkey Government International Bond |
| |||||||||||
3.25% | 03/23/23 | 24,000,000 | 20,640,000 | |||||||||
5.75% | 03/22/24 | 35,060,000 | 32,767,076 | |||||||||
6.00% | 03/25/27 | 47,915,000 | 43,512,809 | |||||||||
6.25% | 09/26/22 | 26,580,000 | 25,815,745 | |||||||||
7.25% | 12/23/23 | 17,000,000 | 16,898,850 | |||||||||
|
| |||||||||||
Total Turkey |
| |||||||||||
(Cost: $171,344,521) |
| 165,584,304 | ||||||||||
|
| |||||||||||
| Ukraine — 4.6% | ||||||||||||
Ukraine Government International Bond |
| |||||||||||
0.00% (1)(7) | 02/28/19 | 45,865,000 | 45,200,416 | |||||||||
7.75% (2) | 09/01/23 | 70,553,000 | 67,313,630 | |||||||||
7.75% (2) | 09/01/25 | 13,210,000 | 12,186,225 | |||||||||
7.75% (2) | 09/01/26 | 27,889,000 | 25,283,749 | |||||||||
8.99% (1) | 02/01/24 | 34,600,000 | 34,362,125 | |||||||||
9.75% (1) | 11/01/28 | 34,600,000 | 34,254,000 | |||||||||
|
| |||||||||||
Total Ukraine |
| |||||||||||
(Cost: $200,061,093) |
| 218,600,145 | ||||||||||
|
| |||||||||||
See accompanying notes to financial statements.
19
Table of Contents
TCW Emerging Markets Income Fund
Schedule of Investments (Continued)
| Issues | Maturity Date | Principal Amount | Value | |||||||||
| United Arab Emirates — 0.7% | ||||||||||||
DP World Crescent, Ltd. |
| |||||||||||
4.85% (1) | 09/26/28 | $ | 23,135,000 | $ | 22,672,300 | |||||||
DP World, Ltd. |
| |||||||||||
5.63% (1) | 09/25/48 | 12,570,000 | 11,936,472 | |||||||||
|
| |||||||||||
Total United Arab Emirates |
| |||||||||||
(Cost: $35,510,250) |
| 34,608,772 | ||||||||||
|
| |||||||||||
Uruguay — 0.9% (Cost: $43,611,607) |
| |||||||||||
Uruguay Government International Bond |
| |||||||||||
4.98% | 04/20/55 | 44,605,000 | 41,482,650 | |||||||||
|
| |||||||||||
| Venezuela — 0.8% | ||||||||||||
Venezuela Government International Bond |
| |||||||||||
8.25% (2)(5) | 10/13/24 | 58,079,200 | 14,955,394 | |||||||||
9.25% (5) | 09/15/27 | 45,685,000 | 11,763,888 | |||||||||
9.25% (2)(5) | 05/07/28 | 49,048,000 | 12,507,240 | |||||||||
|
| |||||||||||
Total Venezuela |
| |||||||||||
(Cost: $50,667,114) |
| 39,226,522 | ||||||||||
|
| |||||||||||
| Zambia — 1.0% | ||||||||||||
First Quantum Minerals, Ltd. |
| |||||||||||
6.88% (1) | 03/01/26 | 14,150,000 | 12,257,437 | |||||||||
7.50% (1) | 04/01/25 | 18,556,000 | 16,730,090 | |||||||||
| Issues | Maturity Date | Principal Amount | Value | |||||||||
| Zambia (Continued) | ||||||||||||
Zambia Government International Bond |
| |||||||||||
8.50% (2) | 04/14/24 | $ | 10,365,000 | $ | 7,164,806 | |||||||
8.97% (2) | 07/30/27 | 16,100,000 | 11,019,162 | |||||||||
|
| |||||||||||
Total Zambia |
| |||||||||||
(Cost: $61,219,709) |
| 47,171,495 | ||||||||||
|
| |||||||||||
Total Fixed Income Securities |
| |||||||||||
(Cost: $4,565,956,700) |
| 4,447,745,111 | ||||||||||
|
| |||||||||||
PURCHASED OPTIONS (0.0%) |
| |||||||||||
(Cost: $1,090,050) (8) |
| 73 | ||||||||||
|
| |||||||||||
| Shares | ||||||||||||
MONEY MARKET INVESTMENTS — 6.5% |
| |||||||||||
State Street Institutional U.S. Government Money Market Fund — Premier Class, 2.09% (9) |
| 306,647,859 | 306,647,859 | |||||||||
|
| |||||||||||
Total Money Market Investments |
| |||||||||||
(Cost: $306,647,859) |
| 306,647,859 | ||||||||||
|
| |||||||||||
Total Investments (101.0%) |
| |||||||||||
(Cost: $4,873,694,609) |
| 4,754,393,043 | ||||||||||
Liabilities in Excess of Other Assets (-1.0%) |
| (46,277,113 | ) | |||||||||
|
| |||||||||||
Total Net Assets (100.0%) |
| $ | 4,708,115,930 | |||||||||
|
| |||||||||||
| Purchased Options — OTC | ||||||||||||||||||||||||||||||||||
| Description | Counterparty | Exercise Price | Expiration Date | Number of Contracts | Notional Amount (000) | Market Value | Premiums Paid (Received) by Fund | Unrealized Appreciation (Depreciation) | ||||||||||||||||||||||||||
USD Put / TRY Call | Citibank N.A. | TRY | 4 | 12/19/18 | 72,670 | $ | 72,670 | $ | 73 | $ | 1,090,050 | $ | (1,089,977 | ) | ||||||||||||||||||||
|
|
|
|
|
| |||||||||||||||||||||||||||||
See accompanying notes to financial statements.
20
Table of Contents
TCW Emerging Markets Income Fund
October 31, 2018 |
| Forward Currency Exchange Contracts | ||||||||||||||||||||||||
| Counterparty | Contracts to Deliver | Units of Currency | Settlement Date | In Exchange for U.S. Dollars | Contracts at Value | Unrealized Appreciation (Depreciation) | ||||||||||||||||||
BUY (10) |
| |||||||||||||||||||||||
Bank of America | SAR | 10,559,508 | 05/20/19 | $ | 2,813,693 | $ | 2,814,635 | $ | 942 | |||||||||||||||
BNP Paribas S.A. | BRL | 186,783,800 | 11/07/18 | 49,916,567 | 50,272,864 | 356,297 | ||||||||||||||||||
Citibank N.A. | SAR | 65,340,492 | 05/20/19 | 17,414,843 | 17,416,493 | 1,650 | ||||||||||||||||||
Citibank N.A. | SAR | 69,663,299 | 04/06/20 | 18,493,045 | 18,521,524 | 28,479 | ||||||||||||||||||
Goldman Sachs & Co. | BRL | 58,258,687 | 11/07/18 | 14,773,345 | 15,680,327 | 906,982 | ||||||||||||||||||
Standard Chartered Bank | BRL | 132,741,313 | 11/07/18 | 33,721,714 | 35,727,328 | 2,005,614 | ||||||||||||||||||
|
|
|
|
|
| |||||||||||||||||||
| $ | 137,133,207 | $ | 140,433,171 | $ | 3,299,964 | |||||||||||||||||||
|
|
|
|
|
| |||||||||||||||||||
SELL (11) |
| |||||||||||||||||||||||
Bank of America | SAR | 10,559,508 | 05/20/19 | $ | 2,782,479 | $ | 2,814,635 | $ | (32,156 | ) | ||||||||||||||
Citibank N.A. | SAR | 65,340,492 | 05/20/19 | 17,217,521 | 17,416,493 | (198,972 | ) | |||||||||||||||||
Citibank N.A. | SAR | 69,663,299 | 04/06/20 | 18,470,000 | 18,521,524 | (51,524 | ) | |||||||||||||||||
Goldman Sachs & Co. | BRL | 188,100,600 | 11/07/18 | 45,800,000 | 50,627,281 | (4,827,281 | ) | |||||||||||||||||
Standard Chartered Bank | BRL | 189,683,200 | 11/07/18 | 46,400,000 | 51,053,238 | (4,653,238 | ) | |||||||||||||||||
|
|
|
|
|
| |||||||||||||||||||
| $ | 130,670,000 | $ | 140,433,171 | $ | (9,763,171 | ) | ||||||||||||||||||
|
|
|
|
|
| |||||||||||||||||||
Notes to the Schedule of Investments:
| BRL - | Brazilian Real. |
| EUR - | Euro Currency. |
| MXN - | Mexican Peso. |
| SAR - | Saudi Riyal. |
| TRY - | Turkish New Lira. |
| USD - | U.S. Dollar. |
| OTC | Over the Counter. |
| (1) | Security exempt from registration under Rule 144A of the Securities Act of 1933, as amended (the “Securities Act”). These securities may be resold, normally only to qualified institutional buyers. At October 31, 2018, the value of these securities amounted to $2,038,849,833 or 43.3% of net assets. These securities are determined to be liquid by the Advisor, unless otherwise noted, under procedures established by and under the general supervision of the Company’s Board of Directors. |
| (2) | Investments issued under Regulation S of the Securities Act may not be offered, sold, or delivered within the United States except under special exemptions. At October 31, 2018, the value of these securities amounted to $1,193,560,458 or 25.4% of net assets. |
| (3) | Floating or variable rate security. The interest shown reflects the rate in effect at October 31, 2018. |
| (4) | Perpetual Maturity. |
| (5) | Security is currently in default due to bankruptcy or failure to make payment of principal or interest of the issuer. Income is not being accrued. |
| (6) | This security is purchased on a when-issued, delayed delivery or forward commitment basis. |
| (7) | Security is not accruing interest. |
| (8) | See options table for description of purchased options. |
| (9) | Rate disclosed is the 7-day net yield as of October 31, 2018. |
| (10) | Fund buys foreign currency, sells U.S. Dollar. |
| (11) | Fund sells foreign currency, buys U.S. Dollar. |
See accompanying notes to financial statements.
21
Table of Contents
TCW Emerging Markets Income Fund
Investments by Industry | October 31, 2018 |
| Industry | Percentage of Net Assets | |||
Auto Parts & Equipment | 0.2 | % | ||
Banks | 3.6 | |||
Building Materials | 0.2 | |||
Chemicals | 0.9 | |||
Commercial Services | 1.2 | |||
Currency Options | 0.0 | * | ||
Diversified Financial Services | 0.8 | |||
Electric | 4.4 | |||
Energy-Alternate Sources | 0.7 | |||
Engineering & Construction | 0.2 | |||
Food | 0.5 | |||
Foreign Government Bonds | 61.8 | |||
Forest Products & Paper | 0.3 | |||
Household Products/Wares | 0.2 | |||
Iron & Steel | 0.9 | |||
Mining | 1.6 | |||
Oil & Gas | 11.2 | |||
Pipelines | 1.2 | |||
Real Estate | 1.1 | |||
Regional (State & Province) | 0.5 | |||
Telecommunications | 2.1 | |||
Transportation | 0.8 | |||
Water | 0.1 | |||
Money Market Investments | 6.5 | |||
|
| |||
Total | 101.0 | % | ||
|
| |||
| * | Amount rounds to less than 0.1% of net assets. |
See accompanying notes to financial statements.
22
Table of Contents
TCW Emerging Markets Income Fund
Fair Valuation Summary | October 31, 2018 |
The following is a summary of the fair valuations according to the inputs used as of October 31, 2018 in valuing the Fund’s investments:
Description | Quoted Prices in Active Markets for Identical Assets (Level 1) | Other Significant Observable Inputs (Level 2) | Significant Unobservable Inputs (Level 3) | Total | ||||||||||||
Fixed Income Securities | ||||||||||||||||
Auto Parts & Equipment | $ | — | $ | 10,978,616 | $ | — | $ | 10,978,616 | ||||||||
Banks | — | 167,393,298 | — | 167,393,298 | ||||||||||||
Building Materials | — | 11,738,250 | — | 11,738,250 | ||||||||||||
Chemicals | — | 40,741,486 | — | 40,741,486 | ||||||||||||
Commercial Services | — | 57,659,013 | — | 57,659,013 | ||||||||||||
Diversified Financial Services | — | 37,661,715 | — | 37,661,715 | ||||||||||||
Electric | — | 208,086,394 | — | 208,086,394 | ||||||||||||
Energy-Alternate Sources | — | 30,846,357 | — | 30,846,357 | ||||||||||||
Engineering & Construction | — | 12,897,847 | — | 12,897,847 | ||||||||||||
Food | — | 21,958,394 | — | 21,958,394 | ||||||||||||
Foreign Government Bonds | — | 2,907,822,146 | — | 2,907,822,146 | ||||||||||||
Forest Products & Paper | — | 11,944,200 | — | 11,944,200 | ||||||||||||
Household Products/Wares | — | 9,469,719 | — | 9,469,719 | ||||||||||||
Iron & Steel | — | 37,379,728 | — | 37,379,728 | ||||||||||||
Mining | — | 76,400,490 | — | 76,400,490 | ||||||||||||
Oil & Gas | — | 528,208,582 | — | 528,208,582 | ||||||||||||
Pipelines | — | 59,202,492 | — | 59,202,492 | ||||||||||||
Real Estate | — | 52,082,336 | — | 52,082,336 | ||||||||||||
Regional (State & Province) | — | 23,007,789 | — | 23,007,789 | ||||||||||||
Telecommunications | — | 98,896,703 | — | 98,896,703 | ||||||||||||
Transportation | — | 37,926,244 | — | 37,926,244 | ||||||||||||
Water | — | 5,443,312 | — | 5,443,312 | ||||||||||||
|
|
|
|
|
|
|
| |||||||||
Total Fixed Income Securities | — | 4,447,745,111 | — | 4,447,745,111 | ||||||||||||
|
|
|
|
|
|
|
| |||||||||
Currency Options | — | 73 | — | 73 | ||||||||||||
Money Market Investments | 306,647,859 | — | — | 306,647,859 | ||||||||||||
|
|
|
|
|
|
|
| |||||||||
Total Investments | 306,647,859 | 4,447,745,184 | — | 4,754,393,043 | ||||||||||||
|
|
|
|
|
|
|
| |||||||||
Asset Derivatives | ||||||||||||||||
Forward Currency Contracts | ||||||||||||||||
Foreign Currency Risk | — | 3,299,964 | — | 3,299,964 | ||||||||||||
|
|
|
|
|
|
|
| |||||||||
Total | $ | 306,647,859 | $ | 4,451,045,148 | $ | — | $ | 4,757,693,007 | ||||||||
|
|
|
|
|
|
|
| |||||||||
Liability Derivatives | ||||||||||||||||
Forward Currency Contracts | ||||||||||||||||
Foreign Currency Risk | $ | — | $ | (9,763,171 | ) | $ | — | $ | (9,763,171 | ) | ||||||
|
|
|
|
|
|
|
| |||||||||
Total | $ | — | $ | (9,763,171 | ) | $ | — | $ | (9,763,171 | ) | ||||||
|
|
|
|
|
|
|
| |||||||||
See accompanying notes to financial statements.
23
Table of Contents
TCW Emerging Markets Local Currency Income Fund
Schedule of Investments
| Issues | Maturity Date | Principal Amount | Value | |||||||||
FIXED INCOME SECURITIES — 86.5% of Net Assets |
| |||||||||||
| Argentina — 1.0% | ||||||||||||
Argentine Republic Government International Bond |
| |||||||||||
6.88% | 04/22/21 | $ | 725,000 | $ | 696,182 | |||||||
Bonos de la Nacion Argentina con Ajuste por CER |
| |||||||||||
4.50% | 06/21/19 | $ | 2,400,000 | 2,398,800 | ||||||||
|
| |||||||||||
Total Argentina |
| |||||||||||
(Cost: $3,080,273) |
| 3,094,982 | ||||||||||
|
| |||||||||||
| Brazil — 13.9% | ||||||||||||
Brazil Notas do Tesouro Nacional, Series F |
| |||||||||||
10.00% | 01/01/21 | BRL | 14,935,000 | 4,163,845 | ||||||||
10.00% | 01/01/23 | BRL | 92,850,000 | 25,647,033 | ||||||||
10.00% | 01/01/25 | BRL | 29,930,000 | 8,185,159 | ||||||||
10.00% | 01/01/27 | BRL | 19,800,000 | 5,334,904 | ||||||||
|
| |||||||||||
Total Brazil |
| |||||||||||
(Cost: $40,063,520) |
| 43,330,941 | ||||||||||
|
| |||||||||||
| Chile — 2.7% | ||||||||||||
Bonos de la Tesoreria de la Republica |
| |||||||||||
2.00% | 03/01/35 | CLP | 5,664,728,650 | 8,185,086 | ||||||||
Bonos del Banco Central de Chile en UF |
| |||||||||||
3.00% | 03/01/23 | CLP | 274,321,000 | 424,257 | ||||||||
|
| |||||||||||
Total Chile |
| |||||||||||
(Cost: $9,347,513) |
| 8,609,343 | ||||||||||
|
| |||||||||||
| Colombia — 7.0% | ||||||||||||
Colombian TES (Treasury) Bond, Series B |
| |||||||||||
7.00% | 05/04/22 | COP | 17,901,900,000 | 5,744,843 | ||||||||
7.50% | 08/26/26 | COP | 25,405,000,000 | 8,129,770 | ||||||||
10.00% | 07/24/24 | COP | 22,334,700,000 | 8,063,800 | ||||||||
|
| |||||||||||
Total Colombia |
| |||||||||||
(Cost: $23,713,725) |
| 21,938,413 | ||||||||||
|
| |||||||||||
Egypt — 0.2% (Cost: $815,150) |
| |||||||||||
Egypt Government Bond |
| |||||||||||
15.16% | 10/10/22 | EGP | 14,500,000 | 736,036 | ||||||||
|
| |||||||||||
| Hungary — 3.3% | ||||||||||||
Hungary Government Bond |
| |||||||||||
3.00% | 10/27/27 | HUF | 2,579,000,000 | 8,550,225 | ||||||||
5.50% | 06/24/25 | HUF | 424,000,000 | 1,688,020 | ||||||||
|
| |||||||||||
Total Hungary |
| |||||||||||
(Cost: $10,958,619) |
| 10,238,245 | ||||||||||
|
| |||||||||||
| Indonesia — 8.2% | ||||||||||||
Indonesia Treasury Bond |
| |||||||||||
6.13% | 05/15/28 | IDR | 27,618,000,000 | 1,540,540 | ||||||||
6.63% | 05/15/33 | IDR | 48,950,000,000 | 2,656,389 | ||||||||
7.00% | 05/15/22 | IDR | 24,145,000,000 | 1,536,211 | ||||||||
7.00% | 05/15/27 | IDR | 7,500,000,000 | 446,325 | ||||||||
7.50% | 08/15/32 | IDR | 57,947,000,000 | 3,417,167 | ||||||||
| Issues | Maturity Date | Principal Amount | Value | |||||||||
| Indonesia (Continued) | ||||||||||||
8.25% | 05/15/29 | IDR | 73,961,000,000 | $ | 4,775,368 | |||||||
8.38% | 03/15/24 | IDR | 48,934,000,000 | 3,194,672 | ||||||||
8.38% | 09/15/26 | IDR | 123,006,000,000 | 8,012,256 | ||||||||
|
| |||||||||||
Total Indonesia |
| |||||||||||
(Cost: $28,946,885) |
| 25,578,928 | ||||||||||
|
| |||||||||||
| Malaysia — 4.5% | ||||||||||||
Malaysia Government Bond |
| |||||||||||
3.48% | 03/15/23 | MYR | 13,410,000 | 3,157,095 | ||||||||
3.80% | 08/17/23 | MYR | 16,928,000 | 4,027,201 | ||||||||
3.90% | 11/16/27 | MYR | 5,300,000 | 1,238,134 | ||||||||
4.05% | 09/30/21 | MYR | 7,870,000 | 1,900,498 | ||||||||
4.18% | 07/15/24 | MYR | 8,400,000 | 2,026,830 | ||||||||
4.89% | 06/08/38 | MYR | 4,300,000 | 1,039,604 | ||||||||
4.92% | 07/06/48 | MYR | 3,000,000 | 714,216 | ||||||||
|
| |||||||||||
Total Malaysia |
| |||||||||||
(Cost: $14,175,637) |
| 14,103,578 | ||||||||||
|
| |||||||||||
| Mexico — 10.0% | ||||||||||||
Mexico Government Bond |
| |||||||||||
6.50% | 06/10/21 | MXN | 74,700,000 | 3,509,731 | ||||||||
Mexico Government Bond (BONOS) |
| |||||||||||
5.75% | 03/05/26 | MXN | 102,950,000 | 4,284,847 | ||||||||
6.50% | 06/09/22 | MXN | 153,200,000 | 7,089,594 | ||||||||
8.00% | 12/07/23 | MXN | 149,900,000 | 7,226,304 | ||||||||
10.00% | 12/05/24 | MXN | 150,495,000 | 7,917,281 | ||||||||
Petroleos Mexicanos |
| |||||||||||
7.19% (1) | 09/12/24 | MXN | 22,240,000 | 914,046 | ||||||||
7.65% (1) | 11/24/21 | MXN | 3,700,000 | 169,902 | ||||||||
|
| |||||||||||
Total Mexico |
| |||||||||||
(Cost: $34,292,713) |
| 31,111,705 | ||||||||||
|
| |||||||||||
| Peru — 2.8% | ||||||||||||
Peruvian Government International Bond |
| |||||||||||
6.15% (2) | 08/12/32 | PEN | 8,950,000 | 2,655,325 | ||||||||
6.35% (2) | 08/12/28 | PEN | 7,050,000 | 2,163,061 | ||||||||
6.95% (1) | 08/12/31 | PEN | 12,071,000 | 3,835,846 | ||||||||
|
| |||||||||||
Total Peru |
| |||||||||||
(Cost: $8,758,369) |
| 8,654,232 | ||||||||||
|
| |||||||||||
| Poland — 2.6% | ||||||||||||
Poland Government Bond |
| |||||||||||
2.50% | 07/25/26 | PLN | 8,500,000 | 2,140,783 | ||||||||
2.50% | 07/25/27 | PLN | 24,075,000 | 5,985,832 | ||||||||
|
| |||||||||||
Total Poland |
| |||||||||||
(Cost: $8,440,210) |
| 8,126,615 | ||||||||||
|
| |||||||||||
| Romania — 4.5% | ||||||||||||
Romania Government Bond |
| |||||||||||
4.25% | 06/28/23 | RON | 24,055,000 | 5,749,618 | ||||||||
See accompanying notes to financial statements.
24
Table of Contents
TCW Emerging Markets Local Currency Income Fund
October 31, 2018 |
| Issues | Maturity Date | Principal Amount | Value | |||||||||
| Romania (Continued) | ||||||||||||
4.75% | 02/24/25 | RON | 11,290,000 | $ | 2,743,791 | |||||||
5.85% | 04/26/23 | RON | 22,350,000 | 5,706,961 | ||||||||
|
| |||||||||||
Total Romania |
| |||||||||||
(Cost: $15,101,125) |
| 14,200,370 | ||||||||||
|
| |||||||||||
| Russia — 8.2% | ||||||||||||
Russian Federal Bond — OFZ |
| |||||||||||
7.00% | 01/25/23 | RUB | 374,000,000 | 5,464,360 | ||||||||
7.05% | 01/19/28 | RUB | 176,000,000 | 2,445,634 | ||||||||
7.10% | 10/16/24 | RUB | 380,030,000 | 5,448,407 | ||||||||
7.40% | 12/07/22 | RUB | 201,500,000 | 2,990,010 | ||||||||
7.60% | 07/20/22 | RUB | 287,000,000 | 4,302,381 | ||||||||
7.75% | 09/16/26 | RUB | 331,600,000 | 4,855,135 | ||||||||
|
| |||||||||||
Total Russia |
| |||||||||||
(Cost: $26,714,330) |
| 25,505,927 | ||||||||||
|
| |||||||||||
Serbia — 1.5% (Cost: $4,712,807) |
| |||||||||||
Serbia Treasury Bond |
| |||||||||||
5.88% | 02/08/28 | RSD | 438,660,000 | 4,559,673 | ||||||||
|
| |||||||||||
| South Africa — 8.2% | ||||||||||||
South Africa Government Bond |
| |||||||||||
8.00% | 01/31/30 | ZAR | 75,254,200 | 4,472,958 | ||||||||
8.75% | 01/31/44 | ZAR | 135,765,000 | 7,932,823 | ||||||||
8.75% | 02/28/48 | ZAR | 126,400,000 | 7,369,356 | ||||||||
8.88% | 02/28/35 | ZAR | 31,100,000 | 1,899,326 | ||||||||
10.50% | 12/21/26 | ZAR | 53,700,000 | 3,866,509 | ||||||||
|
| |||||||||||
Total South Africa |
| |||||||||||
(Cost: $29,825,470) |
| 25,540,972 | ||||||||||
|
| |||||||||||
| Thailand — 4.1% | ||||||||||||
Thailand Government Bond |
| |||||||||||
2.13% | 12/17/26 | THB | 296,500,000 | 8,547,697 | ||||||||
3.40% | 06/17/36 | THB | 144,500,000 | 4,442,948 | ||||||||
|
| |||||||||||
Total Thailand |
| |||||||||||
(Cost: $13,297,495) |
| 12,990,645 | ||||||||||
|
| |||||||||||
| Turkey — 3.6% | ||||||||||||
Turkey Government Bond |
| |||||||||||
8.50% | 07/10/19 | TRY | 5,900,000 | 964,608 | ||||||||
9.20% | 09/22/21 | TRY | 13,760,000 | 1,858,974 | ||||||||
10.60% | 02/11/26 | TRY | 18,500,000 | 2,357,361 | ||||||||
10.70% | 02/17/21 | TRY | 26,700,000 | 3,802,033 | ||||||||
11.00% | 03/02/22 | TRY | 8,686,250 | 1,203,887 | ||||||||
11.00% | 02/24/27 | TRY | 8,500,000 | 1,049,739 | ||||||||
|
| |||||||||||
Total Turkey |
| |||||||||||
(Cost: $17,038,023) |
| 11,236,602 | ||||||||||
|
| |||||||||||
| Issues | Maturity Date | Principal Amount | Value | |||||||||
Uruguay — 0.2% (Cost: $817,412) |
| |||||||||||
Uruguay Government International Bond |
| |||||||||||
9.88% (1) | 06/20/22 | UYU | 25,000,000 | $ | 750,419 | |||||||
|
| |||||||||||
Total Fixed Income Securities |
| |||||||||||
(Cost: $290,099,276) |
| 270,307,626 | ||||||||||
|
| |||||||||||
PURCHASED OPTIONS (0.0%) |
| |||||||||||
(Cost: $168,187) (3) |
| 57,736 | ||||||||||
|
| |||||||||||
| Shares | ||||||||||||
MONEY MARKET INVESTMENTS — 6.1% |
| |||||||||||
State Street Institutional U.S. Government Money Market Fund — Premier Class, 2.09% (4) |
| 19,138,149 | 19,138,149 | |||||||||
|
| |||||||||||
Total Money Market Investments |
| |||||||||||
(Cost: $19,138,149) |
| 19,138,149 | ||||||||||
|
| |||||||||||
| Maturity Date | Principal Amount | |||||||||||
SHORT TERM INVESTMENTS — 5.3% |
| |||||||||||
FOREIGN GOVERNMENT BONDS — 5.3% |
| |||||||||||
Argentina — 0.4% (Cost: $1,112,109) |
| |||||||||||
Argentina Treasury Bill |
| |||||||||||
0.00% (5) | 02/28/19 | ARS | 40,100,000 | 1,169,833 | ||||||||
|
| |||||||||||
| Egypt — 3.9% | ||||||||||||
Egypt Treasury Bills |
| |||||||||||
0.00% (5) | 12/04/18 | EGP | 32,300,000 | 1,770,332 | ||||||||
0.00% (5) | 12/11/18 | EGP | 32,000,000 | 1,751,034 | ||||||||
0.00% (5) | 12/25/18 | EGP | 37,000,000 | 2,005,654 | ||||||||
0.00% (5) | 01/01/19 | EGP | 101,975,000 | 5,506,707 | ||||||||
0.00% (5) | 01/22/19 | EGP | 22,700,000 | 1,212,143 | ||||||||
|
| |||||||||||
Total Egypt |
| |||||||||||
(Cost: $12,247,360) |
| 12,245,870 | ||||||||||
|
| |||||||||||
Nigeria — 1.0% (Cost: $3,066,153) |
| |||||||||||
Nigeria Treasury Bill |
| |||||||||||
0.00% (5) | 01/31/19 | NGN | 1,150,000,000 | 3,072,586 | ||||||||
|
| |||||||||||
Total Short Term Investments |
| |||||||||||
(Cost: $16,425,622) |
| 16,488,289 | ||||||||||
|
| |||||||||||
Total Investments (97.9%) |
| |||||||||||
(Cost: $325,831,234) |
| 305,991,800 | ||||||||||
Excess of Other Assets over Liabilities (2.1%) |
| 6,425,914 | ||||||||||
|
| |||||||||||
Total Net Assets (100.0%) |
| $ | 312,417,714 | |||||||||
|
| |||||||||||
See accompanying notes to financial statements.
25
Table of Contents
TCW Emerging Markets Local Currency Income Fund
Schedule of Investments (Continued)
| Purchased Options — OTC | ||||||||||||||||||||||||||||||||||||
| Description | Counterparty | Exercise Price | Expiration Date | Number of Contracts | Notional Amount (000) | Market Value | Premiums Paid (Received) by Fund | Unrealized Appreciation/ (Depreciation) | ||||||||||||||||||||||||||||
Currency Options |
| |||||||||||||||||||||||||||||||||||
USD Put / TRY Call | Citibank N.A. | TRY | 4 | 12/19/18 | 5,880 | $ | 5,880 | $ | 6 | $ | 88,200 | $ | (88,194 | ) | ||||||||||||||||||||||
USD Put / ZAR Call | Goldman Sachs & Co. | ZAR | 15 | 12/20/18 | 3,180 | 3,180 | 57,730 | 79,987 | (22,257 | ) | ||||||||||||||||||||||||||
|
|
|
|
|
| |||||||||||||||||||||||||||||||
| $ | 57,736 | $ | 168,187 | $ | (110,451 | ) | ||||||||||||||||||||||||||||||
|
|
|
|
|
| |||||||||||||||||||||||||||||||
| Forward Currency Contracts | ||||||||||||||||||||||||
| Counterparty | Contracts to Deliver | Units of Currency | Settlement Date | In Exchange for U.S. Dollars | Contracts at Value | Unrealized Appreciation (Depreciation) | ||||||||||||||||||
BUY (6) | ||||||||||||||||||||||||
Bank of America, N.A. | IDR | 29,967,348,100 | 12/10/18 | $ | 1,955,000 | $ | 1,961,601 | $ | 6,601 | |||||||||||||||
Bank of America, N.A. | THB | 436,205,616 | 01/04/19 | 13,525,000 | 13,188,119 | (336,881 | ) | |||||||||||||||||
Bank of America, N.A. | ZAR | 45,664,480 | 11/14/18 | 3,199,473 | 3,088,049 | (111,424 | ) | |||||||||||||||||
Barclays Bank PLC | COP | 4,712,355,000 | 12/26/18 | 1,570,000 | 1,459,507 | (110,493 | ) | |||||||||||||||||
Barclays Bank PLC | CZK | 328,489,875 | 12/20/18 | 15,150,000 | 14,411,623 | (738,377 | ) | |||||||||||||||||
Barclays Bank PLC | IDR | 13,295,600,000 | 12/10/18 | 860,000 | 870,303 | 10,303 | ||||||||||||||||||
BNP Paribas S.A. | ARS | 44,865,114 | 01/22/19 | 1,100,000 | 1,120,440 | 20,440 | ||||||||||||||||||
BNP Paribas S.A. | BRL | 26,677,342 | 11/07/18 | 7,129,319 | 7,180,207 | 50,888 | ||||||||||||||||||
BNP Paribas S.A. | EUR | 1,470,000 | 01/11/19 | 1,708,070 | 1,676,636 | (31,434 | ) | |||||||||||||||||
BNP Paribas S.A. | PLN | 52,595,768 | 11/19/18 | 14,265,000 | 13,734,291 | (530,709 | ) | |||||||||||||||||
Goldman Sachs & Co. | BRL | 4,065,907 | 11/07/18 | 1,031,040 | 1,094,339 | 63,299 | ||||||||||||||||||
Goldman Sachs & Co. | EUR | 5,900,000 | 01/11/19 | 6,894,230 | 6,729,354 | (164,876 | ) | |||||||||||||||||
Standard Chartered PLC | BRL | 9,264,093 | 11/07/18 | 2,353,458 | 2,493,431 | 139,973 | ||||||||||||||||||
Standard Chartered PLC | HUF | 929,534,840 | 12/27/18 | 3,400,000 | 3,255,281 | (144,719 | ) | |||||||||||||||||
Standard Chartered PLC | PHP | 51,778,600 | 11/13/18 | 970,000 | 967,345 | (2,655 | ) | |||||||||||||||||
|
|
|
|
|
| |||||||||||||||||||
| $ | 75,110,590 | $ | 73,230,526 | $ | (1,880,064 | ) | ||||||||||||||||||
|
|
|
|
|
| |||||||||||||||||||
SELL (7) | ||||||||||||||||||||||||
Bank of America, N.A. | COP | 2,362,355,000 | 12/26/18 | $ | 737,775 | $ | 731,667 | $ | 6,108 | |||||||||||||||
Bank of America, N.A. | PLN | 11,114,400 | 11/19/18 | 3,000,000 | 2,902,294 | 97,706 | ||||||||||||||||||
Barclays Bank PLC | BRL | 25,838,192 | 11/07/18 | 6,270,000 | 6,954,350 | (684,350 | ) | |||||||||||||||||
Barclays Bank PLC | BRL | 17,865,482 | 01/29/19 | 4,770,000 | 4,775,304 | (5,304 | ) | |||||||||||||||||
BNP Paribas S.A | EUR | 7,370,000 | 01/11/19 | 8,783,059 | 8,405,991 | 377,068 | ||||||||||||||||||
BNP Paribas S.A. | COP | 2,350,000,000 | 12/26/18 | 756,917 | 727,840 | 29,077 | ||||||||||||||||||
BNP Paribas S.A. | KRW | 9,022,227,956 | 01/10/19 | 7,951,406 | 7,935,311 | 16,095 | ||||||||||||||||||
BNP Paribas S.A. | ZAR | 45,664,480 | 11/14/18 | 3,200,000 | 3,088,049 | 111,951 | ||||||||||||||||||
Goldman Sachs & Co. | BRL | 14,169,150 | 11/07/18 | 3,450,000 | 3,813,627 | (363,627 | ) | |||||||||||||||||
|
|
|
|
|
| |||||||||||||||||||
| $ | 38,919,157 | $ | 39,334,433 | $ | (415,276 | ) | ||||||||||||||||||
|
|
|
|
|
| |||||||||||||||||||
See accompanying notes to financial statements.
26
Table of Contents
TCW Emerging Markets Local Currency Income Fund
October 31, 2018 |
Notes to the Schedule of Investments:
| ARS - | Argentine Peso. |
| BRL - | Brazilian Real. |
| CLP - | Chilean Peso. |
| COP - | Colombian Peso. |
| CZK - | Czech Koruna. |
| EGP - | Egyptian Pound. |
| EUR - | Euro Currency. |
| HUF - | Hungarian Forint. |
| IDR - | Indonesian Rupiah. |
| KRW - | South Korean Won. |
| MXN - | Mexican Peso. |
| MYR - | Malaysian Ringgit. |
| NGN - | Nigeria Naira. |
| PEN - | Peruvian Nuevo Sol. |
| PHP - | Philippines Peso. |
| PLN - | Polish Zloty. |
| RON - | Romanian New Leu. |
| RSD - | Serbian Dinar. |
| RUB - | Russian Ruble. |
| THB - | Thai Baht. |
| TRY - | Turkish New Lira. |
| USD - | U.S. Dollar. |
| UYU - | Uruguayan Peso. |
| ZAR - | South African Rand. |
| (1) | Investments issued under Regulation S of the Securities Act of 1933, as amended (the “Securities Act”), and may not be offered, sold, or delivered within the United States except under special exemptions. At October 31, 2018, the value of these securities amounted to $5,670,213 or 1.8% of net assets. |
| (2) | Security exempt from registration under Rule 144A of the Securities Act. These securities may be resold, normally only to qualified institutional buyers. At October 31, 2018, the value of these securities amounted to $4,818,386 or 1.5% of net assets. These securities are determined to be liquid by the Advisor, unless otherwise noted, under procedures established by and under the general supervision of the Company’s Board of Directors. |
| (3) | See options table for description of purchased options. |
| (4) | Rate disclosed is the 7-day net yield as of October 31, 2018. |
| (5) | Security is not accruing interest. |
| (6) | Fund buys foreign currency, sells U.S. Dollar. |
| (7) | Fund sells foreign currency, buys U.S. Dollar. |
See accompanying notes to financial statements.
27
Table of Contents
TCW Emerging Markets Local Currency Income Fund
Investments by Industry | October 31, 2018 |
| Industry | Percentage of Net Assets | |||
Banks | 0.1 | % | ||
Currency Options | 0.0 | * | ||
Foreign Government Bonds | 86.0 | |||
Oil & Gas | 0.4 | |||
Short Term Investments | 5.3 | |||
Money Market Investments | 6.1 | |||
|
| |||
Total | 97.9 | % | ||
|
| |||
| * | Value rounds to less than 0.1% of net assets. |
Fair Valuation Summary
The following is a summary of the fair valuations according to the inputs used as of October 31, 2018 in valuing the Fund’s investments:
Description | Quoted Prices in Active Markets for Identical Assets (Level 1) | Other Significant Observable Inputs (Level 2) | Significant Unobservable Inputs (Level 3) | Total | ||||||||||||
Fixed Income Securities | ||||||||||||||||
Banks | $ | — | $ | 424,257 | $ | — | $ | 424,257 | ||||||||
Foreign Government Bonds | — | 268,799,421 | — | 268,799,421 | ||||||||||||
Oil & Gas | — | 1,083,948 | — | 1,083,948 | ||||||||||||
|
|
|
|
|
|
|
| |||||||||
Total Fixed Income Securities | — | 270,307,626 | — | 270,307,626 | ||||||||||||
|
|
|
|
|
|
|
| |||||||||
Currency Options | — | 57,736 | — | 57,736 | ||||||||||||
Money Market Investments | 19,138,149 | — | — | 19,138,149 | ||||||||||||
Short-Term Investments | — | 16,488,289 | — | 16,488,289 | ||||||||||||
|
|
|
|
|
|
|
| |||||||||
Total Investments | 19,138,149 | 286,853,651 | — | 305,991,800 | ||||||||||||
|
|
|
|
|
|
|
| |||||||||
Asset Derivatives | ||||||||||||||||
Forward Currency Contracts | ||||||||||||||||
Foreign Currency Risk | — | 929,509 | — | 929,509 | ||||||||||||
|
|
|
|
|
|
|
| |||||||||
Total | $ | 19,138,149 | $ | 287,783,160 | $ | — | $ | 306,921,309 | ||||||||
|
|
|
|
|
|
|
| |||||||||
Liability Derivatives | ||||||||||||||||
Forward Currency Contracts | ||||||||||||||||
Foreign Currency Risk | $ | — | $ | (3,224,849 | ) | $ | — | $ | (3,224,849 | ) | ||||||
|
|
|
|
|
|
|
| |||||||||
Total | $ | — | $ | (3,224,849 | ) | $ | — | $ | (3,224,849 | ) | ||||||
|
|
|
|
|
|
|
| |||||||||
See accompanying notes to financial statements.
28
Table of Contents
TCW Emerging Markets Multi-Asset Opportunities Fund
Schedule of Investments | October 31, 2018 |
| Issues | Maturity Date | Principal Amount | Value | |||||||||
FIXED INCOME SECURITIES — 48.9% of Net Assets |
| |||||||||||
| Angola — 1.2% | ||||||||||||
Angolan Government International Bond |
| |||||||||||
8.25% (1) | 05/09/28 | $ | 1,025,000 | $ | 1,028,367 | |||||||
9.38% (1) | 05/08/48 | 425,000 | 428,413 | |||||||||
|
| |||||||||||
Total Angola |
| |||||||||||
(Cost: $1,478,631) |
| 1,456,780 | ||||||||||
|
| |||||||||||
| Argentina — 3.0% | ||||||||||||
Argentine Republic Government International Bond |
| |||||||||||
4.63% | 01/11/23 | 245,000 | 207,791 | |||||||||
5.63% | 01/26/22 | 1,145,000 | 1,033,363 | |||||||||
6.88% | 04/22/21 | 1,150,000 | 1,104,287 | |||||||||
6.88% | 01/26/27 | 755,000 | 633,747 | |||||||||
7.50% | 04/22/26 | 680,000 | 597,856 | |||||||||
|
| |||||||||||
Total Argentina |
| |||||||||||
(Cost: $3,689,567) |
| 3,577,044 | ||||||||||
|
| |||||||||||
| Azerbaijan — 0.6% | ||||||||||||
Republic of Azerbaijan International Bond |
| |||||||||||
3.50% (2) | 09/01/32 | 325,000 | 267,399 | |||||||||
Southern Gas Corridor CJSC |
| |||||||||||
6.88% (2) | 03/24/26 | 400,000 | 428,800 | |||||||||
|
| |||||||||||
Total Azerbaijan |
| |||||||||||
(Cost: $703,604) |
| 696,199 | ||||||||||
|
| |||||||||||
| Bahrain — 1.5% | ||||||||||||
Bahrain Government International Bond |
| |||||||||||
6.75% (2) | 09/20/29 | 600,000 | 575,250 | |||||||||
7.00% (1) | 10/12/28 | 855,000 | 837,319 | |||||||||
Oil and Gas Holding Co. (The) |
| |||||||||||
7.50% (1) | 10/25/27 | 200,000 | 195,000 | |||||||||
7.63% (1) | 11/07/24 | 200,000 | 200,000 | |||||||||
|
| |||||||||||
Total Bahrain |
| |||||||||||
(Cost: $1,784,957) |
| 1,807,569 | ||||||||||
|
| |||||||||||
| Brazil — 4.2% | ||||||||||||
Banco do Brasil S.A. |
| |||||||||||
6.25% (U.S. 10-year Treasury Constant Maturity Rate + 4.398%) (2)(3)(4) | 10/29/49 | 200,000 | 172,515 | |||||||||
9.00% (U.S. 10-year Treasury Constant Maturity Rate + 6.362%) (2)(3)(4) | 06/29/49 | 400,000 | 415,000 | |||||||||
Brazil Minas SPE via State of Minas Gerais |
| |||||||||||
5.33% (2) | 02/15/28 | 200,000 | 194,380 | |||||||||
Brazil Notas do Tesouro Nacional, Series F |
| |||||||||||
10.00% | 01/01/23 | BRL | 2,430,000 | 668,934 | ||||||||
Brazilian Government International Bond |
| |||||||||||
4.63% | 01/13/28 | $ | 300,000 | 282,300 | ||||||||
| Issues | Maturity Date | Principal Amount | Value | |||||||||
| Brazil (Continued) | ||||||||||||
Cemig Geracao e Transmissao S.A. |
| |||||||||||
9.25% (1) | 12/05/24 | $ | 200,000 | $ | 214,290 | |||||||
9.25% (2) | 12/05/24 | 200,000 | 214,290 | |||||||||
Light Servicos de Eletricidade SA/Light Energia SA |
| |||||||||||
7.25% (1) | 05/03/23 | 200,000 | 195,260 | |||||||||
MARB BondCo PLC |
| |||||||||||
6.88% (1) | 01/19/25 | 200,000 | 188,565 | |||||||||
Petrobras Global Finance BV |
| |||||||||||
5.75% | 02/01/29 | 1,487,000 | 1,376,962 | |||||||||
6.85% | 12/31/99 | 385,000 | 342,650 | |||||||||
Samarco Mineracao S.A. |
| |||||||||||
4.13% (2)(5) | 11/01/22 | 400,000 | 300,004 | |||||||||
Suzano Austria GmbH |
| |||||||||||
6.00% (1) | 01/15/29 | 200,000 | 204,000 | |||||||||
Vale Overseas, Ltd. |
| |||||||||||
6.88% | 11/21/36 | 200,000 | 223,058 | |||||||||
|
| |||||||||||
Total Brazil |
| |||||||||||
(Cost: $4,819,530) |
| 4,992,208 | ||||||||||
|
| |||||||||||
| Chile — 0.3% | ||||||||||||
C&W Senior Financing Designated Activity Co. |
| |||||||||||
6.88% (1) | 09/15/27 | 200,000 | 191,500 | |||||||||
7.50% (1) | 10/15/26 | 200,000 | 201,000 | |||||||||
|
| |||||||||||
Total Chile |
| |||||||||||
(Cost: $400,000) |
| 392,500 | ||||||||||
|
| |||||||||||
| China — 0.6% | ||||||||||||
China SCE Group Holdings, Ltd. |
| |||||||||||
7.45% (2) | 04/17/21 | 200,000 | 186,814 | |||||||||
CIFI Holdings Group Co., Ltd. |
| |||||||||||
7.75% (2) | 06/05/20 | 200,000 | 198,219 | |||||||||
Kaisa Group Holdings, Ltd. |
| |||||||||||
8.50% (2) | 06/30/22 | 200,000 | 141,639 | |||||||||
New Metro Global, Ltd. |
| |||||||||||
6.50% (2) | 04/23/21 | 200,000 | 188,493 | |||||||||
|
| |||||||||||
Total China |
| |||||||||||
(Cost: $799,058) |
| 715,165 | ||||||||||
|
| |||||||||||
| Colombia — 2.6% | ||||||||||||
Colombia Government International Bond |
| |||||||||||
3.88% | 04/25/27 | 1,000,000 | 954,300 | |||||||||
4.00% | 02/26/24 | 1,000,000 | 987,750 | |||||||||
5.00% | 06/15/45 | 350,000 | 332,850 | |||||||||
Ecopetrol S.A. |
| |||||||||||
5.88% | 05/28/45 | 460,000 | 440,105 | |||||||||
Gilex Holding SARL |
| |||||||||||
8.50% (1) | 05/02/23 | 150,000 | 152,814 | |||||||||
Millicom International Cellular S.A. |
| |||||||||||
6.63% (1) | 10/15/26 | 200,000 | 203,000 | |||||||||
|
| |||||||||||
Total Colombia |
| |||||||||||
(Cost: $3,122,664) |
| 3,070,819 | ||||||||||
|
| |||||||||||
See accompanying notes to financial statements.
29
Table of Contents
TCW Emerging Markets Multi-Asset Opportunities Fund
Schedule of Investments (Continued)
| Issues | Maturity Date | Principal Amount | Value | |||||||||
Costa Rica — 0.3% (Cost: $391,498) |
| |||||||||||
Autopistas del Sol S.A. |
| |||||||||||
7.38% (1) | 12/30/30 | $ | 386,044 | $ | 380,257 | |||||||
|
| |||||||||||
| Dominican Republic — 1.8% | ||||||||||||
AES Andres B.V. / Dominican Power Partners / Empresa Generadora de Electricidad Itabo, S.A. |
| |||||||||||
7.95% (1) | 05/11/26 | 200,000 | 205,752 | |||||||||
Dominican Republic International Bond |
| |||||||||||
5.50% (2) | 01/27/25 | 255,000 | 252,195 | |||||||||
5.95% (1) | 01/25/27 | 775,000 | 772,985 | |||||||||
6.00% (1) | 07/19/28 | 350,000 | 347,812 | |||||||||
6.85% (2) | 01/27/45 | 550,000 | 543,469 | |||||||||
|
| |||||||||||
Total Dominican Republic |
| |||||||||||
(Cost: $2,165,266) |
| 2,122,213 | ||||||||||
|
| |||||||||||
| Ecuador — 1.2% | ||||||||||||
Ecuador Government International Bond |
| |||||||||||
7.88% (1) | 01/23/28 | 800,000 | 676,000 | |||||||||
7.95% (2) | 06/20/24 | 750,000 | 678,750 | |||||||||
|
| |||||||||||
Total Ecuador |
| |||||||||||
(Cost: $1,422,445) |
| 1,354,750 | ||||||||||
|
| |||||||||||
| Egypt — 1.8% | ||||||||||||
Egypt Government International Bond |
| |||||||||||
5.58% (1) | 02/21/23 | 600,000 | 577,500 | |||||||||
6.13% (1) | 01/31/22 | 275,000 | 272,580 | |||||||||
6.59% (1) | 02/21/28 | 600,000 | 551,214 | |||||||||
7.50% (1) | 01/31/27 | 570,000 | 559,312 | |||||||||
8.50% (2) | 01/31/47 | 200,000 | 189,398 | |||||||||
|
| |||||||||||
Total Egypt |
| |||||||||||
(Cost: $2,235,112) |
| 2,150,004 | ||||||||||
|
| |||||||||||
| El Salvador — 0.6% | ||||||||||||
AES El Salvador Trust III |
| |||||||||||
6.75% (2) | 03/28/23 | 200,000 | 186,620 | |||||||||
El Salvador Government International Bond |
| |||||||||||
6.38% (2) | 01/18/27 | 50,000 | 45,020 | |||||||||
7.63% (2) | 02/01/41 | 300,000 | 273,750 | |||||||||
7.65% (2) | 06/15/35 | 250,000 | 231,100 | |||||||||
|
| |||||||||||
Total El Salvador |
| |||||||||||
(Cost: $796,667) |
| 736,490 | ||||||||||
|
| |||||||||||
Ghana — 0.2% (Cost: $206,089) |
| |||||||||||
Ghana Government International Bond |
| |||||||||||
7.88% (2) | 08/07/23 | 200,000 | 204,800 | |||||||||
|
| |||||||||||
| India — 0.8% | ||||||||||||
Azure Power Energy, Ltd. |
| |||||||||||
5.50% (1) | 11/03/22 | 200,000 | 188,385 | |||||||||
Neerg Energy, Ltd. |
| |||||||||||
6.00% (1) | 02/13/22 | 200,000 | 188,794 | |||||||||
| Issues | Maturity Date | Principal Amount | Value | |||||||||
| India (Continued) | ||||||||||||
Rec, Ltd. |
| |||||||||||
5.25% (1)(6) | 11/13/23 | $ | 200,000 | $ | 198,874 | |||||||
Vedanta Resources PLC |
| |||||||||||
6.13% (2) | 08/09/24 | 200,000 | 178,700 | |||||||||
6.38% (1) | 07/30/22 | 200,000 | 188,140 | |||||||||
|
| |||||||||||
Total India |
| |||||||||||
(Cost: $995,142) |
| 942,893 | ||||||||||
|
| |||||||||||
| Indonesia — 2.4% | ||||||||||||
Indonesia Government International Bond |
| |||||||||||
3.38% (2) | 04/15/23 | 200,000 | 191,675 | |||||||||
3.50% | 01/11/28 | 850,000 | 766,612 | |||||||||
Minejesa Capital BV |
| |||||||||||
5.63% (1) | 08/10/37 | 600,000 | 533,250 | |||||||||
Perusahaan Listrik Negara PT |
| |||||||||||
6.15% (2) | 05/21/48 | 400,000 | 390,240 | |||||||||
Perusahaan Penerbit SBSN Indonesia III |
| |||||||||||
4.15% (2) | 03/29/27 | 600,000 | 564,000 | |||||||||
Saka Energi Indonesia PT |
| |||||||||||
4.45% (1) | 05/05/24 | 200,000 | 184,673 | |||||||||
Star Energy Geothermal Wayang Windu, Ltd. |
| |||||||||||
6.75% (1) | 04/24/33 | 196,600 | 177,274 | |||||||||
|
| |||||||||||
Total Indonesia |
| |||||||||||
(Cost: $2,984,689) |
| 2,807,724 | ||||||||||
|
| |||||||||||
Iraq — 0.6% (Cost: $705,636) |
| |||||||||||
Iraq International Bond |
| |||||||||||
5.80% (2) | 01/15/28 | 750,000 | 692,850 | |||||||||
|
| |||||||||||
Ivory Coast — 0.4% (Cost: $553,109) |
| |||||||||||
Ivory Coast Government International Bond |
| |||||||||||
6.13% (1) | 06/15/33 | 600,000 | 521,250 | |||||||||
|
| |||||||||||
| Kazakhstan — 1.8% | ||||||||||||
Kazakhstan Temir Zholy National Co. JSC |
| |||||||||||
4.85% (1) | 11/17/27 | 600,000 | 591,750 | |||||||||
KazMunayGas National Co. JSC |
| |||||||||||
4.75% (1) | 04/19/27 | 600,000 | 588,750 | |||||||||
5.38% (1) | 04/24/30 | 200,000 | 199,060 | |||||||||
5.75% (1) | 04/19/47 | 600,000 | 574,740 | |||||||||
6.38% (1) | 10/24/48 | 200,000 | 203,750 | |||||||||
|
| |||||||||||
Total Kazakhstan |
| |||||||||||
(Cost: $2,190,628) |
| 2,158,050 | ||||||||||
|
| |||||||||||
| Mexico — 2.9% | ||||||||||||
Axtel SAB de CV |
| |||||||||||
6.38% (1) | 11/14/24 | 282,000 | 271,087 | |||||||||
Banco Mercantil del Norte S.A. |
| |||||||||||
6.88% (5 year Treasury Constant Maturity Rate + 5.035%) (1)(3)(4) | 12/31/99 | 400,000 | 395,840 | |||||||||
See accompanying notes to financial statements.
30
Table of Contents
TCW Emerging Markets Multi-Asset Opportunities Fund
October 31, 2018 |
| Issues | Maturity Date | Principal Amount | Value | |||||||||
| Mexico (Continued) | ||||||||||||
Banco Mercantil del Norte S.A. |
| |||||||||||
7.63% (U.S. 10-year Treasury Constant Maturity Rate + 5.353%) (1)(3)(4) | 12/31/99 | $ | 400,000 | $ | 393,004 | |||||||
Cemex SAB de CV |
| |||||||||||
7.75% (2) | 04/16/26 | 200,000 | 211,500 | |||||||||
Cometa Energia SA de CV |
| |||||||||||
6.38% (1) | 04/24/35 | 197,400 | 191,439 | |||||||||
Controladora Mabe SA de CV |
| |||||||||||
5.60% (1) | 10/23/28 | 200,000 | 194,750 | |||||||||
Mexico Government Bond |
| |||||||||||
6.50% | 06/10/21 | MXN | 2,800,000 | 131,556 | ||||||||
Nemak SAB de CV |
| |||||||||||
4.75% (1) | 01/23/25 | $ | 200,000 | 190,750 | ||||||||
Petroleos Mexicanos |
| |||||||||||
5.35% (1) | 02/12/28 | 398,000 | 355,573 | |||||||||
6.50% | 03/13/27 | 375,000 | 363,937 | |||||||||
6.75% | 09/21/47 | 575,000 | 495,247 | |||||||||
Unifin Financiera S.A.B. de C.V. |
| |||||||||||
7.00% (1) | 01/15/25 | 200,000 | 185,980 | |||||||||
|
| |||||||||||
Total Mexico |
| |||||||||||
(Cost: $3,559,945) |
| 3,380,663 | ||||||||||
|
| |||||||||||
| Mongolia — 0.5% | ||||||||||||
Development Bank of Mongolia LLC |
| |||||||||||
7.25% (1) | 10/23/23 | 200,000 | 195,780 | |||||||||
Mongolia Government International Bond |
| |||||||||||
5.13% (2) | 12/05/22 | 400,000 | 379,640 | |||||||||
|
| |||||||||||
Total Mongolia |
| |||||||||||
(Cost: $586,626) |
| 575,420 | ||||||||||
|
| |||||||||||
| Nigeria — 0.9% | ||||||||||||
IHS Netherlands Holdco BV |
| |||||||||||
9.50% (2) | 10/27/21 | 200,000 | 202,840 | |||||||||
Nigeria Government International Bond |
| |||||||||||
5.63% | 06/27/22 | 515,000 | 511,781 | |||||||||
7.14% (1) | 02/23/30 | 200,000 | 184,500 | |||||||||
7.70% (1) | 02/23/38 | 200,000 | 180,900 | |||||||||
|
| |||||||||||
Total Nigeria |
| |||||||||||
(Cost: $1,097,666) |
| 1,080,021 | ||||||||||
|
| |||||||||||
| Oman — 1.9% | ||||||||||||
Oman Government International Bond |
| |||||||||||
4.13% (2) | 01/17/23 | 200,000 | 192,000 | |||||||||
5.63% (1) | 01/17/28 | 1,000,000 | 956,250 | |||||||||
6.75% (1) | 01/17/48 | 900,000 | 823,770 | |||||||||
Oman Sovereign Sukuk SAOC |
| |||||||||||
5.93% (1) | 10/31/25 | 250,000 | 250,000 | |||||||||
|
| |||||||||||
Total Oman |
| |||||||||||
(Cost: $2,244,039) |
| 2,222,020 | ||||||||||
|
| |||||||||||
| Issues | Maturity Date | Principal Amount | Value | |||||||||
Pakistan — 0.5% (Cost: $552,038) |
| |||||||||||
Pakistan Government International Bond |
| |||||||||||
6.88% (2) | 12/05/27 | $ | 600,000 | $ | 555,219 | |||||||
|
| |||||||||||
| Panama — 0.5% | ||||||||||||
AES Panama SRL |
| |||||||||||
6.00% (1) | 06/25/22 | 200,000 | 204,240 | |||||||||
Global Bank Corp. |
| |||||||||||
4.50% (2) | 10/20/21 | 400,000 | 397,240 | |||||||||
|
| |||||||||||
Total Panama |
| |||||||||||
(Cost: $597,275) |
| 601,480 | ||||||||||
|
| |||||||||||
| Paraguay — 0.8% | ||||||||||||
Paraguay Government International Bond |
| |||||||||||
4.70% (2) | 03/27/27 | 600,000 | 585,660 | |||||||||
5.60% (2) | 03/13/48 | 400,000 | 382,000 | |||||||||
|
| |||||||||||
Total Paraguay |
| |||||||||||
(Cost: $984,102) |
| 967,660 | ||||||||||
|
| |||||||||||
| Peru — 1.2% | ||||||||||||
Hunt Oil Co. of Peru LLC Sucursal Del Peru |
| |||||||||||
6.38% (1) | 06/01/28 | 200,000 | 204,000 | |||||||||
Inkia Energy, Ltd. |
| |||||||||||
5.88% (1) | 11/09/27 | 200,000 | 190,250 | |||||||||
Nexa Resources S.A. |
| |||||||||||
5.38% (1) | 05/04/27 | 200,000 | 195,220 | |||||||||
Orazul Energy Egenor S en C por A |
| |||||||||||
5.63% (1) | 04/28/27 | 200,000 | 182,602 | |||||||||
Peru LNG SRL |
| |||||||||||
5.38% (1) | 03/22/30 | 200,000 | 198,375 | |||||||||
Petroleos del Peru S.A. |
| |||||||||||
5.63% (1) | 06/19/47 | 425,000 | 403,219 | |||||||||
|
| |||||||||||
Total Peru |
| |||||||||||
(Cost: $1,416,198) |
| 1,373,666 | ||||||||||
|
| |||||||||||
| Qatar — 1.5% | ||||||||||||
Qatar Government International Bond |
| |||||||||||
4.50% (1) | 04/23/28 | 1,300,000 | 1,329,250 | |||||||||
5.10% (1) | 04/23/48 | 390,000 | 397,527 | |||||||||
|
| |||||||||||
Total Qatar (Cost: $1,704,240) |
| 1,726,777 | ||||||||||
|
| |||||||||||
| Russia — 1.8% | ||||||||||||
Russian Federation Government Bond |
| |||||||||||
4.25% (2) | 06/23/27 | 600,000 | 569,304 | |||||||||
4.38% (1) | 03/21/29 | 400,000 | 379,400 | |||||||||
5.25% (2) | 06/23/47 | 200,000 | 185,460 | |||||||||
Russian Foreign Bond — Eurobond |
| |||||||||||
4.75% (2) | 05/27/26 | 1,000,000 | 988,700 | |||||||||
|
| |||||||||||
Total Russia |
| |||||||||||
(Cost: $2,146,904) |
| 2,122,864 | ||||||||||
|
| |||||||||||
See accompanying notes to financial statements.
31
Table of Contents
TCW Emerging Markets Multi-Asset Opportunities Fund
Schedule of Investments (Continued)
| Issues | Maturity Date | Principal Amount | Value | |||||||||
| Saudi Arabia — 0.5% | ||||||||||||
Saudi Government International Bond |
| |||||||||||
4.50% (2) | 10/26/46 | $ | 450,000 | $ | 409,500 | |||||||
5.00% (1) | 04/17/49 | 200,000 | 192,820 | |||||||||
|
| |||||||||||
Total Saudi Arabia |
| |||||||||||
(Cost: $613,575) |
| 602,320 | ||||||||||
|
| |||||||||||
Senegal — 0.3% (Cost: $364,430) |
| |||||||||||
Senegal Government International Bond |
| |||||||||||
6.25% (2) | 05/23/33 | 400,000 | 347,880 | |||||||||
|
| |||||||||||
| South Africa — 2.5% | ||||||||||||
Eskom Holdings SOC, Ltd. |
| |||||||||||
8.45% (2) | 08/10/28 | 200,000 | 193,680 | |||||||||
Petra Diamonds US Treasury PLC |
| |||||||||||
7.25% (2) | 05/01/22 | 200,000 | 191,750 | |||||||||
SASOL Financing USA LLC |
| |||||||||||
5.88% | 03/27/24 | 200,000 | 201,704 | |||||||||
6.50% | 09/27/28 | 200,000 | 201,920 | |||||||||
South Africa Government Bond |
| |||||||||||
4.30% | 10/12/28 | 200,000 | 171,020 | |||||||||
4.67% | 01/17/24 | 325,000 | 311,935 | |||||||||
4.88% | 04/14/26 | 800,000 | 743,000 | |||||||||
5.88% | 09/16/25 | 400,000 | 395,337 | |||||||||
5.88% | 06/22/30 | 600,000 | 566,880 | |||||||||
|
| |||||||||||
Total South Africa |
| |||||||||||
(Cost: $3,087,836) |
| 2,977,226 | ||||||||||
|
| |||||||||||
| Sri Lanka — 0.7% | ||||||||||||
Sri Lanka Government Bond |
| |||||||||||
5.75% (1) | 04/18/23 | 700,000 | 633,920 | |||||||||
6.20% (1) | 05/11/27 | 225,000 | 193,388 | |||||||||
|
| |||||||||||
Total Sri Lanka |
| |||||||||||
(Cost: $891,653) |
| 827,308 | ||||||||||
|
| |||||||||||
Tanzania — 0.2% (Cost: $205,677) |
| |||||||||||
HTA Group, Ltd. |
| |||||||||||
9.13% (2) | 03/08/22 | 200,000 | 205,000 | |||||||||
|
| |||||||||||
Tunisia — 0.2% (Cost: $197,386) |
| |||||||||||
Banque Centrale de Tunisie International Bond |
| |||||||||||
6.75% (1) | 10/31/23 | EUR | 175,000 | 195,557 | ||||||||
|
| |||||||||||
| Turkey — 2.0% | ||||||||||||
Petkim Petrokimya Holding AS |
| |||||||||||
5.88% (1) | 01/26/23 | $ | 200,000 | 184,000 | ||||||||
Turkcell Iletisim Hizmetleri AS |
| |||||||||||
5.80% (1) | 04/11/28 | 200,000 | 173,703 | |||||||||
Turkey Government International Bond |
| |||||||||||
5.75% | 03/22/24 | 600,000 | 560,760 | |||||||||
6.00% | 03/25/27 | 400,000 | 363,250 | |||||||||
6.13% | 10/24/28 | 325,000 | 290,585 | |||||||||
| Issues | Maturity Date | Principal Amount | Value | |||||||||
| Turkey (Continued) | ||||||||||||
6.25% | 09/26/22 | $ | 600,000 | $ | 582,749 | |||||||
7.25% | 12/23/23 | 200,000 | 198,810 | |||||||||
|
| |||||||||||
Total Turkey |
| |||||||||||
(Cost: $2,399,692) |
| 2,353,857 | ||||||||||
|
| |||||||||||
| Ukraine — 2.3% | ||||||||||||
Ukraine Government International Bond |
| |||||||||||
0.00% (1) (7) | 02/28/19 | 560,000 | 551,885 | |||||||||
7.75% (2) | 09/01/23 | 1,125,000 | 1,073,347 | |||||||||
7.75% (2) | 09/01/25 | 175,000 | 161,437 | |||||||||
7.75% (2) | 09/01/26 | 285,000 | 258,377 | |||||||||
8.99% (1) | 02/01/24 | 325,000 | 322,766 | |||||||||
9.75% (1) | 11/01/28 | 325,000 | 321,750 | |||||||||
|
| |||||||||||
Total Ukraine |
| |||||||||||
(Cost: $2,672,801) |
| 2,689,562 | ||||||||||
|
| |||||||||||
| United Arab Emirates — 0.3% | ||||||||||||
DP World Crescent, Ltd. |
| |||||||||||
4.85% (1) | 09/26/28 | 200,000 | 196,000 | |||||||||
DP World, Ltd. |
| |||||||||||
5.63% (1) | 09/25/48 | 200,000 | 189,920 | |||||||||
|
| |||||||||||
Total United Arab Emirates |
| |||||||||||
(Cost: $397,856) |
| 385,920 | ||||||||||
|
| |||||||||||
Uruguay — 0.4% (Cost: $458,561) |
| |||||||||||
Uruguay Government International Bond |
| |||||||||||
4.98% | 04/20/55 | 470,000 | 437,100 | |||||||||
|
| |||||||||||
| Venezuela — 0.4% | ||||||||||||
Venezuela Government International Bond |
| |||||||||||
8.25% (2) (5) | 10/13/24 | 557,300 | 143,505 | |||||||||
9.25% (5) | 09/15/27 | 550,000 | 141,625 | |||||||||
9.25% (2) (5) | 05/07/28 | 787,000 | 200,685 | |||||||||
|
| |||||||||||
Total Venezuela |
| |||||||||||
(Cost: $599,171) |
| 485,815 | ||||||||||
|
| |||||||||||
| Zambia — 0.7% | ||||||||||||
First Quantum Minerals, Ltd. |
| |||||||||||
7.50% (1) | 04/01/25 | 400,000 | 360,640 | |||||||||
Zambia Government International Bond |
| |||||||||||
8.50% (2) | 04/14/24 | 200,000 | 138,250 | |||||||||
8.97% (2) | 07/30/27 | 400,000 | 273,768 | |||||||||
|
| |||||||||||
Total Zambia |
| |||||||||||
(Cost: $986,995) |
| 772,658 | ||||||||||
|
| |||||||||||
Total Fixed Income Securities |
| |||||||||||
(Cost: $59,208,958) |
| 57,665,558 | ||||||||||
|
| |||||||||||
See accompanying notes to financial statements.
32
Table of Contents
TCW Emerging Markets Multi-Asset Opportunities Fund
October 31, 2018 |
| Issues | Shares | Value | ||||||||
COMMON STOCK — 43.5% |
| |||||||||
| Argentina — 1.1% | ||||||||||
MercadoLibre, Inc. | 600 | $ | 194,700 | |||||||
Vale S.A. (8) | 71,200 | 1,075,121 | ||||||||
|
| |||||||||
Total Argentina | ||||||||||
(Cost: $1,157,915) | 1,269,821 | |||||||||
|
| |||||||||
| Brazil — 3.5% | ||||||||||
B3 S.A. — Brasil Bolsa Balcao | 47,100 | 336,528 | ||||||||
Banco Bradesco S.A. (ADR) | 96,300 | 883,071 | ||||||||
Banco Santander Brasil S.A. | 56,800 | 645,298 | ||||||||
Braskem S.A. (ADR) | 10,600 | 295,316 | ||||||||
BRF S.A. (ADR) (8) | 50,200 | 297,184 | ||||||||
CCR S.A. | 104,300 | 308,029 | ||||||||
Petroleo Brasileiro S.A. (SP ADR) | 81,800 | 1,329,250 | ||||||||
|
| |||||||||
Total Brazil | ||||||||||
(Cost: $3,534,768) | 4,094,676 | |||||||||
|
| |||||||||
| China — 11.6% | ||||||||||
58.Com, Inc. (ADR) (8) | 4,900 | 321,391 | ||||||||
Agricultural Bank of China, Ltd. — Class H | 630,000 | 277,404 | ||||||||
Alibaba Group Holding, Ltd. (SP ADR) (8) | 16,662 | 2,370,669 | ||||||||
Angang Steel Co., Ltd. — Class H (8) | 346,000 | 295,980 | ||||||||
Anhui Conch Cement Co., Ltd. — Class H | 81,500 | 422,563 | ||||||||
China Communications Construction Co., Ltd. — Class H | 318,000 | 291,671 | ||||||||
China Mobile, Ltd. | 64,000 | 599,739 | ||||||||
China Overseas Land & Investment, Ltd. | 156,000 | 490,598 | ||||||||
China Petroleum & Chemical Corp. (ADR) | 5,300 | 427,498 | ||||||||
China Railway Construction Corp., Ltd. — Class H | 264,500 | 336,026 | ||||||||
China Railway Group, Ltd. — Class H | 329,000 | 294,127 | ||||||||
Guangdong Investment, Ltd. | 338,000 | 605,308 | ||||||||
Guangzhou Automobile Group Co., Ltd. — Class H | 154,000 | 156,137 | ||||||||
Hesteel Co., Ltd. — Class A | 1,056,100 | 481,837 | ||||||||
HKT Trust & HKT, Ltd. | 446,000 | 615,309 | ||||||||
Industrial & Commercial Bank of China, Ltd. — Class H | 2,465,000 | 1,672,979 | ||||||||
Ping An Insurance Group Co. of China, Ltd. — Class H | 169,150 | 1,599,669 | ||||||||
Postal Savings Bank of China Co., Ltd. — Class H (1) | 580,000 | 347,132 | ||||||||
Tencent Holdings, Ltd. | 52,312 | 1,792,753 | ||||||||
Wuxi Biologics, Inc. (1) (8) | 41,500 | 297,027 | ||||||||
|
| |||||||||
Total China | ||||||||||
(Cost: $12,725,286) | 13,695,817 | |||||||||
|
| |||||||||
| Issues | Shares | Value | ||||||||
| Colombia — 0.3% (Cost: $333,340) | ||||||||||
Ecopetrol S.A.(ADR) | 14,700 | $ | 341,922 | |||||||
|
| |||||||||
| Czech Republic — 0.4% (Cost: $536,037) | ||||||||||
Komercni banka as | 12,910 | 489,986 | ||||||||
|
| |||||||||
| Egypt — 0.3% (Cost: $390,564) | ||||||||||
Commercial International Bank Egypt SAE | 76,606 | 339,569 | ||||||||
|
| |||||||||
| India — 4.0% | ||||||||||
Aurobindo Pharma, Ltd. | 90,815 | 979,328 | ||||||||
Axis Bank, Ltd. (8) | 55,250 | 432,791 | ||||||||
Dr Reddy’s Laboratories, Ltd. (ADR) | 13,100 | 445,793 | ||||||||
Federal Bank, Ltd. | 268,345 | 299,928 | ||||||||
Havells India, Ltd. | 41,655 | 364,509 | ||||||||
ITC, Ltd. | 145,850 | 550,336 | ||||||||
LIC Housing Finance, Ltd. | 60,740 | 336,757 | ||||||||
Maruti Suzuki India, Ltd. | 6,539 | 583,652 | ||||||||
Tata Consultancy Services, Ltd. | 17,664 | 462,221 | ||||||||
Wipro, Ltd. (ADR) | 57,100 | 295,207 | ||||||||
|
| |||||||||
Total India | ||||||||||
(Cost: $4,860,397) | 4,750,522 | |||||||||
|
| |||||||||
| Indonesia — 1.4% | ||||||||||
Bank Central Asia Tbk PT | 388,900 | 605,541 | ||||||||
Charoen Pokphand Indonesia Tbk PT | 433,600 | 157,056 | ||||||||
Telekomunikasi Indonesia Persero Tbk PT | 2,518,600 | 638,022 | ||||||||
United Tractors Tbk PT | 127,700 | 281,939 | ||||||||
|
| |||||||||
Total Indonesia | ||||||||||
(Cost: $1,690,911) | 1,682,558 | |||||||||
|
| |||||||||
| Jordan — 0.3% (Cost: $326,303) | ||||||||||
Hikma Pharmaceuticals PLC | 13,697 | 332,103 | ||||||||
|
| |||||||||
| Kenya — 0.9% (Cost: $1,068,654) | ||||||||||
Safari.com, Ltd. | 4,605,700 | 1,055,882 | ||||||||
|
| |||||||||
| Mexico — 0.8% | ||||||||||
Alfa S.A.B. de C.V. — Class A | 250,300 | 265,490 | ||||||||
Banco del Bajio SA (1) | 64,300 | 126,562 | ||||||||
Grupo Financiero Banorte S.A.B. de C.V. | 43,900 | 242,771 | ||||||||
Nemak S.A.B. de C.V. (1) | 412,700 | 298,963 | ||||||||
|
| |||||||||
Total Mexico | ||||||||||
(Cost: $1,137,053) | 933,786 | |||||||||
|
| |||||||||
| Poland — 0.5% | ||||||||||
Powszechna Kasa Oszczednosci Bank Polski S.A. | 30,365 | 315,897 | ||||||||
Santander Bank Polska S.A. | 3,058 | 271,424 | ||||||||
|
| |||||||||
Total Poland | ||||||||||
(Cost: $660,867) | 587,321 | |||||||||
|
| |||||||||
See accompanying notes to financial statements.
33
Table of Contents
TCW Emerging Markets Multi-Asset Opportunities Fund
Schedule of Investments (Continued)
| Issues | Shares | Value | ||||||||||
| Qatar — 0.8% | ||||||||||||
Industries Qatar QSC | 9,785 | $ | 376,465 | |||||||||
Qatar National Bank QPSC |
| 11,560 | 618,675 | |||||||||
|
| |||||||||||
Total Qatar |
| |||||||||||
(Cost: $949,619) |
| 995,140 | ||||||||||
|
| |||||||||||
| Russia — 2.3% | ||||||||||||
Evraz PLC |
| 44,152 | 305,809 | |||||||||
Lukoil PJSC (SP ADR) |
| 20,438 | 1,525,492 | |||||||||
Magnitogorsk Iron & Steel Works PJSC |
| 202,600 | 147,153 | |||||||||
Novolipetsk Steel PJSC |
| 59,940 | 146,107 | |||||||||
Sberbank of Russia |
| 108,170 | 310,231 | |||||||||
Tatneft PJSC (ADR) |
| 4,580 | 325,180 | |||||||||
|
| |||||||||||
Total Russia |
| |||||||||||
(Cost: $2,463,424) |
| 2,759,972 | ||||||||||
|
| |||||||||||
| South Africa — 2.5% | ||||||||||||
Capitec Bank Holdings, Ltd. |
| 7,240 | 485,928 | |||||||||
Clicks Group, Ltd. |
| 56,852 | 723,825 | |||||||||
Exxaro Resources, Ltd. |
| 30,435 | 310,995 | |||||||||
FirstRand, Ltd. |
| 66,110 | 288,477 | |||||||||
Mr Price Group, Ltd. |
| 31,748 | 496,622 | |||||||||
Sasol, Ltd. |
| 4,280 | 139,740 | |||||||||
Truworths International, Ltd. |
| 90,417 | 494,821 | |||||||||
|
| |||||||||||
Total South Africa |
| |||||||||||
(Cost: $2,916,422) |
| 2,940,408 | ||||||||||
|
| |||||||||||
| South Korea — 2.3% | ||||||||||||
BGF retail Co., Ltd. |
| 855 | 126,487 | |||||||||
GS Retail Co., Ltd. |
| 4,400 | 138,983 | |||||||||
Handsome Co., Ltd. |
| 8,764 | 279,944 | |||||||||
Hyundai Motor Co. |
| 2,615 | 244,929 | |||||||||
S-Oil Corp. |
| 2,625 | 286,446 | |||||||||
Samsung C&T Corp. |
| 2,795 | 267,503 | |||||||||
Samsung Electronics Co., Ltd. |
| 29,070 | 1,088,258 | |||||||||
SK Telecom Co., Ltd. |
| 1,255 | 294,875 | |||||||||
|
| |||||||||||
Total South Korea |
| |||||||||||
(Cost: $2,819,896) |
| 2,727,425 | ||||||||||
|
| |||||||||||
| Taiwan — 7.5% | ||||||||||||
Accton Technology Corp. |
| 328,000 | 907,878 | |||||||||
Cathay Financial Holding Co., Ltd. |
| 427,000 | 677,936 | |||||||||
E.Sun Financial Holding Co., Ltd. |
| 794,884 | 527,779 | |||||||||
Eclat Textile Co., Ltd. |
| 56,000 | 666,775 | |||||||||
Formosa Chemicals & Fibre Corp. |
| 157,000 | 569,762 | |||||||||
Formosa Petrochemical Corp. |
| 163,000 | 643,488 | |||||||||
Formosa Plastics Corp. |
| 173,000 | 565,724 | |||||||||
Mega Financial Holding Co., Ltd. |
| 361,000 | 305,692 | |||||||||
President Chain Store Corp. |
| 76,000 | 859,724 | |||||||||
Shin Kong Financial Holding Co., Ltd. |
| 517,000 | 170,456 | |||||||||
| Issues | Shares | Value | ||||||||
| Taiwan (Continued) | ||||||||||
Taiwan Semiconductor Manufacturing Co., Ltd. | 348,000 | $ | 2,612,569 | |||||||
Uni-President Enterprises Corp. | 114,000 | 276,319 | ||||||||
|
| |||||||||
Total Taiwan | ||||||||||
(Cost: $9,205,085) | 8,784,102 | |||||||||
|
| |||||||||
| Thailand — 1.1% | ||||||||||
Charoen Pokphand Foods PCL (NVDR) | 194,400 | 148,164 | ||||||||
CP ALL PCL | 131,800 | 267,778 | ||||||||
PTT Exploration & Production PCL — Class N (NVDR) | 221,100 | 926,055 | ||||||||
|
| |||||||||
Total Thailand | ||||||||||
(Cost: $1,358,072) | 1,341,997 | |||||||||
|
| |||||||||
| United Arab Emirates — 1.3% (Cost: $794,755) | ||||||||||
NMC Health PLC | 32,923 | 1,483,960 | ||||||||
|
| |||||||||
| United Kingdom — 0.2% (Cost: $333,002) | ||||||||||
Premier Oil PLC (8) | 179,930 | 246,751 | ||||||||
|
| |||||||||
| United States — 0.4% (Cost: $475,691) | ||||||||||
Xilinx, Inc. | 6,000 | 512,220 | ||||||||
|
| |||||||||
Total Common Stock | ||||||||||
(Cost: $49,738,061) | 51,365,938 | |||||||||
|
| |||||||||
PURCHASED OPTIONS (0.0%) |
| |||||||||
(Cost: $8,400) (10) |
| 1 | ||||||||
|
| |||||||||
MONEY MARKET INVESTMENTS — 7.7% |
| |||||||||
State Street Institutional U.S. Government Money Market Fund — Premier Class, 2.09% (9) | 9,062,858 | 9,062,858 | ||||||||
|
| |||||||||
Total Money Market Investments |
| |||||||||
(Cost: $9,062,858) |
| 9,062,858 | ||||||||
|
| |||||||||
Total Investments (100.1%) |
| |||||||||
(Cost: $118,018,277) |
| 118,094,355 | ||||||||
Liabilities in Excess of Other Assets (-0.1%) |
| (79,648 | ) | |||||||
|
| |||||||||
Total Net Assets (100.0%) |
| $ | 118,014,707 | |||||||
|
| |||||||||
See accompanying notes to financial statements.
34
Table of Contents
TCW Emerging Markets Multi-Asset Opportunities Fund
October 31, 2018 |
| Purchased Options — OTC | ||||||||||||||||||||||||||||||||||
| Description | Counterparty | Exercise Price | Expiration Date | Number of Contracts | Notional Amount (000) | Market Value | Premiums Paid (Received) by Fund | Unrealized Appreciation (Depreciation) | ||||||||||||||||||||||||||
USD Put / TRY Call | Citibank N.A. | TRY | 4 | 12/19/18 | 560 | $ | 560 | $ | 1 | $ | 8,400 | $ | (8,399 | ) | ||||||||||||||||||||
|
|
|
|
|
| |||||||||||||||||||||||||||||
| Forward Currency Contracts | ||||||||||||||||||||||||
| Counterparty | Contracts to Deliver | Units of Currency | Settlement Date | In Exchange for U.S. Dollars | Contracts at Value | Unrealized Appreciation (Depreciation) | ||||||||||||||||||
BUY (11) | ||||||||||||||||||||||||
Bank of America | SAR | 73,915 | 05/20/19 | $ | 19,695 | $ | 19,702 | $ | 7 | |||||||||||||||
BNP Paribas S.A. | BRL | 2,402,815 | 11/07/18 | 642,135 | 646,718 | 4,583 | ||||||||||||||||||
Citibank N.A. | SAR | 457,385 | 05/20/19 | 121,904 | 121,916 | 12 | ||||||||||||||||||
Citibank N.A. | SAR | 565,755 | 04/06/20 | 150,187 | 150,418 | 231 | ||||||||||||||||||
Goldman Sachs & Co. | BRL | 716,795 | 11/07/18 | 181,766 | 192,925 | 11,159 | ||||||||||||||||||
Standard Chartered Bank | BRL | 1,633,205 | 11/07/18 | 414,901 | 439,577 | 24,676 | ||||||||||||||||||
|
|
|
|
|
| |||||||||||||||||||
| $ | 1,530,588 | $ | 1,571,256 | $ | 40,668 | |||||||||||||||||||
|
|
|
|
|
| |||||||||||||||||||
SELL (12) | ||||||||||||||||||||||||
Bank of America | SAR | 73,915 | 05/20/19 | $ | 19,477 | $ | 19,702 | $ | (225 | ) | ||||||||||||||
Citibank N.A. | SAR | 457,385 | 05/20/19 | 120,523 | 121,916 | (1,393 | ) | |||||||||||||||||
Citibank N.A. | SAR | 565,755 | 04/06/20 | 150,000 | 150,418 | (418 | ) | |||||||||||||||||
Goldman Sachs & Co. | BRL | 2,320,455 | 11/07/18 | 565,000 | 624,550 | (59,550 | ) | |||||||||||||||||
Standard Chartered Bank | BRL | 2,432,360 | 11/07/18 | 595,000 | 654,670 | (59,670 | ) | |||||||||||||||||
|
|
|
|
|
| |||||||||||||||||||
| $ | 1,450,000 | $ | 1,571,256 | $ | (121,256 | ) | ||||||||||||||||||
|
|
|
|
|
| |||||||||||||||||||
See accompanying notes to financial statements.
35
Table of Contents
TCW Emerging Markets Multi-Asset Opportunities Fund
Schedule of Investments (Continued)
Notes to the Schedule of Investments:
| BRL - | Brazilian Real. |
| EUR - | Euro Currency. |
| MXN - | Mexican Peso. |
| SAR - | Saudi Riyal. |
| TRY - | Turkish New Lira. |
| USD - | U.S. Dollar. |
| ADR | American Depositary Receipt. ADRs are receipts, typically issued by a U.S. bank or trust company, evidencing ownership of underlying securities issued by a foreign corporation. |
| NVDR | Non-Voting Depositary Receipt. |
| OTC | Over the Counter. |
| PJSC | Private Joint-Stock Company. |
| SP ADR | Sponsored American Depositary Receipt. ADRs are receipts, typically issued by a U.S. bank or trust company, evidencing ownership of underlying securities issued by a foreign corporation. Sponsored ADRs are ADRs issued with the cooperation of the foreign corporation. |
| (1) | Security exempt from registration under Rule 144A of the Securities Act of 1933, as amended (the “Securities Act”). These securities may be resold, normally only to qualified institutional buyers. At October 31, 2018, the value of these securities amounted to $25,961,369 or 22.0% of net assets. These securities are determined to be liquid by the Advisor, unless otherwise noted, under procedures established by and under the general supervision of the Company’s Board of Directors. |
| (2) | Investments issued under Regulation S of the Securities Act and may not be offered, sold, or delivered within the United States except under special exemptions. At October 31, 2018, the value of these securities amounted to $16,152,112 or 13.7% of net assets. |
| (3) | Floating or variable rate security. The interest shown reflects the rate in effect at October 31, 2018. |
| (4) | Perpetual Maturity. |
| (5) | Security is currently in default due to bankruptcy or failure to make payment of principal or interest of the issuer. Income is not being accrued. |
| (6) | This security is purchased on a when-issued, delayed delivery or forward commitment basis. |
| (7) | Security is not accruing interest. |
| (8) | Non-income producing security. |
| (9) | Rate disclosed is the 7-day net yield as of October 31, 2018. |
| (10) | See options table for description of purchased options. |
| (11) | Fund buys foreign currency, sells U.S. Dollar. |
| (12) | Fund sells foreign currency, buys U.S. Dollar. |
See accompanying notes to financial statements.
36
Table of Contents
TCW Emerging Markets Multi-Asset Opportunities Fund
Investments by Industry | October 31, 2018 |
| Industry | Percentage of Net Assets | |||
Agriculture | 0.6 | % | ||
Apparel | 0.8 | |||
Auto Manufacturers | 0.8 | |||
Auto Parts & Equipment | 0.5 | |||
Banks | 8.7 | |||
Building Materials | 0.6 | |||
Chemicals | 2.1 | |||
Coal | 0.3 | |||
Commercial Services | 0.9 | |||
Computers | 0.6 | |||
Currency Options | 0.0 | * | ||
Diversified Financial Services | 2.0 | |||
Electric | 2.6 | |||
Electrical Components & Equipment | 0.3 | |||
Energy-Alternate Sources | 0.4 | |||
Engineering & Construction | 0.7 | |||
Food | 0.8 | |||
Foreign Government Bonds | 32.1 | |||
Forest Products & Paper | 0.2 | |||
Healthcare-Services | 1.3 | |||
Holding Companies — Diversified | 0.2 | |||
Household Products/Wares | 0.2 | |||
Insurance | 2.1 | |||
Internet | 4.0 | |||
Iron & Steel | 2.5 | |||
Machinery-Construction & Mining | 0.2 | |||
Mining | 0.8 | |||
Oil & Gas | 10.4 | |||
Pharmaceuticals | 1.8 | |||
Pipelines | 0.6 | |||
Real Estate | 1.0 | |||
Regional (State & Province) | 0.2 | |||
Retail | 2.8 | |||
Semiconductors | 3.5 | |||
Telecommunications | 4.8 | |||
Transportation | 0.5 | |||
Water | 0.5 | |||
Money Market Investments | 7.7 | |||
|
| |||
Total | 100.1 | % | ||
|
| |||
| * | Amount rounds to less than 0.1% of net assets. |
See accompanying notes to financial statements.
37
Table of Contents
TCW Emerging Markets Multi-Asset Opportunities Fund
Investments by Country
| Country | Percentage of Net Assets | |||
Angola | 1.2 | % | ||
Argentina | 4.1 | |||
Azerbaijan | 0.6 | |||
Bahrain | 1.5 | |||
Brazil | 7.7 | |||
Chile | 0.3 | |||
China | 12.2 | |||
Colombia | 2.9 | |||
Costa Rica | 0.3 | |||
Czech Republic | 0.4 | |||
Dominican Republic | 1.8 | |||
Ecuador | 1.2 | |||
Egypt | 2.1 | |||
El Salvador | 0.6 | |||
Ghana | 0.2 | |||
India | 4.8 | |||
Indonesia | 3.8 | |||
Iraq | 0.6 | |||
Ivory Coast | 0.4 | |||
Jordan | 0.3 | |||
Kazakhstan | 1.8 | |||
Kenya | 0.9 | |||
Mexico | 3.7 | |||
Mongolia | 0.5 | |||
Nigeria | 0.9 | |||
Oman | 1.9 | |||
Pakistan | 0.5 | |||
Panama | 0.5 | |||
Paraguay | 0.8 | |||
Peru | 1.2 | |||
Poland | 0.5 | |||
Qatar | 2.3 | |||
Russia | 4.1 | |||
Saudi Arabia | 0.5 | |||
Senegal | 0.3 | |||
South Africa | 5.0 | |||
South Korea | 2.3 | |||
Sri Lanka | 0.7 | |||
Taiwan | 7.5 | |||
Tanzania | 0.2 | |||
Thailand | 1.1 | |||
Tunisia | 0.2 | |||
Turkey | 2.0 | |||
Ukraine | 2.3 | |||
United Arab Emirates | 1.6 | |||
United Kingdom | 0.2 | |||
United States | 8.1 | |||
Uruguay | 0.4 | |||
Venezuela | 0.4 | |||
Zambia | 0.7 | |||
|
| |||
Total | 100.1 | % | ||
|
| |||
See accompanying notes to financial statements.
38
Table of Contents
TCW Emerging Markets Multi-Asset Opportunities Fund
| Fair Valuation Summary | October 31, 2018 |
The following is a summary of the fair valuations according to the inputs used as of October 31, 2018 in valuing the Fund’s investments:
Description | Quoted Prices in Active Markets for Identical Assets (Level 1) | Other Significant Observable Inputs (Level 2) | Significant Unobservable Inputs (Level 3) | Total | ||||||||||||
Fixed Income Securities | ||||||||||||||||
Auto Parts & Equipment | $ | — | $ | 190,750 | $ | — | $ | 190,750 | ||||||||
Banks | — | 2,121,970 | — | 2,121,970 | ||||||||||||
Building Materials | — | 211,500 | — | 211,500 | ||||||||||||
Chemicals | — | 587,624 | — | 587,624 | ||||||||||||
Commercial Services | — | 766,177 | — | 766,177 | ||||||||||||
Diversified Financial Services | — | 384,854 | — | 384,854 | ||||||||||||
Electric | — | 3,079,187 | — | 3,079,187 | ||||||||||||
Energy-Alternate Sources | — | 377,179 | — | 377,179 | ||||||||||||
Food | — | 188,565 | — | 188,565 | ||||||||||||
Foreign Government Bonds | — | 38,017,223 | — | 38,017,223 | ||||||||||||
Forest Products & Paper | — | 204,000 | — | 204,000 | ||||||||||||
Household Products/Wares | — | 194,750 | — | 194,750 | ||||||||||||
Iron & Steel | — | 523,062 | — | 523,062 | ||||||||||||
Mining | — | 1,114,450 | — | 1,114,450 | ||||||||||||
Oil & Gas | — | 6,127,667 | — | 6,127,667 | ||||||||||||
Pipelines | — | 627,175 | — | 627,175 | ||||||||||||
Real Estate | — | 715,165 | — | 715,165 | ||||||||||||
Regional (State & Province) | — | 194,380 | — | 194,380 | ||||||||||||
Telecommunications | — | 1,448,130 | — | 1,448,130 | ||||||||||||
Transportation | — | 591,750 | — | 591,750 | ||||||||||||
|
|
|
|
|
|
|
| |||||||||
Total Fixed Income Securities | — | 57,665,558 | — | 57,665,558 | ||||||||||||
|
|
|
|
|
|
|
| |||||||||
Common Stock | ||||||||||||||||
Agriculture | — | 707,392 | — | 707,392 | ||||||||||||
Apparel | 279,944 | 666,775 | — | 946,719 | ||||||||||||
Auto Manufacturers | — | 984,717 | — | 984,717 | ||||||||||||
Auto Parts & Equipment | 298,964 | — | — | 298,964 | ||||||||||||
Banks | 2,237,271 | 5,930,464 | — | 8,167,735 | ||||||||||||
Building Materials | — | 422,563 | — | 422,563 | ||||||||||||
Chemicals | 295,316 | 1,651,691 | — | 1,947,007 | ||||||||||||
Coal | — | 310,995 | — | 310,995 | ||||||||||||
Commercial Services | 308,028 | — | — | 308,028 | ||||||||||||
Computers | 295,207 | 462,221 | — | 757,428 | ||||||||||||
Diversified Financial Services | 336,528 | 1,656,157 | — | 1,992,685 | ||||||||||||
Electrical Components & Equipment | — | 364,509 | — | 364,509 | ||||||||||||
Engineering & Construction | — | 921,824 | — | 921,824 | ||||||||||||
Food | 297,184 | 550,971 | — | 848,155 | ||||||||||||
Healthcare-Services | — | 1,483,960 | — | 1,483,960 | ||||||||||||
Holding Companies — Diversified | 265,490 | — | — | 265,490 | ||||||||||||
Insurance | — | 2,448,062 | — | 2,448,062 | ||||||||||||
Internet | 2,886,761 | 1,792,753 | — | 4,679,514 | ||||||||||||
Iron & Steel | 1,075,120 | 1,376,886 | — | 2,452,006 | ||||||||||||
Machinery-Construction & Mining | — | 281,940 | — | 281,940 | ||||||||||||
See accompanying notes to financial statements.
39
Table of Contents
TCW Emerging Markets Multi-Asset Opportunities Fund
Fair Valuation Summary (Continued)
Description | Quoted Prices in Active Markets for Identical Assets (Level 1) | Other Significant Observable Inputs (Level 2) | Significant Unobservable Inputs (Level 3) | Total | ||||||||||||
Oil & Gas | $ | 3,949,342 | $ | 2,102,740 | $ | — | $ | 6,052,082 | ||||||||
Pharmaceuticals | 445,793 | 1,608,457 | — | 2,054,250 | ||||||||||||
Real Estate | — | 490,598 | — | 490,598 | ||||||||||||
Retail | 723,825 | 2,525,430 | — | 3,249,255 | ||||||||||||
Semiconductors | 512,220 | 3,700,827 | — | 4,213,047 | ||||||||||||
Telecommunications | — | 4,111,705 | — | 4,111,705 | ||||||||||||
Water | — | 605,308 | — | 605,308 | ||||||||||||
|
|
|
|
|
|
|
| |||||||||
Total Common Stock | 14,206,993 | 37,158,945 | — | 51,365,938 | ||||||||||||
|
|
|
|
|
|
|
| |||||||||
Currency Options | — | 1 | — | 1 | ||||||||||||
Money Market Investments | 9,062,858 | — | — | 9,062,858 | ||||||||||||
|
|
|
|
|
|
|
| |||||||||
Total Investments | 23,269,851 | 94,824,504 | — | 118,094,355 | ||||||||||||
|
|
|
|
|
|
|
| |||||||||
Asset Derivatives | ||||||||||||||||
Forward Currency Contracts | ||||||||||||||||
Foreign Currency Risk | — | 40,668 | — | 40,668 | ||||||||||||
|
|
|
|
|
|
|
| |||||||||
Total | $ | 23,269,851 | $ | 94,865,172 | $ | — | $ | 118,135,023 | ||||||||
|
|
|
|
|
|
|
| |||||||||
Liability Derivatives | ||||||||||||||||
Forward Currency Contracts | ||||||||||||||||
Foreign Currency Risk | $ | — | $ | (121,256 | ) | $ | — | $ | (121,256 | ) | ||||||
|
|
|
|
|
|
|
| |||||||||
Total | $ | — | $ | (121,256 | ) | $ | — | $ | (121,256 | ) | ||||||
|
|
|
|
|
|
|
| |||||||||
See accompanying notes to financial statements.
40
Table of Contents
TCW International Small Cap Fund
Schedule of Investments | October 31, 2018 |
| Issues | Shares | Value | ||||||
COMMON STOCK — 87.7% of Net Assets |
| |||||||
| Australia — 3.3% | ||||||||
Altium, Ltd. | 2,808 | $ | 43,812 | |||||
Appen, Ltd. | 5,509 | 41,861 | ||||||
Bapcor, Ltd. | 11,920 | 57,873 | ||||||
Magellan Financial Group, Ltd. | 2,685 | 50,932 | ||||||
Northern Star Resources, Ltd. | 12,119 | 75,774 | ||||||
Sonic Healthcare, Ltd. | 3,350 | 53,662 | ||||||
|
| |||||||
Total Australia |
| |||||||
(Cost: $341,002) |
| 323,914 | ||||||
|
| |||||||
| Austria — 4.5% | ||||||||
CA Immobilien Anlagen AG | 1,767 | 57,540 | ||||||
EVN AG | 6,624 | 115,882 | ||||||
S IMMO AG | 5,916 | 101,183 | ||||||
Telekom Austria AG (1) | 9,900 | 73,585 | ||||||
UNIQA Insurance Group AG | 4,536 | 42,378 | ||||||
Vienna Insurance Group AG Wiener Versicherung Gruppe | 1,935 | 51,405 | ||||||
|
| |||||||
Total Austria |
| |||||||
(Cost: $447,212) |
| 441,973 | ||||||
|
| |||||||
| Canada — 1.3% | ||||||||
Bonterra Energy Corp. | 1,800 | 20,299 | ||||||
Tamarack Valley Energy, Ltd. (1) | 20,700 | 55,957 | ||||||
TORC Oil & Gas, Ltd. | 11,300 | 46,551 | ||||||
|
| |||||||
Total Canada |
| |||||||
(Cost: $135,404) |
| 122,807 | ||||||
|
| |||||||
| China — 2.3% | ||||||||
Asia Cement China Holdings Corp. | 85,500 | 73,129 | ||||||
China BlueChemical, Ltd. — Class H | 74,000 | 25,375 | ||||||
HKBN, Ltd. | 71,000 | 106,625 | ||||||
West China Cement, Ltd. | 150,000 | 22,277 | ||||||
|
| |||||||
Total China |
| |||||||
(Cost: $229,745) |
| 227,406 | ||||||
|
| |||||||
| Denmark — 2.0% | ||||||||
Royal Unibrew A/S | 1,324 | 93,986 | ||||||
Topdanmark A/S | 2,210 | 105,084 | ||||||
|
| |||||||
Total Denmark |
| |||||||
(Cost: $177,990) |
| 199,070 | ||||||
|
| |||||||
| Finland — 0.3% (Cost: $24,511) | ||||||||
Kesko OYJ — Class B | 425 | 24,830 | ||||||
|
| |||||||
| France — 3.7% | ||||||||
Air France-KLM (1) | 10,670 | 103,196 | ||||||
Devoteam S.A. | 463 | 50,956 | ||||||
Interparfums S.A. | 2,080 | 86,035 | ||||||
Kaufman & Broad S.A. | 620 | 25,437 | ||||||
| Issues | Shares | Value | ||||||
| France (Continued) | ||||||||
Korian S.A. | 1,835 | $ | 72,325 | |||||
Worldline S.A. (1) | 431 | 22,683 | ||||||
|
| |||||||
Total France |
| |||||||
(Cost: $374,267) |
| 360,632 | ||||||
|
| |||||||
| Germany — 5.5% | ||||||||
LEG Immobilien AG | 485 | 53,034 | ||||||
MorphoSys AG (1) | 790 | 73,177 | ||||||
Nemetschek SE | 857 | 112,699 | ||||||
PATRIZIA Immobilien AG (1) | 2,770 | 47,634 | ||||||
Sixt SE | 427 | 43,422 | ||||||
TAG Immobilien AG | 5,995 | 136,807 | ||||||
Wuestenrot & Wuerttembergische AG | 1,225 | 24,797 | ||||||
XING AG | 160 | 48,124 | ||||||
|
| |||||||
Total Germany |
| |||||||
(Cost: $537,317) |
| 539,694 | ||||||
|
| |||||||
| India — 1.6% | ||||||||
Indian Energy Exchange, Ltd. | 23,250 | 49,777 | ||||||
Manappuram Finance, Ltd. | 26,525 | 28,631 | ||||||
Muthoot Finance, Ltd. | 14,130 | 78,152 | ||||||
|
| |||||||
Total India |
| |||||||
(Cost: $158,770) |
| 156,560 | ||||||
|
| |||||||
| Indonesia — 0.8% | ||||||||
Ace Hardware Indonesia Tbk PT | 618,800 | 55,764 | ||||||
Japfa Comfeed Indonesia Tbk PT | 199,800 | 26,723 | ||||||
|
| |||||||
Total Indonesia |
| |||||||
(Cost: $89,712) |
| 82,487 | ||||||
|
| |||||||
| Ireland — 0.9% | ||||||||
C&C Group PLC | 12,390 | 46,437 | ||||||
Keywords Studios PLC | 2,526 | 44,218 | ||||||
|
| |||||||
Total Ireland |
| |||||||
(Cost: $106,324) |
| 90,655 | ||||||
|
| |||||||
| Israel — 1.1% | ||||||||
Strauss Group, Ltd. | 2,190 | 47,989 | ||||||
Wix.com, Ltd. (1) | 600 | 58,410 | ||||||
|
| |||||||
Total Israel |
| |||||||
(Cost: $109,562) |
| 106,399 | ||||||
|
| |||||||
| Italy — 2.6% | ||||||||
Amplifon SpA | 5,185 | 91,881 | ||||||
FinecoBank Banca Fineco SpA | 6,607 | 69,078 | ||||||
Hera SpA | 8,717 | 24,066 | ||||||
Interpump Group SpA | 1,715 | 49,495 | ||||||
Iren SpA | 11,046 | 23,943 | ||||||
|
| |||||||
Total Italy |
| |||||||
(Cost: $276,556) |
| 258,463 | ||||||
|
| |||||||
See accompanying notes to financial statements.
41
Table of Contents
TCW International Small Cap Fund
Schedule of Investments (Continued)
| Issues | Shares | Value | ||||||
| Japan — 20.8% | ||||||||
77 Bank, Ltd. (The) | 1,100 | $ | 22,717 | |||||
AEON REIT Investment Corp. | 67 | 73,782 | ||||||
Ain Holdings, Inc. | 700 | 54,890 | ||||||
Ariake Japan Co., Ltd. | 1,000 | 88,604 | ||||||
As One Corp. | 400 | 28,469 | ||||||
ASKA Pharmaceutical Co., Ltd. | 2,000 | 26,298 | ||||||
Bank of Okinawa, Ltd. (The) | 700 | 23,342 | ||||||
BML, Inc. | 2,000 | 55,105 | ||||||
Chugoku Bank, Ltd. (The) | 2,600 | 23,344 | ||||||
Cosmos Pharmaceutical Corp. | 300 | 61,308 | ||||||
Dainichiseika Color & Chemicals Manufacturing Co., Ltd. | 1,800 | 53,182 | ||||||
DTS Corp. | 1,600 | 55,579 | ||||||
Fuji Oil Holdings, Inc. | 1,600 | 46,140 | ||||||
Hokkoku Bank, Ltd. (The) | 800 | 29,350 | ||||||
Hokuhoku Financial Group, Inc. | 1,800 | 22,296 | ||||||
Information Services International-Dentsu, Ltd. | 2,000 | 68,780 | ||||||
Kureha Corp. | 700 | 44,977 | ||||||
Kyowa Exeo Corp. | 3,800 | 102,413 | ||||||
Kyushu Financial Group, Inc. | 5,700 | 25,150 | ||||||
Macromill, Inc. | 1,200 | 23,742 | ||||||
Mani, Inc. | 1,800 | 82,702 | ||||||
Mitsubishi Logisnext Co., Ltd. | 6,400 | 76,082 | ||||||
Nakanishi, Inc. | 2,800 | 65,497 | ||||||
NET One Systems Co., Ltd. | 2,600 | 54,425 | ||||||
Nichi-iko Pharmaceutical Co., Ltd. | 1,800 | 24,516 | ||||||
Nippon Soda Co., Ltd. | 1,800 | 46,769 | ||||||
OBIC Business Consultants Co., Ltd. | 400 | 31,965 | ||||||
Orix JREIT, Inc. | 63 | 96,360 | ||||||
Pigeon Corp. | 1,800 | 76,112 | ||||||
Rakus Co., Ltd. | 2,500 | 45,880 | ||||||
Sankyu, Inc. | 1,200 | 56,551 | ||||||
Sanwa Holdings Corp. | 2,500 | 29,332 | ||||||
Shinmaywa Industries, Ltd. | 2,400 | 29,542 | ||||||
Sogo Medical Holdings Co., Ltd. | 1,300 | 27,887 | ||||||
Systena Corp. | 3,600 | 43,313 | ||||||
TechnoPro Holdings, Inc. | 1,400 | 72,923 | ||||||
TIS, Inc. | 1,000 | 44,659 | ||||||
Tokai Carbon Co., Ltd. | 5,900 | 92,359 | ||||||
Tokai Tokyo Financial Holdings, Inc. | 4,800 | 24,775 | ||||||
Towa Pharmaceutical Co., Ltd. | 400 | 30,742 | ||||||
Welcia Holdings Co., Ltd. | 1,100 | 56,108 | ||||||
|
| |||||||
Total Japan |
| |||||||
(Cost: $1,963,561) |
| 2,037,967 | ||||||
|
| |||||||
| Jordan — 0.6% (Cost: $55,122) | ||||||||
Hikma Pharmaceuticals PLC | 2,312 | 56,058 | ||||||
|
| |||||||
| Netherlands — 4.5% | ||||||||
ASR Nederland NV | 3,231 | 146,730 | ||||||
Flow Traders | 2,905 | 92,558 | ||||||
| Issues | Shares | Value | ||||||
| Netherlands (Continued) | ||||||||
IMCD Group NV | 1,605 | $ | 108,877 | |||||
Intertrust NV | 2,970 | 47,928 | ||||||
InterXion Holding NV (1) | 800 | 47,096 | ||||||
|
| |||||||
Total Netherlands |
| |||||||
(Cost: $420,208) |
| 443,189 | ||||||
|
| |||||||
| New Zealand — 0.3% (Cost: $24,593) | ||||||||
Spark New Zealand, Ltd. | 9,750 | 25,198 | ||||||
|
| |||||||
| Norway — 1.8% | ||||||||
BW Offshore, Ltd. (1) | 8,364 | 53,694 | ||||||
Selvaag Bolig ASA | 5,540 | 24,869 | ||||||
SpareBank 1 Nord Norge | 6,630 | 53,130 | ||||||
Storebrand ASA | 5,500 | 45,845 | ||||||
|
| |||||||
Total Norway |
| |||||||
(Cost: $171,641) |
| 177,538 | ||||||
|
| |||||||
| Portugal — 0.5% | ||||||||
GS Retail Co., Ltd. | 740 | 23,375 | ||||||
NOS SGPS S.A. | 4,340 | 24,351 | ||||||
|
| |||||||
Total Portugal |
| |||||||
(Cost: $52,080) |
| 47,726 | ||||||
|
| |||||||
| Russia — 1.0% (Cost: $96,153) | ||||||||
Evraz PLC | 14,247 | 98,678 | ||||||
|
| |||||||
| South Africa — 0.6% (Cost: $56,805) | ||||||||
Clicks Group, Ltd. | 4,720 | 60,094 | ||||||
|
| |||||||
| South Korea — 0.2% (Cost: $26,541) | ||||||||
BGF retail Co., Ltd. | 145 | 21,451 | ||||||
|
| |||||||
| Spain — 1.4% | ||||||||
Almirall S.A. | 4,600 | 83,372 | ||||||
Applus Services S.A. | 3,990 | 54,263 | ||||||
|
| |||||||
Total Spain |
| |||||||
(Cost: $120,098) |
| 137,635 | ||||||
|
| |||||||
| Sweden — 2.9% | ||||||||
Arjo AB | 8,355 | 28,423 | ||||||
Hembla AB (1) | 2,975 | 50,909 | ||||||
Intrum Justitia AB | 3,917 | 100,033 | ||||||
Nobina AB | 3,935 | 26,290 | ||||||
Oncopeptides AB (1) | 4,894 | 78,183 | ||||||
|
| |||||||
Total Sweden |
| |||||||
(Cost: $294,682) |
| 283,838 | ||||||
|
| |||||||
| Switzerland — 5.0% | ||||||||
BKW AG | 1,656 | 105,164 | ||||||
Helvetia Holding AG | 45 | 27,598 | ||||||
Logitech International S.A. | 2,400 | 88,608 | ||||||
Siegfried Holding AG (1) | 175 | 70,283 | ||||||
Sunrise Communications Group AG (1) | 1,075 | 94,741 | ||||||
See accompanying notes to financial statements.
42
Table of Contents
TCW International Small Cap Fund
October 31, 2018 |
| Issues | Shares | Value | ||||||
| Switzerland (Continued) | ||||||||
Tecan Group AG | 210 | $ | 47,432 | |||||
Valiant Holding AG | 460 | 52,007 | ||||||
|
| |||||||
Total Switzerland |
| |||||||
(Cost: $498,559) |
| 485,833 | ||||||
|
| |||||||
| Taiwan — 1.4% | ||||||||
Addcn Technology Co., Ltd. | 6,000 | 46,876 | ||||||
Eclat Textile Co., Ltd. | 4,000 | 47,627 | ||||||
Shin Kong Financial Holding Co., Ltd. | 145,000 | 47,807 | ||||||
|
| |||||||
Total Taiwan |
| |||||||
(Cost: $160,671) |
| 142,310 | ||||||
|
| |||||||
| Thailand — 0.3% (Cost: $27,520) | ||||||||
GFPT PCL | 59,800 | 25,867 | ||||||
|
| |||||||
| United Arab Emirates — 1.3% | ||||||||
Borr Drilling, Ltd. (1) | 12,271 | 47,701 | ||||||
NMC Health PLC | 1,823 | 82,169 | ||||||
|
| |||||||
Total United Arab Emirates |
| |||||||
(Cost: $98,106) |
| 129,870 | ||||||
|
| |||||||
| United Kingdom — 13.7% | ||||||||
Abcam PLC | 2,825 | 43,290 | ||||||
Advanced Medical Solutions Group PLC | 19,462 | 71,370 | ||||||
AVEVA Group PLC | 2,355 | 78,747 | ||||||
B&M European Value Retail S.A. | 21,626 | 115,037 | ||||||
Bank of Georgia Group PLC | 2,305 | 45,928 | ||||||
Beazley PLC | 7,439 | 49,931 | ||||||
Bellway PLC | 680 | 24,932 | ||||||
Bovis Homes Group PLC | 1,990 | 24,588 | ||||||
Britvic PLC | 7,490 | 75,590 | ||||||
Close Brothers Group PLC | 2,682 | 50,356 | ||||||
EI Group PLC (1) | 25,855 | 54,906 | ||||||
EnQuest PLC (1) | 120,529 | 41,781 | ||||||
Fevertree Drinks PLC | 2,210 | 78,429 | ||||||
Greene King PLC | 8,250 | 50,756 | ||||||
Mitchells & Butlers PLC | 7,750 | 25,686 | ||||||
Morgan Advanced Materials PLC | 12,272 | 43,278 | ||||||
Premier Oil PLC (1) | 80,310 | 110,135 | ||||||
Redrow PLC | 7,560 | 51,027 | ||||||
RPC Group PLC | 2,875 | 28,013 | ||||||
Softcat PLC | 9,250 | 76,274 | ||||||
SSP Group PLC | 14,540 | 123,922 | ||||||
Staffline Group PLC | 1,800 | 27,277 | ||||||
Vesuvius PLC | 6,795 | 47,128 | ||||||
|
| |||||||
Total United Kingdom |
| |||||||
(Cost: $1,385,304) |
| 1,338,381 | ||||||
|
| |||||||
| Issues | Shares | Value | ||||||
| United States — 1.5% | ||||||||
Bio-Rad Laboratories, Inc. — Class A (1) | 100 | $ | 27,285 | |||||
Burford Capital, Ltd. | 4,577 | 96,984 | ||||||
FibroGen, Inc. (1) | 500 | 21,435 | ||||||
|
| |||||||
Total United States |
| |||||||
(Cost: $106,626) |
| 145,704 | ||||||
|
| |||||||
Total Common Stock |
| |||||||
(Cost: $8,566,642) |
| 8,592,227 | ||||||
|
| |||||||
PREFERRED STOCK — 0.6% |
| |||||||
| Brazil — 0.6% (Cost: $57,734) | ||||||||
Banco ABC Brasil SA 0.37% | 13,700 | 59,639 | ||||||
|
| |||||||
Total Preferred Stock |
| |||||||
(Cost: $57,734) |
| 59,639 | ||||||
|
| |||||||
MONEY MARKET INVESTMENTS — 10.8% |
| |||||||
State Street Institutional U.S. Government Money Market Fund — Premier Class, 2.09% (2) | 1,054,354 | 1,054,354 | ||||||
|
| |||||||
Total Money Market Investments |
| |||||||
(Cost: $1,054,354) |
| 1,054,354 | ||||||
|
| |||||||
Total Investments (99.1%) |
| |||||||
(Cost: $9,678,730) |
| 9,706,220 | ||||||
Excess of Other Assets over Liabilities (0.9%) |
| 88,415 | ||||||
|
| |||||||
Total Net Assets (100.0%) |
| $ | 9,794,635 | |||||
|
| |||||||
Notes to Schedule of Investments:
| (1) | Non-income producing security. |
| (2) | Rate disclosed is the 7-day net yield as of October 31, 2018. |
See accompanying notes to financial statements.
43
Table of Contents
TCW International Small Cap Fund
Investments by Industry | October 31, 2018 |
| Industry | Percentage of Net Assets | |||
Airlines | 1.1 | % | ||
Banks | 4.2 | |||
Beverages | 3.0 | |||
Biotechnology | 1.4 | |||
Building Products | 0.3 | |||
Capital Markets | 3.6 | |||
Chemicals | 2.7 | |||
Commercial Services & Supplies | 1.0 | |||
Construction & Engineering | 1.0 | |||
Construction Materials | 0.9 | |||
Consumer Finance | 1.1 | |||
Containers & Packaging | 0.3 | |||
Distributors | 0.6 | |||
Diversified Telecommunication Services | 3.2 | |||
Electric Utilities | 2.3 | |||
Energy Equipment & Services | 1.0 | |||
Food & Staples Retailing | 3.4 | |||
Food Products | 2.5 | |||
Health Care Equipment & Supplies | 2.5 | |||
Health Care Providers & Services | 3.9 | |||
Hotels, Restaurants & Leisure | 2.7 | |||
Household Durables | 1.3 | |||
Household Products | 0.8 | |||
Insurance | 5.6 | |||
Interactive Media & Services | 1.9 | |||
IT Services | 5.8 | |||
Life Sciences Tools & Services | 2.2 | |||
Machinery | 2.5 | |||
Media | 0.5 | |||
Metals & Mining | 1.8 | |||
Multi-Utilities | 0.5 | |||
Multiline Retail | 1.2 | |||
Oil, Gas & Consumable Fuels | 2.8 | |||
Personal Products | 0.9 | |||
Pharmaceuticals | 2.2 | |||
Professional Services | 2.1 | |||
Real Estate | 4.5 | |||
Real Estate Management & Development | 1.1 | |||
Road & Rail | 1.3 | |||
Software | 3.6 | |||
Specialty Retail | 0.5 | |||
Technology Hardware, Storage & Peripherals | 0.9 | |||
Textiles, Apparel & Luxury Goods | 0.5 | |||
Trading Companies & Distributors | 1.1 | |||
Money Market Investments | 10.8 | |||
|
| |||
Total | 99.1 | % | ||
|
| |||
See accompanying notes to financial statements.
44
Table of Contents
TCW International Small Cap Fund
Fair Valuation Summary | October 31, 2018 |
The following is a summary of the fair valuations according to the inputs used as of October 31, 2018 in valuing the Fund’s investments:
Description | Quoted Prices in Active Markets for Identical Assets (Level 1) | Other Significant Observable Inputs (Level 2) | Significant Unobservable Inputs (Level 3) | Total | ||||||||||||
Common Stock | ||||||||||||||||
Airlines | $ | — | $ | 103,196 | $ | — | $ | 103,196 | ||||||||
Banks | 45,928 | 320,413 | — | 366,341 | ||||||||||||
Beverages | — | 294,442 | — | 294,442 | ||||||||||||
Biotechnology | 21,435 | 121,474 | — | 142,909 | ||||||||||||
Building Products | — | 29,332 | — | 29,332 | ||||||||||||
Capital Markets | 92,557 | 272,824 | — | 365,381 | ||||||||||||
Chemicals | — | 262,663 | — | 262,663 | ||||||||||||
Commercial Services & Supplies | — | 100,033 | — | 100,033 | ||||||||||||
Construction & Engineering | — | 102,413 | — | 102,413 | ||||||||||||
Construction Materials | — | 95,405 | — | 95,405 | ||||||||||||
Consumer Finance | — | 106,783 | — | 106,783 | ||||||||||||
Containers & Packaging | — | 28,013 | — | 28,013 | ||||||||||||
Distributors | — | 57,874 | — | 57,874 | ||||||||||||
Diversified Telecommunication Services | 73,585 | 226,564 | — | 300,149 | ||||||||||||
Electric Utilities | 115,882 | 105,164 | — | 221,046 | ||||||||||||
Energy Equipment & Services | — | 101,394 | — | 101,394 | ||||||||||||
Food & Staples Retailing | 60,094 | 269,848 | — | 329,942 | ||||||||||||
Food Products | — | 235,322 | — | 235,322 | ||||||||||||
Health Care Equipment & Supplies | 71,370 | 176,622 | — | 247,992 | ||||||||||||
Health Care Providers & Services | — | 383,610 | — | 383,610 | ||||||||||||
Hotels, Restaurants & Leisure | 54,906 | 200,364 | — | 255,270 | ||||||||||||
Household Durables | — | 125,984 | — | 125,984 | ||||||||||||
Household Products | — | 76,113 | — | 76,113 | ||||||||||||
IT Services | 105,506 | 459,435 | — | 564,941 | ||||||||||||
Insurance | — | 541,574 | — | 541,574 | ||||||||||||
Interactive Media & Services | — | 196,183 | — | 196,183 | ||||||||||||
Life Sciences Tools & Services | 27,285 | 190,892 | — | 218,177 | ||||||||||||
Machinery | 43,278 | 202,248 | — | 245,526 | ||||||||||||
Media | — | 48,094 | — | 48,094 | ||||||||||||
Metals & Mining | — | 174,453 | — | 174,453 | ||||||||||||
Multi-Utilities | 23,943 | 24,066 | — | 48,009 | ||||||||||||
Multiline Retail | — | 115,037 | — | 115,037 | ||||||||||||
Oil, Gas & Consumable Fuels | 122,807 | 151,916 | — | 274,723 | ||||||||||||
Personal Products | — | 86,035 | — | 86,035 | ||||||||||||
Pharmaceuticals | — | 220,986 | — | 220,986 | ||||||||||||
Professional Services | 27,277 | 175,114 | — | 202,391 | ||||||||||||
Real Estate Management & Development | 108,449 | — | — | 108,449 | ||||||||||||
Real Estate | — | 432,487 | — | 432,487 | ||||||||||||
Road & Rail | — | 126,263 | — | 126,263 | ||||||||||||
Software | — | 356,416 | — | 356,416 | ||||||||||||
Specialty Retail | 55,764 | — | — | 55,764 | ||||||||||||
Technology Hardware, Storage & Peripherals | 88,608 | — | — | 88,608 | ||||||||||||
Textiles, Apparel & Luxury Goods | — | 47,627 | — | 47,627 | ||||||||||||
Trading Companies & Distributors | — | 108,877 | — | 108,877 | ||||||||||||
|
|
|
|
|
|
|
| |||||||||
Total Common Stock | 1,138,674 | 7,453,553 | — | 8,592,227 | ||||||||||||
|
|
|
|
|
|
|
| |||||||||
See accompanying notes to financial statements.
45
Table of Contents
TCW International Small Cap Fund
Fair Valuation Summary (Continued) | October 31, 2018 |
Description | Quoted Prices in Active Markets for Identical Assets (Level 1) | Other Significant Observable Inputs (Level 2) | Significant Unobservable Inputs (Level 3) | Total | ||||||||||||
Preferred Stock | ||||||||||||||||
Banks | $ | 59,639 | $ | — | $ | — | $ | 59,639 | ||||||||
Money Market Investments | 1,054,354 | — | — | 1,054,354 | ||||||||||||
|
|
|
|
|
|
|
| |||||||||
Total Investments | $ | 2,252,667 | $ | 7,453,553 | $ | — | $ | 9,706,220 | ||||||||
|
|
|
|
|
|
|
| |||||||||
See accompanying notes to financial statements.
46
Table of Contents
Statements of Assets and Liabilities | October 31, 2018 |
| TCW Developing Markets Equity Fund | TCW Emerging Markets Income Fund | TCW Emerging Markets Local Currency Income Fund | TCW Emerging Markets Multi-Asset Opportunities Fund | TCW International Small Cap Fund | ||||||||||||||||
| Dollar Amounts in Thousands (Except per Share Amounts) | ||||||||||||||||||||
ASSETS |
| |||||||||||||||||||
Investments, at Value (1) | $ | 5,137 | $ | 4,754,393 | $ | 305,992 | $ | 118,094 | $ | 9,706 | ||||||||||
Foreign Currency, at Value (2) | 48 | — (3 | ) | 1,822 | 584 | 3 | ||||||||||||||
Cash | 58 | 2,699 | — | 123 | — | |||||||||||||||
Receivable for Securities Sold | 154 | 133,880 | 2,327 | 2,837 | 331 | |||||||||||||||
Receivable for Fund Shares Sold | — | 12,814 | 367 | 401 | — | |||||||||||||||
Interest and Dividends Receivable | 3 | 62,291 | 5,515 | 870 | 18 | |||||||||||||||
Foreign Tax Reclaims Receivable | — | (3) | — | — | 3 | 7 | ||||||||||||||
Receivable from Investment Advisor | 11 | 20 | 20 | 31 | 15 | |||||||||||||||
Unrealized Appreciation on Open Forward Foreign Currency Contracts | — | 3,300 | 930 | 40 | — | |||||||||||||||
Cash Collateral Held for Brokers | — | 7,190 | 1,860 | — | — | |||||||||||||||
Prepaid Expenses | 17 | 42 | 33 | 19 | 10 | |||||||||||||||
|
|
|
|
|
|
|
|
|
| |||||||||||
Total Assets | 5,428 | 4,976,629 | 318,866 | 123,002 | 10,090 | |||||||||||||||
|
|
|
|
|
|
|
|
|
| |||||||||||
LIABILITIES |
| |||||||||||||||||||
Distributions Payable | — | 12,956 | — | — | — | |||||||||||||||
Payable for Securities Purchased | 157 | 214,889 | 2,333 | 4,117 | 194 | |||||||||||||||
Payable for Purchase of When-Issued Securities | — | 17,700 | — | 199 | — | |||||||||||||||
Payable for Fund Shares Redeemed | — | 8,337 | 464 | 286 | — | |||||||||||||||
Disbursements in Excess of Available Cash | — | — | — | — | 25 | |||||||||||||||
Accrued Directors’ Fees and Expenses | 11 | 12 | 12 | 11 | 11 | |||||||||||||||
Accrued Management Fees | 4 | 3,221 | 215 | 104 | 7 | |||||||||||||||
Accrued Distribution Fees | — | (3) | 80 | 12 | 17 | 1 | ||||||||||||||
Collateral Pledged by Forward Foreign Currency Contracts | — | 390 | — | — | — | |||||||||||||||
Unrealized Depreciation on Open Forward Foreign Currency Contracts | — | 9,763 | 3,225 | 121 | — | |||||||||||||||
Other Accrued Expenses | 38 | 1,165 | 187 | 132 | 57 | |||||||||||||||
|
|
|
|
|
|
|
|
|
| |||||||||||
Total Liabilities | 210 | 268,513 | 6,448 | 4,987 | 295 | |||||||||||||||
|
|
|
|
|
|
|
|
|
| |||||||||||
NET ASSETS | $ | 5,218 | $ | 4,708,116 | $ | 312,418 | $ | 118,015 | $ | 9,795 | ||||||||||
|
|
|
|
|
|
|
|
|
| |||||||||||
NET ASSETS CONSIST OF: |
| |||||||||||||||||||
Paid-in Capital | $ | 5,549 | $ | 5,629,997 | $ | 366,463 | $ | 124,979 | $ | 11,370 | ||||||||||
Accumulated Earnings (Loss) | (331 | ) | (921,881 | ) | (54,045 | ) | (6,964 | ) | (1,575 | ) | ||||||||||
|
|
|
|
|
|
|
|
|
| |||||||||||
NET ASSETS | $ | 5,218 | $ | 4,708,116 | $ | 312,418 | $ | 118,015 | $ | 9,795 | ||||||||||
|
|
|
|
|
|
|
|
|
| |||||||||||
NET ASSETS ATTRIBUTABLE TO: |
| |||||||||||||||||||
I Class Share | $ | 3,750 | $ | 4,365,456 | $ | 264,754 | $ | 43,338 | $ | 6,598 | ||||||||||
|
|
|
|
|
|
|
|
|
| |||||||||||
N Class Share | $ | 1,468 | $ | 342,660 | $ | 47,664 | $ | 74,677 | $ | 3,197 | ||||||||||
|
|
|
|
|
|
|
|
|
| |||||||||||
CAPITAL SHARES OUTSTANDING: (4) |
| |||||||||||||||||||
I Class Share | 399,274 | 561,843,376 | 32,533,653 | 4,169,171 | 685,986 | |||||||||||||||
|
|
|
|
|
|
|
|
|
| |||||||||||
N Class Share | 156,292 | 34,251,122 | 5,863,834 | 7,212,531 | 332,104 | |||||||||||||||
|
|
|
|
|
|
|
|
|
| |||||||||||
NET ASSET VALUE PER SHARE: (5) |
| |||||||||||||||||||
I Class Share | $ | 9.39 | $ | 7.77 | $ | 8.14 | $ | 10.39 | $ | 9.62 | ||||||||||
|
|
|
|
|
|
|
|
|
| |||||||||||
N Class Share | $ | 9.39 | $ | 10.00 | $ | 8.13 | $ | 10.35 | $ | 9.63 | ||||||||||
|
|
|
|
|
|
|
|
|
| |||||||||||
| (1) | The identified cost for the TCW Developing Markets Equity Fund, the TCW Emerging Markets Income Fund, the TCW Emerging Markets Local Currency Income Fund, the TCW Emerging Markets Multi-Asset Opportunities Fund and the TCW International Small Cap Fund at October 31, 2018 was $4,928, $4,873,695, $325,831, $118,018 and $9,679, respectively. |
| (2) | The identified cost for the TCW Developing Markets Equity Fund, the TCW Emerging Markets Income Fund, the TCW Emerging Markets Local Currency Income Fund, the TCW Emerging Markets Multi-Asset Opportunities Fund and the TCW International Small Cap Fund at October 31, 2018 was $48, $0, $1,822, $584 and $3, respectively. |
| (3) | Amount rounds to less than $1. |
| (4) | The number of authorized shares, with a par value of $0.001 per share is 4,000,000,000 for each of the I Class and N Class shares. |
| (5) | Represents offering price and redemption price per share. |
See accompanying notes to financial statements.
47
Table of Contents
Statements of Operations | Year Ended October 31, 2018 |
| TCW Developing Markets Equity Fund | TCW Emerging Markets Income Fund | TCW Emerging Markets Local Currency Income Fund | TCW Emerging Markets Multi-Asset Opportunities Fund | TCW International Small Cap Fund | ||||||||||||||||
| Dollar Amounts in Thousands | ||||||||||||||||||||
INVESTMENT INCOME |
| |||||||||||||||||||
Income: |
| |||||||||||||||||||
Dividends | $ | 110 | (1) | $ | — | $ | — | $ | 1,078 | (1) | $ | 191 | (1) | |||||||
Interest | — | 241,911 | (2) | 20,784 | (2) | 2,570 | (2) | — | ||||||||||||
|
|
|
|
|
|
|
|
|
| |||||||||||
Total | 110 | 241,911 | 20,784 | 3,648 | 191 | |||||||||||||||
|
|
|
|
|
|
|
|
|
| |||||||||||
Expenses: |
| |||||||||||||||||||
Management Fees | 50 | 29,351 | 2,279 | 1,011 | 86 | |||||||||||||||
Accounting Services Fees | 1 | 343 | 14 | 6 | 2 | |||||||||||||||
Administration Fees | 1 | 206 | 10 | 4 | 1 | |||||||||||||||
Transfer Agent Fees: |
| |||||||||||||||||||
I Class | 6 | 2,306 | 106 | 14 | 8 | |||||||||||||||
N Class | 6 | 439 | 55 | 67 | 7 | |||||||||||||||
Custodian Fees | 55 | 592 | 314 | 207 | 59 | |||||||||||||||
Professional Fees | 26 | 104 | 42 | 50 | 64 | |||||||||||||||
Directors’ Fees and Expenses | 44 | 44 | 44 | 44 | 44 | |||||||||||||||
Registration Fees: |
| |||||||||||||||||||
I Class | 18 | 91 | 24 | 19 | 18 | |||||||||||||||
N Class | 18 | 43 | 26 | 23 | 18 | |||||||||||||||
Distribution Fees: |
| |||||||||||||||||||
N Class | 4 | 1,044 | 120 | 152 | 9 | |||||||||||||||
Shareholder Reporting Expense | 1 | 15 | 4 | 4 | 2 | |||||||||||||||
Other | 6 | 434 | 24 | 25 | 12 | |||||||||||||||
|
|
|
|
|
|
|
|
|
| |||||||||||
Total | 236 | 35,012 | 3,062 | 1,626 | 330 | |||||||||||||||
|
|
|
|
|
|
|
|
|
| |||||||||||
Less Expenses Borne by Investment Advisor: | ||||||||||||||||||||
I Class | 100 | — | — | 51 | 98 | |||||||||||||||
N Class | 58 | 268 | 160 | 266 | 69 | |||||||||||||||
|
|
|
|
|
|
|
|
|
| |||||||||||
Net Expenses | 78 | 34,744 | 2,902 | 1,309 | 163 | |||||||||||||||
|
|
|
|
|
|
|
|
|
| |||||||||||
Net Investment Income | 32 | 207,167 | 17,882 | 2,339 | 28 | |||||||||||||||
|
|
|
|
|
|
|
|
|
| |||||||||||
NET REALIZED AND UNREALIZED GAIN (LOSS) ON INVESTMENTS |
| |||||||||||||||||||
Net Realized Gain (Loss) on: |
| |||||||||||||||||||
Investments | 225 | (191,393 | ) | (19,566 | ) (3) | (4,368 | ) (3) | 375 | ||||||||||||
Foreign Currency | (19 | ) | (2,972 | ) | (1,645 | ) | (196 | ) | (25 | ) | ||||||||||
Foreign Currency Forward Contracts | — | (3,321 | ) | 89 | (50 | ) | — | |||||||||||||
Options Written | — | 1,774 | 155 | 15 | — | |||||||||||||||
Swap Agreements | — | (6,016 | ) | — | (48 | ) | — | |||||||||||||
Change in Unrealized Appreciation (Depreciation) on: |
| |||||||||||||||||||
Investments | (1,201 | ) | (203,906 | ) | (21,167 | ) | (10,311 | ) | (1,340 | ) | ||||||||||
Foreign Currency | — | (4) | 198 | (49 | ) | 3 | — | (4) | ||||||||||||
Foreign Currency Forward Contracts | — | (4,772 | ) | (2,201 | ) | (75 | ) | — | ||||||||||||
Options Written | — | (11 | ) | 1 | — | (4) | — | |||||||||||||
Swap Agreements | — | 535 | — | 4 | — | |||||||||||||||
|
|
|
|
|
|
|
|
|
| |||||||||||
Net Realized and Unrealized Gain (Loss) on Investments and Foreign Currency Transactions | (995 | ) | (409,884 | ) | (44,383 | ) | (15,026 | ) | (990 | ) | ||||||||||
|
|
|
|
|
|
|
|
|
| |||||||||||
DECREASE IN NET ASSETS RESULTING FROM OPERATIONS | $ | (963 | ) | $ | (202,717 | ) | $ | (26,501 | ) | $ | (12,687 | ) | $ | (962 | ) | |||||
|
|
|
|
|
|
|
|
|
| |||||||||||
| (1) | Net of foreign taxes withheld of $15, $157 and $23 for the TCW Developing Markets Equity Fund, the TCW Emerging Markets Multi-Asset Opportunities Fund and the TCW International Small Cap Fund, respectively. |
| (2) | Net of foreign taxes withheld of $1,291, $794 and $16 for the TCW Emerging Markets Income Fund, the TCW Emerging Markets Local Currency Income Fund and the TCW Emerging Markets Multi-Asset Opportunities Fund, respectively. |
| (3) | Net of capital gain withholding taxes of $142 and $0 for the TCW Emerging Markets Local Currency Income Fund and the TCW Emerging Markets Multi-Asset Opportunities Fund, respectively. |
| (4) | Amount rounds to less than $1. |
See accompanying notes to financial statements.
48
Table of Contents
Statements of Changes in Net Assets
| TCW Developing Markets Equity Fund | TCW Emerging Markets Income Fund | |||||||||||||||
| Year Ended October 31, 2018 | Year Ended October 31, 2017 | Year Ended October 31, 2018 | Year Ended October 31, 2017 | |||||||||||||
| Dollar Amounts in Thousands | ||||||||||||||||
OPERATIONS |
| |||||||||||||||
Net Investment Income | $ | 32 | $ | 40 | $ | 207,167 | $ | 219,406 | ||||||||
Net Realized Gain (Loss) on Investments, Options Written, Swap Contracts and Foreign Currency Transactions | 206 | 286 | (201,928 | ) | 28,426 | |||||||||||
Change in Unrealized Appreciation (Depreciation) on Investments, Options Written and Foreign Currency Transactions | (1,201 | ) | 861 | (207,956 | ) | 11,213 | ||||||||||
|
|
|
|
|
|
|
| |||||||||
Increase (Decrease) in Net Assets Resulting from Operations | (963 | ) | 1,187 | (202,717 | ) | 259,045 | ||||||||||
|
|
|
|
|
|
|
| |||||||||
DISTRIBUTIONS TO SHAREHOLDERS (1) |
| |||||||||||||||
Distributions to Shareholders | (32 | ) | (47 | ) | (172,717 | ) | (176,978 | ) | ||||||||
|
|
|
|
|
|
|
| |||||||||
NET CAPITAL SHARE TRANSACTIONS |
| |||||||||||||||
I Class | 28 | 34 | 1,660,755 | 395,462 | ||||||||||||
N Class | 30 | 40 | (127,753 | ) | (35,930 | ) | ||||||||||
|
|
|
|
|
|
|
| |||||||||
Increase in Net Assets Resulting from Net Capital Shares Transactions | 58 | 74 | 1,533,002 | 359,532 | ||||||||||||
|
|
|
|
|
|
|
| |||||||||
Increase (Decrease) in Net Assets | (937 | ) | 1,214 | 1,157,568 | 441,599 | |||||||||||
NET ASSETS |
| |||||||||||||||
Beginning of Year | 6,155 | 4,941 | 3,550,548 | 3,108,949 | ||||||||||||
|
|
|
|
|
|
|
| |||||||||
End of Year | $ | 5,218 | $ | 6,155 | $ | 4,708,116 | $ | 3,550,548 | ||||||||
|
|
|
|
|
|
|
| |||||||||
| (1) | For the year ended October 31, 2017, the TCW Developing Markets Equity Fund distributed to shareholders $34 and $13 the I Class and N Class shares, respectively, from net investment income; the TCW Emerging Markets Income Fund distributed to shareholders $149,103 and $27,875 for the I Class and N Class shares, respectively, from net investment income. The Securities Exchange Commission eliminated the requirement to disclose distributions to shareholders from each component in 2018. See Note 13. |
See accompanying notes to financial statements.
49
Table of Contents
TCW Funds, Inc.
Statements of Changes in Net Assets
| TCW Emerging Markets Local Currency Income Fund | TCW Emerging Markets Multi-Asset Opportunities Fund | |||||||||||||||
| Year Ended October 31, 2018 | Year Ended October 31, 2017 | Year Ended October 31, 2018 | Year Ended October 31, 2017 | |||||||||||||
| Dollar Amounts in Thousands | ||||||||||||||||
OPERATIONS |
| |||||||||||||||
Net Investment Income | $ | 17,882 | $ | 9,446 | $ | 2,339 | $ | 1,617 | ||||||||
Net Realized Gain (Loss) on Investments, Options Written, Swap Contracts and Foreign Currency Transactions | (20,967 | ) | 3,996 | (4,647 | ) | 848 | ||||||||||
Change in Unrealized Appreciation (Depreciation) on Investments, Options Written and Foreign Currency Transactions | (23,416 | ) | (5,753 | ) | (10,379 | ) | 6,925 | |||||||||
|
|
|
|
|
|
|
| |||||||||
Increase (Decrease) in Net Assets Resulting from Operations | (26,501 | ) | 7,689 | (12,687 | ) | 9,390 | ||||||||||
|
|
|
|
|
|
|
| |||||||||
DISTRIBUTIONS TO SHAREHOLDERS (1) |
| |||||||||||||||
Distributions to Shareholders | (6,699 | ) | (6,855 | ) | (2,016 | ) | (1,409 | ) | ||||||||
Return of Capital | (9,233 | ) | — | — | — | |||||||||||
|
|
|
|
|
|
|
| |||||||||
Total Distributions | (15,932 | ) | (6,855 | ) | (2,016 | ) | (1,409 | ) | ||||||||
|
|
|
|
|
|
|
| |||||||||
NET CAPITAL SHARE TRANSACTIONS |
| |||||||||||||||
I Class | 161,521 | 39,045 | 6,781 | 73 | ||||||||||||
N Class | 20,455 | 20,021 | 43,832 | 31,790 | ||||||||||||
|
|
|
|
|
|
|
| |||||||||
Increase in Net Assets Resulting from Net Capital Shares Transactions | 181,976 | 59,066 | 50,613 | 31,863 | ||||||||||||
|
|
|
|
|
|
|
| |||||||||
Increase in Net Assets | �� | 139,543 | 59,900 | 35,910 | 39,844 | |||||||||||
NET ASSETS |
| |||||||||||||||
Beginning of Year | 172,875 | 112,975 | 82,105 | 42,261 | ||||||||||||
|
|
|
|
|
|
|
| |||||||||
End of Year | $ | 312,418 | $ | 172,875 | $ | 118,015 | $ | 82,105 | ||||||||
|
|
|
|
|
|
|
| |||||||||
| (1) | For the year ended October 31, 2017, the TCW Emerging Markets Local Currency Income Fund distributed to shareholders $5,678 and $1,177 for the I Class and N Class shares, respectively, from net investment income; the TCW Emerging Markets Multi-Asset Opportunities Fund distributed to shareholders $1,353 and $56 for the I Class and N Class shares, respectively, from net investment income. The Securities Exchange Commission eliminated the requirement to disclose distributions to shareholders from each component in 2018. See Note 13. |
See accompanying notes to financial statements.
50
Table of Contents
TCW Funds, Inc.
Statements of Changes in Net Assets
| TCW International Small Cap Fund | ||||||||
| Year Ended October 31, 2018 | Year Ended October 31, 2017 | |||||||
| Dollar Amounts in Thousands | ||||||||
OPERATIONS |
| |||||||
Net Investment Income | $ | 28 | $ | 36 | ||||
Net Realized Gain on Investments and Foreign Currency Transactions | 350 | 1,520 | ||||||
Change in Unrealized Appreciation (Depreciation) on Investments | (1,340 | ) | 724 | |||||
|
|
|
| |||||
Increase (Decrease) in Net Assets Resulting from Operations | (962 | ) | 2,280 | |||||
|
|
|
| |||||
DISTRIBUTIONS TO SHAREHOLDERS (1) |
| |||||||
Distributions to Shareholders | — | (29 | ) | |||||
|
|
|
| |||||
NET CAPITAL SHARE TRANSACTIONS |
| |||||||
I Class | 916 | (793 | ) | |||||
N Class | (98 | ) | (346 | ) | ||||
|
|
|
| |||||
Increase (Decrease) in Net Assets Resulting from Net Capital Shares Transactions | 818 | (1,139 | ) | |||||
|
|
|
| |||||
Increase (Decrease) in Net Assets | (144 | ) | 1,112 | |||||
NET ASSETS |
| |||||||
Beginning of Year | 9,939 | 8,827 | ||||||
|
|
|
| |||||
End of Year | $ | 9,795 | $ | 9,939 | ||||
|
|
|
| |||||
| (1) | For the year ended October 31, 2017, the TCW International Small Cap Fund distributed to shareholders $18 and $11 for the I Class and N Class shares, respectively, from net investment income. The Securities Exchange Commission eliminated the requirement to disclose distributions to shareholders from each component in 2018. See Note 13. |
See accompanying notes to financial statements.
51
Table of Contents
Notes to Financial Statements
Note 1 — Organization
TCW Funds, Inc., a Maryland corporation (the “Company”), is an open-end management investment company registered under the Investment Company Act of 1940, as amended (the “1940 Act”), that currently offers 19 no-load mutual funds (each series, a “Fund” and collectively, the “Funds”). TCW Investment Management Company LLC (the “Advisor”) is the investment advisor to and an affiliate of the Funds and is registered under the Investment Advisers Act of 1940, as amended. Each Fund has distinct investment objectives. The following is a brief description of the investment objectives and principal investment strategies for the Funds that are covered in this report:
TCW Fund | Investment Objective | |
| Diversified Fixed Income Fund | ||
| TCW Emerging Markets Income Fund | Seeks high total return from current income and capital appreciation by investing at least 80% of the value of its net assets in debt securities issued or guaranteed by companies, financial institutions and government entities in emerging market countries. | |
| Non-Diversified Fixed Income Fund | ||
| TCW Emerging Markets Local Currency Income Fund | Seeks to provide high total return from current income and capital appreciation through investment in debt securities denominated in the local currencies of various emerging market countries; invests at least 80% of the value of its net assets in debt securities issued or guaranteed by companies and government entities in emerging market countries denominated in the local currencies of the issuer and in derivative instruments that provide investment exposure to such securities. | |
| Diversified International Equity Fund | ||
| TCW International Small Cap Fund | Seeks long-term capital appreciation by investing at least 80% of its net assets in equity securities of small capitalization companies that are domiciled outside the United States or whose primary business operations are outside the United States. | |
| Non-Diversified International Equity Fund | ||
| TCW Developing Markets Equity Fund | Seeks long-term capital appreciation by investing at least 80% of the value of its net assets in equity securities issued by companies and financial institutions domiciled or with primary business operations in, or with the majority of their net assets in or revenues or net income deriving from, developing market countries. | |
| Diversified Balanced Fund | ||
| TCW Emerging Markets Multi-Asset Opportunities Fund | Seeks current income and long term capital appreciation by investing at least 80% of the value of its net assets in debt and equity securities issued or guaranteed by companies, financial institutions and government entities in emerging market countries. | |
52
Table of Contents
TCW Funds, Inc.
October 31, 2018 |
Note 1 — Organization (Continued)
All Funds offer two classes of shares: I Class and N Class. The two classes of a Fund are substantially the same except that the N Class shares are subject to a distribution fee (see Note 6).
Note 2 — Significant Accounting Policies
The following is a summary of significant accounting policies, which are in conformity with accounting principles generally accepted in the United States of America (“GAAP”) and which are consistently followed by the Funds in the preparation of their financial statements. Each Fund is considered an investment company under the Financial Accounting Standards Board (FASB) Accounting Standards Codification (ASC) No. 946, Financial Services—Investment Companies.
Principles of Accounting: The Funds use the accrual method of accounting for financial reporting purposes.
Net Asset Value: The net asset value (“NAV”) per share of each class of a Fund is determined by dividing the Fund’s net assets attributable to each class by the number of shares issued and outstanding of that class on each day the New York Stock Exchange (“NYSE”) is open for trading.
Security Valuations: Securities listed or traded on the NYSE and other stock exchanges are valued at the latest sale price on that exchange. Securities traded on the NASDAQ stock market (“NASDAQ”) are valued using official closing prices as reported by NASDAQ. All other securities traded over-the-counter (“OTC”) for which market quotations are readily available, including short-term securities, are valued with prices furnished by independent pricing services or by broker dealers.
The Company has adopted, after the approval by the Company’s Board of Directors (the “Board” and each member thereof a “Director”), a fair valuation methodology for foreign equity securities (exclusive of certain Latin American and Canadian equity securities). This methodology is designed to address the effect of movements in the U.S. market on the securities traded on foreign exchanges that have been closed for a period of time due to time zones differences. The utilization of the fair value model may result in the adjustment of prices taking into account fluctuations in the U.S. market. The fair value model is utilized each trading day and not dependent on certain thresholds or triggers.
Securities for which market quotations are not readily available, including in circumstances under which it is determined by the Advisor that prices received are not reflective of their market values, are valued by the Advisor’s Pricing Committee in accordance with the guidelines established by the Board’s Valuation Committee and under the general oversight of the Board.
Fair value is defined as the price that a Fund would receive upon selling an investment in a timely transaction to an independent buyer in the principal or most advantageous market for the investment. In accordance with the authoritative guidance on fair value measurements and disclosures under GAAP, the Funds disclose investments in their financial statements in a three-tier hierarchy. This hierarchy is utilized to establish classification of fair value measurements based on inputs. Inputs that go into fair value measurement refer broadly to the assumptions that market participants would use in pricing the asset or liability, including assumptions about risk. Inputs may be observable or unobservable. Observable inputs are inputs that reflect the assumptions market participants would use in pricing the asset or liability developed based on market data obtained from sources independent of the reporting entity. Unobservable inputs are inputs that reflect the reporting entity’s own assumptions in pricing the asset or liability developed based on the best information available in the circumstances.
53
Table of Contents
TCW Funds, Inc.
Notes to Financial Statements (Continued)
Note 2 — Significant Accounting Policies (Continued)
The three-tier hierarchy of inputs is summarized in the three broad levels listed below.
| Level 1 — | quoted prices in active markets for identical investments. | |
| Level 2 — | other significant observable inputs (including quoted prices for similar investments, interest rates, prepayment speeds, credit risk, etc.). | |
| Level 3 — | significant unobservable inputs (including the Funds’ own assumptions in determining the fair value of investments). |
Changes in valuation techniques may result in transfers in or out of an investment’s assigned level within the hierarchy. The inputs or methodologies used for valuing investments are not necessarily an indication of the risk associated with investing in those investments and the determination of the significance of a particular input to the fair value measurement in its entirety requires judgment and consideration of factors specific to each security.
The availability of observable inputs can vary from security to security and is affected by a wide variety of factors, including, for example, the type of security, whether the security is new and not yet established in the marketplace, the liquidity of markets, and other characteristics particular to the security. To the extent that valuation is based on models or inputs that are less observable or unobservable in the market, the determination of fair value requires more judgment. Accordingly, the degree of judgment exercised in determining fair value is greatest for instruments categorized in Level 3.
In periods of market dislocation, the observability of prices and inputs may be reduced for many instruments. This condition, as well as changes related to liquidity of investments, could cause a security to be reclassified between Level 1, Level 2, or Level 3.
In certain cases, the inputs used to measure fair value may fall into different levels of the fair value hierarchy. In such cases, for disclosure purposes the level in the fair value hierarchy within which the fair value measurement falls in its entirety is determined based on the lowest level input that is significant to the fair value measurement.
Fair Value Measurements: Descriptions of the valuation techniques applied to the Funds’ major categories of assets and liabilities measured at fair value on a recurring basis are as follows:
Corporate bonds. The fair value of corporate bonds is estimated using recently executed transactions, market price quotations (where observable), bond spreads, or credit default swap spreads adjusted for any basis difference between cash and derivative instruments. Corporate bonds are generally categorized in Level 2 of the fair value hierarchy; in instances where prices, spreads, or any of the other aforementioned key inputs are unobservable, they are categorized in Level 3 of the hierarchy.
Equity securities. Securities are generally valued based on quoted prices from the applicable exchange. To the extent these securities are actively traded and valuation adjustments are not applied, they are generally categorized in Level 1 of the fair value hierarchy. Restricted securities issued by publicly held companies are generally categorized in Level 2 of the fair value hierarchy; if a discount is applied and insignificant, they are categorized in Level 3. Restricted securities held in non-public entities are included in Level 3 of the fair value hierarchy because they trade infrequently, and therefore, the inputs are unobservable. Certain foreign securities that are fair valued using a pricing service that considers the correlation of the trading patterns of the foreign security to the intraday trading in the U.S. markets are categorized in Level 2 of the fair value hierarchy.
54
Table of Contents
TCW Funds, Inc.
October 31, 2018 |
Note 2 — Significant Accounting Policies (Continued)
Foreign currency contracts. The fair value of foreign currency contracts is derived from indices, reference rates, and other inputs or a combination of these factors. To the extent that these factors can be observed, foreign currency contracts are categorized in Level 2 of the fair value hierarchy.
Money market funds. Money market funds are open-end mutual funds that invest in short-term debt securities. To the extent that these funds are valued based upon the reported NAV, they are categorized in Level 1 of the fair value hierarchy.
Options contracts. Options contracts traded on exchanges are valued using market mid prices; as such, they are categorized in Level 1. Option contracts traded OTC are fair valued based on pricing models and incorporate various inputs such as interest rates, credit spreads, currency exchange rates and volatility measurements for in-the-money, at-the-money, and out-of-money contracts on a given strike price. To the extent that these inputs are observable and timely, the fair value of OTC option contracts would be categorized in Level 2; otherwise, the fair values would be categorized in Level 3.
Restricted securities. Restricted securities, including illiquid Rule 144A securities, held in non-public entities are included in Level 3 of the fair value hierarchy because they trade infrequently, and therefore, the inputs are unobservable. Any other restricted securities valued similar to publicly traded securities may be categorized in Level 2 or 3 of the fair value hierarchy depending on whether a discount is applied and significant to the fair value.
Short-term investments. Short-term investments are valued using market price quotations, and are reflected in Level 2 of the fair value hierarchy.
U.S. and foreign government and agency securities. Government and agency securities are normally valued using a model that incorporates market observable data such as reported sales of similar securities, broker quotes, yields, bids, offers, quoted market prices, and reference data. Accordingly, U.S. and foreign government and agency securities are normally categorized in Level 1 or 2 of the fair value hierarchy depending on the liquidity and transparency of the market.
The summary of the inputs used as of October 31, 2018 is listed after the Schedule of Investments for each Fund.
The following table shows transfers between Level 1 and Level 2 of the fair value hierarchy:
Fund | Transfer out of Level 1* and Transfer into Level 2 | Transfer out of Level 2* and Transfer into Level 1 | ||||||
TCW Developing Markets Equity Fund | $ | 183,176 | $ | 68,806 | ||||
TCW Emerging Markets Multi-Asset Opportunities Fund | 1,823,750 | 723,825 | ||||||
TCW International Small Cap Fund | 300,150 | — | ||||||
| * | The Funds recognized transfers between the Levels as of the beginning of the period. |
The Funds held no investments or other financial instruments at October 31, 2018 for which fair value was calculated using Level 3 inputs.
Security Transactions and Related Investment Income: Security transactions are recorded as of the trade date. Dividend income is recorded on the ex-dividend date. Interest income is recognized on an accrual basis. Realized gains and losses on investments are recorded on the basis of specific identification.
55
Table of Contents
TCW Funds, Inc.
Notes to Financial Statements (Continued)
Note 2 — Significant Accounting Policies (Continued)
Foreign Currency Translation: The books and records of each Fund are maintained in U.S. dollars as follows: (1) the foreign currency denominated securities and other assets and liabilities stated in foreign currencies are translated using the daily spot rate; and (2) purchases, sales, income and expenses are translated at the rate of exchange prevailing on the respective dates of such transactions. The resultant exchange gains and losses are included in net realized or net unrealized gain (loss) in the Statements of Operations. Pursuant to U.S. federal income tax regulations, certain foreign exchange gains and losses included in realized and unrealized gains and losses are included in, or are a reduction of, ordinary income for federal income tax purposes.
Foreign Taxes: The Funds may be subject to withholding taxes on income and capital gains imposed by certain countries in which they invest. The withholding tax on income is netted against the income accrued or received. Any reclaimable taxes are recorded as income. The withholding tax on realized or unrealized gain is recorded as a liability.
Derivative Instruments: Derivatives are financial instruments whose values are based on the values of one or more indicators, such as a security, asset, currency, interest rate, or index. Derivative transactions can create investment leverage and may be highly volatile. A derivative contract may result in a mark to market loss if the value of the contract decreases due to an unfavorable change in the market rates or values of the underlying instrument. It is possible that a derivative transaction will result in a loss greater than the principal amount invested. The Funds may not be able to close out a derivative transaction at a favorable time or price.
56
Table of Contents
TCW Funds, Inc.
October 31, 2018 |
Note 2 — Significant Accounting Policies (Continued)
For the year ended October 31, 2018, the following Funds had derivatives and transactions in derivatives, grouped in the following risk categories (amounts in thousands except Notional Amounts or Number of Contracts):
| TCW Emerging Markets Income Fund | Credit Risk | Foreign Currency Risk | Total | |||||||||
Statement of Asset and Liabilities | ||||||||||||
Asset Derivatives | ||||||||||||
Investments | $ | — | $ | — | (1) | $ | — | (1) | ||||
Forward Contracts | — | 3,300 | 3,300 | |||||||||
|
|
|
|
|
| |||||||
Total Value | $ | — | $ | 3,300 | $ | 3,300 | ||||||
|
|
|
|
|
| |||||||
Liability Derivatives | ||||||||||||
Forward Contracts | $ | — | $ | (9,763 | ) | $ | (9,763 | ) | ||||
|
|
|
|
|
| |||||||
Total Value | $ | — | $ | (9,763 | ) | $ | (9,763 | ) | ||||
|
|
|
|
|
| |||||||
Statement of Operations: | ||||||||||||
Realized Gain (Loss) | ||||||||||||
Forward Contracts | $ | — | $ | (3,321 | ) | $ | (3,321 | ) | ||||
Investments | — | (2,063 | ) | (2,063 | ) | |||||||
Options Written | — | 1,774 | 1,774 | |||||||||
Swaps Contracts | (6,016 | ) | — | (6,016 | ) | |||||||
|
|
|
|
|
| |||||||
Total Realized Gain (Loss) | $ | (6,016 | ) | $ | (3,610 | ) | $ | (9,626 | ) | |||
|
|
|
|
|
| |||||||
Change in Appreciation (Depreciation) | ||||||||||||
Forward Contracts | $ | — | $ | (4,772 | ) | $ | (4,772 | ) | ||||
Investments | — | (1,192 | ) | (1,192 | ) | |||||||
Options Written | — | (11 | ) | (11 | ) | |||||||
Swaps Contracts | 535 | — | 535 | |||||||||
|
|
|
|
|
| |||||||
Total Change in Appreciation (Depreciation) | $ | 535 | $ | (5,975 | ) | $ | (5,440 | ) | ||||
|
|
|
|
|
| |||||||
Notional Amounts (2) | ||||||||||||
Forward Currency Contracts | $ — | $243,689,138 | $243,689,138 | |||||||||
Options Purchased | $ — | $110,172,940 | $110,172,940 | |||||||||
Options Written | $ — | $58,307,389 | $58,307,389 | |||||||||
Swaps Contracts | $281,208,750 | $ — | $281,208,750 | |||||||||
57
Table of Contents
TCW Funds, Inc.
Notes to Financial Statements (Continued)
Note 2 — Significant Accounting Policies (Continued)
| TCW Emerging Markets Local Currency Income Fund | Foreign Currency Risk | Total | ||||||
Statement of Asset and Liabilities | ||||||||
Asset Derivatives | ||||||||
Investments | $ | 58 | $ | 58 | ||||
Forward Contracts | 930 | 930 | ||||||
|
|
|
| |||||
Total Value | $ | 988 | $ | 988 | ||||
|
|
|
| |||||
Liability Derivatives | ||||||||
Forward Contracts | $ | (3,225 | ) | $ | (3,225 | ) | ||
|
|
|
| |||||
Total Value | $ | (3,225 | ) | $ | (3,225 | ) | ||
|
|
|
| |||||
Statement of Operations: | ||||||||
Realized Gain (Loss) | ||||||||
Forward Contracts | $ | 89 | $ | 89 | ||||
Investments | (447 | ) | (447 | ) | ||||
Options Written | 155 | 155 | ||||||
|
|
|
| |||||
Total Realized Gain (Loss) | $ | (203 | ) | $ | (203 | ) | ||
|
|
|
| |||||
Change in Appreciation (Depreciation) | ||||||||
Forward Contracts | $ | (2,201 | ) | $ | (2,201 | ) | ||
Investments | (123 | ) | (123 | ) | ||||
Options Written | 1 | 1 | ||||||
|
|
|
| |||||
Total Change in Appreciation (Depreciation) | $ | (2,323 | ) | $ | (2,323 | ) | ||
|
|
|
| |||||
Notional Amounts (2) | ||||||||
Forward Currency Contracts | $115,175,423 | $115,175,423 | ||||||
Options Purchased | $12,060,279 | $12,060,279 | ||||||
Options Written | $9,550,286 | $9,550,286 | ||||||
58
Table of Contents
TCW Funds, Inc.
October 31, 2018 |
Note 2 — Significant Accounting Policies (Continued)
| TCW Emerging Markets Multi-Asset Opportunities Fund | Credit Risk | Foreign Currency Risk | Total | |||||||||
Statement of Asset and Liabilities | ||||||||||||
Asset Derivatives | ||||||||||||
Investments | $ | — | $ | — | (1) | $ | — | (1) | ||||
Forward Contracts | — | 40 | 40 | |||||||||
|
|
|
|
|
| |||||||
Total Value | $ | — | $ | 40 | $ | 40 | ||||||
|
|
|
|
|
| |||||||
Liability Derivatives | ||||||||||||
Forward Contracts | $ | — | $ | (121 | ) | $ | (121 | ) | ||||
|
|
|
|
|
| |||||||
Total Value | $ | — | $ | (121 | ) | $ | (121 | ) | ||||
|
|
|
|
|
| |||||||
Statement of Operations: | ||||||||||||
Realized Gain (Loss) | ||||||||||||
Forward Contracts | $ | — | $ | (50 | ) | $ | (50 | ) | ||||
Investments | — | (19 | ) | (19 | ) | |||||||
Options Written | — | 15 | 15 | |||||||||
Swaps Contracts | (48 | ) | — | (48 | ) | |||||||
|
|
|
|
|
| |||||||
Total Realized Gain (Loss) | $ | (48 | ) | $ | (54 | ) | $ | (102 | ) | |||
|
|
|
|
|
| |||||||
Change in Appreciation (Depreciation) | ||||||||||||
Forward Contracts | $ | — | $ | (75 | ) | $ | (75 | ) | ||||
Investments | — | (9 | ) | (9 | ) | |||||||
Options Written | — | — | (1) | — | (1) | |||||||
Swaps Contracts | 4 | — | 4 | |||||||||
|
|
|
|
|
| |||||||
Total Change in Appreciation (Depreciation) | $ | 4 | $ | (84 | ) | $ | (80 | ) | ||||
|
|
|
|
|
| |||||||
Notional Amounts (2) | ||||||||||||
Forward Currency Contracts | $ — | $1,872,326 | $1,872,326 | |||||||||
Options Purchased | $ — | $891,869 | $891,869 | |||||||||
Options Written | $ — | $505,625 | $505,625 | |||||||||
Swaps Contracts | $1,793,750 | $ — | $1,793,750 | |||||||||
| (1) | Amount rounds to less than $1. |
| (2) | Amount disclosed represents average notional amounts which are representative of the volume traded for the year ended October 31, 2018. |
Counterparty Credit Risk: Derivative contracts may be exposed to counterparty risk. Losses can occur if the counterparty does not perform under the contract.
A Fund’s risk of loss from counterparty credit risk on OTC derivatives is generally limited to the aggregate unrealized gain netted against any collateral held by the Fund.
With exchange traded futures and centrally cleared swaps, there is less counterparty credit risk to the Funds since the exchange or clearinghouse, as counterparty to such instruments, guarantees against a possible default. The clearinghouse stands between the buyer and the seller of the contract; therefore, the credit risk is limited to failure of the clearinghouse. While offset rights may exist under applicable law, the Funds do not have a contractual right of offset against a clearing broker or clearinghouse in the event of a default (including the bankruptcy or insolvency) of the clearing broker or clearinghouse. Additionally, credit risk exists in exchange traded futures and centrally cleared swaps with respect to initial and variation margin that is held in a clearing broker’s customer accounts. While clearing brokers are required to segregate customer margin from their own assets, in the event that a clearing broker becomes insolvent or goes into
59
Table of Contents
TCW Funds, Inc.
Notes to Financial Statements (Continued)
Note 2 — Significant Accounting Policies (Continued)
bankruptcy and at that time there is a shortfall in the aggregate amount of margin held by the clearing broker for all its clients, typically the shortfall would be allocated on a pro rata basis across all the clearing broker’s customers, potentially resulting in losses to the Funds.
For OTC derivatives, the Funds mitigate their counterparty risk by entering into an International Swaps and Derivatives Association, Inc. Master Agreement (“ISDA Master Agreement”) or similar agreement with each counterparty. An ISDA Master Agreement is a bilateral agreement between the Funds and a counterparty that governs OTC derivatives and typically contains, among other things, collateral posting terms and netting provisions in the event of a default and/or termination event. Under an ISDA Master Agreement, a Fund may, under certain circumstances, offset with the counterparty certain derivative financial instruments’ payables and/or receivables with collateral held and/or posted and create one single net payment. The provisions of the ISDA Master Agreement typically permit a single net payment in the event of default including the bankruptcy or insolvency of the counterparty. However, bankruptcy or insolvency laws of a particular jurisdiction may impose restrictions on or prohibitions against the right of offset in bankruptcy, insolvency or other events. In addition, certain ISDA Master Agreements allow counterparties to OTC derivatives to terminate derivative contracts prior to maturity in the event a Fund’s net assets decline by a stated percentage or fail to meet the terms of its ISDA Master Agreements, which would cause the Fund to accelerate payment of any net liability owed to the counterparty.
Collateral requirements: For derivatives traded under an ISDA Master Agreement, the collateral requirements are typically calculated by netting the mark to market amount for each transaction under such agreement and comparing that amount to the value of any collateral pledged or received by a Fund.
Cash collateral that has been pledged to cover obligations of a Fund is reported separately on the Statement of Assets and Liabilities. Non-cash collateral pledged by a Fund, if any, is noted in the Schedule of Investments. Generally, the amount of collateral due from or to a party has to exceed a minimum transfer amount threshold, typically $250,000 or $500,000, before a transfer is required, which is determined at the close of each business day and the collateral is transferred on the next business day. To the extent amounts due to a Fund from its counterparties are not fully collateralized, contractually or otherwise, the Fund bears the risk of loss from counterparty non-performance. The Funds attempt to mitigate counterparty risk by entering into agreements only with counterparties that Advisor believes have the financial resources to honor their obligations and by monitoring the financial stability of those counterparties. For financial reporting purposes, the Funds do not offset derivative assets and derivative liabilities that are subject to netting arrangements in the Statements of Assets and Liabilities. The Funds have implemented the disclosure requirements pursuant to FASB ASU No. 2013-11, Disclosures about Offsetting Assets and Liabilities that requires disclosures to make financial statements that are prepared under GAAP more comparable to those prepared under International Financial Reporting Standards.
60
Table of Contents
TCW Funds, Inc.
October 31, 2018 |
Note 2 — Significant Accounting Policies (Continued)
The following table presents the Funds’ OTC derivative assets and liabilities by counterparty net of amounts available for offset under ISDA Master Agreement and net of the related collateral received by the Funds as of October 31, 2018 (in thousands):
TCW Emerging Markets Income Fund
Counterparty | Gross Assets Subject to Master Agreements | Gross Liabilities Subject to Master Agreements | Net Assets (Liabilities) Subject to Master Agreements | Collateral Pledged (Received) | Net Amount (1) | |||||||||||||||
Bank of America | $ | 1 | $ | (32 | ) | $ | (31 | ) | $ | — | $ | (31 | ) | |||||||
BNP Paribas S.A. | 356 | — | 356 | (356 | ) (2) | — | ||||||||||||||
Citibank N.A. | 30 | (251 | ) | (221 | ) | — | (221 | ) | ||||||||||||
Goldman Sachs & Co. | 907 | (4,827 | ) | (3,920 | ) | 3,920 | (2) | — | ||||||||||||
Standard Chartered Bank | 2,006 | (4,653 | ) | (2,647 | ) | 2,647 | (2) | — | ||||||||||||
|
|
|
|
|
|
|
|
|
| |||||||||||
Total | $ | 3,300 | $ | (9,763 | ) | $ | (6,463 | ) | $ | 6,211 | $ | (252 | ) | |||||||
|
|
|
|
|
|
|
|
|
| |||||||||||
| (1) | Represents the net amount receivable (payable) from (to) the counterparty in the event of default. |
| (2) | Amount does not include excess collateral pledged or received. |
TCW Emerging Markets Local Currency Income Fund
Counterparty | Gross Assets Subject to Master Agreements | Gross Liabilities Subject to Master Agreements | Net Assets (Liabilities) Subject to Master Agreements | Collateral Pledged (Received) | Net Amount (1) | |||||||||||||||
Bank of America, N.A. | $ | 111 | $ | (448 | ) | $ | (337 | ) | $ | 260 | $ | (77 | ) | |||||||
Barclays Bank PLC | 10 | (1,539 | ) | (1,529 | ) | 1,300 | (229 | ) | ||||||||||||
BNP Paribas S.A. | 606 | (562 | ) | 44 | — | 44 | ||||||||||||||
Citibank N.A. | — | (2) | — | (2) | — | — | — | |||||||||||||
Goldman Sachs & Co. | 121 | (529 | ) | (408 | ) | 300 | (108 | ) | ||||||||||||
Standard Chartered PLC | 140 | (147 | ) | (7 | ) | — | (7 | ) | ||||||||||||
|
|
|
|
|
|
|
|
|
| |||||||||||
Total | $ | 988 | $ | (3,225 | ) | $ | (2,237 | ) | $ | 1,860 | $ | (377 | ) | |||||||
|
|
|
|
|
|
|
|
|
| |||||||||||
| (1) | Represents the net amount receivable (payable) from (to) the counterparty in the event of default. |
| (2) | Amount rounds to less than $1. |
TCW Emerging Markets Multi-Asset Opportunities Fund
Counterparty | Gross Assets Subject to Master Agreements | Gross Liabilities Subject to Master Agreements | Net Assets (Liabilities) Subject to Master Agreements | Collateral Pledged (Received) | Net Amount (1) | |||||||||||||||
Bank of America | $ | — | (2) | $ | — | (2) | $ | — | $ | — | $ | — | ||||||||
BNP Paribas S.A. | 4 | — | 4 | — | 4 | |||||||||||||||
Citibank N.A. | — | (2) | (2 | ) | (2 | ) | — | (2 | ) | |||||||||||
Goldman Sachs & Co. | 11 | (59 | ) | (48 | ) | — | (48 | ) | ||||||||||||
Standard Chartered Bank | 25 | (60 | ) | (35 | ) | — | (35 | ) | ||||||||||||
|
|
|
|
|
|
|
|
|
| |||||||||||
Total | $ | 40 | $ | (121 | ) | $ | (81 | ) | $ | — | $ | (81 | ) | |||||||
|
|
|
|
|
|
|
|
|
| |||||||||||
| (1) | Represents the net amount receivable (payable) from (to) the counterparty in the event of default. |
| (2) | Amount rounds to less than $1. |
Forward Foreign Currency Contracts: The Funds enter into forward foreign currency contracts as a hedge against fluctuations in foreign exchange rates. Forward foreign currency contracts are marked-to market daily and the change in market value is recorded by each Fund as unrealized gains or losses in the
61
Table of Contents
TCW Funds, Inc.
Notes to Financial Statements (Continued)
Note 2 — Significant Accounting Policies (Continued)
Statement of Assets and Liabilities. When a contract is closed or delivery is taken, a Fund records a realized gain or loss equal to the difference between the value of the contract at the time it was opened and the value at the time it was closed. Risks may arise upon entering into these contracts from the potential inability of counterparties to meet the terms of their contracts and from unanticipated movements in the value of the foreign currency relative to the U.S. dollar. Outstanding foreign currency forward contracts at October 31, 2018 are disclosed in the Schedule of Investments.
Futures Contracts: The Funds may enter into futures contracts. A Fund may seek to manage a variety of different risks through the use of futures contracts, such as interest rate risk, equity price risk, and currency risk. A Fund may use index futures to hedge against broad market risks to its portfolio or to gain broad market exposure. Securities index futures contracts are contracts to buy or sell units of a securities index at a specified future date at a price agreed upon when the contract is made and are settled in cash. Positions in futures may be closed out only on an exchange or board of trade which provides a secondary market for such futures. Because futures contracts are exchange-traded, they typically have minimal exposure to counterparty risk. Parties to a futures contract are not required to post the entire notional amount of the contract, but rather a small percentage of that amount (by way of margin), both at the time they enter into futures transactions, and then on a daily basis if their positions decline in value; as a result, futures contracts are highly leveraged. Such payments are known as variation margin and are recorded by a Fund as unrealized gains or losses. Because futures markets are highly leveraged, they can be extremely volatile, and there can be no assurance that the pricing of a futures contract will correlate precisely with the pricing of the asset or index underlying it or the asset or liability of a Fund that is the subject of the hedge. It may not always be possible for a Fund to enter into a closing transaction with respect to a futures contract it has entered into at a favorable time or price. When a Fund enters into a futures transaction, it is subject to the risk that the value of the futures contract will move in a direction unfavorable to it.
When a Fund uses futures contracts for hedging purposes, it is likely that the Fund will have an asset or liability that will offset any loss (or gain) on the transactions, at least in part. When a futures contract is closed, the Fund records a realized gain or loss equal to the difference between the value of the contract at the time it was opened and the value at the time it was closed. There are no futures contracts outstanding at October 31, 2018.
Options: The Funds purchase and sell put and call options on a security or an index of securities to enhance investment performance or to protect against changes in market prices. The Funds may also enter into currency options to hedge against or to take advantage of currency fluctuations.
Purchasing foreign currency options gives a Fund the right, but not the obligation to buy or sell specified amounts of currency at a rate of exchange that may be exercised by a certain date. These currency options may be used as a short or long hedge against possible variations in foreign exchange rates or to gain exposure to foreign currencies.
When a Fund purchases an option, it runs the risk that it will lose its entire investment in the option in a relatively short period of time, unless the Fund exercises the option or enters into a closing sale transaction before the option’s expiration. If the price of the underlying security does not rise (in the case of a call) or fall (in the case of a put) to an extent sufficient to cover the option premium and transaction costs, the Fund will lose part or all of its investment in the option. Premiums paid for purchasing options that expired are treated as realized losses.
62
Table of Contents
TCW Funds, Inc.
October 31, 2018 |
Note 2 — Significant Accounting Policies (Continued)
Options purchased or sold by a Fund may be traded on a securities or options exchange. Such options typically have minimal exposure to counterparty risk. However, an exchange or market may at times find it necessary to impose restrictions on particular types of options transactions, such as opening transactions. If an underlying security ceases to meet qualifications imposed by an exchange or the Options Clearing Corporation, new series of options on that security will no longer be opened to replace the expiring series, and opening transactions in existing series may be prohibited.
OTC options are options not traded on exchanges or backed by clearinghouses. Rather, they are entered into directly between a Fund and the counterparty to the option. In the case of an OTC option purchased by a Fund, the value of the option to the Fund will depend on the willingness and ability of the option writer to perform its obligations to the Fund. In addition, OTC options may not be transferable and there may be little or no secondary market for them, so they may be considered illiquid. It may not be possible to enter into closing transactions with respect to OTC options or otherwise to terminate such options, and as a result a Fund may be required to remain obligated on an unfavorable OTC option until its expiration. During the year ended October 31, 2018, the TCW Emerging Markets Income Fund, TCW Emerging Markets Local Currency Income Fund, and TCW Emerging Markets Multi-Asset Opportunities Fund entered into options to hedge the currency exposure of the Funds.
Swap Agreements. The Funds may enter into swap agreements. Swap agreements are typically two-party contracts entered into primarily by institutional investors. In a standard “swap” transaction, two parties agree to exchange the returns (or differentials in rates of return) earned or realized on particular predetermined investments or instruments, which may be adjusted for an interest factor. The gross returns to be exchanged or “swapped” between the parties are generally calculated with respect to a “notional amount” (i.e., the return on or increase in value of a particular dollar amount invested at a particular interest rate or in a “basket” of securities representing a particular index).
In a total return swap, one party typically agrees to pay to the other a short-term interest rate in return for a payment at one or more times in the future based on the increase in the value of an underlying security or other asset, or index of securities or assets; if the underlying security, asset, or index declines in value, the party that pays the short-term interest rate must also pay to its counterparty a payment based on the amount of the decline. A Fund may take either side of such a swap, and so may take a long or short position in the underlying security, asset, or index. A Fund may enter into a total return swap to hedge against an exposure in its portfolio — such as interest rate risk (including to adjust the duration or credit quality of a Fund’s bond portfolio), equity risk, or credit risk — or generally to put cash to work efficiently in the markets in anticipation of, or as a replacement for, cash investments. A Fund may also enter into a total return swap to gain exposure to securities or markets in which it might not be able to invest directly (in so-called market access transactions).
Interest rate swaps are agreements in which one party pays a floating rate of interest on a notional principal amount and receives a fixed rate of interest on the same notional principal amount for a specified period of time. Alternatively, a party may pay a fixed rate and receive a floating rate. In more complex swaps, the notional principal amount may decline (or amortize) over time. The Fund’s maximum risk of loss due to counterparty default is the discounted net asset value of the cash flows paid to/received from the counterparty over the interest rate swap’s remaining life.
A Fund may enter into credit default swap transactions as a “buyer” or “seller” of credit protection. In a credit default swap, one party provides what is in effect insurance against a default or other adverse credit
63
Table of Contents
TCW Funds, Inc.
Notes to Financial Statements (Continued)
Note 2 — Significant Accounting Policies (Continued)
event affecting an issuer of debt securities (typically referred to as a “reference entity”). In general, the buyer of credit protection is obligated to pay the protection seller an upfront amount or a periodic stream of payments over the term of the swap. If a “credit event” occurs, the buyer has the right to deliver to the seller bonds or other obligations of the reference entity (with a value up to the full notional value of the swap), and to receive a payment equal to the par value of the bonds or other obligations. Credit events that would trigger a request that the seller make payment are specific to each credit default swap agreement, but generally include bankruptcy, failure to pay, restructuring, obligation acceleration, obligation default, or repudiation/moratorium. When a Fund buys protection, it may or may not own securities of the reference entity. When a Fund sells protection under a credit default swap, the position may have the effect of creating leverage in the Fund’s portfolio through the Fund’s indirect long exposure to the issuer or securities on which the swap is written. When a Fund sells protection, it may do so either to earn additional income or to create such a “synthetic” long position.
Whenever a Fund enters into a swap agreement, it takes on counterparty risk — the risk that its counterparty will be unable or unwilling to meet its obligations under the swap agreement. A Fund also takes the risk that the market will move against its position in the swap agreement. In the case of a total return swap, the swap will change in value depending on the change in value of the asset or index on which the swap is written. When a Fund enters into any type of swap for hedging purposes, it is likely that the Fund will have an asset or liability that will offset any loss (or gain) on the swap, at least in part. Swap agreements may be non-transferable or otherwise highly illiquid, and a Fund may not be able to terminate or transfer a swap agreement at any particular time or at an acceptable price.
During the term of a swap transaction, changes in the value of the swap are recognized as unrealized gains or losses by marking to market to reflect the market value of the swap. When the swap is terminated, a Fund will record a realized gain or loss equal to the difference, if any, between the proceeds from (or cost of) the closing transaction and the Fund’s basis in the agreement. Upfront swap premium payments paid or received by a Fund, if any, are recorded within the value of the open swap agreement on the Fund’s Statement of Assets and Liabilities and represent payments paid or received upon entering into the swap agreement to compensate for differences between stated terms of the swap agreement and prevailing market conditions (credit spreads, currency exchange rates, and other relevant factors). These upfront payments are recorded as realized gains or losses on each Fund’s Statement of Operations upon termination or maturity of the swap agreement.
During the term of a swap transaction, the periodic net payments can be made for a set period of time or may be triggered by a predetermined credit event. The net periodic payments may be based on a fixed or variable interest rate, the change in market value of a specified security, basket of securities or index, or the return generated by a security. These periodic payments received or made by the Funds are recorded as realized gains and losses, respectively. During the year ended October 31, 2018, the TCW Emerging Markets Income Fund and the TCW Emerging Markets Multi-Asset Opportunities Fund used credit default swaps to limit certain credit exposure within each Fund. The Funds had no outstanding swap agreements as of October 31, 2018.
When-Issued, Delayed-Delivery, and Forward Commitment Transactions: The Funds may enter into when-issued, delayed-delivery, or forward commitment transactions in order to lock in the purchase price of the underlying security or to adjust the interest rate exposure of each Fund’s existing portfolio. In when issued, delayed-delivery, or forward commitment transactions, a Fund commits to purchase securities, with
64
Table of Contents
TCW Funds, Inc.
October 31, 2018 |
Note 2 — Significant Accounting Policies (Continued)
payment and delivery to take place at a future date. Although the Fund does not pay for the securities or start earning interest on them until they are delivered, it immediately assumes the risks of ownership, including the risk of price fluctuation. If a Fund’s counterparty fails to deliver a security purchased on a when-issued, delayed-delivery, or forward commitment basis, there may be a loss, and that Fund may have missed an opportunity to make an alternative investment.
Prior to settlement of these transactions, the values of the subject securities will fluctuate with market conditions. In addition, because the Fund is not required to pay for when-issued, delayed-delivery, or forward commitment securities until the delivery date, they may result in a form of leverage to the extent the Fund does not set aside liquid assets to cover the commitment. To guard against this deemed leverage, the Fund monitors the obligations under these transactions on a daily basis and ensures that the Fund has sufficient liquid assets to cover them.
Repurchase Agreements: The Funds may enter into repurchase agreements, under the terms of Master Repurchase Agreement (MRA). The MRA permits a Fund, under certain circumstances, including an event of default (such as bankruptcy or insolvency), to offset payables and/or receivables under the MRA with collateral held and/or posted to the counterparty and create one single net payment due to or from each Fund. However, bankruptcy or insolvency laws of a particular jurisdiction may impose restrictions on or prohibitions against such a right of offset in the event of a MRA counterparty’s bankruptcy or insolvency. Pursuant to the terms of the MRA, each Fund receives securities as collateral with a market value in excess of the repurchase price. Upon a bankruptcy or insolvency of the MRA counterparty, the Funds recognize a liability with respect to such excess collateral to reflect the Funds’ obligation under bankruptcy law to return the excess to the counterparty. The Funds had no repurchase agreements outstanding as of October 31, 2018.
Security Lending: The Funds may lend their securities to qualified brokers. The loans must be collateralized at all times primarily with cash although the Funds can accept money market instruments or U.S. government securities with a market value at least equal to the market value of the securities on loan. As with any extensions of credit, the Funds may bear the risk of delay in recovery or even loss of rights in the collateral if the borrowers of the securities fail financially. The Funds earn additional income for lending their securities by investing the cash collateral in short-term investments. The Funds did not lend any securities during the year ended October 31, 2018.
Allocation of Operating Activity for Multiple Classes: Investment income, common expenses and realized and unrealized gains and losses are allocated among the share classes of the Funds based on the relative net assets of each class. Distribution fees, which are directly attributable to a class of shares, are charged to the operations of that class. All other expenses are charged to each Fund or class as incurred on a specific identification basis. Differences in class specific fees and expenses will result in differences in net investment income, and in turn differences in dividends paid by each class.
Dividends and Distributions: Dividends and distributions to shareholders are recorded on the ex-dividend date. The TCW Emerging Markets Income Fund and the TCW Emerging Markets Local Currency Income Fund declare and pay, or reinvest, dividends from net investment income monthly. The other International Funds declare and pay, or reinvest, dividends from net investment income annually. Capital gains realized by a fund will be distributed at least annually.
Income and capital gain distributions are determined in accordance with income tax regulations which may differ from GAAP. These differences are primarily due to differing treatments for foreign currency
65
Table of Contents
TCW Funds, Inc.
Notes to Financial Statements (Continued)
Note 2 — Significant Accounting Policies (Continued)
transactions, derivative transactions, market discount and premium, losses deferred due to wash sales, excise tax regulations and employing equalization in determining amounts to be distributed to Fund shareholders. Permanent book and tax basis differences relating to shareholder distributions will result in reclassifications between paid-in capital, undistributed net investment income (loss), and/or undistributed accumulated realized gain (loss). Undistributed net investment income or loss may include temporary book and tax basis differences which will reverse in a subsequent period. Any taxable income or capital gain remaining at fiscal year end is distributed in the following fiscal year.
Use of Estimates: The preparation of the accompanying financial statements requires management to make estimates and assumptions that affect the reported amount of assets and liabilities at the date of the financial statements and the reported amounts of income and expenses during the reporting period. Actual results could differ from these estimates.
Note 3 — Risk Considerations
Market Risk: As the Funds’ investments will fluctuate with market conditions, so will the value of your investment in the Funds. You could lose money on your investment in the Funds or the Funds could underperform other investments.
Liquidity Risk: The Funds’ investments in illiquid securities may reduce the returns of the Funds because they may not be able to sell the illiquid securities at an advantageous time or price. Investments in high yield securities, foreign securities, derivatives or other securities with substantial market and/or credit risk tend to have the greatest exposure to liquidity risk. Certain investments in private placements and Rule 144A securities may be considered illiquid investments. The Funds may invest in private placements and Rule 144A securities.
Interest Rate Risk: The values of the Funds’ investments fluctuate in response to movements in interest rates. If rates rise, the values of debt securities generally fall. The longer the average duration of a Fund’s investment portfolio, the greater the change in value.
Derivatives Risk: Use of derivatives, which at times is an important part of the Funds’ investment strategy, involves risks different from, or possibly greater than, the risks associated with investing directly in securities and other traditional investments. Investments in derivatives could cause the Funds to lose more than the principal amount invested. Also, suitable derivative transactions may not be available in all circumstances and there can be no assurance that the Funds will achieve their objective through the use of the derivatives.
Credit Risk: The values of any of the Funds’ investments may also decline in response to events affecting the issuer or its credit rating. The lower rated debt securities in which a Fund may invest are considered speculative and are subject to greater volatility and risk of loss than investment-grade securities, particularly in deteriorating economic conditions.
Counterparty Risk: The Funds may be exposed to counterparty risk, the risk that an entity with which the Funds have unsettled or open transactions may not fulfill its obligations.
Foreign Currency Risk: The Funds may be exposed to the risk that the value of the Funds’ investments denominated in foreign currencies will decline in value because the foreign currency has declined in value relative to the U.S. dollar.
66
Table of Contents
TCW Funds, Inc.
October 31, 2018 |
Note 3 — Risk Considerations (Continued)
Foreign Investing Risk: The Funds may be exposed to the risk that the Funds share prices will fluctuate with market conditions, currency exchange rates and the economic and political climates in countries where the Funds invest.
For complete information on the various risks involved, please refer to the Funds’ prospectus and the Statement of Additional Information which can be obtained on the Funds’ website (www.tcw.com) or by calling the customer service.
Note 4 — Federal Income Taxes
It is the policy of each Fund to comply with the requirements under Subchapter M of the Internal Revenue Code applicable to regulated investment companies and to distribute all of its net taxable income, including any net realized gains on investments, to its shareholders. Therefore, no federal income tax provision is required.
At October 31, 2018, the components of distributable earnings on a tax basis were as follows (amounts in thousands):
| Undistributed Ordinary Income | Undistributed Long-Term Gain | Total Distributable Earnings | ||||||||||
TCW Developing Markets Equity Fund | $ | 12 | $ | — | $ | 12 | ||||||
TCW Emerging Markets Income Fund | 22,330 | — | 22,330 | |||||||||
TCW Emerging Markets Multi-Asset Opportunities Fund | 1,095 | — | 1,095 | |||||||||
TCW International Small Cap Fund | 22 | — | 22 | |||||||||
At the end of the previous fiscal year, October 31, 2017, the components of distributable earnings on a tax basis were as follows (amounts in thousands):
| Undistributed Ordinary Income | Undistributed Long-Term Gain | Total Distributable Earnings | ||||||||||
TCW Developing Markets Equity Fund | $ | 32 | $ | — | $ | 32 | ||||||
TCW Emerging Markets Income Fund | 36,407 | — | 36,407 | |||||||||
TCW Emerging Markets Local Currency Income Fund | 6,568 | — | 6,568 | |||||||||
TCW Emerging Markets Multi-Asset Opportunities Fund | 1,841 | — | 1,841 | |||||||||
| (1) | Amount rounds to less than $1. |
Permanent differences incurred during the year ended October 31, 2018, resulting from differences in book and tax accounting, have been reclassified at year-end between undistributed net investment income (loss), undistributed (accumulated) net realized gain (loss) and paid-in capital as follows, with no impact to the NAV per share (amounts in thousands):
| Undistributed Net Investment Income (Loss) | Undistributed Accumulated Net Realized Gain (Loss) | Paid-in Capital | ||||||||||
TCW Developing Markets Equity Fund | $ | (19 | ) | $ | 19 | $ | — | |||||
TCW Emerging Markets Income Fund | (49,374 | ) | 49,374 | — | ||||||||
TCW Emerging Markets Local Currency Income Fund | (14,246 | ) | 14,262 | (16 | ) | |||||||
TCW Emerging Markets Multi-Asset Opportunities Fund | (1,112 | ) | 1,112 | — | ||||||||
TCW International Small Cap Fund | (4 | ) | 4 | — | (1) | |||||||
| (1) | Amount rounds to less than $1. |
67
Table of Contents
TCW Funds, Inc.
Notes to Financial Statements (Continued)
Note 4 — Federal Income Taxes (Continued)
During the year ended October 31, 2018, the tax character of distributions paid was as follows (amounts in thousands):
| Ordinary Income | Long-Term Capital Gain | Return of Capital | Total Distributions | |||||||||||||
TCW Developing Markets Equity Fund | $ | 32 | $ | — | $ | — | $ | 32 | ||||||||
TCW Emerging Markets Income Fund | 172,717 | — | — | 172,717 | ||||||||||||
TCW Emerging Markets Local Currency Income Fund | 6,699 | — | 9,233 | 15,932 | ||||||||||||
TCW Emerging Markets Multi-Asset Opportunities Fund | 2,016 | — | — | 2,016 | ||||||||||||
For the previous fiscal year ended October 31, 2017 the tax character of distributions paid was as follows (amounts in thousands):
| Ordinary Income | Long-Term Capital Gain | Total Distributions | ||||||||||
TCW Developing Markets Equity Fund | $ | 47 | $ | — | $ | 47 | ||||||
TCW Emerging Markets Income Fund | 176,978 | — | 176,978 | |||||||||
TCW Emerging Markets Local Currency Income Fund | 6,855 | — | 6,855 | |||||||||
TCW Emerging Markets Multi-Asset Opportunities Fund | 1,409 | — | 1,409 | |||||||||
TCW International Small Cap Fund | 29 | — | 29 | |||||||||
At October 31, 2018, net unrealized appreciation (depreciation) on investments for federal income tax purposes was as follows (amounts in thousands):
| Unrealized Appreciation | Unrealized (Depreciation) | Net Unrealized Appreciation (Depreciation) | Cost of Investments for Federal Income Tax Purposes | |||||||||||||
TCW Developing Markets Equity Fund | $ | 359 | $ | (197 | ) | $ | 162 | $ | 4,975 | |||||||
TCW Emerging Markets Income Fund | 52,432 | (194,370 | ) | (141,938 | ) | 4,896,331 | ||||||||||
TCW Emerging Markets Local Currency Income Fund | 3,848 | (30,383 | ) | (26,535 | ) | 332,527 | ||||||||||
TCW Emerging Markets Multi-Asset Opportunities Fund | 3,367 | (4,155 | ) | (788 | ) | 118,882 | ||||||||||
TCW International Small Cap Fund | 473 | (475 | ) | (2 | ) | 9,708 | ||||||||||
At October 31, 2018, the following Funds had net realized losses that will be carried forward indefinitely for federal income tax purposes (amounts in thousands):
| Short-Term Capital Losses | Long-Term Capital Losses | Total | ||||||||||
TCW Developing Markets Equity Fund | $ | 505 | $ | — | $ | 505 | ||||||
TCW Emerging Markets Income Fund | 470,310 | 318,732 | 789,042 | |||||||||
TCW Emerging Markets Local Currency Income Fund | 18,097 | 8,985 | 27,082 | |||||||||
TCW Emerging Markets Multi-Asset Opportunities Fund | 7,259 | — | 7,259 | |||||||||
TCW International Small Cap Fund | 1,593 | — | 1,593 | |||||||||
The Funds did not have any unrecognized tax benefits at October 31, 2018, nor were there any increases or decreases in unrecognized tax benefits for the year ended October 31, 2018. The Funds are subject to examination by the U.S. federal and state tax authorities for returns filed for the prior three and four fiscal years, respectively.
68
Table of Contents
TCW Funds, Inc.
October 31, 2018 |
Note 5 — Fund Management Fees and Other Expenses
The Funds pay to the Advisor, as compensation for services rendered, facilities furnished and expenses borne by it, the following annual management fees as a percentage of daily net assets:
TCW Developing Markets Equity Fund | 0.80 | % | ||
TCW Emerging Markets Income Fund | 0.75 | % | ||
TCW Emerging Markets Local Currency Income Fund | 0.75 | % | ||
TCW Emerging Markets Multi-Asset Opportunities Fund | 0.95 | % | ||
TCW International Small Cap Fund | 0.75 | % |
The Advisor limits the operating expenses of the Funds not to exceed the following expense ratios relative to the Funds’ average daily net assets:
TCW Developing Markets Equity Fund | ||||
I Class | 1.25 | % (1) | ||
N Class | 1.25 | % (1) | ||
TCW Emerging Markets Income Fund | ||||
I Class | 1.08 | % (2) | ||
N Class | 1.08 | % (2) | ||
TCW Emerging Markets Local Currency Income Fund | ||||
I Class | 0.99 | % (1) | ||
N Class | 0.99 | % (1) | ||
TCW Emerging Markets Multi-Asset Opportunities Fund | ||||
I Class | 1.23 | % (1) | ||
N Class | 1.23 | % (1) | ||
TCW International Small Cap Fund | ||||
I Class | 1.44 | % (1) | ||
N Class | 1.44 | % (1) |
| (1) | These limitations are based on an agreement between the Advisor and Company. |
| (2) | Limitation based on average expense ratio as reported by Lipper, Inc., which is subject to change on a monthly basis. This ratio was in effect as of October 31, 2018. These limitations are voluntary and terminable in a six months notice. |
The amount borne by the Advisor during the fiscal year when the operating expenses of a Fund are in excess of the expense limitation cannot be recaptured in the subsequent fiscal years should the expenses drop below the expense limitation in the subsequent years. The Advisor can recapture expenses only within a given fiscal year for that year’s operating expenses.
Directors’ Fees: Directors who are not affiliated with the Advisor receive compensation from the Funds which is shown on the Statements of Operations. Directors may elect to defer receipt of their fees in accordance with the terms of a Non-Qualified Deferred Compensation Plan. Deferred compensation is included within directors’ fees and expenses in the Statements of Assets and Liabilities.
Note 6 — Distribution Plan
TCW Funds Distributors LLC (“Distributor”), an affiliate of the Advisor and the Funds, serves as the nonexclusive distributor of each class of the Funds’ shares. The Funds have a distribution plan pursuant to Rule 12b-1 under the 1940 Act with respect to the N Class shares of each Fund. Under the terms of the plan, each Fund compensates the Distributor at a rate equal to 0.25% of the average daily net assets of the Fund attributable to its N Class shares for distribution and related services.
69
Table of Contents
TCW Funds, Inc.
Notes to Financial Statements (Continued)
Note 7 — Purchases and Sales of Securities
Investment transactions (excluding short-term investments) for the year ended October 31, 2018 were as follows (amounts in thousands):
| Purchases at Cost | Sales or Maturity Proceeds | U.S. Government Purchases at Cost | U.S. Government Sales or Maturity Proceeds | |||||||||||||
TCW Developing Markets Equity Fund | $ | 9,887 | $ | 10,517 | $ | — | $ | — | ||||||||
TCW Emerging Markets Income Fund | 6,946,608 | 5,441,285 | — | — | ||||||||||||
TCW Emerging Markets Local Currency Income Fund | 639,670 | 498,185 | — | — | ||||||||||||
TCW Emerging Markets Multi-Asset Opportunities Fund | 205,848 | 163,444 | — | — | ||||||||||||
TCW International Small Cap Fund | 23,168 | 23,113 | — | — | ||||||||||||
Note 8 — Capital Share Transactions
Transactions in each Fund’s shares were as follows:
| TCW Developing Markets Equity Fund | Year Ended October 31, 2018 | Year Ended October 31, 2017 | ||||||||||||||
| I Class | Shares | Amount (in thousands) | Shares | Amount (in thousands) | ||||||||||||
Shares Sold | 396 | $ | 5 | — | $ | — | ||||||||||
Shares Issued upon Reinvestment of Dividends | 1,988 | 23 | 3,894 | 34 | ||||||||||||
|
|
|
|
|
|
|
| |||||||||
Net Increase | 2,384 | $ | 28 | 3,894 | $ | 34 | ||||||||||
|
|
|
|
|
|
|
| |||||||||
| N Class | Shares | Amount (in thousands) | Shares | Amount (in thousands) | ||||||||||||
Shares Sold | 30,914 | $ | 371 | 2,879 | $ | 27 | ||||||||||
Shares Issued upon Reinvestment of Dividends | 772 | 9 | 1,486 | 13 | ||||||||||||
Shares Redeemed | (29,554 | ) | (350 | ) | — | — | ||||||||||
|
|
|
|
|
|
|
| |||||||||
Net Increase | 2,132 | $ | 30 | 4,365 | $ | 40 | ||||||||||
|
|
|
|
|
|
|
| |||||||||
| TCW Emerging Markets Income Fund | Year Ended October 31, 2018 | Year Ended October 31, 2017 | ||||||||||||||
| I Class | Shares | Amount (in thousands) | Shares | Amount (in thousands) | ||||||||||||
Shares Sold | 325,798,179 | $ | 2,630,542 | 132,574,376 | $ | 1,110,081 | ||||||||||
Shares Issued upon Reinvestment of Dividends | 14,774,392 | 122,504 | 14,432,022 | 120,623 | ||||||||||||
Shares Redeemed | (134,516,022 | ) | (1,092,291 | ) | (99,861,578 | ) | (835,242 | ) | ||||||||
|
|
|
|
|
|
|
| |||||||||
Net Increase | 206,056,549 | $ | 1,660,755 | 47,144,820 | $ | 395,462 | ||||||||||
|
|
|
|
|
|
|
| |||||||||
| N Class | Shares | Amount (in thousands) | Shares | Amount (in thousands) | ||||||||||||
Shares Sold | 10,601,963 | $ | 111,621 | 17,285,880 | $ | 186,830 | ||||||||||
Shares Issued upon Reinvestment of Dividends | 1,769,493 | 18,963 | 2,532,993 | 27,257 | ||||||||||||
Shares Redeemed | (24,566,407 | ) | (258,337 | ) | (23,070,902 | ) | (250,017 | ) | ||||||||
|
|
|
|
|
|
|
| |||||||||
Net Decrease | (12,194,951 | ) | $ | (127,753 | ) | (3,252,029 | ) | $ | (35,930 | ) | ||||||
|
|
|
|
|
|
|
| |||||||||
70
Table of Contents
TCW Funds, Inc.
October 31, 2018 |
Note 8 — Capital Share Transactions (Continued)
| TCW Emerging Markets Local Currency Income Fund | Year Ended October 31, 2018 | Year Ended October 31, 2017 | ||||||||||||||
| I Class | Shares | Amount (in thousands) | Shares | Amount (in thousands) | ||||||||||||
Shares Sold | 24,640,615 | $ | 223,944 | 6,308,760 | $ | 58,940 | ||||||||||
Shares Issued upon Reinvestment of Dividends | 1,421,479 | 13,366 | 434,870 | 4,159 | ||||||||||||
Shares Redeemed | (8,375,628 | ) | (75,789 | ) | (2,597,777 | ) | (24,054 | ) | ||||||||
|
|
|
|
|
|
|
| |||||||||
Net Increase | 17,686,466 | $ | 161,521 | 4,145,853 | $ | 39,045 | ||||||||||
|
|
|
|
|
|
|
| |||||||||
| N Class | Shares | Amount (in thousands) | Shares | Amount (in thousands) | ||||||||||||
Shares Sold | 5,406,607 | $ | 48,629 | 3,259,146 | $ | 30,879 | ||||||||||
Shares Issued upon Reinvestment of Dividends | 271,444 | 2,539 | 93,844 | 899 | ||||||||||||
Shares Redeemed | (3,560,164 | ) | (30,713 | ) | (1,287,565 | ) | (11,757 | ) | ||||||||
|
|
|
|
|
|
|
| |||||||||
Net Increase | 2,117,887 | $ | 20,455 | 2,065,425 | $ | 20,021 | ||||||||||
|
|
|
|
|
|
|
| |||||||||
| TCW Emerging Markets Multi-Asset Opportunities Fund | Year Ended October 31, 2018 | Year Ended October 31, 2017 | ||||||||||||||
| I Class | Shares | Amount (in thousands) | Shares | Amount (in thousands) | ||||||||||||
Shares Sold | 721,682 | $ | 8,402 | 194,195 | $ | 2,080 | ||||||||||
Shares Issued upon Reinvestment of Dividends | 80,386 | 954 | 133,708 | 1,281 | ||||||||||||
Shares Redeemed | (224,954 | ) | (2,575 | ) | (314,370 | ) | (3,288 | ) | ||||||||
|
|
|
|
|
|
|
| |||||||||
Net Increase | 577,114 | $ | 6,781 | 13,533 | $ | 73 | ||||||||||
|
|
|
|
|
|
|
| |||||||||
| N Class | Shares | Amount (in thousands) | Shares | Amount (in thousands) | ||||||||||||
Shares Sold | 4,763,034 | $ | 54,831 | 3,761,005 | $ | 40,095 | ||||||||||
Shares Issued upon Reinvestment of Dividends | 89,753 | 1,061 | 5,841 | 56 | ||||||||||||
Shares Redeemed | (1,076,732 | ) | (12,060 | ) | (822,023 | ) | (8,361 | ) | ||||||||
|
|
|
|
|
|
|
| |||||||||
Net Increase | 3,776,055 | $ | 43,832 | 2,944,823 | $ | 31,790 | ||||||||||
|
|
|
|
|
|
|
| |||||||||
| TCW International Small Cap Fund | Year Ended October 31, 2018 | Year Ended October 31, 2017 | ||||||||||||||
| I Class | Shares | Amount (in thousands) | Shares | Amount (in thousands) | ||||||||||||
Shares Sold | 132,392 | $ | 1,478 | 21,677 | $ | 187 | ||||||||||
Shares Issued upon Reinvestment of Dividends | — | — | 2,311 | 18 | ||||||||||||
Shares Redeemed | (50,186 | ) | (562 | ) | (116,317 | ) | (998 | ) | ||||||||
|
|
|
|
|
|
|
| |||||||||
Net Increase | 82,206 | $ | 916 | (92,329 | ) | $ | (793 | ) | ||||||||
|
|
|
|
|
|
|
| |||||||||
| N Class | Shares | Amount (in thousands) | Shares | Amount (in thousands) | ||||||||||||
Shares Sold | 42,646 | $ | 488 | 215,808 | $ | 1,964 | ||||||||||
Shares Issued upon Reinvestment of Dividends | — | — | 1,363 | 11 | ||||||||||||
Shares Redeemed | (51,416 | ) | (586 | ) | (260,862 | ) | (2,321 | ) | ||||||||
|
|
|
|
|
|
|
| |||||||||
Net Decrease | (8,770 | ) | $ | (98 | ) | (43,691 | ) | $ | (346 | ) | ||||||
|
|
|
|
|
|
|
| |||||||||
Note 9 — Ownership
As of October 31, 2018, affiliates of the Funds and Advisor owned 99.2% and 75.9% of the net assets of TCW Developing Markets Equity Fund and TCW International Small Cap Fund, respectively.
71
Table of Contents
TCW Funds, Inc.
Notes to Financial Statements (Continued)
Note 10 — Restricted Securities
The Funds are permitted to invest in securities that have legal or contractual restrictions on resale. These securities may be sold privately, but are required to be registered before being sold to the public (exemption rules apply). Private placement securities are generally considered to be restricted except for those securities traded between qualified institutional investors under the provisions of Rule 144A of the Securities Act of 1933, as amended (the “Securities Act”). Disposal of these securities may involve time consuming negotiations and expense, and prompt sale at an acceptable price may be difficult. There were no restricted securities held by the Funds as of October 31, 2018.
Note 11 — Committed Line Of Credit
The Company has entered into a $100,000,000 committed revolving line of credit agreement renewed annually with the State Street Bank and Trust Company (the “Bank”) for temporary borrowing purposes. The interest rate on borrowing is the higher of the Federal Funds rate or the overnight LIBOR rate, plus 1.25%. There were no borrowings from the line of credit as of or during the year ended October 31, 2018. The Funds pay the Bank a commitment fee equal to 0.25% per annum on the daily unused portion of the committed line amount. The commitment fees incurred by the Funds are presented in the Statements of Operations. The commitment fees are allocated to each applicable portfolio in proportion to its relative average daily net assets and the interest expenses are charged directly to the applicable portfolio.
Note 12 — Indemnifications
Under the Company’s organizational documents, its Officers and Directors may be indemnified against certain liabilities and expenses arising out of the performance of their duties to the Company. In addition, the Company entered into an agreement with each of the Directors which provides that the Company will indemnify and hold harmless each Director against any expenses actually and reasonably incurred by any Director in any proceeding arising out of or in connection with the Director’s services to the Company, to the fullest extent permitted by the Company’s Articles of Incorporation and By-Laws, the Maryland General Corporation Law, the Securities Act, and the 1940 Act, each as now or hereinafter in force. Additionally, in the normal course of business, the Company enters into agreements with service providers that may contain indemnification clauses. The Company’s maximum exposure under these arrangements is unknown as this would involve future claims that may be made against the Company that have not yet occurred. However, based on experience, the Company expects the risk of loss to be remote. The Company has not accrued any liability in connection with such indemnification.
Note 13 — SEC Simplification
In August 2018, the Securities and Exchange Commission adopted the Disclosure Update and Simplification rule, which amends certain disclosure requirements. The amendment requires presentation of the total, rather than the components, of accumulated or undistributed earnings on the Statements of Assets and Liabilities; the amendment also provides the presentation of the distributions on the Statements of Changes in Net Assets at the total level rather than components and to remove the requirement for disclosure of undistributed net investment income on a book basis. This amendment facilitates compliance of the disclosure of information without significantly altering the information provided to investors.
72
Table of Contents
TCW Funds, Inc.
October 31, 2018 |
Note 14 — New Accounting Pronouncement
In August 2018, the FASB released Accounting Standards Update (ASU) 2018-13, which changes the fair value measurement disclosure requirements of Topic 820. The amendments in this ASU are the result of a broader disclosure project called FASB Concept Statement, Conceptual Framework for Financial Reporting—Chapter 8: Notes to Financial Statements. The objective and primary focus of the project are to improve the effectiveness of disclosures in the notes to the financial statements by facilitating clear communication of the information required by GAAP that is most important to users of the financial statements. The ASU is effective for all entities for fiscal years beginning after December 15, 2019, including interim periods therein. Early adoption is permitted for any eliminated or modified disclosures upon issuance of the ASU. Management is currently evaluating the impact of the ASU to the financial statements.
73
Table of Contents
TCW Developing Markets Equity Fund
Financial Highlights — I Class
| Year Ended October 31, | June 30, 2015 (Commencement of Operations) through October 31, 2015 | |||||||||||||||
| 2018 | 2017 | 2016 | ||||||||||||||
Net Asset Value per Share, Beginning of Year | $ | 11.17 | $ | 9.10 | $ | 8.62 | $ | 10.00 | ||||||||
|
|
|
|
|
|
|
| |||||||||
Income (Loss) from Investment Operations: | ||||||||||||||||
Net Investment Income (1) | 0.06 | 0.07 | 0.10 | 0.01 | ||||||||||||
Net Realized and Unrealized Gain (Loss) on Investments | (1.78 | ) | 2.09 | 0.38 | (1.39 | ) | ||||||||||
|
|
|
|
|
|
|
| |||||||||
Total from Investment Operations | (1.72 | ) | 2.16 | 0.48 | (1.38 | ) | ||||||||||
|
|
|
|
|
|
|
| |||||||||
Less Distributions: | ||||||||||||||||
Distributions from Net Investment Income | (0.06 | ) | (0.09 | ) | (0.00 | ) (2) | — | |||||||||
|
|
|
|
|
|
|
| |||||||||
Net Asset Value per Share, End of Year | $ | 9.39 | $ | 11.17 | $ | 9.10 | $ | 8.62 | ||||||||
|
|
|
|
|
|
|
| |||||||||
Total Return | (15.51 | )% | 23.96 | % | 5.63 | % | (13.80 | )% (3) | ||||||||
Ratios/Supplemental Data: | ||||||||||||||||
Net Assets, End of Year (in thousands) | $ | 3,750 | $ | 4,433 | $ | 3,577 | $ | 3,392 | ||||||||
Ratio of Expenses to Average Net Assets: | ||||||||||||||||
Before Expense Reimbursement | 3.45 | % | 3.94 | % | 3.56 | % | 7.09 | % (4) | ||||||||
After Expense Reimbursement | 1.25 | % | 1.25 | % | 1.25 | % | 1.25 | % (4) | ||||||||
Ratio of Net Investment Income to Average Net Assets | 0.49 | % | 0.77 | % | 1.15 | % | 0.30 | % (4) | ||||||||
Portfolio Turnover Rate | 163.33 | % | 194.58 | % | 154.70 | % | 54.34 | % (3) | ||||||||
| (1) | Computed using average shares outstanding throughout the period. |
| (2) | Amount rounds to less than $0.01 per share. |
| (3) | For the period June 30, 2015 (Commencement of Operations) through October 31, 2015 and is not indicative of a full year’s operating results. |
| (4) | Annualized. |
See accompanying notes to financial statements.
74
Table of Contents
TCW Developing Markets Equity Fund
Financial Highlights — N Class
| Year Ended October 31, | June 30, 2015 (Commencement of Operations) through October 31, 2015 | |||||||||||||||
| 2018 | 2017 | 2016 | ||||||||||||||
Net Asset Value per Share, Beginning of Year | $ | 11.17 | $ | 9.10 | $ | 8.62 | $ | 10.00 | ||||||||
|
|
|
|
|
|
|
| |||||||||
Income (Loss) from Investment Operations: | ||||||||||||||||
Net Investment Income (1) | 0.06 | 0.07 | 0.10 | 0.01 | ||||||||||||
Net Realized and Unrealized Gain (Loss) on Investments | (1.78 | ) | 2.09 | 0.38 | (1.39 | ) | ||||||||||
|
|
|
|
|
|
|
| |||||||||
Total from Investment Operations | (1.72 | ) | 2.16 | 0.48 | (1.38 | ) | ||||||||||
|
|
|
|
|
|
|
| |||||||||
Less Distributions: | ||||||||||||||||
Distributions from Net Investment Income | (0.06 | ) | (0.09 | ) | (0.00 | ) (2) | — | |||||||||
|
|
|
|
|
|
|
| |||||||||
Net Asset Value per Share, End of Year | $ | 9.39 | $ | 11.17 | $ | 9.10 | $ | 8.62 | ||||||||
|
|
|
|
|
|
|
| |||||||||
Total Return | (15.51 | )% | 23.96 | % | 5.63 | % | (13.80 | )% (3) | ||||||||
Ratios/Supplemental Data: | ||||||||||||||||
Net Assets, End of Year (in thousands) | $ | 1,468 | $ | 1,722 | $ | 1,364 | $ | 1,297 | ||||||||
Ratio of Expenses to Average Net Assets: | ||||||||||||||||
Before Expense Reimbursement | 4.51 | % | 5.08 | % | 4.80 | % | 8.39 | % (4) | ||||||||
After Expense Reimbursement | 1.25 | % | 1.25 | % | 1.25 | % | 1.25 | % (4) | ||||||||
Ratio of Net Investment Income to Average Net Assets | 0.49 | % | 0.77 | % | 1.15 | % | 0.29 | % (4) | ||||||||
Portfolio Turnover Rate | 163.33 | % | 194.58 | % | 154.70 | % | 54.34 | % (3) | ||||||||
| (1) | Computed using average shares outstanding throughout the period. |
| (2) | Amount rounds to less than $0.01 per share. |
| (3) | For the period June 30, 2015 (Commencement of Operations) through October 31, 2015 and is not indicative of a full year’s operating results. |
| (4) | Annualized. |
See accompanying notes to financial statements.
75
Table of Contents
TCW Emerging Markets Income Fund
Financial Highlights — I Class
| Year Ended October 31, | ||||||||||||||||||||
| 2018 | 2017 | 2016 | 2015 | 2014 | ||||||||||||||||
Net Asset Value per Share, Beginning of Year | $ | 8.54 | $ | 8.34 | $ | 7.67 | $ | 8.57 | $ | 8.53 | ||||||||||
|
|
|
|
|
|
|
|
|
| |||||||||||
Income (Loss) from Investment Operations: | ||||||||||||||||||||
Net Investment Income (1) | 0.43 | 0.55 | 0.55 | 0.38 | 0.47 | |||||||||||||||
Net Realized and Unrealized Gain (Loss) on Investments | (0.83 | ) | 0.09 | 0.52 | (0.87 | ) | (0.01 | ) | ||||||||||||
|
|
|
|
|
|
|
|
|
| |||||||||||
Total from Investment Operations | (0.40 | ) | 0.64 | 1.07 | (0.49 | ) | 0.46 | |||||||||||||
|
|
|
|
|
|
|
|
|
| |||||||||||
Less Distributions: | ||||||||||||||||||||
Distributions from Net Investment Income | (0.37 | ) | (0.44 | ) | (0.40 | ) | (0.39 | ) | (0.42 | ) | ||||||||||
Distribution from Return of Capital | — | — | — | (0.02 | ) | — | ||||||||||||||
|
|
|
|
|
|
|
|
|
| |||||||||||
Total Distributions | (0.37 | ) | (0.44 | ) | (0.40 | ) | (0.41 | ) | (0.42 | ) | ||||||||||
|
|
|
|
|
|
|
|
|
| |||||||||||
Net Asset Value per Share, End of Year | $ | 7.77 | $ | 8.54 | $ | 8.34 | $ | 7.67 | $ | 8.57 | ||||||||||
|
|
|
|
|
|
|
|
|
| |||||||||||
Total Return | (4.85 | )% | 7.95 | % | 14.29 | % | (5.75 | )% | 5.52 | % | ||||||||||
Ratios/Supplemental Data: | ||||||||||||||||||||
Net Assets, End of Year (in thousands) | $ | 4,365,456 | $ | 3,039,671 | $ | 2,574,798 | $ | 2,733,679 | $ | 4,602,207 | ||||||||||
Ratio of Expenses to Average Net Assets | 0.86 | % | 0.87 | % | 0.87 | % | 0.88 | % | 0.85 | % | ||||||||||
Ratio of Net Investment Income to Average Net Assets | 5.33 | % | 6.56 | % | 6.95 | % | 4.79 | % | 5.44 | % | ||||||||||
Portfolio Turnover Rate | 149.50 | % | 212.16 | % | 214.73 | % | 172.93 | % | 165.55 | % | ||||||||||
| (1) | Computed using average shares outstanding throughout the period. |
See accompanying notes to financial statements.
76
Table of Contents
TCW Emerging Markets Income Fund
Financial Highlights — N Class
| Year Ended October 31, | ||||||||||||||||||||
| 2018 | 2017 | 2016 | 2015 | 2014 | ||||||||||||||||
Net Asset Value per Share, Beginning of Year | $ | 11.00 | $ | 10.75 | $ | 9.89 | $ | 11.05 | $ | 11.01 | ||||||||||
|
|
|
|
|
|
|
|
|
| |||||||||||
Income (Loss) from Investment Operations: | ||||||||||||||||||||
Net Investment Income (1) | 0.53 | 0.68 | 0.68 | 0.46 | 0.57 | |||||||||||||||
Net Realized and Unrealized Gain (Loss) on Investments | (1.08 | ) | 0.12 | 0.67 | (1.11 | ) | (0.02 | ) | ||||||||||||
|
|
|
|
|
|
|
|
|
| |||||||||||
Total from Investment Operations | (0.55 | ) | 0.80 | 1.35 | (0.65 | ) | 0.55 | |||||||||||||
|
|
|
|
|
|
|
|
|
| |||||||||||
Less Distributions: | ||||||||||||||||||||
Distributions from Net Investment Income | (0.45 | ) | (0.55 | ) | (0.49 | ) | (0.48 | ) | (0.51 | ) | ||||||||||
Distribution from Return of Capital | — | — | — | (0.03 | ) | — | ||||||||||||||
|
|
|
|
|
|
|
|
|
| |||||||||||
Total Distributions | (0.45 | ) | (0.55 | ) | (0.49 | ) | (0.48 | ) | (0.51 | ) | ||||||||||
|
|
|
|
|
|
|
|
|
| |||||||||||
Net Asset Value per Share, End of Year | $ | 10.00 | $ | 11.00 | $ | 10.75 | $ | 9.89 | $ | 11.05 | ||||||||||
|
|
|
|
|
|
|
|
|
| |||||||||||
Total Return | (5.16 | )% | 7.67 | % | 13.98 | % | (5.96 | )% | 5.11 | % | ||||||||||
Ratios/Supplemental Data: | ||||||||||||||||||||
Net Assets, End of Year (in thousands) | $ | 342,660 | $ | 510,877 | $ | 534,151 | $ | 521,413 | $ | 782,384 | ||||||||||
Ratio of Expenses to Average Net Assets: | ||||||||||||||||||||
Before Expense Reimbursement | 1.16 | % | 1.15 | % | 1.15 | % | 1.16 | % | 1.13 | % | ||||||||||
After Expense Reimbursement | 1.10 | % | 1.13 | % | N/A | N/A | N/A | |||||||||||||
Ratio of Net Investment Income to Average Net Assets | 5.03 | % | 6.30 | % | 6.71 | % | 4.50 | % | 5.21 | % | ||||||||||
Portfolio Turnover Rate | 149.50 | % | 212.16 | % | 214.73 | % | 172.93 | % | 165.55 | % | ||||||||||
| (1) | Computed using average shares outstanding throughout the period. |
See accompanying notes to financial statements.
77
Table of Contents
TCW Emerging Markets Local Currency Income Fund
Financial Highlights — I Class
| Year Ended October 31, | ||||||||||||||||||||
| 2018 | 2017 | 2016 | 2015 | 2014 | ||||||||||||||||
Net Asset Value per Share, Beginning of Year | $ | 9.30 | $ | 9.13 | $ | 8.18 | $ | 9.69 | $ | 10.14 | ||||||||||
|
|
|
|
|
|
|
|
|
| |||||||||||
Income (Loss) from Investment Operations: | ||||||||||||||||||||
Net Investment Income (1) | 0.53 | 0.64 | 0.52 | 0.46 | 0.55 | |||||||||||||||
Net Realized and Unrealized Gain (Loss) on Investments | (1.19 | ) | (0.06 | ) | 0.43 | (1.94 | ) | (0.88 | ) | |||||||||||
|
|
|
|
|
|
|
|
|
| |||||||||||
Total from Investment Operations | (0.66 | ) | 0.58 | 0.95 | (1.48 | ) | (0.33 | ) | ||||||||||||
|
|
|
|
|
|
|
|
|
| |||||||||||
Less Distributions: | ||||||||||||||||||||
Distributions from Net Investment Income | (0.23 | ) | (0.41 | ) | — | — | — | |||||||||||||
Distributions from Return of Capital | (0.27 | ) | — | — | (0.03 | ) | (0.12 | ) | ||||||||||||
|
|
|
|
|
|
|
|
|
| |||||||||||
Total Distributions | (0.50 | ) | (0.41 | ) | — | (0.03 | ) | (0.12 | ) | |||||||||||
|
|
|
|
|
|
|
|
|
| |||||||||||
Net Asset Value per Share, End of Year | $ | 8.14 | $ | 9.30 | $ | 9.13 | $ | 8.18 | $ | 9.69 | ||||||||||
|
|
|
|
|
|
|
|
|
| |||||||||||
Total Return | (7.74 | )% | 6.33 | % | 11.61 | % | (15.35 | )% | (3.29 | )% | ||||||||||
Ratios/Supplemental Data: | ||||||||||||||||||||
Net Assets, End of Year (in thousands) | $ | 264,754 | $ | 138,068 | $ | 97,650 | $ | 102,034 | $ | 178,828 | ||||||||||
Ratio of Expenses to Average Net Assets: | ||||||||||||||||||||
Before Expense Reimbursement | 0.95 | % | 1.03 | % | 1.00 | % | 1.00 | % | 0.95 | % | ||||||||||
After Expense Reimbursement | N/A | 0.99 | % | 0.99 | % | 0.99 | % | N/A | ||||||||||||
Ratio of Net Investment Income to Average Net Assets | 5.90 | % | 6.83 | % | 6.12 | % | 5.20 | % | 5.61 | % | ||||||||||
Portfolio Turnover Rate | 185.72 | % | 137.44 | % | 209.07 | % | 250.10 | % | 223.55 | % | ||||||||||
| (1) | Computed using average shares outstanding throughout the period. |
See accompanying notes to financial statements.
78
Table of Contents
TCW Emerging Markets Local Currency Income Fund
Financial Highlights — N Class
| Year Ended October 31, | ||||||||||||||||||||
| 2018 | 2017 | 2016 | 2015 | 2014 | ||||||||||||||||
Net Asset Value per Share, Beginning of Year | $ | 9.29 | $ | 9.12 | $ | 8.17 | $ | 9.69 | $ | 10.13 | ||||||||||
|
|
|
|
|
|
|
|
|
| |||||||||||
Income (Loss) from Investment Operations: | ||||||||||||||||||||
Net Investment Income (1) | 0.51 | 0.64 | 0.48 | 0.46 | 0.58 | |||||||||||||||
Net Realized and Unrealized Gain (Loss) on Investments | (1.17 | ) | (0.06 | ) | 0.47 | (1.95 | ) | (0.91 | ) | |||||||||||
|
|
|
|
|
|
|
|
|
| |||||||||||
Total from Investment Operations | (0.66 | ) | 0.58 | 0.95 | (1.49 | ) | (0.33 | ) | ||||||||||||
|
|
|
|
|
|
|
|
|
| |||||||||||
Less Distributions: | ||||||||||||||||||||
Distributions from Net Investment Income | (0.23 | ) | (0.41 | ) | — | — | — | |||||||||||||
Distributions from Return of Capital | (0.27 | ) | — | — | (0.03 | ) | (0.11 | ) | ||||||||||||
|
|
|
|
|
|
|
|
|
| |||||||||||
Total Distributions | (0.50 | ) | (0.41 | ) | — | (0.03 | ) | (0.11 | ) | |||||||||||
|
|
|
|
|
|
|
|
|
| |||||||||||
Net Asset Value per Share, End of Year | $ | 8.13 | $ | 9.29 | $ | 9.12 | $ | 8.17 | $ | 9.69 | ||||||||||
|
|
|
|
|
|
|
|
|
| |||||||||||
Total Return | (7.75 | )% | 6.33 | % | 11.63 | % | (15.37 | )% | (3.37 | )% | ||||||||||
Ratios/Supplemental Data: | ||||||||||||||||||||
Net Assets, End of Year (in thousands) | $ | 47,664 | $ | 34,807 | $ | 15,325 | $ | 153,270 | $ | 55,028 | ||||||||||
Ratio of Expenses to Average Net Assets: | ||||||||||||||||||||
Before Expense Reimbursement | 1.32 | % | 1.35 | % | 1.31 | % | 1.25 | % | 1.24 | % | ||||||||||
After Expense Reimbursement | 0.99 | % | 0.99 | % | 0.99 | % | 0.99 | % | 0.99 | % | ||||||||||
Ratio of Net Investment Income to Average Net Assets | 5.78 | % | 6.88 | % | 6.05 | % | 5.29 | % | 5.87 | % | ||||||||||
Portfolio Turnover Rate | 185.72 | % | 137.44 | % | 209.07 | % | 250.10 | % | 223.55 | % | ||||||||||
| (1) | Computed using average shares outstanding throughout the period. |
See accompanying notes to financial statements.
79
Table of Contents
TCW Emerging Markets Multi-Asset Opportunities Fund
Financial Highlights — I Class
| Year Ended October 31, | ||||||||||||||||||||
| 2018 | 2017 | 2016 | 2015 | 2014 | ||||||||||||||||
Net Asset Value per Share, Beginning of Year | $ | 11.70 | $ | 10.39 | $ | 9.63 | $ | 10.97 | $ | 10.68 | ||||||||||
|
|
|
|
|
|
|
|
|
| |||||||||||
Income (Loss) from Investment Operations: | ||||||||||||||||||||
Net Investment Income (1) | 0.25 | 0.31 | 0.35 | 0.24 | 0.22 | |||||||||||||||
Net Realized and Unrealized Gain (Loss) on Investments | (1.30 | ) | 1.38 | 0.65 | (1.38 | ) | 0.14 | |||||||||||||
|
|
|
|
|
|
|
|
|
| |||||||||||
Total from Investment Operations | (1.05 | ) | 1.69 | 1.00 | (1.14 | ) | 0.36 | |||||||||||||
|
|
|
|
|
|
|
|
|
| |||||||||||
Less Distributions: | ||||||||||||||||||||
Distributions from Net Investment Income | (0.26 | ) | (0.38 | ) | (0.24 | ) | (0.20 | ) | (0.07 | ) | ||||||||||
|
|
|
|
|
|
|
|
|
| |||||||||||
Net Asset Value per Share, End of Year | $ | 10.39 | $ | 11.70 | $ | 10.39 | $ | 9.63 | $ | 10.97 | ||||||||||
|
|
|
|
|
|
|
|
|
| |||||||||||
Total Return | (9.23 | )% | 17.05 | % | 10.75 | % | (10.53 | )% | 3.43 | % | ||||||||||
Ratios/Supplemental Data: | ||||||||||||||||||||
Net Assets, End of Year (in thousands) | $ | 43,338 | $ | 42,041 | $ | 37,173 | $ | 39,739 | $ | 53,652 | ||||||||||
Ratio of Expenses to Average Net Assets: | ||||||||||||||||||||
Before Expense Reimbursement | 1.34 | % | 1.54 | % | 1.57 | % | 1.47 | % | 1.43 | % | ||||||||||
After Expense Reimbursement | 1.23 | % | 1.23 | % | 1.23 | % | 1.23 | % | 1.21 | % | ||||||||||
Ratio of Net Investment Income to Average Net Assets | 2.13 | % | 2.95 | % | 3.74 | % | 2.31 | % | 2.04 | % | ||||||||||
Portfolio Turnover Rate | 160.85 | % | 197.48 | % | 227.75 | % | 145.86 | % | 151.61 | % | ||||||||||
| (1) | Computed using average shares outstanding throughout the period. |
See accompanying notes to financial statements.
80
Table of Contents
TCW Emerging Markets Multi-Asset Opportunities Fund
Financial Highlights — N Class
| Year Ended October 31, | ||||||||||||||||||||
| 2018 | 2017 | 2016 | 2015 | 2014 | ||||||||||||||||
Net Asset Value per Share, Beginning of Year | $ | 11.66 | $ | 10.35 | $ | 9.59 | $ | 10.92 | $ | 10.62 | ||||||||||
|
|
|
|
|
|
|
|
|
| |||||||||||
Income (Loss) from Investment Operations: | ||||||||||||||||||||
Net Investment Income (1) | 0.26 | 0.32 | 0.36 | 0.24 | 0.22 | |||||||||||||||
Net Realized and Unrealized Gain (Loss) on Investments | (1.31 | ) | 1.37 | 0.64 | (1.37 | ) | 0.15 | |||||||||||||
|
|
|
|
|
|
|
|
|
| |||||||||||
Total from Investment Operations | (1.05 | ) | 1.69 | 1.00 | (1.13 | ) | 0.37 | |||||||||||||
|
|
|
|
|
|
|
|
|
| |||||||||||
Less Distributions: | ||||||||||||||||||||
Distributions from Net Investment Income | (0.26 | ) | (0.38 | ) | (0.24 | ) | (0.20 | ) | (0.07 | ) | ||||||||||
|
|
|
|
|
|
|
|
|
| |||||||||||
Net Asset Value per Share, End of Year | $ | 10.35 | $ | 11.66 | $ | 10.35 | $ | 9.59 | $ | 10.92 | ||||||||||
|
|
|
|
|
|
|
|
|
| |||||||||||
Total Return | (9.26 | )% | 17.10 | % | 10.78 | % | (10.50 | )% | 3.54 | % | ||||||||||
Ratios/Supplemental Data: | ||||||||||||||||||||
Net Assets, End of Year (in thousands) | $ | 74,677 | $ | 40,064 | $ | 5,088 | $ | 4,107 | $ | 89 | ||||||||||
Ratio of Expenses to Average Net Assets: | ||||||||||||||||||||
Before Expense Reimbursement | 1.67 | % | 1.96 | % | 2.15 | % | 2.15 | % | 48.38 | % | ||||||||||
After Expense Reimbursement | 1.23 | % | 1.23 | % | 1.23 | % | 1.23 | % | 1.21 | % | ||||||||||
Ratio of Net Investment Income to Average Net Assets | 2.25 | % | 2.95 | % | 3.79 | % | 2.38 | % | 2.01 | % | ||||||||||
Portfolio Turnover Rate | 160.85 | % | 197.48 | % | 227.75 | % | 145.86 | % | 151.61 | % | ||||||||||
| (1) | Computed using average shares outstanding throughout the period. |
See accompanying notes to financial statements.
81
Table of Contents
TCW International Small Cap Fund
Financial Highlights — I Class
| Year Ended October 31, | ||||||||||||||||||||
| 2018 | 2017 | 2016 | 2015 | 2014 | ||||||||||||||||
Net Asset Value per Share, Beginning of Year | $ | 10.52 | $ | 8.17 | $ | 8.57 | $ | 8.72 | $ | 8.92 | ||||||||||
|
|
|
|
|
|
|
|
|
| |||||||||||
Income (Loss) from Investment Operations: | ||||||||||||||||||||
Net Investment Income (1) | 0.03 | 0.04 | 0.02 | 0.01 | 0.01 | |||||||||||||||
Net Realized and Unrealized Gain (Loss) on Investments | (0.93 | ) | 2.34 | (0.05 | ) | (0.11 | ) | (0.13 | ) | |||||||||||
|
|
|
|
|
|
|
|
|
| |||||||||||
Total from Investment Operations | (0.90 | ) | 2.38 | (0.03 | ) | (0.10 | ) | (0.12 | ) | |||||||||||
|
|
|
|
|
|
|
|
|
| |||||||||||
Less Distributions: | ||||||||||||||||||||
Distributions from Net Investment Income | — | (0.03 | ) | (0.37 | ) | (0.05 | ) | (0.08 | ) | |||||||||||
|
|
|
|
|
|
|
|
|
| |||||||||||
Net Asset Value per Share, End of Year | $ | 9.62 | $ | 10.52 | $ | 8.17 | $ | 8.57 | $ | 8.72 | ||||||||||
|
|
|
|
|
|
|
|
|
| |||||||||||
Total Return | (8.65 | )% | 29.21 | % | (0.49 | )% | (1.07 | )% | (1.39 | )% | ||||||||||
Ratios/Supplemental Data: | ||||||||||||||||||||
Net Assets, End of Year (in thousands) | $ | 6,598 | $ | 6,350 | $ | 5,684 | $ | 7,274 | $ | 19,786 | ||||||||||
Ratio of Expenses to Average Net Assets: | ||||||||||||||||||||
Before Expense Reimbursement | 2.71 | % | 2.89 | % | 2.40 | % | 1.67 | % | 1.37 | % | ||||||||||
After Expense Reimbursement | 1.42 | % | 1.43 | % | 1.44 | % | 1.44 | % | N/A | |||||||||||
Ratio of Net Investment Income to Average Net Assets | 0.26 | % | 0.41 | % | 0.29 | % | 0.17 | % | 0.12 | % | ||||||||||
Portfolio Turnover Rate | 213.01 | % | 232.19 | % | 128.62 | % | 243.88 | % | 259.88 | % | ||||||||||
| (1) | Computed using average shares outstanding throughout the period. |
See accompanying notes to financial statements.
82
Table of Contents
TCW International Small Cap Fund
Financial Highlights — N Class
| Year Ended October 31, | ||||||||||||||||||||
| 2018 | 2017 | 2016 | 2015 | 2014 | ||||||||||||||||
Net Asset Value per Share, Beginning of Year | $ | 10.53 | $ | 8.17 | $ | 8.58 | $ | 8.72 | $ | 8.92 | ||||||||||
|
|
|
|
|
|
|
|
|
| |||||||||||
Income (Loss) from Investment Operations: | ||||||||||||||||||||
Net Investment Income (1) | 0.02 | 0.04 | 0.03 | 0.03 | 0.00 | (2) | ||||||||||||||
Net Realized and Unrealized Gain (Loss) on Investments | (0.92 | ) | 2.35 | (0.07 | ) | (0.12 | ) | (0.13 | ) | |||||||||||
|
|
|
|
|
|
|
|
|
| |||||||||||
Total from Investment Operations | (0.90 | ) | 2.39 | (0.04 | ) | (0.09 | ) | (0.13 | ) | |||||||||||
|
|
|
|
|
|
|
|
|
| |||||||||||
Less Distributions: | ||||||||||||||||||||
Distributions from Net Investment Income | — | (0.03 | ) | (0.37 | ) | (0.05 | ) | (0.07 | ) | |||||||||||
|
|
|
|
|
|
|
|
|
| |||||||||||
Net Asset Value per Share, End of Year | $ | 9.63 | $ | 10.53 | $ | 8.17 | $ | 8.58 | $ | 8.72 | ||||||||||
|
|
|
|
|
|
|
|
|
| |||||||||||
Total Return | (8.64 | )% | 29.34 | % | (0.60 | )% | (1.03 | )% | (1.52 | )% | ||||||||||
Ratios/Supplemental Data: | ||||||||||||||||||||
Net Assets, End of Year (in thousands) | $ | 3,197 | $ | 3,589 | $ | 3,143 | $ | 3,440 | $ | 9,437 | ||||||||||
Ratio of Expenses to Average Net Assets: | ||||||||||||||||||||
Before Expense Reimbursement | 3.26 | % | 3.48 | % | 2.88 | % | 2.09 | % | 1.75 | % | ||||||||||
After Expense Reimbursement | 1.42 | % | 1.43 | % | 1.44 | % | 1.44 | % | 1.44 | % | ||||||||||
Ratio of Net Investment Income to Average Net Assets | 0.22 | % | 0.41 | % | 0.33 | % | 0.40 | % | 0.04 | % | ||||||||||
Portfolio Turnover Rate | 213.01 | % | 232.19 | % | 128.62 | % | 243.88 | % | 259.88 | % | ||||||||||
| (1) | Computed using average shares outstanding throughout the period. |
| (2) | Amount rounds to less than $0.01 per share. |
See accompanying notes to financial statements.
83
Table of Contents
Report of Independent Registered Public Accounting Firm
To the Board of Directors and Shareholders of TCW Funds, Inc.
We have audited the accompanying statements of assets and liabilities of TCW Developing Markets Equity Fund, TCW Emerging Markets Income Fund, TCW Emerging Markets Local Currency Income Fund, TCW Emerging Markets Multi-Asset Opportunities Fund, and TCW International Small Cap Fund (collectively, the “TCW International Funds”) (five of nineteen funds comprising TCW Funds, Inc.), including the schedules of investments, as of October 31, 2018, and the related statements of operations for the year then ended, the statements of changes in net assets for each of the two years in the period then ended, the financial highlights for each of the five years in the period then ended for the TCW International Funds, except TCW Developing Markets Equity Fund which is for each of the three years in the period then ended and for the period June 30, 2015 (commencement of operations) to October 31, 2015, and the related notes. In our opinion, the financial statements and financial highlights present fairly, in all material respects, the financial position of each of the respective TCW International Funds as of October 31, 2018, the results of their operations for the year then ended, the changes in its net assets for each of the two years in the period then ended, and the financial highlights for each of the five years in the period then ended for the TCW International Funds, except TCW Developing Markets Equity Fund which is for each of the three years in the period then ended and for the period June 30, 2015 (commencement of operations) to October 31, 2015, in conformity with accounting principles generally accepted in the United States of America.
Basis for Opinion
These financial statements and financial highlights are the responsibility of the TCW International Funds’ management. Our responsibility is to express an opinion on the TCW International Funds’ financial statements and financial highlights based on our audits. We are a public accounting firm registered with the Public Company Accounting Oversight Board (United States) (PCAOB) and are required to be independent with respect to the Funds in accordance with the U.S. federal securities laws and the applicable rules and regulations of the Securities and Exchange Commission and the PCAOB.
We conducted our audits in accordance with the standards of the PCAOB. Those standards require that we plan and perform the audits to obtain reasonable assurance about whether the financial statements and financial highlights are free of material misstatement, whether due to error or fraud. The TCW International Funds are not required to have, nor were we engaged to perform, an audit of their internal control over financial reporting. As part of our audits we are required to obtain an understanding of internal control over financial reporting but not for the purpose of expressing an opinion on the effectiveness of the TCW International Funds’ internal control over financial reporting. Accordingly, we express no such opinion.
Our audits included performing procedures to assess the risks of material misstatement of the financial statements and financial highlights, whether due to error or fraud, and performing procedures that respond to those risks. Such procedures included examining, on a test basis, evidence regarding the amounts and disclosures in the financial statements and financial highlights. Our audits also included evaluating the accounting principles used and significant estimates made by management, as well as evaluating the overall presentation of the financial statements and financial highlights. Our procedures included confirmation of securities owned as of October 31, 2018, by correspondence with the custodian and brokers; when replies were not received from brokers, we performed other auditing procedures. We believe that our audits provide a reasonable basis for our opinion.

Los Angeles, California
December 19, 2018
We have served as the auditor of one or more TCW/Metropolitan West Funds investment companies since 1990.
84
Table of Contents
Shareholder Expenses (Unaudited)
As a shareholder of a Fund, you incur ongoing operational costs of the Fund, including management fees and other fund expenses. The following example is intended to help you understand your ongoing costs (in dollars and cents) of investing in a Fund and to compare these costs with the ongoing costs of investing in other funds.
The example is based on an investment of $1,000 invested at the beginning of the period and held for the entire period from May 1, 2018 to October 31, 2018 (184 days).
Actual Expenses The first line under each Fund in the table below provides information about the actual account values and actual expenses. You may use the information in this line, together with the amount you invested, to estimate the expenses that you paid over the period. Simply divide your account value by $1,000 (for example, an $8,600 account value divided by $1,000 = 8.6), then multiply the result by the number in the first line for your Fund under the heading entitled “Expenses Paid During Period” to estimate the expenses you paid on your account during this period.
Hypothetical Example for Comparison Purposes The second line under each Fund in the table below provides information about the hypothetical expenses based on each Fund’s actual expense ratio and an assumed rate of return of 5% per year before expenses, which is not the Fund’s actual return. The hypothetical account value and expenses may not be used to estimate the actual ending account balance or expenses you paid for the period. You may use this information to compare the ongoing costs of investing in your Fund and other funds. To do so, compare this 5% hypothetical example with the 5% hypothetical examples that appear in the shareholder reports of the other funds.
TCW Funds, Inc. | Beginning Account Value May 1, 2018 | Ending Account Value October 31, 2018 | Annualized Expense Ratio | Expenses Paid During Period (May 1, 2018 to October 31, 2018) | ||||||||||||
| TCW Developing Markets Equity Fund | ||||||||||||||||
I Class Shares | ||||||||||||||||
Actual | $ | 1,000.00 | $ | 810.20 | 1.25 | % | $ | 5.70 | ||||||||
Hypothetical (5% return before expenses) | 1,000.00 | 1,018.90 | 1.25 | % | 6.36 | |||||||||||
N Class Shares | ||||||||||||||||
Actual | $ | 1,000.00 | $ | 810.90 | 1.25 | % | $ | 5.71 | ||||||||
Hypothetical (5% return before expenses) | 1,000.00 | 1,018.90 | 1.25 | % | 6.36 | |||||||||||
| TCW Emerging Markets Income Fund | ||||||||||||||||
I Class Shares | ||||||||||||||||
Actual | $ | 1,000.00 | $ | 965.10 | 0.86 | % | $ | 4.26 | ||||||||
Hypothetical (5% return before expenses) | 1,000.00 | 1,020.87 | 0.86 | % | 4.38 | |||||||||||
N Class Shares | ||||||||||||||||
Actual | $ | 1,000.00 | $ | 963.90 | 1.08 | % | $ | 5.35 | ||||||||
Hypothetical (5% return before expenses) | 1,000.00 | 1,019.76 | 1.08 | % | 5.50 | |||||||||||
| TCW Emerging Markets Local Currency Income Fund | ||||||||||||||||
I Class Shares | ||||||||||||||||
Actual | $ | 1,000.00 | $ | 881.30 | 0.99 | % | $ | 4.69 | ||||||||
Hypothetical (5% return before expenses) | 1,000.00 | 1,020.22 | 0.99 | % | 5.04 | |||||||||||
N Class Shares | ||||||||||||||||
Actual | $ | 1,000.00 | $ | 881.20 | 0.99 | % | $ | 4.69 | ||||||||
Hypothetical (5% return before expenses) | 1,000.00 | 1,020.22 | 0.99 | % | 5.04 | |||||||||||
85
Table of Contents
TCW Funds, Inc.
Shareholder Expenses (Unaudited) (Continued)
TCW Funds, Inc. | Beginning Account Value May 1, 2018 | Ending Account Value October 31, 2018 | Annualized Expense Ratio | Expenses Paid During Period (May 1, 2018 to October 31, 2018) | ||||||||||||
| TCW Emerging Markets Multi-Asset Opportunities Fund | ||||||||||||||||
I Class Shares | ||||||||||||||||
Actual | $ | 1,000.00 | $ | 884.30 | 1.23 | % | $ | 5.84 | ||||||||
Hypothetical (5% return before expenses) | 1,000.00 | 1,019.01 | 1.23 | % | 6.26 | |||||||||||
N Class Shares | ||||||||||||||||
Actual | $ | 1,000.00 | $ | 884.60 | 1.23 | % | $ | 5.84 | ||||||||
Hypothetical (5% return before expenses) | 1,000.00 | 1,019.01 | 1.23 | % | 6.26 | |||||||||||
| TCW International Small Cap Fund | ||||||||||||||||
I Class Shares | ||||||||||||||||
Actual | $ | 1,000.00 | $ | 858.00 | 1.41 | % | $ | 6.60 | ||||||||
Hypothetical (5% return before expenses) | 1,000.00 | 1,018.10 | 1.41 | % | 7.17 | |||||||||||
N Class Shares | ||||||||||||||||
Actual | $ | 1,000.00 | $ | 858.20 | 1.41 | % | $ | 6.60 | ||||||||
Hypothetical (5% return before expenses) | 1,000.00 | 1,018.10 | 1.41 | % | 7.17 | |||||||||||
86
Table of Contents
Privacy Policy (Unaudited)
The TCW Group, Inc. and Subsidiaries
TCW Investment Management Company LLC
TCW Asset Management Company LLC
Metropolitan West Asset Management, LLC
| TCW Funds, Inc. | Sepulveda Management LLC | |
| TCW Strategic Income Fund, Inc. | TCW Direct Lending LLC | |
| Metropolitan West Funds | TCW Direct Lending VII LLC |
What You Should Know
At TCW, we recognize the importance of keeping information about you secure and confidential. We do not sell or share your nonpublic personal and financial information with marketers or others outside our affiliated group of companies.
We carefully manage information among our affiliated group of companies to safeguard your privacy and to provide you with consistently excellent service.
We are providing this notice to you to comply with the requirements of Regulation S-P, “Privacy of Consumer Financial Information,” issued by the United States Securities and Exchange Commission.
Our Privacy Policy
We, The TCW Group, Inc. and its subsidiaries, the TCW Funds, Inc., TCW Strategic Income Fund, Inc., the Metropolitan West Funds, Sepulveda Management LLC and TCW Direct Lending (collectively, “TCW”) are committed to protecting the nonpublic personal and financial information of our customers and consumers who obtain or seek to obtain financial products or services primarily for personal, family or household purposes. We fulfill our commitment by establishing and implementing policies and systems to protect the security and confidentiality of this information.
In our offices, we limit access to nonpublic personal and financial information about you to those TCW personnel who need to know the information in order to provide products or services to you. We maintain physical, electronic and procedural safeguards to protect your nonpublic personal and financial information.
Categories of Information We Collect
We may collect the following types of nonpublic personal and financial information about you from the following sources:
| • | Your name, address and identifying numbers, and other personal and financial information, from you and from identification cards and papers you submit to us, on applications, subscription agreements or other forms or communications. |
| • | Information about your account balances and financial transactions with us, our affiliated entities, or nonaffiliated third parties, from our internal sources, from affiliated entities and from nonaffiliated third parties. |
87
Table of Contents
TCW Funds, Inc.
Privacy Policy (Unaudited) (Continued)
| • | Information about your account balances and financial transactions and other personal and financial information, from consumer credit reporting agencies or other nonaffiliated third parties, to verify information received from you or others. |
Categories of Information We Disclose to Nonaffiliated Third Parties
| • | We may disclose your name, address and account and other identifying numbers, as well as information about your pending or past transactions and other personal financial information, to nonaffiliated third parties, for our everyday business purposes such as necessary to execute, process, service and confirm your securities transactions and mutual fund transactions, to administer and service your account and commingled investment vehicles in which you are invested, to market our products and services through joint marketing arrangements or to respond to court orders and legal investigations. |
| • | We may disclose nonpublic personal and financial information concerning you to law enforcement agencies, federal regulatory agencies, self-regulatory organizations or other nonaffiliated third parties, if required or requested to do so by a court order, judicial subpoena or regulatory inquiry. |
We do not otherwise disclose your nonpublic personal and financial information to nonaffiliated third parties, except where we believe in good faith that disclosure is required or permitted by law. Because we do not disclose your nonpublic personal and financial information to nonaffiliated third parties, our Customer Privacy Policy does not contain opt-out provisions.
Categories of Information We Disclose to Our Affiliated Entities
| • | We may disclose your name, address and account and other identifying numbers, account balances, information about your pending or past transactions and other personal financial information to our affiliated entities for any purpose. |
| • | We regularly disclose your name, address and account and other identifying numbers, account balances and information about your pending or past transactions to our affiliates to execute, process and con- firm securities transactions or mutual fund transactions for you, to administer and service your account and commingled investment vehicles in which you are invested, or to market our products and services to you. |
Information About Former Customers
We do not disclose nonpublic personal and financial information about former customers to nonaffiliated third parties unless required or requested to do so by a court order, judicial subpoena or regulatory inquiry, or otherwise where we believe in good faith that disclosure is required or permitted by law.
Questions
Should you have any questions about our Customer Privacy Policy, please contact us by email or by regular mail at the address at the end of this policy.
88
Table of Contents
TCW Funds, Inc.
Reminder About TCW’s Financial Products
Financial products offered by The TCW Group, Inc. and its subsidiaries, the TCW Funds, Inc., TCW Strategic Income Fund, Inc., the Metropolitan West Funds, Sepulveda Management LLC and TCW Direct Lending.
| • | Are not guaranteed by a bank; |
| • | Are not obligations of The TCW Group, Inc. or of its subsidiaries; |
| • | Are not insured by the Federal Deposit Insurance Corporation; and |
| • | Are subject to investment risks, including possible loss of the principal amount committed or invested, and earnings thereon. |
THE TCW GROUP, INC.
TCW FUNDS, INC.
TCW STRATEGIC INCOME FUND, INC.
METROPOLITAN WEST FUNDS
SEPULVEDA MANAGEMENT LLC
TCW DIRECT LENDING LLC
TCW DIRECT LENDING VII LLC
Attention: Privacy Officer | 865 South Figueroa St. Suite 1800 | Los Angeles, CA 90017 |
email: privacy@tcw.com
89
Table of Contents
Renewal of Investment Advisory and Management Agreement (Unaudited)
TCW Funds, Inc. (the “Corporation”) and TCW Investment Management Company LLC (the “Advisor”) are parties to an Investment Advisory and Management Agreement (“Agreement”), pursuant to which the Advisor is responsible for managing the investments of each separate investment series (each, a “Fund” and collectively, the “Funds”) of the Corporation. Unless terminated by either party, the Agreement continues in effect from year to year provided that the continuance is specifically approved at least annually by the vote of the holders of at least a majority of the outstanding shares of the Funds, or by the Board of Directors of the Corporation (the “Board”), and, in either event, by a majority of the Directors who are not “interested persons” of the Corporation, as such term is defined in Section 2(a)(19) of the Investment Company Act of 1940, as amended (the “Independent Directors”), casting votes in person at a meeting called for that purpose.
On September 24, 2018, the Board approved the renewal of the Agreement for an additional one-year term from February 6, 2019 through February 5, 2020. The renewal of the Agreement was approved by the Board (including by a majority of the Independent Directors) upon the recommendation of the Independent Directors. The Independent Directors met separately by telephone on August 28, 2018, and in person on September 24, 2018, with their independent legal counsel to review and discuss the information that had been requested on their behalf by their independent legal counsel and presented by the Advisor for their consideration. The information, material facts, and conclusions that formed the basis for the Independent Directors’ recommendation and the Board’s subsequent approval are described below.
1. Information received
Materials reviewed — During the course of each year, the Directors receive a wide variety of materials relating to the services provided by the Advisor, including reports on the Advisor’s investment processes, as well as on each Fund’s investment results, portfolio composition, portfolio trading practices, compliance monitoring, shareholder services, and other information relating to the nature, extent, and quality of services provided by the Advisor to the Funds. In addition, the Board reviewed information furnished to the Independent Directors in response to a detailed request sent to the Advisor on their behalf. The information in the Advisor’s responses included extensive materials regarding each Fund’s investment results, advisory fee comparisons to advisory fees charged by the Advisor to its institutional clients, financial and profitability information regarding the Advisor, descriptions of various services provided to the Funds and to other advisory and sub-advisory clients, descriptions of functions such as compliance monitoring and portfolio trading practices, and information about the personnel providing investment management services to each Fund. The Directors also considered information provided by an independent data provider, Broadridge, comparing the investment performance and the fee and expense levels of each Fund to peer groups of mutual funds selected by Broadridge. After reviewing this information, the Directors requested additional financial, profitability and service information from the Advisor, which the Advisor provided and the Directors considered.
Review process — The Directors’ determinations were made on the basis of each Director’s business judgment after consideration of all the information presented. The Independent Directors were advised by their independent legal counsel throughout the renewal process and received and reviewed advice from their independent legal counsel regarding legal and industry standards applicable to the renewal of the Agreement, including a legal memorandum from their independent legal counsel discussing their fiduciary duties related to their approval of the continuation of the Agreement. The Independent Directors also discussed the renewal of the Agreement with the Advisor’s representatives and in private sessions at which no representatives of the Advisor were present. In deciding to recommend the renewal of the Agreement
90
Table of Contents
TCW Funds, Inc.
with respect to each Fund, the Independent Directors did not identify any single piece of information or particular factor that, in isolation, was the controlling factor. Each Independent Director may also have weighed factors differently. This summary describes the most important, but not all, of the factors considered by the Board and the Independent Directors.
2. Nature, extent, and quality of services provided by the Advisor
The Board and the Independent Directors considered the depth and quality of the Advisor’s investment management process, including its research and strong analytical capabilities; the experience, capability, and integrity of its senior management and other personnel; the relatively low turnover rates of its key personnel; the overall resources available to the Advisor; and the ability of its organizational structure to address the growth in assets over the past several years and withstand the recent decline in assets. The Board and the Independent Directors considered the ability of the Advisor to attract and retain well-qualified investment professionals, noting in particular the Advisor’s recent hiring of professionals in various areas over the past several years, continued upgrading of resources in its middle office and back office operations and other areas, as well as a continuing and extensive program of infrastructure and systems enhancements. The Board and the Independent Directors also considered that the Advisor made available to its investment professionals a variety of resources and systems relating to investment management, compliance, trading, operations, administration, research, portfolio accounting, and legal. They noted the substantial additional resources made available by The TCW Group, Inc., the parent company of the Advisor. The Board and the Independent Directors examined and discussed a detailed description of the extensive additional services provided to the Funds to support their operations and compliance, as compared to the much narrower range of services provided to the Advisor’s institutional and sub-advised clients, as well as the Advisor’s oversight and coordination of numerous outside service providers to the Funds. They further noted the high level of regular communication between the Advisor and the Independent Directors. The Advisor explained its responsibility to supervise the activities of the Funds’ various service providers, as well as supporting the Independent Directors and their meetings, regulatory filings, and various operational personnel, and the related costs.
The Board and the Independent Directors concluded that the nature, extent, and quality of the services provided by the Advisor are of a high quality and have benefited and should continue to benefit the Funds and their shareholders.
3. Investment results
The Board and the Independent Directors considered the investment results of each Fund in light of its investment objective(s) and principal investment strategies. They compared each Fund’s total returns with the total returns of other mutual funds in peer group reports prepared by Broadridge with respect to various longer and more recent periods all ended May 31, 2018. The Board and the Independent Directors reviewed information as to peer group selections presented by Broadridge and discussed the methodology for those selections with the Advisor. In reviewing each Fund’s relative performance, the Board and the Independent Directors took into account each Fund’s investment strategies, distinct characteristics, asset size and diversification.
The Board and the Independent Directors noted that most Funds’ performance was satisfactory over the relevant periods. For those Funds that lagged peer group averages, they noted that the Advisor had discussed with the Board the reasons for the underperformance and the actions taken or to be taken by the Advisor to address the underperformance, and they indicated that they would continue to monitor portfolio
91
Table of Contents
TCW Funds, Inc.
Renewal of Investment Advisory and Management Agreement (Unaudited) (Continued)
investment performance on a regular basis and discuss with the Advisor from time to time any instances of long-term underperformance as appropriate. The Board and the Independent Directors noted that the performance of some Funds for periods when they lagged their peer group averages remained satisfactory when assessed on a risk-adjusted basis because performance quintiles do not necessarily reflect the amount of risk employed by peer funds to achieve their returns. With respect to the fixed income Funds, the Board and the Independent Directors recognized the Advisor’s deliberate strategy to manage risk in light of its critical view of the fixed-income securities markets and overall investment market conditions at present and in the near term. For that reason, the Board and the Independent Directors believed that relative performance also should be considered in light of future market conditions expected by the Advisor. The Board and the Independent Directors noted the Advisor’s view that longer term performance can be more meaningful for active fixed income funds because market cycles in fixed income are generally longer than three years.
The Board and the Independent Directors noted that investment performance of most of the Funds was generally close to or above the median performance of the applicable peer group during the three-year period emphasized by Broadridge in the supplemental materials, but seven Funds ranked in the fourth or fifth quintile for that three-year period.
For the U.S. fixed income Funds, the Board and the Independent Directors noted the conservative profile of these Funds, which generally experienced less volatility compared to various other funds in the applicable peer group (except for the relative volatility of Total Return Bond Fund, which is a mortgage focused Fund). They also noted the Advisor’s conservative posture for these Funds with respect to credit and interest rate risks.
For the Total Return Bond Fund, the Board and the Independent Directors noted that the Fund’s performance was in the first quintile for the ten-year period and the second quintile for the five-, three- and one-year periods.
For the Core Fixed Income Fund, the Board and the Independent Directors noted that the Fund’s performance was in the first quintile for the ten-year period, the third quintile for the five-year period, the fourth quintile for the three-year period and the second quintile for the one-year period.
For the High Yield Bond Fund, the Board and the Independent Directors noted that the Fund’s performance was in the third quintile for the ten-year period and the second quintile for the five-, three- and one-year periods.
For the Global Bond Fund, the Board and the Independent Directors noted that the Fund’s performance was in the fourth quintile for the five- and three-year periods and the third quintile for the one-year period.
For the Short Term Bond Fund, the Board and the Independent Directors noted that the Fund’s performance was in the fourth quintile for the ten-, five- and three-year periods and the first quintile for the one-year period.
For the Enhanced Commodity Strategy Fund, the Board and the Independent Directors noted that the Fund’s performance was in the second quintile for the five-year period and the third quintile for the three- and one-year periods.
For the U.S. equity Funds, the Board and the Independent Directors noted that the performance of most Funds for the various periods reviewed ranked in the first, second or third quintiles. The Select Equities
92
Table of Contents
TCW Funds, Inc.
Fund ranked in the fourth quintile for the five-year period. The Relative Value Dividend Appreciation Fund ranked in the fourth quintile for the one-, three- and five-year periods. The Relative Value Large Cap Fund ranked in the fourth quintile for the one- and three-year periods. The Relative Value Mid Cap Fund ranked in the fourth quintile for the ten-year period. The Board and the Independent Directors noted the Advisor’s explanation that the Relative Value Dividend Appreciation Fund’s and the Relative Value Large Cap Fund’s diversification tool used to mitigate risk weighed on their near-term performance in a momentum-driven market and its opinion that each of the Relative Value Funds are well-positioned to excel in a strengthening economic environment. The Global Real Estate Fund ranked in the fifth quintile for the one- and three-year periods, and while it ranked in the third quintile during the quarter ended June 30, 2018, the Board and the Independent Directors determined to continue to closely monitor its performance and did not believe any other immediate action was needed.
For the international and emerging markets Funds, the Board and the Independent Directors noted that the performance of a majority of these Funds ranked in the first, second or third quintiles. The Developing Markets Equity Fund ranked in the fourth quintile for the period since inception, but ranked in the first quintile for the one-year period.
For the asset allocation Fund, the Board the Independent Directors noted that the Conservative Allocation Fund’s performance was in the first quintile for the ten-year period, the second quintile for the five-year period, the third quintile for the three-year period and the first quintile for the one-year period.
The Board and the Independent Directors concluded that the Advisor was implementing each Fund’s investment objective(s) and that the Advisor’s record in managing the Funds indicated that its continued management should benefit each Fund and its shareholders over the long term.
4. Advisory fees and total expenses
The Board and the Independent Directors compared the management fees (which Broadridge defines to include the advisory fee and the administrative fee) and total expenses of each Fund (each as a percentage of average net assets) with the median management fee and operating expense level of the other mutual funds in the relevant Broadridge peer groups. These comparisons assisted the Board and the Independent Directors by providing a reasonable statistical measure to assess each Fund’s fees relative to its relevant peers. The Board and the Independent Directors observed that each Fund’s management fee, after giving effect to applicable waivers and/or reimbursements, was below or near the median of the peer group funds on a current basis, with the exception of the Select Equities Fund, the Emerging Markets Income Fund and the Emerging Markets Local Currency Income Fund. They also observed that each Fund’s total expenses, after giving effect to applicable waivers and/or reimbursements, were below or near the median of the peer group funds, with the exception of the Global Bond Fund primarily due to its smaller size relative to most of the other funds in the peer group. The Board and the Independent Directors also noted the contractual expense limitations to which the Advisor has agreed with respect to each Fund and that the Advisor historically has absorbed any expenses in excess of these limits. The Board and the Independent Directors also noted that for several Funds, their below-median management fee and total expenses were in part due to substantial waiver and/or reimbursement pursuant to the contractual expense limitations. The Board and the Independent Directors concluded that the competitive fees charged by the Advisor, and competitive expense ratios, should continue to benefit each Fund and its shareholders.
The Board and the Independent Directors also reviewed information regarding the advisory fees charged by the Advisor to its institutional and sub-advisory clients with similar investment mandates. The Board and
93
Table of Contents
TCW Funds, Inc.
Renewal of Investment Advisory and Management Agreement (Unaudited) (Continued)
the Independent Directors concluded that, although the fees paid by those clients generally were lower than advisory fees paid by the Funds, the differences appropriately reflected the more extensive services provided by the Advisor to the Funds and the Advisor’s significantly greater responsibilities and expenses with respect to the Funds, including the additional time spent by portfolio managers for reasons such as managing the more active cash flows from purchases and redemptions by shareholders, the additional risks of managing a pool of assets for public investors, administrative burdens, daily pricing, valuation and liquidity responsibilities, the supervision of vendors and service providers, and the costs of additional infrastructure and operational resources and personnel and of complying with and supporting the more comprehensive regulatory and governance regime applicable to mutual funds.
5. The Advisor’s costs, level of profits, and economies of scale
The Board and the Independent Directors reviewed information regarding the Advisor’s costs of providing services to the Funds, as well as the resulting level of profits to the Advisor. They reviewed the Advisor’s stated assumptions and methods of allocating certain costs, such as personnel costs, which constitute the Advisor’s largest operating cost. The Board and the Independent Directors recognized that the Advisor should be entitled to earn a reasonable level of profits for the services that it provides to each Fund. The Board and the Independent Directors also reviewed a comparison of the Advisor’s profitability with respect to the Funds to the profitability of certain unaffiliated publicly traded asset managers, which the Advisor believed supported its view that the Advisor’s profitability was reasonable. Based on their review, the Board and the Independent Directors concluded that they were satisfied that the Advisor’s level of profitability from its relationship with each Fund was not unreasonable or excessive.
The Board and the Independent Directors considered the extent to which potential economies of scale could be realized as the Funds grow and whether the advisory fees reflect those potential economies of scale. They recognized that the advisory fees for the Funds do not have breakpoints, which would otherwise result in lower advisory fee rates as the Funds grow larger. They also recognized the Advisor’s view that the advisory fees compare favorably to peer group fees and expenses and remain competitive even at higher asset levels and that the relatively low advisory fees reflect the potential economies of scale. The Board and the Independent Directors recognized the benefits of the Advisor’s substantial past and on-going investment in the advisory business, such as successfully recruiting and retaining key professional talent, systems and technology upgrades, added resources dedicated to legal and compliance programs, and improvements to the overall firm infrastructure, as well as the financial pressures of competing against much larger firms and passive investment products. The Board and the Independent Directors also noted the Advisor’s explanation of the increased resources required to manage the Funds as a result of both asset growth and increased competitive pressures. The Board and the Independent Directors further noted the Advisor’s past subsidies of the Funds’ operating expenses when they were newer and smaller and the Advisor’s commitment to maintain reasonable overall operating expenses for each Fund. The Board and the Independent Directors also recognized that the Funds benefit from receiving investment advice from an organization with other types of advisory clients in addition to mutual funds. The Board and the Independent Directors concluded that the Advisor was satisfactorily sharing potential economies of scale with the Funds through low fees and expenses, and through reinvesting in its capabilities for serving the Funds and their shareholders.
94
Table of Contents
TCW Funds, Inc.
6. Ancillary benefits
The Board and the Independent Directors also considered ancillary benefits received or to be received by the Advisor and its affiliates as a result of the relationship of the Advisor with the Funds, including compensation for certain compliance support services. The Board and the Independent Directors noted that, in addition to the fees the Advisor receives under the Agreement, the Advisor receives additional benefits in connection with management of the Funds in the form of reports, research and other services from brokers and their affiliates in return for brokerage commissions paid to such brokers. The Board and the Independent Directors concluded that any potential benefits received or to be derived by the Advisor from its relationships with the Funds are reasonably related to the services provided by the Advisor to the Funds.
7. Conclusions
Based on their overall review, including their consideration of each of the factors referred to above (and others), the Board and the Independent Directors concluded that the Agreement is fair and reasonable to each Fund and its shareholders, that each Fund’s shareholders received reasonable value in return for the advisory fees and other amounts paid to the Advisor by each Fund, and that the renewal of the Agreement was in the best interests of each Fund and its shareholders.
95
Table of Contents
Supplemental Information
Proxy Voting Guidelines
The policies and procedures that the Company uses to determine how to vote proxies are available without charge. The Board has delegated the Company’s proxy voting authority to the Advisor.
Disclosure of Proxy Voting Guidelines
The proxy voting guidelines of the Advisor are available:
| 1. | By calling 800-FUND-TCW (800-386-3829) to obtain a hard copy; or |
| 2. | By going to the SEC website at http://www.sec.gov. |
When the Company receives a request for a description of the Advisor’s proxy voting guidelines, it will deliver the description that is disclosed in the Company’s Statement of Additional Information. This information will be sent out via first class mail (or other means designed to ensure equally prompt delivery) within three business days of receiving the request.
The Advisor, on behalf of the Company, prepares and files Form N-PX with the SEC not later than August 31 of each year, which includes the Company’s proxy voting record for the most recent twelve-month period ended June 30 of that year. The Company’s proxy voting record for the most recent twelve-month period ended June 30 is available:
| 1. | By calling 800-FUND-TCW (800-386-3829) to obtain a hard copy; or |
| 2. | By going to the SEC website at http://www.sec.gov. |
When the Company receives a request for the Company’s proxy voting record, it will send the information disclosed in the Company’s most recently filed report on Form N-PX via first class mail (or other means designed to ensure equally prompt delivery) within three business days of receiving the request.
The Company also discloses its proxy voting record on its website as soon as is reasonably practicable after its report on Form N-PX is filed with the SEC.
Filing of Quarterly Portfolio Schedule
The Company files a complete schedule of its portfolio holdings with the SEC for the first and third quarters of its fiscal year on Form N-Q.
96
Table of Contents
Tax Information Notice (Unaudited)
Under Section 854(b)(2) of the Code, the Funds hereby designate the following maximum amounts as qualified dividends for purposes of the maximum rate under Section 1(h)(11) of the Code for the fiscal year ended October 31, 2018 (amount in thousands):
Fund | Qualified Dividend Income | |||
TCW Developing Markets Equity Fund | $ | 79 | ||
TCW Emerging Markets Multi-Asset Opportunities Fund | $ | 768 | ||
TCW International Small Cap Fund | $ | 151 | ||
The following is the dividend received deduction percentage for the Fund’s corporate shareholders:
Fund | Qualified Received Deductions | |||
TCW Developing Markets Equity Fund | 2.15% | |||
TCW Emerging Markets Multi-Asset Opportunities Fund | 0.41% | |||
The following Funds paid foreign taxes during the year ended October 31, 2018 that are available as income tax credits:
Fund | Foreign Tax Credit | |||
TCW Developing Markets Equity Fund | $ | 10 | ||
TCW Emerging Markets Multi-Asset Opportunities Fund | $ | 99 | ||
TCW International Small Cap Fund | $ | 20 | ||
This information is given to meet certain requirements of the Code and should not be used by shareholders for preparing their income tax returns. In February 2019, shareholders will receive Form 1099-DIV which will show the actual distribution received and include their share of qualified dividends during the calendar year of 2018. Shareholders are advised to check with their tax advisors for information on the treatment of these amounts on their individual tax returns.
97
Table of Contents
Directors and Officers of the Company
A board of eight directors is responsible for overseeing the operations of the Company, which consists of 19 Funds at October 31, 2018. The directors of the Company, and their business addresses and their principal occupation for the last five years are set forth below.
Independent Directors
Name, and Year of Birth (1) | Term of Office and Length of Time Served | Principal Occupation(s) During Past 5 Years | Other Directorships held by Director | |||
| Samuel P. Bell (1936) | Indefinite term; Mr. Bell has served as a director of TCW Funds, Inc. since October 2002. | Private Investor. | Point 360 (post production services); TCW Strategic Income Fund, Inc. (closed-end fund). | |||
Patrick C. Haden (1953) Chairman of the Board | Indefinite term; Mr. Haden has served as a director of TCW Funds, Inc. since May 2001. | President (since 2003), Wilson Ave. Consulting (business consulting firm); Senior Advisor to President (July 2016-June 2017) and Athletic Director (August 2010-June 2016), University of Southern California. | Tetra Tech, Inc. (environmental consulting); Auto Club (affiliate of AAA); Metropolitan West Funds (mutual fund); TCW Strategic Income Fund, Inc. (closed end fund). | |||
| Peter McMillan (1957) | Indefinite term; Mr. McMillan has served as a director of TCW Funds, Inc. since August 2010. | Co-founder, Managing Partner and Chief Investment Officer (since May 2013), Temescal Canyon Partners (investment advisory firm); Co-founder and Managing Partner (since 2000), Willowbrook Capital Group, LLC (investment advisory firm); Co-founder and Executive Vice President (since 2005), KBS Capital Advisors (a manager of real estate investment trusts). | KBS Real Estate Investment Trusts (real estate investments); KBS Strategic Opportunity REITS (real estate investments); Metropolitan West Funds (mutual funds); TCW Strategic Income Fund, Inc. (closed-end fund). | |||
| Charles A. Parker (1934) | Indefinite term; Mr. Parker has served as a director of the TCW Funds, Inc. since April 2003. | Private Investor. | Burridge Center for Research in Security Prices (University of Colorado); TCW Strategic Income Fund, Inc. (closed-end fund). | |||
| Victoria B. Rogers (1961) | Indefinite term; Ms. Rogers has served as a director of the TCW Funds, Inc. since October 2011. | President (since 1996), The Rose Hills Foundation (charitable foundation). | Causeway Capital Management Trust (mutual fund); TCW Strategic Income Fund, Inc. (closed-end fund). | |||
| Andrew Tarica (1959) | Indefinite term; Mr. Tarica has served as a director of the TCW Funds, Inc. since March 2012. | Chief Executive Officer (since February 2001), Meadowbrook Capital Management (asset management company); Employee (since 2003), Cowen & Co. (broker-dealer). | Metropolitan West Funds (mutual fund); TCW Strategic Income Fund, Inc. (closed-end fund); TCW Direct Lending VII, LLC (business development company). |
| (1) | The address of each Independent Director is c/o Morgan Lewis, & Bockius LLP, Counsel to the Independent Directors, 300 South Grand Avenue 22nd Floor, Los Angeles, CA 90071. |
98
Table of Contents
TCW Funds, Inc.
Interested Directors
These directors are “interested persons” of the Company as defined in the 1940 Act because they are directors and officers of the Advisor, and shareholders and directors of The TCW Group, Inc., the parent company of the Advisor.
Name and Year of Birth | Term of Office and Length of Time Served | Principal Occupation(s) During Past 5 Years (1) | Other Directorships held by Director | |||
| Marc I. Stern (1944) | Indefinite term; Mr. Stern has served as a director since inception of TCW Funds, Inc. in September 1992. | Chairman (since January 2016), TCW LLC; Chairman (since February 2013), The TCW Group, Inc., TCW Investment Management Company, TCW Asset Management Company and Metropolitan West Asset Management. | Qualcomm Incorporated (wireless communications) | |||
| David S. DeVito (1962) | Indefinite term; Mr. DeVito has served as a director since January 2014. | Executive Vice President and Chief Operating Officer (since January 2016), TCW LLC; Executive Vice President and Chief Operating Officer (since October 2013), TCW Investment Management Company LLC, The TCW Group, Inc., Metropolitan West Asset Management, LLC and TCW Asset Management Company LLC; President and Chief Executive Officer (since January 2014), TCW Strategic Income Fund, Inc.; Treasurer, Principal Financial Officer and Principal Accounting Officer (since 2010), Metropolitan West Funds. | TCW Strategic Income Fund, Inc. (closed-end fund) |
| (1) | Positions with The TCW Group, Inc. and its affiliates may have changed over time. |
The officers of the Company who are not directors of the Company are:
| Name and Year of Birth | Position(s) Held with Company | Principal Occupation(s) During Past 5 Years (1) | ||
| Lisa Eisen (1963) | Tax Officer | Tax Officer (since December 2016), Metropolitan West Funds and TCW Strategic Income Fund, Inc.; Managing Director and Director of Tax (since August 2016), TCW, LLC; Vice President of Corporate Tax and Payroll for Health Net, Inc. (1998 – July 2016). |
99
Table of Contents
TCW Funds, Inc.
Directors and Officers of the Company (Continued)
| Name and Year of Birth | Position(s) Held with Company | Principal Occupation(s) During Past 5 Years (1) | ||
| Meredith S. Jackson (1959) | Senior Vice President, General Counsel and Secretary | Executive Vice President, General Counsel and Secretary (since January 2016), TCW LLC; Executive Vice President, General Counsel and Secretary (since February 2013), TCW Investment Management Company, The TCW Group Inc., TCW Asset Management Company and Metropolitan West Asset Management; Senior Vice President, General Counsel and Secretary (since February 2013), TCW Strategic Income Fund, Inc.; Vice President and Secretary (since February 2013), Metropolitan West Funds; Partner and Chair of the Debt Finance Practice Group (1999 – January 2013), Irell & Manella (law firm). | ||
| Jeffrey Engelsman (1967) | Chief Compliance Officer since September 2014 and AML Officer since December 2016 | AML Officer (since December 2016), Metropolitan West Funds, and TCW Strategic Income Fund, Inc.; Global Chief Compliance Officer (since January 2016), TCW LLC; Chief Compliance Officer (since 2014), Metropolitan West Funds and TCW Strategic Income Fund, Inc.; Managing Director, Global Chief Compliance Officer (since August 2014), TCW Investment Management Company LLC, TCW Asset Management, LLC and Metropolitan West Asset Management, LLC; Global Chief Compliance Officer (since September 2014), The TCW Group, Inc.; Chief Compliance Officer (2009 – August 2014), MainStay Funds (mutual fund); Managing Director (2009 – July 2014), New York Life Investments (investment management). |
100
Table of Contents
TCW Funds, Inc.
| Name and Year of Birth | Position(s) Held with Company | Principal Occupation(s) During Past 5 Years (1) | ||
| Richard Villa (1964) | Treasurer and Principal Financial and Accounting Officer | Managing Director, Chief Financial Officer and Assistant Secretary (since January 2016), TCW LLC; Treasurer and Chief Financial Officer (since January 2014), TCW Strategic Income Fund, Inc.; Managing Director and Chief Financial Officer (since July 2008), TCW Investment Management Company, the TCW Group, Inc., TCW Asset Management Company LLC, and Metropolitan West Asset Management LLC. |
| (1) | Positions with The TCW Group, Inc. and its affiliates may have changed over time. |
| * | Address is 865 South Figueroa Street, 18th Floor, Los Angeles, California 90017 |
In addition, George N. Winn, Senior Vice President of TCW Asset Management Company LLC, Metropolitan West Asset Management, LLC, TCW LLC and the Advisor, is Assistant Treasurer of the Company; and Patrick W. Dennis, Senior Vice President, Associate General Counsel and Assistant Secretary of TCW Asset Management Company LLC, Metropolitan West Asset Management, LLC, TCW LLC and the Advisor, is Vice President and Assistant Secretary of the Company.
The SAI (Statement of Additional Information) has additional information regarding the Board of Directors. A copy is available without charge by calling 1-800-FUND-TCW (1-800-386-3829) to obtain a hard copy or by going to the SEC website at http://www.sec.gov.
101
Table of Contents
TCW Funds, Inc.
865 South Figueroa Street
Los Angeles, California 90017
800 FUND TCW
(800 386 3829)
www.TCW.com
INVESTMENT ADVISOR
TCW Investment Management Company LLC
865 South Figueroa Street
Los Angeles, California 90017
TRANSFER AGENT
U.S. Bancorp Fund Services, LLC
615 E. Michigan Street
Milwaukee, Wisconsin 53202
INDEPENDENT REGISTERED PUBLIC ACCOUNTING FIRM
Deloitte & Touche LLP
555 West 5th Street
Los Angeles, California 90013
CUSTODIAN & ADMINISTRATOR
State Street Bank & Trust Company
One Lincoln Street
Boston, Massachusetts 02111
DISTRIBUTOR
TCW Funds Distributors LLC
865 South Figueroa Street
Los Angeles, California 90017
DIRECTORS
Patrick C. Haden
Director and Chairman of the Board
Samuel P. Bell
Director
David S. DeVito
Director
Peter McMillan
Director
Charles A. Parker
Director
Victoria B. Rogers
Director
Marc I. Stern
Director
Andrew Tarica
Director
OFFICERS
David S. DeVito
President and Chief Executive Officer
Meredith S. Jackson
Senior Vice President,
General Counsel and Secretary
Richard M. Villa
Treasurer and Principal Financial and Accounting Officer
Jeffrey A. Engelsman
Chief Compliance Officer and Anti-Money Laundering Officer
Patrick W. Dennis
Vice President and Assistant Secretary
Lisa Eisen
Tax Officer
George N. Winn
Assistant Treasurer
TCW FAMILY OF FUNDS
EQUITY FUNDS
TCW Artificial Intelligence Equity Fund
TCW Global Real Estate Fund
TCW New America Premier Equities Fund
TCW Relative Value Dividend Appreciation Fund
TCW Relative Value Large Cap Fund
TCW Relative Value Mid Cap Fund
TCW Select Equities Fund
ALLOCATION FUND
TCW Conservative Allocation Fund
FIXED INCOME FUNDS
TCW Core Fixed Income Fund
TCW Enhanced Commodity Strategy Fund
TCW Global Bond Fund
TCW High Yield Bond Fund
TCW Short Term Bond Fund
TCW Total Return Bond Fund
INTERNATIONAL FUNDS
TCW Developing Markets Equity Fund
TCW Emerging Markets Income Fund
TCW Emerging Markets Local Currency Income Fund
TCW Emerging Markets Multi-Asset Opportunities Fund
TCW International Small Cap Fund
FUNDarINT1018
Table of Contents
| Item 2. | Code of Ethics. |
| (a) | The Registrant has adopted a code of ethics that applies to its principal executive officer and principal financial officer or persons performing similar functions. |
| (b) | No disclosures are required by this Item 2(b). |
| (c) | The Registrant has made no material changes to its code of ethics. |
| (d) | The Registrant has not granted any waivers from any provisions of its code of ethics during the period covered by this Form N-CSR. |
| (e) | Not applicable. |
| (f) | A copy of the Registrant’s code of ethics is filed as Exhibit 13(a)(1) to this Form N-CSR. |
| Item 3. | Audit Committee Financial Expert. |
| (a)(1) | The Registrant’s Board of Directors (the “Board”) has determined that the Registrant has two members serving on the Registrant’s Audit Committee that possess the attributes identified in Form N-CSR to qualify as an “audit committee financial expert.” |
| (a)(2) | The audit committee financial experts are Samuel P. Bell and Victoria B. Rogers. Each has been deemed to be “independent” as that term is defined in Form N-CSR. |
| (a)(3) | Not applicable. |
| Item 4. | Principal Accountant Fees and Services. |
The firm of Deloitte & Touche LLP (“Deloitte”) serves as the independent registered public accounting firm for the Registrant.
(a) Audit Fees
For the fiscal years ended October 31, 2018 and October 31, 2017, the aggregate fees billed for professional services rendered by Deloitte for the audit of the Registrant’s annual financial statements or for services that are normally provided by Deloitte in connection with statutory and regulatory filings or engagements were:
2018 | 2017 | |
$538,478 | $568,806 |
3
Table of Contents
(b) Audit-Related Fees
For the fiscal years October 31, 2018 and October 31, 2017, the aggregate fees billed for assurance and related services rendered by Deloitte that are reasonably related to the performance of the audit or review of the Registrant’s financial statements and that are not reported under Audit Fees above were:
2018 | 2017 | |
$0 | $0 |
(c) Tax Fees
For the fiscal years ended October 31, 2018 and October 31, 2017, the aggregate fees billed for tax compliance, tax advice and tax planning by Deloitte were:
2018 | 2017 | |
$104,650 | $126,250 |
Fees were for the preparation and filing of the Registrant’s corporate returns.
(d) All Other Fees
For the fiscal years ended October 31, 2018 and October 31, 2017, the aggregate fees billed by Deloitte to the Registrant for all services other than services reported under Audit Fees, Audit-Related Fees, and Tax Fees were:
2018 | 2017 | |
$16,550 | $36,250 |
Fees were for Passive Foreign Investment Company analysis.
| (e)(1) | The Registrant’s Audit Committee approves each specific service the auditor will perform for the Registrant. Accordingly, the Audit Committee has not established pre-approval policies or procedures for services that the auditor may perform for the Registrant. |
| (e)(2) | None of the services described in each of paragraphs (b) through (d) of this Item were approved by the Registrant’s Audit Committee pursuant to paragraph (c)(7)(i)(C) of Rule 2-01 of Regulation S-X. |
| (f) | Not applicable. |
(g) For the fiscal years ended October 31, 2018 and October 31, 2017, aggregate non-audit fees billed by Deloitte for services rendered to the Registrant were:
2018 | 2017 | |
$121,200 | $162,500 |
For the twelve month periods ended October 31, 2018 and October 31, 2017, aggregate non-audit fees billed by Deloitte for services rendered to the Registrant’s investment adviser and any entity controlling, controlled by or under common control with the investment adviser that provides ongoing services to the Registrant were $0 and $0, respectively.
4
Table of Contents
| (h) | Not applicable. |
| Item 5. | Audit Committee of Listed Registrants. |
Not applicable.
| Item 6. | Investments. |
| (a) | The Schedule of Investments is included as part of the Report to Shareholders filed under Item 1 of this Form N-CSR. |
| (b) | Not applicable. |
| Item 7. | Disclosure of Proxy Voting Policies and Procedures for Closed-End Management Investment Companies. |
Not applicable.
| Item 8. | Portfolio Managers of Closed-End Management Investment Companies. |
Not applicable.
| Item 9. | Purchases of Equity Securities by Closed-End Management Investment Company and Affiliated Purchasers. |
Not applicable.
| Item 10. | Submission of Matters to a Vote of Security Holders. |
There have been no material changes to the procedures by which shareholders may recommend nominees to the Registrant’s Board of Directors.
| Item 11. | Controls and Procedures. |
| (a) | The Chief Executive Officer and Principal Financial and Accounting Officer have concluded that the Registrant’s disclosure controls and procedures (as defined in Rule 30a-3(c) under the Investment Company Act of 1940, as amended (the “1940 Act”)) provide reasonable assurances that material information relating to the Registrant is made known to them by the appropriate persons as of a date within 90 days of the filing date of this report, based on their evaluation of these controls and procedures required by Rule 30a-3(b) under the 1940 Act and 15d-15(b) under the Securities Exchange Act of 1934, as amended. |
| (b) | There were no changes in the Registrant’s internal control over financial reporting (as defined in Rule 30a-3(d) under the 1940 Act) that occurred during the |
5
Table of Contents
| Registrant’s last fiscal quarter of the period covered by this report that have materially affected, or are reasonably likely to materially affect, the Registrant’s internal control over financial reporting. |
| Item 12. | Disclosure of Securities Lending Activities for Closed-End Management Investment Companies. |
Not applicable.
| Item 13. | Exhibits. |
| (a)(1) | Code of Ethics referred to in Item 2 is filed herewith. |
| (a)(2) | The certifications required by Rule 30a-2(a) of the 1940 Act and Section 302 of the Sarbanes-Oxley Act of 2002 (“Sarbanes-Oxley Act”) are filed herewith. |
| (a)(3) | Not applicable. |
| (a)(4) | Not applicable. |
| (b) | The certifications required by Rule 30a-2(b) of the 1940 Act and Section 906 of the Sarbanes-Oxley Act are filed herewith. |
6
Table of Contents
SIGNATURES
Pursuant to the requirements of the Securities Exchange Act of 1934 and the Investment Company Act of 1940, the Registrant has duly caused this report to be signed on its behalf by the undersigned, thereunto duly authorized.
(Registrant) | TCW Funds, Inc. | |||
By (Signature and Title) | ||||
/s/ David S. DeVito | ||||
| David S. DeVito | ||||
| President and Chief Executive Officer | ||||
Date | December 19, 2018 | |||
Pursuant to the requirements of the Securities Exchange Act of 1934 and the Investment Company Act of 1940, this report has been signed below by the following persons on behalf of the Registrant and in the capacities and on the dates indicated.
By (Signature and Title) | ||||
/s/ David S. DeVito | ||||
David S. DeVito | ||||
President and Chief Executive Officer | ||||
Date | December 19, 2018 | |||
By (Signature and Title) | ||||
/s/ Richard M. Villa | ||||
| Richard M. Villa | ||||
| Treasurer and Principal Financial and Accounting Officer | ||||
Date | December 19, 2018 | |||
7