UNITED STATES
SECURITIES AND EXCHANGE COMMISSION
Washington, D.C. 20549
FORM N-CSR
CERTIFIED SHAREHOLDER REPORT OF REGISTERED
MANAGEMENT INVESTMENT COMPANIES
Investment Company Act file number: 811-07170
TCW Funds, Inc.
(Exact name of registrant as specified in charter)
865 South Figueroa Street, Suite 1800, Los Angeles, CA 90017
(Address of principal executive offices)
Patrick W. Dennis, Esq.
Vice President and Assistant Secretary
865 South Figueroa Street, Suite 1800
Los Angeles, CA 90017
(Name and address of agent for service)
Registrant’s telephone number, including area code: (213) 244-0000
Date of fiscal year end: October 31
Date of reporting period: October 31, 2019
| Item 1. | Reports to Shareholders. |


EQUITY FUNDS
TCW Artificial Intelligence Equity Fund
TCW Global Real Estate Fund
TCW New America Premier Equities Fund
TCW Relative Value Dividend Appreciation Fund
TCW Relative Value Large Cap Fund
TCW Relative Value Mid Cap Fund
TCW Select Equities Fund
ASSET ALLOCATION FUND
TCW Conservative Allocation Fund
Beginning on January 1, 2021, as permitted by regulations adopted by the Securities and Exchange Commission, paper copies of the Funds’ annual and semiannual shareholder reports will no longer be sent by mail, unless you specifically request paper copies of the reports. Instead, the reports will be made available on the Funds’ website (www.TCW.com), and you will be notified by mail each time a report is posted and provided with a website link to access the report.
If you already elected to receive shareholder reports electronically, you will not be affected by this change and you need not take any action. You may elect to receive shareholder reports and other communications electronically by contacting your financial intermediary (such as a broker-dealer, bank, or retirement plan), or by calling 1-800-FUND-TCW (1-800-386-3829) if you invest directly with the Funds.
Beginning on January 1, 2019, you may elect to receive all future reports in paper free of charge. You can call 1-800-FUND-TCW (1-800-386-3829), if you invest directly with the Funds, or contact your financial intermediary, if you invest though a financial intermediary, to inform the Funds or the financial intermediary that you wish to continue receiving paper copies of your shareholder reports. Your election to receive reports in paper will apply to all Funds held directly with TCW or through your financial intermediary.
TCW Funds, Inc.
Table of Contents
|
| |
| The Letter to Shareholders and/or Management Discussions contained in this Annual Report are the opinions of each Fund’s portfolio managers and are not the opinions of TCW Funds, Inc. or its Board of Directors. Various matters discussed in the Letter to Shareholders and/or Management Discussions constitute forward-looking statements within the meaning of the federal securities laws. Actual results and the timing of certain events could differ materially from those projected or contemplated by these forward-looking statements due to a number of factors, including general economic conditions, overall availability of securities for investment by a Fund, the level of volatility in the securities markets and in the share price of a Fund, and other risk factors discussed in the SEC filings of TCW Funds, Inc. The data presented in the Letter to Shareholders and/or Management Discussions represents past performance and cannot be used to predict future results. |
| | |
To Our Valued Shareholders | | |
| | |

| | David S. DeVito President, Chief Executive Officer and Director |
Dear Valued Investors,
I am pleased to present the annual report for the TCW Funds, Inc. covering the 12-month period ended October 31, 2019. I would like to express our appreciation for your continued investment in the TCW Funds as well as welcome new shareholders to our fund family. As of October 31, 2019, the TCW Funds held total net assets of approximately $15 billion.
This report contains information and portfolio management discussions of our Equity Funds and the TCW Conservative Allocation Fund.
The U.S. Stock Market
U.S. stocks advanced 13.1% (S&P 500 Total Return Index) during the one-year period ending 10/31/19, as concerns that the US/China trade war might tip the US economy into recession were allayed by expectations of a trade truce together with renewed interest rate cuts by the US Fed. During the course of the year, the US economy was not immune from the global growth slowdown witnessed across the globe, which saw the German economy teetering on the cusp of recession. The breakdown of trade negotiations between the US and China in May unleashed an escalation in tit-for-tat retaliatory measures by both sides, and ultimately US manufacturing data reflected a contraction in that segment of the economy. In August, the US treasury yield curve (3 months vs 10 years) reached its most inverted level in 12 years, and in the following month the 10-year US Treasury yield plunged to a three-year low of 1.46%, prompting worries that the US economy was headed for recession. The US Fed responded by cutting its benchmark Fed Funds reference rate by 25 basis points at each of its July, September, and October meetings, leaving the door open to additional cuts as warranted by economic developments. Although US stocks struggled during the summer months, the resilience of the labor market (unemployment hit its lowest level in 50 years) and continued strength in housing
due to low interest rates helped propel stock prices to a record high at the end of the period.
Looking Ahead
Looking forward, equity investors have once again become accustomed to global central banks providing highly accommodative monetary policy as an underpinning for stock prices, which in turn has made global equity markets more susceptible to negative macroeconomic developments. To the extent the US and China are able to seal a “Phase I” trade truce agreement, a big overhang for stocks will have been placed in abeyance, and perhaps capital spending plans will gradually shift out of their present paralysis. At the company level, corporate earnings reports in the third quarter pointed to modest, low single-digit earnings per share growth for the full year, but whether companies can achieve the double-digit earnings growth embedded in consensus expectations for calendar year 2020 remains an open question. While US equity prices are somewhat elevated with respect to their historical levels of the past several decades (forward P/E ratio is presently about 17.6 versus an average of 15.7), we believe that investors are likely to focus on whether there is a resumption of US and global growth that more decisively assuages the risk of recession and translates into stronger corporate earnings. While the near-term outlook remains mixed, we believe that the medium-to-long term prospects for stocks possessing strong fundamentals remain compelling, and we generally maintain a preference for US stocks relative to those in the other major developed markets because of its more resilient relative economic growth prospects.
We know that you have many choices when it comes to the management of your financial assets. On behalf of everyone at TCW, I would like to thank you for making the TCW Funds part of your long-term investment plan. We truly value our relationship with you. If you have any
1
| | |
Letter to Shareholders (Continued) | | |
questions or require further information, I invite you to visit our website at www.tcw.com, or call our shareholder services department at 800-386-3829.
I look forward to further correspondence with you through our semi-annual report next year.
Sincerely,

David S. DeVito
President, Chief Executive Officer and Director
2
TCW Artificial Intelligence Equity Fund
Management Discussions
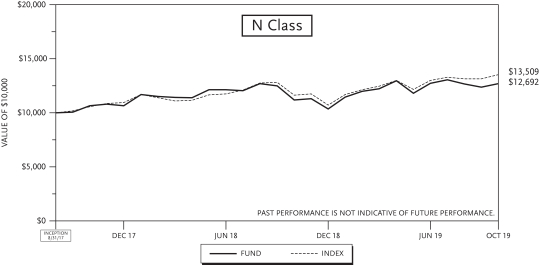
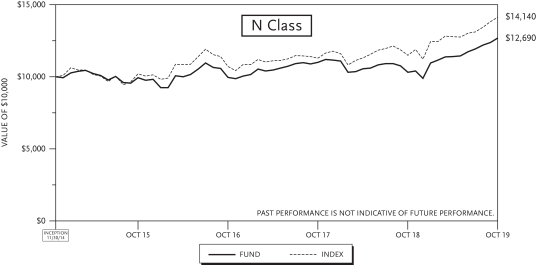
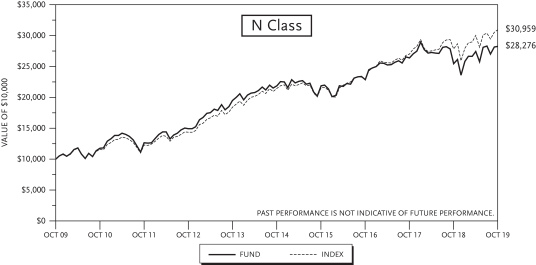
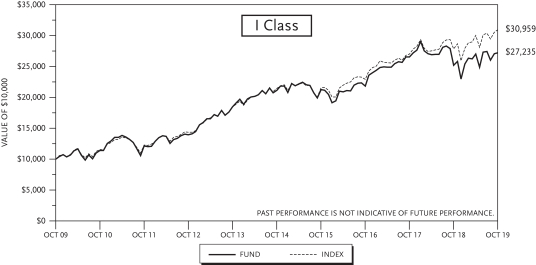
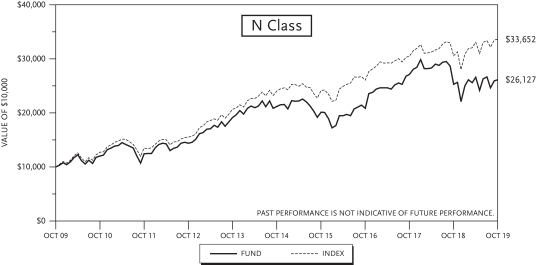
For the year ended October 31, 2019, the TCW Artificial Intelligence Equity Fund (the “Fund”) posted a return of 13.60% and 13.61% on its I Class and N Class, respectively. The Fund’s benchmark, Russell 3000 Growth Index, returned 16.34% over the same period.
The first half of the period was marked by volatility as the major U.S. stock market indices were nearly pushed into bear market territory after an almost 10-year bull-market run. Weaker macroeconomic data weighed on the market and stock market observers digested the implications of a divided government in the wake of the Democratic party’s success in capturing the House in the midterm election.
U.S. stocks rebounded sharply to post their best January performance in 30 years, registering an 8.0% return. Following the severe 4th quarter equity market sell-off, investors were focused on the U.S. Fed’s policy trajectory as well as the prospects for corporate earnings. After initially conveying an undeterred mission to normalize monetary policy by hiking its reference rate and pursuing an “autopilot” run-off of its balance sheet, the Fed moderated its guidance and professed to be “patient” and “data dependent,” which relieved equity market participants’ concerns of a more hawkish interest rate trajectory.
At the same time, global growth continued to falter, with Eurozone manufacturing numbers near a seven-month low and China’s industrial production posting the worst start to a year in nearly a decade. Despite the string of weak macro data, equity prices proved resilient, as many investors attributed first-quarter weakness to the residual effect of the 4Q18 government shutdown, poor weather, and the lingering impact of the U.S./China trade dispute.
Although fallout from the US/China trade war eroded investor sentiment during the second half of the year, President Trump’s decision to delay previously announced tariff increases appeared to boost the prospects for a potential resolution to the ongoing dispute. Furthermore, stock market participants’ concerns about a rising risk of recession were assuaged by other macro data pointing to a strong labor market, a resilient housing backdrop, a still healthy consumer, and the largest monthly gain in US industrial production in the past year.
Looking forward, we believe the equity market will be susceptible to increased volatility given that recession worries will ebb and flow as macroeconomic data points provide clues as to the trajectory of the economy. The possibility of further interest rate cuts by the Fed may provide support to equity prices, and any breakthrough in US/China trade negotiations in the coming weeks and months could serve to allay recession worries. As always, we continue to closely monitor bottom-up corporate fundamentals as we endeavor to identify the most compelling investment targets that meet our growth and valuation criteria.
Our two biggest stock contributors during the year were Lam Research Corp. and ServiceNow Inc., both of which are on the forefront of artificial intelligence technology. Lam Research is a leading semiconductor equipment manufacturer with strong exposure to the memory sector. In a rising data economy that is fueled by artificial intelligence applications and workloads, we believe there will be strong demand for memory solutions. Given its formidable position in this space, we expect Lam Research will be one of the key beneficiaries of this trend.
Lam Research saw positive stock momentum due to a more favorable supply-demand balance in the memory market. Lam Research benefits from upswings in the memory capex cycle and investors are beginning to believe that that memory capex recovery will take hold in 2020. In conversations with investors, management reiterated the view that supply growth in 2019 has been below long-term demand levels and the company’s tracking of pricing, utilization, and inventory metrics all point to a recovery in demand in 2020. Lam Research reported strong earnings results during the tail end of the reporting period,
3
TCW Artificial Intelligence Equity Fund
Management Discussions (Continued)
beating analyst estimates and, further backing its optimistic commentary regarding the recovery of the NAND market. Management raised its outlook for wafer fabrication equipment as the capital expenditure cycle in the industry begins to ramp up. Management also spoke to positive trends emerging in the NAND flash market that should result in strong results in 2020.
ServiceNow, Inc. is an enterprise software company that provides automated workflow processes for its clients. While initial deployments were for managing information technology assets, the company is now seeing use cases expand to security, human resources, and customer service. ServiceNow recently launched a machine learning engine called Intelligent Automation Engine, which will be used to forecast outages, automate routing, predict outcomes, and benchmark performance for clients. In a ServiceNow survey, 86% of companies said that they will need increased automation in order to manage the volume of work that they expect to have in 2020.
ServiceNow continued to deliver strong share price appreciation following strong earnings results announced at the very end of January, which set up positive momentum throughout the period. During its earnings announcement, the company demonstrated impressive growth despite macroeconomic headwinds and delivered billings growth guidance that surpassed investor expectations for 2019. ServiceNow continues to deliver a strong combination of hyper growth with margin expansion.
Our biggest detractor in the period was Tesla Inc. In the first quarter of 2019, Tesla released a memo stating that it would reduce headcount at the company. The cost-cutting measure was a move to maintain profitability as the Model 3 production ramps up and average selling prices come down to an eventual $35,000 price point. Upon holding a press conference to announce the price cut to $35K and a seemingly more modest estimate of Model 3 demand (Musk referenced 500K units versus 700-800K a couple weeks prior), some investors took the news as negative data points as it relates to market demand. Tesla reported disappointing first quarter earnings in April, citing weaker deliveries, lower pricing, and lighter gross margins due to lack of operating leverage on fixed costs. While this fueled negative price momentum throughout the quarter, we would note that Tesla reaffirmed its full year guidance for 360,000 to 400,000 vehicle deliveries, which would imply a significant acceleration in the second half of 2019. Tesla also hosted an investor day during the month, in which it discussed operating a robo-taxi business over a proprietary autonomous network controlled by Tesla. Given the near-term cash flow headwinds the company was facing due to its international expansion and very aggressive autonomous driving programs, we sold shares in the company to fund opportunities that offer what we considered to be better risk/reward prospects.
We believe AI will be the foundational technology of the information age. The leap from computing built on the foundation of humans telling computers how to act, to computing built on the foundation of computers learning how to act has significant implications for every industry.
In our view, there are many structural drivers that are accelerating the need for AI. These include:
| • | | Trend in demographics towards an aging global population |
| • | | Need for greater energy efficiency |
| • | | Drive for greater urbanization as demand for convenience increases |
| • | | Efforts to increase human capital productivity |
The broad applicability of AI also leads us to believe that it is a paradigm-shifting technology for the global economy and a driver behind improving productivity. AI very well could end the period of stagnant
4
TCW Artificial Intelligence Equity Fund
Management Discussions (Continued)
productivity growth in the U.S. We believe that AI technology driven improvements to productivity could, similar to the 1990’s, drive corporations to invest in more capital and labor intensive projects, accelerating growth, improving profitability, and expanding equity valuations. We believe the trend towards AI-enhanced products is accelerating and we highlight recent developments as evidence:
| • | | AI Patents are Rapidly Growing. Patent filings for artificial intelligence technology have dramatically increased since 2013. More than half of all patents related to artificial intelligence have been filed since 2013. The top five applicants fueling the boom are IBM, Microsoft, Toshiba, Samsung, and NEC. The large increase in patents is an indication of how many new AI-based productions, applications, and techniques are expected to hit the market in the coming years. Nick Whigham. Global Patents Show How the AI Race Wants to Change Everything Around Us. news.com.au. February 1, 2019 (https://www.news.com.au/technology/innovation/design/patent-files-show-how-the-ai-race-is-changing-everything-around-us/news-story/5aec1f6a3a291b06cad53d26212e1aad) |
| • | | Russia Raises $2 Billion for AI Investment. The Russian Direct Investment Fund raised $2 billion from foreign investors for the purposes of investing in domestic companies that focus on developing artificial intelligence. Thus far, between five to ten investments related to artificial intelligence are planned on an annual basis. Examples include Oncobox, which selects oncology treatments and develops functional prosthetics using AI, and VisionLabs, which develops face recognition technology. Russia Raises $2 Billion for Investment in Artificial Intelligence. The Moscow Times. May 31, 2019 (https://www.themoscowtimes.com/2019/05/31/russia-raises-2bln-for-investment-in-artificial-intelligence-a65824) |
| • | | McDonald’s Acquires AI Speech Company. McDonald’s announced the acquisition of Apprente, which is an artificial intelligence company that will give McDonald’s the ability to understand speech at its drive-thru locations and self-order kiosks. McDonald’s believes that giving customers the ability to self-order via speech will cut down on service times. McDonald’s has been more aggressive in hiring data scientists and other tech experts, and is also more active in acquiring technology companies. Amelia Lucas. McDonald’s Acquires A.I. Company to Help Automate the Drive-Thru, Its Third Tech Deal This Year. CNBC. September 10, 2019 (https://www.cnbc.com/2019/09/10/mcdonalds-acquires-ai-company-trying-to-automate-the-drive-thru.html) |
We continuously survey the artificial intelligence investment landscape by drawing upon our deep technical knowledge and fundamental research efforts. Our research effort seeks the most attractive opportunities in the AI ecosystem. We appreciate your confidence in and support of the TCW Global Artificial Intelligence Equity Fund.
5
TCW Artificial Intelligence Equity Fund
Management Discussions (Continued)
| | | | | | | | |
| | | Annualized Returns(1) | |
| | | 1 Yr
Return | | | Inception
to Date | |
TCW Artificial Intelligence Equity Fund | | | | | | | | |
Class I (Inception: 8/31/2017) | | | 13.60 | % | | | 11.67 | % |
Class N (Inception: 8/31/2017) | | | 13.61 | % | | | 11.63 | % |
Russell 3000 Growth Index | | | 16.34 | % | | | 14.89 | % |

| (1) | The total returns do not reflect taxes that a shareholder would pay on fund distribution or on the redemption of fund shares. |
6
TCW Conservative Allocation Fund
Management Discussions
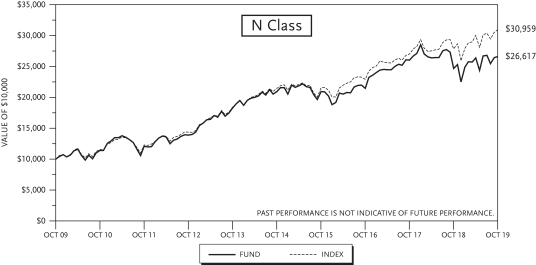
For the year ended October 31, 2019, the TCW Conservative Allocation Fund (the “Fund”) posted a gain of 10.46% for the I Class and 10.16% for the N Class shares. The performance of the Fund’s classes varies because of differing expenses. The Fund’s blended benchmark of 40% S&P 500 Index and 60% Bloomberg Barclay Capital U.S. Aggregate Bond Index returned 13.07% over the same time period.
The Fund posted positive returns over the past year with a positive contributions coming from U.S. equities. The strongest returns came from TCW New America Premier Equities Fund (13.5% allocation) and TCW Global Real Estate Fund (6.4% allocation), with both funds up over 20% over the past year outpacing the S&P 500 Index. At the asset allocation level, the decision to over overweight large cap U.S. equities helped relative performance.
As of October, the allocation for the Fund was 40% equities and 60% fixed income. This gives the Fund a neutral weight to both equities and fixed income as compared to its blended index. Over the past 12 months, the Fund has slightly changed the allocation to Fixed Income. Within Fixed Income, the allocation has been weighted towards higher grade and mortgage-backed fixed income securities. The Fund increased its allocation to TCW Total Return Bond Fund over the past year. Within equites, the fund continued to allocate more to less volatile and defensive equities. The allocation to TCW New America Premier Equities Fund was increased. An allocation to the TCW Global Real Estate Fund was initiated in the early part of the year and was a strong contributor to returns.
U.S. stocks registered strong gains over the past year ending Oct 2019. Equity market performance throughout the year has been marked by volatility as trade war worries intensified and soft macroeconomic data weighed on the market. Equity market investors saw their investments buoyed by the well-telegraphed expectation that the Fed would cut its benchmark interest rate for the first time since 2008, in response to slower macroeconomic growth and tame inflation. Equity prices were further supported by expectations of continued monetary policy easing by the Fed, which at its September meeting lowered its Fed Funds effective rate by 25 basis points to a range of 1.75% - 2.0%. Importantly, Fed Chair Powell noted that additional quantitative easing would be possible should it be needed.
Looking forward, we believe that successful implementation of a US/China trade war “truce” — no matter how limited its scope — would be supportive of the equity markets if only by virtue of its effective impact of forestalling an escalation of a trade dispute which has unequivocally dampened US economic growth. We are of course mindful that the US stock market’s strong advance this year to an all-time high presents risks of its own, particularly given the fact that the vast majority of the gains have been fueled by increased risk appetite and multiple expansion rather than by strong corporate earnings growth. With the US Fed now appearing to be clearly on the sidelines, we believe that the stock market’s trajectory from here will be largely dictated by the extent to which the US and global economies see improved growth, and whether said growth translates into stronger corporate earnings. With US stocks presently trading at a price-to-earnings multiple of 17.5 times forward earnings — compared to an average of 13.9 times over the past five decades — we note that the market remains susceptible to a spike in volatility should the economy show renewed signs of weakness or if trade negotiations get derailed.
Equities and bonds continue to send diverging signals. Though difficult to identify a catalyst to higher growth, which would justify current equity and credit market valuations, the list of downside risks to the market and global economy has grown substantially. Consumer spending has thus far mitigated the manufacturing slowdown, though we believe heightened uncertainty will likely dampen risk appetite and contribute to a broader deleveraging across markets.
7
TCW Conservative Allocation Fund
Management Discussions (Continued)
Unresolved trade tensions, weakening growth, and rising geopolitical risks lifted the global economic policy uncertainty index to record highs during the third calendar quarter of 2019, surpassing peak episodes last seen during the 2008 financial crisis. With estimates of recession probabilities over the next year rising by some measures to as high as 50%, this level of uncertainty could easily translate into further declines in business confidence and investment despite the Fed’s recent efforts to bolster growth. U.S. Treasuries were particularly affected as 10-Year Treasury yields fell over 60 bps on global growth fears, touching as low as 1.4% before rebounding by over 40 bps in September, in what was the largest weekly rise in six years.
The global economy continued to slow with the Organisation for Economic Co-operation and Development (OECD) cutting its 2019 growth forecast to 2.9%, the slowest annual pace since the financial crisis. Contributing to the downgrade was notable slowing in the U.S., China, and Germany. Weak incoming data from business surveys and investment spending underpin these projections. In particular, manufacturing Purchasing Managers’ Indexes (PMIs) indicate that the global economy has dipped into a manufacturing recession, with nearly 70% of economies reporting a decline this quarter.
8
TCW Conservative Allocation Fund
Management Discussions (Continued)
| | | | | | | | | | | | | | | | | | | | |
| | | Annualized Returns(1) | |
| | | 1 Yr
Return | | | 3 Yr
Return | | | 5 Yr
Return | | | 10 Yr
Return | | | Inception
to Date | |
TCW Conservative Allocation Fund | | | | | | | | | | | | | | | | | | | | |
Class I (Inception: 11/16/2006) | | | 10.46 | % | | | 5.83 | % | | | 4.41 | % | | | 6.19 | % | | | 5.22 | % |
Class N (Inception: 11/16/2006) | | | 10.16 | % | | | 5.42 | % | | | 3.96 | % | | | 5.84 | % | | | 4.94 | % |
40% S&P 500 Index/60% Bloomberg Barclays U.S. Aggregate Bond Index | | | 13.07 | % | | | 8.02 | % | | | 6.40 | % | | | 7.84 | % | | | 6.24 | % |
| (1) | The total returns do not reflect taxes that a shareholder would pay on fund distribution or on redemption of fund shares. |
9
TCW Global Real Estate Fund
Management Discussions
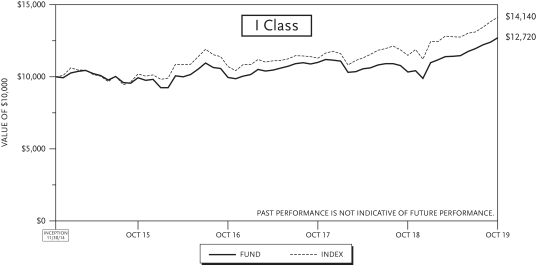
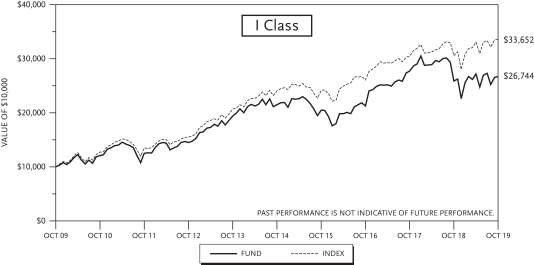
For the year ended October 31, 2019, the TCW Global Real Estate Fund (the “Fund”) generated returns of 23.17% and 22.99% on its I Class and N Class shares, respectively. The performance of the Fund’s classes varies because of differing expenses. The Fund’s benchmark, the S&P Global REIT Index, had a positive return of 23.07% over the same period.
On an attribution basis, the Fund’s in-line performance relative to its benchmark during the period was the result of good stock selection and sector allocation offset by excess cash. From a relative standpoint, the Fund’s largest sector overweight was in Industrial REITs (average weight of 19.67% and up 35.74% for the Fund vs. average weight of 11.16% and up 39.30% for the index), which benefitted performance. The Fund’s largest sector underweight was in Diversified REITs (average weight of 2.80% and up 10.60% for the Fund vs. average weight of 13.92% and up 29.73% for the index), which hurt performance. From a stock selection perspective, positive contributors included Equinix (EQIX) and Goodman Group (GMG AU). Conversely, notable detractors from performance included Deutsche Wohnen (DWNI GR) and Simon Property Group (SPG). Cash was also a drag to performance of around 0.45%.
As US markets closed 2018 with significant volatility and a pronounced sell off in equity markets, by contrast 2019 produced a strong recovery with the S&P 500 advancing 14% from October 31, 2018 to October 31, 2019. Fears of the Federal Reserve rate increases were quickly put to rest early in the year and turned from policy tightening to more accommodation as the global economy showed mounting signs of weakness. The US/China trade war, while not yet resolved, has increasingly been viewed as a potential catalyst for potential upward momentum in an otherwise stalled economy. It still remains unclear to us why markets have responded to softening conditions with such strong performance, but the most likely explanation may just be that US equity markets are still the best asset class to own in a world of low rates and arguably inflated valuations.
While REIT indices underperformed in both 2017 and 2018, they recovered in 2019. Part of this reflation was due to a collapse in rates as the 10 year treasury yield peaked in 2018 above 3.0% and bottomed as low as 1.5% in 2019. Accordingly, many bond proxy like assets found a strong bid in the year as valuations spreads tightened relative to fixed income securities. Because a large fraction of the gains in the year have come from multiple expansion rather than organic earnings or cash flow growth, we have become more concerned that risk is not being properly accounted for in certain sectors.
Our strategy for navigating the current environment is to continue our focus on process and portfolio construction. We source most of our holdings from two separate pools. The first is in underappreciated undervalued companies that could benefit from a change in sentiment. The issues these businesses face are typically transitory and the discount is largely unfounded when viewed on a longer time horizon. The second set of companies that make up the bulk of our portfolio is in the best franchises with high barriers to entry and strong cash flow generation. These companies may also have an ability to invest capital at high rates of return and typically will compound capital at a pace that exceeds that of their peers. The Fund’s portfolio is currently more heavily weighted towards these types of high quality companies. We believe taking risks by owning lower quality businesses at relatively attractive valuations is the wrong approach at this juncture. While our strategy produced adequate returns in absolute terms over the past year, we recognize that relative returns have been lackluster. We believe that a broader market sell off may be an opportunity for the Fund to outperform from a relative standpoint by avoiding losses as well as finding better entry points on more value oriented names.
10
TCW Global Real Estate Fund
Management Discussions (Continued)
| | | | | | | | | | | | |
| | | Annualized Returns(1) | |
| | | 1 Yr
Return | | | 3 Yr
Return | | | Inception
to Date | |
TCW Global Real Estate Fund | | | | | | | | | | | | |
Class I (Inception: 11/28/2014) | | | 23.17 | % | | | 8.46 | % | | | 5.01 | % |
Class N (Inception: 11/28/2014) | | | 22.99 | % | | | 8.38 | % | | | 4.96 | % |
S&P Global REIT Index | | | 23.07 | % | | | 9.72 | % | | | 7.30 | % |
| (1) | The total returns do not reflect taxes that a shareholder would pay on fund distribution or on the redemption of fund shares. |
11
TCW New America Premier Equities Fund
Management Discussions
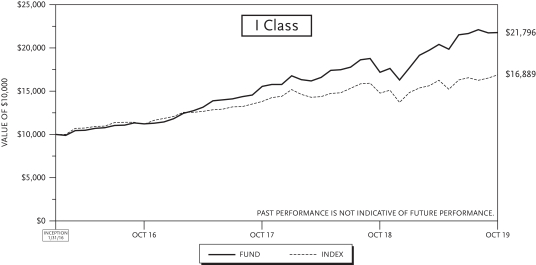
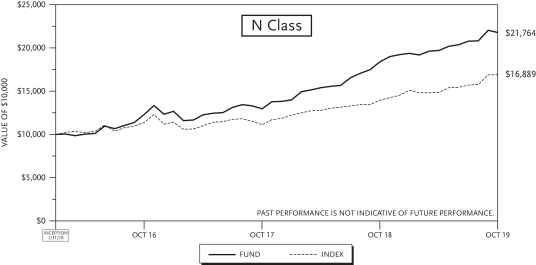
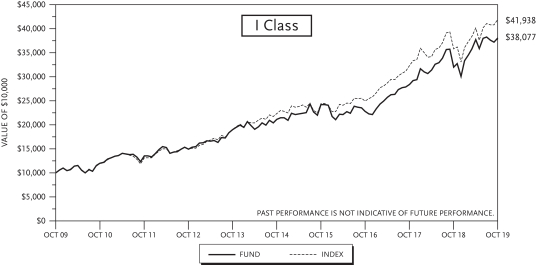
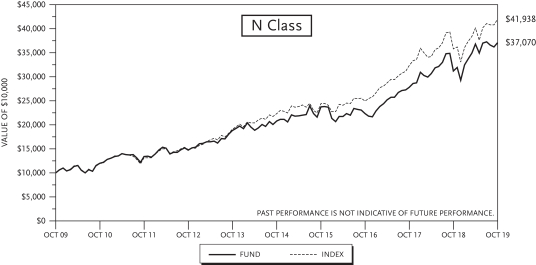
For the fiscal year that ended October 31, 2019, the TCW New America Premier Equities Fund (the “Fund”) returned 26.79% and 26.60% on the I Class and N Class shares, respectively. The Fund’s benchmark, the Russell 1000 Index, returned 14.15% over the same period.
The Fund’s performance benefited from investments in Transdigm, The Trade Desk Inc. and Constellation Software. The Fund’s performance was negatively impacted by investments in Transunion LLC, Broadcom Corporation and Chase Corporation. Security selection was the primary driver of the Fund’s performance during the year.
As we have indicated in the past we eschew a reliance on macroeconomic forecasts and projections of the future direction of markets — our view is that these factors are unknowable. We therefore focus on what we think is knowable. We believe that a careful assessment of investment opportunities at the security level will provide us, in some cases, with a high probability view of the future free cash flows of a business. Risk adjusted cash flow steam is a key determinant of the future returns of an investment and therefore a key determinant of the portfolio’s future returns. We believe that we have made good decisions in this respect and that the portfolio of companies is built to weather most market environments.
Investment Philosophy
The Fund seeks to outperform the broad U.S. indices in both rising and falling markets with less risk and volatility. We seek to accomplish this objective by investing in a concentrated portfolio of businesses that carefully manage their environmental and social resources and that employ best in class corporate governance practices. We invest in businesses that have high barriers to entry, are stable, generate substantial free cash flow and are managed by prudent leaders.
Risk control. Our primary objective, as stewards of your capital, is to control risk while seeking attractive returns. We control risk in a unique manner; initially we apply our proprietary ESG quantitative framework to identify better managed businesses that have lower quantifiable and unquantifiable risks. Subsequently we hone our efforts on those businesses that we believe operate in stable industries with attractive industry structures, businesses that produce products that are critical to their customers, and businesses that we believe are led by proven, appropriately incentivized leaders. We endeavor to further control valuation risk by purchasing securities at attractive prices relative to the current free cash flow generation of the businesses. We believe that businesses that fit our profile produce fairly stable cash flow streams and are less prone to macroeconomic fluctuations, competitive pressures and valuation risks.
Consistency. It is also our objective to deliver a consistently positive outcome. We would view outsized outperformance in one year and poor performance in the subsequent year as a poor outcome for our clients. Our bottom-up investment process is focused on selecting undervalued businesses that we believe should perform well in most market environments and hold up well in negative periods. We believe consistency in approach and consistency in outcome gives us the best chance of minimizing a left tail outcome in any given year. It is our view that if we can consistently deliver above average risk adjusted performance over a long period of time the outcome likely would be outperformance relative to our peers over the full period. That is our goal.
Environmental, Social, Governance Analysis: Traditional fundamental analysis does not capture risks associated with managing environmental resources nor does it assess the performance of businesses from the perspective of resource efficiency. Traditional analysis does not typically assess the risks associated with
12
TCW New America Premier Equities Fund
Management Discussions (Continued)
a heterogeneous workforce nor does it assess the competence, quality and engagement level of a company’s board of directors. Our investment framework not only pays close attention to these issues, we quantify, score, and rank companies and exclude businesses based on these risk factors. While those risks are not quantified through traditional financial analysis, we have found a significant correlation between companies that manage their resources prudently and businesses that sport strong financial metrics. Businesses that meet our rigorous ESG performance requirements typically have higher free cash flow yields, higher total yields, higher margins and lower levels of financial leverage.
Focus on Dominant, Predictable Businesses with High Barriers to Entry: In the long run the investment performance of a portfolio is inextricably linked to the underlying performance of the earnings and cash flows of the businesses comprising the portfolio. We believe one of the greatest risks in investing is valuing a business based on an erroneous view of the future free cash flows of the business. Such a circumstance results in an investor typically overpaying for a business and therefore generating a poor return on the investment.
In fast growing businesses or in industries that are undergoing rapid changes it is extraordinarily difficult and often dangerous to make an investment in a business when the long-term cash generation potential of the enterprise has a wide spectrum of outcomes. We seek to avoid companies and industries that are undergoing rapid changes. What we do seek, however, are stable businesses that have dominant market positions, and whose long term cash flows we believe can be predicted reasonably well. The qualitative characteristics that we seek, including attractive industry structures, pricing power and dominant market positions, make us confident in our forecast of the future cash flows of the businesses and therefore provide greater confidence that our valuation of the business is reasonably accurate. The famed value investor Benjamin Graham once said, “In the short run, the market is a voting machine but in the long run, it is a weighing machine.” Our view is that the market weighs cash flows and in order to consistently purchase a security for less than what it is worth, one should have high confidence in the future free cash flows of a business.
Thank you for joining us as fellow shareholders in the TCW New America Premier Equities Fund. We will continue to work hard to justify your confidence in us.
13
TCW New America Premier Equities Fund
Management Discussions (Continued)
| | | | | | | | | | | | |
| | | Annualized Returns(1) | |
| | | 1 Yr
Return | | | 3 Yr
Return | | | Inception
to Date | |
TCW New America Premier Equities Fund | | | | | | | | | | | | |
Class I (Inception: 1/29/2016) | | | 26.79 | % | | | 24.74 | % | | | 23.09 | % |
Class N (Inception: 1/29/2016) | | | 26.60 | % | | | 24.68 | % | | | 23.04 | % |
Russell 1000 Index | | | 14.15 | % | | | 14.73 | % | | | 15.01 | % |
| (1) | The total returns do not reflect taxes that a shareholder would pay on fund distribution or on the redemption of fund shares. |
14
TCW Relative Value Dividend Appreciation Fund
Management Discussions
For the year ended October 31, 2019, the TCW Relative Value Dividend Appreciation Fund (the “Fund”) posted a return of 11.27% and 11.02% on its I Class and N Class shares, respectively. The performance of the Fund’s classes varies because of differing expenses. The Fund’s benchmark, the Russell 1000 Value Index, returned 11.21% over the same period.
Market Outlook
The Federal Reserve cut rates for the third time in 2019 in October (reversing all of the hikes conducted in 2018) to “provide some insurance against ongoing risks.” Fed Chair Jerome Powell stated “there’s plenty of risk left” but also added that some of the obstacles have eased. It appears as if the Fed is “on pause” with Mr. Powell adding that rate hikes were unlikely in the near future unless inflation moves higher.
The U.S. economy and markets remain attractive. The first reading (advance estimate) for 3Q:19 U.S. GDP came in at 1.9% (2.0% year-over-year) reflecting strong personal consumption and single family housing expenditures which offset declines in nonresidential fixed and private inventory investments. The October jobs report surprised to the upside with nonfarm payrolls rising by 128,000, far better than estimates for 75,000 gains (even accounting for the GM auto strike), and was buttressed by noticeable upward revisions in the prior two months’ figures. With nearly all S&P 500 companies reporting, 3Q:19 corporate earnings have come in better than expected; Earnings are currently flat to slightly positive year-over-year versus expectations of -2% to -3%, with revenue growth of ~4% year-over-year. The third quarter is likely to be the trough in this mid-cycle correction as earnings are estimated to be up slightly in 4Q:19, mid-single digits in each of the first two quarters of 2020, and accelerating into double-digits in the third and fourth quarters. While the Trump impeachment process creates headlines, thus far the proceedings and findings have not had much market impact. For reference, markets movements during the two most recent impeachment inquiries (Richard Nixon; down and Bill Clinton; up) were much more dependent on underlying economic growth.
The risk of a U.S. recession has subsided. Indeed, with the solid jobs report, a resilient U.S. consumer, and a “cease-fire” for the October and December Chinese tariffs, recession fears have faded. Additionally, the 2-10 U.S. Treasury positive yield spread has grown to ~25 bps, and despite contracting for the last three months, there was an uptick in the U.S. ISM Manufacturing Purchasing Managers Index (PMI) report for October. While not in evidence, the classic recessionary causes, such as an overheated economy, earnings recession, runaway inflation, and financial imbalances must be monitored vigilantly.
We believe the U.S. is still the best place to invest given exports of goods and services only account for approximately 12% of GDP. While tariffs are painful and literally counterproductive, the U.S., in general, is a self-sustaining economy. Due in part to trade tensions, global growth concerns remain with China’s official GDP slowing to 6.0% in 3Q:19 and the Eurozone’s largest economy Germany teetering on recession while the UK/Brexit situation remains thorny with a deadline being extended again, now to January 31, 2020, and a UK general election has been called for December 12. Argentina facing a deepening economic crisis, Hong Kong protests, Iran, and Syria are each dampening business confidence. To combat the slowdown, a massive global easing cycle has gained traction with the U.S., Chinese, European, New Zealand, Thailand, Indian, Australian, and most recently Japanese central banks all now in stimulus mode. The transmission mechanisms for central bank easing tend to lag by six to nine months thus positive evidence of their efforts should be felt by year end and into the first half of 2020.
15
TCW Relative Value Dividend Appreciation Fund
Management Discussions (Continued)
There have been many times when the macro has overwhelmed the micro company specific fundamentals, but the “truth will out.” Companies, when faced with adversity, tend to undertake cost cutting and restructuring, and reinvest in the people and technology to stay relevant and competitive. Historically, extreme growth valuation levels have reversed with value sizably outperforming growth over multiple years. The dilemma investors face is whether 1) they should continue to “ride” momentum and the S&P 500 (which are showing signs of fatigue), or 2) consider value stocks as “insurance” with attractive valuations that have been overlooked and oversold as a result of the growth decade. While an allocation to value has been an “insurance” policy over the last few years, we believe strongly it should now be part of an investors’ offensive lineup. As value investors, it is imperative to stick to the fundamentals (cash flow, earnings, and company specific catalysts) and those companies with the balance sheets and management teams to prevail over time. Stocks trading at attractive valuations, with ample long-term growth prospects, should ultimately win investor favor. Finally, prudent investors should maintain diversification in both styles to avoid chasing potential seismic changes as well as curtail risk and be in the position to gain throughout economic cycles which should smooth returns over time.
The Fund remains attractively valued versus both the S&P 500 and the Russell 1000 Value with higher growth potential than the Value Index underscoring the “Search for Value Poised for Growth” Relative Value investment philosophy.
Fund Review
Over the course of the one-year period ending October 31, 2019, the Fund’s top ten conviction-weighted holdings outperformed the portfolio and both benchmarks returning 26.3%, on average, led by Cypress Semiconductor, Johnson Controls, AT&T, Intercontinental Exchange, and Maxim Integrated Products. The Fund’s Consumer Staples names were the best relative performers returning 33.2% versus the group gain of 12.2% led by Procter & Gamble and PepsiCo. Due largely to Cypress Semiconductor and aided and abetted by Seagate Technology and Maxim Integrated Products, the Fund’s Information Technology names outperformed 28.7% versus 22.9% while its Health Care and Communication Services holdings also performed admirably led by Royal Philips, Merck, AT&T, and Comcast. The portfolio’s Energy names outperformed -6.4% versus -12.5%, the only group not to be in the positive for the period. Homebuilder Lennar in the Consumer Discretionary space was additive on an absolute and relative basis. On the downside, holdings in the portfolio’s second smallest sector weight, Materials, were the biggest detractors declining -13.8% below the group rise of 7.4% with disappointing results from Freeport-McMoRan and DuPont. Largely due to Textron and secondly nVent, the portfolio’s Industrials names underperformed their peers 9.8% versus 17.1%; top ten holding Johnson Controls was one notable Industrial contributor offsetting some of the loss. Other detractors included Tapestry in the Consumer Discretionary space and Energy holdings Schlumberger and Baker Hughes. The Fund also lost value due to its overweight in Energy and underweight in Real Estate; offsetting some of this loss was the notable contribution from the overweight in Information Technology.
16
TCW Relative Value Dividend Appreciation Fund
Management Discussions (Continued)
| | | | | | | | | | | | | | | | | | | | | | | | |
| | | Annualized Returns(1) | |
| | | 1 Yr
Return | | | 3 Yr
Return | | | 5 Yr
Return | | | 10 Yr
Return | | | Inception
to Date | | | Inception
Index | |
TCW Relative Value Dividend Appreciation Fund | | | | | | | | | | | | | | | | | | | | | | | | |
Class I (Inception: 10/29/2004) | | | 11.27 | % | | | 7.58 | % | | | 5.52 | % | | | 11.26 | % | | | 6.95 | % | | | 10.14 | % |
Class N (Inception: 09/19/1986) | | | 11.02 | % | | | 7.34 | % | | | 5.27 | % | | | 10.95 | % | | | 8.89 | % | | | 7.80 | % |
Russell 1000 Value Index | | | 11.21 | % | | | 10.51 | % | | | 7.61 | % | | | 11.96 | % | | | | | | | | |
| (1) | The total returns do not reflect taxes that a shareholder would pay on fund distribution or the redemption of fund shares. |
17
TCW Relative Value Large Cap Fund
Management Discussions
For the year ended October 31, 2019, the TCW Relative Value Large Cap Fund (the “Fund”) posted a return of 8.13% and 7.92% on its I Class and N Class shares, respectively. The performance of the Fund’s classes varies because of differing expenses. The Fund’s benchmark, the Russell 1000 Value Index, returned 11.21% over the same period.
Market Outlook
The Federal Reserve cut rates for the third time in 2019 in October (reversing all of the hikes conducted in 2018) to “provide some insurance against ongoing risks.” Fed Chair Jerome Powell stated “there’s plenty of risk left” but also added that some of the obstacles have eased. It appears as if the Fed is “on pause” with Mr. Powell adding that rate hikes were unlikely in the near future unless inflation moves higher.
The U.S. economy and markets remain attractive. The first reading (advance estimate) for 3Q:19 U.S. GDP came in at 1.9% (2.0% year-over-year) reflecting strong personal consumption and single family housing expenditures which offset declines in nonresidential fixed and private inventory investments. The October jobs report surprised to the upside with nonfarm payrolls rising by 128,000, far better than estimates for 75,000 gains (even accounting for the GM auto strike), and was buttressed by noticeable upward revisions in the prior two months’ figures. With nearly all S&P 500 companies reporting, 3Q:19 corporate earnings have come in better than expected; Earnings are currently flat to slightly positive year-over-year versus expectations of -2% to -3%, with revenue growth of ~4% year-over-year. The third quarter is likely to be the trough in this mid-cycle correction as earnings are estimated to be up slightly in 4Q:19, mid-single digits in each of the first two quarters of 2020, and accelerating into double-digits in the third and fourth quarters. While the Trump impeachment process creates headlines, thus far the proceedings and findings have not had much market impact. For reference, markets movements during the two most recent impeachment inquiries (Richard Nixon; down and Bill Clinton; up) were much more dependent on underlying economic growth.
The risk of a U.S. recession has subsided. Indeed, with the solid jobs report, a resilient U.S. consumer, and a “cease-fire” for the October and December Chinese tariffs, recession fears have faded. Additionally, the 2-10 U.S. Treasury positive yield spread has grown to ~25 bps, and despite contracting for the last three months, there was an uptick in the U.S. ISM Manufacturing Purchasing Managers Index (PMI) report for October. While not in evidence, the classic recessionary causes, such as an overheated economy, earnings recession, runaway inflation, and financial imbalances must be monitored vigilantly.
We believe the U.S. is still the best place to invest given exports of goods and services only account for approximately 12% of GDP. While tariffs are painful and literally counterproductive, the U.S., in general, is a self-sustaining economy. Due in part to trade tensions, global growth concerns remain with China’s official GDP slowing to 6.0% in 3Q:19, the Eurozone’s largest economy Germany teetering on recession, while the UK/Brexit situation remains thorny with a deadline being extended again, now to January 31, 2020, and a UK general election has been called for December 12. Argentina facing a deepening economic crisis, Hong Kong protests, Iran, and Syria are each dampening business confidence. To combat the slowdown, a massive global easing cycle has gained traction with the U.S., Chinese, European, New Zealand, Thailand, Indian, Australian, and most recently Japanese central banks all now in stimulus mode. The transmission mechanisms for central bank easing tend to lag by six to nine months thus positive evidence of their efforts should be felt by year end and into the first half of 2020.
There have been many times when the macro has overwhelmed the micro company specific fundamentals, but the “truth will out.” Companies, when faced with adversity, tend to undertake cost cutting and
18
TCW Relative Value Large Cap Fund
Management Discussions (Continued)
restructuring, and reinvest in the people and technology to stay relevant and competitive. Historically, extreme growth valuation levels have reversed with value sizably outperforming growth over multiple years. The dilemma investors face is whether 1) they should continue to “ride” momentum and the S&P 500 (which are showing signs of fatigue), or 2) consider value stocks as “insurance” with attractive valuations that have been overlooked and oversold as a result of the growth decade. While an allocation to value has been an “insurance” policy over the last few years, we believe strongly it should now be part of an investors’ offensive lineup. As value investors, it is imperative to stick to the fundamentals (cash flow, earnings, and company specific catalysts) and those companies with the balance sheets and management teams to prevail over time. Stocks trading at attractive valuations, with ample long-term growth prospects, should ultimately win investor favor. Finally, prudent investors should maintain diversification in both styles to avoid chasing potential seismic changes as well as curtail risk and be in the position to gain throughout economic cycles which should smooth returns over time.
The Fund remains attractively valued versus both the S&P 500 and the Russell 1000 Value with higher growth potential than the Value Index underscoring the “Search for Value Poised for Growth” Relative Value investment philosophy.
Fund Review
Most of the Fund’s underperformance over the one-year period ending October 31, 2019 occurred in the last two months of calendar year 2018. With high dividend yield a most significant factor in 4Q:18 (per Barra Analytics’ thirteen risk indices), the RVLC strategy had a difficult quarter. Usually a long-term positive, the strategy’s diversified portfolio structure was hampered by economically sensitive companies and industries being negatively impacted by President Trump’s trade war along with the rotation to U.S. domestic, high dividend oriented sectors. Equity markets were jilted once again in May and August amid heightened concerns over trade between U.S. and China.
Over the course of the one-year period ending October 31, 2019, the Fund’s top ten conviction-weighted holdings outperformed the portfolio and both benchmarks returning 24.7%, on average, led by Cypress Semiconductor, Intercontinental Exchange, Comcast, and JPMorgan Chase. The Fund’s Information Technology names were the best relative performers returning 28.2% versus the group gain of 22.9% led in large part to Cypress Semiconductor and secondly First Data. With strong returns from Procter & Gamble and PepsiCo, the portfolio’s Consumer Staples names returned 27.3% besting their peers’ rise of 12.2% while Intercontinental Exchange and Hartford Financial Services led to the outperformance in Financials. Lastly, the portfolio’s Energy names outperformed -6.7% versus -12.5%, the only group not to be in the positive for the period. Other positive performers included Lennar and Johnson Controls. On the downside, the portfolio’s Industrials names were the biggest detractors gaining 0.2% below the group rise of 17.1% with disappointing results from Fluor, Textron, and Terex; after a fundamental review Fluor was completely sold. With Health Care coming under some pressure due to the potential of a Warren/Sanders presidency and prospect of “Medicare for All”, the portfolio’s holdings in the sector underperformed their peers -0.6% versus 8.0% due to managed care companies Centene and Molina Healthcare along with pharmaceutical companies Amneal Pharmaceuticals and Gilead which struggled as these companies face potential drug pricing challenges. The portfolio’s Materials stocks also detracted returning -14.6% versus 7.4% with Freeport-McMoRan being the biggest factor. Other notable detractors included Tapestry and Baker Hughes.
19
TCW Relative Value Large Cap Fund
Management Discussions (Continued)
| | | | | | | | | | | | | | | | | | | | | | | | |
| | | Annualized Returns(1) | |
| | | 1 Yr
Return | | | 3 Yr
Return | | | 5 Yr
Return | | | 10 Yr
Return | | | Inception
to Date | | | Inception
Index | |
TCW Relative Value Large Cap Fund | | | | | | | | | | | | | | | | | | | | | | | | |
Class I (Inception: 12/31/2003) | | | 8.13 | % | | | 7.64 | % | | | 5.16 | % | | | 10.54 | % | | | 7.12 | % | | | 7.20 | % |
Class N (Inception: 12/31/1997) | | | 7.92 | % | | | 7.40 | % | | | 4.92 | % | | | 10.28 | % | | | 6.13 | % | | | 7.86 | % |
Russell 1000 Value Index | | | 11.21 | % | | | 10.51 | % | | | 7.61 | % | | | 11.96 | % | | | | | | | | |
| (1) | The total returns do not reflect taxes that a shareholder would pay on fund distribution or on the redemption of fund shares. |
20
TCW Relative Value Mid Cap Fund
Management Discussions
For the year ended October 31, 2019, the TCW Relative Value Mid Cap Fund (the “Fund”) posted a return of 3.18% and 3.12% on its I Class and N Class shares, respectively. The performance of the Fund’s classes varies because of differing expenses. The Fund’s benchmark, the Russell Midcap Value Index, returned 10.08% over the same period. Calendar year-to-date through October 31, the Fund’s I Class and N Class shares have returned 18.25% and 18.14% versus the benchmark gain of 20.11%.
Market Outlook
The Federal Reserve cut rates for the third time in 2019 in October (reversing all of the hikes conducted in 2018) to “provide some insurance against ongoing risks.” Fed Chair Jerome Powell stated “there’s plenty of risk left” but also added that some of the obstacles have eased. It appears as if the Fed is “on pause” with Mr. Powell adding that rate hikes were unlikely in the near future unless inflation moves higher.
The U.S. economy and markets remain attractive. The first reading (advance estimate) for 3Q:19 U.S. GDP came in at 1.9% (2.0% year-over-year) reflecting strong personal consumption and single family housing expenditures which offset declines in nonresidential fixed and private inventory investments. The October jobs report surprised to the upside with nonfarm payrolls rising by 128,000, far better than estimates for 75,000 gains (even accounting for the GM auto strike), and was buttressed by noticeable upward revisions in the prior two months’ figures. With nearly all Russell Midcap companies reporting, despite being negative, 3Q:19 corporate earnings have come in better than expected; Earnings are currently -8% to -9% with revenue growth of 2-3% year-over-year, providing an unbiased view of underlying economic strength. The third quarter is likely to be the trough in this mid-cycle correction as earnings are estimated to be up high single-digits in 4Q:19, maintain that pace through the first half of 2020, and accelerating into double-digits in the third and fourth quarters. While the Trump impeachment process creates headlines, thus far the proceedings and findings have not had much market impact. For reference, markets movements during the two most recent impeachment inquiries (Richard Nixon; down and Bill Clinton; up) were much more dependent on underlying economic growth.
The risk of a U.S. recession has subsided. Indeed, with the solid jobs report, a resilient U.S. consumer, and a “cease-fire” for the October and December Chinese tariffs, recession fears have faded. Additionally, the 2-10 U.S. Treasury positive yield spread has grown to ~25 bps, and despite contracting for the last three months, there was an uptick in the U.S. ISM Manufacturing Purchasing Managers Index (PMI) report for October. While not in evidence, the classic recessionary causes, such as an overheated economy, earnings recession, runaway inflation, and financial imbalances must be monitored vigilantly.
We believe the U.S., and especially mid cap stocks, are the best place to invest given exports of goods and services only account for approximately 12% of GDP. While tariffs are painful and literally counterproductive, the U.S., in general, is a self-sustaining economy. Due in part to trade tensions, global growth concerns remain with China’s official GDP slowing to 6.0% in 3Q:19 and the Eurozone’s largest economy Germany teetering on recession while the UK/Brexit situation remains thorny with a deadline being extended again, now to January 31, 2020, and a UK general election has been called for December 12. Argentina facing a deepening economic crisis, Hong Kong protests, Iran, and Syria are each dampening business confidence. To combat the slowdown, a massive global easing cycle has gained traction with the U.S., Chinese, European, New Zealand, Thailand, Indian, Australian, and most recently Japanese central banks all now in stimulus mode. The transmission mechanisms for central bank easing tend to lag by six to nine months thus positive evidence of their efforts should be felt by year end and at least into the first half of 2020.
21
TCW Relative Value Mid Cap Fund
Management Discussions (Continued)
There have been many times when the macro has overwhelmed the micro company specific fundamentals, but the “truth will out.” Companies, when faced with adversity, tend to undertake cost cutting and restructuring, and reinvest in the people and technology to stay relevant and competitive. In addition, historically, extreme growth valuation levels should reverse with value primed to outperform growth over the next few years. The dilemma investors face is whether 1) they should continue to “ride” momentum or 2) consider mid cap value stocks as “insurance” with attractive valuations that have been overlooked and oversold. While an allocation to mid cap value has been an “insurance” policy over the last few years, we believe strongly it should now be part of an investors’ offensive lineup. Furthermore, mid cap stocks present a compelling investment case as they have outperformed their large cap brethren by over 300 basis points on an annualized basis over the last 20 years (as measured by Russell Midcap and S&P 500 indices) ending October 2019. As value investors, it is imperative to stick to the fundamentals (cash flow, earnings, and company specific catalysts) and those companies with the balance sheets and management teams to prevail over time. Stocks trading at attractive valuations, with ample long-term growth prospects, should ultimately win investor favor. Finally, prudent investors should maintain diversification to curtail risk and be in the position to gain throughout economic cycles which should smooth returns over time.
The Fund remains attractively valued versus the Russell Midcap Value Index and has higher growth potential underscoring the “Search for Value Poised for Growth” Relative Value investment philosophy.
Fund Review
A notable portion of the Fund’s underperformance over the one-year period ending October 31, 2019 occurred in the last two months of calendar year 2018. With the highest quintile dividend yields the most significant alpha contributor in 4Q:18 (per Barra Analytics’ thirteen risk indices), the RVMC strategy’s emphasis on five conservative valuation factors (including but not exclusively dividend yield) led to a difficult quarter. Usually a long-term positive, the strategy’s diversified portfolio structure was hampered by economically sensitive companies and industries being negatively impacted by President Trump’s trade war. Over the course of the one-year period ending October 31, 2019, the Fund’s top ten conviction-weighted holdings outperformed the portfolio and both benchmarks returning 24.3%, on average, led by Cypress Semiconductor, KB Home, and Jacobs Engineering. The Fund’s Information Technology names were the best relative performers returning 49.0% versus the group gain of 17.7% led in large part to Cypress Semiconductor and secondly First Data. With strong returns from homebuilders KB Home, Lennar, and Beazer Homes, the portfolio’s Consumer Discretionary names returned 21.4% besting their peers’ rise of 6.2% while AES led to the outperformance in Utilities. Other positive performers included Santander Consumer USA and Mid-America Apartment Communities in Financials and Real Estate, respectively. On the downside, the portfolio’s Industrials names were the biggest detractors gaining 2.7%, below the group rise of 21.2% with disappointing results from Manitowoc, Textron, and Fluor; after a fundamental review Fluor was completely sold. With Health Care coming under some pressure due to the potential of a Warren/Sanders presidency and prospect of “Medicare for All”, the portfolio’s holdings in the sector underperformed their peers -17.6% versus 4.4% due to managed care companies Centene and Molina Healthcare, behavior care company Acadia Healthcare, and Amneal Pharmaceuticals. Centene and Molina were both reduced and Amneal completely sold on fundamental reviews. The portfolio’s Financials stocks also detracted with their flat return underperforming the group gain of 11.1% with Umpqua Holdings, Comerica, Synovus Financial, and E*Trade the biggest factors; all four were reduced or sold. Other notable detractors included Tapestry, Newpark Resources, and ConAgra.
22
TCW Relative Value Mid Cap Fund
Management Discussions (Continued)
| | | | | | | | | | | | | | | | | | | | | | | | |
| | | Annualized Returns(1) | |
| | | 1 Yr
Return | | | 3 Yr
Return | | | 5 Yr
Return | | | 10 Yr
Return | | | Inception
to Date | | | Inception
Index | |
TCW Relative Value Mid Cap Fund | | | | | | | | | | | | | | | | | | | | | | | | |
Class I (Inception: 11/01/1996) | | | 3.18 | % | | | 7.96 | % | | | 4.45 | % | | | 10.34 | % | | | 9.70 | %(2) | | | 10.25 | % |
Class N (Inception: 10/31/2000) | | | 3.12 | % | | | 7.82 | % | | | 4.27 | % | | | 10.08 | % | | | 7.27 | % | | | 9.59 | % |
Russell Midcap Value Index | | | 10.08 | % | | | 8.90 | % | | | 6.95 | % | | | 12.90 | % | | | | | | | | |
| (1) | The total returns do not reflect taxes that a shareholder would pay on fund distribution or on the redemption of fund shares. |
| (2) | Performance data includes the performance of the predecessor entity for periods before the Fund’s registration became effective. The predecessor entity was not registered under the 1940 Act and, therefore, was not subject to certain investment restrictions that are imposed by the 1940 Act. If the predecessor entity had been registered under the 1940 Act, the predecessor entity’s performance may have been lower. |
23
TCW Select Equities Fund
Management Discussions
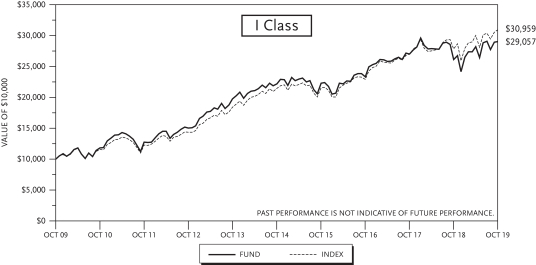
For the year ended October 31, 2019, the TCW Select Equities Fund (the “Fund”) posted a return of 18.98% and 18.74% on its I Class and N Class shares, respectively. The performance of the Fund’s classes varies because of differing expenses. The Fund’s benchmark, Russell 1000 Growth Index, returned 17.10% over the same period.
Fiscal 2019 was marked by increased volatility and a Federal Reserve intent on monetary intervention to extend the longest economic expansion on record. Despite breakeven inflation expectations dropping, financial conditions tightening and the U.S. Treasury 2-10 yield curve flattening, the Fed elected to raise rates in December 2018 (ninth hike since 2015), bringing the target rate for the Fed Funds rate to 2.25%-2.50%. The S&P 500 finished the month down 9% and finished calendar year 2018 -4.4%, the first negative total return year for the S&P 500 since 2008. In January 2019, the Fed abruptly pivoted with Chairman Powell noting that “we can afford to be patient.” By April, the S&P 500 was back to new all-time highs on the heels of a more dovish Fed and a better than expected 1Q19 real GDP report (+3.2%). The unemployment rate remained low (3.8%) and the bond market began to price in rate cuts for the remainder of 2019. The ongoing US-China trade war remained an overhang throughout the year, but thanks in part to an accommodative Fed (three 1/4 point cuts in 2019), the S&P 500 finished fiscal 2019 near an all-time high. Investor focus now turns to whether a long-awaited trade deal will be struck in front of an important 2020 election cycle.
Net of expenses, the Fund outperformed for the year primarily as a result of positive security selection results. Our biggest stock contributors during the year came from the real estate and information technology sectors. Shares of American Tower Corporation (AMT) rallied due to a string of solid earnings reports, as well as news that the company signed a new master lease agreement with AT&T that we believe may streamline wireless network deployments on AMT’s U.S. sites and accelerate AT&T’s deployment of FirstNet and 5G. Mobile data usage continues to increase at a rapid pace, and we believe AMT is uniquely positioned to benefit as carriers roll out 5G and continue to densify their 4G networks. We believe AMT is one of the key beneficiaries of global mobile data growth and we remain bullish on shares give the company’s scale, global footprint and recurring revenue streams. Shares of ServiceNow, Inc. (NOW) moved higher after several earnings reports that included both operating margin as well as TAM (Total Addressable Market) expansion. We believe NOW is a disruptive share gainer with a unique platform that automates workflow processes across several corners of a business enterprise and we remain constructive on shares.
Our biggest stock detractors during the year came from the energy and consumer discretionary sectors. Shares of Concho Resources Inc. (CXO) underperformed due to a value-destroying acquisition as well as a broader energy sector downward rerating. We exited our position earlier in the fiscal year. Shares of ULTA Beauty, Inc. (ULTA) declined after 2Q19 earnings results missed consensus estimates and the company lowered full year EPS guidance due to an abrupt cosmetics sales slowdown in July and August 2019. We believe ULTA is still gaining share in cosmetics, its non-cosmetic business is still comping double-digits and ecommerce is still growing greater than 20% year-over-year but recent trends are a concern given the relative strength of the U.S. consumer. As such, we have placed shares under review.
24
TCW Select Equities Fund
Management Discussions (Continued)
| | | | | | | | | | | | | | | | | | | | | | | | |
| | | Annualized Returns(1) | |
| | | 1 Yr
Return | | | 3 Yr
Return | | | 5 Yr
Return | | | 10 Yr
Return | | | Inception
to Date | | | Inception
Index | |
TCW Select Equities Fund | | | | | | | | | | | | | | | | | | | | | | | | |
Class I (Inception: 07/01/1991) | | | 18.98 | % | | | 18.58 | % | | | 12.52 | % | | | 14.31 | % | | | 10.42 | %(2) | | | 9.73 | % |
Class N (Inception: 2/26/1999) | | | 18.74 | % | | | 18.33 | % | | | 12.26 | % | | | 14.00 | % | | | 6.92 | % | | | 6.04 | % |
Russell 1000 Growth Index | | | 17.10 | % | | | 18.92 | % | | | 13.43 | % | | | 15.41 | % | | | | | | | | |
| (1) | The total returns do not reflect taxes that a shareholder would pay on fund distribution or on the redemption of fund shares. |
| (2) | Performance data includes the performance of the predecessor entity for periods before the Fund’s registration became effective. The predecessor entity was not registered under the 1940 Act and, therefore, was not subject to certain investment restrictions that are imposed by the 1940 Act. If the predecessor entity had been registered under the 1940 Act, the predecessor entity’s performance may have been lower. |
25
TCW Artificial Intelligence Equity Fund
Schedule of Investments
| | | | | | | | |
| Issues | | Shares | | | Value | |
|
COMMON STOCK — 99.7% of Net Assets | |
|
| Application Software — 16.2% | |
| | |
Adobe, Inc. (1) | | | 397 | | | $ | 110,338 | |
| | |
Alteryx, Inc. (1) | | | 184 | | | | 16,836 | |
| | |
Anaplan, Inc. (1) | | | 837 | | | | 39,506 | |
| | |
Autodesk, Inc. (1) | | | 688 | | | | 101,384 | |
| | |
Salesforce.com, Inc. (1) | | | 968 | | | | 151,482 | |
| | |
Splunk, Inc. (1) | | | 795 | | | | 95,368 | |
| | |
Trade Desk, Inc. (The) (1) | | | 301 | | | | 60,441 | |
| | |
Workday, Inc. (1) | | | 374 | | | | 60,648 | |
| | | | | | | | |
| |
| | | | 636,003 | |
| | | | | |
|
| Auto Parts & Equipment — 1.0% | |
| | |
Aptiv PLC | | | 415 | | | | 37,163 | |
| | | | | | | | |
|
| Cable & Satellite — 6.6% | |
| | |
Altice USA, Inc. (1) | | | 2,721 | | | | 84,215 | |
| | |
Charter Communications, Inc. (1) | | | 228 | | | | 106,672 | |
| | |
Comcast Corp. | | | 1,527 | | | | 68,440 | |
| | | | | | | | |
| |
| | | | 259,327 | |
| | | | | |
|
| Communications Equipment — 2.7% | |
| | |
Palo Alto Networks, Inc. (1) | | | 469 | | | | 106,646 | |
| | | | | | | | |
|
| Data Processing & Outsourced Services — 6.2% | |
| | |
Mastercard, Inc. | | | 319 | | | | 88,302 | |
| | |
Square, Inc. (1) | | | 1,094 | | | | 67,205 | |
| | |
Visa, Inc. | | | 498 | | | | 89,072 | |
| | | | | | | | |
| |
| | | | 244,579 | |
| | | | | |
|
| Health Care Equipment — 3.2% | |
| | |
IDEXX Laboratories, Inc. (1) | | | 262 | | | | 74,673 | |
| | |
Intuitive Surgical, Inc. (1) | | | 92 | | | | 50,871 | |
| | | | | | | | |
| |
| | | | 125,544 | |
| | | | | |
|
| Home Entertainment Software — 3.8% | |
| | |
Activision Blizzard, Inc. | | | 1,613 | | | | 90,376 | |
| | |
Electronic Arts, Inc. (1) | | | 606 | | | | 58,419 | |
| | | | | | | | |
| |
| | | | 148,795 | |
| | | | | |
|
| Internet & Direct Marketing Retail — 4.4% | |
| | |
Amazon.com, Inc. (1) | | | 78 | | | | 138,579 | |
| | |
Revolve Group, Inc. (1) | | | 1,705 | | | | 35,396 | |
| | | | | | | | |
| |
| | | | 173,975 | |
| | | | | |
|
| Internet Services & Infrastructure — 10.9% | |
| | |
Alibaba Group Holding, Ltd. (SP ADR) (1) | | | 515 | | | | 90,985 | |
| | |
Alphabet, Inc. (1) | | | 97 | | | | 122,104 | |
| | |
Facebook, Inc. (1) | | | 723 | | | | 138,563 | |
| | |
Tencent Holdings, Ltd. (SP ADR) (China) | | | 1,918 | | | | 77,679 | |
| | | | | | | | |
| |
| | | | 429,331 | |
| | | | | |
| | | | | | | | |
| Issues | | Shares | | | Value | |
|
| IT Consulting & Other Services — 4.1% | |
| | |
Accenture PLC | | | 368 | | | $ | 68,235 | |
| | |
EPAM Systems, Inc. (1) | | | 522 | | | | 91,851 | |
| | | | | | | | |
| |
| | | | 160,086 | |
| | | | | |
|
| Semiconductor Equipment — 12.6% | |
| | |
Analog Devices, Inc. | | | 726 | | | | 77,413 | |
| | |
ASML Holding NV (Netherlands) | | | 617 | | | | 161,636 | |
| | |
Lam Research Corp. | | | 544 | | | | 147,446 | |
| | |
Texas Instruments, Inc. | | | 457 | | | | 53,921 | |
| | |
Xilinx, Inc. | | | 578 | | | | 52,448 | |
| | | | | | | | |
| |
| | | | 492,864 | |
| | | | | |
|
| Semiconductors — 12.2% | |
| | |
Broadcom, Inc. | | | 206 | | | | 60,327 | |
| | |
Intel Corp. | | | 1,594 | | | | 90,109 | |
| | |
Micron Technology, Inc. (1) | | | 2,818 | | | | 133,996 | |
| | |
NVIDIA Corp. | | | 393 | | | | 79,001 | |
| | |
QUALCOMM, Inc. | | | 1,429 | | | | 114,948 | |
| | | | | | | | |
| |
| | | | 478,381 | |
| | | | | |
|
| Specialized REITs — 5.2% | |
| | |
American Tower Corp. | | | 506 | | | | 110,349 | |
| | |
Equinix, Inc. | | | 166 | | | | 94,085 | |
| | | | | | | | |
| |
| | | | 204,434 | |
| | | | | |
|
| Systems Software — 7.8% | |
| | |
Microsoft Corp. | | | 1,136 | | | | 162,868 | |
| | |
ServiceNow, Inc. (1) | | | 587 | | | | 145,142 | |
| | | | | | | | |
| |
| | | | 308,010 | |
| | | | | |
|
| Technology Hardware, Storage & Peripherals — 1.7% | |
| | |
Western Digital Corp. | | | 1,323 | | | | 68,333 | |
| | | | | | | | |
|
| Wireless Telecommunication Services — 1.1% | |
| | |
T-Mobile US, Inc. (1) | | | 521 | | | | 43,066 | |
| | | | | | | | |
|
Total Common Stock | |
| |
(Cost: $3,415,661) | | | | 3,916,537 | |
| | | | | |
|
| MONEY MARKET INVESTMENTS — 2.5% | |
| | |
State Street Institutional U.S. Government Money Market Fund — Premier Class, 1.75% (2) | | | 100,121 | | | | 100,121 | |
| | | | | | | | |
|
Total Money Market Investments | |
| |
(Cost: $100,121) | | | | 100,121 | |
| | | | | |
| | |
Total Investments (102.2%) | | | | | | | | |
| |
(Cost: $3,515,782) | | | | 4,016,658 | |
| |
Liabilities in Excess of Other Assets (-2.2%) | | | | (87,363 | ) |
| | | | | |
| |
Net Assets (100.0%) | | | $ | 3,929,295 | |
| | | | | |
See accompanying notes to financial statements.
26
TCW Artificial Intelligence Equity Fund
October 31, 2019
Notes to the Schedule of Investments
| (1) | | Non-income producing security. |
| (2) | | Rate disclosed is the 7-day net yield as of October 31, 2019. |
| REIT | | Real Estate Investment Trust. |
| SP ADR | | Sponsored American Depositary Receipt. ADRs are receipts, typically issued by a U.S. bank or trust company, evidencing ownership of underlying securities issued by a foreign corporation. Sponsored ADRs are ADRs issued with the cooperation of the foreign corporation. |
See accompanying notes to financial statements.
27
TCW Artificial Intelligence Equity Fund
Investments by Sector | October 31, 2019 |
| | | | |
| Sector | | Percentage of
Net Assets | |
Application Software | | | 16.2 | % |
Auto Parts & Equipment | | | 1.0 | |
Cable & Satellite | | | 6.6 | |
Communications Equipment | | | 2.7 | |
Data Processing & Outsourced Services | | | 6.2 | |
Health Care Equipment | | | 3.2 | |
Home Entertainment Software | | | 3.8 | |
Internet & Direct Marketing Retail | | | 4.4 | |
Internet Services & Infrastructure | | | 10.9 | |
IT Consulting & Other Services | | | 4.1 | |
Semiconductor Equipment | | | 12.6 | |
Semiconductors | | | 12.2 | |
Specialized REITs | | | 5.2 | |
Systems Software | | | 7.8 | |
Technology Hardware, Storage & Peripherals | | | 1.7 | |
Wireless Telecommunication Services | | | 1.1 | |
Money Market Investments | | | 2.5 | |
| | | | |
Total | | | 102.2 | % |
| | | | |
Fair Valuation Summary
The following is a summary of the fair valuations according to the inputs used as of October 31, 2019 in valuing the Fund’s investments:
| | | | | | | | | | | | | | | | |
Description | | Quoted Prices
in Active
Markets for
Identical
Assets
(Level 1) | | | Other
Significant
Observable
Inputs
(Level 2) | | | Significant
Unobservable
Inputs
(Level 3) | | | Total | |
Common Stock | | | | | | | | | | | | | | | | |
Application Software | | $ | 636,003 | | | $ | — | | | $ | — | | | $ | 636,003 | |
Auto Parts & Equipment | | | 37,163 | | | | — | | | | — | | | | 37,163 | |
Cable & Satellite | | | 259,327 | | | | — | | | | — | | | | 259,327 | |
Communications Equipment | | | 106,646 | | | | — | | | | — | | | | 106,646 | |
Data Processing & Outsourced Services | | | 244,579 | | | | — | | | | — | | | | 244,579 | |
Health Care Equipment | | | 125,544 | | | | — | | | | — | | | | 125,544 | |
Home Entertainment Software | | | 148,795 | | | | — | | | | — | | | | 148,795 | |
Internet & Direct Marketing Retail | | | 173,975 | | | | — | | | | — | | | | 173,975 | |
Internet Services & Infrastructure | | | 429,331 | | | | — | | | | — | | | | 429,331 | |
IT Consulting & Other Services | | | 160,086 | | | | — | | | | — | | | | 160,086 | |
Semiconductor Equipment | | | 492,864 | | | | — | | | | — | | | | 492,864 | |
Semiconductors | | | 478,381 | | | | — | | | | — | | | | 478,381 | |
Specialized REITs | | | 204,434 | | | | — | | | | — | | | | 204,434 | |
Systems Software | | | 308,010 | | | | — | | | | — | | | | 308,010 | |
Technology Hardware, Storage & Peripherals | | | 68,333 | | | | — | | | | — | | | | 68,333 | |
Wireless Telecommunication Services | | | 43,066 | | | | — | | | | — | | | | 43,066 | |
| | | | | | | | | | | | | | | | |
Total Common Stock | | | 3,916,537 | | | | — | | | | — | | | | 3,916,537 | |
| | | | | | | | | | | | | | | | |
Money Market Investments | | | 100,121 | | | | — | | | | — | | | | 100,121 | |
| | | | | | | | | | | | | | | | |
Total Investments | | $ | 4,016,658 | | | $ | — | | | $ | — | | | $ | 4,016,658 | |
| | | | | | | | | | | | | | | | |
See accompanying notes to financial statements.
28
TCW Conservative Allocation Fund
Schedule of Investments | October 31, 2019 |
| | | | | | | | |
| Issues | | Shares | | | Value | |
|
EXCHANGE-TRADED FUNDS — 2.5% of Net Assets | |
| | |
iShares MSCI EAFE Index Fund | | | 11,160 | | | $ | 752,407 | |
| | | | | | | | |
| | |
Total Exchange-Traded Funds | | | | | | | | |
| | |
(Cost: $725,446) | | | | | | | 752,407 | |
| | | | | |
|
INVESTMENT COMPANIES — 96.8% | |
|
| Diversified Equity Funds — 37.1% | |
| | |
TCW Global Real Estate Fund — I Class (1) | | | 171,115 | | | | 1,909,641 | |
| | |
TCW New America Premier Equities Fund — I Class (1) | | | 198,279 | | | | 4,033,000 | |
| | |
TCW Relative Value Large Cap Fund — I Class (1) | | | 110,882 | | | | 2,072,391 | |
| | |
TCW Relative Value Mid Cap Fund — I Class (1) | | | 14,579 | | | | 307,040 | |
| | |
TCW Select Equities Fund — I Class (1) | | | 100,202 | | | | 2,769,588 | |
| | | | | | | | |
| | |
| | | | | | | 11,091,660 | |
| | | | | |
|
| Diversified Fixed Income Funds — 59.7% | |
| | |
Metropolitan West Low Duration Bond Fund — I Class (1) | | | 255,276 | | | | 2,241,323 | |
| | |
Metropolitan West Total Return Bond Fund — I Class (1) | | | 306,210 | | | | 3,392,808 | |
| | |
Metropolitan West Unconstrained Bond Fund — I Class (1) | | | 508,161 | | | | 6,057,278 | |
| | | | | | | | |
| Issues | | Shares | | | Value | |
|
| Diversified Fixed Income Funds (Continued) | |
| | |
TCW Global Bond Fund — I Class (1) | | | 73,332 | | | $ | 752,383 | |
| | |
TCW Total Return Bond Fund — I Class (1) | | | 537,232 | | | | 5,409,922 | |
| | | | | | | | |
| | |
| | | | | | | 17,853,714 | |
| | | | | |
| | |
Total Investment Companies | | | | | | | | |
| | |
(Cost: $25,853,016) | | | | | | | 28,945,374 | |
| | | | | |
|
MONEY MARKET INVESTMENTS — 0.7% | |
| | |
State Street Institutional U.S. Government Money Market Fund — Premier Class, 1.75% (2) | | | 215,812 | | | | 215,812 | |
| | | | | | | | |
| | |
Total Money Market Investments | | | | | | | | |
| | |
(Cost: $215,812) | | | | | | | 215,812 | |
| | | | | |
| | |
Total Investments (100.0%) | | | | | | | | |
| | |
(Cost: $26,794,274) | | | | | | | 29,913,593 | |
| |
Excess of Other Assets over Liabilities (0.0%) | | | | 1,418 | |
| | | | | |
| |
Net Assets (100.0%) | | | $ | 29,915,011 | |
| | | | | |
Notes to the Schedule of Investments
| (2) | Rate disclosed is the 7-day net yield as of October 31, 2019. |
See accompanying notes to financial statements.
29
TCW Conservative Allocation Fund
Schedule of Investments (Continued)
The summary of the TCW Conservative Allocation Fund transactions in the affiliated funds for the year ended October 31, 2019 is as follows:
| | | | | | | | | | | | | | | | | | | | | | | | | | | | | | | | | | | | |
Name of
Affiliated
Fund | | Value at
October 31,
2018
(In Thousands) | | | Purchases
at Cost
(In Thousands) | | | Proceeds
from Sales
(In Thousands) | | | Number
of Shares
Held
October 31,
2019 | | | Value at
October 31,
2019
(In Thousands) | | | Dividends and
Interest
Income
Received
(In Thousands) | | | Distributions
Received from
Net Realized
Gain
(In thousands) | | | Net Realized
Gain/(Loss)
on
Investments
(In thousands) | | | Net change in
Unrealized
Gain/(Loss)
on
Investments
(In thousands) | |
Metropolitan West Low Duration Bond Fund—I Class | | | | | | | | | | | | | |
| | $ | 3,515 | | | $ | 89 | | | $ | 1,322 | | | | 255,276 | | | $ | 2,241 | | | $ | 89 | | | $ | — | | | $ | 1 | | | $ | 88 | |
Metropolitan West Total Return Bond Fund—I Class | | | | | | | | | | | | | |
| | $ | 3,594 | | | $ | 247 | | | $ | 725 | | | | 306,210 | | | | 3,393 | | | | 100 | | | | — | | | | (16 | ) | | | 293 | |
Metropolitan West Unconstrained Bond Fund—I Class | | | | | | | | | | | | | |
| | $ | 5,432 | | | $ | 720 | | | $ | 200 | | | | 508,161 | | | | 6,057 | | | | 221 | | | | — | | | | (2 | ) | | | 107 | |
TCW Global Bond Fund—I Class | | | | | | | | | | | | | |
| | $ | 708 | | | $ | 10 | | | $ | 26 | | | | 73,332 | | | | 752 | | | | 11 | | | | — | | | | (1 | ) | | | 61 | |
TCW Global Real Estate Fund—I Class | | | | | | | | | | | | | |
| | $ | — | | | $ | 1,752 | | | $ | 30 | | | | 171,115 | | | | 1,910 | | | | 21 | | | | — | | | | 0 | * | | | 188 | |
TCW New America Premier Equities Fund—I Class | | | | | | | | | | | | | |
| | $ | 2,832 | | | $ | 771 | | | $ | 251 | | | | 198,279 | | | | 4,033 | | | | 2 | | | | 35 | | | | 49 | | | | 633 | |
TCW Relative Value Large Cap Fund—I Class | | | | | | | | | | | | | |
| | $ | 3,299 | | | $ | 377 | | | $ | 1,417 | | | | 110,882 | | | | 2,072 | | | | 51 | | | | 326 | | | | (374 | ) | | | 188 | |
TCW Relative Value Mid Cap Fund—I Class | | | | | | | | | | | | | |
| | $ | 731 | | | $ | 57 | | | $ | 448 | | | | 14,579 | | | | 307 | | | | 4 | | | | 52 | | | | (112 | ) | | | 79 | |
TCW Select Equities Fund—I Class | | | | | | | | | | | | | |
| | $ | 2,687 | | | $ | 355 | | | $ | 385 | | | | 100,202 | | | | 2,770 | | | | — | | | | 355 | | | | (71 | ) | | | 184 | |
TCW Total Return Bond Fund—I Class | | | | | | | | | | | | | |
| | $ | 3,336 | | | $ | 1,988 | | | $ | 125 | | | | 537,232 | | | | 5,410 | | | | 170 | | | | — | | | | (2 | ) | | | 213 | |
| | | | | | | | | | | | | | | | | | | | | | | | | | | | | | | | | | | | |
Total | | | | | | | | | | | | | | | | | | $ | 28,945 | | | $ | 669 | | | $ | 768 | | | $ | (528 | ) | | $ | 2,034 | |
| | | | | | | | | | | | | | | | | | | | | | | | | | | | | | | | | | | | |
| * | Amount rounds to less than $1. |
See accompanying notes to financial statements.
30
TCW Conservative Allocation Fund
Investments by Sector | October 31, 2019 |
| | | | |
| Sector | | Percentage of
Net Assets | |
Diversified Fixed Income Funds | | | 59.7 | % |
Diversified Equity Funds | | | 37.1 | |
Exchange-Traded Funds | | | 2.5 | |
Money Market Investments | | | 0.7 | |
| | | | |
Total | | | 100.0 | % |
| | | | |
Fair Valuation Summary
The following is a summary of the fair valuations according to the inputs used as of October 31, 2019 in valuing the Fund’s investments:
| | | | | | | | | | | | | | | | |
Description | | Quoted Prices
in Active
Markets for
Identical
Assets
(Level 1) | | | Other
Significant
Observable
Inputs
(Level 2) | | | Significant
Unobservable
Inputs
(Level 3) | | | Total | |
Common Stock | | | | | | | | | | | | | | | | |
Exchange-Traded Funds | | $ | 752,407 | | | $ | — | | | $ | — | | | $ | 752,407 | |
Investment Companies | | | 28,945,374 | | | | — | | | | — | | | | 28,945,374 | |
Money Market Investments | | | 215,812 | | | | — | | | | — | | | | 215,812 | |
| | | | | | | | | | | | | | | | |
Total Investments | | $ | 29,913,593 | | | $ | — | | | $ | — | | | $ | 29,913,593 | |
| | | | | | | | | | | | | | | | |
See accompanying notes to financial statements.
31
TCW Global Real Estate Fund
Schedule of Investments
| | | | | | | | |
| Issues | | Shares | | | Value | |
|
COMMON STOCK — 98.4% of Net Assets | |
|
| Australia — 7.1% | |
| | |
Goodman Group | | | 28,726 | | | $ | 285,062 | |
| | |
Mirvac Group | | | 100,889 | | | | 223,428 | |
| | | | | | | | |
| | |
Total Australia | | | | | | | | |
| | |
(Cost: $425,145) | | | | | | | 508,490 | |
| | | | | |
|
| Canada — 2.8% (Cost: $189,454) | |
| | |
Summit Industrial Income REIT | | | 20,777 | | | | 202,024 | |
| | | | | | | | |
|
| China — 4.0% | |
| | |
China Resources Land, Ltd. | | | 22,000 | | | | 93,542 | |
| | |
Link REIT (The) | | | 8,332 | | | | 90,727 | |
| | |
Longfor Group Holdings, Ltd. | | | 25,000 | | | | 103,731 | |
| | | | | | | | |
| | |
Total China | | | | | | | | |
| | |
(Cost: $229,184) | | | | | | | 288,000 | |
| | | | | |
|
| Germany — 1.1% (Cost: $60,637) | |
| | |
Deutsche Wohnen SE | | | 2,176 | | | | 82,066 | |
| | | | | | | | |
|
| Japan — 12.0% | |
| | |
Ichigo Office REIT Investment | | | 274 | | | | 281,591 | |
| | |
Mitsubishi Estate Co., Ltd. | | | 10,000 | | | | 193,947 | |
| | |
Mitsui Fudosan Co., Ltd. | | | 5,900 | | | | 150,778 | |
| | |
Nippon Prologis REIT, Inc. | | | 83 | | | | 231,596 | |
| | | | | | | | |
| | |
Total Japan | | | | | | | | |
| | |
(Cost: $718,202) | | | | | | | 857,912 | |
| | | | | |
|
| United Kingdom — 3.6% (Cost: $185,027) | |
| | |
Segro PLC | | | 23,472 | | | | 256,500 | |
| | | | | | | | |
|
| United States — 67.8% | |
| | |
Alexandria Real Estate Equities, Inc. | | | 1,284 | | | | 203,835 | |
| | |
American Homes 4 Rent | | | 6,616 | | | | 175,126 | |
| | |
American Tower Corp. | | | 1,106 | | | | 241,196 | |
| | |
Americold Realty Trust | | | 8,663 | | | | 347,300 | |
| | |
DR Horton, Inc. | | | 3,716 | | | | 194,607 | |
| | |
Equinix, Inc. | | | 973 | | | | 551,477 | |
| | |
Gaming and Leisure Properties, Inc. | | | 6,786 | | | | 273,883 | |
| | | | | | | | |
| Issues | | Shares | | | Value | |
|
| United States (Continued) | |
| | |
Hilton Worldwide Holdings, Inc. | | | 1,366 | | | $ | 132,447 | |
| | |
Hudson Pacific Properties, Inc. | | | 8,976 | | | | 322,418 | |
| | |
Invitation Homes, Inc. | | | 3,724 | | | | 114,662 | |
| | |
JBG SMITH Properties | | | 4,004 | | | | 161,201 | |
| | |
Kennedy-Wilson Holdings, Inc. | | | 2,939 | | | | 67,626 | |
| | |
Mid-America Apartment Communities, Inc. | | | 1,119 | | | | 155,530 | |
| | |
NexPoint Residential Trust, Inc. | | | 1,431 | | | | 69,790 | |
| | |
Prologis, Inc. | | | 1,815 | | | | 159,284 | |
| | |
Ready Capital Corp. | | | 14,862 | | | | 235,265 | |
| | |
SBA Communications Corp. | | | 800 | | | | 192,520 | |
| | |
Simon Property Group, Inc. | | | 1,550 | | | | 233,554 | |
| | |
Sun Communities, Inc. | | | 1,735 | | | | 282,198 | |
| | |
Terreno Realty Corp. | | | 2,431 | | | | 137,133 | |
| | |
Toll Brothers, Inc. | | | 2,508 | | | | 99,743 | |
| | |
Vail Resorts, Inc. | | | 996 | | | | 231,440 | |
| | |
VICI Properties, Inc. | | | 6,149 | | | | 144,809 | |
| | |
Welltower, Inc. | | | 1,546 | | | | 140,207 | |
| | | | | | | | |
| | |
Total United States | | | | | | | | |
| | |
(Cost: $4,011,408) | | | | | | | 4,867,251 | |
| | | | | |
| | |
Total Common Stock | | | | | | | | |
| | |
(Cost: $5,819,057) | | | | | | | 7,062,243 | |
| | | | | |
| | |
Total Purchased Options (1) (0.1%) | | | | | | | | |
| | |
(Cost: $10,414) | | | | | | | 5,358 | |
| | | | | |
|
MONEY MARKET INVESTMENTS — 1.4% | |
| | |
State Street Institutional U.S. Government Money Market Fund — Premier Class, 1.75% (2) | | | 101,122 | | | | 101,122 | |
| | | | | | | | |
| | |
Total Money Market Investments | | | | | | | | |
| | |
(Cost: $101,122) | | | | | | | 101,122 | |
| | | | | |
| | |
Total Investments (99.9%) | | | | | | | | |
| | |
(Cost: $5,930,593) | | | | | | | 7,168,723 | |
| |
Excess of Other Assets over Liabilities (0.1%) | | | | 6,822 | |
| | | | | | | | |
| |
Net Assets (100.0%) | | | $ | 7,175,545 | |
| | | | | |
| | | | | | | | | | | | | | | | | | | | | | | | | | | | | | |
| Purchased Options — Exchange Traded | |
| | | | | | | | |
| Description | | | | Exercise
Price | | | Expiration
Date | | | Number of
Contracts | | | Notional
Amount
(000) | | | Market
Value | | | Premiums
Paid
by Fund | | | Unrealized
Appreciation/
(Depreciation) | |
PUT | |
Stag Industrial, Inc. | | | | | 30 | | | | 3/20/20 | | | | 1,700 | | | | 52,768 | | | $ | 1,658 | | | $ | 4,522 | | | $ | (2,864 | ) |
Tanger Factory Outlet Centers | | | | | 16 | | | | 1/17/20 | | | | 4,000 | | | | 64,480 | | | | 3,700 | | | | 5,892 | | | | (2,192 | ) |
| | | | | | | | | | | | | | | | | | | | | | | | | | | | | | |
| | | | | | | | | | | | | | | | | | | | $ | 5,358 | | | $ | 10,414 | | | $ | (5,056 | ) |
| | | | | | | | | | | | | | | | | | | | | | | | | | | | | | |
Notes to the Schedule of Investments
| (1) | | See options table for description of purchased options. |
| (2) | | Rate disclosed is the 7-day net yield as of October 31, 2019. |
| REIT | | Real Estate Investment Trust. |
See accompanying notes to financial statements.
32
TCW Global Real Estate Fund
Investments by Sector | October 31, 2019 |
| | | | |
| Sector | | Percentage of
Net Assets | |
Diversified REITs | | | 3.1 | % |
Diversified Real Estate Activities | | | 4.8 | |
Health Care REITs | | | 2.0 | |
Homebuilding | | | 4.1 | |
Hotels, Resorts & Cruise Lines | | | 1.8 | |
Industrial REITs | | | 22.6 | |
Leisure Facilities | | | 3.2 | |
Mortgage REITs | | | 3.3 | |
Office REITs | | | 13.5 | |
Real Estate Development | | | 2.7 | |
Real Estate Operating Companies | | | 2.0 | |
Residential REITs | | | 11.1 | |
Retail REITs | | | 4.6 | |
Purchased Options | | | 0.1 | |
Specialized REITs | | | 19.6 | |
Money Market Investments | | | 1.4 | |
| | | | |
Total | | | 99.9 | % |
| | | | |
Fair Valuation Summary
The following is a summary of the fair valuations according to the inputs used as of October 31, 2019 in valuing the Fund’s investments:
| | | | | | | | | | | | | | | | |
Description | | Quoted Prices
in Active
Markets for
Identical
Assets
(Level 1) | | | Other
Significant
Observable
Inputs
(Level 2) | | | Significant
Unobservable
Inputs
(Level 3) | | | Total | |
Common Stock | | | | | | | | | | | | | | | | |
Diversified REITs | | $ | — | | | $ | 223,428 | | | $ | — | | | $ | 223,428 | |
Diversified Real Estate Activities | | | — | | | | 344,725 | | | | — | | | | 344,725 | |
Health Care REITs | | | 140,207 | | | | — | | | | — | | | | 140,207 | |
Homebuilding | | | 294,350 | | | | — | | | | — | | | | 294,350 | |
Hotels, Resorts & Cruise Lines | | | 132,447 | | | | — | | | | — | | | | 132,447 | |
Industrial REITs | | | 845,741 | | | | 773,158 | | | | — | | | | 1,618,899 | |
Leisure Facilities | | | 231,440 | | | | — | | | | — | | | | 231,440 | |
Mortgage REITs | | | 235,265 | | | | — | | | | — | | | | 235,265 | |
Office REITs | | | 969,045 | | | | — | | | | — | | | | 969,045 | |
Real Estate Development | | | — | | | | 197,273 | | | | — | | | | 197,273 | |
Real Estate Operating Companies | | | 67,626 | | | | 82,066 | | | | — | | | | 149,692 | |
Residential REITs | | | 797,306 | | | | — | | | | — | | | | 797,306 | |
Retail REITs | | | 233,554 | | | | 90,727 | | | | — | | | | 324,281 | |
Specialized REITs | | | 1,403,885 | | | | — | | | | — | | | | 1,403,885 | |
| | | | | | | | | | | | | | | | |
Total Common Stock | | | 5,350,866 | | | | 1,711,377 | | | | — | | | | 7,062,243 | |
| | | | | | | | | | | | | | | | |
Purchased Options | | | 5,358 | | | | — | | | | — | | | | 5,358 | |
| | | | | | | | | | | | | | | | |
Money Market Investments | | | 101,122 | | | | — | | | | — | | | | 101,122 | |
| | | | | | | | | | | | | | | | |
Total Investments | | $ | 5,457,346 | | | $ | 1,711,377 | | | $ | — | | | $ | 7,168,723 | |
| | | | | | | | | | | | | | | | |
See accompanying notes to financial statements.
33
TCW New America Premier Equities Fund
Schedule of Investments
| | | | | | | | |
| Issues | | Shares | | | Value | |
|
COMMON STOCK — 92.4% of Net Assets | |
|
| Aerospace & Defense — 4.7% | |
| | |
HEICO Corp. | | | 13,481 | | | $ | 1,662,745 | |
| | |
TransDigm Group, Inc. | | | 10,770 | | | | 5,668,037 | |
| | | | | | | | |
| |
| | | | 7,330,782 | |
| | | | | |
|
| Alternative Carriers — 1.5% | |
| | |
Zayo Group Holdings, Inc. (1) | | | 69,827 | | | | 2,383,894 | |
| | | | | | | | |
|
| Application Software — 14.1% | |
| | |
Constellation Software, Inc. | | | 19,538 | | | | 19,337,023 | |
| | |
Trade Desk, Inc. (The) (1) | | | 12,526 | | | | 2,515,221 | |
| | | | | | | | |
| |
| | | | 21,852,244 | |
| | | | | |
|
| Communications Equipment — 3.5% | |
| | |
Motorola Solutions, Inc. | | | 32,317 | | | | 5,374,963 | |
| | | | | | | | |
|
| Data Processing & Outsourced Services — 11.4% | |
| | |
Automatic Data Processing, Inc. | | | 9,630 | | | | 1,562,275 | |
| | |
EVO Payments, Inc. (1) | | | 9,311 | | | | 264,711 | |
| | |
Fiserv, Inc. (1) | | | 72,984 | | | | 7,746,522 | |
| | |
Mastercard, Inc. | | | 6,669 | | | | 1,846,046 | |
| | |
Visa, Inc. | | | 35,622 | | | | 6,371,351 | |
| | | | | | | | |
| |
| | | | 17,790,905 | |
| | | | | |
|
| Environmental & Facilities Services — 5.1% | |
| | |
Advanced Disposal Services, Inc. (1) | | | 91,660 | | | | 3,004,615 | |
| | |
Waste Connections, Inc. (Canada) | | | 54,094 | | | | 4,998,285 | |
| | | | | | | | |
| |
| | | | 8,002,900 | |
| | | | | |
|
| Financial Exchanges & Data — 0.9% | |
| | |
S&P Global, Inc. | | | 5,298 | | | | 1,366,831 | |
| | | | | | | | |
|
| Food Retail — 3.1% | |
| | |
Alimentation Couche-Tard, Inc. — Class B (Canada) | | | 158,380 | | | | 4,759,775 | |
| | | | | | | | |
|
| Health Care Equipment — 3.0% | |
| | |
Danaher Corp. | | | 34,326 | | | | 4,730,809 | |
| | | | | | | | |
|
| Industrial Conglomerates — 3.0% | |
| | |
Honeywell International, Inc. | | | 11,308 | | | | 1,953,231 | |
| | |
Roper Technologies, Inc. | | | 8,258 | | | | 2,782,616 | |
| | | | | | | | |
| |
| | | | 4,735,847 | |
| | | | | |
|
| Industrial Gases — 3.2% | |
| | |
Air Products & Chemicals, Inc. | | | 12,667 | | | | 2,701,364 | |
| | |
Linde PLC (Ireland) | | | 11,602 | | | | 2,301,257 | |
| | | | | | | | |
| |
| | | | 5,002,621 | |
| | | | | |
|
| Industrial Machinery — 3.0% | |
| | |
IDEX Corp. | | | 29,920 | | | | 4,653,458 | |
| | | | | | | | |
|
| Integrated Telecommunication Services — 1.9% | |
| | |
AT&T, Inc. | | | 76,597 | | | | 2,948,219 | |
| | | | | | | | |
| | | | | | | | |
| Issues | | Shares | | | Value | |
|
| Life Sciences Tools & Services — 4.0% | |
| | |
Agilent Technologies, Inc. | | | 33,345 | | | $ | 2,525,884 | |
| | |
Thermo Fisher Scientific, Inc. | | | 11,978 | | | | 3,617,116 | |
| | | | | | | | |
| |
| | | | 6,143,000 | |
| | | | | |
|
| Multi-Sector Holdings — 4.9% | |
| | |
Berkshire Hathaway, Inc. — Class B (1) | | | 33,315 | | | | 7,082,103 | |
| | |
GS Acquisition Holdings Corp. (1) | | | 52,062 | | | | 557,063 | |
| | | | | | | | |
| |
| | | | 7,639,166 | |
| | | | | |
|
| Research & Consulting Services — 10.1% | |
| | |
IHS Markit, Ltd. (1) | | | 125,215 | | | | 8,767,554 | |
| | |
TransUnion | | | 84,726 | | | | 7,000,062 | |
| | | | | | | | |
| |
| | | | 15,767,616 | |
| | | | | |
|
| Restaurants — 3.4% | |
| | |
Aramark | | | 119,798 | | | | 5,242,361 | |
| | | | | | | | |
|
| Semiconductors — 4.8% | |
| | |
Broadcom, Inc. | | | 9,847 | | | | 2,883,694 | |
| | |
Cypress Semiconductor Corp. | | | 198,587 | | | | 4,621,120 | |
| | | | | | | | |
| |
| | | | 7,504,814 | |
| | | | | |
|
| Systems Software — 6.8% | |
| | |
Microsoft Corp. | | | 73,371 | | | | 10,519,200 | |
| | | | | | | | |
|
Total Common Stock | |
| |
(Cost: $124,795,223) | | | | 143,749,405 | |
| | | | | |
|
CONVERTIBLE PREFERRED STOCK — 0.8% | |
|
| Health Care Equipment — 0.8% | |
| | |
Danaher Corp. | | | 1,086 | | | | 1,205,808 | |
| | | | | | | | |
|
Total Convertible Preferred Stock | |
| |
(Cost: $1,117,131) | | | | 1,205,808 | |
| | | | | |
|
MONEY MARKET INVESTMENTS — 5.7% | |
| | |
State Street Institutional U.S. Government Money Market Fund — Premier Class, 1.75% (2) | | | 8,944,214 | | | | 8,944,214 | |
| | | | | | | | |
|
Total Money Market Investments | |
| |
(Cost: $8,944,214) | | | | 8,944,214 | |
| | | | | |
| | |
Total Investments (98.9%) | | | | | | | | |
| |
(Cost: $134,856,568) | | | | 153,899,427 | |
| |
Excess of Other Assets over Liabilities (1.1%) | | | | 1,672,722 | |
| | | | | |
| |
Net Assets (100.0%) | | | $ | 155,572,149 | |
| | | | | |
Notes to the Schedule of Investments
| (1) | Non-income producing security. |
| (2) | Rate disclosed is the 7-day net yield as of October 31, 2019. |
See accompanying notes to financial statements.
34
TCW New America Premier Equities Fund
Investments by Sector | October 31, 2019 |
| | | | |
| Sector | | Percentage of
Net Assets | |
Aerospace & Defense | | | 4.7 | % |
Alternative Carriers | | | 1.5 | |
Application Software | | | 14.1 | |
Communications Equipment | | | 3.5 | |
Data Processing & Outsourced Services | | | 11.4 | |
Environmental & Facilities Services | | | 5.1 | |
Financial Exchanges & Data | | | 0.9 | |
Food Retail | | | 3.1 | |
Health Care Equipment | | | 3.8 | |
Industrial Conglomerates | | | 3.0 | |
Industrial Gases | | | 3.2 | |
Industrial Machinery | | | 3.0 | |
Integrated Telecommunication Services | | | 1.9 | |
Life Sciences Tools & Services | | | 4.0 | |
Multi-Sector Holdings | | | 4.9 | |
Research & Consulting Services | | | 10.1 | |
Restaurants | | | 3.4 | |
Semiconductors | | | 4.8 | |
Systems Software | | | 6.8 | |
Money Market Investments | | | 5.7 | |
| | | | |
Total | | | 98.9 | % |
| | | | |
See accompanying notes to financial statements.
35
TCW New America Premier Equities Fund
Fair Valuation Summary | October 31, 2019 |
The following is a summary of the fair valuations according to the inputs used as of October 31, 2019 in valuing the Fund’s investments:
| | | | | | | | | | | | | | | | |
Description | | Quoted Prices
in Active
Markets for
Identical
Assets
(Level 1) | | | Other
Significant
Observable
Inputs
(Level 2) | | | Significant
Unobservable
Inputs
(Level 3) | | | Total | |
Common Stock | | | | | | | | | | | | | | | | |
Aerospace & Defense | | $ | 7,330,782 | | | $ | — | | | $ | — | | | $ | 7,330,782 | |
Alternative Carriers | | | 2,383,894 | | | | — | | | | — | | | | 2,383,894 | |
Application Software | | | 21,852,244 | | | | — | | | | — | | | | 21,852,244 | |
Communications Equipment | | | 5,374,963 | | | | — | | | | — | | | | 5,374,963 | |
Data Processing & Outsourced Services | | | 17,790,905 | | | | — | | | | — | | | | 17,790,905 | |
Environmental & Facilities Services | | | 8,002,900 | | | | — | | | | — | | | | 8,002,900 | |
Financial Exchanges & Data | | | 1,366,831 | | | | — | | | | — | | | | 1,366,831 | |
Food Retail | | | 4,759,775 | | | | — | | | | — | | | | 4,759,775 | |
Health Care Equipment | | | 4,730,809 | | | | — | | | | — | | | | 4,730,809 | |
Industrial Conglomerates | | | 4,735,847 | | | | — | | | | — | | | | 4,735,847 | |
Industrial Gases | | | 5,002,621 | | | | — | | | | — | | | | 5,002,621 | |
Industrial Machinery | | | 4,653,458 | | | | — | | | | — | | | | 4,653,458 | |
Integrated Telecommunication Services | | | 2,948,219 | | | | — | | | | — | | | | 2,948,219 | |
Life Sciences Tools & Services | | | 6,143,000 | | | | — | | | | — | | | | 6,143,000 | |
Multi-Sector Holdings | | | 7,639,166 | | | | — | | | | — | | | | 7,639,166 | |
Research & Consulting Services | | | 15,767,616 | | | | — | | | | — | | | | 15,767,616 | |
Restaurants | | | 5,242,361 | | | | — | | | | — | | | | 5,242,361 | |
Semiconductors | | | 7,504,814 | | | | — | | | | — | | | | 7,504,814 | |
Systems Software | | | 10,519,200 | | | | — | | | | — | | | | 10,519,200 | |
| | | | | | | | | | | | | | | | |
Total Common Stock | | | 143,749,405 | | | | — | | | | — | | | | 143,749,405 | |
| | | | | | | | | | | | | | | | |
Convertible Preferred Stock | | | 1,205,808 | | | | — | | | | — | | | | 1,205,808 | |
| | | | | | | | | | | | | | | | |
Money Market Investments | | | 8,944,214 | | | | — | | | | — | | | | 8,944,214 | |
| | | | | | | | | | | | | | | | |
Total Investments | | $ | 153,899,427 | | | $ | — | | | $ | — | | | $ | 153,899,427 | |
| | | | | | | | | | | | | | | | |
See accompanying notes to financial statements.
36
TCW Relative Value Dividend Appreciation Fund
Schedule of Investments | October 31, 2019 |
| | | | | | | | |
| Issues | | Shares | | | Value | |
|
COMMON STOCK — 99.2% of Net Assets | |
|
| Aerospace & Defense — 0.9% | |
| | |
Textron, Inc. | | | 62,199 | | | $ | 2,866,752 | |
| | | | | | | | |
|
| Air Freight & Logistics — 2.4% | |
| | |
United Parcel Service, Inc. — Class B | | | 64,300 | | | | 7,405,431 | |
| | | | | | | | |
|
| Auto Components — 3.1% | |
| | |
Johnson Controls International PLC (Ireland) | | | 226,589 | | | | 9,818,101 | |
| | | | | | | | |
|
| Banks — 11.6% | |
| | |
Citigroup, Inc. | | | 160,804 | | | | 11,555,376 | |
| | |
JPMorgan Chase & Co. | | | 119,486 | | | | 14,926,191 | |
| | |
PacWest Bancorp | | | 91,800 | | | | 3,395,682 | |
| | |
Zions Bancorp | | | 128,570 | | | | 6,231,788 | |
| | | | | | | | |
| |
| | | | 36,109,037 | |
| | | | | |
|
| Beverages — 2.7% | |
| | |
PepsiCo, Inc. | | | 61,273 | | | | 8,404,817 | |
| | | | | | | | |
|
| Biotechnology — 3.5% | |
| | |
Gilead Sciences, Inc. | | | 170,665 | | | | 10,873,067 | |
| | | | | | | | |
|
| Capital Markets — 4.7% | |
| | |
Ameriprise Financial, Inc. | | | 21,652 | | | | 3,267,070 | |
| | |
Intercontinental Exchange, Inc. | | | 119,270 | | | | 11,249,547 | |
| | | | | | | | |
| |
| | | | 14,516,617 | |
| | | | | |
|
| Chemicals — 2.7% | |
| | |
Corteva, Inc. | | | 161,012 | | | | 4,247,496 | |
| | |
DuPont de Nemours, Inc. | | | 62,570 | | | | 4,123,989 | |
| | | | | | | | |
| |
| | | | 8,371,485 | |
| | | | | |
|
| Communications Equipment — 2.4% | |
| | |
Cisco Systems, Inc. | | | 159,887 | | | | 7,596,231 | |
| | | | | | | | |
|
| Diversified Telecommunication Services — 4.1% | |
| | |
AT&T, Inc. | | | 328,932 | | | | 12,660,593 | |
| | | | | | | | |
|
| Electrical Equipment — 1.5% | |
| | |
nVent Electric PLC (Ireland) | | | 206,282 | | | | 4,756,863 | |
| | | | | | | | |
|
| Electronic Equipment, Instruments & Components — 2.4% | |
| | |
Corning, Inc. | | | 254,184 | | | | 7,531,472 | |
| | | | | | | | |
|
| Energy Equipment & Services — 3.5% | |
| | |
Baker Hughes Co. | | | 320,585 | | | | 6,860,519 | |
| | |
Schlumberger, Ltd. | | | 125,256 | | | | 4,094,619 | |
| | | | | | | | |
| |
| | | | 10,955,138 | |
| | | | | |
|
| Food Products — 0.6% | |
| | |
Conagra Brands, Inc. | | | 69,600 | | | | 1,882,680 | |
| | | | | | | | |
|
| Health Care Equipment & Supplies — 2.0% | |
| | |
Medtronic PLC (Ireland) | | | 57,028 | | | | 6,210,349 | |
| | | | | | | | |
|
| Health Care Providers & Services — 1.7% | |
| | |
McKesson Corp. | | | 40,615 | | | | 5,401,795 | |
| | | | | | | | |
| | | | | | | | |
| Issues | | Shares | | | Value | |
|
| Household Durables — 2.5% | |
| | |
Lennar Corp. | | | 128,282 | | | $ | 7,645,607 | |
| | | | | | | | |
|
| Household Products — 1.9% | |
| | |
Procter & Gamble Co. (The) | | | 47,573 | | | | 5,923,314 | |
| | | | | | | | |
|
| Independent Power and Renewable Electricity Producers — 3.1% | |
| | |
AES Corp. (The) | | | 573,065 | | | | 9,770,758 | |
| | | | | | | | |
|
| Industrial Conglomerates — 4.0% | |
| | |
General Electric Co. | | | 627,279 | | | | 6,260,245 | |
| | |
Koninklijke Philips Electronics NV (NYRS) (Netherlands) | | | 139,267 | | | | 6,113,821 | |
| | | | | | | | |
| |
| | | | 12,374,066 | |
| | | | | |
|
| Insurance — 5.2% | |
| | |
American International Group, Inc. | | | 105,600 | | | | 5,592,576 | |
| | |
MetLife, Inc. | | | 226,178 | | | | 10,582,869 | |
| | | | | | | | |
| |
| | | | 16,175,445 | |
| | | | | |
|
| IT Services — 2.5% | |
| | |
International Business Machines Corp. | | | 59,391 | | | | 7,942,358 | |
| | | | | | | | |
|
| Media — 2.8% | |
| | |
Comcast Corp. | | | 193,094 | | | | 8,654,473 | |
| | | | | | | | |
|
| Metals & Mining — 1.0% | |
| | |
Freeport-McMoRan, Inc. | | | 319,900 | | | | 3,141,418 | |
| | | | | | | | |
|
| Multi-Utilities — 1.1% | |
| | |
Sempra Energy | | | 24,523 | | | | 3,543,819 | |
| | | | | | | | |
|
| Multiline Retail — 1.0% | |
| | |
Target Corp. | | | 27,800 | | | | 2,972,098 | |
| | | | | | | | |
|
| Oil, Gas & Consumable Fuels — 8.2% | |
| | |
Chevron Corp. | | | 110,725 | | | | 12,859,602 | |
| | |
Marathon Petroleum Corp. | | | 57,445 | | | | 3,673,608 | |
| | |
Royal Dutch Shell PLC (SP ADR) (United Kingdom) | | | 155,820 | | | | 9,032,885 | |
| | | | | | | | |
| |
| | | | 25,566,095 | |
| | | | | |
|
| Pharmaceuticals — 4.1% | |
| | |
Merck & Co., Inc. | | | 42,248 | | | | 3,661,212 | |
| | |
Novartis AG (SP ADR) (Switzerland) | | | 102,800 | | | | 8,988,832 | |
| | | | | | | | |
| |
| | | | 12,650,044 | |
| | | | | |
|
| Real Estate Management & Development — 0.6% | |
| | |
Jones Lang LaSalle, Inc. | | | 13,541 | | | | 1,984,027 | |
| | | | | | | | |
|
| REIT — 1.3% | |
| | |
Cousins Properties, Inc. | | | 98,775 | | | | 3,963,841 | |
| | | | | | | | |
|
| Semiconductors & Semiconductor Equipment — 7.3% | |
| | |
Broadcom, Inc. | | | 9,661 | | | | 2,829,224 | |
| | |
Cypress Semiconductor Corp. | | | 425,514 | | | | 9,901,711 | |
| | |
Maxim Integrated Products, Inc. | | | 170,948 | | | | 10,027,809 | |
| | | | | | | | |
| |
| | | | 22,758,744 | |
| | | | | |
See accompanying notes to financial statements.
37
TCW Relative Value Dividend Appreciation Fund
Schedule of Investments (Continued)
| | | | | | | | |
| Issues | | Shares | | | Value | |
|
| Technology Hardware, Storage & Peripherals — 1.3% | |
| | |
Seagate Technology PLC (Ireland) | | | 70,938 | | | $ | 4,116,532 | |
| | | | | | | | |
|
| Textiles, Apparel & Luxury Goods — 1.5% | |
| | |
Tapestry, Inc. | | | 175,421 | | | | 4,536,387 | |
| | | | | | | | |
|
Total Common Stock | |
| |
(Cost: $243,687,478) | | | | 309,079,454 | |
| | | | | |
|
| MONEY MARKET INVESTMENTS — 1.0% | |
| | |
State Street Institutional U.S. Government Money Market Fund — Premier Class, 1.75% (1) | | | 3,285,221 | | | | 3,285,221 | |
| | | | | | | | |
|
Total Money Market Investments | |
| |
(Cost: $3,285,221) | | | | 3,285,221 | |
| | | | | |
| | |
Total Investments (100.2%) | | | | | | | | |
| |
(Cost: $246,972,699) | | | | 312,364,675 | |
| |
Liabilities in Excess of Other Assets (-0.2%) | | | | (728,455 | ) |
| | | | | |
| |
Net Assets (100.0%) | | | $ | 311,636,220 | |
| | | | | | | | |
Notes to the Schedule of Investments
| NYRS | | New York Registry Shares. |
| SP ADR | | Sponsored American Depositary Receipt. ADRs are receipts, typically issued by a U.S. bank or trust company, evidencing ownership of underlying securities issued by a foreign corporation. Sponsored ADRs are ADRs issued with the cooperation of the foreign corporation. |
| (1) | | Rate disclosed is the 7-day net yield as of October 31, 2019. |
See accompanying notes to financial statements.
38
TCW Relative Value Dividend Appreciation Fund
Investments by Sector | October 31, 2019 |
| | | | |
| Sector | | Percentage of
Net Assets | |
Aerospace & Defense | | | 0.9 | % |
Air Freight & Logistics | | | 2.4 | |
Auto Components | | | 3.1 | |
Banks | | | 11.6 | |
Beverages | | | 2.7 | |
Biotechnology | | | 3.5 | |
Capital Markets | | | 4.7 | |
Chemicals | | | 2.7 | |
Communications Equipment | | | 2.4 | |
Diversified Telecommunication Services | | | 4.1 | |
Electrical Equipment | | | 1.5 | |
Electronic Equipment, Instruments & Components | | | 2.4 | |
Energy Equipment & Services | | | 3.5 | |
Food Products | | | 0.6 | |
Health Care Equipment & Supplies | | | 2.0 | |
Health Care Providers & Services | | | 1.7 | |
Household Durables | | | 2.5 | |
Household Products | | | 1.9 | |
Independent Power and Renewable Electricity Producers | | | 3.1 | |
Industrial Conglomerates | | | 4.0 | |
Insurance | | | 5.2 | |
IT Services | | | 2.5 | |
Media | | | 2.8 | |
Metals & Mining | | | 1.0 | |
Multi-Utilities | | | 1.1 | |
Multiline Retail | | | 1.0 | |
Oil, Gas & Consumable Fuels | | | 8.2 | |
Pharmaceuticals | | | 4.1 | |
Real Estate Management & Development | | | 0.6 | |
REIT | | | 1.3 | |
Semiconductors & Semiconductor Equipment | | | 7.3 | |
Technology Hardware, Storage & Peripherals | | | 1.3 | |
Textiles, Apparel & Luxury Goods | | | 1.5 | |
Money Market Investments | | | 1.0 | |
| | | | |
Total | | | 100.2 | % |
| | | | |
See accompanying notes to financial statements.
39
TCW Relative Value Dividend Appreciation Fund
Fair Valuation Summary | October 31, 2019 |
The following is a summary of the fair valuations according to the inputs used as of October 31, 2019 in valuing the Fund’s investments:
| | | | | | | | | | | | | | | | |
Description | | Quoted Prices
in Active
Markets for
Identical
Assets
(Level 1) | | | Other
Significant
Observable
Inputs
(Level 2) | | | Significant
Unobservable
Inputs
(Level 3) | | | Total | |
Common Stock | | | | | | | | | | | | | | | | |
Aerospace & Defense | | $ | 2,866,752 | | | $ | — | | | $ | — | | | $ | 2,866,752 | |
Air Freight & Logistics | | | 7,405,431 | | | | — | | | | — | | | | 7,405,431 | |
Auto Components | | | 9,818,101 | | | | — | | | | — | | | | 9,818,101 | |
Banks | | | 36,109,037 | | | | — | | | | — | | | | 36,109,037 | |
Beverages | | | 8,404,817 | | | | — | | | | — | | | | 8,404,817 | |
Biotechnology | | | 10,873,067 | | | | — | | | | — | | | | 10,873,067 | |
Capital Markets | | | 14,516,617 | | | | — | | | | — | | | | 14,516,617 | |
Chemicals | | | 8,371,485 | | | | — | | | | — | | | | 8,371,485 | |
Communications Equipment | | | 7,596,231 | | | | — | | | | — | | | | 7,596,231 | |
Diversified Telecommunication Services | | | 12,660,593 | | | | — | | | | — | | | | 12,660,593 | |
Electrical Equipment | | | 4,756,863 | | | | — | | | | — | | | | 4,756,863 | |
Electronic Equipment, Instruments & Components | | | 7,531,472 | | | | — | | | | — | | | | 7,531,472 | |
Energy Equipment & Services | | | 10,955,138 | | | | — | | | | — | | | | 10,955,138 | |
Food Products | | | 1,882,680 | | | | — | | | | — | | | | 1,882,680 | |
Health Care Equipment & Supplies | | | 6,210,349 | | | | — | | | | — | | | | 6,210,349 | |
Health Care Providers & Services | | | 5,401,795 | | | | — | | | | — | | | | 5,401,795 | |
Household Durables | | | 7,645,607 | | | | — | | | | — | | | | 7,645,607 | |
Household Products | | | 5,923,314 | | | | — | | | | — | | | | 5,923,314 | |
IT Services | | | 7,942,358 | | | | — | | | | — | | | | 7,942,358 | |
Independent Power and Renewable Electricity Producers | | | 9,770,758 | | | | — | | | | — | | | | 9,770,758 | |
Industrial Conglomerates | | | 12,374,066 | | | | — | | | | — | | | | 12,374,066 | |
Insurance | | | 16,175,445 | | | | — | | | | — | | | | 16,175,445 | |
Media | | | 8,654,473 | | | | — | | | | — | | | | 8,654,473 | |
Metals & Mining | | | 3,141,418 | | | | — | | | | — | | | | 3,141,418 | |
Multi-Utilities | | | 3,543,819 | | | | — | | | | — | | | | 3,543,819 | |
Multiline Retail | | | 2,972,098 | | | | — | | | | — | | | | 2,972,098 | |
Oil, Gas & Consumable Fuels | | | 25,566,095 | | | | — | | | | — | | | | 25,566,095 | |
Pharmaceuticals | | | 12,650,044 | | | | — | | | | — | | | | 12,650,044 | |
Real Estate Management & Development | | | 1,984,027 | | | | — | | | | — | | | | 1,984,027 | |
REIT | | | 3,963,841 | | | | — | | | | — | | | | 3,963,841 | |
Semiconductors & Semiconductor Equipment | | | 22,758,744 | | | | — | | | | — | | | | 22,758,744 | |
Technology Hardware, Storage & Peripherals | | | 4,116,532 | | | | — | | | | — | | | | 4,116,532 | |
Textiles, Apparel & Luxury Goods | | | 4,536,387 | | | | — | | | | — | | | | 4,536,387 | |
| | | | | | | | | | | | | | | | |
Total Common Stock | | | 309,079,454 | | | | — | | | | — | | | | 309,079,454 | |
| | | | | | | | | | | | | | | | |
Money market Investments | | | 3,285,221 | | | | — | | | | — | | | | 3,285,221 | |
| | | | | | | | | | | | | | | | |
Total Investments | | $ | 312,364,675 | | | $ | — | | | $ | — | | | $ | 312,364,675 | |
| | | | | | | | | | | | | | | | |
See accompanying notes to financial statements.
40
TCW Relative Value Large Cap Fund
Schedule of Investments | October 31, 2019 |
| | | | | | | | |
| Issues | | Shares | | | Value | |
|
COMMON STOCK — 98.5% of Net Assets | |
|
| Aerospace & Defense — 2.4% | |
| | |
Textron, Inc. | | | 77,109 | | | $ | 3,553,954 | |
| | | | | | | | |
|
| Air Freight & Logistics — 2.2% | |
| | |
United Parcel Service, Inc. — Class B | | | 28,040 | | | | 3,229,367 | |
| | | | | | | | |
|
| Auto Components — 4.1% | |
| | |
Dana, Inc. | | | 122,802 | | | | 1,993,077 | |
| | |
Johnson Controls International PLC (Ireland) | | | 95,568 | | | | 4,140,961 | |
| | | | | | | | |
| |
| | | | 6,134,038 | |
| | | | | |
|
| Banks — 10.0% | |
| | |
Citigroup, Inc. | | | 70,200 | | | | 5,044,572 | |
| | |
JPMorgan Chase & Co. | | | 54,258 | | | | 6,777,909 | |
| | |
Zions Bancorp | | | 60,800 | | | | 2,946,976 | |
| | | | | | | | |
| |
| | | | 14,769,457 | |
| | | | | |
|
| Beverages — 2.2% | |
| | |
PepsiCo, Inc. | | | 23,700 | | | | 3,250,929 | |
| | | | | | | | |
|
| Biotechnology — 2.5% | |
| | |
Gilead Sciences, Inc. | | | 58,329 | | | | 3,716,141 | |
| | | | | | | | |
|
| Capital Markets — 4.8% | |
| | |
Ameriprise Financial, Inc. | | | 12,679 | | | | 1,913,134 | |
| | |
Intercontinental Exchange, Inc. | | | 55,305 | | | | 5,216,368 | |
| | | | | | | | |
| |
| | | | 7,129,502 | |
| | | | | |
|
| Chemicals — 2.9% | |
| | |
Corteva, Inc. | | | 96,674 | | | | 2,550,260 | |
| | |
DuPont de Nemours, Inc. | | | 27,695 | | | | 1,825,378 | |
| | | | | | | | |
| |
| | | | 4,375,638 | |
| | | | | |
|
| Communications Equipment — 2.7% | |
| | |
Cisco Systems, Inc. | | | 84,262 | | | | 4,003,288 | |
| | | | | | | | |
|
| Diversified Telecommunication Services — 3.4% | |
| | |
AT&T, Inc. | | | 130,897 | | | | 5,038,225 | |
| | | | | | | | |
|
| Electrical Equipment — 1.1% | |
| | |
nVent Electric PLC (Ireland) | | | 71,367 | | | | 1,645,723 | |
| | | | | | | | |
|
| Electronic Equipment, Instruments & Components — 3.8% | |
| | |
Corning, Inc. | | | 129,626 | | | | 3,840,818 | |
| | |
Flex Ltd. (1) | | | 152,300 | | | | 1,789,525 | |
| | | | | | | | |
| |
| | | | 5,630,343 | |
| | | | | |
|
| Energy Equipment & Services — 3.5% | |
| | |
Baker Hughes Co. | | | 165,710 | | | | 3,546,194 | |
| | |
TechnipFMC PLC (United Kingdom) | | | 82,000 | | | | 1,617,860 | |
| | | | | | | | |
| |
| | | | 5,164,054 | |
| | | | | |
|
| Food Products — 1.6% | |
| | |
Conagra Brands, Inc. | | | 88,520 | | | | 2,394,466 | |
| | | | | | | | |
| | | | | | | | |
| Issues | | Shares | | | Value | |
|
| Health Care Equipment & Supplies — 3.0% | |
| | |
Medtronic PLC (Ireland) | | | 26,654 | | | $ | 2,902,621 | |
| | |
Zimmer Biomet Holdings, Inc. | | | 10,841 | | | | 1,498,551 | |
| | | | | | | | |
| |
| | | | 4,401,172 | |
| | | | | |
|
| Health Care Providers & Services — 5.0% | |
| | |
Centene Corp. (1) | | | 35,878 | | | | 1,904,404 | |
| | |
McKesson Corp. | | | 21,101 | | | | 2,806,433 | |
| | |
Molina Healthcare, Inc. (1) | | | 23,036 | | | | 2,709,955 | |
| | | | | | | | |
| |
| | | | 7,420,792 | |
| | | | | |
|
| Household Durables — 2.8% | |
| | |
Lennar Corp. | | | 68,663 | | | | 4,092,315 | |
| | | | | | | | |
|
| Household Products — 1.6% | |
| | |
Procter & Gamble Co. (The) | | | 19,586 | | | | 2,438,653 | |
| | | | | | | | |
|
| Independent Power and Renewable Electricity Producers — 2.6% | |
| | |
AES Corp. (The) | | | 226,800 | | | | 3,866,940 | |
| | | | | | | | |
|
| Industrial Conglomerates — 1.8% | |
| | |
General Electric Co. | | | 267,836 | | | | 2,673,003 | |
| | | | | | | | |
|
| Insurance — 5.3% | |
| | |
American International Group, Inc. | | | 55,000 | | | | 2,912,800 | |
| | |
Hartford Financial Services Group, Inc. | | | 27,384 | | | | 1,563,079 | |
| | |
MetLife, Inc. | | | 73,700 | | | | 3,448,423 | |
| | | | | | | | |
| |
| | | | 7,924,302 | |
| | | | | |
|
| IT Services — 2.6% | |
| | |
International Business Machines Corp. | | | 28,326 | | | | 3,788,036 | |
| | | | | | | | |
|
| Machinery — 0.9% | |
| | |
Terex Corp. | | | 48,230 | | | | 1,328,736 | |
| | | | | | | | |
|
| Media — 6.6% | |
| | |
CBS Corp. — Class B | | | 43,198 | | | | 1,556,856 | |
| | |
Comcast Corp. | | | 126,510 | | | | 5,670,178 | |
| | |
Discovery, Inc. (1) | | | 97,100 | | | | 2,617,331 | |
| | | | | | | | |
| |
| | | | 9,844,365 | |
| | | | | |
|
| Metals & Mining — 1.7% | |
| | |
Freeport-McMoRan, Inc. | | | 249,559 | | | | 2,450,669 | |
| | | | | | | | |
|
| Multi-Utilities — 1.1% | |
| | |
Sempra Energy | | | 11,473 | | | | 1,657,963 | |
| | | | | | | | |
|
| Multiline Retail — 0.8% | |
| | |
Target Corp. | | | 11,200 | | | | 1,197,392 | |
| | | | | | | | |
|
| Oil, Gas & Consumable Fuels — 4.9% | |
| | |
Chevron Corp. | | | 39,000 | | | | 4,529,460 | |
| | |
Marathon Petroleum Corp. | | | 42,444 | | | | 2,714,294 | |
| | | | | | | | |
| |
| | | | 7,243,754 | |
| | | | | |
|
| Pharmaceuticals — 2.2% | |
| | |
Allergan PLC (Ireland) | | | 7,542 | | | | 1,328,221 | |
See accompanying notes to financial statements.
41
TCW Relative Value Large Cap Fund
Schedule of Investments (Continued)
| | | | | | | | |
| Issues | | Shares | | | Value | |
|
| Pharmaceuticals (Continued) | |
| | |
Merck & Co., Inc. | | | 22,780 | | | $ | 1,974,115 | |
| | | | | | | | |
| |
| | | | 3,302,336 | |
| | | | | |
|
| Real Estate Management & Development — 1.7% | |
| | |
Jones Lang LaSalle, Inc. | | | 17,661 | | | | 2,587,690 | |
| | | | | | | | |
|
| REIT — 1.2% | |
| | |
Cousins Properties, Inc. | | | 45,300 | | | | 1,817,889 | |
| | | | | | | | |
|
| Semiconductors & Semiconductor Equipment — 4.2% | |
| | |
Broadcom, Inc. | | | 4,613 | | | | 1,350,917 | |
| | |
Cypress Semiconductor Corp. | | | 212,300 | | | | 4,940,221 | |
| | | | | | | | |
| |
| | | | 6,291,138 | |
| | | | | |
|
| Textiles, Apparel & Luxury Goods — 1.3% | |
| | |
Tapestry, Inc. | | | 74,695 | | | | 1,931,613 | |
| | | | | | | | |
|
Total Common Stock | |
| |
(Cost: $102,882,319) | | | | 146,293,883 | |
| | | | | |
|
| MONEY MARKET INVESTMENTS — 2.1% | |
| | |
State Street Institutional U.S. Government Money Market Fund — Premier Class, 1.75% (2) | | | 3,100,205 | | | | 3,100,205 | |
| | | | | | | | |
|
Total Money Market Investments | |
| |
(Cost: $3,100,205) | | | | 3,100,205 | |
| | | | | |
| | |
Total Investments (100.6%) | | | | | | | | |
| |
(Cost: $105,982,524) | | | | 149,394,088 | |
| |
Liabilities in Excess of Other Assets (-0.6%) | | | | (942,577 | ) |
| | | | | |
| |
Net Assets (100.0%) | | | $ | 148,451,511 | |
| | | | | |
Notes to the Schedule of Investments
| (1) | Non-income producing security. |
| (2) | Rate disclosed is the 7-day net yield as of October 31, 2019. |
See accompanying notes to financial statements.
42
TCW Relative Value Large Cap Fund
Investments by Sector | October 31, 2019 |
| | | | |
| Sector | | Percentage of
Net Assets | |
Aerospace & Defense | | | 2.4 | % |
Air Freight & Logistics | | | 2.2 | |
Auto Components | | | 4.1 | |
Banks | | | 10.0 | |
Beverages | | | 2.2 | |
Biotechnology | | | 2.5 | |
Capital Markets | | | 4.8 | |
Chemicals | | | 2.9 | |
Communications Equipment | | | 2.7 | |
Diversified Telecommunication Services | | | 3.4 | |
Electrical Equipment | | | 1.1 | |
Electronic Equipment, Instruments & Components | | | 3.8 | |
Energy Equipment & Services | | | 3.5 | |
Food Products | | | 1.6 | |
Health Care Equipment & Supplies | | | 3.0 | |
Health Care Providers & Services | | | 5.0 | |
Household Durables | | | 2.8 | |
Household Products | | | 1.6 | |
Independent Power and Renewable Electricity Producers | | | 2.6 | |
Industrial Conglomerates | | | 1.8 | |
Insurance | | | 5.3 | |
IT Services | | | 2.6 | |
Machinery | | | 0.9 | |
Media | | | 6.6 | |
Metals & Mining | | | 1.7 | |
Multi-Utilities | | | 1.1 | |
Multiline Retail | | | 0.8 | |
Oil, Gas & Consumable Fuels | | | 4.9 | |
Pharmaceuticals | | | 2.2 | |
Real Estate Management & Development | | | 1.7 | |
REIT | | | 1.2 | |
Semiconductors & Semiconductor Equipment | | | 4.2 | |
Textiles, Apparel & Luxury Goods | | | 1.3 | |
Money Market Investments | | | 2.1 | |
| | | | |
Total | | | 100.6 | % |
| | | | |
See accompanying notes to financial statements.
43
TCW Relative Value Large Cap Fund
Fair Valuation Summary | October 31, 2019 |
The following is a summary of the fair valuations according to the inputs used as of October 31, 2019 in valuing the Fund’s investments:
| | | | | | | | | | | | | | | | |
Description | | Quoted Prices
in Active
Markets for
Identical
Assets
(Level 1) | | | Other
Significant
Observable
Inputs
(Level 2) | | | Significant
Unobservable
Inputs
(Level 3) | | | Total | |
Common Stock | | | | | | | | | | | | | | | | |
Aerospace & Defense | | $ | 3,553,954 | | | $ | — | | | $ | — | | | $ | 3,553,954 | |
Air Freight & Logistics | | | 3,229,367 | | | | — | | | | — | | | | 3,229,367 | |
Auto Components | | | 6,134,038 | | | | — | | | | — | | | | 6,134,038 | |
Banks | | | 14,769,457 | | | | — | | | | — | | | | 14,769,457 | |
Beverages | | | 3,250,929 | | | | — | | | | — | | | | 3,250,929 | |
Biotechnology | | | 3,716,141 | | | | — | | | | — | | | | 3,716,141 | |
Capital Markets | | | 7,129,502 | | | | — | | | | — | | | | 7,129,502 | |
Chemicals | | | 4,375,638 | | | | — | | | | — | | | | 4,375,638 | |
Communications Equipment | | | 4,003,288 | | | | — | | | | — | | | | 4,003,288 | |
Diversified Telecommunication Services | | | 5,038,225 | | | | — | | | | — | | | | 5,038,225 | |
Electrical Equipment | | | 1,645,723 | | | | — | | | | — | | | | 1,645,723 | |
Electronic Equipment, Instruments & Components | | | 5,630,343 | | | | — | | | | — | | | | 5,630,343 | |
Energy Equipment & Services | | | 5,164,054 | | | | — | | | | — | | | | 5,164,054 | |
Food Products | | | 2,394,466 | | | | — | | | | — | | | | 2,394,466 | |
Health Care Equipment & Supplies | | | 4,401,172 | | | | — | | | | — | | | | 4,401,172 | |
Health Care Providers & Services | | | 7,420,792 | | | | — | | | | — | | | | 7,420,792 | |
Household Durables | | | 4,092,315 | | | | — | | | | — | | | | 4,092,315 | |
Household Products | | | 2,438,653 | | | | — | | | | — | | | | 2,438,653 | |
Independent Power and Renewable Electricity Producers | | | 3,866,940 | | | | — | | | | — | | | | 3,866,940 | |
Industrial Conglomerates | | | 2,673,003 | | | | — | | | | — | | | | 2,673,003 | |
Insurance | | | 7,924,302 | | | | — | | | | — | | | | 7,924,302 | |
IT Services | | | 3,788,036 | | | | — | | | | — | | | | 3,788,036 | |
Machinery | | | 1,328,736 | | | | — | | | | — | | | | 1,328,736 | |
Media | | | 9,844,365 | | | | — | | | | — | | | | 9,844,365 | |
Metals & Mining | | | 2,450,669 | | | | — | | | | — | | | | 2,450,669 | |
Multi-Utilities | | | 1,657,963 | | | | — | | | | — | | | | 1,657,963 | |
Multiline Retail | | | 1,197,392 | | | | — | | | | — | | | | 1,197,392 | |
Oil, Gas & Consumable Fuels | | | 7,243,754 | | | | — | | | | — | | | | 7,243,754 | |
Pharmaceuticals | | | 3,302,336 | | | | — | | | | — | | | | 3,302,336 | |
Real Estate Management & Development | | | 2,587,690 | | | | — | | | | — | | | | 2,587,690 | |
REIT | | | 1,817,889 | | | | — | | | | — | | | | 1,817,889 | |
Semiconductors & Semiconductor Equipment | | | 6,291,138 | | | | — | | | | — | | | | 6,291,138 | |
Textiles, Apparel & Luxury Goods | | | 1,931,613 | | | | — | | | | — | | | | 1,931,613 | |
| | | | | | | | | | | | | | | | |
Total Common Stock | | | 146,293,883 | | | | — | | | | — | | | | 146,293,883 | |
| | | | | | | | | | | | | | | | |
Money Market Investments | | | 3,100,205 | | | | — | | | | — | | | | 3,100,205 | |
| | | | | | | | | | | | | | | | |
Total Investments | | $ | 149,394,088 | | | $ | — | | | $ | — | | | $ | 149,394,088 | |
| | | | | | | | | | | | | | | | |
See accompanying notes to financial statements.
44
TCW Relative Value Mid Cap Fund
Schedule of Investments | October 31, 2019 |
| | | | | | | | |
| Issues | | Shares | | | Value | |
|
COMMON STOCK — 98.7% of Net Assets | |
|
| Aerospace & Defense — 1.9% | |
| | |
Textron, Inc. | | | 32,588 | | | $ | 1,501,981 | |
| | | | | | | | |
|
| Auto Components — 1.4% | |
| | |
Dana, Inc. | | | 65,747 | | | | 1,067,074 | |
| | | | | | | | |
|
| Banks — 13.5% | |
| | |
KeyCorp | | | 133,242 | | | | 2,394,359 | |
| | |
PacWest Bancorp | | | 24,000 | | | | 887,760 | |
| | |
Popular, Inc. | | | 56,965 | | | | 3,102,314 | |
| | |
Synovus Financial Corp. | | | 54,729 | | | | 1,853,671 | |
| | |
Umpqua Holdings Corp. | | | 70,222 | | | | 1,110,912 | |
| | |
Zions Bancorp | | | 24,910 | | | | 1,207,388 | |
| | | | | | | | |
| |
| | | | 10,556,404 | |
| | | | | |
|
| Capital Markets — 3.2% | |
| | |
E*TRADE Financial Corp. | | | 26,900 | | | | 1,124,151 | |
| | |
Evercore Partners, Inc. | | | 18,895 | | | | 1,391,428 | |
| | | | | | | | |
| |
| | | | 2,515,579 | |
| | | | | |
|
| Chemicals — 1.4% | |
| | |
Corteva, Inc. | | | 40,600 | | | | 1,071,028 | |
| | | | | | | | |
|
| Construction & Engineering — 4.2% | |
| | |
Arcosa, Inc. | | | 25,400 | | | | 975,614 | |
| | |
Jacobs Engineering Group, Inc. | | | 24,533 | | | | 2,295,798 | |
| | | | | | | | |
| |
| | | | 3,271,412 | |
| | | | | |
|
| Consumer Finance — 1.0% | |
| | |
Santander Consumer USA Holdings, Inc. | | | 30,600 | | | | 767,448 | |
| | | | | | | | |
|
| Electronic Equipment, Instruments & Components — 2.8% | |
| | |
Flex Ltd. (1) | | | 155,400 | | | | 1,825,950 | |
| | |
TTM Technologies, Inc. (1) | | | 30,400 | | | | 355,984 | |
| | | | | | | | |
| |
| | | | 2,181,934 | |
| | | | | |
|
| Energy Equipment & Services — 3.6% | |
| | |
Newpark Resources, Inc. (1) | | | 320,972 | | | | 1,925,832 | |
| | |
TechnipFMC PLC (United Kingdom) | | | 46,400 | | | | 915,472 | |
| | | | | | | | |
| |
| | | | 2,841,304 | |
| | | | | |
|
| Entertainment — 1.4% | |
| | |
Viacom, Inc. — Class B | | | 51,300 | | | | 1,106,028 | |
| | | | | | | | |
|
| Food Products — 3.3% | |
| | |
Conagra Brands, Inc. | | | 48,322 | | | | 1,307,110 | |
| | |
Hain Celestial Group, Inc. (The) (1) | | | 29,900 | | | | 706,836 | |
| | |
TreeHouse Foods, Inc. (1) | | | 10,000 | | | | 540,200 | |
| | | | | | | | |
| |
| | | | 2,554,146 | |
| | | | | |
|
| Health Care Equipment & Supplies — 2.0% | |
| | |
Zimmer Biomet Holdings, Inc. | | | 11,329 | | | | 1,566,008 | |
| | | | | | | | |
|
| Health Care Providers & Services — 5.8% | |
| | |
Acadia Healthcare Co., Inc. (1) | | | 38,400 | | | | 1,151,616 | |
| | | | | | | | |
| Issues | | Shares | | | Value | |
|
| Health Care Providers & Services (Continued) | |
| | |
Centene Corp. (1) | | | 19,092 | | | $ | 1,013,403 | |
| | |
Magellan Health, Inc. (1) | | | 8,900 | | | | 577,610 | |
| | |
Molina Healthcare, Inc. (1) | | | 15,358 | | | | 1,806,715 | |
| | | | | | | | |
| |
| | | | 4,549,344 | |
| | | | | |
|
| Household Durables — 9.8% | |
| | |
Beazer Homes USA, Inc. (1) | | | 67,279 | | | | 1,009,858 | |
| | |
DR Horton, Inc. | | | 20,900 | | | | 1,094,533 | |
| | |
KB Home | | | 67,660 | | | | 2,414,785 | |
| | |
Lennar Corp. | | | 31,400 | | | | 1,871,440 | |
| | |
Toll Brothers, Inc. | | | 32,568 | | | | 1,295,229 | |
| | | | | | | | |
| |
| | | | 7,685,845 | |
| | | | | |
|
| Independent Power and Renewable Electricity Producers — 3.0% | |
| | |
AES Corp. (The) | | | 138,000 | | | | 2,352,900 | |
| | | | | | | | |
|
| Insurance — 2.6% | |
| | |
Assured Guaranty, Ltd. | | | 38,302 | | | | 1,797,130 | |
| | |
Axis Capital Holdings, Ltd. | | | 4,428 | | | | 263,156 | |
| | | | | | | | |
| |
| | | | 2,060,286 | |
| | | | | |
|
| Machinery — 7.6% | |
| | |
Dover Corp. | | | 15,294 | | | | 1,588,894 | |
| | |
Manitowoc Co., Inc. (The) (1) | | | 148,300 | | | | 1,892,308 | |
| | |
SPX FLOW, Inc. (1) | | | 25,005 | | | | 1,132,226 | |
| | |
Terex Corp. | | | 23,698 | | | | 652,880 | |
| | |
Wabtec Corp. | | | 10,226 | | | | 709,378 | |
| | | | | | | | |
| |
| | | | 5,975,686 | |
| | | | | |
|
| Marine — 3.7% | |
| | |
Kirby Corp. (1) | | | 29,900 | | | | 2,366,884 | |
| | |
Matson, Inc. | | | 13,200 | | | | 503,976 | |
| | | | | | | | |
| |
| | | | 2,870,860 | |
| | | | | |
|
| Media — 1.8% | |
| | |
Discovery, Inc. (1) | | | 51,900 | | | | 1,398,964 | |
| | | | | | | | |
|
| Metals & Mining — 1.8% | |
| | |
Freeport-McMoRan, Inc. | | | 120,004 | | | | 1,178,439 | |
| | |
Worthington Industries, Inc. | | | 7,440 | | | | 273,867 | |
| | | | | | | | |
| |
| | | | 1,452,306 | |
| | | | | |
|
| Multi-Utilities — 1.1% | |
| | |
Sempra Energy | | | 6,228 | | | | 900,008 | |
| | | | | | | | |
|
| Multiline Retail — 1.1% | |
| | |
Nordstrom, Inc. | | | 23,700 | | | | 850,830 | |
| | | | | | | | |
|
| Oil, Gas & Consumable Fuels — 1.4% | |
| | |
Marathon Petroleum Corp. | | | 16,748 | | | | 1,071,035 | |
| | | | | | | | |
|
| Real Estate Management & Development — 2.4% | |
| | |
Jones Lang LaSalle, Inc. | | | 13,120 | | | | 1,922,342 | |
| | | | | | | | |
See accompanying notes to financial statements.
45
TCW Relative Value Mid Cap Fund
Schedule of Investments (Continued)
| | | | | | | | |
| Issues | | Shares | | | Value | |
|
| REIT — 3.9% | |
| | |
Cousins Properties, Inc. | | | 32,225 | | | $ | 1,293,189 | |
| | |
Mid-America Apartment Communities, Inc. | | | 12,800 | | | | 1,779,072 | |
| | | | | | | | |
| |
| | | | 3,072,261 | |
| | | | | |
|
| Road & Rail — 1.4% | |
| | |
Genesee & Wyoming, Inc. (1) | | | 10,200 | | | | 1,132,506 | |
| | | | | | | | |
|
| Semiconductors & Semiconductor Equipment — 7.5% | |
| | |
Cypress Semiconductor Corp. | | | 131,600 | | | | 3,062,332 | |
| | |
Maxim Integrated Products, Inc. | | | 47,646 | | | | 2,794,914 | |
| | | | | | | | |
| |
| | | | 5,857,246 | |
| | | | | |
|
| Software — 1.5% | |
| | |
Cerence, Inc. (1) | | | 8,277 | | | | 128,294 | |
| | |
Nuance Communications, Inc. (1) | | | 66,216 | | | | 1,080,645 | |
| | | | | | | | |
| |
| | | | 1,208,939 | |
| | | | | |
|
| Technology Hardware, Storage & Peripherals — 0.9% | |
| | |
Western Digital Corp. | | | 13,980 | | | | 722,067 | |
| | | | | | | | |
|
| Textiles, Apparel & Luxury Goods — 1.7% | |
| | |
Tapestry, Inc. | | | 51,387 | | | | 1,328,868 | |
| | | | | | | | |
|
| Total Common Stock | |
| |
(Cost: $58,002,769) | | | | 77,412,639 | |
| | | | | |
|
MONEY MARKET INVESTMENTS — 2.6% | |
| | |
State Street Institutional U.S. Government Money Market Fund — Premier Class, 1.75% (2) | | | 2,026,586 | | | | 2,026,586 | |
| | | | | | | | |
|
Total Money Market Investments | |
| |
(Cost: $2,026,586) | | | | 2,026,586 | |
| | | | | |
| | |
Total Investments (101.3%) | | | | | | | | |
| |
(Cost: $60,029,355) | | | | 79,439,225 | |
| |
Liabilities in Excess of Other Assets (-1.3%) | | | | (1,034,627 | ) |
| | | | | |
| |
Net Assets (100.0%) | | | $ | 78,404,598 | |
| | | | | |
Notes to the Schedule of Investments
| (1) | Non-income producing security. |
| (2) | Rate disclosed is the 7-day net yield as of October 31, 2019. |
See accompanying notes to financial statements.
46
TCW Relative Value Mid Cap Fund
Investment by Sector | October 31, 2019 |
| | | | |
| Sector | | Percentage of
Net Assets | |
Aerospace & Defense | | | 1.9 | % |
Auto Components | | | 1.4 | |
Banks | | | 13.5 | |
Capital Markets | | | 3.2 | |
Chemicals | | | 1.4 | |
Construction & Engineering | | | 4.2 | |
Consumer Finance | | | 1.0 | |
Electronic Equipment, Instruments & Components | | | 2.8 | |
Energy Equipment & Services | | | 3.6 | |
Entertainment | | | 1.4 | |
Food Products | | | 3.3 | |
Health Care Equipment & Supplies | | | 2.0 | |
Health Care Providers & Services | | | 5.8 | |
Household Durables | | | 9.8 | |
Independent Power and Renewable Electricity Producers | | | 3.0 | |
Insurance | | | 2.6 | |
Machinery | | | 7.6 | |
Marine | | | 3.7 | |
Media | | | 1.8 | |
Metals & Mining | | | 1.8 | |
Multi-Utilities | | | 1.1 | |
Multiline Retail | | | 1.1 | |
Oil, Gas & Consumable Fuels | | | 1.4 | |
Real Estate Management & Development | | | 2.4 | |
REIT | | | 3.9 | |
Road & Rail | | | 1.4 | |
Semiconductors & Semiconductor Equipment | | | 7.5 | |
Software | | | 1.5 | |
Technology Hardware, Storage & Peripherals | | | 0.9 | |
Textiles, Apparel & Luxury Goods | | | 1.7 | |
Money Market Investments | | | 2.6 | |
| | | | |
Total | | | 101.3 | % |
| | | | |
See accompanying notes to financial statements.
47
TCW Relative Value Mid Cap Fund
Fair Valuation Summary | October 31, 2019 |
The following is a summary of the fair valuations according to the inputs used as of October 31, 2019 in valuing the Fund’s investments:
| | | | | | | | | | | | | | | | |
Description | | Quoted Prices
in Active
Markets for
Identical
Assets
(Level 1) | | | Other
Significant
Observable
Inputs
(Level 2) | | | Significant
Unobservable
Inputs
(Level 3) | | | Total | |
Common Stock | | | | | | | | | | | | | | | | |
Aerospace & Defense | | $ | 1,501,981 | | | $ | — | | | $ | — | | | $ | 1,501,981 | |
Auto Components | | | 1,067,074 | | | | — | | | | — | | | | 1,067,074 | |
Banks | | | 10,556,404 | | | | — | | | | — | | | | 10,556,404 | |
Capital Markets | | | 2,515,579 | | | | — | | | | — | | | | 2,515,579 | |
Chemicals | | | 1,071,028 | | | | — | | | | — | | | | 1,071,028 | |
Construction & Engineering | | | 3,271,412 | | | | — | | | | — | | | | 3,271,412 | |
Consumer Finance | | | 767,448 | | | | — | | | | — | | | | 767,448 | |
Electronic Equipment, Instruments & Components | | | 2,181,934 | | | | — | | | | — | | | | 2,181,934 | |
Energy Equipment & Services | | | 2,841,304 | | | | — | | | | — | | | | 2,841,304 | |
Entertainment | | | 1,106,028 | | | | — | | | | — | | | | 1,106,028 | |
Food Products | | | 2,554,146 | | | | — | | | | — | | | | 2,554,146 | |
Health Care Equipment & Supplies | | | 1,566,008 | | | | — | | | | — | | | | 1,566,008 | |
Health Care Providers & Services | | | 4,549,344 | | | | — | | | | — | | | | 4,549,344 | |
Household Durables | | | 7,685,845 | | | | — | | | | — | | | | 7,685,845 | |
Independent Power and Renewable Electricity Producers | | | 2,352,900 | | | | — | | | | — | | | | 2,352,900 | |
Insurance | | | 2,060,286 | | | | — | | | | — | | | | 2,060,286 | |
Machinery | | | 5,975,686 | | | | — | | | | — | | | | 5,975,686 | |
Marine | | | 2,870,860 | | | | — | | | | — | | | | 2,870,860 | |
Media | | | 1,398,964 | | | | — | | | | — | | | | 1,398,964 | |
Metals & Mining | | | 1,452,306 | | | | — | | | | — | | | | 1,452,306 | |
Multi-Utilities | | | 900,008 | | | | — | | | | — | | | | 900,008 | |
Multiline Retail | | | 850,830 | | | | — | | | | — | | | | 850,830 | |
Oil, Gas & Consumable Fuels | | | 1,071,035 | | | | — | | | | — | | | | 1,071,035 | |
Real Estate Management & Development | | | 1,922,342 | | | | — | | | | — | | | | 1,922,342 | |
REIT | | | 3,072,261 | | | | — | | | | — | | | | 3,072,261 | |
Road & Rail | | | 1,132,506 | | | | — | | | | — | | | | 1,132,506 | |
Semiconductors & Semiconductor Equipment | | | 5,857,246 | | | | — | | | | — | | | | 5,857,246 | |
Software | | | 1,208,939 | | | | — | | | | — | | | | 1,208,939 | |
Technology Hardware, Storage & Peripherals | | | 722,067 | | | | — | | | | — | | | | 722,067 | |
Textiles, Apparel & Luxury Goods | | | 1,328,868 | | | | — | | | | — | | | | 1,328,868 | |
| | | | | | | | | | | | | | | | |
Total Common Stock | | | 77,412,639 | | | | — | | | | — | | | | 77,412,639 | |
| | | | | | | | | | | | | | | | |
Money Market Investments | | | 2,026,586 | | | | — | | | | — | | | | 2,026,586 | |
| | | | | | | | | | | | | | | | |
Total Investments | | $ | 79,439,225 | | | $ | — | | | $ | — | | | $ | 79,439,225 | |
| | | | | | | | | | | | | | | | |
See accompanying notes to financial statements.
48
TCW Select Equities Fund
Schedule of Investments | October 31, 2019 |
| | | | | | | | |
| Issues | | Shares | | | Value | |
|
COMMON STOCK — 99.4% of Net Assets | |
|
| Beverages — 1.9% | |
| | |
Monster Beverage Corp. (1) | | | 304,711 | | | $ | 17,103,429 | |
| | | | | | | | |
|
| Biotechnology — 2.3% | |
| | |
Alexion Pharmaceuticals, Inc. (1) | | | 88,572 | | | | 9,335,489 | |
| | |
BioMarin Pharmaceutical, Inc. (1) | | | 156,213 | | | | 11,436,354 | |
| | | | | | | | |
| |
| | | | 20,771,843 | |
| | | | | |
|
| Capital Markets — 4.0% | |
| | |
Charles Schwab Corp. (The) | | | 432,070 | | | | 17,589,570 | |
| | |
S&P Global, Inc. | | | 71,601 | | | | 18,472,342 | |
| | | | | | | | |
| |
| | | | 36,061,912 | |
| | | | | |
|
| Commercial Services & Supplies — 2.2% | |
| | |
Waste Connections, Inc. (Canada) | | | 210,345 | | | | 19,435,878 | |
| | | | | | | | |
|
| Equity Real Estate — 3.0% | |
| | |
Equinix, Inc. | | | 47,363 | | | | 26,844,401 | |
| | | | | | | | |
|
| Food & Staples Retailing — 2.8% | |
| | |
Costco Wholesale Corp. | | | 83,646 | | | | 24,852,063 | |
| | | | | | | | |
|
| Health Care Equipment & Supplies — 4.1% | |
| | |
Align Technology, Inc. (1) | | | 81,991 | | | | 20,685,509 | |
| | |
Boston Scientific Corp. (1) | | | 386,300 | | | | 16,108,710 | |
| | | | | | | | |
| |
| | | | 36,794,219 | |
| | | | | |
|
| Insurance — 2.4% | |
| | |
Chubb, Ltd. (Switzerland) | | | 141,312 | | | | 21,538,775 | |
| | | | | | | | |
|
| Interactive Media & Services — 10.9% | |
| | |
Alphabet, Inc. — Class C (1) | | | 41,675 | | | | 52,515,084 | |
| | |
Facebook, Inc. (1) | | | 241,177 | | | | 46,221,572 | |
| | | | | | | | |
| |
| | | | 98,736,656 | |
| | | | | |
|
| Internet & Direct Marketing Retail — 6.1% | |
| | |
Amazon.com, Inc. (1) | | | 31,100 | | | | 55,254,126 | |
| | | | | | | | |
|
| IT Services — 14.3% | |
| | |
Mastercard, Inc. | | | 117,848 | | | | 32,621,505 | |
| | |
PayPal Holdings, Inc. (1) | | | 321,351 | | | | 33,452,639 | |
| | |
Visa, Inc. | | | 351,074 | | | | 62,793,096 | |
| | | | | | | | |
| |
| | | | 128,867,240 | |
| | | | | |
|
| Life Sciences Tools & Services — 2.4% | |
| | |
Illumina, Inc. (1) | | | 73,302 | | | | 21,662,207 | |
| | | | | | | | |
|
| Machinery — 2.2% | |
| | |
Xylem, Inc. | | | 260,500 | | | | 19,977,745 | |
| | | | | | | | |
|
| Pharmaceuticals — 3.3% | |
| | |
Zoetis, Inc. | | | 233,800 | | | | 29,907,696 | |
| | | | | | | | |
|
| Professional Services — 5.4% | |
| | |
IHS Markit, Ltd. (1) | | | 300,700 | | | | 21,055,014 | |
| | |
TransUnion | | | 340,399 | | | | 28,123,765 | |
| | | | | | | | |
| |
| | | | 49,178,779 | |
| | | | | |
| | | | | | | | |
| Issues | | Shares | | | Value | |
|
| REIT — 5.5% | |
| | |
American Tower Corp. | | | 227,572 | | | $ | 49,628,902 | |
| | | | | | | | |
|
| Semiconductors & Semiconductor Equipment — 3.8% | |
| | |
ASML Holding NV (Netherlands) | | | 51,722 | | | | 13,549,612 | |
| | |
NVIDIA Corp. | | | 101,918 | | | | 20,487,557 | |
| | | | | | | | |
| |
| | | | 34,037,169 | |
| | | | | |
|
| Software — 17.7% | |
| | |
Adobe, Inc. (1) | | | 170,805 | | | | 47,471,834 | |
| | |
Salesforce.com, Inc. (1) | | | 255,033 | | | | 39,910,114 | |
| | |
ServiceNow, Inc. (1) | | | 164,512 | | | | 40,677,237 | |
| | |
Splunk, Inc. (1) | | | 169,576 | | | | 20,342,337 | |
| | |
Trade Desk, Inc. (The) (1) | | | 56,949 | | | | 11,435,359 | |
| | | | | | | | |
| |
| | | | 159,836,881 | |
| | | | | |
|
| Specialty Retail — 5.1% | |
| | |
Home Depot, Inc. (The) | | | 125,449 | | | | 29,427,826 | |
| | |
Ulta Beauty, Inc. (1) | | | 72,533 | | | | 16,911,069 | |
| | | | | | | | |
| |
| | | | 46,338,895 | |
| | | | | |
|
| Total Common Stock | |
| |
(Cost: $366,865,832) | | | | 896,828,816 | |
| | | | | |
|
MONEY MARKET INVESTMENTS — 0.1% | |
| | |
State Street Institutional U.S. Government Money Market Fund — Premier Class, 1.75% (2) | | | 1,112,128 | | | | 1,112,128 | |
| | | | | | | | |
|
Total Money Market Investments | |
| |
(Cost: $1,112,128) | | | | 1,112,128 | |
| | | | | |
| | |
Total Investments (99.5%) | | | | | | | | |
| |
(Cost: $367,977,960) | | | | 897,940,944 | |
| |
Excess of Other Assets over Liabilities (0.5%) | | | | 4,469,869 | |
| | | | | |
| |
Net Assets (100.0%) | | | $ | 902,410,813 | |
| | | | | |
Notes to the Schedule of Investments
| (1) | | Non-income producing security. |
| (2) | | Rate disclosed is the 7-day net yield as of October 31, 2019. |
| REIT - | | Real Estate Investment Trust. |
See accompanying notes to financial statements.
49
TCW Select Equities Fund
Investments by Sector | October 31, 2019 |
| | | | |
| Sector | | Percentage of Net Assets | |
Beverages | | | 1.9 | % |
Biotechnology | | | 2.3 | |
Capital Markets | | | 4.0 | |
Commercial Services & Supplies | | | 2.2 | |
Equity Real Estate | | | 3.0 | |
Food & Staples Retailing | | | 2.8 | |
Health Care Equipment & Supplies | | | 4.1 | |
Insurance | | | 2.4 | |
Interactive Media & Services | | | 10.9 | |
Internet & Direct Marketing Retail | | | 6.1 | |
IT Services | | | 14.3 | |
Life Sciences Tools & Services | | | 2.4 | |
Machinery | | | 2.2 | |
Pharmaceuticals | | | 3.3 | |
Professional Services | | | 5.4 | |
REIT | | | 5.5 | |
Semiconductors & Semiconductor Equipment | | | 3.8 | |
Software | | | 17.7 | |
Specialty Retail | | | 5.1 | |
Money Market Investments | | | 0.1 | |
| | | | |
Total | | | 99.5 | % |
| | | | |
See accompanying notes to financial statements.
50
TCW Select Equities Fund
Fair Valuation Summary | October 31, 2019 |
The following is a summary of the fair valuations according to the inputs used as of October 31, 2019 in valuing the Fund’s investments:
| | | | | | | | | | | | | | | | |
Description | | Quoted Prices
in Active
Markets for
Identical
Assets
(Level 1) | | | Other
Significant
Observable
Inputs
(Level 2) | | | Significant
Unobservable
Inputs
(Level 3) | | | Total | |
Common Stock | | | | | | | | | | | | | | | | |
Beverages | | $ | 17,103,429 | | | $ | — | | | $ | — | | | $ | 17,103,429 | |
Biotechnology | | | 20,771,843 | | | | — | | | | — | | | | 20,771,843 | |
Capital Markets | | | 36,061,912 | | | | — | | | | — | | | | 36,061,912 | |
Commercial Services & Supplies | | | 19,435,878 | | | | — | | | | — | | | | 19,435,878 | |
Equity Real Estate | | | 26,844,401 | | | | — | | | | — | | | | 26,844,401 | |
Food & Staples Retailing | | | 24,852,063 | | | | — | | | | — | | | | 24,852,063 | |
Health Care Equipment & Supplies | | | 36,794,219 | | | | — | | | | — | | | | 36,794,219 | |
IT Services | | | 128,867,240 | | | | — | | | | — | | | | 128,867,240 | |
Insurance | | | 21,538,775 | | | | — | | | | — | | | | 21,538,775 | |
Interactive Media & Services | | | 98,736,656 | | | | — | | | | — | | | | 98,736,656 | |
Internet & Direct Marketing Retail | | | 55,254,126 | | | | — | | | | — | | | | 55,254,126 | |
Life Sciences Tools & Services | | | 21,662,207 | | | | — | | | | — | | | | 21,662,207 | |
Machinery | | | 19,977,745 | | | | — | | | | — | | | | 19,977,745 | |
Pharmaceuticals | | | 29,907,696 | | | | — | | | | — | | | | 29,907,696 | |
Professional Services | | | 49,178,779 | | | | — | | | | — | | | | 49,178,779 | |
REIT | | | 49,628,902 | | | | — | | | | — | | | | 49,628,902 | |
Semiconductors & Semiconductor Equipment | | | 34,037,169 | | | | — | | | | — | | | | 34,037,169 | |
Software | | | 159,836,881 | | | | — | | | | — | | | | 159,836,881 | |
Specialty Retail | | | 46,338,895 | | | | — | | | | — | | | | 46,338,895 | |
| | | | | | | | | | | | | | | | |
Total Common Stock | | | 896,828,816 | | | | — | | | | — | | | | 896,828,816 | |
| | | | | | | | | | | | | | | | |
Money Market Investments | | | 1,112,128 | | | | — | | | | — | | | | 1,112,128 | |
| | | | | | | | | | | | | | | | |
Total Investments | | $ | 897,940,944 | | | $ | — | | | $ | — | | | $ | 897,940,944 | |
| | | | | | | | | | | | | | | | |
See accompanying notes to financial statements.
51
TCW Funds, Inc.
Statements of Assets and Liabilities | October 31, 2019 |
| | | | | | | | | | | | | | | | |
| | | TCW
Artificial
Intelligence
Equity
Fund | | | TCW
Conservative
Allocation
Fund | | | TCW
Global
Real Estate
Fund | | | TCW
New America
Premier
Equities
Fund | |
| | | Dollar Amounts in Thousands
(Except Per Share Amounts) | |
ASSETS | | | | | | | | | | | | | | | | |
Investments, at Value (1) | | $ | 4,017 | | | $ | 968 | | | $ | 7,169 | | | $ | 153,900 | |
Investment in Affiliated Issuers, at Value | | | — | | | | 28,945 | (2) | | | — | | | | — | |
Receivable for Fund Shares Sold | | | 4 | | | | 4 | | | | — | | | | 1,818 | |
Dividends Receivable | | | 1 | | | | 50 | | | | 8 | | | | 67 | |
Receivable from Investment Advisor | | | 13 | | | | — | | | | 15 | | | | 29 | |
Prepaid Expenses | | | 11 | | | | 25 | | | | 27 | | | | 27 | |
| | | | | | | | | | | | | | | | |
Total Assets | | | 4,046 | | | | 29,992 | | | | 7,219 | | | | 155,841 | |
| | | | | | | | | | | | | | | | |
LIABILITIES | | | | | | | | | | | | | | | | |
Payable for Securities Purchased | | | — | | | | 31 | | | | — | | | | — | |
Payable for Fund Shares Redeemed | | | 1 | | | | — | | | | — | | | | 117 | |
Accrued Directors’ Fees and Expenses | | | 10 | | | | 10 | | | | 10 | | | | 10 | |
Accrued Management Fees | | | 61 | | | | 8 | | | | 5 | | | | 85 | |
Accrued Distribution Fees | | | — | (3) | | | — | (3) | | | — | (3) | | | 10 | |
Other Accrued Expenses | | | 45 | | | | 28 | | | | 28 | | | | 47 | |
| | | | | | | | | | | | | | | | |
Total Liabilities | | | 117 | | | | 77 | | | | 43 | | | | 269 | |
| | | | | | | | | | | | | | | | |
NET ASSETS | | $ | 3,929 | | | $ | 29,915 | | | $ | 7,176 | | | $ | 155,572 | |
| | | | | | | | | | | | | | | | |
NET ASSETS CONSIST OF: | | | | | | | | | | | | | | | | |
Paid-in Capital | | $ | 3,588 | | | $ | 26,176 | | | $ | 6,792 | | | $ | 135,944 | |
Accumulated Earnings (Loss) | | | 341 | | | | 3,739 | | | | 384 | | | | 19,628 | |
| | | | | | | | | | | | | | | | |
NET ASSETS | | $ | 3,929 | | | $ | 29,915 | | | $ | 7,176 | | | $ | 155,572 | |
| | | | | | | | | | | | | | | | |
NET ASSETS ATTRIBUTABLE TO: | | | | | | | | | | | | | | | | |
I Class Share | | $ | 2,940 | | | $ | 29,565 | | | $ | 6,518 | | | $ | 103,442 | |
| | | | | | | | | | | | | | | | |
N Class Share | | $ | 989 | | | $ | 350 | | | $ | 658 | | | $ | 52,130 | |
| | | | | | | | | | | | | | | | |
CAPITAL SHARES OUTSTANDING: (4) | | | | | | | | | | | | | | | | |
I Class Share | | | 231,434 | | | | 2,444,905 | | | | 583,976 | | | | 5,085,766 | |
| | | | | | | | | | | | | | | | |
N Class Share | | | 77,930 | | | | 28,989 | | | | 58,937 | | | | 2,567,342 | |
| | | | | | | | | | | | | | | | |
NET ASSET VALUE PER SHARE: (5) | | | | | | | | | | | | | | | | |
I Class Share | | $ | 12.70 | | | $ | 12.09 | | | $ | 11.16 | | | $ | 20.34 | |
| | | | | | | | | | | | | | | | |
N Class Share | | $ | 12.69 | | | $ | 12.09 | | | $ | 11.16 | | | $ | 20.31 | |
| | | | | | | | | | | | | | | | |
| (1) | The identified cost for the TCW Artificial Intelligence Equity Fund, the TCW Conservative Allocation Fund, the TCW Global Real Estate Fund and the TCW New America Premier Equities Fund at October 31, 2019 was $3,516, $941, $5,931 and $134,857, respectively. |
| (2) | The identified cost for investments in affiliated issuers of the TCW Conservative Allocation Fund was $25,853. |
| (3) | Amount rounds to less than $1. |
| (4) | The number of authorized shares, with a par value of $0.001 per share, is 4,000,000,000 for each of the I Class and N Class shares. |
| (5) | Represents offering price and redemption price per share. |
See accompanying notes to financial statements.
52
TCW Funds, Inc.
Statements of Assets and Liabilities | October 31, 2019 |
| | | | | | | | | | | | | | | | |
| | | TCW
Relative Value
Dividend
Appreciation
Fund | | | TCW
Relative Value
Large Cap
Fund | | | TCW
Relative Value
Mid Cap
Fund | | | TCW
Select Equities
Fund | |
| | | Dollar Amounts in Thousands
(Except Per Share Amounts) | |
ASSETS | | | | | | | | | | | | | | | | |
Investments, at Value (1) | | $ | 312,365 | | | $ | 149,395 | | | $ | 79,439 | | | $ | 897,941 | |
Receivable for Securities Sold | | | 619 | | | | 58 | | | | — | | | | 5,175 | |
Receivable for Fund Shares Sold | | | 10 | | | | 51 | | | | 1 | | | | 103 | |
Dividends Receivable | | | 354 | | | | 160 | | | | 44 | | | | 200 | |
Foreign Tax Reclaims Receivable | | | 64 | | | | — | | | | — | | | | — | |
Receivable from Investment Advisor | | | — | | | | — | | | | 16 | | | | 11 | |
Prepaid Expenses | | | 25 | | | | 26 | | | | 23 | | | | 7 | |
| | | | | | | | | | | | | | | | |
Total Assets | | | 313,437 | | | | 149,690 | | | | 79,523 | | | | 903,437 | |
| | | | | | | | | | | | | | | | |
LIABILITIES | | | | | | | | | | | | | | | | |
Payable for Securities Purchased | | | 1,274 | | | | 985 | | | | 911 | | | | — | |
Payable for Fund Shares Redeemed | | | 181 | | | | 55 | | | | 102 | | | | 280 | |
Accrued Directors’ Fees and Expenses | | | 10 | | | | 10 | | | | 10 | | | | 10 | |
Accrued Management Fees | | | 184 | | | | 102 | | | | 46 | | | | 493 | |
Accrued Distribution Fees | | | 47 | | | | 2 | | | | 3 | | | | 28 | |
Other Accrued Expenses | | | 105 | | | | 84 | | | | 46 | | | | 215 | |
| | | | | | | | | | | | | | | | |
Total Liabilities | | | 1,801 | | | | 1,238 | | | | 1,118 | | | | 1,026 | |
| | | | | | | | | | | | | | | | |
NET ASSETS | | $ | 311,636 | | | $ | 148,452 | | | $ | 78,405 | | | $ | 902,411 | |
| | | | | | | | | | | | | | | | |
NET ASSETS CONSIST OF: | | | | | | | | | | | | | | | | |
Paid-in Capital | | $ | 233,254 | | | $ | 47,956 | | | $ | 58,438 | | | $ | 293,225 | |
Accumulated Earnings (Loss) | | | 78,382 | | | | 100,496 | | | | 19,967 | | | | 609,186 | |
| | | | | | | | | | | | | | | | |
NET ASSETS | | $ | 311,636 | | | $ | 148,452 | | | $ | 78,405 | | | $ | 902,411 | |
| | | | | | | | | | | | | | | | |
NET ASSETS ATTRIBUTABLE TO: | | | | | | | | | | | | | | | | |
I Class Share | | $ | 88,314 | | | $ | 136,917 | | | $ | 63,957 | | | $ | 770,079 | |
| | | | | | | | | | | | | | | | |
N Class Share | | $ | 223,322 | | | $ | 11,535 | | | $ | 14,448 | | | $ | 132,332 | |
| | | | | | | | | | | | | | | | |
CAPITAL SHARES OUTSTANDING: (2) | | | | | | | | | | | | | | | | |
I Class Share | | | 4,928,797 | | | | 7,326,382 | | | | 3,036,920 | | | | 27,858,094 | |
| | | | | | | | | | | | | | | | |
N Class Share | | | 12,242,534 | | | | 619,512 | | | | 706,530 | | | | 5,381,740 | |
| | | | | | | | | | | | | | | | |
NET ASSET VALUE PER SHARE: (3) | | | | | | | | | | | | | | | | |
I Class Share | | $ | 17.92 | | | $ | 18.69 | | | $ | 21.06 | | | $ | 27.64 | |
| | | | | | | | | | | | | | | | |
N Class Share | | $ | 18.24 | | | $ | 18.62 | | | $ | 20.45 | | | $ | 24.59 | |
| | | | | | | | | | | | | | | | |
| (1) | The identified cost for the TCW Relative Value Dividend Appreciation Fund, the TCW Relative Value Large Cap Fund, the TCW Relative Value Mid Cap Fund and the TCW Select Equities Fund at October 31, 2019 was $246,973, $105,983, $60,029 and $367,978, respectively. |
| (2) | The number of authorized shares, with a par value of $0.001 per share, is 4,000,000,000 for each of the I Class and N Class shares. |
| (3) | Represents offering price and redemption price per share. |
See accompanying notes to financial statements.
53
TCW Funds, Inc.
Statements of Operations | Year Ended October 31, 2019 |
| | | | | | | | | | | | | | | | |
| | | TCW
Artificial
Intelligence
Equity
Fund | | | TCW
Conservative
Allocation
Fund | | | TCW
Global
Real Estate
Fund | | | TCW
New America
Premier
Equities
Fund | |
| | | Dollar Amounts in Thousands | |
INVESTMENT INCOME | |
Income: | |
Dividends | | $ | 21 | (1) | | $ | 50 | | | $ | 153 | (1) | | $ | 893 | (1) |
Dividends from Investment in Affiliated Issuers | | | — | | | | 669 | | | | — | | | | — | |
Non-cash Dividend Income | | | — | | | | — | | | | 79 | | | | 222 | |
| | | | | | | | | | | | | | | | |
Total | | | 21 | | | | 719 | | | | 232 | | | | 1,115 | |
| | | | | | | | | | | | | | | | |
Expenses: | |
Management Fees | | | 20 | | | | — | | | | 43 | | | | 541 | |
Accounting Services Fees | | | 6 | | | | 7 | | | | 6 | | | | 9 | |
Administration Fees | | | 18 | | | | 21 | | | | 19 | | | | 25 | |
Transfer Agent Fees: | |
I Class | | | 19 | | | | 10 | | | | 6 | | | | 45 | |
N Class | | | 7 | | | | 8 | | | | 6 | | | | 22 | |
Custodian Fees | | | 9 | | | | 4 | | | | 8 | | | | 14 | |
Professional Fees | | | 20 | | | | 18 | | | | 19 | | | | 32 | |
Directors’ Fees and Expenses | | | 39 | | | | 39 | | | | 39 | | | | 39 | |
Registration Fees: | |
I Class | | | 21 | | | | 18 | | | | 18 | | | | 21 | |
N Class | | | 21 | | | | 18 | | | | 18 | | | | 19 | |
Distribution Fees: | |
N Class | | | 2 | | | | 1 | | | | 1 | | | | 49 | |
Shareholder Reporting Expense | | | 2 | | | | 2 | | | | 2 | | | | 3 | |
Other | | | 6 | | | | 8 | | | | 7 | | | | 11 | |
| | | | | | | | | | | | | | | | |
Total | | | 190 | | | | 154 | | | | 192 | | | | 830 | |
| | | | | | | | | | | | | | | | |
Less Expenses Borne by Investment Advisor: | | | | | | | | | | | | | | | | |
I Class | | | 106 | | | | — | | | | 103 | | | | 70 | |
N Class | | | 58 | | | | 26 | | | | 36 | | | | 54 | |
| | | | | | | | | | | | | | | | |
Net Expenses | | | 26 | | | | 128 | | | | 53 | | | | 706 | |
| | | | | | | | | | | | | | | | |
Net Investment Income (Loss) | | | (5 | ) | | | 591 | | | | 179 | | | | 409 | |
| | | | | | | | | | | | | | | | |
NET REALIZED AND UNREALIZED GAIN (LOSS) ON INVESTMENTS | |
Net Realized Gain (Loss) on: | |
Investments | | | (142 | ) | | | — | | | | (186 | ) | | | 435 | |
Investments in Affiliated Issuers | | | — | | | | (528 | ) | | | — | | | | — | |
Realized Gain Received as Distribution from Affiliated Issuers | | | — | | | | 768 | | | | — | | | | — | |
Foreign Currency | | | — | (2) | | | — | | | | 1 | | | | (29 | ) |
Change in Unrealized Appreciation (Depreciation) on: | |
Investments | | | 429 | | | | 55 | | | | 1,099 | | | | 14,408 | |
Investments in Affiliated Issuers | | | — | | | | 2,034 | | | | — | | | | — | |
| | | | | | | | | | | | | | | | |
Net Realized and Unrealized Gain (Loss) on Investments | | | 287 | | | | 2,329 | | | | 914 | | | | 14,814 | |
| | | | | | | | | | | | | | | | |
INCREASE IN NET ASSETS RESULTING FROM OPERATIONS | | $ | 282 | | | $ | 2,920 | | | $ | 1,093 | | | $ | 15,223 | |
| | | | | | | | | | | | | | | | |
| (1) | Net of foreign taxes withheld of $0, $4 and $38 for the TCW Artificial Intelligence Equity Fund, the TCW Global Real Estate Fund and the TCW New America Premier Equities Fund, respectively. |
| (2) | Amount rounds to less than $1. |
See accompanying notes to financial statements.
54
TCW Funds, Inc.
Statements of Operations | Year Ended October 31, 2019 |
| | | | | | | | | | | | | | | | |
| | | TCW
Relative Value
Dividend
Appreciation
Fund | | | TCW
Relative Value
Large Cap
Fund | | | TCW
Relative Value
Mid Cap
Fund | | | TCW
Select Equities
Fund | |
| | | Dollar Amounts in Thousands | |
INVESTMENT INCOME | |
Income: | |
Dividends | | $ | 10,682 | (1) | | $ | 6,422 | | | $ | 1,432 | (1) | | $ | 4,945 | (1) |
Non-cash Dividend Income | | | 222 | | | | 169 | | | | — | | | | — | |
| | | | | | | | | | | | | | | | |
Total | | | 10,904 | | | | 6,591 | | | | 1,432 | | | | 4,945 | |
| | | | | | | | | | | | | | | | |
Expenses: | |
Management Fees | | | 2,186 | | | | 1,596 | | | | 570 | | | | 5,975 | |
Accounting Services Fees | | | 28 | | | | 24 | | | | 11 | | | | 63 | |
Administration Fees | | | 58 | | | | 49 | | | | 27 | | | | 109 | |
Transfer Agent Fees: | |
I Class | | | 48 | | | | 175 | | | | 34 | | | | 642 | |
N Class | | | 266 | | | | 17 | | | | 18 | | | | 143 | |
Custodian Fees | | | 8 | | | | 10 | | | | 9 | | | | 7 | |
Professional Fees | | | 30 | | | | 33 | | | | 29 | | | | 40 | |
Directors’ Fees and Expenses | | | 39 | | | | 39 | | | | 39 | | | | 39 | |
Registration Fees: | |
I Class | | | 19 | | | | 23 | | | | 18 | | | | 26 | |
N Class | | | 24 | | | | 19 | | | | 18 | | | | 22 | |
Distribution Fees: | |
N Class | | | 676 | | | | 30 | | | | 38 | | | | 346 | |
Shareholder Reporting Expense | | | 7 | | | | 7 | | | | 7 | | | | 7 | |
Other | | | 69 | | | | 57 | | | | 18 | | | | 128 | |
| | | | | | | | | | | | | | | | |
Total | | | 3,458 | | | | 2,079 | | | | 836 | | | | 7,547 | |
| | | | | | | | | | | | | | | | |
Less Expenses Borne by Investment Advisor: | | | | | | | | | | | | | | | | |
I Class | | | 5 | | | | 89 | | | | 33 | | | | — | |
N Class | | | 205 | | | | 36 | | | | 55 | | | | 103 | |
| | | | | | | | | | | | | | | | |
Net Expenses | | | 3,248 | | | | 1,954 | | | | 748 | | | | 7,444 | |
| | | | | | | | | | | | | | | | |
Net Investment Income (Loss) | | | 7,656 | | | | 4,637 | | | | 684 | | | | (2,499 | ) |
| | | | | | | | | | | | | | | | |
NET REALIZED AND UNREALIZED GAIN (LOSS) ON INVESTMENTS | |
Net Realized Gain (Loss) on: | |
Investments | | | 17,572 | | | | 86,921 | | | | 1,274 | | | | 89,854 | |
Foreign Currency | | | — | | | | — | | | | — | | | | — | (2) |
Change in Unrealized Appreciation (Depreciation) on: | |
Investments | | | 1,502 | | | | (68,765 | ) | | | 71 | | | | 63,973 | |
| | | | | | | | | | | | | | | | |
Net Realized and Unrealized Gain (Loss) on Investments | | | 19,074 | | | | 18,156 | | | | 1,345 | | | | 153,827 | |
| | | | | | | | | | | | | | | | |
INCREASE IN NET ASSETS RESULTING FROM OPERATIONS | | $ | 26,730 | | | $ | 22,793 | | | $ | 2,029 | | | $ | 151,328 | |
| | | | | | | | | | | | | | | | |
| (1) | Net of foreign taxes withheld of $153, $7 and $22 for the TCW Relative Value Dividend Appreciation Fund, the TCW Relative Value Mid Cap Fund and the TCW Select Equities Fund, respectively. |
| (2) | Amount rounds to less than $1. |
See accompanying notes to financial statements.
55
TCW Funds, Inc.
Statements of Changes in Net Assets
| | | | | | | | | | | | | | | | |
| | |
TCW
Artificial Intelligence Equity
Fund | | | TCW
Conservative Allocation
Fund | |
| | | Year Ended
October 31,
2019 | | | Year Ended
October 31,
2018 | | | Year Ended
October 31,
2019 | | | Year Ended
October 31,
2018 | |
| | | Dollar Amounts in Thousands | |
OPERATIONS | | | | | | | | | | | | | | | | |
Net Investment Income (Loss) | | $ | (5 | ) | | $ | (6 | ) | | $ | 591 | | | $ | 501 | |
Net Realized Gain (Loss) on Investments and Foreign Currency Transactions | | | (142 | ) | | | (2 | ) | | | 240 | | | | 1,389 | |
Change in Unrealized Appreciation (Depreciation) on Investments | | | 429 | | | | (11 | ) | | | 2,089 | | | | (1,850 | ) |
| | | | | | | | | | | | | | | | |
Increase (Decrease) in Net Assets Resulting from Operations | | | 282 | | | | (19 | ) | | | 2,920 | | | | 40 | |
| | | | | | | | | | | | | | | | |
DISTRIBUTIONS TO SHAREHOLDERS | | | | | | | | | | | | | | | | |
Distributions to Shareholders | | | — | | | | — | (1) | | | (1,727 | ) | | | (1,259 | ) |
| | | | | | | | | | | | | | | | |
NET CAPITAL SHARE TRANSACTIONS | | | | | | | | | | | | | | | | |
I Class | | | 1,387 | | | | 695 | | | | 460 | | | | (1,021 | ) |
N Class | | | 203 | | | | 154 | | | | (181 | ) | | | 7 | |
| | | | | | | | | | | | | | | | |
Increase (Decrease) in Net Assets Resulting from Net Capital Shares Transactions | | | 1,590 | | | | 849 | | | | 279 | | | | (1,014 | ) |
| | | | | | | | | | | | | | | | |
Increase (Decrease) in Net Assets | | | 1,872 | | | | 830 | | | | 1,472 | | | | (2,233 | ) |
NET ASSETS | | | | | | | | | | | | | | | | |
Beginning of Year | | | 2,057 | | | | 1,227 | | | | 28,443 | | | | 30,676 | |
| | | | | | | | | | | | | | | | |
End of Year | | $ | 3,929 | | | $ | 2,057 | | | $ | 29,915 | | | $ | 28,443 | |
| | | | | | | | | | | | | | | | |
| (1) | Amount rounds to less than $1. |
See accompanying notes to financial statements.
56
TCW Funds, Inc.
Statements of Changes in Net Assets
| | | | | | | | | | | | | | | | |
| | |
TCW
Global Real Estate
Fund | | | TCW
New America Premier Equities
Fund | |
| | | Year Ended
October 31,
2019 | | | Year Ended
October 31,
2018 | | | Year Ended
October 31,
2019 | | | Year Ended
October 31,
2018 | |
| | | Dollar Amounts in Thousands | |
OPERATIONS | | | | | | | | | | | | | | | | |
Net Investment Income (Loss) | | $ | 179 | | | $ | 102 | | | $ | 409 | | | $ | (33 | ) |
Net Realized Gain (Loss) on Investments and Foreign Currency Transactions | | | (185 | ) | | | (193 | ) | | | 406 | | | | 512 | |
Change in Unrealized Appreciation (Depreciation) on Investments | | | 1,099 | | | | (161 | ) | | | 14,408 | | | | 1,221 | |
| | | | | | | | | | | | | | | | |
Increase (Decrease) in Net Assets Resulting from Operations | | | 1,093 | | | | (252 | ) | | | 15,223 | | | | 1,700 | |
| | | | | | | | | | | | | | | | |
DISTRIBUTIONS TO SHAREHOLDERS | |
Distributions to Shareholders | | | (124 | ) | | | (82 | ) | | | (480 | ) | | | (677 | ) |
| | | | | | | | | | | | | | | | |
NET CAPITAL SHARE TRANSACTIONS | |
I Class | | | 2,772 | | | | 356 | | | | 62,945 | | | | 11,097 | |
N Class | | | 13 | | | | 1 | | | | 44,519 | | | | 2,405 | |
| | | | | | | | | | | | | | | | |
Increase in Net Assets Resulting from Net Capital Shares Transactions | | | 2,785 | | | | 357 | | | | 107,464 | | | | 13,502 | |
| | | | | | | | | | | | | | | | |
Increase in Net Assets | | | 3,754 | | | | 23 | | | | 122,207 | | | | 14,525 | |
NET ASSETS | |
Beginning of Year | | | 3,422 | | | | 3,399 | | | | 33,365 | | | | 18,840 | |
| | | | | | | | | | | | | | | | |
End of Year | | $ | 7,176 | | | $ | 3,422 | | | $ | 155,572 | | | $ | 33,365 | |
| | | | | | | | | | | | | | | | |
See accompanying notes to financial statements.
57
TCW Funds, Inc.
Statements of Changes in Net Assets
| | | | | | | | | | | | | | | | |
| | |
TCW Relative
Value Dividend
Appreciation Fund | | | TCW Relative
Value Large Cap
Fund | |
| | | Year Ended
October 31,
2019 | | | Year Ended
October 31,
2018 | | | Year Ended
October 31,
2019 | | | Year Ended
October 31,
2018 | |
| | | Dollar Amounts in Thousands | |
OPERATIONS | |
Net Investment Income | | $ | 7,656 | | | $ | 9,806 | | | $ | 4,637 | | | $ | 6,043 | |
Net Realized Gain on Investments | | | 17,572 | | | | 26,207 | | | | 86,921 | | | | 43,418 | |
Change in Unrealized Appreciation (Depreciation) on Investments | | | 1,502 | | | | (48,642 | ) | | | (68,765 | ) | | | (69,355 | ) |
| | | | | | | | | | | | | | | | |
Increase (Decrease) in Net Assets Resulting from Operations | | | 26,730 | | | | (12,629 | ) | | | 22,793 | | | | (19,894 | ) |
| | | | | | | | | | | | | | | | |
DISTRIBUTIONS TO SHAREHOLDERS | |
Distributions to Shareholders | | | (32,961 | ) | | | (33,737 | ) | | | (45,949 | ) | | | (71,597 | ) |
| | | | | | | | | | | | | | | | |
NET CAPITAL SHARE TRANSACTIONS | |
I Class | | | (8,551 | ) | | | (24,898 | ) | | | (242,502 | ) | | | 18,450 | |
N Class | | | (179,813 | ) | | | (44,769 | ) | | | (928 | ) | | | (372 | ) |
| | | | | | | | | | | | | | | | |
Increase (Decrease) in Net Assets Resulting from Net Capital Shares Transactions | | | (188,364 | ) | | | (69,667 | ) | | | (243,430 | ) | | | 18,078 | |
| | | | | | | | | | | | | | | | |
Decrease in Net Assets | | | (194,595 | ) | | | (116,033 | ) | | | (266,586 | ) | | | (73,413 | ) |
NET ASSETS | |
Beginning of Year | | | 506,231 | | | | 622,264 | | | | 415,038 | | | | 488,451 | |
| | | | | | | | | | | | | | | | |
End of Year | | $ | 311,636 | | | $ | 506,231 | | | $ | 148,452 | | | $ | 415,038 | |
| | | | | | | | | | | | | | | | |
See accompanying notes to financial statements.
58
TCW Funds, Inc.
Statements of Changes in Net Assets
| | | | | | | | | | | | | | | | |
| | |
TCW Relative
Value Mid Cap
Fund | | | TCW
Select Equities
Fund | |
| | | Year Ended
October 31,
2019 | | | Year Ended
October 31,
2018 | | | Year Ended
October 31,
2019 | | | Year Ended
October 31,
2018 | |
| | | Dollar Amounts in Thousands | |
OPERATIONS | |
Net Investment Income (Loss) | | $ | 684 | | | $ | 476 | | | $ | (2,499 | ) | | $ | (3,032 | ) |
Net Realized Gain on Investments and Foreign Currency Transactions | | | 1,274 | | | | 6,667 | | | | 89,854 | | | | 134,658 | |
Change in Unrealized Appreciation (Depreciation) on Investments | | | 71 | | | | (13,168 | ) | | | 63,973 | | | | (20,639 | ) |
| | | | | | | | | | | | | | | | |
Increase (Decrease) in Net Assets Resulting from Operations | | | 2,029 | | | | (6,025 | ) | | | 151,328 | | | | 110,987 | |
| | | | | | | | | | | | | | | | |
DISTRIBUTIONS TO SHAREHOLDERS | |
Distributions to Shareholders | | | (6,781 | ) | | | (8,260 | ) | | | (117,727 | ) | | | (201,824 | ) |
| | | | | | | | | | | | | | | | |
NET CAPITAL SHARE TRANSACTIONS | |
I Class | | | (4,776 | ) | | | (213 | ) | | | (566 | ) | | | 48,042 | |
N Class | | | (2,634 | ) | | | 1,834 | | | | (4,361 | ) | | | 9,190 | |
| | | | | | | | | | | | | | | | |
Increase (Decrease) in Net Assets Resulting from Net Capital Shares Transactions | | | (7,410 | ) | | | 1,621 | | | | (4,927 | ) | | | 57,232 | |
| | | | | | | | | | | | | | | | |
Increase (Decrease) in Net Assets | | | (12,162 | ) | | | (12,664 | ) | | | 28,674 | | | | (33,605 | ) |
NET ASSETS | |
Beginning of Year | | | 90,567 | | | | 103,231 | | | | 873,737 | | | | 907,342 | |
| | | | | | | | | | | | | | | | |
End of Year | | $ | 78,405 | | | $ | 90,567 | | | $ | 902,411 | | | $ | 873,737 | |
| | | | | | | | | | | | | | | | |
See accompanying notes to financial statements.
59
TCW Funds, Inc.
Notes to Financial Statements
Note 1 — Organization
TCW Funds, Inc., a Maryland corporation (the “Company”), is an open-end management investment company registered under the Investment Company Act of 1940, as amended (the “1940 Act”), that currently offers 19 no-load mutual funds (each series, a “Fund” and collectively, the “Funds”). TCW Investment Management Company LLC (the “Advisor”) is the investment advisor to and an affiliate of the Funds and is registered under the Investment Advisers Act of 1940 as amended. Each Fund has its own investment objectives and strategies. The following is a brief description of the investment objectives and principal investment strategies for the Funds that are covered in this report:
| | |
TCW Fund | | Investment Objectives and Principal Investment Strategies |
| Non-Diversified U.S. Equity Fund |
| |
| TCW Artificial Intelligence Equity Fund | | Seeks long term capital appreciation by investing at least 80% of the value of its net assets in publicly traded equity securities of businesses that the portfolio managers believe are benefitting from or have the potential to benefit from advances in the use of artificial intelligence. |
| Diversified U.S. Equity Funds |
| |
| TCW Global Real Estate Fund | | Seeks to maximize total return from current income and long-term capital growth by investing at least 80% of its net assets in equity securities of real estate investment trusts (“REITs”) and real estate companies. |
| |
| TCW New America Premier Equities Fund | | Seeks to provide long-term capital appreciation by investing at least 80% of the value of its net assets in equity securities of U.S. companies; intends to achieve its objective by investing in a portfolio of companies the portfolio manager believes are enduring, cash generating businesses whose leaders prudently manage their environmental, social, and financial resources and whose shares are attractively valued relative to free cash flow generated by the businesses. |
| |
| TCW Relative Value Dividend Appreciation Fund | | Seeks to realize a high level of dividend income consistent with prudent investment management, with secondary objective of capital appreciation, by investing at least 80% of the value of its net assets in equity securities of companies that have a record of paying dividends. |
| |
| TCW Relative Value Large Cap Fund | | Seeks capital appreciation, with a secondary goal of current income, by investing at least 80% of the value of its net assets in equity securities of companies with a market capitalization of greater than $1 billion at the time of purchase. |
60
TCW Funds, Inc.
Note 1 — Organization (Continued)
| | |
TCW Fund | | Investment Objectives and Principal Investment Strategies |
| |
| TCW Relative Value Mid Cap Fund | | Seeks to provide long-term capital appreciation by investing at least 65% of the value of its net assets in equity securities issued by companies with market capitalizations, at the time of acquisition, within the capitalization ranges of the companies comprising the Russell Mid Cap Index. |
| |
| TCW Select Equities Fund | | Seeks to provide long-term capital appreciation by investing at least 80% of its net assets in equity securities; uses a highly focused approach to seek to achieve superior long-term returns over a full market cycle by owning shares of companies that the portfolio manager believes to have strong and enduring business models and inherent advantages over their competitors. |
| Fund of Funds |
| |
| TCW Conservative Allocation Fund | | Seeks to provide current income, and secondarily, long-term capital appreciation by investing in a combination of fixed income funds and equity funds that utilize diverse investment styles such as growth and/or value investing. The Fund invests between 20% and 60% of its net assets in equity funds and between 40% and 80% in fixed income funds. |
All Funds offer two classes of shares: I Class and N Class. The two Classes of a Fund are substantially the same except that the N Class shares are subject to a distribution fee (see Note 6).
The TCW Conservative Allocation Fund is a “fund of funds” that invests in affiliated and unaffiliated funds which are identified on the Schedule of Investments.
Note 2 — Significant Accounting Policies
The following is a summary of significant accounting policies which are in conformity with accounting principles generally accepted in the United States of America (“GAAP”) and which are consistently followed by the Funds in the preparation of their financial statements. Each Fund is considered an investment company under the Financial Accounting Standards Board (FASB) Accounting Standards Codification (ASC) No. 946, Financial Services — Investment Companies. Subsequent events, if any, have been evaluated through the date of issuance in the preparation of the financial statements.
Principles of Accounting: The Funds use the accrual method of accounting for financial reporting purposes.
Net Asset Value: The net asset value (“NAV”) per share of each class of a Fund is determined by dividing the Fund’s net assets attributable to each class by the number of shares issued and outstanding of that class on each day the New York Stock Exchange (“NYSE”) is open for trading.
Security Valuations: Equity securities listed or traded on the NYSE and other stock exchanges are valued at the latest sale price on the exchange. Securities traded on the NASDAQ stock market (“NASDAQ”) are valued using official closing prices as reported by NASDAQ, which may not be the last sale price. Options
61
TCW Funds, Inc.
Notes to Financial Statements (Continued)
Note 2 — Significant Accounting Policies (Continued)
on equity securities and options on indexes are valued using mid prices (average of bid and ask prices) as reported by the exchange or pricing service. Investments in open-end mutual funds including money market funds are valued based on the NAV per share as reported by the investment companies. All other securities for which over-the-counter (“OTC”) market quotations are readily available, including short-term securities, are valued with prices furnished by independent pricing services or by broker dealers.
The Company has adopted, after the approval by the Company’s Board of Directors (the “Board” and each member thereof a “Director”), a fair valuation methodology for foreign equity securities (exclusive of certain Latin American and Canadian equity securities). This methodology is designed to address the effect of movements in the U.S. market on the securities traded on foreign exchanges that have been closed for a period of time due to time zones differences. The utilization of the fair value model may result in the adjustment of prices taking into account fluctuations in the U.S. market. The fair value model is utilized each trading day and not dependent on certain thresholds or triggers.
Securities for which market quotations are not readily available, including circumstances under which the prices received are not reflective of a security’s market value, are valued by the Advisor’s Pricing Committee in accordance with the guidelines established by the Board’s Valuation Committee and under the general oversight of the Board.
Fair value is defined as the price that a fund would receive upon selling an investment in a timely transaction to an independent buyer in the principal or most advantageous market for the investment. In accordance with the authoritative guidance on fair value measurements and disclosures under GAAP, the Funds disclose investments in their financial statements in a three-tier hierarchy. This hierarchy is utilized to establish classification of fair value based on inputs. Inputs that go into fair value measurement refer broadly to the assumptions that market participants would use in pricing the asset or liability, including assumptions about risk. Inputs may be observable or unobservable. Observable inputs are inputs that reflect the assumptions market participants would use in pricing the asset or liability developed based on market data obtained from sources independent of the reporting entity. Unobservable inputs are inputs that reflect the reporting entity’s own assumptions about the inputs market participants would use in pricing the asset or liability developed based on the best information available in the circumstances.
The three-tier hierarchy of inputs is summarized in the three broad levels listed below.
| | |
| Level 1 — | | quoted prices in active markets for identical investments. |
| Level 2 — | | other significant observable inputs (including quoted prices for similar investments, interest rates, prepayment speeds, credit risk, etc.). |
| Level 3 — | | significant unobservable inputs (including the Funds’ own assumptions in determining the fair value of investments). |
Changes in valuation techniques may result in transfers in or out of an investment’s assigned level within the hierarchy. The inputs or methodologies used for valuing investments are not necessarily an indication of the risk associated with investing in those investments and the determination of the significance of a particular input to the fair value measurement in its entirety requires judgment and consideration of factors specific to each security.
The availability of observable inputs can vary from security to security and is affected by a wide variety of factors, including, for example, the type of security, whether the security is new and not yet established in the marketplace, the liquidity of markets, and other characteristics particular to the security. To the extent
62
TCW Funds, Inc.
Note 2 — Significant Accounting Policies (Continued)
that valuation is based on models or inputs that are less observable or unobservable in the market, the determination of fair value requires more judgment. Accordingly, the degree of judgment exercised in determining fair value is greatest for instruments categorized in Level 3.
In periods of market dislocation, the observability of prices and inputs may be reduced for many instruments. This condition, as well as changes related to liquidity of investments, could cause a security to be reclassified between Level 1, Level 2, or Level 3.
In certain cases, the inputs used to measure fair value may fall into different levels of the fair value hierarchy. In such cases, for disclosure purposes the level in the fair value hierarchy within which the fair value measurement falls in its entirety is determined based on the lowest level input that is significant to the fair value measurement.
Fair Value Measurements: A description of the valuation techniques applied to the Funds’ major categories of assets and liabilities measured at fair value on a recurring basis is as follows:
Equity securities. Securities are generally valued based on quoted prices from the applicable exchange. To the extent these securities are actively traded and valuation adjustments are not applied, they are generally categorized in Level 1 of the fair value hierarchy. Restricted securities issued by publicly held companies are categorized in Level 2 or 3 of the fair value hierarchy depending on whether a discount is applied and significant. Restricted securities held in non-public entities are included in Level 3 of the fair value hierarchy because they trade infrequently, and therefore, the inputs are unobservable. Certain foreign securities that are fair valued using a pricing service that considers the correlation of the trading patterns of the foreign security to the intraday trading in the U.S. markets are categorized in Level 2 of the fair value hierarchy.
Mutual funds. Open-end mutual funds including money market funds are valued using the NAV as reported by the fund companies. As such, they are categorized in Level 1.
Options contracts. Option contracts traded on securities exchanges are fair valued using market mid prices; as such, they are categorized in Level 1. Option contracts traded OTC are fair valued based on pricing models and incorporate various inputs such as interest rate, credit spreads, currency exchange rates and volatility measurements for in-the-money, at-the-money, and out-of-money contracts on a given strike price. To the extent that these inputs are observable and timely, the fair value of OTC option contracts would be categorized in Level 2; otherwise, the fair values would be categorized in Level 3.
Restricted securities. Restricted securities, including illiquid Rule 144A securities, held in non-public entities are included in Level 3 of the fair value hierarchy because they trade infrequently, and therefore, the inputs are unobservable. Any other restricted securities valued similar to publicly traded securities may be categorized in Level 2 or 3 of the fair value hierarchy depending on whether a discount is applied and significant to the fair value.
The summary of the inputs used as of October 31, 2019 in valuing the Funds’ investments is listed after each Fund’s Schedule of Investments.
The Funds held no investments or other financial instruments at October 31, 2019 for which fair value was calculated using Level 3 inputs.
63
TCW Funds, Inc.
Notes to Financial Statements (Continued)
Note 2 — Significant Accounting Policies (Continued)
Security Transactions and Related Investment Income: Security transactions are recorded as of the trade date. Dividend income is recorded on the ex-dividend date. Interest income is recognized on an accrual basis. Realized gains and losses on investments are recorded on the basis of specific identification.
Allocation of Operating Activity for Multiple Classes: Investment income, common expenses and realized and unrealized gains and losses are allocated among the share classes of the Funds based on the relative net assets of each class. Distribution fees, which are directly attributable to a class of shares, are charged to the operations of that class. All other expenses are charged to each Fund or class as incurred on a specific identification basis. Differences in class specific fees and expenses will result in differences in net investment income for each class, and in turn differences in dividends paid by each class.
Dividends and Distributions: Dividends and distributions to shareholders are recorded on the ex-dividend date. The TCW Global Real Estate Fund and the TCW Relative Value Dividend Appreciation Fund declare and pay, or reinvest, dividends from net investment income quarterly. The other Equity Funds and TCW Conservative Allocation Fund declare and pay, or reinvest, dividends from net investment income annually. Capital gains realized by a Fund will be distributed at least annually.
Income and capital gain distributions are determined in accordance with income tax regulations which may differ from GAAP. These differences are primarily due to differing treatments for foreign currency transactions, market discount and premium, losses deferred due to wash sales, excise tax regulations and employing equalization in determining amounts to be distributed to fund shareholders. Permanent book and tax basis differences relating to shareholder distributions will result in reclassifications between paid-in capital, undistributed net investment income (loss), and/or undistributed accumulated realized gain (loss). Undistributed net investment income or loss may include temporary book and tax differences which will reverse in subsequent periods. Any taxable income or capital gain remaining at fiscal year-end is distributed in the following year. Distributions received from real estate investment trusts may include return of capital which is treated as a reduction in the cost basis of those investments. Distributions received, if any, in excess of the cost basis of a security is recognized as capital gain.
Use of Estimates: The preparation of the accompanying financial statements requires management to make estimates and assumptions that affect the reported amount of assets and liabilities at the date of the financial statements and the reported amounts of income and expenses during the reporting period. Actual results could differ from these estimates.
Foreign Currency Translation: The books and records of each Fund are maintained in U.S. dollars as follows: (1) the market value of foreign securities, and other assets and liabilities stated in foreign currencies, are translated using the daily spot rate; and (2) purchases, sales, income and expenses are translated at the rate of exchange prevailing on the respective dates of such transactions. The resultant exchange gains and losses are included in net realized or net unrealized gain (loss) in the Statements of Operations. Pursuant to U.S. federal income tax regulations, certain foreign exchange gains and losses included in realized and unrealized gains and losses are included in, or are a reduction of, ordinary income for federal income tax purposes.
Foreign Taxes: The Funds may be subject to withholding taxes on income and capital gains imposed by certain countries in which they invest. The withholding tax on income is netted against the income accrued or received. Any reclaimable taxes are recorded as income. The withholding tax on realized or unrealized gain is recorded as a liability.
64
TCW Funds, Inc.
Note 2 — Significant Accounting Policies (Continued)
Derivative Instruments: Derivatives are financial instruments which are valued based on the values of one or more indicators, such as a security, asset, currency, interest rate, or index. Derivative transactions can create investment leverage and may be highly volatile. It is possible that a derivative transaction will result in a loss greater than the principal amount invested. The Funds may not be able to close out a derivative transaction at a favorable time or price.
For the year ended October 31, 2019, the TCW Global Real Estate Fund had the following derivatives and transactions in derivatives, grouped in the following risk categories (amounts in thousands except Numbers of Contracts):
| | | | | | | | |
| | | Equity Risk | | | Total | |
Statement of Asset and Liabilities: | |
Asset Derivatives | | | | | | | | |
Investments (1) | | $ | 5 | | | $ | 5 | |
| | | | | | | | |
Total Value | | $ | 5 | | | $ | 5 | |
| | | | | | | | |
Statement of Operations: | |
Realized Gain (Loss) | |
Investments (2) | | $ | (39 | ) | | $ | (39 | ) |
| | | | | | | | |
Total Realized Gain (Loss) | | $ | (39 | ) | | $ | (39 | ) |
| | | | | | | | |
Change in Appreciation (Depreciation) | |
Investments | | $ | 1 | | | $ | 1 | |
| | | | | | | | |
Total Change in (Depreciation) | | $ | 1 | | | $ | 1 | |
| | | | | | | | |
Number of Contracts, Notional Amounts or Shares/Units (3) | |
Options Purchased | | | 101 | | | | 101 | |
| (1) | Represents purchased options, at value. |
| (2) | Represents realized gain (loss) for purchased options. |
| (3) | Amount disclosed represents average notional amounts which are representative of the volume traded for the year ended October 31, 2019. |
Note 3 — Portfolio Investments
When-Issued, Delayed-Delivery and Forward Commitment Transactions: The Funds, with the exception of the TCW Conservative Allocation Fund, may enter into when-issued, delayed-delivery, or forward commitment transactions in order to lock in the purchase price of the underlying security. In when-issued, delayed-delivery, or forward commitment transactions, a Fund commits to purchase or sell particular securities, with payment and delivery to take place at a future date. Although the Fund does not pay for the securities until they are delivered, it immediately assumes the risks of ownership, including the risk of price fluctuation. If the Fund’s counterparty fails to deliver a security purchased on a when issued, delayed delivery or forward commitment basis, there may be a loss, and the Fund may have missed an opportunity to make an alternative investment.
Prior to settlement of these transactions, the values of the subject securities will fluctuate with market conditions. In addition, because a Fund is not required to pay for when-issued, delayed-delivery or forward commitment securities until the delivery date, they may result in a form of leverage to the extent the Fund does not set aside liquid assets to cover the commitment. To guard against the deemed leverage, the Fund monitors the obligations under these transactions on a daily basis and ensures that the Fund has sufficient liquid assets to cover them. There were no when-issued, delayed-delivery or forward commitment transactions in the Funds during the year ended October 31, 2019.
65
TCW Funds, Inc.
Notes to Financial Statements (Continued)
Note 3 — Portfolio Investments (Continued)
Repurchase Agreements: The Funds may enter into Repurchase Agreements, under the terms of a Master Repurchase Agreement (“MRA”). In a repurchase agreement, the Funds purchase a security from a counterparty who agrees to repurchase the same security at a mutually agreed upon date and price. The MRA permits each Fund, under certain circumstances including an event of default (such as bankruptcy or insolvency), to offset payables and/or receivables under the MRA with collateral held and/or posted to the counterparty and create one single net payment due to or from each Fund. However, bankruptcy or insolvency laws of a particular jurisdiction may impose restrictions on or prohibitions against such a right of offset in the event of a MRA counterparty’s bankruptcy or insolvency. Pursuant to the terms of the MRA, each Fund receives securities as collateral with a market value in excess of the repurchase price. Upon a bankruptcy or insolvency of the MRA counterparty, the Fund recognizes a liability with respect to such excess collateral to reflect the Fund’s obligation under bankruptcy law to return the excess to the counterparty. There were no repurchase agreements outstanding as of October 31, 2019.
Security Lending: The Funds may lend their securities to qualified brokers. The loans must be collateralized at all times primarily with cash although the Funds can accept money market instruments or U.S. government securities with a market value at least equal to the market value of the securities on loan. As with any extensions of credit, the Funds may bear the risk of delay in recovery or even loss of rights in the collateral if the borrowers of the securities fail financially. The Funds earn additional income for lending their securities by investing the cash collateral in short-term investments. The Funds did not lend any securities during the year ended October 31, 2019.
Derivatives:
Options: The Funds may purchase and sell put and call options on a security or an index of securities to enhance investment performance or to protect against changes in market prices. The Funds may also enter into currency options to hedge against or take advantage of changes in currency fluctuations.
A call option gives the holder the right to purchase, and obligates the writer to sell, a security at the strike price at any time before the expiration date. A put option gives the holder the right to sell, and obligates the writer to buy, a security at the exercise price at any time before the expiration date. A Fund may purchase put options to protect portfolio holdings against a decline in market value of a security or securities held by it. A Fund may also purchase a put option hoping to profit from an anticipated decline in the value of the underlying security. If a Fund holds the security underlying the option, the option premium and any transaction costs will reduce any profit the Fund might have realized had it sold the underlying security instead of buying the put option. A Fund may purchase call options to hedge against an increase in the price of securities that the Fund ultimately wants to buy. A Fund may also purchase a call option as a long directional investment hoping to profit from an anticipated increase in the value of the underlying security. In order for a call option to be profitable, the market price of the underlying security must rise sufficiently above the exercise price to cover the premium and transaction costs. These costs will reduce any profit a Fund might have realized had it bought the underlying security at the time it purchased the call option.
When a Fund purchases an option, it runs the risk that it will lose its entire investment in the option in a relatively short period of time, unless the Fund exercises the option or enters into a closing sale transaction before the option’s expiration. If the price of the underlying security does not rise (in the case of a call) or fall (in the case of a put) to an extent sufficient to cover the option premium and transaction costs, the Fund will lose part or all of its investment in the option. Premiums paid for purchasing options that expire are treated as realized losses.
66
TCW Funds, Inc.
Note 3 — Portfolio Investments (Continued)
Options traded on a securities or options exchange typically have minimal exposure to counterparty risk. However, an exchange or market may at times find it necessary to impose restrictions on particular types of options transactions, such as opening transactions. If an underlying security ceases to meet qualifications imposed by an exchange or the Options Clearing Corporation, new series of options on that security will no longer be opened to replace expiring series, and opening transactions in existing series may be prohibited.
OTC options are options not traded on exchanges or backed by clearinghouses. Rather, they are entered into directly between a Fund and the counterparty to the option. In the case of an OTC option purchased by a Fund, the value of the option to the Fund will depend on the willingness and ability of the option writer to perform its obligations to the Fund. In addition, OTC options may not be transferable and there may be little or no secondary market for them, so they may be considered illiquid. It may not be possible to enter into closing transactions with respect to OTC options or otherwise to terminate such options, and as a result a Fund may be required to remain obligated on an unfavorable OTC option until its expiration.
During the year ended October 31, 2019, TCW Global Real Estate Fund entered into option contracts to hedge the Fund’s investments from market volatility in the real estate sector.
Note 4 — Risk Considerations
Market Risk: The Funds’ investments will fluctuate with market conditions, so will the value of your investment in the Funds. You could lose money on your investment in the Funds or the Funds could underperform other investments.
Liquidity Risk: The Funds’ investments in illiquid securities may reduce the returns of the Funds because they may not be able to sell the illiquid securities at an advantageous time or price. Investments in high yield securities, foreign securities, derivatives or other securities with substantial market and/or credit risk tend to have the greatest exposure to liquidity risk. Certain investments in private placements and Rule 144A securities may be considered illiquid investments. The Funds may invest in private placements and Rule 144A securities.
Counterparty Risk: The Funds may be exposed to counterparty risk, the risk that an entity with which the Funds have unsettled or open transactions may not fulfill its obligations.
Investment Style Risk: Certain Funds may also be subject to investment style risk. The Advisor’s investment styles may be out of favor at times or may not produce the best results over short or longer time periods and may increase the volatility of a Fund’s share price.
Equity Risk: Equity securities may include common stock, preferred stock or other securities representing an ownership interest of the right to acquire an ownership interest in an issuer. Equity risk is the risk that stocks and other equity securities generally fluctuate in value more than bonds and can decline in value over short or extended periods. The value of stocks and other equity securities will be affected by changes in a company’s financial condition and in overall market, economic and political conditions.
For complete information on the various risks involved, please refer to the Funds’ prospectus and the Statement of Additional Information which can be obtained on the Funds’ website (www.tcw.com) or by calling customer service at 1-800-FUND-TCW (1-800-386-3829).
Note 5 — Federal Income Taxes
It is the policy of each Fund to comply with the requirements under Subchapter M of the Internal Revenue Code (the “Code”) applicable to regulated investment companies and to distribute all of its net taxable
67
TCW Funds, Inc.
Notes to Financial Statements (Continued)
Note 5 — Federal Income Taxes (Continued)
income, including any net realized gains on investments, to its shareholders. Therefore, no federal income tax provision is required.
At October 31, 2019, the components of distributable earnings on a tax basis were as follows (amounts in thousands):
| | | | | | | | | | | | |
| | | Undistributed
Ordinary
Income | | | Undistributed
Long-Term
Gain | | | Total
Distributable
Earnings | |
TCW Conservative Allocation Fund | | $ | 443 | | | $ | 237 | | | $ | 680 | |
TCW Global Real Estate Fund | | | 65 | | | | — | | | | 65 | |
TCW New America Premier Equities Fund | | | 545 | | | | 575 | | | | 1,120 | |
TCW Relative Value Dividend Appreciation Fund | | | 619 | | | | 19,573 | | | | 20,192 | |
TCW Relative Value Large Cap Fund | | | 3,360 | | | | 56,558 | | | | 59,918 | |
TCW Relative Value Mid Cap Fund | | | 140 | | | | 1,374 | | | | 1,514 | |
TCW Select Equities Fund | | | — | | | | 81,573 | | | | 81,573 | |
For the prior fiscal year ended October 31, 2018, the components of distributable earnings on a tax basis were as follows (amounts in thousands):
| | | | | | | | | | | | |
| | | Undistributed
Ordinary
Income | | | Undistributed
Long-Term
Gain | | | Total
Distributable
Earnings | |
TCW Conservative Allocation Fund | | $ | 341 | | | $ | 1,228 | | | $ | 1,569 | |
TCW New America Premier Equities Fund | | | 166 | | | | 297 | | | | 463 | |
TCW Global Real Estate Fund | | | 33 | | | | — | | | | 33 | |
TCW Relative Value Dividend Appreciation Fund | | | 506 | | | | 25,420 | | | | 25,926 | |
TCW Relative Value Large Cap Fund | | | 4,923 | | | | 39,750 | | | | 44,673 | |
TCW Relative Value Mid Cap Fund | | | — | | | | 6,240 | | | | 6,240 | |
TCW Select Equities Fund | | | — | | | | 117,726 | | | | 117,726 | |
Permanent differences incurred during the year ended October 31, 2019 resulting from differences in book and tax accounting, have been reclassified at year-end between undistributed net investment income (loss), undistributed (accumulated) net realized gain (loss) and paid-in capital as follows, with no impact to the net asset value per share (amounts in thousands):
| | | | | | | | | | | | |
| | | Undistributed
Net Investment
Income (Loss) | | | Undistributed
Accumulated
Net Realized
Gain (Loss) | | | Paid-in
Capital | |
|
TCW Artificial Intelligence Equity Fund | | $ | — | (1) | | $ | — | (1) | | $ | — | (1) |
TCW Conservative Allocation Fund | | | 13 | | | | (32 | ) | | | 19 | |
TCW Global Real Estate Fund | | | (101 | ) | | | 101 | | | | — | |
TCW New America Premier Equities Fund | | | (29 | ) | | | (153 | ) | | | 182 | |
TCW Relative Value Dividend Appreciation Fund | | | — | (1) | | | (3,390 | ) | | | 3,390 | |
TCW Relative Value Large Cap Fund | | | — | | | | (31,948 | ) | | | 31,948 | |
TCW Relative Value Mid Cap Fund | | | (1 | ) | | | (95 | ) | | | 96 | |
TCW Select Equities Fund | | | 275 | | | | (8,184 | ) | | | 7,909 | |
| (1) | Amounts rounds to less than $1. |
68
TCW Funds, Inc.
Note 5 — Federal Income Taxes (Continued)
During the year ended October 31, 2019, the tax character of distributions paid was as follows (amounts in thousands):
| | | | | | | | | | | | |
| | | Ordinary
Income | | | Long-Term
Capital Gain | | | Total
Distributions | |
TCW Conservative Allocation Fund | | $ | 499 | | | $ | 1,228 | | | $ | 1,727 | |
TCW Global Real Estate Fund | | | 124 | | | | — | | | | 124 | |
TCW New America Premier Equities Fund | | | 183 | | | | 297 | | | | 480 | |
TCW Relative Value Dividend Appreciation Fund | | | 7,541 | | | | 25,420 | | | | 32,961 | |
TCW Relative Value Large Cap Fund | | | 6,199 | | | | 39,750 | | | | 45,949 | |
TCW Relative Value Mid Cap Fund | | | 543 | | | | 6,238 | | | | 6,781 | |
TCW Select Equities Fund | | | — | | | | 117,727 | | | | 117,727 | |
During the prior fiscal year ended October 31, 2018, the tax character of distributions paid was as follows (amounts in thousands):
| | | | | | | | | | | | |
| | | Ordinary
Income | | | Long-Term
Capital Gain | | | Total
Distributions | |
TCW Artificial Intelligence Equity Fund | | $ | — | (1) | | $ | — | | | $ | — | (1) |
TCW Conservative Allocation Fund | | | 510 | | | | 749 | | | | 1,259 | |
TCW Global Real Estate Fund | | | 82 | | | | — | | | | 82 | |
TCW New America Premier Equities Fund | | | 669 | | | | 8 | | | | 677 | |
TCW Relative Value Dividend Appreciation Fund | | | 11,067 | | | | 22,670 | | | | 33,737 | |
TCW Relative Value Large Cap Fund | | | 10,302 | | | | 61,295 | | | | 71,597 | |
TCW Relative Value Mid Cap Fund | | | 823 | | | | 7,437 | | | | 8,260 | |
TCW Select Equities Fund | | | — | | | | 201,824 | | | | 201,824 | |
| (1) | Amounts rounds to less than $1. |
At October 31, 2019, net unrealized appreciation (depreciation) on investments for federal income tax purposes was as follows (amounts in thousands):
| | | | | | | | | | | | | | | | |
| | | Unrealized
Appreciation | | | Unrealized
(Depreciation) | | | Net
Unrealized
Appreciation
(Depreciation) | | | Cost of
Investments for
Federal Income
Tax Purposes | |
TCW Artificial Intelligence Equity Fund | | $ | 525 | | | $ | (72 | ) | | $ | 453 | | | $ | 3,564 | |
TCW Conservative Allocation Fund | | | 3,108 | | | | (51 | ) | | | 3,057 | | | | 26,856 | |
TCW Global Real Estate Fund | | | 1,126 | | | | (20 | ) | | | 1,106 | | | | 6,063 | |
TCW New America Premier Equities Fund | | | 18,722 | | | | (213 | ) | | | 18,509 | | | | 135,391 | |
TCW Relative Value Dividend Appreciation Fund | | | 77,756 | | | | (19,566 | ) | | | 58,190 | | | | 254,175 | |
TCW Relative Value Large Cap Fund | | | 46,010 | | | | (5,433 | ) | | | 40,577 | | | | 108,817 | |
TCW Relative Value Mid Cap Fund | | | 22,455 | | | | (4,002 | ) | | | 18,453 | | | | 60,986 | |
TCW Select Equities Fund | | | 535,930 | | | | (6,091 | ) | | | 529,839 | | | | 368,101 | |
At October 31, 2019, the following Funds had net realized loss carryforwards for federal income tax purposes (amounts in thousands):
| | | | | | | | | | | | |
| | | Short-Term
Capital Losses | | | Long-Term
Capital Losses | | | Total | |
TCW Artificial Intelligence Equity Fund | | $ | 97 | | | $ | 7 | | | $ | 104 | |
TCW Global Real Estate Fund | | | 717 | | | | 71 | | | | 788 | |
69
TCW Funds, Inc.
Notes to Financial Statements (Continued)
Note 5 — Federal Income Taxes (Continued)
The Funds did not have any unrecognized tax benefits at October 31, 2019, nor were there any increases or decreases in unrecognized tax benefits for the year ended October 31, 2019. The Funds are subject to examination by the U.S. Federal and state tax authorities for returns filed for the prior three and four fiscal years, respectively.
Note 6 — Fund Management Fees and Other Expenses
The Funds pay to the Advisor, as compensation for services rendered, facilities furnished and expenses borne by it, the following annual management fees as a percentage of daily net assets:
| | | | |
TCW Artificial Intelligence Equity Fund | | | 0.70 | % |
TCW Global Real Estate Fund | | | 0.80 | % |
TCW New America Premier Equities Fund | | | 0.65 | % |
TCW Relative Value Dividend Appreciation Fund | | | 0.60 | % |
TCW Relative Value Large Cap Fund | | | 0.60 | % |
TCW Relative Value Mid Cap Fund | | | 0.70 | % |
TCW Select Equities Fund | | | 0.65 | % |
Effective November 1, 2018, through December 31, 2018 the management fee was as follows:
| | | | |
TCW Artificial Intelligence Equity Fund | | | 0.80 | % |
TCW New America Premier Equities Fund | | | 0.80 | % |
TCW Relative Value Dividend Appreciation Fund | | | 0.65 | % |
TCW Relative Value Large Cap Fund | | | 0.65 | % |
TCW Select Equities Fund | | | 0.75 | % |
The TCW Conservative Allocation Fund does not pay management fees to the Advisor; however, the Fund pays management fees to the Advisor indirectly as a shareholder in the underlying affiliated funds.
The Advisor limits the operating expenses of the Funds not to exceed the following expense ratios relative to the Funds’ average daily net assets. The expense ratios were effective January 1, 2019.
| | | | |
TCW Artificial Intelligence Equity Fund | | | | |
I Class | | | 0.90 | % (1) |
N Class | | | 1.00 | % (1) |
TCW Conservative Allocation Fund | | | | |
I Class | | | 0.85 | % (1) |
N Class | | | 0.85 | % (1) |
TCW Global Real Estate Fund | | | | |
I Class | | | 1.00 | % (1) |
N Class | | | 1.15 | % (1) |
TCW New America Premier Equities Fund | | | | |
I Class | | | 0.80 | % (1) |
N Class | | | 1.00 | % (1) |
TCW Relative Value Dividend Appreciation Fund | | | | |
I Class | | | 0.73 | % (1) |
N Class | | | 0.95 | % (1) |
TCW Relative Value Large Cap Fund | | | | |
I Class | | | 0.72 | % (1) |
N Class | | | 0.95 | % (1) |
TCW Relative Value Mid Cap Fund | | | | |
I Class | | | 0.90 | % (1) |
N Class | | | 1.00 | % (1) |
TCW Select Equities Fund | | | | |
I Class | | | 0.80 | % (1) |
N Class | | | 1.00 | % (1) |
| (1) | These limitations are based on an agreement between the Advisor and the Company. |
70
TCW Funds, Inc.
Note 6 — Fund Management Fees and Other Expenses (Continued)
These ratios were in effect from November 1, 2018 through December 31, 2018.
| | | | |
TCW Artificial Intelligence Equity Fund | | | | |
I Class | | | 1.05 | % |
N Class | | | 1.05 | % |
TCW New America Premier Equities Fund | | | | |
I Class | | | 1.04 | % |
N Class | | | 1.04 | % |
TCW Relative Value Dividend Appreciation Fund | | | | |
I Class | | | 0.80 | % |
N Class | | | 1.00 | % |
TCW Relative Value Large Cap Fund | | | | |
I Class | | | 0.80 | % |
N Class | | | 1.00 | % |
The amount borne by the Advisor during a fiscal year when the operating expenses of a Fund are in excess of the expense limitation cannot be recaptured in the subsequent fiscal years should the expenses drop below the expense limitation in the subsequent years. The Advisor can only recapture expenses within a given fiscal year for that year’s operating expenses.
Directors’ Fees: Directors who are not affiliated with the Advisor receive compensation from the Funds which are shown on the Statement of Operations. Directors may elect to defer receipt of their fees in accordance with the terms of a Non-Qualified Deferred Compensation Plan. Total accrued and deferred amounts are recorded on the Fund’s books as other liabilities.
Note 7 — Distribution Plan
TCW Funds Distributors LLC (“Distributor”), an affiliate of the Advisor and the Funds, serves as the nonexclusive distributor of each class of the Funds’ shares. The Funds have a distribution plan pursuant to Rule 12b-1 under the 1940 Act with respect to the N Class shares of each Fund. Under the terms of the plan, each Fund compensates the Distributor at a rate equal to 0.25% of the average daily net assets of the Fund attributable to its N Class shares for distribution and related services.
Note 8 — Transactions with Affiliates
The ownership percentage of the TCW Conservative Allocation Fund in each of the affiliated underlying funds at October 31, 2019 is as follows:
| | | | |
Name of Affiliated Fund | | Ownership
Percentage (1) | |
Metropolitan West Low Duration Bond Fund | | | 0.11 | % |
Metropolitan West Total Return Bond Fund | | | 0.00 | % (2) |
Metropolitan West Unconstrained Bond Fund | | | 0.18 | % |
TCW Global Bond Fund | | | 4.26 | % |
TCW Global Real Estate Fund | | | 26.61 | % |
TCW New America Premier Equities Fund | | | 2.59 | % |
TCW Relative Value Large Cap Fund | | | 1.40 | % |
TCW Relative Value Mid Cap Fund | | | 0.39 | % |
TCW Select Equities Fund | | | 0.31 | % |
TCW Total Return Bond Fund | | | 0.09 | % |
| (1) | Percentage ownership based on total net assets of the underlying fund. |
| (2) | Amount rounds to less than 0.00%. |
71
TCW Funds, Inc.
Notes to Financial Statements (Continued)
Note 8 — Transactions with Affiliates (Continued)
The financial statements of the Funds not contained in this report are available by calling 800-FUND-TCW (800-386-3829) or by going to the SEC website at www.sec.gov.
Note 9 — Purchases and Sales of Securities
Investment transactions (excluding short-term investments) for the year ended October 31, 2019 were as follows (amounts in thousands):
| | | | | | | | | | | | | | | | |
| | | Purchases
at Cost | | | Sales or Maturity
Proceeds | | | U.S. Government
Purchases at Cost | | | U.S. Government
Sales or Maturity
Proceeds | |
TCW Artificial Intelligence Equity Fund | | $ | 3,280 | | | $ | 1,675 | | | $ | — | | | $ | — | |
TCW Conservative Allocation Fund | | | 6,383 | | | | 6,260 | | | | — | | | | — | |
TCW Global Real Estate Fund | | | 7,269 | | | | 4,328 | | | | — | | | | — | |
TCW New America Premier Equities Fund | | | 182,842 | | | | 83,566 | | | | — | | | | — | |
TCW Relative Value Dividend Appreciation Fund | | | 64,038 | | | | 278,858 | (1) | | | — | | | | — | |
TCW Relative Value Large Cap Fund | | | 50,047 | | | | 333,561 | | | | — | | | | — | |
TCW Relative Value Mid Cap Fund | | | 20,861 | | | | 32,580 | | | | — | | | | — | |
TCW Select Equities Fund | | | 56,756 | | | | 187,109 | | | | — | | | | — | |
| (1) | Sales include the Fund’s sale of certain securities to an affiliated investment account for a total of $72,730 (amount in thousands) in accordance with the provisions set forth in Section 17(a)-7 of the 1940 Act. |
Note 10 — Capital Share Transactions
Transactions in each Fund’s shares were as follows:
| | | | | | | | | | | | | | | | |
| TCW Artificial Intelligence Equity Fund | | Year Ended
October 31, 2019 | | | Year Ended
October 31, 2018 | |
| I Class | | Shares | | | Amount
(in thousands) | | | Shares | | | Amount
(in thousands) | |
Shares Sold | | | 145,852 | | | $ | 1,828 | | | | 87,472 | | | $ | 1,068 | |
Shares Issued upon Reinvestment of Dividends | | | — | | | | — | | | | 12 | | | | — | (1) |
Shares Redeemed | | | (36,510 | ) | | | (441 | ) | | | (30,656 | ) | | | (373 | ) |
| | | | | | | | | | | | | | | | |
Net Increase | | | 109,342 | | | $ | 1,387 | | | | 56,828 | | | $ | 695 | |
| | | | | | | | | | | | | | | | |
| | | | |
| N Class | | Shares | | | Amount
(in thousands) | | | Shares | | | Amount
(in thousands) | |
Shares Sold | | | 27,842 | | | $ | 349 | | | | 20,017 | | | $ | 250 | |
Shares Issued upon Reinvestment of Dividends | | | — | | | | — | | | | 9 | | | | — | (1) |
Shares Redeemed | | | (11,932 | ) | | | (146 | ) | | | (8,006 | ) | | | (96 | ) |
| | | | | | | | | | | | | | | | |
Net Increase | | | 15,910 | | | $ | 203 | | | | 12,020 | | | $ | 154 | |
| | | | | | | | | | | | | | | | |
| | |
| TCW Conservative Allocation Fund | | Year Ended
October 31, 2019 | | | Year Ended
October 31, 2018 | |
| I Class | | Shares | | | Amount
(in thousands) | | | Shares | | | Amount
(in thousands) | |
Shares Sold | | | 91,375 | | | $ | 1,068 | | | | 91,379 | | | $ | 1,110 | |
Shares Issued upon Reinvestment of Dividends | | | 155,645 | | | | 1,671 | | | | 102,921 | | | | 1,217 | |
Shares Redeemed | | | (193,887 | ) | | | (2,279 | ) | | | (280,133 | ) | | | (3,348 | ) |
| | | | | | | | | | | | | | | | |
Net Increase (Decrease) | | | 53,133 | | | $ | 460 | | | | (85,833 | ) | | $ | (1,021 | ) |
| | | | | | | | | | | | | | | | |
| | | | |
| N Class | | Shares | | | Amount
(in thousands) | | | Shares | | | Amount
(in thousands) | |
Shares Sold | | | 4,184 | | | $ | 50 | | | | 8,674 | | | $ | 103 | |
Shares Issued upon Reinvestment of Dividends | | | 2,560 | | | | 27 | | | | 1,528 | | | | 18 | |
Shares Redeemed | | | (22,125 | ) | | | (258 | ) | | | (9,614 | ) | | | (114 | ) |
| | | | | | | | | | | | | | | | |
Net Increase (Decrease) | | | (15,381 | ) | | $ | (181 | ) | | | 588 | | | $ | 7 | |
| | | | | | | | | | | | | | | | |
72
TCW Funds, Inc.
Note 10 — Capital Share Transactions (Continued)
| | | | | | | | | | | | | | | | |
| TCW Global Real Estate Fund | | Year Ended
October 31, 2019 | | | Year Ended
October 31, 2018 | |
| I Class | | Shares | | | Amount
(in thousands) | | | Shares | | | Amount
(in thousands) | |
Shares Sold | | | 294,477 | | | $ | 2,960 | | | | 125,773 | | | $ | 1,281 | |
Shares Issued upon Reinvestment of Dividends | | | 10,892 | | | | 108 | | | | 6,968 | | | | 68 | |
Shares Redeemed | | | (31,703 | ) | | | (296 | ) | | | (101,561 | ) | | | (993 | ) |
| | | | | | | | | | | | | | | | |
Net Increase | | | 273,666 | | | $ | 2,772 | | | | 31,180 | | | $ | 356 | |
| | | | | | | | | | | | | | | | |
| | | | |
| N Class | | Shares | | | Amount
(in thousands) | | | Shares | | | Amount
(in thousands) | |
Shares Sold | | | 9 | | | $ | — | (1) | | | 107 | | | $ | 1 | |
Shares Issued upon Reinvestment of Dividends | | | 1,433 | | | | 14 | | | | 1,110 | | | | 11 | |
Shares Redeemed | | | (108 | ) | | | (1 | ) | | | (1,137 | ) | | | (11 | ) |
| | | | | | | | | | | | | | | | |
Net Increase | | | 1,334 | | | $ | 13 | | | | 80 | | | $ | 1 | |
| | | | | | | | | | | | | | | | |
| | |
| TCW New America Premier Equities Fund | | Year Ended
October 31, 2019 | | | Year Ended
October 31, 2018 | |
| I Class | | Shares | | | Amount
(in thousands) | | | Shares | | | Amount
(in thousands) | |
Shares Sold | | | 4,115,075 | | | $ | 77,882 | | | | 788,224 | | | $ | 13,092 | |
Shares Issued upon Reinvestment of Dividends | | | 26,097 | | | | 395 | | | | 38,162 | | | | 572 | |
Shares Redeemed | | | (806,311 | ) | | | (15,332 | ) | | | (160,059 | ) | | | (2,567 | ) |
| | | | | | | | | | | | | | | | |
Net Increase | | | 3,334,861 | | | $ | 62,945 | | | | 666,327 | | | $ | 11,097 | |
| | | | | | | | | | | | | | | | |
| | | | |
| N Class | | Shares | | | Amount
(in thousands) | | | Shares | | | Amount
(in thousands) | |
Shares Sold | | | 2,893,815 | | | $ | 57,028 | | | | 152,798 | | | $ | 2,489 | |
Shares Issued upon Reinvestment of Dividends | | | 5,126 | | | | 78 | | | | 5,974 | | | | 90 | |
Shares Redeemed | | | (631,500 | ) | | | (12,587 | ) | | | (10,648 | ) | | | (174 | ) |
| | | | | | | | | | | | | | | | |
Net Increase | | | 2,267,441 | | | $ | 44,519 | | | | 148,124 | | | $ | 2,405 | |
| | | | | | | | | | | | | | | | |
| | |
| TCW Relative Value Dividend Appreciation Fund | | Year Ended
October 31, 2019 | | | Year Ended
October 31, 2018 | |
| I Class | | Shares | | | Amount
(in thousands) | | | Shares | | | Amount
(in thousands) | |
Shares Sold | | | 504,129 | | | $ | 8,511 | | | | 1,170,743 | | | $ | 22,458 | |
Shares Issued upon Reinvestment of Dividends | | | 414,078 | | | | 6,433 | | | | 349,698 | | | | 6,687 | |
Shares Redeemed | | | (1,433,844 | ) | | | (23,495 | ) | | | (2,788,916 | ) | | | (54,043 | ) |
| | | | | | | | | | | | | | | | |
Net Decrease | | | (515,637 | ) | | $ | (8,551 | ) | | | (1,268,475 | ) | | $ | (24,898 | ) |
| | | | | | | | | | | | | | | | |
| | | | |
| N Class | | Shares | | | Amount
(in thousands) | | | Shares | | | Amount
(in thousands) | |
Shares Sold | | | 319,044 | | | $ | 5,512 | | | | 1,992,134 | | | $ | 38,575 | |
Shares Issued upon Reinvestment of Dividends | | | 1,656,828 | | | | 25,982 | | | | 1,359,169 | | | | 26,431 | |
Shares Redeemed | | | (12,869,283 | ) | | | (211,307 | ) | | | (5,592,917 | ) | | | (109,775 | ) |
| | | | | | | | | | | | | | | | |
Net Decrease | | | (10,893,411 | ) | | $ | (179,813 | ) | | | (2,241,614 | ) | | $ | (44,769 | ) |
| | | | | | | | | | | | | | | | |
73
TCW Funds, Inc.
Notes to Financial Statements (Continued)
Note 10 — Capital Share Transactions (Continued)
| | | | | | | | | | | | | | | | |
| TCW Relative Value Large Cap Fund | | Year Ended
October 31, 2019 | | | Year Ended
October 31, 2018 | |
| I Class | | Shares | | | Amount
(in thousands) | | | Shares | | | Amount
(in thousands) | |
Shares Sold | | | 1,830,874 | | | $ | 31,979 | | | | 2,750,555 | | | $ | 60,616 | |
Shares Issued upon Reinvestment of Dividends | | | 2,767,903 | | | | 43,456 | | | | 3,059,339 | | | | 66,999 | |
Shares Redeemed | | | (17,557,586 | ) | | | (317,937 | ) | | | (4,954,321 | ) | | | (109,165 | ) |
| | | | | | | | | | | | | | | | |
Net Increase (Decrease) | | | (12,958,809 | ) | | $ | (242,502 | ) | | | 855,573 | | | $ | 18,450 | |
| | | | | | | | | | | | | | | | |
| | | | |
| N Class | | Shares | | | Amount
(in thousands) | | | Shares | | | Amount
(in thousands) | |
Shares Sold | | | 65,333 | | | $ | 1,164 | | | | 48,027 | | | $ | 1,057 | |
Shares Issued upon Reinvestment of Dividends | | | 89,401 | | | | 1,401 | | | | 105,507 | | | | 2,305 | |
Shares Redeemed | | | (193,899 | ) | | | (3,493 | ) | | | (171,260 | ) | | | (3,734 | ) |
| | | | | | | | | | | | | | | | |
Net Decrease | | | (39,165 | ) | | $ | (928 | ) | | | (17,726 | ) | | $ | (372 | ) |
| | | | | | | | | | | | | | | | |
| | | | | | | | | | | | | | | | |
| | |
| TCW Relative Value Mid Cap Fund | | Year Ended
October 31, 2019 | | | Year Ended
October 31, 2018 | |
| I Class | | Shares | | | Amount
(in thousands) | | | Shares | | | Amount
(in thousands) | |
Shares Sold | | | 240,142 | | | $ | 4,861 | | | | 396,213 | | | $ | 10,205 | |
Shares Issued upon Reinvestment of Dividends | | | 304,588 | | | | 5,401 | | | | 260,385 | | | | 6,601 | |
Shares Redeemed | | | (740,307 | ) | | | (15,038 | ) | | | (665,570 | ) | | | (17,019 | ) |
| | | | | | | | | | | | | | | | |
Net Decrease | | | (195,577 | ) | | $ | (4,776 | ) | | | (8,972 | ) | | $ | (213 | ) |
| | | | | | | | | | | | | | | | |
| | | | |
| N Class | | Shares | | | Amount
(in thousands) | | | Shares | | | Amount
(in thousands) | |
Shares Sold | | | 34,016 | | | $ | 679 | | | | 114,082 | | | $ | 2,889 | |
Shares Issued upon Reinvestment of Dividends | | | 71,892 | | | | 1,239 | | | | 58,853 | | | | 1,452 | |
Shares Redeemed | | | (225,969 | ) | | | (4,552 | ) | | | (101,633 | ) | | | (2,507 | ) |
| | | | | | | | | | | | | | | | |
Net Increase (Decrease) | | | (120,061 | ) | | $ | (2,634 | ) | | | 71,302 | | | $ | 1,834 | |
| | | | | | | | | | | | | | | | |
| | |
| TCW Select Equities Fund | | Year Ended
October 31, 2019 | | | Year Ended
October 31, 2018 | |
| I Class | | Shares | | | Amount
(in thousands) | | | Shares | | | Amount
(in thousands) | |
Shares Sold | | | 3,290,816 | | | $ | 83,826 | | | | 5,631,218 | | | $ | 160,868 | |
Shares Issued upon Reinvestment of Dividends | | | 3,365,894 | | | | 73,074 | | | | 4,718,127 | | | | 118,189 | |
Shares Redeemed | | | (6,094,637 | ) | | | (157,466 | ) | | | (8,316,559 | ) | | | (231,015 | ) |
| | | | | | | | | | | | | | | | |
Net Increase (Decrease) | | | 562,073 | | | $ | (566 | ) | | | 2,032,786 | | | $ | 48,042 | |
| | | | | | | | | | | | | | | | |
| | | | |
| N Class | | Shares | | | Amount
(in thousands) | | | Shares | | | Amount
(in thousands) | |
Shares Sold | | | 855,977 | | | $ | 20,126 | | | | 513,203 | | | $ | 13,228 | |
Shares Issued upon Reinvestment of Dividends | | | 966,328 | | | | 18,699 | | | | 1,337,789 | | | | 30,448 | |
Shares Redeemed | | | (1,855,073 | ) | | | (43,186 | ) | | | (1,353,097 | ) | | | (34,486 | ) |
| | | | | | | | | | | | | | | | |
Net Increase (Decrease) | | | (32,768 | ) | | $ | (4,361 | ) | | | 497,895 | | | $ | 9,190 | |
| | | | | | | | | | | | | | | | |
| (1) | Amount rounds to less than $1. |
Note 11 — Ownership
As of October 31, 2019, affiliates of the Funds and Advisor owned 39.76%, 46.65%, 6.38% and 22.71% of the net assets of the TCW Artificial Intelligence Equity Fund, the TCW Global Real Estate Fund, the TCW Relative Value Large Cap Fund and TCW Relative Value Mid Cap Fund, respectively.
74
TCW Funds, Inc.
Note 12 — Restricted Securities
The Funds are permitted to invest in securities that have legal or contractual restrictions on resale. These securities may be sold privately, but are required to be registered before being sold to the public (exemption rules apply). Private placement securities are generally considered to be restricted except for those securities traded between qualified institutional investors under the provisions of Rule 144A of the Securities Act of 1933, as amended (the “Securities Act”). However, the Company considers 144A securities to be restricted if those securities have been deemed illiquid. Disposal of these securities may involve time consuming negotiations and expense, and prompt sale at an acceptable price may be difficult. There were no restricted securities held by the Funds at October 31, 2019.
Note 13 — Committed Line Of Credit
The Company has entered into a $100,000,000 committed revolving line of credit agreement renewed annually with the State Street Bank and Trust Company (the “Bank”) for temporary borrowing purposes. The interest rate on borrowing is the higher of the Federal Funds rate or the overnight LIBOR rate, plus 1.25%. There were no borrowings from the line of credit as of or during the year ended October 31, 2019. The Funds pay the Bank a commitment fee equal to 0.25% per annum on the daily unused portion of the committed line amount. The commitment fees incurred by the Funds are presented in the Statements of Operations. The commitment fees are allocated to each applicable portfolio in proportion to its relative average daily net assets and the interest expenses are charged directly to the applicable portfolio.
Note 14 — Liquidity Risk Management Program
Rule 22e-4 under the 1940 Act (the “Liquidity Rule”) requires that all registered open-end management investment companies, including the Funds, establish a written liquidity risk management program (a “Liquidity Program”). Under a fund’s Liquidity Program, a fund must assess, manage and periodically review the fund’s liquidity risk, classify the liquidity of each of the fund’s portfolio investments, determine a highly liquid investment minimum, limit illiquid investments to 15% of fund investments, and establish policies and procedures regarding how and when a fund will engage in redemptions in-kind. Consistent with the Liquidity Rule, the Board has approved the written Liquidity Program for the Funds and has designated a committee of professionals associated with the Adviser to administer the Funds’ Liquidity Program. On an ongoing basis, the Board will review annual reports from that committee, as the administrator of the Funds’ Liquidity Program, on the operation of the Funds’ Liquidity Program, its adequacy and effectiveness of implementation, and any material changes made to the Funds’ Liquidity Program.
Note 15 — Indemnifications
Under the Company’s organizational documents, its Officers and Directors may be indemnified against certain liabilities and expenses arising out of the performance of their duties to the Company. In addition, the Company entered into an agreement with each of the Directors which provides that the Company will indemnify and hold harmless each Director against any expenses actually and reasonably incurred by any Director in any proceeding arising out of or in connection with the Director’s services to the Company, to the fullest extent permitted by the Company’s Articles of Incorporation and By-Laws, the Maryland General Corporation Law, the Securities Act, and the 1940 Act, each as now or hereinafter in force. Additionally, in the normal course of business, the Company enters into agreements with service providers that may contain indemnification clauses. The Company’s maximum exposure under these arrangements is
75
TCW Funds, Inc.
Notes to Financial Statements (Continued)
Note 15 — Indemnifications (Continued)
unknown as this would involve future claims that may be made against the Company that have not yet occurred. However, based on experience, the Company expects the risk of loss to be remote. The Company has not accrued any liability in connection with such indemnification.
Note 16 — New Accounting Pronouncement
In March 2017, the FASB issued Accounting Standards Update (ASU) No. 2017-08, Receivables — Nonrefundable Fees and Other Costs (Subtopic 310-20): Premium Amortization on Purchased Callable Debt Securities. The amendments in the ASU shorten the amortization period for certain callable debt securities acquired at a premium, to be amortized to the earliest call date. The ASU does not require an accounting change for securities acquired at a discount, which continues to be amortized to maturity. The ASU is effective for fiscal years and interim periods within those fiscal years beginning after December 15, 2018. Management has concluded there was no material impact to the Funds.
76
TCW Artificial Intelligence Equity Fund
Financial Highlights — I Class
| | | | | | | | | | | | |
| | |
| | | Year Ended
October 31, | | | August 31, 2017
(Commencement
of Operations)
through
October 31, 2017 | |
| | | 2019 | | | 2018 | |
Net Asset Value per Share, Beginning of Year | | $ | 11.18 | | | $ | 10.64 | | | $ | 10.00 | |
| | | | | | | | | | | | |
Income (Loss) from Investment Operations: | |
Net Investment Loss | | | (0.02 | ) | | | (0.04 | ) | | | (0.00 | ) (1) |
Net Realized and Unrealized Gain on Investments (2) | | | 1.54 | | | | 0.58 | | | | 0.64 | |
| | | | | | | | | | | | |
Total from Investment Operations | | | 1.52 | | | | 0.54 | | | | 0.64 | |
| | | | | | | | | | | | |
Less Distributions: | |
Distributions from Net Investment Income | | | — | | | | (0.00 | ) (1) | | | — | |
| | | | | | | | | | | | |
Net Asset Value per Share, End of Year | | $ | 12.70 | | | $ | 11.18 | | | $ | 10.64 | |
| | | | | | | | | | | | |
Total Return | | | 13.60 | % | | | 5.09 | % | | | 6.40 | % (3) |
|
Ratios/Supplemental Data: | |
| | | |
Net Assets, End of Year (in thousands) | | $ | 2,940 | | | $ | 1,364 | | | $ | 695 | |
|
Ratio of Expenses to Average Net Assets: | |
| | | |
Before Expense Reimbursement | | | 6.36 | % | | | 8.32 | % | | | 23.66 | % (4) |
| | | |
After Expense Reimbursement | | | 0.92 | % | | | 1.05 | % | | | 1.05 | % (4) |
| | | |
Ratio of Net Investment Income (Loss) to Average Net Assets | | | (0.17 | )% | | | (0.34 | )% | | | 0.23 | % (4) |
| | | |
Portfolio Turnover Rate | | | 61.09 | % | | | 74.22 | % | | | 13.05 | % (3) |
| (1) | Amount rounds to less than $0.01 per share. |
| (2) | Computed using average shares outstanding throughout the period. |
| (3) | For the period August 31, 2017 (commencement of operations) through October 31, 2017. |
See accompanying notes to financial statements.
77
TCW Artificial Intelligence Equity Fund
Financial Highlights — N Class
| | | | | | | | | | | | |
| | |
| | | Year Ended
October 31, | | | August 31, 2017
(Commencement
of Operations)
through
October 31, 2017 | |
| | | 2019 | | | 2018 | |
Net Asset Value per Share, Beginning of Year | | $ | 11.17 | | | $ | 10.64 | | | $ | 10.00 | |
| | | | | | | | | | | | |
Income (Loss) from Investment Operations: | |
Net Investment Loss | | | (0.03 | ) | | | (0.04 | ) | | | (0.00 | ) (1) |
Net Realized and Unrealized Gain on Investments (2) | | | 1.55 | | | | 0.57 | | | | 0.64 | |
| | | | | | | | | | | | |
Total from Investment Operations | | | 1.52 | | | | 0.53 | | | | 0.64 | |
| | | | | | | | | | | | |
Less Distributions: | |
Distributions from Net Investment Income | | | — | | | | (0.00 | ) (1) | | | — | |
| | | | | | | | | | | | |
Net Asset Value per Share, End of Year | | $ | 12.69 | | | $ | 11.17 | | | $ | 10.64 | |
| | | | | | | | | | | | |
Total Return | | | 13.61 | % | | | 5.00 | % | | | 6.40 | % (3) |
|
Ratios/Supplemental Data: | |
| | | |
Net Assets, End of Year (in thousands) | | $ | 989 | | | $ | 693 | | | $ | 532 | |
|
Ratio of Expenses to Average Net Assets: | |
| | | |
Before Expense Reimbursement | | | 7.99 | % | | | 9.60 | % | | | 26.07 | % (4) |
| | | |
After Expense Reimbursement | | | 1.01 | % | | | 1.05 | % | | | 1.05 | % (4) |
| | | |
Ratio of Net Investment Income (Loss) to Average Net Assets | | | (0.25 | )% | | | (0.33 | )% | | | 0.25 | % (4) |
| | | |
Portfolio Turnover Rate | | | 61.09 | % | | | 74.22 | % | | | 13.05 | % (3) |
| (1) | Amount rounds to less than $0.01 per share. |
| (2) | Computed using average shares outstanding throughout the period. |
| (3) | For the period August 31, 2017 (commencement of operations) through October 31, 2017. |
See accompanying notes to financial statements.
78
TCW Conservative Allocation Fund
Financial Highlights — I Class
| | | | | | | | | | | | | | | | | | | | |
| |
| | | Year Ended October 31, | |
| | | 2019 | | | 2018 | | | 2017 | | | 2016 | | | 2015 | |
Net Asset Value per Share, Beginning of Year | | $ | 11.68 | | | $ | 12.17 | | | $ | 12.13 | | | $ | 12.50 | | | $ | 12.24 | |
| | | | | | | | | | | | | | | | | | | | |
Income (Loss) from Investment Operations: | |
Net Investment Income (1) | | | 0.24 | | | | 0.20 | | | | 0.15 | | | | 0.17 | | | | 0.13 | |
Net Realized and Unrealized Gain (Loss) on Investments | | | 0.89 | | | | (0.19 | ) | | | 0.67 | | | | (0.07 | ) | | | 0.33 | |
| | | | | | | | | | | | | | | | | | | | |
Total from Investment Operations | | | 1.13 | | | | 0.01 | | | | 0.82 | | | | 0.10 | | | | 0.46 | |
| | | | | | | | | | | | | | | | | | | | |
Less Distributions: | |
Distributions from Net Investment Income | | | (0.21 | ) | | | (0.20 | ) | | | (0.29 | ) | | | (0.19 | ) | | | (0.14 | ) |
Distributions from Net Realized Gain | | | (0.51 | ) | | | (0.30 | ) | | | (0.49 | ) | | | (0.28 | ) | | | (0.06 | ) |
| | | | | | | | | | | | | | | | | | | | |
Total Distributions | | | (0.72 | ) | | | (0.50 | ) | | | (0.78 | ) | | | (0.47 | ) | | | (0.20 | ) |
| | | | | | | | | | | | | | | | | | | | |
Net Asset Value per Share, End of Year | | $ | 12.09 | | | $ | 11.68 | | | $ | 12.17 | | | $ | 12.13 | | | $ | 12.50 | |
| | | | | | | | | | | | | | | | | | | | |
Total Return | | | 10.46 | % | | | 0.04 | % | | | 7.28 | % | | | 0.78 | % | | | 3.88 | % |
|
Ratios/Supplemental Data: | |
| | | | | |
Net Assets, End of Year (in thousands) | | $ | 29,565 | | | $ | 27,925 | | | $ | 30,144 | | | $ | 28,982 | | | $ | 33,909 | |
| | | | | |
Ratio of Expenses to Average Net Assets (2) | | | 0.44 | % | | | 0.37 | % | | | 0.36 | % | | | 0.30 | % | | | 0.25 | % |
| | | | | |
Ratio of Net Investment Income to Average Net Assets | | | 2.03 | % | | | 1.68 | % | | | 1.26 | % | | | 1.41 | % | | | 1.01 | % |
| | | | | |
Portfolio Turnover Rate | | | 21.66 | % | | | 19.79 | % | | | 55.53 | % | | | 37.62 | % | | | 30.24 | % |
| (1) | Computed using average shares outstanding throughout the period. |
| (2) | Does not include expenses of the underlying affiliated funds. |
See accompanying notes to financial statements.
79
TCW Conservative Allocation Fund
Financial Highlights — N Class
| | | | | | | | | | | | | | | | | | | | |
| |
| | | Year Ended October 31, | |
| | | 2019 | | | 2018 | | | 2017 | | | 2016 | | | 2015 | |
Net Asset Value per Share, Beginning of Year | | $ | 11.67 | | | $ | 12.15 | | | $ | 12.07 | | | $ | 12.44 | | | $ | 12.17 | |
| | | | | | | | | | | | | | | | | | | | |
Income (Loss) from Investment Operations: | |
Net Investment Income (1) | | | 0.20 | | | | 0.15 | | | | 0.11 | | | | 0.11 | | | | 0.04 | |
Net Realized and Unrealized Gain (Loss) on Investments | | | 0.90 | | | | (0.18 | ) | | | 0.66 | | | | (0.08 | ) | | | 0.35 | |
| | | | | | | | | | | | | | | | | | | | |
Total from Investment Operations | | | 1.10 | | | | (0.03 | ) | | | 0.77 | | | | 0.03 | | | | 0.39 | |
| | | | | | | | | | | | | | | | | | | | |
Less Distributions: | |
Distributions from Net Investment Income | | | (0.17 | ) | | | (0.15 | ) | | | (0.20 | ) | | | (0.12 | ) | | | (0.06 | ) |
Distributions from Net Realized Gain | | | (0.51 | ) | | | (0.30 | ) | | | (0.49 | ) | | | (0.28 | ) | | | (0.06 | ) |
| | | | | | | | | | | | | | | | | | | | |
Total Distributions | | | (0.68 | ) | | | (0.45 | ) | | | (0.69 | ) | | | (0.40 | ) | | | (0.12 | ) |
| | | | | | | | | | | | | | | | | | | | |
Net Asset Value per Share, End of Year | | $ | 12.09 | | | $ | 11.67 | | | $ | 12.15 | | | $ | 12.07 | | | $ | 12.44 | |
| | | | | | | | | | | | | | | | | | | | |
Total Return | | | 10.16 | % | | | (0.35 | )% | | | 6.74 | % | | | 0.31 | % | | | 3.31 | % |
|
Ratios/Supplemental Data: | |
| | | | | |
Net Assets, End of Year (in thousands) | | $ | 350 | | | $ | 518 | | | $ | 532 | | | $ | 1,597 | | | $ | 1,876 | |
| | | | | |
Ratio of Expenses to Average Net Assets: (2) | | | | | | | | | | | | | | | | | | | | |
| | | | | |
Before Expense Reimbursement | | | 6.89 | % | | | 5.14 | % | | | 3.30 | % | | | 1.54 | % | | | 1.61 | % |
| | | | | |
After Expense Reimbursement | | | 0.74 | % | | | 0.76 | % | | | 0.81 | % | | | 0.82 | % | | | 0.84 | % |
| | | | | |
Ratio of Net Investment Income to Average Net Assets | | | 1.75 | % | | | 1.28 | % | | | 0.89 | % | | | 0.89 | % | | | 0.36 | % |
| | | | | |
Portfolio Turnover Rate | | | 21.66 | % | | | 19.79 | % | | | 55.53 | % | | | 37.62 | % | | | 30.24 | % |
| (1) | Computed using average shares outstanding throughout the period. |
| (2) | Does not include expenses of the underlying affiliated funds. |
See accompanying notes to financial statements.
80
TCW Global Real Estate Fund
Financial Highlights — I Class
| | | | | | | | | | | | | | | | | | | | |
| | |
| | | Year Ended October 31, | | | November 28, 2014
(Commencement
of Operations)
through
October 31, 2015 | |
| | | 2019 | | | 2018 | | | 2017 | | | 2016 | |
Net Asset Value per Share, Beginning of Year | | $ | 9.30 | | | $ | 10.10 | | | $ | 9.42 | | | $ | 9.71 | | | $ | 10.00 | |
| | | | | | | | | | | | | | | | | | | | |
Income (Loss) from Investment Operations: | |
Net Investment Income (1) | | | 0.33 | | | | 0.25 | | | | 0.25 | | | | 0.30 | | | | 0.21 | |
Net Realized and Unrealized Gain (Loss) on Investments | | | 1.78 | | | | (0.85 | ) | | | 0.70 | | | | (0.26 | ) | | | (0.27 | ) |
| | | | | | | | | | | | | | | | | | | | |
Total from Investment Operations | | | 2.11 | | | | (0.60 | ) | | | 0.95 | | | | 0.04 | | | | (0.06 | ) |
| | | | | | | | | | | | | | | | | | | | |
Less Distributions: | |
Distributions from Net Investment Income | | | (0.25 | ) | | | (0.20 | ) | | | (0.27 | ) | | | (0.29 | ) | | | (0.23 | ) |
Distributions from Net Realized Gain | | | — | | | | — | | | | — | | | | (0.01 | ) | | | — | |
Distributions from Return of Capital | | | — | | | | — | | | | — | | | | (0.03 | ) | | | — | |
| | | | | | | | | | | | | | | | | | | | |
Total Distributions | | | (0.25 | ) | | | (0.20 | ) | | | (0.27 | ) | | | (0.33 | ) | | | (0.23 | ) |
| | | | | | | | | | | | | | | | | | | | |
Net Asset Value per Share, End of Year | | $ | 11.16 | | | $ | 9.30 | | | $ | 10.10 | | | $ | 9.42 | | | $ | 9.71 | |
| | | | | | | | | | | | | | | | | | | | |
Total Return | | | 23.17 | % | | | (6.06 | )% | | | 10.28 | % | | | 0.31 | % | | | (0.62 | )% (2) |
| | | | | |
Ratios/Supplemental Data: | | | | | | | | | | | | | | | | | | | | |
| | | | | |
Net Assets, End of Year (in thousands) | | $ | 6,518 | | | $ | 2,886 | | | $ | 2,818 | | | $ | 3,499 | | | $ | 4,320 | |
| | | | | |
Ratio of Expenses to Average Net Assets: | | | | | | | | | | | | | | | | | | | | |
| | | | | |
Before Expense Reimbursement | | | 3.15 | % | | | 3.78 | % | | | 4.38 | % | | | 3.29 | % | | | 5.28 | % (3) |
| | | | | |
After Expense Reimbursement | | | 1.00 | % | | | 1.12 | % | | | 1.37 | % | | | 1.40 | % | | | 1.43 | % (3) |
| | | | | |
Ratio of Net Investment Income to Average Net Assets | | | 3.25 | % | | | 2.55 | % | | | 2.57 | % | | | 3.14 | % | | | 2.27 | % (3) |
| | | | | |
Portfolio Turnover Rate | | | 85.18 | % | | | 121.67 | % | | | 74.51 | % | | | 68.69 | % | | | 23.58 | % (2) |
| (1) | Computed using average shares outstanding throughout the period. |
| (2) | For the period November 28, 2014 (Commencement of Operations) through October 31, 2015. |
See accompanying notes to financial statements.
81
TCW Global Real Estate Fund
Financial Highlights — N Class
| | | | | | | | | | | | | | | | | | | | |
| | | Year Ended October 31, | | | November 28, 2014
(Commencement
of Operations)
through
October 31, 2015 | |
| | | 2019 | | | 2018 | | | 2017 | | | 2016 | |
Net Asset Value per Share, Beginning of Year | | $ | 9.30 | | | $ | 10.10 | | | $ | 9.42 | | | $ | 9.70 | | | $ | 10.00 | |
| | | | | | | | | | | | | | | | | | | | |
Income (Loss) from Investment Operations: | |
Net Investment Income (1) | | | 0.39 | | | | 0.24 | | | | 0.25 | | | | 0.32 | | | | 0.24 | |
Net Realized and Unrealized Gain (Loss) on Investments | | | 1.71 | | | | (0.85 | ) | | | 0.70 | | | | (0.27 | ) | | | (0.31 | ) |
| | | | | | | | | | | | | | | | | | | | |
Total from Investment Operations | | | 2.10 | | | | (0.61 | ) | | | 0.95 | | | | 0.05 | | | | (0.07 | ) |
| | | | | | | | | | | | | | | | | | | | |
Less Distributions: | |
Distributions from Net Investment Income | | | (0.24 | ) | | | (0.19 | ) | | | (0.27 | ) | | | (0.29 | ) | | | (0.23 | ) |
Distributions from Net Realized Gain | | | — | | | | — | | | | — | | | | (0.01 | ) | | | — | |
Distributions from Return of Capital | | | — | | | | — | | | | — | | | | (0.03 | ) | | | — | |
| | | | | | | | | | | | | | | | | | | | |
Total Distributions | | | (0.24 | ) | | | (0.19 | ) | | | (0.27 | ) | | | (0.33 | ) | | | (0.23 | ) |
| | | | | | | | | | | | | | | | | | | | |
Net Asset Value per Share, End of Year | | $ | 11.16 | | | $ | 9.30 | | | $ | 10.10 | | | $ | 9.42 | | | $ | 9.70 | |
| | | | | | | | | | | | | | | | | | | | |
Total Return | | | 22.99 | % | | | (6.14 | )% | | | 10.28 | % | | | 0.41 | % | | | (0.72 | )% (2) |
| | | | | |
Ratios/Supplemental Data: | | | | | | | | | | | | | | | | | | | | |
| | | | | |
Net Assets, End of Year (in thousands) | | $ | 658 | | | $ | 536 | | | $ | 581 | | | $ | 517 | | | $ | 510 | |
| | | | | |
Ratio of Expenses to Average Net Assets: | | | | | | | | | | | | | | | | | | | | |
| | | | | |
Before Expense Reimbursement | | | 7.17 | % | | | 7.65 | % | | | 7.92 | % | | | 6.66 | % | | | 9.21 | % (3) |
| | | | | |
After Expense Reimbursement | | | 1.15 | % | | | 1.22 | % | | | 1.37 | % | | | 1.40 | % | | | 1.43 | % (3) |
| | | | | |
Ratio of Net Investment Income to Average Net Assets | | | 3.88 | % | | | 2.46 | % | | | 2.51 | % | | | 3.34 | % | | | 2.58 | % (3) |
| | | | | |
Portfolio Turnover Rate | | | 85.18 | % | | | 121.67 | % | | | 74.51 | % | | | 68.69 | % | | | 23.58 | % (2) |
| (1) | Computed using average shares outstanding throughout the period. |
| (2) | For the period November 28, 2014 (Commencement of Operations) through October 31, 2015. |
See accompanying notes to financial statements.
82
TCW New America Premier Equities Fund
Financial Highlights — I Class
| | | | | | | | | | | | | | | | |
| | | Year Ended October 31, | | | January 29, 2016
(Commencement
of Operations)
through
October 31, 2016 | |
| | | 2019 | | | 2018 | | | 2017 | |
Net Asset Value per Share, Beginning of Year | | $ | 16.27 | | | $ | 15.24 | | | $ | 11.23 | | | $ | 10.00 | |
| | | | | | | | | | | | | | | | |
Income (Loss) from Investment Operations: | |
Net Investment Income (Loss) (1) | | | 0.11 | | | | (0.02 | ) | | | 0.01 | | | | 0.08 | |
Net Realized and Unrealized Gain on Investments | | | 4.18 | | | | 1.59 | | | | 4.22 | | | | 1.15 | |
| | | | | | | | | | | | | | | | |
Total from Investment Operations | | | 4.29 | | | | 1.57 | | | | 4.23 | | | | 1.23 | |
| | | | | | | | | | | | | | | | |
Less Distributions: | |
Distributions from Net Investment Income | | | (0.01 | ) | | | — | | | | (0.05 | ) | | | — | |
Distributions from Net Realized Gain | | | (0.21 | ) | | | (0.54 | ) | | | (0.17 | ) | | | — | |
| | | | | | | | | | | | | | | | |
Total Distributions | | | (0.22 | ) | | | (0.54 | ) | | | (0.22 | ) | | | — | |
| | | | | | | | | | | | | | | | |
Net Asset Value per Share, End of Year | | $ | 20.34 | | | $ | 16.27 | | | $ | 15.24 | | | $ | 11.23 | |
| | | | | | | | | | | | | | | | |
Total Return | | | 26.79 | % | | | 10.60 | % | | | 38.41 | % | | | 12.30 | % (2) |
|
Ratios/Supplemental Data: | |
| | | | |
Net Assets, End of Year (in thousands) | | $ | 103,442 | | | $ | 28,486 | | | $ | 16,527 | | | $ | 3,143 | |
|
Ratio of Expenses to Average Net Assets: | |
| | | | |
Before Expense Reimbursement | | | 0.93 | % | | | 1.28 | % | | | 1.79 | % | | | 4.72 | % (3) |
| | | | |
After Expense Reimbursement | | | 0.82 | % | | | 1.04 | % | | | 1.04 | % | | | 1.05 | % (3) |
| | | | |
Ratio of Net Investment Income (Loss) to Average Net Assets | | | 0.56 | % | | | (0.13 | )% | | | 0.11 | % | | | 1.03 | % (3) |
| | | | |
Portfolio Turnover Rate | | | 105.28 | % | | | 49.68 | % | | | 114.48 | % | | | 73.83 | % (2) |
| (1) | Computed using average shares outstanding throughout the period. |
| (2) | For the period January 29, 2016 (commencement of operations) through October 31, 2016. |
See accompanying notes to financial statements.
83
TCW New America Premier Equities Fund
Financial Highlights — N Class
| | | | | | | | | | | | | | | | |
| | |
| | | Year Ended October 31, | | | January 29, 2016
(Commencement
of Operations)
through
October 31, 2016 | |
| | | 2019 | | | 2018 | | | 2017 | |
Net Asset Value per Share, Beginning of Year | | $ | 16.27 | | | $ | 15.24 | | | $ | 11.23 | | | $ | 10.00 | |
| | | | | | | | | | | | | | | | |
Income (Loss) from Investment Operations: | |
Net Investment Income (Loss) (1) | | | 0.06 | | | | (0.02 | ) | | | 0.01 | | | | 0.08 | |
Net Realized and Unrealized Gain on Investments | | | 4.20 | | | | 1.59 | | | | 4.22 | | | | 1.15 | |
| | | | | | | | | | | | | | | | |
Total from Investment Operations | | | 4.26 | | | | 1.57 | | | | 4.23 | | | | 1.23 | |
| | | | | | | | | | | | | | | | |
Less Distributions: | |
Distributions from Net Investment Income | | | (0.01 | ) | | | — | | | | (0.05 | ) | | | — | |
Distributions from Net Realized Gain | | | (0.21 | ) | | | (0.54 | ) | | | (0.17 | ) | | | — | |
| | | | | | | | | | | | | | | | |
Total Distributions | | | (0.22 | ) | | | (0.54 | ) | | | (0.22 | ) | | | — | |
| | | | | | | | | | | | | | | | |
Net Asset Value per Share, End of Year | | $ | 20.31 | | | $ | 16.27 | | | $ | 15.24 | | | $ | 11.23 | |
| | | | | | | | | | | | | | | | |
Total Return | | | 26.60 | % | | | 10.60 | % | | | 38.41 | % | | | 12.30 | % (2) |
|
Ratios/Supplemental Data: | |
| | | | |
Net Assets, End of Year (in thousands) | | $ | 52,130 | | | $ | 4,879 | | | $ | 2,313 | | | $ | 1,128 | |
|
Ratio of Expenses to Average Net Assets: | |
| | | | |
Before Expense Reimbursement | | | 1.28 | % | | | 2.14 | % | | | 3.64 | % | | | 6.08 | % (3) |
| | | | |
After Expense Reimbursement | | | 1.00 | % | | | 1.04 | % | | | 1.04 | % | | | 1.05 | % (3) |
| | | | |
Ratio of Net Investment Income (Loss) to Average Net Assets | | | 0.32 | % | | | (0.13 | )% | | | 0.11 | % | | | 0.98 | % (3) |
| | | | |
Portfolio Turnover Rate | | | 105.28 | % | | | 49.68 | % | | | 114.48 | % | | | 73.83 | % (2) |
| (1) | Computed using average shares outstanding throughout the period. |
| (2) | For the period January 29, 2016 (commencement of operations) through October 31, 2016. |
See accompanying notes to financial statements.
84
TCW Relative Value Dividend Appreciation Fund
Financial Highlights — I Class
| | | | | | | | | | | | | | | | | | | | |
| |
| | | Year Ended October 31, | |
| | | 2019 | | | 2018 | | | 2017 | | | 2016 | | | 2015 | |
Net Asset Value per Share, Beginning of Year | | $ | 17.47 | | | $ | 19.14 | | | $ | 16.95 | | | $ | 16.49 | | | $ | 16.71 | |
| | | | | | | | | | | | | | | | | | | | |
Income (Loss) from Investment Operations: | | | | | | | | | | | | | | | | | | | | |
Net Investment Income (1) | | | 0.39 | | | | 0.35 | | | | 0.48 | | | | 0.35 | | | | 0.30 | |
Net Realized and Unrealized Gain (Loss) on Investments | | | 1.37 | | | | (0.90 | ) | | | 2.17 | | | | 0.41 | | | | (0.24 | ) |
| | | | | | | | | | | | | | | | | | | | |
Total from Investment Operations | | | 1.76 | | | | (0.55 | ) | | | 2.65 | | | | 0.76 | | | | 0.06 | |
| | | | | | | | | | | | | | | | | | | | |
Less Distributions: | | | | | | | | | | | | | | | | | | | | |
Distributions from Net Investment Income | | | (0.39 | ) | | | (0.40 | ) | | | (0.46 | ) | | | (0.30 | ) | | | (0.28 | ) |
Distributions from Net Realized Gain | | | (0.92 | ) | | | (0.72 | ) | | | — | | | | — | | | | — | |
| | | | | | | | | | | | | | | | | | | | |
Total Distributions | | | (1.31 | ) | | | (1.12 | ) | | | (0.46 | ) | | | (0.30 | ) | | | (0.28 | ) |
| | | | | | | | | | | | | | | | | | | | |
Net Asset Value per Share, End of Year | | $ | 17.92 | | | $ | 17.47 | | | $ | 19.14 | | | $ | 16.95 | | | $ | 16.49 | |
| | | | | | | | | | | | | | | | | | | | |
Total Return | | | 11.27 | % | | | (3.28 | )% | | | 15.69 | % | | | 4.66 | % | | | 0.40 | % |
|
Ratios/Supplemental Data: | |
| | | | | |
Net Assets, End of Year (in thousands) | | $ | 88,314 | | | $ | 95,108 | | | $ | 128,498 | | | $ | 165,331 | | | $ | 175,694 | |
|
Ratio of Expenses to Average Net Assets: | |
| | | | | |
Before Expense Reimbursement | | | 0.75 | % | | | 0.78 | % | | | 0.78 | % | | | 0.87 | % | | | 0.86 | % |
| | | | | |
After Expense Reimbursement | | | 0.74 | % | | | N/A | | | | N/A | | | | N/A | | | | N/A | |
| | | | | |
Ratio of Net Investment Income to Average Net Assets | | | 2.28 | % | | | 1.84 | % | | | 2.60 | % | | | 2.11 | % | | | 1.81 | % |
| | | | | |
Portfolio Turnover Rate | | | 17.71 | % | | | 18.48 | % | | | 23.45 | % | | | 19.13 | % | | | 17.95 | % |
| (1) | Computed using average shares outstanding throughout the period. |
See accompanying notes to financial statements.
85
TCW Relative Value Dividend Appreciation Fund
Financial Highlights — N Class
| | | | | | | | | | | | | | | | | | | | |
| |
| | | Year Ended October 31, | |
| | | 2019 | | | 2018 | | | 2017 | | | 2016 | | | 2015 | |
Net Asset Value per Share, Beginning of Year | | $ | 17.77 | | | $ | 19.46 | | | $ | 17.23 | | | $ | 16.76 | | | $ | 16.99 | |
| | | | | | | | | | | | | | | | | | | | |
Income (Loss) from Investment Operations: | |
Net Investment Income (1) | | | 0.37 | | | | 0.32 | | | | 0.43 | | | | 0.31 | | | | 0.26 | |
Net Realized and Unrealized Gain (Loss) on Investments | | | 1.38 | | | | (0.93 | ) | | | 2.23 | | | | 0.43 | | | | (0.25 | ) |
| | | | | | | | | | | | | | | | | | | | |
Total from Investment Operations | | | 1.75 | | | | (0.61 | ) | | | 2.66 | | | | 0.74 | | | | 0.01 | |
| | | | | | | | | | | | | | | | | | | | |
Less Distributions: | |
Distributions from Net Investment Income | | | (0.36 | ) | | | (0.36 | ) | | | (0.43 | ) | | | (0.27 | ) | | | (0.24 | ) |
Distributions from Net Realized Gain | | | (0.92 | ) | | | (0.72 | ) | | | — | | | | — | | | | — | |
| | | | | | | | | | | | | | | | | | | | |
Total Distributions | | | (1.28 | ) | | | (1.08 | ) | | | (0.43 | ) | | | (0.27 | ) | | | (0.24 | ) |
| | | | | | | | | | | | | | | | | | | | |
Net Asset Value per Share, End of Year | | $ | 18.24 | | | $ | 17.77 | | | $ | 19.46 | | | $ | 17.23 | | | $ | 16.76 | |
| | | | | | | | | | | | | | | | | | | | |
Total Return | | | 11.02 | % | | | (3.52 | )% | | | 15.46 | % | | | 4.43 | % | | | 0.10 | % |
|
Ratios/Supplemental Data: | |
| | | | | |
Net Assets, End of Year (in thousands) | | $ | 223,322 | | | $ | 411,123 | | | $ | 493,766 | | | $ | 876,421 | | | $ | 878,544 | |
|
Ratio of Expenses to Average Net Assets: | |
| | | | | |
Before Expense Reimbursement | | | 1.04 | % | | | 1.05 | % | | | 1.05 | % | | | 1.15 | % | | | 1.14 | % |
| | | | | |
After Expense Reimbursement | | | 0.96 | % | | | 1.00 | % | | | 1.00 | % | | | 1.11 | % | | | N/A | |
| | | | | |
Ratio of Net Investment Income to Average Net Assets | | | 2.10 | % | | | 1.62 | % | | | 2.24 | % | | | 1.86 | % | | | 1.53 | % |
| | | | | |
Portfolio Turnover Rate | | | 17.71 | % | | | 18.48 | % | | | 23.45 | % | | | 19.13 | % | | | 17.95 | % |
| (1) | Computed using average shares outstanding throughout the period. |
See accompanying notes to financial statements.
86
TCW Relative Value Large Cap Fund
Financial Highlights — I Class
| | | | | | | | | | | | | | | | | | | | |
| |
| | | Year Ended October 31, | |
| | | 2019 | | | 2018 | | | 2017 | | | 2016 | | | 2015 | |
Net Asset Value per Share, Beginning of Year | | $ | 19.82 | | | $ | 24.30 | | | $ | 21.38 | | | $ | 21.99 | | | $ | 22.09 | |
| | | | | | | | | | | | | | | | | | | | |
Income (Loss) from Investment Operations: | |
Net Investment Income (1) | | | 0.33 | | | | 0.28 | | | | 0.49 | | | | 0.32 | | | | 0.26 | |
Net Realized and Unrealized Gain (Loss) on Investments | | | 0.84 | | | | (1.18 | ) | | | 3.96 | | | | 0.19 | | | | (0.14 | ) |
| | | | | | | | | | | | | | | | | | | | |
Total from Investment Operations | | | 1.17 | | | | (0.90 | ) | | | 4.45 | | | | 0.51 | | | | 0.12 | |
| | | | | | | | | | | | | | | | | | | | |
Less Distributions: | |
Distributions from Net Investment Income | | | (0.31 | ) | | | (0.47 | ) | | | (0.41 | ) | | | (0.25 | ) | | | (0.22 | ) |
Distributions from Net Realized Gain | | | (1.99 | ) | | | (3.11 | ) | | | (1.12 | ) | | | (0.87 | ) | | | — | |
| | | | | | | | | | | | | | | | | | | | |
Total Distributions | | | (2.30 | ) | | | (3.58 | ) | | | (1.53 | ) | | | (1.12 | ) | | | (0.22 | ) |
| | | | | | | | | | | | | | | | | | | | |
Net Asset Value per Share, End of Year | | $ | 18.69 | | | $ | 19.82 | | | $ | 24.30 | | | $ | 21.38 | | | $ | 21.99 | |
| | | | | | | | | | | | | | | | | | | | |
Total Return | | | 8.13 | % | | | (5.11 | )% | | | 21.55 | % | | | 2.61 | % | | | 0.50 | % |
|
Ratios/Supplemental Data: | |
| | | | | |
Net Assets, End of Year (in thousands) | | $ | 136,917 | | | $ | 402,035 | | | $ | 472,078 | | | $ | 480,174 | | | $ | 667,957 | |
|
Ratio of Expenses to Average Net Assets: | |
| | | | | |
Before Expense Reimbursement | | | 0.78 | % | | | 0.77 | % | | | 0.77 | % | | | 0.88 | % | | | 0.88 | % |
| | | | | |
After Expense Reimbursement | | | 0.74 | % | | | N/A | | | | N/A | | | | N/A | | | | N/A | |
| | | | | |
Ratio of Net Investment Income to Average Net Assets | | | 1.79 | % | | | 1.28 | % | | | 2.11 | % | | | 1.57 | % | | | 1.14 | % |
| | | | | |
Portfolio Turnover Rate | | | 19.47 | % | | | 20.47 | % | | | 24.44 | % | | | 14.71 | % | | | 21.60 | % |
| (1) | Computed using average shares outstanding throughout the period. |
See accompanying notes to financial statements.
87
TCW Relative Value Large Cap Fund
Financial Highlights — N Class
| | | | | | | | | | | | | | | | | | | | |
| |
| | | Year Ended October 31, | |
| | | 2019 | | | 2018 | | | 2017 | | | 2016 | | | 2015 | |
Net Asset Value per Share, Beginning of Year | | $ | 19.74 | | | $ | 24.21 | | | $ | 21.31 | | | $ | 21.91 | | | $ | 22.04 | |
| | | | | | | | | | | | | | | | | | | | |
Income (Loss) from Investment Operations: | |
Net Investment Income (1) | | | 0.28 | | | | 0.23 | | | | 0.44 | | | | 0.28 | | | | 0.19 | |
Net Realized and Unrealized Gain (Loss) on Investments | | | 0.86 | | | | (1.18 | ) | | | 3.94 | | | | 0.19 | | | | (0.14 | ) |
| | | | | | | | | | | | | | | | | | | | |
Total from Investment Operations | | | 1.14 | | | | (0.95 | ) | | | 4.38 | | | | 0.47 | | | | 0.05 | |
| | | | | | | | | | | | | | | | | | | | |
Less Distributions: | |
Distributions from Net Investment Income | | | (0.27 | ) | | | (0.41 | ) | | | (0.36 | ) | | | (0.20 | ) | | | (0.18 | ) |
Distributions from Net Realized Gain | | | (1.99 | ) | | | (3.11 | ) | | | (1.12 | ) | | | (0.87 | ) | | | — | |
| | | | | | | | | | | | | | | | | | | | |
Total Distributions | | | (2.26 | ) | | | (3.52 | ) | | | (1.48 | ) | | | (1.07 | ) | | | (0.18 | ) |
| | | | | | | | | | | | | | | | | | | | |
Net Asset Value per Share, End of Year | | $ | 18.62 | | | $ | 19.74 | | | $ | 24.21 | | | $ | 21.31 | | | $ | 21.91 | |
| | | | | | | | | | | | | | | | | | | | |
Total Return | | | 7.92 | % | | | (5.35 | )% | | | 21.27 | % | | | 2.42 | % | | | 0.20 | % |
|
Ratios/Supplemental Data: | |
| | | | | |
Net Assets, End of Year (in thousands) | | $ | 11,535 | | | $ | 13,003 | | | $ | 16,373 | | | $ | 19,530 | | | $ | 25,084 | |
|
Ratio of Expenses to Average Net Assets: | |
| | | | | |
Before Expense Reimbursement | | | 1.24 | % | | | 1.21 | % | | | 1.16 | % | | | 1.23 | % | | | 1.20 | % |
| | | | | |
After Expense Reimbursement | | | 0.95 | % | | | 0.99 | % | | | 1.00 | % | | | 1.10 | % | | | 1.16 | % |
| | | | | |
Ratio of Net Investment Income to Average Net Assets | | | 1.52 | % | | | 1.05 | % | | | 1.93 | % | | | 1.35 | % | | | 0.86 | % |
| | | | | |
Portfolio Turnover Rate | | | 19.47 | % | | | 20.47 | % | | | 24.44 | % | | | 14.71 | % | | | 21.60 | % |
| (1) | Computed using average shares outstanding throughout the period. |
See accompanying notes to financial statements.
88
TCW Relative Value Mid Cap Fund
Financial Highlights — I Class
| | | | | | | | | | | | | | | | | | | | |
| |
| | | Year Ended October 31, | |
| | | 2019 | | | 2018 | | | 2017 | | | 2016 | | | 2015 | |
Net Asset Value per Share, Beginning of Year | | $ | 22.44 | | | $ | 25.96 | | | $ | 20.02 | | | $ | 22.43 | | | $ | 26.62 | |
| | | | | | | | | | | | | | | | | | | | |
Income (Loss) from Investment Operations: | |
Net Investment Income (1) | | | 0.18 | | | | 0.12 | | | | 0.11 | | | | 0.18 | | | | 0.17 | |
Net Realized and Unrealized Gain (Loss) on Investments | | | 0.21 | | | | (1.56 | ) | | | 5.96 | | | | 0.34 | | | | (1.16 | ) |
| | | | | | | | | | | | | | | | | | | | |
Total from Investment Operations | | | 0.39 | | | | (1.44 | ) | | | 6.07 | | | | 0.52 | | | | (0.99 | ) |
| | | | | | | | | | | | | | | | | | | | |
Less Distributions: | |
Distributions from Net Investment Income | | | (0.15 | ) | | | (0.13 | ) | | | (0.13 | ) | | | (0.16 | ) | | | (0.12 | ) |
Distributions from Net Realized Gain | | | (1.62 | ) | | | (1.95 | ) | | | — | | | | (2.77 | ) | | | (3.08 | ) |
| | | | | | | | | | | | | | | | | | | | |
Total Distributions | | | (1.77 | ) | | | (2.08 | ) | | | (0.13 | ) | | | (2.93 | ) | | | (3.20 | ) |
| | | | | | | | | | | | | | | | | | | | |
Net Asset Value per Share, End of Year | | $ | 21.06 | | | $ | 22.44 | | | $ | 25.96 | | | $ | 20.02 | | | $ | 22.43 | |
| | | | | | | | | | | | | | | | | | | | |
Total Return | | | 3.18 | % | | | (6.48 | )% | | | 30.40 | % | | | 3.53 | % | | | (4.58 | )% |
|
Ratios/Supplemental Data: | |
| | | | | |
Net Assets, End of Year (in thousands) | | $ | 63,957 | | | $ | 72,527 | | | $ | 84,136 | | | $ | 74,840 | | | $ | 93,356 | |
|
Ratio of Expenses to Average Net Assets: | |
| | | | | |
Before Expense Reimbursement | | | 0.95 | % | | | 0.92 | % | | | 0.99 | % | | | 0.98 | % | | | 0.96 | % |
| | | | | |
After Expense Reimbursement | | | 0.90 | % | | | N/A | | | | N/A | | | | N/A | | | | N/A | |
| | | | | |
Ratio of Net Investment Income to Average Net Assets | | | 0.86 | % | | | 0.48 | % | | | 0.45 | % | | | 0.96 | % | | | 0.68 | % |
| | | | | |
Portfolio Turnover Rate | | | 25.89 | % | | | 22.60 | % | | | 31.93 | % | | | 17.81 | % | | | 23.15 | % |
| (1) | Computed using average shares outstanding throughout the period. |
See accompanying notes to financial statements.
89
TCW Relative Value Mid Cap Fund
Financial Highlights — N Class
| | | | | | | | | | | | | | | | | | | | |
| |
| | | Year Ended October 31, | |
| | | 2019 | | | 2018 | | | 2017 | | | 2016 | | | 2015 | |
Net Asset Value per Share, Beginning of Year | | $ | 21.82 | | | $ | 25.28 | | | $ | 19.50 | | | $ | 21.90 | | | $ | 26.08 | |
| | | | | | | | | | | | | | | | | | | | |
Income (Loss) from Investment Operations: | | | | | | | | | | | | | | | | | | | | |
Net Investment Income (1) | | | 0.15 | | | | 0.09 | | | | 0.07 | | | | 0.14 | | | | 0.10 | |
Net Realized and Unrealized Gain (Loss) on Investments | | | 0.21 | | | | (1.52 | ) | | | 5.80 | | | | 0.32 | | | | (1.12 | ) |
| | | | | | | | | | | | | | | | | | | | |
Total from Investment Operations | | | 0.36 | | | | (1.43 | ) | | | 5.87 | | | | 0.46 | | | | (1.02 | ) |
| | | | | | | | | | | | | | | | | | | | |
Less Distributions: | | | | | | | | | | | | | | | | | | | | |
Distributions from Net Investment Income | | | (0.11 | ) | | | (0.08 | ) | | | (0.09 | ) | | | (0.09 | ) | | | (0.08 | ) |
Distributions from Net Realized Gain | | | (1.62 | ) | | | (1.95 | ) | | | — | | | | (2.77 | ) | | | (3.08 | ) |
| | | | | | | | | | | | | | | | | | | | |
Total Distributions | | | (1.73 | ) | | | (2.03 | ) | | | (0.09 | ) | | | (2.86 | ) | | | (3.16 | ) |
| | | | | | | | | | | | | | | | | | | | |
Net Asset Value per Share, End of Year | | $ | 20.45 | | | $ | 21.82 | | | $ | 25.28 | | | $ | 19.50 | | | $ | 21.90 | |
| | | | | | | | | | | | | | | | | | | | |
Total Return | | | 3.12 | % | | | (6.61 | )% | | | 30.15 | % | | | 3.30 | % | | | (4.78 | )% |
| | | | | |
Ratios/Supplemental Data: | | | | | | | | | | | | | | | | | | | | |
| | | | | |
Net Assets, End of Year (in thousands) | | $ | 14,448 | | | $ | 18,040 | | | $ | 19,095 | | | $ | 16,839 | | | $ | 19,559 | |
| | | | | |
Ratio of Expenses to Average Net Assets: | | | | | | | | | | | | | | | | | | | | |
| | | | | |
Before Expense Reimbursement | | | 1.37 | % | | | 1.31 | % | | | 1.37 | % | | | 1.35 | % | | | 1.30 | % |
| | | | | |
After Expense Reimbursement | | | 1.00 | % | | | 1.04 | % | | | 1.16 | % | | | 1.20 | % | | | 1.21 | % |
| | | | | |
Ratio of Net Investment Income to Average Net Assets | | | 0.76 | % | | | 0.36 | % | | | 0.29 | % | | | 0.74 | % | | | 0.44 | % |
| | | | | |
Portfolio Turnover Rate | | | 25.89 | % | | | 22.60 | % | | | 31.93 | % | | | 17.81 | % | | | 23.15 | % |
| (1) | Computed using average shares outstanding throughout the period. |
See accompanying notes to financial statements.
90
TCW Select Equities Fund
Financial Highlights — I Class
| | | | | | | | | | | | | | | | | | | | |
| |
| | | Year Ended October 31, | |
| | | 2019 | | | 2018 | | | 2017 | | | 2016 | | | 2015 | |
Net Asset Value per Share, Beginning of Year | | $ | 27.13 | | | $ | 30.42 | | | $ | 26.06 | | | $ | 29.65 | | | $ | 26.71 | |
| | | | | | | | | | | | | | | | | | | | |
Income (Loss) from Investment Operations: | | | | | | | | | | | | | | | | | | | | |
Net Investment Loss (1) | | | (0.06 | ) | | | (0.08 | ) | | | (0.05 | ) | | | (0.10 | ) | | | (0.02 | ) |
Net Realized and Unrealized Gain (Loss) on Investments | | | 4.21 | | | | 3.37 | | | | 5.99 | | | | (1.42 | ) | | | 3.80 | |
| | | | | | | | | | | | | | | | | | | | |
Total from Investment Operations | | | 4.15 | | | | 3.29 | | | | 5.94 | | | | (1.52 | ) | | | 3.78 | |
| | | | | | | | | | | | | | | | | | | | |
Less Distributions: | | | | | | | | | | | | | | | | | | | | |
Distributions from Net Realized Gain | | | (3.64 | ) | | | (6.58 | ) | | | (1.58 | ) | | | (2.07 | ) | | | (0.84 | ) |
| | | | | | | | | | | | | | | | | | | | |
Net Asset Value per Share, End of Year | | $ | 27.64 | | | $ | 27.13 | | | $ | 30.42 | | | $ | 26.06 | | | $ | 29.65 | |
| | | | | | | | | | | | | | | | | | | | |
Total Return | | | 18.98 | % | | | 12.59 | % | | | 24.47 | % | | | (5.56 | )% | | | 14.54 | % |
| | | | | |
Ratios/Supplemental Data: | | | | | | | | | | | | | | | | | | | | |
| | | | | |
Net Assets, End of Year (in thousands) | | $ | 770,079 | | | $ | 740,485 | | | $ | 768,535 | | | $ | 1,264,622 | | | $ | 1,629,090 | |
| | | | | |
Ratio of Expenses to Average Net Assets | | | 0.80 | % | | | 0.87 | % | | | 0.88 | % | | | 0.89 | % | | | 0.88 | % |
| | | | | |
Ratio of Net Investment Loss to Average Net Assets | | | (0.25 | )% | | | (0.29 | )% | | | (0.18 | )% | | | (0.38 | )% | | | (0.08 | )% |
| | | | | |
Portfolio Turnover Rate | | | 6.41 | % | | | 15.43 | % | | | 17.95 | % | | | 14.05 | % | | | 27.19 | % |
| (1) | Computed using average shares outstanding throughout the period. |
See accompanying notes to financial statements.
91
TCW Select Equities Fund
Financial Highlights — N Class
| | | | | | | | | | | | | | | | | | | | |
| |
| | | Year Ended October 31, | |
| | | 2019 | | | 2018 | | | 2017 | | | 2016 | | | 2015 | |
Net Asset Value per Share, Beginning of Year | | $ | 24.61 | | | $ | 28.23 | | | $ | 24.35 | | | $ | 27.91 | | | $ | 25.26 | |
| | | | | | | | | | | | | | | | | | | | |
Income (Loss) from Investment Operations: | | | | | | | | | | | | | | | | | | | | |
Net Investment Loss (1) | | | (0.11 | ) | | | (0.13 | ) | | | (0.10 | ) | | | (0.16 | ) | | | (0.09 | ) |
Net Realized and Unrealized Gain (Loss) on Investments | | | 3.73 | | | | 3.09 | | | | 5.56 | | | | (1.33 | ) | | | 3.58 | |
| | | | | | | | | | | | | | | | | | | | |
Total from Investment Operations | | | 3.62 | | | | 2.96 | | | | 5.46 | | | | (1.49 | ) | | | 3.49 | |
| | | | | | | | | | | | | | | | | | | | |
Less Distributions: | | | | | | | | | | | | | | | | | | | | |
Distributions from Net Realized Gain | | | (3.64 | ) | | | (6.58 | ) | | | (1.58 | ) | | | (2.07 | ) | | | (0.84 | ) |
| | | | | | | | | | | | | | | | | | | | |
Net Asset Value per Share, End of Year | | $ | 24.59 | | | $ | 24.61 | | | $ | 28.23 | | | $ | 24.35 | | | $ | 27.91 | |
| | | | | | | | | | | | | | | | | | | | |
Total Return | | | 18.74 | % | | | 12.36 | % | | | 24.20 | % | | | (5.81 | )% | | | 14.22 | % |
| | | | | |
Ratios/Supplemental Data: | | | | | | | | | | | | | | | | | | | | |
| | | | | |
Net Assets, End of Year (in thousands) | | $ | 132,332 | | | $ | 133,252 | | | $ | 138,807 | | | $ | 151,174 | | | $ | 274,026 | |
| | | | | |
Ratio of Expenses to Average Net Assets: | | | | | | | | | | | | | | | | | | | | |
| | | | | |
Before Expense Reimbursement | | | 1.08 | % | | | 1.15 | % | | | 1.16 | % | | | 1.16 | % | | | 1.14 | % |
| | | | | |
After Expense Reimbursement | | | 1.01 | % | | | 1.08 | % | | | 1.11 | % | | | 1.14 | % | | | N/A | |
| | | | | |
Ratio of Net Investment Loss to Average Net Assets | | | (0.45 | )% | | | (0.50 | )% | | | (0.39 | )% | | | (0.64 | )% | | | (0.33 | )% |
| | | | | |
Portfolio Turnover Rate | | | 6.41 | % | | | 15.43 | % | | | 17.95 | % | | | 14.05 | % | | | 27.19 | % |
| (1) | Computed using average shares outstanding throughout the period. |
See accompanying notes to financial statements.
92
TCW Funds, Inc.
Report of Independent Registered Public Accounting Firm
To the Board of Directors and Shareholders of TCW Funds, Inc.:
Opinion on the Financial Statements and Financial Highlights
We have audited the accompanying statements of assets and liabilities of TCW Artificial Intelligence Equity Fund, TCW Conservative Allocation Fund, TCW Global Real Estate Fund, TCW New America Premier Equities Fund, TCW Relative Value Dividend Appreciation Fund, TCW Relative Value Large Cap Fund, TCW Relative Value Mid Cap Fund, and TCW Select Equities Fund (collectively, the “TCW Equity and Asset Allocation Funds”) (eight of nineteen funds comprising TCW Funds, Inc.), including the schedules of investments, as of October 31, 2019, the related statements of operations for the year then ended, the statements of changes in net assets for each of the two years in the period then ended, the financial highlights for each of the five years in the period then ended for the TCW Equity and Asset Allocation Funds, except, TCW Artificial Intelligence Equity Fund which is for each of the two years in the period then ended and for the period August 31, 2017 (commencement of operations) to October 31, 2017, TCW Global Real Estate Fund which is for each of the four years in the period then ended and for the period November 28, 2014 (commencement of operations) to October 31, 2015, and TCW New America Premier Equities Fund which is for each of the three years in the period then ended and for the period January 29, 2016 (commencement of operations) to October 31, 2016, and the related notes. In our opinion, the financial statements and financial highlights present fairly, in all material respects, the financial position of each of the respective TCW Equity and Asset Allocation Funds as of October 31, 2019, and the results of their operations for the year then ended, the changes in their net assets for each of the two years in the period then ended, and the financial highlights for each of the five years in the period then ended for the TCW Equity and Asset Allocation Funds, except, TCW Artificial Intelligence Equity Fund which is for each of the two years in the period then ended and for the period August 31, 2017 (commencement of operations) to October 31, 2017, TCW Global Real Estate Fund which is for each of the four years in the period then ended and for the period November 28, 2014 (commencement of operations) to October 31, 2015, and TCW New America Premier Equities Fund which is for each of the three years in the period then ended and for the period January 29, 2016 (commencement of operations) to October 31, 2016, in conformity with accounting principles generally accepted in the United States of America.
Basis for Opinion
These financial statements and financial highlights are the responsibility of the TCW Equity and Asset Allocation Funds’ management. Our responsibility is to express an opinion on the TCW Equity and Asset Allocation Funds’ financial statements and financial highlights based on our audits. We are a public accounting firm registered with the Public Company Accounting Oversight Board (United States) (PCAOB) and are required to be independent with respect to the Funds in accordance with the U.S. federal securities laws and the applicable rules and regulations of the Securities and Exchange Commission and the PCAOB.
We conducted our audits in accordance with the standards of the PCAOB. Those standards require that we plan and perform the audits to obtain reasonable assurance about whether the financial statements and financial highlights are free of material misstatement, whether due to error or fraud. The TCW Equity and Asset Allocation Funds are not required to have, nor were we engaged to perform, an audit of their internal control over financial reporting. As part of our audits we are required to obtain an understanding of internal control over financial reporting but not for the purpose of expressing an opinion on the effectiveness of the TCW Equity and Asset Allocation Funds’ internal control over financial reporting. Accordingly, we express no such opinion.
Our audits included performing procedures to assess the risks of material misstatement of the financial statements and financial highlights, whether due to error or fraud, and performing procedures that respond to those risks. Such procedures included examining, on a test basis, evidence regarding the amounts and disclosures in the financial statements and financial highlights. Our audits also included evaluating the accounting principles used and significant estimates made by management, as well as evaluating the overall presentation of the financial statements and financial highlights. Our procedures included confirmation of securities owned as of October 31, 2019, by correspondence with the custodian and brokers; when replies were not received from brokers, we performed other auditing procedures. We believe that our audits provide a reasonable basis for our opinion.

Los Angeles, California
December 20, 2019
We have served as the auditor of one or more TCW/Metropolitan West Funds investment companies since 1990.
93
TCW Funds, Inc.
Shareholder Expenses (Unaudited)
As a shareholder of a Fund, you incur ongoing operational costs of the Fund, including management fees and other fund expenses. The following example is intended to help you understand your ongoing costs (in dollars and cents) of investing in a Fund and to compare these costs with the ongoing costs of investing in other funds.
The example is based on an investment of $1,000 invested at the beginning of the period and held for the entire period from May 1, 2019 to October 31, 2019 (184 days).
Actual Expenses The first line under each Fund in the table below provides information about the actual account values and actual expenses. You may use the information in this line, together with the amount you invested, to estimate the expenses that you paid over the period. Simply divide your account value by $1,000 (for example, an $8,600 account value divided by $1,000 = 8.6), then multiply the result by the number in the first line for your Fund under the heading entitled “Expenses Paid During Period” to estimate the expenses you paid on your account during this period.
Hypothetical Example for Comparison Purposes The second line under each Fund in the table below provides information about the hypothetical expenses based on each Fund’s actual expense ratio and an assumed rate of return of 5% per year before expenses, which is not the Fund’s actual return. The hypothetical account value and expenses may not be used to estimate the actual ending account balance or expenses you paid for the period. You may use this information to compare the ongoing costs of investing in your Fund and other funds. To do so, compare this 5% hypothetical example with the 5% hypothetical examples that appear in the shareholder reports of the other funds.
| | | | | | | | | | | | | | | | |
TCW Funds, Inc. | | Beginning
Account Value
May 1, 2019 | | | Ending
Account Value
October 31, 2019 | | | Annualized
Expense Ratio | | | Expenses Paid
During Period
(May 1, 2019 to
October 31, 2019) | |
| TCW Artificial Intelligence Equity Fund | | | | | | | | | | | | | | | | |
I Class Shares | | | | | | | | | | | | | | | | |
Actual | | $ | 1,000.00 | | | $ | 980.70 | | | | 0.90 | % | | $ | 4.49 | |
Hypothetical (5% return before expenses) | | | 1,000.00 | | | | 1,020.67 | | | | 0.90 | % | | | 4.58 | |
| | | | |
N Class Shares | | | | | | | | | | | | | | | | |
Actual | | $ | 1,000.00 | | | $ | 980.70 | | | | 1.00 | % | | $ | 4.99 | |
Hypothetical (5% return before expenses) | | | 1,000.00 | | | | 1,020.16 | | | | 1.00 | % | | | 5.09 | |
| | | | |
| TCW Conservative Allocation Fund | | | | | | | | | | | | | | | | |
I Class Shares | | | | | | | | | | | | | | | | |
Actual | | $ | 1,000.00 | | | $ | 1,034.20 | | | | 0.47 | % (1) | | $ | 2.41 | (1) |
Hypothetical (5% return before expenses) | | | 1,000.00 | | | | 1,022.84 | | | | 0.47 | % (1) | | | 2.40 | (1) |
| | | | |
N Class Shares | | | | | | | | | | | | | | | | |
Actual | | $ | 1,000.00 | | | $ | 1,032.50 | | | | 0.73 | % | | $ | 3.74 | |
Hypothetical (5% return before expenses) | | | 1,000.00 | | | | 1,021.53 | | | | 0.73 | % | | | 3.72 | |
| | | | |
| TCW Global Real Estate Fund | | | | | | | | | | | | | | | | |
I Class Shares | | | | | | | | | | | | | | | | |
Actual | | $ | 1,000.00 | | | $ | 1,114.10 | | | | 1.00 | % | | $ | 5.33 | |
Hypothetical (5% return before expenses) | | | 1,000.00 | | | | 1,020.16 | | | | 1.00 | % | | | 5.09 | |
| | | | |
N Class Shares | | | | | | | | | | | | | | | | |
Actual | | $ | 1,000.00 | | | $ | 1,113.20 | | | | 1.15 | % | | $ | 6.13 | |
Hypothetical (5% return before expenses) | | | 1,000.00 | | | | 1,019.41 | | | | 1.15 | % | | | 5.85 | |
94
TCW Funds, Inc.
| | | | | | | | | | | | | | | | |
TCW Funds, Inc. | | Beginning
Account Value
May 1, 2019 | | | Ending
Account Value
October 31, 2019 | | | Annualized
Expense Ratio | | | Expenses Paid
During Period
(May 1, 2019 to
October 31, 2019) | |
| TCW New America Premier Equities Fund | | | | | | | | | | | | | | | | |
I Class Shares | | | | | | | | | | | | | | | | |
Actual | | $ | 1,000.00 | | | $ | 1,068.30 | | | | 0.80 | % | | $ | 4.17 | |
Hypothetical (5% return before expenses) | | | 1,000.00 | | | | 1,021.17 | | | | 0.80 | % | | | 4.08 | |
| | | | |
N Class Shares | | | | | | | | | | | | | | | | |
Actual | | $ | 1,000.00 | | | $ | 1,067.30 | | | | 1.00 | % | | $ | 5.21 | |
Hypothetical (5% return before expenses) | | | 1,000.00 | | | | 1,020.16 | | | | 1.00 | % | | | 5.09 | |
| | | | |
| TCW Relative Value Dividend Appreciation Fund | | | | | | | | | | | | | | | | |
I Class Shares | | | | | | | | | | | | | | | | |
Actual | | $ | 1,000.00 | | | $ | 1,030.80 | | | | 0.74 | % | | $ | 3.79 | |
Hypothetical (5% return before expenses) | | | 1,000.00 | | | | 1,021.48 | | | | 0.74 | % | | | 3.77 | |
| | | | |
N Class Shares | | | | | | | | | | | | | | | | |
Actual | | $ | 1,000.00 | | | $ | 1,029.90 | | | | 0.95 | % | | $ | 4.86 | |
Hypothetical (5% return before expenses) | | | 1,000.00 | | | | 1,020.42 | | | | 0.95 | % | | | 4.84 | |
| | | | |
| TCW Relative Value Large Cap Fund | | | | | | | | | | | | | | | | |
I Class Shares | | | | | | | | | | | | | | | | |
Actual | | $ | 1,000.00 | | | $ | 1,008.60 | | | | 0.73 | % | | $ | 3.70 | |
Hypothetical (5% return before expenses) | | | 1,000.00 | | | | 1,021.53 | | | | 0.73 | % | | | 3.72 | |
| | | | |
N Class Shares | | | | | | | | | | | | | | | | |
Actual | | $ | 1,000.00 | | | $ | 1,007.60 | | | | 0.95 | % | | $ | 4.81 | |
Hypothetical (5% return before expenses) | | | 1,000.00 | | | | 1,020.42 | | | | 0.95 | % | | | 4.84 | |
| | | | |
| TCW Relative Value Mid Cap Fund | | | | | | | | | | | | | | | | |
I Class Shares | | | | | | | | | | | | | | | | |
Actual | | $ | 1,000.00 | | | $ | 983.20 | | | | 0.90 | % | | $ | 4.50 | |
Hypothetical (5% return before expenses) | | | 1,000.00 | | | | 1,020.67 | | | | 0.90 | % | | | 4.58 | |
| | | | |
N Class Shares | | | | | | | | | | | | | | | | |
Actual | | $ | 1,000.00 | | | $ | 982.70 | | | | 1.00 | % | | $ | 5.00 | |
Hypothetical (5% return before expenses) | | | 1,000.00 | | | | 1,020.16 | | | | 1.00 | % | | | 5.09 | |
| | | | |
| TCW Select Equities Fund | | | | | | | | | | | | | | | | |
I Class Shares | | | | | | | | | | | | | | | | |
Actual | | $ | 1,000.00 | | | $ | 1,008.40 | | | | 0.78 | % | | $ | 3.95 | |
Hypothetical (5% return before expenses) | | | 1,000.00 | | | | 1,021.27 | | | | 0.78 | % | | | 3.97 | |
| | | | |
N Class Shares | | | | | | | | | | | | | | | | |
Actual | | $ | 1,000.00 | | | $ | 1,007.40 | | | | 1.00 | % | | $ | 5.06 | |
Hypothetical (5% return before expenses) | | | 1,000.00 | | | | 1,020.16 | | | | 1.00 | % | | | 5.09 | |
| (1) | Does not include expenses of the underlying affiliated investments. |
95
TCW Funds, Inc.
Privacy Policy
The TCW Group, Inc. and Subsidiaries
TCW Investment Management Company LLC
TCW Asset Management Company LLC
Metropolitan West Asset Management, LLC
| | |
| TCW Funds, Inc. | | Sepulveda Management LLC |
| TCW Strategic Income Fund, Inc. | | TCW Direct Lending LLC |
| Metropolitan West Funds | | TCW Direct Lending VII LLC |
What You Should Know
At TCW, we recognize the importance of keeping information about you secure and confidential. We do not sell or share your nonpublic personal and financial information with marketers or others outside our affiliated group of companies.
We carefully manage information among our affiliated group of companies to safeguard your privacy and to provide you with consistently excellent service.
We are providing this notice to you to comply with the requirements of Regulation S-P, “Privacy of Consumer Financial Information,” issued by the United States Securities and Exchange Commission.
Our Privacy Policy
We, The TCW Group, Inc. and its subsidiaries, the TCW Funds, Inc., TCW Strategic Income Fund, Inc., the Metropolitan West Funds, Sepulveda Management LLC and TCW Direct Lending (collectively, “TCW”) are committed to protecting the nonpublic personal and financial information of our customers and consumers who obtain or seek to obtain financial products or services primarily for personal, family or household purposes. We fulfill our commitment by establishing and implementing policies and systems to protect the security and confidentiality of this information.
In our offices, we limit access to nonpublic personal and financial information about you to those TCW personnel who need to know the information in order to provide products or services to you. We maintain physical, electronic and procedural safeguards to protect your nonpublic personal and financial information.
Categories of Information We Collect
We may collect the following types of nonpublic personal and financial information about you from the following sources:
| • | | Your name, address and identifying numbers, and other personal and financial information, from you and from identification cards and papers you submit to us, on applications, subscription agreements or other forms or communications. |
| • | | Information about your account balances and financial transactions with us, our affiliated entities, or nonaffiliated third parties, from our internal sources, from affiliated entities and from nonaffiliated third parties. |
96
TCW Funds, Inc.
| • | | Information about your account balances and financial transactions and other personal and financial information, from consumer credit reporting agencies or other nonaffiliated third parties, to verify information received from you or others. |
Categories of Information We Disclose to Nonaffiliated Third Parties
| • | | We may disclose your name, address and account and other identifying numbers, as well as information about your pending or past transactions and other personal financial information, to nonaffiliated third parties, for our everyday business purposes such as necessary to execute, process, service and confirm your securities transactions and mutual fund transactions, to administer and service your account and commingled investment vehicles in which you are invested, to market our products and services through joint marketing arrangements or to respond to court orders and legal investigations. |
| • | | We may disclose nonpublic personal and financial information concerning you to law enforcement agencies, federal regulatory agencies, self-regulatory organizations or other nonaffiliated third parties, if required or requested to do so by a court order, judicial subpoena or regulatory inquiry. |
We do not otherwise disclose your nonpublic personal and financial information to nonaffiliated third parties, except where we believe in good faith that disclosure is required or permitted by law. Because we do not disclose your nonpublic personal and financial information to nonaffiliated third parties, our Customer Privacy Policy does not contain opt-out provisions.
Categories of Information We Disclose to Our Affiliated Entities
| • | | We may disclose your name, address and account and other identifying numbers, account balances, information about your pending or past transactions and other personal financial information to our affiliated entities for any purpose. |
| • | | We regularly disclose your name, address and account and other identifying numbers, account balances and information about your pending or past transactions to our affiliates to execute, process and con- firm securities transactions or mutual fund transactions for you, to administer and service your account and commingled investment vehicles in which you are invested, or to market our products and services to you. |
Information About Former Customers
We do not disclose nonpublic personal and financial information about former customers to nonaffiliated third parties unless required or requested to do so by a court order, judicial subpoena or regulatory inquiry, or otherwise where we believe in good faith that disclosure is required or permitted by law.
Questions
Should you have any questions about our Customer Privacy Policy, please contact us by email or by regular mail at the address at the end of this policy.
97
TCW Funds, Inc.
Privacy Policy (Continued)
Reminder About TCW’s Financial Products
Financial products offered by The TCW Group, Inc. and its subsidiaries, the TCW Funds, Inc., TCW Strategic Income Fund, Inc., the Metropolitan West Funds, Sepulveda Management LLC and TCW Direct Lending.
| • | | Are not guaranteed by a bank; |
| • | | Are not obligations of The TCW Group, Inc. or of its subsidiaries; |
| • | | Are not insured by the Federal Deposit Insurance Corporation; and |
| • | | Are subject to investment risks, including possible loss of the principal amount committed or invested, and earnings thereon. |
THE TCW GROUP, INC.
TCW FUNDS, INC.
TCW STRATEGIC INCOME FUND, INC.
METROPOLITAN WEST FUNDS
SEPULVEDA MANAGEMENT LLC
TCW DIRECT LENDING LLC
TCW DIRECT LENDING VII LLC
Attention: Privacy Officer | 865 South Figueroa St. Suite 1800 | Los Angeles, CA 90017 | email: privacy@tcw.com
98
TCW Funds, Inc.
Approval of Investment Management and Advisory Agreement
Renewal of Investment Advisory and Management Agreement (Unaudited)
TCW Funds, Inc. (the “Corporation”) and TCW Investment Management Company LLC (the “Advisor”) are parties to an Investment Advisory and Management Agreement (“Agreement”), pursuant to which the Advisor is responsible for managing the investments of each separate investment series (each, a “Fund” and collectively, the “Funds”) of the Corporation. Unless terminated by either party, the Agreement continues in effect from year to year provided that the continuance is specifically approved at least annually by the vote of the holders of at least a majority of the outstanding shares of the Funds, or by the Board of Directors of the Corporation (the “Board”), and, in either event, by a majority of the Directors who are not “interested persons” of the Corporation, as such term is defined in Section 2(a)(19) of the Investment Company Act of 1940, as amended (the “Independent Directors”), casting votes in person at a meeting called for that purpose.
On September 16, 2019, the Board approved the renewal of the Agreement for an additional one-year term from February 6, 2020 through February 5, 2021. The renewal of the Agreement was approved by the Board (including by a majority of the Independent Directors) upon the recommendation of the Independent Directors. The Independent Directors met separately by telephone on August 27, 2019, and in person on September 15, 2019, with their independent legal counsel to review and discuss the information that had been requested on their behalf by their independent legal counsel and presented by the Advisor for their consideration. The information, material facts, and conclusions that formed the basis for the Independent Directors’ recommendation and the Board’s subsequent approval are described below.
1. Information received
Materials reviewed — During the course of each year, the Directors receive a wide variety of materials relating to the services provided by the Advisor, including reports on the Advisor’s investment processes, as well as on each Fund’s investment results, portfolio composition, portfolio trading practices, compliance monitoring, shareholder services, and other information relating to the nature, extent, and quality of services provided by the Advisor to the Funds. In addition, the Board reviewed information furnished to the Independent Directors in response to a detailed request sent to the Advisor on their behalf. The information in the Advisor’s responses included extensive materials regarding each Fund’s investment results, advisory fee comparisons to advisory fees charged by the Advisor to its institutional clients, financial and profitability information regarding the Advisor, descriptions of various services provided to the Funds and to other advisory and sub-advisory clients, descriptions of functions such as compliance monitoring and portfolio trading practices, and information about the personnel providing investment management services to each Fund. The Directors also considered information provided by an independent data provider, Broadridge, comparing the investment performance and the fee and expense levels of each Fund to those of appropriate peer groups of mutual funds selected by Broadridge. After reviewing this information, the Directors requested additional financial, profitability and service information from the Advisor, which the Advisor provided and the Directors considered.
Review process — The Directors’ determinations were made on the basis of each Director’s business judgment after consideration of all the information presented. The Independent Directors were advised by their independent legal counsel throughout the renewal process and received and reviewed advice from their independent legal counsel regarding legal and industry standards applicable to the renewal of the Agreement, including a legal memorandum from their independent legal counsel discussing their fiduciary duties related to their approval of the continuation of the Agreement. The Independent Directors also
99
TCW Funds, Inc.
Approval of Investment Management and Advisory Agreement (Continued)
discussed the renewal of the Agreement with the Advisor’s representatives and in private sessions at which no representatives of the Advisor were present. In deciding to recommend the renewal of the Agreement with respect to each Fund, the Independent Directors did not identify any single piece of information or particular factor that, in isolation, was the controlling factor. Each Independent Director may also have weighed factors differently. This summary describes the most important, but not all, of the factors considered by the Board and the Independent Directors.
2. Nature, extent, and quality of services provided by the Advisor
The Board and the Independent Directors considered the depth and quality of the Advisor’s investment management process, including its research and strong analytical capabilities; the experience, capability, and integrity of its senior management and other personnel; the relatively low turnover rates of its key personnel; the overall resources available to the Advisor; and the ability of its organizational structure to address the growth in assets over the past several years and withstand the recent decline in assets. The Board and the Independent Directors considered the ability of the Advisor to attract and retain well-qualified investment professionals, noting in particular the Advisor’s hiring of professionals in various areas over the past several years, continued upgrading of resources in its middle office and back office operations and other areas, as well as a continuing and extensive program of infrastructure and systems enhancements. The Board and the Independent Directors also considered that the Advisor made available to its investment professionals a variety of resources and systems relating to investment management, compliance, trading, operations, administration, research, portfolio accounting, and legal matters. They noted the substantial additional resources made available by The TCW Group, Inc., the parent company of the Advisor. The Board and the Independent Directors examined and discussed a detailed description of the extensive additional services provided to the Funds to support their operations and compliance, as compared to the much narrower range of services provided to the Advisor’s institutional and sub-advised clients, as well as the Advisor’s oversight and coordination of numerous outside service providers to the Funds. They further noted the high level of regular communication between the Advisor and the Independent Directors. The Advisor explained its responsibility to supervise the activities of the Funds’ various service providers, as well as supporting the Independent Directors and their meetings, regulatory filings, and various operational personnel, and the related costs.
The Board and the Independent Directors concluded that the nature, extent, and quality of the services provided by the Advisor are of a high quality and have benefited and should continue to benefit the Funds and their shareholders.
3. Investment results
The Board and the Independent Directors considered the investment results of each Fund in light of its investment objective(s) and principal investment strategies. They compared each Fund’s total returns with the total returns of other mutual funds in peer group reports prepared by Broadridge with respect to various longer and more recent periods all ended May 31, 2019. The Board and the Independent Directors reviewed information as to peer group selections presented by Broadridge and discussed the methodology for those selections with Broadridge. In reviewing each Fund’s relative performance, the Board and the Independent Directors took into account each Fund’s investment strategies, distinct characteristics, asset size and diversification.
The Board and the Independent Directors noted that most Funds’ performance was satisfactory over the relevant periods. The Board and the Independent Directors noted that investment performance of most of
100
TCW Funds, Inc.
the Funds was generally close to or above the median performance of the applicable peer group during the three-year period emphasized by Broadridge in the supplemental materials, but eight Funds ranked in the fourth or fifth quintile of their peer groups for that three-year period. For those Funds that lagged peer group averages, they noted that the Advisor had discussed with the Board the reasons for the underperformance and the actions taken or to be taken by the Advisor to address the underperformance, and they indicated that they would continue to monitor portfolio investment performance on a regular basis and discuss with the Advisor from time to time any instances of long-term underperformance as appropriate. The Board and the Independent Directors noted that the performance of some Funds for periods when they lagged their peer group averages remained satisfactory when assessed on a risk-adjusted basis because performance quintiles do not necessarily reflect the degree of risk employed by peer funds to achieve their returns.
With respect to the fixed income Funds, the Board and the Independent Directors recognized the Advisor’s deliberate strategy to manage risk in light of its critical view of the fixed-income securities markets and overall investment market conditions at present and in the near term. For that reason, the Board and the Independent Directors believed that relative performance also should be considered in light of future market conditions expected by the Advisor. The Board and the Independent Directors noted the Advisor’s view that longer term performance can be more meaningful for active fixed income funds than shorter term performance because fixed income market cycles are generally longer than three years.
For the U.S. fixed income Funds, the Board and the Independent Directors noted the conservative profile of these Funds, which generally experienced less volatility compared to various other funds in the applicable peer group (except for the relative volatility of Total Return Bond Fund, which is a mortgage-focused Fund). They also noted the Advisor’s conservative posture for these Funds with respect to credit and interest rate risks.
For the Total Return Bond Fund, the Board and the Independent Directors noted that the Fund’s performance was in the first quintile for the ten-year period, the second quintile for the three- and five-year periods and the first quintile for the one-year period.
For the Core Fixed Income Fund, the Board and the Independent Directors noted that the Fund’s performance was in the second quintile for the ten-year period, the third quintile for the five- and three-year periods and the second quintile for the one-year period.
For the Global Bond Fund, the Board and the Independent Directors noted that the Fund’s performance was in the fourth quintile for the five-year period, the fifth quintile for the three-year period and the third quintile for the one-year period.
For the High Yield Bond Fund, the Board and the Independent Directors noted that the Fund’s performance was in the third quintile for the ten-year period, the first quintile for the five-year period, the third quintile for the three-year period and the first quintile for the one-year period.
For the Short Term Bond Fund, the Board and the Independent Directors noted that the Fund’s performance was in the third quintile for the ten-year period, the fourth quintile for the five- and three-year periods and the fifth quintile for the one-year period.
For the Enhanced Commodity Strategy Fund, the Board and the Independent Directors noted that the Fund’s performance was in the second quintile for the five- and three-year periods and the first quintile for the one-year period.
101
TCW Funds, Inc.
Approval of Investment Management and Advisory Agreement (Continued)
With respect to the U.S. equity Funds, the Board and the Independent Directors noted that the performance of most Funds for the various periods reviewed ranked in the first, second or third quintiles.
The Relative Value Dividend Appreciation Fund ranked in the fifth quintile for the one-, three- and five-year periods. The Relative Value Large Cap Fund ranked in the fifth quintile for the one- and three-year periods and the fourth quintile for the five-year period. The Relative Value Mid Cap Fund ranked in the fifth quintile for the one-, five- and ten-year periods. The Board and the Independent Directors noted the Advisor’s explanation that the diversification tool used to mitigate risk of the Relative Value Dividend Appreciation Fund and the Relative Value Large Cap Fund weighed on their near-term performance in a momentum-driven market and its opinion that each of the Relative Value Funds is well-positioned to excel in a strengthening economic environment. The Board and the Independent Directors also noted that the Relative Value Dividend Appreciation Fund and the Relative Value Large Cap Fund ranked in the first quintile for the six-month period ended June 30, 2019.
The Artificial Intelligence Equity Fund ranked in the fourth quintile for the one-year period and the period since inception. The Board and the Independent Directors considered the Advisor’s explanation that the peer funds had greater exposure to the information technology sector, making the peer group less useful in comparing relative performance than if those funds’ principal investment strategies were more closely aligned with the Fund’s investment focus. The Board and the Independent Directors also noted the relatively short operating history of the Fund and determined to continue to closely monitor its performance.
The Global Real Estate Fund ranked in the fifth quintile for the three-year period but in the third quintile for the one-year period and the first quintile for the six months ended June 30, 2019. The Board and the Independent Directors determined to continue to closely monitor its performance and did not believe any other immediate action was needed.
With respect to the international and emerging markets Funds, the Board and the Independent Directors noted that the performance of a majority of these Funds ranked in the first, second or third quintiles over various time periods. The Emerging Markets Local Currency Income Fund ranked in the fourth quintile for the one-year period but in the second quintile for the three-year period and the first quintile for the five-year period. The Emerging Markets Multi-Asset Opportunities Fund ranked in the fifth quintile for the one-year period but in the second quintile for the three-year period and the third quintile for the five-year period. The International Small Cap Fund ranked in the fifth quintile for the one- and five-year periods and the fourth quintile for the three-year period. The Developing Markets Equity Fund ranked in the fifth quintile for the one-year period and the fourth quintile for the three-year period. The Board and the Independent Directors noted the Advisor’s explanation that the challenging international and emerging market conditions over the last twelve months weighed on near-term performance and its opinion that each of the international and emerging markets Funds is well-positioned to excel in a strengthening economic environment.
For the asset allocation Fund, the Board the Independent Directors noted that the Conservative Allocation Fund’s performance was in the second quintile for the ten-year period, the first quintile for the five-year period, the second quintile for the three- and one-year periods.
The Board and the Independent Directors concluded that the Advisor was implementing each Fund’s investment objective(s) and that the Advisor’s record in managing the Funds indicated that its continued management should benefit each Fund and its shareholders over the long term.
102
TCW Funds, Inc.
4. Advisory fees and total expenses
The Board and the Independent Directors compared the management fees (which Broadridge defines to include the advisory fee and the administrative fee) and total expenses of each Fund (each as a percentage of average net assets) with the median management fee and operating expense level of the other mutual funds in the relevant Broadridge peer groups. These comparisons assisted the Board and the Independent Directors by providing a reasonable statistical measure to assess each Fund’s fees relative to its relevant peers. The Board and the Independent Directors observed that each Fund’s management fee, after giving effect to applicable waivers and/or reimbursements, was below or near the median of the peer group funds on a current basis, with the exception of the Select Equities Fund, the Emerging Markets Income Fund, the Emerging Markets Local Currency Income Fund and the Emerging Markets Multi-Asset Opportunities Fund. They also observed that each Fund’s total expenses, after giving effect to applicable waivers and/or reimbursements, were below or near the median of the peer group funds, with the exception of the Global Bond Fund primarily due to its smaller size relative to most of the other funds in the peer group. The Board and the Independent Directors also noted the contractual expense limitations to which the Advisor has agreed with respect to each Fund and that the Advisor historically has absorbed any expenses in excess of these limits. The Board and the Independent Directors noted that for several Funds, their below-median management fee and total expenses were in part due to substantial waiver and/or reimbursement pursuant to the contractual expense limitations. The Board and the Independent Directors concluded that the competitive fees charged by the Advisor, and competitive expense ratios, should continue to benefit each Fund and its shareholders.
The Board and the Independent Directors also reviewed information regarding the advisory fees charged by the Advisor to its institutional and sub-advisory clients with similar investment mandates. The Board and the Independent Directors concluded that, although the fees paid by those clients generally were lower than advisory fees paid by the Funds, the differences appropriately reflected the more extensive services provided by the Advisor to the Funds and the Advisor’s significantly greater responsibilities and expenses with respect to the Funds, including the additional time spent by portfolio managers for reasons such as managing the more active cash flows from purchases and redemptions by shareholders, the additional risks of managing a pool of assets for public investors, administrative burdens, daily pricing, valuation and liquidity responsibilities, the supervision of vendors and service providers, and the costs of additional infrastructure and operational resources and personnel and of complying with and supporting the more comprehensive regulatory and governance regime applicable to mutual funds.
5. The Advisor’s costs, level of profits, and economies of scale
The Board and the Independent Directors reviewed information regarding the Advisor’s costs of providing services to the Funds, as well as the resulting level of profits to the Advisor. They reviewed the Advisor’s stated assumptions and methods of allocating certain costs, such as personnel costs, which constitute the Advisor’s largest operating cost. The Board and the Independent Directors recognized that the Advisor should be entitled to earn a reasonable level of profits for the services that it provides to each Fund. The Board and the Independent Directors also reviewed a comparison of the Advisor’s profitability with respect to the Funds to the profitability of certain unaffiliated publicly traded asset managers, which the Advisor believed supported its view that the Advisor’s profitability was reasonable. Based on their review, the Board and the Independent Directors concluded that they were satisfied that the Advisor’s level of profitability from its relationship with each Fund was not unreasonable or excessive.
103
TCW Funds, Inc.
Approval of Investment Management and Advisory Agreement (Continued)
The Board and the Independent Directors considered the extent to which potential economies of scale could be realized as the Funds grow and whether the advisory fees reflect those potential economies of scale. They recognized that the advisory fees for the Funds do not have breakpoints, which would otherwise result in lower advisory fee rates as the Funds grow larger. They also recognized the Advisor’s view that the advisory fees compare favorably to peer group fees and expenses and remain competitive even at higher asset levels and that the relatively low advisory fees reflect the potential economies of scale. The Board and the Independent Directors recognized the benefits of the Advisor’s substantial past and on-going investment in the advisory business, such as successfully recruiting and retaining key professional talent, systems and technology upgrades, added resources dedicated to legal and compliance programs, and improvements to the overall firm infrastructure, as well as the financial pressures of competing against much larger firms and passive investment products. The Board and the Independent Directors further noted the Advisor’s past and continuing subsidies of the Funds’ operating expenses when they were newer and smaller and the Advisor’s commitment to maintain reasonable overall operating expenses for each Fund. The Board and the Independent Directors also recognized that the Funds benefit from receiving investment advice from an organization with other types of advisory clients in addition to mutual funds. The Board and the Independent Directors concluded that the Advisor was satisfactorily sharing potential economies of scale with the Funds through low fees and expenses, and through reinvesting in its capabilities for serving the Funds and their shareholders.
6. Ancillary benefits
The Board and the Independent Directors also considered ancillary benefits received or to be received by the Advisor and its affiliates as a result of the relationship of the Advisor with the Funds, including compensation for certain compliance support services. The Board and the Independent Directors noted that, in addition to the fees the Advisor receives under the Agreement, the Advisor receives additional benefits in connection with management of the Funds in the form of reports, research and other services from brokers and their affiliates in return for brokerage commissions paid to such brokers. The Board and the Independent Directors concluded that any potential benefits received or to be derived by the Advisor from its relationships with the Funds are reasonably related to the services provided by the Advisor to the Funds.
7. Conclusions
Based on their overall review, including their consideration of each of the factors referred to above (and others), the Board and the Independent Directors concluded that the Agreement is fair and reasonable to each Fund and its shareholders, that each Fund’s shareholders received reasonable value in return for the advisory fees and other amounts paid to the Advisor by each Fund, and that the renewal of the Agreement was in the best interests of each Fund and its shareholders.
104
TCW Funds, Inc.
Supplemental Information
Proxy Voting Guidelines
The policies and procedures that the Company uses to determine how to vote proxies are available without charge. The Board has delegated the Company’s proxy voting authority to the Advisor.
Disclosure of Proxy Voting Guidelines
The proxy voting guidelines of the Advisor are available:
| | 1. | By calling 800-FUND-TCW (800-386-3829) to obtain a hard copy; or |
| | 2. | By going to the SEC website at http://www.sec.gov. |
When the Company receives a request for a description of the Advisor’s proxy voting guidelines, it will deliver the description that is disclosed in the Company’s Statement of Additional Information. This information will be sent out via first class mail (or other means designed to ensure equally prompt delivery) within three business days of receiving the request.
The Advisor, on behalf of the Company, prepares and files Form N-PX with the SEC not later than August 31 of each year, which includes the Company’s proxy voting record for the most recent twelve-month period ended June 30 of that year. The Company’s proxy voting record for the most recent twelve-month period ended June 30 is available:
| | 1. | By calling 800-FUND-TCW (800-386-3829) to obtain a hard copy; or |
| | 2. | By going to the SEC website at http://www.sec.gov. |
When the Company receives a request for the Company’s proxy voting record, it will send the information disclosed in the Company’s most recently filed report on Form N-PX via first class mail (or other means designed to ensure equally prompt delivery) within three business days of receiving the request.
The Company also discloses its proxy voting record on its website as soon as is reasonably practicable after its report on Form N-PX is filed with the SEC.
Availability of Quarterly Portfolio Schedule
The Company files a complete schedule of its portfolio holdings with the SEC for the first and third quarters of its fiscal year on Form N-PORT-EX. Such filings occur no later than 60 days after the end of the Funds’ first and third quarters and are available on the SEC’s website at www.sec.gov.
105
TCW Funds, Inc.
Tax Information Notice (Unaudited)
On account of the year ended October 31, 2019, the following Funds paid a capital gain distribution within the meaning 852 (b) (3) (c) of the Code. Each fund also designates as a capital gain distribution a portion of earnings and profits paid to shareholders in redemption of their shares.
| | | | |
Fund | | Amounts per
Share | |
TCW Conservative Allocation Fund | | $ | 0.10 | |
TCW New America Premier Equities Fund | | $ | 0.09 | |
TCW Relative Value Dividend Appreciation Fund | | $ | 1.34 | |
TCW Relative Value Large Cap Fund | | $ | 11.14 | |
TCW Relative Value Mid Cap Fund | | $ | 0.39 | |
TCW Select Equities Fund | | $ | 2.70 | |
Under Section 854 (b) (2) of the Code, the Funds hereby designate the following maximum amounts as qualified dividends for purposes of the maximum rate under Section 1 (h) (11) of the Code for the fiscal year ended October 31, 2019 (amounts in thousands):
| | | | |
Fund | | Qualified
Dividend Income | |
TCW Artificial Intelligence Equity Fund | | $ | 16 | |
TCW Conservative Allocation Fund | | $ | 712 | |
TCW Global Real Estate Fund | | $ | 158 | |
TCW New America Premier Equities Fund | | $ | 1,035 | |
TCW Relative Value Dividend Appreciation Fund | | $ | 10,516 | |
TCW Relative Value Large Cap Fund | | $ | 6,517 | |
TCW Relative Value Mid Cap Fund | | $ | 1,299 | |
TCW Select Equities Fund | | $ | 2,793 | |
The following are dividend received deduction percentages for the Funds’ corporate shareholders:
| | | | |
Fund | | Dividends
Received Deductions | |
TCW Conservative Allocation Fund | | | 7.78% | |
TCW Global Real Estate Fund | | | 5.21% | |
TCW New America Premier Equities Fund | | | 100% | |
TCW Relative Value Dividend Appreciation Fund | | | 100% | |
TCW Relative Value Large Cap Fund | | | 100% | |
TCW Relative Value Mid Cap Fund | | | 100% | |
This information is given to meet certain requirements of the Code and should not be used by shareholders for preparing their income tax returns. In February 2020, shareholders will receive Form 1099-DIV which will show the actual distribution received and include their share of qualified dividends during the calendar year of 2019. Shareholders are advised to check with their tax advisors for information on the treatment of these amounts on their individual tax returns.
106
TCW Funds, Inc.
Directors and Officers of the Company
A board of seven directors is responsible for overseeing the operations of the Company, which consists of 19 Funds at October 31, 2019. The directors of the Company, and their business addresses and their principal occupation for the last five years are set forth below.
Independent Directors
| | | | | | |
Name, and Year of Birth (1) | | Term of Office and Length of Time Served | | Principal Occupation(s) During Past 5 Years | | Other Directorships held by Director |
| Samuel P. Bell (1936) | | Mr. Bell has served as a director of TCW Funds, Inc. since October 2002. | | Private Investor. | | Point.360 (post production services); TCW Strategic Income Fund, Inc. (closed-end fund). |
Patrick C. Haden (1953) Chairman of the Board | | Mr. Haden has served as a director of TCW Funds, Inc. since May 2001. | | President (since 2003), Wilson Ave. Consulting (business consulting firm); Senior Advisor to President (July 2016 – June 2017) and Athletic Director (August 2010 – June 2016), University of Southern California. | | Tetra Tech, Inc. (environmental consulting); Auto Club (affiliate of AAA); Metropolitan West Funds (mutual fund); TCW Strategic Income Fund, Inc. (closed end fund). |
| Peter McMillan (1957) | | Mr. McMillan has served as a director of TCW Funds, Inc. since August 2010. | | Co-founder, Managing Partner and Chief Investment Officer (since May 2013), Temescal Canyon Partners (investment advisory firm); Co-founder and Executive Vice President (since 2005), KBS Capital Advisors (a manager of real estate investment trusts); Co-founder and Managing Partner (since 2000), Willowbrook Capital Group, LLC (investment advisory firm). | | KBS Real Estate Investment Trusts (real estate investments); KBS Strategic Opportunity REITS (real estate investments); Keppel-KBS U.S. REIT (real estate investments); Metropolitan West Funds (mutual funds); TCW Strategic Income Fund, Inc. (closed-end fund); TCW DL VII Financing LLC (business development company). |
| Victoria B. Rogers (1961) | | Ms. Rogers has served as a director of the TCW Funds, Inc. since October 2011. | | President and Chief Executive Officer (since 1996), The Rose Hills Foundation (charitable foundation). | | Causeway Capital Management Trust (mutual fund; 6 portfolios); Causeway ETML Trust (mutual fund); The Rose Hills Foundation (charitable foundation) TCW Strategic Income Fund, Inc. (closed-end fund); Norton Simon Museum (art museum); Stanford University (university). |
| Andrew Tarica (1959) | | Mr. Tarica has served as a director of the TCW Funds, Inc. since March 2012. | | Employee (since 2003), Cowen & Co, (broker-dealer); Chief Executive Officer (since February 2001), Meadowbrook Capital Management (asset management company); and Employee (since 2003), Cowen Prime Services (broker dealer) | | Metropolitan West Funds (mutual fund); TCW Strategic Income Fund, Inc. (closed-end fund); TCW Direct Lending VII, LLC (business development company). |
| (1) | The address of each Independent Director is c/o Morgan, Lewis & Bockius LLP, Counsel to the Independent Directors, 300 South Grand Avenue 22nd Floor, Los Angeles, CA 90071. |
107
TCW Funds, Inc.
Directors and Officers of the Company (Continued)
Interested Directors
These directors are “interested persons” of the Company as defined in the 1940 Act because they are directors and officers of the Advisor, and shareholders and directors of The TCW Group, Inc., the parent company of the Advisor.
| | | | | | |
Name and Year of Birth | | Term of Office and Length of Time Served | | Principal Occupation(s)
During Past 5 Years | | Other Directorships held by Director |
| Marc I. Stern (1944) | | Mr. Stern has served as a director of TCW Funds, Inc. since its inception in September 1992. | | Chairman (since January 2016), TCW LLC; Chairman (since February 2013), The TCW Group Inc., TCW Investment Management Company LLC, TCW Asset Management Company LLC and Metropolitan West Asset Management, LLC; Vice Chairman (November 2010 – December 2014) and Chairman (2014 – December 2015), Trust Company of the West. | | N/A |
David S. DeVito (1962) President and Chief Executive Officer | | Mr. DeVito has served as a director of the TCW Funds, Inc. since January 2014 and as its President and Chief Executive Officer since January 2014. | | Executive Vice President and Chief Operating Officer (since January 2016), TCW LLC; Executive Vice President and Chief Operating Officer (since October 2013), TCW Investment Management Company LLC, The TCW Group, Inc., Metropolitan West Asset Management, LLC and TCW Asset Management Company LLC; President and Chief Executive Officer (since January 2014), TCW Strategic Income Fund, Inc.; Chief Financial Officer and Treasurer (since 2010), Metropolitan West Funds. | | TCW Strategic Income Fund, Inc. (closed-end fund) |
The officers of the Company who are not directors of the Company are:
| | | | |
| Name and Year of Birth | | Position(s) Held with Company | | Principal Occupation(s) During Past 5 Years (1) |
Lisa Eisen (1963) Tax Officer | | Ms. Eisen has served as Tax Officer of TCW Funds, Inc. since December 2016. | | Tax Officer (since December 2016), Metropolitan West Funds and TCW Strategic Income Fund, Inc.; Managing Director and Director of Tax (since August 2016), TCW LLC; Vice President of Corporate Tax and Payroll for Health Net, Inc. (1998 – July 2016). |
108
TCW Funds, Inc.
| | | | |
| Name and Year of Birth | | Position(s) Held with Company | | Principal Occupation(s) During Past 5 Years (1) |
Meredith S. Jackson (1959) Senior Vice President, General Counsel and Secretary | | Ms. Jackson has served as Senior Vice President since January 2016 and General Counsel and Secretary of TCW Funds, Inc. since February 2013. | | Executive Vice President, General Counsel and Secretary (since January 2016), TCW LLC; Executive Vice President, General Counsel and Secretary (since February 2013), TCW Investment Management Company LLC, The TCW Group Inc., TCW Asset Management Company LLC, Metropolitan West Asset Management, LLC and Trust Company of the West (2013 – December 2015); Senior Vice President, General Counsel and Secretary (since February 2013), TCW Strategic Income Fund, Inc. and Metropolitan West Funds. |
Jeffrey Engelsman (1967) Chief Compliance Officer and AML Officer | | Mr. Engelsman has served as Chief Compliance Officer of TCW Funds, Inc. since September 2014 and AML Officer of TCW Funds, Inc. since December 2016. | | AML Officer (since December 2016), Metropolitan West Funds, and TCW Strategic Income Fund, Inc.; Managing Director and Global Chief Compliance Officer (since January 2016), TCW LLC; Chief Compliance Officer (since 2014), Metropolitan West Funds, Metropolitan West Asset Management Company, LLC (since August 2014) and Trust Company of the West (2014 – December 2015); Global Chief Compliance Officer (since September 2014), The TCW Group, Inc.; Chief Compliance Officer (since September 2014), TCW Strategic Income Fund, Inc.; Chief Compliance Officer (2009 – August 2014), MainStay Funds (mutual fund); Managing Director (2009 – July 2014), New York Life Investments (investment management). |
Richard M. Villa (1964) Treasurer, Principal Financial and Accounting Officer | | Mr. Villa has served as Treasurer and Principal Financial and Accounting Officer of TCW Funds, Inc. since February 2014. | | Managing Director, Chief Financial Officer and Assistant Secretary (since January 2016), TCW LLC; Treasurer and Principal Financial and Accounting Officer (since February 2014), TCW Strategic Income Fund, Inc.; Managing Director and Chief Financial Officer and Assistant Secretary (since July 2008), TCW Investment Management Company LLC, the TCW Group, Inc., TCW Asset Management Company LLC, Metropolitan West Asset Management, LLC and Trust Company of the West (2008 – December 2015). |
| (1) | Positions with The TCW Group, Inc. and its affiliates may have changed over time. |
| * | Address is 865 South Figueroa Street, 18th Floor, Los Angeles, California 90017 |
109
TCW Funds, Inc.
Directors and Officers of the Company (Continued)
In addition, Eric Chan, Senior Vice President of Fund Operations for the Advisor, TCW Asset Management Company LLC, TCW LLC (since 2009), and Metropolitan West Asset Management, LLC (since November 2006), is Assistant Treasurer of the Company (since June 2019) and Metropolitan West Funds (since 2010). Mr. Chan is a Certified Public Accountant. Patrick W. Dennis, Senior Vice President, Associate General Counsel and Assistant Secretary of TCW Asset Management Company LLC, Metropolitan West Asset Management, LLC, TCW LLC, the Advisor (since February 2013) and Trust Company of the West (February 2013 – December 2015), is Vice President and Assistant Secretary of the Company.
The SAI (Statement of Additional Information) has additional information regarding the Board of Directors. A copy is available without charge by calling 1-800-FUND-TCW (1-800-386-3829) to obtain a hard copy or by going to the SEC website at www.sec.gov. or the Company’s website at www.tcw.com.
110
TCW Funds, Inc.
865 South Figueroa Street
Los Angeles, California 90017
800 FUND TCW
(800 386 3829)
www.TCW.com
INVESTMENT ADVISOR
TCW Investment Management Company LLC
865 South Figueroa Street
Los Angeles, California 90017
TRANSFER AGENT
U.S. Bancorp Fund Services, LLC
615 E. Michigan Street
Milwaukee, Wisconsin 53202
INDEPENDENT REGISTERED PUBLIC ACCOUNTING FIRM
Deloitte & Touche LLP
555 West 5th Street
Los Angeles, California 90013
CUSTODIAN & ADMINISTRATOR
State Street Bank & Trust Company
One Lincoln Street
Boston, Massachusetts 02111
DISTRIBUTOR
TCW Funds Distributors LLC
865 South Figueroa Street
Los Angeles, California 90017
DIRECTORS
Patrick C. Haden
Director and Chairman of the Board
Samuel P. Bell
Director
David S. DeVito
Director
Peter McMillan
Director
Victoria B. Rogers
Director
Marc I. Stern
Director
Andrew Tarica
Director
OFFICERS
David S. DeVito
President and Chief Executive Officer
Meredith S. Jackson
Senior Vice President,
General Counsel and Secretary
Richard M. Villa
Treasurer and Principal Financial and Accounting Officer
Jeffrey A. Engelsman
Chief Compliance Officer and Anti-Money Laundering Officer
Patrick W. Dennis
Vice President and Assistant Secretary
Lisa Eisen
Tax Officer
Eric W. Chan
Assistant Treasurer
TCW FAMILY OF FUNDS
EQUITY FUNDS
TCW Artificial Intelligence Equity Fund
TCW Global Real Estate Fund
TCW New America Premier Equities Fund
TCW Relative Value Dividend Appreciation Fund
TCW Relative Value Large Cap Fund
TCW Relative Value Mid Cap Fund
TCW Select Equities Fund
ASSET ALLOCATION FUND
TCW Conservative Allocation Fund
FIXED INCOME FUNDS
TCW Core Fixed Income Fund
TCW Enhanced Commodity Strategy Fund
TCW Global Bond Fund
TCW High Yield Bond Fund
TCW Short Term Bond Fund
TCW Total Return Bond Fund
INTERNATIONAL FUNDS
TCW Developing Markets Equity Fund
TCW Emerging Markets Income Fund
TCW Emerging Markets Local Currency Income Fund
TCW Emerging Markets Multi-Asset Opportunities Fund
TCW International Small Cap Fund
FUNDarEQ1019


FIXED INCOME FUNDS
TCW Core Fixed Income Fund
TCW Enhanced Commodity Strategy Fund
TCW Global Bond Fund
TCW High Yield Bond Fund
TCW Short Term Bond Fund
TCW Total Return Bond Fund
Beginning on January 1, 2021, as permitted by regulations adopted by the Securities and Exchange Commission, paper copies of the Funds’ annual and semi-annual shareholder reports will no longer be sent by mail, unless you specifically request paper copies of the reports. Instead, the reports will be made available on the Funds’ website (www.tcw.com), and you will be notified by mail each time a report is posted and provided with a website link to access the report.
If you already elected to receive shareholder reports electronically, you will not be affected by this change and you need not take any action. You may elect to receive shareholder reports and other communications from the Funds or your financial intermediary electronically by contacting your financial intermediary (such as a broker-dealer or bank) if you invest through a financial intermediary, or by calling 1-800-FUND-TCW (1-800-386-3829) if you invest directly with the Funds.
Beginning on January 1, 2019, you may elect to receive all future reports in paper free of charge. You can call 1-800-FUND-TCW (1-800-386-3829), if you invest directly with the Funds, or contact your financial intermediary, if you invest though a financial intermediary, to inform the Funds or the financial intermediary that you wish to continue receiving paper copies of your shareholder reports. Your election to receive reports in paper will apply to all Funds held directly with TCW or through your financial intermediary.
TCW Funds, Inc.
Table of Contents
|
| |
| The Letter to Shareholders and/or Management Discussions contained in this Annual Report are the opinions of each Fund’s portfolio managers and are not the opinions of TCW Funds, Inc. or its Board of Directors. Various matters discussed in the Letter to Shareholders and/or Management Discussions constitute forward-looking statements within the meaning of the federal securities laws. Actual results and the timing of certain events could differ materially from those projected or contemplated by these forward-looking statements due to a number of factors, including general economic conditions, overall availability of securities for investment by a Fund, the level of volatility in the securities markets and in the share price of a Fund, and other risk factors discussed in the SEC filings of TCW Funds, Inc. The data presented in the Letter to Shareholders and/or Management Discussions represents past performance and cannot be used to predict future results. |
| | |
To Our Valued Shareholders | | |
| | |

| | David S. DeVito President, Chief Executive Officer and Director |
Dear Valued Investors,
I am pleased to present the 2019 annual report for the TCW Funds, Inc. covering the 12-month period ended October 31, 2019. I would like to express our appreciation for your continued investment in the TCW Funds as well as to welcome new shareholders to our fund family. As of October 31, 2019, the TCW Funds held total net assets of approximately $15 billion.
This report contains information and portfolio management discussions of our TCW Fixed Income Funds.
Economic Review and Market Environment
Following a close to 2018 that saw considerable risk market volatility and a rallying U.S. Treasury market, it only took a few days into the new year before the Fed pivoted from tightening to a more accommodative posture. The softer messaging, memorialized in the first Federal Open Market Committee (FOMC) meeting of the year, provided the impetus and cover for return-hungry investors domestically and internationally. After thus setting the stage for a policy reversal, the Fed ultimately delivered on rate cuts with three eases of 25 basis points in June, September and October. Renewed central bank support (both in the U.S. and abroad) shifted investor sentiment, calming markets of the 2018 volatility and, not to be forgotten, rising rates. The 2019 shift, however, was not solely about addressing market volatility, as trade tensions persisted, global recessionary concerns mounted and economic fundamentals suggested caution. Of particular concern is record levels of debt issuance that have weakened credit metrics, discouraging growth. With a contractionary U.S. Purchasing Managers’ Index (PMI) and a 10-year low in German manufacturing as evidence, businesses are skeptical of the prospective environment and survey-based measures of expectations, confidence and spending decisions show it.
Despite the late cycle conditions defining the U.S. and global economy (soaring debt, slowing growth), to date, a resilient consumer and accommodative Fed have sustained the expansion. Asset prices are higher, too, fixed income in no small part due to collapsing year-over-year U.S. Treasury rates, highlighted by a roughly 150 basis point decline in the 10-Year. Meanwhile, notwithstanding periodic sell-offs, equity markets continued their ascent to record highs, reflected in a 14.3% gain for the S&P 500 Index during the trailing twelve-month period. Bonds, broadly speaking, have posted impressive total returns, with the Bloomberg Barclays Aggregate Index up 11.5% for the year. This was driven by investment grade credit, which returned more than 15.3% and outpaced duration-matched Treasuries by over 220 bps. High yield corporates trailed investment grade, but still delivered an 8.4% return during the period. Among non-corporate credit, the top performing sector was municipals, which gained an impressive 19.3%. Outside of credit, securitized products were mixed, as agency mortgage-backed securities (MBS) trailed given the continued headwinds of Fed balance sheet reduction in addition to uncertainty stemming from the introduction of the single security platform for TBA issues. In contrast, non-agency MBS continued to post consistent, positive returns, particularly from issues backed by subprime and alt-A collateral. Commercial MBS (CMBS) also delivered positive returns, led by non-agency backed CMBS securities. Finally, asset-backed securities (ABS) outperformed duration-matched Treasuries by nearly 60 bps.
The Economy and Market Ahead
Following a prolonged, albeit not especially vigorous, expansion, TCW has increasingly viewed current conditions as late-cycle in character, with a slowing pace of growth a consequence. Given the decidedly tightening posture of the Fed between late 2016 and early 2019 — nine rate hikes and significant balance sheet reduction — it’s not surprising that activity would turn down somewhat,
1
| | |
Letter to Shareholders (Continued) | | |
particularly with a flatter yield curve reducing the incentives for financial intermediaries to expand their lending books. Add in the uncertainty of trade policy and you have players in the real economy deferring capital investment (weakening business confidence) and production volume (falling Institute for Supply Management (ISM) manufacturing), putting further downward pressure on potential growth. Against this backdrop, credit markets have been resilient as investor demand for yield continues to be the dominant force, with technicals generally superseding deteriorating credit fundamentals. Given peak corporate leverage levels that are unlikely to meaningfully improve in the foreseeable future as record debt issuance shows no sign of slowing, combined with weakening issuance practices, our view with regards to credit exposure is particularly cautious even as spreads continued to tighten. The investment management team continues to emphasize a cycle-aware philosophy to mitigate the effects of a more challenging downturn and remains positioned to expand the risk budget when long-term expected returns are more favorable. Portfolios remain true to this disciplined, value-based approach, reflected via a focus on higher quality, more defensive areas of the market.
Data sources for the discussion above include Bloomberg Barclays
TCW Total Return Bond Fund Receives 2019 Lipper Fund Award From Refinitiv
On March 8, 2019, the TCW Total Return Bond Fund was named the Best U.S. Mortgage Fund for the 10-Year Period ended 11/30/18 by Lipper Fund Awards From Refinitiv.
We know that you have many choices when it comes to the management of your financial assets. On behalf of everyone at TCW, I would like to thank you for making the TCW Funds part of your long-term investment plan. We truly value our relationship with you. If you have any questions or require further information, I invite you to visit our website at www.tcw.com, or call our shareholder services department at 800-386-3829.
I look forward to further correspondence with you through our semi-annual report next year.
Sincerely,

David S. DeVito
President, Chief Executive Officer and Director
2
TCW Core Fixed Income Bond Fund
Management Discussions
The TCW Core Fixed Income Fund — I Class gained 11.48% (net of fees) for the one-year period that ended October 31, 2019, performing largely in line with the Bloomberg Barclays Aggregate Index. Given the disciplined lengthening of Fund duration relative to the benchmark in last year’s rate run-up, performance benefitted from the yield decline over the first half of the period, contributing to returns versus the Index, and positioning has since been trimmed as rates have declined. While the underweight to corporate credit also rewarded returns late in 2018 as yield spreads widened, subsequent tightening resulted in a slight drag. Nevertheless, the impact from corporate positioning overall was positive, driven largely by selective exposure across more conservative, less cyclical areas of the market, and disciplined additions late last year as price weakness presented buy opportunities in selective corporate names that recovered significantly in the first quarter. Small contributions came from the legacy non-agency residential MBS position, particularly securities backed by subprime collateral that enjoyed renewed investor demand and steady fundamentals. Meanwhile, agency MBS positioning was largely neutral versus the Index for most of the period, which insulated performance from widening in the sector, though the position was sized-up (with additions in the low coupon space) at attractive valuations given the widening. ABS was a slight drag as government guaranteed student loans held in the portfolio lagged index ABS, as was the allocation to Treasury futures (used to manage duration) as financing rates have recently exceeded yields.
As Treasuries rallied during the period, the duration profile moved from longer than the benchmark to largely neutral at the end of the period. By way of sector positioning, the Fund maintains a defensive credit stance with minimal exposure to the more vulnerable (i.e., “breakable”) issuers and industries. Exposure emphasizes communications and consumer non-cyclicals such as pharmaceuticals, healthcare, or food and beverage, with an eye towards adding opportunistically across credit during bouts of volatility when prices look relatively more attractive. Outside of credit, senior parts of the structured products markets remain a haven from credit excesses while still generating incremental return, though we remain vigilant to pockets of looser underwriting standards, particularly in current vintage CMBS. Residential MBS also remains an area to pick up relatively reliable yield, particularly in the legacy non-agency MBS space, which continues to present attractive risk-adjusted return potential despite a shrinking market, while the allocation to agency MBS is slightly ahead of the benchmark. Finally, the Fund focuses on super senior ABS backed by government guaranteed student loan collateral and agency-backed issues within CMBS.
| | | | | | | | | | | | | | | | | | | | |
| | | Performance through October 31, 2019(1) | |
| | | 1 Year (annualized) | | | 3 Year (annualized) | | | 5 Year (annualized) | | | 10 Year
(annualized) | | | Since
Inception (annualized) | |
TCW Core Fixed Income Bond Fund | | | | | | | | | | | | | | | | | | | | |
Class I (Inception: January 1, 1990) | | | 11.48 | % | | | 3.27 | % | | | 3.00 | % | | | 4.22 | % | | | 5.96 | %(2) |
Barclays Aggregate Index | | | 11.51 | % | | | 3.29 | % | | | 3.24 | % | | | 3.73 | % | | | 5.95 | % |
Class N (Inception: March 1, 1999) | | | 11.27 | % | | | 3.03 | % | | | 2.75 | % | | | 3.91 | % | | | 5.04 | % |
Barclays Aggregate Index | | | 11.51 | % | | | 3.29 | % | | | 3.24 | % | | | 3.73 | % | | | 4.88 | % |
For Class I the total expense ratio is 0.51% and the net expense ratio is 0.49%*. For Class N the total expense ratio is 0.81% and the net expense ratio is 0.70%*.
| * | Effective February 28, 2019, the Advisor has contractually agreed to cap the expenses (excluding interest, brokerage, extraordinary expenses and acquired fund fees and expenses, if any) of the I share class of the Fund at 0.49% and the N share class of the Fund at 0.73% until March 1, 2020. |
3
TCW Core Fixed Income Bond Fund
Management Discussions (Continued)
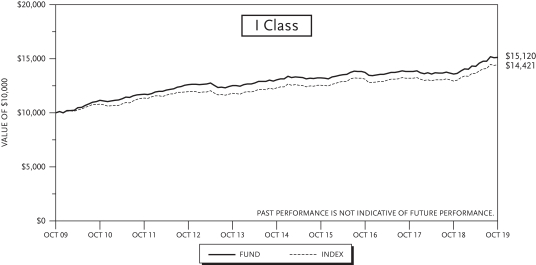
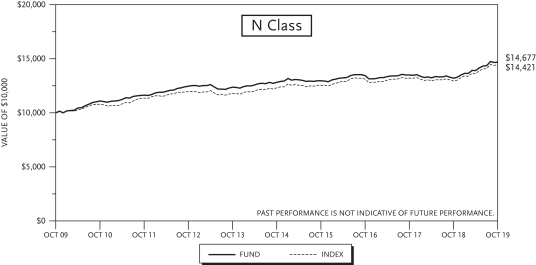
| (1) | The total returns do not reflect taxes that a shareholder would pay on fund distributions or on the redemption of fund shares. |
| (2) | Performance data includes the performance of the predecessor entity for periods before the Fund’s registration became effective. The predecessor entity was not registered under the 1940 Act and, therefore, was not subject to certain investment restrictions that are imposed by the 1940 Act. If the predecessor entity had been registered under the 1940 Act, the predecessor entity’s performance may have been lower. |
4
TCW Enhanced Commodity Strategy Fund
Management Discussions
The TCW Enhanced Commodities Strategy Fund — I Class (“Fund”) fell 0.96% (net of fees) for the one-year period ending October 31, 2019, outpacing the Bloomberg Commodities Index by over 160 bps. Fund performance was driven by the allocation across industrial and financial corporates as yield spreads compressed modestly year-over-year, with banking, P&C insurance, REITS, and consumer non-cyclical industries most additive. Securitized products further contributed, driven by CMBS, which rose alongside corporate, as well as non-agency residential MBS, which were led higher by subprime and alt-A collateral types amid still solid housing fundamentals (i.e. rising home prices, albeit at a slower pace than previous years). Supported by a strong consumer buoyed by a solid job market, ABS added to Fund returns, particularly government guaranteed student loans and credit card sectors.
As Treasuries rallied during the period, the duration profile moved from longer than the benchmark to a mild underweight at the end of the period. By way of sector positioning, the Fund maintains a defensive credit stance with minimal exposure to the more vulnerable (i.e., “breakable”) issuers and industries. Exposure emphasizes consumer non-cyclicals such as pharmaceuticals, healthcare, or food and beverage, as well as short autos, banking, and REITs, with an eye towards adding opportunistically across credit during bouts of volatility when prices look relatively more attractive. Outside of credit, senior parts of the structured products markets remain a haven from credit excesses while still generating incremental return. We remain vigilant to pockets of looser underwriting standards, particularly in current vintage CMBS, though agency-backed issues within CMBS remain a focus. Residential MBS also represents an area to pick up relatively reliable yield, particularly in the legacy non-agency MBS space, which continues to present attractive risk-adjusted return potential despite a shrinking market, while the larger allocation to agency MBS is focused on floating rate collateralized mortgage obligations (CMOs) given relatively stable duration profiles.
| | | | | | | | | | | | | | | | |
| | | Performance through October 31, 2019(1) | |
| | | 1 Year (annualized) | | | 3 Year (annualized) | | | 5 Year (annualized) | | | Since
Inception (annualized) | |
TCW Enhanced Commodity Strategy Fund | | | | | | | | | | | | | | | | |
Class I (Inception: March 31, 2011) | | | -0.96 | % | | | 0.50 | % | | | -5.77 | % | | | -6.22 | % |
Class N (Inception: March 31, 2011) | | | -1.16 | % | | | 0.43 | % | | | -5.82 | % | | | -6.25 | % |
Bloomberg Commodities Index1 | | | -2.58 | % | | | -0.68 | % | | | -6.65 | % | | | -7.90 | % |
For Class I the total expense ratio is 17.82% and net expense ratio is 0.70%. For Class N the total expense ratio is 19.14% and the net expense ratio is 0.75%.
| * | Effective February 28, 2018, the Advisor has contractually agreed to cap the expenses (excluding interest and required fund fees and expenses, if any) of the I share class of the Fund at 0.70% and the N share class at 0.75% until March 1, 2019. |
| 1 | Formerly the Dow Jones UBS Commodity Total Return Index. Rebranded July 1, 2014. |
5
TCW Enhanced Commodity Strategy Fund
Management Discussions (Continued)

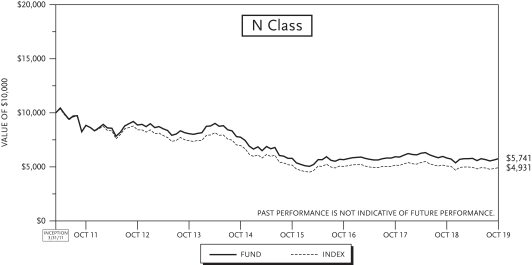
| (1) | The total returns do not reflect taxes that a shareholder would pay on fund distributions or on the redemption of fund shares. |
6
TCW Global Bond Fund
Management Discussions
The TCW Global Bond Fund — I Class gained 10.42% (net of fees) for the one-year period ended October 31, 2019, outperforming the Bloomberg Barclays Global Aggregate Index by 88 bps. From a country perspective, the Fund’s exposure to U.S. rates was additive, as the Fund was long duration in the U.S. as rates significantly rallied, with the Treasury 10-Year yield falling over 140 bps since October 2018. This outperformance more than offset the drag from shorter duration positions across other countries, in particular the Euro area. Currency performance was mixed as gains associated with the Fund’s emphasis on U.S. dollar assets were offset by losses from overweight positions in the Norwegian Krone (NOK), the Polish Zloty (PLN), the Czech Koruna (CZK) and the Colombian Peso (COP), which depreciated significantly against the dollar in Q3 2019. Looking at sector allocation, the Fund remained overweight U.S. structured products such as MBS, ABS, and CMBS which provided a boost to performance. Exposure to corporate credit, which was underweight on a spread duration basis, offset some of these gains. Finally, the most significant performance gains were achieved through security selection. The Fund’s emphasis on U.S. financials, communications, and consumer non-cyclicals was additive along with the overweight to the off-benchmark exposure of non-agency CMBS, which significantly supported relative performance.
The Fund remains true to its disciplined, value-based approach, reflected in a focus on higher quality, more defensive areas of the market and a relatively short duration profile. As risks have risen globally and monetary policy has turned dovish, volatility is likely to increase and markets will need to adjust to this new reality. Given the advanced stage of the U.S. cycle, there is an increased likelihood of a painful and disorderly deleveraging event, with spillover effects into non-U.S. markets. U.S. — China trade tensions continue to challenge to the global economy. These factors, combined with the relatively better U.S. growth prospects, informs an underweight to most of Europe and Asia, particularly continental Europe and Japan, and a modest overweight to the U.S. Similarly, currency exposure remains significantly underweight the euro in favor of exposure to “euro proxies” such as such as NOK, CZK and PLN. Given the broader relative growth prospects the Fund also maintains a small U.S. dollar overweight as a defensive position, with exposure adjusted depending on overall global FX performance. Finally, exposures to select high quality emerging markets with strong external liquidity positions should provide exposure to those countries that are better positioned to weather the rising risks to the global outlook. Finally, tight valuations and historically high leverage in the corporate sector inform our underweight credit positioning, which favors regulated sectors like U.S. financials and REITs, along with significant exposure to U.S. securitized products, which continue to provide protection from excesses in credit markets and offer opportunities for attractive risk-adjusted returns.
| | | | | | | | | | | | | | | | |
| | | Performance through October 31, 2019(1) | |
| | | 1 Year (annualized) | | | 3 Year (annualized) | | | 5 Year (annualized) | | | Since
Inception (annualized) | |
TCW Global Bond Fund | | | | | | | | | | | | | | | | |
Class I (Inception: December 1, 2011) | | | 10.42 | % | | | 2.84 | % | | | 1.89 | % | | | 2.70 | % |
Barclays Global Aggregate Index | | | 9.54 | % | | | 2.77 | % | | | 2.13 | % | | | 1.84 | % |
Class N (Inception: December 1, 2011) | | | 10.32 | % | | | 2.81 | % | | | 1.87 | % | | | 2.68 | % |
Barclays Global Aggregate Index | | | 9.54 | % | | | 2.77 | % | | | 2.13 | % | | | 1.84 | % |
Class I the total expense ratio is 1.79% and the net expense ratio is 0.66*%. For Class N the total expense ratio is 2.09% and the net expense ratio is 0.74*%.
| * | Effective February 28, 2019, the Advisor has contractually agreed to cap the expenses (excluding interest, brokerage, extraordinary expenses and acquired fund fees and expenses, if any) to 0.60% of average daily net assets with respect to Class I shares and 0.70% of average daily net assets with respect to Class N shares until March 1, 2020. |
7
TCW Global Bond Fund
Management Discussions (Continued)
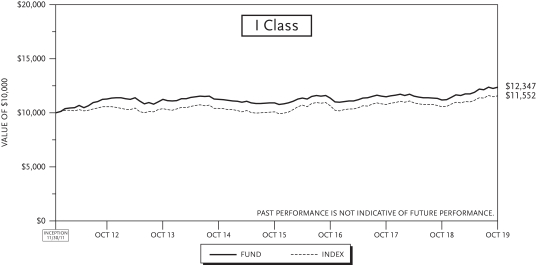

| (1) | The total returns do not reflect taxes that a shareholder would pay on fund distributions or on the redemption of fund shares. |
8
TCW High Yield Bond Fund
Management Discussions
The TCW High Yield Fund — I Class returned 10.44% (net of fees) for the one-year period ended October 31, 2019, delivering a 285 bps premium over the FTSE High Yield Cash Pay Custom Index return. Outperformance was driven by the Fund’s corporate credit positioning that focused on higher quality issues, as the BB-rated cohort significantly outpaced the lower-rated CCC segment. An emphasis on communications and consumer non-cyclicals also benefitted performance, with particularly robust contributions from strong healthcare, pharmaceutical and wireless credits. The underweight to energy credits was also additive, as commodity price volatility weighed on the sector, though this was slightly offset by the underweight to technology, which outperformed the Index. Finally, performance was held back by the Fund’s relatively short duration profile which acted as a headwind as rates fell across the curve.
As stated above, a backdrop of reduced investor risk tolerance combined with limited market liquidity presents potential opportunities for the Fund. As overvalued market risk gives way to what we view as necessary re-pricings in bouts of volatility, we believe that our credit-intensive, bottom-up investment approach, informed first and foremost by valuations, remains the key to prospective returns. This disciplined approach to portfolio construction is reflected in the Fund’s focus on higher quality, more senior areas of the market, while the introduction of risk into the portfolio is done in a measured and selective way. Industrials with more market sensitivity continue to represent a relative underweight, instead emphasizing non-cyclical sectors as well as select companies with solid asset coverage and stable cash flows within lower beta packaging, transportation, communication, food & beverage, and healthcare sectors. Finally, the cash position is maintained to preserve ample capacity to deploy capital as opportunities emerge.
| | | | | | | | | | | | | | | | | | | | |
| | | Performance through October 31, 2019(1) | |
| | | 1 Year (annualized) | | | 3 Year (annualized) | | | 5 Year (annualized) | | | 10 Year
(annualized) | | | Since
Inception (annualized) | |
TCW High Yield Bond Fund | | | | | | | | | | | | | | | | | | | | |
Class I (Inception: February 1, 1989) | | | 10.44 | % | | | 6.15 | % | | | 5.04 | % | | | 6.63 | % | | | 7.15 | %(2) |
Citigroup High Yield Cash Pay Capped Index | | | 7.58 | % | | | 5.67 | % | | | 4.70 | % | | | 7.29 | % | | | 7.81 | % |
Class N (Inception: March 31, 1999) | | | 10.16 | % | | | 5.86 | % | | | 4.73 | % | | | 6.41 | % | | | 5.35 | % |
Citigroup High Yield Cash Pay Capped Index | | | 7.58 | % | | | 5.67 | % | | | 4.70 | % | | | 7.29 | % | | | 6.58 | % |
For Class I the total expense ratio is 1.68% and the net expense ratio is 0.55%*. For Class N the total expense ratio is 2.05% and the net expense ratio is 0.80%*.
| * | Effective February 28, 2019, the Advisor has contractually agreed to cap the expenses (excluding interest, brokerage, extraordinary expenses and acquired fund fees and expenses, if any) of the I share class of the Fund at 0.55% and the N share class of the Fund at 0.80% until March 1, 2020. |
9
TCW High Yield Bond Fund
Management Discussions (Continued)

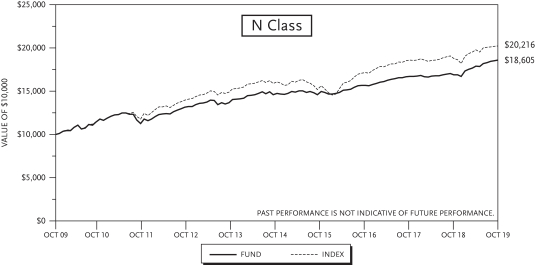
| (1) | The total returns do not reflect taxes that a shareholder would pay on fund distributions or on the redemption of fund shares. |
| (2) | Performance data includes the performance of the predecessor entity for periods before the Fund’s registration became effective. The predecessor entity was not registered under the 1940 Act and, therefore, was not subject to certain investment restrictions that are imposed by the 1940 Act. If the predecessor entity had been registered under the 1940 Act, the predecessor entity’s performance may have been lower. |
10
TCW Short Term Bond Fund
Management Discussions
The TCW Short Term Bond Fund — I Class returned 3.83% (net of fees), outpacing the Citigroup 1-Year Treasury Index by 58 basis points for the one-year period ended October 31, 2019. As rates declined throughout late 2018 and 2019, the duration of the Fund was trimmed in a disciplined fashion, dollar cost averaging the position from 0.5 years long the Index at the start of the period to 0.1 years short by the end. The longer than index duration position over the first half of the period contributed to relative performance as rates fell, and had little impact in the second half as positioning was largely neutral before going short the benchmark at the end. Relative returns also benefitted from the allocation to short corporate credit, which led fixed income with an excess return vs. duration-matched Treasuries of over 100 bps. Among short corporates, nearly all industries posted positive excess returns (performance beyond that attributable to the move in interest rates). Holdings remained focused on non-cyclicals, autos, banks, and REITs all of which outpaced Treasuries during the period. Further, disciplined additions late last year were additive as price weakness presented buy opportunities in selective corporate names that recovered significantly in the first quarter. Structured products also contributed, particularly floating rate CMOs, which insulated performance from widening in the sector over the period. Finally, marginal contributions came from CMBS and legacy residential non-agency MBS as the sector edged steadily higher, supported by solid demand and attractive fundamentals.
As Treasuries rallied during the period, the duration profile moved from longer than the benchmark to a mild underweight at the end of the period. By way of sector positioning, the Fund maintains a defensive credit stance with minimal exposure to the more vulnerable (i.e., “breakable”) issuers and industries. Exposure emphasizes consumer non-cyclicals such as pharmaceuticals, healthcare, or food and beverage, as well as short autos, banking, and REITs, with an eye towards adding opportunistically across credit during bouts of volatility when prices look relatively more attractive. Outside of credit, senior parts of the structured products markets remain a haven from credit excesses while still generating incremental return, though we remain vigilant to pockets of looser underwriting standards, particularly in current vintage CMBS, though agency-backed issues within CMBS remain a focus. Residential MBS also remains an area to pick up relatively reliable yield, particularly in the legacy non-agency MBS space, which continues to present attractive risk-adjusted return potential despite a shrinking market, while the larger allocation to agency MBS is focused on floating rate CMOs given relatively stable duration profiles.
| | | | | | | | | | | | | | | | | | | | |
| | | Performance through October 31, 2019(1) | |
| | | 1 Year (annualized) | | | 3 Year (annualized) | | | 5 Year (annualized) | | | 10 Year (annualized) | | | Since
Inception (annualized) | |
TCW Short Term Bond Fund | | | | | | | | | | | | | | | | | | | | |
Class I (Inception: February 1, 1990) | | | 3.83 | % | | | 1.94 | % | | | 1.38 | % | | | 2.07 | % | | | 3.87 | %(2) |
Citigroup 1-Year Treasury Index | | | 3.25 | % | | | 1.72 | % | | | 1.20 | % | | | 0.82 | % | | | 3.47 | % |
For Class I the total expense ratio is 3.37% and the net expense ratio is 0.44%.
| * | Effective February 28, 2019, the Advisor has contractually agreed to cap the expenses (excluding interest, brokerage, extraordinary expenses and acquired fund fees and expenses, if any) of the I share class of the Fund at 0.44% until March 1, 2020. |
11
TCW Short Term Bond Fund
Management Discussions (Continued)
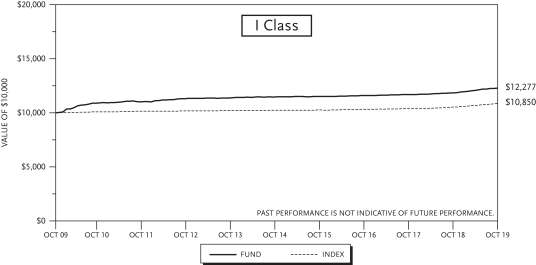
| (1) | The total returns do not reflect taxes that a shareholder would pay on fund distributions or on the redemption of fund shares. |
| (2) | Performance data includes the performance of the predecessor entity for periods before the Fund’s registration became effective. The predecessor entity was not registered under the 1940 Act and, therefore, was not subject to certain investment restrictions that are imposed by the 1940 Act. If the predecessor entity had been registered under the 1940 Act, the predecessor entity’s performance may have been lower. |
12
TCW Total Return Bond Fund
Management Discussions
The TCW Total Return Bond Fund — I Class (“Fund”) gained 10.82% (net of fees) for the one-year period ending October 31, 2019, trailing the Bloomberg Barclays Aggregate Index by 69 bps. Returns benefitted from the off-Index allocation to non-agency MBS, particularly securities backed by subprime collateral that enjoyed renewed investor demand and steady fundamentals. An overweight to agency MBS had a more muted impact as the sector faced technical headwinds related to the removal of Fed balance sheet support and the single security TBA platform initiative, though issue selection was a positive. Elsewhere in securitized, the small allocation to CMBS and ABS remained overweight with a focus on agency CMBS and government guaranteed student loans, though these had minimal impact on returns during the period. Meanwhile, the largest drag on performance came from the lack of exposure to corporate credit. This positioning rewarded returns late in 2018 as yield spreads widened, but the subsequent round-trip in corporate spreads and strong total return profile of the sector resulted in a significant drag. Finally, also weighing on returns was an allocation to Treasury futures (used to manage duration) as financing rates have recently exceeded yields.
While the duration profile of the Fund started the period approximately 0.2 year long relative to the Index, as Treasuries rallied this was sortened in a dollar cost averaging fashion, ending October 2019 at roughly 0.1 years shorter than the Index. By way of sector positioning, the Fund maintains a defensive stance with an up in quality emphasis. Residential MBS remains an area to pick up relatively reliable yield, particularly in the legacy non-agency MBS space, which continues to present attractive risk-adjusted return potential despite a shrinking market, while the allocation to agency MBS is overweight that of the benchmark given strong liquidity characteristics, high quality, and wider spreads. Finally, the Fund focuses on super senior ABS backed by government guaranteed student loan collateral and agency-backed issues within CMBS. The very small allocation to non-agency CMBS is made up of seasoned issues at the top of the capital structure and single asset single borrower deals to avoid the underwriting challenges faced by current vintage issues. Meanwhile, corporate credit remains absent in the Fund given the mortgage focus.
| | | | | | | | | | | | | | | | | | | | |
| | | Performance through October 31, 2019(1) | |
| | | 1 Year (annualized) | | | 3 Year (annualized) | | | 5 Year (annualized) | | | 10 Year (annualized) | | | Since
Inception (annualized) | |
TCW Total Return Bond Fund | | | | | | | | | | | | | | | | | | | | |
Class I (Inception: June 17, 1993) | | | 10.82 | % | | | 3.15 | % | | | 3.06 | % | | | 4.87 | % | | | 6.31 | % |
Barclays Aggregate Index | | | 11.51 | % | | | 3.29 | % | | | 3.24 | % | | | 3.73 | % | | | 5.28 | % |
Class N (Inception: March 1, 1999) | | | 10.46 | % | | | 2.83 | % | | | 2.73 | % | | | 4.55 | % | | | 5.77 | % |
Barclays Aggregate Index | | | 11.51 | % | | | 3.29 | % | | | 3.24 | % | | | 3.73 | % | | | 4.88 | % |
For Class I the total expense ratio is 0.62% and the net expense ratio is 0.49%. For Class N the total expense ratio is 0.88% and the net expense ratio is 0.79%.
| * | Effective February 28, 2019, the Advisor has contractually agreed to cap the expenses (excluding interest, brokerage, extraordinary expenses and acquired fund fees and expenses, if any) of the I share class of the Fund at 0.49% and the N share class of the Fund at 0.79% until March 1, 2020. |
13
TCW Total Return Bond Fund
Management Discussions (Continued)
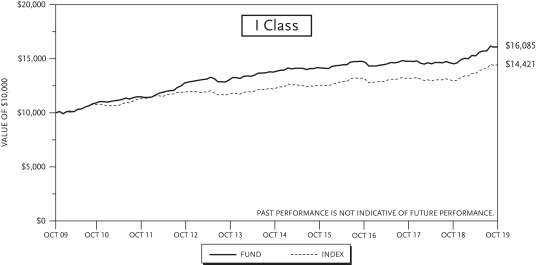
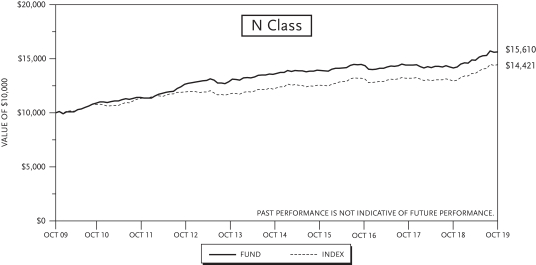
| (1) | The total returns do not reflect taxes that a shareholder would pay on fund distributions or on the redemption of fund shares. |
Derivatives risk refers to the risk that changes in the value of a derivative may not correlate perfectly with the underlying asset. Foreign securities risk refers to the value of the Fund’s investments in foreign securities on changing currency values, political and economic environments in the countries where the Fund invests. Asset-backed securities risk refers to the risk that certain asset-backed securities do not have the benefit of the same security interest in the related collateral as do mortgage-backed securities; nor are they provided government guarantees of repayment. Prepayment risk refers to the possibility that falling interest rates may cause the owners of the underlying mortgages to pay off their mortgages at a faster than expected rate. This tends to reduce returns since the funds prepaid will have to be reinvested at the then lower prevailing rates. Short sale risk refers to the limited ability of the Fund to sell a debt or equity security short (without owning it) and to borrow the same security from a broker or other institution to complete the sale. If the value of the short sale increases, a Fund would lose money because it will need to replace the borrowed security by purchasing it at a higher price. Leverage Risk refers to the limited ability of a Fund to borrow from broker-dealers or other institutions to leverage a transaction, provided that the borrowing is fully-collateralized. The Fund’s assets may change in value while the borrowing is outstanding which could create interest expenses that can exceed the income from the assets retained.
14
The views and forecasts expressed here are as of November 2019, are subject to change without notice and may not come to pass. Investment strategies may not achieve the desired results due to implementation lag, other timing factors, portfolio management decision making, economic or market conditions or other unanticipated factors.
This report must be preceded or accompanied by a prospectus.
15
TCW Core Fixed Income Fund
Schedule of Investments
| | | | | | | | | | | | |
| Issues | | Maturity
Date | | | Principal
Amount | | | Value | |
|
FIXED INCOME SECURITIES — 104.4% of Net Assets | |
|
CORPORATE BONDS — 23.8% | |
|
| Aerospace/Defense — 0.1% | |
| |
L3Harris Technologies, Inc. | | | | | |
| | | |
4.40% (1) | | | 06/15/28 | | | $ | 1,270,000 | | | $ | 1,433,353 | |
| | | | | | | | | | | | |
|
| Agriculture — 0.4% | |
| |
BAT Capital Corp. | | | | | |
| | | |
4.39% | | | 08/15/37 | | | | 470,000 | | | | 464,980 | |
| | | |
4.76% | | | 09/06/49 | | | | 1,200,000 | | | | 1,203,426 | |
| |
Reynolds American, Inc. | | | | | |
| | | |
5.85% | | | 08/15/45 | | | | 2,570,000 | | | | 2,861,814 | |
| | | | | | | | | | | | |
| |
| | | | 4,530,220 | |
| | | | | | | | | | | | |
|
| Airlines — 0.4% | |
| |
America West Airlines, Inc. Pass-Through Certificates (01-1) (EETC) | | | | | |
| | | |
7.10% | | | 10/02/22 | | | | 885,437 | | | | 914,037 | |
| |
Continental Airlines, Inc. Pass-Through Certificates (00-2-A1) (EETC) | | | | | |
| | | |
7.71% | | | 10/02/22 | | | | 8,795 | | | | 9,102 | |
| |
Continental Airlines, Inc. Pass-Through Certificates, (07-1-A) (EETC) | | | | | |
| | | |
5.98% | | | 10/19/23 | | | | 773,415 | | | | 820,300 | |
| |
Continental Airlines, Inc. Pass-Through Certificates, (09-2-A1) (EETC) | | | | | |
| | | |
7.25% | | | 05/10/21 | | | | 522,344 | | | | 522,940 | |
| |
Northwest Airlines LLC Pass-Through Certificates, (01-1-A1) (EETC) | | | | | |
| | | |
7.04% | | | 10/01/23 | | | | 417,083 | | | | 452,201 | |
| |
US Airways Group, Inc. Pass-Through Certificates (12-1-A) (EETC) | | | | | |
| | | |
5.90% | | | 04/01/26 | | | | 1,371,875 | | | | 1,533,136 | |
| |
US Airways Group, Inc. Pass-Through Certificates, (10-1A) (EETC) | | | | | |
| | | |
6.25% | | | 10/22/24 | | | | 311,361 | | | | 342,603 | |
| |
US Airways Group, Inc. Pass-Through Certificates, (12-2-A) (EETC) | | | | | |
| | | |
4.63% | | | 12/03/26 | | | | 572,266 | | | | 618,291 | |
| | | | | | | | | | | | |
| |
| | | | 5,212,610 | |
| | | | | | | | | | | | |
|
| Auto Manufacturers — 1.4% | |
| |
Ford Motor Credit Co. LLC | | | | | |
| | | |
2.34% | | | 11/02/20 | | | | 1,500,000 | | | | 1,494,938 | |
| | | |
2.43% | | | 06/12/20 | | | | 650,000 | | | | 649,308 | |
| | | |
2.88% (3 mo. USD LIBOR + 0.880%) (2) | | | 10/12/21 | | | | 2,265,000 | | | | 2,234,583 | |
| | | |
3.37% (3 mo. USD LIBOR + 1.080%) (2) | | | 08/03/22 | | | | 1,000,000 | | | | 981,162 | |
| | | |
5.60% | | | 01/07/22 | | | | 3,740,000 | | | | 3,940,408 | |
| | | |
5.88% | | | 08/02/21 | | | | 1,795,000 | | | | 1,883,680 | |
| | | |
8.13% | | | 01/15/20 | | | | 1,265,000 | | | | 1,279,398 | |
| | | | | | | | | | | | |
| Issues | | Maturity
Date | | | Principal
Amount | | | Value | |
|
| Auto Manufacturers (Continued) | |
| |
General Motors Co. | | | | | |
| | | |
6.60% | | | 04/01/36 | | | $ | 1,545,000 | | | $ | 1,790,432 | |
| |
General Motors Financial Co., Inc. | | | | | |
| | | |
3.55% | | | 04/09/21 | | | | 1,750,000 | | | | 1,778,034 | |
| | | | | | | | | | | | |
| |
| | | | 16,031,943 | |
| | | | | | | | | | | | |
|
| Banks — 2.7% | |
| |
Bank of America Corp. | | | | | |
| | | |
2.74% (2.738% to 01/23/21 then 3 mo. USD LIBOR +0.37%) (2) | | | 01/23/22 | | | | 1,105,000 | | | | 1,113,824 | |
| | | |
3.00% (3.004% to 02/20/22 then 3 mo. USD LIBOR +0.79%) (2) | | | 12/20/23 | | | | 4,161,000 | | | | 4,258,561 | |
| |
Discover Bank | | | | | |
| | | |
7.00% | | | 04/15/20 | | | | 1,375,000 | | | | 1,404,560 | |
| |
Goldman Sachs Group, Inc. (The) | | | | | |
| | | |
2.63% | | | 04/25/21 | | | | 920,000 | | | | 928,779 | |
| | | |
3.27% (3 mo. USD LIBOR + 1.201%) (2) | | | 09/29/25 | | | | 2,235,000 | | | | 2,315,913 | |
| | | |
3.81% (3.814% to 04/23/28 then 3 mo. USD LIBOR + 1.158%) (2) | | | 04/23/29 | | | | 1,615,000 | | | | 1,715,671 | |
| | | |
6.00% | | | 06/15/20 | | | | 50,000 | | | | 51,246 | |
| |
JPMorgan Chase & Co. | | | | | |
| | | |
3.22% (3 mo. USD LIBOR + 1.155%) (2) | | | 03/01/25 | | | | 2,985,000 | | | | 3,100,436 | |
| | | |
4.02% (4.023% to 12/05/23 then 3 mo. USD LIBOR +1.00%) (2) | | | 12/05/24 | | | | 965,000 | | | | 1,030,970 | |
| |
Lloyds Banking Group PLC (United Kingdom) | | | | | |
| | | |
2.86% (3 mo. USD LIBOR + 1.249%) (2) | | | 03/17/23 | | | | 1,790,000 | | | | 1,809,629 | |
| | | |
2.91% (2.907% to 11/07/22 then 3 mo. USD LIBOR + 0.81%) (2) | | | 11/07/23 | | | | 1,600,000 | | | | 1,624,126 | |
| | | |
4.05% | | | 08/16/23 | | | | 1,540,000 | | | | 1,629,772 | |
| |
Lloyds TSB Bank PLC (United Kingdom) | | | | | |
| | | |
5.80% (1) | | | 01/13/20 | | | | 780,000 | | | | 785,767 | |
| |
Santander UK Group Holdings PLC (United Kingdom) | | | | | |
| | | |
3.37% (3.373% to 01/05/23 then 3 mo. USD LIBOR + 1.08%) (2) | | | 01/05/24 | | | | 2,460,000 | | | | 2,512,573 | |
| |
Santander UK PLC (United Kingdom) | | | | | |
| | | |
3.40% | | | 06/01/21 | | | | 2,050,000 | | | | 2,094,601 | |
| |
Wells Fargo & Co. | | | | | |
| | | |
2.41% (3 mo. USD LIBOR + 0.825%) (2) | | | 10/30/25 | | | | 850,000 | | | | 851,316 | |
| | | |
2.60% | | | 07/22/20 | | | | 2,165,000 | | | | 2,177,153 | |
| | | |
3.00% | | | 04/22/26 | | | | 1,015,000 | | | | 1,043,354 | |
See accompanying notes to financial statements.
16
TCW Core Fixed Income Fund
| | | | | | | | | | | | |
| Issues | | Maturity
Date | | | Principal
Amount | | | Value | |
|
| Banks (Continued) | |
| |
Wells Fargo Bank N.A. | | | | | |
| | | |
2.08% (3 mo. USD LIBOR + 0.650%) (2) | | | 09/09/22 | | | $ | 1,840,000 | | | $ | 1,837,463 | |
| | | | | | | | | | | | |
| |
| | | | 32,285,714 | |
| | | | | | | | | | | | |
|
| Beverages — 0.4% | |
| |
Anheuser-Busch Cos LLC / Anheuser-Busch InBev Worldwide, Inc. | | | | | |
| | | |
4.90% | | | 02/01/46 | | | | 2,425,000 | | | | 2,901,625 | |
| |
Bacardi, Ltd. | | | | | |
| | | |
4.70% (1) | | | 05/15/28 | | | | 1,240,000 | | | | 1,358,382 | |
| | | | | | | | | | | | |
| |
| | | | 4,260,007 | |
| | | | | | | | | | | | |
|
| Biotechnology — 0.5% | |
| |
Amgen, Inc. | | | | | |
| | | |
4.40% | | | 05/01/45 | | | | 1,590,000 | | | | 1,791,564 | |
| |
Biogen, Inc. | | | | | |
| | | |
5.20% | | | 09/15/45 | | | | 1,073,000 | | | | 1,319,164 | |
| |
Celgene Corp. | | | | | |
| | | |
5.00% | | | 08/15/45 | | | | 2,020,000 | | | | 2,580,913 | |
| | | | | | | | | | | | |
| |
| | | | 5,691,641 | |
| | | | | | | | | | | | |
|
| Chemicals — 0.2% | |
| |
International Flavors & Fragrances, Inc. | | | | | |
| | | |
5.00% | | | 09/26/48 | | | | 1,735,000 | | | | 2,007,437 | |
| | | | | | | | | | | | |
|
| Commercial Services — 0.2% | |
| |
IHS Markit, Ltd. | | | | | |
| | | |
4.75% (1) | | | 02/15/25 | | | | 750,000 | | | | 827,153 | |
| | | |
4.75% | | | 08/01/28 | | | | 1,750,000 | | | | 1,951,425 | |
| | | | | | | | | | | | |
| | | |
| | | | | | | | | | | 2,778,578 | |
| | | | | | | | | | | | |
|
| Diversified Financial Services — 1.7% | |
| |
AerCap Ireland Capital DAC / AerCap Global Aviation Trust (Ireland) | | | | | |
| | | |
3.95% | | | 02/01/22 | | | | 685,000 | | | | 708,941 | |
| | | |
4.50% | | | 05/15/21 | | | | 1,690,000 | | | | 1,751,262 | |
| |
AerCap Ireland Capital, Ltd. / AerCap Global Aviation Trust (Ireland) | | | | | |
| | | |
5.00% | | | 10/01/21 | | | | 1,590,000 | | | | 1,670,494 | |
| |
Air Lease Corp. | | | | | |
| | | |
4.75% | | | 03/01/20 | | | | 3,120,000 | | | | 3,146,161 | |
| |
GE Capital International Funding Co. Unlimited Co. (Ireland) | | | | | |
| | | |
2.34% | | | 11/15/20 | | | | 4,907,000 | | | | 4,903,231 | |
| | | |
4.42% | | | 11/15/35 | | | | 4,460,000 | | | | 4,715,194 | |
| |
Park Aerospace Holdings, Ltd. | | | | | |
| | | |
4.50% (1) | | | 03/15/23 | | | | 2,210,000 | | | | 2,327,119 | |
| |
Raymond James Financial, Inc. | | | | | |
| | | |
4.95% | | | 07/15/46 | | | | 965,000 | | | | 1,169,155 | |
| | | | | | | | | | | | |
| | | |
| | | | | | | | | | | 20,391,557 | |
| | | | | | | | | | | | |
| | | | | | | | | | | | |
| Issues | | Maturity
Date | | | Principal
Amount | | | Value | |
|
| Electric — 2.3% | |
| |
Appalachian Power Co. | | | | | |
| | | |
4.45% | | | 06/01/45 | | | $ | 690,000 | | | $ | 818,206 | |
| |
Dominion Energy, Inc. | | | | | |
| | | |
2.54% (3 mo. USD LIBOR + 0.400%) (1)(2) | | | 12/01/20 | | | | 4,595,000 | | | | 4,602,053 | |
| |
Duke Energy Florida LLC | | | | | |
| | | |
2.10% | | | 12/15/19 | | | | 298,750 | | | | 298,776 | |
| |
Duke Energy Progress LLC | | | | | |
| | | |
3.70% | | | 10/15/46 | | | | 1,325,000 | | | | 1,432,174 | |
| |
El Paso Electric Co. | | | | | |
| | | |
3.30% | | | 12/15/22 | | | | 2,065,000 | | | | 2,082,809 | |
| |
Entergy Mississippi, Inc. | | | | | |
| | | |
3.10% | | | 07/01/23 | | | | 2,755,000 | | | | 2,837,279 | |
| |
Indiana Michigan Power Co. | | | | | |
| | | |
4.55% | | | 03/15/46 | | | | 920,000 | | | | 1,124,889 | |
| |
KCP&L Greater Missouri Operations Co. | | | | | |
| | | |
8.27% | | | 11/15/21 | | | | 1,100,000 | | | | 1,238,468 | |
| |
Metropolitan Edison Co. | | | | | |
| | | |
3.50% (1) | | | 03/15/23 | | | | 3,030,000 | | | | 3,162,528 | |
| |
MidAmerican Energy Co. | | | | | |
| | | |
5.80% | | | 10/15/36 | | | | 1,655,000 | | | | 2,218,962 | |
| |
NextEra Energy Capital Holdings, Inc. | | | | | |
| | | |
2.69% (3 mo. USD LIBOR + 0.55%) (2) | | | 08/28/21 | | | | 2,000,000 | | | | 2,000,583 | |
| |
Niagara Mohawk Power Corp. | | | | | |
| | | |
2.72% (1) | | | 11/28/22 | | | | 920,000 | | | | 932,187 | |
| |
Public Service Co. of Oklahoma | | | | | |
| | | |
4.40% | | | 02/01/21 | | | | 1,840,000 | | | | 1,891,862 | |
| |
Puget Energy, Inc. | | | | | |
| | | |
6.00% | | | 09/01/21 | | | | 1,820,000 | | | | 1,942,568 | |
| |
Tucson Electric Power Co. | | | | | |
| | | |
5.15% | | | 11/15/21 | | | | 1,000,000 | | | | 1,047,134 | |
| | | | | | | | | | | | |
| | | |
| | | | | | | | | | | 27,630,478 | |
| | | | | | | | | | | | |
|
| Energy-Alternate Sources — 0.1% | |
| |
Alta Wind Holdings LLC | | | | | |
| | | |
7.00% (1)(3)(4) | | | 06/30/35 | | | | 869,414 | | | | 984,406 | |
| | | | | | | | | | | | |
|
| Food — 0.9% | |
| |
Kraft Heinz Foods Co. | | | | | |
| | | |
3.00% | | | 06/01/26 | | | | 1,885,000 | | | | 1,879,565 | |
| | | |
4.38% | | | 06/01/46 | | | | 2,885,000 | | | | 2,802,681 | |
| | | |
4.88% (1) | | | 10/01/49 | | | | 2,830,000 | | | | 2,926,081 | |
| | | |
5.00% | | | 06/04/42 | | | | 968,000 | | | | 1,015,711 | |
| | | |
5.20% | | | 07/15/45 | | | | 350,000 | | | | 371,647 | |
| |
Kroger Co. (The) | | | | | |
| | | |
5.40% | | | 01/15/49 | | | | 1,320,000 | | | | 1,570,546 | |
| | | | | | | | | | | | |
| | | |
| | | | | | | | | | | 10,566,231 | |
| | | | | | | | | | | | |
See accompanying notes to financial statements.
17
TCW Core Fixed Income Fund
Schedule of Investments (Continued)
| | | | | | | | | | | | |
| Issues | | Maturity
Date | | | Principal
Amount | | | Value | |
|
| Gas — 0.3% | |
| |
CenterPoint Energy Resources Corp. | | | | | |
| | | |
6.25% | | | 02/01/37 | | | $ | 1,610,000 | | | $ | 2,029,482 | |
| |
KeySpan Gas East Corp. | | | | | |
| | | |
5.82% (1) | | | 04/01/41 | | | | 1,551,000 | | | | 2,052,925 | |
| | | | | | | | | | | | |
| | | |
| | | | | | | | | | | 4,082,407 | |
| | | | | | | | | | | | |
|
| Healthcare-Products — 0.2% | |
| |
Becton Dickinson and Co. | | | | | |
| | | |
2.98% (3 mo. USD LIBOR + 0.875%) (2) | | | 12/29/20 | | | | 2,756,000 | | | | 2,757,369 | |
| | | | | | | | | | | | |
|
| Healthcare-Services — 1.8% | |
| |
Anthem, Inc. | | | | | |
| | | |
3.65% | | | 12/01/27 | | | | 2,405,000 | | | | 2,548,090 | |
| |
Hartford HealthCare Corp. | | | | | |
| | | |
5.75% | | | 04/01/44 | | | | 2,545,000 | | | | 3,292,038 | |
| |
HCA, Inc. | | | | | |
| | | |
5.13% | | | 06/15/39 | | | | 665,000 | | | | 732,636 | |
| | | |
5.25% | | | 04/15/25 | | | | 1,770,000 | | | | 1,971,697 | |
| | | |
5.25% | | | 06/15/49 | | | | 1,525,000 | | | | 1,694,190 | |
| |
Humana, Inc. | | | | | |
| | | |
3.95% | | | 08/15/49 | | | | 1,675,000 | | | | 1,717,229 | |
| |
NYU Hospitals Center | | | | | |
| | | |
4.43% | | | 07/01/42 | | | | 2,755,000 | | | | 3,334,878 | |
| |
Saint Barnabas Health Care System | | | | | |
| | | |
4.00% | | | 07/01/28 | | | | 3,290,000 | | | | 3,563,237 | |
| |
Sutter Health | | | | | |
| | | |
2.29% | | | 08/15/53 | | | | 2,270,000 | | | | 2,272,093 | |
| | | | | | | | | | | | |
| | | |
| | | | | | | | | | | 21,126,088 | |
| | | | | | | | | | | | |
|
| Insurance — 0.5% | |
| |
Farmers Exchange Capital | | | | | |
| | | |
7.20% (1) | | | 07/15/48 | | | | 1,495,000 | | | | 1,968,732 | |
| |
Farmers Exchange Capital II | | | | | |
| | | |
6.15% (3 mo. USD LIBOR + 3.744%) (1)(2) | | | 11/01/53 | | | | 2,065,000 | | | | 2,501,231 | |
| |
Prudential Financial, Inc. | | | | | |
| | | |
4.50% | | | 11/15/20 | | | | 920,000 | | | | 945,175 | |
| | | | | | | | | | | | |
| | | |
| | | | | | | | | | | 5,415,138 | |
| | | | | | | | | | | | |
|
| Media — 0.6% | |
| |
CBS Corp. | | | | | |
| | | |
3.70% | | | 06/01/28 | | | | 2,395,000 | | | | 2,512,573 | |
| |
Charter Communications Operating LLC / Charter Communications Operating Capital | | | | | |
| | | |
4.91% | | | 07/23/25 | | | | 2,500,000 | | | | 2,760,500 | |
| |
Comcast Corp. | | | | | |
| | | |
4.60% | | | 10/15/38 | | | | 820,000 | | | | 975,983 | |
| |
Time Warner Cable LLC | | | | | |
| | | |
5.88% | | | 11/15/40 | | | | 1,200,000 | | | | 1,385,172 | |
| | | | | | | | | | | | |
| | | |
| | | | | | | | | | | 7,634,228 | |
| | | | | | | | | | | | |
| | | | | | | | | | | | |
| Issues | | Maturity
Date | | | Principal
Amount | | | Value | |
|
| Miscellaneous Manufacturers — 0.8% | |
| |
General Electric Co. | | | | | |
| | | |
2.64% (3 mo. USD LIBOR + 0.480%) (2) | | | 08/15/36 | | | $ | 3,045,000 | | | $ | 2,255,377 | |
| | | |
4.13% | | | 10/09/42 | | | | 625,000 | | | | 639,335 | |
| | | |
4.63% | | | 01/07/21 | | | | 2,080,000 | | | | 2,135,300 | |
| | | |
5.50% | | | 01/08/20 | | | | 2,660,000 | | | | 2,675,970 | |
| | | |
6.75% | | | 03/15/32 | | | | 1,000,000 | | | | 1,274,753 | |
| | | | | | | | | | | | |
| | | |
| | | | | | | | | | | 8,980,735 | |
| | | | | | | | | | | | |
|
| Oil & Gas — 0.6% | |
| |
Petroleos Mexicanos | | | | | |
| | | |
6.50% | | | 01/23/29 | | | | 2,140,000 | | | | 2,237,035 | |
| | | |
6.63% | | | 06/15/35 | | | | 1,105,000 | | | | 1,131,023 | |
| | | |
6.75% | | | 09/21/47 | | | | 2,625,000 | | | | 2,619,750 | |
| | | |
7.69% (1) | | | 01/23/50 | | | | 1,025,000 | | | | 1,117,660 | |
| | | | | | | | | | | | |
| | | |
| | | | | | | | | | | 7,105,468 | |
| | | | | | | | | | | | |
|
| Packaging & Containers — 0.2% | |
| |
Amcor Finance USA, Inc. | | | | | |
| | | |
3.63% (1) | | | 04/28/26 | | | | 1,380,000 | | | | 1,438,274 | |
| |
WRKCo, Inc. | | | | | |
| | | |
4.90% | | | 03/15/29 | | | | 1,225,000 | | | | 1,407,422 | |
| | | | | | | | | | | | |
| | | |
| | | | | | | | | | | 2,845,696 | |
| | | | | | | | | | | | |
|
| Pharmaceuticals — 2.3% | |
| |
AbbVie, Inc. | | | | | |
| | | |
4.40% | | | 11/06/42 | | | | 1,350,000 | | | | 1,400,203 | |
| | | |
4.45% | | | 05/14/46 | | | | 1,035,000 | | | | 1,071,079 | |
| |
Actavis Funding SCS (Luxembourg) | | | | | |
| | | |
3.80% | | | 03/15/25 | | | | 1,653,000 | | | | 1,747,076 | |
| |
Allergan Finance LLC | | | | | |
| | | |
3.25% | | | 10/01/22 | | | | 936,000 | | | | 959,164 | |
| |
Bayer US Finance II LLC | | | | | |
| | | |
4.38% (1) | | | 12/15/28 | | | | 4,290,000 | | | | 4,655,448 | |
| | | |
4.63% (1) | | | 06/25/38 | | | | 500,000 | | | | 548,391 | |
| | | |
4.88% (1) | | | 06/25/48 | | | | 2,250,000 | | | | 2,518,675 | |
| |
Cigna Corp. | | | | | |
| | | |
3.05% (1) | | | 10/15/27 | | | | 775,000 | | | | 778,269 | |
| | | |
4.13% | | | 11/15/25 | | | | 4,545,000 | | | | 4,928,989 | |
| |
CVS Health Corp. | | | | | |
| | | |
3.88% | | | 07/20/25 | | | | 3,600,000 | | | | 3,838,164 | |
| | | |
5.05% | | | 03/25/48 | | | | 3,870,000 | | | | 4,467,741 | |
| | | | | | | | | | | | |
| | | |
| | | | | | | | | | | 26,913,199 | |
| | | | | | | | | | | | |
|
| Pipelines — 1.5% | |
| |
Enbridge Energy Partners LP | | | | | |
| | | |
5.88% | | | 10/15/25 | | | | 333,000 | | | | 386,448 | |
| |
Energy Transfer Partners LP | | | | | |
| | | |
5.15% | | | 03/15/45 | | | | 1,100,000 | | | | 1,150,632 | |
| | | |
5.95% | | | 10/01/43 | | | | 630,000 | | | | 704,564 | |
See accompanying notes to financial statements.
18
TCW Core Fixed Income Fund
| | | | | | | | | | | | |
| Issues | | Maturity
Date | | | Principal
Amount | | | Value | |
|
| Pipelines (Continued) | |
| |
Plains All American Pipeline LP / PAA Finance Corp. | | | | | |
| | | |
4.65% | | | 10/15/25 | | | $ | 2,115,000 | | | $ | 2,255,496 | |
| |
Rockies Express Pipeline LLC | | | | | |
| | | |
4.95% (1) | | | 07/15/29 | | | | 2,000,000 | | | | 1,997,290 | |
| | | |
6.88% (1) | | | 04/15/40 | | | | 350,000 | | | | 371,035 | |
| |
Ruby Pipeline LLC | | | | | |
| | | |
6.50% (1) | | | 04/01/22 | | | | 1,726,894 | | | | 1,791,653 | |
| |
Southern Natural Gas Co. LLC | | | | | |
| | | |
7.35% | | | 02/15/31 | | | | 2,380,000 | | | | 3,145,186 | |
| |
Sunoco Logistics Partners Operations LP | | | | | |
| | | |
5.40% | | | 10/01/47 | | | | 825,000 | | | | 886,418 | |
| |
TC PipeLines LP | | | | | |
| | | |
4.38% | | | 03/13/25 | | | | 1,840,000 | | | | 1,970,163 | |
| |
Texas Eastern Transmission LP | | | | | |
| | | |
2.80% (1) | | | 10/15/22 | | | | 920,000 | | | | 927,497 | |
| |
TransCanada PipeLines, Ltd. (Canada) | | | | | |
| | | |
6.10% | | | 06/01/40 | | | | 375,000 | | | | 483,393 | |
| |
Williams Partners LP | | | | | |
| | | |
6.30% | | | 04/15/40 | | | | 1,150,000 | | | | 1,395,627 | |
| | | | | | | | | | | | |
| | | |
| | | | | | | | | | | 17,465,402 | |
| | | | | | | | | | | | |
|
| REIT — 1.6% | |
| |
American Campus Communities Operating Partnership LP | | | | | |
| | | |
3.30% | | | 07/15/26 | | | | 1,000,000 | | | | 1,032,406 | |
| | | |
3.35% | | | 10/01/20 | | | | 1,840,000 | | | | 1,859,915 | |
| | | |
4.13% | | | 07/01/24 | | | | 425,000 | | | | 454,899 | |
| |
AvalonBay Communities, Inc. | | | | | |
| | | |
3.95% | | | 01/15/21 | | | | 920,000 | | | | 938,690 | |
| |
GLP Capital LP / GLP Financing II, Inc. | | | | | |
| | | |
4.00% | | | 01/15/30 | | | | 620,000 | | | | 627,112 | |
| | | |
5.30% | | | 01/15/29 | | | | 1,280,000 | | | | 1,416,000 | |
| | | |
5.38% | | | 04/15/26 | | | | 1,308,000 | | | | 1,441,612 | |
| | | |
5.75% | | | 06/01/28 | | | | 1,600,000 | | | | 1,817,152 | |
| |
HCP, Inc. | | | | | |
| | | |
3.88% | | | 08/15/24 | | | | 2,110,000 | | | | 2,251,238 | |
| | | |
4.00% | | | 12/01/22 | | | | 333,000 | | | | 350,363 | |
| | | |
4.25% | | | 11/15/23 | | | | 470,000 | | | | 504,249 | |
| |
Healthcare Realty Trust, Inc. | | | | | |
| | | |
3.75% | | | 04/15/23 | | | | 1,840,000 | | | | 1,902,697 | |
| |
SL Green Operating Partnership LP | | | | | |
| | | |
3.25% | | | 10/15/22 | | | | 2,380,000 | | | | 2,433,043 | |
| |
SL Green Realty Corp. | | | | | |
| | | |
7.75% | | | 03/15/20 | | | | 920,000 | | | | 938,119 | |
| |
Ventas Realty LP | | | | | |
| | | |
3.85% | | | 04/01/27 | | | | 690,000 | | | | 737,953 | |
| |
Welltower, Inc. | | | | | |
| | | |
3.75% | | | 03/15/23 | | | | 555,000 | | | | 582,245 | |
| | | | | | | | | | | | |
| | | |
| | | | | | | | | | | 19,287,693 | |
| | | | | | | | | | | | |
| | | | | | | | | | | | |
| Issues | | Maturity
Date | | | Principal
Amount | | | Value | |
|
| Retail — 0.2% | |
| |
Alimentation Couche-Tard, Inc. (Canada) | | | | | |
| | | |
3.55% (1) | | | 07/26/27 | | | $ | 1,710,000 | | | $ | 1,778,098 | |
| | | | | | | | | | | | |
|
| Savings & Loans — 0.1% | |
| |
Nationwide Building Society (United Kingdom) | | | | | |
| | | |
3.62% (3 mo. USD LIBOR + 1.181%) (1)(2) | | | 04/26/23 | | | | 800,000 | | | | 822,718 | |
| | | |
3.77% (3.766% until 3/08/23 then 3 mo. USD LIBOR + 1.064%) (1)(2) | | | 03/08/24 | | | | 500,000 | | | | 519,953 | |
| | | |
4.36% (3 mo. USD LIBOR + 1.392%) (1)(2) | | | 08/01/24 | | | | 400,000 | | | | 424,549 | |
| | | | | | | | | | | | |
| | | |
| | | | | | | | | | | 1,767,220 | |
| | | | | | | | | | | | |
|
| Semiconductors — 0.2% | |
| |
Broadcom Corp. / Broadcom Cayman Finance, Ltd. | | | | | |
| | | |
2.38% | | | 01/15/20 | | | | 2,675,000 | | | | 2,677,080 | |
| | | | | | | | | | | | |
|
| Telecommunications — 1.6% | |
| |
AT&T, Inc. | | | | | |
| | | |
4.80% | | | 06/15/44 | | | | 1,390,000 | | | | 1,545,024 | |
| | | |
4.85% | | | 03/01/39 | | | | 1,554,000 | | | | 1,758,162 | |
| | | |
5.25% | | | 03/01/37 | | | | 3,655,000 | | | | 4,303,808 | |
| |
Koninklijke KPN NV (Netherlands) | | | | | |
| | | |
8.38% | | | 10/01/30 | | | | 900,000 | | | | 1,220,771 | |
| |
Qwest Corp. | | | | | |
| | | |
7.25% | | | 09/15/25 | | | | 920,000 | | | | 1,052,584 | |
| |
Sprint Spectrum Co. LLC / Sprint Spectrum Co. II LLC / Sprint Spectrum Co. III LLC | | | | | |
| | | |
3.36% (1) | | | 03/20/23 | | | | 500,000 | | | | 503,750 | |
| | | |
4.74% (1) | | | 09/20/29 | | | | 3,240,000 | | | | 3,462,783 | |
| |
Verizon Communications, Inc. | | | | | |
| | | |
4.27% | | | 01/15/36 | | | | 1,324,000 | | | | 1,499,118 | |
| |
Vodafone Group PLC (United Kingdom) | | | | | |
| | | |
4.88% | | | 06/19/49 | | | | 1,647,000 | | | | 1,858,955 | |
| |
Vodafone Group PLC (United Kingdom) | | | | | |
| | | |
5.25% | | | 05/30/48 | | | | 1,800,000 | | | | 2,100,267 | |
| | | | | | | | | | | | |
| | | |
| | | | | | | | | | | 19,305,222 | |
| | | | | | | | | | | | |
| | |
Total Corporate Bonds | | | | | | | | | |
| | |
(Cost: $265,527,431) | | | | | | | | 282,945,218 | |
| | | | | | | | | | | | |
|
| MUNICIPAL BONDS — 0.6% | |
| |
Fiscal Year 2005 Securitization Corp., Special Obligation Bond for the City of New York | | | | | |
| | | |
4.93% | | | 04/01/20 | | | | 5,000 | | | | 5,065 | |
| |
Los Angeles Unified School District/CA, General Obligation | | | | | |
| | | |
5.76% | | | 07/01/29 | | | | 2,500,000 | | | | 3,045,925 | |
| |
New York State, Build America Bonds, General Obligation | | | | | |
| | | |
5.82% | | | 10/01/31 | | | | 730,000 | | | | 755,462 | |
See accompanying notes to financial statements.
19
TCW Core Fixed Income Fund
Schedule of Investments (Continued)
| | | | | | | | | | | | |
| Issues | | Maturity
Date | | | Principal
Amount | | | Value | |
|
| MUNICIPAL BONDS (Continued) | |
| |
State of California, General Obligation | | | | | |
| | | |
7.95% | | | 03/01/36 | | | $ | 3,000,000 | | | $ | 3,057,480 | |
| | | | | | | | | | | | |
| | |
Total Municipal Bonds | | | | | | | | | |
| | |
(Cost: $7,156,593) | | | | | | | | 6,863,932 | |
| | | | | | | | | | | | |
|
| ASSET-BACKED SECURITIES — 6.3% | |
| |
321 Henderson Receivables I LLC (13-3A-A) | | | | | |
| | | |
4.08% (1) | | | 01/17/73 | | | | 1,465,912 | | | | 1,599,465 | |
| |
321 Henderson Receivables I LLC (14-2A-A) | | | | | |
| | | |
3.61% (1) | | | 01/17/73 | | | | 1,724,899 | | | | 1,846,252 | |
| |
Babson CLO, Ltd. (16-2A-AR) | | | | | |
| | | |
3.05% (3 mo. USD LIBOR + 1.080%) (1)(2) | | | 07/20/28 | | | | 3,100,000 | | | | 3,101,320 | |
| |
Brazos Education Loan Authority, Inc. (12-1-A1) | | | | | |
| | | |
2.52% (1 mo. USD LIBOR + 0.700%) (2) | | | 12/26/35 | | | | 808,676 | | | | 806,634 | |
| |
Brazos Higher Education Authority, Inc. (10-1-A2) | | | | | |
| | | |
3.33% (3 mo. USD LIBOR + 1.200%) (2) | | | 02/25/35 | | | | 675,000 | | | | 680,364 | |
| |
Brazos Higher Education Authority, Inc. (11-1-A3) | | | | | |
| | | |
3.18% (3 mo. USD LIBOR + 1.050%) (2) | | | 11/25/33 | | | | 1,695,000 | | | | 1,693,008 | |
| |
Dryden XXVI Senior Loan Fund (13-26A-AR) | | | | | |
| | | |
2.90% (3 mo. USD LIBOR + 0.900%) (1)(2) | | | 04/15/29 | | | | 2,200,000 | | | | 2,196,192 | |
| |
Educational Funding of the South, Inc. (11-1-A2) | | | | | |
| | | |
2.59% (3 mo. USD LIBOR + 0.650%) (2) | | | 04/25/35 | | | | 1,160,044 | | | | 1,154,492 | |
| |
Educational Services of America, Inc. (12-2-A) | | | | | |
| | | |
2.55% (1 mo. USD LIBOR + 0.730%) (1)(2) | | | 04/25/39 | | | | 556,377 | | | | 553,557 | |
| |
GCO Education Loan Funding Master Trust (06-2AR-A1RN) | | | | | |
| | | |
2.47% (1 mo. USD LIBOR + 0.650%) (1)(2) | | | 08/27/46 | | | | 2,536,457 | | | | 2,419,197 | |
| |
Global SC Finance SRL (14-1A-A2) | | | | | |
| | | |
3.09% (1) | | | 07/17/29 | | | | 1,465,375 | | | | 1,468,486 | |
| |
GoldenTree Loan Opportunities IX, Ltd. (14-9A-AR2) | | | | | |
| | | |
3.04% (3 mo. USD LIBOR + 1.110%) (1)(2) | | | 10/29/29 | | | | 3,100,000 | | | | 3,095,235 | |
| |
Higher Education Funding I (14-1-A) | | | | | |
| | | |
3.18% (3 mo. USD LIBOR + 1.050%) (1)(2) | | | 05/25/34 | | | | 2,695,551 | | | | 2,706,754 | |
| |
Navient Student Loan Trust (14-2-A) | | | | | |
| | | |
2.46% (1 mo. USD LIBOR + 0.640%) (2) | | | 03/25/83 | | | | 3,436,259 | | | | 3,383,797 | |
| |
Navient Student Loan Trust (14-3-A) | | | | | |
| | | |
2.44% (1 mo. USD LIBOR + 0.620%) (2) | | | 03/25/83 | | | | 3,589,169 | | | | 3,529,445 | |
| |
Navient Student Loan Trust (14-4-A) | | | | | |
| | | |
2.44% (1 mo. USD LIBOR + 0.620%) (2) | | | 03/25/83 | | | | 1,732,418 | | | | 1,708,896 | |
| | | | | | | | | | | | |
| Issues | | Maturity
Date | | | Principal
Amount | | | Value | |
|
| ASSET-BACKED SECURITIES (Continued) | |
| |
Navient Student Loan Trust (16-1A-A) | | | | | |
| | | |
2.52% (1 mo. USD LIBOR + 0.700%) (1)(2) | | | 02/25/70 | | | $ | 3,548,041 | | | $ | 3,511,158 | |
| |
Nelnet Student Loan Trust (11-1A-A) | | | | | |
| | | |
2.67% (1 mo. USD LIBOR + 0.850%) (1)(2) | | | 02/25/48 | | | | 2,115,489 | | | | 2,114,823 | |
| |
Nelnet Student Loan Trust (14-4A-A2) | | | | | |
| | | |
2.77% (1 mo. USD LIBOR + 0.950%) (1)(2) | | | 11/25/48 | | | | 2,965,000 | | | | 2,908,764 | |
| |
Nelnet Student Loan Trust (19-4A-A) | | | | | |
| | | |
2.69% (1 mo. USD LIBOR + 0.870%) (1)(2) | | | 09/26/67 | | | | 2,967,787 | | | | 2,971,913 | |
| |
Octagon Investment Partners 25, Ltd. (15-1A-AR) | | | | | |
| | | |
2.77% (3 mo. USD LIBOR + 0.800%) (1)(2) | | | 10/20/26 | | | | 4,500,000 | | | | 4,500,242 | |
| |
PHEAA Student Loan Trust (15-1A-A) | | | | | |
| | | |
2.42% (1 mo. USD LIBOR + 0.600%) (1)(2) | | | 10/25/41 | | | | 1,717,587 | | | | 1,685,246 | |
| |
SLM Student Loan Trust (03-7A-A5A) | | | | | |
| | | |
3.32% (3 mo. USD LIBOR + 1.200%) (1)(2) | | | 12/15/33 | | | | 2,755,876 | | | | 2,726,527 | |
| |
SLM Student Loan Trust (06-2-A6) | | | | | |
| | | |
2.11% (3 mo. USD LIBOR + 0.170%) (2) | | | 01/25/41 | | | | 2,973,393 | | | | 2,863,595 | |
| |
SLM Student Loan Trust (08-2-B) | | | | | |
| | | |
3.14% (3 mo. USD LIBOR + 1.200%) (2) | | | 01/25/83 | | | | 710,000 | | | | 680,119 | |
| |
SLM Student Loan Trust (08-3-B) | | | | | |
| | | |
3.14% (3 mo. USD LIBOR + 1.200%) (2) | | | 04/26/83 | | | | 710,000 | | | | 681,112 | |
| |
SLM Student Loan Trust (08-4-A4) | | | | | |
| | | |
3.59% (3 mo. USD LIBOR + 1.650%) (2) | | | 07/25/22 | | | | 4,743,668 | | | | 4,789,315 | |
| |
SLM Student Loan Trust (08-4-B) | | | | | |
| | | |
3.79% (3 mo. USD LIBOR + 1.850%) (2) | | | 04/25/73 | | | | 710,000 | | | | 707,100 | |
| |
SLM Student Loan Trust (08-5-B) | | | | | |
| | | |
3.79% (3 mo. USD LIBOR + 1.850%) (2) | | | 07/25/73 | | | | 710,000 | | | | 716,446 | |
| |
SLM Student Loan Trust (08-6-A4) | | | | | |
| | | |
3.04% (3 mo. USD LIBOR + 1.100%) (2) | | | 07/25/23 | | | | 3,874,136 | | | | 3,853,223 | |
| |
SLM Student Loan Trust (08-6-B) | | | | | |
| | | |
3.79% (3 mo. USD LIBOR + 1.850%) (2) | | | 07/26/83 | | | | 710,000 | | | | 703,228 | |
| |
SLM Student Loan Trust (08-7-B) | | | | | |
| | | |
3.79% (3 mo. USD LIBOR + 1.850%) (2) | | | 07/26/83 | | | | 710,000 | | | | 703,907 | |
| |
SLM Student Loan Trust (08-8-B) | | | | | |
| | | |
4.19% (3 mo. USD LIBOR + 2.250%) (2) | | | 10/25/75 | | | | 710,000 | | | | 714,718 | |
See accompanying notes to financial statements.
20
TCW Core Fixed Income Fund
| | | | | | | | | | | | |
| Issues | | Maturity
Date | | | Principal
Amount | | | Value | |
|
| ASSET-BACKED SECURITIES (Continued) | |
| |
SLM Student Loan Trust (08-9-A) | | | | | |
| | | |
3.44% (3 mo. USD LIBOR + 1.500%) (2) | | | 04/25/23 | | | $ | 1,493,264 | | | $ | 1,503,546 | |
| |
SLM Student Loan Trust (08-9-B) | | | | | |
| | | |
4.19% (3 mo. USD LIBOR + 2.250%) (2) | | | 10/25/83 | | | | 710,000 | | | | 714,252 | |
| |
SLM Student Loan Trust (11-2-A2) | | | | | |
| | | |
3.02% (1 mo. USD LIBOR + 1.200%) (2) | | | 10/25/34 | | | | 2,000,000 | | | | 2,021,990 | |
| |
SLM Student Loan Trust (12-7-A3) | | | | | |
| | | |
2.47% (1 mo. USD LIBOR + 0.650%) (2) | | | 05/26/26 | | | | 2,041,761 | | | | 1,993,912 | |
| | | | | | | | | | | | |
| | |
Total Asset-backed Securities | | | | | | | | | |
| | |
(Cost: $74,527,683) | | | | | | | | 75,008,230 | |
| | | | | | | | | | | | |
|
COMMERCIAL MORTGAGE-BACKED SECURITIES —
AGENCY — 4.3% | |
| |
Fannie Mae, Pool #AE0134 | | | | | |
| | | |
4.40% | | | 02/01/20 | | | | 202,002 | | | | 202,672 | |
| |
Fannie Mae, Pool #AM3058 | | | | | |
| | | |
3.41% | | | 04/01/28 | | | | 3,358,522 | | | | 3,631,501 | |
| |
Fannie Mae, Pool #AM8645 | | | | | |
| | | |
2.69% | | | 05/01/27 | | | | 4,598,518 | | | | 4,782,083 | |
| |
Fannie Mae, Pool #AM9536 | | | | | |
| | | |
3.34% | | | 08/01/30 | | | | 2,997,603 | | | | 3,239,094 | |
| |
Fannie Mae, Pool #AN0245 | | | | | |
| | | |
3.42% | | | 11/01/35 | | | | 2,140,853 | | | | 2,328,423 | |
| |
Fannie Mae, Pool #AN5742 | | | | | |
| | | |
3.19% | | | 05/01/30 | | | | 3,350,206 | | | | 3,588,879 | |
| |
Fannie Mae, Pool #AN5977 | | | | | |
| | | |
3.49% | | | 02/01/33 | | | | 3,000,000 | | | | 3,349,508 | |
| |
Fannie Mae, Pool #AN9655 | | | | | |
| | | |
3.71% | | | 06/01/30 | | | | 4,480,000 | | | | 5,022,661 | |
| |
Fannie Mae, Pool #BL0844 | | | | | |
| | | |
3.87% | | | 02/01/29 | | | | 5,965,000 | | | | 6,730,446 | |
| |
Freddie Mac Multifamily Structured Pass-Through Certificates (K158-A3) | | | | | |
| | | |
0.00% (5) | | | 10/25/33 | | | | 2,250,000 | | | | 2,603,053 | |
| |
Freddie Mac Multifamily Structured Pass-Through Certificates (K155-A3) | | | | | |
| | | |
3.75% | | | 04/25/33 | | | | 4,045,000 | | | | 4,608,446 | |
| |
Freddie Mac Multifamily Structured Pass-Through Certificates (KJ05-A1) | | | | | |
| | | |
1.42% | | | 05/25/21 | | | | 539,875 | | | | 538,480 | |
| |
Freddie Mac Multifamily Structured Pass-Through Certificates (Q004-A2H) | | | | | |
| | | |
3.03% (6) | | | 01/25/46 | | | | 5,127,361 | | | | 5,162,685 | |
| |
Freddie Mac Multifamily Structured Pass-Through Certificates (Q006-A-PT2) | | | | | |
| | | |
2.49% (6) | | | 09/25/26 | | | | 4,685,009 | | | | 4,831,275 | |
| | | | | | | | | | | | |
| Issues | | Maturity
Date | | | Principal
Amount | | | Value | |
|
COMMERCIAL MORTGAGE-BACKED SECURITIES —
AGENCY (Continued) | |
| |
NCUA Guaranteed Notes (11-C1-2A) | | | | | |
| | | |
2.52% (1 mo. USD LIBOR + 0.530%) (2) | | | 03/09/21 | | | $ | 540,713 | | | $ | 540,996 | |
| | | | | | | | | | | | |
| | |
Total Commercial Mortgage-backed Securities — Agency | | | | | | | | | |
| | |
(Cost: $47,770,001) | | | | | | | | 51,160,202 | |
| | | | | | | | | | | | |
|
COMMERCIAL MORTGAGE-BACKED SECURITIES —
NON-AGENCY — 2.0% | |
| |
BAMLL Commercial Mortgage Securities Trust (18-PARK-A) | | | | | |
| | | |
4.09% (1),(6) | | | 08/10/38 | | | | 1,930,000 | | | | 2,179,746 | |
| |
BBCMS Trust (13-TYSN-A2) | | | | | |
| | | |
3.76% (1) | | | 09/05/32 | | | | 1,740,000 | | | | 1,762,469 | |
| |
CALI Mortgage Trust (19-101C-A) | | | | | |
| | | |
3.96% (1) | | | 03/10/39 | | | | 1,285,000 | | | | 1,443,137 | |
| |
CityLine Commercial Mortgage Trust (16-CLNE-A) | | | | | |
| | | |
2.78% (1),(6) | | | 11/10/31 | | | | 1,815,000 | | | | 1,854,298 | |
| |
COMM Mortgage Trust (13-300P-A1) | | | | | |
| | | |
4.35% (1) | | | 08/10/30 | | | | 1,515,000 | | | | 1,622,793 | |
| |
COMM Mortgage Trust (14-277P-A) | | | | | |
| | | |
3.61% (1),(6) | | | 08/10/49 | | | | 400,000 | | | | 427,336 | |
| |
COMM Mortgage Trust (16-787S-A) | | | | | |
| | | |
3.55% (1) | | | 02/10/36 | | | | 1,635,000 | | | | 1,751,009 | |
| |
CPT Mortgage Trust | | | | | |
| | | |
2.87% (7) | | | 11/13/39 | | | | 1,105,000 | | | | 1,138,129 | |
| |
DC Office Trust (19-MTC-A) | | | | | |
| | | |
2.97% (1) | | | 09/15/45 | | | | 1,180,000 | | | | 1,226,754 | |
| |
Hudson Yards Mortgage Trust (19-30HY-A) | | | | | |
| | | |
3.23% (1) | | | 07/10/39 | | | | 2,185,000 | | | | 2,344,088 | |
| |
JPMorgan Chase Commercial Mortgage Securities Trust (19-OSB-A) | | | | | |
| | | |
3.40% (1) | | | 06/05/39 | | | | 1,160,000 | | | | 1,249,573 | |
| |
One Bryant Park Trust (19-OBP-A) | | | | | |
| | | |
2.52% (1) | | | 09/15/54 | | | | 1,495,000 | | | | 1,497,636 | |
| |
SFAVE Commercial Mortgage Securities Trust (15-5AVE-A1) | | | | | |
| | | |
3.87% (1),(6) | | | 01/05/43 | | | | 1,710,000 | | | | 1,833,745 | |
| |
SFAVE Commercial Mortgage Securities Trust (15-5AVE-A2B) | | | | | |
| | | |
4.14% (1),(6) | | | 01/05/43 | | | | 165,000 | | | | 177,338 | |
| |
VNDO Mortgage Trust (12-6AVE-A) | | | | | |
| | | |
3.00% (1) | | | 11/15/30 | | | | 1,550,000 | | | | 1,588,101 | |
| |
VNDO Mortgage Trust (13-PENN-A) | | | | | |
| | | |
3.81% (1) | | | 12/13/29 | | | | 1,675,000 | | | | 1,697,333 | |
| | | | | | | | | | | | |
| | |
Total Commercial Mortgage-backed Securities — Non-agency | | | | | | | | | |
| | |
(Cost: $23,096,389) | | | | | | | | 23,793,485 | |
| | | | | | | | | | | | |
See accompanying notes to financial statements.
21
TCW Core Fixed Income Fund
Schedule of Investments (Continued)
| | | | | | | | | | | | |
| Issues | | Maturity
Date | | | Principal
Amount | | | Value | |
|
RESIDENTIAL MORTGAGE-BACKED SECURITIES —
AGENCY — 33.5% | |
| |
Fannie Mae (01-14-SH) (I/F) | | | | | |
| | | |
21.45% (-3.50 x 1 mo. USD LIBOR + 27.825%) (2) | | | 03/25/30 | | | $ | 121,210 | | | $ | 189,353 | |
| |
Fannie Mae (01-34-FV) | | | | | |
| | | |
2.32% (1 mo. USD LIBOR + 0.500%) (2) | | | 08/25/31 | | | | 158,111 | | | | 159,091 | |
| |
Fannie Mae (04-W10-A6) (PAC) | | | | | |
| | | |
5.75% | | | 08/25/34 | | | | 1,728,618 | | | | 1,895,514 | |
| |
Fannie Mae (07-89-GF) | | | | | |
| | | |
2.34% (1 mo. USD LIBOR + 0.520%) (2) | | | 09/25/37 | | | | 626,723 | | | | 629,999 | |
| |
Fannie Mae (08-30-SA) (I/O) (I/F) | | | | | |
| | | |
5.03% (-1.00 x 1 mo. USD LIBOR + 6.850%) (2) | | | 04/25/38 | | | | 102,514 | | | | 21,677 | |
| |
Fannie Mae (08-62-SN) (I/O) (I/F) | | | | | |
| | | |
4.38% (-1.00 x 1 mo. USD LIBOR + 6.200%) (2) | | | 07/25/38 | | | | 155,858 | | | | 30,705 | |
| |
Fannie Mae (09-64-TB) | | | | | |
| | | |
4.00% | | | 08/25/29 | | | | 1,504,807 | | | | 1,580,276 | |
| |
Fannie Mae (09-68-SA) (I/O) (I/F) | | | | | |
| | | |
4.93% (-1.00 x 1 mo. USD LIBOR + 6.750%) (2) | | | 09/25/39 | | | | 76,455 | | | | 14,164 | |
| |
Fannie Mae (10-26-AS) (I/O) (I/F) | | | | | |
| | | |
4.51% (-1.00 x 1 mo. USD LIBOR + 6.330%) (2) | | | 03/25/40 | | | | 1,171,925 | | | | 156,406 | |
| |
Fannie Mae (11-111-DB) | | | | | |
| | | |
4.00% | | | 11/25/41 | | | | 4,000,000 | | | | 4,272,427 | |
| |
Fannie Mae (18-38-LA) | | | | | |
| | | |
3.00% | | | 06/25/48 | | | | 4,902,988 | | | | 4,957,959 | |
| |
Fannie Mae (18-43-CT) | | | | | |
| | | |
3.00% | | | 06/25/48 | | | | 3,882,100 | | | | 3,938,371 | |
| |
Fannie Mae, Pool #254634 | | | | | |
| | | |
5.50% | | | 02/01/23 | | | | 7,109 | | | | 7,423 | |
| |
Fannie Mae, Pool #596686 | | | | | |
| | | |
6.50% | | | 11/01/31 | | | | 11,504 | | | | 12,822 | |
| |
Fannie Mae, Pool #679263 | | | | | |
| | | |
4.50% | | | 11/01/24 | | | | 6,814 | | | | 7,163 | |
| |
Fannie Mae, Pool #727575 | | | | | |
| | | |
5.00% | | | 06/01/33 | | | | 36,102 | | | | 38,609 | |
| |
Fannie Mae, Pool #748751 | | | | | |
| | | |
5.50% | | | 10/01/33 | | | | 91,569 | | | | 98,379 | |
| |
Fannie Mae, Pool #AB2127 | | | | | |
| | | |
3.50% | | | 01/01/26 | | | | 748,296 | | | | 775,057 | |
| |
Fannie Mae, Pool #AL0209 | | | | | |
| | | |
4.50% | | | 05/01/41 | | | | 608,933 | | | | 669,970 | |
| |
Fannie Mae, Pool #AL0851 | | | | | |
| | | |
6.00% | | | 10/01/40 | | | | 602,556 | | | | 693,504 | |
| |
Fannie Mae, Pool #AS9830 | | | | | |
| | | |
4.00% | | | 06/01/47 | | | | 4,106,332 | | | | 4,316,802 | |
| | | | | | | | | | | | |
| Issues | | Maturity
Date | | | Principal
Amount | | | Value | |
|
RESIDENTIAL MORTGAGE-BACKED SECURITIES —
AGENCY (Continued) | |
| |
Fannie Mae, Pool #CA1710 | | | | | |
| | | |
4.50% | | | 05/01/48 | | | $ | 6,381,815 | | | $ | 6,760,237 | |
| |
Fannie Mae, Pool #CA1711 | | | | | |
| | | |
4.50% | | | 05/01/48 | | | | 4,509,046 | | | | 4,776,418 | |
| |
Fannie Mae, Pool #CA2208 | | | | | |
| | | |
4.50% | | | 08/01/48 | | | | 4,054,560 | | | | 4,274,710 | |
| |
Fannie Mae, Pool #CA2327 | | | | | |
| | | |
4.00% | | | 09/01/48 | | | | 1,223,653 | | | | 1,311,370 | |
| |
Fannie Mae, Pool #MA1146 | | | | | |
| | | |
4.00% | | | 08/01/42 | | | | 1,919,149 | | | | 2,050,215 | |
| |
Fannie Mae, Pool #MA1561 | | | | | |
| | | |
3.00% | | | 09/01/33 | | | | 2,810,413 | | | | 2,909,647 | |
| |
Fannie Mae, Pool #MA1584 | | | | | |
| | | |
3.50% | | | 09/01/33 | | | | 4,383,213 | | | | 4,573,487 | |
| |
Fannie Mae, Pool #MA3182 | | | | | |
| | | |
3.50% | | | 11/01/47 | | | | 1,464,338 | | | | 1,517,397 | |
| |
Fannie Mae, Pool #MA3834 | | | | | |
| | | |
3.00% (7) | | | 11/01/49 | | | | 11,672,833 | | | | 11,866,073 | |
| |
Fannie Mae, Pool #MA3846 | | | | | |
| | | |
3.00% (7) | | | 11/01/49 | | | | 5,920,000 | | | | 5,973,353 | |
| |
Freddie Mac (2439-KZ) | | | | | |
| | | |
6.50% | | | 04/15/32 | | | | 123,082 | | | | 139,104 | |
| |
Freddie Mac (2575-FD) (PAC) | | | | | |
| | | |
2.37% (1 mo. USD LIBOR + 0.450%) (2) | | | 02/15/33 | | | | 295,703 | | | | 296,752 | |
| |
Freddie Mac (2662-MT) (TAC) | | | | | |
| | | |
4.50% | | | 08/15/33 | | | | 193,779 | | | | 201,817 | |
| |
Freddie Mac (3315-S) (I/O) (I/F) | | | | | |
| | | |
4.49% (-1.00 x 1 mo. USD LIBOR + 6.410%) (2) | | | 05/15/37 | | | | 28,563 | | | | 3,798 | |
| |
Freddie Mac (3339-JS) (I/F) | | | | | |
| | | |
30.35% (-6.50 x 1 mo. USD LIBOR + 42.835%) (2) | | | 07/15/37 | | | | 425,187 | | | | 897,402 | |
| |
Freddie Mac (3351-ZC) | | | | | |
| | | |
5.50% | | | 07/15/37 | | | | 324,685 | | | | 368,381 | |
| |
Freddie Mac (3380-SM) (I/O) (I/F) | | | | | |
| | | |
4.49% (-1.00 x 1 mo. USD LIBOR + 6.410%) (2) | | | 10/15/37 | | | | 524,917 | | | | 106,313 | |
| |
Freddie Mac (3382-FL) | | | | | |
| | | |
2.62% (1 mo. USD LIBOR + 0.700%) (2) | | | 11/15/37 | | | | 176,392 | | | | 177,910 | |
| |
Freddie Mac (3439-SC) (I/O) (I/F) | | | | | |
| | | |
3.98% (-1.00 x 1 mo. USD LIBOR + 5.900%) (2) | | | 04/15/38 | | | | 1,761,884 | | | | 285,516 | |
See accompanying notes to financial statements.
22
TCW Core Fixed Income Fund
| | | | | | | | | | | | |
| Issues | | Maturity
Date | | | Principal
Amount | | | Value | |
|
RESIDENTIAL MORTGAGE-BACKED SECURITIES —
AGENCY (Continued) | |
| |
Freddie Mac (3578-DI) (I/O) (I/F) | | | | | |
| | | |
4.73% (-1.00 x 1 mo. USD LIBOR + 6.650%) (2) | | | 04/15/36 | | | $ | 725,741 | | | $ | 132,660 | |
| |
Freddie Mac (4818-CA) | | | | | |
| | | |
3.00% | | | 04/15/48 | | | | 2,728,892 | | | | 2,789,983 | |
| |
Freddie Mac, Pool #A97179 | | | | | |
| | | |
4.50% | | | 03/01/41 | | | | 1,938,042 | | | | 2,157,835 | |
| |
Freddie Mac, Pool #C90526 | | | | | |
| | | |
5.50% | | | 02/01/22 | | | | 4,661 | | | | 4,783 | |
| |
Freddie Mac, Pool #G06360 | | | | | |
| | | |
4.00% | | | 03/01/41 | | | | 2,331,479 | | | | 2,527,738 | |
| |
Freddie Mac, Pool #G06498 | | | | | |
| | | |
4.00% | | | 04/01/41 | | | | 1,693,594 | | | | 1,820,162 | |
| |
Freddie Mac, Pool #G06499 | | | | | |
| | | |
4.00% | | | 03/01/41 | | | | 1,236,183 | | | | 1,323,734 | |
| |
Freddie Mac, Pool #G07849 | | | | | |
| | | |
3.50% | | | 05/01/44 | | | | 1,373,731 | | | | 1,450,535 | |
| |
Freddie Mac, Pool #G07924 | | | | | |
| | | |
3.50% | | | 01/01/45 | | | | 2,689,797 | | | | 2,838,501 | |
| |
Freddie Mac, Pool #G08710 | | | | | |
| | | |
3.00% | | | 06/01/46 | | | | 4,293,993 | | | | 4,406,257 | |
| |
Freddie Mac, Pool #G08711 | | | | | |
| | | |
3.50% | | | 06/01/46 | | | | 7,917,367 | | | | 8,231,365 | |
| |
Freddie Mac, Pool #G08715 | | | | | |
| | | |
3.00% | | | 08/01/46 | | | | 8,035,382 | | | | 8,245,461 | |
| |
Freddie Mac, Pool #G08716 | | | | | |
| | | |
3.50% | | | 08/01/46 | | | | 5,340,475 | | | | 5,552,274 | |
| |
Freddie Mac, Pool #G08721 | | | | | |
| | | |
3.00% | | | 09/01/46 | | | | 6,475,034 | | | | 6,644,319 | |
| |
Freddie Mac, Pool #G08722 | | | | | |
| | | |
3.50% | | | 09/01/46 | | | | 2,089,172 | | | | 2,172,027 | |
| |
Freddie Mac, Pool #G08726 | | | | | |
| | | |
3.00% | | | 10/01/46 | | | | 6,218,520 | | | | 6,381,099 | |
| |
Freddie Mac, Pool #G08732 | | | | | |
| | | |
3.00% | | | 11/01/46 | | | | 6,049,756 | | | | 6,207,922 | |
| |
Freddie Mac, Pool #G08795 | | | | | |
| | | |
3.00% | | | 01/01/48 | | | | 1,254,290 | | | | 1,281,128 | |
| |
Freddie Mac, Pool #G08816 | | | | | |
| | | |
3.50% | | | 06/01/48 | | | | 1,887,122 | | | | 1,942,151 | |
| |
Freddie Mac, Pool #G08826 | | | | | |
| | | |
5.00% | | | 06/01/48 | | | | 1,381,173 | | | | 1,480,355 | |
| |
Freddie Mac, Pool #G16584 | | | | | |
| | | |
3.50% | | | 08/01/33 | | | | 5,054,931 | | | | 5,254,760 | |
| |
Freddie Mac, Pool #G18592 | | | | | |
| | | |
3.00% | | | 03/01/31 | | | | 1,789,964 | | | | 1,841,212 | |
| |
Freddie Mac, Pool #G18670 | | | | | |
| | | |
3.00% | | | 12/01/32 | | | | 1,348,981 | | | | 1,387,414 | |
| |
Freddie Mac, Pool #G18713 | | | | | |
| | | |
3.50% | | | 11/01/33 | | | | 4,022,422 | | | | 4,168,527 | |
| | | | | | | | | | | | |
| Issues | | Maturity
Date | | | Principal
Amount | | | Value | |
|
RESIDENTIAL MORTGAGE-BACKED SECURITIES —
AGENCY (Continued) | |
| |
Freddie Mac, Pool #G60344 | | | | | |
| | | |
4.00% | | | 12/01/45 | | | $ | 1,215,228 | | | $ | 1,300,681 | |
| |
Freddie Mac, Pool #G67700 | | | | | |
| | | |
3.50% | | | 08/01/46 | | | | 1,821,381 | | | | 1,919,798 | |
| |
Freddie Mac, Pool #G67703 | | | | | |
| | | |
3.50% | | | 04/01/47 | | | | 10,839,167 | | | | 11,406,724 | |
| |
Freddie Mac, Pool #G67706 | | | | | |
| | | |
3.50% | | | 12/01/47 | | | | 7,376,051 | | | | 7,758,746 | |
| |
Freddie Mac, Pool #G67707 | | | | | |
| | | |
3.50% | | | 01/01/48 | | | | 12,876,424 | | | | 13,600,862 | |
| |
Freddie Mac, Pool #G67708 | | | | | |
| | | |
3.50% | | | 03/01/48 | | | | 14,455,885 | | | | 15,155,684 | |
| |
Freddie Mac, Pool #G67710 | | | | | |
| | | |
3.50% | | | 03/01/48 | | | | 12,618,473 | | | | 13,172,857 | |
| |
Freddie Mac, Pool #G67711 | | | | | |
| | | |
4.00% | | | 03/01/48 | | | | 4,109,141 | | | | 4,389,352 | |
| |
Freddie Mac, Pool #G67718 | | | | | |
| | | |
4.00% | | | 01/01/49 | | | | 5,365,287 | | | | 5,684,150 | |
| |
Freddie Mac, Pool #Q05261 | | | | | |
| | | |
3.50% | | | 12/01/41 | | | | 1,908,799 | | | | 2,017,383 | |
| |
Freddie Mac, Pool #Q20178 | | | | | |
| | | |
3.50% | | | 07/01/43 | | | | 3,369,877 | | | | 3,575,402 | |
| |
Ginnie Mae (08-27-SI) (I/O) (I/F) | | | | | |
| | | |
4.62% (-1.00 x 1 mo. USD LIBOR + 6.470%) (2) | | | 03/20/38 | | | | 316,709 | | | | 64,282 | |
| |
Ginnie Mae (08-81-S) (I/O) (I/F) | | | | | |
| | | |
4.35% (-1.00 x 1 mo. USD LIBOR + 6.200%) (2) | | | 09/20/38 | | | | 1,197,340 | | | | 239,393 | |
| |
Ginnie Mae (09-66-UF) | | | | | |
| | | |
2.89% (1 mo. USD LIBOR + 1.000%) (2) | | | 08/16/39 | | | | 466,044 | | | | 475,106 | |
| |
Ginnie Mae (10-1-S) (I/O) (I/F) | | | | | |
| | | |
3.90% (-1.00 x 1 mo. USD LIBOR + 5.750%) (2) | | | 01/20/40 | | | | 1,867,790 | | | | 193,519 | |
| |
Ginnie Mae (18-124-NW) | | | | | |
| | | |
3.50% | | | 09/20/48 | | | | 2,344,628 | | | | 2,404,874 | |
| |
Ginnie Mae, Pool #608259 | | | | | |
| | | |
4.50% | | | 08/15/33 | | | | 38,706 | | | | 41,649 | |
| |
Ginnie Mae, Pool #782114 | | | | | |
| | | |
5.00% | | | 09/15/36 | | | | 125,638 | | | | 140,924 | |
| |
Ginnie Mae, Pool #MA4127 | | | | | |
| | | |
3.50% | | | 12/20/46 | | | | 4,107,669 | | | | 4,292,024 | |
| |
Ginnie Mae II, Pool #MA6030 | | | | | |
| | | |
3.50% (7) | | | 07/20/49 | | | | 1,759,254 | | | | 1,798,902 | |
| |
Ginnie Mae II, Pool #MA3521 | | | | | |
| | | |
3.50% | | | 03/20/46 | | | | 3,251,217 | | | | 3,406,278 | |
See accompanying notes to financial statements.
23
TCW Core Fixed Income Fund
Schedule of Investments (Continued)
| | | | | | | | | | | | |
| Issues | | Maturity
Date | | | Principal
Amount | | | Value | |
|
RESIDENTIAL MORTGAGE-BACKED SECURITIES —
AGENCY (Continued) | |
| |
Ginnie Mae II, Pool #MA3597 | | | | | |
| | | |
3.50% | | | 04/20/46 | | | $ | 3,133,980 | | | $ | 3,283,450 | |
| |
Ginnie Mae II, Pool #MA3663 | | | | | |
| | | |
3.50% | | | 05/20/46 | | | | 3,156,377 | | | | 3,304,461 | |
| |
Ginnie Mae II, Pool #MA4126 | | | | | |
| | | |
3.00% | | | 12/20/46 | | | | 8,362,556 | | | | 8,644,553 | |
| |
Ginnie Mae II, Pool #MA4196 | | | | | |
| | | |
3.50% | | | 01/20/47 | | | | 2,693,145 | | | | 2,810,480 | |
| |
Ginnie Mae II, Pool #MA4454 | | | | | |
| | | |
5.00% | | | 05/20/47 | | | | 1,060,995 | | | | 1,139,795 | |
| |
Ginnie Mae II, Pool #MA4510 | | | | | |
| | | |
3.50% | | | 06/20/47 | | | | 1,551,104 | | | | 1,616,221 | |
| |
Ginnie Mae II, Pool #MA4589 | | | | | |
| | | |
5.00% | | | 07/20/47 | | | | 2,737,359 | | | | 2,943,588 | |
| |
Ginnie Mae II, Pool #MA4722 | | | | | |
| | | |
5.00% | | | 09/20/47 | | | | 983,855 | | | | 1,057,935 | |
| |
Ginnie Mae II, Pool #MA4777 | | | | | |
| | | |
3.00% | | | 10/20/47 | | | | 1,177,898 | | | | 1,217,574 | |
| |
Ginnie Mae II, Pool #MA4836 | | | | | |
| | | |
3.00% | | | 11/20/47 | | | | 4,657,869 | | | | 4,802,873 | |
| |
Ginnie Mae II, Pool #MA4837 | | | | | |
| | | |
3.50% | | | 11/20/47 | | | | 10,273,506 | | | | 10,703,053 | |
| |
Ginnie Mae II, Pool #MA4838 | | | | | |
| | | |
4.00% | | | 11/20/47 | | | | 3,064,189 | | | | 3,212,210 | |
| |
Ginnie Mae II, Pool #MA4901 | | | | | |
| | | |
4.00% | | | 12/20/47 | | | | 5,338,112 | | | | 5,595,808 | |
| |
Ginnie Mae II, Pool #MA5078 | | | | | |
| | | |
4.00% | | | 03/20/48 | | | | 4,590,936 | | | | 4,808,241 | |
| |
Ginnie Mae II, Pool #MA5399 | | | | | |
| | | |
4.50% | | | 08/20/48 | | | | 9,849,071 | | | | 10,370,636 | |
| |
Ginnie Mae II, Pool #MA5466 | | | | | |
| | | |
4.00% | | | 09/20/48 | | | | 317,016 | | | | 330,809 | |
| |
Ginnie Mae II, Pool #MA5467 | | | | | |
| | | |
4.50% | | | 09/20/48 | | | | 634,006 | | | | 666,986 | |
| |
Ginnie Mae II, Pool #MA6209 | | | | | |
| | | |
3.00% (7) | | | 10/20/49 | | | | 5,895,000 | | | | 5,978,057 | |
| |
Ginnie Mae II TBA, 30 Year | | | | | |
| | | |
3.00% (8) | | | 06/01/49 | | | | 19,075,000 | | | | 19,636,802 | |
| | | |
4.50% (8) | | | 07/01/48 | | | | 7,485,000 | | | | 7,848,964 | |
| |
Uniform Mortgage-Backed Securities TBA, 15 Year | | | | | |
| | | |
2.50% (8) | | | 07/01/34 | | | | 25,750,000 | | | | 26,028,623 | |
| | | |
3.00% (8) | | | 12/01/33 | | | | 730,000 | | | | 747,311 | |
| |
Uniform Mortgage-Backed Securities TBA, 30 Year | | | | | |
| | | |
2.50% (8) | | | 08/01/49 | | | | 4,400,000 | | | | 4,369,062 | |
| | | |
3.00% (8) | | | 06/01/49 | | | | 9,150,000 | | | | 9,300,117 | |
| | | |
4.50% (8) | | | 09/01/48 | | | | 5,685,000 | | | | 5,986,350 | |
| | | | | | | | | | | | |
| Issues | | Maturity
Date | | | Principal
Amount | | | Value | |
|
RESIDENTIAL MORTGAGE-BACKED SECURITIES —
AGENCY (Continued) | |
| | | |
5.00% (8) | | | 10/01/48 | | | $ | 4,425,000 | | | $ | 4,736,133 | |
| | | | | | | | | | | | |
| | |
Total Residential Mortgage-backed Securities — Agency | | | | | | | | | |
| | |
(Cost: $387,729,112) | | | | | | | | 397,376,455 | |
| | | | | | | | | | | | |
|
RESIDENTIAL MORTGAGE-BACKED SECURITIES —
NON-AGENCY — 6.3% | |
| |
Aames Mortgage Investment Trust (06-1-A4) | | | | | |
| | | |
2.38% (1 mo. USD LIBOR + 0.560%) (2) | | | 04/25/36 | | | | 6,245,361 | | | | 6,201,874 | |
| |
Aegis Asset Backed Securities Trust (05-5-2A) | | | | | |
| | | |
2.07% (1 mo. USD LIBOR + 0.250%) (2) | | | 12/25/35 | | | | 3,284,756 | | | | 3,294,134 | |
| |
Banc of America Funding Trust (15-R2-9A1) | | | | | |
| | | |
2.04% (1 mo. USD LIBOR + 0.215%) (1),(2) | | | 03/27/36 | | | | 1,613,399 | | | | 1,612,717 | |
| |
Centex Home Equity (02-C-AF6) | | | | | |
| | | |
4.50% (6) | | | 09/25/32 | | | | 8,805 | | | | 8,845 | |
| |
CIM Trust (17-7-A) | | | | | |
| | | |
3.00% (1),(6) | | | 04/25/57 | | | | 5,657,484 | | | | 5,711,147 | |
| |
Citigroup Mortgage Loan Trust (06-2AD) | | | | | |
| | | |
2.06% | | | 08/25/36 | | | | 2,252,042 | | | | 2,226,641 | |
| |
Citigroup Mortgage Loan Trust, Inc. (05-5-2A2) | | | | | |
| | | |
5.75% (9) | | | 08/25/35 | | | | 319,523 | | | | 265,428 | |
| |
Conseco Financial Corp. (98-6-A8) | | | | | |
| | | |
6.66% (6) | | | 06/01/30 | | | | 416,038 | | | | 430,346 | |
| |
Credit Suisse First Boston Mortgage Securities Corp. (03-8-4PPA) | | | | | |
| | | |
5.75% | | | 04/22/33 | | | | 7,290 | | | | 7,834 | |
| |
CSMC Series, Ltd. (10-3R-2A3) | | | | | |
| | | |
4.50% (1),(6) | | | 12/26/36 | | | | 3,403,539 | | | | 3,488,803 | |
| |
CSMC Series, Ltd. (15-5R-1A1) | | | | | |
| | | |
3.37% (1),(6) | | | 09/27/46 | | | | 2,903,871 | | | | 2,901,525 | |
| |
CSMC Trust (14-7R-8A1) | | | | | |
| | | |
3.82% (1),(6) | | | 07/27/37 | | | | 2,245,631 | | | | 2,254,816 | |
| |
CSMC Trust (18-RPL9-A) | | | | | |
| | | |
3.85% (1),(6) | | | 09/25/57 | | | | 5,165,345 | | | | 5,458,001 | |
| |
GS Mortgage-Backed Securities Trust (18-RPL1-A1A) | | | | | |
| | | |
3.75% (1) | | | 10/25/57 | | | | 5,138,772 | | | | 5,252,141 | |
| |
GSAA Home Equity Trust (05-11-2A2) | | | | | |
| | | |
2.14% (1 mo. USD LIBOR + 0.320%) (2) | | | 10/25/35 | | | | 1,520,813 | | | | 1,540,368 | |
| |
Home Equity Asset Trust (06-3-1A1) | | | | | |
| | | |
2.02% (1 mo. USD LIBOR + 0.200%) (2) | | | 07/25/36 | | | | 2,204,021 | | | | 2,210,113 | |
| |
Indymac Index Mortgage Loan Trust (05-AR6-2A1) | | | | | |
| | | |
2.30% (1 mo. USD LIBOR + 0.480%) (2) | | | 04/25/35 | | | | 792,362 | | | | 780,889 | |
See accompanying notes to financial statements.
24
TCW Core Fixed Income Fund
| | | | | | | | | | | | |
| Issues | | Maturity
Date | | | Principal
Amount | | | Value | |
|
RESIDENTIAL MORTGAGE-BACKED SECURITIES —
NON-AGENCY (Continued) | |
| |
Mid-State Trust (04-1-B) | | | | | |
| | | |
8.90% | | | 08/15/37 | | | $ | 1,019,223 | | | $ | 1,160,256 | |
| |
Morgan Stanley Capital, Inc. (04-WMC2-M1) | | | | | |
| | | |
2.74% (1 mo. USD LIBOR + 0.915%) (2) | | | 07/25/34 | | | | 1,073,714 | | | | 1,082,501 | |
| |
Morgan Stanley Mortgage Loan Trust (04-3-4A) | | | | | |
| | | |
5.61% (6) | | | 04/25/34 | | | | 175,399 | | | | 191,701 | |
| |
New Century Home Equity Loan Trust (05-D-A1) | | | | | |
| | | |
2.04% (1 mo. USD LIBOR + 0.220%) (2) | | | 02/25/36 | | | | 4,973,006 | | | | 4,889,046 | |
| |
Nomura Resecuritization Trust (14-5R-3A1) | | | | | |
| | | |
2.26% (1 mo. USD LIBOR + 0.240%) (1)(2) | | | 05/26/37 | | | | 26,397 | | | | 26,516 | |
| |
Nomura Resecuritization Trust (15-5R-2A1) | | | | | |
| | | |
4.23% (1),(6) | | | 03/26/35 | | | | 1,012,895 | | | | 1,024,695 | |
| |
Option One Mortgage Loan Trust (05-2-M1) | | | | | |
| | | |
2.48% (1 mo. USD LIBOR + 0.660%) (2) | | | 05/25/35 | | | | 3,141,948 | | | | 3,156,723 | |
|
Structured Asset Investment Loan Trust (04-6-A3) | |
| | | |
2.62% (1 mo. USD LIBOR + 0.800%)(2) | | | 07/25/34 | | | | 3,303,393 | | | | 3,232,824 | |
| |
Structured Asset Securities Corp. (03-34A-5A4) | | | | | |
| | | |
4.28% (6) | | | 11/25/33 | | | | 341,179 | | | | 355,083 | |
| |
WaMu Mortgage Pass-Through Certificates (05-AR15-A1A1) | | | | | |
| | | |
2.08% (1 mo. USD LIBOR + 0.260%) (2) | | | 11/25/45 | | | | 4,605,146 | | | | 4,529,683 | |
| |
WaMu Mortgage Pass-Through Certificates (05-AR3-A2) | | | | | |
| | | |
4.43% (6) | | | 03/25/35 | | | | 1,246,523 | | | | 1,283,389 | |
| |
Wells Fargo Alternative Loan Trust (07-PA3-2A1) | | | | | |
| | | |
6.00% | | | 07/25/37 | | | | 95,730 | | | | 96,055 | |
| |
Wells Fargo Home Equity Asset-Backed Securities Trust (05-3-M6) | | | | | |
| | | |
2.83% (1 mo. USD LIBOR + 1.005%) (2) | | | 11/25/35 | | | | 4,087,681 | | | | 4,103,119 | |
| |
Wells Fargo Home Equity Trust (04-2-A33) | | | | | |
| | | |
2.82% (1 mo. USD LIBOR + 1.000%) (2) | | | 10/25/34 | | | | 5,475,454 | | | | 5,486,861 | |
| | | | | | | | | | | | |
| | |
Total Residential Mortgage-backed Securities — Non-agency | | | | | | | | | |
| | |
(Cost: $72,436,100) | | | | | | | | 74,264,074 | |
| | | | | | | | | | | | |
|
| U.S. TREASURY BONDS — 5.1% (Cost: $60,797,311) | |
| | |
U.S. Treasury Bond, 2.25%, due 08/15/49 | | | | 59,521,000 | | | | 60,497,516 | |
| | | | | | | | | | | | |
|
| U.S. TREASURY SECURITIES — 22.5% | |
| |
U.S. Treasury Inflation Indexed Note | | | | | |
| | | |
0.13% (10) | | | 07/15/24 | | | | 1,815,223 | | | | 1,818,145 | |
| | | | | | | | | | | | |
| Issues | | Maturity
Date | | | Principal
Amount | | | Value | |
|
| U.S. TREASURY SECURITIES (Continued) | |
| | | |
0.13% (10) | | | 10/15/24 | | | $ | 4,834,855 | | | $ | 4,848,838 | |
| | | |
0.13% (10) | | | 07/15/26 | | | | 3,730,100 | | | | 3,731,749 | |
| | | |
0.25% (10) | | | 07/15/29 | | | | 12,924,529 | | | | 13,068,068 | |
| | | |
1.00% (10) | | | 02/15/49 | | | | 12,502,864 | | | | 14,082,496 | |
| |
U.S. Treasury Note | | | | | |
| | | |
1.25% | | | 08/31/24 | | | | 48,199,000 | | | | 47,617,129 | |
| | | |
1.50% | | | 08/31/21 | | | | 22,985,000 | | | | 22,962,553 | |
| | | |
1.50% | | | 09/30/21 | | | | 11,195,000 | | | | 11,185,555 | |
| | | |
1.50% | | | 10/31/21 | | | | 17,215,000 | | | | 17,208,196 | |
| | | |
1.50% | | | 09/30/24 | | | | 75,030,000 | | | | 74,945,053 | |
| | | |
1.50% | | | 10/31/24 | | | | 45,050,000 | | | | 45,009,525 | |
| | | |
1.63% | | | 08/15/29 | | | | 10,776,000 | | | | 10,713,280 | |
| | | | | | | | | | | | |
| | |
Total U.S. Treasury Securities | | | | | | | | | |
| | |
(Cost: $266,161,489) | | | | | | | | 267,190,587 | |
| | | | | | | | | | | | |
| | |
Total Fixed Income Securities | | | | | | | | | |
| | |
(Cost: $1,205,202,109) | | | | | | | | 1,239,099,699 | |
| | | | | | | | | | | | |
| | | |
| | | | | | | | | | | | |
| | | | | | Number of
Shares | | | | |
|
| MONEY MARKET INVESTMENTS — 3.8% | |
| | |
Dreyfus Government Cash Management Fund — Institutional Shares, 1.67% (11) | | | | 424,000 | | | | 424,000 | |
| | |
State Street Institutional U.S. Government Money Market Fund — Premier Class, 1.75% (11) | | | | 44,649,791 | | | | 44,649,791 | |
| | | | | | | | | | | | |
| |
Total Money Market Investments | | | | | |
| |
(Cost: $45,073,791) | | | | 45,073,791 | |
| | | | | | | | | | | | |
| | | |
| | | | | | | | | | | | |
| | | | | | Principal
Amount | | | | |
|
SHORT TERM INVESTMENTS — 1.9% | |
|
COMMERCIAL PAPER — 0.3% (Cost: $3,448,469) | |
|
Auto Manufacturers — 0.3% (Cost: $3,448,469) | |
| | |
Ford Motor Credit Co. | | | | | | | | | |
| | | |
3.24% | | | 10/14/20 | | | $ | 3,555,000 | | | | 3,449,713 | |
| | | | | | | | | | | | |
|
FOREIGN GOVERNMENT BONDS — 1.5% | |
| |
Japan Treasury Bill | | | | | |
| | | |
0.00% (5) | | | 01/20/20 | | | JPY | 640,000,000 | | | | 5,923,154 | |
| | | |
0.00% (5) | | | 01/27/20 | | | JPY | 645,000,000 | | | | 5,969,608 | |
| | | |
0.00% (5) | | | 01/14/20 | | | JPY | 640,000,000 | | | | 5,922,428 | |
| | | | | | | | | | | | |
| |
Total Foreign Government Bonds | | | | | |
| |
(Cost: $17,850,198) | | | | 17,815,190 | |
| | | | | | | | | | | | |
|
U.S. TREASURY SECURITIES — 0.1% (Cost: $1,338,135) | |
| |
U.S. Treasury Bill | | | | | |
| | | |
1.54% (12)(13) | | | 12/26/19 | | | | 1,342,000 | | | | 1,338,858 | |
| | | | | | | | | | | | |
See accompanying notes to financial statements.
25
TCW Core Fixed Income Fund
Schedule of Investments (Continued)
| | | | | | | | |
| Issues | | | | | | Value | |
| |
Total Short Term Investments | | | | |
| |
(Cost: $22,636,802) | | $ | 22,603,761 | |
| | | | | | | | |
| |
Total Investments (110.1%) | | | | |
| |
(Cost: $1,272,912,702) | | | 1,306,777,251 | |
| |
Liabilities In Excess Of Other Assets (-10.1%) | | | (119,774,568 | ) |
| | | | | | | | |
| |
Net Assets (100.0%) | | $ | 1,187,002,683 | |
| | | | | | | | |
| | | | | | | | | | | | | | | | | | |
| Futures Contracts | |
| | | | | |
Number of
Contracts | | Type | | Expiration
Date | | | Notional | | | Value | | | Net Unrealized
Appreciation/
Depreciation | |
Long Futures | | | | | | | | | | | | | | | | | | |
| 317 | | 2-Year U.S. Treasury Note Futures | | | 12/31/19 | | | $ | 68,483,586 | | | $ | 68,345,695 | | | $ | (137,891 | ) |
| 72 | | 2-Year U.S. Treasury Note Futures | | | 03/31/20 | | | | 15,529,293 | | | | 15,553,125 | | | | 23,832 | |
| 296 | | 5-Year U.S. Treasury Note Futures | | | 12/31/19 | | | | 35,419,735 | | | | 35,284,125 | | | | (135,610 | ) |
| 49 | | 5-Year U.S. Treasury Note Futures | | | 03/31/20 | | | | 5,859,868 | | | | 5,857,414 | | | | (2,454 | ) |
| | | | | | | | | | | | | | | | | | |
| | | | | | | | $ | 125,292,482 | | | $ | 125,040,359 | | | $ | (252,123 | ) |
| | | | | | | | | | | | | | | | | | |
| | | | | | | | | | | | | | | | | | | | | | | | |
| Forward Currency Exchange Contracts | |
| | | | | | |
| Counterparty | | Contracts to
Deliver | | | Units of
Currency | | | Settlement
Date | | | In Exchange for
U.S. Dollars | | | Contracts at
Value | | | Unrealized
Appreciation
(Depreciation) | |
SELL (14) | | | | | | | | | | | | | | | | | | | | | | | | |
Citibank N.A. | | | JPY | | | | 645,000,000 | | | | 01/27/20 | | | $ | 5,983,552 | | | $ | 6,000,161 | | | $ | (16,609 | ) |
Goldman Sachs & Co. | | | JPY | | | | 640,000,000 | | | | 01/14/20 | | | | 6,000,628 | | | | 5,949,168 | | | | 51,460 | |
Goldman Sachs & Co. | | | JPY | | | | 640,000,000 | | | | 01/21/20 | | | | 5,987,128 | | | | 5,951,580 | | | | 35,548 | |
| | | | | | | | | | | | | | | | | | | | | | | | |
| | | | | | | | | | | | | | $ | 17,971,308 | | | $ | 17,900,909 | | | $ | 70,399 | |
| | | | | | | | | | | | | | | | | | | | | | | | |
| | | | | | | | | | | | | | | | | | | | | | | | |
| Centrally Cleared-Interest Rate Swap Agreements | | | | | | | | | |
| | | | | | | |
Notional
Amount | | Expiration
Date | | | Payment
Frequency | | | Payment Made
by Fund | | Payment Received
by Fund | | Unrealized
Appreciation | | | Premium
Paid | | | Value | |
| 66,260,000 (15) | | | 04/11/22 | | | | Quarterly | | | 3 Month USD LIBOR | | 2.26% | | $ | 1,054,044 | | | $ | — | | | $ | 1,054,044 | |
| 25,640,000 (15) | | | 05/08/22 | | | | Quarterly | | | 3 Month USD LIBOR | | 2.28% | | | 422,086 | | | | — | | | | 422,086 | |
| 10,505,000 (15) | | | 05/08/25 | | | | Quarterly | | | 2.37% | | 3 Month USD LIBOR | | | (463,296 | ) | | | — | | | | (463,296 | ) |
| 27,240,000 (15) | | | 04/11/25 | | | | Quarterly | | | 2.33% | | 3 Month USD LIBOR | | | (1,157,934 | ) | | | — | | | | (1,157,934 | ) |
| | | | | | | | | | | | | | | | | | | | | | | | |
| | | | | | | | | | | | | | $ | (145,100 | ) | | $ | — | | | $ | (145,100 | ) |
| | | | | | | | | | | | | | | | | | | | | | | | |
See accompanying notes to financial statements.
26
TCW Core Fixed Income Fund
Notes to Schedule of Investments:
| ABS - | | Asset-Backed Securities. |
| ACES - | | Alternative Credit Enhancement Securities. |
| CLO - | | Collateralized Loan Obligation. |
| EETC - | | Enhanced Equipment Trust Certificate. |
| I/F - | | Inverse Floating rate security whose interest rate moves in the opposite direction of prevailing interest rates. |
| I/O - | | Interest Only Security. |
| PAC - | | Planned Amortization Class. |
| REIT - | | Real Estate Investment Trust. |
| TAC - | | Target Amortization Class. |
| (1) | | Security exempt from registration under Rule 144A of the Securities Act of 1933, as amended. These securities may be resold, normally only to qualified institutional buyers. At October 31, 2019, the value of these securities amounted to $139,308,808 or 11.7% of net assets. These securities are determined to be liquid by the Fund’s investment advisor, unless otherwise noted, under procedures established by and under the general supervision of the Company’s Board of Directors. |
| (2) | | Floating or variable rate security. The interest shown reflects the rate in effect at October 31, 2019. |
| (3) | | For fair value measurement disclosure purposes, security is categorized as Level 3. Security is valued using significant unobservable inputs. |
| (4) | | Restricted security (Note 11). |
| (5) | | Security is not accruing interest. |
| (6) | | Variable rate security. Interest rate disclosed is as of the most recent information available. Certain variable rate securities are not based on a published reference rate and spread but are determined by the issuer or agent and are based on current market conditions. These securities do not indicate a reference rate and spread in their description above. |
| (7) | | This security is purchased on a when-issued, delayed delivery or forward commitment basis. |
| (8) | | Security purchased on a forward commitment with an approximate principal amount. The actual principal amount and maturity date will be determined upon settlement when the security is delivered. |
| (9) | | A portion of the principal balance has been written-off during the period due to defaults in the underlying loans. Cost basis has been adjusted. |
| (10) | | Interest rate for this security is a stated rate. Interest payments are determined based on the inflation-adjusted principal. |
| (11) | | Rate disclosed is the 7-day net yield as of October 31, 2019. |
| (12) | | Rate shown represents yield-to-maturity. |
| (13) | | All or a portion of this security is held as collateral for open futures contracts. |
| (14) | | Fund sells foreign currency, buys U.S. Dollar. |
| (15) | | This instrument has a forward starting effective date. See Note 2, Significant Accounting Policies in the Notes to Financial Statements for further information. |
See accompanying notes to financial statements.
27
TCW Core Fixed Income Fund
Investments by Sector | October 31, 2019 |
| | | | |
| Sector | | Percentage of
Net Assets | |
Residential Mortgage-Backed Securities — Agency | | | 33.5 | % |
U.S. Treasury Securities | | | 27.7 | |
Corporate Bonds | | | 23.8 | |
Asset-Backed Securities | | | 6.3 | |
Residential Mortgage-Backed Securities — Non-Agency | | | 6.3 | |
Commercial Mortgage-Backed Securities — Agency | | | 4.3 | |
Money Market Investments | | | 3.8 | |
Commercial Mortgage-Backed Securities — Non-Agency | | | 2.0 | |
Foreign Government Bonds | | | 1.5 | |
Municipal Bonds | | | 0.6 | |
Commercial Paper | | | 0.3 | |
Other* | | | (10.1 | ) |
| | | | |
Total | | | 100.0 | % |
| | | | |
| * | Includes futures, and swaps, pending trades, interest receivable, fund share transactions and accrued expenses payable. |
See accompanying notes to financial statements.
28
TCW Core Fixed Income Fund
Fair Valuation Summary | October 31, 2019 |
The following is a summary of the fair valuations according to the inputs used as of October 31, 2019 in valuing the Fund’s investments:
| | | | | | | | | | | | | | | | |
Description | | Quoted Prices
in Active
Markets for
Identical Assets
(Level 1) | | | Other
Significant
Observable
Inputs
(Level 2) | | | Significant
Unobservable
Inputs
(Level 3) | | | Total | |
Fixed Income Securities | | | | | | | | | | | | | | | | |
Corporate Bonds* | | $ | — | | | $ | 281,960,812 | | | $ | 984,406 | | | $ | 282,945,218 | |
Municipal Bonds | | | — | | | | 6,863,932 | | | | — | | | | 6,863,932 | |
Asset-Backed Securities | | | — | | | | 75,008,230 | | | | — | | | | 75,008,230 | |
Commercial Mortgage-Backed Securities — Agency | | | — | | | | 51,160,202 | | | | — | | | | 51,160,202 | |
Commercial Mortgage-Backed Securities — Non-Agency | | | — | | | | 23,793,485 | | | | — | | | | 23,793,485 | |
Residential Mortgage-Backed Securities — Agency | | | — | | | | 397,376,455 | | | | — | | | | 397,376,455 | |
Residential Mortgage-Backed Securities — Non-Agency | | | — | | | | 74,264,074 | | | | — | | | | 74,264,074 | |
U.S. Treasury Bonds | | | 60,497,516 | | | | — | | | | — | | | | 60,497,516 | |
U.S. Treasury Securities | | | 229,641,291 | | | | 37,549,296 | | | | — | | | | 267,190,587 | |
| | | | | | | | | | | | | | | | |
Total Fixed Income Securities | | | 290,138,807 | | | | 947,976,486 | | | | 984,406 | | | | 1,239,099,699 | |
| | | | | | | | | | | | | | | | |
Money Market Investments | | | 45,073,791 | | | | — | | | | — | | | | 45,073,791 | |
Short-Term Investments* | | | 1,338,858 | | | | 21,264,903 | | | | — | | | | 22,603,761 | |
| | | | | | | | | | | | | | | | |
Total Investments | | $ | 336,551,456 | | | $ | 969,241,389 | | | $ | 984,406 | | | $ | 1,306,777,251 | |
| | | | | | | | | | | | | | | | |
Asset Derivatives | | | | | | | | | | | | | | | | |
Forward Currency Contracts | | | | | | | | | | | | | | | | |
Foreign Currency Risk | | | — | | | | 87,008 | | | | — | | | | 87,008 | |
Futures Contracts | | | | | | | | | | | | | | | | |
Interest Rate Risk | | | 23,832 | | | | — | | | | — | | | | 23,832 | |
Swap Agreements | | | | | | | | | | | | | | | | |
Interest Rate Risk | | | — | | | | 1,476,130 | | | | — | | | | 1,476,130 | |
| | | | | | | | | | | | | | | | |
Total | | $ | 336,575,288 | | | $ | 970,804,527 | | | $ | 984,406 | | | $ | 1,308,364,221 | |
| | | | | | | | | | | | | | | | |
Liability Derivatives | | | | | | | | | | | | | | | | |
Futures Contracts | | | | | | | | | | | | | | | | |
Interest Rate Risk | | $ | (275,955 | ) | | $ | — | | | $ | — | | | $ | (275,955 | ) |
Forward Currency Contracts | | | | | | | | | | | | | | | | |
Foreign Currency Risk | | | — | | | | (16,609 | ) | | | — | | | | (16,609 | ) |
Swap Agreements | | | | | | | | | | | | | | | | |
Interest Rate Risk | | | — | | | | (1,621,230 | ) | | | — | | | | (1,621,230 | ) |
| | | | | | | | | | | | | | | | |
Total | | $ | (275,955 | ) | | $ | (1,637,839 | ) | | $ | — | | | $ | (1,913,794 | ) |
| | | | | | | | | | | | | | | | |
| * | See Schedule of Investments for corresponding industries. |
See accompanying notes to financial statements.
29
TCW Enhanced Commodity Strategy Fund
Consolidated Schedule of Investments
| | | | | | | | | | | | |
| Issues | | Maturity
Date | | | Principal
Amount | | | Value | |
|
FIXED INCOME SECURITIES — 78.7% | |
|
ASSET-BACKED SECURITIES — 9.6% | |
| |
BA Credit Card Trust (18-A2-A2) | | | | | |
| | | |
3.00% | | | 09/15/23 | | | $ | 10,000 | | | $ | 10,170 | |
| |
BlueMountain CLO, Ltd. (13-1A-A1R2) | | | | | |
| | | |
3.20% (3 mo. USD LIBOR + 1.230%) (1)(2) | | | 01/20/29 | | | | 7,000 | | | | 7,006 | |
| |
Chase Issuance Trust (12-A7-A7) | | | | | |
| | | |
2.16% | | | 09/15/24 | | | | 10,000 | | | | 10,084 | |
| |
Citibank Credit Card Issuance Trust (14-A5-A5) | | | | | |
| | | |
2.68% | | | 06/07/23 | | | | 10,000 | | | | 10,139 | |
| |
Educational Services of America, Inc. (12-2-A) | | | | | |
| | | |
2.55% (1 mo. USD LIBOR + 0.730%) (1)(2) | | | 04/25/39 | | | | 5,564 | | | | 5,536 | |
| |
Madison Park Funding, Ltd. (18-30A-A) | | | | | |
| | | |
2.75% (3 mo. USD LIBOR + 0.750%) (1)(2) | | | 04/15/29 | | | | 10,000 | | | | 9,921 | |
| |
Nelnet Student Loan Trust (12-5A-A) | | | | | |
| | | |
2.42% (1 mo. USD LIBOR + 0.600%) (1)(2) | | | 10/27/36 | | | | 3,615 | | | | 3,595 | |
| |
Scholar Funding Trust (11-A-A) | | | | | |
| | | |
2.84% (3 mo. USD LIBOR + 0.900%) (1)(2) | | | 10/28/43 | | | | 3,166 | | | | 3,132 | |
| |
SLM Student Loan Trust (05-4-A3) | | | | | |
| | | |
2.06% (3 mo. USD LIBOR + 0.120%) (2) | | | 01/25/27 | | | | 11,265 | | | | 11,248 | |
| |
SLM Student Loan Trust (08-1-A4) | | | | | |
| | | |
2.59% (3 mo. USD LIBOR + 0.650%) (2) | | | 01/25/22 | | | | 9,661 | | | | 9,564 | |
| |
SLM Student Loan Trust (08-3-A3) | | | | | |
| | | |
2.94% (3 mo. USD LIBOR + 1.000%) (2) | | | 10/25/21 | | | | 9,944 | | | | 9,859 | |
| |
SLM Student Loan Trust (08-3-B) | | | | | |
| | | |
3.14% (3 mo. USD LIBOR + 1.200%) (2) | | | 04/26/83 | | | | 10,000 | | | | 9,593 | |
| |
SLM Student Loan Trust (13-4-A) | | | | | |
| | | |
2.37% (1 mo. USD LIBOR + 0.550%) (2) | | | 06/25/43 | | | | 9,221 | | | | 9,120 | |
| |
SLM Student Loan Trust (13-6-A3) | | | | | |
| | | |
2.47% (1 mo. USD LIBOR + 0.650%) (2) | | | 06/25/55 | | | | 10,628 | | | | 10,597 | |
| | | | | | | | | | | | |
| | | |
Total Asset-backed Securities | | | | | | | | | | | | |
| | | |
(Cost: $119,276) | | | | | | | | | | | 119,564 | |
| | | | | | | | | | | | |
|
COMMERCIAL MORTGAGE-BACKED SECURITIES —
AGENCY — 8.5% | |
| |
Fannie Mae (10-M5-X) (I/O) | | | | | |
| | | |
0.96% (3) | | | 07/25/20 | | | | 570,090 | | | | 1,973 | |
| |
Fannie Mae (12-M2-X) (I/O) | | | | | |
| | | |
0.69% (3) | | | 02/25/22 | | | | 138,166 | | | | 1,856 | |
| |
Fannie Mae, Pool #AL8939 | | | | | |
| | | |
2.48% | | | 11/01/22 | | | | 10,114 | | | | 10,256 | |
| | | | | | | | | | | | |
| Issues | | Maturity
Date | | | Principal
Amount | | | Value | |
|
COMMERCIAL MORTGAGE-BACKED SECURITIES —
AGENCY (Continued) | |
| |
Freddie Mac (KJ14-A1) | | | | | |
| | | |
2.20% | | | 11/25/23 | | | $ | 3,283 | | | $ | 3,313 | |
| |
Freddie Mac (KJ20-A1) | | | | | |
| | | |
3.21% | | | 10/25/24 | | | | 7,891 | | | | 8,264 | |
| |
Freddie Mac Multifamily Structured Pass-Through Certificates (KJ16-A1) | | | | | |
| | | |
1.97% | | | 04/25/22 | | | | 2,865 | | | | 2,875 | |
| |
Freddie Mac Multifamily Structured Pass-Through Certificates (KS03-A4) | | | | | |
| | | |
3.16% (3) | | | 05/25/25 | | | | 1,000 | | | | 1,049 | |
| |
Freddie Mac Multifamily Structured Pass-Through CertificatesFreddie Mac Multifamily Structured Pass Through Certificates (KC01-X1) (I/O) | | | | | |
| | | |
0.70% (3) | | | 12/25/22 | | | | 595,706 | | | | 6,047 | |
| |
Freddie Mac Multifamily Structured Pass-Through Certificates (KF19-A) | | | | | |
| | | |
2.47% (1 mo. USD LIBOR + 0.450%) (2) | | | 06/25/23 | | | | 5,443 | | | | 5,441 | |
| |
Freddie Mac Multifamily Structured Pass-Through Certificates (KF05-A) | | | | | |
| | | |
2.37% (1 mo. USD LIBOR + 0.350%) (2) | | | 09/25/21 | | | | 762 | | | | 762 | |
| |
Freddie Mac Multifamily Structured Pass-Through Certificates (KF14-A) | | | | | |
| | | |
2.67% (1 mo. USD LIBOR + 0.650%) (2) | | | 01/25/23 | | | | 6,852 | | | | 6,871 | |
| |
Freddie Mac Multifamily Structured Pass-Through Certificates (KS07-X) (I/O) | | | | | |
| | | |
0.65% (3) | | | 09/25/25 | | | | 500,000 | | | | 17,407 | |
| |
Freddie Mac Multifamily Structured Pass-Through Certificates (KS10-A10) | | | | | |
| | | |
2.41% (1 mo. USD LIBOR + 0.610%) (2) | | | 10/25/28 | | | | 14,441 | | | | 14,424 | |
| |
FRESB Mortgage Trust (16-SB17-A5F) | | | | | |
| | | |
1.86% (3) | | | 06/25/21 | | | | 10,606 | | | | 10,580 | |
| |
FRESB Mortgage Trust (16-SB20-A5F) | | | | | |
| | | |
1.74% (3) | | | 07/25/21 | | | | 4,437 | | | | 4,403 | |
| |
Ginnie Mae (11-53-IO) (I/O) | | | | | |
| | | |
0.00% (3) | | | 05/16/51 | | | | 559,560 | | | | 4,982 | |
| |
Ginnie Mae (13-1-IO) (I/O) | | | | | |
| | | |
0.66% (3) | | | 02/16/54 | | | | 149,556 | | | | 4,898 | |
| | | | | | | | | | | | |
| | |
Total Commercial Mortgage-backed Securities — Agency | | | | | | | | | |
| | | |
(Cost: $101,188) | | | | | | | | | | | 105,401 | |
| | | | | | | | | | | | |
|
COMMERCIAL MORTGAGE-BACKED SECURITIES —
NON-AGENCY — 9.8% | |
| |
Citigroup Commercial Mortgage Trust (13-GC11-AAB) | | | | | |
| | | |
2.69% | | | 04/10/46 | | | | 7,015 | | | | 7,075 | |
| |
COMM Mortgage Trust (12-CR2-ASB) | | | | | |
| | | |
2.75% | | | 08/15/45 | | | | 3,617 | | | | 3,629 | |
See accompanying notes to financial statements.
30
TCW Enhanced Commodity Strategy Fund
| | | | | | | | | | | | |
| Issues | | Maturity
Date | | | Principal
Amount | | | Value | |
|
COMMERCIAL MORTGAGE-BACKED SECURITIES —
NON-AGENCY (Continued) | |
| |
COMM Mortgage Trust (13-LC6-XB) (I/O) | | | | | |
| | | |
0.33% (1)(3) | | | 01/10/46 | | | $ | 100,000 | | | $ | 1,172 | |
| |
GS Mortgage Securities Corp. Trust (17-GPTX-XCP) (I/O) | | | | | |
| | | |
0.79% (1)(3) | | | 05/10/34 | | | | 150,000 | | | | 615 | |
| |
GS Mortgage Securities Trust (11-GC5-XA) (I/O) | | | | | |
| | | |
1.33% (1)(3) | | | 08/10/44 | | | | 773,716 | | | | 13,615 | |
| |
GS Mortgage Securities Trust (13-GC13-AAB) | | | | | |
| | | |
3.72% (3) | | | 07/10/46 | | | | 7,266 | | | | 7,466 | |
| |
JPMBB Commercial Mortgage Securities Trust (13-C17-XA) (I/O) | | | | | |
| | | |
0.76% (3) | | | 01/15/47 | | | | 133,690 | | | | 3,608 | |
| |
JPMBB Commercial Mortgage Securities Trust (14-C21-XA) (I/O) | | | | | |
| | | |
1.01% (3) | | | 08/15/47 | | | | 286,684 | | | | 10,772 | |
| |
JPMorgan Chase Commercial Mortgage Securities Trust (11-C4-XA) (I/O) | | | | | |
| | | |
1.18% (1)(3) | | | 07/15/46 | | | | 560,751 | | | | 7,560 | |
| |
LB-UBS Commercial Mortgage Trust (06-C6-XCL) (I/O) | | | | | |
| | | |
0.69% (1)(3)(4) | | | 09/15/39 | | | | 518,081 | | | | 4,392 | |
| |
Morgan Stanley Bank of America Merrill Lynch Trust (15-C20-ASB) | | | | | |
| | | |
3.07% | | | 02/15/48 | | | | 15,000 | | | | 15,425 | |
| |
Morgan Stanley Bank of America Merrill Lynch Trust (15-C25-ASB) | | | | | |
| | | |
3.38% | | | 10/15/48 | | | | 10,000 | | | | 10,434 | |
| |
Morgan Stanley Capital I Trust (11-C3-A4) | | | | | |
| | | |
4.12% | | | 07/15/49 | | | | 7,057 | | | | 7,247 | |
| |
Morgan Stanley Capital I Trust (15-MS1-ASB) | | | | | |
| | | |
3.46% | | | 05/15/48 | | | | 10,000 | | | | 10,384 | |
| |
Morgan Stanley Capital I Trust (18-H3-A1) | | | | | |
| | | |
3.18% | | | 07/15/51 | | | | 12,230 | | | | 12,418 | |
| |
WFRBS Commercial Mortgage Trust (12-C9-XA) (I/O) | | | | | |
| | | |
1.90% (1)(3) | | | 11/15/45 | | | | 113,197 | | | | 5,277 | |
| |
WFRBS Commercial Mortgage Trust (14-C20-A3) | | | | | |
| | | |
3.64% | | | 05/15/47 | | | | 1,452 | | | | 1,480 | |
| | | | | | | | | | | | |
| | |
Total Commercial Mortgage-backed Securities — Non-agency | | | | | | | | | |
| | | |
(Cost: $118,076) | | | | | | | | | | | 122,569 | |
| | | | | | | | | | | | |
|
RESIDENTIAL MORTGAGE-BACKED SECURITIES —
AGENCY — 0.9% (Cost: $10,544) | |
| |
Fannie Mae (05-W3-2AF) | | | | | |
| | | |
2.04% (1 mo. USD LIBOR + 0.220%) (2) | | | 03/25/45 | | | | 10,815 | | | | 10,776 | |
| | | | | | | | | | | | |
|
RESIDENTIAL MORTGAGE-BACKED SECURITIES —
NON-AGENCY — 10.1% | |
| |
Centex Home Equity Loan Trust (05-A-AF5) | | | | | |
| | | |
5.78% | | | 01/25/35 | | | | 54,080 | | | | 54,340 | |
| | | | | | | | | | | | |
| Issues | | Maturity
Date | | | Principal
Amount | | | Value | |
|
RESIDENTIAL MORTGAGE-BACKED SECURITIES —
NON-AGENCY (Continued) | |
| |
Credit-Based Asset Servicing and Securitization LLC (03-CB5-M1) | | | | | |
| | | |
2.84% (1 mo. USD LIBOR + 1.020%) (2) | | | 11/25/33 | | | $ | 8,965 | | | $ | 8,927 | |
| |
First Franklin Mortgage Loan Asset-Backed Certificates (04-FF5-A3C) | | | | | |
| | | |
2.82% (1 mo. USD LIBOR + 1.000%) (2) | | | 08/25/34 | | | | 7,209 | | | | 7,227 | |
| |
JPMorgan Mortgage Trust (05-A5-TA1) | | | | | |
| | | |
4.53% (3) | | | 08/25/35 | | | | 1,176 | | | | 1,212 | |
| |
JPMorgan Mortgage Trust (05-A6-7A1) | | | | | |
| | | |
4.24% (3) | | | 08/25/35 | | | | 16,932 | | | | 16,804 | |
| |
MASTR Seasoned Securitization Trust (05-1-4A1) | | | | | |
| | | |
4.57% (3) | | | 10/25/32 | | | | 13,625 | | | | 14,203 | |
| |
Mid-State Trust (04-1-M1) | | | | | |
| | | |
6.50% | | | 08/15/37 | | | | 18,798 | | | | 19,855 | |
| |
Morgan Stanley Mortgage Loan Trust (04-6AR-1A) | | | | | |
| | | |
2.72% (1 mo. USD LIBOR + 0.900%) (2) | | | 07/25/34 | | | | 1,845 | | | | 1,854 | |
| |
Residential Asset Mortgage Products, Inc. (04-SL3-A2) | | | | | |
| | | |
6.50% | | | 12/25/31 | | | | 756 | | | | 756 | |
| | | | | | | | | | | | |
| | |
Total Residential Mortgage-backed Securities — Non-agency | | | | | | | | | |
| | | |
(Cost: $111,935) | | | | | | | | | | | 125,178 | |
| | | | | | | | | | | | |
|
| CORPORATE BONDS — 31.0% | |
|
| Aerospace/Defense — 0.3% | |
| |
United Technologies Corp. | | | | | |
| | | |
2.82% (3 mo. USD LIBOR + 0.650%) (2) | | | 08/16/21 | | | | 4,000 | | | | 4,001 | |
| | | | | | | | | | | | |
|
| Agriculture — 0.4% | |
| |
BAT Capital Corp. | | | | | |
| | | |
2.76% | | | 08/15/22 | | | | 5,000 | | | | 5,050 | |
| | | | | | | | | | | | |
|
| Airlines — 2.0% | |
| |
Continental Airlines, Inc. Pass-Through Certificates (00-1-A1) (EETC) | | | | | |
| | | |
8.05% | | | 05/01/22 | | | | 16,849 | | | | 17,158 | |
| |
US Airways Group, Inc. Pass-Through Certificates (12-1-A) (EETC) | | | | | |
| | | |
5.90% | | | 04/01/26 | | | | 7,020 | | | | 7,846 | |
| | | | | | | | | | | | |
| | | |
| | | | | | | | | | | 25,004 | |
| | | | | | | | | | | | |
|
| Auto Manufacturers — 1.7% | |
| |
Ford Motor Credit Co. LLC | | | | | |
| | | |
4.25% | | | 09/20/22 | | | | 10,000 | | | | 10,276 | |
| | | |
5.75% | | | 02/01/21 | | | | 5,000 | | | | 5,174 | |
| |
General Motors Financial Co., Inc. | | | | | |
| | | |
3.55% | | | 04/09/21 | | | | 5,000 | | | | 5,080 | |
| | | | | | | | | | | | |
| | | |
| | | | | | | | | | | 20,530 | |
| | | | | | | | | | | | |
See accompanying notes to financial statements.
31
TCW Enhanced Commodity Strategy Fund
Consolidated Schedule of Investments (Continued)
| | | | | | | | | | | | |
| Issues | | Maturity
Date | | | Principal
Amount | | | Value | |
|
| Banks — 6.3% | |
| |
Bank of America NA | | | | | |
| | | |
3.34% (3.335% to 1/25/22 then 3 mo. USD LIBOR + 0.650%) (2) | | | 01/25/23 | | | $ | 10,000 | | | $ | 10,262 | |
| |
Citigroup, Inc. | | | | | |
| | | |
2.89% (3 mo. USD LIBOR + 0.950%) (2) | | | 07/24/23 | | | | 22,000 | | | | 22,142 | |
| |
Goldman Sachs Group, Inc. (The) | | | | | |
| | | |
2.91% (3 mo. USD LIBOR + 0.990%) (2) | | | 07/24/23 | | | | 5,000 | | | | 5,088 | |
| |
JPMorgan Chase & Co. | | | | | |
| | | |
3.00% (3 mo. USD LIBOR + 1.000%) (2) | | | 01/15/23 | | | | 25,000 | | | | 25,258 | |
| |
Lloyds TSB Bank PLC (United Kingdom) | | | | | |
| | | |
6.38% | | | 01/21/21 | | | | 10,000 | | | | 10,528 | |
| |
Santander UK Group Holdings PLC (United Kingdom) | | | | | |
| | | |
3.13% | | | 01/08/21 | | | | 5,000 | | | | 5,047 | |
| | | | | | | | | | | | |
| | | |
| | | | | | | | | | | 78,325 | |
| | | | | | | | | | | | |
|
| Commercial Services — 0.4% | |
| |
IHS Markit, Ltd. | | | | | |
| | | |
5.00% (1) | | | 11/01/22 | | | | 5,000 | | | | 5,352 | |
| | | | | | | | | | | | |
|
| Diversified Financial Services — 0.7% | |
| |
AerCap Ireland Capital DAC / AerCap Global Aviation Trust (Ireland) | | | | | |
| | | |
4.63% | | | 10/30/20 | | | | 6,000 | | | | 6,148 | |
| |
Park Aerospace Holdings, Ltd. | | | | | |
| | | |
4.50% (1) | | | 03/15/23 | | | | 2,000 | | | | 2,106 | |
| | | | | | | | | | | | |
| | | |
| | | | | | | | | | | 8,254 | |
| | | | | | | | | | | | |
|
| Food — 1.2% | |
| |
Conagra Brands, Inc. | | | | | |
| | | |
2.51% (3 mo. USD LIBOR + 0.500%) (2) | | | 10/09/20 | | | | 10,000 | | | | 10,016 | |
| |
Kraft Heinz Foods Co. | | | | | |
| | | |
3.00% | | | 06/01/26 | | | | 5,000 | | | | 4,986 | |
| | | | | | | | | | | | |
| | | |
| | | | | | | | | | | 15,002 | |
| | | | | | | | | | | | |
|
| Healthcare-Products — 0.4% | |
| |
Becton Dickinson and Co. | | | | | |
| | | |
2.89% | | | 06/06/22 | | | | 5,000 | | | | 5,087 | |
| | | | | | | | | | | | |
|
| Healthcare-Services — 0.9% | |
| |
Fresenius Medical Care US Finance II, Inc. | | | | | |
| | | |
4.13% (1) | | | 10/15/20 | | | | 5,000 | | | | 5,066 | |
| | | |
HCA, Inc. | | | | | | | | | | | | |
| | | |
5.00% | | | 03/15/24 | | | | 5,000 | | | | 5,454 | |
| | | | | | | | | | | | |
| | | |
| | | | | | | | | | | 10,520 | |
| | | | | | | | | | | | |
|
| Insurance — 5.6% | |
| |
Nationwide Mutual Insurance Co. | | | | | |
| | | |
4.41% (3 mo. USD LIBOR + 2.290%) (1)(2) | | | 12/15/24 | | | | 70,000 | | | | 70,175 | |
| | | | | | | | | | | | |
| | | | | | | | | | | | |
| Issues | | Maturity
Date | | | Principal
Amount | | | Value | |
|
| Media — 0.3% | |
| |
Charter Communications Operating LLC / Charter Communications Operating Capital | | | | | |
| | | |
3.56% (3 mo. USD LIBOR + 1.650%) (2) | | | 02/01/24 | | | $ | 4,000 | | | $ | 4,118 | |
| | | | | | | | | | | | |
|
| Miscellaneous Manufacturers — 0.6% | |
| |
General Electric Co. | | | | | |
| | | |
2.64% (3 mo. USD LIBOR + 0.480%) (2) | | | 08/15/36 | | | | 10,000 | | | | 7,407 | |
| | | | | | | | | | | | |
|
| Pharmaceuticals — 2.2% | |
| |
Allergan Sales LLC | | | | | |
| | | |
5.00% (1) | | | 12/15/21 | | | | 6,000 | | | | 6,308 | |
| |
Bayer US Finance II LLC | | | | | |
| | | |
3.13% (3 mo. USD LIBOR + 1.010%) (1)(2) | | | 12/15/23 | | | | 10,000 | | | | 10,048 | |
| |
CVS Health Corp. | | | | | |
| | | |
2.82% (3 mo. USD LIBOR + 0.720%) (2) | | | 03/09/21 | | | | 8,000 | | | | 8,046 | |
| | | |
4.30% | | | 03/25/28 | | | | 3,000 | | | | 3,266 | |
| | | | | | | | | | | | |
| | | |
| | | | | | | | | | | 27,668 | |
| | | | | | | | | | | | |
|
| Pipelines — 0.6% | |
| |
Energy Transfer Operating LP | | | | | |
| | | |
4.50% | | | 04/15/24 | | | | 5,000 | | | | 5,340 | |
| |
Plains All American Pipeline LP / PAA Finance Corp. | | | | | |
| | | |
4.50% | | | 12/15/26 | | | | 2,000 | | | | 2,102 | |
| | | | | | | | | | | | |
| | | |
| | | | | | | | | | | 7,442 | |
| | | | | | | | | | | | |
|
| REIT — 5.0% | |
| |
American Campus Communities Operating Partnership LP | | | | | |
| | | |
3.75% | | | 04/15/23 | | | | 5,000 | | | | 5,220 | |
| |
Boston Properties LP (REIT) | | | | | |
| | | |
4.13% | | | 05/15/21 | | | | 5,000 | | | | 5,139 | |
| |
Camden Property Trust | | | | | |
| | | |
2.95% | | | 12/15/22 | | | | 5,000 | | | | 5,106 | |
| |
GLP Capital LP / GLP Financing II, Inc. | | | | | |
| | | |
5.38% | | | 11/01/23 | | | | 5,000 | | | | 5,456 | |
| |
HCP, Inc. | | | | | |
| | | |
3.15% | | | 08/01/22 | | | | 15,000 | | | | 15,352 | |
| |
Healthcare Trust of America Holdings LP | | | | | |
| | | |
3.70% | | | 04/15/23 | | | | 5,000 | | | | 5,176 | |
| |
National Retail Properties, Inc. | | | | | |
| | | |
3.80% | | | 10/15/22 | | | | 5,000 | | | | 5,199 | |
| |
SL Green Operating Partnership LP | | | | | |
| | | |
3.25% | | | 10/15/22 | | | | 5,000 | | | | 5,111 | |
| |
UDR, Inc. | | | | | |
| | | |
4.63% | | | 01/10/22 | | | | 5,000 | | | | 5,221 | |
| |
WEA Finance LLC | | | | | |
| | | |
3.15% (1) | | | 04/05/22 | | | | 5,000 | | | | 5,103 | |
| | | | | | | | | | | | |
| | | |
| | | | | | | | | | | 62,083 | |
| | | | | | | | | | | | |
See accompanying notes to financial statements.
32
TCW Enhanced Commodity Strategy Fund
| | | | | | | | | | | | |
| Issues | | Maturity
Date | | | Principal
Amount | | | Value | |
|
| Retail — 0.4% | |
| |
Alimentation Couche-Tard, Inc. (Canada) | | | | | |
| | | |
2.70% (1) | | | 07/26/22 | | | $ | 5,000 | | | $ | 5,060 | |
| | | | | | | | | | | | |
|
| Savings & Loans — 0.4% | |
| |
Nationwide Building Society (United Kingdom) | | | | | |
| | | |
4.36% (3 mo. USD LIBOR + 1.392%) (1)(2) | | | 08/01/24 | | | | 5,000 | | | | 5,307 | |
| | | | | | | | | | | | |
|
| Semiconductors — 0.4% | |
| |
Broadcom, Inc. | | | | | |
| | | |
3.13% (1) | | | 04/15/21 | | | | 5,000 | | | | 5,060 | |
| | | | | | | | | | | | |
|
| Telecommunications — 1.2% | |
| |
AT&T, Inc. | | | | | |
| | | |
3.31% (3 mo. USD LIBOR + 1.180%) (2) | | | 06/12/24 | | | | 10,000 | | | | 10,176 | |
| |
Vodafone Group PLC (United Kingdom) | | | | | |
| | | |
3.75% | | | 01/16/24 | | | | 4,000 | | | | 4,225 | |
| | | | | | | | | | | | |
| | | |
| | | | | | | | | | | 14,401 | |
| | | | | | | | | | | | |
| | | |
Total Corporate Bonds | | | | | | | | | | | | |
| | | |
(Cost: $375,488) | | | | | | | | | | | 385,846 | |
| | | | | | | | | | | | |
| | | | | | | | | | | | |
| Issues | | Maturity
Date | | | Principal
Amount | | | Value | |
|
U.S. TREASURY SECURITIES — 8.8%
| |
| |
U.S. Treasury Note | | | | | |
| | | |
1.50% | | | 08/31/21 | | | | 29,000 | | | | 28,972 | |
| | | |
1.50% | | | 09/30/21 | | | | 47,000 | | | | 46,960 | |
| | | |
1.50% | | | 10/31/21 | | | | 34,000 | | | | 33,987 | |
| | | | | | | | | | | | |
| | | |
Total U.S. Treasury Securities | | | | | | | | | | | | |
| | | |
(Cost: $109,772) | | | | | | | | | | | 109,919 | |
| | | | | | | | | | | | |
| | | |
Total Fixed Income Securities | | | | | | | | | | | | |
| | | |
(Cost: $946,279) | | | | | | | | | | | 979,253 | |
| | | | | | | | | | | | |
| | | |
| | | | | | | | | | | | |
| Security | | | | | Shares | | | | |
|
| Money Market Investments — 23.5% | |
| | |
State Street Institutional U.S. Government Money Market Fund — Premier Class 1.75% (5)(6) | | | | 292,069 | | | | 292,069 | |
| | | | | | | | | | | | |
| |
Total Money Market Investments | | | | | |
| |
(Cost: $292,069) | | | | 292,069 | |
| | | | | | | | | | | | |
| |
Total Investments (102.2%) | | | | | |
| |
(Cost: $1,238,348) | | | | 1,271,322 | |
| |
Liabilities In Excess Of Other Assets (-2.2%) | | | | (26,884 | ) |
| | | | | | | | | | | | |
| |
Net Assets (100.0%) | | | $ | 1,244,438 | |
| | | | | | | | | | | | |
| | | | | | | | | | | | | | | | | | | | | | | | | | | | |
| Total Return Swaps (5) | | | | | | | | | | | | |
| | | | | | | | |
Notional
Amount | | | Expiration
Date | | | Counterparty | | Payment Made by Fund | | Payment Received by Fund | | Payment
Frequency | | | Unrealized
Appreciation | | | Premium
Paid | | | Value | |
| | OTC Swaps | | | | | | | | | | | | | | | | | | | | |
| | 1,231,117 | | | | 11/19/19 | | | Credit Suisse International | | 3-Month U.S.
Treasury Bills plus 0.2% | | Credit Suisse Custom 24 Total Return Index (7) | | | Monthly | | | | $ 8,479 | | | $ | — | | | $ | 8,479 | |
| | | | | | | | | | | | | | | | | | | | | | | | | | | | |
Notes to Schedule of Investments:
| CLO - | | Collateralized Loan Obligation. |
| EETC - | | Enhanced Equipment Trust Certificate. |
| I/O - | | Interest Only Security. |
| REIT - | | Real Estate Investment Trust. |
| (1) | | Security exempt from registration under Rule 144A of the Securities Act of 1933, as amended. These securities may be resold, normally only to qualified institutional buyers. At October 31, 2019, the value of these securities amounted to $181,406 or 14.6% of net assets. These securities are determined to be liquid by the Fund’s investment advisor, unless otherwise noted, under procedures established by and under the general supervision of the Company’s Board of Directors. |
| (2) | | Floating or variable rate security. The interest shown reflects the rate in effect at October 31, 2019. |
| (3) | | Variable rate security. Interest rate disclosed is as of the most recent information available. Certain variable rate securities are not based on a published reference rate and spread but are determined by the issuer or agent and are based on current market conditions. These securities do not indicate a reference rate and spread in their description above. |
| (4) | | Restricted security (Note 11). |
| (5) | | All or a portion of this security is owned by TCW Cayman Enhanced Commodity Fund, Ltd. |
| (6) | | Rate disclosed is the 7-day net yield as of October 31, 2019. |
| (7) | | Custom Index has exposure to the following commodities as shown on the next page. |
See accompanying notes to financial statements.
33
TCW Enhanced Commodity Strategy Fund
Components of Total Return Swap | October 31, 2019 |
| | | | | | | | | | | | |
| Description(1) | | Notional
Amount | | | Weight % | | | Unrealized
Appreciation (Depreciation) | |
Gold | | $ | 168,539 | | | | 13.69 | % | | $ | 2,310 | |
WTI Crude Oil | | | 99,351 | | | | 8.07 | % | | | 824 | |
Brent Crude Oil | | | 87,163 | | | | 7.08 | % | | | 412 | |
Copper High Grade | | | 85,686 | | | | 6.96 | % | | | 95 | |
Natural Gas | | | 92,457 | | | | 7.51 | % | | | 3,290 | |
Corn | | | 71,774 | | | | 5.83 | % | | | (618 | ) |
Soybeans | | | 70,912 | | | | 5.76 | % | | | (1,170 | ) |
Aluminium Primary | | | 47,890 | | | | 3.89 | % | | | 355 | |
Live Cattle | | | 47,398 | | | | 3.85 | % | | | 1,397 | |
Silver | | | 52,446 | | | | 4.26 | % | | | 1,431 | |
Zinc High Grade | | | 37,180 | | | | 3.02 | % | | | 471 | |
RBOB Gasoline | | | 31,024 | | | | 2.52 | % | | | 344 | |
Soybean Meal | | | 38,288 | | | | 3.11 | % | | | (543 | ) |
Gasoil | | | 31,640 | | | | 2.57 | % | | | (819 | ) |
Sugar #11 | | | 36,195 | | | | 2.94 | % | | | 468 | |
Soybean Oil | | | 39,396 | | | | 3.20 | % | | | 478 | |
Nickel Primary | | | 47,398 | | | | 3.85 | % | | | 1247 | |
Lean Hogs | | | 25,607 | | | | 2.08 | % | | | (1,187 | ) |
SRW Wheat | | | 36,564 | | | | 2.97 | % | | | (1,658 | ) |
Heating Oil | | | 26,592 | | | | 2.16 | % | | | (683 | ) |
Coffee ‘C’ Arabica | | | 29,670 | | | | 2.41 | % | | | 1,794 | |
Cotton | | | 15,020 | | | | 1.22 | % | | | (42 | ) |
HRW Wheat | | | 12,927 | | | | 1.05 | % | | | (448 | ) |
United States Treasury Bill | | | — | | | | — | | | | 731 | |
| | | | | | | | | | | | |
| | $ | 1,231,117 | | | | 100.00 | % | | $ | 8,479 | |
| | | | | | | | | | | | |
| (1) | Commodity Exposures of the Credit Suisse Custom 24 Total Return Index. |
See accompanying notes to financial statements.
34
TCW Enhanced Commodity Strategy Fund
Consolidated Investments by Sector | October 31, 2019 |
| | | | |
| Sector | | Percentage of
Net Assets | |
Corporate Bonds | | | 31.0 | % |
Money Market Investments | | | 23.5 | |
Residential Mortgage-Backed Securities — Non-Agency | | | 10.1 | |
Commercial Mortgage-Backed Securities — Non-Agency | | | 9.8 | |
Asset-Backed Securities | | | 9.6 | |
U.S. Treasury Securities | | | 8.8 | |
Commercial Mortgage-Backed Securities — Agency | | | 8.5 | |
Residential Mortgage-Backed Securities — Agency | | | 0.9 | |
Other* | | | (2.2 | ) |
| | | | |
Total | | | 100.0 | % |
| | | | |
| * | Includes cash, swaps, interest receivable and accrued expenses payable. |
See accompanying notes to financial statements.
35
TCW Enhanced Commodity Strategy Fund
Fair Valuation Summary | October 31, 2019 |
The following is a summary of the fair valuations according to the inputs used as of October 31, 2019 in valuing the Fund’s investments:
| | | | | | | | | | | | | | | | |
Description | | Quoted Prices
in Active
Markets for
Identical
Assets
(Level 1) | | | Other
Significant
Observable
Inputs
(Level 2) | | | Significant
Unobservable
Inputs
(Level 3) | | | Total | |
Fixed Income Securities | | | | | | | | | | | | | | | | |
Asset-Backed Securities | | $ | — | | | $ | 119,564 | | | $ | — | | | $ | 119,564 | |
Commercial Mortgage-Backed Securities — Agency | | | — | | | | 105,401 | | | | — | | | | 105,401 | |
Commercial Mortgage-Backed Securities — Non-Agency | | | — | | | | 122,569 | | | | — | | | | 122,569 | |
Residential Mortgage-Backed Securities — Agency | | | — | | | | 10,776 | | | | — | | | | 10,776 | |
Residential Mortgage-Backed Securities — Non-Agency | | | — | | | | 125,178 | | | | — | | | | 125,178 | |
Corporate Bonds* | | | — | | | | 385,846 | | | | — | | | | 385,846 | |
U.S. Treasury Securities | | | 75,932 | | | | 33,987 | | | | — | | | | 109,919 | |
| | | | | | | | | | | | | | | | |
Total Fixed Income Securities | | | 75,932 | | | | 903,321 | | | | — | | | | 979,253 | |
| | | | | | | | | | | | | | | | |
Money Market Investments | | | 292,069 | | | | — | | | | — | | | | 292,069 | |
| | | | | | | | | | | | | | | | |
Total Investments | | | 368,001 | | | | 903,321 | | | | — | | | | 1,271,322 | |
| | | | | | | | | | | | | | | | |
Asset Derivatives | | | | | | | | | | | | | | | | |
Swap Agreements | | | | | | | | | | | | | | | | |
Commodity Risk | | | — | | | | 8,479 | | | | — | | | | 8,479 | |
| | | | | | | | | | | | | | | | |
Total | | $ | 368,001 | | | $ | 911,800 | | | $ | — | | | $ | 1,279,801 | |
| | | | | | | | | | | | | | | | |
| * | See Schedule of Investments for corresponding industries. |
See accompanying notes to financial statements.
36
TCW Global Bond Fund
Schedule of Investments | October 31, 2019 |
| | | | | | | | | | | | |
| Issues | | Maturity
Date | | | Principal
Amount | | | Value | |
|
FIXED INCOME SECURITIES — 100.2% of Net Assets | |
|
CORPORATE BONDS — 21.1% | |
|
| Aerospace/Defense — 0.2% | |
| |
L3Harris Technologies, Inc. | | | | | |
| | | |
4.40% (1) | | | 06/15/28 | | | $ | 25,000 | | | $ | 28,216 | |
| | | | | | | | | | | | |
|
| Agriculture — 0.8% | |
| |
BAT Capital Corp. | | | | | |
| | | |
4.54% | | | 08/15/47 | | | | 10,000 | | | | 9,722 | |
| | | |
4.76% | | | 09/06/49 | | | | 20,000 | | | | 20,057 | |
| |
BAT International Finance PLC (United Kingdom) | | | | | |
| | | |
2.25% (2) | | | 01/16/30 | | | | 100,000 | | | | 115,223 | |
| | | | | | | | | | | | |
| | | |
| | | | | | | | | | | 145,002 | |
| | | | | �� | | | | | | | |
|
| Airlines — 0.7% | |
| |
Continental Airlines, Inc. Pass-Through Trust (01-1A-1) (EETC) | | | | | |
| | | |
6.70% | | | 12/15/22 | | | | 11,260 | | | | 11,946 | |
| |
Delta Air Lines, Inc. Pass-Through Certificates (02-1G1) (EETC) | | | | | |
| | | |
6.72% | | | 07/02/24 | | | | 60,889 | | | | 64,402 | |
| |
US Airways Group, Inc. Pass-Through Certificates (10-1A) (EETC) | | | | | |
| | | |
6.25% | | | 10/22/24 | | | | 11,281 | | | | 12,413 | |
| |
US Airways Group, Inc. Pass-Through Certificates (12-1-A) (EETC) | | | | | |
| | | |
5.90% | | | 04/01/26 | | | | 35,101 | | | | 39,228 | |
| | | | | | | | | | | | |
| | | |
| | | | | | | | | | | 127,989 | |
| | | | | | | | | | | | |
|
| Auto Manufacturers — 1.1% | |
| |
Ford Motor Credit Co. LLC | | | | | |
| | | |
2.34% | | | 11/02/20 | | | | 25,000 | | | | 24,916 | |
| | | |
3.20% | | | 01/15/21 | | | | 40,000 | | | | 40,056 | |
| | | |
3.37% (3 mo. USD LIBOR + 1.080%) (3) | | | 08/03/22 | | | | 25,000 | | | | 24,529 | |
| | | |
3.37% (3 mo. USD LIBOR + 1.270%) (3) | | | 03/28/22 | | | | 20,000 | | | | 19,755 | |
| | | |
5.88% | | | 08/02/21 | | | | 10,000 | | | | 10,494 | |
| | | |
8.13% | | | 01/15/20 | | | | 65,000 | | | | 65,740 | |
| | | | | | | | | | | | |
| | | |
| | | | | | | | | | | 185,490 | |
| | | | | | | | | | | | |
|
| Banks — 3.1% | |
| |
Bank of America Corp. | | | | | |
| | | |
3.00% (3.004% to 12/20/22 then 3 mo. USD LIBOR +0.790%) (3) | | | 12/20/23 | | | | 10,000 | | | | 10,234 | |
| |
Bank of New York Mellon Corp. (The) | | | | | |
| | | |
3.25% | | | 09/11/24 | | | | 10,000 | | | | 10,548 | |
| |
Citigroup, Inc. | | | | | |
| | | |
3.14% (3 mo. USD LIBOR + 0.722%) (3) | | | 01/24/23 | | | | 75,000 | | | | 76,521 | |
| | | | | | | | | | | | |
| Issues | | Maturity
Date | | | Principal
Amount | | | Value | |
|
| Banks (Continued) | |
| |
Goldman Sachs Group, Inc. (The) | | | | | |
| | | |
2.88% (2.876% to 10/31/17 then 3 mo. USD LIBOR +0.821%) (3) | | | 10/31/22 | | | $ | 100,000 | | | $ | 101,350 | |
| | | |
2.91% (3 mo. USD LIBOR + 0.990%) (3) | | | 07/24/23 | | | | 50,000 | | | | 50,876 | |
| |
JPMorgan Chase & Co. | | | | | |
| | | |
3.56% (3 mo. USD LIBOR + 0.73%) (3) | | | 04/23/24 | | | | 100,000 | | | | 104,491 | |
| |
Lloyds Banking Group PLC (United Kingdom) | | | | | |
| | | |
2.91% (2.907% to 11/07/22 then 3 mo. USD LIBOR +0.810%) (3) | | | 11/07/23 | | | | 50,000 | | | | 50,754 | |
| |
Santander UK Group Holdings PLC (United Kingdom) | | | | | |
| | | |
4.80% (4.796% to 11/15/23 then 3 mo. USD LIBOR +1.570%) (3) | | | 11/15/24 | | | | 50,000 | | | | 53,947 | |
| |
Wells Fargo & Co. | | | | | |
| | | |
3.00% | | | 04/22/26 | | | | 85,000 | | | | 87,375 | |
| | | | | | | | | | | | |
| | | |
| | | | | | | | | | | 546,096 | |
| | | | | | | | | | | | |
|
| Beverages — 0.5% | |
| |
Anheuser-Busch Cos LLC / Anheuser-Busch InBev Worldwide, Inc. | | | | | |
| | | |
4.90% | | | 02/01/46 | | | | 29,000 | | | | 34,700 | |
| |
Anheuser-Busch InBev Worldwide, Inc. | | | | | |
| | | |
4.75% | | | 01/23/29 | | | | 25,000 | | | | 29,078 | |
| |
Bacardi, Ltd. | | | | | |
| | | |
4.70% (1) | | | 05/15/28 | | | | 15,000 | | | | 16,432 | |
| | | | | | | | | | | | |
| | | |
| | | | | | | | | | | 80,210 | |
| | | | | | | | | | | | |
|
| Biotechnology — 0.3% | |
| |
Amgen, Inc. | | | | | |
| | | |
4.40% | | | 05/01/45 | | | | 25,000 | | | | 28,169 | |
| |
Celgene Corp. | | | | | |
| | | |
3.88% | | | 08/15/25 | | | | 20,000 | | | | 21,658 | |
| | | | | | | | | | | | |
| | | |
| | | | | | | | | | | 49,827 | |
| | | | | | | | | | | | |
|
| Commercial Services — 0.2% | |
| |
IHS Markit, Ltd. | | | | | |
| | | |
4.75% | | | 08/01/28 | | | | 30,000 | | | | 33,453 | |
| | | | | | | | | | | | |
|
| Diversified Financial Services — 0.5% | |
| |
AerCap Ireland Capital DAC / AerCap Global Aviation Trust (Ireland) | | | | | |
| | | |
3.95% | | | 02/01/22 | | | | 25,000 | | | | 25,874 | |
| |
Air Lease Corp. | | | | | |
| | | |
2.13% | | | 01/15/20 | | | | 35,000 | | | | 34,996 | |
| |
Park Aerospace Holdings, Ltd. | | | | | |
| | | |
4.50% (1) | | | 03/15/23 | | | | 10,000 | | | | 10,530 | |
| | | |
5.50% (1) | | | 02/15/24 | | | | 15,000 | | | | 16,510 | |
| | | | | | | | | | | | |
| | | |
| | | | | | | | | | | 87,910 | |
| | | | | | | | | | | | |
See accompanying notes to financial statements.
37
TCW Global Bond Fund
Schedule of Investments (Continued)
| | | | | | | | | | | | |
| Issues | | Maturity
Date | | | Principal
Amount | | | Value | |
|
| Electric — 1.1% | |
| |
AEP Texas Central Co. | | | | | |
| | | |
3.85% (1) | | | 10/01/25 | | | $ | 50,000 | | | $ | 53,023 | |
| |
ITC Holdings Corp. | | | | | |
| | | |
3.65% | | | 06/15/24 | | | | 40,000 | | | | 42,365 | |
| |
MidAmerican Energy Co. | | | | | |
| | | |
3.10% | | | 05/01/27 | | | | 40,000 | | | | 42,417 | |
| |
Pennsylvania Electric Co. | | | | | |
| | | |
3.25% (1) | | | 03/15/28 | | | | 50,000 | | | | 51,909 | |
| | | | | | | | | | | | |
| | | |
| | | | | | | | | | | 189,714 | |
| | | | | | | | | | | | |
|
| Entertainment — 0.1% | |
| |
Churchill Downs, Inc. | | | | | |
| | | |
4.75% (1) | | | 01/15/28 | | | | 10,000 | | | | 10,400 | |
| | | |
5.50% (1) | | | 04/01/27 | | | | 3,000 | | | | 3,180 | |
| | | | | | | | | | | | |
| | | |
| | | | | | | | | | | 13,580 | |
| | | | | | | | | | | | |
|
| Food — 0.5% | |
| |
Kraft Heinz Foods Co. | | | | | |
| | | |
3.00% | | | 06/01/26 | | | | 35,000 | | | | 34,899 | |
| | | |
3.95% | | | 07/15/25 | | | | 35,000 | | | | 36,880 | |
| |
Kroger Co. (The) | | | | | |
| | | |
4.50% | | | 01/15/29 | | | | 15,000 | | | | 16,829 | |
| |
Post Holdings, Inc. | | | | | |
| | | |
5.50% (1) | | | 12/15/29 | | | | 7,000 | | | | 7,397 | |
| | | | | | | | | | | | |
| | | |
| | | | | | | | | | | 96,005 | |
| | | | | | | | | | | | |
|
| Healthcare-Products — 0.2% | |
| |
Becton Dickinson and Co. | | | | | |
| | | |
2.89% | | | 06/06/22 | | | | 30,000 | | | | 30,523 | |
| | | | | | | | | | | | |
|
| Healthcare-Services — 0.9% | |
| |
Anthem, Inc. | | | | | |
| | | |
3.50% | | | 08/15/24 | | | | 50,000 | | | | 52,870 | |
| |
Catalent Pharma Solutions, Inc. | | | | | |
| | | |
4.88% (1) | �� | | 01/15/26 | | | | 15,000 | | | | 15,562 | |
| |
Encompass Health Corp. | | | | | |
| | | |
4.75% | | | 02/01/30 | | | | 8,000 | | | | 8,270 | |
| |
HCA, Inc. | | | | | |
| | | |
4.13% | | | 06/15/29 | | | | 30,000 | | | | 31,762 | |
| | | |
5.00% | | | 03/15/24 | | | | 3,000 | | | | 3,273 | |
| | | |
5.25% | | | 04/15/25 | | | | 2,000 | | | | 2,228 | |
| |
Humana, Inc. | | | | | |
| | | |
4.95% | | | 10/01/44 | | | | 10,000 | | | | 11,451 | |
| |
Molina Healthcare, Inc. | | | | | |
| | | |
5.38% | | | 11/15/22 | | | | 8,000 | | | | 8,480 | |
| |
Tenet Healthcare Corp. | | | | | |
| | | |
4.88% (1) | | | 01/01/26 | | | | 7,000 | | | | 7,254 | |
| | | |
5.13% (1) | | | 11/01/27 | | | | 12,000 | | | | 12,495 | |
| | | | | | | | | | | | |
| | | |
| | | | | | | | | | | 153,645 | |
| | | | | | | | | | | | |
| | | | | | | | | | | | |
| Issues | | Maturity
Date | | | Principal
Amount | | | Value | |
|
| Insurance — 0.5% | |
| |
Farmers Exchange Capital II | | | | | |
| | | |
6.15% (3 mo. USD LIBOR + 3.744%) (1)(3) | | | 11/01/53 | | | $ | 80,000 | | | $ | 96,900 | |
| | | | | | | | | | | | |
|
| Media — 0.3% | |
| |
Charter Communications Operating LLC / Charter Communications Operating Capital | | | | | |
| | | |
6.48% | | | 10/23/45 | | | | 30,000 | | | | 36,898 | |
| |
CSC Holdings LLC | | | | | |
| | | |
6.50% (1) | | | 02/01/29 | | | | 7,000 | | | | 7,831 | |
| |
Sirius XM Radio, Inc. | | | | | |
| | | |
3.88% (1) | | | 08/01/22 | | | | 15,000 | | | | 15,338 | |
| | | | | | | | | | | | |
| | | |
| | | | | | | | | | | 60,067 | |
| | | | | | | | | | | | |
|
| Miscellaneous Manufacturers — 1.7% | |
| |
General Electric Co. | | | | | |
| | | |
2.64% (3 mo. USD LIBOR + 0.480%) (3) | | | 08/15/36 | | | | 200,000 | | | | 148,137 | |
| | | |
2.67% (3 mo. USD LIBOR + 0.38%) (3) | | | 05/05/26 | | | | 100,000 | | | | 92,365 | |
| | | |
3.00% (3 mo. USD LIBOR + 1.000%) (3) | | | 04/15/23 | | | | 40,000 | | | | 39,653 | |
| | | |
5.55% | | | 01/05/26 | | | | 25,000 | | | | 28,182 | |
| | | | | | | | | | | | |
| | | |
| | | | | | | | | | | 308,337 | |
| | | | | | | | | | | | |
|
| Oil & Gas — 1.8% | |
| |
Antero Resources Corp. | | | | | |
| | | |
5.00% | | | 03/01/25 | | | | 20,000 | | | | 13,300 | |
| | | |
5.13% | | | 12/01/22 | | | | 6,000 | | | | 4,522 | |
| |
Parsley Energy LLC / Parsley Finance Corp. | | | | | |
| | | |
5.38% (1) | | | 01/15/25 | | | | 3,000 | | | | 3,103 | |
| |
Petrobras Global Finance BV | | | | | |
| | | |
8.75% | | | 05/23/26 | | | | 70,000 | | | | 89,824 | |
| |
Petroleos Mexicanos | | | | | |
| | | |
3.13% (2) | | | 11/27/20 | | | EUR | 100,000 | | | | 115,139 | |
| | | |
5.50% (2) | | | 02/24/25 | | | EUR | 30,000 | | | | 37,847 | |
| | | |
6.84% (1) | | | 01/23/30 | | | | 20,000 | | | | 21,336 | |
| |
Range Resources Corp. | | | | | |
| | | |
4.88% | | | 05/15/25 | | | | 9,000 | | | | 7,267 | |
| |
Transocean Pontus, Ltd. | | | | | |
| | | |
6.13% (1) | | | 08/01/25 | | | | 14,240 | | | | 14,276 | |
| |
Transocean Poseidon, Ltd. | | | | | |
| | | |
6.88% (1) | | | 02/01/27 | | | | 7,000 | | | | 7,093 | |
| | | | | | | | | | | | |
| | | |
| | | | | | | | | | | 313,707 | |
| | | | | | | | | | | | |
|
| Oil & Gas Services — 0.0% | |
| |
USA Compression Partners LP / USA Compression Finance Corp. | | | | | |
| | | |
6.88% (1) | | | 09/01/27 | | | | 4,000 | | | | 4,020 | |
| | | | | | | | | | | | |
See accompanying notes to financial statements.
38
TCW Global Bond Fund
| | | | | | | | | | | | |
| Issues | | Maturity
Date | | | Principal
Amount | | | Value | |
|
| Packaging & Containers — 0.5% | |
| |
Bemis Co., Inc. | | | | | |
| | | |
3.10% (1) | | | 09/15/26 | | | $ | 25,000 | | | $ | 24,807 | |
| |
Berry Global, Inc. | | | | | |
| | | |
4.88% (1) | | | 07/15/26 | | | | 4,000 | | | | 4,215 | |
| |
Graphic Packaging International LLC | | | | | |
| | | |
4.88% | | | 11/15/22 | | | | 8,000 | | | | 8,420 | |
| |
Reynolds Group Issuer, Inc. / Reynolds Group Issuer LLC / Reynolds Group Issuer (Luxembourg) | | | | | |
| | | |
5.50% (3 mo. USD LIBOR + 3.500%) (1)(3) | | | 07/15/21 | | | | 20,000 | | | | 20,100 | |
| | | |
5.75% | | | 10/15/20 | | | | 4,846 | | | | 4,858 | |
| |
Sealed Air Corp. | | | | | |
| | | |
5.50% (1) | | | 09/15/25 | | | | 14,000 | | | | 15,295 | |
| |
WRKCo, Inc. | | | | | |
| | | |
4.65% | | | 03/15/26 | | | | 15,000 | | | | 16,589 | |
| | | | | | | | | | | | |
| | | |
| | | | | | | | | | | 94,284 | |
| | | | | | | | | | | | |
|
| Pharmaceuticals — 1.0% | |
| |
AbbVie, Inc. | | | | | |
| | | |
4.50% | | | 05/14/35 | | | | 25,000 | | | | 27,173 | |
| |
AstraZeneca PLC (United Kingdom) | | | | | |
| | | |
3.38% | | | 11/16/25 | | | | 25,000 | | | | 26,456 | |
| |
Bayer US Finance II LLC | | | | | |
| | | |
3.13% (3 mo. USD LIBOR + 1.01%) (1)(3) | | | 12/15/23 | | | | 50,000 | | | | 50,242 | |
| | | |
4.25% (1) | | | 12/15/25 | | | | 20,000 | | | | 21,527 | |
| |
CVS Health Corp. | | | | | |
| | | |
5.05% | | | 03/25/48 | | | | 40,000 | | | | 46,178 | |
| | | | | | | | | | | | |
| | | |
| | | | | | | | | | | 171,576 | |
| | | | | | | | | | | | |
|
| Pipelines — 0.5% | |
| |
Energy Transfer Partners LP | | | | | |
| | | |
5.15% | | | 03/15/45 | | | | 50,000 | | | | 52,301 | |
| |
Rockies Express Pipeline LLC | | | | | |
| | | |
5.63% (1) | | | 04/15/20 | | | | 24,000 | | | | 24,463 | |
| |
Sabine Pass Liquefaction LLC | | | | | |
| | | |
5.75% | | | 05/15/24 | | | | 15,000 | | | | 16,787 | |
| |
Targa Resources Partners LP / Targa Resources Partners Finance Corp. | | | | | |
| | | |
6.88% (1) | | | 01/15/29 | | | | 3,000 | | | | 3,251 | |
| | | | | | | | | | | | |
| | | |
| | | | | | | | | | | 96,802 | |
| | | | | | | | | | | | |
|
| REIT — 1.4% | |
| |
American Campus Communities Operating Partnership LP | | | | | |
| | | |
3.35% | | | 10/01/20 | | | | 50,000 | | | | 50,541 | |
| |
GLP Capital LP / GLP Financing II, Inc. | | | | | |
| | | |
3.35% | | | 09/01/24 | | | | 45,000 | | | | 45,647 | |
| | | |
5.30% | | | 01/15/29 | | | | 15,000 | | | | 16,594 | |
| | | |
5.38% | | | 04/15/26 | | | | 25,000 | | | | 27,554 | |
| |
HCP, Inc. | | | | | |
| | | |
3.15% | | | 08/01/22 | | | | 50,000 | | | | 51,174 | |
| | | | | | | | | | | | |
| Issues | | Maturity
Date | | | Principal
Amount | | | Value | |
|
| REIT (Continued) | |
| |
SL Green Operating Partnership LP | | | | | |
| | | |
3.15% (3 mo. USD LIBOR + 0.98%) (3) | | | 08/16/21 | | | $ | 50,000 | | | $ | 50,010 | |
| | | | | | | | | | | | |
| | | |
| | | | | | | | | | | 241,520 | |
| | | | | | | | | | | | |
|
| Retail — 0.5% | |
| |
Alimentation Couche-Tard, Inc. (Canada) | | | | | |
| | | |
2.70% (1) | | | 07/26/22 | | | | 10,000 | | | | 10,120 | |
| |
eG Global Finance PLC (United Kingdom) | | | | | |
| | | |
6.75% (1) | | | 02/07/25 | | | | 9,000 | | | | 9,034 | |
| |
Rite Aid Corp. | | | | | |
| | | |
6.13% (1) | | | 04/01/23 | | | | 17,000 | | | | 14,536 | |
| |
Walgreens Boots Alliance, Inc. | | | | | |
| | | |
3.45% | | | 06/01/26 | | | | 60,000 | | | | 62,252 | |
| | | | | | | | | | | | |
| | | |
| | | | | | | | | | | 95,942 | |
| | | | | | | | | | | | |
|
| Savings & Loans — 0.1% | |
| |
Nationwide Building Society (United Kingdom) | | | | | |
| | | |
3.77% (3.766% to 03/08/23 then 3 mo. USD LIBOR +1.064%) (1)(3) | | | 03/08/24 | | | | 15,000 | | | | 15,599 | |
| | | | | | | | | | | | |
|
| Semiconductors — 0.3% | |
| |
Broadcom, Inc. | | | | | |
| | | |
3.13% (1) | | | 04/15/21 | | | | 60,000 | | | | 60,722 | |
| | | | | | | | | | | | |
|
| Telecommunications — 2.3% | |
| |
AT&T, Inc. | | | | | |
| | | |
3.40% | | | 05/15/25 | | | | 45,000 | | | | 47,233 | |
| | | |
3.88% | | | 01/15/26 | | | | 25,000 | | | | 26,779 | |
| | | |
4.80% | | | 06/15/44 | | | | 44,000 | | | | 48,907 | |
| |
Intelsat Jackson Holdings S. A. (Luxembourg) | | | | | |
| | | |
8.50% (1) | | | 10/15/24 | | | | 8,000 | | | | 8,067 | |
| | | |
9.75% (1) | | | 07/15/25 | | | | 15,000 | | | | 15,640 | |
| |
Level 3 Financing, Inc. | | | | | |
| | | |
4.63% (1) | | | 09/15/27 | | | | 3,000 | | | | 3,060 | |
| |
Qwest Corp. | | | | | |
| | | |
7.25% | | | 09/15/25 | | | | 14,000 | | | | 16,018 | |
| |
Sprint Communications, Inc. | | | | | |
| | | |
7.00% (1) | | | 03/01/20 | | | | 6,000 | | | | 6,103 | |
| |
Sprint Spectrum Co. LLC / Sprint Spectrum Co. II LLC / Sprint Spectrum Co. III LLC | | | | | |
| | | |
3.36% (1) | | | 03/20/23 | | | | 87,500 | | | | 88,156 | |
| |
T-Mobile USA, Inc. | | | | | |
| | | |
6.00% | | | 04/15/24 | | | | 26,000 | | | | 27,040 | |
| |
Verizon Communications, Inc. | | | | | |
| | | |
4.27% | | | 01/15/36 | | | | 55,000 | | | | 62,274 | |
| |
Vodafone Group PLC (United Kingdom) | | | | | |
| | | |
4.88% | | | 06/19/49 | | | | 48,000 | | | | 54,177 | |
| | | | | | | | | | | | |
| | | |
| | | | | | | | | | | 403,454 | |
| | | | | | | | | | | | |
| | |
Total Corporate Bonds | | | | | | | | | |
| | |
(Cost: $3,590,494) | | | | | | | | 3,730,590 | |
| | | | | | | | | | | | |
See accompanying notes to financial statements.
39
TCW Global Bond Fund
Schedule of Investments (Continued)
| | | | | | | | | | | | |
| Issues | | Maturity
Date | | | Principal
Amount | | | Value | |
|
| MUNICIPAL BOND — 0.3% (Cost: $40,000) | |
| |
Alabama Economic Settlement Authority, Revenue Bond | | | | | |
| | | |
4.26% | | | 09/15/32 | | | | $ 40,000 | | | $ | 45,306 | |
| | | | | | | | | | | | |
|
| FOREIGN GOVERNMENT BONDS — 45.5% | |
| |
Australia Government Bond | | | | | |
| | | |
2.75% (2) | | | 04/21/24 | | | AUD | 99,000 | | | | 73,880 | |
| | | |
3.25% (2) | | | 04/21/29 | | | AUD | 170,000 | | | | 139,708 | |
| |
Brazil Notas do Tesouro Nacional, Series F | | | | | |
| | | |
10.00% | | | 01/01/25 | | | BRL | 185,000 | | | | 55,635 | |
| | | |
10.00% | | | 01/01/29 | | | BRL | 135,000 | | | | 41,137 | |
| |
Canadian Government Bond | | | | | |
| | | |
0.50% | | | 03/01/22 | | | CAD | 215,000 | | | | 159,759 | |
| | | |
0.75% | | | 03/01/21 | | | CAD | 375,000 | | | | 282,194 | |
| | | |
1.00% | | | 09/01/22 | | | CAD | 120,000 | | | | 90,015 | |
| |
China Development Bank | | | | | |
| | | |
3.18% | | | 04/05/26 | | | CNY | 1,400,000 | | | | 192,140 | |
| | | |
3.30% | | | 02/01/24 | | | CNY | 600,000 | | | | 84,174 | |
| |
China Government Bond | | | | | |
| | | |
3.22% | | | 12/06/25 | | | CNY | 1,210,000 | | | | 172,100 | |
| |
Colombian TES | | | | | |
| | | |
6.25% | | | 11/26/25 | | | COP | 130,000,000 | | | | 40,031 | |
| | | |
7.75% | | | 09/18/30 | | | COP | 100,000,000 | | | | 33,519 | |
| |
Czech Republic Government Bond | | | | | |
| | | |
0.45% (2) | | | 10/25/23 | | | CZK | 3,680,000 | | | | 155,982 | |
| | | |
2.75% | | | 07/23/29 | | | CZK | 1,540,000 | | | | 75,945 | |
| | | |
3.75% (2) | | | 09/12/20 | | | CZK | 2,400,000 | | | | 107,228 | |
| |
France Government Bond OAT | | | | | |
| | | |
2.00% (2) | | | 05/25/48 | | | EUR | 130,000 | | | | 196,631 | |
| |
Hungary Government Bond | | | | | |
| | | |
3.00% | | | 08/21/30 | | | HUF | 14,000,000 | | | | 52,655 | |
| |
Indonesia Government International Bond | | | | | |
| | | |
1.40% | | | 10/30/31 | | | EUR | 100,000 | | | | 111,155 | |
| |
Indonesia Treasury Bond | | | | | |
| | | |
8.25% | | | 05/15/29 | | | IDR | 2,105,000,000 | | | | 163,082 | |
| | | |
8.38% | | | 03/15/24 | | | IDR | 775,000,000 | | | | 59,137 | |
| |
Ireland Government Bond | | | | | |
| | | |
0.90% (2) | | | 05/15/28 | | | EUR | 125,000 | | | | 151,277 | |
| | | |
1.30% (2) | | | 05/15/33 | | | EUR | 90,000 | | | | 113,764 | |
| | | |
2.00% (2) | | | 02/18/45 | | | EUR | 85,000 | | | | 123,744 | |
| |
Israel Government Bond | | | | | |
| | | |
3.75% | | | 03/31/47 | | | ILS | 445,000 | | | | 174,000 | |
| |
Italy Buoni Ordinari del Tesoro BOT | | | | | |
| | | |
0.20% | | | 10/15/20 | | | EUR | 315,000 | | | | 352,941 | |
| |
Italy Buoni Poliennali Del Tesoro | | | | | |
| | | |
3.10% (2) | | | 03/01/40 | | | EUR | 32,000 | | | | 43,853 | |
| | | |
3.85% (2) | | | 09/01/49 | | | EUR | 33,000 | | | | 51,989 | |
| |
Japan Government Ten-Year Bond | | | | | |
| | | |
1.00% | | | 09/20/21 | | | JPY | 56,050,000 | | | | 530,509 | |
| |
Japan Government Thirty Year Bond | | | | | |
| | | |
0.70% | | | 12/20/48 | | | JPY | 7,250,000 | | | | 72,960 | |
| | | | | | | | | | | | |
| Issues | | Maturity
Date | | | Principal
Amount | | | Value | |
|
| FOREIGN GOVERNMENT BONDS (Continued) | |
| |
Japan Government Thirty-Year Bond | | | | | |
| | | |
2.00% | | | 03/20/42 | | | JPY | 41,200,000 | | | $ | 524,134 | |
| |
Japan Government Twenty Year Bond | | | | | |
| | | |
0.50% | | | 09/20/36 | | | JPY | 10,100,000 | | | | 98,987 | |
| |
Kingdom of Belgium Government Bond | | | | | |
| | | |
1.70% (2) | | | 06/22/50 | | | EUR | 35,000 | | | | 49,414 | |
| |
Korea Treasury Bond | | | | | |
| | | |
1.75% | | | 12/10/20 | | | KRW | 205,000,000 | | | | 176,896 | |
| | | |
1.88% | | | 06/10/26 | | | KRW | 90,000,000 | | | | 78,250 | |
| |
Malaysia Government Bond | | | | | |
| | | |
4.06% | | | 09/30/24 | | | MYR | 225,000 | | | | 55,606 | |
| | | |
4.64% | | | 11/07/33 | | | MYR | 130,000 | | | | 34,141 | |
| |
Mexican Bonos | | | | | |
| | | |
7.75% | | | 11/23/34 | | | MXN | 700,000 | | | | 39,119 | |
| |
Norway Government Bond | | | | | |
| | | |
1.75% (2) | | | 02/17/27 | | | NOK | 650,000 | | | | 72,964 | |
| | | |
1.75% (2) | | | 09/06/29 | | | NOK | 355,000 | | | | 40,081 | |
| | | |
2.00% (2) | | | 05/24/23 | | | NOK | 2,860,000 | | | | 319,714 | |
| | | |
3.00% (2) | | | 03/14/24 | | | NOK | 730,000 | | | | 85,499 | |
| | | |
3.75% (2) | | | 05/25/21 | | | NOK | 450,000 | | | | 50,908 | |
| |
Peru Government Bond | | | | | |
| | | |
5.70% | | | 08/12/24 | | | PEN | 85,000 | | | | 28,195 | |
| |
Peruvian Government International Bond | | | | | |
| | | |
6.35% (2) | | | 08/12/28 | | | PEN | 185,000 | | | | 63,976 | |
| |
Poland Government Bond | | | | | |
| | | |
1.75% | | | 07/25/21 | | | PLN | 200,000 | | | | 52,747 | |
| | | |
2.75% | | | 10/25/29 | | | PLN | 750,000 | | | | 210,393 | |
| | | |
3.25% | | | 07/25/25 | | | PLN | 265,000 | | | | 74,915 | |
|
Portugal Obrigacoes do Tesouro OT | |
| | | |
2.13% (2) | | | 10/17/28 | | | EUR | 100,000 | | | | 131,545 | |
|
Republic of Poland Government Bond | |
| | | |
2.25% | | | 10/25/24 | | | PLN | 275,000 | | | | 73,897 | |
|
Saudi Government International Bond | |
| | | |
0.75% (2) | | | 07/09/27 | | | EUR | 100,000 | | | | 114,170 | |
|
Singapore Government Bond | |
| | | |
2.00% | | | 07/01/20 | | | SGD | 110,000 | | | | 81,020 | |
| | | |
2.75% | | | 03/01/46 | | | SGD | 220,000 | | | | 183,261 | |
| | | |
3.00% | | | 09/01/24 | | | SGD | 90,000 | | | | 70,323 | |
|
Slovenia Government Bond | |
| | | |
1.00% (2) | | | 03/06/28 | | | EUR | 40,000 | | | | 48,453 | |
|
South Africa Government Bond | |
| | | |
8.00% | | | 01/31/30 | | | ZAR | 1,880,000 | | | | 114,877 | |
|
Spain Government Bond | |
| | | |
1.30% (2) | | | 10/31/26 | | | EUR | 100,000 | | | | 121,688 | |
| | | |
1.40% | | | 01/31/20 | | | EUR | 85,000 | | | | 95,268 | |
| | | |
1.85% (2) | | | 07/30/35 | | | EUR | 100,000 | | | | 131,602 | |
| | | |
2.35% (2) | | | 07/30/33 | | | EUR | 40,000 | | | | 55,497 | |
| | | |
2.90% (2) | | | 10/31/46 | | | EUR | 57,000 | | | | 90,769 | |
See accompanying notes to financial statements.
40
TCW Global Bond Fund
| | | | | | | | | | | | |
| Issues | | Maturity
Date | | | Principal
Amount | | | Value | |
|
| FOREIGN GOVERNMENT BONDS (Continued) | |
|
United Kingdom Gilt | |
| | | |
1.63% (2) | | | 10/22/28 | | | GBP | 190,000 | | | $ | 269,333 | |
| | | |
1.75% (2) | | | 09/07/37 | | | GBP | 154,000 | | | | 222,866 | |
| | | |
2.00% (2) | | | 07/22/20 | | | GBP | 90,000 | | | | 117,537 | |
| | | |
2.75% (2) | | | 09/07/24 | | | GBP | 110,000 | | | | 158,237 | |
| | | | | | | | | | | | |
| | |
Total Foreign Government Bonds | | | | | | | | | |
| | | |
(Cost: $8,007,206) | | | | | | | | | | | 8,037,426 | |
| | | | | | | | | | | | |
| |
| ASSET-BACKED SECURITIES — 2.4% | | | | |
|
Babson CLO, Ltd. (13-IA-AR) | |
| | | |
2.77% (3 mo. USD LIBOR + 0.08%) (1)(3) | | | 01/20/28 | | | $ | 40,000 | | | | 39,921 | |
| |
BlueMountain CLO, Ltd. (13-1A-A1R2) | | | | | |
| | | |
3.20% (3 mo. USD LIBOR + 1.23%) (1)(3) | | | 01/20/29 | | | | 45,000 | | | | 45,040 | |
| |
Educational Funding of the South, Inc. (11-1-A2) | | | | | |
| | | |
2.59% (3 mo. USD LIBOR + 0.650%) (3) | | | 04/25/35 | | | | 18,229 | | | | 18,142 | |
| |
LCM XIII LP (13A-ARR) | | | | | |
| | | |
3.11% (3 mo. USD LIBOR + 1.140%) (1)(3) | | | 07/19/27 | | | | 45,000 | | | | 44,980 | |
| |
Navient Student Loan Trust (17-1A-A3) | | | | | |
| | | |
2.97% (1 mo. USD LIBOR + 1.150%) (1)(3) | | | 07/26/66 | | | | 100,000 | | | | 101,590 | |
|
Palmer Square CLO, Ltd. (19-1A-A1) | |
| | | |
3.02% (3 mo. USD LIBOR + 1.05%) (1)(3) | | | 04/20/27 | | | | 34,165 | | | | 34,176 | |
| |
SLC Student Loan Trust (06-1-A6) | | | | | |
| | | |
2.28% (3 mo. USD LIBOR + 0.160%) (3) | | | 03/15/55 | | | | 100,000 | | | | 94,502 | |
| |
Student Loan Consolidation Center (02-2-B2) | | | | | |
| | | |
0.00% (28-Day Auction Rate) (1)(3)(4) | | | 07/01/42 | | | | 50,000 | | | | 46,496 | |
| | | | | | | | | | | | |
| | |
Total Asset-backed Securities | | | | | | | | | |
| | | |
(Cost: $418,706) | | | | | | | | | | | 424,847 | |
| | | | | | | | | | | | |
| |
COMMERCIAL MORTGAGE-BACKED SECURITIES —
AGENCY — 3.5% | | | | |
|
Fannie Mae (16-M2-X3) (I/O) | |
| | | |
2.02% (5) | | | 04/25/36 | | | | 1,992,981 | | | | 70,262 | |
|
Fannie Mae (16-M4-X2) (I/O) | |
| | | |
2.65% (5) | | | 01/25/39 | | | | 1,181,374 | | | | 91,944 | |
|
Freddie Mac Multifamily Structured Pass Through Certificates (K028-X1) (I/O) | |
| | | |
0.28% (5) | | | 02/25/23 | | | | 3,546,671 | | | | 27,854 | |
| |
Freddie Mac Multifamily Structured Pass Through Certificates (Q010-APT1) | | | | | |
| | | |
2.82% (5) | | | 04/25/46 | | | | 77,739 | | | | 78,550 | |
| |
Freddie Mac Multifamily Structured Pass Through Certificates (Q010-APT2) | | | | | |
| | | |
2.83% (5) | | | 12/25/47 | | | | 43,299 | | | | 43,925 | |
| | | | | | | | | | | | |
| Issues | | Maturity
Date | | | Principal
Amount | | | Value | |
| |
COMMERCIAL MORTGAGE-BACKED SECURITIES —
AGENCY (Continued) | | | | |
| |
Freddie Mac Multifamily Structured Pass-Through Certificates (K022-X3) (I/O) | | | | | |
| | | |
1.81% (5) | | | 08/25/40 | | | $ | 800,000 | | | $ | 38,655 | |
| |
Freddie Mac Multifamily Structured Pass-Through Certificates (K025-X3) (I/O) | | | | | |
| | | |
1.75% (5) | | | 11/25/40 | | | | 2,850,000 | | | | 142,701 | |
| |
Freddie Mac Multifamily Structured Pass-Through Certificates (KJ26-A1) | | | | | |
| | | |
2.14% | | | 07/25/25 | | | | 110,000 | | | | 110,418 | |
| |
FREMF Mortgage Trust (10-K6-AX2) (I/O) | | | | | |
| | | |
0.10% (1)(5) | | | 12/25/46 | | | | 52,698,929 | | | | 287 | |
| |
Ginnie Mae (11-147-IO) (I/O) | | | | | |
| | | |
0.01% (5) | | | 10/16/44 | | | | 3,796,018 | | | | 18,771 | |
| | | | | | | | | | | | |
| | |
Total Commercial Mortgage-backed Securities — Agency | | | | | | | | | |
| | | |
(Cost: $664,185) | | | | | | | | | | | 623,367 | |
| | | | | | | | | | | | |
| |
COMMERCIAL MORTGAGE-BACKED SECURITIES —
NON-AGENCY — 6.0% | | | | |
| |
Bank of America-First Union NB Commercial Mortgage (01-3-XC) (I/O) | | | | | |
| | | |
1.30% (1)(5)(6) | | | 04/11/37 | | | | 1,148,848 | | | | 22,276 | |
| |
COMM Mortgage Trust (13-CR7-XA) (I/O) | | | | | |
| | | |
1.21% (5) | | | 03/10/46 | | | | 883,791 | | | | 28,524 | |
| |
COMM Mortgage Trust (12-CR4-XA) (I/O) | | | | | |
| | | |
1.70% (5) | | | 10/15/45 | | | | 853,175 | | | | 36,222 | |
| |
CPT Mortgage Trust | | | | | |
| | | |
2.87% (7) | | | 11/13/39 | | | | 35,000 | | | | 36,049 | |
| |
DC Office Trust (19-MTC-A) | | | | | |
| | | |
2.97% (1) | | | 09/15/45 | | | | 35,000 | | | | 36,387 | |
| |
GS Mortgage Securities Trust (10-C1-X) (I/O) | | | | | |
| | | |
1.33% (1)(5) | | | 08/10/43 | | | | 7,103,481 | | | | 42,438 | |
| |
GS Mortgage Securities Trust (11-GC3-X) (I/O) | | | | | |
| | | |
0.66% (1)(5) | | | 03/10/44 | | | | 4,931,143 | | | | 30,774 | |
| |
GS Mortgage Securities Trust (13-GC12-XA) (I/O) | | | | | |
| | | |
1.42% (5) | | | 06/10/46 | | | | 5,098,546 | | | | 199,701 | |
| |
GS Mortgage Securities Trust (14-GC20-XA) (I/O) | | | | | |
| | | |
1.06% (5) | | | 04/10/47 | | | | 1,418,890 | | | | 46,018 | |
| |
JP Morgan Chase Commercial Mortgage Securities Trust (14-C19-XA) (I/O) | | | | | |
| | | |
0.75% (5) | | | 04/15/47 | | | | 3,066,283 | | | | 70,432 | |
| |
JPMorgan Chase Commercial Mortgage Securities Trust (11-C3-XB) (I/O) | | | | | |
| | | |
0.49% (1)(5) | | | 02/15/46 | | | | 6,530,305 | | | | 44,028 | |
| |
Morgan Stanley Bank of America Merrill Lynch Trust (13-C7-XA) (I/O) | | | | | |
| | | |
1.35% (5) | | | 02/15/46 | | | | 2,230,652 | | | | 81,104 | |
| |
Morgan Stanley Bank of America Merrill Lynch Trust (13-C9-XB) (I/O) | | | | | |
| | | |
0.31% (1)(5) | | | 05/15/46 | | | | 10,000,000 | | | | 115,200 | |
| |
One Bryant Park Trust (19-OBP-A) | | | | | |
| | | |
2.52% (1) | | | 09/15/54 | | | | 40,000 | | | | 40,071 | |
See accompanying notes to financial statements.
41
TCW Global Bond Fund
Schedule of Investments (Continued)
| | | | | | | | | | | | |
| Issues | | Maturity
Date | | | Principal
Amount | | | Value | |
| |
COMMERCIAL MORTGAGE-BACKED SECURITIES —
NON-AGENCY (Continued) | | | | |
| |
WFRBS Commercial Mortgage Trust (12-C9-XA) (I/O) | | | | | |
| | | |
1.90% (1),(5) | | | 11/15/45 | | | $ | 2,732,352 | | | $ | 127,382 | |
| |
WFRBS Commercial Mortgage Trust (14-LC14-XA) (I/O) | | | | | |
| | | |
1.22% (5) | | | 03/15/47 | | | | 2,345,818 | | | | 94,713 | |
| | | | | | | | | | | | |
| | |
Total Commercial Mortgage-backed Securities — Non-agency | | | | | | | | | |
| | | |
(Cost: $963,458) | | | | | | | | | | | 1,051,319 | |
| | | | | | | | | | | | |
|
RESIDENTIAL MORTGAGE-BACKED SECURITIES —
AGENCY — 17.8% | |
|
Fannie Mae, Pool #MA3811 | |
| | | |
3.00% (7) | | | 10/01/49 | | | | 99,701 | | | | 100,600 | |
|
Fannie Mae (07-52-LS) (I/O) (I/F) | |
| | | |
4.23% (-1.00 X 1 mo. USD LIBOR + 6.050%) (3) | | | 06/25/37 | | | | 70,022 | | | | 8,001 | |
|
Fannie Mae (08-18-SM) (I/O) (I/F) | |
| | | |
5.18% (-1.00 X 1 mo. USD LIBOR + 7.000%) (3) | | | 03/25/38 | | | | 60,344 | | | | 10,395 | |
|
Fannie Mae (09-115-SB) (I/O) (I/F) | |
| | | |
4.43% (-1.00 X 1 mo. USD LIBOR + 6.250%) (3) | | | 01/25/40 | | | | 49,451 | | | | 8,530 | |
|
Fannie Mae (10-116-SE) (I/O) (I/F) | |
| | | |
4.78% (-1.00 X 1 mo. USD LIBOR + 6.600%) (3) | | | 10/25/40 | | | | 97,911 | | | | 12,129 | |
|
Fannie Mae, Pool #AB3679 | |
| | | |
3.50% | | | 10/01/41 | | | | 93,208 | | | | 97,867 | |
|
Fannie Mae, Pool #AB4045 | |
| | | |
3.50% | | | 12/01/41 | | | | 121,897 | | | | 128,560 | |
|
Fannie Mae, Pool #AT5914 | |
| | | |
3.50% | | | 06/01/43 | | | | 45,619 | | | | 47,847 | |
|
Fannie Mae, Pool #BD7081 | |
| | | |
4.00% | | | 03/01/47 | | | | 73,847 | | | | 77,537 | |
|
Fannie Mae, Pool #CA0996 | |
| | | |
3.50% | | | 01/01/48 | | | | 130,518 | | | | 136,755 | |
|
Fannie Mae, Pool #CA2208 | |
| | | |
4.50% | | | 08/01/48 | | | | 7,873 | | | | 8,300 | |
|
Fannie Mae, Pool #MA1527 | |
| | | |
3.00% | | | 08/01/33 | | | | 27,168 | | | | 28,127 | |
|
Fannie Mae, Pool #MA1652 | |
| | | |
3.50% | | | 11/01/33 | | | | 44,343 | | | | 46,268 | |
|
Freddie Mac, Pool #SD8016 | |
| | | |
3.00% (7) | | | 10/01/49 | | | | 401,606 | | | | 408,425 | |
|
Freddie Mac (2990-ND) (I/F) (PAC) | |
| | | |
12.01% (-2.54 X 1 mo. USD LIBOR + 16.891%) (3) | | | 12/15/34 | | | | 11 | | | | 12 | |
|
Freddie Mac (3439-SC) (I/O) (I/F) | |
| | | |
3.98% (-1.00 X 1 mo. USD LIBOR + 5.900%) (3) | | | 04/15/38 | | | | 67,280 | | | | 10,903 | |
|
Freddie Mac, Pool #G08681 | |
| | | |
3.50% | | | 12/01/45 | | | | 65,766 | | | | 68,539 | |
|
Freddie Mac, Pool #G08698 | |
| | | |
3.50% | | | 03/01/46 | | | | 65,203 | | | | 67,912 | |
| | | | | | | | | | | | |
| Issues | | Maturity
Date | | | Principal
Amount | | | Value | |
|
RESIDENTIAL MORTGAGE-BACKED SECURITIES —
AGENCY (Continued) | |
|
Freddie Mac, Pool #G08716 | |
| | | |
3.50% | | | 08/01/46 | | | $ | 64,266 | | | $ | 66,814 | |
|
Freddie Mac, Pool #G08721 | |
| | | |
3.00% | | | 09/01/46 | | | | 11,125 | | | | 11,416 | |
|
Freddie Mac, Pool #G08722 | |
| | | |
3.50% | | | 09/01/46 | | | | 6,428 | | | | 6,683 | |
|
Freddie Mac, Pool #G08732 | |
| | | |
3.00% | | | 11/01/46 | | | | 15,210 | | | | 15,608 | |
|
Freddie Mac, Pool #G08762 | |
| | | |
4.00% | | | 05/01/47 | | | | 71,615 | | | | 75,117 | |
|
Freddie Mac, Pool #G08833 | |
| | | |
5.00% | | | 07/01/48 | | | | 10,693 | | | | 11,467 | |
|
Freddie Mac, Pool #G18592 | |
| | | |
3.00% | | | 03/01/31 | | | | 8,112 | | | | 8,344 | |
|
Freddie Mac, Pool #ZT1703 | |
| | | |
4.00% | | | 01/01/49 | | | | 146,118 | | | | 154,517 | |
|
Ginnie Mae (11-146-EI) (I/O) (PAC) | |
| | | |
5.00% | | | 11/16/41 | | | | 70,448 | | | | 14,583 | |
|
Ginnie Mae (11-69-GI) (I/O) | |
| | | |
5.00% | | | 05/16/40 | | | | 88,842 | | | | 4,191 | |
|
Ginnie Mae (12-7-PI) (I/O) (PAC) | |
| | | |
3.50% | | | 01/20/38 | | | | 19,009 | | | | 107 | |
|
Ginnie Mae II, Pool #MA3597 | |
| | | |
3.50% | | | 04/20/46 | | | | 36,870 | | | | 38,629 | |
|
Ginnie Mae II, Pool #MA3663 | |
| | | |
3.50% | | | 05/20/46 | | | | 5,461 | | | | 5,717 | |
|
Ginnie Mae II, Pool #MA3803 | |
| | | |
3.50% | | | 07/20/46 | | | | 26,186 | | | | 27,457 | |
|
Ginnie Mae II, Pool #MA4454 | |
| | | |
5.00% | | | 05/20/47 | | | | 26,144 | | | | 28,085 | |
|
Ginnie Mae II, Pool #MA4900 | |
| | | |
3.50% | | | 12/20/47 | | | | 144,907 | | | | 150,867 | |
|
Ginnie Mae II, Pool #MA5399 | |
| | | |
4.50% | | | 08/20/48 | | | | 82,190 | | | | 86,542 | |
|
Ginnie Mae II, Pool #MA6209 | |
| | | |
3.00% (7) | | | 10/20/49 | | | | 75,000 | | | | 76,057 | |
|
Ginnie Mae II TBA, 30 Year | |
| | | |
3.00% (8) | | | 06/01/49 | | | | 350,000 | | | | 360,308 | |
|
Ginnie Mae TBA, 30 Year | |
| | | |
5.00% (8) | | | 08/01/48 | | | | 25,000 | | | | 26,377 | |
|
Uniform Mortgage-Backed Securities TBA, 15 Year | |
| | | |
2.50% (8) | | | 07/01/34 | | | | 525,000 | | | | 530,681 | |
| | | |
3.50% (8) | | | 08/01/33 | | | | 25,000 | | | | 25,899 | |
|
Uniform Mortgage-Backed Securities TBA, 30 Year | |
| | | |
3.00% (8) | | | 06/01/49 | | | | 125,000 | | | | 127,051 | |
| | | |
2.50% (8) | | | 08/01/49 | | | | 25,000 | | | | 24,824 | |
| | | | | | | | | | | | |
| | |
Total Residential Mortgage-backed Securities — Agency | | | | | | | | | |
| | |
(Cost: $3,029,614) | | | | | | | | 3,144,048 | |
| | | | | | | | | | | | |
See accompanying notes to financial statements.
42
TCW Global Bond Fund
| | | | | | | | | | | | |
| Issues | | Maturity
Date | | | Principal
Amount | | | Value | |
|
RESIDENTIAL MORTGAGE-BACKED SECURITIES — NON-
AGENCY — 3.4% | |
|
ACE Securities Corp. Home Equity Loan Trust (05-HE3-M2) | |
| | | |
2.50% (1 mo. USD LIBOR + 0.675%) (3) | | | 05/25/35 | | | $ | 29,968 | | | $ | 30,140 | |
|
Banc of America Funding Trust (05-C-A3) | |
| | | |
2.15% (1 mo. USD LIBOR + 0.300%) (3) | | | 05/20/35 | | | | 39,893 | | | | 39,856 | |
|
BCMSC Trust (00-A-A4) | |
| | | |
8.29% (5) | | | 06/15/30 | | | | 189,525 | | | | 69,016 | |
|
Bear Stearns ALT-A Trust (05-8-11A1) | |
| | | |
2.36% (1 mo. USD LIBOR + 0.540%) (3) | | | 10/25/35 | | | | 48,680 | | | | 48,404 | |
|
First Horizon Mortgage Pass-Through Trust (05-AR4-2A1) | |
| | | |
4.11% (5) | | | 10/25/35 | | | | 43,945 | | | | 43,101 | |
|
Green Tree Financial Corp. (98-6-A8) | |
| | | |
6.66% (5) | | | 06/01/30 | | | | 14,264 | | | | 14,755 | |
|
JPMorgan Mortgage Trust (05-A6-7A1) | |
| | | |
4.24% (5) | | | 08/25/35 | | | | 30,023 | | | | 29,794 | |
|
Merrill Lynch Alternative Note Asset Trust (07-A3-A2D) | |
| | | |
2.15% (1 mo. USD LIBOR + 0.330%) (3)(9) | | | 04/25/37 | | | | 1,251,739 | | | | 104,216 | |
|
MortgageIT Trust (05-1-1A1) | |
| | | |
2.46% (1 mo. USD LIBOR + 0.640%) (3) | | | 02/25/35 | | | | 41,008 | | | | 41,610 | |
|
Structured Adjustable Rate Mortgage Loan Trust (04-18-4A1) | |
| | | |
4.41% (5) | | | 12/25/34 | | | | 27,323 | | | | 27,702 | |
| |
Structured Asset Mortgage Investments II Trust (05-AR6-2A1) | | | | | |
| | | |
2.44% (1 mo. USD LIBOR + 0.310%) (3) | | | 09/25/45 | | | | 47,768 | | | | 47,859 | |
| |
Structured Asset Mortgage Investments, Inc. (06-AR3-22A1) | | | | | |
| | | |
3.69% (5) | | | 05/25/36 | | | | 157,449 | | | | 106,621 | |
| | | | | | | | | | | | |
| | |
Total Residential Mortgage-backed Securities — Non-agency | | | | | | | | | |
| | | |
(Cost: $641,818) | | | | | | | | | | | 603,074 | |
| | | | | | | | | | | | |
|
| U.S. TREASURY BONDS — 0.1% (Cost: $16,944) | |
| | | |
U.S. Treasury Bond, 2.25%, due 08/15/49 | | | | | | | 17,000 | | | | 17,279 | |
| | | | | | | | | | | | |
|
| U.S. TREASURY SECURITIES — 0.1% | |
| |
U.S. Treasury Note | | | | | |
| | | |
1.50% | | | 09/30/21 | | | | 14,000 | | | | 13,988 | |
| | | |
1.50% | | | 09/30/24 | | | | 9,000 | | | | 8,990 | |
| | | | | | | | | | | | |
| | |
Total U.S. Treasury Securities | | | | | | | | | |
| | | |
(Cost: $22,893) | | | | | | | | | | | 22,978 | |
| | | | | | | | | | | | |
| | |
Total Fixed Income Securities | | | | | | | | | |
| | | |
(Cost: $17,395,318) | | | | | | | | | | | 17,700,234 | |
| | | | | | | | | | | | |
| | | |
| | | | | | | | | | | | |
| | | | | | | | | | | | |
| Security | | | | | Shares | | | Value | |
|
INVESTMENT COMPANIES — 2.3% | |
| | | |
TCW Emerging Markets Income Fund — I Class (10) | | | | | | | 48,220 | | | $ | 401,675 | |
| | | | | | | | | | | | |
| | |
Total Investment Companies | | | | | | | | | |
| | | |
(Cost: $387,781) | | | | | | | | | | | 401,675 | |
| | | | | | | | | | | | |
|
| MONEY MARKET INVESTMENTS — 1.4% | |
| | | |
State Street Institutional U.S. Government Money Market Fund — Premier Class, 1.75% (11) | | | | | | | 251,797 | | | | 251,797 | |
| | | | | | | | | | | | |
| | |
Total Money Market Investments | | | | | | | | | |
| | | |
(Cost: $251,797) | | | | | | | | | | | 251,797 | |
| | | | | | | | | | | | |
| | | |
| | | | | | | | | | | | |
| Issues | | Maturity
Date | | | Principal
Amount | | | | |
|
SHORT TERM INVESTMENTS — 4.6% | |
|
| FOREIGN GOVERNMENT BONDS — 2.3% | |
| |
Brazil Letras do Tesouro Nacional | | | | | |
| | | |
0.00% (4) | | | 10/01/20 | | | BRL | 350,000 | | | | 84,010 | |
| |
Japan Treasury Bill | | | | | |
| | | |
0.00% (4) | | | 01/20/20 | | | JPY | 20,000,000 | | | | 185,098 | |
| | | |
0.00% (4) | | | 01/27/20 | | | JPY | 14,000,000 | | | | 129,573 | |
| | | | | | | | | | | | |
| | |
Total Foreign Government Bonds | | | | | | | | | |
| | | |
(Cost: $395,626) | | | | | | | | | | | 398,681 | |
| | | | | | | | | | | | |
|
| COMMERCIAL PAPER — 0.2% | |
|
| Auto Manufacturers — 0.2% (Cost: $43,675) | |
| |
Ford Motor Credit Co. | | | | | |
| | | |
3.24% | | | 10/08/20 | | | | 45,000 | | | | 43,689 | |
| | | | | | | | | | | | |
|
| U.S. TREASURY SECURITIES — 2.1% | |
| |
U.S. Treasury Bill | | | | | |
| | | |
1.54% (12) | | | 01/02/20 | | | | 285,000 | | | | 284,243 | |
| | | |
1.53% (12)(13) | | | 12/26/19 | | | | 93,000 | | | | 92,782 | |
| | | | | | | | | | | | |
| | |
Total U.S. Treasury Securities | | | | | | | | | |
| | |
(Cost: $376,757) | | | | | | | | 377,025 | |
| | | | | | | | | | | | |
| |
Total Short Term Investments | | | | | |
| | |
(Cost: $816,058) | | | | | | | | 819,395 | |
| | | | | | | | | | | | |
| | |
Total Investments (108.5%) | | | | | | | | | |
| | |
(Cost: $18,850,954) | | | | | | | | 19,173,101 | |
| |
Liabilities In Excess Of Other Assets (-8.5%) | | | | (1,507,559 | ) |
| | | | | | | | | | | | |
| | |
Net Assets (100.0%) | | | | | | | $ | 17,665,542 | |
| | | | | | | | | | | | |
See accompanying notes to financial statements.
43
TCW Global Bond Fund
Schedule of Investments (Continued)
| | | | | | | | | | | | | | | | | | | | | | | | |
| Forward Currency Exchange Contracts | |
| | | | | | |
| Counterparty | | Contracts to
Deliver | | | Units of
Currency | | | Settlement
Date | | | In Exchange for
U.S. Dollars | | | Contracts at
Value | | | Unrealized
Appreciation
(Depreciation) | |
BUY (14) | | | | | | | | | | | | | | | | | | | | | | | | |
Barclays Capital | | | BRL | | | | 85,000 | | | | 01/24/20 | | | $ | 21,187 | | | $ | 21,080 | | | $ | (107 | ) |
State Street Bank & Trust Co. | | | EUR | | | | 825,000 | | | | 01/24/20 | | | | 920,701 | | | | 925,643 | | | | 4,942 | |
Goldman Sachs & Co. | | | GBP | | | | 45,000 | | | | 01/24/20 | | | | 58,194 | | | | 58,387 | | | | 193 | |
State Street Bank & Trust Co. | | | JPY | | | | 150,350,000 | | | | 01/24/20 | | | | 1,392,567 | | | | 1,398,400 | | | | 5,833 | |
State Street Bank��& Trust Co. | | | SEK | | | | 635,000 | | | | 01/24/20 | | | | 65,293 | | | | 66,220 | | | | 927 | |
| | | | | | | | | | | | | | | | | | | | | | | | |
| | | | | | | | | | | | | | $ | 2,457,942 | | | $ | 2,469,730 | | | $ | 11,788 | |
| | | | | | | | | | | | | | | | | | | | | | | | |
SELL (15) | | | | | | | | | | | | | | | | | | | | | | | | |
State Street Bank & Trust Co. | | | AUD | | | | 190,000 | | | | 01/24/20 | | | $ | 128,843 | | | $ | 131,169 | | | $ | (2,326 | ) |
Barclays Capital | | | BRL | | | | 465,000 | | | | 01/24/20 | | | | 111,146 | | | | 115,319 | | | | (4,173 | ) |
State Street Bank & Trust Co. | | | CNY | | | | 2,815,000 | | | | 01/23/20 | | | | 393,753 | | | | 399,409 | | | | (5,656 | ) |
State Street Bank & Trust Co. | | | CZK | | | | 1,200,000 | | | | 01/24/20 | | | | 51,659 | | | | 52,568 | | | | (909 | ) |
State Street Bank & Trust Co. | | | EUR | | | | 80,000 | | | | 10/15/20 | | | | 90,808 | | | | 91,166 | | | | (358 | ) |
State Street Bank & Trust Co. | | | GBP | | | | 45,000 | | | | 01/24/20 | | | | 58,016 | | | | 58,387 | | | | (371 | ) |
State Street Bank & Trust Co. | | | HUF | | | | 13,700,000 | | | | 01/24/20 | | | | 45,843 | | | | 46,780 | | | | (937 | ) |
State Street Bank & Trust Co. | | | ILS | | | | 615,000 | | | | 01/24/20 | | | | 176,024 | | | | 175,279 | | | | 745 | |
Goldman Sachs & Co. | | | JPY | | | | 20,000,000 | | | | 01/21/20 | | | | 187,098 | | | | 185,987 | | | | 1,111 | |
Goldman Sachs & Co. | | | JPY | | | | 14,000,000 | | | | 01/27/20 | | | | 129,395 | | | | 130,236 | | | | (841 | ) |
Citibank N.A. | | | KRW | | | | 95,000,000 | | | | 01/23/20 | | | | 80,272 | | | | 81,827 | | | | (1,555 | ) |
State Street Bank & Trust Co. | | | NOK | | | | 1,600,000 | | | | 01/24/20 | | | | 174,629 | | | | 174,357 | | | | 272 | |
State Street Bank & Trust Co. | | | SGD | | | | 97,000 | | | | 01/24/20 | | | | 70,862 | | | | 71,336 | | | | (474 | ) |
State Street Bank & Trust Co. | | | ZAR | | | | 600,000 | | | | 01/24/20 | | | | 39,696 | | | | 39,401 | | | | 295 | |
| | | | | | | | | | | | | | | | | | | | | | | | |
| | | | | | | | | | | | | | $ | 1,738,044 | | | $ | 1,753,221 | | | $ | (15,177 | ) |
| | | | | | | | | | | | | | | | | | | | | | | | |
| | | | | | | | | | | | | | | | | | |
| Futures Contracts | |
| | | | | |
Number of
Contracts | | Type | | Expiration
Date | | | Notional | | | Value | | | Net Unrealized
Appreciation/
Depreciation | |
Long Futures | | | | | | | | | | | | | | | | |
| 4 | | 5 Year Government of Canada Bond Futures | | | 12/18/19 | | | | $377,838 | | | $ | 374,086 | | | $ | (3,752 | ) |
| 5 | | 2-Year U.S. Treasury Note Futures | | | 12/31/19 | | | | 1,080,099 | | | | 1,078,008 | | | | (2,091 | ) |
| 4 | | 5-Year U.S. Treasury Note Futures | | | 12/31/19 | | | | 476,367 | | | | 476,812 | | | | 445 | |
| 1 | | 5-Year U.S. Treasury Note Futures | | | 03/31/20 | | | | 119,589 | | | | 119,539 | | | | (50 | ) |
| 7 | | 10-Year U.S. Ultra Treasury Note Futures | | | 12/19/19 | | | | 1,004,989 | | | | 994,766 | | | | (10,223 | ) |
| 3 | | U.S. Ultra Long Bond Futures | | | 12/19/19 | | | | 578,750 | | | | 569,250 | | | | (9,500 | ) |
| | | | | | | | | | | | | | | | | | |
| | | | | | | | $ | 3,637,632 | | | $ | 3,612,461 | | | $ | (25,171 | ) |
| | | | | | | | | | | | | | | | | | |
See accompanying notes to financial statements.
44
TCW Global Bond Fund
Notes to Schedule of Investments:
| CLO - | | Collateralized Loan Obligation. |
| EETC - | | Enhanced Equipment Trust Certificate. |
| I/F - | | Inverse Floating rate security whose interest rate moves in the opposite direction of prevailing interest rates. |
| I/O - | | Interest Only Security. |
| PAC - | | Planned Amortization Class. |
| REIT - | | Real Estate Investment Trust. |
| GBP - | | British Pound Sterling. |
| PEN - | | Peruvian Nuevo Sol. |
| ZAR - | | South African Rand. |
| (1) | | Security exempt from registration under Rule 144A of the Securities Act of 1933, as amended. These securities may be resold, normally only to qualified institutional buyers. At October 31, 2019, the value of these securities amounted to $1,568,788 or 8.9% of net assets. These securities are determined to be liquid by the Fund’s investment advisor, unless otherwise noted, under procedures established by and under the general supervision of the Company’s Board of Directors. |
| (2) | | Investments issued under Regulation S of the Securities Act of 1933, as amended, may not be offered, sold, or delivered within the United States except under special exemptions. At October 31, 2019, the value of these securities amounted to $3,570,518 or 20.2% of net assets. |
| (3) | | Floating or variable rate security. The interest shown reflects the rate in effect at October 31, 2019. |
| (4) | | Security is not accruing interest. |
| (5) | | Variable rate security. Interest rate disclosed is as of the most recent information available. Certain variable rate securities are not based on a published reference rate and spread but are determined by the issuer or agent and are based on current market conditions. These securities do not indicate a reference rate and spread in their description above. |
| (6) | | Restricted security (Note 11). |
| (7) | | This security is purchased on a when-issued, delayed delivery or forward commitment basis. |
| (8) | | Security purchased on a forward commitment with an approximate principal amount. The actual principal amount and maturity date will be determined upon settlement when the security is delivered. |
| (9) | | For fair value measurement disclosure purposes, security is categorized as Level 3. Security is valued using significant unobservable inputs. |
| (11) | | Rate disclosed is the 7-day net yield as of October 31, 2019. |
| (12) | | Rate shown represents yield-to-maturity. |
| (13) | | All or a portion of this security is held as collateral for open futures contracts. |
| (14) | | Fund buys foreign currency, sells U.S. Dollar. |
| (15) | | Fund sells foreign currency, buys U.S. Dollar. |
See accompanying notes to financial statements.
45
TCW Global Bond Fund
Schedule of Investments (Continued)
The summary of the TCW Global Bond Fund transactions in the affiliated fund for the year ended October 31, 2019 is as follows:
| | | | | | | | | | | | | | | | | | | | | | | | | | | | | | | | | | | | |
Name of
Affiliated
Fund | | Value at
October 31,
2018
(In Thousands) | | | Purchases
at Cost
(In Thousands) | | | Proceeds
from Sales
(In Thousands) | | | Number
of Shares
Held
October 31,
2019 | | | Value at
October 31,
2019
(In Thousands) | | | Dividends and
Interest
Income
Received
(In Thousands) | | | Distributions
Received from
Net Realized
Gain
(In thousands) | | | Net Realized
Gain/(Loss)
on
Investments
(In thousands) | | | Net change in
Unrealized
Gain/(Loss)
on
Investments
(In thousands) | |
TCW Emerging Markets Income Fund—I Class | | | | | | | | | | | | | | | | | |
| | $ | 356 | | | $ | 19 | | | $ | — | | | | 48,220 | | | $ | 402 | | | $ | 21 | | | $ | — | | | $ | — | | | $ | 26 | |
| | | | | | | | | | | | | | | | | | | | | |
Total | | | | | | | | | | | | | | | | | | $ | 402 | | | $ | 21 | | | $ | — | | | $ | — | | | $ | 26 | |
| | | | | | | | | | | | | | | | | | | | | |
See accompanying notes to financial statements.
46
TCW Global Bond Fund
Investments by Sector | October 31, 2019 |
| | | | |
| Sector | | Percentage of
Net Assets | |
Foreign Government Bonds | | | 47.8 | % |
Corporate Bonds | | | 21.1 | |
Residential Mortgage-Backed Securities — Agency | | | 17.8 | |
Commercial Mortgage-Backed Securities — Non-Agency | | | 6.0 | |
Commercial Mortgage-Backed Securities — Agency | | | 3.5 | |
Residential Mortgage-Backed Securities — Non-Agency | | | 3.4 | |
Asset-Backed Securities | | | 2.4 | |
Investment Companies | | | 2.3 | |
U.S. Treasury Securities | | | 2.3 | |
Money Market Investments | | | 1.4 | |
Municipal Bonds | | | 0.3 | |
Commercial Paper | | | 0.2 | |
Other* | | | (8.5 | ) |
| | | | |
Total | | | 100.0 | % |
| | | | |
| * | Includes cash, futures, pending trades, foreign exchange transactions, interest receivable and accrued expenses payable |
See accompanying notes to financial statements.
47
TCW Global Bond Fund
Investments by Country | October 31, 2019 |
| | | | |
| Country | | Percentage of
Net Assets | |
Australia | | | 1.2 | % |
Belgium | | | 0.3 | |
Bermuda | | | 0.3 | |
Brazil | | | 1.5 | |
Canada | | | 3.1 | |
Cayman Islands | | | 1.2 | |
China | | | 2.5 | |
Colombia | | | 0.4 | |
Czech Republic | | | 1.9 | |
France | | | 1.1 | |
Great Britain | | | 6.2 | |
Hungary | | | 0.3 | |
Indonesia | | | 1.9 | |
Ireland | | | 2.3 | |
Israel | | | 1.0 | |
Italy | | | 2.5 | |
Japan | | | 8.7 | |
Luxembourg | | | 0.1 | |
Malaysia | | | 0.5 | |
Mexico | | | 1.2 | |
Norway | | | 3.2 | |
Peru | | | 0.5 | |
Poland | | | 2.3 | |
Portugal | | | 0.8 | |
Saudi Arabia | | | 0.7 | |
Singapore | | | 1.9 | |
Slovenia | | | 0.3 | |
South Africa | | | 0.7 | |
South Korea | | | 1.5 | |
Spain | | | 2.8 | |
United States | | | 55.6 | |
| | | | |
Total | | | 108.5 | % |
| | | | |
See accompanying notes to financial statements.
48
TCW Global Bond Fund
Fair Valuation Summary | October 31, 2019 |
The following is a summary of the fair valuations according to the inputs used as of October 31, 2019 in valuing the Fund’s investments:
| | | | | | | | | | | | | | | | |
Description | | Quoted Prices
in Active
Markets for
Identical
Assets
(Level 1) | | | Other
Significant
Observable
Inputs
(Level 2) | | | Significant
Unobservable
Inputs
(Level 3) | | | Total | |
Fixed Income Securities | | | | | | | | | | | | | | | | |
Corporate Bonds* | | $ | — | | | $ | 3,730,590 | | | $ | — | | | $ | 3,730,590 | |
Municipal Bonds | | | — | | | | 45,306 | | | | — | | | | 45,306 | |
Foreign Government Bonds | | | — | | | | 8,037,426 | | | | — | | | | 8,037,426 | |
Asset-Backed Securities | | | — | | | | 424,847 | | | | — | | | | 424,847 | |
Commercial Mortgage-Backed Securities — Agency | | | — | | | | 623,367 | | | | — | | | | 623,367 | |
Commercial Mortgage-Backed Securities — Non-Agency | | | — | | | | 1,051,319 | | | | — | | | | 1,051,319 | |
Residential Mortgage-Backed Securities — Agency | | | — | | | | 3,144,048 | | | | — | | | | 3,144,048 | |
Residential Mortgage-Backed Securities — Non-Agency | | | — | | | | 498,858 | | | | 104,216 | | | | 603,074 | |
U.S. Treasury Securities | | | 40,257 | | | | — | | | | — | | | | 40,257 | |
| | | | | | | | | | | | | | | | |
Total Fixed Income Securities | | | 40,257 | | | | 17,555,761 | | | | 104,216 | | | | 17,700,234 | |
| | | | | | | | | | | | | | | | |
Equity Securities | | | | | | | | | | | | | | | | |
Investment Companies | | | 401,675 | | | | — | | | | — | | | | 401,675 | |
Money Market Investments | | | 251,797 | | | | — | | | | — | | | | 251,797 | |
Short-Term Investments* | | | 377,025 | | | | 442,370 | | | | — | | | | 819,395 | |
| | | | | | | | | | | | | | | | |
Total Investments | | $ | 1,070,754 | | | $ | 17,998,131 | | | $ | 104,216 | | | $ | 19,173,101 | |
| | | | | | | | | | | | | | | | |
Asset Derivatives | | | | | | | | | | | | | | | | |
Forward Currency Contracts | | | | | | | | | | | | | | | | |
Foreign Currency Risk | | | — | | | | 14,318 | | | | — | | | | 14,318 | |
Futures Contracts | | | | | | | | | | | | | | | | |
Interest Rate Risk | | | 445 | | | | — | | | | — | | | | 445 | |
| | | | | | | | | | | | | | | | |
Total | | $ | 1,071,199 | | | $ | 18,012,449 | | | $ | 104,216 | | | $ | 19,187,864 | |
| | | | | | | | | | | | | | | | |
Liability Derivatives | | | | | | | | | | | | | | | | |
Forward Currency Contracts | | | | | | | | | | | | | | | | |
Foreign Currency Risk | | $ | — | | | $ | (17,707 | ) | | $ | — | | | $ | (17,707 | ) |
Futures Contracts | | | | | | | | | | | | | | | | |
Interest Rate Risk | | | (25,616 | ) | | | — | | | | — | | | | (25,616 | ) |
| | | | | | | | | | | | | | | | |
Total | | $ | (25,616 | ) | | $ | (17,707 | ) | | $ | — | | | $ | (43,323 | ) |
| | | | | | | | | | | | | | | | |
| * | See Schedule of Investments for corresponding industries. |
See accompanying notes to financial statements.
49
TCW High Yield Bond Fund
Schedule of Investments
| | | | | | | | | | | | |
| Issues | | Maturity
Date | | | Principal
Amount | | | Value | |
|
FIXED INCOME SECURITIES — 90.7% of Net Assets | |
|
BANK LOANS — 8.7% | |
|
| Chemicals — 0.2% | |
| |
U.S. Coating Acquisition, Inc., Term Loan B3 | | | | | |
| | | |
3.54% (3 mo. USD LIBOR + 1.750%) (1) | | | 06/01/24 | | | $ | 60,846 | | | $ | 60,853 | |
| | | | | | | | | | | | |
|
| Commercial Services — 2.3% | |
| |
MPH Acquisition Holdings LLC, 2016 Term Loan B | | | | | |
| | | |
4.85% (3 mo. USD LIBOR + 2.750%) (1) | | | 06/07/23 | | | | 80,000 | | | | 75,241 | |
| |
SBA Senior Finance II LLC, 2018 Term Loan B | | | | | |
| | | |
3.79% (3 mo. USD LIBOR + 2.000%) (1) | | | 04/11/25 | | | | 198,747 | | | | 199,469 | |
| |
Scientific Games International, Inc., 2018 Term Loan B5 | | | | | |
| | | |
4.54% (3 mo. USD LIBOR + 2.750%) (1) | | | 08/14/24 | | | | 32,468 | | | | 32,146 | |
| |
SS&C Technologies Holdings Europe S.A.R.L., 2018 Term Loan B4 | | | | | |
| | | |
4.04% (3 mo. USD LIBOR + 2.250%) (1) | | | 04/16/25 | | | | 98,924 | | | | 99,308 | |
| |
SS&C Technologies, Inc., 2018 Term Loan B3 | | | | | |
| | | |
4.04% (3 mo. USD LIBOR + 2.250%) (1) | | | 04/16/25 | | | | 151,544 | | | | 152,131 | |
| |
VICI Properties 1 LLC, Term Loan B | | | | | |
| | | |
2.00% (3 mo. USD LIBOR + 2.000%) (1) | | | 12/20/24 | | | | 125,000 | | | | 125,560 | |
| | | | | | | | | | | | |
| | | |
| | | | | | | | | | | 683,855 | |
| | | | | | | | | | | | |
|
| Computers — 0.1% | |
| |
TierPoint LLC, 2017 1st Lien Term Loan | | | | | |
| | | |
5.54% (3 mo. USD LIBOR + 3.750%) (1) | | | 05/06/24 | | | | 34,939 | | | | 31,620 | |
| | | | | | | | | | | | |
|
| Electric — 0.3% | |
| |
TEX Operations Co. LLC, Exit Term Loan B | | | | | |
| | | |
3.79% (3 mo. USD LIBOR + 2.000%) (1) | | | 08/04/23 | | | | 24,385 | | | | 24,493 | |
| |
Vistra Energy Co., 1st Lien Term Loan B3 | | | | | |
| | | |
3.83% (3 mo. USD LIBOR + 2.000%) (1) | | | 12/31/25 | | | | 58,433 | | | | 58,696 | |
| | | | | | | | | | | | |
| | | |
| | | | | | | | | | | 83,189 | |
| | | | | | | | | | | | |
|
| Entertainment — 0.5% | |
| |
Caesars Entertainment Operating Co., Exit Term Loan | | | | | |
| | | |
3.79% (3 mo. USD LIBOR + 2.000%) (1) | | | 10/07/24 | | | | 81,169 | | | | 81,233 | |
| |
Churchill Downs, Inc., 2017 Term Loan B | | | | | |
| | | |
3.79% (3 mo. USD LIBOR + 2.000%) (1) | | | 12/27/24 | | | | 64,835 | | | | 65,051 | |
| | | | | | | | | | | | |
| | | |
| | | | | | | | | | | 146,284 | |
| | | | | | | | | | | | |
|
| Environmental Control — 0.3% | |
| |
GFL Environmental, Inc., 2018 USD Term Loan B | | | | | |
| | | |
4.79% (3 mo. USD LIBOR + 3.000%) (1) | | | 05/30/25 | | | | 97,753 | | | | 97,569 | |
| | | | | | | | | | | | |
| | | | | | | | | | | | |
| Issues | | Maturity
Date | | | Principal
Amount | | | Value | |
|
| Food — 0.7% | |
| |
Dhanani Group, Inc., 2018 Term Loan B | | | | | |
| | | |
5.54% (3 mo. USD LIBOR +3.750%) (1) | | | 07/20/25 | | | $ | 39,749 | | | $ | 36,271 | |
| |
JBS USA Lux S.A., 2019 Term Loan B | | | | | |
| | | |
2.50% (3 mo. USD LIBOR + 2.500%) (1) | | | 05/01/26 | | | | 177,554 | | | | 178,341 | |
| | | | | | | | | | | | |
| | | |
| | | | | | | | | | | 214,612 | |
| | | | | | | | | | | | |
|
| Healthcare-Products — 0.1% | |
| |
Auris Luxembourg III S.A.R.L., 2018 USD Term Loan B2 | | | | | |
| | | |
5.54% (3 mo. USD LIBOR + 3.750%) (1) | | | 02/27/26 | | | | 16,418 | | | | 16,171 | |
| | | | | | | | | | | | |
|
| Healthcare-Services — 0.7% | |
| |
Acadia Healthcare Co., Inc., 2018 Term Loan B4 | | | | | |
| | | |
4.29% (3 mo. USD LIBOR + 2.500%) (1) | | | 02/16/23 | | | | 71,688 | | | | 71,879 | |
| |
Aveanna Healthcare LLC, 2017 1st Lien Term Loan | | | | | |
| | | |
6.04% (3 mo. USD LIBOR + 4.250%) (1) | | | 03/18/24 | | | | 44,511 | | | | 39,059 | |
| |
Aveanna Healthcare LLC, 2017 2nd Lien Term Loan | | | | | |
| | | |
9.79% (3 mo. USD LIBOR + 8.000%) (1) | | | 03/17/25 | | | | 13,000 | | | | 12,545 | |
| |
Gentiva Health Services, Inc., 2018 1st Lien Term Loan | | | | | |
| | | |
5.56% (3 mo. USD LIBOR + 3.750%) (1) | | | 07/02/25 | | | | 73,317 | | | | 73,317 | |
| | | | | | | | | | | | |
| | | |
| | | | | | | | | | | 196,800 | |
| | | | | | | | | | | | |
|
| Lodging — 0.3% | |
| |
CityCenter Holdings LLC, 2017 Term Loan B | | | | | |
| | | |
4.04% (3 mo. USD LIBOR + 2.500%) (1) | | | 04/18/24 | | | | 80,985 | | | | 81,067 | |
| | | | | | | | | | | | |
|
Media — 0.3% | |
| |
Diamond Sports Group LLC, Term Loan | | | | | |
| | | |
5.08% (3 mo. USD LIBOR + 3.250%) (1) | | | 08/24/26 | | | | 61,000 | | | | 61,374 | |
| |
Sinclair Television Group, Inc., Term Loan B2B | | | | | |
| | | |
4.43% (3 mo. USD LIBOR + 2.500%) (1) | | | 09/30/26 | | | | 20,000 | | | | 20,056 | |
| | | | | | | | | | | | |
| |
| | | | 81,430 | |
| | | | | | | | | | | | |
|
| Pharmaceuticals — 0.2% | |
| |
Alphabet Holding Co., Inc., 2017 1st Lien Term Loan | | | | | |
| | | |
5.29% (3 mo. USD LIBOR + 3.500%) (1) | | | 09/26/24 | | | | 76,006 | | | | 69,609 | |
| | | | | | | | | | | | |
|
| REIT — 0.3% | |
| |
MGM Growth Properties Operating Partnership LP, 2016 Term Loan B | | | | | |
| | | |
3.79% (3 mo. USD LIBOR + 2.250%) (1) | | | 03/21/25 | | | | 97,747 | | | | 98,167 | |
| | | | | | | | | | | | |
See accompanying notes to financial statements.
50
TCW High Yield Bond Fund
| | | | | | | | | | | | |
| Issues | | Maturity
Date | | | Principal
Amount | | | Value | |
|
| Retail — 0.3% | |
| |
1011778 B.C. Unlimited Liability Co., Term Loan B3 | | | | | |
| | | |
4.04% (3 mo. USD LIBOR + 2.250%) (1) | | | 02/16/24 | | | $ | 84,873 | | | $ | 85,138 | |
| | | | | | | | | | | | |
|
| Software — 0.2% | |
| |
IQVIA, Inc., 2018 USD Term Loan B3 | | | | | |
| | | |
3.85% (3 mo. USD LIBOR + 1.750%) (1) | | | 06/11/25 | | | | 70,821 | | | | 70,871 | |
| | | | | | | | | | | | |
|
| Telecommunications — 1.9% | |
| |
Frontier Communications Corp., 2017 Term Loan B1 | | | | | |
| | | |
5.54% (3 mo. USD LIBOR + 3.750% 3 mo. USD LIBOR + 3.750%) (1) | | | 06/15/24 | | | | 115,000 | | | | 114,813 | |
| |
Intelsat Jackson Holdings S.A., 2017 Term Loan B5 | | | | | |
| | | |
6.63% (3 mo. USD LIBOR + 6.630%) (1) | | | 01/02/24 | | | | 14,000 | | | | 14,373 | |
| |
Level 3 Financing, Inc., 2017 Term Loan B | | | | | |
| | | |
4.04% (3 mo. USD LIBOR + 2.250%) (1) | | | 02/22/24 | | | | 205,000 | | | | 205,513 | |
| |
Sprint Communications, Inc., 1st Lien Term Loan B | | | | | |
| | | |
4.31% (3 mo. USD LIBOR + 2.500%) (1) | | | 02/02/24 | | | | 210,460 | | | | 208,444 | |
| | | | | | | | | | | | |
| | | |
| | | | | | | | | | | 543,143 | |
| | | | | | | | | | | | |
| | |
Total Bank Loans | | | | | | | | | |
| | | |
(Cost: $2,573,973) | | | | | | | | | | | 2,560,378 | |
| | | | | | | | | | | | |
|
| CORPORATE BONDS — 78.2% | |
|
| Advertising — 0.1% | |
| |
Lamar Media Corp. | | | | | |
| | | |
5.75% | | | 02/01/26 | | | | 24,000 | | | | 25,620 | |
| | | | | | | | | | | | |
|
| Aerospace/Defense — 0.2% | |
| |
Bombardier, Inc. (Canada) | | | | | |
| | | |
7.88% (2) | | | 04/15/27 | | | | 63,000 | | | | 59,535 | |
| | | | | | | | | | | | |
|
| Airlines — 1.2% | |
| |
American Airlines, Inc. Pass-Through Trust (13-2-B) (EETC) | | | | | |
| | | |
5.60% (2) | | | 01/15/22 | | | | 146,939 | | | | 149,473 | |
| |
Delta Air Lines, Inc. Pass-Through Certificates (02-1-G-1) (EETC) | | | | | |
| | | |
6.72% | | | 07/02/24 | | | | 207,575 | | | | 219,552 | |
| | | | | | | | | | | | |
| | | |
| | | | | | | | | | | 369,025 | |
| | | | | | | | | | | | |
|
| Auto Manufacturers — 1.5% | |
| |
Ford Motor Credit Co. LLC | | | | | |
| | | |
3.22% (3 mo. USD LIBOR + 0.930%) (1) | | | 11/04/19 | | | | 255,000 | | | | 255,080 | |
| | | |
5.88% | | | 08/02/21 | | | | 169,000 | | | | 177,349 | |
| | | | | | | | | | | | |
| | | |
| | | | | | | | | | | 432,429 | |
| | | | | | | | | | | | |
| | | | | | | | | | | | |
| Issues | | Maturity
Date | | | Principal
Amount | | | Value | |
|
| Beverages — 0.7% | |
| |
Bacardi, Ltd. | | | | | |
| | | |
4.50% (2) | | | 01/15/21 | | | $ | 99,000 | | | $ | 100,962 | |
| | | |
5.30% (2) | | | 05/15/48 | | | | 104,000 | | | | 117,319 | |
| | | | | | | | | | | | |
| | | |
| | | | | | | | | | | 218,281 | |
| | | | | | | | | | | | |
|
| Commercial Services — 1.7% | |
| |
IHS Markit, Ltd. | | | | | |
| | | |
5.00% (2) | | | 11/01/22 | | | | 406,000 | | | | 434,560 | |
| |
Service Corp. International | | | | | |
| | | |
4.63% | | | 12/15/27 | | | | 65,000 | | | | 68,169 | |
| | | | | | | | | | | | |
| | | |
| | | | | | | | | | | 502,729 | |
| | | | | | | | | | | | |
|
| Computers — 0.7% | |
| |
EMC Corp. | | | | | |
| | | |
2.65% | | | 06/01/20 | | | | 193,000 | | | | 193,362 | |
| | | | | | | | | | | | |
|
| Diversified Financial Services — 2.4% | |
| |
AerCap Ireland Capital DAC / AerCap Global Aviation Trust (Ireland) | | | | | |
| | | |
3.50% | | | 01/15/25 | | | | 172,000 | | | | 177,801 | |
| |
Avolon Holdings Funding, Ltd. | | | | | |
| | | |
5.13% (2) | | | 10/01/23 | | | | 90,000 | | | | 97,335 | |
| |
GE Capital International Funding Co. Unlimited Co. (Ireland) | | | | | |
| | | |
4.42% | | | 11/15/35 | | | | 170,000 | | | | 179,727 | |
| |
Park Aerospace Holdings, Ltd. | | | | | |
| | | |
4.50% (2) | | | 03/15/23 | | | | 251,000 | | | | 264,302 | |
| | | | | | | | | | | | |
| | | |
| | | | | | | | | | | 719,165 | |
| | | | | | | | | | | | |
|
| Electric — 1.1% | |
| |
Vistra Operations Co. LLC | | | | | |
| | | |
3.55% (2) | | | 07/15/24 | | | | 309,000 | | | | 315,759 | |
| | | | | | | | | | | | |
|
| Electrical Components & Equipment — 0.1% | |
| |
Energizer Holdings, Inc. | | | | | |
| | | |
6.38% (2) | | | 07/15/26 | | | | 34,000 | | | | 36,339 | |
| | | | | | | | | | | | |
|
| Entertainment — 0.9% | |
| |
Caesars Resort Collection LLC / CRC Finco, Inc. | | | | | |
| | | |
5.25% (2) | | | 10/15/25 | | | | 61,000 | | | | 62,601 | |
| |
Churchill Downs, Inc. | | | | | |
| | | |
4.75% (2) | | | 01/15/28 | | | | 70,000 | | | | 72,800 | |
| | | |
5.50% (2) | | | 04/01/27 | | | | 111,000 | | | | 117,660 | |
| | | | | | | | | | | | |
| | | |
| | | | | | | | | | | 253,061 | |
| | | | | | | | | | | | |
|
| Environmental Control — 1.0% | |
| |
Clean Harbors, Inc. | | | | | |
| | | |
4.88% (2) | | | 07/15/27 | | | | 166,000 | | | | 173,460 | |
| |
Waste Pro USA, Inc. | | | | | |
| | | |
5.50% (2) | | | 02/15/26 | | | | 105,000 | | | | 108,938 | |
| | | | | | | | | | | | |
| | | |
| | | | | | | | | | | 282,398 | |
| | | | | | | | | | | | |
See accompanying notes to financial statements.
51
TCW High Yield Bond Fund
Schedule of Investments (Continued)
| | | | | | | | | | | | |
| Issues | | Maturity
Date | | | Principal
Amount | | | Value | |
|
| Food — 2.7% | |
| |
JBS USA LUX SA / JBS USA Food Co. / JBS USA Finance, Inc. | | | | | |
| | | |
5.50% (2) | | | 01/15/30 | | | $ | 120,000 | | | $ | 129,450 | |
| |
Kraft Heinz Foods Co. | | | | | |
| | | |
4.88% (2) | | | 02/15/25 | | | | 74,000 | | | | 76,320 | |
| | | |
6.88% | | | 01/26/39 | | | | 55,000 | | | | 68,693 | |
| |
Nathan’s Famous, Inc. | | | | | |
| | | |
6.63% (2) | | | 11/01/25 | | | | 15,000 | | | | 15,187 | |
| |
Post Holdings, Inc. | | | | | |
| | | |
5.50% (2) | | | 12/15/29 | | | | 84,000 | | | | 88,763 | |
| |
Sigma Holdco BV (Netherlands) | | | | | |
| | | |
7.88% (2) | | | 05/15/26 | | | | 55,000 | | | | 53,350 | |
| |
Smithfield Foods, Inc. | | | | | |
| | | |
2.70% (2) | | | 01/31/20 | | | | 210,000 | | | | 211,048 | |
| | | |
5.20% (2) | | | 04/01/29 | | | | 143,000 | | | | 157,998 | |
| | | | | | | | | | | | |
| | | |
| | | | | | | | | | | 800,809 | |
| | | | | | | | | | | | |
|
| Healthcare-Products — 2.9% | |
| |
Becton Dickinson and Co. | | | | | |
| | | |
2.40% | | | 06/05/20 | | | | 210,000 | | | | 210,565 | |
| | | |
3.25% | | | 11/12/20 | | | | 259,000 | | | | 262,115 | |
| |
Hill-Rom Holdings, Inc. | | | | | |
| | | |
4.38% (2) | | | 09/15/27 | | | | 215,000 | | | | 221,987 | |
| |
Hologic, Inc. | | | | | |
| | | |
4.63% (2) | | | 02/01/28 | | | | 90,000 | | | | 94,838 | |
| |
Teleflex, Inc. | | | | | |
| | | |
4.88% | | | 06/01/26 | | | | 55,000 | | | | 57,802 | |
| | | | | | | | | | | | |
| | | |
| | | | | | | | | | | 847,307 | |
| | | | | | | | | | | | |
|
| Healthcare-Services — 8.4% | |
| |
Catalent Pharma Solutions, Inc. | | | | | |
| | | |
4.88% (2) | | | 01/15/26 | | | | 101,000 | | | | 104,787 | |
| |
Centene Corp. | | | | | |
| | | |
4.75% | | | 05/15/22 | | | | 781,000 | | | | 800,525 | |
| |
Encompass Health Corp. | | | | | |
| | | |
4.75% | | | 02/01/30 | | | | 255,000 | | | | 263,606 | |
| |
HCA, Inc. | | | | | |
| | | |
5.00% | | | 03/15/24 | | | | 234,000 | | | | 255,267 | |
| | | |
5.25% | | | 04/15/25 | | | | 175,000 | | | | 194,942 | |
| | | |
5.88% | | | 02/01/29 | | | | 379,000 | | | | 430,165 | |
| |
Molina Healthcare, Inc. | | | | | |
| | | |
5.38% | | | 11/15/22 | | | | 65,000 | | | | 68,900 | |
| |
Tenet Healthcare Corp. | | | | | |
| | | |
4.63% | | | 07/15/24 | | | | 33,000 | | | | 34,114 | |
| | | |
4.63% (2) | | | 09/01/24 | | | | 316,000 | | | | 324,485 | |
| | | | | | | | | | | | |
| | | |
| | | | | | | | | | | 2,476,791 | |
| | | | | | | | | | | | |
|
| Household Products/Wares — 0.4% | |
| |
Spectrum Brands, Inc. | | | | | |
| | | |
5.75% | | | 07/15/25 | | | | 101,000 | | | | 105,388 | |
| | | | | | | | | | | | |
| | | | | | | | | | | | |
| Issues | | Maturity
Date | | | Principal
Amount | | | Value | |
|
| Machinery-Diversified — 0.5% | |
| |
Titan Acquisition, Ltd. / Titan Co-Borrower LLC | | | | | |
| | | |
7.75% (2) | | | 04/15/26 | | | $ | 153,000 | | | $ | 144,203 | |
| | | | | | | | | | | | |
|
| Media — 10.2% | |
| |
CCO Holdings LLC / CCO Holdings Capital Corp. | | | | | |
| | | |
5.38% (2) | | | 06/01/29 | | | | 134,000 | | | | 143,380 | |
| | | |
5.88% (2) | | | 04/01/24 | | | | 50,000 | | | | 52,250 | |
| |
Charter Communications Operating LLC / Charter Communications Operating Capital | | | | | |
| | | |
3.75% | | | 02/15/28 | | | | 200,000 | | | | 206,234 | |
| | | |
4.91% | | | 07/23/25 | | | | 423,000 | | | | 467,077 | |
| |
CSC Holdings LLC | | | | | |
| | | |
5.38% (2) | | | 02/01/28 | | | | 200,000 | | | | 212,000 | |
| | | |
6.50% (2) | | | 02/01/29 | | | | 192,000 | | | | 214,800 | |
| |
DISH DBS Corp. | | | | | |
| | | |
5.88% | | | 11/15/24 | | | | 31,000 | | | | 31,151 | |
| | | |
7.75% | | | 07/01/26 | | | | 30,000 | | | | 30,350 | |
| |
DISH Network Corp. | | | | | |
| | | |
3.38% | | | 08/15/26 | | | | 44,000 | | | | 41,253 | |
| |
EW Scripps Co. (The) | | | | | |
| | | |
5.13% (2) | | | 05/15/25 | | | | 56,000 | | | | 56,980 | |
| |
Midcontinent Communications & Finance Co. | | | | | |
| | | |
5.38% (2) | | | 08/15/27 | | | | 139,000 | | | | 145,950 | |
| |
Neptune Finco Corp. | | | | | |
| | | |
6.63% (2) | | | 10/15/25 | | | | 419,000 | | | | 447,282 | |
| |
Scripps Escrow, Inc. | | | | | |
| | | |
5.88% (2) | | | 07/15/27 | | | | 154,000 | | | | 157,996 | |
| |
Sinclair Television Group, Inc. | | | | | |
| | | |
6.13% | | | 10/01/22 | | | | 94,000 | | | | 95,527 | |
| |
Sirius XM Radio, Inc. | | | | | |
| | | |
3.88% (2) | | | 08/01/22 | | | | 349,000 | | | | 356,852 | |
| |
Univision Communications, Inc. | | | | | |
| | | |
5.13% (2) | | | 02/15/25 | | | | 73,000 | | | | 71,358 | |
| |
Virgin Media Secured Finance PLC (United Kingdom) | | | | | |
| | | |
5.50% (2) | | | 05/15/29 | | | | 268,000 | | | | 285,420 | |
| | | | | | | | | | | | |
| | | |
| | | | | | | | | | | 3,015,860 | |
| | | | | | | | | | | | |
|
| Miscellaneous Manufacturers — 0.1% | |
| |
General Electric Co. | | | | | |
| | | |
2.64% (3 mo. USD LIBOR + 0.480%) (1) | | | 08/15/36 | | | | 52,000 | | | | 38,516 | |
| | | | | | | | | | | | |
|
| Oil & Gas — 2.5% | |
| |
Antero Resources Corp. | | | | | |
| | | |
5.00% | | | 03/01/25 | | | | 159,000 | | | | 105,735 | |
| | | |
5.63% | | | 06/01/23 | | | | 40,000 | | | | 28,150 | |
| |
Diamondback Energy, Inc. | | | | | |
| | | |
4.75% | | | 11/01/24 | | | | 11,000 | | | | 11,358 | |
| |
Endeavor Energy Resources LP / EER Finance, Inc. | | | | | |
| | | |
5.75% (2) | | | 01/30/28 | | | | 81,000 | | | | 85,659 | |
| |
EQT Corp. | | | | | |
| | | |
3.90% | | | 10/01/27 | | | | 75,000 | | | | 66,896 | |
See accompanying notes to financial statements.
52
TCW High Yield Bond Fund
| | | | | | | | | | | | |
| Issues | | Maturity
Date | | | Principal
Amount | | | Value | |
|
| Oil & Gas (Continued) | |
| |
Gulfport Energy Corp. | | | | | |
| | | |
6.38% | | | 05/15/25 | | | $ | 4,000 | | | $ | 2,440 | |
| |
Hess Corp. | | | | | |
| | | |
5.60% | | | 02/15/41 | | | | 85,000 | | | | 95,459 | |
| |
Parsley Energy LLC / Parsley Finance Corp. | | | | | |
| | | |
5.25% (2) | | | 08/15/25 | | | | 10,000 | | | | 10,300 | |
| | | |
5.63% (2) | | | 10/15/27 | | | | 13,000 | | | | 13,455 | |
| |
Petroleos Mexicanos | | | | | |
| | | |
6.75% | | | 09/21/47 | | | | 63,000 | | | | 62,874 | |
| | | |
7.69% (2) | | | 01/23/50 | | | | 65,000 | | | | 70,876 | |
| |
Range Resources Corp. | | | | | |
| | | |
4.88% | | | 05/15/25 | | | | 89,000 | | | | 71,867 | |
| |
Transocean Pontus, Ltd. | | | | | |
| | | |
6.13% (2) | | | 08/01/25 | | | | 32,040 | | | | 32,120 | |
| |
Transocean Poseidon, Ltd. | | | | | |
| | | |
6.88% (2) | | | 02/01/27 | | | | 29,000 | | | | 29,385 | |
| |
Valaris PLC | | | | | |
| | | |
7.75% | | | 02/01/26 | | | | 35,000 | | | | 18,550 | |
| |
WPX Energy, Inc. | | | | | |
| | | |
5.25% | | | 09/15/24 | | | | 19,000 | | | | 19,237 | |
| | | |
5.75% | | | 06/01/26 | | | | 14,000 | | | | 14,123 | |
| | | | | | | | | | | | |
| | | |
| | | | | | | | | | | 738,484 | |
| | | | | | | | | | | | |
|
| Oil & Gas Services — 1.8% | |
| |
Transocean Phoenix 2, Ltd. | | | | | |
| | | |
7.75% (2) | | | 10/15/24 | | | | 226,100 | | | | 234,579 | |
| |
Transocean Proteus, Ltd. | | | | | |
| | | |
6.25% (2) | | | 12/01/24 | | | | 137,250 | | | | 138,279 | |
| |
USA Compression Partners LP / USA Compression Finance Corp. | | | | | |
| | | |
6.88% | | | 04/01/26 | | | | 53,000 | | | | 53,795 | |
| | | |
6.88% (2) | | | 09/01/27 | | | | 100,000 | | | | 100,500 | |
| | | | | | | | | | | | |
| | | |
| | | | | | | | | | | 527,153 | |
| | | | | | | | | | | | |
|
| Packaging & Containers — 10.9% | |
| |
Ardagh Packaging Finance PLC / Ardagh Holdings USA, Inc. (Ireland) | | | | | |
| | | |
4.13% (2) | | | 08/15/26 | | | | 231,000 | | | | 233,818 | |
| | | |
4.25% (2) | | | 09/15/22 | | | | 366,000 | | | | 371,032 | |
| |
Ball Corp. | | | | | |
| | | |
4.00% | | | 11/15/23 | | | | 128,000 | | | | 134,400 | |
| | | |
4.38% | | | 12/15/20 | | | | 218,000 | | | | 222,360 | |
| |
Berry Global, Inc. | | | | | |
| | | |
4.88% (2) | | | 07/15/26 | | | | 161,000 | | | | 169,654 | |
| |
Crown Americas LLC / Crown Americas Capital Corp. V | | | | | |
| | | |
4.25% | | | 09/30/26 | | | | 78,000 | | | | 81,705 | |
| |
Graphic Packaging International LLC | | | | | |
| | | |
4.75% (2) | | | 07/15/27 | | | | 160,000 | | | | 170,600 | |
| | | |
4.88% | | | 11/15/22 | | | | 319,000 | | | | 335,747 | |
| | | | | | | | | | | | |
| Issues | | Maturity
Date | | | Principal
Amount | | | Value | |
|
| Packaging & Containers (Continued) | |
| |
Reynolds Group Issuer, Inc. / Reynolds Group Issuer LLC / Reynolds Group Issuer (Luxembourg) | | | | | |
| | | |
5.50% (3 mo. USD LIBOR + 3.500%) (1)(2) | | | 07/15/21 | | | $ | 798,000 | | | $ | 801,990 | |
| | | |
5.75% | | | 10/15/20 | | | | 47,486 | | | | 47,605 | |
| |
Sealed Air Corp. | | | | | |
| | | |
5.25% (2) | | | 04/01/23 | | | | 72,000 | | | | 77,220 | |
| | | |
5.50% (2) | | | 09/15/25 | | | | 234,000 | | | | 255,645 | |
| |
Silgan Holdings, Inc. | | | | | |
| | | |
4.75% | | | 03/15/25 | | | | 59,000 | | | | 60,623 | |
| |
Trident Merger Sub, Inc. | | | | | |
| | | |
6.63% (2) | | | 11/01/25 | | | | 34,000 | | | | 30,515 | |
| |
Trivium Packaging Finance BV (Netherlands) | | | | | |
| | | |
5.50% (2) | | | 08/15/26 | | | | 175,000 | | | | 183,750 | |
| | | |
8.50% (2) | | | 08/15/27 | | | | 25,000 | | | | 26,719 | |
| | | | | | | | | | | | |
| | | |
| | | | | | | | | | | 3,203,383 | |
| | | | | | | | | | | | |
|
| Pharmaceuticals — 5.5% | |
| |
Bausch Health Cos, Inc. (Canada) | | | | | |
| | | |
5.50% (2) | | | 11/01/25 | | | | 163,000 | | | | 170,948 | |
| | | |
5.75% (2) | | | 08/15/27 | | | | 122,000 | | | | 132,789 | |
| | | |
5.88% (2) | | | 05/15/23 | | | | 9,000 | | | | 9,146 | |
| | | |
7.00% (2) | | | 03/15/24 | | | | 185,000 | | | | 194,005 | |
| |
Bayer US Finance II LLC | | | | | |
| | | |
4.38% (2) | | | 12/15/28 | | | | 79,000 | | | | 85,730 | |
| | | |
5.50% (2) | | | 08/15/25 | | | | 54,000 | | | | 60,396 | |
| |
CVS Health Corp. | | | | | |
| | | |
5.05% | | | 03/25/48 | | | | 121,000 | | | | 139,689 | |
| |
Elanco Animal Health, Inc. | | | | | |
| | | |
3.91% | | | 08/27/21 | | | | 371,000 | | | | 381,035 | |
| | | |
4.27% | | | 08/28/23 | | | | 70,000 | | | | 73,523 | |
|
Valeant Pharmaceuticals International, Inc. (Canada) | |
| | | |
6.50% (2) | | | 03/15/22 | | | | 363,000 | | | | 373,890 | |
| | | | | | | | | | | | |
| | | |
| | | | | | | | | | | 1,621,151 | |
| | | | | | | | | | | | |
| | | |
| Pipelines — 2.9% | | | | | | | | | |
|
Cheniere Corpus Christi Holdings LLC | |
| | | |
5.13% | | | 06/30/27 | | | | 13,000 | | | | 14,040 | |
| | | |
NGPL PipeCo LLC | | | | | | | | | | | | |
| | | |
4.38% (2) | | | 08/15/22 | | | | 125,000 | | | | 129,851 | |
|
Rockies Express Pipeline LLC | |
| | | |
5.63% (2) | | | 04/15/20 | | | | 261,000 | | | | 266,036 | |
| | | |
6.88% (2) | | | 04/15/40 | | | | 158,000 | | | | 167,496 | |
| |
Targa Resources Partners LP / Targa Resources Partners Finance Corp. | | | | | |
| | | |
6.88% (2) | | | 01/15/29 | | | | 198,000 | | | | 214,583 | |
|
TransMontaigne Partners LP / TLP Finance Corp. | |
| | | |
6.13% | | | 02/15/26 | | | | 74,000 | | | | 71,249 | |
| | | | | | | | | | | | |
| | | |
| | | | | | | | | | | 863,255 | |
| | | | | | | | | | | | |
See accompanying notes to financial statements.
53
TCW High Yield Bond Fund
Schedule of Investments (Continued)
| | | | | | | | | | | | |
| Issues | | Maturity
Date | | | Principal
Amount | | | Value | |
| | | |
| REIT — 1.9% | | | | | | | | | |
|
GLP Capital LP / GLP Financing II, Inc. | |
| | | |
4.38% | | | 04/15/21 | | | $ | 127,000 | | | $ | 129,888 | |
| | | |
5.38% | | | 11/01/23 | | | | 149,000 | | | | 162,596 | |
| | | |
5.75% | | | 06/01/28 | | | | 91,000 | | | | 103,351 | |
| |
MGM Growth Properties Operating Partnership LP / MGP Finance Co-Issuer, Inc. | | | | | |
| | | |
4.50% | | | 01/15/28 | | | | 40,000 | | | | 42,100 | |
| | | |
5.63% | | | 05/01/24 | | | | 106,000 | | | | 117,130 | |
| | | | | | | | | | | | |
| | | |
| | | | | | | | | | | 555,065 | |
| | | | | | | | | | | | |
| | | |
| Retail — 1.0% | | | | | | | | | |
| | |
Cumberland Farms, Inc. | | | | | | | | | |
| | | |
6.75% (2) | | | 05/01/25 | | | | 43,000 | | | | 46,275 | |
| | | |
Rite Aid Corp. | | | | | | | | | | | | |
| | | |
6.13% (2) | | | 04/01/23 | | | | 284,000 | | | | 242,834 | |
| | | | | | | | | | | | |
| | | |
| | | | | | | | | | | 289,109 | |
| | | | | | | | | | | | |
| | | |
| Software — 0.9% | | | | | | | | | |
| |
Change Healthcare Holdings LLC / Change Healthcare Finance, Inc. | | | | | |
| | | |
5.75% (2) | | | 03/01/25 | | | | 77,000 | | | | 78,979 | |
| | | |
IQVIA, Inc. | | | | | | | | | | | | |
| | | |
5.00% (2) | | | 05/15/27 | | | | 160,000 | | | | 169,200 | |
| | | |
MSCI, Inc. | | | | | | | | | | | | |
| | | |
5.75% (2) | | | 08/15/25 | | | | 31,000 | | | | 32,666 | |
| | | | | | | | | | | | |
| | | |
| | | | | | | | | | | 280,845 | |
| | | | | | | | | | | | |
| |
| Telecommunications — 14.0% | | | | |
| |
CommScope Finance LLC | | | | | |
| | | |
6.00% (2) | | | 03/01/26 | | | | 132,000 | | | | 136,290 | |
| | |
Frontier Communications Corp. | | | | | | | | | |
| | | |
7.13% | | | 01/15/23 | | | | 197,000 | | | | 90,620 | |
| | | |
8.00% (2) | | | 04/01/27 | | | | 82,000 | | | | 86,203 | |
|
Intelsat Jackson Holdings S. A. (Luxembourg) | |
| | | |
8.50% (2) | | | 10/15/24 | | | | 402,000 | | | | 405,347 | |
| | | |
9.75% (2) | | | 07/15/25 | | | | 209,000 | | | | 217,920 | |
|
Intelsat Luxembourg S.A. (Luxembourg) | |
| | | |
8.13% | | | 06/01/23 | | | | 85,000 | | | | 71,559 | |
|
Koninklijke KPN NV (Netherlands) | |
| | | |
8.38% | | | 10/01/30 | | | | 70,000 | | | | 94,949 | |
|
Level 3 Financing, Inc. | |
| | | |
4.63% (2) | | | 09/15/27 | | | | 130,000 | | | | 132,600 | |
| | | |
Qwest Corp. | | | | | | | | | | | | |
| | | |
6.75% | | | 12/01/21 | | | | 546,000 | | | | 591,329 | |
| | | |
7.25% | | | 09/15/25 | | | | 142,000 | | | | 162,464 | |
|
SES Global Americas Holdings GP | |
| | | |
5.30% (2) | | | 03/25/44 | | | | 130,000 | | | | 137,117 | |
| |
Sprint Communications, Inc. | | | | | |
| | | |
7.00% (2) | | | 03/01/20 | | | | 460,000 | | | | 467,866 | |
| | | | | | | | | | | | |
| Issues | | Maturity
Date | | | Principal
Amount | | | Value | |
| |
| Telecommunications (Continued) | | | | |
| |
Sprint Spectrum Co. LLC / Sprint Spectrum Co. II LLC / Sprint Spectrum Co. III LLC | | | | | |
| | | |
4.74% (2) | | | 09/20/29 | | | $ | 190,000 | | | $ | 203,064 | |
| | | |
5.15% (2) | | | 09/20/29 | | | | 218,000 | | | | 237,879 | |
|
T-Mobile USA, Inc. | |
| | | |
6.00% | | | 03/01/23 | | | | 132,000 | | | | 134,970 | |
| | | |
6.00% | | | 04/15/24 | | | | 540,000 | | | | 561,600 | |
| | | |
6.50% | | | 01/15/24 | | | | 176,000 | | | | 183,040 | |
|
T-Mobile USA, Inc. (Contingent payment) | |
| | | |
4.50% (3)(4) | | | 02/01/26 | | | | 95,000 | | | | — | |
| | | |
4.75% (3)(4) | | | 02/01/28 | | | | 141,000 | | | | — | |
| | | |
6.50% (3)(4) | | | 01/15/24 | | | | 170,000 | | | | — | |
|
Telesat Canada / Telesat LLC | |
| | | |
6.50% (2) | | | 10/15/27 | | | | 210,000 | | | | 219,776 | |
|
Windstream Services LLC / Windstream Finance Corp. | |
| | | |
9.00% (2)(5) | | | 06/30/25 | | | | 6,000 | | | | 3,135 | |
| | | | | | | | | | | | |
| |
| | | | 4,137,728 | |
| | | | | | | | | | | | |
| | |
Total Corporate Bonds | | | | | | | | | |
| |
(Cost: $22,677,451) | | | | 23,052,750 | |
| | | | | | | | | | | | |
|
RESIDENTIAL MORTGAGE-BACKED SECURITIES —
NON-AGENCY — 3.8% | |
| |
Ajax Mortgage Loan Trust (19-D-A1) | | | | | |
| | | |
2.96% (2) | | | 09/25/65 | | | | 94,267 | | | | 94,292 | |
| |
Banc of America Funding Trust (05-C-A1) | | | | | |
| | | |
2.09% (1 mo. USD LIBOR + 0.240%) (1) | | | 05/20/35 | | | | 112,015 | | | | 112,520 | |
| |
Bear Stearns ALT-A Trust (05-4-1A1) | | | | | |
| | | |
2.26% (1 mo. USD LIBOR + 0.440%) (1) | | | 04/25/35 | | | | 78,539 | | | | 78,729 | |
| |
Citigroup Mortgage Loan Trust (15-6-2A1) | | | | | |
| | | |
2.56% (2)(6) | | | 12/25/35 | | | | 119,870 | | | | 119,701 | |
| |
First Horizon Alternative Mortgage Securities Trust (04-AA3-A1) | | | | | |
| | | |
4.05% (6) | | | 09/25/34 | | | | 82,085 | | | | 82,855 | |
| |
GSAMP Trust (05-HE4-M3) | | | | | |
| | | |
2.60% (1 mo. USD LIBOR + 0.780%) (1) | | | 07/25/45 | | | | 100,000 | | | | 99,429 | |
| |
Homebanc Mortgage Trust (05-3-A1) | | | | | |
| | | |
2.06% (1 mo. USD LIBOR + 0.240) (1) | | | 07/25/35 | | | | 80,648 | | | | 80,490 | |
| |
Merrill Lynch Mortgage Investors Trust (04-A-A1) | | | | | |
| | | |
2.28% (1 mo. USD LIBOR + 0.460%) (1) | | | 04/25/29 | | | | 94,484 | | | | 92,617 | |
| |
Opteum Mortgage Acceptance Corp. Asset Backed Pass-Through Certificates (05-4-1APT) | | | | | |
| | | |
2.13% (1 mo. USD LIBOR + 0.310%) (1) | | | 11/25/35 | | | | 78,308 | | | | 78,924 | |
| |
Sequoia Mortgage Trust (04-4-A) | | | | | |
| | | |
2.49% (6 mo. USD LIBOR + 0.520%) (1) | | | 05/20/34 | | | | 90,084 | | | | 89,483 | |
See accompanying notes to financial statements.
54
TCW High Yield Bond Fund
| | | | | | | | | | | | |
| Issues | | Maturity
Date | | | Principal
Amount | | | Value | |
|
RESIDENTIAL MORTGAGE-BACKED SECURITIES —
NON-AGENCY (Continued) | |
| |
WaMu Mortgage Pass-Through Certificates (05-AR19-A1B2) | | | | | |
| | | |
2.23% (1 mo. USD LIBOR + 0.410%) (1) | | | 12/25/45 | | | $ | 100,981 | | | $ | 99,409 | |
| |
WaMu Mortgage Pass-Through Certificates (05-AR8-2AB2) | | | | | |
| | | |
2.66% (1 mo. USD LIBOR + 0.840%) (1) | | | 07/25/45 | | | | 89,881 | | | | 88,421 | |
| | | | | | | | | | | | |
| |
Total Residential Mortgage-backed Securities — Non-agency | | | | | |
| | | |
(Cost: $1,111,558) | | | | | | | | | | | 1,116,870 | |
| | | | | | | | | | | | |
| |
Total Fixed Income Securities | | | | | |
| | | |
(Cost: $26,362,982) | | | | | | | | | | | 26,729,998 | |
| | | | | | | | | | | | |
| | | |
| | | | | | | | | | | | |
| | | | | | Shares | | | | |
|
COMMON STOCK — 0.1% | |
| | | |
| Electric — 0.1% | | | | | | | | | |
| | |
Homer City Holdings LLC — Series A (3)(4) | | | | 5,610 | | | | 25,245 | |
| | | | | | | | | | | | |
| | | |
Total Common Stock | | | | | | | | | | | | |
| | | |
(Cost: $327,224) | | | | | | | | | | | 25,245 | |
| | | | | | | | | | | | |
| | | | | | | | | | | | |
| Issues | | | | | Shares | | | Value | |
|
| MONEY MARKET INVESTMENTS — 12.6% | |
| | |
State Street Institutional U.S. Government Money Market Fund — Premier Class, 1.75% (7) | | | | 3,733,582 | | | $ | 3,733,582 | |
| | | | | | | | | | | | |
| |
Total Money Market Investments | | | | | |
| | | |
(Cost: $3,733,582) | | | | | | | | | | | 3,733,582 | |
| | | | | | | | | | | | |
| | | |
| | | | | | | | | | | | |
| | | Maturity
Date | | | Principal
Amount | | | | |
|
Short Term Investments — 0.1% | |
| | | |
U.S. Treasury Bill | | | | | | | | | | | | |
| | | |
1.53% (8)(9) | | | 12/26/19 | | | $ | 31,000 | | | | 30,927 | |
| | | | | | | | | | | | |
| |
Total U.S. Treasury Securities | | | | | |
| | | |
(Cost: $30,911) | | | | | | | | | | | 30,927 | |
| | | | | | | | | | | | |
| |
Total Investments (103.5%) | | | | | |
| | | |
(Cost: $30,454,699) | | | | | | | | | | | 30,519,752 | |
| |
Liabilities In Excess Of Other Assets (-3.5%) | | | | (1,033,298 | ) |
| | | | | | | | | | | | |
| | |
Net Assets (100.0%) | | | | | | | $ | 29,486,454 | |
| | | | | | | | | | | | |
| | | | | | | | | | | | | | | | | | |
| Futures Contracts | | | | |
| | | | | |
Number of
Contracts | | Type | | Expiration
Date | | | Notional | | | Value | | | Net Unrealized
Appreciation/
Depreciation | |
Long Futures | | | | | | | | | | | | | |
| 56 | | 5-Year U.S. Treasury Note Futures | | | 12/31/19 | | | $ | 6,672,066 | | | $ | 6,675,375 | | | $ | 3,309 | |
| 8 | | 5-Year U.S. Treasury Note Futures | | | 03/31/20 | | | | 956,713 | | | | 956,312 | | | | (401 | ) |
| | | | | | | | | | | | | | | | | | |
| | | | | | | | $ | 7,628,779 | | | $ | 7,631,687 | | | $ | 2,908 | |
| | | | | | | | | | | | | | | | | | |
Short Futures | | | | | | | | | | | | | |
| 13 | | 10-Year U.S. Ultra Treasury Note Futures | | | 12/19/19 | | | $ | (1,867,254 | ) | | $ | (1,847,422 | ) | | $ | 19,832 | |
| 2 | | U.S. Ultra Long Bond Futures | | | 12/19/19 | | | | (387,184 | ) | | | (379,500 | ) | | | 7,684 | |
| | | | | | | | | | | | | | | | | | |
| | | | | | | | $ | (2,254,438 | ) | | $ | (2,226,922 | ) | | $ | 27,516 | |
| | | | | | | | | | | | | | | | | | |
See accompanying notes to financial statements.
55
TCW High Yield Bond Fund
Schedule of Investments (Continued)
Notes to Schedule of Investments:
| EETC - | | Enhanced Equipment Trust Certificate. |
| REIT - | | Real Estate Investment Trust. |
| (1) | | Floating or variable rate security. The interest shown reflects the rate in effect at October 31, 2019. |
| (2) | | Security exempt from registration under Rule 144A of the Securities Act of 1933, as amended. These securities may be resold, normally only to qualified institutional buyers. At October 31, 2019, the value of these securities amounted to $13,749,837 or 46.6% of net assets. These securities are determined to be liquid by the Fund’s investment advisor, unless otherwise noted, under procedures established by and under the general supervision of the Company’s Board of Directors. |
| (3) | | For fair value measurement disclosure purposes, security is categorized as Level 3. Secuirty is valued using significant unobservable inputs. |
| (4) | | Non-income producing security. |
| (5) | | Security is currently in default due to bankruptcy or failure to make payment of principal or interest of the issuer. Income is not being accrued. |
| (6) | | Variable rate security. Interest rate disclosed is as of the most recent information available. Certain variable rate securities are not based on a published reference rate and spread but are determined by the issuer or agent and are based on current market conditions. These securities do not indicate a reference rate and spread in their description above. |
| (7) | | Rate disclosed is the 7-day net yield as of October 31, 2019. |
| (8) | | Rate shown represents yield-to-maturity. |
| (9) | | All or a portion of this security is held as collateral for open futures contracts. |
See accompanying notes to financial statements.
56
TCW High Yield Bond Fund
Investments by Sector | October 31, 2019 |
| | | | |
| Sector | | Percentage of
Net Assets | |
Corporate Bonds | | | 78.2 | % |
Money Market Investments | | | 12.6 | |
Bank Loans | | | 8.7 | |
Residential Mortgage-Backed Securities — Non-Agency | | | 3.8 | |
U.S. Treasury Securities | | | 0.1 | |
Common Stock | | | 0.1 | |
Other* | | | (3.5 | ) |
| | | | |
Total | | | 100.0 | % |
| | | | |
| * | Includes capstock, futures, pending trades, interest receivable and accrued expenses payable. |
See accompanying notes to financial statements.
57
TCW High Yield Bond Fund
Fair Valuation Summary | October 31, 2019 |
The following is a summary of the fair valuations according to the inputs used as of October 31, 2019 in valuing the Fund’s investments:
| | | | | | | | | | | | | | | | |
Description | | Quoted Prices
in Active
Markets for
Identical
Assets
(Level 1) | | | Other
Significant
Observable
Inputs
(Level 2) | | | Significant
Unobservable
Inputs
(Level 3) | | | Total | |
Fixed Income Securities | | | | | | | | | | | | | | | | |
Bank Loans* | | $ | — | | | $ | 2,560,378 | | | $ | — | | | $ | 2,560,378 | |
Corporate Bonds* | | | — | | | | 23,052,750 | | | | — | | | | 23,052,750 | |
Residential Mortgage-Backed Securities — Non-Agency | | | — | | | | 1,116,870 | | | | — | | | | 1,116,870 | |
| | | | | | | | | | | | | | | | |
Total Fixed Income Securities | | | — | | | | 26,729,998 | | | | — | | | | 26,729,998 | |
| | | | | | | | | | | | | | | | |
Equity Securities | | | | | | | | | | | | | | | | |
Common Stock* | | | — | | | | — | | | | 25,245 | | | | 25,245 | |
Money Market Investments | | | 3,733,582 | | | | — | | | | — | | | | 3,733,582 | |
Short-Term Investments* | | | 30,927 | | | | — | | | | — | | | | 30,927 | |
| | | | | | | | | | | | | | | | |
Total Investments | | $ | 3,764,509 | | | $ | 26,729,998 | | | $ | 25,245 | | | $ | 30,519,752 | |
| | | | | | | | | | | | | | | | |
Asset Derivatives | | | | | | | | | | | | | | | | |
Futures Contracts | | | | | | | | | | | | | | | | |
Interest Rate Risk | | | 30,825 | | | | — | | | | — | | | | 30,825 | |
| | | | | | | | | | | | | | | | |
Total Investments | | $ | 3,795,334 | | | $ | 26,729,998 | | | $ | 25,245 | | | $ | 30,550,577 | |
| | | | | | | | | | | | | | | | |
Liability Derivatives | | | | | | | | | | | | | | | | |
Futures Contracts | | | | | | | | | | | | | | | | |
Interest Rate Risk | | $ | (401 | ) | | $ | — | | | $ | — | | | $ | (401 | ) |
| | | | | | | | | | | | | | | | |
Total | | $ | (401 | ) | | $ | — | | | $ | — | | | $ | (401 | ) |
| | | | | | | | | | | | | | | | |
| * | See Schedule of Investments for corresponding industries. |
See accompanying notes to financial statements.
58
TCW Short Term Bond Fund
Schedule of Investments | October 31, 2019 |
| | | | | | | | | | | | |
| Issues | | Maturity
Date | | | Principal
Amount | | | Value | |
|
FIXED INCOME SECURITIES — 82.4% of Net Assets | |
|
COMMERCIAL MORTGAGE-BACKED SECURITIES —
AGENCY — 5.6% | |
| |
Fannie Mae, Pool #468764 | | | | | |
| | | |
4.16% | | | 07/01/21 | | | $ | 45,000 | | | $ | 46,526 | |
| |
Freddie Mac Multifamily Structured Pass-Through Certificates (KF17-A) | | | | | |
| | | |
2.57% (1 mo. USD LIBOR + 0.550%) (2) | | | 03/25/23 | | | | 25,538 | | | | 25,586 | |
| |
Freddie Mac Multifamily Structured Pass-Through Certificates (KF19-A) | | | | | |
| | | |
2.47% (1 mo. USD LIBOR + 0.450%) (2) | | | 06/25/23 | | | | 25,039 | | | | 25,029 | |
| |
Freddie Mac Multifamily Structured Pass-Through Certificates (KF22-A) | | | | | |
| | | |
2.52% (1 mo. USD LIBOR + 0.500%) (2) | | | 07/25/23 | | | | 21,207 | | | | 21,232 | |
| |
Freddie Mac Multifamily Structured Pass-Through Certificates (J22F-A1) | | | | | |
| | | |
3.45% | | | 05/25/23 | | | | 20,089 | | | | 20,699 | |
| |
Freddie Mac Multifamily Structured Pass-Through Certificates (K007-X1) (I/O) | | | | | |
| | | |
1.03% (1) | | | 04/25/20 | | | | 2,713,735 | | | | 730 | |
| |
Freddie Mac Multifamily Structured Pass-Through Certificates (K012-X3) (I/O) | | | | | |
| | | |
2.25% (1) | | | 01/25/41 | | | | 295,045 | | | | 7,593 | |
| |
Freddie Mac Multifamily Structured Pass-Through Certificates (K025-X3) (I/O) | | | | | |
| | | |
1.75% (1) | | | 11/25/40 | | | | 150,000 | | | | 7,511 | |
| |
Freddie Mac Multifamily Structured Pass-Through Certificates (K031-X1) (I/O) | | | | | |
| | | |
0.22% (1) | | | 04/25/23 | | | | 880,978 | | | | 6,240 | |
| |
Freddie Mac Multifamily Structured Pass-Through Certificates (K056-XAM) (I/O) | | | | | |
| | | |
1.15% (1) | | | 05/25/26 | | | | 100,000 | | | | 6,937 | |
| |
Freddie Mac Multifamily Structured Pass-Through Certificates (KF04-A) | | | | | |
| | | |
2.33% (1 mo. USD LIBOR + 0.310%) (2) | | | 06/25/21 | | | | 8,615 | | | | 8,610 | |
| |
Freddie Mac Multifamily Structured Pass-Through Certificates (KF14-A) | | | | | |
| | | |
2.67% (1 mo. USD LIBOR + 0.650%) (2) | | | 01/25/23 | | | | 48,646 | | | | 48,783 | |
| |
Freddie Mac Multifamily Structured Pass-Through Certificates (KP02-A2) | | | | | |
| | | |
2.36% (1) | | | 04/25/21 | | | | 3,543 | | | | 3,538 | |
| |
Freddie Mac Multifamily Structured Pass-Through Certificates (KS05-A) | | | | | |
| | | |
2.52% (1 mo. USD LIBOR + 0.500%) (2) | | | 01/25/23 | | | | 33,769 | | | | 33,774 | |
| |
Freddie Mac Multifamily Structured Pass-Through Certificates (KS07-X) (I/O) | | | | | |
| | | |
0.65% (1) | | | 09/25/25 | | | | 250,000 | | | | 8,704 | |
| | | | | | | | | | | | |
| Issues | | Maturity
Date | | | Principal
Amount | | | Value | |
|
COMMERCIAL MORTGAGE-BACKED SECURITIES —
AGENCY (Continued) | |
| |
Freddie Mac Multifamily Structured Pass-Through Certificates (KS10-A10) | | | | | |
| | | |
2.41% (1 mo. USD LIBOR + 0.610%) (2) | | | 10/25/28 | | | $ | 28,882 | | | $ | 28,849 | |
| |
FREMF Mortgage Trust (13-K713-X2A) (I/O) | | | | | |
| | | |
0.10% (3) | | | 04/25/46 | | | | 62,639,609 | | | | 7,842 | |
| |
Ginnie Mae (06-3-C) | | | | | |
| | | |
5.24% (1) | | | 04/16/39 | | | | 4,702 | | | | 4,696 | |
| |
Ginnie Mae (11-165-IO) (I/O) | | | | | |
| | | |
0.41% (1) | | | 10/16/51 | | | | 832,419 | | | | 6,451 | |
| | | | | | | | | | | | |
|
Total Commercial Mortgage-backed Securities — Agency | |
| |
(Cost: $341,653) | | | | 319,330 | |
| | | | | | | | | | | | |
|
COMMERCIAL MORTGAGE-BACKED SECURITIES —
NON-AGENCY — 4.0% | |
| |
Citigroup Commercial Mortgage Trust (12-GC8-XA) (I/O) | | | | | |
| | | |
1.77% (1)(3)(4) | | | 09/10/45 | | | | 152,918 | | | | 6,279 | |
| |
COMM Mortgage Trust (13-CR13-XA) (I/O) | | | | | |
| | | |
0.77% (1) | | | 11/10/46 | | | | 780,678 | | | | 21,475 | |
| |
COMM Mortgage Trust (13-CR7-XA) (I/O) | | | | | |
| | | |
1.21% (1) | | | 03/10/46 | | | | 235,987 | | | | 7,616 | |
| |
Four Times Square Trust Commercial Mortgage Pass-Through Certificates (06-4TS-A) | | | | | |
| | | |
5.40% (3) | | | 12/13/28 | | | | 9,318 | | | | 9,671 | |
| |
JPMBB Commercial Mortgage Securities Trust
(13-C17-XA) (I/O) | | | | | |
| | | |
0.76% (1) | | | 01/15/47 | | | | 730,204 | | | | 19,704 | |
| |
JPMBB Commercial Mortgage Securities Trust (14-C23-XA) (I/O) | | | | | |
| | | |
0.66% (1) | | | 09/15/47 | | | | 2,161,464 | | | | 52,350 | |
| |
JPMorgan Chase Commercial Mortgage Securities Trust (13-C10-XA) (I/O) | | | | | |
| | | |
0.98% (1) | | | 12/15/47 | | | | 302,441 | | | | 7,982 | |
| |
Morgan Stanley Bank of America Merrill Lynch Trust (13-C7-XA) (I/O) | | | | | |
| | | |
1.35% (1) | | | 02/15/46 | | | | 271,110 | | | | 9,857 | |
| |
Morgan Stanley Capital Barclays Bank Trust (16-MART-A) | | | | | |
| | | |
2.20% (3) | | | 09/13/31 | | | | 15,000 | | | | 15,012 | |
| |
Morgan Stanley Capital I Trust (11-C3-A4) | | | | | |
| | | |
4.12% | | | 07/15/49 | | | | 10,585 | | | | 10,870 | |
| |
WFRBS Commercial Mortgage Trust (12-C9-XA) (I/O) | | | | | |
| | | |
1.90% (1)(3) | | | 11/15/45 | | | | 878,256 | | | | 40,944 | |
| |
WFRBS Commercial Mortgage Trust (13-C13-XA) (I/O) | | | | | |
| | | |
1.20% (1)(3) | | | 05/15/45 | | | | 215,332 | | | | 7,605 | |
| |
WFRBS Commercial Mortgage Trust (14-C21-XA) (I/O) | | | | | |
| | | |
1.04% (1) | | | 08/15/47 | | | | 406,722 | | | | 16,317 | |
| | | | | | | | | | | | |
| |
Total Commercial Mortgage-backed Securities — Non-agency | | | | | |
| |
(Cost: $247,334) | | | | 225,682 | |
| | | | | | | | | | | | |
See accompanying notes to financial statements.
59
TCW Short Term Bond Fund
Schedule of Investments (Continued)
| | | | | | | | | | | | |
| Issues | | Maturity
Date | | | Principal
Amount | | | Value | |
|
RESIDENTIAL MORTGAGE-BACKED SECURITIES —
AGENCY — 17.9% | |
| |
Fannie Mae (03-11-FA) | | | | | |
| | | |
2.82% (1 mo. USD LIBOR + 1.000%) (2) | | | 09/25/32 | | | $ | 13,924 | | | $ | 14,304 | |
| |
Fannie Mae (03-122-MF) (PAC) | | | | | |
| | | |
2.22% (1 mo. USD LIBOR + 0.400%) (2) | | | 08/25/33 | | | | 33,488 | | | | 33,379 | |
| |
Fannie Mae (03-52-NF) | | | | | |
| | | |
2.22% (1 mo. USD LIBOR + 0.400%) (2) | | | 06/25/23 | | | | 11,771 | | | | 11,770 | |
| |
Fannie Mae (05-114-PF) (PAC) | | | | | |
| | | |
2.20% (1 mo. USD LIBOR + 0.375%) (2) | | | 08/25/35 | | | | 15,668 | | | | 15,667 | |
| |
Fannie Mae (06-60-DF) | | | | | |
| | | |
2.25% (1 mo. USD LIBOR + 0.430%) (2) | | | 04/25/35 | | | | 12,012 | | | | 12,025 | |
| |
Fannie Mae (06-84-WF) (PAC) | | | | | |
| | | |
2.12% (1 mo. USD LIBOR + 0.300%) (2) | | | 02/25/36 | | | | 5,328 | | | | 5,326 | |
| |
Fannie Mae (07-64-FA) | | | | | |
| | | |
2.29% (1 mo. USD LIBOR + 0.470%) (2) | | | 07/25/37 | | | | 29,397 | | | | 29,504 | |
| |
Fannie Mae (07-67-FA) | | | | | |
| | | |
2.07% (1 mo. USD LIBOR + 0.250%) (2) | | | 04/25/37 | | | | 227 | | | | 227 | |
| |
Fannie Mae (08-15-JN) | | | | | |
| | | |
4.50% | | | 02/25/23 | | | | 4,273 | | | | 4,293 | |
| |
Fannie Mae (08-24-PF) (PAC) | | | | | |
| | | |
2.47% (1 mo. USD LIBOR + 0.650%) (2) | | | 02/25/38 | | | | 20,870 | | | | 20,985 | |
| |
Fannie Mae (09-33-FB) | | | | | |
| | | |
2.64% (1 mo. USD LIBOR + 0.820%) (2) | | | 03/25/37 | | | | 22,308 | | | | 22,638 | |
| |
Fannie Mae (10-118-GF) (PAC) | | | | | |
| | | |
2.37% (1 mo. USD LIBOR + 0.550%) (2) | | | 10/25/39 | | | | 55,927 | | | | 55,841 | |
| |
Fannie Mae (11-124-DF) | | | | | |
| | | |
2.27% (1 mo. USD LIBOR + 0.450%) (2) | | | 08/25/40 | | | | 10,584 | | | | 10,593 | |
| |
Fannie Mae (11-75-HP) (PAC) | | | | | |
| | | |
2.50% | | | 07/25/40 | | | | 22,082 | | | | 22,237 | |
| |
Fannie Mae (12-93-GF) (PAC) | | | | | |
| | | |
2.07% (1 mo. USD LIBOR + 0.250%) (2) | | | 07/25/40 | | | | 46,327 | | | | 45,922 | |
| |
Fannie Mae, Pool #254548 | | | | | |
| | | |
5.50% | | | 12/01/32 | | | | 11,560 | | | | 12,738 | |
| |
Fannie Mae, Pool #600187 | | | | | |
| | | |
7.00% | | | 07/01/31 | | | | 25,945 | | | | 29,072 | |
| |
Fannie Mae, Pool #995364 | | | | | |
| | | |
6.00% | | | 10/01/38 | | | | 13,616 | | | | 15,625 | |
| |
Fannie Mae, Pool #AL0851 | | | | | |
| | | |
6.00% | | | 10/01/40 | | | | 6,834 | | | | 7,866 | |
| | | | | | | | | | | | |
| Issues | | Maturity
Date | | | Principal
Amount | | | Value | |
|
RESIDENTIAL MORTGAGE-BACKED SECURITIES —
AGENCY (Continued) | |
| |
Freddie Mac (2550-FI) (TAC) | | | | | |
| | | |
2.27% (1 mo. USD LIBOR + 0.350%) (2) | | | 11/15/32 | | | $ | 25,606 | | | $ | 25,521 | |
| |
Freddie Mac (2763-FC) | | | | | |
| | | |
2.27% (1 mo. USD LIBOR + 0.350%) (2) | | | 04/15/32 | | | | 2,371 | | | | 2,371 | |
| |
Freddie Mac (2990-DE) | | | | | |
| | | |
2.30% (1 mo. USD LIBOR + 0.380%) (2) | | | 11/15/34 | | | | 10,035 | | | | 10,041 | |
| |
Freddie Mac (3071-TF) (PAC) | | | | | |
| | | |
2.22% (1 mo. USD LIBOR + 0.300%) (2) | | | 04/15/35 | | | | 35,497 | | | | 35,406 | |
| |
Freddie Mac (3084-FN) | | | | | |
| | | |
2.42% (1 mo. USD LIBOR + 0.500%) (2) | | | 12/15/34 | | | | 20,997 | | | | 20,998 | |
| |
Freddie Mac (3139-FL) (PAC) | | | | | |
| | | |
2.22% (1 mo. USD LIBOR + 0.300%) (2) | | | 01/15/36 | | | | 8,286 | | | | 8,285 | |
| |
Freddie Mac (3196-FA) (PAC) | | | | | |
| | | |
2.27% (1 mo. USD LIBOR + 0.350%) (2) | | | 04/15/32 | | | | 30,694 | | | | 30,699 | |
| |
Freddie Mac (3300-FA) | | | | | |
| | | |
2.22% (1 mo. USD LIBOR + 0.300%) (2) | | | 08/15/35 | | | | 36,658 | | | | 36,539 | |
| |
Freddie Mac (3318-F) | | | | | |
| | | |
2.17% (1 mo. USD LIBOR + 0.250%) (2) | | | 05/15/37 | | | | 44,118 | | | | 43,935 | |
| |
Freddie Mac (3645-EH) | | | | | |
| | | |
3.00% | | | 12/15/20 | | | | 3,174 | | | | 3,172 | |
| |
Freddie Mac (3767-JF) (PAC) | | | | | |
| | | |
2.22% (1 mo. USD LIBOR + 0.300%) (2) | | | 02/15/39 | | | | 26,559 | | | | 26,583 | |
| |
Freddie Mac (3879-MF) | | | | | |
| | | |
2.27% (1 mo. USD LIBOR + 0.350%) (2) | | | 09/15/38 | | | | 24,012 | | | | 24,033 | |
| |
Freddie Mac (3940-PF) (PAC) | | | | | |
| | | |
2.27% (1 mo. USD LIBOR + 0.350%) (2) | | | 05/15/40 | | | | 47,581 | | | | 47,629 | |
| |
Freddie Mac (3946-FG) (PAC) | | | | | |
| | | |
2.27% (1 mo. USD LIBOR + 0.350%) (2) | | | 10/15/39 | | | | 21,357 | | | | 21,342 | |
| |
Freddie Mac (4231-FD) | | | | | |
| | | |
2.27% (1 mo. USD LIBOR + 0.350%) (2) | | | 10/15/32 | | | | 57,727 | | | | 57,401 | |
| |
Freddie Mac (263-F5) | | | | | |
| | | |
2.42% (1 mo. USD LIBOR + 0.500%) (2) | | | 06/15/42 | | | | 44,735 | | | | 44,688 | |
| |
Ginnie Mae (05-60-FK) (PAC) | | | | | |
| | | |
2.07% (1 mo. USD LIBOR + 0.220%) (2) | | | 02/20/34 | | | | 846 | | | | 846 | |
See accompanying notes to financial statements.
60
TCW Short Term Bond Fund
| | | | | | | | | | | | |
| Issues | | Maturity
Date | | | Principal
Amount | | | Value | |
|
RESIDENTIAL MORTGAGE-BACKED SECURITIES —
AGENCY (Continued) | |
| |
Ginnie Mae (12-13-KF) | | | | | |
| | | |
2.15% (1 mo. USD LIBOR + 0.300%) (2) | | | 07/20/38 | | | $ | 16,219 | | | $ | 16,191 | |
| |
Ginnie Mae II, Pool #80022 | | | | | |
| | | |
4.13% (1 year Treasury Constant Maturity Rate + 1.500%) (2) | | | 12/20/26 | | | | 12,186 | | | | 12,532 | |
| |
Ginnie Mae II, Pool #80636 | | | | | |
| | | |
3.75% (1 year Treasury Constant Maturity Rate + 1.500%) (2) | | | 09/20/32 | | | | 9,364 | | | | 9,683 | |
| |
Ginnie Mae II, Pool #80757 | | | | | |
| | | |
3.75% (1 year Treasury Constant Maturity Rate + 1.500%) (2) | | | 10/20/33 | | | | 3,896 | | | | 3,918 | |
| |
Ginnie Mae II, Pool #80797 | | | | | |
| | | |
4.00% (1 year Treasury Constant Maturity Rate + 1.500%) (2) | | | 01/20/34 | | | | 49,301 | | | | 51,358 | |
| |
Ginnie Mae II, Pool #80937 | | | | | |
| | | |
3.88% (1 year Treasury Constant Maturity Rate + 1.500%) (2) | | | 06/20/34 | | | | 16,904 | | | | 17,600 | |
| |
NCUA Guaranteed Notes (10-R1-1A) | | | | | |
| | | |
2.44% (1 mo. USD LIBOR + 0.450%) (2) | | | 10/07/20 | | | | 92,531 | | | | 92,576 | |
| | | | | | | | | | | | |
| |
Total Residential Mortgage-backed Securities — Agency | | | | | |
| |
(Cost: $990,687) | | | | 1,013,359 | |
| | | | | | | | | | | | |
|
RESIDENTIAL MORTGAGE-BACKED SECURITIES —
NON-AGENCY — 0.9% | |
| |
Credit Suisse First Boston Mortgage Securities Corp. (02-AR31-6A1) | | | | | |
| | | |
4.06% (1) | | | 11/25/32 | | | | 29,258 | | | | 30,649 | |
| |
First Franklin Mortgage Loan Asset-Backed Certificates (04-FF5-A3C) | | | | | |
| | | |
2.82% (1 mo. USD LIBOR + 1.000%) (2) | | | 08/25/34 | | | | 14,418 | | | | 14,453 | |
| |
Morgan Stanley Mortgage Loan Trust (04-6AR-1A) | | | | | |
| | | |
2.72% (1 mo. USD LIBOR + 0.900%) (2) | | | 07/25/34 | | | | 3,690 | | | | 3,709 | |
| |
Residential Accredit Loans, Inc. (02-QS16-A2) | | | | | |
| | | |
2.37% (1 mo. USD LIBOR + 0.550%) (2)(5) | | | 10/25/17 | | | | 83 | | | | 86 | |
| | | | | | | | | | | | |
| |
Total Residential Mortgage-backed Securities — Non-agency | | | | | |
| |
(Cost: $45,911) | | | | 48,897 | |
| | | | | | | | | | | | |
| | | | | | | | | | | | |
| Issues | | Maturity
Date | | | Principal
Amount | | | Value | |
| |
CORPORATE BONDS — 31.4% | | | | | |
| |
| Aerospace/Defense — 1.0% | | | | |
| |
BAE Systems Holdings, Inc. | | | | | |
| | | |
2.85% (3) | | | 12/15/20 | | | $ | 15,000 | | | $ | 15,116 | |
| |
L3Harris Technologies, Inc. | | | | | |
| | | |
4.95% (3) | | | 02/15/21 | | | | 15,000 | | | | 15,427 | |
| |
United Technologies Corp. | | | | | |
| | | |
2.82% (3 mo. USD LIBOR + 0.650%) (2) | | | 08/16/21 | | | | 25,000 | | | | 25,005 | |
| | | | | | | | | | | | |
| |
| | | | 55,548 | |
| | | | | | | | | | | | |
| |
| Agriculture — 0.5% | | | | |
| |
BAT Capital Corp. | | | | | |
| | | |
2.76% | | | 08/15/22 | | | | 30,000 | | | | 30,297 | |
| | | | | | | | | | | | |
| |
| Auto Manufacturers — 2.9% | | | | |
| |
BMW US Capital LLC | | | | | |
| | | |
2.42% (3 mo. USD LIBOR + 0.380%) (2)(3) | | | 04/06/20 | | | | 30,000 | | | | 30,039 | |
| |
Daimler Finance North America LLC | | | | | |
| | | |
3.75% (3) | | | 11/05/21 | | | | 25,000 | | | | 25,796 | |
| |
Ford Motor Credit Co. LLC | | | | | |
| | | |
2.46% | | | 03/27/20 | | | | 25,000 | | | | 25,004 | |
| | | |
2.60% | | | 11/04/19 | | | | 25,000 | | | | 25,000 | |
| | | |
5.88% | | | 08/02/21 | | | | 10,000 | | | | 10,494 | |
| | | |
8.13% | | | 01/15/20 | | | | 10,000 | | | | 10,114 | |
| |
General Motors Financial Co., Inc. | | | | | |
| | | |
2.45% | | | 11/06/20 | | | | 35,000 | | | | 35,061 | |
| | | | | | | | | | | | |
| |
| | | | 161,508 | |
| | | | | | | | | | | | |
| | | |
| Banks — 10.1% | | | | | | | | | |
| |
Bank of America Corp. | | | | | |
| | | |
2.37% (3 mo. USD LIBOR + 0.66%) (2) | | | 07/21/21 | | | | 100,000 | | | | 100,286 | |
| | | |
2.74% (3 mo. USD LIBOR + 0.37%) (2) | | | 01/23/22 | | | | 25,000 | | | | 25,200 | |
| |
Citigroup, Inc. | | | | | |
| | | |
2.45% | | | 01/10/20 | | | | 25,000 | | | | 25,013 | |
| | | |
2.90% | | | 12/08/21 | | | | 25,000 | | | | 25,459 | |
| |
JPMorgan Chase & Co. | | | | | |
| | | |
2.82% (3 mo. USD LIBOR + 0.680%) (2) | | | 06/01/21 | | | | 75,000 | | | | 75,176 | |
| |
JPMorgan Chase Bank NA | | | | | |
| | | |
3.09% (3.086% until 4/26/20 then 3 mo. USD LIBOR +0.350%) (2) | | | 04/26/21 | | | | 50,000 | | | | 50,261 | |
| |
Lloyds Bank PLC (United Kingdom) | | | | | |
| | | |
5.80% (3) | | | 01/13/20 | | | | 30,000 | | | | 30,222 | |
| |
Morgan Stanley | | | | | |
| | | |
2.73% (3 mo. USD LIBOR + 0.550%) (2) | | | 02/10/21 | | | | 30,000 | | | | 30,029 | |
| | | |
5.50% | | | 01/26/20 | | | | 35,000 | | | | 35,283 | |
See accompanying notes to financial statements.
61
TCW Short Term Bond Fund
Schedule of Investments (Continued)
| | | | | | | | | | | | |
| Issues | | Maturity
Date | | | Principal
Amount | | | Value | |
| | | |
| Banks (Continued) | | | | | | | | | |
| |
Santander UK Group Holdings PLC (United Kingdom) | | | | | |
| | | |
3.13% | | | 01/08/21 | | | $ | 30,000 | | | $ | 30,282 | |
| |
Wells Fargo & Co. | | | | | |
| | | |
2.15% | | | 01/30/20 | | | | 40,000 | | | | 40,026 | |
| |
Wells Fargo Bank N.A. | | | | | |
| | | |
2.08% (3 mo. USD LIBOR + 0.650%) (2) | | | 09/09/22 | | | | 5,000 | | | | 4,993 | |
| | | |
2.40% | | | 01/15/20 | | | | 100,000 | | | | 100,146 | |
| | | | | | | | | | | | |
| |
| | | | 572,376 | |
| | | | | | | | | | | | |
| | | |
| Beverages — 1.1% | | | | | | | | | |
| |
Anheuser-Busch InBev Worldwide, Inc. | | | | | |
| | | |
6.88% | | | 11/15/19 | | | | 25,000 | | | | 25,035 | |
| |
Constellation Brands, Inc. | | | | | |
| | | |
2.00% | | | 11/07/19 | | | | 25,000 | | | | 25,000 | |
| |
Molson Coors Brewing Co. | | | | | |
| | | |
2.25% | | | 03/15/20 | | | | 15,000 | | | | 15,006 | |
| | | | | | | | | | | | |
| |
| | | | 65,041 | |
| | | | | | | | | | | | |
| | | |
| Chemicals — 0.4% | | | | | | | | | |
| |
International Flavors & Fragrances, Inc. | | | | | |
| | | |
3.40% | | | 09/25/20 | | | | 20,000 | | | | 20,237 | |
| | | | | | | | | | | | |
| |
| Commercial Services — 0.5% | | | | |
| |
IHS Markit, Ltd. | | | | | |
| | | |
5.00% (3) | | | 11/01/22 | | | | 25,000 | | | | 26,759 | |
| | | | | | | | | | | | |
|
| Diversified Financial Services — 1.8% | |
| |
AerCap Ireland Capital DAC / AerCap Global Aviation Trust (Ireland) | | | | | |
| | | |
3.95% | | | 02/01/22 | | | | 10,000 | | | | 10,350 | |
| |
Air Lease Corp. | | | | | |
| | | |
3.50% | | | 01/15/22 | | | | 30,000 | | | | 30,861 | |
| |
GE Capital International Funding Co. Unlimited Co. (Ireland) | | | | | |
| | | |
2.34% | | | 11/15/20 | | | | 45,000 | | | | 44,965 | |
| |
Park Aerospace Holdings, Ltd. | | | | | |
| | | |
3.63% (3) | | | 03/15/21 | | | | 10,000 | | | | 10,119 | |
| | | |
4.50% (3) | | | 03/15/23 | | | | 5,000 | | | | 5,265 | |
| | | | | | | | | | | | |
| |
| | | | 101,560 | |
| | | | | | | | | | | | |
| | | |
| Food — 2.0% | | | | | | | | | |
| |
Campbell Soup Co. | | | | | |
| | | |
2.62% (3 mo. USD LIBOR + 0.500%) (2) | | | 03/16/20 | | | | 15,000 | | | | 15,014 | |
| |
Conagra Brands, Inc. | | | | | |
| | | |
2.51% (3 mo. USD LIBOR + 0.500%) (2) | | | 10/09/20 | | | | 25,000 | | | | 25,041 | |
| |
Kraft Heinz Foods Co. | | | | | |
| | | |
4.00% | | | 06/15/23 | | | | 35,000 | | | | 36,775 | |
| |
Smithfield Foods, Inc. | | | | | |
| | | |
2.70% (3) | | | 01/31/20 | | | | 20,000 | | | | 20,100 | |
| | | | | | | | | | | | |
| Issues | | Maturity
Date | | | Principal
Amount | | | Value | |
| | | |
| Food (Continued) | | | | | | | | | |
| |
Tyson Foods, Inc. | | | | | |
| | | |
2.60% (3 mo. USD LIBOR + 0.450%) (2) | | | 08/21/20 | | | $ | 15,000 | | | $ | 14,996 | |
| | | | | | | | | | | | |
| |
| | | | 111,926 | |
| | | | | | | | | | | | |
|
| Healthcare-Products — 0.5% | |
| |
Becton Dickinson and Co. | | | | | |
| | | |
2.98% (3 mo. USD LIBOR + 0.875%) (2) | | | 12/29/20 | | | | 15,000 | | | | 15,008 | |
| |
Zimmer Biomet Holdings, Inc. | | | | | |
| | | |
2.91% (3 mo. USD LIBOR + 0.750%) (2) | | | 03/19/21 | | | | 15,000 | | | | 15,001 | |
| | | | | | | | | | | | |
| |
| | | | 30,009 | |
| | | | | | | | | | | | |
|
| Healthcare-Services — 1.2% | |
| |
Anthem, Inc. | | | | | |
| | | |
3.70% | | | 08/15/21 | | | | 30,000 | | | | 30,752 | |
| |
Humana, Inc. | | | | | |
| | | |
2.50% | | | 12/15/20 | | | | 15,000 | | | | 15,100 | |
| |
Sutter Health | | | | | |
| | | |
2.29% | | | 08/15/53 | | | | 25,000 | | | | 25,023 | |
| | | | | | | | | | | | |
| |
| | | | 70,875 | |
| | | | | | | | | | | | |
| |
| Insurance — 0.4% | | | | |
| |
Allstate Corp. (The) | | | | | |
| | | |
2.53% (3 mo. USD LIBOR + 0.430%) (2) | | | 03/29/21 | | | | 25,000 | | | | 25,066 | |
| | | | | | | | | | | | |
| | | |
| Media — 0.2% | | | | | | | | | |
| |
Discovery Communications LLC | | | | | |
| | | |
2.80% | | | 06/15/20 | | | | 10,000 | | | | 10,044 | |
| | | | | | | | | | | | |
|
| Miscellaneous Manufacturers — 0.9% | |
| |
General Electric Co. | | | | | |
| | | |
2.20% | | | 01/09/20 | | | | 45,000 | | | | 44,992 | |
| | | |
2.67% (3 mo. USD LIBOR + 0.38%) (2) | | | 05/05/26 | | | | 5,000 | | | | 4,618 | |
| | | | | | | | | | | | |
| | | |
| | | | | | | | | | | 49,610 | |
| | | | | | | | | | | | |
| | | |
| Oil & Gas — 0.3% | | | | | | | | | |
| | | |
Petroleos Mexicanos | | | | | | | | | | | | |
| | | |
5.35% | | | 02/12/28 | | | | 15,000 | | | | 14,809 | |
| | | | | | | | | | | | |
|
| Packaging & Containers — 0.4% | |
| | | |
Bemis Company, Inc. | | | | | | | | | | | | |
| | | |
4.50% (3) | | | 10/15/21 | | | | 20,000 | | | | 20,713 | |
| | | | | | | | | | | | |
|
| Pharmaceuticals — 0.8% | |
| | | |
Bayer US Finance LLC | | | | | | | | | | | | |
| | | |
2.20% (3) | | | 07/15/22 | | | | 45,000 | | | | 44,358 | |
| | | | | | | | | | | | |
See accompanying notes to financial statements.
62
TCW Short Term Bond Fund
October 31, 2019
| | | | | | | | | | | | |
| Issues | | Maturity
Date | | | Principal
Amount | | | Value | |
| | | |
| REIT — 3.7% | | | | | | | | | |
| |
American Campus Communities Operating Partnership LP | | | | | |
| | | |
3.35% | | | 10/01/20 | | | $ | 20,000 | | | $ | 20,217 | |
| | | |
Camden Property Trust | | | | | | | | | | | | |
| | | |
2.95% | | | 12/15/22 | | | | 25,000 | | | | 25,530 | |
| | | |
Essex Portfolio LP (REIT) | | | | | | | | | | | | |
| | | |
5.20% | | | 03/15/21 | | | | 20,000 | | | | 20,677 | |
| |
GLP Capital LP / GLP Financing II, Inc. | | | | | |
| | | |
4.38% | | | 04/15/21 | | | | 10,000 | | | | 10,227 | |
| | | |
5.38% | | | 11/01/23 | | | | 20,000 | | | | 21,825 | |
| | | |
HCP, Inc. | | | | | | | | | | | | |
| | | |
4.00% | | | 12/01/22 | | | | 9,000 | | | | 9,469 | |
| | | |
Kimco Realty Corp. | | | | | | | | | | | | |
| | | |
3.40% | | | 11/01/22 | | | | 20,000 | | | | 20,709 | |
| |
National Retail Properties, Inc. | | | | | |
| | | |
3.80% | | | 10/15/22 | | | | 30,000 | | | | 31,196 | |
| |
SL Green Operating Partnership LP | | | | | |
| | | |
3.15% (3 mo. USD LIBOR + 0.980%) (2) | | | 08/16/21 | | | | 40,000 | | | | 40,008 | |
| | | |
WEA Finance LLC | | | | | | | | | | | | |
| | | |
3.15% (3) | | | 04/05/22 | | | | 10,000 | | | | 10,207 | |
| | | | | | | | | | | | |
| | | |
| | | | | | | | | | | 210,065 | |
| | | | | | | | | | | | |
| | | |
| Retail — 0.8% | | | | | | | | | |
| |
Alimentation Couche-Tard, Inc. (Canada) | | | | | |
| | | |
2.35% (3) | | | 12/13/19 | | | | 20,000 | | | | 20,008 | |
| | | |
Dollar Tree, Inc. | | | | | | | | | | | | |
| | | |
2.70% (3 mo. USD LIBOR + 0.700%) (2) | | | 04/17/20 | | | | 25,000 | | | | 25,004 | |
| | | | | | | | | | | | |
| | | |
| | | | | | | | | | | 45,012 | |
| | | | | | | | | | | | |
| | |
| Savings & Loans — 0.3% | | | | | | | |
| |
Nationwide Building Society (United Kingdom) | | | | | |
| | | |
3.62% (3 mo. USD LIBOR + 0.181%) (3)(2) | | | 04/26/23 | | | | 15,000 | | | | 15,426 | |
| | | | | | | | | | | | |
| | |
| Semiconductors — 0.9% | | | | | | | |
| |
Analog Devices, Inc. | | | | | |
| | | |
2.85% | | | 03/12/20 | | | | 10,000 | | | | 10,031 | |
| |
Broadcom Corp. / Broadcom Cayman Finance, Ltd. | | | | | |
| | | |
2.38% | | | 01/15/20 | | | | 15,000 | | | | 15,012 | |
| |
NXP BV / NXP Funding LLC (Netherlands) | | | | | |
| | | |
4.13% (3) | | | 06/01/21 | | | | 25,000 | | | | 25,698 | |
| | | | | | | | | | | | |
| |
| | | | 50,741 | |
| | | | | | | | | | | | |
| | |
| Telecommunications — 0.4% | | | | | | | |
| |
Sprint Spectrum Co. LLC / Sprint Spectrum Co. II LLC / Sprint Spectrum Co. III LLC | | | | | |
| | | |
3.36% (3) | | | 03/20/23 | | | | 25,000 | | | | 25,187 | |
| | | | | | | | | | | | |
| | | | | | | | | | | | |
| Issues | | Maturity
Date | | | Principal
Amount | | | Value | |
|
| Trucking & Leasing — 0.3% | |
| |
Aviation Capital Group LLC | | | | | |
| | | |
3.08% (3 mo. USD LIBOR + 0.950%) (2)(3) | | | 06/01/21 | | | $ | 15,000 | | | $ | 15,035 | |
| | | | | | | | | | | | |
| | | |
Total Corporate Bonds | | | | | | | | | | | | |
| |
(Cost: $1,759,756) | | | | 1,772,202 | |
| | | | | | | | | | | | |
| |
| U.S. TREASURY SECURITIES — 22.1% | | | | |
| |
U.S. Treasury Floating Rate Note | | | | | |
| | | |
1.86% (3 mo. Treasury Money Market Yield + 0.220%) (2) | | | 07/31/21 | | | | 300,000 | | | | 300,012 | |
| |
U.S. Treasury Note | | | | | |
| | | |
1.50% | | | 08/31/21 | | | | 242,000 | | | | 241,764 | |
| | | |
1.50% | | | 09/30/21 | | | | 298,000 | | | | 297,748 | |
| | | |
1.50% | | | 10/31/21 | | | | 408,000 | | | | 407,839 | |
| | | | | | | | | | | | |
| | |
Total U.S. Treasury Securities | | | | | | | | | |
| |
(Cost: $1,245,526) | | | | 1,247,363 | |
| | | | | | | | | | | | |
| |
ASSET-BACKED SECURITIES — 0.5%
(Cost: $26,274) | | | | |
| |
Corevest American Finance Trust (19-1-XA) (I/O) | | | | | |
| | | |
2.16% (1)(3) | | | 03/15/52 | | | | 278,628 | | | | 26,075 | |
| | | | | | | | | | | | |
| | |
Total Fixed Income Securities | | | | | | | | | |
| |
(Cost: $4,657,141) | | | | 4,652,908 | |
| | | | | | | | | | | | |
| | | |
| | | | | | | | | | | | |
| | | | | | Shares | | | | |
| |
| MONEY MARKET INVESTMENTS — 19.2% | | | | |
| | | |
State Street Institutional U.S. Government Money Market Fund — Premier Class, 1.75% (6) | | | | | | | 1,084,313 | | | | 1,084,313 | |
| | | | | | | | | | | | |
| | |
Total Money Market Investments | | | | | | | | | |
| |
(Cost: $1,084,313) | | | | 1,084,313 | |
| | | | | | | | | | | | |
| | | |
| | | | | | | | | | | | |
| | | | | | Principal
Amount | | | | |
| |
| SHORT TERM INVESTMENTS — 3.0% | | | | |
| |
U.S. TREASURY SECURITIES — 0.3% (Cost: $16,951) | | | | | |
| |
U.S. Treasury Bill | | | | | |
| | | |
1.54% (7)(8) | | | 12/26/19 | | | $ | 17,000 | | | | 16,960 | |
| | | | | | | | | | | | |
| |
| Foreign Government Bonds — 2.5% | | | | |
| |
Japan Treasury Bill | | | | | |
| | | |
0.00% (9) | | | 01/20/20 | | | JPY | 5,000,000 | | | | 46,275 | |
| | | |
0.00% (9) | | | 01/27/20 | | | JPY | 10,000,000 | | | | 92,552 | |
| | | | | | | | | | | | |
| | |
Total Foreign Government Bonds | | | | | | | | | |
| |
(Cost: $138,391) | | | | 138,827 | |
| | | | | | | | | | | | |
See accompanying notes to financial statements.
63
TCW Short Term Bond Fund
Schedule of Investments (Continued)
| | | | | | | | | | | | |
| Issues | | Maturity
Date | | | Principal
Amount | | | Value | |
| | |
| Commercial Paper — 0.2% | | | | | | | |
| |
| Auto Manufacturers 0.2% (Cost: $9,706) | | | | |
| |
Ford Motor Credit Co. | | | | | |
| | | |
3.24% | | | 10/08/20 | | | $ | 10,000 | | | $ | 9,709 | |
| | | | | | | | | | | | |
| | |
Total Short Term Investments | | | | | | | | | |
| |
(Cost: $165,048) | | | | 165,496 | |
| | | | | | | | | | | | |
| | | |
Total Investments (104.6%) (Cost: $5,906,502) | | | | | | | | | | | 5,902,717 | |
| |
Liabilities In Excess Of Other Assets (-4.6%) | | | | (258,837 | ) |
| | | | | | | | | �� | | | |
| |
Net Assets (100.0%) | | | $ | 5,643,880 | |
| | | | | | | | | | | | |
| | | | | | | | | | | | | | | | | | |
| Futures Contracts | | | | | | | |
| | | | | |
Number of
Contracts | | Type | | Expiration
Date | | | Notional | | | Value | | | Net
Unrealized
Depreciation | |
Long Futures | | | | | | | | | | | | | | | | |
| 2 | | 2-Year U.S. Treasury Note Futures | | | 12/31/19 | | | $ | 432,038 | | | $ | 431,203 | | | $ | (835 | ) |
| | | | | | | | | | | | | | | | | | |
| | | | | | | | | | | | | | | | | | | | | | | | |
| Forward Currency Exchange Contracts | | | | |
| | | | | | |
| Counterparty | | Contracts to
Deliver | | | Units of
Currency | | | Settlement
Date | | | In Exchange for
U.S. Dollars | | | Contracts at
Value | | | Unrealized
Appreciation
(Depreciation) | |
SELL (10) | | | | | | | | | | | | | | | | | | | | | | | | |
Goldman Sachs & Co. | | | JPY | | | | 5,000,000 | | | | 01/21/20 | | | $ | 46,774 | | | $ | 46,497 | | | $ | 277 | |
Goldman Sachs & Co. | | | JPY | | | | 5,000,000 | | | | 01/27/20 | | | | 46,212 | | | | 46,512 | | | | (300 | ) |
Citibank N.A. | | | JPY | | | | 5,000,000 | | | | 01/27/20 | | | | 46,384 | | | | 46,512 | | | | (128 | ) |
| | | | | | | | | | | | | | | | | | | | | | | | |
| | | | | | | | | | | | | | $ | 139,370 | | | $ | 139,521 | | | $ | (151 | ) |
| | | | | | | | | | | | | | | | | | | | | | | | |
Notes to Schedule of Investments:
| I/O - | | Interest Only Security. |
| PAC - | | Planned Amortization Class. |
| REIT - | | Real Estate Investment Trust. |
| TAC - | | Target Amortization Class. |
| (1) | | Variable rate security. Interest rate disclosed is as of the most recent information available. Certain variable rate securities are not based on a published reference rate and spread but are determined by the issuer or agent and are based on current market conditions. These securities do not indicate a reference rate and spread in their description above. |
| (2) | | Floating or variable rate security. The interest shown reflects the rate in effect at October 31, 2019. |
| (3) | | Security exempt from registration under Rule 144A of the Securities Act of 1933, as amended. These securities may be resold, normally only to qualified institutional buyers. At October 31, 2019, the value of these securities amounted to $468,903 or 8.3% of net assets. These securities are determined to be liquid by the Fund’s investment advisor, unless otherwise noted, under procedures established by and under the general supervision of the Company’s Board of Directors. |
| (4) | | Restricted security (Note 11). |
| (5) | | The maturity date of the security has been extended past the date disclosed. The new maturity date is not known as of October 31, 2019. |
| (6) | | Rate disclosed is the 7-day net yield as of October 31, 2019. |
| (7) | | Rate shown represents yield-to-maturity. |
| (8) | | All or a portion of this security is held as collateral for open futures contracts. |
| (9) | | Security is not accruing interest. |
| (10) | | Fund sells foreign currency, buys U.S. Dollar. |
See accompanying notes to financial statements.
64
TCW Short Term Bond Fund
Investments by Sector | October 31, 2019 |
| | | | |
| Sector | | Percentage of
Net Assets | |
Corporate Bonds | | | 31.4 | % |
U.S. Treasury Securities | | | 22.4 | |
Money Market Investments | | | 19.2 | |
Residential Mortgage-Backed Securities — Agency | | | 17.9 | |
Commercial Mortgage-Backed Securities — Agency | | | 5.6 | |
Commercial Mortgage-Backed Securities — Non-Agency | | | 4.0 | |
Foreign Government Bonds | | | 2.5 | |
Residential Mortgage-Backed Securities — Non-Agency | | | 0.9 | |
Asset-Backed Securities | | | 0.5 | |
Commercial Paper | | | 0.2 | |
Other* | | | (4.6 | ) |
| | | | |
Total | | | 100.0 | % |
| | | | |
| * | Includes futures, pending trades, interest receivable and accrued expenses payable. |
See accompanying notes to financial statements.
65
TCW Short Term Bond Fund
Fair Valuation Summary | October 31, 2019 |
The following is a summary of the fair valuations according to the inputs used as of October 31, 2019 in valuing the Fund’s investments:
| | | | | | | | | | | | | | | | |
Description | | Quoted Prices
in Active
Markets for
Identical
Assets
(Level 1) | | | Other
Significant
Observable
Inputs
(Level 2) | | | Significant
Unobservable
Inputs
(Level 3) | | | Total | |
Fixed Income Securities | | | | | | | | | | | | | | | | |
Commercial Mortgage-Backed Securities — Agency | | $ | — | | | $ | 319,330 | | | $ | — | | | $ | 319,330 | |
Commercial Mortgage-Backed Securities — Non-Agency | | | — | | | | 225,682 | | | | — | | | | 225,682 | |
Residential Mortgage-Backed Securities — Agency | | | — | | | | 1,013,359 | | | | — | | | | 1,013,359 | |
Residential Mortgage-Backed Securities — Non-Agency | | | — | | | | 48,897 | | | | — | | | | 48,897 | |
Corporate Bonds* | | | — | | | | 1,772,202 | | | | — | | | | 1,772,202 | |
U.S. Treasury Securities | | | 1,247,363 | | | | — | | | | — | | | | 1,247,363 | |
Asset-Backed Securities | | | — | | | | 26,075 | | | | — | | | | 26,075 | |
| | | | | | | | | | | | | | | | |
Total Fixed Income Securities | | | 1,247,363 | | | | 3,405,545 | | | | — | | | | 4,652,908 | |
| | | | | | | | | | | | | | | | |
Money Market Investments | | | 1,084,313 | | | | — | | | | — | | | | 1,084,313 | |
Short-Term Investments* | | | 16,960 | | | | 148,536 | | | | — | | | | 165,496 | |
| | | | | | | | | | | | | | | | |
Total Investments | | | 2,348,636 | | | | 3,554,081 | | | $ | — | | | | 5,902,717 | |
| | | | | | | | | | | | | | | | |
Asset Derivatives | | | | | | | | | | | | | | | | |
Forward Currency Contracts | | | | | | | | | | | | | | | | |
Foreign Currency Risk | | | — | | | | 277 | | | | — | | | | 277 | |
| | | | | | | | | | | | | | | | |
Total Investments | | $ | 2,348,636 | | | $ | 3,554,358 | | | $ | — | | | $ | 5,902,994 | |
| | | | | | | | | | | | | | | | |
Liability Derivatives | | | | | | | | | | | | | | | | |
Futures Contracts | | | | | | | | | | | | | | | | |
Interest Rate Risk | | $ | (835 | ) | | $ | — | | | $ | — | | | $ | (835 | ) |
Forward Currency Contracts | | | | | | | | | | | | | | | | |
Foreign Currency Risk | | | — | | | | (428 | ) | | | — | | | | (428 | ) |
| | | | | | | | | | | | | | | | |
Total | | $ | (835 | ) | | $ | (428 | ) | | $ | — | | | $ | (1,263 | ) |
| | | | | | | | | | | | | | | | |
| * | See Schedule of Investments for corresponding industries. |
See accompanying notes to financial statements.
66
TCW Total Return Bond Fund
Schedule of Investments | October 31, 2019 |
| | | | | | | | | | | | |
| Issues | | Maturity
Date | | | Principal
Amount | | | Value | |
|
FIXED INCOME SECURITIES —103.2% of Net Assets | |
|
ASSET-BACKED SECURITIES — 2.2% | |
| |
321 Henderson Receivables I LLC (13-3A-A) | | | | | |
| | | |
4.08% (1) | | | 01/17/73 | | | $ | 7,147,587 | | | $ | 7,798,771 | |
| |
EFS Volunteer No 2 LLC (12-1-A2) | | | | | |
| | | |
3.17% (1 mo. USD LIBOR + 1.350%) (1)(2) | | | 03/25/36 | | | | 7,086,300 | | | | 7,184,710 | |
| |
EFS Volunteer No 3 LLC (12-1-A3) | | | | | |
| | | |
2.82% (1 mo. USD LIBOR + 1.000%) (1)(2) | | | 04/25/33 | | | | 15,609,461 | | | | 15,580,787 | |
| |
Global SC Finance SRL (14-1A-A2) | | | | | |
| | | |
3.09% (1) | | | 07/17/29 | | | | 7,773,375 | | | | 7,789,878 | |
| |
Higher Education Funding I (14-1-A) | | | | | |
| | | |
3.18% (3 mo. USD LIBOR + 1.050%) (1)(2) | | | 05/25/34 | | | | 18,182 | | | | 18,258 | |
| |
Navient Student Loan Trust (14-2-A) | | | | | |
| | | |
2.46% (1 mo. USD LIBOR + 0.640%) (2) | | | 03/25/83 | | | | 23,074,910 | | | | 22,722,626 | |
| |
Navient Student Loan Trust (14-3-A) | | | | | |
| | | |
2.44% (1 mo. USD LIBOR + 0.620%) (2) | | | 03/25/83 | | | | 24,101,724 | | | | 23,700,666 | |
| |
Navient Student Loan Trust (14-4-A) | | | | | |
| | | |
2.44% (1 mo. USD LIBOR + 0.620%) (2) | | | 03/25/83 | | | | 13,495,394 | | | | 13,312,159 | |
| |
Navient Student Loan Trust (16-5A-A) | | | | | |
| | | |
3.07% (1 mo. USD LIBOR + 1.250%) (1)(2) | | | 06/25/65 | | | | 16,138,687 | | | | 16,284,168 | |
| |
Navient Student Loan Trust (17-1A-A3) | | | | | |
| | | |
2.97% (1 mo. USD LIBOR + 1.150%) (1)(2) | | | 07/26/66 | | | | 6,130,000 | | | | 6,227,464 | |
| |
SLM Student Loan Trust (08-8-B) | | | | | |
| | | |
4.19% (3 mo. USD LIBOR + 2.250%) (2) | | | 10/25/75 | | | | 5,706,000 | | | | 5,743,916 | |
| | | | | | | | | | | | |
| | | |
Total Asset-backed Securities | | | | | | | | | | | | |
| | | |
(Cost: $125,536,273) | | | | | | | | | | | 126,363,403 | |
| | | | | | | | | | | | |
|
COMMERCIAL MORTGAGE-BACKED SECURITIES —
AGENCY — 3.6% | |
| |
Fannie Mae (12-M12-1A) (ACES) | | | | | |
| | | |
2.84% (3) | | | 08/25/22 | | | | 37,552,043 | | | | 38,311,267 | |
| |
Fannie Mae, Pool #AL2660 | | | | | |
| | | |
2.63% | | | 10/01/22 | | | | 13,822,688 | | | | 14,104,470 | |
| |
Fannie Mae, Pool #AN9555 | | | | | |
| | | |
3.81% | | | 06/01/30 | | | | 20,679,000 | | | | 23,308,844 | |
| |
Fannie Mae, Pool #BL0552 | | | | | |
| | | |
3.95% | | | 11/01/30 | | | | 11,549,000 | | | | 13,067,643 | |
| |
Fannie Mae, Pool #BL0710 | | | | | |
| | | |
4.03% | | | 11/01/30 | | | | 28,324,000 | | | | 32,364,884 | |
| |
Fannie Mae, Pool #BL0740 | | | | | |
| | | |
4.08% | | | 12/01/33 | | | | 21,998,000 | | | | 25,449,777 | |
| |
Fannie Mae, Pool #BL2360 | | | | | |
| | | |
3.45% | | | 05/01/34 | | | | 24,962,000 | | | | 27,416,165 | |
| | | | | | | | | | | | |
| Issues | | Maturity
Date | | | Principal
Amount | | | Value | |
|
COMMERCIAL MORTGAGE-BACKED SECURITIES —
AGENCY (Continued) | |
| |
Freddie Mac (K-1510-A3) | | | | | |
| | | |
3.79% | | | 01/25/34 | | | $ | 31,000,000 | | | $ | 35,586,763 | |
| | | | | | | | | | | | |
| |
Total Commercial Mortgage-backed Securities — Agency | | | | | |
| | | |
(Cost: $198,064,483) | | | | | | | | | | | 209,609,813 | |
| | | | | | | | | | | | |
| |
COMMERCIAL MORTGAGE-BACKED SECURITIES
— NON-AGENCY — 0.6% | | | | |
| |
CPT Mortgage Trust | | | | | |
| | | |
2.87% (1)(4) | | | 11/13/39 | | | | 5,485,000 | | | | 5,649,444 | |
| |
DBRR Trust (11-LC2-A4A) | | | | | |
| | | |
4.54% (1)(3) | | | 07/12/44 | | | | 10,288,605 | | | | 10,544,886 | |
| |
DBWF Mortgage Trust (16-85T-A) | | | | | |
| | | |
3.79% (1) | | | 12/10/36 | | | | 6,385,000 | | | | 6,949,079 | |
| |
DC Office Trust (19-MTC-A) | | | | | |
| | | |
2.97% (1) | | | 09/15/45 | | | | 5,750,000 | | | | 5,977,825 | |
| |
GS Mortgage Securities Corp. (12-ALOH-A) | | | | | |
| | | |
3.55% (1) | | | 04/10/34 | | | | 6,105,000 | | | | 6,285,386 | |
| |
SFAVE Commercial Mortgage Securities Trust (15-5AVE-A2B) | | | | | |
| | | |
4.14% (1)(3) | | | 01/05/43 | | | | 820,000 | | | | 881,316 | |
| | | | | | | | | | | | |
| | |
Total Commercial Mortgage-backed Securities — Non-agency | | | | | | | | | |
| |
(Cost: $36,430,891) | | | | 36,287,936 | |
| | | | | | | | | | | | |
|
RESIDENTIAL MORTGAGE-BACKED SECURITIES —
AGENCY — 57.0% | |
| |
Fannie Mae, Pool #MA3811 | | | | | |
| | | |
3.00% | | | 10/01/49 | | | | 29,486,616 | | | | 29,752,360 | |
| |
Fannie Mae (01-40-Z) | | | | | |
| | | |
6.00% | | | 08/25/31 | | | | 170,579 | | | | 188,452 | |
| |
Fannie Mae (03-117-TG) (PAC) | | | | | |
| | | |
4.75% | | | 08/25/33 | | | | 358,083 | | | | 377,869 | |
| |
Fannie Mae (04-52-SW) (I/O) (I/F) | | | | | |
| | | |
5.28% (1 mo. USD LIBOR + 7.100%)(2) | | | 07/25/34 | | | | 561,073 | | | | 83,714 | |
| |
Fannie Mae (04-65-LT) | | | | | |
| | | |
4.50% | | | 08/25/24 | | | | 872,276 | | | | 907,726 | |
| |
Fannie Mae (04-68-LC) | | | | | |
| | | |
5.00% | | | 09/25/29 | | | | 1,281,157 | | | | 1,378,573 | |
| |
Fannie Mae (05-117-LC) (PAC) | | | | | |
| | | |
5.50% | | | 11/25/35 | | | | 3,242,217 | | | | 3,368,949 | |
| |
Fannie Mae (05-74-CP) (I/F) (PAC) | | | | | |
| | | |
18.07% (-3.67 X 1 mo. USD LIBOR + 24.750%) (2) | | | 05/25/35 | | | | 203,156 | | | | 276,700 | |
| |
Fannie Mae (07-103-AI) (I/O) (I/F) | | | | | |
| | | |
4.48% (1 mo. USD LIBOR + 6.500%) (2) | | | 03/25/37 | | | | 4,000,945 | | | | 647,464 | |
See accompanying notes to financial statements.
67
TCW Total Return Bond Fund
Schedule of Investments (Continued)
| | | | | | | | | | | | |
| Issues | | Maturity
Date | | | Principal
Amount | | | Value | |
|
RESIDENTIAL MORTGAGE-BACKED SECURITIES —
AGENCY (Continued) | |
| |
Fannie Mae (07-20-SI) (I/O) (I/F) | | | | | |
| | | |
4.63% (-1.00 X 1 mo. USD LIBOR + 6.450%) (2) | | | 03/25/37 | | | $ | 1,167,780 | | | $ | 192,171 | |
| |
Fannie Mae (07-21-SE) (I/O) (I/F) | | | | | |
| | | |
4.42% (-1.00 X 1 mo. USD LIBOR + 6.440%) (2) | | | 03/25/37 | | | | 966,619 | | | | 139,630 | |
| |
Fannie Mae (07-56-SG) (I/O) (I/F) | | | | | |
| | | |
4.39% (-1.00 X 1 mo. USD LIBOR + 6.410%) | | | 06/25/37 | | | | 1,060,679 | | | | 116,524 | |
| |
Fannie Mae (07-58-SV) (I/O) (I/F) | | | | | |
| | | |
4.93% (-1.00 X 1 mo. USD LIBOR + 6.750%) (2) | | | 06/25/37 | | | | 4,753,925 | | | | 591,944 | |
| |
Fannie Mae (07-65-S) (I/O) (I/F) | | | | | |
| | | |
4.78% (-1.00 X 1 mo. USD LIBOR + 6.600%) (2) | | | 07/25/37 | | | | 872,490 | | | | 132,993 | |
| |
Fannie Mae (07-88-FY) | | | | | |
| | | |
2.28% (1 mo. USD LIBOR + 0.460%) (2) | | | 09/25/37 | | | | 643,703 | | | | 644,845 | |
| |
Fannie Mae (07-B2-ZA) | | | | | |
| | | |
5.50% | | | 06/25/37 | | | | 11,861,148 | | | | 13,377,762 | |
| |
Fannie Mae (08-1-AI) (I/O) (I/F) | | | | | |
| | | |
4.23% (-1.00 X 1 mo. USD LIBOR + 6.250%) (2) | | | 05/25/37 | | | | 4,415,205 | | | | 662,496 | |
| |
Fannie Mae (08-13-SB) (I/O) (I/F) | | | | | |
| | | |
4.42% (-1.00 X 1 mo. USD LIBOR + 6.240%) (2) | | | 03/25/38 | | | | 3,924,786 | | | | 809,647 | |
| |
Fannie Mae (08-23-SB) (I/O) (I/F) | | | | | |
| | | |
5.03% (-1.00 X 1 mo. USD LIBOR + 6.850%) (2) | | | 04/25/38 | | | | 6,718,819 | | | | 1,078,651 | |
| |
Fannie Mae (08-35-SD) (I/O) (I/F) | | | | | |
| | | |
4.63% (-1.00 X 1 mo. USD LIBOR + 6.450%) (2) | | | 05/25/38 | | | | 524,230 | | | | 36,529 | |
| |
Fannie Mae (08-66-SG) (I/O) (I/F) | | | | | |
| | | |
4.25% (-1.00 X 1 mo. USD LIBOR + 6.070%) (2) | | | 08/25/38 | | | | 8,920,233 | | | | 1,761,980 | |
| |
Fannie Mae (08-68-SA) (I/O) (I/F) | | | | | |
| | | |
4.15% (-1.00 X 1 mo. USD LIBOR + 5.970%) (2) | | | 08/25/38 | | | | 3,376,269 | | | | 509,289 | |
| |
Fannie Mae (09-3-SH) (I/O) (I/F) | | | | | |
| | | |
3.63% (-1.00 X 1 mo. USD LIBOR + 5.450%) (2) | | | 06/25/37 | | | | 1,202,654 | | | | 154,975 | |
| |
Fannie Mae (09-47-SV) (I/O) (I/F) | | | | | |
| | | |
4.93% (-1.00 X 1 mo. USD LIBOR + 6.750%) (2) | | | 07/25/39 | | | | 1,035,352 | | | | 114,864 | |
| |
Fannie Mae (09-51-SA) (I/O) (I/F) | | | | | |
| | | |
4.93% (-1.00 X 1 mo. USD LIBOR + 6.750%) (2) | | | 07/25/39 | | | | 4,024,991 | | | | 641,765 | |
| |
Fannie Mae (09-6-SD) (I/O) (I/F) | | | | | |
| | | |
3.73% (-1.00 X 1 mo. USD LIBOR + 5.550%) (2) | | | 02/25/39 | | | | 1,635,882 | | | | 199,541 | |
| | | | | | | | | | | | |
| Issues | | Maturity
Date | | | Principal
Amount | | | Value | |
|
RESIDENTIAL MORTGAGE-BACKED SECURITIES —
AGENCY (Continued) | |
| |
Fannie Mae (09-68-KB) | | | | | |
| | | |
4.00% | | | 09/25/24 | | | $ | 3,563,866 | | | $ | 3,640,725 | |
| |
Fannie Mae (09-71-LB) | | | | | |
| | | |
4.00% | | | 09/25/29 | | | | 11,282,113 | | | | 11,880,345 | |
| |
Fannie Mae (09-72-AC) | | | | | |
| | | |
4.00% | | | 09/25/29 | | | | 14,583,637 | | | | 15,357,448 | |
| |
Fannie Mae (09-72-JS) (I/O) (I/F) | | | | | |
| | | |
5.43% (-1.00 X 1 mo. USD LIBOR + 7.250%) (2) | | | 09/25/39 | | | | 894,944 | | | | 200,779 | |
| |
Fannie Mae (10-136-CX) (PAC) | | | | | |
| | | |
4.00% | | | 08/25/39 | | | | 20,937,000 | | | | 21,989,331 | |
| |
Fannie Mae (11-111-DB) | | | | | |
| | | |
4.00% | | | 11/25/41 | | | | 25,000,000 | | | | 26,702,670 | |
| |
Fannie Mae (11-123-ZP) (PAC) | | | | | |
| | | |
4.50% | | | 12/25/41 | | | | 4,814,743 | | | | 5,750,067 | |
| |
Fannie Mae (12-128-UY) (PAC) | | | | | |
| | | |
2.50% | | | 11/25/42 | | | | 11,738,000 | | | | 11,536,173 | |
| |
Fannie Mae (12-133-GC) (PAC) | | | | | |
| | | |
2.50% | | | 08/25/41 | | | | 22,623,769 | | | | 22,685,976 | |
| |
Fannie Mae (12-153-PC) (PAC) | | | | | |
| | | |
2.00% | | | 05/25/42 | | | | 6,780,430 | | | | 6,720,717 | |
| |
Fannie Mae (13-101-BO) (P/O) | | | | | |
| | | |
0.00% (5) | | | 10/25/43 | | | | 6,881,998 | | | | 6,053,468 | |
| |
Fannie Mae (13-101-CO) (P/O) | | | | | |
| | | |
0.00% (5) | | | 10/25/43 | | | | 16,132,393 | | | | 13,962,893 | |
| |
Fannie Mae (13-21-EC) (I/O) | | | | | |
| | | |
2.00% | | | 12/25/38 | | | | 9,872,623 | | | | 9,867,540 | |
| |
Fannie Mae (13-95-PN) (PAC) | | | | | |
| | | |
3.00% | | | 01/25/43 | | | | 21,400,000 | | | | 21,999,397 | |
| |
Fannie Mae (18-52 PZ) (PAC) | | | | | |
| | | |
4.00% | | | 07/25/48 | | | | 2,982,657 | | | | 3,255,553 | |
| |
Fannie Mae (18-55 PA) (PAC) | | | | | |
| | | |
3.50% | | | 01/25/47 | | | | 17,927,903 | | | | 18,513,161 | |
| |
Fannie Mae (19-57) | | | | | |
| | | |
2.50% | | | 10/25/49 | | | | 19,449,211 | | | | 19,563,956 | |
| |
Fannie Mae (93-202-SZ) (I/F) (PAC) | | | | | |
| | | |
10.00% (Prime + 44.285%) (2) | | | 11/25/23 | | | | 36,787 | | | | 40,186 | |
| |
Fannie Mae (95-21-C) (P/O) | | | | | |
| | | |
0.00% (5) | | | 05/25/24 | | | | 210,262 | | | | 202,608 | |
| |
Fannie Mae (G92-29-J) | | | | | |
| | | |
8.00% | | | 07/25/22 | | | | 10,450 | | | | 11,093 | |
| |
Fannie Mae, Pool #254634 | | | | | |
| | | |
5.50% | | | 02/01/23 | | | | 56,871 | | | | 59,387 | |
| |
Fannie Mae, Pool #257536 | | | | | |
| | | |
5.00% | | | 01/01/29 | | | | 1,222,606 | | | | 1,305,774 | |
| |
Fannie Mae, Pool #310033 | | | | | |
| | | |
6.00% | | | 07/01/47 | | | | 452,455 | | | | 523,882 | |
See accompanying notes to financial statements.
68
TCW Total Return Bond Fund
| | | | | | | | | | | | |
| Issues | | Maturity
Date | | | Principal
Amount | | | Value | |
|
RESIDENTIAL MORTGAGE-BACKED SECURITIES —
AGENCY (Continued) | |
| |
Fannie Mae, Pool #555424 | | | | | |
| | | |
5.50% | | | 05/01/33 | | | $ | 2,951,401 | | | $ | 3,289,019 | |
| |
Fannie Mae, Pool #661856 | | | | | |
| | | |
3.87% (12 mo. USD LIBOR + 1.623%) (2) | | | 10/01/32 | | | | 31,755 | | | | 31,756 | |
| |
Fannie Mae, Pool #671133 | | | | | |
| | | |
3.91% (6 mo. USD LIBOR + 1.413%) (2) | | | 02/01/33 | | | | 74,044 | | | | 76,370 | |
| |
Fannie Mae, Pool #672272 | | | | | |
| | | |
4.80% (12 mo. USD LIBOR + 1.579%) (2) | | | 12/01/32 | | | | 28,347 | | | | 29,395 | |
| |
Fannie Mae, Pool #687847 | | | | | |
| | | |
4.66% (12 mo. USD LIBOR + 1.590%) (2) | | | 02/01/33 | | | | 74,010 | | | | 77,535 | |
| |
Fannie Mae, Pool #692104 | | | | | |
| | | |
3.66% (6 mo. USD LIBOR + 1.413%) (2) | | | 02/01/33 | | | | 398,392 | | | | 411,189 | |
| |
Fannie Mae, Pool #699866 | | | | | |
| | | |
4.50% (12 mo. USD LIBOR + 1.588%) (2) | | | 04/01/33 | | | | 214,389 | | | | 225,516 | |
| |
Fannie Mae, Pool #704454 | | | | | |
| | | |
4.55% (12 mo. USD LIBOR + 1.695%) (2) | | | 05/01/33 | | | | 73,491 | | | | 76,168 | |
| |
Fannie Mae, Pool #728824 | | | | | |
| | | |
4.14% (12 mo. USD LIBOR + 1.586%) (2) | | | 07/01/33 | | | | 74,324 | | | | 78,307 | |
| |
Fannie Mae, Pool #734384 | | | | | |
| | | |
5.50% | | | 07/01/33 | | | | 359,730 | | | | 393,910 | |
| |
Fannie Mae, Pool #888593 | | | | | |
| | | |
7.00% | | | 06/01/37 | | | | 330,375 | | | | 387,804 | |
| |
Fannie Mae, Pool #934103 | | | | | |
| | | |
5.00% | | | 07/01/38 | | | | 282,323 | | | | 299,787 | |
| |
Fannie Mae, Pool #979563 | | | | | |
| | | |
5.00% | | | 04/01/28 | | | | 659,532 | | | | 704,397 | |
| |
Fannie Mae, Pool #995040 | | | | | |
| | | |
5.00% | | | 06/01/23 | | | | 284,656 | | | | 295,067 | |
| |
Fannie Mae, Pool #995425 | | | | | |
| | | |
6.00% | | | 01/01/24 | | | | 1,257,464 | | | | 1,318,191 | |
| |
Fannie Mae, Pool #995573 | | | | | |
| | | |
6.00% | | | 01/01/49 | | | | 1,316,363 | | | | 1,412,562 | |
| |
Fannie Mae, Pool #995953 | | | | | |
| | | |
6.00% | | | 11/01/28 | | | | 3,420,300 | | | | 3,779,956 | |
| |
Fannie Mae, Pool #995954 | | | | | |
| | | |
6.00% | | | 03/01/29 | | | | 1,891,656 | | | | 2,090,835 | |
| |
Fannie Mae, Pool #AA3303 | | | | | |
| | | |
5.50% | | | 06/01/38 | | | | 2,762,951 | | | | 2,990,016 | |
| |
Fannie Mae, Pool #AB6210 | | | | | |
| | | |
3.00% | | | 09/01/42 | | | | 29,800,215 | | | | 30,755,394 | |
| |
Fannie Mae, Pool #AE0588 | | | | | |
| | | |
6.00% | | | 08/01/37 | | | | 6,329,004 | | | | 7,279,576 | |
| | | | | | | | | | | | |
| Issues | | Maturity
Date | | | Principal
Amount | | | Value | |
|
RESIDENTIAL MORTGAGE-BACKED SECURITIES —
AGENCY (Continued) | |
| |
Fannie Mae, Pool #AL0851 | | | | | |
| | | |
6.00% | | | 10/01/40 | | | $ | 4,309,016 | | | $ | 4,959,403 | |
| |
Fannie Mae, Pool #AL1594 | | | | | |
| | | |
6.00% | | | 07/01/40 | | | | 3,257,139 | | | | 3,790,231 | |
| |
Fannie Mae, Pool #AL9106 | | | | | |
| | | |
4.50% | | | 02/01/46 | | | | 25,580,687 | | | | 27,585,146 | |
| |
Fannie Mae, Pool #AS9454 | | | | | |
| | | |
4.00% | | | 04/01/47 | | | | 6,840,691 | | | | 7,171,107 | |
| |
Fannie Mae, Pool #AS9749 | | | | | |
| | | |
4.00% | | | 06/01/47 | | | | 17,150,349 | | | | 18,032,352 | |
| |
Fannie Mae, Pool #AS9830 | | | | | |
| | | |
4.00% | | | 06/01/47 | | | | 21,212,897 | | | | 22,300,160 | |
| |
Fannie Mae, Pool #AS9972 | | | | | |
| | | |
4.00% | | | 07/01/47 | | | | 18,200,832 | | | | 19,087,768 | |
| |
Fannie Mae, Pool #BN4316 | | | | | |
| | | |
4.00% | | | 01/01/49 | | | | 477,671 | | | | 507,293 | |
| |
Fannie Mae, Pool #BN6264 | | | | | |
| | | |
4.00% | | | 04/01/49 | | | | 12,147,284 | | | | 12,910,252 | |
| |
Fannie Mae, Pool #CA1540 | | | | | |
| | | |
4.00% | | | 04/01/48 | | | | 33,848,177 | | | | 36,047,648 | |
| |
Fannie Mae, Pool #CA1710 | | | | | |
| | | |
4.50% | | | 05/01/48 | | | | 26,320,770 | | | | 27,881,510 | |
| |
Fannie Mae, Pool #CA1711 | | | | | |
| | | |
4.50% | | | 05/01/48 | | | | 24,568,518 | | | | 26,025,354 | |
| |
Fannie Mae, Pool #CA2208 | | | | | |
| | | |
4.50% | | | 08/01/48 | | | | 28,598,424 | | | | 30,151,230 | |
| |
Fannie Mae, Pool #MA1561 | | | | | |
| | | |
3.00% | | | 09/01/33 | | | | 38,654,892 | | | | 40,019,773 | |
| |
Fannie Mae, Pool #MA1584 | | | | | |
| | | |
3.50% | | | 09/01/33 | | | | 26,296,809 | | | | 27,438,342 | |
| |
Fannie Mae, Pool #MA2871 | | | | | |
| | | |
3.00% | | | 01/01/32 | | | | 11,555,753 | | | | 11,868,435 | |
| |
Fannie Mae, Pool #MA2995 | | | | | |
| | | |
4.00% | | | 05/01/47 | | | | 16,159,790 | | | | 16,940,636 | |
| |
Fannie Mae, Pool #MA3248 | | | | | |
| | | |
3.50% | | | 01/01/33 | | | | 14,157,015 | | | | 14,710,046 | |
| |
Fannie Mae, Pool #MA3313 | | | | | |
| | | |
3.50% | | | 03/01/33 | | | | 3,659,638 | | | | 3,790,689 | |
| |
Fannie Mae, Pool #MA3340 | | | | | |
| | | |
3.50% | | | 04/01/33 | | | | 32,122,384 | | | | 33,372,145 | |
| |
Fannie Mae, Pool #MA3427 | | | | | |
| | | |
4.00% | | | 07/01/33 | | | | 29,168,658 | | | | 30,529,846 | |
| |
Freddie Mac (4896-DA) | | | | | |
| | | |
3.00% | | | 01/15/49 | | | | 8,338,060 | | | | 8,480,399 | |
| |
Freddie Mac, Pool #SD8016 | | | | | |
| | | |
3.00% | | | 10/01/49 | | | | 44,563,342 | | | | 45,320,077 | |
| |
Freddie Mac (1829-ZB) | | | | | |
| | | |
6.50% | | | 03/15/26 | | | | 69,535 | | | | 73,784 | |
See accompanying notes to financial statements.
69
TCW Total Return Bond Fund
Schedule of Investments (Continued)
| | | | | | | | | | | | |
| Issues | | Maturity
Date | | | Principal
Amount | | | Value | |
|
RESIDENTIAL MORTGAGE-BACKED SECURITIES —
AGENCY (Continued) | |
| |
Freddie Mac (2367-ZK) | | | | | |
| | | |
6.00% | | | 10/15/31 | | | $ | 134,981 | | | $ | 149,791 | |
| |
Freddie Mac (2514-PZ) (PAC) | | | | | |
| | | |
5.50% | | | 10/15/32 | | | | 1,873,119 | | | | 2,059,895 | |
| |
Freddie Mac (2571-PZ) (PAC) | | | | | |
| | | |
5.50% | | | 02/15/33 | | | | 4,550,674 | | | | 5,002,992 | |
| |
Freddie Mac (2642-AR) | | | | | |
| | | |
4.50% | | | 07/15/23 | | | | 317,479 | | | | 326,487 | |
| |
Freddie Mac (2647-OV) (P/O) | | | | | |
| | | |
0.00% (5) | | | 07/15/33 | | | | 604,092 | | | | 522,808 | |
| |
Freddie Mac (2662-MT) (TAC) | | | | | |
| | | |
4.50% | | | 08/15/33 | | | | 2,137,680 | | | | 2,226,354 | |
| |
Freddie Mac (2666-BD) | | | | | |
| | | |
4.50% | | | 08/15/23 | | | | 709,851 | | | | 731,587 | |
| |
Freddie Mac (2700-B) | | | | | |
| | | |
4.50% | | | 11/15/23 | | | | 1,145,190 | | | | 1,188,699 | |
| |
Freddie Mac (2752-GZ) (PAC) | | | | | |
| | | |
5.00% | | | 02/15/34 | | | | 18,449,077 | | | | 20,012,516 | |
| |
Freddie Mac (277-30) | | | | | |
| | | |
3.00% | | | 09/15/42 | | | | 27,135,878 | | | | 27,789,042 | |
| |
Freddie Mac (2882-JH) (PAC) | | | | | |
| | | |
4.50% | | | 10/15/34 | | | | 142,380 | | | | 144,565 | |
| |
Freddie Mac (2903-PO) (P/O) | | | | | |
| | | |
0.00% (5) | | | 11/15/23 | | | | 212,111 | | | | 204,190 | |
| |
Freddie Mac (3045-HZ) | | | | | |
| | | |
4.50% | | | 10/15/35 | | | | 1,927,168 | | | | 2,007,484 | |
| |
Freddie Mac (3063-YG) (PAC) | | | | | |
| | | |
5.50% | | | 11/15/35 | | | | 21,557,269 | | | | 24,261,909 | |
| |
Freddie Mac (3114-KZ) | | | | | |
| | | |
5.00% | | | 02/15/36 | | | | 16,511,482 | | | | 18,188,386 | |
| |
Freddie Mac (3146-GE) | | | | | |
| | | |
5.50% | | | 04/15/26 | | | | 4,021,580 | | | | 4,302,320 | |
| |
Freddie Mac (3149-OD) (P/O) (PAC) | | | | | |
| | | |
0.00% (5) | | | 05/15/36 | | | | 4,738,931 | | | | 4,340,314 | |
| |
Freddie Mac (3315-S) (I/O) (I/F) | | | | | |
| | | |
4.49% (-1.00 X 1 mo. USD LIBOR + 6.410%) (2) | | | 05/15/37 | | | | 1,402,136 | | | | 186,464 | |
| |
Freddie Mac (3376-SX) (I/O) (I/F) | | | | | |
| | | |
4.12% (-1.00 X 1 mo. USD LIBOR + 6.040%) (2) | | | 10/15/37 | | | | 2,859,700 | | | | 433,883 | |
| |
Freddie Mac (3410-IS) (I/O) (I/F) | | | | | |
| | | |
4.35% (-1.00 X 1 mo. USD LIBOR + 6.270%) (2) | | | 02/15/38 | | | | 3,783,840 | | | | 530,539 | |
| |
Freddie Mac (3424-BI) (I/O) (I/F) | | | | | |
| | | |
4.88% (-1.00 X 1 mo. USD LIBOR + 6.800%) (2) | | | 04/15/38 | | | | 4,259,335 | | | | 1,002,385 | |
| |
Freddie Mac (3512-AY) | | | | | |
| | | |
4.00% | | | 02/15/24 | | | | 383,341 | | | | 384,809 | |
| | | | | | | | | | | | |
| Issues | | Maturity
Date | | | Principal
Amount | | | Value | |
|
RESIDENTIAL MORTGAGE-BACKED SECURITIES —
AGENCY (Continued) | |
| |
Freddie Mac (3519-SH) (I/O) (I/F) | | | | | |
| | | |
3.58% (-1.00 X 1 mo. USD LIBOR + 5.500%) (2) | | | 07/15/37 | | | $ | 386,871 | | | $ | 38,455 | |
| |
Freddie Mac (3531-SC) (I/O) (I/F) | | | | | |
| | | |
4.38% (-1.00 X 1 mo. USD LIBOR + 6.300%) (2) | | | 05/15/39 | | | | 5,969,989 | | | | 427,866 | |
| |
Freddie Mac (3541-SA) (I/O) (I/F) | | | | | |
| | | |
4.83% (-1.00 X 1 mo. USD LIBOR + 6.750%) (2) | | | 06/15/39 | | | | 1,809,913 | | | | 357,949 | |
| |
Freddie Mac (3550-GS) (I/O) (I/F) | | | | | |
| | | |
4.83% (-1.00 X 1 mo. USD LIBOR + 6.750%) (2) | | | 07/15/39 | | | | 5,462,469 | | | | 1,161,201 | |
| |
Freddie Mac (3551-VZ) | | | | | |
| | | |
5.50% | | | 12/15/32 | | | | 2,404,547 | | | | 2,664,595 | |
| |
Freddie Mac (3557-KB) | | | | | |
| | | |
4.50% | | | 07/15/29 | | | | 5,191,631 | | | | 5,422,620 | |
| |
Freddie Mac (3557-NB) | | | | | |
| | | |
4.50% | | | 07/15/29 | | | | 11,890,314 | | | | 12,726,052 | |
| |
Freddie Mac (3558-KB) | | | | | |
| | | |
4.00% | | | 08/15/29 | | | | 5,801,204 | | | | 6,101,145 | |
| |
Freddie Mac (3565-XB) | | | | | |
| | | |
4.00% | | | 08/15/24 | | | | 6,885,055 | | | | 7,118,302 | |
| |
Freddie Mac (3575-D) | | | | | |
| | | |
4.50% | | | 03/15/37 | | | | 730,407 | | | | 783,948 | |
| |
Freddie Mac (3626-MD) (PAC) | | | | | |
| | | |
5.00% | | | 01/15/38 | | | | 13,562,307 | | | | 13,960,168 | |
| |
Freddie Mac (3719-PJ) (PAC) | | | | | |
| | | |
4.50% | | | 09/15/40 | | | | 20,025,406 | | | | 22,051,637 | |
| |
Freddie Mac (3788-SB) (I/O) (I/F) | | | | | |
| | | |
4.56% (-1.00 X 1 mo. USD LIBOR + 6.480%) (2) | | | 01/15/41 | | | | 7,870,219 | | | | 1,678,503 | |
| |
Freddie Mac (3885-PO) (P/O) (PAC) | | | | | |
| | | |
0.00% (5) | | | 11/15/33 | | | | 1,921,261 | | | | 1,732,517 | |
| |
Freddie Mac (3930-KE) (PAC) | | | | | |
| | | |
4.00% | | | 09/15/41 | | | | 10,470,000 | | | | 11,677,315 | |
| |
Freddie Mac (4030-HS) (I/O) (I/F) | | | | | |
| | | |
4.69% (-1.00 X 1 mo. USD LIBOR + 6.610%) (2) | | | 04/15/42 | | | | 3,231,530 | | | | 627,390 | |
| |
Freddie Mac (4604-PB) (PAC) | | | | | |
| | | |
3.00% | | | 01/15/46 | | | | 2,201,517 | | | | 2,287,778 | |
| |
Freddie Mac (4846-PA) | | | | | |
| | | |
4.00% | | | 06/15/47 | | | | 11,115,604 | | | | 12,012,854 | |
| |
Freddie Mac (R002-ZA) | | | | | |
| | | |
5.50% | | | 06/15/35 | | | | 4,228,867 | | | | 4,793,389 | |
| |
Freddie Mac, Pool #A91162 | | | | | |
| | | |
5.00% | | | 02/01/40 | | | | 19,374,030 | | | | 21,787,398 | |
| |
Freddie Mac, Pool #A92195 | | | | | |
| | | |
5.00% | | | 05/01/40 | | | | 5,780,855 | | | | 6,433,884 | |
See accompanying notes to financial statements.
70
TCW Total Return Bond Fund
| | | | | | | | | | | | |
| Issues | | Maturity
Date | | | Principal
Amount | | | Value | |
|
RESIDENTIAL MORTGAGE-BACKED SECURITIES —
AGENCY (Continued) | |
| |
Freddie Mac, Pool #C90552 | | | | | |
| | | |
6.00% | | | 06/01/22 | | | $ | 17,511 | | | $ | 18,741 | |
| |
Freddie Mac, Pool #G01959 | | | | | |
| | | |
5.00% | | | 12/01/35 | | | | 113,557 | | | | 125,467 | |
| |
Freddie Mac, Pool #G06173 | | | | | |
| | | |
4.00% | | | 11/01/40 | | | | 23,824,709 | | | | 25,642,428 | |
| |
Freddie Mac, Pool #G07556 | | | | | |
| | | |
4.00% | | | 11/01/43 | | | | 7,355,167 | | | | 8,011,367 | |
| |
Freddie Mac, Pool #G07786 | | | | | |
| | | |
4.00% | | | 08/01/44 | | | | 26,849,384 | | | | 28,990,166 | |
| |
Freddie Mac, Pool #G07848 | | | | | |
| | | |
3.50% | | | 04/01/44 | | | | 59,761,927 | | | | 63,198,883 | |
| |
Freddie Mac, Pool #G08687 | | | | | |
| | | |
3.50% | | | 01/01/46 | | | | 71,580,777 | | | | 74,553,834 | |
| |
Freddie Mac, Pool #G08710 | | | | | |
| | | |
3.00% | | | 06/01/46 | | | | 3,522,849 | | | | 3,614,951 | |
| |
Freddie Mac, Pool #G08715 | | | | | |
| | | |
3.00% | | | 08/01/46 | | | | 67,798,071 | | | | 69,570,599 | |
| |
Freddie Mac, Pool #G08716 | | | | | |
| | | |
3.50% | | | 08/01/46 | | | | 20,028,350 | | | | 20,822,660 | |
| |
Freddie Mac, Pool #G08721 | | | | | |
| | | |
3.00% | | | 09/01/46 | | | | 75,212,010 | | | | 77,178,370 | |
| |
Freddie Mac, Pool #G08737 | | | | | |
| | | |
3.00% | | | 12/01/46 | | | | 39,334,816 | | | | 40,363,194 | |
| |
Freddie Mac, Pool #G08833 | | | | | |
| | | |
5.00% | | | 07/01/48 | | | | 11,955,887 | | | | 12,821,910 | |
| |
Freddie Mac, Pool #G08840 | | | | | |
| | | |
5.00% | | | 08/01/48 | | | | 2,533,629 | | | | 2,713,985 | |
| |
Freddie Mac, Pool #G08849 | | | | | |
| | | |
5.00% | | | 11/01/48 | | | | 17,848,430 | | | | 19,110,136 | |
| |
Freddie Mac, Pool #G11678 | | | | | |
| | | |
4.50% | | | 04/01/20 | | | | 8,032 | | | | 8,284 | |
| |
Freddie Mac, Pool #G12635 | | | | | |
| | | |
5.50% | | | 03/01/22 | | | | 128,902 | | | | 131,040 | |
| |
Freddie Mac, Pool #G12702 | | | | | |
| | | |
4.50% | | | 09/01/20 | | | | 12,249 | | | | 12,256 | |
| |
Freddie Mac, Pool #G13390 | | | | | |
| | | |
6.00% | | | 01/01/24 | | | | 323,539 | | | | 335,588 | |
| |
Freddie Mac, Pool #G16085 | | | | | |
| | | |
2.50% | | | 02/01/32 | | | | 6,254,466 | | | | 6,356,280 | |
| |
Freddie Mac, Pool #G16258 | | | | | |
| | | |
2.50% | | | 06/01/32 | | | | 29,841,568 | | | | 30,312,642 | |
| |
Freddie Mac, Pool #G16598 | | | | | |
| | | |
2.50% | | | 12/01/31 | | | | 38,014,482 | | | | 38,648,337 | |
| |
Freddie Mac, Pool #G18592 | | | | | |
| | | |
3.00% | | | 03/01/31 | | | | 32,194,243 | | | | 33,115,977 | |
| |
Freddie Mac, Pool #G18627 | | | | | |
| | | |
3.00% | | | 01/01/32 | | | | 18,784,315 | | | | 19,304,016 | |
| | | | | | | | | | | | |
| Issues | | Maturity
Date | | | Principal
Amount | | | Value | |
|
RESIDENTIAL MORTGAGE-BACKED SECURITIES —
AGENCY (Continued) | |
| |
Freddie Mac, Pool #G30194 | | | | | |
| | | |
6.50% | | | 04/01/21 | | | $ | 3,000 | | | $ | 3,048 | |
| |
Freddie Mac, Pool #G30450 | | | | | |
| | | |
6.00% | | | 01/01/29 | | | | 1,319,488 | | | | 1,466,868 | |
| |
Freddie Mac, Pool #G30452 | | | | | |
| | | |
6.00% | | | 10/01/28 | | | | 1,327,794 | | | | 1,471,524 | |
| |
Freddie Mac, Pool #G30454 | | | | | |
| | | |
5.00% | | | 05/01/29 | | | | 1,775,229 | | | | 1,904,152 | |
| |
Freddie Mac, Pool #G60440 | | | | | |
| | | |
3.50% | | | 03/01/46 | | | | 57,815,554 | | | | 60,957,644 | |
| |
Freddie Mac, Pool #G67700 | | | | | |
| | | |
3.50% | | | 08/01/46 | | | | 51,548,404 | | | | 54,333,785 | |
| |
Freddie Mac, Pool #G67703 | | | | | |
| | | |
3.50% | | | 04/01/47 | | | | 66,335,402 | | | | 69,808,839 | |
| |
Freddie Mac, Pool #G67705 | | | | | |
| | | |
4.00% | | | 10/01/47 | | | | 8,363,529 | | | | 8,906,165 | |
| |
Freddie Mac, Pool #G67706 | | | | | |
| | | |
3.50% | | | 12/01/47 | | | | 57,364,672 | | | | 60,340,949 | |
| |
Freddie Mac, Pool #G67707 | | | | | |
| | | |
3.50% | | | 01/01/48 | | | | 27,163,620 | | | | 28,691,867 | |
| |
Freddie Mac, Pool #G67708 | | | | | |
| | | |
3.50% | | | 03/01/48 | | | | 79,730,424 | | | | 83,590,118 | |
| |
Freddie Mac, Pool #G67709 | | | | | |
| | | |
3.50% | | | 03/01/48 | | | | 45,659,622 | | | | 48,028,601 | |
| |
Freddie Mac, Pool #G67710 | | | | | |
| | | |
3.50% | | | 03/01/48 | | | | 57,220,701 | | | | 59,734,652 | |
| |
Freddie Mac, Pool #G67717 | | | | | |
| | | |
4.00% | | | 11/01/48 | | | | 84,379,460 | | | | 89,891,033 | |
| |
Freddie Mac, Pool #G67718 | | | | | |
| | | |
4.00% | | | 01/01/49 | | | | 28,776,202 | | | | 30,486,392 | |
| |
Freddie Mac, Pool #H82001 | | | | | |
| | | |
5.50% | | | 07/01/37 | | | | 184,005 | | | | 199,886 | |
| |
Freddie Mac, Pool #N70081 | | | | | |
| | | |
5.50% | | | 07/01/38 | | | | 3,017,277 | | | | 3,359,740 | |
| |
Freddie Mac, Pool #P51350 | | | | | |
| | | |
5.00% | | | 03/01/36 | | | | 3,133,833 | | | | 3,465,235 | |
| |
Ginnie Mae (03-42-SH) (I/O) (I/F) | | | | | |
| | | |
4.70% (-1.00 X 1 mo. USD LIBOR + 6.550%) (2) | | | 05/20/33 | | | | 705,398 | | | | 110,241 | |
| |
Ginnie Mae (11-70-BO) (P/O) | | | | | |
| | | |
0.00% (5) | | | 05/20/41 | | | | 8,957,742 | | | | 8,147,273 | |
| |
Ginnie Mae (15-42-ZB) | | | | | |
| | | |
3.00% | | | 03/20/45 | | | | 18,303,035 | | | | 18,989,772 | |
| |
Ginnie Mae (15-43-DM) | | | | | |
| | | |
2.50% | | | 03/20/45 | | | | 37,325,347 | | | | 37,239,426 | |
| |
Ginnie Mae (15-44-Z) | | | | | |
| | | |
3.00% | | | 03/20/45 | | | | 12,385,826 | | | | 13,062,816 | |
See accompanying notes to financial statements.
71
TCW Total Return Bond Fund
Schedule of Investments (Continued)
| | | | | | | | | | | | |
| Issues | | Maturity
Date | | | Principal
Amount | | | Value | |
|
RESIDENTIAL MORTGAGE-BACKED SECURITIES —
AGENCY (Continued) | |
| |
Ginnie Mae II, Pool #MA6030 | | | | | |
| | | |
3.50% (4) | | | 07/20/49 | | | $ | 42,831,639 | | | $ | 43,796,938 | |
| |
Ginnie Mae II, Pool #80963 | | | | | |
| | | |
3.75% (1 year Treasury Constant Maturity Rate + 1.500%) (2) | | | 07/20/34 | | | | 152,556 | | | | 156,522 | |
| |
Ginnie Mae II, Pool #MA2374 | | | | | |
| | | |
5.00% | | | 11/20/44 | | | | 598,812 | | | | 650,867 | |
| |
Ginnie Mae II, Pool #MA2828 | | | | | |
| | | |
4.50% | | | 05/20/45 | | | | 406,399 | | | | 434,690 | |
| |
Ginnie Mae II, Pool #MA3456 | | | | | |
| | | |
4.50% | | | 02/20/46 | | | | 2,307,738 | | | | 2,468,265 | |
| |
Ginnie Mae II, Pool #MA3521 | | | | | |
| | | |
3.50% | | | 03/20/46 | | | | 68,090,116 | | | | 71,337,559 | |
| |
Ginnie Mae II, Pool #MA3663 | | | | | |
| | | |
3.50% | | | 05/20/46 | | | | 33,330,355 | | | | 34,894,084 | |
| |
Ginnie Mae II, Pool #MA3665 | | | | | |
| | | |
4.50% | | | 05/20/46 | | | | 3,736,659 | | | | 4,004,891 | |
| |
Ginnie Mae II, Pool #MA3736 | | | | | |
| | | |
3.50% | | | 06/20/46 | | | | 26,268,496 | | | | 27,500,910 | |
| |
Ginnie Mae II, Pool #MA3739 | | | | | |
| | | |
5.00% | | | 06/20/46 | | | | 6,713,536 | | | | 7,395,735 | |
| |
Ginnie Mae II, Pool #MA3876 | | | | | |
| | | |
4.50% | | | 08/20/46 | | | | 237,168 | | | | 254,193 | |
| |
Ginnie Mae II, Pool #MA3877 | | | | | |
| | | |
5.00% | | | 08/20/46 | | | | 3,071,434 | | | | 3,345,463 | |
| |
Ginnie Mae II, Pool #MA4006 | | | | | |
| | | |
4.50% | | | 10/20/46 | | | | 110,207 | | | | 118,428 | |
| |
Ginnie Mae II, Pool #MA4007 | | | | | |
| | | |
5.00% | | | 10/20/46 | | | | 6,697,148 | | | | 7,404,977 | |
| |
Ginnie Mae II, Pool #MA4071 | | | | | |
| | | |
4.50% | | | 11/20/46 | | | | 516,056 | | | | 554,296 | |
| |
Ginnie Mae II, Pool #MA4126 | | | | | |
| | | |
3.00% | | | 12/20/46 | | | | 90,856,789 | | | | 93,920,609 | |
| |
Ginnie Mae II, Pool #MA4129 | | | | | |
| | | |
4.50% | | | 12/20/46 | | | | 158,914 | | | | 171,772 | |
| |
Ginnie Mae II, Pool #MA4199 | | | | | |
| | | |
5.00% | | | 01/20/47 | | | | 6,481,285 | | | | 7,163,843 | |
| |
Ginnie Mae II, Pool #MA4264 | | | | | |
| | | |
4.50% | | | 02/20/47 | | | | 19,887,850 | | | | 21,129,029 | |
| |
Ginnie Mae II, Pool #MA4265 | | | | | |
| | | |
5.00% | | | 02/20/47 | | | | 6,271,942 | | | | 6,801,998 | |
| |
Ginnie Mae II, Pool #MA4324 | | | | | |
| | | |
5.00% | | | 03/20/47 | | | | 7,085,708 | | | | 7,668,329 | |
| |
Ginnie Mae II, Pool #MA4385 | | | | | |
| | | |
5.00% | | | 04/20/47 | | | | 1,408,822 | | | | 1,515,299 | |
| |
Ginnie Mae II, Pool #MA4454 | | | | | |
| | | |
5.00% | | | 05/20/47 | | | | 1,182,606 | | | | 1,270,437 | |
| | | | | | | | | | | | |
| Issues | | Maturity
Date | | | Principal
Amount | | | Value | |
|
RESIDENTIAL MORTGAGE-BACKED SECURITIES —
AGENCY (Continued) | |
| |
Ginnie Mae II, Pool #MA4512 | | | | | |
| | | |
4.50% | | | 06/20/47 | | | $ | 54,430,248 | | | $ | 57,776,152 | |
| |
Ginnie Mae II, Pool #MA4513 | | | | | |
| | | |
5.00% | | | 06/20/47 | | | | 4,427,864 | | | | 4,762,647 | |
| |
Ginnie Mae II, Pool #MA4781 | | | | | |
| | | |
5.00% | | | 10/20/47 | | | | 5,795,355 | | | | 6,231,666 | |
| |
Ginnie Mae II, Pool #MA4836 | | | | | |
| | | |
3.00% | | | 11/20/47 | | | | 31,388,011 | | | | 32,365,152 | |
| |
Ginnie Mae II, Pool #MA4837 | | | | | |
| | | |
3.50% | | | 11/20/47 | | | | 37,014,307 | | | | 38,561,919 | |
| |
Ginnie Mae II, Pool #MA4838 | | | | | |
| | | |
4.00% | | | 11/20/47 | | | | 32,991,387 | | | | 34,585,096 | |
| |
Ginnie Mae II, Pool #MA4900 | | | | | |
| | | |
3.50% | | | 12/20/47 | | | | 24,151,157 | | | | 25,144,513 | |
| |
Ginnie Mae II, Pool #MA4901 | | | | | |
| | | |
4.00% | | | 12/20/47 | | | | 23,889,616 | | | | 25,042,878 | |
| |
Ginnie Mae II, Pool #MA4962 | | | | | |
| | | |
3.50% | | | 01/20/48 | | | | 30,055,436 | | | | 31,282,248 | |
| |
Ginnie Mae II, Pool #MA5466 | | | | | |
| | | |
4.00% | | | 09/20/48 | | | | 24,454,424 | | | | 25,518,409 | |
| |
Ginnie Mae II, Pool #MA5467 | | | | | |
| | | |
4.50% | | | 09/20/48 | | | | 2,957,325 | | | | 3,111,160 | |
| |
Ginnie Mae II, Pool #MA5528 | | | | | |
| | | |
4.00% | | | 10/20/48 | | | | 21,048,898 | | | | 21,964,713 | |
| |
Ginnie Mae II, Pool #MA6209 | | | | | |
| | | |
3.00% | | | 10/20/49 | | | | 29,055,000 | | | | 29,464,369 | |
| |
Ginnie Mae II TBA, 30 Year | | | | | |
| | | |
3.00% (6) | | | 06/01/49 | | | | 121,800,000 | | | | 125,387,284 | |
| |
Ginnie Mae II, Pool, Pool #MA6080 | | | | | |
| | | |
3.00% | | | 08/20/49 | | | | 2,786,450 | | | | 2,825,710 | |
| |
Ginnie Mae II, Pool, Pool #MA6081 | | | | | |
| | | |
3.50% | | | 08/20/49 | | | | 9,939,930 | | | | 10,174,933 | |
| |
Ginnie Mae TBA, 30 Year | | | | | |
| | | |
5.00% (6) | | | 08/01/48 | | | | 11,490,000 | | | | 12,122,848 | |
| |
Uniform Mortgage-Backed Securities TBA, 15 Year | | | | | |
| | | |
3.00% (6) | | | 12/01/33 | | | | 960,000 | | | | 982,765 | |
| | | |
2.50% (6) | | | 07/01/34 | | | | 88,185,000 | | | | 89,139,190 | |
| |
Uniform Mortgage-Backed Securities TBA, 30 Year | | | | | |
| | | |
3.00% (6) | | | 06/01/49 | | | | 21,575,000 | | | | 21,928,965 | |
| | | |
2.50% (6) | | | 08/01/49 | | | | 44,200,000 | | | | 43,889,219 | |
| | | |
4.50% (6) | | | 09/01/48 | | | | 28,870,000 | | | | 30,400,337 | |
| | | |
5.00% (6) | | | 10/01/48 | | | | 5,825,000 | | | | 6,234,570 | |
| | | | | | | | | | | | |
| | |
Total Residential Mortgage-backed Securities — Agency | | | | | | | | | |
| | |
(Cost: $3,298,485,139) | | | | | | | | 3,338,816,317 | |
| | | | | | | | | | | | |
See accompanying notes to financial statements.
72
TCW Total Return Bond Fund
| | | | | | | | | | | | |
| Issues | | Maturity
Date | | | Principal
Amount | | | Value | |
|
RESIDENTIAL MORTGAGE-BACKED SECURITIES —
NON-AGENCY — 15.5% | |
| |
ACE Securities Corp. (06-ASP1-A2D) | | | | | |
| | | |
2.44% (1 mo. USD LIBOR + 0.620%) (2) | | | 12/25/35 | | | $ | 2,055,589 | | | $ | 2,046,588 | |
| |
ACE Securities Corp. (07-ASP1-A2C) | | | | | |
| | | |
2.08% (1 mo. USD LIBOR + 0.260%) (2) | | | 03/25/37 | | | | 13,882,031 | | | | 8,854,376 | |
| |
ACE Securities Corp. (07-ASP1-A2D) | | | | | |
| | | |
2.20% (1 mo. USD LIBOR + 0.380%) (2) | | | 03/25/37 | | | | 7,461,444 | | | | 4,857,774 | |
| |
Adjustable Rate Mortgage Trust (04-5-3A1) | | | | | |
| | | |
4.40% (3) | | | 04/25/35 | | | | 236,424 | | | | 236,082 | |
| |
Asset-Backed Funding Certificates (07-NC1-A2) | | | | | |
| | | |
2.12% (1 mo. USD LIBOR + 0.300%) (1)(2) | | | 05/25/37 | | | | 7,559,179 | | | | 7,462,308 | |
| |
Asset-Backed Funding Certificates (07-WMC1-A2A) | | | | | |
| | | |
2.57% (1 mo. USD LIBOR + 0.750%) (2) | | | 06/25/37 | | | | 14,113,038 | | | | 12,562,966 | |
| |
Banc of America Funding Corp. (04-B-3A1) | | | | | |
| | | |
4.26% (3)(7) | | | 12/20/34 | | | | 258,105 | | | | 201,127 | |
| |
Banc of America Funding Corp. (06-D-2A1) | | | | | |
| | | |
3.54% (3) | | | 05/20/36 | | | | 57,355 | | | | 53,677 | |
| |
Banc of America Funding Corp. (06-D-3A1) | | | | | |
| | | |
4.23% (3) | | | 05/20/36 | | | | 2,856,419 | | | | 2,803,966 | |
| |
Banc of America Funding Corp. (15-R8-1A1) | | | | | |
| | | |
3.28% (1)(3) | | | 11/26/46 | | | | 4,852,506 | | | | 4,902,511 | |
| |
Banc of America Funding Trust (06-3-4A14) | | | | | |
| | | |
6.00% | | | 03/25/36 | | | | 821,079 | | | | 819,770 | |
| |
Banc of America Funding Trust (06-3-5A3) | | | | | |
| | | |
5.50% | | | 03/25/36 | | | | 2,882,761 | | | | 2,761,123 | |
| |
BCAP LLC Trust (08-IND2-A1) | | | | | |
| | | |
3.47% (1 mo. USD LIBOR + 1.650%)(2) | | | 04/25/38 | | | | 6,203,199 | | | | 6,270,390 | |
| |
BCAP LLC Trust (11-RR3-5A3) | | | | | |
| | | |
3.62% (1)(3) | | | 11/27/37 | | | | 98,522 | | | | 98,894 | |
| |
BCAP LLC Trust (11-RR4-3A3) | | | | | |
| | | |
4.09% (1)(3) | | | 07/26/36 | | | | 721,313 | | | | 725,811 | |
| |
BCAP LLC Trust (11-RR9-7A1) | | | | | |
| | | |
3.52% (1)(3) | | | 04/26/37 | | | | 49,894 | | | | 49,921 | |
| |
Bear Stearns Alt-A Trust (05-2-2A4) | | | | | |
| | | |
4.19% (3) | | | 04/25/35 | | | | 3,020 | | | | 3,070 | |
| |
Bear Stearns Alt-A Trust (05-4-23A1) | | | | | |
| | | |
4.44% (3) | | | 05/25/35 | | | | 4,434,559 | | | | 4,531,381 | |
| |
Bear Stearns Alt-A Trust (06-4-32A1) | | | | | |
| | | |
4.10% (3) | | | 07/25/36 | | | | 447,232 | | | | 386,486 | |
| |
Bear Stearns ARM Trust (04-12-1A1) | | | | | |
| | | |
4.54% (3) | | | 02/25/35 | | | | 723,309 | | | | 724,444 | |
| |
Bear Stearns ARM Trust (05-10-A3) | | | | | |
| | | |
4.72% (3) | | | 10/25/35 | | | | 4,122,664 | | | | 4,176,744 | |
| | | | | | | | | | | | |
| Issues | | Maturity
Date | | | Principal
Amount | | | Value | |
|
RESIDENTIAL MORTGAGE-BACKED SECURITIES —
NON-AGENCY (Continued) | |
| |
Bear Stearns ARM Trust (06-2-2A1) | | | | | |
| | | |
4.27% (3) | | | 07/25/36 | | | $ | 1,430,528 | | | $ | 1,364,855 | |
| |
Bear Stearns ARM Trust (07-1-2A1) | | | | | |
| | | |
4.90% (3) | | | 02/25/47 | | | | 200,450 | | | | 199,453 | |
| |
Bear Stearns ARM Trust (07-5-3A1) | | | | | |
| | | |
4.04% (3) | | | 08/25/47 | | | | 964,738 | | | | 868,033 | |
| |
Bear Stearns Asset-Backed Securities I Trust
(05-AC6-1A3) | | | | | |
| | | |
5.50% (3) | | | 09/25/35 | | | | 1,448,047 | | | | 1,490,797 | |
| |
Bear Stearns Asset-Backed Securities I Trust
(05-AC6-1A4) | | | | | |
| | | |
5.40% (3) | | | 09/25/35 | | | | 3,096,170 | | | | 3,181,037 | |
| |
Bear Stearns Mortgage Funding Trust (06-AR3-1A1) | | | | | |
| | | |
2.00% (1 mo. USD LIBOR + 0.180%) (2) | | | 10/25/36 | | | | 613,425 | | | | 585,021 | |
| |
Chase Mortgage Finance Corp. (06-A1-2A1) | | | | | |
| | | |
4.30% (3) | | | 09/25/36 | | | | 684,872 | | | | 657,917 | |
| |
Chase Mortgage Finance Corp. (07-A1-8A1) | | | | | |
| | | |
4.37% (3) | | | 02/25/37 | | | | 2,974,665 | | | | 3,140,954 | |
| |
Chaseflex Trust (05-1-1A5) | | | | | |
| | | |
6.50% | | | 02/25/35 | | | | 3,350,575 | | | | 3,357,209 | |
| |
CIM Trust (17-7-A) | | | | | |
| | | |
3.00% (1)(3) | | | 12/25/65 | | | | 28,066,292 | | | | 28,077,291 | |
| |
CIM Trust (18-R5-A1) | | | | | |
| | | |
3.75% (1)(3) | | | 07/25/58 | | | | 27,125,150 | | | | 27,571,264 | |
| |
CIM Trust (18-R6-A1) | | | | | |
| | | |
3.11% (1 mo. USD LIBOR + 1.076%) (1)(2) | | | 09/25/58 | | | | 20,436,033 | | | | 20,324,491 | |
| |
CIM Trust (19-R3-A) | | | | | |
| | | |
2.63% (1)(3) | | | 06/25/58 | | | | 25,000,000 | | | | 25,443,137 | |
| |
Citicorp Mortgage Securities Trust, Inc. (07-4-3A1) | | | | | |
| | | |
5.50% | | | 05/25/37 | | | | 479,236 | | | | 487,027 | |
| |
Citigroup Mortgage Loan Trust (06-HE3-A1) | | | | | |
| | | |
1.96% (1 mo. USD LIBOR + 0.140%) (1)(2) | | | 12/25/36 | | | | 14,353,040 | | | | 14,055,007 | |
| |
Citigroup Mortgage Loan Trust, Inc. (06-AR5-1A1A) | | | | | |
| | | |
4.39% (3) | | | 07/25/36 | | | | 3,346,297 | | | | 2,820,277 | |
| |
Citigroup Mortgage Loan Trust, Inc. (07-12-2A1) | | | | | |
| | | |
6.50% (1) | | | 10/25/36 | | | | 3,167,536 | | | | 2,632,461 | |
| |
Citigroup Mortgage Loan Trust, Inc. (14-10-2A1) | | | | | |
| | | |
2.27% (1 mo. USD LIBOR + 0.250%) (1)(2) | | | 07/25/37 | | | | 1,059,298 | | | | 1,060,173 | |
| |
Conseco Financial Corp. (99-2-A7) | | | | | |
| | | |
6.44% | | | 12/01/30 | | | | 2,740,925 | | | | 2,958,233 | |
| |
Countrywide Alternative Loan Trust (05-20CB-4A1) | | | | | |
| | | |
5.25% | | | 07/25/20 | | | | 113,139 | | | | 113,193 | |
| |
Countrywide Alternative Loan Trust (05-84-1A1) | | | | | |
| | | |
3.67% (3) | | | 02/25/36 | | | | 210,038 | | | | 168,479 | |
See accompanying notes to financial statements.
73
TCW Total Return Bond Fund
Schedule of Investments (Continued)
| | | | | | | | | | | | |
| Issues | | Maturity
Date | | | Principal
Amount | | | Value | |
|
RESIDENTIAL MORTGAGE-BACKED SECURITIES —
NON-AGENCY (Continued) | |
| |
Countrywide Alternative Loan Trust (05-J1-2A1) | | | | | |
| | | |
5.50% | | | 02/25/25 | | | $ | 578,687 | | | $ | 585,521 | |
| |
Countrywide Alternative Loan Trust (06-HY12-A5) | | | | | |
| | | |
3.94% (3) | | | 08/25/36 | | | | 10,778,539 | | | | 11,391,957 | |
| |
Countrywide Alternative Loan Trust (06-J3-3A1) | | | | | |
| | | |
5.50% | | | 04/25/21 | | | | 100,090 | | | | 100,309 | |
| |
Countrywide Home Loans Mortgage Pass-Through Trust (04-13-1A3) | | | | | |
| | | |
5.50% | | | 08/25/34 | | | | 5,129,761 | | | | 5,424,084 | |
| |
Countrywide Home Loans Mortgage Pass-Through Trust (05-9-1A1) | | | | | |
| | | |
2.42% (1 mo. USD LIBOR + 0.600%) (2) | | | 05/25/35 | | | | 10,076,379 | | | | 8,850,664 | |
| |
Countrywide Home Loans Mortgage Pass-Through Trust (05-HYB5-4A1) | | | | | |
| | | |
4.04% (3)(7) | | | 09/20/35 | | | | 25,456 | | | | 22,081 | |
| |
Countrywide Home Loans Mortgage Pass-Through Trust (07-HY5-1A1) | | | | | |
| | | |
4.41% (3) | | | 09/25/47 | | | | 6,508 | | | | 6,471 | |
| |
Countrywide Home Loans Mortgage Pass-Through Trust (07-HYB1-1A1) | | | | | |
| | | |
3.29% (3) | | | 03/25/37 | | | | 39,777 | | | | 34,550 | |
| |
Credit Suisse First Boston Mortgage Securities Corp. (03-8-4PPA) | | | | | |
| | | |
5.75% | | | 04/22/33 | | | | 29,158 | | | | 31,336 | |
| |
Credit Suisse First Boston Mortgage Securities Corp. (05-11-1A1) | | | | | |
| | | |
6.50% | | | 12/25/35 | | | | 2,130,781 | | | | 1,802,132 | |
| |
Credit Suisse First Boston Mortgage Securities Corp. (05-12-1A1) | | | | | |
| | | |
6.50% | | | 01/25/36 | | | | 7,801,828 | | | | 4,540,418 | |
| |
Credit Suisse Mortgage Capital Certificates
(15-5R-2A1) | | | | | |
| | | |
2.30% (1 mo. USD LIBOR + 0.280%) (1)(2) | | | 04/27/47 | | | | 4,283,066 | | | | 4,240,944 | |
| |
Credit Suisse Mortgage Trust (13-7R-4A1) | | | | | |
| | | |
2.34% (1 mo. USD LIBOR + 0.160%) (1)(2) | | | 07/26/36 | | | | 1,789,876 | | | | 1,734,522 | |
| |
Credit-Based Asset Servicing and Securitization LLC (06-CB1-AF2) | | | | | |
| | | |
3.30% (3) | | | 01/25/36 | | | | 3,896,730 | | | | 3,380,197 | |
| |
Credit-Based Asset Servicing and Securitization LLC (06-CB7-A4) | | | | | |
| | | |
1.98% (1 mo. USD LIBOR + 0.160%) (2) | | | 10/25/36 | | | | 27,050,640 | | | | 20,917,462 | |
| |
Credit-Based Asset Servicing and Securitization LLC (06-CB9-A4) | | | | | |
| | | |
2.05% (1 mo. USD LIBOR + 0.230%) (2) | | | 11/25/36 | | | | 15,731,655 | | | | 10,065,527 | |
| | | | | | | | | | | | |
| Issues | | Maturity
Date | | | Principal
Amount | | | Value | |
|
RESIDENTIAL MORTGAGE-BACKED SECURITIES —
NON-AGENCY (Continued) | |
| |
Credit-Based Asset Servicing and Securitization LLC (07-CB2-A2B) | | | | | |
| | | |
3.98% (3) | | | 02/25/37 | | | $ | 3,338,204 | | | $ | 2,666,891 | |
| |
Credit-Based Asset Servicing and Securitization LLC (07-CB2-A2C) | | | | | |
| | | |
3.98% (3) | | | 02/25/37 | | | | 11,482,779 | | | | 9,172,460 | |
| |
CSMC Mortgage-Backed Trust (06-8-3A1) | | | | | |
| | | |
6.00% | | | 10/25/21 | | | | 1,828,427 | | | | 1,603,959 | |
| |
CSMC Mortgage-Backed Trust (06-9-5A1) | | | | | |
| | | |
5.50% | | | 11/25/36 | | | | 2,316,553 | | | | 2,284,616 | |
| |
CSMC Mortgage-Backed Trust (07-2-3A4) | | | | | |
| | | |
5.50% | | | 03/25/37 | | | | 7,100,067 | | | | 6,133,080 | |
| |
Deutsche Alt-A Securities, Inc. Mortgage Loan Trust (06-AR6-A6) | | | | | |
| | | |
2.01% (1 mo. USD LIBOR + 0.190%) (2) | | | 02/25/37 | | | | 332,989 | | | | 310,906 | |
| |
DSLA Mortgage Loan Trust (05-AR6-2A1A) | | | | | |
| | | |
2.14% (1 mo. USD LIBOR + 0.290%) (2) | | | 10/19/45 | | | | 2,593,925 | | | | 2,525,788 | |
| |
DSLA Mortgage Loan Trust (06-AR2-2A1A) | | | | | |
| | | |
2.05% (1 mo. USD LIBOR + 0.200%) (2) | | | 10/19/36 | | | | 27,362,396 | | | | 25,042,740 | |
| |
DSLA Mortgage Loan Trust (07-AR1-2A1A) | | | | | |
| | | |
1.99% (1 mo. USD LIBOR + 0.140%) (2) | | | 04/19/47 | | | | 7,550,872 | | | | 6,752,677 | |
| |
Fieldstone Mortgage Investment Corp. (07-1-2A2) | | | | | |
| | | |
2.09% (1 mo. USD LIBOR + 0.270%) (2) | | | 04/25/47 | | | | 3,901,671 | | | | 3,245,322 | |
| |
First Franklin Mortgage Loan Asset-Backed Certificates (06-FF18-A2C) | | | | | |
| | | |
1.98% (1 mo. USD LIBOR + 0.160%) (2) | | | 12/25/37 | | | | 16,070,127 | | | | 14,991,833 | |
| |
First Franklin Mortgage Loan Asset-Backed Certificates (06-FF18-A2D) | | | | | |
| | | |
2.03% (1 mo. USD LIBOR + 0.210%) (2) | | | 12/25/37 | | | | 9,430,498 | | | | 8,843,907 | |
| |
First Franklin Mortgage Loan Asset-Backed Certificates (07-FF1-A2C) | | | | | |
| | | |
1.96% (1 mo. USD LIBOR + 0.140%) (2) | | | 01/25/38 | | | | 4,487,743 | | | | 3,191,237 | |
| |
First Franklin Mortgage Loan Asset-Backed Certificates (07-FF1-A2D) | | | | | |
| | | |
2.04% (1 mo. USD LIBOR + 0.220%) (2) | | | 01/25/38 | | | | 21,965,682 | | | | 15,840,339 | |
| |
First Franklin Mortgage Loan Trust (06-FF9-2A4) | | | | | |
| | | |
2.07% (1 mo. USD LIBOR + 0.250%) (2) | | | 06/25/36 | | | | 5,068,000 | | | | 4,593,319 | |
| |
First Horizon Alternative Mortgage Securities Trust
(05-AA3-3A1) | | | | | |
| | | |
3.93% (3) | | | 05/25/35 | | | | 2,991,650 | | | | 2,976,203 | |
See accompanying notes to financial statements.
74
TCW Total Return Bond Fund
| | | | | | | | | | | | |
| Issues | | Maturity
Date | | | Principal
Amount | | | Value | |
|
RESIDENTIAL MORTGAGE-BACKED SECURITIES —
NON-AGENCY (Continued) | |
| |
First Horizon Alternative Mortgage Securities Trust
(05-AA7-1A1) | | | | | |
| | | |
3.81% (3) | | | 09/25/35 | | | $ | 2,816,993 | | | $ | 2,540,443 | |
| |
First Horizon Alternative Mortgage Securities Trust
(05-AA7-2A1) | | | | | |
| | | |
4.08% (3) | | | 09/25/35 | | | | 2,004,313 | | | | 1,953,369 | |
| |
First Horizon Alternative Mortgage Securities Trust
(06-AA7-A1) | | | | | |
| | | |
4.08% (3) | | | 01/25/37 | | | | 8,638,841 | | | | 7,950,235 | |
| |
Fremont Home Loan Trust (05-E-2A4) | | | | | |
| | | |
2.15% (1 mo. USD LIBOR + 0.330%) (2) | | | 01/25/36 | | | | 14,402,161 | | | | 14,128,565 | |
| |
Fremont Home Loan Trust (06-1-2A3) | | | | | |
| | | |
2.00% (1 mo. USD LIBOR + 0.180%) (2) | | | 04/25/36 | | | | 2,308,077 | | | | 2,250,943 | |
| |
GMAC Mortgage Loan Trust (05-AR5-2A1) | | | | | |
| | | |
4.51% (3) | | | 09/19/35 | | | | 2,389,579 | | | | 1,927,018 | |
| |
GreenPoint Mortgage Funding Trust (05-AR3-1A1) | | | | | |
| | | |
2.06% (1 mo. USD LIBOR + 0.240%) (2) | | | 08/25/45 | | | | 509,642 | | | | 458,018 | |
| |
GreenPoint Mortgage Funding Trust (06-AR5-A2A2) | | | | | |
| | | |
1.97% (1 mo. USD LIBOR + 0.150%) (2)(8) | | | 10/25/46 | | | | 137 | | | | — | |
| |
GSAA Home Equity Trust (05-7-AF5) | | | | | |
| | | |
4.61% (3) | | | 05/25/35 | | | | 498,782 | | | | 508,041 | |
| |
GSAA Home Equity Trust (05-9-2A3) | | | | | |
| | | |
2.19% (1 mo. USD LIBOR + 0.370%) (2) | | | 08/25/35 | | | | 80,822 | | | | 80,998 | |
| |
GSR Mortgage Loan Trust (04-9-3A1) | | | | | |
| | | |
4.50% (3) | | | 08/25/34 | | | | 1,881,927 | | | | 1,890,509 | |
| |
GSR Mortgage Loan Trust (07-3F-3A7) | | | | | |
| | | |
6.00% | | | 05/25/37 | | | | 9,210,371 | | | | 8,512,909 | |
| |
GSR Mortgage Loan Trust (07-AR2-2A1) | | | | | |
| | | |
4.53% (3) | | | 05/25/37 | | | | 2,789,673 | | | | 2,461,774 | |
| |
GSR Mortgage Loan Trust (07-AR2-5A1A) | | | | | |
| | | |
4.30% (3) | | | 05/25/37 | | | | 1,417,051 | | | | 1,296,529 | |
| |
Harborview Mortgage Loan Trust (05-9-2A1A) | | | | | |
| | | |
2.19% (1 mo. USD LIBOR + 0.340%) (2) | | | 06/20/35 | | | | 2,445,046 | | | | 2,461,149 | |
| |
Harborview Mortgage Loan Trust (06-8-2A1A) | | | | | |
| | | |
2.04% (1 mo. USD LIBOR + 0.190%) (2) | | | 07/21/36 | | | | 6,918,588 | | | | 5,993,726 | |
| |
HSI Asset Loan Obligation Trust (07-2-2A12) | | | | | |
| | | |
6.00% | | | 09/25/37 | | | | 806,926 | | | | 744,257 | |
| |
Impac CMB Trust (04-5-1A1) | | | | | |
| | | |
2.54% (1 mo. USD LIBOR + 0.720%) (2) | | | 10/25/34 | | | | 4,310 | | | | 4,309 | |
| |
Impac CMB Trust (05-1-1A1) | | | | | |
| | | |
2.34% (1 mo. USD LIBOR + 0.520%) (2) | | | 04/25/35 | | | | 1,039,331 | | | | 1,013,144 | |
| | | | | | | | | | | | |
| Issues | | Maturity
Date | | | Principal
Amount | | | Value | |
|
RESIDENTIAL MORTGAGE-BACKED SECURITIES —
NON-AGENCY (Continued) | |
| |
Impac CMB Trust (05-5-A2) | | | | | |
| | | |
2.26% (1 mo. USD LIBOR + 0.440%) (2) | | | 08/25/35 | | | $ | 5,104,124 | | | $ | 5,099,124 | |
| |
Impac Secured Assets Trust (06-3-A1) | | | | | |
| | | |
1.99% (1 mo. USD LIBOR + 0.170%) (2) | | | 11/25/36 | | | | 7,814,422 | | | | 7,580,149 | |
| |
Indymac Index Mortgage Loan Trust (04-AR4-2A) | | | | | |
| | | |
4.38% (3) | | | 08/25/34 | | | | 4,746,119 | | | | 4,914,509 | |
| |
Indymac Index Mortgage Loan Trust (04-AR9-4A) | | | | | |
| | | |
4.39% (3) | | | 11/25/34 | | | | 662,916 | | | | 606,900 | |
| |
Indymac Index Mortgage Loan Trust (05-AR17-3A1) | | | | | |
| | | |
3.96% (3) | | | 09/25/35 | | | | 3,962,802 | | | | 3,405,210 | |
| |
Indymac Index Mortgage Loan Trust (05-AR23-2A1) | | | | | |
| | | |
3.88% (3) | | | 11/25/35 | | | | 2,852,149 | | | | 2,759,767 | |
| |
Indymac Index Mortgage Loan Trust (05-AR23-6A1) | | | | | |
| | | |
3.68% (3) | | | 11/25/35 | | | | 3,820,523 | | | | 3,641,624 | |
| |
Indymac Index Mortgage Loan Trust (05-AR25-2A1) | | | | | |
| | | |
3.72% (3)(7) | | | 12/25/35 | | | | 2,040,809 | | | | 1,947,961 | |
| |
Indymac Index Mortgage Loan Trust (05-AR7-2A1) | | | | | |
| | | |
3.92% (3) | | | 06/25/35 | | | | 2,490,825 | | | | 2,245,679 | |
| |
Indymac Index Mortgage Loan Trust (06-AR39-A1) | | | | | |
| | | |
2.00% (1 mo. USD LIBOR + 0.180%) (2) | | | 02/25/37 | | | | 7,493,392 | | | | 7,379,173 | |
| |
Indymac Index Mortgage Loan Trust (07-AR11-1A1) | | | | | |
| | | |
3.34% (3)(7) | | | 06/25/37 | | | | 19,961 | | | | 17,019 | |
| |
Indymac Index Mortgage Loan Trust (07-AR5-2A1) | | | | | |
| | | |
3.77% (3) | | | 05/25/37 | | | | 13,227,928 | | | | 12,760,546 | |
| |
Indymac Index Mortgage Loan Trust (07-AR7-1A1) | | | | | |
| | | |
3.69% (3) | | | 11/25/37 | | | | 3,013,429 | | | | 2,981,571 | |
| |
JPMorgan Alternative Loan Trust (06-A2-5A1) | | | | | |
| | | |
4.06% (3) | | | 05/25/36 | | | | 5,770,406 | | | | 4,545,885 | |
| |
JPMorgan Alternative Loan Trust (06-A4-A8) | | | | | |
| | | |
3.84% (3) | | | 09/25/36 | | | | 1,438,057 | | | | 1,414,795 | |
| |
JPMorgan Mortgage Acquisition Corp. (06-CH2-AF4) | | | | | |
| | | |
5.76% (3) | | | 10/25/36 | | | | 6,145,509 | | | | 4,943,745 | |
| |
JPMorgan Mortgage Trust (05-A6-7A1) | | | | | |
| | | |
4.24% (3) | | | 08/25/35 | | | | 296,644 | | | | 294,384 | |
| |
JPMorgan Mortgage Trust (06-A2-5A3) | | | | | |
| | | |
4.38% (3) | | | 11/25/33 | | | | 1,625,703 | | | | 1,618,350 | |
| |
JPMorgan Mortgage Trust (06-A4-1A4) | | | | | |
| | | |
4.51% (3) | | | 06/25/36 | | | | 435,349 | | | | 399,423 | |
| |
JPMorgan Mortgage Trust (06-A7-2A4R) | | | | | |
| | | |
4.08% (3) | | | 01/25/37 | | | | 18,599 | | | | 18,260 | |
| |
JPMorgan Mortgage Trust (06-S2-2A2) | | | | | |
| | | |
5.88% | | | 06/25/21 | | | | 401,935 | | | | 379,590 | |
| |
JPMorgan Resecuritization Trust Series (14-6-3A1) | | | | | |
| | | |
2.23% (1 mo. USD LIBOR + 0.210%) (1)(2) | | | 07/27/46 | | | | 2,178,014 | | | | 2,187,803 | |
See accompanying notes to financial statements.
75
TCW Total Return Bond Fund
Schedule of Investments (Continued)
| | | | | | | | | | | | |
| Issues | | Maturity
Date | | | Principal
Amount | | | Value | |
|
RESIDENTIAL MORTGAGE-BACKED SECURITIES —
NON-AGENCY (Continued) | |
| |
Lehman Mortgage Trust (06-4-4A1) | | | | | |
| | | |
6.00% | | | 08/25/21 | | | $ | 1,088,047 | | | $ | 1,094,236 | |
| |
Lehman XS Trust (06-10N-1A3A) | | | | | |
| | | |
2.03% (1 mo. USD LIBOR + 0.210%) (2) | | | 07/25/46 | | | | 12,957,698 | | | | 12,989,833 | |
| |
Lehman XS Trust (06-12N-A2A1) | | | | | |
| | | |
1.97% (1 mo. USD LIBOR + 0.150%) (2)(8) | | | 08/25/46 | | | | 175 | | | | — | |
| |
Lehman XS Trust (06-12N-A31A) | | | | | |
| | | |
2.02% (1 mo. USD LIBOR + 0.200%) (2) | | | 08/25/46 | | | | 4,395,918 | | | | 4,224,354 | |
| |
Lehman XS Trust (06-13-1A2) | | | | | |
| | | |
2.16% (1 mo. USD LIBOR + 0.170%) (2) | | | 09/25/36 | | | | 527,788 | | | | 549,068 | |
| |
Lehman XS Trust (06-GP1-A2A) | | | | | |
| | | |
1.99% (1 mo. USD LIBOR + 0.170%) (2)(8) | | | 05/25/46 | | | | 38 | | | | — | |
| |
Lehman XS Trust (06-GP4-3A2A) | | | | | |
| | | |
1.98% (1 mo. USD LIBOR + 0.160%) (2)(8) | | | 08/25/46 | | | | 13,412 | | | | — | |
| |
MASTR Alternative Loans Trust (05-4-1A1) | | | | | |
| | | |
6.50% | | | 05/25/35 | | | | 5,184,864 | | | | 5,094,806 | |
| |
MASTR Alternative Loans Trust (06-2-2A1) | | | | | |
| | | |
2.22% (1 mo. USD LIBOR + 0.400%) (2)(8) | | | 03/25/36 | | | | 66,228 | | | | 7,217 | |
| |
MASTR Asset Securitization Trust (06-3-2A1) | | | | | |
| | | |
2.27% (1 mo. USD LIBOR + 0.450%) (2) | | | 10/25/36 | | | | 38,843 | | | | 15,477 | |
| |
MASTR Asset-Backed Securities Trust (06-AB1-A4) | | | | | |
| | | |
5.72% (3) | | | 02/25/36 | | | | 761,059 | | | | 726,343 | |
| |
MASTR Asset-Backed Securities Trust (06-HE1-A4) | | | | | |
| | | |
2.11% (1 mo. USD LIBOR + 0.290%) (2) | | | 01/25/36 | | | | 1,567,839 | | | | 1,575,563 | |
| |
MASTR Asset-Backed Securities Trust (06-HE5-A3) | | | | | |
| | | |
1.98% (1 mo. USD LIBOR + 0.160%) (2) | | | 11/25/36 | | | | 19,621,572 | | | | 14,712,150 | |
| |
MASTR Seasoned Securitization Trust (04-1-4A1) | | | | | |
| | | |
4.47% (3) | | | 10/25/32 | | | | 8,098 | | | | 8,445 | |
| |
Merrill Lynch Alternative Note Asset Trust (07-A1-A2C) | | | | | |
| | | |
2.05% (1 mo. USD LIBOR + 0.230%) (2) | | | 01/25/37 | | | | 1,866,625 | | | | 901,252 | |
| |
Merrill Lynch Alternative Note Asset Trust (07-A1-A3) | | | | | |
| | | |
1.98% (1 mo. USD LIBOR + 0.160%) (2) | | | 01/25/37 | | | | 960,191 | | | | 459,228 | |
| |
Merrill Lynch First Franklin Mortgage Loan Trust
(07-1-A2B) | | | | | |
| | | |
1.99% (1 mo. USD LIBOR + 0.170%) (2) | | | 04/25/37 | | | | 7,525,365 | | | | 4,504,753 | |
| |
Merrill Lynch First Franklin Mortgage Loan Trust
(07-1-A2C) | | | | | |
| | | |
2.07% (1 mo. USD LIBOR + 0.250%) (2)(7) | | | 04/25/37 | | | | 25,420,908 | | | | 15,458,210 | |
| | | | | | | | | | | | |
| Issues | | Maturity
Date | | | Principal
Amount | | | Value | |
|
RESIDENTIAL MORTGAGE-BACKED SECURITIES —
NON-AGENCY (Continued) | |
| |
Merrill Lynch First Franklin Mortgage Loan Trust
(07-1-A2D) | | | | | |
| | | |
2.16% (1 mo. USD LIBOR + 0.340%) (2) | | | 04/25/37 | | | $ | 6,490,558 | | | $ | 4,016,078 | |
| |
Merrill Lynch First Franklin Mortgage Loan Trust
(07-2-A2C) | | | | | |
| | | |
2.06% (1 mo. USD LIBOR + 0.240%) (2) | | | 05/25/37 | | | | 5,736,145 | | | | 3,694,779 | |
| |
Merrill Lynch First Franklin Mortgage Loan Trust
(07-3-A2B) | | | | | |
| | | |
1.95% (1 mo. USD LIBOR + 0.130%) (2) | | | 06/25/37 | | | | 2,683,620 | | | | 2,139,199 | |
| |
Merrill Lynch First Franklin Mortgage Loan Trust
(07-4-2A3) | | | | | |
| | | |
1.98% (1 mo. USD LIBOR + 0.160%) (2) | | | 07/25/37 | | | | 34,176,242 | | | | 22,919,782 | |
| |
Merrill Lynch Mortgage-Backed Securities Trust
(07-2-1A1) | | | | | |
| | | |
4.14% (1 year Treasury Constant Maturity Rate + 2.400%) (2) | | | 08/25/36 | | | | 1,442,237 | | | | 1,441,261 | |
| |
Mid-State Trust (05-1-A) | | | | | |
| | | |
5.75% | | | 01/15/40 | | | | 2,773,019 | | | | 3,034,565 | |
| |
Morgan Stanley ABS Capital I, Inc. Trust (04-NC8-M2) | | | | | |
| | | |
2.78% (1 mo. USD LIBOR + 0.960%) (2) | | | 09/25/34 | | | | 705,886 | | | | 709,914 | |
| |
Morgan Stanley Home Equity Loan Trust (06-2-A4) | | | | | |
| | | |
2.10% (1 mo. USD LIBOR + 0.280%) (2) | | | 02/25/36 | | | | 2,558,856 | | | | 2,544,100 | |
| |
Morgan Stanley Mortgage Loan Trust (05-6AR-1A1) | | | | | |
| | | |
2.10% (1 mo. USD LIBOR + 0.280%) (2) | | | 11/25/35 | | | | 122,040 | | | | 122,321 | |
| |
Morgan Stanley Mortgage Loan Trust (07-3XS-2A6) | | | | | |
| | | |
5.76% (3) | | | 01/25/47 | | | | 2,573,337 | | | | 1,301,728 | |
| |
Morgan Stanley Mortgage Loan Trust (07-7AX-2A1) | | | | | |
| | | |
1.94% (1 mo. USD LIBOR + 0.120%) (2) | | | 04/25/37 | | | | 3,520,693 | | | | 1,626,326 | |
| |
Morgan Stanley REREMIC Trust (13-R2-1A) | | | | | |
| | | |
3.39% (1)(3) | | | 10/26/36 | | | | 1,919,659 | | | | 1,926,868 | |
| |
Morgan Stanley Resecuritization Trust (14-R2-2A) | | | | | |
| | | |
3.67% (1)(3) | | | 12/26/46 | | | | 4,707,795 | | | | 4,756,484 | |
| |
MortgageIT Trust (05-4-A1) | | | | | |
| | | |
2.10% (1 mo. USD LIBOR + 0.280%) (2) | | | 10/25/35 | | | | 2,017,350 | | | | 2,035,783 | |
| |
Nomura Resecuritization Trust (15-2R-1A1) | | | | | |
| | | |
3.30% (12 mo. Monthly Treasury Average Index + 1.000%) (1)(2) | | | 08/26/46 | | | | 2,566,031 | | | | 2,563,616 | |
| |
Nomura Resecuritization Trust (15-4R-2A1) | | | | | |
| | | |
2.16% (1 mo. USD LIBOR + 0.306%) (1)(2) | | | 10/26/36 | | | | 2,875,296 | | | | 2,877,223 | |
See accompanying notes to financial statements.
76
TCW Total Return Bond Fund
| | | | | | | | | | | | |
| Issues | | Maturity
Date | | | Principal
Amount | | | Value | |
|
RESIDENTIAL MORTGAGE-BACKED SECURITIES —
NON-AGENCY (Continued) | |
| |
Nomura Resecuritization Trust (15-5R-2A1) | | | | | |
| | | |
4.23% (1)(3) | | | 03/26/35 | | | $ | 3,088,114 | | | $ | 3,124,090 | |
| |
Nomura Resecuritization Trust (15-7R-2A1) | | | | | |
| | | |
3.96% (1)(3) | | | 08/26/36 | | | | 1,583,364 | | | | 1,598,865 | |
| |
Oakwood Mortgage Investors, Inc. (02-A-A4) | | | | | |
| | | |
6.97% (3) | | | 03/15/32 | | | | 1,979,770 | | | | 2,096,689 | |
| |
Oakwood Mortgage Investors, Inc. (99-E-A1) | | | | | |
| | | |
7.61% (3) | | | 03/15/30 | | | | 4,172,725 | | | | 3,586,183 | |
| |
Opteum Mortgage Acceptance Corp. (06-1-2A1) | | | | | |
| | | |
5.75% (3) | | | 04/25/36 | | | | 1,160,206 | | | | 1,165,254 | |
| |
Ownit Mortgage Loan Asset-Backed Certificates
(06-3-A2D) | | | | | |
| | | |
2.09% (1 mo. USD LIBOR + 0.270%) (2) | | | 03/25/37 | | | | 17,198,148 | | | | 15,364,603 | |
| |
Ownit Mortgage Loan Asset-Backed Certificates
(06-6-A2C) | | | | | |
| | | |
1.98% (1 mo. USD LIBOR + 0.160%) (2) | | | 09/25/37 | | | | 16,273,783 | | | | 9,387,059 | |
| |
Prime Mortgage Trust (06-1-1A1) | | | | | |
| | | |
5.50% | | | 06/25/36 | | | | 1,674,113 | | | | 1,686,961 | |
| |
RAAC Series Trust (05-SP1-4A1) | | | | | |
| | | |
7.00% | | | 09/25/34 | | | | 3,092,453 | | | | 3,218,065 | |
| |
RAAC Series Trust (07-SP1-A3) | | | | | |
| | | |
2.30% (1 mo. USD LIBOR + 0.480%) (2) | | | 03/25/37 | | | | 666,390 | | | | 669,034 | |
| |
RALI Trust (05-QA13-2A1) | | | | | |
| | | |
4.78% (3) | | | 12/25/35 | | | | 686,996 | | | | 638,854 | |
| |
RALI Trust (05-QA7-A21) | | | | | |
| | | |
4.57% (3) | | | 07/25/35 | | | | 2,269,028 | | | | 2,181,007 | |
| |
RALI Trust (06-QA3-A1) | | | | | |
| | | |
2.02% (1 mo. USD LIBOR + 0.200%) (2) | | | 04/25/36 | | | | 2,650,970 | | | | 2,691,154 | |
| |
Residential Accredit Loans, Inc. (05-QA8-CB21) | | | | | |
| | | |
4.62% (3) | | | 07/25/35 | | | | 4,669,226 | | | | 3,600,141 | |
| |
Residential Accredit Loans, Inc. (05-QS7-A1) | | | | | |
| | | |
5.50% | | | 06/25/35 | | | | 857,445 | | | | 788,262 | |
| |
Residential Accredit Loans, Inc. (06-QA1-A21) | | | | | |
| | | |
4.92% (3) | | | 01/25/36 | | | | 17,423 | | | | 15,721 | |
| |
Residential Accredit Loans, Inc. (06-QA10-A2) | | | | | |
| | | |
2.00% (1 mo. USD LIBOR + 0.180%) (2) | | | 12/25/36 | | | | 15,857,969 | | | | 15,143,074 | |
| |
Residential Accredit Loans, Inc. (06-QA2-1A1) | | | | | |
| | | |
2.07% (1 mo. USD LIBOR + 0.250%) (2) | | | 02/25/36 | | | | 20,801 | | | | 16,024 | |
| |
Residential Accredit Loans, Inc. (06-QS10-AV) (I/O) | | | | | |
| | | |
0.55% (3)(8) | | | 08/25/36 | | | | 37,396,480 | | | | 868,492 | |
| |
Residential Accredit Loans, Inc. (06-QS11-AV) (I/O) | | | | | |
| | | |
0.35% (3)(8) | | | 08/25/36 | | | | 37,875,432 | | | | 571,639 | |
| | | | | | | | | | | | |
| Issues | | Maturity
Date | | | Principal
Amount | | | Value | |
|
RESIDENTIAL MORTGAGE-BACKED SECURITIES —
NON-AGENCY (Continued) | |
| |
Residential Accredit Loans, Inc. (06-QS5-A5) | | | | | |
| | | |
6.00% | | | 05/25/36 | | | $ | 4,635,608 | | | $ | 4,466,468 | |
| |
Residential Accredit Loans, Inc. (06-QS6-1AV) (I/O) | | | | | |
| | | |
0.76% (3)(8) | | | 06/25/36 | | | | 48,668,130 | | | | 1,283,189 | |
| |
Residential Accredit Loans, Inc. (06-QS7-AV) (I/O) | | | | | |
| | | |
0.71% (3)(8) | | | 06/25/36 | | | | 10,515,209 | | | | 267,861 | |
| |
Residential Accredit Loans, Inc. (07-QS1-2AV) (I/O) | | | | | |
| | | |
0.17% (3)(8) | | | 01/25/37 | | | | 2,554,699 | | | | 20,134 | |
| |
Residential Accredit Loans, Inc. (07-QS2-AV) (I/O) | | | | | |
| | | |
0.33% (3)(8) | | | 01/25/37 | | | | 19,040,307 | | | | 229,994 | |
| |
Residential Accredit Loans, Inc. (07-QS3-AV) (I/O) | | | | | |
| | | |
0.35% (3)(8) | | | 02/25/37 | | | | 78,177,731 | | | | 1,057,643 | |
| |
Residential Accredit Loans, Inc. (07-QS4-3AV) (I/O) | | | | | |
| | | |
0.37% (3)(8) | | | 03/25/37 | | | | 9,124,313 | | | | 133,647 | |
| |
Residential Accredit Loans, Inc. (07-QS5-AV) (I/O) | | | | | |
| | | |
0.27% (3)(8) | | | 03/25/37 | | | | 12,705,443 | | | | 119,519 | |
| |
Residential Accredit Loans, Inc. (07-QS6-A45) | | | | | |
| | | |
5.75% | | | 04/25/37 | | | | 2,759,608 | | | | 2,615,217 | |
| |
Residential Accredit Loans, Inc. (07-QS8-AV) (I/O) | | | | | |
| | | |
0.40% (3)(8) | | | 06/25/37 | | | | 18,854,546 | | | | 357,251 | |
| |
Residential Funding Mortgage Securities I (05-SA5-2A) | | | | | |
| | | |
4.51% (3) | | | 11/25/35 | | | | 18,167 | | | | 17,510 | |
| |
Residential Funding Mortgage Securities I (06-S9-A3) (PAC) | | | | | |
| | | |
5.75% (7) | | | 09/25/36 | | | | 592,461 | | | | 564,031 | |
| |
Residential Funding Mortgage Securities I (07-S2-A9) | | | | | |
| | | |
6.00% | | | 02/25/37 | | | | 6,649,824 | | | | 6,383,122 | |
|
Residential Funding Mortgage Securities I (07-SA2-2A2) | |
| | | |
4.88% (3) | | | 04/25/37 | | | | 20,532 | | | | 19,600 | |
| |
Saxon Asset Securities Trust (06-2-A2) | | | | | |
| | | |
1.95% (1 mo. USD LIBOR + 0.130%) (2) | | | 09/25/36 | | | | 3,609,982 | | | | 3,593,016 | |
| |
Saxon Asset Securities Trust (06-3-A3) | | | | | |
| | | |
1.99% (1 mo. USD LIBOR + 0.170%) (2) | | | 10/25/46 | | | | 9,897,984 | | | | 9,761,475 | |
| |
Saxon Asset Securities Trust (07-2-A2D) | | | | | |
| | | |
2.12% (1 mo. USD LIBOR + 0.300%) (2) | | | 05/25/47 | | | | 17,602,119 | | | | 14,603,403 | |
| |
Securitized Asset-Backed Receivables LLC Trust (07-BR1-A2C) | | | | | |
| | | |
2.16% (1 mo. USD LIBOR + 0.340%) (2) | | | 02/25/37 | | | | 3,116,210 | | | | 1,821,225 | |
| |
Securitized Asset-Backed Receivables LLC Trust (07-BR2-A2) | | | | | |
| | | |
2.05% (1 mo. USD LIBOR + 0.230%) (2) | | | 02/25/37 | | | | 33,618,032 | | | | 19,249,147 | |
| |
Securitized Asset-Backed Receivables LLC Trust (07-NC2-A2B) | | | | | |
| | | |
1.96% (1 mo. USD LIBOR + 0.140%) (2) | | | 01/25/37 | | | | 16,926,534 | | | | 14,366,183 | |
See accompanying notes to financial statements.
77
TCW Total Return Bond Fund
Schedule of Investments (Continued)
| | | | | | | | | | | | |
| Issues | | Maturity
Date | | | Principal
Amount | | | Value | |
|
RESIDENTIAL MORTGAGE-BACKED SECURITIES —
NON-AGENCY (Continued) | |
| |
Sequoia Mortgage Trust (03-8-A1) | | | | | |
| | | |
2.49% (1 mo. USD LIBOR + 0.640%) (2) | | | 01/20/34 | | | $ | 782,171 | | | $ | 763,816 | |
| |
SG Mortgage Securities Trust (07-NC1-A2) | | | | | |
| | | |
2.06% (1 mo. USD LIBOR + 0.240%) (1)(2) | | | 12/25/36 | | | | 19,764,930 | | | | 13,141,077 | |
| |
Soundview Home Equity Loan Trust (06-OPT4-2A4) | | | | | |
| | | |
2.05% (1 mo. USD LIBOR + 0.230%) (2) | | | 06/25/36 | | | | 10,400,000 | | | | 10,117,108 | |
| |
Soundview Home Equity Loan Trust (07-OPT3-2A4) | | | | | |
| | | |
2.07% (1 mo. USD LIBOR + 0.250%) (2) | | | 08/25/37 | | | | 4,000,000 | | | | 3,806,437 | |
| |
Structured Adjustable Rate Mortgage Loan Trust (04-12-2A) | | | | | |
| | | |
4.15% (3) | | | 09/25/34 | | | | 1,478,074 | | | | 1,483,161 | |
| |
Structured Adjustable Rate Mortgage Loan Trust (04-14-2A) | | | | | |
| | | |
4.17% (3) | | | 10/25/34 | | | | 2,659,648 | | | | 2,676,945 | |
| |
Structured Adjustable Rate Mortgage Loan Trust (05-16XS-A2A) | | | | | |
| | | |
2.77% (1 mo. USD LIBOR + 0.950%) (2) | | | 08/25/35 | | | | 1,855,193 | | | | 1,857,863 | |
| |
Structured Adjustable Rate Mortgage Loan Trust (06-2-5A1) | | | | | |
| | | |
4.46% (3) | | | 03/25/36 | | | | 403,460 | | | | 379,818 | |
| |
Structured Adjustable Rate Mortgage Loan Trust (06-4-5A1) | | | | | |
| | | |
4.20% (3) | | | 05/25/36 | | | | 1,825,696 | | | | 1,667,080 | |
| |
Structured Adjustable Rate Mortgage Loan Trust (06-5-1A1) | | | | | |
| | | |
4.53% (3) | | | 06/25/36 | | | | 3,624,464 | | | | 3,517,191 | |
| |
Structured Adjustable Rate Mortgage Loan Trust (07-1-1A1) | | | | | |
| | | |
4.70% (3) | | | 02/25/37 | | | | 2,432,059 | | | | 1,952,834 | |
| |
Structured Asset Securities Corp. (05-2XS-1A5B) | | | | | |
| | | |
5.15% (3) | | | 02/25/35 | | | | 41,972 | | | | 42,206 | |
| |
Structured Asset Securities Corp. (06-WF2-A4) | | | | | |
| | | |
2.13% (1 mo. USD LIBOR + 0.310%) (2) | | | 07/25/36 | | | | 457,083 | | | | 460,762 | |
| |
Suntrust Adjustable Rate Mortgage Loan Trust (07-2-2A1) | | | | | |
| | | |
4.67% (3) | | | 04/25/37 | | | | 164,001 | | | | 132,642 | |
| |
Suntrust Adjustable Rate Mortgage Loan Trust (07-3-1A1) | | | | | |
| | | |
4.73% (3) | | | 06/25/37 | | | | 4,431 | | | | 3,992 | |
| |
Suntrust Adjustable Rate Mortgage Loan Trust (07-S1-2A1) | | | | | |
| | | |
4.95% (3) | | | 01/25/37 | | | | 497,732 | | | | 506,788 | |
| |
Wachovia Mortgage Loan Trust LLC (06-AMN1-A3) | | | | | |
| | | |
2.06% (1 mo. USD LIBOR + 0.240%) (2) | | | 08/25/36 | | | | 7,802,533 | | | | 4,636,669 | |
| | | | | | | | | | | | |
| Issues | | Maturity
Date | | | Principal
Amount | | | Value | |
|
RESIDENTIAL MORTGAGE-BACKED SECURITIES —
NON-AGENCY (Continued) | |
| |
WaMu Mortgage Pass-Through Certificates (04-AR14-A1) | | | | | |
| | | |
4.39% (3) | | | 01/25/35 | | | $ | 4,840,990 | | | $ | 5,049,551 | |
| |
WaMu Mortgage Pass-Through Certificates (05-AR13-A1A1) | | | | | |
| | | |
2.11% (1 mo. USD LIBOR + 0.290%) (2) | | | 10/25/45 | | | | 6,476,223 | | | | 6,470,453 | |
| |
WaMu Mortgage Pass-Through Certificates (05-AR13-A1A2) | | | | | |
| | | |
3.84% (12 mo. Monthly Treasury Average Index + 1.450%) (2) | | | 10/25/45 | | | | 521,900 | | | | 526,126 | |
| |
WaMu Mortgage Pass-Through Certificates (05-AR14-2A1) | | | | | |
| | | |
3.95% (3) | | | 12/25/35 | | | | 1,125,143 | | | | 1,113,398 | |
| |
WaMu Mortgage Pass-Through Certificates (05-AR18-1A1) | | | | | |
| | | |
4.25% (3) | | | 01/25/36 | | | | 1,751,856 | | | | 1,709,281 | |
| |
WaMu Mortgage Pass-Through Certificates (05-AR2-2A1A) | | | | | |
| | | |
2.13% (1 mo. USD LIBOR + 0.310%) (2) | | | 01/25/45 | | | | 197,173 | | | | 192,220 | |
| |
WaMu Mortgage Pass-Through Certificates (05-AR9-A1A) | | | | | |
| | | |
2.46% (1 mo. USD LIBOR + 0.640%) (2) | | | 07/25/45 | | | | 4,714,245 | | | | 4,712,853 | |
|
WaMu Mortgage Pass-Through Certificates (06-AR1-2A1A) | |
| | | |
3.46% (12 mo. Monthly Treasury Average Index + 1.070%) (2) | | | 01/25/46 | | | | 14,236,847 | | | | 14,082,554 | |
|
WaMu Mortgage Pass-Through Certificates (06-AR11-1A) | |
| | | |
3.35% (12 mo. Monthly Treasury Average Index + 0.960%) (2)(7) | | | 09/25/46 | | | | 3,791,868 | | | | 3,541,597 | |
|
WaMu Mortgage Pass-Through Certificates (06-AR17-1A1A) | |
| | | |
3.26% (12 mo. Monthly Treasury Average Index + 0.810%) (2) | | | 12/25/46 | | | | 4,602,183 | | | | 4,582,651 | |
|
Washington Mutual Alternative Mortgage Pass-Through Certificates (02-AR1-1A1) | |
| | | |
4.30% (3) | | | 11/25/30 | | | | 102,809 | | | | 106,551 | |
|
Washington Mutual Alternative Mortgage Pass-Through Certificates (06-1-3A2) | |
| | | |
5.75% (7) | | | 02/25/36 | | | | 939,681 | | | | 896,420 | |
|
Washington Mutual Alternative Mortgage Pass-Through Certificates (06-5-1A1) | |
| | | |
2.42% (1 mo. USD LIBOR + 0.600%) (2) | | | 07/25/36 | | | | 2,018,299 | | | | 1,365,346 | |
|
Washington Mutual Alternative Mortgage Pass-Through Certificates (06-AR10-A2A) | |
| | | |
1.99% (1 mo. USD LIBOR + 0.170%) (2) | | | 12/25/36 | | | | 3,537,241 | | | | 3,211,139 | |
See accompanying notes to financial statements.
78
TCW Total Return Bond Fund
| | | | | | | | | | | | |
| Issues | | Maturity
Date | | | Principal
Amount | | | Value | |
|
RESIDENTIAL MORTGAGE-BACKED SECURITIES —
NON-AGENCY (Continued) | |
|
Washington Mutual Alternative Mortgage Pass-Through Certificates (07-OA3-5A) | |
| | | |
2.41% (11th District Cost of Funds + 1.250%) (2) | | | 04/25/47 | | | $ | 1,526,962 | | | $ | 1,402,969 | |
|
Washington Mutual Alternative Mortgage Pass-Through Certificates (07-OC2-A3) | |
| | | |
2.13% (1 mo. USD LIBOR + 0.310%) (2) | | | 06/25/37 | | | | 4,268,968 | | | | 4,133,146 | |
|
Washington Mutual Asset-Backed Certificates (06-HE1-2A4) | |
| | | |
2.10% (1 mo. USD LIBOR + 0.280%) (2) | | | 04/25/36 | | | | 8,291,191 | | | | 8,001,168 | |
|
Wells Fargo Home Equity Asset-Backed Securities (06-3-A2) | |
| | | |
1.97% (1 mo. USD LIBOR + 0.150%) (2) | | | 01/25/37 | | | | 3,616,912 | | | | 3,610,135 | |
|
Wells Fargo Home Equity Asset-Backed Securities (07-1-A3) | |
| | | |
2.14% (1 mo. USD LIBOR + 0.320%) (2) | | | 03/25/37 | | | | 5,521,000 | | | | 4,863,456 | |
|
Wells Fargo Mortgage-Backed Securities Trust (04-DD-2A6) | |
| | | |
5.00% (3) | | | 01/25/35 | | | | 1,081,380 | | | | 1,131,780 | |
|
Wells Fargo Mortgage-Backed Securities Trust (06-AR11-A6) | |
| | | |
4.86% (3) | | | 08/25/36 | | | | 2,560,568 | | | | 2,529,204 | |
|
Wells Fargo Mortgage-Backed Securities Trust (06-AR6-4A1) | |
| | | |
4.79% (3) | | | 03/25/36 | | | | 1,910,657 | | | | 1,961,470 | |
|
Wells Fargo Mortgage-Backed Securities Trust (07-10-1A32) | |
| | | |
6.00% | | | 07/25/37 | | | | 2,427,717 | | | | 2,456,177 | |
|
Wells Fargo Mortgage-Backed Securities Trust (07-AR4-A1) | |
| | | |
4.85% (3) | | | 08/25/37 | | | | 189,713 | | | | 191,224 | |
|
Wells Fargo Mortgage-Backed Securities Trust (08-1-4A1) | |
| | | |
5.75% | | | 02/25/38 | | | | 1,074,824 | | | | 1,146,771 | |
| | | | | | | | | | | | |
| |
Total Residential Mortgage-backed Securities — Non-agency | | | | | |
| |
(Cost: $716,917,488) | | | | 911,212,370 | |
| | | | | |
|
| U.S. TREASURY BONDS — 10.0% (Cost: $590,587,360) | |
|
U.S. Treasury Bond | |
| | | |
2.25% | | | 08/15/49 | | | | 576,347,000 | | | | 585,802,693 | |
| | | | | | | | | | | | |
|
| U.S. TREASURY SECURITIES — 14.3% | |
|
U.S. Treasury Note | |
| | | |
1.25% | | | 08/31/24 | | | | 63,390,000 | | | | 62,624,740 | |
| | | |
1.50% | | | 08/31/21 | | | | 55,160,000 | | | | 55,106,131 | |
| | | |
1.50% | | | 09/30/21 | | | | 59,520,000 | | | | 59,469,785 | |
| | | |
1.50% | | | 10/31/21 | | | | 60,550,000 | | | | 60,526,066 | |
| | | |
1.50% | | | 09/30/24 | | | | 409,694,000 | | | | 409,230,157 | |
| | | |
1.50% | | | 10/31/24 | | | | 105,050,000 | | | | 104,955,619 | |
| | | |
1.63% | | | 08/15/29 | | | | 84,880,000 | | | | 84,385,972 | |
| | | | | | | | | | | | |
| | |
Total U.S. Treasury Securities | | | | | | | | | |
| | | |
(Cost: $834,818,067) | | | | | | | | | | | 836,298,470 | |
| | | | | | | | | | | | |
| | |
Total Fixed Income Securities | | | | | | | | | |
| | | |
(Cost: $5,800,839,701) | | | | | | | | | | | 6,044,391,002 | |
| | | | | | | | | | | | |
| | | | | | | | | | | | |
| Issues | | Maturity
Date | | | Shares | | | Value | |
|
MONEY MARKET INVESTMENTS — 3.1% | |
| | | |
State Street Institutional U.S. Government Money Market Fund — Premier Class 1.75% (9) | | | | | | | 182,781,853 | | | $ | 182,781,853 | |
| | | | | | | | | | | | |
| |
Total Money Market Investments | | | | | |
| | | |
(Cost: $182,781,853) | | | | | | | | | | | 182,781,853 | |
| | | | | | | | | | | | |
| | | |
| | | | | | | | | | | | |
| | | | | | Principal
Amount | | | | |
| |
SHORT TERM INVESTMENTS — 1.1% | | | | | |
| |
FOREIGN GOVERNMENT BONDS — 1.0%
(Cost: $59,303,846) | | | | |
| | | |
Japan Treasury Bill | | | | | | | | | | | | |
| | | |
0.00% (5) | | | 01/14/20 | | | JPY | 6,355,000,000 | | | | 58,807,861 | |
| | | | | | | | | | | | |
| |
U.S. TREASURY SECURITIES — 0.1%
(Cost: $8,796,594) | | | | |
| | | |
U.S. Treasury Bill | | | | | | | | | | | | |
| | | |
1.53% (10)(11) | | | 12/26/19 | | | | 8,822,000 | | | | 8,801,345 | |
| | | | | | | | | | | | |
| |
Total Short Term Investments | | | | | |
| | | |
(Cost: $68,100,440) | | | | | | | | | | | 67,609,206 | |
| | | | | | | | | | | | |
| |
Total Investments (107.4%) | | | | 6,294,782,061 | |
| | | |
(Cost: $6,051,721,994) | | | | | | | | | | | | |
| |
Liabilities In Excess Of Other Assets (-7.4%) | | | | (433,167,124 | ) |
| | | | | | | | | | | | |
| | | |
Net Assets (100.0%) | | | | | | | | | | $ | 5,861,614,937 | |
| | | | | | | | | | | | |
See accompanying notes to financial statements.
79
TCW Total Return Bond Fund
Schedule of Investments (Continued)
| | | | | | | | | | | | | | | | | | |
| Futures Contracts | | | | | | | |
| | | | | |
Number of
Contracts | | Type | | Expiration
Date | | | Notional | | | Value | | | Net Unrealized
Appreciation/
Depreciation | |
Long Futures | | | | | | | | | | | | | | | | |
| 609 | | 2-Year U.S. Treasury Note Futures | | | 03/31/20 | | | $ | 131,351,737 | | | $ | 131,553,516 | | | $ | 201,779 | |
| 34 | | U.S. Ultra Long Bond Futures | | | 12/19/19 | | | | 6,562,127 | | | | 6,451,500 | | | | (110,627 | ) |
| 323 | | 10-Year U.S. Ultra Treasury Note Futures | | | 12/19/19 | | | | 46,351,864 | | | | 45,901,328 | | | | (450,536 | ) |
| 967 | | 10-Year U.S. Treasury Note Futures | | | 12/19/19 | | | | 126,905,691 | | | | 125,997,078 | | | | (908,613 | ) |
| 2,616 | | 2-Year U.S. Treasury Note Futures | | | 12/31/19 | | | | 565,130,633 | | | | 564,013,686 | | | | (1,116,947 | ) |
| 1,897 | | 5-Year U.S. Treasury Note Futures | | | 12/31/19 | | | | 226,873,213 | | | | 226,128,328 | | | | (744,885 | ) |
| 315 | | 5-Year U.S. Treasury Note Futures | | | 03/31/20 | | | | 37,670,578 | | | | 37,654,805 | | | | (15,773 | ) |
| | | | | | | | | | | | | | | | | | |
| | | | | | | | $ | 1,140,845,843 | | | $ | 1,137,700,241 | | | $ | (3,145,602 | ) |
| | | | | | | | | | | | | | | | | | |
| | | | | | | | | | | | | | | | | | | | | | | | |
|
| Forward Currency Exchange Contracts | |
| | | | | | |
| Counterparty | | Contracts to
Deliver | | | Units of
Currency | | | Settlement
Date | | | In Exchange for
U.S. Dollars | | | Contracts at
Value | | | Unrealized
Appreciation
(Depreciation) | |
SELL (12) | | | | | | | | |
Goldman Sachs & Co. | | | JPY | | | | 6,355,000,000 | | | | 01/14/20 | | | $ | 59,685,086 | | | $ | 59,073,376 | | | $ | 611,710 | |
| | | | | | | | | | | | | | | | | | | | | | | | |
Notes to Schedule of Investments:
| ABS - | | Asset-Backed Securities. |
| ACES - | | Alternative Credit Enhancement Securities. |
| ARM - | | Adjustable Rate Mortgage. |
| I/F - | | Inverse Floating rate security whose interest rate moves in the opposite direction of prevailing interest rates. |
| I/O - | | Interest Only Security. |
| PAC - | | Planned Amortization Class. |
| P/O - | | Principal Only Security. |
| TAC - | | Target Amortization Class. |
| (1) | | Security exempt from registration under Rule 144A of the Securities Act of 1933, as amended. These securities may be resold, normally only to qualified institutional buyers. At October 31, 2019, the value of these securities amounted to $267,726,733 or 4.6% of net assets. These securities are determined to be liquid by the Fund’s investment advisor, unless otherwise noted, under procedures established by and under the general supervision of the Company’s Board of Directors. |
| (2) | | Floating or variable rate security. The interest shown reflects the rate in effect at October 31, 2019. |
| (3) | | Variable rate security. Interest rate disclosed is as of the most recent information available. Certain variable rate securities are not based on a published reference rate and spread but are determined by the issuer or agent and are based on current market conditions. These securities do not indicate a reference rate and spread in their description above. |
| (4) | | This security is purchased on a when-issued, delayed delivery or forward commitment basis. |
| (5) | | Security is not accruing interest. |
| (6) | | Security purchased on a forward commitment with an approximate principal amount. The actual principal amount and maturity date will be determined upon settlement when the security is delivered. |
| (7) | | A portion of the principal balance has been written-off during the period due to defaults in the underlying loans. Cost basis has been adjusted. |
| (8) | | For fair value measurement disclosure purposes, security is categorized as Level 3. Security is valued using significant unobservable inputs. |
| (9) | | Rate disclosed is the 7-day net yield as of October 31, 2019. |
| (10) | | Rate shown represents yield-to-maturity. |
| (11) | | All or a portion of this security is held as collateral for open futures contracts. |
| (12) | | Fund sells foreign currency, buys U.S. Dollar. |
See accompanying notes to financial statements.
80
TCW Total Return Bond Fund
Investments by Sector | October 31, 2019 |
| | | | |
| Sector | |
Percentage of
Net Assets | |
Residential Mortgage-Backed Securities — Agency | | | 57.0 | % |
Residential Mortgage-Backed Securities — Non-Agency | | | 15.5 | |
U.S. Treasury Securities | | | 24.4 | |
Commercial Mortgage-Backed Securities — Agency | | | 3.6 | |
Money Market Investments | | | 3.1 | |
Asset-Backed Securities | | | 2.2 | |
Foreign Government Bonds | | | 1.0 | |
Commercial Mortgage-Backed Securities — Non-Agency | | | 0.6 | |
Other* | | | (7.4 | ) |
| | | | |
Total | | | 100.0 | % |
| | | | |
| * | Includes capstock, foreign exchange transactions, futures, pending trades, interest receivable and accrued expenses payable. |
See accompanying notes to financial statements.
81
TCW Total Return Bond Fund
Fair Valuation Summary | October 31, 2019 |
The following is a summary of the fair valuations according to the inputs used as of October 31, 2019 in valuing the Fund’s investments:
| | | | | | | | | | | | | | | | |
Description | | Quoted Prices
in Active
Markets for
Identical
Assets
(Level 1) | | | Other
Significant
Observable
Inputs
(Level 2) | | | Significant
Unobservable
Inputs
(Level 3) | | | Total | |
Fixed Income Securities | | | | | | | | | | | | | | | | |
Asset-Backed Securities | | $ | — | | | $ | 126,363,403 | | | $ | — | | | $ | 126,363,403 | |
Commercial Mortgage-Backed Securities — Agency | | | — | | | | 209,609,813 | | | | — | | | | 209,609,813 | |
Commercial Mortgage-Backed Securities — Non-Agency | | | — | | | | 36,287,936 | | | | — | | | | 36,287,936 | |
Residential Mortgage-Backed Securities — Agency | | | — | | | | 3,338,816,317 | | | | — | | | | 3,338,816,317 | |
Residential Mortgage-Backed Securities — Non-Agency | | | — | | | | 906,295,784 | | | | 4,916,586 | | | | 911,212,370 | |
U.S. Treasury Bonds | | | 585,802,693 | | | | — | | | | — | | | | 585,802,693 | |
U.S. Treasury Securities | | | 836,298,470 | | | | — | | | | — | | | | 836,298,470 | |
| | | | | | | | | | | | | | | | |
Total Fixed Income Securities | | | 1,422,101,163 | | | | 4,617,373,253 | | | | 4,916,586 | | | | 6,044,391,002 | |
| | | | | | | | | | | | | | | | |
Money Market Investments | | | 182,781,853 | | | | — | | | | — | | | | 182,781,853 | |
Short-Term Investments | | | 8,801,345 | | | | 58,807,861 | | | | — | | | | 67,609,206 | |
| | | | | | | | | | | | | | | | |
Total Investments | | $ | 1,613,684,361 | | | $ | 4,676,181,114 | | | $ | 4,916,586 | | | $ | 6,294,782,061 | |
| | | | | | | | | | | | | | | | |
Asset Derivatives | | | | | | | | | | | | | | | | |
Forward Currency Contracts | | | | | | | | | | | | | | | | |
Foreign Currency Risk | | | — | | | | 611,710 | | | | — | | | | 611,710 | |
Futures Contracts | | | | | | | | | | | | | | | | |
Interest Rate Risk | | | 201,779 | | | | — | | | | — | | | | 201,779 | |
| | | | | | | | | | | | | | | | |
Total Investments | | $ | 1,613,886,140 | | | $ | 4,676,792,824 | | | $ | 4,916,586 | | | $ | 6,295,595,550 | |
| | | | | | | | | | | | | | | | |
Liability Derivatives | | | | | | | | | | | | | | | | |
Futures Contracts | | | | | | | | | | | | | | | | |
Interest Rate Risk | | $ | (3,347,381 | ) | | $ | — | | | $ | — | | | $ | (3,347,381 | ) |
| | | | | | | | | | | | | | | | |
Total | | $ | (3,347,381 | ) | | $ | — | | | $ | — | | | $ | (3,347,381 | ) |
| | | | | | | | | | | | | | | | |
See accompanying notes to financial statements.
82
TCW Funds, Inc.
Statements of Assets and Liabilities | October 31, 2019 |
| | | | | | | | | | | | |
| | | TCW
Core Fixed
Income
Fund | | | TCW
Enhanced
Commodity
Strategy
Fund (1) | | | TCW
Global Bond
Fund | |
| | | Dollar Amounts In Thousands
(Except Per Share Amounts) | |
ASSETS | | | | | | | | | | | | |
Investments, at Value (2) | | $ | 1,306,778 | | | $ | 1,271 | | | $ | 18,771 | |
Investment in Affiliated Issuers, at Value | | | — | | | | — | | | | 402 | (3) |
Foreign Currency, at Value | | | — | | | | — | | | | 109 | (4) |
Cash | | | — | | | | — | | | | 1 | |
Cash Collateral Held for Brokers | | | 467 | | | | 80 | | | | — | |
Receivable for Securities Sold | | | 13,389 | | | | — | | | | 61 | |
Receivable for Sale of When-Issued Securities | | | 63,391 | | | | — | | | | 889 | |
Receivable for Fund Shares Sold | | | 423 | | | | — | | | | — | |
Interest and Dividends Receivable | | | 4,955 | | | | 14 | | | | 161 | |
Receivable from Investment Advisor | | | 5 | | | | 17 | | | | 33 | |
Unrealized Appreciation on Open Forward Foreign Currency Contracts | | | 87 | | | | — | | | | 14 | |
Receivable for Daily Variation Margin on Open Financial Futures Contracts | | | 337 | | | | — | | | | 24 | |
Open Swap Agreements, at Value | | | — | | | | 9 | | | | — | |
Prepaid Expenses | | | 8 | | | | — | (5) | | | 28 | |
| | | | | | | | | | | | |
Total Assets | | | 1,389,840 | | | | 1,391 | | | | 20,493 | |
| | | | | | | | | | | | |
LIABILITIES | | | | | | | | | | | | |
Distributions Payable | | | 2,510 | | | | — | | | | 45 | |
Payable for Securities Purchased | | | 30,217 | | | | — | (5) | | | 92 | |
Payable for Purchase of When-Issued Securities | | | 168,500 | | | | — | | | | 2,599 | |
Payable for Fund Shares Redeemed | | | 808 | | | | — | | | | — | |
Accrued Capital Gain Withholding Taxes | | | — | | | | — | | | | 1 | |
Accrued Directors’ Fees and Expenses | | | 10 | | | | 10 | | | | 10 | |
Accrued Management Fees | | | 403 | | | | 1 | | | | 7 | |
Accrued Distribution Fees | | | 51 | | | | — | (5) | | | 2 | |
Interest Payable on Swap Agreements | | | — | | | | 1 | | | | — | |
Payable for Daily Variation Margin on Open Centrally Cleared Swap Contracts | | | 16 | | | | — | | | | — | |
Unrealized Depreciation on Open Forward Foreign Currency Contracts | | | 17 | | | | — | | | | 18 | |
Other Accrued Expenses | | | 305 | | | | 135 | | | | 53 | |
| | | | | | | | | | | | |
Total Liabilities | | | 202,837 | | | | 147 | | | | 2,827 | |
| | | | | | | | | | | | |
NET ASSETS | | $ | 1,187,003 | | | $ | 1,244 | | | $ | 17,666 | |
| | | | | | | | | | | | |
NET ASSETS CONSIST OF: | | | | | | | | | | | | |
Paid-in Capital | | $ | 1,165,328 | | | $ | 1,323 | | | $ | 17,042 | |
Accumulated Earnings (Loss) | | | 21,675 | | | | (79 | ) | | | 624 | |
| | | | | | | | | | | | |
NET ASSETS | | $ | 1,187,003 | | | $ | 1,244 | | | $ | 17,666 | |
| | | | | | | | | | | | |
NET ASSETS ATTRIBUTABLE TO: | | | | | | | | | | | | |
I Class Share | | $ | 946,896 | | | $ | 740 | | | $ | 9,384 | |
| | | | | | | | | | | | |
N Class Share | | $ | 240,107 | | | $ | 504 | | | $ | 8,282 | |
| | | | | | | | | | | | |
CAPITAL SHARES OUTSTANDING: (6) | | | | | | | | | | | | |
I Class Share | | | 83,005,256 | | | | 152,813 | | | | 914,904 | |
| | | | | | | | | | | | |
N Class Share | | | 21,104,999 | | | | 104,298 | | | | 807,412 | |
| | | | | | | | | | | | |
NET ASSET VALUE PER SHARE: (7) | | | | | | | | | | | | |
I Class Share | | $ | 11.41 | | | $ | 4.84 | | | $ | 10.26 | |
| | | | | | | | | | | | |
N Class Share | | $ | 11.38 | | | $ | 4.84 | | | $ | 10.26 | |
| | | | | | | | | | | | |
| (1) | Consolidated Statement of Asset and Liabilities (See Note 2). |
| (2) | The identified cost for the TCW Core Fixed Income Fund, the TCW Enhanced Commodity Strategy Fund and the TCW Global Bond Fund at October 31, 2019 was $1,272,913, $1,238 and $18,463, respectively. |
| (3) | The identified cost for the TCW Global Bond Fund at October 31, 2019 was $388. |
| (4) | The identified cost for the TCW Global Bond Fund at October 31, 2019 was $109 |
| (5) | Amount rounds to less than $1. |
| (6) | The number of authorized shares, with a par value of $0.001 per share is 4,000,000,000 for each of the I Class and N Class shares. |
| (7) | Represents offering price and redemption price per share. |
See accompanying notes to financial statements.
83
TCW Funds, Inc.
Statements of Assets and Liabilities | October 31, 2019 |
| | | | | | | | | | | | |
| | | TCW
High Yield
Bond Fund | | | TCW
Short Term
Bond Fund | | | TCW
Total Return
Bond Fund | |
| | | Dollar Amounts In Thousands
(Except Per Share Amounts) | |
ASSETS | | | | | | | | | | | | |
Investments, at Value (1) | | $ | 30,520 | | | $ | 5,903 | | | $ | 6,294,782 | |
Receivable for Securities Sold | | | — | | | | — | | | | 20,216 | |
Receivable for Sale of When-Issued Securities | | | — | | | | — | | | | 308,001 | |
Receivable for Fund Shares Sold | | | 72 | | | | — | | | | 7,703 | |
Interest and Dividends Receivable | | | 291 | | | | 33 | | | | 15,564 | |
Receivable from Investment Advisor | | | 31 | | | | 29 | | | | 348 | |
Unrealized Appreciation on Open Forward Foreign Currency Contracts | | | — | | | | — | (2) | | | 612 | |
Receivable for Daily Variation Margin on Open Financial Futures Contracts | | | 10 | | | | 1 | | | | 3,730 | |
Prepaid Expenses | | | 14 | | | | 12 | | | | 37 | |
| | | | | | | | | | | | |
Total Assets | | | 30,938 | | | | 5,978 | | | | 6,650,993 | |
| | | | | | | | | | | | |
LIABILITIES | | | | | | | | | | | | |
Distributions Payable | | | 98 | | | | 28 | | | | 17,290 | |
Payable for Securities Purchased | | | 1,276 | | | | 211 | | | | 15,482 | |
Payable for Purchase of When-Issued Securities | | | — | | | | — | | | | 746,135 | |
Payable for Fund Shares Redeemed | | | 3 | | | | 32 | | | | 6,282 | |
Accrued Directors’ Fees and Expenses | | | 10 | | | | 10 | | | | 10 | |
Accrued Management Fees | | | 11 | | | | 2 | | | | 2,496 | |
Accrued Distribution Fees | | | 2 | | | | — | | | | 210 | |
Unrealized Depreciation on Open Forward Foreign Currency Contracts | | | — | | | | — | (2) | | | — | |
Other Accrued Expenses | | | 52 | | | | 51 | | | | 1,473 | |
| | | | | | | | | | | | |
Total Liabilities | | | 1,452 | | | | 334 | | | | 789,378 | |
| | | | | | | | | | | | |
NET ASSETS | | $ | 29,486 | | | $ | 5,644 | | | $ | 5,861,615 | |
| | | | | | | | | | | | |
NET ASSETS CONSIST OF: | | | | | | | | | | | | |
Paid-in Capital | | $ | 29,609 | | | $ | 5,956 | | | $ | 5,727,769 | |
Accumulated Earnings (Loss) | | | (123 | ) | | | (312 | ) | | | 133,846 | |
| | | | | | | | | | | | |
NET ASSETS | | $ | 29,486 | | | $ | 5,644 | | | $ | 5,861,615 | |
| | | | | | | | | | | | |
NET ASSETS ATTRIBUTABLE TO: | | | | | | | | | | | | |
I Class Share | | $ | 19,563 | | | $ | 5,644 | | | $ | 4,898,103 | |
| | | | | | | | | | | | |
N Class Share | | $ | 9,923 | | | $ | — | | | $ | 963,512 | |
| | | | | | | | | | | | |
CAPITAL SHARES OUTSTANDING: (3) | | | | | | | | | | | | |
I Class Share | | | 3,012,542 | | | | 657,289 | | | | 486,384,188 | |
| | | | | | | | | | | | |
N Class Share | | | 1,518,270 | | | | — | | | | 92,870,737 | |
| | | | | | | | | | | | |
NET ASSET VALUE PER SHARE: (4) | | | | | | | | | | | | |
I Class Share | | $ | 6.49 | | | $ | 8.59 | | | $ | 10.07 | |
| | | | | | | | | | | | |
N Class Share | | $ | 6.54 | | | $ | — | | | $ | 10.37 | |
| | | | | | | | | | | | |
| (1) | The identified cost for the TCW High Yield Bond Fund, the TCW Short Term Bond Fund and the TCW Total Return Bond Fund at October 31, 2019 was $30,455, $5,907 and $6,051,722, respectively. |
| (2) | Amount rounds to less than $1. |
| (3) | The number of authorized shares, with a par value of $0.001 per share is 4,000,000,000 for each of the I Class and N Class shares. |
| (4) | Represents offering price and redemption price per share. |
See accompanying notes to financial statements.
84
TCW Funds, Inc.
Statements of Operations | Year Ended October 31, 2019 |
| | | | | | | | | | | | |
| | | TCW
Core Fixed
Income
Fund | | | TCW
Enhanced
Commodity
Strategy
Fund (1) | | | TCW
Global
Bond Fund | |
| | | Dollar Amounts in Thousands | |
INVESTMENT INCOME | | | | | | | | | | | | |
Income: | | | | | | | | | | | | |
Dividends from Investment in Affiliated Issuers | | $ | — | | | $ | — | | | $ | 21 | |
Interest | | | 37,788 | | | | 55 | | | | 510 | (2) |
| | | | | | | | | | | | |
Total | | | 37,788 | | | | 55 | | | | 531 | |
| | | | | | | | | | | | |
Expenses: | | | | | | | | | | | | |
Management Fees | | | 4,754 | | | | 8 | | | | 84 | |
Accounting Services Fees | | | 70 | | | | 41 | | | | 7 | |
Administration Fees | | | 131 | | | | 67 | | | | 21 | |
Transfer Agent Fees: | | | | | | | | | | | | |
I Class | | | 602 | | | | 10 | | | | 6 | |
N Class | | | 259 | | | | 8 | | | | 7 | |
Custodian Fees | | | 51 | | | | 12 | | | | 32 | |
Professional Fees | | | 109 | | | | 43 | | | | 60 | |
Directors’ Fees and Expenses | | | 39 | | | | 39 | | | | 39 | |
Registration Fees: | | | | | | | | | | | | |
I Class | | | 31 | | | | — | (3) | | | 18 | |
N Class | | | 25 | | | | — | (3) | | | 18 | |
Distribution Fees: | | | | | | | | | | | | |
N Class | | | 628 | | | | 1 | | | | 20 | |
Shareholder Reporting Expense | | | 7 | | | | 2 | | | | 2 | |
Other | | | 111 | | | | 8 | | | | 13 | |
| | | | | | | | | | | | |
Total | | | 6,817 | | | | 239 | | | | 327 | |
| | | | | | | | | | | | |
Less Expenses Borne by Investment Advisor: | | | | | | | | | | | | |
I Class | | | 193 | | | | 141 | | | | 102 | |
N Class | | | 269 | | | | 88 | | | | 106 | |
| | | | | | | | | | | | |
Net Expenses | | | 6,355 | | | | 10 | | | | 119 | |
| | | | | | | | | | | | |
Net Investment Income | | | 31,433 | | | | 45 | | | | 412 | |
| | | | | | | | | | | | |
NET REALIZED AND UNREALIZED GAIN (LOSS) ON INVESTMENTS | | | | | | | | | | | | |
Net Realized Gain (Loss) on: | | | | | | | | | | | | |
Investments | | | 32,696 | | | | 5 | | | | 16 | (4) |
Foreign Currency | | | (28 | ) | | | — | | | | (2 | ) |
Foreign Currency Forward Contracts | | | (409 | ) | | | — | | | | (19 | ) |
Futures Contracts | | | 7,527 | | | | — | | | | 310 | |
Swap Agreements | | | 6 | | | | (159 | ) | | | — | |
Change in Unrealized Appreciation (Depreciation) on: | | | | | | | | | | | | |
Investments | | | 56,027 | | | | 8 | | | | 861 | (5) |
Foreign Currency | | | — | | | | — | | | | 1 | |
Foreign Currency Forward Contracts | | | 63 | | | | — | | | | 5 | |
Futures Contracts | | | 1,320 | | | | — | | | | 36 | |
Investments in Affiliated Issuers | | | — | | | | — | | | | 26 | |
Swap Agreements | | | (145 | ) | | | 65 | | | | — | |
| | | | | | | | | | | | |
Net Realized and Unrealized Gain (Loss) on Investments and Foreign Currency Transactions | | | 97,057 | | | | (81 | ) | | | 1,234 | |
| | | | | | | | | | | | |
INCREASE (DECREASE) IN NET ASSETS RESULTING FROM OPERATIONS | | $ | 128,490 | | | $ | (36 | ) | | $ | 1,646 | |
| | | | | | | | | | | | |
| (1) | Consolidated Statement of Operations (See Note 2). |
| (2) | Net of foreign taxes withheld of $3 for the TCW Global Bond Fund |
| (3) | Amount rounds to less than $1. |
| (4) | Net of capital gain withholding taxes of $0 for the TCW Global Bond Fund |
| (5) | Net of capital gain withholding taxes of $1 for the TCW Global Bond Fund |
See accompanying notes to financial statements.
85
TCW Funds, Inc.
Statements of Operations | Year Ended October 31, 2019 |
| | | | | | | | | | | | |
| | | TCW
High Yield
Bond Fund | | | TCW
Short Term
Bond Fund | | | TCW
Total Return
Bond Fund | |
| | | Dollar Amounts in Thousands | |
INVESTMENT INCOME | | | | | | | | | | | | |
Income: | | | | | | | | | | | | |
Interest | | $ | 865 | | | $ | 219 | | | $ | 246,999 | |
| | | | | | | | | | | | |
Total | | | 865 | | | | 219 | | | | 246,999 | |
| | | | | | | | | | | | |
Expenses: | | | | | | | | | | | | |
Management Fees | | | 82 | | | | 23 | | | | 31,228 | |
Accounting Services Fees | | | 29 | | | | 4 | | | | 379 | |
Administration Fees | | | 22 | | | | 20 | | | | 643 | |
Transfer Agent Fees: | | | | | | | | | | | | |
I Class | | | 14 | | | | 10 | | | | 4,116 | |
N Class | | | 13 | | | | — | | | | 963 | |
Custodian Fees | | | 28 | | | | 17 | | | | 69 | |
Professional Fees | | | 38 | | | | 75 | | | | 292 | |
Directors’ Fees and Expenses | | | 39 | | | | 39 | | | | 39 | |
Registration Fees: | | | | | | | | | | | | |
I Class | | | 22 | | | | 22 | | | | 67 | |
N Class | | | 19 | | | | — | | | | 35 | |
Distribution Fees: | | | | | | | | | | | | |
N Class | | | 18 | | | | — | | | | 2,628 | |
Shareholder Reporting Expense | | | 3 | | | | — | | | | 15 | |
Other | | | 7 | | | | 7 | | | | 787 | |
| | | | | | | | | | | | |
Total | | | 334 | | | | 217 | | | | 41,261 | |
| | | | | | | | | | | | |
Less Expenses Borne by Investment Advisor: | | | | | | | | | | | | |
I Class | | | 124 | | | | 189 | | | | 6,562 | |
N Class | | | 92 | | | | — | | | | 940 | |
| | | | | | | | | | | | |
Net Expenses | | | 118 | | | | 28 | | | | 33,759 | |
| | | | | | | | | | | | |
Net Investment Income | | | 747 | | | | 191 | | | | 213,240 | |
| | | | | | | | | | | | |
NET REALIZED AND UNREALIZED GAIN (LOSS) ON INVESTMENTS | | | | | | | | | | | | |
Net Realized Gain (Loss) on: | | | | | | | | | | | | |
Investments | | | 476 | | | | 49 | | | | 194,821 | |
Foreign Currency | | | — | | | | — | (1) | | | 285 | |
Foreign Currency Forward Contracts | | | — | | | | — | | | | (3,224 | ) |
Futures Contracts | | | (12 | ) | | | 11 | | | | 48,539 | |
Swap Agreements | | | (2 | ) | | | — | | | | — | |
Change in Unrealized Appreciation (Depreciation) on: | | | | | | | | | | | | |
Investments | | | 485 | | | | (9 | ) | | | 191,318 | |
Foreign Currency Forward Contracts | | | — | | | | — | (1) | | | 577 | |
Futures Contracts | | | 31 | | | | 4 | | | | 4,425 | |
Swap Agreements | | | 1 | | | | — | | | | — | |
| | | | | | | | | | | | |
Net Realized and Unrealized Gain (Loss) on Investments | | | 979 | | | | 55 | | | | 436,741 | |
| | | | | | | | | | | | |
INCREASE IN NET ASSETS RESULTING FROM OPERATIONS | | $ | 1,726 | | | $ | 246 | | | $ | 649,981 | |
| | | | | | | | | | | | |
| (1) | Amount rounds to less than $1. |
See accompanying notes to financial statements.
86
TCW Funds, Inc.
Statements of Changes in Net Assets
| | | | | | | | | | | | | | | | |
| | | TCW
Core Fixed Income
Fund | | | TCW
Enhanced Commodity Strategy
Fund (1) | |
| | | Year Ended
October 31,
2019 | | | Year Ended
October 31,
2018 | | | Year Ended
October 31,
2019 | | | Year Ended
October 31,
2018 | |
| | | Dollar Amounts in Thousands | |
OPERATIONS | | | | | | | | | | | | | | | | |
Net Investment Income | | $ | 31,433 | | | $ | 35,592 | | | $ | 45 | | | $ | 34 | |
Net Realized Gain (Loss) on Investments, Futures Contracts, Swap Agreements and Foreign Currency Transactions | | | 39,792 | | | | (32,201 | ) | | | (154 | ) | | | (16 | ) |
Change in Unrealized Appreciation (Depreciation) on Investments, Futures Contracts, Foreign Currency Transactions and Swap Agreements | | | 57,265 | | | | (33,832 | ) | | | 73 | | | | (78 | ) |
| | | | | | | | | | | | | | | | |
Increase (Decrease) in Net Assets Resulting from Operations | | | 128,490 | | | | (30,441 | ) | | | (36 | ) | | | (60 | ) |
| | | | | | | | | | | | | | | | |
DISTRIBUTIONS TO SHAREHOLDERS | | | | | | | | | | | | | | | | |
Distributions to Shareholders | | | (32,114 | ) | | | (36,700 | ) | | | (38 | ) | | | (32 | ) |
| | | | | | | | | | | | | | | | |
NET CAPITAL SHARE TRANSACTIONS | | | | | | | | | | | | | | | | |
I Class | | | (104,699 | ) | | | (349,830 | ) | | | (411 | ) | | | 522 | |
N Class | | | (50,892 | ) | | | (72,937 | ) | | | 14 | | | | 10 | |
| | | | | | | | | | | | | | | | |
Increase (Decrease) in Net Assets Resulting from Net Capital Shares Transactions | | | (155,591 | ) | | | (422,767 | ) | | | (397 | ) | | | 532 | |
| | | | | | | | | | | | | | | | |
Increase (Decrease) in Net Assets | | | (59,215 | ) | | | (489,908 | ) | | | (471 | ) | | | 440 | |
NET ASSETS | | | | | | | | | | | | | | | | |
Beginning of Year | | | 1,246,218 | | | | 1,736,126 | | | | 1,715 | | | | 1,275 | |
| | | | | | | | | | | | | | | | |
End of Year | | $ | 1,187,003 | | | $ | 1,246,218 | | | $ | 1,244 | | | $ | 1,715 | |
| | | | | | | | | | | | | | | | |
| (1) | Consolidated Statement of Changes (See Note 2). |
See accompanying notes to financial statements.
87
TCW Funds, Inc.
Statements of Changes in Net Assets
| | | | | | | | | | | | | | | | |
| | | TCW
Global Bond
Fund | | | TCW
High Yield Bond
Fund | |
| | | Year Ended
October 31,
2019 | | | Year Ended
October 31,
2018 | | | Year Ended
October 31,
2019 | | | Year Ended
October 31,
2018 | |
| | | Dollar Amounts in Thousands | |
OPERATIONS | | | | | | | | | | | | | | | | |
Net Investment Income | | $ | 412 | | | $ | 326 | | | $ | 747 | | | $ | 692 | |
Net Realized Gain (Loss) on Investments, Futures Contracts, Swap Agreements and Foreign Currency Transactions | | | 305 | | | | (379 | ) | | | 462 | | | | 34 | |
Change in Unrealized Appreciation (Depreciation) on Investments, Futures Contracts, Foreign Currency Transactions and Swap Agreements | | | 929 | | | | (359 | ) | | | 517 | | | | (517 | ) |
| | | | | | | | | | | | | | | | |
Increase (Decrease) in Net Assets Resulting from Operations | | | 1,646 | | | | (412 | ) | | | 1,726 | | | | 209 | |
| | | | | | | | | | | | | | | | |
DISTRIBUTIONS TO SHAREHOLDERS | | | | | | | | | | | | | | | | |
Distributions to Shareholders | | | (260 | ) | | | (109 | ) | | | (826 | ) | | | (799 | ) |
| | | | | | | | | | | | | | | | |
NET CAPITAL SHARE TRANSACTIONS | | | | | | | | | | | | | | | | |
I Class | | | 141 | | | | 67 | | | | 11,288 | | | | (6,067 | ) |
N Class | | | 158 | | | | 42 | | | | 4,508 | | | | (1,682 | ) |
| | | | | | | | | | | | | | | | |
Increase (Decrease) in Net Assets Resulting from Net Capital Shares Transactions | | | 299 | | | | 109 | | | | 15,796 | | | | (7,749 | ) |
| | | | | | | | | | | | | | | | |
Increase (Decrease) in Net Assets | | | 1,685 | | | | (412 | ) | | | 16,696 | | | | (8,339 | ) |
NET ASSETS | | | | | | | | | | | | | | | | |
Beginning of Year | | | 15,981 | | | | 16,393 | | | | 12,790 | | | | 21,129 | |
| | | | | | | | | | | | | | | | |
End of Year | | $ | 17,666 | | | $ | 15,981 | | | $ | 29,486 | | | $ | 12,790 | |
| | | | | | | | | | | | | | | | |
See accompanying notes to financial statements.
88
TCW Funds, Inc.
Statements of Changes in Net Assets | October 31, 2019 |
| | | | | | | | | | | | | | | | |
| | | TCW
Short Term
Bond Fund | | | TCW
Total Return
Bond Fund | |
| | | Year Ended
October 31,
2019 | | | Year Ended
October 31,
2018 | | | Year Ended
October 31,
2019 | | | Year Ended
October 31,
2018 | |
| | | Dollar Amounts in Thousands | |
OPERATIONS | | | | | | | | | | | | | | | | |
Net Investment Income | | $ | 191 | | | $ | 131 | | | $ | 213,240 | | | $ | 250,578 | |
Net Realized Gain (Loss) on Investments, Futures Contracts and Foreign Currency Transactions | | | 60 | | | | (23 | ) | | | 240,421 | | | | (199,454 | ) |
Change in Unrealized Appreciation (Depreciation) on Investments, Foreign Currency Transactions and Futures Contracts | | | (5 | ) | | | (17 | ) | | | 196,320 | | | | (193,099 | ) |
| | | | | | | | | | | | | | | | |
Increase (Decrease) in Net Assets Resulting from Operations | | | 246 | | | | 91 | | | | 649,981 | | | | (141,975 | ) |
| | | | | | | | | | | | | | | | |
DISTRIBUTIONS TO SHAREHOLDERS | | | | | | | | | | | | | | | | |
Distributions to Shareholders | | | (199 | ) | | | (167 | ) | | | (252,214 | ) | | | (275,920 | ) |
| | | | | | | | | | | | | | | | |
NET CAPITAL SHARE TRANSACTIONS | | | | | | | | | | | | | | | | |
I Class | | | (1,683 | ) | | | (595 | ) | | | (1,022,016 | ) | | | (1,172,213 | ) |
N Class | | | — | | | | — | | | | (223,545 | ) | | | (706,623 | ) |
| | | | | | | | | | | | | | | | |
Decrease in Net Assets Resulting from Net Capital Shares Transactions | | | (1,683 | ) | | | (595 | ) | | | (1,245,561 | ) | | | (1,878,836 | ) |
| | | | | | | | | | | | | | | | |
Decrease in Net Assets | | | (1,636 | ) | | | (671 | ) | | | (847,794 | ) | | | (2,296,731 | ) |
NET ASSETS | | | | | | | | | | | | | | | | |
Beginning of Year | | | 7,280 | | | | 7,951 | | | | 6,709,409 | | | | 9,006,140 | |
| | | | | | | | | | | | | | | | |
End of Year | | $ | 5,644 | | | $ | 7,280 | | | $ | 5,861,615 | | | $ | 6,709,409 | |
| | | | | | | | | | | | | | | | |
See accompanying notes to financial statements.
89
TCW Funds, Inc.
Notes to Financial Statements
Note 1 — Organization
TCW Funds, Inc., a Maryland corporation (the “Company”), is an open-end management investment company registered under the Investment Company Act of 1940, as amended (the “1940 Act”), that currently offers 19 no-load mutual funds (each series a “Fund” and collectively the “Funds”). TCW Investment Management Company LLC (the “Advisor”) is the investment advisor to and an affiliate of the Funds and is registered under the Investment Advisers Act of 1940, as amended. Each Fund has distinct investment objectives and strategies. The following is a brief description of the investment objectives and principal investment strategies for the Funds that are covered in this report:
| | |
TCW Fund | | Investment Objectives and Principal Investment
Strategies |
| Diversified Fixed Income Funds | | |
| |
| TCW Core Fixed Income Fund | | Seeks to maximize current income and achieve above average total return consistent with prudent investment management over a full market cycle by investing at least 80% of the value of its net assets in debt securities; uses a controlled risk approach and active asset allocation; monitors the duration of portfolio securities to seek to mitigate exposure to interest rate risk. |
| |
| TCW Enhanced Commodity Strategy Fund | | Seeks total return which exceeds that of its commodity benchmark by investing in commodity linked derivative instruments backed by a portfolio of fixed income instruments. |
| |
| TCW Global Bond Fund | | Seeks total return by investing at least 80% of its net assets in debt securities of government and corporate issuers; invests in securities of issuers located in at least three countries, representing at least 30% of its net assets in securities of issuers located outside the United States. |
| |
| TCW High Yield Bond Fund | | Seeks to maximize income and achieve above average total return consistent with reasonable risk over a full market cycle by investing at least 80% of the value of its net assets in high yield/below investment grade bonds, commonly known as “junk-bonds”. |
| |
| TCW Short Term Bond Fund | | Seeks to maximize current income by investing at least 80% of the value of its net assets in a diversified portfolio of debt securities of varying maturities including bonds, notes and other similar fixed income instruments issued by governmental or private sector issuers. |
90
TCW Funds, Inc.
Note 1 — Organization (Continued)
| | |
TCW Fund | | Investment Objectives and Principal Investment
Strategies |
| TCW Total Return Bond Fund | | Seeks to maximize current income and achieve above average total return consistent with prudent investment management over a full market cycle by investing at least 80% of the value of its net assets in debt securities; invests at least 50% of the value in securitized obligations guaranteed by the U.S. government or its agencies, instrumentalities or sponsored corporations, privately issued mortgage-backed and asset-backed securities rated at time of investment Aa3 or higher by Moody’s, AA- or higher by Standard & Poor’s or the equivalent by any other nationally recognized statistical organization, other obligations of the U.S. government or its agencies, instrumentalities or sponsored corporations, and money market instruments. |
All Funds, except for the TCW Short Term Bond Fund, offer two classes of shares: I Class and N Class. The TCW Short Term Bond Fund offers only the I Class shares. The two classes of a Fund are substantially the same except that the N Class shares are subject to a distribution fee (see Note 6).
Note 2 — Significant Accounting Policies
The following is a summary of significant accounting policies, which are in conformity with accounting principles generally accepted in the United States of America (“GAAP”) and which are consistently followed by the Funds in the preparation of their financial statements. Each Fund is considered an investment company under the Financial Accounting Standards Board (FASB) Accounting Standards Codification (ASC) No. 946, Financial Services — Investment Companies. Subsequent events, if any, have been evaluated through the date of issuance in the preparation of the financial statements.
Principles of Accounting: The Funds use the accrual method of accounting for financial reporting purposes.
Principles of Consolidation: The TCW Cayman Enhanced Commodity Fund, Ltd. (the “Subsidiary”), a Cayman Islands exempted company, was incorporated as a wholly owned subsidiary acting as an investment vehicle for the TCW Enhanced Commodity Strategy Fund (the “Parent”) in order to effect certain investments for the Parent consistent with the Parent’s investment objectives and policies as specified in its prospectus and statement of additional information. The accompanying financial statements are consolidated and include the accounts of the Subsidiary. The Parent may invest up to 25% of its total assets in the Subsidiary. The net assets of the Subsidiary at October 31, 2019 were $149,469 or 12.01% of the Parent’s consolidated net assets. Intercompany balances and transactions have been eliminated in consolidation.
Net Asset Value: The net asset value (“NAV”) per share of each class of a Fund is determined by dividing the Fund’s net assets attributable to each class by the number of shares issued and outstanding of that class on each day the New York Stock Exchange (“NYSE”) is open for trading.
91
TCW Funds, Inc.
Notes to Financial Statements (Continued)
Note 2 — Significant Accounting Policies (Continued)
Security Valuations: Securities listed or traded on the NYSE and other stock exchanges are valued at the latest sale price on that exchange. Securities traded on the NASDAQ stock market (“NASDAQ”) are valued using official closing prices as reported by NASDAQ, which may not be the last sale price. Investments in open-end mutual funds, including money market funds, are valued based on the NAV per share as reported by the investment companies. All other securities including short-term securities traded over the counter (“OTC”) for which market quotations are readily available are valued with prices furnished by independent pricing services or by broker dealers.
Securities for which market quotations are not readily available, including in circumstances under which it is determined by the Advisor that prices received are not reflective of their market values, are valued by the Advisor’s Pricing Committee in accordance with the guidelines established by the Valuation Committee of the Company’s Board of Directors (the “Board”, and each member thereof, a “Director”) and under the general oversight of the Board.
Fair value is defined as the price that a Fund would receive upon selling an investment in a timely transaction to an independent buyer in the principal or most advantageous market for the investment. In accordance with the authoritative guidance on fair value measurements and disclosures under GAAP, the Funds disclose investments in their financial statements in a three-tier hierarchy. This hierarchy is utilized to establish classification of fair value measurements based on inputs. Inputs that go into fair value measurement refer broadly to the assumptions that market participants would use in pricing the asset or liability, including assumptions about risk. Inputs may be observable or unobservable. Observable inputs are inputs that reflect the assumptions market participants would use in pricing the asset or liability developed based on market data obtained from sources independent of the reporting entity. Unobservable inputs are inputs that reflect the reporting entity’s own assumptions about the inputs market participants would use in pricing the asset or liability developed based on the best information available in the circumstances.
The three-tier hierarchy of inputs is summarized in three broad levels listed below.
| | |
| Level 1 — | | quoted prices in active markets for identical investments. |
| Level 2 — | | other significant observable inputs (including quoted prices for similar investments, interest rates, prepayment speeds, credit risk, etc.). |
| Level 3 — | | significant unobservable inputs (including the Funds’ own assumptions in determining the fair value of investments). |
Changes in valuation techniques may result in transfers in or out of an investment’s assigned Level within the hierarchy. The inputs or methodologies used for valuing investments are not necessarily an indication of the risk associated with investing in those investments and the determination of the significance of a particular input to the fair value measurement in its entirety requires judgment and consideration of factors specific to each security.
The availability of observable inputs can vary from security to security and is affected by a wide variety of factors, including, for example, the type of security, whether the security is new and not yet established in the marketplace, the liquidity of markets, and other characteristics particular to the security. To the extent that valuation is based on models or inputs that are less observable or unobservable in the market, the determination of fair value requires more judgment. Accordingly, the degree of judgment exercised in determining fair value is greatest for instruments categorized in Level 3.
92
TCW Funds, Inc.
Note 2 — Significant Accounting Policies (Continued)
In periods of market dislocation, the observability of prices and inputs may be reduced for many instruments. This condition, as well as changes related to liquidity of investments, could cause a security to be reclassified between Level 1, Level 2, or Level 3.
In certain cases, the inputs used to measure fair value may fall into different levels of the fair value hierarchy. In such cases, for disclosure purposes the level in the fair value hierarchy within which the fair value measurement falls in its entirety is determined based on the lowest level input that is significant to the fair value measurement.
Fair Value Measurements: Descriptions of the valuation techniques applied to the Funds’ major categories of assets and liabilities measured at fair value on a recurring basis are as follows:
Asset-backed securities (“ABS”) and mortgage-backed securities (“MBS”). The fair value of ABS and MBS is estimated based on pricing models that consider the estimated cash flows of each debt tranche of the issuer, establish a benchmark yield, and develop an estimated tranche specific spread to the benchmark yield based on the unique attributes of the tranche including, but not limited to, the prepayment speed assumptions and attributes of the collateral. To the extent the inputs are observable and timely, the values would be categorized in Level 2 of the fair value hierarchy; otherwise, they would be categorized in Level 3.
Bank loans. The fair value of bank loans is estimated using recently executed transactions, market price quotations, credit/market events, and cross-asset pricing. Inputs are generally observable and are obtained from independent sources. Bank loans are generally categorized in Level 2 of the fair value hierarchy.
Corporate bonds. The fair value of corporate bonds is estimated using recently executed transactions, market price quotations (where observable), bond spreads, or credit default swap spreads adjusted for any basis difference between cash and derivative instruments. Corporate bonds are generally categorized in Level 2 of the fair value hierarchy.
Foreign currency contracts. The fair values of foreign currency contracts are derived from indices, reference rates, and other inputs or a combination of these factors. To the extent that these factors can be observed, foreign currency contracts are categorized in Level 2 of the fair value hierarchy.
Futures contracts. Futures contracts are generally valued at the settlement price established at the close of business each day by the exchange on which they are traded. They are categorized in Level 1.
Government and agency securities. Government and agency securities are normally valued using a model that incorporates market observable data such as reported sales of similar securities, broker quotes, yields, bids, offers, quoted market prices, and reference data. Accordingly, government and agency securities are normally categorized in Level 1 or 2 of the fair value hierarchy depending on the liquidity and transparency of the market.
Interest rate and total return swaps. Interest rate and total return swaps are fair valued using pricing models that take into account among other factors, index spread curves, nominal values, modified duration values and cash flows. To the extent that these inputs are observable and timely, the fair values of interest rate and total return swaps would be categorized as Level 2; otherwise, the fair values would be categorized in Level 3.
Money market funds. Money market funds are open-end mutual funds that invest in short-term debt securities. To the extent that these funds are valued based upon the reported NAV, they are categorized in Level 1 of the fair value hierarchy.
93
TCW Funds, Inc.
Notes to Financial Statements (Continued)
Note 2 — Significant Accounting Policies (Continued)
Municipal bonds. Municipal bonds are fair valued based on pricing models that take into account, among other factors, information received from market makers and broker-dealers, current trades, bid wants lists, offerings, market movements, the callability of the bond, state of issuance, benchmark yield curves, and bond insurance. To the extent that these inputs are observable and timely, the fair values of municipal bonds are categorized in Level 2; otherwise, the fair values are categorized in Level 3.
Restricted securities. Restricted securities, including illiquid Rule 144A securities, issued by non-public entities are included in Level 3 of the fair value hierarchy because they trade infrequently, and therefore, the inputs are unobservable. Any other restricted securities valued similar to publicly traded securities may be categorized in Level 2 or 3 of the fair value hierarchy depending on whether a discount is applied and significant to the fair value.
Short-term investments. Short-term investments are valued using market price quotations, and are reflected in Level 1 or Level 2 of the fair value hierarchy.
The summary of the inputs used as of October 31, 2019 is listed after the Schedule of Investments for each Fund.
Following is a reconciliation of investments in which significant unobservable inputs (Level 3) were used in determining value:
| | | | | | | | | | | | | | | | |
| | | TCW Core
Fixed
Income Fund | | | TCW
Global
Bond Fund | | | TCW
High Yield
Bond Fund | | | TCW
Total Return
Bond Fund | |
Balance as of October 31, 2018 | | $ | 1,036,315 | | | $ | 127,112 | | | $ | 47,685 | | | $ | 5,610,158 | |
Accrued Discounts (Premiums) | | | (1,464 | ) | | | 16,425 | | | | — | | | | (748,666 | ) |
Realized Gain (Loss) | | | (4,192 | ) | | | | | | | — | | | | 9,999 | |
Change in Unrealized Appreciation | | | 48,327 | | | | (39,321 | ) | | | (22,440 | ) | | | 56,394 | |
Purchases | | | — | | | | — | | | | — | | | | 69,075 | |
Sales | | | (94,580 | ) | | | — | | | | — | | | | (80,374 | ) |
Transfers in to Level 3 | | | — | | | | — | | | | — | | | | — | |
Transfers out of Level 3 | | | — | | | | — | | | | — | | | | — | |
| | | | | | | | | | | | | | | | |
Balance as of October 31, 2019 | | $ | 984,406 | | | $ | 104,216 | | | $ | 25,245 | | | $ | 4,916,586 | |
| | | | | | | | | | | | | | | | |
Change in Unrealized Appreciation from Investments Still Held at October 31, 2019 | | $ | 48,327 | | | $ | (39,321 | ) | | $ | (22,440 | ) | | $ | 55,544 | |
| | | | | | | | | | | | | | | | |
Significant unobservable valuations inputs for Level 3 investments as of October 31, 2019 are as follows:
| | | | | | | | | | | | |
Description | | Fair Value at
10/31/2019 | | | Valuation Techniques* | | Unobservable
Input | | Price or Price
Range | | Average
Weighted
Price |
TCW Core Fixed Income Fund |
Corporate Bonds | | $ | 984,406 | | | Third-party Vendor | | Vendor Prices | | $113.226 | | $113.226 |
TCW Global Bond Fund |
Residential Mortgage-Backed Securities — Non-Agency | | $ | 104,216 | | | Third-party Vendor | | Vendor Prices | | $8.326 | | $8.326 |
TCW High Yield Bond Fund |
Common Stocks | | $ | 25,245 | | | Third-party Vendor | | Vendor Prices | | $4.500 | | $4.500 |
TCW Total Return Bond Fund |
Residential Mortgage-Backed Securities — Non-Agency | | $ | 7,217 | | | Third-party Vendor | | Vendor Prices | | $10.897 | | $10.897 |
Residential Mortgage-Backed Securities — Non-Agency (Interest Only, Collateral Strip Rate Securities) | | $ | 4,909,369 | | | Third-party Vendor | | Vendor Prices | | $0.788–2.637 | | $1.786 |
| * | The valuation technique employed on the Level 3 securities involves the use of the vendor prices. The Advisor monitors the effectiveness of vendor pricing using the Advisor’s own model and inputs. |
94
TCW Funds, Inc.
Note 2 — Significant Accounting Policies (Continued)
Security Transactions and Related Investment Income: Security transactions are recorded as of the trade date. Dividend income is recorded on the ex-dividend date. Interest income is recognized on an accrual basis. Realized gains and losses on investments are recorded on the basis of specific identification.
Allocation of Operating Activity for Multiple Classes: Investment income, common expenses and realized and unrealized gains and losses are allocated among the classes of shares of a Fund based on the relative net assets of each class. Distribution fees, which are directly attributable to a class of shares, are charged to the operations of that class. All other expenses are charged to each Fund or class as incurred on a specific identification basis. Differences in class specific fees and expenses will result in differences in net investment income, and in turn differences in dividends paid by each class.
Dividends and Distributions: Dividends and distributions to shareholders are recorded on the ex-dividend date. The TCW Enhanced Commodity Strategy Fund declares and pays, or reinvests, dividends from net investment income quarterly. The other Fixed Income Funds declare and pay, or reinvest, dividends from net investment income monthly. Any net long-term and net short-term capital gains earned by a Fund will be distributed at least annually.
Income and capital gain distributions are determined in accordance with income tax regulations which may differ from GAAP. These differences are primarily due to differing treatments for foreign currency transactions, market discount and premium, losses deferred due to wash sales, excise tax regulations and employing equalization in determining amounts to be distributed to Fund shareholders. Permanent book and tax basis differences relating to shareholder distributions will result in reclassifications between paid-in capital, undistributed net investment income (loss), and/or undistributed accumulated realized gain (loss). Undistributed net investment income or loss may include temporary book and tax basis differences which will reverse in subsequent periods. Any taxable income or capital gain remaining at fiscal year-end is distributed in the following year.
Use of Estimates: The preparation of the accompanying financial statements requires management to make estimates and assumptions that affect the reported amount of assets and liabilities at the date of the financial statements and the reported amounts of income and expenses during the reporting period. Actual results could differ from these estimates.
Foreign Currency Translation: The books and records of each Fund are maintained in U.S. dollars as follows: (1) the foreign currency denominated securities and other assets and liabilities stated in foreign currencies are translated using the daily spot rate; and (2) purchases, sales, income and expenses are translated at the rate of exchange prevailing on the respective dates of such transactions. The resultant exchange gains and losses are included in net realized or net unrealized gain (loss) in the Statements of Operations. Pursuant to U.S. federal income tax regulations, certain foreign exchange gains and losses included in realized and unrealized gains and losses are included in, or are a reduction of, ordinary income for federal income tax purposes.
Foreign Taxes: The Funds may be subject to withholding taxes on income and capital gains imposed by certain countries in which they invest. The withholding tax on income is netted against the income accrued or received. Any reclaimable taxes are recorded as income. The withholding tax on realized or unrealized gain is recorded as a liability.
Derivative Instruments: Derivatives are financial instruments whose values are based on the values of one or more indicators, such as a security, asset, currency, interest rate, or index. Derivative transactions
95
TCW Funds, Inc.
Notes to Financial Statements (Continued)
Note 2 — Significant Accounting Policies (Continued)
can create investment leverage and may be highly volatile. A derivative contract may result in a mark to market loss if the value of the contract decreases due to an unfavorable change in the market rates or values of the underlying instrument. It is possible that a derivative transaction will result in a loss greater than the principal amount invested. The Funds may not be able to close out a derivative transaction at a favorable time or price.
For the year ended October 31, 2019 , the following Funds had derivatives and transactions in derivatives, grouped in the following risk categories (amounts in thousands except notional amounts or number of contracts):
TCW Core Fixed Income Fund
| | | | | | | | | | | | | | | | | | | | |
| | | Credit Risk | | | Commodity
Risk | | | Foreign
Currency
Risk | | | Interest
Rate
Risk | | | Total | |
Statement of Asset and Liabilities | | | | | | | | | | | | | | | | | | | | |
Asset Derivatives | | | | | | | | | | | | | | | | | | | | |
Swap Agreements | | $ | — | | | $ | — | | | $ | — | | | $ | 1,476 | | | $ | 1,476 | |
Futures Contracts (1) | | | — | | | | — | | | | — | | | | 24 | | | | 24 | |
Forward Contracts | | | — | | | | — | | | | 87 | | | | — | | | | 87 | |
| | | | | | | | | | | | | | | | | | | | |
Total Value | | $ | — | | | $ | — | | | $ | 87 | | | $ | 1,500 | | | $ | 1,587 | |
| | | | | | | | | | | | | | | | | | | | |
| | | | | | | | | | | | | | | | | | | | |
Liability Derivatives | | | | | | | | | | | | | | | | | | | | |
Forward Contracts | | $ | — | | | $ | — | | | $ | (17 | ) | | $ | — | | | $ | (17 | ) |
Swap Agreements | | | — | | | | — | | | | — | | | | (1,621 | ) | | | (1,621 | ) |
Futures Contracts (1) | | | — | | | | — | | | | — | | | | (276 | ) | | | (276 | ) |
| | | | | | | | | | | | | | | | | | | | |
Total Value | | $ | — | | | $ | — | | | $ | (17 | ) | | $ | (1,897 | ) | | $ | (1,914 | ) |
| | | | | | | | | | | | | | | | | | | | |
| | | | | | | | | | | | | | | | | | | | |
Statement of Operations: | | | | | | | | | | | | | | | | | | | | |
Realized Gain (Loss) | | | | | | | | | | | | | | | | | | | | |
Forward Contracts | | $ | — | | | $ | — | | | $ | (409 | ) | | $ | — | | | $ | (409 | ) |
Futures Contracts | | | — | | | | — | | | | — | | | | 7,527 | | | | 7,527 | |
Swap Agreements | | | — | | | | — | | | | — | | | | 6 | | | | 6 | |
| | | | | | | | | | | | | | | | | | | | |
Total Realized Gain (Loss) | | $ | — | | | $ | — | | | $ | (409 | ) | | $ | 7,533 | | | $ | 7,124 | |
| | | | | | | | | | | | | | | | | | | | |
| | | | | | | | | | | | | | | | | | | | |
Change in Appreciation (Depreciation) | |
Forward Contracts | | $ | — | | | $ | — | | | $ | 63 | | | $ | — | | | $ | 63 | |
Futures Contracts | | | — | | | | — | | | | — | | | | 1,320 | | | | 1,320 | |
Swap Agreements | | | — | | | | — | | | | — | | | | (145 | ) | | | (145 | ) |
| | | | | | | | | | | | | | | | | | | | |
Total Change in Appreciation (Depreciation) | | $ | — | | | $ | — | | | $ | 63 | | | $ | 1,175 | | | $ | 1,238 | |
| | | | | | | | | | | | | | | | | | | | |
| | | | | | | | | | | | | | | | | | | | |
Number of Contracts or Notional Amounts (3) | | | | | | | | | | | | | | | | | | | | |
Forward Currency Contracts | | | $ — | | | | $ — | | | | $15,534,097 | | | | $ — | | | | $15,534,097 | |
Futures Contracts | | | — | | | | — | | | | — | | | | 1,372 | | | | 1,372 | |
Swap Agreements | | | $ — | | | | $ — | | | | $ — | | | | $11,572,500 | | | | $11,572,500 | |
96
TCW Funds, Inc.
Note 2 — Significant Accounting Policies (Continued)
TCW Enhanced Commodity Strategy Fund
| | | | | | | | | | | | | | | | | | | | |
| | | Credit Risk | | | Commodity
Risk | | | Foreign
Currency
Risk | | | Interest
Rate Risk | | | Total | |
Statement of Asset and Liabilities | | | | | | | | | | | | | | | | | | | | |
Asset Derivatives | | | | | | | | | | | | | | | | | | | | |
Swap Agreements | | $ | — | | | $ | 9 | | | $ | — | | | $ | — | | | $ | 9 | |
| | | | | | | | | | | | | | | | | | | | |
Total Value | | $ | — | | | $ | 9 | | | $ | — | | | $ | — | | | $ | 9 | |
| | | | | | | | | | | | | | | | | | | | |
| | | | | | | | | | | | | | | | | | | | |
Statement of Operations: | | | | | | | | | | | | | | | | | | | | |
Realized Gain (Loss) | | | | | | | | | | | | | | | | | | | | |
Swap Agreements | | $ | — | | | $ | (159 | ) | | $ | — | | | $ | — | | | $ | (159 | ) |
| | | | | | | | | | | | | | | | | | | | |
Total Realized Gain (Loss) | | $ | — | | | $ | (159 | ) | | $ | — | | | $ | — | | | $ | (159 | ) |
| | | | | | | | | | | | | | | | | | | | |
| | | | | | | | | | | | | | | | | | | | |
Change in Appreciation (Depreciation) | |
Swap Agreements | | $ | — | | | $ | 65 | | | $ | — | | | $ | — | | | $ | 65 | |
| | | | | | | | | | | | | | | | | | | | |
Total Realized Gain (Loss) | | $ | — | | | $ | 65 | | | $ | — | | | $ | — | | | $ | 65 | |
| | | | | | | | | | | | | | | | | | | | |
| | | | | | | | | | | | | | | | | | | | |
Notional Amounts (3) | |
Swaps Agreements | | | $ — | | | | $1,271,026 | | | | $ — | | | | $ — | | | | $1,271,026 | |
TCW Global Bond Fund
| | | | | | | | | | | | | | | | | | | | |
| | | Credit Risk | | | Commodity
Risk | | | Foreign
Currency
Risk | | | Interest
Rate
Risk | | | Total | |
Statement of Asset and Liabilities | | | | | | | | | | | | | | | | | | | | |
Asset Derivatives | | | | | | | | | | | | | | | | | | | | |
Futures Contracts (1) | | $ | — | | | $ | — | | | $ | — | | | $ | — | (2) | | $ | — | |
Forward Contracts | | | — | | | | — | | | | 14 | | | | — | | | | 14 | |
| | | | | | | | | | | | | | | | | | | | |
Total Value | | $ | — | | | $ | — | | | $ | 14 | | | $ | — | | | $ | 14 | |
| | | | | | | | | | | | | | | | | | | | |
Liability Derivatives | | | | | | | | | | | | | | | | | | | | |
Forward Contracts | | $ | — | | | $ | — | | | $ | (18 | ) | | $ | — | | | $ | (18 | ) |
Futures Contracts (1) | | | — | | | | — | | | | — | | | | (26 | ) | | | (26 | ) |
| | | | | | | | | | | | | | | | | | | | |
Total Value | | $ | — | | | $ | — | | | $ | (18 | ) | | $ | (26 | ) | | $ | (44 | ) |
| | | | | | | | | | | | | | | | | | | | |
Statement of Operations: | | | | | | | | | | | | | | | | | | | | |
Realized Gain (Loss) | | | | | | | | | | | | | | | | | | | | |
Forward Contracts | | $ | — | | | $ | — | | | $ | (19 | ) | | $ | — | | | $ | (19 | ) |
Futures Contracts | | | — | | | | — | | | | — | | | | 310 | | | | 310 | |
| | | | | | | | | | | | | | | | | | | | |
Total Realized Gain (Loss) | | $ | — | | | $ | — | | | $ | (19 | ) | | $ | 310 | | | $ | 291 | |
| | | | | | | | | | | | | | | | | | | | |
Change in Appreciation (Depreciation) | | | | | | | | | | | | | | | | | | | | |
Forward Contracts | | $ | — | | | $ | — | | | $ | 5 | | | $ | — | | | $ | 5 | |
Futures Contracts | | | — | | | | — | | | | — | | | | 36 | | | | 36 | |
| | | | | | | | | | | | | | | | | | | | |
Total Change in Appreciation (Depreciation) | | $ | — | | | $ | — | | | $ | 4 | | | $ | 40 | | | $ | 44 | |
| | | | | | | | | | | | | | | | | | | | |
Number of Contracts or Notional Amounts (3) | | | | | |
Forward Currency Contracts | | | $ — | | | | $ — | | | | $2,998,209 | | | | $ — | | | | $2,998,209 | |
Futures Contracts | | | — | | | | — | | | | — | | | | 33 | | | | 33 | |
97
TCW Funds, Inc.
Notes to Financial Statements (Continued)
Note 2 — Significant Accounting Policies (Continued)
TCW High Yield Bond Fund
| | | | | | | | | | | | | | | | | | | | |
| | | Credit Risk | | | Commodity
Risk | | | Foreign
Currency
Risk | | | Interest
Rate
Risk | | | Total | |
Statement of Asset and Liabilities | | | | | | | | | | | | | | | | | | | | |
Asset Derivatives | | | | | |
Futures Contracts (1) | | $ | — | | | $ | — | | | $ | — | | | $ | 31 | | | $ | 31 | |
| | | | | | | | | | | | | | | | | | | | |
Total Value | | $ | — | | | $ | — | | | $ | — | | | $ | 31 | | | $ | 31 | |
| | | | | | | | | | | | | | | | | | | | |
Liability Derivatives | | | | | |
Futures Contracts (1) | | $ | — | | | $ | — | | | $ | — | | | $ | — | (2) | | $ | — | |
| | | | | | | | | | | | | | | | | | | | |
Total Value | | $ | — | | | $ | — | | | $ | — | | | $ | — | | | $ | — | |
| | | | | | | | | | | | | | | | | | | | |
Statement of Operations: | | | | | |
Realized Gain (Loss) | | | | | |
Futures Contracts | | $ | — | | | $ | — | | | $ | — | | | $ | (12 | ) | | $ | (12 | ) |
Swap Agreements | | | (2 | ) | | | — | | | | — | | | | — | | | | (2 | ) |
| | | | | | | | | | | | | | | | | | | | |
Total Realized Gain (Loss) | | $ | (2 | ) | | $ | — | | | $ | — | | | $ | (12 | ) | | $ | (14 | ) |
| | | | | | | | | | | | | | | | | | | | |
Change in Appreciation (Depreciation) | | | | | |
Futures Contracts | | $ | — | | | $ | — | | | $ | — | | | $ | 31 | | | $ | 31 | |
Swap Agreements | | | 1 | | | | — | | | | — | | | | — | | | | 1 | |
| | | | | | | | | | | | | | | | | | | | |
Total Change in Appreciation (Depreciation) | | $ | 1 | | | $ | — | | | $ | — | | | $ | 31 | | | $ | 32 | |
| | | | | | | | | | | | | | | | | | | | |
Number of Contracts or Notional Amounts (3) | | | | | |
Futures Contracts | | | — | | | | — | | | | — | | | | 37 | | | | 37 | |
Swap Agreements | | | $250,000 | | | | $ — | | | | $ — | | | | $ — | | | | $250,000 | |
TCW Short Term Bond Fund
| | | | | | | | | | | | | | | | | | | | |
| | | Credit Risk | | | Commodity
Risk | | | Foreign
Currency
Risk | | | Interest
Rate
Risk | | | Total | |
Statement of Asset and Liabilities | | | | | | | | | | | | | | | | | | | | |
Asset Derivatives | | | | | |
Forward Contracts | | $ | — | | | $ | — | | | $ | — | (2) | | $ | — | (2) | | $ | — | |
| | | | | | | | | | | | | | | | | | | | |
Total Value | | $ | — | | | $ | — | | | $ | — | | | $ | — | | | $ | — | |
| | | | | | | | | | | | | | | | | | | | |
Liability Derivatives | | | | | |
Forward Contracts | | $ | — | | | $ | — | | | $ | — | (2) | | $ | — | | | $ | — | |
Futures Contracts (1) | | $ | — | | | | — | | | | — | | | | (1 | ) | | | (1 | ) |
| | | | | | | | | | | | | | | | | | | | |
Total Value | | $ | — | | | $ | — | | | $ | — | | | $ | (1 | ) | | $ | (1 | ) |
| | | | | | | | | | | | | | | | | | | | |
Statement of Operations: | | | | | |
Realized Gain (Loss) | | | | | |
Futures Contracts | | $ | — | | | $ | — | | | $ | — | | | $ | 11 | | | $ | 11 | |
| | | | | | | | | | | | | | | | | | | | |
Total Realized Gain (Loss) | | $ | — | | | $ | — | | | $ | — | | | $ | 11 | | | $ | 11 | |
| | | | | | | | | | | | | | | | | | | | |
Change in Appreciation (Depreciation) | | | | | |
Futures Contracts | | $ | — | | | $ | — | | | $ | — | | | $ | 4 | | | $ | 4 | |
Forward Contracts | | $ | — | | | | — | | | | — | (2) | | | — | | | | — | |
| | | | | | | | | | | | | | | | | | | | |
Total Change in Appreciation (Depreciation) | | $ | — | | | $ | — | | | $ | — | | | $ | 4 | | | $ | 4 | |
| | | | | | | | | | | | | | | | | | | | |
Number of Contracts or Notional Amounts (3) | | | | | |
Forward Currency Contracts | | | $ — | | | | $ — | | | | $139,371 | | | | $ — | | | | $139,371 | |
Futures Contracts | | | — | | | | — | | | | — | | | | 3 | | | | 3 | |
98
TCW Funds, Inc.
Note 2 — Significant Accounting Policies (Continued)
TCW Total Return Bond Fund
| | | | | | | | | | | | | | | | | | | | |
| | | Credit Risk | | | Commodity
Risk | | | Foreign
Currency
Risk | | | Interest
Rate
Risk | | | Total | |
Statement of Asset and Liabilities | | | | | | | | | | | | | | | | | | | | |
Asset Derivatives | | | | | |
Futures Contracts (1) | | $ | — | | | $ | — | | | $ | — | | | $ | 202 | | | $ | 202 | |
Forward Contracts | | | — | | | | — | | | | 612 | | | | — | | | | 612 | |
| | | | | | | | | | | | | | | | | | | | |
Total Value | | $ | — | | | $ | — | | | $ | 612 | | | $ | 202 | | | $ | 814 | |
| | | | | | | | | | | | | | | | | | | | |
Liability Derivatives | | | | | |
Futures Contracts (1) | | $ | — | | | $ | — | | | $ | — | | | $ | (3,347 | ) | | $ | (3,347 | ) |
| | | | | | | | | | | | | | | | | | | | |
Total Value | | $ | — | | | $ | — | | | $ | — | | | $ | (3,347 | ) | | $ | (3,347 | ) |
| | | | | | | | | | | | | | | | | | | | |
Statement of Operations: | | | | | |
Realized Gain (Loss) | | | | | |
Forward Contracts | | $ | — | | | $ | — | | | $ | (3,224 | ) | | $ | — | | | $ | (3,224 | ) |
Futures Contracts | | | — | | | | — | | | | — | | | | 48,539 | | | | 48,539 | |
| | | | | | | | | | | | | | | | | | | | |
Total Realized Gain (Loss) | | $ | — | | | $ | — | | | $ | (3,224 | ) | | $ | 48,539 | | | $ | 45,315 | |
| | | | | | | | | | | | | | | | | | | | |
Change in Appreciation (Depreciation) | | | | | |
Forward Contracts | | $ | — | | | $ | — | | | $ | 577 | | | $ | — | | | $ | 577 | |
Futures Contracts | | | — | | | | — | | | | — | | | | 4,425 | | | | 4,425 | |
| | | | | | | | | | | | | | | | | | | | |
Total Change in Appreciation (Depreciation) | | $ | — | | | $ | — | | | $ | 577 | | | $ | 4,425 | | | $ | 5,002 | |
| | | | | | | | | | | | | | | | | | | | |
Number of Contracts or Notional Amounts (3) | | | | | |
Forward Currency Contracts | | | $ — | | | | $ — | | | | $99,941,426 | | | | $ — | | | | $99,941,426 | |
Futures Contracts | | | — | | | | — | | | | — | | | | 8,036 | | | | 8,036 | |
| (1) | Includes cumulative appreciation (depreciation) of futures contracts as reported in the Schedule of Investments. Only variation margin on October 31, 2019 is reported within the Statement of Assets and Liabilities. |
| (2) | Amount rounds to less than $1. |
| (3) | Amount disclosed represents average number of contracts or notional amounts, which are representative of the volume traded for the year ended October 31, 2019. |
Counterparty Credit Risk: Derivative contracts may be exposed to counterparty risk. Losses can occur if the counterparty does not perform under the contract.
The Funds’ risk of loss from counterparty credit risk on OTC derivatives is generally limited to the aggregate unrealized gain netted against any collateral held by the Funds.
With exchange traded futures and centrally cleared swaps, there is less counterparty credit risk to the Funds since the exchange or clearinghouse, as counterparty to such instruments, guarantees against a possible default. The clearinghouse stands between the buyer and the seller of the contract; therefore, the credit risk is limited to failure of the clearinghouse. While offset rights may exist under applicable law, the Funds do not have a contractual right of offset against a clearing broker or clearinghouse in the event of a default (including the bankruptcy or insolvency) of the clearing broker or clearinghouse. Additionally, credit risk exists in exchange traded futures and centrally cleared swaps with respect to initial and variation margin that is held in a clearing broker’s customer accounts. While clearing brokers are required to segregate customer margin from their own assets, in the event that a clearing broker becomes insolvent or goes into bankruptcy and at that time there is a shortfall in the aggregate amount of margin held by the clearing broker for all its clients, typically the shortfall would be allocated on a pro rata basis across all the clearing broker’s customers, potentially resulting in losses to the Funds.
99
TCW Funds, Inc.
Notes to Financial Statements (Continued)
Note 2 — Significant Accounting Policies (Continued)
For OTC derivatives, the Funds entered into an International Swaps and Derivatives Association, Inc. Master Agreement (“ISDA Master Agreement”) with each counterparty. An ISDA Master Agreement is a bilateral agreement between the Funds and a counterparty that governs OTC derivatives and typically contains, among other things, collateral posting terms and netting provisions in the event of a default and/or termination event. Under an ISDA Master Agreement, the Funds may, under certain circumstances, offset with the counterparty certain derivative financial instruments’ payables and/or receivables with collateral held and/or posted and create one single net payment. The provisions of the ISDA Master Agreement typically permit a single net payment in the event of default including the bankruptcy or insolvency of the counterparty. However, bankruptcy or insolvency laws of a particular jurisdiction may impose restrictions on or prohibitions against the right of offset in bankruptcy, insolvency or other events. In addition, certain ISDA Master Agreements allow counterparties to OTC derivatives to terminate derivative contracts prior to maturity in the event a Fund’s net assets declines by a stated percentage or a Fund fails to meet the terms of its ISDA Master Agreements, which would cause the Fund to accelerate payment of any net liability owed to the counterparty.
Collateral requirements: For derivatives traded under an ISDA Master Agreement, the collateral requirements are typically calculated by netting the mark to market amount for each transaction under such agreement and comparing that amount to the value of any collateral pledged or received by a Fund.
Cash collateral that has been pledged to cover obligations of a Fund is reported separately on the Statement of Assets and Liabilities. Non-cash collateral pledged by a Fund, if any, is noted in the Schedule of Investments. Generally, the amount of collateral due from or to a party has to exceed a minimum transfer amount threshold, typically $250,000 or $500,000, before a transfer is required, which is determined at the close of each business day and the collateral is transferred on the next business day. To the extent amounts due to a Fund from its counterparties are not fully collateralized, contractually or otherwise, the Fund bears the risk of loss from counterparty non-performance. The Funds attempt to mitigate counterparty risk by entering into agreements only with counterparties that the Advisor believes have the financial resources to honor their obligations and by monitoring the financial stability of those counterparties. For financial reporting purposes, the Funds do not offset derivative assets and derivative liabilities that are subject to netting arrangements in the Statement of Assets and Liabilities. The Funds have implemented the disclosure requirements pursuant to FASB ASU No. 2013-01, Disclosures about Offsetting Assets and Liabilities that requires disclosures to make financial statements that are prepared under GAAP more comparable to those prepared under International Financial Reporting Standards.
The following table presents the Funds’ OTC derivatives assets and liabilities by counterparty net of amounts available for offset under an ISDA Master Agreement and net of the related collateral received by the Funds as of October 31, 2019 (in thousands):
TCW Core Fixed Income Fund
| | | | | | | | | | | | | | | | | | | | |
Counterparty | | Gross Assets
Subject to Master
Agreements | | | Gross Liabilities
Subject to Master
Agreements | | | Net Assets
(Liabilities)
Subject to Master
Agreements | | | Collateral
Pledged
(Received) | | | Net
Amount (1) | |
Citibank N.A. | | $ | — | | | $ | (17 | ) | | $ | (17 | ) | | $ | — | | | $ | (17 | ) |
Goldman Sachs & Co. | | | 87 | | | | — | | | | 87 | | | | — | | | | 87 | |
| | | | | | | | | | | | | | | | | | | | |
Total | | $ | 87 | | | $ | (17 | ) | | $ | 70 | | | $ | — | | | $ | 70 | |
| | | | | | | | | | | | | | | | | | | | |
| (1) | Represents the net amount receivable (payable) from (to) the counterparty in the event of default. |
100
TCW Funds, Inc.
Note 2 — Significant Accounting Policies (Continued)
TCW Enhanced Commodity Strategy Fund
| | | | | | | | | | | | | | | | | | | | |
Counterparty | | Gross Assets
Subject to Master
Agreements | | | Gross Liabilities
Subject to Master
Agreements | | | Net Assets
(Liabilities)
Subject to Master
Agreements | | | Collateral
Pledged
(Received) | | | Net
Amount (1) | |
Credit Suisse International | | $ | 9 | | | $ | — | | | $ | 9 | | | $ | — | | | $ | 9 | |
| | | | | | | | | | | | | | | | | | | | |
Total | | $ | 9 | | | $ | — | | | $ | 9 | | | $ | — | | | $ | 9 | |
| | | | | | | | | | | | | | | | | | | | |
| (1) | Represents the net amount receivable (payable) from (to) the counterparty in the event of default. |
TCW Global Bond Fund
| | | | | | | | | | | | | | | | | | | | |
Counterparty | | Gross Assets
Subject to Master
Agreements | | | Gross Liabilities
Subject to Master
Agreements | | | Net Assets
(Liabilities)
Subject to Master
Agreements | | | Collateral
Pledged
(Received) | | | Net
Amount (1) | |
Barclays Capital | | $ | — | | | $ | (4 | ) | | $ | (4 | ) | | $ | — | | | $ | (4 | ) |
Citibank N.A. | | | — | | | | (2 | ) | | | (2 | ) | | | — | | | | (2 | ) |
Goldman Sachs & Co. | | | 1 | | | | (1 | ) | | | — | | | | — | | | | — | |
State Street Bank & Trust Co. | | | 13 | | | | (11 | ) | | | 2 | | | | — | | | | 2 | |
| | | | | | | | | | | | | | | | | | | | |
Total | | $ | 14 | | | $ | (18 | ) | | $ | (4 | ) | | $ | — | | | $ | (4 | ) |
| | | | | | | | | | | | | | | | | | | | |
| (1) | Represents the net amount receivable (payable) from (to) the counterparty in the event of default. |
TCW Short Term Bond Fund
| | | | | | | | | | | | | | | | | | | | |
Counterparty | | Gross Assets
Subject to Master
Agreements | | | Gross Liabilities
Subject to Master
Agreements | | | Net Assets
(Liabilities)
Subject to Master
Agreements | | | Collateral
Pledged
(Received) | | | Net
Amount (1) | |
Citibank N.A. | | $ | — | (2) | | $ | — | (2) | | $ | — | (2) | | $ | — | | | $ | — | |
Goldman Sachs & Co. | | | — | (2) | | | — | (2) | | | — | (2) | | | — | | | | — | |
| | | | | | | | | | | | | | | | | | | | |
Total | | $ | — | | | $ | — | | | $ | — | | | $ | — | | | $ | — | |
| | | | | | | | | | | | | | | | | | | | |
| (1) | Represents the net amount receivable (payable) from (to) the counterparty in the event of default. |
| (2) | Amount rounds to less than $1. |
TCW Total Return Bond Fund
| | | | | | | | | | | | | | | | | | | | |
Counterparty | | Gross Assets
Subject to Master
Agreements | | | Gross Liabilities
Subject to Master
Agreements | | | Net Assets
(Liabilities)
Subject to Master
Agreements | | | Collateral
Pledged
(Received) | | | Net
Amount (1) | |
Goldman Sachs & Co. | | $ | 612 | | | $ | — | | | $ | 612 | | | $ | — | | | $ | 612 | |
| | | | | | | | | | | | | | | | | | | | |
Total | | $ | 612 | | | $ | — | | | $ | 612 | | | $ | — | | | $ | 612 | |
| | | | | | | | | | | | | | | | | | | | |
| (1) | Represents the net amount receivable (payable) from (to) the counterparty in the event of default. |
Note 3 — Portfolio Investments
Mortgage-Backed Securities: The Funds may invest in MBS which represent interests in pools of mortgages in which payments of both principal and interest on the securities are generally made monthly, in effect “passing through” monthly payments made by borrowers on the residential or commercial mortgage loans which underlie the securities (net of any fees paid to the issuer or guarantor of the securities). Mortgage pass-through securities differ from other forms of debt securities which normally provide for periodic payment of interest in fixed amounts with principal payments at maturity or specified
101
TCW Funds, Inc.
Notes to Financial Statements (Continued)
Note 3 — Portfolio Investments (Continued)
call dates. The Funds may also invest in Collateralized Mortgage Obligations (“CMOs”). CMOs are debt obligations collateralized by residential or commercial mortgage loans or residential or commercial mortgage pass-through securities. Interest and principal are generally paid monthly. CMOs may be collateralized by whole mortgage loans or private mortgage pass-through securities but are more typically collateralized by portfolios of mortgage pass-through securities guaranteed by Ginnie Mae, Freddie Mac or Fannie Mae. The issuer of a series of CMOs may elect to be treated for tax purposes as a Real Estate Mortgage Investment Conduit. CMOs are structured into multiple classes, each bearing a different stated maturity. Monthly payment of principal received from the pool of underlying mortgages, including prepayments, is first returned to investors holding the shortest maturity class. Investors holding the longer maturity classes usually receive principal only after shorter classes have been retired. An investor may be partially protected against a sooner than desired return of principal because of the sequential payments. The Funds may invest in stripped MBS. Stripped MBS are usually structured with two classes that receive different proportions of the interest and principal distributions on a pool of mortgage assets. In certain cases, one class will receive all of the interest (the interest-only or “IO” class), while the other class will receive all of the principal (the principal-only or “PO” class). The yield to maturity on IOs is sensitive to the rate of principal repayments (including prepayments) on the related underlying mortgage assets, and principal payments may have a material effect on yield to maturity. If the underlying mortgage assets experience greater than anticipated prepayments of principal, a Fund may not fully recoup its initial investment in IOs.
Inflation-Indexed Bonds: The Funds may invest in inflation-indexed bonds, which are fixed income securities whose principal value or coupon is periodically adjusted according to the rate of inflation. Any increase or decrease in the principal amount of an inflation-indexed bond will be included as interest income.
Inflation-indexed securities issued by the U.S. Treasury have maturities of five, ten, twenty, or thirty years, although it is possible that securities with other maturities will be issued in the future. The U.S. Treasury securities pay interest on a semi-annual basis, equal to a fixed percentage of the inflation-adjusted principal amount.
If the periodic adjustment rate measuring inflation falls, the principal value of inflation-indexed bonds will be adjusted downward, and consequently the interest payable on these securities (calculated with respect to a smaller principal amount) will be reduced. Repayment of the original bond principal upon maturity (as adjusted for inflation) is guaranteed in the case of U.S. Treasury inflation-indexed bonds, even during a period of deflation. However, the current market value of the bonds is not guaranteed, and will fluctuate. The Funds may also invest in other inflation related bonds which may or may not provide a similar guarantee. If a guarantee of principal is not provided, the adjusted principal value of the bond repaid at maturity may be less than the original principal.
The value of inflation-indexed bonds is expected to change in response to changes in real interest rates. Real interest rates in turn are tied to the relationship between nominal interest rates and the rate of inflation. Therefore, if inflation were to rise at a faster rate than nominal interest rates, real interest rates might decline, leading to an increase in value of inflation-indexed bonds. In contrast, if nominal interest rates increased at a faster rate than inflation, real interest rates might rise, leading to a decrease in value of inflation-indexed bonds.
102
TCW Funds, Inc.
Note 3 — Portfolio Investments (Continued)
While the values of these securities are expected to be protected from long-term inflationary trends, short term increases in inflation may lead to declines in values. If interest rates rise due to reasons other than inflation (for example, due to changes in currency exchange rates), investors in these securities may not be protected to the extent that the increase is not reflected in the bond’s inflation measure.
When-Issued, Delayed-Delivery, To be Announced (“TBA”) and Forward Commitment Transactions: The Funds may enter into when-issued, delayed-delivery, TBA or forward commitment transactions in order to lock in the purchase price of the underlying security or to adjust the interest rate exposure of the Funds’ existing portfolios. In when-issued, delayed-delivery, or forward commitment transactions, a Fund commits to purchase securities, with payment and delivery to take place at a future date. Although the Fund does not pay for the securities or start earning interest on them until they are delivered, it immediately assumes the risks of ownership, including the risk of price fluctuation. If a Fund’s counterparty fails to deliver a security purchased on a when-issued, delayed-delivery, TBA or forward commitment basis, there may be a loss, and that Fund may have missed an opportunity to make an alternative investment.
Prior to settlement of these transactions, the value of the subject securities will fluctuate with market movement. In addition, because a Fund is not required to pay for when-issued, delayed-delivery, TBA or forward commitment securities until the delivery date, they may result in a form of leverage to the extent a Fund does not set aside liquid assets to cover the commitment. To guard against the deemed leverage, the Fund monitors the obligations under these transactions and ensures that the Fund has sufficient liquid assets to cover them.
Dollar Roll Transactions: The Funds may enter into dollar roll transactions with financial institutions to take advantage of opportunities in the MBS market. A dollar roll transaction involves a simultaneous sale of securities by a Fund with an agreement to repurchase substantially similar securities at an agreed upon price and date, but generally will be collateralized at time of delivery by different pools of mortgages with different prepayment histories than those securities sold. These transactions are accounted for as financing transactions as opposed to sales and purchases. The differential between the sale price and the repurchase price is recorded as deferred income and recognized between the settlement dates of the sale and repurchase. During the period between the sale and repurchase, a Fund will not be entitled to receive interest and principal payments on the securities sold. Dollar roll transactions involve risk that the market value of the security sold by a Fund may decline below the repurchase price of the security and the potential inability of counterparties to complete the transaction. There were no such transactions by the Funds for the year ended October 31, 2019.
Repurchase Agreements: The Funds may enter into repurchase agreements, under the terms of a Master Repurchase Agreement (“MRA”). In a repurchase agreement, the Funds purchase a security from a counterparty who agrees to repurchase the same security at a mutually agreed upon date and price. The MRA permits a Fund, under certain circumstances including an event of default (such as bankruptcy or insolvency), to offset payables and/or receivables under the MRA with collateral held and/or posted to the counterparty and create one single net payment due to or from the Fund. However, bankruptcy or insolvency laws of a particular jurisdiction may impose restrictions on or prohibitions against such a right of offset in the event of a MRA counterparty’s bankruptcy or insolvency. Pursuant to the terms of the MRA, each Fund receives securities as collateral with a market value in excess of the repurchase price. Upon a bankruptcy or insolvency of the MRA counterparty, a Fund recognizes a liability with respect to such excess collateral to reflect the Fund’s obligation under bankruptcy law to return the excess to the counterparty. There were no repurchase agreements outstanding as of October 31, 2019.
103
TCW Funds, Inc.
Notes to Financial Statements (Continued)
Note 3 — Portfolio Investments (Continued)
Reverse Repurchase Agreements: The Funds may enter into reverse repurchase agreements. Under a reverse repurchase agreement, a Fund sells portfolio assets subject to an agreement by the Fund to repurchase the same assets at an agreed upon price and date. The Funds may utilize reverse repurchase agreements when it is anticipated that the interest income to be earned from the investment of the proceeds of the transaction is greater than the interest expense of the transaction. During the term of the reverse repurchase agreement, the Funds continue to receive the principal and interest payments on the securities sold. There were no reverse repurchase agreements outstanding during the year ended October 31, 2019.
Security Lending: The Funds may lend their securities to qualified brokers. The loans must be collateralized at all times primarily with cash although the Funds can accept money market instruments or U.S. Government securities with a market value at least equal to the market value of the securities on loan. As with any extensions of credit, the Funds may bear the risk of delay in recovery or even loss of rights in the collateral if the borrowers of the securities fail financially. The Funds earn additional income for lending their securities by investing the cash collateral in short-term investments. The Funds did not lend any securities during the year ended October 31, 2019.
Derivatives:
Forward Foreign Currency Contracts: The Funds enter into forward foreign currency contracts as a hedge against fluctuations in foreign exchange rates. Forward foreign currency contracts are marked to market daily and the change in market value is recorded by the Funds as unrealized gains or losses in the Statement of Assets and Liabilities. When a contract is closed or delivery is taken, a Fund records a realized gain or loss equal to the difference between the value of the contract at the time it was opened and the value at the time it was closed. Risks may arise upon entering into these contracts from the potential inability of counterparties to meet the terms of their contracts and from unanticipated movements in the value of the foreign currency relative to the U.S. dollar. The TCW Core Fixed Income Fund, the TCW Global Bond Fund, the TCW Short Term Bond Fund and the TCW Total Return Bond Fund entered into forward foreign currency contracts during the year to hedge against the foreign currency exposure within the Funds. Outstanding foreign currency forward contracts at October 31, 2019 are disclosed in the Schedule of Investments.
Futures Contracts: The Funds may enter into futures contracts. A Fund may seek to manage a variety of different risks through the use of futures contracts, such as interest rate risk, equity price risk, and currency risk. A Fund may use index futures to hedge against broad market risks to its portfolio or to gain broad market exposure. Securities index futures contracts are contracts to buy or sell units of a securities index at a specified future date at a price agreed upon when the contract is made and are settled in cash. Positions in futures may be closed out only on an exchange or board of trade which provides a secondary market for such futures. Because futures contracts are exchange-traded, they typically have minimal exposure to counterparty risk. Parties to a futures contract are not required to post the entire notional amount of the contract, but rather a small percentage of that amount (by way of margin), both at the time they enter into futures transactions, and then on a daily basis if their positions decline in value; as a result, futures contracts are highly leveraged. Such payments are known as variation margin and are recorded by a Fund as unrealized gains or losses. Because futures markets are highly leveraged, they can be extremely volatile, and there can be no assurance that the pricing of a futures contract will correlate precisely with the pricing of the asset or index underlying it or the asset or liability of a Fund that is the subject of the hedge. It may not always be possible for a Fund to enter into a closing transaction with respect to a futures contract it has entered into at a favorable time or price. When a Fund enters into a futures transaction, it is subject to the risk that the value of the futures contract will move in a direction unfavorable to it.
104
TCW Funds, Inc.
Note 3 — Portfolio Investments (Continued)
When a Fund uses futures contracts for hedging purposes, it is likely that the Fund will have an asset or liability that will offset any loss (or gain) on the transactions, at least in part. When a futures contract is closed, the Fund records a realized gain or loss equal to the difference between the value of the contract at the time it was opened and the value at the time it was closed. The TCW Core Fixed Income Fund, the TCW Global Bond Fund, the TCW High Yield Bond Fund, the TCW Short Term Bond Fund and the TCW Total Return Bond Fund utilized futures during the year ended October 31, 2019 to help manage interest rate duration of those Funds. Futures contracts outstanding at October 31, 2019 are listed on the Schedule of Investments.
Swap Agreements: The Funds may enter into swap agreements. Swap agreements are typically two-party contracts entered into primarily by institutional investors. In a standard “swap” transaction, two parties agree to exchange the returns (or differentials in rates of return) earned or realized on particular predetermined investments or instruments, which may be adjusted for an interest factor. The gross returns to be exchanged or “swapped” between the parties are generally calculated with respect to a “notional amount” (i.e., the return on or increase in value of a particular dollar amount invested at a particular interest rate or in a “basket” of securities representing a particular index).
In a total return swap, one party typically agrees to pay to the other a short-term interest rate in return for a payment at one or more times in the future based on the increase in the value of an underlying security or other asset, or index of securities or assets; if the underlying security, asset, or index declines in value, the party that pays the short-term interest rate must also pay to its counterparty a payment based on the amount of the decline. A Fund may take either side of such a swap, and so may take a long or short position in the underlying security, asset, or index. A Fund may enter into a total return swap to hedge against an exposure in its portfolio — such as interest rate risk (including to adjust the duration or credit quality of a Fund’s bond portfolio), equity risk, or credit risk — or generally to put cash to work efficiently in the markets in anticipation of, or as a replacement for, cash investments. A Fund may also enter into a total return swap to gain exposure to securities or markets in which it might not be able to invest directly (in so called market access transactions).
Interest rate swaps are agreements in which one party pays a floating rate of interest on a notional principal amount and receives a fixed rate of interest on the same notional principal amount for a specified period of time. Alternatively, a party may pay a fixed rate and receive a floating rate. In more complex swaps, the notional principal amount may decline (or amortize) over time. A Fund’s maximum risk of loss from counterparty default is the discounted NAV of the cash flows paid to the counterparty over the interest rate swap’s remaining life.
A Fund may enter into credit default swap transactions as a “buyer” or “seller” of credit protection. In a credit default swap, one party provides what is in effect insurance against a default or other adverse credit event affecting an issuer of debt securities (typically referred to as a “reference entity”). In general, the buyer of credit protection is obligated to pay the protection seller an upfront amount or a periodic stream of payments over the term of the swap. If a “credit event” occurs, the buyer has the right to deliver to the seller bonds (or other obligations of the reference entity with a value up to the full notional value of the swap), and to receive a payment equal to the par value of the bonds or other obligations. Credit events that would trigger a request that the seller make payment are specific to each credit default swap agreement, but generally include bankruptcy, failure to pay, restructuring, obligation acceleration, obligation default, or repudiation/moratorium. When a Fund buys protection, it may or may not own securities of the reference entity. When a Fund sells protection under a credit default swap, the position may have the effect of
105
TCW Funds, Inc.
Notes to Financial Statements (Continued)
Note 3 — Portfolio Investments (Continued)
creating leverage in the Fund’s portfolio through the Fund’s indirect long exposure to the issuer or securities on which the swap is written. When a Fund sells protection, it may do so either to earn additional income or to create such a “synthetic” long position.
Whenever a Fund enters into a swap agreement, it takes on counterparty risk — the risk that its counterparty will be unable or unwilling to meet its obligations under the swap agreement. A Fund also takes the risk that the market will move against its position in the swap agreement. In the case of a total return swap, the swap will change in value depending on the change in value of the asset or index on which the swap is written. When a Fund enters into any type of swap for hedging purposes, it is likely that the Fund will have an asset or liability that will offset any loss (or gain) on the swap, at least in part. Swap agreements may be non-transferable or otherwise highly illiquid, and a Fund may not be able to terminate or transfer a swap agreement at any particular time or at an acceptable price.
During the term of a swap transaction, changes in the value of the swap are recognized as unrealized gains or losses by marking to market to reflect the market value of the swap. When the swap is terminated, a Fund will record a realized gain or loss equal to the difference, if any, between the proceeds from the closing transaction and the Fund’s basis in the agreement. Upfront swap premium payments paid or received by a Fund, if any, are recorded within the value of the open swap agreement on the Fund’s Statement of Assets and Liabilities and represent payments paid or received upon entering into the swap agreement to compensate for differences between stated terms of the swap agreement and prevailing market conditions (credit spreads, currency exchange rates, and other relevant factors). These upfront payments are recorded as realized gains or losses on each Fund’s Statement of Operations upon termination or maturity of the swap agreement.
During the term of a swap transaction, the periodic net payments can be made for a set period of time or may be triggered by a predetermined credit event. The net periodic payments may be based on a fixed or variable interest rate, the change in market value of a specified security, basket of securities or index, or the return generated by a security. These periodic payments received or made by the Funds are recorded as realized gains and losses, respectively. During the year ended October 31, 2019, the TCW Core Fixed Income Fund entered into interest rate swaps to manage duration, the yield curve or interest rate risk by economically hedging the value of the fixed-rate bonds which may decrease when interest rates rise (interest rate risk); the TCW High Yield Bond Fund utilized credit default swaps to manage credit market exposure; and the TCW Enhanced Commodity Strategy Fund used total return swap agreements to gain exposure to the commodity market.
Note 4 — Risk Considerations
Market Risk: The Funds’ investments will fluctuate with market conditions, so will the value of your investment in the Funds. You could lose money on your investment in the Funds or the Funds could underperform other investments.
Liquidity Risk: The Funds’ investments in illiquid securities may reduce the returns of the Funds because they may not be able to sell the illiquid securities at an advantageous time or price. Investments in high yield securities, foreign securities, derivatives or other securities with substantial market and/or credit risk tend to have the greatest exposure to liquidity risk. Certain investments in private placements and Rule 144A securities may be considered illiquid investments. The Funds may invest in private placements and Rule 144A securities.
106
TCW Funds, Inc.
Note 4 — Risk Considerations (Continued)
Interest Rate Risk: The values of the Funds’ investments fluctuate in response to movements in interest rates. If rates rise, the values of debt securities generally fall. The longer the average duration of a Fund’s investment portfolio, the greater the change in value.
Mortgage-Backed Securities Risk: Each Fund may invest in mortgage-backed securities. The values of some mortgage-backed securities may expose a Fund to a lower rate of return upon reinvestment of principal. When interest rates rise, the value of mortgage-related securities generally will decline; however, when interest rates are declining, the value of mortgage related-securities with prepayment features may not increase as much as other fixed-income securities. The rate of prepayments on underlying mortgages will affect the price and volatility of a mortgage-related security, and may shorten or extend the effective maturity of the security beyond what was anticipated at the time of purchase. The value of these securities may fluctuate in response to the market’s perception of the creditworthiness of the issuers. Additionally, although mortgages and mortgage-related securities are generally supported by some form of government or private guarantee and/or insurance, there is no assurance that private guarantors or insurers will meet their obligations.
Derivatives Risk: Use of derivatives, which at times is an important part of the Funds’ investment strategies, involves risks different from, or possibly greater than, the risks associated with investing directly in securities and other traditional investments. Investments in derivatives could cause the Funds to lose more than the principal amount invested. Also, suitable derivative transactions may not be available in all circumstances and there can be no assurance that the Funds will achieve their objective through the use of the derivatives.
Credit Risk: The values of any of the Funds’ investments may also decline in response to events affecting the issuer or its credit rating. The lower rated debt securities in which a Fund may invest are considered speculative and are subject to greater volatility and risk of loss than investment-grade securities, particularly in deteriorating economic conditions. The value of some mortgage-related securities in which the Funds invest also may fall because of unanticipated levels of principal prepayments that can occur when interest rates decline. Certain Funds invest a material portion of their assets in securities of issuers that hold mortgage- and asset-backed securities and direct investments in securities backed by commercial and residential mortgage loans and other financial assets. The value and related income of these securities are sensitive to changes in economic conditions, including delinquencies and/or defaults. Continuing shifts in the market’s perception of credit quality on securities backed by commercial and residential mortgage loans and other financial assets may result in increased volatility of market price and periods of illiquidity that can negatively impact the valuation of certain issuers held by the Funds.
MBS and ABS are characterized and classified in a variety of different ways. These classifications include a view of the securities’ cash flow structure (pass through, sequential pay, prepayment-protected, interest only, principal-only, etc.), the security of the claim on the underlying assets (senior, mezzanine and subordinated), as well as types of underlying collateral (prime conforming loans, prime non-conforming loans, Alt-A loans, subprime loans, commercial loans, etc.). In many cases, the classification incorporates a degree of subjectivity: a particular loan might be categorized as “prime” by the underwriting standards of one mortgage issuer while another might classify the loan as “subprime.” In addition to other functions, the risk associated with an investment in a mortgage loan must take into account the nature of the collateral, the form and the level of credit enhancement, the vintage of the loan, the geography of the loan,
107
TCW Funds, Inc.
Notes to Financial Statements (Continued)
Note 4 — Risk Considerations (Continued)
the purpose of the loan (refinance versus purchase versus equity takeout), the borrower’s credit quality (e.g., FICO score), and whether the loan is a first trust deed or a second lien.
Counterparty Risk: The Funds may be exposed to counterparty risk, the risk that an entity with which the Funds have unsettled or open transactions may not fulfill its obligations.
Commodities Risk: The TCW Enhanced Commodity Strategy Fund has exposure to commodity markets through its investments in total return swap agreements. Therefore, the price of its shares is affected by factors particular to the commodity markets and may decline and fluctuate more than the price of shares of a fund with a broader range of investments. Commodity prices can be extremely volatile and are affected by many factors, including changes in overall market movements, real or perceived inflationary trends, commodity index volatility, changes in interest rates or currency exchange rates, population growth and changing demographics, nationalization, expropriation, or other confiscation, international regulatory, political and economic developments (e.g., regime changes and changes in economic activity levels), and developments affecting a particular industry or commodity, such as drought, floods or other weather conditions, livestock disease, trade embargoes, competition from substitute products, transportation bottlenecks or shortages, fluctuations in supply and demand and tariffs.
Foreign Currency Risk: The Funds may be exposed to the risk that the value of the Funds’ investments denominated in foreign currencies will decline in value because the foreign currencies have declined in value relative to the U.S. dollar.
Foreign Investment Risk: The Funds may be exposed to the risk that the Funds’ share prices will fluctuate with market conditions, currency exchange rates and the economic and political climates in countries where the Funds invest.
Investment Style Risk: Certain Funds may also be subject to investment style risk. The Advisor’s investment styles may be out of favor at times or may not produce the best results over short or longer time periods and may increase the volatility of a Fund’s share price.
LIBOR Risk: The London Interbank Offered Rate (“LIBOR”) is used extensively in the U.S. and globally as a “benchmark” or “reference rate” for various commercial and financial contracts, including corporate and municipal bonds, bank loans, asset-backed and mortgage-related securities, interest rate swaps and other derivatives. For example, debt securities in which a Fund invests may pay interest at floating rates based on LIBOR or may be subject to interest caps or floors based on LIBOR. A Fund’s derivative investments may also reference LIBOR. In addition, issuers of instruments in which a Fund invests may obtain financing at floating rates based on LIBOR, and a Fund may use leverage or borrowings based on LIBOR. In July 2017, the head of the United Kingdom Financial Conduct Authority announced the intention to phase out the use of LIBOR by the end of 2021. There is currently no definitive information regarding the future utilization of LIBOR or of any particular replacement reference rate. Abandonment of or modifications to LIBOR could have adverse impacts on newly issued financial instruments and existing financial instruments that reference LIBOR. The expected discontinuation of LIBOR could have a significant impact on the financial markets and may present a material risk for certain market participants, including investment companies such as the Funds. Abandonment of or modifications to LIBOR could lead to significant short- and long-term uncertainty and market instability. The risks associated with this discontinuation and transition may be exacerbated if the work necessary to effect an orderly transition to an alternative reference rate is not completed in a timely manner. It remains uncertain how such changes would be implemented and the
108
TCW Funds, Inc.
Note 4 — Risk Considerations (Continued)
effects such changes would have on the Funds, issuers of instruments in which the Funds invest, and the financial markets generally.
For complete information on the various risks involved, please refer to the Funds’ prospectus and the Statement of Additional Information which can be obtained on the Funds’ website (www.tcw.com) or by calling customer service at 800-FUND-TCW (800-386-3829).
Note 5 — Federal Income Taxes
It is the policy of each Fund to comply with the requirements under Subchapter M of the Internal Revenue Code applicable to regulated investment companies and to distribute all of its net taxable income, including any net realized gains on investments, to its shareholders. Therefore, no federal income tax provision is required.
At October 31, 2019, the components of distributable earnings on a tax basis were as follows (amounts in thousands):
| | | | | | | | | | | | |
| | | Undistributed
Ordinary
Income | | | Undistributed
Long-Term
Gain | | | Total
Distributable
Earnings | |
TCW Core Fixed Income Fund | | $ | 2,835 | | | $ | — | | | $ | 2,835 | |
TCW Enhanced Commodity Strategy Fund | | | 12 | | | | 2 | | | | 14 | |
TCW Global Bond Fund | | | 264 | | | | 206 | | | | 470 | |
TCW High Yield Bond Fund | | | 118 | | | | — | | | | 118 | |
TCW Short Term Bond Fund | | | 23 | | | | — | | | | 23 | |
TCW Total Return Bond Fund | | | 38,911 | | | | — | | | | 38,911 | |
At the end of the previous fiscal year ended October 31, 2018, the components of distributable earnings on a tax basis were as follows (amounts in thousands):
| | | | | | | | | | | | |
| | | Undistributed
Ordinary
Income | | | Undistributed
Long-Term
Gain | | | Total
Distributable
Earnings | |
TCW Core Fixed Income Fund | | $ | 3,339 | | | $ | — | | | $ | 3,339 | |
TCW Enhanced Commodity Strategy Fund | | | 5 | | | | — | | | | 5 | |
TCW High Yield Bond Fund | | | 80 | | | | — | | | | 80 | |
TCW Short Term Bond Fund | | | 49 | | | | — | | | | 49 | |
TCW Total Return Bond Fund | | | 49,961 | | | | — | | | | 49,961 | |
Permanent differences incurred during the year ended October 31, 2019 resulting from differences in book and tax accounting, have been reclassified at year-end between undistributed net investment income (loss), undistributed (accumulated) net realized gain (loss) and paid-in capital as follows, with no impact to the net asset value per share (amounts in thousands):
| | | | | | | | | | | | |
| | | Undistributed
Net Investment
Income (Loss) | | | Undistributed
(Accumulated)
Net Realized
Gain (Loss) | | | Paid-in
Capital | |
TCW Core Fixed Income Fund | | $ | 405 | | | $ | (405 | ) | | $ | — | |
TCW Enhanced Commodity Strategy Fund | | | — | (1) | | | — | (1) | | | — | (1) |
TCW Global Bond Fund | | | (216 | ) | | | 212 | | | | 4 | |
TCW High Yield Bond Fund | | | 71 | | | | (71 | ) | | | — | |
TCW Short Term Bond Fund | | | 11 | | | | 100 | | | | (111 | ) |
TCW Total Return Bond Fund | | | 5,996 | | | | (5,996 | ) | | | — | (1) |
| (1) | Amount rounds to less than $1. |
109
TCW Funds, Inc.
Notes to Financial Statements (Continued)
Note 5 — Federal Income Taxes (Continued)
During the year ended October 31, 2019, the tax character of distributions paid was as follows (amounts in
thousands):
| | | | | | | | | | | | |
| | | Ordinary
Income | | | Long-Term
Capital Gain | | | Total
Distributions | |
TCW Core Fixed Income Fund | | $ | 32,114 | | | $ | — | | | $ | 32,114 | |
TCW Enhanced Commodity Strategy Fund | | | 38 | | | | — | | | | 38 | |
TCW Global Bond Fund | | | 260 | | | | — | | | | 260 | |
TCW High Yield Bond Fund | | | 826 | | | | — | | | | 826 | |
TCW Short Term Bond Fund | | | 199 | | | | — | | | | 199 | |
TCW Total Return Bond Fund | | | 252,214 | | | | — | | | | 252,214 | |
During the previous fiscal year ended October 31, 2018, the tax character of distributions paid was as follows (amounts in thousands):
| | | | | | | | | | | | |
| | | Ordinary
Income | | | Long-Term
Capital Gain | | | Total
Distributions | |
TCW Core Fixed Income Fund | | $ | 36,700 | | | $ | — | | | $ | 36,700 | |
TCW Enhanced Commodity Strategy Fund | | | 32 | | | | — | | | | 32 | |
TCW Global Bond Fund | | | 92 | | | | 17 | | | | 109 | |
TCW High Yield Bond Fund | | | 799 | | | | — | | | | 799 | |
TCW Short Term Bond Fund | | | 167 | | | | — | | | | 167 | |
TCW Total Return Bond Fund | | | 275,920 | | | | — | | | | 275,920 | |
At October 31, 2019, net unrealized appreciation (depreciation) on investments for federal income tax purposes was as follows (amounts in thousands):
| | | | | | | | | | | | | | | | |
| | | Unrealized
Appreciation | | | Unrealized
(Depreciation) | | | Net
Unrealized
Appreciation
(Depreciation) | | | Cost of
Investments for
Federal Income
Tax Purposes | |
TCW Core Fixed Income Fund | | $ | 32,811 | | | $ | (2,848 | ) | | $ | 29,963 | | | $ | 1,276,815 | |
TCW Enhanced Commodity Strategy Fund | | | 43 | | | | (1 | ) | | | 42 | | | | 1,238 | |
TCW Global Bond Fund | | | 692 | | | | (486 | ) | | | 206 | | | | 18,967 | |
TCW High Yield Bond Fund | | | 723 | | | | (509 | ) | | | 214 | | | | 30,305 | |
TCW Short Term Bond Fund | | | 46 | | | | (42 | ) | | | 4 | | | | 5,899 | |
TCW Total Return Bond Fund | | | 314,660 | | | | (67,475 | ) | | | 247,185 | | | | 6,047,597 | |
At October 31, 2019, the following Funds had net realized loss carryforwards for federal income tax purposes (amounts in thousands):
| | | | | | | | | | | | |
| | | No Expiration (2) | | | | |
| | | Short-Term
Capital Losses | | | Long-Term
Capital Losses | | | Total | |
TCW Core Fixed Income Fund | | $ | 8,613 | | | $ | — | | | $ | 8,613 | |
TCW High Yield Bond Fund | | | — | | | | 356 | | | | 356 | |
TCW Short Term Bond Fund | | | 90 | | | | 222 | | | | 312 | |
TCW Total Return Bond Fund | | | 134,960 | | | | — | | | | 134,960 | |
The Funds did not have any unrecognized tax benefits at October 31, 2019, nor were there any increases or decreases in unrecognized tax benefits for the year ended October 31, 2019. The Funds are subject to examination by U.S. federal and state tax authorities for returns filed for the prior three and four fiscal years, respectively.
110
TCW Funds, Inc.
Note 6 — Fund Management Fees and Other Expenses
The Funds pay to the Advisor, as compensation for services rendered, facilities furnished and expenses borne by it, the following annual management fees as a percentage of daily NAV:
| | | | |
TCW Core Fixed Income Fund | | | 0.40 | % |
TCW Enhanced Commodity Strategy Fund | | | 0.50 | % |
TCW Global Bond Fund | | | 0.50 | % (1) |
TCW High Yield Bond Fund | | | 0.45 | % |
TCW Short Term Bond Fund | | | 0.35 | % |
TCW Total Return Bond Fund | | | 0.50 | % |
| (1) | From November 1, 2018 through December 31, 2018, the management fee was 0.55% |
The Advisor limits the operating expenses of the Funds not to exceed the following expense ratios relative to the Funds’ average daily net assets.
| | | | |
TCW Core Fixed Income Fund | | | | |
I Class | | | 0.49% | (1) |
N Class | | | 0.73% | (1) |
TCW Enhanced Commodity Strategy Fund | | | | |
I Class | | | 0.70% | (1) |
N Class | | | 0.75% | (1) |
TCW Global Bond Fund | | | | |
I Class | | | 0.60% | (1)(2) |
N Class | | | 0.70% | (1)(2) |
TCW High Yield Bond Fund | | | | |
I Class | | | 0.55% | (1) |
N Class | | | 0.80% | (1) |
TCW Short Term Bond Fund | | | | |
I Class | | | 0.44% | (1) |
TCW Total Return Bond Fund | | | | |
I Class | | | 0.49% | (1) |
N Class | | | 0.79% | (1) |
| (1) | These limitations are based on an agreement between the Advisor and Company. |
| (2) | This limitation was in effect January 1, 2019. From November 1, 2018, through December 31, 2018, the expense limitation was 1.04% for Class I and Class N. |
The amount borne by the Advisor during the fiscal year when the operating expenses of a Fund are in excess of the expense limitation cannot be recaptured in the subsequent fiscal years should the expenses drop below the expense limitation in the subsequent years. The Advisor can recapture expenses only within a given fiscal year for that year’s operating expenses.
Directors’ Fees: Directors who are not affiliated with the Advisor receive compensation from the Funds which are shown on the Statement of Operations. Directors may elect to defer receipt of their fees in accordance with the terms of a Non-Qualified Deferred Compensation Plan. Deferred compensation is included within directors’ fees and expenses in the Statements of Assets and Liabilities.
Note 7 — Distribution Plan
TCW Funds Distributors LLC (“Distributor”), an affiliate of the Advisor and the Funds, serves as the nonexclusive distributor of each class of the Funds’ shares. The Funds have a distribution plan pursuant to Rule 12b-1 under the 1940 Act with respect to the N Class shares of each Fund. Under the terms of the plan, each Fund compensates the Distributor at a rate equal to 0.25% of the average daily net assets of the Fund attributable to its N Class shares for distribution and related services.
111
TCW Funds, Inc.
Notes to Financial Statements (Continued)
Note 8 — Purchases and Sales of Securities
Investment transactions (excluding short-term investments) for the year ended October 31, 2019 were as follows (amounts in thousands):
| | | | | | | | | | | | | | | | |
| | | Purchases
at Cost | | | Sales or Maturity
Proceeds | | | U.S. Government
Purchases at Cost | | | U.S. Government
Sales or Maturity
Proceeds | |
TCW Core Fixed Income Fund | | $ | 166,269 | | | $ | 368,709 | | | $ | 2,389,469 | (1) | | $ | 2,304,790 | |
TCW Enhanced Commodity Strategy Fund | | | 648 | | | | 176 | | | | 861 | | | | 825 | |
TCW Global Bond Fund | | | 9,321 | | | | 8,106 | | | | 6,738 | | | | 4,966 | |
TCW High Yield Bond Fund | | | 32,907 | | | | 19,486 | | | | — | | | | — | |
TCW Short Term Bond Fund | | | 1,165 | | | | 1,555 | | | | 12,690 | | | | 14,239 | |
TCW Total Return Bond Fund | | | 92,789 | | | | 375,829 | | | | 10,887,183 | (2) | | | 11,587,341 | |
| (1) | Purchases include the Fund’s purchase of a security from an affiliated investment account for a total of $13,285 (amount in thousands) in accordance with the provisions set forth in Section 17(a)-7 of the 1940 Act. |
| (2) | Purchases include the Fund’s purchase of a security from an affiliated investment account for a total of $1,763 (amount in thousands) in accordance with the provisions set forth in Section 17(a)-7 of the 1940 Act. |
Note 9 — Capital Share Transactions
Transactions in each Fund’s shares were as follows:
| | | | | | | | | | | | | | | | |
| TCW Core Fixed Income Fund | | Year Ended
October 31, 2019 | | | Year Ended
October 31, 2018 | |
| I Class | | Shares | | | Amount
(in thousands) | | | Shares | | | Amount
(in thousands) | |
Shares Sold | | | 20,412,530 | | | $ | 224,801 | | | | 31,871,049 | | | $ | 344,924 | |
Shares Issued upon Reinvestment of Dividends | | | 2,215,980 | | | | 24,277 | | | | 2,461,509 | | | | 26,542 | |
Shares Redeemed | | | (32,398,242 | ) | | | (353,777 | ) | | | (67,085,708 | ) | | | (721,296 | ) |
| | | | | | | | | | | | | | | | |
Net Decrease | | | (9,769,732 | ) | | $ | (104,699 | ) | | | (32,753,150 | ) | | $ | (349,830 | ) |
| | | | | | | | | | | | | | | | |
| | | | |
| N Class | | Shares | | | Amount
(in thousands) | | | Shares | | | Amount
(in thousands) | |
Shares Sold | | | 3,728,977 | | | $ | 40,890 | | | | 6,167,589 | | | $ | 66,350 | |
Shares Issued upon Reinvestment of Dividends | | | 474,381 | | | | 5,181 | | | | 493,732 | | | | 5,307 | |
Shares Redeemed | | | (8,883,465 | ) | | | (96,963 | ) | | | (13,445,430 | ) | | | (144,594 | ) |
| | | | | | | | | | | | | | | | |
Net Decrease | | | (4,680,107 | ) | | $ | (50,892 | ) | | | (6,784,109 | ) | | $ | (72,937 | ) |
| | | | | | | | | | | | | | | | |
| | |
| TCW Enhanced Commodity Strategy Fund | | Year Ended
October 31, 2019 | | | Year Ended
October 31, 2018 | |
| I Class | | Shares | | | Amount
(in thousands) | | | Shares | | | Amount
(in thousands) | |
Shares Sold | | | — | | | $ | — | | | | 91,408 | | | $ | 500 | |
Shares Issued upon Reinvestment of Dividends | | | 4,371 | | | | 21 | | | | 4,198 | | | | 22 | |
Shares Redeemed | | | (92,757 | ) | | | (432 | ) | | | — | | | | — | |
| | | | | | | | | | | | | | | | |
Net Increase (Decrease) | | | (88,386 | ) | | $ | (411 | ) | | | 95,606 | | | $ | 522 | |
| | | | | | | | | | | | | | | | |
| | | | |
| N Class | | Shares | | | Amount
(in thousands) | | | Shares | | | Amount
(in thousands) | |
Shares Sold | | | — | | | $ | — | | | | — | | | $ | — | |
Shares Issued upon Reinvestment of Dividends | | | 2,986 | | | | 14 | | | | 1,943 | | | | 10 | |
Shares Redeemed | | | — | | | | — | | | | — | | | | — | |
| | | | | | | | | | | | | | | | |
Net Increase | | | 2,986 | | | $ | 14 | | | | 1,943 | | | $ | 10 | |
| | | | | | | | | | | | | | | | |
112
TCW Funds, Inc.
Note 9 — Capital Share Transactions (Continued)
| | | | | | | | | | | | | | | | |
| | |
| TCW Global Bond Fund | | Year Ended
October 31, 2019 | | | Year Ended
October 31, 2018 | |
| I Class | | Shares | | | Amount
(in thousands) | | | Shares | | | Amount
(in thousands) | |
Shares Sold | | | 5,125 | | | $ | 49 | | | | 11,813 | | | $ | 115 | |
Shares Issued upon Reinvestment of Dividends | | | 12,018 | | | | 118 | | | | 7,300 | | | | 71 | |
Shares Redeemed | | | (2,718 | ) | | | (26 | ) | | | (12,111 | ) | | | (119 | ) |
| | | | | | | | | | | | | | | | |
Net Increase | | | 14,425 | | | $ | 141 | | | | 7,002 | | | $ | 67 | |
| | | | | | | | | | | | | | | | |
| | | | |
| N Class | | Shares | | | Amount
(in thousands) | | | Shares | | | Amount
(in thousands) | |
Shares Sold | | | 5,987 | | | $ | 61 | | | | 68 | | | $ | 1 | |
Shares Issued upon Reinvestment of Dividends | | | 9,971 | | | | 98 | | | | 6,434 | | | | 63 | |
Shares Redeemed | | | (65 | ) | | | (1 | ) | | | (2,263 | ) | | | (22 | ) |
| | | | | | | | | | | | | | | | |
Net Increase | | | 15,893 | | | $ | 158 | | | | 4,239 | | | $ | 42 | |
| | | | | | | | | | | | | | | | |
| | |
| TCW High Yield Bond Fund | | Year Ended
October 31, 2019 | | | Year Ended
October 31, 2018 | |
| I Class | | Shares | | | Amount
(in thousands) | | | Shares | | | Amount
(in thousands) | |
Shares Sold | | | 2,794,449 | | | $ | 17,910 | | | | 572,054 | | | $ | 3,575 | |
Shares Issued upon Reinvestment of Dividends | | | 70,867 | | | | 449 | | | | 67,107 | | | | 421 | |
Shares Redeemed | | | (1,112,414 | ) | | | (7,071 | ) | | | (1,606,329 | ) | | | (10,063 | ) |
| | | | | | | | | | | | | | | | |
Net Increase (Decrease) | | | 1,752,902 | | | $ | 11,288 | | | | (967,168 | ) | | $ | (6,067 | ) |
| | | | | | | | | | | | | | | | |
| | | | |
| N Class | | Shares | | | Amount
(in thousands) | | | Shares | | | Amount
(in thousands) | |
Shares Sold | | | 1,338,853 | | | $ | 8,560 | | | | 380,994 | | | $ | 2,407 | |
Shares Issued upon Reinvestment of Dividends | | | 47,067 | | | | 300 | | | | 37,265 | | | | 235 | |
Shares Redeemed | | | (681,680 | ) | | | (4,352 | ) | | | (684,444 | ) | | | (4,324 | ) |
| | | | | | | | | | | | | | | | |
Net Increase (Decrease) | | | 704,240 | | | $ | 4,508 | | | | (266,185 | ) | | $ | (1,682 | ) |
| | | | | | | | | | | | | | | | |
| | |
| TCW Short Term Bond Fund | | Year Ended
October 31, 2019 | | | Year Ended
October 31, 2018 | |
| I Class | | Shares | | | Amount
(in thousands) | | | Shares | | | Amount
(in thousands) | |
Shares Sold | | | 78,821 | | | $ | 676 | | | | 262,262 | | | $ | 2,251 | |
Shares Issued upon Reinvestment of Dividends | | | 19,359 | | | | 166 | | | | 17,601 | | | | 151 | |
Shares Redeemed | | | (293,559 | ) | | | (2,525 | ) | | | (349,163 | ) | | | (2,997 | ) |
| | | | | | | | | | | | | | | | |
Net Decrease | | | (195,379 | ) | | $ | (1,683 | ) | | | (69,300 | ) | | $ | (595 | ) |
| | | | | | | | | | | | | | | | |
| | |
| TCW Total Return Bond Fund | | Year Ended
October 31, 2019 | | | Year Ended
October 31, 2018 | |
| I Class | | Shares | | | Amount
(in thousands) | | | Shares | | | Amount
(in thousands) | |
Shares Sold | | | 157,210,742 | | | $ | 1,541,045 | | | | 204,848,174 | | | $ | 2,002,728 | |
Shares Issued upon Reinvestment of Dividends | | | 12,113,185 | | | | 118,950 | | | | 12,103,452 | | | | 118,065 | |
Shares Redeemed | | | (273,291,006 | ) | | | (2,682,011 | ) | | | (338,581,903 | ) | | | (3,293,006 | ) |
| | | | | | | | | | | | | | | | |
Net Decrease | | | (103,967,079 | ) | | $ | (1,022,016 | ) | | | (121,630,277 | ) | | $ | (1,172,213 | ) |
| | | | | | | | | | | | | | | | |
| | | | |
| N Class | | Shares | | | Amount
(in thousands) | | | Shares | | | Amount
(in thousands) | |
Shares Sold | | | 14,032,682 | | | $ | 142,224 | | | | 13,094,820 | | | $ | 131,597 | |
Shares Issued upon Reinvestment of Dividends | | | 3,830,880 | | | | 38,750 | | | | 4,256,561 | | | | 42,830 | |
Shares Redeemed | | | (39,974,125 | ) | | | (404,519 | ) | | | (87,235,011 | ) | | | (881,050 | ) |
| | | | | | | | | | | | | | | | |
Net Decrease | | | (22,110,563 | ) | | $ | (223,545 | ) | | | (69,883,630 | ) | | $ | (706,623 | ) |
| | | | | | | | | | | | | | | | |
113
TCW Funds, Inc.
Notes to Financial Statements (Continued)
Note 10 — Affiliate Ownership
As of October 31, 2019, affiliates of the Funds and Advisor owned 99.83% and 96.68% of the NAV of TCW Enhanced Commodity Strategy Fund and the TCW Global Bond Fund, respectively.
Note 11 — Restricted Securities
The Funds are permitted to invest in securities that have legal or contractual restrictions on resale. These securities may be sold privately, but are required to be registered before being sold to the public (exemption rules apply). Private placement securities are generally considered to be restricted except for those securities traded between qualified institutional investors under the provisions of Rule 144A of the Securities Act of 1933, as amended (the “Securities Act”). However, the Company considers 144A securities to be restricted if those securities have been deemed illiquid. Disposal of these securities may involve time consuming negotiations and expense, and prompt sale at an acceptable price may be difficult. Restricted securities held by the Funds at October 31, 2019 are listed below:
TCW Core Fixed Income Fund
| | | | | | | | | | | | | | |
Issuer Description | | Acquisition
Date | | Acquisition
Cost | | | Aggregate
Value | | | Percentage
of Net Assets | |
Alta Wind Holdings LLC, (144A), 7%, due 06/30/35 | | 7/14/10 | | $ | 907,270 | | | $ | 984,406 | | | | 0.08 | % |
| | | | | | | | | | | | | | |
| |
| TCW Enhanced Commodity Strategy Fund | | | | | |
Issuer Description | | Acquisition
Date | | Acquisition
Cost | | | Aggregate
Value | | | Percentage
of Net Assets | |
LB-UBS Commercial Mortgage Trust (06-C6 XCL), (144A), 0.687%, due 09/15/39 | | 7/15/16 | | $ | 971 | | | $ | 4,392 | | | | 0.35 | % |
| | | | | | | | | | | | | | |
| |
| TCW Global Bond Fund | | | | | |
| | | | |
Issuer Description | | Acquisition
Date | | Acquisition
Cost | | | Aggregate
Value | | | Percentage
of Net Assets | |
Bank of America-First Union NB Commercial Mortgage (01-3-XC), (144A), 1.298%, due 04/11/37 | | 3/26/15 | | $ | 0 | | | $ | 22,276 | | | | 0.13 | % |
| | | | | | | | | | | | | | |
| |
| TCW Short Term Bond Fund | | | | | |
| | | | |
Issuer Description | | Acquisition
Date | | Acquisition
Cost | | | Aggregate
Value | | | Percentage
of Net Assets | |
Citigroup Commercial Mortgage Trust (12-GC8-XA) | | Date | | $ | 7,462 | | | $ | 6,279 | | | | 0.11 | % |
| | | | | | | | | | | | | | |
Note 12 — Committed Line Of Credit
The Company has entered into a $100,000,000 committed revolving line of credit agreement with the State Street Bank and Trust Company (the “Bank”) for temporary borrowing purposes renewable annually. The interest rate on borrowing is the higher of the federal funds rate or the overnight LIBOR rate, plus 1.25%. There were no borrowings from the line of credit as of or during the year ended October 31, 2019. The Funds pay the Bank a commitment fee equal to 0.25% per annum on the daily unused portion of the committed line amount. The commitment fees incurred by the Funds, if any, are presented in the Statements of Operations. The commitment fees are allocated to each applicable portfolio in proportion to its relative average daily net assets and the interest expenses are charged directly to the applicable portfolio.
114
TCW Funds, Inc.
Note 13 — Liquidity Risk Management Program
Rule 22e-4 under the 1940 Act (the “Liquidity Rule”) requires that all registered open-end management investment companies, including the Funds, establish a written liquidity risk management program (a “Liquidity Program”). Under a fund’s Liquidity Program, a fund must assess, manage and periodically review the fund’s liquidity risk, classify the liquidity of each of the fund’s portfolio investments, determine a highly liquid investment minimum, limit illiquid investments to 15% of fund investments, and establish policies and procedures regarding how and when a fund will engage in redemptions in-kind. Consistent with the Liquidity Rule, the Board has approved the written Liquidity Program for the Funds and has designated a committee of professionals associated with the Adviser to administer the Funds’ Liquidity Program. On an ongoing basis, the Board will review annual reports from that committee, as the administrator of the Funds’ Liquidity Program, on the operation of the Funds’ Liquidity Program, its adequacy and effectiveness of implementation, and any material changes made to the Funds’ Liquidity Program.
Note 14 — Indemnifications
Under the Company’s organizational documents, its Officers and Directors may be indemnified against certain liabilities and expenses arising out of the performance of their duties to the Company. In addition, the Company entered into an agreement with each of the Directors which provides that the Company will indemnify and hold harmless each Director against any expenses actually and reasonably incurred by such Director in any proceeding arising out of or in connection with the Director’s services to the Company, to the fullest extent permitted by the Company’s Articles of Incorporation and By-Laws, the Maryland General Corporation Law, the Securities Act, and the 1940 Act, each as now or hereinafter in force. Additionally, in the normal course of business, the Company enters into agreements with service providers that may contain indemnification clauses. The Company’s maximum exposure under these arrangements is unknown as this would involve future claims that may be made against the Company that have not yet occurred. However, based on experience, the Company expects the risk of loss to be remote. The Company has not accrued any liability in connection with such indemnification.
Note 15 — New Accounting Pronouncement
In March 2017, the FASB issued Accounting Standards Update (ASU) No. 2017-08, Receivables — Nonrefundable Fees and Other Costs (Subtopic 310-20): Premium Amortization on Purchased Callable Debt Securities. The amendments in the ASU shorten the amortization period for certain callable debt securities acquired at a premium, to be amortized to the earliest call date. The ASU does not require an accounting change for securities acquired at a discount, which continues to be amortized to maturity. The ASU is effective for fiscal years and interim periods within those fiscal years beginning after December 15, 2018. Management has concluded there was no material impact to the Funds.
115
TCW Core Fixed Income Fund
Financial Highlights — I Class
| | | | | | | | | | | | | | | | | | | | |
| |
| | | Year Ended October 31, | |
| | | 2019 | | | 2018 | | | 2017 | | | 2016 | | | 2015 | |
Net Asset Value per Share, Beginning of Year | | $ | 10.52 | | | $ | 10.99 | | | $ | 11.28 | | | $ | 11.14 | | | $ | 11.22 | |
| | | | | | | | | | | | | | | | | | | | |
Income (Loss) from Investment Operations: | | | | | | | | | | | | | | | | | | | | |
Net Investment Income (1) | | | 0.30 | | | | 0.25 | | | | 0.22 | | | | 0.19 | | | | 0.18 | |
Net Realized and Unrealized Gain (Loss) on Investments | | | 0.89 | | | | (0.45 | ) | | | (0.15 | ) | | | 0.24 | | | | (0.04 | ) |
| | | | | | | | | | | | | | | | | | | | |
Total from Investment Operations | | | 1.19 | | | | (0.20 | ) | | | 0.07 | | | | 0.43 | | | | 0.14 | |
| | | | | | | | | | | | | | | | | | | | |
Less Distributions: | | | | | | | | | | | | | | | | | | | | |
Distributions from Net Investment Income | | | (0.30 | ) | | | (0.27 | ) | | | (0.23 | ) | | | (0.19 | ) | | | (0.19 | ) |
Distributions from Net Realized Gain | | | — | | | | — | | | | (0.13 | ) | | | (0.10 | ) | | | (0.03 | ) |
| | | | | | | | | | | | | | | | | | | | |
Total Distributions | | | (0.30 | ) | | | (0.27 | ) | | | (0.36 | ) | | | (0.29 | ) | | | (0.22 | ) |
| | | | | | | | | | | | | | | | | | | | |
Net Asset Value per Share, End of Year | | $ | 11.41 | | | $ | 10.52 | | | $ | 10.99 | | | $ | 11.28 | | | $ | 11.14 | |
| | | | | | | | | | | | | | | | | | | | |
Total Return | | | 11.48 | % | | | (1.87 | )% | | | 0.68 | % | | | 3.97 | % | | | 1.25 | % |
| | | | | |
Ratios/Supplemental Data: | | | | | | | | | | | | | | | | | | | | |
| | | | | |
Net Assets, End of Year (in thousands) | | $ | 946,896 | | | $ | 975,741 | | | $ | 1,379,196 | | | $ | 1,421,267 | | | $ | 1,109,630 | |
| | | | | |
Ratio of Expenses to Average Net Assets: | | | | | | | | | | | | | | | | | | | | |
| | | | | |
Before Expense Reimbursement | | | 0.51 | % | | | 0.51 | % | | | 0.51 | % | | | 0.51 | % | | | 0.50 | % |
| | | | | |
After Expense Reimbursement | | | 0.49 | % | | | 0.49 | % | | | 0.49 | % | | | 0.49 | % | | | 0.49 | % |
| | | | | |
Ratio of Net Investment Income to Average Net Assets | | | 2.69 | % | | | 2.34 | % | | | 1.96 | % | | | 1.70 | % | | | 1.57 | % |
| | | | | |
Portfolio Turnover Rate | | | 214.76 | % | | | 267.96 | % | | | 287.39 | % | | | 283.38 | % | | | 332.85 | % |
| (1) | Computed using average shares outstanding throughout the period. |
See accompanying notes to financial statements.
116
TCW Core Fixed Income Fund
Financial Highlights — N Class
| | | | | | | | | | | | | | | | | | | | |
| |
| | | Year Ended October 31, | |
| | | 2019 | | | 2018 | | | 2017 | | | 2016 | | | 2015 | |
Net Asset Value per Share, Beginning of Year | | $ | 10.49 | | | $ | 10.96 | | | $ | 11.25 | | | $ | 11.12 | | | $ | 11.20 | |
| | | | | | | | | | | | | | | | | | | | |
Income (Loss) from Investment Operations: | | | | | | | | | | | | | | | | | | | | |
Net Investment Income (1) | | | 0.27 | | | | 0.23 | | | | 0.19 | | | | 0.16 | | | | 0.14 | |
Net Realized and Unrealized Gain (Loss) on Investments | | | 0.90 | | | | (0.46 | ) | | | (0.15 | ) | | | 0.24 | | | | (0.03 | ) |
| | | | | | | | | | | | | | | | | | | | |
Total from Investment Operations | | | 1.17 | | | | (0.23 | ) | | | 0.04 | | | | 0.40 | | | | 0.11 | |
| | | | | | | | | | | | | | | | | | | | |
Less Distributions: | | | | | | | | | | | | | | | | | | | | |
Distributions from Net Investment Income | | | (0.28 | ) | | | (0.24 | ) | | | (0.20 | ) | | | (0.17 | ) | | | (0.16 | ) |
Distributions from Net Realized Gain | | | — | | | | — | | | | (0.13 | ) | | | (0.10 | ) | | | (0.03 | ) |
| | | | | | | | | | | | | | | | | | | | |
Total Distributions | | | (0.28 | ) | | | (0.24 | ) | | | (0.33 | ) | | | (0.27 | ) | | | (0.19 | ) |
| | | | | | | | | | | | | | | | | | | | |
Net Asset Value per Share, End of Year | | $ | 11.38 | | | $ | 10.49 | | | $ | 10.96 | | | $ | 11.25 | | | $ | 11.12 | |
| | | | | | | | | | | | | | | | | | | | |
Total Return | | | 11.27 | % | | | (2.10 | )% | | | 0.41 | % | | | 3.66 | % | | | 1.00 | % |
| | | | | |
Ratios/Supplemental Data: | | | | | | | | | | | | | | | | | | | | |
| | | | | |
Net Assets, End of Year (in thousands) | | $ | 240,107 | | | $ | 270,477 | | | $ | 356,930 | | | $ | 487,223 | | | $ | 542,103 | |
| | | | | |
Ratio of Expenses to Average Net Assets: | | | | | | | | | | | | | | | | | | | | |
| | | | | |
Before Expense Reimbursement | | | 0.81 | % | | | 0.81 | % | | | 0.79 | % | | | 0.79 | % | | | 0.79 | % |
| | | | | |
After Expense Reimbursement | | | 0.70 | % | | | 0.72 | % | | | 0.75 | % | | | 0.77 | % | | | 0.79 | % (2) |
| | | | | |
Ratio of Net Investment Income to Average Net Assets | | | 2.48 | % | | | 2.12 | % | | | 1.69 | % | | | 1.41 | % | | | 1.25 | % |
| | | | | |
Portfolio Turnover Rate | | | 214.76 | % | | | 267.96 | % | | | 287.39 | % | | | 283.38 | % | | | 332.85 | % |
| (1) | Computed using average shares outstanding throughout the period. |
| (2) | Reimbursement is less than 0.01%. |
See accompanying notes to financial statements.
117
TCW Enhanced Commodity Strategy Fund
Financial Highlights — I Class
| | | | | | | | | | | | | | | | | | | | |
| |
| | | Year Ended October 31, | |
| | | 2019 | | | 2018 | | | 2017 | | | 2016 | | | 2015 | |
Net Asset Value per Share, Beginning of Year | | $ | 5.01 | | | $ | 5.20 | | | $ | 5.15 | | | $ | 5.30 | | | $ | 7.18 | |
| | | | | | | | | | | | | | | | | | | | |
Income (Loss) from Investment Operations: | | | | | | | | | | | | | | | | | | | | |
Net Investment Income (1) | | | 0.17 | | | | 0.11 | | | | 0.12 | | | | 0.04 | | | | 0.05 | |
Net Realized and Unrealized Gain (Loss) on Investments | | | (0.20 | ) | | | (0.20 | ) | | | 0.10 | | | | (0.14 | ) | | | (1.87 | ) |
| | | | | | | | | | | | | | | | | | | | |
Total from Investment Operations | | | (0.03 | ) | | | (0.09 | ) | | | 0.22 | | | | (0.10 | ) | | | (1.82 | ) |
| | | | | | | | | | | | | | | | | | | | |
Less Distributions: | | | | | | | | | | | | | | | | | | | | |
Distributions from Net Investment Income | | | (0.14 | ) | | | (0.10 | ) | | | (0.11 | ) | | | (0.05 | ) | | | (0.06 | ) |
Distributions from Net Realized Gain | | | — | | | | — | | | | (0.06 | ) | | | — | | | | — | |
| | | | | | | | | | | | | | | | | | | | |
Total Distributions | | | (0.14 | ) | | | (0.10 | ) | | | (0.17 | ) | | | (0.05 | ) | | | (0.06 | ) |
| | | | | | | | | | | | | | | | | | | | |
Net Asset Value per Share, End of Year | | $ | 4.84 | | | $ | 5.01 | | | $ | 5.20 | | | $ | 5.15 | | | $ | 5.30 | |
| | | | | | | | | | | | | | | | | | | | |
Total Return | | | (0.96 | )% | | | (1.96 | )% | | | 4.55 | % | | | (1.83 | )% | | | (25.47 | )% |
| | | | | |
Ratios/Supplemental Data: | | | | | | | | | | | | | | | | | | | | |
| | | | | |
Net Assets, End of Year (in thousands) | | $ | 740 | | | $ | 1,208 | | | $ | 758 | | | $ | 725 | | | $ | 1,443 | |
| | | | | |
Ratio of Expenses to Average Net Assets: | | | | | | | | | | | | | | | | | | | | |
| | | | | |
Before Expense Reimbursement | | | 17.82 | % | | | 11.53 | % | | | 16.65 | % | | | 9.74 | % | | | 7.82 | % |
| | | | | |
After Expense Reimbursement | | | 0.70 | % | | | 0.70 | % | | | 0.70 | % | | | 0.70 | % | | | 0.70 | % |
| | | | | |
Ratio of Net Investment Income to Average Net Assets | | | 3.45 | % | | | 2.06 | % | | | 2.31 | % | | | 0.88 | % | | | 0.88 | % |
| | | | | |
Portfolio Turnover Rate | | | 122.23 | % | | | 75.52 | % | | | 0.00 | % | | | 2.44 | % | | | 10.68 | % |
| (1) | Computed using average shares outstanding throughout the period. |
See accompanying notes to financial statements.
118
TCW Enhanced Commodity Strategy Fund
Financial Highlights — N Class
| | | | | | | | | | | | | | | | | | | | |
| |
| | | Year Ended October 31, | |
| | | 2019 | | | 2018 | | | 2017 | | | 2016 | | | 2015 | |
Net Asset Value per Share, Beginning of Year | | $ | 5.01 | | | $ | 5.21 | | | $ | 5.15 | | | $ | 5.31 | | | $ | 7.18 | |
| | | | | | | | | | | | | | | | | | | | |
Income (Loss) from Investment Operations: | | | | | | | | | | | | | | | | | | | | |
Net Investment Income (1) | | | 0.17 | | | | 0.11 | | | | 0.12 | | | | 0.04 | | | | 0.05 | |
Net Realized and Unrealized Gain (Loss) on Investments | | | (0.20 | ) | | | (0.21 | ) | | | 0.11 | | | | (0.15 | ) | | | (1.86 | ) |
| | | | | | | | | | | | | | | | | | | | |
Total from Investment Operations | | | (0.03 | ) | | | (0.10 | ) | | | 0.23 | | | | (0.11 | ) | | | (1.81 | ) |
| | | | | | | | | | | | | | | | | | | | |
Less Distributions: | | | | | | | | | | | | | | | | | | | | |
Distributions from Net Investment Income | | | (0.14 | ) | | | (0.10 | ) | | | (0.11 | ) | | | (0.05 | ) | | | (0.06 | ) |
Distributions from Net Realized Gain | | | — | | | | — | | | | (0.06 | ) | | | — | | | | — | |
| | | | | | | | | | | | | | | | | | | | |
Total Distributions | | | (0.14 | ) | | | (0.10 | ) | | | (0.17 | ) | | | (0.05 | ) | | | (0.06 | ) |
| | | | | | | | | | | | | | | | | | | | |
Net Asset Value per Share, End of Year | | $ | 4.84 | | | $ | 5.01 | | | $ | 5.21 | | | $ | 5.15 | | | $ | 5.31 | |
| | | | | | | | | | | | | | | | | | | | |
Total Return | | | (1.16 | )% | | | (1.96 | )% | | | 4.55 | % | | | (2.03 | )% | | | (25.36 | )% |
| | | | | |
Ratios/Supplemental Data: | | | | | | | | | | | | | | | | | | | | |
| | | | | |
Net Assets, End of Year (in thousands) | | $ | 504 | | | $ | 507 | | | $ | 517 | | | $ | 496 | | | $ | 1,153 | |
| | | | | |
Ratio of Expenses to Average Net Assets: | | | | | | | | | | | | | | | | | | | | |
| | | | | |
Before Expense Reimbursement | | | 19.14 | % | | | 12.59 | % | | | 18.01 | % | | | 10.21 | % | | | 8.32 | % |
| | | | | |
After Expense Reimbursement | | | 0.75 | % | | | 0.75 | % | | | 0.75 | % | | | 0.75 | % | | | 0.75 | % |
| | | | | |
Ratio of Net Investment Income to Average Net Assets | | | 3.57 | % | | | 2.02 | % | | | 2.26 | % | | | 0.83 | % | | | 0.83 | % |
| | | | | |
Portfolio Turnover Rate | | | 122.23 | % | | | 75.52 | % | | | 0.00 | % | | | 2.44 | % | | | 10.68 | % |
| (1) | Computed using average shares outstanding throughout the period. |
See accompanying notes to financial statements.
119
TCW Global Bond Fund
Financial Highlights — I Class
| | | | | | | | | | | | | | | | | | | | |
| |
| | | Year Ended October 31, | |
| | | 2019 | | | 2018 | | | 2017 | | | 2016 | | | 2015 | |
Net Asset Value per Share, Beginning of Year | | $ | 9.45 | | | $ | 9.75 | | | $ | 9.88 | | | $ | 9.85 | | | $ | 10.26 | |
| | | | | | | | | | | | | | | | | | | | |
Income (Loss) from Investment Operations: | | | | | | | | | | | | | | | | | | | | |
Net Investment Income (1) | | | 0.24 | | | | 0.19 | | | | 0.17 | | | | 0.20 | | | | 0.19 | |
Net Realized and Unrealized Gain (Loss) on Investments | | | 0.73 | | | | (0.43 | ) | | | (0.07 | ) | | | 0.19 | | | | (0.49 | ) |
| | | | | | | | | | | | | | | | | | | | |
Total from Investment Operations | | | 0.97 | | | | (0.24 | ) | | | 0.10 | | | | 0.39 | | | | (0.30 | ) |
| | | | | | | | | | | | | | | | | | | | |
Less Distributions: | | | | | | | | | | | | | | | | | | | | |
Distributions from Net Investment Income | | | (0.16 | ) | | | (0.05 | ) | | | (0.16 | ) | | | (0.22 | ) | | | (0.09 | ) |
Distributions from Net Realized Gain | | | — | | | | (0.01 | ) | | | (0.07 | ) | | | (0.14 | ) | | | (0.02 | ) |
| | | | | | | | | | | | | | | | | | | | |
Total Distributions | | | (0.16 | ) | | | (0.06 | ) | | | (0.23 | ) | | | (0.36 | ) | | | (0.11 | ) |
| | | | | | | | | | | | | | | | | | | | |
Net Asset Value per Share, End of Year | | $ | 10.26 | | | $ | 9.45 | | | $ | 9.75 | | | $ | 9.88 | | | $ | 9.85 | |
| | | | | | | | | | | | | | | | | | | | |
Total Return | | | 10.42 | % | | | (2.54 | )% | | | 1.07 | % | | | 4.03 | % | | | (2.96 | )% |
| | | | | |
Ratios/Supplemental Data: | | | | | | | | | | | | | | | | | | | | |
| | | | | |
Net Assets, End of Year (in thousands) | | $ | 9,384 | | | $ | 8,505 | | | $ | 8,714 | | | $ | 8,648 | | | $ | 7,878 | |
| | | | | |
Ratio of Expenses to Average Net Assets: | | | | | | | | | | | | | | | | | | | | |
| | | | | |
Before Expense Reimbursement | | | 1.79 | % | | | 1.63 | % | | | 1.60 | % | | | 1.48 | % | | | 1.37 | % |
| | | | | |
After Expense Reimbursement | | | 0.66 | % | | | 1.00 | % | | | 1.04 | % | | | 1.05 | % | | | 1.08 | % |
| | | | | |
Ratio of Net Investment Income to Average Net Assets | | | 2.48 | % | | | 1.99 | % | | | 1.75 | % | | | 2.02 | % | | | 1.92 | % |
| | | | | |
Portfolio Turnover Rate | | | 83.18 | % | | | 102.42 | % | | | 90.08 | % | | | 116.87 | % | | | 147.16 | % |
| (1) | Computed using average shares outstanding throughout the period. |
See accompanying notes to financial statements.
120
TCW Global Bond Fund
Financial Highlights — N Class
| | | | | | | | | | | | | | | | | | | | |
| |
| | | Year Ended October 31, | |
| | | 2019 | | | 2018 | | | 2017 | | | 2016 | | | 2015 | |
Net Asset Value per Share, Beginning of Year | | $ | 9.45 | | | $ | 9.75 | | | $ | 9.88 | | | $ | 9.85 | | | $ | 10.26 | |
| | | | | | | | | | | | | | | | | | | | |
Income (Loss) from Investment Operations: | | | | | | | | | | | | | | | | | | | | |
Net Investment Income (1) | | | 0.24 | | | | 0.19 | | | | 0.17 | | | | 0.20 | | | | 0.19 | |
Net Realized and Unrealized Gain (Loss) on Investments | | | 0.72 | | | | (0.43 | ) | | | (0.07 | ) | | | 0.19 | | | | (0.49 | ) |
| | | | | | | | | | | | | | | | | | | | |
Total from Investment Operations | | | 0.96 | | | | (0.24 | ) | | | 0.10 | | | | 0.39 | | | | (0.30 | ) |
| | | | | | | | | | | | | | | | | | | | |
Less Distributions: | | | | | | | | | | | | | | | | | | | | |
Distributions from Net Investment Income | | | (0.15 | ) | | | (0.05 | ) | | | (0.16 | ) | | | (0.22 | ) | | | (0.09 | ) |
Distributions from Net Realized Gain | | | — | | | | (0.01 | ) | | | (0.07 | ) | | | (0.14 | ) | | | (0.02 | ) |
| | | | | | | | | | | | | | | | | | | | |
Total Distributions | | | (0.15 | ) | | | (0.06 | ) | | | (0.23 | ) | | | (0.36 | ) | | | (0.11 | ) |
| | | | | | | | | | | | | | | | | | | | |
Net Asset Value per Share, End of Year | | $ | 10.26 | | | $ | 9.45 | | | $ | 9.75 | | | $ | 9.88 | | | $ | 9.85 | |
| | | | | | | | | | | | | | | | | | | | |
Total Return | | | 10.32 | % | | | (2.54 | )% | | | 1.07 | % | | | 4.03 | % | | | (2.96 | )% |
| | | | | |
Ratios/Supplemental Data: | | | | | | | | | | | | | | | | | | | | |
| | | | | |
Net Assets, End of Year (in thousands) | | $ | 8,282 | | | $ | 7,476 | | | $ | 7,679 | | | $ | 7,586 | | | $ | 7,358 | |
| | | | | |
Ratio of Expenses to Average Net Assets: | | | | | | | | | | | | | | | | | | | | |
| | | | | |
Before Expense Reimbursement | | | 2.09 | % | | | 1.92 | % | | | 1.89 | % | | | 1.76 | % | | | 1.64 | % |
| | | | | |
After Expense Reimbursement | | | 0.74 | % | | | 1.00 | % | | | 1.04 | % | | | 1.05 | % | | | 1.08 | % |
| | | | | |
Ratio of Net Investment Income to Average Net Assets | | | 2.39 | % | | | 1.99 | % | | | 1.75 | % | | | 2.02 | % | | | 1.92 | % |
| | | | | |
Portfolio Turnover Rate | | | 83.18 | % | | | 102.42 | % | | | 90.08 | % | | | 116.87 | % | | | 147.16 | % |
| (1) | Computed using average shares outstanding throughout the period. |
See accompanying notes to financial statements.
121
TCW High Yield Bond Fund
Financial Highlights — I Class
| | | | | | | | | | | | | | | | | | | | |
| |
| | | Year Ended October 31, | |
| | | 2019 | | | 2018 | | | 2017 | | | 2016 | | | 2015 | |
Net Asset Value per Share, Beginning of Year | | $ | 6.15 | | | $ | 6.37 | | | $ | 6.23 | | | $ | 6.18 | | | $ | 6.35 | |
| | | | | | | | | | | | | | | | | | | | |
Income (Loss) from Investment Operations: | | | | | | | | | | | | | | | | | | | | |
Net Investment Income (1) | | | 0.27 | | | | 0.26 | | | | 0.24 | | | | 0.24 | | | | 0.26 | |
Net Realized and Unrealized Gain (Loss) on Investments | | | 0.36 | | | | (0.17 | ) | | | 0.18 | | | | 0.06 | | | | (0.15 | ) |
| | | | | | | | | | | | | | | | | | | | |
Total from Investment Operations | | | 0.63 | | | | 0.09 | | | | 0.42 | | | | 0.30 | | | | 0.11 | |
| | | | | | | | | | | | | | | | | | | | |
Less Distributions: | | | | | | | | | | | | | | | | | | | | |
Distributions from Net Investment Income | | | (0.29 | ) | | | (0.31 | ) | | | (0.28 | ) | | | (0.25 | ) | | | (0.28 | ) |
| | | | | | | | | | | | | | | | | | | | |
Net Asset Value per Share, End of Year | | $ | 6.49 | | | $ | 6.15 | | | $ | 6.37 | | | $ | 6.23 | | | $ | 6.18 | |
| | | | | | | | | | | | | | | | | | | | |
Total Return | | | 10.44 | % | | | 1.40 | % | | | 6.80 | % | | | 5.06 | % | | | 1.74 | % |
| | | | | |
Ratios/Supplemental Data: | | | | | | | | | | | | | | | | | | | | |
| | | | | |
Net Assets, End of Year (in thousands) | | $ | 19,563 | | | $ | 7,749 | | | $ | 14,195 | | | $ | 20,265 | | | $ | 20,791 | |
| | | | | |
Ratio of Expenses to Average Net Assets: | | | | | | | | | | | | | | | | | | | | |
| | | | | |
Before Expense Reimbursement | | | 1.68 | % | | | 1.50 | % | | | 1.22 | % | | | 1.03 | % | | | 1.03 | % |
| | | | | |
After Expense Reimbursement | | | 0.55 | % | | | 0.55 | % | | | 0.55 | % | | | 0.55 | % | | | 0.55 | % |
| | | | | |
Ratio of Net Investment Income to Average Net Assets | | | 4.18 | % | | | 4.13 | % | | | 3.85 | % | | | 3.88 | % | | | 4.11 | % |
| | | | | |
Portfolio Turnover Rate | | | 121.56 | % | | | 104.21 | % | | | 179.87 | % | | | 244.36 | % | | | 195.97 | % |
| (1) | Computed using average shares outstanding throughout the period. |
See accompanying notes to financial statements.
122
TCW High Yield Bond Fund
Financial Highlights — N Class
| | | | | | | | | | | | | | | | | | | | |
| |
| | | Year Ended October 31, | |
| | | 2019 | | | 2018 | | | 2017 | | | 2016 | | | 2015 | |
Net Asset Value per Share, Beginning of Year | | $ | 6.19 | | | $ | 6.42 | | | $ | 6.28 | | | $ | 6.23 | | | $ | 6.41 | |
| | | | | | | | | | | | | | | | | | | | |
Income (Loss) from Investment Operations: | | | | | | | | | | | | | | | | | | | | |
Net Investment Income (1) | | | 0.25 | | | | 0.25 | | | | 0.23 | | | | 0.22 | | | | 0.25 | |
Net Realized and Unrealized Gain (Loss) on Investments | | | 0.38 | | | | (0.18 | ) | | | 0.18 | | | | 0.07 | | | | (0.17 | ) |
| | | | | | | | | | | | | | | | | | | | |
Total from Investment Operations | | | 0.63 | | | | 0.07 | | | | 0.41 | | | | 0.29 | | | | 0.08 | |
| | | | | | | | | | | | | | | | | | | | |
Less Distributions: | | | | | | | | | | | | | | | | | | | | |
Distributions from Net Investment Income | | | (0.28 | ) | | | (0.30 | ) | | | (0.27 | ) | | | (0.24 | ) | | | (0.26 | ) |
| | | | | | | | | | | | | | | | | | | | |
Net Asset Value per Share, End of Year | | $ | 6.54 | | | $ | 6.19 | | | $ | 6.42 | | | $ | 6.28 | | | $ | 6.23 | |
| | | | | | | | | | | | | | | | | | | | |
Total Return | | | 10.16 | % | | | 1.04 | % | | | 6.59 | % | | | 4.82 | % | | | 1.34 | % |
| | | | | |
Ratios/Supplemental Data: | | | | | | | | | | | | | | | | | | | | |
| | | | | |
Net Assets, End of Year (in thousands) | | $ | 9,923 | | | $ | 5,041 | | | $ | 6,934 | | | $ | 7,526 | | | $ | 15,910 | |
| | | | | |
Ratio of Expenses to Average Net Assets: | | | | | | | | | | | | | | | | | | | | |
| | | | | |
Before Expense Reimbursement | | | 2.05 | % | | | 1.98 | % | | | 1.65 | % | | | 1.40 | % | | | 1.38 | % |
| | | | | |
After Expense Reimbursement | | | 0.80 | % | | | 0.80 | % | | | 0.80 | % | | | 0.80 | % | | | 0.80 | % |
| | | | | |
Ratio of Net Investment Income to Average Net Assets | | | 3.96 | % | | | 3.90 | % | | | 3.60 | % | | | 3.64 | % | | | 3.87 | % |
| | | | | |
Portfolio Turnover Rate | | | 121.56 | % | | | 104.21 | % | | | 179.87 | % | | | 244.36 | % | | | 195.97 | % |
| (1) | Computed using average shares outstanding throughout the period. |
See accompanying notes to financial statements.
123
TCW Short Term Bond Fund
Financial Highlights — I Class
| | | | | | | | | | | | | | | | | | | | |
| |
| | | Year Ended October 31, | |
| | | 2019 | | | 2018 | | | 2017 | | | 2016 | | | 2015 | |
Net Asset Value per Share, Beginning of Year | | $ | 8.54 | | | $ | 8.62 | | | $ | 8.70 | | | $ | 8.69 | | | $ | 8.75 | |
| | | | | | | | | | | | | | | | | | | | |
Income (Loss) from Investment Operations: | | | | | | | | | | | | | | | | | | | | |
Net Investment Income (1) | | | 0.25 | | | | 0.15 | | | | 0.08 | | | | 0.05 | | | | 0.05 | |
Net Realized and Unrealized Gain (Loss) on Investments | | | 0.07 | | | | (0.04 | ) | | | (0.01 | ) | | | 0.02 | | | | (0.03 | ) |
| | | | | | | | | | | | | | | | | | | | |
Total from Investment Operations | | | 0.32 | | | | 0.11 | | | | 0.07 | | | | 0.07 | | | | 0.02 | |
| | | | | | | | | | | | | | | | | | | | |
Less Distributions: | | | | | | | | | | | | | | | | | | | | |
Distributions from Net Investment Income | | | (0.27 | ) | | | (0.19 | ) | | | (0.15 | ) | | | (0.06 | ) | | | (0.08 | ) |
| | | | | | | | | | | | | | | | | | | | |
Net Asset Value per Share, End of Year | | $ | 8.59 | | | $ | 8.54 | | | $ | 8.62 | | | $ | 8.70 | | | $ | 8.69 | |
| | | | | | | | | | | | | | | | | | | | |
Total Return | | | 3.83 | % | | | 1.26 | % | | | 0.75 | % | | | 0.84 | % | | | 0.25 | % |
| | | | | |
Ratios/Supplemental Data: | | | | | | | | | | | | | | | | | | | | |
| | | | | |
Net Assets, End of Year (in thousands) | | $ | 5,644 | | | $ | 7,280 | | | $ | 7,951 | | | $ | 7,698 | | | $ | 9,614 | |
| | | | | |
Ratio of Expenses to Average Net Assets: | | | | | | | | | | | | | | | | | | | | |
| | | | | |
Before Expense Reimbursement | | | 3.37 | % | | | 2.28 | % | | | 1.65 | % | | | 2.46 | % | | | 1.57 | % |
| | | | | |
After Expense Reimbursement | | | 0.44 | % | | | 0.44 | % | | | 0.44 | % | | | 0.44 | % | | | 0.44 | % |
| | | | | |
Ratio of Net Investment Income to Average Net Assets | | | 2.94 | % | | | 1.70 | % | | | 0.96 | % | | | 0.58 | % | | | 0.53 | % |
| | | | | |
Portfolio Turnover Rate | | | 248.19 | % | | | 199.55 | % | | | 131.31 | % | | | 46.36 | % | | | 8.51 | % |
| (1) | Computed using average shares outstanding throughout the period. |
See accompanying notes to financial statements.
124
TCW Total Return Bond Fund
Financial Highlights — I Class
| | | | | | | | | | | | | | | | | | | | |
| |
| | | Year Ended October 31, | |
| | | 2019 | | | 2018 | | | 2017 | | | 2016 | | | 2015 | |
Net Asset Value per Share, Beginning of Year | | $ | 9.46 | | | $ | 9.98 | | | $ | 10.33 | | | $ | 10.28 | | | $ | 10.31 | |
| | | | | | | | | | | | | | | | | | | | |
Income (Loss) from Investment Operations: | | | | | | | | | | | | | | | | | | | | |
Net Investment Income (1) | | | 0.34 | | | | 0.31 | | | | 0.27 | | | | 0.26 | | | | 0.25 | |
Net Realized and Unrealized Gain (Loss) on Investments | | | 0.68 | | | | (0.48 | ) | | | (0.20 | ) | | | 0.11 | | | | (0.02 | ) |
| | | | | | | | | | | | | | | | | | | | |
Total from Investment Operations | | | 1.02 | | | | (0.17 | ) | | | 0.07 | | | | 0.37 | | | | 0.23 | |
| | | | | | | | | | | | | | | | | | | | |
Less Distributions: | | | | | | | | | | | | | | | | | | | | |
Distributions from Net Investment Income | | | (0.41 | ) | | | (0.35 | ) | | | (0.26 | ) | | | (0.25 | ) | | | (0.22 | ) |
Distributions from Net Realized Gain | | | — | | | | — | | | | (0.16 | ) | | | (0.07 | ) | | | (0.04 | ) |
| | | | | | | | | | | | | | | | | | | | |
Total Distributions | | | (0.41 | ) | | | (0.35 | ) | | | (0.42 | ) | | | (0.32 | ) | | | (0.26 | ) |
| | | | | | | | | | | | | | | | | | | | |
Net Asset Value per Share, End of Year | | $ | 10.07 | | | $ | 9.46 | | | $ | 9.98 | | | $ | 10.33 | | | $ | 10.28 | |
| | | | | | | | | | | | | | | | | | | | |
Total Return | | | 10.82 | % | | | (1.67 | )% | | | 0.72 | % | | | 3.63 | % | | | 2.24 | % |
| | | | | |
Ratios/Supplemental Data: | | | | | | | | | | | | | | | | | | | | |
| | | | | |
Net Assets, End of Year (in thousands) | | $ | 4,898,103 | | | $ | 5,587,668 | | | $ | 7,103,832 | | | $ | 8,042,194 | | | $ | 6,360,295 | |
| | | | | |
Ratio of Expenses to Average Net Assets: | | | | | | | | | | | | | | | | | | | | |
| | | | | |
Before Expense Reimbursement | | | 0.62 | % | | | 0.62 | % | | | 0.61 | % | | | 0.60 | % | | | 0.60 | % |
| | | | | |
After Expense Reimbursement | | | 0.49 | % | | | 0.49 | % | | | 0.49 | % | | | 0.49 | % | | | 0.49 | % |
| | | | | |
Ratio of Net Investment Income to Average Net Assets | | | 3.47 | % | | | 3.20 | % | | | 2.73 | % | | | 2.55 | % | | | 2.46 | % |
| | | | | |
Portfolio Turnover Rate | | | 177.80 | % | | | 241.76 | % | | | 287.55 | % | | | 318.48 | % | | | 287.85 | % |
| (1) | Computed using average shares outstanding throughout the period. |
See accompanying notes to financial statements.
125
TCW Total Return Bond Fund
Financial Highlights — N Class
| | | | | | | | | | | | | | | | | | | | |
| |
| | | Year Ended October 31, | |
| | | 2019 | | | 2018 | | | 2017 | | | 2016 | | | 2015 | |
Net Asset Value per Share, Beginning of Year | | $ | 9.76 | | | $ | 10.29 | | | $ | 10.65 | | | $ | 10.60 | | | $ | 10.64 | |
| | | | | | | | | | | | | | | | | | | | |
Income (Loss) from Investment Operations: | | | | | | | | | | | | | | | | | | | | |
Net Investment Income (1) | | | 0.32 | | | | 0.29 | | | | 0.25 | | | | 0.24 | | | | 0.23 | |
Net Realized and Unrealized Gain (Loss) on Investments | | | 0.69 | | | | (0.49 | ) | | | (0.21 | ) | | | 0.11 | | | | (0.04 | ) |
| | | | | | | | | | | | | | | | | | | | |
Total from Investment Operations | | | 1.01 | | | | (0.20 | ) | | | 0.04 | | | | 0.35 | | | | 0.19 | |
| | | | | | | | | | | | | | | | | | | | |
Less Distributions: | | | | | | | | | | | | | | | | | | | | |
Distributions from Net Investment Income | | | (0.40 | ) | | | (0.33 | ) | | | (0.24 | ) | | | (0.23 | ) | | | (0.19 | ) |
Distributions from Net Realized Gain | | | — | | | | — | | | | (0.16 | ) | | | (0.07 | ) | | | (0.04 | ) |
| | | | | | | | | | | | | | | | | | | | |
Total Distributions | | | (0.40 | ) | | | (0.33 | ) | | | (0.40 | ) | | | (0.30 | ) | | | (0.23 | ) |
| | | | | | | | | | | | | | | | | | | | |
Net Asset Value per Share, End of Year | | $ | 10.37 | | | $ | 9.76 | | | $ | 10.29 | | | $ | 10.65 | | | $ | 10.60 | |
| | | | | | | | | | | | | | | | | | | | |
Total Return | | | 10.46 | % | | | (1.96 | )% | | | 0.41 | % | | | 3.35 | % | | | 1.83 | % |
| | | | | |
Ratios/Supplemental Data: | | | | | | | | | | | | | | | | | | | | |
| | | | | |
Net Assets, End of Year (in thousands) | | $ | 963,512 | | | $ | 1,121,741 | | | $ | 1,902,308 | | | $ | 2,762,803 | | | $ | 2,399,850 | |
| | | | | |
Ratio of Expenses to Average Net Assets: | | | | | | | | | | | | | | | | | | | | |
| | | | | |
Before Expense Reimbursement | | | 0.88 | % | | | 0.88 | % | | | 0.88 | % | | | 0.87 | % | | | 0.88 | % |
| | | | | |
After Expense Reimbursement | | | 0.79 | % | | | 0.79 | % | | | 0.79 | % | | | 0.79 | % | | | 0.79 | % |
| | | | | |
Ratio of Net Investment Income to Average Net Assets | | | 3.16 | % | | | 2.89 | % | | | 2.42 | % | | | 2.25 | % | | | 2.17 | % |
| | | | | |
Portfolio Turnover Rate | | | 177.80 | % | | | 241.76 | % | | | 287.55 | % | | | 318.48 | % | | | 287.85 | % |
| (1) | Computed using average shares outstanding throughout the period. |
See accompanying notes to financial statements.
126
TCW Funds, Inc.
Report of Independent Registered Public Accounting Firm
To the Shareholders and Board of Directors of the TCW Fund, Inc.:
Opinion on the Financial Statements and Financial Highlights
We have audited the accompanying statements of assets and liabilities of TCW Core Fixed Income Fund, TCW Global Bond Fund, TCW High Yield Bond Fund, TCW Short Term Bond Fund, and TCW Total Return Bond Fund and the consolidated statement of assets and liabilities of TCW Enhanced Commodity Strategy Fund (collectively, the “TCW Fixed Income Funds”) (six of nineteen funds comprising the TCW Funds, Inc.), including the schedules of investments of TCW Core Fixed Income Fund, TCW Global Bond Fund, TCW High Yield Bond Fund, TCW Short Term Bond Fund, and TCW Total Return Bond Fund and the consolidated schedule of investments of TCW Enhanced Commodity Strategy Fund, as of October 31, 2019, and the related statements of operations for TCW Core Fixed Income Fund, TCW Global Bond Fund, TCW High Yield Bond Fund, TCW Short Term Bond Fund, and TCW Total Return Bond Fund and the related consolidated statement of operations for TCW Enhanced Commodity Strategy Fund for the year then ended, the statements of changes in net assets for TCW Core Fixed Income Fund, TCW Global Bond Fund, TCW High Yield Bond Fund, TCW Short Term Bond Fund, and TCW Total Return Bond Fund and the consolidated statement of changes in net assets for TCW Enhanced Commodity Strategy Fund for each of the two years in the period then ended, the financial highlights for TCW Core Fixed Income Fund, TCW Global Bond Fund, TCW High Yield Bond Fund, TCW Short Term Bond Fund, and TCW Total Return Bond Fund and the consolidated financial highlights for TCW Enhanced Commodity Strategy Fund for each of the five years in the period then ended, and the related notes. In our opinion, the financial statements and financial highlights for TCW Core Fixed Income Fund, TCW Global Bond Fund, TCW High Yield Bond Fund, TCW Short Term Bond Fund, and TCW Total Return Bond Fund and the consolidated financial statements and consolidated financial highlights for TCW Enhanced Commodity Strategy Fund present fairly, in all material respects, the financial position of each of the respective TCW Fixed Income Funds as of October 31, 2019, the results of their operations for the year then ended, the changes in their net assets for each of the two years in the period then ended and the financial highlights for each of the five years in the period then ended, in conformity with accounting principles generally accepted in the United States of America.
Basis for Opinion
These financial statements and financial highlights are the responsibility of the TCW Fixed Income Funds’ management. Our responsibility is to express an opinion on the TCW Fixed Income Funds’ financial statements and financial highlights based on our audits. We are a public accounting firm registered with the Public Company Accounting Oversight Board (United States) (PCAOB) and are required to be independent with respect to the Funds in accordance with the U.S. federal securities laws and the applicable rules and regulations of the Securities and Exchange Commission and the PCAOB.
We conducted our audits in accordance with the standards of the PCAOB. Those standards require that we plan and perform the audits to obtain reasonable assurance about whether the financial statements and financial highlights are free of material misstatement, whether due to error or fraud. The TCW Fixed Income Funds are not required to have, nor were we engaged to perform, an audit of their internal control over financial reporting. As part of our audits we are required to obtain an understanding of internal control over financial reporting but not for the purpose of expressing an opinion on the effectiveness of the TCW Fixed Income Funds’ internal control over financial reporting. Accordingly, we express no such opinion.
Our audits included performing procedures to assess the risks of material misstatement of the financial statements and financial highlights, whether due to error or fraud, and performing procedures that respond to those risks. Such procedures included examining, on a test basis, evidence regarding the amounts and disclosures in the financial statements and financial highlights. Our audits also included evaluating the accounting principles used and significant estimates made by management, as well as evaluating the overall presentation of the financial statements and financial highlights. Our procedures included confirmation of securities owned as of October 31, 2019, by correspondence with the custodian and brokers; when replies were not received from brokers, we performed other auditing procedures. We believe that our audits provide a reasonable basis for our opinion.

Los Angeles, California
December 20, 2019
We have served as the auditor of one or more TCW/Metropolitan West Funds investment companies since 1990.
127
TCW Funds, Inc.
Shareholder Expenses (Unaudited)
As a shareholder of a Fund, you incur ongoing operational costs of the Fund, including management fees and other fund expenses. The following example is intended to help you understand your ongoing costs (in dollars and cents) of investing in a Fund and to compare these costs with the ongoing costs of investing in other funds.
The example is based on an investment of $1,000 invested at the beginning of the period and held for the entire period from May 1, 2019 to October 31, 2019 (184 days).
Actual Expenses The first line under each Fund in the table below provides information about the actual account values and actual expenses. You may use the information in this line, together with the amount you invested, to estimate the expenses that you paid over the period. Simply divide your account value by $1,000 (for example, an $8,600 account value divided by $1,000 = 8.6), then multiply the result by the number in the first line for your Fund under the heading entitled “Expenses Paid During Period” to estimate the expenses you paid on your account during this period.
Hypothetical Example for Comparison Purposes The second line under each Fund in the table below provides information about the hypothetical expenses based on each Fund’s actual expense ratio and an assumed rate of return of 5% per year before expenses, which is not the Fund’s actual return. The hypothetical account value and expenses may not be used to estimate the actual ending account balance or expenses you paid for the period. You may use this information to compare the ongoing costs of investing in your Fund and other funds. To do so, compare this 5% hypothetical example with the 5% hypothetical examples that appear in the shareholder reports of the other funds.
| | | | | | | | | | | | | | | | |
TCW Funds, Inc. | | Beginning
Account Value
May 1, 2019 | | | Ending
Account Value
October 31, 2019 | | | Annualized
Expense Ratio | | | Expenses Paid
During Period
(May 1, 2019 to
October 31, 2019) | |
| TCW Core Fixed Income Fund | | | | | | | | | | | | | | | | |
I Class Shares | | | | | | | | | | | | | | | | |
Actual | | $ | 1,000.00 | | | $ | 1,057.60 | | | | 0.49 | % | | $ | 2.54 | |
Hypothetical (5% return before expenses) | | | 1,000.00 | | | | 1,022.74 | | | | 0.49 | % | | | 2.50 | |
| | | | |
N Class Shares | | | | | | | | | | | | | | | | |
Actual | | $ | 1,000.00 | | | $ | 1,056.60 | | | | 0.70 | % | | $ | 3.63 | |
Hypothetical (5% return before expenses) | | | 1,000.00 | | | | 1,021.68 | | | | 0.70 | % | | | 3.57 | |
| | | | |
| TCW Enhanced Commodity Strategy Fund | | | | | | | | | | | | | | | | |
I Class Shares | | | | | | | | | | | | | | | | |
Actual | | $ | 1,000.00 | | | $ | 996.80 | | | | 0.70 | % | | $ | 3.52 | |
Hypothetical (5% return before expenses) | | | 1,000.00 | | | | 1,021.68 | | | | 0.70 | % | | | 3.57 | |
| | | | |
N Class Shares | | | | | | | | | | | | | | | | |
Actual | | $ | 1,000.00 | | | $ | 994.70 | | | | 0.75 | % | | $ | 3.77 | |
Hypothetical (5% return before expenses) | | | 1,000.00 | | | | 1,021.42 | | | | 0.75 | % | | | 3.82 | |
| | | | |
| TCW Global Bond Fund | | | | | | | | | | | | | | | | |
I Class Shares | | | | | | | | | | | | | | | | |
Actual | | $ | 1,000.00 | | | $ | 1,053.00 | | | | 0.60 | % (1) | | $ | 3.10 | (1) |
Hypothetical (5% return before expenses) | | | 1,000.00 | | | | 1,022.18 | | | | 0.60 | % (1) | | | 3.06 | (1) |
| | | | |
N Class Shares | | | | | | | | | | | | | | | | |
Actual | | $ | 1,000.00 | | | $ | 1,052.40 | | | | 0.70 | % (1) | | $ | 3.62 | (1) |
Hypothetical (5% return before expenses) | | | 1,000.00 | | | | 1,021.68 | | | | 0.70 | % (1) | | | 3.57 | (1) |
128
TCW Funds, Inc.
| | | | | | | | | | | | | | | | |
TCW Funds, Inc. | | Beginning
Account Value
May 1, 2019 | | | Ending
Account Value
October 31, 2019 | | | Annualized
Expense Ratio | | | Expenses Paid
During Period
(May 1, 2019 to
October 31, 2019) | |
| | | | |
| TCW High Yield Bond Fund | | | | | | | | | | | | | | | | |
I Class Shares | | | | | | | | | | | | | | | | |
Actual | | $ | 1,000.00 | | | $ | 1,042.50 | | | | 0.55 | % | | $ | 2.83 | |
Hypothetical (5% return before expenses) | | | 1,000.00 | | | | 1,022.43 | | | | 0.55 | % | | | 2.80 | |
| | | | |
N Class Shares | | | | | | | | | | | | | | | | |
Actual | | $ | 1,000.00 | | | $ | 1,039.60 | | | | 0.80 | % | | $ | 4.11 | |
Hypothetical (5% return before expenses) | | | 1,000.00 | | | | 1,021.17 | | | | 0.80 | % | | | 4.08 | |
| | | | |
| TCW Short Term Bond Fund | | | | | | | | | | | | | | | | |
I Class Shares | | | | | | | | | | | | | | | | |
Actual | | $ | 1,000.00 | | | $ | 1,018.10 | | | | 0.44 | % | | $ | 2.24 | |
Hypothetical (5% return before expenses) | | | 1,000.00 | | | | 1,022.99 | | | | 0.44 | % | | | 2.24 | |
| | | | |
| TCW Total Return Bond Fund | | | | | | | | | | | | | | | | |
I Class Shares | | | | | | | | | | | | | | | | |
Actual | | $ | 1,000.00 | | | $ | 1,054.40 | | | | 0.49 | % | | $ | 2.54 | |
Hypothetical (5% return before expenses) | | | 1,000.00 | | | | 1,022.74 | | | | 0.49 | % | | | 2.50 | |
| | | | |
N Class Shares | | | | | | | | | | | | | | | | |
Actual | | $ | 1,000.00 | | | $ | 1,052.30 | | | | 0.79 | % | | $ | 4.09 | |
Hypothetical (5% return before expenses) | | | 1,000.00 | | | | 1,021.22 | | | | 0.79 | % | | | 4.02 | |
| (1) | Does not include expenses of the underlying affiliated investments. |
129
TCW Funds, Inc.
Privacy Policy
The TCW Group, Inc. and Subsidiaries
TCW Investment Management Company LLC
TCW Asset Management Company LLC
Metropolitan West Asset Management, LLC
| | |
| TCW Funds, Inc. | | Sepulveda Management LLC |
| TCW Strategic Income Fund, Inc. | | TCW Direct Lending LLC |
| Metropolitan West Funds | | TCW Direct Lending VII LLC |
What You Should Know
At TCW, we recognize the importance of keeping information about you secure and confidential. We do not sell or share your nonpublic personal and financial information with marketers or others outside our affiliated group of companies.
We carefully manage information among our affiliated group of companies to safeguard your privacy and to provide you with consistently excellent service.
We are providing this notice to you to comply with the requirements of Regulation S-P, “Privacy of Consumer Financial Information,” issued by the United States Securities and Exchange Commission.
Our Privacy Policy
We, The TCW Group, Inc. and its subsidiaries, the TCW Funds, Inc., TCW Strategic Income Fund, Inc., the Metropolitan West Funds, Sepulveda Management LLC and TCW Direct Lending (collectively, “TCW”) are committed to protecting the nonpublic personal and financial information of our customers and consumers who obtain or seek to obtain financial products or services primarily for personal, family or household purposes. We fulfill our commitment by establishing and implementing policies and systems to protect the security and confidentiality of this information.
In our offices, we limit access to nonpublic personal and financial information about you to those TCW personnel who need to know the information in order to provide products or services to you. We maintain physical, electronic and procedural safeguards to protect your nonpublic personal and financial information.
Categories of Information We Collect
We may collect the following types of nonpublic personal and financial information about you from the following sources:
| • | | Your name, address and identifying numbers, and other personal and financial information, from you and from identification cards and papers you submit to us, on applications, subscription agreements or other forms or communications. |
| • | | Information about your account balances and financial transactions with us, our affiliated entities, or nonaffiliated third parties, from our internal sources, from affiliated entities and from nonaffiliated third parties. |
130
TCW Funds, Inc.
| • | | Information about your account balances and financial transactions and other personal and financial information, from consumer credit reporting agencies or other nonaffiliated third parties, to verify information received from you or others. |
Categories of Information We Disclose to Nonaffiliated Third Parties
| • | | We may disclose your name, address and account and other identifying numbers, as well as information about your pending or past transactions and other personal financial information, to nonaffiliated third parties, for our everyday business purposes such as necessary to execute, process, service and confirm your securities transactions and mutual fund transactions, to administer and service your account and commingled investment vehicles in which you are invested, to market our products and services through joint marketing arrangements or to respond to court orders and legal investigations. |
| • | | We may disclose nonpublic personal and financial information concerning you to law enforcement agencies, federal regulatory agencies, self-regulatory organizations or other nonaffiliated third parties, if required or requested to do so by a court order, judicial subpoena or regulatory inquiry. |
We do not otherwise disclose your nonpublic personal and financial information to nonaffiliated third parties, except where we believe in good faith that disclosure is required or permitted by law. Because we do not disclose your nonpublic personal and financial information to nonaffiliated third parties, our Customer Privacy Policy does not contain opt-out provisions.
Categories of Information We Disclose to Our Affiliated Entities
| • | | We may disclose your name, address and account and other identifying numbers, account balances, information about your pending or past transactions and other personal financial information to our affiliated entities for any purpose. |
| • | | We regularly disclose your name, address and account and other identifying numbers, account balances and information about your pending or past transactions to our affiliates to execute, process and confirm securities transactions or mutual fund transactions for you, to administer and service your account and commingled investment vehicles in which you are invested, or to market our products and services to you. |
Information About Former Customers
We do not disclose nonpublic personal and financial information about former customers to nonaffiliated third parties unless required or requested to do so by a court order, judicial subpoena or regulatory inquiry, or otherwise where we believe in good faith that disclosure is required or permitted by law.
Questions
Should you have any questions about our Customer Privacy Policy, please contact us by email or by regular mail at the address at the end of this policy.
131
TCW Funds, Inc.
Privacy Policy (Continued)
Reminder About TCW’s Financial Products
Financial products offered by The TCW Group, Inc. and its subsidiaries, the TCW Funds, Inc., TCW Strategic Income Fund, Inc., the Metropolitan West Funds, Sepulveda Management LLC and TCW Direct Lending.
| • | | Are not guaranteed by a bank; |
| • | | Are not obligations of The TCW Group, Inc. or of its subsidiaries; |
| • | | Are not insured by the Federal Deposit Insurance Corporation; and |
| • | | Are subject to investment risks, including possible loss of the principal amount committed or invested, and earnings thereon. |
THE TCW GROUP, INC.
TCW FUNDS, INC.
TCW STRATEGIC INCOME FUND, INC.
METROPOLITAN WEST FUNDS
SEPULVEDA MANAGEMENT LLC
TCW DIRECT LENDING LLC
TCW DIRECT LENDING VII LLC
Attention: Privacy Officer | 865 South Figueroa St. Suite 1800 | Los Angeles, CA 90017 |
email: privacy@tcw.com
132
TCW Funds, Inc.
Approval of Investment Management and Advisory Agreement
Renewal of Investment Advisory and Management Agreement (unaudited)
TCW Funds, Inc. (the “Corporation”) and TCW Investment Management Company LLC (the “Advisor”) are parties to an Investment Advisory and Management Agreement (“Agreement”), pursuant to which the Advisor is responsible for managing the investments of each separate investment series (each, a “Fund” and collectively, the “Funds”) of the Corporation. Unless terminated by either party, the Agreement continues in effect from year to year provided that the continuance is specifically approved at least annually by the vote of the holders of at least a majority of the outstanding shares of the Funds, or by the Board of Directors of the Corporation (the “Board”), and, in either event, by a majority of the Directors who are not “interested persons” of the Corporation, as such term is defined in Section 2(a)(19) of the Investment Company Act of 1940, as amended (the “Independent Directors”), casting votes in person at a meeting called for that purpose.
On September 16, 2019, the Board approved the renewal of the Agreement for an additional one-year term from February 6, 2020 through February 5, 2021. The renewal of the Agreement was approved by the Board (including by a majority of the Independent Directors) upon the recommendation of the Independent Directors. The Independent Directors met separately by telephone on August 27, 2019, and in person on September 15, 2019, with their independent legal counsel to review and discuss the information that had been requested on their behalf by their independent legal counsel and presented by the Advisor for their consideration. The information, material facts, and conclusions that formed the basis for the Independent Directors’ recommendation and the Board’s subsequent approval are described below.
1. Information received
Materials reviewed — During the course of each year, the Directors receive a wide variety of materials relating to the services provided by the Advisor, including reports on the Advisor’s investment processes, as well as on each Fund’s investment results, portfolio composition, portfolio trading practices, compliance monitoring, shareholder services, and other information relating to the nature, extent, and quality of services provided by the Advisor to the Funds. In addition, the Board reviewed information furnished to the Independent Directors in response to a detailed request sent to the Advisor on their behalf. The information in the Advisor’s responses included extensive materials regarding each Fund’s investment results, advisory fee comparisons to advisory fees charged by the Advisor to its institutional clients, financial and profitability information regarding the Advisor, descriptions of various services provided to the Funds and to other advisory and sub-advisory clients, descriptions of functions such as compliance monitoring and portfolio trading practices, and information about the personnel providing investment management services to each Fund. The Directors also considered information provided by an independent data provider, Broadridge, comparing the investment performance and the fee and expense levels of each Fund to those of appropriate peer groups of mutual funds selected by Broadridge. After reviewing this information, the Directors requested additional financial, profitability and service information from the Advisor, which the Advisor provided and the Directors considered.
Review process — The Directors’ determinations were made on the basis of each Director’s business judgment after consideration of all the information presented. The Independent Directors were advised by their independent legal counsel throughout the renewal process and received and reviewed advice from their independent legal counsel regarding legal and industry standards applicable to the renewal of the Agreement, including a legal memorandum from their independent legal counsel discussing their fiduciary duties related to their approval of the continuation of the Agreement. The Independent Directors also
133
TCW Funds, Inc.
Approval of Investment Management and Advisory Agreement (Continued)
discussed the renewal of the Agreement with the Advisor’s representatives and in private sessions at which no representatives of the Advisor were present. In deciding to recommend the renewal of the Agreement with respect to each Fund, the Independent Directors did not identify any single piece of information or particular factor that, in isolation, was the controlling factor. Each Independent Director may also have weighed factors differently. This summary describes the most important, but not all, of the factors considered by the Board and the Independent Directors.
2. Nature, extent, and quality of services provided by the Advisor
The Board and the Independent Directors considered the depth and quality of the Advisor’s investment management process, including its research and strong analytical capabilities; the experience, capability, and integrity of its senior management and other personnel; the relatively low turnover rates of its key personnel; the overall resources available to the Advisor; and the ability of its organizational structure to address the growth in assets over the past several years and withstand the recent decline in assets. The Board and the Independent Directors considered the ability of the Advisor to attract and retain well-qualified investment professionals, noting in particular the Advisor’s hiring of professionals in various areas over the past several years, continued upgrading of resources in its middle office and back office operations and other areas, as well as a continuing and extensive program of infrastructure and systems enhancements. The Board and the Independent Directors also considered that the Advisor made available to its investment professionals a variety of resources and systems relating to investment management, compliance, trading, operations, administration, research, portfolio accounting, and legal matters. They noted the substantial additional resources made available by The TCW Group, Inc., the parent company of the Advisor. The Board and the Independent Directors examined and discussed a detailed description of the extensive additional services provided to the Funds to support their operations and compliance, as compared to the much narrower range of services provided to the Advisor’s institutional and sub-advised clients, as well as the Advisor’s oversight and coordination of numerous outside service providers to the Funds. They further noted the high level of regular communication between the Advisor and the Independent Directors. The Advisor explained its responsibility to supervise the activities of the Funds’ various service providers, as well as supporting the Independent Directors and their meetings, regulatory filings, and various operational personnel, and the related costs.
The Board and the Independent Directors concluded that the nature, extent, and quality of the services provided by the Advisor are of a high quality and have benefited and should continue to benefit the Funds and their shareholders.
3. Investment results
The Board and the Independent Directors considered the investment results of each Fund in light of its investment objective(s) and principal investment strategies. They compared each Fund’s total returns with the total returns of other mutual funds in peer group reports prepared by Broadridge with respect to various longer and more recent periods all ended May 31, 2019. The Board and the Independent Directors reviewed information as to peer group selections presented by Broadridge and discussed the methodology for those selections with Broadridge. In reviewing each Fund’s relative performance, the Board and the Independent Directors took into account each Fund’s investment strategies, distinct characteristics, asset size and diversification.
The Board and the Independent Directors noted that most Funds’ performance was satisfactory over the relevant periods. The Board and the Independent Directors noted that investment performance of most of
134
TCW Funds, Inc.
the Funds was generally close to or above the median performance of the applicable peer group during the three-year period emphasized by Broadridge in the supplemental materials, but eight Funds ranked in the fourth or fifth quintile of their peer groups for that three-year period. For those Funds that lagged peer group averages, they noted that the Advisor had discussed with the Board the reasons for the underperformance and the actions taken or to be taken by the Advisor to address the underperformance, and they indicated that they would continue to monitor portfolio investment performance on a regular basis and discuss with the Advisor from time to time any instances of long-term underperformance as appropriate. The Board and the Independent Directors noted that the performance of some Funds for periods when they lagged their peer group averages remained satisfactory when assessed on a risk-adjusted basis because performance quintiles do not necessarily reflect the degree of risk employed by peer funds to achieve their returns.
With respect to the fixed income Funds, the Board and the Independent Directors recognized the Advisor’s deliberate strategy to manage risk in light of its critical view of the fixed-income securities markets and overall investment market conditions at present and in the near term. For that reason, the Board and the Independent Directors believed that relative performance also should be considered in light of future market conditions expected by the Advisor. The Board and the Independent Directors noted the Advisor’s view that longer term performance can be more meaningful for active fixed income funds than shorter term performance because fixed income market cycles are generally longer than three years.
For the U.S. fixed income Funds, the Board and the Independent Directors noted the conservative profile of these Funds, which generally experienced less volatility compared to various other funds in the applicable peer group (except for the relative volatility of Total Return Bond Fund, which is a mortgage-focused Fund). They also noted the Advisor’s conservative posture for these Funds with respect to credit and interest rate risks.
For the Total Return Bond Fund, the Board and the Independent Directors noted that the Fund’s performance was in the first quintile for the ten-year period, the second quintile for the three- and five-year periods and the first quintile for the one-year period.
For the Core Fixed Income Fund, the Board and the Independent Directors noted that the Fund’s performance was in the second quintile for the ten-year period, the third quintile for the five- and three-year periods and the second quintile for the one-year period.
For the Global Bond Fund, the Board and the Independent Directors noted that the Fund’s performance was in the fourth quintile for the five-year period, the fifth quintile for the three-year period and the third quintile for the one-year period.
For the High Yield Bond Fund, the Board and the Independent Directors noted that the Fund’s performance was in the third quintile for the ten-year period, the first quintile for the five-year period, the third quintile for the three-year period and the first quintile for the one-year period.
For the Short Term Bond Fund, the Board and the Independent Directors noted that the Fund’s performance was in the third quintile for the ten-year period, the fourth quintile for the five- and three-year periods and the fifth quintile for the one-year period.
For the Enhanced Commodity Strategy Fund, the Board and the Independent Directors noted that the Fund’s performance was in the second quintile for the five- and three-year periods and the first quintile for the one-year period.
135
TCW Funds, Inc.
Approval of Investment Management and Advisory Agreement (Continued)
With respect to the U.S. equity Funds, the Board and the Independent Directors noted that the performance of most Funds for the various periods reviewed ranked in the first, second or third quintiles.
The Relative Value Dividend Appreciation Fund ranked in the fifth quintile for the one-, three- and five-year periods. The Relative Value Large Cap Fund ranked in the fifth quintile for the one- and three-year periods and the fourth quintile for the five-year period. The Relative Value Mid Cap Fund ranked in the fifth quintile for the one-, five- and ten-year periods. The Board and the Independent Directors noted the Advisor’s explanation that the diversification tool used to mitigate risk of the Relative Value Dividend Appreciation Fund and the Relative Value Large Cap Fund weighed on their near-term performance in a momentum-driven market and its opinion that each of the Relative Value Funds is well-positioned to excel in a strengthening economic environment. The Board and the Independent Directors also noted that the Relative Value Dividend Appreciation Fund and the Relative Value Large Cap Fund ranked in the first quintile for the six-month period ended June 30, 2019.
The Artificial Intelligence Equity Fund ranked in the fourth quintile for the one-year period and the period since inception. The Board and the Independent Directors considered the Advisor’s explanation that the peer funds had greater exposure to the information technology sector, making the peer group less useful in comparing relative performance than if those funds’ principal investment strategies were more closely aligned with the Fund’s investment focus. The Board and the Independent Directors also noted the relatively short operating history of the Fund and determined to continue to closely monitor its performance.
The Global Real Estate Fund ranked in the fifth quintile for the three-year period but in the third quintile for the one-year period and the first quintile for the six months ended June 30, 2019. The Board and the Independent Directors determined to continue to closely monitor its performance and did not believe any other immediate action was needed.
With respect to the international and emerging markets Funds, the Board and the Independent Directors noted that the performance of a majority of these Funds ranked in the first, second or third quintiles over various time periods. The Emerging Markets Local Currency Income Fund ranked in the fourth quintile for the one-year period but in the second quintile for the three-year period and the first quintile for the five-year period. The Emerging Markets Multi-Asset Opportunities Fund ranked in the fifth quintile for the one-year period but in the second quintile for the three-year period and the third quintile for the five-year period. The International Small Cap Fund ranked in the fifth quintile for the one- and five-year periods and the fourth quintile for the three-year period. The Developing Markets Equity Fund ranked in the fifth quintile for the one-year period and the fourth quintile for the three-year period. The Board and the Independent Directors noted the Advisor’s explanation that the challenging international and emerging market conditions over the last twelve months weighed on near-term performance and its opinion that each of the international and emerging markets Funds is well-positioned to excel in a strengthening economic environment.
For the asset allocation Fund, the Board the Independent Directors noted that the Conservative Allocation Fund’s performance was in the second quintile for the ten-year period, the first quintile for the five-year period, the second quintile for the three- and one-year periods.
The Board and the Independent Directors concluded that the Advisor was implementing each Fund’s investment objective(s) and that the Advisor’s record in managing the Funds indicated that its continued management should benefit each Fund and its shareholders over the long term.
136
TCW Funds, Inc.
4. Advisory fees and total expenses
The Board and the Independent Directors compared the management fees (which Broadridge defines to include the advisory fee and the administrative fee) and total expenses of each Fund (each as a percentage of average net assets) with the median management fee and operating expense level of the other mutual funds in the relevant Broadridge peer groups. These comparisons assisted the Board and the Independent Directors by providing a reasonable statistical measure to assess each Fund’s fees relative to its relevant peers. The Board and the Independent Directors observed that each Fund’s management fee, after giving effect to applicable waivers and/or reimbursements, was below or near the median of the peer group funds on a current basis, with the exception of the Select Equities Fund, the Emerging Markets Income Fund, the Emerging Markets Local Currency Income Fund and the Emerging Markets Multi-Asset Opportunities Fund. They also observed that each Fund’s total expenses, after giving effect to applicable waivers and/or reimbursements, were below or near the median of the peer group funds, with the exception of the Global Bond Fund primarily due to its smaller size relative to most of the other funds in the peer group. The Board and the Independent Directors also noted the contractual expense limitations to which the Advisor has agreed with respect to each Fund and that the Advisor historically has absorbed any expenses in excess of these limits. The Board and the Independent Directors noted that for several Funds, their below-median management fee and total expenses were in part due to substantial waiver and/or reimbursement pursuant to the contractual expense limitations. The Board and the Independent Directors concluded that the competitive fees charged by the Advisor, and competitive expense ratios, should continue to benefit each Fund and its shareholders.
The Board and the Independent Directors also reviewed information regarding the advisory fees charged by the Advisor to its institutional and sub-advisory clients with similar investment mandates. The Board and the Independent Directors concluded that, although the fees paid by those clients generally were lower than advisory fees paid by the Funds, the differences appropriately reflected the more extensive services provided by the Advisor to the Funds and the Advisor’s significantly greater responsibilities and expenses with respect to the Funds, including the additional time spent by portfolio managers for reasons such as managing the more active cash flows from purchases and redemptions by shareholders, the additional risks of managing a pool of assets for public investors, administrative burdens, daily pricing, valuation and liquidity responsibilities, the supervision of vendors and service providers, and the costs of additional infrastructure and operational resources and personnel and of complying with and supporting the more comprehensive regulatory and governance regime applicable to mutual funds.
5. The Advisor’s costs, level of profits, and economies of scale
The Board and the Independent Directors reviewed information regarding the Advisor’s costs of providing services to the Funds, as well as the resulting level of profits to the Advisor. They reviewed the Advisor’s stated assumptions and methods of allocating certain costs, such as personnel costs, which constitute the Advisor’s largest operating cost. The Board and the Independent Directors recognized that the Advisor should be entitled to earn a reasonable level of profits for the services that it provides to each Fund. The Board and the Independent Directors also reviewed a comparison of the Advisor’s profitability with respect to the Funds to the profitability of certain unaffiliated publicly traded asset managers, which the Advisor believed supported its view that the Advisor’s profitability was reasonable. Based on their review, the Board and the Independent Directors concluded that they were satisfied that the Advisor’s level of profitability from its relationship with each Fund was not unreasonable or excessive.
137
TCW Funds, Inc.
Approval of Investment Management and Advisory Agreement (Continued)
The Board and the Independent Directors considered the extent to which potential economies of scale could be realized as the Funds grow and whether the advisory fees reflect those potential economies of scale. They recognized that the advisory fees for the Funds do not have breakpoints, which would otherwise result in lower advisory fee rates as the Funds grow larger. They also recognized the Advisor’s view that the advisory fees compare favorably to peer group fees and expenses and remain competitive even at higher asset levels and that the relatively low advisory fees reflect the potential economies of scale. The Board and the Independent Directors recognized the benefits of the Advisor’s substantial past and on-going investment in the advisory business, such as successfully recruiting and retaining key professional talent, systems and technology upgrades, added resources dedicated to legal and compliance programs, and improvements to the overall firm infrastructure, as well as the financial pressures of competing against much larger firms and passive investment products. The Board and the Independent Directors further noted the Advisor’s past and continuing subsidies of the Funds’ operating expenses when they were newer and smaller and the Advisor’s commitment to maintain reasonable overall operating expenses for each Fund. The Board and the Independent Directors also recognized that the Funds benefit from receiving investment advice from an organization with other types of advisory clients in addition to mutual funds. The Board and the Independent Directors concluded that the Advisor was satisfactorily sharing potential economies of scale with the Funds through low fees and expenses, and through reinvesting in its capabilities for serving the Funds and their shareholders.
6. Ancillary benefits
The Board and the Independent Directors also considered ancillary benefits received or to be received by the Advisor and its affiliates as a result of the relationship of the Advisor with the Funds, including compensation for certain compliance support services. The Board and the Independent Directors noted that, in addition to the fees the Advisor receives under the Agreement, the Advisor receives additional benefits in connection with management of the Funds in the form of reports, research and other services from brokers and their affiliates in return for brokerage commissions paid to such brokers. The Board and the Independent Directors concluded that any potential benefits received or to be derived by the Advisor from its relationships with the Funds are reasonably related to the services provided by the Advisor to the Funds.
7. Conclusions
Based on their overall review, including their consideration of each of the factors referred to above (and others), the Board and the Independent Directors concluded that the Agreement is fair and reasonable to each Fund and its shareholders, that each Fund’s shareholders received reasonable value in return for the advisory fees and other amounts paid to the Advisor by each Fund, and that the renewal of the Agreement was in the best interests of each Fund and its shareholders.
138
TCW Funds, Inc.
Supplemental Information
Proxy Voting Guidelines
The policies and procedures that the Company uses to determine how to vote proxies are available without charge. The Board has delegated the Company’s proxy voting authority to the Advisor.
Disclosure of Proxy Voting Guidelines
The proxy voting guidelines of the Advisor are available:
| | 1. By | calling 800-FUND-TCW (800-386-3829) to obtain a hard copy; or |
| | 2. By | going to the SEC website at http://www.sec.gov. |
When the Company receives a request for a description of the Advisor’s proxy voting guidelines, it will deliver the description that is disclosed in the Company’s Statement of Additional Information. This information will be sent out via first class mail (or other means designed to ensure equally prompt delivery) within three business days of receiving the request.
The Advisor, on behalf of the Company, prepares and files Form N-PX with the SEC not later than August 31 of each year, which includes the Company’s proxy voting record for the most recent twelve-month period ended June 30 of that year. The Company’s proxy voting record for the most recent twelve-month period ended June 30 is available:
| | 1. By | calling 800-FUND-TCW (800-386-3829) to obtain a hard copy; or |
| | 2. By | going to the SEC website at http://www.sec.gov. |
When the Company receives a request for the Company’s proxy voting record, it will send the information disclosed in the Company’s most recently filed report on Form N-PX via first class mail (or other means designed to ensure equally prompt delivery) within three business days of receiving the request.
The Company also discloses its proxy voting record on its website as soon as is reasonably practicable after its report on Form N-PX is filed with the SEC.
Availability of Quarterly Portfolio Schedule
The Company files a complete schedule of its portfolio holdings with the SEC for the first and third quarters of its fiscal year on Form N-PORT-EX. Such filings occur no later than 60 days after the end of the Funds’ first and third quarters and are available on the SEC’s website at www.sec.gov.
139
TCW Funds, Inc.
Tax Information Notice (Unaudited)
On account of the year ended October 31, 2019, the following Funds paid a capital gain distribution within the meaning 852 (b)(3)(c) of the Code. Each Fund also designates as a capital gain distribution a portion of earnings and profits paid to shareholders in redemption of their shares.
| | | | |
Fund | | Amounts per
Share | |
TCW Enhanced Commodity Strategy Fund | | $ | 0.01 | |
TCW Global Bond Fund | | $ | 0.12 | |
This information is given to meet certain requirements of the Code and should not be used by shareholders for preparing their income tax returns. In February 2020, shareholders will receive Form 1099-DIV which will show the actual distribution received and include their share of qualified dividends during the calendar year of 2019. Shareholders are advised to check with their tax advisors for information on the treatment of these amounts on their individual tax returns.
140
TCW Funds, Inc.
Directors and Officers of the Company
A board of seven directors is responsible for overseeing the operations of the Company, which consists of 19 Funds at October 31, 2019. The directors of the Company, and their business addresses and their principal occupation for the last five years are set forth below.
Independent Directors
| | | | | | |
Name, and Year of Birth (1) | | Term of Office and Length of Time Served | | Principal Occupation(s) During Past 5 Years | | Other Directorships held by Director |
| Samuel P. Bell (1936) | | Mr. Bell has served as a director of TCW Funds, Inc. since October 2002. | | Private Investor. | | Point.360 (post production services); TCW Strategic Income Fund, Inc. (closed-end fund). |
Patrick C. Haden (1953) Chairman of the Board | | Mr. Haden has served as a director of TCW Funds, Inc. since May 2001. | | President (since 2003), Wilson Ave. Consulting (business consulting firm); Senior Advisor to President (July 2016 – June 2017) and Athletic Director (August 2010 – June 2016), University of Southern California. | | Tetra Tech, Inc. (environmental consulting); Auto Club (affiliate of AAA); Metropolitan West Funds (mutual fund); TCW Strategic Income Fund, Inc. (closed end fund). |
| Peter McMillan (1957) | | Mr. McMillan has served as a director of TCW Funds, Inc. since August 2010. | | Co-founder, Managing Partner and Chief Investment Officer (since May 2013), Temescal Canyon Partners (investment advisory firm); Co-founder and Executive Vice President (since 2005), KBS Capital Advisors (a manager of real estate investment trusts); Co-founder and Managing Partner (since 2000), Willowbrook Capital Group, LLC (investment advisory firm). | | KBS Real Estate Investment Trusts (real estate investments); KBS Strategic Opportunity REITS (real estate investments); Keppel-KBS U.S. REIT (real estate investments); Metropolitan West Funds (mutual funds); TCW Strategic Income Fund, Inc. (closed-end fund); TCW DL VII Financing LLC (business development company). |
| Victoria B. Rogers (1961) | | Ms. Rogers has served as a director of the TCW Funds, Inc. since October 2011. | | President and Chief Executive Officer (since 1996), The Rose Hills Foundation (charitable foundation). | | Causeway Capital Management Trust (mutual fund; 6 portfolios); Causeway ETML Trust (mutual fund); The Rose Hills Foundation (charitable foundation) TCW Strategic Income Fund, Inc. (closed-end fund); Norton Simon Museum (art museum); Stanford University (university). |
| Andrew Tarica (1959) | | Mr. Tarica has served as a director of the TCW Funds, Inc. since March 2012. | | Chief Executive Officer (since February 2001), Meadowbrook Capital Management (asset management company); and Employee (since 2003), Cowen Prime Services (broker dealer). | | Metropolitan West Funds (mutual fund); TCW Strategic Income Fund, Inc. (closed-end fund); TCW Direct Lending VII, LLC (business development company). |
| (1) | The address of each Independent Director is c/o Morgan, Lewis & Bockius LLP, Counsel to the Independent Directors, 300 South Grand Avenue 22nd Floor, Los Angeles, CA 90071. |
141
TCW Funds, Inc.
Directors and Officers of the Company (Continued)
Interested Directors
These directors are “interested persons” of the Company as defined in the 1940 Act because they are directors and officers of the Advisor, and shareholders and directors of The TCW Group, Inc., the parent company of the Advisor.
| | | | | | |
Name and Year of Birth | | Term of Office and Length of Time Served | | Principal Occupation(s)
During Past 5 Years | | Other Directorships held by Director |
| Marc I. Stern (1944) | | Mr. Stern has served as a director of TCW Funds, Inc. since its inception in September 1992. | | Chairman (since January 2016), TCW LLC; Chairman (since February 2013), The TCW Group Inc., TCW Investment Management Company LLC, TCW Asset Management Company LLC and Metropolitan West Asset Management, LLC; Vice Chairman (November 2010 – December 2014) and Chairman (2014 – December 2015), Trust Company of the West. | | N/A |
David S. DeVito (1962) President and Chief Executive Officer | | Mr. DeVito has served as a director of TCW Funds, Inc. since January 2014 and as its President and Chief Executive Officer since January 2014. | | Executive Vice President and Chief Operating Officer (since January 2016), TCW LLC; Executive Vice President and Chief Operating Officer (since October 2013), TCW Investment Management Company LLC, The TCW Group, Inc., Metropolitan West Asset Management, LLC and TCW Asset Management Company LLC; President and Chief Executive Officer (since January 2014), TCW Strategic Income Fund, Inc.; Chief Financial Officer and Treasurer (since 2010), Metropolitan West Funds. | | TCW Strategic Income Fund, Inc. (closed-end fund) |
The officers of the Company who are not directors of the Company are:
| | | | |
| Name and Year of Birth | | Position(s) Held with Company | | Principal Occupation(s) During Past 5 Years (1) |
Lisa Eisen (1963) Tax Officer | | Ms. Eisen has served as Tax Officer of TCW Funds, Inc. since December 2016. | | Tax Officer (since December 2016), Metropolitan West Funds and TCW Strategic Income Fund, Inc.; Managing Director and Director of Tax (since August 2016), TCW LLC; Vice President of Corporate Tax and Payroll for Health Net, Inc. (1998 – July 2016). |
142
TCW Funds, Inc.
| | | | |
| Name and Year of Birth | | Position(s) Held with Company | | Principal Occupation(s) During Past 5 Years (1) |
Meredith S. Jackson (1959) Senior Vice President, General Counsel and Secretary | | Ms. Jackson has served as Senior Vice President since January 2016 and General Counsel and Secretary of TCW Funds, Inc. since February 2013. | | Executive Vice President, General Counsel and Secretary (since January 2016), TCW LLC; Executive Vice President, General Counsel and Secretary (since February 2013), TCW Investment Management Company LLC, The TCW Group Inc., TCW Asset Management Company LLC, Metropolitan West Asset Management, LLC and Trust Company of the West (2013 – December 2015); Senior Vice President, General Counsel and Secretary (since February 2013), TCW Strategic Income Fund, Inc. and Metropolitan West Funds. |
Jeffrey Engelsman (1967) Chief Compliance Officer and AML Officer | | Mr. Engelsman has served as Chief Compliance Officer of TCW Funds, Inc. since September 2014 and AML Officer of TCW Funds, Inc. since December 2016. | | AML Officer (since December 2016), Metropolitan West Funds, and TCW Strategic Income Fund, Inc.; Managing Director and Global Chief Compliance Officer (since January 2016), TCW LLC; Chief Compliance Officer (since 2014), Metropolitan West Funds, Metropolitan West Asset Management Company, LLC, and TCW Asset Management Company LLC (since August 2014) and Trust Company of the West (2014 – December 2015); Global Chief Compliance Officer (since September 2014), The TCW Group, Inc.; Chief Compliance Officer (since September 2014), TCW Strategic Income Fund, Inc.; Chief Compliance Officer (2009 – August 2014), MainStay Funds (mutual fund); Managing Director (2009 – July 2014), New York Life Investments (investment management). |
Richard M. Villa (1964) Treasurer, Principal Financial and Accounting Officer | | Mr. Villa has served as Treasurer and Principal Financial and Accounting Officer of TCW Funds, Inc. since February 2014. | | Managing Director, Chief Financial Officer and Assistant Secretary (since January 2016), TCW LLC; Treasurer and Principal Financial and Accounting Officer (since February 2014), TCW Strategic Income Fund, Inc.; Managing Director and Chief Financial Officer and Assistant Secretary (since July 2008), TCW Investment Management Company LLC, the TCW Group, Inc., TCW Asset Management Company LLC, Metropolitan West Asset Management, LLC and Trust Company of the West (2008 – December 2015). |
| (1) | Positions with The TCW Group, Inc. and its affiliates may have changed over time. |
| * | Address is 865 South Figueroa Street, 18th Floor, Los Angeles, California 90017 |
In addition, Eric Chan, Senior Vice President of Fund Operations for the Advisor, TCW Asset Management Company LLC, TCW LLC (since 2009), and Metropolitan West Asset Management, LLC (since November 2006), is Assistant Treasurer of the Company (since June 2019) and Metropolitan West Funds (since 2010). Mr. Chan is a Certified Public Accountant. Patrick W. Dennis, Senior Vice President, Associate
143
TCW Funds, Inc.
Directors and Officers of the Company (Continued)
General Counsel and Assistant Secretary of TCW Asset Management Company LLC, Metropolitan West Asset Management, LLC, TCW LLC, the Advisor (since February 2013) and Trust Company of the West (February 2013 – December 2015), is Vice President and Assistant Secretary of the Company.
The SAI (Statement of Additional Information) has additional information regarding the Board of Directors. A copy is available without charge by calling 1-800-FUND-TCW (1-800-386-3829) to obtain a hard copy or by going to the SEC website at www.sec.gov. or the Company’s website at www.tcw.com.
144
TCW Funds, Inc.
Disclaimers for Use of Bloomberg Barclays Indexes
BARCLAYS is a trademark and service mark of Barclays Bank Plc, used under license. Barclays Capital Inc. and its affiliates (“Barclays”) is not the issuer or producer of TCW Funds, Inc. (the “Funds”) and Barclays has no responsibilities, obligations or duties to investors in TCW Funds, Inc. Barclays’ only relationship with the Funds is the licensing of the BARCLAYS mark as part of the name of the respective Barclays Indexes, which Barclays does not determine, compose or calculate. Additionally, the Funds may for itself execute transaction(s) with Barclays in or relating to the Indexes used in connection with the Funds. Investors who acquire the Funds neither acquire any interest in the Indexes nor enter into any relationship of any kind whatsoever with Barclays upon making an investment in the Funds. The Funds are not sponsored, endorsed, sold or promoted by Barclays. Barclays does not make any representation or warranty, express or implied regarding the advisability of investing in the Funds or the advisability of investing in securities generally or the ability of the Indexes to track corresponding or relative market performance. Barclays has not passed on the legality or suitability of the Funds with respect to any person or entity. Barclays is not responsible for and has not participated in the determination of the timing of, prices at, or quantities of the Funds to be issued. Barclays has no obligation or liability in connection with administration, marketing or trading of the Funds.
The licensing agreement between Bloomberg and Barclays is solely for the benefit of Bloomberg and Barclays and not for the benefit of the owners of the Funds’ investors or other third parties.
BARCLAYS SHALL HAVE NO LIABILITY TO THE ISSUER, INVESTORS OR TO OTHER THIRD PARTIES FOR THE QUALITY, ACCURACY AND/OR COMPLETENESS OF THE INDEXES OR ANY DATA INCLUDED THEREIN OR FOR INTERRUPTIONS IN THE DELIVERY OF THE INDEXES. BARCLAYS MAKES NO WARRANTY, EXPRESS OR IMPLIED, AS TO RESULTS TO BE OBTAINED BY THE ISSUER, THE INVESTORS OR ANY OTHER PERSON OR ENTITY FROM THE USE OF THE INDEXES OR ANY DATA INCLUDED THEREIN. BARCLAYS MAKES NO EXPRESS OR IMPLIED WARRANTIES, AND HEREBY EXPRESSLY DISCLAIMS ALL WARRANTIES OF MERCHANTABILITY OR FITNESS FOR A PARTICULAR PURPOSE OR USE WITH RESPECT TO THE INDEXES OR ANY DATA INCLUDED THEREIN. BARCLAYS DOES NOT CALCULATE OR PUBLISH THE BLOOMBERG BARCLAYS INDEXES AND SHALL NOT BE LIABLE FOR ANY MISCALCULATION OF OR ANY INCORRECT, DELAYED OR INTERRUPTED PUBLICATION WITH RESPECT TO ANY OF THE BLOOMBERG BARCLAYS INDEXES. BARCLAYS SHALL NOT BE LIABLE FOR ANY DAMAGES, INCLUDING, WITHOUT LIMITATION, ANY SPECIAL, INDIRECT OR CONSEQUENTIAL DAMAGES, OR ANY LOST PROFITS AND EVEN IF ADVISED OF THE POSSIBILITY OF SUCH, RESULTING FROM THE USE OF THE INDEXES OR ANY DATA INCLUDED THEREIN OR WITH RESPECT TO THE FUNDS.
None of the information supplied by Barclays and used in this publication may be reproduced in any manner without the prior written permission of Barclays Capital, the investment banking division of Barclays Bank Plc. Barclays Bank Plc is registered in England No. 1026167. Registered office 1 Churchill Place London E14 5HP.
BLOOMBERG is a trademark and service mark of Bloomberg Finance L.P. Bloomberg Finance L.P. and its affiliates (collectively, “Bloomberg”) or Bloomberg’s licensors own all proprietary right in the Barclays Indexes. Bloomberg does not guarantee the timeliness, accuracy or completeness of any data or information relating to the Indexes. Bloomberg makes no warranty, express or implied, as to the Indexes or any data or values relating thereto or results to be obtained therefrom, and expressly disclaims all warranties of merchantability and fitness for a particular purpose with respect thereto. It is not possible to
145
TCW Funds, Inc.
Disclaimers for Use of Bloomberg Barclays Indexes (Continued)
invest directly in an index. Back-tested performance is not actual performance. To the maximum extent allowed by law, Bloomberg, its licensors, and its and their respective employees, contractors, agents, suppliers and vendors shall have no liability or responsibility whatsoever for any injury or damages — whether direct, indirect, consequential, incidental, punitive or otherwise — arising in connection with Indexes or any data or values relating thereto — whether arising from their negligence or otherwise. Nothing in the Indexes shall constitute or be construed as an offering of financial instruments or as investment advice or investment recommendations (i.e., recommendations as to whether or not to “buy”, “sell”, “hold”, or to enter or not to enter into any other transaction involving any specific interest or interests) by Bloomberg or its affiliates or a recommendation as to an investment or other strategy by Bloomberg or its affiliates. Data and other information available via the Indexes should not be considered as information sufficient upon which to base an investment decision. All information provided by the Indexes is impersonal and not tailored to the needs of any person, entity or group of persons. Bloomberg and its affiliates do not express an opinion on the future or expected value of any security or other interest and do not explicitly or implicitly recommend or suggest an investment strategy of any kind.
The only relationship of Bloomberg or any of its subsidiaries or affiliates to the Funds is the licensing of certain trademarks, trade names and service marks and of the Indexes, which is determined, composed and calculated by Bloomberg without regard to the Funds. Bloomberg has no obligation to take the needs of the Funds or the owners of the Funds into consideration in determining, composing or calculating the Indexes. The Funds are not sponsored, endorsed, sold or promoted by Bloomberg or any of its subsidiaries or affiliates.
146
TCW Funds, Inc.
865 South Figueroa Street
Los Angeles, California 90017
800 FUND TCW
(800 386 3829)
www.TCW.com
INVESTMENT ADVISOR
TCW Investment Management Company LLC
865 South Figueroa Street
Los Angeles, California 90017
TRANSFER AGENT
U.S. Bancorp Fund Services, LLC
615 E. Michigan Street
Milwaukee, Wisconsin 53202
INDEPENDENT REGISTERED PUBLIC ACCOUNTING FIRM
Deloitte & Touche LLP
555 West 5th Street
Los Angeles, California 90013
CUSTODIAN & ADMINISTRATOR
State Street Bank & Trust Company
One Lincoln Street
Boston, Massachusetts 02111
DISTRIBUTOR
TCW Funds Distributors LLC
865 South Figueroa Street
Los Angeles, California 90017
DIRECTORS
Patrick C. Haden
Director and Chairman of the Board
Samuel P. Bell
Director
David S. DeVito
Director
Peter McMillan
Director
Victoria B. Rogers
Director
Marc I. Stern
Director
Andrew Tarica
Director
OFFICERS
David S. DeVito
President and Chief Executive Officer
Meredith S. Jackson
Senior Vice President,
General Counsel and Secretary
Richard M. Villa
Treasurer and Principal Financial and Accounting Officer
Jeffrey A. Engelsman
Chief Compliance Officer and Anti-Money Laundering Officer
Patrick W. Dennis
Vice President and Assistant Secretary
Lisa Eisen
Tax Officer
Eric W. Chan
Assistant Treasurer
TCW FAMILY OF FUNDS
EQUITY FUNDS
TCW Artificial Intelligence Equity Fund
TCW Global Real Estate Fund
TCW New America Premier Equities Fund
TCW Relative Value Dividend Appreciation Fund
TCW Relative Value Large Cap Fund
TCW Relative Value Mid Cap Fund
TCW Select Equities Fund
ASSET ALLOCATION FUND
TCW Conservative Allocation Fund
FIXED INCOME FUNDS
TCW Core Fixed Income Fund
TCW Enhanced Commodity Strategy Fund
TCW Global Bond Fund
TCW High Yield Bond Fund
TCW Short Term Bond Fund
TCW Total Return Bond Fund
INTERNATIONAL FUNDS
TCW Developing Markets Equity Fund
TCW Emerging Markets Income Fund
TCW Emerging Markets Local Currency Income Fund
TCW Emerging Markets Multi-Asset Opportunities Fund
TCW International Small Cap Fund
FUNDarFI1019


INTERNATIONAL FUNDS
TCW Developing Markets Equity Fund
TCW Emerging Markets Income Fund
TCW Emerging Markets Local Currency Income Fund
TCW Emerging Markets Multi-Asset Opportunities Fund
TCW International Small Cap Fund
Beginning on January 1, 2021, as permitted by regulations adopted by the Securities and Exchange Commission, paper copies of the Funds’ annual and semi-annual shareholder reports will no longer be sent by mail, unless you specifically request paper copies of the reports. Instead, the reports will be made available on the Funds’ website (www.tcw.com), and you will be notified by mail each time a report is posted and provided with a website link to access the report.
If you already elected to receive shareholder reports electronically, you will not be affected by this change and you need not take any action. You may elect to receive shareholder reports and other communications from the Funds or your financial intermediary electronically by contacting your financial intermediary (such as a broker-dealer or bank) if you invest through a financial intermediary, or by calling 1-800-FUND-TCW (1-800-386-3829) if you invest directly with the Funds.
Beginning on January 1, 2019, you may elect to receive all future reports in paper free of charge. You can call 1-800-FUND-TCW (1-800-386-3829), if you invest directly with the Funds, or contact your financial intermediary, if you invest though a financial intermediary, to inform the Funds or the financial intermediary that you wish to continue receiving paper copies of your shareholder reports. Your election to receive reports in paper will apply to all Funds held directly with TCW or through your financial intermediary.
TCW Funds, Inc.
Table of Contents
|
| |
| The Letter to Shareholders and/or Management Discussions contained in this Annual Report are the opinions of each Fund’s portfolio managers and are not the opinions of TCW Funds, Inc. or its Board of Directors. Various matters discussed in the Letter to Shareholders and/or Management Discussions constitute forward-looking statements within the meaning of the federal securities laws. Actual results and the timing of certain events could differ materially from those projected or contemplated by these forward-looking statements due to a number of factors, including general economic conditions, overall availability of securities for investment by a Fund, the level of volatility in the securities markets and in the share price of a Fund, and other risk factors discussed in the SEC filings of TCW Funds, Inc. The data presented in the Letter to Shareholders and/or Management Discussions represents past performance and cannot be used to predict future results. |
| | |
To Our Valued Shareholders | | |
| | |

| | David S. DeVito President, Chief Executive Officer and Director |
Dear Valued Investors,
I am pleased to present the annual report for the TCW Funds, Inc. covering the 12-month period ended October 31, 2019. I would like to express our appreciation for your continued investment in the TCW Funds as well as welcome new shareholders to our fund family. As of October 31, 2019, the TCW Funds held total net assets of approximately $15 billion.
This report contains information and portfolio management discussions of our TCW International Funds.
The International Markets
Our outlook for international markets is cautiously optimistic. While uncertainties remain, we believe global growth will improve slightly year-over-year in 2020, and is more likely to overshoot than undershoot, as indicated by green shoots in the European Union and Japan, and economic indicators starting to surprise to the upside in a number of EM economies.
Still, we believe the major Central Banks will remain cautious and biased toward easing. This more accommodative policy stance could extend the current low rate environment into the medium term, which we believe will continue to drive inflows into higher-yielding asset classes, like Emerging Markets Debt. This environment should also provide EM central banks the policy space to enact pro-growth measures as needed, especially as inflation remains relatively benign.
Geopolitical risks will likely remain elevated and complicate the outlook for 2020, but we could see improvements in one or more of the more important geopolitical issues, such as Brexit and/or the U.S./China trade war. While we are not convinced we will see a meaningful trade deal or major concessions from either side, recent headlines suggest some progress.
Should we see signs of a broader turnaround in growth outside the US — notably in China and the EU — and/or a de-escalation in the larger geopolitical risks, equities and EM local currency debt could present interesting opportunities in 2020. In the meantime, we have a preference for dollar-denominated EM debt, which presents attractive carry relative to developed markets.
As of October 31, 2019, the TCW Emerging Markets Income Fund (TGEIX) received an Overall Morningstar RatingTM of 5 Stars based on risk-adjusted returns among 242 Emerging Markets Bond Funds1 and ranked in the first quartile of its Morningstar Emerging Markets Bond peer group for the Year-to-Date, 3-year and 10-year time periods ended October 31, 20192. As of October, 31, 2019, the TCW Emerging Markets Local Currency Income Fund (TGWIX) received an Overall Morningstar RatingTM of 4 Stars based on risk-adjusted returns among 73 EM Local-Currency Bond Funds1 and ranked in the first quartile of its Morningstar EM Local-Currency Bond peer group for the 5-year and 7-year time periods ended October 31, 20192.
We know that you have many choices when it comes to the management of your financial assets. On behalf of everyone at TCW, I would like to thank you for making the TCW Funds part of your long-term investment plan. We truly value our relationship with you. If you have any questions or require further information, I invite you to visit our website at www.tcw.com, or call our shareholder services department at 800-386-3829.
I look forward to further correspondence with you through our semi-annual report next year.
Sincerely,

David S. DeVito
President, Chief Executive Officer and Director
1
| | |
Letter to Shareholders (Continued) | | |
1. Morningstar Rating Disclosure:
©2019 Morningstar, Inc. All Rights Reserved. The information contained herein: (1) is proprietary to Morningstar; (2) may not be copied or distributed; and (3) is not warranted to be accurate, complete or timely. Neither Morningstar nor its content providers are responsible for any damages or losses arising from any use of this information. Past performance is no guarantee of future results.
The Morningstar RatingTM for funds, or “star rating,” is calculated for managed products (including mutual funds, variable annuity and variable life subaccounts, exchange-traded funds, closed-end funds, and separate accounts) with at least a three-year history. Exchange-traded funds and open-ended mutual funds are considered a single population for comparative purposes. It is calculated based on a Morningstar Risk-Adjusted Return measure that accounts for variation in a managed product’s monthly excess performance, placing more emphasis on downward variations and rewarding consistent performance. The top 10% of products in each product category receive 5 stars, the next 22.5% receive 4 stars, the next 35% receive 3 stars, the next 22.5% receive 2 stars, and the bottom 10% receive 1 star. The Morningstar Overall Rating for a managed product is derived from a weighted average of the performance figures associated with its three-, five-, and 10-year (if applicable) Morningstar Rating metrics. The weights are: 100% three-year rating for 36-59 months of total returns, 60% five-year rating/40% three-year rating for 60-119 months of total returns, and 50% 10-year rating/30% five-year rating/20% three-year rating for 120 or more months of total returns. While the 10-year overall star rating formula seems to give the most weight to the 10-year period, the most recent
three-year period actually has the greatest impact because it is included in all three rating periods. The TCW Emerging Markets Income Fund, I Share was rated against the following numbers of Emerging Markets Bond funds over the following time periods: 242 funds (4 stars) in the last 3-years; 181 funds (4 stars) in the last 5-years, and 49 funds (5 stars) in the last 10-years, as of October 31, 2019. The TCW Emerging Markets Local Currency Income Fund, I Share was rated against the following numbers of EM Local-Currency Bond funds over the following time periods: 73 funds (3 stars) in the last 3-years; and 65 funds (4 stars) in the last 5-years, as of October 31, 2019. Past performance is no guarantee of future results.
2. Morningstar Quartile Ranking Disclosure:
Morningstar Emerging Markets Bond Fund and EM Local-Currency Bond Universes — The universe of all funds in the category as defined by Morningstar as of October 31, 2019. For the Morningstar Emerging Markets Bond universe, the Year-to-Date period included 286 funds, the 3-year period included 247 funds, and the 10-year period included 55 funds. For the Morningstar EM Local-Currency Bond Universe, the 5-year period included 65 funds and the 7-year period included 52 funds. The Morningstar percentile ranking is based on the fund’s total-return rank relative to all funds that have the same category for the same time period. The highest (or most favorable) percentile rank is 1 and the lowest (or least favorable) percentile rank is 100. The top-performing fund in a category will always receive a rank of 1. Percentile ranks within Categories are most useful in those categories that have a large number of funds. Morningstar total return includes both income and capital gains or losses and is not adjusted for sales charges. Past performance is not guarantee of future results.
2
TCW Developing Markets Equity Fund
Management Discussions
For the year ended October 31, 2019, the TCW Developing Markets Equity Fund (the “Fund”) returned 8.46% on the I Class share and 8.46% on the N Class shares. The Fund’s benchmark, the MSCI Emerging Markets Net Total Return Index (“Index”), returned 11.84% over the same period.
Select idiosyncratic risk, which we have largely exited, hurt relative performance. On the other hand, overweight exposure to Taiwanese technology companies, along with overweight positioning in Greece and Egypt, which benefited from improvements in economic growth, helped mitigate this underperformance.
Our outlook for Emerging Markets equities is cautiously optimistic for 2020. While uncertainties remain, we believe global growth will improve slightly year-over-year in 2020, and is more likely to overshoot than undershoot, as indicated by green shoots in the European Union and Japan, and economic indicators starting to surprise to the upside in a number of EM economies. We believe the growth differential between EM and developed markets is poised to widen, which historically has been supportive of EM assets. In addition, North Asia, which constitutes the bulk of the benchmark, should benefit from stabilization in Chinese growth, with the added potential of supportive government stimulus.
In addition, we believe the major Central Banks will remain cautious and biased toward easing. This more accommodative policy stance could extend the current low rate environment into the medium term, which we believe will continue to drive inflows into risk assets. This environment should also provide EM central banks the policy space to enact pro-growth measures as needed, especially as inflation remains relatively benign.
Geopolitical risks will likely remain elevated and complicate the outlook for 2020, but we could see improvements in one or more of the more important geopolitical issues, such as Brexit and/or the U.S./China trade war. While we are not convinced we will see a meaningful trade deal or major concessions from either side, recent headlines suggest some progress.
The portfolio remains exposed to a number of long term structural themes, which we view as largely independent from the geopolitical volatility, such as proliferation of big data, resilient luxury consumption, the buildout of 5G networks and structural growth in EM healthcare. In addition, we continue to seek exposures in small countries that are more insulated from the global growth dynamic, such as Greece and Egypt.
We believe the dollar may weaken relative to EMFX in 2020 as EM growth prospects improve relative to the US growth dynamic. If this transpires, a weaker US dollar, stronger EM growth, supportive liquidity backdrop and some stabilization in trade dynamics would provide a favorable environment for EM equity returns in our view.
3
TCW Developing Markets Equity Fund
Management Discussions (Continued)
| | | | | | | | | | | | |
| | | Annualized Return(1) | |
| | | 1 Yr
Return | | | 3 Yr
Return | | | Inception
to Date | |
TCW Developing Markets Equity Fund | | | | | | | | | | | | |
Class I (Inception: 06/30/2015) | | | 8.46 | % | | | 4.34 | % | | | 0.78 | % |
Class N (Inception: 06/30/2015) | | | 8.46 | % | | | 4.34 | % | | | 0.78 | % |
MSCI Emerging Markets Net Total Return Index | | | 11.84 | % | | | 7.35 | % | | | 4.08 | % |

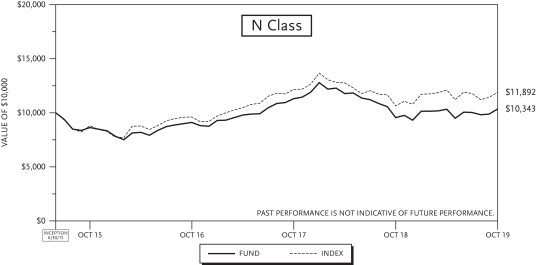
| (1) | The total returns do not reflect taxes that a shareholder would pay on fund distributions or on the redemption of fund shares. |
4
TCW Emerging Markets Income Fund
Management Discussions
For the year ended October 31, 2019, the TCW Emerging Markets Income Fund (the “Fund”) returned 13.13% and 12.85% net on its I Class and N Class shares, respectively. The performance of the Fund’s classes varies because of differing expenses. The Fund’s benchmark, the JP Morgan EMBI Global Diversified Index (“EMBI”), returned 14.35% over the same period.
As of October 31, 2019, the TCW Emerging Markets Income Fund (TGEIX) received an Overall Morningstar RatingTM of 5 Stars based on risk-adjusted returns among 242 Emerging Markets Bond Funds1 and ranked in the first quartile of its Morningstar Emerging Markets Bond peer group for the 2019 year-to date, 3-year and 10-year time periods ended October 31, 20192.
Underperformance was primarily driven by our overweight position in Argentina leading into the primaries of the presidential election in August. This overweight was predicated upon polls showing increasing support for the administration. However, the less market-friendly opposition surprisingly posted strong results, by a large margin, in the primary elections, and bonds fell. We reduced exposure quickly which helped us limit losses. On the other hand, overweight positioning and security selection in Brazil helped contribute to relative outperformance, driven by a combination of corporate and long duration exposure. In addition, long duration exposure in Indonesia and Middle Eastern sovereigns contributed to relative outperformance.
Our outlook for Emerging Markets debt is cautiously optimistic. While uncertainties remain, we believe global growth will improve slightly year-over-year in 2020, and is more likely to overshoot than undershoot, as indicated by green shoots in the European Union and Japan, and economic indicators starting to surprise to the upside in a number of EM economies.
Still, we believe the major Central Banks will remain cautious and biased toward easing. This more accommodative policy stance could extend the current low rate environment into the medium term, which we believe will continue to drive inflows into higher-yielding asset classes, like Emerging Markets Debt. This environment should also provide EM central banks the policy space to enact pro-growth measures as needed, especially as inflation remains relatively benign.
Geopolitical risks will likely remain elevated and complicate the outlook for 2020, but we could see improvements in one or more of the more important geopolitical issues, such as Brexit and/or the U.S./China trade war. While we are not convinced we will see a meaningful trade deal or major concessions from either side, recent headlines suggest some progress.
Should we see signs of a broader turnaround in global growth — notably in China and the EU — and/or a de-escalation in the larger geopolitical risks, EM local currency debt could present interesting opportunities in 2020. In the meantime, we have a preference for dollar-denominated EM debt, which presents attractive carry relative to developed markets.
Finally, institutional investors continue to add exposure to the asset class. We believe this will continue given attractive valuations relative to lower-yielding developed markets.
5
TCW Emerging Markets Income Fund
Management Discussions (Continued)
1. Morningstar Rating Disclosure:
©2019 Morningstar, Inc. All Rights Reserved. The information contained herein: (1) is proprietary to Morningstar; (2) may not be copied or distributed; and (3) is not warranted to be accurate, complete or timely. Neither Morningstar nor its content providers are responsible for any damages or losses arising from any use of this information. Past performance is no guarantee of future results.
The Morningstar RatingTM for funds, or “star rating,” is calculated for managed products (including mutual funds, variable annuity and variable life subaccounts, exchange-traded funds, closed-end funds, and separate accounts) with at least a three-year history. Exchange-traded funds and open-ended mutual funds are considered a single population for comparative purposes. It is calculated based on a Morningstar Risk-Adjusted Return measure that accounts for variation in a managed product’s monthly excess performance, placing more emphasis on downward variations and rewarding consistent performance. The top 10% of products in each product category receive 5 stars, the next 22.5% receive 4 stars, the next 35% receive 3 stars, the next 22.5% receive 2 stars, and the bottom 10% receive 1 star. The Morningstar Overall Rating for a managed product is derived from a weighted average of the performance figures associated with its three-, five-, and 10-year (if applicable) Morningstar Rating metrics. The weights are: 100% three-year rating for 36-59 months of total returns, 60% five-year rating/40% three-year rating for 60-119 months of total returns, and 50% 10-year rating/30% five-year rating/20% three-year rating for 120 or more months of total returns. While the 10-year overall star rating formula seems to give the most weight to the 10-year period, the most recent three-year period actually has the greatest impact because it is included in all three rating periods. The TCW Emerging Markets Income Fund, I Share was rated against the following numbers of Emerging Markets Bond funds over the following time periods: 242 funds (4 stars) in the last 3-years; 181 funds (4 stars) in the last 5-years, and 49 funds (5 stars) in the last 10-years, as of October 31, 2019. The TCW Emerging Markets Local Currency Income Fund, I Share was rated against the following numbers of EM Local-Currency Bond funds over the following time periods: 73 funds (3 stars) in the last 3-years; and 65 funds (4 stars) in the last 5-years, as of October 31, 2019. Past performance is no guarantee of future results.
2. Morningstar Quartile Ranking Disclosure:
Morningstar Emerging Markets Bond Fund and EM Local-Currency Bond Universes — The universe of all funds in the category as defined by Morningstar as of October 31, 2019. For the Morningstar Emerging Markets Bond universe, the 3-year period included 247 funds, and the 10-year period included 55 funds. For the Morningstar EM Local-Currency Bond Universe, the 5-year period included 65 funds and the 7-year period included 52 funds. The Morningstar percentile ranking is based on the fund’s total-return rank relative to all funds that have the same category for the same time period. The highest (or most favorable) percentile rank is 1 and the lowest (or least favorable) percentile rank is 100. The top-performing fund in a category will always receive a rank of 1. Percentile ranks within Categories are most useful in those categories that have a large number of funds. Morningstar total return includes both income and capital gains or losses and is not adjusted for sales charges. Past performance is not guarantee of future results.
6
TCW Emerging Markets Income Fund
Management Discussions (Continued)
| | | | | | | | | | | | | | | | | | | | | | | | |
| | | Annualized Return(1) | |
| | | 1 Yr
Return | | | 3 Yr
Return | | | 5 Yr
Return | | | 10 Yr
Return | | | Inception
to Date | | | Inception
Index | |
TCW Emerging Markets Income Fund | | | | | | | | | | | | | | | | | | | | | | | | |
Class I (Inception: 09/01/1996) | | | 13.13 | % | | | 5.14 | % | | | 4.59 | % | | | 7.04 | % | | | 9.12 | %(2) | | | 9.09 | % |
Class N (Inception: 02/27/2004) | | | 12.85 | % | | | 4.84 | % | | | 4.31 | % | | | 6.74 | % | | | 7.63 | % | | | 7.51 | % |
| JPMorgan EMBI Global Diversified Index | | | 14.35 | % | | | 5.14 | % | | | 5.44 | % | | | 6.90 | % | | | | | | | | |
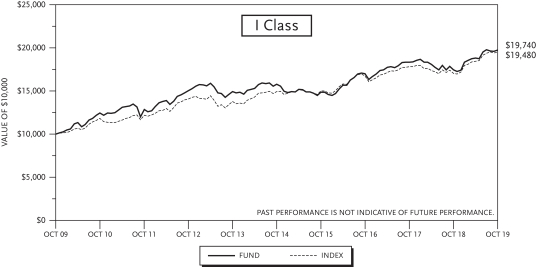
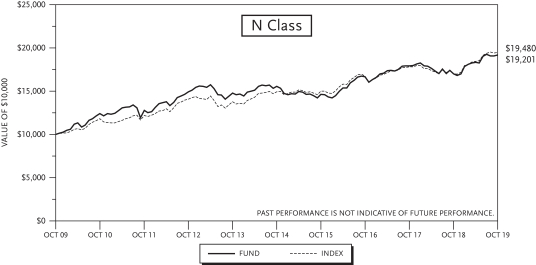
| (1) | The total returns do not reflect taxes that a shareholder would pay on fund distributions or on the redemption of fund shares. |
| (2) | Performance data includes the performance of the predecessor entity for periods before the Fund’s registration became effective. The predecessor entity was not registered under the 1940 Act, and therefore, was not subject to certain investment restrictions that we imposed by the 1940 Act. If the predecessor entity had been registered under the 1940 Act, the predecessor entity’s performance may have been lower. |
7
TCW Emerging Markets Local Currency Income Fund
Management Discussions
For the year ended October 31, 2019, the TCW Emerging Markets Local Currency Income Fund (the “Fund”) returned 14.26% and 14.14% net on its I Class and N class shares, respectively. The performance of the Fund’s classes varies because of differing expenses. The Fund’s benchmark, the JP Morgan GBI-EM Global Diversified Index (“GBI-EM”), returned 15.59% over the same period.
As of October, 31, 2019, the TCW Emerging Markets Local Currency Income Fund (TGWIX) received an Overall Morningstar RatingTM of 4 Stars based on risk-adjusted returns among 73 EM Local-Currency Bond Funds1 and ranked in the first quartile of its Morningstar EM Local-Currency Bond peer group for the 5-year and 7-year time periods ended October 31, 20192.
Underperformance during the period was primarily driven by a combination of election-related weakness in Turkey and Argentina and underweight positioning in Thailand rates. On the other hand, off-index exposure to Egypt and Ukraine, and overweight positioning in Russia helped mitigate this underperformance.
Our outlook for Emerging Markets local currency debt is cautiously optimistic for 2020. While uncertainties remain, we believe global growth will improve slightly year-over-year in 2020, and is more likely to overshoot than undershoot, as indicated by green shoots in the European Union and Japan, and economic indicators starting to surprise to the upside in a number of EM economies.
Still, we believe the major Central Banks will remain cautious and biased toward easing. This more accommodative policy stance could extend the current low rate environment into the medium term, which we believe will continue to drive inflows into higher-yielding asset classes, like Emerging Markets Debt. This environment should also provide EM central banks the policy space to enact pro-growth measures as needed, especially as inflation remains relatively benign.
Geopolitical risks will likely remain elevated and complicate the outlook for 2020, but we could see improvements in one or more of the more important geopolitical issues, such as Brexit and/or the U.S./China trade war. While we are not convinced we will see a meaningful trade deal or major concessions from either side, recent headlines suggest some progress.
Should we see signs of a broader turnaround in growth outside the US — notably in China and the EU — and/or a de-escalation in the larger geopolitical risks, EM local currency debt could present interesting opportunities in 2020, especially as EMFX trades near historic lows relative to the dollar.
1. Morningstar Rating Disclosure:
©2019 Morningstar, Inc. All Rights Reserved. The information contained herein: (1) is proprietary to Morningstar; (2) may not be copied or distributed; and (3) is not warranted to be accurate, complete or timely. Neither Morningstar nor its content providers are responsible for any damages or losses arising from any use of this information. Past performance is no guarantee of future results.
8
TCW Emerging Markets Local Currency Income Fund
Management Discussions (Continued)
The Morningstar RatingTM for funds, or “star rating,” is calculated for managed products (including mutual funds, variable annuity and variable life subaccounts, exchange-traded funds, closed-end funds, and separate accounts) with at least a three-year history. Exchange-traded funds and open-ended mutual funds are considered a single population for comparative purposes. It is calculated based on a Morningstar Risk-Adjusted Return measure that accounts for variation in a managed product’s monthly excess performance, placing more emphasis on downward variations and rewarding consistent performance. The top 10% of products in each product category receive 5 stars, the next 22.5% receive 4 stars, the next 35% receive 3 stars, the next 22.5% receive 2 stars, and the bottom 10% receive 1 star. The Morningstar Overall Rating for a managed product is derived from a weighted average of the performance figures associated with its three-, five-, and 10-year (if applicable) Morningstar Rating metrics. The weights are: 100% three-year rating for 36-59 months of total returns, 60% five-year rating/40% three-year rating for 60-119 months of total returns, and 50% 10-year rating/30% five-year rating/20% three-year rating for 120 or more months of total returns. While the 10-year overall star rating formula seems to give the most weight to the 10-year period, the most recent three-year period actually has the greatest impact because it is included in all three rating periods. The TCW Emerging Markets Income Fund, I Share was rated against the following numbers of Emerging Markets Bond funds over the following time periods: 242 funds (4 stars) in the last 3-years; 181 funds (4 stars) in the last 5-years, and 49 funds (5 stars) in the last 10-years, as of October 31, 2019. The TCW Emerging Markets Local Currency Income Fund, I Share was rated against the following numbers of EM Local-Currency Bond funds over the following time periods: 73 funds (3 stars) in the last 3-years; and 65 funds (4 stars) in the last 5-years, as of October 31, 2019. Past performance is no guarantee of future results.
2. Morningstar Quartile Ranking Disclosure:
Morningstar Emerging Markets Bond Fund and EM Local-Currency Bond Universes — The universe of all funds in the category as defined by Morningstar as of October 31, 2019. For the Morningstar Emerging Markets Bond universe, the 3-year period included 247 funds, and the 10-year period included 55 funds. For the Morningstar EM Local-Currency Bond Universe, the 5-year period included 65 funds and the 7-year period included 52 funds. The Morningstar percentile ranking is based on the fund’s total-return rank relative to all funds that have the same category for the same time period. The highest (or most favorable) percentile rank is 1 and the lowest (or least favorable) percentile rank is 100. The top-performing fund in a category will always receive a rank of 1. Percentile ranks within Categories are most useful in those categories that have a large number of funds. Morningstar total return includes both income and capital gains or losses and is not adjusted for sales charges. Past performance is not guarantee of future results.
9
TCW Emerging Markets Local Currency Income Fund
Management Discussions (Continued)
| | | | | | | | | | | | | | | | |
| | | Annualized Return(1) | |
| | | 1 Yr
Return | | | 3 Yr
Return | | | 5 Yr
Return | | | Inception
to Date | |
TCW Emerging Markets Local Currency Income Fund | | | | | | | | | | | | | | | | |
Class I (Inception: 12/14/2010) | | | 14.26 | % | | | 3.87 | % | | | 1.15 | % | | | 1.62 | % |
Class N (Inception: 12/14/2010) | | | 14.14 | % | | | 3.84 | % | | | 1.13 | % | | | 1.59 | % |
JPMorgan GBI-EM Global Diversified Index | | | 15.59 | % | | | 4.34 | % | | | 0.82 | % | | | 1.24 | % |
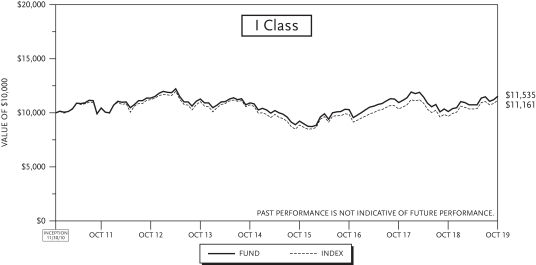
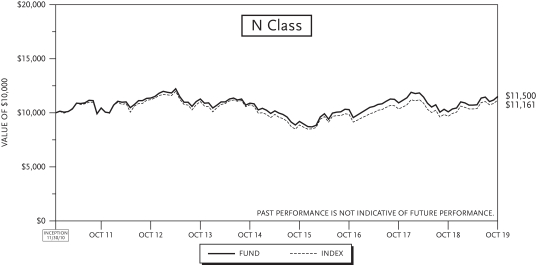
| (1) | The total returns do not reflect taxes that a shareholder would pay on fund distributions or on the redemption of fund shares. |
10
TCW Emerging Markets Multi-Asset Opportunities Fund
Management Discussions
For the year ended October 31, 2019, the TCW Emerging Markets Multi-Asset Opportunities Fund (the “Fund”) returned 10.50% and 10.25% on its I Class and N Class shares, respectively. The performance of the Fund’s classes varies because of differing expenses. The Fund’s blended benchmark, 50% JP Morgan EMBI Global Diversified Index (“EMBI”) and 50% MSCI Daily Total Return Net Emerging Markets Index (“MSCI EM”) returned 13.36% over the same period.
Underperformance was primarily driven by our positioning in Asian equities at the start of the period, as this segment of the market was particularly impacted by negative trade-related headlines and the overall market sell-off in the fourth quarter of 2018. We have performed more in line with the benchmark since then.
Our outlook for Emerging Markets is cautiously optimistic for 2020. While uncertainties remain, we believe global growth will improve slightly year-over-year in 2020, and is more likely to overshoot than undershoot, as indicated by green shoots in the European Union and Japan, and economic indicators starting to surprise to the upside in a number of EM economies. In light of this, we are overweight equities relative to fixed income.
In addition, we believe the major Central Banks will remain cautious and biased toward easing. This more accommodative policy stance could extend the current low rate environment into the medium term, which we believe will continue to drive inflows into risk assets, like Emerging Markets. This environment should also provide EM central banks the policy space to enact pro-growth measures as needed, especially as inflation remains relatively benign.
Geopolitical risks will likely remain elevated and complicate the outlook for 2020, but we could see improvements in one or more of the more important geopolitical issues, such as Brexit and/or the U.S./China trade war. While we are not convinced we will see a meaningful trade deal or major concessions from either side, recent headlines suggest some progress.
Should we see signs of a broader turnaround in growth outside the US — notably in China and the EU — and/or a de-escalation in the larger geopolitical risks, a higher allocation to EM equities and local currency debt may be warranted in 2020.
11
TCW Emerging Markets Multi-Asset Opportunities Fund
Management Discussions (Continued)
| | | | | | | | | | | | | | | | |
| | | Annualized Return(1) | |
| | | 1 Yr
Return | | | 3 Yr
Return | | | 5 Yr
Return | | | Inception
to Date | |
TCW EM Multi-Asset Opportunities Fund | | | | | | | | | | | | | | | | |
Class I (Inception: 06/28/2013) | | | 10.50 | % | | | 5.49 | % | | | 3.07 | % | | | 4.03 | % |
Class N (Inception: 06/28/2013) | | | 10.25 | % | | | 5.42 | % | | | 3.04 | % | | | 3.94 | % |
50% JPM EMBI Global Diversified Index/50% MSCI Daily Total Return Net Emerging Markets Index | | | 13.36 | % | | | 6.42 | % | | | 4.39 | % | | | 5.36 | % |
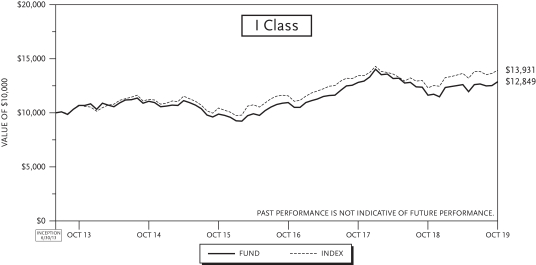
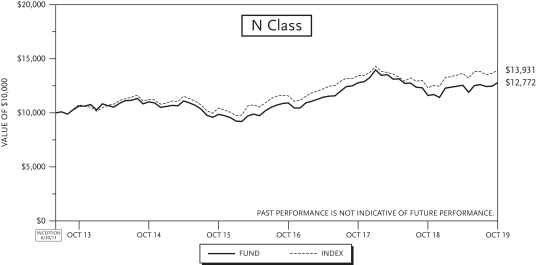
| (1) | The total returns do not reflect taxes that a shareholder would pay on fund distributions or on the redemption of fund shares. |
12
TCW International Small Cap Fund
Management Discussions
For the year ended October 31, 2019, the TCW International Small Cap Fund (the “Fund”) returned 3.65% and 3.44% on its I Class and N Class shares, respectively. The performance of the Fund’s classes varies because of differing expenses. The Fund’s benchmark, the MSCI All Country World (ex USA) Small Cap Net Index (the “Index”), returned 8.77% over the same time period.
The bulk of the underperformance occurred at the beginning of the fiscal year. The fourth quarter of 2018 was characterized by especially challenging market conditions. This particularly impacted our exposure in the information technology (IT), commodities and consumer sectors. We are working to recoup this underperformance.
Our outlook for international equities is cautiously optimistic for 2020. While uncertainties remain, we believe global growth will improve slightly year-over-year in 2020, and is more likely to overshoot than undershoot, as indicated by green shoots in the European Union and Japan, and economic indicators starting to surprise to the upside in a number of EM economies. In addition, North Asia, should benefit from stabilization in Chinese growth, with the added potential of supportive government stimulus.
In addition, we believe the major Central Banks will remain cautious and biased toward easing. This more accommodative policy stance could extend the current low rate environment into the medium term, which we believe will continue to drive inflows into risk assets. This environment should also provide EM central banks the policy space to enact pro-growth measures as needed, especially as inflation remains relatively benign.
Geopolitical risks will likely remain elevated and complicate the outlook for 2020, but we could see improvements in one or more of the more important geopolitical issues, such as Brexit and/or the U.S./China trade war. While we are not convinced we will see a meaningful trade deal or major concessions from either side, recent headlines suggest some progress.
We believe the dollar may weaken in 2020 as international growth prospects improve relative to the US growth dynamic. If this transpires, a weaker US dollar, stronger international growth, supportive liquidity backdrop and some stabilization in trade dynamics would provide a favorable environment for international equity returns in our view.
We continue to focus on idiosyncratic long-term growth stories at attractive valuations, and believe differentiating between companies will continue to be key. In our view, there will be significant dispersion in returns going forward, allowing for an actively managed portfolio to capture attractive returns in those securities best positioned for the evolving environment.
13
TCW International Small Cap Fund
Management Discussions (Continued)
| | | | | | | | | | | | | | | | |
| | | Annualized Return(1) | |
| | | 1 Yr
Return | | | 3 Yr
Return | | | 5 Yr
Return | | | Inception
to Date | |
TCW International Small Cap Fund | | | | | | | | | | | | | | | | |
Class I (Inception: 02/28/2011) | | | 3.65 | % | | | 6.95 | % | | | 3.79 | % | | | 1.46 | % |
Class N (Inception: 02/28/2011) | | | 3.44 | % | | | 6.92 | % | | | 3.76 | % | | | 1.40 | % |
MSCI All Country World (ex USA) Small Cap Net Index | | | 8.77 | % | | | 6.98 | % | | | 5.31 | % | | | 4.36 | % |
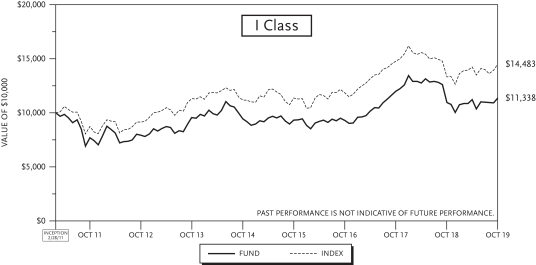
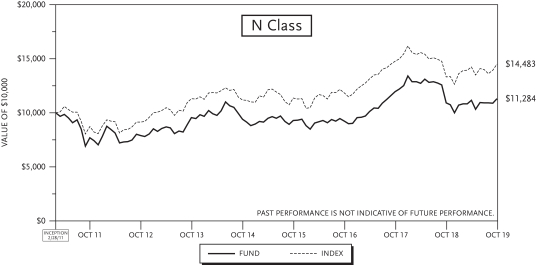
| (1) | The total returns do not reflect taxes that a shareholder would pay on fund distributions or on the redemption of fund shares. |
14
TCW Developing Markets Equity Fund
Schedule of Investments | October 31, 2019 |
| | | | | | | | |
| Issues | | Shares | | | Value | |
|
COMMON STOCK — 98.2% of Net Assets | |
|
| Australia — 0.4% (Cost: $25,862) | |
| | |
BHP Group, Ltd. | | | 500 | | | $ | 24,455 | |
| | | | | | | | |
|
| Brazil — 6.1% | |
| | |
B3 S.A. — Brasil Bolsa Balcao | | | 7,500 | | | | 90,387 | |
| | |
CCR S.A. | | | 13,500 | | | | 55,286 | |
| | |
Cyrela Brazil Realty SA Empreendimentos e Participacoes | | | 5,300 | | | | 35,554 | |
| | |
Direcional Engenharia S.A. | | | 3,900 | | | | 11,609 | |
| | |
IRB Brasil Resseguros S.A. | | | 6,900 | | | | 64,954 | |
| | |
JBS SA | | | 7,500 | | | | 52,854 | |
| | |
YDUQS Part (1) | | | 3,300 | | | | 32,265 | |
| | | | | | | | |
|
Total Brazil | |
| |
(Cost: $275,944) | | | | 342,909 | |
| | | | | | | | |
|
| China — 34.0% | |
| | |
58.Com, Inc. (ADR) (1) | | | 400 | | | | 21,124 | |
| | |
Alibaba Group Holding, Ltd. (SP ADR) (1) | | | 1,984 | | | | 350,513 | |
| | |
Bank of Communications Co., Ltd. — Class H | | | 40,000 | | | | 27,312 | |
| | |
CGN Power Co., Ltd. — Class H | | | 99,000 | | | | 25,707 | |
| | |
China Galaxy Securities Co., Ltd. — Class H | | | 75,000 | | | | 38,233 | |
| | |
China International Travel Service Corp., Ltd. | | | 2,100 | | | | 26,944 | |
| | |
China Merchants Port Holdings Co., Ltd. | | | 16,000 | | | | 25,011 | |
| | |
China National Building Material Co., Ltd. — Class H | | | 30,000 | | | | 25,279 | |
| | |
China National Chemical Engineering Co., Ltd. | | | 34,000 | | | | 28,874 | |
| | |
Country Garden Services Holdings Co., Ltd. | | | 9,000 | | | | 30,488 | |
| | |
Foshan Haitian Flavouring & Food Co., Ltd. | | | 3,430 | | | | 54,430 | |
| | |
Galaxy Entertainment Group, Ltd. | | | 20,000 | | | | 137,682 | |
| | |
Greentown Service Group Co., Ltd. | | | 32,000 | | | | 36,298 | |
| | |
Guangzhou Automobile Group Co., Ltd. — Class H | | | 26,000 | | | | 25,961 | |
| | |
Luye Pharma Group, Ltd. | | | 37,500 | | | | 27,712 | |
| | |
Melco Crown Entertainment, Ltd. (ADR) | | | 1,200 | | | | 25,848 | |
| | |
Ping An Insurance Group Co. of China, Ltd. — Class H | | | 13,650 | | | | 157,510 | |
| | |
Q Technology Group Co., Ltd. (1) | | | 56,000 | | | | 74,226 | |
| | |
Shenzhen Mindray Bio-Medical Electronics Co., Ltd. | | | 1,100 | | | | 27,791 | |
| | |
Sichuan Swellfun Co., Ltd. | | | 12,900 | | | | 97,297 | |
| | |
Sino Biopharmaceutical, Ltd. | | | 21,000 | | | | 31,260 | |
| | |
Sinotruk Hong Kong, Ltd. | | | 18,500 | | | | 27,949 | |
| | |
Tencent Holdings, Ltd. | | | 7,300 | | | | 296,043 | |
| | |
Tus Environmental Science And Technology Development Co., Ltd. | | | 20,000 | | | | 24,601 | |
| | |
Weibo Corp. (SP ADR) (1) | | | 600 | | | | 29,514 | |
| | |
WH Group, Ltd. | | | 76,000 | | | | 80,203 | |
| | |
WuXi AppTec Co., Ltd. — Class H (1) | | | 3,360 | | | | 40,502 | |
| | |
Wuxi Biologics, Inc. (1) | | | 6,500 | | | | 76,367 | |
| | |
Zhongsheng Group Holdings, Ltd. | | | 15,000 | | | | 49,717 | |
| | | | | | | | |
|
Total China | |
| |
(Cost: $1,606,533) | | | | 1,920,396 | |
| | | | | | | | |
| | | | | | | | |
| Issues | | Shares | | | Value | |
|
| Egypt — 2.2% (Cost: $104,909) | |
| | |
Commercial International Bank Egypt SAE | | | 24,567 | | | $ | 123,292 | |
| | | | | | | | |
|
| Greece — 4.7% | |
| | |
Alpha Bank AE (1) | | | 58,135 | | | | 124,087 | |
| | |
Motor Oil Hellas Corinth Refineries S.A. | | | 1,657 | | | | 40,994 | |
| | |
OPAP S.A. | | | 1,261 | | | | 13,718 | |
| | |
Piraeus Bank S.A. (1) | | | 24,395 | | | | 85,113 | |
| | | | | | | | |
|
Total Greece | |
| |
(Cost: $200,040) | | | | 263,912 | |
| | | | | | | | |
|
| Hungary — 0.5% (Cost: $25,088) | |
| | |
Richter Gedeon Nyrt | | | 1,424 | | | | 26,430 | |
| | | | | | | | |
|
| India — 4.9% | |
| | |
HDFC Bank, Ltd. (ADR) | | | 400 | | | | 24,436 | |
| | |
ICICI Bank, Ltd. (SP ADR) | | | 2,200 | | | | 28,666 | |
| | |
Larsen & Toubro, Ltd. | | | 2,425 | | | | 50,347 | |
| | |
Maruti Suzuki India, Ltd. | | | 597 | | | | 63,610 | |
| | |
Reliance Industries, Ltd. | | | 3,107 | | | | 64,072 | |
| | |
Titan Co., Ltd. | | | 2,561 | | | | 48,069 | |
| | | | | | | | |
|
Total India | |
| |
(Cost: $259,404) | | | | 279,200 | |
| | | | | | | | |
|
| Indonesia — 1.0% (Cost: $51,273) | |
| | |
Semen Indonesia Persero Tbk PT | | | 62,900 | | | | 56,729 | |
| | | | | | | | |
|
| Kenya — 2.1% (Cost: $103,864) | |
| | |
Safaricom, Ltd. | | | 414,100 | | | | 119,259 | |
| | | | | | | | |
|
| Philippines — 1.0% | |
| | |
International Container Terminal Services, Inc. | | | 11,550 | | | | 27,001 | |
| | |
Wilcon Depot, Inc. | | | 83,600 | | | | 27,179 | |
| | | | | | | | |
|
Total Philippines | |
| |
(Cost: $56,940) | | | | 54,180 | |
| | | | | | | | |
|
| Russia — 6.9% | |
| | |
Gazprom Neft PJSC | | | 4,240 | | | | 27,416 | |
| | |
Inter RAO UES PJSC | | | 424,000 | | | | 28,699 | |
| | |
LUKOIL PJSC (SP ADR) | | | 583 | | | | 53,671 | |
| | |
MMC Norilsk Nickel PJSC (ADR) | | | 570 | | | | 15,809 | |
| | |
Novatek PJSC | | | 195 | | | | 41,730 | |
| | |
Novolipetsk Steel PJSC | | | 1,550 | | | | 30,318 | |
| | |
Polyus PJSC | | | 460 | | | | 27,071 | |
| | |
Sberbank of Russia PJSC | | | 15,960 | | | | 58,439 | |
| | |
X5 Retail Group NV | | | 820 | | | | 27,437 | |
| | |
Yandex N.V. (1) | | | 2,300 | | | | 76,797 | |
| | | | | | | | |
|
Total Russia | |
| |
(Cost: $359,052) | | | | 387,387 | |
| | | | | | | | |
|
| Saudi Arabia — 0.7% (Cost: $41,348) | |
| | |
Bupa Arabia for Cooperative Insurance Co. | | | 1,485 | | | | 42,543 | |
| | | | | | | | |
|
| Slovenia — 0.2% (Cost: $13,073) | |
| | |
Nova Ljubljanska Banka dd (1) | | | 1,005 | | | | 11,997 | |
| | | | | | | | |
See accompanying notes to financial statements.
15
TCW Developing Markets Equity Fund
Schedule of Investments (Continued)
| | | | | | | | |
| Issues | | Shares | | | Value | |
|
| South Africa — 3.6% | |
| | |
Capitec Bank Holdings, Ltd. | | | 258 | | | $ | 23,525 | |
| | |
Clicks Group, Ltd. | | | 2,843 | | | | 46,360 | |
| | |
Gold Fields, Ltd. | | | 4,500 | | | | 28,034 | |
| | |
Standard Bank Group, Ltd. | | | 7,209 | | | | 83,019 | |
| | |
Telkom S.A. SOC, Ltd. | | | 5,454 | | | | 25,011 | |
| | | | | | | | |
|
Total South Africa | |
| |
(Cost: $190,695) | | | | 205,949 | |
| | | | | | | | |
|
| South Korea — 6.5% | |
| | |
Doosan Bobcat, Inc. (1) | | | 1,015 | | | | 27,367 | |
| | |
Hyundai Motor Co. | | | 446 | | | | 46,716 | |
| | |
Kia Motors Corp. | | | 725 | | | | 26,497 | |
| | |
LG Household & Health Care, Ltd. | | | 24 | | | | 25,970 | |
| | |
Meritz Securities Co., Ltd. | | | 10,520 | | | | 40,670 | |
| | |
Samsung Electronics Co., Ltd. | | | 3,309 | | | | 143,014 | |
| | |
Shinsegae, Inc. | | | 125 | | | | 25,333 | |
| | |
SK Holdings Co., Ltd. | | | 140 | | | | 31,060 | |
| | | | | | | | |
|
Total South Korea | |
| |
(Cost: $337,912) | | | | 366,627 | |
| | | | | | | | |
|
| Taiwan — 19.5% | |
| | |
Accton Technology Corp. | | | 18,000 | | | | 107,076 | |
| | |
ASPEED Technology, Inc. | | | 2,000 | | | | 52,264 | |
| | |
Catcher Technology Co., Ltd. | | | 3,000 | | | | 25,428 | |
| | |
Chailease Holding Co., Ltd. | | | 6,000 | | | | 27,036 | |
| | |
Chroma ATE, Inc. | | | 5,000 | | | | 24,861 | |
| | |
E.Sun Financial Holding Co., Ltd. | | | 33,000 | | | | 29,817 | |
| | |
Eva Airways Corp. | | | 59,000 | | | | 27,645 | |
| | |
Global Unichip Corp. | | | 3,000 | | | | 26,303 | |
| | |
Highwealth Construction Corp. | | | 15,000 | | | | 23,023 | |
| | |
Pou Chen Corp. | | | 21,000 | | | | 28,076 | |
| | |
Realtek Semiconductor Corp. | | | 4,000 | | | | 29,672 | |
| | |
Standard Foods Corp. | | | 13,000 | | | | 26,250 | |
| | |
Taiwan Semiconductor Manufacturing Co., Ltd. | | | 37,000 | | | | 362,593 | |
| | |
Taiwan Union Technology Corp. | | | 34,000 | | | | 149,007 | |
| | |
United Microelectronics Corp. | | | 74,000 | | | | 34,079 | |
| | |
Win Semiconductors Corp. | | | 3,000 | | | | 31,226 | |
| | |
Wistron Corp. | | | 34,000 | | | | 31,171 | |
| | |
Yageo Corp. | | | 3,000 | | | | 30,784 | |
| | |
Zhen Ding Technology Holding, Ltd. | | | 7,000 | | | | 33,099 | |
| | | | | | | | |
|
Total Taiwan | |
| |
(Cost: $899,461) | | | | 1,099,410 | |
| | | | | | | | |
|
| United Arab Emirates — 0.9% (Cost: $25,997) | |
| | |
NMC Health PLC | | | 1,765 | | | | 49,980 | |
| | | | | | | | |
|
| United States — 3.0% | |
| | |
Applied Materials, Inc. | | | 1,900 | | | | 103,094 | |
| | |
MSCI, Inc. | | | 200 | | | | 46,912 | |
| | | | | | | | |
| Issues | | Shares | | | Value | |
|
| United States (Continued) | |
| | |
Western Digital Corp. | | | 400 | | | $ | 20,660 | |
| | | | | | | | |
|
Total United States | |
| |
(Cost: $134,516) | | | | 170,666 | |
| | | | | | | | |
|
Total Common Stock | |
| |
(Cost: $4,711,911) | | | | 5,545,321 | |
| | | | | | | | |
|
PREFERRED STOCK — 1.4% | |
|
| Brazil — 1.4% | |
| | |
Centrais Eletricas Brasileiras S.A., 3.43% | | | 4,900 | | | | 50,033 | |
| | |
Cia Paranaense de Energia, 2.63% | | | 2,100 | | | | 29,122 | |
| | | | | | | | |
|
Total Brazil | |
| |
(Cost: $73,453) | | | | 79,155 | |
| | | | | | | | |
|
Total Preferred Stock | |
| |
(Cost: $73,453) | | | | 79,155 | |
| | | | | | | | |
| |
Total Investments (99.6%) | | | | | |
| |
(Cost: $4,785,364) | | | | 5,624,476 | |
| |
Excess of Other Assets over Liabilities (0.4%) | | | | 21,796 | |
| | | | | | | | |
| |
Total Net Assets (100.0%) | | | $ | 5,646,272 | |
| | | | | | | | |
Notes to the Schedule of Investments:
| ADR | | American Depositary Receipt. ADRs are receipts typically issued by a U.S. bank or trust company, evidencing ownership of underlying securities issued by a foreign corporation. |
| PJSC | | Private Joint-Stock Company. |
| SP ADR | | Sponsored American Depositary Receipt. ADRs are receipts, typically issued by a U.S. bank or trust company, evidencing ownership of underlying securities issued by a foreign corporation. Sponsored ADRs are ADRs issued with the cooperation of the foreign corporation. |
| (1) | | Non-income producing security. |
See accompanying notes to financial statements.
16
TCW Developing Markets Equity Fund
Investments by Sector | October 31, 2019 |
| | | | |
| Sector | | Percentage of
Net Assets | |
Airlines | | | 0.5 | % |
Automobiles | | | 2.9 | |
Banks | | | 10.9 | |
Beverages | | | 1.7 | |
Capital Markets | | | 3.8 | |
Commercial Services & Supplies | | | 1.5 | |
Communications Equipment | | | 1.9 | |
Construction & Engineering | | | 1.4 | |
Construction Materials | | | 1.4 | |
Diversified Consumer Services | | | 0.6 | |
Diversified Financial Services | | | 0.5 | |
Diversified Telecommunication Services | | | 0.4 | |
Electric Utilities | | | 1.9 | |
Electronic Equipment, Instruments & Components | | | 4.1 | |
Food & Staples Retailing | | | 1.3 | |
Food Products | | | 3.8 | |
Health Care Equipment & Supplies | | | 0.5 | |
Health Care Providers & Services | | | 0.9 | |
Hotels, Restaurants & Leisure | | | 3.7 | |
Household Durables | | | 2.1 | |
Household Products | | | 0.5 | |
Independent Power and Renewable Electricity Producers | | | 0.5 | |
Industrial Conglomerates | | | 0.6 | |
Insurance | | | 4.7 | |
Interactive Media & Services | | | 13.7 | |
Life Sciences Tools & Services | | | 2.1 | |
Machinery | | | 1.0 | |
Metals & Mining | | | 2.2 | |
Multiline Retail | | | 0.4 | |
Oil, Gas & Consumable Fuels | | | 4.0 | |
Pharmaceuticals | | | 1.6 | |
Real Estate Management & Development | | | 0.4 | |
Semiconductors & Semiconductor Equipment | | | 11.3 | |
Specialty Retail | | | 1.4 | |
Technology Hardware, Storage & Peripherals | | | 4.0 | |
Textiles, Apparel & Luxury Goods | | | 1.4 | |
Transportation Infrastructure | | | 1.9 | |
Wireless Telecommunication Services | | | 2.1 | |
| | | | |
Total | | | 99.6 | % |
| | | | |
See accompanying notes to financial statements.
17
TCW Developing Markets Equity Fund
Fair Valuation Summary | October 31, 2019 |
The following is a summary of the fair valuations according to the inputs used as of October 31, 2019 in valuing the Fund’s investments:
| | | | | | | | | | | | | | | | |
Description | | Quoted Prices
in Active
Markets for
Identical
Assets
(Level 1) | | | Other
Significant
Observable
Inputs
(Level 2) | | | Significant
Unobservable
Inputs
(Level 3) | | | Total | |
Common Stock | | | | | | | | | | | | | | | | |
Airlines | | $ | — | | | $ | 27,645 | | | $ | — | | | $ | 27,645 | |
Automobiles | | | — | | | | 162,784 | | | | — | | | | 162,784 | |
Banks | | | 188,391 | | | | 431,312 | | | | — | | | | 619,703 | |
Beverages | | | — | | | | 97,297 | | | | — | | | | 97,297 | |
Capital Markets | | | 137,299 | | | | 78,903 | | | | — | | | | 216,202 | |
Commercial Services & Supplies | | | — | | | | 91,387 | | | | — | | | | 91,387 | |
Communications Equipment | | | — | | | | 107,076 | | | | — | | | | 107,076 | |
Construction & Engineering | | | — | | | | 79,220 | | | | — | | | | 79,220 | |
Construction Materials | | | — | | | | 82,008 | | | | — | | | | 82,008 | |
Diversified Consumer Services | | | 32,265 | | | | — | | | | — | | | | 32,265 | |
Diversified Financial Services | | | — | | | | 27,036 | | | | — | | | | 27,036 | |
Diversified Telecommunication Services | | | — | | | | 25,010 | | | | — | | | | 25,010 | |
Electric Utilities | | | — | | | | 28,700 | | | | — | | | | 28,700 | |
Electronic Equipment, Instruments & Components | | | — | | | | 237,750 | | | | — | | | | 237,750 | |
Food & Staples Retailing | | | 27,437 | | | | 46,360 | | | | — | | | | 73,797 | |
Food Products | | | 52,854 | | | | 160,883 | | | | — | | | | 213,737 | |
Health Care Equipment & Supplies | | | — | | | | 27,791 | | | | — | | | | 27,791 | |
Health Care Providers & Services | | | — | | | | 49,980 | | | | — | | | | 49,980 | |
Hotels, Restaurants & Leisure | | | 25,848 | | | | 178,344 | | | | — | | | | 204,192 | |
Household Durables | | | 47,164 | | | | 74,226 | | | | — | | | | 121,390 | |
Household Products | | | — | | | | 25,970 | | | | — | | | | 25,970 | |
Independent Power and Renewable Electricity Producers | | | — | | | | 25,707 | | | | — | | | | 25,707 | |
Industrial Conglomerates | | | — | | | | 31,060 | | | | — | | | | 31,060 | |
Insurance | | | 64,954 | | | | 200,053 | | | | — | | | | 265,007 | |
Interactive Media & Services | | | 477,948 | | | | 296,043 | | | | — | | | | 773,991 | |
Life Sciences Tools & Services | | | — | | | | 116,869 | | | | — | | | | 116,869 | |
Machinery | | | — | | | | 55,316 | | | | — | | | | 55,316 | |
Metals & Mining | | | 97,653 | | | | 28,034 | | | | — | | | | 125,687 | |
Multiline Retail | | | — | | | | 25,333 | | | | — | | | | 25,333 | |
Oil, Gas & Consumable Fuels | | | 95,401 | | | | 132,482 | | | | — | | | | 227,883 | |
Pharmaceuticals | | | 26,430 | | | | 58,972 | | | | — | | | | 85,402 | |
Real Estate Management & Development | | | — | | | | 23,023 | | | | — | | | | 23,023 | |
Semiconductors & Semiconductor Equipment | | | 103,094 | | | | 536,137 | | | | — | | | | 639,231 | |
Specialty Retail | | | — | | | | 76,896 | | | | — | | | | 76,896 | |
Technology Hardware, Storage & Peripherals | | | 20,660 | | | | 199,614 | | | | — | | | | 220,274 | |
Textiles, Apparel & Luxury Goods | | | — | | | | 76,145 | | | | — | | | | 76,145 | |
Transportation Infrastructure | | | 55,286 | | | | 52,012 | | | | — | | | | 107,298 | |
Wireless Telecommunication Services | | | 119,259 | | | | — | | | | — | | | | 119,259 | |
| | | | | | | | | | | | | | | | |
Total Common Stock | | | 1,571,943 | | | | 3,973,378 | | | | — | | | | 5,545,321 | |
| | | | | | | | | | | | | | | | |
Preferred Stock | | | | | | | | | | | | | | | | |
Electric Utilities | | | 79,155 | | | | — | | | | — | | | | 79,155 | |
| | | | | | | | | | | | | | | | |
Total Investments | | $ | 1,651,098 | | | $ | 3,973,378 | | | $ | — | | | $ | 5,624,476 | |
| | | | | | | | | | | | | | | | |
See accompanying notes to financial statements.
18
TCW Emerging Markets Income Fund
Schedule of Investments | October 31, 2019 |
| | | | | | | | | | | | |
| Issues | | Maturity
Date | | | Principal
Amount | | | Value | |
|
FIXED INCOME SECURITIES — 96.8% of Net Assets | |
|
| Angola — 1.6% | |
|
Angolan Government International Bond | |
| | | |
8.25% (1) | | | 05/09/28 | | | $ | 56,439,000 | | | $ | 59,146,308 | |
| | | |
9.38% (1) | | | 05/08/48 | | | | 32,640,000 | | | | 34,634,100 | |
| | | | | | | | | | | | |
|
Total Angola | |
| |
(Cost: $90,160,274) | | | | 93,780,408 | |
| | | | | | | | | | | | |
|
| Argentina — 1.6% | |
|
Argentine Republic Government International Bond | |
| | | |
4.63% | | | 01/11/23 | | | | 27,232,000 | | | | 11,084,275 | |
| | | |
5.88% | | | 01/11/28 | | | | 37,275,000 | | | | 14,350,875 | |
| | | |
6.88% | | | 01/26/27 | | | | 62,560,000 | | | | 24,945,800 | |
| | | |
7.50% | | | 04/22/26 | | | | 56,675,000 | | | | 24,103,878 | |
| | | |
7.63% | | | 04/22/46 | | | | 47,975,000 | | | | 19,535,420 | |
| | | | | | | | | | | | |
|
Total Argentina | |
| |
(Cost: $180,821,246) | | | | 94,020,248 | |
| | | | | | | | | | | | |
|
| Azerbaijan — 0.6% (Cost: $37,502,069) | |
|
Southern Gas Corridor CJSC | |
| | | |
6.88% (2) | | | 03/24/26 | | | | 31,840,000 | | | | 37,198,672 | |
| | | | | | | | | | | | |
|
| Bahrain — 3.1% | |
|
Bahrain Government International Bond | |
| | | |
5.63% (1) | | | 09/30/31 | | | | 28,415,000 | | | | 29,914,403 | |
| | | |
6.75% (2) | | | 09/20/29 | | | | 46,390,000 | | | | 53,000,575 | |
| | | |
7.00% (1) | | | 10/12/28 | | | | 28,980,000 | | | | 33,521,709 | |
| | | |
7.50% (2) | | | 09/20/47 | | | | 29,115,000 | | | | 34,223,773 | |
|
Oil and Gas Holding Co. (The) | |
| | | |
7.50% (1) | | | 10/25/27 | | | | 17,680,000 | | | | 19,826,462 | |
| | | |
8.38% (1) | | | 11/07/28 | | | | 12,850,000 | | | | 15,149,919 | |
| | | | | | | | | | | | |
|
| Total Bahrain | |
| |
(Cost: $162,534,925) | | | | 185,636,841 | |
| | | | | | | | | | | | |
|
| Brazil — 7.8% | |
|
Banco BTG Pactual S.A. | |
| | | |
7.75% (5 year U.S. Treasury Constant Maturity Rate + 5.257%) (1)(3) | | | 02/15/29 | | | | 31,225,000 | | | | 33,067,275 | |
|
Banco do Brasil S.A. | |
| | | |
6.25% (10 year U.S. Treasury Constant Maturity Rate + 4.398%) (2)(3)(4) | | | 10/29/49 | | | | 41,842,000 | | | | 40,184,910 | |
|
Brazil Notas do Tesouro Nacional, Series F | |
| | | |
10.00% | | | 01/01/27 | | | BRL | 183,800,000 | | | | 56,939,290 | |
|
CIMPOR Financial Operations BV | |
| | | |
5.75% (2) | | | 07/17/24 | | | $ | 5,295,000 | | | | 3,918,353 | |
|
CSN Islands XII Corp. | |
| | | |
7.00% (2)(4) | | | 09/29/49 | | | | 20,188,000 | | | | 17,845,990 | |
| | | | | | | | | | | | |
| Issues | | Maturity
Date | | | Principal
Amount | | | Value | |
|
| Brazil (Continued) | |
|
JBS Investments II GmbH | |
| | | |
5.75% (1) | | | 01/15/28 | | | $ | 9,520,000 | | | $ | 9,920,792 | |
|
Light Servicos de Eletricidade S.A./Light Energia S.A. | |
| | | |
7.25% (1) | | | 05/03/23 | | | | 14,935,000 | | | | 16,134,467 | |
|
MARB BondCo PLC | |
| | | |
6.88% (1) | | | 01/19/25 | | | | 12,785,000 | | | | 13,350,097 | |
|
MV24 Capital BV | |
| | | |
6.75% (1) | | | 06/01/34 | | | | 26,790,000 | | | | 28,100,199 | |
|
NBM US Holdings, Inc. | |
| | | |
7.00% (2) | | | 05/14/26 | | | | 14,030,000 | | | | 14,922,659 | |
|
Petrobras Global Finance B.V. | |
| | | |
6.85% | | | 06/05/15 | | | | 158,203,000 | | | | 182,249,856 | |
|
Prumo Participacoes e Investimentos S/A | |
| | | |
7.50% (1) | | | 12/31/31 | | | | 21,800,000 | | | | 22,672,000 | |
|
Usiminas International S.A.R.L. | |
| | | |
5.88% (1) | | | 07/18/26 | | | | 26,705,000 | | | | 27,272,481 | |
| | | | | | | | | | | | |
|
Total Brazil | |
| |
(Cost: $447,967,598) | | | | 466,578,369 | |
| | | | | | | | | | | | |
|
| Chile — 0.8% | |
|
AES Gener S.A. | |
| | | |
7.13% (USD 5 Year Swap rate + 4.644%) (1)(3) | | | 03/26/79 | | | | 25,553,000 | | | | 26,559,788 | |
|
Latam Finance, Ltd. | |
| | | |
7.00% (1) | | | 03/01/26 | | | | 19,907,000 | | | | 21,508,892 | |
| | | | | | | | | | | | |
|
Total Chile | |
| |
(Cost: $46,862,345) | | | | 48,068,680 | |
| | | | | | | | | | | | |
|
| China — 2.1% | |
|
China Evergrande Group | |
| | | |
8.25% (2) | | | 03/23/22 | | | | 32,890,000 | | | | 30,568,971 | |
|
Fantasia Holdings Group Co. Ltd | |
| | | |
7.38% (2) | | | 10/04/21 | | | | 30,500,000 | | | | 28,413,800 | |
|
Kaisa Group Holdings, Ltd. | |
| | | |
8.50% (2) | | | 06/30/22 | | | | 25,655,000 | | | | 24,345,806 | |
|
New Metro Global, Ltd. | |
| | | |
6.50% (2) | | | 04/23/21 | | | | 24,080,000 | | | | 23,776,592 | |
|
Sunac China Holdings, Ltd. | |
| | | |
7.88% (2) | | | 02/15/22 | | | | 19,000,000 | | | | 19,446,500 | |
| | | | | | | | | | | | |
|
Total China | |
| |
(Cost: $126,822,695) | | | | 126,551,669 | |
| | | | | | | | | | | | |
|
| Colombia — 2.8% | |
|
Colombia Government International Bond | |
| | | |
4.50% | | | 03/15/29 | | | | 27,270,000 | | | | 30,488,133 | |
| | | |
5.00% | | | 06/15/45 | | | | 38,420,000 | | | | 44,837,341 | |
|
Ecopetrol S.A. | |
| | | |
5.88% | | | 05/28/45 | | | | 41,005,000 | | | | 47,422,282 | |
|
Gran Tierra Energy, Inc. | |
| | | |
7.75% (1) | | | 05/23/27 | | | | 16,555,000 | | | | 15,841,479 | |
See accompanying notes to financial statements.
19
TCW Emerging Markets Income Fund
Schedule of Investments (Continued)
| | | | | | | | | | | | |
| Issues | | Maturity
Date | | | Principal
Amount | | | Value | |
|
| Colombia (Continued) | |
|
Millicom International Cellular S.A. | |
| | | |
6.25% (1) | | | 03/25/29 | | | $ | 26,780,000 | | | $ | 29,214,302 | |
| | | | | | | | | | | | |
|
Total Colombia | |
| |
(Cost: $149,549,497) | | | | 167,803,537 | |
| | | | | | | | | | | | |
|
| Costa Rica — 2.0% | |
|
Autopistas del Sol S.A. | |
| | | |
7.38% (1) | | | 12/30/30 | | | | 22,507,520 | | | | 22,676,326 | |
|
Costa Rica Government International Bond | |
| | | |
4.38% (2) | | | 04/30/25 | | | | 36,895,000 | | | | 35,534,497 | |
| | | |
7.00% (2) | | | 04/04/44 | | | | 23,089,000 | | | | 22,858,341 | |
| | | |
7.16% (2) | | | 03/12/45 | | | | 36,894,000 | | | | 36,894,000 | |
| | | | | | | | | | | | |
|
Total Costa Rica | |
| |
(Cost: $113,391,544) | | | | 117,963,164 | |
| | | | | | | | | | | | |
|
| Dominican Republic — 3.3% | |
|
Dominican Republic International Bond | |
| | | |
5.95% (1) | | | 01/25/27 | | | | 47,383,000 | | | | 52,284,179 | |
| | | |
6.00% (1) | | | 07/19/28 | | | | 37,435,000 | | | | 41,623,041 | |
| | | |
6.40% (1) | | | 06/05/49 | | | | 71,825,000 | | | | 78,020,624 | |
| | | |
6.85% (2) | | | 01/27/45 | | | | 20,831,000 | | | | 23,587,853 | |
| | | | | | | | | | | | |
|
Total Dominican Republic | |
| |
(Cost: $183,795,602) | | | | 195,515,697 | |
| | | | | | | | | | | | |
|
| Ecuador — 3.0% | |
|
Ecuador Government International Bond | |
| | | |
7.88% (1) | | | 03/27/25 | | | | 28,825,000 | | | | 27,184,857 | |
| | | |
7.88% (1) | | | 01/23/28 | | | | 68,528,000 | | | | 61,579,261 | |
| | | |
7.95% (2) | | | 06/20/24 | | | | 50,180,000 | | | | 48,486,927 | |
| | | |
9.50% (1) | | | 03/27/30 | | | | 23,575,000 | | | | 22,787,595 | |
| | | |
10.75% (1) | | | 01/31/29 | | | | 16,315,000 | | | | 16,600,513 | |
| | | | | | | | | | | | |
|
Total Ecuador | |
| |
(Cost: $175,203,865) | | | | 176,639,153 | |
| | | | | | | | | | | | |
|
| Egypt — 3.2% | |
|
Egypt Government International Bond | |
| | | |
6.59% (1) | | | 02/21/28 | | | | 30,898,000 | | | | 31,540,099 | |
| | | |
7.60% (1) | | | 03/01/29 | | | | 74,575,000 | | | | 79,109,160 | |
| | | |
8.50% (2) | | | 01/31/47 | | | | 18,265,000 | | | | 19,276,443 | |
| | | |
8.70% (1) | | | 03/01/49 | | | | 57,347,000 | | | | 61,618,491 | |
| | | | | | | | | | | | |
| | | |
Total Egypt | | | | | | | | | | | | |
| | | |
(Cost: $183,012,690) | | | | | | | | | | | 191,544,193 | |
| | | | | | | | | | | | |
|
| El Salvador — 1.7% | |
| |
El Salvador Government International Bond | | | | | |
| | | |
5.88% (2) | | | 01/30/25 | | | | 31,465,000 | | | | 32,767,651 | |
| | | |
7.12% (1) | | | 01/20/50 | | | | 31,775,000 | | | | 32,766,380 | |
| | | |
7.63% (2) | | | 02/01/41 | | | | 15,850,000 | | | | 17,312,955 | |
| | | |
7.65% (2) | | | 06/15/35 | | | | 16,312,000 | | | | 17,869,286 | |
| | | | | | | | | | | | |
| | | |
Total El Salvador | | | | | | | | | | | | |
| | | |
(Cost: $95,894,205) | | | | | | | | | | | 100,716,272 | |
| | | | | | | | | | | | |
| | | | | | | | | | | | |
| Issues | | Maturity
Date | | | Principal
Amount | | | Value | |
|
| Ghana — 2.1% | |
| |
Ghana Government International Bond | | | | | |
| | | |
7.63% (2) | | | 05/16/29 | | | $ | 18,175,000 | | | $ | 18,464,664 | |
| | | |
8.13% (1) | | | 03/26/32 | | | | 67,150,000 | | | | 68,157,250 | |
| | | |
8.95% (1) | | | 03/26/51 | | | | 40,055,000 | | | | 40,730,928 | |
| | | | | | | | | | | | |
| | | |
Total Ghana | | | | | | | | | | | | |
| | | |
(Cost: $125,316,945) | | | | | | | | | | | 127,352,842 | |
| | | | | | | | | | | | |
|
| Guatemala — 0.5% (Cost: $27,354,680) | |
| |
Guatemala Government Bond | | | | | |
| | | |
4.90% (1) | | | 06/01/30 | | | | 27,395,000 | | | | 29,244,163 | |
| | | | | | | | | | | | |
|
| India — 2.3% | |
| |
Adani Ports & Special Economic Zone, Ltd. | | | | | |
| | | |
4.38% (1) | | | 07/03/29 | | | | 17,685,000 | | | | 18,479,516 | |
| |
Delhi International Airport, Ltd. | | | | | |
| | | |
6.45% (1) | | | 06/04/29 | | | | 19,355,000 | | | | 20,782,431 | |
| |
Greenko Mauritius, Ltd. | | | | | |
| | | |
6.25% (1) | | | 02/21/23 | | | | 19,680,000 | | | | 20,049,000 | |
| |
Greenko Solar Mauritius, Ltd. | | | | | |
| | | |
5.95% (1) | | | 07/29/26 | | | | 19,175,000 | | | | 19,366,750 | |
| |
Neerg Energy, Ltd. | | | | | |
| | | |
6.00% (1) | | | 02/13/22 | | | | 18,042,000 | | | | 17,884,133 | |
| |
ReNew Power, Ltd. | | | | | |
| | | |
6.45% (1) | | | 09/27/22 | | | | 14,825,000 | | | | 15,031,160 | |
| |
Vedanta Resources Finance II PLC | | | | | |
| | | |
9.25% (2) | | | 04/23/26 | | | | 10,397,000 | | | | 10,397,000 | |
| |
Vedanta Resources PLC | | | | | |
| | | |
6.13% (2) | | | 08/09/24 | | | | 19,158,000 | | | | 17,815,247 | |
| | | | | | | | | | | | |
| | | |
Total India | | | | | | | | | | | | |
| | | |
(Cost: $136,966,485) | | | | | | | | | | | 139,805,237 | |
| | | | | | | | | | | | |
|
| Indonesia — 5.4% | |
| |
Freeport-McMoRan, Inc. | | | | | |
| | | |
5.40% | | | 11/14/34 | | | | 27,730,000 | | | | 27,210,063 | |
| |
Indonesia Asahan Aluminium Persero PT | | | | | |
| | | |
6.53% (1) | | | 11/15/28 | | | | 18,588,000 | | | | 22,572,803 | |
| | | |
6.76% (1) | | | 11/15/48 | | | | 43,857,000 | | | | 56,553,601 | |
| |
Minejesa Capital BV | | | | | |
| | | |
4.63% (2) | | | 08/10/30 | | | | 17,326,000 | | | | 17,976,070 | |
| | | |
5.63% (1) | | | 08/10/37 | | | | 56,985,000 | | | | 61,999,680 | |
| |
Perusahaan Penerbit SBSN Indonesia III | | | | | |
| | | |
4.15% (2) | | | 03/29/27 | | | | 65,605,000 | | | | 70,320,359 | |
| | | |
4.45% (2) | | | 02/20/29 | | | | 22,770,000 | | | | 25,160,850 | |
| |
Saka Energi Indonesia PT | | | | | |
| | | |
4.45% (1) | | | 05/05/24 | | | | 40,219,000 | | | | 40,633,256 | |
| | | | | | | | | | | | |
| | | |
Total Indonesia | | | | | | | | | | | | |
| | | |
(Cost: $295,157,366) | | | | | | | | | | | 322,426,682 | |
| | | | | | | | | | | | |
|
| Iraq — 0.2% (Cost: $12,259,237) | |
| |
Iraq International Bond | | | | | |
| | | |
5.80% (2) | | | 01/15/28 | | | | 14,230,000 | | | | 13,705,269 | |
| | | | | | | | | | | | |
See accompanying notes to financial statements.
20
TCW Emerging Markets Income Fund
| | | | | | | | | | | | |
| Issues | | Maturity
Date | | | Principal
Amount | | | Value | |
|
| Ivory Coast — 1.6% | |
| |
Ivory Coast Government International Bond | | | | | |
| | | |
5.88% (1) | | | 10/17/31 | | | EUR | 21,360,000 | | | $ | 24,192,397 | |
| | | |
6.13% (1) | | | 06/15/33 | | | $ | 39,340,000 | | | | 38,762,194 | |
| | | |
6.88% (1) | | | 10/17/40 | | | EUR | 27,405,000 | | | | 31,452,255 | |
| | | | | | | | | | | | |
| | | |
Total Ivory Coast | | | | | | | | | | | | |
| | | |
(Cost: $89,427,831) | | | | | | | | | | | 94,406,846 | |
| | | | | | | | | | | | |
|
| Kazakhstan — 2.7% | |
| |
KazMunayGas National Co. JSC | | | | | |
| | | |
5.38% (1) | | | 04/24/30 | | | $ | 63,190,000 | | | | 73,073,311 | |
| | | |
5.75% (1) | | | 04/19/47 | | | | 74,499,000 | | | | 87,182,455 | |
| | | | | | | | | | | | |
| | | |
Total Kazakhstan | | | | | | | | | | | | |
| | | |
(Cost: $143,229,077) | | | | | | | | | | | 160,255,766 | |
| | | | | | | | | | | | |
|
| Kenya —1.7% | |
| |
Kenya Government International Bond | | | | | |
| | | |
7.00% (1) | | | 05/22/27 | | | | 50,695,000 | | | | 53,234,008 | |
| | | |
8.00% (1) | | | 05/22/32 | | | | 46,772,000 | | | | 49,945,995 | |
| | | | | | | | | | | | |
| | | |
Total Kenya | | | | | | | | | | | | |
| | | |
(Cost: $100,276,098) | | | | | | | | | | | 103,180,003 | |
| | | | | | | | | | | | |
|
| Lebanon — 1.0% | |
| |
Lebanon Government International Bond | | | | | |
| | | |
6.00% (2) | | | 01/27/23 | | | | 44,809,000 | | | | 26,829,389 | |
| | | |
6.10% (2) | | | 10/04/22 | | | | 23,140,000 | | | | 14,115,400 | |
| | | |
6.65% (2) | | | 04/22/24 | | | | 30,230,000 | | | | 17,495,612 | |
| | | | | | | | | | | | |
| | | |
Total Lebanon | | | | | | | | | | | | |
| | | |
(Cost: $84,358,105) | | | | | | | | | | | 58,440,401 | |
| | | | | | | | | | | | |
|
| Mexico — 7.1% | |
| |
Alpek SAB de CV | | | | | |
| | | |
4.25% (1) | | | 09/18/29 | | | | 14,600,000 | | | | 14,849,660 | |
| |
Banco Mercantil del Norte S.A. | | | | | |
| | | |
6.88% (5 year U.S. Treasury Constant Maturity Rate + 5.035%) (1)(3)(4) | | | 12/31/99 | | | | 17,405,000 | | | | 18,016,895 | |
| |
Banco Mercantil del Norte S.A. | | | | | |
| | | |
7.50% (10 year Treasury Constant Maturity Rate + 5.470%) (1)(3)(4) | | | 12/31/99 | | | | 18,500,000 | | | | 19,314,000 | |
| |
Industrias Penoles SAB de CV | | | | | |
| | | |
5.65% (1) | | | 09/12/49 | | | | 35,665,000 | | | | 36,860,312 | |
| |
Mexico Government International Bond | | | | | |
| | | |
4.60% | | | 01/23/46 | | | | 44,985,000 | | | | 48,239,384 | |
| |
Petroleos Mexicanos | | | | | |
| | | |
5.35% | | | 02/12/28 | | | | 54,703,000 | | | | 54,008,272 | |
| | | |
6.50% | | | 01/23/29 | | | | 117,968,000 | | | | 123,317,117 | |
| | | |
7.69% (1) | | | 01/23/50 | | | | 87,430,000 | | | | 95,333,672 | |
| | | | | | | | | | | | |
| Issues | | Maturity
Date | | | Principal
Amount | | | Value | |
|
| Mexico (Continued) | |
| |
Unifin Financiera SAB de CV SOFOM ENR | | | | | |
| | | |
8.38% (1) | | | 01/27/28 | | | $ | 15,840,000 | | | $ | 16,335,000 | |
| | | | | | | | | | | | |
| | | |
Total Mexico | | | | | | | | | | | | |
| | | |
(Cost: $412,234,433) | | | | | | | | | | | 426,274,312 | |
| | | | | | | | | | | | |
|
| Mongolia — 0.3% (Cost: $14,468,306) | |
| |
Development Bank of Mongolia LLC | | | | | |
| | | |
7.25% (1) | | | 10/23/23 | | | | 14,680,000 | | | | 15,439,231 | |
| | | | | | | | | | | | |
|
| Nigeria — 2.5% | |
| |
IHS Netherlands Holdco BV | | | | | |
| | | |
7.13% (1) | | | 03/18/25 | | | | 16,600,000 | | | | 17,181,000 | |
| |
Nigeria Government International Bond | | | | | |
| | | |
7.14% (1) | | | 02/23/30 | | | | 39,075,000 | | | | 39,349,746 | |
| | | |
7.70% (1) | | | 02/23/38 | | | | 95,485,000 | | | | 95,809,649 | |
| | | | | | | | | | | | |
| | | |
Total Nigeria | | | | | | | | | | | | |
| | | |
(Cost: $148,839,809) | | | | | | | | | | | 152,340,395 | |
| | | | | | | | | | | | |
|
| Oman — 2.9% | |
| |
Oman Government International Bond | | | | | |
| | | |
5.63% (1) | | | 01/17/28 | | | | 53,685,000 | | | | 53,254,178 | |
| | | |
6.00% (1) | | | 08/01/29 | | | | 53,565,000 | | | | 53,688,199 | |
| | | |
6.75% (2) | | | 01/17/48 | | | | 71,566,000 | | | | 67,354,341 | |
| | | | | | | | | | | | |
| | | |
Total Oman | | | | | | | | | | | | |
| | | |
(Cost: $169,850,223) | | | | | | | | | | | 174,296,718 | |
| | | | | | | | | | | | |
|
| Panama — 1.8% | |
| |
Aeropuerto Internacional de Tocumen S. A. | | | | | |
| | | |
6.00% (1) | | | 11/18/48 | | | | 16,565,000 | | | | 20,644,959 | |
| |
C&W Senior Financing DAC | | | | | |
| | | |
6.88% (1) | | | 09/15/27 | | | | 22,924,000 | | | | 24,157,311 | |
| |
Cable Onda SA | | | | | |
| | | |
4.50% (1) | | | 01/30/30 | | | | 7,650,000 | | | | 7,766,816 | |
| |
Global Bank Corp. | | | | | |
| | | |
5.25% (3 mo. USD LIBOR + 3.300%) (1)(3) | | | 04/16/29 | | | | 36,995,000 | | | | 39,718,757 | |
| |
Sable International Finance, Ltd. | | | | | |
| | | |
5.75% (1) | | | 09/07/27 | | | | 14,300,000 | | | | 14,899,170 | |
| | | | | | | | | | | | |
| | | |
Total Panama | | | | | | | | | | | | |
| | | |
(Cost: $98,364,150) | | | | | | | | | | | 107,187,013 | |
| | | | | | | | | | | | |
|
| Paraguay — 0.8% | |
| |
Paraguay Government International Bond | | | | | |
| | | |
5.40% (1) | | | 03/30/50 | | | | 22,500,000 | | | | 25,607,812 | |
| | | |
5.60% (2) | | | 03/13/48 | | | | 18,067,000 | | | | 20,972,174 | |
| | | | | | | | | | | | |
| | | |
Total Paraguay | | | | | | | | | | | | |
| | | |
(Cost: $40,813,064) | | | | | | | | | | | 46,579,986 | |
| | | | | | | | | | | | |
|
| Peru — 1.3% | |
| |
Banco de Credito del Peru | | | | | |
| | | |
2.70% (1) | | | 01/11/25 | | | | 13,425,000 | | | | 13,404,863 | |
See accompanying notes to financial statements.
21
TCW Emerging Markets Income Fund
Schedule of Investments (Continued)
| | | | | | | | | | | | |
| Issues | | Maturity
Date | | | Principal
Amount | | | Value | |
|
| Peru (Continued) | |
| |
Nexa Resources S.A. | | | | | |
| | | |
5.38% (2) | | | 05/04/27 | | | $ | 22,988,000 | | | $ | 24,496,817 | |
| |
Peru LNG SRL | | | | | |
| | | |
5.38% (1) | | | 03/22/30 | | | | 39,627,000 | | | | 40,776,185 | |
| | | | | | | | | | | | |
| | | |
Total Peru | | | | | | | | | | | | |
| | | |
(Cost: $78,114,728) | | | | | | | | | | | 78,677,865 | |
| | | | | | | | | | | | |
|
| Qatar — 3.2% | |
| |
Qatar Government International Bond | | | | | |
| | | |
4.00% (1) | | | 03/14/29 | | | | 112,304,000 | | | | 125,096,128 | |
| | | |
4.82% (1) | | | 03/14/49 | | | | 23,000,000 | | | | 28,347,730 | |
| | | |
5.10% (1) | | | 04/23/48 | | | | 29,225,000 | | | | 37,328,508 | |
| | | | | | | | | | | | |
| | | |
Total Qatar | | | | | | | | | | | | |
| | | |
(Cost: $168,604,001) | | | | | | | | | | | 190,772,366 | |
| | | | | | | | | | | | |
|
| Russia — 3.3% | |
| |
Russian Federation Government Bond | | | | | |
| | | |
4.25% (2) | | | 06/23/27 | | | | 45,200,000 | | | | 48,590,226 | |
| | | |
4.38% (1) | | | 03/21/29 | | | | 46,800,000 | | | | 50,778,234 | |
| | | |
5.10% (1) | | | 03/28/35 | | | | 86,800,000 | | | | 100,340,800 | |
| | | | | | | | | | | | |
| | | |
Total Russia | | | | | | | | | | | | |
| | | |
(Cost: $178,521,970) | | | | | | | | | | | 199,709,260 | |
| | | | | | | | | | | | |
|
| Saudi Arabia — 3.7% | |
| |
Saudi Arabian Oil Co. | | | | | |
| | | |
3.50% (1) | | | 04/16/29 | | | | 25,535,000 | | | | 26,423,618 | |
| | | |
4.25% (1) | | | 04/16/39 | | | | 36,465,000 | | | | 39,191,488 | |
|
Saudi Government International Bond | |
| | | |
3.25% (2) | | | 10/26/26 | | | | 45,860,000 | | | | 47,504,310 | |
| | | |
4.50% (2) | | | 10/26/46 | | | | 100,895,000 | | | | 111,287,185 | |
| | | | | | | | | | | | |
| | | |
Total Saudi Arabia | | | | | | | | | | | | |
| | | |
(Cost: $211,965,077) | | | | | | | | | | | 224,406,601 | |
| | | | | | | | | | | | |
|
| South Africa — 3.7% | |
| |
Gold Fields Orogen Holdings BVI, Ltd. | | | | | |
| | | |
6.13% (1) | | | 05/15/29 | | | | 10,235,000 | | | | 11,591,138 | |
| |
Petra Diamonds US Treasury PLC | | | | | |
| | | |
7.25% (2) | | | 05/01/22 | | | | 19,281,000 | | | | 13,834,117 | |
| |
SASOL Financing USA LLC | | | | | |
| | | |
6.50% | | | 09/27/28 | | | | 19,425,000 | | | | 21,683,157 | |
| |
South Africa Government Bond | | | | | |
| | | |
4.30% | | | 10/12/28 | | | | 76,575,000 | | | | 73,990,594 | |
| | | |
5.75% | | | 09/30/49 | | | | 72,145,000 | | | | 69,923,295 | |
| | | |
5.88% | | | 06/22/30 | | | | 28,805,000 | | | | 30,670,124 | |
| | | | | | | | | | | | |
| | | |
| Total South Africa | | | | | | | | | |
| | | |
(Cost: $220,524,745) | | | | | | | | | | | 221,692,425 | |
| | | | | | | | | | | | |
|
| Sri Lanka — 3.0% | |
| |
Sri Lanka Government Bond | | | | | |
| | | |
5.75% (1) | | | 04/18/23 | | | | 53,585,000 | | | | 53,894,788 | |
| | | | | | | | | | | | |
| Issues | | Maturity
Date | | | Principal
Amount | | | Value | |
|
| Sri Lanka (Continued) | |
| | | |
6.75% (2) | | | 04/18/28 | | | $ | 38,813,000 | | | $ | 38,009,571 | |
| | | |
6.85% (1) | | | 03/14/24 | | | | 24,605,000 | | | | 25,441,570 | |
| | | |
7.55% (1) | | | 03/28/30 | | | | 41,725,000 | | | | 42,194,406 | |
| | | |
7.85% (1) | | | 03/14/29 | | | | 21,615,000 | | | | 22,315,326 | |
| | | | | | | | | | | | |
| | | |
| Total Sri Lanka | | | | | | | | | |
| | | |
(Cost: $173,966,011) | | | | | | | | | | | 181,855,661 | |
| | | | | | | | | | | | |
|
| Tanzania — 0.2% (Cost: $13,118,419) | |
| |
HTA Group, Ltd. | | | | | |
| | | |
9.13% (2) | | | 03/08/22 | | | | 12,829,000 | | | | 13,381,930 | |
| | | | | | | | | | | | |
|
| Turkey — 2.8% | |
| |
Turkey Government International Bond | | | | | |
| | | |
4.88% | | | 10/09/26 | | | | 75,275,000 | | | | 70,817,309 | |
| | | |
5.75% | | | 03/22/24 | | | | 41,060,000 | | | | 41,502,678 | |
| | | |
6.00% | | | 03/25/27 | | | | 38,730,000 | | | | 38,530,298 | |
|
Turkiye Vakiflar Bankasi TAO | |
| | | |
6.88% (USD 5 Year Swap rate + 5.439%) (2)(3) | | | 02/03/25 | | | | 16,975,000 | | | | 16,422,430 | |
| | | | | | | | | | | | |
| | | |
Total Turkey | | | | | | | | | | | | |
| | | |
(Cost: $164,150,297) | | | | | | | | | | | 167,272,715 | |
| | | | | | | | | | | | |
|
| Ukraine — 4.2% | |
| |
Ukraine Government International Bond | | | | | |
| | | |
0.00% (2)(5)(6) | | | 05/31/40 | | | | 63,344,000 | | | | 59,780,900 | |
| | | |
7.38% (2) | | | 09/25/32 | | | | 82,450,000 | | | | 86,503,159 | |
| | | |
7.75% (2) | | | 09/01/26 | | | | 39,915,000 | | | | 42,988,455 | |
| | | |
7.75% (2) | | | 09/01/27 | | | | 57,566,000 | | | | 62,102,201 | |
| | | | | | | | | | | | |
| | | |
Total Ukraine | | | | | | | | | | | | |
| | | |
(Cost: $233,651,540) | | | | | | | | | | | 251,374,715 | |
| | | | | | | | | | | | |
|
| United Arab Emirates — 2.0% | |
| |
Abu Dhabi Government International Bond | | | | | |
| | | |
2.50% (1) | | | 09/30/29 | | | | 21,265,000 | | | | 21,185,256 | |
| | | |
3.13% (1) | | | 09/30/49 | | | | 60,805,000 | | | | 58,676,825 | |
|
DP World PLC | |
| | | |
4.70% (1) | | | 09/30/49 | | | | 17,400,000 | | | | 17,414,442 | |
| | | |
5.63% (1) | | | 09/25/48 | | | | 19,130,000 | | | | 22,238,625 | |
| | | | | | | | | | | | |
| | |
Total United Arab Emirates | | | | | | | | | |
| | | |
(Cost: $116,650,061) | | | | | | | | | | | 119,515,148 | |
| | | | | | | | | | | | |
|
| Uruguay — 2.1% | |
| |
Uruguay Government International Bond | | | | | |
| | | |
4.38% | | | 01/23/31 | | | | 37,650,000 | | | | 42,083,664 | |
| | | |
4.98% | | | 04/20/55 | | | | 71,160,000 | | | | 83,435,812 | |
| | | | | | | | | | | | |
| | | |
Total Uruguay | | | | | | | | | | | | |
| | | |
(Cost: $112,712,185) | | | | | | | | | | | 125,519,476 | |
| | | | | | | | | | | | |
|
| Venezuela — 0.3% | |
| |
Venezuela Government International Bond | | | | | |
| | | |
8.25% (7)(8) | | | 10/13/24 | | | | 60,057,200 | | | | 6,306,006 | |
See accompanying notes to financial statements.
22
TCW Emerging Markets Income Fund
| | | | | | | | | | | | |
| Issues | | Maturity
Date | | | Principal
Amount | | | Value | |
|
| Venezuela (Continued) | |
| | | |
9.25% (7)(8) | | | 09/15/27 | | | $ | 60,955,000 | | | $ | 6,400,275 | |
| | | |
9.25% (7)(8) | | | 05/07/28 | | | | 49,048,000 | | | | 5,150,040 | |
| | | | | | | | | | | | |
| | | |
Total Venezuela | | | | | | | | | | | | |
| | | |
(Cost: $55,533,009) | | | | | | | | | | | 17,856,321 | |
| | | | | | | | | | | | |
|
| Vietnam — 0.5% (Cost: $28,392,125) | |
| |
Mong Duong Finance Holdings BV | | | | | |
| | | |
5.13% (1) | | | 05/07/29 | | | | 28,310,000 | | | | 28,779,946 | |
| | | | | | | | | | | | |
| |
Total Fixed Income Securities | | | | | |
| | | |
(Cost: $5,648,338,532) | | | | | | | | | | | 5,793,766,196 | |
| | | | | | | | | | | | |
| | | | | | | | | | | | |
Issues | | | | | Shares | | | Value | |
|
| MONEY MARKET INVESTMENTS — 4.2% of Net Assets | |
| | | |
State Street Institutional U.S. Government Money Market Fund — Premier Class, 1.75% (9) | | | | | | | 252,627,324 | | | $ | 252,627,324 | |
| | | | | | | | | | | | |
| | | |
Total Money Market Investments | | | | | | | | | | | | |
| | | |
(Cost: $252,627,324) | | | | | | | | | | | 252,627,324 | |
| | | | | | | | | | | | |
| | | |
Total Investments (101.0%) | | | | | | | | | | | | |
| | | |
(Cost: $5,900,965,856) | | | | | | | | | | | 6,046,393,520 | |
| |
Liabilities in Excess of Other Assets (-1.0%) | | | | (57,349,539 | ) |
| | | | | | | | | | | | |
| | | |
Total Net Assets (100.0%) | | | | | | | | | | $ | 5,989,043,981 | |
| | | | | | | | | | | | |
| | | | | | | | | | | | | | | | | | | | | | | | |
| Forward Currency Exchange Contracts | |
| | | | | | |
| Counterparty | | Contracts to
Deliver | | | Units of
Currency | | | Settlement
Date | | | In Exchange for
U.S. Dollars | | | Contracts at
Value | | | Unrealized
Appreciation
(Depreciation) | |
BUY (10) | | | | | | | | | | | | | | | | | | | | | | | | |
Citibank N.A. | | | BRL | | | | 62,640,000 | | | | 11/06/19 | | | $ | 16,000,000 | | | $ | 15,602,029 | | | $ | (397,971 | ) |
Citibank N.A. | | | SAR | | | | 69,663,299 | | | | 04/06/20 | | | | 18,493,045 | | | | 18,575,328 | | | | 82,283 | |
| | | | | | | | | | | | | | | | | | | | | | | | |
| | | | | | | | | | | | | | $ | 34,493,045 | | | $ | 34,177,357 | | | $ | (315,688 | ) |
| | | | | | | | | | | | | | | | | | | | | | | | |
SELL (11) | | | | | | | | | | | | | | | | | | | | | | | | |
Citibank N.A. | | | BRL | | | | 62,640,000 | | | | 11/06/19 | | | $ | 15,270,600 | | | $ | 15,602,029 | | | $ | (331,429 | ) |
Citibank N.A. | | | SAR | | | | 69,663,299 | | | | 04/06/20 | | | | 18,470,000 | | | | 18,575,328 | | | | (105,328 | ) |
| | | | | | | | | | | | | | | | | | | | | | | | |
| | | | | | | | | | | | | | $ | 33,740,600 | | | $ | 34,177,357 | | | $ | (436,757 | ) |
| | | | | | | | | | | | | | | | | | | | | | | | |
| | | | | | | | | | | | | | | | | | |
| Futures Contracts | |
| | | | | |
Number of
Contracts | | Type | | Expiration
Date | | | Notional
Amount | | | Value | | | Net Unrealized
Appreciation/
Depreciation | |
Long Futures | |
| 957 | | U.S. Ultra Long Bond Futures | | | 12/19/19 | | | $ | 189,382,562 | | | $ | 181,590,750 | | | $ | (7,791,812 | ) |
| | | | | | | | | | | | | | | | | | |
See accompanying notes to financial statements.
23
TCW Emerging Markets Income Fund
Schedule of Investments (Continued)
Notes to the Schedule of Investments:
| (1) | | Security exempt from registration under Rule 144A of the Securities Act of 1933, as amended. These securities may be resold, normally only to qualified institutional buyers. At October 31, 2019, the value of these securities amounted to $3,126,598,728 or 52.2% of net assets. These securities are determined to be liquid by the Fund’s investment advisor, unless otherwise noted, under procedures established by and under the general supervision of the Company’s Board of Directors. |
| (2) | | Investments issued under Regulation S of the Securities Act of 1933, as amended, may not be offered, sold, or delivered within the United States except under special exemptions. At October 31, 2019, the value of these securities amounted to $1,467,942,230 or 24.5% of net assets. |
| (3) | | Floating or variable rate security. The interest shown reflects the rate in effect at October 31, 2019. |
| (5) | | Variable rate security. Interest rate disclosed is as of the most recent information available. Certain variable rate securities are not based on a published reference rate and spread but are determined by the issuer or agent and are based on current market conditions. These securities do not indicate a reference rate and spread in their description above. |
| (6) | | Security is not accruing interest. |
| (7) | | For fair value measurement disclosure purposes, security is categorized as Level 3. Security is valued using significant unobservable inputs. |
| (8) | | Security is currently in default due to bankruptcy or failure to make payment of principal or interest of the issuer. Income is not being accrued. |
| (9) | | Rate disclosed is the 7-day net yield as of October 31, 2019. |
| (10) | | Fund buys foreign currency, sells U.S. Dollar. |
| (11) | | Fund sells foreign currency, buys U.S. Dollar. |
See accompanying notes to financial statements.
24
TCW Emerging Markets Income Fund
Investments by Sector | October 31, 2019 |
| | | | |
| Sector | | Percentage of
Net Assets | |
Agriculture | | | 0.2 | % |
Airlines | | | 0.4 | |
Banks | | | 2.5 | |
Building Materials | | | 0.1 | |
Chemicals | | | 0.6 | |
Commercial Services | | | 1.4 | |
Diversified Financial Services | | | 0.8 | |
Electric | | | 2.5 | |
Energy-Alternate Sources | | | 1.2 | |
Engineering & Construction | | | 1.0 | |
Food | | | 0.5 | |
Foreign Government Bonds | | | 61.8 | |
Iron & Steel | | | 0.8 | |
Media | | | 0.1 | |
Metal Fabricate & Hardware | | | 0.2 | |
Mining | | | 3.7 | |
Oil & Gas | | | 13.7 | |
Pipelines | | | 1.3 | |
Real Estate | | | 2.1 | |
Telecommunications | | | 1.1 | |
Transportation | | | 0.8 | |
Money Market Investments | | | 4.2 | |
| | | | |
Total | | | 101.0 | % |
| | | | |
See accompanying notes to financial statements.
25
TCW Emerging Markets Income Fund
Fair Valuation Summary | October 31, 2019 |
The following is a summary of the fair valuations according to the inputs used as of October 31, 2019 in valuing the Fund’s investments:
| | | | | | | | | | | | | | | | |
Description | | Quoted Prices
in Active
Markets for
Identical
Assets
(Level 1) | | | Other
Significant
Observable
Inputs
(Level 2) | | | Significant
Unobservable
Inputs
(Level 3) | | | Total | |
Fixed Income Securities | | | | | | | | | | | | | | | | |
Agriculture | | $ | — | | | $ | 9,920,792 | | | $ | — | | | $ | 9,920,792 | |
Airlines | | | — | | | | 21,508,891 | | | | — | | | | 21,508,891 | |
Banks | | | — | | | | 147,061,854 | | | | — | | | | 147,061,854 | |
Building Materials | | | — | | | | 3,918,353 | | | | — | | | | 3,918,353 | |
Chemicals | | | — | | | | 36,532,817 | | | | — | | | | 36,532,817 | |
Commercial Services | | | — | | | | 80,808,910 | | | | — | | | | 80,808,910 | |
Diversified Financial Services | | | — | | | | 49,402,275 | | | | — | | | | 49,402,275 | |
Electric | | | — | | | | 151,449,952 | | | | — | | | | 151,449,952 | |
Energy-Alternate Sources | | | — | | | | 72,331,043 | | | | — | | | | 72,331,043 | |
Engineering & Construction | | | — | | | | 58,608,391 | | | | — | | | | 58,608,391 | |
Food | | | — | | | | 28,272,756 | | | | — | | | | 28,272,756 | |
Foreign Government Bonds | | | — | | | | 3,685,272,831 | | | | 17,856,321 | | | | 3,703,129,152 | |
Iron & Steel | | | — | | | | 45,118,471 | | | | — | | | | 45,118,471 | |
Media | | | — | | | | 7,766,816 | | | | — | | | | 7,766,816 | |
Metal Fabricate & Hardware | | | — | | | | 13,381,930 | | | | — | | | | 13,381,930 | |
Mining | | | — | | | | 221,331,098 | | | | — | | | | 221,331,098 | |
Oil & Gas | | | — | | | | 819,653,188 | | | | — | | | | 819,653,188 | |
Pipelines | | | — | | | | 77,974,857 | | | | — | | | | 77,974,857 | |
Real Estate | | | — | | | | 126,551,669 | | | | — | | | | 126,551,669 | |
Telecommunications | | | — | | | | 68,270,783 | | | | — | | | | 68,270,783 | |
Transportation | | | — | | | | 50,772,198 | | | | — | | | | 50,772,198 | |
| | | | | | | | | | | | | | | | |
Total Fixed Income Securities | | | — | | | | 5,775,909,875 | | | | 17,856,321 | | | | 5,793,766,196 | |
| | | | | | | | | | | | | | | | |
Money Market Investments | | | 252,627,324 | | | | — | | | | — | | | | 252,627,324 | |
| | | | | | | | | | | | | | | | |
Total Investments | | $ | 252,627,324 | | | $ | 5,775,909,875 | | | $ | 17,856,321 | | | $ | 6,046,393,520 | |
| | | | | | | | | | | | | | | | |
Asset Derivatives | | | | | | | | | | | | | | | | |
Forward Currency Contracts | | | | | | | | | | | | | | | | |
Foreign Currency Risk | | | — | | | | 82,283 | | | | — | | | | 82,283 | |
| | | | | | | | | | | | | | | | |
Total | | $ | 252,627,324 | | | $ | 5,775,992,158 | | | $ | 17,856,321 | | | $ | 6,046,475,803 | |
| | | | | | | | | | | | | | | | |
Liability Derivatives | | | | | | | | | | | | | | | | |
Forward Currency Contracts | | | | | | | | | | | | | | | | |
Foreign Currency Risk | | $ | — | | | $ | (834,728 | ) | | $ | — | | | $ | (834,728 | ) |
Futures Contracts | | | | | | | | | | | | | | | | |
Interest Rate Risk | | | (7,791,812 | ) | | | — | | | | — | | | | (7,791,812 | ) |
| | | | | | | | | | | | | | | | |
Total | | $ | (7,791,812 | ) | | $ | (834,728 | ) | | $ | — | | | $ | (8,626,540 | ) |
| | | | | | | | | | | | | | | | |
See accompanying notes to financial statements.
26
TCW Emerging Markets Local Currency Income Fund
Schedule of Investments | October 31, 2019 |
| | | | | | | | | | | | |
| Issues | | Maturity
Date | | | Principal
Amount | | | Value | |
|
FIXED INCOME SECURITIES — 90.8% of Net Assets | |
|
| Brazil — 10.0% | |
| |
Brazil Notas do Tesouro Nacional, Series F | | | | | |
| | | |
10.00% | | | 01/01/23 | | | BRL | 38,590,000 | | | $ | 10,858,282 | |
| | | |
10.00% | | | 01/01/25 | | | BRL | 23,140,000 | | | | 6,768,497 | |
| | | |
10.00% | | | 01/01/27 | | | BRL | 23,910,000 | | | | 7,210,277 | |
| | | | | | | | | | | | |
| | | |
Total Brazil | | | | | | | | | | | | |
| | |
(Cost: $22,491,043) | | | | | | | | 24,837,056 | |
| | | | | | | | | | | | |
|
| Chile — 1.5% | |
|
Bonos de la Tesoreria de la Republica | |
| | | |
2.00% | | | 03/01/35 | | | CLP | 2,104,901,250 | | | | 3,359,966 | |
| | | |
4.50% | | | 03/01/26 | | | CLP | 300,000,000 | | | | 440,864 | |
| | | | | | | | | | | | |
| | | |
Total Chile | | | | | | | | | | | | |
| | | |
(Cost: $3,638,768) | | | | | | | | | | | 3,800,830 | |
| | | | | | | | | | | | |
|
| Colombia — 6.3% | |
| |
Colombian TES (Treasury) Bond, Series B | | | | | |
| | | |
6.00% | | | 04/28/28 | | | COP | 12,572,800,000 | | | | 3,759,090 | |
| | | |
7.00% | | | 05/04/22 | | | COP | 3,180,000,000 | | | | 986,449 | |
| | | |
7.50% | | | 08/26/26 | | | COP | 9,259,000,000 | | | | 3,030,041 | |
| | | |
7.75% | | | 09/18/30 | | | COP | 10,802,000,000 | | | | 3,620,682 | |
| | | |
10.00% | | | 07/24/24 | | | COP | 12,134,700,000 | | | | 4,293,311 | |
| | | | | | | | | | | | |
| | | |
Total Colombia | | | | | | | | | | | | |
| | |
(Cost: $15,662,097) | | | | | | | | 15,689,573 | |
| | | | | | | | | | | | |
|
| Dominican Republic — 0.1% (Cost: $181,106) | |
| |
Dominican Republic International Bond | | | | | |
| | | |
9.75% (1) | | | 06/05/26 | | | DOP | 9,150,000 | | | | 177,004 | |
| | | | | | | | | | | | |
|
| Egypt — 0.4% (Cost: $815,149) | |
| |
Egypt Government Bond | | | | | |
| | | |
15.16% | | | 10/10/22 | | | EGP | 14,500,000 | | | | 917,269 | |
| | | | | | | | | | | | |
|
| Hungary — 3.0% | |
| |
Hungary Government Bond | | | | | |
| | | |
3.00% | | | 08/21/30 | | | HUF | 1,044,000,000 | | | | 3,926,536 | |
| | | |
3.25% | | | 10/22/31 | | | HUF | 955,000,000 | | | | 3,658,771 | |
| | | | | | | | | | | | |
| | | |
Total Hungary | | | | | | | | | | | | |
| | | |
(Cost: $7,277,684) | | | | | | | | | | | 7,585,307 | |
| | | | | | | | | | | | |
|
| Indonesia — 10.3% | |
| |
Indonesia Treasury Bond | | | | | |
| | | |
6.63% | | | 05/15/33 | | | IDR | 12,625,000,000 | | | | 844,545 | |
| | | |
7.00% | | | 05/15/22 | | | IDR | 8,382,000,000 | | | | 608,930 | |
| | | |
7.00% | | | 05/15/27 | | | IDR | 21,200,000,000 | | | | 1,532,949 | |
| | | |
7.50% | | | 08/15/32 | | | IDR | 57,258,000,000 | | | | 4,119,867 | |
| | | |
7.50% | | | 06/15/35 | | | IDR | 50,700,000,000 | | | | 3,634,500 | |
| | | |
8.25% | | | 05/15/29 | | | IDR | 18,834,000,000 | | | | 1,459,142 | |
| | | |
8.38% | | | 09/15/26 | | | IDR | 31,656,000,000 | | | | 2,463,787 | |
| | | |
8.38% | | | 03/15/34 | | | IDR | 111,789,000,000 | | | | 8,586,657 | |
| | | |
9.00% | | | 03/15/29 | | | IDR | 29,398,000,000 | | | | 2,363,442 | |
| | | | | | | | | | | | |
| | | |
Total Indonesia | | | | | | | | | | | | |
| | |
(Cost: $23,941,815) | | | | | | | | 25,613,819 | |
| | | | | | | | | | | | |
| | | | | | | | | | | | |
| Issues | | Maturity
Date | | | Principal
Amount | | | Value | |
|
| Malaysia — 5.8% | |
| |
Malaysia Government Bond | | | | | |
| | | |
3.48% | | | 03/15/23 | | | MYR | 11,720,000 | | | $ | 2,827,974 | |
| | | |
3.84% | | | 04/15/33 | | | MYR | 2,503,000 | | | | 606,510 | |
| | | |
3.89% | | | 08/15/29 | | | MYR | 21,900,000 | | | | 5,440,278 | |
| | | |
3.90% | | | 11/16/27 | | | MYR | 9,610,000 | | | | 2,370,704 | |
| | | |
4.18% | | | 07/15/24 | | | MYR | 7,860,000 | | | | 1,948,776 | |
| | | |
4.89% | | | 06/08/38 | | | MYR | 4,338,000 | | | | 1,173,861 | |
| | | | | | | | | | | | |
| | | |
Total Malaysia | | | | | | | | | | | | |
| | | |
(Cost: $14,289,091) | | | | | | | | | | | 14,368,103 | |
| | | | | | | | | | | | |
|
| Mexico — 11.3% | |
| |
Mexican Bonos | | | | | |
| | | |
8.00% | | | 09/05/24 | | | MXN | 41,060,000 | | | | 2,262,669 | |
| | | |
8.50% | | | 11/18/38 | | | MXN | 66,630,000 | | | | 3,982,589 | |
|
Mexico Government Bond (BONOS) | |
| | | |
5.75% | | | 03/05/26 | | | MXN | 63,420,000 | | | | 3,149,499 | |
| | | |
7.50% | | | 06/03/27 | | | MXN | 84,020,000 | | | | 4,577,889 | |
| | | |
7.75% | | | 05/29/31 | | | MXN | 55,720,000 | | | | 3,111,014 | |
| | | |
7.75% | | | 11/13/42 | | | MXN | 105,988,000 | | | | 5,890,372 | |
| | | |
10.00% | | | 12/05/24 | | | MXN | 87,995,000 | | | | 5,261,249 | |
| | | | | | | | | | | | |
| | | |
Total Mexico | | | | | | | | | | | | |
| | | |
(Cost: $26,665,433) | | | | | | | | | | | 28,235,281 | |
| | | | | | | | | | | | |
|
| Peru — 4.2% | |
| |
Alicorp SAA | | | | | |
| | | |
6.88% (1) | | | 04/17/27 | | | PEN | 1,726,000 | | | | 558,357 | |
| |
Peruvian Government International Bond | | | | | |
| | | |
5.40% (2) | | | 08/12/34 | | | PEN | 730,000 | | | | 232,557 | |
| | | |
6.15% (2) | | | 08/12/32 | | | PEN | 5,352,000 | | | | 1,825,617 | |
| | | |
6.90% (2) | | | 08/12/37 | | | PEN | 9,246,000 | | | | 3,376,567 | |
| | | |
6.95% (2) | | | 08/12/31 | | | PEN | 4,661,000 | | | | 1,687,538 | |
| |
Telefonica del Peru S.A. | | | | | |
| | | |
7.38% (1) | | | 04/10/27 | | | PEN | 8,450,000 | | | | 2,712,463 | |
| | | | | | | | | | | | |
| | | |
Total Peru | | | | | | | | | | | | |
| | | |
(Cost: $9,605,040) | | | | | | | | | | | 10,393,099 | |
| | | | | | | | | | | | |
|
| Philippines — 0.3% (Cost: $622,709) | |
| |
Philippine Government Bond | | | | | |
| | | |
5.50% | | | 03/08/23 | | | PHP | 33,300,000 | | | | 687,228 | |
| | | | | | | | | | | | |
|
| Poland — 7.0% | |
| |
Poland Government Bond | | | | | |
| | | |
2.50% | | | 07/25/27 | | | PLN | 29,654,000 | | | | 8,094,026 | |
| | | |
2.75% | | | 10/25/29 | | | PLN | 33,600,000 | | | | 9,425,615 | |
| | | | | | | | | | | | |
| | | |
Total Poland | | | | | | | | | | | | |
| | | |
(Cost: $16,859,404) | | | | | | | | | | | 17,519,641 | |
| | | | | | | | | | | | |
|
| Romania — 2.3% | |
| |
Romania Government Bond | | | | | |
| | | |
4.25% | | | 06/28/23 | | | RON | 12,855,000 | | | | 3,071,372 | |
| | | |
5.00% | | | 02/12/29 | | | RON | 4,500,000 | | | | 1,122,038 | |
| | | |
5.85% | | | 04/26/23 | | | RON | 6,340,000 | | | | 1,592,357 | |
| | | | | | | | | | | | |
| | | |
Total Romania | | | | | | | | | | | | |
| | | |
(Cost: $5,767,449) | | | | | | | | | | | 5,785,767 | |
| | | | | | | | | | | | |
See accompanying notes to financial statements.
27
TCW Emerging Markets Local Currency Income Fund
Schedule of Investments (Continued)
| | | | | | | | | | | | |
| Issues | | Maturity
Date | | | Principal
Amount | | | Value | |
|
| Russia — 10.5% | |
| |
Russian Federal Bond — OFZ | | | | | |
| | | |
6.90% | | | 05/23/29 | | | RUB | 409,100,000 | | | $ | 6,625,190 | |
| | | |
7.00% | | | 08/16/23 | | | RUB | 63,200,000 | | | | 1,017,967 | |
| | | |
7.10% | | | 10/16/24 | | | RUB | 185,400,000 | | | | 3,013,740 | |
| | | |
7.65% | | | 04/10/30 | | | RUB | 152,000,000 | | | | 2,601,292 | |
| | | |
7.70% | | | 03/23/33 | | | RUB | 292,400,000 | | | | 5,026,813 | |
| | | |
7.75% | | | 09/16/26 | | | RUB | 114,500,000 | | | | 1,936,186 | |
| | | |
8.15% | | | 02/03/27 | | | RUB | 133,300,000 | | | | 2,303,526 | |
| | | |
8.50% | | | 09/17/31 | | | RUB | 207,500,000 | | | | 3,773,450 | |
| | | | | | | | | | | | |
| | | |
Total Russia | | | | | | | | | | | | |
| | | |
(Cost: $24,663,752) | | | | | | | | | | | 26,298,164 | |
| | | | | | | | | | | | |
|
| South Africa — 8.9% | |
| |
South Africa Government Bond | | | | | |
| | | |
6.50% | | | 02/28/41 | | | ZAR | 75,400,000 | | | | 3,470,313 | |
| | | |
8.25% | | | 03/31/32 | | | ZAR | 35,300,000 | | | | 2,124,715 | |
| | | |
8.50% | | | 01/31/37 | | | ZAR | 107,660,000 | | | | 6,305,501 | |
| | | |
8.75% | | | 01/31/44 | | | ZAR | 78,600,000 | | | | 4,584,196 | |
| | | |
8.75% | | | 02/28/48 | | | ZAR | 72,400,000 | | | | 4,210,721 | |
| | | |
8.88% | | | 02/28/35 | | | ZAR | 22,600,000 | | | | 1,394,052 | |
| | | | | | | | | | | | |
| | | |
Total South Africa | | | | | | | | | | | | |
| | | |
(Cost: $23,655,658) | | | | | | | | | | | 22,089,498 | |
| | | | | | | | | | | | |
|
| Thailand — 4.1% | |
|
Thailand Government Bond | |
| | | |
2.13% | | | 12/17/26 | | | THB | 151,393,000 | | | | 5,221,401 | |
| | | |
3.30% | | | 06/17/38 | | | THB | 89,489,000 | | | | 3,740,896 | |
| | | |
3.40% | | | 06/17/36 | | | THB | 29,739,000 | | | | 1,235,297 | |
| | | | | | | | | | | | |
| | | |
Total Thailand | | | | | | | | | | | | |
| | | |
(Cost: $8,933,932) | | | | | | | | | | | 10,197,594 | |
| | | | | | | | | | | | |
|
| Turkey — 3.9% | |
|
Turkey Government Bond | |
| | | |
9.50% | | | 01/12/22 | | | TRY | 12,500,000 | | | | 2,078,757 | |
| | | |
10.50% | | | 08/11/27 | | | TRY | 9,479,044 | | | | 1,500,040 | |
| | | |
10.70% | | | 02/17/21 | | | TRY | 6,919,271 | | | | 1,193,314 | |
| | | |
11.00% | | | 03/02/22 | | | TRY | 10,136,250 | | | | 1,728,781 | |
| | | |
11.00% | | | 02/24/27 | | | TRY | 15,550,000 | | | | 2,526,087 | |
| | | |
16.20% | | | 06/14/23 | | | TRY | 3,050,000 | | | | 591,308 | |
| | | | | | | | | | | | |
| | | |
Total Turkey | | | | | | | | | | | | |
| | | |
(Cost: $9,564,604) | | | | | | | | | | | 9,618,287 | |
| | | | | | | | | | | | |
|
| Ukraine — 0.9% | |
|
Ukraine Government International Bond | |
| | | |
6.75% (1) | | | 06/20/26 | | | EUR | 830,000 | | | | 1,025,904 | |
| | | |
14.50% (1) | | | 08/19/20 | | | UAH | 15,000,000 | | | | 603,509 | |
| | | |
14.64% (1) | | | 06/10/20 | | | UAH | 8,453,000 | | | | 339,443 | |
| | | |
17.25% (1) | | | 09/30/20 | | | UAH | 7,547,000 | | | | 307,921 | |
| | | | | | | | | | | | |
| | | |
Total Ukraine | | | | | | | | | | | | |
| | | |
(Cost: $2,153,623) | | | | | | | | | | | 2,276,777 | |
| | | | | | | | | | | | |
| |
Total Fixed Income Securities | | | | | |
| | | |
(Cost: $216,788,357) | | | | | | | | | | | 226,090,297 | |
| | | | | | | | | | | | |
| | | | | | | | | | | | |
| Issues | | Maturity
Date | | | Shares | | | Value | |
|
MONEY MARKET INVESTMENTS — 2.3% | |
| | |
State Street Institutional U.S. Government Money Market Fund — Premier Class,1.75% (3) | | | | 5,720,785 | | | $ | 5,720,785 | |
| | | | | | | | | | | | |
| |
Total Money Market Investments | | | | | |
| |
(Cost: $5,720,785) | | | | 5,720,785 | |
| | | | | | | | | | | | |
| | | |
| | | | | | | | | | | | |
| | | | | | Principal
Amount | | | | |
|
SHORT TERM INVESTMENTS — 6.1% | |
|
FOREIGN GOVERNMENT BONDS — 6.1% | |
|
| Egypt — 4.1% | |
|
Egypt Treasury Bills | |
| | | |
0.00% (4) | | | 11/12/19 | | | EGP | 45,000,000 | | | | 2,776,478 | |
| | | |
0.00% (4) | | | 11/19/19 | | | EGP | 48,900,000 | | | | 3,009,092 | |
| | | |
0.00% (4) | | | 12/17/19 | | | EGP | 36,775,000 | | | | 2,235,449 | |
| | | |
0.00% (4) | | | 01/07/20 | | | EGP | 21,250,000 | | | | 1,280,141 | |
| | | |
0.00% (4) | | | 01/28/20 | | | EGP | 17,150,000 | | | | 1,027,248 | |
| | | | | | | | | | | | |
| | | |
Total Egypt | | | | | | | | | | | | |
| | | |
(Cost: $10,120,847) | | | | | | | | | | | 10,328,408 | |
| | | | | | | | | | | | |
|
| Nigeria — 1.0% | |
|
Nigeria Treasury Bills | |
| | | |
0.00% (4) | | | 09/17/20 | | | NGN | 404,990,000 | | | | 994,803 | |
| | | |
0.00% (4) | | | 09/17/20 | | | NGN | 585,010,000 | | | | 1,436,998 | |
| | | | | | | | | | | | |
| | | |
Total Nigeria | | | | | | | | | | | | |
| | | |
(Cost: $2,420,300) | | | | | | | | | | | 2,431,801 | |
| | | | | | | | | | | | |
|
| Ukraine — 1.0% | |
| |
Ukraine Government Bills | | | | | |
| | | |
0.00% (1)(4) | | | 12/04/19 | | | UAH | 27,000,000 | | | | 1,074,304 | |
| | | |
0.00% (1)(4) | | | 01/29/20 | | | UAH | 22,232,000 | | | | 864,805 | |
| | | |
0.00% (1)(4) | | | 04/01/20 | | | UAH | 12,985,000 | | | | 490,069 | |
| | | | | | | | | | | | |
| | | |
Total Ukraine | | | | | | | | | | | | |
| | | |
(Cost: $2,373,813) | | | | | | | | | | | 2,429,178 | |
| | | | | | | | | | | | |
| |
Total Short Term Investments | | | | | |
| | | |
(Cost: $14,914,960) | | | | | | | | | | | 15,189,387 | |
| | | | | | | | | | | | |
| | |
Total Investments (99.2%) | | | | | | | | | |
| | | |
(Cost: $237,424,102) | | | | | | | | | | | 247,000,469 | |
| |
Excess of Other Assets over Liabilities (0.8%) | | | | 1,978,483 | |
| | | | | | | | | | | | |
| |
Total Net Assets (100.0%) | | | $ | 248,978,952 | |
| | | | | | | | | | | | |
See accompanying notes to financial statements.
28
TCW Emerging Markets Local Currency Income Fund
| | | | | | | | | | | | | | | | | | | | | | | | |
| Forward Currency Contracts | |
| | | | | | |
| Counterparty | | Contracts to
Deliver | | | Units of
Currency | | | Settlement
Date | | | In Exchange for
U.S. Dollars | | | Contracts at
Value | | | Unrealized
Appreciation
(Depreciation) | |
BUY (5) | | | | | | | | | | | | | | | | | | | | |
Bank of America, N.A. | | | CZK | | | | 226,279,049 | | | | 12/10/19 | | | $ | 9,700,000 | | | $ | 9,900,412 | | | $ | 200,412 | |
Bank of America, N.A. | | | HUF | | | | 1,539,247,475 | | | | 12/10/19 | | | | 5,165,000 | | | | 5,241,827 | | | | 76,827 | |
Bank of America, N.A. | | | THB | | | | 18,386,011 | | | | 11/21/19 | | | | 605,000 | | | | 608,989 | | | | 3,989 | |
Barclays Bank PLC | | | CLP | | | | 1,573,977,470 | | | | 01/21/20 | | | | 2,210,000 | | | | 2,128,341 | | | | (81,659 | ) |
Barclays Bank PLC | | | MXN | | | | 26,410,175 | | | | 12/30/19 | | | | 1,370,000 | | | | 1,365,969 | | | | (4,031 | ) |
Barclays Bank PLC | | | PLN | | | | 20,964,019 | | | | 01/29/20 | | | | 5,440,000 | | | | 5,498,326 | | | | 58,326 | |
Barclays Bank PLC | | | THB | | | | 326,423,797 | | | | 11/21/19 | | | | 10,570,000 | | | | 10,811,941 | | | | 241,941 | |
Barclays Bank PLC | | | TWD | | | | 81,905,602 | | | | 11/20/19 | | | | 2,653,157 | | | | 2,692,486 | | | | 39,329 | |
Barclays Bank PLC | | | ZAR | | | | 2,645,341 | | | | 11/08/19 | | | | 170,000 | | | | 175,519 | | | | 5,519 | |
BNP Paribas S.A. | | | EUR | | | | 1,800,000 | | | | 11/26/19 | | | | 2,001,286 | | | | 2,011,023 | | | | 9,737 | |
BNP Paribas S.A. | | | THB | | | | 54,354,671 | | | | 11/21/19 | | | | 1,775,000 | | | | 1,800,357 | | | | 25,357 | |
BNP Paribas S.A. | | | ZAR | | | | 31,698,934 | | | | 11/08/19 | | | | 2,107,657 | | | | 2,103,234 | | | | (4,423 | ) |
Citibank N.A. | | | CZK | | | | 29,517,388 | | | | 12/10/19 | | | | 1,250,000 | | | | 1,291,477 | | | | 41,477 | |
Citibank N.A. | | | PLN | | | | 44,255,197 | | | | 11/07/19 | | | | 11,450,000 | | | | 11,600,435 | | | | 150,435 | |
Goldman Sachs & Co. | | | COP | | | | 3,050,220,000 | | | | 01/03/20 | | | | 896,596 | | | | 900,805 | | | | 4,209 | |
Standard Chartered Bank | | | CZK | | | | 13,144,229 | | | | 12/10/19 | | | | 570,000 | | | | 575,101 | | | | 5,101 | |
Standard Chartered Bank | | | EUR | | | | 2,996,486 | | | | 11/26/19 | | | | 3,288,655 | | | | 3,347,780 | | | | 59,125 | |
| | | | | | | | | | | | | | | | | | | | | | | | |
| | | $ | 61,222,351 | | | $ | 62,054,022 | | | $ | 831,671 | |
| | | | | | | | | | | | | |
SELL (6) | | | | | | | | | | | | | | | | | | | | |
Bank of America, N.A. | | | COP | | | | 3,050,220,000 | | | | 01/03/20 | | | $ | 870,000 | | | $ | 900,805 | | | $ | (30,805 | ) |
Bank of America, N.A. | | | EUR | | | | 4,796,486 | | | | 11/26/19 | | | | 5,350,000 | | | | 5,358,804 | | | | (8,804 | ) |
Bank of America, N.A. | | | HUF | | | | 694,700,000 | | | | 12/10/19 | | | | 2,274,349 | | | | 2,365,764 | | | | (91,415 | ) |
Bank of America, N.A. | | | PEN | | | | 4,817,624 | | | | 01/03/20 | | | | 1,413,000 | | | | 1,437,611 | | | | (24,611 | ) |
Bank of America, N.A. | | | THB | | | | 15,523,329 | | | | 11/21/19 | | | | 510,000 | | | | 514,170 | | | | (4,170 | ) |
Bank of America, N.A. | | | TRY | | | | 7,447,950 | | | | 01/21/20 | | | | 1,215,000 | | | | 1,276,896 | | | | (61,896 | ) |
Bank of America, N.A. | | | TWD | | | | 38,782,425 | | | | 11/20/19 | | | | 1,243,425 | | | | 1,274,896 | | | | (31,471 | ) |
Barclays Bank PLC | | | HUF | | | | 783,532,567 | | | | 12/10/19 | | | | 2,650,651 | | | | 2,668,279 | | | | (17,628 | ) |
Barclays Bank PLC | | | MXN | | | | 43,457,841 | | | | 12/30/19 | | | | 2,167,000 | | | | 2,247,697 | | | | (80,697 | ) |
Barclays Bank PLC | | | PLN | | | | 16,322,361 | | | | 11/07/19 | | | | 4,232,977 | | | | 4,278,514 | | | | (45,537 | ) |
Barclays Bank PLC | | | SGD | | | | 3,677,967 | | | | 12/05/19 | | | | 2,665,000 | | | | 2,703,342 | | | | (38,342 | ) |
BNP Paribas S.A. | | | PLN | | | | 11,318,728 | | | | 11/07/19 | | | | 2,935,000 | | | | 2,966,932 | | | | (31,932 | ) |
BNP Paribas S.A. | | | TWD | | | | 43,123,176 | | | | 11/20/19 | | | | 1,386,575 | | | | 1,417,590 | | | | (31,015 | ) |
BNP Paribas S.A. | | | ZAR | | | | 34,344,275 | | | | 11/08/19 | | | | 2,290,000 | | | | 2,278,752 | | | | 11,248 | |
Citibank N.A. | | | CZK | | | | 13,995,384 | | | | 12/10/19 | | | | 600,000 | | | | 612,342 | | | | (12,342 | ) |
Citibank N.A. | | | HUF | | | | 61,014,909 | | | | 12/10/19 | | | | 205,000 | | | | 207,783 | | | | (2,783 | ) |
Citibank N.A. | | | PLN | | | | 16,614,108 | | | | 11/07/19 | | | | 4,200,000 | | | | 4,354,989 | | | | (154,989 | ) |
JPMorgan Chase Bank | | | MXN | | | | 33,874,449 | | | | 12/30/19 | | | | 1,700,000 | | | | 1,752,031 | | | | (52,031 | ) |
JPMorgan Chase Bank | | | SGD | | | | 648,898 | | | | 12/05/19 | | | | 470,000 | | | | 476,946 | | | | (6,946 | ) |
| | | | | | | | | | | | | | | | | | | | | | | | |
| | | $ | 38,377,977 | | | $ | 39,094,143 | | | $ | (716,166 | ) |
| | | | | | | | | | | | | |
| | | | | | | | | | | | | | | | | | |
| Futures Contracts | | | | |
| | | | | |
Number of
Contracts | | Type | | Expiration
Date | | | Notional
Contract
Value | | | Value | | | Net Unrealized
Appreciation
(Depreciation) | |
Long Futures | |
| 11 | | U.S. Ultra Long Bond Futures | | | 12/19/19 | | | $ | 2,134,712 | | | $ | 2,087,250 | | | $ | (47,462 | ) |
| | | | | | | | | | | | | | | | | | |
See accompanying notes to financial statements.
29
TCW Emerging Markets Local Currency Income Fund
Schedule of Investments (Continued)
Notes to the Schedule of Investments:
| PEN - | | Peruvian Nuevo Sol. |
| ZAR - | | South African Rand. |
| (1) | | Security exempt from registration under Rule 144A of the Securities Act of 1933, as amended. These securities may be resold, normally only to qualified institutional buyers. At October 31, 2019, the value of these securities amounted to $8,153,779 or 3.3% of net assets. These securities are determined to be liquid by the Fund’s investment advisor, unless otherwise noted, under procedures established by and under the general supervision of the Company’s Board of Directors. |
| (2) | | Investments issued under Regulation S of the Securities Act of 1933, as amended, may not be offered, sold, or delivered within the United States except under special exemptions. At October 31, 2019, the value of these securities amounted to $7,122,279 or 2.9% of net assets. |
| (3) | | Rate disclosed is the 7-day net yield as of October 31, 2019. |
| (4) | | Security is not accruing interest. |
| (5) | | Fund buys foreign currency, sells U.S. Dollar. |
| (6) | | Fund sells foreign currency, buys U.S. Dollar. |
See accompanying notes to financial statements.
30
TCW Emerging Markets Local Currency Income Fund
Investments by Sector | October 31, 2019 |
| | | | |
| Sector | | Percentage of
Net Assets | |
Food | | | 0.2 | % |
Foreign Government Bonds | | | 89.5 | |
Short Term Investments | | | 6.1 | |
Telecommunications | | | 1.1 | |
Money Market Investments | | | 2.3 | |
| | | | |
Total | | | 99.2 | % |
| | | | |
See accompanying notes to financial statements.
31
TCW Emerging Markets Local Currency Income Fund
Fair Valuation Summary | October 31, 2019 |
The following is a summary of the fair valuations according to the inputs used as of October 31, 2019 in valuing the Fund’s investments:
| | | | | | | | | | | | | | | | |
Description | | Quoted Prices
in Active
Markets for
Identical
Assets
(Level 1) | | | Other
Significant
Observable
Inputs
(Level 2) | | | Significant
Unobservable
Inputs
(Level 3) | | | Total | |
Fixed Income Securities | | | | | | | | | | | | | | | | |
Food | | $ | — | | | $ | 558,357 | | | $ | — | | | $ | 558,357 | |
Foreign Government Bonds | | | — | | | | 222,819,478 | | | | — | | | | 222,819,478 | |
Telecommunications | | | — | | | | 2,712,462 | | | | — | | | | 2,712,462 | |
| | | | | | | | | | | | | | | | |
Total Fixed Income Securities | | | — | | | | 226,090,297 | | | | — | | | | 226,090,297 | |
| | | | | | | | | | | | | | | | |
Money Market Investments | | | 5,720,785 | | | | — | | | | — | | | | 5,720,785 | |
| | | | | | | | | | | | | | | | |
Short-Term Investments | | | — | | | | 15,189,387 | | | | — | | | | 15,189,387 | |
| | | | | | | | | | | | | | | | |
Total Investments | | | 5,720,785 | | | | 241,279,684 | | | | — | | | | 247,000,469 | |
| | | | | | | | | | | | | | | | |
Asset Derivatives | | | | | | | | | | | | | | | | |
Forward Currency Contracts | | | | | | | | | | | | | | | | |
Foreign Currency Risk | | | — | | | | 933,032 | | | | — | | | | 933,032 | |
| | | | | | | | | | | | | | | | |
Total | | $ | 5,720,785 | | | $ | 242,212,716 | | | $ | — | | | $ | 247,933,501 | |
| | | | | | | | | | | | | | | | |
Liability Derivatives | | | | | | | | | | | | | | | | |
Futures Contracts | | | | | | | | | | | | | | | | |
Interest Rate Risk | | $ | (47,462 | ) | | $ | — | | | $ | — | | | $ | (47,462 | ) |
Forward Currency Contracts | | | | | | | | | | | | | | | | |
Foreign Currency Risk | | | — | | | | (817,527 | ) | | | — | | | | (817,527 | ) |
| | | | | | | | | | | | | | | | |
Total | | $ | (47,462 | ) | | $ | (817,527 | ) | | $ | — | | | $ | (864,989 | ) |
| | | | | | | | | | | | | | | | |
See accompanying notes to financial statements.
32
TCW Emerging Markets Multi-Asset Opportunities Fund
Schedule of Investments | October 31, 2019 |
| | | | | | | | | | | | |
| Issues | | Maturity
Date | | | Principal
Amount | | | Value | |
|
FIXED INCOME SECURITIES — 41.5% of Net Assets | |
|
| Angola — 0.7% | |
|
Angolan Government International Bond | |
| | | |
8.25% (1) | | | 05/09/28 | | | $ | 225,000 | | | $ | 235,793 | |
| | | |
9.38% (1) | | | 05/08/48 | | | | 425,000 | | | | 450,965 | |
| | | | | | | | | | | | |
|
Total Angola | |
| |
(Cost: $643,579) | | | | 686,758 | |
| | | | | | | | | | | | |
|
| Argentina — 0.7% | |
|
Argentine Republic Government International Bond | |
| | | |
4.63% | | | 01/11/23 | | | | 105,000 | | | | 42,738 | |
| | | |
5.88% | | | 01/11/28 | | | | 305,000 | | | | 117,425 | |
| | | |
6.88% | | | 01/26/27 | | | | 240,000 | | | | 95,700 | |
| | | |
7.50% | | | 04/22/26 | | | | 450,000 | | | | 191,385 | |
| | | |
7.63% | | | 04/22/46 | | | | 690,000 | | | | 280,968 | |
| | | | | | | | | | | | |
|
Total Argentina | |
| |
(Cost: $1,378,000) | | | | 728,216 | |
| | | | | | | | | | | | |
|
| Azerbaijan — 0.2% (Cost: $235,954) | |
|
Southern Gas Corridor CJSC | |
| | | |
6.88% (2) | | | 03/24/26 | | | | 200,000 | | | | 233,660 | |
| | | | | | | | | | | | |
|
| Bahrain — 1.4% | |
|
Bahrain Government International Bond | |
| | | |
5.63% (1) | | | 09/30/31 | | | | 220,000 | | | | 231,609 | |
| | | |
6.75% (2) | | | 09/20/29 | | | | 400,000 | | | | 457,000 | |
| | | |
7.00% (1) | | | 10/12/28 | | | | 355,000 | | | | 410,635 | |
| | | |
7.50% (2) | | | 09/20/47 | | | | 250,000 | | | | 293,867 | |
| | | | | | | | | | | | |
|
Total Bahrain | |
| |
(Cost: $1,186,038) | | | | 1,393,111 | |
| | | | | | | | | | | | |
|
| Brazil — 3.4% | |
|
Banco do Brasil S.A. | |
| | | |
6.25% (10-year U.S. Treasury Constant Maturity Rate + 4.398%) (2)(3)(4) | | | 10/29/49 | | | | 400,000 | | | | 387,756 | |
|
Brazil Notas do Tesouro Nacional, Series F | |
| | | |
10.00% | | | 01/01/27 | | | BRL | 1,320,000 | | | | 408,922 | |
|
CSN Islands XII Corp. | |
| | | |
7.00% (2)(4) | | | 09/29/49 | | | $ | 200,000 | | | | 176,798 | |
|
Light Servicos de Eletricidade S.A./Light Energia S.A. | |
| | | |
7.25% (1) | | | 05/03/23 | | | | 200,000 | | | | 216,063 | |
|
MV24 Capital BV | |
| | | |
6.75% (1) | | | 06/01/34 | | | | 200,000 | | | | 209,781 | |
|
NBM US Holdings, Inc. | |
| | | |
7.00% (2) | | | 05/14/26 | | | | 200,000 | | | | 212,725 | |
|
Petrobras Global Finance B.V. | |
| | | |
6.85% | | | 06/05/15 | | | | 1,195,000 | | | | 1,376,640 | |
|
Prumo Participacoes e Investimentos S/A | |
| | | |
7.50% (1) | | | 12/31/31 | | | | 200,000 | | | | 208,000 | |
|
Usiminas International S.A.R.L. | |
| | | |
5.88% (1) | | | 07/18/26 | | | | 200,000 | | | | 204,250 | |
| | | | | | | | | | | | |
|
Total Brazil | |
| |
(Cost: $3,190,343) | | | | 3,400,935 | |
| | | | | | | | | | | | |
| | | | | | | | | | | | |
| Issues | | Maturity
Date | | | Principal
Amount | | | Value | |
|
| Chile — 0.4% | |
|
AES Gener S.A. | |
| | | |
7.13% (USD 5 Year Swap rate + 4.644%) (1)(3) | | | 03/26/79 | | | $ | 200,000 | | | $ | 207,880 | |
|
Latam Finance, Ltd. | |
| | | |
7.00% (1) | | | 03/01/26 | | | | 200,000 | | | | 216,094 | |
| | | | | | | | | | | | |
|
Total Chile | |
| |
(Cost: $419,029) | | | | 423,974 | |
| | | | | | | | | | | | |
|
| China — 1.0% | |
|
Fantasia Holdings Group Co. Ltd | |
| | | |
7.38% (2) | | | 10/04/21 | | | | 200,000 | | | | 186,320 | |
|
Kaisa Group Holdings, Ltd. | |
| | | |
8.50% (2) | | | 06/30/22 | | | | 200,000 | | | | 189,794 | |
|
New Metro Global, Ltd. | |
| | | |
6.50% (2) | | | 04/23/21 | | | | 200,000 | | | | 197,480 | |
|
Sunac China Holdings, Ltd. | |
| | | |
7.88% (2) | | | 02/15/22 | | | | 400,000 | | | | 409,400 | |
| | | | | | | | | | | | |
|
Total China | |
| |
(Cost: $978,132) | | | | 982,994 | |
| | | | | | | | | | | | |
|
| Colombia — 1.3% | |
|
Colombia Government International Bond | |
| | | |
5.00% | | | 06/15/45 | | | | 370,000 | | | | 431,802 | |
|
Ecopetrol S.A. | |
| | | |
5.88% | | | 05/28/45 | | | | 340,000 | | | | 393,210 | |
|
Gran Tierra Energy, Inc. | |
| | | |
7.75% (1) | | | 05/23/27 | | | | 200,000 | | | | 191,380 | |
|
Millicom International Cellular S.A. | |
| | | |
6.25% (1) | | | 03/25/29 | | | | 200,000 | | | | 218,180 | |
| | | | | | | | | | | | |
|
Total Colombia | |
| |
(Cost: $1,100,222) | | | | 1,234,572 | |
| | | | | | | | | | | | |
|
| Costa Rica — 0.8% | |
|
Autopistas del Sol S.A. | |
| | | |
7.38% (1) | | | 12/30/30 | | | | 185,652 | | | | 187,044 | |
|
Costa Rica Government International Bond | |
| | | |
4.38% (2) | | | 04/30/25 | | | | 400,000 | | | | 385,250 | |
| | | |
7.16% (2) | | | 03/12/45 | | | | 200,000 | | | | 200,000 | |
| | | | | | | | | | | | |
|
Total Costa Rica | |
| |
(Cost: $742,549) | | | | 772,294 | |
| | | | | | | | | | | | |
|
| Dominican Republic — 1.4% | |
|
Dominican Republic International Bond | |
| | | |
5.95% (1) | | | 01/25/27 | | | | 395,000 | | | | 435,858 | |
| | | |
6.00% (1) | | | 07/19/28 | | | | 200,000 | | | | 222,375 | |
| | | |
6.40% (1) | | | 06/05/49 | | | | 700,000 | | | | 760,382 | |
| | | | | | | | | | | | |
|
Total Dominican Republic | |
| |
(Cost: $1,342,230) | | | | 1,418,615 | |
| | | | | | | | | | | | |
|
| Ecuador — 1.2% | |
|
Ecuador Government International Bond | |
| | | |
7.88% (1) | | | 03/27/25 | | | | 200,000 | | | | 188,620 | |
See accompanying notes to financial statements.
33
TCW Emerging Markets Multi-Asset Opportunities Fund
Schedule of Investments (Continued)
| | | | | | | | | | | | |
| Issues | | Maturity
Date | | | Principal
Amount | | | Value | |
|
| Ecuador (Continued) | |
| | | |
7.88% (1) | | | 01/23/28 | | | $ | 200,000 | | | $ | 179,720 | |
| | | |
7.95% (2) | | | 06/20/24 | | | | 350,000 | | | | 338,191 | |
| | | |
9.50% (1) | | | 03/27/30 | | | | 300,000 | | | | 289,980 | |
| | | |
10.75% (1) | | | 01/31/29 | | | | 200,000 | | | | 203,500 | |
| | | | | | | | | | | | |
|
Total Ecuador | |
| |
(Cost: $1,201,203) | | | | 1,200,011 | |
| | | | | | | | | | | | |
|
| Egypt — 1.5% | |
|
Egypt Government International Bond | |
| | | |
7.60% (1) | | | 03/01/29 | | | | 870,000 | | | | 922,896 | |
| | | |
8.50% (2) | | | 01/31/47 | | | | 200,000 | | | | 211,075 | |
| | | |
8.70% (1) | | | 03/01/49 | | | | 275,000 | | | | 295,484 | |
| | | | | | | | | | | | |
|
Total Egypt | |
| |
(Cost: $1,365,253) | | | | 1,429,455 | |
| | | | | | | | | | | | |
|
| El Salvador — 0.7% | |
|
El Salvador Government International Bond | |
| | | |
5.88% (2) | | | 01/30/25 | | | | 235,000 | | | | 244,729 | |
| | | |
7.12% (1) | | | 01/20/50 | | | | 150,000 | | | | 154,680 | |
| | | |
7.63% (2) | | | 02/01/41 | | | | 150,000 | | | | 163,845 | |
| | | |
7.65% (2) | | | 06/15/35 | | | | 115,000 | | | | 125,979 | |
| | | | | | | | | | | | |
|
Total El Salvador | |
| |
(Cost: $651,806) | | | | 689,233 | |
| | | | | | | | | | | | |
|
| Ghana — 0.9% | |
|
Ghana Government International Bond | |
| | | |
7.63% (2) | | | 05/16/29 | | | | 200,000 | | | | 203,188 | |
| | | |
8.13% (1) | | | 03/26/32 | | | | 400,000 | | | | 406,000 | |
| | | |
8.95% (1) | | | 03/26/51 | | | | 300,000 | | | | 305,062 | |
| | | | | | | | | | | | |
|
Total Ghana | |
| |
(Cost: $890,822) | | | | 914,250 | |
| | | | | | | | | | | | |
|
| Guatemala — 0.2% (Cost: $196,516) | |
|
Guatemala Government Bond | |
| | | |
4.90% (1) | | | 06/01/30 | | | | 200,000 | | | | 213,500 | |
| | | | | | | | | | | | |
|
| India — 1.1% | |
|
Adani Ports & Special Economic Zone, Ltd. | |
| | | |
4.38% (1) | | | 07/03/29 | | | | 200,000 | | | | 208,985 | |
|
Greenko Mauritius, Ltd. | |
| | | |
6.25% (1) | | | 02/21/23 | | | | 200,000 | | | | 203,750 | |
|
Greenko Solar Mauritius, Ltd. | |
| | | |
5.95% (1) | | | 07/29/26 | | | | 200,000 | | | | 202,000 | |
|
Neerg Energy, Ltd. | |
| | | |
6.00% (1) | | | 02/13/22 | | | | 200,000 | | | | 198,250 | |
|
ReNew Power, Ltd. | |
| | | |
6.45% (1) | | | 09/27/22 | | | | 130,000 | | | | 131,808 | |
|
Vedanta Resources PLC | |
| | | |
6.13% (2) | | | 08/09/24 | | | | 200,000 | | | | 185,982 | |
| | | | | | | | | | | | |
|
Total India | |
| |
(Cost: $1,120,819) | | | | 1,130,775 | |
| | | | | | | | | | | | |
| | | | | | | | | | | | |
| Issues | | Maturity
Date | | | Principal
Amount | | | Value | |
|
| Indonesia — 2.3% | |
|
Freeport-McMoRan, Inc. | |
| | | |
5.40% | | | 11/14/34 | | | $ | 230,000 | | | $ | 225,688 | |
|
Indonesia Asahan Aluminium Persero PT | |
| | | |
6.53% (1) | | | 11/15/28 | | | | 200,000 | | | | 242,875 | |
|
Minejesa Capital BV | |
| | | |
4.63% (2) | | | 08/10/30 | | | | 200,000 | | | | 207,504 | |
| | | |
5.63% (1) | | | 08/10/37 | | | | 400,000 | | | | 435,200 | |
|
Perusahaan Penerbit SBSN Indonesia III | |
| | | |
4.15% (2) | | | 03/29/27 | | | | 500,000 | | | | 535,937 | |
| | | |
4.45% (2) | | | 02/20/29 | | | | 200,000 | | | | 221,000 | |
|
Saka Energi Indonesia PT | |
| | | |
4.45% (1) | | | 05/05/24 | | | | 400,000 | | | | 404,120 | |
| | | | | | | | | | | | |
|
Total Indonesia | |
| |
(Cost: $2,107,460) | | | | 2,272,324 | |
| | | | | | | | | | | | |
|
| Ivory Coast — 0.7% | |
|
Ivory Coast Government International Bond | |
| | | |
6.13% (1) | | | 06/15/33 | | | | 400,000 | | | | 394,125 | |
| | | |
6.88% (1) | | | 10/17/40 | | | EUR | 245,000 | | | | 281,182 | |
| | | | | | | | | | | | |
|
Total Ivory Coast | |
| |
(Cost: $632,468) | | | | 675,307 | |
| | | | | | | | | | | | |
|
| Kazakhstan — 0.9% | |
|
KazMunayGas National Co. JSC | |
| | | |
5.38% (1) | | | 04/24/30 | | | $ | 600,000 | | | | 693,844 | |
| | | |
5.75% (1) | | | 04/19/47 | | | | 200,000 | | | | 234,050 | |
| | | | | | | | | | | | |
|
Total Kazakhstan | |
| |
(Cost: $838,194) | | | | 927,894 | |
| | | | | | | | | | | | |
|
| Kenya — 0.8% | |
|
Kenya Government International Bond | |
| | | |
7.00% (1) | | | 05/22/27 | | | | 200,000 | | | | 210,017 | |
| | | |
8.00% (1) | | | 05/22/32 | | | | 500,000 | | | | 533,930 | |
| | | | | | | | | | | | |
|
Total Kenya | |
| |
(Cost: $725,999) | | | | 743,947 | |
| | | | | | | | | | | | |
|
| Lebanon — 0.5% | |
|
Lebanon Government International Bond | |
| | | |
6.00% (2) | | | 01/27/23 | | | | 397,000 | | | | 237,704 | |
| | | |
6.10% (2) | | | 10/04/22 | | | | 285,000 | | | | 173,850 | |
| | | |
6.65% (2) | | | 04/22/24 | | | | 198,000 | | | | 114,592 | |
| | | | | | | | | | | | |
|
Total Lebanon | |
| |
(Cost: $776,750) | | | | 526,146 | |
| | | | | | | | | | | | |
|
| Mexico — 3.1% | |
|
Banco Mercantil del Norte S.A. | |
| | | |
6.88% (5 year U.S. Treasury Constant Maturity Rate + 5.035%) (1)(3)(4) | | | 12/31/99 | | | | 200,000 | | | | 207,031 | |
|
Industrias Penoles SAB de CV | |
| | | |
5.65% (1) | | | 09/12/49 | | | | 200,000 | | | | 206,703 | |
See accompanying notes to financial statements.
34
TCW Emerging Markets Multi-Asset Opportunities Fund
| | | | | | | | | | | | |
| Issues | | Maturity
Date | | | Principal
Amount | | | Value | |
|
| Mexico (Continued) | |
|
Mexico Government International Bond | |
| | | |
4.60% | | | 01/23/46 | | | $ | 480,000 | | | $ | 514,725 | |
|
Petroleos Mexicanos | |
| | | |
5.35% | | | 02/12/28 | | | | 378,000 | | | | 373,200 | |
| | | |
6.50% | | | 01/23/29 | | | | 850,000 | | | | 888,542 | |
| | | |
7.69% (1) | | | 01/23/50 | | | | 628,000 | | | | 684,771 | |
|
Unifin Financiera SAB de CV SOFOM ENR | |
| | | |
8.38% (1) | | | 01/27/28 | | | | 200,000 | | | | 206,250 | |
| | | | | | | | | | | | |
|
Total Mexico | |
| |
(Cost: $2,983,000) | | | | 3,081,222 | |
| | | | | | | | | | | | |
|
| Mongolia — 0.2% (Cost: $196,899) | |
|
Development Bank of Mongolia LLC | |
| | | |
7.25% (1) | | | 10/23/23 | | | | 200,000 | | | | 210,344 | |
| | | | | | | | | | | | |
|
| Nigeria — 1.2% | |
|
IHS Netherlands Holdco BV | |
| | | |
7.13% (1) | | | 03/18/25 | | | | 200,000 | | | | 207,000 | |
|
Nigeria Government International Bond | |
| | | |
7.14% (1) | | | 02/23/30 | | | | 200,000 | | | | 201,406 | |
| | | |
7.70% (1) | | | 02/23/38 | | | | 800,000 | | | | 802,720 | |
| | | | | | | | | | | | |
|
Total Nigeria | |
| |
(Cost: $1,183,393) | | | | 1,211,126 | |
| | | | | | | | | | | | |
|
| Oman — 1.4% | |
|
Oman Government International Bond | |
| | | |
5.63% (1) | | | 01/17/28 | | | | 220,000 | | | | 218,235 | |
| | | |
6.00% (1) | | | 08/01/29 | | | | 625,000 | | | | 626,437 | |
| | | |
6.75% (2) | | | 01/17/48 | | | | 530,000 | | | | 498,809 | |
| | | | | | | | | | | | |
|
Total Oman | |
| |
(Cost: $1,307,839) | | | | 1,343,481 | |
| | | | | | | | | | | | |
|
| Panama — 0.7% | |
|
C&W Senior Financing DAC | |
| | | |
6.88% (1) | | | 09/15/27 | | | | 200,000 | | | | 210,760 | |
|
Global Bank Corp. | |
| | | |
5.25% (3 mo. USD LIBOR + 3.300%) (1)(3) | | | 04/16/29 | | | | 270,000 | | | | 289,879 | |
|
Sable International Finance, Ltd. | |
| | | |
5.75% (1) | | | 09/07/27 | | | | 200,000 | | | | 208,380 | |
| | | | | | | | | | | | |
|
Total Panama | |
| |
(Cost: $676,251) | | | | 709,019 | |
| | | | | | | | | | | | |
|
| Paraguay — 0.2% (Cost: $195,000) | |
|
Paraguay Government International Bond | |
| | | |
5.60% (2) | | | 03/13/48 | | | | 200,000 | | | | 232,160 | |
| | | | | | | | | | | | |
|
| Peru — 0.4% | |
|
Banco de Credito del Peru | |
| | | |
2.70% (1) | | | 01/11/25 | | | | 115,000 | | | | 114,827 | |
| | | | | | | | | | | | |
| Issues | | Maturity
Date | | | Principal
Amount | | | Value | |
|
| Peru (Continued) | |
|
Peru LNG SRL | |
| | | |
5.38% (1) | | | 03/22/30 | | | $ | 280,000 | | | $ | 288,120 | |
| | | | | | | | | | | | |
|
Total Peru | |
| |
(Cost: $411,181) | | | | 402,947 | |
| | | | | |
|
| Qatar — 1.2% | |
|
Qatar Government International Bond | |
| | | |
4.00% (1) | | | 03/14/29 | | | | 825,000 | | | | 918,973 | |
| | | |
4.82% (1) | | | 03/14/49 | | | | 200,000 | | | | 246,502 | |
| | | | | | | | | | | | |
|
Total Qatar | |
| |
(Cost: $1,027,751) | | | | 1,165,475 | |
| | | | | |
|
| Russia — 1.4% | |
|
Russian Federation Government Bond | |
| | | |
4.25% (2) | | | 06/23/27 | | | | 200,000 | | | | 215,001 | |
| | | |
4.38% (1) | | | 03/21/29 | | | | 400,000 | | | | 434,002 | |
| | | |
5.10% (1) | | | 03/28/35 | | | | 600,000 | | | | 693,600 | |
| | | | | | | | | | | | |
|
Total Russia | |
| |
(Cost: $1,181,617) | | | | 1,342,603 | |
| | | | | |
|
| Saudi Arabia — 1.5% | |
|
Saudi Arabian Oil Co. | |
| | | |
3.50% (1) | | | 04/16/29 | | | | 200,000 | | | | 206,960 | |
| | | |
4.25% (1) | | | 04/16/39 | | | | 200,000 | | | | 214,954 | |
|
Saudi Government International Bond | |
| | | |
3.25% (2) | | | 10/26/26 | | | | 380,000 | | | | 393,625 | |
| | | |
4.50% (2) | | | 10/26/46 | | | | 620,000 | | | | 683,860 | |
| | | | | | | | | | | | |
|
Total Saudi Arabia | |
| |
(Cost: $1,465,299) | | | | 1,499,399 | |
| | | | | |
|
| South Africa — 1.4% | |
|
Petra Diamonds US Treasury PLC | |
| | | |
7.25% (2) | | | 05/01/22 | | | | 200,000 | | | | 143,500 | |
|
South Africa Government Bond | |
| | | |
4.30% | | | 10/12/28 | | | | 700,000 | | | | 676,375 | |
| | | |
5.75% | | | 09/30/49 | | | | 200,000 | | | | 193,841 | |
| | | |
5.88% | | | 06/22/30 | | | | 325,000 | | | | 346,044 | |
| | | | | | | | | | | | |
|
Total South Africa | |
| |
(Cost: $1,369,576) | | | | 1,359,760 | |
| | | | | |
|
| Sri Lanka — 1.2% | |
|
Sri Lanka Government Bond | |
| | | |
5.75% (1) | | | 04/18/23 | | | | 300,000 | | | | 301,734 | |
| | | |
6.75% (2) | | | 04/18/28 | | | | 200,000 | | | | 195,860 | |
| | | |
7.55% (1) | | | 03/28/30 | | | | 300,000 | | | | 303,375 | |
| | | |
7.85% (1) | | | 03/14/29 | | | | 400,000 | | | | 412,960 | |
| | | | | | | | | | | | |
|
Total Sri Lanka | |
| |
(Cost: $1,172,395) | | | | 1,213,929 | |
| | | | | |
|
| Tanzania — 0.2% (Cost: $204,139) | |
|
HTA Group, Ltd. | |
| | | |
9.13% (2) | | | 03/08/22 | | | | 200,000 | | | | 208,620 | |
| | | | | | | | | | | | |
See accompanying notes to financial statements.
35
TCW Emerging Markets Multi-Asset Opportunities Fund
Schedule of Investments (Continued)
| | | | | | | | | | | | |
Issues | | Maturity
Date | | | Principal
Amount | | | Value | |
|
| Turkey — 1.2% | |
|
Turkey Government International Bond | |
| | | |
4.88% | | | 10/09/26 | | | $ | 320,000 | | | $ | 301,050 | |
| | | |
5.75% | | | 03/22/24 | | | | 200,000 | | | | 202,156 | |
| | | |
6.00% | | | 03/25/27 | | | | 200,000 | | | | 198,969 | |
| | | |
6.13% | | | 10/24/28 | | | | 325,000 | | | | 320,840 | |
|
Turkiye Vakiflar Bankasi TAO | |
| | | |
6.88% (USD 5 Year Swap rate + 5.439%) (2)(3) | | | 02/03/25 | | | | 200,000 | | | | 193,490 | |
| | | | | | | | | | | | |
|
Total Turkey | |
| |
(Cost: $1,200,975) | | | | 1,216,505 | |
| | | | | |
|
| Ukraine — 1.7% | |
|
Ukraine Government International Bond | |
| | | |
0.00% (2)(5)(6) | | | 05/31/40 | | | | 694,000 | | | | 654,962 | |
| | | |
7.38% (2) | | | 09/25/32 | | | | 200,000 | | | | 209,832 | |
| | | |
7.75% (2) | | | 09/01/26 | | | | 300,000 | | | | 323,100 | |
| | | |
7.75% (2) | | | 09/01/27 | | | | 440,000 | | | | 474,672 | |
| | | | | | | | | | | | |
|
Total Ukraine | |
| |
(Cost: $1,443,755) | | | | 1,662,566 | |
| | | | | |
|
| United Arab Emirates — 1.0% | |
|
Abu Dhabi Government International Bond | |
| | | |
2.50% (1) | | | 09/30/29 | | | | 200,000 | | | | 199,250 | |
| | | |
3.13% (1) | | | 09/30/49 | | | | 400,000 | | | | 386,000 | |
|
DP World PLC | |
| | | |
4.70% (1) | | | 09/30/49 | | | | 200,000 | | | | 200,166 | |
| | | |
5.63% (1) | | | 09/25/48 | | | | 200,000 | | | | 232,500 | |
| | | | | | | | | | | | |
|
Total United Arab Emirates | |
| |
(Cost: $1,000,292) | | | | 1,017,916 | |
| | | | | |
|
| Uruguay — 0.9% | |
|
Uruguay Government International Bond | |
| | | |
4.38% | | | 01/23/31 | | | | 255,000 | | | | 285,029 | |
| | | |
4.98% | | | 04/20/55 | | | | 525,000 | | | | 615,568 | |
| | | | | | | | | | | | |
|
Total Uruguay | |
| |
(Cost: $793,850) | | | | 900,597 | |
| | | | | |
|
| Venezuela — 0.2% | |
|
Venezuela Government International Bond | |
| | | |
9.25% (7)(8) | | | 09/15/27 | | | | 550,000 | | | | 57,750 | |
| | | |
9.25% (2)(7)(8) | | | 05/07/28 | | | | 787,000 | | | | 82,635 | |
| | | | | | | | | | | | |
|
Total Venezuela | |
| |
(Cost: $413,470) | | | | 140,385 | |
| | | | | |
|
| Vietnam — 0.3% (Cost: $250,000) | |
|
Mong Duong Finance Holdings BV | |
| | | |
5.13% (1) | | | 05/07/29 | | | | 250,000 | | | | 254,150 | |
| | | | | | | | | | | | |
|
Total Fixed Income Securities | |
| |
(Cost: $40,200,048) | | | | 41,170,175 | |
| | | | | |
| | | | | | | | |
Issues | | Shares | | | Value | |
|
PREFERRED STOCK — 0.7% | |
|
| Brazil — 0.7% | |
| | |
Centrais Eletricas Brasileiras S.A., 3.48% | | | 32,200 | | | $ | 328,786 | |
| | |
Cia Paranaense de Energia, 2.83% | | | 24,000 | | | | 332,822 | |
| | | | | | | | |
|
Total Brazil | |
| |
(Cost: $590,390) | | | | 661,608 | |
| | | | | | | | |
|
Total Preferred Stock | |
| |
(Cost: $590,390) | | | | 661,608 | |
| | | | | | | | |
|
COMMON STOCK — 54.1% | |
|
Australia — 0.3% (Cost: $325,868) | |
| | |
BHP Group, Ltd. | | | 6,300 | | | | 308,133 | |
| | | | | | | | |
|
| Brazil — 3.3% | |
| | |
B3 S.A. — Brasil Bolsa Balcao | | | 67,500 | | | | 813,484 | |
| | |
CCR S.A. | | | 108,700 | | | | 445,155 | |
| | |
Cyrela Brazil Realty SA Empreendimentos e Participacoes | | | 56,500 | | | | 379,022 | |
| | |
Direcional Engenharia S.A. | | | 37,800 | | | | 112,522 | |
| | |
IRB Brasil Resseguros S.A. | | | 71,400 | | | | 672,132 | |
| | |
JBS SA | | | 73,100 | | | | 515,145 | |
| | |
YDUQS Part (9) | | | 36,300 | | | | 354,916 | |
| | | | | | | | |
|
Total Brazil | |
| |
(Cost: $2,638,173) | | | | 3,292,376 | |
| | | | | | | | |
|
| China — 19.0% | |
| | |
Alibaba Group Holding, Ltd. (SP ADR) (9) | | | 18,262 | | | | 3,226,348 | |
| | |
Bank of Communications Co., Ltd. — Class H | | | 750,000 | | | | 512,096 | |
| | |
CGN Power Co., Ltd. — Class H | | | 1,046,000 | | | | 271,608 | |
| | |
China Galaxy Securities Co., Ltd. — Class H | | | 698,000 | | | | 355,821 | |
| | |
China International Travel Service Corp., Ltd. | | | 22,700 | | | | 291,252 | |
| | |
China Merchants Port Holdings Co., Ltd. | | | 162,000 | | | | 253,235 | |
| | |
China National Building Material Co., Ltd. — Class H | | | 298,000 | | | | 251,105 | |
| | |
China National Chemical Engineering Co., Ltd. | | | 305,000 | | | | 259,014 | |
| | |
Country Garden Services Holdings Co., Ltd. | | | 159,000 | | | | 538,631 | |
| | |
Foshan Haitian Flavouring & Food Co., Ltd. | | | 31,500 | | | | 499,869 | |
| | |
Galaxy Entertainment Group, Ltd. | | | 163,000 | | | | 1,122,108 | |
| | |
Greentown Service Group Co., Ltd. | | | 330,000 | | | | 374,324 | |
| | |
Guangzhou Automobile Group Co., Ltd. — Class H | | | 282,000 | | | | 281,581 | |
| | |
Luye Pharma Group, Ltd. | | | 342,500 | | | | 253,102 | |
| | |
Melco Crown Entertainment, Ltd. | | | 13,900 | | | | 299,406 | |
| | |
Ping An Insurance Group Co. of China, Ltd. — Class H | | | 162,150 | | | | 1,871,082 | |
| | |
Q Technology Group Co., Ltd. (9) | | | 413,000 | | | | 547,418 | |
| | |
Shenzhen Mindray Bio-Medical Electronics Co., Ltd. | | | 12,300 | | | | 310,749 | |
See accompanying notes to financial statements.
36
TCW Emerging Markets Multi-Asset Opportunities Fund
| | | | | | | | |
| Issues | | Shares | | | Value | |
|
| China (Continued) | |
| | |
Sichuan Swellfun Co., Ltd. | | | 108,700 | | | $ | 819,863 | |
| | |
Sinotruk Hong Kong, Ltd. | | | 173,500 | | | | 262,112 | |
| | |
Tencent Holdings, Ltd. | | | 72,112 | | | | 2,924,420 | |
| | |
Tus Environmental Science And Technology Development Co., Ltd. | | | 184,000 | | | | 226,326 | |
| | |
Weibo Corp. (SP ADR) (9) | | | 5,400 | | | | 265,626 | |
| | |
Weichai Power Co., Ltd. — Class H | | | 190,000 | | | | 298,997 | |
| | |
WH Group, Ltd. | | | 751,000 | | | | 792,535 | |
| | |
WuXi AppTec Co., Ltd. — Class H (9) | | | 40,460 | | | | 487,706 | |
| | |
Wuxi Biologics, Inc. (9) | | | 60,500 | | | | 710,804 | |
| | |
Zhongsheng Group Holdings, Ltd. | | | 154,500 | | | | 512,087 | |
| | | | | | | | |
|
Total China | |
| |
(Cost: $15,887,071) | | | | 18,819,225 | |
| | | | | | | | |
|
Egypt — 1.1% (Cost: $920,004) | |
| | |
Commercial International Bank Egypt SAE | | | 220,127 | | | | 1,104,727 | |
| | | | | | | | |
|
| Greece — 2.5% | |
| | |
Alpha Bank AE (9) | | | 504,445 | | | | 1,076,717 | |
| | |
Motor Oil Hellas Corinth Refineries S.A. | | | 17,263 | | | | 427,086 | |
| | |
OPAP S.A. | | | 13,142 | | | | 142,969 | |
| | |
Piraeus Bank S.A. (9) | | | 238,063 | | | | 830,585 | |
| | | | | | | | |
|
Total Greece | |
| |
(Cost: $1,779,571) | | | | 2,477,357 | |
| | | | | | | | |
|
| Hungary — 0.3% (Cost: $297,975) | |
| | |
Richter Gedeon Nyrt | | | 16,913 | | | | 313,918 | |
| | | | | | | | |
|
| India — 3.0% | |
| | |
HDFC Bank, Ltd. (ADR) | | | 5,200 | | | | 317,668 | |
| | |
ICICI Bank, Ltd. (SP ADR) | | | 20,000 | | | | 260,600 | |
| | |
Larsen & Toubro, Ltd. | | | 21,000 | | | | 435,990 | |
| | |
Maruti Suzuki India, Ltd. | | | 9,535 | | | | 1,015,949 | |
| | |
Reliance Industries, Ltd. | | | 26,761 | | | | 551,861 | |
| | |
Titan Co., Ltd. | | | 23,301 | | | | 437,354 | |
| | | | | | | | |
|
Total India | |
| |
(Cost: $2,840,373) | | | | 3,019,422 | |
| | | | | | | | |
|
| Indonesia — 0.6% (Cost: $504,328) | |
| | |
Semen Indonesia Persero Tbk PT | | | 630,400 | | | | 568,549 | |
| | | | | | | | |
|
| Kenya — 1.3% (Cost: $1,068,654) | |
| | |
Safari.com, Ltd. | | | 4,605,700 | | | | 1,326,424 | |
| | | | | | | | |
|
| Philippines — 0.3% (Cost: $314,229) | |
| | |
International Container Terminal Services, Inc. | | | 110,010 | | | | 257,178 | |
| | | | | | | | |
|
| Russia — 3.8% | |
| | |
Gazprom Neft PJSC | | | 39,360 | | | | 254,500 | |
| | |
Inter RAO UES PJSC | | | 3,188,000 | | | | 215,788 | |
| | |
Lukoil PJSC (SP ADR) | | | 7,040 | | | | 648,102 | |
| | |
MMC Norilsk Nickel PJSC (ADR) | | | 5,400 | | | | 149,769 | |
| | | | | | | | |
| Issues | | Shares | | | Value | |
|
| Russia (Continued) | |
| | |
Novatek PJSC (SP GDR) | | | 1,863 | | | $ | 398,682 | |
| | |
Novolipetsk Steel PJSC | | | 18,003 | | | | 352,139 | |
| | |
Polyus PJSC | | | 4,340 | | | | 255,409 | |
| | |
Sberbank of Russia PJSC | | | 185,260 | | | | 678,347 | |
| | |
Yandex N.V. (9) | | | 24,400 | | | | 814,716 | |
| | | | | | | | |
|
Total Russia | |
| |
(Cost: $3,466,452) | | | | 3,767,452 | |
| | | | | | | | |
|
| Saudi Arabia — 0.3% (Cost: $291,930) | |
| | |
Bupa Arabia for Cooperative Insurance Co. | | | 10,515 | | | | 301,241 | |
| | | | | | | | |
|
| South Africa — 1.9% | |
| | |
Capitec Bank Holdings, Ltd. | | | 2,373 | | | | 216,378 | |
| | |
Clicks Group, Ltd. | | | 26,037 | | | | 424,575 | |
| | |
Gold Fields, Ltd. | | | 46,200 | | | | 287,815 | |
| | |
Standard Bank Group, Ltd. | | | 62,761 | | | | 722,760 | |
| | |
Telkom S.A. SOC, Ltd. | | | 49,948 | | | | 229,047 | |
| | | | | | | | |
|
| Total South Africa | |
| |
(Cost: $1,726,061) | | | | 1,880,575 | |
| | | | | | | | |
|
| South Korea — 3.6% | |
| | |
Doosan Bobcat, Inc. (9) | | | 11,815 | | | | 318,563 | |
| | |
Hyundai Motor Co. | | | 5,073 | | | | 531,368 | |
| | |
LG Household & Health Care, Ltd. | | | 221 | | | | 239,143 | |
| | |
Meritz Securities Co., Ltd. | | | 59,791 | | | | 231,150 | |
| | |
Samsung Electronics Co., Ltd. | | | 40,222 | | | | 1,738,389 | |
| | |
Shinsegae Inc. | | | 1,136 | | | | 230,224 | |
| | |
SK Holdings Co., Ltd. | | | 1,271 | | | | 281,977 | |
| | | | | | | | |
|
Total South Korea | |
| |
(Cost: $3,224,015) | | | | 3,570,814 | |
| | | | | | | | |
|
| Taiwan — 10.9% | |
| | |
Accton Technology Corp. | | | 179,000 | | | | 1,064,813 | |
| | |
ASPEED Technology, Inc. | | | 11,000 | | | | 287,454 | |
| | |
Chailease Holding Co., Ltd. | | | 60,000 | | | | 270,361 | |
| | |
Chroma ATE, Inc. | | | 48,000 | | | | 238,661 | |
| | |
E.Sun Financial Holding Co., Ltd. | | | 320,000 | | | | 289,139 | |
| | |
Eva Airways Corp. | | | 555,000 | | | | 260,055 | |
| | |
Global Unichip Corp. | | | 44,000 | | | | 385,774 | |
| | |
Highwealth Construction Corp. | | | 157,000 | | | | 240,977 | |
| | |
Largan Precision Co., Ltd. | | | 4,000 | | | | 586,937 | |
| | |
Pou Chen Corp. | | | 193,000 | | | | 258,028 | |
| | |
Standard Foods Corp. | | | 143,000 | | | | 288,749 | |
| | |
Taiwan Semiconductor Manufacturing Co., Ltd. | | | 361,000 | | | | 3,537,727 | |
| | |
Taiwan Union Technology Corp. | | | 314,000 | | | | 1,376,121 | |
| | |
United Microelectronics Corp. | | | 556,000 | | | | 256,049 | |
| | |
Walsin Technology Corp. | | | 45,000 | | | | 269,409 | |
| | |
Win Semiconductors Corp. | | | 28,000 | | | | 291,447 | |
| | |
Wistron Corp. | | | 336,000 | | | | 308,045 | |
See accompanying notes to financial statements.
37
TCW Emerging Markets Multi-Asset Opportunities Fund
Schedule of Investments (Continued)
| | | | | | | | |
| Issues | | Shares | | | Value | |
|
| Taiwan (Continued) | |
| | |
Yageo Corp. | | | 25,000 | | | $ | 256,535 | |
| | |
Zhen Ding Technology Holding, Ltd. | | | 64,000 | | | | 302,617 | |
| | | | | | | | |
| | |
Total Taiwan | | | | | | | | |
| | |
(Cost: $8,744,149) | | | | | | | 10,768,898 | |
| | | | | | | | |
|
| United Arab Emirates — 0.4% (Cost: $212,411) | |
| | |
NMC Health PLC | | | 14,186 | | | | 401,706 | |
| | | | | | | | |
|
| United States — 1.5% | |
| | |
Applied Materials, Inc. | | | 18,500 | | | | 1,003,810 | |
| | |
MSCI, Inc. | | | 1,200 | | | | 281,472 | |
| | |
Western Digital Corp. | | | 4,900 | | | | 253,085 | |
| | | | | | | | |
| | |
Total United States | | | | | | | | |
| | |
(Cost: $1,237,625) | | | | | | | 1,538,367 | |
| | | | | | | | |
| | |
Total Common Stock | | | | | | | | |
| | |
(Cost: $45,478,889) | | | | | | | 53,716,362 | |
| | | | | | | | |
| | | | | | | | |
| Issues | | Shares | | | Value | |
|
| MONEY MARKET INVESTMENTS — 1.7% | |
| | |
State Street Institutional U.S. Government Money Market Fund — Premier Class, 1.75% (10) | | | 1,638,129 | | | $ | 1,638,129 | |
| | | | | | | | |
| | |
Total Money Market Investments | | | | | | | | |
| | |
(Cost: $1,638,129) | | | | | | | 1,638,129 | |
| | | | | | | | |
| | |
Total Investments (98.0%) | | | | | | | | |
| |
(Cost: $87,907,456) | | | | 97,186,274 | |
| |
Excess of Other Assets over Liabilities (2.0%) | | | | 2,027,574 | |
| | | | | | | | |
| |
Total Net Assets (100.0%) | | | $ | 99,213,848 | |
| | | | | | | | |
| | | | | | | | | | | | | | | | | | | | | | | | |
| |
| Forward Currency Contracts | |
| | | | | | |
| Counterparty | | Contracts to
Deliver | | | Units of
Currency | | | Settlement
Date | | | In Exchange for
U.S. Dollars | | | Contracts at
Value | | | Unrealized
Appreciation
(Depreciation) | |
BUY (11) | | | | | | | | | | | | | | | | | | | | |
Citibank N.A. | | | BRL | | | | 508,950 | | | | 11/06/19 | | | $ | 130,000 | | | $ | 126,766 | | | $ | (3,234 | ) |
Citibank N.A. | | | SAR | | | | 565,755 | | | | 04/06/20 | | | | 150,187 | | | | 150,855 | | | | 668 | |
| | | | | | | | | | | | | | | | | | | | | | | | |
| | | $ | 280,187 | | | $ | 277,621 | | | $ | (2,566 | ) |
| | | | | | | | | | | | | |
SELL (12) | | | | | | | | | | | | | | | | | | | | |
Citibank N.A. | | | BRL | | | | 508,950 | | | | 11/06/19 | | | $ | 124,074 | | | $ | 126,767 | | | $ | (2,693 | ) |
Citibank N.A. | | | SAR | | | | 565,755 | | | | 04/06/20 | | | | 150,000 | | | | 150,855 | | | | (855 | ) |
| | | | | | | | | | | | | | | | | | | | | | | | |
| | | $ | 274,074 | | | $ | 277,622 | | | $ | (3,548 | ) |
| | | | | | | | | | | | | |
| | | | | | | | | | | | | | | | | | |
| Futures Contracts | |
| |
| | | | | |
Number of
Contracts | | Type | | Expiration
Date | | | Notional
Amount | | | Value | | | Net Unrealized
Appreciation/
Depreciation | |
Long Futures | |
| 7 | | U.S. Ultra Long Bond Futures | | | 12/19/19 | | | $ | 1,386,922 | | | $ | 1,328,250 | | | $ | (58,672 | ) |
| | | | | | | | | | | | | | | | | | |
See accompanying notes to financial statements.
38
TCW Emerging Markets Multi-Asset Opportunities Fund
Notes to the Schedule of Investments:
| ADR | | American Depositary Receipt. ADRs are receipts typically issued by a U.S. bank or trust company, evidencing ownership of underlying securities issued by a foreign corporation. |
| PJSC | | Private Joint-Stock Company. |
| (1) | | Security exempt from registration under Rule 144A of the Securities Act of 1933, as amended. These securities may be resold, normally only to qualified institutional buyers. At October 31, 2019, the value of these securities amounted to $21,827,856 or 22.0% of net assets. These securities are determined to be liquid by the Fund’s investment advisor, unless otherwise noted, under procedures established by and under the general supervision of the Company’s Board of Directors. |
| (2) | | Investments issued under Regulation S of the Securities Act of 1933, as amended, may not be offered, sold, or delivered within the United States except under special exemptions. At October 31, 2019, the value of these securities amounted to $10,803,752 or 10.9% of net assets. |
| (3) | | Floating or variable rate security. The interest shown reflects the rate in effect at October 31, 2019. |
| (5) | | Variable rate security. Interest rate disclosed is as of the most recent information available. Certain variable rate securities are not based on a published reference rate and spread but are determined by the issuer or agent and are based on current market conditions. These securities do not indicate a reference rate and spread in their description above. |
| (6) | | Security is not accruing interest. |
| (7) | | Security is currently in default due to bankruptcy or failure to make payment of principal or interest of the issuer. Income is not being accrued. |
| (8) | | For fair value measurement disclosure purposes, security is categorized as Level 3. Security is valued using significant unobservable inputs. |
| (9) | | Non-income producing security. |
| (10) | | Rate disclosed is the 7-day net yield as of October 31, 2019. |
| (11) | | Fund buys foreign currency, sells U.S. Dollar. |
| (12) | | Fund sells foreign currency, buys U.S. Dollar. |
See accompanying notes to financial statements.
39
TCW Emerging Markets Multi-Asset Opportunities Fund
Investments by Sector | October 31, 2019 |
| | | | |
| Sector | | Percentage of
Net Assets | |
Airlines | | | 0.5 | % |
Apparel | | | 0.3 | |
Auto Manufacturers | | | 2.1 | |
Auto Parts & Equipment | | | 0.3 | |
Banks | | | 6.8 | |
Beverages | | | 0.8 | |
Building Materials | | | 0.8 | |
Commercial Services | | | 2.2 | |
Computers | | | 0.6 | |
Cosmetics/Personal Care | | | 0.2 | |
Diversified Financial Services | | | 2.4 | |
Electric | | | 2.5 | |
Electronics | | | 3.0 | |
Energy-Alternate Sources | | | 0.7 | |
Engineering & Construction | | | 0.9 | |
Entertainment | | | 0.2 | |
Environmental Control | | | 0.2 | |
Food | | | 2.3 | |
Foreign Government Bonds | | | 26.6 | |
Healthcare-Products | | | 0.3 | |
Healthcare-Services | | | 1.6 | |
Insurance | | | 2.9 | |
Internet | | | 7.3 | |
Iron & Steel | | | 0.7 | |
Leisure Time | | | 0.3 | |
Lodging | | | 1.4 | |
Machinery-Constr&Mining | | | 0.3 | |
Metal Fabricate & Hardware | | | 0.2 | |
Mining | | | 2.0 | |
Miscellaneous Manufacturers | | | 0.6 | |
Oil & Gas | | | 8.3 | |
Pharmaceuticals | | | 0.6 | |
Pipelines | | | 0.5 | |
Real Estate | | | 2.7 | |
Retail | | | 1.6 | |
Semiconductors | | | 7.6 | |
Software | | | 0.3 | |
Telecommunications | | | 3.3 | |
Transportation | | | 0.4 | |
Money Market Investments | | | 1.7 | |
| | | | |
Total | | | 98.0 | % |
| | | | |
See accompanying notes to financial statements.
40
TCW Emerging Markets Multi-Asset Opportunities Fund
Investments by Country | October 31, 2019 |
| | | | |
| Country | | Percentage of
Net Assets | |
Angola | | | 0.7 | % |
Argentina | | | 0.7 | |
Australia | | | 0.3 | |
Azerbaijan | | | 0.2 | |
Bahrain | | | 1.4 | |
Brazil | | | 7.4 | |
Chile | | | 0.4 | |
China | | | 20.0 | |
Colombia | | | 1.2 | |
Costa Rica | | | 0.8 | |
Dominican Republic | | | 1.4 | |
Ecuador | | | 1.2 | |
Egypt | | | 2.6 | |
El Salvador | | | 0.7 | |
Ghana | | | 0.9 | |
Greece | | | 2.5 | |
Guatemala | | | 0.2 | |
Hungary | | | 0.3 | |
India | | | 4.2 | |
Indonesia | | | 2.9 | |
Ivory Coast | | | 0.7 | |
Kazakhstan | | | 0.9 | |
Kenya | | | 2.1 | |
Lebanon | | | 0.5 | |
Mexico | | | 3.1 | |
Mongolia | | | 0.2 | |
Nigeria | | | 1.2 | |
Oman | | | 1.4 | |
Panama | | | 0.7 | |
Paraguay | | | 0.2 | |
Peru | | | 0.4 | |
Philippines | | | 0.3 | |
Qatar | | | 1.2 | |
Russia | | | 5.2 | |
Saudi Arabia | | | 1.8 | |
South Africa | | | 3.3 | |
South Korea | | | 3.6 | |
Sri Lanka | | | 1.2 | |
Taiwan | | | 10.9 | |
Tanzania | | | 0.2 | |
Turkey | | | 1.2 | |
Ukraine | | | 1.7 | |
United Arab Emirates | | | 1.4 | |
United States | | | 3.2 | |
Uruguay | | | 0.9 | |
Venezuela | | | 0.2 | |
Vietnam | | | 0.3 | |
| | | | |
Total | | | 98.0 | % |
| | | | |
See accompanying notes to financial statements.
41
TCW Emerging Markets Multi-Asset Opportunities Fund
Fair Valuation Summary | October 31, 2019 |
The following is a summary of the fair valuations according to the inputs used as of October 31, 2019 in valuing the Fund’s investments:
| | | | | | | | | | | | | | | | |
Description | | Quoted Prices
in Active
Markets for
Identical
Assets
(Level 1) | | | Other
Significant
Observable
Inputs
(Level 2) | | | Significant
Unobservable
Inputs
(Level 3) | | | Total | |
Fixed Income Securities | | | | | | | | | | | | | | | | |
Airlines | | $ | — | | | $ | 216,094 | | | $ | — | | | $ | 216,094 | |
Banks | | | — | | | | 1,192,983 | | | | — | | | | 1,192,983 | |
Commercial Services | | | — | | | | 828,696 | | | | — | | | | 828,696 | |
Diversified Financial Services | | | — | | | | 206,250 | | | | — | | | | 206,250 | |
Electric | | | — | | | | 1,320,796 | | | | — | | | | 1,320,796 | |
Energy-Alternate Sources | | | — | | | | 735,808 | | | | — | | | | 735,808 | |
Engineering & Construction | | | — | | | | 207,000 | | | | — | | | | 207,000 | |
Food | | | — | | | | 212,725 | | | | — | | | | 212,725 | |
Foreign Government Bonds | | | — | | | | 26,293,476 | | | | 140,385 | | | | 26,433,861 | |
Iron & Steel | | | — | | | | 381,048 | | | | — | | | | 381,048 | |
Metal Fabricate & Hardware | | | — | | | | 208,620 | | | | — | | | | 208,620 | |
Mining | | | — | | | | 1,004,748 | | | | — | | | | 1,004,748 | |
Oil & Gas | | | — | | | | 5,661,671 | | | | — | | | | 5,661,671 | |
Pipelines | | | — | | | | 521,780 | | | | — | | | | 521,780 | |
Real Estate | | | — | | | | 982,994 | | | | — | | | | 982,994 | |
Telecommunications | | | — | | | | 637,320 | | | | — | | | | 637,320 | |
Transportation | | | — | | | | 417,781 | | | | — | | | | 417,781 | |
| | | | | | | | | | | | | | | | |
Total Fixed Income Securities | | | — | | | | 41,029,790 | | | | 140,385 | | | | 41,170,175 | |
| | | | | | | | | | | | | | | | |
Preferred Stock | | | | | | | | | | | | | | | | |
Electric | | | 661,608 | | | | — | | | | — | | | | 661,608 | |
| | | | | | | | | | | | | | | | |
Common Stock | | | | | | | | | | | | | | | | |
Airlines | | | — | | | | 260,055 | | | | — | | | | 260,055 | |
Apparel | | | — | | | | 258,028 | | | | — | | | | 258,028 | |
Auto Manufacturers | | | — | | | | 2,091,009 | | | | — | | | | 2,091,009 | |
Auto Parts & Equipment | | | — | | | | 298,997 | | | | — | | | | 298,997 | |
Banks | | | 1,682,995 | | | | 3,820,505 | | | | — | | | | 5,503,500 | |
Beverages | | | — | | | | 819,863 | | | | — | | | | 819,863 | |
Building Materials | | | — | | | | 819,654 | | | | — | | | | 819,654 | |
Commercial Services | | | 800,070 | | | | 510,414 | | | | — | | | | 1,310,484 | |
Computers | | | 253,085 | | | | 308,045 | | | | — | | | | 561,130 | |
Cosmetics/Personal Care | | | — | | | | 239,143 | | | | — | | | | 239,143 | |
Diversified Financial Services | | | 813,484 | | | | 1,362,851 | | | | — | | | | 2,176,335 | |
Electric | | | — | | | | 487,396 | | | | — | | | | 487,396 | |
Electronics | | | — | | | | 2,990,761 | | | | — | | | | 2,990,761 | |
Engineering & Construction | | | — | | | | 695,004 | | | | — | | | | 695,004 | |
Entertainment | | | — | | | | 142,969 | | | | — | | | | 142,969 | |
Environmental Control | | | — | | | | 226,326 | | | | — | | | | 226,326 | |
Food | | | 515,145 | | | | 1,581,154 | | | | — | | | | 2,096,299 | |
Healthcare-Products | | | — | | | | 310,749 | | | | — | | | | 310,749 | |
Healthcare-Services | | | — | | | | 1,600,217 | | | | — | | | | 1,600,217 | |
Insurance | | | 672,132 | | | | 2,172,322 | | | | — | | | | 2,844,454 | |
Internet | | | 4,306,689 | | | | 2,924,420 | | | | — | | | | 7,231,109 | |
Iron & Steel | | | 352,139 | | | | — | | | | — | | | | 352,139 | |
See accompanying notes to financial statements.
42
TCW Emerging Markets Multi-Asset Opportunities Fund
| | | | | | | | | | | | | | | | |
Description | | Quoted Prices
in Active
Markets for
Identical
Assets
(Level 1) | | | Other
Significant
Observable
Inputs
(Level 2) | | | Significant
Unobservable
Inputs
(Level 3) | | | Total | |
Leisure Time | | $ | — | | | $ | 291,252 | | | $ | — | | | $ | 291,252 | |
Lodging | | | 299,406 | | | | 1,122,108 | | | | — | | | | 1,421,514 | |
Machinery-Constr&Mining | | | — | | | | 318,563 | | | | — | | | | 318,563 | |
Mining | | | 713,311 | | | | 287,815 | | | | — | | | | 1,001,126 | |
Miscellaneous Manufacturers | | | — | | | | 586,937 | | | | — | | | | 586,937 | |
Oil & Gas | | | 1,046,784 | | | | 1,515,424 | | | | — | | | | 2,562,208 | |
Pharmaceuticals | | | 313,918 | | | | 253,102 | | | | — | | | | 567,020 | |
Real Estate | | | 491,544 | | | | 1,153,932 | | | | — | | | | 1,645,476 | |
Retail | | | — | | | | 1,604,239 | | | | — | | | | 1,604,239 | |
Semiconductors | | | 1,003,810 | | | | 6,496,840 | | | | — | | | | 7,500,650 | |
Software | | | 281,472 | | | | — | | | | — | | | | 281,472 | |
Telecommunications | | | 1,326,424 | | | | 1,293,860 | | | | — | | | | 2,620,284 | |
| | | | | | | | | | | | | | | | |
Total Common Stock | | | 14,872,408 | | | | 38,843,954 | | | | — | | | | 53,716,362 | |
| | | | | | | | | | | | | | | | |
Money Market Investments | | | 1,638,129 | | | | — | | | | — | | | | 1,638,129 | |
| | | | | | | | | | | | | | | | |
Total Investments | | $ | 17,172,145 | | | $ | 79,873,744 | | | $ | 140,385 | | | $ | 97,186,274 | |
| | | | | | | | | | | | | | | | |
Asset Derivatives | | | | | | | | | | | | | | | | |
Forward Currency Contracts | | | | | | | | | | | | | | | | |
Foreign Currency Risk | | | — | | | | 668 | | | | — | | | | 668 | |
| | | | | | | | | | | | | | | | |
Total | | $ | 17,172,145 | | | $ | 79,874,412 | | | $ | 140,385 | | | $ | 97,186,942 | |
| | | | | | | | | | | | | | | | |
Liability Derivatives | | | | | | | | | | | | | | | | |
Forward Currency Contracts | | | | | | | | | | | | | | | | |
Foreign Currency Risk | | $ | — | | | $ | (6,782 | ) | | $ | — | | | $ | (6,782 | ) |
Futures Contracts | | | | | | | | | | | | | | | | |
Interest Rate Risk | | | (58,672 | ) | | | — | | | | — | | | | (58,672 | ) |
| | | | | | | | | | | | | | | | |
Total | | $ | (58,672 | ) | | $ | (6,782 | ) | | $ | — | | | $ | (65,454 | ) |
| | | | | | | | | | | | | | | | |
See accompanying notes to financial statements.
43
TCW International Small Cap Fund
Schedule of Investments
| | | | | | | | |
| Issues | | Shares | | | Value | |
|
COMMON STOCK — 95.3% of Net Assets | |
|
| Argentina — 0.5% (Cost: $51,674) | |
| | |
Globant S.A. (1) | | | 500 | | | $ | 46,630 | |
| | | | | | | | |
|
| Australia — 6.3% | |
| | |
Charter Hall Group | | | 6,167 | | | | 48,025 | |
| | |
Charter Hall Long Wale REIT | | | 12,547 | | | | 49,669 | |
| | |
IDP Education, Ltd. | | | 4,200 | | | | 51,450 | |
| | |
Megaport, Ltd. (1) | | | 10,263 | | | | 65,586 | |
| | |
Nine Entertainment Co. Holdings, Ltd. | | | 40,000 | | | | 50,724 | |
| | |
Pendal Group, Ltd. | | | 10,490 | | | | 51,765 | |
| | |
Pro Medicus, Ltd. | | | 13,291 | | | | 243,761 | |
| | |
WiseTech Global, Ltd. | | | 4,135 | | | | 74,216 | |
| | | | | | | | |
|
Total Australia | |
| |
(Cost: $594,747) | | | | 635,196 | |
| | | | | | | | |
|
| Austria — 1.2% | |
| | |
ams AG (1) | | | 2,183 | | | | 98,063 | |
| | |
Vienna Insurance Group AG Wiener Versicherung Gruppe | | | 932 | | | | 25,267 | |
| | | | | | | | |
|
Total Austria | |
| |
(Cost: $127,531) | | | | 123,330 | |
| | | | | | | | |
|
| Belgium — 1.5% (Cost: $115,482) | |
| | |
Warehouses De Pauw CVA | | | 796 | | | | 147,595 | |
| | | | | | | | |
|
| Brazil — 2.3% | |
| | |
Cia de Saneamento do Parana | | | 1,400 | | | | 31,805 | |
| | |
Cyrela Brazil Realty SA Empreendimentos e Participacoes | | | 8,300 | | | | 55,679 | |
| | |
Direcional Engenharia S.A. | | | 17,500 | | | | 52,094 | |
| | |
IRB Brasil Resseguros S.A. | | | 9,300 | | | | 87,547 | |
| | | | | | | | |
|
Total Brazil | |
| |
(Cost: $213,785) | | | | 227,125 | |
| | | | | | | | |
|
| Canada — 1.0% | |
| | |
Descartes Systems Group, Inc. (The) (1) | | | 1,300 | | | | 50,690 | |
| | |
Parkland Fuel Corp. | | | 1,500 | | | | 49,930 | |
| | | | | | | | |
|
Total Canada | |
| |
(Cost: $95,156) | | | | 100,620 | |
| | | | | | | | |
|
| China — 5.0% | |
| | |
Greentown Service Group Co., Ltd. | | | 46,000 | | | | 52,179 | |
| | |
Lonking Holdings, Ltd. | | | 171,000 | | | | 47,388 | |
| | |
Melco International Development, Ltd. | | | 41,000 | | | | 108,640 | |
| | |
Q Technology Group Co., Ltd. (1) | | | 138,000 | | | | 182,914 | |
| | |
Sichuan Swellfun Co., Ltd. | | | 15,400 | | | | 116,153 | |
| | | | | | | | |
|
Total China | |
| |
(Cost: $451,967) | | | | 507,274 | |
| | | | | | | | |
|
| Denmark — 0.3% (Cost: $26,021) | |
| | |
Genmab A/S (1) | | | 146 | | | | 31,915 | |
| | | | | | | | |
|
| Egypt — 0.8% (Cost: $69,246) | |
| | |
Commercial International Bank Egypt SAE | | | 16,165 | | | | 81,125 | |
| | | | | | | | |
| | | | | | | | |
| Issues | | Shares | | | Value | |
|
| France — 0.3% (Cost: $30,320) | |
| | |
SOITEC (1) | | | 300 | | | $ | 33,101 | |
| | | | | | | | |
|
| Germany — 7.3% | |
| | |
Evotec SE (1) | | | 1,712 | | | | 39,227 | |
| | |
Indus Holding AG | | | 1,200 | | | | 45,748 | |
| | |
KION Group AG | | | 1,264 | | | | 84,130 | |
| | |
MorphoSys AG (1) | | | 525 | | | | 57,325 | |
| | |
Nemetschek SE | | | 2,789 | | | | 142,346 | |
| | |
New Work SE | | | 253 | | | | 79,738 | |
| | |
TLG Immobilien AG | | | 6,452 | | | | 188,952 | |
| | |
Varta AG (1) | | | 885 | | | | 100,072 | |
| | | | | | | | |
|
| Total Germany | |
| |
(Cost: $685,186) | | | | 737,538 | |
| | | | | | | | |
|
| Greece — 4.6% | |
| | |
Alpha Bank AE (1) | | | 99,750 | | | | 212,912 | |
| | |
Motor Oil Hellas Corinth Refineries S.A. | | | 936 | | | | 23,157 | |
| | |
OPAP S.A. | | | 2,284 | | | | 24,847 | |
| | |
Piraeus Bank S.A. (1) | | | 58,111 | | | | 202,745 | |
| | | | | | | | |
|
Total Greece | |
| |
(Cost: $363,526) | | | | 463,661 | |
| | | | | | | | |
|
| Iceland — 0.9% (Cost: $69,751) | |
| | |
Ossur HF | | | 13,244 | | | | 95,934 | |
| | | | | | | | |
|
| India — 2.0% | |
| | |
Manappuram Finance, Ltd. | | | 34,038 | | | | 81,466 | |
| | |
Muthoot Finance, Ltd. | | | 7,165 | | | | 71,090 | |
| | |
TV18 Broadcast, Ltd. (1) | | �� | 151,345 | | | | 52,215 | |
| | | | | | | | |
|
Total India | |
| |
(Cost: $141,373) | | | | 204,771 | |
| | | | | | | | |
|
| Indonesia — 1.5% | |
| | |
Ace Hardware Indonesia Tbk PT | | | 618,800 | | | | 74,475 | |
| | |
Semen Indonesia Persero Tbk PT | | | 79,976 | | | | 72,129 | |
| | | | | | | | |
|
Total Indonesia | |
| |
(Cost: $124,475) | | | | 146,604 | |
| | | | | | | | |
|
| Italy — 5.9% | |
| | |
Banca Farmafactoring SpA | | | 4,209 | | | | 25,514 | |
| | |
BPER Banca | | | 6,292 | | | | 28,158 | |
| | |
FinecoBank Banca Fineco SpA | | | 12,892 | | | | 145,382 | |
| | |
Hera SpA | | | 38,218 | | | | 163,766 | |
| | |
Iren SpA | | | 18,000 | | | | 55,867 | |
| | |
Moncler SpA | | | 4,500 | | | | 173,704 | |
| | | | | | | | |
|
Total Italy | |
| |
(Cost: $549,980) | | | | 592,391 | |
| | | | | | | | |
|
| Japan — 21.9% | |
| | |
77 Bank, Ltd. (The) | | | 3,300 | | | | 51,933 | |
| | |
Anritsu Corp. | | | 6,400 | | | | 121,920 | |
| | |
Aozora Bank, Ltd. | | | 2,000 | | | | 51,262 | |
See accompanying notes to financial statements.
44
TCW International Small Cap Fund
| | | | | | | | |
| Issues | | Shares | | | Value | |
|
| Japan (Continued) | |
| | |
Azbil Corp. | | | 1,900 | | | $ | 52,815 | |
| | |
Broadleaf Co., Ltd. | | | 4,400 | | | | 24,694 | |
| | |
DMG Mori Co., Ltd. | | | 3,400 | | | | 54,988 | |
| | |
Elecom Co., Ltd. | | | 800 | | | | 31,032 | |
| | |
Fancl Corp. | | | 1,800 | | | | 50,812 | |
| | |
FCC Co., Ltd. | | | 1,300 | | | | 26,869 | |
| | |
Fuji Corp/Aichi | | | 4,000 | | | | 66,350 | |
| | |
GLP J-REIT | | | 37 | | | | 48,190 | |
| | |
GMO Payment Gateway, Inc. | | | 700 | | | | 51,534 | |
| | |
Haseko Corp. | | | 4,900 | | | | 63,164 | |
| | |
Hazama Ando Corp. | | | 6,500 | | | | 50,309 | |
| | |
Ibiden Co., Ltd. | | | 3,800 | | | | 87,651 | |
| | |
Itochu Techno-Solutions Corp. | | | 1,800 | | | | 48,424 | |
| | |
Jafco Co., Ltd. | | | 2,500 | | | | 93,805 | |
| | |
Kansai Mirai Financial Group, Inc. | | | 7,800 | | | | 50,693 | |
| | |
Kenedix Office Investment Corp. | | | 7 | | | | 54,780 | |
| | |
Lasertec Corp. | | | 700 | | | | 50,267 | |
| | |
Mani, Inc. | | | 6,300 | | | | 166,146 | |
| | |
Musashi Seimitsu Industry Co., Ltd. | | | 1,900 | | | | 26,366 | |
| | |
Nabtesco Corp. | | | 1,700 | | | | 54,062 | |
| | |
Nachi-Fujikoshi Corp. | | | 600 | | | | 28,682 | |
| | |
NET One Systems Co., Ltd. | | | 2,600 | | | | 70,023 | |
| | |
Nippon Chemi-Con Corp. | | | 1,500 | | | | 24,768 | |
| | |
Nippon Sheet Glass Co., Ltd. (1) | | | 4,900 | | | | 30,667 | |
| | |
Nippon Thompson Co., Ltd. | | | 5,600 | | | | 24,981 | |
| | |
NSD Co., Ltd. | | | 1,700 | | | | 52,346 | |
| | |
Optorun Co., Ltd. | | | 800 | | | | 24,103 | |
| | |
Orix JREIT, Inc. | | | 43 | | | | 97,125 | |
| | |
Outsourcing, Inc. | | | 5,000 | | | | 53,763 | |
| | |
Penta-Ocean Construction Co., Ltd. | | | 8,800 | | | | 53,926 | |
| | |
SCREEN Holdings Co., Ltd. | | | 800 | | | | 55,480 | |
| | |
SCSK Corp. | | | 1,300 | | | | 66,105 | |
| | |
Ship Healthcare Holdings, Inc. | | | 1,000 | | | | 42,576 | |
| | |
Tadano, Ltd. | | | 5,500 | | | | 49,800 | |
| | |
Toda Corp. | | | 8,100 | | | | 50,543 | |
| | |
TPR Co., Ltd. | | | 1,500 | | | | 26,825 | |
| | |
Tsubakimoto Chain Co. | | | 800 | | | | 27,304 | |
| | |
Ulvac, Inc. | | | 1,100 | | | | 48,073 | |
| | | | | | | | |
| | |
Total Japan | | | | | | | | |
| | |
(Cost: $1,994,059) | | | | | | | 2,205,156 | |
| | | | | | | | |
|
| Luxembourg — 0.2% (Cost: $25,044) | |
| | |
Befesa SA | | | 670 | | | | 24,866 | |
| | | | | | | | |
|
| Netherlands — 3.9% | |
| | |
Argenx SE (1) | | | 197 | | | | 23,996 | |
| | |
ASR Nederland NV | | | 3,875 | | | | 142,097 | |
| | |
BE Semiconductor Industries NV | | | 4,745 | | | | 175,966 | |
| | |
IMCD Group NV | | | 673 | | | | 52,567 | |
| | | | | | | | |
|
Total Netherlands | |
| |
(Cost: $324,009) | | | | 394,626 | |
| | | | | | | | |
| | | | | | | | |
| Issues | | Shares | | | Value | |
|
| Norway — 2.1% | |
| | |
Storebrand ASA | | | 8,340 | | | $ | 59,056 | |
| | |
Tomra Systems ASA | | | 5,658 | | | | 152,750 | |
| | | | | | | | |
| | |
Total Norway | | | | | | | | |
| | |
(Cost: $218,366) | | | | | | | 211,806 | |
| | | | | | | | |
|
| Philippines — 1.4% | |
| | |
International Container Terminal Services, Inc. | | | 20,700 | | | | 48,392 | |
| | |
Wilcon Depot, Inc. | | | 286,700 | | | | 93,207 | |
| | | | | | | | |
| | |
Total Philippines | | | | | | | | |
| | |
(Cost: $134,296) | | | | | | | 141,599 | |
| | | | | | | | |
|
| Spain — 0.8% | |
| | |
Gestamp Automocion SA | | | 5,500 | | | | 23,575 | |
| | |
Talgo S.A. (1) | | | 8,469 | | | | 52,952 | |
| | | | | | | | |
| | |
Total Spain | | | | | | | | |
| | |
(Cost: $76,535) | | | | | | | 76,527 | |
| | | | | | | | |
|
| Sweden — 1.4% | |
| | |
Evolution Gaming Group AB | | | 3,723 | | | | 89,244 | |
| | |
Nobia AB | | | 8,100 | | | | 51,833 | |
| | | | | | | | |
| | |
Total Sweden | | | | | | | | |
| | |
(Cost: $126,228) | | | | | | | 141,077 | |
| | | | | | | | |
|
| Switzerland — 0.7% | |
| | |
Emmi AG | | | 52 | | | | 44,003 | |
| | |
Helvetia Holding AG | | | 190 | | | | 26,682 | |
| | | | | | | | |
| | |
Total Switzerland | | | | | | | | |
| | |
(Cost: $71,213) | | | | | | | 70,685 | |
| | | | | | | | |
|
| Taiwan — 5.6% | |
| | |
Accton Technology Corp. | | | 32,000 | | | | 190,358 | |
| | |
ASPEED Technology, Inc. | | | 2,000 | | | | 52,264 | |
| | |
Elite Material Co., Ltd. | | | 6,000 | | | | 24,922 | |
| | |
Realtek Semiconductor Corp. | | | 6,000 | | | | 44,508 | |
| | |
Taiwan Union Technology Corp. | | | 36,000 | | | | 157,772 | |
| | |
Win Semiconductors Corp. | | | 5,000 | | | | 52,044 | |
| | |
Yageo Corp. | | | 4,000 | | | | 41,046 | |
| | | | | | | | |
| | |
Total Taiwan | | | | | | | | |
| | |
(Cost: $434,542) | | | | | | | 562,914 | |
| | | | | | | | |
|
| Thailand — 0.6% (Cost: $54,054) | |
| | |
Carabao Group PCL | | | 22,200 | | | | 61,971 | |
| | | | | | | | |
|
| United Kingdom — 12.4% | |
| | |
Arrow Global Group PLC | | | 17,065 | | | | 52,511 | |
| | |
Babcock International Group PLC | | | 7,380 | | | | 52,949 | |
| | |
Bellway PLC | | | 1,185 | | | | 48,451 | |
| | |
Britvic PLC | | | 10,983 | | | | 140,214 | |
| | |
Close Brothers Group PLC | | | 2,814 | | | | 50,406 | |
| | |
Costain Group PLC | | | 11,085 | | | | 23,954 | |
| | |
Dechra Pharmaceuticals PLC | | | 1,490 | | | | 50,773 | |
See accompanying notes to financial statements.
45
TCW International Small Cap Fund
Schedule of Investments (Continued)
| | | | | | | | |
| Issues | | Shares | | | Value | |
|
| United Kingdom (Continued) | |
| | |
Dialog Semiconductor PLC (1) | | | 1,225 | | | $ | 55,118 | |
| | |
Galliford Try PLC | | | 12,019 | | | | 113,957 | |
| | |
Genus PLC | | | 1,565 | | | | 58,738 | |
| | |
Hammerson PLC | | | 6,070 | | | | 22,779 | |
| | |
Hays PLC | | | 25,200 | | | | 51,230 | |
| | |
Intu Properties PLC (1) | | | 39,300 | | | | 22,884 | |
| | |
N Brown Group PLC | | | 33,635 | | | | 54,492 | |
| | |
OneSavings Bank PLC | | | 4,890 | | | | 22,787 | |
| | |
Quilter PLC | | | 62,200 | | | | 110,247 | |
| | |
Redrow PLC | | | 6,235 | | | | 48,556 | |
| | |
Rightmove PLC | | | 6,880 | | | | 53,348 | |
| | |
Serco Group PLC (1) | | | 31,250 | | | | 63,083 | |
| | |
Softcat PLC | | | 8,130 | | | | 98,980 | |
| | |
SThree PLC | | | 7,015 | | | | 25,916 | |
| | |
Virgin Money UK PLC | | | 14,550 | | | | 25,863 | |
| | | | | | | | |
| | |
Total United Kingdom | | | | | | | | |
| | |
(Cost: $1,180,190) | | | | | | | 1,247,236 | |
| | | | | | | | |
|
| United States — 2.9% | |
| | |
Americold Realty Trust | | | 2,200 | | | | 88,198 | |
| | |
Bruker Corp. | | | 1,300 | | | | 57,850 | |
| | |
FibroGen, Inc. (1) | | | 2,300 | | | | 90,045 | |
| | |
Silicon Laboratories, Inc. (1) | | | 500 | | | | 53,120 | |
| | | | | | | | |
| | |
Total United States | | | | | | | | |
| | |
(Cost: $280,546) | | | | | | | 289,213 | |
| | | | | | | | |
| | |
Total Common Stock | | | | | | | | |
| | |
(Cost: $8,629,302) | | | | | | | 9,602,486 | |
| | | | | | | | |
| | | | | | | | |
| Issues | | Shares | | | Value | |
|
PREFERRED STOCK — 0.7% | |
|
| Brazil — 0.7% | |
| | |
Banco do Estado do Rio Grande do Sul S.A., Class B, 10.62% | | | 7,900 | | | $ | 44,003 | |
| | |
Cia Paranaense de Energia, 2.63% | | | 1,900 | | | | 26,348 | |
| | | | | | | | |
| | |
Total Brazil | | | | | | | | |
| | |
(Cost: $70,211) | | | | | | | 70,351 | |
| | | | | | | | |
| | |
Total Preferred Stock | | | | | | | | |
| | |
(Cost: $70,211) | | | | | | | 70,351 | |
| | | | | | | | |
|
| MONEY MARKET INVESTMENTS — 4.4% | |
| | |
State Street Institutional U.S. Government Money Market Fund — Premier Class 1.75% (2) | | | 448,304 | | | | 448,304 | |
| | | | | | | | |
|
Total Money Market Investments | |
| |
(Cost: $448,304) | | | | 448,304 | |
| | | | | | | | |
| |
Total Investments (100.4%) | | | | | |
| | |
(Cost: $9,147,817) | | | | | | | 10,121,141 | |
| |
Liabilities in Excess of Other Assets (-0.4%) | | | | (45,119 | ) |
| | | | | | | | |
| |
Total Net Assets (100.0%) | | | $ | 10,076,022 | |
| | | | | | | | |
Notes to Schedule of Investments:
| (1) | Non-income producing security. |
| (2) | Rate disclosed is the 7-day net yield as of October 31, 2019. |
See accompanying notes to financial statements.
46
TCW International Small Cap Fund
Investments by Sector | October 31, 2019 |
| | | | |
| Sector | | Percentage of
Net Assets | |
Auto Components | | | 1.2 | % |
Automobiles | | | 0.4 | |
Banks | | | 8.4 | |
Beverages | | | 3.1 | |
Biotechnology | | | 2.0 | |
Building Products | | | 0.3 | |
Capital Markets | | | 3.0 | |
Commercial Services & Supplies | | | 3.3 | |
Communications Equipment | | | 1.9 | |
Construction & Engineering | | | 2.8 | |
Construction Materials | | | 0.7 | |
Consumer Finance | | | 1.5 | |
Diversified Consumer Services | | | 0.5 | |
Diversified Financial Services | | | 0.8 | |
Electric Utilities | | | 0.3 | |
Electrical Equipment | | | 1.0 | |
Electronic Equipment, Instruments & Components | | | 5.1 | |
Equity Real Estate | | | 3.1 | |
Food Products | | | 0.4 | |
Health Care Equipment & Supplies | | | 2.6 | |
Health Care Providers & Services | | | 0.4 | |
Health Care Technology | | | 2.4 | |
Hotels, Restaurants & Leisure | | | 2.3 | |
Household Durables | | | 5.0 | |
IT Services | | | 4.6 | |
Industrial Conglomerates | | | 0.4 | |
Insurance | | | 3.4 | |
Interactive Media & Services | | | 1.3 | |
Internet & Direct Marketing Retail | | | 0.6 | |
Life Sciences Tools & Services | | | 1.6 | |
Machinery | | | 4.9 | |
Media | | | 1.0 | |
Multi-Utilities | | | 2.2 | |
Oil, Gas & Consumable Fuels | | | 0.7 | |
Personal Products | | | 0.5 | |
Pharmaceuticals | | | 0.5 | |
Professional Services | | | 1.3 | |
REIT | | | 1.7 | |
Real Estate | | | 1.0 | |
Real Estate Management & Development | | | 1.9 | |
Semiconductors & Semiconductor Equipment | | | 7.4 | |
Software | | | 3.3 | |
Specialty Retail | | | 1.7 | |
Technology Hardware, Storage & Peripherals | | | 0.3 | |
Textiles, Apparel & Luxury Goods | | | 1.7 | |
Thrifts & Mortgage Finance | | | 0.2 | |
Trading Companies & Distributors | | | 0.5 | |
Transportation Infrastructure | | | 0.5 | |
Water Utilities | | | 0.3 | |
Money Market Investments | | | 4.4 | |
| | | | |
Total | | | 100.4 | % |
| | | | |
See accompanying notes to financial statements.
47
TCW International Small Cap Fund
Fair Valuation Summary | October 31, 2019 |
The following is a summary of the fair valuations according to the inputs used as of October 31, 2019 in valuing the Fund’s investments:
| | | | | | | | | | | | | | | | |
Description | | Quoted Prices
in Active
Markets for
Identical
Assets
(Level 1) | | | Other
Significant
Observable
Inputs
(Level 2) | | | Significant
Unobservable
Inputs
(Level 3) | | | Total | |
Common Stock | | | | | | | | | | | | | | | | |
Auto Components | | $ | — | | | $ | 103,634 | | | $ | — | | | $ | 103,634 | |
Banks | | | 81,125 | | | | 768,948 | | | | — | | | | 850,073 | |
Beverages | | | — | | | | 318,338 | | | | — | | | | 318,338 | |
Biotechnology | | | 90,045 | | | | 114,649 | | | | — | | | | 204,694 | |
Building Products | | | — | | | | 30,667 | | | | — | | | | 30,667 | |
Capital Markets | | | — | | | | 306,223 | | | | — | | | | 306,223 | |
Commercial Services & Supplies | | | 63,082 | | | | 282,745 | | | | — | | | | 345,827 | |
Communications Equipment | | | — | | | | 190,358 | | | | — | | | | 190,358 | |
Construction & Engineering | | | 23,954 | | | | 268,735 | | | | — | | | | 292,689 | |
Construction Materials | | | — | | | | 72,129 | | | | — | | | | 72,129 | |
Consumer Finance | | | — | | | | 152,556 | | | | — | | | | 152,556 | |
Diversified Consumer Services | | | — | | | | 51,450 | | | | — | | | | 51,450 | |
Diversified Financial Services | | | 52,511 | | | | 25,515 | | | | — | | | | 78,026 | |
Electrical Equipment | | | — | | | | 100,072 | | | | — | | | | 100,072 | |
Electronic Equipment, Instruments & Components | | | — | | | | 510,894 | | | | — | | | | 510,894 | |
Equity Real Estate | | | 258,678 | | | | 49,669 | | | | — | | | | 308,347 | |
Food Products | | | 44,003 | | | | — | | | | — | | | | 44,003 | |
Health Care Equipment & Supplies | | | 95,934 | | | | 166,146 | | | | — | | | | 262,080 | |
Health Care Providers & Services | | | — | | | | 42,576 | | | | — | | | | 42,576 | |
Health Care Technology | | | — | | | | 243,761 | | | | — | | | | 243,761 | |
Hotels, Restaurants & Leisure | | | — | | | | 222,731 | | | | — | | | | 222,731 | |
Household Durables | | | 107,773 | | | | 394,919 | | | | — | | | | 502,692 | |
IT Services | | | — | | | | 452,999 | | | | — | | | | 452,999 | |
Industrial Conglomerates | | | — | | | | 45,747 | | | | — | | | | 45,747 | |
Insurance | | | 112,814 | | | | 227,834 | | | | — | | | | 340,648 | |
Interactive Media & Services | | | 79,738 | | | | 53,348 | | | | — | | | | 133,086 | |
Internet & Direct Marketing Retail | | | 54,492 | | | | — | | | | — | | | | 54,492 | |
Life Sciences Tools & Services | | | 57,850 | | | | 96,551 | | | | — | | | | 154,401 | |
Machinery | | | — | | | | 490,636 | | | | — | | | | 490,636 | |
Media | | | — | | | | 102,940 | | | | — | | | | 102,940 | |
Multi-Utilities | | | 55,867 | | | | 163,766 | | | | — | | | | 219,633 | |
Oil, Gas & Consumable Fuels | | | 49,930 | | | | 23,156 | | | | — | | | | 73,086 | |
Personal Products | | | — | | | | 50,812 | | | | — | | | | 50,812 | |
Pharmaceuticals | | | — | | | | 50,773 | | | | — | | | | 50,773 | |
Professional Services | | | 25,916 | | | | 104,993 | | | | — | | | | 130,909 | |
REIT | | | 102,970 | | | | 70,804 | | | | — | | | | 173,774 | |
Real Estate Management & Development | | | 188,952 | | | | — | | | | — | | | | 188,952 | |
Real Estate | | | — | | | | 97,125 | | | | — | | | | 97,125 | |
Semiconductors & Semiconductor Equipment | | | 53,120 | | | | 688,987 | | | | — | | | | 742,107 | |
Software | | | 97,321 | | | | 241,256 | | | | — | | | | 338,577 | |
Specialty Retail | | | — | | | | 167,681 | | | | — | | | | 167,681 | |
Technology Hardware, Storage & Peripherals | | | — | | | | 31,032 | | | | — | | | | 31,032 | |
Textiles, Apparel & Luxury Goods | | | — | | | | 173,704 | | | | — | | | | 173,704 | |
Thrifts & Mortgage Finance | | | — | | | | 22,787 | | | | — | | | | 22,787 | |
See accompanying notes to financial statements.
48
TCW International Small Cap Fund
| | | | | | | | | | | | | | | | |
Description | | Quoted Prices
in Active
Markets for
Identical
Assets
(Level 1) | | | Other
Significant
Observable
Inputs
(Level 2) | | | Significant
Unobservable
Inputs
(Level 3) | | | Total | |
Trading Companies & Distributors | | $ | — | | | $ | 52,567 | | | $ | — | | | $ | 52,567 | |
Transportation Infrastructure | | | — | | | | 48,392 | | | | — | | | | 48,392 | |
Water Utilities | | | 31,806 | | | | — | | | | — | | | | 31,806 | |
| | | | | | | | | | | | | | | | |
Total Common Stock | | | 1,727,881 | | | | 7,874,605 | | | | — | | | | 9,602,486 | |
| | | | | | | | | | | | | | | | |
Preferred Stock | | | | | | | | | | | | | | | | |
Automobiles | | | 44,003 | | | | — | | | | — | | | | 44,003 | |
Electric Utilities | | | 26,348 | | | | — | | | | — | | | | 26,348 | |
| | | | | | | | | | | | | | | | |
Total Preferred Stock | | | 70,351 | | | | — | | | | — | | | | 70,351 | |
| | | | | | | | | | | | | | | | |
Money Market Investments | | | 448,304 | | | | — | | | | — | | | | 448,304 | |
| | | | | | | | | | | | | | | | |
Total Investments | | $ | 2,246,536 | | | $ | 7,874,605 | | | $ | — | | | $ | 10,121,141 | |
| | | | | | | | | | | | | | | | |
See accompanying notes to financial statements.
49
TCW Funds, Inc.
Statements of Assets and Liabilities | October 31, 2019 |
| | | | | | | | | | | | | | | | | | | | |
| | | TCW
Developing
Markets
Equity Fund | | | TCW
Emerging
Markets
Income Fund | | | TCW
Emerging
Markets
Local
Currency
Income Fund | | | TCW
Emerging
Markets
Multi-Asset
Opportunities
Fund | | | TCW
International
Small Cap
Fund | |
| | | Dollar Amounts in Thousands
(Except Per Share Amounts) | |
ASSETS | | | | | | | | | | | | | | | | | | | | |
Investments, at Value (1) | | $ | 5,624 | | | $ | 6,046,394 | | | $ | 247,000 | | | $ | 97,186 | | | $ | 10,121 | |
Foreign Currency, at Value (2) | | | 3 | | | | 5,877 | | | | 1 | | | | 144 | | | | — | |
Cash Collateral Held for Brokers | | | — | | | | 5,495 | | | | 131 | | | | 49 | | | | — | |
Receivable for Securities Sold | | | 68 | | | | 94,626 | | | | — | | | | 3,060 | | | | 321 | |
Receivable for Fund Shares Sold | | | — | | | | 12,765 | | | | 1,296 | | | | 26 | | | | — | |
Interest and Dividends Receivable | | | 2 | | | | 71,957 | | | | 3,839 | | | | 581 | | | | 18 | |
Foreign Tax Reclaims Receivable | | | — | (3) | | | — | | | | — | | | | 3 | | | | 6 | |
Receivable from Investment Advisor | | | 27 | | | | 35 | | | | 25 | | | | 18 | | | | 28 | |
Unrealized Appreciation on Open Forward Foreign Currency Contracts | | | — | | | | 82 | | | | 933 | | | | 1 | | | | — | |
Receivable for Daily Variation Margin on Open Financial Futures Contracts | | | — | | | | 3,200 | | | | 37 | | | | 23 | | | | — | |
Prepaid Expenses | | | 21 | | | | 27 | | | | 44 | | | | 21 | | | | 13 | |
| | | | | | | | | | | | | | | | | | | | |
Total Assets | | | 5,745 | | | | 6,240,458 | | | | 253,306 | | | | 101,112 | | | | 10,507 | |
| | | | | | | | | | | | | | | | | | | | |
LIABILITIES | | | | | | | | | | | | | | | | | | | | |
Distributions Payable | | | — | | | | 26,113 | | | | — | | | | — | | | | — | |
Payable for Securities Purchased | | | 31 | | | | 213,782 | | | | 2,726 | | | | 1,618 | | | | 302 | |
Payable for Fund Shares Redeemed | | | — | | | | 5,788 | | | | 280 | | | | 67 | | | | — | |
Accrued Capital Gain Withholding Taxes | | | — | | | | — | | | | 118 | | | | — | | | | — | |
Disbursements in Excess of Available Cash | | | 2 | | | | — | | | | — | | | | — | | | | 53 | |
Accrued Directors’ Fees and Expenses | | | 10 | | | | 10 | | | | 10 | | | | 10 | | | | 10 | |
Accrued Management Fees | | | 4 | | | | 3,783 | | | | 200 | | | | 75 | | | | 6 | |
Accrued Distribution Fees | | | — | (3) | | | 68 | | | | 6 | | | | 3 | | | | 1 | |
Unrealized Depreciation on Open Forward Foreign Currency Contracts | | | — | | | | 835 | | | | 818 | | | | 7 | | | | — | |
Other Accrued Expenses | | | 52 | | | | 1,035 | | | | 169 | | | | 118 | | | | 59 | |
| | | | | | | | | | | | | | | | | | | | |
Total Liabilities | | | 99 | | | | 251,414 | | | | 4,327 | | | | 1,898 | | | | 431 | |
| | | | | | | | | | | | | | | | | | | | |
NET ASSETS | | $ | 5,646 | | | $ | 5,989,044 | | | $ | 248,979 | | | $ | 99,214 | | | $ | 10,076 | |
| | | | | | | | | | | | | | | | | | | | |
See accompanying notes to financial statements.
50
TCW Funds, Inc.
Statements of Assets and Liabilities (Continued) | October 31, 2019 |
| | | | | | | | | | | | | | | | | | | | |
| | | TCW
Developing
Markets
Equity Fund | | | TCW
Emerging
Markets
Income Fund | | | TCW
Emerging
Markets
Local
Currency
Income Fund | | | TCW
Emerging
Markets
Multi-Asset
Opportunities
Fund | | | TCW
International
Small Cap
Fund | |
| | | Dollar Amounts in Thousands
(Except Per Share Amounts) | |
NET ASSETS CONSIST OF: | | | | | | | | | | | | | | | | | | | | |
Paid-in Capital | | $ | 5,558 | | | $ | 6,544,131 | | | $ | 270,938 | | | $ | 97,103 | | | $ | 11,353 | |
Accumulated Earnings (Loss) | | | 88 | | | | (555,087 | ) | | | (21,959 | ) | | | 2,111 | | | | (1,277 | ) |
| | | | | | | | | | | | | | | | | | | | |
NET ASSETS | | $ | 5,646 | | | $ | 5,989,044 | | | $ | 248,979 | | | $ | 99,214 | | | $ | 10,076 | |
| | | | | | | | | | | | | | | | | | | | |
NET ASSETS ATTRIBUTABLE TO: | |
I Class Share | | $ | 4,071 | | | $ | 5,668,552 | | | $ | 220,968 | | | $ | 87,430 | | | $ | 7,004 | |
| | | | | | | | | | | | | | | | | | | | |
N Class Share | | $ | 1,575 | | | $ | 320,492 | | | $ | 28,011 | | | $ | 11,784 | | | $ | 3,072 | |
| | | | | | | | | | | | | | | | | | | | |
CAPITAL SHARES OUTSTANDING: (4) | |
I Class Share | | | 401,265 | | | | 680,846,675 | | | | 24,089,977 | | | | 7,732,286 | | | | 706,193 | |
| | | | | | | | | | | | | | | | | | | | |
N Class Share | | | 155,338 | | | | 29,885,510 | | | | 3,059,652 | | | | 1,048,464 | | | | 309,945 | |
| | | | | | | | | | | | | | | | | | | | |
NET ASSET VALUE PER SHARE: (5) | |
I Class Share | | $ | 10.14 | | | $ | 8.33 | | | $ | 9.17 | | | $ | 11.31 | | | $ | 9.92 | |
| | | | | | | | | | | | | | | | | | | | |
N Class Share | | $ | 10.14 | | | $ | 10.72 | | | $ | 9.15 | | | $ | 11.24 | | | $ | 9.91 | |
| | | | | | | | | | | | | | | | | | | | |
| (1) | The identified cost for the TCW Developing Markets Equity Fund, the TCW Emerging Markets Income Fund, the TCW Emerging Markets Local Currency Income Fund, the TCW Emerging Markets Multi-Asset Opportunities Fund and the TCW International Small Cap Fund at October 31, 2019 was $4,785, $5,900,966, $237,424, $87,907 and $9,148, respectively. |
| (2) | The identified cost for the TCW Developing Markets Equity Fund, the TCW Emerging Markets Income Fund, the TCW Emerging Markets Local Currency Income Fund and the TCW Emerging Markets Multi-Asset Opportunities Fund at October 31, 2019 was $3, $5,857, $1 and $144, respectively. |
| (3) | Amount rounds to less than $1. |
| (4) | The number of authorized shares, with a par value of $0.001 per share is 4,000,000,000 for each of the I Class and N Class shares. |
| (5) | Represents offering price and redemption price per share. |
See accompanying notes to financial statements.
51
TCW Funds, Inc.
Statements of Operations | Year Ended October 31, 2019 |
| | | | | | | | | | | | | | | | | | | | |
| | | TCW
Developing
Markets
Equity Fund | | | TCW
Emerging
Markets
Income Fund | | | TCW
Emerging
Markets
Local
Currency
Income Fund | | | TCW
Emerging
Markets
Multi-Asset
Opportunities
Fund | | | TCW
International
Small Cap
Fund | |
| | | Dollar Amounts in Thousands | |
INVESTMENT INCOME | |
Income: | |
Dividends | | $ | 123 | (1) | | $ | — | | | $ | — | | | $ | 1,282 | (1) | | $ | 210 | (1) |
Interest | | | — | | | | 351,962 | | | | 19,535 | (2) | | | 3,376 | (2) | | | — | |
| | | | | | | | | | | | | | | | | | | | |
Total | | | 123 | | | | 351,962 | | | | 19,535 | | | | 4,658 | | | | 210 | |
| | | | | | | | | | | | | | | | | | | | |
Expenses: | |
Management Fees | | | 43 | | | | 40,853 | | | | 1,944 | | | | 990 | | | | 75 | |
Accounting Services Fees | | | 5 | | | | 340 | | | | 23 | | | | 13 | | | | 6 | |
Administration Fees | | | 19 | | | | 542 | | | | 47 | | | | 32 | | | | 19 | |
Transfer Agent Fees: | |
I Class | | | 7 | | | | 2,773 | | | | 141 | | | | 43 | | | | 9 | |
N Class | | | 6 | | | | 301 | | | | 44 | | | | 52 | | | | 7 | |
Custodian Fees | | | 62 | | | | 194 | | | | 315 | | | | 158 | | | | 61 | |
Professional Fees | | | 30 | | | | 158 | | | | 44 | | | | 53 | | | | 40 | |
Directors’ Fees and Expenses | | | 39 | | | | 39 | | | | 39 | | | | 39 | | | | 39 | |
Registration Fees: | |
I Class | | | 19 | | | | 128 | | | | 32 | | | | 21 | | | | 19 | |
N Class | | | 19 | | | | 35 | | | | 26 | | | | 24 | | | | 18 | |
Distribution Fees: | |
N Class | | | 4 | | | | 825 | | | | 94 | | | | 100 | | | | 8 | |
Shareholder Reporting Expense | | | 2 | | | | 14 | | | | 6 | | | | 5 | | | | 2 | |
Other | | | 27 | | | | 615 | | | | 44 | | | | 36 | | | | 17 | |
| | | | | | | | | | | | | | | | | | | | |
Total | | | 282 | | | | 46,817 | | | | 2,799 | | | | 1,566 | | | | 320 | |
| | | | | | | | | | | | | | | | | | | | |
Less Expenses Borne by Investment Advisor: | | | | | | | | | | | | | | | | | | | | |
I Class | | | 141 | | | | — | | | | 324 | | | | 199 | | | | 134 | |
N Class | | | 73 | | | | 293 | | | | 182 | | | | 178 | | | | 74 | |
| | | | | | | | | | | | | | | | | | | | |
Net Expenses | | | 68 | | | | 46,524 | | | | 2,293 | | | | 1,189 | | | | 112 | |
| | | | | | | | | | | | | | | | | | | | |
Net Investment Income | | | 55 | | | | 305,438 | | | | 17,242 | | | | 3,469 | | | | 98 | |
| | | | | | | | | | | | | | | | | | | | |
NET REALIZED AND UNREALIZED GAIN (LOSS) ON INVESTMENTS | | | | | | | | | | | | | | | | | | | | |
Net Realized (Loss) on: | |
Investments | | | (233 | ) | | | 96,588 | (3) | | | (8,935 | ) (3) | | | (1,810 | ) (3) | | | (694 | ) |
Foreign Currency | | | (11 | ) | | | (218 | ) | | | (330 | ) | | | (121 | ) | | | (12 | ) |
Foreign Currency Forward Contracts | | | — | | | | (10,942 | ) | | | (3,198 | ) | | | (109 | ) | | | — | |
Futures Contracts | | | — | | | | 7,341 | | | | — | | | | 60 | | | | — | |
Options Written | | | — | | | | — | | | | 97 | | | | — | | | | — | |
Change in Unrealized Appreciation (Depreciation) on: | |
Investments | | | 630 | | | | 264,730 | | | | 29,297 | (4) | | | 9,203 | | | | 946 | |
Foreign Currency | | | — | | | | 30 | | | | 139 | | | | (4 | ) | | | 1 | |
Foreign Currency Forward Contracts | | | — | | | | 5,710 | | | | 2,410 | | | | 75 | | | | — | |
Futures Contracts | | | — | | | | (7,792 | ) | | | (47 | ) | | | (59 | ) | | | — | |
| | | | | | | | | | | | | | | | | | | | |
Net Realized and Unrealized Gain (Loss) on Investments and Foreign Currency Transactions | | | 386 | | | | 355,447 | | | | 19,433 | | | | 7,235 | | | | 241 | |
| | | | | | | | | | | | | | | | | | | | |
INCREASE IN NET ASSETS RESULTING FROM OPERATIONS | | $ | 441 | | | $ | 660,885 | | | $ | 36,675 | | | $ | 10,704 | | | $ | 339 | |
| | | | | | | | | | | | | | | | | | | | |
| (1) | Net of foreign taxes withheld of $15, $161 and $24 for the TCW Developing Markets Equity Fund, the TCW Emerging Markets Multi-Asset Opportunities Fund and the TCW International Small Cap Fund, respectively. |
| (2) | Net of foreign taxes withheld of $603 and $1 for the TCW Emerging Markets Local Currency Income Fund and the TCW Emerging Markets Multi-Asset Opportunities Fund, respectively. |
| (3) | Net of capital gain withholding taxes of $36, $75 and $0 for the TCW Emerging Markets Income Fund, the TCW Emerging Markets Local Currency Income Fund and the TCW Emerging Markets Multi-Asset Opportunities Fund, respectively. |
| (4) | Net of capital gain withholding taxes of $118 for the TCW Emerging Markets Local Currency Income Fund. |
See accompanying notes to financial statements.
52
TCW Funds, Inc.
Statements of Changes in Net Assets
| | | | | | | | | | | | | | | | |
| | | TCW
Developing Markets Equity
Fund | | | TCW
Emerging Markets Income
Fund | |
| | | Year Ended
October 31,
2019 | | | Year Ended
October 31,
2018 | | | Year Ended
October 31,
2019 | | | Year Ended
October 31,
2018 | |
| | | Dollar Amounts in Thousands | |
OPERATIONS | |
Net Investment Income | | $ | 55 | | | $ | 32 | | | $ | 305,438 | | | $ | 207,167 | |
Net Realized Gain (Loss) on Investments, Futures Contracts and Foreign Currency Transactions | | | (244 | ) | | | 206 | | | | 92,769 | | | | (201,928 | ) |
Change in Unrealized Appreciation (Depreciation) on Investments, Futures Contracts and Foreign Currency Transactions | | | 630 | | | | (1,201 | ) | | | 262,678 | | | | (207,956 | ) |
| | | | | | | | | | | | | | | | |
Increase (Decrease) in Net Assets Resulting from Operations | | | 441 | | | | (963 | ) | | | 660,885 | | | | (202,717 | ) |
| | | | | | | | | | | | | | | | |
DISTRIBUTIONS TO SHAREHOLDERS | |
Distributions to Shareholders | | | (22 | ) | | | (32 | ) | | | (294,091 | ) | | | (172,717 | ) |
| | | | | | | | | | | | | | | | |
NET CAPITAL SHARE TRANSACTIONS | |
I Class | | | 18 | | | | 28 | | | | 958,795 | | | | 1,660,755 | |
N Class | | | (9 | ) | | | 30 | | | | (44,661 | ) | | | (127,753 | ) |
| | | | | | | | | | | | | | | | |
Increase in Net Assets Resulting from Net Capital Shares Transactions | | | 9 | | | | 58 | | | | 914,134 | | | | 1,533,002 | |
| | | | | | | | | | | | | | | | |
Increase (Decrease) in Net Assets | | | 428 | | | | (937 | ) | | | 1,280,928 | | | | 1,157,568 | |
NET ASSETS | |
Beginning of Year | | | 5,218 | | | | 6,155 | | | | 4,708,116 | | | | 3,550,548 | |
| | | | | | | | | | | | | | | | |
End of Year | | $ | 5,646 | | | $ | 5,218 | | | $ | 5,989,044 | | | $ | 4,708,116 | |
| | | | | | | | | | | | | | | | |
See accompanying notes to financial statements.
53
TCW Funds, Inc.
Statements of Changes in Net Assets
| | | | | | | | | | | | | | | | |
| | | TCW
Emerging Markets Local
Currency Income Fund | | | TCW
Emerging Markets Multi-Asset
Opportunities Fund | |
| | | Year Ended
October 31,
2019 | | | Year Ended
October 31,
2018 | | | Year Ended
October 31,
2019 | | | Year Ended
October 31,
2018 | |
| | | Dollar Amounts in Thousands | |
OPERATIONS | |
Net Investment Income | | $ | 17,242 | | | $ | 17,882 | | | $ | 3,469 | | | $ | 2,339 | |
Net Realized Loss on Investments, Futures Contracts, Options Written and Foreign Currency Transactions | | | (12,366 | ) | | | (20,967 | ) | | | (1,980 | ) | | | (4,647 | ) |
Change in Unrealized Appreciation (Depreciation) on Investments, Futures Contracts and Foreign Currency Transactions | | | 31,799 | | | | (23,416 | ) | | | 9,215 | | | | (10,379 | ) |
| | | | | | | | | | | | | | | | |
Increase (Decrease) in Net Assets Resulting from Operations | | | 36,675 | | | | (26,501 | ) | | | 10,704 | | | | (12,687 | ) |
| | | | | | | | | | | | | | | | |
DISTRIBUTIONS TO SHAREHOLDERS | |
Distributions to Shareholders | | | (4,591 | ) | | | (6,699 | ) | | | (1,629 | ) | | | (2,016 | ) |
Return of Capital | | | — | | | | (9,233 | ) | | | — | | | | — | |
| | | | | | | | | | | | | | | | |
Total Distributions to Shareholders | | | (4,591 | ) | | | (15,932 | ) | | | (1,629 | ) | | | (2,016 | ) |
| | | | | | | | | | | | | | | | |
NET CAPITAL SHARE TRANSACTIONS | |
I Class | | | (70,994 | ) | | | 161,521 | | | | 40,611 | | | | 6,781 | |
N Class | | | (24,529 | ) | | | 20,455 | | | | (68,487 | ) | | | 43,832 | |
| | | | | | | | | | | | | | | | |
Increase (Decrease) in Net Assets Resulting from Net Capital Shares Transactions | | | (95,523 | ) | | | 181,976 | | | | (27,876 | ) | | | 50,613 | |
| | | | | | | | | | | | | | | | |
Increase (Decrease) in Net Assets | | | (63,439 | ) | | | 139,543 | | | | (18,801 | ) | | | 35,910 | |
NET ASSETS | |
Beginning of Year | | | 312,418 | | | | 172,875 | | | | 118,015 | | | | 82,105 | |
| | | | | | | | | | | | | | | | |
End of Year | | $ | 248,979 | | | $ | 312,418 | | | $ | 99,214 | | | $ | 118,015 | |
| | | | | | | | | | | | | | | | |
See accompanying notes to financial statements.
54
TCW Funds, Inc.
Statements of Changes in Net Assets
| | | | | | | | |
| | | TCW
International Small Cap
Fund | |
| | | Year Ended
October 31,
2019 | | | Year Ended
October 31,
2018 | |
| | | Dollar Amounts in Thousands | |
OPERATIONS | |
Net Investment Income | | $ | 98 | | | $ | 28 | |
Net Realized Gain (Loss) on Investments and Foreign Currency Transactions | | | (706 | ) | | | 350 | |
Change in Unrealized Appreciation (Depreciation) on Investments and Foreign Currency Transactions | | | 947 | | | | (1,340 | ) |
| | | | | | | | |
Increase (Decrease) in Net Assets Resulting from Operations | | | 339 | | | | (962 | ) |
| | | | | | | | |
DISTRIBUTIONS TO SHAREHOLDERS | |
Distributions to Shareholders | | | (41 | ) | | | — | |
| | | | | | | | |
NET CAPITAL SHARE TRANSACTIONS | |
I Class | | | 195 | | | | 916 | |
N Class | | | (212 | ) | | | (98 | ) |
| | | | | | | | |
Increase (Decrease) in Net Assets Resulting from Net Capital Shares Transactions | | | (17 | ) | | | 818 | |
| | | | | | | | |
Increase (Decrease) in Net Assets | | | 281 | | | | (144 | ) |
NET ASSETS | |
Beginning of Year | | | 9,795 | | | | 9,939 | |
| | | | | | | | |
End of Year | | $ | 10,076 | | | $ | 9,795 | |
| | | | | | | | |
See accompanying notes to financial statements.
55
TCW Funds, Inc.
Notes to Financial Statements
Note 1 — Organization
TCW Funds, Inc., a Maryland corporation (the “Company”), is an open-end management investment company registered under the Investment Company Act of 1940, as amended (the “1940 Act”), that currently offers 19 no-load mutual funds (each series, a “Fund” and collectively, the “Funds”). TCW Investment Management Company LLC (the “Advisor”) is the investment advisor to and an affiliate of the Funds and is registered under the Investment Advisers Act of 1940, as amended. Each Fund has its own investment objectives and strategies. The following is a brief description of the investment objectives and principal investment strategies for the Funds that are covered in this report:
| | |
TCW Fund | | Investment Objectives and Principal Investment Strategies |
| Diversified Fixed Income Fund |
| |
| TCW Emerging Markets Income Fund | | Seeks high total return from current income and capital appreciation by investing at least 80% of the value of its net assets in debt securities issued or guaranteed by companies, financial institutions and government entities in emerging market countries. |
| Non-Diversified Fixed Income Fund |
| |
| TCW Emerging Markets Local Currency Income Fund | | Seeks to provide high total return from current income and capital appreciation through investment in debt securities denominated in the local currencies of various emerging market countries; invests at least 80% of the value of its net assets in debt securities issued or guaranteed by companies and government entities in emerging market countries denominated in the local currencies of the issuer and in derivative instruments that provide investment exposure to such securities. |
| Diversified International Equity Funds |
| |
| TCW International Small Cap Fund | | Seeks long-term capital appreciation by investing at least 80% of its net assets in equity securities of small capitalization companies that are domiciled outside the United States or whose primary business operations are outside the United States. |
| |
| TCW Developing Markets Equity Fund | | Seeks long-term capital appreciation by investing at least 80% of the value of its net assets in equity securities issued by companies and financial institutions domiciled or with primary business operations in, or with the majority of their net assets in or revenues or net income deriving from, developing market countries. |
| Diversified Balanced Fund |
| |
| TCW Emerging Markets Multi-Asset Opportunities Fund | | Seeks current income and long term capital appreciation by investing at least 80% of the value of its net assets in debt and equity securities issued or guaranteed by companies, financial institutions and government entities in emerging market countries. |
All Funds offer two classes of shares: I Class and N Class. The two classes of a Fund are substantially the same except that the N Class shares are subject to a distribution fee (see Note 6).
56
TCW Funds, Inc.
Note 2 — Significant Accounting Policies
The following is a summary of significant accounting policies, which are in conformity with accounting principles generally accepted in the United States of America (“GAAP”) and which are consistently followed by the Funds in the preparation of their financial statements. Each Fund is considered an investment company under the Financial Accounting Standards Board (FASB) Accounting Standards Codification (ASC) No. 946, Financial Services — Investment Companies. Subsequent events, if any, have been evaluated through the date of issuance in the preparation of the financial statements.
Principles of Accounting: The Funds use the accrual method of accounting for financial reporting purposes.
Net Asset Value: The net asset value (“NAV”) per share of each class of a Fund is determined by dividing the Fund’s net assets attributable to each class by the number of shares issued and outstanding of that class on each day the New York Stock Exchange (“NYSE”) is open for trading.
Security Valuations: Securities listed or traded on the NYSE and other stock exchanges are valued at the latest sale price on that exchange. Securities traded on the NASDAQ stock market (“NASDAQ”) are valued using official closing prices as reported by NASDAQ. All other securities traded over-the-counter (“OTC”) for which market quotations are readily available, including short-term securities, are valued with prices furnished by independent pricing services or by broker dealers.
The Company has adopted, after the approval by the Company’s Board of Directors (the “Board” and each member thereof a “Director”), a fair valuation methodology for foreign equity securities (exclusive of certain Latin American and Canadian equity securities). This methodology is designed to address the effect of movements in the U.S. market on the securities traded on foreign exchanges that have been closed for a period of time due to time zones differences. The utilization of the fair value model may result in the adjustment of prices taking into account fluctuations in the U.S. market. The fair value model is utilized each trading day and not dependent on certain thresholds or triggers.
Securities for which market quotations are not readily available, including in circumstances under which it is determined by the Advisor that prices received are not reflective of their market values, are valued by the Advisor’s Pricing Committee in accordance with the guidelines established by the Board’s Valuation Committee and under the general oversight of the Board.
Fair value is defined as the price that a Fund would receive upon selling an investment in a timely transaction to an independent buyer in the principal or most advantageous market for the investment. In accordance with the authoritative guidance on fair value measurements and disclosures GAAP, the Funds disclose investments in their financial statements in a three-tier hierarchy. This hierarchy is utilized to establish classification of fair value measurements based on inputs. Inputs that go into fair value measurement refer broadly to the assumptions that market participants would use in pricing the asset or liability, including assumptions about risk. Inputs may be observable or unobservable. Observable inputs are inputs that reflect the assumptions market participants would use in pricing the asset or liability developed based on market data obtained from sources independent of the reporting entity. Unobservable inputs are inputs that reflect the reporting entity’s own assumptions in pricing the asset or liability developed based on the best information available in the circumstances.
57
TCW Funds, Inc.
Notes to Financial Statements (Continued)
Note 2 — Significant Accounting Policies (Continued)
The three-tier hierarchy of inputs is summarized in the three broad levels listed below.
| | |
| Level 1 — | | quoted prices in active markets for identical investments. |
| Level 2 — | | other significant observable inputs (including quoted prices for similar investments, interest rates, prepayment speeds, credit risk, etc.). |
| Level 3 — | | significant unobservable inputs (including the Funds’ own assumptions in determining the fair value of investments). |
Changes in valuation techniques may result in transfers in or out of an investment’s assigned level within the hierarchy. The inputs or methodologies used for valuing investments are not necessarily an indication of the risk associated with investing in those investments and the determination of the significance of a particular input to the fair value measurement in its entirety requires judgment and consideration of factors specific to each security.
The availability of observable inputs can vary from security to security and is affected by a wide variety of factors, including, for example, the type of security, whether the security is new and not yet established in the marketplace, the liquidity of markets, and other characteristics particular to the security. To the extent that valuation is based on models or inputs that are less observable or unobservable in the market, the determination of fair value requires more judgment. Accordingly, the degree of judgment exercised in determining fair value is greatest for instruments categorized in Level 3.
In periods of market dislocation, the observability of prices and inputs may be reduced for many instruments. This condition, as well as changes related to liquidity of investments, could cause a security to be reclassified between Level 1, Level 2, or Level 3.
In certain cases, the inputs used to measure fair value may fall into different levels of the fair value hierarchy. In such cases, for disclosure purposes the level in the fair value hierarchy within which the fair value measurement falls in its entirety is determined based on the lowest level input that is significant to the fair value measurement.
Fair Value Measurements: Descriptions of the valuation techniques applied to the Funds’ major categories of assets and liabilities measured at fair value on a recurring basis are as follows:
Corporate bonds. The fair value of corporate bonds is estimated using recently executed transactions, market price quotations (where observable), bond spreads, or credit default swap spreads adjusted for any basis difference between cash and derivative instruments. Corporate bonds are generally categorized in Level 2 of the fair value hierarchy; in instances where prices, spreads, or any of the other aforementioned key inputs are unobservable, they are categorized in Level 3 of the hierarchy.
Equity securities. Securities are generally valued based on quoted prices from the applicable exchange. To the extent these securities are actively traded and valuation adjustments are not applied, they are generally categorized in Level 1 of the fair value hierarchy. Restricted securities issued by publicly held companies are generally categorized in Level 2 of the fair value hierarchy; if a discount is applied and significant, they are categorized in Level 3. Restricted securities held in non-public entities are included in Level 3 of the fair value hierarchy because they trade infrequently, and therefore, the inputs are unobservable. Certain foreign securities that are fair valued using a pricing service that considers the correlation of the trading patterns of the foreign security to the intraday trading in the U.S. markets are categorized in Level 2 of the fair value hierarchy.
58
TCW Funds, Inc.
Note 2 — Significant Accounting Policies (Continued)
Foreign currency contracts. The fair value of foreign currency contracts is derived from indices, reference rates, and other inputs or a combination of these factors. To the extent that these factors can be observed, foreign currency contracts are categorized in Level 2 of the fair value hierarchy.
Money market funds. Money market funds are open-end mutual funds that invest in short-term debt securities. To the extent that these funds are valued based upon the reported NAV, they are categorized in Level 1 of the fair value hierarchy.
Restricted securities. Restricted securities, including illiquid Rule 144A securities, held in non-public entities are included in Level 3 of the fair value hierarchy because they trade infrequently, and therefore, the inputs are unobservable. Any other restricted securities valued similar to publicly traded securities may be categorized in Level 2 or 3 of the fair value hierarchy depending on whether a discount is applied and significant to the fair value.
Short-term investments. Short-term investments are valued using market price quotations, and are reflected in Level 2 of the fair value hierarchy.
U.S. and foreign government and agency securities. Government and agency securities are normally valued using a model that incorporates market observable data such as reported sales of similar securities, broker quotes, yields, bids, offers, quoted market prices, and reference data. Accordingly, U.S. and foreign government and agency securities are normally categorized in Level 1 or 2 of the fair value hierarchy depending on the liquidity and transparency of the market.
The summary of the inputs used as of October 31, 2019 is listed after the Schedule of Investments for each Fund.
Following is a reconciliation of investments in which significant unobservable inputs (Level 3) were used in determining value:
| | | | | | | | |
| | | TCW
Emerging
Markets Income
Fund | | | TCW
Emerging
Markets Multi-Asset
Opportunities Fund | |
Balance as of October 31, 2018 | | $ | — | | | $ | — | |
Accrued Discounts (Premiums) | | | — | | | | — | |
Realized Gain (Loss) | | | (2,139,197 | ) | | | — | |
Change in Unrealized Appreciation | | | (26,236,096 | ) | | | (201,925 | ) |
Purchases | | | 7,784,800 | | | | — | |
Sales | | | (779,708 | ) | | | — | |
Transfers in to Level 3 (1) | | | 39,226,522 | (1) | | | 342,310 | (1) |
Transfers out of Level 3 (1) | | | — | | | | — | |
| | | | | | | | |
Balance as of October 31, 2019 | | $ | 17,856,321 | | | $ | 140,385 | |
| | | | | | | | |
Change in Unrealized Appreciation from Investments Still Held at October 31, 2019 | | $ | (26,236,096 | ) | | $ | (201,925 | ) |
| | | | | | | | |
| (1) | Financial assets transferred between Level 2 and Level 3 were due to a change in observable and/or unobservable inputs. |
59
TCW Funds, Inc.
Notes to Financial Statements (Continued)
Note 2 — Significant Accounting Policies (Continued)
Significant unobservable valuations inputs for Level 3 investments as of October 31, 2019 are as follows:
| | | | | | | | | | | | |
Description | | Fair Value at
10/31/2019 | | | Valuation Techniques* | | Unobservable
Input | | Price or Price
Range | | Average
Weighted
Price |
| TCW Emerging Markets Income Fund |
Government Issues | | $ | 17,856,321 | | | Third-party Vendor | | Vendor Prices | | $10.500 | | $10.500 |
|
| TCW Emerging Markets Multi-Asset Opportunities Fund |
Government Issues | | $ | 140,385 | | | Third-party Vendor | | Vendor Prices | | $10.500 | | $10.500 |
| * | The valuation technique employed on the Level 3 securities involves the use of the vendor prices. The Advisor monitors the effectiveness of vendor pricing using the Advisor’s own model and inputs. |
Security Transactions and Related Investment Income: Security transactions are recorded as of the trade date. Dividend income is recorded on the ex-dividend date. Interest income is recognized on an accrual basis. Realized gains and losses on investments are recorded on the basis of specific identification.
Allocation of Operating Activity for Multiple Classes: Investment income, common expenses and realized and unrealized gains and losses are allocated among the share classes of the Funds based on the relative net assets of each class. Distribution fees, which are directly attributable to a class of shares, are charged to the operations of that class. All other expenses are charged to each Fund or class as incurred on a specific identification basis. Differences in class specific fees and expenses will result in differences in net investment income, and in turn differences in dividends paid by each class.
Dividends and Distributions: Dividends and distributions to shareholders are recorded on the ex-dividend date. The TCW Emerging Markets Income Fund and the TCW Emerging Markets Local Currency Income Fund declare and pay, or reinvest, dividends from net investment income monthly. The other International Funds declare and pay, or reinvest, dividends from net investment income annually. Capital gains realized by a Fund will be distributed at least annually.
Income and capital gain distributions are determined in accordance with income tax regulations which may differ from GAAP. These differences are primarily due to differing treatments for foreign currency transactions, derivative transactions, market discount and premium, losses deferred due to wash sales, excise tax regulations and employing equalization in determining amounts to be distributed to Fund shareholders. Permanent book and tax basis differences relating to shareholder distributions will result in reclassifications between paid-in capital, undistributed net investment income (loss), and/or undistributed accumulated realized gain (loss). Undistributed net investment income or loss may include temporary book and tax basis differences which will reverse in a subsequent period. Any taxable income or capital gain remaining at fiscal year end is distributed in the following fiscal year.
Use of Estimates: The preparation of the accompanying financial statements requires management to make estimates and assumptions that affect the reported amount of assets and liabilities at the date of the financial statements and the reported amounts of income and expenses during the reporting period. Actual results could differ from these estimates.
Foreign Currency Translation: The books and records of each Fund are maintained in U.S. dollars as follows: (1) the foreign currency denominated securities and other assets and liabilities stated in foreign currencies are translated using the daily spot rate; and (2) purchases, sales, income and expenses are translated at the rate of exchange prevailing on the respective dates of such transactions. The resultant exchange gains and losses are included in net realized or net unrealized gain (loss) in the Statements of
60
TCW Funds, Inc.
Note 2 — Significant Accounting Policies (Continued)
Operations. Pursuant to U.S. federal income tax regulations, certain foreign exchange gains and losses included in realized and unrealized gains and losses are included in, or are a reduction of, ordinary income for federal income tax purposes.
Foreign Taxes: The Funds may be subject to withholding taxes on income and capital gains imposed by certain countries in which they invest. The withholding tax on income is netted against the income accrued or received. Any reclaimable taxes are recorded as income. The withholding tax on realized or unrealized gain is recorded as a liability.
Derivative Instruments: Derivatives are financial instruments whose values are based on the values of one or more indicators, such as a security, asset, currency, interest rate, or index. Derivative transactions can create investment leverage and may be highly volatile. A derivative contract may result in a mark to market loss if the value of the contract decreases due to an unfavorable change in the market rates or values of the underlying instrument. It is possible that a derivative transaction will result in a loss greater than the principal amount invested. The Funds may not be able to close out a derivative transaction at a favorable time or price.
For the year ended October 31, 2019, the following Funds had derivatives and transactions in derivatives, grouped in the following risk categories (amounts in thousands except Number of Contracts or Notional Amounts):
TCW Emerging Markets Income Fund
| | | | | | | | | | | | |
| | | Foreign
Currency
Risk | | | Interest
Rate Risk | | | Total | |
Statement of Assets and Liabilities | | | | | | | | | | | | |
Asset Derivatives | |
Forward Contracts | | $ | 82 | | | $ | — | | | $ | 82 | |
| | | | | | | | | | | | |
Total Value | | $ | 82 | | | $ | — | | | $ | 82 | |
| | | | | | | | | | | | |
Liability Derivatives | |
Forward Contracts | | $ | (835 | ) | | $ | — | | | $ | (835 | ) |
Futures Contracts (1) | | | — | | | | (7,792 | ) | | | (7,792 | ) |
| | | | | | | | | | | | |
Total Value | | $ | (835 | ) | | $ | (7,792 | ) | | $ | (8,627 | ) |
| | | | | | | | | | | | |
Statement of Operations: | |
Realized Gain (Loss) | |
Forward Contracts | | $ | (10,942 | ) | | $ | — | | | | (10,942 | ) |
Futures Contracts | | | — | | | | 7,341 | | | | 7,341 | |
Investments (2) | | | (3,111 | ) | | | — | | | | (3,111 | ) |
| | | | | | | | | | | | |
Total Realized Gain (Loss) | | $ | (14,053 | ) | | $ | 7,341 | | | $ | (6,712 | ) |
| | | | | | | | | | | | |
Change in Appreciation (Depreciation) | |
Forward Contracts | | $ | 5,710 | | | $ | — | | | $ | 5,710 | |
Futures Contracts | | | — | | | | (7,792 | ) | | | (7,792 | ) |
Investments (3) | | | 1,090 | | | | — | | | | 1,090 | |
| | | | | | | | | | | | |
Total Change in Appreciation (Depreciation) | | $ | 6,800 | | | $ | (7,792 | ) | | $ | (992 | ) |
| | | | | | | | | | | | |
Number of Contracts or Notional Amounts (4) | |
Forward Currency Contracts | | | $231,065,776 | | | | $ — | | | | $231,065,776 | |
Options Purchased | | | $77,613,000 | | | | $ — | | | | $77,613,000 | |
Futures Contracts | | | — | | | | 844 | | | | 844 | |
| | | | | | | | | | | | |
61
TCW Funds, Inc.
Notes to Financial Statements (Continued)
Note 2 — Significant Accounting Policies (Continued)
TCW Emerging Markets Local Currency Income Fund
| | | | | | | | | | | | |
| | | Foreign
Currency
Risk | | | Interest
Rate Risk | | | Total | |
Statement of Assets and Liabilities | | | | | | | | | | | | |
Asset Derivatives | |
Forward Contracts | | $ | 933 | | | $ | — | | | $ | 933 | |
| | | | | | | | | | | | |
Total Value | | $ | 933 | | | $ | — | | | $ | 933 | |
| | | | | | | | | | | | |
Liability Derivatives | |
Forward Contracts | | $ | (818 | ) | | $ | — | | | $ | (818 | ) |
Futures Contracts (1) | | | — | | | | (47 | ) | | | (47 | ) |
| | | | | | | | | | | | |
Total Value | | $ | (818 | ) | | $ | (47 | ) | | $ | (865 | ) |
| | | | | | | | | | | | |
Statement of Operations: | |
Realized Gain (Loss) | |
Forward Contracts | | $ | (3,198 | ) | | $ | — | | | $ | (3,198 | ) |
Investments (2) | | | (451 | ) | | | — | | | | (451 | ) |
Options Written | | | 97 | | | | — | | | | 97 | |
| | | | | | | | | | | | |
Total Realized Gain (Loss) | | $ | (3,552 | ) | | $ | — | | | $ | (3,552 | ) |
| | | | | | | | | | | | |
Change in Appreciation (Depreciation) | |
Forward Contracts | | $ | 2,410 | | | $ | — | | | $ | 2,410 | |
Futures Contracts | | | — | | | | (47 | ) | | | (47 | ) |
Investments (3) | | | 110 | | | | — | | | | 110 | |
| | | | | | | | | | | | |
Total Change in Appreciation (Depreciation) | | $ | 2,520 | | | $ | (47 | ) | | $ | 2,473 | |
| | | | | | | | | | | | |
Number of Contracts or Notional Amounts (4) | |
Forward Currency Contracts | | | $113,416,635 | | | | $ — | | | | $113,416,635 | |
Options Purchased | | | $8,912,784 | | | | $ — | | | | $8,912,784 | |
Options Written | | | $7,582,847 | | | | $ — | | | | $7,582,847 | |
Futures Contracts | | | — | | | | 11 | | | | 11 | |
| | | | | | | | | | | | |
TCW Emerging Markets Multi-Asset Opportunities Fund
| | | | | | | | | | | | |
| | | Foreign
Currency
Risk | | | Interest
Rate
Risk | | | Total | |
Statement of Assets and Liabilities | | | | | | | | | | | | |
Asset Derivatives | |
Forward Contracts | | $ | 1 | | | $ | — | | | $ | 1 | |
| | | | | | | | | | | | |
Total Value | | $ | 1 | | | $ | — | | | $ | 1 | |
| | | | | | | | | | | | |
Liability Derivatives | |
Forward Contracts | | $ | (7 | ) | | $ | — | | | $ | (7 | ) |
Futures Contracts (1) | | | — | | | | (59 | ) | | | (59 | ) |
| | | | | | | | | | | | |
Total Value | | $ | (7 | ) | | $ | (59 | ) | | $ | (66 | ) |
| | | | | | | | | | | | |
Statement of Operations: | |
Realized Gain (Loss) | |
Forward Contracts | | $ | (109 | ) | | $ | — | | | $ | (109 | ) |
Futures Contracts | | | — | | | | 60 | | | | 60 | |
Investments (2) | | | (23 | ) | | | — | | | | (23 | ) |
| | | | | | | | | | | | |
Total Realized Gain (Loss) | | $ | (132 | ) | | $ | 60 | | | $ | (72 | ) |
| | | | | | | | | | | | |
62
TCW Funds, Inc.
Note 2 — Significant Accounting Policies (Continued)
TCW Emerging Markets Multi-Asset Opportunities Fund (Continued)
| | | | | | | | | | | | |
| | | Foreign
Currency
Risk | | | Interest
Rate
Risk | | | Total | |
Change in Appreciation (Depreciation) | |
Forward Contracts | | $ | 75 | | | $ | — | | | $ | 75 | |
Futures Contracts | | | — | | | | (59 | ) | | | (59 | ) |
Investments (3) | | | 8 | | | | — | | | | 8 | |
| | | | | | | | | | | | |
Total Change in Appreciation (Depreciation) | | $ | 83 | | | $ | (59 | ) | | $ | 24 | |
| | | | | | | | | | | | |
Number of Contracts or Notional Amounts (4) | |
Forward Currency Contracts | | | $2,180,847 | | | | $ — | | | | $2,180,847 | |
Options Purchased | | | $542,500 | | | | $ — | | | | $542,500 | |
Futures Contracts | | | — | | | | 6 | | | | 6 | |
| (1) | Includes cumulative appreciation (depreciation) of futures contracts as reported in the Schedule of Investments. Only variation margin on October 31, 2019 is reported within the Statement of Assets and Liabilities. |
| (2) | Represents realized gain (loss) for purchased options. |
| (3) | Represents change in unrealized appreciation (depreciation) for purchased options during the year. |
| (4) | Amount disclosed represents average number of contracts or notional amounts, which are representative of the volume traded for the year ended October 31, 2019. |
Counterparty Credit Risk: Derivative contracts may be exposed to counterparty risk. Losses can occur if the counterparty does not perform under the contract.
A Fund’s risk of loss from counterparty credit risk on OTC derivatives is generally limited to the aggregate unrealized gain netted against any collateral held by the Fund.
With exchange traded futures and centrally cleared swaps, there is less counterparty credit risk to the Funds since the exchange or clearinghouse, as counterparty to such instruments, guarantees against a possible default. The clearinghouse stands between the buyer and the seller of the contract; therefore, the credit risk is limited to failure of the clearinghouse. While offset rights may exist under applicable law, the Funds do not have a contractual right of offset against a clearing broker or clearinghouse in the event of a default (including the bankruptcy or insolvency) of the clearing broker or clearinghouse. Additionally, credit risk exists in exchange traded futures and centrally cleared swaps with respect to initial and variation margin that is held in a clearing broker’s customer accounts. While clearing brokers are required to segregate customer margin from their own assets, in the event that a clearing broker becomes insolvent or goes into bankruptcy and at that time there is a shortfall in the aggregate amount of margin held by the clearing broker for all its clients, typically the shortfall would be allocated on a pro rata basis across all the clearing broker’s customers, potentially resulting in losses to the Funds.
For OTC derivatives the Funds mitigate their counterparty risk by entering into an International Swaps and Derivatives Association, Inc. Master Agreement (“ISDA Master Agreement”) or similar agreement with each counterparty. An ISDA Master Agreement is a bilateral agreement between the Funds and a counterparty that governs OTC derivatives and typically contains, among other things, collateral posting terms and netting provisions in the event of a default and/or termination event. Under an ISDA Master Agreement, a Fund may, under certain circumstances, offset with the counterparty certain derivative financial instruments’ payables and/or receivables with collateral held and/or posted and create one single net payment. The provisions of the ISDA Master Agreement typically permit a single net payment in the event of default including the bankruptcy or insolvency of the counterparty. However, bankruptcy or insolvency laws of a particular jurisdiction may impose restrictions on or prohibitions against the right of
63
TCW Funds, Inc.
Notes to Financial Statements (Continued)
Note 2 — Significant Accounting Policies (Continued)
offset in bankruptcy, insolvency or other events. In addition, certain ISDA Master Agreements allow counterparties to OTC derivatives to terminate derivative contracts prior to maturity in the event a Fund’s net assets decline by a stated percentage or fail to meet the terms of its ISDA Master Agreements, which would cause the Fund to accelerate payment of any net liability
owed to the counterparty.
Collateral requirements: For derivatives traded under an ISDA Master Agreement, the collateral requirements are typically calculated by netting the mark to market amount for each transaction under such agreement and comparing that amount to the value of any collateral pledged or received by a Fund.
Cash collateral that has been pledged to cover obligations of a Fund is reported separately on the Statement of Assets and Liabilities. Non-cash collateral pledged by a Fund, if any, is noted in the Schedule of Investments. Generally, the amount of collateral due from or to a party has to exceed a minimum transfer amount threshold, typically $250,000 or $500,000, before a transfer is required, which is determined at the close of each business day and the collateral is transferred on the next business day. To the extent amounts due to a Fund from its counterparties are not fully collateralized, contractually or otherwise, the Fund bears the risk of loss from counterparty non-performance. The Funds attempt to mitigate counterparty risk by entering into agreements only with counterparties that Advisor believes have the financial resources to honor their obligations and by monitoring the financial stability of those counterparties. For financial reporting purposes, the Funds do not offset derivative assets and derivative liabilities that are subject to netting arrangements in the Statements of Assets and Liabilities. The Funds have implemented the disclosure requirements pursuant to FASB ASU No. 2013-01, Disclosures about Offsetting Assets and Liabilities that requires disclosures to make financial statements that are prepared under GAAP more comparable to those prepared under International Financial Reporting Standards.
The following table presents the Funds’ OTC derivative assets and liabilities by counterparty net of amounts available for offset under ISDA Master Agreement and net of the related collateral received by the Funds as of October 31, 2019 (in thousands):
TCW Emerging Markets Income Fund
| | | | | | | | | | | | | | | | | | | | |
Counterparty | | Gross Assets
Subject to Master
Agreements | | | Gross Liabilities
Subject to Master
Agreements | | | Net Assets
(Liabilities)
Subject to Master
Agreements | | | Collateral
Pledged
(Received) | | | Net
Amount (1) | |
Citibank N.A. | | | 82 | | | | (835 | ) | | $ | (753 | ) | | $ | 753 | (2) | | $ | — | |
| | | | | | | | | | | | | | | | | | | | |
Total | | $ | 82 | | | $ | (835 | ) | | $ | (753 | ) | | $ | 753 | (2) | | $ | — | |
| | | | | | | | | | | | | | | | | | | | |
| (1) | Represents the net amount receivable (payable) from (to) the counterparty in the event of default. |
| (2) | Amount does not include excess collateral pledged or received. |
64
TCW Funds, Inc.
Note 2 — Significant Accounting Policies (Continued)
TCW Emerging Markets Local Currency Income Fund
| | | | | | | | | | | | | | | | | | | | |
Counterparty | | Gross Assets
Subject to Master
Agreements | | | Gross Liabilities
Subject to Master
Agreements | | | Net Assets
(Liabilities)
Subject to Master
Agreements | | | Collateral
Pledged
(Received) | | | Net
Amount (1) | |
Bank of America, N.A | | | 281 | | | | (253 | ) | | $ | 28 | | | $ | — | | | $ | 28 | |
Barclays Bank PLC | | | 345 | | | | (268 | ) | | | 77 | | | | — | | | | 77 | |
BNP Paribas S.A. | | | 47 | | | | (68 | ) | | | (21 | ) | | | — | | | | (21 | ) |
Citibank N.A. | | | 192 | | | | (170 | ) | | | 22 | | | | — | | | | 22 | |
Goldman Sachs & Co. | | | 4 | | | | — | | | | 4 | | | | — | | | | 4 | |
JPMorgan Chase Bank | | | — | | | | (59 | ) | | | (59 | ) | | | — | | | | (59 | ) |
Standard Chartered Bank | | | 64 | | | | — | | | | 64 | | | | — | | | | 64 | |
| | | | | | | | | | | | | | | | | | | | |
Total | | $ | 933 | | | $ | (818 | ) | | $ | 115 | | | $ | — | | | $ | 115 | |
| | | | | | | | | | | | | | | | | | | | |
| (1) | Represents the net amount receivable (payable) from (to) the counterparty in the event of default. |
TCW Emerging Markets Multi-Asset Opportunities Fund
| | | | | | | | | | | | | | | | | | | | |
Counterparty | | Gross Assets
Subject to Master
Agreements | | | Gross Liabilities
Subject to Master
Agreements | | | Net Assets
(Liabilities)
Subject to Master
Agreements | | | Collateral
Pledged
(Received) | | | Net
Amount (1) | |
Citibank N.A. | | | 1 | | | | (7 | ) | | $ | (6 | ) | | $ | — | | | $ | (6 | ) |
| | | | | | | | | | | | | | | | | | | | |
Total | | $ | 1 | | | $ | (7 | ) | | $ | (6 | ) | | $ | — | | | $ | (6 | ) |
| | | | | | | | | | | | | | | | | | | | |
| (1) | Represents the net amount receivable (payable) from (to) the counterparty in the event of default. |
Note 3 — Portfolio Investments
When-Issued, Delayed-Delivery, and Forward Commitment Transactions: The Funds may enter into when-issued, delayed-delivery, or forward commitment transactions in order to lock in the purchase price of the underlying security or to adjust the interest rate exposure of each Fund’s existing portfolio. In when issued, delayed-delivery, or forward commitment transactions, a Fund commits to purchase securities, with payment and delivery to take place at a future date. Although the Fund does not pay for the securities or start earning interest on them until they are delivered, it immediately assumes the risks of ownership, including the risk of price fluctuation. If a Fund’s counterparty fails to deliver a security purchased on a when-issued, delayed-delivery, or forward commitment basis, there may be a loss, and that Fund may have missed an opportunity to make an alternative investment.
Prior to settlement of these transactions, the values of the subject securities will fluctuate with market conditions. In addition, because the Fund is not required to pay for when-issued, delayed-delivery, or forward commitment securities until the delivery date, they may result in a form of leverage to the extent the Fund does not set aside liquid assets to cover the commitment. To guard against this deemed leverage, the Fund monitors the obligations under these transactions on a daily basis and ensures that the Fund has sufficient liquid assets to cover them.
Repurchase Agreements: The Funds may enter into repurchase agreements, under the terms of Master Repurchase Agreement (MRA). The MRA permits a Fund, under certain circumstances, including an event of default (such as bankruptcy or insolvency), to offset payables and/or receivables under the MRA with collateral held and/or posted to the counterparty and create one single net payment due to or from each Fund. However, bankruptcy or insolvency laws of a particular jurisdiction may impose restrictions on or prohibitions against such a right of offset in the event of a MRA counterparty’s bankruptcy or insolvency.
65
TCW Funds, Inc.
Notes to Financial Statements (Continued)
Note 3 — Portfolio Investments (Continued)
Pursuant to the terms of the MRA, each Fund receives securities as collateral with a market value in excess of the repurchase price. Upon a bankruptcy or insolvency of the MRA counterparty, the Funds recognize a liability with respect to such excess collateral to reflect the Funds’ obligation under bankruptcy law to return the excess to the counterparty. The Funds had no repurchase agreements outstanding as of October 31, 2019.
Participation Notes: The Funds may invest in participation notes of equity-linked instruments (collectively, participation notes), through which a counterparty provides exposure to common stock, in the form of an unsecured interest, in markets where direct investment by a Fund is not possible. Participation notes provide the economic benefit of common stock ownership to a Fund, while legal ownership and voting rights are retained by the counterparty. Although participation notes are usually structured with a defined maturity or termination date, early redemption may be possible. Risks associated with participation notes include possible failure of the counterparty to perform in accordance with the terms of the agreement, inability to transfer or liquidate the notes, potential delays or an inability to redeem before maturity under certain market conditions, and limited legal recourse against the issuer of the underlying common stock. None of the Funds held participation notes as of October 31, 2019.
Security Lending: The Funds may lend their securities to qualified brokers. The loans must be collateralized at all times primarily with cash although the Funds can accept money market instruments or U.S. government securities with a market value at least equal to the market value of the securities on loan. As with any extensions of credit, the Funds may bear the risk of delay in recovery or even loss of rights in the collateral if the borrowers of the securities fail financially. The Funds earn additional income for lending their securities by investing the cash collateral in short-term investments. The Funds did not lend any securities during the year ended October 31, 2019.
Derivatives:
Forward Foreign Currency Contracts: The Funds enter into forward foreign currency contracts as a hedge against fluctuations in foreign exchange rates. Forward foreign currency contracts are marked-to market daily and the change in market value is recorded by each Fund as unrealized gains or losses in the Statement of Assets and Liabilities. When a contract is closed or delivery is taken, a Fund records a realized gain or loss equal to the difference between the value of the contract at the time it was opened and the value at the time it was closed. Risks may arise upon entering into these contracts from the potential inability of counterparties to meet the terms of their contracts and from unanticipated movements in the value of the foreign currency relative to the U.S. dollar. Outstanding foreign currency forward contracts at October 31, 2019 are disclosed in the Schedule of Investments.
Futures Contracts: The Funds may enter into futures contracts. A Fund may seek to manage a variety of different risks through the use of futures contracts, such as interest rate risk, equity price risk, and currency risk. A Fund may use index futures to hedge against broad market risks to its portfolio or to gain broad market exposure. Securities index futures contracts are contracts to buy or sell units of a securities index at a specified future date at a price agreed upon when the contract is made and are settled in cash. Positions in futures may be closed out only on an exchange or board of trade which provides a secondary market for such futures. Because futures contracts are exchange-traded, they typically have minimal exposure to counterparty risk. Parties to a futures contract are not required to post the entire notional amount of the contract, but rather a small percentage of that amount (by way of margin), both at the time they enter into futures transactions, and then on a daily basis if their positions decline in value; as a result, futures
66
TCW Funds, Inc.
Note 3 — Portfolio Investments (Continued)
contracts are highly leveraged. Such payments are known as variation margin and are recorded by a Fund as unrealized gains or losses. Because futures markets are highly leveraged, they can be extremely volatile, and there can be no assurance that the pricing of a futures contract will correlate precisely with the pricing of the asset or index underlying it or the asset or liability of a Fund that is the subject of the hedge. It may not always be possible for a Fund to enter into a closing transaction with respect to a futures contract it has entered into at a favorable time or price. When a Fund enters into a futures transaction, it is subject to the risk that the value of the futures contract will move in a direction unfavorable to it.
When a Fund uses futures contracts for hedging purposes, it is likely that the Fund will have an asset or liability that will offset any loss (or gain) on the transactions, at least in part. When a futures contract is closed, the Fund records a realized gain or loss equal to the difference between the value of the contract at the time it was opened and the value at the time it was closed. The TCW Emerging Markets Income Fund, the TCW Emerging Markets Local Currency Income Fund, and the TCW Emerging Markets Multi-Asset Opportunities Fund utilized futures during the year ended October 31, 2019 to help manage interest rate duration of those Funds.
Options: The Funds purchase and sell put and call options on a security or an index of securities to enhance investment performance or to protect against changes in market prices. The Funds may also enter into currency options to hedge against or to take advantage of currency fluctuations.
Purchasing foreign currency options gives a Fund the right, but not the obligation to buy or sell specified amounts of currency at a rate of exchange that may be exercised by a certain date. These currency options may be used as a short or long hedge against possible variations in foreign exchange rates or to gain exposure to foreign currencies.
When a Fund purchases an option, it runs the risk that it will lose its entire investment in the option in a relatively short period of time, unless the Fund exercises the option or enters into a closing sale transaction before the option’s expiration. If the price of the underlying security does not rise (in the case of a call) or fall (in the case of a put) to an extent sufficient to cover the option premium and transaction costs, the Fund will lose part or all of its investment in the option. Premiums paid for purchasing options that expired are treated as realized losses.
Options purchased or sold by a Fund may be traded on a securities or options exchange. Such options typically have minimal exposure to counterparty risk. However, an exchange or market may at times find it necessary to impose restrictions on particular types of options transactions, such as opening transactions. If an underlying security ceases to meet qualifications imposed by an exchange or the Options Clearing Corporation, new series of options on that security will no longer be opened to replace the expiring series, and opening transactions in existing series may be prohibited.
OTC options are options not traded on exchanges or backed by clearinghouses. Rather, they are entered into directly between a Fund and the counterparty to the option. In the case of an OTC option purchased by a Fund, the value of the option to the Fund will depend on the willingness and ability of the option writer to perform its obligations to the Fund. In addition, OTC options may not be transferable and there may be little or no secondary market for them, so they may be considered illiquid. It may not be possible to enter into closing transactions with respect to OTC options or otherwise to terminate such options, and as a result a Fund may be required to remain obligated on an unfavorable OTC option until its expiration. During the year ended October 31, 2019, the TCW Emerging Markets Income Fund, TCW Emerging
67
TCW Funds, Inc.
Notes to Financial Statements (Continued)
Note 3 — Portfolio Investments (Continued)
Markets Local Currency Income Fund, and TCW Emerging Markets Multi-Asset Opportunities Fund entered into options to hedge the currency exposure of the Funds.
Swap Agreements. The Funds may enter into swap agreements. Swap agreements are typically two-party contracts entered into primarily by institutional investors. In a standard “swap” transaction, two parties agree to exchange the returns (or differentials in rates of return) earned or realized on particular predetermined investments or instruments, which may be adjusted for an interest factor. The gross returns to be exchanged or “swapped” between the parties are generally calculated with respect to a “notional amount” (i.e., the return on or increase in value of a particular dollar amount invested at a particular interest rate or in a “basket” of securities representing a particular index).
In a total return swap, one party typically agrees to pay to the other a short-term interest rate in return for a payment at one or more times in the future based on the increase in the value of an underlying security or other asset, or index of securities or assets; if the underlying security, asset, or index declines in value, the party that pays the short-term interest rate must also pay to its counterparty a payment based on the amount of the decline. A Fund may take either side of such a swap, and so may take a long or short position in the underlying security, asset, or index. A Fund may enter into a total return swap to hedge against an exposure in its portfolio — such as interest rate risk (including to adjust the duration or credit quality of a Fund’s bond portfolio), equity risk, or credit risk — or generally to put cash to work efficiently in the markets in anticipation of, or as a replacement for, cash investments. A Fund may also enter into a total return swap to gain exposure to securities or markets in which it might not be able to invest directly (in so-called market access transactions).
Interest rate swaps are agreements in which one party pays a floating rate of interest on a notional principal amount and receives a fixed rate of interest on the same notional principal amount for a specified period of time. Alternatively, a party may pay a fixed rate and receive a floating rate. In more complex swaps, the notional principal amount may decline (or amortize) over time. The Fund’s maximum risk of loss due to counterparty default is the discounted NAV of the cash flows paid to/received from the counterparty over the interest rate swap’s remaining life.
A Fund may enter into credit default swap transactions as a “buyer” or “seller” of credit protection. In a credit default swap, one party provides what is in effect insurance against a default or other adverse credit event affecting an issuer of debt securities (typically referred to as a “reference entity”). In general, the buyer of credit protection is obligated to pay the protection seller an upfront amount or a periodic stream of payments over the term of the swap. If a “credit event” occurs, the buyer has the right to deliver to the seller bonds or other obligations of the reference entity (with a value up to the full notional value of the swap), and to receive a payment equal to the par value of the bonds or other obligations. Credit events that would trigger a request that the seller make payment are specific to each credit default swap agreement, but generally include bankruptcy, failure to pay, restructuring, obligation acceleration, obligation default, or repudiation/moratorium. When a Fund buys protection, it may or may not own securities of the reference entity. When a Fund sells protection under a credit default swap, the position may have the effect of creating leverage in the Fund’s portfolio through the Fund’s indirect long exposure to the issuer or securities on which the swap is written. When a Fund sells protection, it may do so either to earn additional income or to create such a “synthetic” long position.
Whenever a Fund enters into a swap agreement, it takes on counterparty risk — the risk that its counterparty will be unable or unwilling to meet its obligations under the swap agreement. A Fund also
68
TCW Funds, Inc.
Note 3 — Portfolio Investments (Continued)
takes the risk that the market will move against its position in the swap agreement. In the case of a total return swap, the swap will change in value depending on the change in value of the asset or index on which the swap is written. When a Fund enters into any type of swap for hedging purposes, it is likely that the Fund will have an asset or liability that will offset any loss (or gain) on the swap, at least in part. Swap agreements may be non-transferable or otherwise highly illiquid, and a Fund may not be able to terminate or transfer a swap agreement at any particular time or at an acceptable price.
During the term of a swap transaction, changes in the value of the swap are recognized as unrealized gains or losses by marking to market to reflect the market value of the swap. When the swap is terminated, a Fund will record a realized gain or loss equal to the difference, if any, between the proceeds from (or cost of) the closing transaction and the Fund’s basis in the agreement. Upfront swap premium payments paid or received by a Fund, if any, are recorded within the value of the open swap agreement on the Fund’s Statement of Assets and Liabilities and represent payments paid or received upon entering into the swap agreement to compensate for differences between stated terms of the swap agreement and prevailing market conditions (credit spreads, currency exchange rates, and other relevant factors). These upfront payments are recorded as realized gains or losses on each Fund’s Statement of Operations upon termination or maturity of the swap agreement.
During the term of a swap transaction, the periodic net payments can be made for a set period of time or may be triggered by a predetermined credit event. The net periodic payments may be based on a fixed or variable interest rate, the change in market value of a specified security, basket of securities or index, or the return generated by a security. These periodic payments received or made by the Funds are recorded as realized gains and losses, respectively. For the year ended October 31, 2019, none of the Funds had swaps.
Note 4 — Risk Considerations
Market Risk: As the Funds’ investments will fluctuate with market conditions, so will the value of your investment in the Funds. You could lose money on your investment in the Funds or the Funds could underperform other investments.
Liquidity Risk: The Funds’ investments in illiquid securities may reduce the returns of the Funds because they may not be able to sell the illiquid securities at an advantageous time or price. Investments in high yield securities, foreign securities, derivatives or other securities with substantial market and/or credit risk tend to have the greatest exposure to liquidity risk. Certain investments in private placements and Rule 144A securities may be considered illiquid investments. The Funds may invest in private placements and Rule 144A securities.
Interest Rate Risk: The values of the Funds’ investments fluctuate in response to movements in interest rates. If rates rise, the values of debt securities generally fall. The longer the average duration of a Fund’s investment portfolio, the greater the change in value.
Investment Style Risk: Certain Funds may also be subject to investment style risk. The Advisor’s investment styles may be out of favor at times or may not produce the best results over short or longer time periods and may increase the volatility of a Fund’s share price.
LIBOR Risk: The London Interbank Offered Rate (“LIBOR”) is used extensively in the U.S. and globally as a “benchmark” or “reference rate” for various commercial and financial contracts, including corporate and municipal bonds, bank loans, asset-backed and mortgage-related securities, interest rate swaps and other
69
TCW Funds, Inc.
Notes to Financial Statements (Continued)
Note 4 — Risk Considerations (Continued)
derivatives. For example, debt securities in which a Fund invests may pay interest at floating rates based on LIBOR or may be subject to interest caps or floors based on LIBOR. A Fund’s derivative investments may also reference LIBOR. In addition, issuers of instruments in which a Fund invests may obtain financing at floating rates based on LIBOR, and a Fund may use leverage or borrowings based on LIBOR. In July 2017, the head of the United Kingdom Financial Conduct Authority announced the intention to phase out the use of LIBOR by the end of 2021. There is currently no definitive information regarding the future utilization of LIBOR or of any particular replacement reference rate. Abandonment of or modifications to LIBOR could have adverse impacts on newly issued financial instruments and existing financial instruments that reference LIBOR. The expected discontinuation of LIBOR could have a significant impact on the financial markets and may present a material risk for certain market participants, including investment companies such as the Funds. Abandonment of or modifications to LIBOR could lead to significant short- and long-term uncertainty and market instability. The risks associated with this discontinuation and transition may be exacerbated if the work necessary to effect an orderly transition to an alternative reference rate is not completed in a timely manner. It remains uncertain how such changes would be implemented and the effects such changes would have on the Funds, issuers of instruments in which the Funds invest, and the financial markets generally.
Derivatives Risk: Use of derivatives, which at times is an important part of the Funds’ investment strategies, involves risks different from, or possibly greater than, the risks associated with investing directly in securities and other traditional investments. Investments in derivatives could cause the Funds to lose more than the principal amount invested. Also, suitable derivative transactions may not be available in all circumstances and there can be no assurance that the Funds will achieve their objective through the use of the derivatives.
Credit Risk: The values of any of the Funds’ investments may also decline in response to events affecting the issuer or its credit rating. The lower rated debt securities in which a Fund may invest are considered speculative and are subject to greater volatility and risk of loss than investment-grade securities, particularly in deteriorating economic conditions.
Counterparty Risk: The Funds may be exposed to counterparty risk, which is the risk that an entity with which the Funds have unsettled or open transactions may not fulfill its obligations.
Foreign Currency Risk: The Funds may be exposed to the risk that the value of the Funds’ investments denominated in foreign currencies will decline in value because the foreign currency has declined in value relative to the U.S. dollar.
Foreign Investing Risk: The Funds may be exposed to the risk that the Funds share prices will fluctuate with market conditions, currency exchange rates and the economic and political climates in countries where the Funds invest.
For complete information on the various risks involved, please refer to the Funds’ prospectus and the Statement of Additional Information which can be obtained on the Funds’ website (www.tcw.com) or by calling customer service at 800-FUND-TCW (800-386-3829).
70
TCW Funds, Inc.
Note 5 — Federal Income Taxes
It is the policy of each Fund to comply with the requirements under Subchapter M of the Internal Revenue Code applicable to regulated investment companies and to distribute all of its net taxable income, including any net realized gains on investments, to its shareholders. Therefore, no federal income tax provision is required.
At October 31, 2019, the components of distributable earnings on a tax basis were as follows (amounts in thousands):
| | | | | | | | | | | | |
| | | Undistributed
Ordinary
Income | | | Undistributed
Long-Term
Gain | | | Total
Distributable
Earnings | |
TCW Developing Markets Equity Fund | | $ | 36 | | | $ | — | | | $ | 36 | |
TCW Emerging Markets Income Fund | | | 23,323 | | | | — | | | | 23,323 | |
TCW Emerging Markets Local Currency Income Fund | | | 1,190 | | | | — | | | | 1,190 | |
TCW Emerging Markets Multi-Asset Opportunities Fund | | | 2,702 | | | | — | | | | 2,702 | |
TCW International Small Cap Fund | | | 285 | | | | — | | | | 285 | |
At the end of the previous fiscal year, October 31, 2018, the components of distributable earnings on a tax basis were as follows (amounts in thousands):
| | | | | | | | | | | | |
| | | Undistributed
Ordinary
Income | | | Undistributed
Long-Term
Gain | | | Total
Distributable
Earnings | |
TCW Developing Markets Equity Fund | | $ | 12 | | | $ | — | | | $ | 12 | |
TCW Emerging Markets Income Fund | | | 22,330 | | | | — | | | | 22,330 | |
TCW Emerging Markets Local Currency Income Fund | | | 1,095 | | | | — | | | | 1,095 | |
TCW Emerging Markets Multi-Asset Opportunities Fund | | | 22 | | | | — | | | | 22 | |
| (1) | Amount rounds to less than $1. |
Permanent differences incurred during the year ended October 31, 2019, resulting from differences in book and tax accounting, have been reclassified at year-end between undistributed net investment income (loss), undistributed (accumulated) net realized gain (loss) and paid-in capital as follows, with no impact to the NAV per share (amounts in thousands):
| | | | | | | | | | | | |
| | | Undistributed
Net Investment
Income (Loss) | | | Undistributed
Accumulated
Net Realized
Gain (Loss) | | | Paid-in
Capital | |
TCW Developing Markets Equity Fund | | $ | (11 | ) | | $ | 11 | | | $ | — | |
TCW Emerging Markets Income Fund | | | (24,669 | ) | | | 24,669 | | | | — | |
TCW Emerging Markets Local Currency Income Fund | | | (14,411 | ) | | | 14,413 | | | | (2 | ) |
TCW Emerging Markets Multi-Asset Opportunities Fund | | | (245 | ) | | | 245 | | | | — | |
TCW International Small Cap Fund | | | 97 | | | | (97 | ) | | | — | |
During the year ended October 31, 2019, the tax character of distributions paid was as follows (amounts in thousands):
| | | | | | | | | | | | |
| | | Ordinary
Income | | | Long-Term
Capital Gain | | | Total
Distributions | |
TCW Developing Markets Equity Fund | | $ | 22 | | | $ | — | | | $ | 22 | |
TCW Emerging Markets Income Fund | | | 294,091 | | | | — | | | | 294,091 | |
TCW Emerging Markets Local Currency Income Fund | | | 4,591 | | | | — | | | | 4,591 | |
TCW Emerging Markets Multi-Asset Opportunities Fund | | | 1,629 | | | | — | | | | 1,629 | |
TCW International Small Cap Fund | | | 41 | | | | — | | | | 41 | |
71
TCW Funds, Inc.
Notes to Financial Statements (Continued)
Note 5 — Federal Income Taxes (Continued)
For the previous fiscal year ended October 31, 2018, the tax character of distributions paid was as follows (amounts in thousands):
| | | | | | | | | | | | | | | | |
| | | Ordinary
Income | | | Long-Term
Capital Gain | | | Return of
Capital Gain | | | Total
Distributions | |
TCW Developing Markets Equity Fund | | $ | 32 | | | $ | — | | | $ | — | | | $ | 32 | |
TCW Emerging Markets Income Fund | | | 172,717 | | | | — | | | | — | | | | 172,717 | |
TCW Emerging Markets Multi-Asset Opportunities Fund | | | 6,699 | | | | — | | | | 9,233 | | | | 15,932 | |
TCW International Small Cap Fund | | | 2,016 | | | | — | | | | — | | | | 2,016 | |
At October 31, 2019, net unrealized appreciation (depreciation) on investments for federal income tax purposes was as follows (amounts in thousands):
| | | | | | | | | | | | | | | | |
| | | Unrealized
Appreciation | | | Unrealized
(Depreciation) | | | Net
Unrealized
Appreciation
(Depreciation) | | | Cost of
Investments for
Federal Income
Tax Purposes | |
TCW Developing Markets Equity Fund | | $ | 884 | | | $ | (66 | ) | | $ | 818 | | | $ | 4,807 | |
TCW Emerging Markets Income Fund | | | 310,500 | | | | (171,008 | ) | | | 139,492 | | | | 5,906,901 | |
TCW Emerging Markets Local Currency Income Fund | | | 6,171 | | | | (2,167 | ) | | | 4,004 | | | | 242,996 | |
TCW Emerging Markets Multi-Asset Opportunities Fund | | | 10,759 | | | | (1,976 | ) | | | 8,783 | | | | 88,403 | |
TCW International Small Cap Fund | | | 974 | | | | (133 | ) | | | 841 | | | | 9,280 | |
At October 31, 2019, following Funds had net realized losses that will be carried forward indefinitely for federal income tax purposes (amounts in thousands):
| | | | | | | | | | | | |
| | | Short-Term
Capital Losses | | | Long-Term
Capital Losses | | | Total | |
TCW Developing Markets Equity Fund | | $ | 766 | | | $ | — | | | $ | 766 | |
TCW Emerging Markets Income Fund | | | 390,218 | | | | 301,556 | | | | 691,774 | |
TCW Emerging Markets Local Currency Income Fund | | | 15,553 | | | | 11,669 | | | | 27,222 | |
TCW Emerging Markets Multi-Asset Opportunities Fund | | | 9,372 | | | | — | | | | 9,372 | |
TCW International Small Cap Fund | | | 2,403 | | | | — | | | | 2,403 | |
The Funds did not have any unrecognized tax benefits at October 31, 2019, nor were there any increases or decreases in unrecognized tax benefits for the year ended October 31, 2019. The Funds are subject to examination by the U.S. federal and state tax authorities for returns filed for the prior three and four fiscal years, respectively.
Note 6 — Fund Management Fees and Other Expenses
The Funds pay to the Advisor, as compensation for services rendered, facilities furnished and expenses borne by it, the following annual management fees as a percentage of daily net assets:
| | | | |
TCW Developing Markets Equity Fund | | | 0.80 | % |
TCW Emerging Markets Income Fund | | | 0.75 | % |
TCW Emerging Markets Local Currency Income Fund | | | 0.75 | % |
TCW Emerging Markets Multi-Asset Opportunities Fund | | | 0.90 | % (1) |
TCW International Small Cap Fund | | | 0.75 | % |
| (1) | From November 1, 2018 through December 31, 2018 the management fee was 0.95%. |
72
TCW Funds, Inc.
Note 6 — Fund Management Fees and Other Expenses (Continued)
The Advisor limits the operating expenses of the Funds not to exceed the following expense ratios relative to the Funds’ average daily net assets:
| | | | |
TCW Developing Markets Equity Fund | | | | |
I Class | | | 1.25 | % (1) |
N Class | | | 1.25 | % (1) |
TCW Emerging Markets Income Fund | | | | |
I Class | | | 1.04 | % (2) |
N Class | | | 1.04 | % (2) |
TCW Emerging Markets Local Currency Income Fund | | | | |
I Class | | | 0.85 | % (1) |
N Class | | | 0.90 | % (1) |
TCW Emerging Markets Multi-Asset Opportunities Fund | | | | |
I Class | | | 1.00 | % (1) |
N Class | | | 1.20 | % (1) |
TCW International Small Cap Fund | | | | |
I Class | | | 1.00 | % (1) |
N Class | | | 1.20 | % (1) |
| (1) | These limitations are based on an agreement between the Advisor and the Company. |
| (2) | Limitation based on average expense ratio as reported by Lipper, Inc., which is subject to change on a monthly basis. This ratio was in effect as of October 31, 2019. These limitations are voluntary and terminable in a six month’s notice. |
These ratios were in effect from November 1, 2018 through December 31, 2018.
| | | | |
TCW Emerging Markets Local Currency Income Fund | | | | |
I Class | | | 0.99 | % |
N Class | | | 0.99 | % |
TCW Emerging Markets Multi-Asset Opportunities Fund | | | | |
I Class | | | 1.23 | % |
N Class | | | 1.23 | % |
TCW International Small Cap Fund | | | | |
I Class | | | 1.44 | % |
N Class | | | 1.44 | % |
The amount borne by the Advisor during the fiscal year when the operating expenses of a Fund are in excess of the expense limitation cannot be recaptured in the subsequent fiscal years should the expenses drop below the expense limitation in the subsequent years. The Advisor can recapture expenses only within a given fiscal year for that year’s operating expenses.
Directors’ Fees: Directors who are not affiliated with the Advisor receive compensation from the Funds which is shown on the Statements of Operations. Directors may elect to defer receipt of their fees in accordance with the terms of a Non-Qualified Deferred Compensation Plan. Deferred compensation is included within directors’ fees and expenses in the Statements of Assets and Liabilities.
Note 7 — Distribution Plan
TCW Funds Distributors LLC (“Distributor”), an affiliate of the Advisor and the Funds, serves as the nonexclusive distributor of each class of the Funds’ shares. The Funds have a distribution plan pursuant to Rule 12b-1 under the 1940 Act with respect to the N Class shares of each Fund. Under the terms of the plan, each Fund compensates the Distributor at a rate equal to 0.25% of the average daily net assets of the Fund attributable to its N Class shares for distribution and related services.
73
TCW Funds, Inc.
Notes to Financial Statements (Continued)
Note 8 — Purchases and Sales of Securities
Investment transactions (excluding short-term investments) for the year ended October 31, 2019 were as follows (amounts in thousands):
| | | | | | | | | | | | | | | | |
| | | Purchases
at Cost | | | Sales or Maturity
Proceeds | | | U.S. Government
Purchases at Cost | | | U.S. Government
Sales or Maturity
Proceeds | |
TCW Developing Markets Equity Fund | | $ | 11,567 | | | $ | 10,848 | | | $ | — | | | $ | — | |
TCW Emerging Markets Income Fund | | | 8,085,748 | | | | 7,070,352 | | | | — | | | | — | |
TCW Emerging Markets Local Currency Income Fund | | | 297,622 | | | | 361,260 | | | | — | | | | — | |
TCW Emerging Markets Multi-Asset Opportunities Fund | | | 200,502 | | | | 220,985 | | | | — | | | | — | |
TCW International Small Cap Fund | | | 24,217 | | | | 23,448 | | | | — | | | | — | |
Note 9 — Capital Share Transactions
Transactions in each Fund’s shares were as follows:
| | | | | | | | | | | | | | | | |
| TCW Developing Markets Equity Fund | | Year Ended
October 31, 2019 | | | Year Ended
October 31, 2018 | |
| I Class | | Shares | | | Amount
(in thousands) | | | Shares | | | Amount
(in thousands) | |
Shares Sold | | | 228 | | | $ | 2 | | | | 396 | | | $ | 5 | |
Shares Issued upon Reinvestment of Dividends | | | 1,763 | | | | 16 | | | | 1,988 | | | | 23 | |
| | | | | | | | | | | | | | | | |
Net Increase | | | 1,991 | | | $ | 18 | | | | 2,384 | | | $ | 28 | |
| | | | | | | | | | | | | | | | |
| | | | |
| N Class | | Shares | | | Amount
(in thousands) | | | Shares | | | Amount
(in thousands) | |
Shares Sold | | | 11 | | | $ | — | | | | 30,914 | | | $ | 371 | |
Shares Issued upon Reinvestment of Dividends | | | 690 | | | | 6 | | | | 772 | | | | 9 | |
Shares Redeemed | | | (1,655 | ) | | | (15 | ) | | | (29,554 | ) | | | (350 | ) |
| | | | | | | | | | | | | | | | |
Net Increase (Decrease) | | | (954 | ) | | $ | (9 | ) | | | 2,132 | | | $ | 30 | |
| | | | | | | | | | | | | | | | |
| | |
| TCW Emerging Markets Income Fund | | Year Ended
October 31, 2019 | | | Year Ended
October 31, 2018 | |
| I Class | | Shares | | | Amount
(in thousands) | | | Shares | | | Amount
(in thousands) | |
Shares Sold | | | 325,616,046 | | | $ | 2,622,013 | | | | 325,798,179 | | | $ | 2,630,542 | |
Shares Issued upon Reinvestment of Dividends | | | 19,612,811 | | | | 158,858 | | | | 14,774,392 | | | | 122,504 | |
Shares Redeemed | | | (226,225,558 | ) | | | (1,822,076 | ) | | | (134,516,022 | ) | | | (1,092,291 | ) |
| | | | | | | | | | | | | | | | |
Net Increase | | | 119,003,299 | | | $ | 958,795 | | | | 206,056,549 | | | $ | 1,660,755 | |
| | | | | | | | | | | | | | | | |
| | | | |
| N Class | | Shares | | | Amount
(in thousands) | | | Shares | | | Amount
(in thousands) | |
Shares Sold | | | 9,325,603 | | | $ | 97,734 | | | | 10,601,963 | | | $ | 111,621 | |
Shares Issued upon Reinvestment of Dividends | | | 1,544,925 | | | | 16,071 | | | | 1,769,493 | | | | 18,963 | |
Shares Redeemed | | | (15,236,140 | ) | | | (158,466 | ) | | | (24,566,407 | ) | | | (258,337 | ) |
| | | | | | | | | | | | | | | | |
Net Decrease | | | (4,365,612 | ) | | $ | (44,661 | ) | | | (12,194,951 | ) | | $ | (127,753 | ) |
| | | | | | | | | | | | | | | | |
74
TCW Funds, Inc.
Note 9 — Capital Share Transactions (Continued)
| | | | | | | | | | | | | | | | |
| TCW Emerging Markets Local Currency Income Fund | | Year Ended
October 31, 2019 | | | Year Ended
October 31, 2018 | |
| I Class | | Shares | | | Amount
(in thousands) | | | Shares | | | Amount
(in thousands) | |
Shares Sold | | | 14,235,609 | | | $ | 125,091 | | | | 24,640,615 | | | $ | 223,944 | |
Shares Issued upon Reinvestment of Dividends | | | 419,536 | | | | 3,579 | | | | 1,421,479 | | | | 13,366 | |
Shares Redeemed | | | (23,098,821 | ) | | | (199,664 | ) | | | (8,375,628 | ) | | | (75,789 | ) |
| | | | | | | | | | | | | | | | |
Net Increase (Decrease) | | | (8,443,676 | ) | | $ | (70,994 | ) | | | 17,686,466 | | | $ | 161,521 | |
| | | | | | | | | | | | | | | | |
| | | | |
| N Class | | Shares | | | Amount
(in thousands) | | | Shares | | | Amount
(in thousands) | |
Shares Sold | | | 3,108,306 | | | $ | 27,354 | | | | 5,406,607 | | | $ | 48,629 | |
Shares Issued upon Reinvestment of Dividends | | | 71,740 | | | | 611 | | | | 271,444 | | | | 2,539 | |
Shares Redeemed | | | (5,984,228 | ) | | | (52,494 | ) | | | (3,560,164 | ) | | | (30,713 | ) |
| | | | | | | | | | | | | | | | |
Net Increase (Decrease) | | | (2,804,182 | ) | | $ | (24,529 | ) | | | 2,117,887 | | | $ | 20,455 | |
| | | | | | | | | | | | | | | | |
| | |
TCW Emerging Markets Multi-Asset Opportunities
Fund | | Year Ended
October 31, 2019 | | | Year Ended
October 31, 2018 | |
| I Class | | Shares | | | Amount
(in thousands) | | | Shares | | | Amount
(in thousands) | |
Shares Sold | | | 5,474,863 | | | $ | 61,399 | | | | 721,682 | | | $ | 8,402 | |
Shares Issued upon Reinvestment of Dividends | | | 58,600 | | | | 589 | | | | 80,386 | | | | 954 | |
Shares Redeemed | | | (1,970,348 | ) | | | (21,377 | ) | | | (224,954 | ) | | | (2,575 | ) |
| | | | | | | | | | | | | | | | |
Net Increase | | | 3,563,115 | | | $ | 40,611 | | | | 577,114 | | | $ | 6,781 | |
| | | | | | | | | | | | | | | | |
| | | | |
| N Class | | Shares | | | Amount
(in thousands) | | | Shares | | | Amount
(in thousands) | |
Shares Sold | | | 835,903 | | | $ | 8,722 | | | | 4,763,034 | | | $ | 54,831 | |
Shares Issued upon Reinvestment of Dividends | | | 102,937 | | | | 1,032 | | | | 89,753 | | | | 1,061 | |
Shares Redeemed | | | (7,102,907 | ) | | | (78,241 | ) | | | (1,076,732 | ) | | | (12,060 | ) |
| | | | | | | | | | | | | | | | |
Net Increase (Decrease) | | | (6,164,067 | ) | | $ | (68,487 | ) | | | 3,776,055 | | | $ | 43,832 | |
| | | | | | | | | | | | | | | | |
| | |
| TCW International Small Cap Fund | | Year Ended
October 31, 2019 | | | Year Ended
October 31, 2018 | |
| I Class | | Shares | | | Amount
(in thousands) | | | Shares | | | Amount
(in thousands) | |
Shares Sold | | | 118,744 | | | $ | 1,118 | | | | 132,392 | | | $ | 1,478 | |
Shares Issued upon Reinvestment of Dividends | | | 3,297 | | | | 28 | | | | — | | | | — | |
Shares Redeemed | | | (101,834 | ) | | | (951 | ) | | | (50,186 | ) | | | (562 | ) |
| | | | | | | | | | | | | | | | |
Net Increase | | | 20,207 | | | $ | 195 | | | | 82,206 | | | $ | 916 | |
| | | | | | | | | | | | | | | | |
| | | | |
| N Class | | Shares | | | Amount
(in thousands) | | | Shares | | | Amount
(in thousands) | |
Shares Sold | | | 2,514 | | | $ | 24 | | | | 42,646 | | | $ | 488 | |
Shares Issued upon Reinvestment of Dividends | | | 1,364 | | | | 12 | | | | — | | | | — | |
Shares Redeemed | | | (26,037 | ) | | | (248 | ) | | | (51,416 | ) | | | (586 | ) |
| | | | | | | | | | | | | | | | |
Net Decrease | | | (22,159 | ) | | $ | (212 | ) | | | (8,770 | ) | | $ | (98 | ) |
| | | | | | | | | | | | | | | | |
Note 10 — Affiliate Ownership
As of October 31, 2019, affiliates of the Funds and Advisor owned 99.42 %, 5.57% and 75.70 % of the net assets of the TCW Developing Markets Equity Fund, the TCW Emerging Markets Multi-Asset Opportunities Fund and the TCW International Small Cap Fund, respectively.
75
TCW Funds, Inc.
Notes to Financial Statements (Continued)
Note 11 — Restricted Securities
The Funds are permitted to invest in securities that have legal or contractual restrictions on resale. These securities may be sold privately, but are required to be registered before being sold to the public (exemption rules apply). Private placement securities are generally considered to be restricted except for those securities traded between qualified institutional investors under the provisions of Rule 144A of the Securities Act of 1933, as amended (the “Securities Act”). However, the Company considers 144A securities to be restricted if those securities have been deemed illiquid. Disposal of these securities may involve time consuming negotiations and expense, and prompt sale at an acceptable price may be difficult. There were no restricted securities held by the Funds as of October 31, 2019.
Note 12 — Committed Line Of Credit
The Company has entered into a $100,000,000 committed revolving line of credit agreement renewed annually with the State Street Bank and Trust Company (the “Bank”) for temporary borrowing purposes. The interest rate on borrowing is the higher of the Federal Funds rate or the overnight LIBOR rate, plus 1.25%. There were no borrowings from the line of credit as of or during the year ended October 31, 2019. The Funds pay the Bank a commitment fee equal to 0.25% per annum on the daily unused portion of the committed line amount. The commitment fees incurred by the Funds are presented in the Statements of Operations. The commitment fees are allocated to each applicable portfolio in proportion to its relative average daily net assets and the interest expenses are charged directly to the applicable portfolio.
Note 13 — Liquidity Risk Management Program
Rule 22e-4 under the 1940 Act (the “Liquidity Rule”) requires that all registered open-end management investment companies, including the Funds, establish a written liquidity risk management program (a “Liquidity Program”). Under a fund’s Liquidity Program, a fund must assess, manage and periodically review the fund’s liquidity risk, classify the liquidity of each of the fund’s portfolio investments, determine a highly liquid investment minimum, limit illiquid investments to 15% of fund investments, and establish policies and procedures regarding how and when a fund will engage in redemptions in-kind. Consistent with the Liquidity Rule, the Board has approved the written Liquidity Program for the Funds and has designated a committee of professionals associated with the Adviser to administer the Funds’ Liquidity Program. On an ongoing basis, the Board will review annual reports from that committee, as the administrator of the Funds’ Liquidity Program, on the operation of the Funds’ Liquidity Program, its adequacy and effectiveness of implementation, and any material changes made to the Funds’ Liquidity Program.
Note 14 — Indemnifications
Under the Company’s organizational documents, its Officers and Directors may be indemnified against certain liabilities and expenses arising out of the performance of their duties to the Company. In addition, the Company entered into an agreement with each of the Directors which provides that the Company will indemnify and hold harmless each Director against any expenses actually and reasonably incurred by such Director in any proceeding arising out of or in connection with the Director’s services to the Company, to the fullest extent permitted by the Company’s Articles of Incorporation and By-Laws, the Maryland General Corporation Law, the Securities Act, and the 1940 Act, each as now or hereinafter in force. Additionally, in the normal course of business, the Company enters into agreements with service providers that may contain indemnification clauses. The Company’s maximum exposure under these arrangements is unknown as this would involve future claims that may be made against the Company that have not yet occurred. However, based on experience, the Company expects the risk of loss to be remote. The Company has not accrued any liability in connection with such indemnification.
76
TCW Funds, Inc.
Note 15 — New Accounting Pronouncement
In March 2017, the FASB issued Accounting Standards Update (ASU) No. 2017-08, Receivables — Nonrefundable Fees and Other Costs (Subtopic 310-20): Premium Amortization on Purchased Callable Debt Securities. The amendments in the ASU shorten the amortization period for certain callable debt securities acquired at a premium, to be amortized to the earliest call date. The ASU does not require an accounting change for securities acquired at a discount, which continues to be amortized to maturity. The ASU is effective for fiscal years and interim periods within those fiscal years beginning after December 15, 2018. Management has concluded there was no material impact to the Funds.
Note 16 — Subsequent Event
On December 9, 2019, the Advisor recommended and the Board approved the liquidation of the TCW International Small Cap Fund. As a result, the Fund will liquidate and distribute its assets to its shareholders on or about February 13, 2020. The Fund no longer accepts any new subscriptions or exchanges into the Fund. Shareholders can redeem their Fund shares, or exchange them for shares of other TCW Funds, any time before the liquidation date in accordance with the Fund’s normal procedures.
77
TCW Developing Markets Equity Fund
Financial Highlights — I Class
| | | | | | | | | | | | | | | | | | | | |
| | | Year Ended October 31, | | | June 30, 2015
(Commencement
of Operations)
through
October 31, 2015 | |
| | | 2019 | | | 2018 | | | 2017 | | | 2016 | |
Net Asset Value per Share, Beginning of Year | | $ | 9.39 | | | $ | 11.17 | | | $ | 9.10 | | | $ | 8.62 | | | $ | 10.00 | |
| | | | | | | | | | | | | | | | | | | | |
Income (Loss) from Investment Operations: | |
Net Investment Income (1) | | | 0.10 | | | | 0.06 | | | | 0.07 | | | | 0.10 | | | | 0.01 | |
Net Realized and Unrealized Gain (Loss) on Investments | | | 0.69 | | | | (1.78 | ) | | | 2.09 | | | | 0.38 | | | | (1.39 | ) |
| | | | | | | | | | | | | | | | | | | | |
Total from Investment Operations | | | 0.79 | | | | (1.72 | ) | | | 2.16 | | | | 0.48 | | | | (1.38 | ) |
| | | | | | | | | | | | | | | | | | | | |
Less Distributions: | |
Distributions from Net Investment Income | | | (0.04 | ) | | | (0.06 | ) | | | (0.09 | ) | | | (0.00 | ) (2) | | | — | |
| | | | | | | | | | | | | | | | | | | | |
Net Asset Value per Share, End of Year | | $ | 10.14 | | | $ | 9.39 | | | $ | 11.17 | | | $ | 9.10 | | | $ | 8.62 | |
| | | | | | | | | | | | | | | | | | | | |
Total Return | | | 8.46 | % | | | (15.51 | )% | | | 23.96 | % | | | 5.63 | % | | | (13.80 | )% (3) |
|
Ratios/Supplemental Data: | |
| | | | | |
Net Assets, End of Year (in thousands) | | $ | 4,071 | | | $ | 3,750 | | | $ | 4,433 | | | $ | 3,577 | | | $ | 3,392 | |
|
Ratio of Expenses to Average Net Assets: | |
| | | | | |
Before Expense Reimbursement | | | 4.88 | % | | | 3.45 | % | | | 3.94 | % | | | 3.56 | % | | | 7.09 | % (4) |
| | | | | |
After Expense Reimbursement | | | 1.25 | % | | | 1.25 | % | | | 1.25 | % | | | 1.25 | % | | | 1.25 | % (4) |
| | | | | |
Ratio of Net Investment Income to Average Net Assets | | | 1.03 | % | | | 0.49 | % | | | 0.77 | % | | | 1.15 | % | | | 0.30 | % (4) |
| | | | | |
Portfolio Turnover Rate | | | 207.48 | % | | | 163.33 | % | | | 194.58 | % | | | 154.70 | % | | | 54.34 | % (4) |
| (1) | Computed using average shares outstanding throughout the period. |
| (2) | Amount rounds to less than $0.01 per share. |
| (3) | For the period June 30, 2015 (Commencement of Operations) through October 31, 2015 and is not indicative of a full year’s operating results. |
See accompanying notes to financial statements.
78
TCW Developing Markets Equity Fund
Financial Highlights — N Class
| | | | | | | | | | | | | | | | | | | | |
| | | Year Ended October 31, | | | June 30, 2015
(Commencement
of Operations)
through
October 31, 2015 | |
| | | 2019 | | | 2018 | | | 2017 | | | 2016 | |
Net Asset Value per Share, Beginning of Year | | $ | 9.39 | | | $ | 11.17 | | | $ | 9.10 | | | $ | 8.62 | | | $ | 10.00 | |
| | | | | | | | | | | | | | | | | | | | |
Income (Loss) from Investment Operations: | |
Net Investment Income (1) | | | 0.10 | | | | 0.06 | | | | 0.07 | | | | 0.10 | | | | 0.01 | |
Net Realized and Unrealized Gain (Loss) on Investments | | | 0.69 | | | | (1.78 | ) | | | 2.09 | | | | 0.38 | | | | (1.39 | ) |
| | | | | | | | | | | | | | | | | | | | |
Total from Investment Operations | | | 0.79 | | | | (1.72 | ) | | | 2.16 | | | | 0.48 | | | | (1.38 | ) |
| | | | | | | | | | | | | | | | | | | | |
Less Distributions: | |
Distributions from Net Investment Income | | | (0.04 | ) | | | (0.06 | ) | | | (0.09 | ) | | | (0.00 | ) (2) | | | — | |
| | | | | | | | | | | | | | | | | | | | |
Net Asset Value per Share, End of Year | | $ | 10.14 | | | $ | 9.39 | | | $ | 11.17 | | | $ | 9.10 | | | $ | 8.62 | |
| | | | | | | | | | | | | | | | | | | | |
Total Return | | | 8.46 | % | | | (15.51 | )% | | | 23.96 | % | | | 5.63 | % | | | (13.80 | )% (3) |
Ratios/Supplemental Data: | |
| | | | | |
Net Assets, End of Year (in thousands) | | $ | 1,575 | | | $ | 1,468 | | | $ | 1,722 | | | $ | 1,364 | | | $ | 1,297 | |
|
Ratio of Expenses to Average Net Assets: | |
| | | | | |
Before Expense Reimbursement | | | 6.11 | % | | | 4.51 | % | | | 5.08 | % | | | 4.80 | % | | | 8.39 | % (4) |
| | | | | |
After Expense Reimbursement | | | 1.25 | % | | | 1.25 | % | | | 1.25 | % | | | 1.25 | % | | | 1.25 | % (4) |
| | | | | |
Ratio of Net Investment Income to Average Net Assets | | | 1.03 | % | | | 0.49 | % | | | 0.77 | % | | | 1.15 | % | | | 0.29 | % (4) |
| | | | | |
Portfolio Turnover Rate | | | 207.48 | % | | | 163.33 | % | | | 194.58 | % | | | 154.70 | % | | | 54.34 | % (4) |
| (1) | Computed using average shares outstanding throughout the period. |
| (2) | Amount rounds to less than $0.01 per share. |
| (3) | For the period June 30, 2015 (Commencement of Operations) through October 31, 2015 and is not indicative of a full year’s operating results. |
See accompanying notes to financial statements.
79
TCW Emerging Markets Income Fund
Financial Highlights — I Class
| | | | | | | | | | | | | | | | | | | | |
| |
| | | Year Ended October 31, | |
| | | 2019 | | | 2018 | | | 2017 | | | 2016 | | | 2015 | |
Net Asset Value per Share, Beginning of Year | | $ | 7.77 | | | $ | 8.54 | | | $ | 8.34 | | | $ | 7.67 | | | $ | 8.57 | |
| | | | | | | | | | | | | | | | | | | | |
Income (Loss) from Investment Operations: | |
Net Investment Income (1) | | | 0.46 | | | | 0.43 | | | | 0.55 | | | | 0.55 | | | | 0.38 | |
Net Realized and Unrealized Gain (Loss) on Investments | | | 0.54 | | | | (0.83 | ) | | | 0.09 | | | | 0.52 | | | | (0.87 | ) |
| | | | | | | | | | | | | | | | | | | | |
Total from Investment Operations | | | 1.00 | | | | (0.40 | ) | | | 0.64 | | | | 1.07 | | | | (0.49 | ) |
| | | | | | | | | | | | | | | | | | | | |
Less Distributions: | |
Distributions from Net Investment Income | | | (0.44 | ) | | | (0.37 | ) | | | (0.44 | ) | | | (0.40 | ) | | | (0.39 | ) |
Distributions from Return of Capital | | | — | | | | — | | | | — | | | | — | | | | (0.02 | ) |
| | | | | | | | | | | | | | | | | | | | |
Total Distributions | | | (0.44 | ) | | | (0.37 | ) | | | (0.44 | ) | | | (0.40 | ) | | | (0.41 | ) |
| | | | | | | | | | | | | | | | | | | | |
Net Asset Value per Share, End of Year | | $ | 8.33 | | | $ | 7.77 | | | $ | 8.54 | | | $ | 8.34 | | | $ | 7.67 | |
| | | | | | | | | | | | | | | | | | | | |
Total Return | | | 13.13 | % | | | (4.85 | )% | | | 7.95 | % | | | 14.29 | % | | | (5.75 | )% |
|
Ratios/Supplemental Data: | |
| | | | | |
Net Assets, End of Year (in thousands) | | $ | 5,668,552 | | | $ | 4,365,456 | | | $ | 3,039,671 | | | $ | 2,574,798 | | | $ | 2,733,679 | |
| | | | | |
Ratio of Expenses to Average Net Assets | | | 0.84 | % | | | 0.86 | % | | | 0.87 | % | | | 0.87 | % | | | 0.88 | % |
| | | | | |
Ratio of Net Investment Income to Average Net Assets | | | 5.62 | % | | | 5.33 | % | | | 6.56 | % | | | 6.95 | % | | | 4.79 | % |
| | | | | |
Portfolio Turnover Rate | | | 136.47 | % | | | 149.50 | % | | | 212.16 | % | | | 214.73 | % | | | 172.93 | % |
| (1) | Computed using average shares outstanding throughout the period. |
See accompanying notes to financial statements.
80
TCW Emerging Markets Income Fund
Financial Highlights — N Class
| | | | | | | | | | | | | | | | | | | | |
| |
| | | Year Ended October 31, | |
| | | 2019 | | | 2018 | | | 2017 | | | 2016 | | | 2015 | |
Net Asset Value per Share, Beginning of Year | | $ | 10.00 | | | $ | 11.00 | | | $ | 10.75 | | | $ | 9.89 | | | $ | 11.05 | |
| | | | | | | | | | | | | | | | | | | | |
Income (Loss) from Investment Operations: | |
Net Investment Income (1) | | | 0.57 | | | | 0.53 | | | | 0.68 | | | | 0.68 | | | | 0.46 | |
Net Realized and Unrealized Gain (Loss) on Investments | | | 0.69 | | | | (1.08 | ) | | | 0.12 | | | | 0.67 | | | | (1.11 | ) |
| | | | | | | | | | | | | | | | | | | | |
Total from Investment Operations | | | 1.26 | | | | (0.55 | ) | | | 0.80 | | | | 1.35 | | | | (0.65 | ) |
| | | | | | | | | | | | | | | | | | | | |
Less Distributions: | |
Distributions from Net Investment Income | | | (0.54 | ) | | | (0.45 | ) | | | (0.55 | ) | | | (0.49 | ) | | | (0.48 | ) |
Distributions from Return of Capital | | | — | | | | — | | | | — | | | | — | | | | (0.03 | ) |
| | | | | | | | | | | | | | | | | | | | |
Total Distributions | | | (0.54 | ) | | | (0.45 | ) | | | (0.55 | ) | | | (0.49 | ) | | | (0.51 | ) |
| | | | | | | | | | | | | | | | | | | | |
Net Asset Value per Share, End of Year | | $ | 10.72 | | | $ | 10.00 | | | $ | 11.00 | | | $ | 10.75 | | | $ | 9.89 | |
| | | | | | | | | | | | | | | | | | | | |
Total Return | | | 12.85 | % | | | (5.16 | )% | | | 7.67 | % | | | 13.98 | % | | | (5.96 | )% |
|
Ratios/Supplemental Data: | |
| | | | | |
Net Assets, End of Year (in thousands) | | $ | 320,492 | | | $ | 342,660 | | | $ | 510,877 | | | $ | 534,151 | | | $ | 521,413 | |
|
Ratio of Expenses to Average Net Assets: | |
| | | | | |
Before Expense Reimbursement | | | 1.14 | % | | | 1.16 | % | | | 1.15 | % | | | 1.15 | % | | | 1.16 | % |
| | | | | |
After Expense Reimbursement | | | 1.05 | % | | | 1.10 | % | | | 1.13 | % | | | N/A | | | | N/A | |
| | | | | |
Ratio of Net Investment Income to Average Net Assets | | | 5.41 | % | | | 5.03 | % | | | 6.30 | % | | | 6.71 | % | | | 4.50 | % |
| | | | | |
Portfolio Turnover Rate | | | 136.47 | % | | | 149.50 | % | | | 212.16 | % | | | 214.73 | % | | | 172.93 | % |
| (1) | Computed using average shares outstanding throughout the period. |
See accompanying notes to financial statements.
81
TCW Emerging Markets Local Currency Income Fund
Financial Highlights — I Class
| | | | | | | | | | | | | | | | | | | | |
| |
| | | Year Ended October 31, | |
| | | 2019 | | | 2018 | | | 2017 | | | 2016 | | | 2015 | |
Net Asset Value per Share, Beginning of Year | | $ | 8.14 | | | $ | 9.30 | | | $ | 9.13 | | | $ | 8.18 | | | $ | 9.69 | |
| | | | | | | | | | | | | | | | | | | | |
Income (Loss) from Investment Operations: | |
Net Investment Income (1) | | | 0.58 | | | | 0.53 | | | | 0.64 | | | | 0.52 | | | | 0.46 | |
Net Realized and Unrealized Gain (Loss) on Investments | | | 0.57 | | | | (1.19 | ) | | | (0.06 | ) | | | 0.43 | | | | (1.94 | ) |
| | | | | | | | | | | | | | | | | | | | |
Total from Investment Operations | | | 1.15 | | | | (0.66 | ) | | | 0.58 | | | | 0.95 | | | | (1.48 | ) |
| | | | | | | | | | | | | | | | | | | | |
Less Distributions: | |
Distributions from Net Investment Income | | | (0.12 | ) | | | (0.23 | ) | | | (0.41 | ) | | | — | | | | — | |
Distributions from Return of Capital | | | — | | | | (0.27 | ) | | | — | | | | — | | | | (0.03 | ) |
| | | | | | | | | | | | | | | | | | | | |
Total Distributions | | | (0.12 | ) | | | (0.50 | ) | | | (0.41 | ) | | | — | | | | (0.03 | ) |
| | | | | | | | | | | | | | | | | | | | |
Net Asset Value per Share, End of Year | | $ | 9.17 | | | $ | 8.14 | | | $ | 9.30 | | | $ | 9.13 | | | $ | 8.18 | |
| | | | | | | | | | | | | | | | | | | | |
Total Return | | | 14.26 | % | | | (7.74 | )% | | | 6.33 | % | | | 11.61 | % | | | (15.35 | )% |
|
Ratios/Supplemental Data: | |
| | | | | |
Net Assets, End of Year (in thousands) | | $ | 220,968 | | | $ | 264,754 | | | $ | 138,068 | | | $ | 97,650 | | | $ | 102,034 | |
|
Ratio of Expenses to Average Net Assets: | |
| | | | | |
Before Expense Reimbursement | | | 1.03 | % | | | 0.95 | % | | | 1.03 | % | | | 1.00 | % | | | 1.00 | % |
| | | | | |
After Expense Reimbursement | | | 0.88 | % | | | N/A | | | | 0.99 | % | | | 0.99 | % | | | 0.99 | % |
| | | | | |
Ratio of Net Investment Income to Average Net Assets | | | 6.66 | % | | | 5.90 | % | | | 6.83 | % | | | 6.12 | % | | | 5.20 | % |
| | | | | |
Portfolio Turnover Rate | | | 127.74 | % | | | 185.72 | % | | | 137.44 | % | | | 209.07 | % | | | 250.10 | % |
| (1) | Computed using average shares outstanding throughout the period. |
See accompanying notes to financial statements.
82
TCW Emerging Markets Local Currency Income Fund
Financial Highlights — N Class
| | | | | | | | | | | | | | | | | | | | |
| |
| | | Year Ended October 31, | |
| | | 2019 | | | 2018 | | | 2017 | | | 2016 | | | 2015 | |
Net Asset Value per Share, Beginning of Year | | $ | 8.13 | | | $ | 9.29 | | | $ | 9.12 | | | $ | 8.17 | | | $ | 9.69 | |
| | | | | | | | | | | | | | | | | | | | |
Income (Loss) from Investment Operations: | | | | | | | | | | | | | | | | | | | | |
Net Investment Income (1) | | | 0.57 | | | | 0.51 | | | | 0.64 | | | | 0.48 | | | | 0.46 | |
Net Realized and Unrealized Gain (Loss) on Investments | | | 0.57 | | | | (1.17 | ) | | | (0.06 | ) | | | 0.47 | | | | (1.95 | ) |
| | | | | | | | | | | | | | | | | | | | |
Total from Investment Operations | | | 1.14 | | | | (0.66 | ) | | | 0.58 | | | | 0.95 | | | | (1.49 | ) |
| | | | | | | | | | | | | | | | | | | | |
Less Distributions: | | | | | | | | | | | | | | | | | | | | |
Distributions from Net Investment Income | | | (0.12 | ) | | | (0.23 | ) | | | (0.41 | ) | | | — | | | | — | |
Distributions from Return of Capital | | | — | | | | (0.27 | ) | | | — | | | | — | | | | (0.03 | ) |
| | | | | | | | | | | | | | | | | | | | |
Total Distributions | | | (0.12 | ) | | | (0.50 | ) | | | (0.41 | ) | | | — | | | | (0.03 | ) |
| | | | | | | | | | | | | | | | | | | | |
Net Asset Value per Share, End of Year | | $ | 9.15 | | | $ | 8.13 | | | $ | 9.29 | | | $ | 9.12 | | | $ | 8.17 | |
| | | | | | | | | | | | | | | | | | | | |
Total Return | | | 14.14 | % | | | (7.75 | ) | | | %6.33 | % | | | 11.63 | % | | | (15.37 | )% |
| | | | | |
Ratios/Supplemental Data: | | | | | | | | | | | | | | | | | | | | |
| | | | | |
Net Assets, End of Year (in thousands) | | $ | 28,011 | | | $ | 47,664 | | | $ | 34,807 | | | $ | 15,325 | | | $ | 153,270 | |
| | | | | |
Ratio of Expenses to Average Net Assets: | | | | | | | | | | | | | | | | | | | | |
| | | | | |
Before Expense Reimbursement | | | 1.40 | % | | | 1.32 | % | | | 1.35 | % | | | 1.31 | % | | | 1.25 | % |
| | | | | |
After Expense Reimbursement | | | 0.92 | % | | | 0.99 | % | | | 0.99 | % | | | 0.99 | % | | | 0.99 | % |
| | | | | |
Ratio of Net Investment Income to Average Net Assets | | | 6.63 | % | | | 5.78 | % | | | 6.88 | % | | | 6.05 | % | | | 5.29 | % |
| | | | | |
Portfolio Turnover Rate | | | 127.74 | % | | | 185.72 | % | | | 137.44 | % | | | 209.07 | % | | | 250.10 | % |
| (1) | Computed using average shares outstanding throughout the period. |
See accompanying notes to financial statements.
83
TCW Emerging Markets Multi-Asset Opportunities Fund
Financial Highlights — I Class
| | | | | | | | | | | | | | | | | | | | |
| |
| | | Year Ended October 31, | |
| | | 2019 | | | 2018 | | | 2017 | | | 2016 | | | 2015 | |
Net Asset Value per Share, Beginning of Year | | $ | 10.39 | | | $ | 11.70 | | | $ | 10.39 | | | $ | 9.63 | | | $ | 10.97 | |
| | | | | | | | | | | | | | | | | | | | |
Income (Loss) from Investment Operations: | |
Net Investment Income (1) | | | 0.38 | | | | 0.25 | | | | 0.31 | | | | 0.35 | | | | 0.24 | |
Net Realized and Unrealized Gain (Loss) on Investments | | | 0.69 | | | | (1.30 | ) | | | 1.38 | | | | 0.65 | | | | (1.38 | ) |
| | | | | | | | | | | | | | | | | | | | |
Total from Investment Operations | | | 1.07 | | | | (1.05 | ) | | | 1.69 | | | | 1.00 | | | | (1.14 | ) |
| | | | | | | | | | | | | | | | | | | | |
Less Distributions: | |
Distributions from Net Investment Income | | | (0.15 | ) | | | (0.26 | ) | | | (0.38 | ) | | | (0.24 | ) | | | (0.20 | ) |
| | | | | | | | | | | | | | | | | | | | |
Net Asset Value per Share, End of Year | | $ | 11.31 | | | $ | 10.39 | | | $ | 11.70 | | | $ | 10.39 | | | $ | 9.63 | |
| | | | | | | | | | | | | | | | | | | | |
Total Return | | | 10.50 | % | | | (9.23 | )% | | | 17.05 | % | | | 10.75 | % | | | (10.53 | )% |
|
Ratios/Supplemental Data: | |
| | | | | |
Net Assets, End of Year (in thousands) | | $ | 87,430 | | | $ | 43,338 | | | $ | 42,041 | | | $ | 37,173 | | | $ | 39,739 | |
|
Ratio of Expenses to Average Net Assets: | |
| | | | | |
Before Expense Reimbursement | | | 1.31 | % | | | 1.34 | % | | | 1.54 | % | | | 1.57 | % | | | 1.47 | % |
| | | | | |
After Expense Reimbursement | | | 1.02 | % | | | 1.23 | % | | | 1.23 | % | | | 1.23 | % | | | 1.23 | % |
| | | | | |
Ratio of Net Investment Income to Average Net Assets | | | 3.51 | % | | | 2.13 | % | | | 2.95 | % | | | 3.74 | % | | | 2.31 | % |
| | | | | |
Portfolio Turnover Rate | | | 188.64 | % | | | 160.85 | % | | | 197.48 | % | | | 227.75 | % | | | 145.86 | % |
| (1) | Computed using average shares outstanding throughout the period. |
See accompanying notes to financial statements.
84
TCW Emerging Markets Multi-Asset Opportunities Fund
Financial Highlights — N Class
| | | | | | | | | | | | | | | | | | | | |
| |
| | | Year Ended October 31, | |
| | | 2019 | | | 2018 | | | 2017 | | | 2016 | | | 2015 | |
Net Asset Value per Share, Beginning of Year | | $ | 10.35 | | | $ | 11.66 | | | $ | 10.35 | | | $ | 9.59 | | | $ | 10.92 | |
| | | | | | | | | | | | | | | | | | | | |
Income (Loss) from Investment Operations: | |
Net Investment Income (1) | | | 0.28 | | | | 0.26 | | | | 0.32 | | | | 0.36 | | | | 0.24 | |
Net Realized and Unrealized Gain (Loss) on Investments | | | 0.76 | | | | (1.31 | ) | | | 1.37 | | | | 0.64 | | | | (1.37 | ) |
| | | | | | | | | | | | | | | | | | | | |
Total from Investment Operations | | | 1.04 | | | | (1.05 | ) | | | 1.69 | | | | 1.00 | | | | (1.13 | ) |
| | | | | | | | | | | | | | | | | | | | |
Less Distributions: | |
Distributions from Net Investment Income | | | (0.15 | ) | | | (0.26 | ) | | | (0.38 | ) | | | (0.24 | ) | | | (0.20 | ) |
| | | | | | | | | | | | | | | | | | | | |
Net Asset Value per Share, End of Year | | $ | 11.24 | | | $ | 10.35 | | | $ | 11.66 | | | $ | 10.35 | | | $ | 9.59 | |
| | | | | | | | | | | | | | | | | | | | |
Total Return | | | 10.25 | % | | | (9.26 | )% | | | 17.10 | % | | | 10.78 | % | | | (10.50 | )% |
|
Ratios/Supplemental Data: | |
| | | | | |
Net Assets, End of Year (in thousands) | | $ | 11,784 | | | $ | 74,677 | | | $ | 40,064 | | | $ | 5,088 | | | $ | 4,107 | |
|
Ratio of Expenses to Average Net Assets: | |
| | | | | |
Before Expense Reimbursement | | | 1.65 | % | | | 1.67 | % | | | 1.96 | % | | | 2.15 | % | | | 2.15 | % |
| | | | | |
After Expense Reimbursement | | | 1.21 | % | | | 1.23 | % | | | 1.23 | % | | | 1.23 | % | | | 1.23 | % |
| | | | | |
Ratio of Net Investment Income to Average Net Assets | | | 2.64 | % | | | 2.25 | % | | | 2.95 | % | | | 3.79 | % | | | 2.38 | % |
| | | | | |
Portfolio Turnover Rate | | | 188.64 | % | | | 160.85 | % | | | 197.48 | % | | | 227.75 | % | | | 145.86 | % |
| (1) | Computed using average shares outstanding throughout the period. |
See accompanying notes to financial statements.
85
TCW International Small Cap Fund
Financial Highlights — I Class
| | | | | | | | | | | | | | | | | | | | |
| |
| | | Year Ended October 31, | |
| | | 2019 | | | 2018 | | | 2017 | | | 2016 | | | 2015 | |
Net Asset Value per Share, Beginning of Year | | $ | 9.62 | | | $ | 10.52 | | | $ | 8.17 | | | $ | 8.57 | | | $ | 8.72 | |
| | | | | | | | | | | | | | | | | | | | |
Income (Loss) from Investment Operations: | | | | | | | | | | | | | | | | | | | | |
Net Investment Income (1) | | | 0.10 | | | | 0.03 | | | | 0.04 | | | | 0.02 | | | | 0.01 | |
Net Realized and Unrealized Gain (Loss) on Investments | | | 0.24 | | | | (0.93 | ) | | | 2.34 | | | | (0.05 | ) | | | (0.11 | ) |
| | | | | | | | | | | | | | | | | | | | |
Total from Investment Operations | | | 0.34 | | | | (0.90 | ) | | | 2.38 | | | | (0.03 | ) | | | (0.10 | ) |
| | | | | | | | | | | | | | | | | | | | |
Less Distributions: | | | | | | | | | | | | | | | | | | | | |
Distributions from Net Investment Income | | | (0.04 | ) | | | — | | | | (0.03 | ) | | | (0.37 | ) | | | (0.05 | ) |
| | | | | | | | | | | | | | | | | | | | |
Net Asset Value per Share, End of Year | | $ | 9.92 | | | $ | 9.62 | | | $ | 10.52 | | | $ | 8.17 | | | $ | 8.57 | |
| | | | | | | | | | | | | | | | | | | | |
Total Return | | | 3.65 | % | | | (8.65 | )% | | | 29.21 | % | | | (0.49 | )% | | | (1.07 | )% |
| | | | | |
Ratios/Supplemental Data: | | | | | | | | | | | | | | | | | | | | |
| | | | | |
Net Assets, End of Year (in thousands) | | $ | 7,004 | | | $ | 6,598 | | | $ | 6,350 | | | $ | 5,684 | | | $ | 7,274 | |
| | | | | |
Ratio of Expenses to Average Net Assets: | | | | | | | | | | | | | | | | | | | | |
| | | | | |
Before Expense Reimbursement | | | 3.00 | % | | | 2.71 | % | | | 2.89 | % | | | 2.40 | % | | | 1.67 | % |
| | | | | |
After Expense Reimbursement | | | 1.06 | % | | | 1.42 | % | | | 1.43 | % | | | 1.44 | % | | | 1.44 | % |
| | | | | |
Ratio of Net Investment Income to Average Net Assets | | | 1.05 | % | | | 0.26 | % | | | 0.41 | % | | | 0.29 | % | | | 0.17 | % |
| | | | | |
Portfolio Turnover Rate | | | 244.29 | % | | | 213.01 | % | | | 232.19 | % | | | 128.62 | % | | | 243.88 | % |
| (1) | Computed using average shares outstanding throughout the period. |
See accompanying notes to financial statements.
86
TCW International Small Cap Fund
Financial Highlights — N Class
| | | | | | | | | | | | | | | | | | | | |
| |
| | | Year Ended October 31, | |
| | | 2019 | | | 2018 | | | 2017 | | | 2016 | | | 2015 | |
Net Asset Value per Share, Beginning of Year | | $ | 9.63 | | | $ | 10.53 | | | $ | 8.17 | | | $ | 8.58 | | | $ | 8.72 | |
| | | | | | | | | | | | | | | | | | | | |
Income (Loss) from Investment Operations: | |
Net Investment Income (1) | | | 0.08 | | | | 0.02 | | | | 0.04 | | | | 0.03 | | | | 0.03 | |
Net Realized and Unrealized Gain (Loss) on Investments | | | 0.24 | | | | (0.92 | ) | | | 2.35 | | | | (0.07 | ) | | | (0.12 | ) |
| | | | | | | | | | | | | | | | | | | | |
Total from Investment Operations | | | 0.32 | | | | (0.90 | ) | | | 2.39 | | | | (0.04 | ) | | | (0.09 | ) |
| | | | | | | | | | | | | | | | | | | | |
Less Distributions: | |
Distributions from Net Investment Income | | | (0.04 | ) | | | — | | | | (0.03 | ) | | | (0.37 | ) | | | (0.05 | ) |
| | | | | | | | | | | | | | | | | | | | |
Net Asset Value per Share, End of Year | | $ | 9.91 | | | $ | 9.63 | | | $ | 10.53 | | | $ | 8.17 | | | $ | 8.58 | |
| | | | | | | | | | | | | | | | | | | | |
Total Return | | | 3.44 | % | | | (8.64 | )% | | | 29.34 | % | | | (0.60 | )% | | | (1.03 | )% |
|
Ratios/Supplemental Data: | |
| | | | | |
Net Assets, End of Year (in thousands) | | $ | 3,072 | | | $ | 3,197 | | | $ | 3,589 | | | $ | 3,143 | | | $ | 3,440 | |
|
Ratio of Expenses to Average Net Assets: | |
| | | | | |
Before Expense Reimbursement | | | 3.68 | % | | | 3.26 | % | | | 3.48 | % | | | 2.88 | % | | | 2.09 | % |
| | | | | |
After Expense Reimbursement | | | 1.23 | % | | | 1.42 | % | | | 1.43 | % | | | 1.44 | % | | | 1.44 | % |
| | | | | |
Ratio of Net Investment Income to Average Net Assets | | | 0.88 | % | | | 0.22 | % | | | 0.41 | % | | | 0.33 | % | | | 0.40 | % |
| | | | | |
Portfolio Turnover Rate | | | 244.29 | % | | | 213.01 | % | | | 232.19 | % | | | 128.62 | % | | | 243.88 | % |
| (1) | Computed using average shares outstanding throughout the period. |
See accompanying notes to financial statements.
87
TCW Funds, Inc.
Report of Independent Registered Public Accounting Firm
To the Board of Directors and Shareholders of TCW Funds, Inc.
Opinion on the Financial Statements and Financial Highlights
We have audited the accompanying statements of assets and liabilities of TCW Developing Markets Equity Fund, TCW Emerging Markets Income Fund, TCW Emerging Markets Local Currency Income Fund, TCW Emerging Markets Multi-Asset Opportunities Fund, and TCW International Small Cap Fund (collectively, the “TCW International Funds”) (five of nineteen funds comprising TCW Funds, Inc.), including the schedules of investments, as of October 31, 2019, and the related statements of operations for the year then ended, the statements of changes in net assets for each of the two years in the period then ended, the financial highlights for each of the five years in the period then ended for the TCW International Funds, except, TCW Developing Markets Equity Fund which is for each of the four years in the period then ended and for the period June 30, 2015 (commencement of operations) to October 31, 2015, and the related notes. In our opinion, the financial statements and financial highlights present fairly, in all material respects, the financial position of each of the respective TCW International Funds as of October 31, 2019, the results of their operations for the year then ended, the changes in its net assets for each of the two years in the period then ended, and the financial highlights for each of the five years in the period then ended for the TCW International Funds, except, TCW Developing Markets Equity Fund which is for each of the four years in the period then ended and for the period June 30, 2015 (commencement of operations) to October 31, 2015, in conformity with accounting principles generally accepted in the United States of America.
Basis for Opinion
These financial statements and financial highlights are the responsibility of the TCW International Funds’ management. Our responsibility is to express an opinion on the TCW International Funds’ financial statements and financial highlights based on our audits. We are a public accounting firm registered with the Public Company Accounting Oversight Board (United States) (PCAOB) and are required to be independent with respect to the Funds in accordance with the U.S. federal securities laws and the applicable rules and regulations of the Securities and Exchange Commission and the PCAOB.
We conducted our audits in accordance with the standards of the PCAOB. Those standards require that we plan and perform the audits to obtain reasonable assurance about whether the financial statements and financial highlights are free of material misstatement, whether due to error or fraud. The TCW International Funds are not required to have, nor were we engaged to perform, an audit of their internal control over financial reporting. As part of our audits we are required to obtain an understanding of internal control over financial reporting but not for the purpose of expressing an opinion on the effectiveness of the TCW International Funds’ internal control over financial reporting. Accordingly, we express no such opinion.
Our audits included performing procedures to assess the risks of material misstatement of the financial statements and financial highlights, whether due to error or fraud, and performing procedures that respond to those risks. Such procedures included examining, on a test basis, evidence regarding the amounts and disclosures in the financial statements and financial highlights. Our audits also included evaluating the accounting principles used and significant estimates made by management, as well as evaluating the overall presentation of the financial statements and financial highlights. Our procedures included confirmation of securities owned as of October 31, 2019, by correspondence with the custodian and brokers; when replies were not received from brokers, we performed other auditing procedures. We believe that our audits provide a reasonable basis for our opinion.

Los Angeles, California
December 20, 2019
We have served as the auditor of one or more TCW/Metropolitan West Funds investment companies since 1990.
88
TCW Funds, Inc.
Shareholder Expenses (Unaudited)
As a shareholder of a Fund, you incur ongoing operational costs of the Fund, including management fees and other fund expenses. The following example is intended to help you understand your ongoing costs (in dollars and cents) of investing in a Fund and to compare these costs with the ongoing costs of investing in other funds.
The example is based on an investment of $1,000 invested at the beginning of the period and held for the entire period from May 1, 2019 to October 31, 2019 (184 days).
Actual Expenses The first line under each Fund in the table below provides information about the actual account values and actual expenses. You may use the information in this line, together with the amount you invested, to estimate the expenses that you paid over the period. Simply divide your account value by $1,000 (for example, an $8,600 account value divided by $1,000 = 8.6), then multiply the result by the number in the first line for your Fund under the heading entitled “Expenses Paid During Period” to estimate the expenses you paid on your account during this period.
Hypothetical Example for Comparison Purposes The second line under each Fund in the table below provides information about the hypothetical expenses based on each Fund’s actual expense ratio and an assumed rate of return of 5% per year before expenses, which is not the Fund’s actual return. The hypothetical account value and expenses may not be used to estimate the actual ending account balance or expenses you paid for the period. You may use this information to compare the ongoing costs of investing in your Fund and other funds. To do so, compare this 5% hypothetical example with the 5% hypothetical examples that appear in the shareholder reports of the other funds.
| | | | | | | | | | | | | | | | |
TCW Funds, Inc. | | Beginning
Account Value
May 1, 2019 | | | Ending
Account Value
October 31, 2019 | | | Annualized
Expense Ratio | | | Expenses Paid
During Period
(May 1, 2019 to
October 31, 2019) | |
| TCW Developing Markets Equity Fund | | | | | | | | | | | | | | | | |
I Class Shares | | | | | | | | | | | | | | | | |
Actual | | $ | 1,000.00 | | | $ | 1,003.00 | | | | 1.25 | % | | $ | 6.31 | |
Hypothetical (5% return before expenses) | | | 1,000.00 | | | | 1,018.90 | | | | 1.25 | % | | | 6.36 | |
| | | | |
N Class Shares | | | | | | | | | | | | | | | | |
Actual | | $ | 1,000.00 | | | $ | 1,003.00 | | | | 1.25 | % | | $ | 6.31 | |
Hypothetical (5% return before expenses) | | | 1,000.00 | | | | 1,018.90 | | | | 1.25 | % | | | 6.36 | |
| | | | |
| TCW Emerging Markets Income Fund | | | | | | | | | | | | | | | | |
I Class Shares | | | | | | | | | | | | | | | | |
Actual | | $ | 1,000.00 | | | $ | 1,048.00 | | | | 0.85 | % | | $ | 4.39 | |
Hypothetical (5% return before expenses) | | | 1,000.00 | | | | 1,020.92 | | | | 0.85 | % | | | 4.33 | |
| | | | |
N Class Shares | | | | | | | | | | | | | | | | |
Actual | | $ | 1,000.00 | | | $ | 1,046.80 | | | | 1.04 | % | | $ | 5.37 | |
Hypothetical (5% return before expenses) | | | 1,000.00 | | | | 1,019.96 | | | | 1.04 | % | | | 5.30 | |
| | | | |
| TCW Emerging Markets Local Currency Income Fund | | | | | | | | | | | | | | | | |
I Class Shares | | | | | | | | | | | | | | | | |
Actual | | $ | 1,000.00 | | | $ | 1,075.00 | | | | 0.85 | % | | $ | 4.45 | |
Hypothetical (5% return before expenses) | | | 1,000.00 | | | | 1,020.92 | | | | 0.85 | % | | | 4.33 | |
| | | | |
N Class Shares | | | | | | | | | | | | | | | | |
Actual | | $ | 1,000.00 | | | $ | 1,075.20 | | | | 0.90 | % | | $ | 4.71 | |
Hypothetical (5% return before expenses) | | | 1,000.00 | | | | 1,020.67 | | | | 0.90 | % | | | 4.58 | |
89
TCW Funds, Inc.
Shareholder Expenses (Unaudited) (Continued)
| | | | | | | | | | | | | | | | |
TCW Funds, Inc. | | Beginning
Account Value
May 1, 2019 | | | Ending
Account Value
October 31, 2019 | | | Annualized
Expense Ratio | | | Expenses Paid
During Period
(May 1, 2019 to
October 31, 2019) | |
| TCW Emerging Markets Multi-Asset Opportunities Fund | | | | | | | | | | | | | | | | |
I Class Shares | | | | | | | | | | | | | | | | |
Actual | | $ | 1,000.00 | | | $ | 1,018.90 | | | | 1.00 | % | | $ | 5.09 | |
Hypothetical (5% return before expenses) | | | 1,000.00 | | | | 1,020.16 | | | | 1.00 | % | | | 5.09 | |
| | | | |
N Class Shares | | | | | | | | | | | | | | | | |
Actual | | $ | 1,000.00 | | | $ | 1,018.10 | | | | 1.20 | % | | $ | 6.10 | |
Hypothetical (5% return before expenses) | | | 1,000.00 | | | | 1,019.16 | | | | 1.20 | % | | | 6.11 | |
| | | | |
| TCW International Small Cap Fund | | | | | | | | | | | | | | | | |
I Class Shares | | | | | | | | | | | | | | | | |
Actual | | $ | 1,000.00 | | | $ | 1,013.30 | | | | 1.00 | % | | $ | 5.07 | |
Hypothetical (5% return before expenses) | | | 1,000.00 | | | | 1,020.16 | | | | 1.00 | % | | | 5.09 | |
| | | | |
N Class Shares | | | | | | | | | | | | | | | | |
Actual | | $ | 1,000.00 | | | $ | 1,012.30 | | | | 1.20 | % | | $ | 6.09 | |
Hypothetical (5% return before expenses) | | | 1,000.00 | | | | 1,019.16 | | | | 1.20 | % | | | 6.11 | |
90
TCW Funds, Inc.
Privacy Policy
The TCW Group, Inc. and Subsidiaries
TCW Investment Management Company LLC
TCW Asset Management Company LLC
Metropolitan West Asset Management, LLC
| | |
| TCW Funds, Inc. | | Sepulveda Management LLC |
| TCW Strategic Income Fund, Inc. | | TCW Direct Lending LLC |
| Metropolitan West Funds | | TCW Direct Lending VII LLC |
What You Should Know
At TCW, we recognize the importance of keeping information about you secure and confidential. We do not sell or share your nonpublic personal and financial information with marketers or others outside our affiliated group of companies.
We carefully manage information among our affiliated group of companies to safeguard your privacy and to provide you with consistently excellent service.
We are providing this notice to you to comply with the requirements of Regulation S-P, “Privacy of Consumer Financial Information,” issued by the United States Securities and Exchange Commission.
Our Privacy Policy
We, The TCW Group, Inc. and its subsidiaries, the TCW Funds, Inc., TCW Strategic Income Fund, Inc., the Metropolitan West Funds, Sepulveda Management LLC and TCW Direct Lending (collectively, “TCW”) are committed to protecting the nonpublic personal and financial information of our customers and consumers who obtain or seek to obtain financial products or services primarily for personal, family or household purposes. We fulfill our commitment by establishing and implementing policies and systems to protect the security and confidentiality of this information.
In our offices, we limit access to nonpublic personal and financial information about you to those TCW personnel who need to know the information in order to provide products or services to you. We maintain physical, electronic and procedural safeguards to protect your nonpublic personal and financial information.
Categories of Information We Collect
We may collect the following types of nonpublic personal and financial information about you from the following sources:
| • | | Your name, address and identifying numbers, and other personal and financial information, from you and from identification cards and papers you submit to us, on applications, subscription agreements or other forms or communications. |
| • | | Information about your account balances and financial transactions with us, our affiliated entities, or nonaffiliated third parties, from our internal sources, from affiliated entities and from nonaffiliated third parties. |
91
TCW Funds, Inc.
Privacy Policy (Continued)
| • | | Information about your account balances and financial transactions and other personal and financial information, from consumer credit reporting agencies or other nonaffiliated third parties, to verify information received from you or others. |
Categories of Information We Disclose to Nonaffiliated Third Parties
| • | | We may disclose your name, address and account and other identifying numbers, as well as information about your pending or past transactions and other personal financial information, to nonaffiliated third parties, for our everyday business purposes such as necessary to execute, process, service and confirm your securities transactions and mutual fund transactions, to administer and service your account and commingled investment vehicles in which you are invested, to market our products and services through joint marketing arrangements or to respond to court orders and legal investigations. |
| • | | We may disclose nonpublic personal and financial information concerning you to law enforcement agencies, federal regulatory agencies, self-regulatory organizations or other nonaffiliated third parties, if required or requested to do so by a court order, judicial subpoena or regulatory inquiry. |
We do not otherwise disclose your nonpublic personal and financial information to nonaffiliated third parties, except where we believe in good faith that disclosure is required or permitted by law. Because we do not disclose your nonpublic personal and financial information to nonaffiliated third parties, our Customer Privacy Policy does not contain opt-out provisions.
Categories of Information We Disclose to Our Affiliated Entities
| • | | We may disclose your name, address and account and other identifying numbers, account balances, information about your pending or past transactions and other personal financial information to our affiliated entities for any purpose. |
| • | | We regularly disclose your name, address and account and other identifying numbers, account balances and information about your pending or past transactions to our affiliates to execute, process and con- firm securities transactions or mutual fund transactions for you, to administer and service your account and commingled investment vehicles in which you are invested, or to market our products and services to you. |
Information About Former Customers
We do not disclose nonpublic personal and financial information about former customers to nonaffiliated third parties unless required or requested to do so by a court order, judicial subpoena or regulatory inquiry, or otherwise where we believe in good faith that disclosure is required or permitted by law.
Questions
Should you have any questions about our Customer Privacy Policy, please contact us by email or by regular mail at the address at the end of this policy.
92
TCW Funds, Inc.
Reminder About TCW’s Financial Products
Financial products offered by The TCW Group, Inc. and its subsidiaries, the TCW Funds, Inc., TCW Strategic Income Fund, Inc., the Metropolitan West Funds, Sepulveda Management LLC and TCW Direct Lending.
| • | | Are not guaranteed by a bank; |
| • | | Are not obligations of The TCW Group, Inc. or of its subsidiaries; |
| • | | Are not insured by the Federal Deposit Insurance Corporation; and |
| • | | Are subject to investment risks, including possible loss of the principal amount committed or invested, and earnings thereon. |
THE TCW GROUP, INC.
TCW FUNDS, INC.
TCW STRATEGIC INCOME FUND, INC.
METROPOLITAN WEST FUNDS
SEPULVEDA MANAGEMENT LLC
TCW DIRECT LENDING LLC
TCW DIRECT LENDING VII LLC
Attention: Privacy Officer | 865 South Figueroa St. Suite 1800 | Los Angeles, CA 90017 |
email: privacy@tcw.com
93
TCW Funds, Inc.
Approval of Investment Management and Advisory Agreement
Renewal of Investment Advisory and Management Agreement (Unaudited)
TCW Funds, Inc. (the “Corporation”) and TCW Investment Management Company LLC (the “Advisor”) are parties to an Investment Advisory and Management Agreement (“Agreement”), pursuant to which the Advisor is responsible for managing the investments of each separate investment series (each, a “Fund” and collectively, the “Funds”) of the Corporation. Unless terminated by either party, the Agreement continues in effect from year to year provided that the continuance is specifically approved at least annually by the vote of the holders of at least a majority of the outstanding shares of the Funds, or by the Board of Directors of the Corporation (the “Board”), and, in either event, by a majority of the Directors who are not “interested persons” of the Corporation, as such term is defined in Section 2(a)(19) of the Investment Company Act of 1940, as amended (the “Independent Directors”), casting votes in person at a meeting called for that purpose.
On September 16, 2019, the Board approved the renewal of the Agreement for an additional one-year term from February 6, 2020 through February 5, 2021. The renewal of the Agreement was approved by the Board (including by a majority of the Independent Directors) upon the recommendation of the Independent Directors. The Independent Directors met separately by telephone on August 27, 2019, and in person on September 15, 2019, with their independent legal counsel to review and discuss the information that had been requested on their behalf by their independent legal counsel and presented by the Advisor for their consideration. The information, material facts, and conclusions that formed the basis for the Independent Directors’ recommendation and the Board’s subsequent approval are described below.
1. Information received
Materials reviewed — During the course of each year, the Directors receive a wide variety of materials relating to the services provided by the Advisor, including reports on the Advisor’s investment processes, as well as on each Fund’s investment results, portfolio composition, portfolio trading practices, compliance monitoring, shareholder services, and other information relating to the nature, extent, and quality of services provided by the Advisor to the Funds. In addition, the Board reviewed information furnished to the Independent Directors in response to a detailed request sent to the Advisor on their behalf. The information in the Advisor’s responses included extensive materials regarding each Fund’s investment results, advisory fee comparisons to advisory fees charged by the Advisor to its institutional clients, financial and profitability information regarding the Advisor, descriptions of various services provided to the Funds and to other advisory and sub-advisory clients, descriptions of functions such as compliance monitoring and portfolio trading practices, and information about the personnel providing investment management services to each Fund. The Directors also considered information provided by an independent data provider, Broadridge, comparing the investment performance and the fee and expense levels of each Fund to those of appropriate peer groups of mutual funds selected by Broadridge. After reviewing this information, the Directors requested additional financial, profitability and service information from the Advisor, which the Advisor provided and the Directors considered.
Review process — The Directors’ determinations were made on the basis of each Director’s business judgment after consideration of all the information presented. The Independent Directors were advised by their independent legal counsel throughout the renewal process and received and reviewed advice from their independent legal counsel regarding legal and industry standards applicable to the renewal of the Agreement, including a legal memorandum from their independent legal counsel discussing their fiduciary duties related to their approval of the continuation of the Agreement. The Independent Directors also
94
TCW Funds, Inc.
discussed the renewal of the Agreement with the Advisor’s representatives and in private sessions at which no representatives of the Advisor were present. In deciding to recommend the renewal of the Agreement with respect to each Fund, the Independent Directors did not identify any single piece of information or particular factor that, in isolation, was the controlling factor. Each Independent Director may also have weighed factors differently. This summary describes the most important, but not all, of the factors considered by the Board and the Independent Directors.
2. Nature, extent, and quality of services provided by the Advisor
The Board and the Independent Directors considered the depth and quality of the Advisor’s investment management process, including its research and strong analytical capabilities; the experience, capability, and integrity of its senior management and other personnel; the relatively low turnover rates of its key personnel; the overall resources available to the Advisor; and the ability of its organizational structure to address the growth in assets over the past several years and withstand the recent decline in assets. The Board and the Independent Directors considered the ability of the Advisor to attract and retain well-qualified investment professionals, noting in particular the Advisor’s hiring of professionals in various areas over the past several years, continued upgrading of resources in its middle office and back office operations and other areas, as well as a continuing and extensive program of infrastructure and systems enhancements. The Board and the Independent Directors also considered that the Advisor made available to its investment professionals a variety of resources and systems relating to investment management, compliance, trading, operations, administration, research, portfolio accounting, and legal matters. They noted the substantial additional resources made available by The TCW Group, Inc., the parent company of the Advisor. The Board and the Independent Directors examined and discussed a detailed description of the extensive additional services provided to the Funds to support their operations and compliance, as compared to the much narrower range of services provided to the Advisor’s institutional and sub-advised clients, as well as the Advisor’s oversight and coordination of numerous outside service providers to the Funds. They further noted the high level of regular communication between the Advisor and the Independent Directors. The Advisor explained its responsibility to supervise the activities of the Funds’ various service providers, as well as supporting the Independent Directors and their meetings, regulatory filings, and various operational personnel, and the related costs.
The Board and the Independent Directors concluded that the nature, extent, and quality of the services provided by the Advisor are of a high quality and have benefited and should continue to benefit the Funds and their shareholders.
3. Investment results
The Board and the Independent Directors considered the investment results of each Fund in light of its investment objective(s) and principal investment strategies. They compared each Fund’s total returns with the total returns of other mutual funds in peer group reports prepared by Broadridge with respect to various longer and more recent periods all ended May 31, 2019. The Board and the Independent Directors reviewed information as to peer group selections presented by Broadridge and discussed the methodology for those selections with Broadridge. In reviewing each Fund’s relative performance, the Board and the Independent Directors took into account each Fund’s investment strategies, distinct characteristics, asset size and diversification.
The Board and the Independent Directors noted that most Funds’ performance was satisfactory over the relevant periods. The Board and the Independent Directors noted that investment performance of most of
95
TCW Funds, Inc.
Approval of Investment Management and Advisory Agreement (Continued)
the Funds was generally close to or above the median performance of the applicable peer group during the three-year period emphasized by Broadridge in the supplemental materials, but eight Funds ranked in the fourth or fifth quintile of their peer groups for that three-year period. For those Funds that lagged peer group averages, they noted that the Advisor had discussed with the Board the reasons for the underperformance and the actions taken or to be taken by the Advisor to address the underperformance, and they indicated that they would continue to monitor portfolio investment performance on a regular basis and discuss with the Advisor from time to time any instances of long-term underperformance as appropriate. The Board and the Independent Directors noted that the performance of some Funds for periods when they lagged their peer group averages remained satisfactory when assessed on a risk-adjusted basis because performance quintiles do not necessarily reflect the degree of risk employed by peer funds to achieve their returns.
With respect to the fixed income Funds, the Board and the Independent Directors recognized the Advisor’s deliberate strategy to manage risk in light of its critical view of the fixed-income securities markets and overall investment market conditions at present and in the near term. For that reason, the Board and the Independent Directors believed that relative performance also should be considered in light of future market conditions expected by the Advisor. The Board and the Independent Directors noted the Advisor’s view that longer term performance can be more meaningful for active fixed income funds than shorter term performance because fixed income market cycles are generally longer than three years.
For the U.S. fixed income Funds, the Board and the Independent Directors noted the conservative profile of these Funds, which generally experienced less volatility compared to various other funds in the applicable peer group (except for the relative volatility of Total Return Bond Fund, which is a mortgage-focused Fund). They also noted the Advisor’s conservative posture for these Funds with respect to credit and interest rate risks.
For the Total Return Bond Fund, the Board and the Independent Directors noted that the Fund’s performance was in the first quintile for the ten-year period, the second quintile for the three- and five-year periods and the first quintile for the one-year period.
For the Core Fixed Income Fund, the Board and the Independent Directors noted that the Fund’s performance was in the second quintile for the ten-year period, the third quintile for the five- and three-year periods and the second quintile for the one-year period.
For the Global Bond Fund, the Board and the Independent Directors noted that the Fund’s performance was in the fourth quintile for the five-year period, the fifth quintile for the three-year period and the third quintile for the one-year period.
For the High Yield Bond Fund, the Board and the Independent Directors noted that the Fund’s performance was in the third quintile for the ten-year period, the first quintile for the five-year period, the third quintile for the three-year period and the first quintile for the one-year period.
For the Short Term Bond Fund, the Board and the Independent Directors noted that the Fund’s performance was in the third quintile for the ten-year period, the fourth quintile for the five- and three-year periods and the fifth quintile for the one-year period.
For the Enhanced Commodity Strategy Fund, the Board and the Independent Directors noted that the Fund’s performance was in the second quintile for the five- and three-year periods and the first quintile for the one-year period.
96
TCW Funds, Inc.
With respect to the U.S. equity Funds, the Board and the Independent Directors noted that the performance of most Funds for the various periods reviewed ranked in the first, second or third quintiles.
The Relative Value Dividend Appreciation Fund ranked in the fifth quintile for the one-, three- and five-year periods. The Relative Value Large Cap Fund ranked in the fifth quintile for the one- and three-year periods and the fourth quintile for the five-year period. The Relative Value Mid Cap Fund ranked in the fifth quintile for the one-, five- and ten-year periods. The Board and the Independent Directors noted the Advisor’s explanation that the diversification tool used to mitigate risk of the Relative Value Dividend Appreciation Fund and the Relative Value Large Cap Fund weighed on their near-term performance in a momentum-driven market and its opinion that each of the Relative Value Funds is well-positioned to excel in a strengthening economic environment. The Board and the Independent Directors also noted that the Relative Value Dividend Appreciation Fund and the Relative Value Large Cap Fund ranked in the first quintile for the six-month period ended June 30, 2019.
The Artificial Intelligence Equity Fund ranked in the fourth quintile for the one-year period and the period since inception. The Board and the Independent Directors considered the Advisor’s explanation that the peer funds had greater exposure to the information technology sector, making the peer group less useful in comparing relative performance than if those funds’ principal investment strategies were more closely aligned with the Fund’s investment focus. The Board and the Independent Directors also noted the relatively short operating history of the Fund and determined to continue to closely monitor its performance.
The Global Real Estate Fund ranked in the fifth quintile for the three-year period but in the third quintile for the one-year period and the first quintile for the six months ended June 30, 2019. The Board and the Independent Directors determined to continue to closely monitor its performance and did not believe any other immediate action was needed.
With respect to the international and emerging markets Funds, the Board and the Independent Directors noted that the performance of a majority of these Funds ranked in the first, second or third quintiles over various time periods. The Emerging Markets Local Currency Income Fund ranked in the fourth quintile for the one-year period but in the second quintile for the three-year period and the first quintile for the five-year period. The Emerging Markets Multi-Asset Opportunities Fund ranked in the fifth quintile for the one-year period but in the second quintile for the three-year period and the third quintile for the five-year period. The International Small Cap Fund ranked in the fifth quintile for the one- and five-year periods and the fourth quintile for the three-year period. The Developing Markets Equity Fund ranked in the fifth quintile for the one-year period and the fourth quintile for the three-year period. The Board and the Independent Directors noted the Advisor’s explanation that the challenging international and emerging market conditions over the last twelve months weighed on near-term performance and its opinion that each of the international and emerging markets Funds is well-positioned to excel in a strengthening economic environment.
For the asset allocation Fund, the Board the Independent Directors noted that the Conservative Allocation Fund’s performance was in the second quintile for the ten-year period, the first quintile for the five-year period, the second quintile for the three- and one-year periods.
The Board and the Independent Directors concluded that the Advisor was implementing each Fund’s investment objective(s) and that the Advisor’s record in managing the Funds indicated that its continued management should benefit each Fund and its shareholders over the long term.
97
TCW Funds, Inc.
Approval of Investment Management and Advisory Agreement (Continued)
4. Advisory fees and total expenses
The Board and the Independent Directors compared the management fees (which Broadridge defines to include the advisory fee and the administrative fee) and total expenses of each Fund (each as a percentage of average net assets) with the median management fee and operating expense level of the other mutual funds in the relevant Broadridge peer groups. These comparisons assisted the Board and the Independent Directors by providing a reasonable statistical measure to assess each Fund’s fees relative to its relevant peers. The Board and the Independent Directors observed that each Fund’s management fee, after giving effect to applicable waivers and/or reimbursements, was below or near the median of the peer group funds on a current basis, with the exception of the Select Equities Fund, the Emerging Markets Income Fund, the Emerging Markets Local Currency Income Fund and the Emerging Markets Multi-Asset Opportunities Fund. They also observed that each Fund’s total expenses, after giving effect to applicable waivers and/or reimbursements, were below or near the median of the peer group funds, with the exception of the Global Bond Fund primarily due to its smaller size relative to most of the other funds in the peer group. The Board and the Independent Directors also noted the contractual expense limitations to which the Advisor has agreed with respect to each Fund and that the Advisor historically has absorbed any expenses in excess of these limits. The Board and the Independent Directors noted that for several Funds, their below-median management fee and total expenses were in part due to substantial waiver and/or reimbursement pursuant to the contractual expense limitations. The Board and the Independent Directors concluded that the competitive fees charged by the Advisor, and competitive expense ratios, should continue to benefit each Fund and its shareholders.
The Board and the Independent Directors also reviewed information regarding the advisory fees charged by the Advisor to its institutional and sub-advisory clients with similar investment mandates. The Board and the Independent Directors concluded that, although the fees paid by those clients generally were lower than advisory fees paid by the Funds, the differences appropriately reflected the more extensive services provided by the Advisor to the Funds and the Advisor’s significantly greater responsibilities and expenses with respect to the Funds, including the additional time spent by portfolio managers for reasons such as managing the more active cash flows from purchases and redemptions by shareholders, the additional risks of managing a pool of assets for public investors, administrative burdens, daily pricing, valuation and liquidity responsibilities, the supervision of vendors and service providers, and the costs of additional infrastructure and operational resources and personnel and of complying with and supporting the more comprehensive regulatory and governance regime applicable to mutual funds.
5. The Advisor’s costs, level of profits, and economies of scale
The Board and the Independent Directors reviewed information regarding the Advisor’s costs of providing services to the Funds, as well as the resulting level of profits to the Advisor. They reviewed the Advisor’s stated assumptions and methods of allocating certain costs, such as personnel costs, which constitute the Advisor’s largest operating cost. The Board and the Independent Directors recognized that the Advisor should be entitled to earn a reasonable level of profits for the services that it provides to each Fund. The Board and the Independent Directors also reviewed a comparison of the Advisor’s profitability with respect to the Funds to the profitability of certain unaffiliated publicly traded asset managers, which the Advisor believed supported its view that the Advisor’s profitability was reasonable. Based on their review, the Board and the Independent Directors concluded that they were satisfied that the Advisor’s level of profitability from its relationship with each Fund was not unreasonable or excessive.
98
TCW Funds, Inc.
The Board and the Independent Directors considered the extent to which potential economies of scale could be realized as the Funds grow and whether the advisory fees reflect those potential economies of scale. They recognized that the advisory fees for the Funds do not have breakpoints, which would otherwise result in lower advisory fee rates as the Funds grow larger. They also recognized the Advisor’s view that the advisory fees compare favorably to peer group fees and expenses and remain competitive even at higher asset levels and that the relatively low advisory fees reflect the potential economies of scale. The Board and the Independent Directors recognized the benefits of the Advisor’s substantial past and on-going investment in the advisory business, such as successfully recruiting and retaining key professional talent, systems and technology upgrades, added resources dedicated to legal and compliance programs, and improvements to the overall firm infrastructure, as well as the financial pressures of competing against much larger firms and passive investment products. The Board and the Independent Directors further noted the Advisor’s past and continuing subsidies of the Funds’ operating expenses when they were newer and smaller and the Advisor’s commitment to maintain reasonable overall operating expenses for each Fund. The Board and the Independent Directors also recognized that the Funds benefit from receiving investment advice from an organization with other types of advisory clients in addition to mutual funds. The Board and the Independent Directors concluded that the Advisor was satisfactorily sharing potential economies of scale with the Funds through low fees and expenses, and through reinvesting in its capabilities for serving the Funds and their shareholders.
6. Ancillary benefits
The Board and the Independent Directors also considered ancillary benefits received or to be received by the Advisor and its affiliates as a result of the relationship of the Advisor with the Funds, including compensation for certain compliance support services. The Board and the Independent Directors noted that, in addition to the fees the Advisor receives under the Agreement, the Advisor receives additional benefits in connection with management of the Funds in the form of reports, research and other services from brokers and their affiliates in return for brokerage commissions paid to such brokers. The Board and the Independent Directors concluded that any potential benefits received or to be derived by the Advisor from its relationships with the Funds are reasonably related to the services provided by the Advisor to the Funds.
7. Conclusions
Based on their overall review, including their consideration of each of the factors referred to above (and others), the Board and the Independent Directors concluded that the Agreement is fair and reasonable to each Fund and its shareholders, that each Fund’s shareholders received reasonable value in return for the advisory fees and other amounts paid to the Advisor by each Fund, and that the renewal of the Agreement was in the best interests of each Fund and its shareholders.
99
TCW Funds, Inc.
Supplemental Information
Proxy Voting Guidelines
The policies and procedures that the Company uses to determine how to vote proxies are available without charge. The Board has delegated the Company’s proxy voting authority to the Advisor.
Disclosure of Proxy Voting Guidelines
The proxy voting guidelines of the Advisor are available:
| | 1. | By calling 800-FUND-TCW (800-386-3829) to obtain a hard copy; or |
| | 2. | By going to the SEC website at http://www.sec.gov. |
When the Company receives a request for a description of the Advisor’s proxy voting guidelines, it will deliver the description that is disclosed in the Company’s Statement of Additional Information. This information will be sent out via first class mail (or other means designed to ensure equally prompt delivery) within three business days of receiving the request.
The Advisor, on behalf of the Company, prepares and files Form N-PX with the SEC not later than August 31 of each year, which includes the Company’s proxy voting record for the most recent twelve-month period ended June 30 of that year. The Company’s proxy voting record for the most recent twelve-month period ended June 30 is available:
| | 1. | By calling 800-FUND-TCW (800-386-3829) to obtain a hard copy; or |
| | 2. | By going to the SEC website at http://www.sec.gov. |
When the Company receives a request for the Company’s proxy voting record, it will send the information disclosed in the Company’s most recently filed report on Form N-PX via first class mail (or other means designed to ensure equally prompt delivery) within three business days of receiving the request.
The Company also discloses its proxy voting record on its website as soon as is reasonably practicable after its report on Form N-PX is filed with the SEC.
Availability of Quarterly Portfolio Schedule
The Company files a complete schedule of its portfolio holdings with the SEC for the first and third quarters of its fiscal year on Form N-PORT-EX. Such filings occur no later than 60 days after the end of the Funds’ first and third quarters and are available on the SEC’s website at www.sec.gov.
100
TCW Funds, Inc.
Tax Information Notice (Unaudited)
Under Section 854(b)(2) of the Internal Revenue Code of 1986, as amended (the “Code”), the Funds hereby designate the following maximum amounts as qualified dividends for purposes of the maximum rate under Section 1(h)(11) of the Code for the fiscal year ended October 31, 2019 (amount in thousands):
| | | | |
Fund | | Qualified
Dividend Income | |
TCW Developing Markets Equity Fund | | $ | 66 | |
TCW Emerging Markets Multi-Asset Opportunities Fund | | $ | 704 | |
TCW International Small Cap Fund | | $ | 151 | |
The following is the dividend received deduction percentage for the Fund’s corporate shareholders:
| | | | |
Fund | | Qualified
Received Deductions | |
TCW Developing Markets Equity Fund | | | 5.04% | |
The following Funds paid foreign taxes during the year ended October 31, 2019 that are available as income tax credits:
| | | | |
Fund | | Foreign Tax Credit | |
TCW Developing Markets Equity Fund | | $ | 8 | |
TCW Emerging Markets Income Fund | | $ | 90 | |
TCW Emerging Markets Local Currency Income Fund | | $ | 175 | |
TCW Emerging Markets Multi-Asset Opportunities Fund | | $ | 91 | |
TCW International Small Cap Fund | | $ | 20 | |
This information is given to meet certain requirements of the Code and should not be used by shareholders for preparing their income tax returns. In February 2020, shareholders will receive Form 1099-DIV which will show the actual distribution received and include their share of qualified dividends during the calendar year of 2019. Shareholders are advised to check with their tax advisors for information on the treatment of these amounts on their individual tax returns.
101
TCW Funds, Inc.
Directors and Officers of the Company
A board of seven directors is responsible for overseeing the operations of the Company, which consists of 19 Funds at October 31, 2019. The directors of the Company, and their business addresses and their principal occupation for the last five years are set forth below.
Independent Directors
| | | | | | |
Name, and Year of Birth (1) | | Term of Office and Length of Time Served | | Principal Occupation(s) During Past 5 Years | | Other Directorships held by Director |
| Samuel P. Bell (1936) | | Mr. Bell has served as a director of TCW Funds, Inc. since October 2002. | | Private Investor. | | Point.360 (post production services); TCW Strategic Income Fund, Inc. (closed-end fund). |
Patrick C. Haden (1953) Chairman of the Board | | Mr. Haden has served as a director of TCW Funds, Inc. since May 2001. | | President (since 2003), Wilson Ave. Consulting (business consulting firm); Senior Advisor to President (July 2016 – June 2017) and Athletic Director (August 2010 – June 2016), University of Southern California. | | Tetra Tech, Inc. (environmental consulting); Auto Club (affiliate of AAA); Metropolitan West Funds (mutual fund); TCW Strategic Income Fund, Inc. (closed end fund). |
| Peter McMillan (1957) | | Mr. McMillan has served as a director of TCW Funds, Inc. since August 2010. | | Co-founder, Managing Partner and Chief Investment Officer (since May 2013), Temescal Canyon Partners (investment advisory firm); Co-founder and Executive Vice President (since 2005), KBS Capital Advisors (a manager of real estate investment trusts); Co-founder and Managing Partner (since 2000), Willowbrook Capital Group, LLC (investment advisory firm). | | KBS Real Estate Investment Trusts (real estate investments); KBS Strategic Opportunity REITS (real estate investments); Keppel-KBS U.S. REIT (real estate investments); Metropolitan West Funds (mutual funds); TCW Strategic Income Fund, Inc. (closed-end fund); TCW DL VII Financing LLC (business development company). |
| Victoria B. Rogers (1961) | | Ms. Rogers has served as a director of the TCW Funds, Inc. since October 2011. | | President and Chief Executive Officer (since 1996), The Rose Hills Foundation (charitable foundation). | | Causeway Capital Management Trust (mutual fund; 6 portfolios); Causeway ETML Trust (mutual fund); The Rose Hills Foundation (charitable foundation) TCW Strategic Income Fund, Inc. (closed-end fund); Norton Simon Museum (art museum); Stanford University (university). |
| Andrew Tarica (1959) | | Mr. Tarica has served as a director of the TCW Funds, Inc. since March 2012. | | Chief Executive Officer (since February 2001), Meadowbrook Capital Management (asset management company); and Employee (since 2003), Cowen Prime Services (broker dealer). | | Metropolitan West Funds (mutual fund); TCW Strategic Income Fund, Inc. (closed-end fund); TCW Direct Lending VII, LLC (business development company). |
| (1) | The address of each Independent Director is c/o Morgan, Lewis & Bockius LLP, Counsel to the Independent Directors, 300 South Grand Avenue 22nd Floor, Los Angeles, CA 90071. |
102
TCW Funds, Inc.
Interested Directors
These directors are “interested persons” of the Company as defined in the 1940 Act because they are directors and officers of the Advisor, and shareholders and directors of The TCW Group, Inc., the parent company of the Advisor.
| | | | | | |
Name and Year of Birth | | Term of Office and Length of Time Served | | Principal Occupation(s)
During Past 5 Years | | Other Directorships held by Director |
| Marc I. Stern (1944) | | Mr. Stern has served as a director of TCW Funds, Inc. since its inception in September 1992. | | Chairman (since January 2016), TCW LLC; Chairman (since February 2013), The TCW Group Inc., TCW Investment Management Company LLC, TCW Asset Management Company LLC and Metropolitan West Asset Management, LLC; Vice Chairman (November 2010 – December 2014) and Chairman (2014 – December 2015), Trust Company of the West. | | N/A |
David S. DeVito (1962) President and Chief Executive Officer | | Mr. DeVito has served as a director of TCW Funds, Inc. since January 2014 and as its President and Chief Executive Officer since January 2014. | | Executive Vice President and Chief Operating Officer (since January 2016), TCW LLC; Executive Vice President and Chief Operating Officer (since October 2013), TCW Investment Management Company LLC, The TCW Group, Inc., Metropolitan West Asset Management, LLC and TCW Asset Management Company LLC; President and Chief Executive Officer (since January 2014), TCW Strategic Income Fund, Inc.; Chief Financial Officer and Treasurer (since 2010), Metropolitan West Funds. | | TCW Strategic Income Fund, Inc. (closed-end fund) |
The officers of the Company who are not directors of the Company are:
| | | | |
| Name and Year of Birth | | Position(s) Held
with Company | | Principal Occupation(s)
During Past 5 Years (1) |
Lisa Eisen (1963) Tax Officer | | Ms. Eisen has served as Tax Officer of TCW Funds, Inc. since December 2016. | | Tax Officer (since December 2016), Metropolitan West Funds and TCW Strategic Income Fund, Inc.; Managing Director and Director of Tax (since August 2016), TCW LLC; Vice President of Corporate Tax and Payroll for Health Net, Inc. (1998 – July 2016). |
103
TCW Funds, Inc.
Directors and Officers of the Company (Continued)
| | | | |
| Name and Year of Birth | | Position(s) Held
with Company | | Principal Occupation(s)
During Past 5 Years (1) |
Meredith S. Jackson (1959) Senior Vice President, General Counsel and Secretary | | Ms. Jackson has served as Senior Vice President since January 2016 and General Counsel and Secretary of TCW Funds, Inc. since February 2013. | | Executive Vice President, General Counsel and Secretary (since January 2016), TCW LLC; Executive Vice President, General Counsel and Secretary (since February 2013), TCW Investment Management Company LLC, The TCW Group Inc., TCW Asset Management Company LLC, Metropolitan West Asset Management, LLC and Trust Company of the West (2013 – December 2015); Senior Vice President, General Counsel and Secretary (since February 2013), TCW Strategic Income Fund, Inc. and Metropolitan West Funds. |
Jeffrey Engelsman (1967) Chief Compliance Officer and AML Officer | | Mr. Engelsman has served as Chief Compliance Officer of TCW Funds, Inc. since September 2014 and AML Officer of TCW Funds, Inc. since December 2016. | | AML Officer (since December 2016), Metropolitan West Funds, and TCW Strategic Income Fund, Inc.; Managing Director and Global Chief Compliance Officer (since January 2016), TCW LLC; Chief Compliance Officer (since 2014), Metropolitan West Funds; , Metropolitan West Asset Management Company, LLC, and TCW Asset Management Company LLC (since August 2014) and Trust Company of the West (2014 – December 2015); Global Chief Compliance Officer (since September 2014), The TCW Group, Inc.; Chief Compliance Officer (since September 2014), TCW Strategic Income Fund, Inc.; Chief Compliance Officer (2009 – August 2014), MainStay Funds (mutual fund); Managing Director (2009 – July 2014), New York Life Investments (investment management). |
Richard M. Villa (1964) Treasurer, Principal Financial and Accounting Officer | | Mr. Villa has served as Treasurer and Principal Financial and Accounting Officer of TCW Funds, Inc. since February 2014. | | Managing Director, Chief Financial Officer and Assistant Secretary (since January 2016), TCW LLC; Treasurer and Principal Financial and Accounting Officer (since February 2014), TCW Strategic Income Fund, Inc.; Managing Director and Chief Financial Officer and Assistant Secretary (since July 2008), TCW Investment Management Company LLC, the TCW Group, Inc., TCW Asset Management Company LLC, Metropolitan West Asset Management, LLC and Trust Company of the West (2008 – December 2015). |
| (1) | Positions with The TCW Group, Inc. and its affiliates may have changed over time. |
| * | Address is 865 South Figueroa Street, 18th Floor, Los Angeles, California 90017 |
In addition, Eric Chan, Senior Vice President of Fund Operations for the Advisor, TCW Asset Management Company LLC, TCW LLC (since 2009), and Metropolitan West Asset Management, LLC (since November 2006), is Assistant Treasurer of the Company (since June 2019) and Metropolitan West Funds (since 2010).
104
TCW Funds, Inc.
Mr. Chan is a Certified Public Accountant. Patrick W. Dennis, Senior Vice President, Associate General Counsel and Assistant Secretary of TCW Asset Management Company LLC, Metropolitan West Asset Management, LLC, TCW LLC, the Advisor (since February 2013) and Trust Company of the West (February 2013 — December 2015), is Vice President and Assistant Secretary of the Company.
The SAI (Statement of Additional Information) has additional information regarding the Board of Directors. A copy is available without charge by calling 1-800-FUND-TCW (1-800-386-3829) to obtain a hard copy or by going to the SEC website at www.sec.gov. or the Company’s website at www.tcw.com.
105
TCW Funds, Inc.
865 South Figueroa Street
Los Angeles, California 90017
800 FUND TCW
(800 386 3829)
www.TCW.com
INVESTMENT ADVISOR
TCW Investment Management Company LLC
865 South Figueroa Street
Los Angeles, California 90017
TRANSFER AGENT
U.S. Bancorp Fund Services, LLC
615 E. Michigan Street
Milwaukee, Wisconsin 53202
INDEPENDENT REGISTERED PUBLIC ACCOUNTING FIRM
Deloitte & Touche LLP
555 West 5th Street
Los Angeles, California 90013
CUSTODIAN & ADMINISTRATOR
State Street Bank & Trust Company
One Lincoln Street
Boston, Massachusetts 02111
DISTRIBUTOR
TCW Funds Distributors LLC
865 South Figueroa Street
Los Angeles, California 90017
DIRECTORS
Patrick C. Haden
Director and Chairman of the Board
Samuel P. Bell
Director
David S. DeVito
Director
Peter McMillan
Director
Victoria B. Rogers
Director
Marc I. Stern
Director
Andrew Tarica
Director
OFFICERS
David S. DeVito
President and Chief Executive Officer
Meredith S. Jackson
Senior Vice President,
General Counsel and Secretary
Richard M. Villa
Treasurer and Principal Financial and Accounting Officer
Jeffrey A. Engelsman
Chief Compliance Officer and Anti-Money Laundering Officer
Patrick W. Dennis
Vice President and Assistant Secretary
Lisa Eisen
Tax Officer
Eric W. Chan
Assistant Treasurer
TCW FAMILY OF FUNDS
EQUITY FUNDS
TCW Artificial Intelligence Equity Fund
TCW Global Real Estate Fund
TCW New America Premier Equities Fund
TCW Relative Value Dividend Appreciation Fund
TCW Relative Value Large Cap Fund
TCW Relative Value Mid Cap Fund
TCW Select Equities Fund
ASSET ALLOCATION FUND
TCW Conservative Allocation Fund
FIXED INCOME FUNDS
TCW Core Fixed Income Fund
TCW Enhanced Commodity Strategy Fund
TCW Global Bond Fund
TCW High Yield Bond Fund
TCW Short Term Bond Fund
TCW Total Return Bond Fund
INTERNATIONAL FUNDS
TCW Developing Markets Equity Fund
TCW Emerging Markets Income Fund
TCW Emerging Markets Local Currency Income Fund
TCW Emerging Markets Multi-Asset Opportunities Fund
TCW International Small Cap Fund
FUNDarINT1019
| (a) | The Registrant has adopted a code of ethics that applies to its principal executive officer and principal financial officer or persons performing similar functions. |
| (b) | No disclosures are required by this Item 2(b). |
| (c) | The Registrant has made no material changes to its code of ethics. |
| (d) | The Registrant has not granted any waivers from any provisions of its code of ethics during the period covered by this Form N-CSR. |
| (f) | A copy of the Registrant’s code of ethics is filed as Exhibit 13(a)(1) to this Form N-CSR. |
| Item 3. | Audit Committee Financial Expert. |
| (a)(1) | The Registrant’s Board of Directors (the “Board”) has determined that the Registrant has two members serving on the Registrant’s Audit Committee that possess the attributes identified in Form N-CSR to qualify as an “audit committee financial expert.” |
| (a)(2) | The audit committee financial experts are Samuel P. Bell and Victoria B. Rogers. Each has been deemed to be “independent” as that term is defined in Form N-CSR. |
| Item 4. | Principal Accountant Fees and Services. |
The firm of Deloitte & Touche LLP (“Deloitte”) serves as the independent registered public accounting firm for the Registrant.
For the fiscal years ended October 31, 2019 and October 31, 2018, the aggregate fees billed for professional services rendered by Deloitte for the audit of the Registrant’s annual financial statements or for services that are normally provided by Deloitte in connection with statutory and regulatory filings or engagements were:
| | | | |
2019 | | 2018 | |
$538,478 | | $ | 538,478 | |
For the fiscal years October 31, 2019 and October 31, 2018, the aggregate fees billed for assurance and related services rendered by Deloitte that are reasonably related to the performance of the audit or review of the Registrant’s financial statements and that are not reported under Audit Fees above were:
[TCW to provide nature of the services comprising the fees disclosed under this category, if any for 2019]
For the fiscal years ended October 31, 2019 and October 31, 2018, the aggregate fees billed for tax compliance, tax advice and tax planning by Deloitte were:
| | | | |
2019 | | 2018 | |
$109,885 | | $ | 104,650 | |
[Fees were for the preparation and filing of the Registrant’s corporate returns.]
For the fiscal years ended October 31, 2019 and October 31, 2018, the aggregate fees billed by Deloitte to the Registrant for all services other than services reported under Audit Fees, Audit-Related Fees, and Tax Fees were:
| | | | |
2019 | | 2018 | |
$13,177 | | $ | 16,550 | |
[Fees were for Passive Foreign Investment Company analysis.]
| (e)(1) | The Registrant’s Audit Committee approves each specific service the auditor will perform for the Registrant. Accordingly, the Audit Committee has not established pre-approval policies or procedures for services that the auditor may perform for the Registrant. |
| (e)(2) | None of the services described in each of paragraphs (b) through (d) of this Item were approved by the Registrant’s Audit Committee pursuant to paragraph (c)(7)(i)(C) of Rule 2-01 of Regulation S-X. |
| (g) | For the fiscal years ended October 31, 2019 and October 31, 2018, aggregate non-audit fees billed by Deloitte for services rendered to the Registrant were: |
| | | | |
2019 | | 2018 | |
$123,062 | | $ | 121,200 | |
For the twelve month periods ended October 31, 2019 and October 31, 2018, aggregate non-audit fees billed by Deloitte for services rendered to the Registrant’s investment adviser and any entity controlling, controlled by or under common control with the investment adviser that provides ongoing services to the Registrant were $0 and $0, respectively.
| Item 5. | Audit Committee of Listed Registrants. |
Not applicable.
| (a) | The Schedule of Investments is included as part of the Report to Shareholders filed under Item 1 of this Form N-CSR. |
| Item 7. | Disclosure of Proxy Voting Policies and Procedures for Closed-End Management Investment Companies. |
Not applicable.
| Item 8. | Portfolio Managers of Closed-End Management Investment Companies. |
Not applicable.
| Item 9. | Purchases of Equity Securities by Closed-End Management Investment Company and Affiliated Purchasers. |
Not applicable.
| Item 10. | Submission of Matters to a Vote of Security Holders. |
There have been no material changes to the procedures by which shareholders may recommend nominees to the Registrant’s Board of Directors.
| Item 11. | Controls and Procedures. |
| (a) | The Chief Executive Officer and Principal Financial and Accounting Officer have concluded that the Registrant’s disclosure controls and procedures (as defined in Rule 30a-3(c) under the Investment Company Act of 1940, as amended (the “1940 Act”)) provide reasonable assurances that material information relating to the Registrant is made known to them by the appropriate persons as of a date within 90 days of the filing date of this report, based on their evaluation of these controls and procedures required by Rule 30a-3(b) under the 1940 Act and 15d-15(b) under the Securities Exchange Act of 1934, as amended. |
| (b) | There were no changes in the Registrant’s internal control over financial reporting (as defined in Rule 30a-3(d) under the 1940 Act) that occurred during the period covered by this report that have materially affected, or are reasonably likely to materially affect, the Registrant’s internal control over financial reporting. |
| Item 12. | Disclosure of Securities Lending Activities for Closed-End Management Investment Companies. |
Not applicable.
| (a)(1) | Code of Ethics referred to in Item 2 is filed herewith. |
| (a)(2) | The certifications required by Rule 30a-2(a) of the 1940 Act and Section 302 of the Sarbanes-Oxley Act of 2002 (“Sarbanes-Oxley Act”) are filed herewith. |
| (b) | The certifications required by Rule 30a-2(b) of the 1940 Act and Section 906 of the Sarbanes-Oxley Act are filed herewith. |
SIGNATURES
Pursuant to the requirements of the Securities Exchange Act of 1934, as amended, and the Investment Company Act of 1940, as amended, the Registrant has duly caused this report to be signed on its behalf by the undersigned, thereunto duly authorized.
| | | | |
| (Registrant) | | TCW Funds, Inc. | | |
| | |
| By (Signature and Title) | | | | |
| | /s/ David S. DeVito | | |
| | David S. DeVito | | |
| | President and Chief Executive Officer | | |
| | |
| Date | | December 31, 2019 | | |
Pursuant to the requirements of the Securities Exchange Act of 1934, as amended, and the Investment Company Act of 1940, as amended, this report has been signed below by the following persons on behalf of the Registrant and in the capacities and on the dates indicated.
| | | | |
| By (Signature and Title) | | | | |
| | /s/ David S. DeVito | | |
| | David S. DeVito | | |
| | President and Chief Executive Officer | | |
| | |
| Date | | December 31, 2019 | | |
| | | | |
| By (Signature and Title) | | | | |
| | /s/ Richard M. Villa | | |
| | Richard M. Villa | | |
| | Treasurer and Principal Financial and Accounting Officer | | |
| | |
| Date | | December 31, 2019 | | |